Análisis para el Intel Core i5-1135G7 procesador
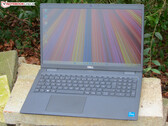
Análisis de Dell Latitude 3520: El portátil de oficina Core i5 ofrece una buena autonomía
El 15.6 incher de Dell ofrece un procesador Tiger Lake, tasas de emisión moderadas y buena duración de batería. El sistema operativo es Windows 10 Pro (se puede actualizar a Windows 11).
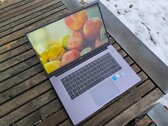
Intel Core i5-1135G7, Iris Xe G7 80EUs, 15.6", 1.8 kgAnálisis del portátil Huawei MateBook D 15 Intel: Corredor silencioso y económico
El portátil de oficina Huawei MateBook D 15 convence con un bajo precio de 549 Euros, sigue siendo excepcionalmente silencioso con un alto rendimiento de sistema, y ofrece una elegante carcasa de metal con una pantalla IPS mate suficientemente brillante. El teclado y el touchpad del portátil de 15.6 pulgadas también convencen, pero la rápida RAM LPDDR4X no es ampliable.
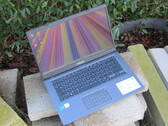
Intel Core i5-1135G7, Iris Xe G7 80EUs, 15.6", 1.5 kgAnálisis del Asus F415EA: Portátil de oficina Core i5 frío y silencioso
El Asus F415EA de 14 pulgadas cuenta con un procesador Tiger Lake, apenas se calienta y hace muy poco ruido. La pantalla FHD instalada, sin embargo, resulta ser una elección equivocada.
Intel Core i5-1135G7, Iris Xe G7 80EUs, 14", 1.6 kgAnálisis del Huawei MateBook D 14: Portátil de oficina silencioso y con una batería de larga duración
El portátil de 14 pulgadas de Huawei incluye un procesador Tiger Lake, trae una elegante carcasa metálica, hace poco ruido y ofrece una batería de larga duración. En el momento de nuestra prueba, el paquete completo está disponible a partir de 600 Euros.
Intel Core i5-1135G7, Iris Xe G7 80EUs, 14", 1.4 kgAnálisis del Ace Magician TK11-A0: Mini PC eficiente con Thunderbolt 4 y características útiles adicionales
Bajo la etiqueta Ace Magician TK11-A0, Minipc Union ofrece un moderno PC de oficina para muchos escenarios de uso. Descubre el rendimiento de este SoC de Tiger Lake en este detallado análisis con numerosas mediciones y pruebas de rendimiento.
Intel Core i5-1135G7, Iris Xe G7 96EUs, 586 gLenovo IdeaPad 5 Pro 14ITL6: Intel Iris Xe Graphics G7 80EUs, 14.00", 1.4 kg
análise » Análisis del Lenovo IdeaPad 5 Pro 14ITL6: un portátil de 14 pulgadas de gran calidad
HP Envy 14-eb0252ng: Intel Iris Xe Graphics G7 80EUs, 14.00", 1.5 kg
análise » Análisis del portátil HP Envy 14: Un todoterreno de éxito
Microsoft Surface Laptop Go 2 Core i5: Intel Iris Xe Graphics G7 80EUs, 12.40", 1.1 kg
análise » Análisis del Microsoft Surface Laptop Go 2: compañero compacto con hardware antiguo
LG Gram 14T90P: Intel Iris Xe Graphics G7 80EUs, 14.00", 1.2 kg
análise » Análisis del convertible LG Gram 14T90P: El aspirante al Lenovo Yoga y al HP Spectre
Dell Latitude 5320-TM4V2: Intel Iris Xe Graphics G7 80EUs, 13.30", 1.3 kg
análise » Latitude 5320 en revisión: Dell estropea el reemplazo del ratón
Samsung Galaxy Book Pro 360 15 NP950QDB-KC3DE: Intel Iris Xe Graphics G7 80EUs, 15.60", 1.4 kg
análise » Análisis del Samsung Galaxy Book Pro 360 de 15 pulgadas convertible: mayor tamaño y potencia
Acer Extensa 15 EX215-54-5103: Intel Iris Xe Graphics G7 80EUs, 15.60", 1.9 kg
análise » Análisis del Acer Extensa 15 EX215-54: Potencia del Core i5 por poco dinero
Acer Swift 3 SF314-511-54ZK: Intel Iris Xe Graphics G7 80EUs, 14.00", 1.2 kg
análise » Análisis del Acer Swift 3 SF314: El portátil supera la prueba con éxito
Acer TravelMate P4 TMP414-51-59MR: Intel Iris Xe Graphics G7 80EUs, 14.00", 1.4 kg
análise » Análisis del Acer TravelMate P4: Corredor de resistencia empresarial con Thunderbolt 4
Dell Latitude 14 5420-D2G5W: Intel Iris Xe Graphics G7 80EUs, 14.00", 1.5 kg
análise » Análisis del Dell Latitude 14 5420: Un portátil que está muy cerca de conquistar la corona empresarial
Dell Inspiron 15 3000 3511: Intel Iris Xe Graphics G7 80EUs, 15.60", 1.7 kg
análise » Análisis del portátil Dell Inspiron 15 3000 3511: Hacer más barato es mejor
HP Pavilion 14-dv0357ng: Intel Iris Xe Graphics G7 80EUs, 14.00", 1.4 kg
análise » Análisis del portátil HP Pavilion 14: Un dispositivo bien pensado, un exterior atractivo
Beelink GTI 11: Intel Iris Xe Graphics G7 80EUs, 0.6 kg
análise » Nuestra mejor alternativa al Intel NUC 11: Análisis del mini PC Beelink GTI 11
Lenovo ThinkPad L14 G2-20X1003WGE: Intel Iris Xe Graphics G7 80EUs, 14.00", 1.7 kg
análise » Análisis del Lenovo ThinkPad L14 G2: Bueno incluso con Intel
Asus ExpertBook B1 B1400CEAE, i5-1135G7: Intel Iris Xe Graphics G7 80EUs, 14.00", 1.5 kg
análise » Análisis del Asus ExpertBook B1 B1400: Pequeño, ligero y asequible
Asus ExpertBook B1 B1500CEAE, i5-1135G7: Intel Iris Xe Graphics G7 80EUs, 15.60", 1.7 kg
análise » Análisis del Asus ExpertBook B1 B1500: Muchos puertos en el portátil de negocios
Asus ExpertBook B5 Flip B5302FEA: Intel Iris Xe Graphics G7 80EUs, 13.30", 1.3 kg
análise » Análisis del Asus ExpertBook B5 Flip: Convertible compacto y resistente ideal para la universidad, la oficina y el sofá
Lenovo Yoga Slim 7 14ITL05 82A300CNGE: Intel Iris Xe Graphics G7 80EUs, 14.00", 1.4 kg
análise » Análisis del Lenovo Yoga Slim 7 14ITL05: Un portátil de 14 pulgadas silencioso y resistente
Dynabook Tecra A40-J-12E: Intel Iris Xe Graphics G7 80EUs, 14.00", 1.4 kg
análise » Análisis del Dynabook Tecra A40: Un susurro en la oficina...
Gateway GWTN141-10GR: Intel Iris Xe Graphics G7 80EUs, 14.10", 1.6 kg
análise » Reseña del portátil Gateway GWTN141 de Walmart: Un potencial punto dulce de 500 dólares
LG Gram 17Z90P-G.AA56G: Intel Iris Xe Graphics G7 80EUs, 17.00", 1.4 kg
análise » Análisis del LG Gram 17Z90P: Ligero y flexible con pantalla 16:10
Fujitsu LifeBook U7311 i5: Intel Iris Xe Graphics G7 80EUs, 13.30", 1.2 kg
análise » Análisis del portátil Fujitsu LifeBook U7311: Un montón de puertos...
HP Envy 17-cg: NVIDIA GeForce MX450, 17.30", 2.7 kg
análise » Análisis del HP Envy 17 cg1356ng: Un gran portátil multimedia
HP Pavilion x360 14-dy0157ng: Intel Iris Xe Graphics G7 80EUs, 14.00", 1.5 kg
análise » Análisis de HP Pavilion x360 14 (2021): El portátil 2 en 1 admite entrada de lápiz y Power Delivery
Dell Inspiron 13 5301-0D0XN: Intel Iris Xe Graphics G7 80EUs, 13.30", 1.1 kg
análise » Análisis del Dell Inspiron 13 5301: Subportátil elegante y compacto, pero...
HP Pavilion x360 15-er0155ng: Intel Iris Xe Graphics G7 80EUs, 15.60", 1.8 kg
análise » Análisis del portátil 2 en 1 HP Pavilion x360 de 15 pulgadas (2021): Pantalla tenue, precio elevado
Samsung Galaxy Book NP750XDA: Intel Iris Xe Graphics G7 80EUs, 15.60", 1.6 kg
análise » Galaxy Book (2021) en revisión: El portátil asequible de Samsung para usuarios de oficina
Honor MagicBook 15 i5 1135G7: Intel Iris Xe Graphics G7 80EUs, 15.60", 1.5 kg
análise » Honor Análisis del MagicBook 15 (2021) - El cambio a Intel es innecesariamente caro
Acer Spin 3 SP313-51N-56YV: Intel Iris Xe Graphics G7 80EUs, 13.30", 1.4 kg
análise » Análisis del convertible Acer Spin 3 SP313-51N: Un buen todoterreno con puntos débiles
Samsung Galaxy Book Pro 360 13: Intel Iris Xe Graphics G7 80EUs, 13.20", 1.1 kg
análise » Samsung Galaxy Book Pro 360 13" en revisión: La nueva clase empresarial de Samsung para los convertibles
Asus VivoBook Flip 14 TP470EZ: Intel Iris Xe MAX Graphics, 14.00", 1.5 kg
análise » Análisis del Asus VivoBook Flip 14 TP470EZ Convertible: Un buen todoterreno con el Iris Xe Max como talón de Aquiles
Dell XPS 13 9305 Core i5 FHD: Intel Iris Xe Graphics G7 80EUs, 13.30", 1.2 kg
análise » Revisión del portátil Dell XPS 13 9305 Core i5 Full HD: Menos pantalla, mejores colores
HP Spectre x360 13-aw2003dx: Intel Iris Xe Graphics G7 80EUs, 13.30", 1.2 kg
análise » Análisis del HP Spectre x360 13 convertible de 11ª generación de Intel: La prueba de que el OLED no lo es todo
Acer TravelMate Spin P4 TMP414RN-51-53J8: Intel Iris Xe Graphics G7 80EUs, 14.00", 1.4 kg
análise » Análisis del portátil Acer TravelMate Spin P4: modelo comercial con Thunderbolt 4
Lenovo ThinkPad L13 Yoga Gen2-20VK000VGE: Intel Iris Xe Graphics G7 80EUs, 13.30", 1.5 kg
análise » Análisis del portátil Lenovo ThinkPad L13 Yoga Gen 2: Convertible de negocios ahora con Tiger Lake
Lenovo ThinkBook 15 Gen2 ITL: Intel Iris Xe Graphics G7 80EUs, 15.60", 1.8 kg
análise » Análisis del portátil Lenovo ThinkBook 15 Gen2: Portátil asequible Tiger Lake
Intel NUC11TNKi5: Intel Iris Xe Graphics G7 80EUs, 0.5 kg
análise » Reseña del Intel NUC11TNKi5 Pro Mini Tiger Canyon: El NUC más pequeño Tiger Lake
Schenker VIA 14 Late 2020: Intel Iris Xe Graphics G7 80EUs, 14.00", 1.1 kg
análise » Reseña del portátil VIA 14 de Schenker: Un ultrabook ligero de magnesio con una duración de batería extremadamente larga
Lenovo ThinkBook 14 G2 ITL 20VD008WGE: Intel Iris Xe Graphics G7 80EUs, 14.00", 1.5 kg
análise » Análisis del Lenovo ThinkBook 14 Gen 2 Tiger Lake: Portátil de oficina con poca resistencia
Acer Swift 5 SF514-55T-58DN: Intel Iris Xe Graphics G7 80EUs, 14.00", 1 kg
análise » Análisis del portátil Acer Swift 5 SF514-55T: Un todoterreno delgado con base EVO
Microsoft Surface Pro 7 Plus: Intel Iris Xe Graphics G7 80EUs, 12.30", 0.8 kg
análise » Análisis de la Microsoft Surface Pro 7 Plus: Tiger Lake proporciona un aumento de rendimiento
HP Envy 14-eb0010nr: NVIDIA GeForce GTX 1650 Ti Max-Q, 14.00", 1.6 kg
análise » 2021 Análisis del portátil HP Envy 14: Tiger Lake, 16:10 y GeForce GTX 1650 Ti Max-Q All-In-One
Acer Aspire 5 A515-56-511A: Intel Iris Xe Graphics G7 80EUs, 15.60", 1.9 kg
análise » Análisis del Acer Aspire 5 A515: Un vistazo a un portátil de Tiger Lake
Lenovo ThinkPad L13 Gen2-20VH0017GE: Intel Iris Xe Graphics G7 80EUs, 13.30", 1.4 kg
análise » Revisión del portátil Lenovo ThinkPad L13 Gen 2: Ultraportátil elegante ahora con Intel Tiger Lake
GPD Win 3: Intel Iris Xe Graphics G7 80EUs, 5.50", 0.6 kg
análise » GPD gana la revisión de 3: El cambio no oficial de Microsoft
Lenovo ThinkBook 13s-ITL-20V90003GE: Intel Iris Xe Graphics G7 80EUs, 13.30", 1.3 kg
análise » Los ThinkBook 13 de Lenovo en revisión: Duración o rendimiento de la batería? Tú decides.
Schenker XMG Core 14: NVIDIA GeForce GTX 1650 Mobile, 14.00", 1.4 kg
análise » Revisión del portátil Schenker XMG Core 14 (Clevo NV40MB): bebé jugador
Dell Inspiron 15 7506 2-in-1 P97F: Intel Iris Xe Graphics G7 80EUs, 15.60", 1.8 kg
análise » Dell Inspiron 15 7506 2-in-1 Convertible Review: Fácil de usar, fácil de poseer
Lenovo Yoga 9i 14ITL5: Intel Iris Xe Graphics G7 80EUs, 14.00", 1.4 kg
análise » Revisión del convertible de Lenovo Yoga 9i 14: El Yoga C940 Twin
Lenovo Yoga 7 14ITL5: Intel Iris Xe Graphics G7 80EUs, 14.00", 1.5 kg
análise » Review de la computadora portátil Tiger Lake Lenovo Yoga 7i de 14 pulgadas: Debut del Core i5-1135G7
Asus ZenBook Flip 14 UP5401EA, i5-1135G7: Intel Iris Xe Graphics G7 80EUs, 14.00", 1.4 kg
análise externo » Asus ZenBook Flip 14 UP5401EA, i5-1135G7
Honor MagicBook X 15 2022, i5-1135G7: Intel Iris Xe Graphics G7 80EUs, 15.60", 1.6 kg
análise externo » Honor MagicBook X 15 2022, i5-1135G7
Acer Extensa 15 EX215-54-57VY: Intel Iris Xe Graphics G7 80EUs, 15.60", 1.9 kg
análise externo » Acer Extensa 15 EX215-54-57VY
Asus VivoBook 15 F1500EA, i5-1135G7: Intel Iris Xe Graphics G7 80EUs, 15.60", 1.8 kg
análise externo » Asus VivoBook 15 F1500EA, i5-1135G7
Asus Vivobook 14 F1400EA-EB1837W: Intel Iris Xe Graphics G7 80EUs, 14.00", 1.6 kg
análise externo » Asus Vivobook 14 F1400EA-EB1837W
Dell Vostro 15 3500, i5-1135G7 iGPU: Intel Iris Xe Graphics G7 80EUs, 15.60", 1.8 kg
análise externo » Dell Vostro 15 3500, i5-1135G7 iGPU
Asus Vivobook 14 F1400EA-EB1517W: Intel Iris Xe Graphics G7 80EUs, 14.00", 1.6 kg
análise externo » Asus Vivobook 14 F1400EA-EB1517W
Asus Vivobook Flip 14 TP470EA-EC384W: Intel Iris Xe Graphics G7 80EUs, 14.00", 1.5 kg
análise externo » Asus Vivobook Flip 14 TP470EA-EC384W
Acer TravelMate P2 TMP214-53-53VY: Intel Iris Xe Graphics G7 80EUs, 14.00", 1.6 kg
análise externo » Acer TravelMate P2 TMP214-53-53VY
Fujitsu CH 13 4ZR1C22927: Intel Iris Xe Graphics G7 80EUs, 13.30", 1 kg
análise externo » Fujitsu CH 13 4ZR1C22927
Asus ExpertBook P1 P1512CEA-EJ0213: Intel Iris Xe Graphics G7 80EUs, 15.60", 1.8 kg
análise externo » Asus ExpertBook P1 P1512CEA-EJ0213
Asus Vivobook 14 F1400EA-EB1648 : Intel Iris Xe Graphics G7 80EUs, 14.00", 1.6 kg
análise externo » Asus Vivobook 14 F1400EA-EB1648
Asus VivoBook 15 F515EA-EJ2079W: Intel Iris Xe Graphics G7 80EUs, 15.60", 1.8 kg
análise externo » Asus VivoBook 15 F515EA-EJ2079W
Monster Huma H5 V3.1: Intel Iris Xe Graphics G7 80EUs, 15.60", 1.7 kg
análise externo » Monster Huma H5 V3.1
Asus VivoBook 15 K513EA-L12891W: Intel Iris Xe Graphics G7 80EUs, 15.60", 1.8 kg
análise externo » Asus VivoBook 15 K513EA-L12891W
Asus Vivobook 14 K413EA-EB1156T: Intel Iris Xe Graphics G7 80EUs, 14.00", 1.4 kg
análise externo » Asus Vivobook 14 K413EA-EB1156T
Lenovo ThinkPad E14 Gen2-20TA00HKSP: Intel Iris Xe Graphics G7 80EUs, 14.00", 1.6 kg
análise externo » Lenovo ThinkPad E14 Gen2-20TA00HKSP
Acer Aspire 3 A315-58-54JJ: Intel Iris Xe Graphics G7 80EUs, 15.60", 1.7 kg
análise externo » Acer Aspire 3 A315-58-54JJ
HP 15s-fq2708nd: Intel Iris Xe Graphics G7 80EUs, 15.60", 1.7 kg
análise externo » HP 15s-fq2708nd
Acer Aspire 3 A315-58-57F6: Intel Iris Xe Graphics G7 80EUs, 15.60", 1.7 kg
análise externo » Acer Aspire 3 A315-58-57F6
Asus VivoBook 14 X415EA-EB1703W: Intel Iris Xe Graphics G7 80EUs, 14.10", 1.6 kg
análise externo » Asus VivoBook 14 X415EA-EB1703W
Intel NUC M15 LAPBC510: Intel Iris Xe Graphics G7 80EUs, 15.60", 1.7 kg
análise externo » Intel NUC M15 LAPBC510
Asus Vivobook 14 F415EA-EK1255W: Intel Iris Xe Graphics G7 80EUs, 14.00", 1.6 kg
análise externo » Asus Vivobook 14 F415EA-EK1255W
HP Envy 13-ba1009ns: Intel Iris Xe Graphics G7 80EUs, 13.30", 1.3 kg
análise externo » HP Envy 13-ba1009ns
Lenovo ThinkPad P14s G2 20VX00A7GE: NVIDIA T500 Laptop GPU, 14.00", 1.4 kg
análise externo » Lenovo ThinkPad P14s G2 20VX00A7GE
Lenovo IdeaPad 5 Pro 14ITL6: Intel Iris Xe Graphics G7 80EUs, 14.00", 1.4 kg
análise externo » Lenovo IdeaPad 5 Pro 14ITL6
Asus VivoBook 15 X515EA-BQ943T: Intel Iris Xe Graphics G7 80EUs, 15.60", 1.8 kg
análise externo » Asus VivoBook 15 X515EA-BQ943T
Lenovo IdeaPad 3 14ITL6-9QSP: Intel Iris Xe Graphics G7 80EUs, 14.10", 1.4 kg
análise externo » Lenovo IdeaPad 3 14ITL6-9QSP
Lenovo V14 G2 ITL-82KA001KSP: Intel Iris Xe Graphics G7 80EUs, 14.00", 1.6 kg
análise externo » Lenovo V14 G2 ITL-82KA001KSP
Asus VivoBook 14 K413EA-EB362T: Intel Iris Xe Graphics G7 80EUs, 14.00", 1.4 kg
análise externo » Asus VivoBook 14 K413EA-EB362T
HP Pavilion x360 14-dy0018ns: Intel Iris Xe Graphics G7 80EUs, 14.00", 1.8 kg
análise externo » HP Pavilion x360 14-dy0018ns
HP Envy x360 13-bd0018na: Intel Iris Xe Graphics G7 80EUs, 13.30", 1.3 kg
análise externo » HP Envy x360 13-bd0018na
LG Gram 14T90P: Intel Iris Xe Graphics G7 80EUs, 14.00", 1.2 kg
análise externo » LG Gram 14T90P
Microsoft Surface Laptop Go 2 Core i5: Intel Iris Xe Graphics G7 80EUs, 12.40", 1.1 kg
análise externo » Microsoft Surface Laptop Go 2 Core i5
Dynabook Satellite Pro C40-J-11I: Intel Iris Xe Graphics G7 80EUs, 14.00", 1.6 kg
análise externo » Dynabook Satellite Pro C40-J-11I
Acer TravelMate P4 TMP414-51-59MR: Intel Iris Xe Graphics G7 80EUs, 14.00", 1.4 kg
análise externo » Acer TravelMate P4 TMP414-51-59MR
Asus Expertbook B5 B5302C, i5-1135G7: Intel Iris Xe Graphics G7 80EUs, 13.30", 1.2 kg
análise externo » Asus Expertbook B5 B5302C, i5-1135G7
Acer Swift 3 SF314-59-50MZ: Intel Iris Xe Graphics G7 80EUs, 14.00", 1.2 kg
análise externo » Acer Swift 3 SF314-59-50MZ
Asus Vivobook 14 X413EA-EK1338T: Intel Iris Xe Graphics G7 80EUs, 14.00", 1.4 kg
análise externo » Asus Vivobook 14 X413EA-EK1338T
Asus Vivobook 14 F415EA-EK1005W: Intel Iris Xe Graphics G7 80EUs, 14.00", 1.6 kg
análise externo » Asus Vivobook 14 F415EA-EK1005W
Asus VivoBook 14 K413EA-EK231T: Intel Iris Xe Graphics G7 80EUs, 14.00", 1.4 kg
análise externo » Asus VivoBook 14 K413EA-EK231T
Acer Aspire 5 A514-54-501Z: Intel Iris Xe Graphics G7 80EUs, 14.00", 1.6 kg
análise externo » Acer Aspire 5 A514-54-501Z
Asus VivoBook 15 K513EA-AB54: Intel Iris Xe Graphics G7 80EUs, 15.60", 1.8 kg
análise externo » Asus VivoBook 15 K513EA-AB54
Dell Vostro 13 5301-V078G: Intel Iris Xe Graphics G7 80EUs, 13.30", 1.1 kg
análise externo » Dell Vostro 13 5301-V078G
Acer Chromebook Spin 713 CP713-3W-5102: NVIDIA GeForce MX330, 13.50", 1.4 kg
análise externo » Acer Chromebook Spin 713 CP713-3W-5102
Lenovo ThinkPad L15 G2-20X300P0GE: Intel Iris Xe Graphics G7 80EUs, 15.60", 2 kg
análise externo » Lenovo ThinkPad L15 G2-20X300P0GE
Acer Aspire 5 A517-52G-59GP: NVIDIA GeForce MX450, 17.30", 2.6 kg
análise externo » Acer Aspire 5 A517-52G-59GP
Acer Aspire 3 A317-53-58F1: Intel Iris Xe Graphics G7 80EUs, 17.30", 2.6 kg
análise externo » Acer Aspire 3 A317-53-58F1
HP ZBook Firefly 14 G8-2C9Q8EA: Intel Iris Xe Graphics G7 80EUs, 14.00", 1.4 kg
análise externo » HP ZBook Firefly 14 G8-2C9Q8EA
Asus ExpertBook B3 Flip B3402FEA-EC0048R: Intel Iris Xe Graphics G7 80EUs, 14.00", 1.6 kg
análise externo » Asus ExpertBook B3 Flip B3402FEA-EC0048R
Acer Swift 3 SF314-511-54ZK: Intel Iris Xe Graphics G7 80EUs, 14.00", 1.2 kg
análise externo » Acer Swift 3 SF314-511-54ZK
Asus VivoBook 15 X513EA-BQ003T: Intel Iris Xe Graphics G7 80EUs, 15.60", 1.8 kg
análise externo » Asus VivoBook 15 X513EA-BQ003T
MSI Modern 15 A11MU-619XES: Intel Iris Xe Graphics G7 80EUs, 15.60", 1.6 kg
análise externo » MSI Modern 15 A11MU-619XES
HP Envy x360 13-bd0055nf: Intel Iris Xe Graphics G7 80EUs, 13.30", 1.3 kg
análise externo » HP Envy x360 13-bd0055nf
HP 15s-fq2079ns: Intel Iris Xe Graphics G7 80EUs, 15.60", 1.7 kg
análise externo » HP 15s-fq2079ns
Medion Akoya S15449-MD62127: Intel Iris Xe Graphics G7 80EUs, 15.60", 1.8 kg
análise externo » Medion Akoya S15449-MD62127
Asus Chromebook Flip CX5 CX5500FEA-E60030: Intel Iris Xe Graphics G7 80EUs, 15.60", 2 kg
análise externo » Asus Chromebook Flip CX5 CX5500FEA-E60030
HP 17-cn0025nr: Intel Iris Xe Graphics G7 80EUs, 17.30", 2.1 kg
análise externo » HP 17-cn0025nr
HP 15s-fq2016sa: Intel Iris Xe Graphics G7 80EUs, 15.60", 1.7 kg
análise externo » HP 15s-fq2016sa
Dynabook Tecra A50-J-18Z: Intel Iris Xe Graphics G7 80EUs, 15.60", 1.7 kg
análise externo » Dynabook Tecra A50-J-18Z
Lenovo ThinkPad X1 Yoga G6-20XY003GGE: Intel Iris Xe Graphics G7 80EUs, 14.00", 1.4 kg
análise externo » Lenovo ThinkPad X1 Yoga G6-20XY003GGE
HP 470 G8-3S8S1EA: Intel Iris Xe Graphics G7 80EUs, 17.30", 2.1 kg
análise externo » HP 470 G8-3S8S1EA
HP ProBook 430 G8-2W1H2EA: Intel Iris Xe Graphics G7 80EUs, 13.30", 1.4 kg
análise externo » HP ProBook 430 G8-2W1H2EA
Lenovo V17 G2 ITL-82NX00EBMH: Intel Iris Xe Graphics G7 80EUs, 17.30", 2.2 kg
análise externo » Lenovo V17 G2 ITL-82NX00EBMH
Asus VivoBook 15 K513EA-L11430T: Intel Iris Xe Graphics G7 80EUs, 15.60", 1.7 kg
análise externo » Asus VivoBook 15 K513EA-L11430T
MSI Modern 14 B11SB, i5-1135G7 MX450: NVIDIA GeForce MX450, 14.00", 1.3 kg
análise externo » MSI Modern 14 B11SB, i5-1135G7 MX450
Medion Akoya E16401-MD62290: Intel Iris Xe Graphics G7 80EUs, 16.10", 2 kg
análise externo » Medion Akoya E16401-MD62290
Lenovo ThinkBook 15 Gen2 ITL: Intel Iris Xe Graphics G7 80EUs, 15.60", 1.8 kg
análise externo » Lenovo ThinkBook 15 Gen2 ITL
Asus ExpertBook B1 B1500CEAE, i5-1135G7: Intel Iris Xe Graphics G7 80EUs, 15.60", 1.7 kg
análise externo » Asus ExpertBook B1 B1500CEAE, i5-1135G7
Asus VivoBook S15 S533EA-L11012T: Intel Iris Xe Graphics G7 80EUs, 15.60", 1.8 kg
análise externo » Asus VivoBook S15 S533EA-L11012T
Asus Zenbook 14X UX5400EG, i5-1135G7: NVIDIA GeForce MX450, 14.00", 1.4 kg
análise externo » Asus Zenbook 14X UX5400EG, i5-1135G7
Asus VivoBook Flip 14 TP470EA-EC084T: Intel Iris Xe Graphics G7 80EUs, 14.00", 1.5 kg
análise externo » Asus VivoBook Flip 14 TP470EA-EC084T
Medion Akoya S15449-MD62034: Intel Iris Xe Graphics G7 80EUs, 15.60", 1.9 kg
análise externo » Medion Akoya S15449-MD62034
HP Chromebook x360 14c-cc0025no: Intel Iris Xe Graphics G7 80EUs, 14.00", 1.7 kg
análise externo » HP Chromebook x360 14c-cc0025no
Acer Chromebook Spin 713 CP713-3W-503Z: Intel Iris Xe Graphics G7 80EUs, 13.50", 1.4 kg
análise externo » Acer Chromebook Spin 713 CP713-3W-503Z
HP Envy 13-ba1013na: Intel Iris Xe Graphics G7 80EUs, 13.30", 1.3 kg
análise externo » HP Envy 13-ba1013na
Asus ExpertBook B5 Flip B5302FEA: Intel Iris Xe Graphics G7 80EUs, 13.30", 1.3 kg
análise externo » Asus ExpertBook B5 Flip B5302FEA
Asus VivoBook S14 S433EA-AM464T: Intel Iris Xe Graphics G7 80EUs, 14.00", 1.4 kg
análise externo » Asus VivoBook S14 S433EA-AM464T
Asus VivoBook Flip 14 TP470EA-EC163T: Intel Iris Xe Graphics G7 80EUs, 14.00", 1.5 kg
análise externo » Asus VivoBook Flip 14 TP470EA-EC163T
Alldocube iWork GT i5: Intel Iris Xe Graphics G7 80EUs, 10.95", 0.6 kg
análise externo » Alldocube iWork GT i5
Acer Aspire 5 A515-56-572C: Intel Iris Xe Graphics G7 80EUs, 15.60", 1.9 kg
análise externo » Acer Aspire 5 A515-56-572C
Acer Swift 3 SF314-511-58NS: Intel Iris Xe Graphics G7 80EUs, 14.00", 1.2 kg
análise externo » Acer Swift 3 SF314-511-58NS
HP 15-dy2024nr: Intel Iris Xe Graphics G7 80EUs, 15.60", 1.7 kg
análise externo » HP 15-dy2024nr
Asus Chromebook Flip CX5 CX5500FEA-E60025: Intel UHD Graphics Xe G4 48EUs, 15.60", 2 kg
análise externo » Asus Chromebook Flip CX5 CX5500FEA-E60025
HP Envy x360 15-ed1016ur: Intel Iris Xe Graphics G7 80EUs, 15.60", 1.9 kg
análise externo » HP Envy x360 15-ed1016ur
Asus Chromebook Flip CX5 CX5500FEA-E60038: Intel Iris Xe Graphics G7 80EUs, 15.60", 2 kg
análise externo » Asus Chromebook Flip CX5 CX5500FEA-E60038
Dell Latitude 15 3520-7D36T: Intel Iris Xe Graphics G7 80EUs, 15.60", 1.8 kg
análise externo » Dell Latitude 15 3520-7D36T
Lenovo IdeaPad Flex 5 CB 13ITL6-82M70028GE: Intel Iris Xe Graphics G7 80EUs, 13.30", 1.6 kg
análise externo » Lenovo IdeaPad Flex 5 CB 13ITL6-82M70028GE
Lenovo IdeaPad Slim 5 Pro 14ITL6-82L3009LIN: Intel Iris Xe Graphics G7 80EUs, 14.00", 1.4 kg
análise externo » Lenovo IdeaPad Slim 5 Pro 14ITL6-82L3009LIN
Asus Chromebook CX9400, i5-1135G7: Intel Iris Xe Graphics G7 80EUs, 14.00", 1.1 kg
análise externo » Asus Chromebook CX9400, i5-1135G7
HP Pavilion x360 15-er0155ng: Intel Iris Xe Graphics G7 80EUs, 15.60", 1.8 kg
análise externo » HP Pavilion x360 15-er0155ng
Acer Aspire 5 A515-56-50RS: Intel Iris Xe Graphics G7 80EUs, 15.60", 1.7 kg
análise externo » Acer Aspire 5 A515-56-50RS
Dell Inspiron 14 5410 2-in-1: Intel Iris Xe Graphics G7 80EUs, 14.00", 1.7 kg
análise externo » Dell Inspiron 14 5410 2-in-1
HP Pavilion x360 14-dy0009ns: Intel Iris Xe Graphics G7 80EUs, 14.00", 1.6 kg
análise externo » HP Pavilion x360 14-dy0009ns
Lenovo IdeaPad 3 17ITL6-82H9008UMH: Intel Iris Xe Graphics G7 80EUs, 17.30", 2.1 kg
análise externo » Lenovo IdeaPad 3 17ITL6-82H9008UMH
HP Pavilion x360 14-dw1028ns: Intel Iris Xe Graphics G7 80EUs, 14.00", 1.6 kg
análise externo » HP Pavilion x360 14-dw1028ns
Asus VivoBook 15 K513EA-L512TS: Intel Iris Xe Graphics G7 80EUs, 15.60", 1.8 kg
análise externo » Asus VivoBook K513EA-L512TS
Getac S410 G4, 1135G7: Intel Iris Xe Graphics G7 80EUs, 14.00", 2.4 kg
análise externo » Getac S410 G4, 1135G7
Fujitsu Stylistic Q7311, i5-1135G7: Intel Iris Xe Graphics G7 80EUs, 13.30", 0.8 kg
análise externo » Fujitsu Stylistic Q7311, i5-1135G7
Lenovo Yoga Duet 7 13ITL6-82MA000QGE: Intel Iris Xe Graphics G7 80EUs, 13.00", 0.8 kg
análise externo » Lenovo Yoga Duet 7 13ITL6-82MA000QGE
Asus VivoBook 14 X415, i5-1135G7: Intel Iris Xe Graphics G7 80EUs, 14.00", 1.6 kg
análise externo » Asus VivoBook 14 X415, i5-1135G7
Asus ExpertBook B1 B1500C, i5-1135G7 MX330: NVIDIA GeForce MX330, 15.60", 1.7 kg
análise externo » Asus ExpertBook B1 B1500C, i5-1135G7 MX330
Dynabook Tecra A40-J-12E: Intel Iris Xe Graphics G7 80EUs, 14.00", 1.4 kg
análise externo » Dynabook Tecra A40-J-12E
MSI Summit E13 Flip Evo A11MT-095: Intel Iris Xe Graphics G7 80EUs, 13.40", 1.4 kg
análise externo » MSI Summit E13 Flip Evo A11MT-095
Realme Book Slim i5: Intel Iris Xe Graphics G7 80EUs, 14.00", 1.4 kg
análise externo » realme Book Slim i5
Dell Inspiron 15 3501-PFV0X: Intel Iris Xe Graphics G7 80EUs, 15.60", 1.9 kg
análise externo » Dell Inspiron 15 3501-PFV0X
LG Gram 14Z90P-G.AP55G: Intel Iris Xe Graphics G7 80EUs, 14.00", 1 kg
análise externo » LG Gram 14Z90P-G.AP55G
Samsung Galaxy Book Pro 13 NP930XDB-KH1US: Intel Iris Xe Graphics G7 80EUs, 13.30", 0.9 kg
análise externo » Samsung Galaxy Book Pro 13 NP930XDB-KH1US
Lenovo Yoga Slim 9 14ITL5-82D10044LT: Intel Iris Xe Graphics G7 80EUs, 14.00", 1.3 kg
análise externo » Lenovo Yoga Slim 9 14ITL5-82D10044LT
Lenovo IdeaPad 3 14ITL6-82H7009FSP: Intel Iris Xe Graphics G7 80EUs, 14.00", 1.4 kg
análise externo » Lenovo IdeaPad 3 14ITL6-82H7009FSP
Lenovo ThinkPad X1 Carbon G9-20XW0026GE: Intel Iris Xe Graphics G7 80EUs, 14.00", 1.1 kg
análise externo » Lenovo ThinkPad X1 Carbon G9-20XW0026GE
HP 15s-fq2038ns: Intel Iris Xe Graphics G7 80EUs, 15.60", 1.7 kg
análise externo » HP 15s-fq2038ns
HP Envy 13-ba1014ns: Intel Iris Xe Graphics G7 80EUs, 13.30", 1.3 kg
análise externo » HP Envy 13-ba1014ns
Asus VivoBook 14 X413EA-EB070T: Intel Iris Xe Graphics G7 80EUs, 14.00", 1.5 kg
análise externo » Asus VivoBook 14 X413EA-EB070T
Lenovo ThinkPad X13 G2-20WK00AHGE: Intel Iris Xe Graphics G7 80EUs, 13.30", 1.3 kg
análise externo » Lenovo ThinkPad X13 G2-20WK00AHGE
Gateway GWTN141-10GR: Intel Iris Xe Graphics G7 80EUs, 14.10", 1.6 kg
análise externo » Gateway GWTN141-10GR
Acer Aspire 5 A517-52-59SV: Intel Iris Xe Graphics G7 80EUs, 17.30", 2.6 kg
análise externo » Acer Aspire 5 A517-52-59SV
Acer Swift 3 SF314-59-5021: Intel Iris Xe Graphics G7 80EUs, 14.00", 1.2 kg
análise externo » Acer Swift 3 SF314-59-5021
Asus ExpertBook B1 B1400CEAE, i5-1135G7: Intel Iris Xe Graphics G7 80EUs, 14.00", 1.5 kg
análise externo » Asus ExpertBook B1 B1400CEAE, i5-1135G7
Dell Latitude 13 3320, i5-1135G7: Intel Iris Xe Graphics G7 80EUs, 13.30", 1.2 kg
análise externo » Dell Latitude 13 3320, i5-1135G7
Dell Latitude 14 9420 2-in-1, i5-1135G7: Intel Iris Xe Graphics G7 80EUs, 14.00", 1.3 kg
análise externo » Dell Latitude 14 9420 2-in-1, i5-1135G7
HP Pavilion x360 14-dw1024nr: Intel Iris Xe Graphics G7 80EUs, 14.00", 1.6 kg
análise externo » HP Pavilion x360 14-dw1024nr
HP Pavilion 14-dv0007na: Intel Iris Xe Graphics G7 80EUs, 14.00", 1.4 kg
análise externo » HP Pavilion 14-dv0007na
HP 15s-fq2005ns: Intel Iris Xe Graphics G7 80EUs, 15.60", 1.7 kg
análise externo » HP 15s-fq2005ns
Samsung Galaxy Book 15, i5-1135G7: Intel Iris Xe Graphics G7 80EUs, 15.60", 1.6 kg
análise externo » Samsung Galaxy Book 15, i5-1135G7
HP 14s-dq2003ns: Intel Iris Xe Graphics G7 80EUs, 14.00", 1.5 kg
análise externo » HP 14s-dq2003ns
Lenovo Yoga Duet 7 13IML05, i5-1135G7: Intel Iris Xe Graphics G7 80EUs, 13.00", 0.8 kg
análise externo » Lenovo Yoga Duet 7 13IML05, i5-1135G7
Acer Swift 5 SF514-55T-5001: Intel Iris Xe Graphics G7 80EUs, 14.00", 1.1 kg
análise externo » Acer Swift 5 SF514-55T-5001
Lenovo Yoga Slim 7 15ITL05-82AC002FGE: Intel Iris Xe Graphics G7 80EUs, 15.60", 1.9 kg
análise externo » Lenovo Yoga Slim 7 15ITL05-82AC002FGE
Acer Swift 3X SF314-510G-55EP: Intel Iris Xe Graphics G7 80EUs, 14.00", 1.4 kg
análise externo » Acer Swift 3X SF314-510G-55EP
MSI Prestige 15 A11SB-449: NVIDIA GeForce MX450, 15.60", 1.7 kg
análise externo » MSI Prestige 15 A11SB-449
Lenovo Yoga Slim 7 13ITL5-82CU002JGE: Intel Iris Xe Graphics G7 80EUs, 13.30", 1.2 kg
análise externo » Lenovo Yoga Slim 7 13ITL5-82CU002JGE
Lenovo IdeaPad Flex 5 14ITL05-82HS004TGE: Intel Iris Xe Graphics G7 80EUs, 14.00", 1.5 kg
análise externo » Lenovo IdeaPad Flex 5 14ITL05-82HS004TGE
Acer Chromebook 514 CB514-1WT-57YM: Intel Iris Xe Graphics G7 80EUs, 14.00", 1.4 kg
análise externo » Acer Chromebook 514 CB514-1WT-57YM
VAIO SE14 NP14V3IN033P: Intel Iris Xe Graphics G7 80EUs, 14.00", 1.4 kg
análise externo » VAIO SE14 NP14V3IN033P
Dynabook Portégé X30L-J-10G: Intel Iris Xe Graphics G7 80EUs, 13.30", 0.9 kg
análise externo » Dynabook Portégé X30L-J-10G
HP Pavilion 14-dv0021ns: Intel Iris Xe Graphics G7 80EUs, 14.00", 1.4 kg
análise externo » HP Pavilion 14-dv0021ns
HP 15s-fq2041ns: Intel Iris Xe Graphics G7 80EUs, 15.60", 1.7 kg
análise externo » HP 15s-fq2041ns
Lenovo ThinkPad L13 Yoga Gen2-20VK000VGE: Intel Iris Xe Graphics G7 80EUs, 13.30", 1.5 kg
análise externo » Lenovo ThinkPad L13 Yoga Gen2-20VK000VGE
Acer Swift 3X SF314-510G-52N1: Intel Iris Xe Graphics G7 80EUs, 14.00", 1.4 kg
análise externo » Acer Swift 3X SF314-510G-52N1
Honor MagicBook 15 i5 1135G7: Intel Iris Xe Graphics G7 80EUs, 15.60", 1.5 kg
análise externo » Honor MagicBook 15 i5 1135G7
Samsung Book 15 NP550XDA-KF2BR: Intel Iris Xe Graphics G7 80EUs, 15.60", 1.8 kg
análise externo » Samsung Book 15 NP550XDA-KF2BR
Huawei MateBook 14 2021, i5-1135G7: Intel Iris Xe Graphics G7 80EUs, 14.00", 1.5 kg
análise externo » Huawei MateBook 14 2021, i5-1135G7
HP Pavilion x360 14-dy0157ng: Intel Iris Xe Graphics G7 80EUs, 14.00", 1.5 kg
análise externo » HP Pavilion x360 14-dy0157ng
Lenovo Yoga Slim 7 Carbon 13ITL5-82EV0048GE: Intel Iris Xe Graphics G7 80EUs, 13.30", 1 kg
análise externo » Lenovo Yoga Slim 7 Carbon 13ITL5-82EV0048GE
Lenovo ThinkPad L13 Gen2-20VH0017GE: Intel Iris Xe Graphics G7 80EUs, 13.30", 1.4 kg
análise externo » Lenovo ThinkPad L13 Gen2-20VH0017GE
Lenovo ThinkBook 13s G2 ITL-20V90003GE: Intel Iris Xe Graphics G7 80EUs, 13.30", 1.3 kg
análise externo » Lenovo ThinkBook 13s G2 ITL-20V90003GE
HP Pavilion x360 14-dw1001ns: Intel Iris Xe Graphics G7 80EUs, 14.00", 1.6 kg
análise externo » HP Pavilion x360 14-dw1001ns
HP 15-dy2021nr: Intel Iris Xe Graphics G7 80EUs, 15.60", 1.7 kg
análise externo » HP 15-dy2021nr
HP Spectre x360 13-aw2003dx: Intel Iris Xe Graphics G7 80EUs, 13.30", 1.2 kg
análise externo » HP Spectre x360 13-aw2003dx
Xiaomi RedmiBook Pro 14 2021, i5-1135G7: Intel Iris Xe Graphics G7 80EUs, 14.00", 1.5 kg
análise externo » Xiaomi RedmiBook Pro 14 2021, i5-1135G7
Acer Chromebook Spin 713 CP713-3W-57R0: Intel Iris Xe Graphics G7 80EUs, 13.50", 1.4 kg
análise externo » Acer Chromebook Spin 713 CP713-3W-57R0
HP Envy x360 13-bd0062TU: Intel Iris Xe Graphics G7 80EUs, 13.30", 1.3 kg
análise externo » HP Envy x360 13-bd0062TU
Acer Aspire 5 A514-54G-58R8: NVIDIA GeForce MX350, 14.00", 1.7 kg
análise externo » Acer Aspire 5 A514-54G-58R8
Acer TravelMate Spin P4 TMP414RN-51-53J8: Intel Iris Xe Graphics G7 80EUs, 14.00", 1.4 kg
análise externo » Acer TravelMate Spin P4 TMP414RN-51-53J8
Asus VivoBook X515EP, i5-1135G7 MX330: NVIDIA GeForce MX330, 15.60", 1.8 kg
análise externo » Asus VivoBook X515EP, i5-1135G7 MX330
HP Pavilion x360 14-dw1002ns: Intel Iris Xe Graphics G7 80EUs, 14.00", 1.6 kg
análise externo » HP Pavilion x360 14-dw1002ns
HP Pavilion 14-dv0001ns: Intel Iris Xe Graphics G7 80EUs, 14.00", 1.4 kg
análise externo » HP Pavilion 14-dv0001ns
HP Pavilion 13-bb0062tu: Intel Iris Xe Graphics G7 80EUs, 13.30", 1.2 kg
análise externo » HP Pavilion 13-bb0062tu
Dynabook Portégé X30L-J-11J: Intel Iris Xe Graphics G7 80EUs, 13.30", 0.9 kg
análise externo » Dynabook Portégé X30L-J-11J
Lenovo IdeaPad 3 15ITL6-82H800KDGE: Intel Iris Xe Graphics G7 80EUs, 15.60", 1.7 kg
análise externo » Lenovo IdeaPad 3 15ITL6-82H800KDGE
HP 14s-dq2004ns: Intel Iris Xe Graphics G7 80EUs, 14.00", 1.5 kg
análise externo » HP 14s-dq2004ns
Lenovo IdeaPad 3 15ITL6-82H800BXGE: Intel Iris Xe Graphics G7 80EUs, 15.60", 1.7 kg
análise externo » Lenovo IdeaPad 3 15ITL6-82H800BXGE
HP Pavilion 15-eg0005ns: Intel Iris Xe Graphics G7 80EUs, 15.60", 1.8 kg
análise externo » HP Pavilion 15-eg0005ns
Dell Inspiron 13 5301, i5-1135G7: Intel Iris Xe Graphics G7 80EUs, 13.30", 1.2 kg
análise externo » Dell Inspiron 13 5301, i5-1135G7
Acer Aspire 5 A515-56-55LT: Intel Iris Xe Graphics G7 80EUs, 15.60", 1.7 kg
análise externo » Acer Aspire 5 A515-56-55LT
Acer Aspire 5 A514-54-552U: Intel Iris Xe Graphics G7 80EUs, 14.00", 1.5 kg
análise externo » Acer Aspire 5 A514-54-552U
Samsung Galaxy Book Pro 360 13: Intel Iris Xe Graphics G7 80EUs, 13.20", 1.1 kg
análise externo » Samsung Galaxy Book Pro 360 13
Microsoft Surface Laptop 4 13 i5: Intel Iris Xe Graphics G7 80EUs, 13.50", 1.3 kg
análise externo » Microsoft Surface Laptop 4 13 i5
MSI Modern 14 B11SB, i5-1135G7: Intel Iris Xe Graphics G7 80EUs, 14.00", 1.3 kg
análise externo » MSI Modern 14 B11SB, i5-1135G7
Asus VivoBook S14 S435EA-HM003T: Intel Iris Xe Graphics G7 80EUs, 14.00", 1.3 kg
análise externo » Asus VivoBook S14 S435EA-HM003T
Acer Spin 5 SP513-55N-53HZ: Intel Iris Xe Graphics G7 80EUs, 13.50", 1.2 kg
análise externo » Acer Spin 5 SP513-55N-53HZ
Dell Precision 15 3560 J6V7Y: NVIDIA T500 Laptop GPU, 15.60", 1.6 kg
análise externo » Dell Precision 15 3560 J6V7Y
HP Envy 13-ba1028TU: Intel Iris Xe Graphics G7 80EUs, 13.30", 1.2 kg
análise externo » HP Envy 13-ba1028TU
Dell Latitude 13 5320, i5-1135G7: Intel Iris Xe Graphics G7 80EUs, 13.30", 1.2 kg
análise externo » Dell Latitude 13 5320, i5-1135G7
Dell Latitude 15 5520, i5-1135G7: Intel Iris Xe Graphics G7 80EUs, 15.60", 1.6 kg
análise externo » Dell Latitude 15 5520, i5-1135G7
HP Pavilion 13-bb0154ng: Intel Iris Xe Graphics G7 80EUs, 13.30", 1.2 kg
análise externo » HP Pavilion 13-bb0154ng
Lenovo ThinkBook 13s-ITL-20V90003GE: Intel Iris Xe Graphics G7 80EUs, 13.30", 1.3 kg
análise externo » Lenovo ThinkBook 13s-ITL-20V90003GE
Acer Swift 3 SF314-59-52Q3: Intel Iris Xe Graphics G7 80EUs, 14.00", 1.2 kg
análise externo » Acer Swift 3 Infinity 3 SF314-59, i5-1135G7
Honor MagicBook 14, i5-1135G7: Intel Iris Xe Graphics G7 80EUs, 14.00", 1.4 kg
análise externo » Honor MagicBook 14, i5-1135G7
Huawei MateBook D 15 2021, i5-1135G7: Intel Iris Xe Graphics G7 80EUs, 15.60", 1.5 kg
análise externo » Huawei MateBook D 15 2021, i5-1135G7
HP Pavilion 14-dv0020ns: Intel Iris Xe Graphics G7 80EUs, 14.00", 1.4 kg
análise externo » HP Pavilion 14-dv0020ns
Dell XPS 13 9310, i5-1135G7 FHD: Intel Iris Xe Graphics G7 80EUs, 13.40", 1.2 kg
análise externo » Dell XPS 13 9310, i5-1135G7 FHD
Dell Vostro 14 5402, i5-1135G7: Intel Iris Xe Graphics G7 80EUs, 14.00", 1.4 kg
análise externo » Dell Vostro 14 5402, i5-1135G7
Asus Zenbook Flip 13 UX363EA-EM087T: Intel Iris Xe Graphics G7 80EUs, 14.00", 1.3 kg
análise externo » Asus Zenbook Flip 13 UX363EA-EM087T
HP 15s-fq2086ns: Intel Iris Xe Graphics G7 80EUs, 15.60"
análise externo » HP 15s-fq2086ns
HP 14s-dq2012ns: Intel Iris Xe Graphics G7 80EUs, 14.00", 1.5 kg
análise externo » HP 14s-dq2012ns
Acer Swift 5 SF514-55TA-574H: Intel Iris Xe Graphics G7 80EUs, 14.00", 1.1 kg
análise externo » Acer Swift 5 SF514-55TA-574H
HP Pavilion 14-dv0000ns: Intel Iris Xe Graphics G7 80EUs, 14.00", 1.4 kg
análise externo » HP Pavilion 14-dv0000ns
HP 15s-fq2087ns: Intel Iris Xe Graphics G7 80EUs, 15.60", 1.7 kg
análise externo » HP 15s-fq2087ns
HP 15s-fq2000ns: Intel Iris Xe Graphics G7 80EUs, 15.60", 1.7 kg
análise externo » HP 15s-fq2000ns
Lenovo ThinkBook 14 G2 ITL 20VD008WGE: Intel Iris Xe Graphics G7 80EUs, 14.00", 1.5 kg
análise externo » Lenovo ThinkBook 14 G2 ITL 20VD008WGE
MSI Modern 15 A11M-007NE: Intel Iris Xe Graphics G7 80EUs, 15.60", 1.6 kg
análise externo » MSI Modern 15 A11M-007NE
HP 15s-fq2091ns: Intel Iris Xe Graphics G7 80EUs, 15.60", 1.7 kg
análise externo » HP 15s-fq2091ns
HP Pavilion 14-dv0006ns: NVIDIA GeForce MX350, 14.00", 1.4 kg
análise externo » HP Pavilion 14-dv0006ns
HP 15s-fq2007ns: Intel Iris Xe Graphics G7 80EUs, 15.60", 1.7 kg
análise externo » HP 15s-fq2007ns
HP 15s-fq2002ns: Intel Iris Xe Graphics G7 80EUs, 15.60", 1.7 kg
análise externo » HP 15s-fq2002ns
Dell Latitude 13 7320, i5-1135G7: Intel Iris Xe Graphics G7 80EUs, 13.30", 1.1 kg
análise externo » Dell Latitude 7320, i5-1135G7
Lenovo ThinkBook 14s Yoga ITL, i5-1135G7: Intel Iris Xe Graphics G7 80EUs, 14.00", 1.5 kg
análise externo » Lenovo ThinkBook 14s Yoga ITL, i5-1135G7
MSI Modern 15 A11M, i5-1135G7: Intel Iris Xe Graphics G7 80EUs, 15.60", 1.6 kg
análise externo » MSI Modern 15 A11M, i5-1135G7
Dell Inspiron 15 7506 2-in-1 P97F: Intel Iris Xe Graphics G7 80EUs, 15.60", 1.8 kg
análise externo » Dell Inspiron 15 7506 2-in-1 P97F
Acer Swift 5 SF514-55T-58DN: Intel Iris Xe Graphics G7 80EUs, 14.00", 1 kg
análise externo » Acer Swift 5 SF514-55T-58DN
Dynabook Portégé X30W-J-10H: Intel Iris Xe Graphics G7 80EUs, 13.30", 1 kg
análise externo » Dynabook Portégé X30W-J-10H
Lenovo ThinkPad E15 Gen2-20TD0003GE: Intel Iris Xe Graphics G7 80EUs, 15.60", 1.7 kg
análise externo » Lenovo ThinkPad E15 Gen2-20TD0003GE
HP 15s-fq2009ns: Intel Iris Xe Graphics G7 80EUs, 15.60", 1.7 kg
análise externo » HP 15s-fq2009ns
Microsoft Surface Pro 7 Plus: Intel Iris Xe Graphics G7 80EUs, 12.30", 0.8 kg
análise externo » Microsoft Surface Pro 7 Plus
HP 15s-fq2013ns: Intel Iris Xe Graphics G7 80EUs, 15.60", 1.7 kg
análise externo » HP 15s-fq2013ns
Microsoft Surface Pro 7+ 3BQ-00003: Intel Iris Xe Graphics G7 80EUs, 12.30", 0.8 kg
análise externo » Microsoft Surface Pro 7+ 3BQ-00003
HP EliteBook 840 Aero G8: Intel Iris Xe Graphics G7 80EUs, 14.00", 1.2 kg
análise externo » HP EliteBook 840 Aero G8
HP Pavilion 14-dv0065tx: NVIDIA GeForce MX450, 14.00", 1.4 kg
análise externo » HP Pavilion 14-dv0065tx
HP 15s-fq2004ns: Intel Iris Xe Graphics G7 80EUs, 15.60", 1.7 kg
análise externo » HP 15s-fq2004ns
HP 14s-dq2006ns: Intel Iris Xe Graphics G7 80EUs, 14.00", 1.5 kg
análise externo » HP 14s-dq2006ns
Medion Akoya S15449 MD61991: Intel Iris Xe Graphics G7 80EUs, 15.60", 1.8 kg
análise externo » Medion Akoya S15449 MD61991
HP ProBook 450 G8, i5-1135G7: Intel Iris Xe Graphics G7 80EUs, 15.60", 1.7 kg
análise externo » HP ProBook 450 G8, i5-1135G7
HP Envy 13-ba1018ns : Intel Iris Xe Graphics G7 80EUs, 13.30", 1.3 kg
análise externo » HP Envy 13-ba1018ns
HP 15s-fq2008ns: Intel Iris Xe Graphics G7 80EUs, 15.60", 1.7 kg
análise externo » HP 15s-fq2008ns
Asus Zenbook Flip S UX371EA-HL144R: Intel Iris Xe Graphics G7 80EUs, 13.30", 1.2 kg
análise externo » Asus Zenbook Flip S UX371EA-HL144R
Lenovo IdeaPad 5 15ITL05-82FG00B0GE: Intel Iris Xe Graphics G7 80EUs, 15.60", 1.7 kg
análise externo » Lenovo IdeaPad 5 15ITL05-82FG00B0GE
Dell XPS 13 9310 2-in-1, i5-1135G7: Intel Iris Xe Graphics G7 80EUs, 13.40", 1.3 kg
análise externo » Dell XPS 13 9310 2-in-1, i5-1135G7
Acer Swift 3 Air 3: Intel Iris Xe Graphics G7 80EUs, 13.50", 1.2 kg
análise externo » Acer Swift 3 Air 3
Lenovo Yoga Slim 7 14ITL05, i5-1135G7: Intel Iris Xe Graphics G7 80EUs, 14.00", 1.4 kg
análise externo » Lenovo Yoga Slim 7 14ITL05, i5-1135G7
Fujitsu UH-X, i5: Intel Iris Xe Graphics G7 80EUs, 13.30", 0.7 kg
análise externo » Fujitsu UH-X
HP Pavilion 15-eg0656ng: Intel Iris Xe Graphics G7 80EUs, 15.60", 1.8 kg
análise externo » HP Pavilion 15-eg0656ng
HP ProBook 650 G8, i5-1135G7: Intel Iris Xe Graphics G7 80EUs, 15.60", 1.7 kg
análise externo » HP ProBook 650 G8, i5-1135G7
Asus VivoBook Flip 14 TP470EA-EC033T: Intel Iris Xe Graphics G7 80EUs, 14.00", 1.5 kg
análise externo » Asus VivoBook Flip 14 TP470EA-EC033T
Lenovo ThinkPad E14 Gen2-20TA004FUS: Intel Iris Xe Graphics G7 80EUs, 14.00", 1.6 kg
análise externo » Lenovo ThinkPad E14 Gen2-20TA004FUS
Acer Book RS Porsche Design AP714-51T-59ZV: Intel Iris Xe Graphics G7 80EUs, 14.00", 1.3 kg
análise externo » Acer Book RS Porsche Design AP714-51T-59ZV
Asus Vivobook Flip 14 TP470EA-EC029TS: Intel Iris Xe Graphics G7 80EUs, 14.00", 1.5 kg
análise externo » Asus Vivobook Flip 14 TP470EA-EC029TS
Dell Inspiron 14 5406, i5-1135G7 MX330: NVIDIA GeForce MX330, 14.00", 1.7 kg
análise externo » Dell Inspiron 14 5406, i5-1135G7 MX330
HP Envy 14-eb0010nr: NVIDIA GeForce GTX 1650 Ti Max-Q, 14.00", 1.6 kg
análise externo » HP Envy 14-eb0010nr
HP Pavilion 14-dv0301ng: Intel Iris Xe Graphics G7 80EUs, 14.00", 1.4 kg
análise externo » HP Pavilion 14-dv0301ng
Acer Aspire 5 A515-56G-51YF: NVIDIA GeForce MX350, 15.60", 1.7 kg
análise externo » Acer Aspire 5 A515-56G-51YF
Lenovo Yoga 7 14ITL5: Intel Iris Xe Graphics G7 80EUs, 14.00", 1.5 kg
análise externo » Lenovo Yoga 7 14ITL5
Acer Aspire 5 A514-54-59BP: Intel Iris Xe Graphics G7 80EUs, 14.00", 1.6 kg
análise externo » Acer Aspire 5 A514-54-59BP
Asus VivoBook S14 S433EA-EB043T: Intel Iris Xe Graphics G7 80EUs, 14.00", 1.4 kg
análise externo » Asus VivoBook S14 S433EA-EB043T
Asus ZenBook 13 UX325EA, i5-1135G7: Intel Iris Xe Graphics G7 80EUs, 13.30", 1.1 kg
análise externo » Asus ZenBook 13 UX325EA, i5-1135G7
Lenovo IdeaPad Slim 5 15, i5-1135G7: Intel Iris Xe Graphics G7 80EUs, 15.60", 1.7 kg
análise externo » Lenovo IdeaPad Slim 5 15, i5-1135G7
Acer Aspire 5 A514-54-55X7: Intel Iris Xe Graphics G7 80EUs, 14.00", 1.7 kg
análise externo » Acer Aspire 5 A514-54-55X7
Medion Akoya S15449 MD61865: Intel Iris Xe Graphics G7 80EUs, 15.60", 1.8 kg
análise externo » Medion Akoya S15449 MD61865
Acer Swift 5 SF514-55TA-57P3: Intel Iris Xe Graphics G7 80EUs, 14.00", 1.1 kg
análise externo » Acer Swift 5 SF514-55TA-57P3
Acer Aspire 5 A515-56-51P5: Intel Iris Xe Graphics G7 80EUs, 15.60", 1.9 kg
análise externo » Acer Aspire 5 A515-56-51P5
Asus ZenBook 14 UX435EA: Intel Iris Xe Graphics G7 80EUs, 14.00", 1.3 kg
análise externo » Asus ZenBook 14 UX435EA
Asus ZenBook 14 UX425EA-HM038T: Intel Iris Xe Graphics G7 80EUs, 14.00", 1.4 kg
análise externo » Asus ZenBook 14 UX425EA-HM038T
Lenovo Yoga 9i 14ITL5: Intel Iris Xe Graphics G7 80EUs, 14.00", 1.4 kg
análise externo » Lenovo Yoga 9i 14ITL5
Asus Vivobook 15 K513EQ, i5-1135G7: Intel Iris Xe Graphics G7 80EUs, 15.60", 1.8 kg
análise externo » Asus Vivobook 15 K513, i5-1135G7
Acer Swift 3 SF314-59-52A6 silber: Intel Iris Xe Graphics G7 80EUs, 14.00"
análise externo » Acer Swift 3 SF314-59-52A6 silber
Asus Zenbook Flip 13 UX363EA-EM179R: Intel Iris Xe Graphics G7 80EUs, 13.30", 1.3 kg
análise externo » Asus Zenbook Flip 13 UX363EA-EM179R
Acer Book RS Porsche Design AP714-51T-57D6: Intel Iris Xe Graphics G7 80EUs, 14.00", 1.3 kg
análise externo » Acer Book RS Porsche Design AP714-51T-57D6
Asus Zenbook Flip 13 UX363EA-EM111T: Intel Iris Xe Graphics G7 80EUs, 13.30", 1.3 kg
análise externo » Asus Zenbook Flip 13 UX363EA-EM111T
Asus VivoBook 15 S513EA-EJ118T: Intel Iris Xe Graphics G7 80EUs, 15.60", 1.7 kg
análise externo » Asus VivoBook 15 S513EA-EJ118T
Acer Aspire 5 A515-56-511A: Intel Iris Xe Graphics G7 80EUs, 15.60", 1.9 kg
análise externo » Acer Aspire 5 A515-56-511A
Acer Swift 3 SF314-59-74VC: Intel Iris Xe Graphics G7 80EUs, 14.00", 1.2 kg
análise externo » Acer Swift 3 SF314-59-74VC
Acer Swift 5 SF514-55T-55WL: Intel Iris Xe Graphics G7 96EUs, 14.00", 1.1 kg
análise externo » Acer Swift 5 SF514-55T-55WL
Beelink GTI 11: Intel Iris Xe Graphics G7 80EUs, 0.6 kg
» El mini PC Beelink GTI 11 golpea al NUC de Intel donde más le duele: El precio
LG Gram 17Z90P-G.AA56G: Intel Iris Xe Graphics G7 80EUs, 17.00", 1.4 kg
» El nuevo LG Gram 17: un rendimiento alto pero demasiado flexible
Intel NUC11TNKi5: Intel Iris Xe Graphics G7 80EUs, 0.5 kg
» El Intel NUC11TNK con Core i5 ya está a la venta por 579 dólares sin RAM, sistema operativo ni almacenamiento
Acer Aspire 5 A515-56-511A: Intel Iris Xe Graphics G7 80EUs, 15.60", 1.9 kg
» Acer Aspire 5 con Tiger Lake: Un portátil como muchos otros
GPD Win 3: Intel Iris Xe Graphics G7 80EUs, 5.50", 0.6 kg
» El GPD Win 3 es dos veces más caro que una Playstation 5. ¿Realmente vale la pena?
Lenovo ThinkBook 13s-ITL-20V90003GE: Intel Iris Xe Graphics G7 80EUs, 13.30", 1.3 kg
» Lenovo ThinkBook 13s: Más duración de la batería, menos flexibilidad
Asus VivoBook Flip 14 TP470EZ: Intel Iris Xe MAX Graphics, 14.00", 1.5 kg
» Intel Iris Xe Max-impulsado Asus VivoBook Flip 14 TP470 en revisión: Buenas ganancias sobre los gráficos Xe G7 96 EUs, MX350 y GTX 1050 en las pruebas de GPU sintéticas
Lenovo Yoga 7 14ITL5: Intel Iris Xe Graphics G7 80EUs, 14.00", 1.5 kg
» La CPU del Lenovo Yoga 7i Core i5-1135G7 está a la par del Core i7-1165G7, pero sus gráficos Iris Xe están muy por detrás