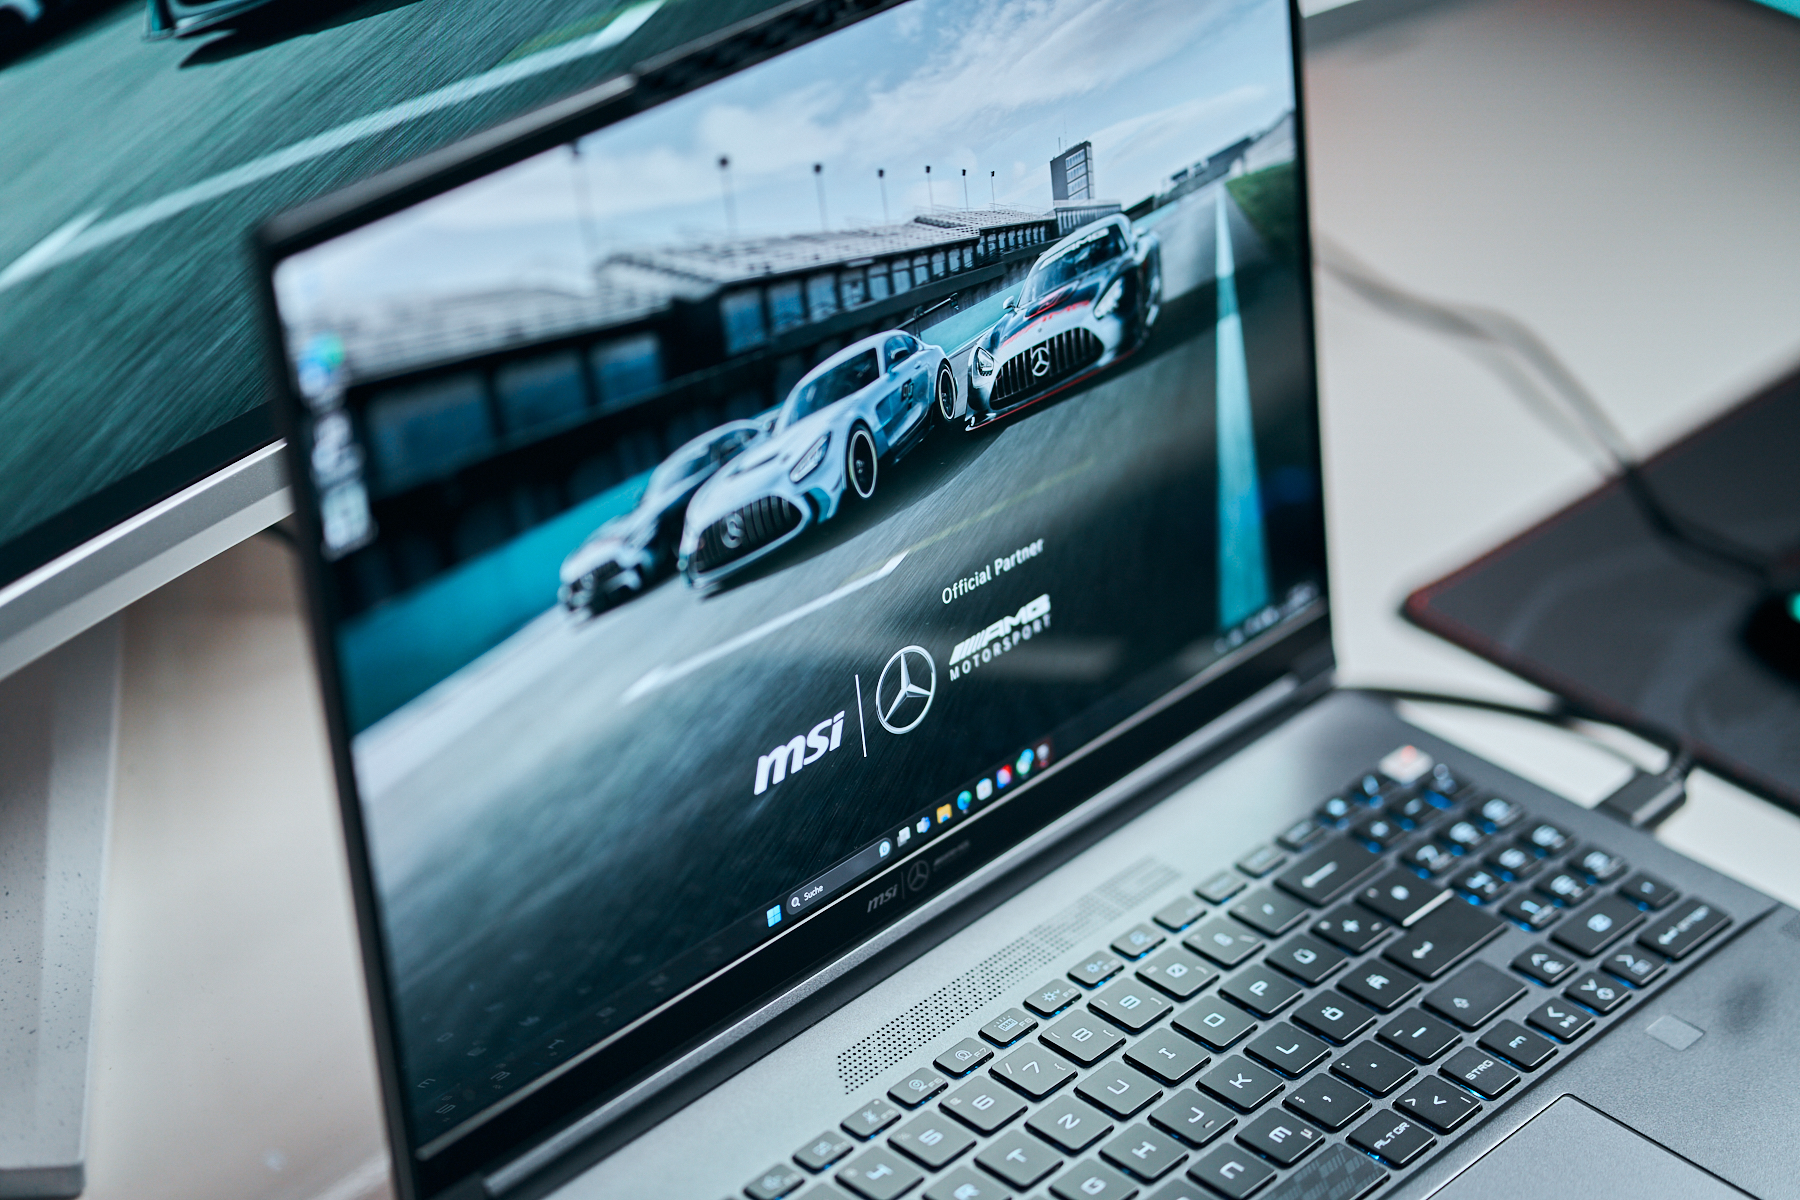
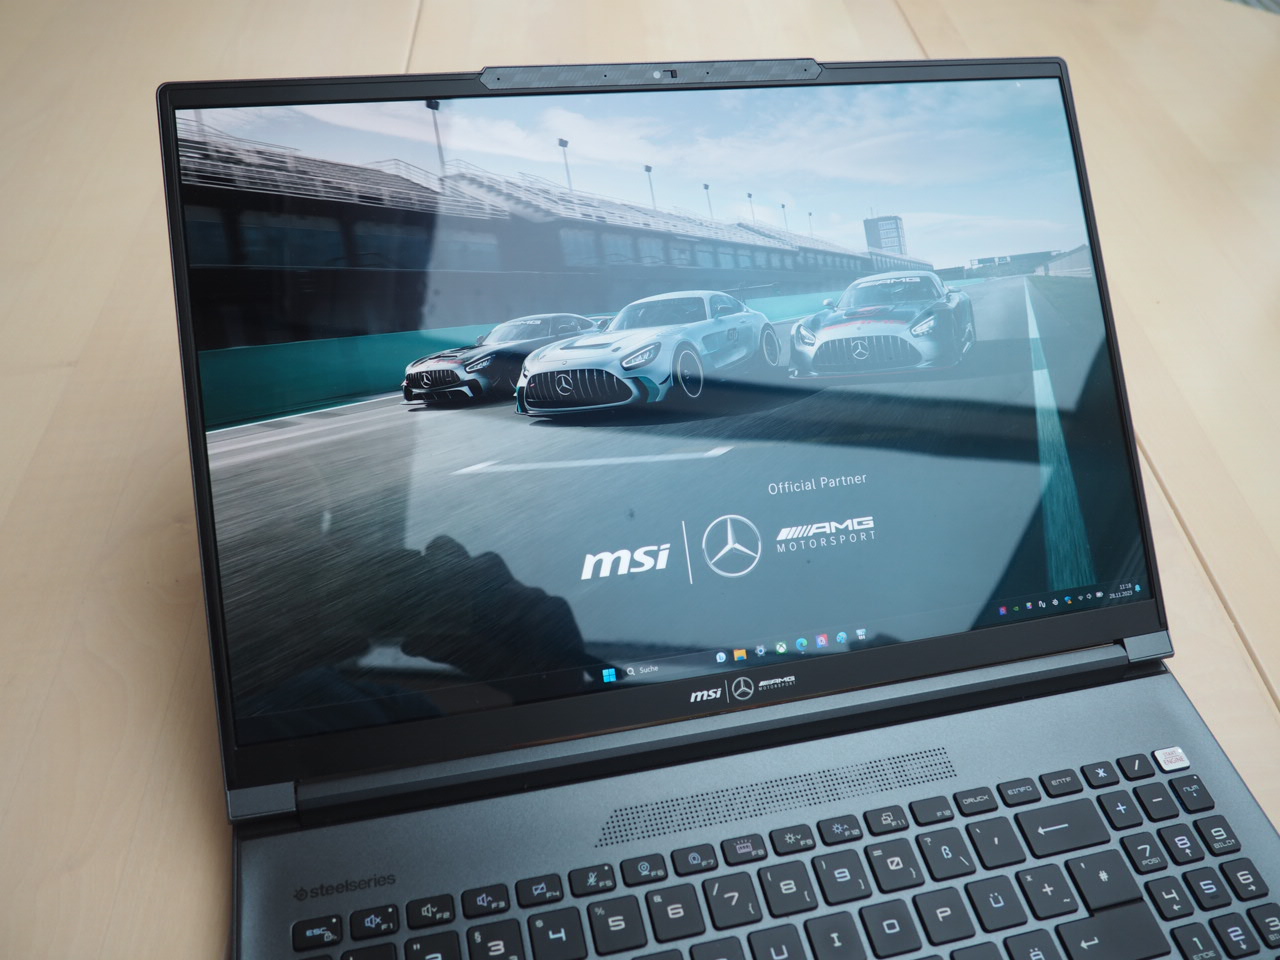
Reseña del portátil MSI Stealth 16 Mercedes-AMG Motorsport: Móvil de carreras con pantalla OLED

Mientras que el Stealth 16 'estándar' cuenta con un Core i7-13700Hel modelo Mercedes-AMG Motorsport sube de nivel con el ligeramente más rápido Core i9-13900H. En lugar del panel IPS QHD+ mate que funciona a 240 Hz, la Motorsport Edition cuenta con una pantalla OLED UHD+ brillante con una frecuencia de actualización de 60 Hz. La tarjeta gráfica (RTX 4070), la RAM (2x 16 GB DDR5) y la capacidad de la SSD (2 TB) siguen siendo idénticas a las del modelo superior. Dado que la carcasa, los dispositivos de entrada y las conexiones son los mismos, con sólo unos pocos detalles ópticos que los diferencian, no volveremos sobre categorías específicas en este artículo. Puede consultar la información pertinente en la reseña del Stealth 16 Studio. La Motorsport Edition tiene actualmente un precio de 2.899 dólares, una inversión notable para un portátil RTX 4070.
Entre los competidores del Stealth 16 se encuentran otros portátiles para juegos de 16 pulgadas que incorporan la RTX 4070, como el HP Omen Transcend 16el Lenovo Legion Pro 5 16ARX8y los portátiles Schenker XMG Pro 16 Studio y XMG Core 16. Estos modelos figuran en las tablas comparativas
Posibles contendientes en la comparación
Valoración | Fecha | Modelo | Peso | Altura | Tamaño | Resolución | Precio |
|---|---|---|---|---|---|---|---|
| 89.1 % v7 (old) | 11/2023 | MSI Stealth 16 Mercedes-AMG Motorsport A13VG i9-13900H, GeForce RTX 4070 Laptop GPU | 1.9 kg | 20 mm | 16.00" | 3840x2400 | |
| 88.8 % v7 (old) | 07/2023 | MSI Stealth 16 Studio A13VG i7-13700H, GeForce RTX 4070 Laptop GPU | 2 kg | 19.95 mm | 16.00" | 2560x1600 | |
| 87.9 % v7 (old) | 10/2023 | Schenker XMG Pro 16 Studio (Mid 23) i9-13900H, GeForce RTX 4070 Laptop GPU | 2.6 kg | 19.9 mm | 16.00" | 2560x1600 | |
| 87.9 % v7 (old) | 08/2023 | HP Omen Transcend 16 i9-13900HX, GeForce RTX 4070 Laptop GPU | 2.3 kg | 19.8 mm | 16.00" | 2560x1600 | |
| 88.4 % v7 (old) | 05/2023 | Lenovo Legion Pro 5 16ARX8 R7 7745HX, GeForce RTX 4070 Laptop GPU | 2.5 kg | 26.8 mm | 16.00" | 2560x1600 | |
| 89.2 % v7 (old) | 10/2023 | Schenker XMG CORE 16 (L23) R7 7840HS, GeForce RTX 4070 Laptop GPU | 2.4 kg | 26.1 mm | 16.00" | 2560x1600 |
Caso
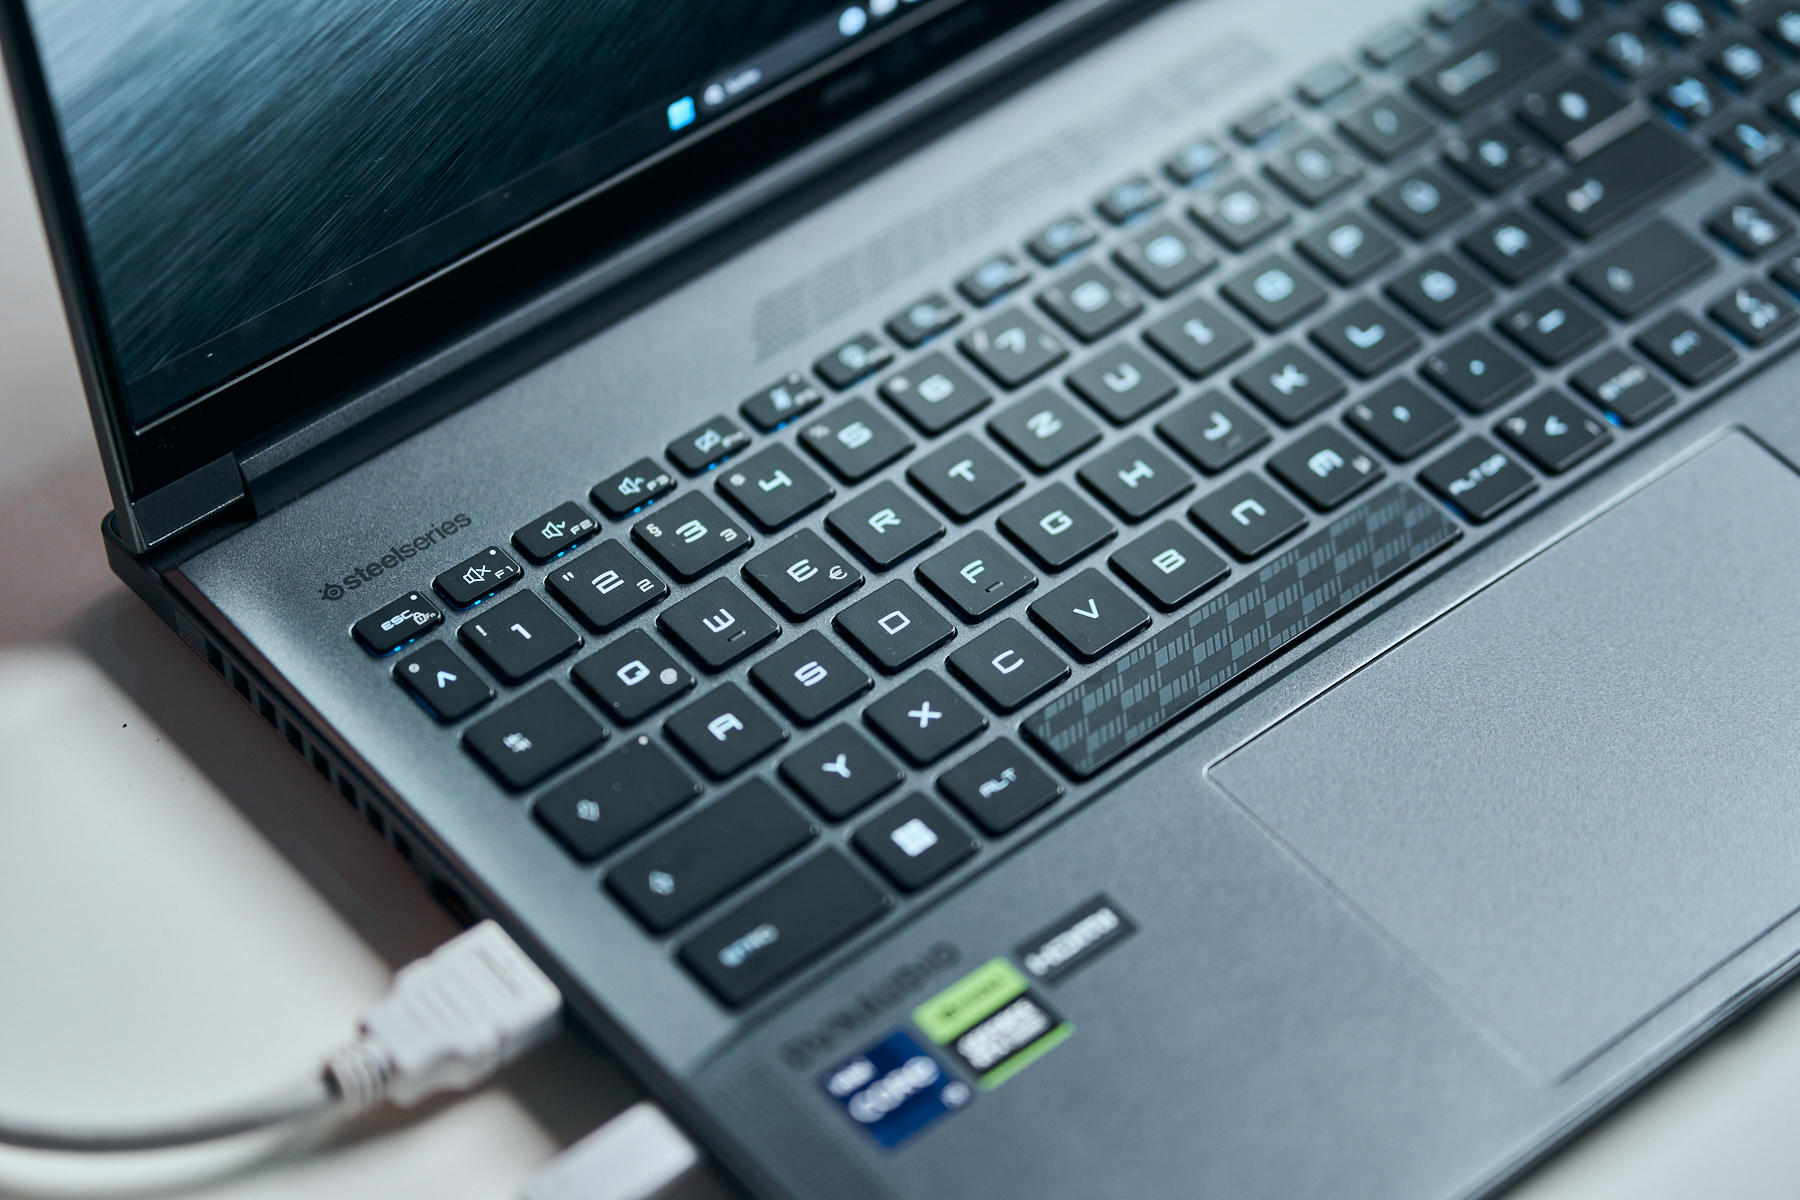
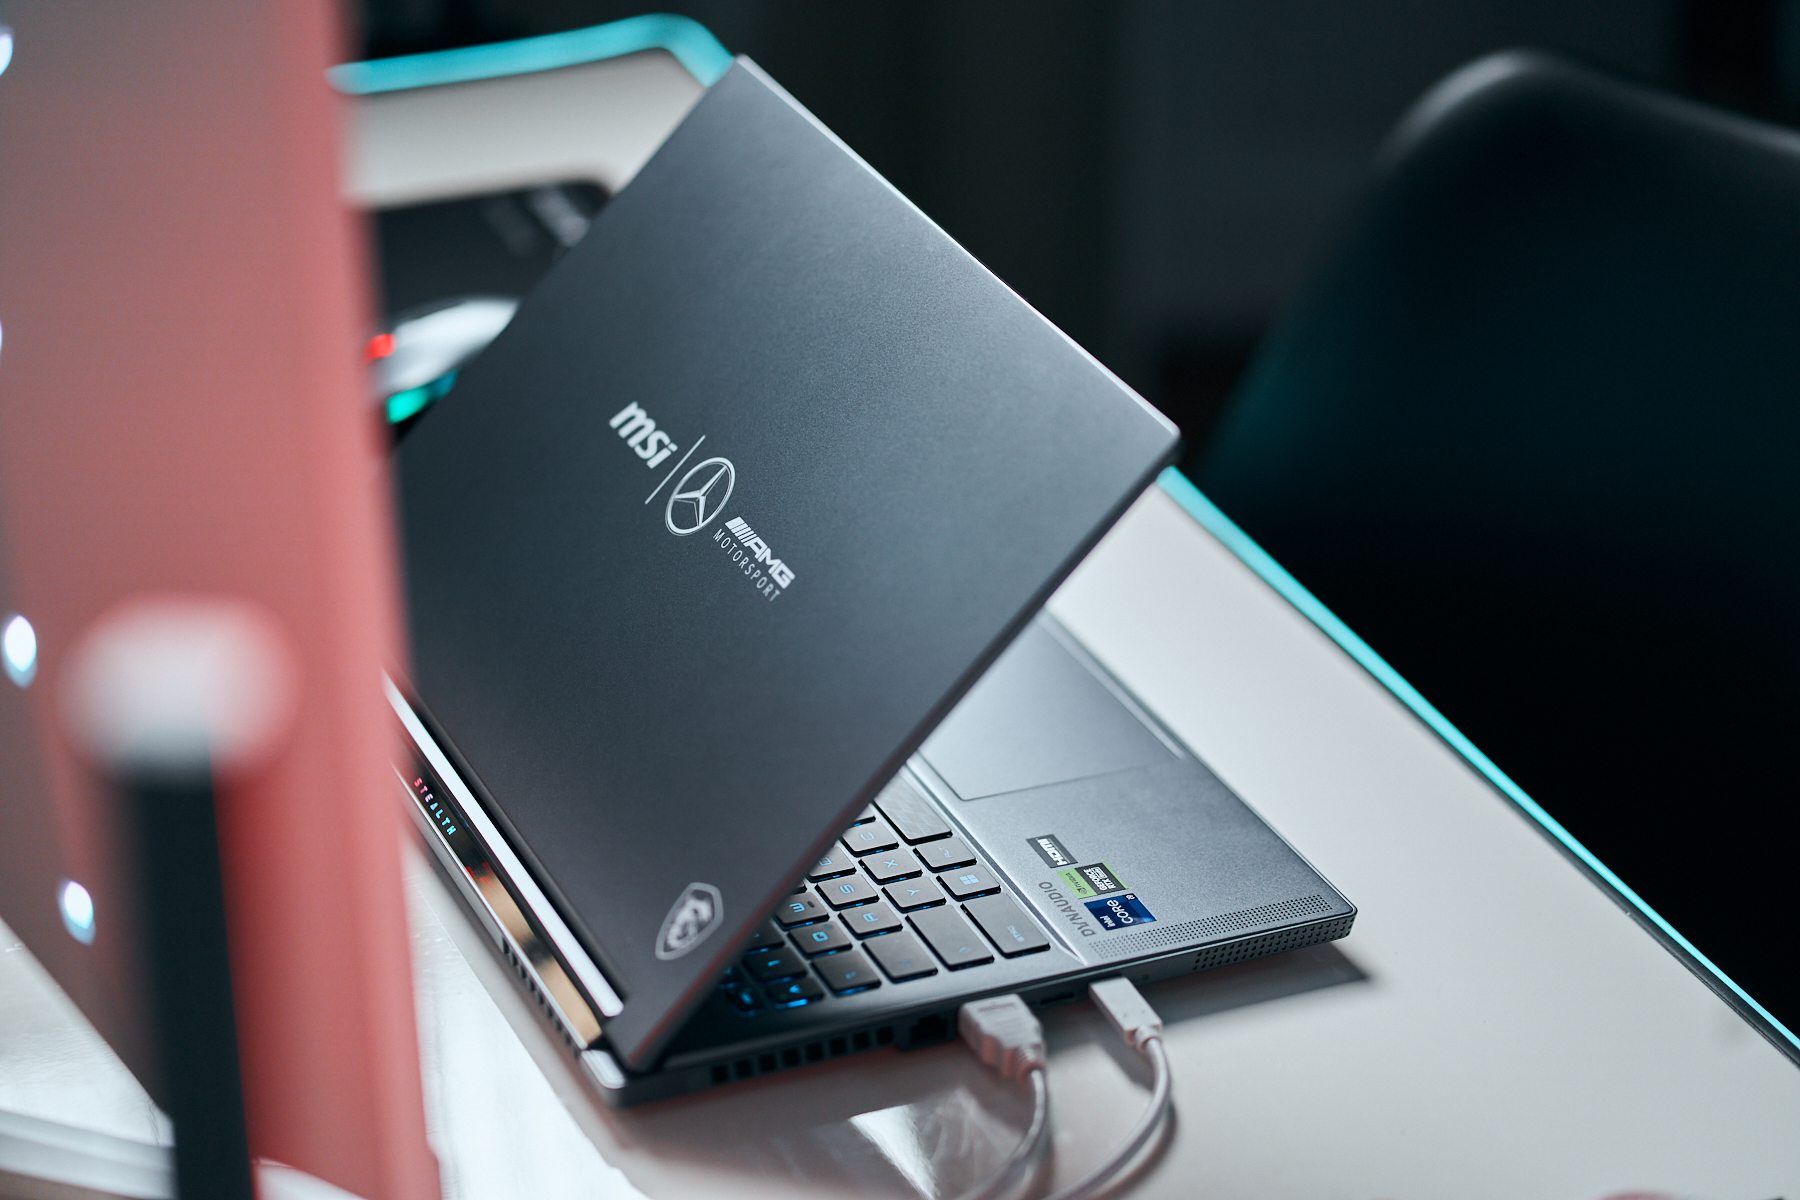
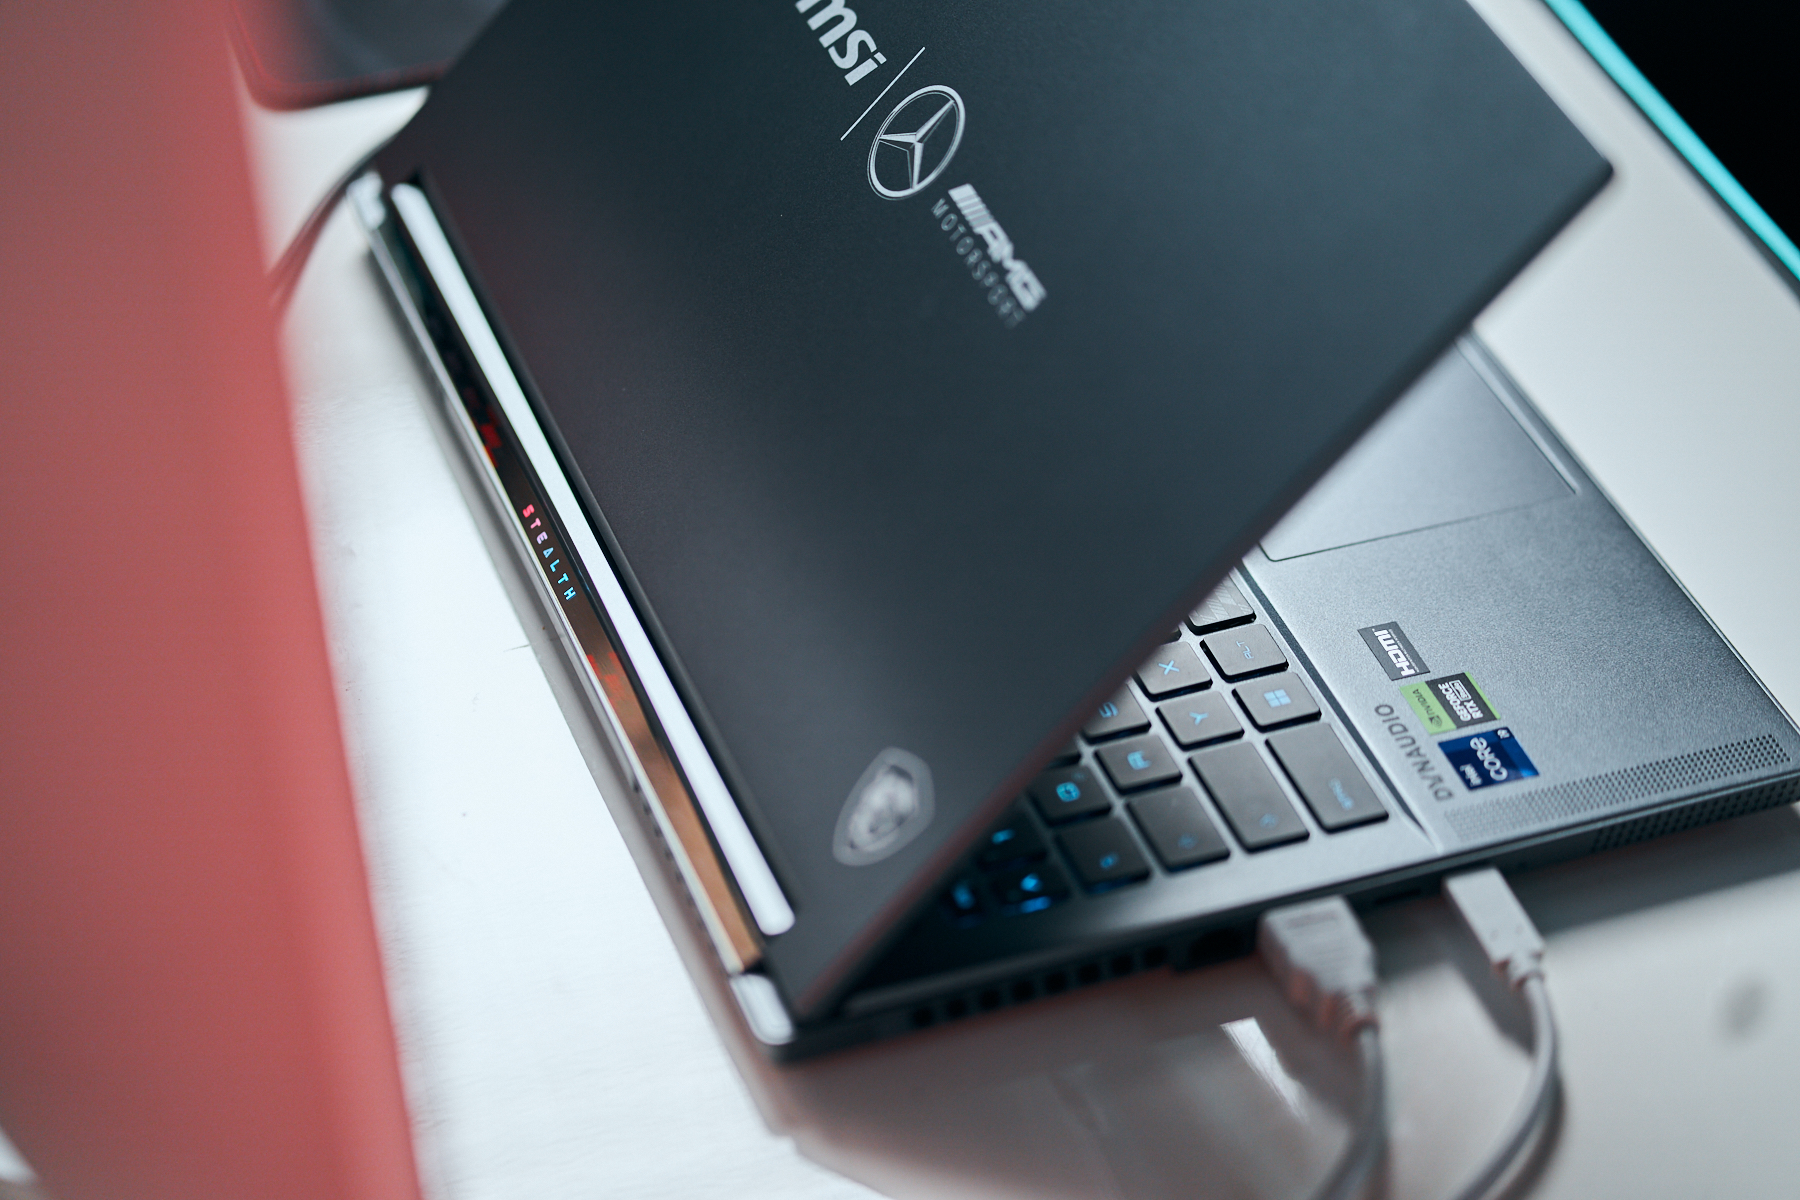
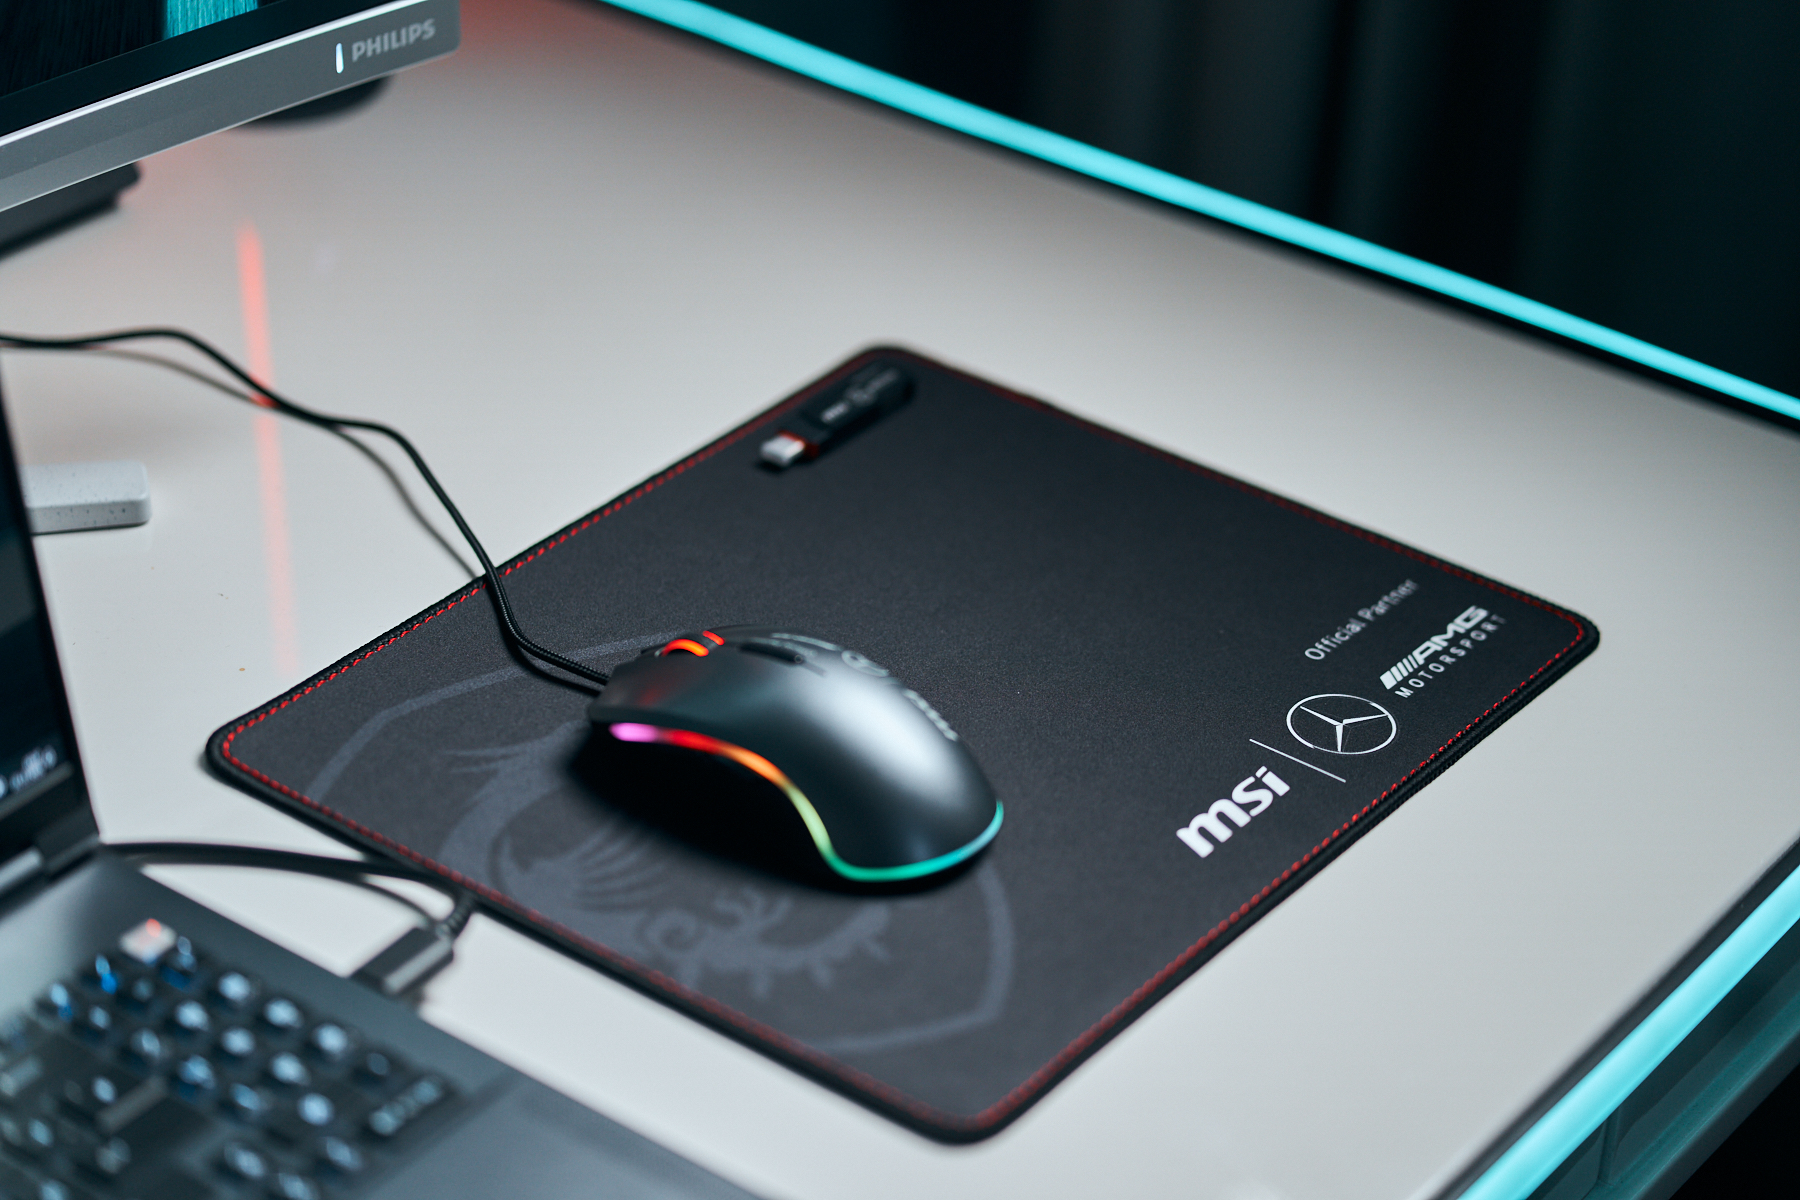
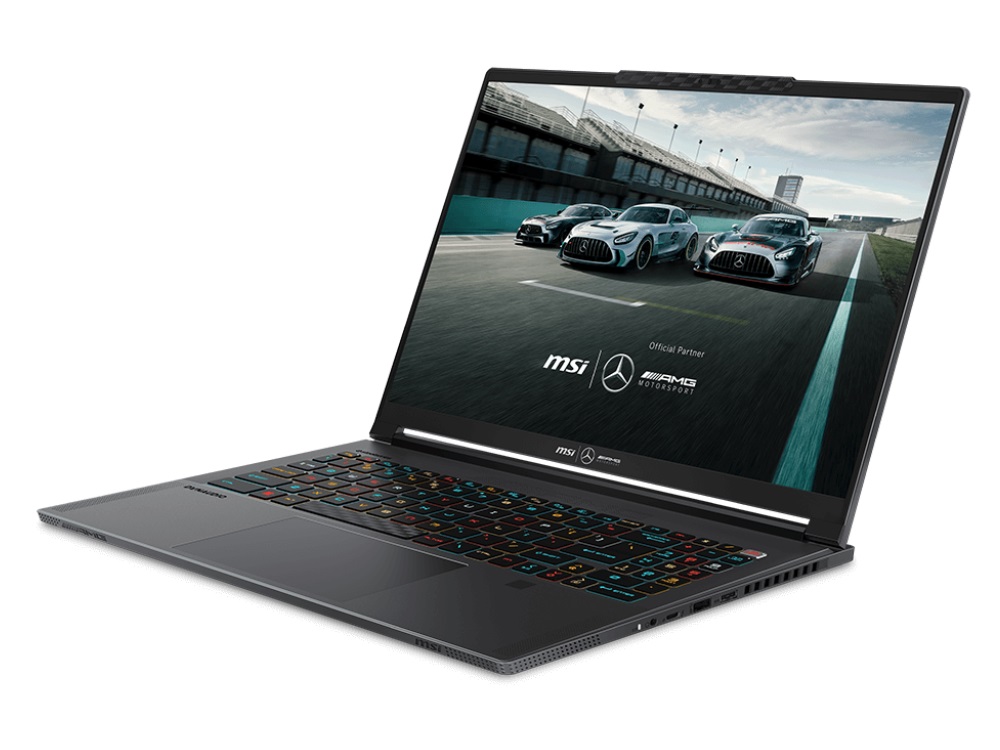
MSI ha invertido un importante esfuerzo en el diseño visual de la edición especial, incorporando referencias al fabricante automovilístico por toda la carcasa. Entre ellas se incluyen varias colocaciones de las letras AMG (tapa, frontal, marco de la pantalla, rejilla de ventilación, base), así como otros elementos de diseño que recuerdan al automovilismo. Algunos ejemplos son un diseño en forma de bandera en la barra de la cámara web, la tecla espaciadora y las patas de goma, junto con un botón de encendido con el texto "Arrancar motor".


Conectividad
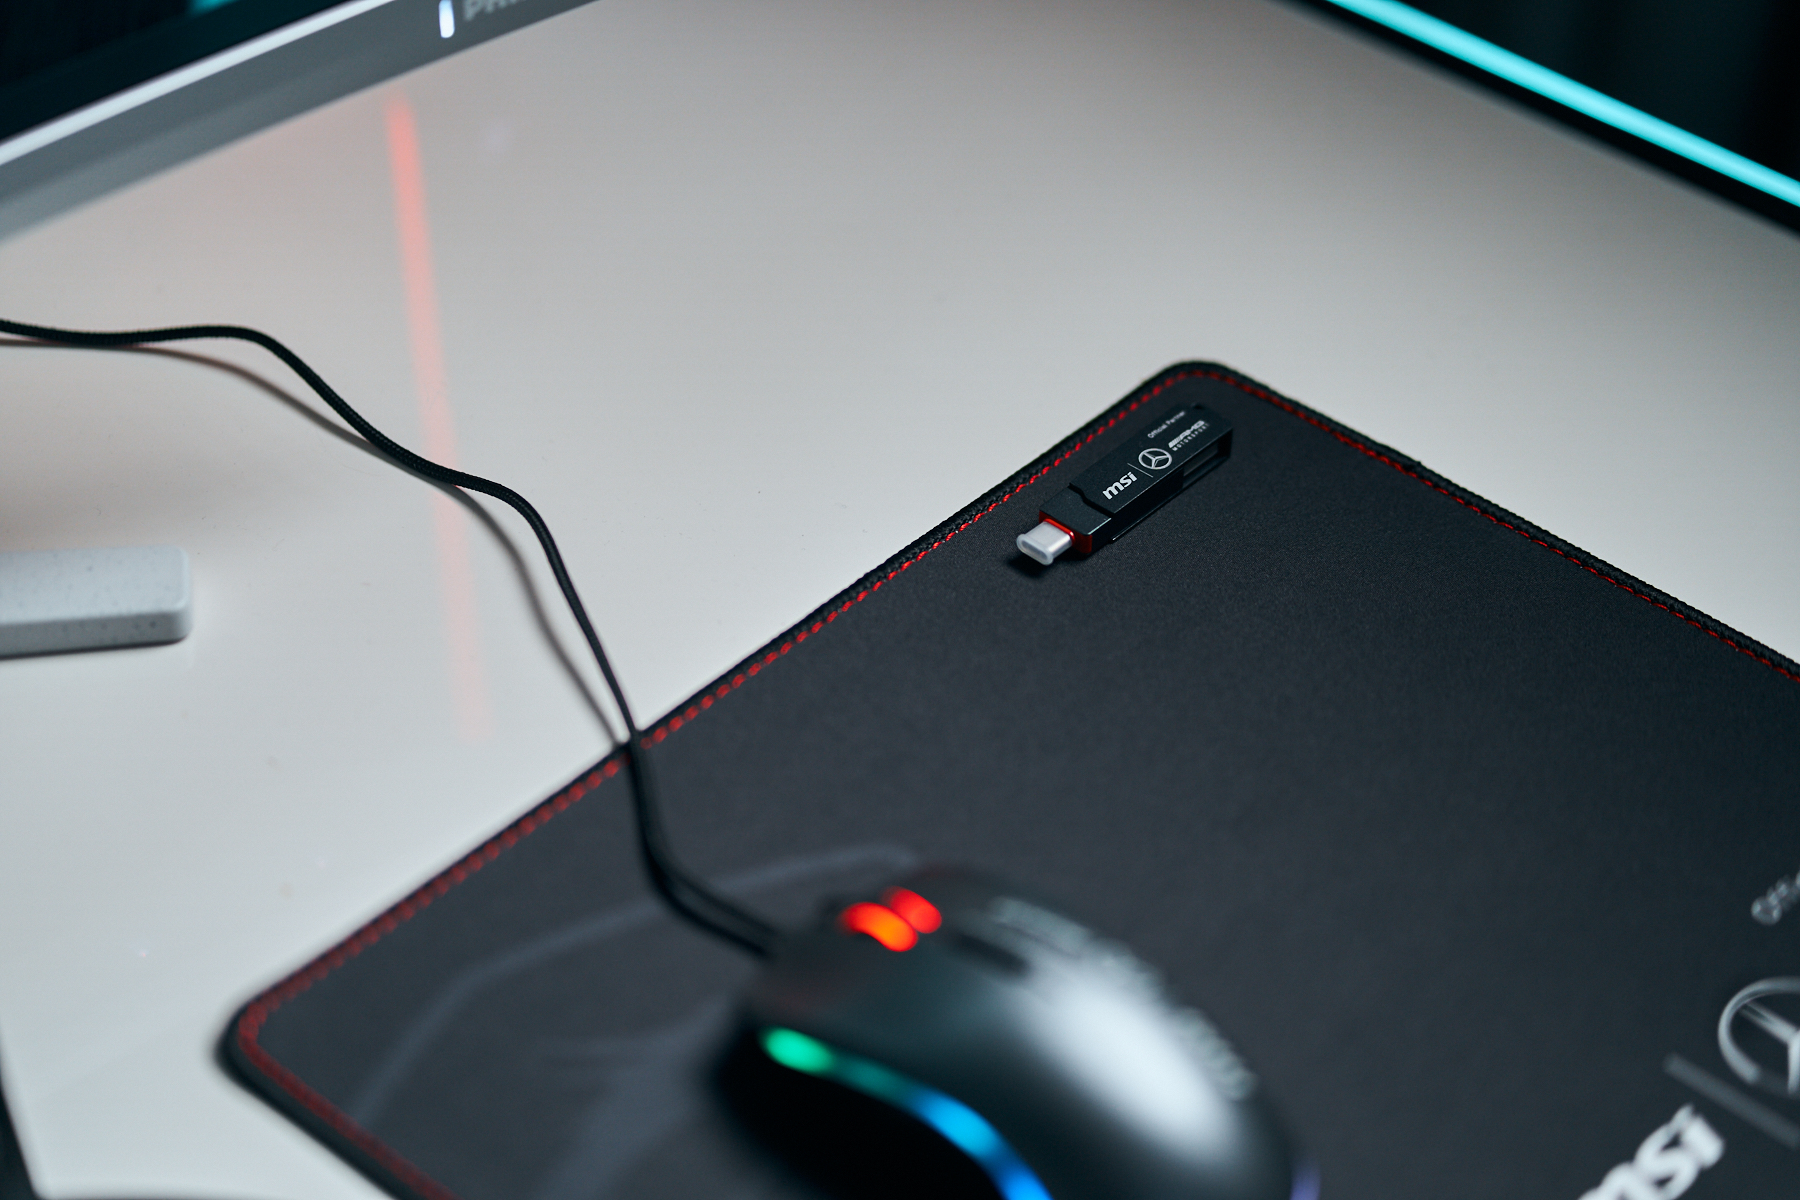
En cuanto al equipamiento, destaca especialmente el suntuoso volumen de suministro. Junto al portátil y la fuente de alimentación de 240 vatios, la versión Mercedes incluye un ratón, una alfombrilla, una memoria USB y una bolsa de accesorios.
Lector de tarjetas SD
| SD Card Reader | |
| average JPG Copy Test (av. of 3 runs) | |
| MSI Stealth 16 Mercedes-AMG Motorsport A13VG (AV PRO microSD 128 GB V60) | |
| MSI Stealth 16 Studio A13VG | |
| Media de la clase Gaming (20.9 - 210, n=54, últimos 2 años) | |
| Schenker XMG Pro 16 Studio (Mid 23) (AV PRO microSD 128 GB V60) | |
| Schenker XMG CORE 16 (L23) | |
| maximum AS SSD Seq Read Test (1GB) | |
| MSI Stealth 16 Mercedes-AMG Motorsport A13VG (AV PRO microSD 128 GB V60) | |
| MSI Stealth 16 Studio A13VG | |
| Media de la clase Gaming (25.5 - 261, n=51, últimos 2 años) | |
| Schenker XMG Pro 16 Studio (Mid 23) (AV PRO microSD 128 GB V60) | |
| Schenker XMG CORE 16 (L23) | |
Comunicación
Cámara web


Mostrar
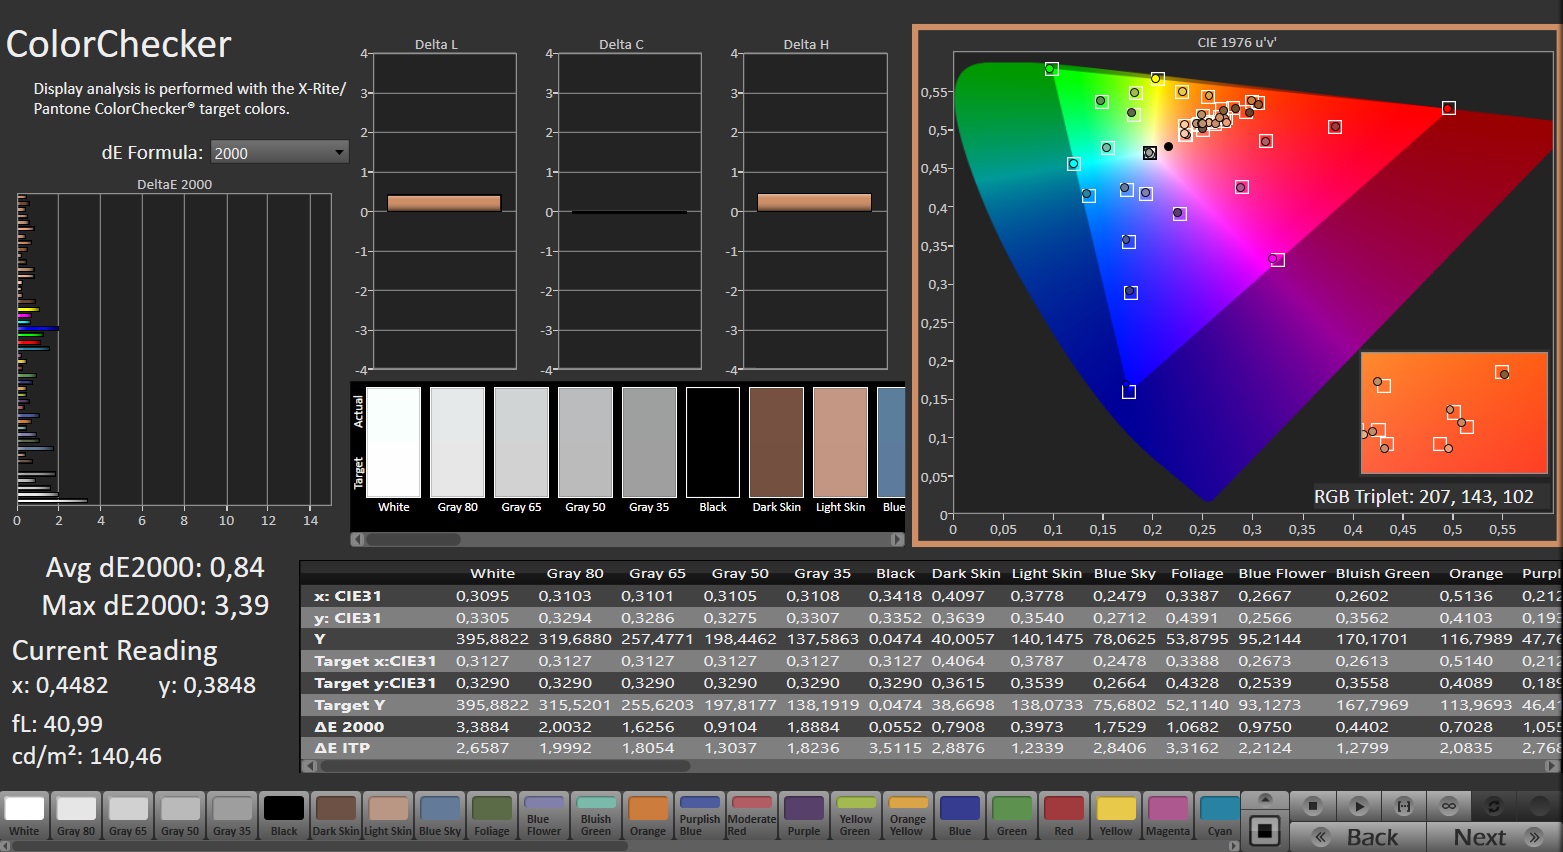
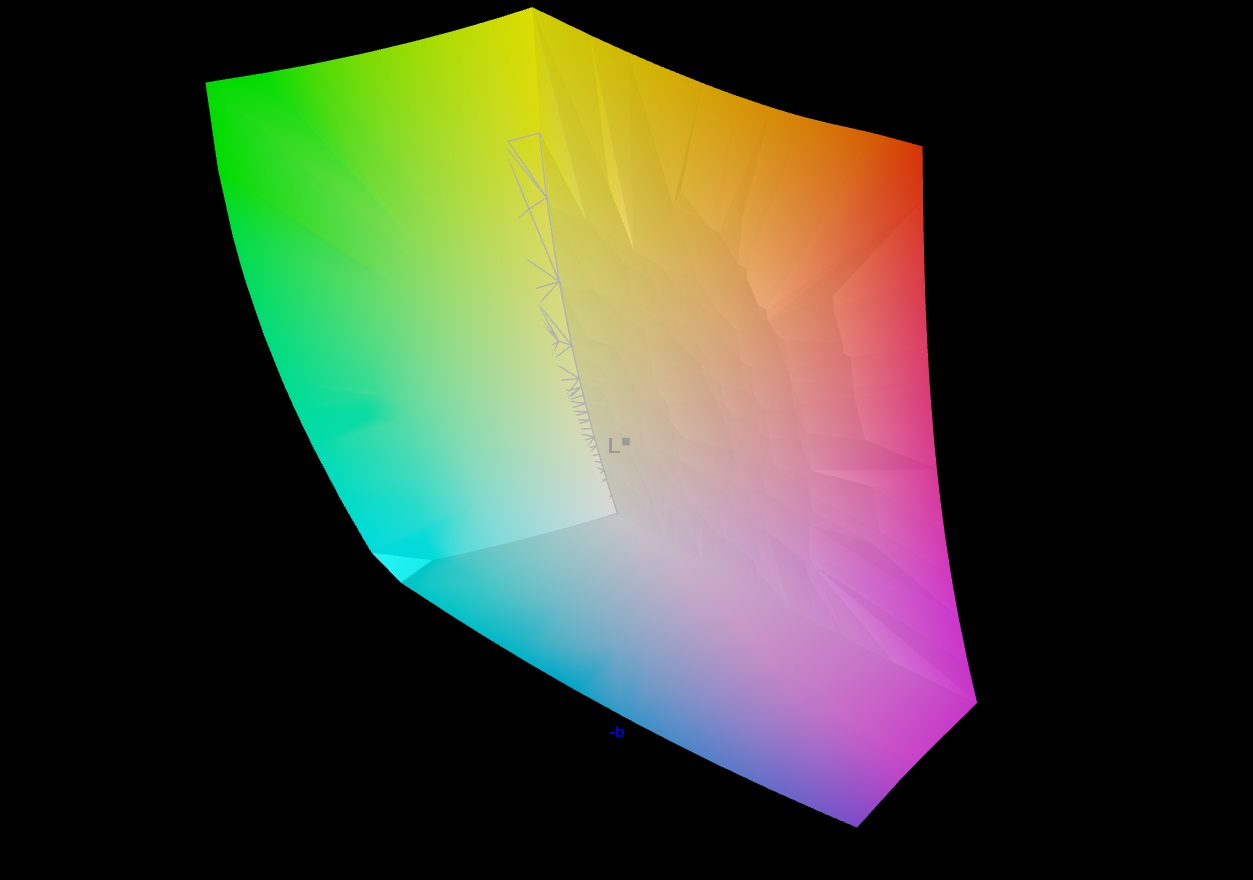
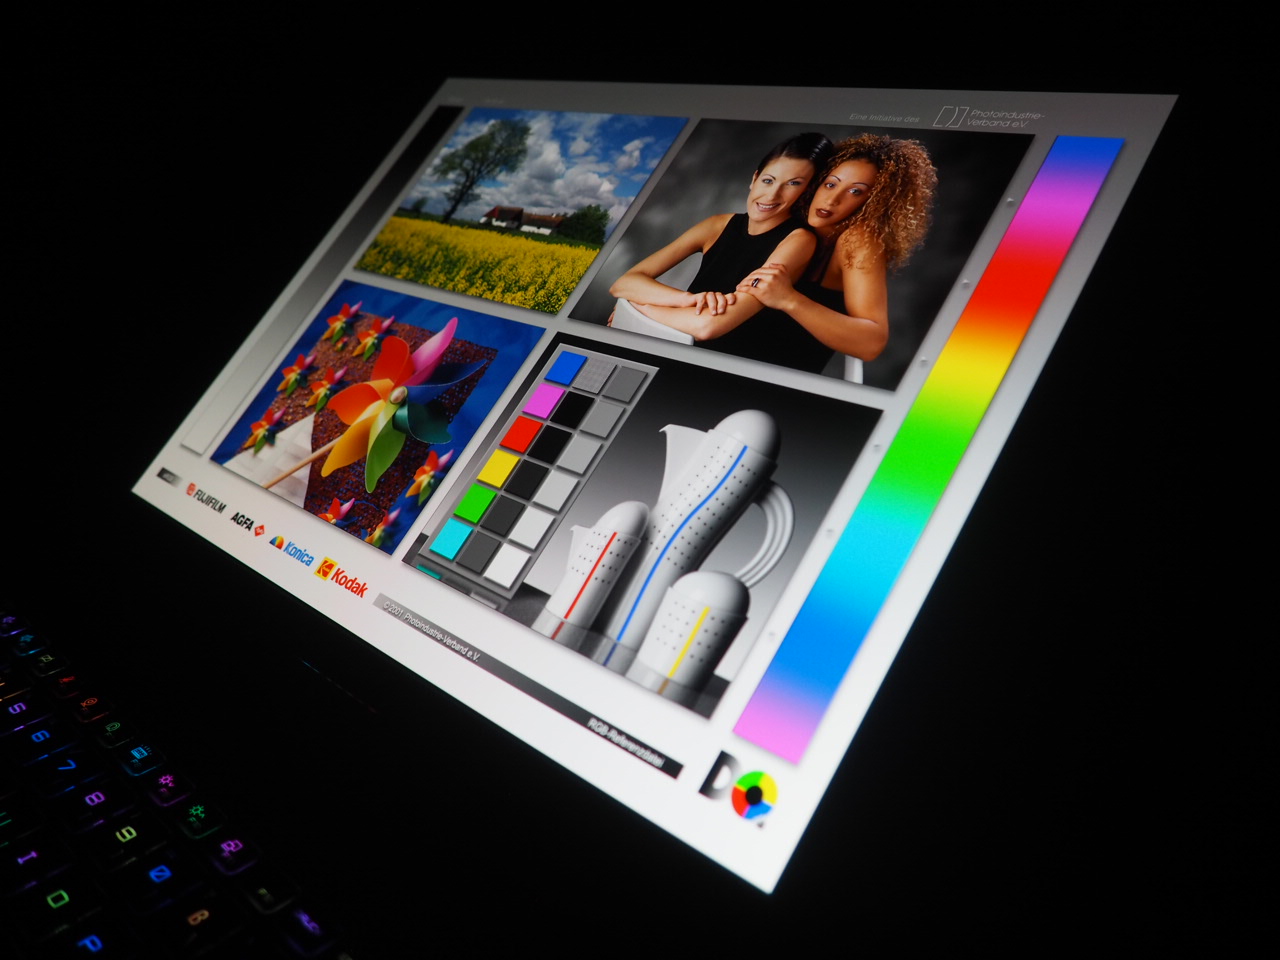
Como ya se ha mencionado, la edición especial cuenta con un panel OLED que ofrece una imagen extremadamente nítida, gracias a su alta resolución de 3.840 x 2.400 píxeles en formato 16:10.
| |||||||||||||||||||||||||
iluminación: 96 %
Brillo con batería: 382 cd/m²
Contraste: ∞:1 (Negro: 0 cd/m²)
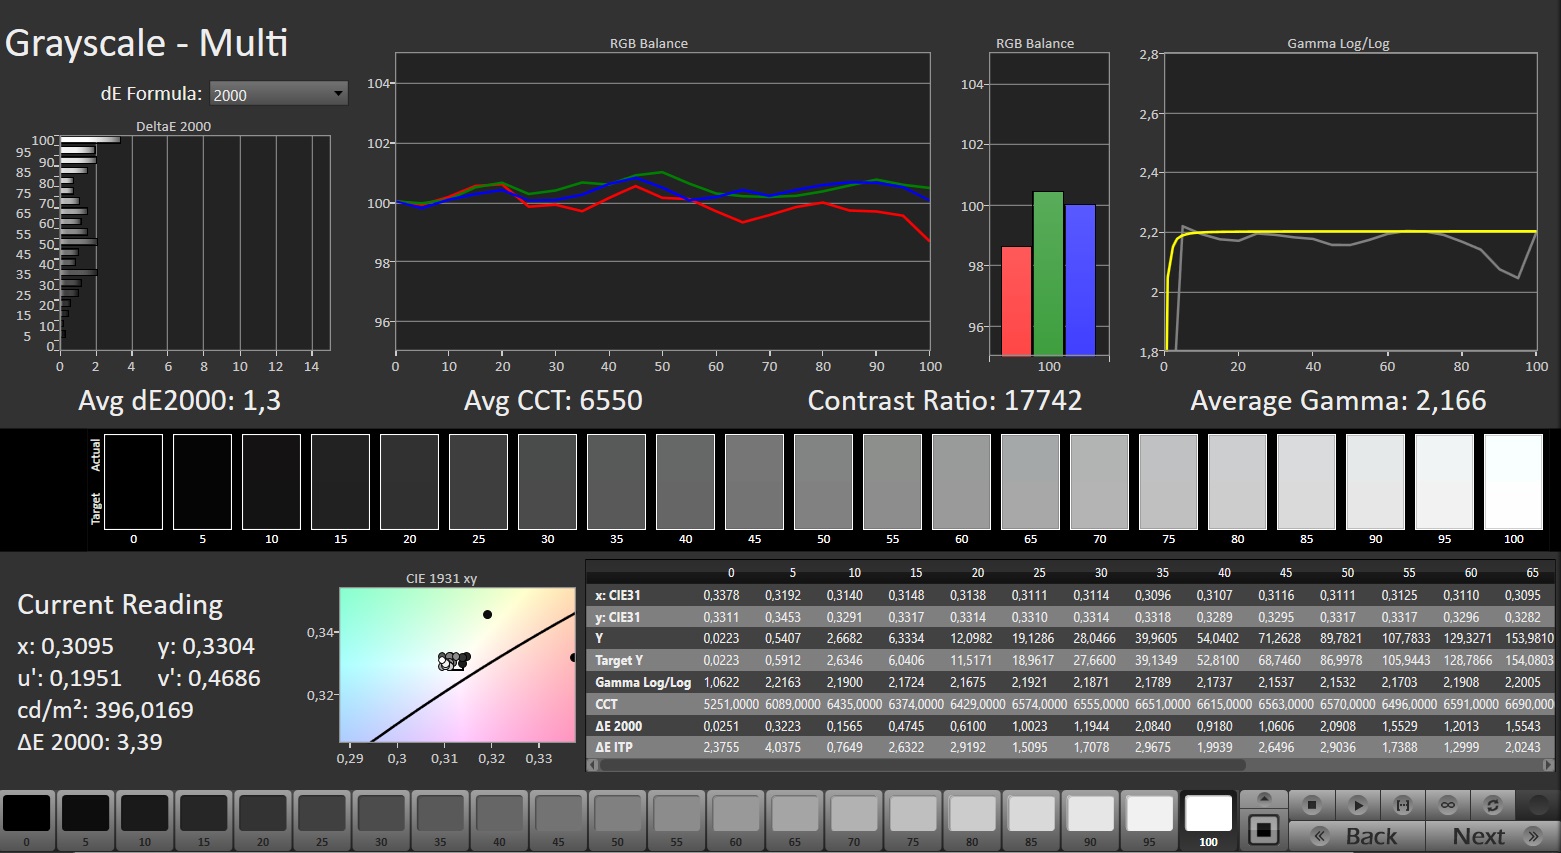
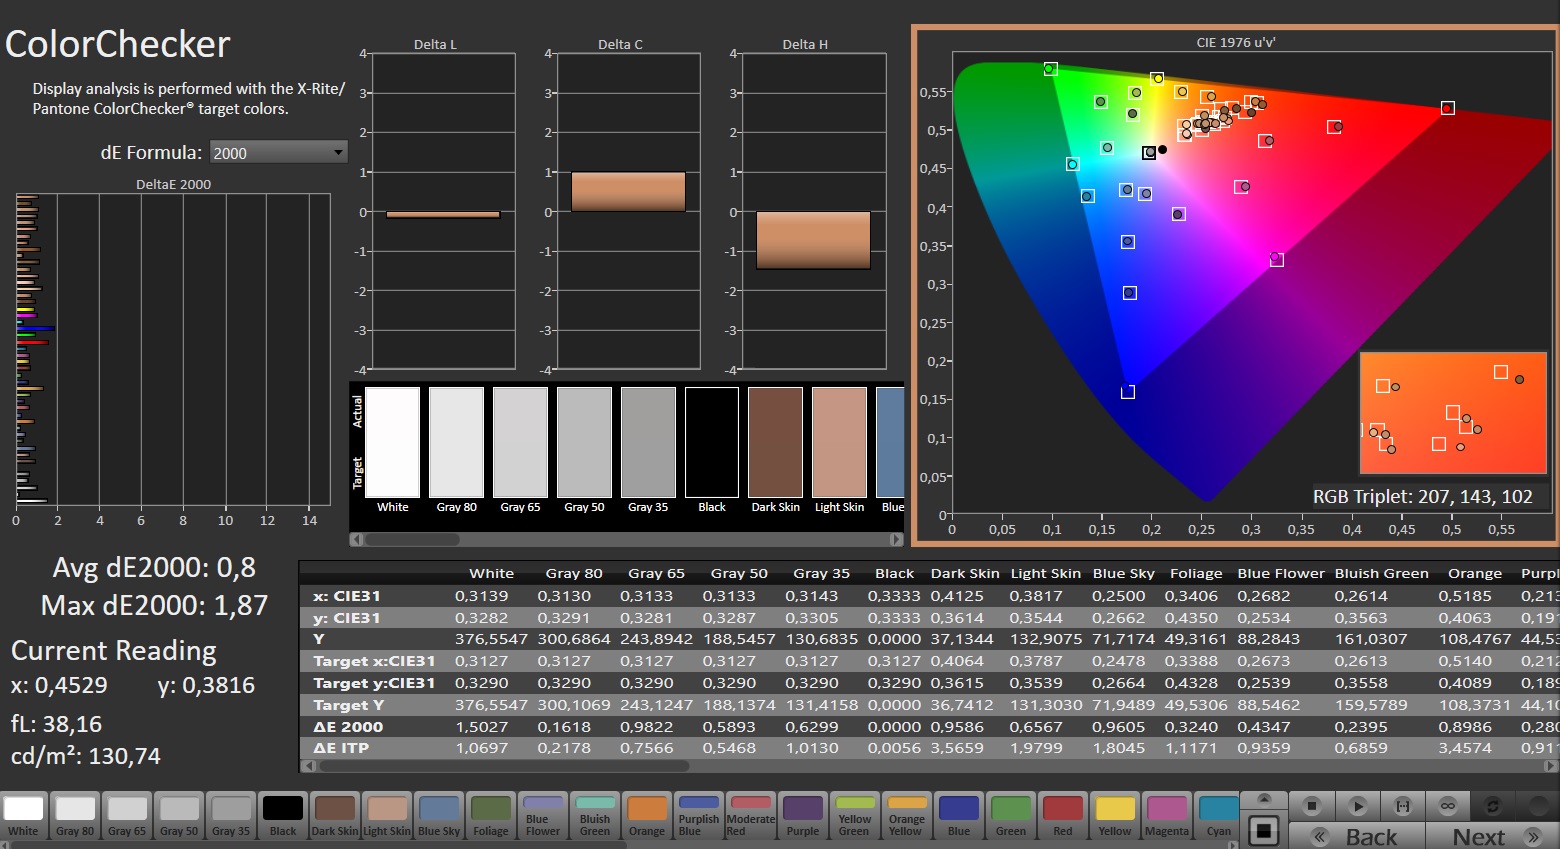
ΔE ColorChecker Calman: 0.84 | ∀{0.5-29.43 Ø4.71}
calibrated: 0.8
ΔE Greyscale Calman: 1.3 | ∀{0.09-98 Ø4.96}
88.4% AdobeRGB 1998 (Argyll 3D)
99.9% sRGB (Argyll 3D)
99.2% Display P3 (Argyll 3D)
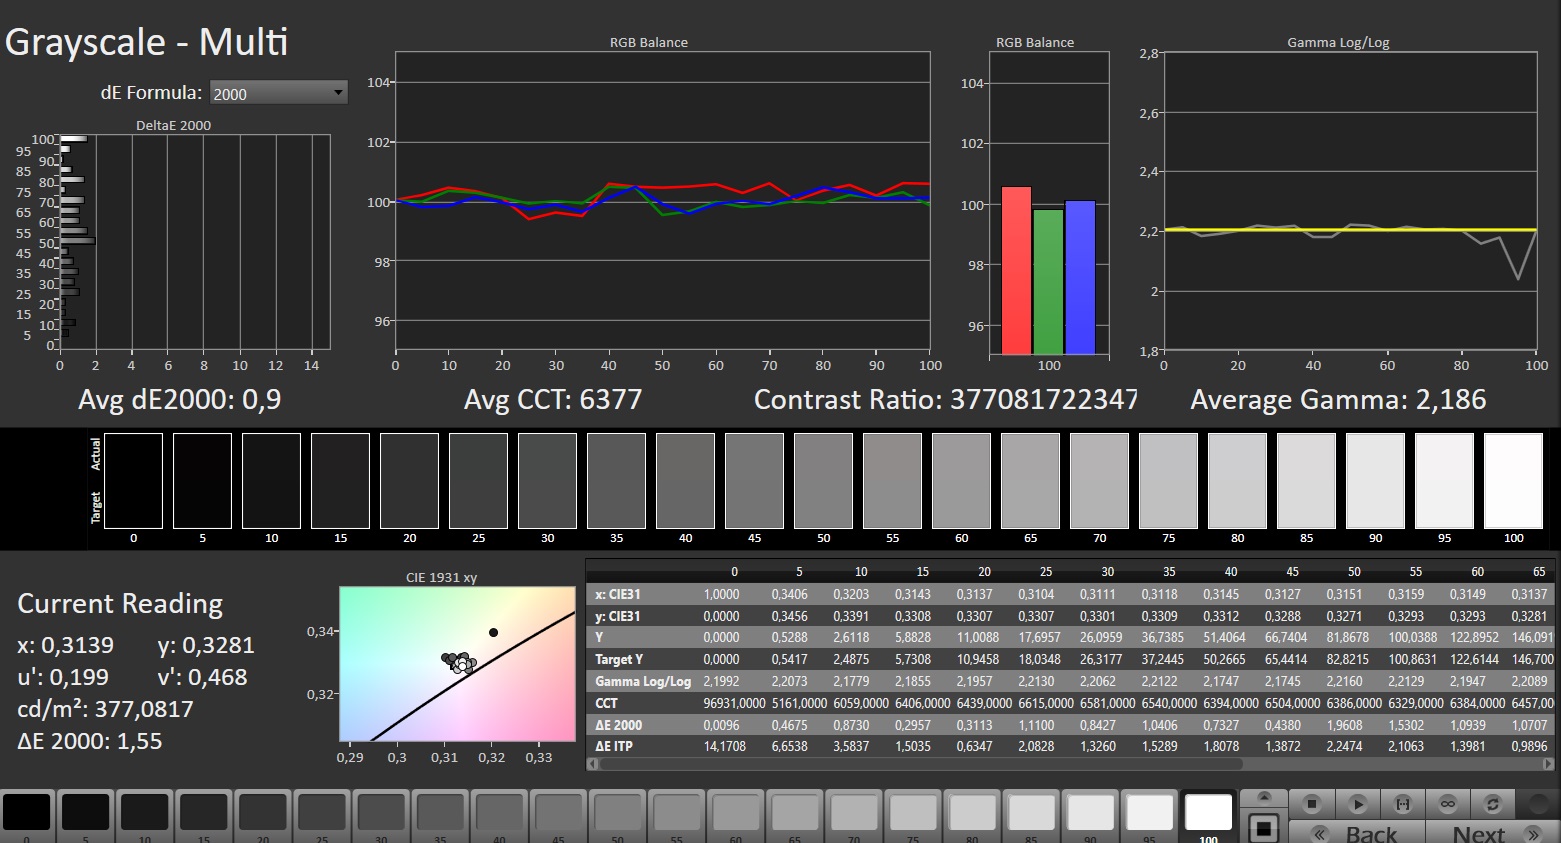
Gamma: 2.166
CCT: 6550 K
| MSI Stealth 16 Mercedes-AMG Motorsport A13VG ATNA60YV09-0 (SDC4191), OLED, 3840x2400, 16" | MSI Stealth 16 Studio A13VG AUO26A9, IPS, 2560x1600, 16" | Schenker XMG Pro 16 Studio (Mid 23) BOE CQ NE160QDM-NZ1, IPS, 2560x1600, 16" | HP Omen Transcend 16 AUOA3A6, Mini-LED, 2560x1600, 16" | Lenovo Legion Pro 5 16ARX8 CSOT T3 MNG007DA1-Q, IPS, 2560x1600, 16" | Schenker XMG CORE 16 (L23) BOE0AF0 (), IPS, 2560x1600, 16" | |
|---|---|---|---|---|---|---|
| Display | -2% | -18% | -0% | -16% | -18% | |
| Display P3 Coverage (%) | 99.2 | 96.4 -3% | 69.4 -30% | 99.2 0% | 70.4 -29% | 68.3 -31% |
| sRGB Coverage (%) | 99.9 | 99.7 0% | 98.2 -2% | 100 0% | 99.6 0% | 98.6 -1% |
| AdobeRGB 1998 Coverage (%) | 88.4 | 84.8 -4% | 70.1 -21% | 87.6 -1% | 72.6 -18% | 69.6 -21% |
| Response Times | -280% | -628% | -1955% | -513% | -615% | |
| Response Time Grey 50% / Grey 80% * (ms) | 1.5 ? | 4.4 ? -193% | 12.2 ? -713% | 26.4 ? -1660% | 7 ? -367% | 13.2 ? -780% |
| Response Time Black / White * (ms) | 1.2 ? | 5.6 ? -367% | 7.7 ? -542% | 28.2 ? -2250% | 9.1 ? -658% | 6.6 ? -450% |
| PWM Frequency (Hz) | 60 ? | 3506 ? | ||||
| Screen | -127% | -74% | -120% | 2% | -75% | |
| Brightness middle (cd/m²) | 382 | 424 11% | 349 -9% | 791.1 107% | 355.3 -7% | 376 -2% |
| Brightness (cd/m²) | 383 | 411 7% | 348 -9% | 800 109% | 340 -11% | 358 -7% |
| Brightness Distribution (%) | 96 | 88 -8% | 93 -3% | 95 -1% | 91 -5% | 88 -8% |
| Black Level * (cd/m²) | 0.37 | 0.32 | 0.04 | 0.32 | 0.33 | |
| Colorchecker dE 2000 * | 0.84 | 3.04 -262% | 1.98 -136% | 4.37 -420% | 1.13 -35% | 2.74 -226% |
| Colorchecker dE 2000 max. * | 3.39 | 7.5 -121% | 7.56 -123% | 10.39 -206% | 2.78 18% | 6.78 -100% |
| Colorchecker dE 2000 calibrated * | 0.8 | 3.04 -280% | 1.45 -81% | 1.04 -30% | 0.32 60% | 0.88 -10% |
| Greyscale dE 2000 * | 1.3 | 4.34 -234% | 3.3 -154% | 6.5 -400% | 1.4 -8% | 3.57 -175% |
| Gamma | 2.166 102% | 2.32 95% | 2.137 103% | 2.28 96% | 2.24 98% | 2.4 92% |
| CCT | 6550 99% | 6952 93% | 6672 97% | 6000 108% | 6372 102% | 7246 90% |
| Contrast (:1) | 1146 | 1091 | 19778 | 1110 | 1139 | |
| Media total (Programa/Opciones) | -136% /
-121% | -240% /
-152% | -692% /
-396% | -176% /
-88% | -236% /
-151% |
* ... más pequeño es mejor
La pantalla también ofrece un rendimiento de bueno a muy bueno en varios aspectos. Con una cobertura de casi el 100% de sRGB o DCI-P3 y del 88% de AdobeRGB, destaca en el espacio de color. Además, la precisión del color es de primera clase, eliminando la necesidad de calibrado, a diferencia de algunos competidores. El extraordinario nivel de negro de la pantalla, cercano a 0,0 cd/m², contribuye a un impresionante contraste característico de los OLED, superando a los paneles IPS tradicionales. La misma superioridad se extiende a la estabilidad del ángulo de visión y al tiempo de respuesta, lo que convierte a los portátiles OLED en la referencia actual en estos aspectos.

No obstante, los compradores deben enfrentarse a los típicos inconvenientes, como la baja frecuencia y el parpadeo. La pantalla parpadea a 60 Hz por debajo del 90% de brillo y a 240 Hz por debajo del 50%. Estos valores pueden plantear problemas a las personas sensibles a tales factores.
La superficie brillante, que ocasionalmente provoca reflejos importantes, puede ser una preocupación para muchos usuarios en el uso diario. A pesar de un respetable brillo medio de 383 cd/m², la idoneidad de la Stealth 16 para exteriores o entornos bien iluminados es algo limitada.
Tiempos de respuesta del display
| ↔ Tiempo de respuesta de Negro a Blanco | ||
|---|---|---|
| 1.2 ms ... subida ↗ y bajada ↘ combinada | ↗ 0.6 ms subida | 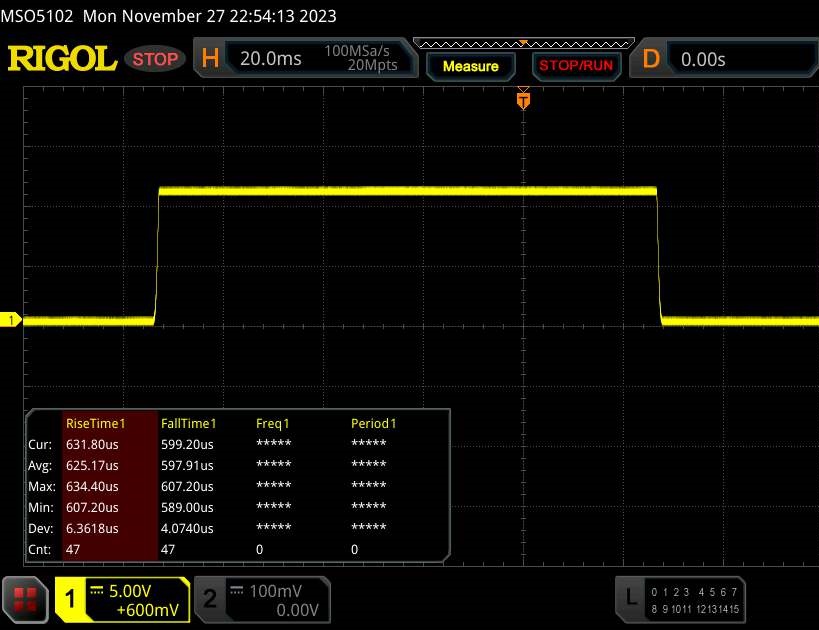 |
| ↘ 0.6 ms bajada | ||
| La pantalla mostró tiempos de respuesta muy rápidos en nuestros tests y debería ser adecuada para juegos frenéticos. En comparación, todos los dispositivos de prueba van de ##min### (mínimo) a 240 (máximo) ms. » 6 % de todos los dispositivos son mejores. Esto quiere decir que el tiempo de respuesta medido es mejor que la media (19.8 ms) de todos los dispositivos testados. | ||
| ↔ Tiempo de respuesta 50% Gris a 80% Gris | ||
| 1.5 ms ... subida ↗ y bajada ↘ combinada | ↗ 0.8 ms subida | 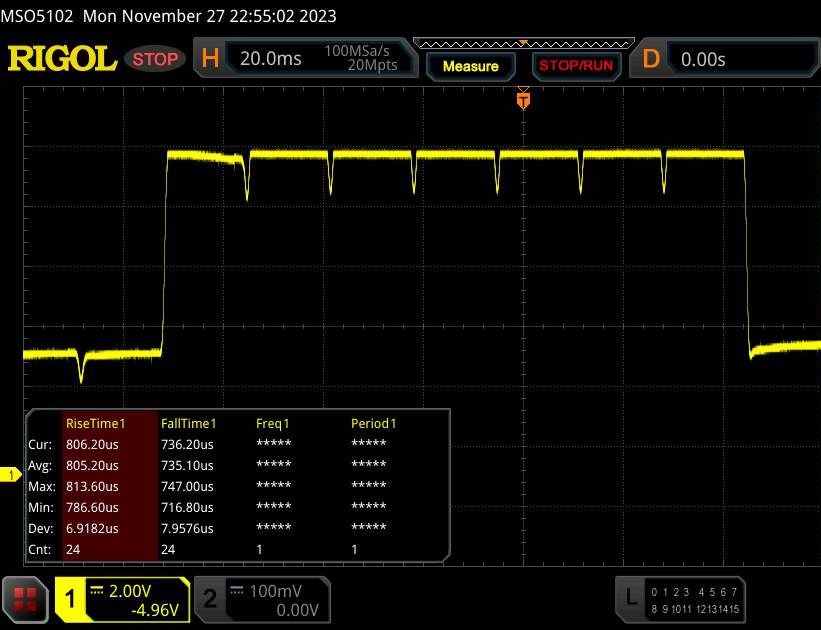 |
| ↘ 0.7 ms bajada | ||
| La pantalla mostró tiempos de respuesta muy rápidos en nuestros tests y debería ser adecuada para juegos frenéticos. En comparación, todos los dispositivos de prueba van de ##min### (mínimo) a 636 (máximo) ms. » 7 % de todos los dispositivos son mejores. Esto quiere decir que el tiempo de respuesta medido es mejor que la media (31 ms) de todos los dispositivos testados. | ||
Parpadeo de Pantalla / PWM (Pulse-Width Modulation)
| Parpadeo de Pantalla / PWM detectado | 60 Hz | ≤ 90 % de brillo | 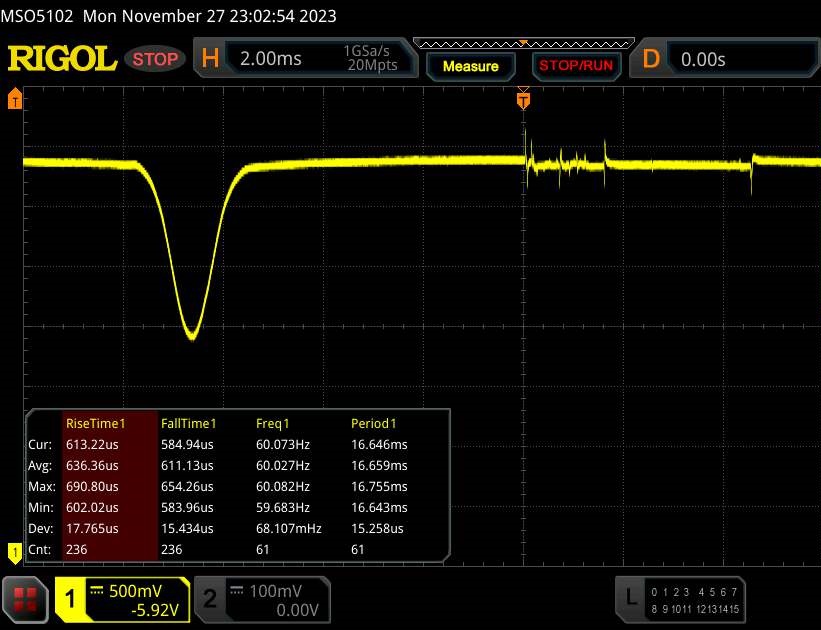 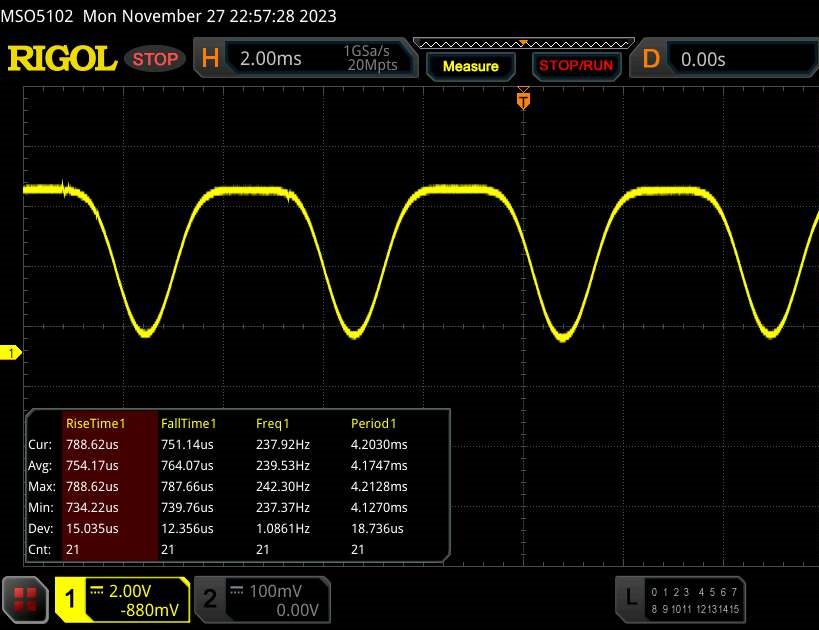 |
La retroiluminación del display parpadea a 60 Hz (seguramente usa PWM - Pulse-Width Modulation) a un brillo del 90 % e inferior. Sobre este nivel de brillo no debería darse parpadeo / PWM. La frecuencia de 60 Hz es bajísima, por lo que el parpadeo puede causar fatiga visual y cefaleas cuando se usa mucho tiempo. Comparación: 52 % de todos los dispositivos testados no usaron PWM para atenuar el display. Si se usó, medimos una media de 7757 (mínimo: 5 - máxmo: 343500) Hz. | |||
Rendimiento
Con sólo 8 GB de VRAM para la GeForce RTX 4070, que se consideraba desfasada en este segmento de precios en el momento de su lanzamiento, el Stealth 16 se sitúa en la gama media alta, sobre todo en términos de rendimiento de la GPU. El rendimiento de su CPU es de primer nivel, el Stealth 16 está justo en la parte superior, y la amplia configuración de RAM y SSD debería ofrecer reservas suficientes para la mayoría de los usuarios.

Condiciones de prueba
El MSI Center preinstalado ofrece varios modos de funcionamiento, desde Eco hasta Sport. Todas las mediciones se realizaron en el modo Smart Auto, en el que el sistema ajusta automáticamente la configuración. La conmutación de gráficos (MSHybrid) estaba activada por defecto.
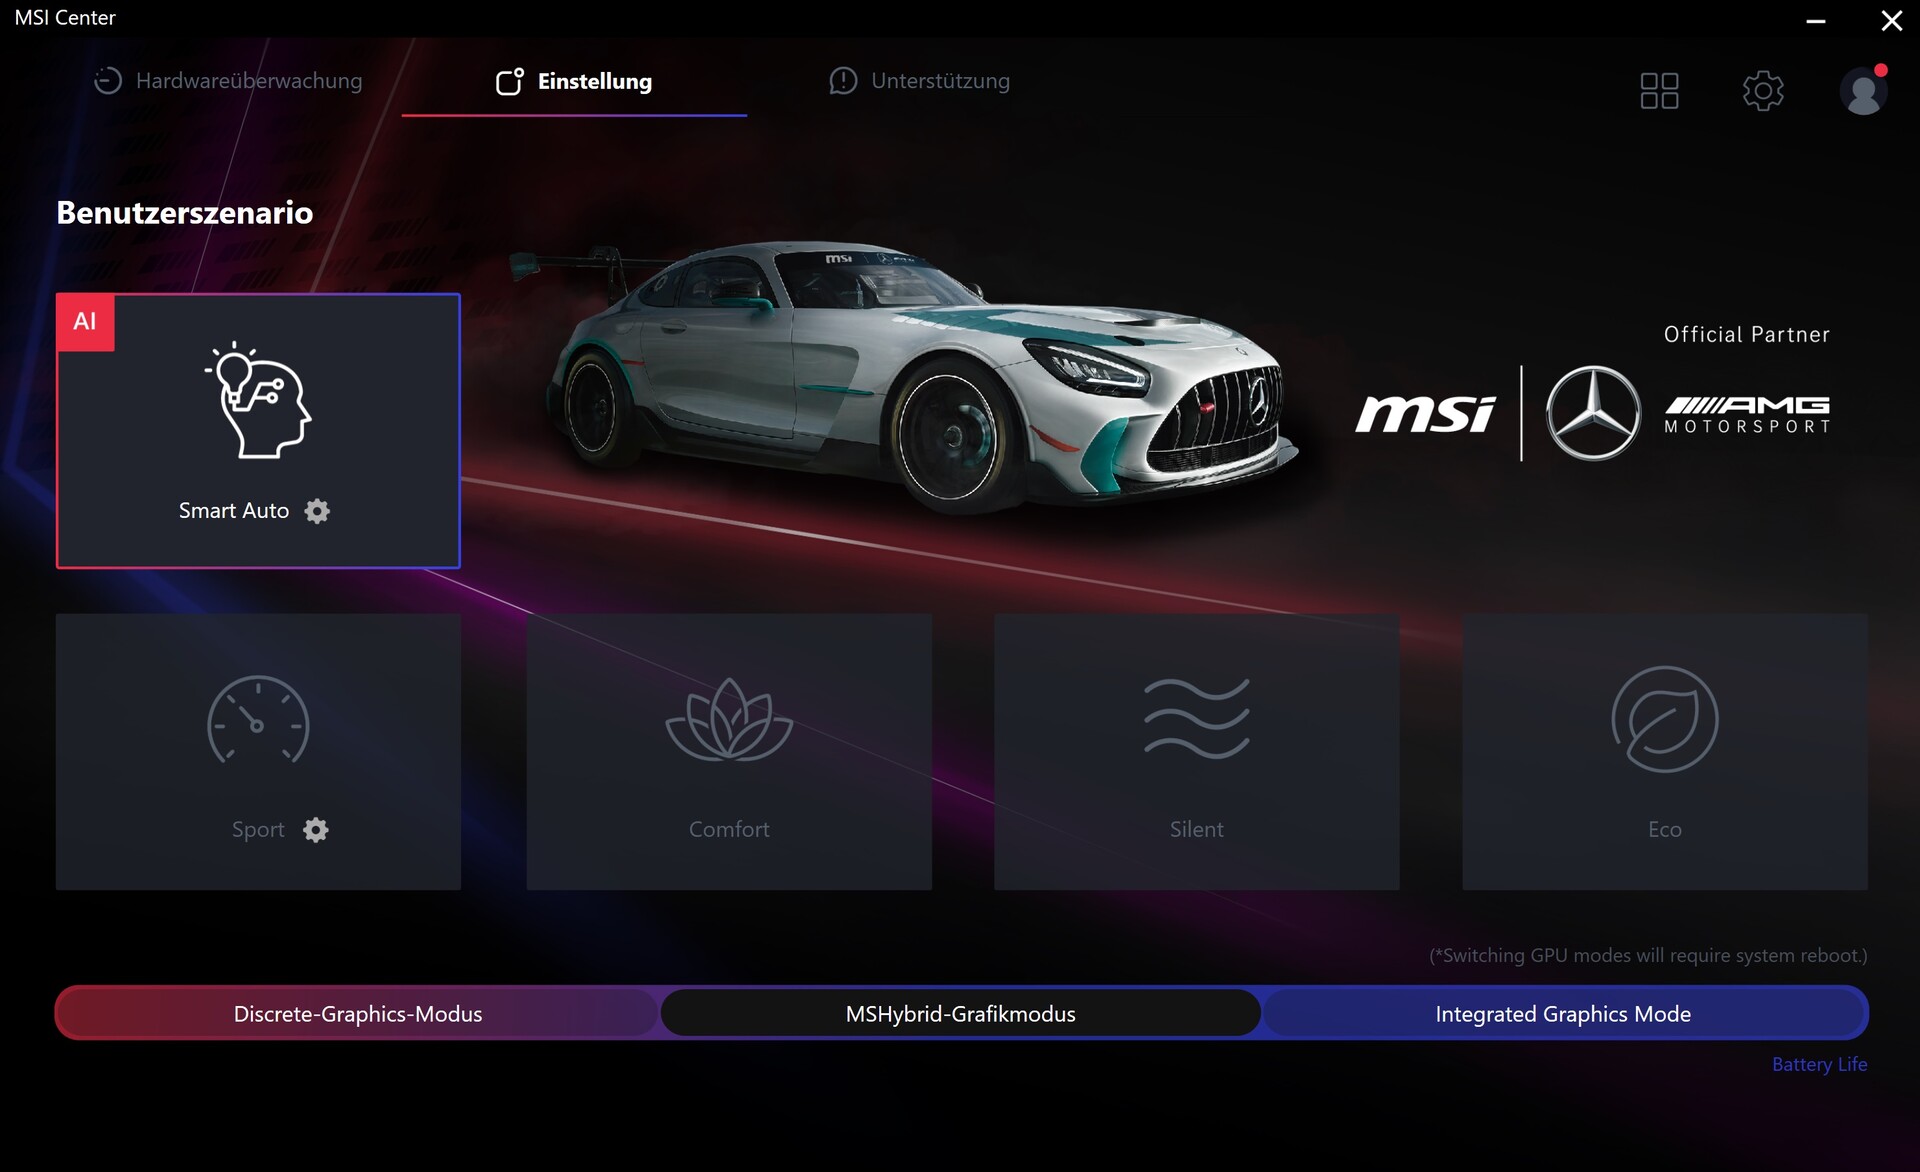
| Deporte | Confort | Silenciosa | Eco | |
|---|---|---|---|---|
| Rendimiento (Witcher 3, FHD/Ultra) | 120 fps | 110 fps | 90 fps | 90 fps |
| Ruido (Witcher 3, FHD/Ultra) | 49 dB(A) | 45 dB(A) | 36 dB(A) | 34 dB(A) |
| Límite de potencia 1 (HWInfo) | 100 w | 45 w | 25 w | 15 w |
| Límite de potencia 2 (HWInfo) | 160 w | 45 w | 45 w | 15 w |
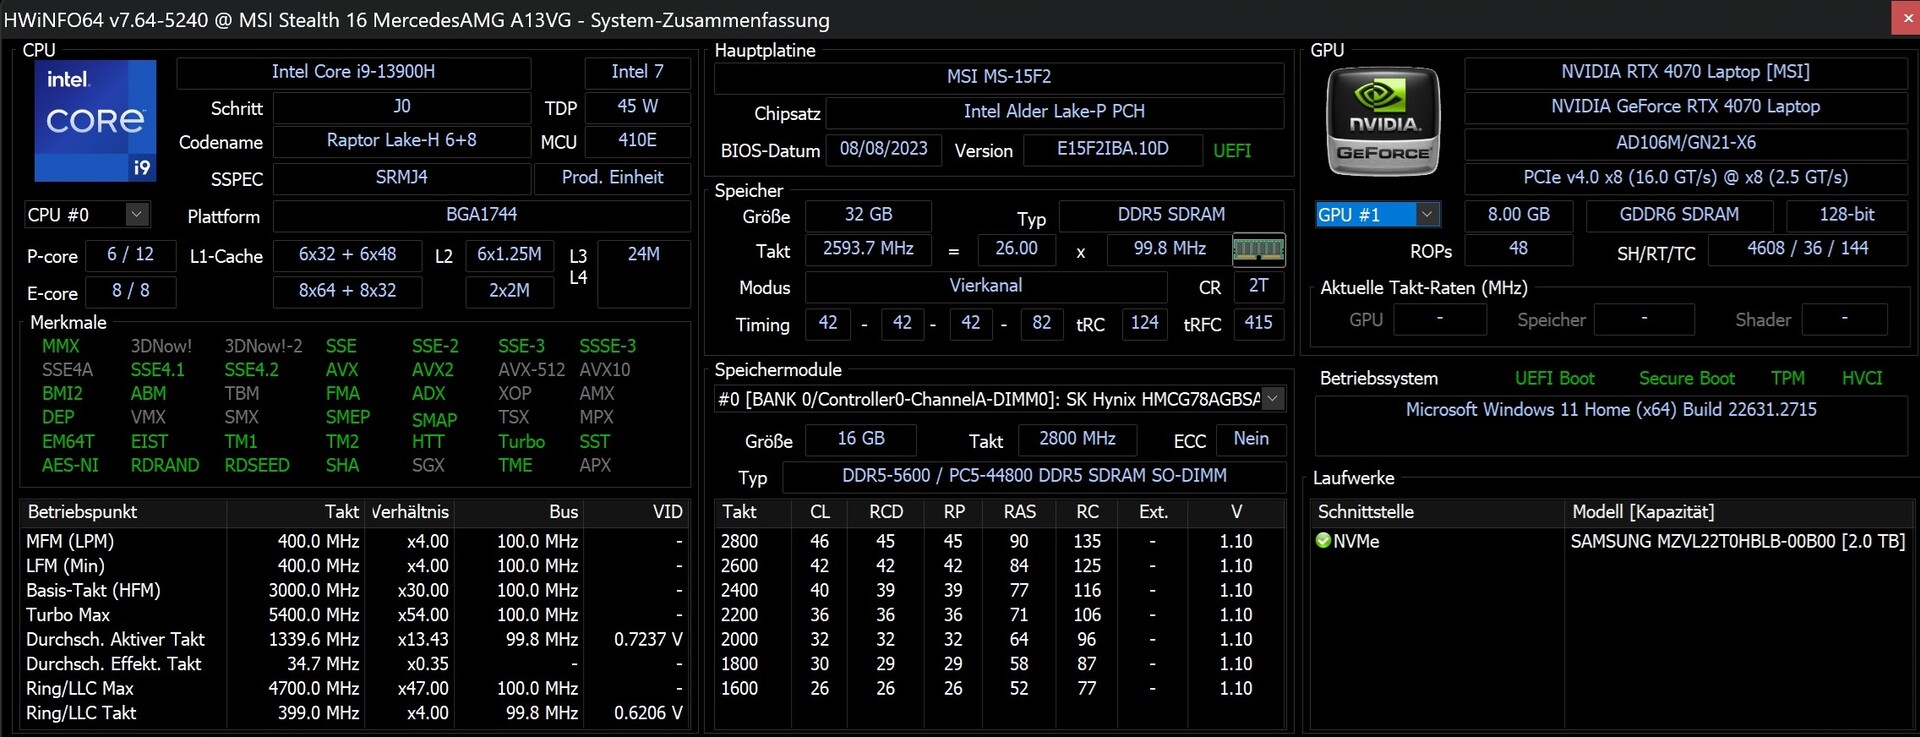
Procesador
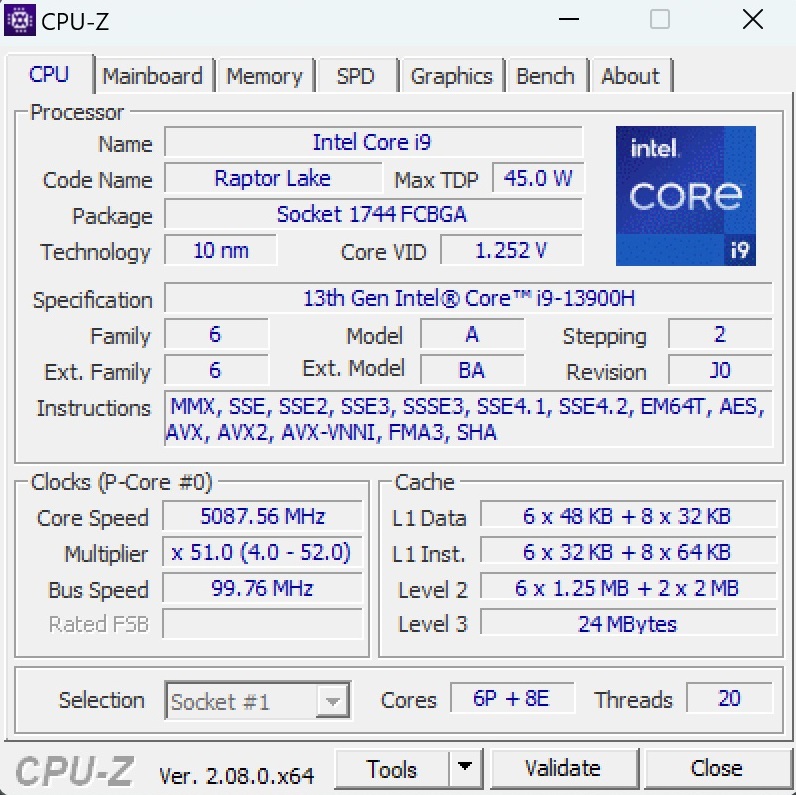
La actualización del i7-13700H al i9-13900H en nuestras pruebas de CPU mostró una mejora marginal del rendimiento. Los resultados de los benchmarks se mantuvieron similares a los de la versión estándar. Durante el bucle Cinebench, se produjeron dos caídas temporales, a diferencia de la competencia. El Core i9-13900H es un chip de gama alta potente pero que consume mucha energía, con 6 núcleos de rendimiento con Hyper-Threading y 8 núcleos de eficiencia sin HT (20 hilos en total).
Cinebench R15 Multi Loop
* ... más pequeño es mejor
AIDA64: FP32 Ray-Trace | FPU Julia | CPU SHA3 | CPU Queen | FPU SinJulia | FPU Mandel | CPU AES | CPU ZLib | FP64 Ray-Trace | CPU PhotoWorxx
| Performance rating | |
| Media de la clase Gaming | |
| HP Omen Transcend 16 | |
| Lenovo Legion Pro 5 16ARX8 | |
| Schenker XMG CORE 16 (L23) | |
| MSI Stealth 16 Mercedes-AMG Motorsport A13VG | |
| Schenker XMG Pro 16 Studio (Mid 23) | |
| MSI Stealth 16 Studio A13VG | |
| Medio Intel Core i9-13900H | |
| AIDA64 / FP32 Ray-Trace | |
| Media de la clase Gaming (10227 - 85542, n=105, últimos 2 años) | |
| Lenovo Legion Pro 5 16ARX8 | |
| Schenker XMG CORE 16 (L23) | |
| HP Omen Transcend 16 | |
| MSI Stealth 16 Mercedes-AMG Motorsport A13VG | |
| MSI Stealth 16 Studio A13VG | |
| Schenker XMG Pro 16 Studio (Mid 23) | |
| Medio Intel Core i9-13900H (6788 - 19557, n=25) | |
| AIDA64 / FPU Julia | |
| Media de la clase Gaming (51376 - 238426, n=105, últimos 2 años) | |
| Lenovo Legion Pro 5 16ARX8 | |
| Schenker XMG CORE 16 (L23) | |
| HP Omen Transcend 16 | |
| MSI Stealth 16 Mercedes-AMG Motorsport A13VG | |
| Schenker XMG Pro 16 Studio (Mid 23) | |
| MSI Stealth 16 Studio A13VG | |
| Medio Intel Core i9-13900H (22551 - 95579, n=25) | |
| AIDA64 / CPU SHA3 | |
| Media de la clase Gaming (2180 - 10115, n=105, últimos 2 años) | |
| HP Omen Transcend 16 | |
| Lenovo Legion Pro 5 16ARX8 | |
| Schenker XMG CORE 16 (L23) | |
| MSI Stealth 16 Mercedes-AMG Motorsport A13VG | |
| MSI Stealth 16 Studio A13VG | |
| Schenker XMG Pro 16 Studio (Mid 23) | |
| Medio Intel Core i9-13900H (2491 - 4270, n=25) | |
| AIDA64 / CPU Queen | |
| Lenovo Legion Pro 5 16ARX8 | |
| HP Omen Transcend 16 | |
| Media de la clase Gaming (49785 - 173351, n=90, últimos 2 años) | |
| MSI Stealth 16 Mercedes-AMG Motorsport A13VG | |
| MSI Stealth 16 Studio A13VG | |
| Medio Intel Core i9-13900H (65121 - 120936, n=25) | |
| Schenker XMG CORE 16 (L23) | |
| Schenker XMG Pro 16 Studio (Mid 23) | |
| AIDA64 / FPU SinJulia | |
| Lenovo Legion Pro 5 16ARX8 | |
| Schenker XMG CORE 16 (L23) | |
| Media de la clase Gaming (4424 - 33636, n=105, últimos 2 años) | |
| HP Omen Transcend 16 | |
| MSI Stealth 16 Mercedes-AMG Motorsport A13VG | |
| MSI Stealth 16 Studio A13VG | |
| Schenker XMG Pro 16 Studio (Mid 23) | |
| Medio Intel Core i9-13900H (6108 - 11631, n=25) | |
| AIDA64 / FPU Mandel | |
| Media de la clase Gaming (25115 - 128721, n=105, últimos 2 años) | |
| Lenovo Legion Pro 5 16ARX8 | |
| Schenker XMG CORE 16 (L23) | |
| HP Omen Transcend 16 | |
| MSI Stealth 16 Mercedes-AMG Motorsport A13VG | |
| MSI Stealth 16 Studio A13VG | |
| Schenker XMG Pro 16 Studio (Mid 23) | |
| Medio Intel Core i9-13900H (11283 - 48474, n=25) | |
| AIDA64 / CPU AES | |
| Schenker XMG Pro 16 Studio (Mid 23) | |
| HP Omen Transcend 16 | |
| Media de la clase Gaming (39258 - 247074, n=105, últimos 2 años) | |
| Schenker XMG CORE 16 (L23) | |
| Medio Intel Core i9-13900H (3691 - 149377, n=25) | |
| MSI Stealth 16 Mercedes-AMG Motorsport A13VG | |
| MSI Stealth 16 Studio A13VG | |
| Lenovo Legion Pro 5 16ARX8 | |
| AIDA64 / CPU ZLib | |
| HP Omen Transcend 16 | |
| Media de la clase Gaming (574 - 2531, n=105, últimos 2 años) | |
| MSI Stealth 16 Mercedes-AMG Motorsport A13VG | |
| Lenovo Legion Pro 5 16ARX8 | |
| Schenker XMG CORE 16 (L23) | |
| Schenker XMG Pro 16 Studio (Mid 23) | |
| Medio Intel Core i9-13900H (789 - 1254, n=25) | |
| MSI Stealth 16 Studio A13VG | |
| AIDA64 / FP64 Ray-Trace | |
| Media de la clase Gaming (5509 - 45446, n=105, últimos 2 años) | |
| Lenovo Legion Pro 5 16ARX8 | |
| Schenker XMG CORE 16 (L23) | |
| HP Omen Transcend 16 | |
| MSI Stealth 16 Mercedes-AMG Motorsport A13VG | |
| MSI Stealth 16 Studio A13VG | |
| Schenker XMG Pro 16 Studio (Mid 23) | |
| Medio Intel Core i9-13900H (3655 - 10716, n=25) | |
| AIDA64 / CPU PhotoWorxx | |
| HP Omen Transcend 16 | |
| Schenker XMG Pro 16 Studio (Mid 23) | |
| MSI Stealth 16 Mercedes-AMG Motorsport A13VG | |
| MSI Stealth 16 Studio A13VG | |
| Media de la clase Gaming (12271 - 89891, n=105, últimos 2 años) | |
| Schenker XMG CORE 16 (L23) | |
| Medio Intel Core i9-13900H (10871 - 50488, n=25) | |
| Lenovo Legion Pro 5 16ARX8 | |
Rendimiento del sistema
A pesar de albergar componentes muy rápidos, el rendimiento del sistema de la Stealth 16 ocupa el penúltimo lugar en la comparativa, justo por delante de la versión Studio estándar. Las diferencias son menores y, en el uso práctico, es poco probable que los usuarios noten distinciones significativas.
CrossMark: Overall | Productivity | Creativity | Responsiveness
| PCMark 10 / Score | |
| Media de la clase Gaming (5828 - 12414, n=93, últimos 2 años) | |
| Lenovo Legion Pro 5 16ARX8 | |
| Schenker XMG CORE 16 (L23) | |
| HP Omen Transcend 16 | |
| Schenker XMG Pro 16 Studio (Mid 23) | |
| Medio Intel Core i9-13900H, NVIDIA GeForce RTX 4070 Laptop GPU (5855 - 8538, n=8) | |
| MSI Stealth 16 Mercedes-AMG Motorsport A13VG | |
| MSI Stealth 16 Studio A13VG | |
| PCMark 10 / Essentials | |
| Schenker XMG Pro 16 Studio (Mid 23) | |
| HP Omen Transcend 16 | |
| Lenovo Legion Pro 5 16ARX8 | |
| Schenker XMG CORE 16 (L23) | |
| MSI Stealth 16 Mercedes-AMG Motorsport A13VG | |
| Medio Intel Core i9-13900H, NVIDIA GeForce RTX 4070 Laptop GPU (8835 - 11940, n=8) | |
| Media de la clase Gaming (8810 - 11935, n=97, últimos 2 años) | |
| MSI Stealth 16 Studio A13VG | |
| PCMark 10 / Productivity | |
| Media de la clase Gaming (6845 - 25323, n=95, últimos 2 años) | |
| Schenker XMG CORE 16 (L23) | |
| Schenker XMG Pro 16 Studio (Mid 23) | |
| Lenovo Legion Pro 5 16ARX8 | |
| Medio Intel Core i9-13900H, NVIDIA GeForce RTX 4070 Laptop GPU (7967 - 10991, n=8) | |
| HP Omen Transcend 16 | |
| MSI Stealth 16 Mercedes-AMG Motorsport A13VG | |
| MSI Stealth 16 Studio A13VG | |
| PCMark 10 / Digital Content Creation | |
| Media de la clase Gaming (7602 - 19954, n=95, últimos 2 años) | |
| HP Omen Transcend 16 | |
| Lenovo Legion Pro 5 16ARX8 | |
| Schenker XMG CORE 16 (L23) | |
| Medio Intel Core i9-13900H, NVIDIA GeForce RTX 4070 Laptop GPU (7738 - 13575, n=8) | |
| Schenker XMG Pro 16 Studio (Mid 23) | |
| MSI Stealth 16 Studio A13VG | |
| MSI Stealth 16 Mercedes-AMG Motorsport A13VG | |
| CrossMark / Overall | |
| Lenovo Legion Pro 5 16ARX8 | |
| Media de la clase Gaming (1366 - 2409, n=94, últimos 2 años) | |
| HP Omen Transcend 16 | |
| Schenker XMG Pro 16 Studio (Mid 23) | |
| Medio Intel Core i9-13900H, NVIDIA GeForce RTX 4070 Laptop GPU (1104 - 1974, n=7) | |
| MSI Stealth 16 Studio A13VG | |
| Schenker XMG CORE 16 (L23) | |
| CrossMark / Productivity | |
| Lenovo Legion Pro 5 16ARX8 | |
| Schenker XMG Pro 16 Studio (Mid 23) | |
| Media de la clase Gaming (1386 - 2254, n=94, últimos 2 años) | |
| HP Omen Transcend 16 | |
| Medio Intel Core i9-13900H, NVIDIA GeForce RTX 4070 Laptop GPU (1058 - 1914, n=7) | |
| MSI Stealth 16 Studio A13VG | |
| Schenker XMG CORE 16 (L23) | |
| CrossMark / Creativity | |
| HP Omen Transcend 16 | |
| Media de la clase Gaming (1343 - 2786, n=94, últimos 2 años) | |
| Lenovo Legion Pro 5 16ARX8 | |
| Schenker XMG Pro 16 Studio (Mid 23) | |
| Medio Intel Core i9-13900H, NVIDIA GeForce RTX 4070 Laptop GPU (1178 - 2254, n=7) | |
| MSI Stealth 16 Studio A13VG | |
| Schenker XMG CORE 16 (L23) | |
| CrossMark / Responsiveness | |
| Schenker XMG Pro 16 Studio (Mid 23) | |
| Lenovo Legion Pro 5 16ARX8 | |
| Media de la clase Gaming (1226 - 2334, n=94, últimos 2 años) | |
| Medio Intel Core i9-13900H, NVIDIA GeForce RTX 4070 Laptop GPU (1037 - 1952, n=7) | |
| MSI Stealth 16 Studio A13VG | |
| HP Omen Transcend 16 | |
| Schenker XMG CORE 16 (L23) | |
| PCMark 10 Score | 7334 puntos | |
ayuda | ||
| AIDA64 / Memory Copy | |
| HP Omen Transcend 16 | |
| Media de la clase Gaming (21750 - 129946, n=105, últimos 2 años) | |
| Schenker XMG Pro 16 Studio (Mid 23) | |
| MSI Stealth 16 Studio A13VG | |
| MSI Stealth 16 Mercedes-AMG Motorsport A13VG | |
| Schenker XMG CORE 16 (L23) | |
| Medio Intel Core i9-13900H (37448 - 74486, n=25) | |
| Lenovo Legion Pro 5 16ARX8 | |
| AIDA64 / Memory Read | |
| HP Omen Transcend 16 | |
| Schenker XMG Pro 16 Studio (Mid 23) | |
| Media de la clase Gaming (22956 - 118858, n=105, últimos 2 años) | |
| MSI Stealth 16 Studio A13VG | |
| MSI Stealth 16 Mercedes-AMG Motorsport A13VG | |
| Medio Intel Core i9-13900H (41599 - 75433, n=25) | |
| Schenker XMG CORE 16 (L23) | |
| Lenovo Legion Pro 5 16ARX8 | |
| AIDA64 / Memory Write | |
| Schenker XMG CORE 16 (L23) | |
| Media de la clase Gaming (22297 - 135096, n=105, últimos 2 años) | |
| HP Omen Transcend 16 | |
| MSI Stealth 16 Mercedes-AMG Motorsport A13VG | |
| Schenker XMG Pro 16 Studio (Mid 23) | |
| MSI Stealth 16 Studio A13VG | |
| Medio Intel Core i9-13900H (36152 - 88505, n=25) | |
| Lenovo Legion Pro 5 16ARX8 | |
| AIDA64 / Memory Latency | |
| Media de la clase Gaming (75.3 - 259, n=105, últimos 2 años) | |
| Medio Intel Core i9-13900H (75.8 - 102.3, n=25) | |
| MSI Stealth 16 Mercedes-AMG Motorsport A13VG | |
| Schenker XMG CORE 16 (L23) | |
| HP Omen Transcend 16 | |
| MSI Stealth 16 Studio A13VG | |
| Schenker XMG Pro 16 Studio (Mid 23) | |
| Lenovo Legion Pro 5 16ARX8 | |
* ... más pequeño es mejor
Latencia del CPD
MSI podría mejorar la latencia en el Stealth 16. Tal y como se entrega, el LatencyMon indica posibles interrupciones en el procesamiento de audio y vídeo en tiempo real. Sin embargo, este fenómeno afecta a muchos portátiles.
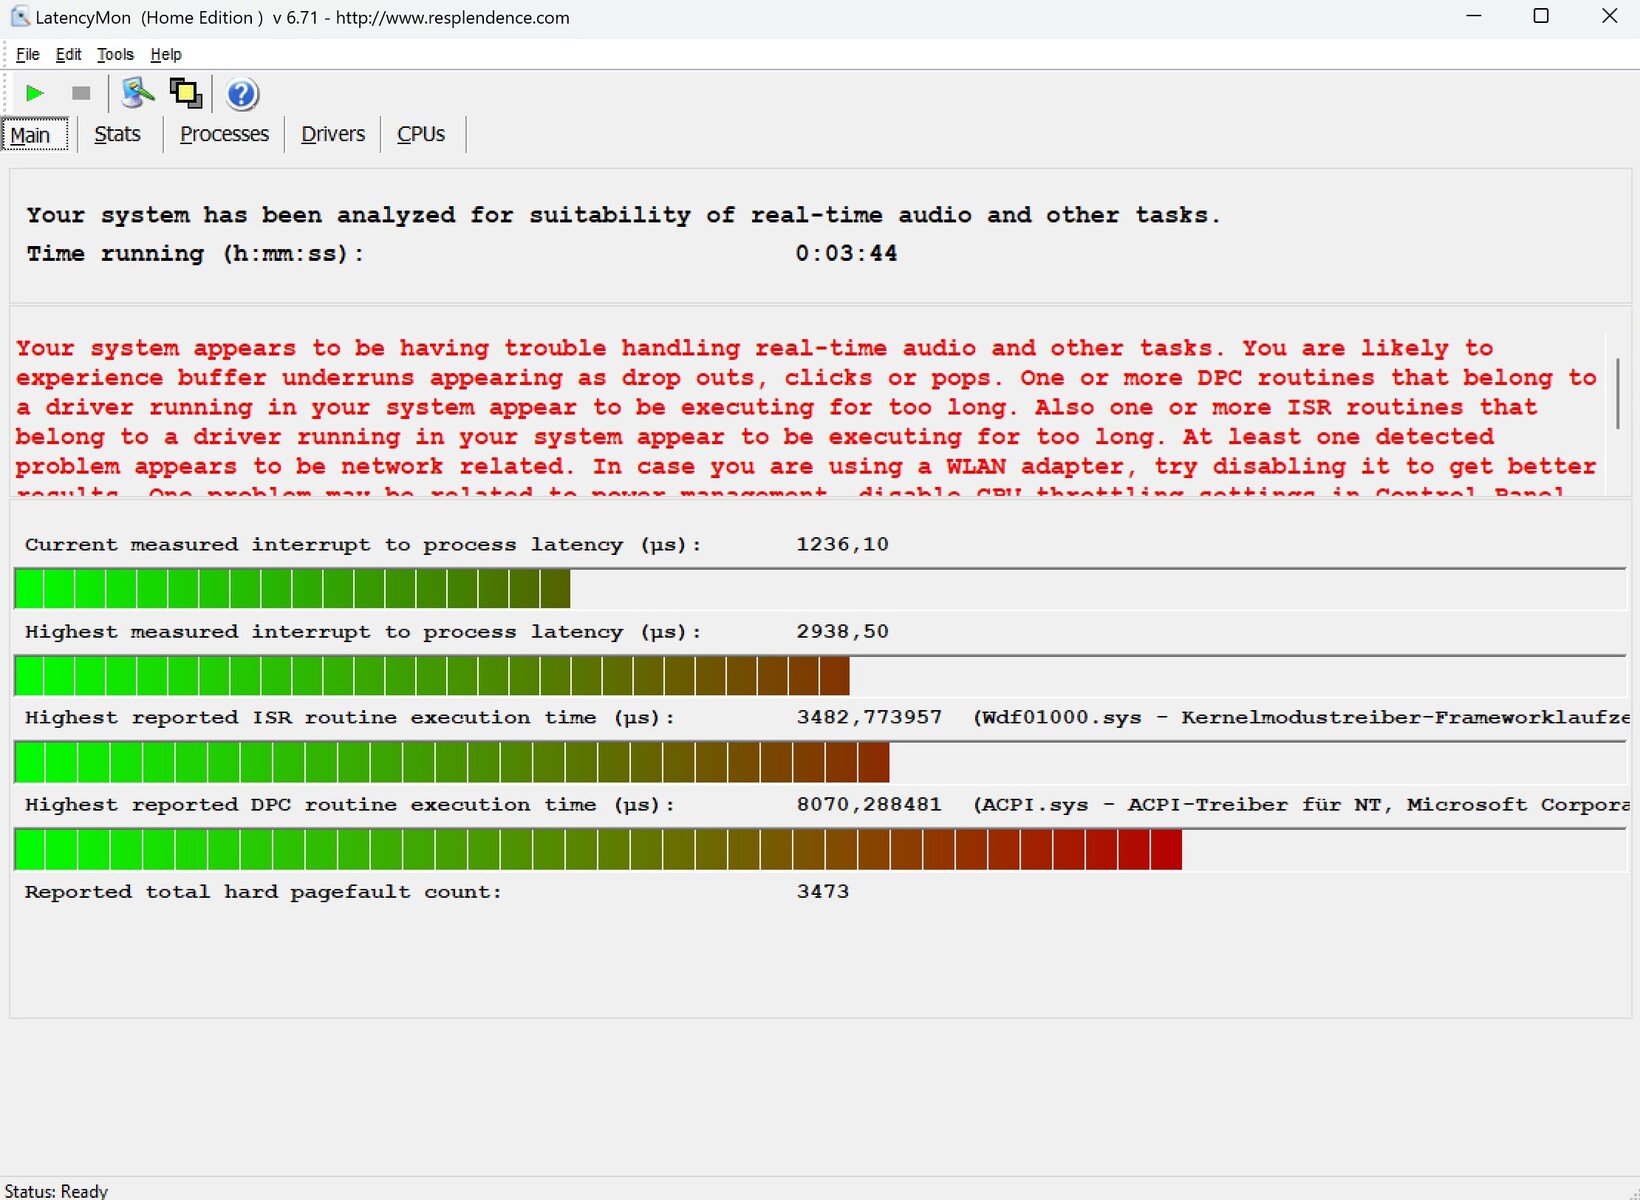
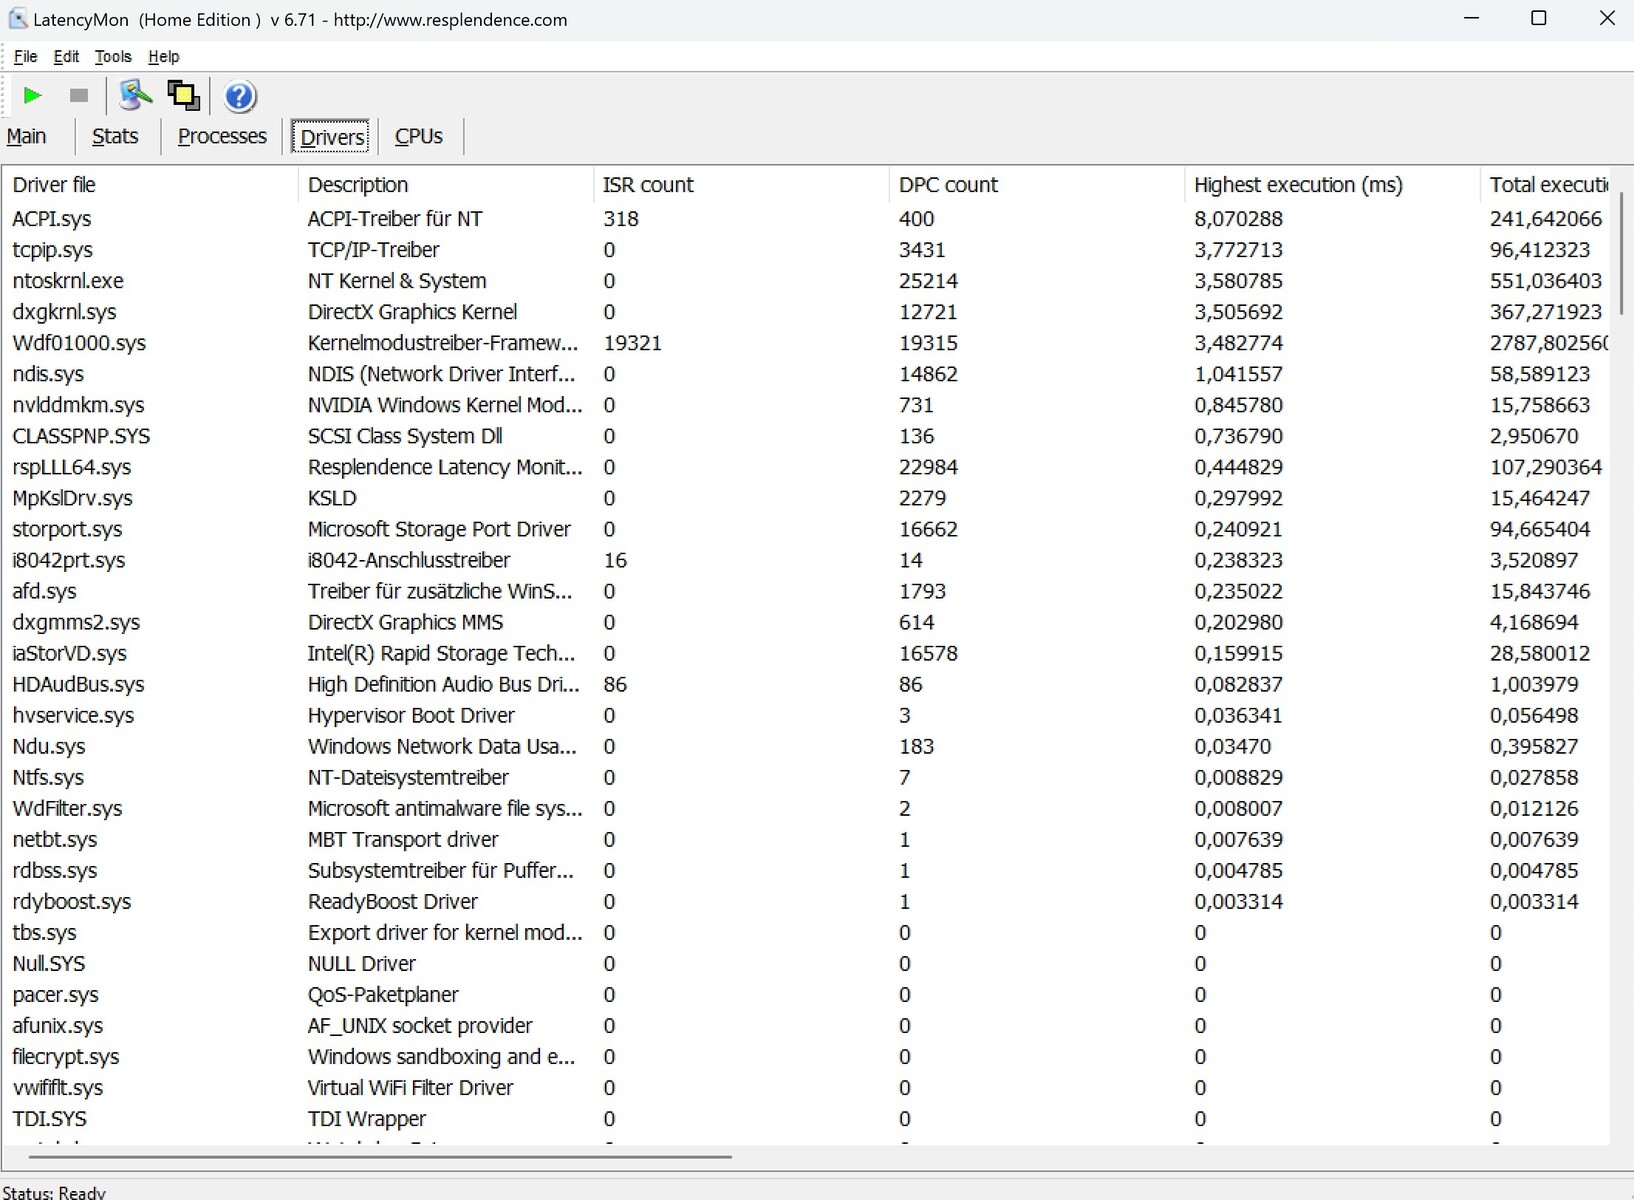
| DPC Latencies / LatencyMon - interrupt to process latency (max), Web, Youtube, Prime95 | |
| MSI Stealth 16 Studio A13VG | |
| MSI Stealth 16 Mercedes-AMG Motorsport A13VG | |
| Schenker XMG Pro 16 Studio (Mid 23) | |
| HP Omen Transcend 16 | |
| Schenker XMG CORE 16 (L23) | |
| Lenovo Legion Pro 5 16ARX8 | |
* ... más pequeño es mejor
Dispositivos de almacenamiento
La unidad SSD Samsung de 2 TB (modelo PM9A1) en el dispositivo de prueba funcionó bien inicialmente pero experimentó graves caídas de rendimiento, o ralentización, bajo carga prolongada. Por desgracia, MSI aún no ha solucionado este problema, similar al del Stealth 16 estándar. La mayoría de la competencia rinde mejor en este aspecto, con la excepción del Lenovo Legion Pro 5.

* ... más pequeño es mejor
Continuous power read: DiskSpd Read Loop, Queue Depth 8
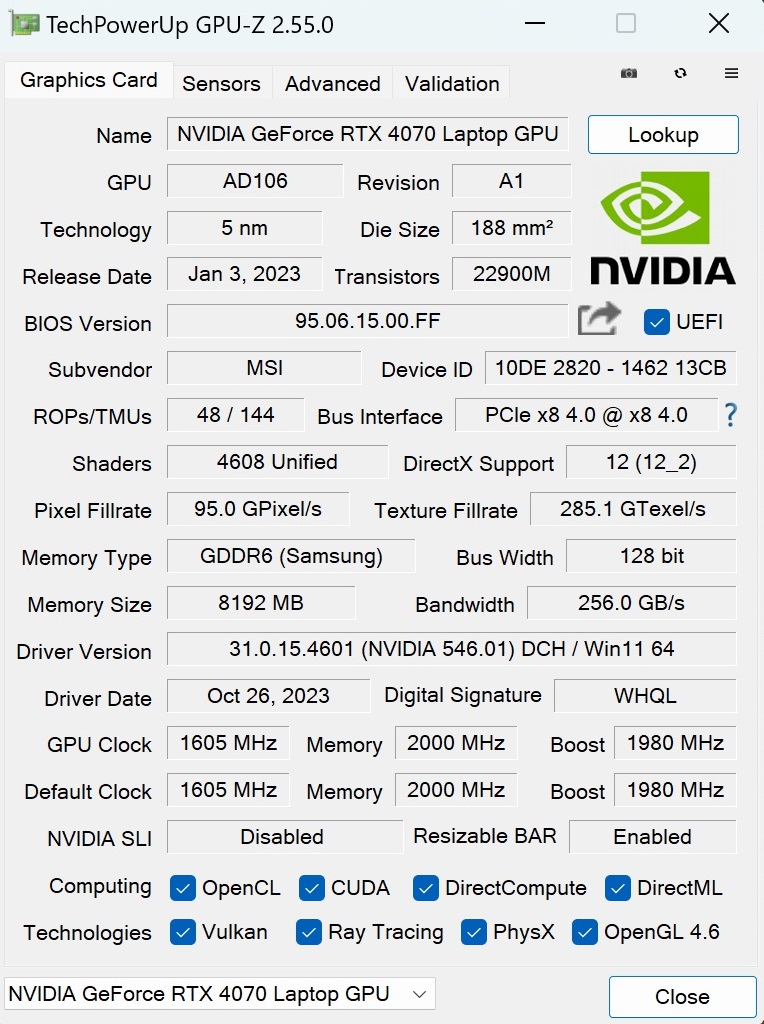
Tarjeta gráfica
A pesar del TGP de la GPU de 105 vatios, el rendimiento de la RTX 4070 en la Stealth 16 se alinea con la media de esta tarjeta gráfica.
| 3DMark Ice Storm Standard Score | 99001 puntos | |
| 3DMark Cloud Gate Standard Score | 52847 puntos | |
| 3DMark Fire Strike Score | 22419 puntos | |
| 3DMark Time Spy Score | 11694 puntos | |
ayuda | ||
* ... más pequeño es mejor
Rendimiento en juegos
Como la pantalla OLED no admite una resolución UHD clásica (3.840 x 2.160 píxeles), utilizamos un máximo de 2.560 x 1.440 píxeles para las pruebas comparativas de juegos. Ir más allá a menudo sobrecarga la RTX 4070, especialmente en los ajustes más altos, como es evidente en laPágina de la GPU. No obstante, la Stealth 16 rinde admirablemente en QHD, utilizando plenamente la capacidad de 60 Hz del panel OLED en la mayoría de los títulos, excepto en los más exigentes y menos optimizados como Alan Wake 2.
| Counter-Strike 2 - 2560x1440 Very High Preset | |
| Media de la clase Gaming (15.7 - 224, n=5, últimos 2 años) | |
| XMG Pro 15 E23 | |
| Medio NVIDIA GeForce RTX 4070 Laptop GPU (87.9 - 100.6, n=2) | |
| MSI Stealth 16 Mercedes-AMG Motorsport A13VG | |
| Alan Wake 2 - 2560x1440 High Preset | |
| Media de la clase Gaming (36.7 - 93.1, n=33, últimos 2 años) | |
| Medio NVIDIA GeForce RTX 4070 Laptop GPU (40.2 - 44.5, n=7) | |
| MSI Stealth 16 Mercedes-AMG Motorsport A13VG | |
| XMG Pro 15 E23 | |
| EA Sports WRC - 2560x1440 Ultra Preset AA:Epic AF:16x | |
| XMG Pro 15 E23 | |
| Medio NVIDIA GeForce RTX 4070 Laptop GPU (59.6 - 68.8, n=3) | |
| MSI Stealth 16 Mercedes-AMG Motorsport A13VG | |
Durante una prueba de 60 minutos de Witcher 3en ajustes FHD/Ultra, no se produjeron caídas de la tasa de imágenes por segundo, pero la velocidad bajó casi un 10% en el transcurso de la prueba.
Witcher 3 FPS chart
| bajo | medio | alto | ultra | QHD | |
|---|---|---|---|---|---|
| GTA V (2015) | 176 | 164.9 | 100.3 | 87.6 | |
| The Witcher 3 (2015) | 317 | 205 | 110 | 77.7 | |
| Dota 2 Reborn (2015) | 178.3 | 144.5 | 135.9 | 126.9 | |
| Final Fantasy XV Benchmark (2018) | 138 | 101.4 | 74.1 | ||
| X-Plane 11.11 (2018) | 144.7 | 118.1 | 98 | ||
| Strange Brigade (2018) | 276 | 220 | 190.6 | 126.3 | |
| Counter-Strike 2 (2023) | 160.2 | 151.5 | 121.5 | 87.9 | |
| Alan Wake 2 (2023) | 66.9 | 65.1 | 42.3 | ||
| EA Sports WRC (2023) | 90.6 | 85 | 77.1 | 59.6 |
Emisiones
Ruido del sistema
Aunque el nivel de ruido al ralentí es similar al de la Stealth 16 estándar, la Motorsport Edition es ligeramente más ruidosa bajo carga. Sin embargo, en comparación con la competencia, los valores medidos se mantienen dentro de unos límites razonables, siendo el HP Omen Transcend 16 más perceptible en modo 3D.
Ruido
| Ocioso |
| 25 / 26 / 27 dB(A) |
| Carga |
| 39 / 51 dB(A) |
 | ||
30 dB silencioso 40 dB(A) audible 50 dB(A) ruidosamente alto |
||
min: | ||
| MSI Stealth 16 Mercedes-AMG Motorsport A13VG i9-13900H, GeForce RTX 4070 Laptop GPU | MSI Stealth 16 Studio A13VG i7-13700H, GeForce RTX 4070 Laptop GPU | Schenker XMG Pro 16 Studio (Mid 23) i9-13900H, GeForce RTX 4070 Laptop GPU | HP Omen Transcend 16 i9-13900HX, GeForce RTX 4070 Laptop GPU | Lenovo Legion Pro 5 16ARX8 R7 7745HX, GeForce RTX 4070 Laptop GPU | Schenker XMG CORE 16 (L23) R7 7840HS, GeForce RTX 4070 Laptop GPU | |
|---|---|---|---|---|---|---|
| Noise | 6% | -8% | -10% | 5% | -0% | |
| apagado / medio ambiente * (dB) | 25 | 24 4% | 25 -0% | 22.9 8% | 23.2 7% | 23 8% |
| Idle Minimum * (dB) | 25 | 24 4% | 26 -4% | 29.1 -16% | 23.2 7% | 23 8% |
| Idle Average * (dB) | 26 | 24 8% | 29 -12% | 29.1 -12% | 23.2 11% | 28.48 -10% |
| Idle Maximum * (dB) | 27 | 24 11% | 34 -26% | 29.1 -8% | 26.2 3% | 28.48 -5% |
| Load Average * (dB) | 39 | 34.81 11% | 43 -10% | 45.7 -17% | 31.4 19% | 30 23% |
| Witcher 3 ultra * (dB) | 45 | 44.05 2% | 48 -7% | 54.3 -21% | 48.4 -8% | 54.12 -20% |
| Load Maximum * (dB) | 51 | 51.57 -1% | 48 6% | 54.3 -6% | 53.8 -5% | 54.12 -6% |
* ... más pequeño es mejor
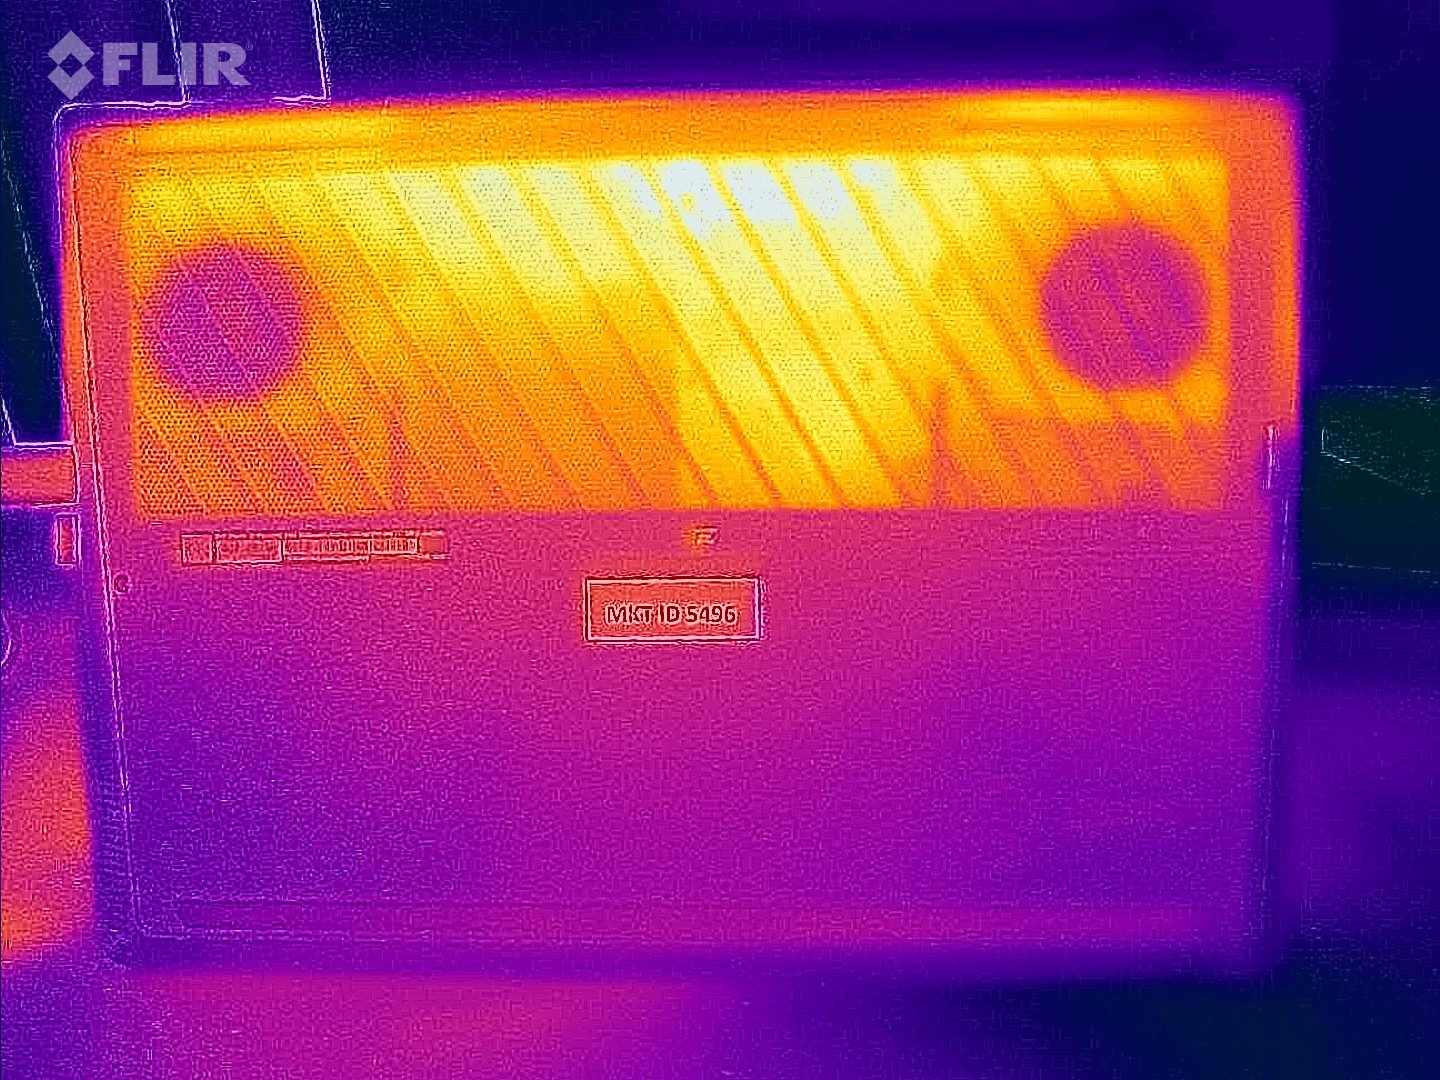
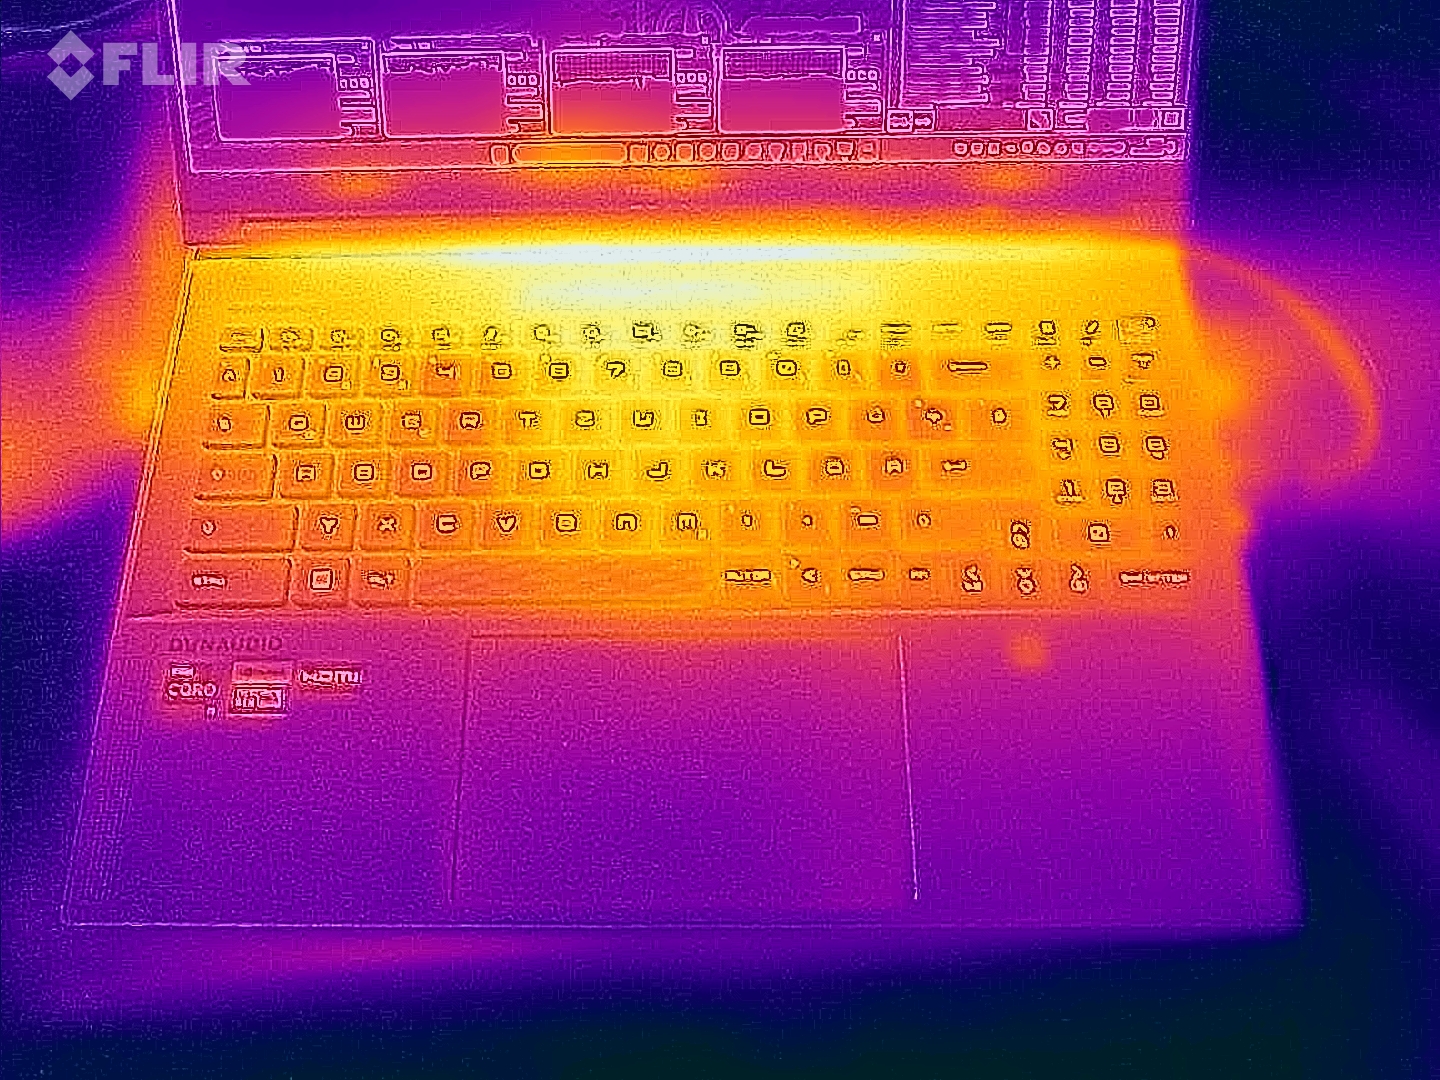
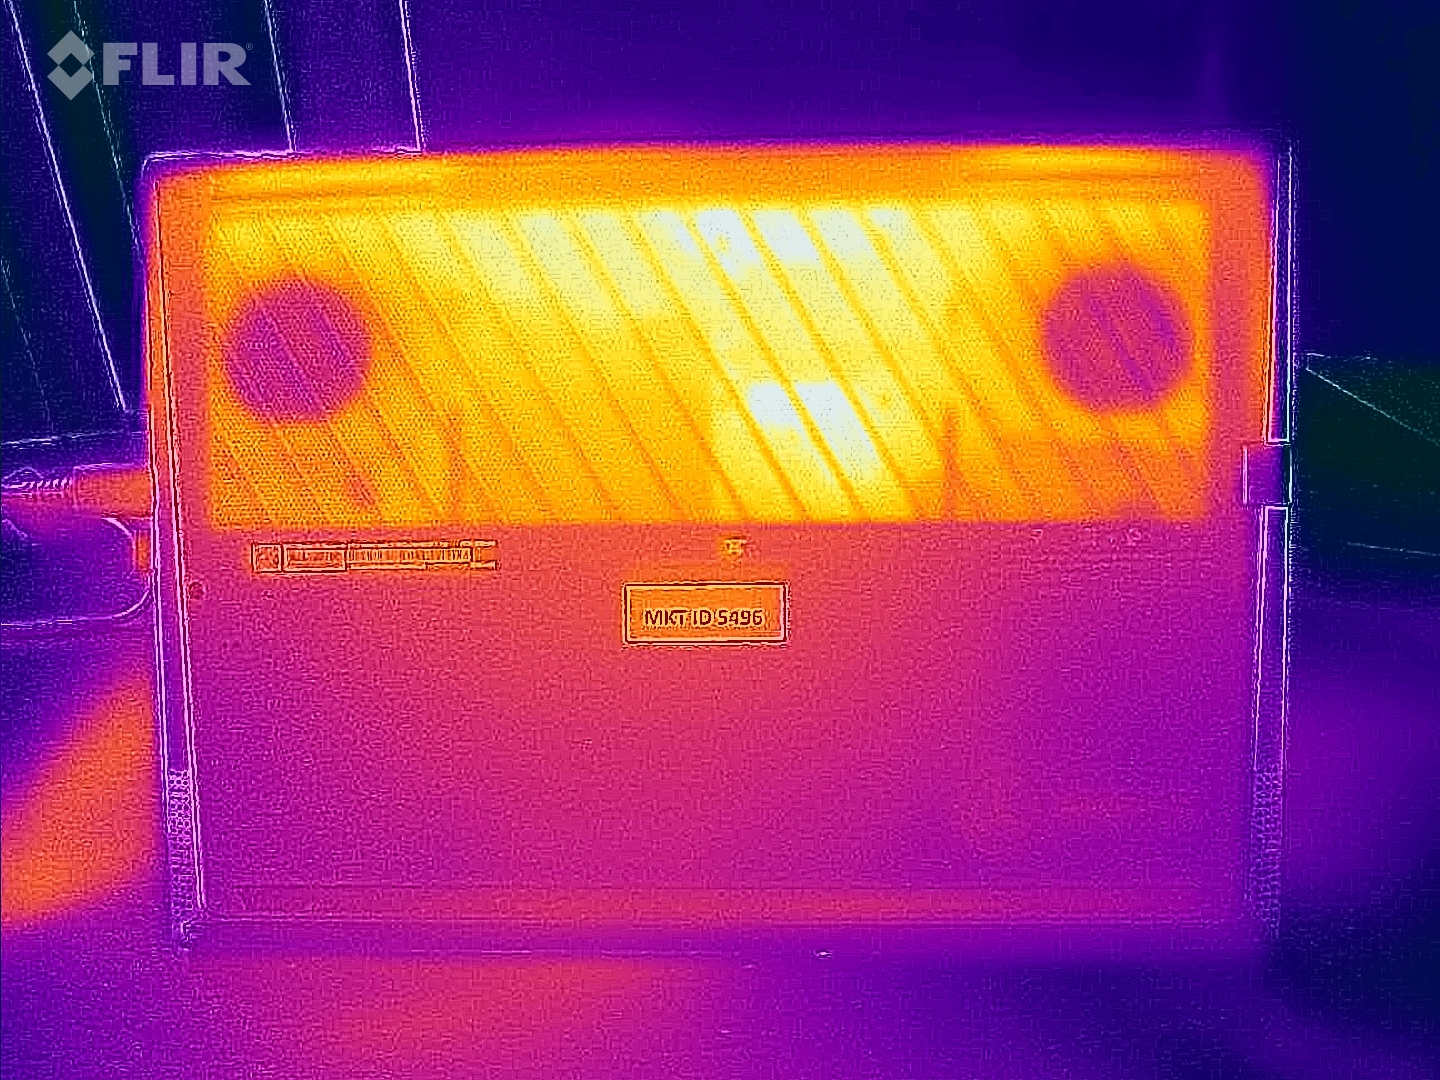
Temperatura
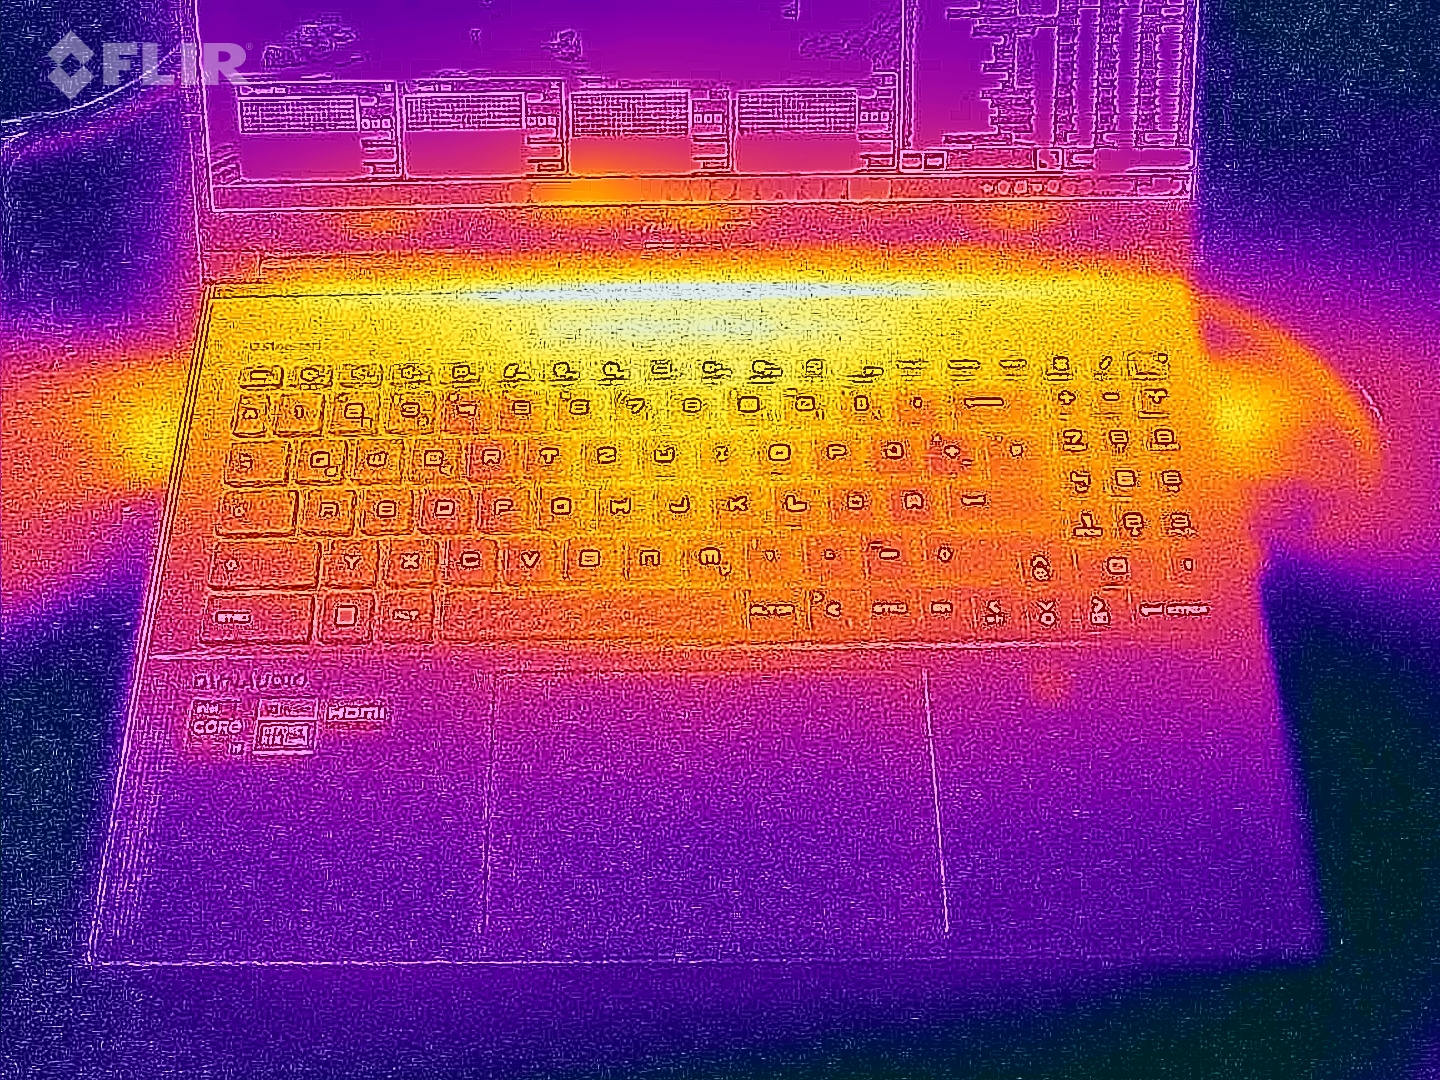
Las temperaturas están en el rango medio, con un máximo de 120,2 °F en la parte superior y 125,6 °F en la inferior. Aunque no son bajas, siguen siendo razonablemente aceptables para el hardware instalado, sobre todo porque la zona de la palma de la mano permanece agradablemente fresca.
(-) La temperatura máxima en la parte superior es de 49 °C / 120 F, frente a la media de 40.4 °C / 105 F, que oscila entre 21.2 y 68.8 °C para la clase Gaming.
(-) El fondo se calienta hasta un máximo de 52 °C / 126 F, frente a la media de 43.2 °C / 110 F
(+) En reposo, la temperatura media de la parte superior es de 29.1 °C / 84# F, frente a la media del dispositivo de 33.9 °C / 93 F.
(-) Jugando a The Witcher 3, la temperatura media de la parte superior es de 40 °C / 104 F, frente a la media del dispositivo de 33.9 °C / 93 F.
(+) Los reposamanos y el panel táctil alcanzan como máximo la temperatura de la piel (32 °C / 89.6 F) y, por tanto, no están calientes.
(-) La temperatura media de la zona del reposamanos de dispositivos similares fue de 28.8 °C / 83.8 F (-3.2 °C / -5.8 F).
| MSI Stealth 16 Mercedes-AMG Motorsport A13VG i9-13900H, GeForce RTX 4070 Laptop GPU | MSI Stealth 16 Studio A13VG i7-13700H, GeForce RTX 4070 Laptop GPU | Schenker XMG Pro 16 Studio (Mid 23) i9-13900H, GeForce RTX 4070 Laptop GPU | HP Omen Transcend 16 i9-13900HX, GeForce RTX 4070 Laptop GPU | Lenovo Legion Pro 5 16ARX8 R7 7745HX, GeForce RTX 4070 Laptop GPU | Schenker XMG CORE 16 (L23) R7 7840HS, GeForce RTX 4070 Laptop GPU | |
|---|---|---|---|---|---|---|
| Heat | -17% | -11% | 6% | 14% | 6% | |
| Maximum Upper Side * (°C) | 49 | 60 -22% | 55 -12% | 47.4 3% | 41.8 15% | 46 6% |
| Maximum Bottom * (°C) | 52 | 61 -17% | 66 -27% | 54.4 -5% | 41.4 20% | 44 15% |
| Idle Upper Side * (°C) | 32 | 38.2 -19% | 33 -3% | 28.4 11% | 29 9% | 32 -0% |
| Idle Bottom * (°C) | 34 | 37.7 -11% | 35 -3% | 29.2 14% | 30.4 11% | 33 3% |
* ... más pequeño es mejor
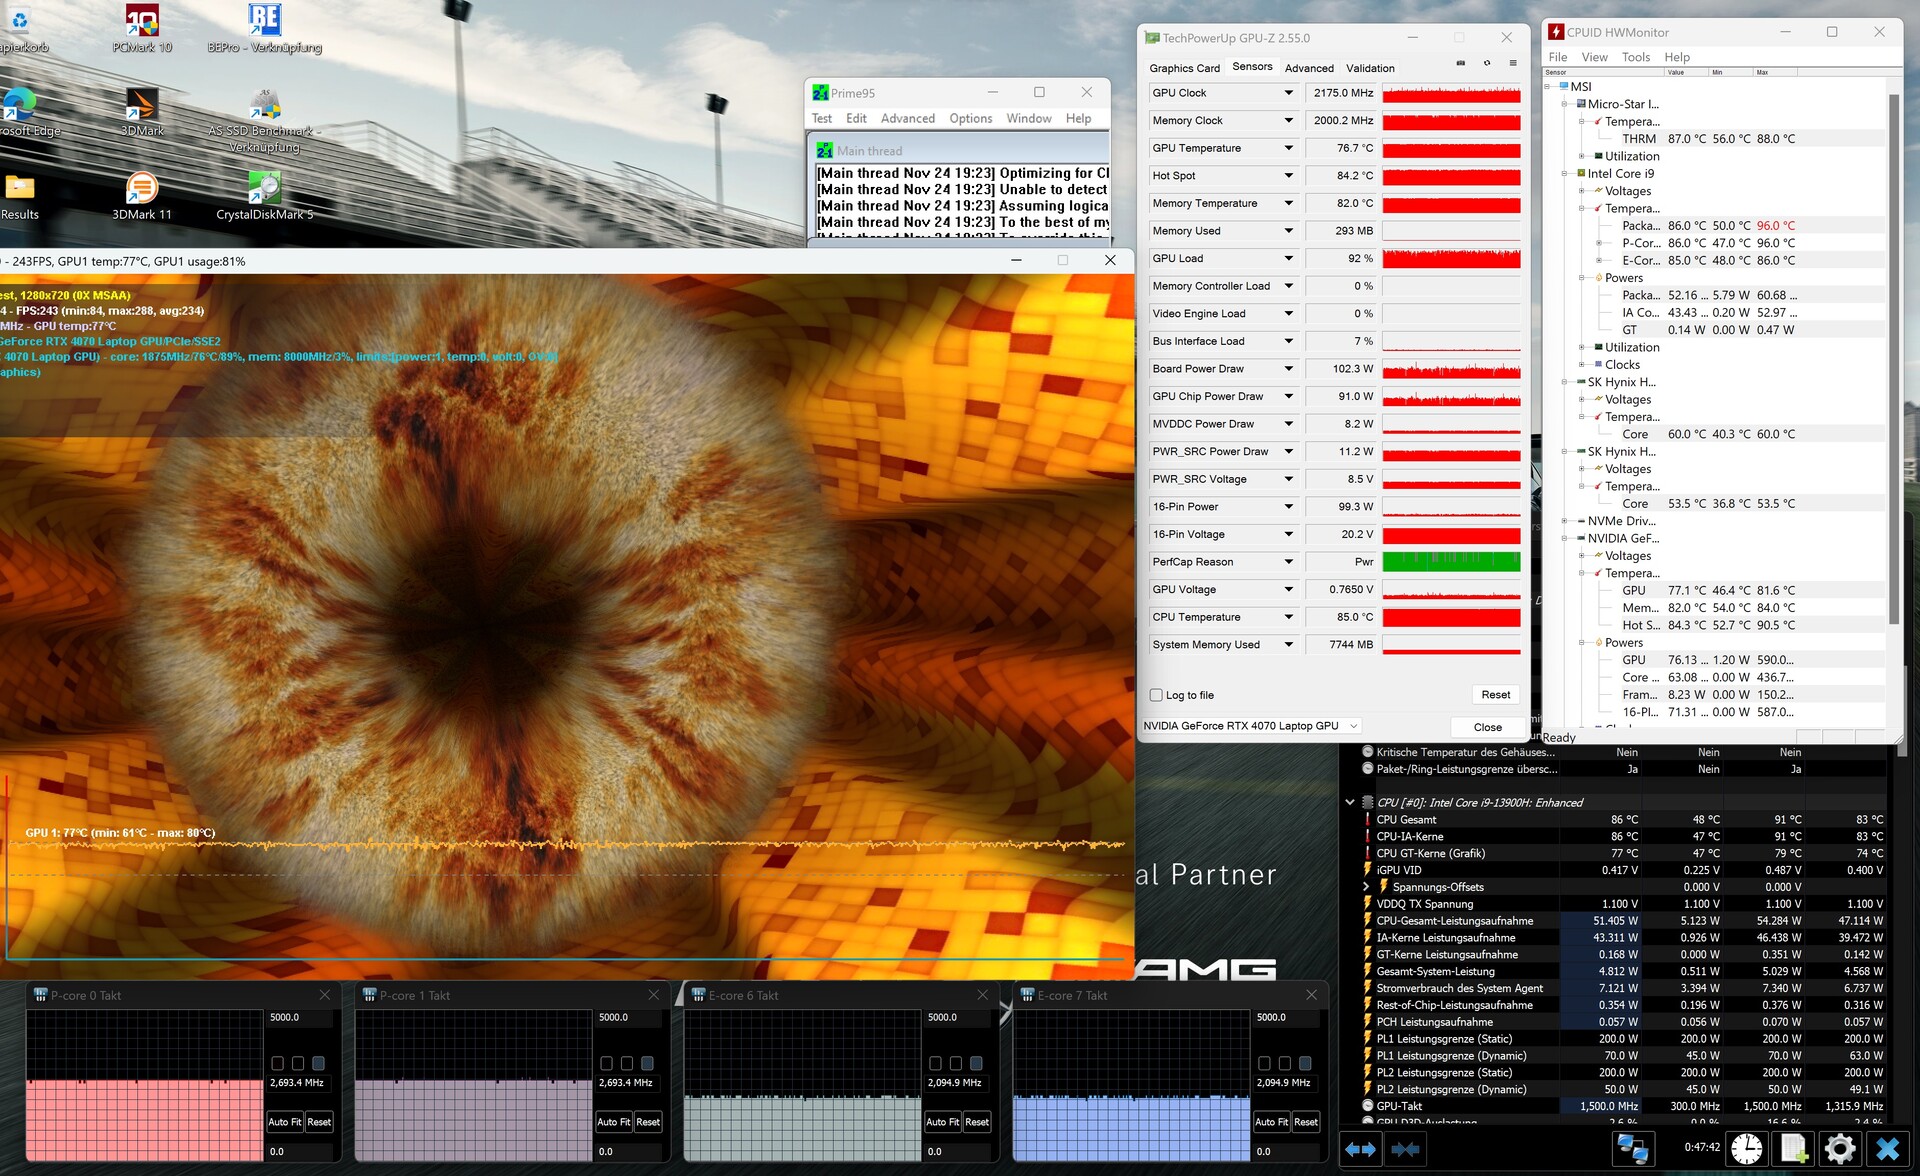
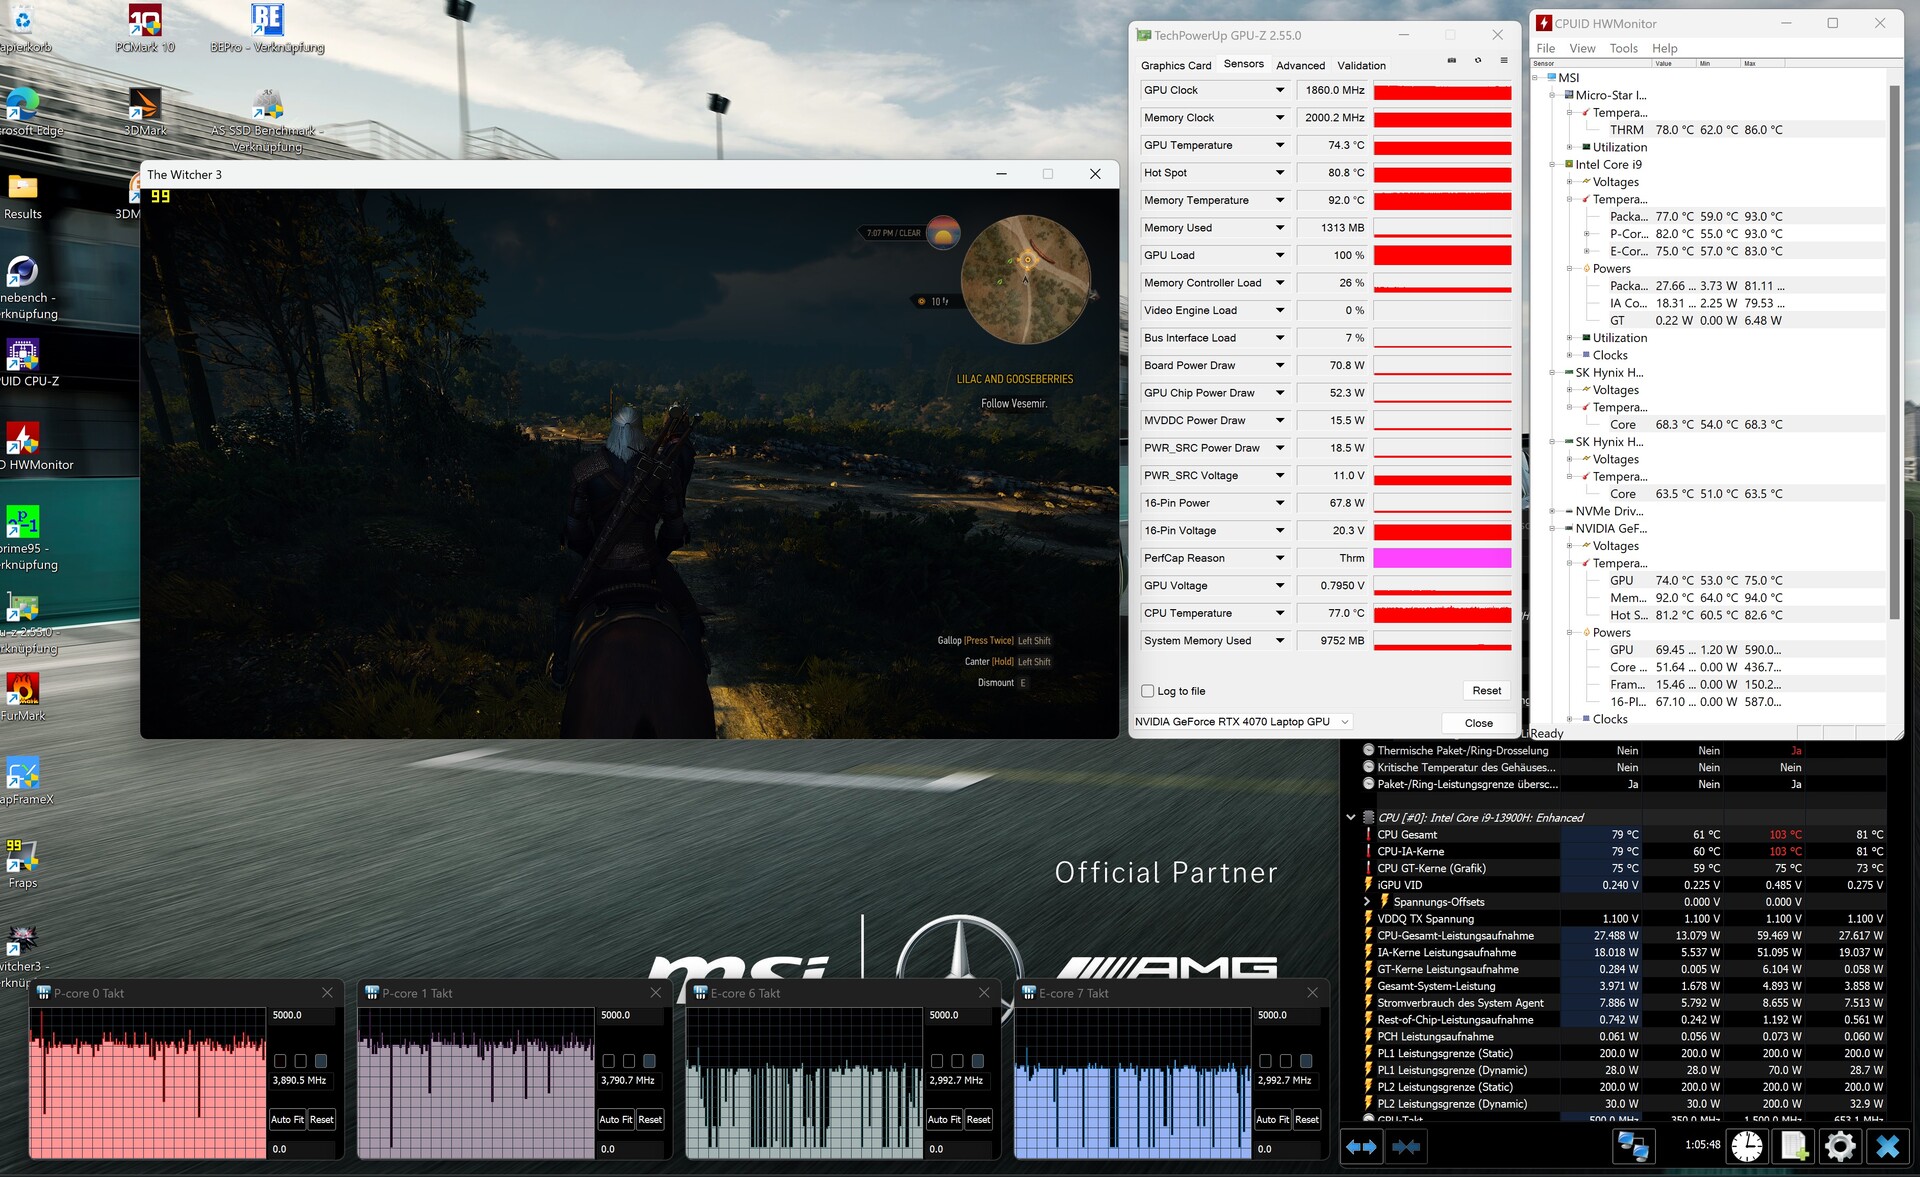
Prueba de estrés
Durante la prueba de estrés con Furmark y Prime95, la RTX 4070 mantuvo alrededor de 183,2 °F (reloj de la GPU ~2.175 MHz), y el Core i9-13900H alcanzó aproximadamente 186,8 °F (núcleos P ~2,7 GHz, núcleos E ~2,1 GHz), ambos valores aceptables.
Altavoces
MSI Stealth 16 Mercedes-AMG Motorsport A13VG análisis de audio
(+) | los altavoces pueden reproducir a un volumen relativamente alto (#91 dB)
Graves 100 - 315 Hz
(-) | casi sin bajos - de media 18.1% inferior a la mediana
(±) | la linealidad de los graves es media (7.3% delta a frecuencia anterior)
Medios 400 - 2000 Hz
(+) | medios equilibrados - a sólo 1.6% de la mediana
(+) | los medios son lineales (3.7% delta a la frecuencia anterior)
Altos 2 - 16 kHz
(+) | máximos equilibrados - a sólo 3.2% de la mediana
(+) | los máximos son lineales (2.6% delta a la frecuencia anterior)
Total 100 - 16.000 Hz
(+) | el sonido global es lineal (11.8% de diferencia con la mediana)
En comparación con la misma clase
» 11% de todos los dispositivos probados de esta clase eran mejores, 4% similares, 85% peores
» El mejor tuvo un delta de 6%, la media fue 18%, el peor fue ###max##%
En comparación con todos los dispositivos probados
» 9% de todos los dispositivos probados eran mejores, 3% similares, 89% peores
» El mejor tuvo un delta de 4%, la media fue 23%, el peor fue ###max##%
HP Omen Transcend 16 análisis de audio
(+) | los altavoces pueden reproducir a un volumen relativamente alto (#82.3 dB)
Graves 100 - 315 Hz
(-) | casi sin bajos - de media 20% inferior a la mediana
(±) | la linealidad de los graves es media (14.3% delta a frecuencia anterior)
Medios 400 - 2000 Hz
(±) | medias más altas - de media 5.2% más altas que la mediana
(+) | los medios son lineales (3.7% delta a la frecuencia anterior)
Altos 2 - 16 kHz
(+) | máximos equilibrados - a sólo 2% de la mediana
(+) | los máximos son lineales (6.7% delta a la frecuencia anterior)
Total 100 - 16.000 Hz
(±) | la linealidad del sonido global es media (17% de diferencia con la mediana)
En comparación con la misma clase
» 45% de todos los dispositivos probados de esta clase eran mejores, 12% similares, 43% peores
» El mejor tuvo un delta de 6%, la media fue 18%, el peor fue ###max##%
En comparación con todos los dispositivos probados
» 31% de todos los dispositivos probados eran mejores, 8% similares, 61% peores
» El mejor tuvo un delta de 4%, la media fue 23%, el peor fue ###max##%
Gestión de la energía
Consumo de energía
Gracias a la conmutación de gráficos, el dispositivo de 16 pulgadas funciona eficientemente en modo inactivo, consumiendo entre 11 y 28 vatios (14 vatios de media), en consonancia con la mayoría de los competidores. Bajo carga, la edición AMG consumió entre 83 vatios (valor medio en 3DMark 06) y 204 vatios (valor máximo en la prueba de estrés). La fuente de alimentación de 240 vatios suministrada, adornada con un logotipo de automovilismo, está adecuadamente dimensionada para estos requisitos.
| Off / Standby | |
| Ocioso | |
| Carga |
|
Clave:
min: | |
| MSI Stealth 16 Mercedes-AMG Motorsport A13VG i9-13900H, GeForce RTX 4070 Laptop GPU | MSI Stealth 16 Studio A13VG i7-13700H, GeForce RTX 4070 Laptop GPU | Schenker XMG Pro 16 Studio (Mid 23) i9-13900H, GeForce RTX 4070 Laptop GPU | HP Omen Transcend 16 i9-13900HX, GeForce RTX 4070 Laptop GPU | Lenovo Legion Pro 5 16ARX8 R7 7745HX, GeForce RTX 4070 Laptop GPU | Schenker XMG CORE 16 (L23) R7 7840HS, GeForce RTX 4070 Laptop GPU | Media de la clase Gaming | |
|---|---|---|---|---|---|---|---|
| Power Consumption | -2% | 2% | -63% | -16% | -1% | -20% | |
| Idle Minimum * (Watt) | 11 | 11 -0% | 8 27% | 19.2 -75% | 8.1 26% | 11 -0% | 13 ? -18% |
| Idle Average * (Watt) | 14 | 18 -29% | 12 14% | 22.7 -62% | 15.9 -14% | 15.2 -9% | 19 ? -36% |
| Idle Maximum * (Watt) | 28 | 19 32% | 23 18% | 55.4 -98% | 37.2 -33% | 16 43% | 24.6 ? 12% |
| Load Average * (Watt) | 83 | 91 -10% | 94 -13% | 128.4 -55% | 90.9 -10% | 64 23% | 110.7 ? -33% |
| Witcher 3 ultra * (Watt) | 140 | 130 7% | 181.5 -30% | 206 -47% | 189.6 -35% | 179 -28% | |
| Load Maximum * (Watt) | 204 | 228 -12% | 215 -5% | 292 -43% | 263.5 -29% | 280 -37% | 259 ? -27% |
* ... más pequeño es mejor
Power consumption Witcher 3 / stress test
Power consumption with external monitor
Duración de las pilas
Debido al Core i9-13900H y al panel OLED, la autonomía de la Motorsport Edition es ligeramente inferior a la de la versión estándar. Conseguir algo menos de 6,5 horas de navegación por Internet con el brillo reducido a 150 cd/m² sigue siendo más que decente para un portátil de juegos. La batería, de generosas dimensiones y 99 Wh, contribuye a estas respetables cifras.
| MSI Stealth 16 Mercedes-AMG Motorsport A13VG i9-13900H, GeForce RTX 4070 Laptop GPU, 99.99 Wh | MSI Stealth 16 Studio A13VG i7-13700H, GeForce RTX 4070 Laptop GPU, 99.9 Wh | Schenker XMG Pro 16 Studio (Mid 23) i9-13900H, GeForce RTX 4070 Laptop GPU, 73 Wh | HP Omen Transcend 16 i9-13900HX, GeForce RTX 4070 Laptop GPU, 97 Wh | Lenovo Legion Pro 5 16ARX8 R7 7745HX, GeForce RTX 4070 Laptop GPU, 80 Wh | Schenker XMG CORE 16 (L23) R7 7840HS, GeForce RTX 4070 Laptop GPU, 99 Wh | Media de la clase Gaming | |
|---|---|---|---|---|---|---|---|
| Duración de Batería | 20% | 5% | -35% | -38% | 29% | 9% | |
| WiFi v1.3 (h) | 6.5 | 7.8 20% | 6.8 5% | 4.2 -35% | 4 -38% | 8.4 29% | 7.11 ? 9% |
| Reader / Idle (h) | 11 | 6.3 | 6.5 | 8.27 ? | |||
| H.264 (h) | 7.7 | 10.2 | 8.32 ? | ||||
| Load (h) | 2.4 | 1.2 | 1 | 2.4 | 1.502 ? |
Pro
Contra
Veredicto
Más allá de los acertados elementos de diseño, la edición Mercedes-AMG Motorsport del Stealth 16 comparte casi los mismos puntos fuertes y débiles que la versión estándar (consulte la prueba completa). Afortunadamente, los aspectos positivos superan a los negativos.
En el lado positivo, el portátil presume de una carcasa agradablemente ligera y compacta pero robusta, un sonido potente y unos dispositivos de entrada relativamente buenos. Las deducciones vienen principalmente en forma de una nota B debido a la ralentización del SSD con el tiempo y a la conectividad USB algo limitada (sólo un puerto Tipo A).
Elegir entre el panel OLED de la versión Motorsport y la pantalla IPS depende de las preferencias personales.
Aunque el panel OLED ofrece unos valores de imagen sobresalientes (nivel de negro, contraste, espacio de color, ángulo de visión, tiempo de respuesta), viene con una superficie reflectante, una frecuencia modesta (60 Hz) y un posible parpadeo.
En general, sigue mereciendo una calificación de "muy bueno". Entre las alternativas se incluyen portátiles con procesador Intel como el HP Omen Transcend 16 y el Schenker XMG Pro 16 mencionados en el artículo. Para los entusiastas de AMD, merece la pena considerar el Lenovo Legion Pro 5 y el Schenker XMG Core 16, ambos con una calificación de "muy bueno".
Precio y disponibilidad
El MSI Stealth 16 Mercedes-AMG Motorsport A13VG tiene un precio de 2.899 dólares y puede adquirirse directamente en MSI.
MSI Stealth 16 Mercedes-AMG Motorsport A13VG
- 11/28/2023 v7 (old)
Florian Glaser
Transparencia
La selección de los dispositivos que se van a reseñar corre a cargo de nuestro equipo editorial. La muestra de prueba fue proporcionada al autor en calidad de préstamo por el fabricante o el minorista a los efectos de esta reseña. El prestamista no tuvo ninguna influencia en esta reseña, ni el fabricante recibió una copia de la misma antes de su publicación. No había ninguna obligación de publicar esta reseña. Como empresa de medios independiente, Notebookcheck no está sujeta a la autoridad de fabricantes, minoristas o editores.
Así es como prueba Notebookcheck
Cada año, Notebookcheck revisa de forma independiente cientos de portátiles y smartphones utilizando procedimientos estandarizados para asegurar que todos los resultados son comparables. Hemos desarrollado continuamente nuestros métodos de prueba durante unos 20 años y hemos establecido los estándares de la industria en el proceso. En nuestros laboratorios de pruebas, técnicos y editores experimentados utilizan equipos de medición de alta calidad. Estas pruebas implican un proceso de validación en varias fases. Nuestro complejo sistema de clasificación se basa en cientos de mediciones y puntos de referencia bien fundamentados, lo que mantiene la objetividad.Price comparison

