Análisis del portátil para juegos SCHENKER XMG Core 16 - Un auténtico competidor del Lenovo Legion Pro 5 16

El último XMG Core, que también probamos, fue elXMG Core 15(88 %) de hace un año - en aquel momento, con unaRTX 3060. Ahora, Schenker ha sacado una versión de 16 pulgadas del Core. Vamos a echar un vistazo a todo lo que ha cambiado, aparte de su tamaño de pantalla.
Compararemos el Core 16 con el Lenovo Legion Pro 5 16 Gen 8, el Acer Nitro 16 AN16-41, el HP Omen Transcend 16, el MSI Stealth 16 Studio y el HP Victus 16.
Posibles contendientes en la comparación
Valoración | Fecha | Modelo | Peso | Altura | Tamaño | Resolución | Precio |
|---|---|---|---|---|---|---|---|
| 89.2 % v7 (old) | 10/2023 | Schenker XMG CORE 16 (L23) R7 7840HS, GeForce RTX 4070 Laptop GPU | 2.4 kg | 26.1 mm | 16.00" | 2560x1600 | |
| 88.4 % v7 (old) | 05/2023 | Lenovo Legion Pro 5 16ARX8 R7 7745HX, GeForce RTX 4070 Laptop GPU | 2.5 kg | 26.8 mm | 16.00" | 2560x1600 | |
| 88.1 % v7 (old) | 06/2023 | Acer Nitro 16 AN16-41 R7 7735HS, GeForce RTX 4070 Laptop GPU | 2.7 kg | 27.9 mm | 16.00" | 2560x1600 | |
| 87.9 % v7 (old) | 08/2023 | HP Omen Transcend 16 i9-13900HX, GeForce RTX 4070 Laptop GPU | 2.3 kg | 19.8 mm | 16.00" | 2560x1600 | |
| 88.8 % v7 (old) | 07/2023 | MSI Stealth 16 Studio A13VG i7-13700H, GeForce RTX 4070 Laptop GPU | 2 kg | 19.95 mm | 16.00" | 2560x1600 | |
| 85.1 % v7 (old) | 09/2023 | HP Victus 16-r0077ng i7-13700H, GeForce RTX 4070 Laptop GPU | 2.4 kg | 24 mm | 16.10" | 1920x1080 |
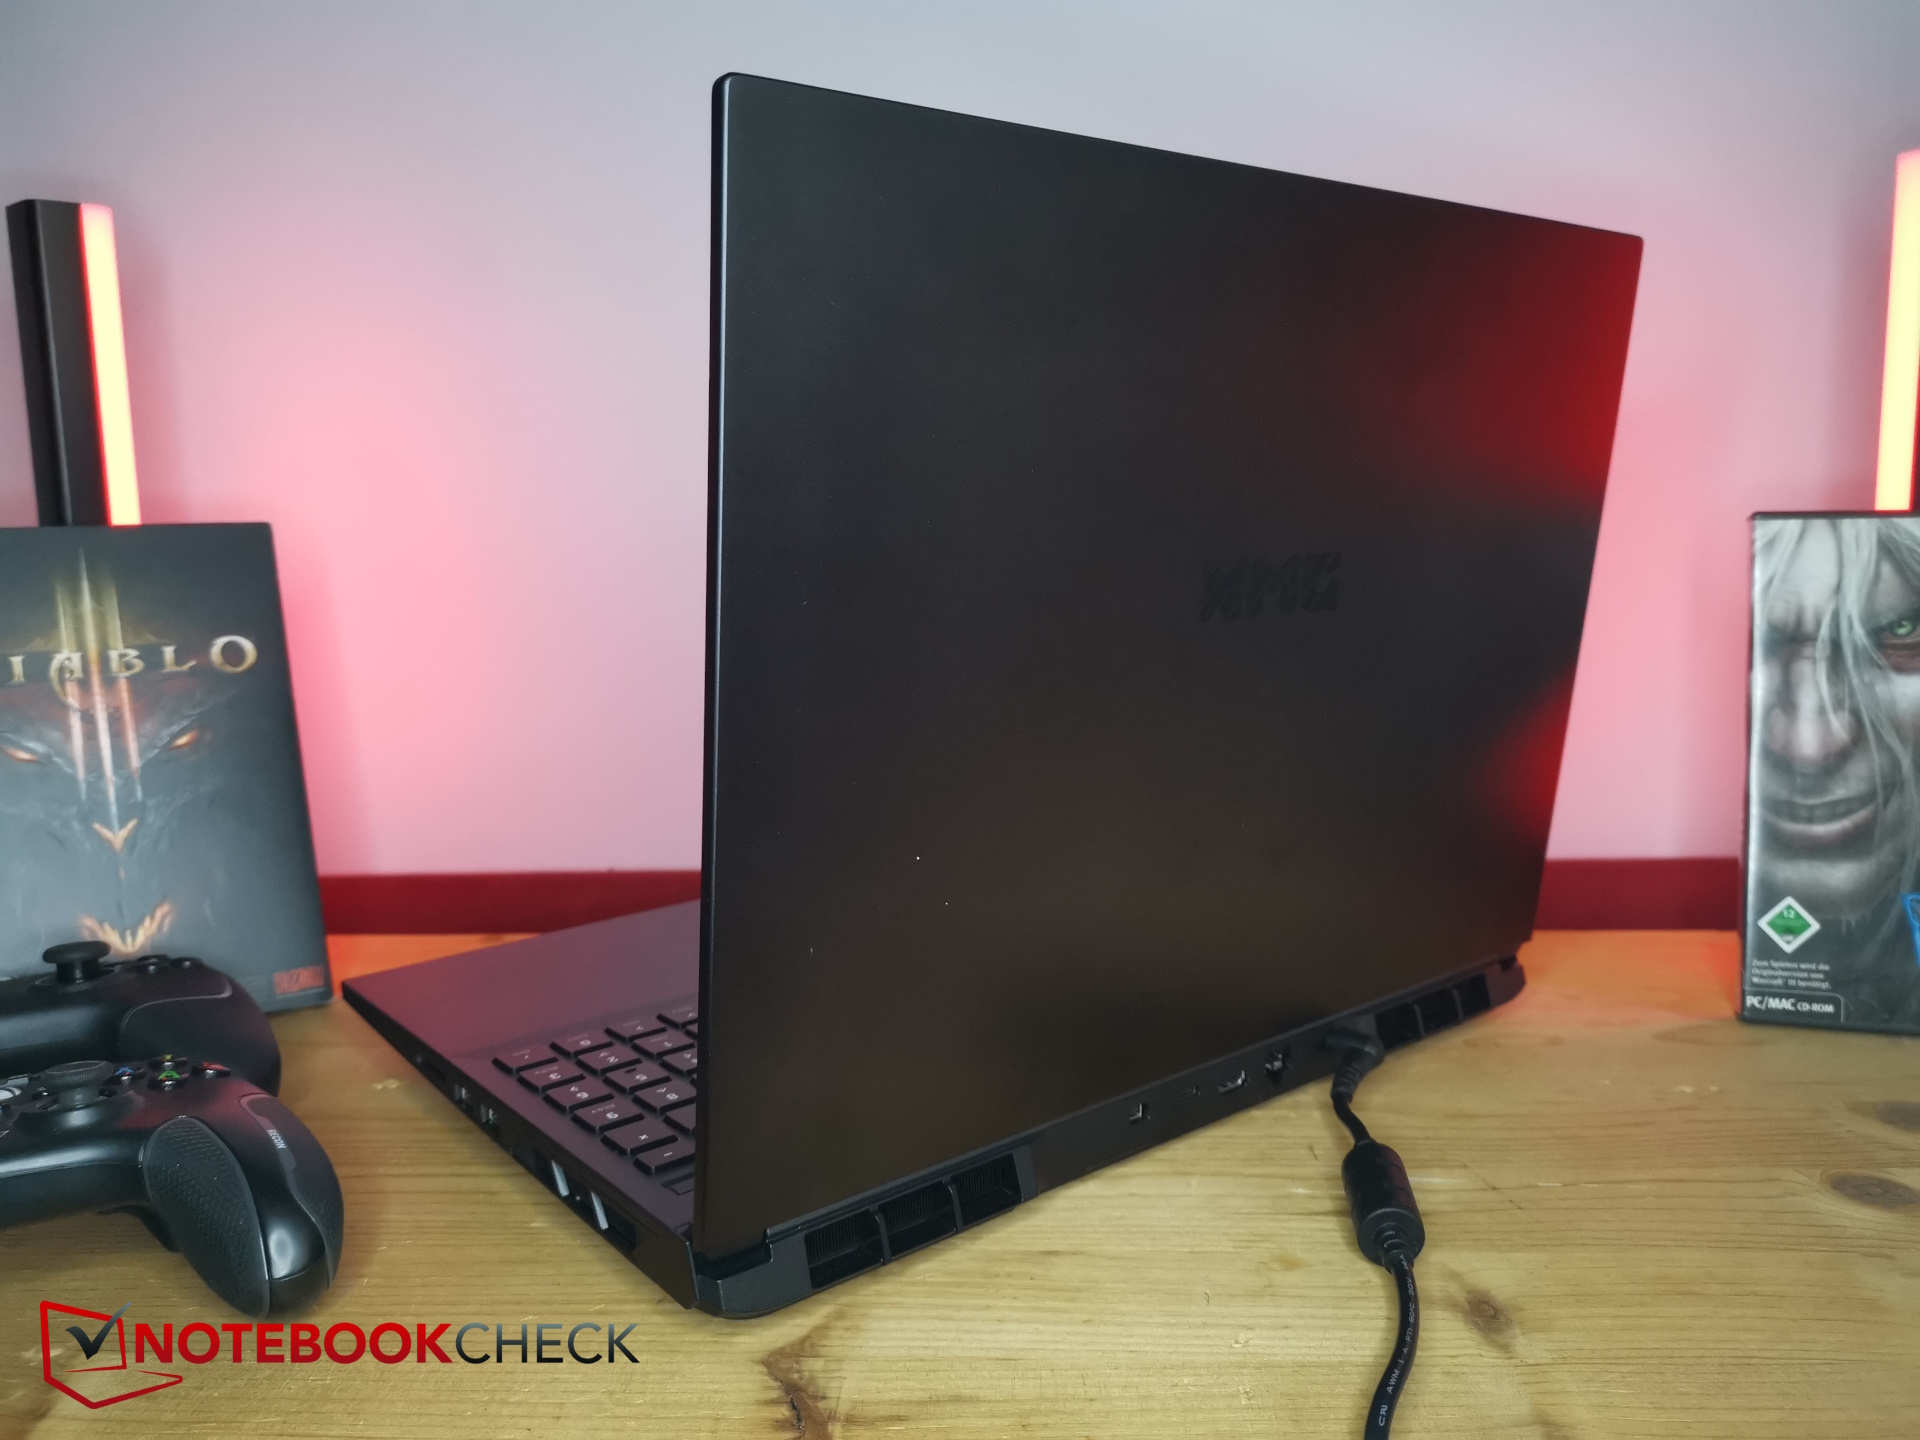
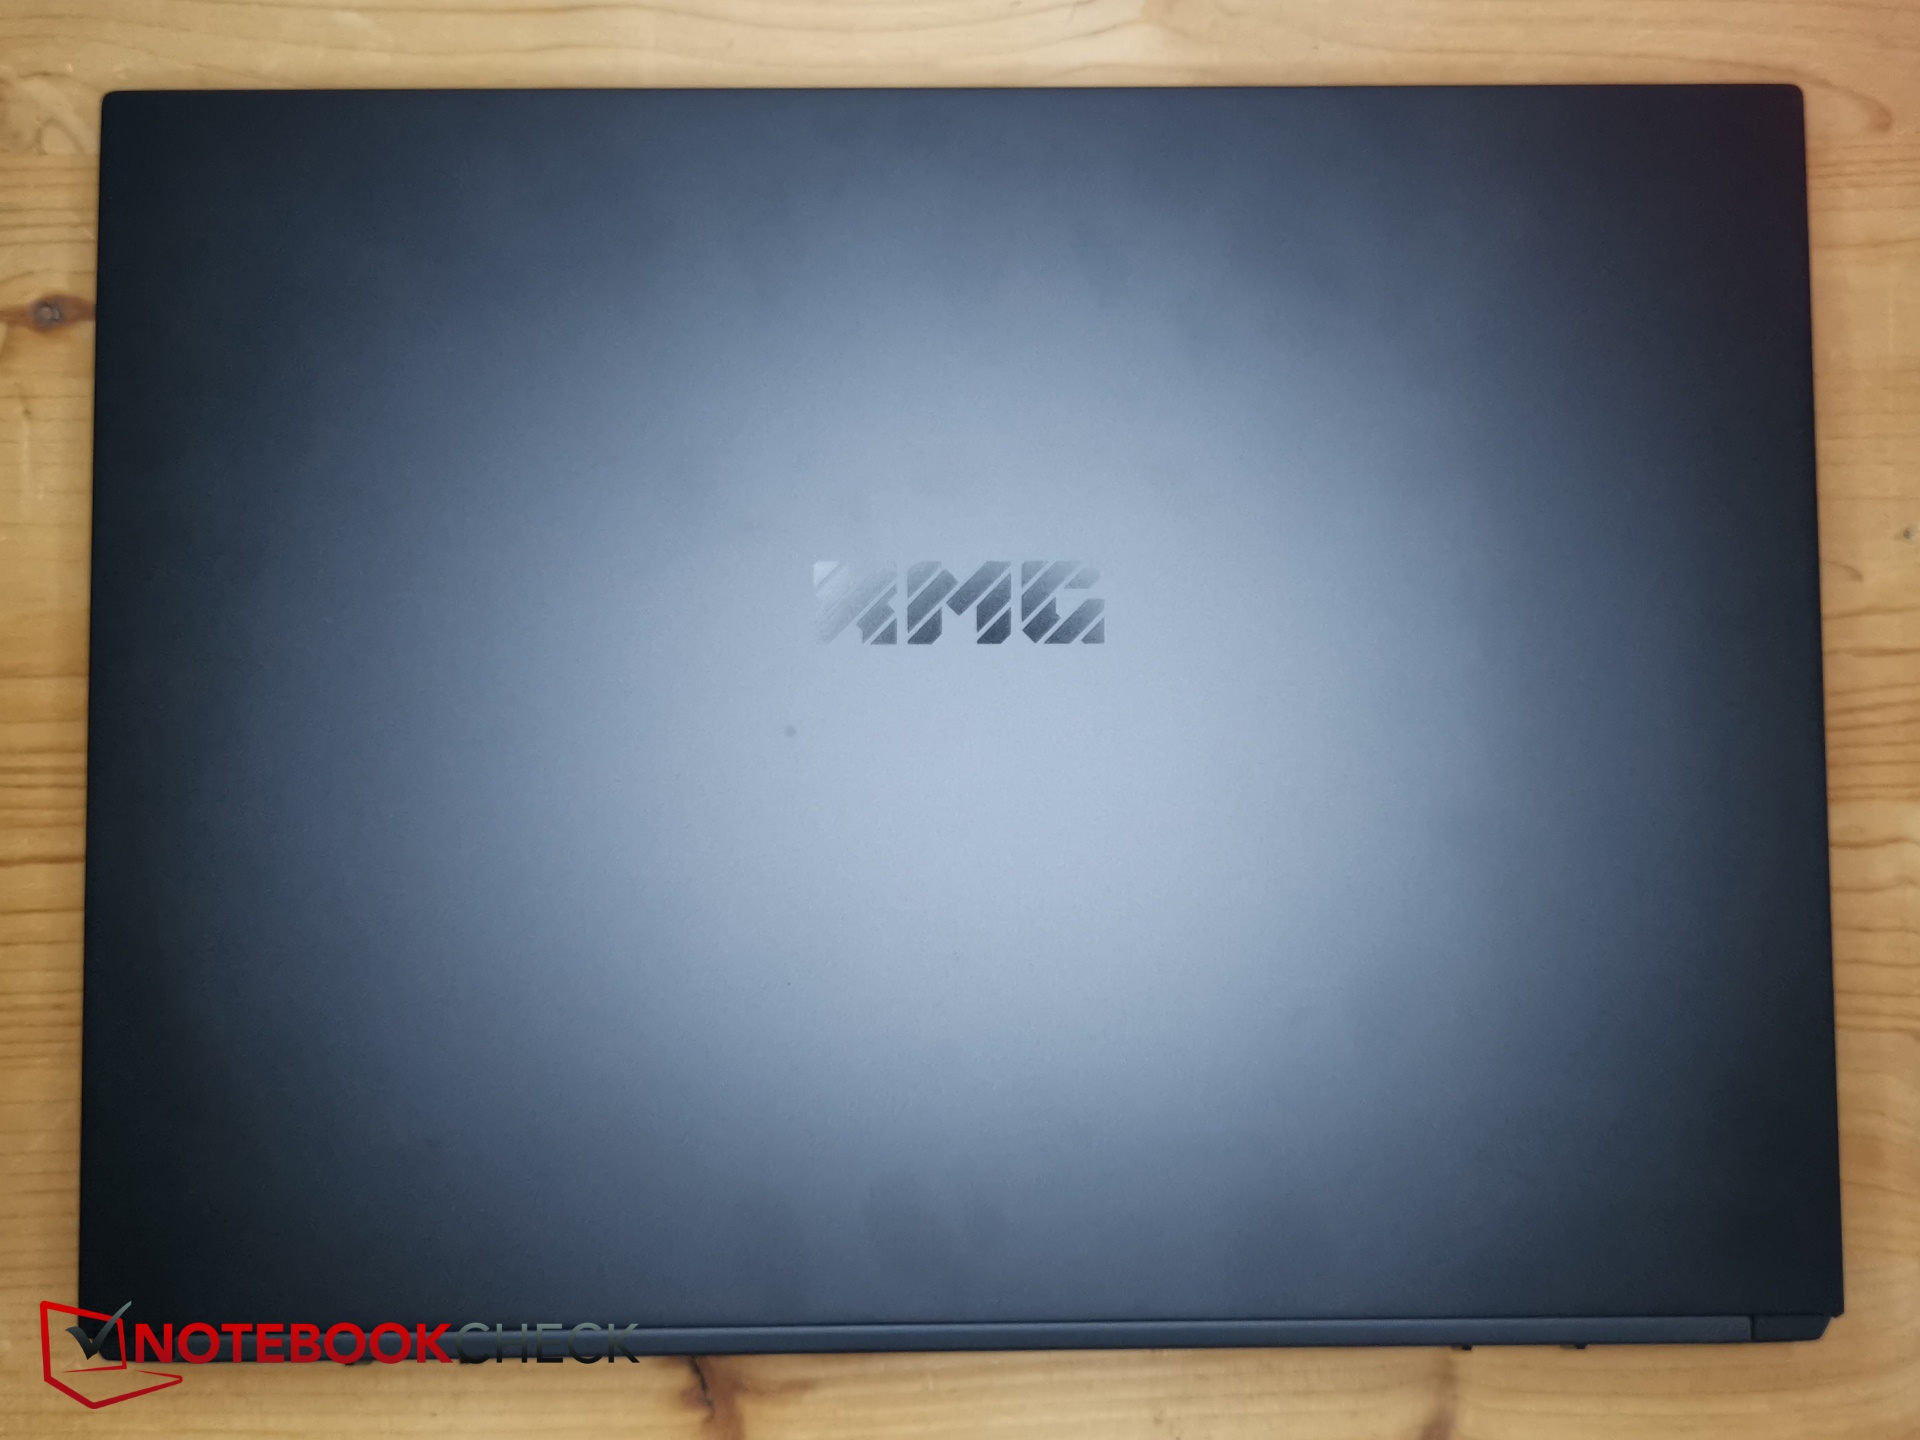
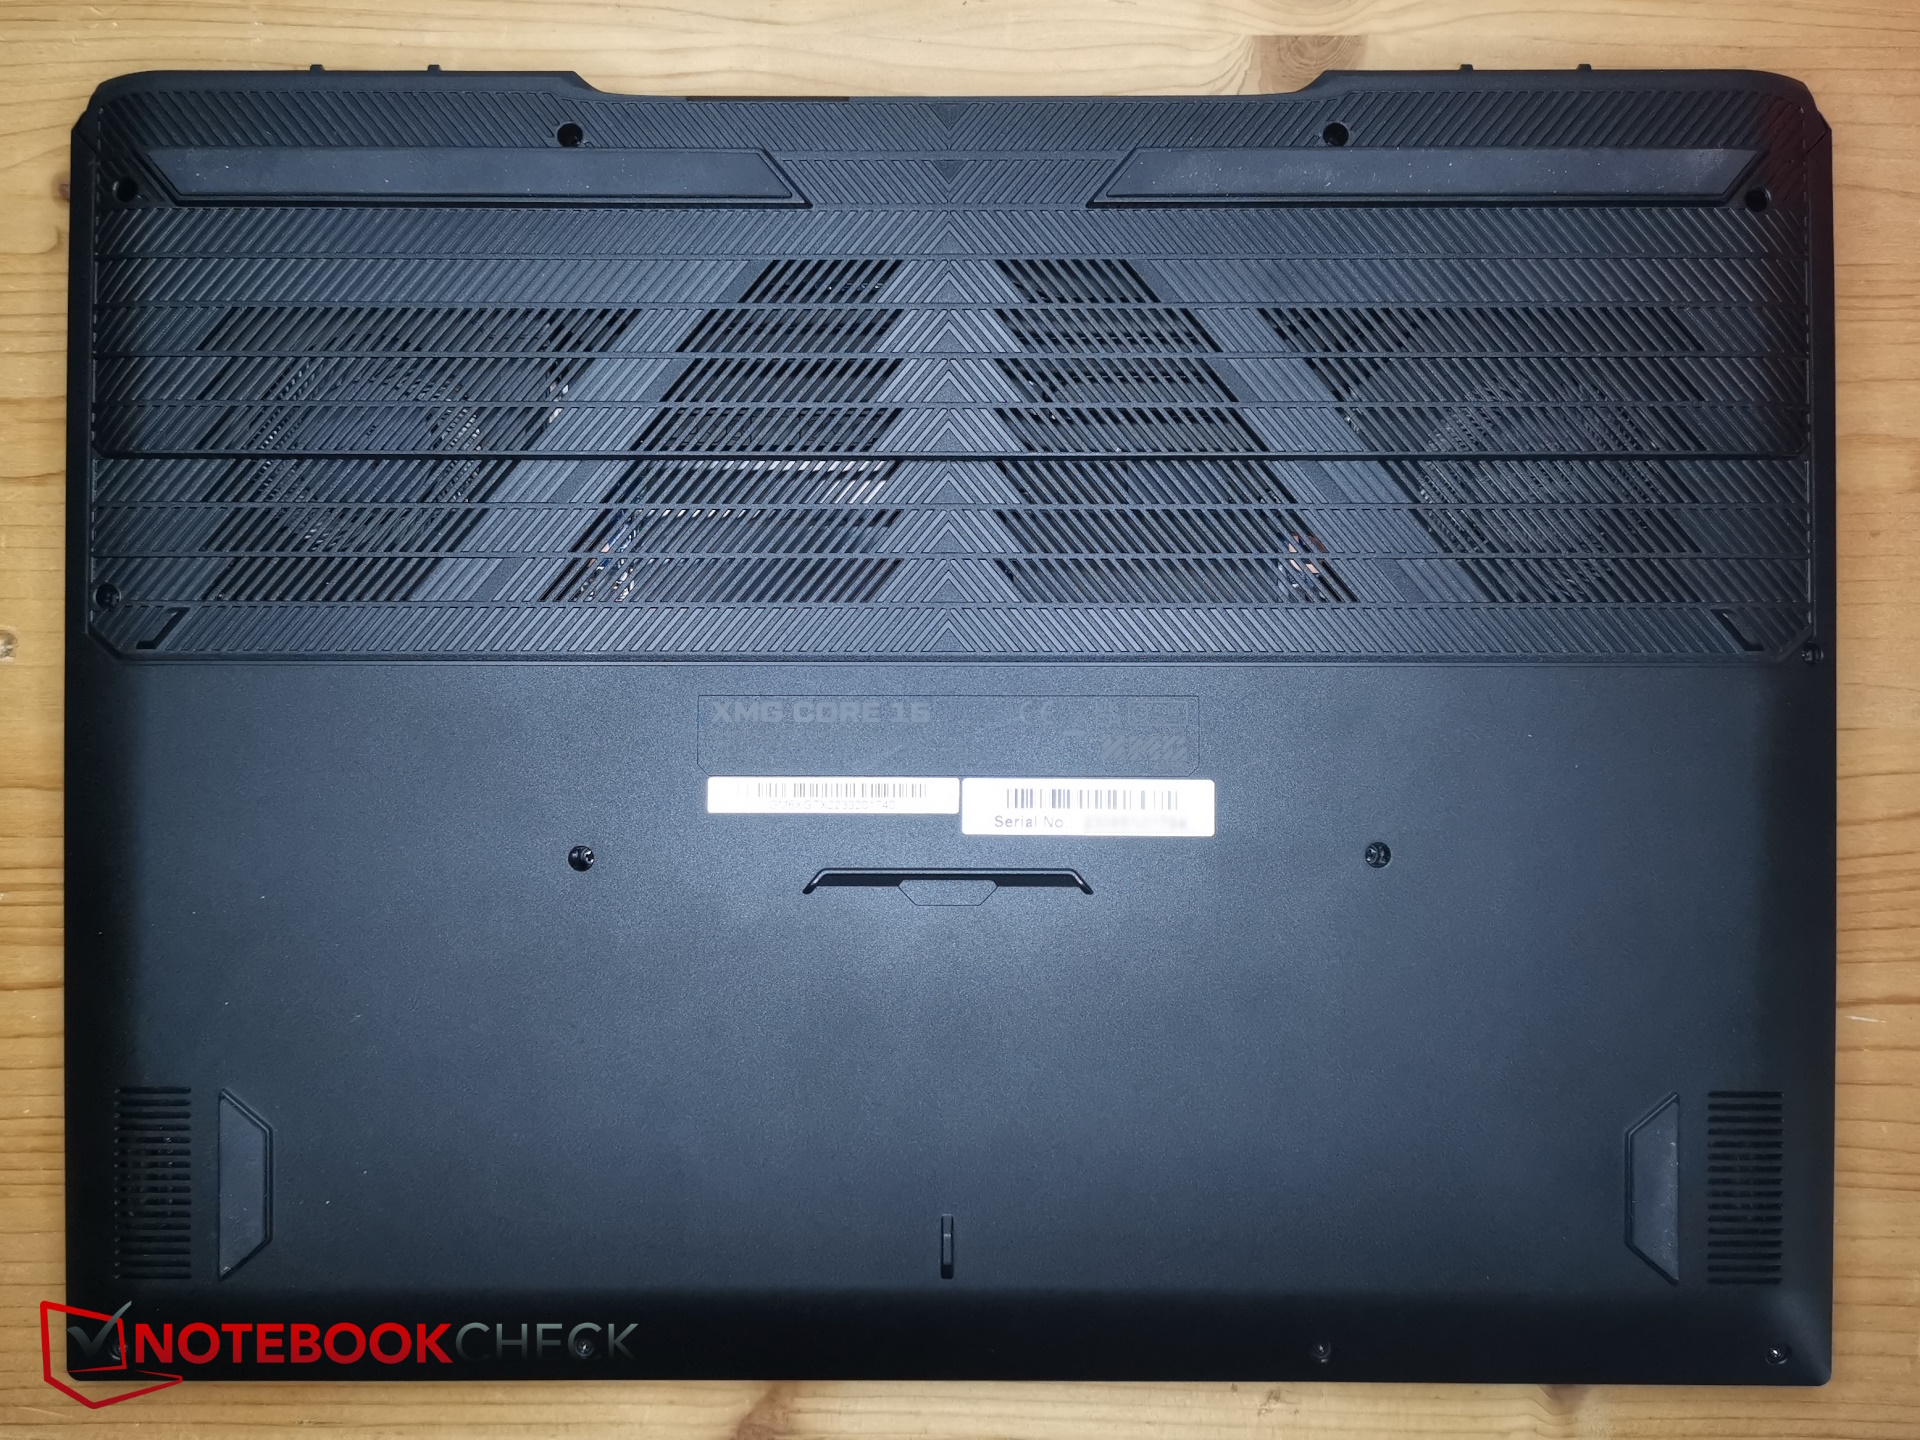
Carcasa y conectividad - El elegante Core 16
Este portátil ha adoptado el enfoque elegante típico de Schenker: todo se mantiene en gris oscuro. La base más dura y la placa inferior más blanda son de plástico, y la tapa brillante de la pantalla es de metal. Esta última es un poco un imán para las huellas dactilares. La tapa puede abrirse hasta 135 grados.
Todo parece bastante estable y su construcción es buena. El lateral izquierdo de la base sólo crujió la primera vez que intentamos girarlo.
Tiene un tamaño y un peso medios, comparables a los del Lenovo Legion Pro 5 16.
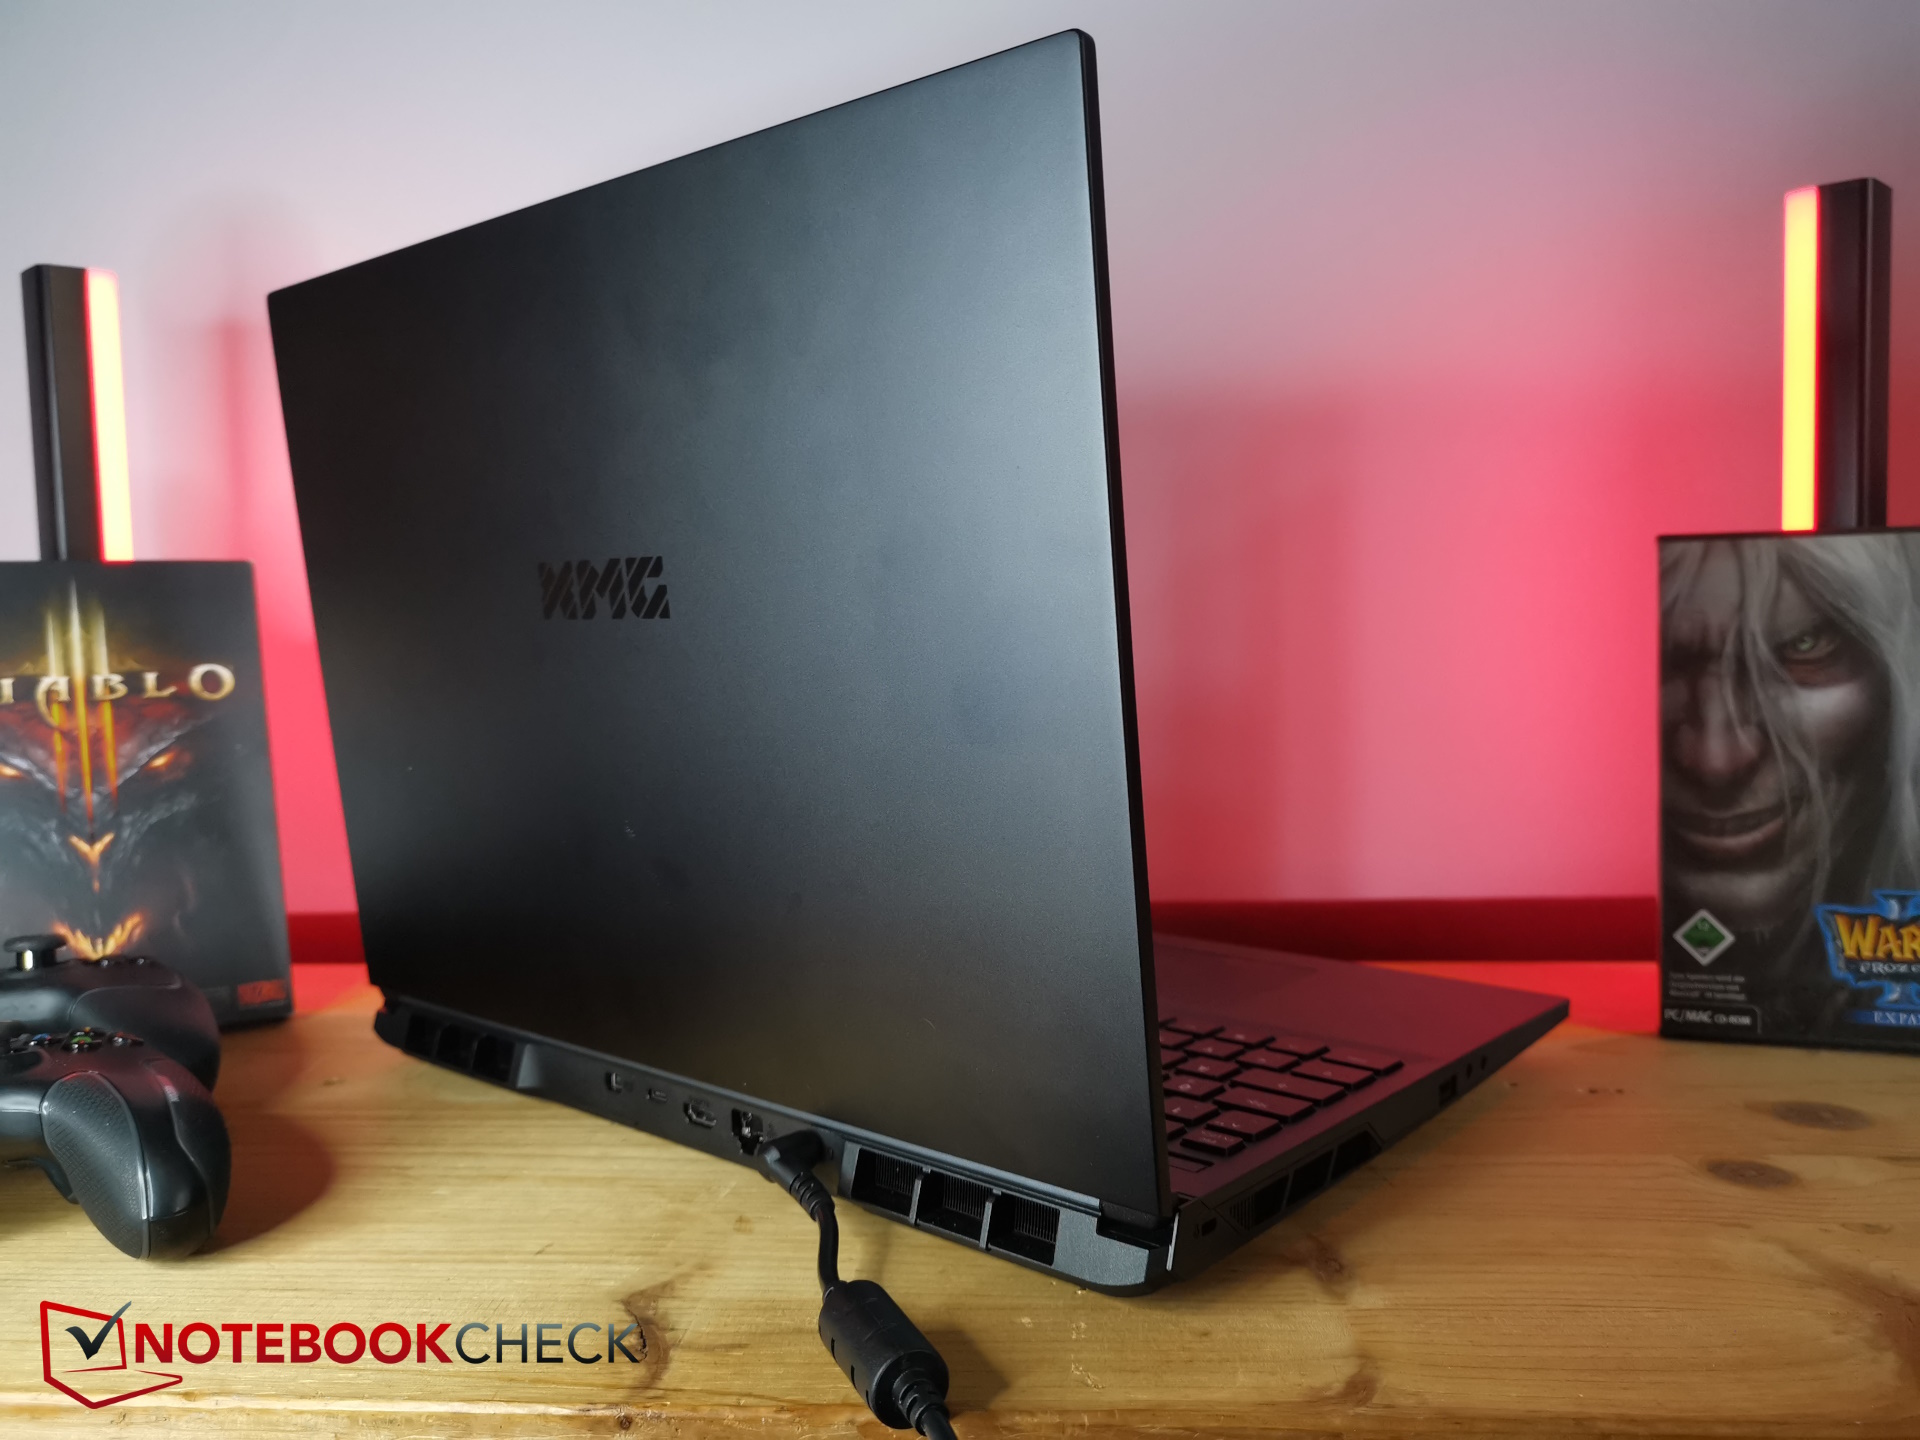
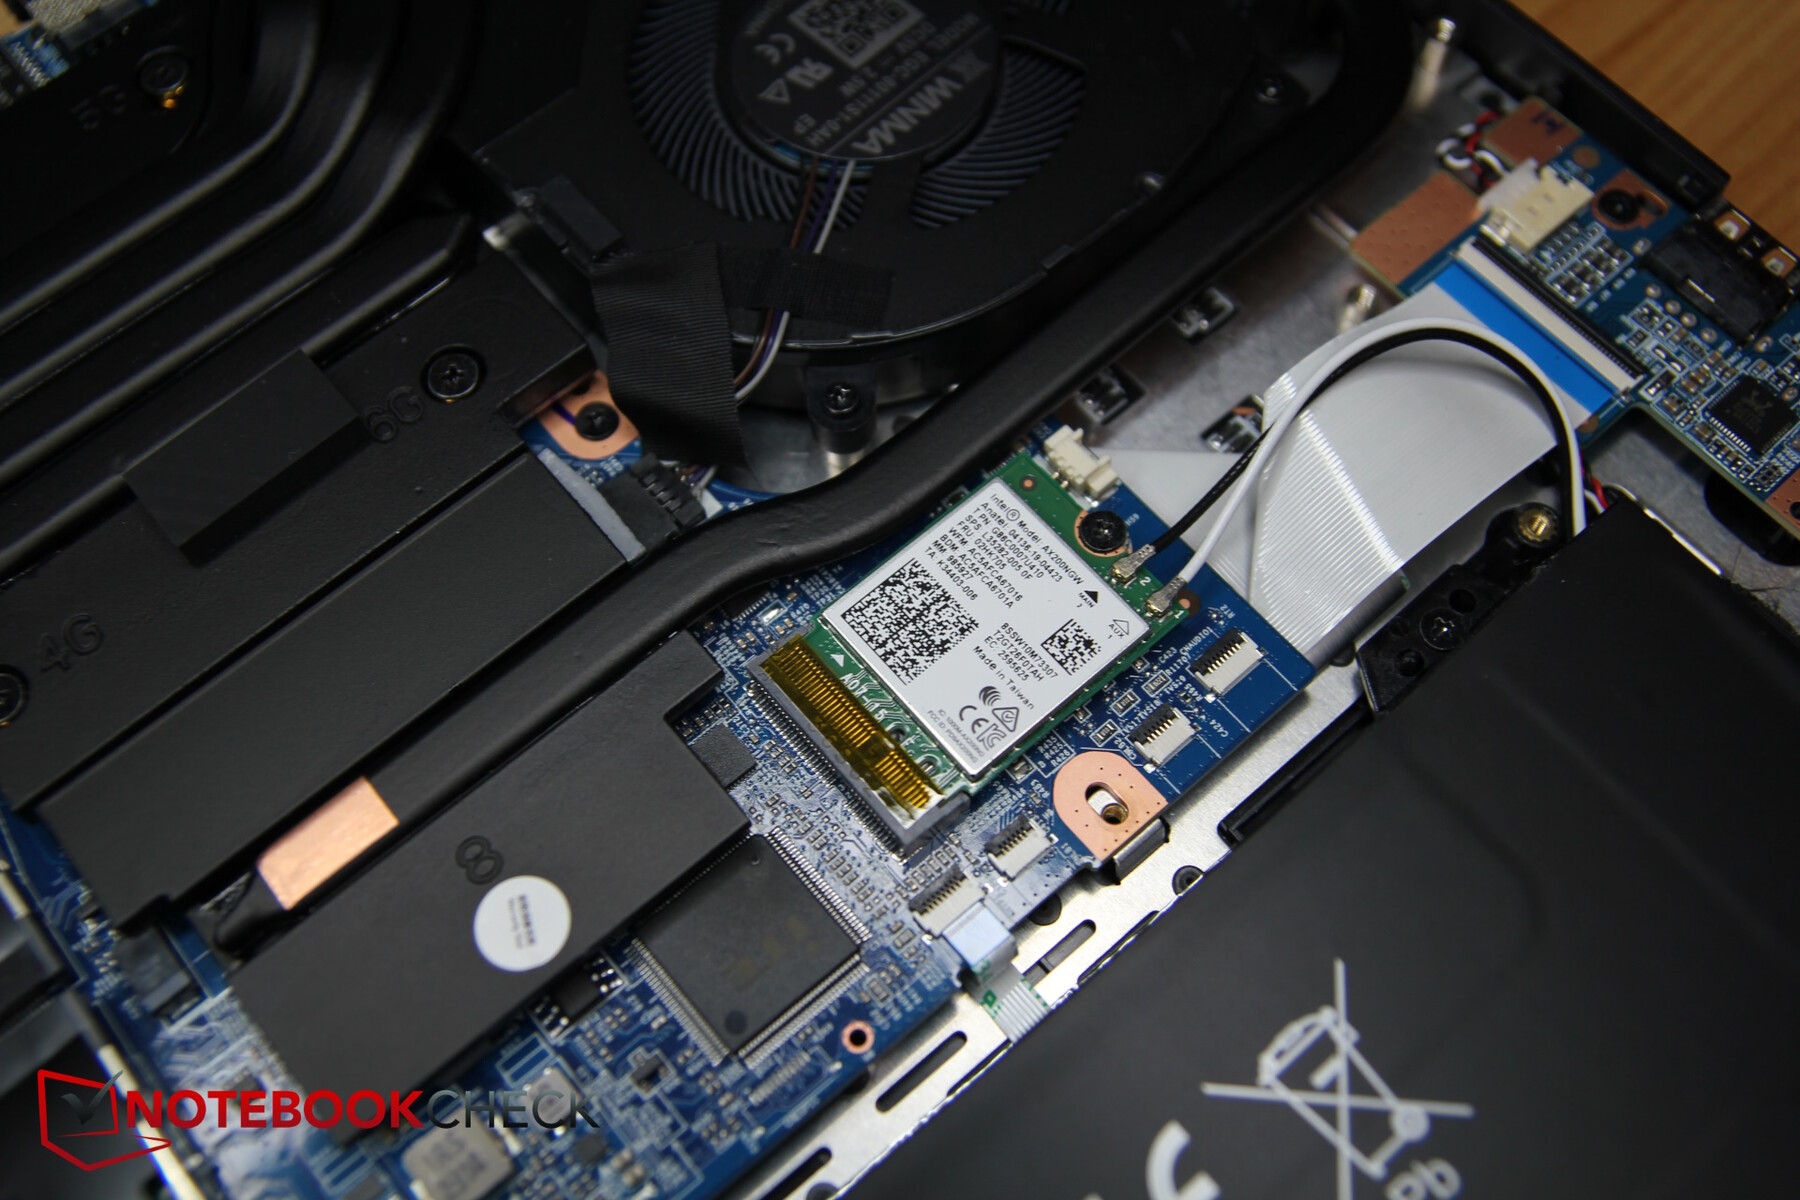
El portátil para juegos incluye todos los puertos más importantes, incluido un lector de tarjetas SD completo. Por desgracia, el puerto USB-C no es compatible con Thunderbolt, Power Delivery o DisplayPort. Para este último, el portátil cuenta con un MiniDisplayPort dedicado. El dispositivo no se puede cargar a través de USB-C y el puerto USB-A del lado izquierdo sigue siendo de tipo 2.0
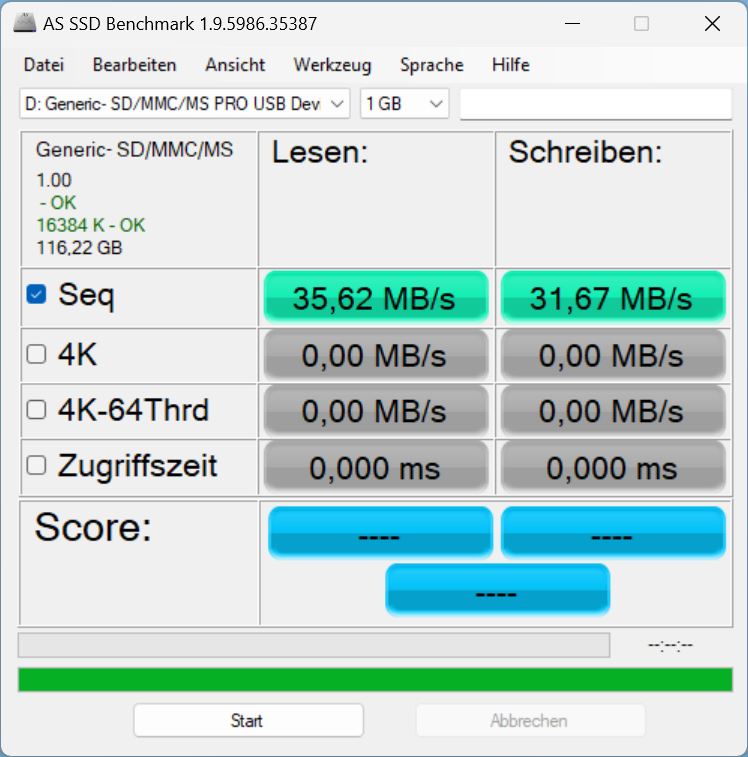
El lector de tarjetas SD antes mencionado es por desgracia muy lento, más que en todos sus predecesores y competidores. Al menos cuenta con uno.
El Intel AX200 soporta WiFi 6, pero sólo dentro de la frecuencia de 5 GHz. Sus velocidades de transferencia son buenas y relativamente estables.
| SD Card Reader | |
| average JPG Copy Test (av. of 3 runs) | |
| MSI Stealth 16 Studio A13VG | |
| Media de la clase Gaming (20.9 - 210, n=54, últimos 2 años) | |
| Acer Nitro 16 AN16-41 (AV Pro SD microSD 128 GB V60) | |
| Schenker XMG CORE 16 (L23) | |
| maximum AS SSD Seq Read Test (1GB) | |
| MSI Stealth 16 Studio A13VG | |
| Media de la clase Gaming (25.5 - 261, n=51, últimos 2 años) | |
| Acer Nitro 16 AN16-41 (AV Pro SD microSD 128 GB V60) | |
| Schenker XMG CORE 16 (L23) | |

 GeForce RTX 4070 Laptop GPU, R7 7840HS, Samsung 990 Pro 1 TB")
 GeForce RTX 4070 Laptop GPU, R7 7840HS, Samsung 990 Pro 1 TB")
Dispositivos de entrada - Teclas mecánicas o de membrana
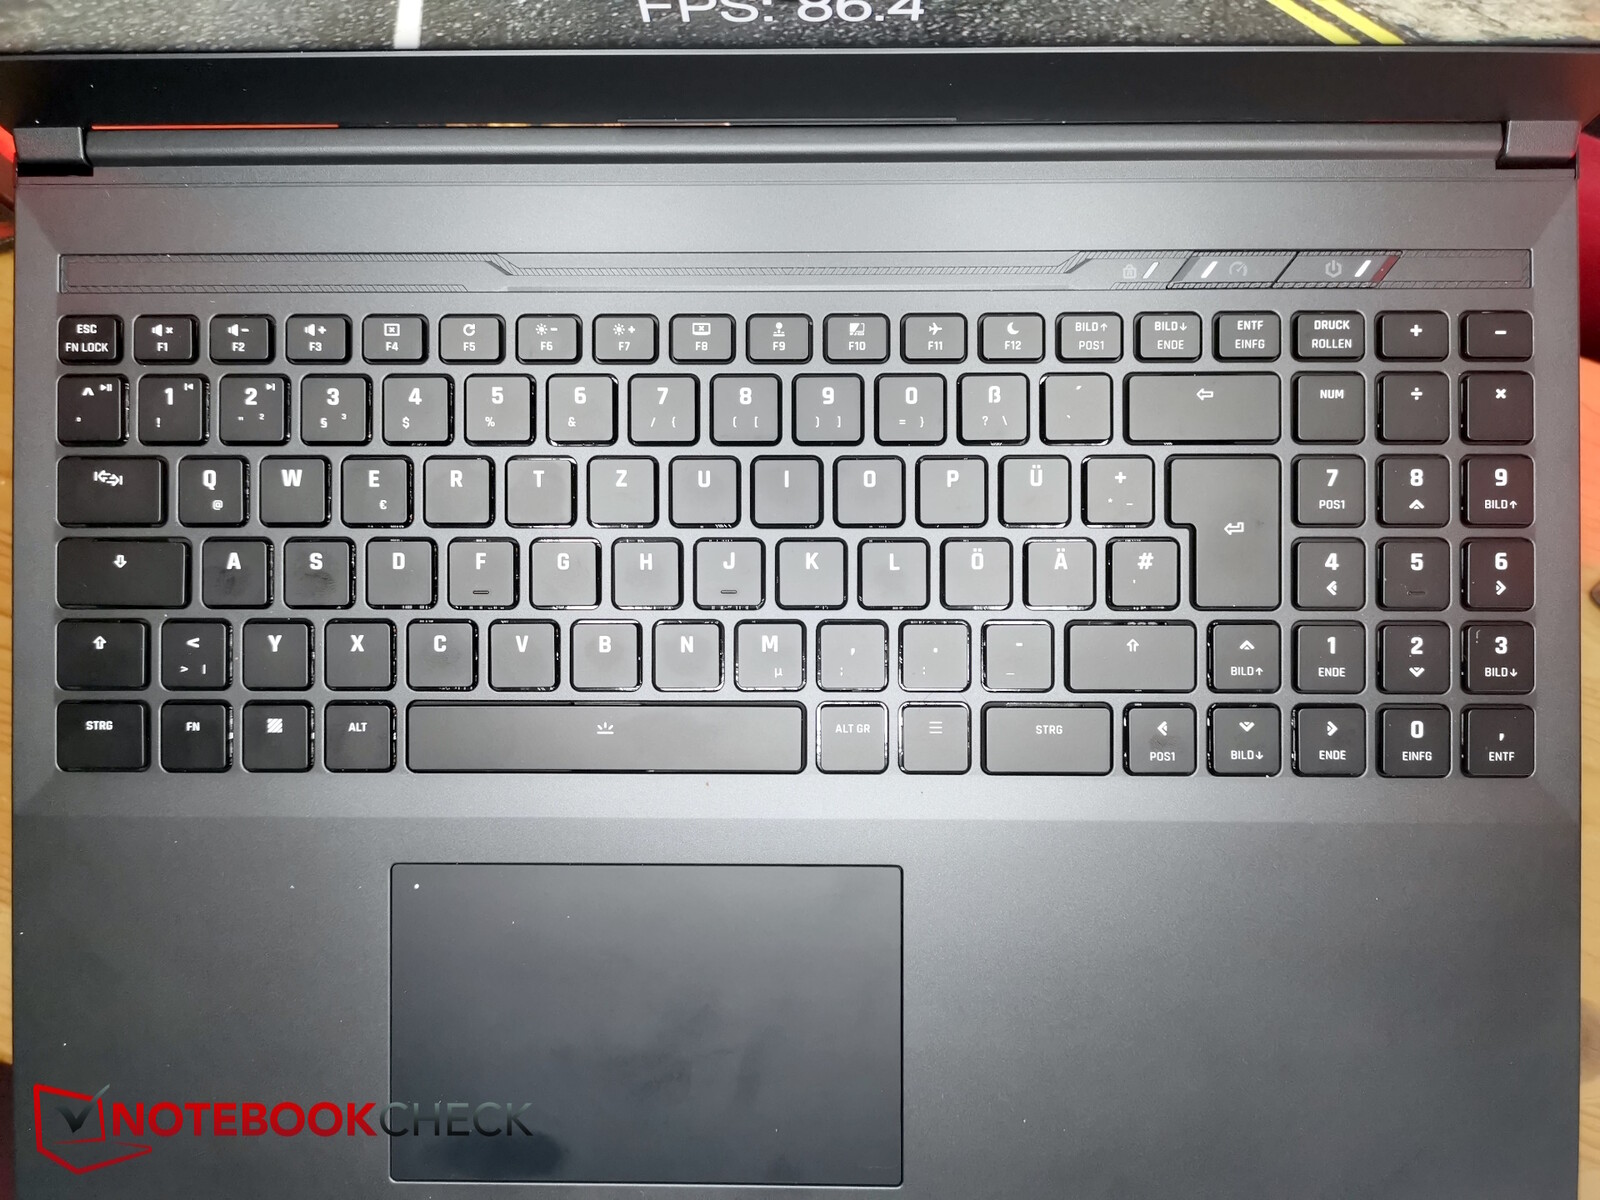
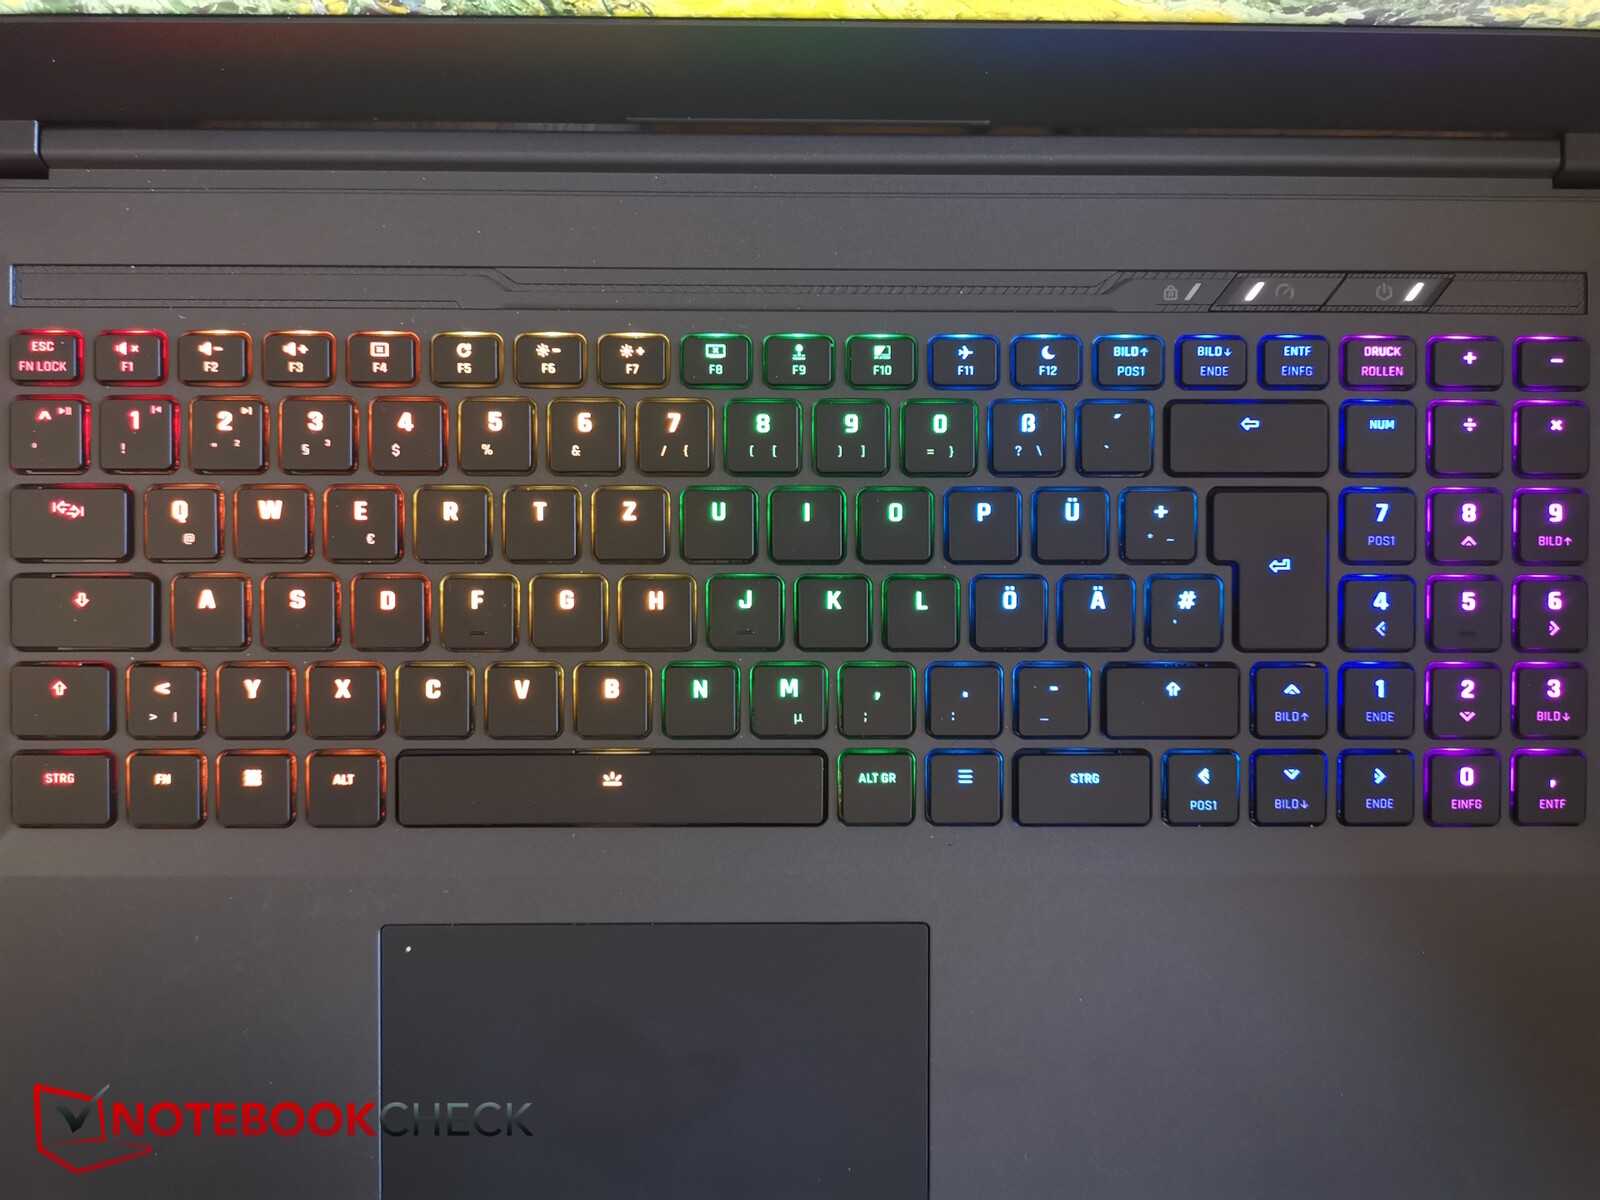
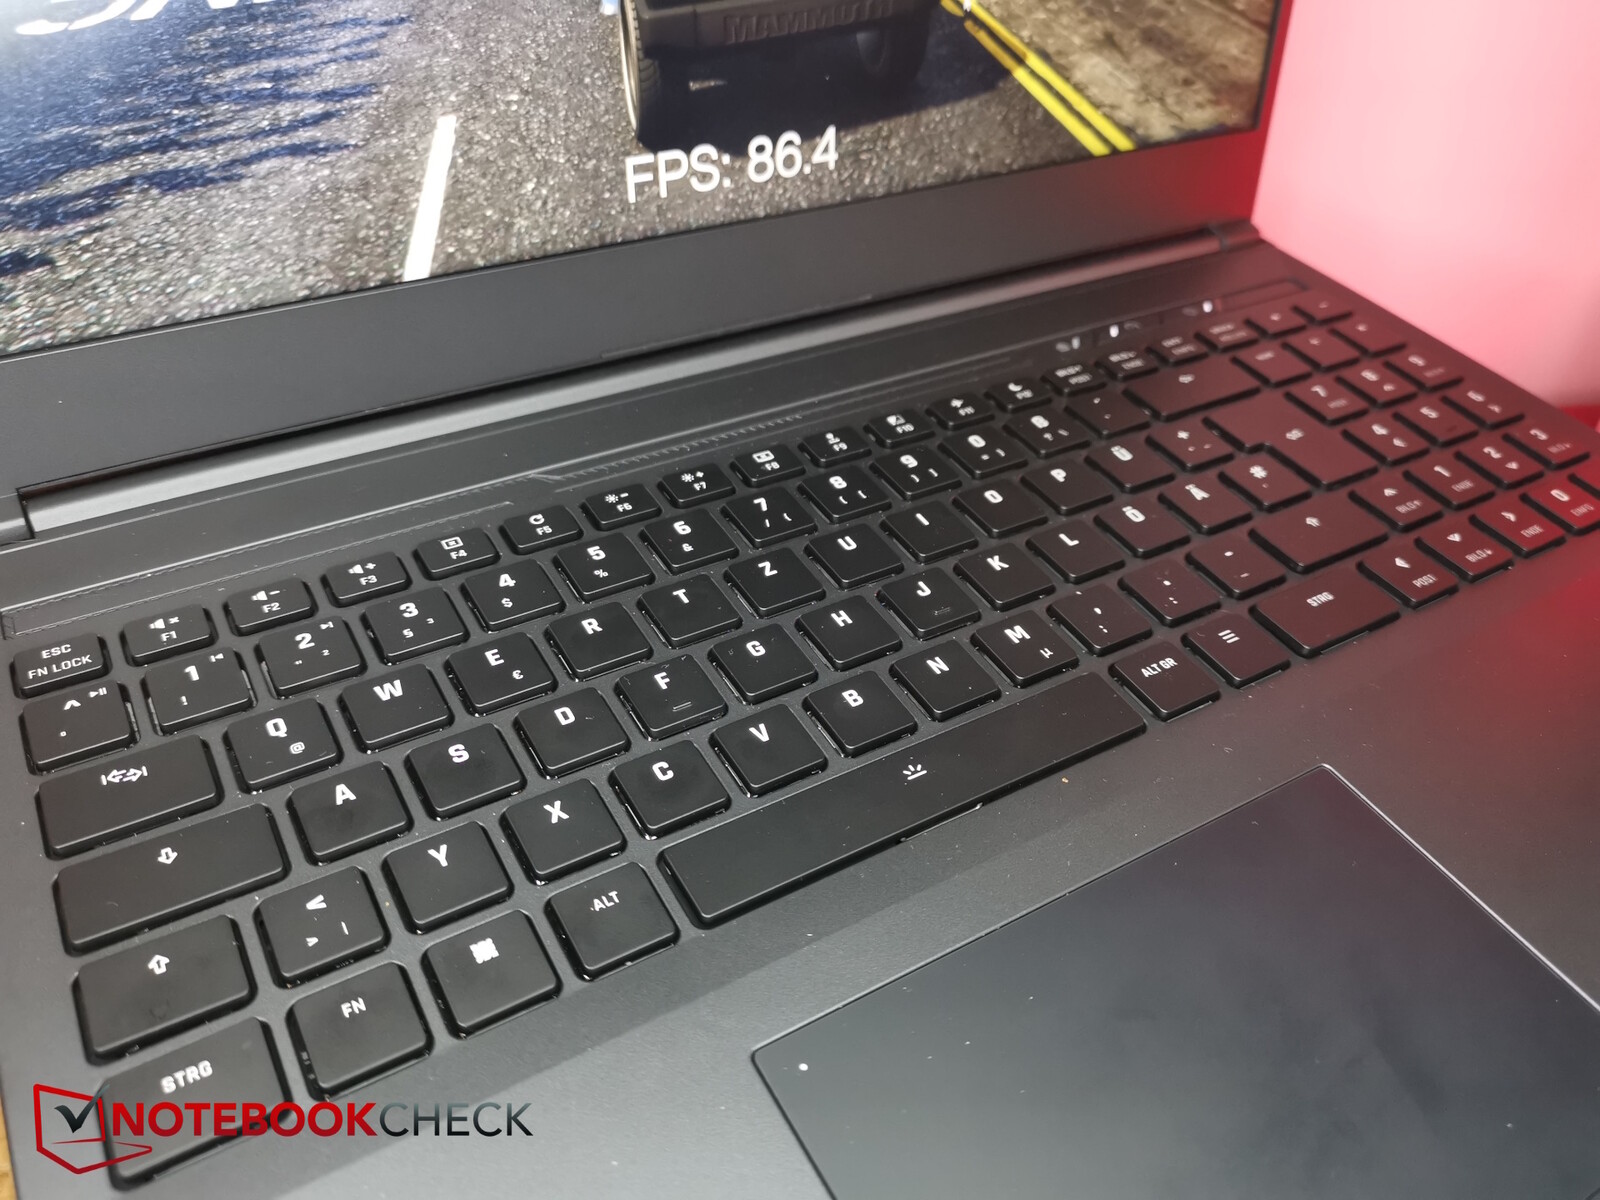
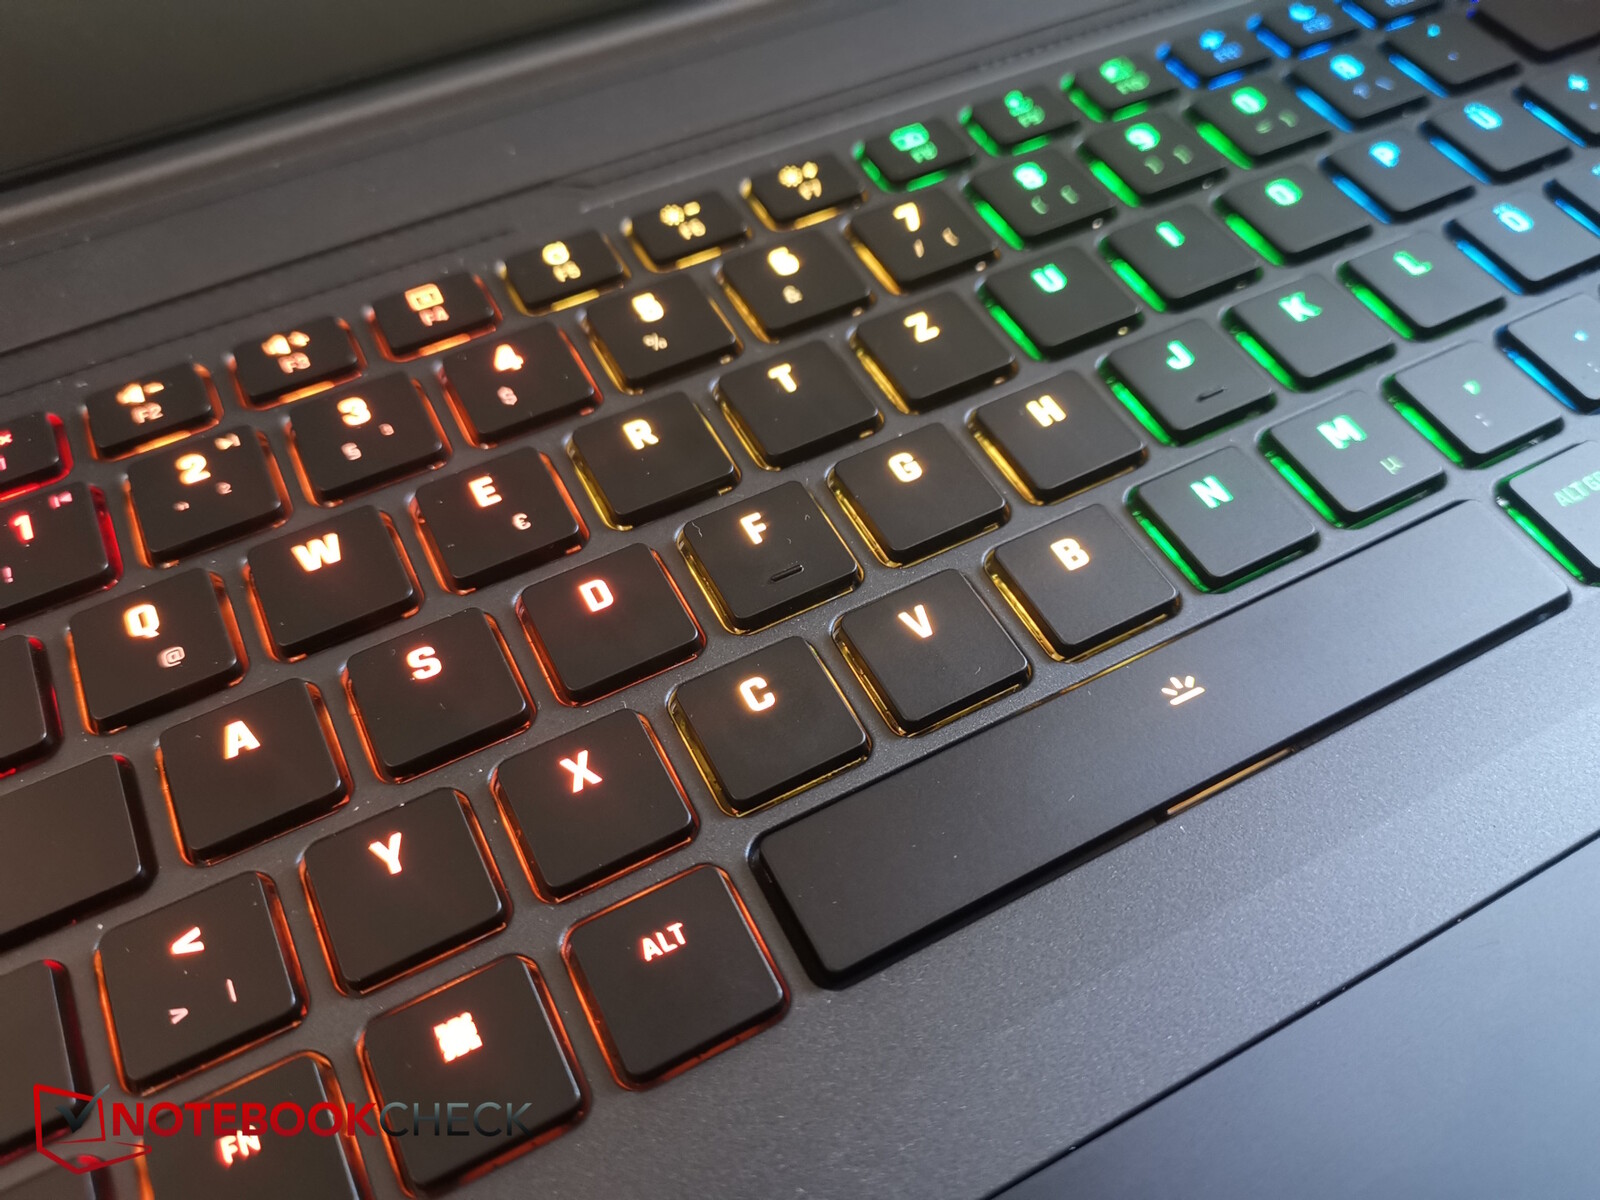
En este portátil, puede elegir entre teclas mecánicas, como las que incorpora nuestro modelo de pruebas, o un "teclado de membrana silencioso". Ambos vienen con retroiluminación RGB, pero sólo el teclado mecánico dispone de teclas con iluminación RGB individual. La versión de membrana silenciosa sólo dispone de iluminación RGB de una sola zona.
El teclado mecánico sólo tiene interruptores de membrana más silenciosos en lo que se refiere a las teclas de función. Todas las demás teclas tienen un gran punto de presión y ofrecen una respuesta nítida. Tiene que gustarle el fuerte ruido al teclear y desde luego no es adecuado para llevárselo a una biblioteca.
Como es habitual, Schenker ha implementado una disposición muy ordenada y sin acentos. Todo cabe en seis filas de teclas rectas, incluido el teclado numérico. Esto significa que podrá encontrarlo todo con suma facilidad - por lo general, las teclas son bastante pequeñas (alrededor de 1,45 x 1,45 cm).
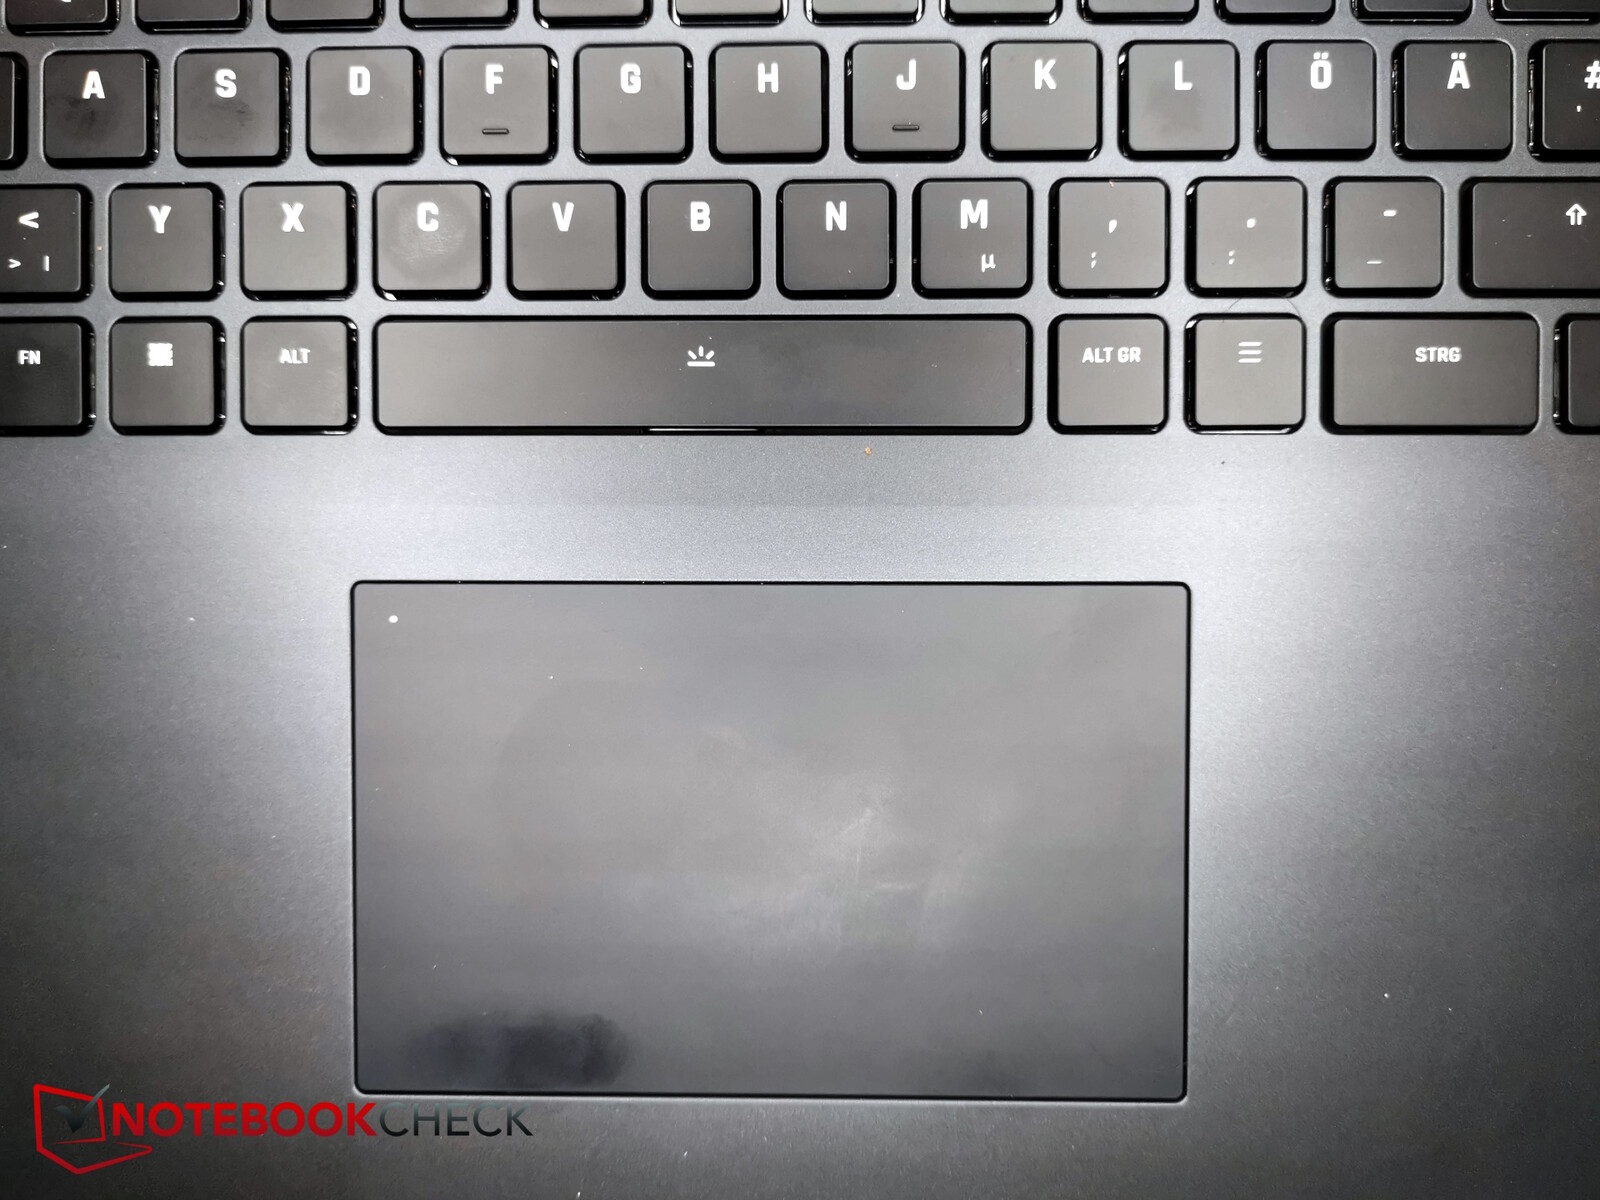
El touchpad es un poco pequeño (alrededor de 11,7 x 7,2 cm) pero es agradable y suave, incluso si sus dedos no están completamente secos. Puede (des)activar el pad haciendo doble clic en la esquina superior izquierda y un mini LED muestra su estado actual. Los botones de clic integrados le ofrecen una respuesta decente pero no son demasiado ruidosos. A veces, el clic se atasca un poco, lo que significa que no se suelta inmediatamente después de soltarlo tras arrastrar y soltar.
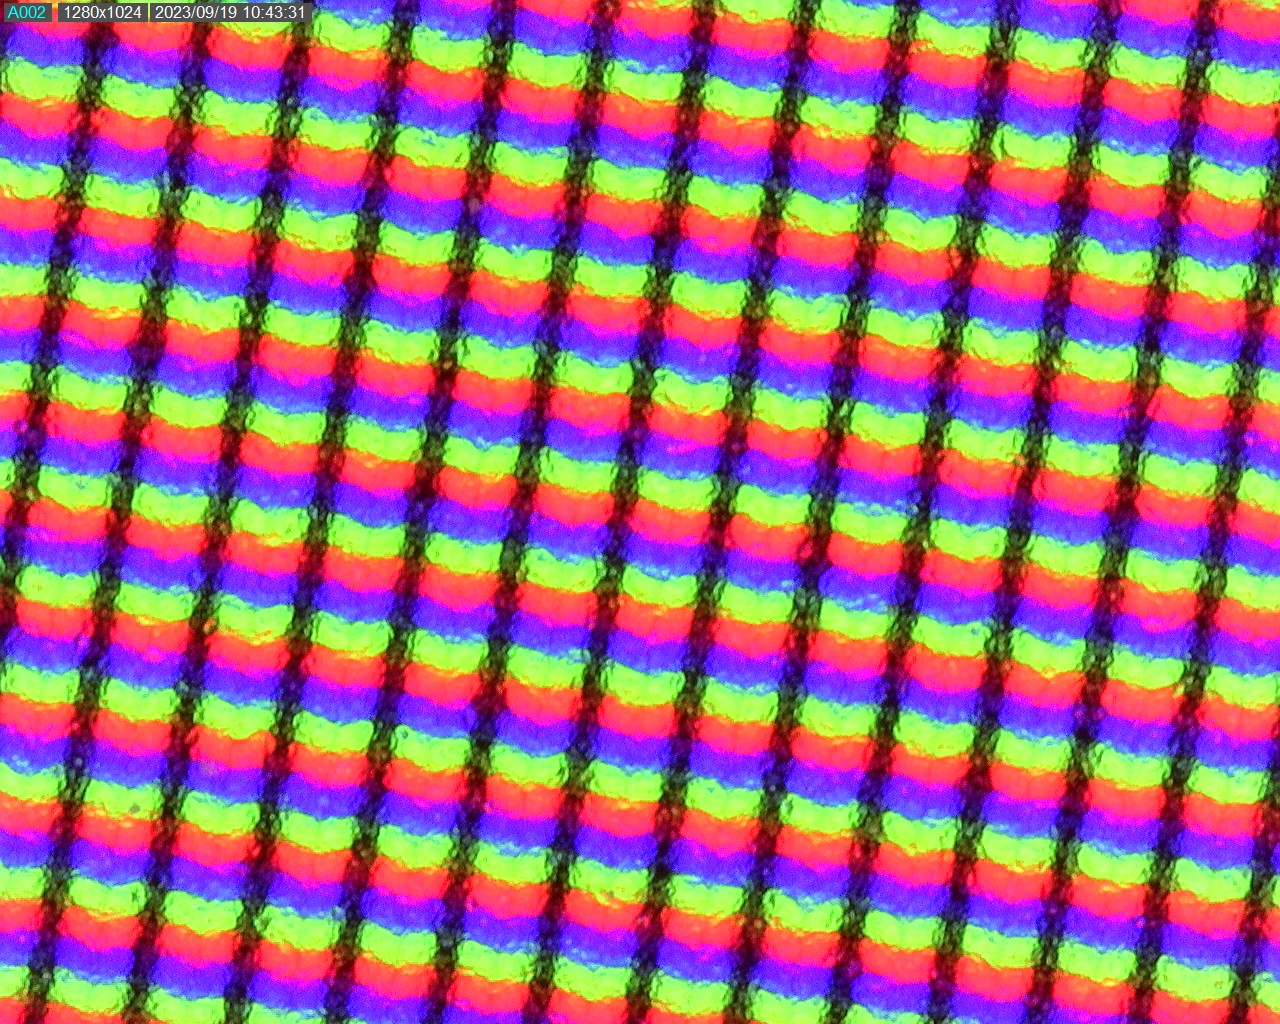
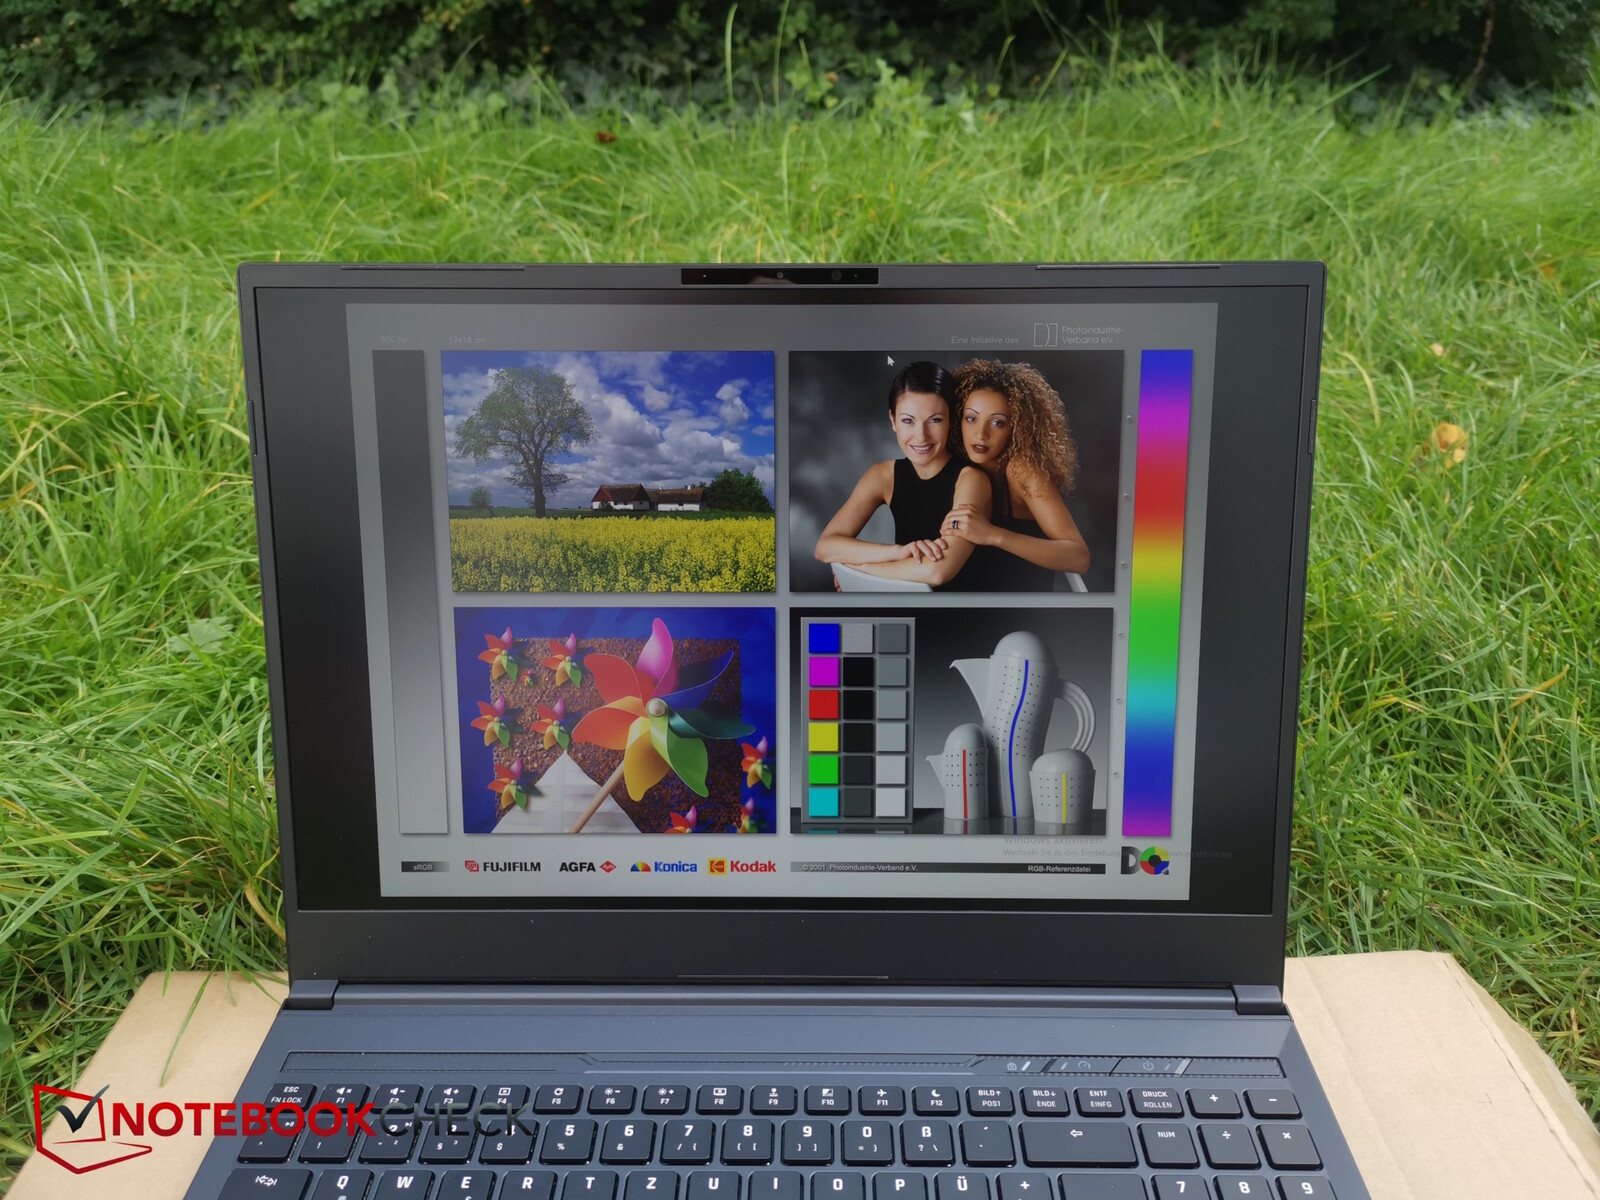
Pantalla - Conocido panel IPS 16:10 1.600p
Por lo que parece, Schenker utiliza la misma pantalla mate 1:10 de 240 Hz con una resolución de 1.600p en todos sus modelos de 16 pulgadas. Esto significa que vimos el mismo panel BOE en elSchenker Vision 16 Proy en elXMG Neo 16.
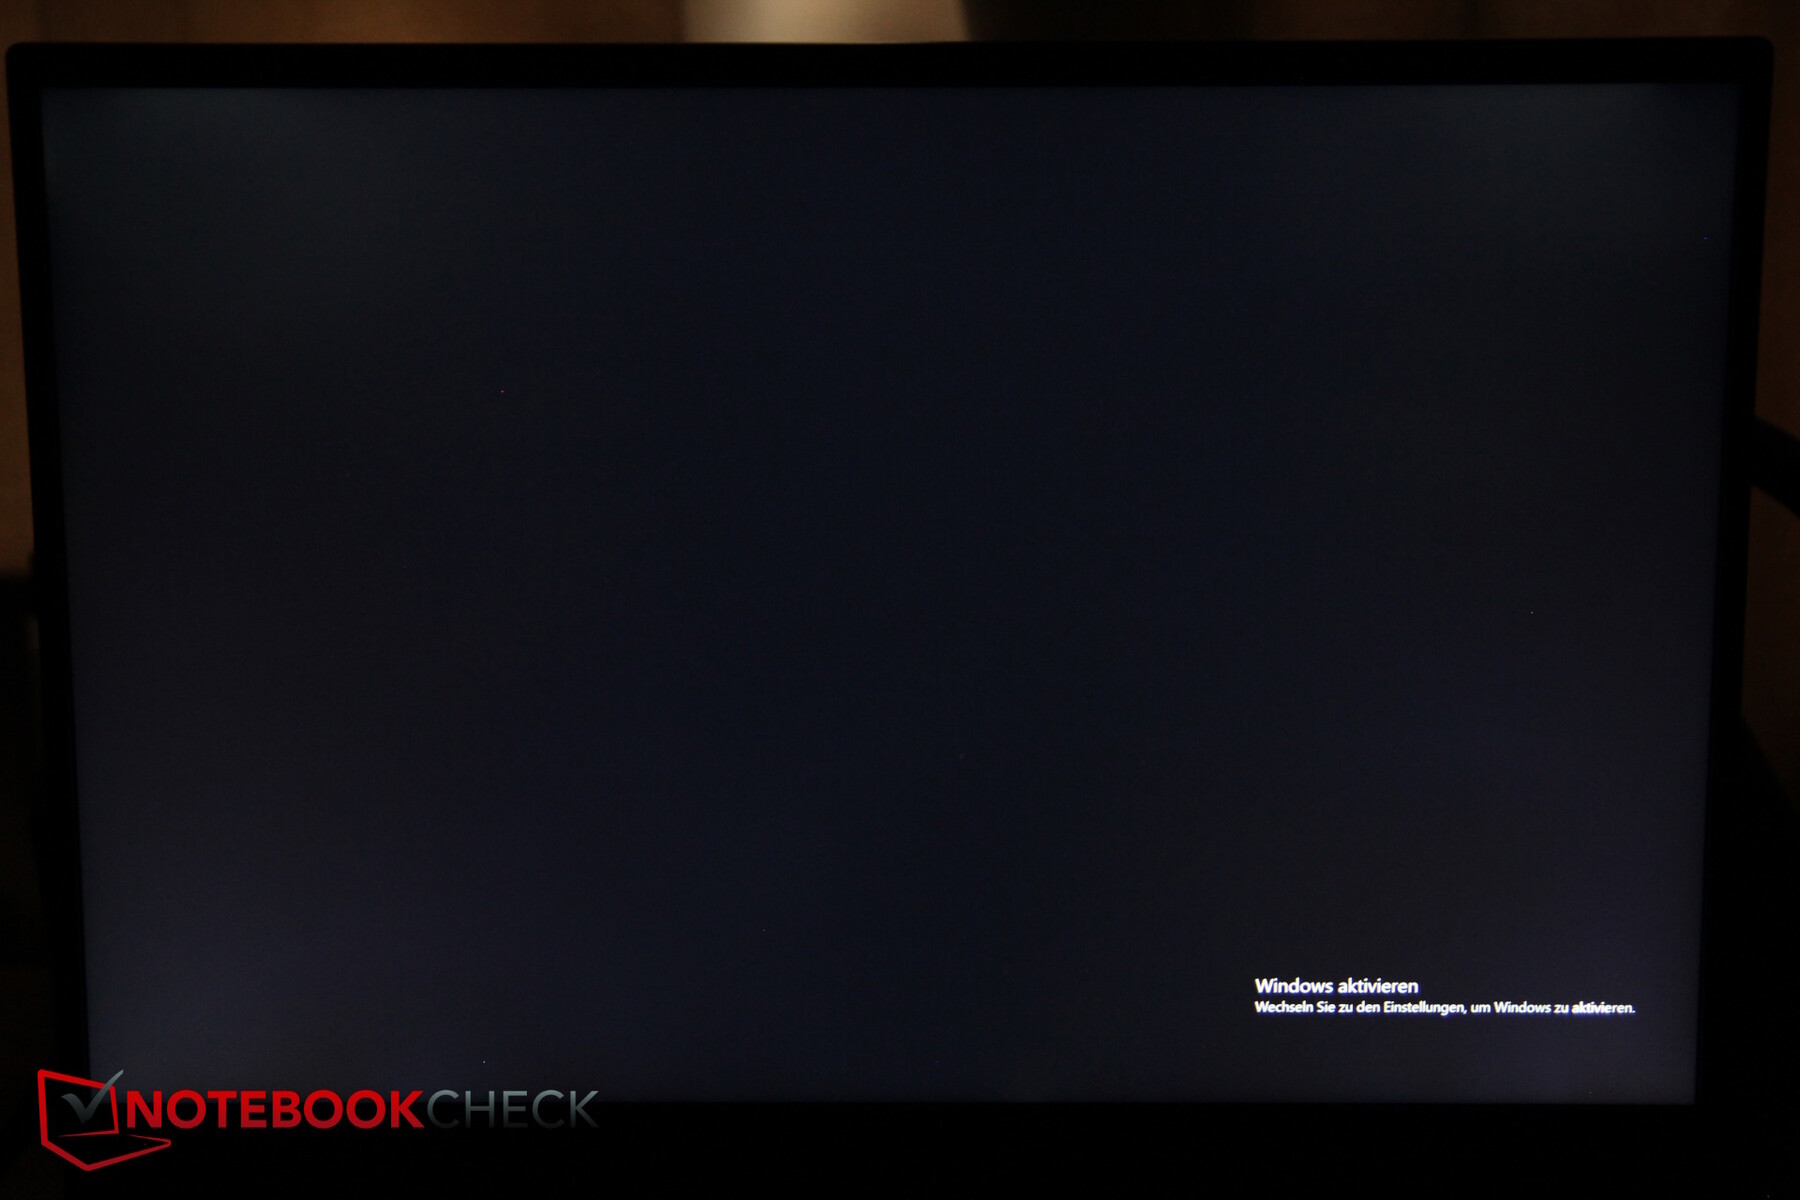
La pantalla alcanza ciertamente buenos valores. Tiene un brillo de 350 nits y un valor de contraste de algo más de 1.000:1. La pantalla sRGB es suficientemente rápida y no notamos ningún PWM. Se aprecia algo de sangrado de retroiluminación, pero nada demasiado grave.
Una cosa que notamos es que cambiar el brillo a través de las teclas especiales sólo tiene efecto cuando suelta las teclas de nuevo, lo que es un poco molesto.
| |||||||||||||||||||||||||
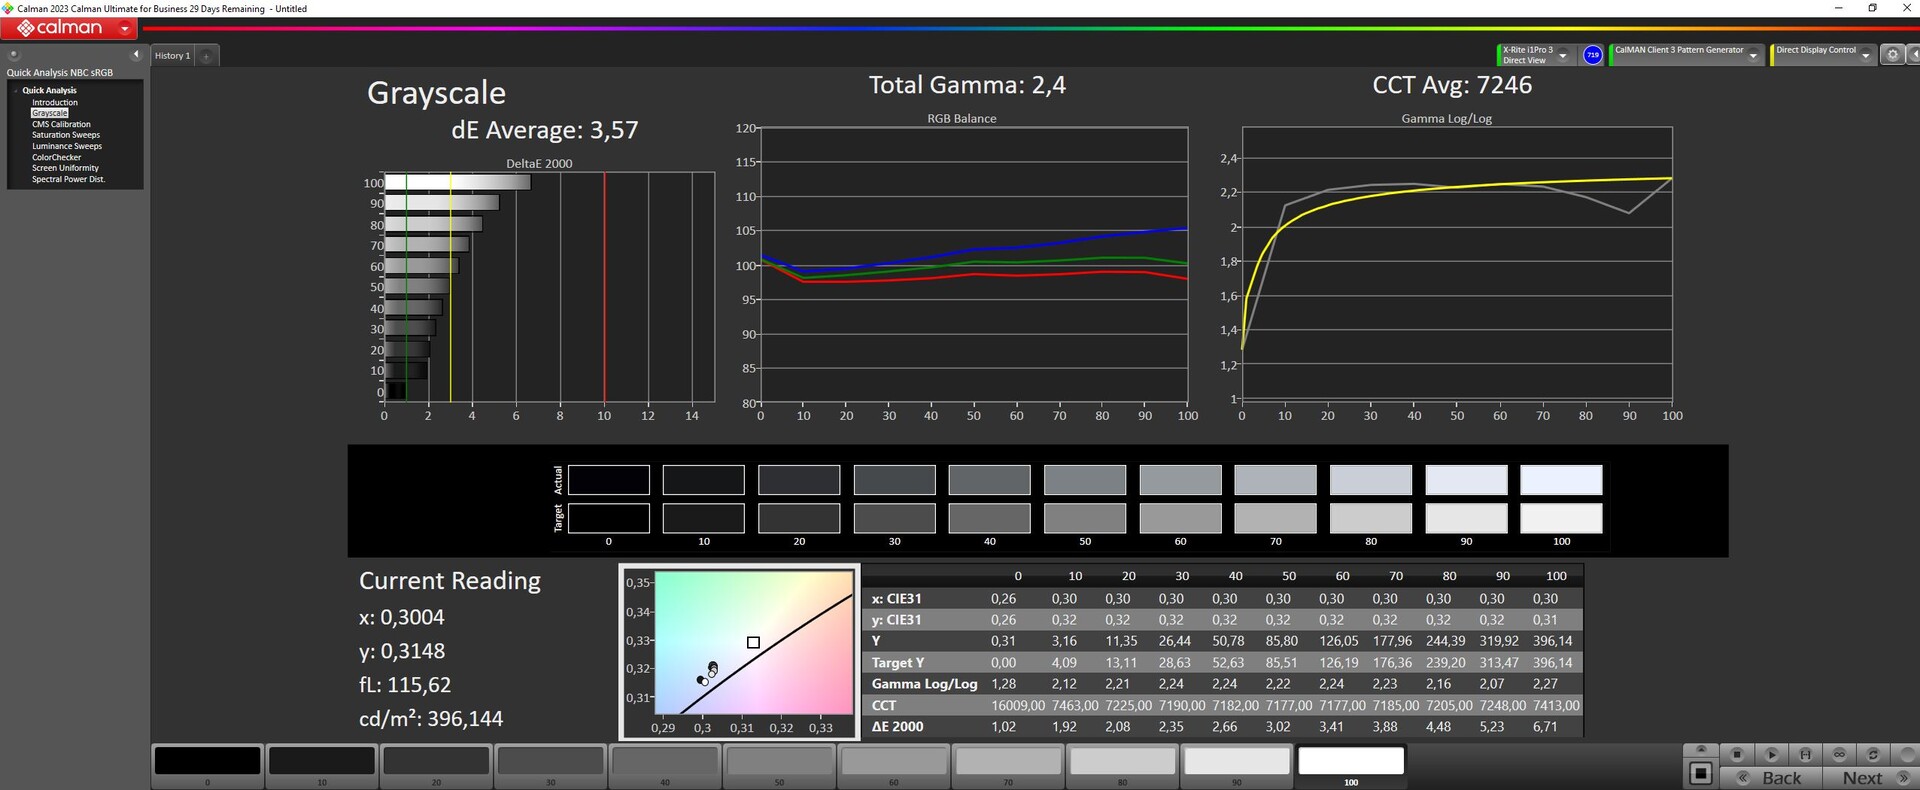
iluminación: 88 %
Brillo con batería: 372 cd/m²
Contraste: 1139:1 (Negro: 0.33 cd/m²)
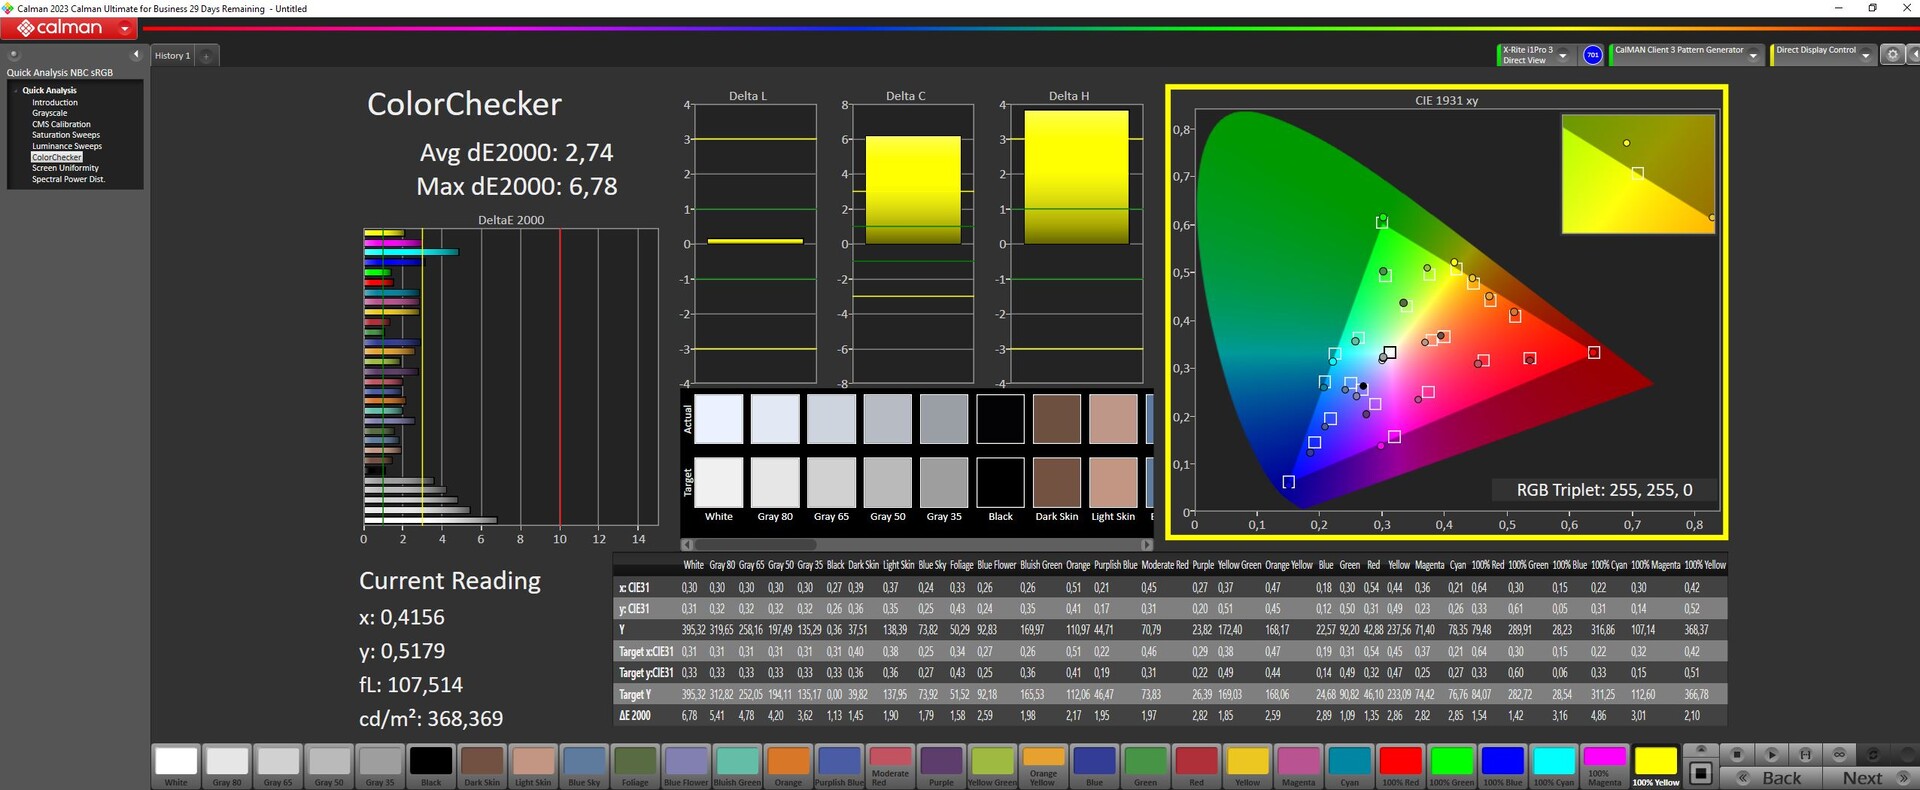
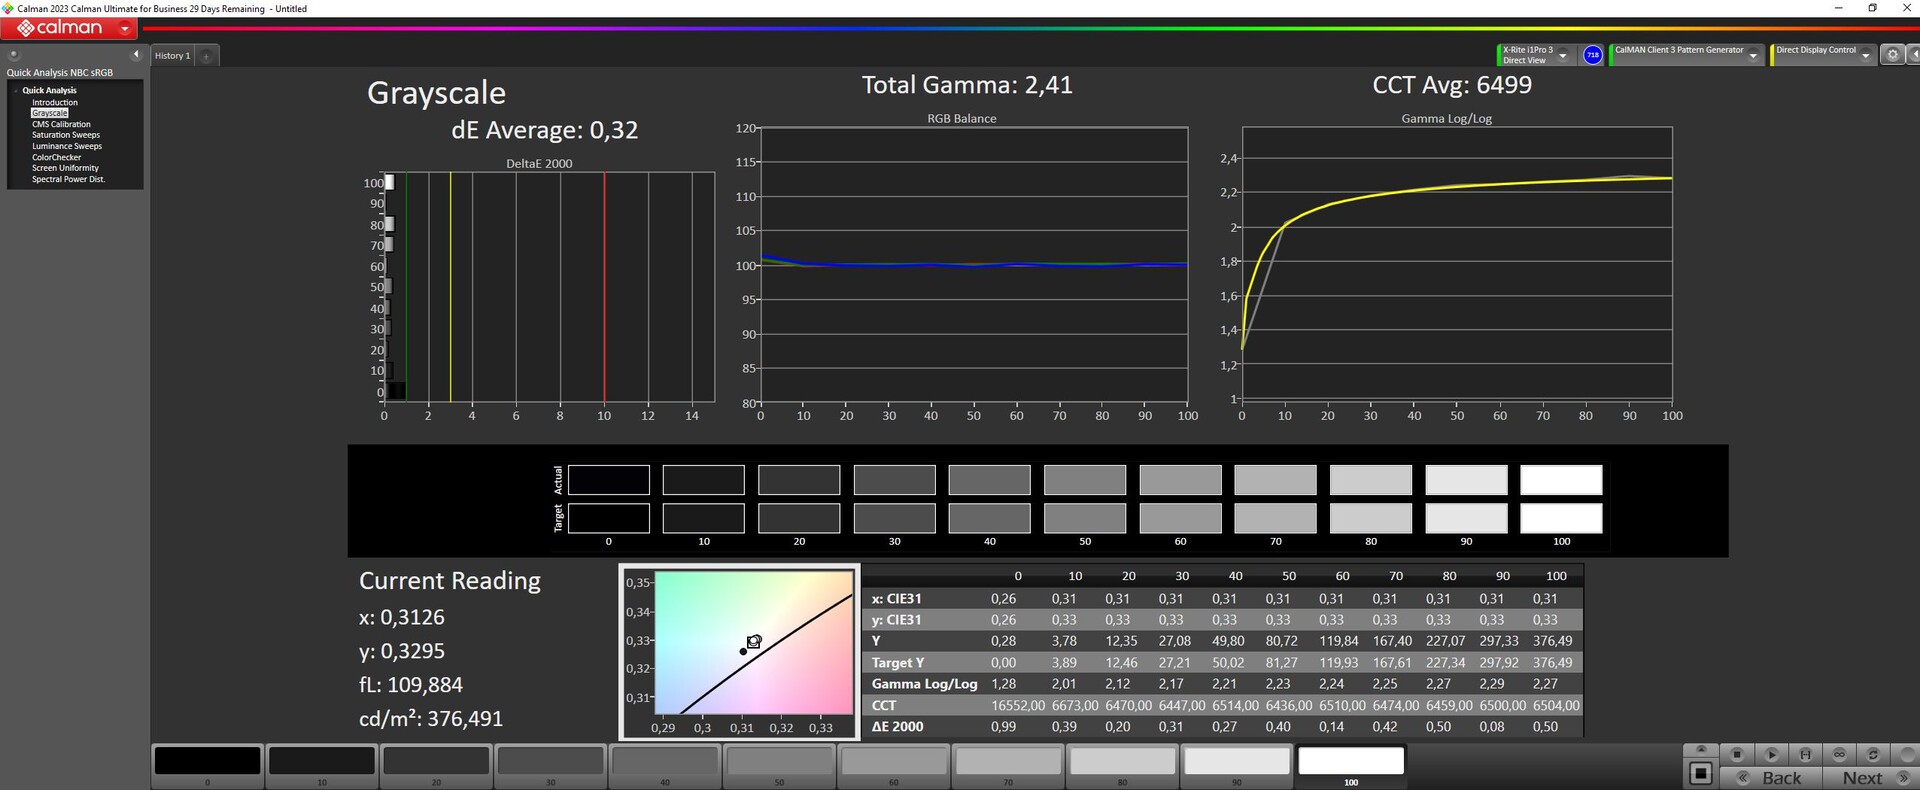
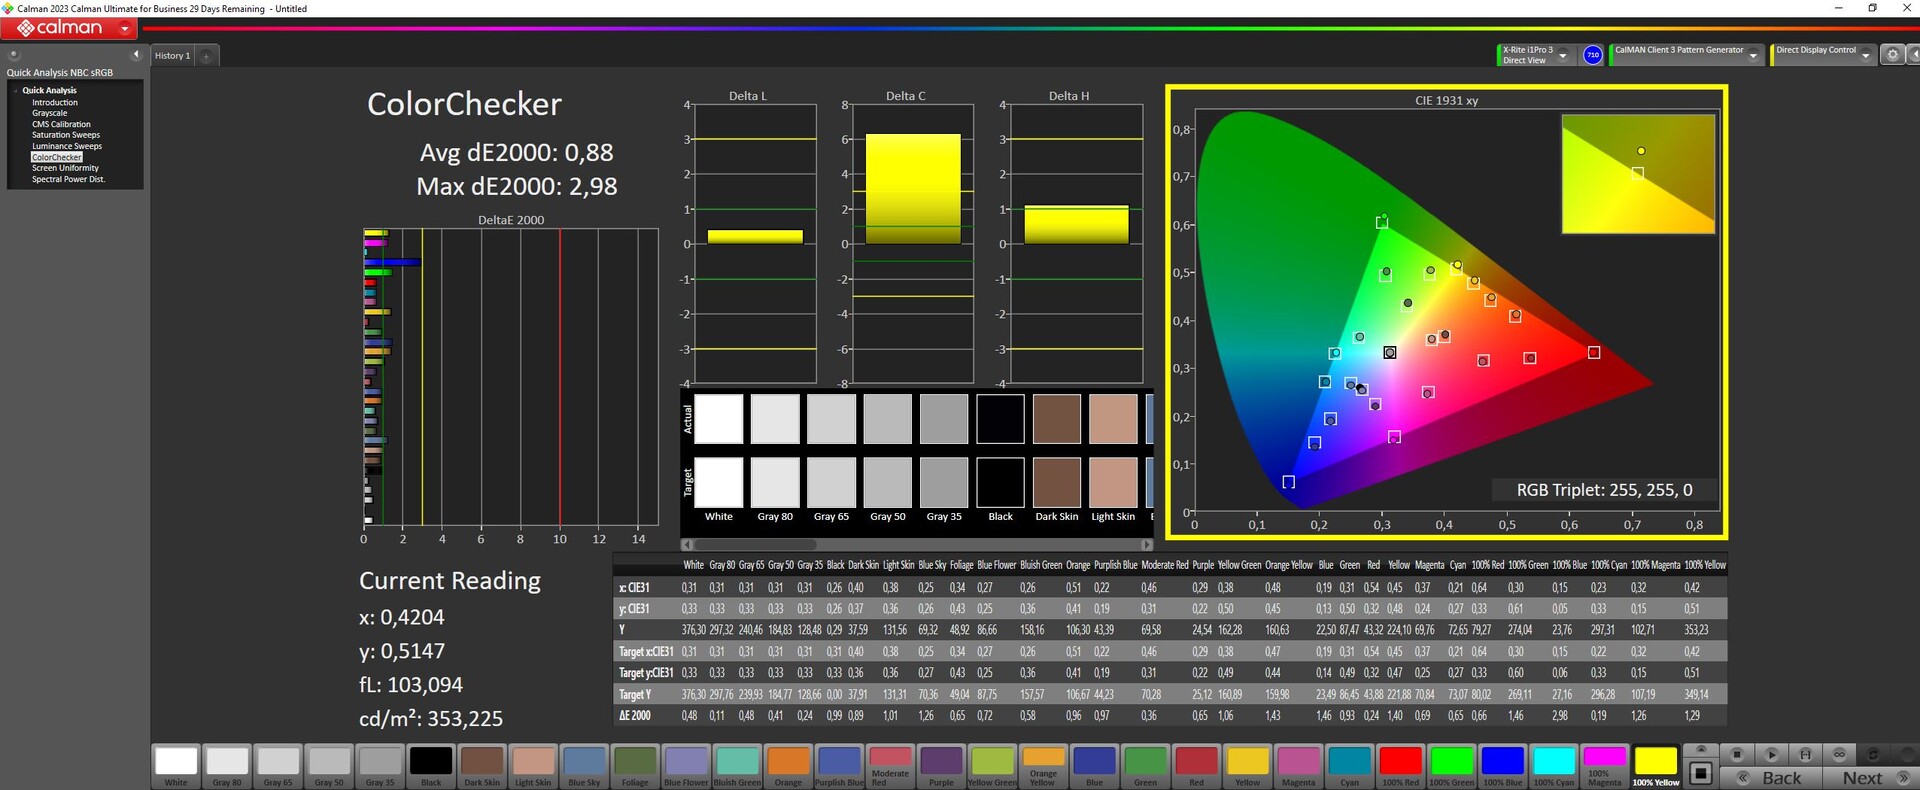
ΔE ColorChecker Calman: 2.74 | ∀{0.5-29.43 Ø4.73}
calibrated: 0.88
ΔE Greyscale Calman: 3.57 | ∀{0.09-98 Ø4.97}
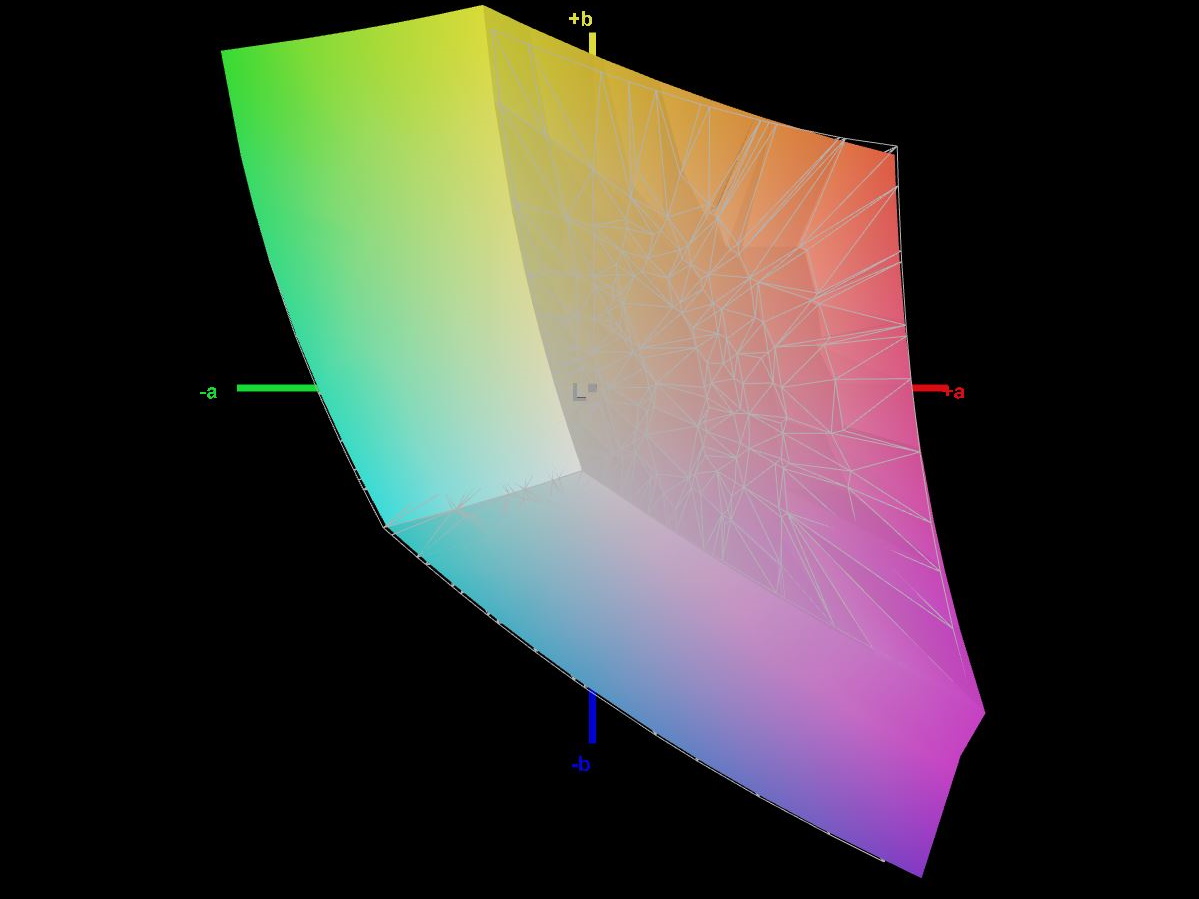
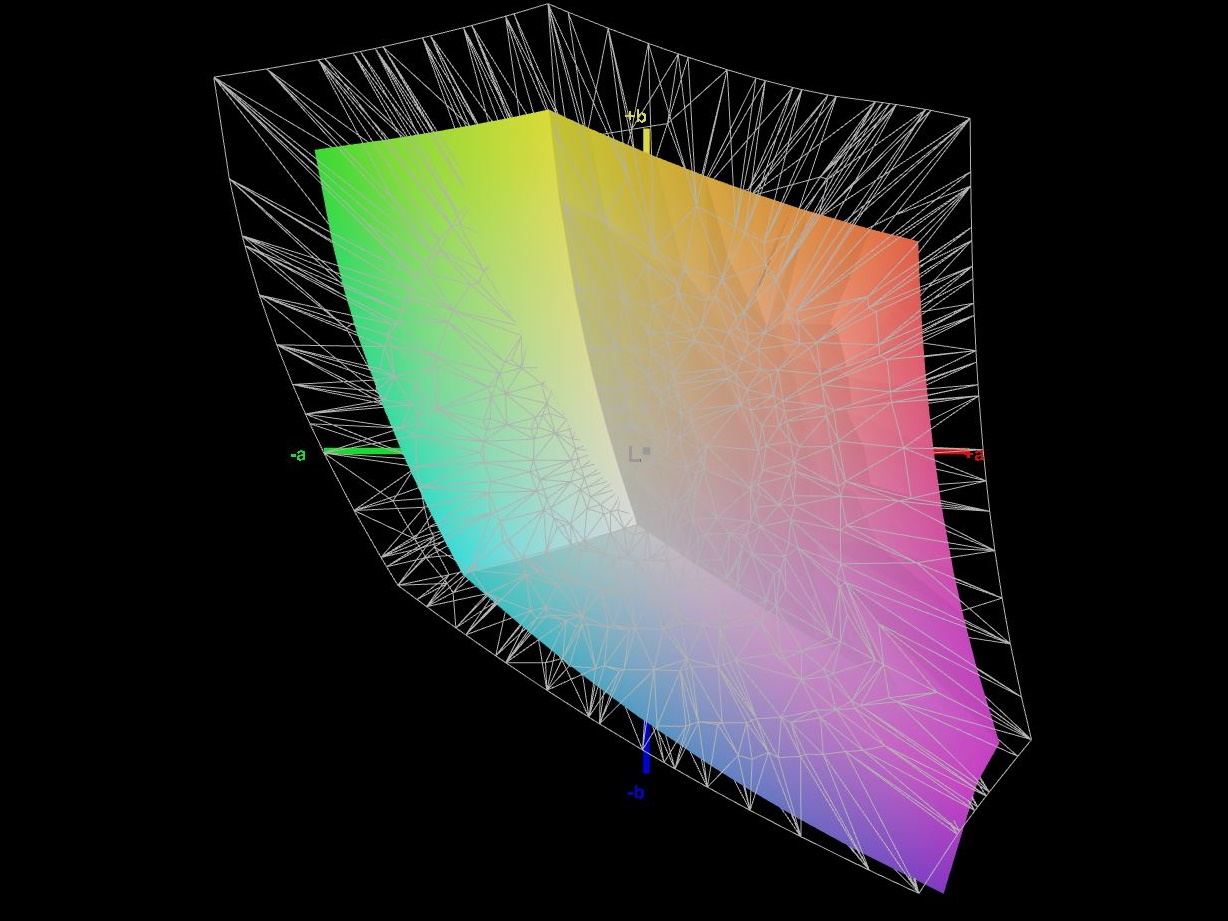
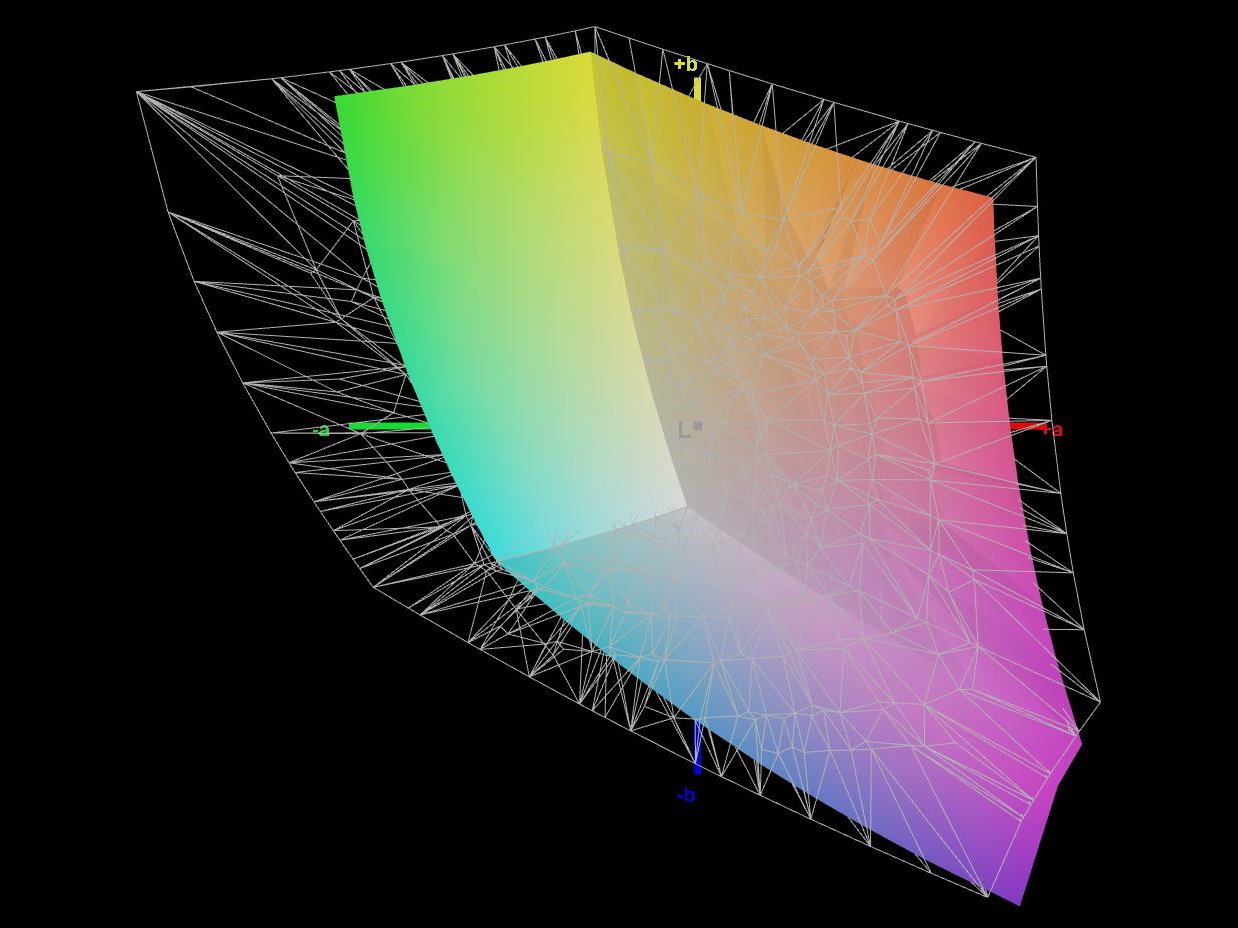
69.6% AdobeRGB 1998 (Argyll 3D)
98.6% sRGB (Argyll 3D)
68.3% Display P3 (Argyll 3D)
Gamma: 2.4
CCT: 7246 K
| Schenker XMG CORE 16 (L23) BOE0AF0 (), IPS, 2560x1600, 16" | Lenovo Legion Pro 5 16ARX8 CSOT T3 MNG007DA1-Q, IPS, 2560x1600, 16" | Acer Nitro 16 AN16-41 BOE CQ NE16QDM-NY1, IPS, 2560x1600, 16" | HP Omen Transcend 16 AUOA3A6, Mini-LED, 2560x1600, 16" | MSI Stealth 16 Studio A13VG AUO26A9, IPS, 2560x1600, 16" | HP Victus 16-r0077ng CMN162D, IPS, 1920x1080, 16.1" | |
|---|---|---|---|---|---|---|
| Display | 3% | 0% | 24% | 21% | -1% | |
| Display P3 Coverage (%) | 68.3 | 70.4 3% | 67.9 -1% | 99.2 45% | 96.4 41% | 66.7 -2% |
| sRGB Coverage (%) | 98.6 | 99.6 1% | 99.1 1% | 100 1% | 99.7 1% | 98 -1% |
| AdobeRGB 1998 Coverage (%) | 69.6 | 72.6 4% | 69.9 0% | 87.6 26% | 84.8 22% | 69 -1% |
| Response Times | 5% | 21% | -214% | 41% | -13% | |
| Response Time Grey 50% / Grey 80% * (ms) | 13.2 ? | 7 ? 47% | 11 ? 17% | 26.4 ? -100% | 4.4 ? 67% | 13.3 ? -1% |
| Response Time Black / White * (ms) | 6.6 ? | 9.1 ? -38% | 5 ? 24% | 28.2 ? -327% | 5.6 ? 15% | 8.2 ? -24% |
| PWM Frequency (Hz) | 3506 ? | |||||
| Screen | 26% | 18% | 195% | -30% | 17% | |
| Brightness middle (cd/m²) | 376 | 355.3 -6% | 520 38% | 791.1 110% | 424 13% | 308 -18% |
| Brightness (cd/m²) | 358 | 340 -5% | 494 38% | 800 123% | 411 15% | 285 -20% |
| Brightness Distribution (%) | 88 | 91 3% | 91 3% | 95 8% | 88 0% | 85 -3% |
| Black Level * (cd/m²) | 0.33 | 0.32 3% | 0.39 -18% | 0.04 88% | 0.37 -12% | 0.25 24% |
| Contrast (:1) | 1139 | 1110 -3% | 1333 17% | 19778 1636% | 1146 1% | 1232 8% |
| Colorchecker dE 2000 * | 2.74 | 1.13 59% | 1.94 29% | 4.37 -59% | 3.04 -11% | 1.3 53% |
| Colorchecker dE 2000 max. * | 6.78 | 2.78 59% | 5.62 17% | 10.39 -53% | 7.5 -11% | 2.76 59% |
| Colorchecker dE 2000 calibrated * | 0.88 | 0.32 64% | 0.74 16% | 1.04 -18% | 3.04 -245% | 0.92 -5% |
| Greyscale dE 2000 * | 3.57 | 1.4 61% | 2.94 18% | 6.5 -82% | 4.34 -22% | 1.7 52% |
| Gamma | 2.4 92% | 2.24 98% | 2.37 93% | 2.28 96% | 2.32 95% | 2.167 102% |
| CCT | 7246 90% | 6372 102% | 6443 101% | 6000 108% | 6952 93% | 6767 96% |
| Media total (Programa/Opciones) | 11% /
18% | 13% /
14% | 2% /
100% | 11% /
-9% | 1% /
9% |
* ... más pequeño es mejor
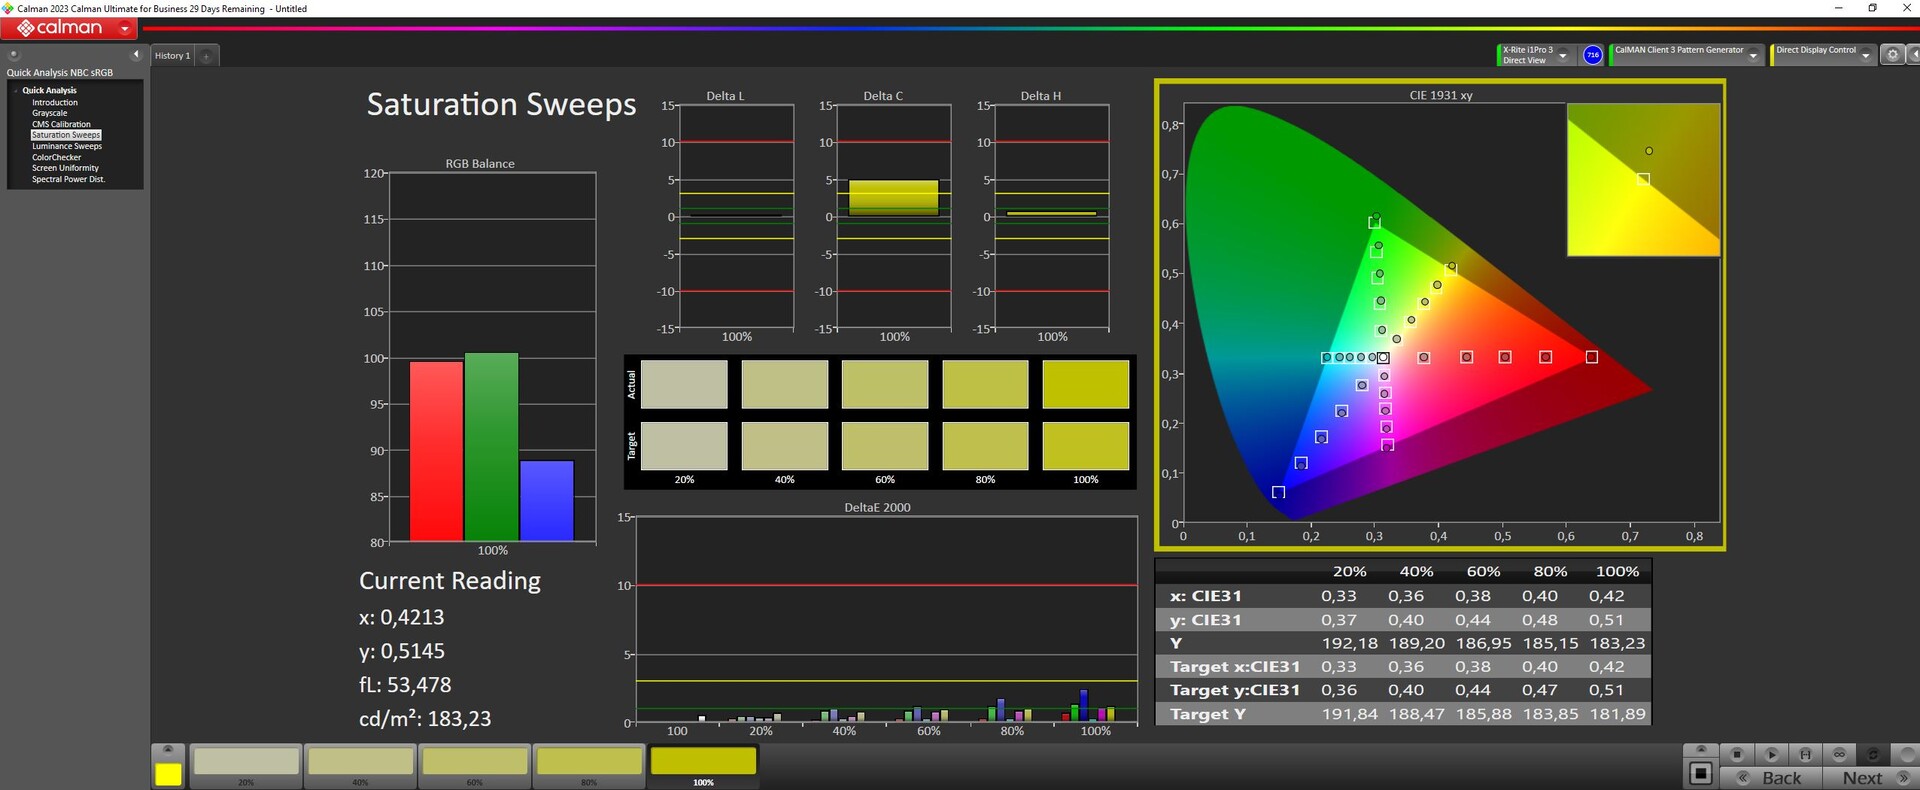
Utilizando nuestro dispositivo de medición del color Xrite y el software Calman, pudimos mejorar masivamente la buena (pero no del todo óptima) representación del color de la pantalla nada más sacarla de la caja, lo que hizo que los valores DeltaE (desviaciones de la norma) del color y de la escala de grises se hundieran hasta 1. Esto significa que la pantalla es adecuada para editar fotos, al menos en el espacio de color sRGB.

Tiempos de respuesta del display
| ↔ Tiempo de respuesta de Negro a Blanco | ||
|---|---|---|
| 6.6 ms ... subida ↗ y bajada ↘ combinada | ↗ 2.5 ms subida | 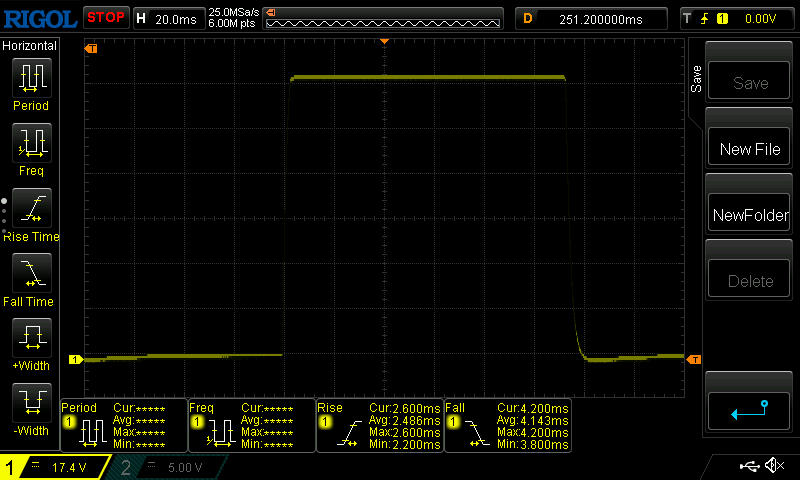 |
| ↘ 4.1 ms bajada | ||
| La pantalla mostró tiempos de respuesta muy rápidos en nuestros tests y debería ser adecuada para juegos frenéticos. En comparación, todos los dispositivos de prueba van de ##min### (mínimo) a 240 (máximo) ms. » 20 % de todos los dispositivos son mejores. Esto quiere decir que el tiempo de respuesta medido es mejor que la media (19.9 ms) de todos los dispositivos testados. | ||
| ↔ Tiempo de respuesta 50% Gris a 80% Gris | ||
| 13.2 ms ... subida ↗ y bajada ↘ combinada | ↗ 6.1 ms subida | 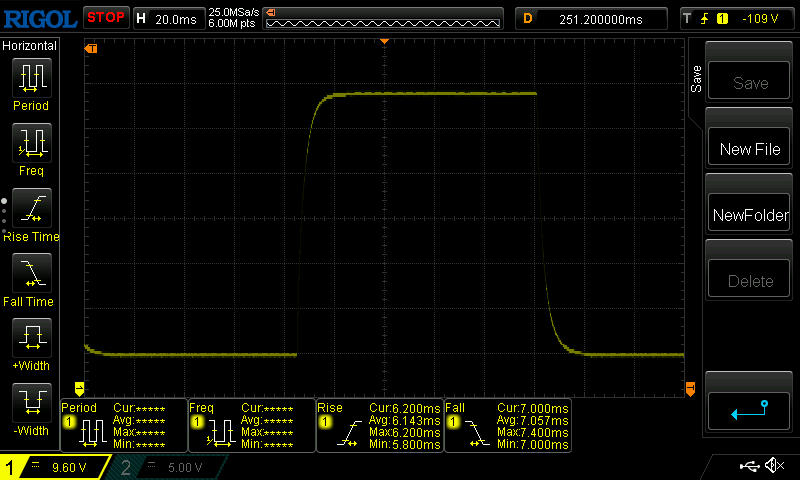 |
| ↘ 7.1 ms bajada | ||
| La pantalla mostró buenos tiempos de respuesta en nuestros tests pero podría ser demasiado lenta para los jugones competitivos. En comparación, todos los dispositivos de prueba van de ##min### (mínimo) a 636 (máximo) ms. » 27 % de todos los dispositivos son mejores. Esto quiere decir que el tiempo de respuesta medido es mejor que la media (31.1 ms) de todos los dispositivos testados. | ||
Parpadeo de Pantalla / PWM (Pulse-Width Modulation)
| Parpadeo de Pantalla / PWM no detectado |  | ||
Comparación: 52 % de todos los dispositivos testados no usaron PWM para atenuar el display. Si se usó, medimos una media de 7798 (mínimo: 5 - máxmo: 343500) Hz. | |||
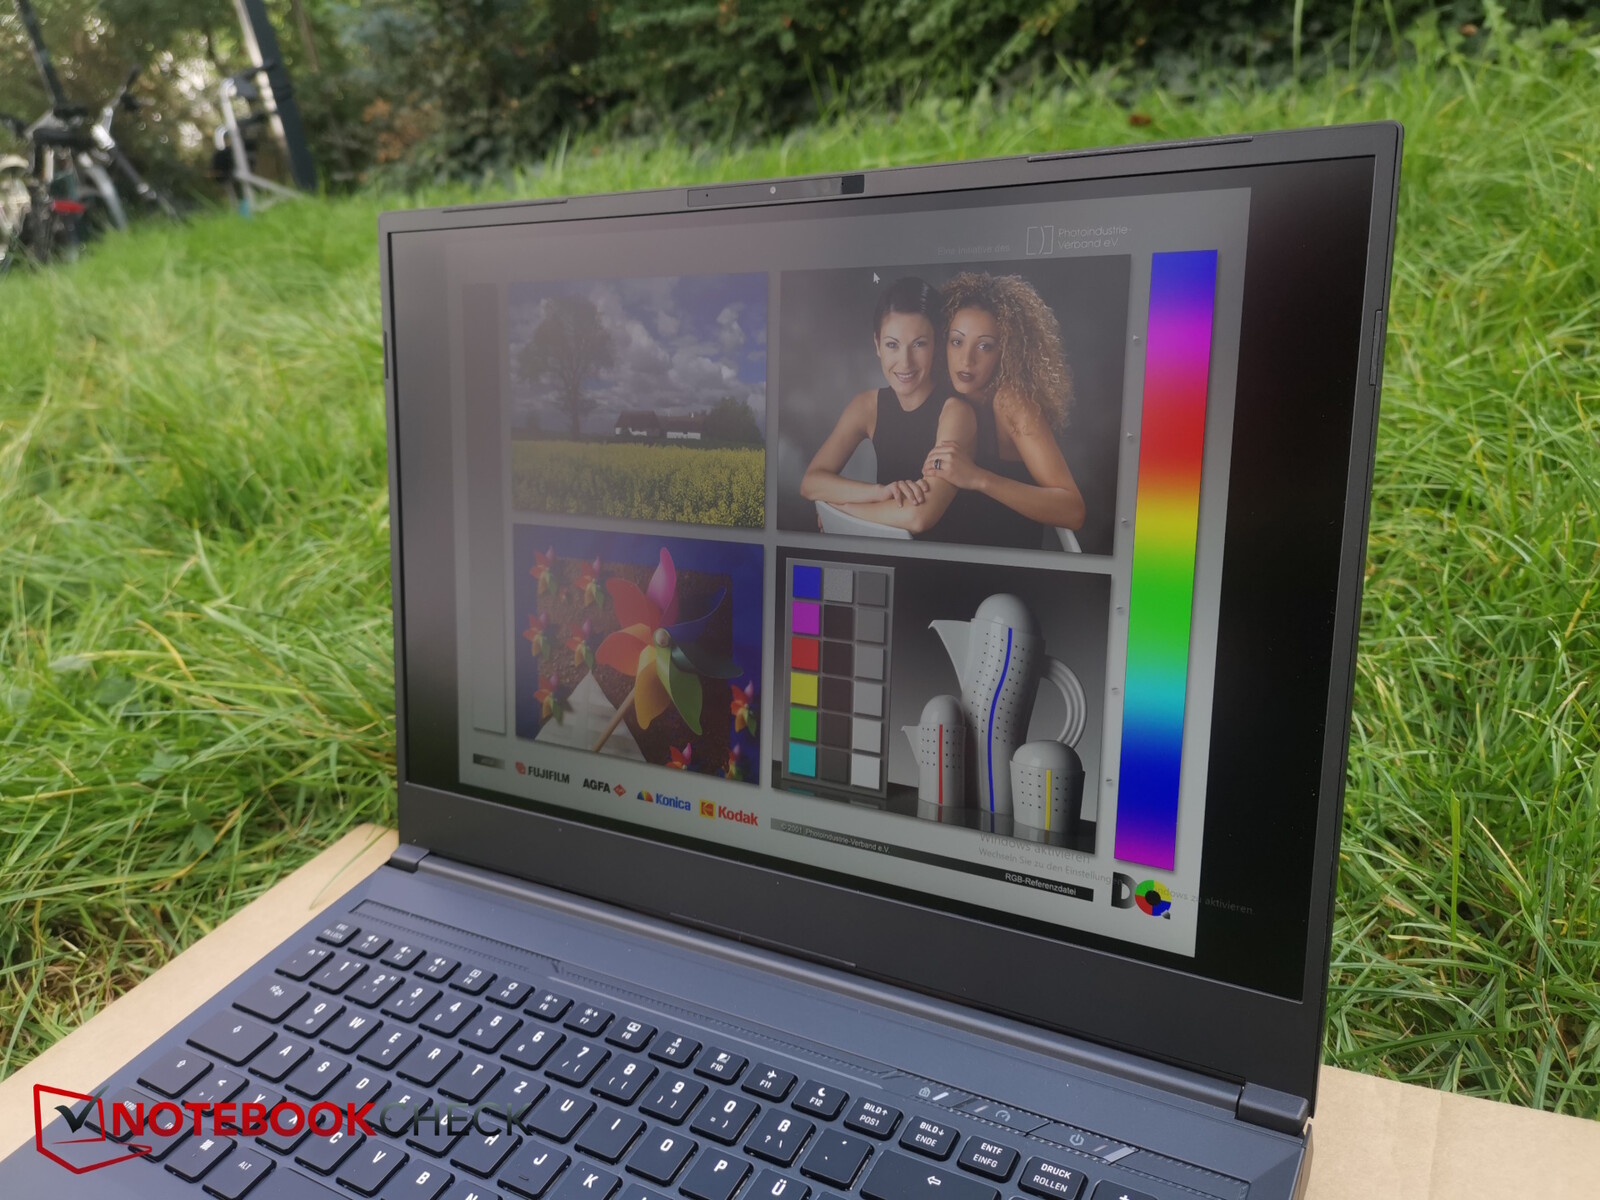
En el exterior, se puede leer bien en la pantalla en zonas sombreadas cuando se está directamente frente a ella.

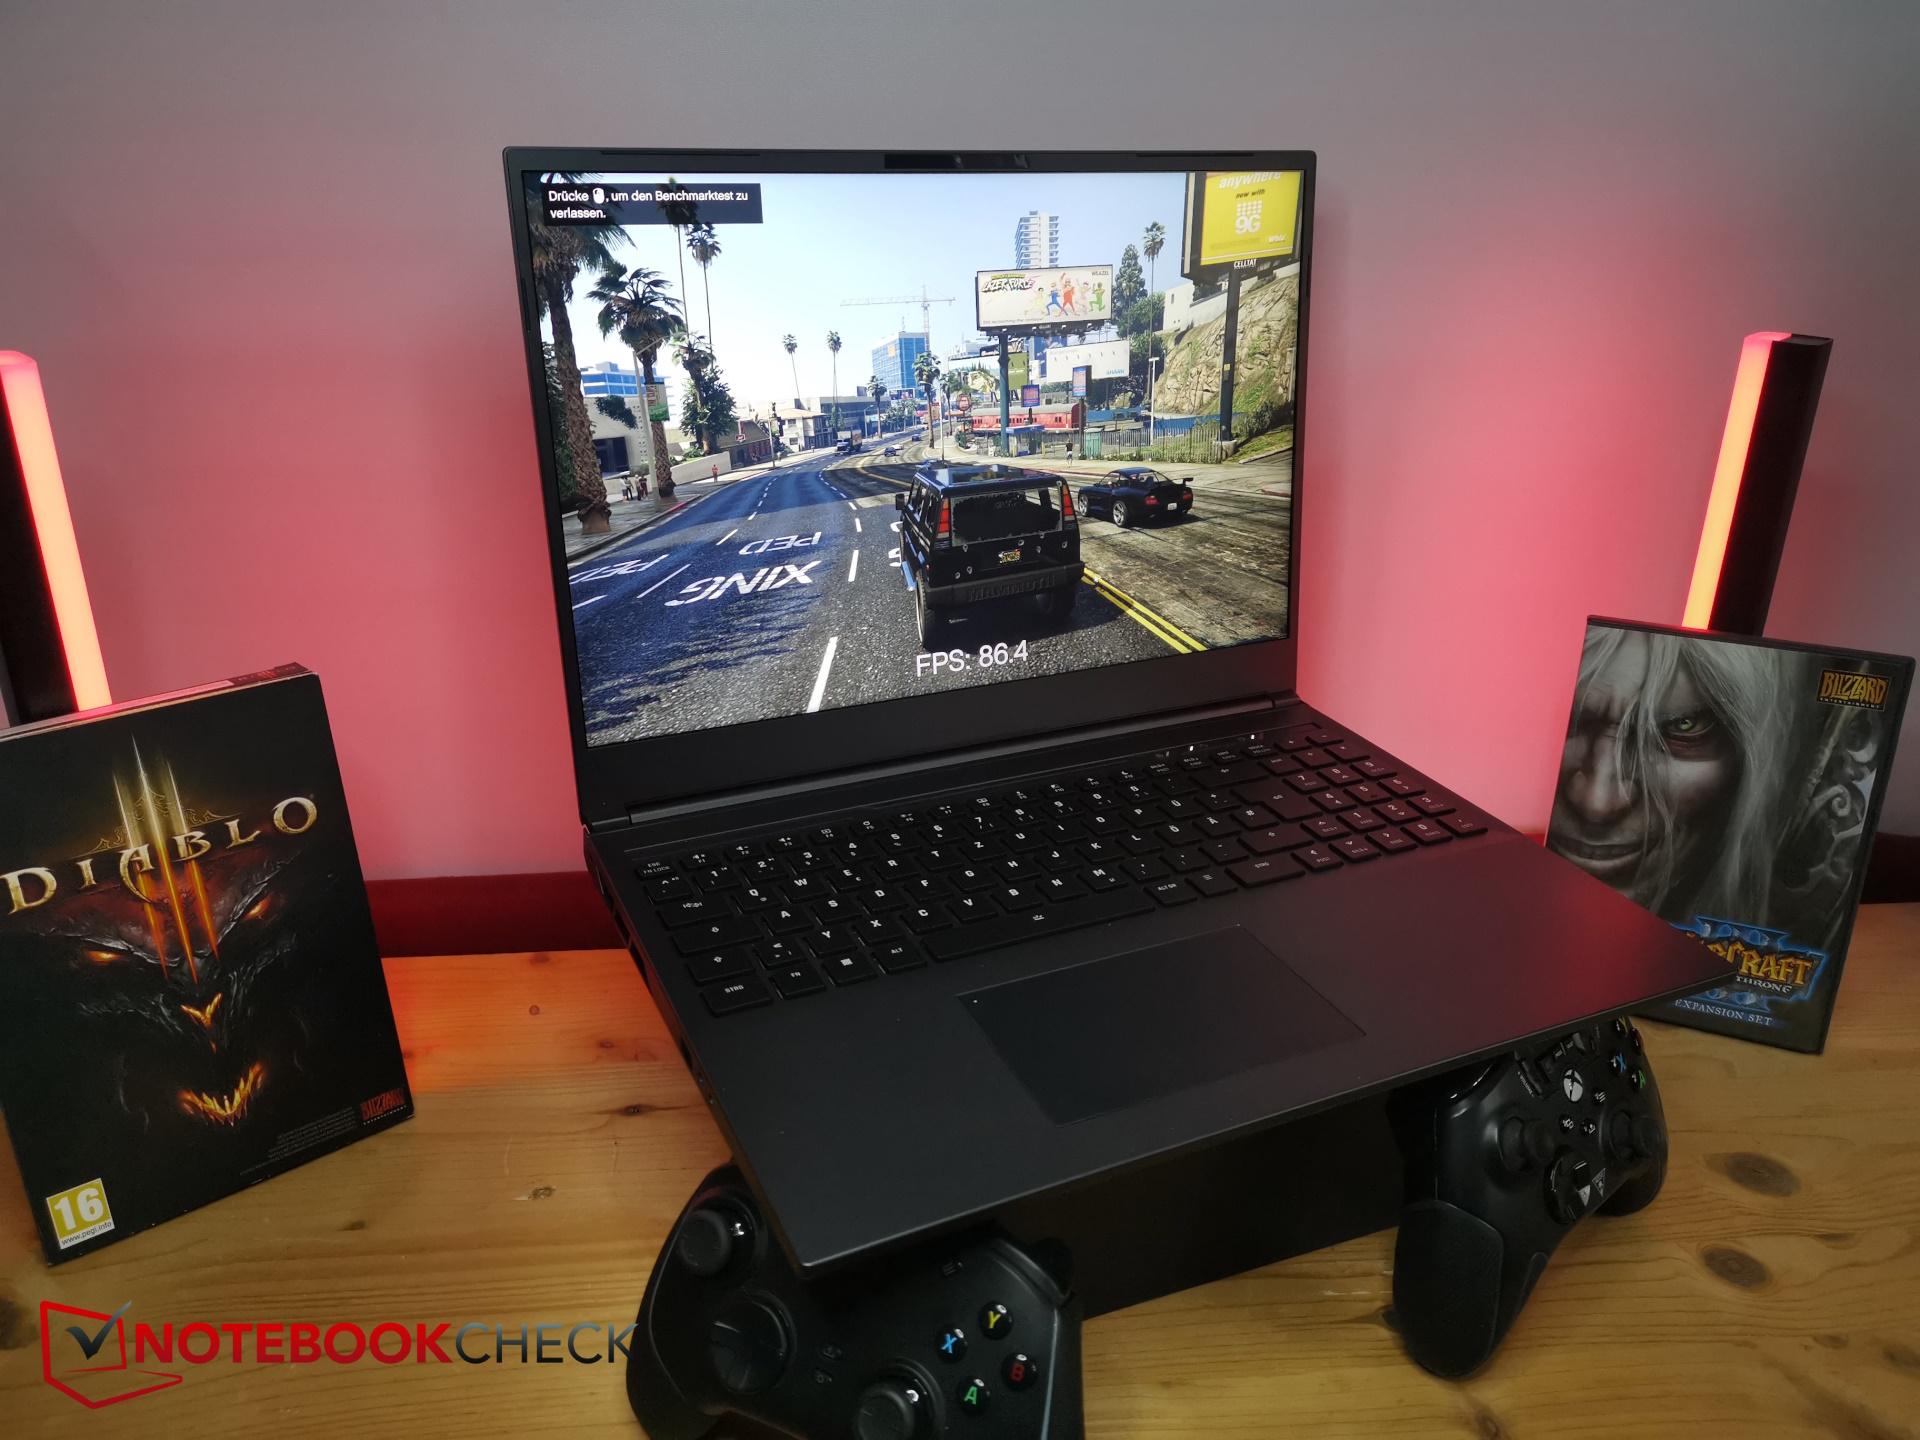
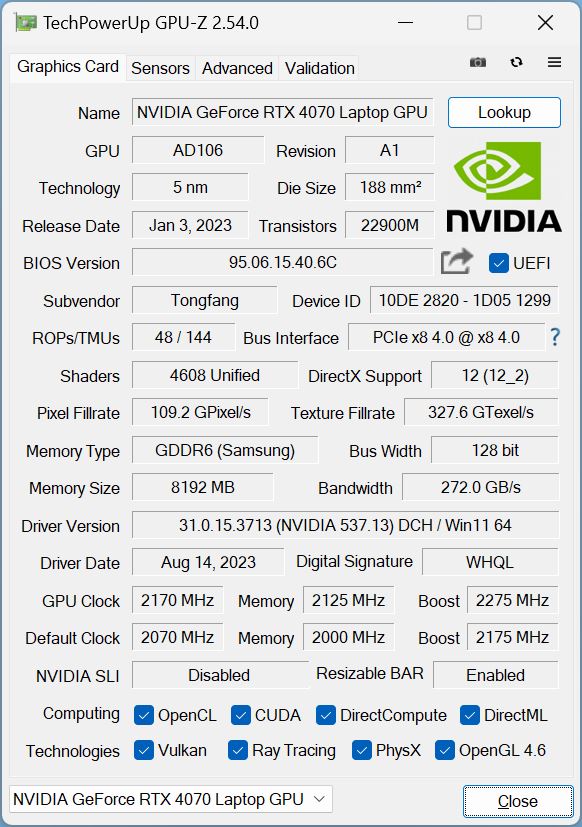
Rendimiento - Potente RTX 4070 con Ryzen 7
LaRTX 4070es lo que convierte al Core 16 en un portátil para juegos. El dispositivo también podría interesar a profesionales y creativos - sin embargo, el espacio de color sRGB podría no ser suficiente para estas personas y DisplayP3 no está cubierto.
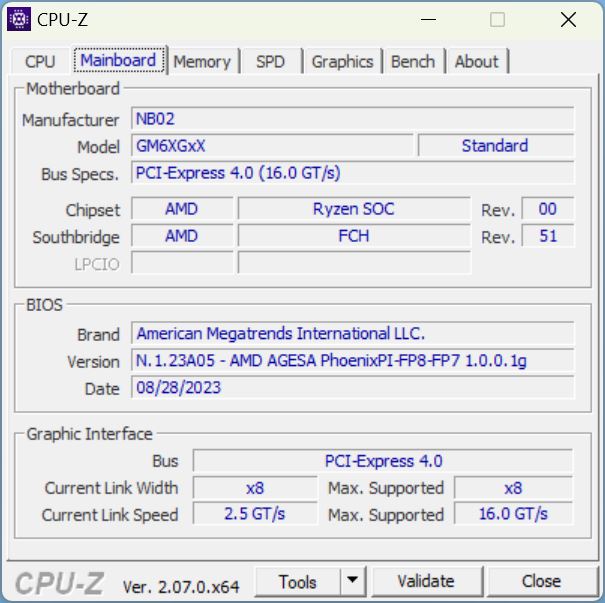
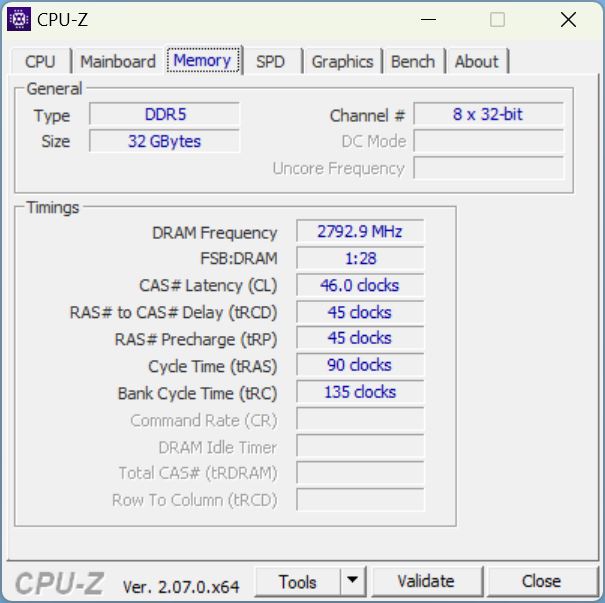
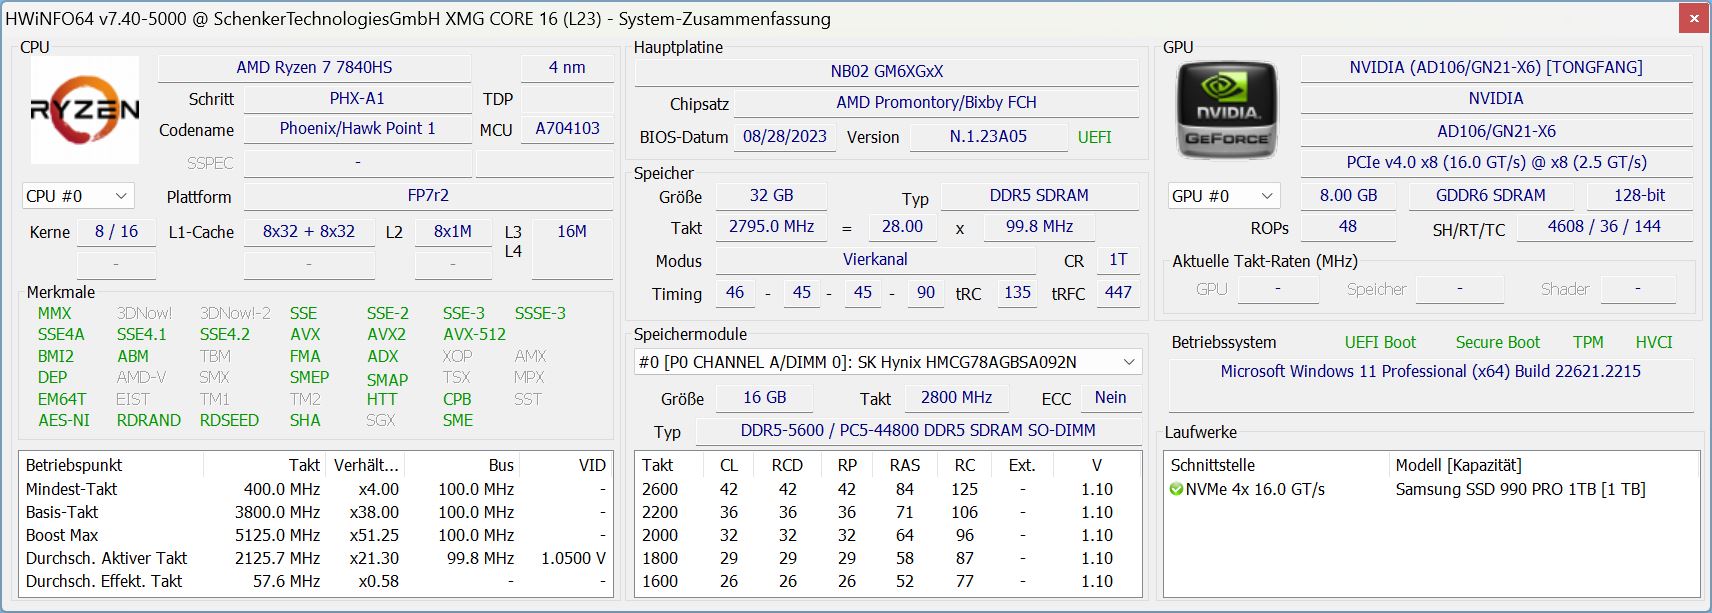
En comparación con la combinación más habitual con una CPU Intel, este dispositivo tiene un AMD Ryzen 7 7840HSinstalada. La CPU de gama alta, junto con sus 32 GB de RAM y la tarjeta gráfica, hacen que el dispositivo sea más bien un portátil de gama alta para juegos. Casi todos los juegos actuales se pueden jugar sin problemas en su resolución nativa de 1.600p y con el máximo detalle.
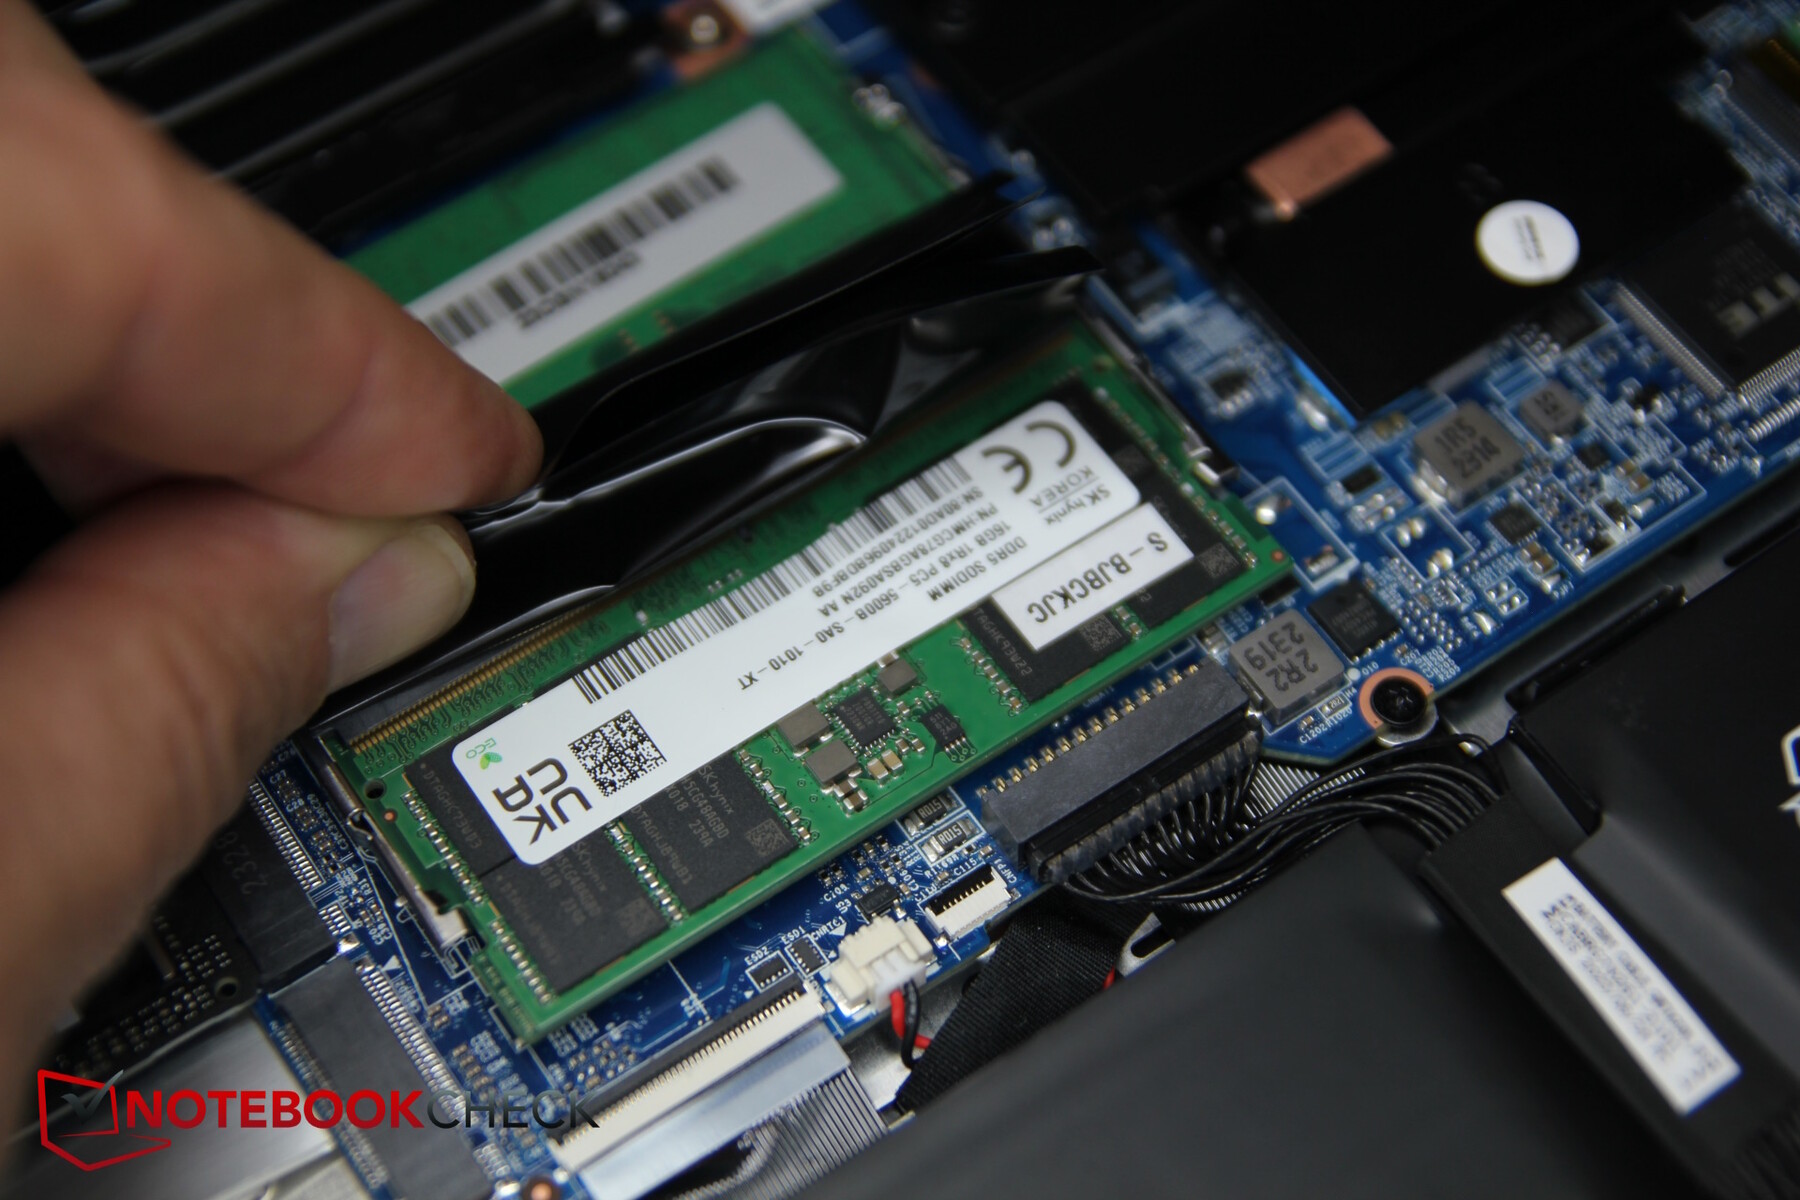
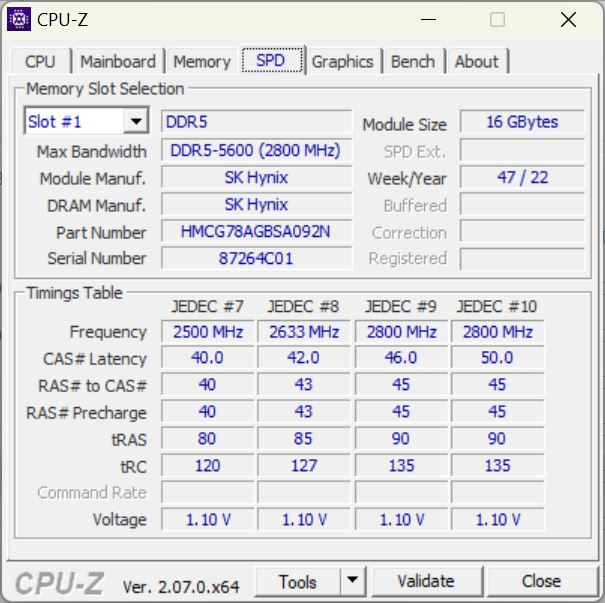
En bestware.com, el sitio web de pedidos de Schenker, puede configurar el portátil ampliamente, elegir entre varios fabricantes de SSD y RAM, y mucho más. Debe tener esto en cuenta, ya que nuestra prueba sólo tiene en cuenta nuestra configuración específica.
Condiciones de prueba
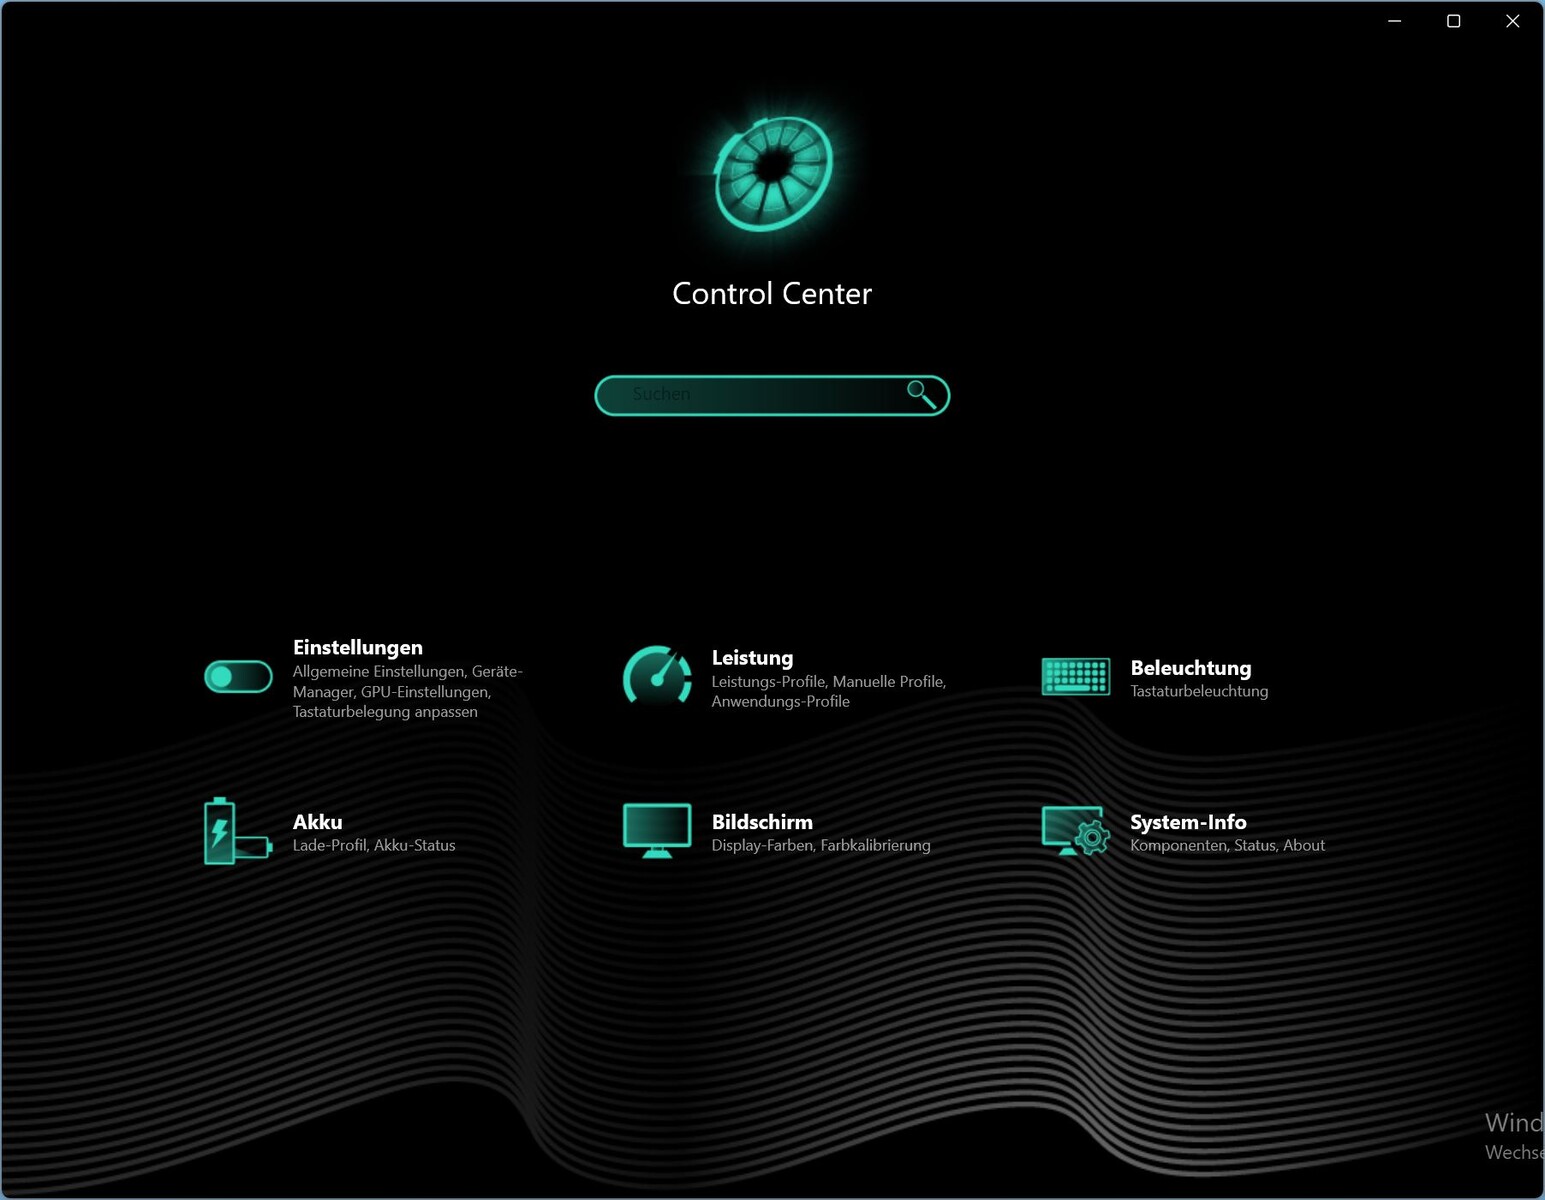
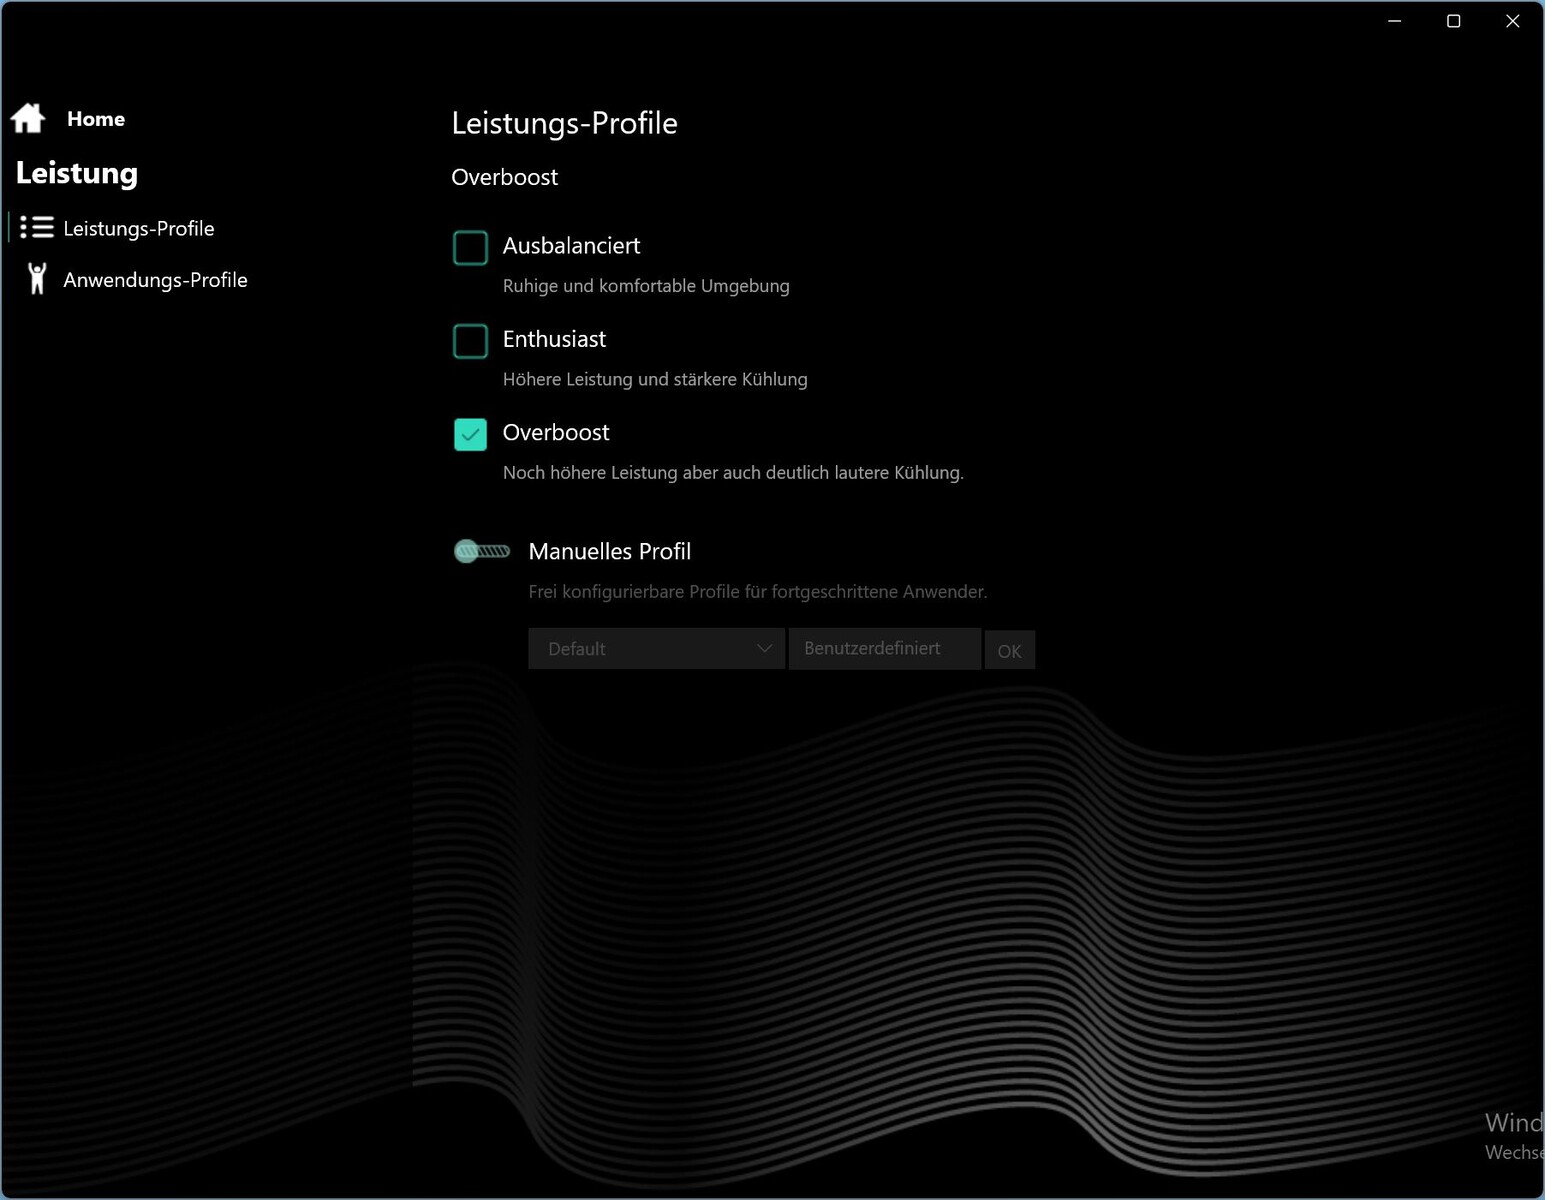
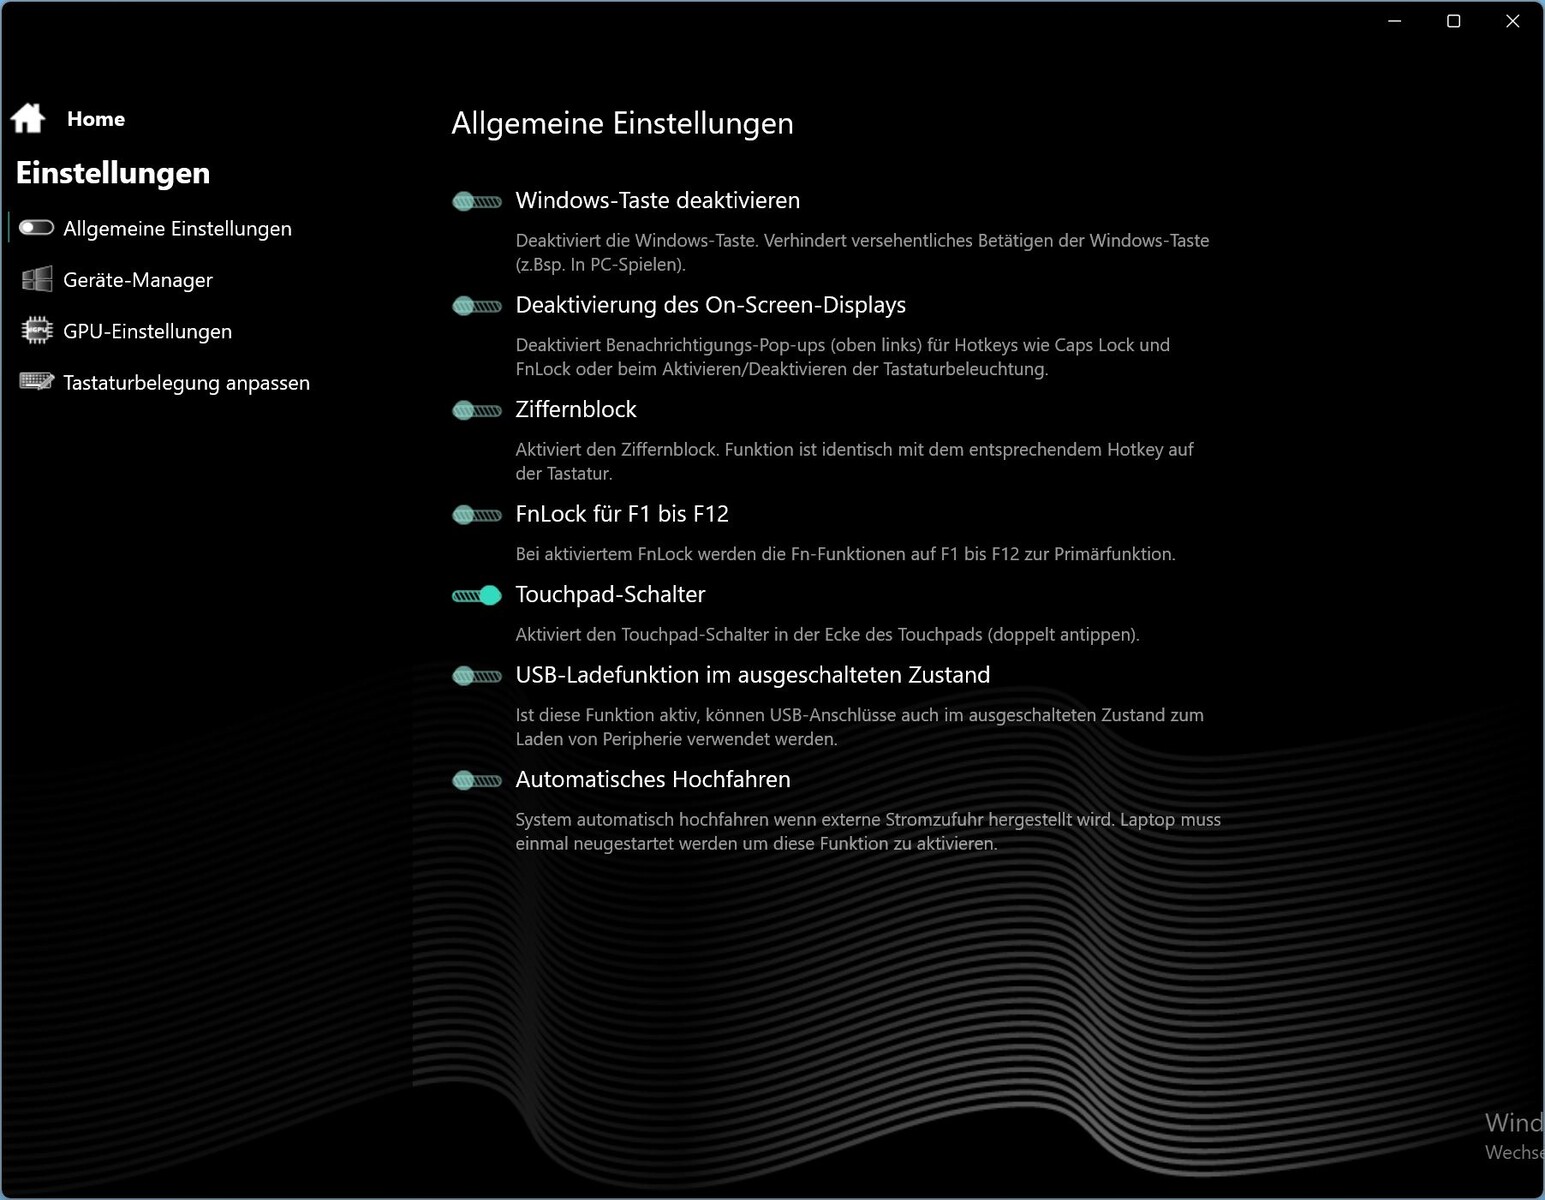
El Centro de control de los dispositivos Schenker le permite establecer preajustes de rendimiento, así como configurar manualmente parámetros de rendimiento individuales. Esto significa que puede cambiar el comportamiento del portátil para juegos para adaptarlo a sus necesidades individuales. Lo mismo puede decirse de otros ajustes, como la iluminación del teclado, el comportamiento de carga y la pantalla.
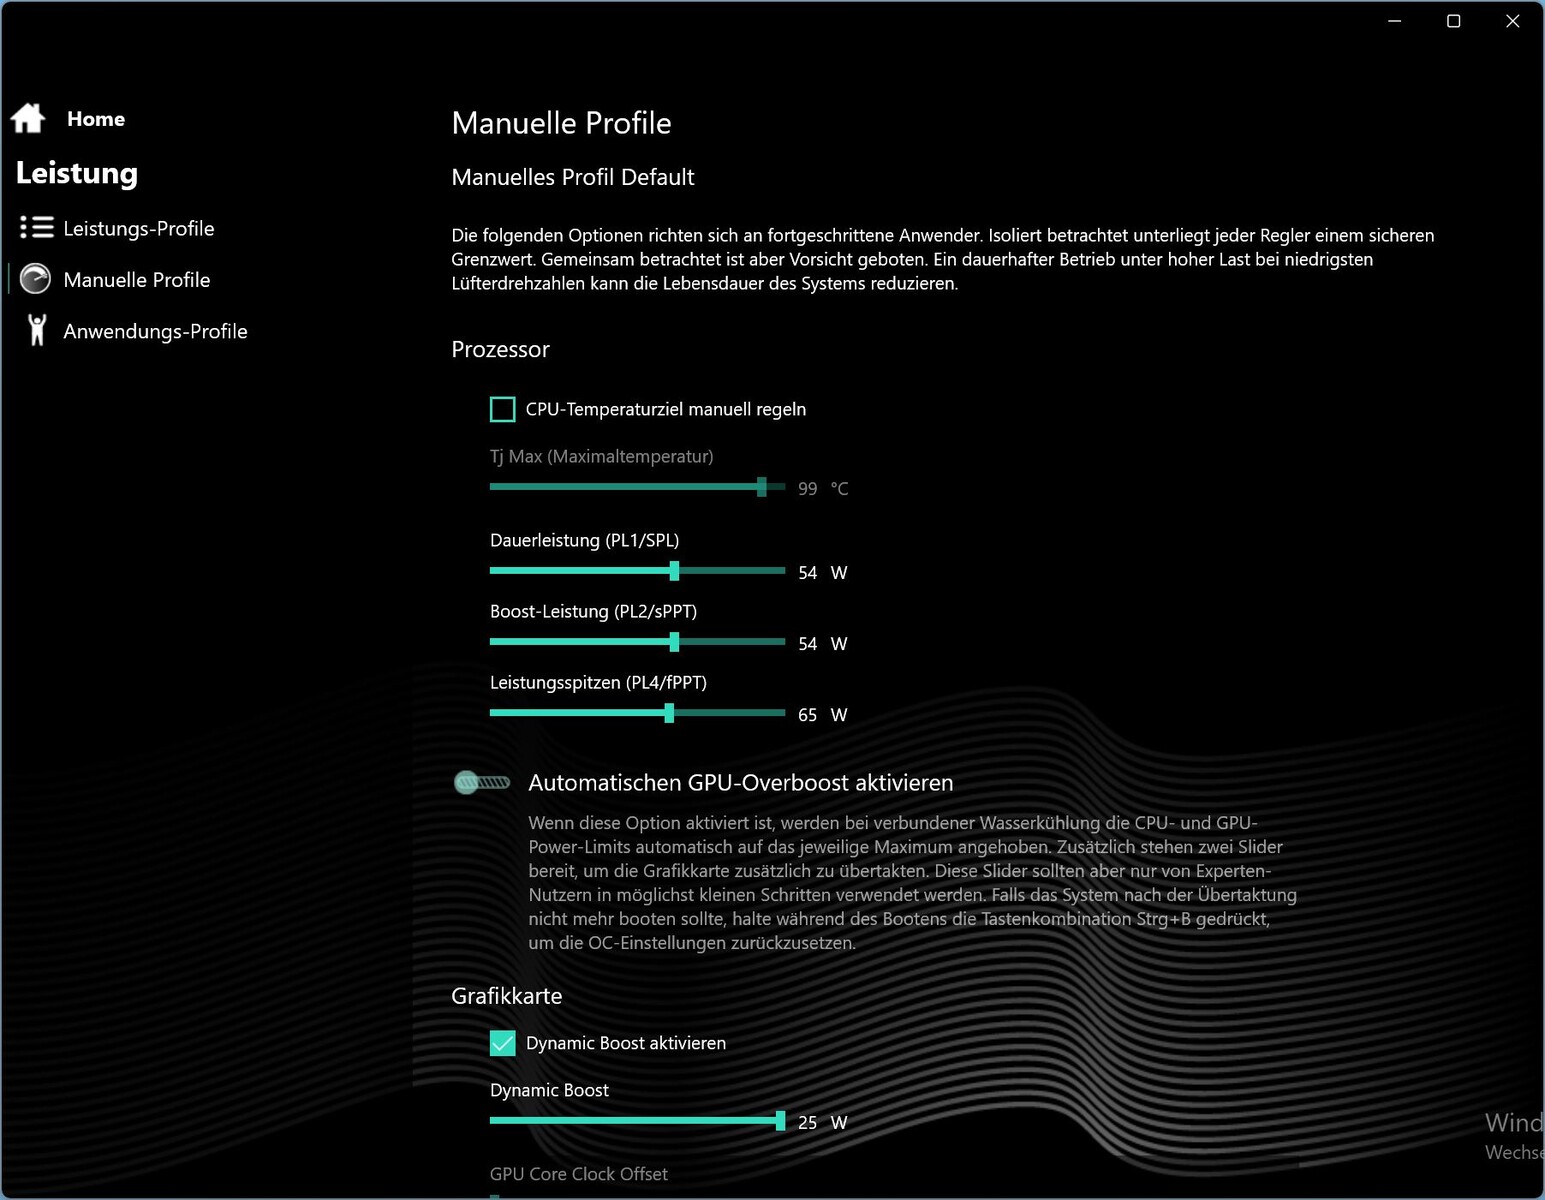
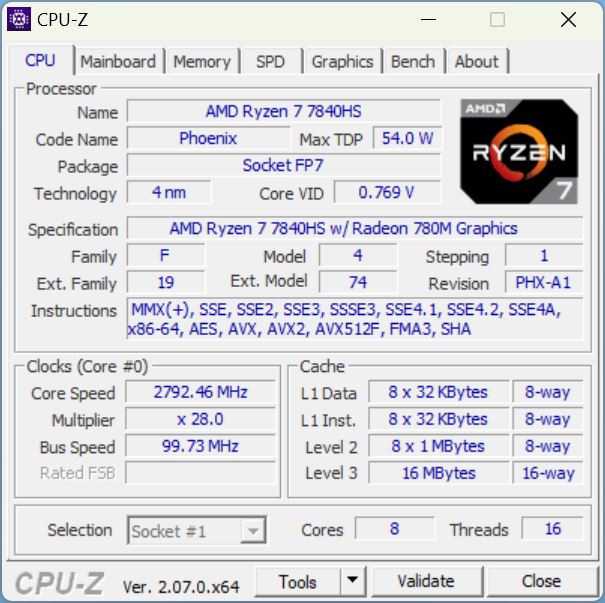
Procesador
El Ryzen 7 7840HS de AMDcuenta con 8 núcleos Zen 4 y, gracias al SMT, se suman 16 hilos. Los núcleos van desde los 3,8 GHz (reloj base) hasta los 5,1 GHz (boost mononúcleo). Esto la convierte en la segunda CPU más rápida de la serie Pheonix, por detrás delRyzen 9 7940HS.

En comparación, su rendimiento está a un nivel similar al delCore i7-13700H. El HPVictus 16es más lento con esta CPU y elMSI Stealth 16 Studiocon la misma CPU es más rápido. Los procesadores HX de Intel, especialmente el mucho más caroi9-13900HXtoman claramente la delantera.
Durante la prueba continua Cinebench R15, no notamos ninguna pérdida de rendimiento - se mantuvo constantemente alto incluso después de las primeras ejecuciones. Con ello, la CPU alcanzó un TDP constante de 80 vatios.
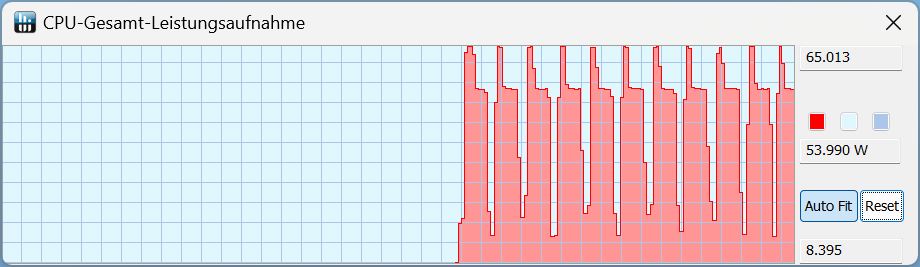
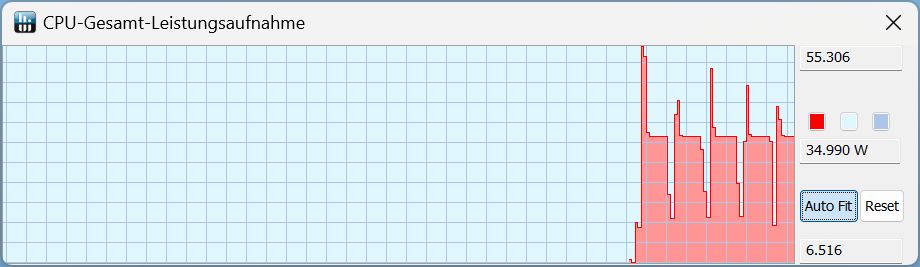
En el modo Enthusiast, las ejecuciones se iniciaron a 65 vatios y luego descendieron a 55 vatios. En el modo Equilibrado, sólo se mantuvo entre 50 y 55 vatios durante un breve periodo de tiempo, y luego bajó a 35 vatios.
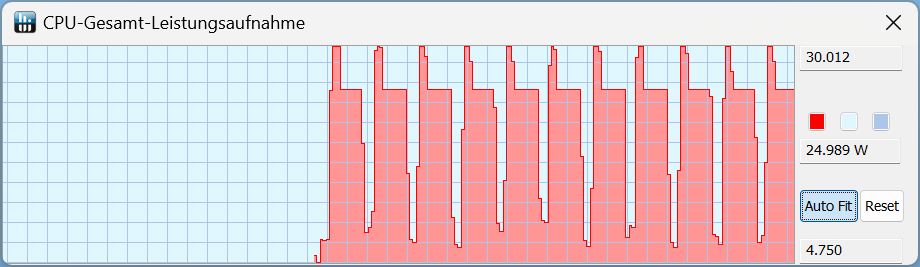
En modo batería, medimos 30 vatios durante un breve espacio de tiempo al principio, luego 25 vatios. Su puntuación Cinebench R15 se hundió de 2.681 a 1.730, un descenso del 35%.
Cinebench R15 Multi continuous test
Cinebench R23: Multi Core | Single Core
Cinebench R20: CPU (Multi Core) | CPU (Single Core)
Cinebench R15: CPU Multi 64Bit | CPU Single 64Bit
Blender: v2.79 BMW27 CPU
7-Zip 18.03: 7z b 4 | 7z b 4 -mmt1
Geekbench 5.5: Multi-Core | Single-Core
HWBOT x265 Benchmark v2.2: 4k Preset
LibreOffice : 20 Documents To PDF
R Benchmark 2.5: Overall mean
| CPU Performance rating | |
| HP Omen Transcend 16 | |
| Media de la clase Gaming | |
| Lenovo Legion Pro 5 16ARX8 | |
| MSI Stealth 16 Studio A13VG | |
| Medio AMD Ryzen 7 7840HS | |
| Schenker XMG CORE 16 (L23) | |
| HP Victus 16-r0077ng | |
| Acer Nitro 16 AN16-41 | |
| Cinebench R23 / Multi Core | |
| HP Omen Transcend 16 | |
| Media de la clase Gaming (10488 - 40970, n=112, últimos 2 años) | |
| MSI Stealth 16 Studio A13VG | |
| Lenovo Legion Pro 5 16ARX8 | |
| Schenker XMG CORE 16 (L23) | |
| Medio AMD Ryzen 7 7840HS (14784 - 17214, n=19) | |
| HP Victus 16-r0077ng | |
| Acer Nitro 16 AN16-41 | |
| Cinebench R23 / Single Core | |
| HP Omen Transcend 16 | |
| Media de la clase Gaming (1166 - 2356, n=112, últimos 2 años) | |
| MSI Stealth 16 Studio A13VG | |
| Lenovo Legion Pro 5 16ARX8 | |
| Medio AMD Ryzen 7 7840HS (1718 - 1812, n=19) | |
| Schenker XMG CORE 16 (L23) | |
| HP Victus 16-r0077ng | |
| Acer Nitro 16 AN16-41 | |
| Cinebench R20 / CPU (Multi Core) | |
| Media de la clase Gaming (4029 - 16108, n=111, últimos 2 años) | |
| HP Omen Transcend 16 | |
| MSI Stealth 16 Studio A13VG | |
| Lenovo Legion Pro 5 16ARX8 | |
| Schenker XMG CORE 16 (L23) | |
| Medio AMD Ryzen 7 7840HS (5761 - 6744, n=19) | |
| HP Victus 16-r0077ng | |
| Acer Nitro 16 AN16-41 | |
| Cinebench R20 / CPU (Single Core) | |
| HP Omen Transcend 16 | |
| Media de la clase Gaming (442 - 895, n=111, últimos 2 años) | |
| MSI Stealth 16 Studio A13VG | |
| Lenovo Legion Pro 5 16ARX8 | |
| Schenker XMG CORE 16 (L23) | |
| Medio AMD Ryzen 7 7840HS (661 - 705, n=19) | |
| HP Victus 16-r0077ng | |
| Acer Nitro 16 AN16-41 | |
| Cinebench R15 / CPU Multi 64Bit | |
| HP Omen Transcend 16 | |
| Media de la clase Gaming (1578 - 6271, n=111, últimos 2 años) | |
| Lenovo Legion Pro 5 16ARX8 | |
| MSI Stealth 16 Studio A13VG | |
| Schenker XMG CORE 16 (L23) | |
| Medio AMD Ryzen 7 7840HS (2300 - 2729, n=19) | |
| Acer Nitro 16 AN16-41 | |
| HP Victus 16-r0077ng | |
| Cinebench R15 / CPU Single 64Bit | |
| HP Omen Transcend 16 | |
| Media de la clase Gaming (188.8 - 343, n=111, últimos 2 años) | |
| Lenovo Legion Pro 5 16ARX8 | |
| Medio AMD Ryzen 7 7840HS (270 - 286, n=19) | |
| MSI Stealth 16 Studio A13VG | |
| Schenker XMG CORE 16 (L23) | |
| Acer Nitro 16 AN16-41 | |
| HP Victus 16-r0077ng | |
| Blender / v2.79 BMW27 CPU | |
| Acer Nitro 16 AN16-41 | |
| HP Victus 16-r0077ng | |
| Medio AMD Ryzen 7 7840HS (185 - 231, n=20) | |
| Schenker XMG CORE 16 (L23) | |
| Lenovo Legion Pro 5 16ARX8 | |
| MSI Stealth 16 Studio A13VG | |
| Media de la clase Gaming (80 - 330, n=109, últimos 2 años) | |
| HP Omen Transcend 16 | |
| 7-Zip 18.03 / 7z b 4 | |
| HP Omen Transcend 16 | |
| Media de la clase Gaming (33491 - 148086, n=110, últimos 2 años) | |
| MSI Stealth 16 Studio A13VG | |
| Lenovo Legion Pro 5 16ARX8 | |
| Schenker XMG CORE 16 (L23) | |
| Medio AMD Ryzen 7 7840HS (59538 - 73035, n=20) | |
| HP Victus 16-r0077ng | |
| Acer Nitro 16 AN16-41 | |
| 7-Zip 18.03 / 7z b 4 -mmt1 | |
| Lenovo Legion Pro 5 16ARX8 | |
| HP Omen Transcend 16 | |
| Schenker XMG CORE 16 (L23) | |
| Medio AMD Ryzen 7 7840HS (6049 - 6754, n=20) | |
| Media de la clase Gaming (4199 - 7436, n=110, últimos 2 años) | |
| MSI Stealth 16 Studio A13VG | |
| Acer Nitro 16 AN16-41 | |
| HP Victus 16-r0077ng | |
| Geekbench 5.5 / Multi-Core | |
| HP Omen Transcend 16 | |
| Media de la clase Gaming (6460 - 27010, n=110, últimos 2 años) | |
| MSI Stealth 16 Studio A13VG | |
| Lenovo Legion Pro 5 16ARX8 | |
| Schenker XMG CORE 16 (L23) | |
| Medio AMD Ryzen 7 7840HS (8446 - 12339, n=23) | |
| HP Victus 16-r0077ng | |
| Acer Nitro 16 AN16-41 | |
| Geekbench 5.5 / Single-Core | |
| HP Omen Transcend 16 | |
| Media de la clase Gaming (986 - 2474, n=110, últimos 2 años) | |
| Lenovo Legion Pro 5 16ARX8 | |
| Medio AMD Ryzen 7 7840HS (1837 - 2017, n=23) | |
| Schenker XMG CORE 16 (L23) | |
| MSI Stealth 16 Studio A13VG | |
| HP Victus 16-r0077ng | |
| Acer Nitro 16 AN16-41 | |
| HWBOT x265 Benchmark v2.2 / 4k Preset | |
| Media de la clase Gaming (11.5 - 44.3, n=110, últimos 2 años) | |
| HP Omen Transcend 16 | |
| Lenovo Legion Pro 5 16ARX8 | |
| Schenker XMG CORE 16 (L23) | |
| Medio AMD Ryzen 7 7840HS (11.7 - 21.8, n=20) | |
| MSI Stealth 16 Studio A13VG | |
| Acer Nitro 16 AN16-41 | |
| HP Victus 16-r0077ng | |
| LibreOffice / 20 Documents To PDF | |
| Schenker XMG CORE 16 (L23) | |
| HP Victus 16-r0077ng | |
| MSI Stealth 16 Studio A13VG | |
| Acer Nitro 16 AN16-41 | |
| Media de la clase Gaming (19 - 88.8, n=110, últimos 2 años) | |
| Medio AMD Ryzen 7 7840HS (38.3 - 68.3, n=20) | |
| HP Omen Transcend 16 | |
| Lenovo Legion Pro 5 16ARX8 | |
| R Benchmark 2.5 / Overall mean | |
| HP Victus 16-r0077ng | |
| Acer Nitro 16 AN16-41 | |
| MSI Stealth 16 Studio A13VG | |
| Medio AMD Ryzen 7 7840HS (0.4184 - 0.4739, n=20) | |
| Schenker XMG CORE 16 (L23) | |
| Media de la clase Gaming (0.3439 - 0.759, n=111, últimos 2 años) | |
| Lenovo Legion Pro 5 16ARX8 | |
| HP Omen Transcend 16 | |
* ... más pequeño es mejor
AIDA64: FP32 Ray-Trace | FPU Julia | CPU SHA3 | CPU Queen | FPU SinJulia | FPU Mandel | CPU AES | CPU ZLib | FP64 Ray-Trace | CPU PhotoWorxx
| Performance rating | |
| Media de la clase Gaming | |
| HP Omen Transcend 16 | |
| Medio AMD Ryzen 7 7840HS | |
| Lenovo Legion Pro 5 16ARX8 | |
| Schenker XMG CORE 16 (L23) | |
| MSI Stealth 16 Studio A13VG | |
| Acer Nitro 16 AN16-41 | |
| HP Victus 16-r0077ng | |
| AIDA64 / FP32 Ray-Trace | |
| Media de la clase Gaming (10227 - 85542, n=109, últimos 2 años) | |
| Lenovo Legion Pro 5 16ARX8 | |
| Schenker XMG CORE 16 (L23) | |
| Medio AMD Ryzen 7 7840HS (22845 - 28921, n=21) | |
| HP Omen Transcend 16 | |
| MSI Stealth 16 Studio A13VG | |
| Acer Nitro 16 AN16-41 | |
| HP Victus 16-r0077ng | |
| AIDA64 / FPU Julia | |
| Media de la clase Gaming (51376 - 238426, n=109, últimos 2 años) | |
| Lenovo Legion Pro 5 16ARX8 | |
| Schenker XMG CORE 16 (L23) | |
| HP Omen Transcend 16 | |
| Medio AMD Ryzen 7 7840HS (97164 - 123167, n=21) | |
| Acer Nitro 16 AN16-41 | |
| MSI Stealth 16 Studio A13VG | |
| HP Victus 16-r0077ng | |
| AIDA64 / CPU SHA3 | |
| Media de la clase Gaming (2180 - 9817, n=109, últimos 2 años) | |
| HP Omen Transcend 16 | |
| Lenovo Legion Pro 5 16ARX8 | |
| Schenker XMG CORE 16 (L23) | |
| Medio AMD Ryzen 7 7840HS (4293 - 5155, n=21) | |
| MSI Stealth 16 Studio A13VG | |
| Acer Nitro 16 AN16-41 | |
| HP Victus 16-r0077ng | |
| AIDA64 / CPU Queen | |
| Lenovo Legion Pro 5 16ARX8 | |
| HP Omen Transcend 16 | |
| Media de la clase Gaming (49785 - 173351, n=100, últimos 2 años) | |
| Medio AMD Ryzen 7 7840HS (102271 - 125820, n=21) | |
| Acer Nitro 16 AN16-41 | |
| MSI Stealth 16 Studio A13VG | |
| Schenker XMG CORE 16 (L23) | |
| HP Victus 16-r0077ng | |
| AIDA64 / FPU SinJulia | |
| Lenovo Legion Pro 5 16ARX8 | |
| Schenker XMG CORE 16 (L23) | |
| Medio AMD Ryzen 7 7840HS (13767 - 15525, n=21) | |
| Media de la clase Gaming (4424 - 33636, n=109, últimos 2 años) | |
| HP Omen Transcend 16 | |
| Acer Nitro 16 AN16-41 | |
| MSI Stealth 16 Studio A13VG | |
| HP Victus 16-r0077ng | |
| AIDA64 / FPU Mandel | |
| Media de la clase Gaming (25115 - 128721, n=109, últimos 2 años) | |
| Lenovo Legion Pro 5 16ARX8 | |
| Schenker XMG CORE 16 (L23) | |
| Medio AMD Ryzen 7 7840HS (52084 - 65812, n=21) | |
| HP Omen Transcend 16 | |
| Acer Nitro 16 AN16-41 | |
| MSI Stealth 16 Studio A13VG | |
| HP Victus 16-r0077ng | |
| AIDA64 / CPU AES | |
| Medio AMD Ryzen 7 7840HS (67389 - 177158, n=21) | |
| HP Omen Transcend 16 | |
| Media de la clase Gaming (39258 - 247074, n=109, últimos 2 años) | |
| Schenker XMG CORE 16 (L23) | |
| MSI Stealth 16 Studio A13VG | |
| Lenovo Legion Pro 5 16ARX8 | |
| HP Victus 16-r0077ng | |
| Acer Nitro 16 AN16-41 | |
| AIDA64 / CPU ZLib | |
| HP Omen Transcend 16 | |
| Media de la clase Gaming (574 - 2531, n=109, últimos 2 años) | |
| Lenovo Legion Pro 5 16ARX8 | |
| Schenker XMG CORE 16 (L23) | |
| Medio AMD Ryzen 7 7840HS (944 - 1123, n=21) | |
| MSI Stealth 16 Studio A13VG | |
| HP Victus 16-r0077ng | |
| Acer Nitro 16 AN16-41 | |
| AIDA64 / FP64 Ray-Trace | |
| Media de la clase Gaming (5509 - 45446, n=109, últimos 2 años) | |
| Lenovo Legion Pro 5 16ARX8 | |
| Schenker XMG CORE 16 (L23) | |
| Medio AMD Ryzen 7 7840HS (12248 - 15599, n=21) | |
| HP Omen Transcend 16 | |
| MSI Stealth 16 Studio A13VG | |
| Acer Nitro 16 AN16-41 | |
| HP Victus 16-r0077ng | |
| AIDA64 / CPU PhotoWorxx | |
| HP Omen Transcend 16 | |
| MSI Stealth 16 Studio A13VG | |
| Media de la clase Gaming (12271 - 89891, n=109, últimos 2 años) | |
| Schenker XMG CORE 16 (L23) | |
| HP Victus 16-r0077ng | |
| Medio AMD Ryzen 7 7840HS (17615 - 41516, n=21) | |
| Lenovo Legion Pro 5 16ARX8 | |
| Acer Nitro 16 AN16-41 | |
Rendimiento del sistema
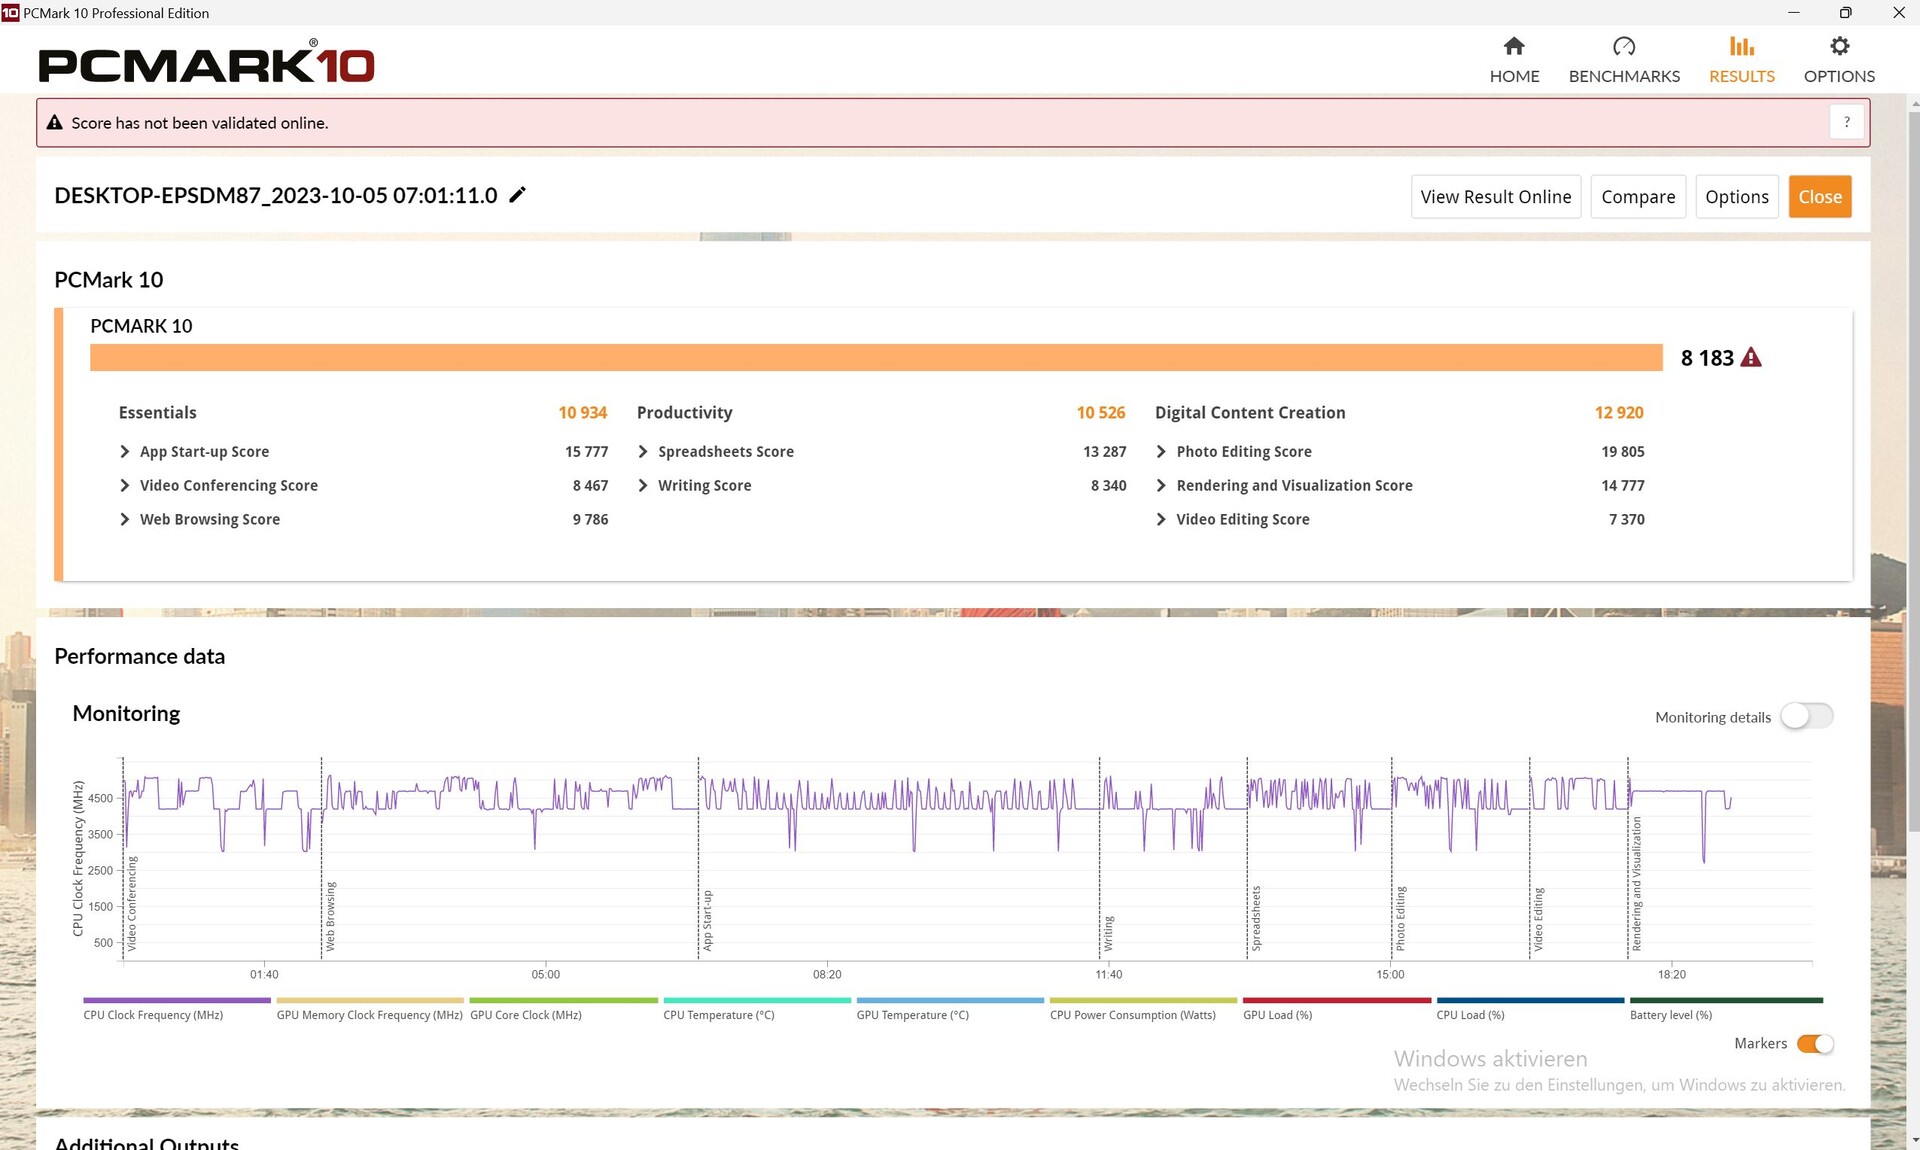
Junto con el Lenovo Legion Pro 5 16y el HP Omen Transcend 16el Core 16 quedó en cabeza en lo que se refiere al rendimiento del sistema. Subjetivamente, todo funciona también sin problemas.
CrossMark: Overall | Productivity | Creativity | Responsiveness
| PCMark 10 / Score | |
| Media de la clase Gaming (5828 - 11574, n=95, últimos 2 años) | |
| Lenovo Legion Pro 5 16ARX8 | |
| Schenker XMG CORE 16 (L23) | |
| Medio AMD Ryzen 7 7840HS, NVIDIA GeForce RTX 4070 Laptop GPU (8167 - 8183, n=2) | |
| HP Omen Transcend 16 | |
| MSI Stealth 16 Studio A13VG | |
| Acer Nitro 16 AN16-41 | |
| HP Victus 16-r0077ng | |
| PCMark 10 / Essentials | |
| HP Omen Transcend 16 | |
| Medio AMD Ryzen 7 7840HS, NVIDIA GeForce RTX 4070 Laptop GPU (10934 - 11250, n=2) | |
| Lenovo Legion Pro 5 16ARX8 | |
| Schenker XMG CORE 16 (L23) | |
| HP Victus 16-r0077ng | |
| Media de la clase Gaming (8810 - 12600, n=99, últimos 2 años) | |
| Acer Nitro 16 AN16-41 | |
| MSI Stealth 16 Studio A13VG | |
| PCMark 10 / Productivity | |
| Media de la clase Gaming (6845 - 18766, n=97, últimos 2 años) | |
| Schenker XMG CORE 16 (L23) | |
| Medio AMD Ryzen 7 7840HS, NVIDIA GeForce RTX 4070 Laptop GPU (10179 - 10526, n=2) | |
| Lenovo Legion Pro 5 16ARX8 | |
| HP Omen Transcend 16 | |
| MSI Stealth 16 Studio A13VG | |
| Acer Nitro 16 AN16-41 | |
| HP Victus 16-r0077ng | |
| PCMark 10 / Digital Content Creation | |
| Media de la clase Gaming (7602 - 19657, n=97, últimos 2 años) | |
| HP Omen Transcend 16 | |
| Lenovo Legion Pro 5 16ARX8 | |
| Schenker XMG CORE 16 (L23) | |
| Medio AMD Ryzen 7 7840HS, NVIDIA GeForce RTX 4070 Laptop GPU (12908 - 12920, n=2) | |
| MSI Stealth 16 Studio A13VG | |
| Acer Nitro 16 AN16-41 | |
| HP Victus 16-r0077ng | |
| CrossMark / Overall | |
| Lenovo Legion Pro 5 16ARX8 | |
| Media de la clase Gaming (1366 - 2409, n=97, últimos 2 años) | |
| HP Omen Transcend 16 | |
| MSI Stealth 16 Studio A13VG | |
| Schenker XMG CORE 16 (L23) | |
| Medio AMD Ryzen 7 7840HS, NVIDIA GeForce RTX 4070 Laptop GPU (n=1) | |
| Acer Nitro 16 AN16-41 | |
| CrossMark / Productivity | |
| Lenovo Legion Pro 5 16ARX8 | |
| Media de la clase Gaming (1386 - 2254, n=97, últimos 2 años) | |
| HP Omen Transcend 16 | |
| MSI Stealth 16 Studio A13VG | |
| Schenker XMG CORE 16 (L23) | |
| Medio AMD Ryzen 7 7840HS, NVIDIA GeForce RTX 4070 Laptop GPU (n=1) | |
| Acer Nitro 16 AN16-41 | |
| CrossMark / Creativity | |
| HP Omen Transcend 16 | |
| Media de la clase Gaming (1343 - 2729, n=97, últimos 2 años) | |
| Lenovo Legion Pro 5 16ARX8 | |
| MSI Stealth 16 Studio A13VG | |
| Schenker XMG CORE 16 (L23) | |
| Medio AMD Ryzen 7 7840HS, NVIDIA GeForce RTX 4070 Laptop GPU (n=1) | |
| Acer Nitro 16 AN16-41 | |
| CrossMark / Responsiveness | |
| Lenovo Legion Pro 5 16ARX8 | |
| Media de la clase Gaming (1226 - 2334, n=97, últimos 2 años) | |
| MSI Stealth 16 Studio A13VG | |
| HP Omen Transcend 16 | |
| Schenker XMG CORE 16 (L23) | |
| Medio AMD Ryzen 7 7840HS, NVIDIA GeForce RTX 4070 Laptop GPU (n=1) | |
| Acer Nitro 16 AN16-41 | |
| PCMark 10 Score | 8183 puntos | |
ayuda | ||
| AIDA64 / Memory Copy | |
| HP Omen Transcend 16 | |
| Media de la clase Gaming (21750 - 129946, n=109, últimos 2 años) | |
| MSI Stealth 16 Studio A13VG | |
| Schenker XMG CORE 16 (L23) | |
| Medio AMD Ryzen 7 7840HS (30937 - 72158, n=21) | |
| HP Victus 16-r0077ng | |
| Lenovo Legion Pro 5 16ARX8 | |
| Acer Nitro 16 AN16-41 | |
| AIDA64 / Memory Read | |
| HP Omen Transcend 16 | |
| MSI Stealth 16 Studio A13VG | |
| Media de la clase Gaming (22956 - 118858, n=109, últimos 2 años) | |
| HP Victus 16-r0077ng | |
| Schenker XMG CORE 16 (L23) | |
| Medio AMD Ryzen 7 7840HS (30497 - 62147, n=21) | |
| Lenovo Legion Pro 5 16ARX8 | |
| Acer Nitro 16 AN16-41 | |
| AIDA64 / Memory Write | |
| Schenker XMG CORE 16 (L23) | |
| Medio AMD Ryzen 7 7840HS (34590 - 93323, n=21) | |
| HP Omen Transcend 16 | |
| Media de la clase Gaming (22297 - 135096, n=109, últimos 2 años) | |
| MSI Stealth 16 Studio A13VG | |
| HP Victus 16-r0077ng | |
| Acer Nitro 16 AN16-41 | |
| Lenovo Legion Pro 5 16ARX8 | |
| AIDA64 / Memory Latency | |
| Media de la clase Gaming (75.3 - 259, n=109, últimos 2 años) | |
| HP Victus 16-r0077ng | |
| Acer Nitro 16 AN16-41 | |
| Medio AMD Ryzen 7 7840HS (85.1 - 112, n=21) | |
| Schenker XMG CORE 16 (L23) | |
| HP Omen Transcend 16 | |
| MSI Stealth 16 Studio A13VG | |
| Lenovo Legion Pro 5 16ARX8 | |
* ... más pequeño es mejor
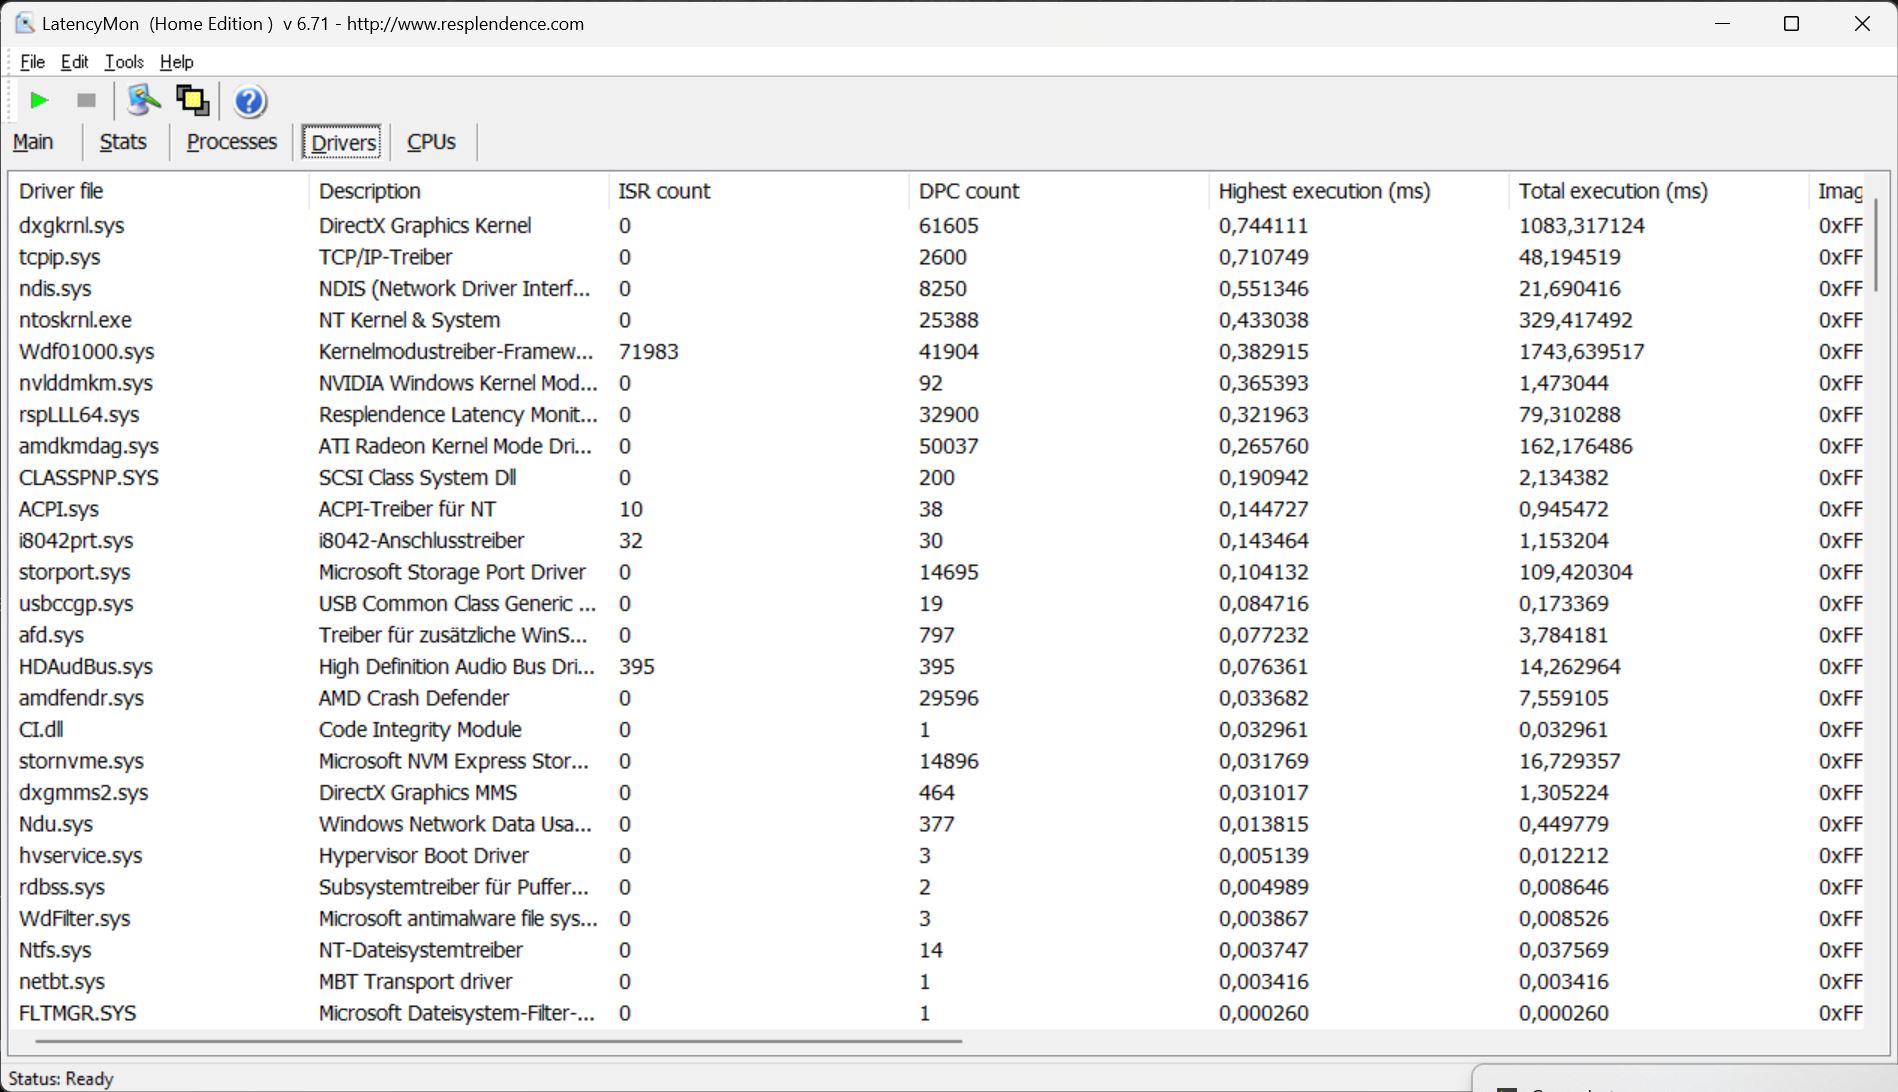
Latencia del CPD
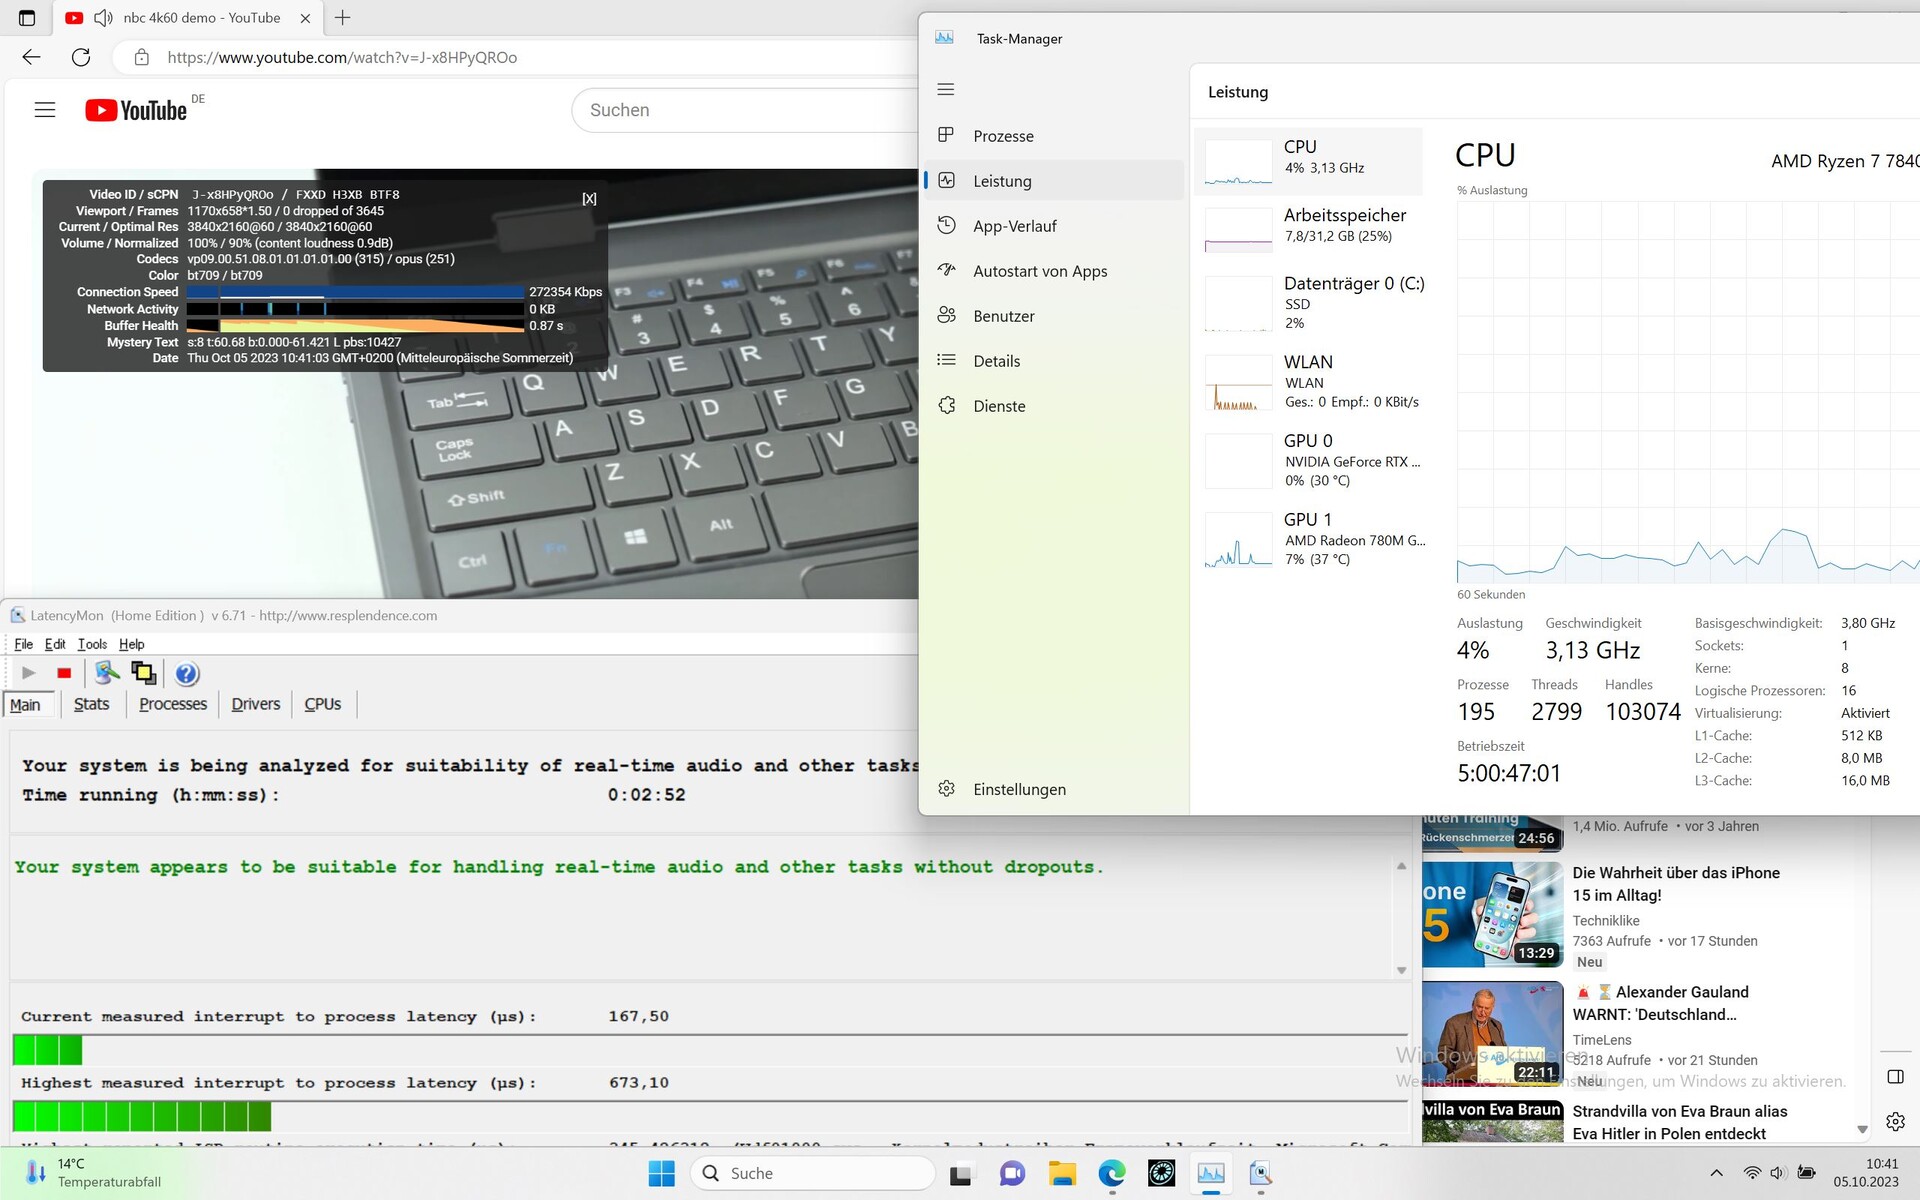
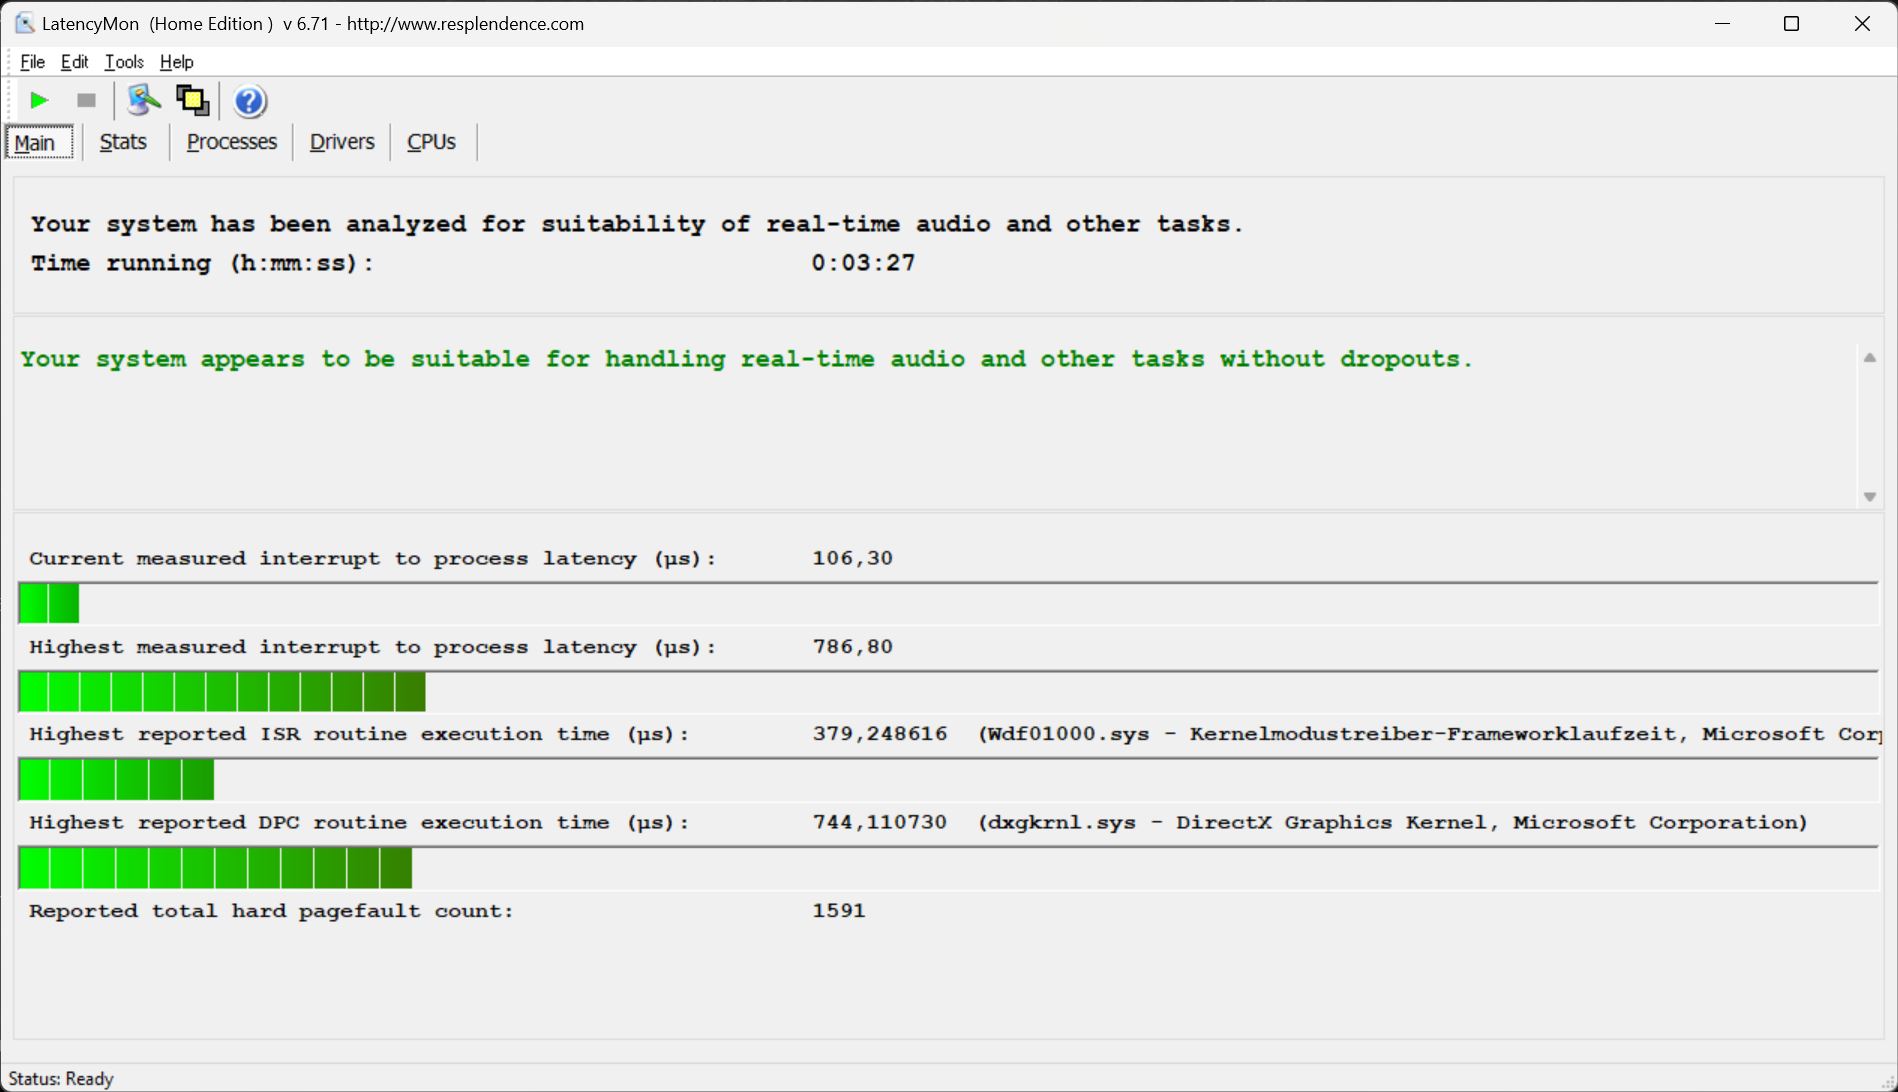
En comparación, el Core 16 es uno de los pocos portátiles para juegos que no tiene que luchar contra ninguna latencia según LatencyMon. Al menos, la herramienta no fue capaz de identificar ninguna latencia inusualmente alta en nuestra prueba - ¡muy bien! Nuestro vídeo 4K/60 fps de YouTube se reprodujo sin problemas y sin caídas de fotogramas. Sólo el Lenovo Legion Pro 5 16tuvo un rendimiento similar en este campo.
| DPC Latencies / LatencyMon - interrupt to process latency (max), Web, Youtube, Prime95 | |
| MSI Stealth 16 Studio A13VG | |
| HP Victus 16-r0077ng | |
| HP Omen Transcend 16 | |
| Acer Nitro 16 AN16-41 | |
| Schenker XMG CORE 16 (L23) | |
| Lenovo Legion Pro 5 16ARX8 | |
* ... más pequeño es mejor
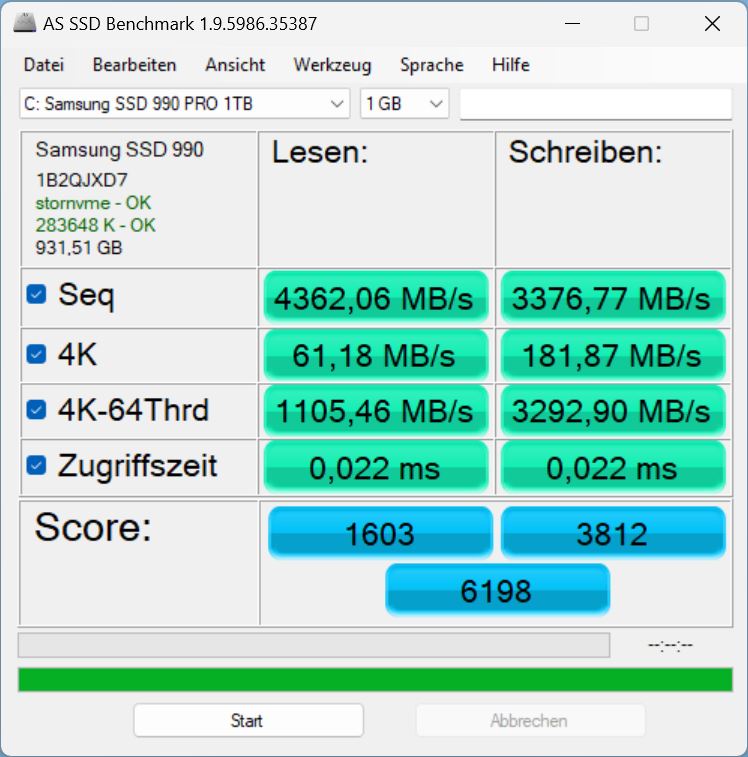
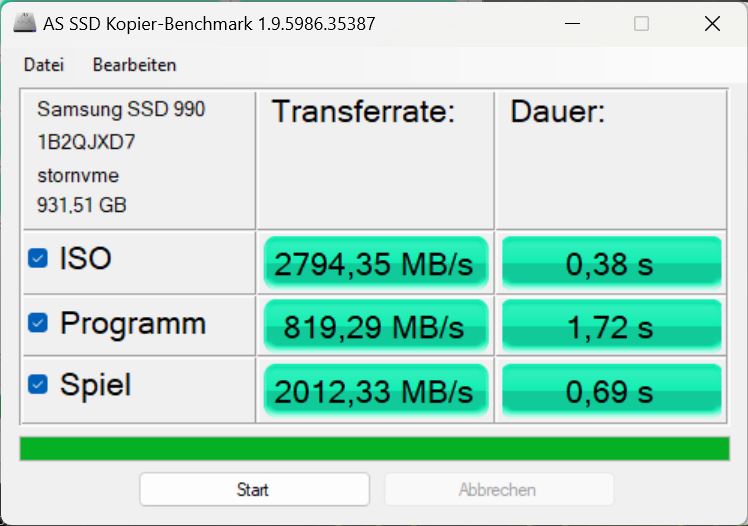
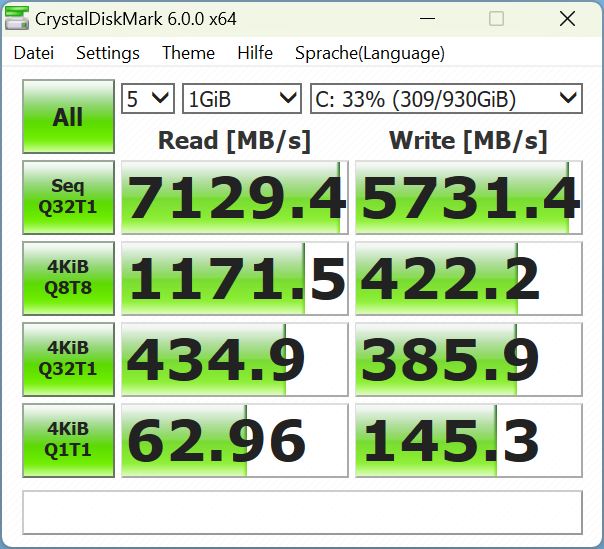
Dispositivos de almacenamiento
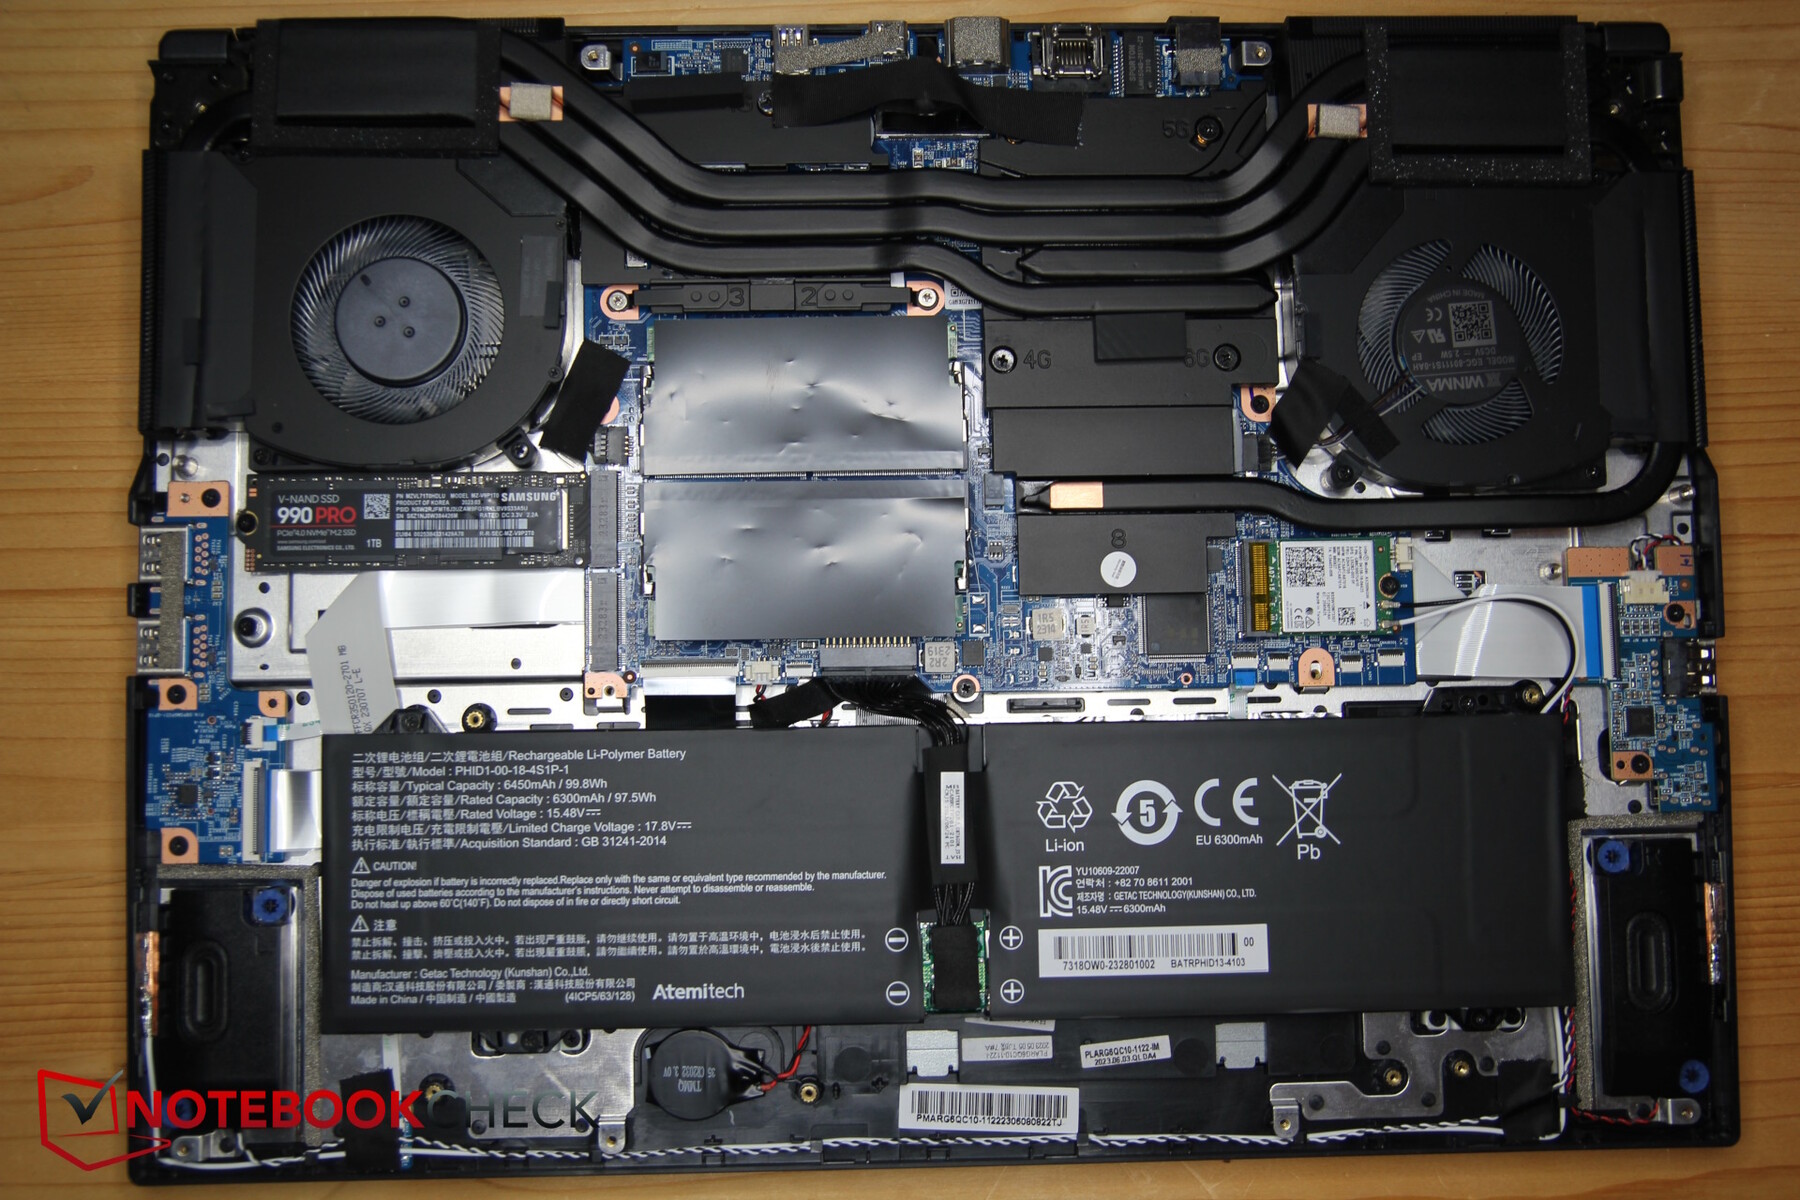
Schenker ha instalado una Samsung 990 Pro de 1 TB en el dispositivo. Esta unidad SSD es uno de los modelos más rápidos disponibles - en nuestraLista de los mejores SSDocupa el 4º lugar. Dentro del Core 16, no se aprovecha todo su potencial, pero sigue siendo extremadamente rápido. Además, su rendimiento se mantiene constante durante un largo periodo de tiempo, en contraste con la SSD igualmente rápida dentro delLenovo Legion Pro 5 16.

* ... más pequeño es mejor
Reading continuous performance: DiskSpd Read Loop, Queue Depth 8
Tarjeta gráfica
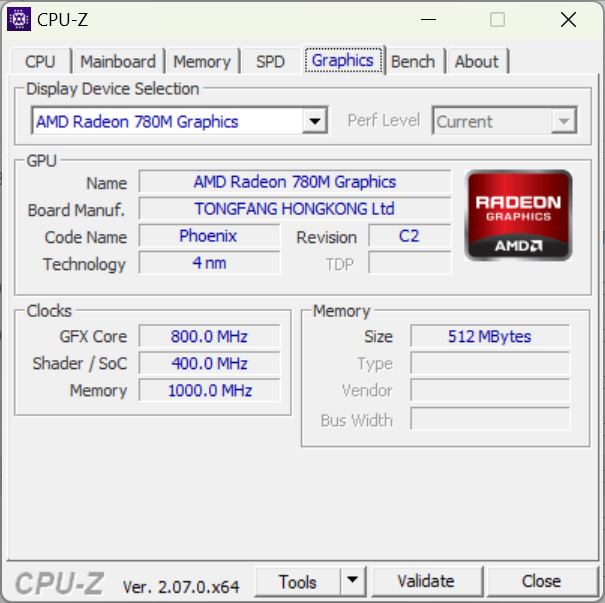
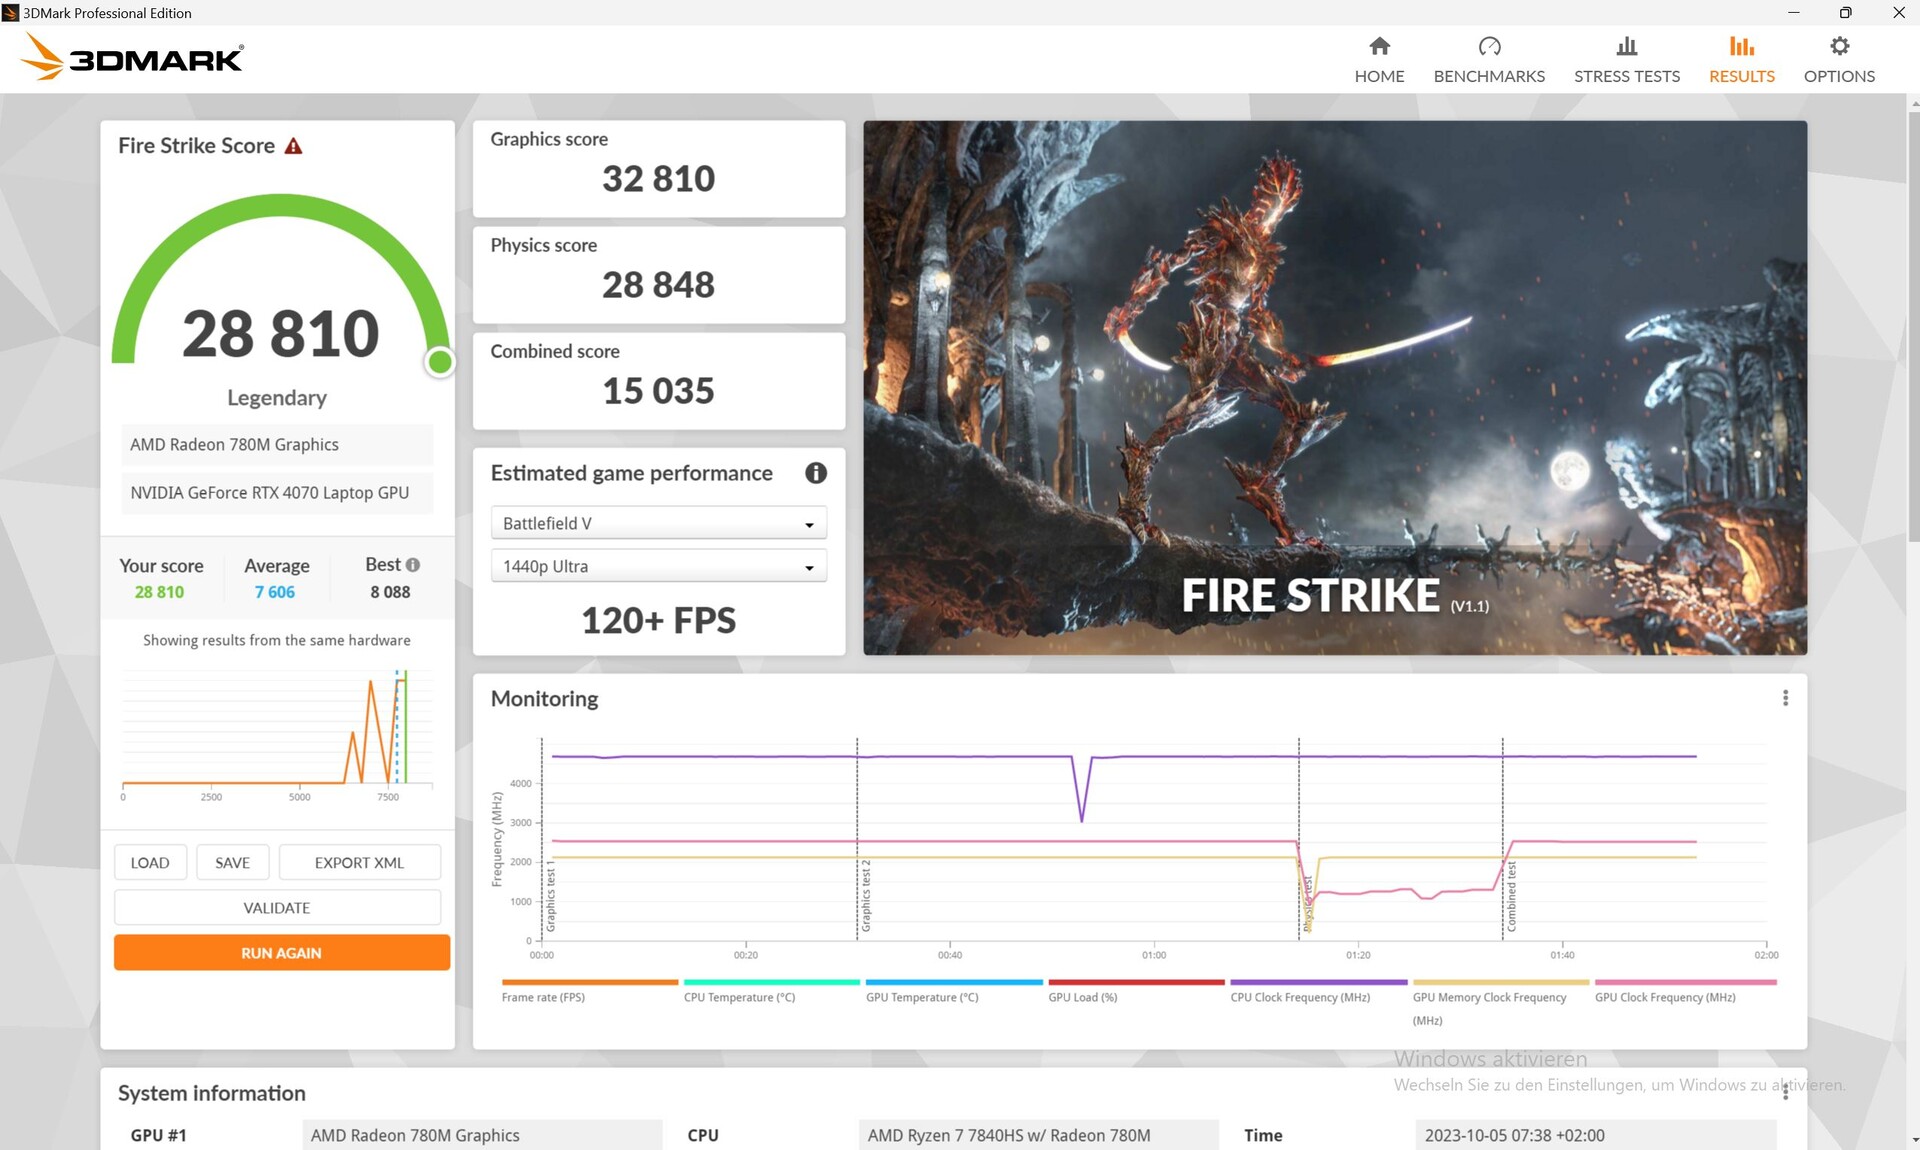
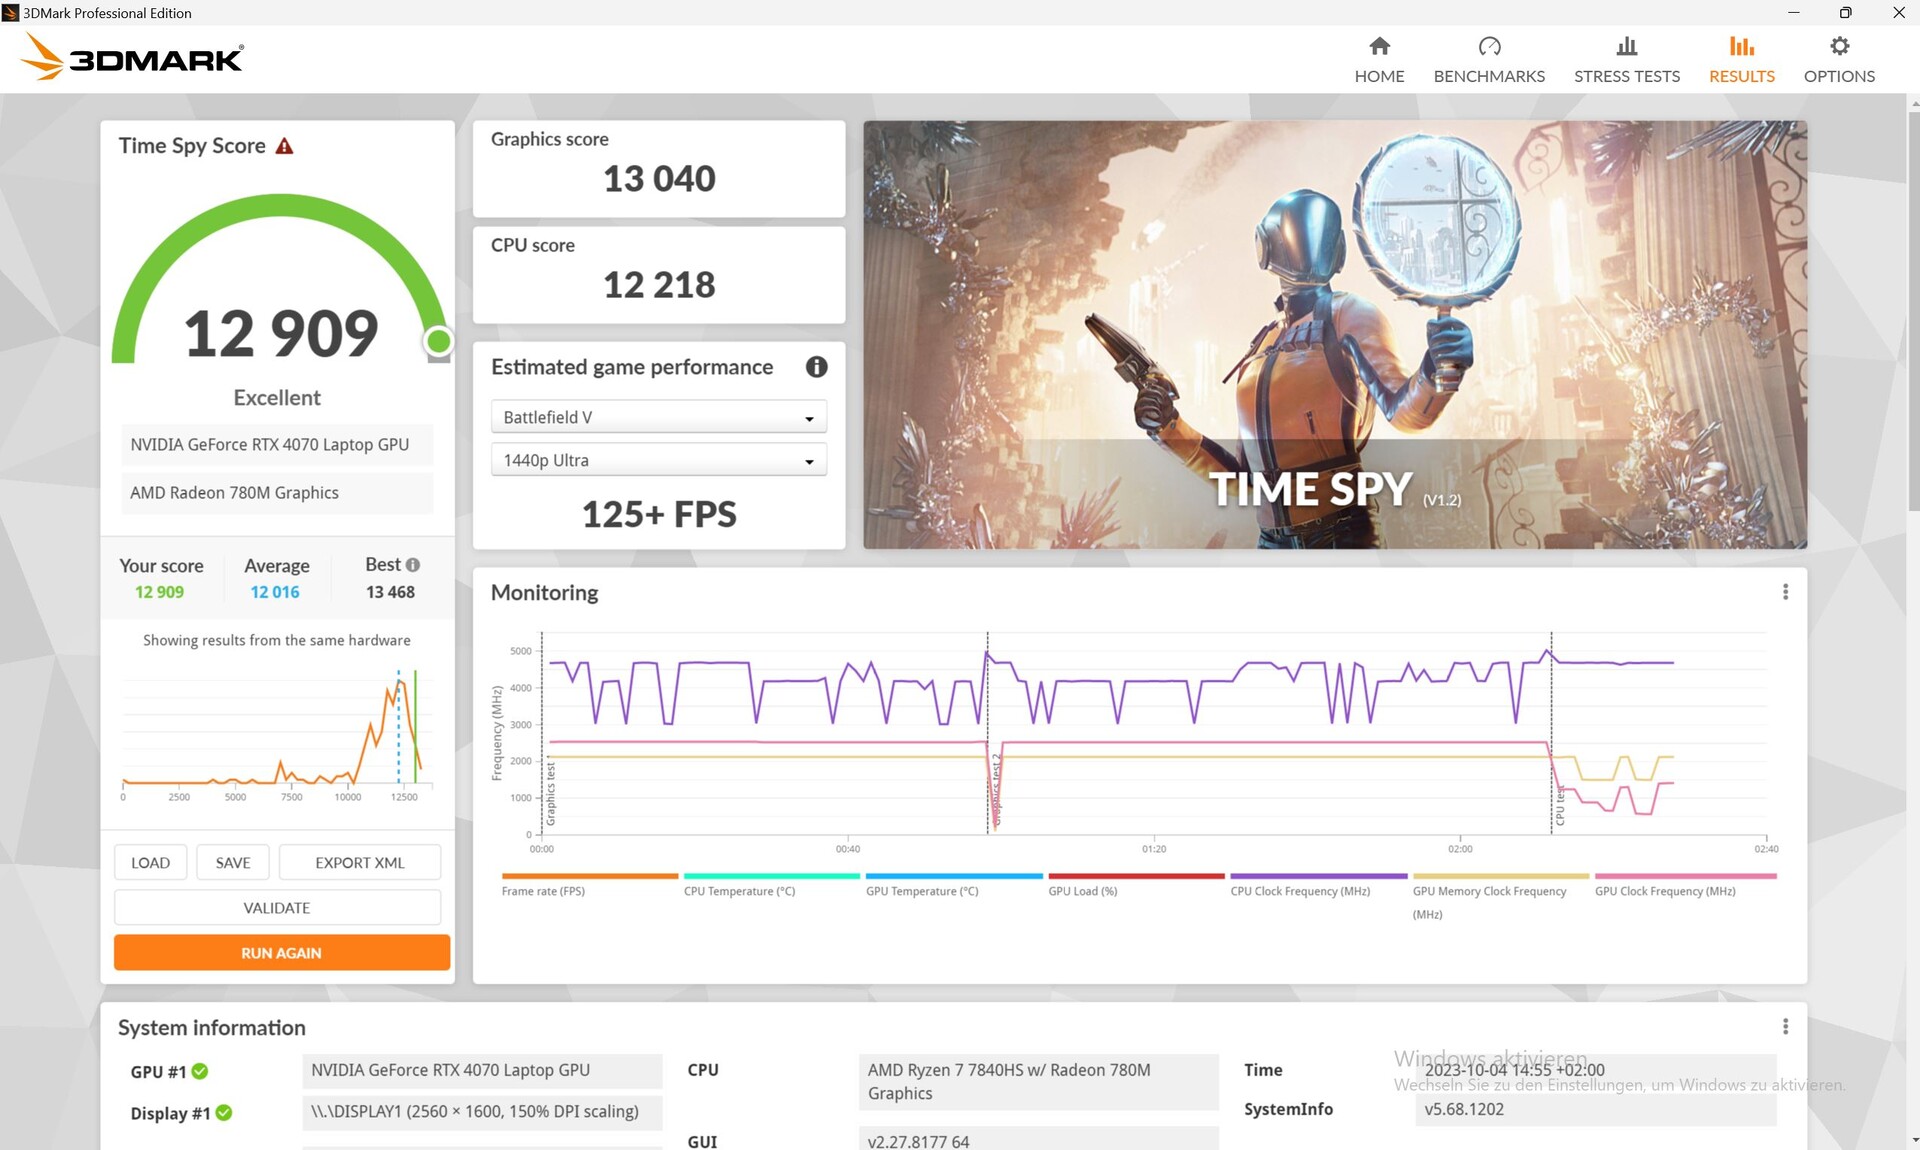
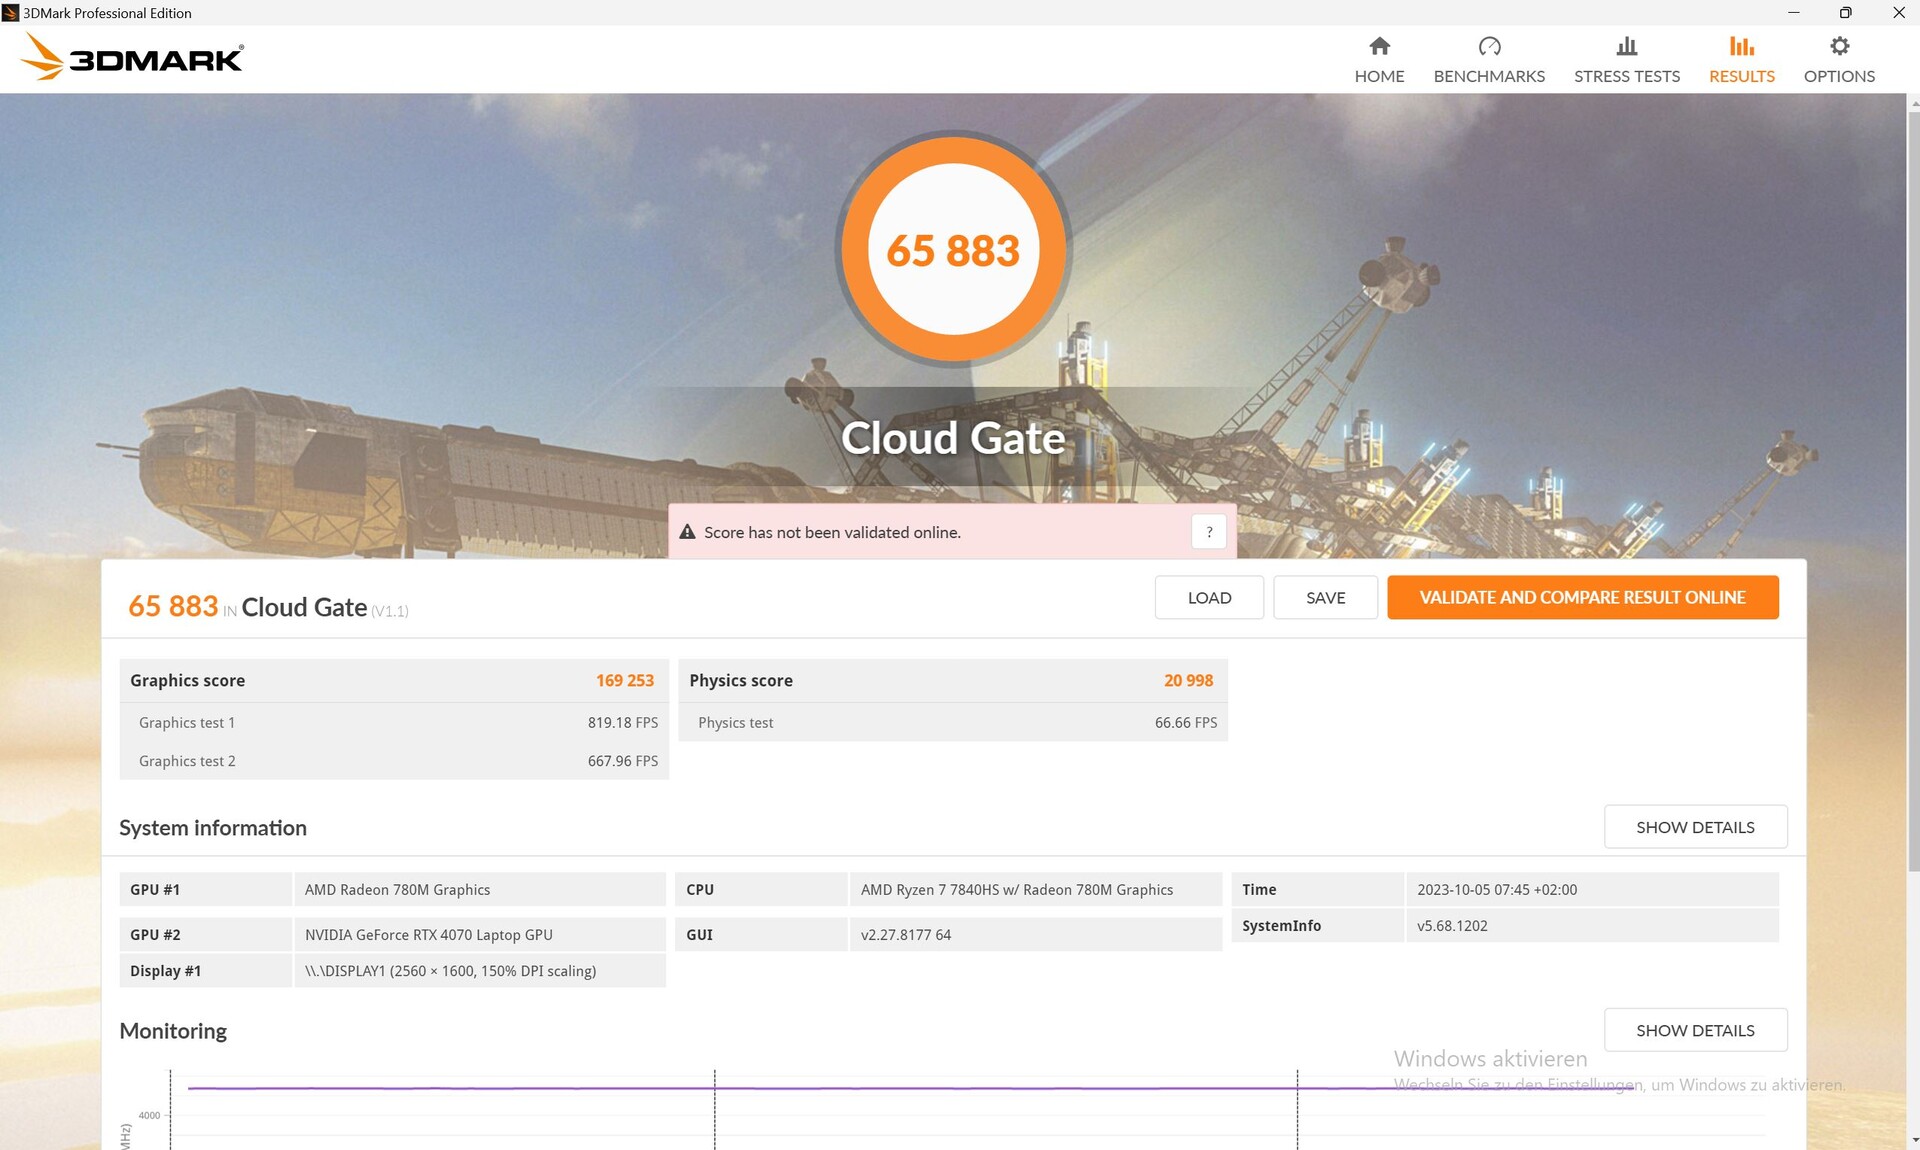
ElGPU NVIDIA GeForce RTX 4070 para portátileses capaz de aprovechar los 140 vatios completos (115 vatios + 25 vatios de Dynamic Boost). Como alternativa, puede conseguir el portátil por un poco menos con una GPURTX 4060. En el 3DMarks sintético, el Core 16 tomó la delantera a sus competidores: su rendimiento se situó en torno a un 13% por encima de la media típica del RTX 4070 en nuestra base de datos.
En modo batería, sólo quedaban 16.407 puntos de los 32.810 puntos originales conseguidos cuando ejecutamos Fire Strike de nuevo - un descenso del 50 por ciento.
La Core 16 también es rápida durante los juegos, aunque esta vez no salió victoriosa. Esto se debe probablemente a los juegos que consumen mucha CPU, como DOTA 2. Aquí, bastantes competidores lograron mejores rendimientos de CPU.
En modo equilibrado, se comportó de forma extraña al ejecutar The Witcher 3: El juego funcionó a unos 117 fps, que es casi tan rápido como en overdrive. Esto también significó que los ventiladores no funcionaron realmente más silenciosos. Después de alrededor de un minuto, la velocidad de fotogramas bajó repentinamente a 30 y los ventiladores sólo produjeron emisiones de ruido de 28 dB. Parece que este modo no está del todo optimizado.
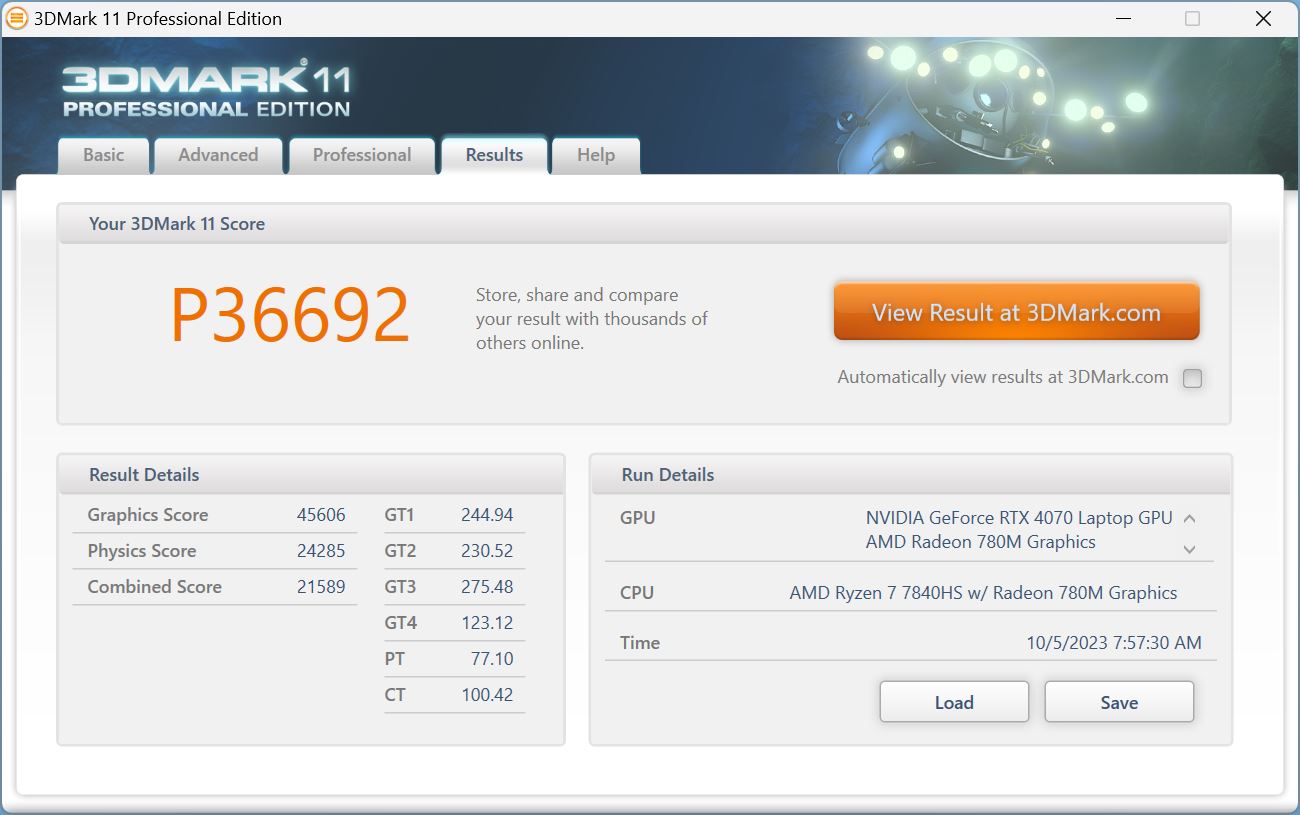
| 3DMark 11 Performance | 36692 puntos | |
| 3DMark Cloud Gate Standard Score | 65883 puntos | |
| 3DMark Fire Strike Score | 28810 puntos | |
| 3DMark Time Spy Score | 12909 puntos | |
ayuda | ||
* ... más pequeño es mejor
| Performance rating - Percent | |
| Media de la clase Gaming | |
| Lenovo Legion Pro 5 16ARX8 | |
| HP Omen Transcend 16 -2! | |
| MSI Stealth 16 Studio A13VG | |
| Schenker XMG CORE 16 (L23) | |
| HP Victus 16-r0077ng | |
| Acer Nitro 16 AN16-41 | |
| The Witcher 3 - 1920x1080 Ultra Graphics & Postprocessing (HBAO+) | |
| Media de la clase Gaming (95 - 240, n=8, últimos 2 años) | |
| Schenker XMG CORE 16 (L23) | |
| Lenovo Legion Pro 5 16ARX8 | |
| MSI Stealth 16 Studio A13VG | |
| HP Victus 16-r0077ng | |
| Acer Nitro 16 AN16-41 | |
| HP Omen Transcend 16 | |
| GTA V - 1920x1080 Highest AA:4xMSAA + FX AF:16x | |
| Media de la clase Gaming (48.3 - 186.9, n=102, últimos 2 años) | |
| Lenovo Legion Pro 5 16ARX8 | |
| MSI Stealth 16 Studio A13VG | |
| Schenker XMG CORE 16 (L23) | |
| HP Victus 16-r0077ng | |
| Acer Nitro 16 AN16-41 | |
| Final Fantasy XV Benchmark - 1920x1080 High Quality | |
| Media de la clase Gaming (41 - 215, n=103, últimos 2 años) | |
| Schenker XMG CORE 16 (L23) | |
| Lenovo Legion Pro 5 16ARX8 | |
| MSI Stealth 16 Studio A13VG | |
| HP Victus 16-r0077ng | |
| Acer Nitro 16 AN16-41 | |
| Strange Brigade - 1920x1080 ultra AA:ultra AF:16 | |
| Media de la clase Gaming (76.3 - 456, n=93, últimos 2 años) | |
| Lenovo Legion Pro 5 16ARX8 | |
| Schenker XMG CORE 16 (L23) | |
| HP Omen Transcend 16 | |
| MSI Stealth 16 Studio A13VG | |
| Acer Nitro 16 AN16-41 | |
| HP Victus 16-r0077ng | |
| Dota 2 Reborn - 1920x1080 ultra (3/3) best looking | |
| Lenovo Legion Pro 5 16ARX8 | |
| HP Omen Transcend 16 | |
| MSI Stealth 16 Studio A13VG | |
| Media de la clase Gaming (84.8 - 248, n=112, últimos 2 años) | |
| Schenker XMG CORE 16 (L23) | |
| HP Victus 16-r0077ng | |
| Acer Nitro 16 AN16-41 | |
Witcher 3 FPS diagram
| bajo | medio | alto | ultra | QHD | 4K | |
|---|---|---|---|---|---|---|
| GTA V (2015) | 185.4 | 174.1 | 116.1 | |||
| The Witcher 3 (2015) | 364.2 | 291.5 | 245.2 | 120 | 92 | |
| Dota 2 Reborn (2015) | 161.2 | 153.5 | 142.2 | 134.8 | 136.9 | |
| Final Fantasy XV Benchmark (2018) | 215 | 171.4 | 124.8 | 91 | ||
| X-Plane 11.11 (2018) | 123.7 | 108.3 | 85.5 | 85.7 | ||
| Strange Brigade (2018) | 367 | 302 | 249 | 218 | ||
| Hogwarts Legacy (2023) | 77.2 | 55.3 |
Emisiones y potencia - El Core 16 fresco y con aguante
Emisiones sonoras
En el modo de ralentí, los ventiladores a menudo no giran en absoluto, especialmente en el modo equilibrado. Incluso en overdrive, esto ocurre a menudo pero aquí, los ventiladores a veces también giran rápidamente.
Bajo carga, los niveles de ruido del Core 16 aumentan de forma constante y no a grandes saltos. Esto significa que sus niveles de ruido permanecen relativamente bajos bajo carga media, como en la primera escena del benchmark 3DMark06.
Durante sesiones de juego continuas, puede llegar a ser bastante más ruidoso, pero la competencia alcanza niveles de ruido similares - el Acer Nitro 16 llega a ser insoportablemente ruidoso. El MSI Stealth 16 Studio y especialmente el más débil HP Victus 16 siguen siendo más silenciosos.
Ruido
| Ocioso |
| 23 / 28.48 / 28.48 dB(A) |
| Carga |
| 30 / 54.12 dB(A) |
 | ||
30 dB silencioso 40 dB(A) audible 50 dB(A) ruidosamente alto |
||
min: | ||
| Schenker XMG CORE 16 (L23) GeForce RTX 4070 Laptop GPU, R7 7840HS, Samsung 990 Pro 1 TB | Lenovo Legion Pro 5 16ARX8 GeForce RTX 4070 Laptop GPU, R7 7745HX, Samsung PM9A1 MZVL21T0HCLR | Acer Nitro 16 AN16-41 GeForce RTX 4070 Laptop GPU, R7 7735HS, Samsung PM9A1 MZVL21T0HCLR | HP Omen Transcend 16 GeForce RTX 4070 Laptop GPU, i9-13900HX, SK hynix PC801 HFS002TEJ9X101N | MSI Stealth 16 Studio A13VG GeForce RTX 4070 Laptop GPU, i7-13700H, Micron 3400 2TB MTFDKBA2T0TFH | HP Victus 16-r0077ng GeForce RTX 4070 Laptop GPU, i7-13700H, Kioxia XG8 KXG80ZNV1T02 | |
|---|---|---|---|---|---|---|
| Noise | 5% | -6% | -12% | 5% | -8% | |
| apagado / medio ambiente * (dB) | 23 | 23.2 -1% | 25.7 -12% | 22.9 -0% | 24 -4% | 25 -9% |
| Idle Minimum * (dB) | 23 | 23.2 -1% | 25.7 -12% | 29.1 -27% | 24 -4% | 28 -22% |
| Idle Average * (dB) | 28.48 | 23.2 19% | 25.7 10% | 29.1 -2% | 24 16% | 29 -2% |
| Idle Maximum * (dB) | 28.48 | 26.2 8% | 26.3 8% | 29.1 -2% | 24 16% | 30 -5% |
| Load Average * (dB) | 30 | 31.4 -5% | 33.9 -13% | 45.7 -52% | 34.81 -16% | 43 -43% |
| Witcher 3 ultra * (dB) | 54.12 | 48.4 11% | 54.3 -0% | 44.05 19% | 46 15% | |
| Load Maximum * (dB) | 54.12 | 53.8 1% | 62 -15% | 54.3 -0% | 51.57 5% | 48 11% |
* ... más pequeño es mejor
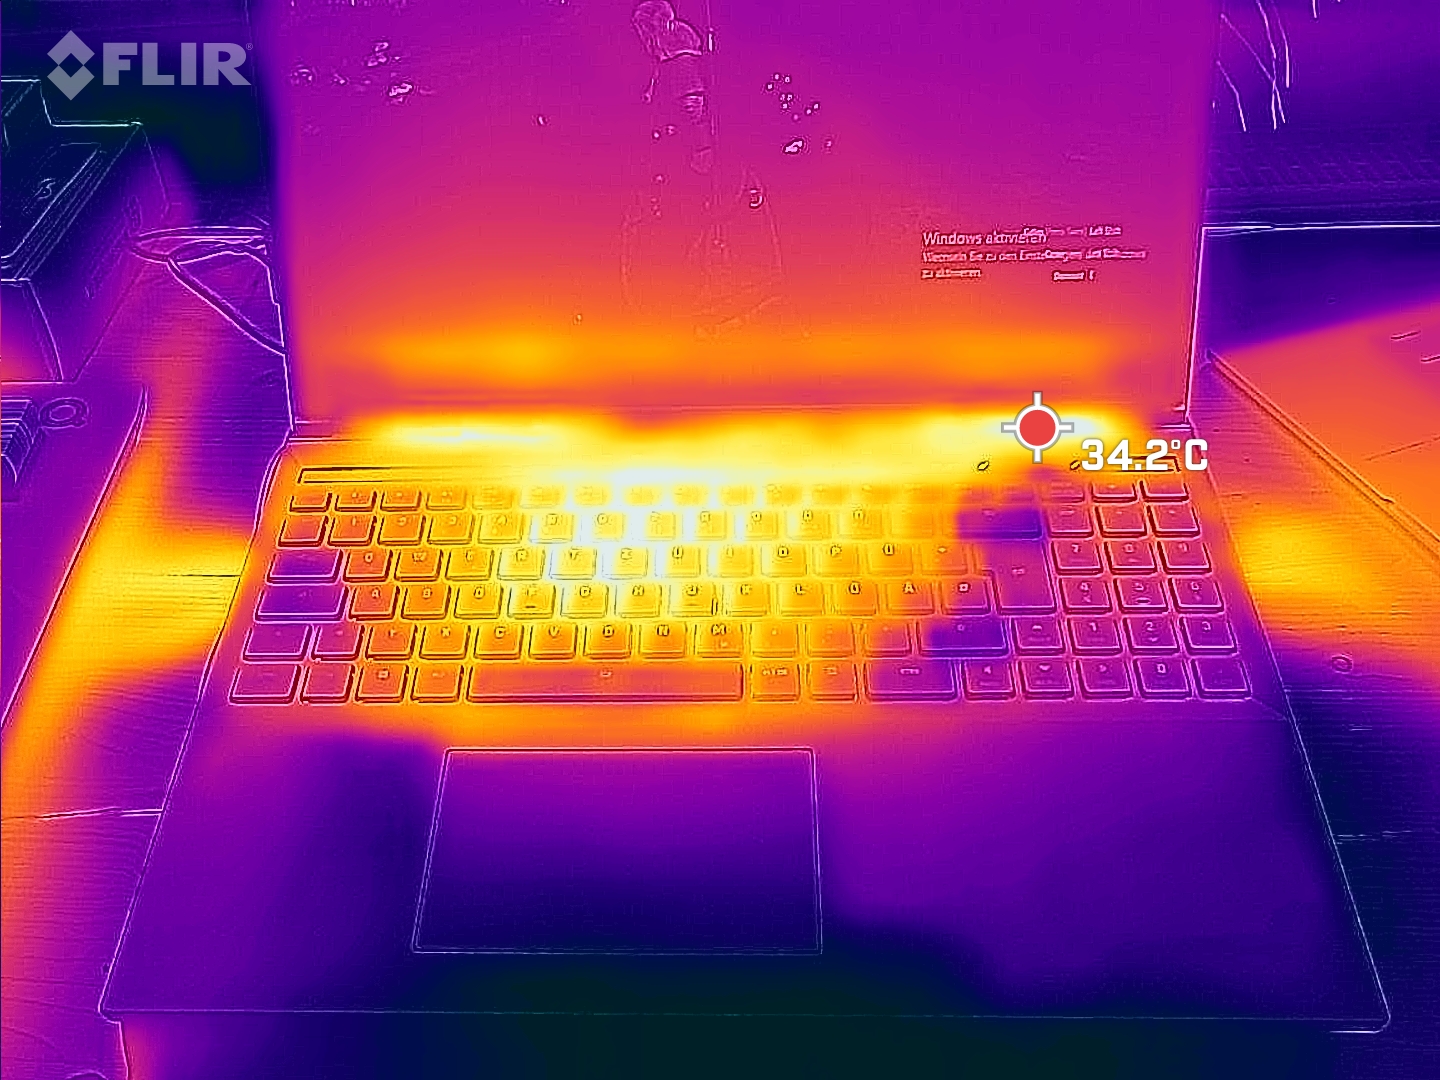
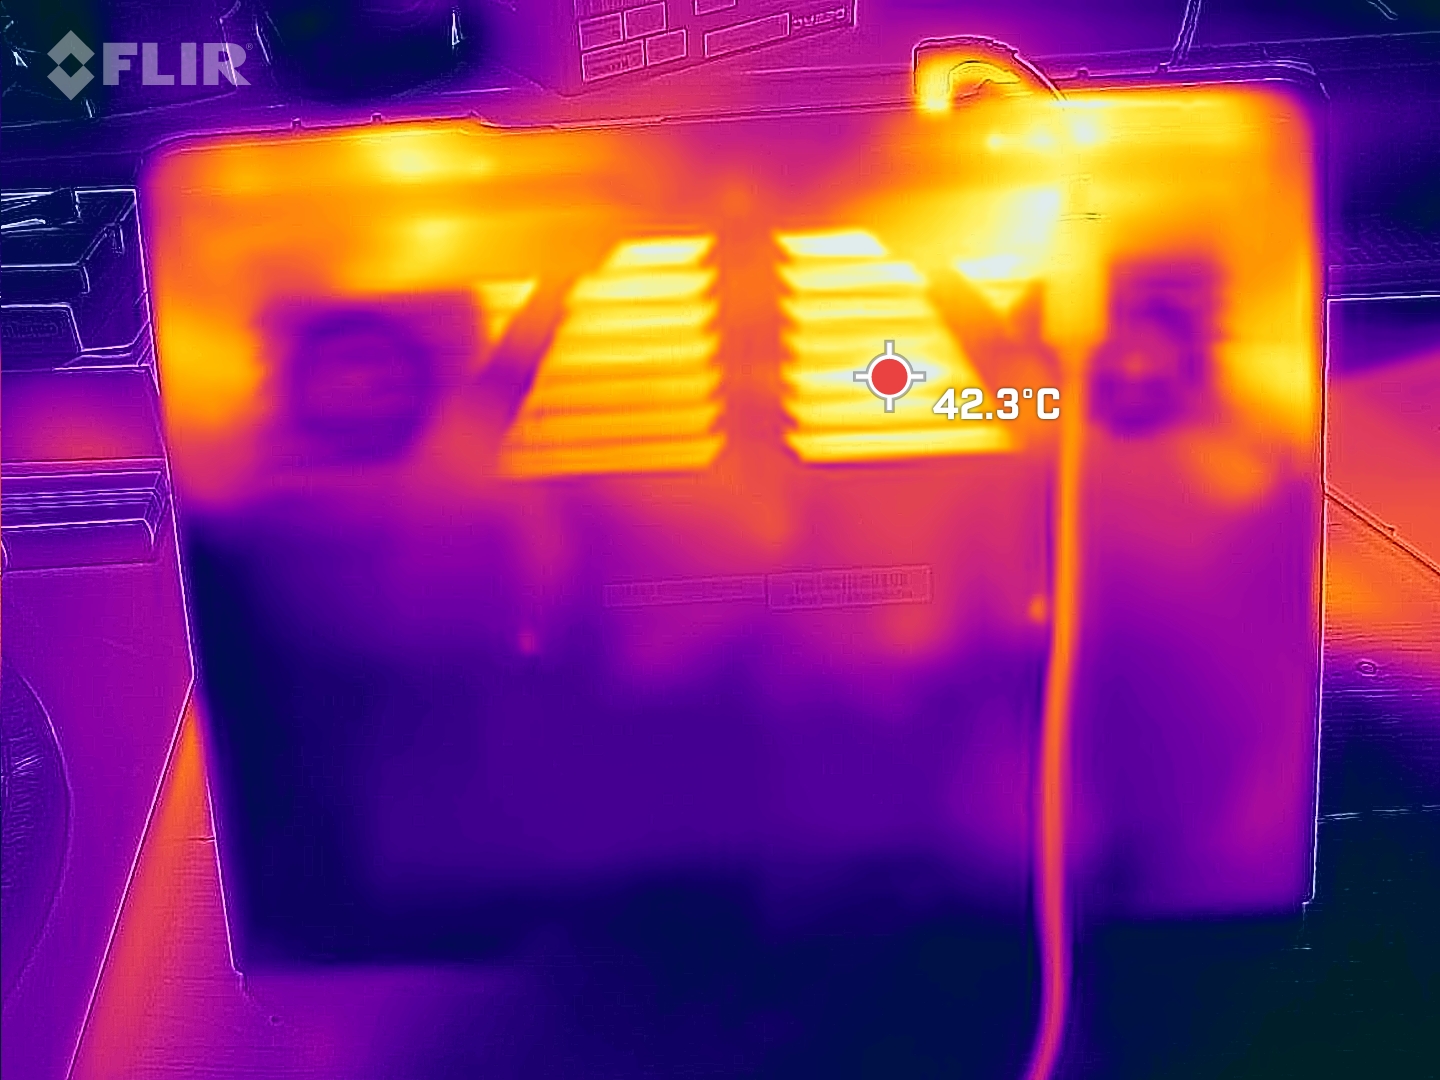
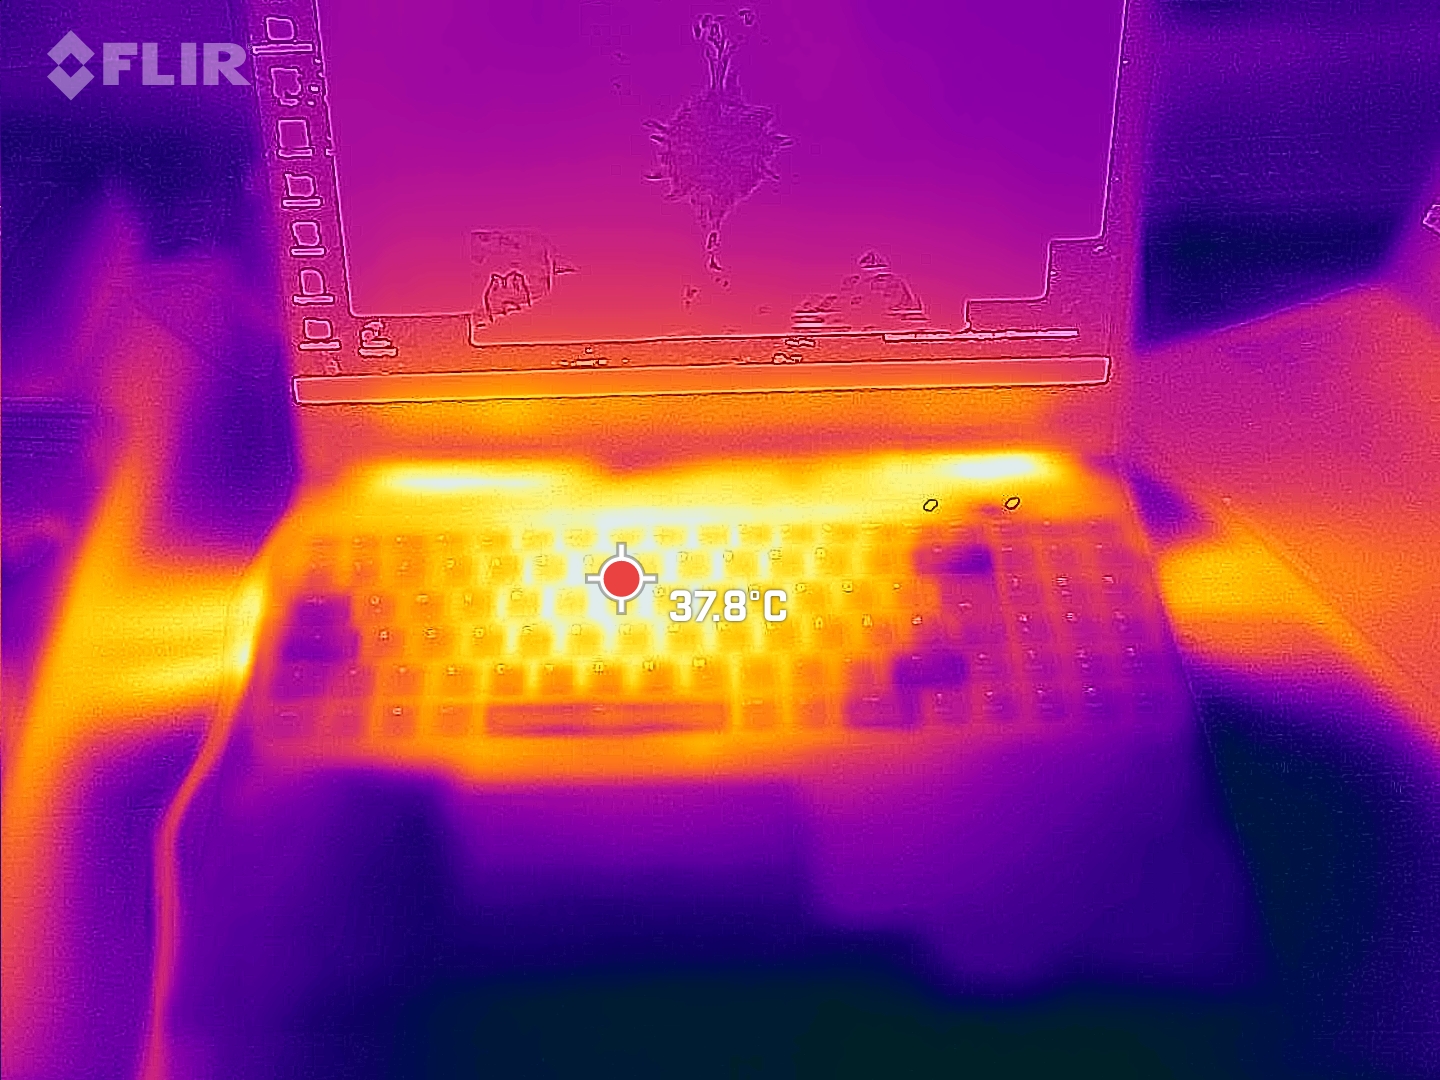
Temperatura
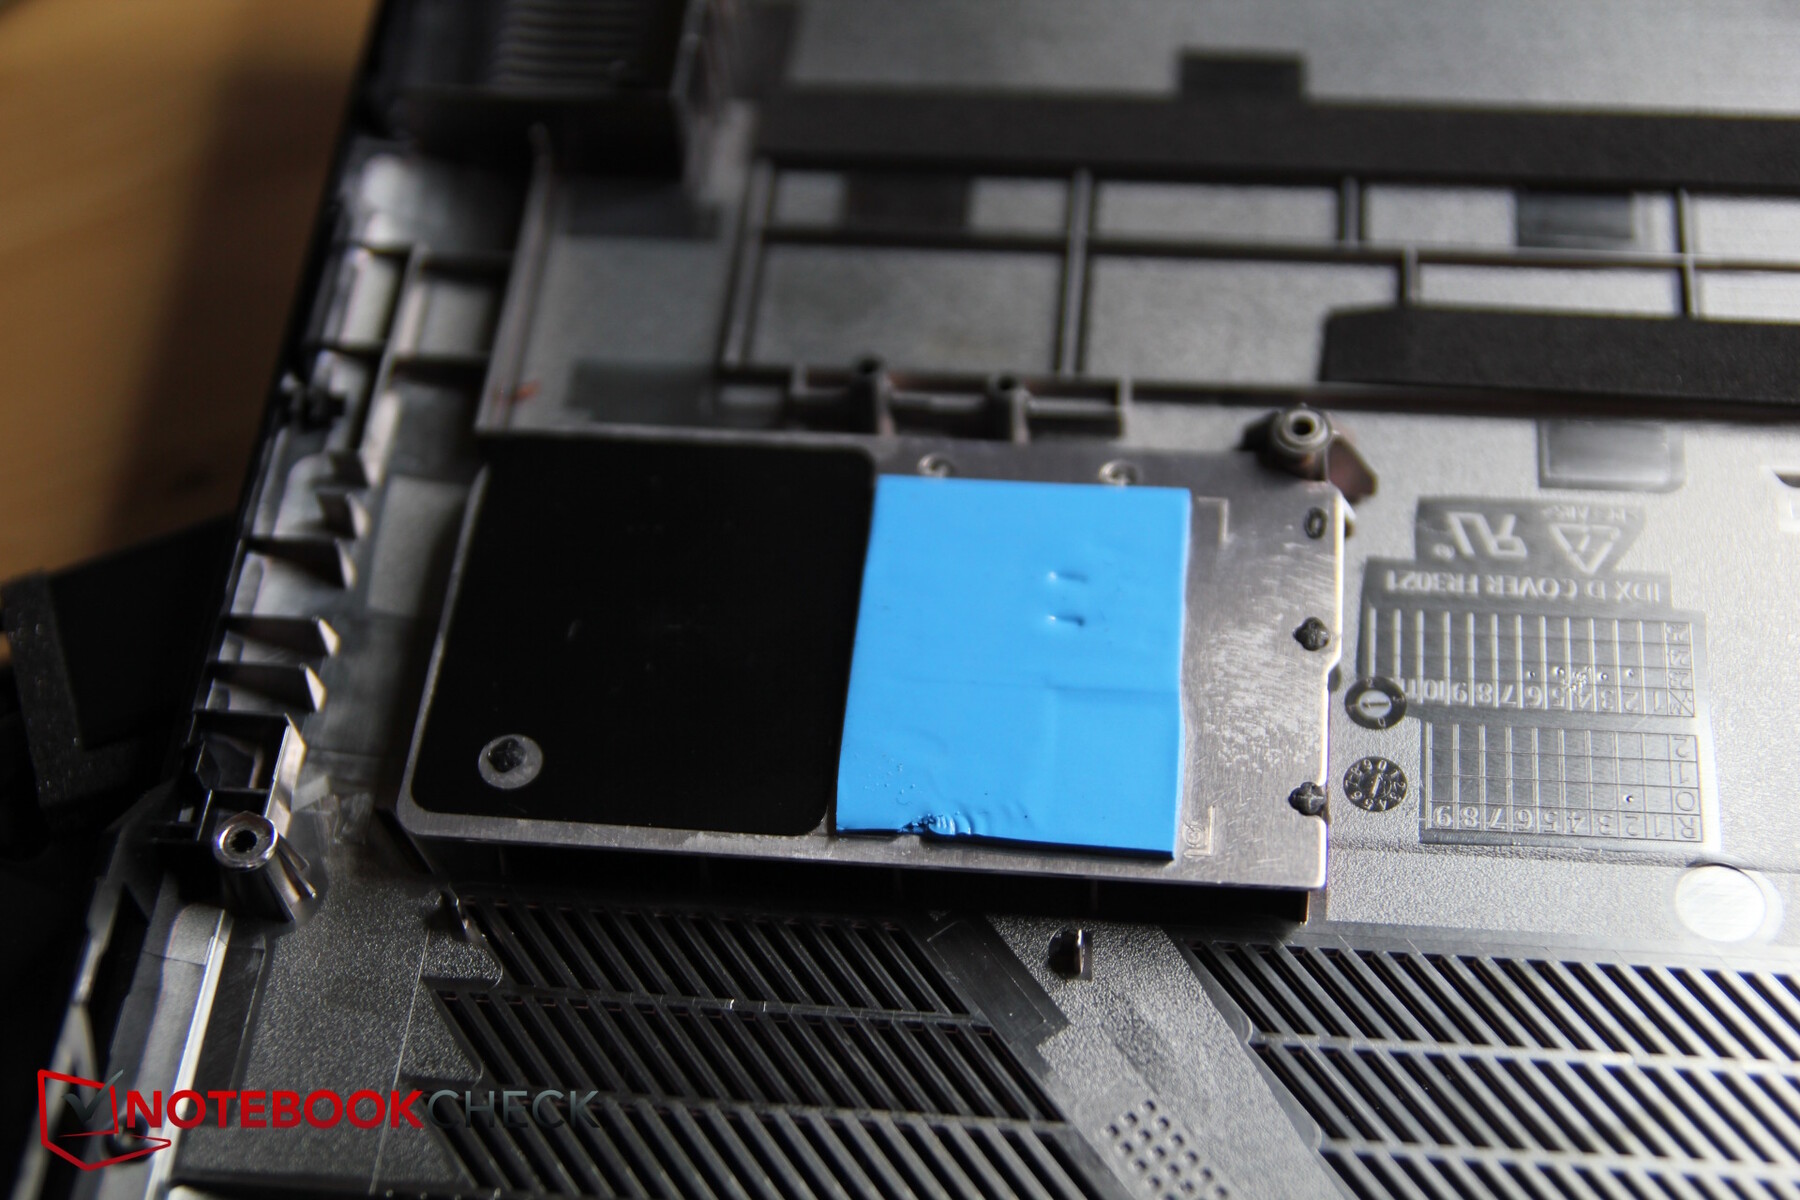
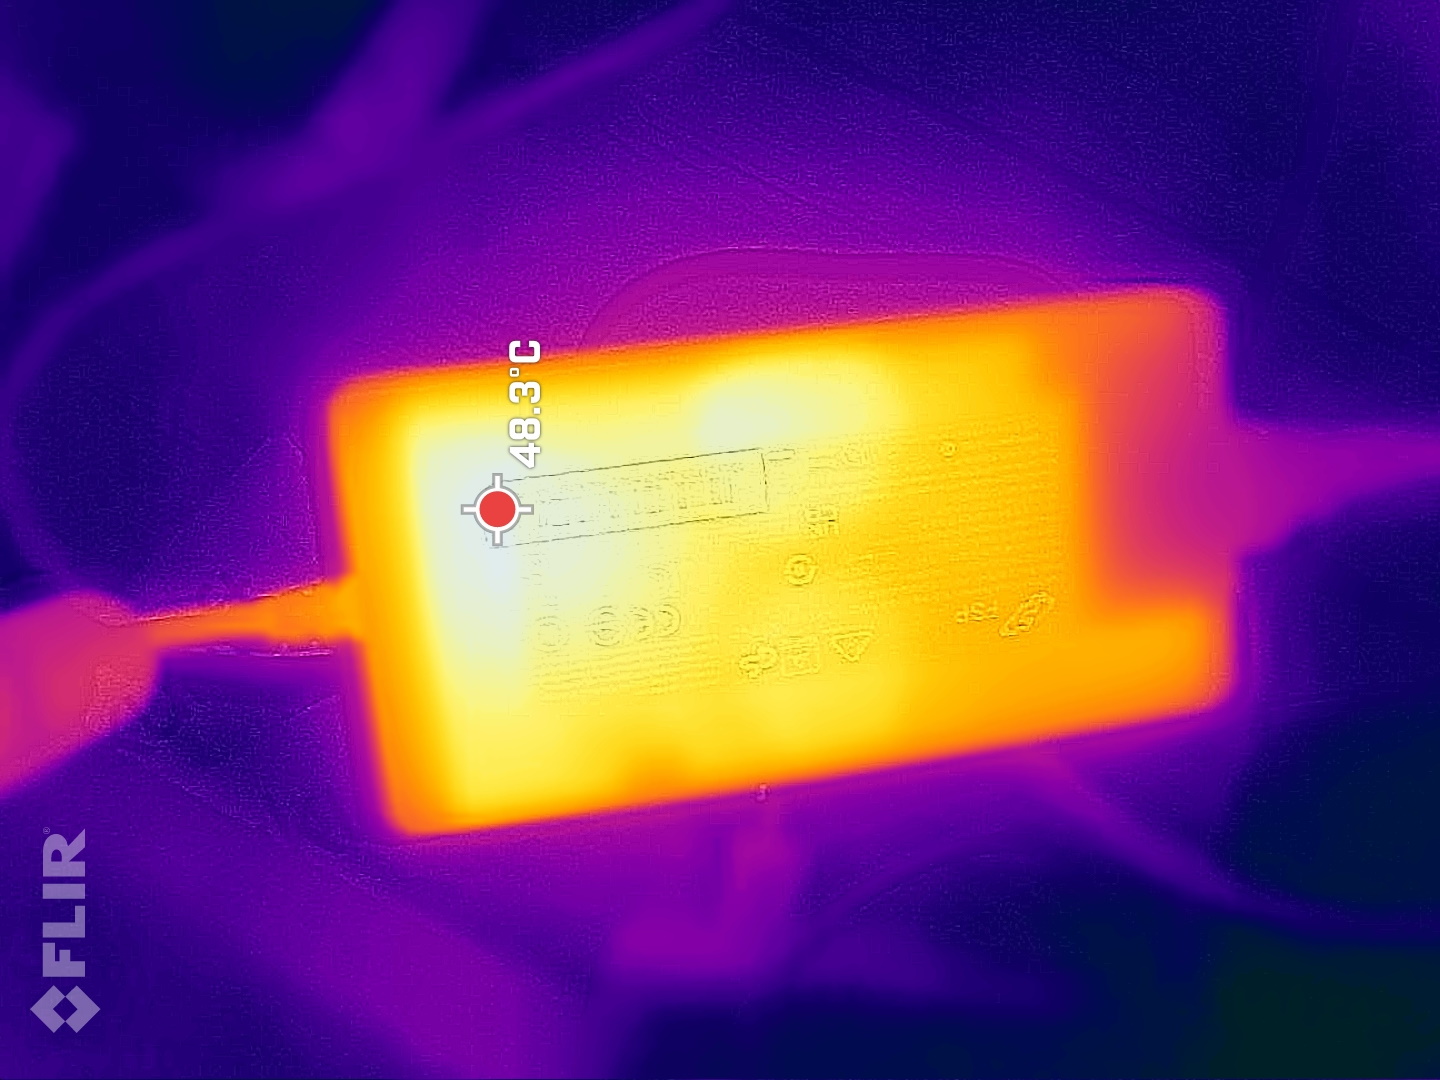
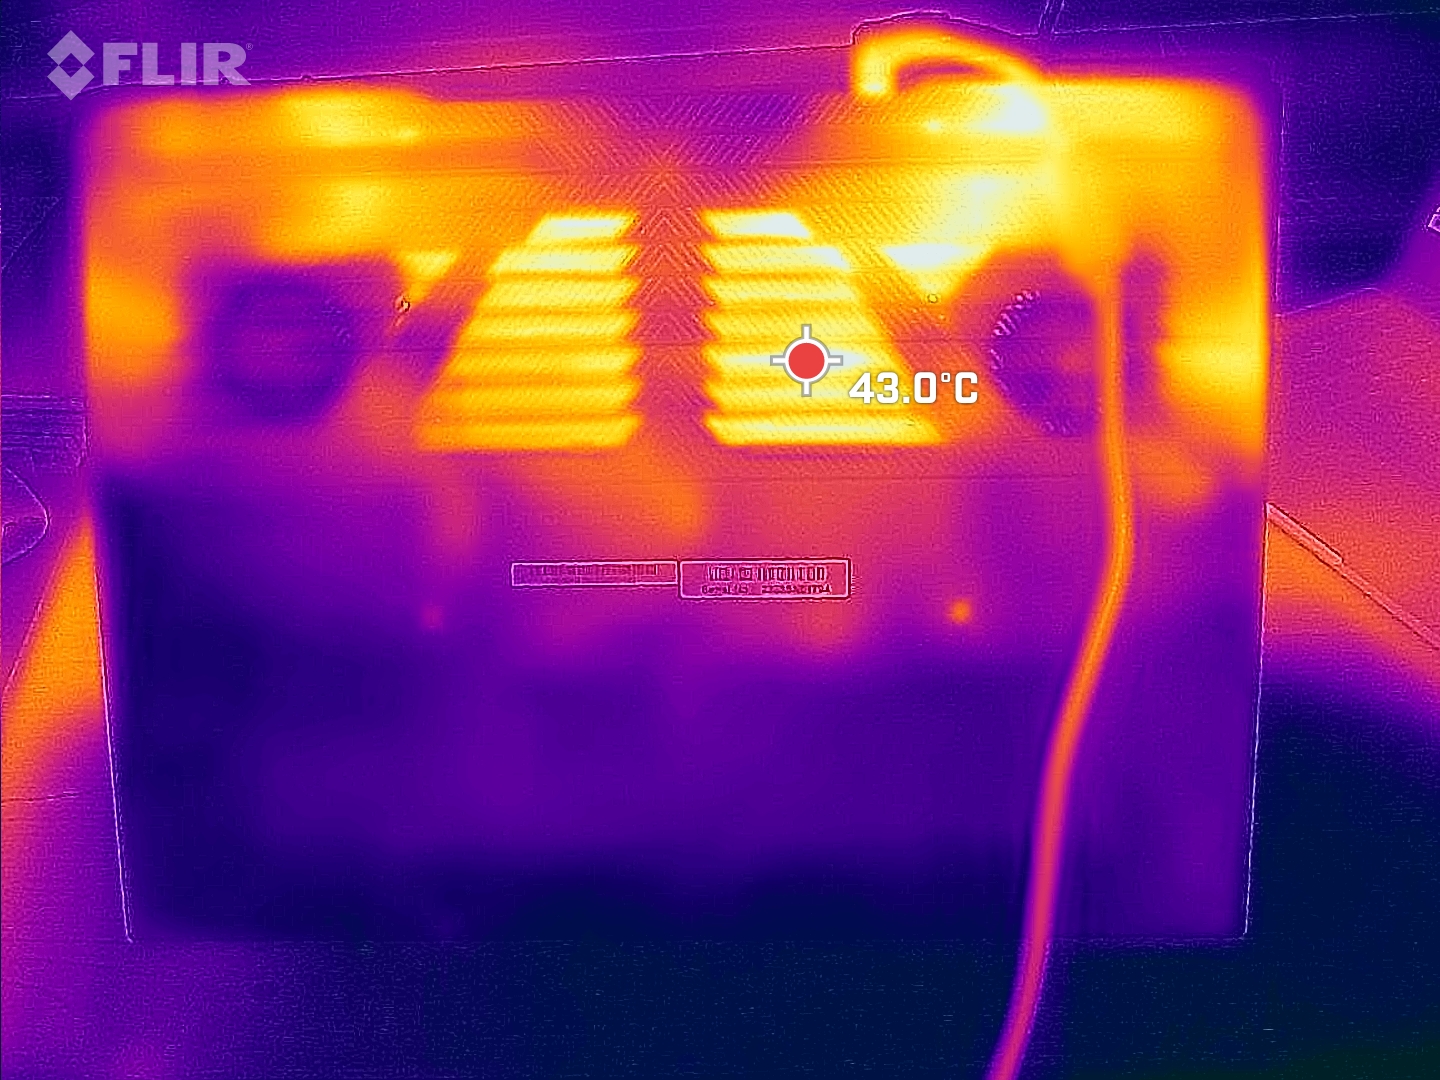
Schenker destaca que utiliza pasta térmica de metal líquido. El Core 16 nunca se calienta adecuadamente - medimos puntos calientes de 46 °C alrededor del centro de la parte trasera bajo carga continua. El lado izquierdo y las teclas WASD parecen calentarse un poco más que el lado derecho. 39 °C bajo carga sigue estando bien.
(-) La temperatura máxima en la parte superior es de 46 °C / 115 F, frente a la media de 40.4 °C / 105 F, que oscila entre 21.2 y 68.8 °C para la clase Gaming.
(±) El fondo se calienta hasta un máximo de 44 °C / 111 F, frente a la media de 43.2 °C / 110 F
(+) En reposo, la temperatura media de la parte superior es de 29.7 °C / 85# F, frente a la media del dispositivo de 33.9 °C / 93 F.
(±) Jugando a The Witcher 3, la temperatura media de la parte superior es de 35 °C / 95 F, frente a la media del dispositivo de 33.9 °C / 93 F.
(+) El reposamanos y el panel táctil están a una temperatura inferior a la de la piel, con un máximo de 27 °C / 80.6 F y, por tanto, son fríos al tacto.
(±) La temperatura media de la zona del reposamanos de dispositivos similares fue de 28.8 °C / 83.8 F (+1.8 °C / 3.2 F).
| Schenker XMG CORE 16 (L23) AMD Ryzen 7 7840HS, NVIDIA GeForce RTX 4070 Laptop GPU | Lenovo Legion Pro 5 16ARX8 AMD Ryzen 7 7745HX, NVIDIA GeForce RTX 4070 Laptop GPU | Acer Nitro 16 AN16-41 AMD Ryzen 7 7735HS, NVIDIA GeForce RTX 4070 Laptop GPU | HP Omen Transcend 16 Intel Core i9-13900HX, NVIDIA GeForce RTX 4070 Laptop GPU | MSI Stealth 16 Studio A13VG Intel Core i7-13700H, NVIDIA GeForce RTX 4070 Laptop GPU | HP Victus 16-r0077ng Intel Core i7-13700H, NVIDIA GeForce RTX 4070 Laptop GPU | |
|---|---|---|---|---|---|---|
| Heat | 8% | -3% | -1% | -26% | -10% | |
| Maximum Upper Side * (°C) | 46 | 41.8 9% | 41.5 10% | 47.4 -3% | 60 -30% | 51 -11% |
| Maximum Bottom * (°C) | 44 | 41.4 6% | 51.8 -18% | 54.4 -24% | 61 -39% | 54 -23% |
| Idle Upper Side * (°C) | 32 | 29 9% | 31.6 1% | 28.4 11% | 38.2 -19% | 37 -16% |
| Idle Bottom * (°C) | 33 | 30.4 8% | 34.5 -5% | 29.2 12% | 37.7 -14% | 29 12% |
* ... más pequeño es mejor
Altavoces
Los altavoces estéreo no presumen de un volumen alto, ni de muchos graves, ni de graves y medios equilibrados. Sólo los agudos son equilibrados y lineales. Para disfrutar de una mejor experiencia de audio, debe utilizar auriculares o un sistema externo. Dispone de una toma de auriculares y una entrada de micrófono para conectar los primeros.
Schenker XMG CORE 16 (L23) análisis de audio
(±) | la sonoridad del altavoz es media pero buena (79.4 dB)
Graves 100 - 315 Hz
(-) | casi sin bajos - de media 21.6% inferior a la mediana
(±) | la linealidad de los graves es media (11.4% delta a frecuencia anterior)
Medios 400 - 2000 Hz
(±) | medias más altas - de media 5.4% más altas que la mediana
(+) | los medios son lineales (6.7% delta a la frecuencia anterior)
Altos 2 - 16 kHz
(+) | máximos equilibrados - a sólo 2.3% de la mediana
(+) | los máximos son lineales (6.6% delta a la frecuencia anterior)
Total 100 - 16.000 Hz
(±) | la linealidad del sonido global es media (17.1% de diferencia con la mediana)
En comparación con la misma clase
» 46% de todos los dispositivos probados de esta clase eran mejores, 12% similares, 43% peores
» El mejor tuvo un delta de 6%, la media fue 18%, el peor fue ###max##%
En comparación con todos los dispositivos probados
» 31% de todos los dispositivos probados eran mejores, 8% similares, 61% peores
» El mejor tuvo un delta de 4%, la media fue 24%, el peor fue ###max##%
Lenovo Legion Pro 5 16ARX8 análisis de audio
(±) | la sonoridad del altavoz es media pero buena (80.9 dB)
Graves 100 - 315 Hz
(-) | casi sin bajos - de media 24% inferior a la mediana
(±) | la linealidad de los graves es media (13.4% delta a frecuencia anterior)
Medios 400 - 2000 Hz
(+) | medios equilibrados - a sólo 4.7% de la mediana
(+) | los medios son lineales (6.2% delta a la frecuencia anterior)
Altos 2 - 16 kHz
(+) | máximos equilibrados - a sólo 2.5% de la mediana
(+) | los máximos son lineales (6.2% delta a la frecuencia anterior)
Total 100 - 16.000 Hz
(±) | la linealidad del sonido global es media (21.9% de diferencia con la mediana)
En comparación con la misma clase
» 79% de todos los dispositivos probados de esta clase eran mejores, 6% similares, 16% peores
» El mejor tuvo un delta de 6%, la media fue 18%, el peor fue ###max##%
En comparación con todos los dispositivos probados
» 63% de todos los dispositivos probados eran mejores, 7% similares, 31% peores
» El mejor tuvo un delta de 4%, la media fue 24%, el peor fue ###max##%
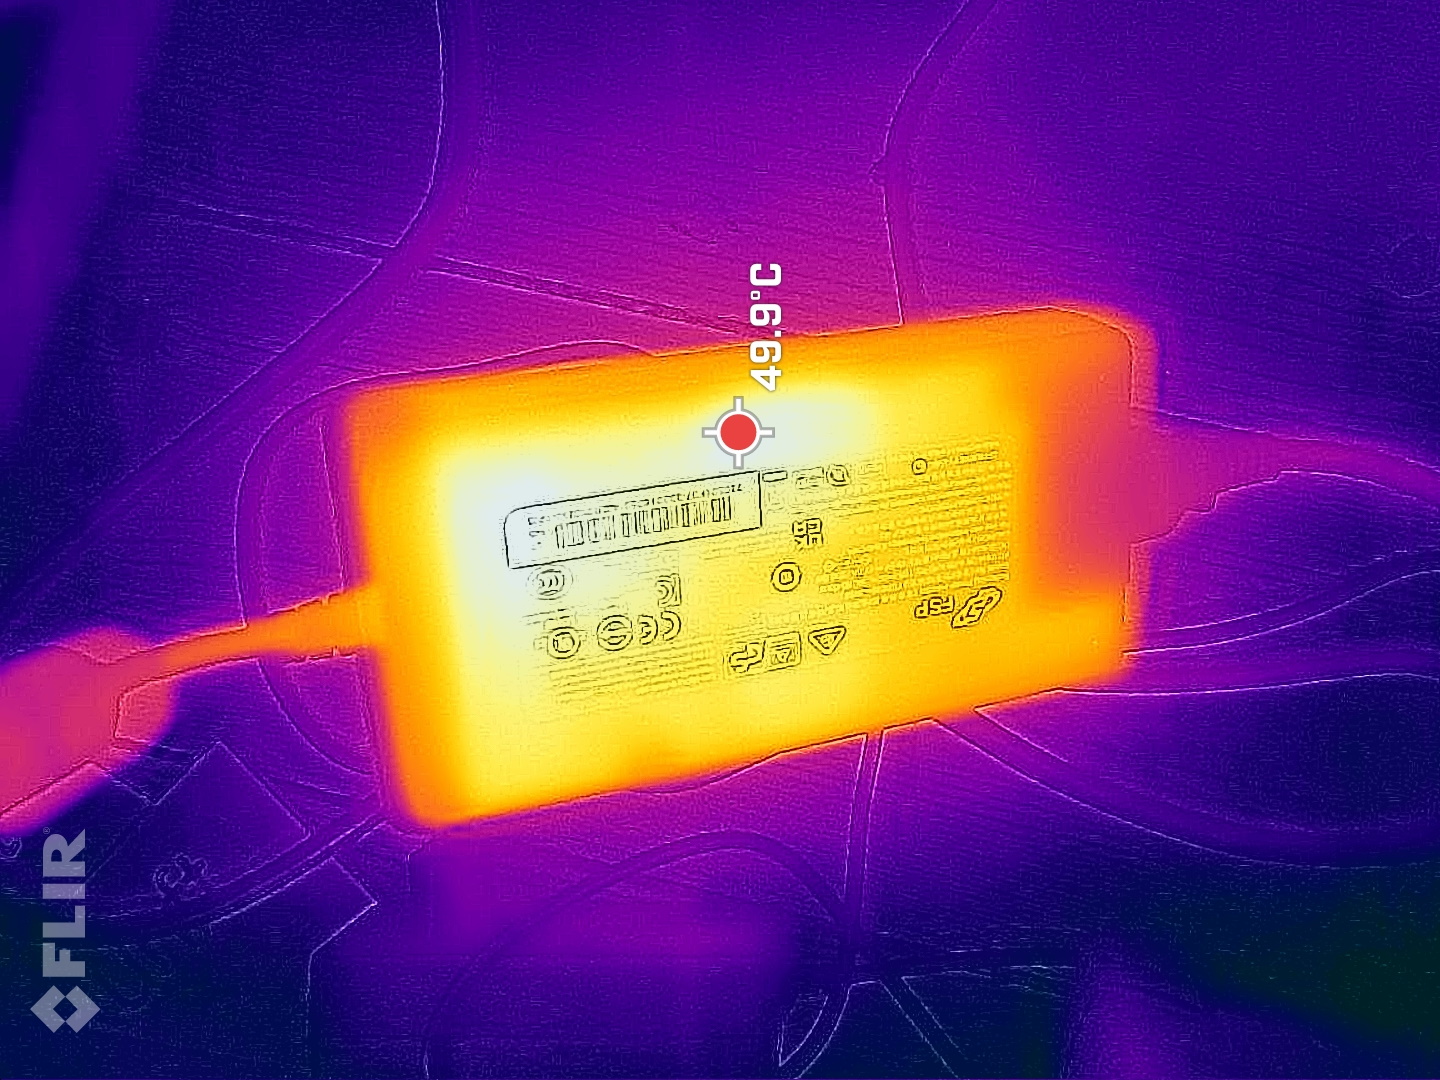
Consumo de energía
En modo inactivo, su consumo de energía es moderado - estamos acostumbrados a valores más altos de los últimos modelos XMG. Mientras juega, su consumo está ligado a su rendimiento, por lo que este portátil se sitúa entre elLenovo Legion Pro 5y el HP Omen Transcend 16por un lado, y entre el MSI Stealth 16 Studioy el HP Victus 16por otro.
Medimos un consumo máximo a corto plazo de 280 vatios - la fuente de alimentación de 230 vatios (ahora FSP en lugar de LiteOn) podría luchar bastante con esto. Sin embargo, el Core consume una media de 179 vatios cuando se ejecuta The Witcher 3 en Full HD Ultra, lo que significa que la fuente de alimentación debería tener reservas suficientes para los juegos y que siempre puede cargar el portátil de forma fiable. No obstante, medimos un consumo que superaba constantemente los 230 vatios durante los primeros minutos de la prueba de estrés - véase la curva a continuación.
| Off / Standby | |
| Ocioso | |
| Carga |
|
Clave:
min: | |
| Schenker XMG CORE 16 (L23) R7 7840HS, GeForce RTX 4070 Laptop GPU, Samsung 990 Pro 1 TB, IPS, 2560x1600, 16" | Lenovo Legion Pro 5 16ARX8 R7 7745HX, GeForce RTX 4070 Laptop GPU, Samsung PM9A1 MZVL21T0HCLR, IPS, 2560x1600, 16" | Acer Nitro 16 AN16-41 R7 7735HS, GeForce RTX 4070 Laptop GPU, Samsung PM9A1 MZVL21T0HCLR, IPS, 2560x1600, 16" | HP Omen Transcend 16 i9-13900HX, GeForce RTX 4070 Laptop GPU, SK hynix PC801 HFS002TEJ9X101N, Mini-LED, 2560x1600, 16" | MSI Stealth 16 Studio A13VG i7-13700H, GeForce RTX 4070 Laptop GPU, Micron 3400 2TB MTFDKBA2T0TFH, IPS, 2560x1600, 16" | HP Victus 16-r0077ng i7-13700H, GeForce RTX 4070 Laptop GPU, Kioxia XG8 KXG80ZNV1T02, IPS, 1920x1080, 16.1" | Medio NVIDIA GeForce RTX 4070 Laptop GPU | Media de la clase Gaming | |
|---|---|---|---|---|---|---|---|---|
| Power Consumption | -26% | -19% | -82% | -6% | 1% | -25% | -31% | |
| Idle Minimum * (Watt) | 11 | 8.1 26% | 11.6 -5% | 19.2 -75% | 11 -0% | 8 27% | 13.2 ? -20% | 13.2 ? -20% |
| Idle Average * (Watt) | 15.2 | 15.9 -5% | 15.6 -3% | 22.7 -49% | 18 -18% | 13 14% | 18.2 ? -20% | 18.9 ? -24% |
| Idle Maximum * (Watt) | 16 | 37.2 -133% | 16.5 -3% | 55.4 -246% | 19 -19% | 22 -38% | 24.6 ? -54% | 24.3 ? -52% |
| Load Average * (Watt) | 64 | 90.9 -42% | 155 -142% | 128.4 -101% | 91 -42% | 86 -34% | 97 ? -52% | 108 ? -69% |
| Witcher 3 ultra * (Watt) | 179 | 189.6 -6% | 154.8 14% | 206 -15% | 130 27% | 141.8 21% | ||
| Load Maximum * (Watt) | 280 | 263.5 6% | 205 27% | 292 -4% | 228 19% | 233 17% | 221 ? 21% | 254 ? 9% |
* ... más pequeño es mejor
Power consumption Witcher 3 / stress test
Power consumption with external monitor
Tiempos de ejecución
Schenker ha instalado una batería de 99 Wh en el portátil. ElLenovo Legion Pro 5 16sólo cuenta con un modelo de 80 Wh, pero algunos competidores como el MSI Stealth 16o el HP Omen Transcend 16disponen de baterías de igual capacidad.
Aún así, echamos en falta un modo de ahorro de energía en el Centro de Control - el modo equilibrado es el modo más bajo disponible. Aún así se consiguen buenos tiempos de ejecución. Nuestra película codificada en H.264 se reprodujo en bucle continuo durante más de 8 horas con el brillo reducido. El Core también logró casi 8,5 horas en la prueba WLAN a 150 nits. Sólo el Acer Nitro 16 pudo mantener el ritmo aquí.
| Schenker XMG CORE 16 (L23) R7 7840HS, GeForce RTX 4070 Laptop GPU, 99 Wh | Lenovo Legion Pro 5 16ARX8 R7 7745HX, GeForce RTX 4070 Laptop GPU, 80 Wh | Acer Nitro 16 AN16-41 R7 7735HS, GeForce RTX 4070 Laptop GPU, 90 Wh | HP Omen Transcend 16 i9-13900HX, GeForce RTX 4070 Laptop GPU, 97 Wh | MSI Stealth 16 Studio A13VG i7-13700H, GeForce RTX 4070 Laptop GPU, 99.9 Wh | HP Victus 16-r0077ng i7-13700H, GeForce RTX 4070 Laptop GPU, 83 Wh | Media de la clase Gaming | |
|---|---|---|---|---|---|---|---|
| Duración de Batería | -55% | -6% | -50% | -11% | -15% | -25% | |
| H.264 (h) | 10.2 | 10.2 0% | 7.7 -25% | 8.26 ? -19% | |||
| WiFi v1.3 (h) | 8.4 | 4 -52% | 9 7% | 4.2 -50% | 7.8 -7% | 7.1 -15% | 7.02 ? -16% |
| Load (h) | 2.4 | 1 -58% | 1.8 -25% | 1.2 -50% | 2.4 0% | 1.47 ? -39% | |
| Reader / Idle (h) | 6.5 | 12.2 | 6.3 | 11 | 8.71 ? |
Pro
Contra
Veredicto - Un gran portátil para juegos sin mayores debilidades
los portátiles de 16 pulgadas con una RTX 4070 parten de unos 1.600 dólares. Esto no hace que el Core 16 sea del todo barato (véase más abajo). A cambio, sí ofrece un buen rendimiento 3D, una de las unidades SSD más rápidas del mercado, un teclado mecánico opcional, un buen panel sRGB de 1.600p con valores DeltaE bajos y mucho más. Es un portátil para juegos muy completo cuyo rendimiento es el adecuado. Para niveles de rendimiento aún mejores, tendría que ser un procesador HX, ya que la RTX 4070 rinde de maravilla.
Hay que mirar el aparato más de cerca para encontrar algún punto criticable. Su fuente de alimentación de 230 vatios puede verse sobrecargada en escenarios extremos; al menos, superó sus especificaciones durante bastantes minutos durante nuestra prueba de estrés. Mientras jugaba, esto no supuso ningún problema. No se ha perfeccionado del todo su modo equilibrado, que sólo funcionó realmente tras un minuto de juego y el rendimiento se hundió hasta el nivel de la batería.
El XMG Core 16 demostró ser un buen portátil para juegos en todas nuestras pruebas, con su potente RTX 4070 y una pantalla sRGB muy bien calibrada.
El mayor competidor del Core 16 es elLenovo Legion Pro 5 16ARX8que lo hizo igual de bien en muchas áreas, pero cuesta menos. Por otro lado, no tiene unos tiempos de ejecución tan buenos.
Precio y disponibilidad
Puede comprar los portátiles de Schenker a través de bestware.com. Nuestra configuración puede conseguirse por unos 2.360 dólares.
Schenker XMG CORE 16 (L23)
- 10/05/2023 v7 (old)
Christian Hintze
Transparencia
La selección de los dispositivos que se van a reseñar corre a cargo de nuestro equipo editorial. La muestra de prueba fue proporcionada al autor en calidad de préstamo por el fabricante o el minorista a los efectos de esta reseña. El prestamista no tuvo ninguna influencia en esta reseña, ni el fabricante recibió una copia de la misma antes de su publicación. No había ninguna obligación de publicar esta reseña. Como empresa de medios independiente, Notebookcheck no está sujeta a la autoridad de fabricantes, minoristas o editores.
Así es como prueba Notebookcheck
Cada año, Notebookcheck revisa de forma independiente cientos de portátiles y smartphones utilizando procedimientos estandarizados para asegurar que todos los resultados son comparables. Hemos desarrollado continuamente nuestros métodos de prueba durante unos 20 años y hemos establecido los estándares de la industria en el proceso. En nuestros laboratorios de pruebas, técnicos y editores experimentados utilizan equipos de medición de alta calidad. Estas pruebas implican un proceso de validación en varias fases. Nuestro complejo sistema de clasificación se basa en cientos de mediciones y puntos de referencia bien fundamentados, lo que mantiene la objetividad.Price comparison

