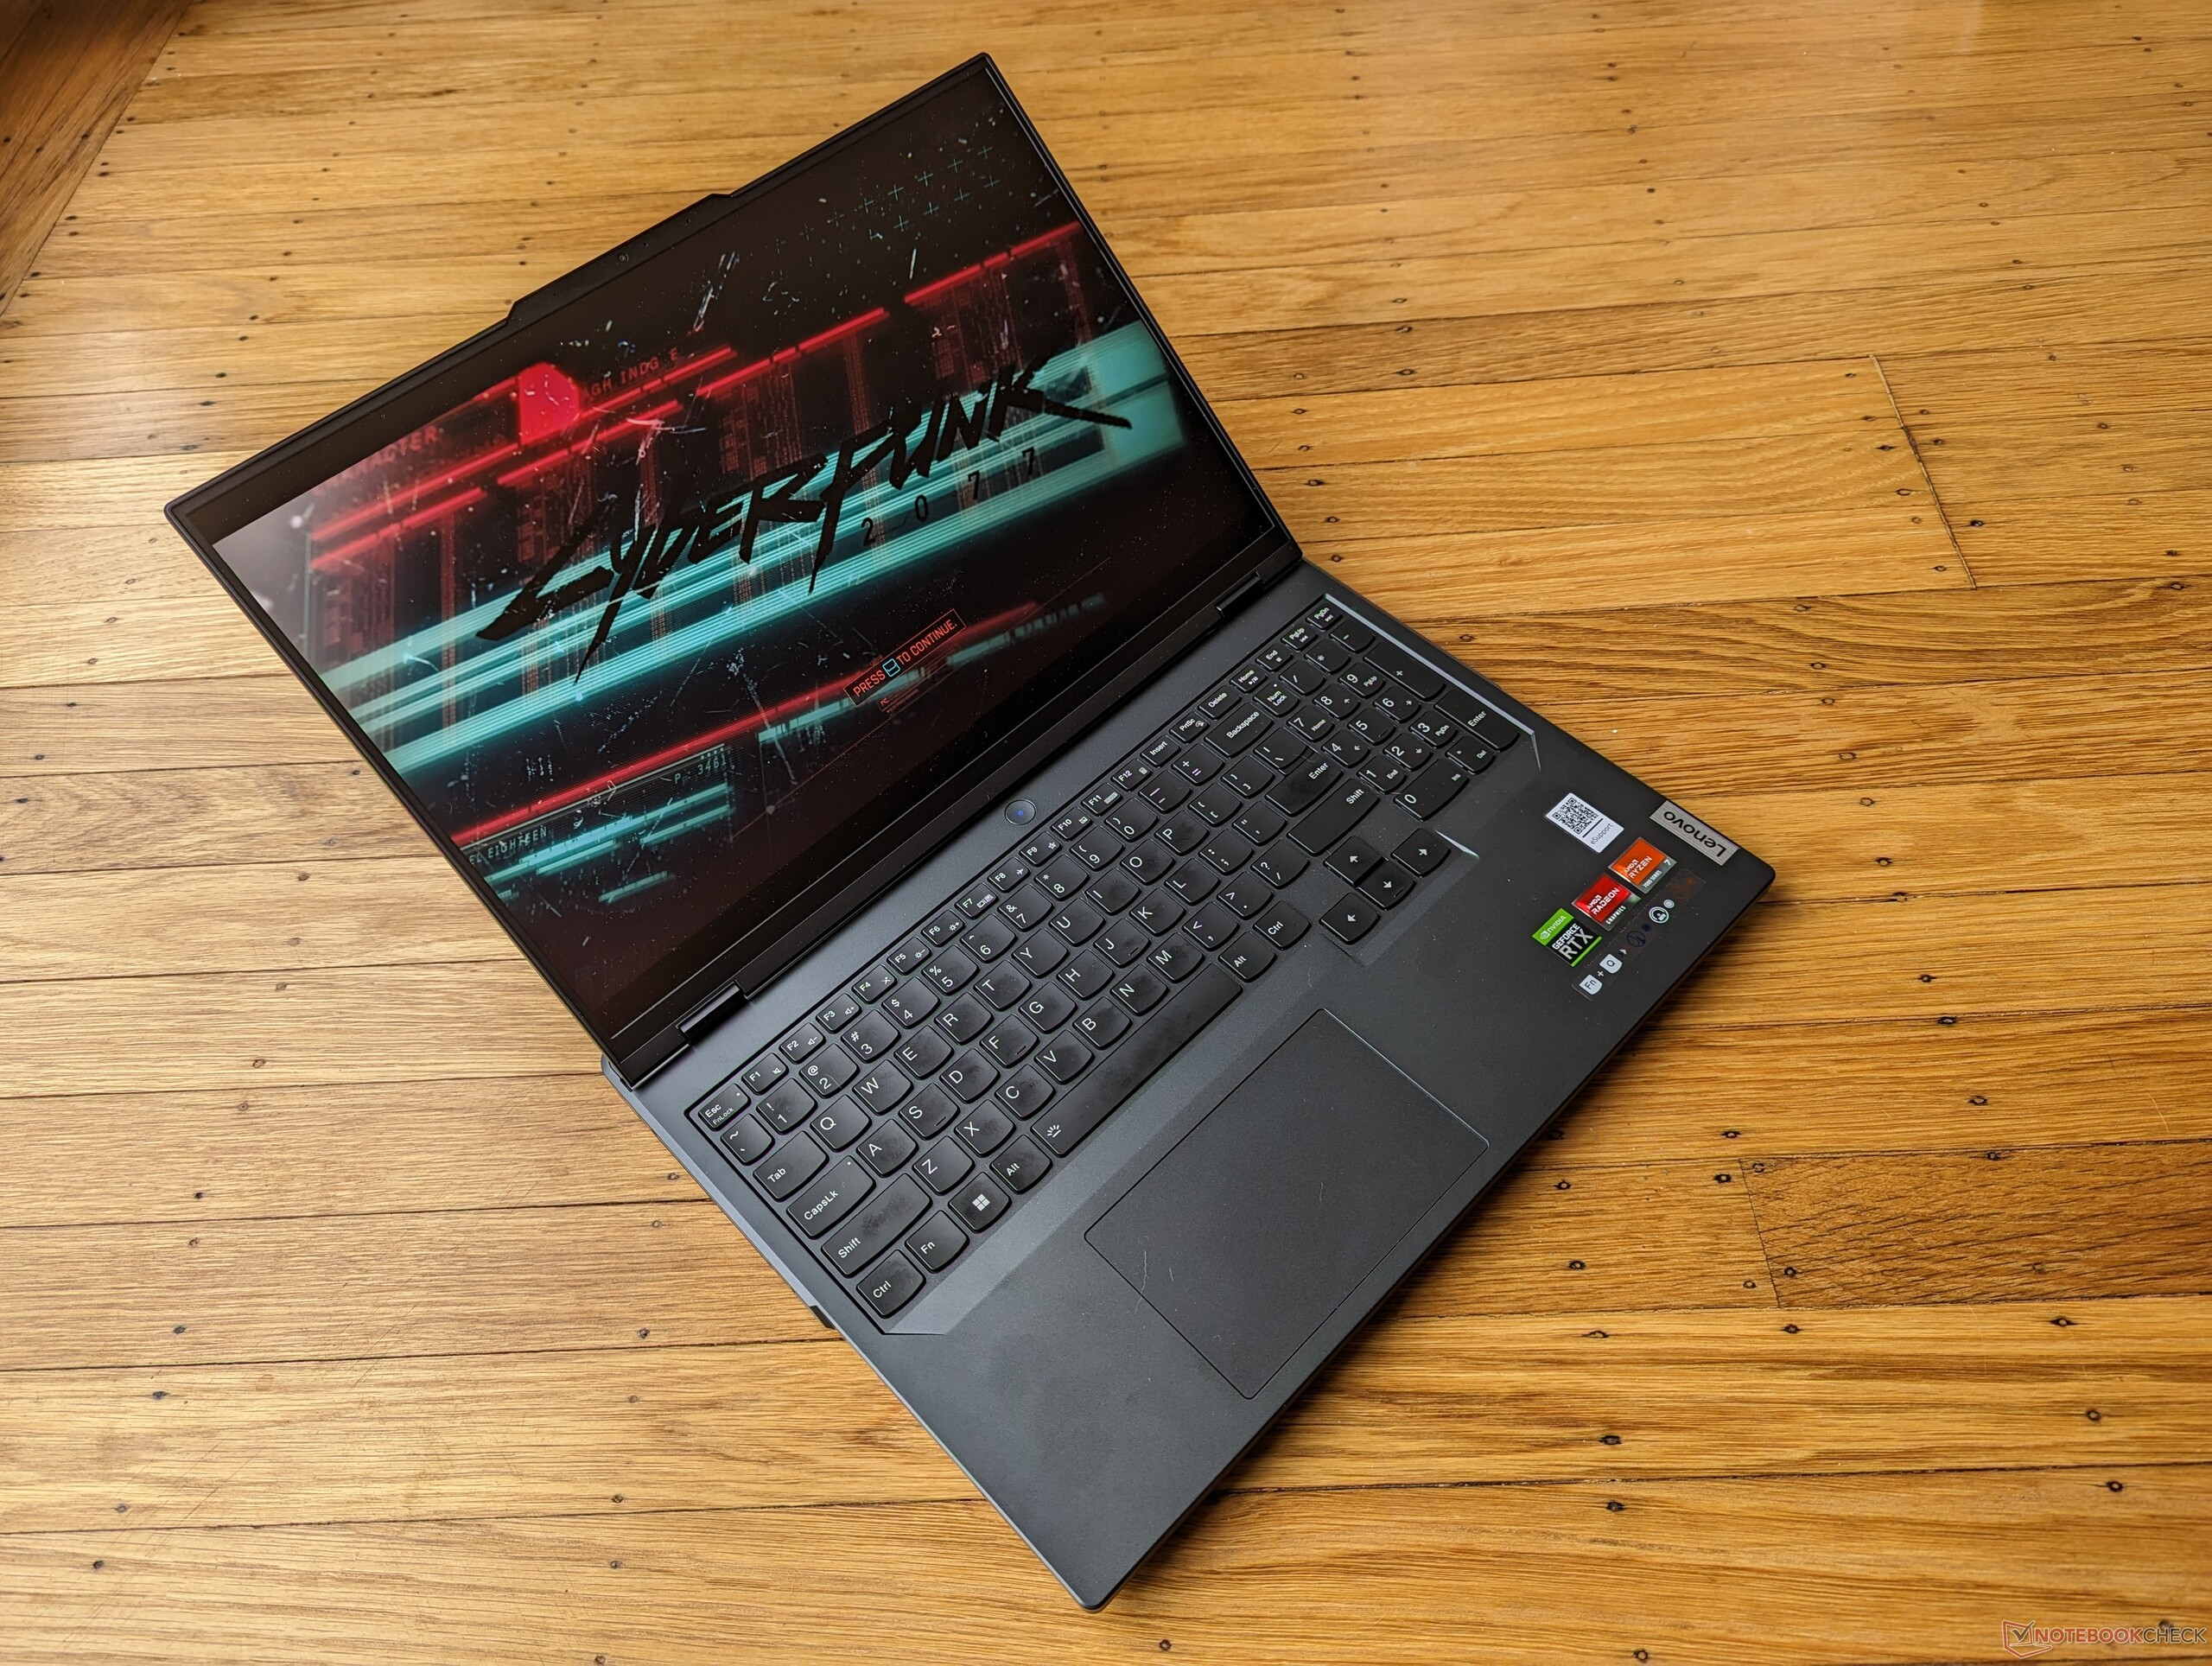
Debut del rendimiento de Ryzen 7 7745HX: Análisis del portátil Lenovo Legion Pro 5 16 Gen 8

El Lenovo Legion Pro 5 16ARX8 es la versión AMD del Intel Legion Pro 5 16IRX8. Ambos modelos utilizan el mismo chasis Legion Pro 5 16 Gen 8 y, por lo demás, son visualmente idénticos. Recomendamos consultar nuestro análisis existente sobre el Legion Pro 5 16IRX8 para obtener más información sobre las características físicas del modelo, ya que muchos de nuestros comentarios siguen siendo válidos para el Legion Pro 5 16ARX8.
Nuestra unidad de pruebas es una configuración de gama alta con la CPU Zen 4 Ryzen 7 7745HX, GPU GeForce RTX 4070 de 140 W y pantalla IPS 1600p de 165 Hz que se vende por unos 1600 dólares. Otras SKU pueden incluir Ryzen 5 7645HX, GeForce RTX 4050 o pantalla IPS de 240 Hz. Este modelo en concreto es uno de los primeros en incluir el Ryzen 7 7745HX de gama media, mientras que los anteriores Zen 4 solo estaban disponibles con el Ryzen 9 7945HX, más caro.
Entre sus competidores se encuentran otros portátiles para juegos de gama media y alta como el Asus ROG Strix G16, Razer Blade 16, Uniwill GM6PX7Xo MSI Pulse GL76. La serie Legion 7 está un paso por encima de nuestro Legion Pro 5 con opciones de CPU y GPU mucho más rápidas entre las que elegir.
Más análisis de Lenovo:
Posibles contendientes en la comparación
Valoración | Fecha | Modelo | Peso | Altura | Tamaño | Resolución | Precio |
|---|---|---|---|---|---|---|---|
| 88.4 % v7 (old) | 05/2023 | Lenovo Legion Pro 5 16ARX8 R7 7745HX, GeForce RTX 4070 Laptop GPU | 2.5 kg | 26.8 mm | 16.00" | 2560x1600 | |
| 87.9 % v7 (old) | 05/2023 | Lenovo Legion Pro 5 16IRX8 i7-13700HX, GeForce RTX 4060 Laptop GPU | 2.5 kg | 26.8 mm | 16.00" | 2560x1600 | |
| 88.2 % v7 (old) | 03/2023 | Uniwill GM6PX7X RTX 4070 i7-13700HX, GeForce RTX 4070 Laptop GPU | 2.2 kg | 22 mm | 16.00" | 2560x1600 | |
| 87.7 % v7 (old) | 04/2023 | Schenker XMG Neo 16 E23 i9-13900HX, GeForce RTX 4090 Laptop GPU | 2.5 kg | 29.9 mm | 16.00" | 2560x1600 | |
| 88.4 % v7 (old) | 03/2023 | Asus ROG Strix G16 G614JZ i9-13980HX, GeForce RTX 4080 Laptop GPU | 2.4 kg | 30.4 mm | 16.00" | 2560x1600 | |
| 88 % v7 (old) | 04/2023 | Asus Zephyrus Duo 16 GX650PY-NM006W R9 7945HX, GeForce RTX 4090 Laptop GPU | 2.7 kg | 29.7 mm | 16.00" | 2560x1600 |
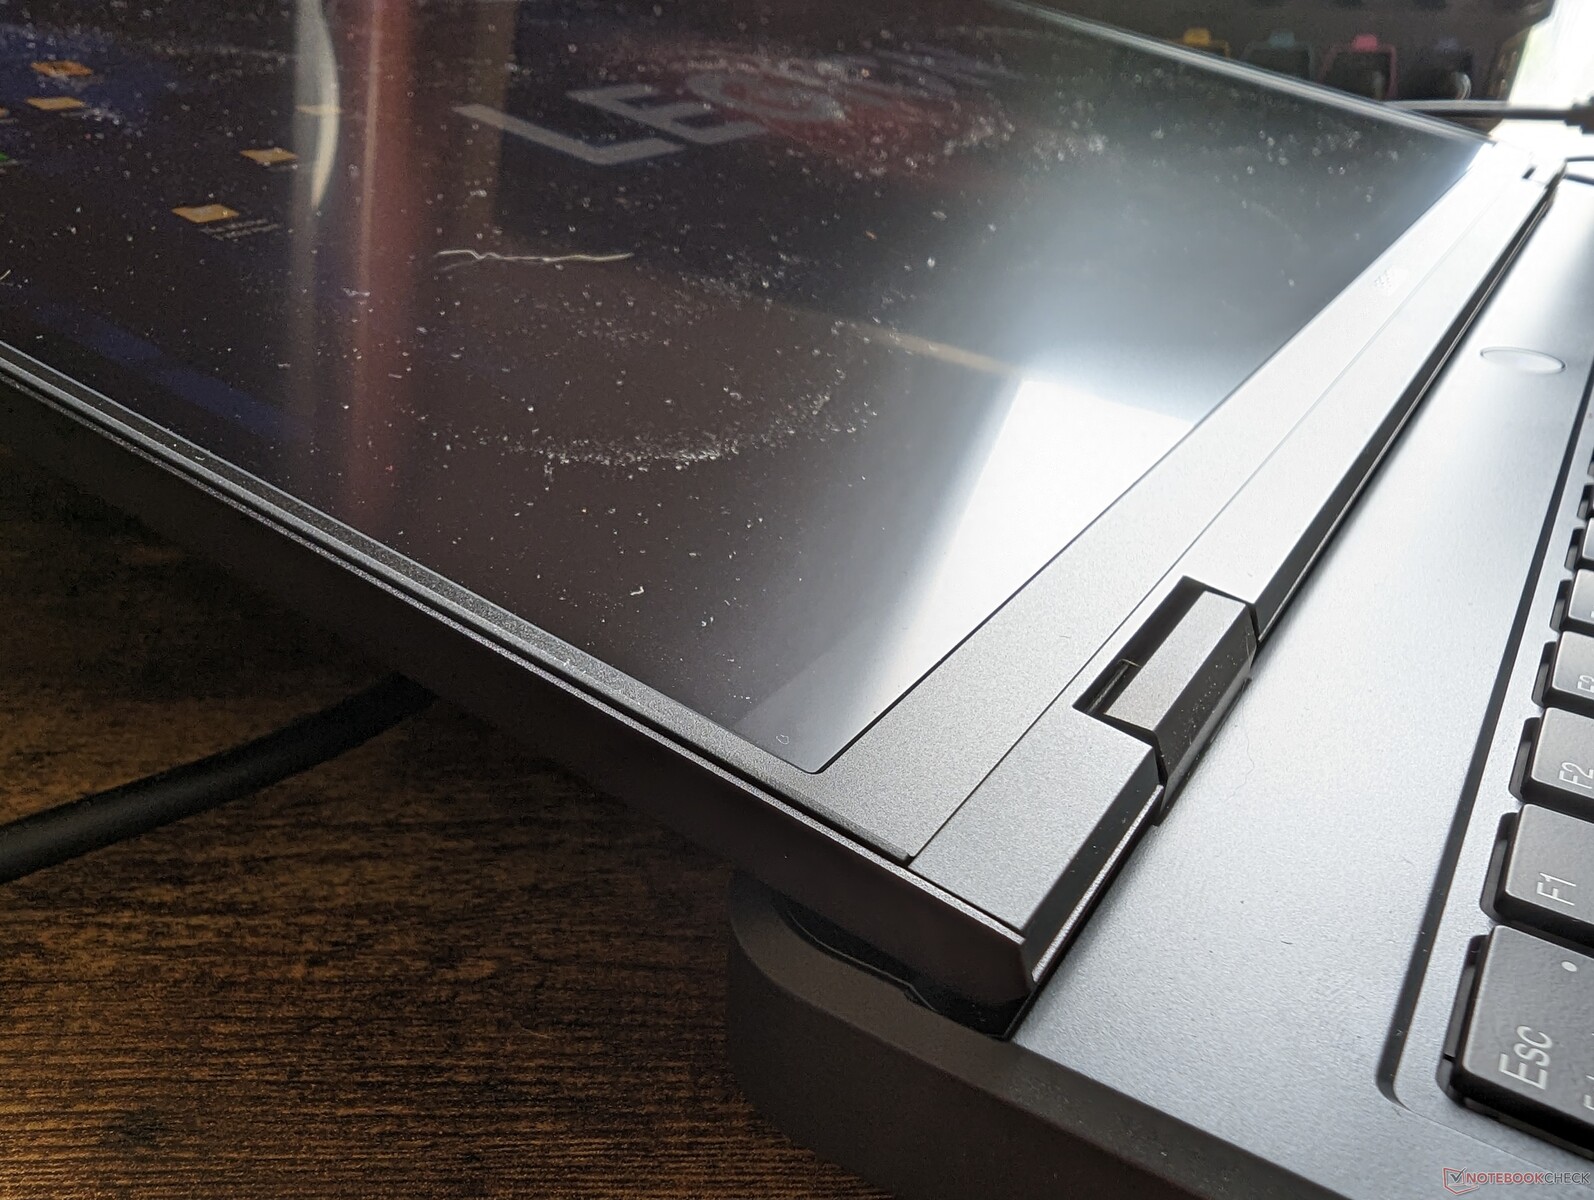
Caja - Mismo aspecto con puertos idénticos
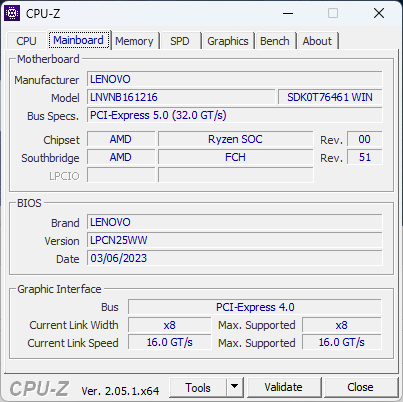
El AMD Legion Pro 5 16ARX8 comparte el mismo chasis que el Intel Legion Pro 5 16IRX8. Aunque suele haber algunas diferencias de puertos entre la mayoría de variantes AMD e Intel, en realidad no hay ninguna entre estos dos modelos ya que Lenovo ha optado por excluir tanto el soporte USB 4 como Thunderbolt en todas las SKU Legion 5 Pro independientemente de la opción de CPU. Esto puede verse como una forma de forzar a los usuarios a considerar la serie Legion 7, más cara, que incluye soporte Thunderbolt por defecto.
Comunicación
El modelo AMD sustituye el común Intel AX211 por el menos común MediaTek MT7922. Por lo demás, el rendimiento es estable y fiable cuando se conecta a nuestra red de 6 GHz.
| Networking | |
| iperf3 transmit AXE11000 | |
| Schenker XMG Neo 16 E23 | |
| Asus ROG Strix G16 G614JZ | |
| Lenovo Legion Pro 5 16ARX8 | |
| Uniwill GM6PX7X RTX 4070 | |
| Lenovo Legion Pro 5 16IRX8 | |
| iperf3 receive AXE11000 | |
| Schenker XMG Neo 16 E23 | |
| Asus ROG Strix G16 G614JZ | |
| Lenovo Legion Pro 5 16ARX8 | |
| Uniwill GM6PX7X RTX 4070 | |
| Lenovo Legion Pro 5 16IRX8 | |
| iperf3 transmit AXE11000 6GHz | |
| Asus Zephyrus Duo 16 GX650PY-NM006W | |
| Lenovo Legion Pro 5 16ARX8 | |
| Lenovo Legion Pro 5 16IRX8 | |
| iperf3 receive AXE11000 6GHz | |
| Asus Zephyrus Duo 16 GX650PY-NM006W | |
| Lenovo Legion Pro 5 16ARX8 | |
| Lenovo Legion Pro 5 16IRX8 | |
Cámara web


Mantenimiento
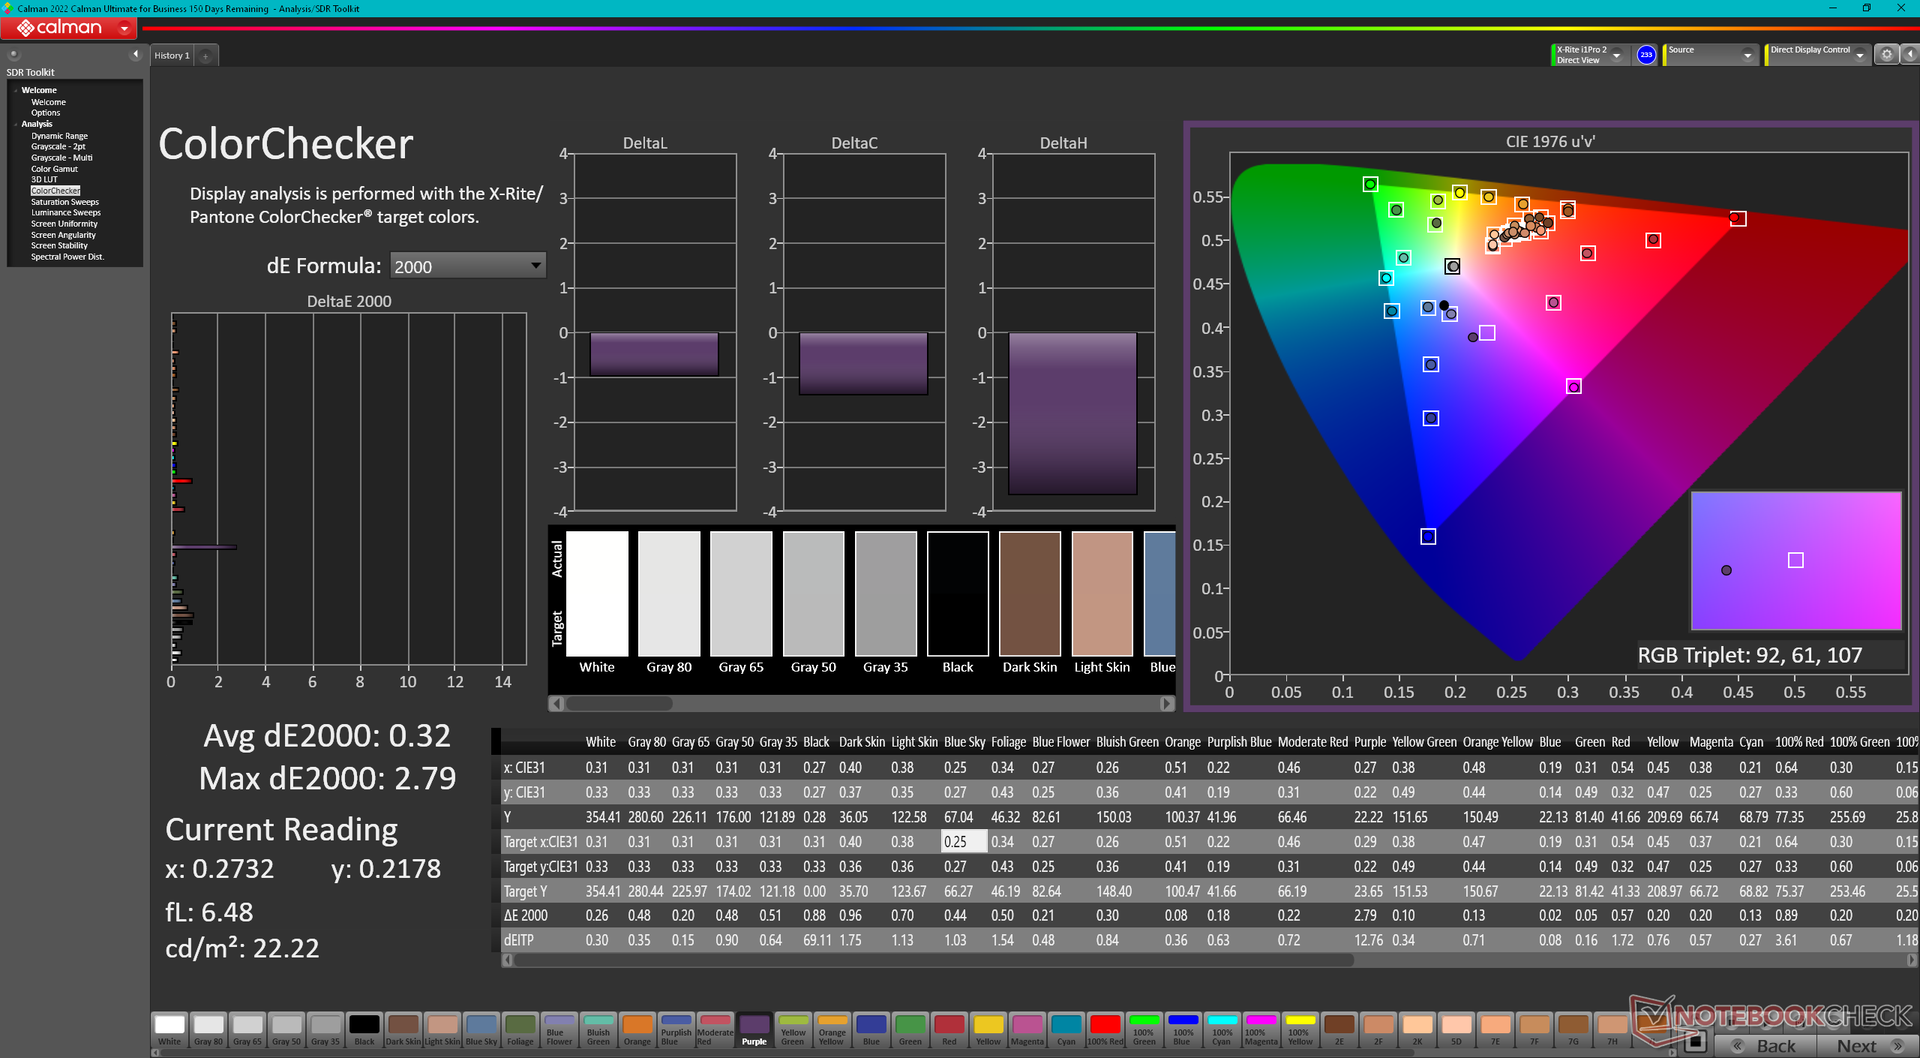
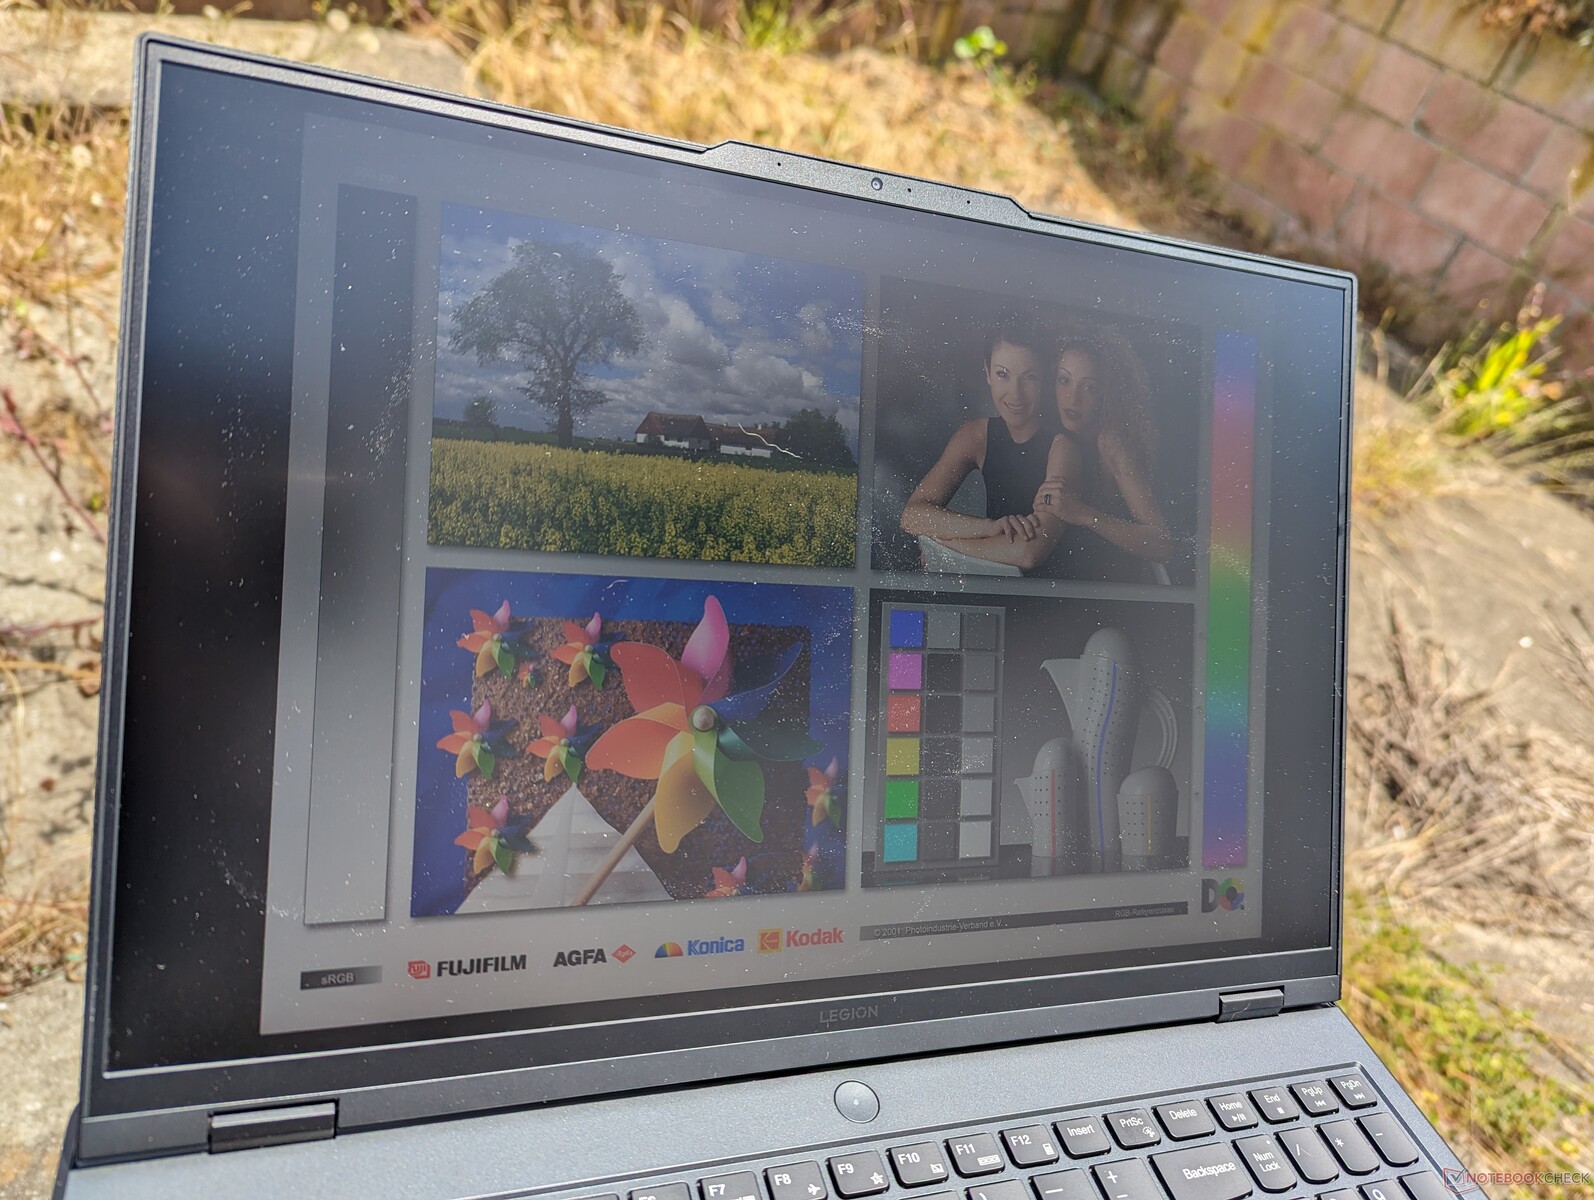
Pantalla - 165 Hz, 1600p y Full sRGB
Curiosamente, nuestro Legion Pro 5 16ARX8 con AMD usa un panel IPS diferente al del Legion Pro 5 16IRX8 con Intel (CSOT MNG007DA1-Q vs. AU Optronics B160QAN03.1) aunque ambos paneles tienen una tasa de refresco nativa similar de 165 Hz, resolución nativa 1600p, ratio de contraste ~1000:1, y cobertura sRGB completa del 100%. El panel CSOT tiene tiempos de respuesta ligeramente más rápidos en blanco y negro y gris, pero las diferencias son marginales en el mejor de los casos para una experiencia de visualización esencialmente idéntica.
Hay disponible un segundo panel que promete una retroiluminación aún más brillante de 500 nits y una frecuencia de refresco más rápida de 240 Hz. Nuestras mediciones reflejan sólo el panel básico de 165 Hz.

| |||||||||||||||||||||||||
iluminación: 91 %
Brillo con batería: 355.3 cd/m²
Contraste: 1110:1 (Negro: 0.32 cd/m²)
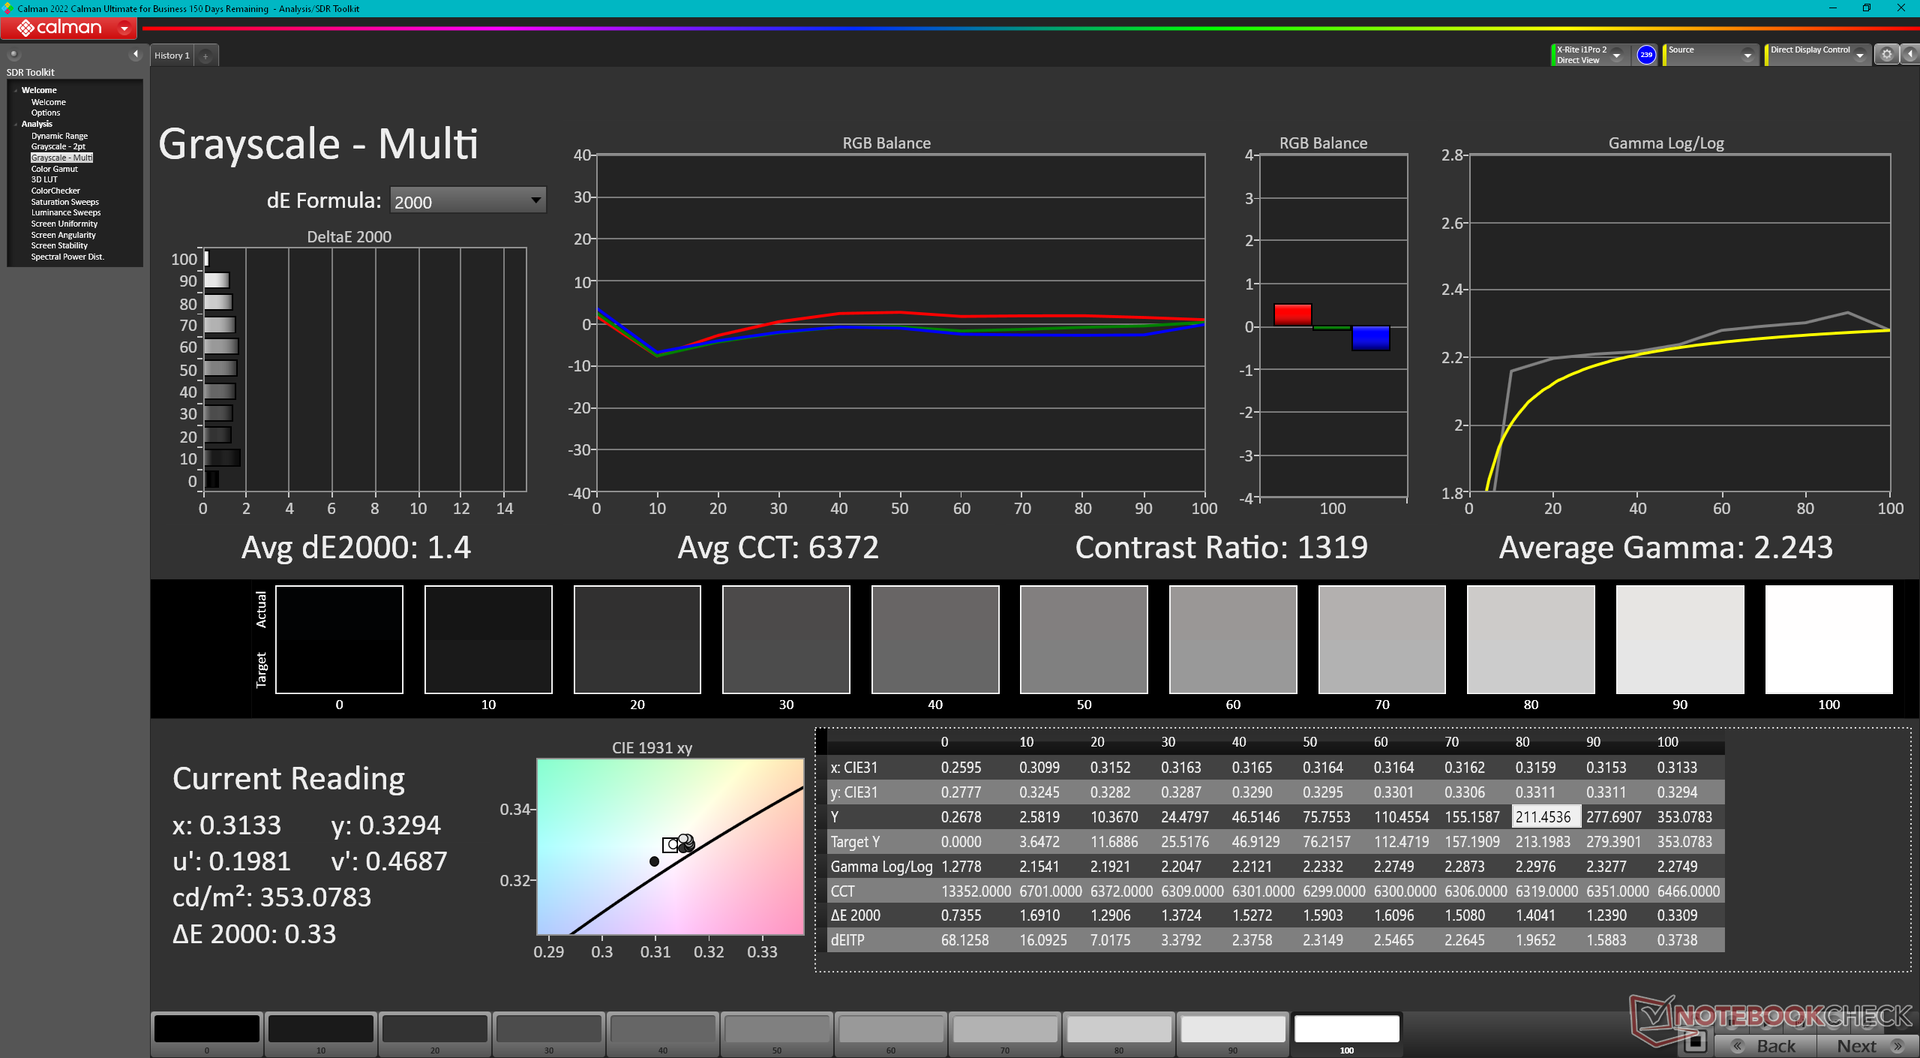
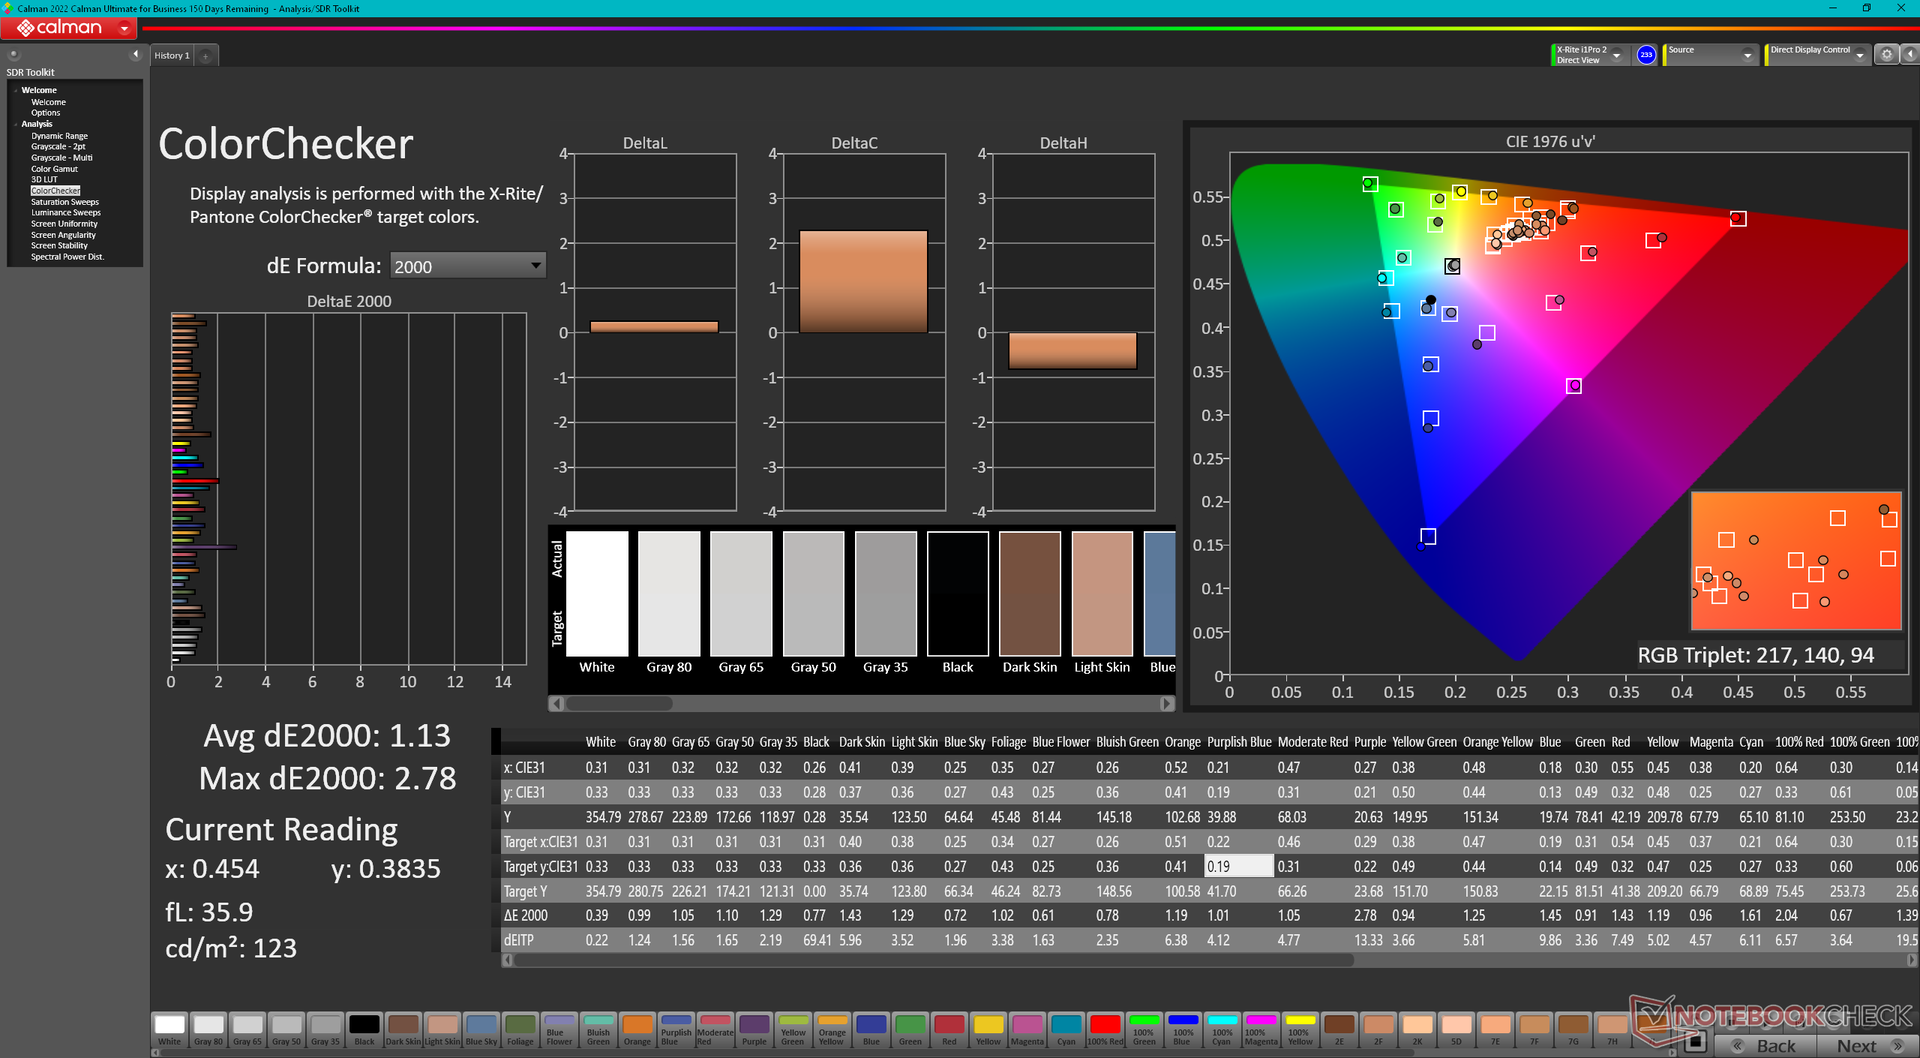
ΔE ColorChecker Calman: 1.13 | ∀{0.5-29.43 Ø4.72}
calibrated: 0.32
ΔE Greyscale Calman: 1.4 | ∀{0.09-98 Ø4.97}
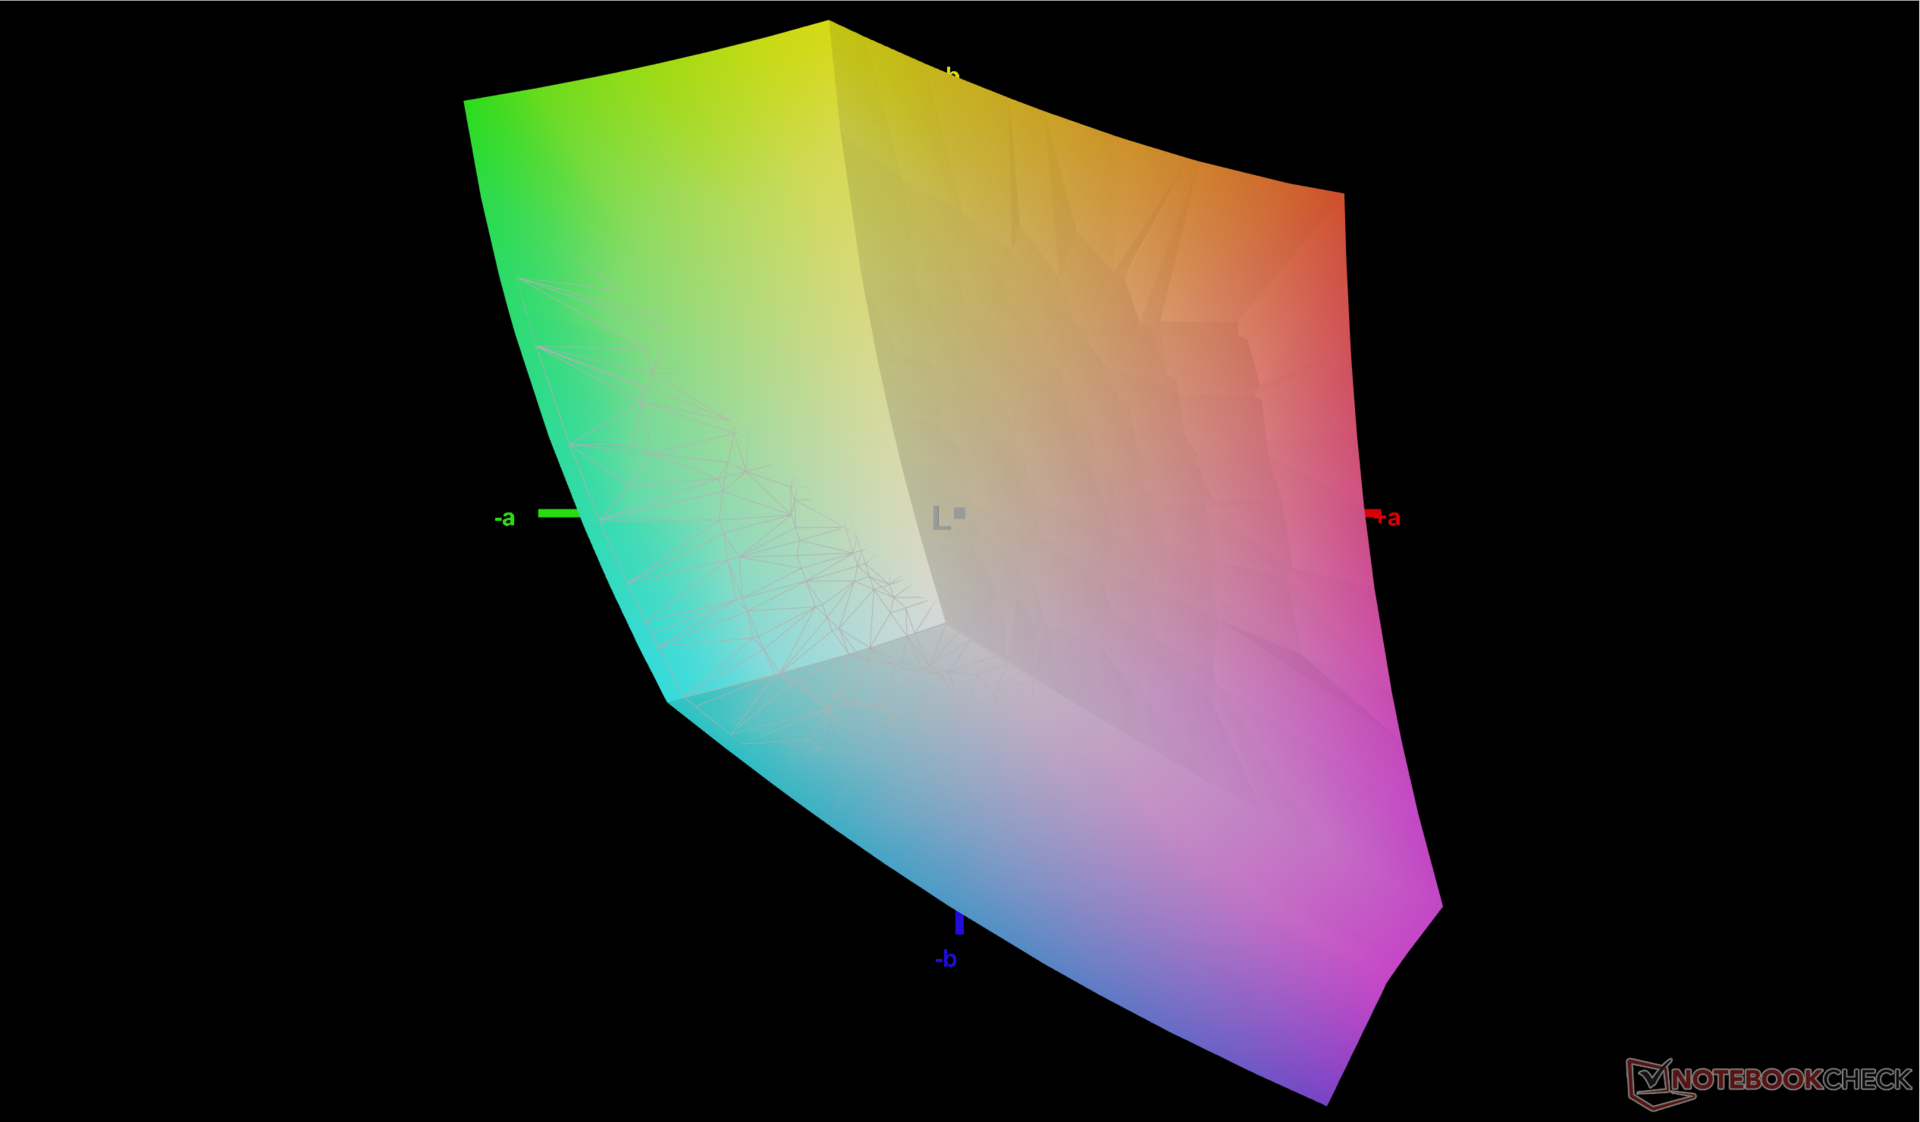
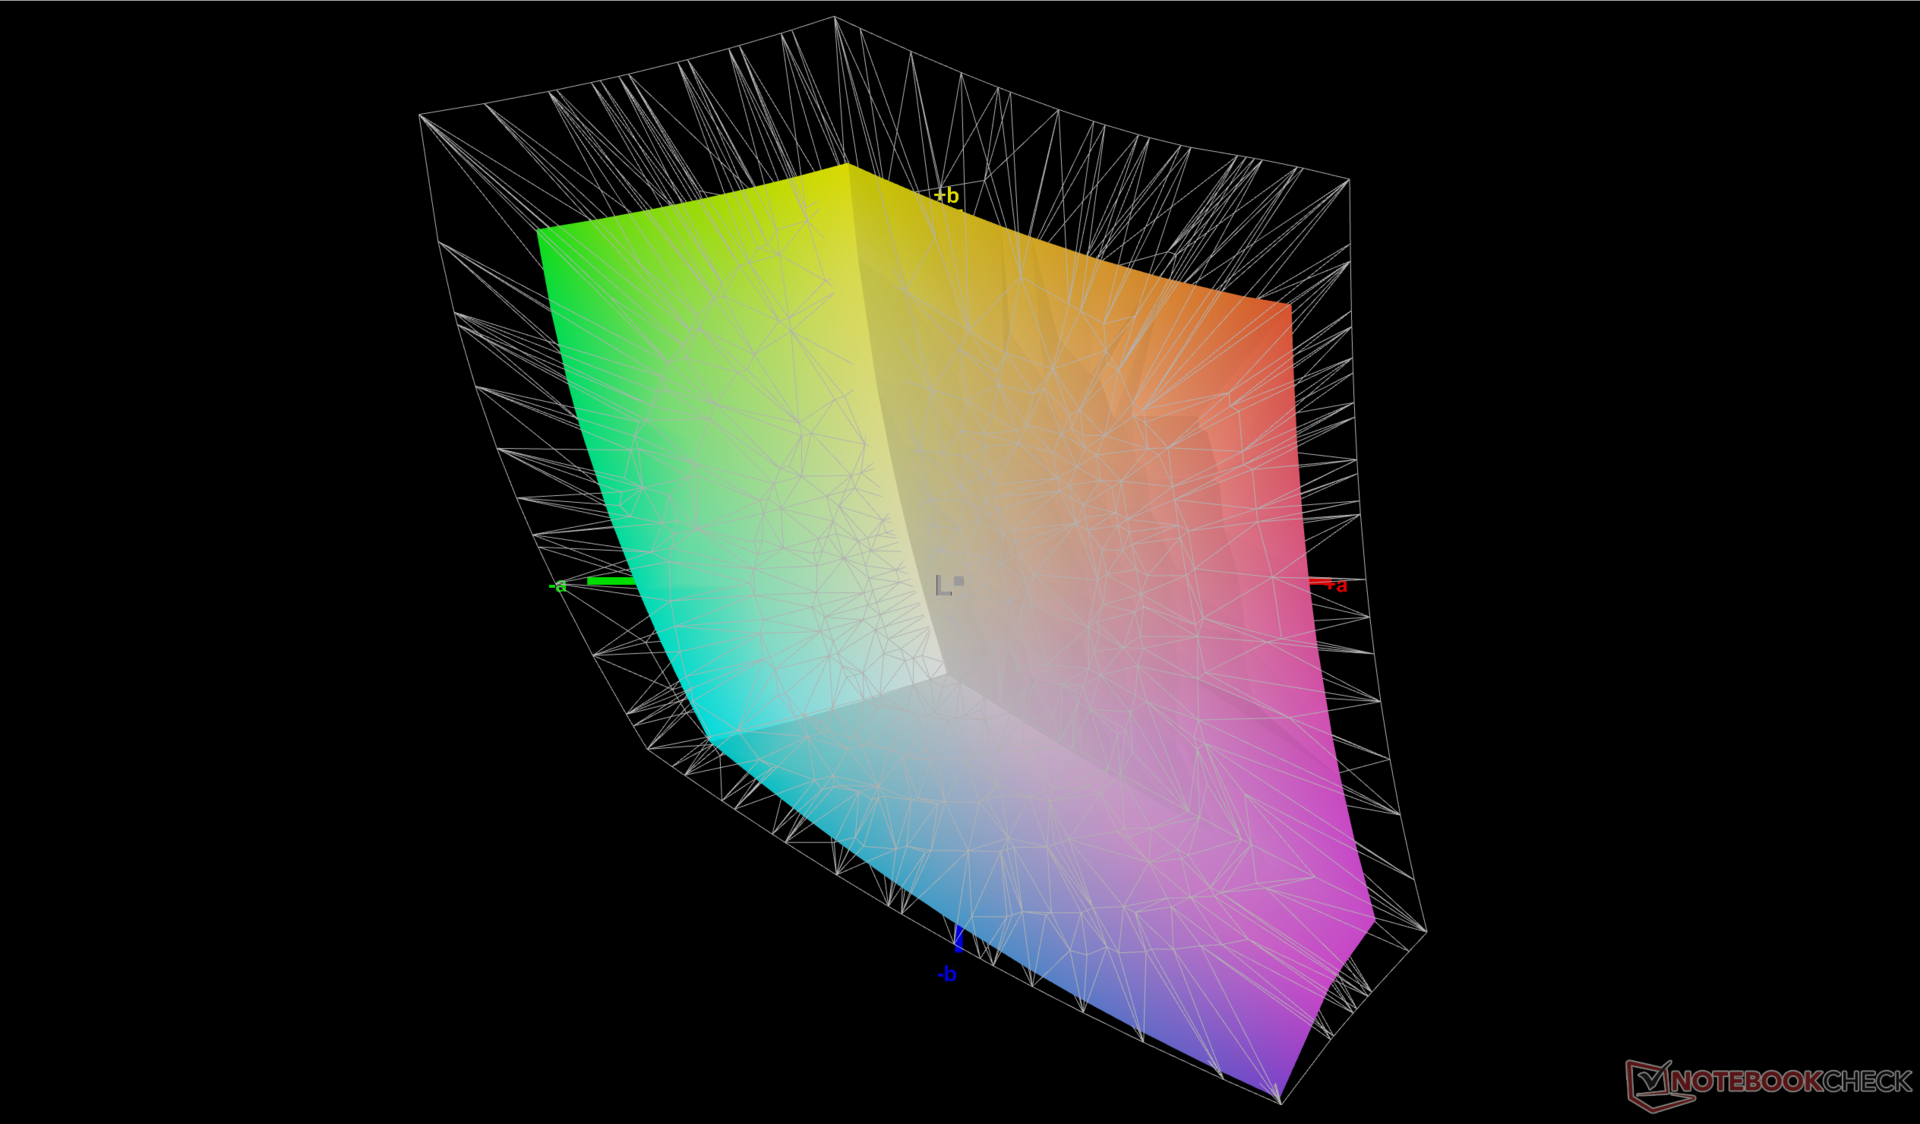
72.6% AdobeRGB 1998 (Argyll 3D)
99.6% sRGB (Argyll 3D)
70.4% Display P3 (Argyll 3D)
Gamma: 2.24
CCT: 6372 K
| Lenovo Legion Pro 5 16ARX8 CSOT T3 MNG007DA1-Q, IPS, 2560x1600, 16" | Lenovo Legion Pro 5 16IRX8 AU Optronics B160QAN03.1, IPS, 2560x1600, 16" | Uniwill GM6PX7X RTX 4070 BOE CQ NE160QDM-NZ1, IPS, 2560x1600, 16" | Schenker XMG Neo 16 E23 BOE0AF0 NE160QDM-NZ1, IPS, 2560x1600, 16" | Asus ROG Strix G16 G614JZ TL160ADMP03-0, IPS, 2560x1600, 16" | Asus Zephyrus Duo 16 GX650PY-NM006W NE160QDM-NM4, MiniLED, 2560x1600, 16" | |
|---|---|---|---|---|---|---|
| Display | 0% | -4% | -4% | 18% | 22% | |
| Display P3 Coverage (%) | 70.4 | 71.2 1% | 67.5 -4% | 67.3 -4% | 97 38% | 99.4 41% |
| sRGB Coverage (%) | 99.6 | 98.8 -1% | 96.4 -3% | 96.7 -3% | 99.9 0% | 100 0% |
| AdobeRGB 1998 Coverage (%) | 72.6 | 73.3 1% | 68.6 -6% | 68.9 -5% | 84.9 17% | 90.8 25% |
| Response Times | -61% | -44% | -51% | 27% | -113% | |
| Response Time Grey 50% / Grey 80% * (ms) | 7 ? | 14.5 ? -107% | 12.6 ? -80% | 14.5 ? -107% | 5.1 ? 27% | 15.2 ? -117% |
| Response Time Black / White * (ms) | 9.1 ? | 10.4 ? -14% | 9.8 ? -8% | 8.6 ? 5% | 6.6 ? 27% | 19 ? -109% |
| PWM Frequency (Hz) | 12000 ? | |||||
| Screen | -17% | -69% | -54% | -39% | 71% | |
| Brightness middle (cd/m²) | 355.3 | 405.7 14% | 338.6 -5% | 372 5% | 470 32% | 712 100% |
| Brightness (cd/m²) | 340 | 368 8% | 328 -4% | 349 3% | 459 35% | 703 107% |
| Brightness Distribution (%) | 91 | 87 -4% | 89 -2% | 88 -3% | 93 2% | 95 4% |
| Black Level * (cd/m²) | 0.32 | 0.38 -19% | 0.32 -0% | 0.32 -0% | 0.42 -31% | 0.07 78% |
| Contrast (:1) | 1110 | 1068 -4% | 1058 -5% | 1163 5% | 1119 1% | 10171 816% |
| Colorchecker dE 2000 * | 1.13 | 1.65 -46% | 2.18 -93% | 2.06 -82% | 1.86 -65% | 1.7 -50% |
| Colorchecker dE 2000 max. * | 2.78 | 4.2 -51% | 7.14 -157% | 3 -8% | 3.87 -39% | 4 -44% |
| Colorchecker dE 2000 calibrated * | 0.32 | 0.53 -66% | 0.93 -191% | 1.5 -369% | 0.93 -191% | 1.2 -275% |
| Greyscale dE 2000 * | 1.4 | 1.2 14% | 3.7 -164% | 1.9 -36% | 2.7 -93% | 2.8 -100% |
| Gamma | 2.24 98% | 2.3 96% | 2.18 101% | 2.312 95% | 2.246 98% | 2.21 100% |
| CCT | 6372 102% | 6453 101% | 7245 90% | 6747 96% | 6711 97% | 6978 93% |
| Media total (Programa/Opciones) | -26% /
-20% | -39% /
-52% | -36% /
-43% | 2% /
-17% | -7% /
34% |
* ... más pequeño es mejor
La pantalla viene precalibrada de fábrica con unos excelentes valores DeltaE medios de escala de grises y color de sólo 1,4 y 1,13, respectivamente. Si se intenta calibrar aún más la pantalla con nuestro colorímetro X-Rite, los valores deltaE de la escala de grises y del color mejoran hasta <0,5 cada uno. Aun así, una calibración por parte del usuario final no suele ser necesaria si los valores deltaE ya son <2.
Tiempos de respuesta del display
| ↔ Tiempo de respuesta de Negro a Blanco | ||
|---|---|---|
| 9.1 ms ... subida ↗ y bajada ↘ combinada | ↗ 4.9 ms subida | 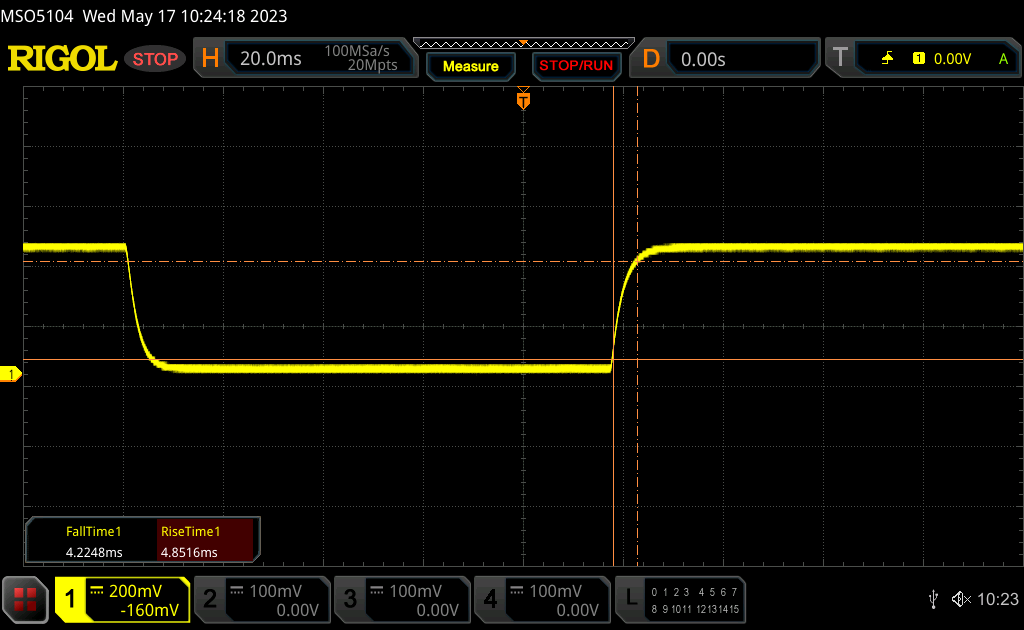 |
| ↘ 4.2 ms bajada | ||
| La pantalla mostró tiempos de respuesta rápidos en nuestros tests y debería ser adecuada para juegos. En comparación, todos los dispositivos de prueba van de ##min### (mínimo) a 240 (máximo) ms. » 25 % de todos los dispositivos son mejores. Esto quiere decir que el tiempo de respuesta medido es mejor que la media (19.8 ms) de todos los dispositivos testados. | ||
| ↔ Tiempo de respuesta 50% Gris a 80% Gris | ||
| 7 ms ... subida ↗ y bajada ↘ combinada | ↗ 3.2 ms subida | 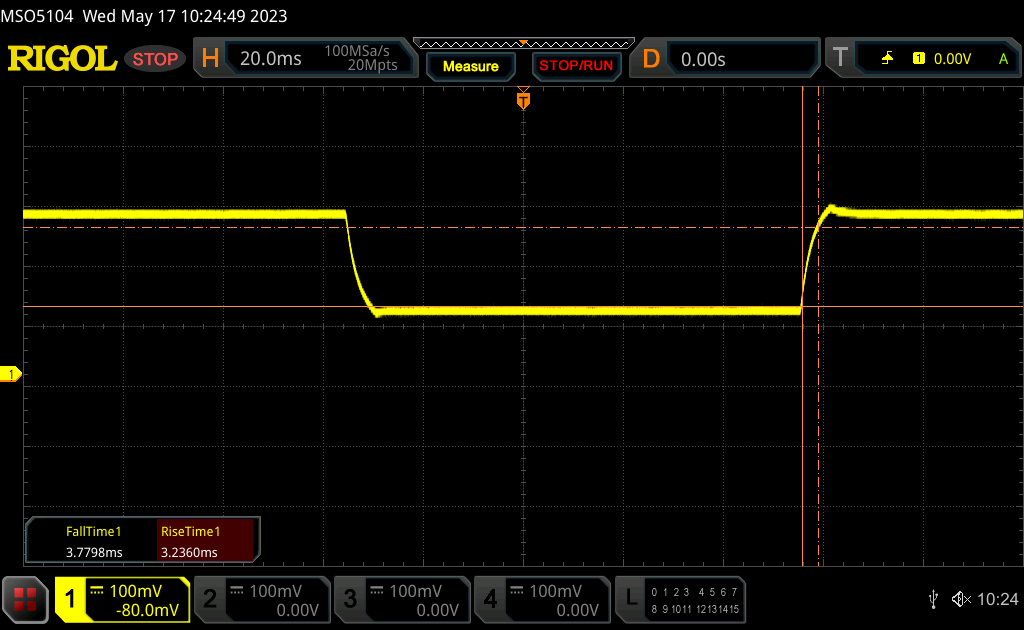 |
| ↘ 3.8 ms bajada | ||
| La pantalla mostró tiempos de respuesta muy rápidos en nuestros tests y debería ser adecuada para juegos frenéticos. En comparación, todos los dispositivos de prueba van de ##min### (mínimo) a 636 (máximo) ms. » 20 % de todos los dispositivos son mejores. Esto quiere decir que el tiempo de respuesta medido es mejor que la media (31 ms) de todos los dispositivos testados. | ||
Parpadeo de Pantalla / PWM (Pulse-Width Modulation)
| Parpadeo de Pantalla / PWM no detectado | 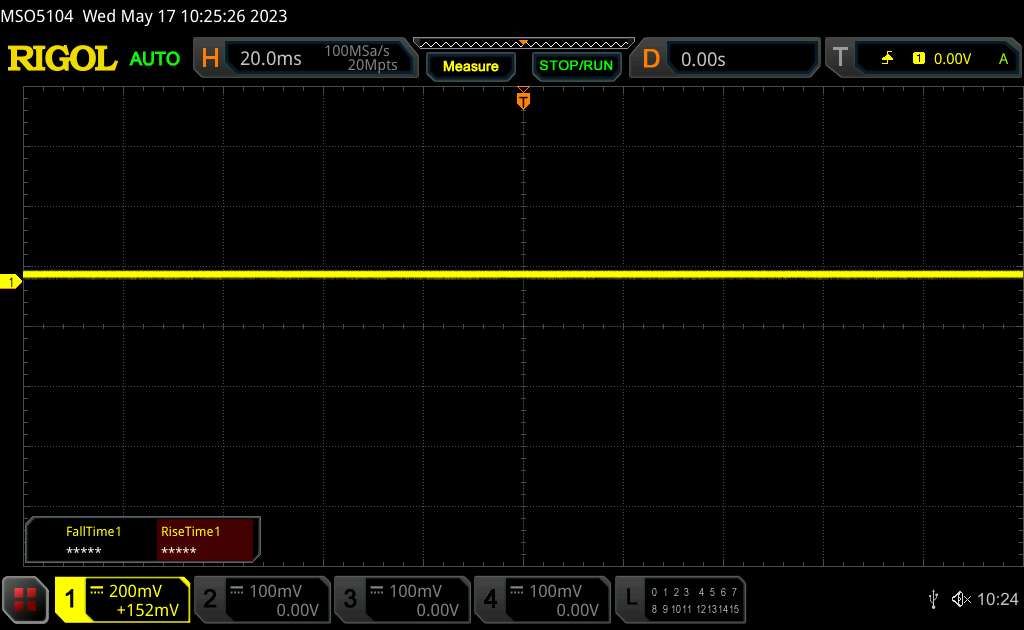 | ||
Comparación: 52 % de todos los dispositivos testados no usaron PWM para atenuar el display. Si se usó, medimos una media de 7781 (mínimo: 5 - máxmo: 343500) Hz. | |||
La visibilidad en exteriores está en la media de la categoría, ya que las pantallas de la mayoría de portátiles de juego suelen oscilar entre 300 y 400 nits. La opción de panel de 240 Hz promete 500 nits o unos 200 nits más que nuestro panel de 165 Hz, lo que debería mejorar la visibilidad en exteriores si es un problema. En cualquier caso, conviene trabajar a la sombra siempre que sea posible para minimizar los reflejos y conservar los colores.

Rendimiento - Zen 4 Ryzen 7 de gama media

Condiciones de ensayo
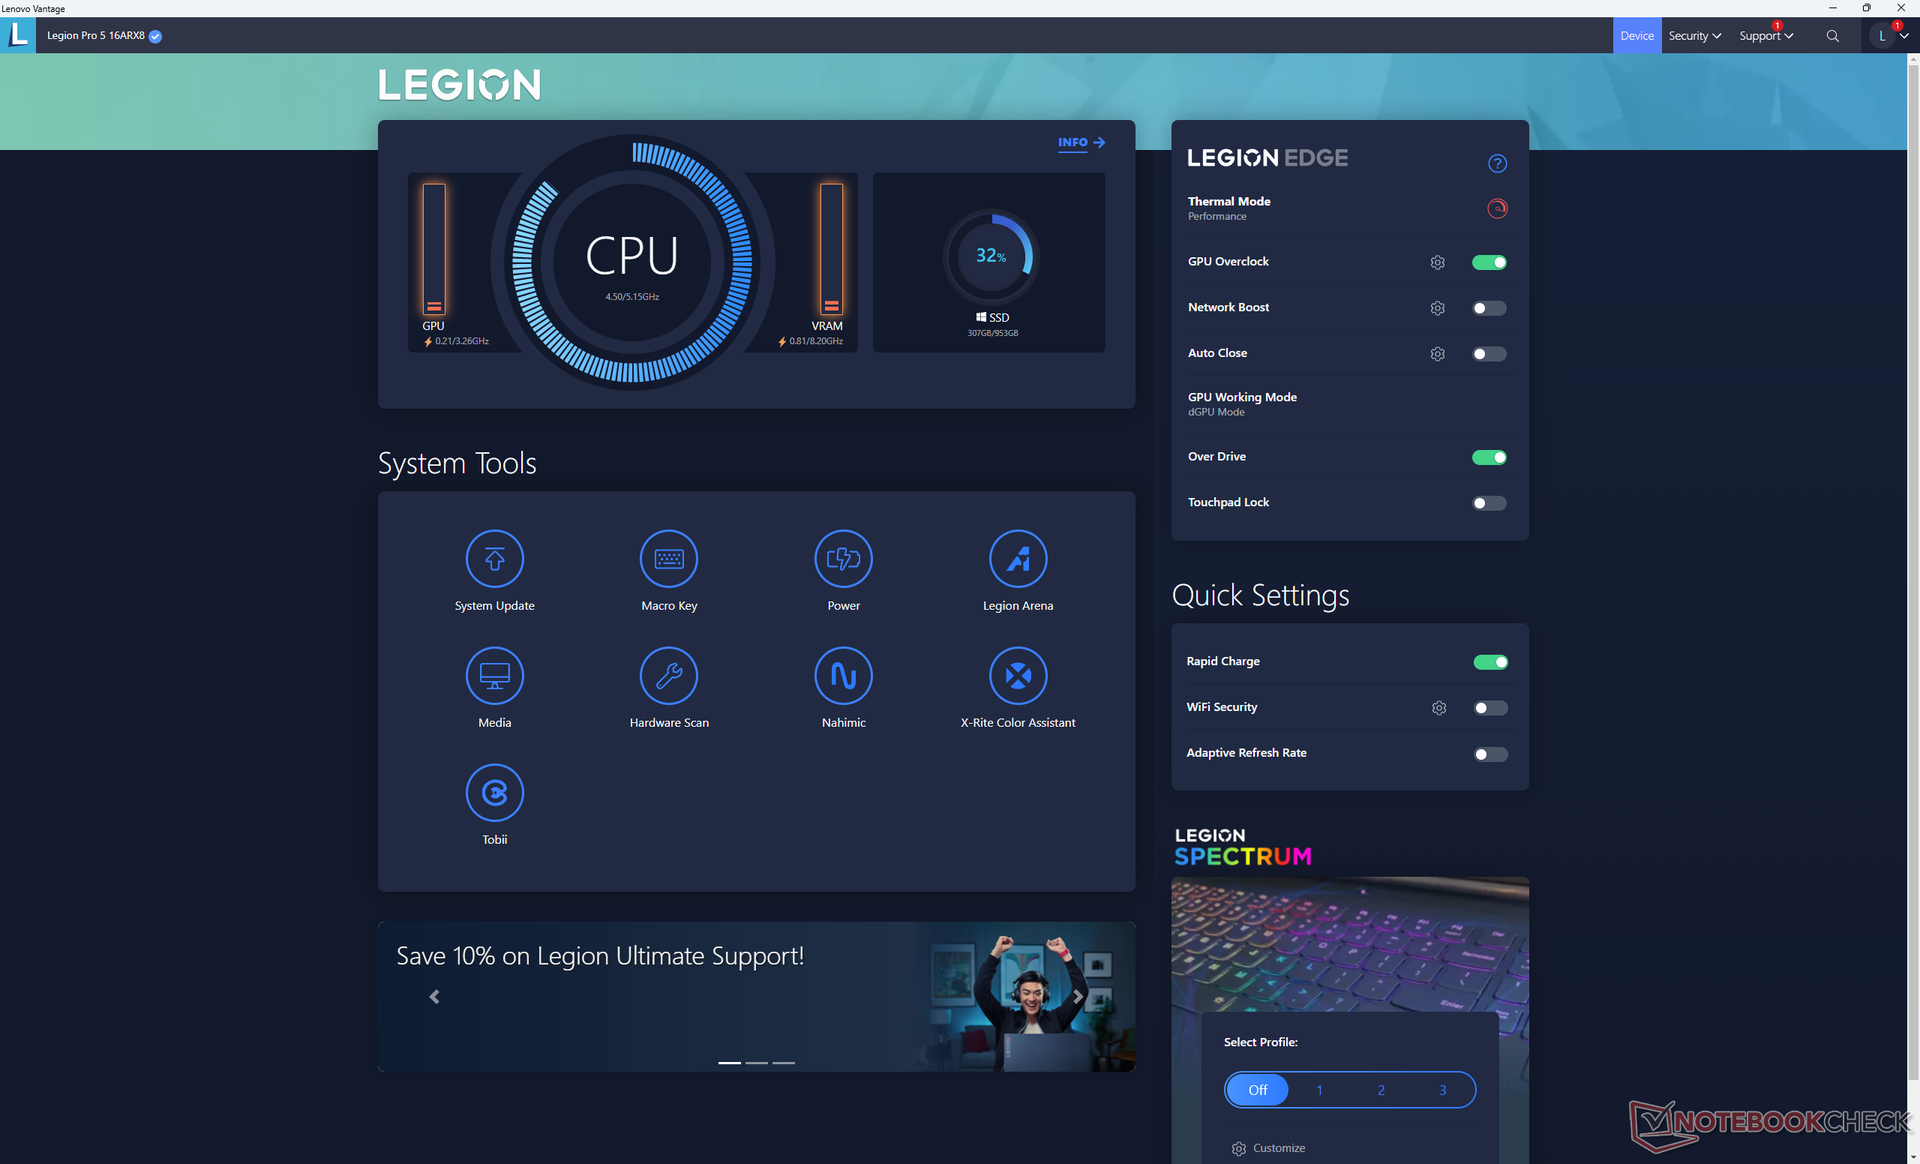
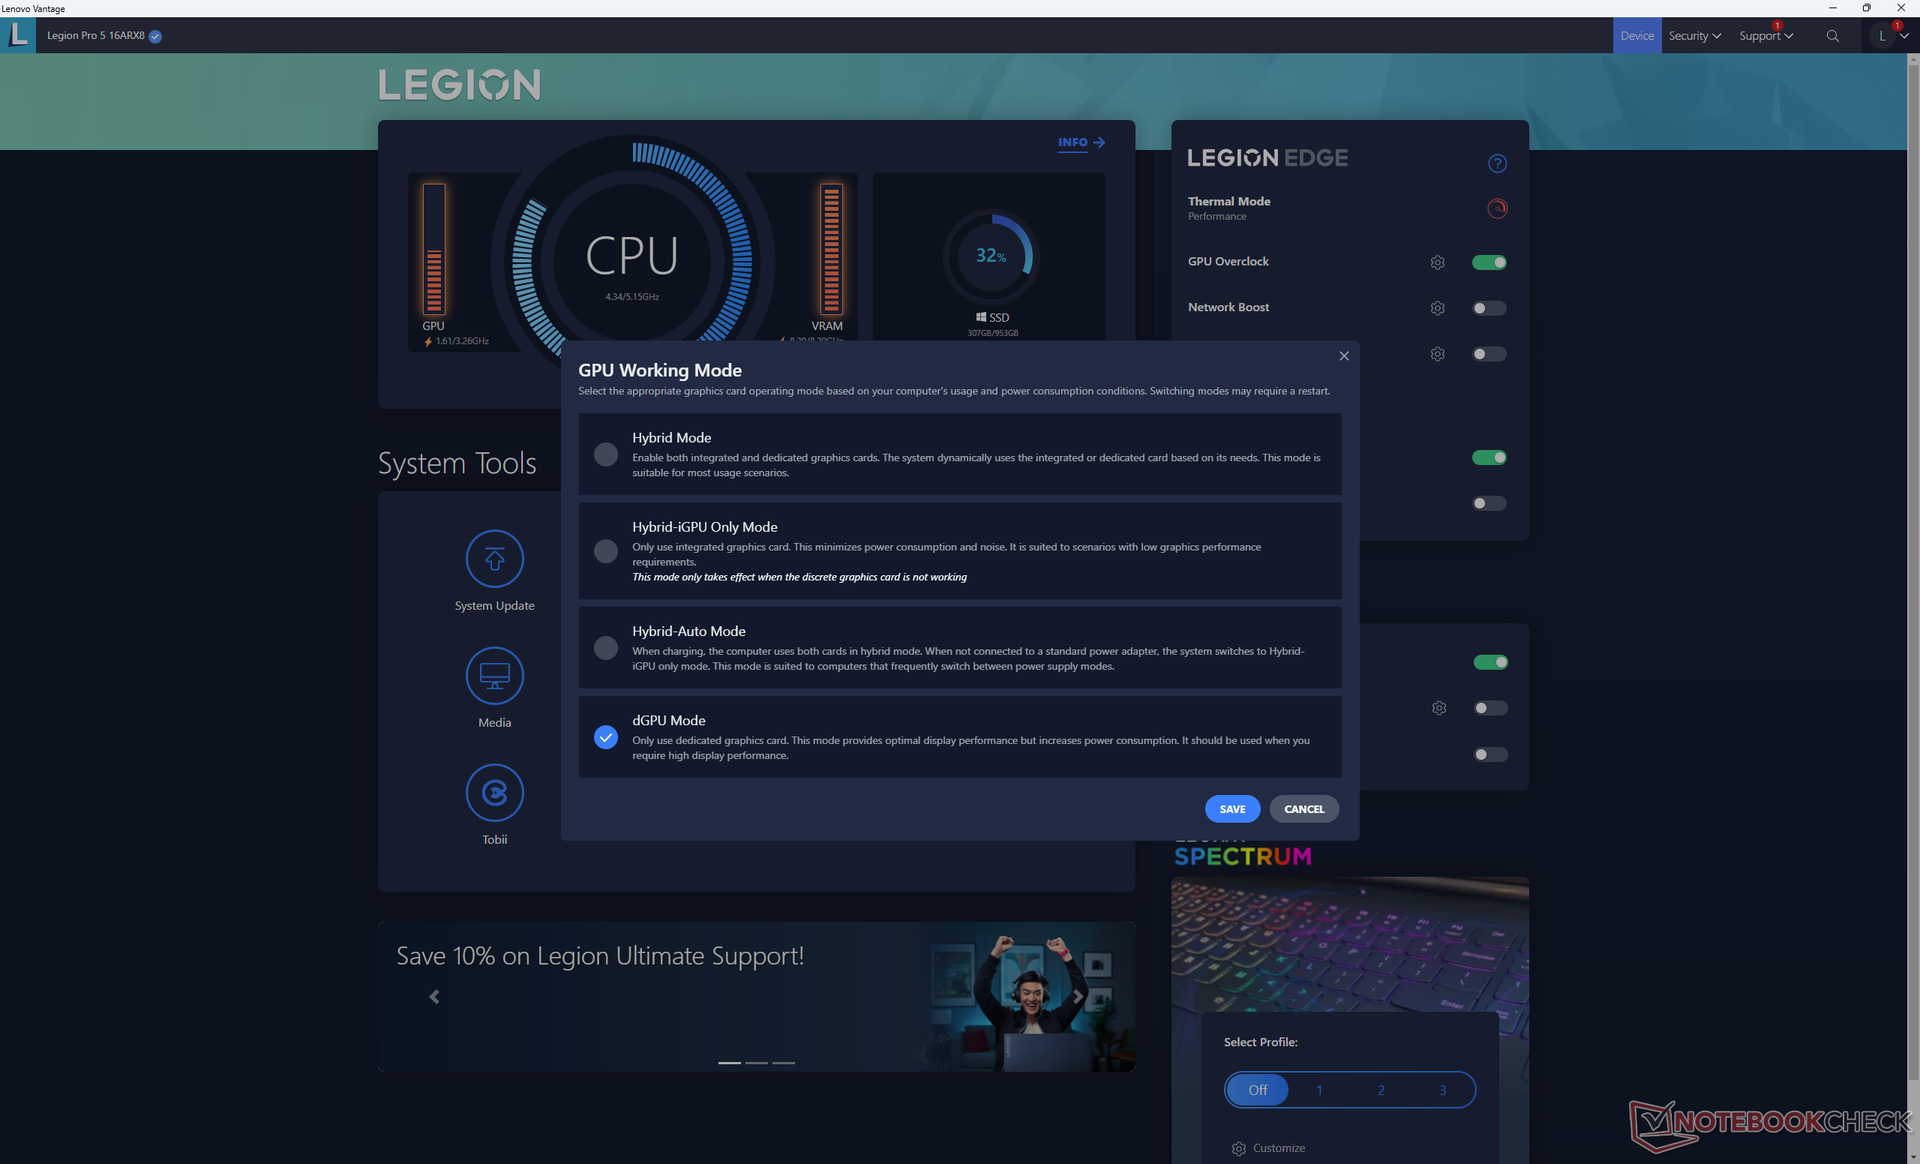
Configuramos nuestra unidad en modo Rendimiento tanto a través de Windows como del software Lenovo Vantage antes de ejecutar los siguientes benchmarks. También nos aseguramos de configurar los gráficos en modo dGPU con la función GPU Overclock preestablecida activa. Se recomienda familiarizarse con Vantage ya que es la interfaz principal para controlar las funciones de iluminación del teclado, las actualizaciones específicas de Lenovo, el comportamiento de la GPU y mucho más.
MUX es compatible para cambiar entre Optimus (iGPU + dGPU) o dGPU solamente. G-Sync es compatible con la pantalla interna sólo cuando en el modo dGPU. Es necesario reiniciar el sistema cuando se cambia entre los modos Optimus y dGPU, ya que Advanced Optimus no está soportado. Por desgracia, el proceso de reinicio al cambiar entre los modos de gráficos sería mucho más largo que un reinicio normal.
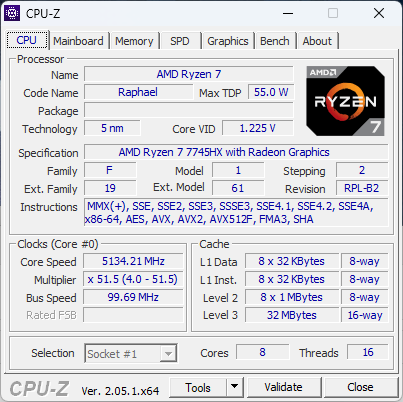
Procesador
Después de experimentar el increíble Zen 4Ryzen 9 7945HX y decepcionarnos con el decepcionante Zen 3Ryzen 7 7735HSno estábamos seguros de qué esperar del Zen 4Ryzen 7 7745HX. Afortunadamente, los resultados son excelentes para una CPU de gama media, con puntuaciones de rendimiento en subprocesos simples y múltiples un 15 y un 30 por ciento superiores, respectivamente, a las del Ryzen 7 7735HS. Por lo tanto, el Ryzen 7 7745HX está al alcance del competidor Core i7-13700HX por solo entre un 5 y un 15 por ciento en la mayoría de las pruebas, incluyendo LibreOffice y HWBOT x265 4K. Sin duda es una mejora razonable respecto alRyzen 7 6800H o Ryzen 9 6900HX en comparación con el Ryzen 7 7735HX.
Lenovo ofrece una opción Ryzen 5 7645HX más lenta con menos núcleos que el Ryzen 7 7745HX (6 frente a 8). Sin embargo, aún no hemos probado personalmente el Ryzen 5 7645HX en el momento de escribir este artículo, por lo que las diferencias de rendimiento entre las dos opciones son desconocidas por ahora.
Cinebench R15 Multi Loop
Cinebench R23: Multi Core | Single Core
Cinebench R20: CPU (Multi Core) | CPU (Single Core)
Cinebench R15: CPU Multi 64Bit | CPU Single 64Bit
Blender: v2.79 BMW27 CPU
7-Zip 18.03: 7z b 4 | 7z b 4 -mmt1
Geekbench 5.5: Multi-Core | Single-Core
HWBOT x265 Benchmark v2.2: 4k Preset
LibreOffice : 20 Documents To PDF
R Benchmark 2.5: Overall mean
| CPU Performance rating | |
| Schenker XMG SECTOR, i9 13900K, RTX 4090 | |
| Alienware m18 R1 | |
| Schenker XMG Neo 16 E23 | |
| Medio AMD Ryzen 7 7745HX | |
| Lenovo Legion Pro 5 16ARX8 | |
| MSI GE67 HX 12UGS | |
| Lenovo Legion Pro 5 16IRX8 | |
| MSI Pulse GL76 12UGK | |
| Asus TUF Gaming A16 FA617 | |
| Schenker XMG Core 15 (M22) | |
| Asus ROG Strix G15 G513RW | |
| MSI Alpha 15 B5EEK-008 | |
| Cinebench R23 / Multi Core | |
| Schenker XMG SECTOR, i9 13900K, RTX 4090 | |
| Alienware m18 R1 | |
| Schenker XMG Neo 16 E23 | |
| MSI GE67 HX 12UGS | |
| Lenovo Legion Pro 5 16IRX8 | |
| Medio AMD Ryzen 7 7745HX (18060 - 18845, n=2) | |
| Lenovo Legion Pro 5 16ARX8 | |
| MSI Pulse GL76 12UGK | |
| Schenker XMG Core 15 (M22) | |
| Asus TUF Gaming A16 FA617 | |
| Asus ROG Strix G15 G513RW | |
| MSI Alpha 15 B5EEK-008 | |
| Cinebench R23 / Single Core | |
| Schenker XMG SECTOR, i9 13900K, RTX 4090 | |
| Alienware m18 R1 | |
| Schenker XMG Neo 16 E23 | |
| Medio AMD Ryzen 7 7745HX (1846 - 1854, n=2) | |
| Lenovo Legion Pro 5 16ARX8 | |
| MSI GE67 HX 12UGS | |
| MSI Pulse GL76 12UGK | |
| Lenovo Legion Pro 5 16IRX8 | |
| Asus TUF Gaming A16 FA617 | |
| Schenker XMG Core 15 (M22) | |
| Asus ROG Strix G15 G513RW | |
| MSI Alpha 15 B5EEK-008 | |
| Cinebench R20 / CPU (Multi Core) | |
| Schenker XMG SECTOR, i9 13900K, RTX 4090 | |
| Alienware m18 R1 | |
| Schenker XMG Neo 16 E23 | |
| MSI GE67 HX 12UGS | |
| Medio AMD Ryzen 7 7745HX (7072 - 7399, n=2) | |
| Lenovo Legion Pro 5 16ARX8 | |
| Lenovo Legion Pro 5 16IRX8 | |
| MSI Pulse GL76 12UGK | |
| Schenker XMG Core 15 (M22) | |
| Asus TUF Gaming A16 FA617 | |
| Asus ROG Strix G15 G513RW | |
| MSI Alpha 15 B5EEK-008 | |
| Cinebench R20 / CPU (Single Core) | |
| Schenker XMG SECTOR, i9 13900K, RTX 4090 | |
| Alienware m18 R1 | |
| Schenker XMG Neo 16 E23 | |
| Medio AMD Ryzen 7 7745HX (717 - 719, n=2) | |
| Lenovo Legion Pro 5 16ARX8 | |
| MSI GE67 HX 12UGS | |
| MSI Pulse GL76 12UGK | |
| Lenovo Legion Pro 5 16IRX8 | |
| Asus TUF Gaming A16 FA617 | |
| Schenker XMG Core 15 (M22) | |
| Asus ROG Strix G15 G513RW | |
| MSI Alpha 15 B5EEK-008 | |
| Cinebench R15 / CPU Multi 64Bit | |
| Schenker XMG SECTOR, i9 13900K, RTX 4090 | |
| Alienware m18 R1 | |
| Schenker XMG Neo 16 E23 | |
| MSI GE67 HX 12UGS | |
| Lenovo Legion Pro 5 16IRX8 | |
| Medio AMD Ryzen 7 7745HX (2978 - 2994, n=2) | |
| Lenovo Legion Pro 5 16ARX8 | |
| MSI Pulse GL76 12UGK | |
| Schenker XMG Core 15 (M22) | |
| Asus TUF Gaming A16 FA617 | |
| Asus ROG Strix G15 G513RW | |
| MSI Alpha 15 B5EEK-008 | |
| Cinebench R15 / CPU Single 64Bit | |
| Schenker XMG SECTOR, i9 13900K, RTX 4090 | |
| Alienware m18 R1 | |
| Schenker XMG Neo 16 E23 | |
| Medio AMD Ryzen 7 7745HX (294 - 295, n=2) | |
| Lenovo Legion Pro 5 16ARX8 | |
| Lenovo Legion Pro 5 16IRX8 | |
| MSI GE67 HX 12UGS | |
| MSI Pulse GL76 12UGK | |
| Schenker XMG Core 15 (M22) | |
| Asus TUF Gaming A16 FA617 | |
| Asus ROG Strix G15 G513RW | |
| MSI Alpha 15 B5EEK-008 | |
| Blender / v2.79 BMW27 CPU | |
| MSI Alpha 15 B5EEK-008 | |
| Asus ROG Strix G15 G513RW | |
| Asus TUF Gaming A16 FA617 | |
| Schenker XMG Core 15 (M22) | |
| MSI Pulse GL76 12UGK | |
| Lenovo Legion Pro 5 16ARX8 | |
| Medio AMD Ryzen 7 7745HX (169 - 174, n=2) | |
| MSI GE67 HX 12UGS | |
| Lenovo Legion Pro 5 16IRX8 | |
| Schenker XMG Neo 16 E23 | |
| Alienware m18 R1 | |
| Schenker XMG SECTOR, i9 13900K, RTX 4090 | |
| 7-Zip 18.03 / 7z b 4 | |
| Schenker XMG SECTOR, i9 13900K, RTX 4090 | |
| Alienware m18 R1 | |
| Schenker XMG Neo 16 E23 | |
| Medio AMD Ryzen 7 7745HX (75557 - 83268, n=2) | |
| Lenovo Legion Pro 5 16IRX8 | |
| MSI GE67 HX 12UGS | |
| Lenovo Legion Pro 5 16ARX8 | |
| MSI Pulse GL76 12UGK | |
| Schenker XMG Core 15 (M22) | |
| Asus TUF Gaming A16 FA617 | |
| Asus ROG Strix G15 G513RW | |
| MSI Alpha 15 B5EEK-008 | |
| 7-Zip 18.03 / 7z b 4 -mmt1 | |
| Medio AMD Ryzen 7 7745HX (7244 - 7275, n=2) | |
| Lenovo Legion Pro 5 16ARX8 | |
| Schenker XMG SECTOR, i9 13900K, RTX 4090 | |
| Schenker XMG Neo 16 E23 | |
| Alienware m18 R1 | |
| Asus ROG Strix G15 G513RW | |
| Schenker XMG Core 15 (M22) | |
| Asus TUF Gaming A16 FA617 | |
| Lenovo Legion Pro 5 16IRX8 | |
| MSI Pulse GL76 12UGK | |
| MSI GE67 HX 12UGS | |
| MSI Alpha 15 B5EEK-008 | |
| Geekbench 5.5 / Multi-Core | |
| Schenker XMG SECTOR, i9 13900K, RTX 4090 | |
| Alienware m18 R1 | |
| Schenker XMG Neo 16 E23 | |
| MSI GE67 HX 12UGS | |
| Lenovo Legion Pro 5 16IRX8 | |
| Medio AMD Ryzen 7 7745HX (12378 - 13462, n=2) | |
| Lenovo Legion Pro 5 16ARX8 | |
| MSI Pulse GL76 12UGK | |
| Schenker XMG Core 15 (M22) | |
| Asus TUF Gaming A16 FA617 | |
| Asus ROG Strix G15 G513RW | |
| MSI Alpha 15 B5EEK-008 | |
| Geekbench 5.5 / Single-Core | |
| Schenker XMG SECTOR, i9 13900K, RTX 4090 | |
| Alienware m18 R1 | |
| Medio AMD Ryzen 7 7745HX (2040 - 2067, n=2) | |
| Schenker XMG Neo 16 E23 | |
| Lenovo Legion Pro 5 16ARX8 | |
| Lenovo Legion Pro 5 16IRX8 | |
| MSI GE67 HX 12UGS | |
| MSI Pulse GL76 12UGK | |
| Asus ROG Strix G15 G513RW | |
| Asus TUF Gaming A16 FA617 | |
| Schenker XMG Core 15 (M22) | |
| MSI Alpha 15 B5EEK-008 | |
| HWBOT x265 Benchmark v2.2 / 4k Preset | |
| Schenker XMG SECTOR, i9 13900K, RTX 4090 | |
| Alienware m18 R1 | |
| Schenker XMG Neo 16 E23 | |
| MSI GE67 HX 12UGS | |
| Lenovo Legion Pro 5 16IRX8 | |
| Medio AMD Ryzen 7 7745HX (23.2 - 24.1, n=2) | |
| Lenovo Legion Pro 5 16ARX8 | |
| MSI Pulse GL76 12UGK | |
| Schenker XMG Core 15 (M22) | |
| Asus TUF Gaming A16 FA617 | |
| Asus ROG Strix G15 G513RW | |
| MSI Alpha 15 B5EEK-008 | |
| LibreOffice / 20 Documents To PDF | |
| Schenker XMG Core 15 (M22) | |
| Asus ROG Strix G15 G513RW | |
| Asus TUF Gaming A16 FA617 | |
| MSI Alpha 15 B5EEK-008 | |
| Alienware m18 R1 | |
| MSI Pulse GL76 12UGK | |
| MSI GE67 HX 12UGS | |
| Medio AMD Ryzen 7 7745HX (37.9 - 41.4, n=2) | |
| Lenovo Legion Pro 5 16ARX8 | |
| Schenker XMG Neo 16 E23 | |
| Schenker XMG SECTOR, i9 13900K, RTX 4090 | |
| Lenovo Legion Pro 5 16IRX8 | |
| R Benchmark 2.5 / Overall mean | |
| MSI Alpha 15 B5EEK-008 | |
| Asus TUF Gaming A16 FA617 | |
| Asus ROG Strix G15 G513RW | |
| Schenker XMG Core 15 (M22) | |
| Lenovo Legion Pro 5 16IRX8 | |
| MSI Pulse GL76 12UGK | |
| MSI GE67 HX 12UGS | |
| Lenovo Legion Pro 5 16ARX8 | |
| Medio AMD Ryzen 7 7745HX (0.4141 - 0.421, n=2) | |
| Alienware m18 R1 | |
| Schenker XMG Neo 16 E23 | |
| Schenker XMG SECTOR, i9 13900K, RTX 4090 | |
* ... más pequeño es mejor
AIDA64: FP32 Ray-Trace | FPU Julia | CPU SHA3 | CPU Queen | FPU SinJulia | FPU Mandel | CPU AES | CPU ZLib | FP64 Ray-Trace | CPU PhotoWorxx
| Performance rating | |
| Asus ROG Strix G16 G614JZ | |
| Schenker XMG Neo 16 E23 | |
| Medio AMD Ryzen 7 7745HX | |
| Lenovo Legion Pro 5 16ARX8 | |
| Uniwill GM6PX7X RTX 4070 | |
| Lenovo Legion Pro 5 16IRX8 | |
| AIDA64 / FP32 Ray-Trace | |
| Lenovo Legion Pro 5 16ARX8 | |
| Medio AMD Ryzen 7 7745HX (29066 - 29656, n=2) | |
| Asus ROG Strix G16 G614JZ | |
| Schenker XMG Neo 16 E23 | |
| Uniwill GM6PX7X RTX 4070 | |
| Lenovo Legion Pro 5 16IRX8 | |
| AIDA64 / FPU Julia | |
| Asus ROG Strix G16 G614JZ | |
| Medio AMD Ryzen 7 7745HX (120974 - 123689, n=2) | |
| Lenovo Legion Pro 5 16ARX8 | |
| Schenker XMG Neo 16 E23 | |
| Uniwill GM6PX7X RTX 4070 | |
| Lenovo Legion Pro 5 16IRX8 | |
| AIDA64 / CPU SHA3 | |
| Asus ROG Strix G16 G614JZ | |
| Schenker XMG Neo 16 E23 | |
| Medio AMD Ryzen 7 7745HX (4974 - 5204, n=2) | |
| Lenovo Legion Pro 5 16ARX8 | |
| Uniwill GM6PX7X RTX 4070 | |
| Lenovo Legion Pro 5 16IRX8 | |
| AIDA64 / CPU Queen | |
| Asus ROG Strix G16 G614JZ | |
| Schenker XMG Neo 16 E23 | |
| Medio AMD Ryzen 7 7745HX (126954 - 128143, n=2) | |
| Lenovo Legion Pro 5 16ARX8 | |
| Lenovo Legion Pro 5 16IRX8 | |
| Uniwill GM6PX7X RTX 4070 | |
| AIDA64 / FPU SinJulia | |
| Asus ROG Strix G16 G614JZ | |
| Medio AMD Ryzen 7 7745HX (15887 - 16221, n=2) | |
| Lenovo Legion Pro 5 16ARX8 | |
| Schenker XMG Neo 16 E23 | |
| Lenovo Legion Pro 5 16IRX8 | |
| Uniwill GM6PX7X RTX 4070 | |
| AIDA64 / FPU Mandel | |
| Asus ROG Strix G16 G614JZ | |
| Medio AMD Ryzen 7 7745HX (64255 - 64969, n=2) | |
| Lenovo Legion Pro 5 16ARX8 | |
| Schenker XMG Neo 16 E23 | |
| Uniwill GM6PX7X RTX 4070 | |
| Lenovo Legion Pro 5 16IRX8 | |
| AIDA64 / CPU AES | |
| Schenker XMG Neo 16 E23 | |
| Uniwill GM6PX7X RTX 4070 | |
| Asus ROG Strix G16 G614JZ | |
| Lenovo Legion Pro 5 16IRX8 | |
| Medio AMD Ryzen 7 7745HX (71191 - 95481, n=2) | |
| Lenovo Legion Pro 5 16ARX8 | |
| AIDA64 / CPU ZLib | |
| Asus ROG Strix G16 G614JZ | |
| Schenker XMG Neo 16 E23 | |
| Uniwill GM6PX7X RTX 4070 | |
| Lenovo Legion Pro 5 16IRX8 | |
| Medio AMD Ryzen 7 7745HX (1147 - 1176, n=2) | |
| Lenovo Legion Pro 5 16ARX8 | |
| AIDA64 / FP64 Ray-Trace | |
| Medio AMD Ryzen 7 7745HX (15975 - 16358, n=2) | |
| Lenovo Legion Pro 5 16ARX8 | |
| Asus ROG Strix G16 G614JZ | |
| Schenker XMG Neo 16 E23 | |
| Lenovo Legion Pro 5 16IRX8 | |
| Uniwill GM6PX7X RTX 4070 | |
| AIDA64 / CPU PhotoWorxx | |
| Schenker XMG Neo 16 E23 | |
| Uniwill GM6PX7X RTX 4070 | |
| Asus ROG Strix G16 G614JZ | |
| Lenovo Legion Pro 5 16IRX8 | |
| Medio AMD Ryzen 7 7745HX (28499 - 33304, n=2) | |
| Lenovo Legion Pro 5 16ARX8 | |
Rendimiento del sistema
CrossMark: Overall | Productivity | Creativity | Responsiveness
| PCMark 10 / Score | |
| Asus Zephyrus Duo 16 GX650PY-NM006W | |
| Uniwill GM6PX7X RTX 4070 | |
| Schenker XMG Neo 16 E23 | |
| Lenovo Legion Pro 5 16ARX8 | |
| Lenovo Legion Pro 5 16IRX8 | |
| Asus ROG Strix G16 G614JZ | |
| PCMark 10 / Essentials | |
| Asus Zephyrus Duo 16 GX650PY-NM006W | |
| Asus ROG Strix G16 G614JZ | |
| Uniwill GM6PX7X RTX 4070 | |
| Lenovo Legion Pro 5 16ARX8 | |
| Schenker XMG Neo 16 E23 | |
| Lenovo Legion Pro 5 16IRX8 | |
| PCMark 10 / Productivity | |
| Asus Zephyrus Duo 16 GX650PY-NM006W | |
| Uniwill GM6PX7X RTX 4070 | |
| Lenovo Legion Pro 5 16ARX8 | |
| Schenker XMG Neo 16 E23 | |
| Lenovo Legion Pro 5 16IRX8 | |
| Asus ROG Strix G16 G614JZ | |
| PCMark 10 / Digital Content Creation | |
| Schenker XMG Neo 16 E23 | |
| Asus Zephyrus Duo 16 GX650PY-NM006W | |
| Uniwill GM6PX7X RTX 4070 | |
| Lenovo Legion Pro 5 16ARX8 | |
| Lenovo Legion Pro 5 16IRX8 | |
| Asus ROG Strix G16 G614JZ | |
| CrossMark / Overall | |
| Asus ROG Strix G16 G614JZ | |
| Schenker XMG Neo 16 E23 | |
| Asus Zephyrus Duo 16 GX650PY-NM006W | |
| Lenovo Legion Pro 5 16ARX8 | |
| Uniwill GM6PX7X RTX 4070 | |
| Lenovo Legion Pro 5 16IRX8 | |
| CrossMark / Productivity | |
| Asus ROG Strix G16 G614JZ | |
| Schenker XMG Neo 16 E23 | |
| Asus Zephyrus Duo 16 GX650PY-NM006W | |
| Lenovo Legion Pro 5 16ARX8 | |
| Uniwill GM6PX7X RTX 4070 | |
| Lenovo Legion Pro 5 16IRX8 | |
| CrossMark / Creativity | |
| Schenker XMG Neo 16 E23 | |
| Asus ROG Strix G16 G614JZ | |
| Asus Zephyrus Duo 16 GX650PY-NM006W | |
| Lenovo Legion Pro 5 16ARX8 | |
| Uniwill GM6PX7X RTX 4070 | |
| Lenovo Legion Pro 5 16IRX8 | |
| CrossMark / Responsiveness | |
| Asus ROG Strix G16 G614JZ | |
| Lenovo Legion Pro 5 16ARX8 | |
| Uniwill GM6PX7X RTX 4070 | |
| Schenker XMG Neo 16 E23 | |
| Asus Zephyrus Duo 16 GX650PY-NM006W | |
| Lenovo Legion Pro 5 16IRX8 | |
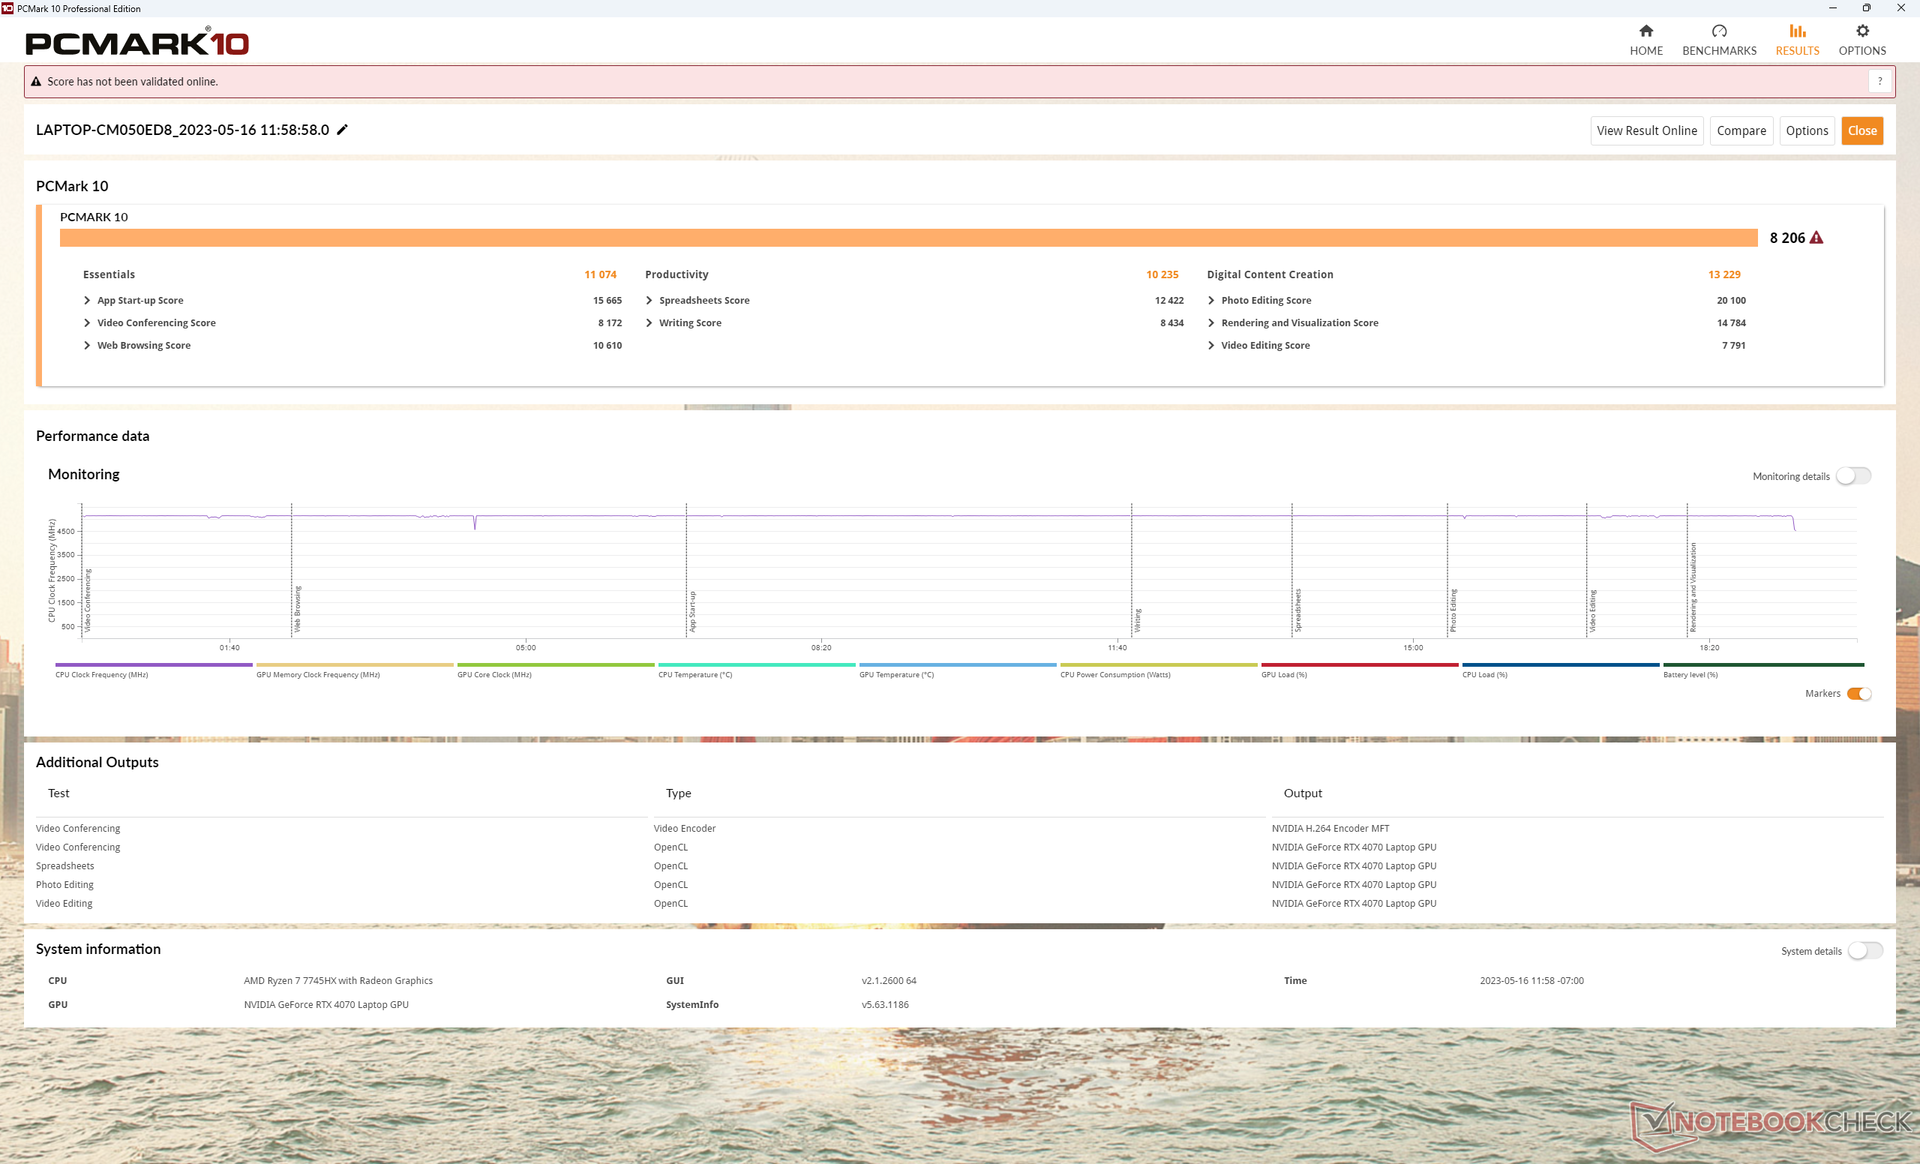
| PCMark 10 Score | 8206 puntos | |
ayuda | ||
| AIDA64 / Memory Copy | |
| Schenker XMG Neo 16 E23 | |
| Uniwill GM6PX7X RTX 4070 | |
| Asus ROG Strix G16 G614JZ | |
| Lenovo Legion Pro 5 16IRX8 | |
| Medio AMD Ryzen 7 7745HX (50007 - 53867, n=2) | |
| Lenovo Legion Pro 5 16ARX8 | |
| AIDA64 / Memory Read | |
| Schenker XMG Neo 16 E23 | |
| Asus ROG Strix G16 G614JZ | |
| Uniwill GM6PX7X RTX 4070 | |
| Lenovo Legion Pro 5 16IRX8 | |
| Medio AMD Ryzen 7 7745HX (50703 - 54278, n=2) | |
| Lenovo Legion Pro 5 16ARX8 | |
| AIDA64 / Memory Write | |
| Schenker XMG Neo 16 E23 | |
| Lenovo Legion Pro 5 16IRX8 | |
| Uniwill GM6PX7X RTX 4070 | |
| Medio AMD Ryzen 7 7745HX (54587 - 70803, n=2) | |
| Asus ROG Strix G16 G614JZ | |
| Lenovo Legion Pro 5 16ARX8 | |
| AIDA64 / Memory Latency | |
| Asus ROG Strix G16 G614JZ | |
| Uniwill GM6PX7X RTX 4070 | |
| Lenovo Legion Pro 5 16ARX8 | |
| Schenker XMG Neo 16 E23 | |
| Medio AMD Ryzen 7 7745HX (80.7 - 86.5, n=2) | |
| Lenovo Legion Pro 5 16IRX8 | |
* ... más pequeño es mejor
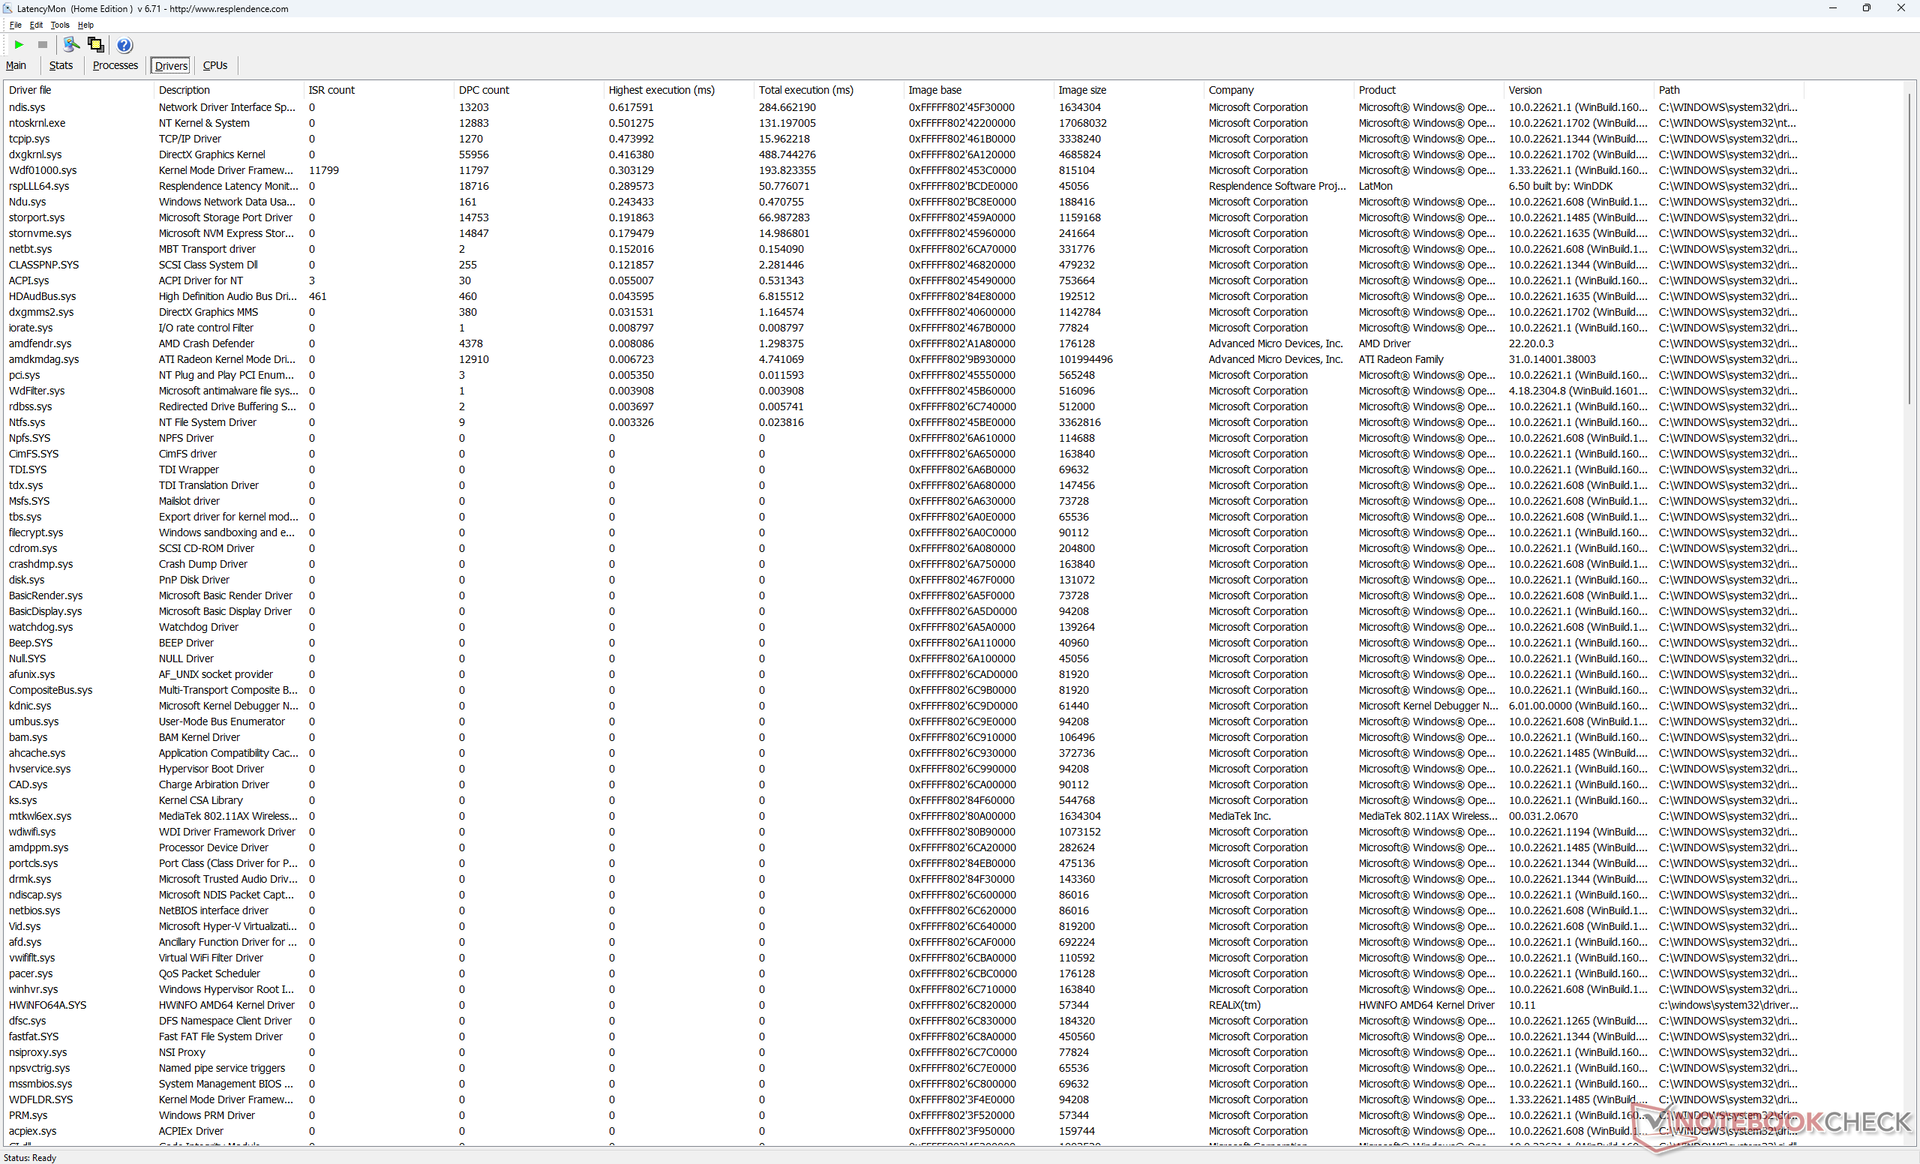
Latencia del CPD
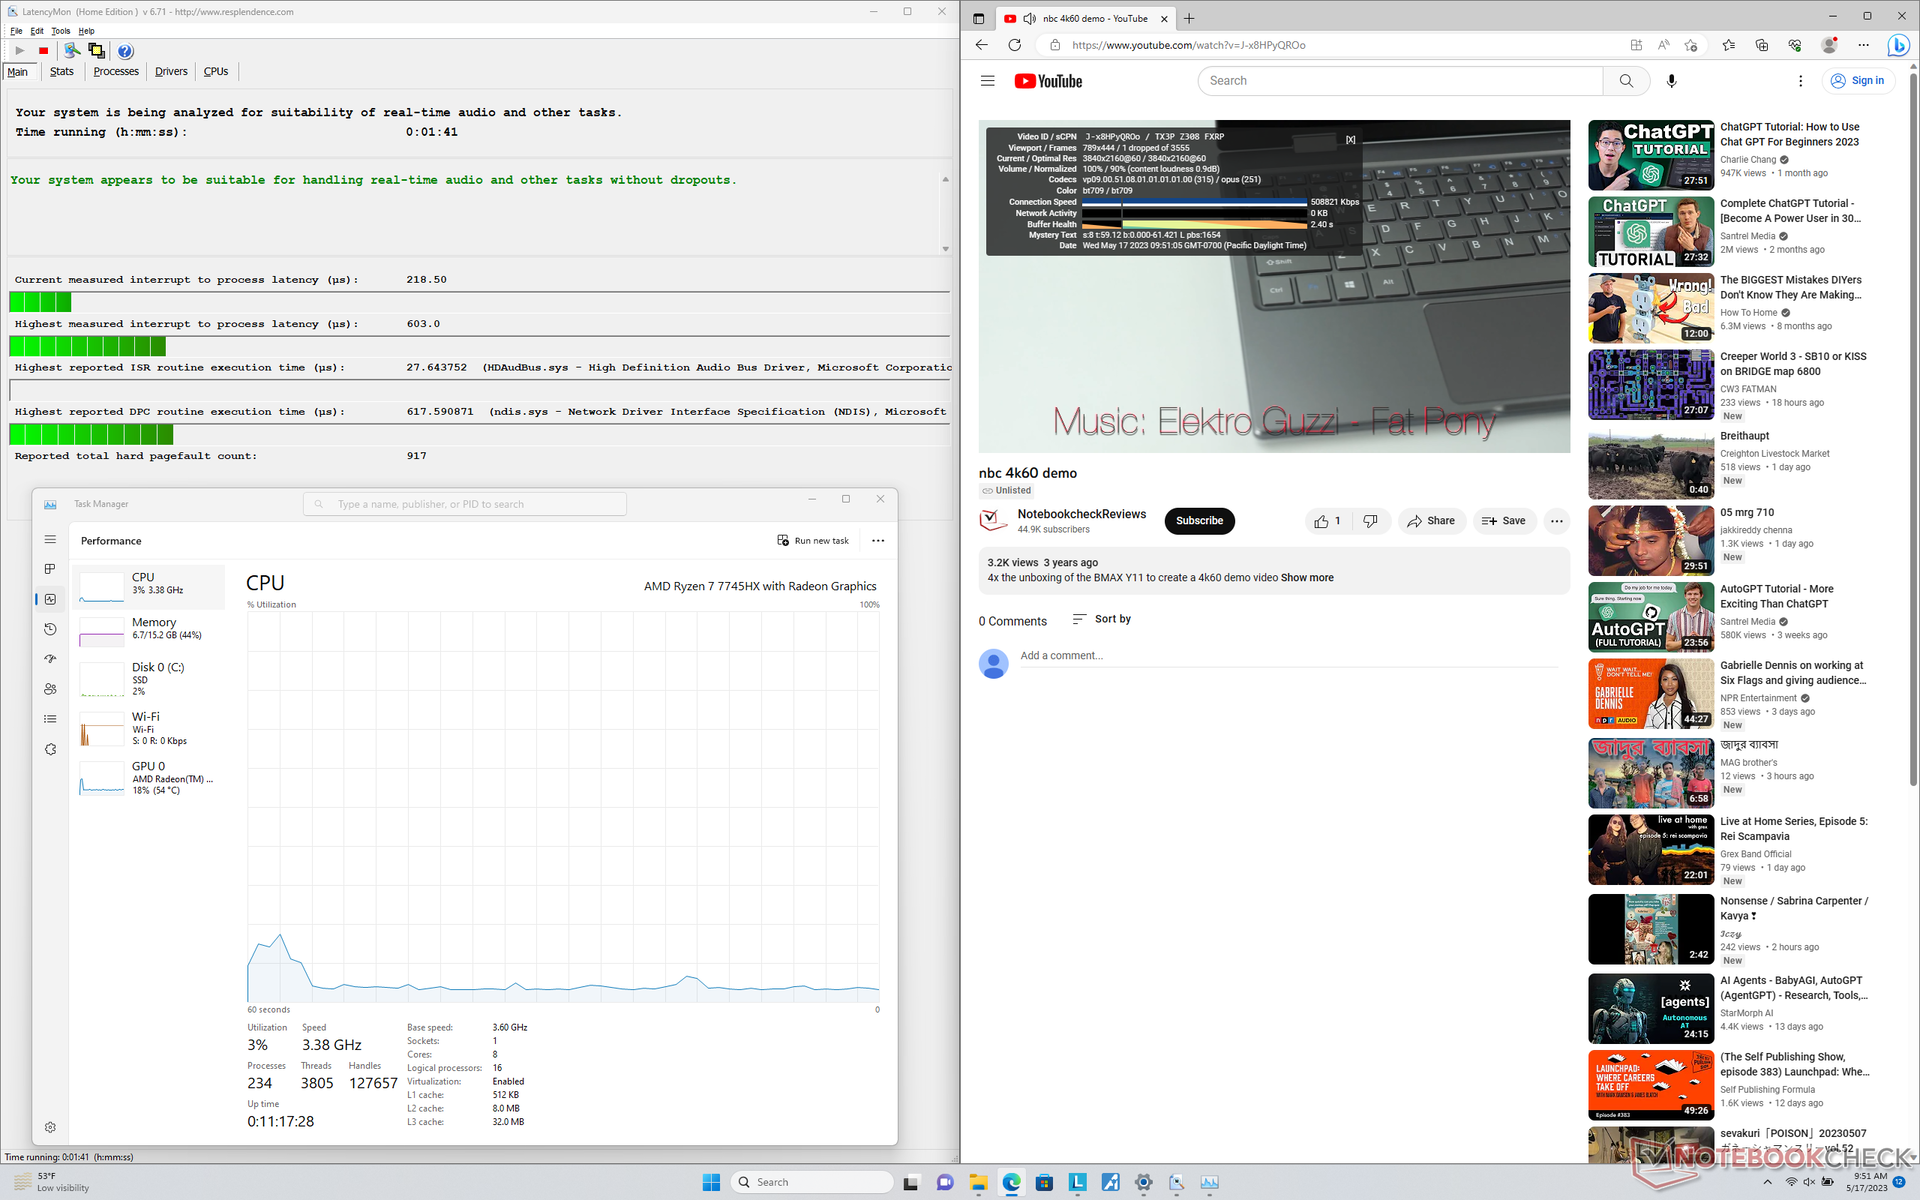
LatencyMon no revela problemas importantes de CPD al abrir varias pestañas de navegador de nuestra página de inicio o al ejecutar Prime95 bajo estrés. la reproducción de vídeo 4K a 60 FPS es excelente, con una sola caída de fotograma en nuestro vídeo de prueba.
| DPC Latencies / LatencyMon - interrupt to process latency (max), Web, Youtube, Prime95 | |
| Asus Zephyrus Duo 16 GX650PY-NM006W | |
| Schenker XMG Neo 16 E23 | |
| Asus ROG Strix G16 G614JZ | |
| Uniwill GM6PX7X RTX 4070 | |
| Lenovo Legion Pro 5 16IRX8 | |
| Lenovo Legion Pro 5 16ARX8 | |
* ... más pequeño es mejor
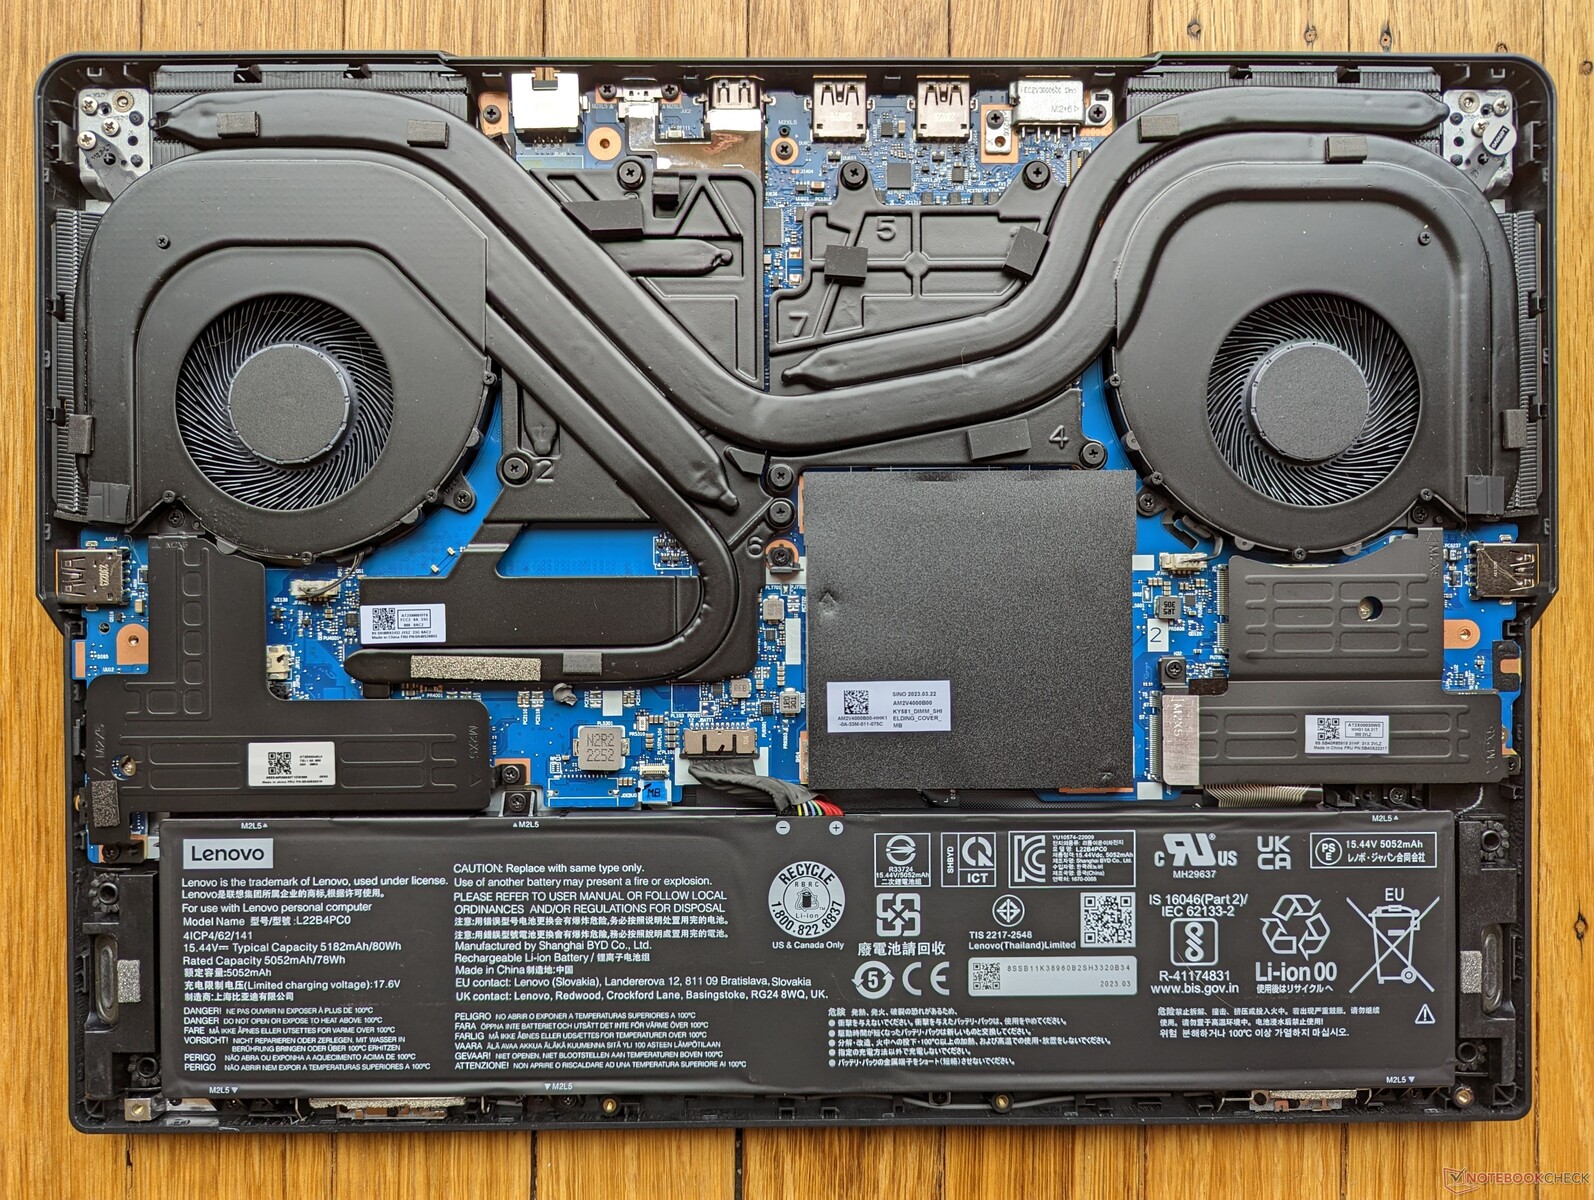
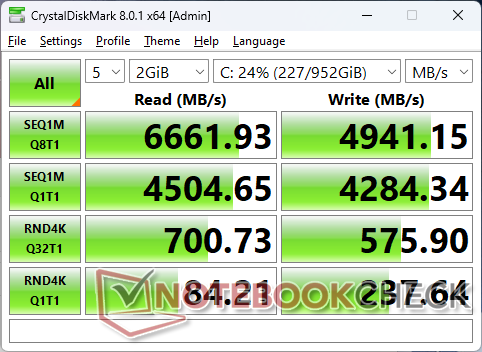
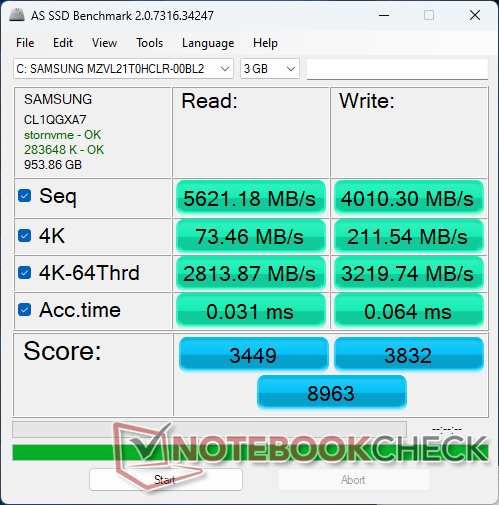
Dispositivos de almacenamiento: hasta dos unidades PCIe4 x4
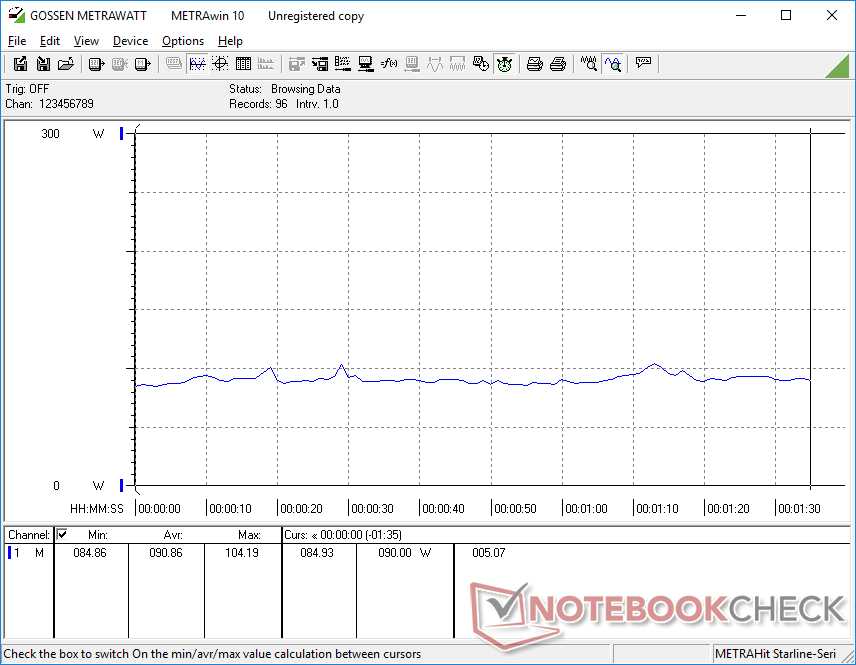
Nuestra unidad se entrega con un Samsung PM9A1 NVMe de 1 TB, que es uno de los SSD PCIe4 x4 más rápidos del mercado. Las tasas de transferencia alcanzan los 6600 MB/s, pero el rendimiento se ralentiza hasta los 3300 MB/s a los pocos minutos de nuestra prueba de estrés, como muestra el siguiente gráfico. Los resultados sugieren que el SSD del Lenovo no se refrigera adecuadamente, como el mismo SSD en otros portátiles como el Uniwill GM6PX7X pueden mantener tasas de transferencia más altas durante periodos mucho más largos.

| Drive Performance rating - Percent | |
| Lenovo Legion Pro 5 16ARX8 | |
| Lenovo Legion Pro 5 16IRX8 | |
| Uniwill GM6PX7X RTX 4070 | |
| Asus Zephyrus Duo 16 GX650PY-NM006W | |
| Asus ROG Strix G16 G614JZ | |
| Schenker XMG Neo 16 E23 | |
* ... más pequeño es mejor
Disk Throttling: DiskSpd Read Loop, Queue Depth 8
Rendimiento de la GPU: una tarjeta gráfica de gama media-alta
El rendimiento gráfico bruto es comparable al de la eForce RTX 3070 Ti para portátiles. El objetivo TGP de 140 W permite que la RTX 4070 móvil del Lenovo supere marginalmente a la mayoría de portátiles con la misma GPU.
El cambio a la rTX 4060 para portátiles o rTX 4050 móvil Se espera que disminuya el rendimiento en un 15 por ciento y un 20 por ciento, respectivamente. Lamentablemente, no existe una versión rTX 4080 móvil que habría aumentado el rendimiento significativamente entre un 40 y un 50 por ciento respecto a nuestra RTX 4070 móvil. En su lugar, estas opciones de GPU de gama alta están reservadas para la serie Legion 7 de gama alta de Lenovo.
Ejecutar la dGPU en el perfil de energía equilibrado sin overclocking reduciría el rendimiento gráfico en un 13% según 3DMark Time Spy.
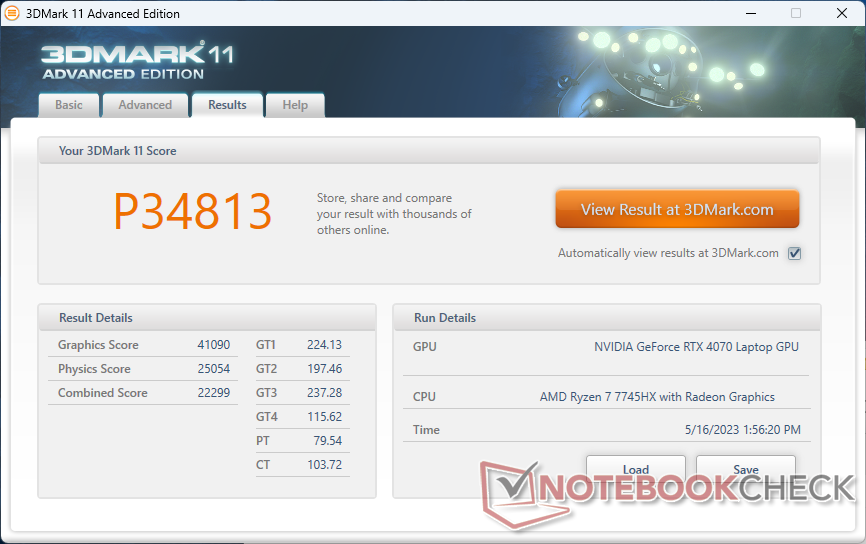
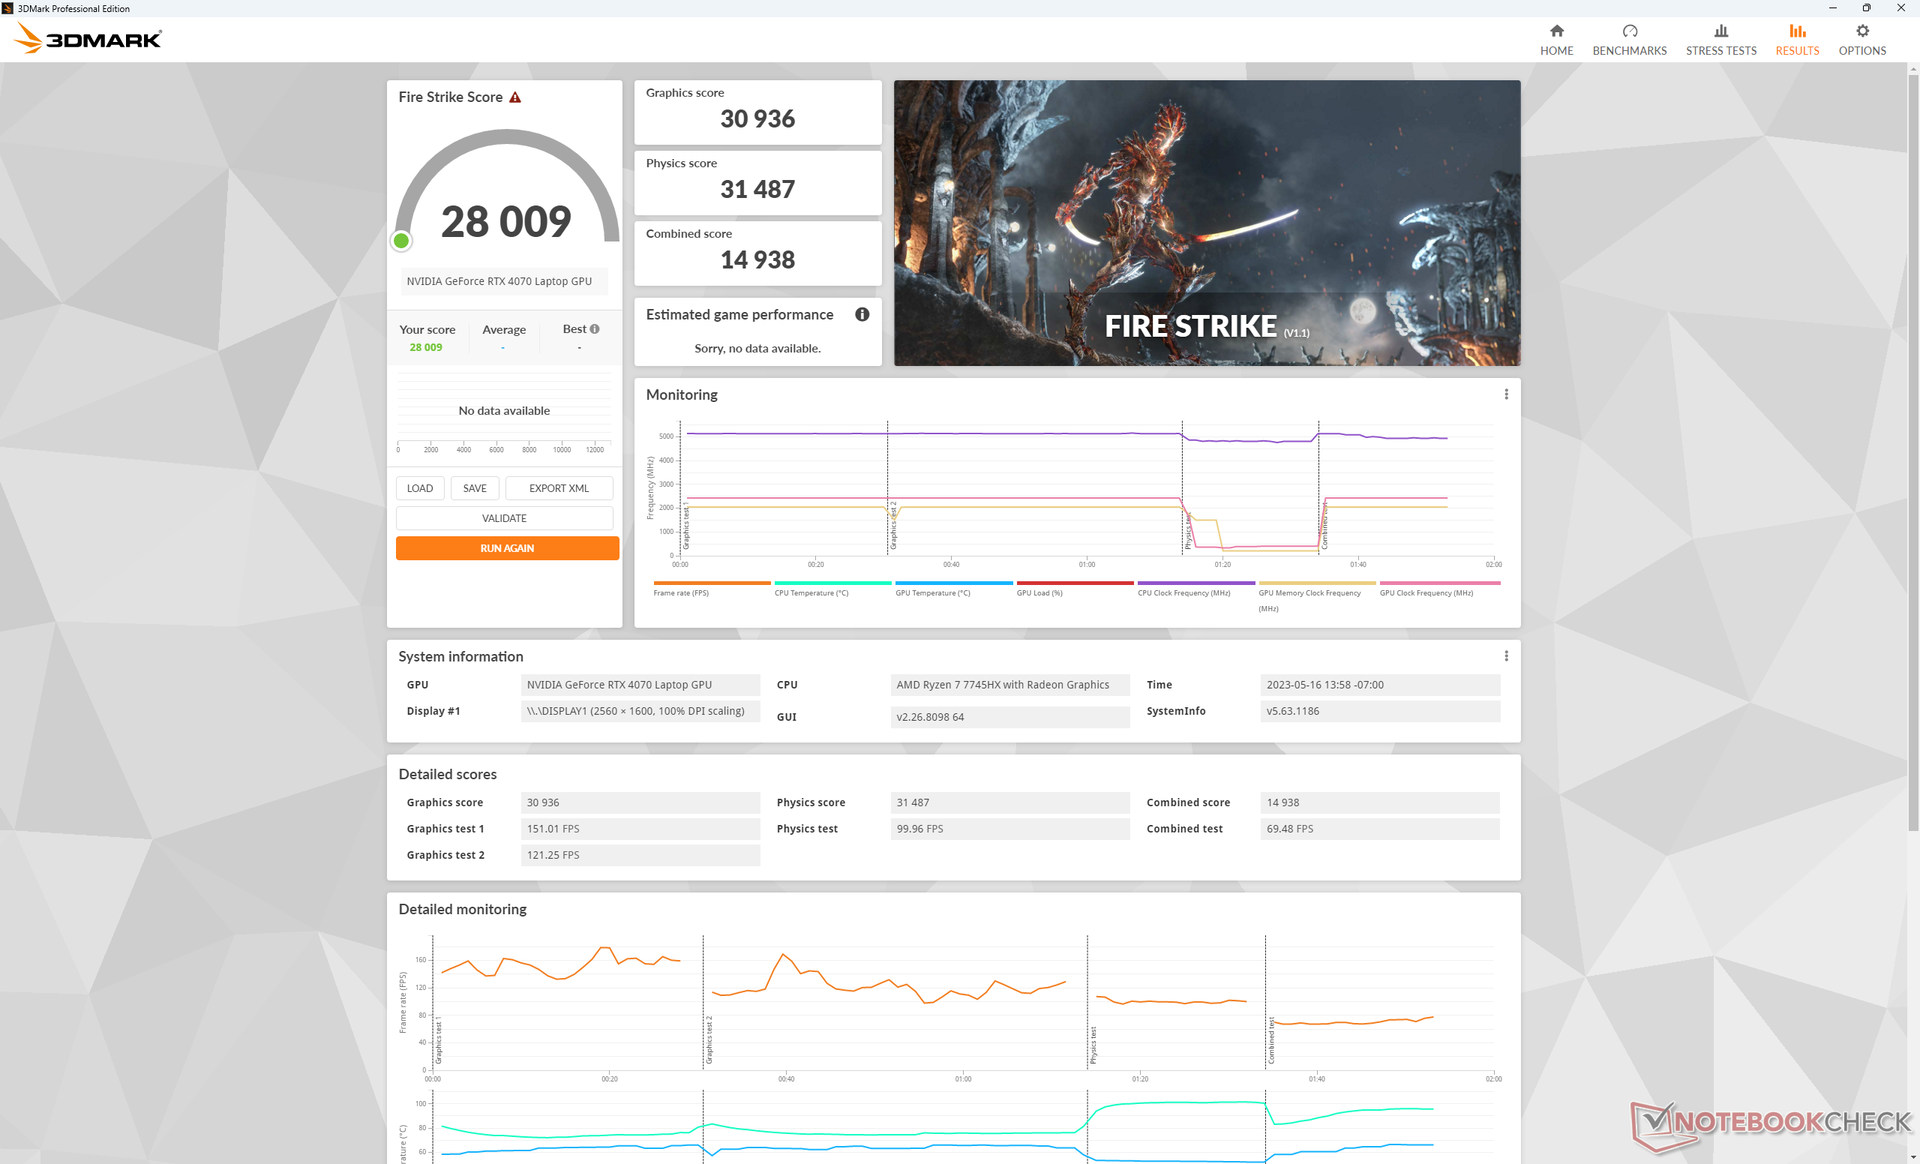
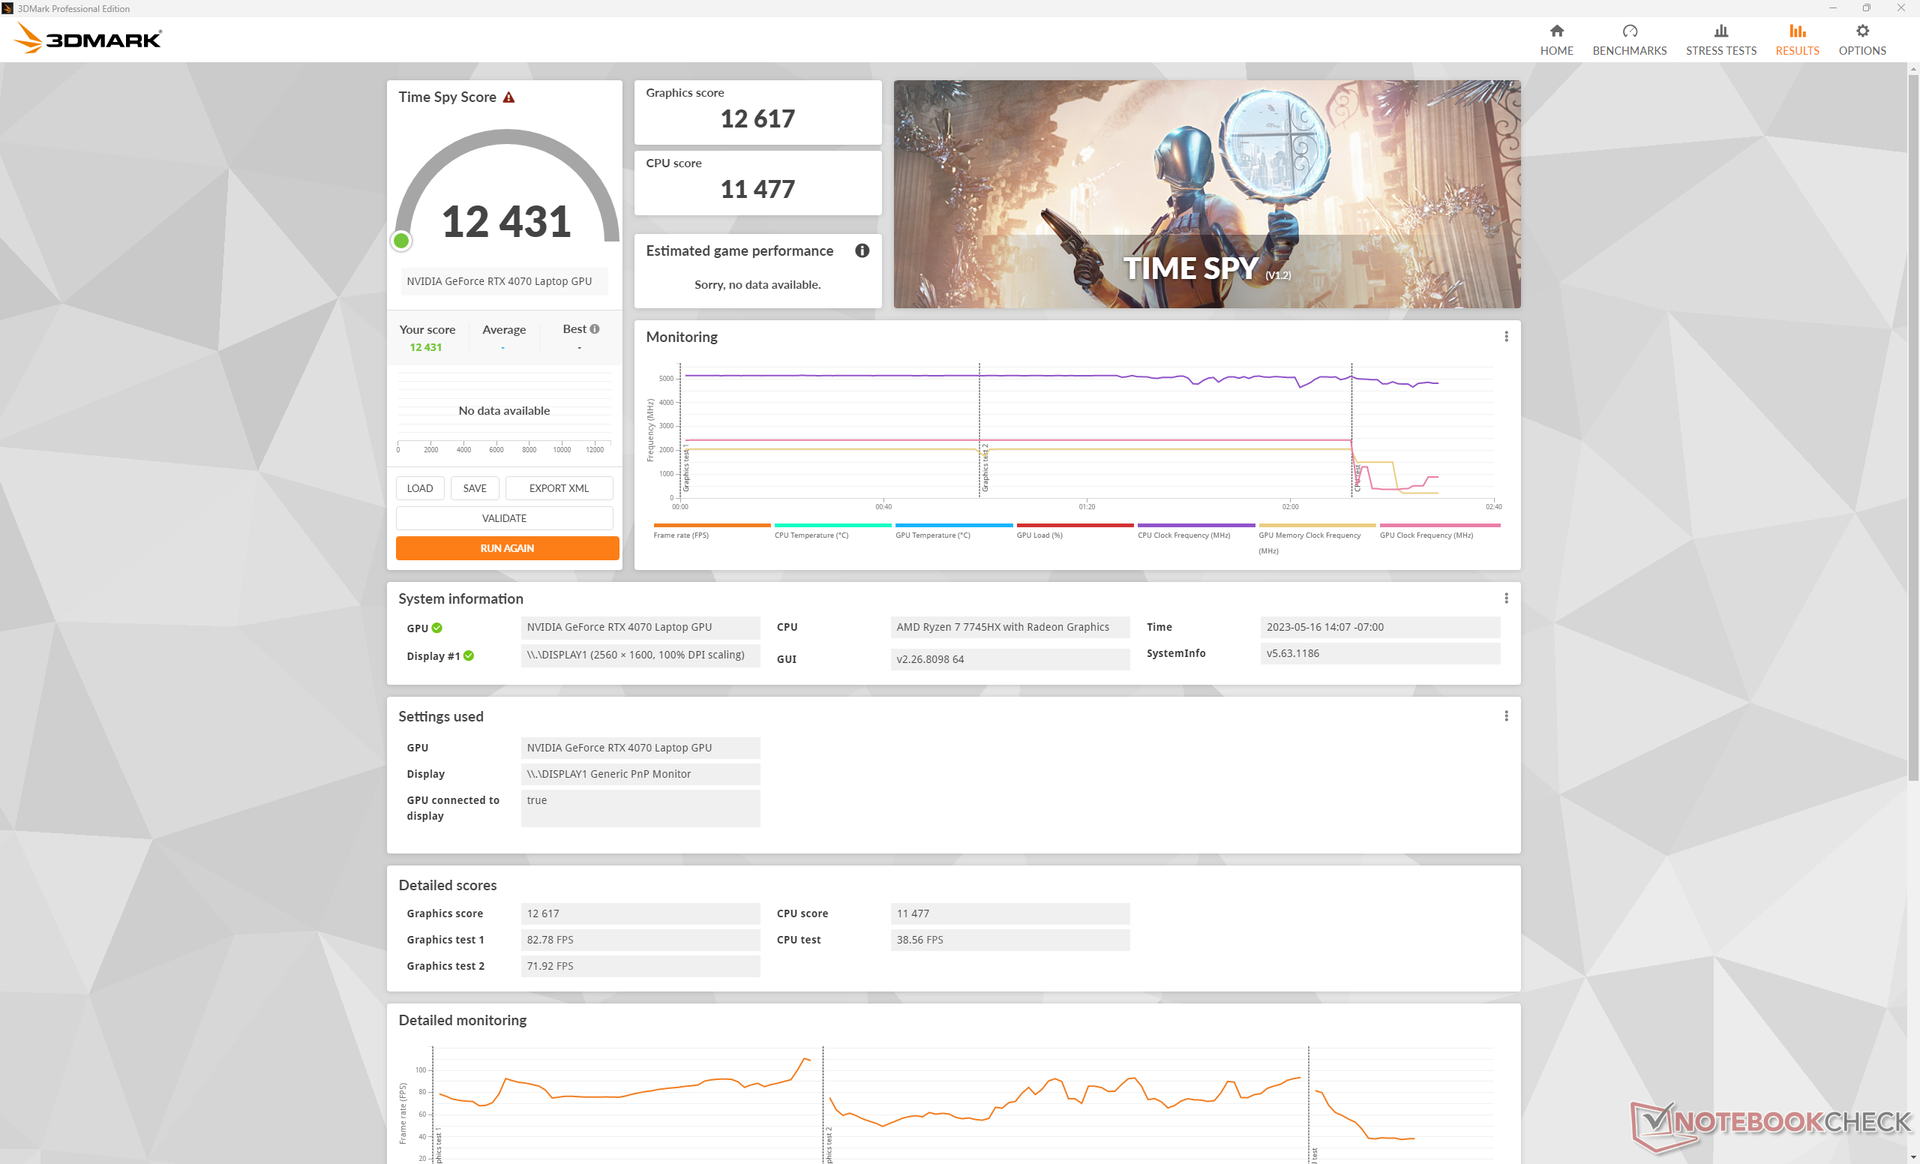
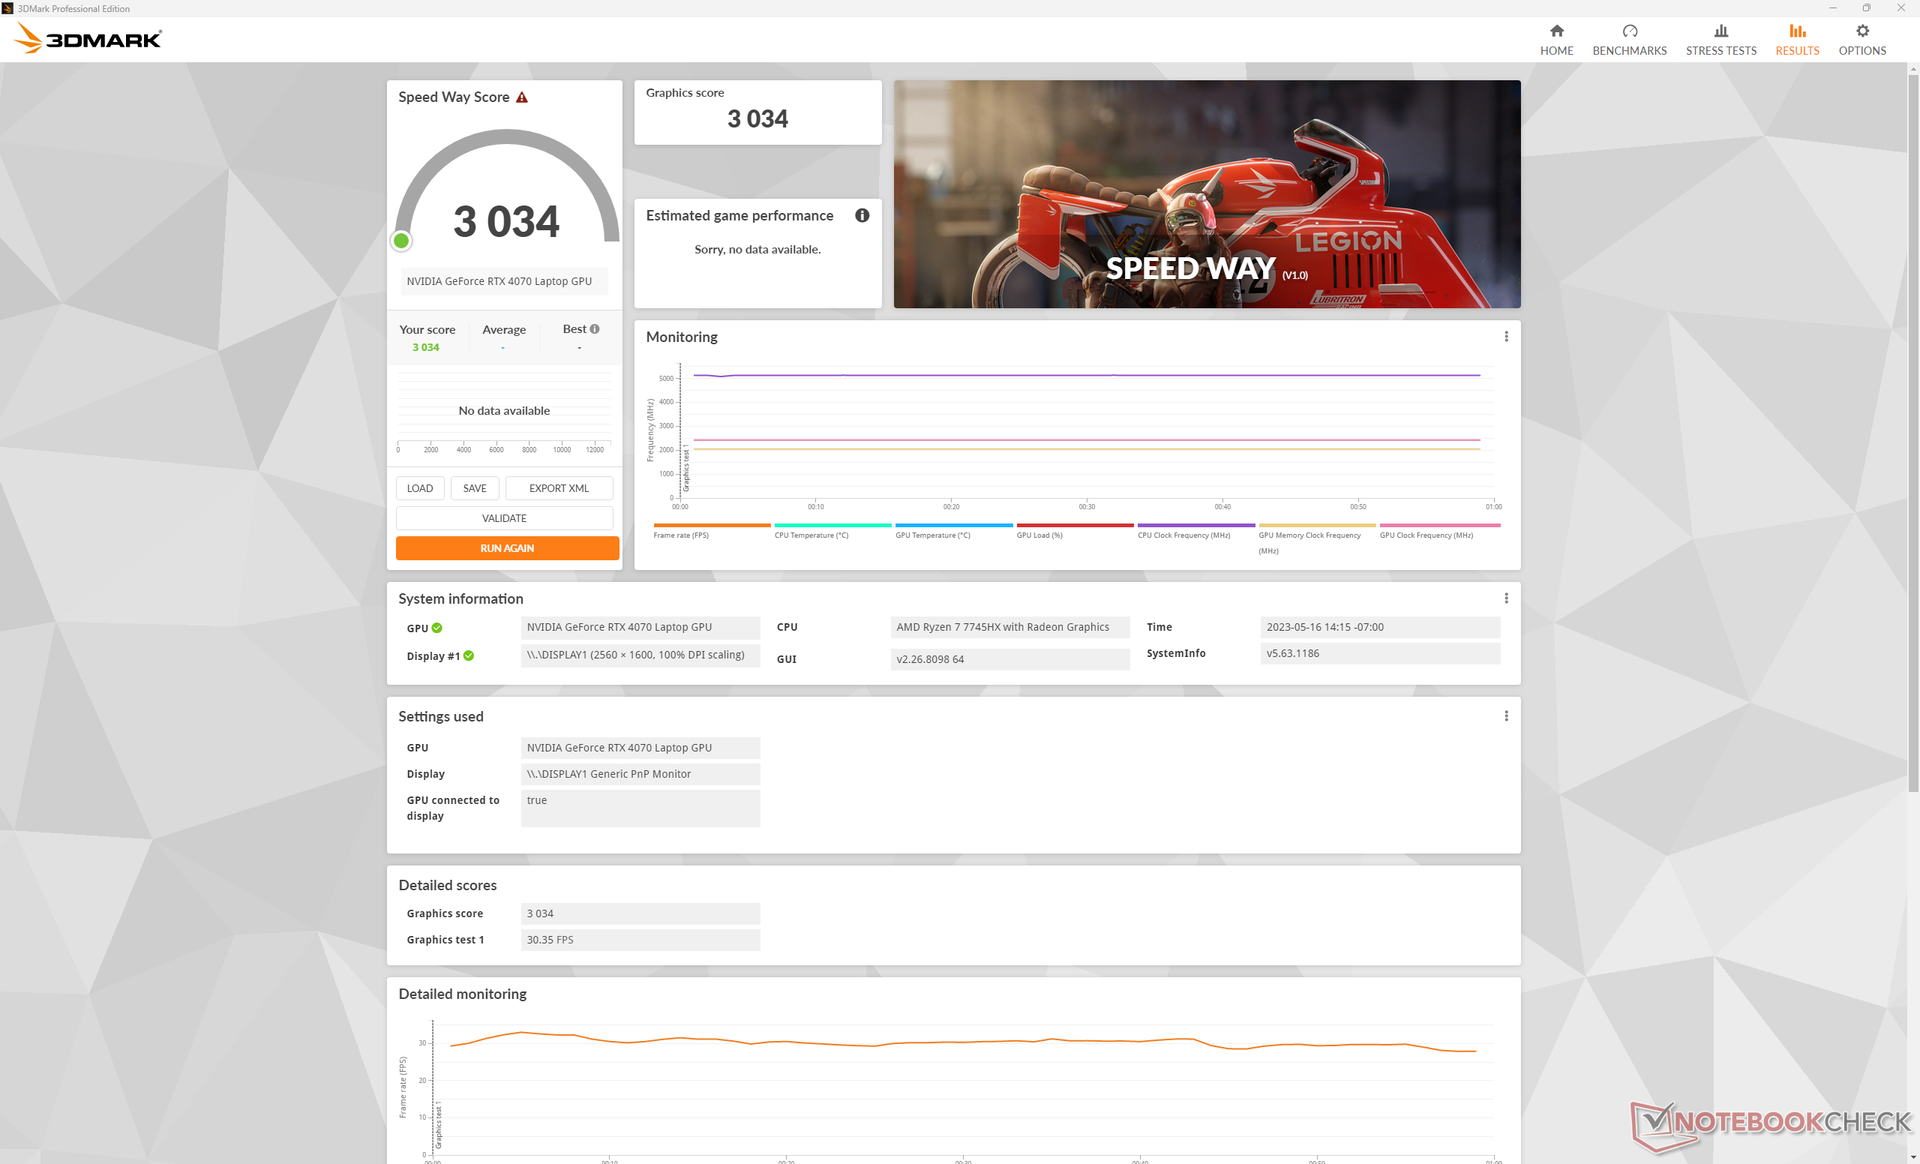
| 3DMark 11 Performance | 34813 puntos | |
| 3DMark Fire Strike Score | 28009 puntos | |
| 3DMark Time Spy Score | 12431 puntos | |
ayuda | ||
* ... más pequeño es mejor
Rendimiento en juegos
En el peor de los casos, nuestro modelo RTX 4070 con tecnología AMD ofrece el mismo rendimiento que el modelo RTX 4060 con tecnología Intel, y en el mejor de los casos es hasta un 20% más rápido. Como era de esperar, la diferencia de rendimiento entre las dos GPU tiende a aumentar al jugar a títulos más exigentes con resoluciones y ajustes más altos. Por ejemplo, F1 22 y Returnal se ejecutan entre un 15 y un 20 por ciento más rápido en nuestro modelo AMD Legion, mientras que títulos más antiguos como GTA V muestran ventajas menores en la tasa de imágenes por segundo, de entre un 5 y un 10 por ciento. Por lo tanto, para aprovechar mejor la RTX 4070 para portátiles, conviene jugar a más títulos nuevos.
En general, la RTX 4070 móvil combina bien con la pantalla de resolución nativa de 2560 x 1600, sobre todo porque admite G-Sync. Aunque la versión móvil es mucho más débil que la versión de sobremesa en torno a un 30%, sigue siendo lo bastante potente como para ejecutar los últimos juegos a 1600p y 60+ FPS en ajustes altos. Los jugadores a los que no les molesten las desventajas de la generación de fotogramas pueden activar DLSS3 en los títulos compatibles para obtener velocidades de fotogramas aún mayores.
Witcher 3 FPS Chart
| bajo | medio | alto | ultra | QHD | 4K | |
|---|---|---|---|---|---|---|
| GTA V (2015) | 185.8 | 185.1 | 178.6 | 119.9 | 93.2 | 93.7 |
| The Witcher 3 (2015) | 597 | 415.1 | 257.3 | 119.8 | 76.2 | |
| Dota 2 Reborn (2015) | 238 | 203 | 191.8 | 182 | 151.5 | |
| Final Fantasy XV Benchmark (2018) | 229 | 172.5 | 119.9 | 119.9 | 49.2 | |
| X-Plane 11.11 (2018) | 186.3 | 155.2 | 117.8 | 99.5 | ||
| Strange Brigade (2018) | 636 | 334 | 260 | 223 | 146.4 | 76.8 |
| Shadow of the Tomb Raider (2018) | 168 | 110 | 53 | |||
| Far Cry 6 (2021) | 110 | 88 | 43 | |||
| Cyberpunk 2077 1.6 (2022) | 185.8 | 157.6 | 121.3 | 98.9 | 58.1 | 24.7 |
| Tiny Tina's Wonderlands (2022) | 263.6 | 217.3 | 144.5 | 112.1 | 76.9 | 39.7 |
| F1 22 (2022) | 311 | 300 | 235 | 84.1 | 54.8 | 26.4 |
| Call of Duty Modern Warfare 2 2022 (2022) | 108 | 77 | 44 | |||
| Returnal (2023) | 93 | 90 | 85 | 77 | 55 | 29 |
| Star Wars Jedi Survivor (2023) | 77.9 | 50.4 | 24.2 |
Emisiones
Ruido del sistema: unos 50 dB(A) en juegos
El ruido del ventilador al jugar es prácticamente el mismo entre los modelos AMD e Intel, con unos 48 dB(A). Sin embargo, si la CPU se estresa mucho más, el ruido del ventilador puede alcanzar un máximo de 54 dB(A). El rango bajo de 50 dB(A) es típico de la mayoría de portátiles para juegos, incluido elAsus ROG Strix G16 oRazer Blade 16.
Curiosamente, el ruido del ventilador es un poco más silencioso y con pulsaciones menos frecuentes cuando se ejecutan cargas poco exigentes como trabajo de oficina o reproducción de vídeo. La CPU AMD consume menos energía que la CPU Intel al aumentar la potencia, lo que puede contribuir a que el ruido del ventilador sea más constante.
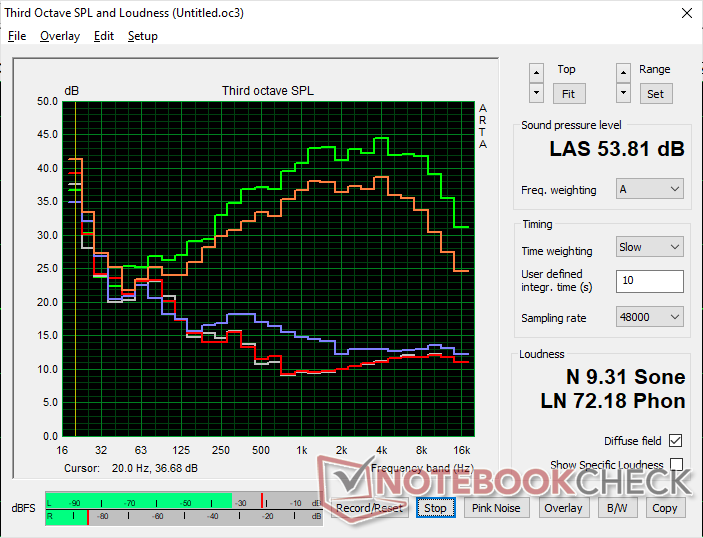
Ruido
| Ocioso |
| 23.2 / 23.2 / 26.2 dB(A) |
| Carga |
| 31.4 / 53.8 dB(A) |
 | ||
30 dB silencioso 40 dB(A) audible 50 dB(A) ruidosamente alto |
||
min: | ||
| Lenovo Legion Pro 5 16ARX8 GeForce RTX 4070 Laptop GPU, R7 7745HX, Samsung PM9A1 MZVL21T0HCLR | Lenovo Legion Pro 5 16IRX8 GeForce RTX 4060 Laptop GPU, i7-13700HX, SK hynix PC801 HFS512GEJ9X115N | Uniwill GM6PX7X RTX 4070 GeForce RTX 4070 Laptop GPU, i7-13700HX, Samsung PM9A1 MZVL2512HCJQ | Schenker XMG Neo 16 E23 GeForce RTX 4090 Laptop GPU, i9-13900HX, Crucial P5 Plus 1TB CT1000P5PSSD8 | Asus ROG Strix G16 G614JZ GeForce RTX 4080 Laptop GPU, i9-13980HX, WD PC SN560 SDDPNQE-1T00 | Asus Zephyrus Duo 16 GX650PY-NM006W GeForce RTX 4090 Laptop GPU, R9 7945HX, SK hynix PC801 HFS002TEJ9X101N | |
|---|---|---|---|---|---|---|
| Noise | -2% | -9% | -37% | -15% | -19% | |
| apagado / medio ambiente * (dB) | 23.2 | 23 1% | 22.4 3% | 25 -8% | 25 -8% | 23.9 -3% |
| Idle Minimum * (dB) | 23.2 | 23.1 -0% | 22.9 1% | 31 -34% | 26 -12% | 23.9 -3% |
| Idle Average * (dB) | 23.2 | 23.1 -0% | 29 -25% | 33 -42% | 28 -21% | 32.9 -42% |
| Idle Maximum * (dB) | 26.2 | 26.6 -2% | 29 -11% | 42 -60% | 30 -15% | 36.5 -39% |
| Load Average * (dB) | 31.4 | 34.7 -11% | 40.2 -28% | 58 -85% | 48 -53% | 42.9 -37% |
| Witcher 3 ultra * (dB) | 48.4 | 47.6 2% | 48.7 -1% | 57 -18% | 49 -1% | 51.2 -6% |
| Load Maximum * (dB) | 53.8 | 54.8 -2% | 55 -2% | 59 -10% | 52 3% | 56 -4% |
* ... más pequeño es mejor
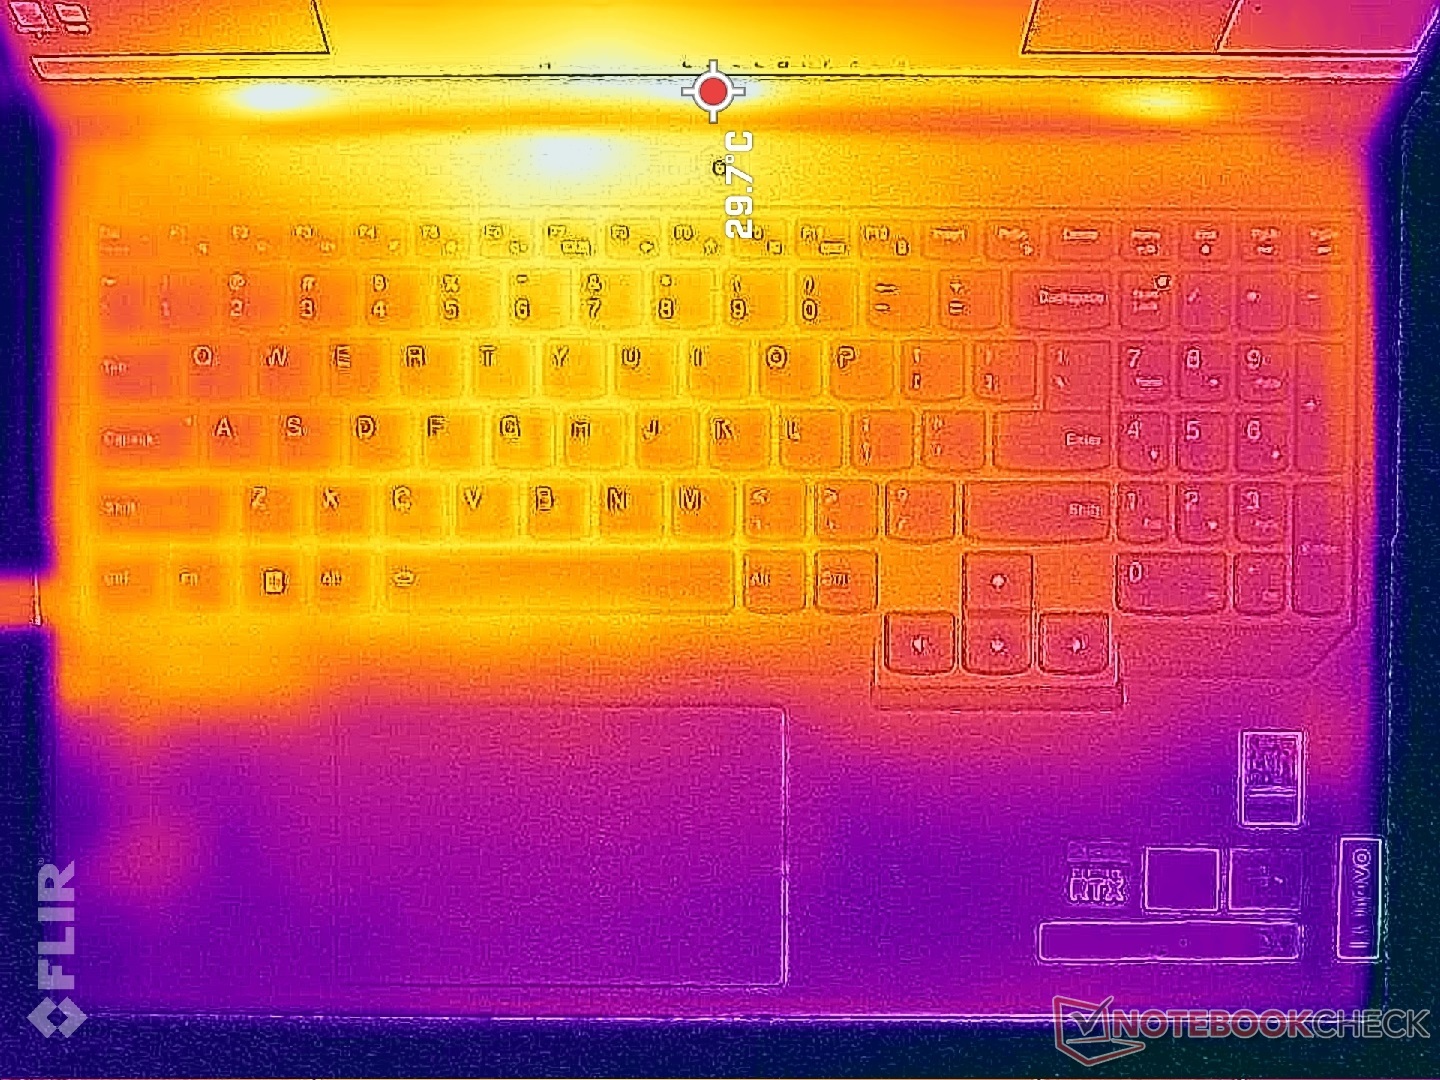
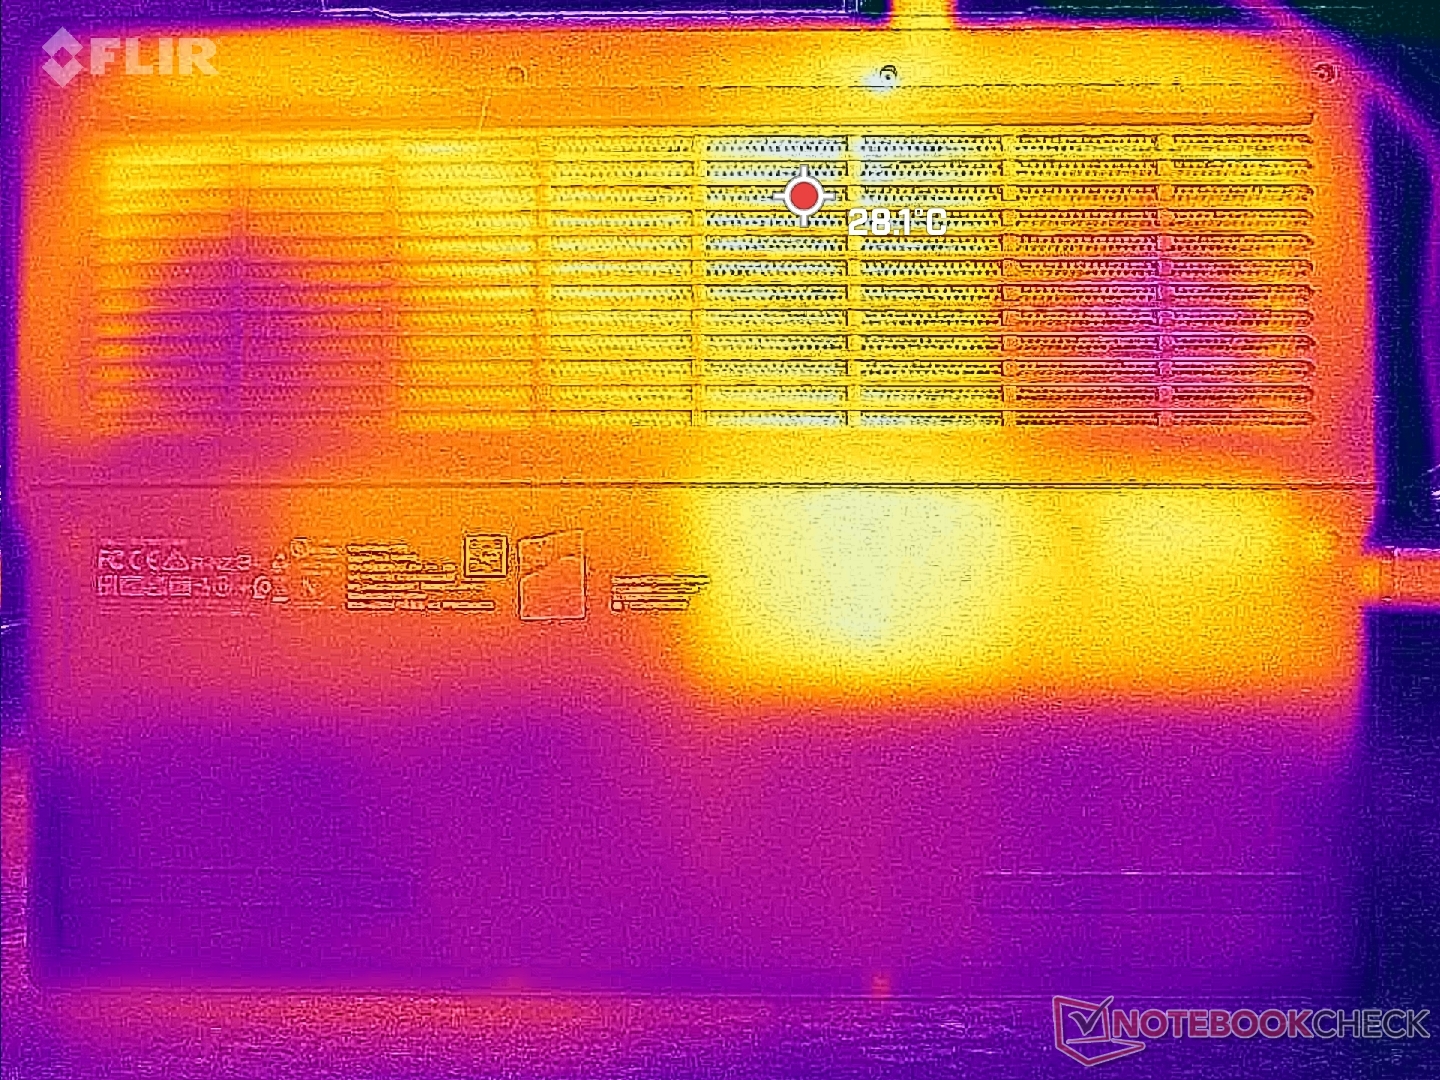
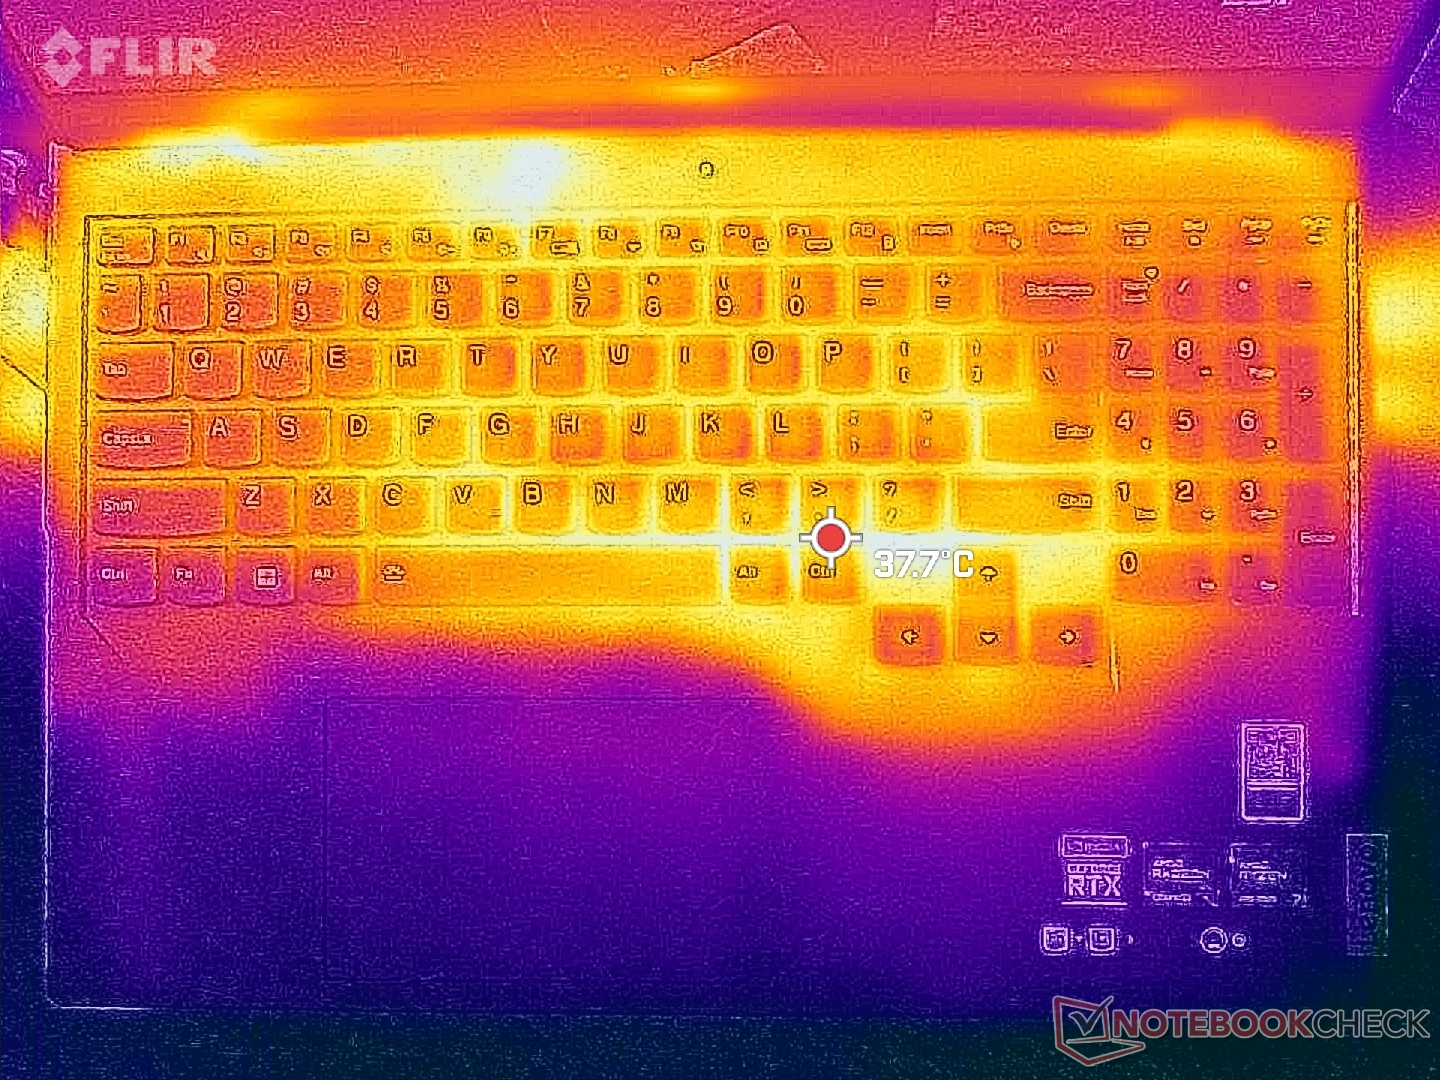
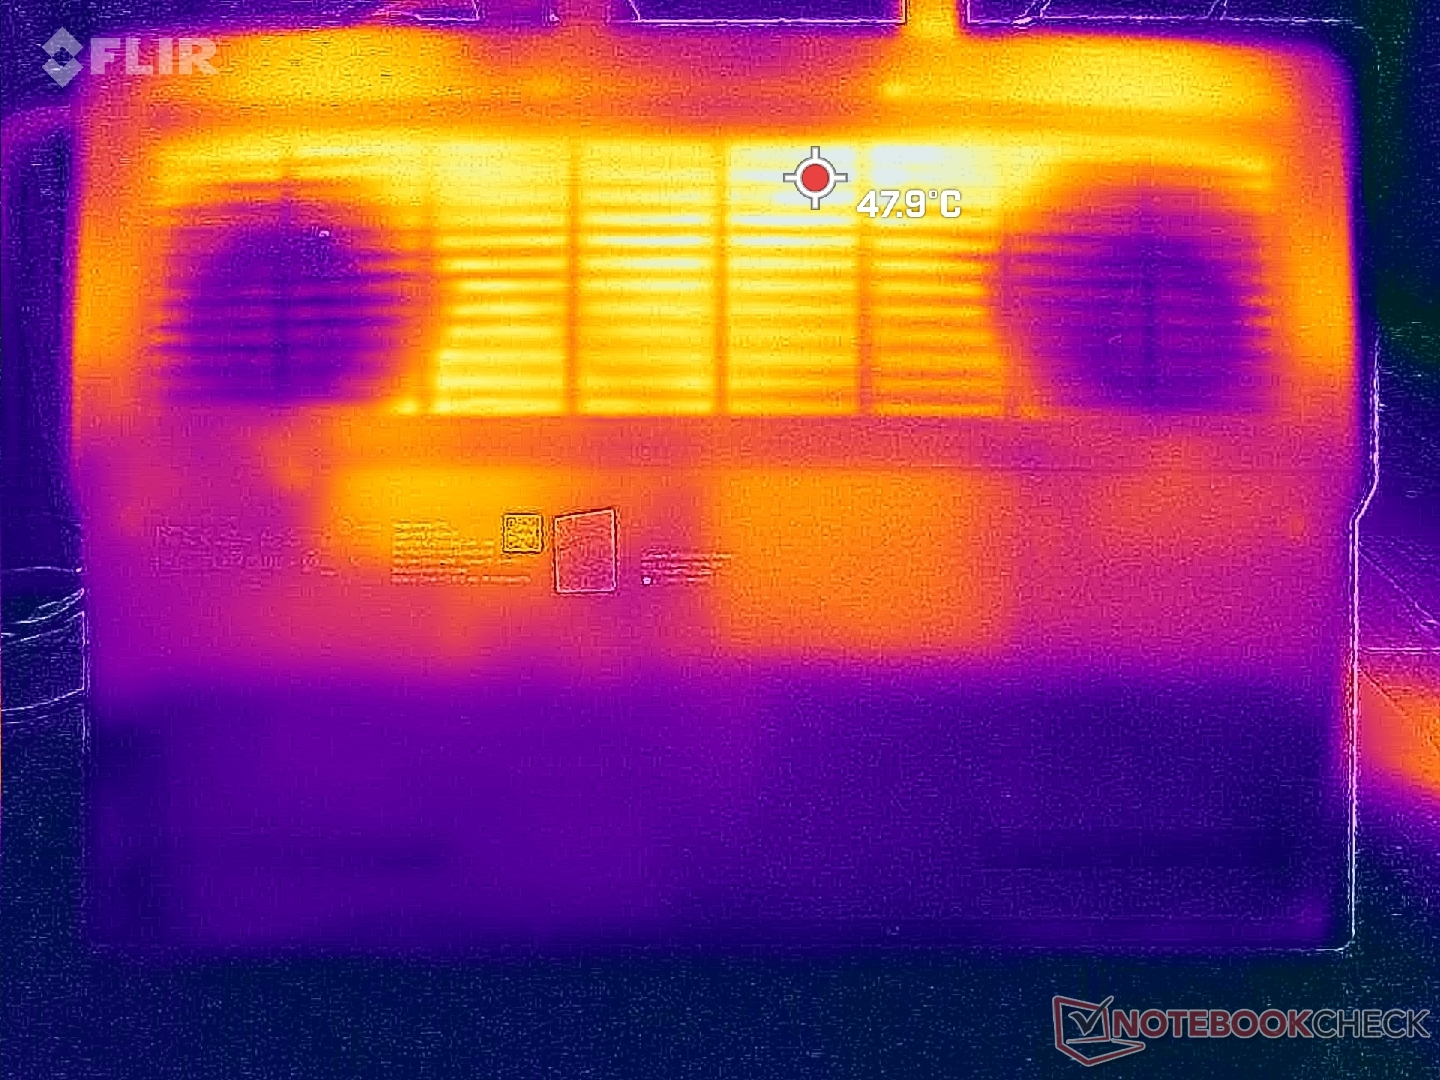
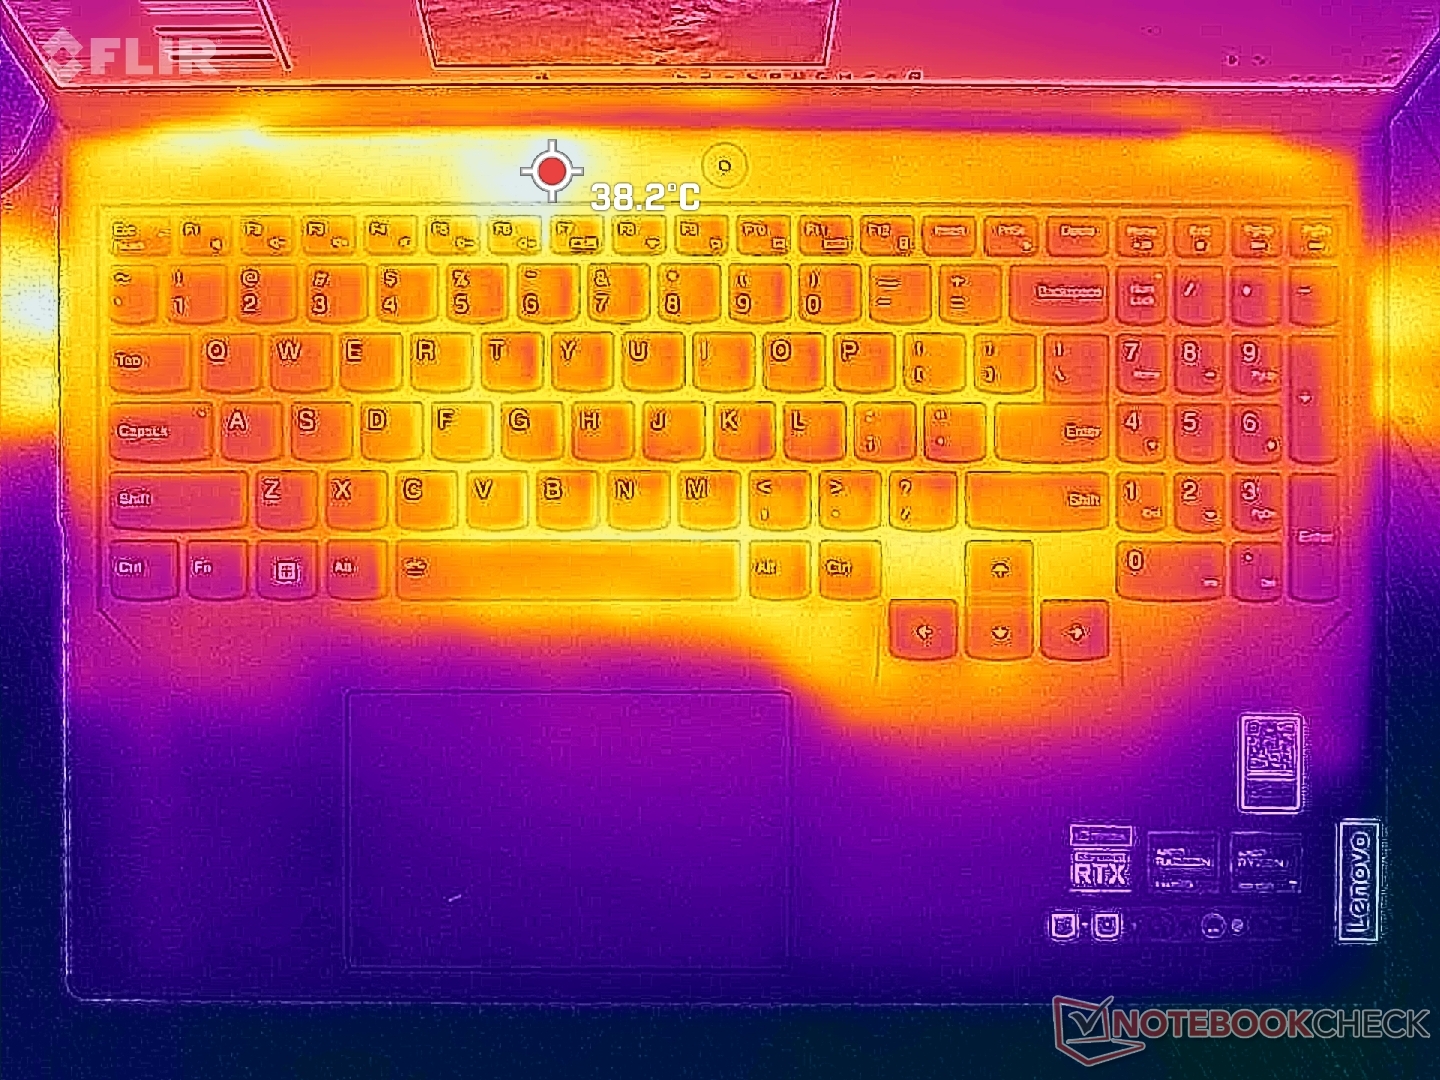
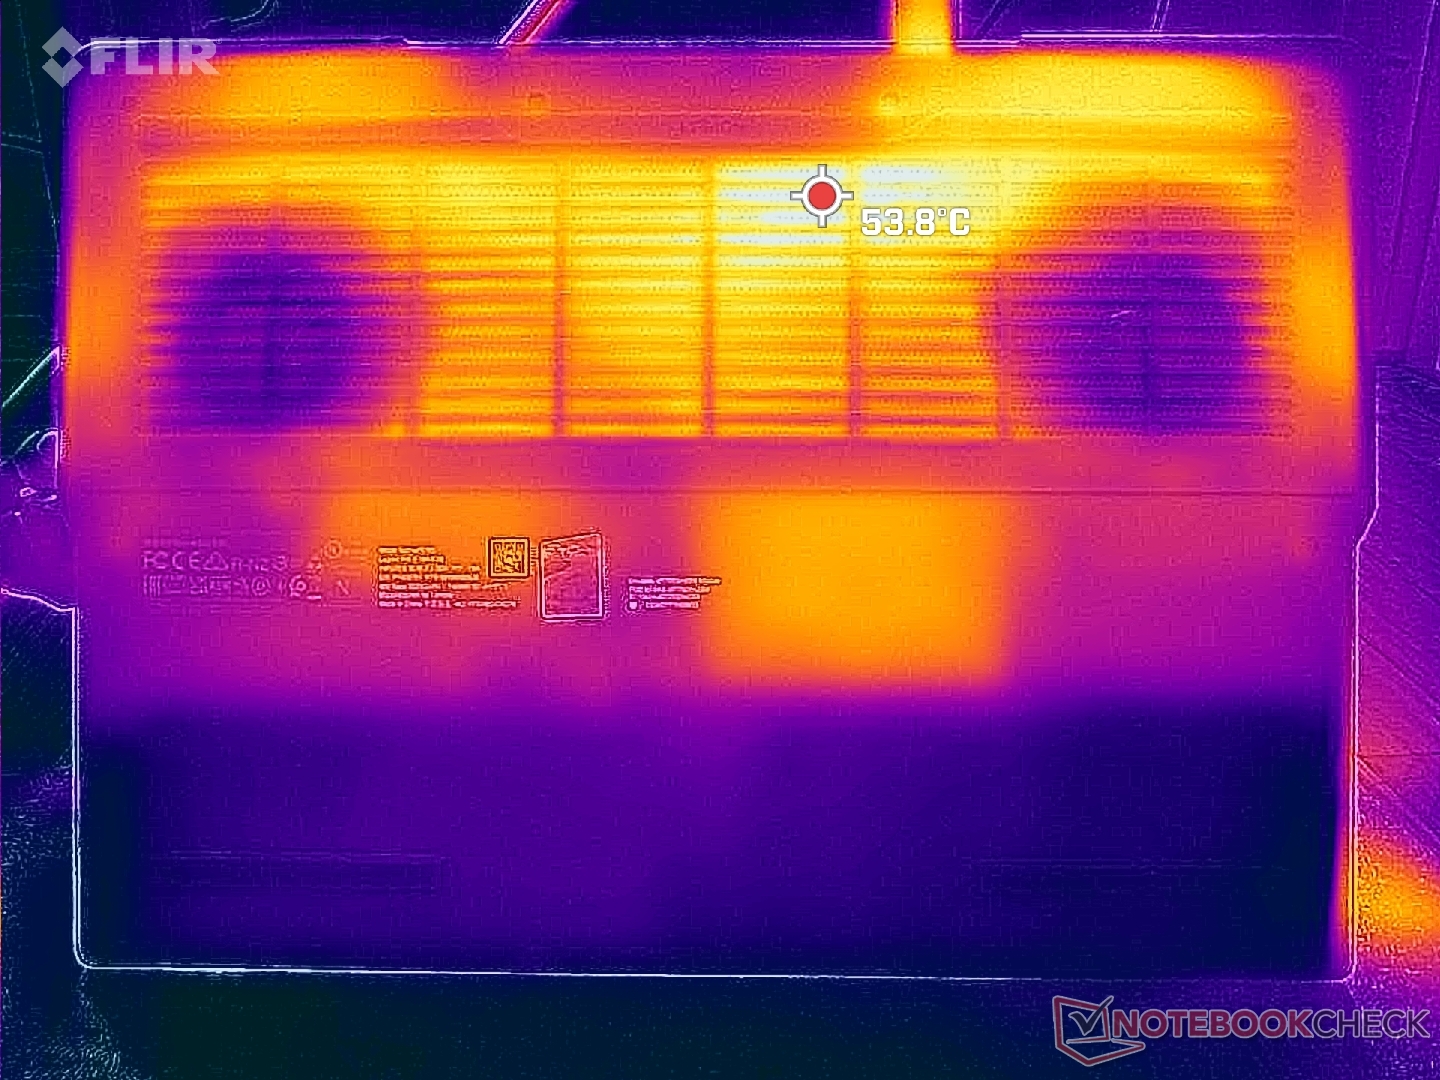
Temperatura
Las temperaturas superficiales son más cálidas cerca del centro y la parte trasera del chasis, donde los puntos calientes pueden alcanzar algo más de 40 C cuando se juega. Modelos de la competencia como elAsus ROG Zephyrus M16 se calientan incluso más de 50 C en condiciones de prueba similares. No hay duda de que las rejillas de ventilación comparativamente más grandes del diseño de Legion son en parte responsables de las mejores temperaturas.
Los reposamanos apenas se calientan sin importar la carga en pantalla para mantener las manos cómodas cuando se juega.
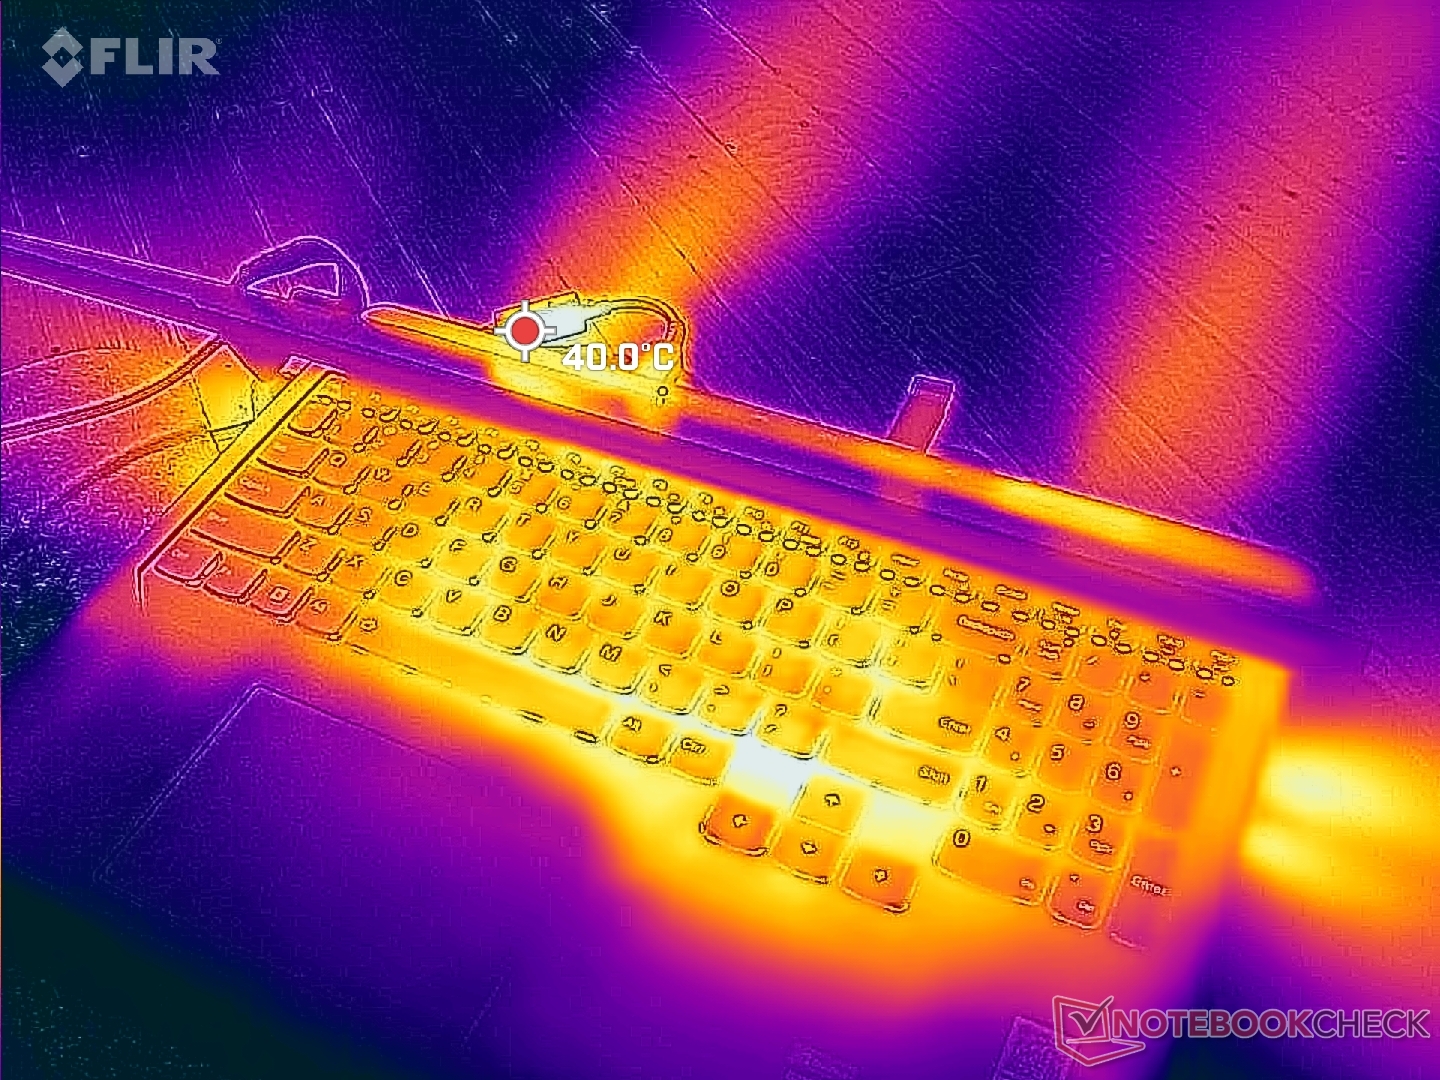
(±) La temperatura máxima en la parte superior es de 41.8 °C / 107 F, frente a la media de 40.4 °C / 105 F, que oscila entre 21.2 y 68.8 °C para la clase Gaming.
(±) El fondo se calienta hasta un máximo de 41.4 °C / 107 F, frente a la media de 43.2 °C / 110 F
(+) En reposo, la temperatura media de la parte superior es de 26.2 °C / 79# F, frente a la media del dispositivo de 33.9 °C / 93 F.
(±) Jugando a The Witcher 3, la temperatura media de la parte superior es de 34.2 °C / 94 F, frente a la media del dispositivo de 33.9 °C / 93 F.
(+) El reposamanos y el panel táctil están a una temperatura inferior a la de la piel, con un máximo de 30.4 °C / 86.7 F y, por tanto, son fríos al tacto.
(±) La temperatura media de la zona del reposamanos de dispositivos similares fue de 28.8 °C / 83.8 F (-1.6 °C / -2.9 F).
| Lenovo Legion Pro 5 16ARX8 AMD Ryzen 7 7745HX, NVIDIA GeForce RTX 4070 Laptop GPU | Lenovo Legion Pro 5 16IRX8 Intel Core i7-13700HX, NVIDIA GeForce RTX 4060 Laptop GPU | Uniwill GM6PX7X RTX 4070 Intel Core i7-13700HX, NVIDIA GeForce RTX 4070 Laptop GPU | Schenker XMG Neo 16 E23 Intel Core i9-13900HX, NVIDIA GeForce RTX 4090 Laptop GPU | Asus ROG Strix G16 G614JZ Intel Core i9-13980HX, NVIDIA GeForce RTX 4080 Laptop GPU | Asus Zephyrus Duo 16 GX650PY-NM006W AMD Ryzen 9 7945HX, NVIDIA GeForce RTX 4090 Laptop GPU | |
|---|---|---|---|---|---|---|
| Heat | -9% | -12% | -7% | -18% | -5% | |
| Maximum Upper Side * (°C) | 41.8 | 42.8 -2% | 38.2 9% | 50 -20% | 54 -29% | 44.2 -6% |
| Maximum Bottom * (°C) | 41.4 | 50 -21% | 45 -9% | 51 -23% | 55 -33% | 46.8 -13% |
| Idle Upper Side * (°C) | 29 | 29.6 -2% | 33.6 -16% | 28 3% | 29 -0% | 29.2 -1% |
| Idle Bottom * (°C) | 30.4 | 34 -12% | 39.6 -30% | 26 14% | 33 -9% | 30.2 1% |
* ... más pequeño es mejor
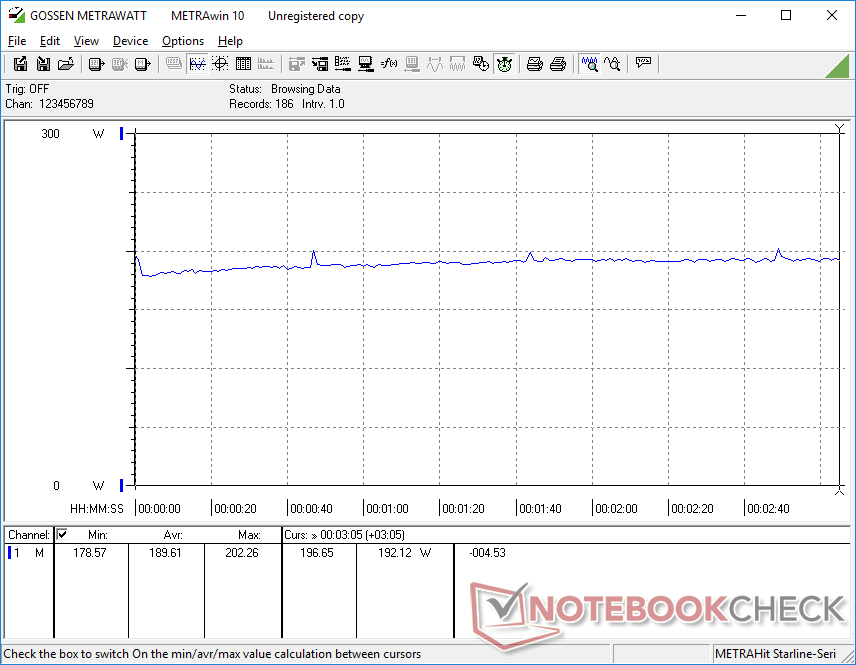
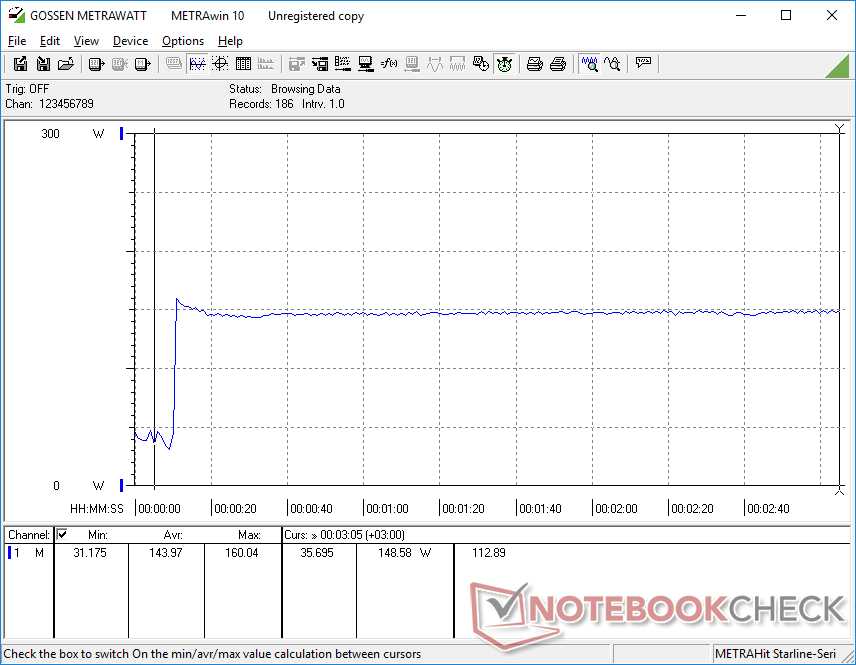
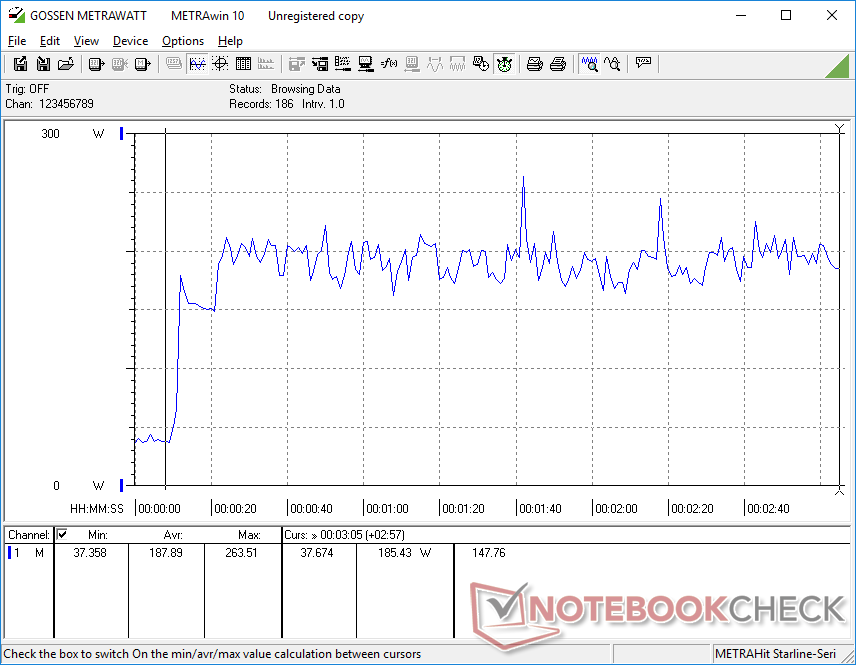
Prueba de estrés - Una CPU tostada
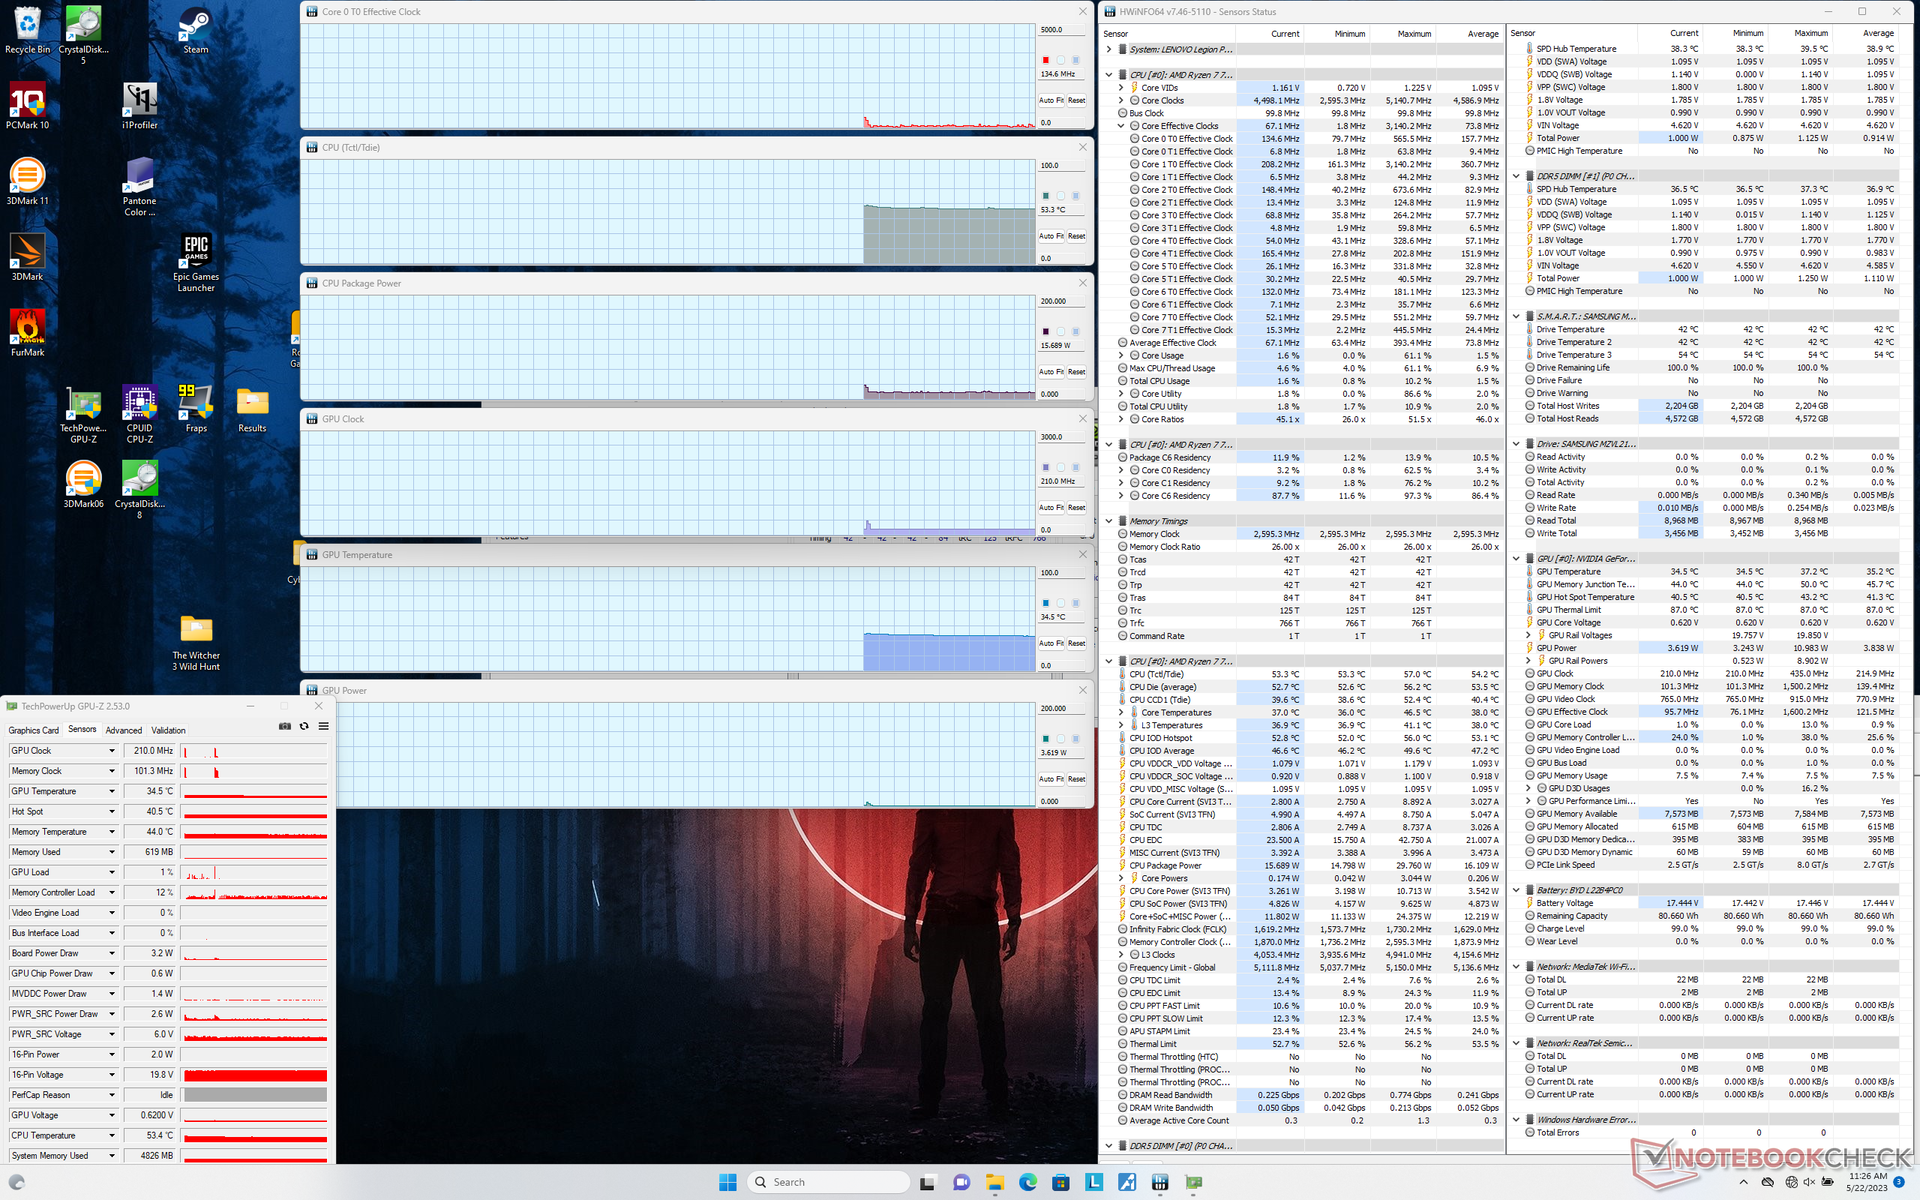
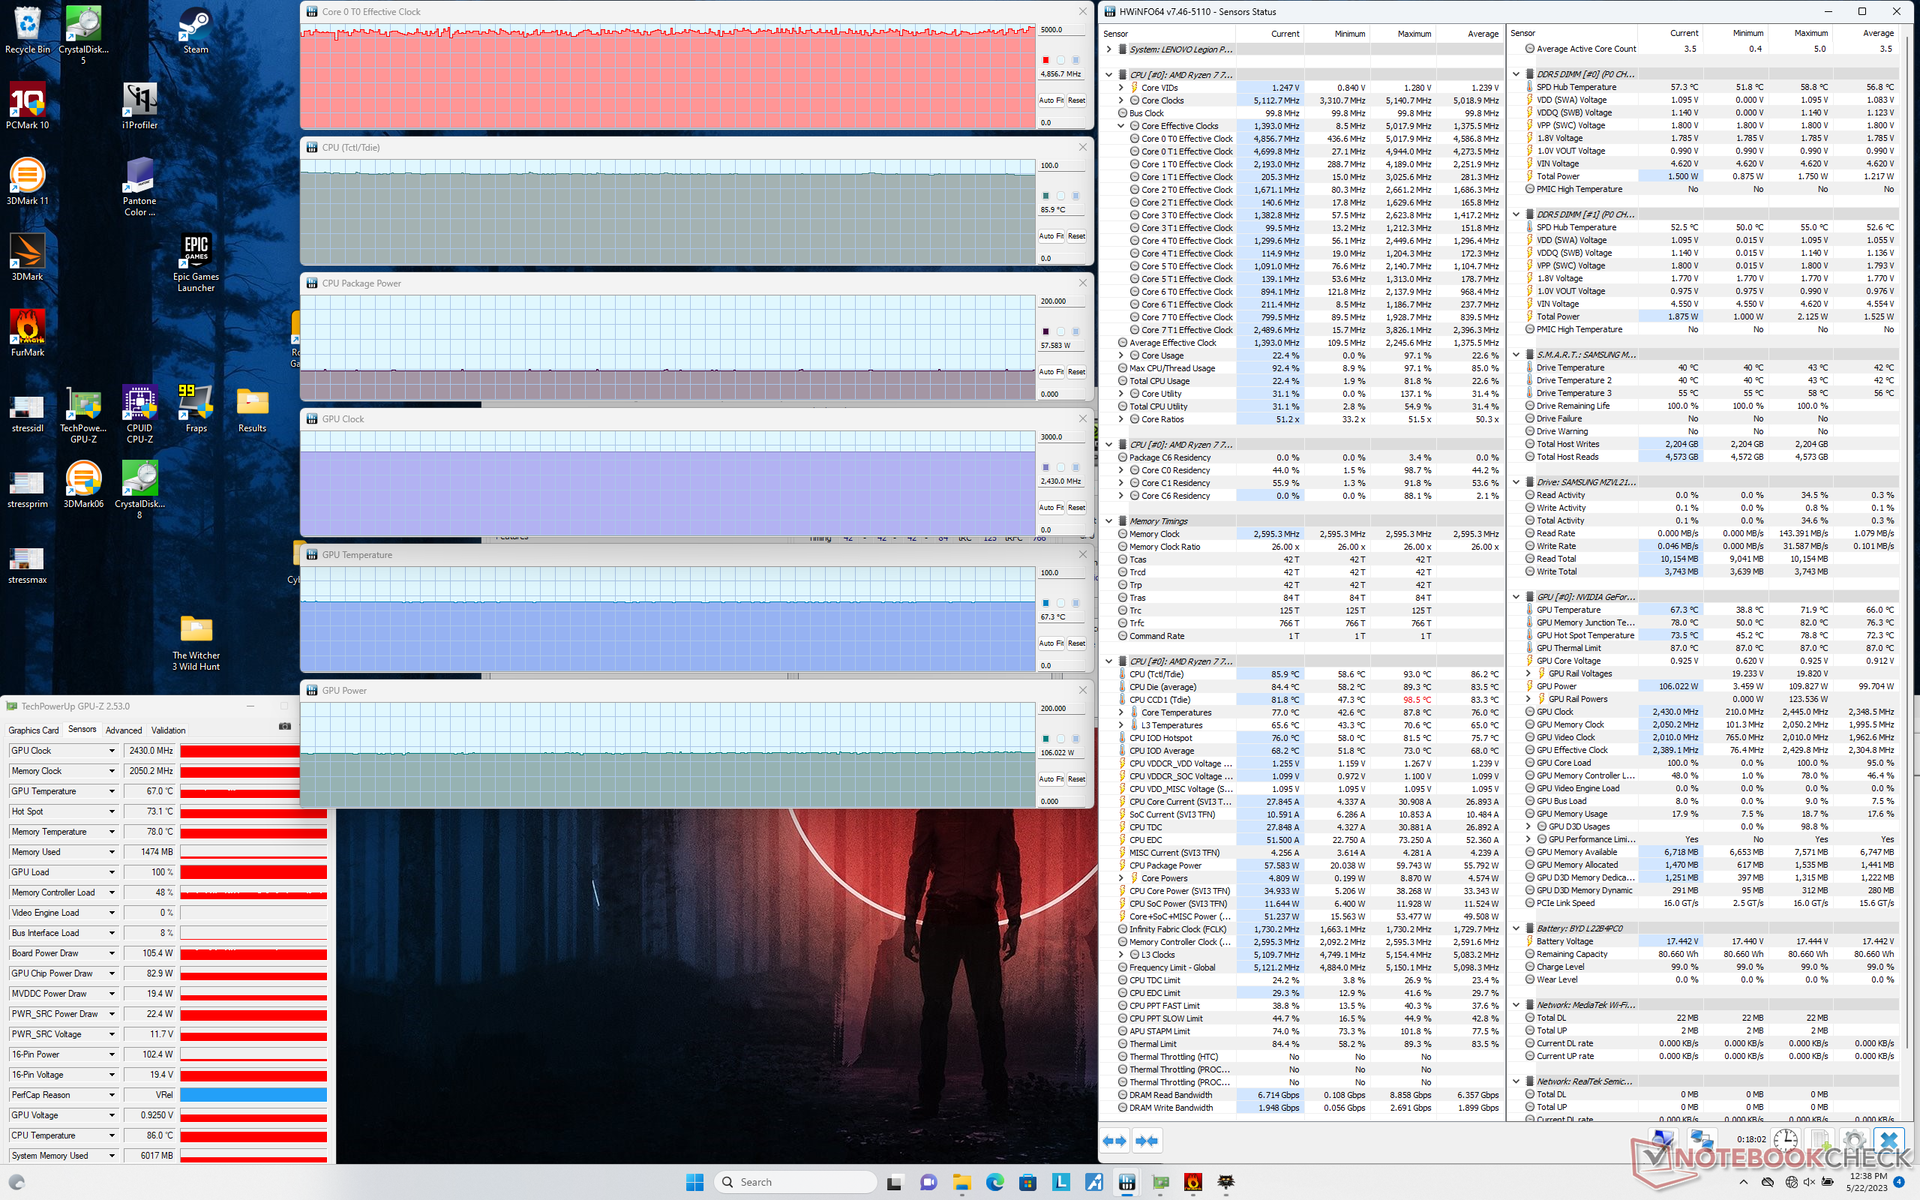
Al ejecutar Prime95 para estresar la CPU, las frecuencias de reloj y el consumo de la placa se disparaban hasta los 4,9 GHz y los 110 W, respectivamente, antes de caer rápidamente hasta los 4,6 GHz y los 90 W unos segundos después. La temperatura del núcleo se estabilizaría en el rango muy alto de 90 C a 100 C, que es incluso más caliente por unos pocos grados que el ya caliente Core i7-13700HX en el modelo alternativo de Intel modelo alternativo de Intel Legion . Está claro que la CPU Ryzen 7 está llegando a los límites de la solución de refrigeración del chasis y que una solución Ryzen 9 más rápida habría necesitado compromisos.
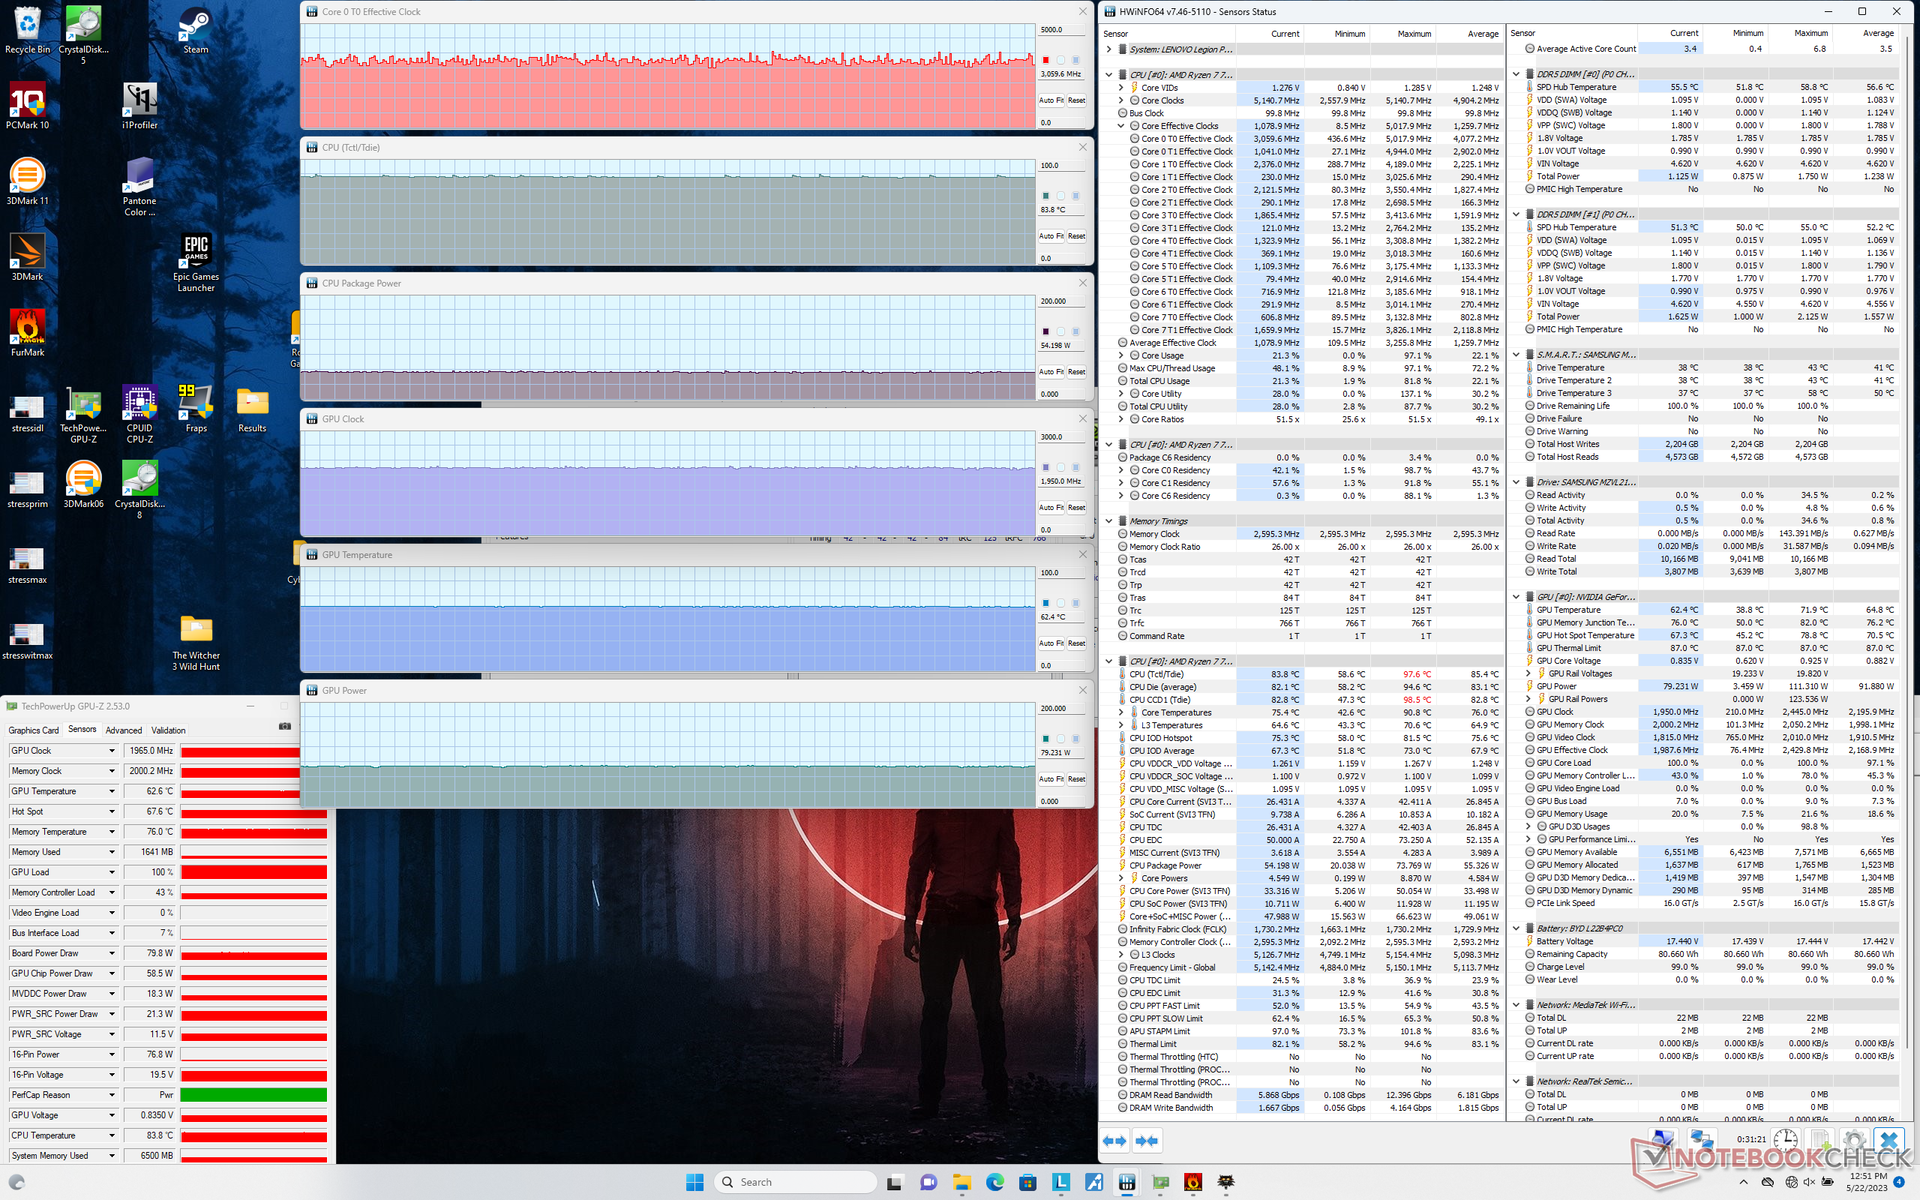
La dGPU se estabilizaría a 2430 MHz de núcleo, 2050 MHz de memoria, 67 C, y 105 W frente a un TGP objetivo de 140 W cuando se ejecuta en modo Rendimiento Witcher 3 en modo de rendimiento. La RTX 4060 en el modelo Intel Legion también se estabilizaría entre 105 W y 110 W, ya que ambas GPU están bajo envolventes energéticas similares a pesar de sus diferencias de rendimiento. Si juegas en modo Equilibrado con la función GPU Overclock desactivada, el reloj de la GPU será más lento, de 1965 MHz, y el consumo de la placa será mucho menor, de solo 80 W. El déficit de rendimiento entre los modos Equilibrado y Rendimiento es de entre un 10 y un 15 por ciento, como ya se ha mencionado.
El funcionamiento con batería reduce el rendimiento. Una prueba de Fire Strike a pilas arrojaría unas puntuaciones de Física y Gráficos de 10865 y 9334 puntos, respectivamente, frente a los 11477 y 12617 puntos de la red eléctrica.
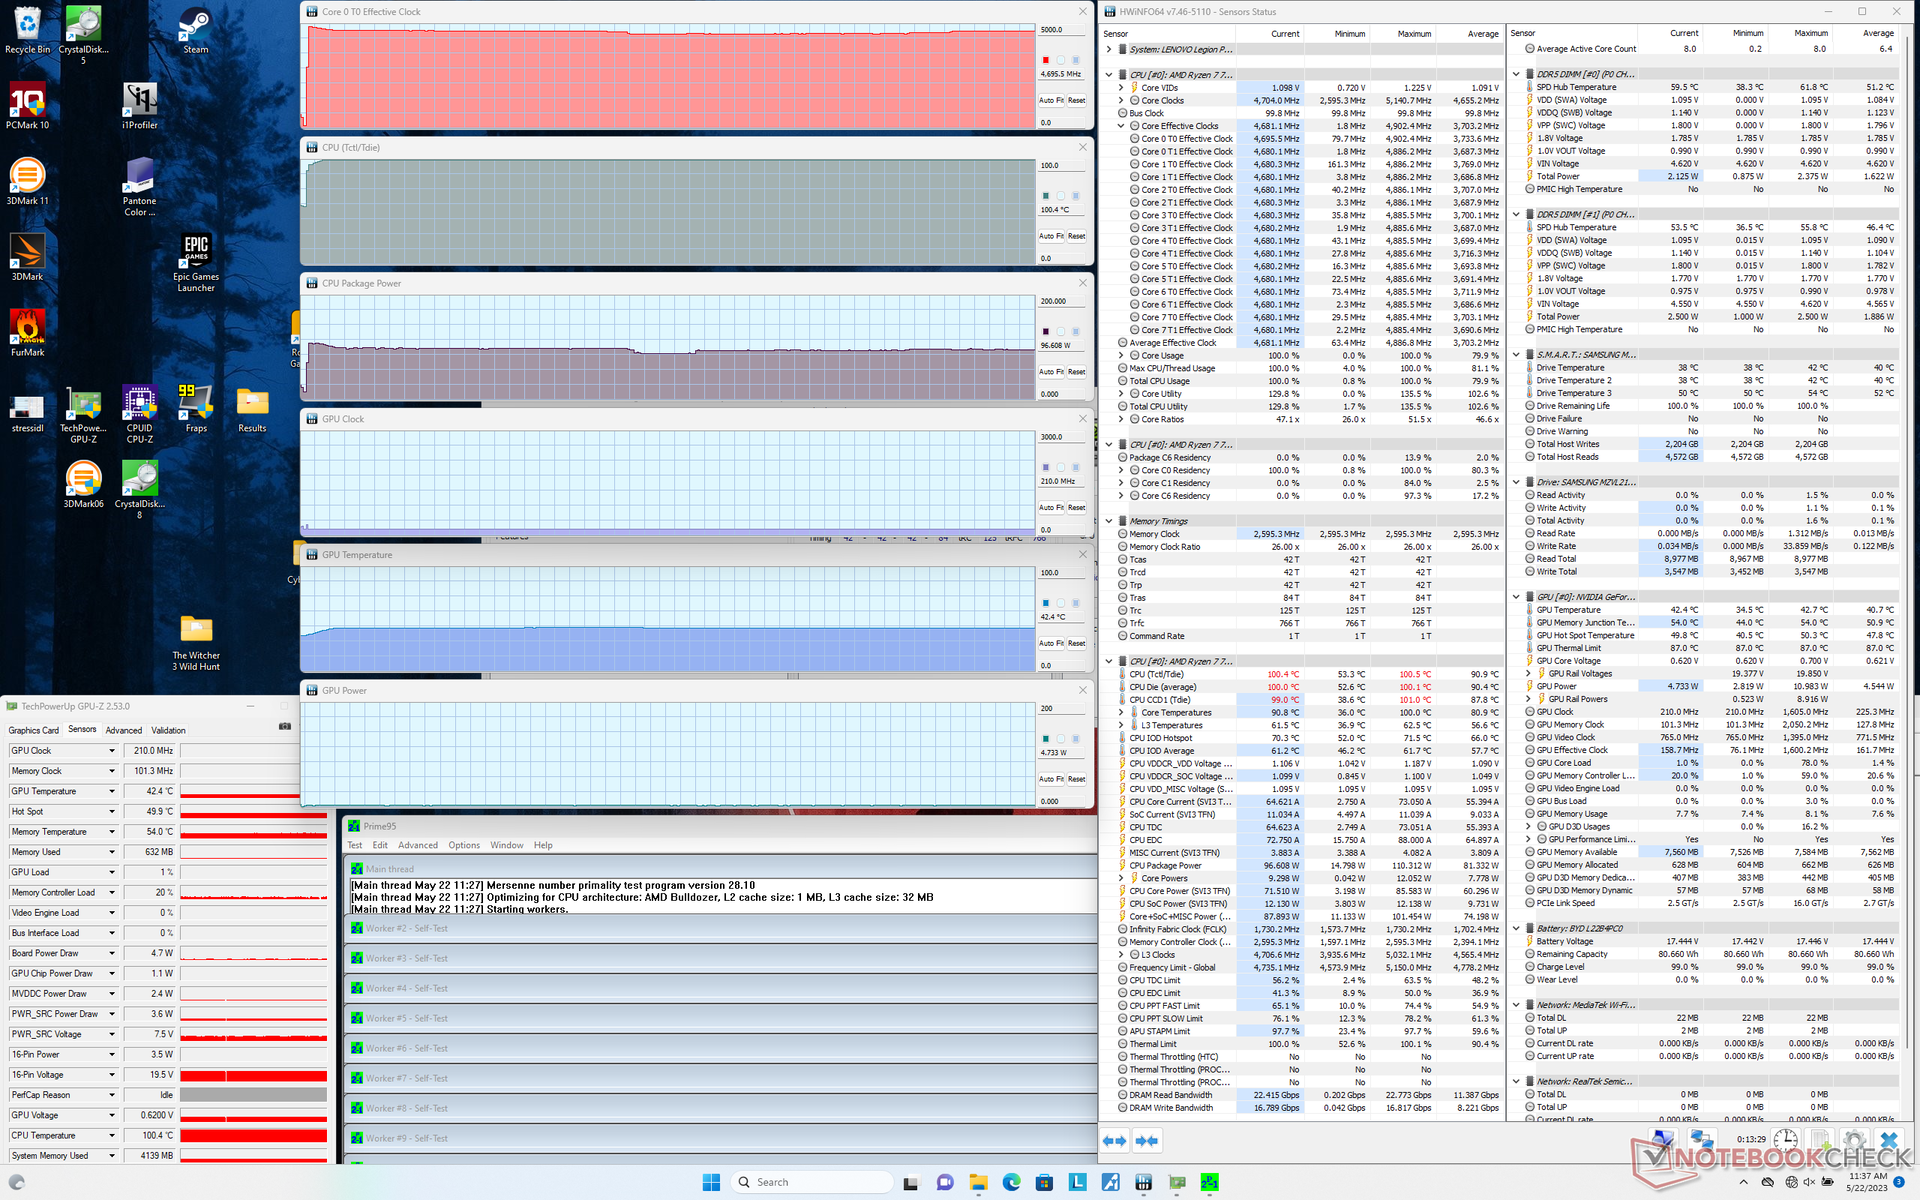
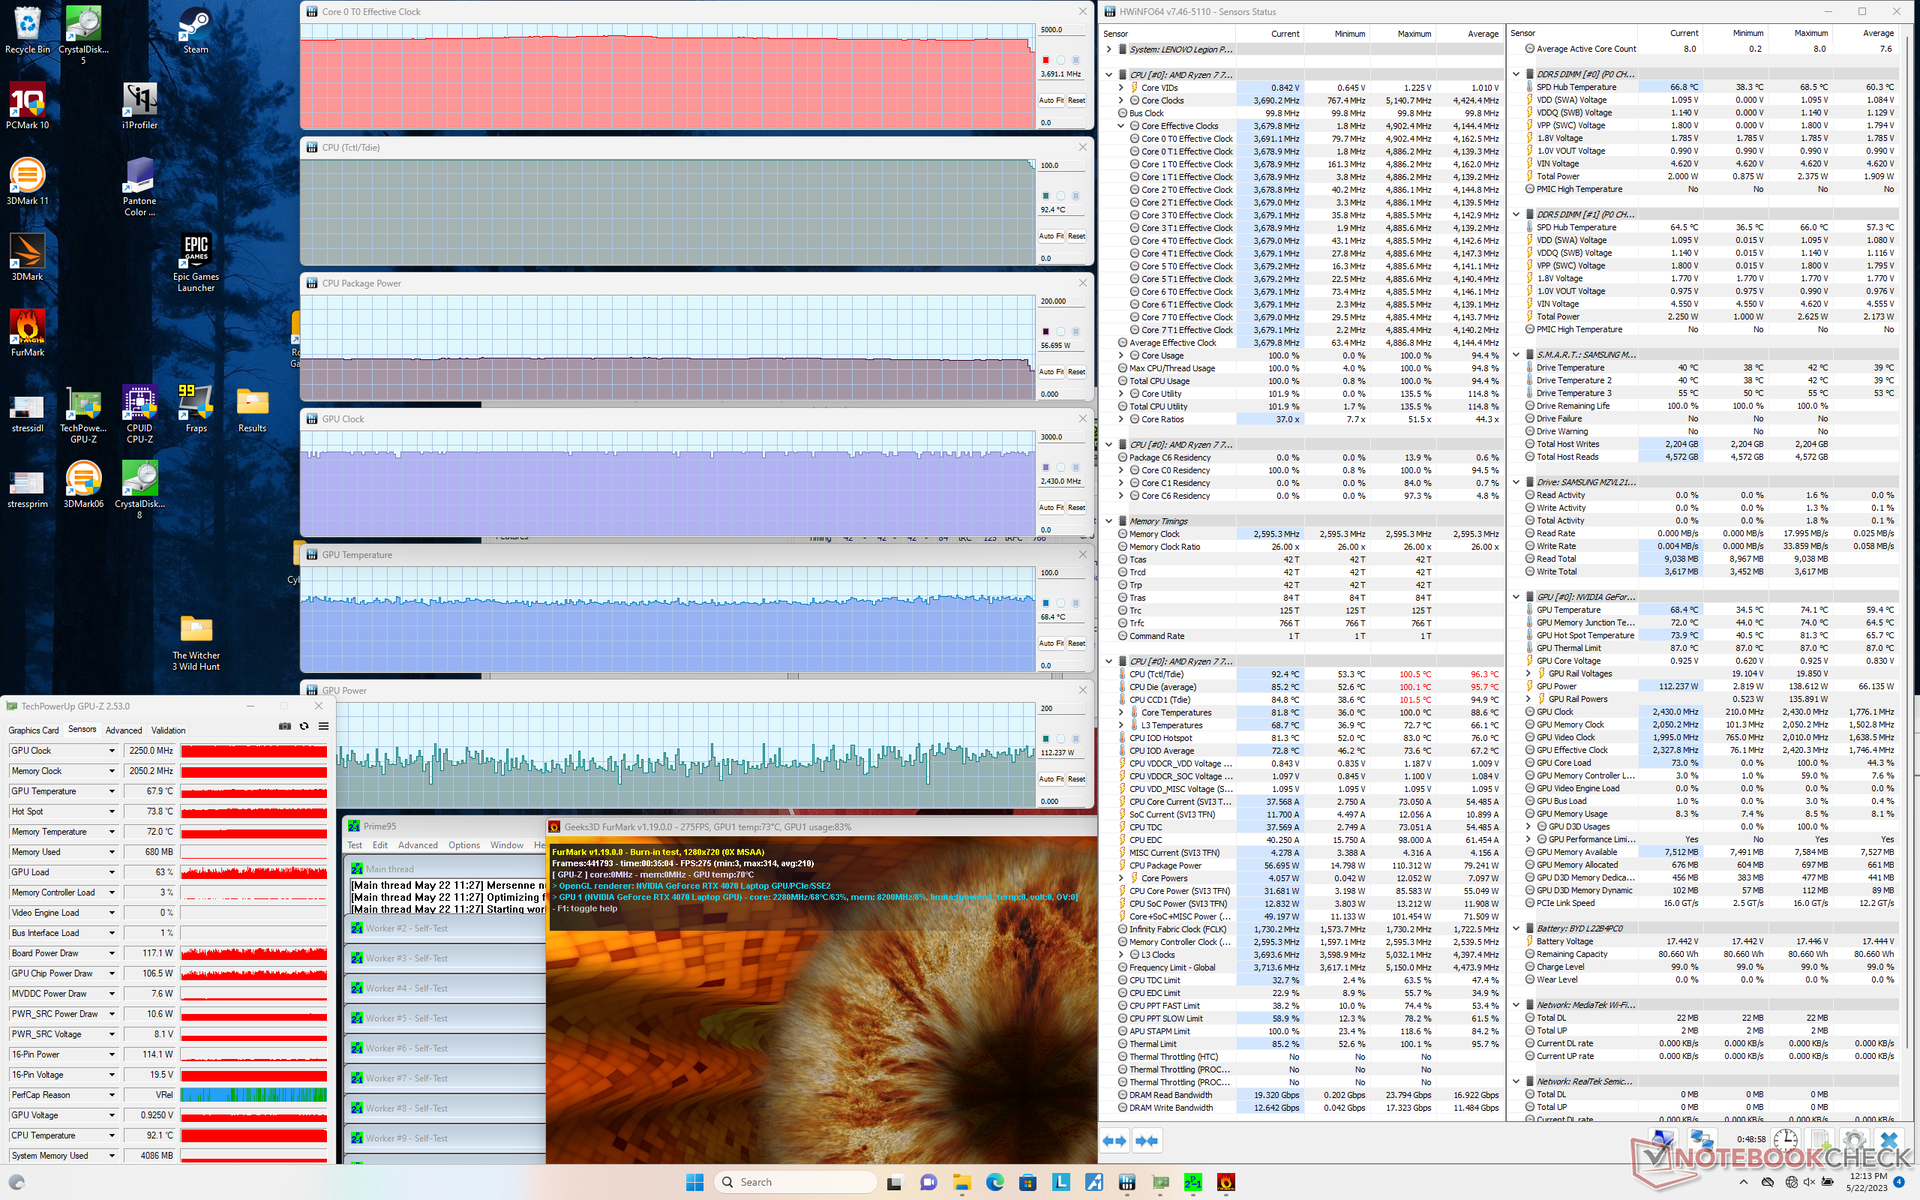
| RelojCPU (GHz) | Reloj GPU (MHz) | Temperatura mediaCPU (°C) | Temperatura media GPU (°C) | |
| Sistema en reposo | -- | -- | 53 | 35 |
| Prime95 Stress | 4.6 - 4.7 | -- | 100 | 42 |
| Prime95+ FurMark Estrés | 3,7 - 4,3 | 2250 | 92 - 100 | 69 |
| Witcher 3 Estrés (modoRendimiento) | 4,9 | 2430 | 86 | 67 |
| Witcher 3 Estrés (modoequilibrado) | 3,1 | 1965 | 84 | 62 |
Altavoces
Lenovo Legion Pro 5 16ARX8 análisis de audio
(±) | la sonoridad del altavoz es media pero buena (80.9 dB)
Graves 100 - 315 Hz
(-) | casi sin bajos - de media 24% inferior a la mediana
(±) | la linealidad de los graves es media (13.4% delta a frecuencia anterior)
Medios 400 - 2000 Hz
(+) | medios equilibrados - a sólo 4.7% de la mediana
(+) | los medios son lineales (6.2% delta a la frecuencia anterior)
Altos 2 - 16 kHz
(+) | máximos equilibrados - a sólo 2.5% de la mediana
(+) | los máximos son lineales (6.2% delta a la frecuencia anterior)
Total 100 - 16.000 Hz
(±) | la linealidad del sonido global es media (21.9% de diferencia con la mediana)
En comparación con la misma clase
» 79% de todos los dispositivos probados de esta clase eran mejores, 6% similares, 16% peores
» El mejor tuvo un delta de 6%, la media fue 18%, el peor fue ###max##%
En comparación con todos los dispositivos probados
» 63% de todos los dispositivos probados eran mejores, 7% similares, 31% peores
» El mejor tuvo un delta de 4%, la media fue 24%, el peor fue ###max##%
Apple MacBook Pro 16 2021 M1 Pro análisis de audio
(+) | los altavoces pueden reproducir a un volumen relativamente alto (#84.7 dB)
Graves 100 - 315 Hz
(+) | buen bajo - sólo 3.8% lejos de la mediana
(+) | el bajo es lineal (5.2% delta a la frecuencia anterior)
Medios 400 - 2000 Hz
(+) | medios equilibrados - a sólo 1.3% de la mediana
(+) | los medios son lineales (2.1% delta a la frecuencia anterior)
Altos 2 - 16 kHz
(+) | máximos equilibrados - a sólo 1.9% de la mediana
(+) | los máximos son lineales (2.7% delta a la frecuencia anterior)
Total 100 - 16.000 Hz
(+) | el sonido global es lineal (4.6% de diferencia con la mediana)
En comparación con la misma clase
» 0% de todos los dispositivos probados de esta clase eran mejores, 0% similares, 100% peores
» El mejor tuvo un delta de 5%, la media fue 17%, el peor fue ###max##%
En comparación con todos los dispositivos probados
» 0% de todos los dispositivos probados eran mejores, 0% similares, 100% peores
» El mejor tuvo un delta de 4%, la media fue 24%, el peor fue ###max##%
Gestión de la energía
Consumo energético - Menor impulso de la CPU que el Core i7-13700HX
El modelo AMD es más eficiente energéticamente que el modelo Intel cuando está en reposo en el escritorio. Por lo demás, ambos modelos consumen aproximadamente la misma cantidad de energía cuando ejecutan cargas más altas, como juegos. Ambos modelos también vienen con el mismo adaptador de CA de 300 W, que ofrece margen más que suficiente para la GPU de ~140 W y la CPU de ~100 W.
Merece la pena señalar que el Core i7-13700HX del modelo Intel puede alcanzar un consumo de placa de 159 W frente a los 110 W de nuestro Ryzen 7 7745HX, lo que explicaría en parte su ventaja de rendimiento sobre la CPU AMD. Sin embargo, cuando las velocidades de reloj de Turbo Boost se estabilizan tras un par de minutos de estrés, el consumo de energía entre los dos modelos se acercaría mucho más, como muestran los gráficos comparativos a continuación. Por ejemplo, al ejecutar Prime95 durante unos minutos, los modelos de Intel y AMD se estabilizan en 158 W y 149 W, respectivamente, aunque el modelo de Intel puede alcanzar los 220 W al inicio de la prueba.
| Off / Standby | |
| Ocioso | |
| Carga |
|
Clave:
min: | |
| Lenovo Legion Pro 5 16ARX8 R7 7745HX, GeForce RTX 4070 Laptop GPU, Samsung PM9A1 MZVL21T0HCLR, IPS, 2560x1600, 16" | Lenovo Legion Pro 5 16IRX8 i7-13700HX, GeForce RTX 4060 Laptop GPU, SK hynix PC801 HFS512GEJ9X115N, IPS, 2560x1600, 16" | Uniwill GM6PX7X RTX 4070 i7-13700HX, GeForce RTX 4070 Laptop GPU, Samsung PM9A1 MZVL2512HCJQ, IPS, 2560x1600, 16" | Schenker XMG Neo 16 E23 i9-13900HX, GeForce RTX 4090 Laptop GPU, Crucial P5 Plus 1TB CT1000P5PSSD8, IPS, 2560x1600, 16" | Asus ROG Strix G16 G614JZ i9-13980HX, GeForce RTX 4080 Laptop GPU, WD PC SN560 SDDPNQE-1T00, IPS, 2560x1600, 16" | Asus Zephyrus Duo 16 GX650PY-NM006W R9 7945HX, GeForce RTX 4090 Laptop GPU, SK hynix PC801 HFS002TEJ9X101N, MiniLED, 2560x1600, 16" | |
|---|---|---|---|---|---|---|
| Power Consumption | -46% | -13% | -23% | -17% | -51% | |
| Idle Minimum * (Watt) | 8.1 | 24.5 -202% | 12.6 -56% | 8 1% | 10 -23% | 19.2 -137% |
| Idle Average * (Watt) | 15.9 | 29.2 -84% | 17.7 -11% | 18 -13% | 16 -1% | 29.7 -87% |
| Idle Maximum * (Watt) | 37.2 | 34.3 8% | 31.8 15% | 28 25% | 27 27% | 30.8 17% |
| Load Average * (Watt) | 90.9 | 98.7 -9% | 101.4 -12% | 133 -46% | 129 -42% | 126 -39% |
| Witcher 3 ultra * (Watt) | 189.6 | 178.6 6% | 185.3 2% | 294 -55% | 247 -30% | 258 -36% |
| Load Maximum * (Watt) | 263.5 | 249.6 5% | 298 -13% | 399 -51% | 342 -30% | 330 -25% |
* ... más pequeño es mejor
Power Consumption Witcher 3 / Stresstest
Power Consumption external Monitor
Duración de la batería
La autonomía WLAN es ligeramente superior a la de la versión Intel en unos 30 minutos cuando se configura en el perfil de energía equilibrado con la iGPU activa. Aunque no está mal para un portátil de juegos, alternativas como el Schenker XMG Neo 16 o elAsus ROG Strix G16 tienen baterías de mayor capacidad y autonomía de más de dos horas cada una.
La carga desde vacío a plena capacidad con el adaptador de CA incluido es rápida, entre 1 y 1,5 horas. La carga rápida está activada por defecto, a diferencia de los modelos anteriores Legion o Yoga, en los que puede estar desactivada. La carga con adaptadores USB-C de terceros sólo es compatible con el puerto USB-C de la trasera.
| Lenovo Legion Pro 5 16ARX8 R7 7745HX, GeForce RTX 4070 Laptop GPU, 80 Wh | Lenovo Legion Pro 5 16IRX8 i7-13700HX, GeForce RTX 4060 Laptop GPU, 80 Wh | Uniwill GM6PX7X RTX 4070 i7-13700HX, GeForce RTX 4070 Laptop GPU, 62 Wh | Schenker XMG Neo 16 E23 i9-13900HX, GeForce RTX 4090 Laptop GPU, 99 Wh | Asus ROG Strix G16 G614JZ i9-13980HX, GeForce RTX 4080 Laptop GPU, 90 Wh | Asus Zephyrus Duo 16 GX650PY-NM006W R9 7945HX, GeForce RTX 4090 Laptop GPU, 90 Wh | |
|---|---|---|---|---|---|---|
| Duración de Batería | -14% | 0% | 68% | 76% | 0% | |
| Reader / Idle (h) | 6.5 | 6.7 3% | ||||
| WiFi v1.3 (h) | 4 | 3.4 -15% | 4 0% | 6.7 68% | 9.7 142% | 4 0% |
| Load (h) | 1 | 0.7 -30% | 1.1 10% | 1 0% | ||
| H.264 (h) | 5.8 | 3.8 | ||||
| Witcher 3 ultra (h) | 1.4 |
Pro
Contra
Veredicto - AMD es la mejor opción para los jugadores
Lenovo tiene dos opciones muy interesantes aquí: El Intel Core i7-13700HX Legion Pro 5 16 con gráficos RTX 4060 por $1600 USD o el AMD Ryzen 7 7745HX Legion Pro 5 16 con gráficos RTX 4070 - también por $1600 USD. El primero ofrece un rendimiento de CPU aproximadamente un 10 % más rápido a costa de un rendimiento de GPU un 15 % más lento, mientras que el segundo es todo lo contrario. Casi todo lo demás sobre las dos opciones es idéntico, ya que ambas comparten el mismo diseño de chasis. Por tanto, los usuarios que valoren más el rendimiento de la CPU que el de la GPU pueden decantarse por la opción de Intel, mientras que los usuarios que valoren más la GPU pueden decantarse por la opción de AMD.
Dado que el Legion Pro 5 16 es ante todo un portátil para juegos, la mayoría de los usuarios querrán elegir la opción AMD por los gráficos RTX 4070 más rápidos. Casi todos los juegos más recientes están ligados a la GPU, por lo que cualquier ventaja adicional de rendimiento de la CPU por encima del Ryzen 7 7745HX tendría un impacto mínimo en la experiencia de juego. En este escenario, el precio relativamente alto de 1600 $ está mejor justificado ya que los usuarios se llevan una RTX 4070 en vez de la más lenta RTX 4060.
Precio y disponibilidad
Lenovo está enviando actualmente su Legion Pro 5 16 Gen 8 a partir de $1280 USD para la configuración base Ryzen 5/RTX 4050 hasta $1600 para nuestra configuración Ryzen 7/RTX 4070. El modelo aún no está ampliamente disponible a través de los principales distribuidores como Best Buy o Amazon en el momento de escribir este artículo.
Lenovo Legion Pro 5 16ARX8
- 05/24/2023 v7 (old)
Allen Ngo
Transparencia
La selección de los dispositivos que se van a reseñar corre a cargo de nuestro equipo editorial. La muestra de prueba fue proporcionada al autor en calidad de préstamo por el fabricante o el minorista a los efectos de esta reseña. El prestamista no tuvo ninguna influencia en esta reseña, ni el fabricante recibió una copia de la misma antes de su publicación. No había ninguna obligación de publicar esta reseña. Como empresa de medios independiente, Notebookcheck no está sujeta a la autoridad de fabricantes, minoristas o editores.
Así es como prueba Notebookcheck
Cada año, Notebookcheck revisa de forma independiente cientos de portátiles y smartphones utilizando procedimientos estandarizados para asegurar que todos los resultados son comparables. Hemos desarrollado continuamente nuestros métodos de prueba durante unos 20 años y hemos establecido los estándares de la industria en el proceso. En nuestros laboratorios de pruebas, técnicos y editores experimentados utilizan equipos de medición de alta calidad. Estas pruebas implican un proceso de validación en varias fases. Nuestro complejo sistema de clasificación se basa en cientos de mediciones y puntos de referencia bien fundamentados, lo que mantiene la objetividad.Price comparison

