Review de Trinity de Zotac GeForce RTX 3090 - Anunciando el amanecer de los juegos de 8K
Introducción
El lanzamiento de Ampere de NVIDIA este año será recordado por varias razones. La generación de Turing tuvo que soportar bastantes críticas no sólo por el éxito de rendimiento que supuso el trazado de rayos, sino también por los precios exorbitantes de las tarjetas en el lanzamiento. NVIDIA esperaba remediar muchos de los problemas iniciales de Turing con el Ampere, y las primeras revisiones del RTX 3080 han sido ampliamente positivas, ya sea por las importantes ganancias sobre el RTX 2080 o por los precios más razonables del buque insignia RTX 3080 Founders Edition.
Aunque el RTX 3080 está siendo comercializado por NVIDIA como la tarjeta gráfica insignia de Ampere, todavía no es una tarjeta de clase Titán cuando se trata de ser lo mejor para los creadores y los jugadores. Aquí es donde entra el RTX 3090. El RTX 3090 se considera el sucesor del Titan RTX. Anteriormente, si alguna vez querías un Titán, la única tarjeta disponible era la Edición Fundadores directamente de NVIDIA. Este año, el diseño del RTX 3090 también se subcontratará a socios de tarjetas complementarias (AiB), lo que significa más variedad y mejor disponibilidad. Aunque no estamos seguros de que NVIDIA vaya a lanzar una tarjeta con el nombre de Titán algún tiempo después, el RTX 3090, por su parte, supera al RTX Titán en términos de especificaciones y rendimiento.
El RTX 3090 cuenta con 35,6 TFLOPs de pico de sombreo FP32 (vs. 16,3 en el RTX de Titán), 69,5 TFLOPs de trazado de rayos (vs. 49,2 en el RTX de Titán), y 284,7 TFLOPs de tensor al usar la función Sparsity para la inferencia de IA. Las especificaciones completas se resumen en la siguiente tabla.
Comparison of the RTX 3090 with other NVIDIA GPUs
| Especificaciones: TX 3090, TITAN X Pascal, TX 2080, TX 2080, TX 2070, GTX 1080. |
| Chip |
| FinFET Process |
| CUDA cores |
| Texture Units |
| Tensor Cores |
| RT Cores |
| Velocidad base de la GPU |
| Velocidad Boost de la GPU |
| Memory Bus |
| Ancho de banda de la memoria |
| Memoria de video |
| Consumo de energía |
Con un precio de venta al público de 1.499 dólares, la RTX 3090 Founders Edition no es una tarjeta para las masas. Está destinada a los creadores que, en términos de NVIDIA, "entienden el valor de un búfer de fotogramas más grande". Claro que se puede jugar en esta cosa bastante bien, pero el verdadero valor de esta tarjeta radica en jugar a 4K 144 Hz, y ahora, a 8K 30 Hz y más de frecuencia de actualización.
Un recorrido por el juego de Zotac GeForce RTX 3090 Trinity
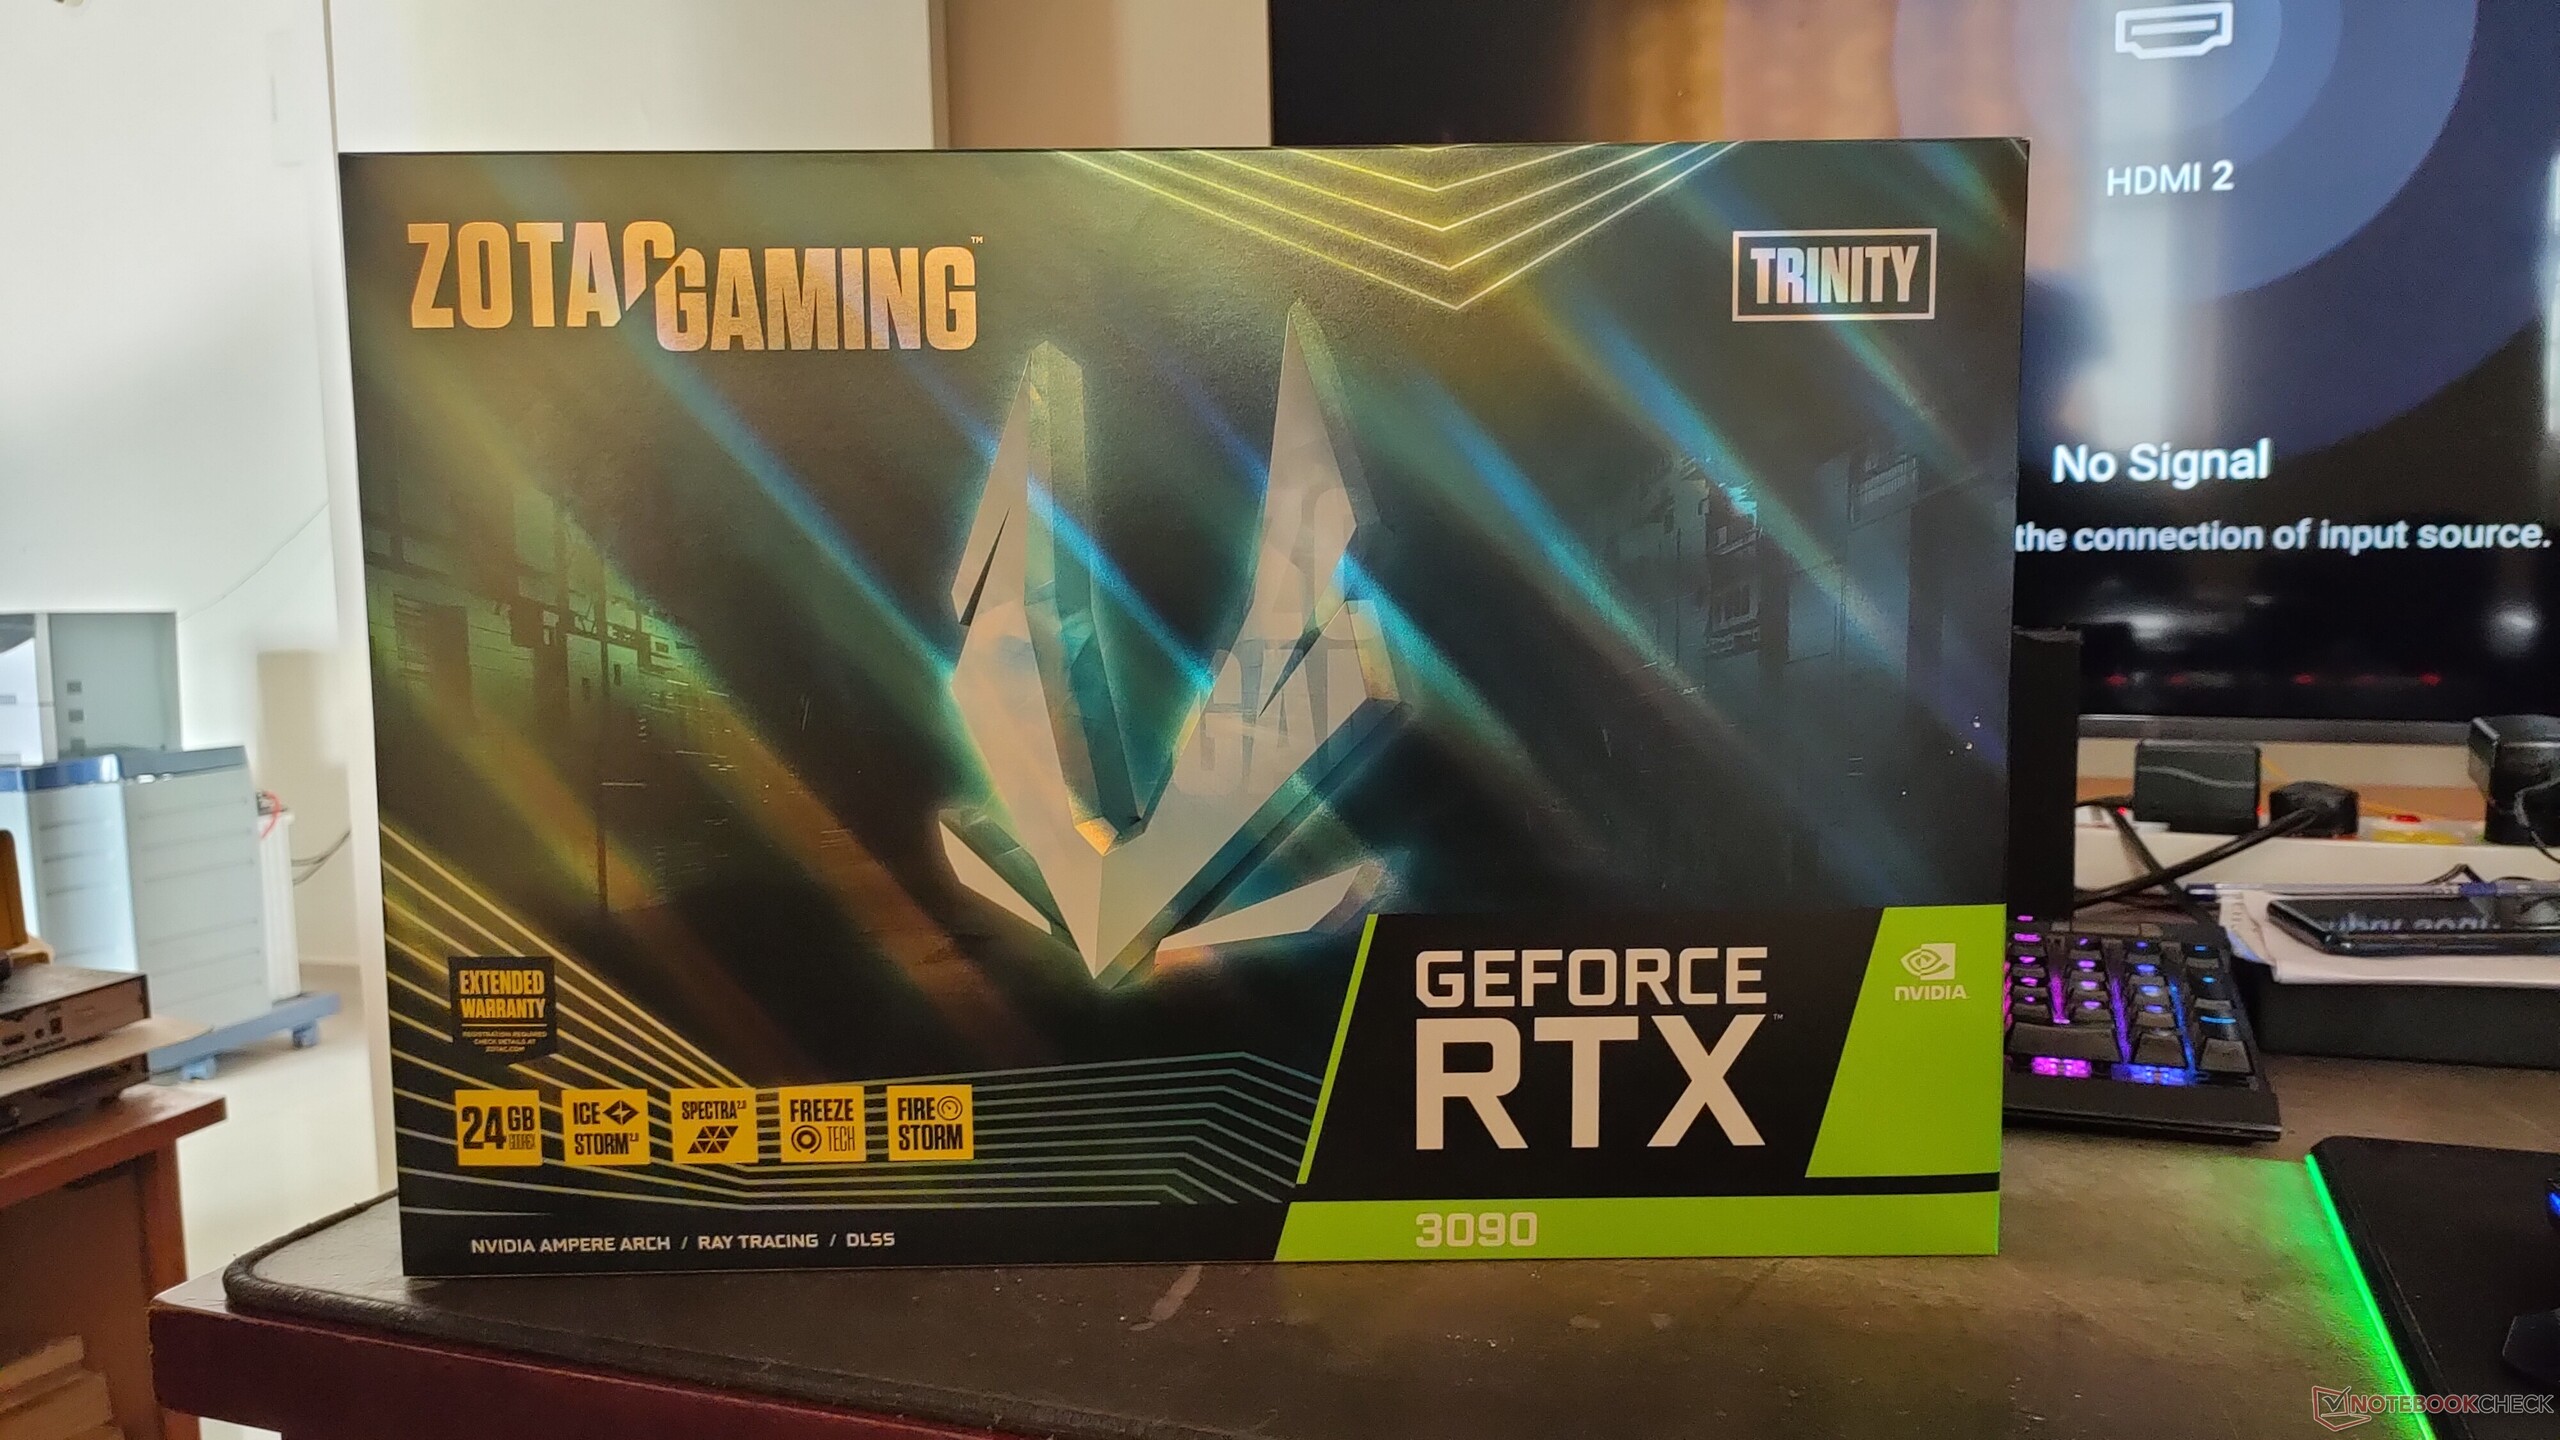
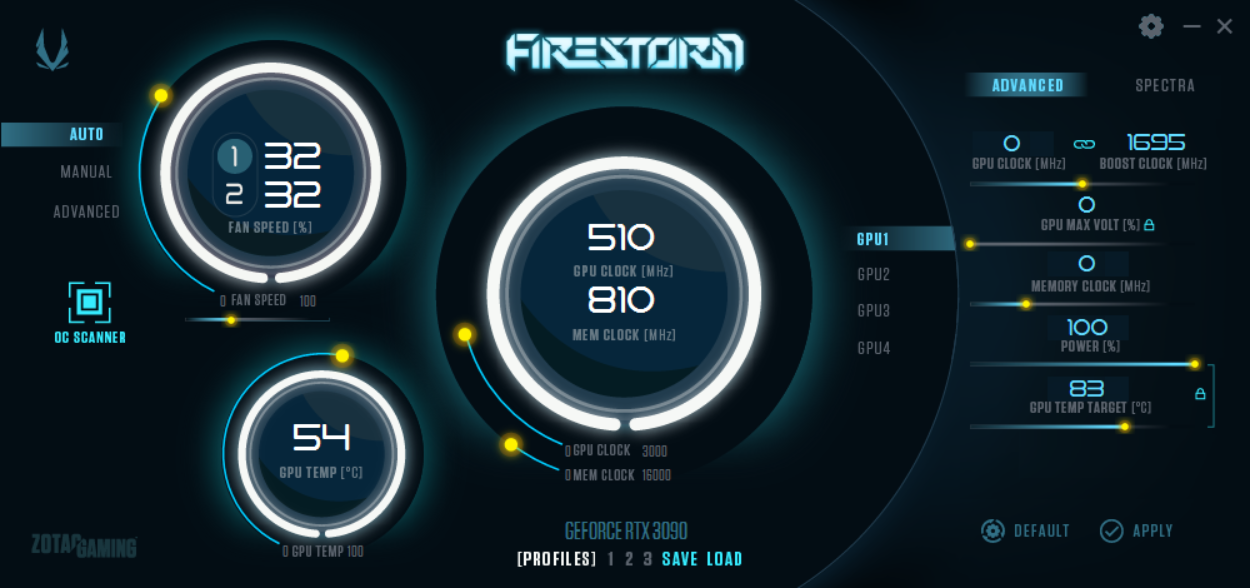
Para esta revisión, usaremos la tarjeta GeForce RTX 3090 Trinity AiB de Zotac Gaming. La Zotac RTX 3090 usa un PCB personalizado, y su diseño difiere mucho del de la RTX 3090 Founders Edition. La tarjeta usa un sistema de enfriamiento de triple ventilador, que Zotac llama IceStorm 2.0. El RTX 3090 Trinity también tiene un diseño de ventilador de 11 palas y tres grupos de disipadores de aluminio con siete tubos de calor de cobre. La compañía dice que los nuevos ventiladores ayudan a aumentar el flujo de aire en un 10% en comparación con la generación anterior. Las rotaciones de los ventiladores se pueden ajustar de forma independiente en la ahora actualizada utilidad FireStorm que también permite un poco de overclocking; los ventiladores se detienen completamente mientras están en ralentí.
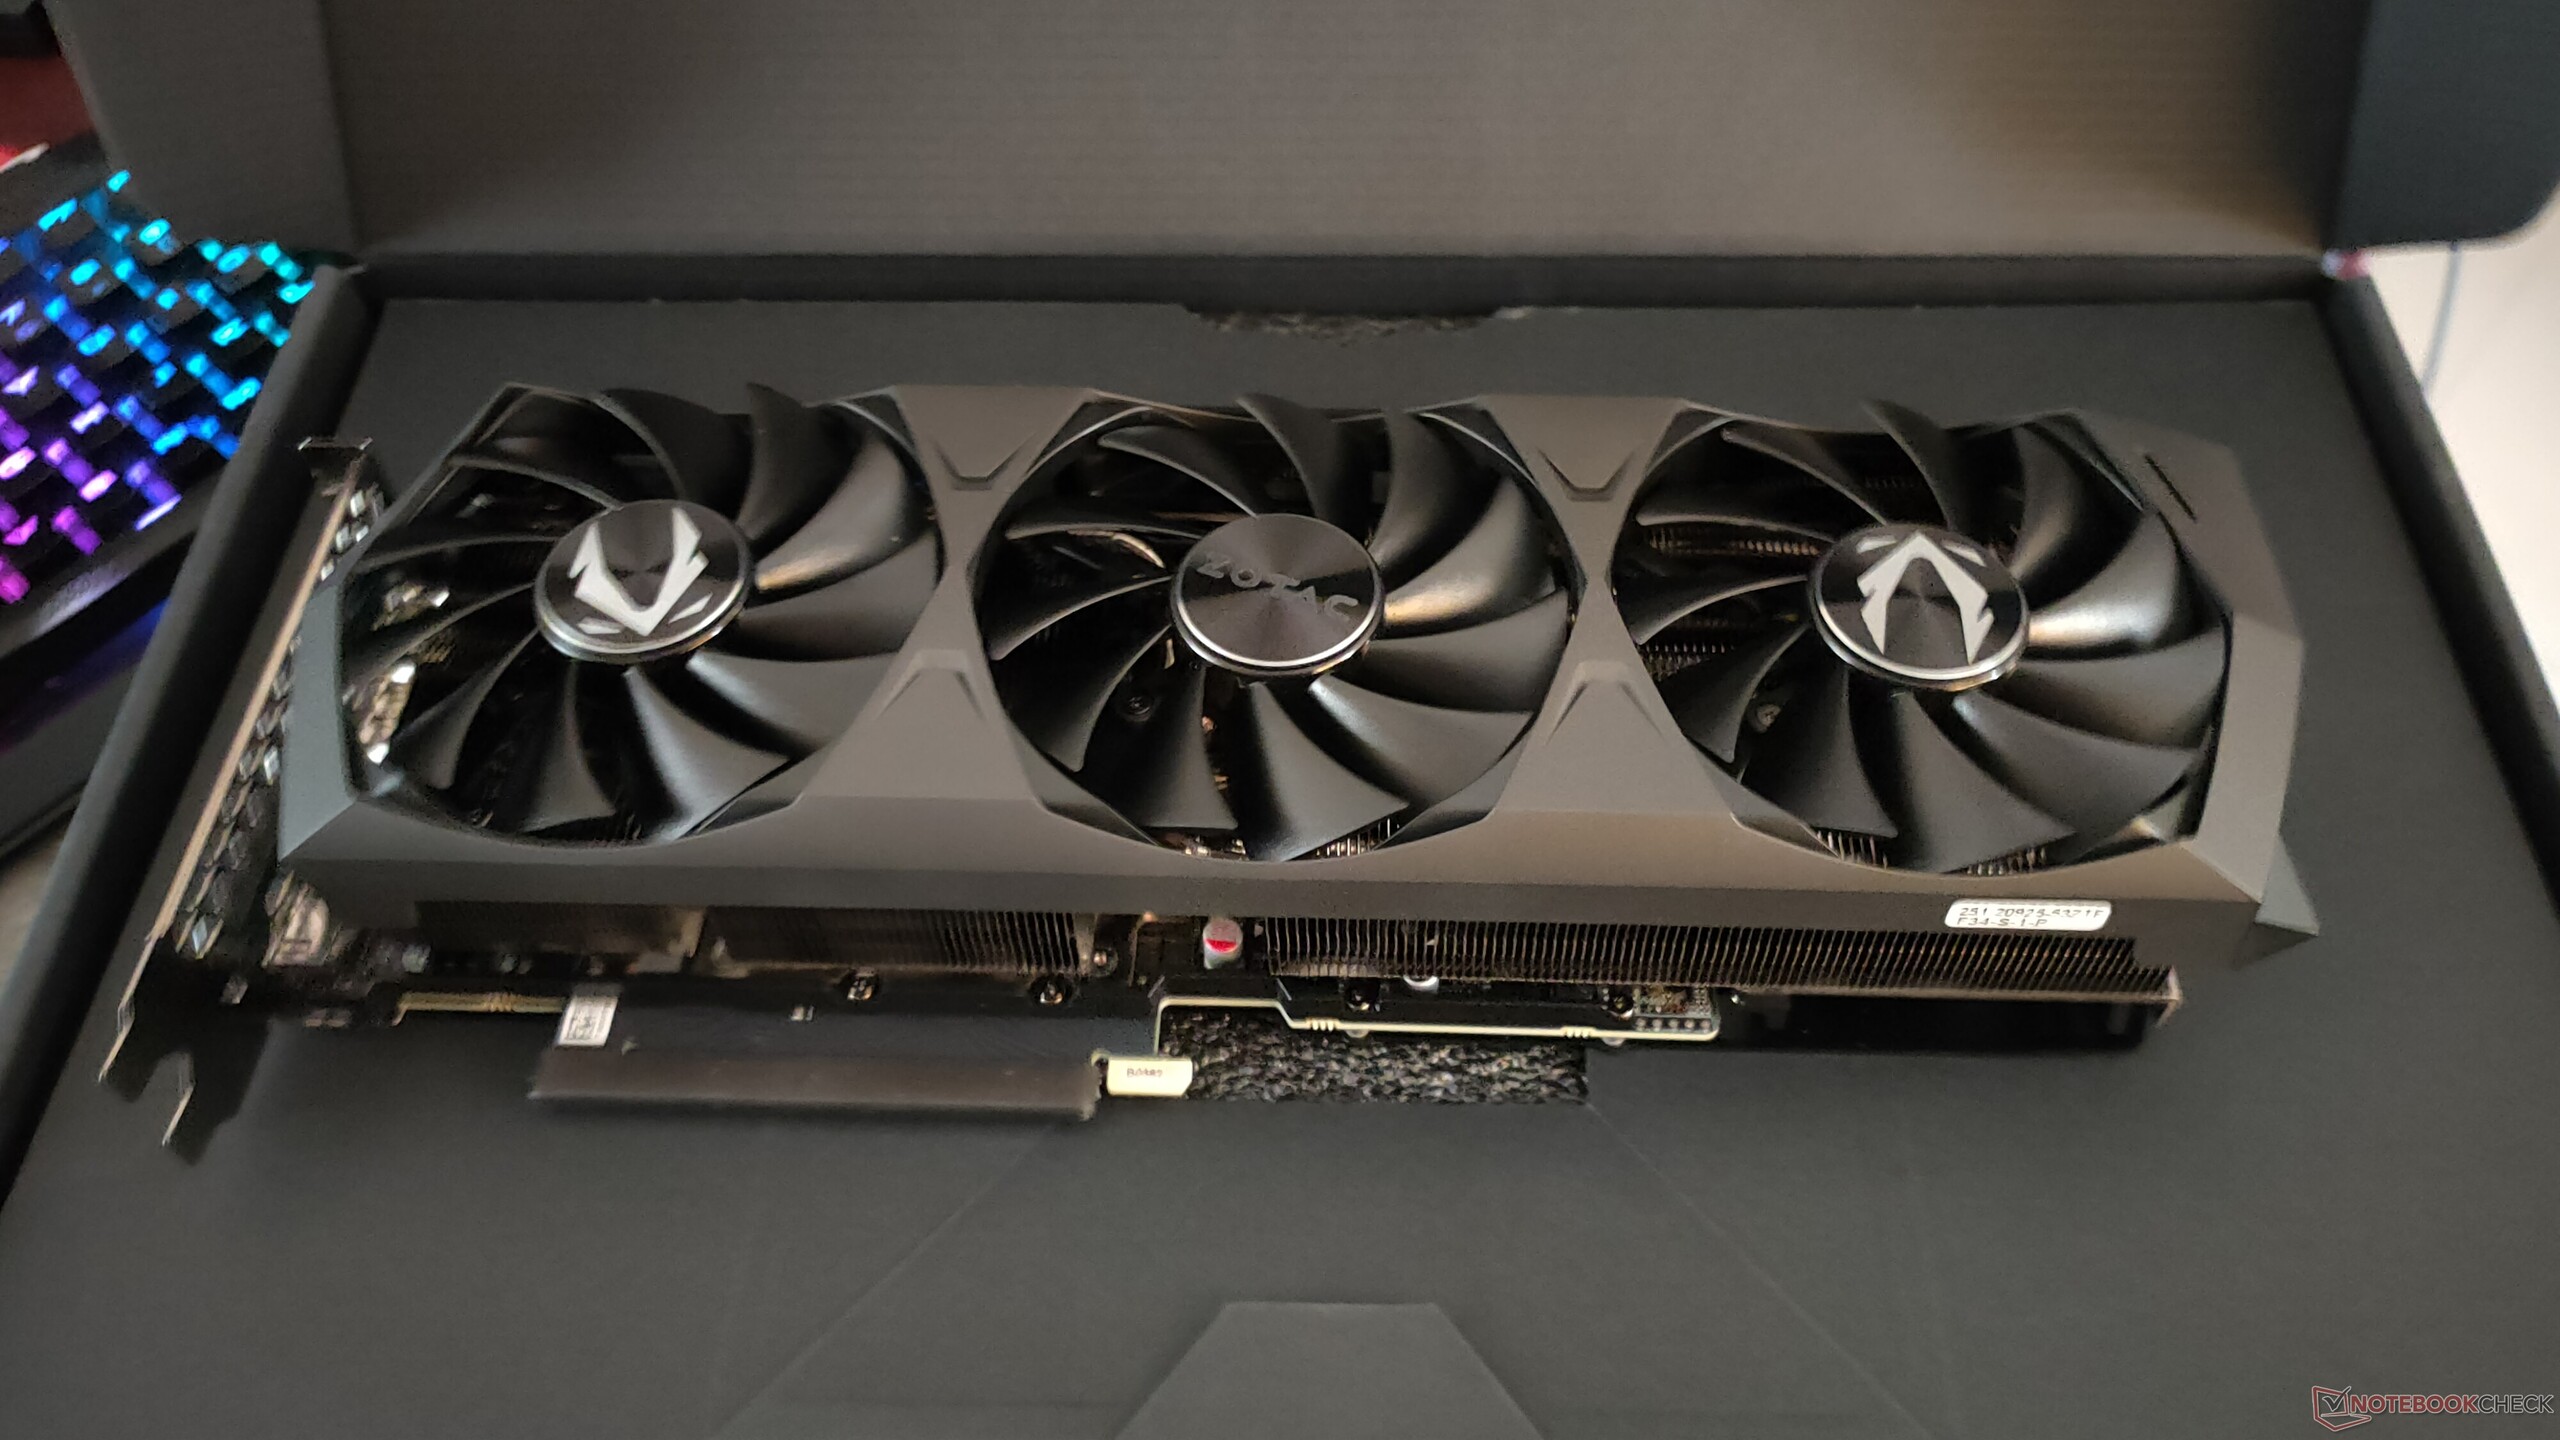
El RTX 3090 Edición Fundadores es una GPU gigantesca que ocupa tres ranuras PCIe. En comparación, el Zotac RTX 3090 Trinity es su tarjeta normal de 2,5 ranuras, lo que significa que no tendrá que sacrificar la expansión PCIe en la mayoría de las tarjetas ATX. Dicho esto, la tarjeta es más larga de lo normal con 12,5 pulgadas e incluso supera ligeramente la longitud de la placa E-ATX de nuestro banco de pruebas.
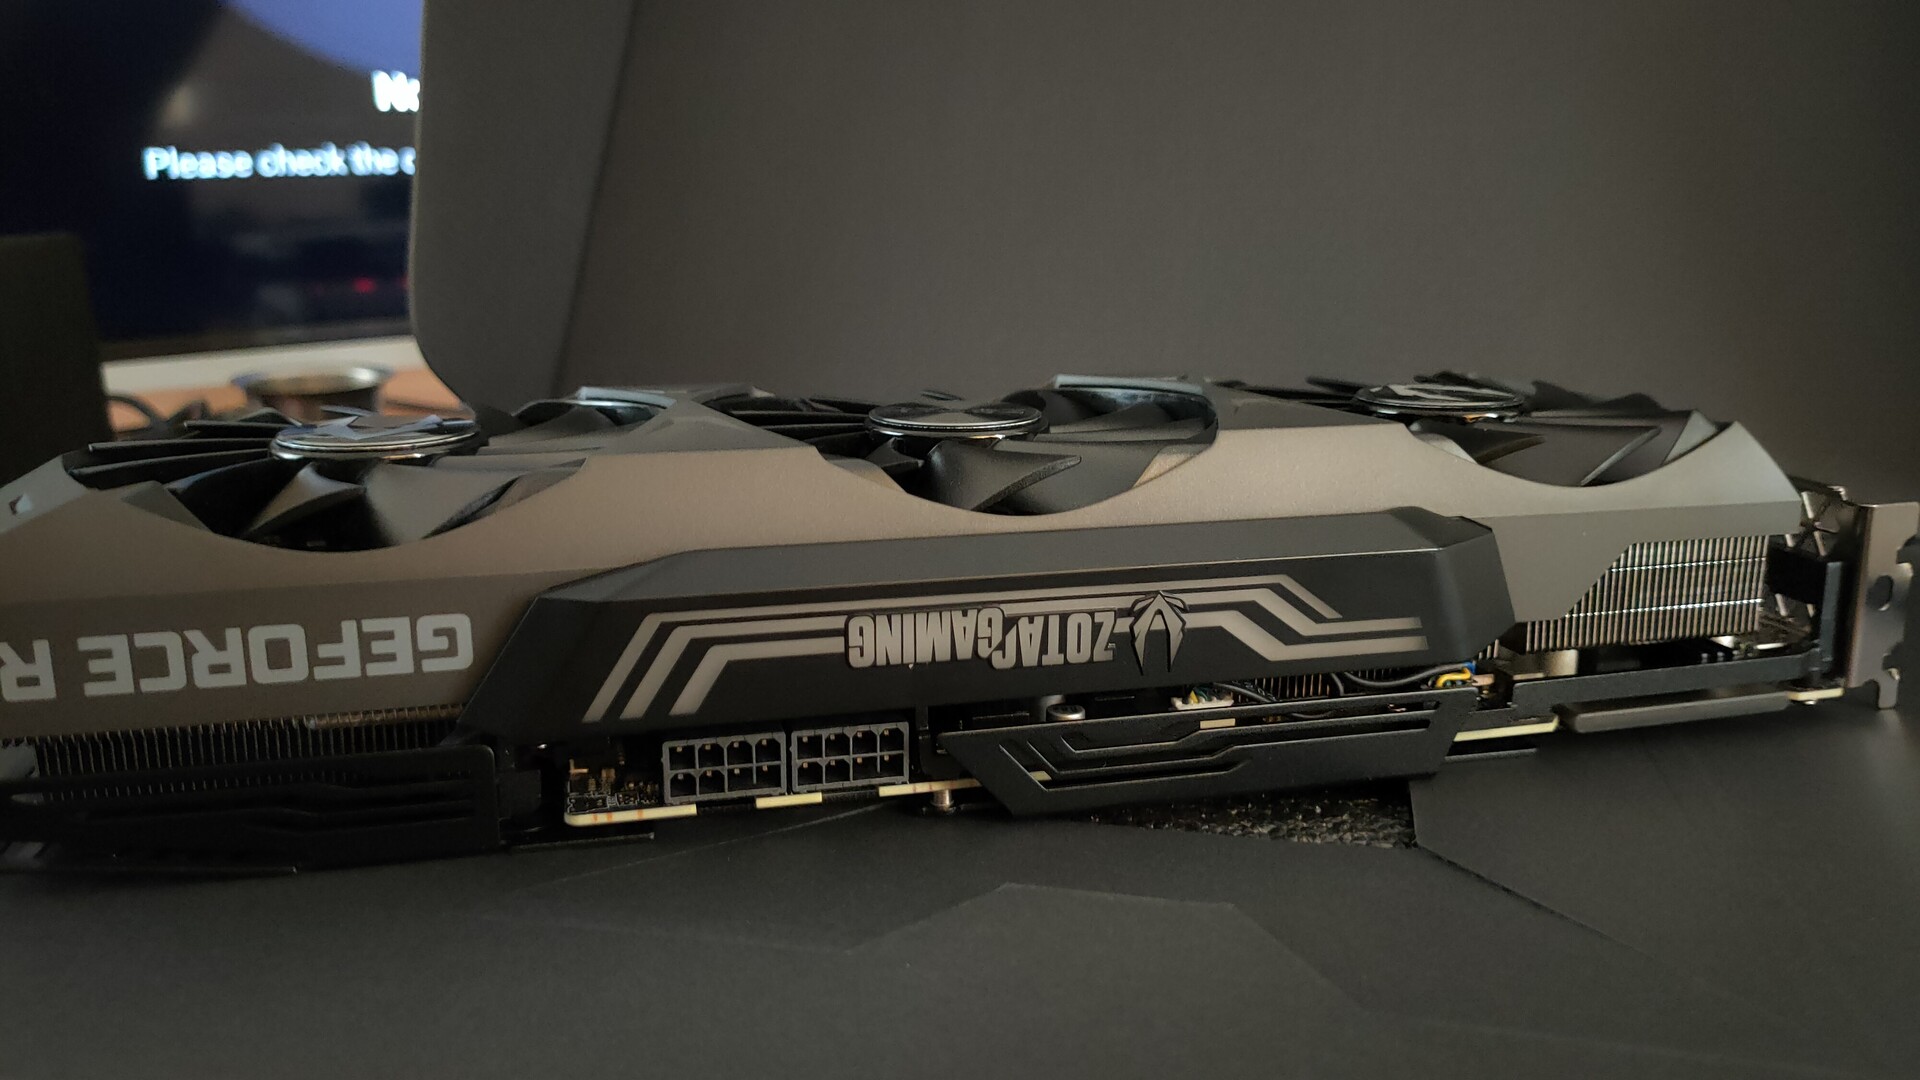
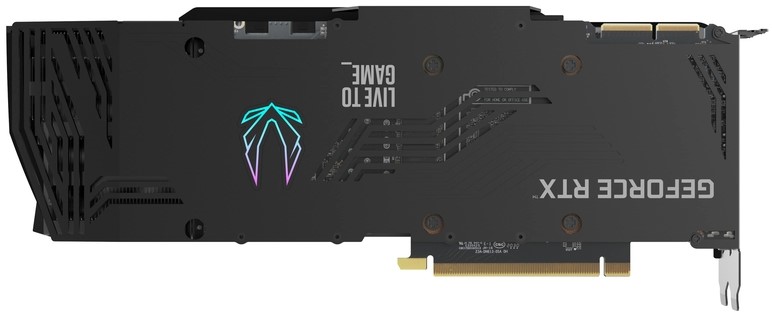
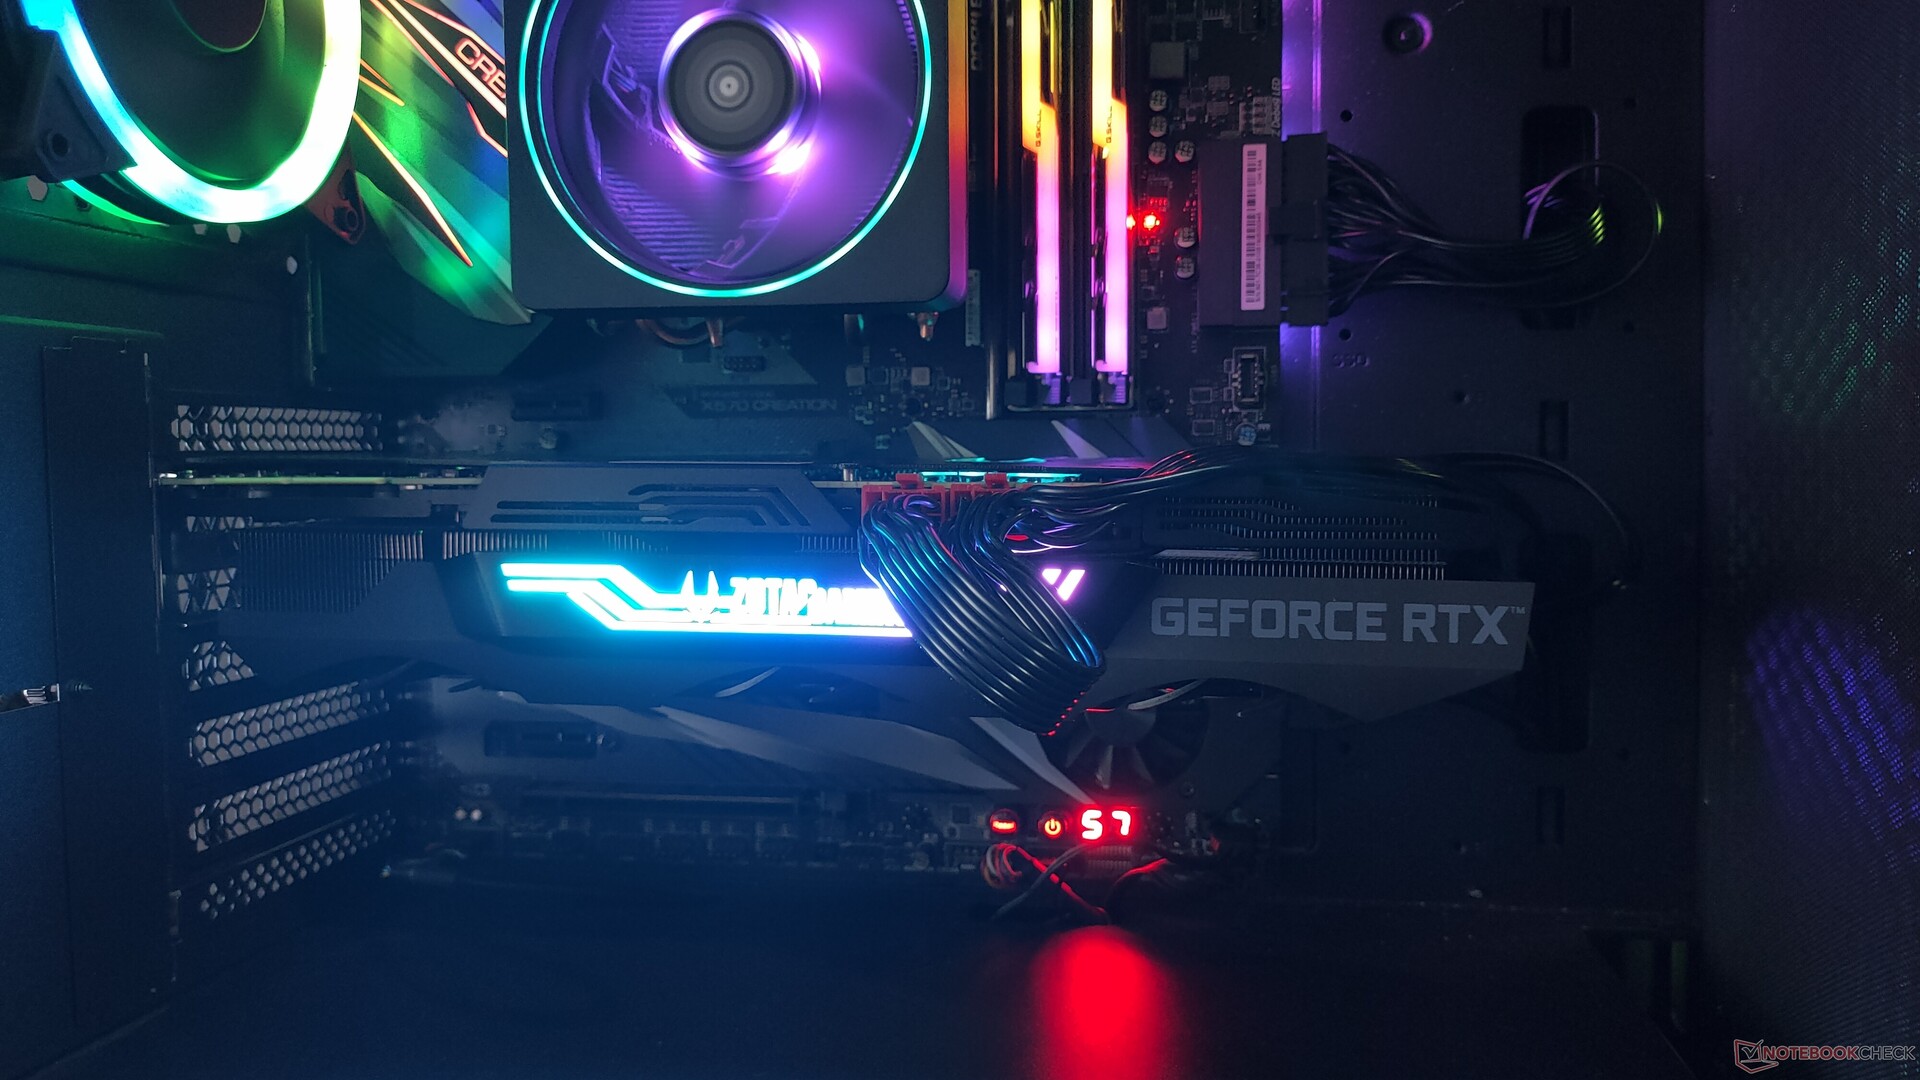
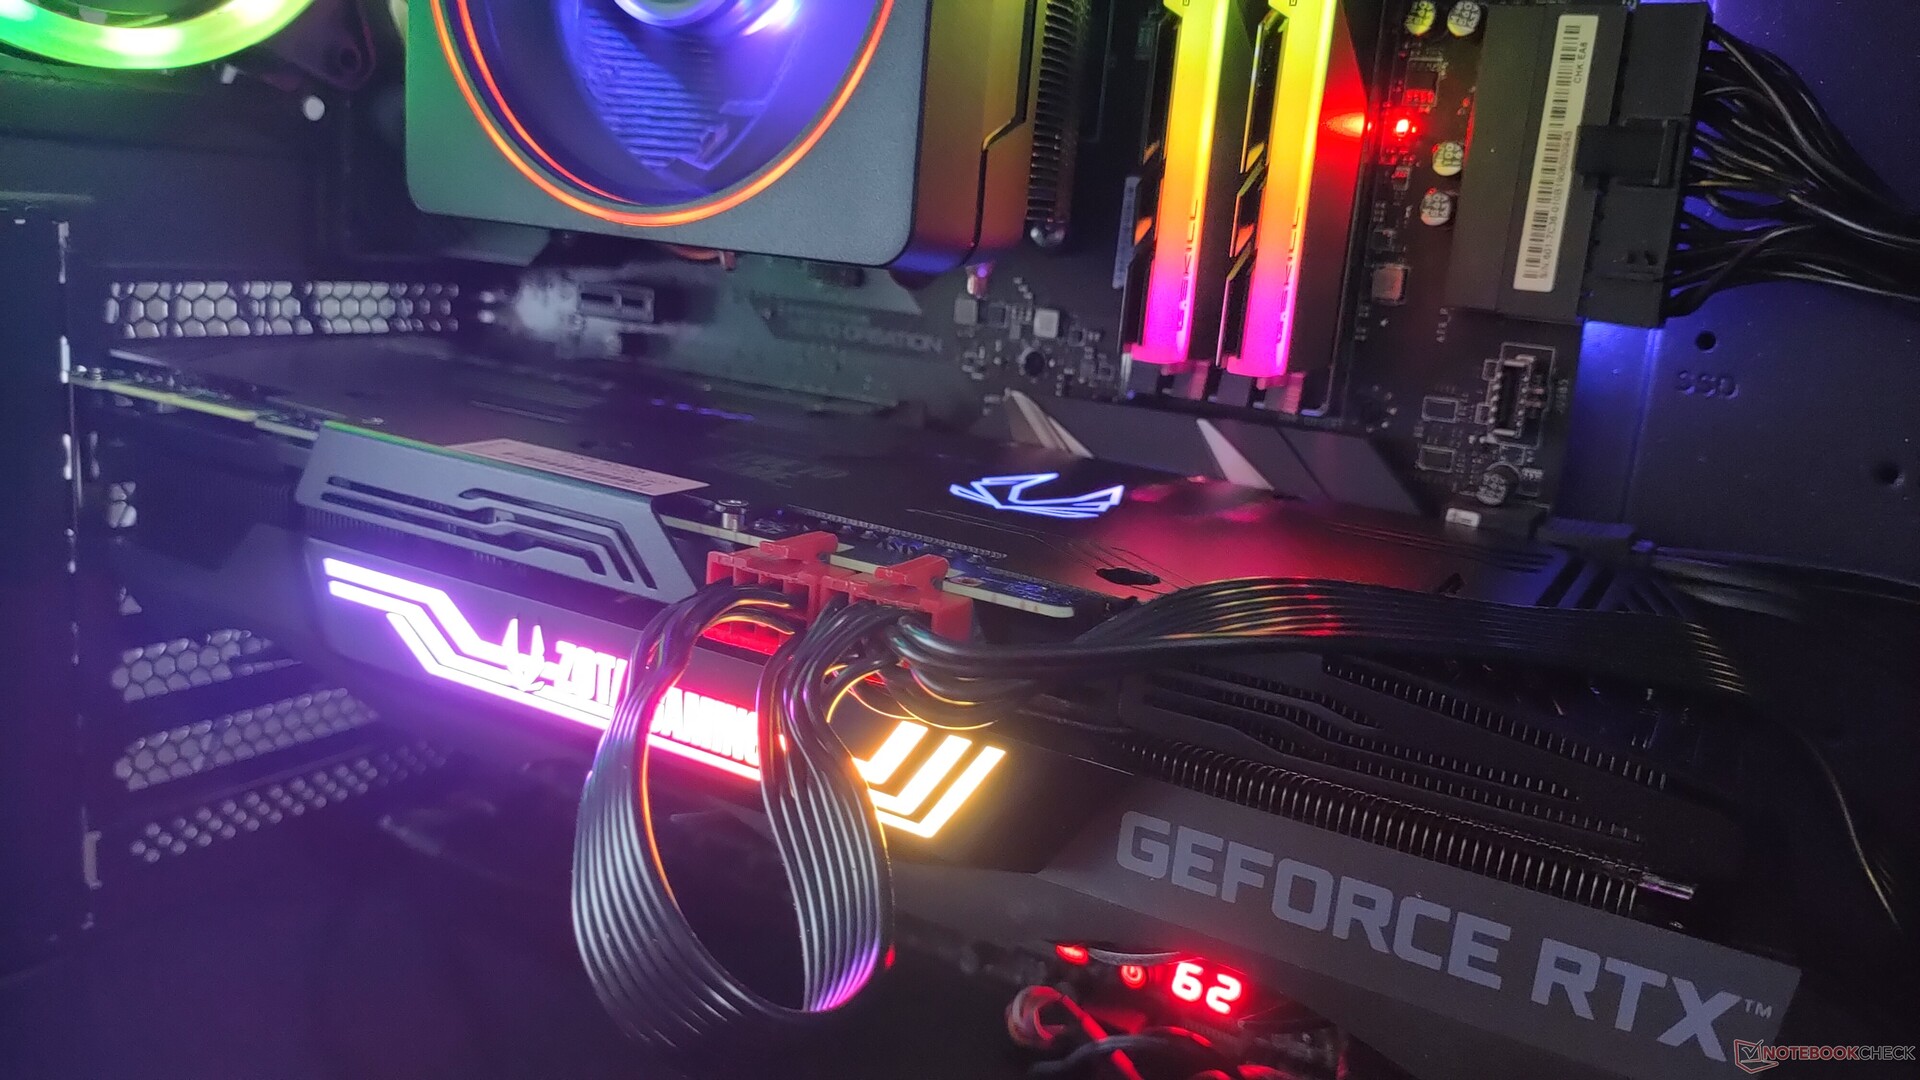
Con la decisión de NVIDIA de prescindir del conector USB tipo C VirtuaLink en esta generación, obtenemos el conjunto estándar de tres puertos DisplayPort 1.4a y un puerto HDMI 2.1 que soportan hasta 8K 60 Hz de salida. Hacia la parte superior de la tarjeta, encontramos el área del logo RGB de Zotac Gaming, cuyos efectos pueden ser personalizados en la utilidad FireStorm. Es una tarifa estándar con las tarjetas AiB, pero habría sido genial si la etiqueta de GeForce RTX también se iluminara ya que muchos querrían mostrar sus preciadas tarjetas RTX en sus construcciones. El RTX 3090 Trinity ofrece placas frontales y traseras de metal fundido. Mientras que la placa trasera está bien construida en su mayor parte, parecía un poco endeble cuando uno va hacia el final de la tarjeta. La placa trasera lleva el logo de Zotac que está equipado con iluminación LED ARGB.
NVIDIA se ha ido alejando de los continuos SLI/NVLink para los jugadores. En la generación Ampere, la RTX 3090 es por ahora la única tarjeta de consumo con un conector NVLink.
Como todas las demás tarjetas Ampere AiB que hemos visto hasta ahora, el RTX 3090 Trinity usa conectores duales estándar de 8 pines en lugar de la nueva variante de 12 pines de la Edición de Fundadores. Una pequeña peculiaridad del RTX 3090 Trinity es la colocación de los conectores duales de 8 pines - están situados más hacia el centro de la tarjeta que en el borde derecho habitual. Esto hace que llegar a ellos con cables de alimentación PCIe de longitud regular sea un poco engorroso y puede requerir la compra de un cable más largo.
El Zotac Gaming GeForce RTX 3090 Trinity se vende al por menor por 1.694,73 dólares de los EE.UU. (₹149,990).
Nota: Debido a la escasez de unidades disponibles tanto de NVIDIA como de AiB, nuestra revisión de RTX 3080 seguirá en breve. Por ahora, siempre que sea necesario, hemos considerado las puntuaciones de la excelente revisión de la RTX 3080 Founders Edition de Hardwareluxx.de para hacer comparaciones.
No pudimos conseguir la edición fundadora de RTX 3090, pero NVIDIA India nos proporcionó la GeForce RTX 3090 Trinity de Zotac Gaming para que la probáramos. Hicimos todo lo posible para acomodar tantas pruebas como fuera posible dentro de la breve ventana de revisión para dar a nuestros lectores una idea básica del tipo de rendimiento que se puede esperar de esta GPU. Se pueden esperar más pruebas y artículos en los próximos días.
El banco de pruebas
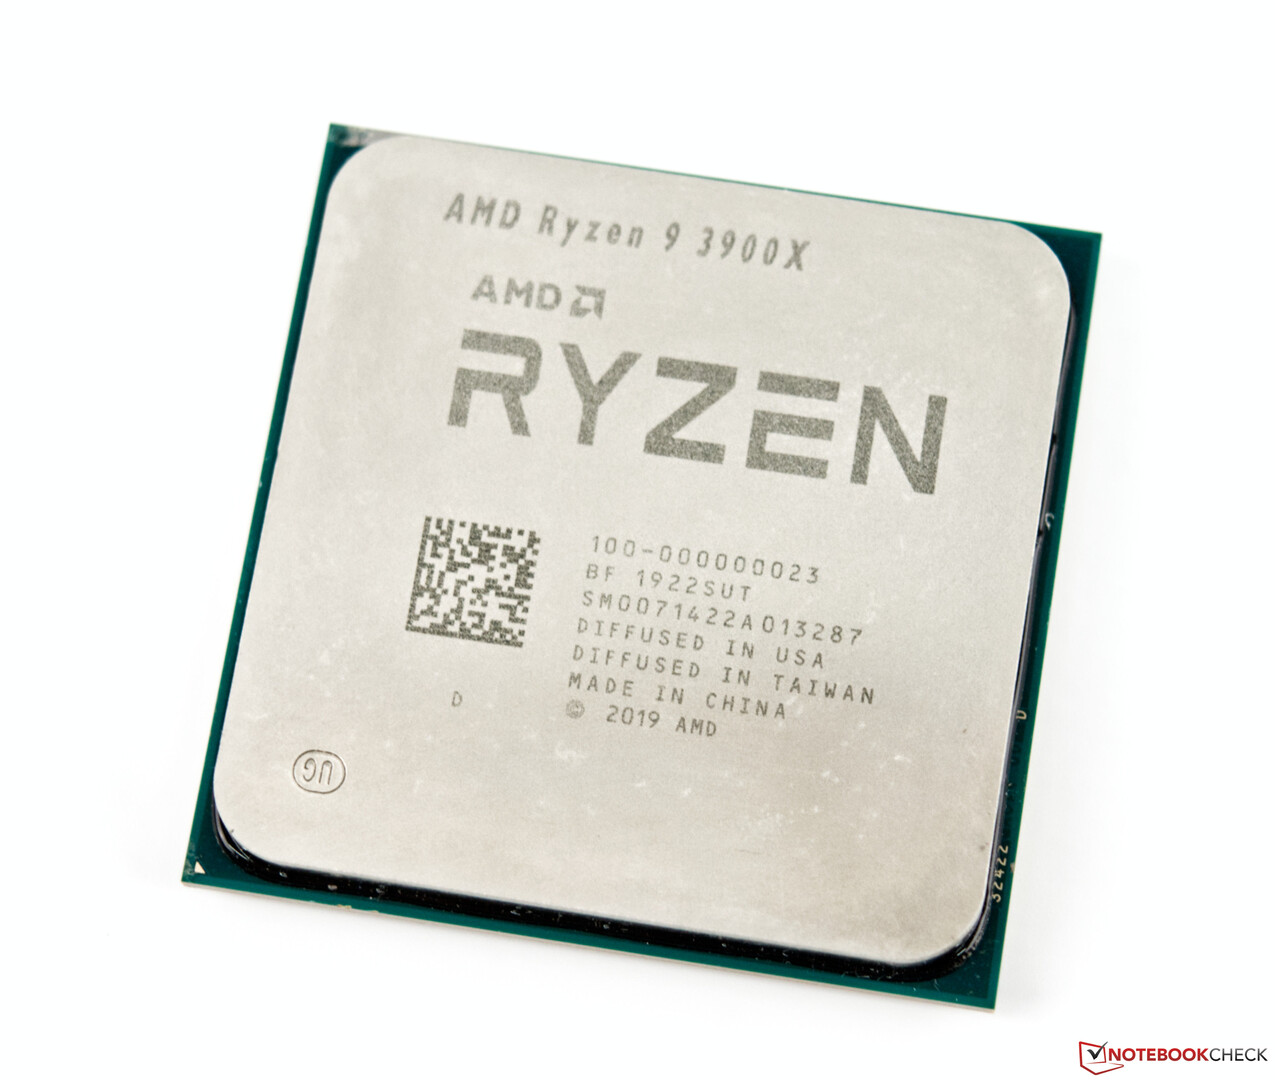
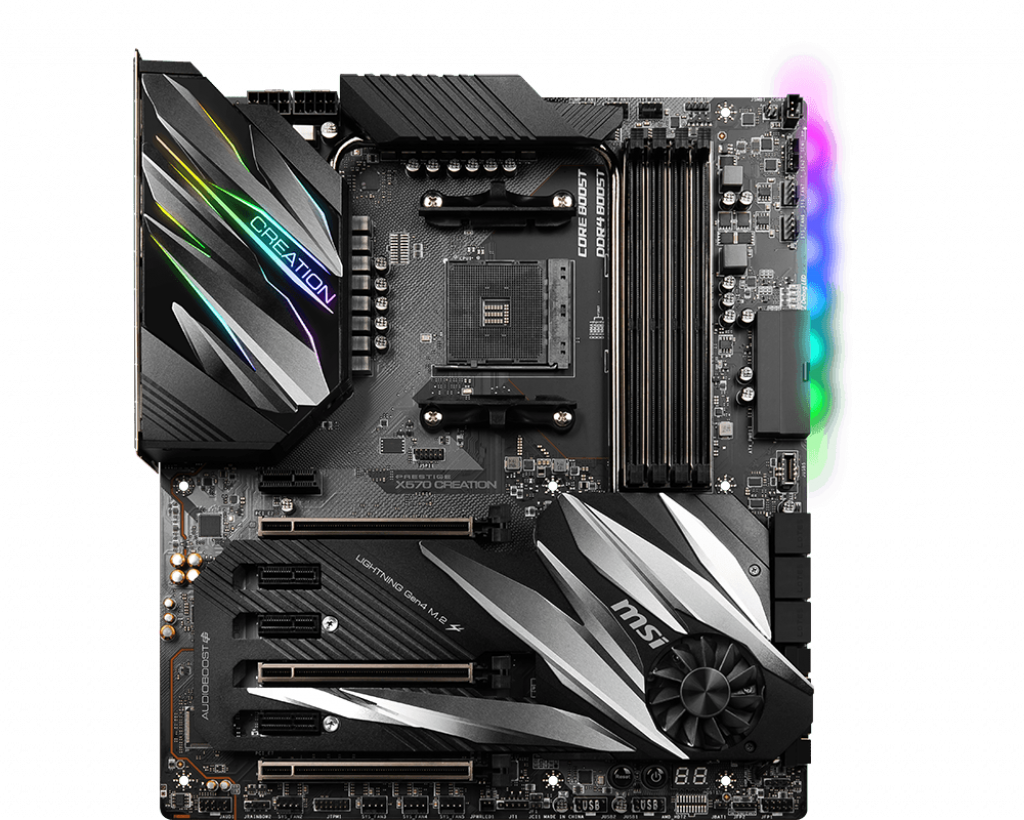
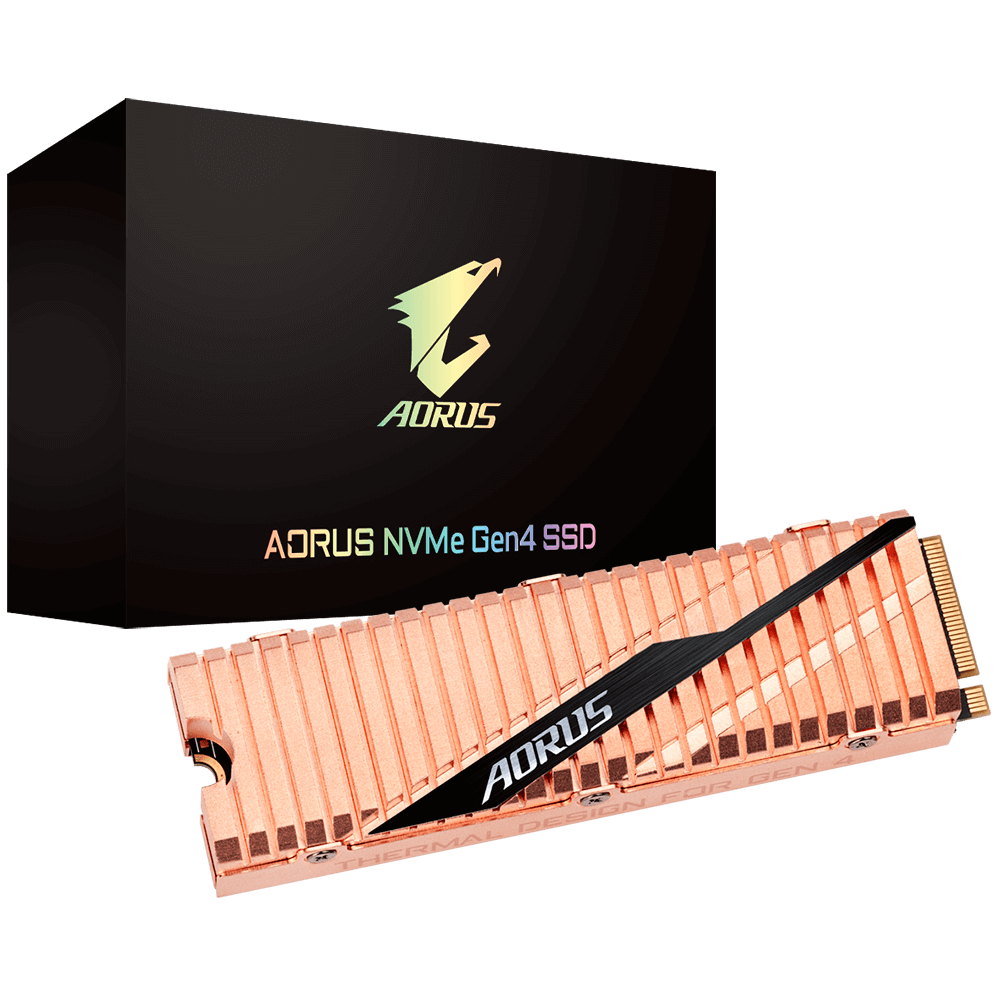
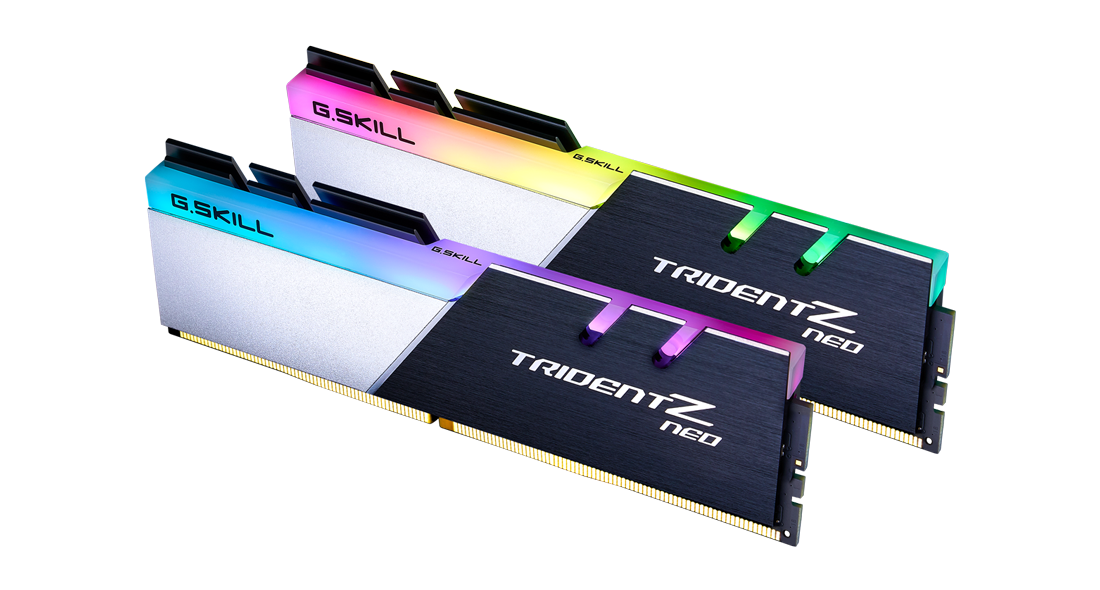
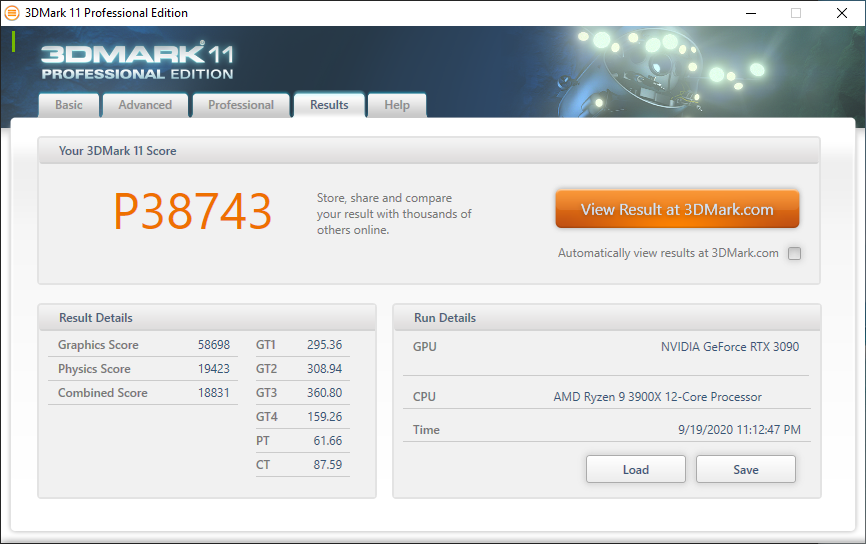
Nuestro banco de pruebas está basado en la plataforma AMD Ryzen 3000 X570. Usamos un CPU AMD Ryzen 9 3900X en una placa madre MSI Prestige X570 Creation. La CPU se emparejó con 32 GB (16 GB x2) de RAM G.SKILL Trident Z Neo DDR4-3600 con tiempos 16-19-19-39. Windows 10 2004 con las últimas actualizaciones acumuladas (Build 19041.508) se instaló en un Gigabyte Aorus NVMe Gen4 1 TB SSD mientras que 2x 1 TB cada uno de los Crucial MX500 SATA SSD se utilizaron para ejecutar benchmarks y juegos. El sistema fue enfriado por aire usando el enfriador de Prisma Espectro de AMD. Para permitir un mejor flujo de aire, las pruebas se realizaron sin el panel lateral templado de la carcasa (Antec NX800).
Todos los controladores, incluyendo el BIOS (AGESA Combo 1.0.8.1) y VGA (456.38) fueron actualizados a las últimas versiones disponibles antes de la evaluación comparativa.
Emparejamos el RTX 3090 Trinity con un televisor inteligente OnePlus U Series 55U1 (revisión práctica próximamente) que funciona a 4K 60 Hz nativos. La salida de color se configuró a RGB completo de 32 bits en el Panel de Control de NVIDIA y la escala de Windows se configuró al 100%.
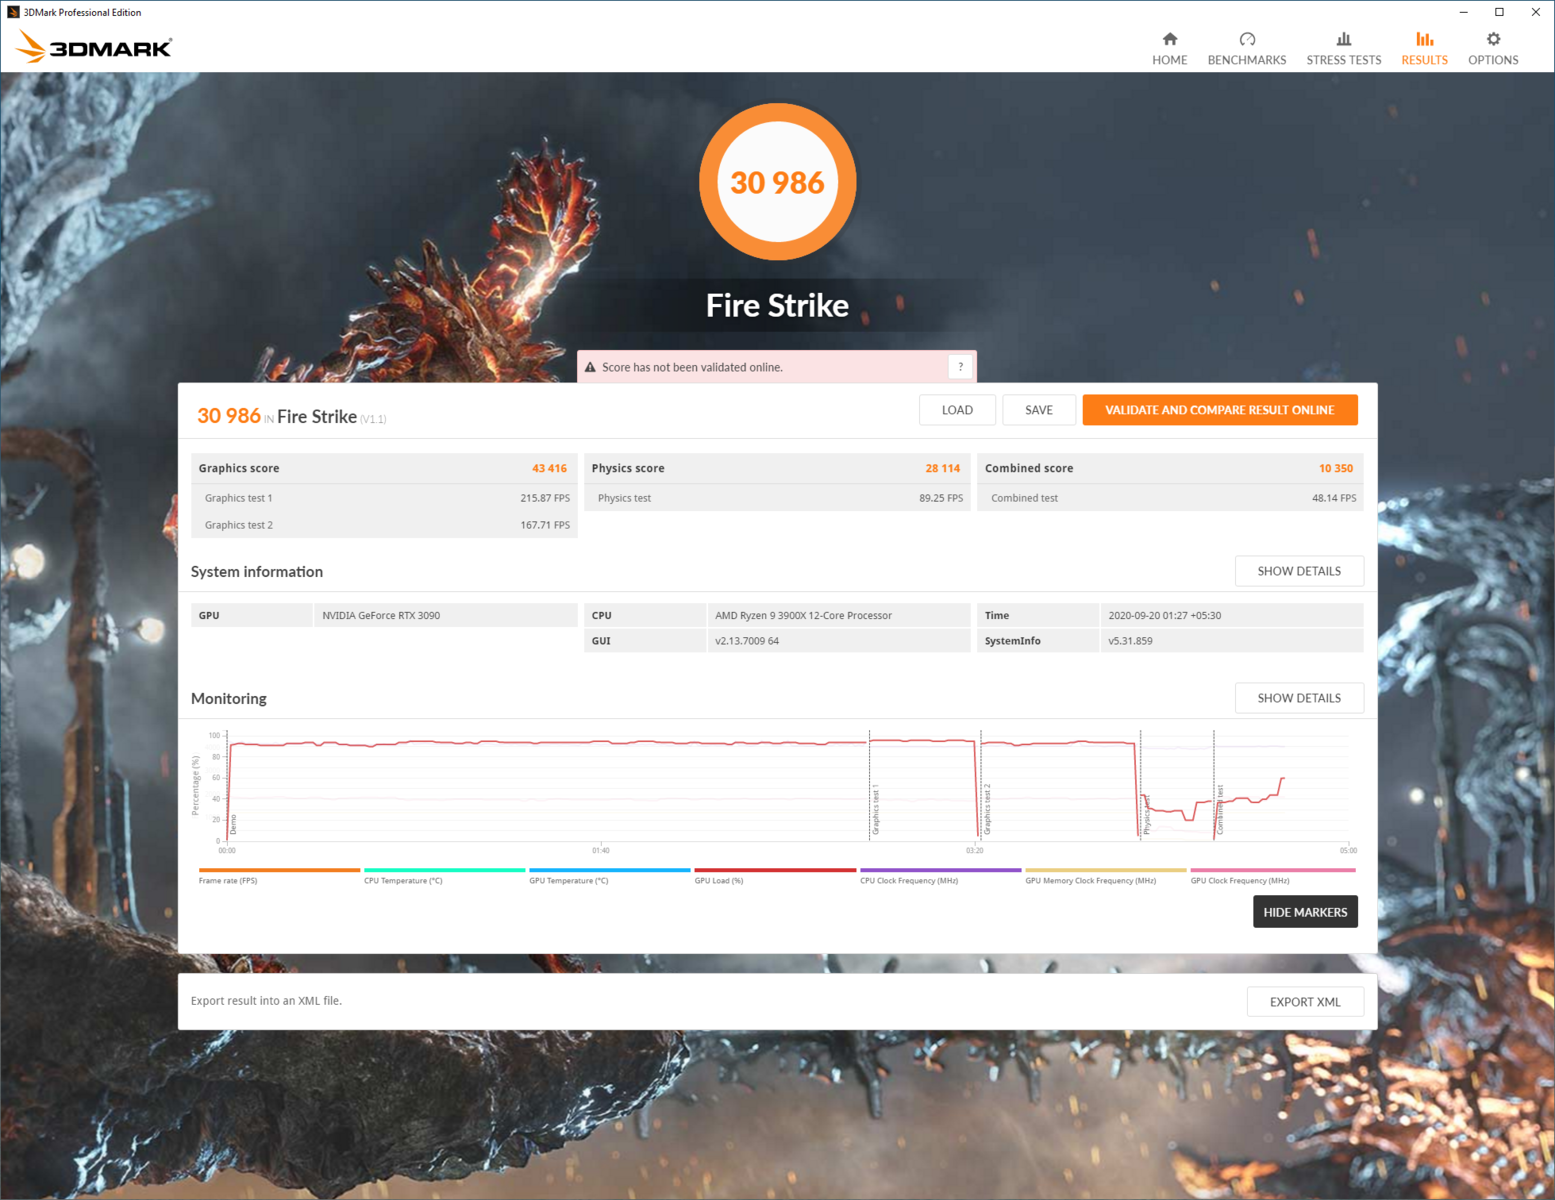
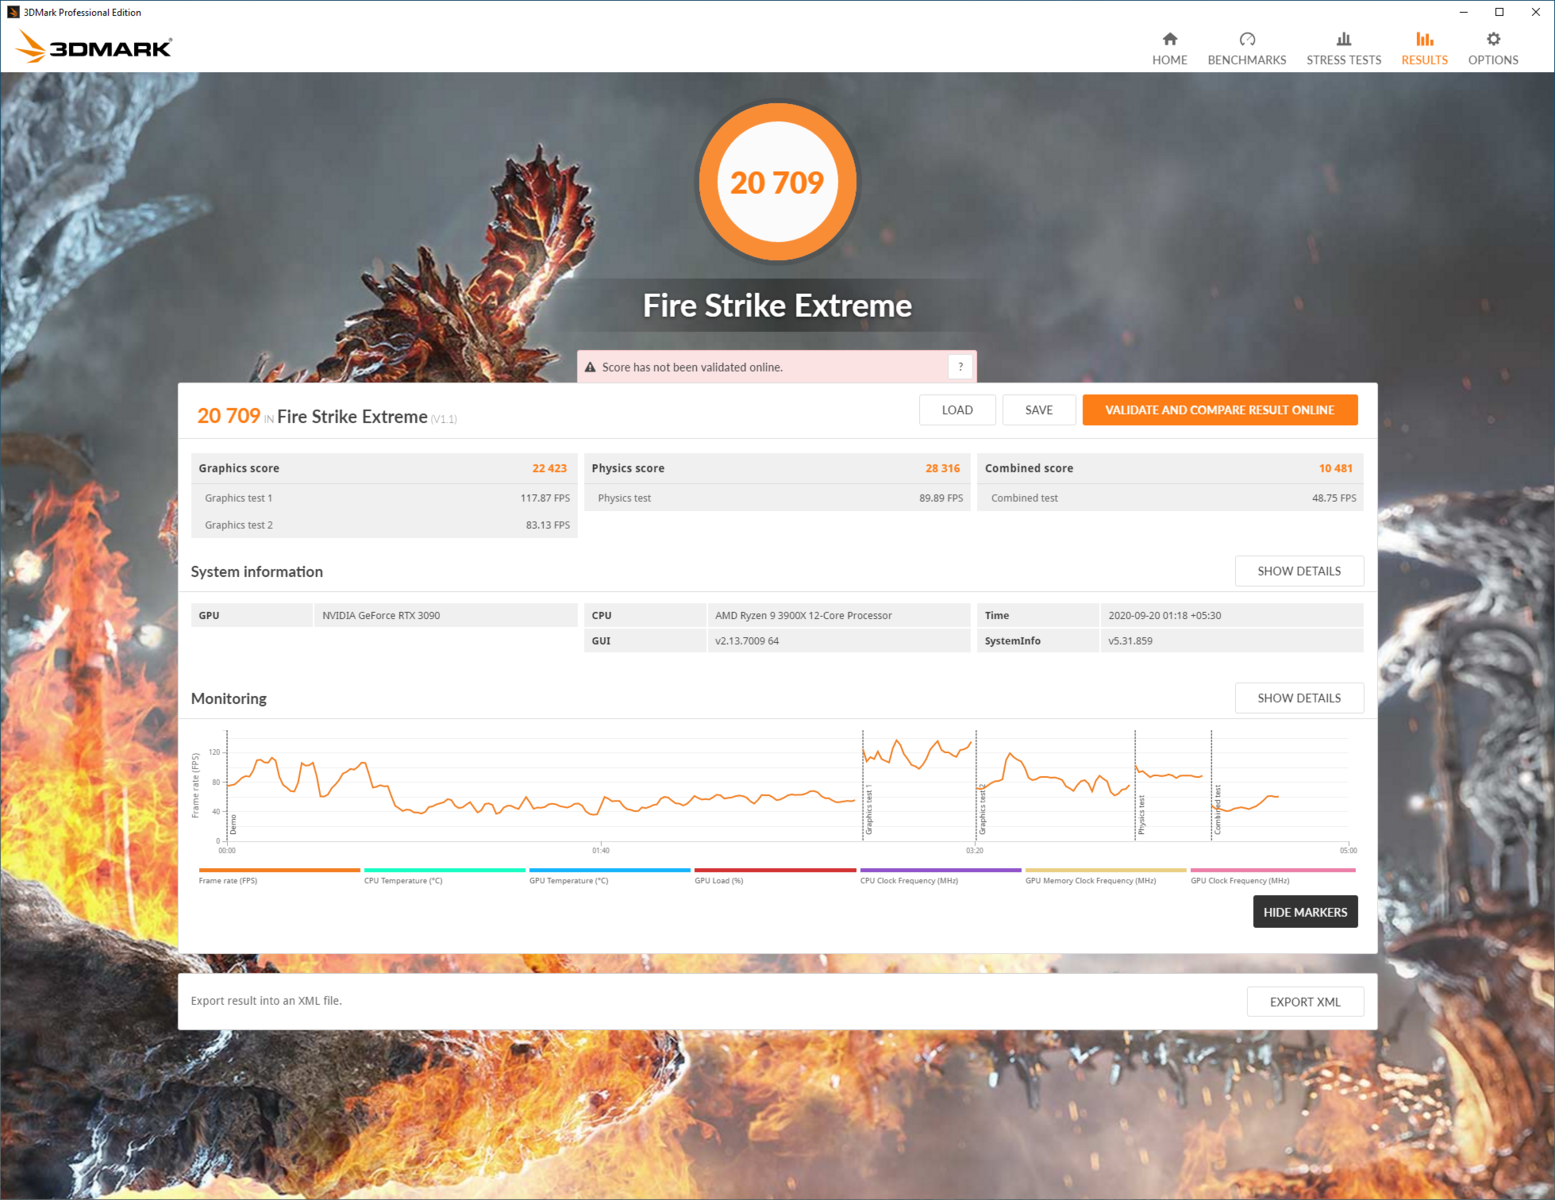
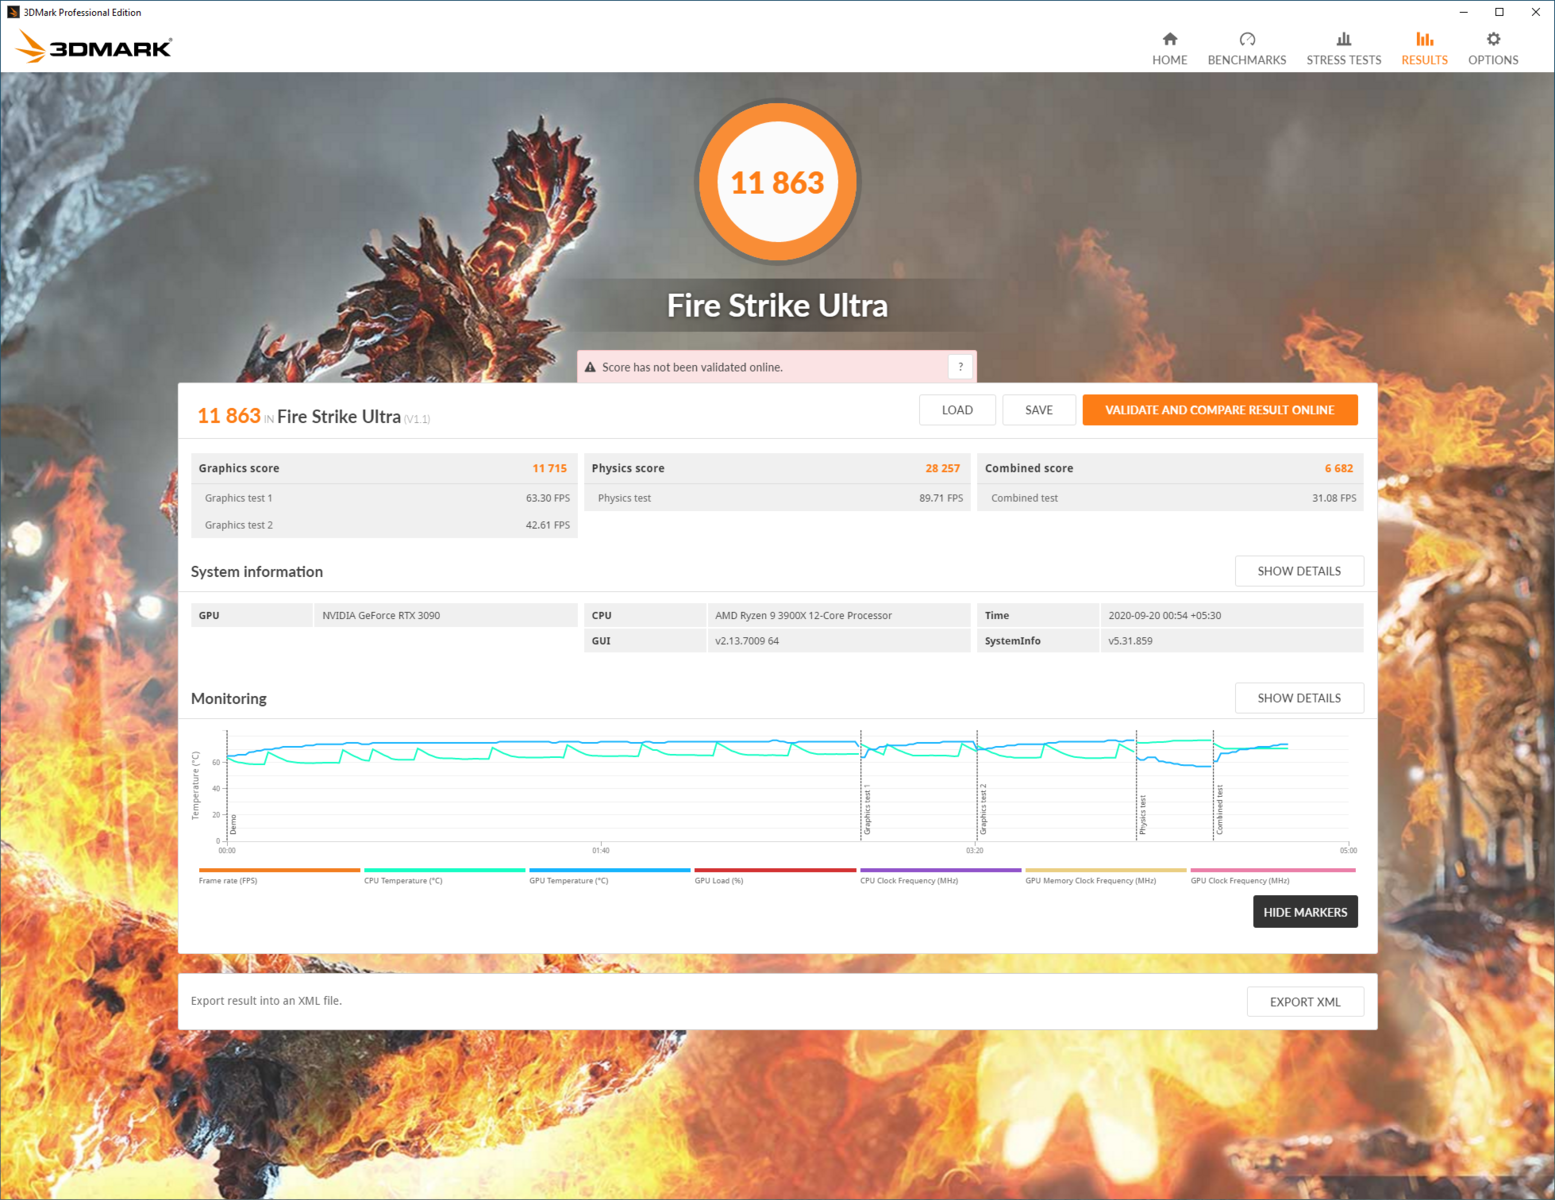
Puntos de referencia sintéticos
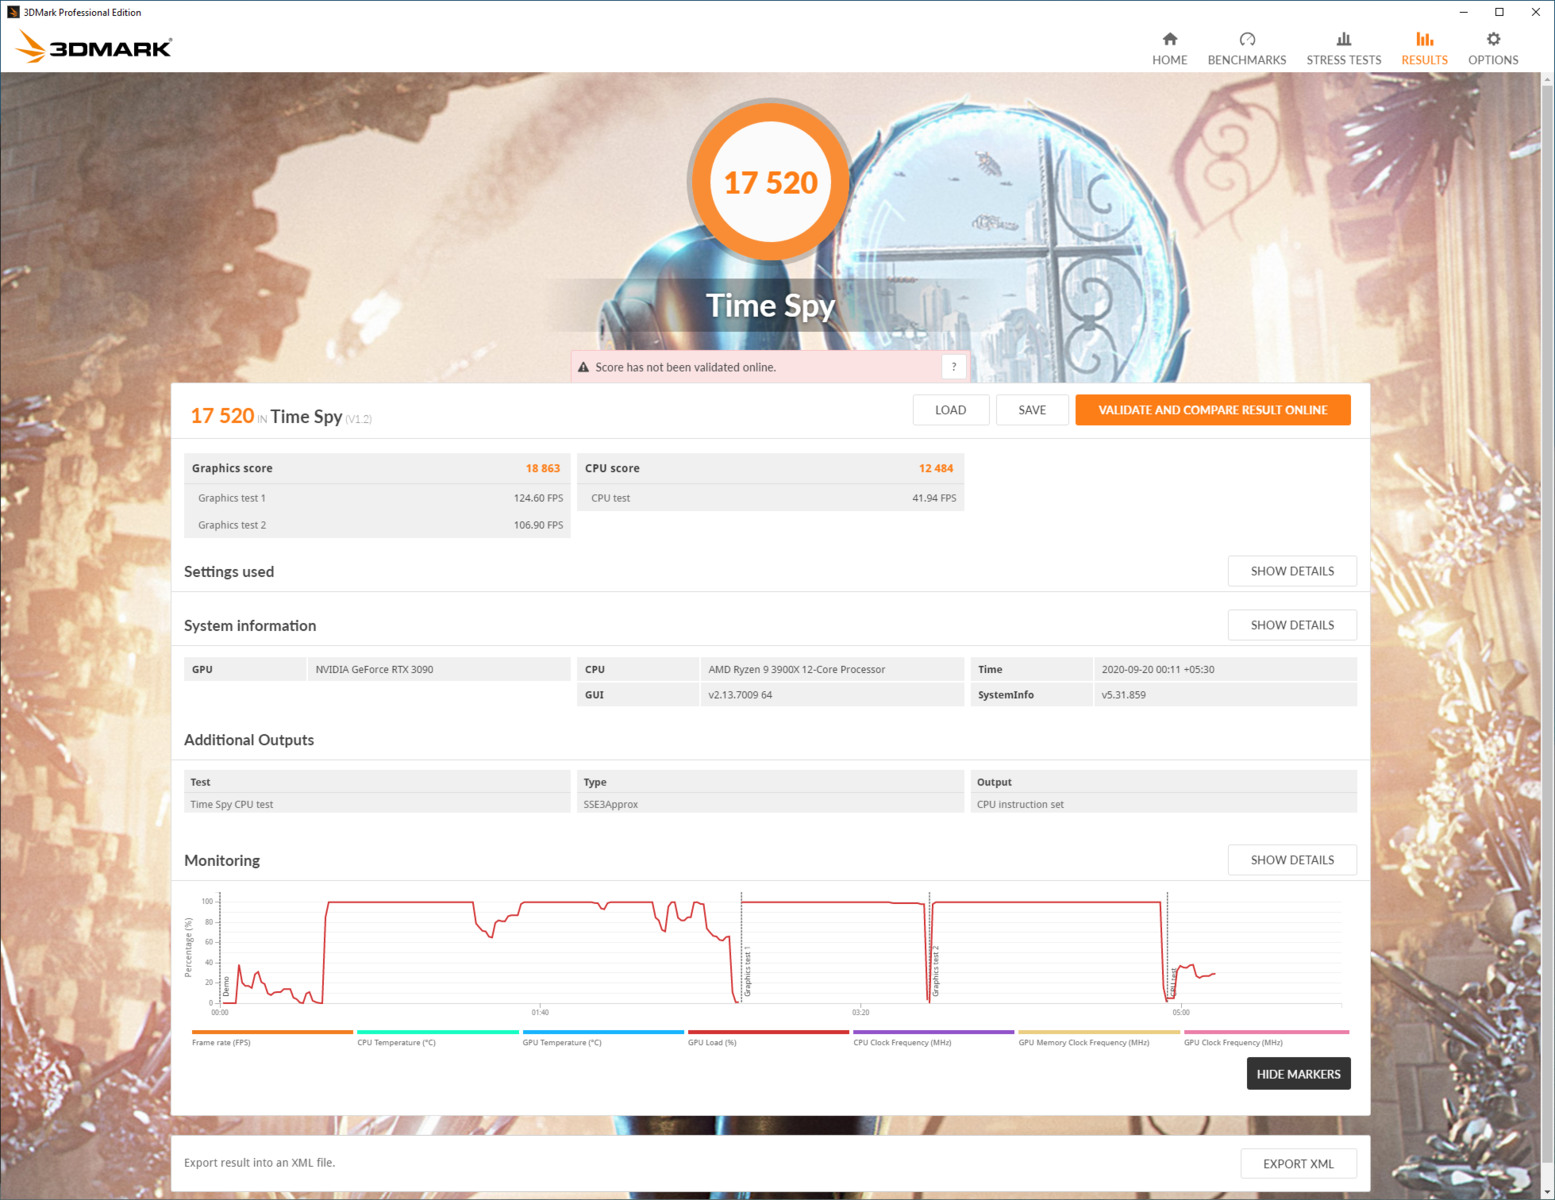
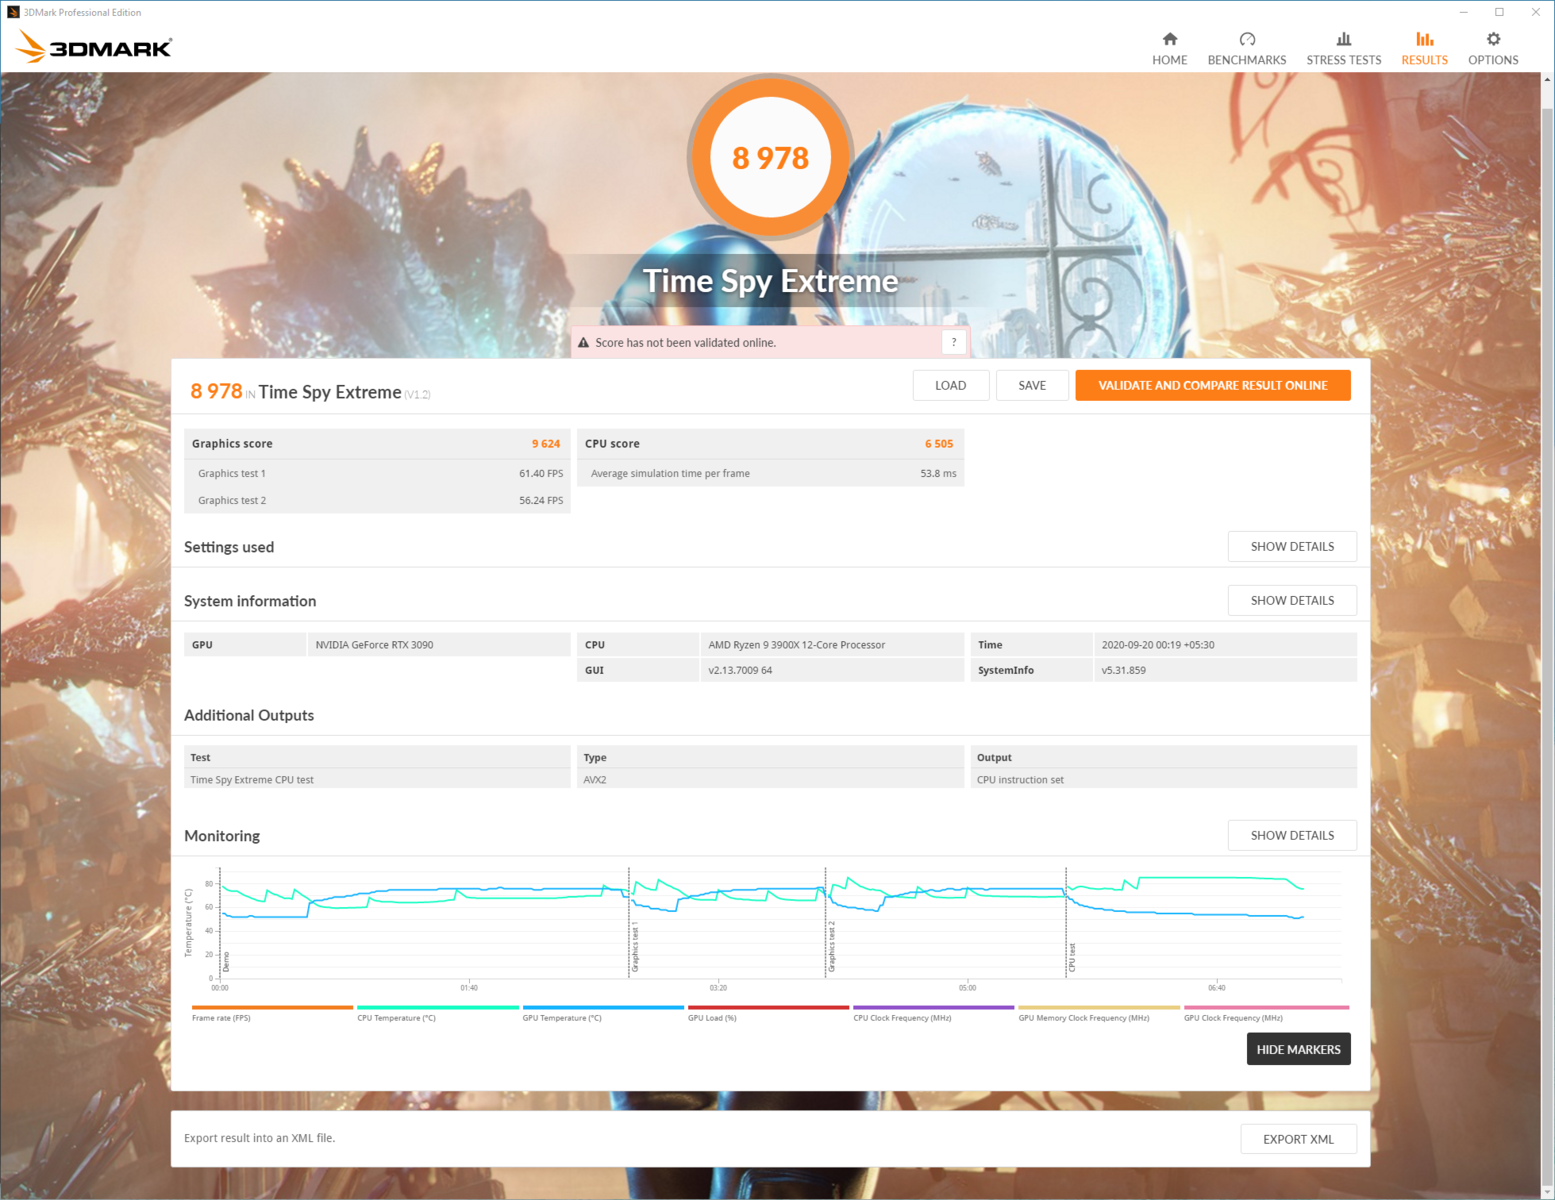
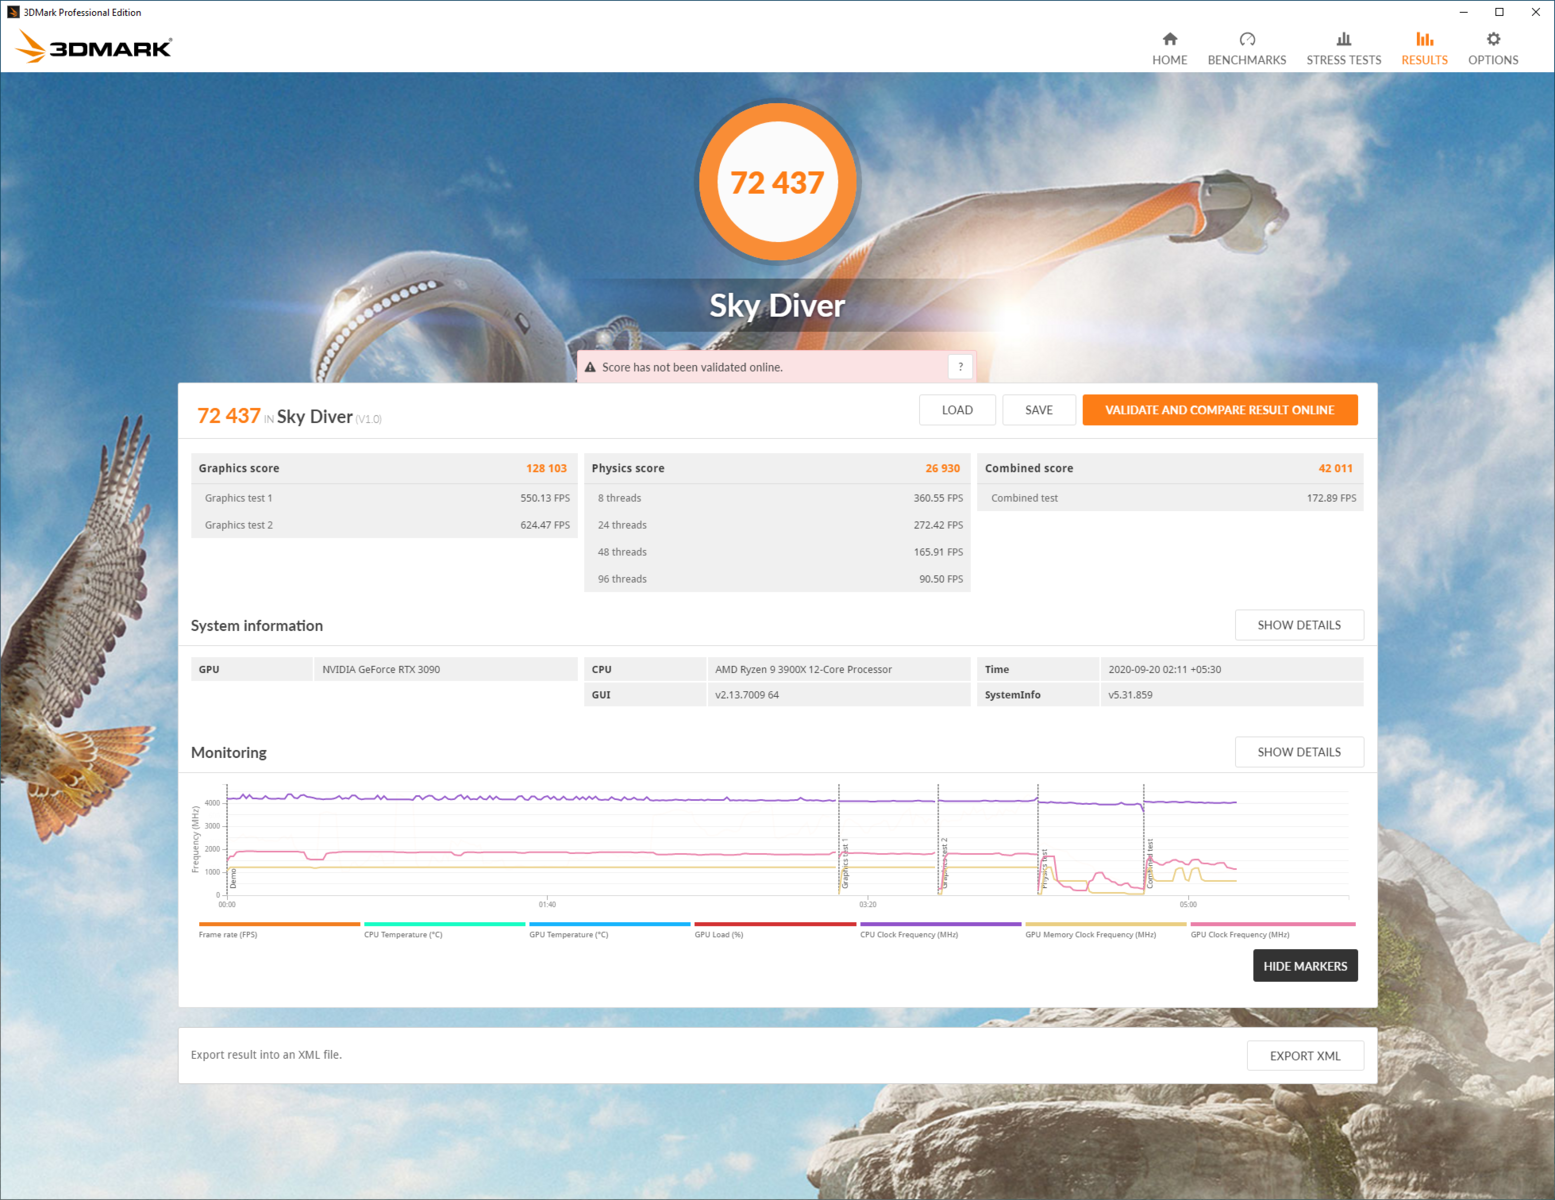
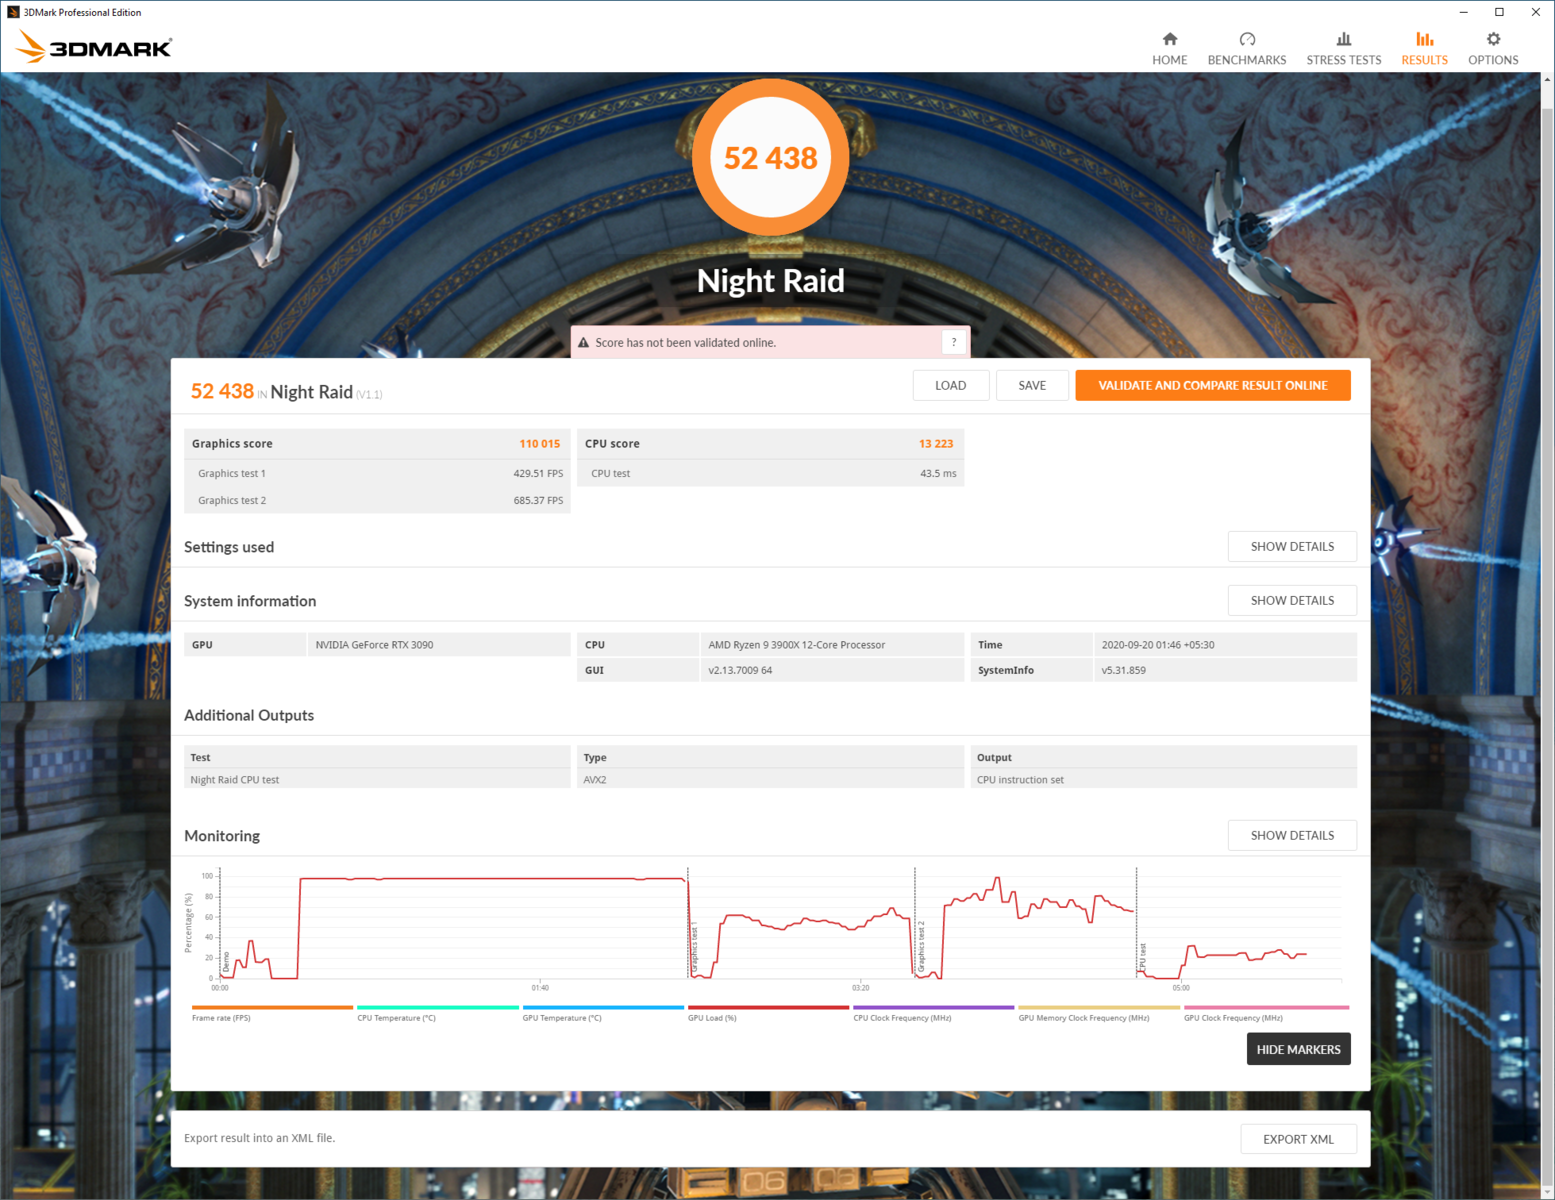
Usamos los benchmarks de 3DMark y Unigine para probar el rendimiento del RTX 3090 en cargas sintéticas. Vemos que el RTX 3090 ofrece las mejores ganancias en los puntos de referencia que corren a 1440p y más resoluciones. En Fire Strike Ultra, por ejemplo, vemos una saludable ventaja de 36% sobre el RTX Titan. El RTX 3090 también lidera el RTX del Titán por un 31% en el Fire Strike Extreme. Sin embargo, comparado con el RTX 3080 (20.834 puntos de Hardwareluxx), la diferencia sólo llega a un 7%.
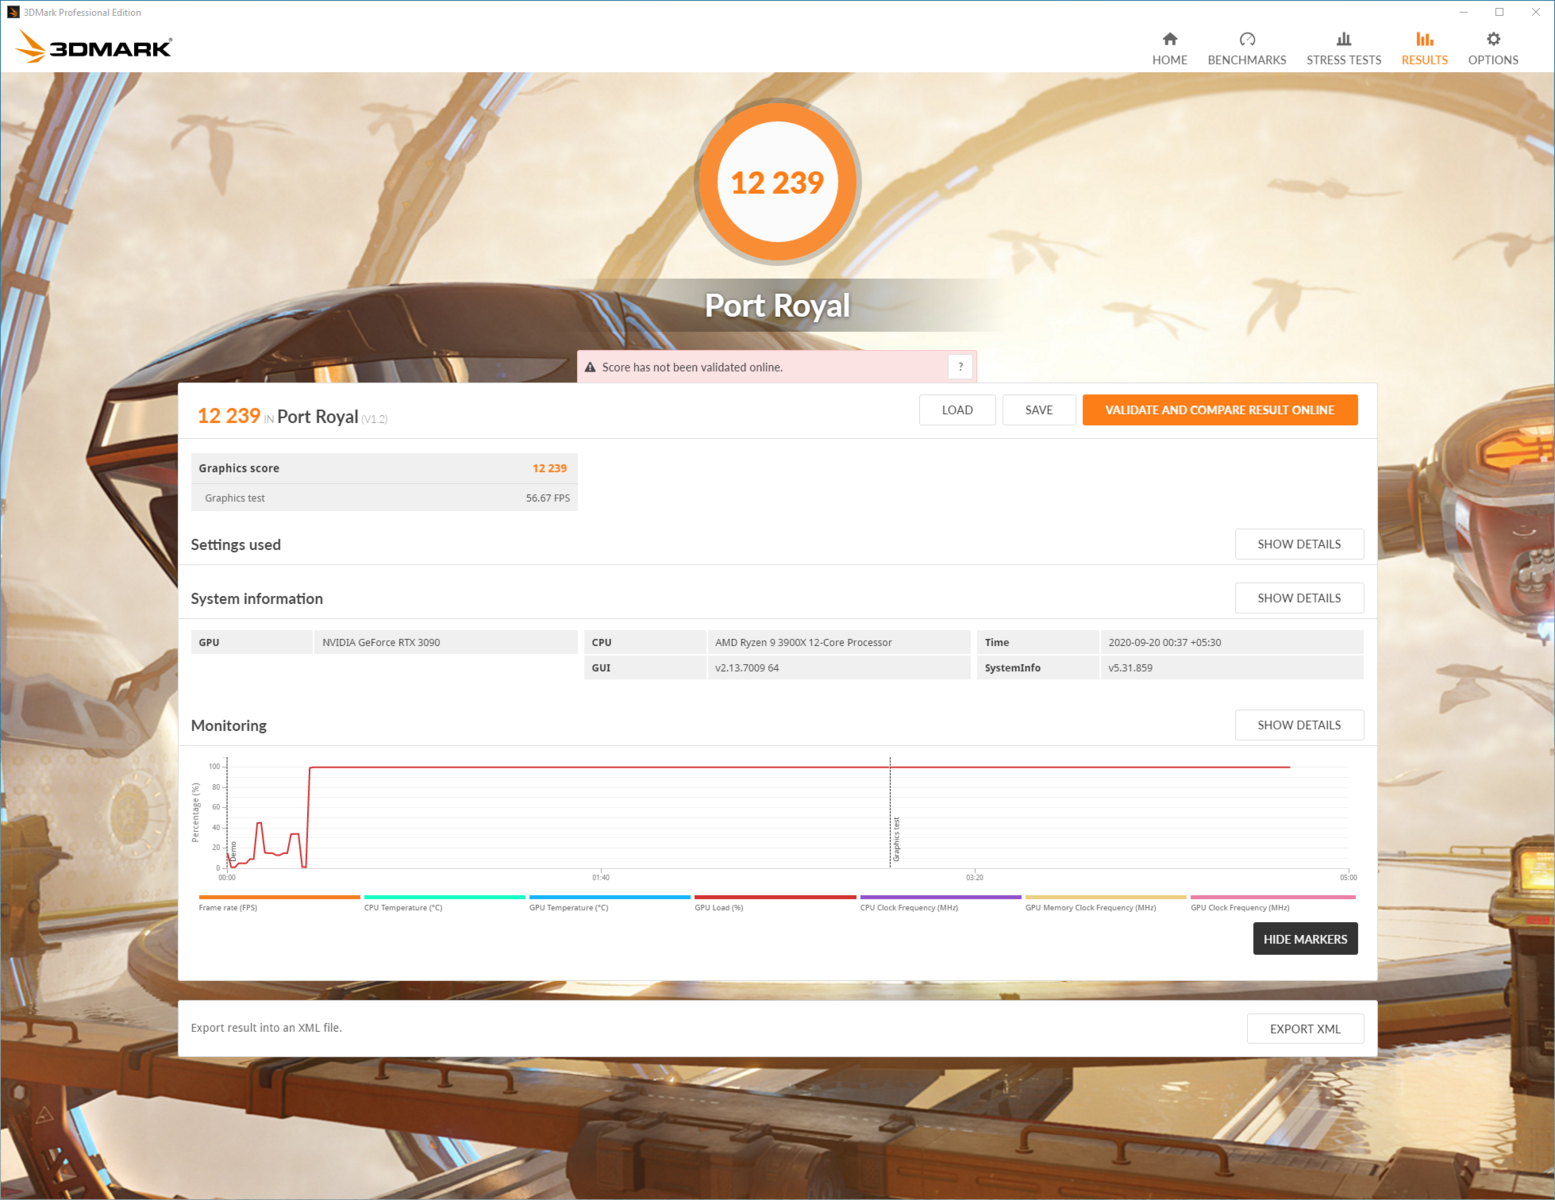
En el benchmark de Port Royal que prueba el rendimiento del trazado de rayos, vemos que el RTX 3090 registra casi 1,5 veces más puntos en comparación con el RTX 2080 Ti. Una vez más, sin embargo, el RTX 3090 sólo ofrece un aumento efectivo de alrededor del 7,25% en comparación con el RTX 3080 (11.426 puntos de Hardwareluxx).
En Unigine, vemos ganancias de hasta 36% en el punto de referencia de Valley 1.0 y hasta 31% en Heaven 4.0. Tengan en cuenta que el RTX 2080 Ti es capaz de ofrecer un mejor rendimiento aquí en comparación con el RTX de Titán. La superposición Unigine es un punto de referencia más exigente y vemos que el RTX 3090 Trinity es capaz de lograr una fuerte ventaja del 33% en los presets optimizados de 4K y 8K.
Una cosa que es bastante evidente de estas pruebas sintéticas es que no hay mucho incentivo para elegir un RTX 3090 sobre un RTX 3080 ya que la diferencia de rendimiento será de alrededor de 7-8% en el mejor de los casos. Dicho esto, si usted está actualizando una tarjeta Titan anterior, el RTX 3090 ofrece beneficios tangibles, especialmente en resoluciones más altas.
| 3DMark | |
| 2560x1440 Port Royal Graphics | |
| NVIDIA GeForce RTX 3090 | |
| NVIDIA Titan RTX | |
| NVIDIA GeForce RTX 2080 Ti (Desktop) | |
| NVIDIA GeForce RTX 2080 Super (Desktop) | |
| NVIDIA Titan X Pascal | |
| 2560x1440 Time Spy Graphics | |
| NVIDIA GeForce RTX 3090 | |
| NVIDIA Titan RTX | |
| NVIDIA GeForce RTX 2080 Ti (Desktop) | |
| NVIDIA GeForce RTX 2080 Super (Desktop) | |
| NVIDIA Titan X Pascal | |
| AMD Radeon RX 5700 XT (Desktop) | |
| 3840x2160 Fire Strike Ultra Graphics | |
| NVIDIA GeForce RTX 3090 | |
| NVIDIA Titan RTX | |
| NVIDIA GeForce RTX 2080 Ti (Desktop) | |
| NVIDIA Titan X Pascal | |
| NVIDIA GeForce RTX 2080 Super (Desktop) | |
| AMD Radeon RX 5700 XT (Desktop) | |
| Fire Strike Extreme Graphics | |
| NVIDIA GeForce RTX 3090 | |
| NVIDIA Titan RTX | |
| NVIDIA GeForce RTX 2080 Ti (Desktop) | |
| NVIDIA Titan X Pascal | |
| NVIDIA GeForce RTX 2080 Super (Desktop) | |
| AMD Radeon RX 5700 XT (Desktop) | |
| 1920x1080 Fire Strike Graphics | |
| NVIDIA GeForce RTX 3090 | |
| NVIDIA Titan RTX | |
| NVIDIA GeForce RTX 2080 Ti (Desktop) | |
| NVIDIA GeForce RTX 2080 Super (Desktop) | |
| AMD Radeon RX 5700 XT (Desktop) | |
| NVIDIA Titan X Pascal | |
| 3DMark 11 - 1280x720 Performance GPU | |
| NVIDIA GeForce RTX 3090 | |
| NVIDIA Titan RTX | |
| NVIDIA GeForce RTX 2080 Ti (Desktop) | |
| NVIDIA GeForce RTX 2080 Super (Desktop) | |
| NVIDIA Titan X Pascal | |
| AMD Radeon RX 5700 XT (Desktop) | |
| Unigine Valley 1.0 - 1920x1080 Extreme HD DirectX AA:x8 | |
| NVIDIA GeForce RTX 3090 | |
| NVIDIA Titan RTX | |
| NVIDIA GeForce RTX 2080 Ti (Desktop) | |
| NVIDIA Titan X Pascal | |
| NVIDIA GeForce RTX 2080 Super (Desktop) | |
| AMD Radeon RX 5700 XT (Desktop) | |
| Unigine Heaven 4.0 - Extreme Preset DX11 | |
| NVIDIA GeForce RTX 3090 | |
| NVIDIA Titan RTX | |
| NVIDIA GeForce RTX 2080 Ti (Desktop) | |
| NVIDIA GeForce RTX 2080 Super (Desktop) | |
| NVIDIA Titan X Pascal | |
| AMD Radeon RX 5700 XT (Desktop) | |
| Unigine Superposition | |
| 7680x4320 8k Optimized | |
| NVIDIA GeForce RTX 3090 | |
| NVIDIA Titan RTX | |
| NVIDIA Titan X Pascal | |
| AMD Radeon RX 5700 XT (Desktop) | |
| 3840x2160 4k Optimized | |
| NVIDIA GeForce RTX 3090 | |
| NVIDIA Titan RTX | |
| NVIDIA Titan X Pascal | |
| AMD Radeon RX 5700 XT (Desktop) | |
| 1920x1080 1080p Extreme | |
| NVIDIA GeForce RTX 3090 | |
| NVIDIA Titan RTX | |
| NVIDIA Titan X Pascal | |
| AMD Radeon RX 5700 XT (Desktop) | |
| 1920x1080 1080p High | |
| NVIDIA GeForce RTX 3090 | |
| NVIDIA Titan RTX | |
| NVIDIA Titan X Pascal | |
| AMD Radeon RX 5700 XT (Desktop) | |
Calcular los puntos de referencia
El RTX 3090 Trinity brilla en los benchmarks de computación ofreciendo una alta ventaja de 74% en el QJuliaRayTrace de ComputeMark y una alta puntuación general de 61% en el benchmark sobre el RTX de Titán. En las pruebas de la Sala LuxMark y la Sala de la GPU, el RTX 3090 obtiene un fácil margen de 25% y 36% sobre el RTX de Titán. Por lo tanto, las cargas de trabajo que hacen uso de extensos cálculos en la GPU deberían obtener buenos beneficios al actualizarse a esta tarjeta.
| ComputeMark v2.1 | |
| 1024x600 Normal, Score | |
| NVIDIA GeForce RTX 3090 | |
| NVIDIA Titan RTX | |
| NVIDIA GeForce RTX 2080 Ti (Desktop) | |
| NVIDIA GeForce RTX 2080 Super (Desktop) | |
| 1024x600 Normal, Fluid 3DTex | |
| NVIDIA GeForce RTX 3090 | |
| NVIDIA Titan RTX | |
| NVIDIA GeForce RTX 2080 Ti (Desktop) | |
| NVIDIA GeForce RTX 2080 Super (Desktop) | |
| 1024x600 Normal, Fluid 2DTexArr | |
| NVIDIA GeForce RTX 3090 | |
| NVIDIA Titan RTX | |
| NVIDIA GeForce RTX 2080 Ti (Desktop) | |
| NVIDIA GeForce RTX 2080 Super (Desktop) | |
| 1024x600 Normal, Mandel Vector | |
| NVIDIA GeForce RTX 3090 | |
| NVIDIA Titan RTX | |
| NVIDIA GeForce RTX 2080 Ti (Desktop) | |
| NVIDIA GeForce RTX 2080 Super (Desktop) | |
| 1024x600 Normal, Mandel Scalar | |
| NVIDIA GeForce RTX 3090 | |
| NVIDIA Titan RTX | |
| NVIDIA GeForce RTX 2080 Ti (Desktop) | |
| NVIDIA GeForce RTX 2080 Super (Desktop) | |
| 1024x600 Normal, QJuliaRayTrace | |
| NVIDIA GeForce RTX 3090 | |
| NVIDIA Titan RTX | |
| NVIDIA GeForce RTX 2080 Ti (Desktop) | |
| NVIDIA GeForce RTX 2080 Super (Desktop) | |
| LuxMark v2.0 64Bit | |
| Sala GPUs-only | |
| NVIDIA GeForce RTX 3090 | |
| NVIDIA Titan RTX | |
| NVIDIA GeForce RTX 2080 Ti (Desktop) | |
| NVIDIA GeForce RTX 2080 Super (Desktop) | |
| Room GPUs-only | |
| NVIDIA GeForce RTX 3090 | |
| NVIDIA Titan RTX | |
| NVIDIA GeForce RTX 2080 Ti (Desktop) | |
| NVIDIA GeForce RTX 2080 Super (Desktop) | |
| Geekbench 5.5 | |
| OpenCL Score | |
| NVIDIA GeForce RTX 3090 | |
| Vulkan Score 5.5 | |
| NVIDIA GeForce RTX 3090 | |
Aplicaciones profesionales
NVIDIA querría que los profesionales de las industrias médica, automovilística y de renderizado 3D utilizaran de forma ideal su línea Quadro. Las tarjetas Quadro basadas en amperios aún no han sido anunciadas y esperamos que superen fácilmente al RTX 3090. El RTX 3090 utiliza controladores GeForce, que no están certificados para su uso en aplicaciones profesionales. No obstante, con la disponibilidad de una VRAM GDDR6X de 24 GB y un núcleo Ampere de primera línea, la aplicabilidad del RTX 3090 en estos escenarios no se puede descartar totalmente. Vemos resultados interesantes en nuestra comparación con la Titan RTX y otras tarjetas NVIDIA.
En SPECviewperf 12, las mejores ganancias se vieron con las cargas de trabajo de Maya y 3DS Max con Showcase ofreciendo claros beneficios también en comparación con la Titan RTX. Sin embargo, el RTX 3090 obtuvo una buena puntuación en pruebas como Solidworks, Catia, Siemens NX, etc.
Del mismo modo, en SPECviewperf 13, Maya, 3DS Max, Creo, y Showcase muestran buenas mejoras con el resto de las puntuaciones bajando mucho en comparación con incluso el Titan X Pascal.
Esto podría deberse en gran parte a los conductores y a la optimización, y esperamos que las puntuaciones mejoren con el tiempo. Dicho esto, el apreciable aumento de rendimiento en 3DS Max y Maya será de interés para los que se dedican al modelado en 3D, ya que podrán obtener buenos beneficios sin tener que invertir necesariamente en una tarjeta Quadro más cara.
| NVIDIA GeForce RTX 3090 GeForce RTX 3090, R9 3900X | NVIDIA Titan RTX Titan RTX, R7 2700X, ADATA Premier Pro SP900NS38 512 GB | NVIDIA Titan X Pascal Titan X Pascal, TR 1950X, Samsung SM951 MZHPV512HDGL m.2 PCI-e | NVIDIA GeForce RTX 2080 Ti (Desktop) GeForce RTX 2080 Ti (Desktop), R9 3900X, Corsair MP600 | NVIDIA GeForce RTX 2080 Super (Desktop) GeForce RTX 2080 Super (Desktop), R7 2700X | NVIDIA Quadro M5000M Quadro M5000M, E3-1505M v5, Toshiba NVMe THNSN5256GPU7 | |
|---|---|---|---|---|---|---|
| SPECviewperf 12 | 222% | 145% | -16% | -27% | 39% | |
| 1900x1060 Solidworks (sw-03) (fps) | 77.1 | 139.6 81% | 77.1 0% | 78.4 2% | 70.8 -8% | 101 31% |
| 1900x1060 Siemens NX (snx-02) (fps) | 13.03 | 256.3 1867% | 206.8 1487% | 12.16 -7% | 12.26 -6% | 86.9 567% |
| 1900x1060 Showcase (showcase-01) (fps) | 237 | 191.6 -19% | 137 -42% | 175.6 -26% | 143.6 -39% | 44.14 -81% |
| 1900x1060 Medical (medical-01) (fps) | 80.9 | 87 8% | 79.6 -2% | 48.61 -40% | 45 -44% | 31.35 -61% |
| 1900x1060 Maya (maya-04) (fps) | 170 | 132.8 -22% | 79.7 -53% | 177.8 5% | 134.8 -21% | 69.6 -59% |
| 1900x1060 Energy (energy-01) (fps) | 24.81 | 28.12 13% | 19.78 -20% | 15.86 -36% | 13.09 -47% | 6.86 -72% |
| 1900x1060 Creo (creo-01) (fps) | 69.4 | 106.3 53% | 75.4 9% | 63.1 -9% | 52.7 -24% | 81.3 17% |
| 1900x1060 Catia (catia-04) (fps) | 132 | 178.1 35% | 100.3 -24% | 118.5 -10% | 104.2 -21% | 94.4 -28% |
| 1900x1060 3ds Max (3dsmax-05) (fps) | 329 | 268.2 -18% | 151.9 -54% | 258.1 -22% | 225.8 -31% | |
| SPECviewperf 13 | 206% | 132% | -15% | -27% | ||
| Solidworks (sw-04) (fps) | 108 | 132.9 23% | 82.1 -24% | 111.8 4% | 99.6 -8% | |
| Siemens NX (snx-03) (fps) | 23.62 | 462.4 1858% | 370.9 1470% | 21.99 -7% | 21.94 -7% | |
| Showcase (showcase-02) (fps) | 237 | 192 -19% | 136.8 -42% | 180.4 -24% | 144.5 -39% | |
| Medical (medical-02) (fps) | 102 | 89.3 -12% | 71.4 -30% | 82.1 -20% | 71.6 -30% | |
| Maya (maya-05) (fps) | 433 | 367.8 -15% | 236.5 -45% | 386.6 -11% | 328.7 -24% | |
| Energy (energy-02) (fps) | 44.36 | 51.9 17% | 32.46 -27% | 31.52 -29% | 23.78 -46% | |
| Creo (creo-02) (fps) | 328 | 307.6 -6% | 185.2 -44% | 286.5 -13% | 220.1 -33% | |
| Catia (catia-05) (fps) | 203 | 260.4 28% | 161.4 -20% | 178.8 -12% | 157.7 -22% | |
| 3ds Max (3dsmax-06) (fps) | 333 | 268.7 -19% | 153.4 -54% | 269.4 -19% | 227.8 -32% | |
| Media total (Programa/Opciones) | 214% /
214% | 139% /
138% | -16% /
-15% | -27% /
-27% | 39% /
39% |
Edición de 8K en DaVinci Resolve
Blackmagicdesign DaVinci Resolve ha recibido recientemente una actualización (versión 16.2.7) para ser compatible con las últimas GPU Ampere, y NVIDIA nos ha proporcionado un proyecto REDCODE RAW de 8K y una licencia Resolve Studio de duración limitada para evaluar el rendimiento del RTX 3090 en las funciones de decodificación y eliminación de capas de Resolve y suavizar el desplazamiento en la línea de tiempo de 8K mientras se aplican los efectos de desenfoque por movimiento y reducción temporal del ruido.
Para esta prueba, Resolve se configuró para utilizar los núcleos CUDA del RTX 3090 y la opción de decodificación de la GPU para la descompresión y el debayer. La Reducción de Ruido Temporal fue fijada por defecto a cinco cuadros y la estimación de movimiento fue fijada en "Mejor". Se aplicó un valor de Desenfoque de movimiento de 50. NVIDIA dijo que incluso un RTX 3080 mostrará un error de procesamiento de imagen debido a la limitada cantidad de VRAM.
Como pueden ver en nuestro vídeo a continuación, esta actividad ya utiliza cerca de 16 GB de memoria de vídeo y la tarjeta saca unos 280 W. Curiosamente, el GPU Boost parece permitir un aumento superior a lo esperado hasta 1.920 MHz con una temperatura global de unos 71 °C.
La exportación del clip RAW de 17 segundos tomó cerca de 1:30 minutos y consumió casi 18 GB de VRAM. De hecho, la reproducción del archivo MP4 de 8K exportado también pareció consumir la misma cantidad de memoria, aunque con un menor uso de la GPU de ~35%.
Los puntos de referencia del juego
NVIDIA nunca posicionó realmente la RTX 3090 como una tarjeta de juego. Sin embargo, varios benchmarks de juego del RTX 3090 que han logrado filtrarse en los últimos días causaron cierta consternación entre los jugadores que esperaban un aumento significativo de fps en comparación con el RTX 3080. De hecho, NVIDIA ha declarado oficialmente oficialmente que se puede esperar que el RTX 3090 ofrezca entre un 10 y un 15% más de cuadros que el RTX 3080. Si bien esto es cierto, sí hay beneficios para los jugadores que se actualizan de un RTX Titan o incluso del RTX 2080 Ti, especialmente cuando juegan a resoluciones de 4k y superiores.
Aquellos que deseen extraer cada cuadro de los juegos deberían idealmente emparejar el RTX 3090 con el Intel Comet Lake-S Core i9-10900K, especialmente en resoluciones más bajas para minimizar cualquier cuello de botella. A resoluciones superiores a 1440p, el sistema AMD es bastante capaz de ayudarte a sacar el máximo provecho del RTX 3090.
| Borderlands 3 | |
| 3840x2160 Badass Overall Quality (DX11) | |
| NVIDIA GeForce RTX 3090 | |
| NVIDIA Titan RTX | |
| NVIDIA GeForce RTX 2080 Ti (Desktop) | |
| NVIDIA Titan RTX | |
| NVIDIA GeForce RTX 2080 Super (Desktop) | |
| NVIDIA Titan X Pascal | |
| AMD Radeon RX 5700 XT (Desktop) | |
| 2560x1440 Badass Overall Quality (DX11) | |
| NVIDIA GeForce RTX 3090 | |
| NVIDIA Titan RTX | |
| NVIDIA Titan RTX | |
| NVIDIA GeForce RTX 2080 Ti (Desktop) | |
| NVIDIA GeForce RTX 2080 Super (Desktop) | |
| NVIDIA Titan X Pascal | |
| AMD Radeon RX 5700 XT (Desktop) | |
| 1920x1080 Badass Overall Quality (DX11) | |
| NVIDIA GeForce RTX 3090 | |
| NVIDIA Titan RTX | |
| NVIDIA Titan RTX | |
| NVIDIA GeForce RTX 2080 Ti (Desktop) | |
| NVIDIA GeForce RTX 2080 Super (Desktop) | |
| NVIDIA Titan X Pascal | |
| AMD Radeon RX 5700 XT (Desktop) | |
| 1920x1080 High Overall Quality (DX11) | |
| NVIDIA GeForce RTX 2080 Ti (Desktop) | |
| NVIDIA Titan RTX | |
| NVIDIA Titan RTX | |
| NVIDIA GeForce RTX 3090 | |
| NVIDIA GeForce RTX 2080 Super (Desktop) | |
| NVIDIA Titan X Pascal | |
| AMD Radeon RX 5700 XT (Desktop) | |
| Gears Tactics | |
| 3840x2160 Ultra Preset | |
| NVIDIA GeForce RTX 3090 | |
| NVIDIA Titan RTX | |
| NVIDIA GeForce RTX 2080 Super (Desktop) | |
| NVIDIA Titan X Pascal | |
| AMD Radeon RX 5700 XT (Desktop) | |
| 2560x1440 Ultra Preset | |
| NVIDIA GeForce RTX 3090 | |
| NVIDIA Titan RTX | |
| NVIDIA GeForce RTX 2080 Super (Desktop) | |
| NVIDIA Titan X Pascal | |
| AMD Radeon RX 5700 XT (Desktop) | |
| 1920x1080 Ultra Preset | |
| NVIDIA Titan RTX | |
| NVIDIA GeForce RTX 3090 | |
| NVIDIA GeForce RTX 2080 Super (Desktop) | |
| NVIDIA Titan X Pascal | |
| AMD Radeon RX 5700 XT (Desktop) | |
| 1920x1080 High Preset | |
| NVIDIA GeForce RTX 2080 Super (Desktop) | |
| NVIDIA Titan RTX | |
| NVIDIA GeForce RTX 3090 | |
| NVIDIA Titan X Pascal | |
| AMD Radeon RX 5700 XT (Desktop) | |
| Total War: Three Kingdoms | |
| 3840x2160 Ultra (incl textures) | |
| NVIDIA GeForce RTX 3090 | |
| NVIDIA Titan RTX | |
| NVIDIA GeForce RTX 2080 Super (Desktop) | |
| NVIDIA Titan X Pascal | |
| AMD Radeon RX 5700 XT (Desktop) | |
| 2560x1440 Ultra (incl textures) | |
| NVIDIA GeForce RTX 3090 | |
| NVIDIA Titan RTX | |
| NVIDIA GeForce RTX 2080 Super (Desktop) | |
| NVIDIA Titan X Pascal | |
| AMD Radeon RX 5700 XT (Desktop) | |
| 1920x1080 Ultra (incl textures) | |
| NVIDIA GeForce RTX 3090 | |
| NVIDIA Titan RTX | |
| NVIDIA GeForce RTX 2080 Super (Desktop) | |
| NVIDIA Titan X Pascal | |
| AMD Radeon RX 5700 XT (Desktop) | |
| 1920x1080 High (incl textures) | |
| NVIDIA GeForce RTX 3090 | |
| NVIDIA Titan RTX | |
| NVIDIA GeForce RTX 2080 Super (Desktop) | |
| NVIDIA Titan X Pascal | |
| AMD Radeon RX 5700 XT (Desktop) | |
| Death Stranding | |
| 3840x2160 Very High Preset | |
| NVIDIA GeForce RTX 3090 | |
| NVIDIA Titan RTX | |
| NVIDIA GeForce RTX 2080 Super (Desktop) | |
| NVIDIA Titan X Pascal | |
| AMD Radeon RX 5700 XT (Desktop) | |
| 2560x1440 Very High Preset | |
| NVIDIA Titan RTX | |
| NVIDIA GeForce RTX 3090 | |
| NVIDIA GeForce RTX 2080 Super (Desktop) | |
| NVIDIA Titan X Pascal | |
| AMD Radeon RX 5700 XT (Desktop) | |
| 1920x1080 Very High Preset | |
| NVIDIA GeForce RTX 3090 | |
| NVIDIA Titan RTX | |
| NVIDIA GeForce RTX 2080 Super (Desktop) | |
| AMD Radeon RX 5700 XT (Desktop) | |
| NVIDIA Titan X Pascal | |
| 1920x1080 Default Preset | |
| NVIDIA GeForce RTX 3090 | |
| NVIDIA Titan RTX | |
| NVIDIA GeForce RTX 2080 Super (Desktop) | |
| AMD Radeon RX 5700 XT (Desktop) | |
| NVIDIA Titan X Pascal | |
| Dirt Rally 2.0 | |
| 3840x2160 Ultra Preset AA:T AF:16x | |
| NVIDIA GeForce RTX 3090 | |
| 2560x1440 Ultra Preset AA:T AF:16x | |
| NVIDIA GeForce RTX 3090 | |
| 1920x1080 Ultra Preset AA:T AF:16x | |
| NVIDIA GeForce RTX 3090 | |
| 1920x1080 High Preset AA:T AF:8x | |
| NVIDIA GeForce RTX 3090 | |
| Shadow of the Tomb Raider | |
| 3840x2160 Highest Preset AA:T | |
| NVIDIA GeForce RTX 3090 | |
| NVIDIA Titan RTX | |
| NVIDIA Titan RTX | |
| NVIDIA Titan RTX | |
| NVIDIA Titan X Pascal | |
| 2560x1440 Highest Preset AA:T | |
| NVIDIA GeForce RTX 3090 | |
| NVIDIA Titan RTX | |
| NVIDIA Titan RTX | |
| 1920x1080 Highest Preset AA:T | |
| NVIDIA GeForce RTX 3090 | |
| NVIDIA GeForce RTX 3090 | |
| NVIDIA GeForce RTX 3090 | |
| NVIDIA Titan RTX | |
| NVIDIA Titan RTX | |
| NVIDIA Titan RTX | |
| AMD Radeon RX 5700 XT (Desktop) | |
| NVIDIA Titan X Pascal | |
| 1920x1080 High Preset AA:SM | |
| NVIDIA GeForce RTX 3090 | |
| NVIDIA GeForce RTX 3090 | |
| NVIDIA Titan RTX | |
| NVIDIA Titan RTX | |
| NVIDIA Titan RTX | |
| NVIDIA Titan X Pascal | |
| F1 2020 | |
| 3840x2160 Ultra High Preset AA:T AF:16x | |
| NVIDIA GeForce RTX 3090 | |
| NVIDIA Titan RTX | |
| NVIDIA GeForce RTX 2080 Super (Desktop) | |
| AMD Radeon RX 5700 XT (Desktop) | |
| NVIDIA Titan X Pascal | |
| 2560x1440 Ultra High Preset AA:T AF:16x | |
| NVIDIA GeForce RTX 3090 | |
| NVIDIA Titan RTX | |
| NVIDIA GeForce RTX 2080 Super (Desktop) | |
| AMD Radeon RX 5700 XT (Desktop) | |
| NVIDIA Titan X Pascal | |
| 1920x1080 Ultra High Preset AA:T AF:16x | |
| NVIDIA GeForce RTX 3090 | |
| NVIDIA Titan RTX | |
| NVIDIA GeForce RTX 2080 Super (Desktop) | |
| AMD Radeon RX 5700 XT (Desktop) | |
| NVIDIA Titan X Pascal | |
| 1920x1080 High Preset AA:T AF:16x | |
| NVIDIA Titan RTX | |
| NVIDIA GeForce RTX 3090 | |
| NVIDIA GeForce RTX 2080 Super (Desktop) | |
| AMD Radeon RX 5700 XT (Desktop) | |
| NVIDIA Titan X Pascal | |
| Doom Eternal | |
| 3840x2160 Ultra Preset | |
| NVIDIA GeForce RTX 3090 | |
| NVIDIA Titan RTX | |
| NVIDIA GeForce RTX 2080 Super (Desktop) | |
| AMD Radeon RX 5700 XT (Desktop) | |
| NVIDIA Titan X Pascal | |
| 2560x1440 Ultra Preset | |
| NVIDIA GeForce RTX 3090 | |
| NVIDIA Titan RTX | |
| NVIDIA GeForce RTX 2080 Super (Desktop) | |
| AMD Radeon RX 5700 XT (Desktop) | |
| NVIDIA Titan X Pascal | |
| 1920x1080 Ultra Preset | |
| NVIDIA GeForce RTX 3090 | |
| NVIDIA Titan RTX | |
| NVIDIA GeForce RTX 2080 Super (Desktop) | |
| NVIDIA Titan X Pascal | |
| AMD Radeon RX 5700 XT (Desktop) | |
| 1920x1080 High Preset | |
| NVIDIA GeForce RTX 3090 | |
| NVIDIA Titan RTX | |
| NVIDIA GeForce RTX 2080 Super (Desktop) | |
| NVIDIA Titan X Pascal | |
| AMD Radeon RX 5700 XT (Desktop) | |
| GRID 2019 | |
| 3840x2160 Ultra High Preset | |
| NVIDIA GeForce RTX 3090 | |
| NVIDIA Titan RTX | |
| NVIDIA GeForce RTX 2080 Super (Desktop) | |
| AMD Radeon RX 5700 XT (Desktop) | |
| NVIDIA Titan X Pascal | |
| 2560x1440 Ultra High Preset | |
| NVIDIA Titan RTX | |
| NVIDIA GeForce RTX 3090 | |
| NVIDIA GeForce RTX 2080 Super (Desktop) | |
| NVIDIA Titan X Pascal | |
| AMD Radeon RX 5700 XT (Desktop) | |
| 1920x1080 Ultra High Preset | |
| NVIDIA Titan RTX | |
| NVIDIA GeForce RTX 3090 | |
| NVIDIA GeForce RTX 2080 Super (Desktop) | |
| NVIDIA Titan X Pascal | |
| AMD Radeon RX 5700 XT (Desktop) | |
| 1920x1080 High Preset | |
| NVIDIA Titan RTX | |
| NVIDIA Titan X Pascal | |
| NVIDIA GeForce RTX 2080 Super (Desktop) | |
| AMD Radeon RX 5700 XT (Desktop) | |
| NVIDIA GeForce RTX 3090 | |
| Hitman 2 | |
| 3840x2160 Ultra AF:16x | |
| NVIDIA GeForce RTX 3090 | |
| NVIDIA Titan RTX | |
| NVIDIA Titan X Pascal | |
| 2560x1440 Ultra AF:16x | |
| NVIDIA GeForce RTX 3090 | |
| 1920x1080 Ultra AF:16x | |
| NVIDIA GeForce RTX 3090 | |
| NVIDIA Titan RTX | |
| NVIDIA Titan X Pascal | |
| 1920x1080 High AF:8x | |
| NVIDIA GeForce RTX 3090 | |
| NVIDIA Titan RTX | |
| NVIDIA Titan X Pascal | |
| Horizon Zero Dawn | |
| 3840x2160 Ultimate Quality | |
| NVIDIA GeForce RTX 3090 | |
| NVIDIA Titan RTX | |
| NVIDIA GeForce RTX 2080 Super (Desktop) | |
| AMD Radeon RX 5700 XT (Desktop) | |
| NVIDIA Titan X Pascal | |
| 2560x1440 Ultimate Quality | |
| NVIDIA GeForce RTX 3090 | |
| NVIDIA Titan RTX | |
| NVIDIA GeForce RTX 2080 Super (Desktop) | |
| AMD Radeon RX 5700 XT (Desktop) | |
| NVIDIA Titan X Pascal | |
| 1920x1080 Ultimate Quality | |
| NVIDIA GeForce RTX 3090 | |
| NVIDIA Titan RTX | |
| NVIDIA GeForce RTX 2080 Super (Desktop) | |
| AMD Radeon RX 5700 XT (Desktop) | |
| NVIDIA Titan X Pascal | |
| 1920x1080 Favor Quality | |
| NVIDIA GeForce RTX 3090 | |
| NVIDIA Titan RTX | |
| NVIDIA GeForce RTX 2080 Super (Desktop) | |
| AMD Radeon RX 5700 XT (Desktop) | |
| NVIDIA Titan X Pascal | |
| Anno 1800 | |
| 3840x2160 Ultra Graphics Quality (DX11) | |
| NVIDIA GeForce RTX 3090 | |
| NVIDIA GeForce RTX 2080 Ti (Desktop) | |
| 2560x1440 Ultra Graphics Quality (DX11) | |
| NVIDIA GeForce RTX 3090 | |
| NVIDIA GeForce RTX 2080 Ti (Desktop) | |
| 1920x1080 Ultra Graphics Quality (DX11) | |
| NVIDIA GeForce RTX 3090 | |
| AMD Radeon RX 5700 XT (Desktop) | |
| NVIDIA GeForce RTX 2080 Ti (Desktop) | |
| 1920x1080 High Graphics Quality (DX11) | |
| NVIDIA GeForce RTX 3090 | |
| NVIDIA GeForce RTX 2080 Ti (Desktop) | |
| Assassin´s Creed Odyssey | |
| 3840x2160 Ultra High Preset | |
| NVIDIA GeForce RTX 3090 | |
| NVIDIA Titan RTX | |
| NVIDIA Titan X Pascal | |
| 2560x1440 Ultra High Preset | |
| NVIDIA GeForce RTX 3090 | |
| 1920x1080 Ultra High Preset | |
| NVIDIA GeForce RTX 3090 | |
| NVIDIA Titan RTX | |
| NVIDIA Titan X Pascal | |
| 1920x1080 High Preset | |
| NVIDIA GeForce RTX 3090 | |
| NVIDIA Titan RTX | |
| NVIDIA Titan X Pascal | |
| Far Cry 5 | |
| 3840x2160 Ultra Preset AA:T | |
| NVIDIA GeForce RTX 3090 | |
| NVIDIA Titan RTX | |
| NVIDIA GeForce RTX 2080 Ti (Desktop) | |
| NVIDIA Titan RTX | |
| NVIDIA Titan RTX | |
| NVIDIA Titan X Pascal | |
| 2560x1440 Ultra Preset AA:T | |
| NVIDIA GeForce RTX 3090 | |
| NVIDIA GeForce RTX 2080 Ti (Desktop) | |
| NVIDIA Titan RTX | |
| NVIDIA Titan RTX | |
| 1920x1080 Ultra Preset AA:T | |
| NVIDIA GeForce RTX 2080 Ti (Desktop) | |
| NVIDIA GeForce RTX 3090 | |
| NVIDIA Titan RTX | |
| NVIDIA Titan RTX | |
| AMD Radeon RX 5700 XT (Desktop) | |
| NVIDIA Titan RTX | |
| NVIDIA Titan X Pascal | |
| 1920x1080 High Preset AA:T | |
| NVIDIA GeForce RTX 2080 Ti (Desktop) | |
| NVIDIA GeForce RTX 3090 | |
| NVIDIA Titan RTX | |
| NVIDIA Titan RTX | |
| NVIDIA Titan RTX | |
| NVIDIA Titan X Pascal | |
| Far Cry New Dawn | |
| 3840x2160 Ultra Preset | |
| NVIDIA GeForce RTX 3090 | |
| NVIDIA Titan RTX | |
| NVIDIA GeForce RTX 2080 Ti (Desktop) | |
| NVIDIA Titan RTX | |
| 2560x1440 Ultra Preset | |
| NVIDIA GeForce RTX 3090 | |
| NVIDIA GeForce RTX 2080 Ti (Desktop) | |
| NVIDIA Titan RTX | |
| NVIDIA Titan RTX | |
| 1920x1080 Ultra Preset | |
| NVIDIA GeForce RTX 3090 | |
| NVIDIA Titan RTX | |
| AMD Radeon RX 5700 XT (Desktop) | |
| NVIDIA GeForce RTX 2080 Ti (Desktop) | |
| NVIDIA Titan RTX | |
| 1920x1080 High Preset | |
| NVIDIA GeForce RTX 3090 | |
| NVIDIA Titan RTX | |
| NVIDIA GeForce RTX 2080 Ti (Desktop) | |
| NVIDIA Titan RTX | |
| Call of Duty Modern Warfare 2019 | |
| 3840x2160 Maximum Settings with Raytracing AA:T2X Filmic SM | |
| NVIDIA GeForce RTX 3090 | |
| NVIDIA Titan RTX | |
| NVIDIA GeForce RTX 2080 Super (Desktop) | |
| NVIDIA Titan X Pascal | |
| 1920x1080 Maximum Settings with Raytracing AA:T2X Filmic SM | |
| NVIDIA Titan RTX | |
| NVIDIA GeForce RTX 3090 | |
| NVIDIA GeForce RTX 2080 Super (Desktop) | |
| NVIDIA Titan X Pascal | |
| 3840x2160 Maximum Settings AA:T2X Filmic SM | |
| NVIDIA GeForce RTX 3090 | |
| NVIDIA Titan RTX | |
| NVIDIA GeForce RTX 2080 Super (Desktop) | |
| NVIDIA Titan X Pascal | |
| AMD Radeon RX 5700 XT (Desktop) | |
| 2560x1440 Maximum Settings AA:T2X Filmic SM | |
| NVIDIA GeForce RTX 3090 | |
| NVIDIA Titan RTX | |
| NVIDIA GeForce RTX 2080 Super (Desktop) | |
| NVIDIA Titan X Pascal | |
| AMD Radeon RX 5700 XT (Desktop) | |
| 1920x1080 Maximum Settings AA:T2X Filmic SM | |
| NVIDIA Titan RTX | |
| NVIDIA GeForce RTX 3090 | |
| NVIDIA GeForce RTX 2080 Super (Desktop) | |
| NVIDIA Titan X Pascal | |
| AMD Radeon RX 5700 XT (Desktop) | |
| 1920x1080 High Settings AA:1X SM | |
| NVIDIA Titan RTX | |
| NVIDIA GeForce RTX 3090 | |
| NVIDIA GeForce RTX 2080 Super (Desktop) | |
| NVIDIA Titan X Pascal | |
| AMD Radeon RX 5700 XT (Desktop) | |
| The Division 2 | |
| 3840x2160 Ultra Preset | |
| NVIDIA GeForce RTX 3090 | |
| NVIDIA GeForce RTX 2080 Ti (Desktop) | |
| 2560x1440 Ultra Preset | |
| NVIDIA GeForce RTX 3090 | |
| NVIDIA GeForce RTX 2080 Ti (Desktop) | |
| 1920x1080 Ultra Preset | |
| NVIDIA GeForce RTX 3090 | |
| NVIDIA GeForce RTX 2080 Ti (Desktop) | |
| 1920x1080 High Preset | |
| NVIDIA GeForce RTX 3090 | |
| NVIDIA GeForce RTX 2080 Ti (Desktop) | |
| Battlefield V | |
| 1920x1080 Ultra Preset DXR | |
| NVIDIA GeForce RTX 3090 | |
| 3840x2160 Ultra Preset | |
| NVIDIA GeForce RTX 3090 | |
| NVIDIA GeForce RTX 3090 | |
| NVIDIA Titan RTX | |
| NVIDIA Titan X Pascal | |
| 2560x1440 Ultra Preset | |
| NVIDIA GeForce RTX 3090 | |
| 1920x1080 Ultra Preset | |
| NVIDIA GeForce RTX 3090 | |
| NVIDIA Titan RTX | |
| NVIDIA Titan X Pascal | |
| 1920x1080 High Preset | |
| NVIDIA GeForce RTX 3090 | |
| NVIDIA Titan RTX | |
| NVIDIA Titan X Pascal | |
| Star Wars Jedi Fallen Order | |
| 3840x2160 Epic Preset | |
| NVIDIA GeForce RTX 3090 | |
| NVIDIA Titan RTX | |
| NVIDIA GeForce RTX 2080 Ti (Desktop) | |
| NVIDIA GeForce RTX 2080 Super (Desktop) | |
| NVIDIA Titan X Pascal | |
| AMD Radeon RX 5700 XT (Desktop) | |
| 2560x1440 Epic Preset | |
| NVIDIA Titan RTX | |
| NVIDIA GeForce RTX 2080 Super (Desktop) | |
| NVIDIA GeForce RTX 2080 Ti (Desktop) | |
| NVIDIA GeForce RTX 3090 | |
| NVIDIA Titan X Pascal | |
| AMD Radeon RX 5700 XT (Desktop) | |
| 1920x1080 Epic Preset | |
| NVIDIA Titan RTX | |
| NVIDIA GeForce RTX 2080 Super (Desktop) | |
| NVIDIA Titan X Pascal | |
| AMD Radeon RX 5700 XT (Desktop) | |
| NVIDIA GeForce RTX 2080 Ti (Desktop) | |
| NVIDIA GeForce RTX 3090 | |
| 1920x1080 High Preset | |
| NVIDIA Titan RTX | |
| NVIDIA GeForce RTX 2080 Super (Desktop) | |
| NVIDIA Titan X Pascal | |
| AMD Radeon RX 5700 XT (Desktop) | |
| NVIDIA GeForce RTX 2080 Ti (Desktop) | |
| NVIDIA GeForce RTX 3090 | |
| Red Dead Redemption 2 | |
| 3840x2160 Maximum Settings | |
| NVIDIA GeForce RTX 3090 | |
| NVIDIA GeForce RTX 2080 Ti (Desktop) | |
| NVIDIA Titan RTX | |
| NVIDIA GeForce RTX 2080 Super (Desktop) | |
| AMD Radeon RX 5700 XT (Desktop) | |
| NVIDIA Titan X Pascal | |
| 2560x1440 Maximum Settings | |
| NVIDIA GeForce RTX 3090 | |
| NVIDIA Titan RTX | |
| NVIDIA GeForce RTX 2080 Ti (Desktop) | |
| NVIDIA GeForce RTX 2080 Super (Desktop) | |
| AMD Radeon RX 5700 XT (Desktop) | |
| NVIDIA Titan X Pascal | |
| 1920x1080 Maximum Settings | |
| NVIDIA GeForce RTX 3090 | |
| NVIDIA Titan RTX | |
| NVIDIA GeForce RTX 2080 Ti (Desktop) | |
| NVIDIA GeForce RTX 2080 Super (Desktop) | |
| AMD Radeon RX 5700 XT (Desktop) | |
| NVIDIA Titan X Pascal | |
| 1920x1080 High Settings | |
| NVIDIA GeForce RTX 3090 | |
| NVIDIA Titan RTX | |
| NVIDIA GeForce RTX 2080 Ti (Desktop) | |
| NVIDIA GeForce RTX 2080 Super (Desktop) | |
| AMD Radeon RX 5700 XT (Desktop) | |
| NVIDIA Titan X Pascal | |
| GTA V | |
| 3840x2160 High/On (Advanced Graphics Off) AA:FX AF:8x | |
| NVIDIA GeForce RTX 3090 | |
| NVIDIA Titan RTX | |
| NVIDIA Titan X Pascal | |
| 3840x2160 Highest AA:4xMSAA + FX AF:16x | |
| NVIDIA GeForce RTX 3090 | |
| 2560x1440 Highest AA:4xMSAA + FX AF:16x | |
| NVIDIA GeForce RTX 3090 | |
| 1920x1080 Highest AA:4xMSAA + FX AF:16x | |
| NVIDIA Titan RTX | |
| NVIDIA Titan X Pascal | |
| NVIDIA GeForce RTX 3090 | |
| 1920x1080 High/On (Advanced Graphics Off) AA:2xMSAA + FX AF:8x | |
| NVIDIA GeForce RTX 3090 | |
| NVIDIA Titan RTX | |
| NVIDIA Titan X Pascal | |
| Metro Exodus | |
| 1920x1080 Ultra Quality DXR AF:16x | |
| NVIDIA Titan RTX | |
| NVIDIA GeForce RTX 3090 | |
| NVIDIA Titan RTX | |
| NVIDIA GeForce RTX 2080 Ti (Desktop) | |
| 3840x2160 Ultra Quality AF:16x | |
| NVIDIA GeForce RTX 3090 | |
| NVIDIA Titan RTX | |
| NVIDIA Titan RTX | |
| NVIDIA GeForce RTX 2080 Ti (Desktop) | |
| 2560x1440 Ultra Quality AF:16x | |
| NVIDIA GeForce RTX 3090 | |
| NVIDIA Titan RTX | |
| NVIDIA Titan RTX | |
| NVIDIA GeForce RTX 2080 Ti (Desktop) | |
| 1920x1080 Ultra Quality AF:16x | |
| NVIDIA GeForce RTX 3090 | |
| NVIDIA Titan RTX | |
| NVIDIA Titan RTX | |
| NVIDIA GeForce RTX 2080 Ti (Desktop) | |
| 1920x1080 High Quality AF:16x | |
| NVIDIA GeForce RTX 3090 | |
| NVIDIA Titan RTX | |
| NVIDIA Titan RTX | |
| NVIDIA GeForce RTX 2080 Ti (Desktop) | |
| Forza Horizon 4 | |
| 3840x2160 Ultra Preset AA:2xMS | |
| NVIDIA GeForce RTX 3090 | |
| NVIDIA Titan RTX | |
| NVIDIA Titan RTX | |
| NVIDIA GeForce RTX 2080 Ti (Desktop) | |
| NVIDIA Titan RTX | |
| NVIDIA Titan X Pascal | |
| 2560x1440 Ultra Preset AA:2xMS | |
| NVIDIA GeForce RTX 3090 | |
| NVIDIA Titan RTX | |
| NVIDIA Titan RTX | |
| NVIDIA GeForce RTX 2080 Ti (Desktop) | |
| 1920x1080 Ultra Preset AA:2xMS | |
| NVIDIA Titan RTX | |
| NVIDIA GeForce RTX 2080 Ti (Desktop) | |
| NVIDIA GeForce RTX 3090 | |
| NVIDIA Titan RTX | |
| AMD Radeon RX 5700 XT (Desktop) | |
| NVIDIA Titan RTX | |
| NVIDIA Titan X Pascal | |
| 1920x1080 High Preset AA:2xMS | |
| NVIDIA Titan RTX | |
| NVIDIA GeForce RTX 2080 Ti (Desktop) | |
| NVIDIA GeForce RTX 3090 | |
| NVIDIA Titan RTX | |
| NVIDIA Titan RTX | |
| NVIDIA Titan X Pascal | |
| Control | |
| 1920x1080 High Quality Preset & High Ray Tracing Preset (DX12) | |
| NVIDIA GeForce RTX 3090 | |
| NVIDIA GeForce RTX 2080 Ti (Desktop) | |
| NVIDIA GeForce RTX 2080 Super (Desktop) | |
| NVIDIA Titan X Pascal | |
| 3840x2160 High Quality Preset | |
| NVIDIA GeForce RTX 3090 | |
| NVIDIA GeForce RTX 2080 Ti (Desktop) | |
| NVIDIA GeForce RTX 2080 Super (Desktop) | |
| AMD Radeon RX 5700 XT (Desktop) | |
| NVIDIA Titan X Pascal | |
| 2560x1440 High Quality Preset | |
| NVIDIA GeForce RTX 3090 | |
| NVIDIA GeForce RTX 2080 Ti (Desktop) | |
| NVIDIA GeForce RTX 2080 Super (Desktop) | |
| NVIDIA Titan X Pascal | |
| AMD Radeon RX 5700 XT (Desktop) | |
| 1920x1080 High Quality Preset | |
| NVIDIA GeForce RTX 3090 | |
| NVIDIA GeForce RTX 2080 Ti (Desktop) | |
| NVIDIA GeForce RTX 2080 Super (Desktop) | |
| AMD Radeon RX 5700 XT (Desktop) | |
| NVIDIA Titan X Pascal | |
| bajo | medio | alto | ultra | QHD | 4K | |
|---|---|---|---|---|---|---|
| GTA V (2015) | 165 | 104 | 99.3 | 152 | ||
| Far Cry 5 (2018) | 139 | 129 | 121 | 120 | 101 | |
| Shadow of the Tomb Raider (2018) | 148 | 148 | 145 | 137 | 89.3 | |
| Forza Horizon 4 (2018) | 175 | 175 | 166 | 164 | 147 | |
| Assassin´s Creed Odyssey (2018) | 138 | 121 | 92 | 82 | 65 | |
| Hitman 2 (2018) | 102 | 93.6 | 95.1 | 91.4 | 91.2 | |
| Battlefield V (2018) | 184 | 188 | 187 | 178 | 130 | |
| Far Cry New Dawn (2019) | 122 | 115 | 104 | 102 | 92 | |
| Metro Exodus (2019) | 139 | 123 | 108 | 102 | 71.7 | |
| Dirt Rally 2.0 (2019) | 171 | 166 | 150 | 137 | 93 | |
| The Division 2 (2019) | 183 | 157 | 140 | 120 | 71.9 | |
| Anno 1800 (2019) | 116 | 87.7 | 51.5 | 53 | 53.2 | |
| Total War: Three Kingdoms (2019) | 172.7 | 135.5 | 123.5 | 100 | 51.4 | |
| Control (2019) | 223 | 174 | 118 | 61.8 | ||
| Borderlands 3 (2019) | 134 | 124 | 117 | 109 | 71.5 | |
| GRID 2019 (2019) | 178 | 116 | 129 | 106 | 91.2 | |
| Call of Duty Modern Warfare 2019 (2019) | 177 | 169 | 169 | 149 | 96.4 | |
| Star Wars Jedi Fallen Order (2019) | 104 | 100 | 97.4 | 101 | 87.1 | |
| Red Dead Redemption 2 (2019) | 152 | 143 | 110 | 91.9 | 61.9 | |
| Doom Eternal (2020) | 393 | 330 | 282 | 271 | 182 | |
| Gears Tactics (2020) | 206.4 | 144.9 | 123 | 121.8 | 74.5 | |
| F1 2020 (2020) | 248 | 245 | 227 | 204 | 133 | |
| Death Stranding (2020) | 184 | 178 | 173 | 107 | 164 | |
| Horizon Zero Dawn (2020) | 158 | 147 | 138 | 126 | 82 |
Juego 8K
Aunque los juegos de 4K aún no se han generalizado, NVIDIA ya está lanzando la RTX 3090 como una tarjeta que puede jugar hábilmente a 8K. No sólo se puede jugar en 8K, sino que el RTX 3090 también puede capturar simultáneamente 8K 30 fps de vídeo para su reproducción o difusión. Las GPU Ampere vienen con un decodificador de hardware para el nuevo códec AV1, lo que debería ayudar a codificar/decodificar más eficientemente los flujos de 8K que utilizan menos ancho de banda localmente o en medios sociales como YouTube. Tenga en cuenta que sólo hay un puñado de televisores de 8K disponibles actualmente, y también necesitaría un cable HDMI 2.1 que pueda manejar todo el ancho de banda.
NVIDIA recomienda un Intel Core i9-9900K, 64 GB DDR4-3200 RAM, un NVMe SSD, y una PSU de 850 W, 80 Plus Gold como la especificación mínima requerida para jugar juegos en 8K usando el RTX 3090. En cuanto a la televisión, los modelos actualmente soportados incluyen las series LG Nano099, Nano098, Nano097 y Nano095, las series Samsung Q900T y Q800T (las actualizaciones de firmware se realizarán próximamente), y la Sony Master Series Z9H.
Nuestra configuración utiliza un televisor OnePlus 55U1 4K HDR. Para probar cómo le iría al RTX 3090 en pruebas de 8K, utilizamos la función de súper resolución dinámica (DSR) de NVIDIA para permitir el procesamiento de 8K en la GPU. Se considera que la resolución 8K por defecto es 7680x4320 en la relación de aspecto 16:9, que arroja 33,18 millones de píxeles. Sin embargo, el OnePlus 55U1 ofrecía una resolución de 8192x4320 en una relación de aspecto de 256:135, que rinde alrededor de 35,39 millones de píxeles.
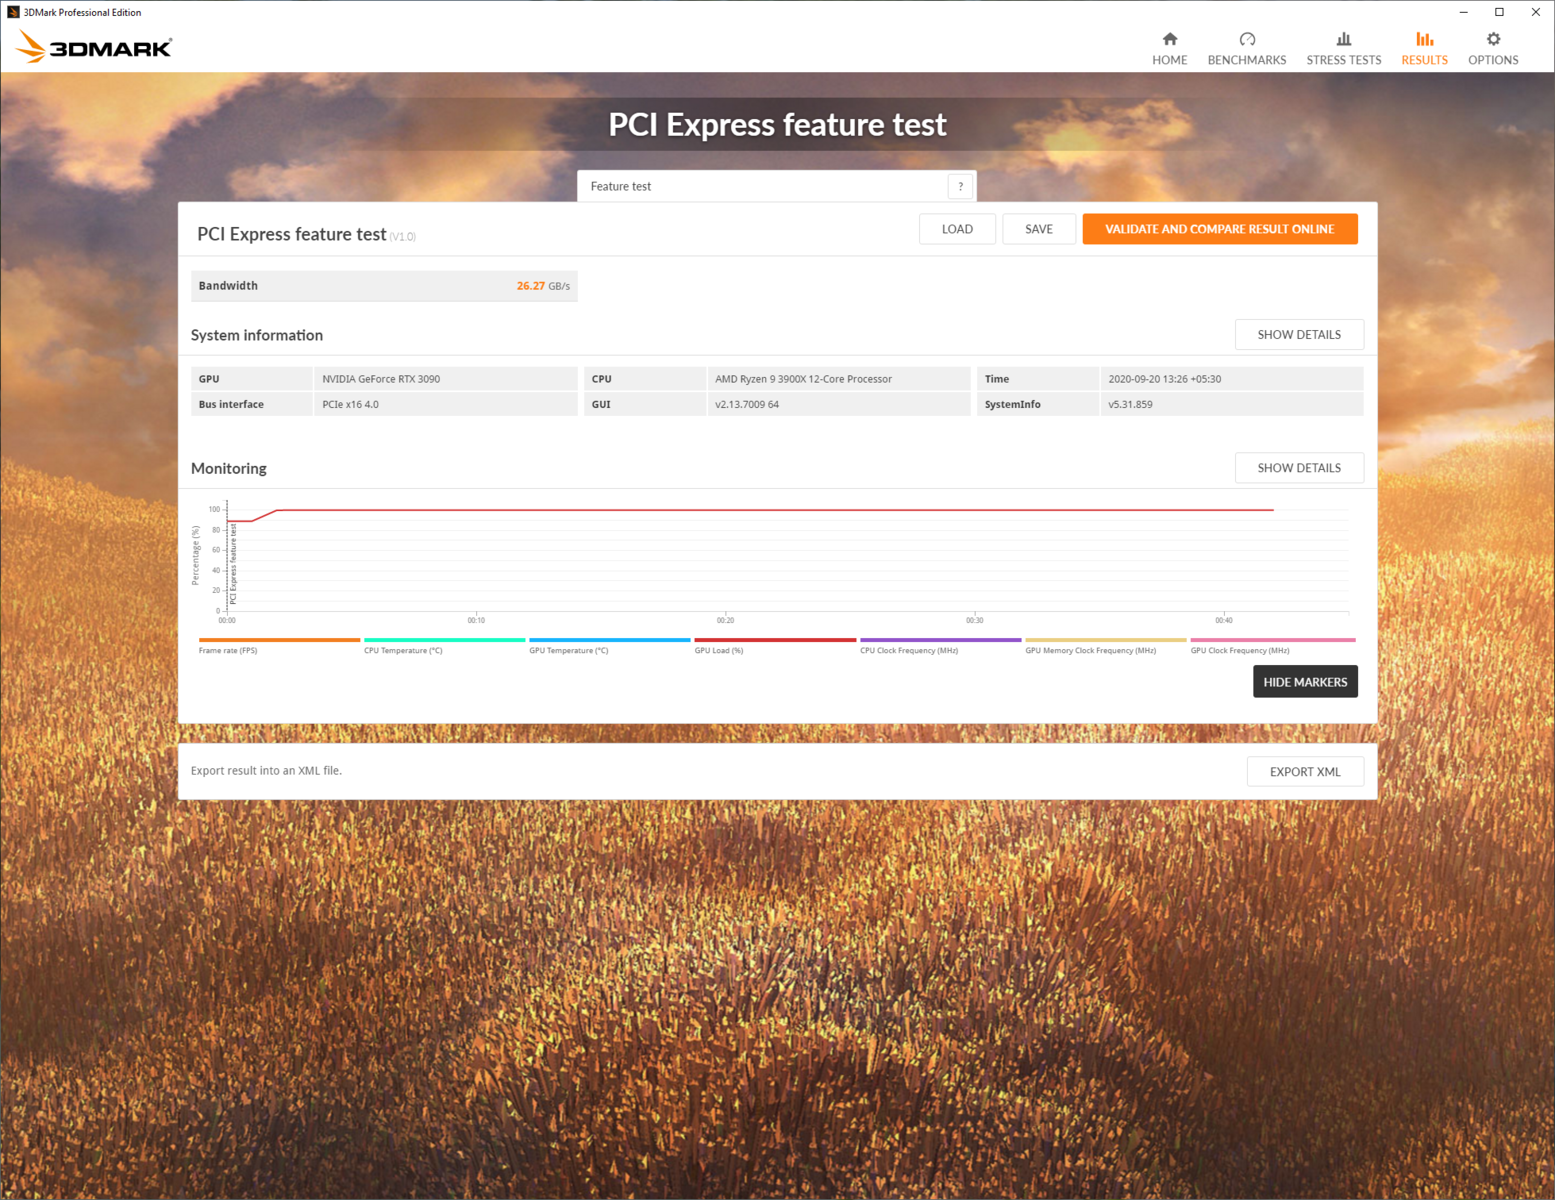
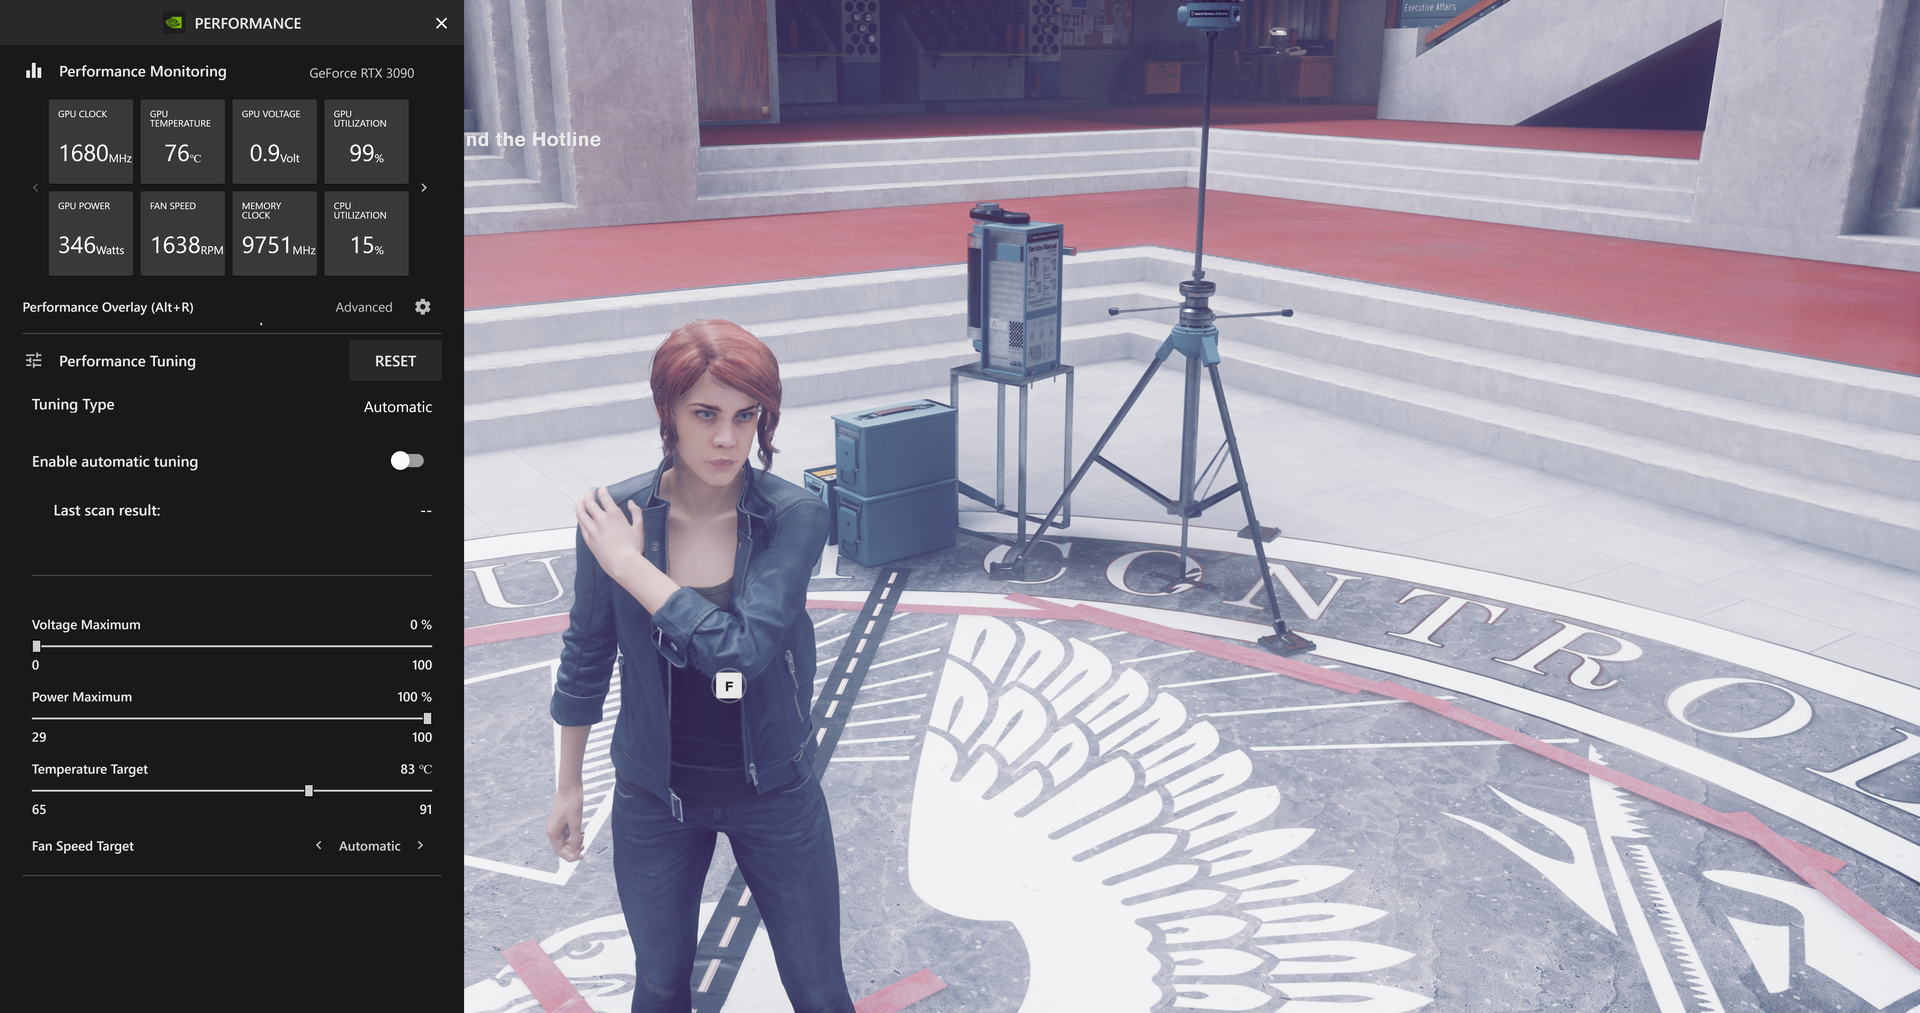
El juego se grabó con el último software NVIDIA ShadowPlay que viene con GeForce Experience Beta v3.20.5. La última versión Beta de GeForce Experience también añade nuevas herramientas de monitorización del rendimiento y de ajuste de la GPU, lo que prácticamente anula la necesidad de utilizar software de terceros para el overclocking.
Esencialmente, estamos superando 2,21 millones de píxeles más que las especificaciones. El Zotac RTX 3090 Trinity podría navegar a través de la mayoría de las pruebas sin tanto problema como se puede ver a continuación.
Aunque no todos los juegos serán capaces de rendir nativamente a 8K sin estrés. NVIDIA está impulsando la DLSS 2.0 como medio para lograr un juego estable a 8K 30 o, a veces, incluso a 8K 60 fps. Pronto hablaremos más sobre DLSS 2.0 en un artículo dedicado. En resumen, DLSS renderiza la escena en la GPU a una resolución más baja, pero utiliza la IA para subirla de nivel sin pérdida de calidad notable a la resolución nativa de la pantalla.
Se nos proporcionó un acceso beta privado para Control, Death Stranding y Wolfenstein: Youngblood que permiten usar el nuevo modo DLSS 2.0 Ultra Performance. Doom Eternal y Forza Horizon 4 se ejecutaron con resoluciones nativas de 8K (DSR), ya que aún no cuentan con compatibilidad con DLSS. Una cosa que nos gustaría destacar aquí es que, aunque NVIDIA recomendó que se habilitara el modo HDR, tuvimos problemas para habilitar el modo HDR en Windows en el OnePlus 55U1. Por lo tanto, el juego se grabó con el HDR desactivado.
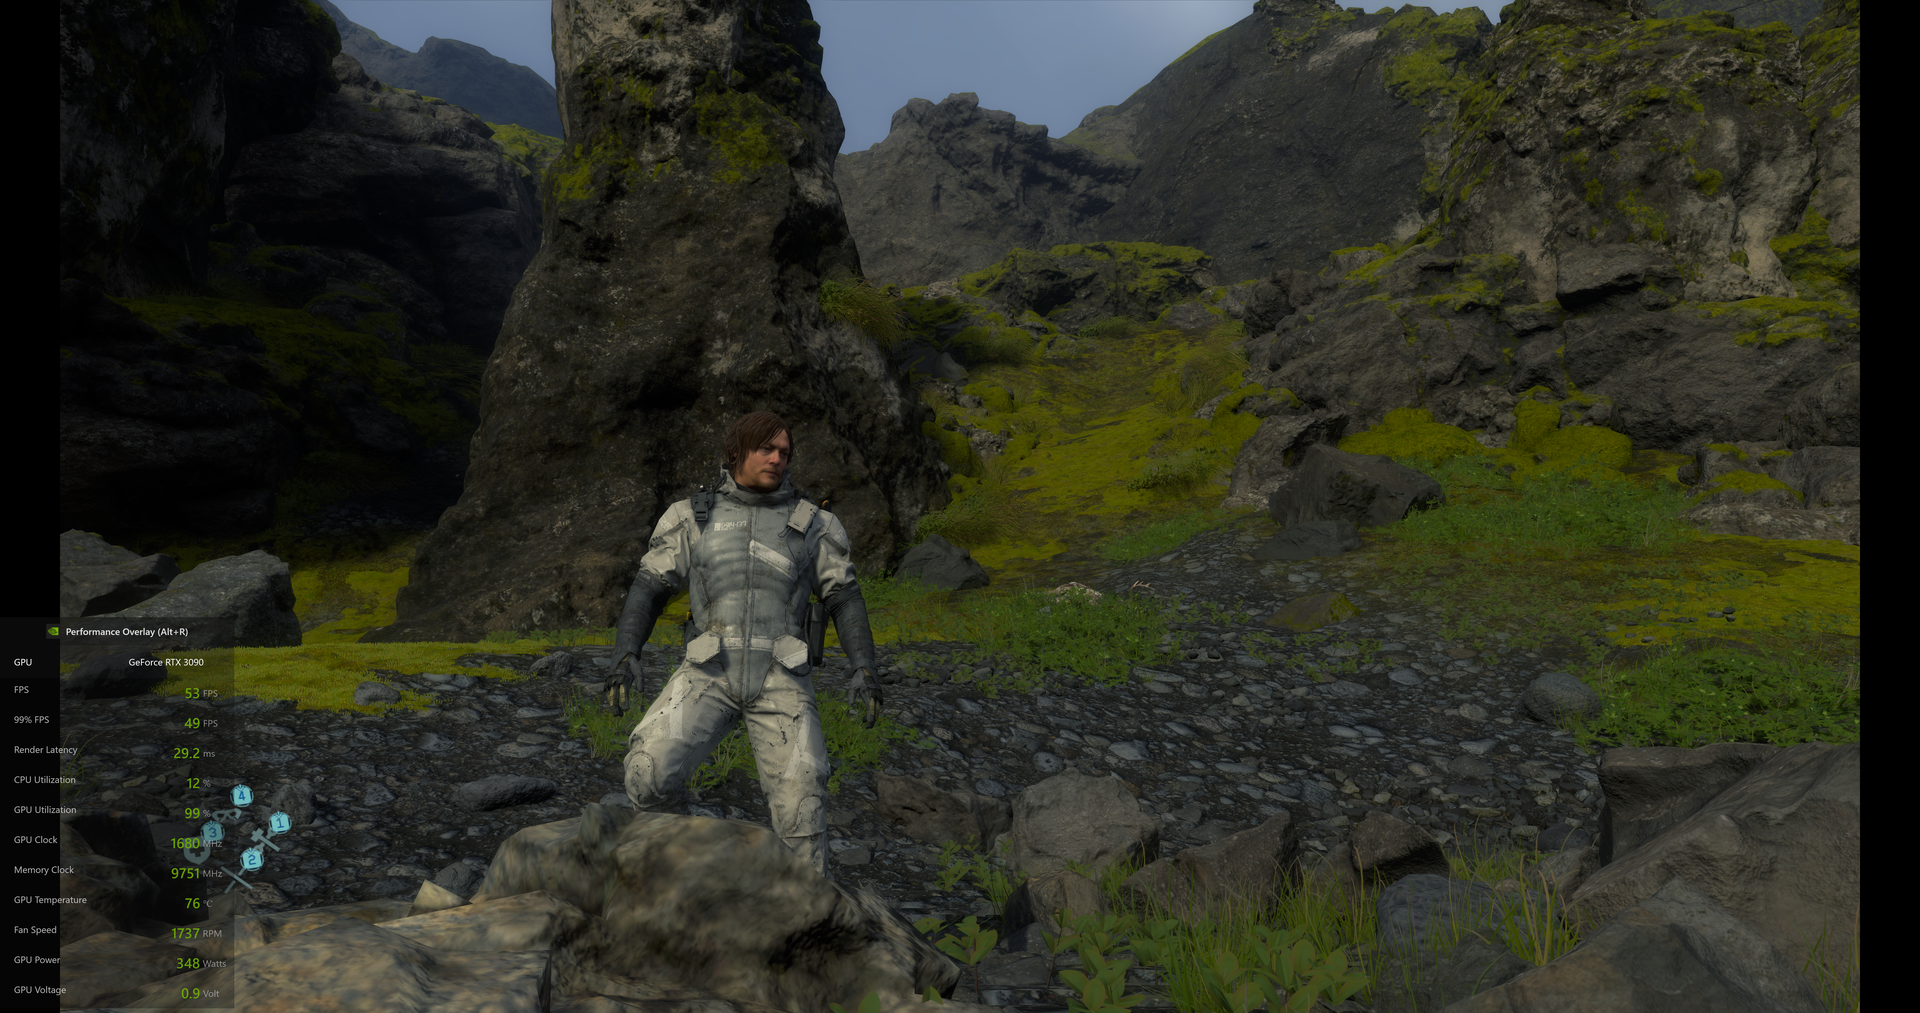
Control 8K con DLSS y RTX activado
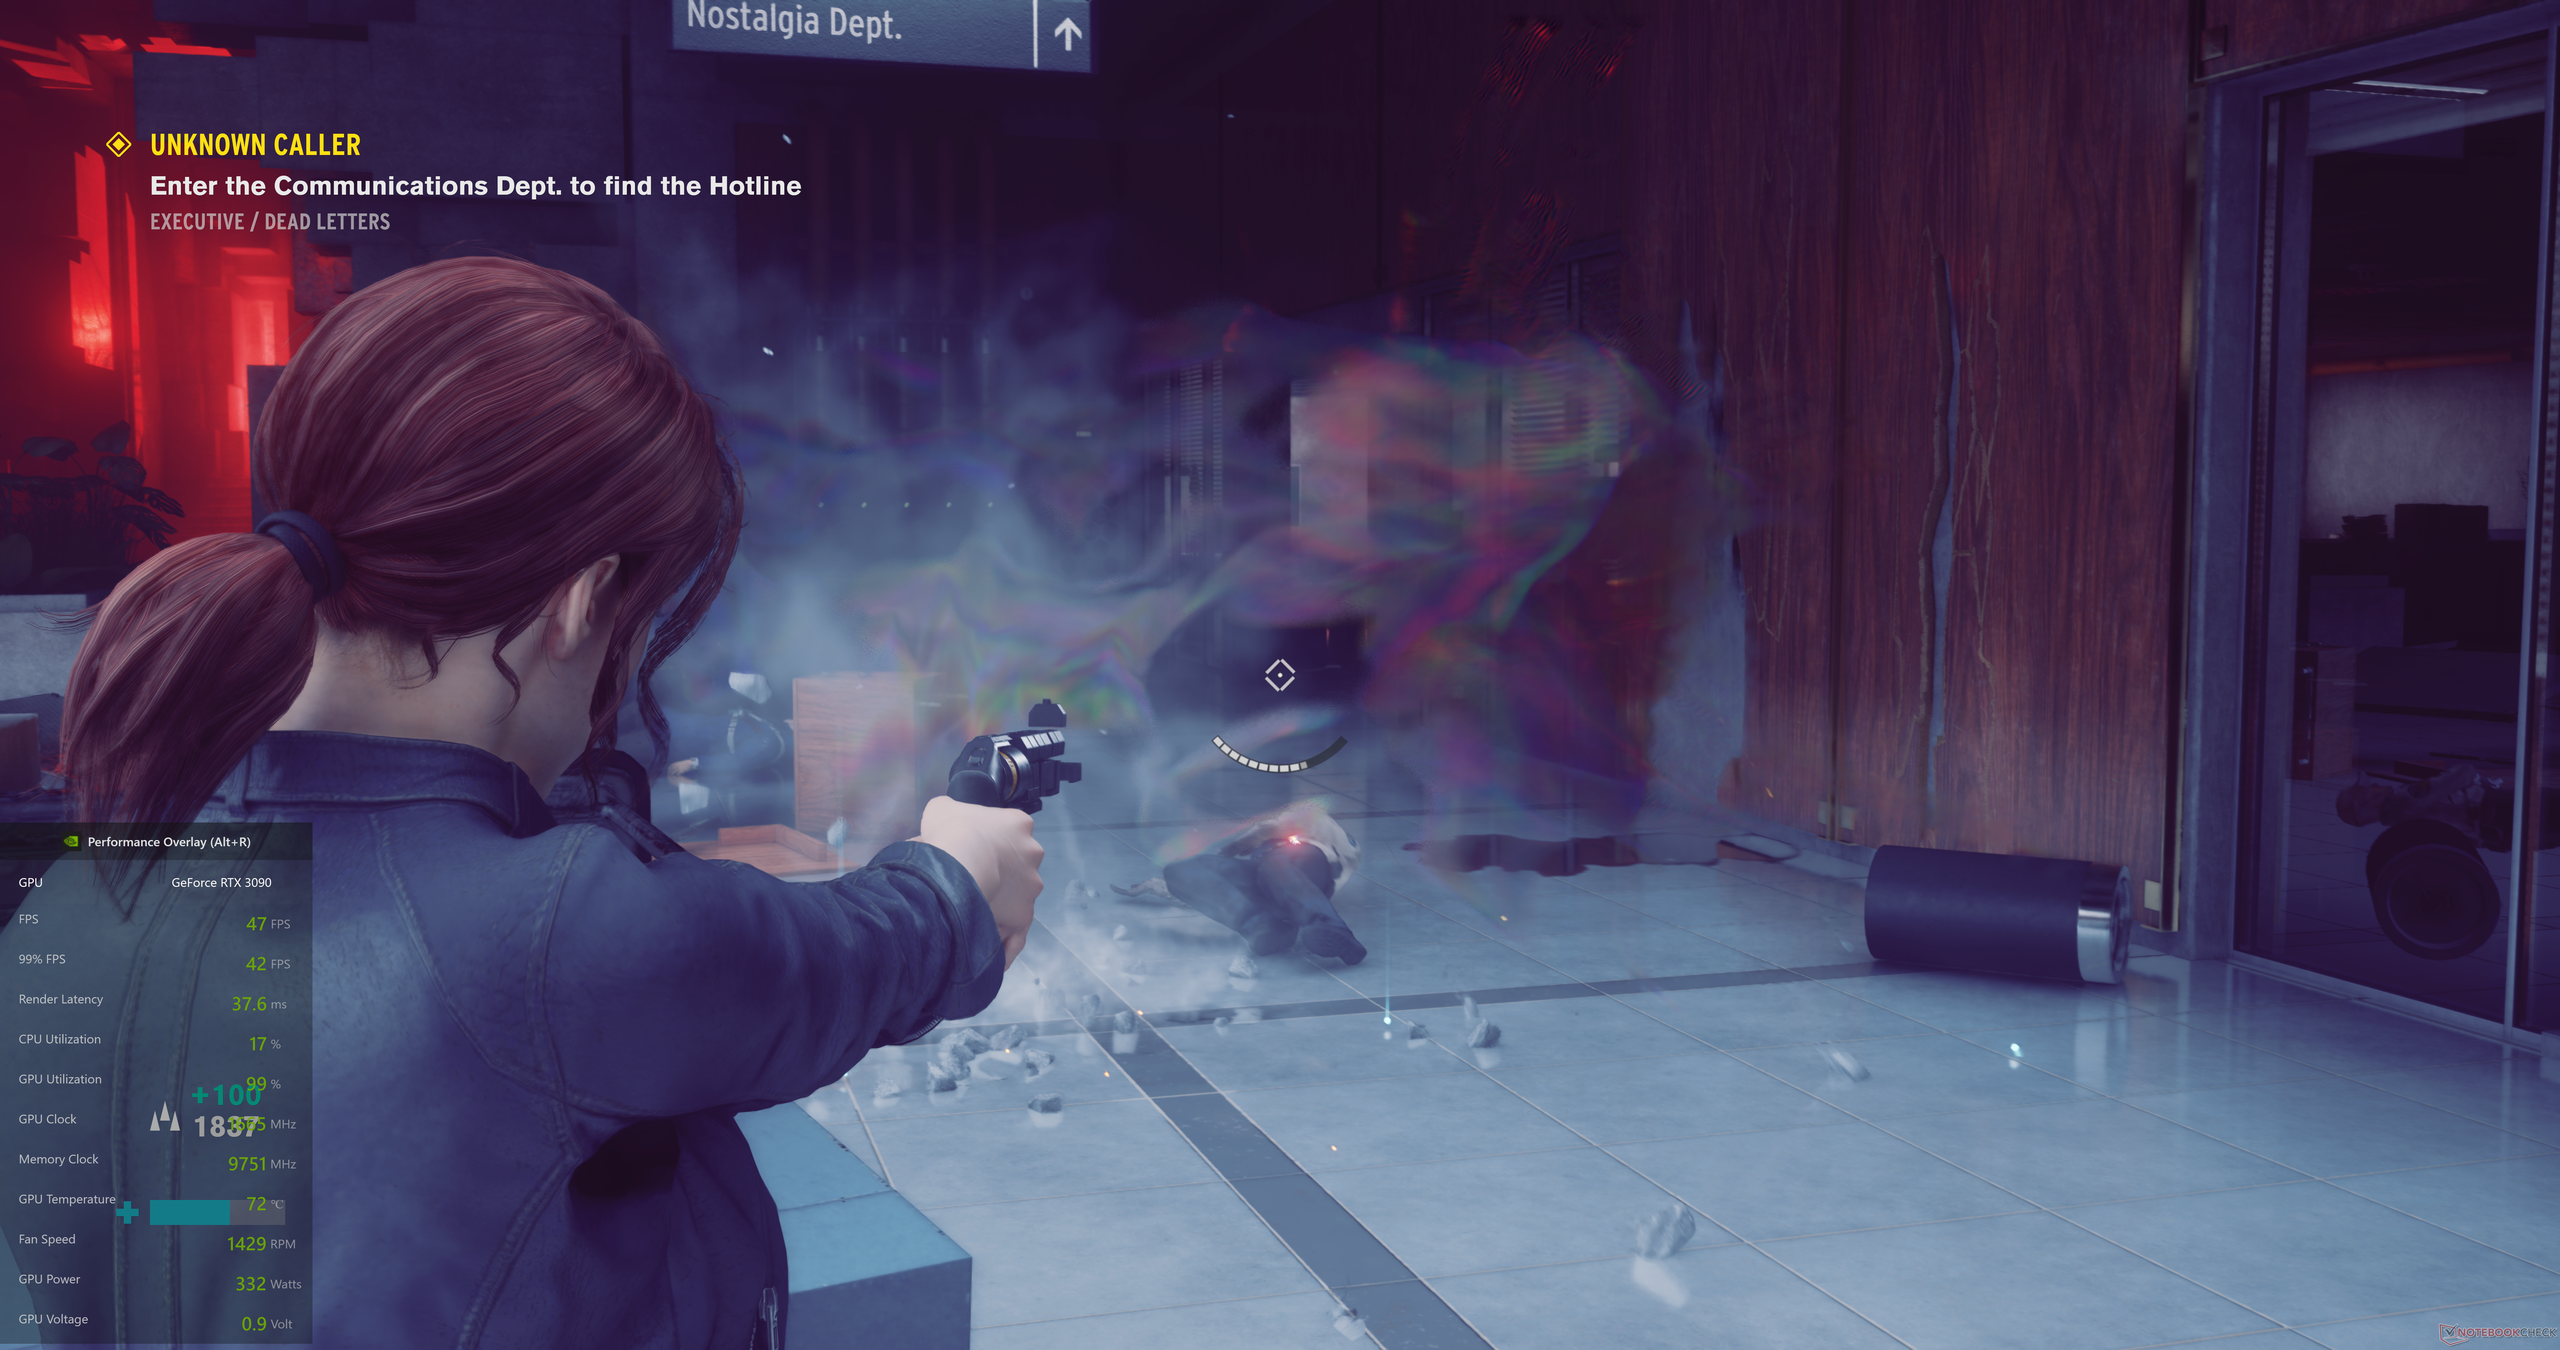
Control ha sido un fuerte defensor de las características de RTX y DLSS en la generación de Turing y con Ampere esas características han recibido un disparo en el brazo. Probamos a Control con una resolución de 8K usando una resolución de 1440p con DLSS habilitado y el preajuste de Ray Tracing en High. El juego fue grabado usando la última versión beta de ShadowPlay a 8K 30 fps con una tasa de bits de 100 Mbps.
Un problema que observamos con la actual versión beta de ShadowPlay es que no graba la nueva superposición de rendimiento de la Experiencia GeForce junto con el vídeo. Por lo tanto, tuvimos que usar una alternativa como el contador de FPS en la barra de juegos de Xbox para mostrar las estadísticas del sistema. Sin embargo, tomamos capturas de pantalla para dar una idea de los parámetros de la GPU durante el juego.
Como podéis ver a continuación, el modelo de personaje es extremadamente detallado a 8K y fuimos capaces de conseguir cerca de 50 fps con mucha acción en la escena. El procesamiento es definitivamente intensivo en potencia y el RTX 3090 casi alcanza su límite de potencia de 350 W durante la carrera. También observamos un uso de VRAM de unos 13 GB. Echa un vistazo al video del juego a continuación.
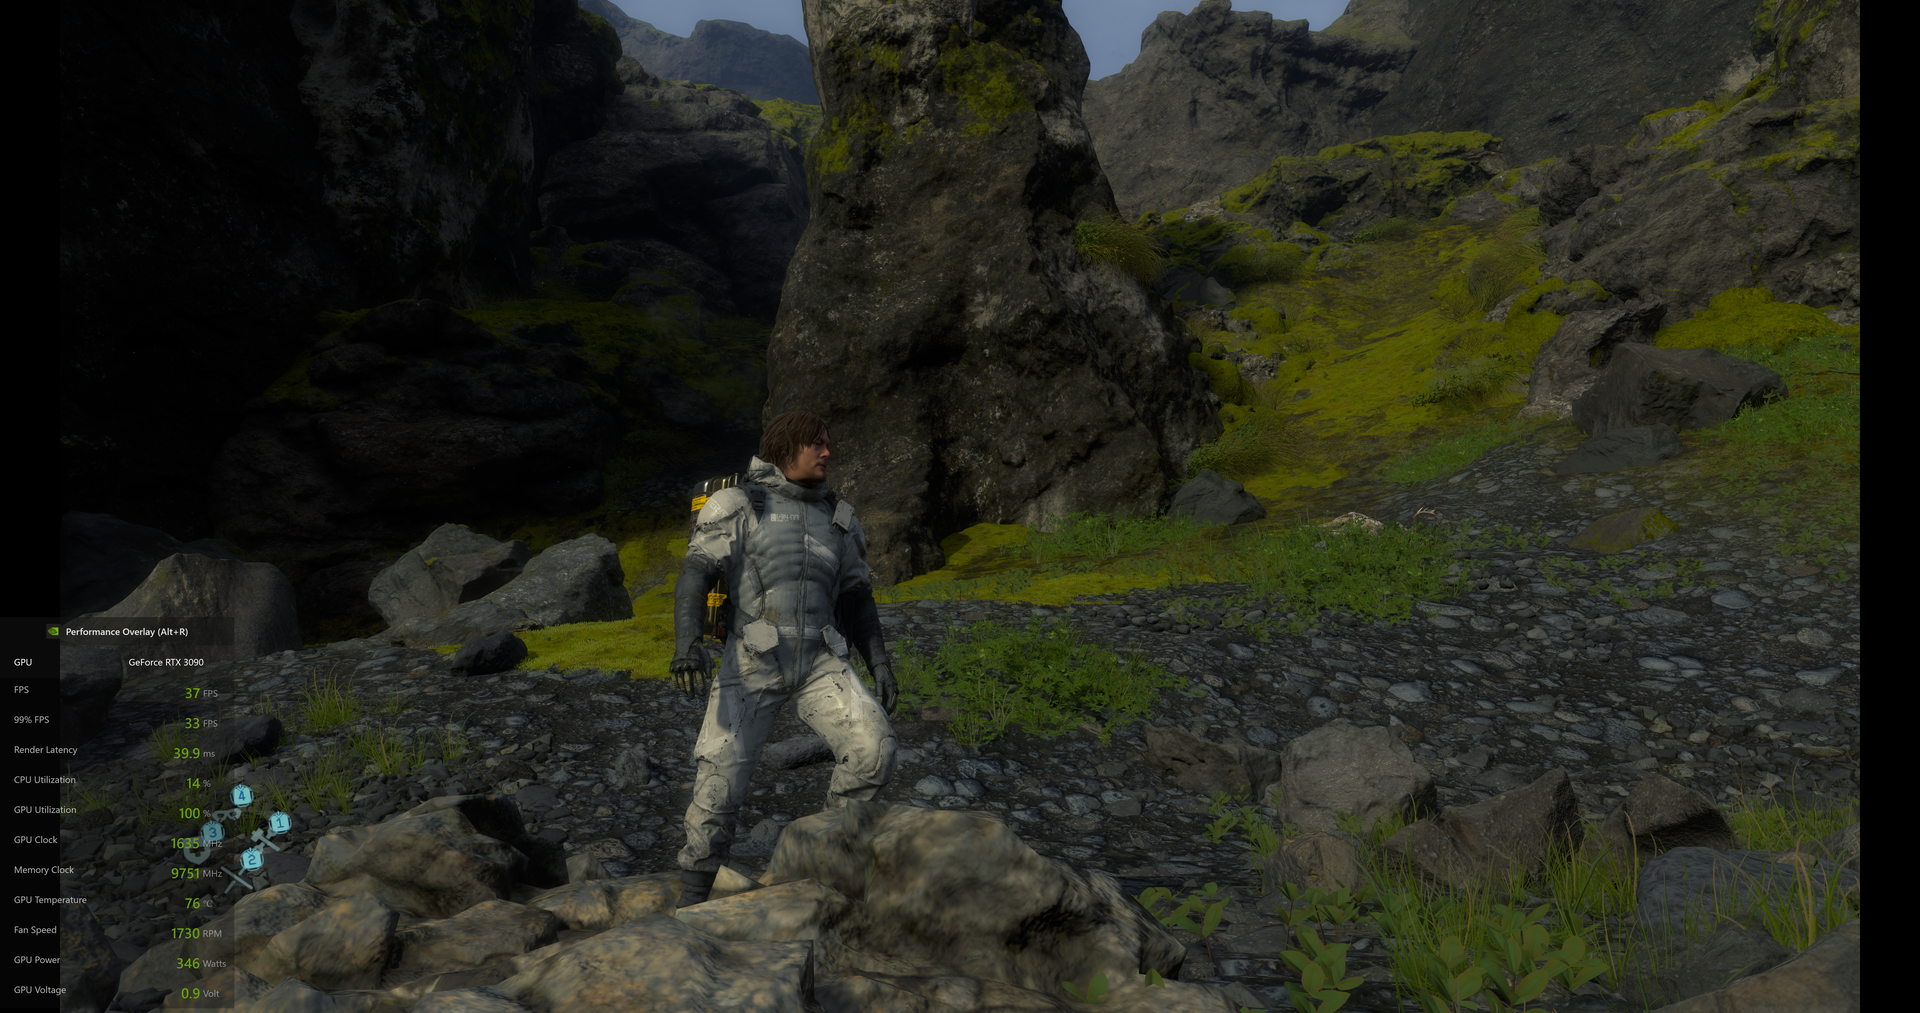
Death Stranding 8K con DLSS
Death Stranding se beneficia mucho de la DLSS y se ve preciosa en 8K. Sin la DLSS encendida, podríamos alcanzar unos 37 fps en 8K DSR. Ese valor sube a unos maravillosos 70 fps cuando DLSS está activado en el modo de Ultra Rendimiento. Nos dimos cuenta de que algunas de las texturas rocosas tenían una superficie insípida. Inicialmente pensamos que esto era un problema de DLSS, pero lo mismo se vio en 4K nativo sin DLSS también. El video del juego está incrustado abajo. Tengan en cuenta que la banda sonora ha sido silenciada para evitar posibles reclamaciones de derechos de autor.
Wolfenstein: Youngblood 4K nativo con DLSS y RTX activado
Wolfenstein: Youngblood introduced support for RTX features back during CES this year. We tried running the game at 8K DSR, but it didn't allow us to bump the resolution beyond 4K. Nevertheless, we could achieve up to 200 fps at native 4K with RTX and DLSS Ultra Performance mode enabled.
Doom Eterno nativo 8K DSR
Uno de los primeros juegos que NVIDIA mostró durante el lanzamiento de RTX 3080 fue Doom Eternal. Ya hemos visto en la comparación de juegos anterior cómo el RTX 3090 ofrece un excelente rendimiento en este juego a 4K Ultra Preset. Ejecutamos Doom Eternal a 8K DSR en el Ultra Preset con la escala de resolución desactivada y las estadísticas del sistema ajustadas a Ultra Nightmare. Aunque el juego logra alcanzar los 60 fps a veces, el punto dulce se encuentra entre 47 y 55 fps dependiendo de la acción de la escena.
Forza Horizon 4 8K DSR
Forza Horizon 4 ofrecía una experiencia de inmersión mientras se jugaba en escenarios de 8K de altura. Realizamos la prueba de referencia integrada y descubrimos que el RTX 3090 Trinity podía alcanzar una media de 64 fps, lo cual es realmente bueno. Incluso en los ajustes de High, los gráficos eran espectaculares y los detalles menores, como la forma del agua en el coche, la gente en las aceras, el follaje y otros elementos, tenían un nivel de detalle extremo.
Emisiones
Sólo pudimos hacer algunas pruebas limitadas de las temperaturas y de la potencia de la tarjeta y la mayoría de ellas fueron observaciones en el juego o en el cálculo de la carga de trabajo. A pesar de no usar el nuevo diseño de la nevera de la Edición Fundadores, la implementación de la IceStorm 2.0 de triple ventilador de Zotac ha sido muy buena hasta ahora. Los ventiladores se detienen completamente cuando están en reposo y comienzan a subir sólo después de unos 57 °C en el perfil de ventilador predeterminado. La tarjeta está configurada para acelerar térmicamente una vez que alcanza los 83 °C. Durante la mayor parte de nuestra evaluación comparativa, el RTX 3090 Trinity se mantuvo dentro de la marca de 80 °C incluso a plena carga. La GPU consume toda la potencia de 350 W, pero es una potencia bien gastada dadas sus capacidades. Esperamos seguir probando las capacidades térmicas y de overclocking del RTX 3090 en un futuro artículo.
Verdict

NVIDIA ha conseguido un gran éxito con el lanzamiento del Ampere, dado lo rápido que se agotó el primer lote de tarjetas a los pocos momentos de estar disponibles. Aunque la compañía está lanzando el RTX 3080 como la GPU de juegos insignia, el verdadero monstruo es el RTX 3090. Con una hoja de especificaciones que vale la pena babeando y un rendimiento que muestra buenas mejoras en general en comparación con el RTX Titan en las pruebas de sintéticos y juegos, el RTX 3090 parece convincente. ¿Pero es para todos?
Incluso según NVIDIA, el RTX 3090 está dirigido principalmente a creadores de contenidos exigentes que puedan hacer un buen uso de toda la VRAM de 24 GB disponible. Dicho esto, hemos encontrado cierta regresión en el rendimiento de las aplicaciones del sector según las mediciones de SPECviewperf. Si esa situación mejorará con los futuros impulsores es algo a lo que hay que prestar atención. NVIDIA aún no ha hecho oficial la línea de productos Quadro, pero el RTX 3090 seguramente parece ofrecer una alternativa decente y más barata por el momento si se siguen las tendencias de precios anteriores.
Los creadores que necesiten trabajar en activos de 8K encontrarán en la GeForce RTX 3090 de NVIDIA un excelente compañero. También lo serán aquellos a quienes les gusta que sus PCs produzcan el máximo número de cuadros posibles a 4K de altura o en configuraciones Ultra. Los jugadores habituales de la corriente principal están mejor servidos en otro lugar.
Parece que hemos alcanzado un techo de rendimiento con la mayoría de los motores de juego actuales. Nuestra revisión del RTX 3080 está en camino, pero algunos de los números ya publicados parecen sugerir que los jugadores están mejor servidos con el RTX 3080 cuando se trata de obtener un mejor rendimiento por dólar. Dicho esto, con el RTX 3090, se obtiene una tarjeta que puede hacer un buen juego de 8K sin mucho alboroto al mismo costo que un RTX 2080 Ti en el lanzamiento. Los jugadores que también deseen aumentar la velocidad de cuadro a 4K de altura o incluso la configuración Ultra pueden encontrar una inversión en el RTX 3090 que vale la pena el costo inicial. Los rumores recientes que apuntan a la probable disponibilidad de una versión de 20 GB del RTX 3080 indican que más VRAM es una especificación definitiva para las GPU en el futuro.
Nuestra unidad GeForce RTX 3090 Trinity para juegos de Zotac se comportó admirablemente en todas las pruebas, sin sudar un ápice. La refrigeración es excelente y los ventiladores no son demasiado ruidosos incluso bajo carga. Hay algunas cosas que Zotac puede rectificar, como ofrecer el conector de alimentación en un lugar más accesible y usar una placa de respaldo más resistente. Por lo demás, la tarjeta se ve muy bien y ahorra espacio en comparación con el diseño de 3 ranuras de la edición de los fundadores. Creemos que el Zotac RTX 3090 Trinity puede ser considerado como un buen prospecto si decides eventualmente morder la bala y obtener el RTX 3090.
Con todo, parece que NVIDIA ha puesto el listón muy alto una vez más con la GeForce RTX 3090. Los planes de AMD con el RDNA2 siguen siendo esquivos, excepto por un vistazo a una de las cartas de la semana pasada, y la compañía tendrá que sacar un conejo del sombrero mágico si tiene algún plan de tomar el RTX 3090 de frente.
Price comparison
