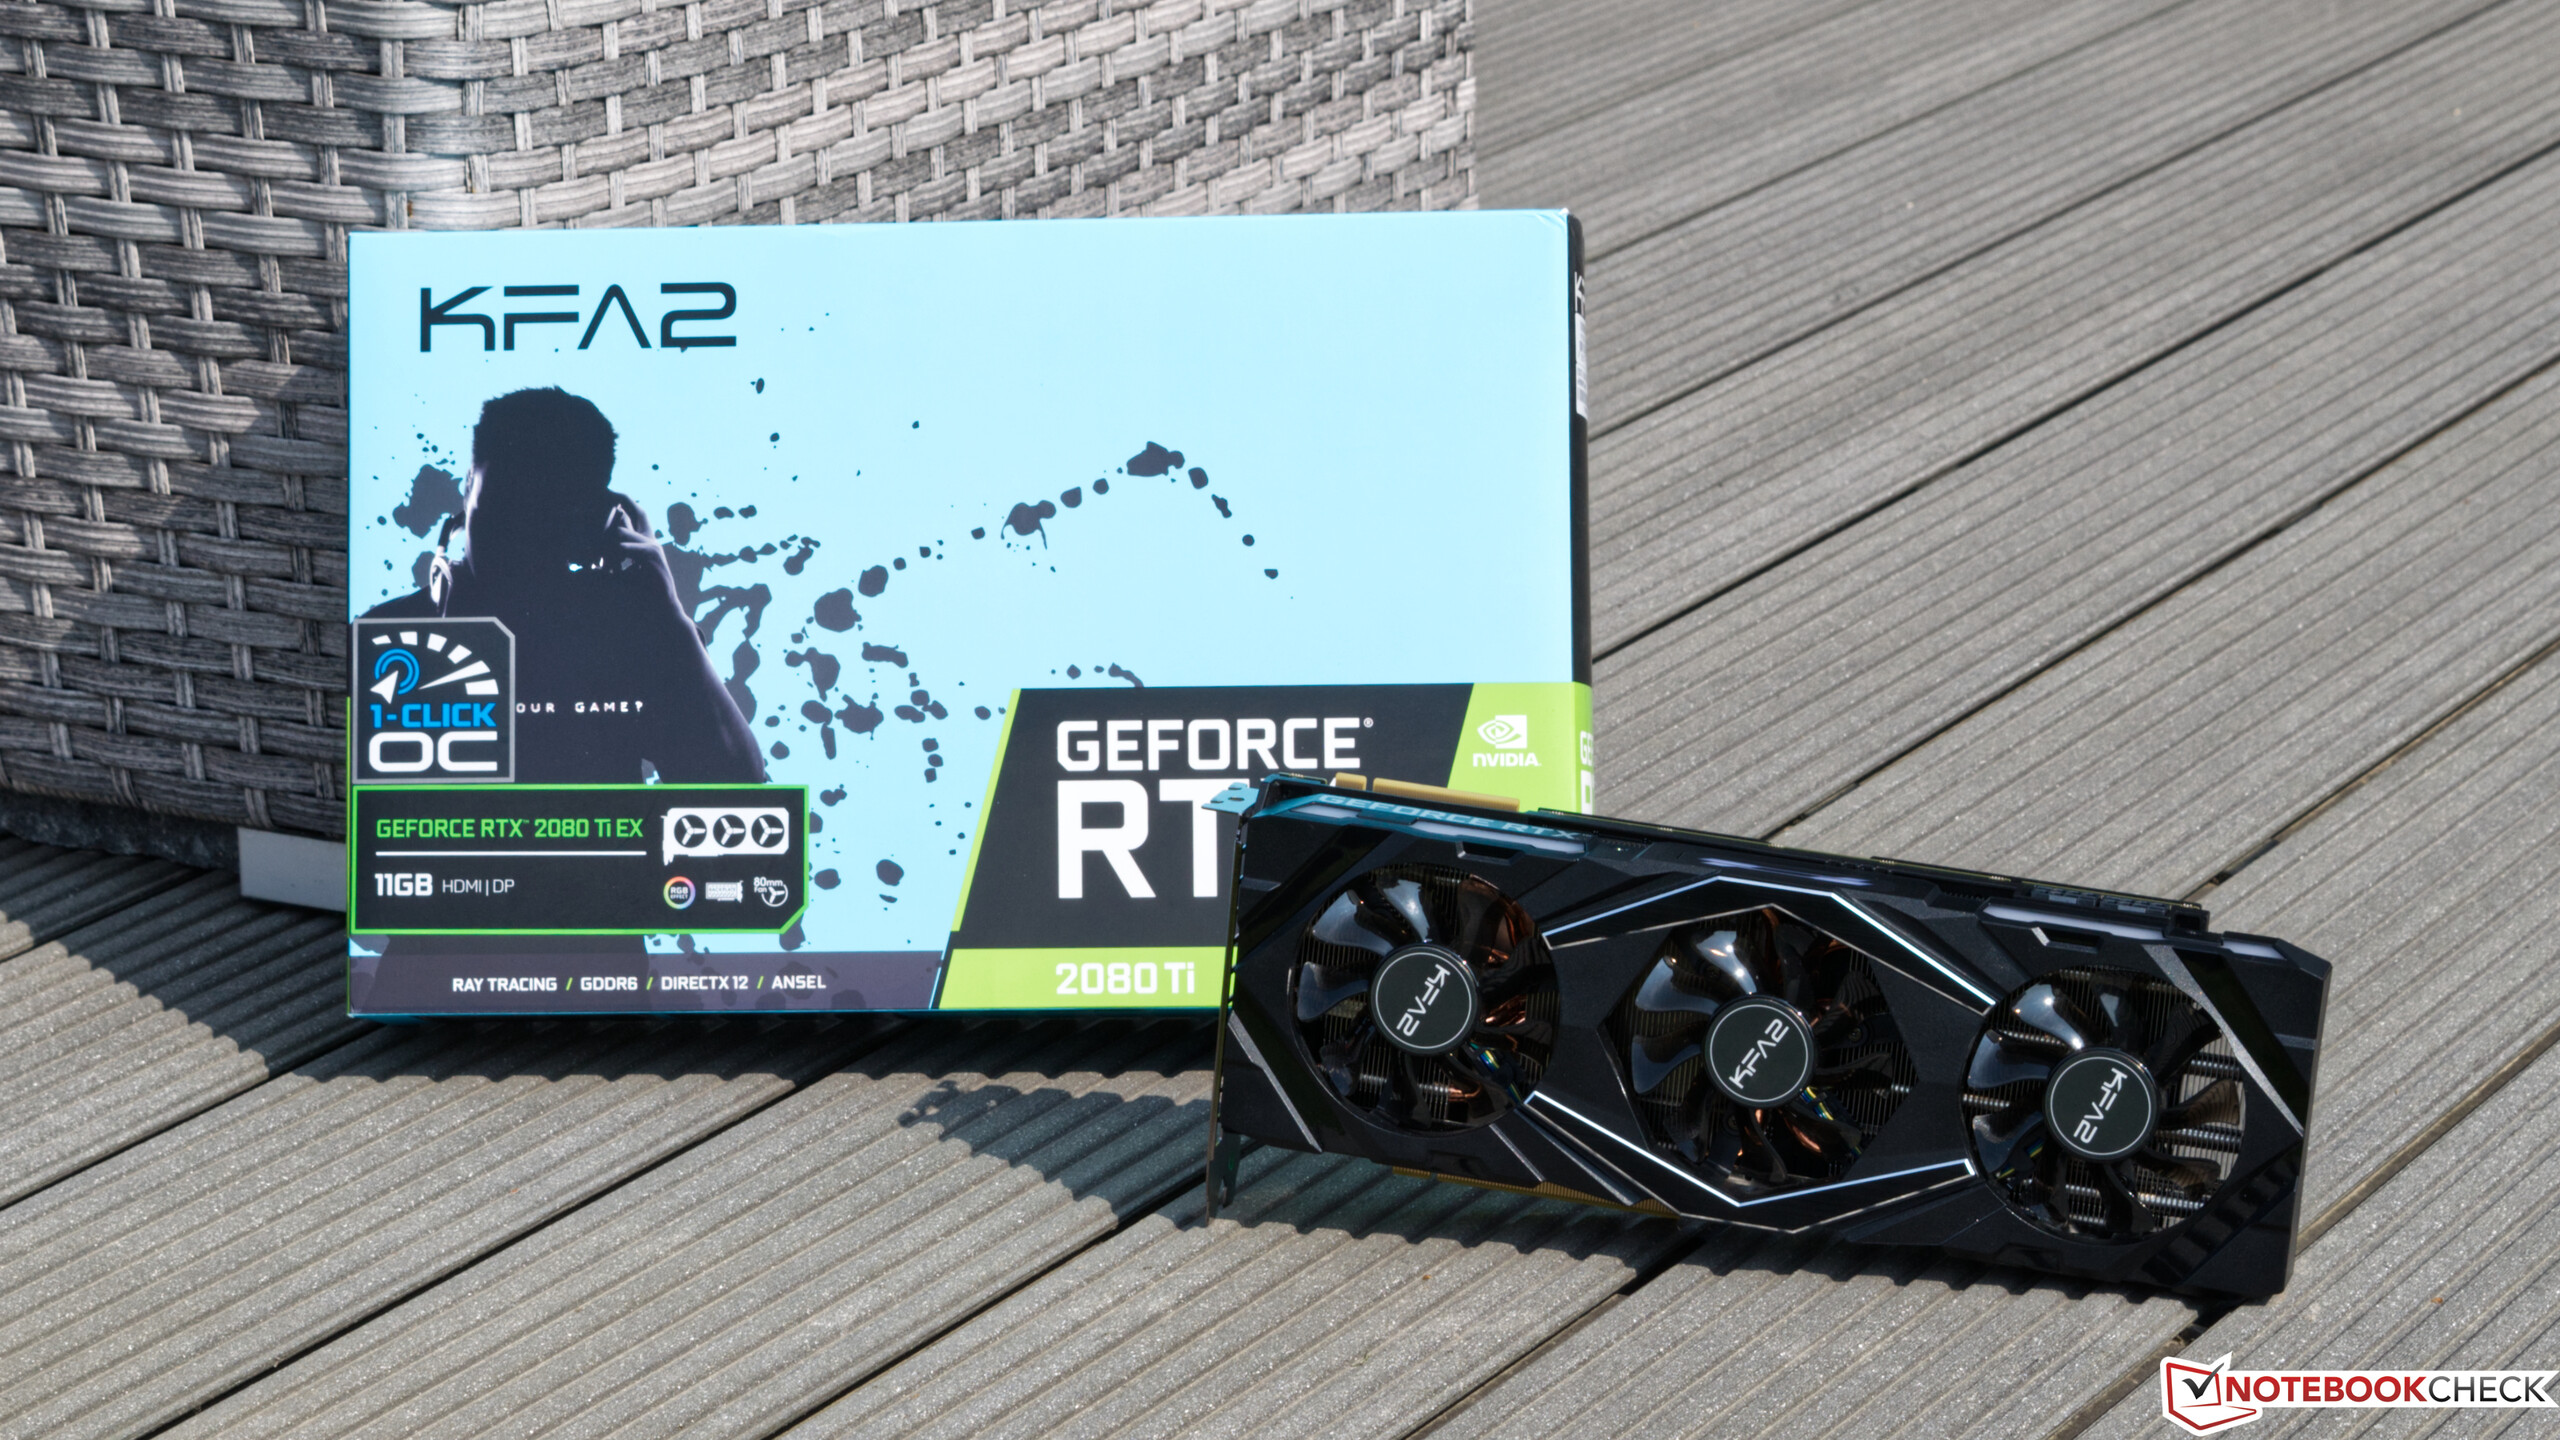
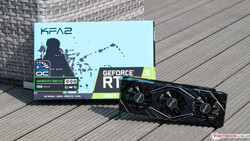
Review de KFA2 GeForce RTX 2080 Ti EX - GPU Nvidia de gama alta con una solución de refrigeración personalizada


Después de que Nvidia lanzara las tarjetas gráficas Super-brand, que de hecho eran sólo versiones ligeramente mejoradas de los modelos RTX 2060, RTX 2070 y RTX 2080, la GeForce RTX 2080 Ti sigue siendo la única GPU de gama alta de Nvidia que no se ha actualizado. Sin embargo, con 11 GB de VRAM, este modelo ofrece más memoria de vídeo que todos los demás modelos. Recientemente hemos revisado una GeForce RTX 2060 Super de KFA2 y ahora tenemos la oportunidad de echar un vistazo a la GeForce RTX 2080 Ti EX de KFA2.
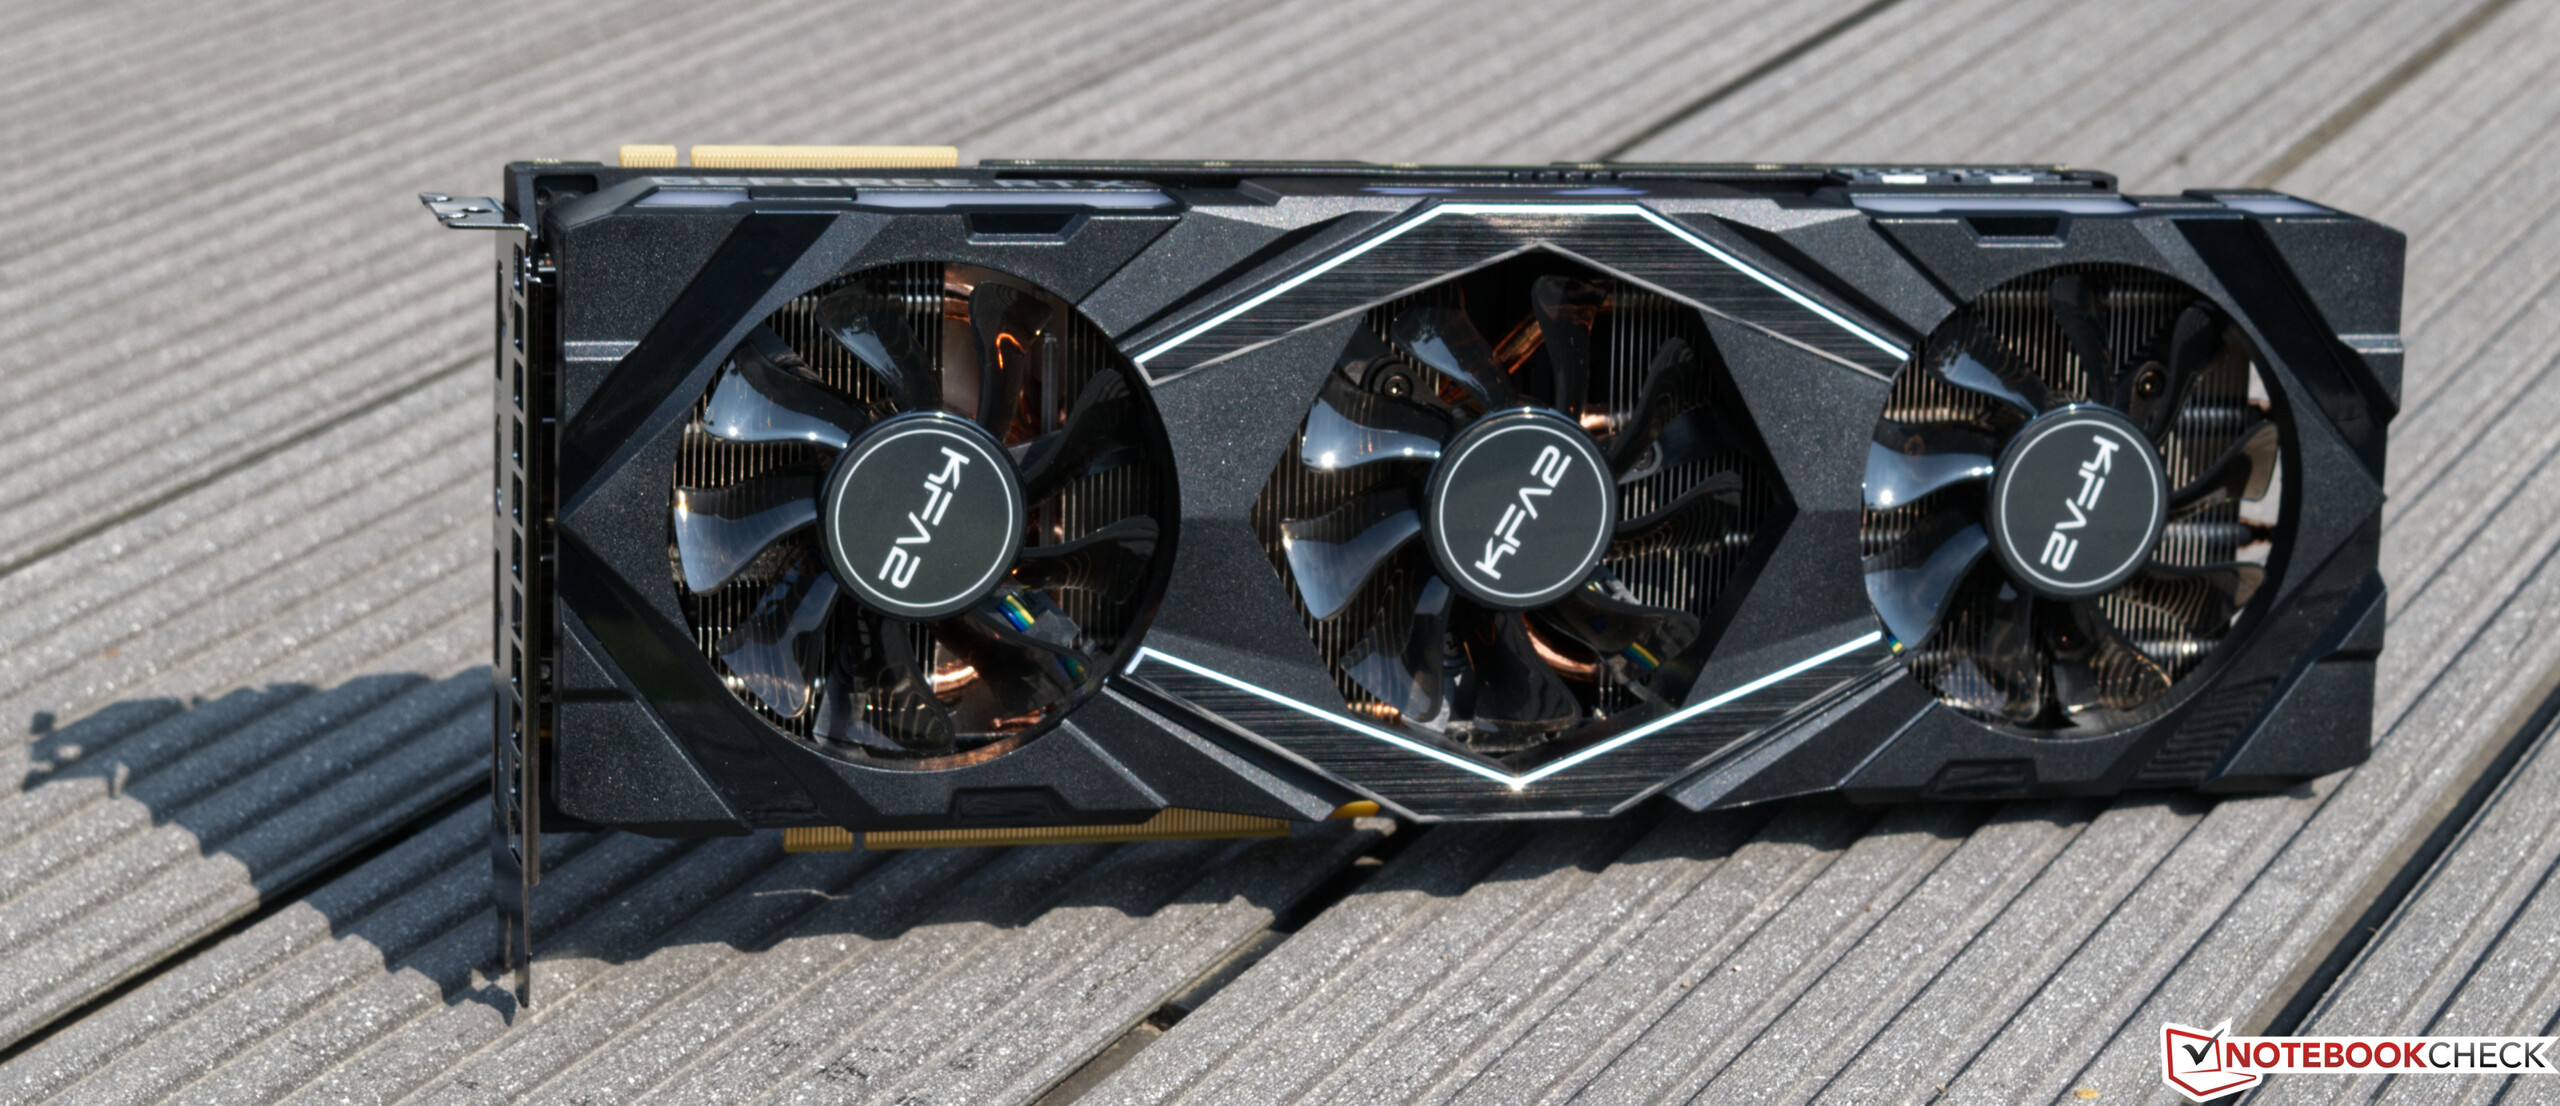
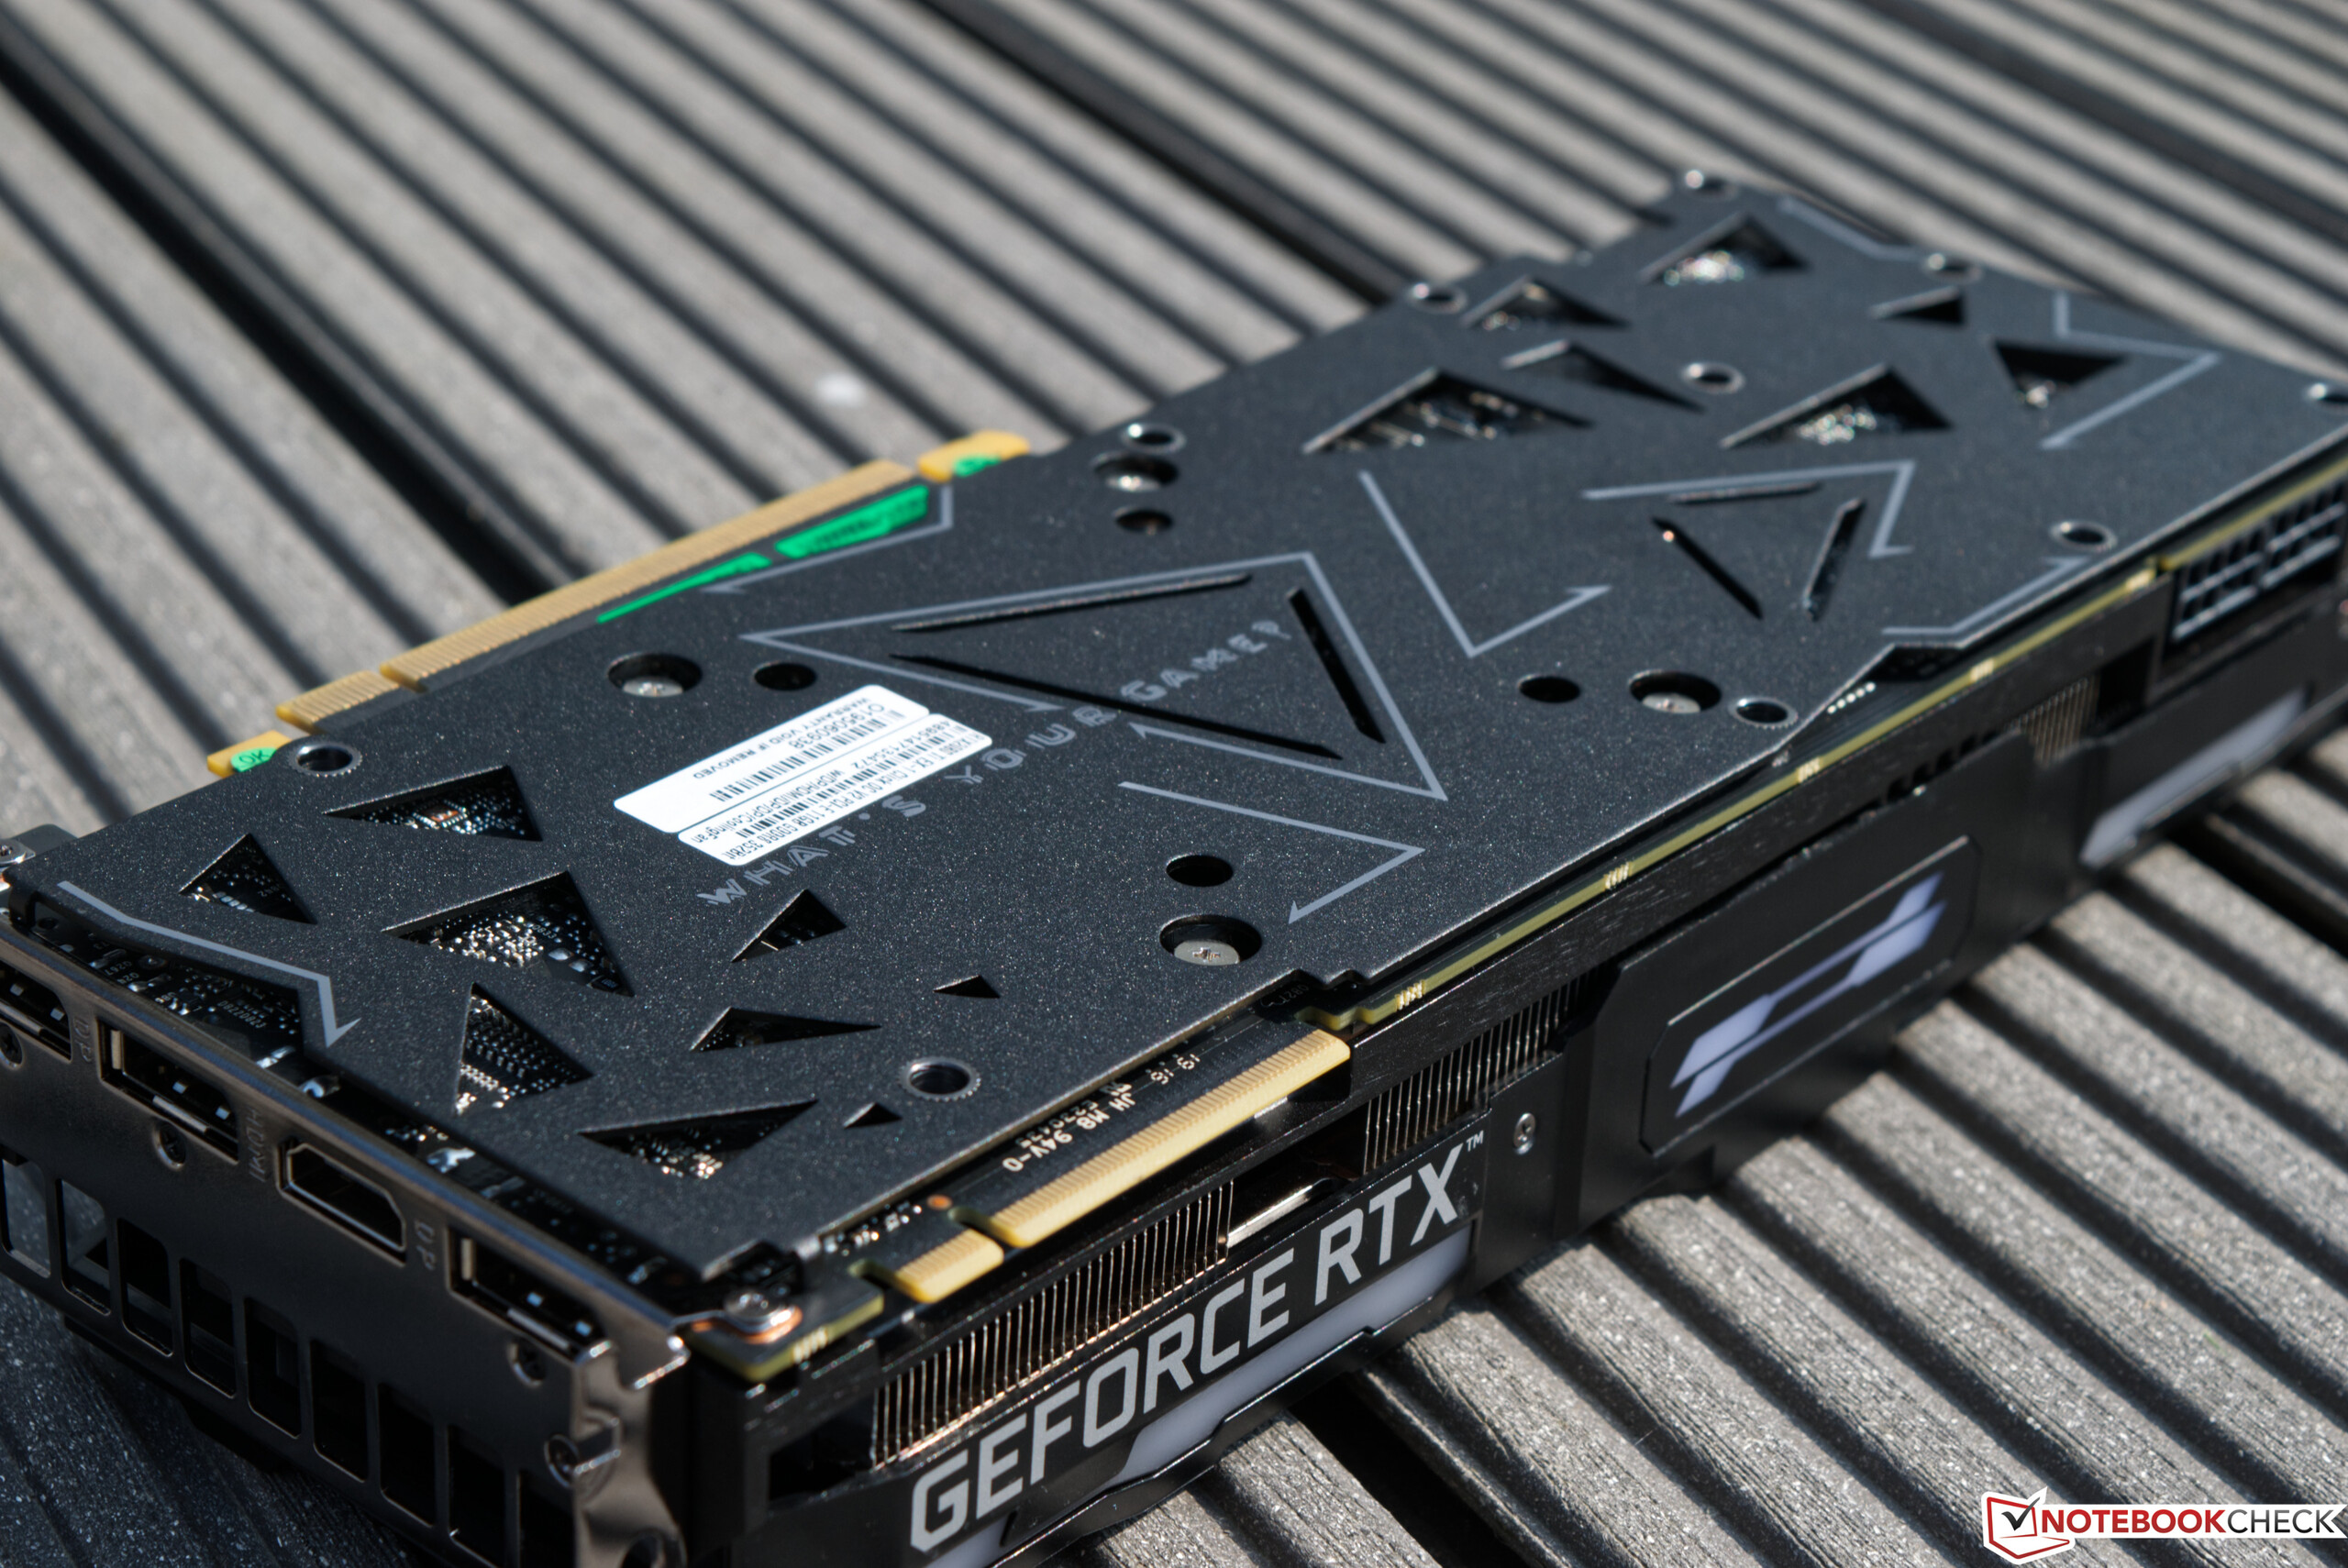
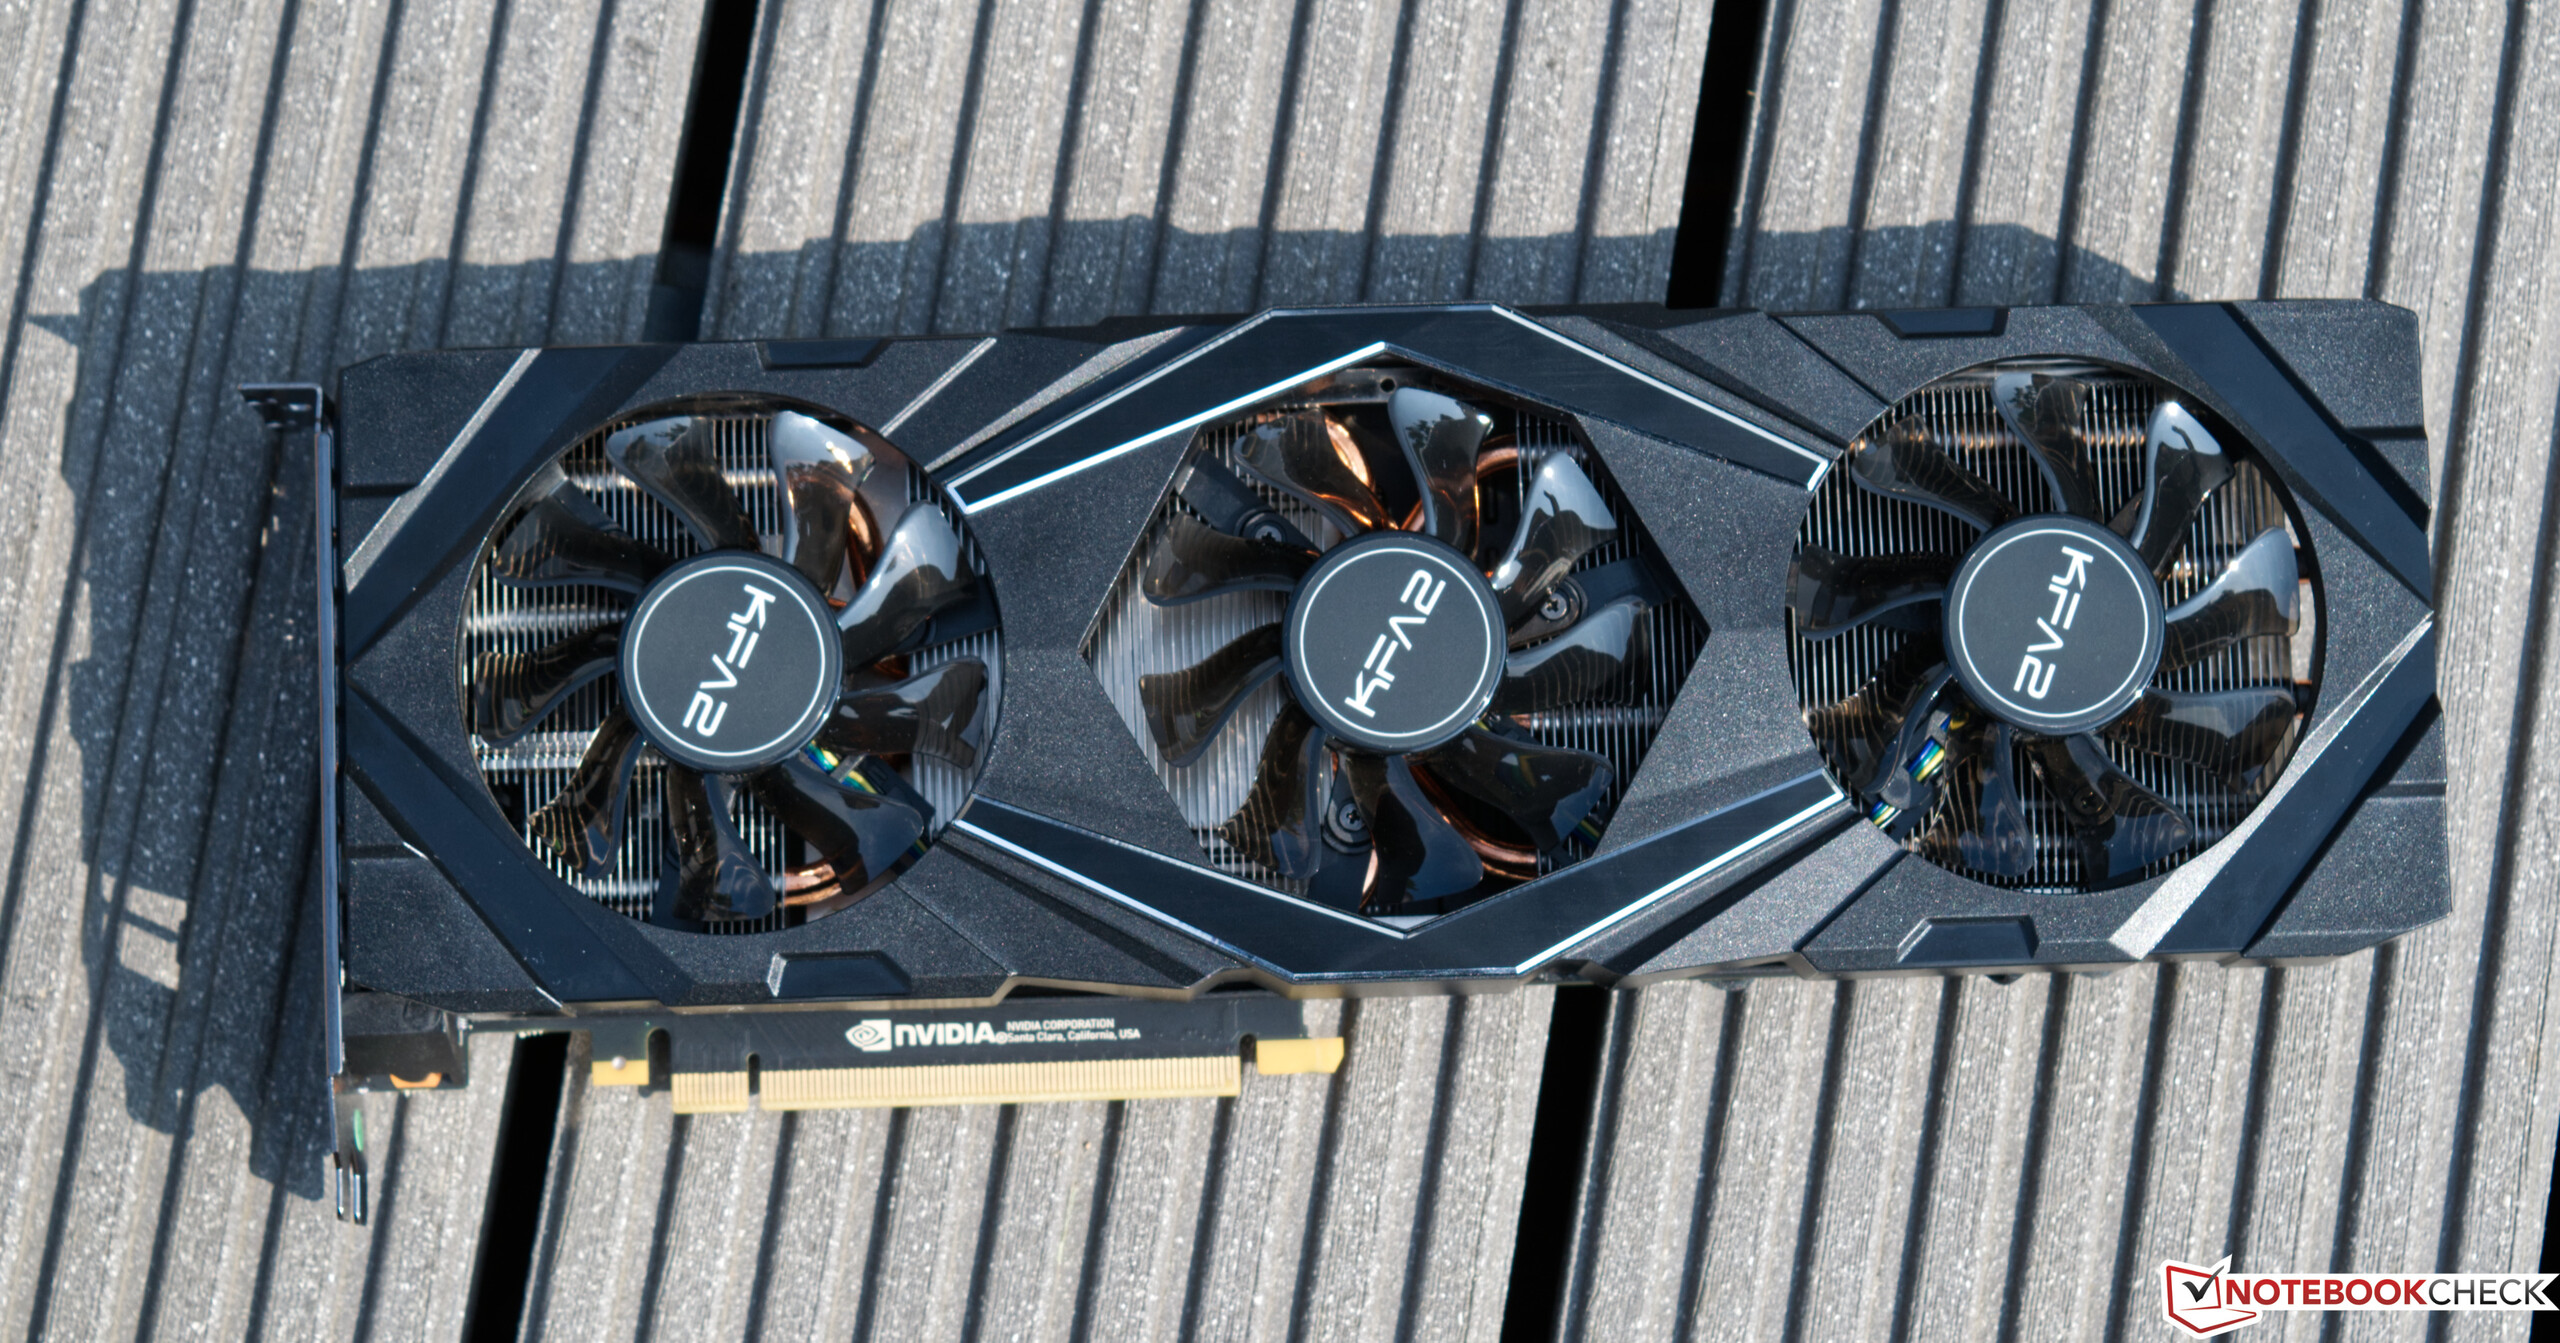
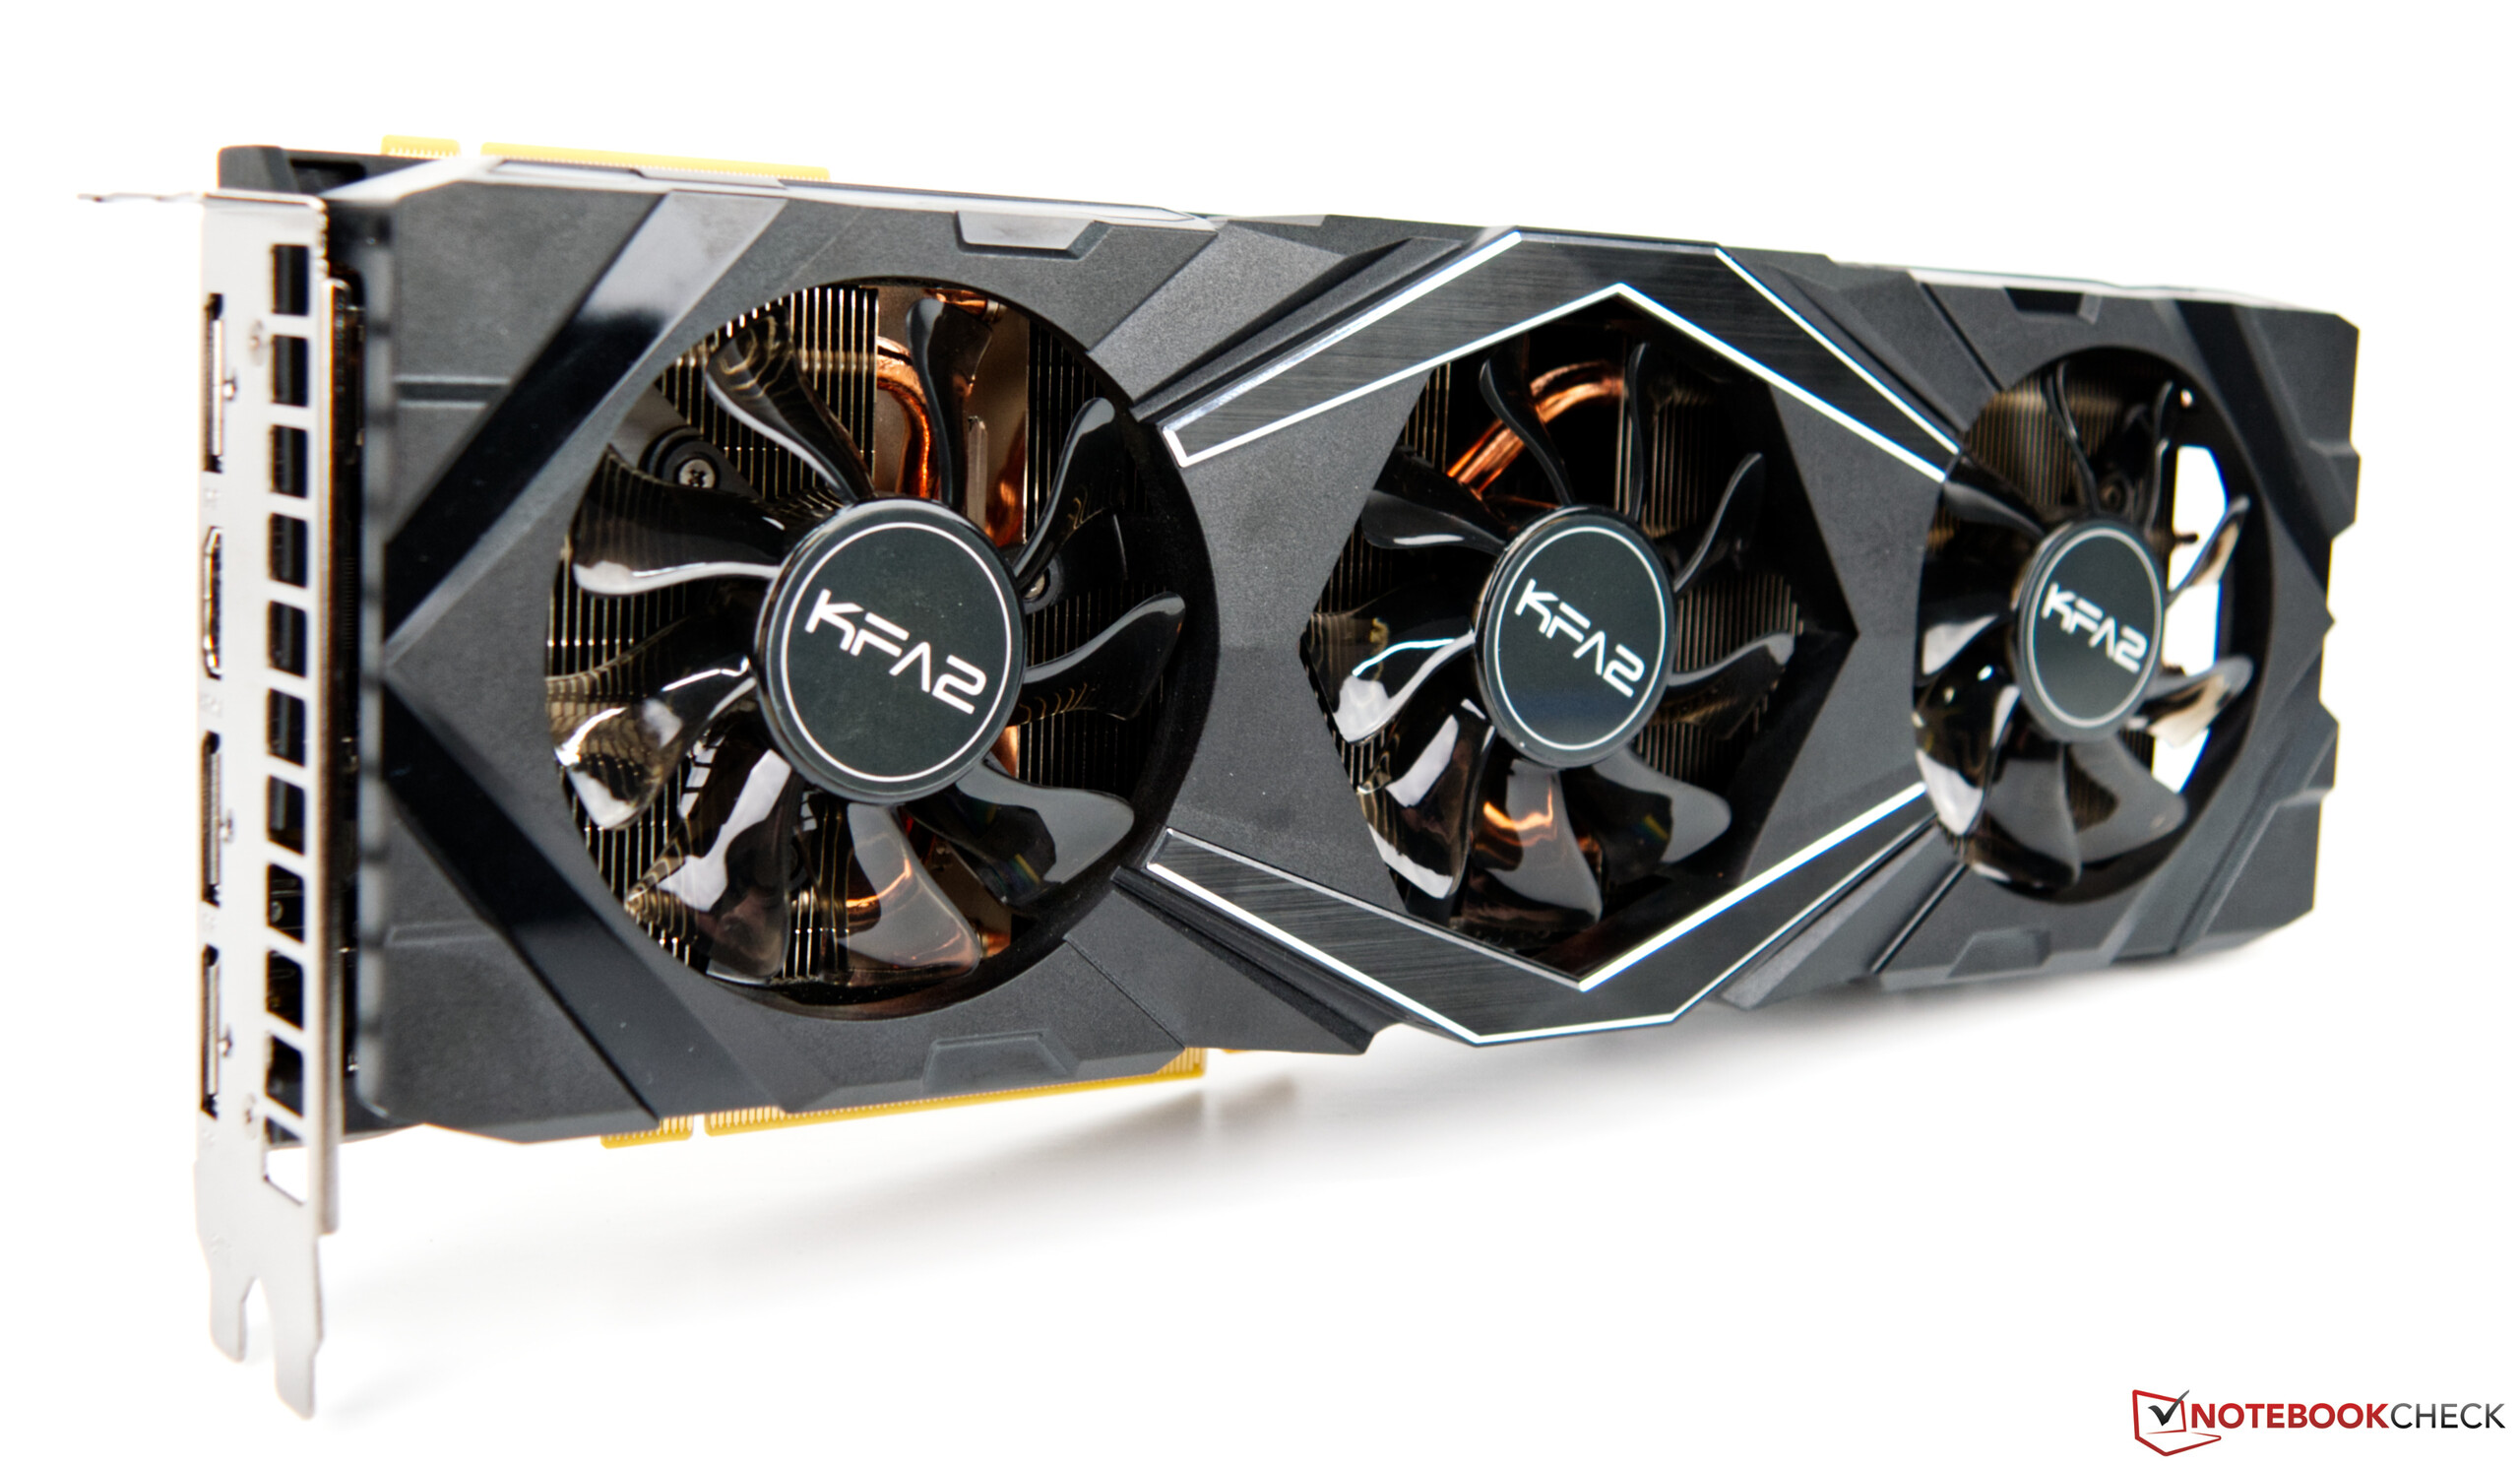
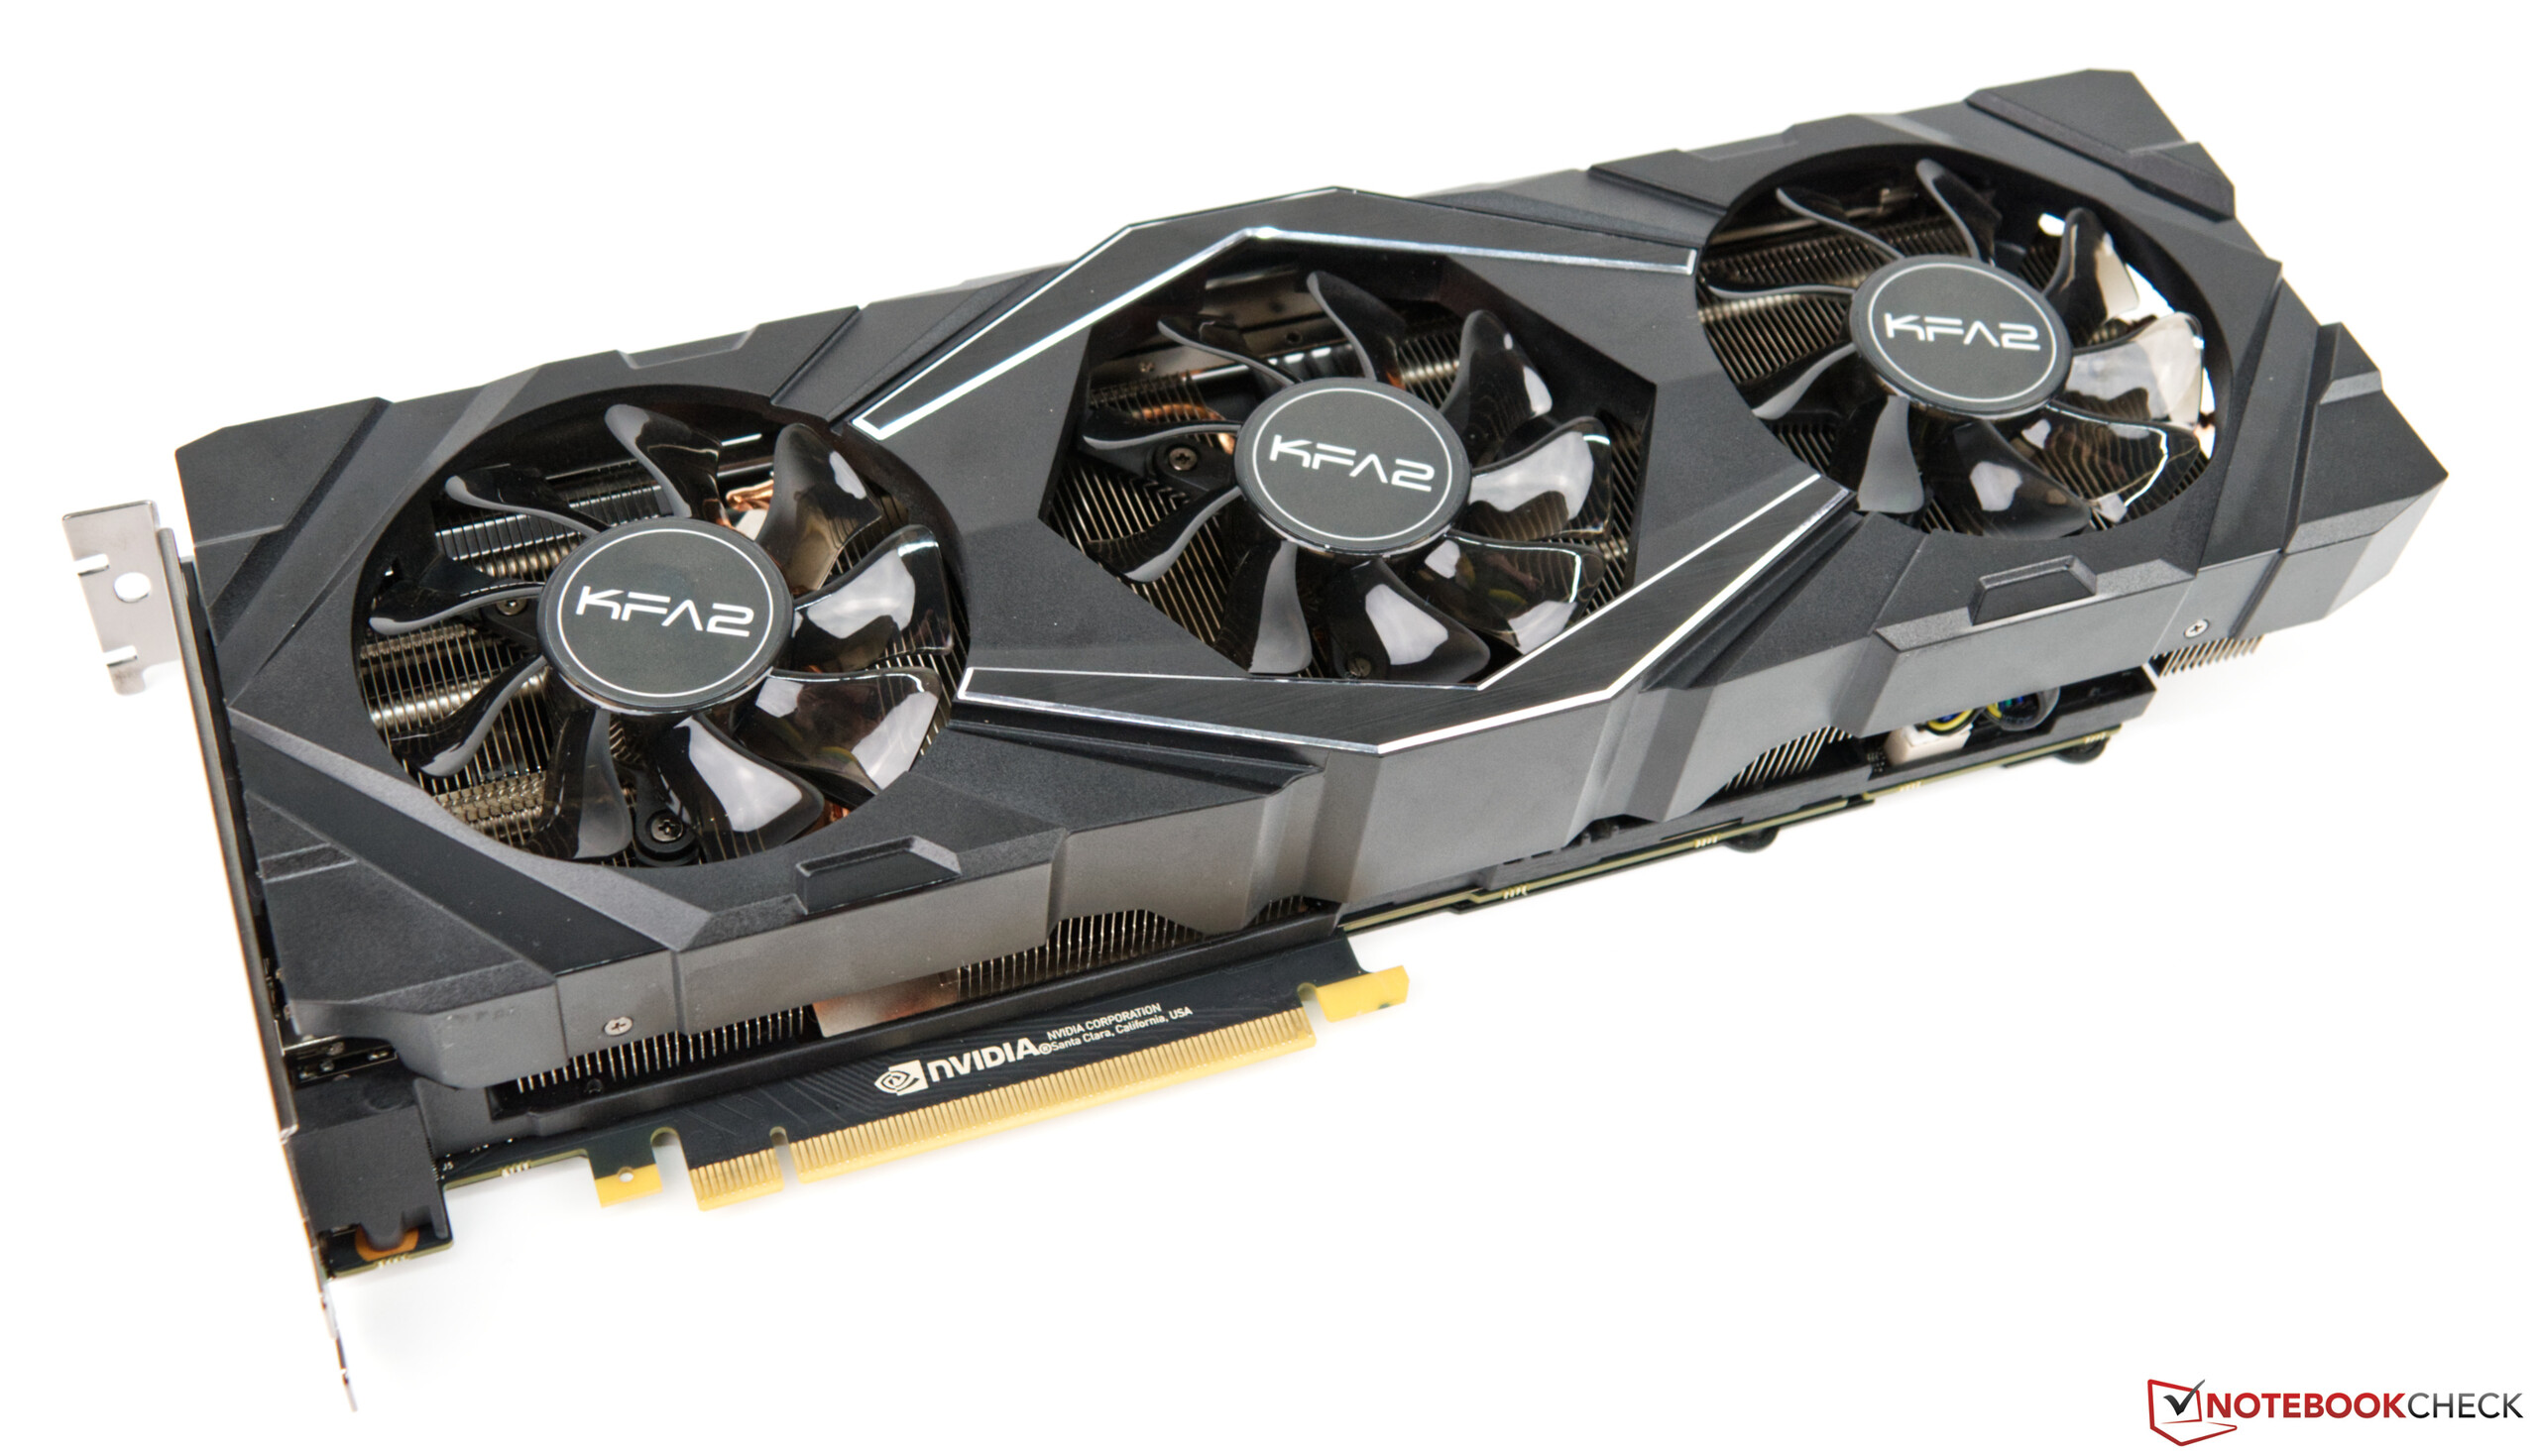
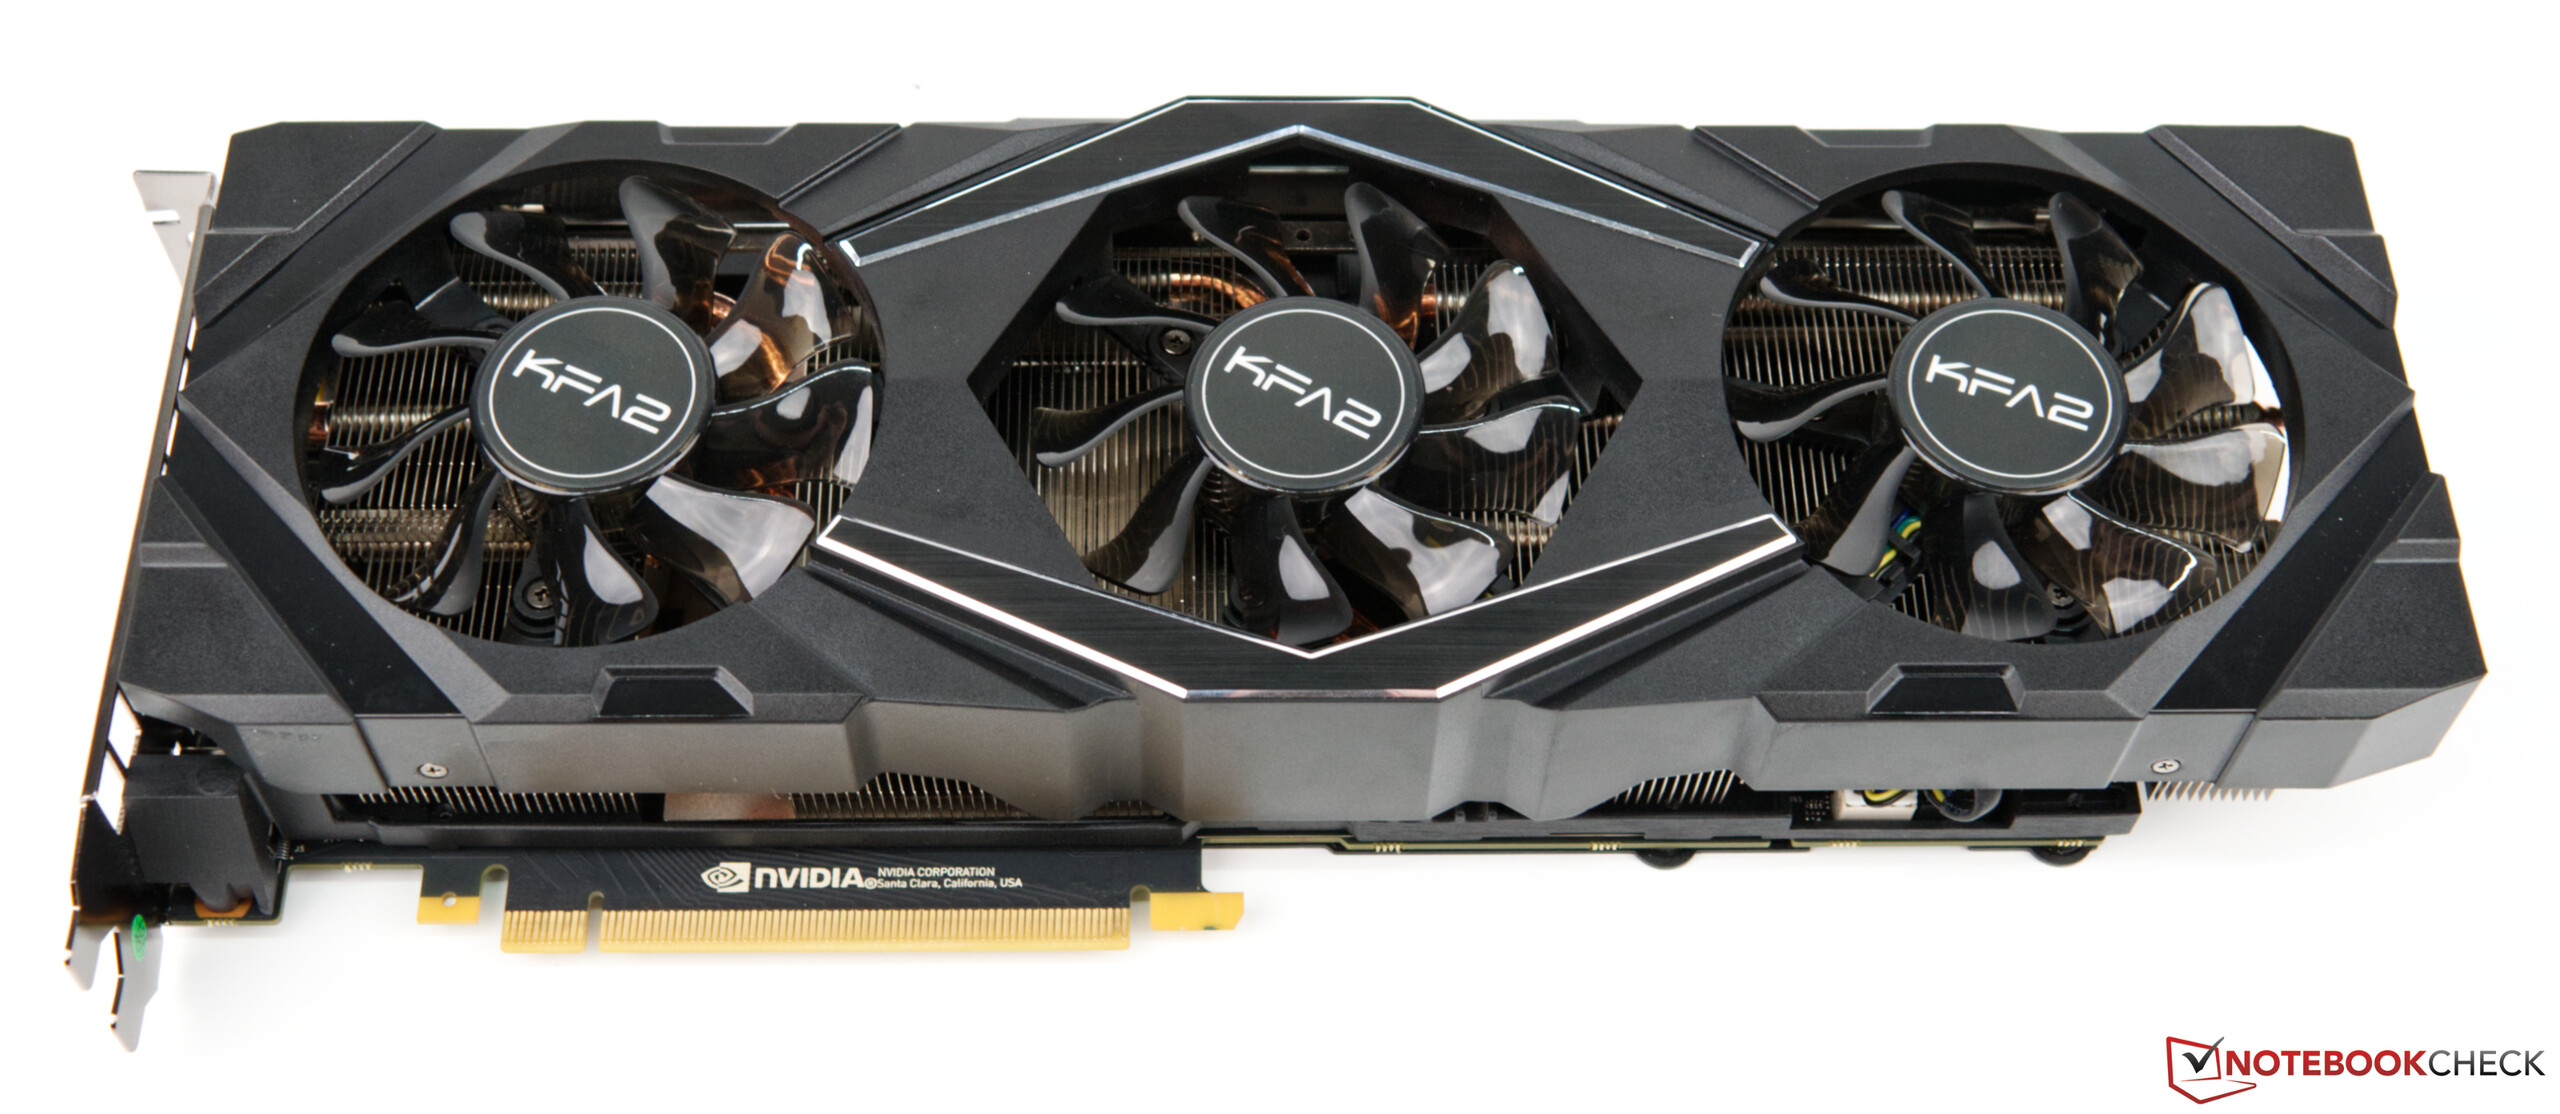
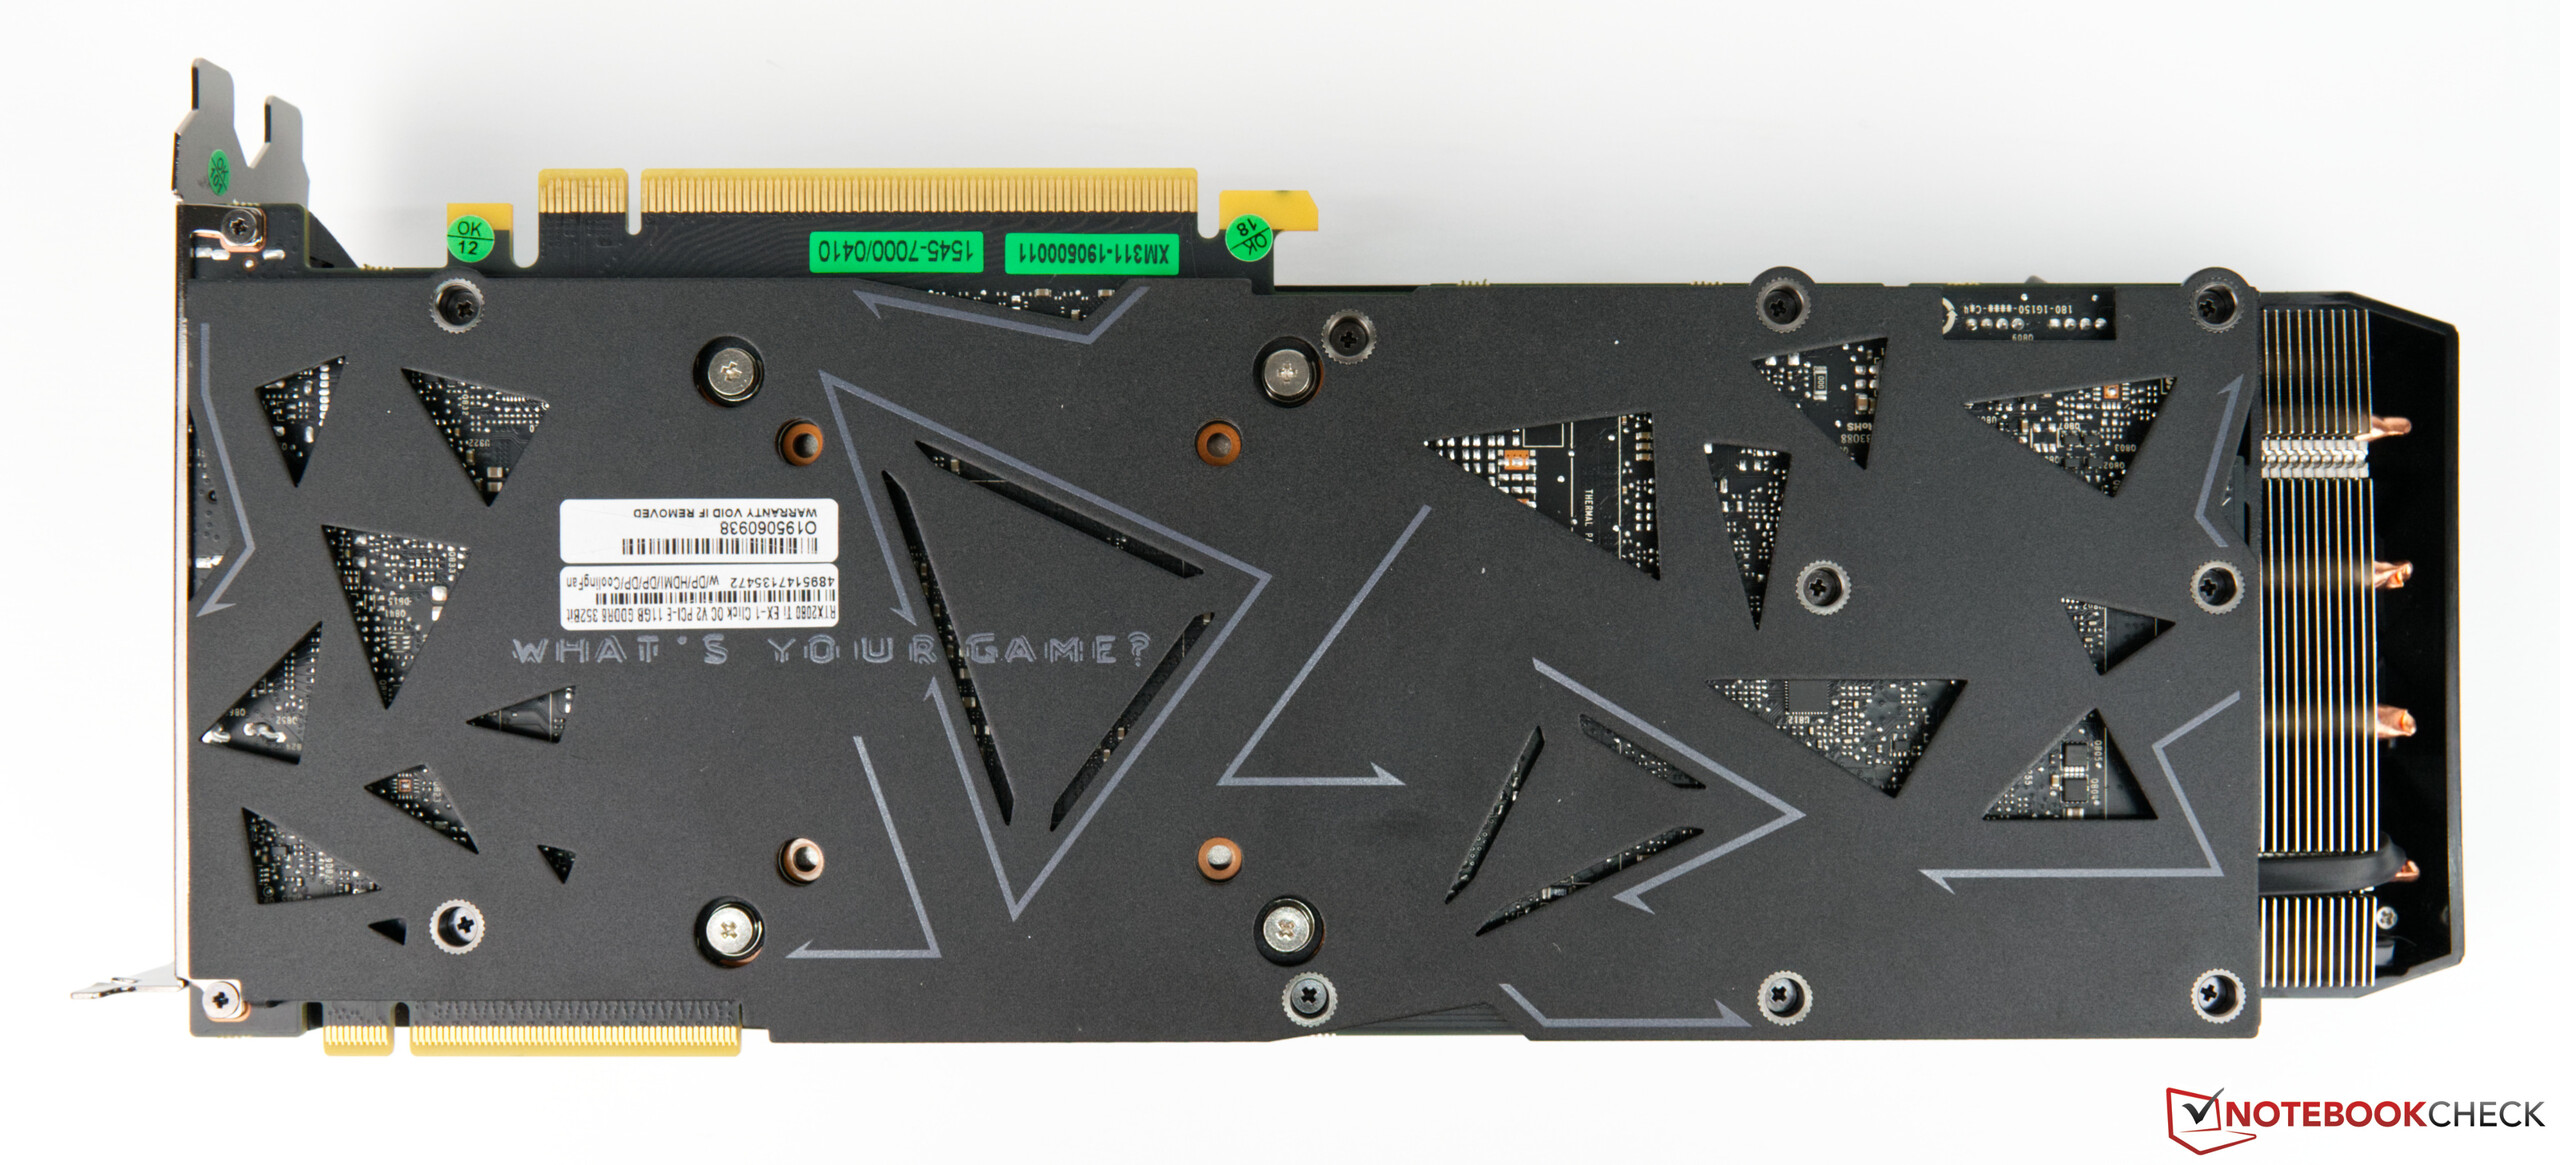
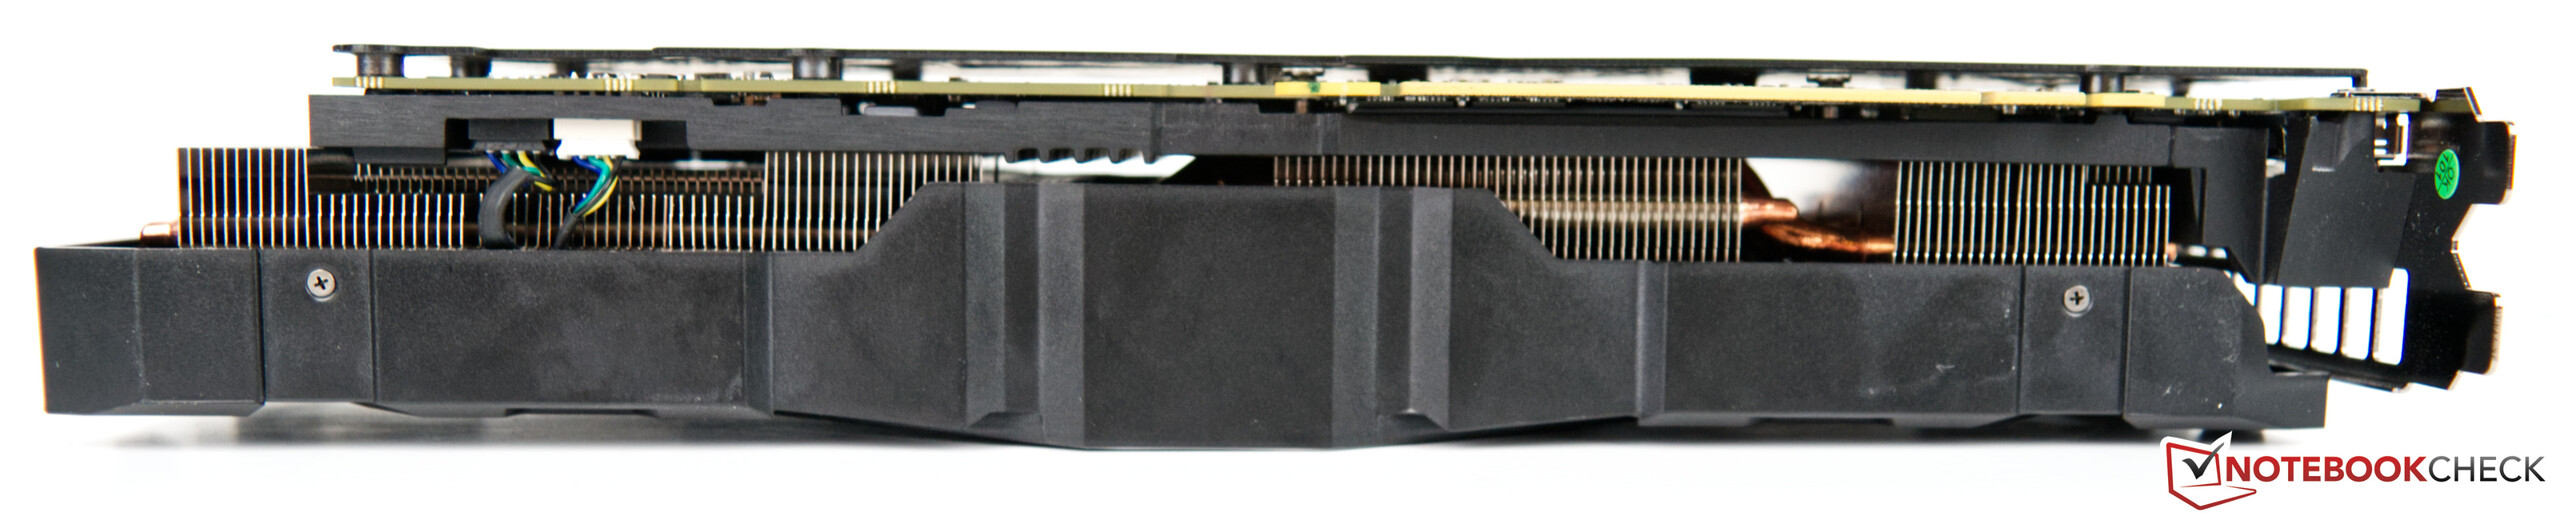
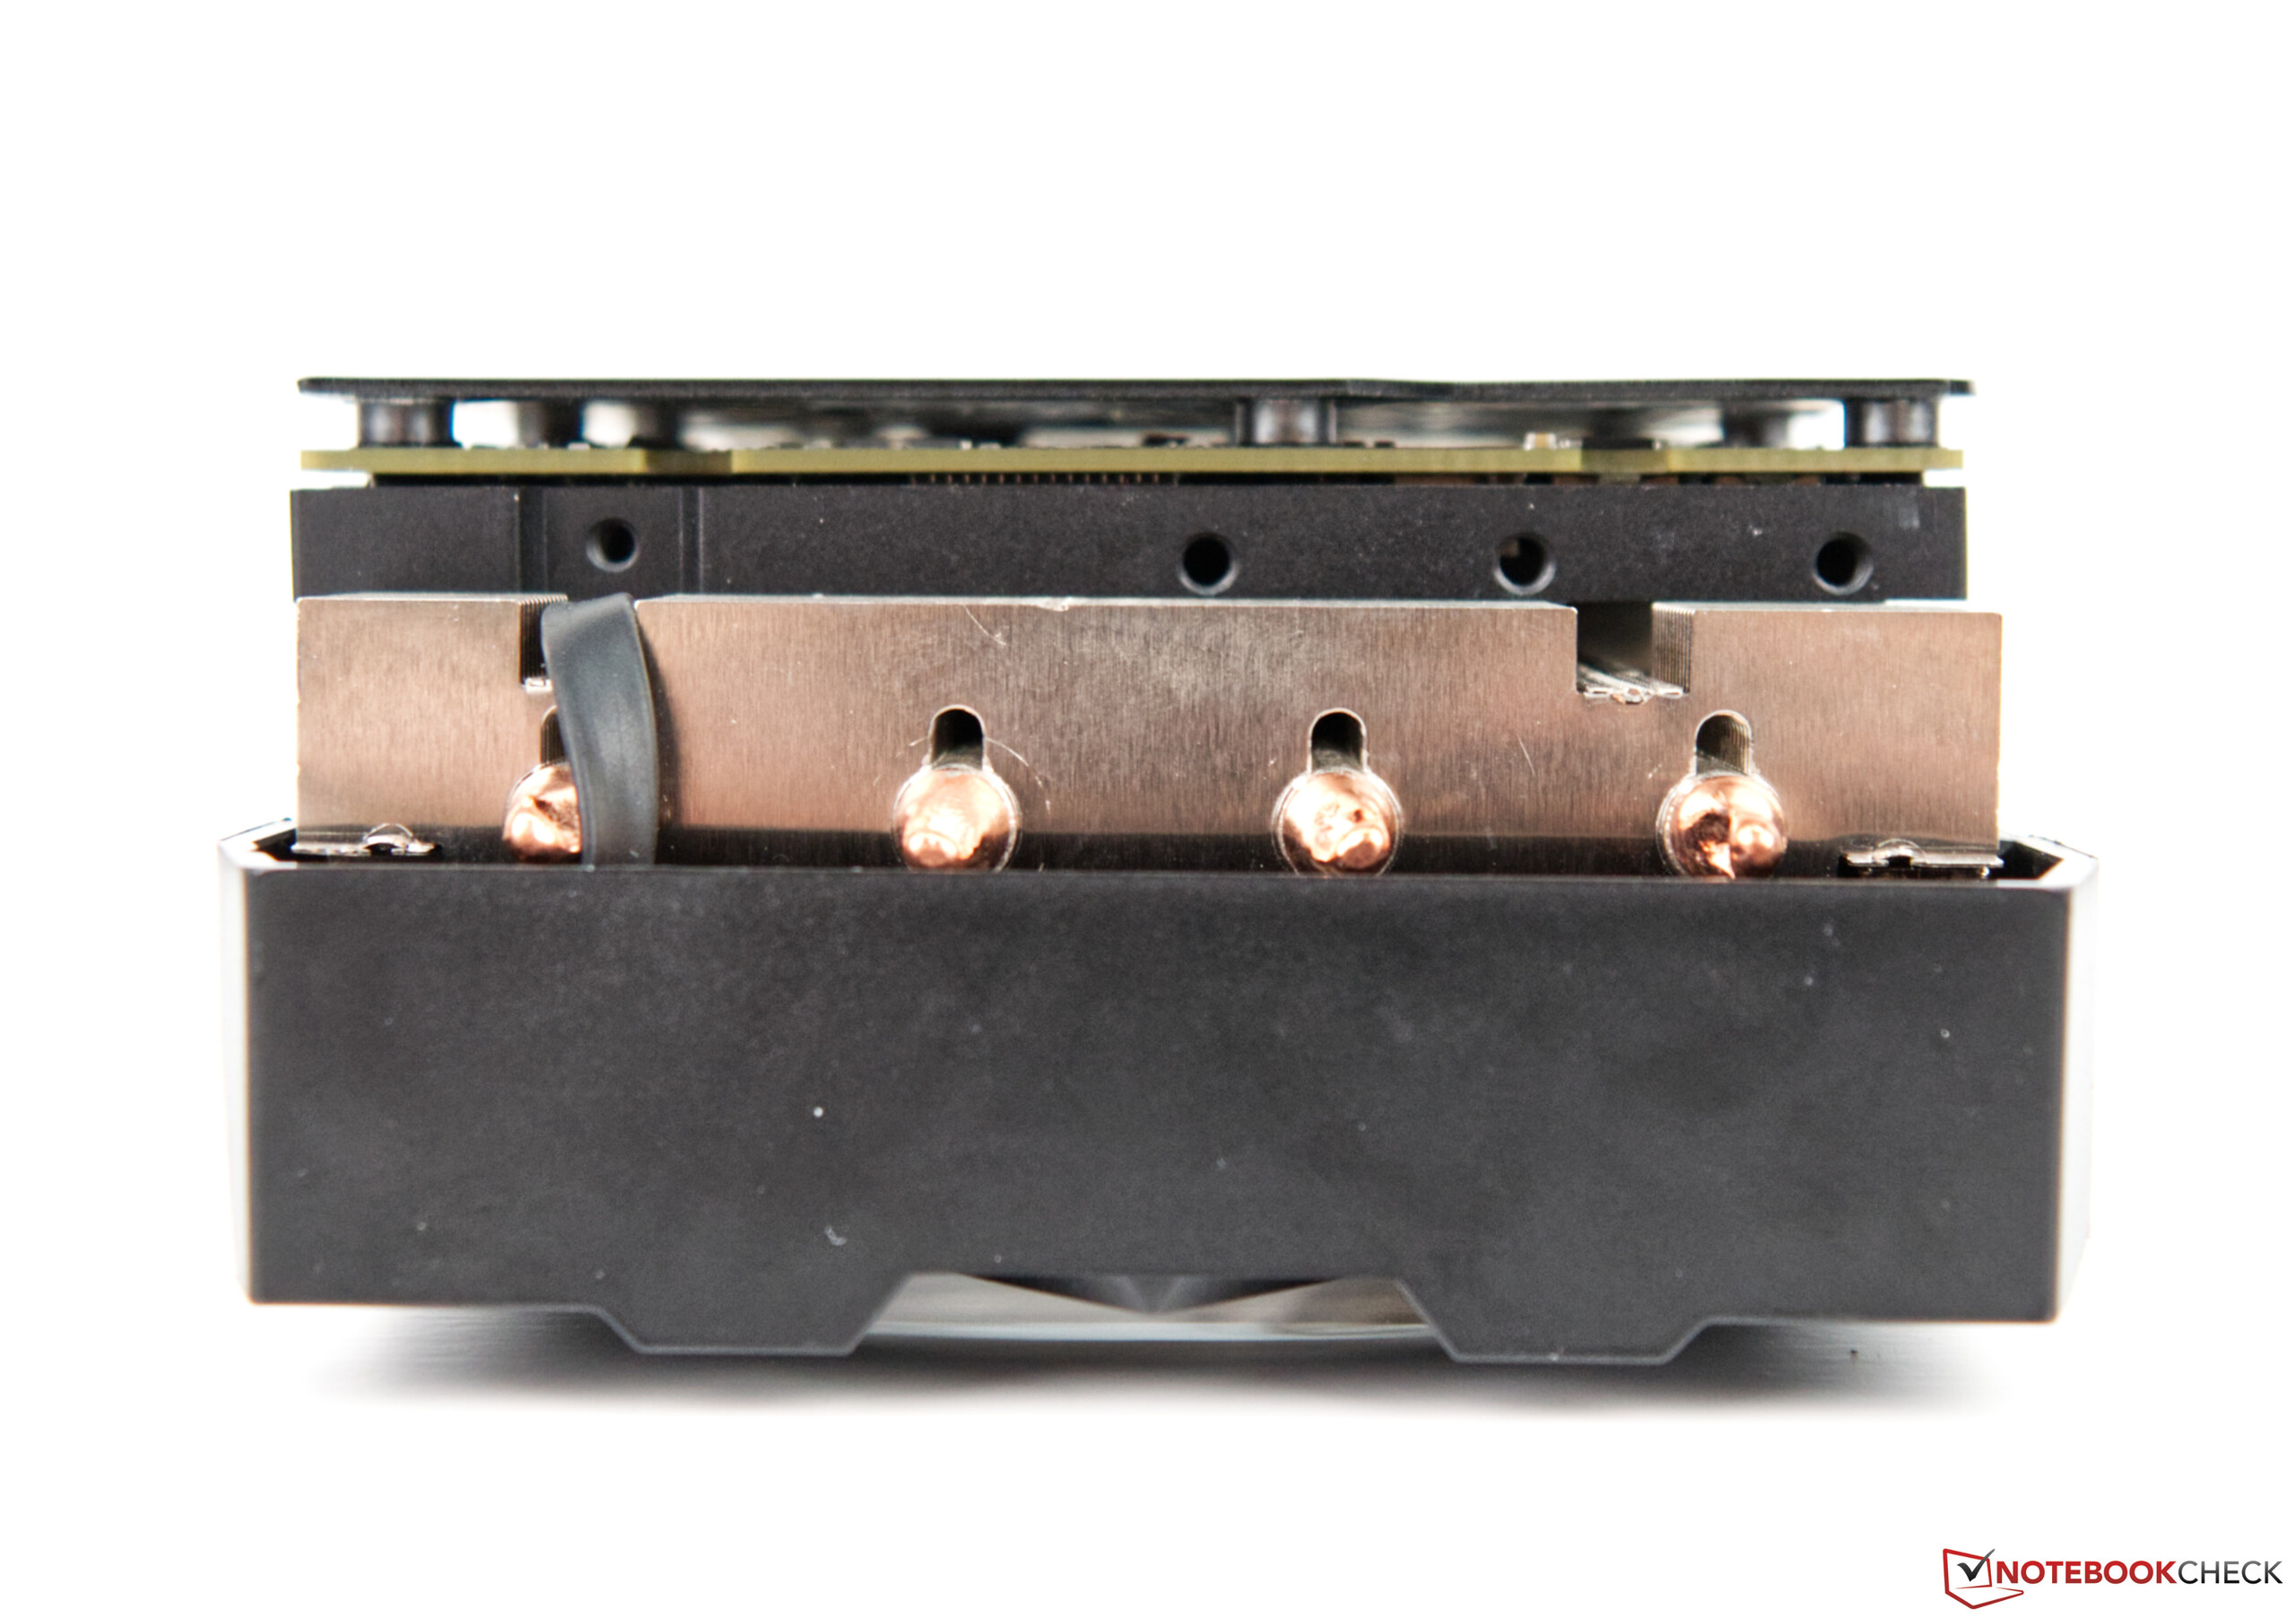
No hay diferencias en términos de especificaciones entre el modelo KFA2 y el modelo de referencia. Sin embargo, la tarjeta de vídeo KFA2 tiene un aspecto diferente, ya que presenta una solución de refrigeración personalizada más potente con tres ventiladores axiales. La tarjeta gráfica KFA2 utiliza la tarjeta de referencia, por lo que no debería haber ningún problema de compatibilidad si decides enfriar tu GPU por agua. No obstante, antes de comprometerte a comprar, debes asegurarte de que tu GPU cumple los requisitos de enfriamiento por agua.
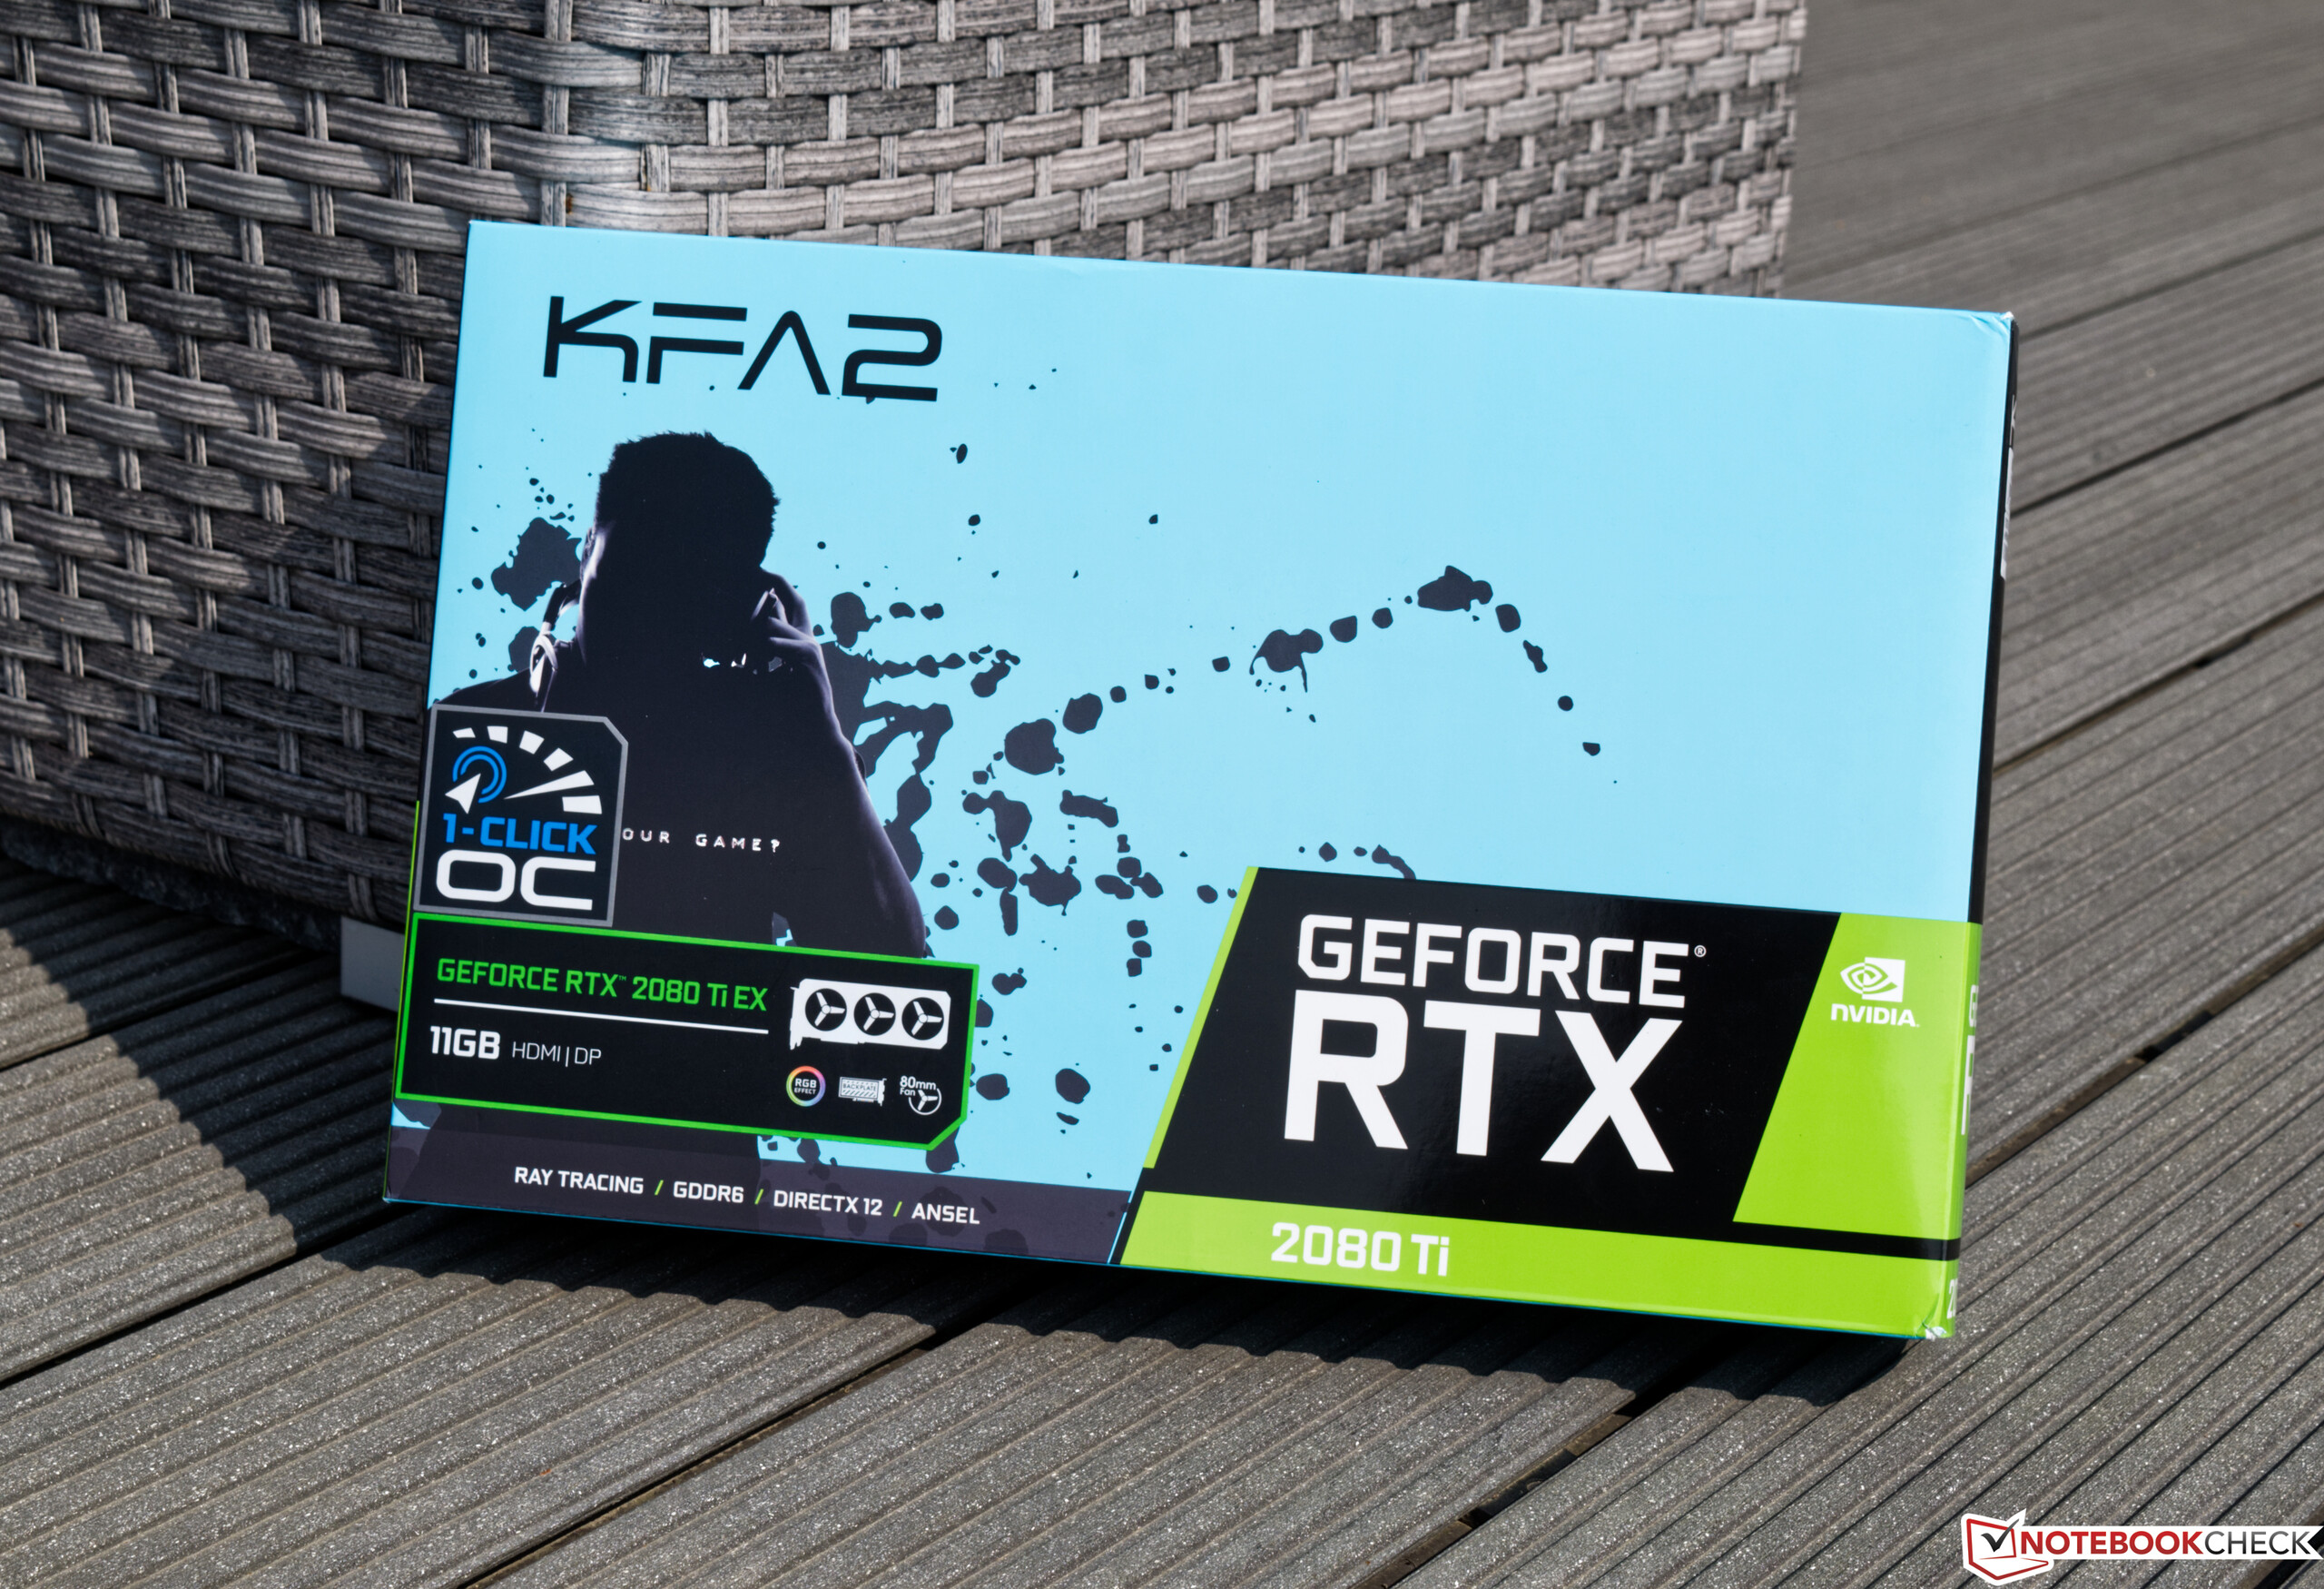
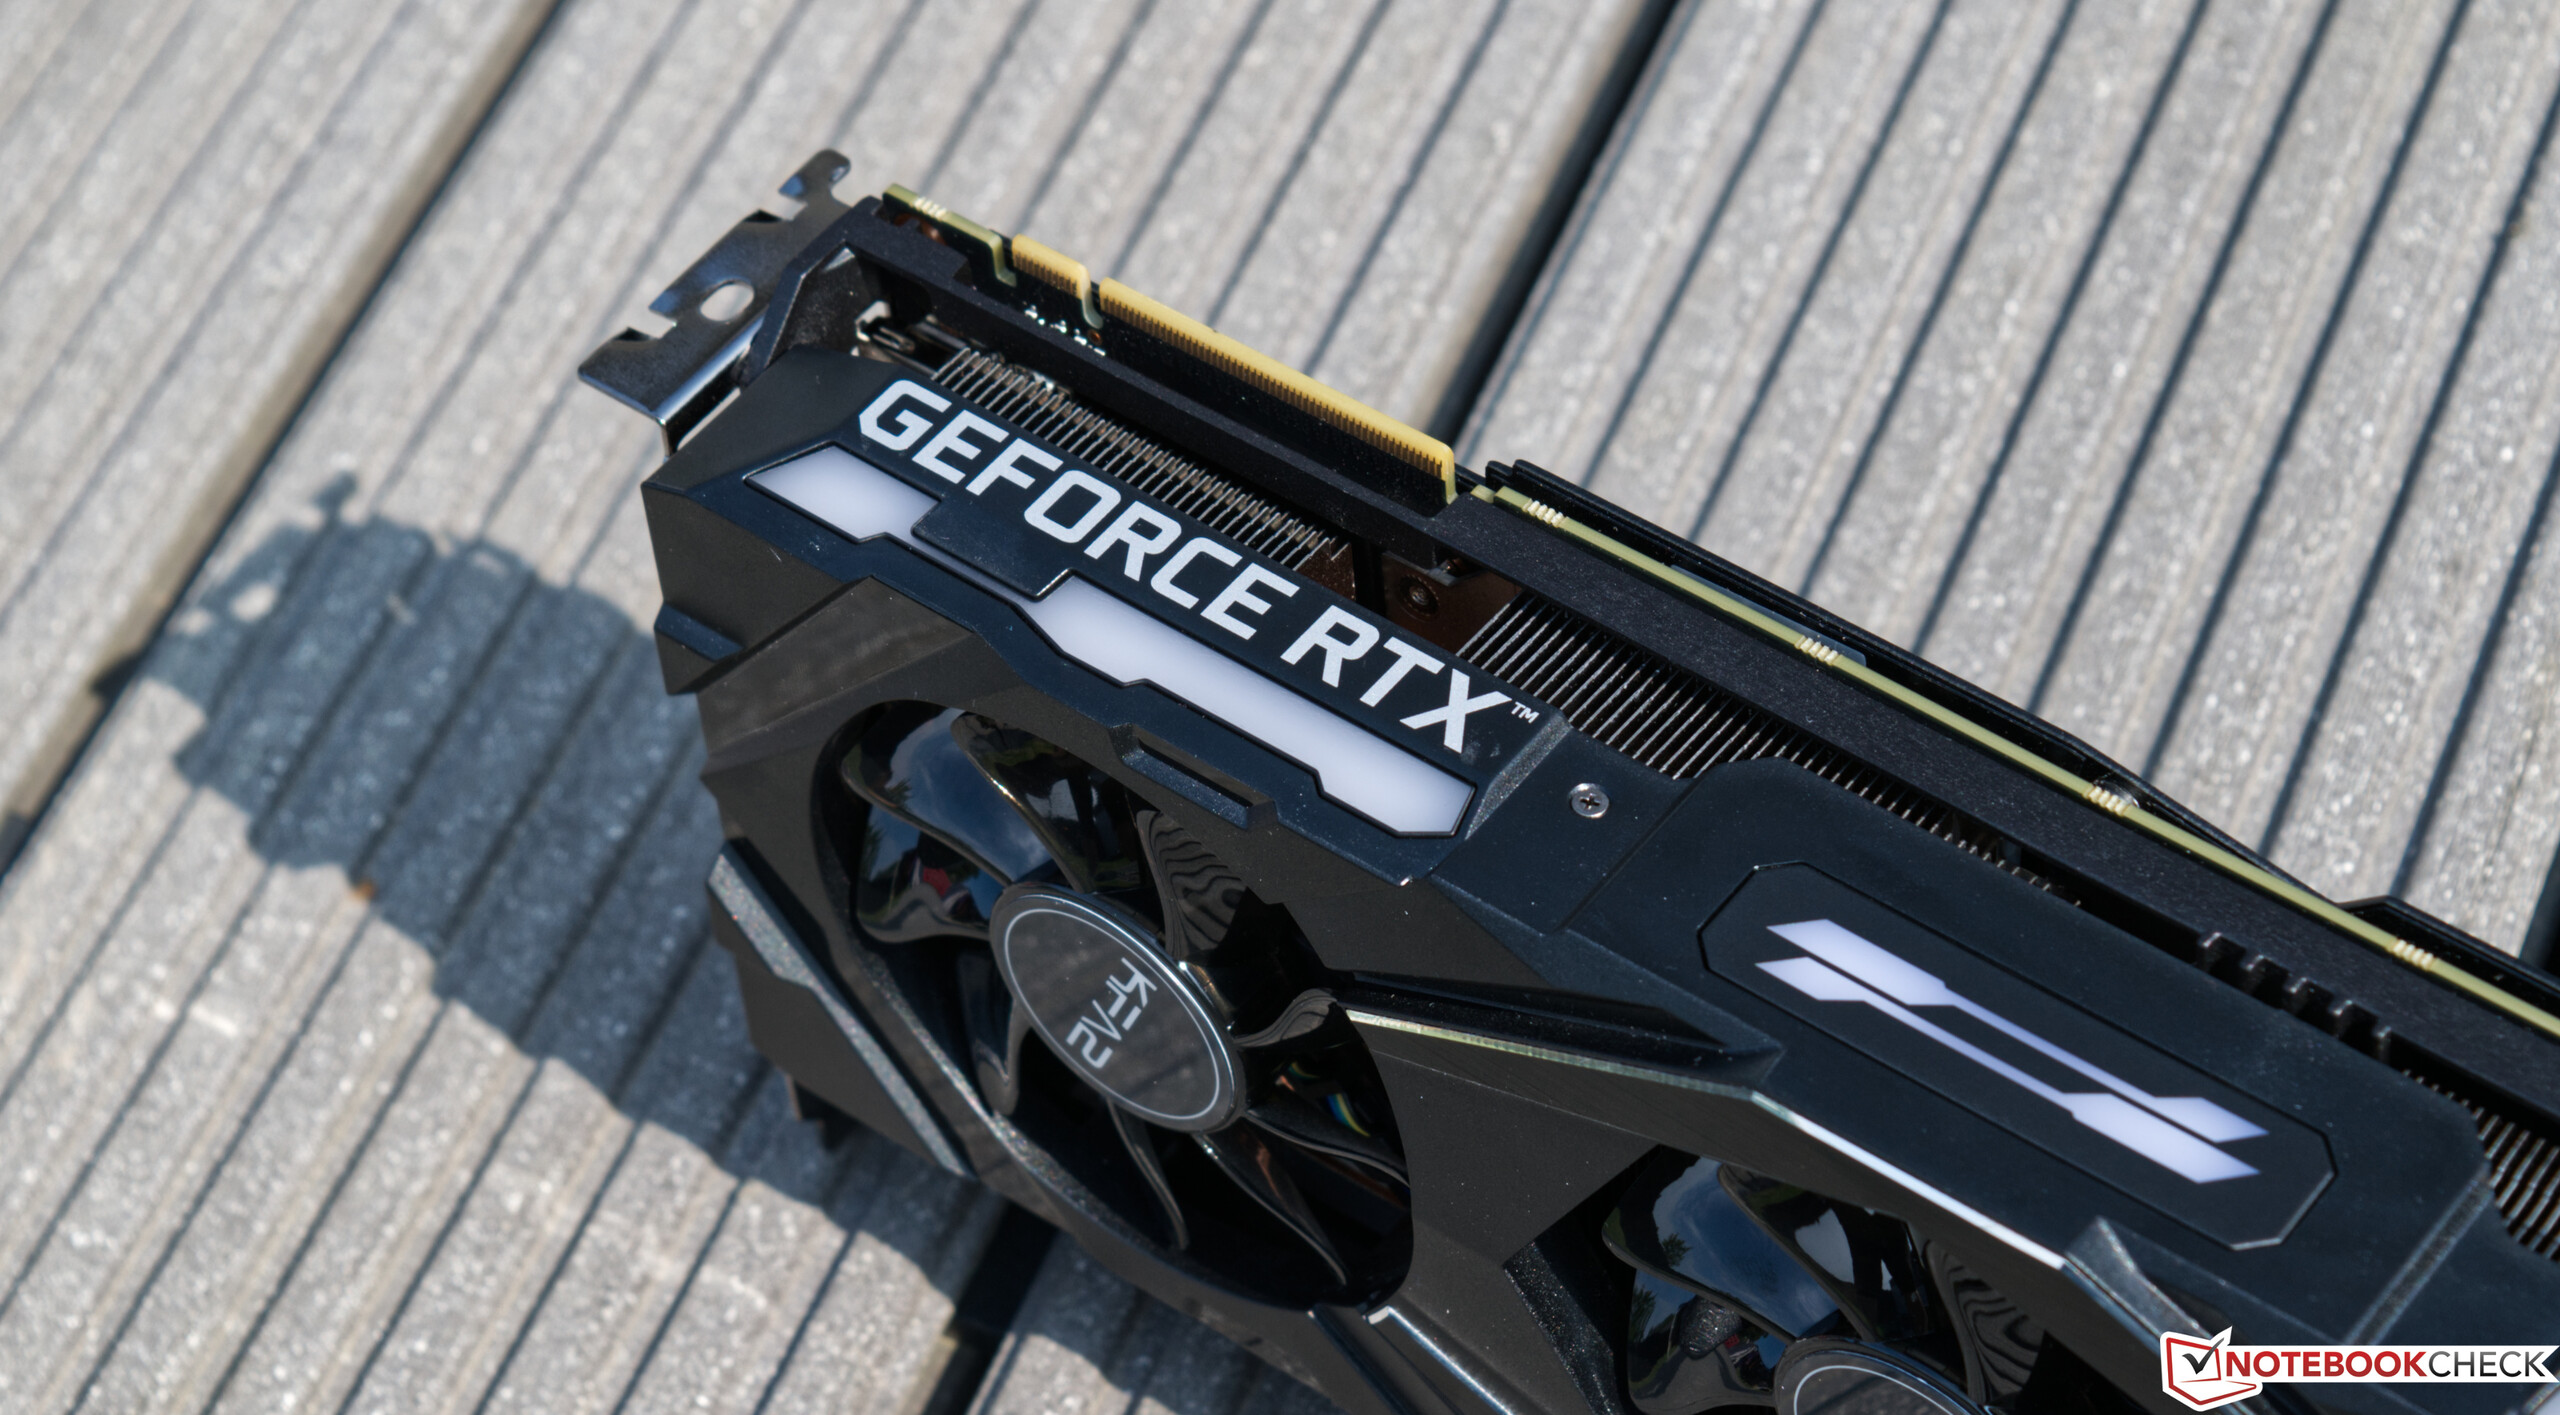
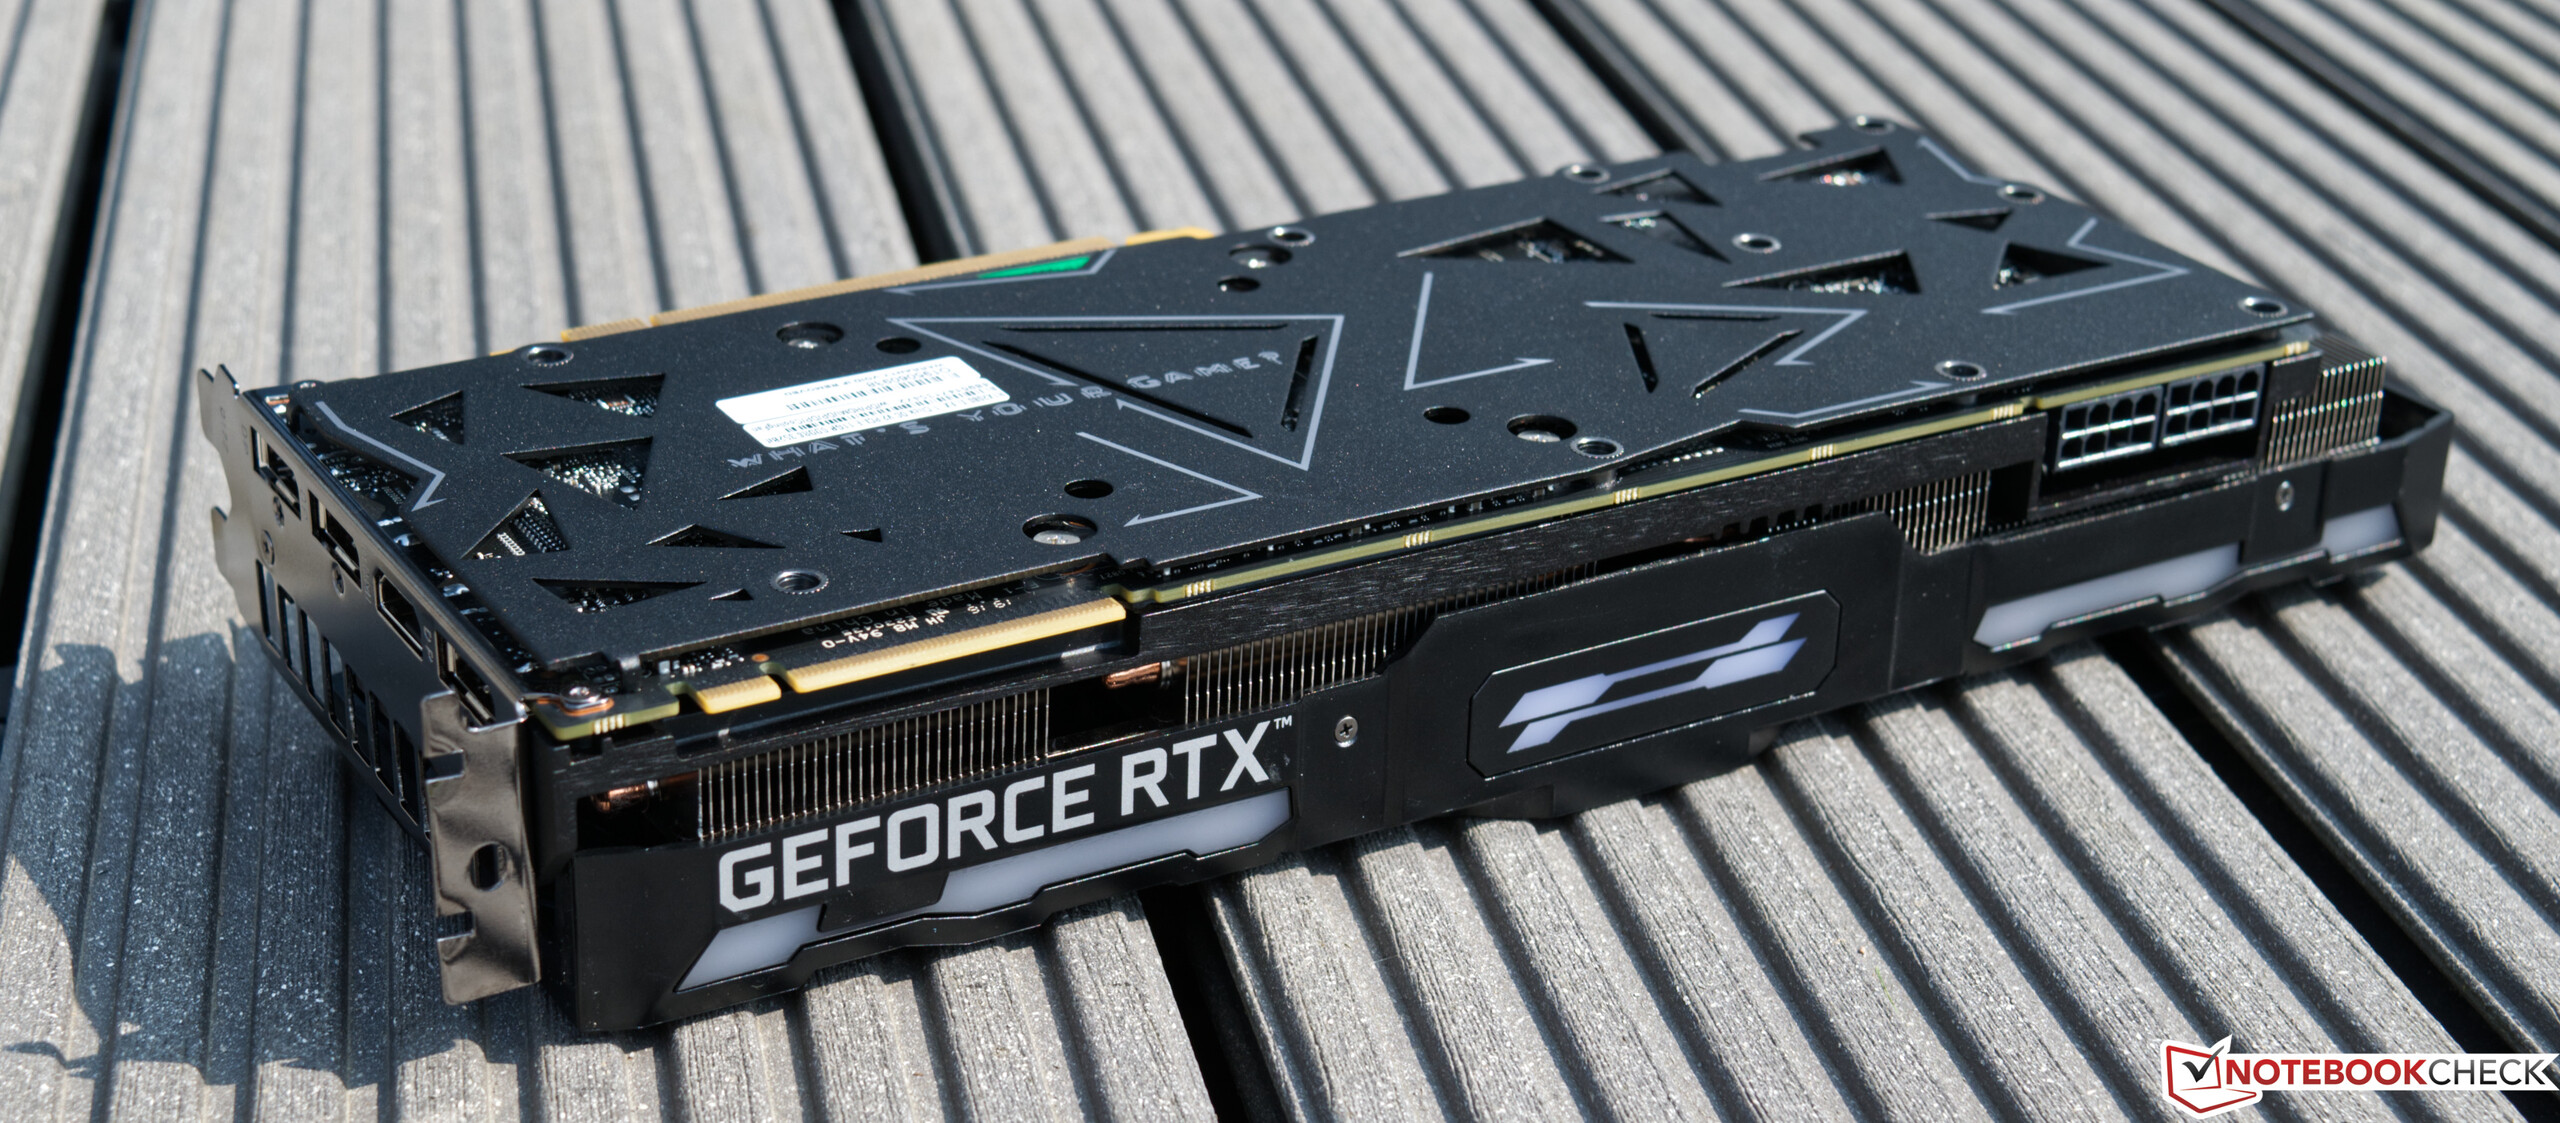
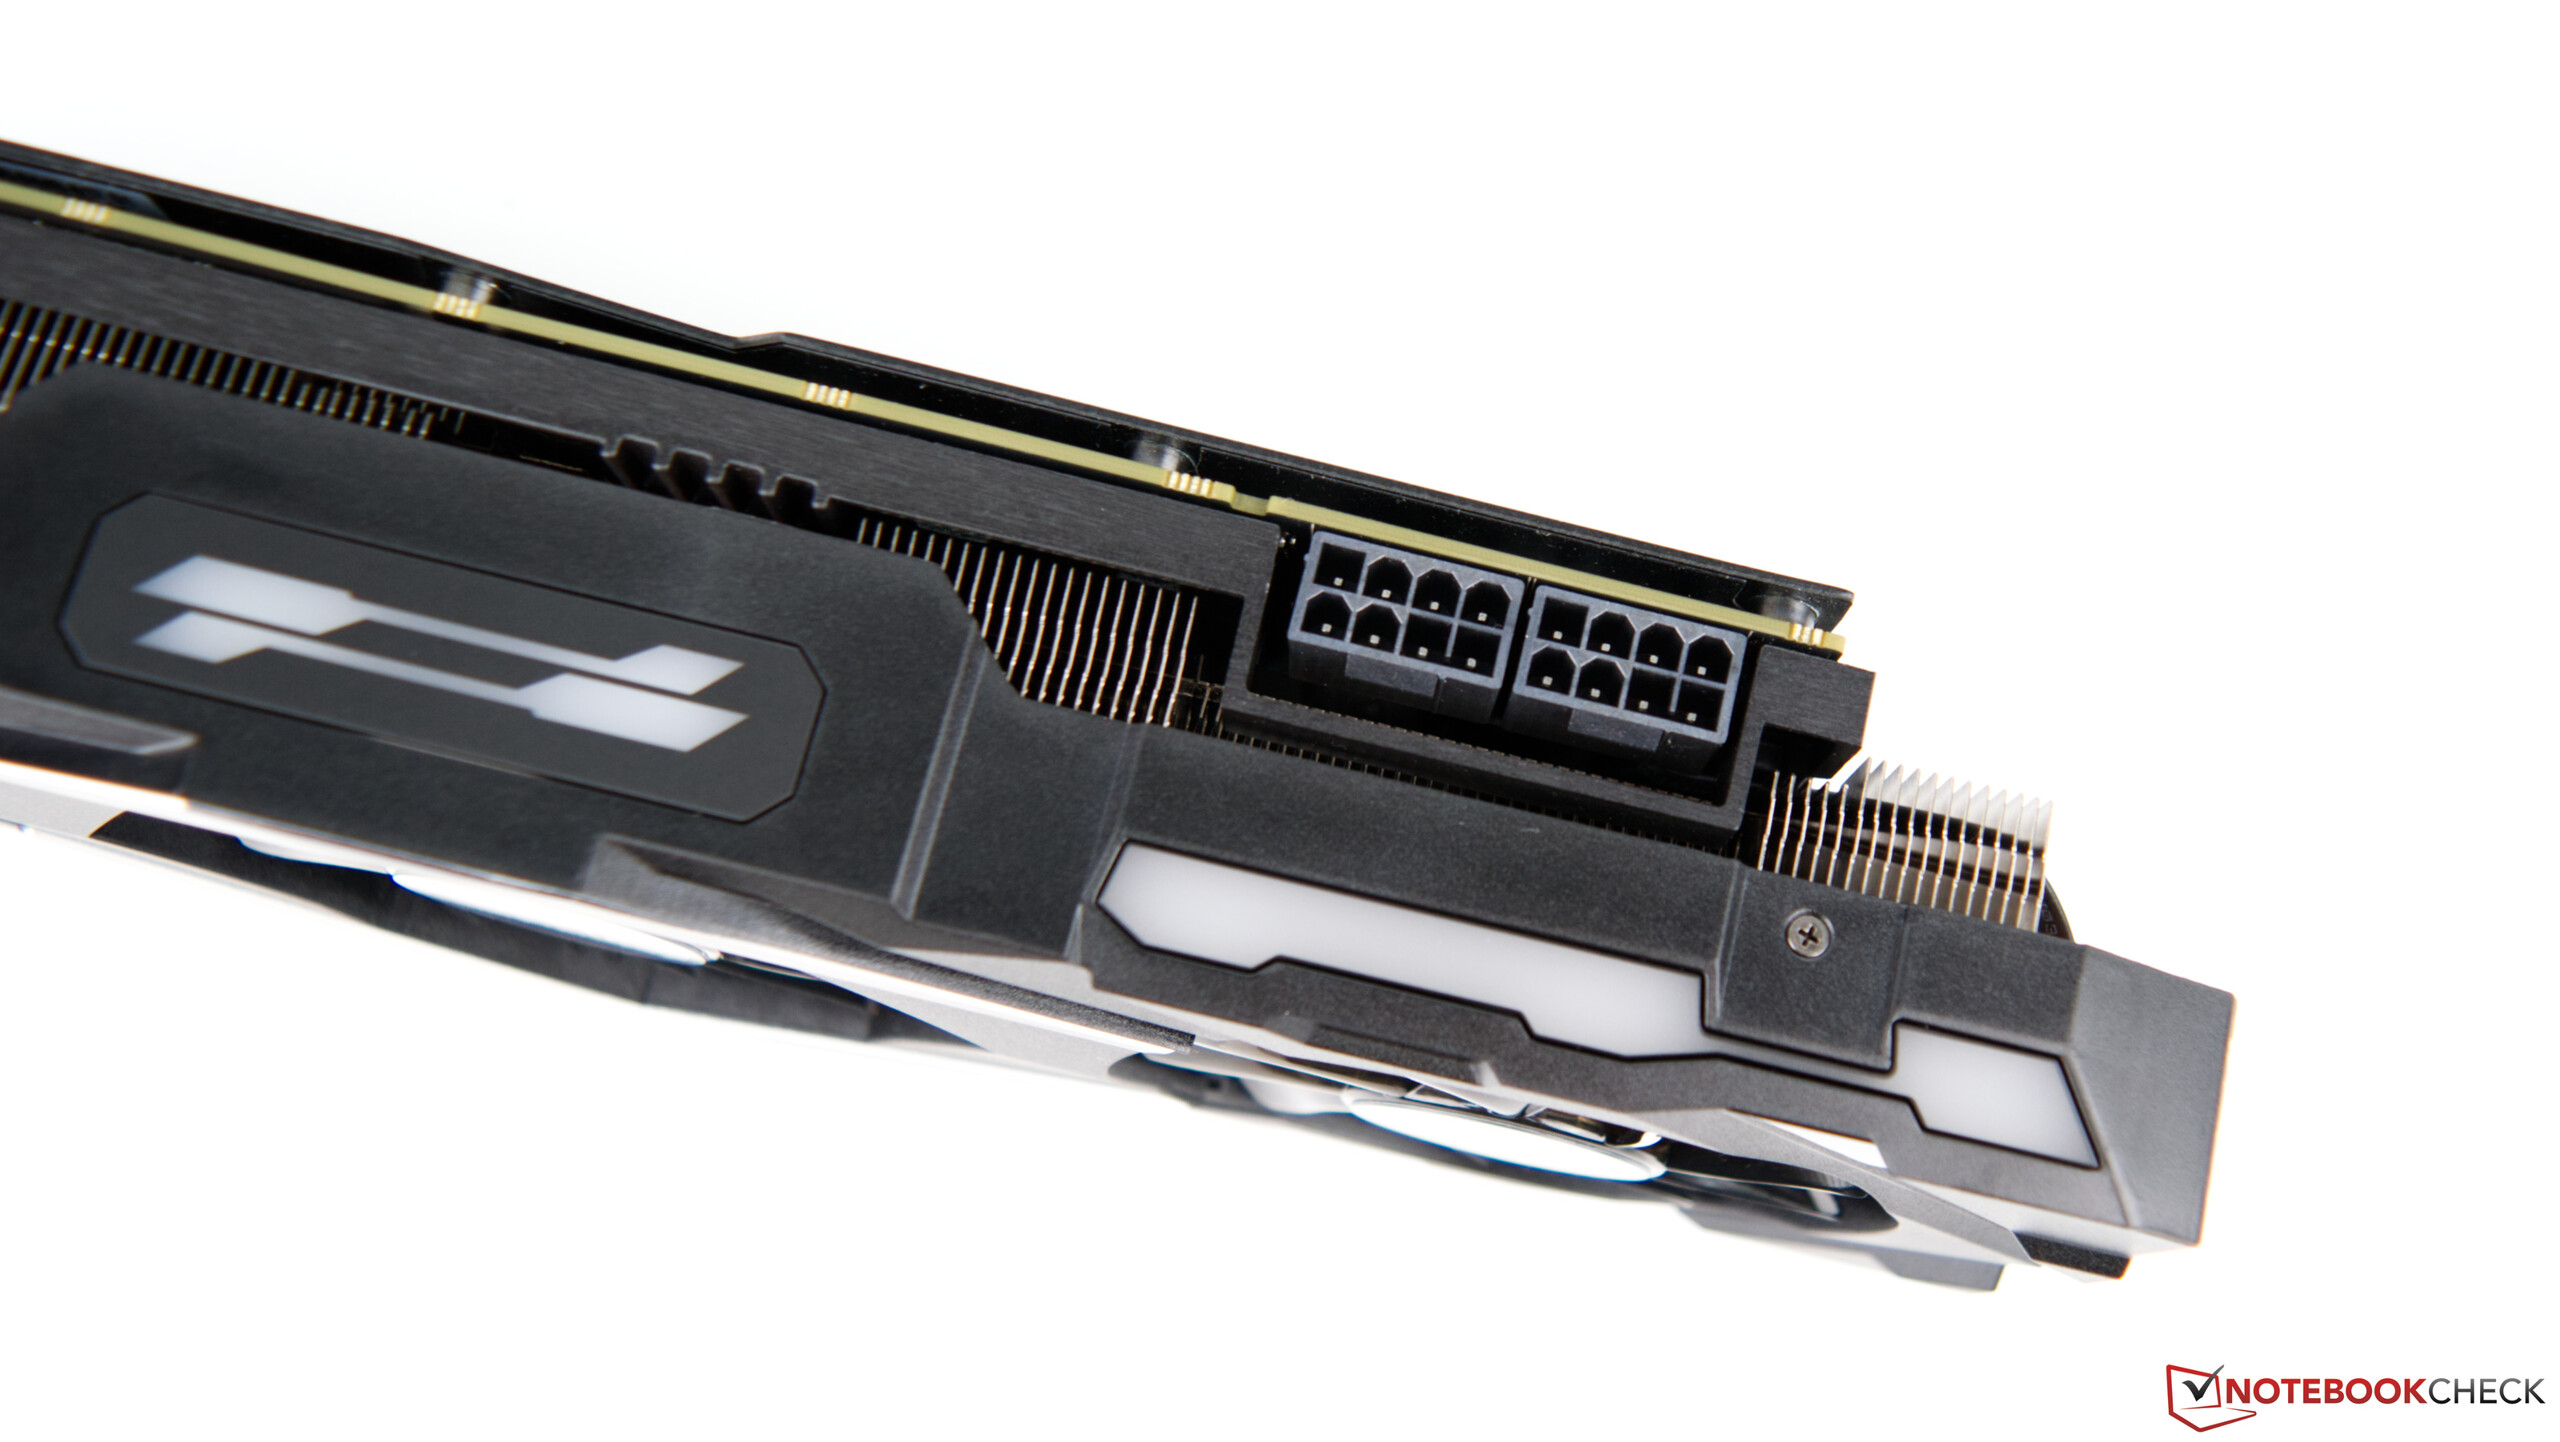
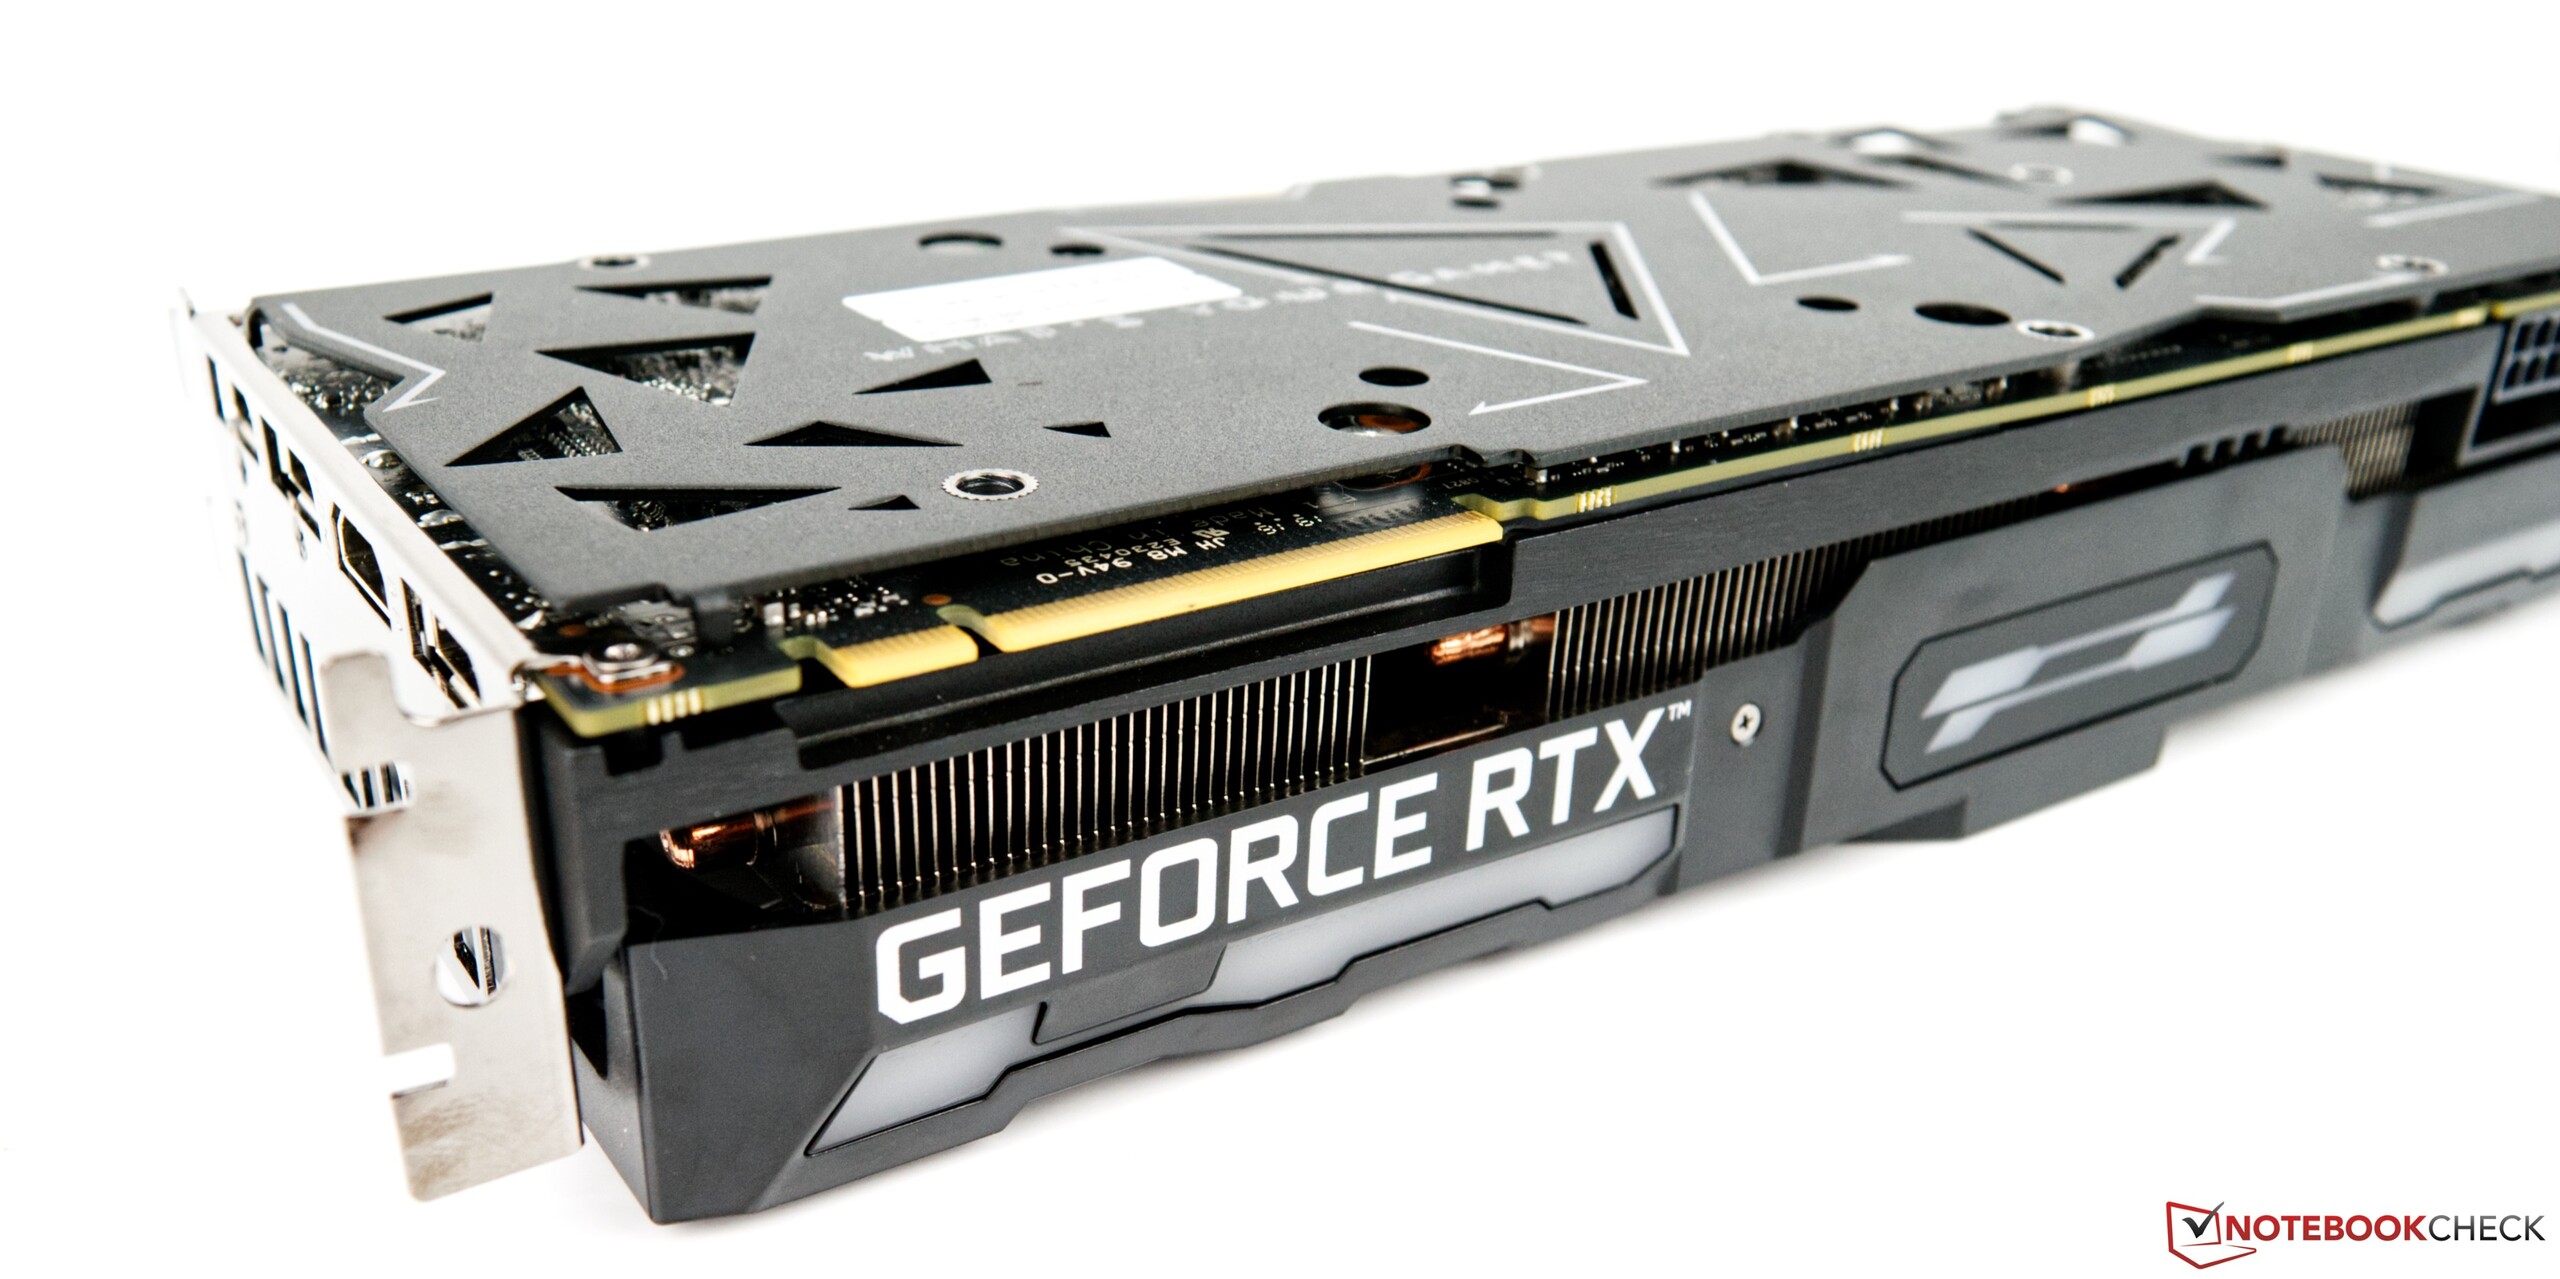
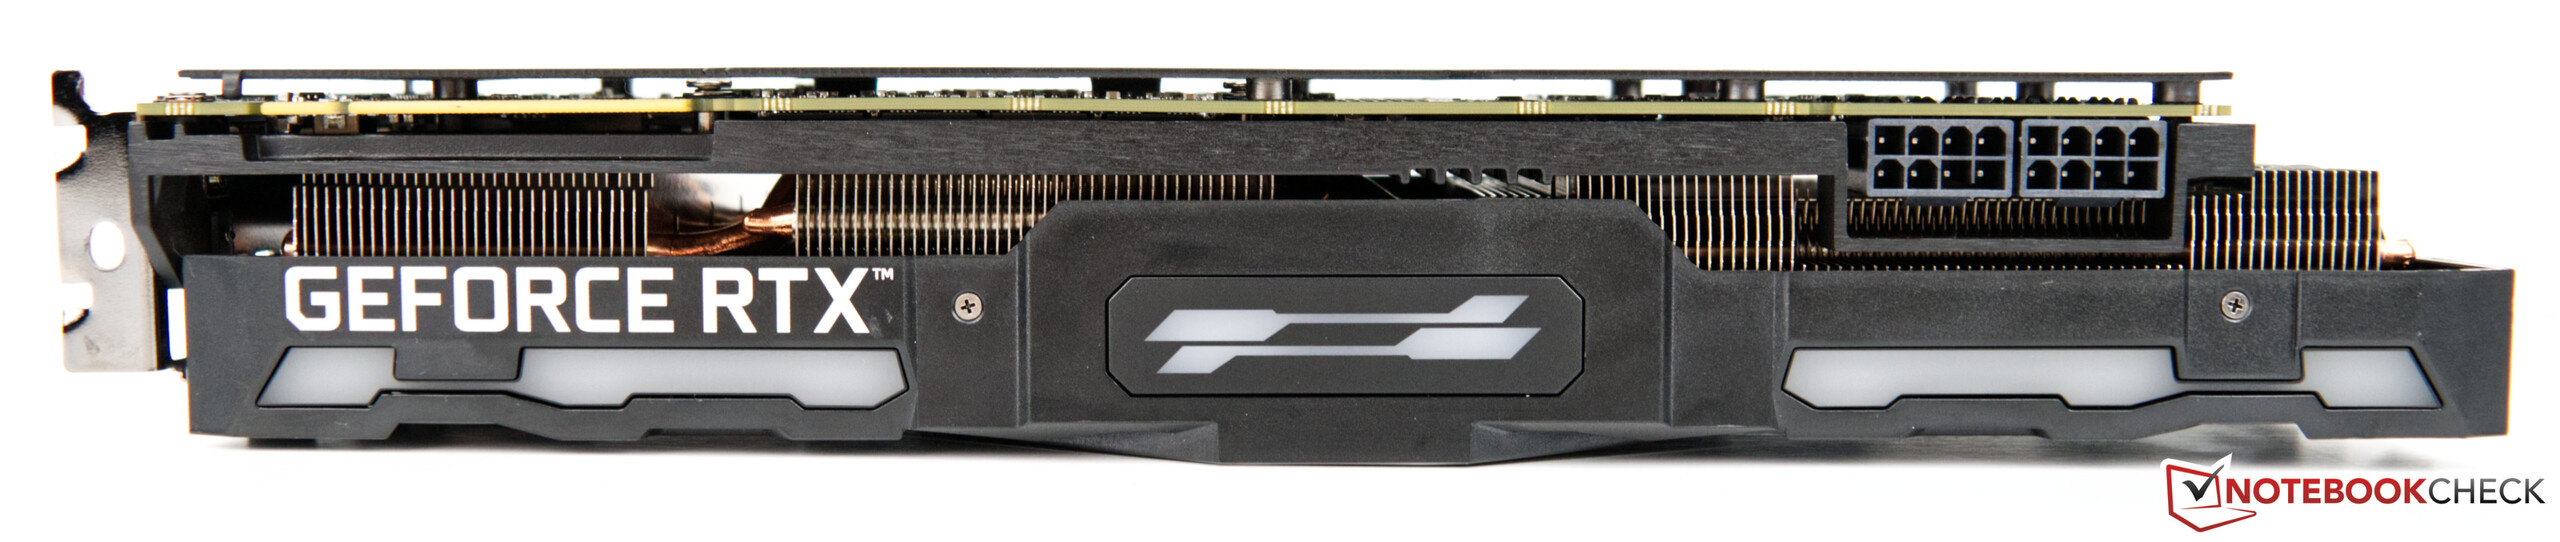
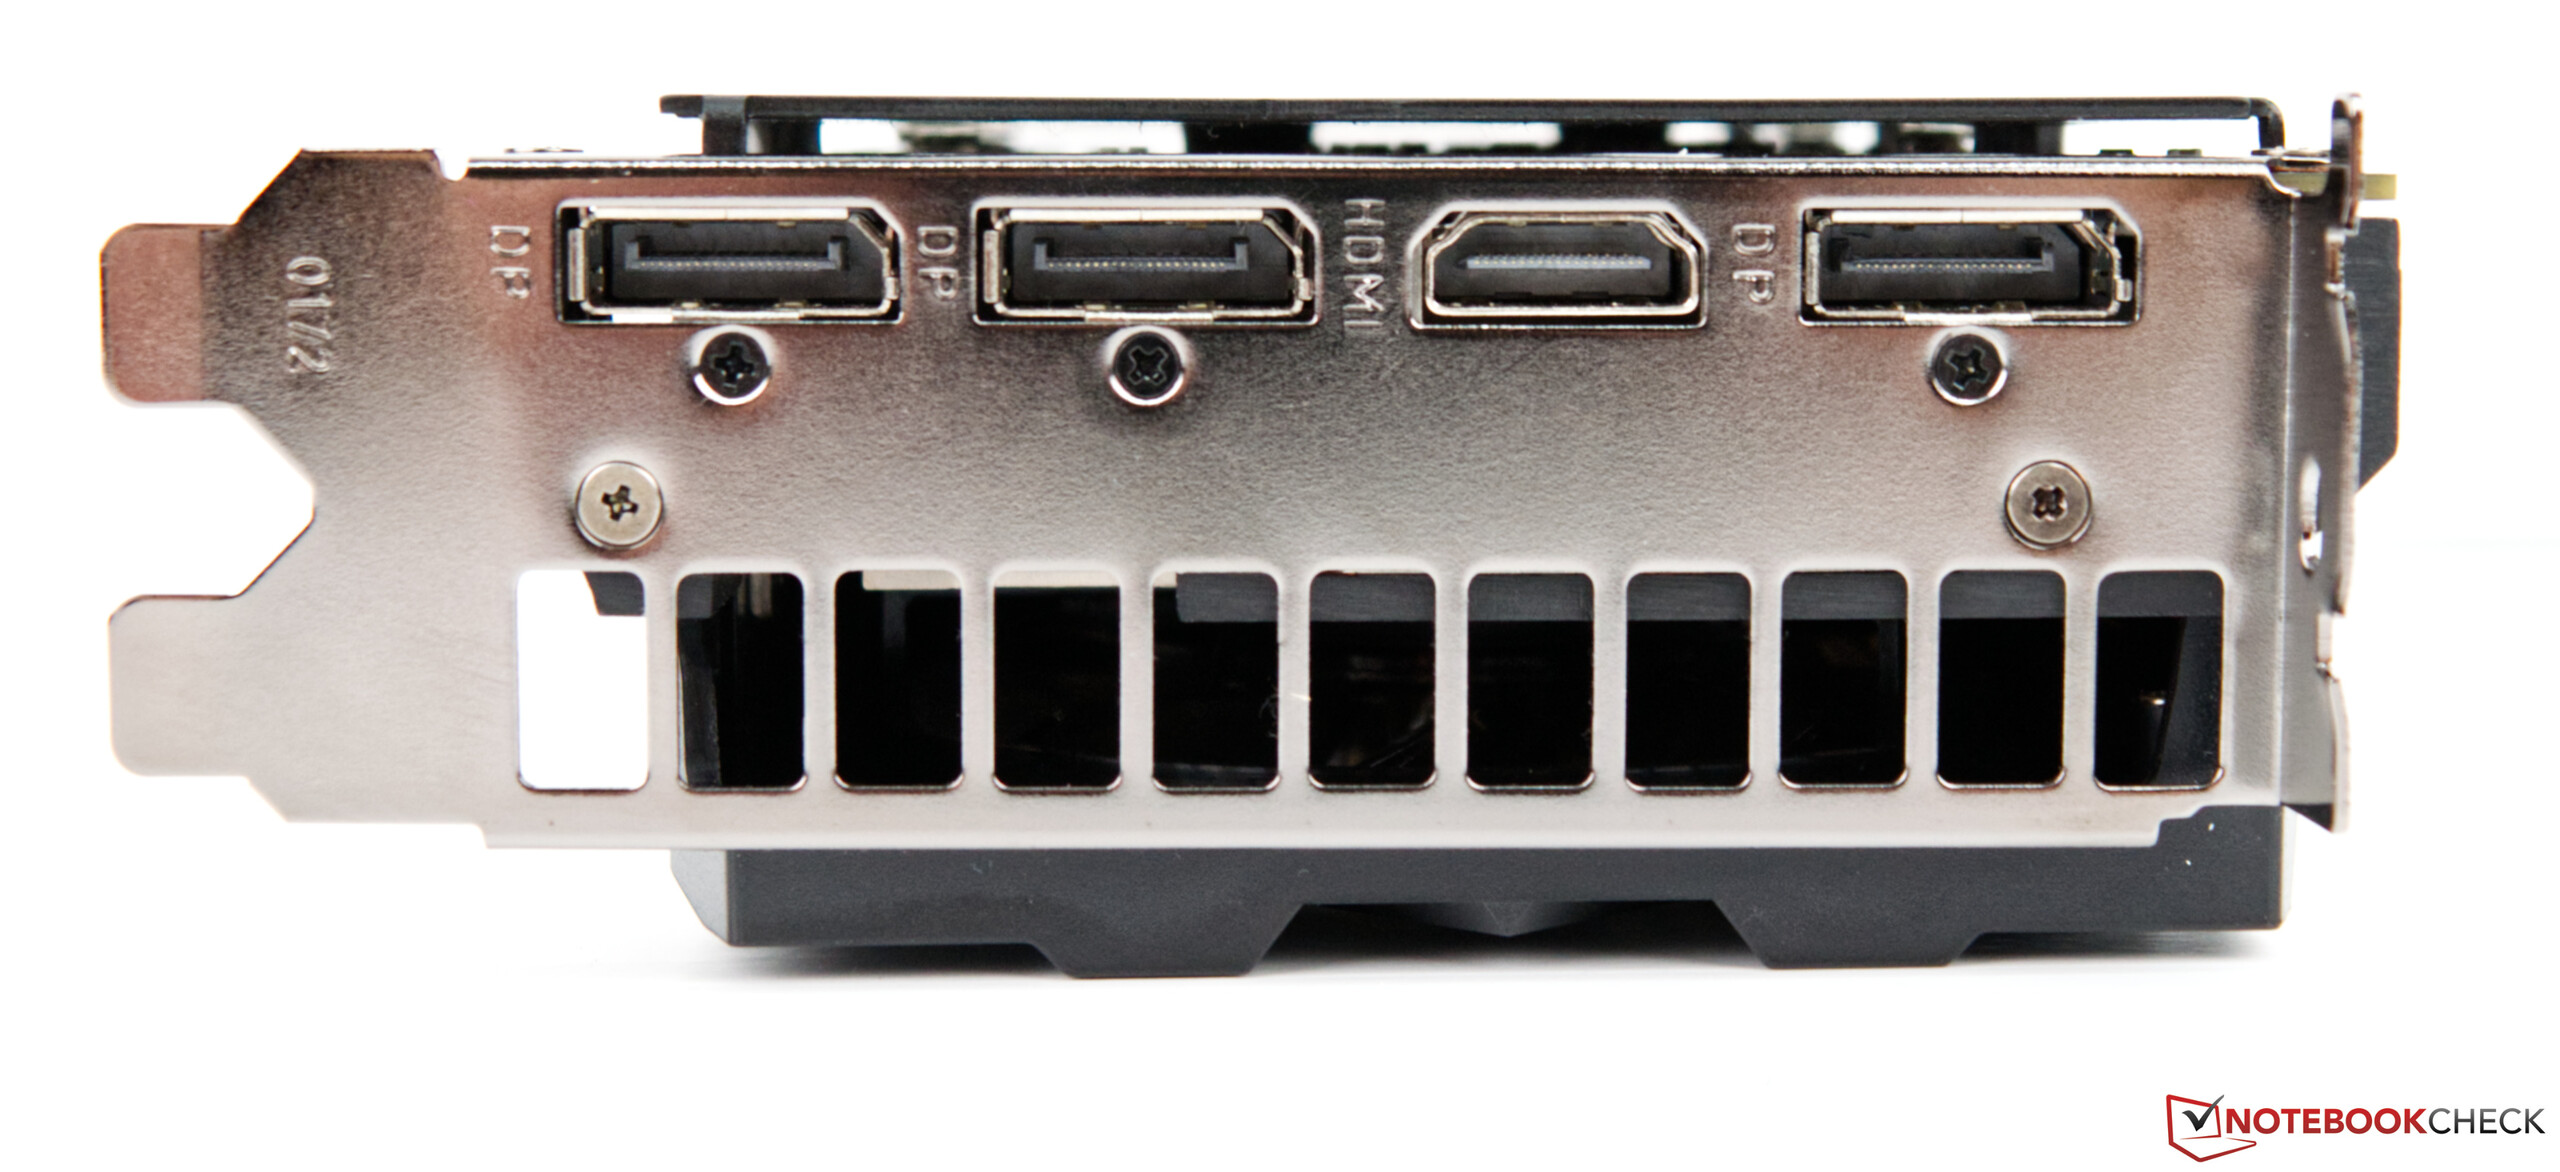
En el momento de escribir este artículo, la KFA2 GeForce RTX 2080 Ti EX se vende al por menor por unos 1070 euros ($1097), lo que es mucho para una GPU. Sin embargo, el modelo de Founders Edition cuesta mucho más. Aquí Nvidia pide 1259 Euros ($1381). Esto pone las cosas en perspectiva y hace que el modelo KFA2 parezca más atractivo, ya que es uno de los modelos más baratos del mercado. Aquellos que se decidan por un modelo KFA2 obtendrán una tarjeta gráfica muy potente con una buena nevera que es extremadamente silenciosa en funcionamiento 2D. Tampoco tendrá que renunciar a la iluminación RGB, ya que hay varios elementos RGB en el lateral, que se pueden configurar a través de la utilidad Xtreme Tuner. Desafortunadamente, el modelo KFA2 no dispone de un puerto USB tipo C, lo que resulta muy útil para las aplicaciones de RV. Aquellos que no utilizan la RV y no planean utilizarla en un futuro previsible no se verán afectados por la ausencia de un puerto USB de tipo C. Además, la KFA2 GeForce RTX 2080 Ti EX ofrece tres puertos DP y un puerto HDMI. La GPU requiere 250 vatios de energía y dos conectores de alimentación de 8 patillas.
Debido a que la solución de refrigeración sobredimensionada se extiende sobre la placa de circuito impreso, tendrá que asegurarse de que su carcasa tenga suficiente espacio libre. En comparación con el modelo de referencia, la GPU KFA2 es seis centímetros más larga (~2,4 pulgadas).
Las especificaciones de Turing en detalle
| Especificaciones | RTX 2060 | RTX 2060S | RTX 2070 | RTX 2070S | RTX 2080 | RTX 2080S | RTX 2080 Ti | KFA2 RTX 2080 Ti | Titan RTX |
| Arquitectura de la GPU | TU106 | TU106 | TU106 | TU104 | TU104 | TU104 | TU102 | TU102 | TU102 |
| Proceso de fabricación | 12 nm | 12 nm | 12 nm | 12 nm | 12 nm | 12 nm | 12 nm | 12 nm | 12 nm |
| CUDA Cores | 1.920 | 2.176 | 2.304 | 2.560 | 2.944 | 3.072 | 4.352 | 4.352 | 4.608 |
| Unidades de mapeo de texturas | 120 | 136 | 144 | 160 | 184 | 192 | 272 | 272 | 288 |
| Núcleos tensores | 240 | 272 | 288 | 320 | 368 | 384 | 544 | 544 | 572 |
| RT Cores | 30 | 34 | 36 | 40 | 46 | 48 | 68 | 68 | 72 |
| Frecuencia Base del Núcleo | 1.365 MHz | 1.470 MHz | 1.410 MHz | 1.605 MHz | 1.515 MHz | 1.650 MHz | 1.350 MHz | 1.350 MHz | 1.350 MHz |
| Frecuencia Boost del Núcleo | 1.680 MHz | 1.650 MHz | 1.620 MHz | 1.770 MHz | 1.710 MHz | 1.815 MHz | 1.545 MHz | 1.545 MHz | 1.770 MHz |
| Interfaz de memoria | 192 Bit | 256 Bit | 256 Bit | 256 Bit | 256 Bit | 256 Bit | 352 Bit | 352 Bit | 384 Bit |
| Ancho de banda de memoria | 336 GB/s | 448 GB/s | 448 GB/s | 448 GB/s | 448 GB/s | 496,1 GB/s | 616 GB/s | 616 GB/s | 672 GB/s |
| Memory Capacity | 6 GB GDDR6 | 8 GB GDDR6 | 8 GB GDDR6 | 8 GB GDDR6 | 8 GB GDDR6 | 8 GB GDDR6 | 11 GB GDDR6 | 11 GB GDDR6 | 24 GB GDDR6 |
| TDP | 160 W | 175 W | 175 W | 215 W | 215 W | 250 W | 250 W | 250 W | 280 W |
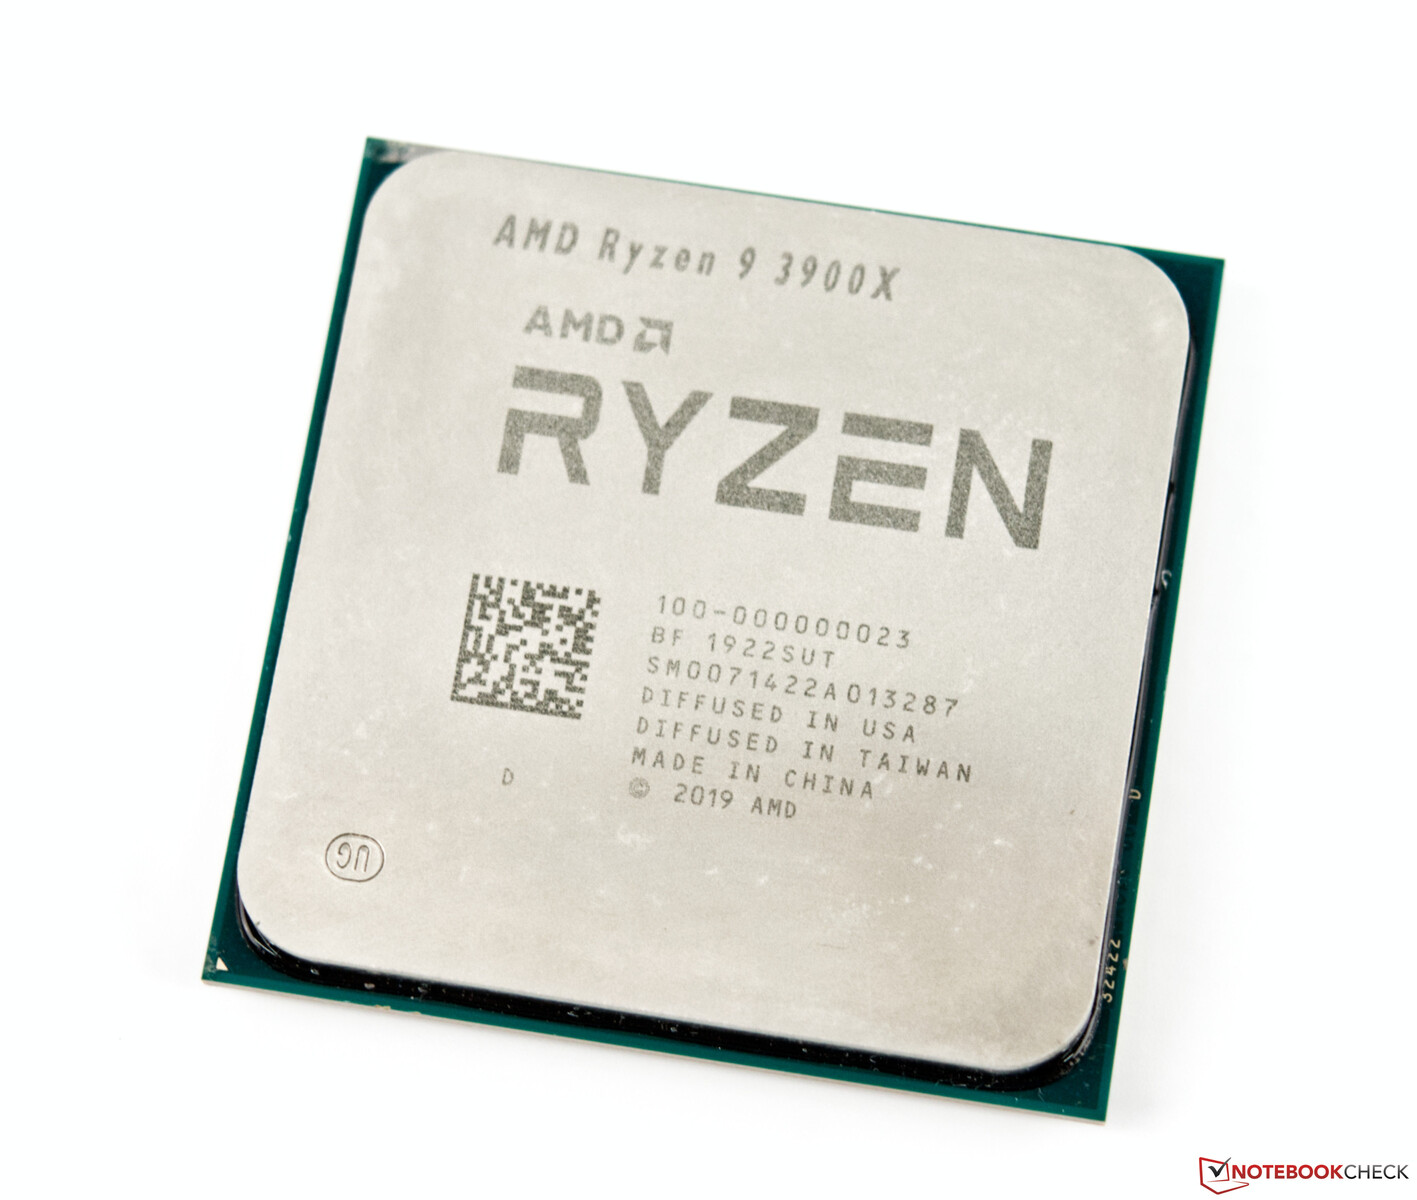
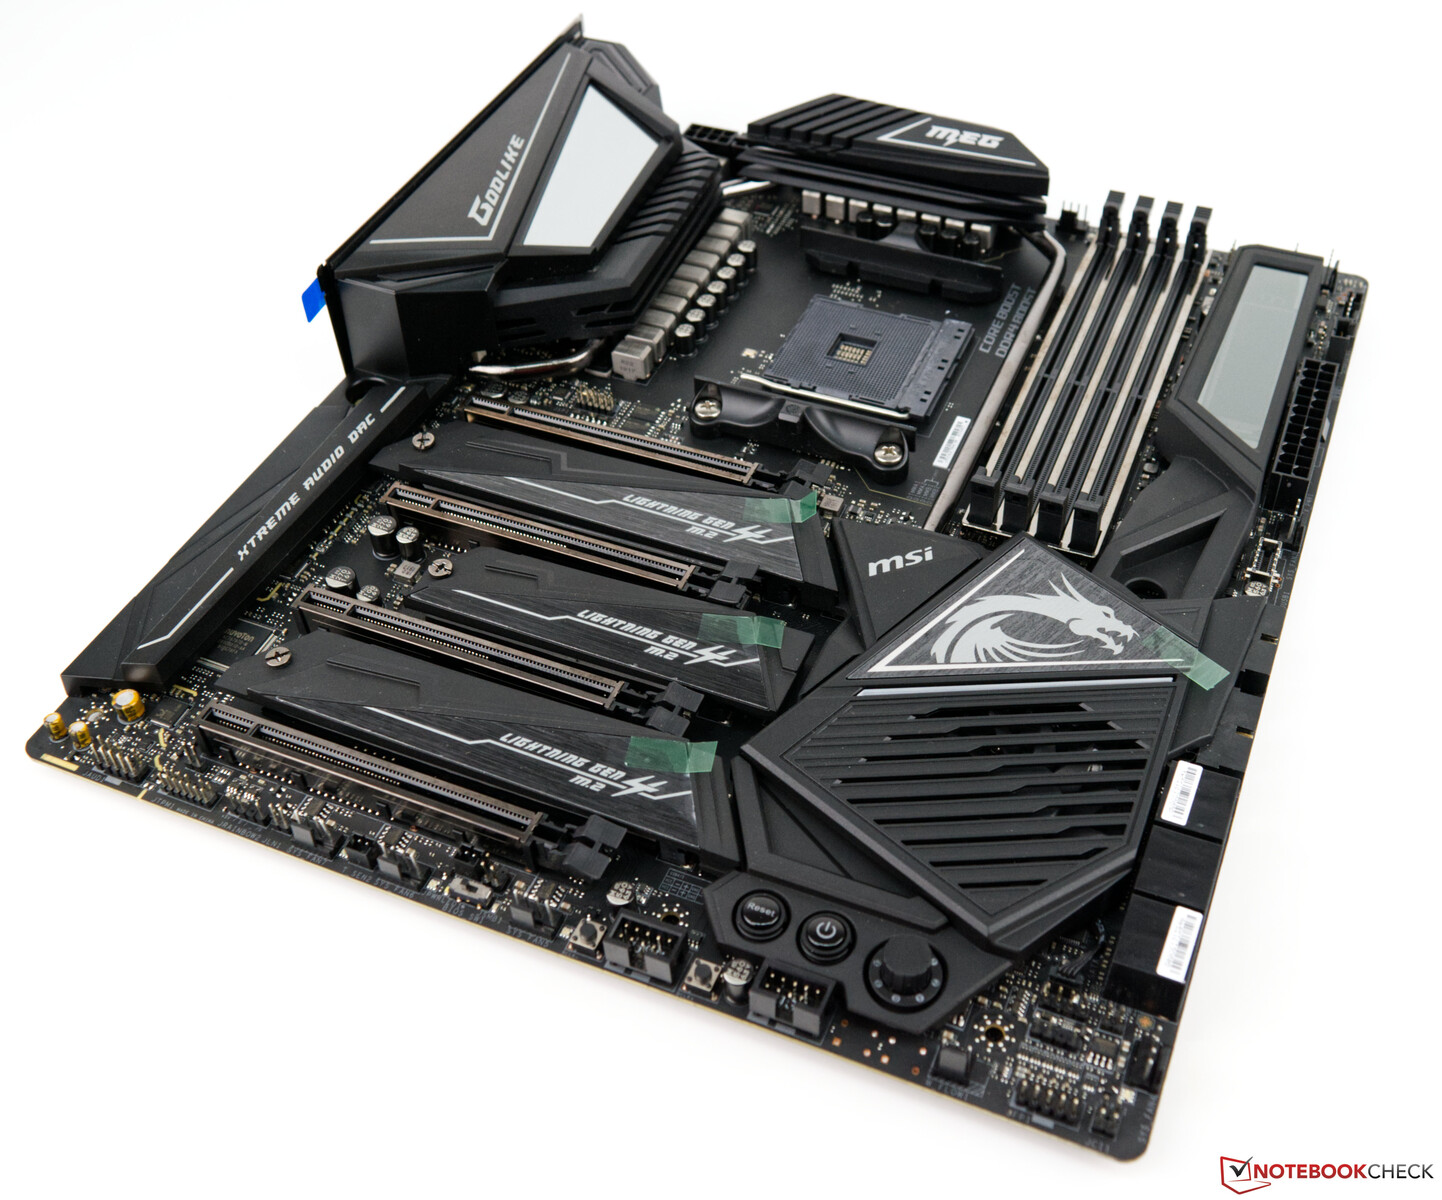
El banco de pruebas - Basado en el AMD Ryzen 9 3900X
Nuestro banco de pruebas se basa en una plataforma AMD actual. El MSI MEG X570 Godlike sirve como placa base. La CPU, conocida como AMD Ryzen 9 3900X, ofrece un gran rendimiento. El sistema es enfriado por un enfriador de agua todo en uno de Be Quiet (Silent Loop 280mm). Los 16 GB de 3600 MHz RAM provienen de G-Skill. El Acer Predator XB321HK no representa un cuello de botella, gracias a su resolución de 4K. Estamos muy agradecidos a AMD por habernos proporcionado el sistema antes mencionado.
Para los siguientes puntos de referencia utilizamos el siguiente sistema:
- Corsair Carbide Air 540 ATX Cube
- AMD Ryzen 9 3900X
- KFA2 GeForce RTX 2080 Ti EX 1-Click-OC (GeForce 436.30 driver)
- MSI MEG X570 Godlike (BIOS 1.20, default settings, XMP 1 for DDR4-3600 CL16)
- Antec 1200-watt power supply
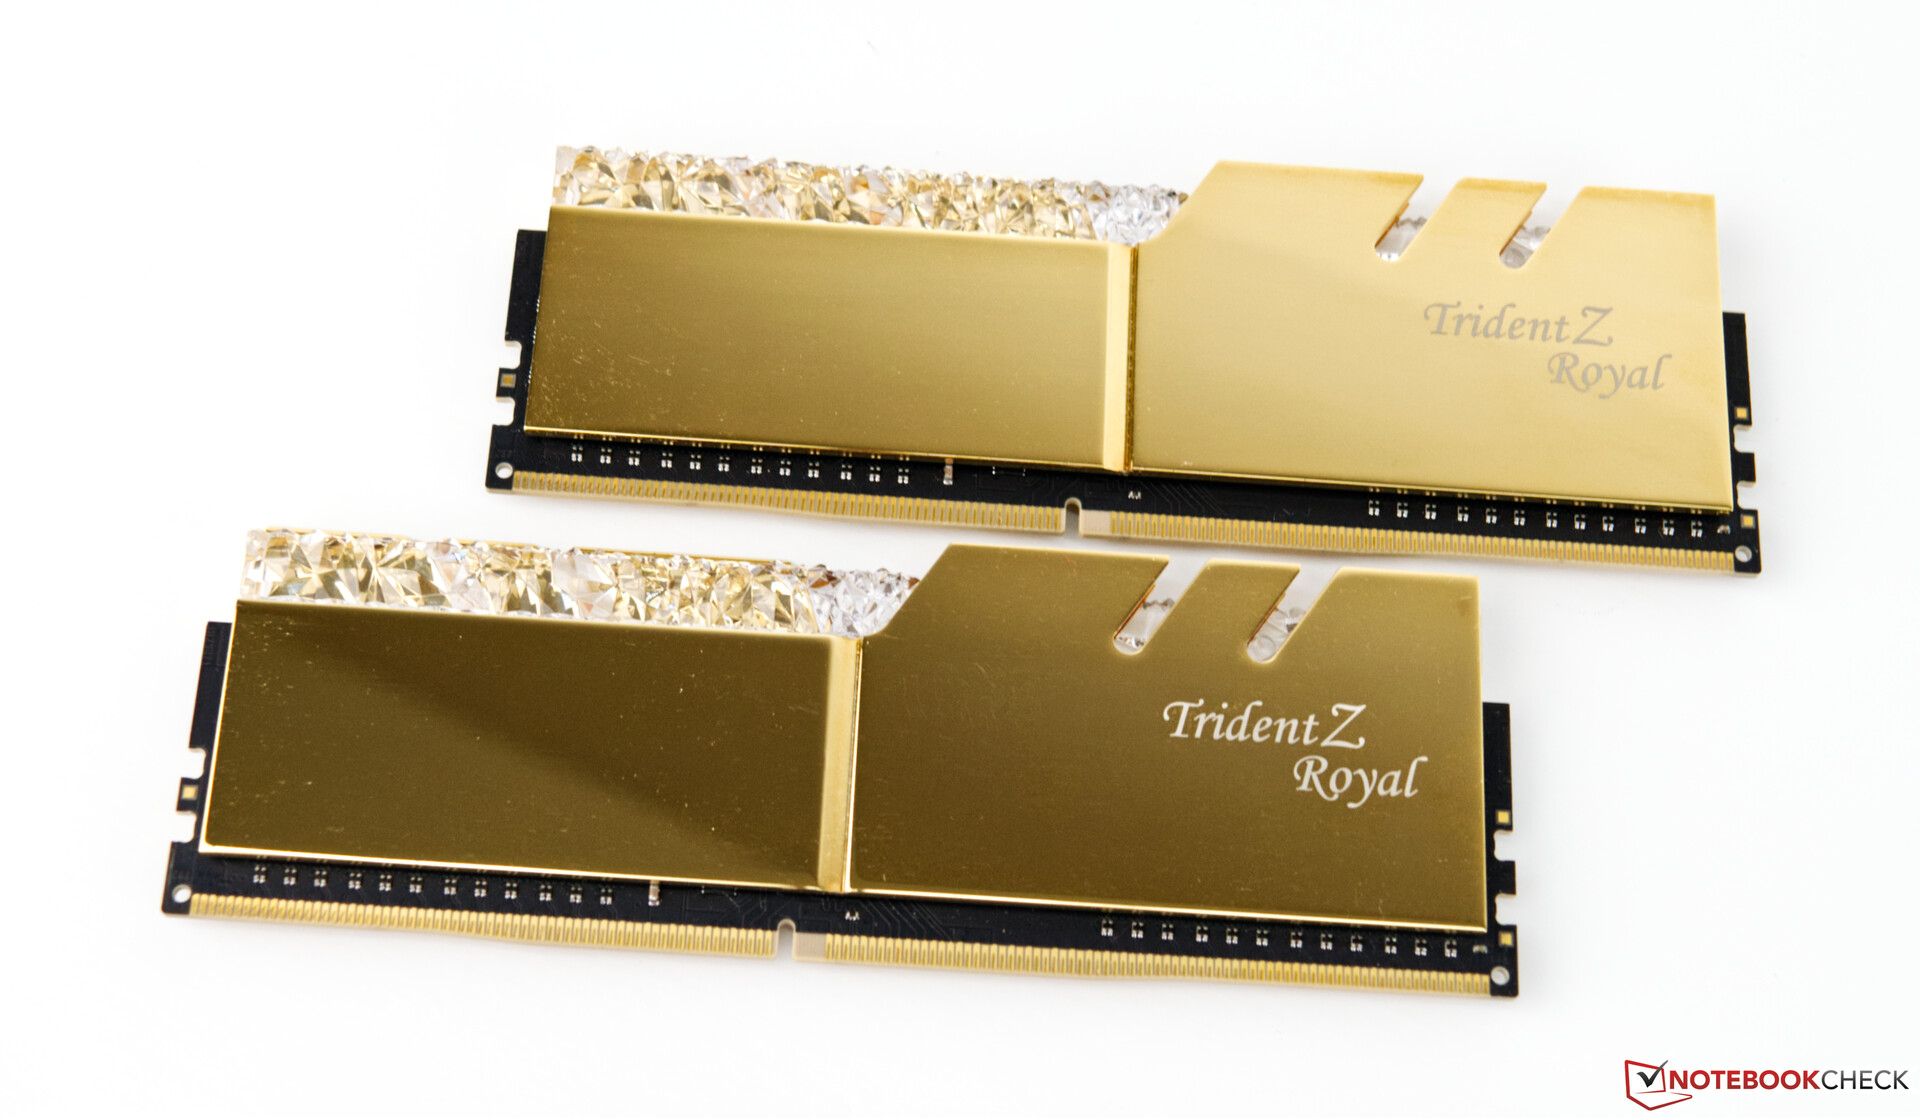
- G-Skill Trident Z Royal gold DDR4-3600 16 GB (2 x 8 GB), a 3600 MHz; ritmos: CL16-16-16-36
- SSD Corsair MP600 2TB M.2 PCIe 4.0
- Crucial MX500 2TB (para juegos)
Los relojes con núcleo de la GeForce RTX 2080 Ti EX KFA2
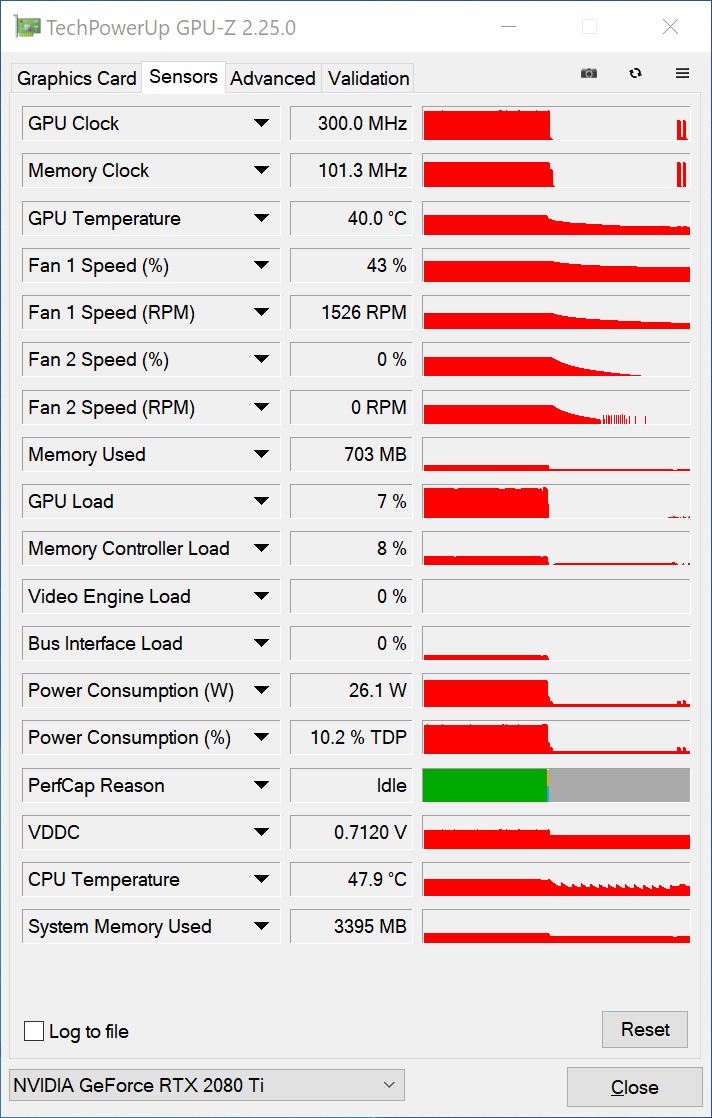
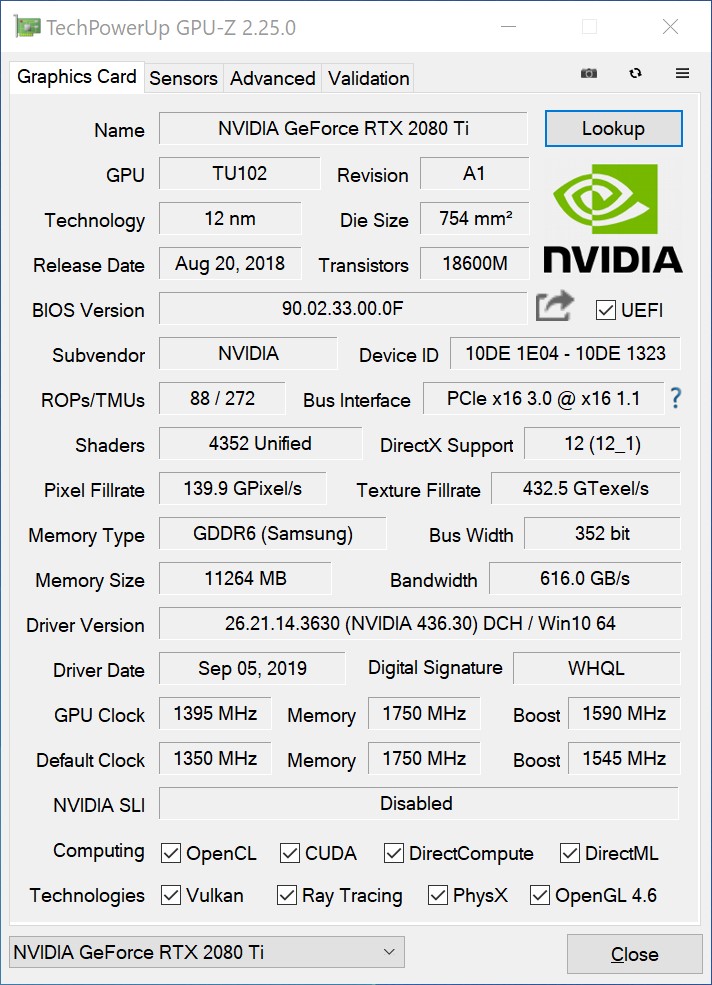
El modelo KFA2 tiene los mismos relojes de núcleo que el modelo de referencia. De acuerdo con la hoja de especificaciones, el reloj base es de 1350 MHz y el reloj de refuerzo es de 1545 MHz. Sin embargo, cuando se juega, la GPU funciona entre 1800 y 1900 MHz. El RTX 2080 Ti tiene 11 GB de VRAM, que está registrado a 1750 MHz (velocidad efectiva de la memoria: 14 GHz). Gracias al bus de 352 bits, el ancho de banda de memoria es de 616 GB/s.
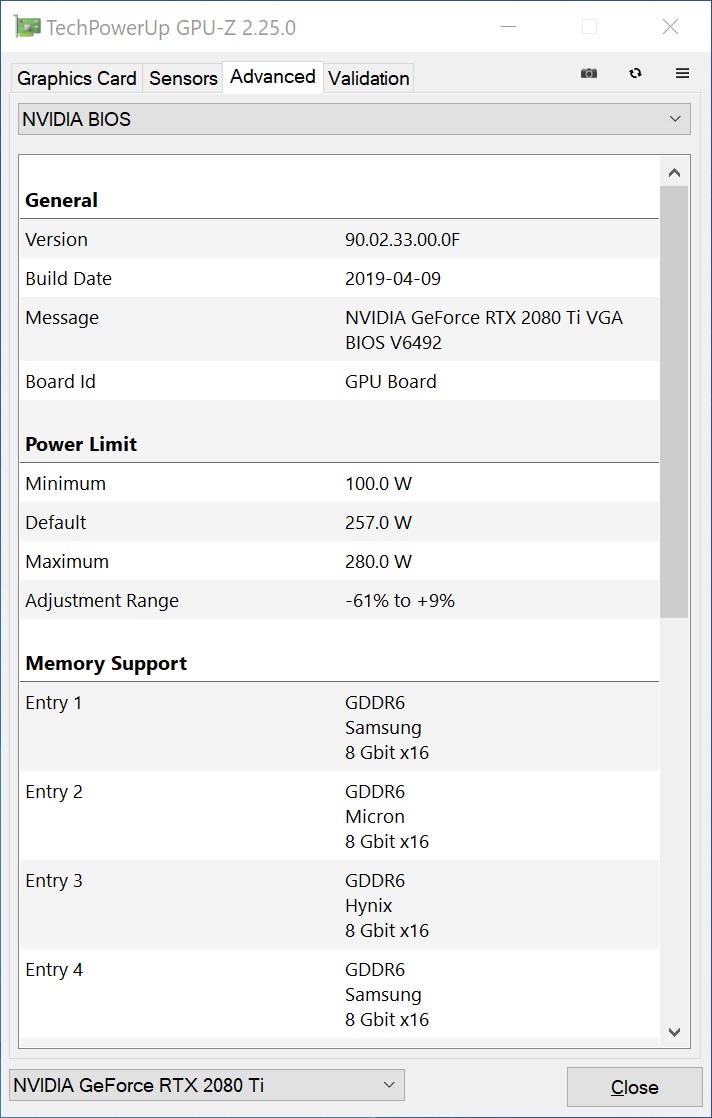
El TDP de la GPU KFA2 es de 250 vatios, es decir, 10 vatios menos que el del modelo de referencia. El modelo KFA2 casi siempre alcanza el límite de potencia, lo que significa que la GPU funciona a toda velocidad. El límite de potencia se puede aumentar con la utilidad de sintonización. Esto conduce a un reloj de empuje más alto y más estable. La KFA2 GeForce RTX 2080 Ti EX viene con la función 1 Click OC, que aumenta el reloj base en 45 MHz y fija el objetivo de potencia en un 108%.
Benchmarks sintéticos
Las pruebas de rendimiento sintéticas confirman que la GeForce RTX 2080 Ti EX de KFA2 ofrece un gran rendimiento. Sin embargo, la GeForce RTX 2080 Ti del Corsair One i160 supera a nuestro modelo de revisión. Esto demuestra que un sistema basado en Intel sigue siendo el mejor sistema para los juegos. Dicho esto, con una diferencia del 4%, nuestro sistema basado en Ryzen 9 funciona casi tan bien como el PC basado en Intel. La GeForce RTX 2080 Ti es un 23% más rápida que la GeForce RTX 2080 Super.
| 3DMark 11 - 1280x720 Performance GPU | |
| Corsair One i160 | |
| KFA2 GeForce RTX 2080 Ti EX | |
| Nvidia Titan RTX | |
| MSI RTX 2080 Gaming X Trio | |
| Nvidia GeForce RTX 2080 Super | |
| AMD Radeon VII | |
| AMD Radeon RX 5700 XT | |
| Nvidia GeForce RTX 2070 Super | |
| AMD Radeon RX 5700 | |
| MSI RTX 2070 Gaming Z 8G | |
| Nvidia GeForce RTX 2060 Super | |
| AMD Radeon RX Vega 64 | |
| MSI RTX 2060 Gaming Z 6G | |
| Unigine Valley 1.0 | |
| 1920x1080 Extreme HD DirectX AA:x8 | |
| Corsair One i160 | |
| KFA2 GeForce RTX 2080 Ti EX | |
| Nvidia Titan RTX | |
| Nvidia GeForce RTX 2080 Super | |
| MSI RTX 2080 Gaming X Trio | |
| Nvidia GeForce RTX 2070 Super | |
| MSI RTX 2070 Gaming Z 8G | |
| AMD Radeon VII | |
| Nvidia GeForce RTX 2060 Super | |
| AMD Radeon RX 5700 XT | |
| AMD Radeon RX 5700 | |
| MSI RTX 2060 Gaming Z 6G | |
| 1920x1080 Extreme HD Preset OpenGL AA:x8 | |
| KFA2 GeForce RTX 2080 Ti EX | |
| Corsair One i160 | |
| Nvidia Titan RTX | |
| Nvidia GeForce RTX 2080 Super | |
| MSI RTX 2080 Gaming X Trio | |
| Nvidia GeForce RTX 2070 Super | |
| MSI RTX 2070 Gaming Z 8G | |
| Nvidia GeForce RTX 2060 Super | |
| AMD Radeon RX 5700 XT | |
| MSI RTX 2060 Gaming Z 6G | |
| AMD Radeon RX 5700 | |
| AMD Radeon VII | |
| 3DMark 05 Standard | 52639 puntos | |
| 3DMark 06 Standard Score | 44825 puntos | |
| 3DMark Vantage P Result | 82093 puntos | |
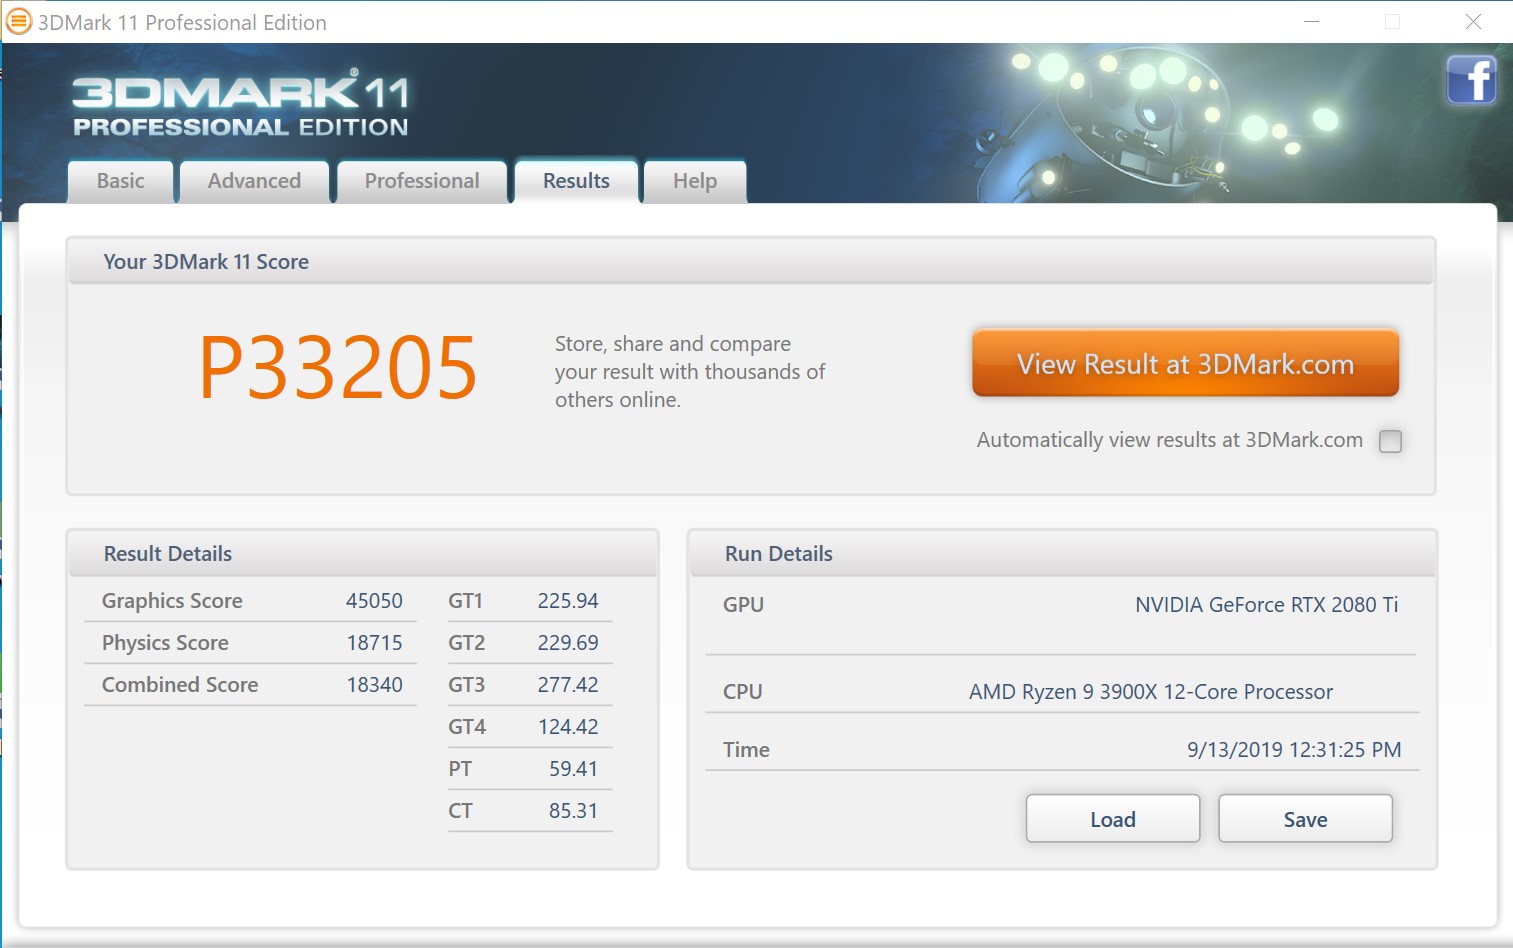
| 3DMark 11 Performance | 33205 puntos | |
| 3DMark Ice Storm Standard Score | 209400 puntos | |
| 3DMark Cloud Gate Standard Score | 57827 puntos | |
| 3DMark Fire Strike Score | 25890 puntos | |
| 3DMark Fire Strike Extreme Score | 15211 puntos | |
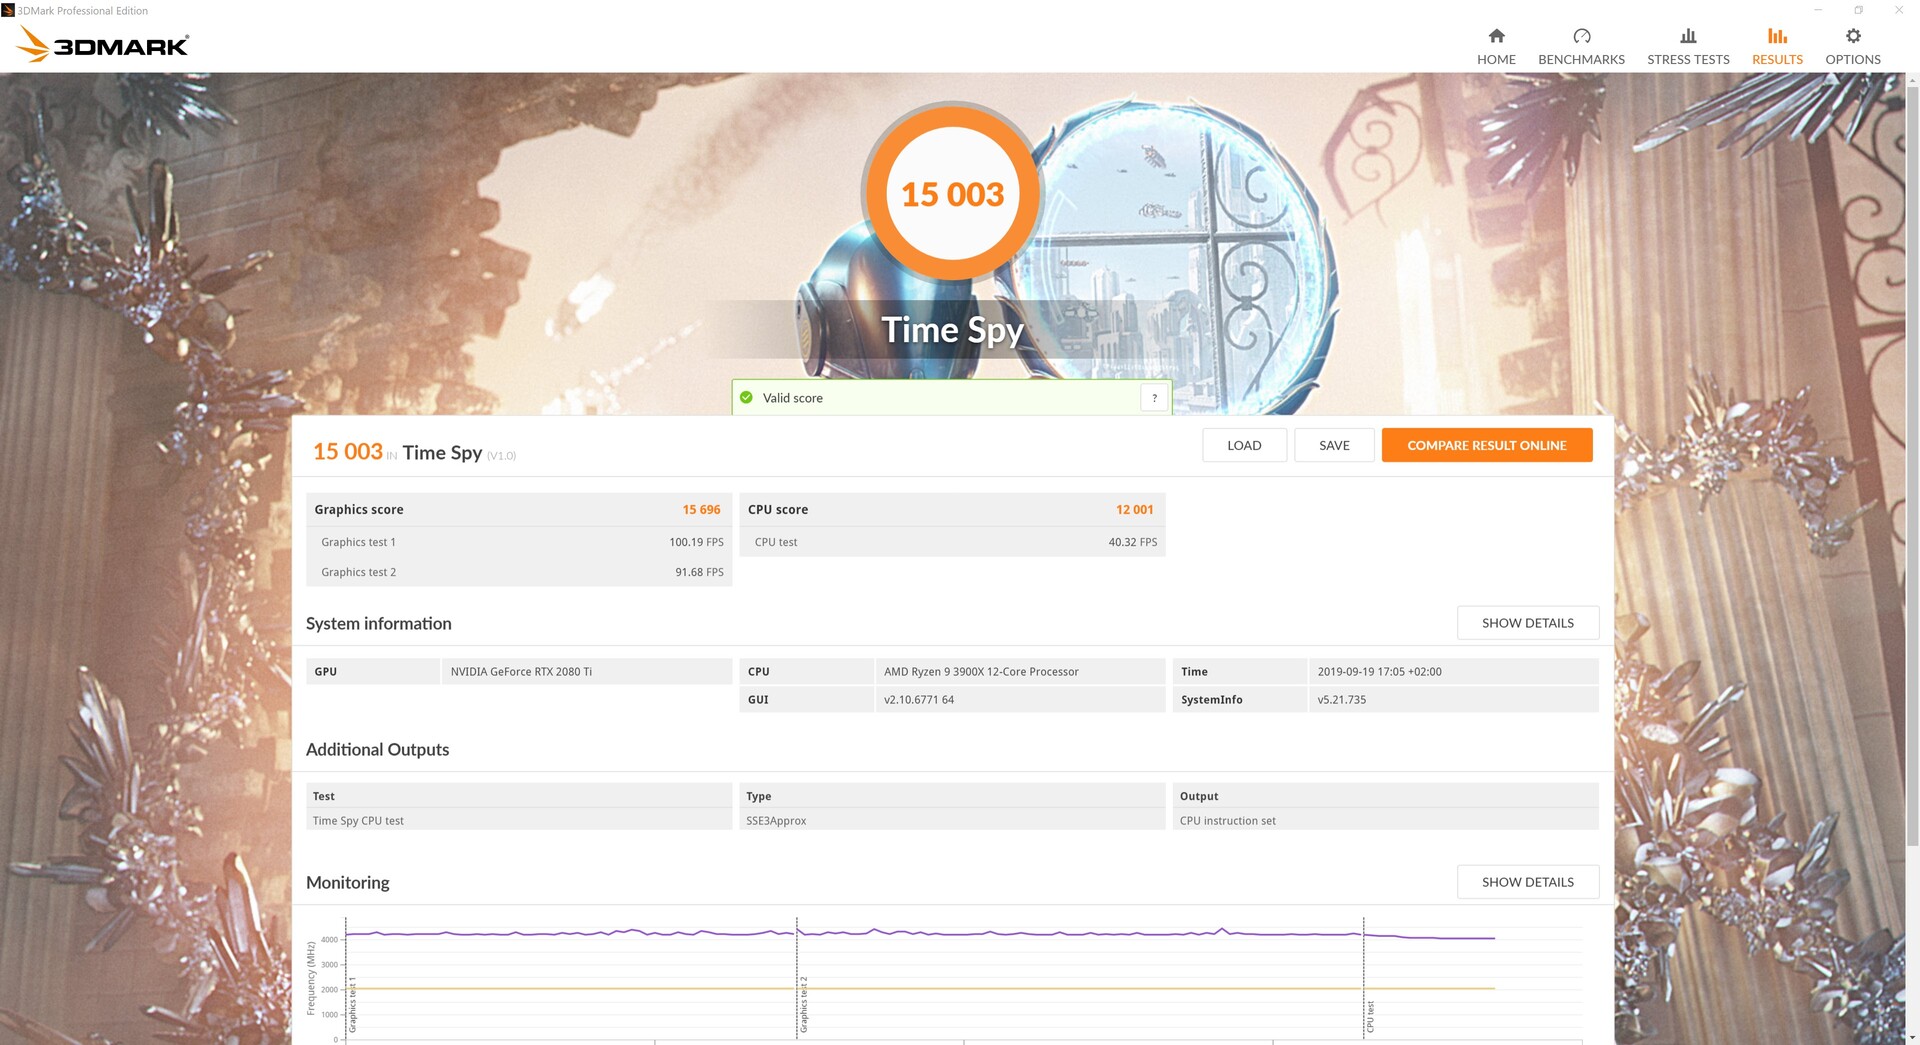
| 3DMark Time Spy Score | 13424 puntos | |
ayuda | ||
Benchmarks de juego
Las pruebas de juego no dejan ninguna duda de que la KFA2 GeForce RTX 2080 Ti es una tarjeta gráfica muy rápida. No importa si usas un sistema basado en Intel o un PC con tecnología Ryzen. Por supuesto, hay juegos que funcionan mejor con una CPU u otra. Cuando comparamos juegos con resoluciones muy altas, la CPU deja de ser el principal cuello de botella, que es el de resoluciones más bajas. La GeForce RTX 2080 Ti puede ejecutar todos los títulos actuales en 4K sin problemas. Además, las características adicionales de RTX hacen que los juegos se vean mucho más impresionantes.
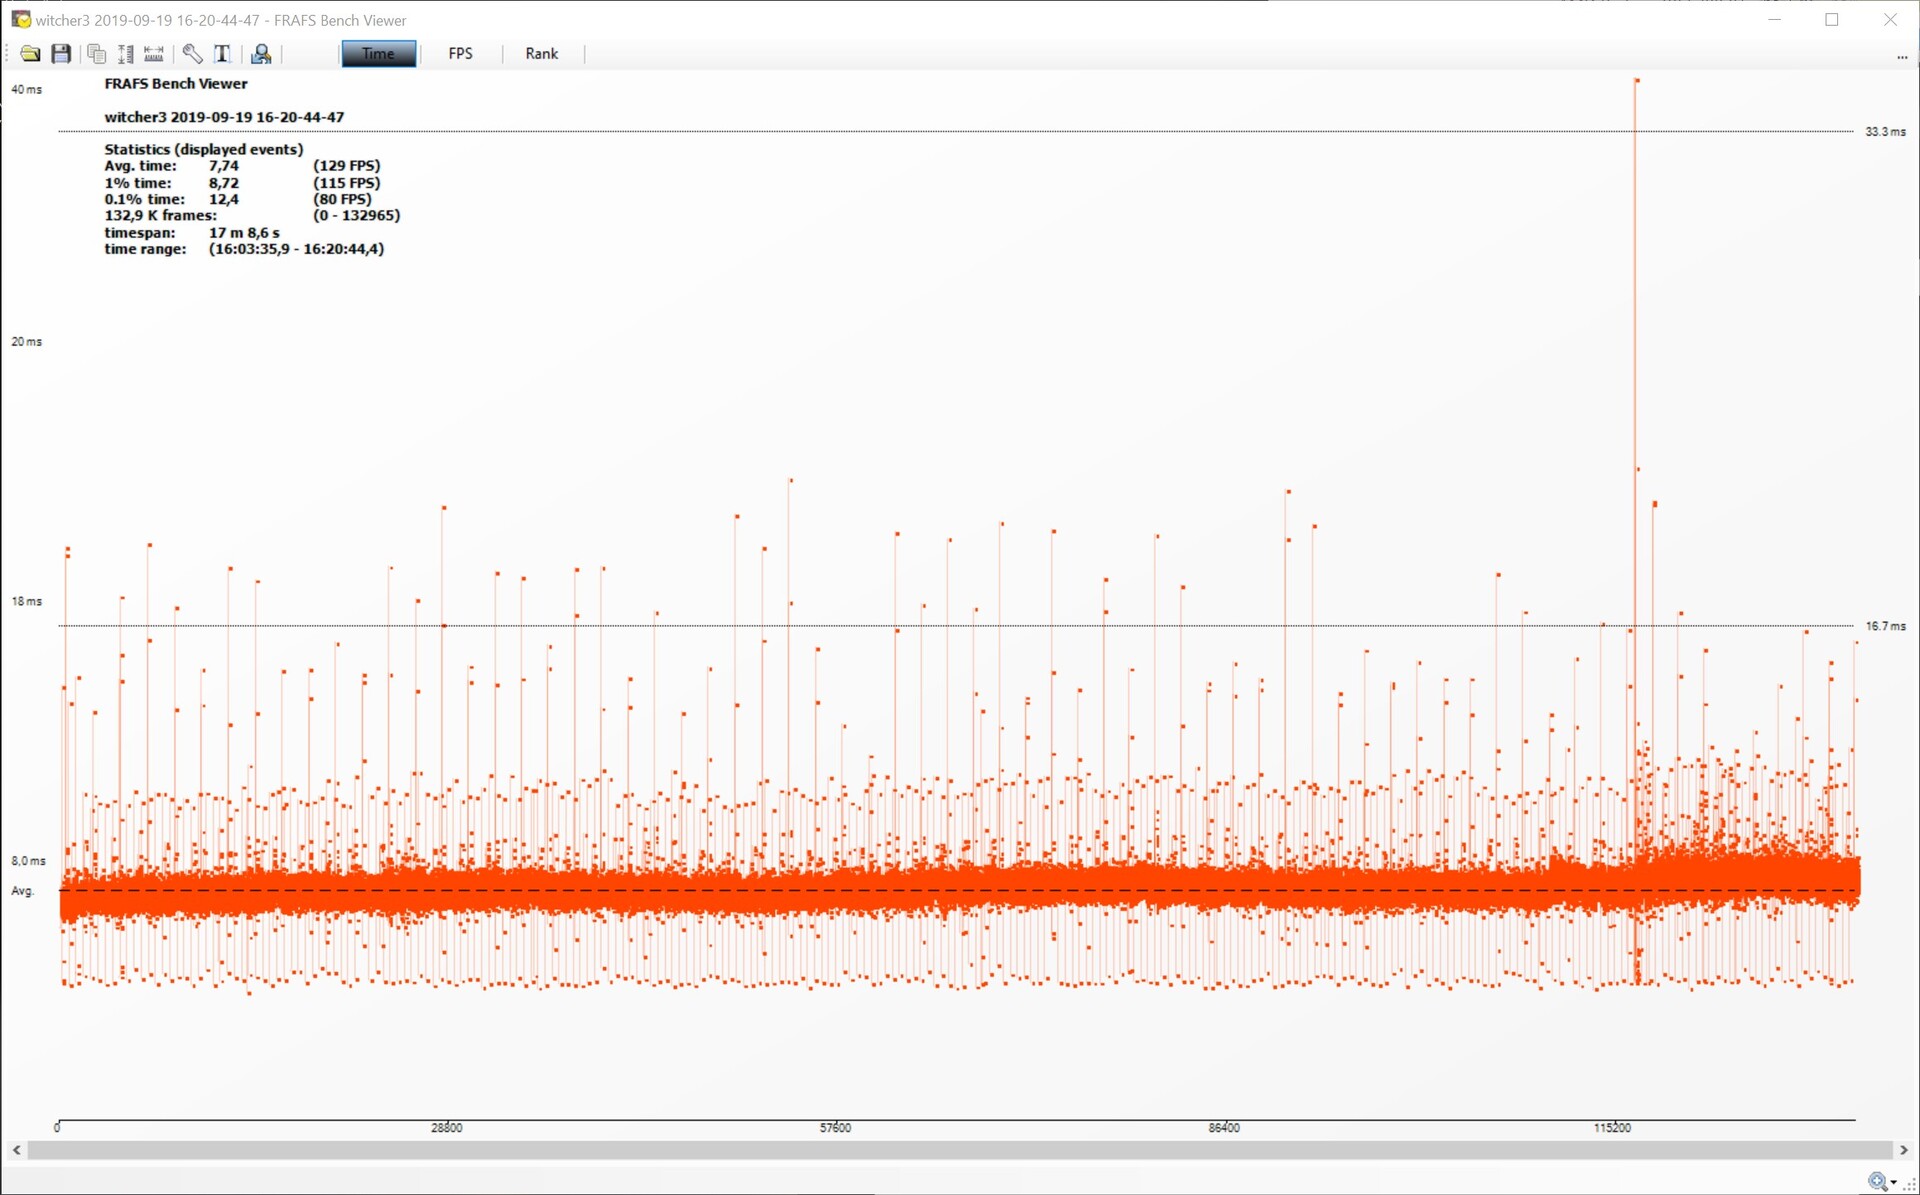
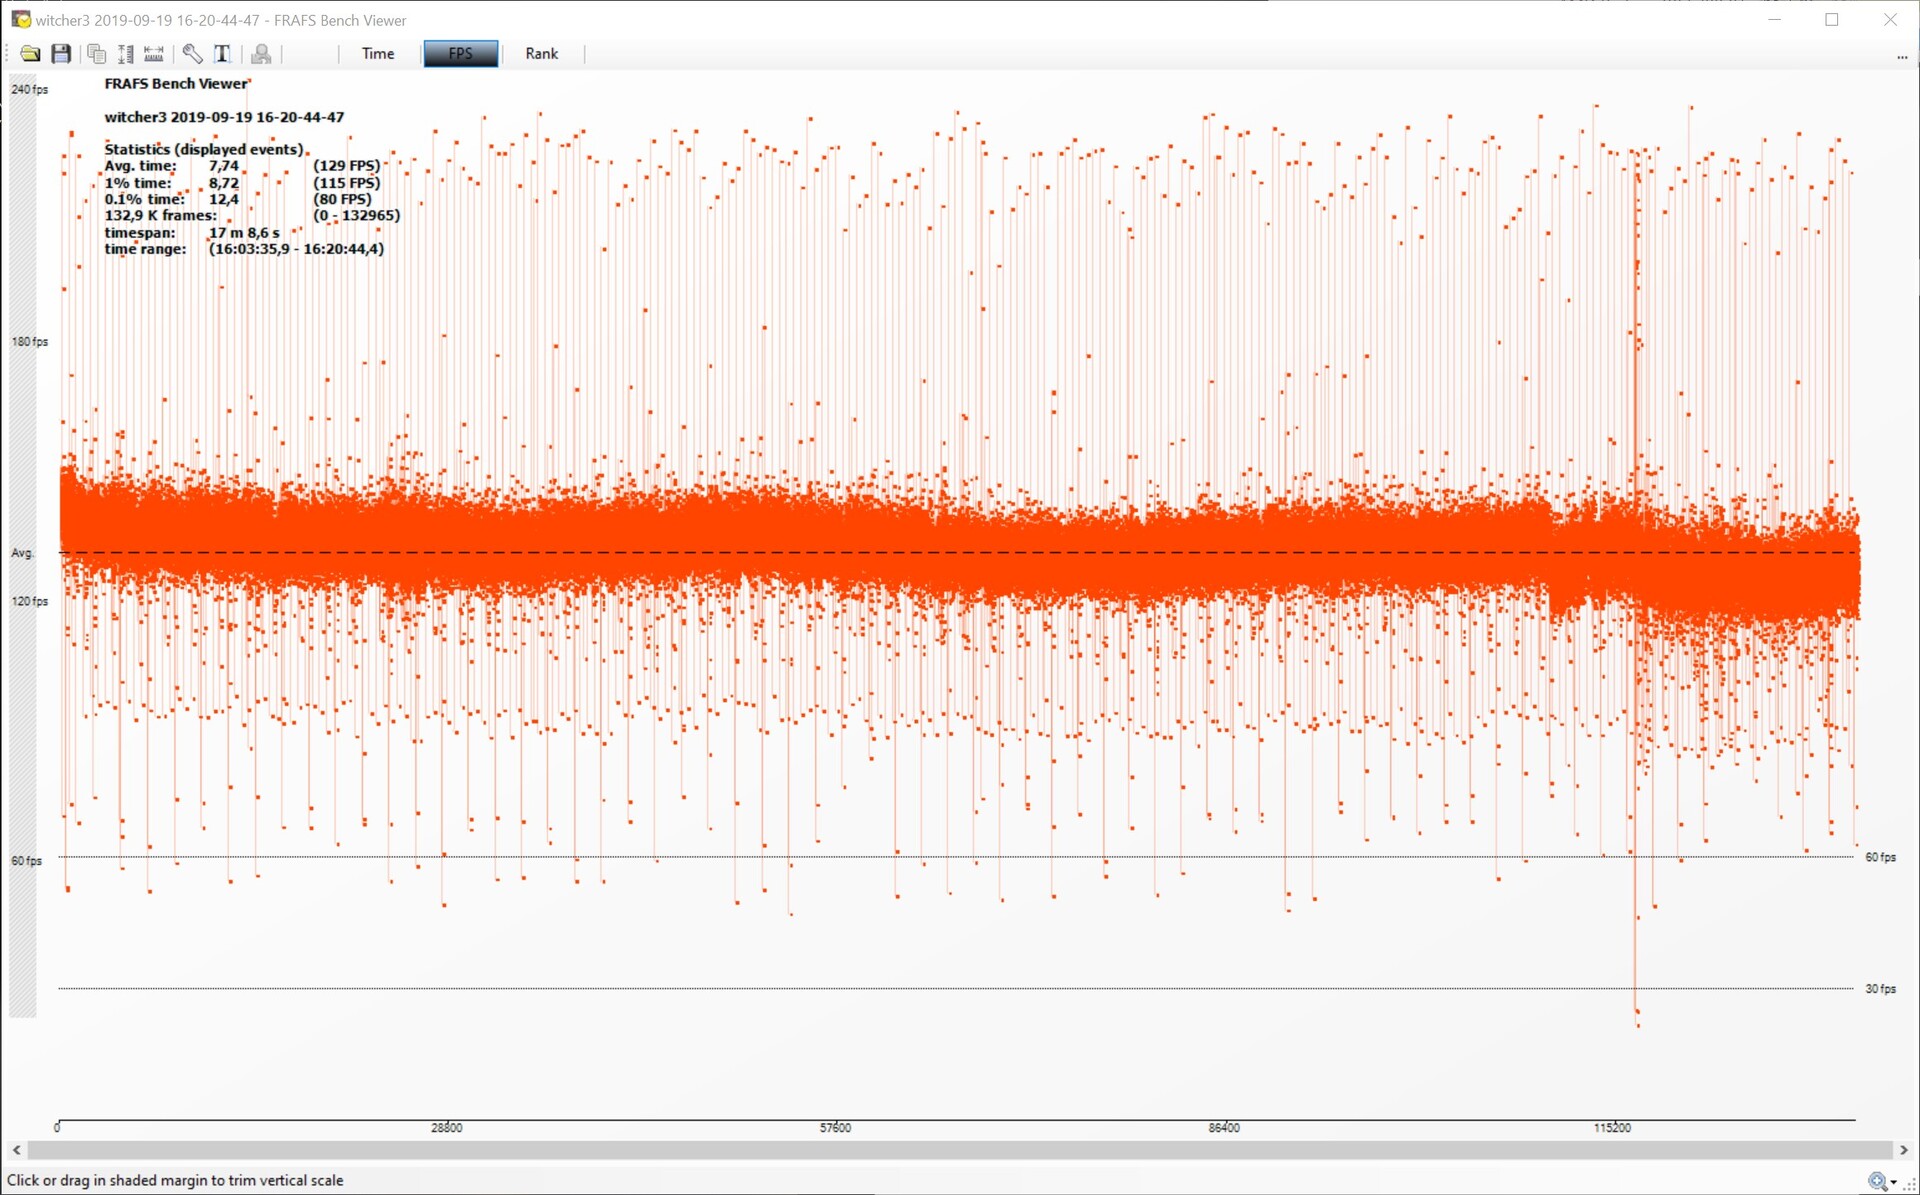
No encontramos ningún comportamiento anormal cuando se trata de tiempos y frecuencias de cuadro. Hay picos y caídas ocasionales en las frecuencias de cuadro, pero son muy cortos y no se notan durante el juego real. Recopilamos los datos de tiempo y frecuencia de fotogramas con el videojuego conocido como The Witcher 3 (preset: Ultra). El rendimiento del modelo KFA2 cayó ligeramente en el transcurso de nuestra carrera de referencia, se hundió de 135 FPS a 130 FPS. Estas tasas de fotogramas siguen siendo muy altas, lo que significa que el juego seguirá siendo más que jugable incluso durante sesiones de juego muy largas.
La frecuencia de imagen de Witcher 3 en ultra
| Forza Horizon 4 | |
| 1920x1080 Ultra Preset AA:2xMS | |
| KFA2 GeForce RTX 2080 Ti EX | |
| Corsair One i160 | |
| AMD Radeon RX 5700 XT | |
| MSI RTX 2080 Gaming X Trio | |
| AMD Radeon RX 5700 XT | |
| Nvidia GeForce RTX 2080 Super | |
| Nvidia Titan RTX | |
| AMD Radeon VII | |
| Nvidia GeForce RTX 2070 Super | |
| AMD Radeon RX Vega 64 | |
| AMD Radeon RX 5700 | |
| MSI RTX 2070 Gaming Z 8G | |
| Nvidia GeForce RTX 2060 Super | |
| MSI RTX 2060 Gaming Z 6G | |
| 3840x2160 Ultra Preset AA:2xMS | |
| KFA2 GeForce RTX 2080 Ti EX | |
| Corsair One i160 | |
| Nvidia Titan RTX | |
| MSI RTX 2080 Gaming X Trio | |
| Nvidia GeForce RTX 2080 Super | |
| AMD Radeon RX 5700 XT | |
| AMD Radeon VII | |
| Nvidia GeForce RTX 2070 Super | |
| AMD Radeon RX 5700 | |
| MSI RTX 2070 Gaming Z 8G | |
| AMD Radeon RX Vega 64 | |
| Nvidia GeForce RTX 2060 Super | |
| MSI RTX 2060 Gaming Z 6G | |
| 2560x1440 Ultra Preset AA:2xMS | |
| KFA2 GeForce RTX 2080 Ti EX | |
| Corsair One i160 | |
| AMD Radeon RX 5700 XT | |
| MSI RTX 2080 Gaming X Trio | |
| Nvidia GeForce RTX 2080 Super | |
| Nvidia GeForce RTX 2070 Super | |
| AMD Radeon RX 5700 | |
| MSI RTX 2070 Gaming Z 8G | |
| Nvidia GeForce RTX 2060 Super | |
| F1 2018 | |
| 1920x1080 Ultra High Preset AA:T AF:16x | |
| Corsair One i160 | |
| Nvidia Titan RTX | |
| MSI RTX 2080 Gaming X Trio | |
| AMD Radeon VII | |
| Nvidia GeForce RTX 2070 Super | |
| Nvidia GeForce RTX 2080 Super | |
| MSI RTX 2070 Gaming Z 8G | |
| Nvidia GeForce RTX 2060 Super | |
| KFA2 GeForce RTX 2080 Ti EX | |
| MSI RTX 2060 Gaming Z 6G | |
| AMD Radeon RX Vega 64 | |
| 3840x2160 Ultra High Preset AA:T AF:16x | |
| Nvidia Titan RTX | |
| Corsair One i160 | |
| KFA2 GeForce RTX 2080 Ti EX | |
| MSI RTX 2080 Gaming X Trio | |
| Nvidia GeForce RTX 2080 Super | |
| AMD Radeon VII | |
| Nvidia GeForce RTX 2070 Super | |
| MSI RTX 2070 Gaming Z 8G | |
| Nvidia GeForce RTX 2060 Super | |
| MSI RTX 2060 Gaming Z 6G | |
| AMD Radeon RX Vega 64 | |
| 2560x1440 Ultra High Preset AA:T AF:16x | |
| Corsair One i160 | |
| MSI RTX 2080 Gaming X Trio | |
| Nvidia GeForce RTX 2080 Super | |
| KFA2 GeForce RTX 2080 Ti EX | |
| Nvidia GeForce RTX 2070 Super | |
| MSI RTX 2070 Gaming Z 8G | |
| Nvidia GeForce RTX 2060 Super | |
| Monster Hunter World | |
| 1920x1080 Highest Preset (Image Quality High) | |
| Corsair One i160 | |
| Nvidia Titan RTX | |
| MSI RTX 2080 Gaming X Trio | |
| Nvidia GeForce RTX 2080 Super | |
| Nvidia GeForce RTX 2070 Super | |
| MSI RTX 2070 Gaming Z 8G | |
| AMD Radeon VII | |
| Nvidia GeForce RTX 2060 Super | |
| AMD Radeon RX 5700 XT | |
| MSI RTX 2060 Gaming Z 6G | |
| AMD Radeon RX Vega 64 | |
| AMD Radeon RX 5700 | |
| 3840x2160 Highest Preset (Image Quality High) | |
| Nvidia Titan RTX | |
| Corsair One i160 | |
| MSI RTX 2080 Gaming X Trio | |
| Nvidia GeForce RTX 2080 Super | |
| Nvidia GeForce RTX 2070 Super | |
| AMD Radeon VII | |
| MSI RTX 2070 Gaming Z 8G | |
| AMD Radeon RX 5700 XT | |
| AMD Radeon RX Vega 64 | |
| Nvidia GeForce RTX 2060 Super | |
| AMD Radeon RX 5700 | |
| MSI RTX 2060 Gaming Z 6G | |
| 2560x1440 Highest Preset (Image Quality High) | |
| Corsair One i160 | |
| MSI RTX 2080 Gaming X Trio | |
| Nvidia GeForce RTX 2080 Super | |
| Nvidia GeForce RTX 2070 Super | |
| MSI RTX 2070 Gaming Z 8G | |
| AMD Radeon RX 5700 XT | |
| Nvidia GeForce RTX 2060 Super | |
| AMD Radeon RX 5700 | |
| Destiny 2 | |
| 1920x1080 Highest Preset AA:SM AF:16x | |
| Corsair One i160 | |
| KFA2 GeForce RTX 2080 Ti EX | |
| Nvidia Titan RTX | |
| MSI RTX 2070 Gaming Z 8G | |
| Nvidia GeForce RTX 2080 Super | |
| MSI RTX 2080 Gaming X Trio | |
| Nvidia GeForce RTX 2060 Super | |
| Nvidia GeForce RTX 2070 Super | |
| AMD Radeon RX 5700 XT | |
| AMD Radeon RX 5700 | |
| AMD Radeon VII | |
| MSI RTX 2060 Gaming Z 6G | |
| 3840x2160 Highest Preset AA:SM AF:16x | |
| Nvidia Titan RTX | |
| Corsair One i160 | |
| KFA2 GeForce RTX 2080 Ti EX | |
| Nvidia GeForce RTX 2080 Super | |
| MSI RTX 2080 Gaming X Trio | |
| Nvidia GeForce RTX 2070 Super | |
| MSI RTX 2070 Gaming Z 8G | |
| AMD Radeon RX 5700 XT | |
| Nvidia GeForce RTX 2060 Super | |
| AMD Radeon VII | |
| MSI RTX 2060 Gaming Z 6G | |
| AMD Radeon RX 5700 | |
| 2560x1440 Highest Preset AA:SM AF:16x | |
| Corsair One i160 | |
| KFA2 GeForce RTX 2080 Ti EX | |
| Nvidia GeForce RTX 2080 Super | |
| MSI RTX 2080 Gaming X Trio | |
| Nvidia GeForce RTX 2070 Super | |
| MSI RTX 2070 Gaming Z 8G | |
| AMD Radeon RX 5700 XT | |
| Nvidia GeForce RTX 2060 Super | |
| AMD Radeon RX 5700 | |
| The Witcher 3 | |
| 1920x1080 Ultra Graphics & Postprocessing (HBAO+) | |
| KFA2 GeForce RTX 2080 Ti EX | |
| Corsair One i160 | |
| Nvidia Titan RTX | |
| MSI RTX 2080 Gaming X Trio | |
| Nvidia GeForce RTX 2080 Super | |
| Nvidia GeForce RTX 2070 Super | |
| AMD Radeon RX 5700 XT | |
| AMD Radeon RX 5700 XT | |
| MSI RTX 2070 Gaming Z 8G | |
| AMD Radeon RX 5700 | |
| Nvidia GeForce RTX 2060 Super | |
| AMD Radeon RX Vega 64 | |
| AMD Radeon VII | |
| MSI RTX 2060 Gaming Z 6G | |
| 3840x2160 High Graphics & Postprocessing (Nvidia HairWorks Off) | |
| Nvidia Titan RTX | |
| Corsair One i160 | |
| KFA2 GeForce RTX 2080 Ti EX | |
| Nvidia GeForce RTX 2080 Super | |
| MSI RTX 2080 Gaming X Trio | |
| Nvidia GeForce RTX 2070 Super | |
| MSI RTX 2070 Gaming Z 8G | |
| Nvidia GeForce RTX 2060 Super | |
| AMD Radeon VII | |
| AMD Radeon RX 5700 XT | |
| MSI RTX 2060 Gaming Z 6G | |
| AMD Radeon RX Vega 64 | |
| AMD Radeon RX 5700 | |
| Watch Dogs 2 | |
| 1920x1080 Ultra Preset | |
| Corsair One i160 | |
| KFA2 GeForce RTX 2080 Ti EX | |
| Nvidia Titan RTX | |
| Nvidia GeForce RTX 2080 Super | |
| MSI RTX 2080 Gaming X Trio | |
| Nvidia GeForce RTX 2070 Super | |
| MSI RTX 2070 Gaming Z 8G | |
| Nvidia GeForce RTX 2060 Super | |
| AMD Radeon RX Vega 64 | |
| MSI RTX 2060 Gaming Z 6G | |
| AMD Radeon VII | |
| 3840x2160 High Preset | |
| Nvidia Titan RTX | |
| Corsair One i160 | |
| KFA2 GeForce RTX 2080 Ti EX | |
| Nvidia GeForce RTX 2080 Super | |
| MSI RTX 2080 Gaming X Trio | |
| Nvidia GeForce RTX 2070 Super | |
| MSI RTX 2070 Gaming Z 8G | |
| Nvidia GeForce RTX 2060 Super | |
| AMD Radeon VII | |
| MSI RTX 2060 Gaming Z 6G | |
| AMD Radeon RX Vega 64 | |
| Battlefield 1 | |
| 1920x1080 Ultra Preset AA:T | |
| Corsair One i160 | |
| KFA2 GeForce RTX 2080 Ti EX | |
| Nvidia Titan RTX | |
| Nvidia GeForce RTX 2070 Super | |
| Nvidia GeForce RTX 2080 Super | |
| MSI RTX 2080 Gaming X Trio | |
| AMD Radeon RX Vega 64 | |
| Nvidia GeForce RTX 2060 Super | |
| MSI RTX 2070 Gaming Z 8G | |
| AMD Radeon VII | |
| MSI RTX 2060 Gaming Z 6G | |
| 3840x2160 High Preset AA:T | |
| Corsair One i160 | |
| KFA2 GeForce RTX 2080 Ti EX | |
| Nvidia Titan RTX | |
| Nvidia GeForce RTX 2080 Super | |
| MSI RTX 2080 Gaming X Trio | |
| AMD Radeon VII | |
| Nvidia GeForce RTX 2070 Super | |
| MSI RTX 2070 Gaming Z 8G | |
| Nvidia GeForce RTX 2060 Super | |
| AMD Radeon RX Vega 64 | |
| MSI RTX 2060 Gaming Z 6G | |
| For Honor | |
| 1920x1080 Extreme Preset AA:T AF:16x | |
| Nvidia Titan RTX | |
| Corsair One i160 | |
| KFA2 GeForce RTX 2080 Ti EX | |
| Nvidia GeForce RTX 2080 Super | |
| MSI RTX 2080 Gaming X Trio | |
| AMD Radeon RX 5700 XT | |
| AMD Radeon RX 5700 XT | |
| Nvidia GeForce RTX 2070 Super | |
| AMD Radeon RX 5700 | |
| MSI RTX 2070 Gaming Z 8G | |
| Nvidia GeForce RTX 2060 Super | |
| AMD Radeon RX Vega 64 | |
| MSI RTX 2060 Gaming Z 6G | |
| AMD Radeon VII | |
| 3840x2160 High Preset AA:T AF:8x | |
| Nvidia Titan RTX | |
| KFA2 GeForce RTX 2080 Ti EX | |
| Corsair One i160 | |
| Nvidia GeForce RTX 2080 Super | |
| MSI RTX 2080 Gaming X Trio | |
| Nvidia GeForce RTX 2070 Super | |
| AMD Radeon VII | |
| AMD Radeon RX 5700 XT | |
| MSI RTX 2070 Gaming Z 8G | |
| Nvidia GeForce RTX 2060 Super | |
| AMD Radeon RX 5700 | |
| MSI RTX 2060 Gaming Z 6G | |
| AMD Radeon RX Vega 64 | |
| Ghost Recon Wildlands | |
| 1920x1080 Ultra Preset AA:T AF:16x | |
| Corsair One i160 | |
| Nvidia Titan RTX | |
| KFA2 GeForce RTX 2080 Ti EX | |
| Nvidia GeForce RTX 2080 Super | |
| MSI RTX 2080 Gaming X Trio | |
| Nvidia GeForce RTX 2070 Super | |
| AMD Radeon RX 5700 XT | |
| MSI RTX 2070 Gaming Z 8G | |
| Nvidia GeForce RTX 2060 Super | |
| AMD Radeon RX 5700 | |
| MSI RTX 2060 Gaming Z 6G | |
| AMD Radeon RX Vega 64 | |
| AMD Radeon VII | |
| 3840x2160 Ultra Preset AA:T AF:16x | |
| Nvidia Titan RTX | |
| Corsair One i160 | |
| KFA2 GeForce RTX 2080 Ti EX | |
| Nvidia GeForce RTX 2080 Super | |
| MSI RTX 2080 Gaming X Trio | |
| Nvidia GeForce RTX 2070 Super | |
| AMD Radeon RX 5700 XT | |
| MSI RTX 2070 Gaming Z 8G | |
| AMD Radeon RX 5700 | |
| Nvidia GeForce RTX 2060 Super | |
| GTA V | |
| 1920x1080 Highest AA:4xMSAA + FX AF:16x | |
| Nvidia Titan RTX | |
| MSI RTX 2080 Gaming X Trio | |
| AMD Radeon VII | |
| MSI RTX 2070 Gaming Z 8G | |
| Corsair One i160 | |
| MSI RTX 2060 Gaming Z 6G | |
| KFA2 GeForce RTX 2080 Ti EX | |
| Nvidia GeForce RTX 2060 Super | |
| Nvidia GeForce RTX 2070 Super | |
| Nvidia GeForce RTX 2080 Super | |
| AMD Radeon RX 5700 | |
| AMD Radeon RX 5700 XT | |
| 3840x2160 High/On (Advanced Graphics Off) AA:FX AF:8x | |
| Corsair One i160 | |
| Nvidia Titan RTX | |
| KFA2 GeForce RTX 2080 Ti EX | |
| Nvidia GeForce RTX 2080 Super | |
| Nvidia GeForce RTX 2070 Super | |
| AMD Radeon RX 5700 XT | |
| MSI RTX 2080 Gaming X Trio | |
| Nvidia GeForce RTX 2060 Super | |
| AMD Radeon RX 5700 | |
| AMD Radeon VII | |
| MSI RTX 2070 Gaming Z 8G | |
| MSI RTX 2060 Gaming Z 6G | |
| Battlefield 4 - 3840x2160 High Preset | |
| Nvidia Titan RTX | |
| Corsair One i160 | |
| KFA2 GeForce RTX 2080 Ti EX | |
| Nvidia GeForce RTX 2080 Super | |
| MSI RTX 2080 Gaming X Trio | |
| Nvidia GeForce RTX 2070 Super | |
| MSI RTX 2070 Gaming Z 8G | |
| AMD Radeon RX Vega 64 | |
| AMD Radeon VII | |
| Nvidia GeForce RTX 2060 Super | |
| MSI RTX 2060 Gaming Z 6G | |
| Rage 2 | |
| 3840x2160 Ultra Preset (Resolution Scale Off) | |
| Corsair One i160 | |
| KFA2 GeForce RTX 2080 Ti EX | |
| Nvidia Titan RTX 24 GB | |
| Nvidia GeForce RTX 2080 Super | |
| MSI RTX 2080 Gaming X Trio | |
| Nvidia GeForce RTX 2070 Super | |
| MSI RTX 2070 Gaming Z 8G | |
| AMD Radeon RX 5700 XT | |
| Nvidia GeForce RTX 2060 Super | |
| AMD Radeon RX Vega 64 | |
| AMD Radeon RX 5700 | |
| MSI RTX 2060 Gaming Z 6G | |
| 1920x1080 Ultra Preset (Resolution Scale Off) | |
| Corsair One i160 | |
| KFA2 GeForce RTX 2080 Ti EX | |
| Nvidia Titan RTX 24 GB | |
| Nvidia GeForce RTX 2080 Super | |
| MSI RTX 2080 Gaming X Trio | |
| Nvidia GeForce RTX 2070 Super | |
| MSI RTX 2070 Gaming Z 8G | |
| AMD Radeon RX Vega 64 | |
| Nvidia GeForce RTX 2060 Super | |
| AMD Radeon RX 5700 XT | |
| MSI RTX 2060 Gaming Z 6G | |
| 2560x1440 Ultra Preset (Resolution Scale Off) | |
| Corsair One i160 | |
| KFA2 GeForce RTX 2080 Ti EX | |
| Nvidia Titan RTX 24 GB | |
| Nvidia GeForce RTX 2080 Super | |
| MSI RTX 2080 Gaming X Trio | |
| Nvidia GeForce RTX 2070 Super | |
| MSI RTX 2070 Gaming Z 8G | |
| AMD Radeon RX Vega 64 | |
| Nvidia GeForce RTX 2060 Super | |
| AMD Radeon RX 5700 XT | |
| AMD Radeon RX 5700 | |
| MSI RTX 2060 Gaming Z 6G | |
| F1 2019 | |
| 3840x2160 Ultra High Preset AA:T AF:16x | |
| Nvidia Titan RTX 24 GB | |
| Corsair One i160 | |
| KFA2 GeForce RTX 2080 Ti EX | |
| Nvidia GeForce RTX 2080 Super | |
| Nvidia GeForce RTX 2070 Super | |
| AMD Radeon RX 5700 XT | |
| AMD Radeon RX 5700 | |
| Nvidia GeForce RTX 2060 Super | |
| AMD Radeon RX Vega 64 | |
| 1920x1080 Ultra High Preset AA:T AF:16x | |
| Corsair One i160 | |
| KFA2 GeForce RTX 2080 Ti EX | |
| AMD Radeon RX 5700 XT | |
| Nvidia GeForce RTX 2080 Super | |
| AMD Radeon RX 5700 XT | |
| Nvidia GeForce RTX 2070 Super | |
| Nvidia Titan RTX 24 GB | |
| AMD Radeon RX Vega 64 | |
| AMD Radeon RX 5700 | |
| Nvidia GeForce RTX 2060 Super | |
| 2560x1440 Ultra High Preset AA:T AF:16x | |
| KFA2 GeForce RTX 2080 Ti EX | |
| Corsair One i160 | |
| Nvidia Titan RTX 24 GB | |
| Nvidia GeForce RTX 2080 Super | |
| Nvidia GeForce RTX 2070 Super | |
| AMD Radeon RX 5700 XT | |
| AMD Radeon RX 5700 | |
| Nvidia GeForce RTX 2060 Super | |
| AMD Radeon RX Vega 64 | |
| FIFA 20 | |
| 3840x2160 Ultra Preset AA:4xMS | |
| KFA2 GeForce RTX 2080 Ti EX | |
| Nvidia GeForce RTX 2080 Super | |
| Nvidia GeForce RTX 2070 Super | |
| AMD Radeon RX 5700 XT | |
| Nvidia GeForce RTX 2060 Super | |
| AMD Radeon RX 5700 | |
| 2560x1440 Ultra Preset AA:4xMS | |
| AMD Radeon RX 5700 XT | |
| AMD Radeon RX 5700 | |
| Nvidia GeForce RTX 2080 Super | |
| KFA2 GeForce RTX 2080 Ti EX | |
| Nvidia GeForce RTX 2070 Super | |
| Nvidia GeForce RTX 2060 Super | |
| 1920x1080 Ultra Preset AA:4xMS | |
| AMD Radeon RX 5700 | |
| AMD Radeon RX 5700 XT | |
| KFA2 GeForce RTX 2080 Ti EX | |
| Nvidia GeForce RTX 2080 Super | |
| Nvidia GeForce RTX 2070 Super | |
| Nvidia GeForce RTX 2060 Super | |
| Control | |
| 3840x2160 High Quality Preset | |
| Nvidia Titan RTX 24 GB | |
| KFA2 GeForce RTX 2080 Ti EX | |
| Nvidia GeForce RTX 2070 Super | |
| Nvidia GeForce RTX 2080 Super | |
| AMD Radeon RX 5700 XT | |
| Nvidia GeForce RTX 2060 Super | |
| AMD Radeon RX 5700 | |
| 2560x1440 High Quality Preset | |
| Nvidia Titan RTX 24 GB | |
| KFA2 GeForce RTX 2080 Ti EX | |
| Nvidia GeForce RTX 2070 Super | |
| Nvidia GeForce RTX 2080 Super | |
| AMD Radeon RX 5700 XT | |
| Nvidia GeForce RTX 2060 Super | |
| AMD Radeon RX 5700 | |
| 1920x1080 High Quality Preset | |
| Nvidia Titan RTX 24 GB | |
| KFA2 GeForce RTX 2080 Ti EX | |
| Nvidia GeForce RTX 2070 Super | |
| Nvidia GeForce RTX 2080 Super | |
| AMD Radeon RX 5700 XT | |
| Nvidia GeForce RTX 2060 Super | |
| AMD Radeon RX 5700 | |
| Borderlands 3 | |
| 3840x2160 Badass Overall Quality (DX11) | |
| Nvidia Titan RTX 24 GB | |
| KFA2 GeForce RTX 2080 Ti EX | |
| Nvidia GeForce RTX 2080 Super | |
| Nvidia GeForce RTX 2070 Super | |
| AMD Radeon RX 5700 XT | |
| Nvidia GeForce RTX 2060 Super | |
| AMD Radeon RX 5700 | |
| 2560x1440 Badass Overall Quality (DX11) | |
| KFA2 GeForce RTX 2080 Ti EX | |
| Nvidia Titan RTX 24 GB | |
| Nvidia GeForce RTX 2080 Super | |
| Nvidia GeForce RTX 2070 Super | |
| AMD Radeon RX 5700 XT | |
| Nvidia GeForce RTX 2060 Super | |
| AMD Radeon RX 5700 | |
| 1920x1080 Badass Overall Quality (DX11) | |
| KFA2 GeForce RTX 2080 Ti EX | |
| Nvidia GeForce RTX 2080 Super | |
| Nvidia GeForce RTX 2070 Super | |
| Nvidia Titan RTX 24 GB | |
| AMD Radeon RX 5700 XT | |
| Nvidia GeForce RTX 2060 Super | |
| AMD Radeon RX 5700 | |
| bajo | medio | alto | ultra | QHD | 4K | |
|---|---|---|---|---|---|---|
| BioShock Infinite (2013) | 394 | 349 | 325 | 233 | ||
| Battlefield 4 (2013) | 200 | 200 | 200 | 200 | 148.5 | |
| GTA V (2015) | 177 | 172 | 162 | 99 | 138 | |
| The Witcher 3 (2015) | 403 | 341 | 245 | 135 | 96 | |
| Dota 2 Reborn (2015) | 163.7 | 148.9 | 143.9 | 141.2 | 139.6 | |
| Rainbow Six Siege (2015) | 470 | 379 | 332 | 313 | 173 | |
| Rise of the Tomb Raider (2016) | 324 | 223 | 212 | 198 | 93 | |
| Far Cry Primal (2016) | 129 | 116 | 107 | 100 | 88 | |
| The Division (2016) | 328 | 279 | 196 | 160 | 86 | |
| Doom (2016) | 194 | 178 | 163 | 167 | 131 | |
| Overwatch (2016) | 300 | 300 | 300 | 295 | 188 | |
| Deus Ex Mankind Divided (2016) | 167 | 156 | 135 | 100 | 67 | |
| Battlefield 1 (2016) | 200 | 196 | 184 | 171 | 112 | |
| Dishonored 2 (2016) | 92 | 89 | 88 | 82 | 86 | |
| Watch Dogs 2 (2016) | 155 | 141 | 126 | 101 | 66 | |
| For Honor (2017) | 358 | 257 | 246 | 195 | 99 | |
| Ghost Recon Wildlands (2017) | 147 | 122 | 120 | 82 | 64 | |
| Rocket League (2017) | 250 | 250 | 249 | 209 | ||
| Dirt 4 (2017) | 269 | 207 | 183 | 170 | 123 | |
| Playerunknown's Battlegrounds (PUBG) (2017) | 214 | 190 | 183 | 180 | 86 | |
| Destiny 2 (2017) | 181 | 178 | 178 | 178 | 157 | 89 |
| Assassin´s Creed Origins (2017) | 145 | 127 | 121 | 104 | 89 | 62 |
| Call of Duty WWII (2017) | 305 | 302 | 221 | 200 | 166 | 110 |
| Fortnite (2018) | 349 | 290 | 218 | 197 | 141 | 76 |
| Final Fantasy XV Benchmark (2018) | 185 | 155 | 118 | 55.6 | ||
| Kingdom Come: Deliverance (2018) | 175 | 155 | 122 | 85 | 83 | 50 |
| X-Plane 11.11 (2018) | 127 | 113 | 91 | 79 | ||
| Far Cry 5 (2018) | 139 | 124 | 119 | 111 | 109 | 74 |
| The Crew 2 (2018) | 60 | 60 | 60 | 60 | 60 | 60 |
| F1 2018 (2018) | 201 | 172 | 143 | 116 | 114 | 95 |
| Shadow of the Tomb Raider (2018) | 148 | 138 | 136 | 130 | 108 | 60 |
| FIFA 19 (2018) | 364 | 358 | 330 | 323 | 319 | 298 |
| Forza Horizon 4 (2018) | 207 | 182 | 180 | 168 | 147 | 107 |
| Assassin´s Creed Odyssey (2018) | 135 | 121 | 105 | 80 | 71 | 46 |
| Call of Duty Black Ops 4 (2018) | 288 | 241 | 232 | 223 | 159 | 84 |
| Hitman 2 (2018) | 66 | 63 | 56.8 | 55.8 | 55.1 | 54.8 |
| Battlefield V (2018) | 181 | 147 | 137 | 127 | 108 | 73 |
| Farming Simulator 19 (2018) | 220 | 163 | 143 | 133 | 132 | 104 |
| Darksiders III (2018) | 159 | 100 | 96 | 91 | 91 | 68 |
| Just Cause 4 (2018) | 227 | 195 | 153 | 148 | 111 | 67 |
| Apex Legends (2019) | 144 | 144 | 144 | 144 | 144 | 109 |
| Far Cry New Dawn (2019) | 128 | 110 | 106 | 96 | 92 | 73 |
| Metro Exodus (2019) | 143.9 | 122.9 | 104.4 | 89.7 | 71.9 | 47.5 |
| Anthem (2019) | 127 | 121 | 120 | 113 | 105 | 65 |
| Dirt Rally 2.0 (2019) | 302 | 212 | 200 | 139 | 112 | 70 |
| The Division 2 (2019) | 208 | 172 | 124 | 123 | 92 | 53 |
| Anno 1800 (2019) | 100 | 100 | 77 | 43.3 | 41.8 | 37.6 |
| Rage 2 (2019) | 212 | 181 | 164 | 159 | 110 | 55.7 |
| F1 2019 (2019) | 238 | 217 | 178 | 164 | 147 | 95 |
| Control (2019) | 239 | 163 | 126 | 84 | 42.6 | |
| Borderlands 3 (2019) | 147.8 | 131.1 | 116.5 | 101.3 | 78 | 43.6 |
| FIFA 20 (2019) | 269 | 269 | 255 | 253 | 247 | 249 |
Rendimiento de cálculo
El rendimiento del cálculo a menudo depende de la CPU. El Intel Core i9-9900K en combinación con el RTX 2080 Ti es la mejor opción, razón por la cual nuestro modelo de revisión de KFA2 ha sido superado en productividad. La GeForce RTX 2080 Ti no puede seguir el ritmo de la Nvidia Titan RTX. Aquellos que realmente necesiten utilizar aplicaciones intensivas en cálculo deberían echar un vistazo a las GPUs Quadro profesionales. Estas tarjetas ofrecen un rendimiento significativamente mayor gracias a unos controladores mejor optimizados.
| SiSoft Sandra 2016 | |
| Image Processing | |
| AMD Radeon VII | |
| Corsair One i160 | |
| KFA2 GeForce RTX 2080 Ti EX | |
| Nvidia GeForce RTX 2080 Super | |
| MSI RTX 2080 Gaming X Trio | |
| Nvidia GeForce RTX 2070 Super | |
| MSI RTX 2070 Gaming Z 8G | |
| Nvidia GeForce RTX 2060 Super | |
| AMD Radeon RX 5700 XT | |
| MSI RTX 2060 Gaming Z 6G | |
| AMD Radeon RX 5700 | |
| GP Cryptography (Higher Security AES256+SHA2-512) | |
| KFA2 GeForce RTX 2080 Ti EX | |
| Corsair One i160 | |
| MSI RTX 2080 Gaming X Trio | |
| AMD Radeon VII | |
| Nvidia GeForce RTX 2080 Super | |
| Nvidia GeForce RTX 2070 Super | |
| MSI RTX 2070 Gaming Z 8G | |
| Nvidia GeForce RTX 2060 Super | |
| MSI RTX 2060 Gaming Z 6G | |
| GP Financial Analysis (FP High/Double Precision) | |
| AMD Radeon VII | |
| Corsair One i160 | |
| KFA2 GeForce RTX 2080 Ti EX | |
| MSI RTX 2080 Gaming X Trio | |
| Nvidia GeForce RTX 2080 Super | |
| Nvidia GeForce RTX 2070 Super | |
| MSI RTX 2070 Gaming Z 8G | |
| Nvidia GeForce RTX 2060 Super | |
| MSI RTX 2060 Gaming Z 6G | |
| AMD Radeon RX 5700 XT | |
| AMD Radeon RX 5700 | |
Emisiones de la GeForce RTX 2080 Ti EX KFA2
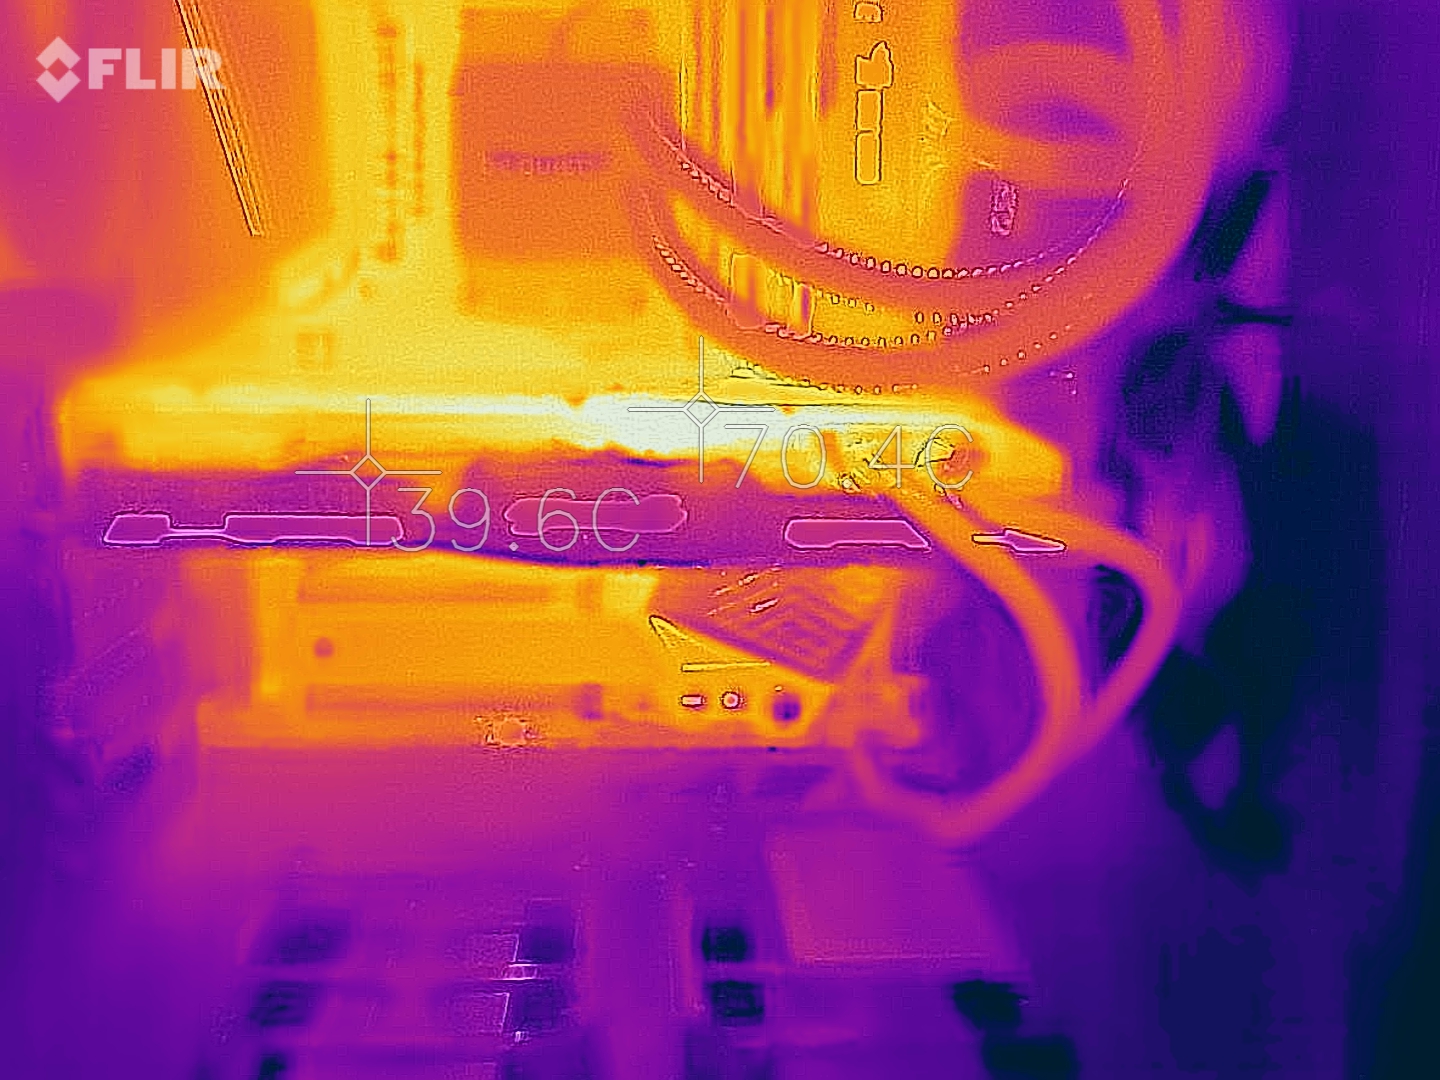
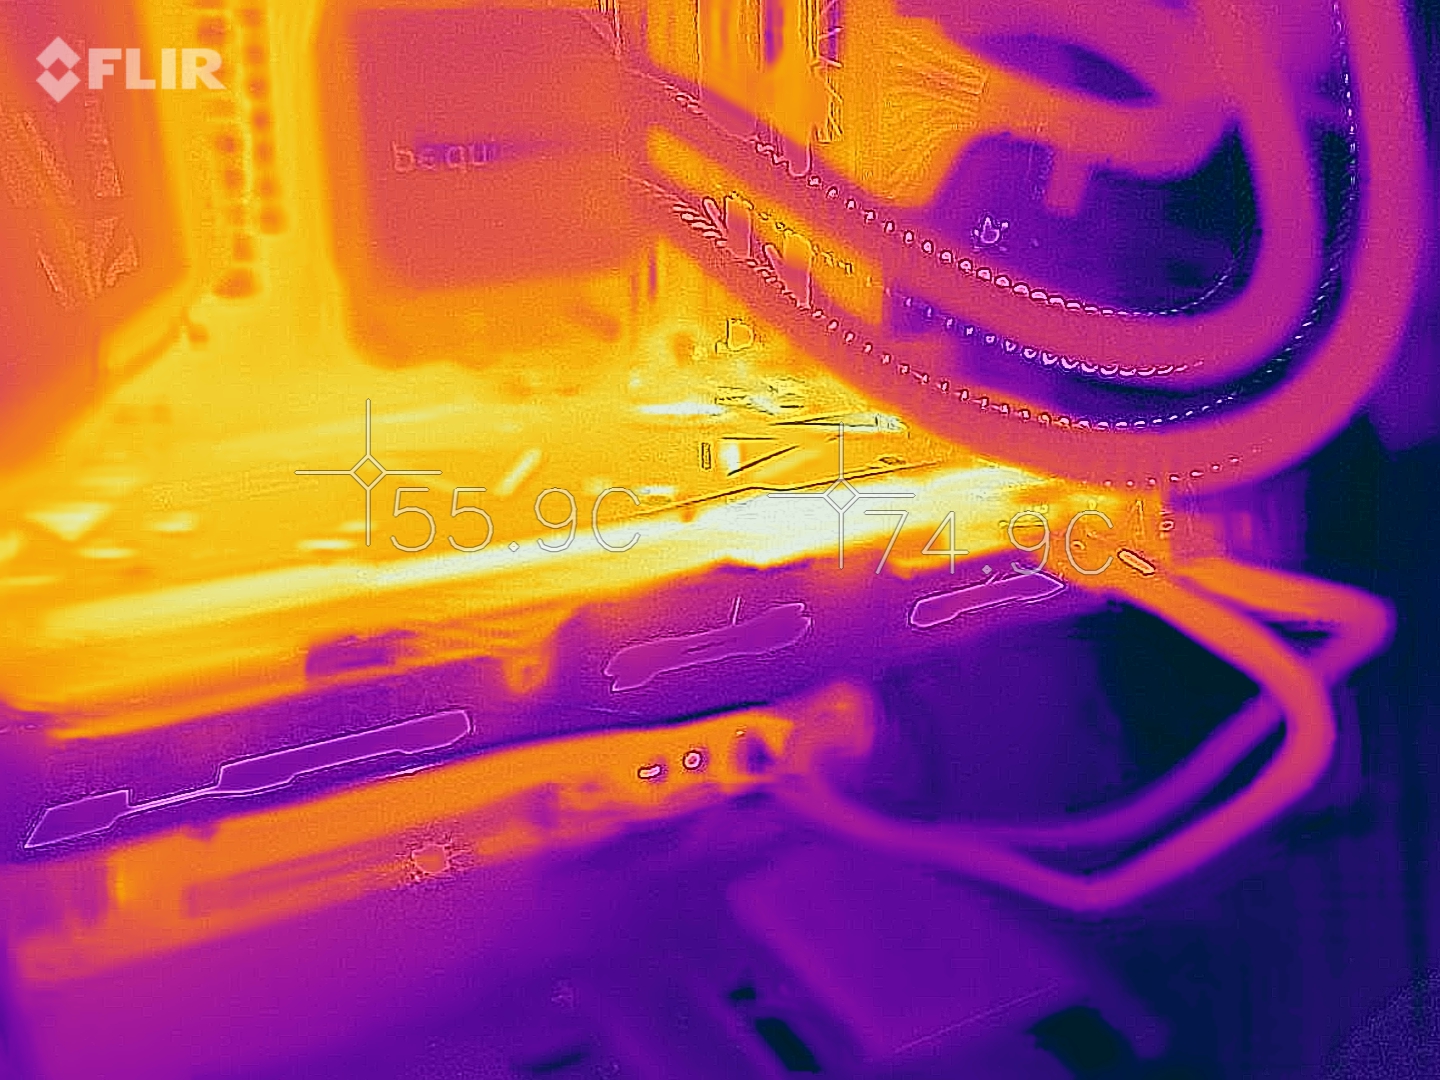
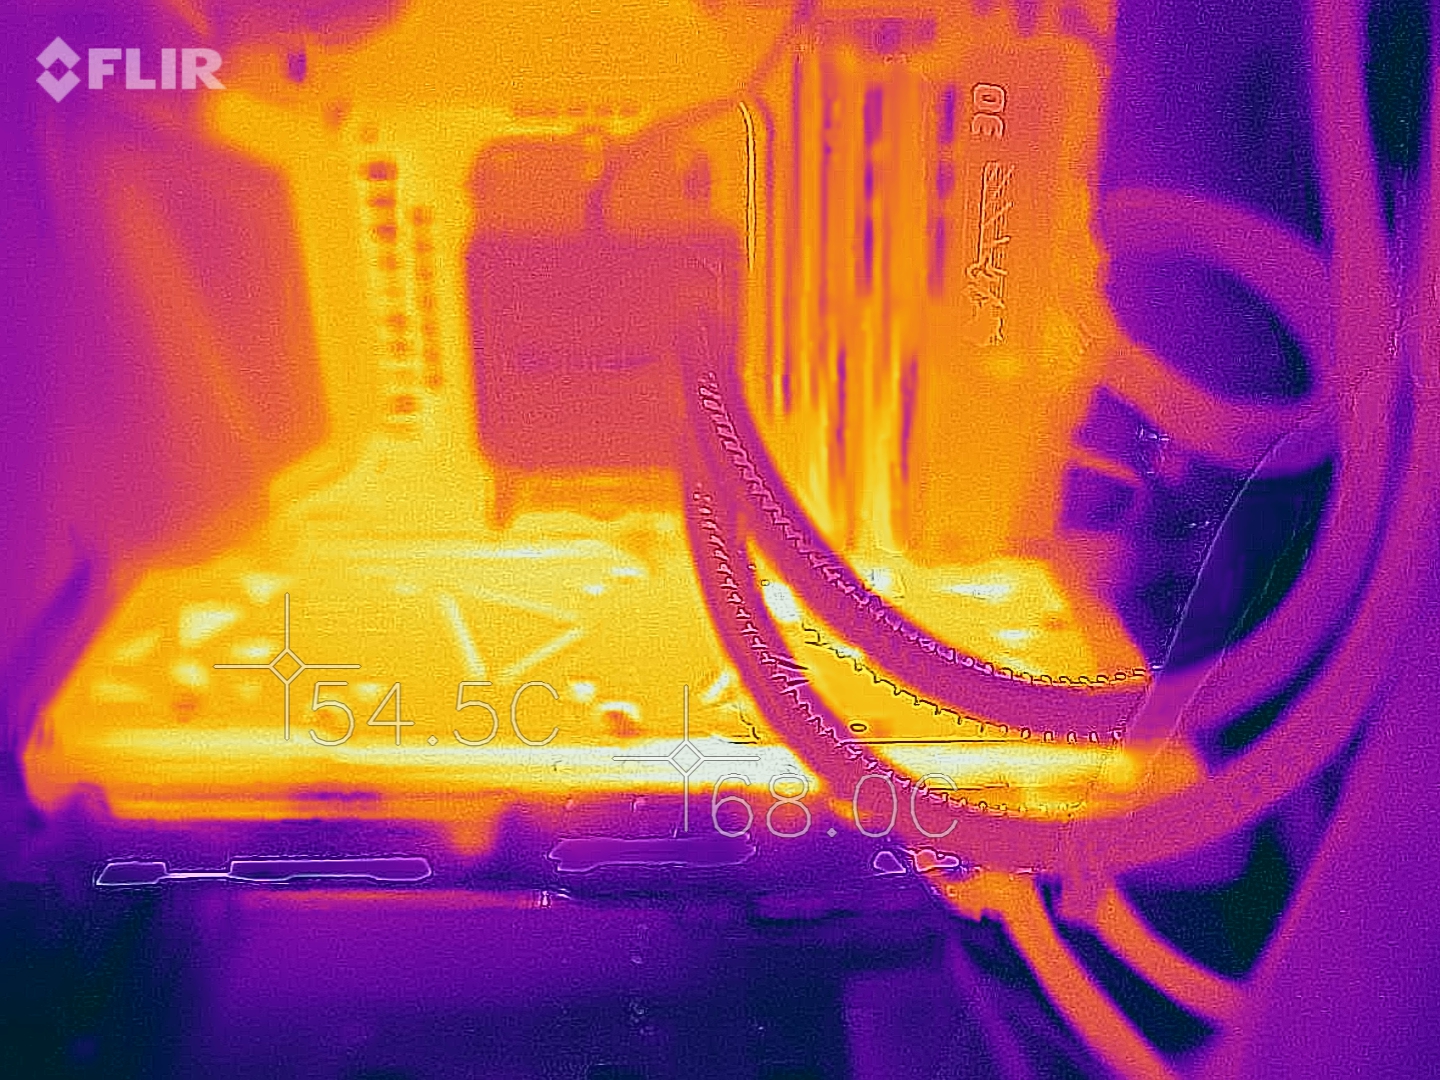
La GeForce RTX 2080 Ti EX de KFA2 tiene exactamente las mismas especificaciones que el modelo de referencia. El único factor diferenciador es la solución de refrigeración. A diferencia del modelo de referencia, el RTX 2080 Ti de KFA2 viene con tres ventiladores axiales de refrigeración. Los dos ventiladores situados en la parte frontal de la GPU están siempre activos. Sin embargo, giran a 1200 RPM (o 34%) en funcionamiento 2D, por lo que son muy silenciosos. El ventilador trasero sólo se activa cuando la GPU está gravada.
La GPU KFA2 tiene un TDP de 250 vatios. Esto es 10 vatios menos que el TDP de la tarjeta gráfica Founders Edition, que necesita 260 vatios de energía. El objetivo de potencia de nuestro modelo puede aumentarse en un 8%, lo que lleva a un TDP de 270 vatios.
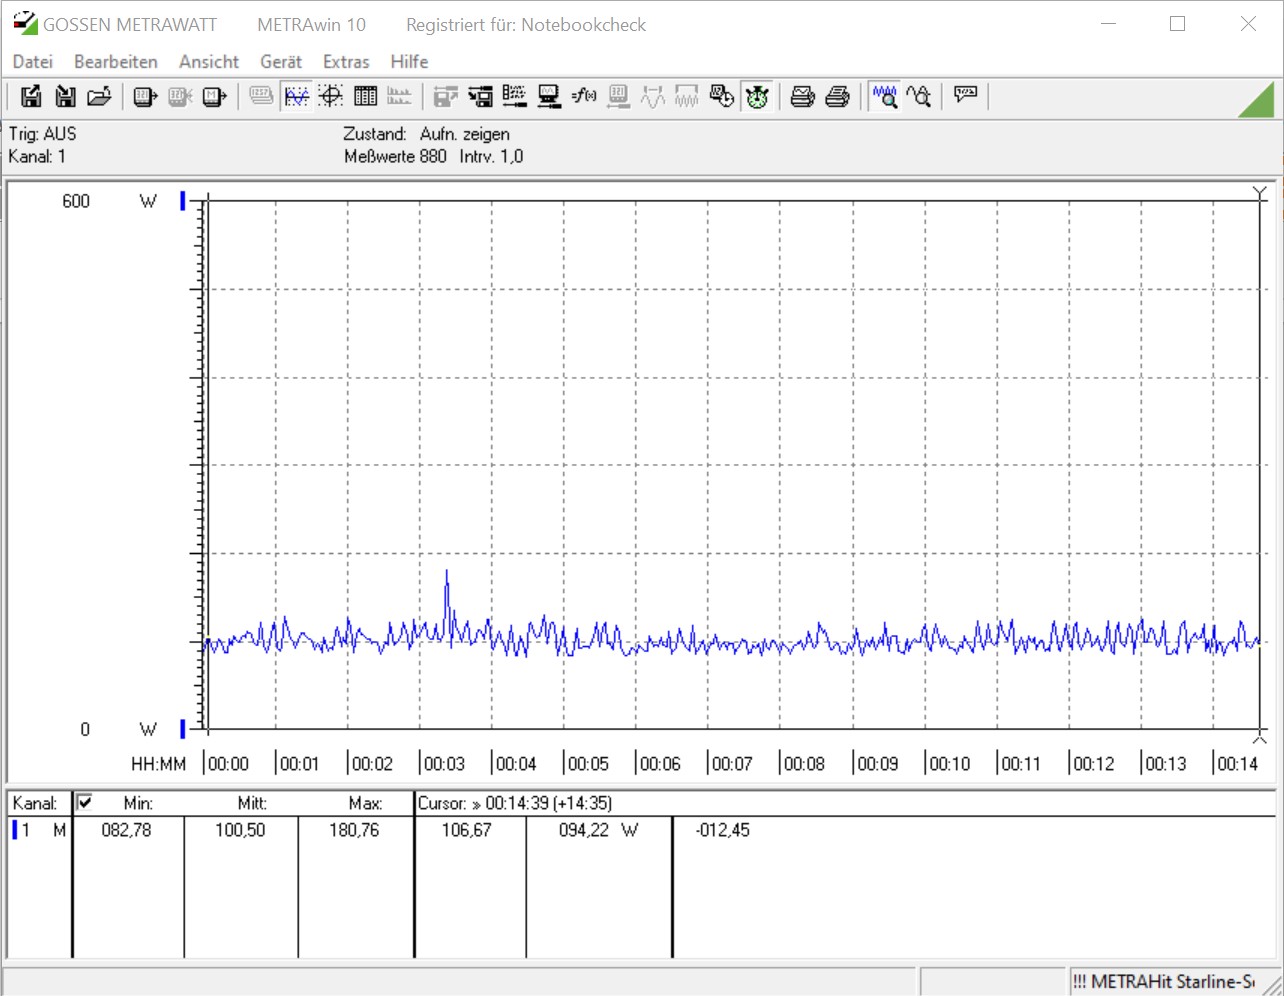
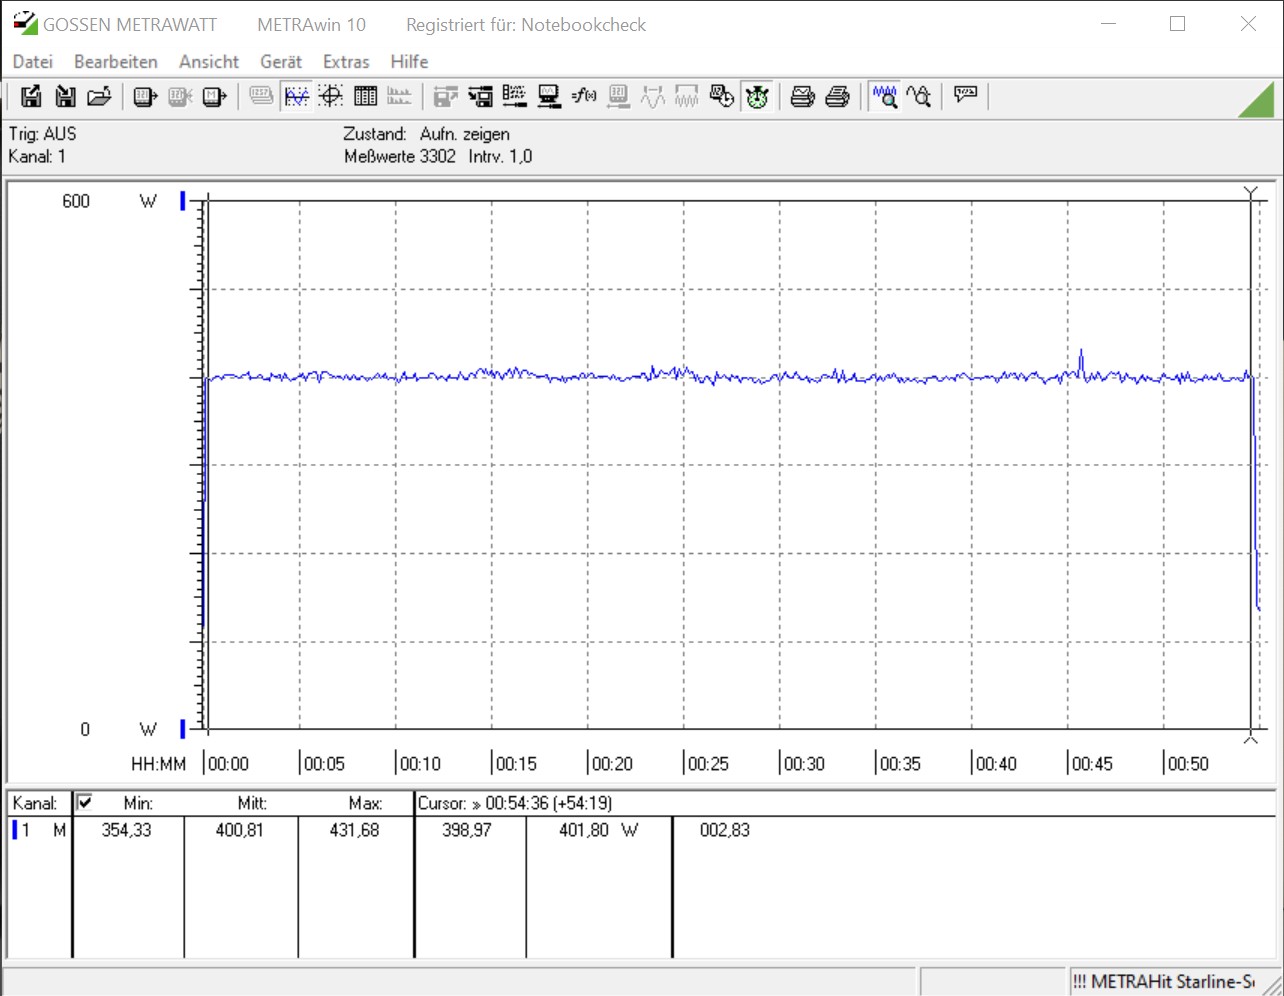
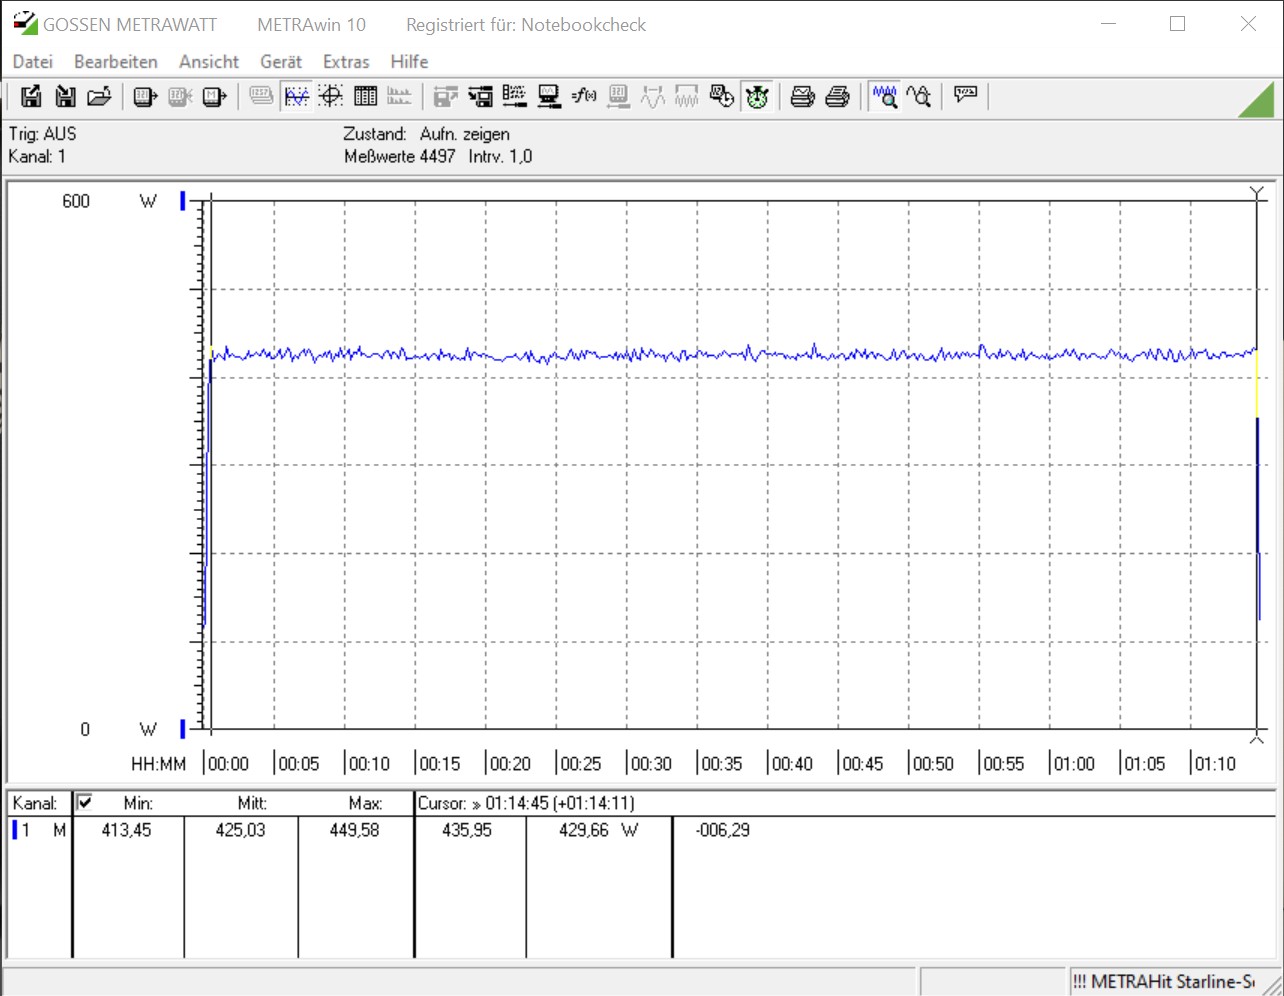
Cuando está inactivo, el consumo de energía del sistema asciende a 100,5 vatios. Bajo cargas pesadas, el consumo de energía del sistema (sin el monitor) alcanzó su punto máximo de 401 vatios. Estas cifras se ven confirmadas por la GPU-Z, que sitúa la potencia de la tarjeta gráfica en unos 250 vatios. Con el objetivo de mayor potencia, la GPU consume hasta 268,5 vatios. No hay problemas térmicos con la GPU KFA2. Bajo carga, las temperaturas alcanzan hasta 69 °C (156,2 °F). Con el objetivo de potencia ajustado al 108%, las temperaturas son sólo 2 °C (3,6 °F) superiores.
Todos los puntos de referencia se llevaron a cabo con el caso cerrado para simular un escenario de uso realista.
| Power Consumption | |
| 1920x1080 The Witcher 3 ultra (external Monitor) | |
| KFA2 GeForce RTX 2080 Ti EX (Idle: 100.5 W) | |
| Nvidia Titan RTX | |
| Nvidia GeForce RTX 2080 Super (Idle: 86.2 W) | |
| AMD Radeon RX Vega 64 (Idle: 81.56 W) | |
| Nvidia GeForce RTX 2070 Super (Idle: 92.6 W) | |
| AMD Radeon RX 5700 XT (Idle: 83.2 W) | |
| Corsair One i160 (Idle: 51.5 W) | |
| KFA2 GeForce RTX 2060 Super (81.7 fps, Idle: 93.8 W) | |
| Nvidia GeForce RTX 2060 Super (Idle: 86.7 W) | |
| AMD Radeon RX 5700 (Idle: 77.9 W) | |
| 1280x720 FurMark 1.19 GPU Stress Test (external Monitor) | |
| Nvidia GeForce RTX 2080 Super (Idle: 86.2 W) | |
| KFA2 GeForce RTX 2080 Ti EX (Idle: 100.5 W) | |
| Nvidia GeForce RTX 2070 Super (Idle: 92.6 W) | |
| AMD Radeon RX 5700 XT (Idle: 83.2 W) | |
| Corsair One i160 (Idle: 51.5 W) | |
| KFA2 GeForce RTX 2060 Super (234 fps, Idle: 93.8 W) | |
| Nvidia GeForce RTX 2060 Super (Idle: 86.7 W) | |
| AMD Radeon RX 5700 (Idle: 77.9 W) | |
* ... más pequeño es mejor
Overclocking - RTX 2080 Ti con potencial de overclocking
A pesar de que la KFA2 GeForce RTX 2080 Ti EX ha sido una cifra muy buena en nuestra revisión en términos de rendimiento, decidimos explorar su potencial de overclocking. La GPU KFA2 incluye la función OC de un clic, que eleva el reloj base en 45 MHz y el objetivo de potencia al 108%. Esto conduce a un reloj de empuje más alto y más estable. Con la función OC de un clic activada, la GPU se comporta un 4% mejor en 3DMark 11.
Sin embargo, esto no fue suficiente para nosotros. A través del overclocking manual pudimos aumentar el reloj del núcleo en 250 MHz y la velocidad de la memoria en 1250 MHz. Los resultados hablan por sí solos. La GPU funciona un 13% mejor en aplicaciones 3D después del overclock manual. En el punto de referencia Time Spy basado en DirectX 12, en realidad estamos viendo un aumento del 14% en el rendimiento.
Por supuesto, la tarjeta gráfica es lo suficientemente rápida como está, por lo que no hay necesidad real de overclocking. Sin embargo, el potencial del overclocking será muy útil a medida que envejezca la GPU. En realidad, el hecho de que la GPU consuma 250 o 270 vatios bajo carga no supone una gran diferencia en el gran esquema de cosas.
Aquellos que decidan enfriar la GPU por agua podrán sacar un poco más de rendimiento de la misma. Sin embargo, en ese caso, tendrá que renunciar a la iluminación RGB.
Pro
Contra
Veredicto - Un modelo de gama absolutamente alta
Antes de mencionar el precio, nos gustaría decir que la KFA2 GeForce RTX 2080 Ti EX es una tarjeta gráfica de sobremesa muy potente. Debido a la longitud, los usuarios tendrán que asegurarse de que este monstruo encaja en su caso particular antes de comprometerse a comprar. Además, la GPU requiere una fuente de alimentación de 650 vatios y dos conectores de 8 clavijas.
En términos de rendimiento, esta tarjeta gráfica está al mismo nivel que otras RTX 2080 Ti y sólo es superada por la significativamente más cara Nvidia Titan RTX. Aquellos que quieran obtener esta GPU sólo deberían hacerlo si planean jugar con resoluciones muy superiores a 1080p, ya que actualmente la GeForce RTX 2080 Ti sólo tiene éxito con resoluciones muy altas.
Pagar más de 1000 euros ($1097) por una tarjeta gráfica no es fácil de aguantar, pero si realmente quieres jugar a 4K, entonces deberías considerar seriamente esta GPU.
Sin embargo, la KFA2 GeForce RTX 2080 Ti EX no saldrá volando de las estanterías, ya que un precio de cuatro cifras da mucho miedo en una GPU. Sin embargo, el modelo KFA2 es algo más barato que el modelo de referencia, que se vende al por menor por 1259 euros (1.381 dólares). Además, la GPU KFA2 también ofrece una mayor refrigeración e iluminación RGB. La tarjeta gráfica KFA2 es una de las versiones más económicas del RTX 2080 Ti.
En resumen, la GeForce RTX 2080 Ti ofrece el rendimiento suficiente para poder ejecutar cualquier título moderno a 2160p. El RTX 2080 Ti puede ser interesante para aquellos que actualizan su GPU cada dos años, ya que seguirá siendo muy capaz incluso dentro de dos años, especialmente a 1080p o 1440p y con Raytracing desactivado.
La GeForce RTX 2080 Ti también consigue algunos puntos importantes con sus funciones RTX. Sin embargo, algunos títulos como Control ya requieren una GPU muy potente para poder jugar con Raytracing activado. En este caso, la KFA2 GeForce RTX 2080 Ti EX alcanza una frecuencia de imagen media de 72 FPS a 1080p, mientras que la GeForce RTX 2080 Super sólo alcanza una media de 53 FPS.
Referencias de todas las GPU GeForce RTX 2080 Ti
Benchmarks
3DM Vant. Perf. total +
specvp12 sw-03 +
Cinebench R15 OpenGL 64 Bit +
* A menor número, mayor rendimiento
Pruebas de juegos
Los siguientes benchmarks se derivan de nuestros benchmarks de los portátiles de análisis. El rendimiento depende de la memoria gráfica utilizada, velocidad de reloj, procesador, configuración del sistema, controladores y sistemas operativos. Así que los resultados no tienen que ser representativos de todos los portátiles con esta GPU. Para información más detallada sobre los resultados del benchmark, haga clic en el número de fps.

F1 2021
2021
Days Gone
2021


Outriders
2021
Hitman 3
2021
Cyberpunk 2077 1.0
2020

Yakuza Like a Dragon
2020


Dirt 5
2020
Watch Dogs Legion
2020
FIFA 21
2020
Star Wars Squadrons
2020

Serious Sam 4
2020
Crysis Remastered
2020

Horizon Zero Dawn
2020
Death Stranding
2020
F1 2020
2020
Valorant
2020
Gears Tactics
2020
Doom Eternal
2020
Hunt Showdown
2020
Escape from Tarkov
2020


Need for Speed Heat
2019

GRID 2019
2019

FIFA 20
2019
Borderlands 3
2019
Control
2019
F1 2019
2019

Rage 2
2019
Anno 1800
2019
The Division 2
2019
Dirt Rally 2.0
2019
Anthem
2019
Far Cry New Dawn
2019
Metro Exodus
2019
Apex Legends
2019
Just Cause 4
2018
Darksiders III
2018
Battlefield V
2018
Farming Simulator 19
2018
Hitman 2
2018


Forza Horizon 4
2018
FIFA 19
2018

F1 2018
2018
Monster Hunter World
2018
The Crew 2
2018
Far Cry 5
2018
World of Tanks enCore
2018
X-Plane 11.11
2018


Fortnite
2018


Call of Duty WWII
2017

Destiny 2
2017
ELEX
2017

Dirt 4
2017Rocket League
2017Prey
2017For Honor
2017
Resident Evil 7
2017Watch Dogs 2
2016
Dishonored 2
2016
Battlefield 1
2016
Overwatch
2016
Doom
2016

The Division
2016
Far Cry Primal
2016

Rainbow Six Siege
2015
World of Warships
2015Dota 2 Reborn
2015
The Witcher 3
2015
GTA V
2015
Battlefield 4
2013BioShock Infinite
2013Counter-Strike: GO
2012| bajo | medio | alto | ultra | QHD | 4K | |
|---|---|---|---|---|---|---|
| F1 2021 | 254 | 237 | 147 | 119 | 68 | |
| Days Gone | 163 | 158 | 135 | 105 | 63.9 | |
| Mass Effect Legendary Edition | 132 | 126 | 125 | 115 | ||
| Resident Evil Village | 183 | 181 | 181 | 147 | 74.3 | |
| Outriders | 135 | 135 | 132 | 114 | 61.8 | |
| Hitman 3 | 171 | 164 | 162 | 147 | 85.2 | |
| Cyberpunk 2077 1.0 | 114 | 107 | 95.4 | 64 | 32.2 | |
| Immortals Fenyx Rising | 113 | 102 | 93 | 81 | 59 | |
| Yakuza Like a Dragon | 161 | 156 | 139 | 100 | 53.8 | |
| Call of Duty Black Ops Cold War | 155 | 133 | 118 | 89.2 | 54.4 | |
| Assassin´s Creed Valhalla | 107 | 91 | 80 | 67 | 46 | |
| Dirt 5 | 134 | 112 | 73.4 | 64.8 | 50 | |
| Watch Dogs Legion | 111 | 98.7 | 89.6 | 72.9 | 44 | |
| FIFA 21 | 269 | 266 | 255 | 254 | 251 | 247 |
| Star Wars Squadrons | 360 | 354 | 331 | 326 | 246 | 144 |
| Mafia Definitive Edition | 131 | 120 | 117 | 105 | 62.4 | |
| Serious Sam 4 | 185 | 123 | 117 | 108 | 107 | 86.3 |
| Crysis Remastered | 179 | 106 | 71.3 | 57.9 | 37.6 | |
| Flight Simulator 2020 | 84.4 | 70.8 | 58.6 | 47.3 | 46.5 | 32.7 |
| Horizon Zero Dawn | 159 | 146 | 133 | 115 | 94 | 54 |
| Death Stranding | 174 | 173 | 170 | 169 | 133 | 78.8 |
| F1 2020 | 289 | 247 | 240 | 202 | 162 | 100 |
| Valorant | 290 | 285 | 267 | 266 | 259 | |
| Gears Tactics | 321 | 243 | 166 | 126 | 101 | 64.7 |
| Doom Eternal | 315 | 290 | 266 | 259 | 204 | 113 |
| Hunt Showdown | 235 | 200 | 170 | 125 | 60.4 | |
| Escape from Tarkov | 121 | 121 | 121 | 121 | 120 | 73.4 |
| Red Dead Redemption 2 | 127 | 119 | 103 | 76 | 63 | 42.3 |
| Star Wars Jedi Fallen Order | 106 | 106 | 104 | 105 | 73 | |
| Need for Speed Heat | 93 | 91 | 67 | |||
| Call of Duty Modern Warfare 2019 | 162 | 127 | 77 | |||
| GRID 2019 | 141 | 118 | 77 | |||
| Ghost Recon Breakpoint | 103 | 82 | 52 | |||
| FIFA 20 | 269 | 269 | 255 | 253 | 247 | 249 |
| Borderlands 3 | 155 | 137 | 122 | 105 | 81 | 45 |
| Control | 240 | 166 | 129 | 87 | 44 | |
| F1 2019 | 269 | 243 | 192 | 171 | 145 | 96 |
| Total War: Three Kingdoms | 96.3 | 81.1 | 43.8 | |||
| Rage 2 | 287 | 195 | 171 | 166 | 114 | 58 |
| Anno 1800 | 108 | 106 | 81 | 45 | 43 | 40 |
| The Division 2 | 211 | 180 | 144 | 127 | 96 | 55 |
| Dirt Rally 2.0 | 304 | 228 | 220 | 166 | 133 | 83 |
| Anthem | 117 | 120 | 118 | 112 | 106 | 69 |
| Far Cry New Dawn | 133 | 114 | 110 | 100 | 98 | 76 |
| Metro Exodus | 154 | 131 | 109 | 94 | 75 | 50 |
| Apex Legends | 144 | 144 | 144 | 144 | 144 | 111 |
| Just Cause 4 | 232 | 197 | 156 | 149 | 112 | 66 |
| Darksiders III | 208 | 135 | 127 | 121 | 112 | 71 |
| Battlefield V | 189 | 170 | 164 | 159 | 134 | 86 |
| Farming Simulator 19 | 245 | 184 | 159 | 146 | 146 | 107 |
| Hitman 2 | 88 | 85 | 77 | 74 | 74 | 62 |
| Call of Duty Black Ops 4 | 285 | 244 | 235 | 213 | 166 | 87 |
| Assassin´s Creed Odyssey | 137 | 125 | 108 | 82 | 72 | 50 |
| Forza Horizon 4 | 212 | 184 | 182 | 163 | 143 | 105 |
| FIFA 19 | 361 | 346 | 321 | 317 | 313 | 300 |
| Shadow of the Tomb Raider | 158 | 144 | 143 | 136 | 110 | 61 |
| F1 2018 | 248 | 216 | 167 | 141 | 133 | 97 |
| Monster Hunter World | 188 | 182 | 179 | 145 | 102 | 49 |
| The Crew 2 | 60 | 60 | 60 | 60 | 60 | 60 |
| Far Cry 5 | 153 | 136 | 130 | 121 | 116 | 77 |
| World of Tanks enCore | 105 | |||||
| X-Plane 11.11 | 130 | 117 | 92 | 78 | ||
| Kingdom Come: Deliverance | 187 | 163 | 132 | 91 | 84 | 50 |
| Final Fantasy XV Benchmark | 198 | 162 | 121 | 57 | ||
| Fortnite | 381 | 302 | 232 | 216 | 151 | 79 |
| Star Wars Battlefront 2 | 198 | 190 | 179 | 138 | 76.9 | |
| Need for Speed Payback | 163 | 157 | 154 | 151 | 95.6 | |
| Call of Duty WWII | 313 | 308 | 224 | 203 | 172 | 113 |
| Assassin´s Creed Origins | 146 | 131 | 126 | 107 | 93 | 64 |
| Destiny 2 | 193 | 191 | 190 | 190 | 162 | 91 |
| ELEX | 121 | 121 | 121 | 116 | 62.3 | |
| Middle-earth: Shadow of War | 204 | 180 | 153 | 78 | ||
| Playerunknown's Battlegrounds (PUBG) | 221 | 201 | 193 | 191 | 88 | |
| Dirt 4 | 364 | 268 | 231 | 183 | 125 | |
| Rocket League | 250 | 250 | 249 | 209 | ||
| Prey | 144 | 144 | 144 | 123 | ||
| Ghost Recon Wildlands | 169 | 139 | 135 | 86 | 66 | |
| For Honor | 369 | 270 | 258 | 206 | 99 | |
| Resident Evil 7 | 599 | 382 | 316 | 117 | ||
| Watch Dogs 2 | 166 | 156 | 135 | 107 | 68 | |
| Dishonored 2 | 106 | 105 | 104 | 101 | 96 | |
| Battlefield 1 | 200 | 198 | 192 | 185 | 115 | |
| Deus Ex Mankind Divided | 177 | 165 | 143 | 103 | 69 | |
| Overwatch | 300 | 300 | 300 | 297 | 193 | |
| Doom | 191 | 176 | 164 | 162 | 138 | |
| Ashes of the Singularity | 89.4 | 83.4 | ||||
| The Division | 341 | 282 | 196 | 158 | 90 | |
| Far Cry Primal | 139 | 126 | 116 | 107 | 90 | |
| Rise of the Tomb Raider | 335 | 231 | 217 | 200 | 95 | |
| Rainbow Six Siege | 448 | 370 | 338 | 320 | 180 | |
| World of Warships | 168 | |||||
| Dota 2 Reborn | 154 | 145 | 146 | 140 | 137 | |
| The Witcher 3 | 399 | 342 | 247 | 134 | 98 | |
| GTA V | 180 | 174 | 165 | 103 | 142 | |
| Battlefield 4 | 200 | 200 | 200 | 200 | 152 | |
| BioShock Infinite | 419 | 384 | 355 | 246 | ||
| Counter-Strike: GO | 270 | |||||
| bajo | medio | alto | ultra | QHD | 4K | < 30 fps < 60 fps < 120 fps ≥ 120 fps | 6 62 | 13 74 | 1 21 66 | 2 29 55 | 3 38 27 | 23 57 16 |
Para ver más juegos jugables y una lista de todos los juegos y tarjetas gráficas visita nuestroListado de juegos