Review de la CPU de escritorio AMD Ryzen 7 3800XT: Refresco de Matisse para el zócalo de AM4
Conocemos la arquitectura Zen2 desde hace casi exactamente un año. Las ventajas del diseño del chipset son obvias y antes de que Zen3 reemplace a Zen2 como su sucesor, AMD ha introducido tres nuevos procesadores basados en la arquitectura Zen2. El buque insignia, el AMD Ryzen 9 3950X, sigue siendo el mismo. Los procesadores de 12, 8 y 6 núcleos, sin embargo, han sufrido varias modificaciones en la velocidad del reloj. En el esquema de nomenclatura, a los nuevos modelos Ryzen se les da un XT, que indica los CPUs de Refresco.
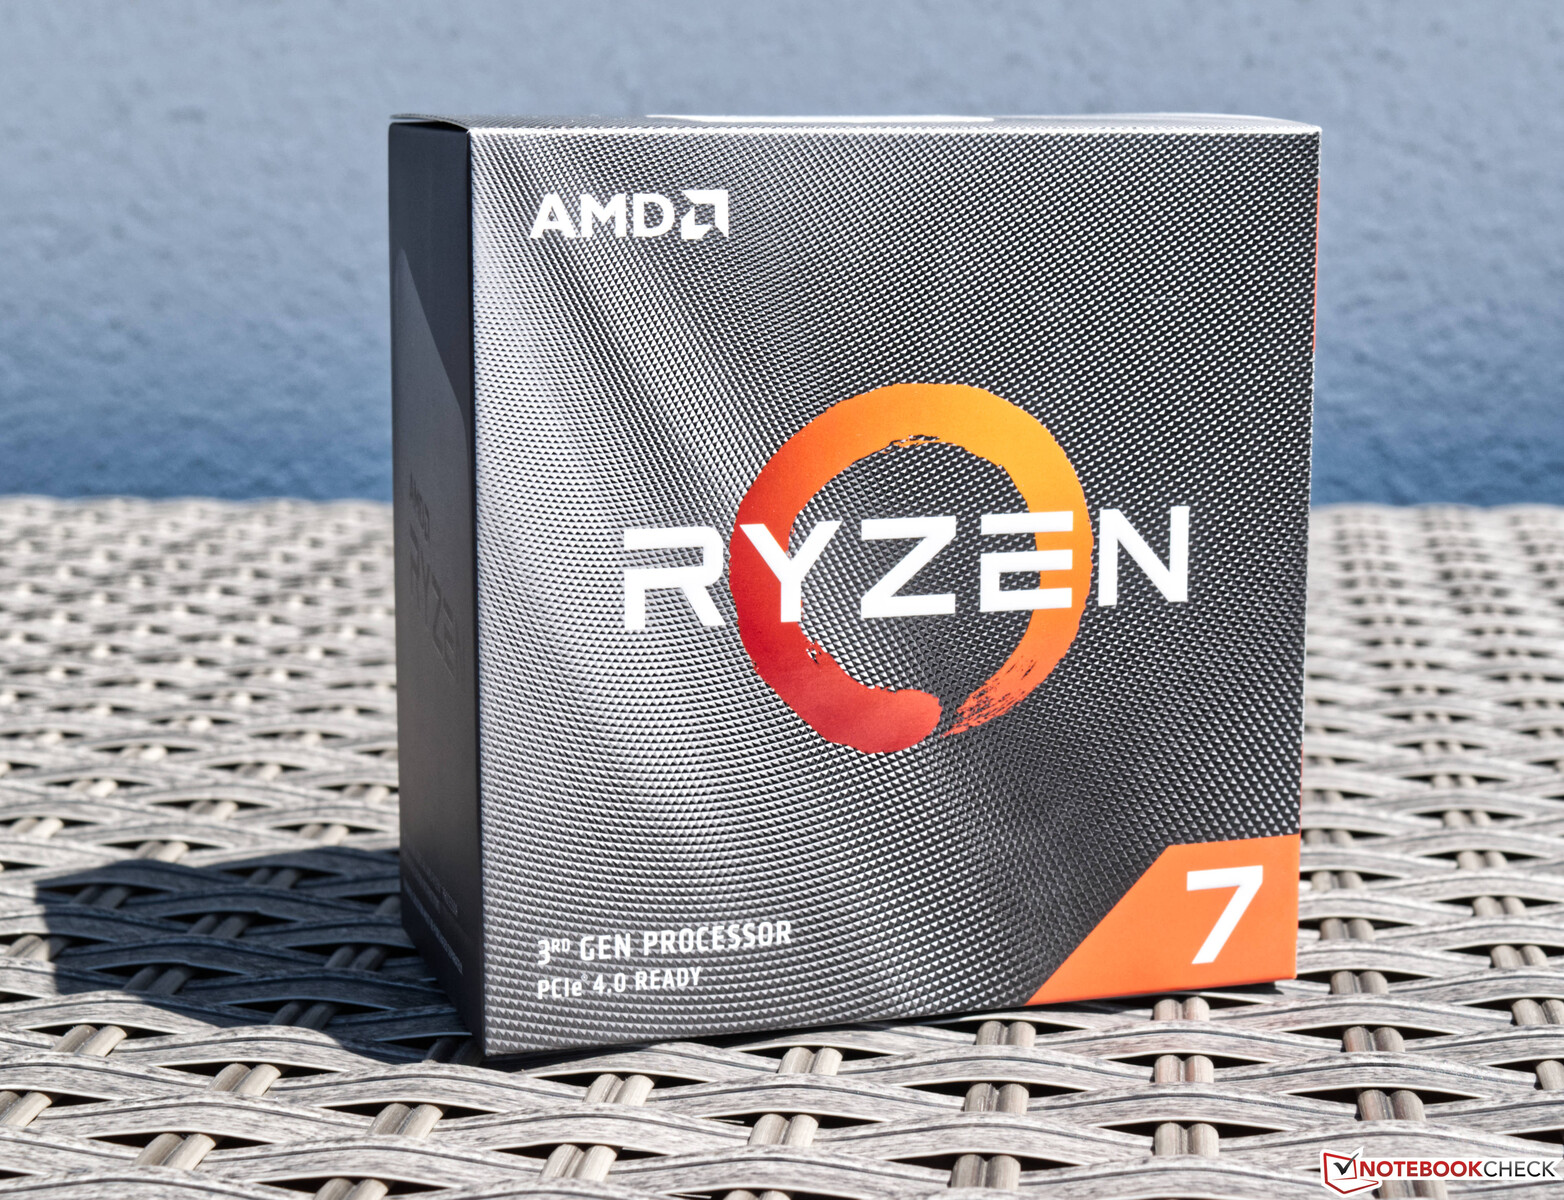
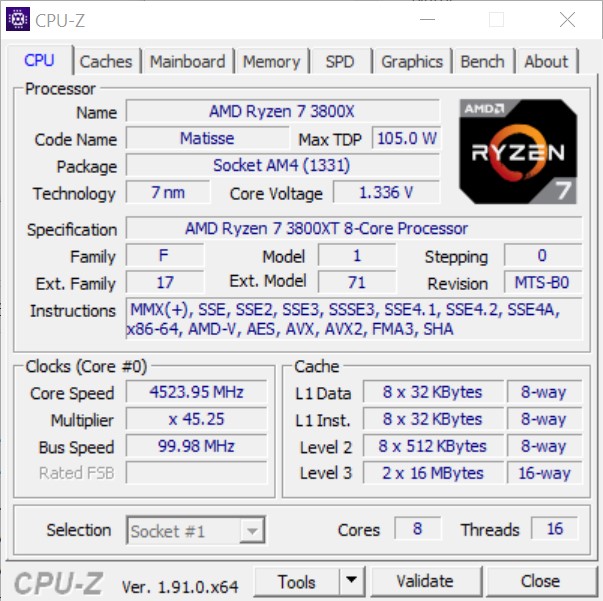
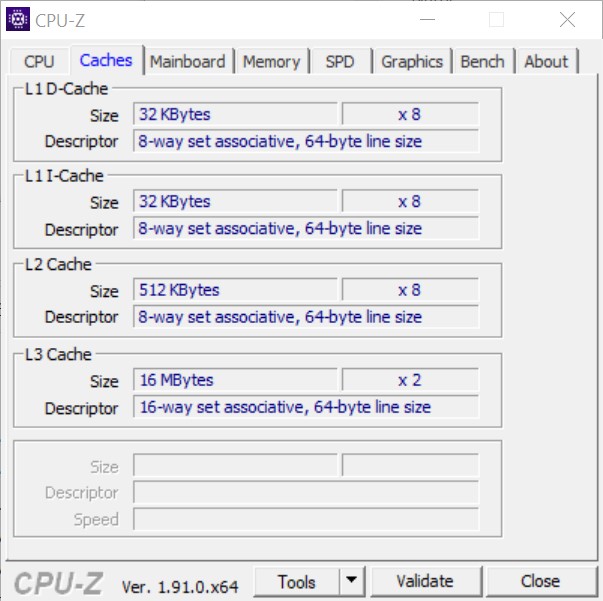
En nuestra revisión, examinamos más de cerca el AMD Ryzen 7 3800XT con sus 8 núcleos y 16 hilos y le permitimos competir con los modelos actuales de sus propias filas, así como con los actuales procesadores de Intel para una comparación directa. AMD no cambia el reloj base del Ryzen 7 3800XT comparado con el Ryzen 7 3800X. Sólo el reloj de aumento ha sido aumentado en 200 MHz, de modo que ahora se puede alcanzar los 4,7 GHz. En el Ryzen 5 3600XT y el Ryzen 9 3900XT, el aumento de la potencia máxima es de apenas 100 MHz, lo que significa una menor diferencia de rendimiento con respecto a los modelos no XT.
Nuestra muestra tiene un precio de 419 Euros (~$475). Para el Ryzen 5 3600XT AMD cobra 259 Euros (~$293), mientras que para el modelo de 12 núcleos cobra 529 Euros (~$599). Estos precios ya incluyen el IVA alemán.
Los procesadores AMD Ryzen de un vistazo
| Modelo | Cores / Hilos | Velocidad base | Velocidad turbo | Caché L3 | Precio de lanzamiento |
|---|---|---|---|---|---|
| Ryzen R9 3950X | 16/32 | 3.5 GHz | 4.7 GHz | 64 MB | 105 watts |
| Ryzen R9 3900XT | 12/24 | 3.8 GHz | 4.7 GHz | 64 MB | 105 watts |
| Ryzen R9 3900X | 12/24 | 3.8 GHz | 4.6 GHz | 64 MB | 105 watts |
| Ryzen R7 3800XT | 8/16 | 3.9 GHz | 4.7 GHz | 32 MB | 105 watts |
| Ryzen R7 3800X | 8/16 | 3.9 GHz | 4.5 GHz | 32 MB | 105 watts |
| Ryzen R7 3700X | 8/16 | 3.6 GHz | 4.4 GHz | 32 MB | 65 watts |
| Ryzen R5 3600XT | 6/12 | 3.8 GHz | 4.5 GHz | 32 MB | 95 watts |
| Ryzen R5 3600X | 6/12 | 3.8 GHz | 4.4 GHz | 32 MB | 95 watts |
| Ryzen R5 3600 | 6/12 | 3.6 GHz | 4.2 GHz | 32 MB | 65 watts |
| Ryzen R3 3300X | 4/8 | 3.8 GHz | 4.3 GHz | 16 MB | 65 watts |
| Ryzen R3 3100 | 4/8 | 3.6 GHz | 3.9 GHz | 16 MB | 65 watts |
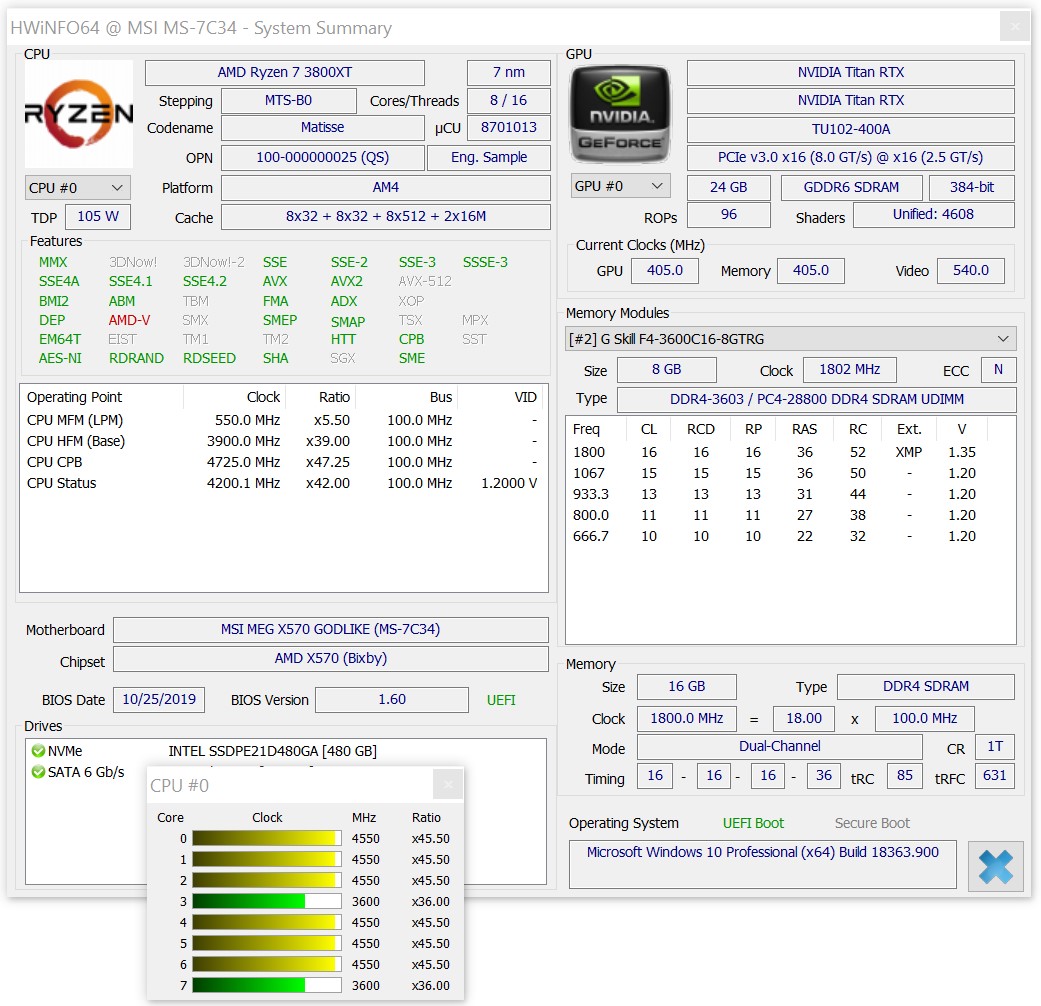
Los detalles sobre nuestro sistema de pruebas
Usamos el siguiente hardware para nuestro sistema de pruebas:
- Raijintek Pean Benchtable
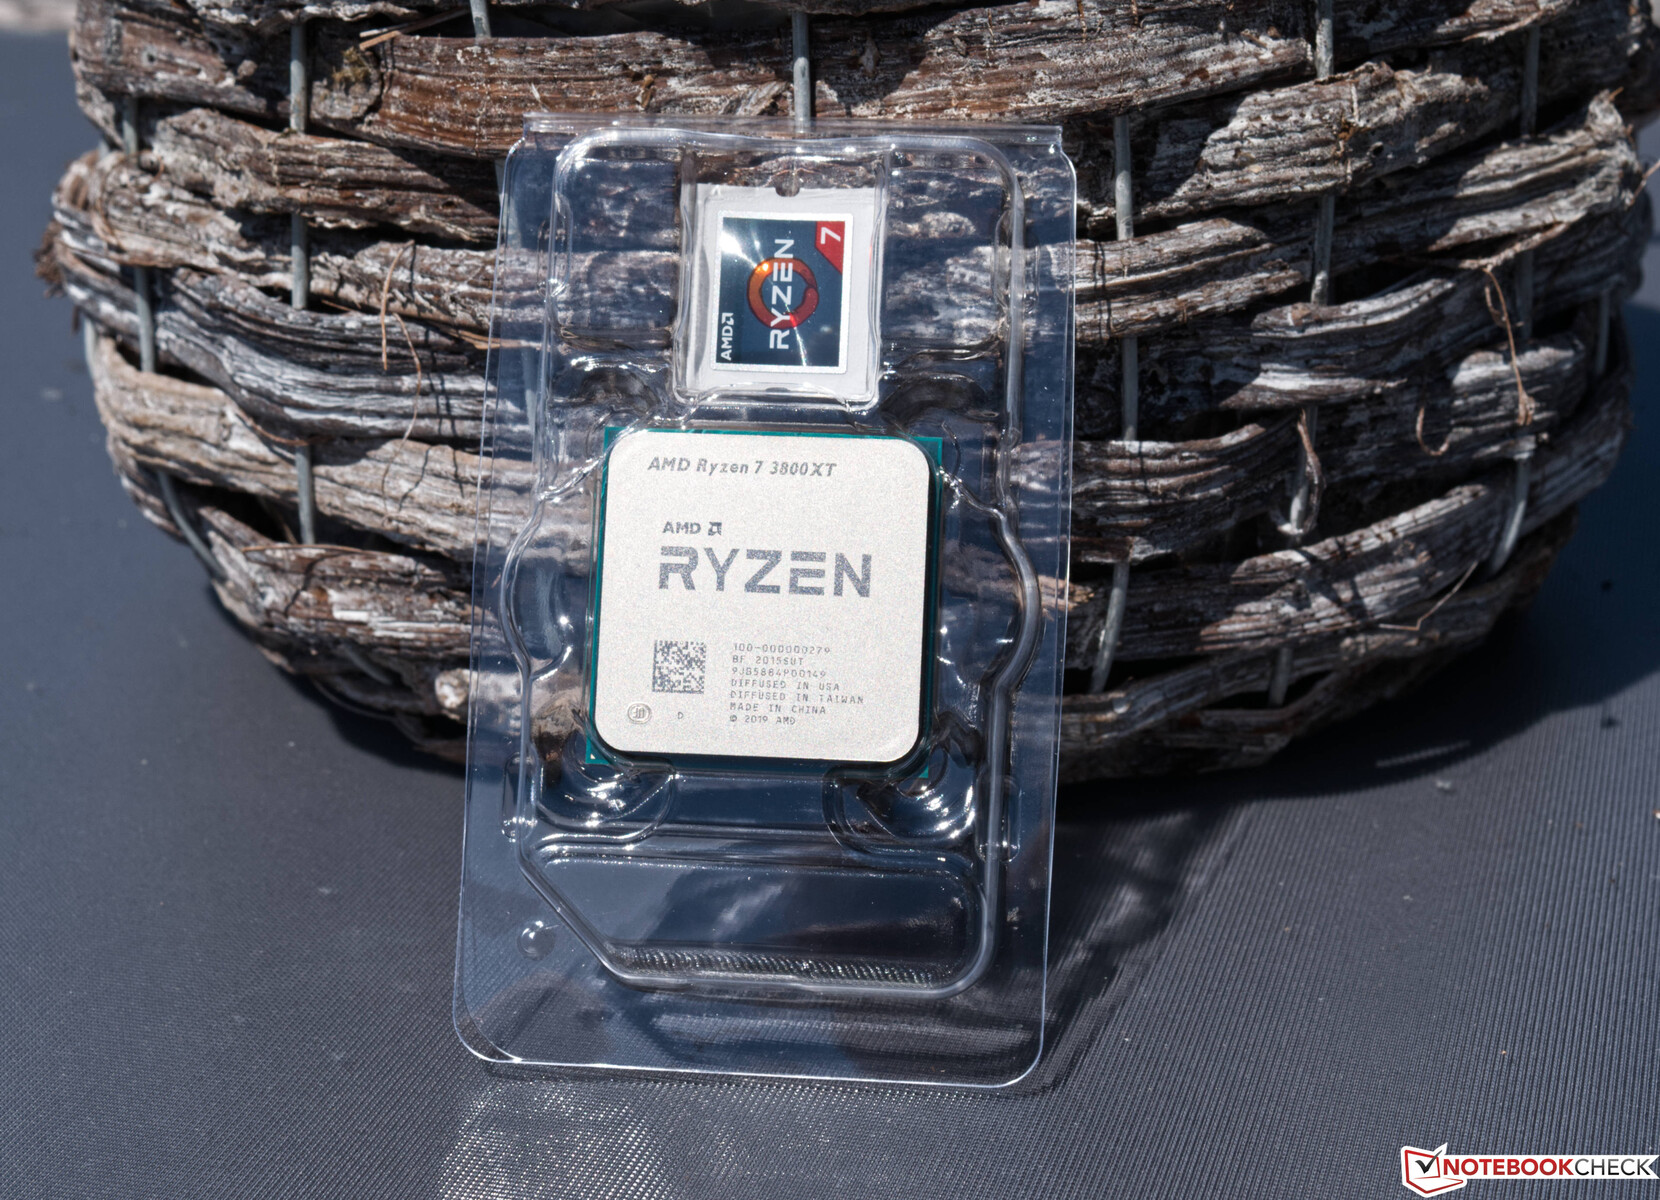
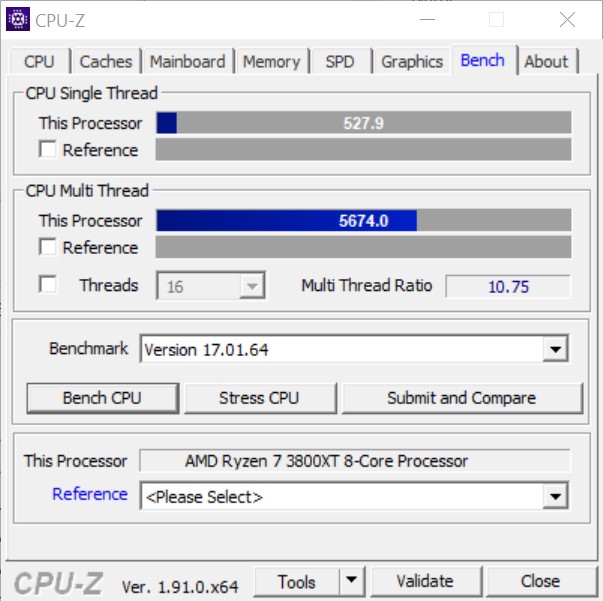
- AMD Ryzen 7 3800XT
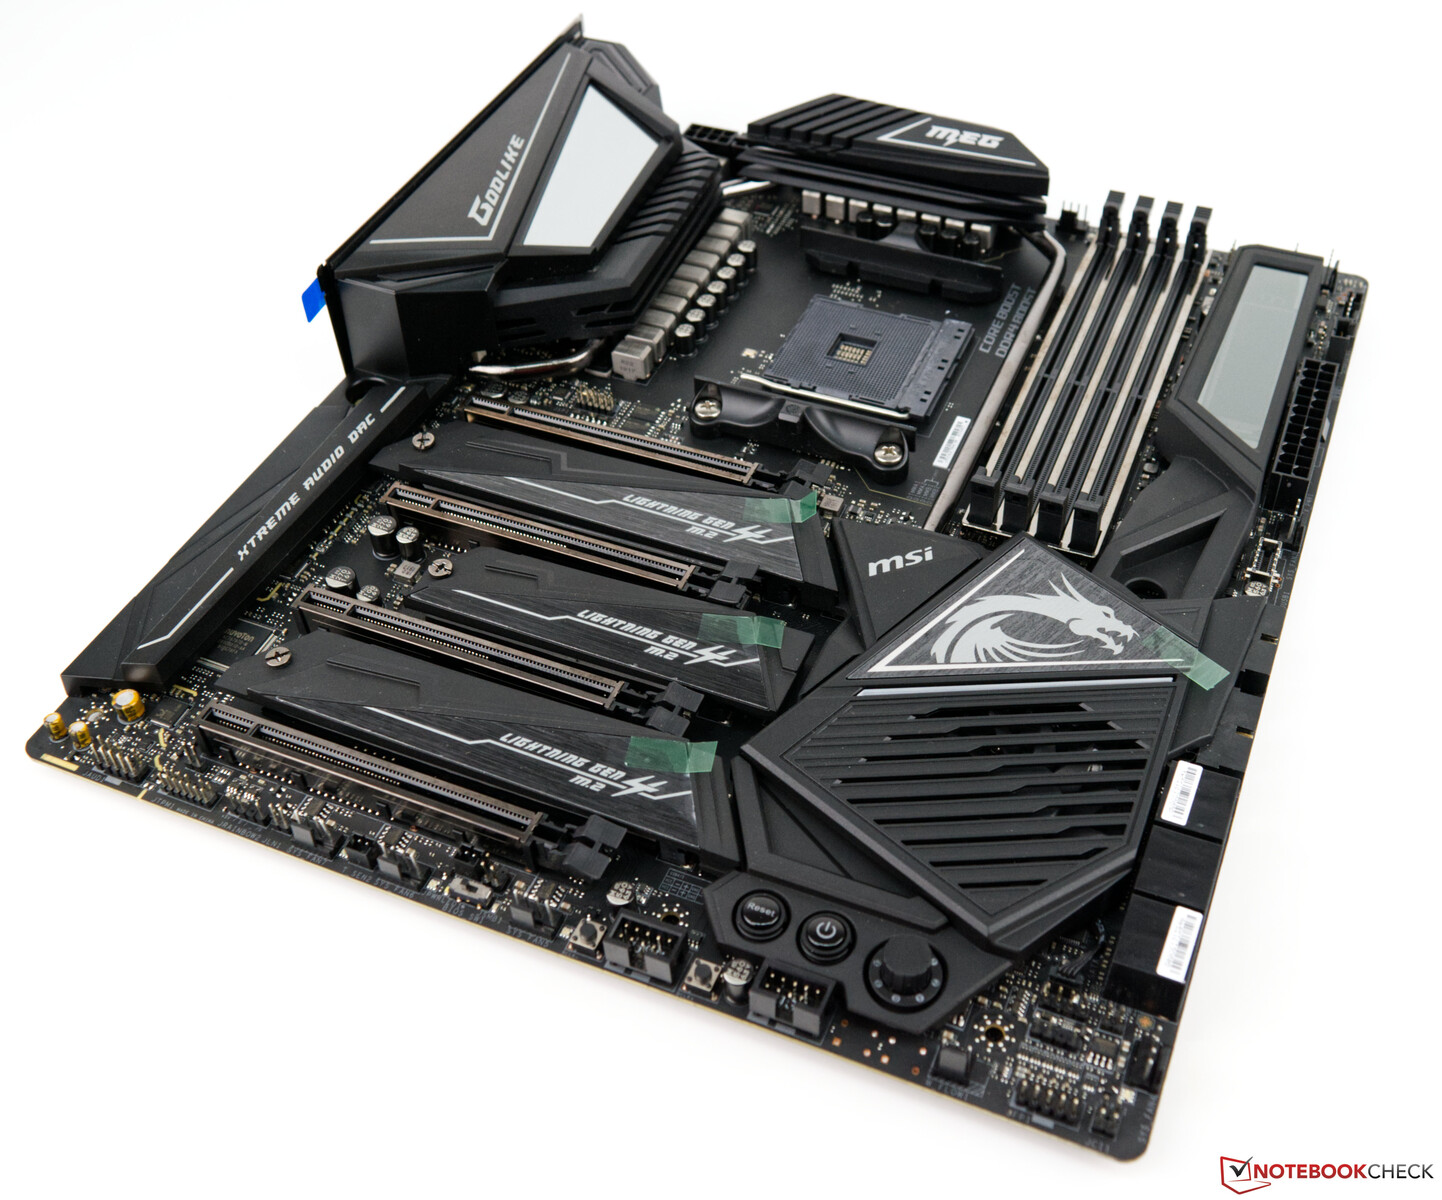
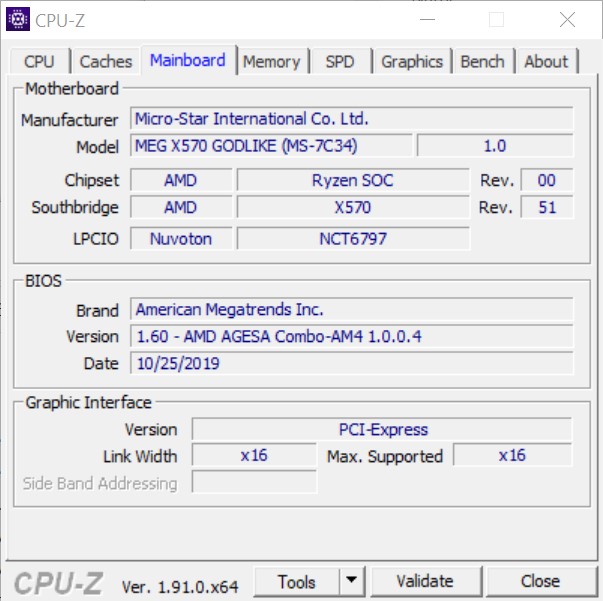
- MSI MEG X570 Godlike
- Alphacool Eisbear 280 AiO
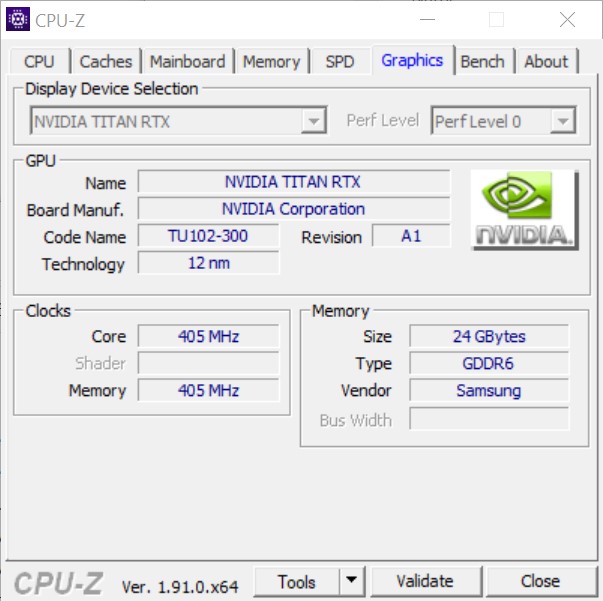
- Nvidia Titan RTX
- Corsair RM 1000X PSU
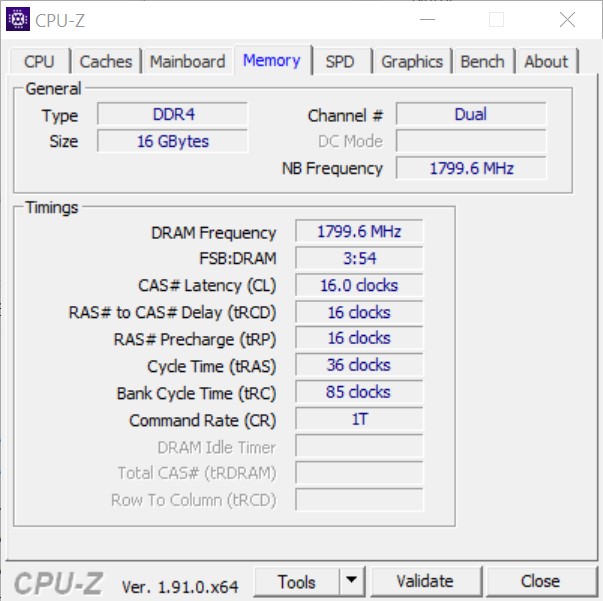
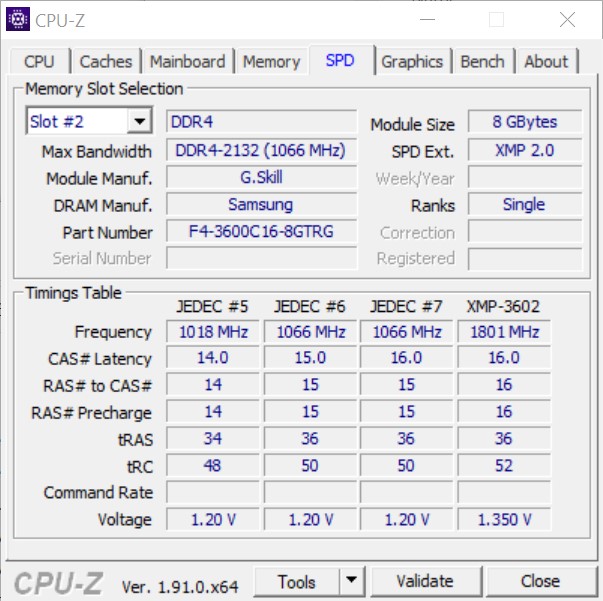
- G-Skill Trident Z Royal gold DDR4-3600 memory kit 2 x 8 GB, set to DDR4-3600 CL16-16-16-36
- Intel Optane 905P 480GB PCIe-SSD
- Microsoft Windows 10 Professional 64-Bit (Version 1909)
Queremos agradecer a Caseking por prestarnos el Raijintek Pean, que venía con grabados láser personalizados. La placa base y la RAM son directamente de AMD y se incluyeron en el kit de prensa para el lanzamiento de los procesadores Zen2 AMD Ryzen 9 3900X y AMD Ryzen 7 3700X. Como refrigeración utilizamos el Alphacool Eisbear 280, que nos proporcionó Alphacool.
Puntos de referencia del procesador
En los benchmarks de CPU puro, el AMD Ryzen 7 3800XT supera al Intel Core i7-9700K. Sin embargo, esta comparación, que la propia AMD utiliza en su informe de producto, no es del todo justa en nuestra opinión, porque el Core i7-9700K sólo ofrece 8 hilos con 8 núcleos. Más bien, la comparación con un Intel Core i9-9900K vale la pena porque tiene un precio similar. El Ryzen 7 3800XT también tiene la ventaja aquí, aunque el punto para el mejor rendimiento de un solo núcleo va a Intel. El Ryzen 7 3800XT sin embargo no puede competir con un Intel Core i9-10900K. La extremadamente alta velocidad de reloj del buque insignia de Intel en combinación con 10 núcleos proporciona un mejor rendimiento, pero también tiene sus inconvenientes (palabra clave: TDP).
El AMD Ryzen 7 3800X ha tenido dificultades para confirmar su derecho a existir junto al mucho más económico Ryzen 7 3700X. Debido a la ahora mayor velocidad del reloj de impulso, el papel del Ryzen 7 3800XT es ahora algo más claro, aunque la ventaja de rendimiento sobre el Ryzen 7 3700X sigue siendo sólo un pequeño porcentaje.
| R Benchmark 2.5 - Overall mean | |
| Intel Core i5-10600K | |
| AMD Ryzen 9 3900X | |
| AMD Ryzen 3 3300X | |
| Intel Core i9-10900K | |
| AMD Ryzen 9 3950X | |
| AMD Ryzen 7 3800XT | |
| LibreOffice - 20 Documents To PDF | |
| Intel Core i9-10900K | |
| AMD Ryzen 9 3900X | |
| AMD Ryzen 9 3950X | |
| AMD Ryzen 3 3300X | |
| Intel Core i5-10600K | |
| AMD Ryzen 7 3800XT | |
| WebXPRT 3 - Overall | |
| Intel Core i9-10900K | |
| AMD Ryzen 7 3800XT | |
| AMD Ryzen 9 3950X | |
| Intel Core i5-10600K | |
| AMD Ryzen 3 3300X | |
| Mozilla Kraken 1.1 - Total | |
| Intel Core i5-10600K | |
| AMD Ryzen 3 3300X | |
| Intel Core i9-10900K | |
| AMD Ryzen 9 3950X | |
| AMD Ryzen 7 3800XT | |
* ... más pequeño es mejor
Prueba de estrés con el Cinebench R15 multi loop
Nuestra prueba de estrés, el Cinebench R15 multi loop no plantea ningún problema para el AMD Ryzen 7 3800XT. El AiO incorporado junto con el radiador de 280 milímetros (11 pulgadas) puede enfriar el AMD Ryzen 7 3800XT sin dificultad.
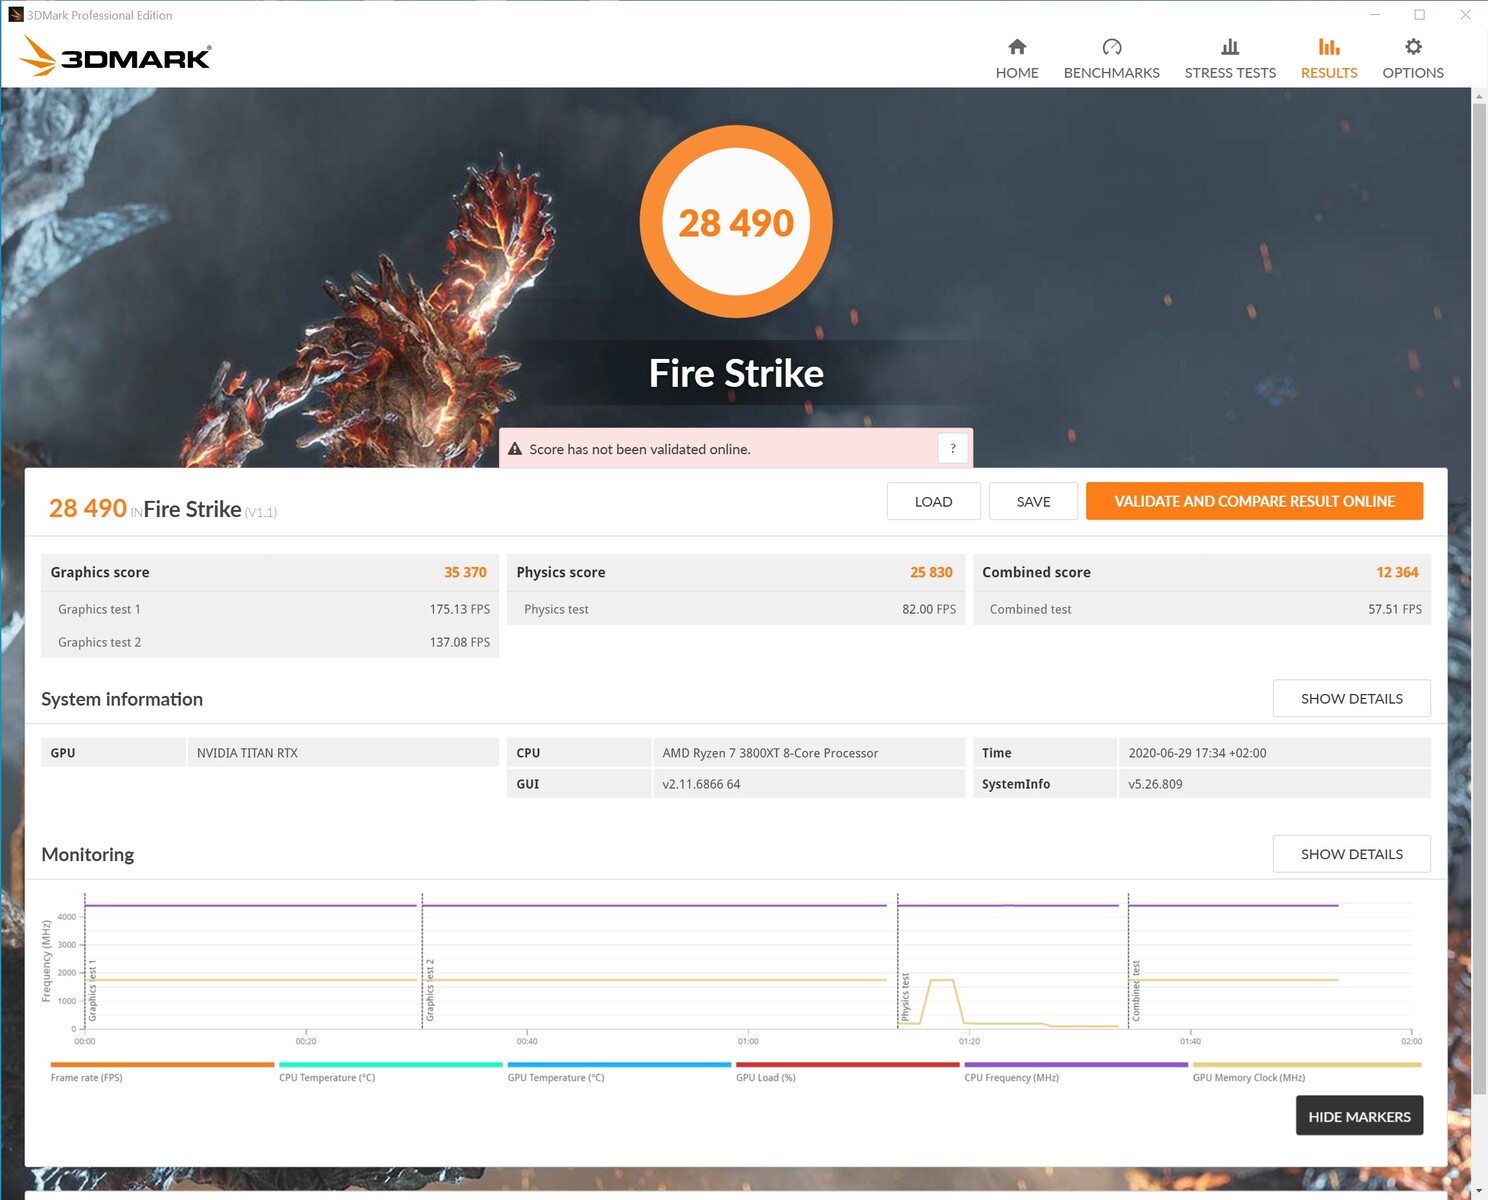
Rendimiento de la aplicación
Muchas aplicaciones se escalan bastante bien con hasta 8 núcleos. Más allá de eso, un mayor número de núcleos sólo aumenta ligeramente el rendimiento, como puede verse en la comparación con el AMD Ryzen 9 3950X. El buque insignia, significativamente más caro, está sólo tres puntos porcentuales por delante del Ryzen 7 3800XT y justo a la par en los benchmarks de 3D sintético. Incluso el económico Ryzen 3 3300X puede mantenerse a la altura con la misma configuración de GPU. Intel se las arregla para obtener una pequeña, pero en nuestro caso no muy significativa, ventaja.
El rendimiento de los juegos
El AMD Ryzen 7 3800XT es definitivamente adecuado para un sistema de juego puro. Sin embargo, debes saber que Intel tiene las mejores CPUs de juego del mercado con los actuales procesadores Comet Lake S. Sin embargo, en resoluciones más altas y con detalles máximos, la ventaja de las CPU de Intel sobre los modelos Ryzen de AMD disminuye. En combinación con nuestro Nvidia Titan RTX (comparable a un RTX 2080 Ti), incluso los títulos más modernos pueden disfrutarse con los máximos detalles. Sin embargo, con el aumento de la carga gráfica la CPU juega un papel menor. Sin embargo, si quieres transmitir al mismo tiempo, los 8 núcleos serán muy útiles.
| Borderlands 3 | |
| 1280x720 Very Low Overall Quality (DX11) | |
| Intel Core i9-10900K | |
| Intel Core i5-10600K | |
| Intel Core i9-9900KS, Nvidia Titan RTX | |
| AMD Ryzen 9 3900X | |
| AMD Ryzen 9 3950X | |
| AMD Ryzen 7 3800XT | |
| AMD Ryzen 3 3300X | |
| AMD Radeon RX Vega 64 | |
| AMD Ryzen 3 3100 | |
| 1920x1080 Badass Overall Quality (DX11) | |
| Intel Core i9-10900K | |
| AMD Ryzen 7 3800XT | |
| Intel Core i5-10600K | |
| Intel Core i9-9900KS, Nvidia Titan RTX | |
| AMD Ryzen 9 3900X | |
| AMD Ryzen 9 3950X | |
| AMD Ryzen 3 3300X | |
| AMD Ryzen 3 3100 | |
| AMD Radeon RX Vega 64 | |
| Metro Exodus | |
| 1280x720 Low Quality AF:4x | |
| Intel Core i9-10900K | |
| Intel Core i5-10600K | |
| Intel Core i9-9900KS, Nvidia Titan RTX | |
| AMD Ryzen 7 3800XT | |
| AMD Ryzen 9 3900X | |
| AMD Ryzen 3 3300X | |
| AMD Ryzen 9 3950X | |
| AMD Ryzen 3 3100 | |
| 1920x1080 Ultra Quality AF:16x | |
| Intel Core i9-10900K | |
| Intel Core i5-10600K | |
| Intel Core i9-9900KS, Nvidia Titan RTX | |
| AMD Ryzen 3 3300X | |
| AMD Ryzen 7 3800XT | |
| AMD Ryzen 9 3900X | |
| AMD Ryzen 9 3950X | |
| AMD Ryzen 3 3100 | |
| X-Plane 11.11 | |
| 1280x720 low (fps_test=1) | |
| Intel Core i9-10900K | |
| Intel Core i9-9900KS, Nvidia Titan RTX | |
| Intel Core i5-10600K | |
| AMD Ryzen 7 3800XT | |
| AMD Ryzen 9 3900X | |
| AMD Ryzen 9 3950X | |
| AMD Ryzen 3 3300X | |
| AMD Ryzen 3 3100 | |
| AMD Radeon RX Vega 64 | |
| AMD Radeon RX Vega 64 | |
| 1920x1080 high (fps_test=3) | |
| Intel Core i9-9900KS, Nvidia Titan RTX | |
| Intel Core i9-10900K | |
| Intel Core i5-10600K | |
| AMD Ryzen 7 3800XT | |
| AMD Ryzen 9 3900X | |
| AMD Ryzen 9 3950X | |
| AMD Ryzen 3 3300X | |
| AMD Ryzen 3 3100 | |
| AMD Radeon RX Vega 64 | |
| AMD Radeon RX Vega 64 | |
| Dota 2 Reborn | |
| 1280x720 min (0/3) fastest | |
| Intel Core i9-10900K | |
| Intel Core i9-9900KS, Nvidia Titan RTX | |
| Intel Core i5-10600K | |
| AMD Ryzen 7 3800XT | |
| AMD Radeon RX Vega 64 | |
| AMD Ryzen 9 3900X | |
| AMD Radeon RX Vega 64 | |
| AMD Ryzen 9 3950X | |
| AMD Ryzen 3 3300X | |
| AMD Ryzen 3 3100 | |
| 1920x1080 ultra (3/3) best looking | |
| Intel Core i9-10900K | |
| Intel Core i9-9900KS, Nvidia Titan RTX | |
| Intel Core i5-10600K | |
| AMD Radeon RX Vega 64 | |
| AMD Ryzen 7 3800XT | |
| AMD Ryzen 9 3900X | |
| AMD Radeon RX Vega 64 | |
| AMD Ryzen 9 3950X | |
| AMD Ryzen 3 3300X | |
| AMD Ryzen 3 3100 | |
Intel Core i9-10900K + Nvidia Titan RTX
| bajo | medio | alto | ultra | QHD | 4K | |
|---|---|---|---|---|---|---|
| The Witcher 3 (2015) | 388 | 348 | 252 | 139 | 103 | |
| Dota 2 Reborn (2015) | 169.8 | 151.6 | 151.2 | 139.7 | 138.1 | |
| Final Fantasy XV Benchmark (2018) | 189 | 161 | 118 | 59.3 | ||
| X-Plane 11.11 (2018) | 131 | 118 | 96 | 82.8 | ||
| Far Cry 5 (2018) | 148 | 129 | 122 | 115 | 110 | 78 |
| Shadow of the Tomb Raider (2018) | 154 | 145 | 142 | 138 | 118 | 66.8 |
| Forza Horizon 4 (2018) | 210 | 185 | 184 | 173 | 157 | 112 |
| Far Cry New Dawn (2019) | 132 | 115 | 111 | 101 | 97 | 76 |
| Metro Exodus (2019) | 169 | 142 | 121 | 99.3 | 80.2 | 52.3 |
| Borderlands 3 (2019) | 151 | 138 | 124 | 116 | 93.1 | 52.8 |
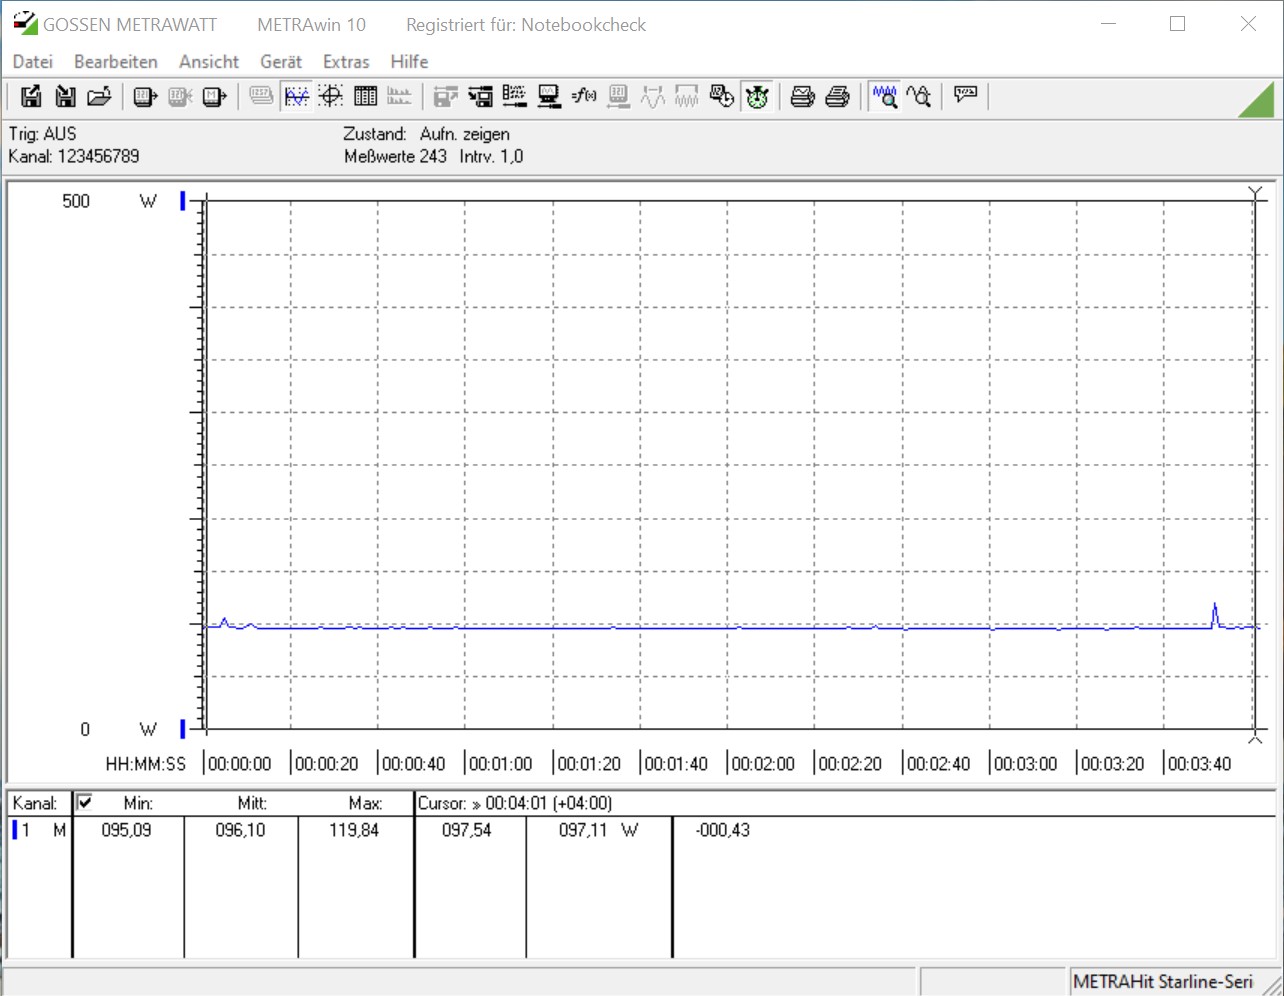
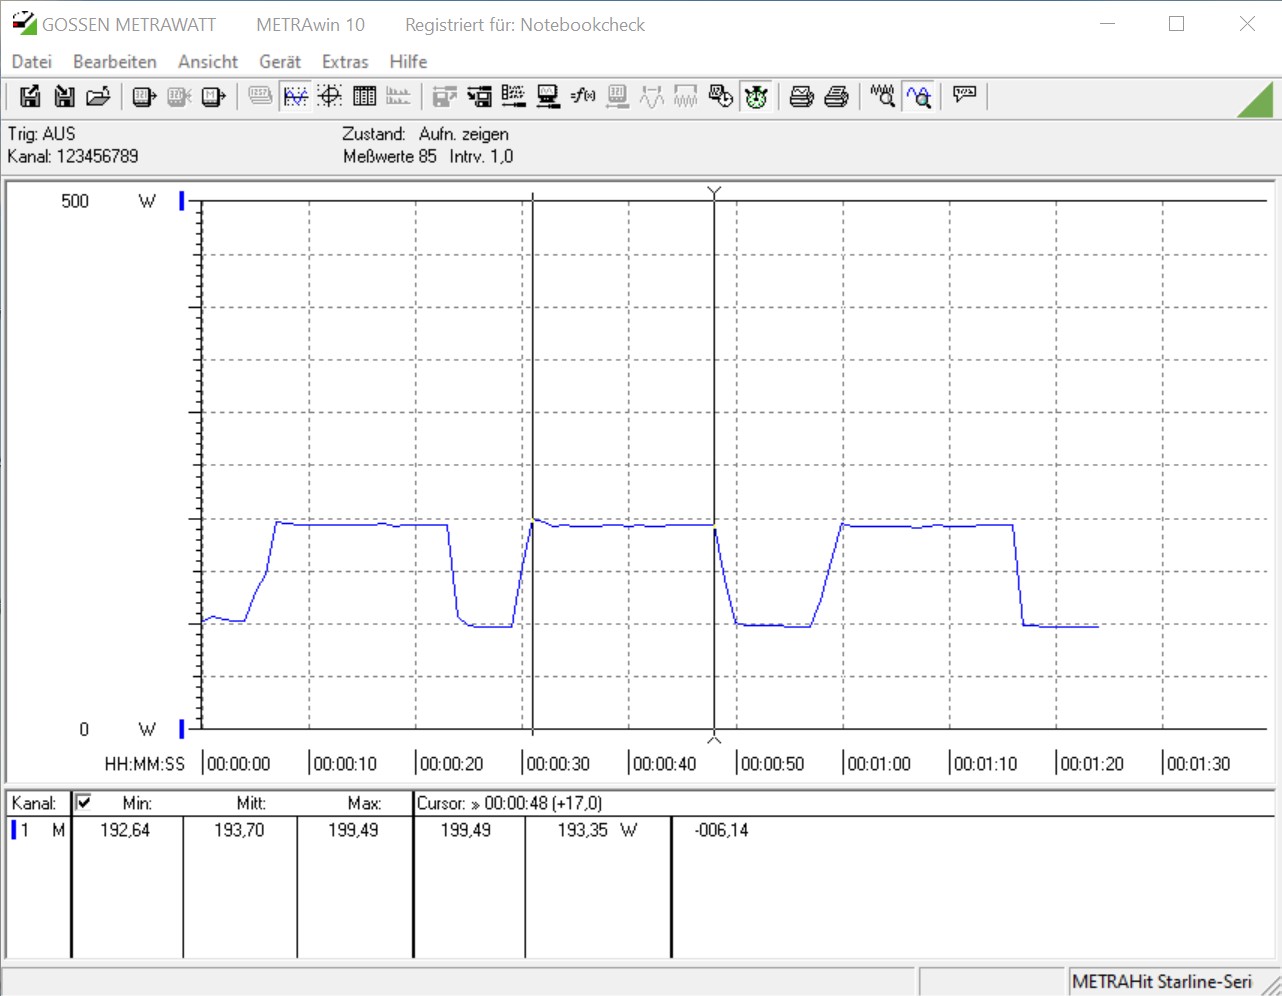
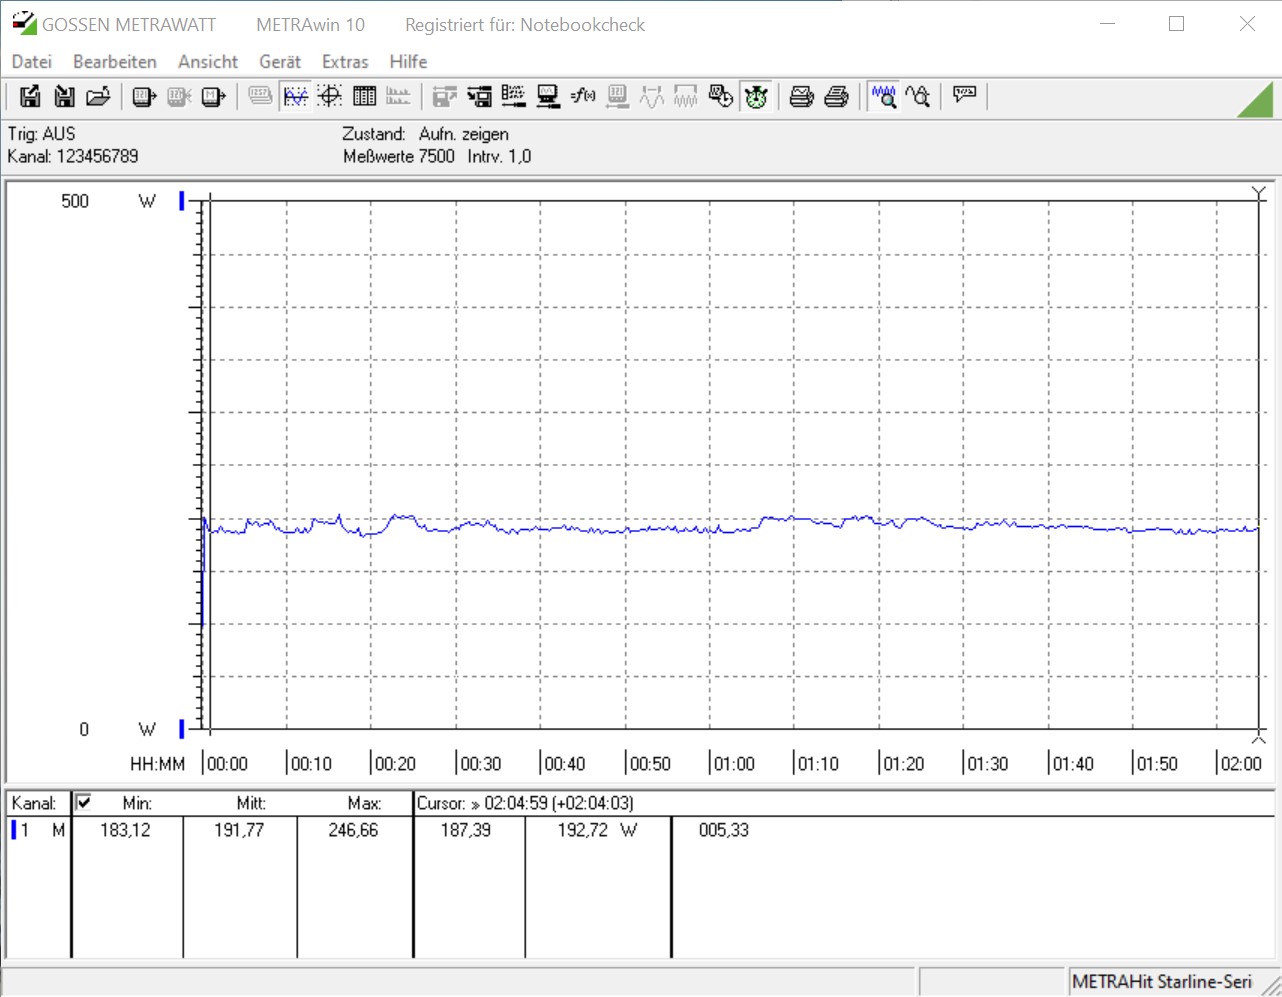
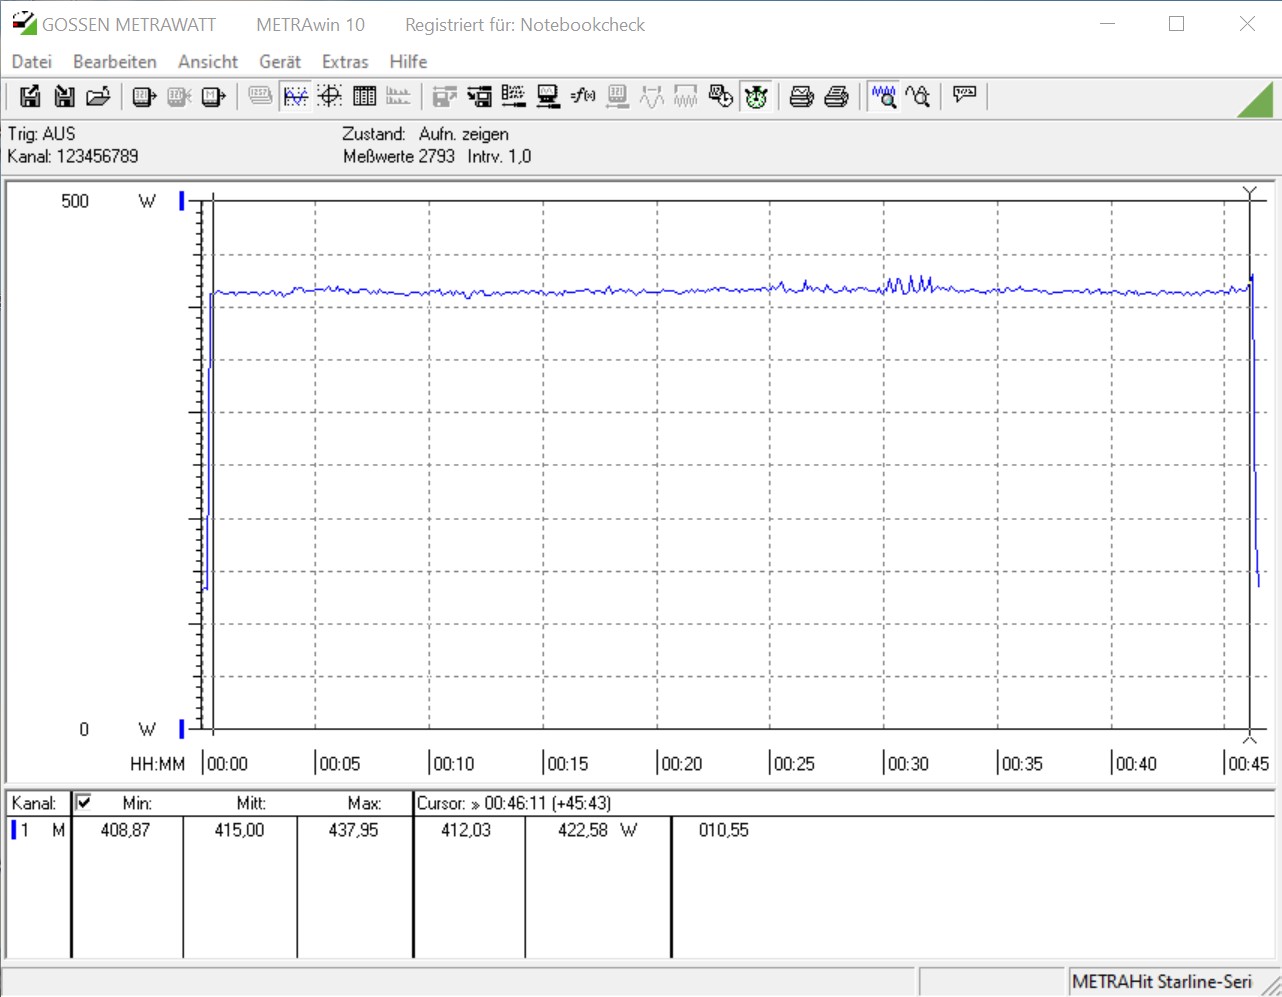
El consumo de energía es más eficiente que el de Intel
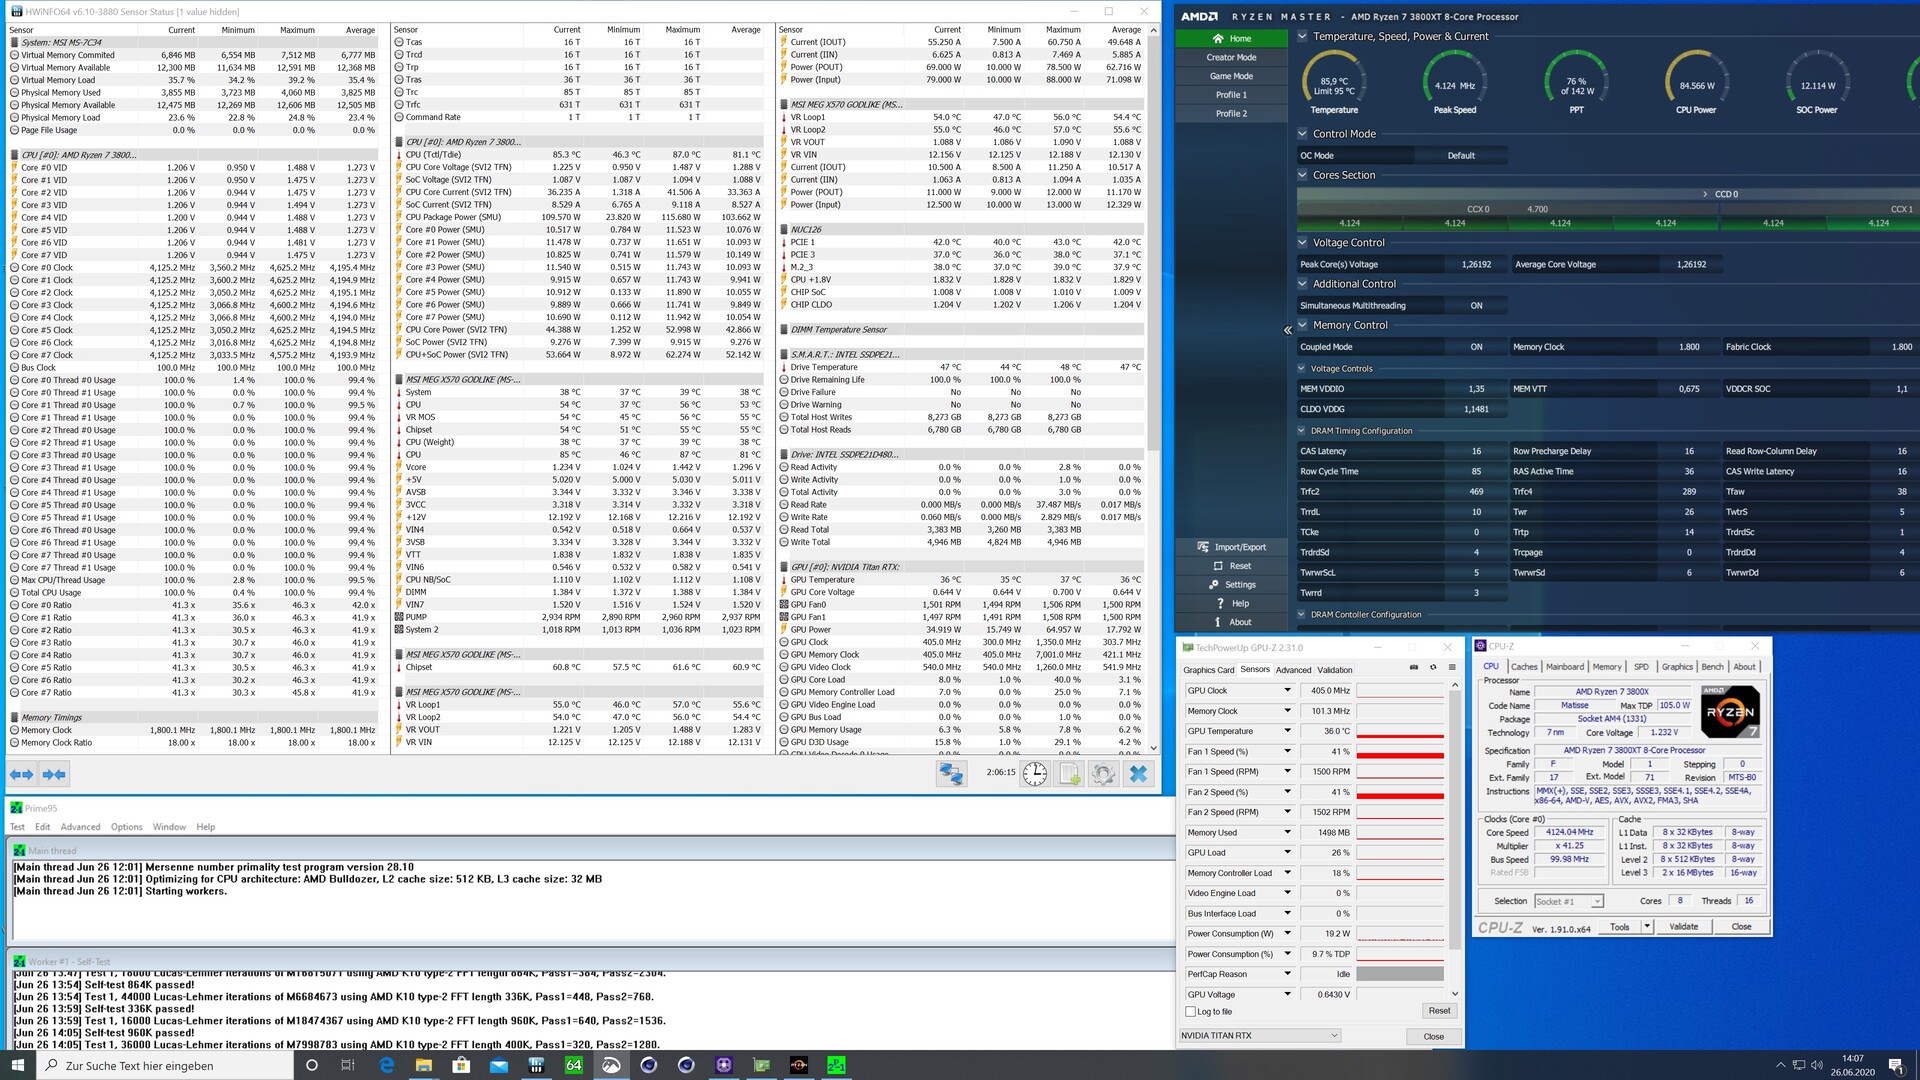
AMD especifica un TDP de 105 vatios para el Ryzen 7 3800XT. El mismo que para los dos modelos Ryzen 9. Sin embargo, sabemos que bajo ciertas circunstancias este límite de TDP puede ser excedido. Intel hace lo mismo e incluso permite hasta 250 vatios en el Core i9-10900K. En nuestra prueba de estrés con Prime95 (v.28.10), el HWiNFO muestra un máximo de 115 vatios para la CPU. El consumo medio se estabilizó en 103,7 vatios. Para todo el sistema medimos 191,8 vatios durante la prueba de esfuerzo, que es mínimamente menor en comparación con el Ryzen 9 3900X. El consumo sube a 415 vatios durante el juego debido a la carga adicional de la GPU. En comparación con los dos modelos Ryzen 9, el Ryzen 7 3800XT no consume mucho menos.
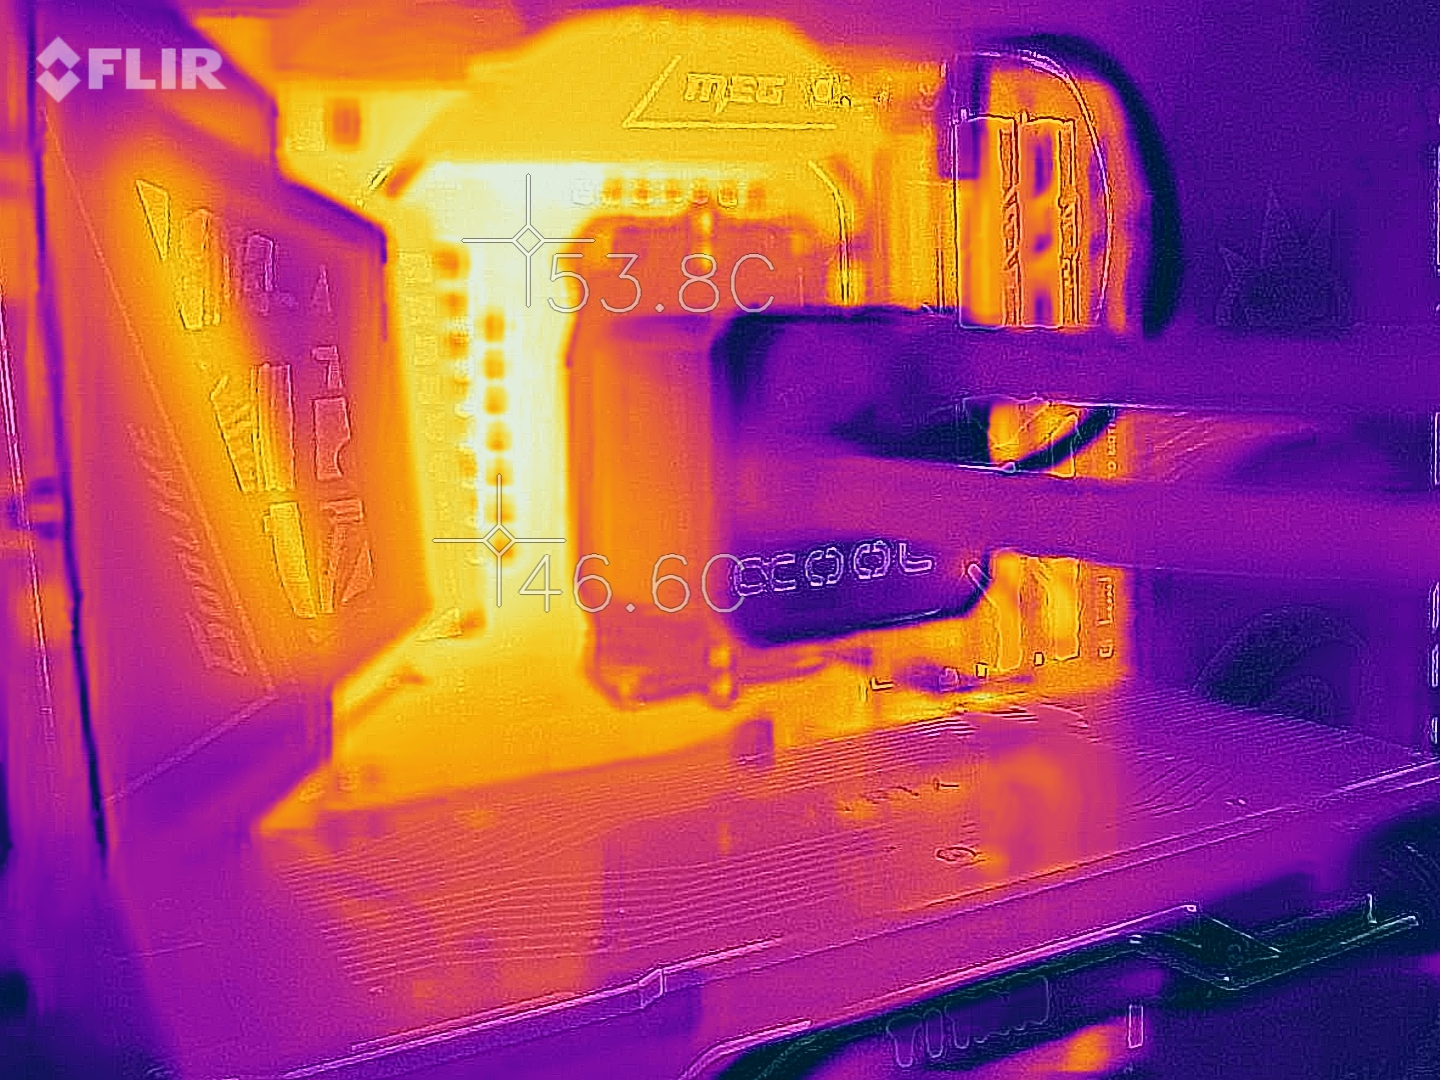
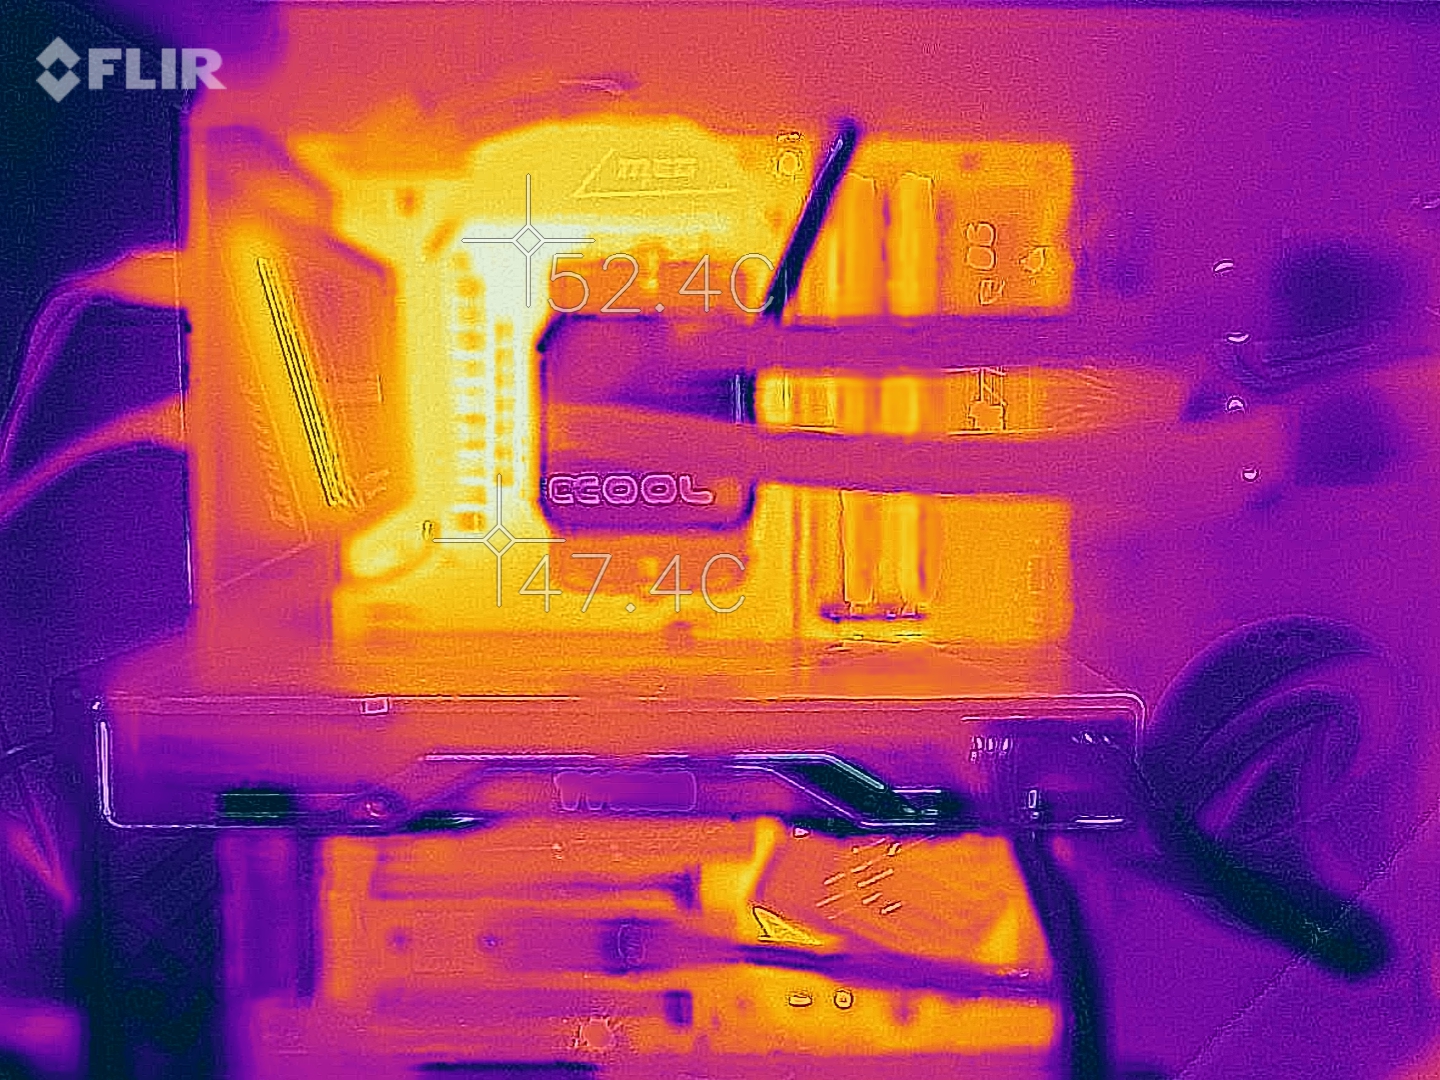
Las temperaturas de la CPU se midieron en una configuración de prueba abierta en nuestro banco de pruebas. A pesar del bien dimensionado AiO de Alphacool, la máxima temperatura de la CPU durante la prueba de esfuerzo fue de 87 °C (188,6 °F). Dado que AMD vende el Ryzen 7 3800X sin ventilador, la compra de esta CPU debería implicar considerar también un potente refrigerador.
* ... más pequeño es mejor
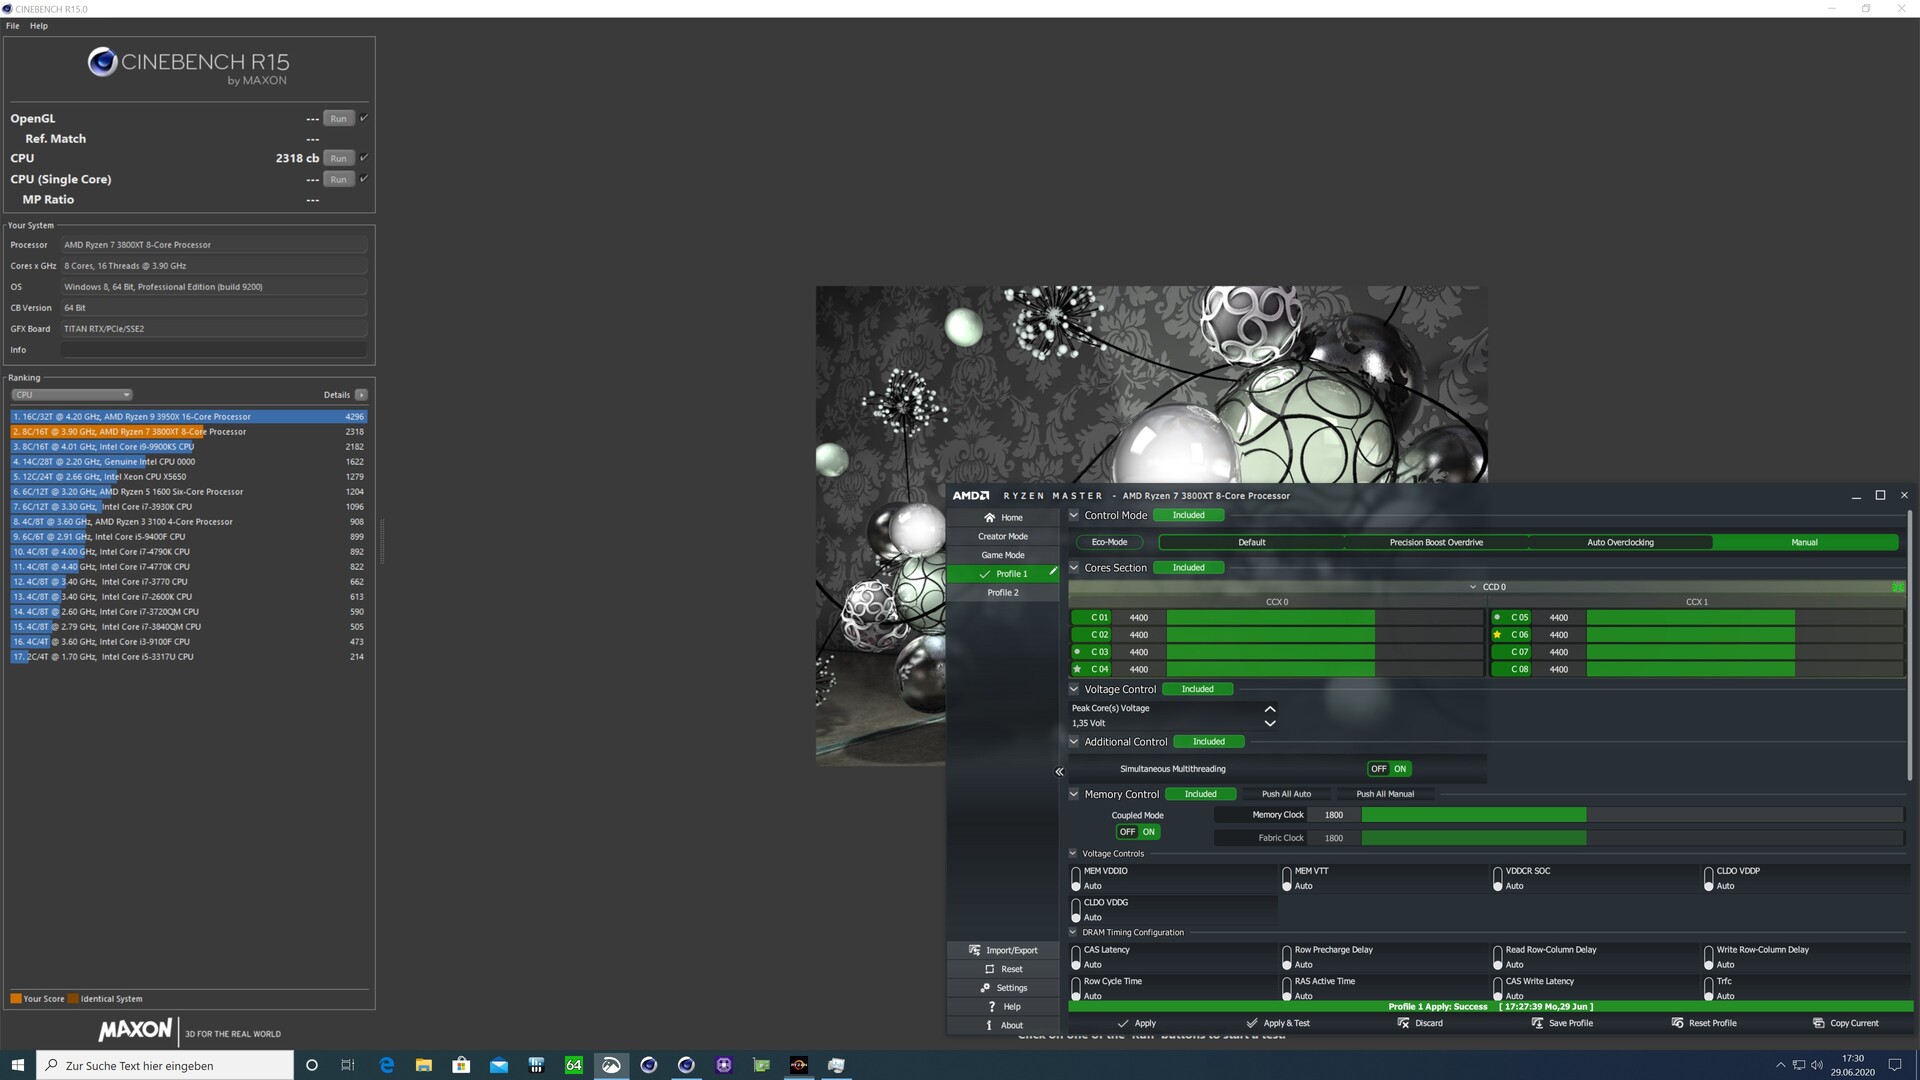
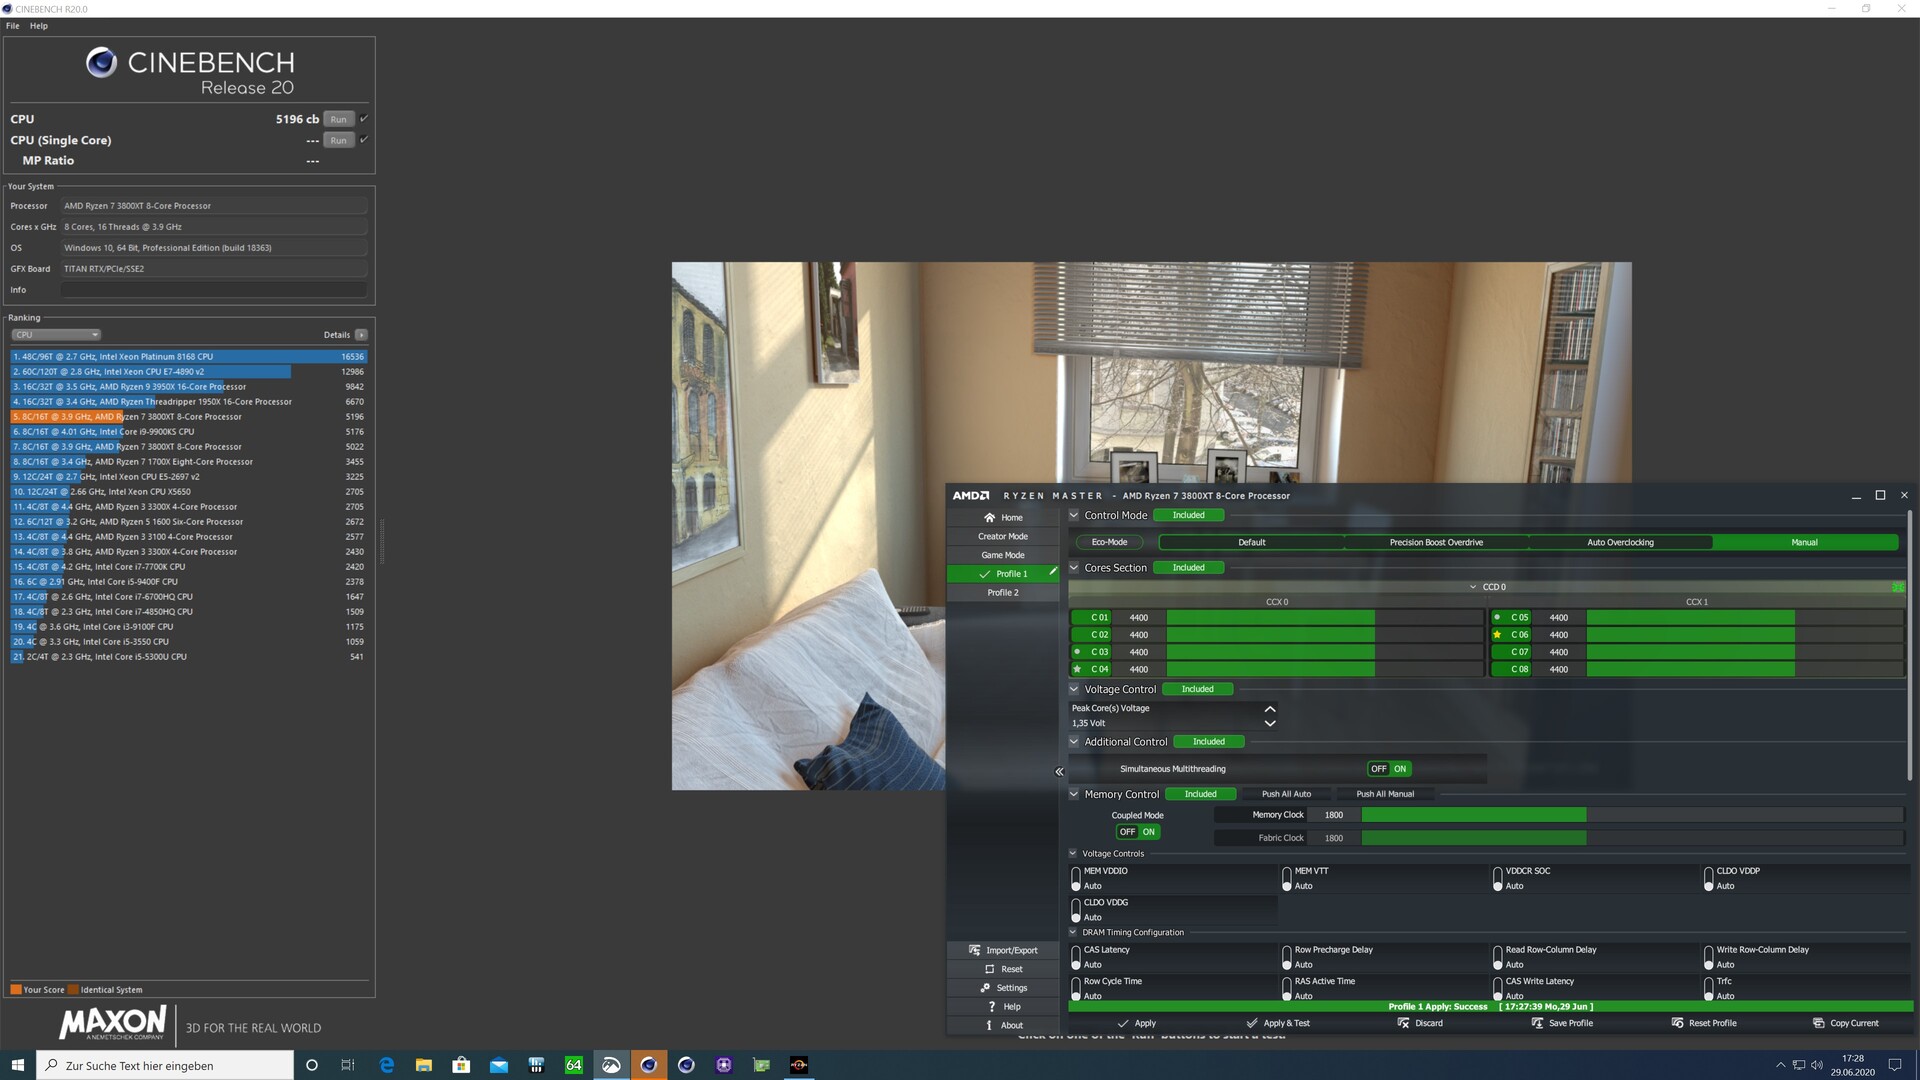
Overclocking - no recomendado
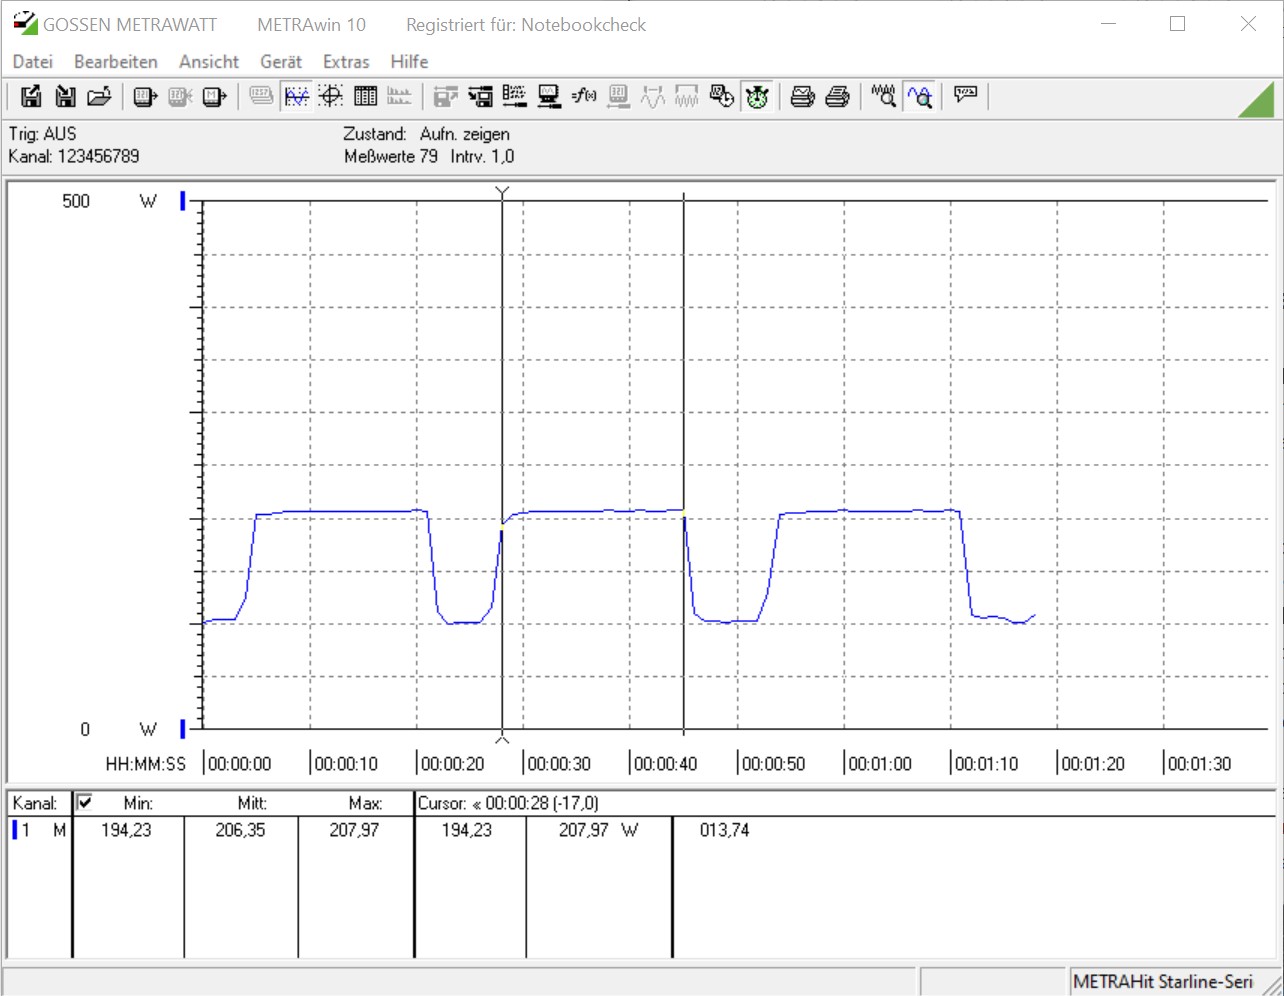
Aunque el AMD Ryzen 7 3800XT ya ofrece un rendimiento muy bueno, muchos quieren exprimir un poco más de su CPU con la ayuda del overclocking. Con el Ryzen Master puedes hacer overclocking de los procesadores AMD Ryzen fácilmente desde Windows. Sin embargo, debes saber que esto anulará todas las garantías. Además, se desactiva el PBO (Precision Boost Overdrive), que ya no permite el turbo máximo de 4,7 GHz y por lo tanto tiene un impacto negativo en el rendimiento de un solo hilo. En nuestro caso pudimos hacer funcionar el AMD Ryzen 7 3800XT a 4,4 GHz en los ocho núcleos sin mucho esfuerzo. El aumento de rendimiento puede ser medido, pero no es perceptible. En el mismo tiempo, el voltaje tuvo que ser aumentado ligeramente, lo que resulta en un consumo de energía ligeramente mayor. Precisamente, el consumo de energía del sistema aumentó en 13 vatios en el multi benchmark Cinebench R15, hasta ahora 206 vatios.
Aconsejamos no operar continuamente fuera de las especificaciones dadas por las razones mencionadas anteriormente. El aumento esperado en el rendimiento es simplemente demasiado bajo.
Pro
Contra
Veredicto - el precio decide la victoria o la derrota!

El AMD Ryzen 7 3800XT sucede al AMD Ryzen 7 3800X, que debido a su difícil colocación aún no ha podido destacar entre la multitud. La actualización del Ryzen 7 3800X también tendrá que vivir con estos prejuicios. En nuestra prueba, la CPU de 8 núcleos ofrece un buen rendimiento, que se nivela entre el Ryzen 7 3700X y el Ryzen 9 3900X. Esto era de esperar. Al mismo tiempo, el mayor TDP en comparación con el Ryzen 7 3700X sigue siendo un punto de crítica al elegir una CPU de 8 núcleos de AMD. El TDP 40 vatios más alto del Ryzen 7 3800XT de AMD comparado con el Ryzen 7 3700X no refleja una ganancia de rendimiento notable. El aumento del turbo hasta 4,7 GHz beneficiará principalmente a las aplicaciones de un solo hilo.
El AMD Ryzen 7 3800XT es una CPU de juego rápida, que seguirá teniendo dificultades para atraer a los compradores debido a su precio.
AMD está pidiendo 529 Euros (~$599) por la liberación de este CPU, que en nuestra opinión es al menos 100 Euros demasiado caro si se mira el rendimiento en relación a este precio. El Ryzen 7 3800X está ahora disponible por tan sólo 310 Euros (~351$), lo que no juega exactamente a favor del Ryzen 7 3800XT.
En general, AMD sólo hace un mantenimiento mínimo del producto con los procesadores XT. La pregunta que surge es por qué estos procesadores están siendo lanzados ahora, ya que se espera que el lanzamiento del Zen3 llegue este año, si se cree el rumor de la fábrica.