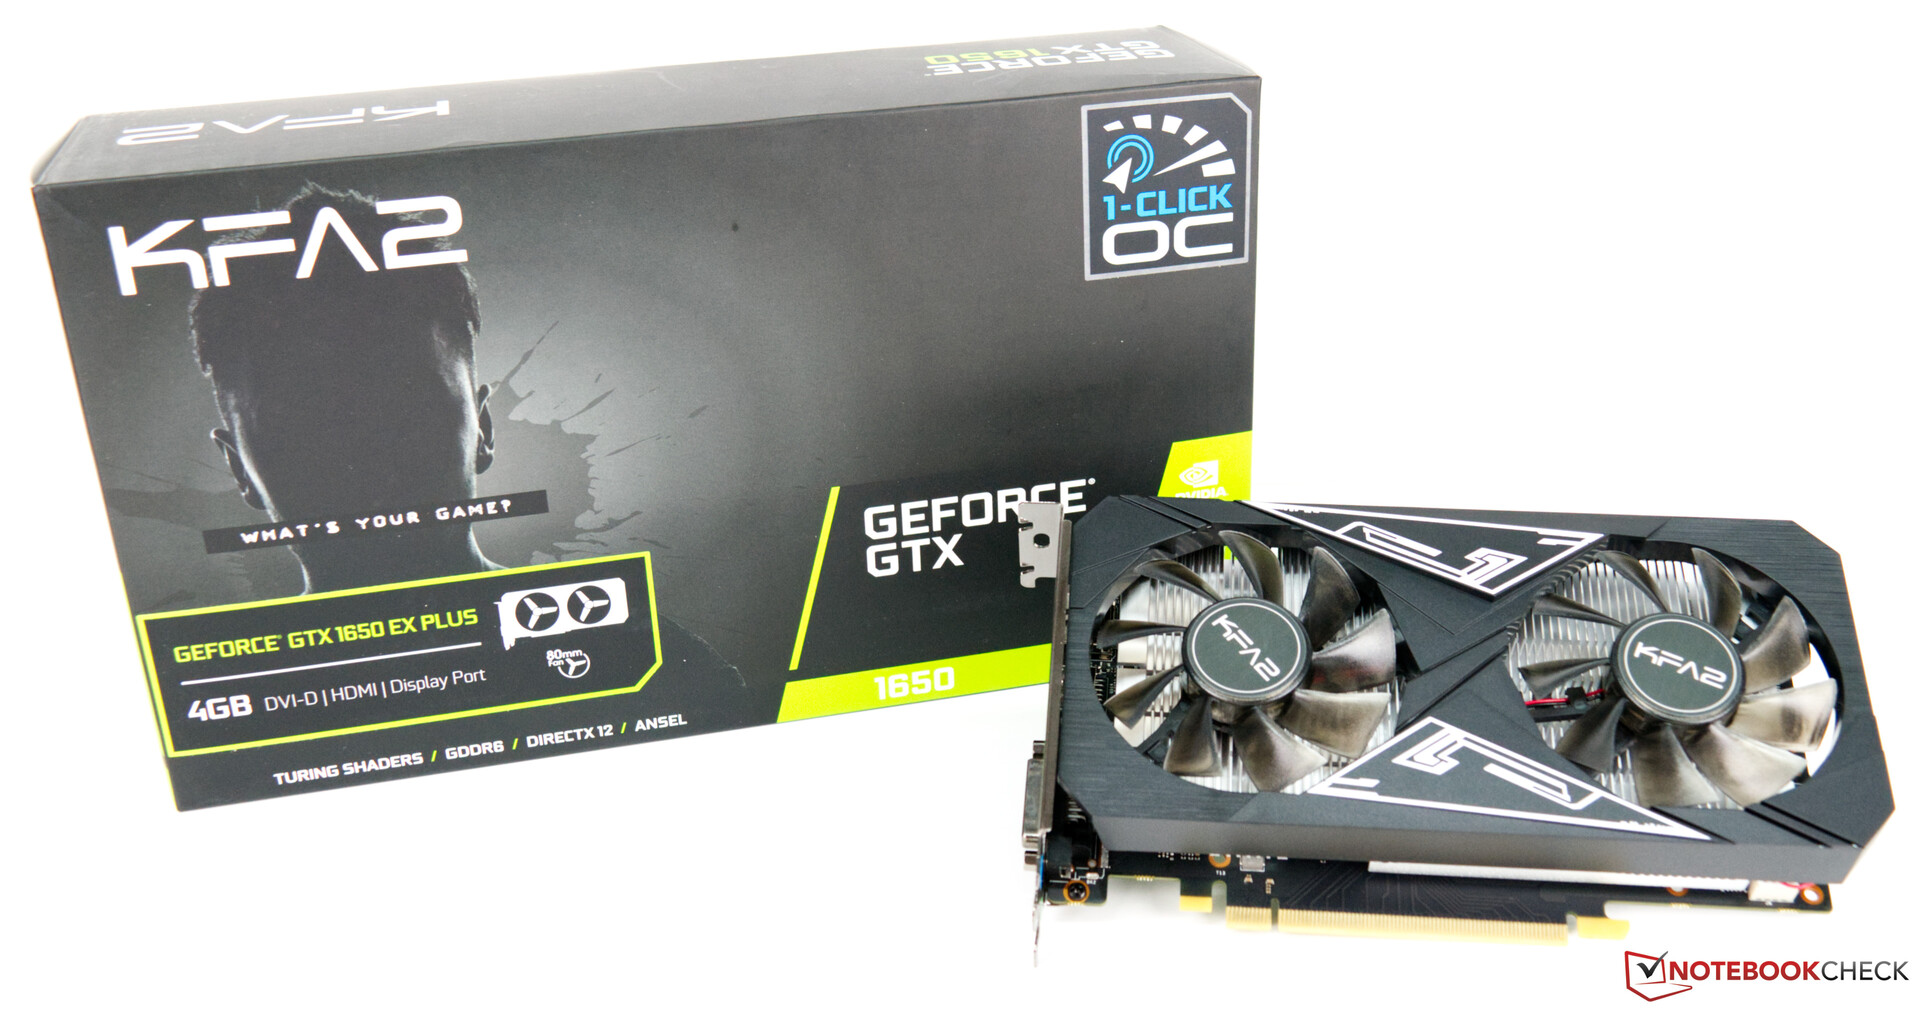
Review de la KFA2 GeForce GTX 1650 EX Plus: más rendimiento y VRAM más rápida para la GPU de escritorio más pequeña basada en Turing

Las GPU básicas basadas en Turing se encuentran en la serie GTX de NVIDIA. A diferencia de los modelos RTX, las tarjetas gráficas GTX no son compatibles con la aceleración de trazado de rayos basada en hardware y el supermuestreo de aprendizaje profundo (DLSS). La falta de estas características puede ser perdonada, dado que las tarjetas de vídeo GTX son mucho más lentas que las GPU RTX. Desde el lanzamiento de la arquitectura, NVIDIA y los socios de la tarjeta han llevado al mercado muchos modelos actualizados. La KFA2 GeForce GTX 1650 EX Plus (1-Click OC) es uno de esos modelos.
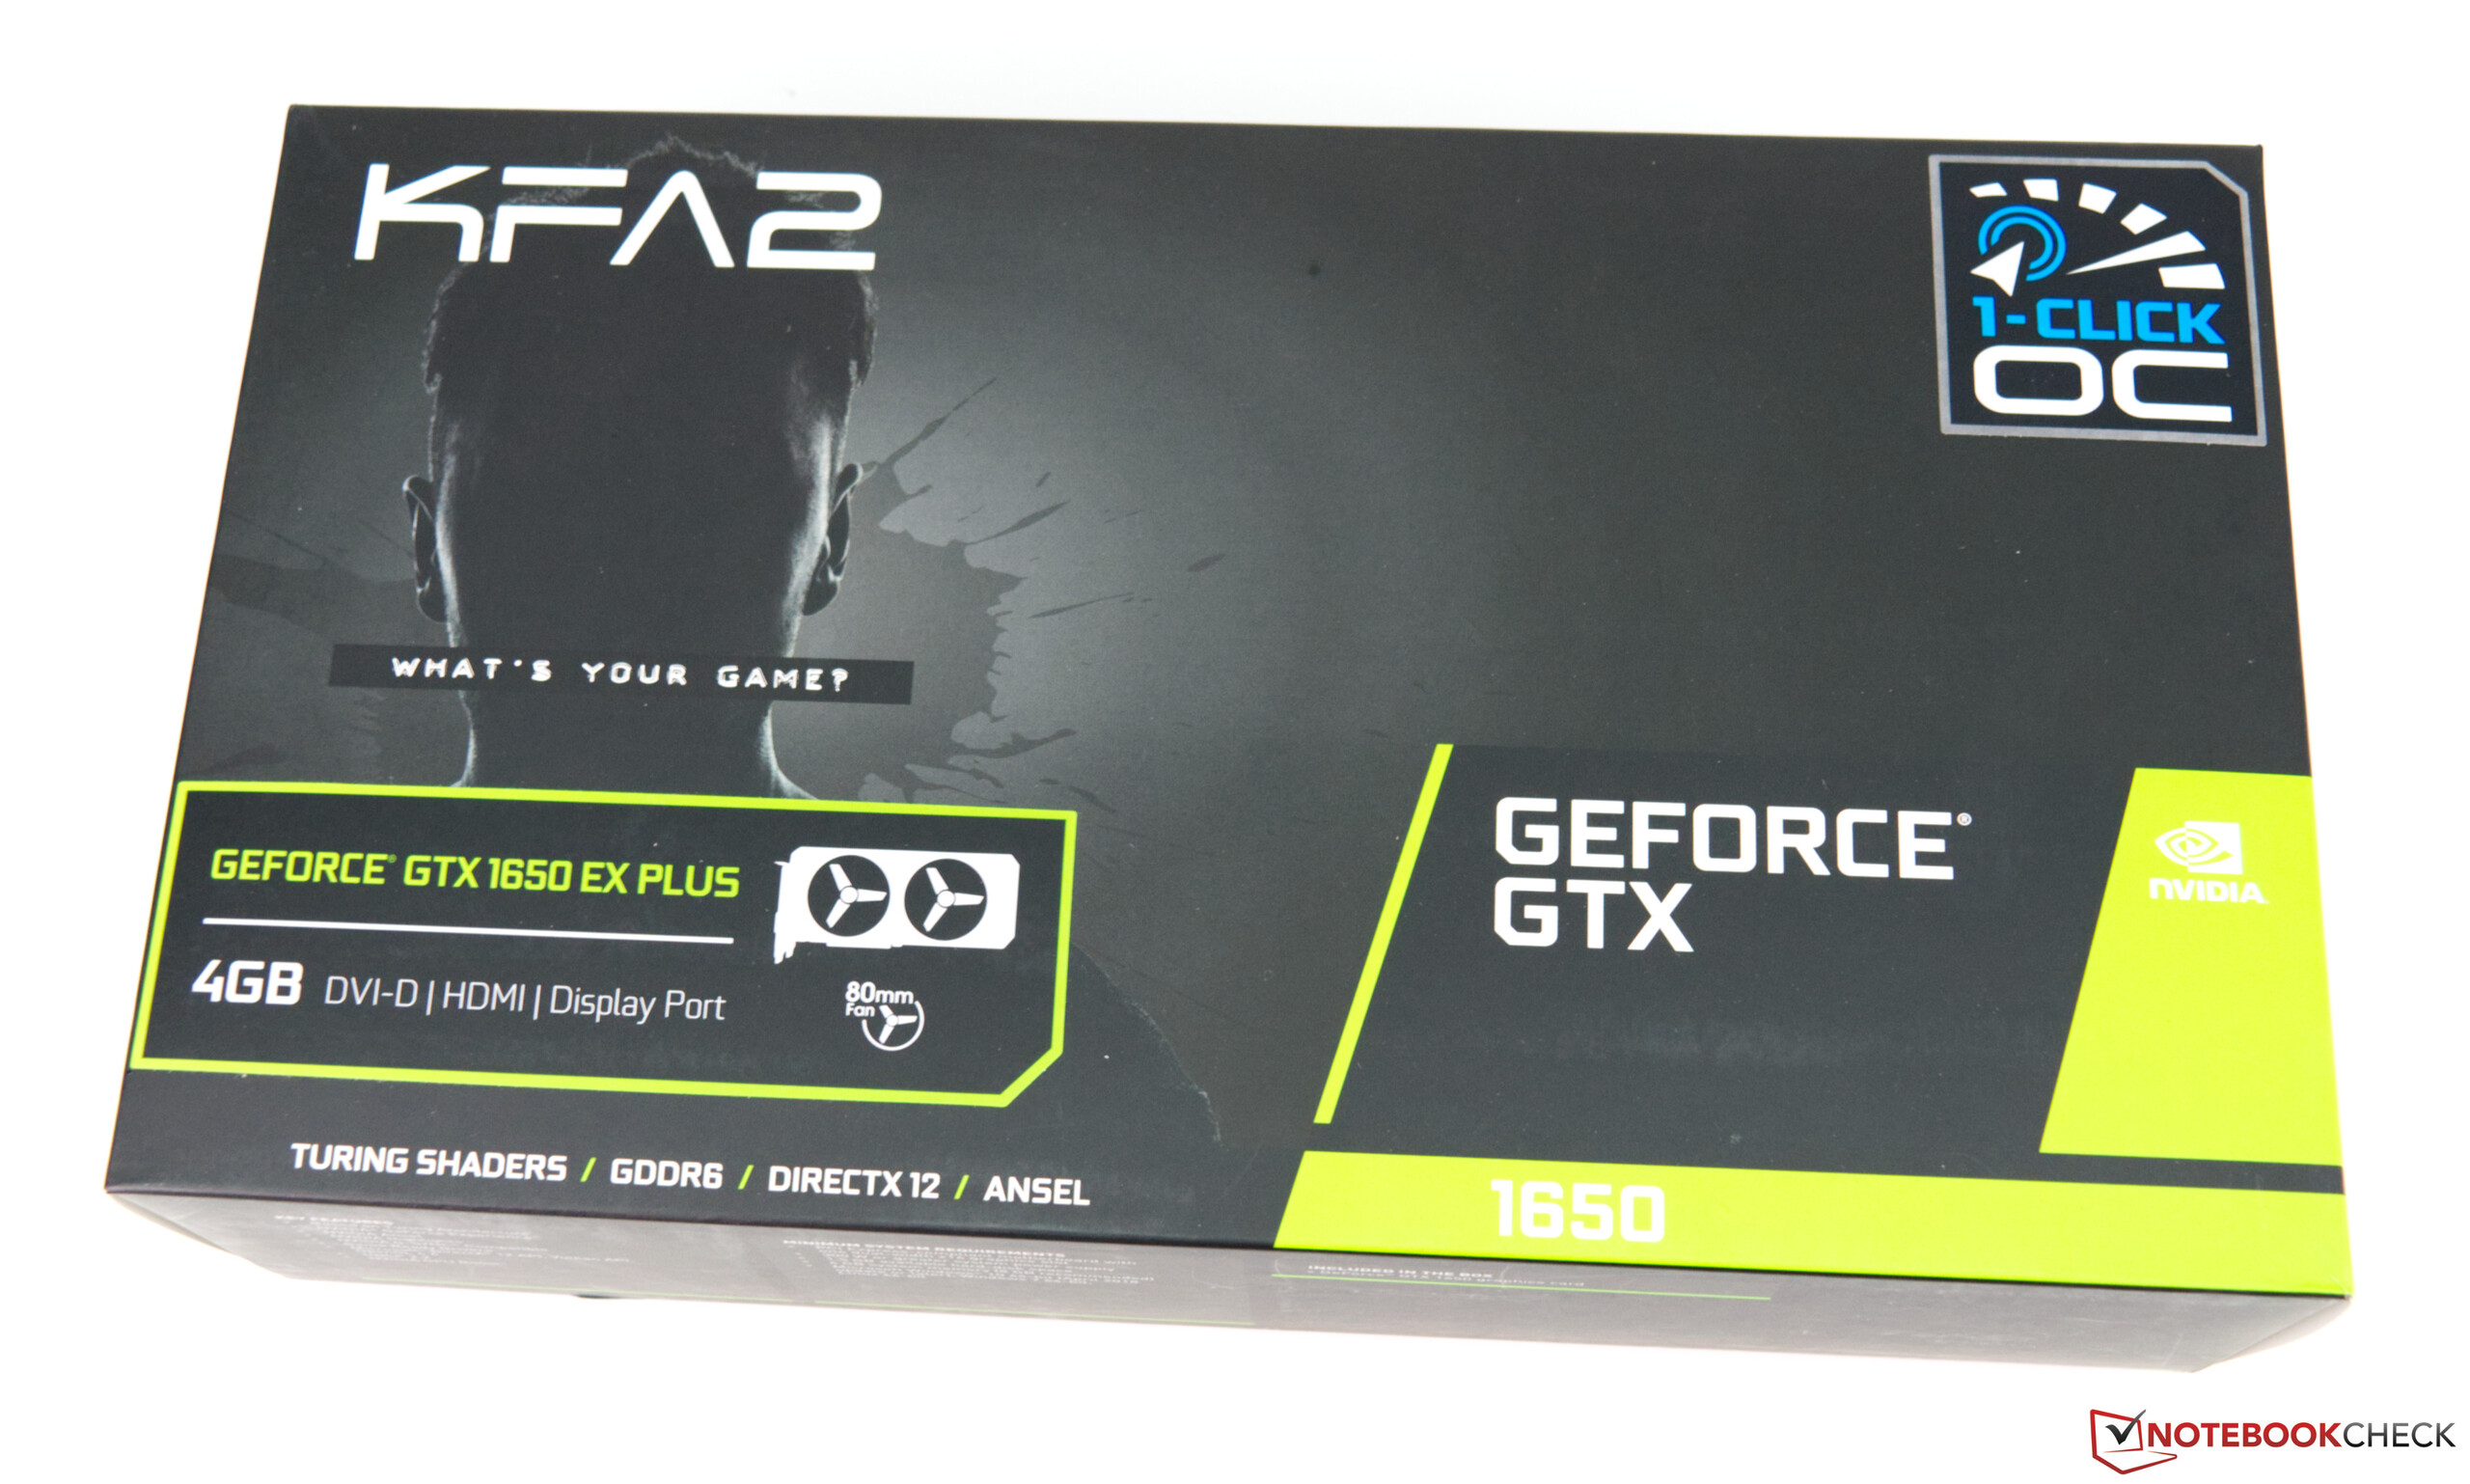
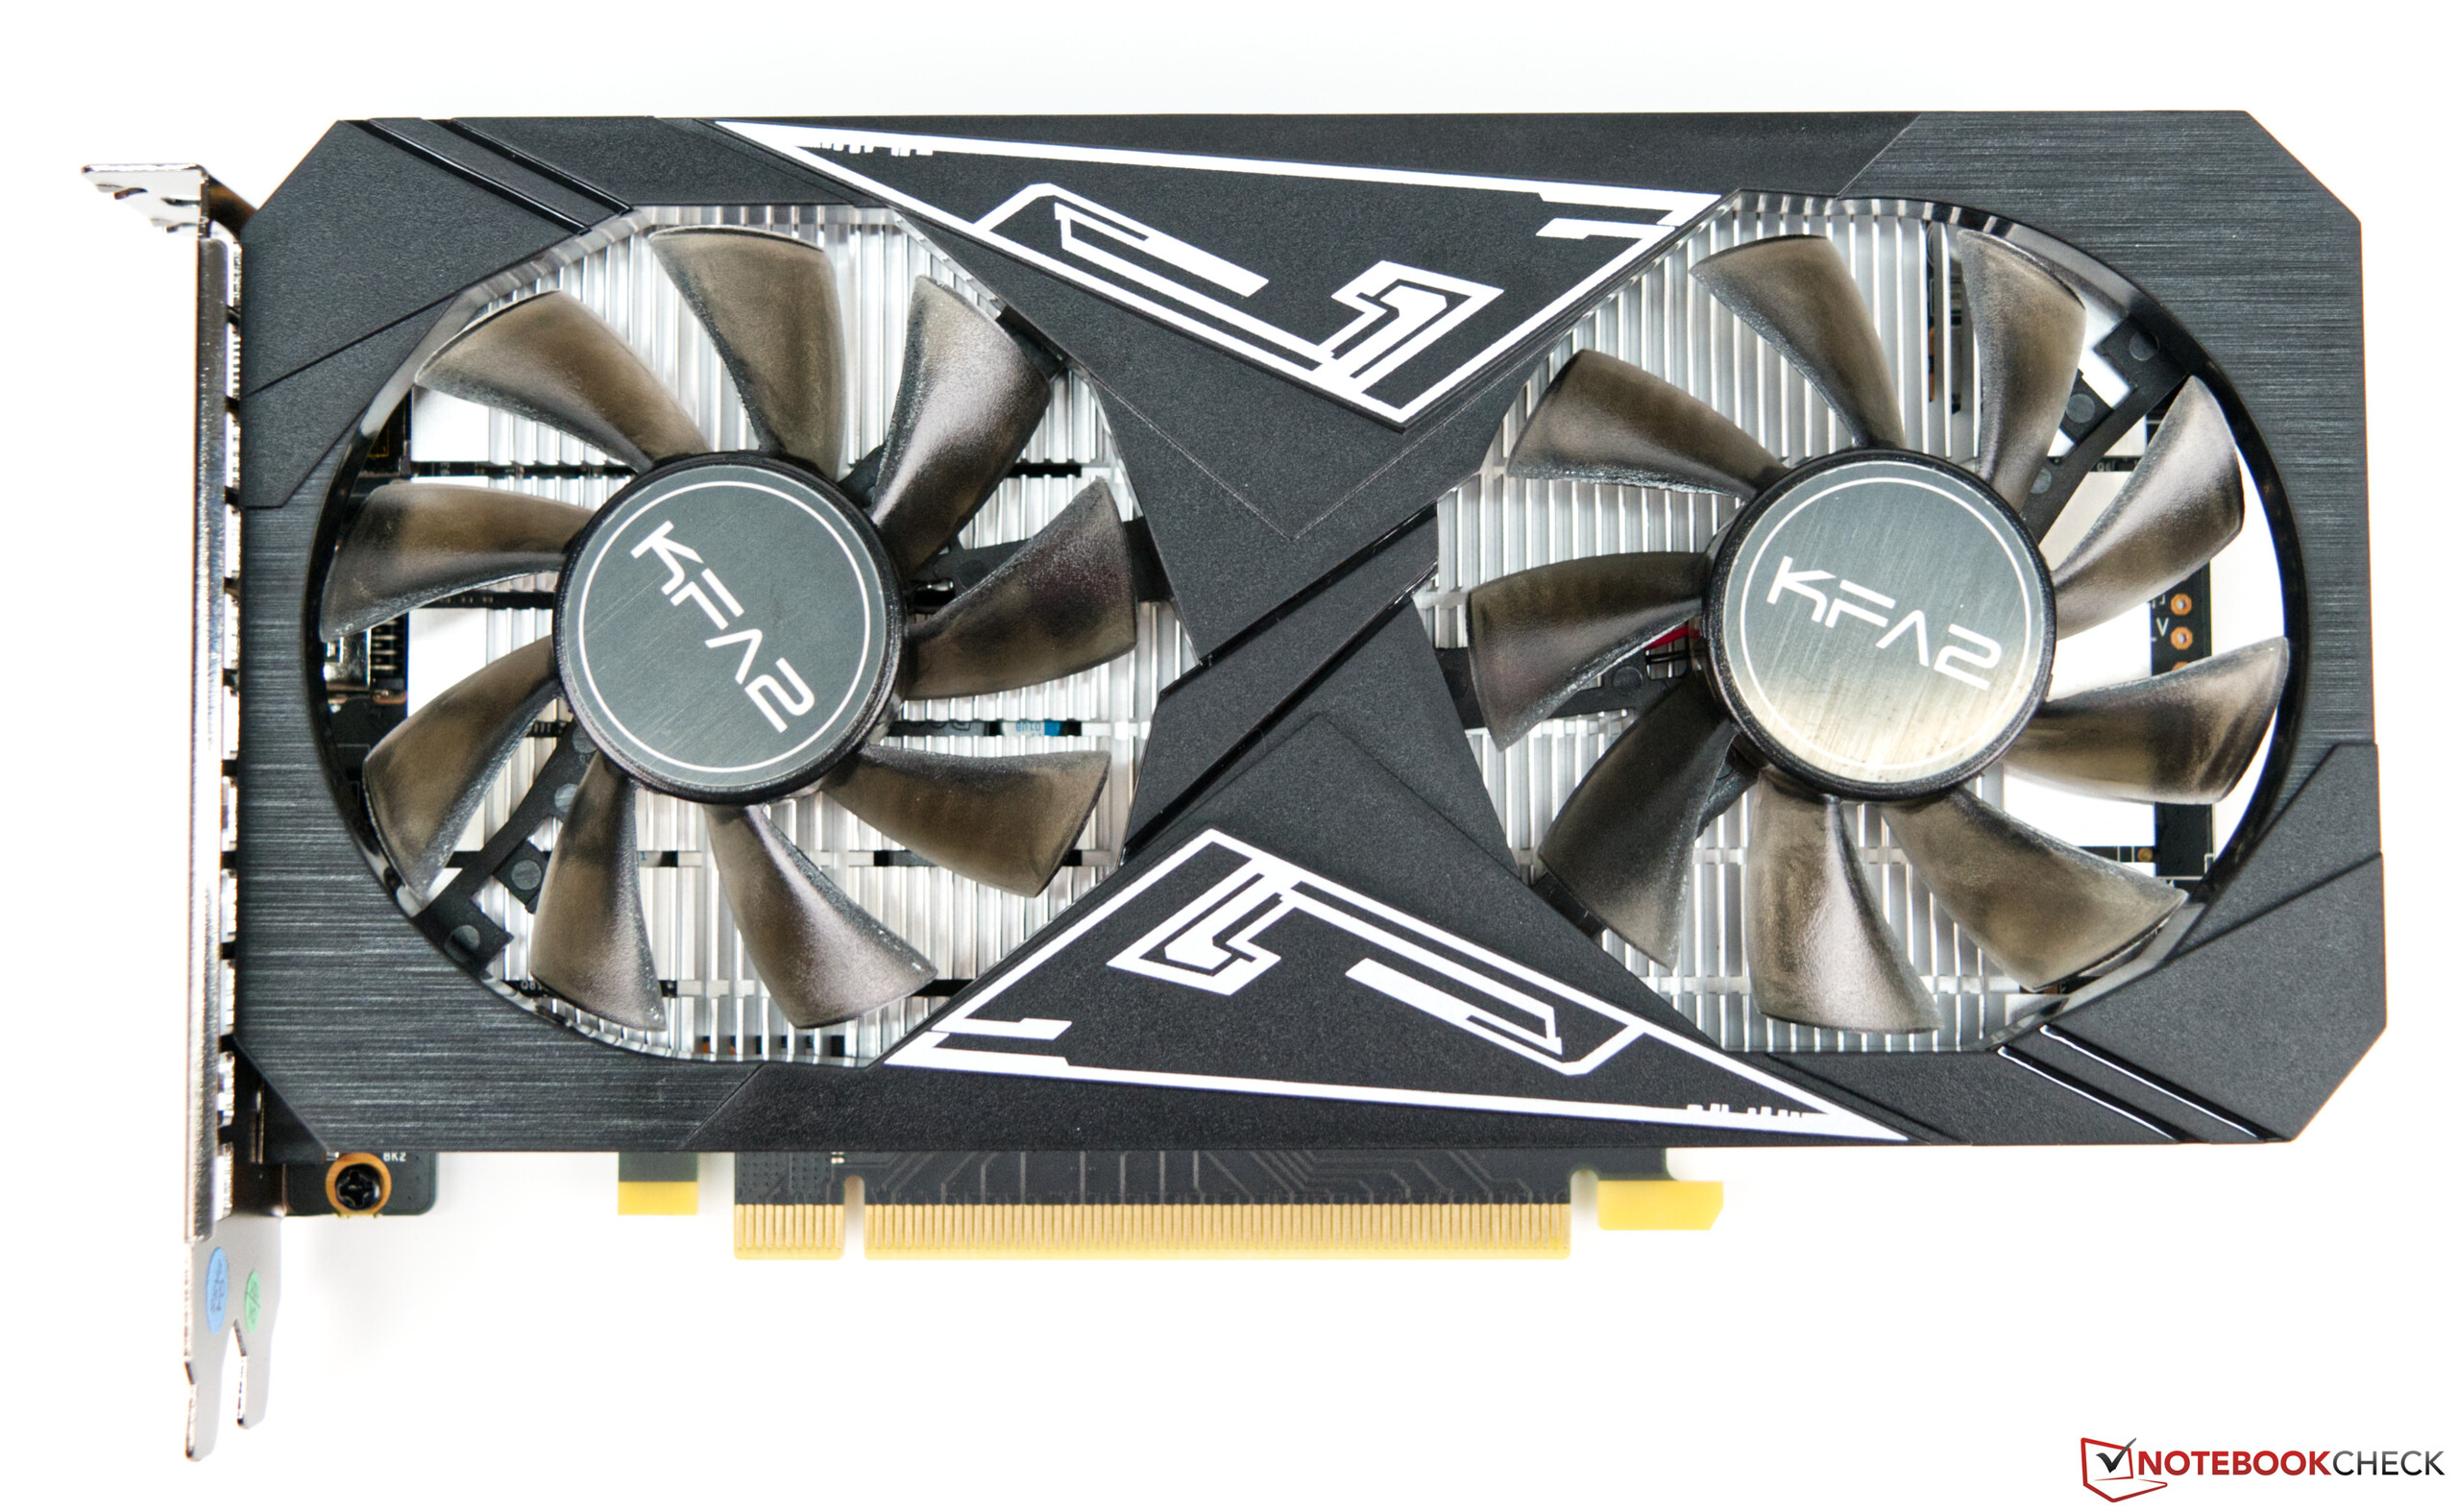
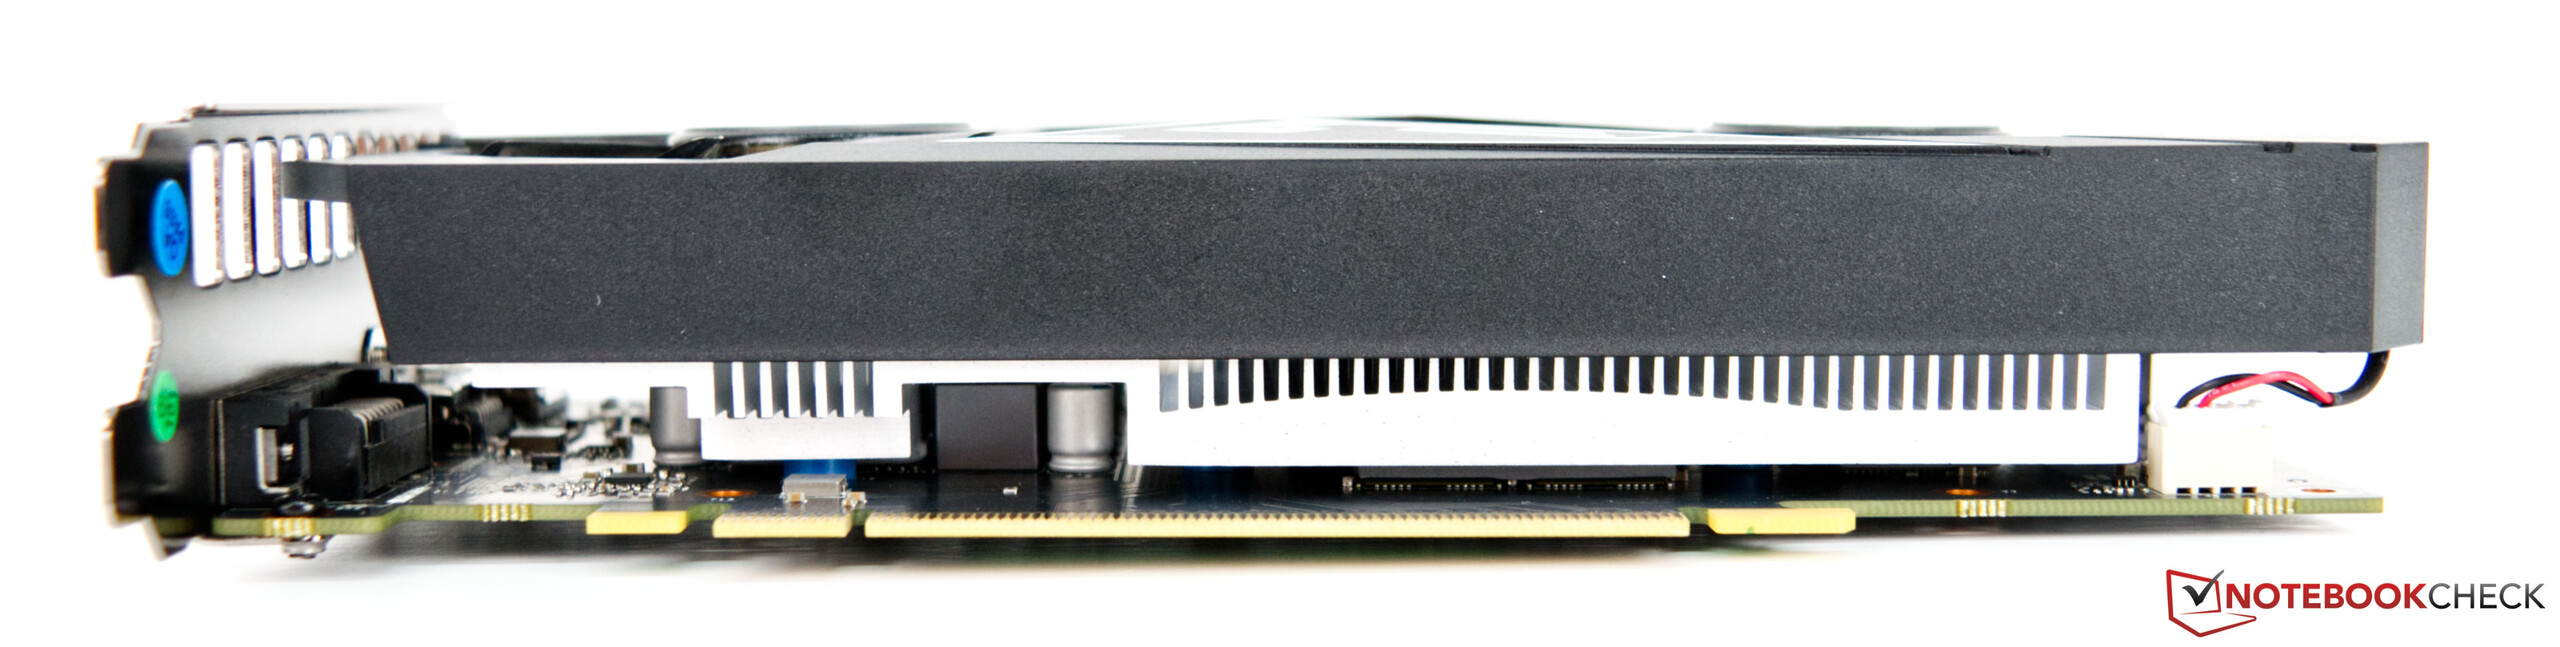
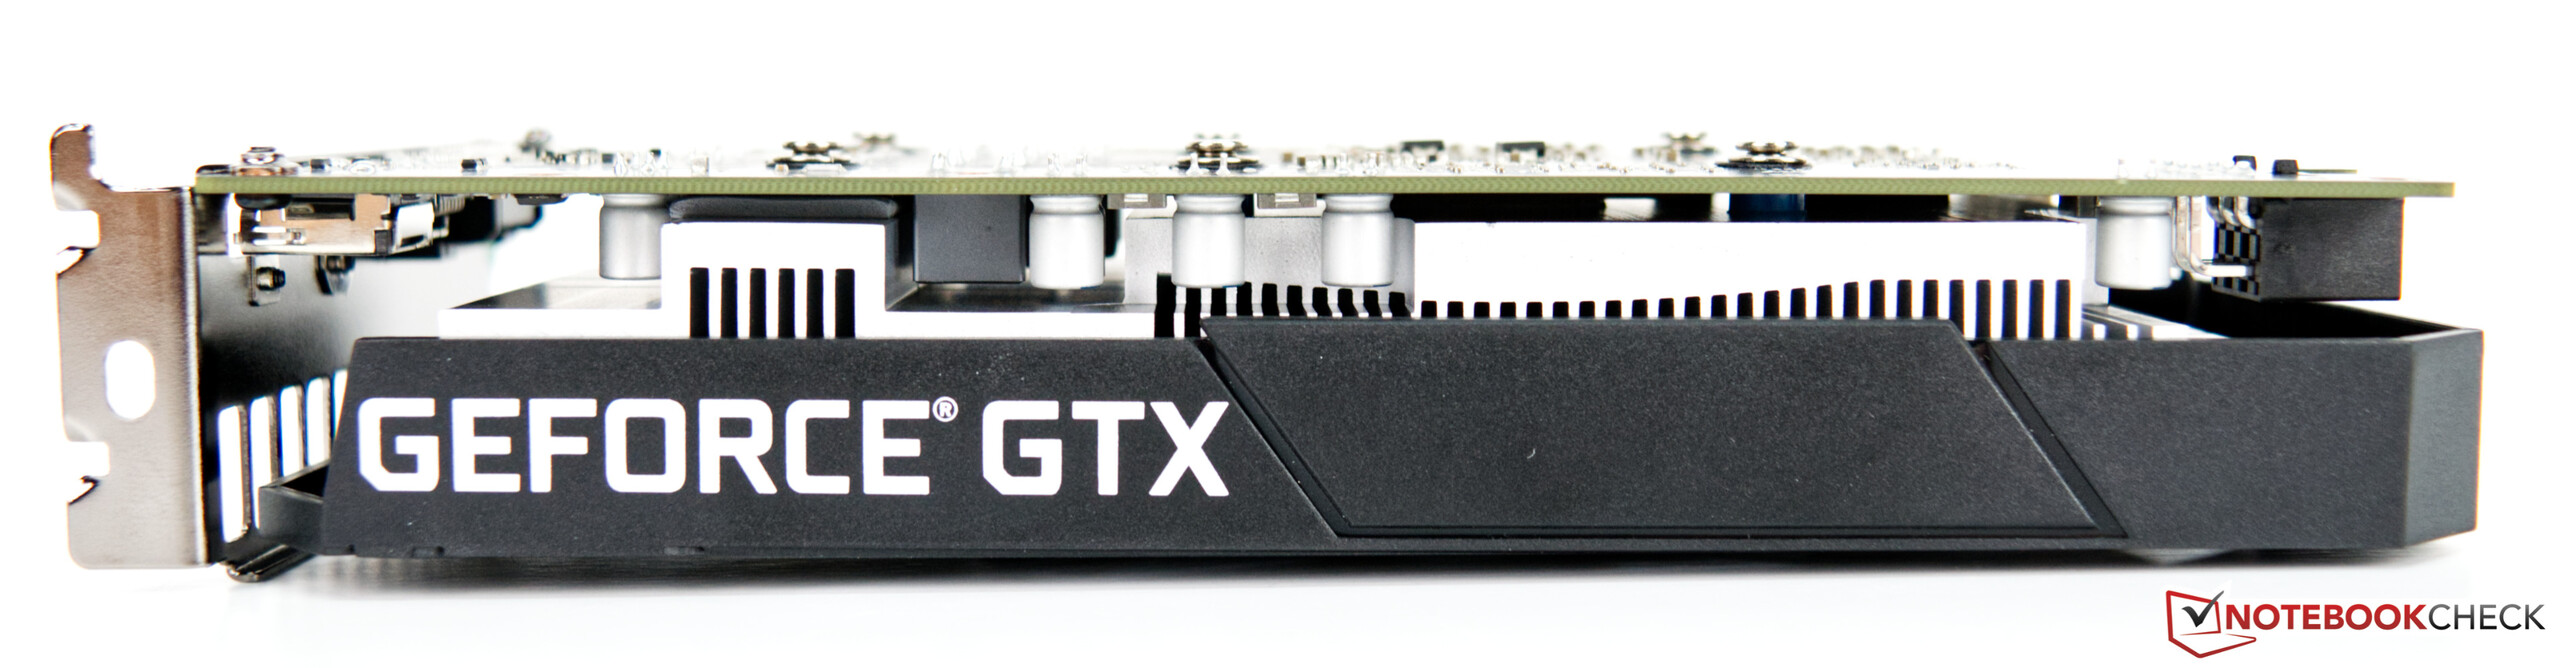
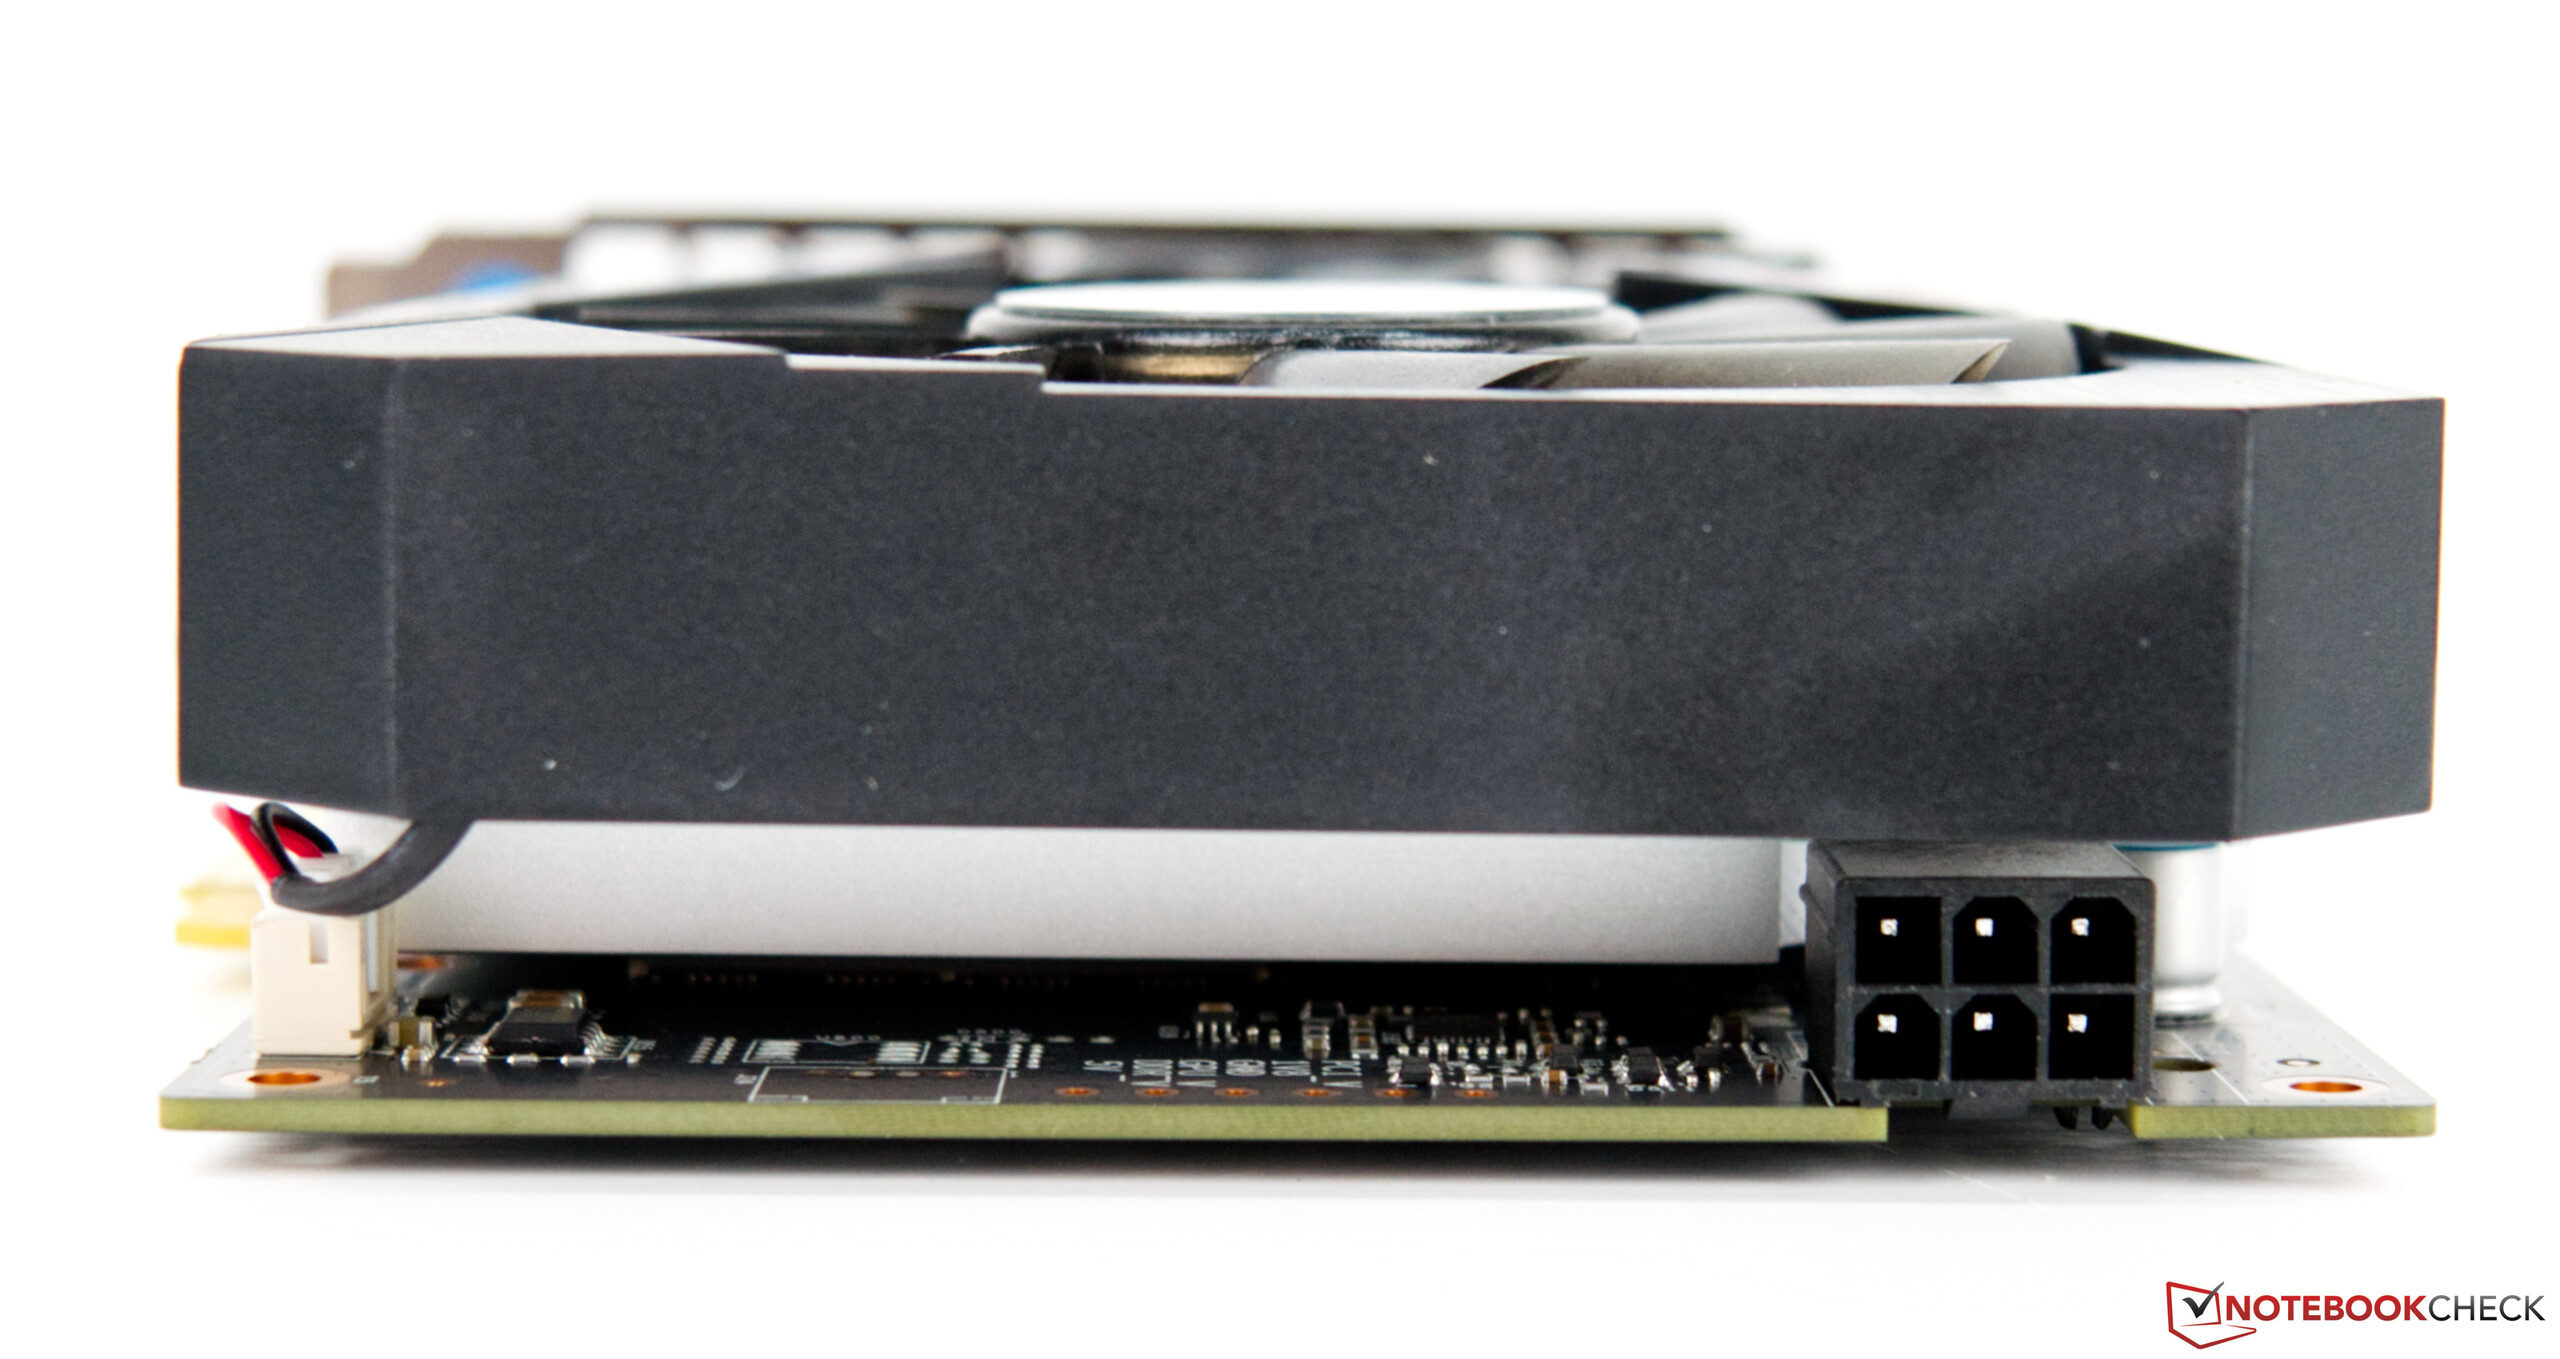
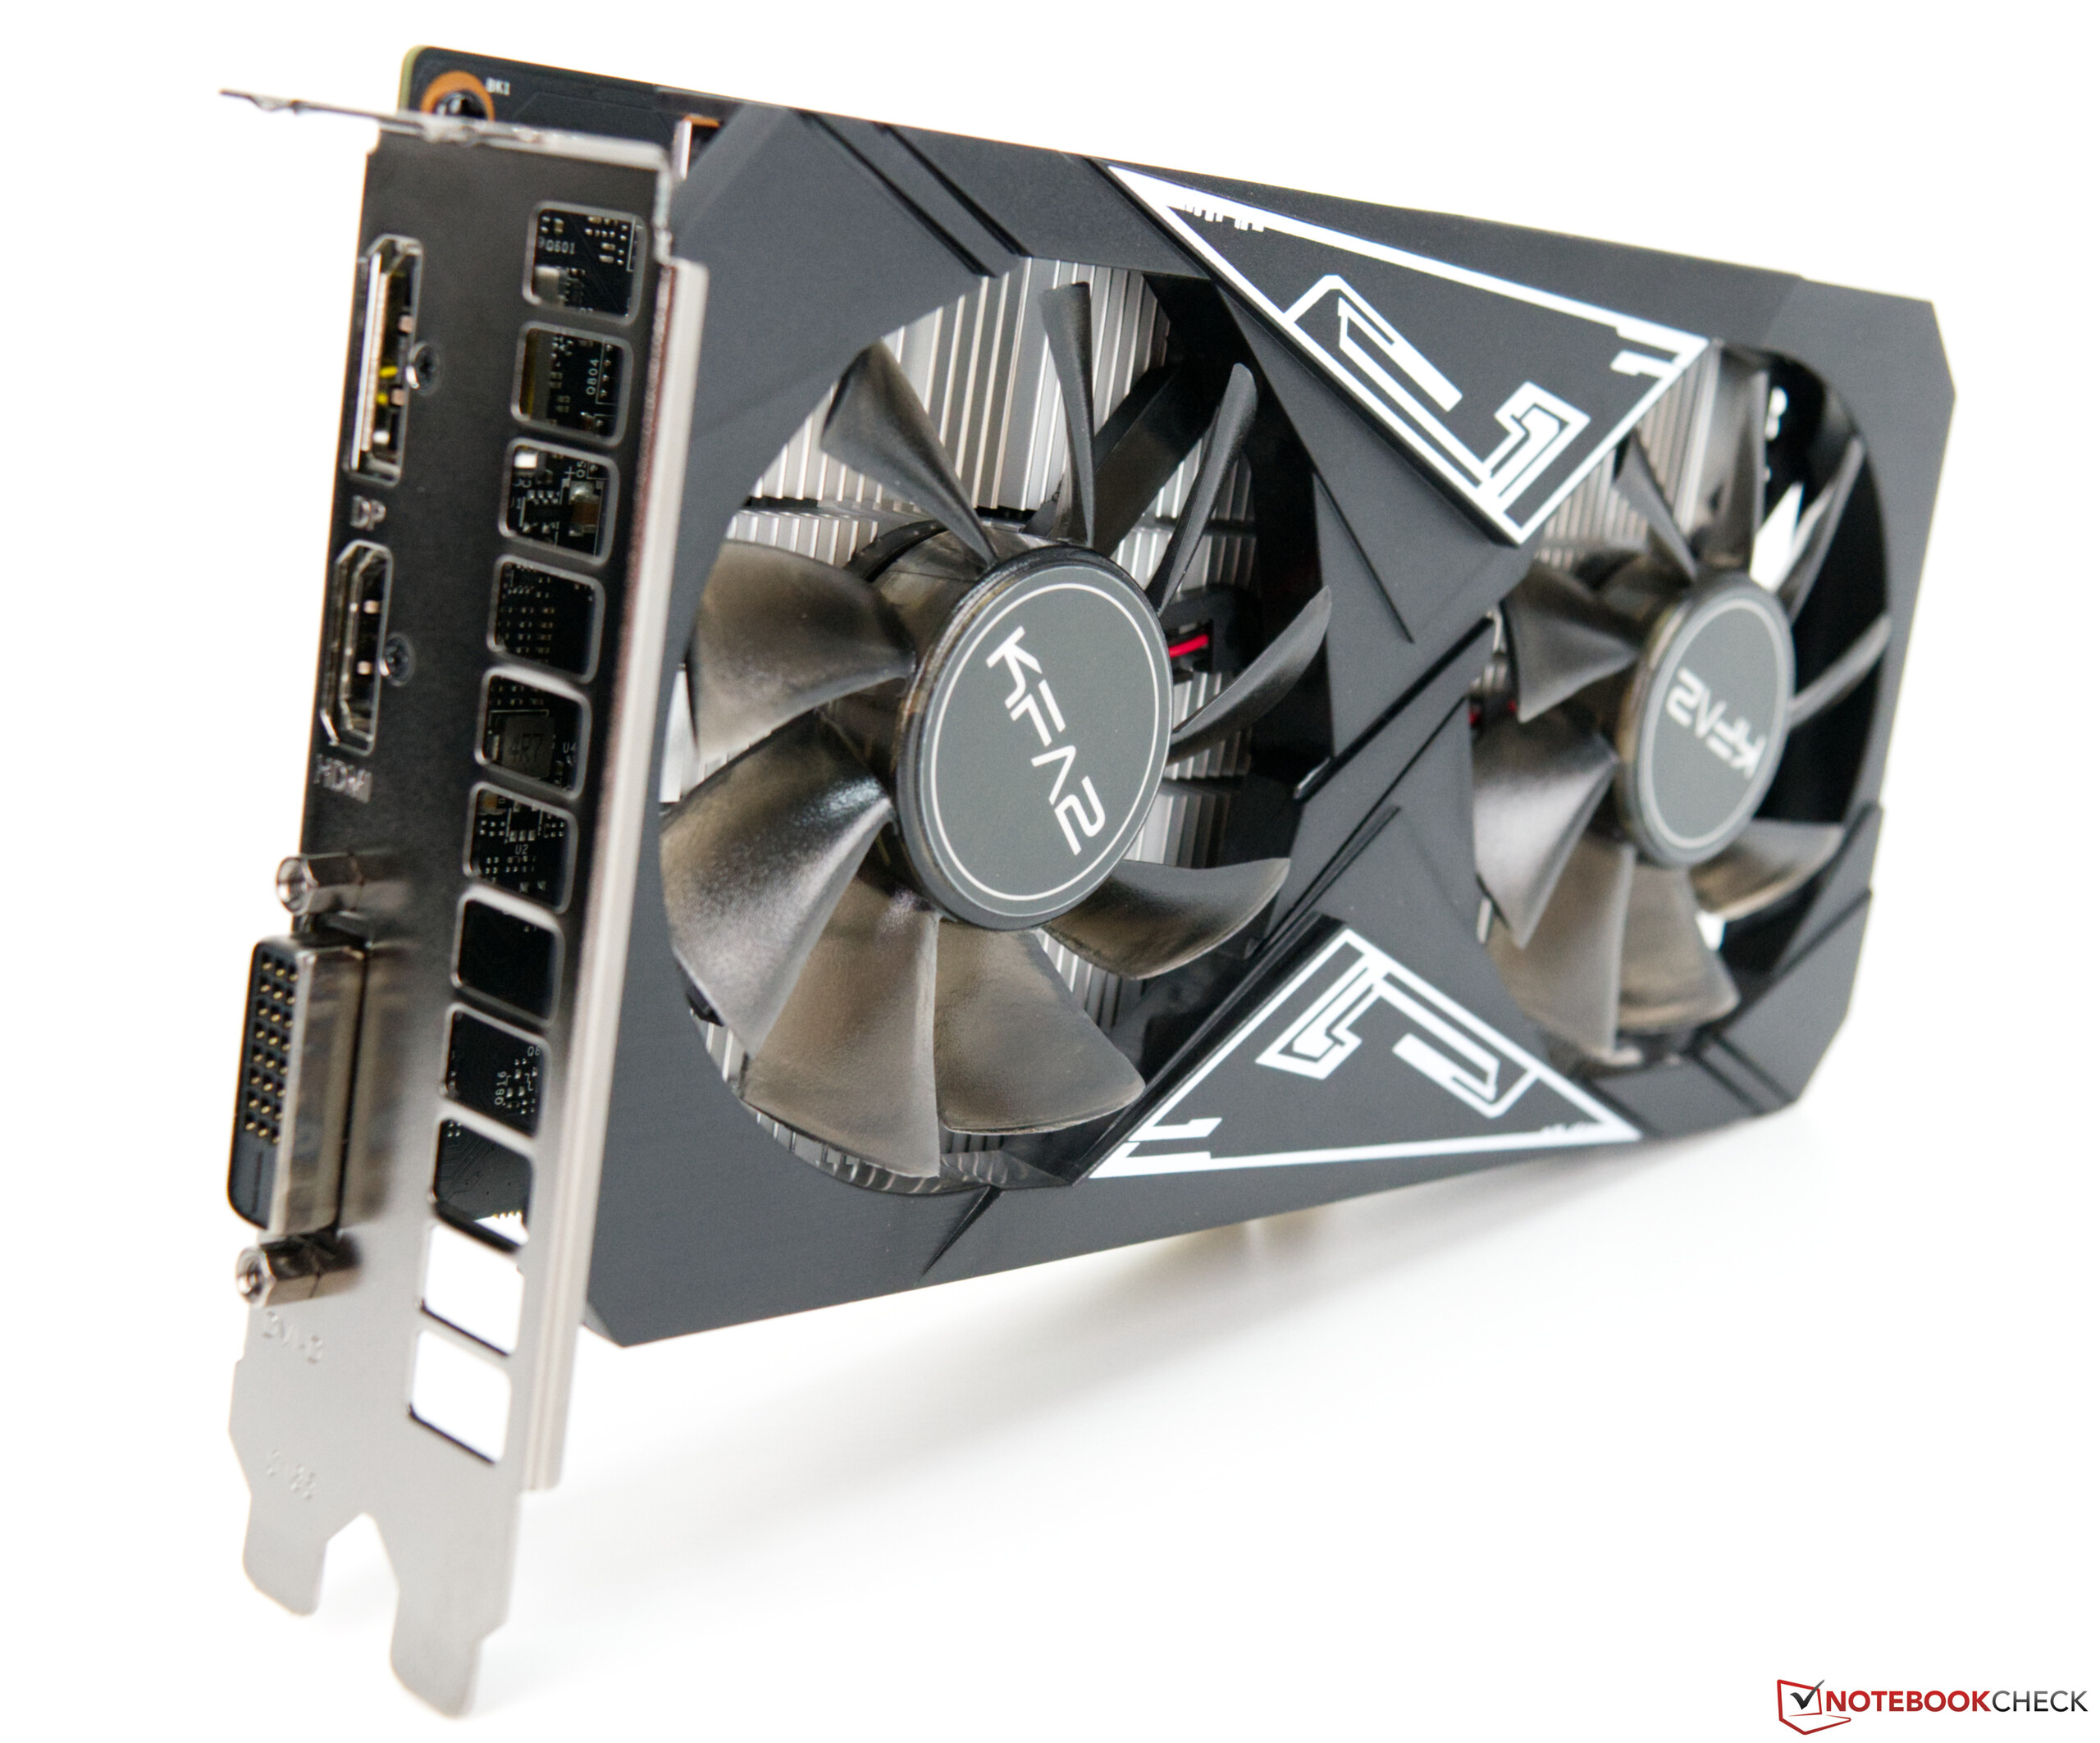
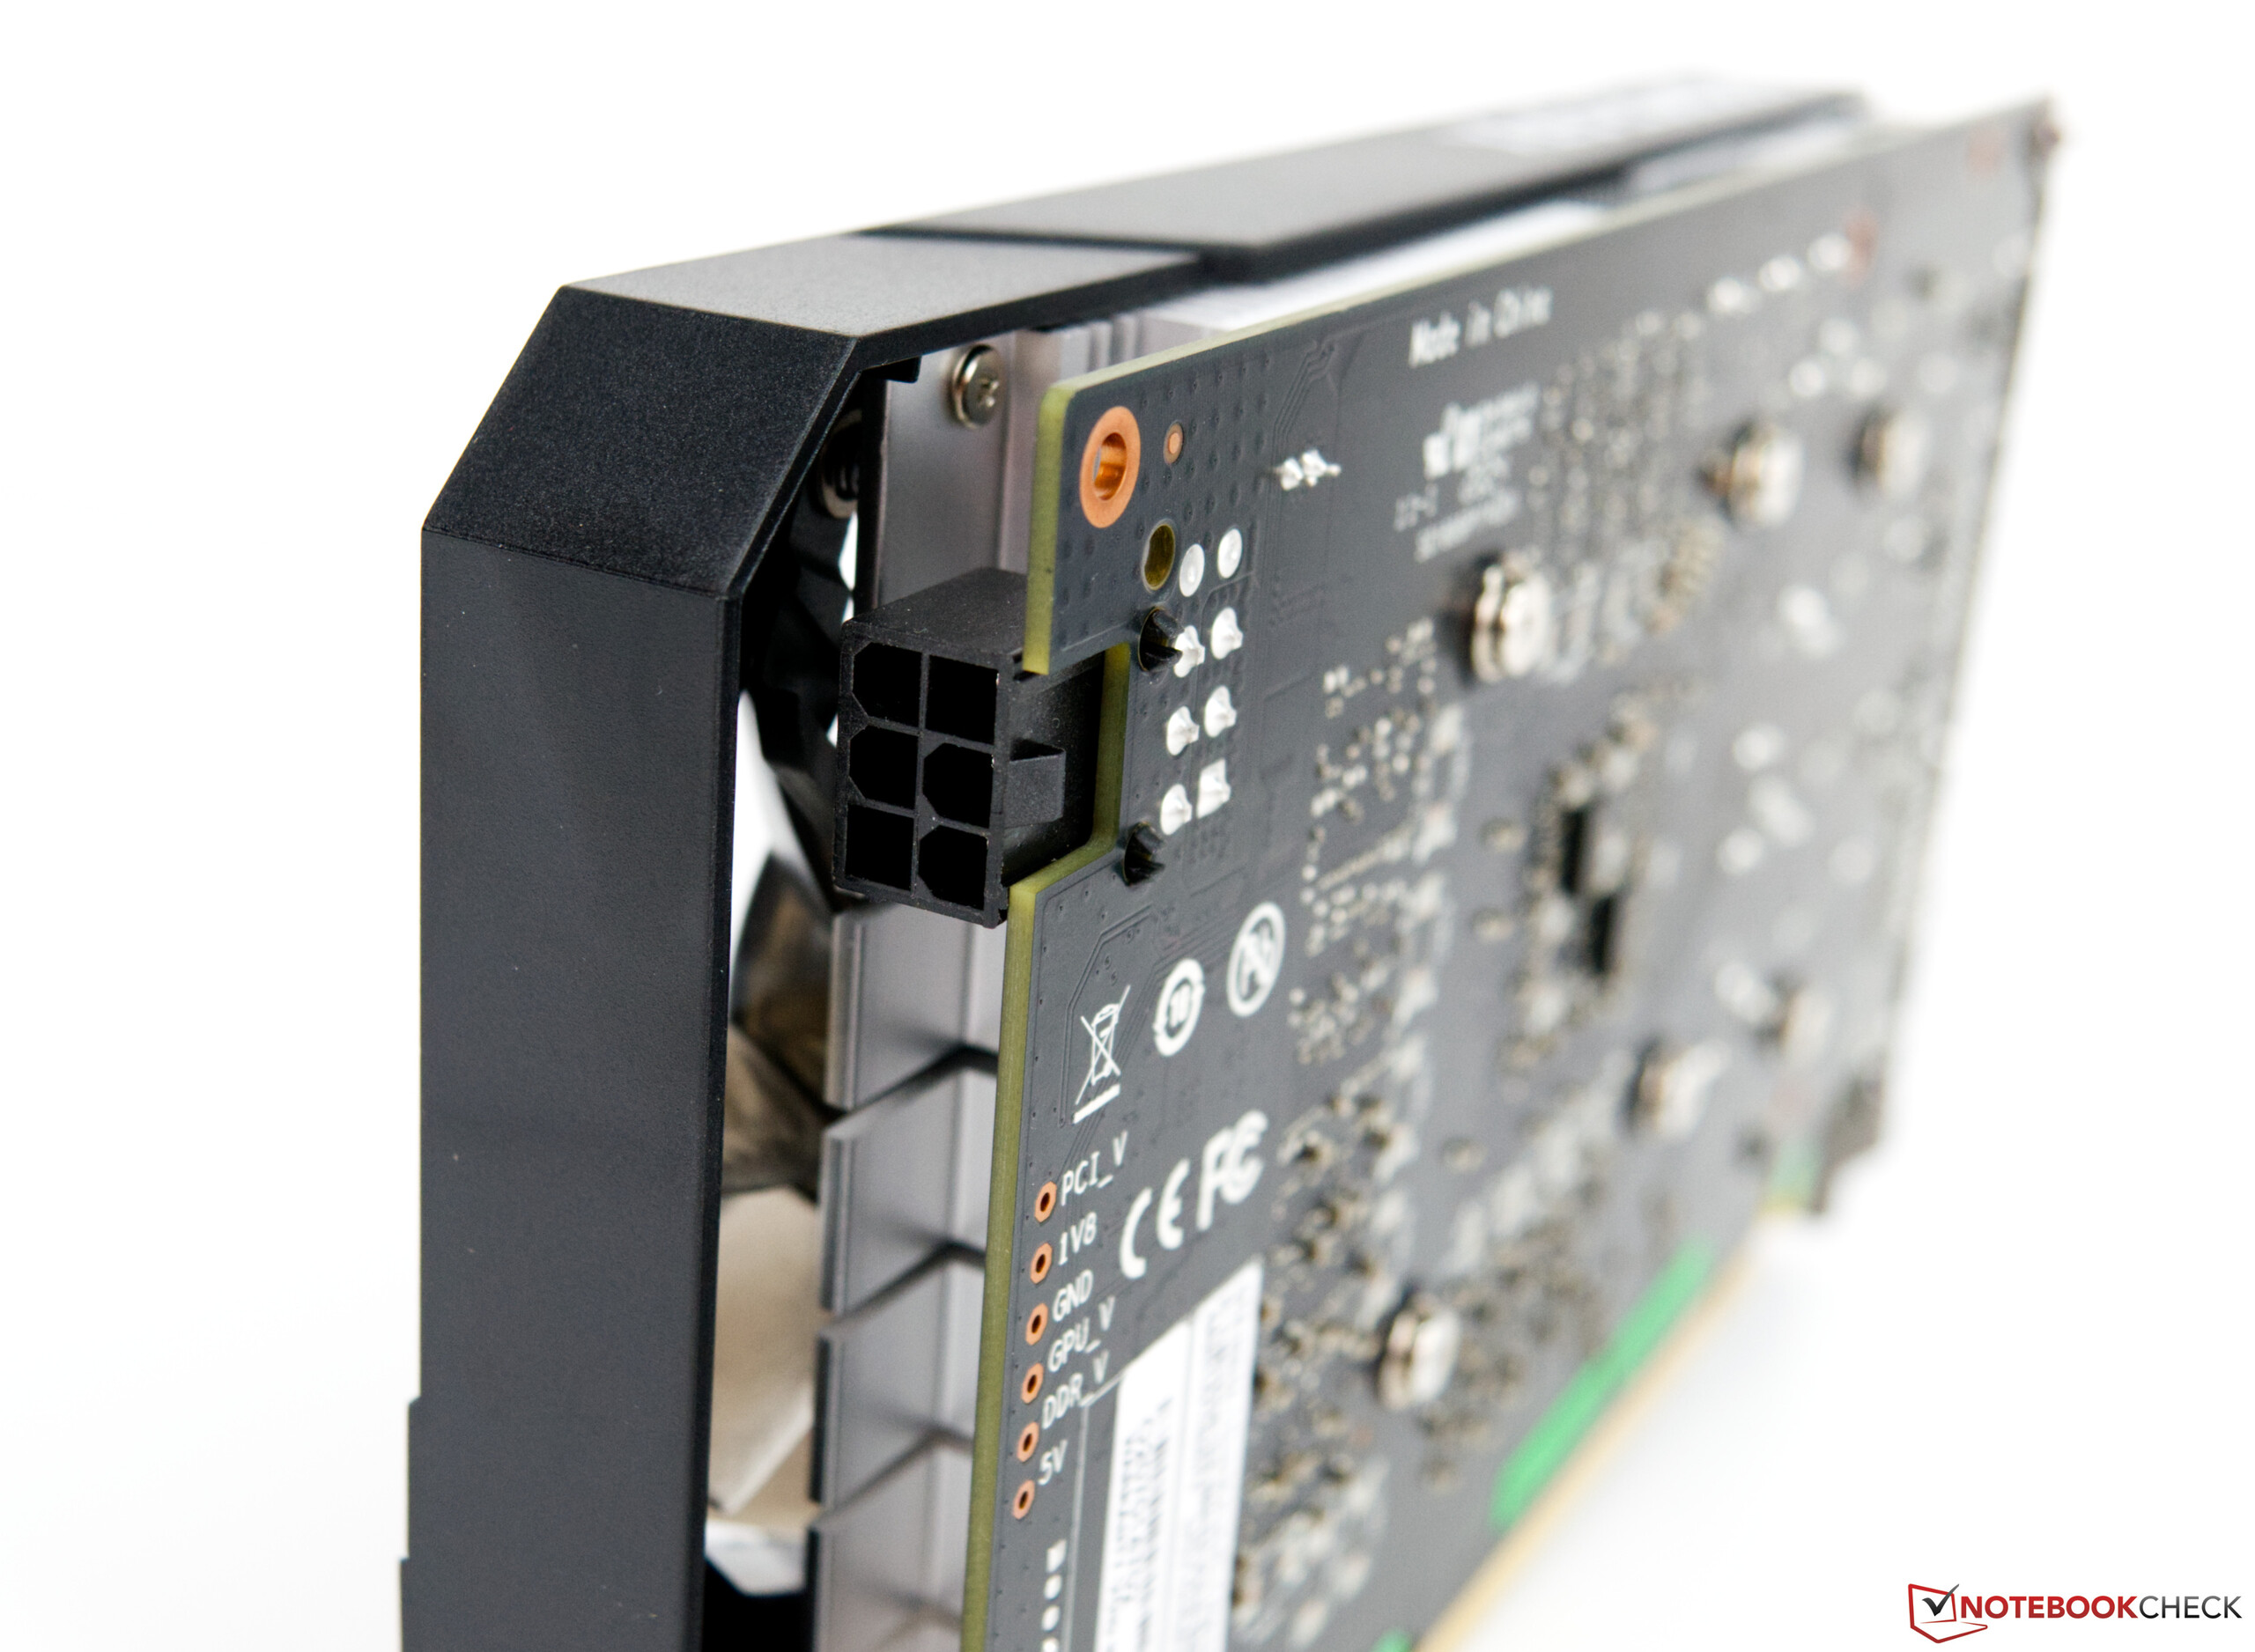
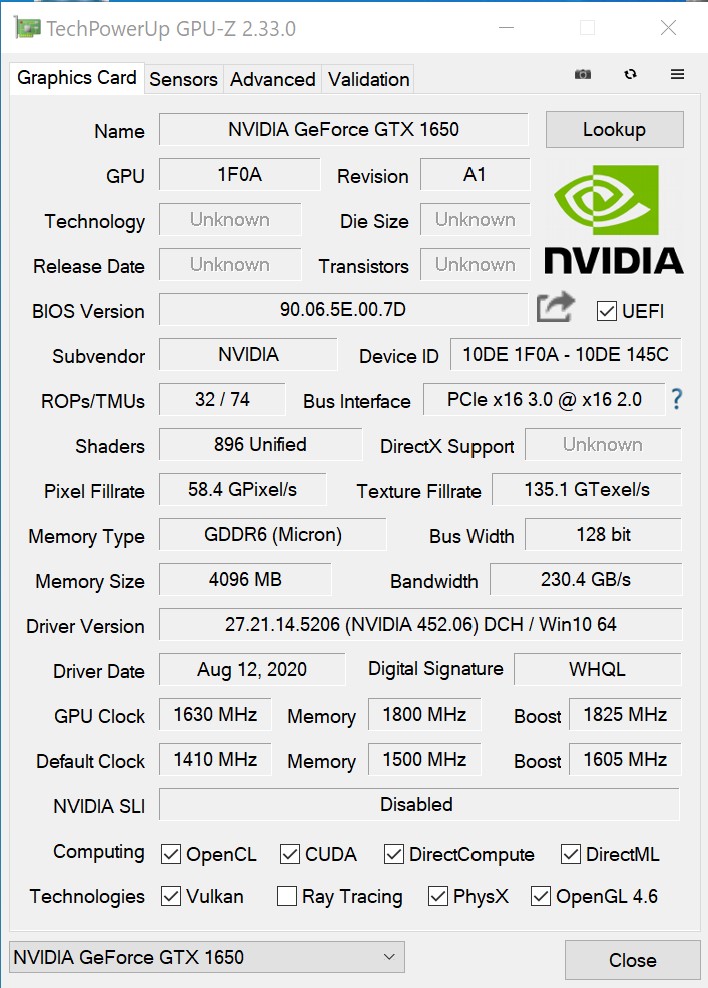
Lo que tenemos aquí es una versión de la GeForce GTX 1650 con más unidades de mapeo de texturas. La GPU todavía tiene 896 núcleos CUDA. El siguiente paso es la GeForce GTX 1650 Super, que ofrece algo más de rendimiento gracias a sus 1280 procesadores de vapor. La mayor diferencia entre los dos modelos no Super es la configuración VRAM. La GTX 1650 EX Plus de KFA2 tiene 4 GB de VRAM GDDR6 más rápida con un ancho de banda de memoria de 192 GB/s. Sin embargo, hay una desventaja en todo esto. El modelo KFA2 requiere 15 vatios más de potencia, por lo que viene con un conector de alimentación de 6 pines. La GPU sólo puede extraer 75 vatios de potencia de la ranura PCI.
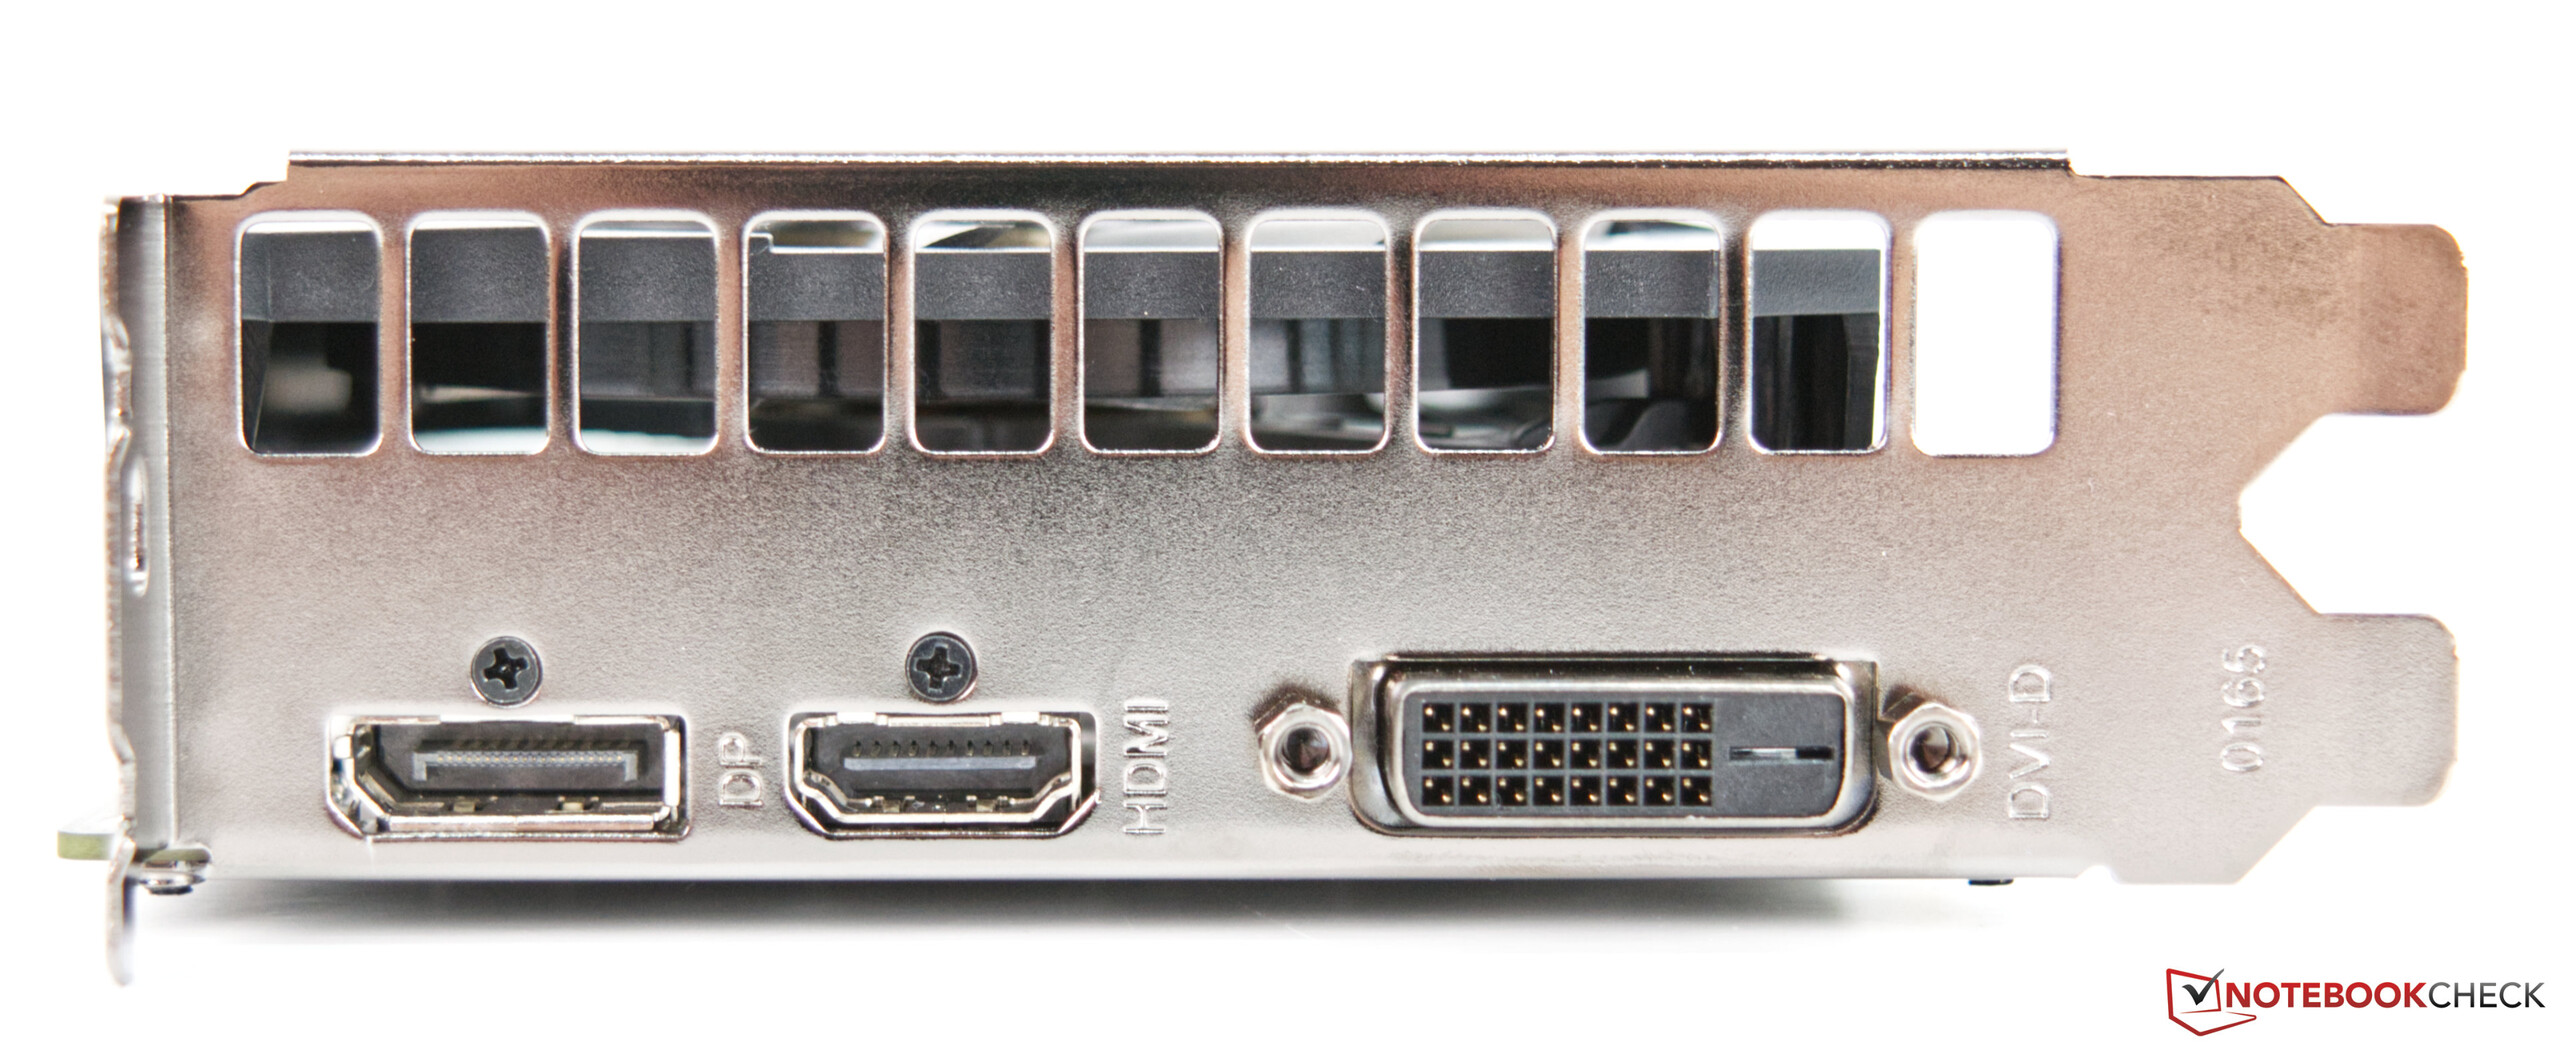
En el momento de escribir este artículo, la tarjeta gráfica puede ser comprada por tan sólo 130 euros en varios comercios online. La tarjeta de video cuenta con un puerto DP 1.4, un puerto HDMI 2.0b y un puerto DVI.

Visión general de la gama de GPU de Turing
| Especificaciones | GTX 1650 | KFA2 GTX 1650 EX Plus | GTX 1650 Super | GTX 1660 | GTX 1660 Super | GTX 1660 Ti | RTX 2060 | RTX 2060 Super | RTX 2070 | RTX 2070 Super | RTX 2080 | RTX 2080 Super | RTX 2080 Ti |
| Nombre de la GPU | TU117 | TU117 | TU116 | TU116 | TU116 | TU116 | TU106 | TU106 | TU106 | TU104 | TU104 | TU104 | TU102 |
| El proceso de fabricación | 12 nm | 12 nm | 12 nm | 12 nm | 12 nm | 12 nm | 12 nm | 12 nm | 12 nm | 12 nm | 12 nm | 12 nm | 12 nm |
| CUDA Cores | 896 | 896 | 1.280 | 1.408 | 1.408 | 1.536 | 1.920 | 2.176 | 2.304 | 2.560 | 2.944 | 3.072 | 4.352 |
| TMUs | 56 | 74 | 80 | 88 | 88 | 96 | 120 | 136 | 144 | 160 | 184 | 192 | 272 |
| Tensor Cores | - | - | - | - | - | - | 240 | 272 | 288 | 320 | 368 | 384 | 544 |
| RT Cores | - | - | - | - | - | - | 30 | 34 | 36 | 40 | 46 | 48 | 68 |
| Frecuencia base | 1.485 MHz | 1.410 MHz | 1.530 MHz | 1.530 MHz | 1.530 MHz | 1.500 MHz | 1.365 MHz | 1.470 MHz | 1.410 MHz | 1.605 MHz | 1.515 MHz | 1.650 MHz | 1.350 MHz |
| Frecuencia turbo | 1.665 MHz | 1.605 MHz | 1.725 MHz | 1.785 MHz | 1.785 MHz | 1.770 MHz | 1.680 MHz | 1.650 MHz | 1.620 MHz | 1.770 MHz | 1.710 MHz | 1.815 MHz | 1.545 MHz |
| Ancho del bus de memoria | 128 Bits | 128 Bits | 128 Bits | 192 Bits | 192 Bits | 192 Bits | 192 Bits | 256 Bits | 256 Bits | 256 Bits | 256 Bits | 256 Bits | 352 Bits |
| Ancho de banda de la memoria | 128 GB/s | 192 GB/s | 192 GB/s | 192.1 GB/s | 336 GB/s | 288 GB/s | 336 GB/s | 448 GB/s | 448 GB/s | 448 GB/s | 448 GB/s | 496,1 GB/s | 616 GB/s |
| Frame Buffer | 4 GB GDDR5 | 4 GB GDDR6 | 4 GB GDDR6 | 6 GB GDDR5 | 6 GB GDDR6 | 6 GB GDDR6 | 6 GB GDDR6 | 6 GB GDDR6 | 8 GB GDDR6 | 8 GB GDDR6 | 8 GB GDDR6 | 8 GB GDDR6 | 11 GB GDDR6 |
| GCP (en vatios) | 75 W | 90 W | 100 W | 120 W | 120 W | 125 W | 160 W | 175 W | 175 W | 215 W | 215 W | 250 W | 250 W |
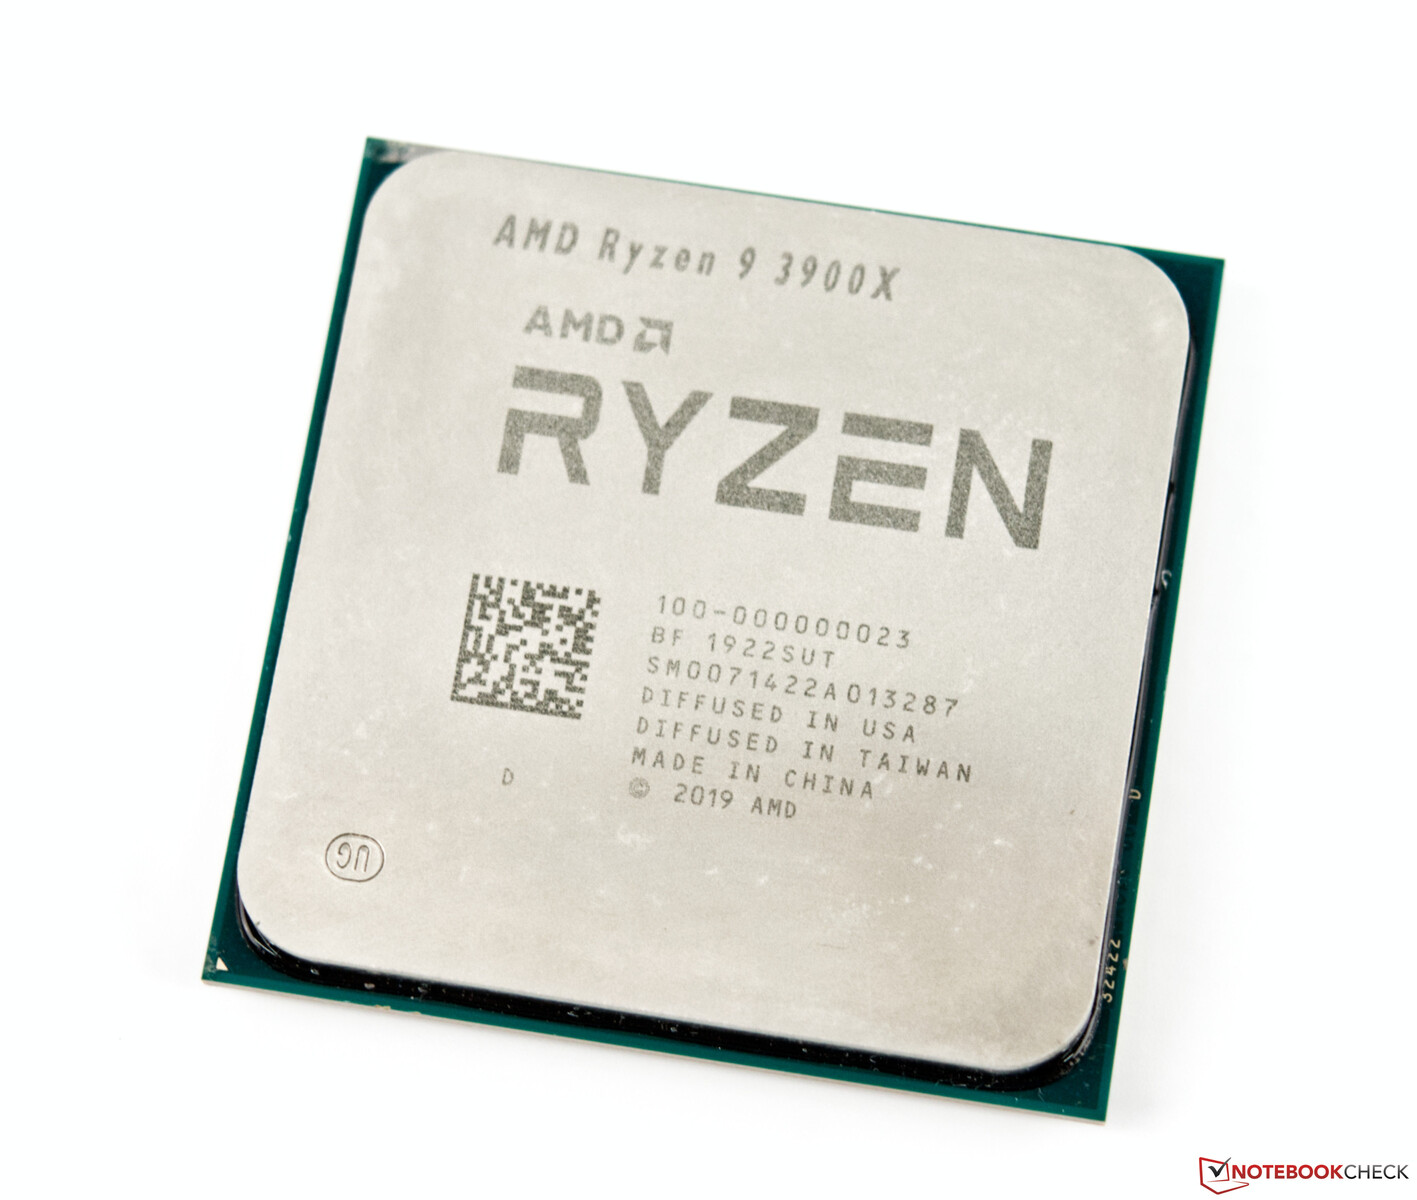
Nuestro banco de pruebas está basado en el AMD Ryzen 9 3900X
Nuestro banco de pruebas se basa en una plataforma actual de AMD. El Asus ROG Crosshair VIII Hero WiFi sirve como placa madre. La CPU, que se conoce como AMD Ryzen 9 3900X, ofrece mucho rendimiento. El sistema es enfriado por un enfriador de agua todo en uno de Alphacool (Eisbear Aurora 360). Los 16 GB de memoria RAM de 3600 MHz provienen de G-Skill. Nuestro monitor, (Acer Predator XB321HK) no representa un cuello de botella, gracias a su resolución de 4K.
Más información sobre nuestro banco de pruebas - AMD vs. Intel
Utilizamos el siguiente sistema para llevar a cabo nuestros puntos de referencia:
- Raijintek Pean benchtable
- AMD Ryzen 9 3950X
- Asus ROG Crosshair VIII Hero WiFi
- Alphacool Eisbear Aurora 360
- KFA2 GeForce GTX 1650 EX Plus (1-Click OC)
- Fuente de alimentación Corsair RM 1000X
- G-Skill Trident Z Royal Gold DDR4 3600 kit de memoria, 2 x 8 GB, frecuencia: 3600 MHz; tiempos: CL16-16-16-36
- SSD M.2 PCIe 4.0 Corsair MP600 2TB
- Crucial MX500 2TB (gaming)
- Versión 64-it de Microsoft Windows 10 Professional (Build 2004)
Agradecemos a Caseking por proporcionarnos el banco de pruebas Raijintek Pean, que cuenta con grabados láser personalizados. AMD nos proporcionó el Ryzen 9 3900X, la placa madre, la RAM y el Corsair MP600. Nuestra solución de refrigeración, Alphacool Eisbear Aurora 360, nos fue proporcionada por cortesía de Alphacool.
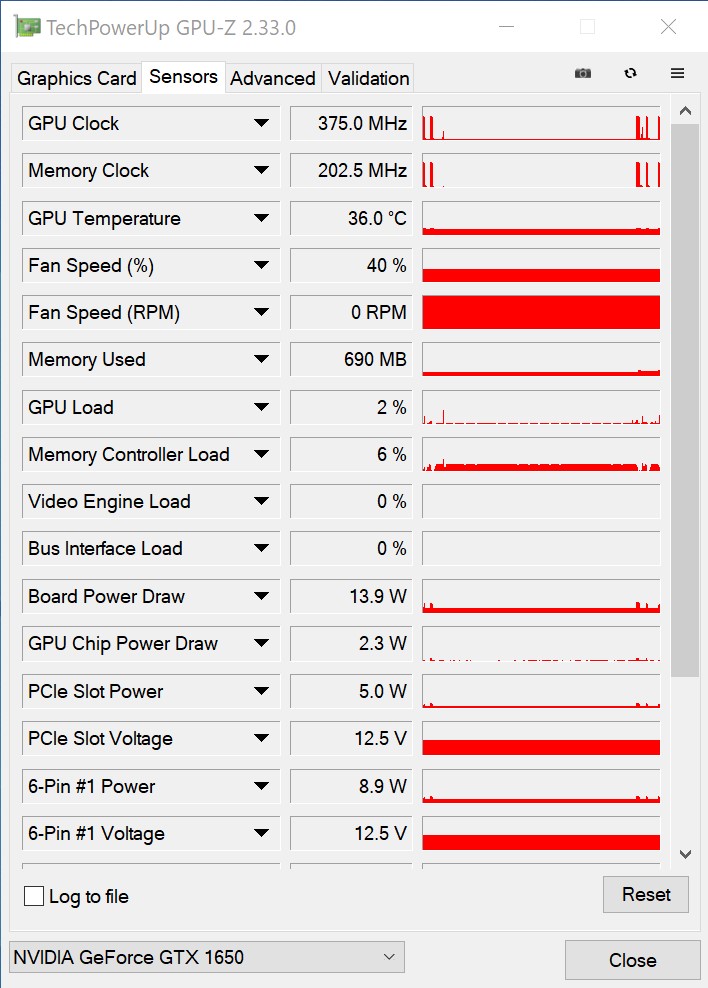
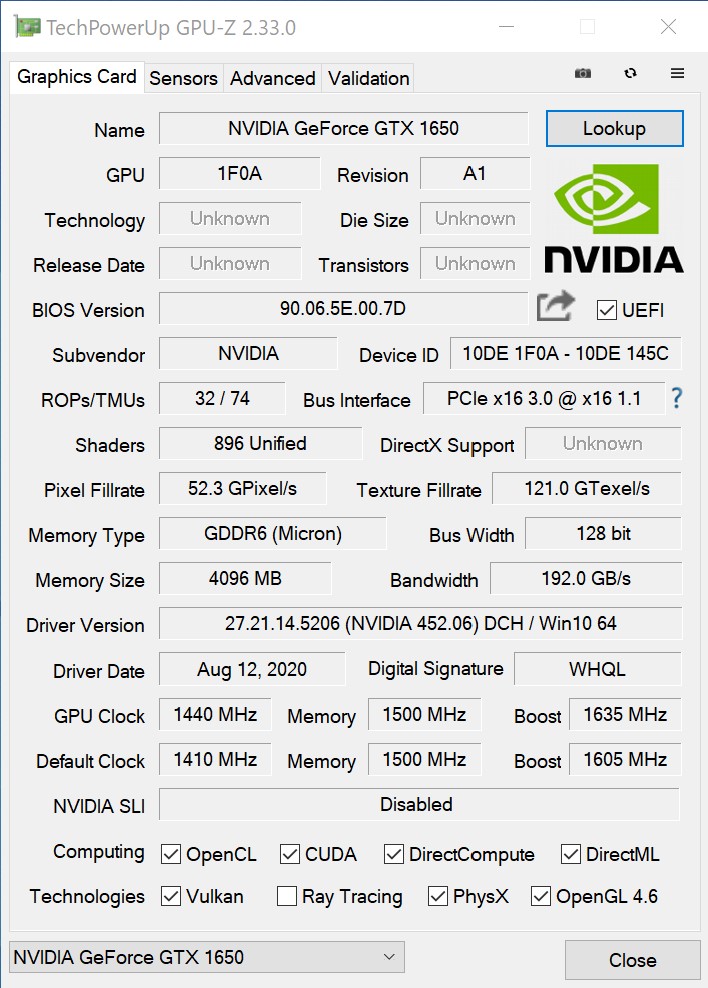
Las velocidades de la KFA2 GeForce GTX 1650 EX Plus (1-Click OC)
El modelo KFA2 tiene velocidades más bajas que el modelo de referencia. Sin embargo, utiliza una VRAM GDDR6 más rápida. El número de TMUs se ha incrementado de 56 a 74, lo que debería resultar en un aumento significativo del rendimiento en comparación con la antigua GeForce GTX 1650. Para eliminar los cuellos de botella de potencia, el TGP se ha aumentado hasta 90 vatios, lo que permite a la GPU lograr velocidades turbo estables de 1605 MHz en nuestro caso particular. Al igual que casi todas las demás GPU KFA2, la GeForce GTX 1650 EX Plus viene con la función 1-Click OC. Puede activarse en la utilidad conocida como Sintonizador Xtreme. Al hacerlo, aumentará la velocidad de la GPU en 30 MHz. Este es un paso en la dirección correcta, porque a menudo la función 1-Click OC sólo ofrece un aumento de 15 MHz. En nuestra opinión, un aumento de la velocidad central de 50 o 75 MHz en combinación con un aumento simultáneo de la velocidad de la memoria habría sido más sostenible. Sin embargo, la velocidad de la memoria no cambia.
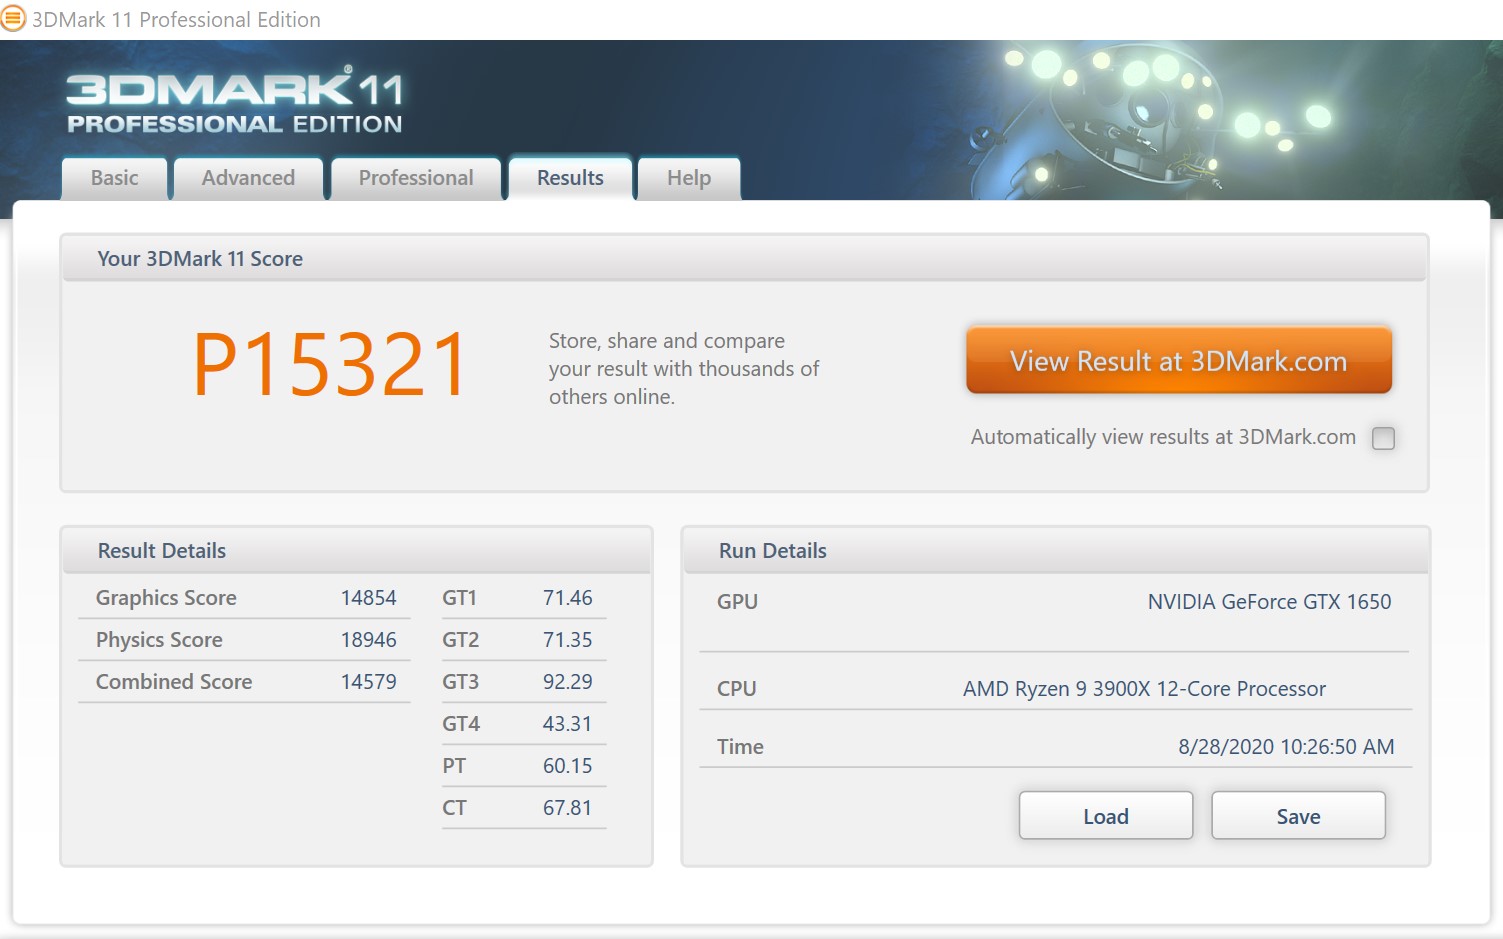
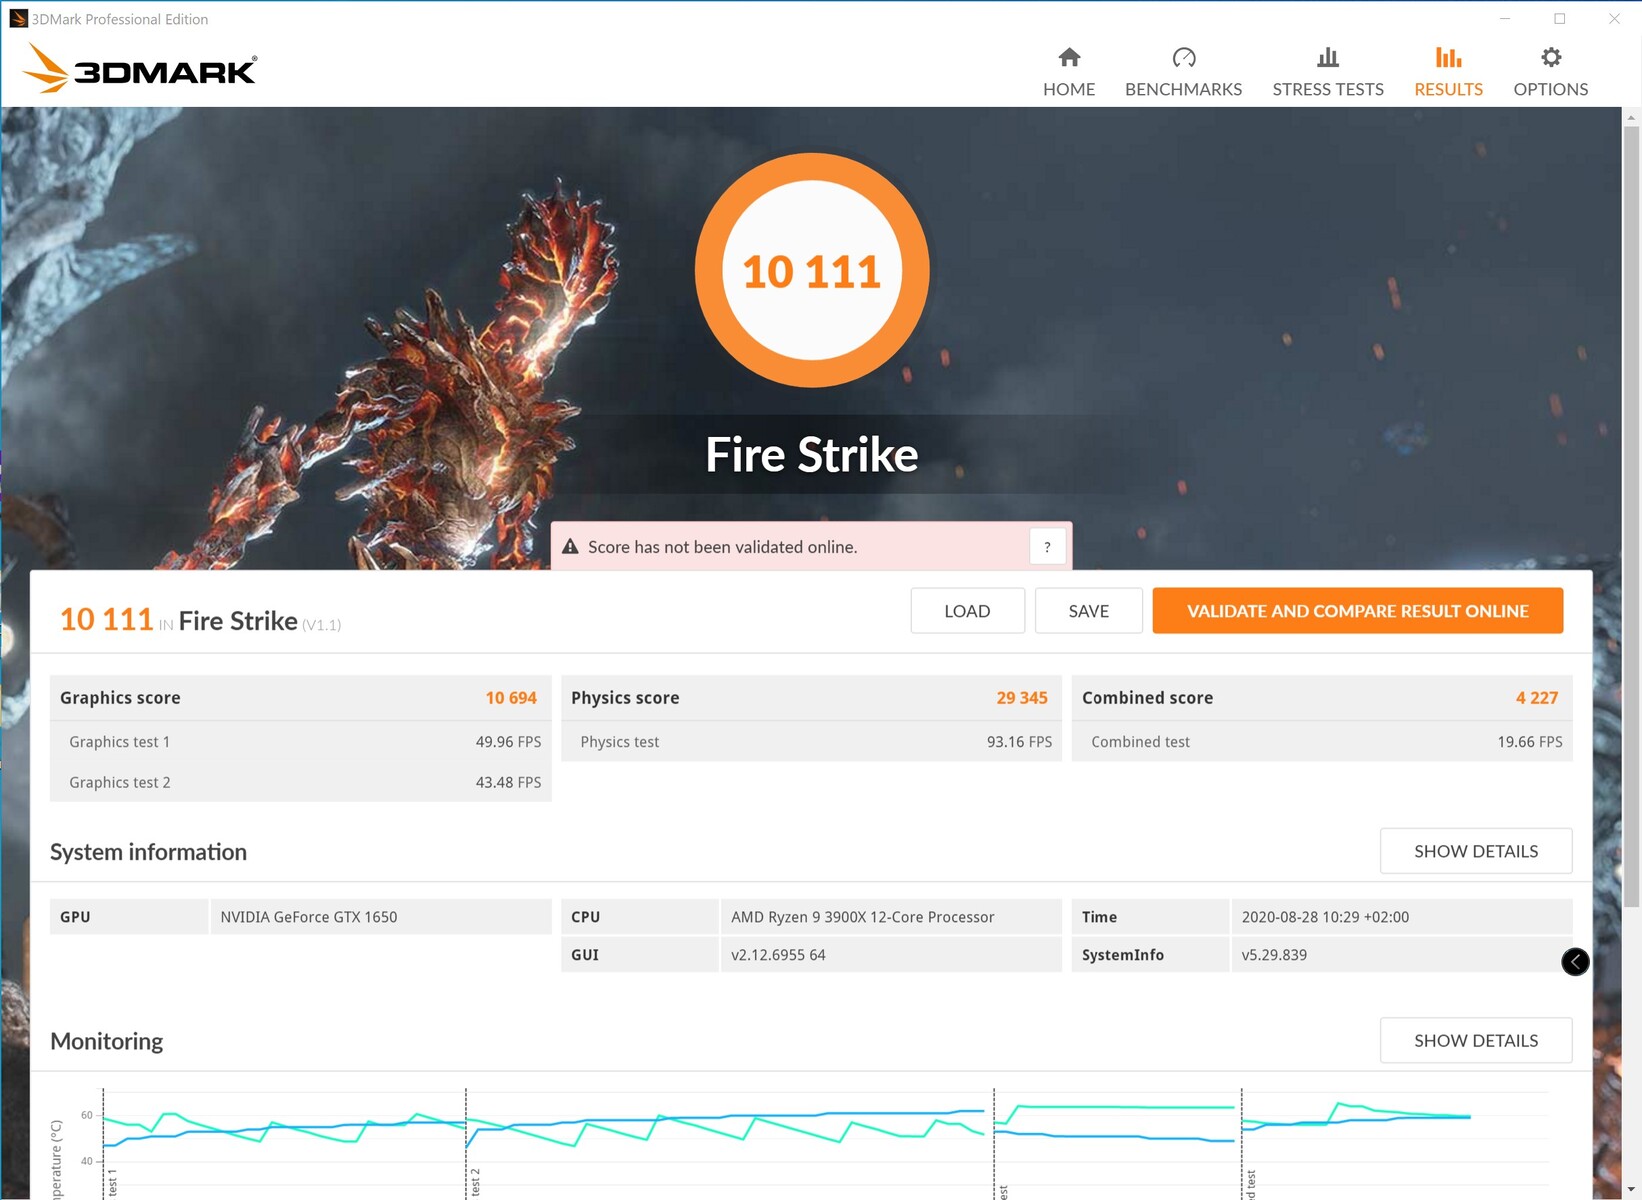
Puntos de referencia sintéticos
Mirando la hoja de especificaciones se puede deducir que la KFA2 GeForce GTX 1650 EX Plus es probable que se coloque entre la GeForce GTX 1650 y la GeForce GTX 1660. Este es exactamente el caso en nuestros benchmarks sintéticos. La KFA2 GeForce GTX 1650 EX Plus es vencida por la AMD Radeon RX 570. La primera GPU NVIDIA, que puede superar a la RX 570, es la GTX 1660 Super.
| Performance rating - Percent | |
| AMD Radeon RX 5700 XT -1! | |
| Nvidia GeForce RTX 2060 Super -31! | |
| KFA2 GeForce RTX 2060 Super | |
| AMD Radeon RX 5700 -1! | |
| Sapphire AMD Radeon RX 5600 XT -9! | |
| MSI RTX 2060 Gaming Z 6G | |
| Zotac GeForce GTX 1660 Ti 6 GB | |
| XFX AMD Radeon RX 590 OC+ 8 GB -3! | |
| KFA 2 GeForce GTX 1660 Super | |
| Sapphire NITRO+ RX 570 8 GB -1! | |
| PNY GeForce GTX 1660 | |
| KFA2 GeForce GTX 1650 EX One Click Plus | |
| Gainward GeForce GTX 1650 4 GB | |
| 3DMark 11 - 1280x720 Performance GPU | |
| AMD Radeon RX 5700 XT | |
| AMD Radeon RX 5700 | |
| Sapphire AMD Radeon RX 5600 XT | |
| Nvidia GeForce RTX 2060 Super | |
| KFA2 GeForce RTX 2060 Super | |
| MSI RTX 2060 Gaming Z 6G | |
| XFX AMD Radeon RX 590 OC+ 8 GB | |
| Zotac GeForce GTX 1660 Ti 6 GB | |
| KFA 2 GeForce GTX 1660 Super | |
| PNY GeForce GTX 1660 | |
| Sapphire NITRO+ RX 570 8 GB | |
| Gainward GeForce GTX 1650 4 GB | |
| KFA2 GeForce GTX 1650 EX One Click Plus | |
| Unigine Heaven 4.0 | |
| Extreme Preset OpenGL | |
| KFA2 GeForce RTX 2060 Super | |
| MSI RTX 2060 Gaming Z 6G | |
| AMD Radeon RX 5700 XT | |
| AMD Radeon RX 5700 | |
| Zotac GeForce GTX 1660 Ti 6 GB | |
| Sapphire AMD Radeon RX 5600 XT | |
| KFA 2 GeForce GTX 1660 Super | |
| PNY GeForce GTX 1660 | |
| XFX AMD Radeon RX 590 OC+ 8 GB | |
| KFA2 GeForce GTX 1650 EX One Click Plus | |
| Sapphire NITRO+ RX 570 8 GB | |
| Gainward GeForce GTX 1650 4 GB | |
| Extreme Preset DX11 | |
| KFA2 GeForce RTX 2060 Super | |
| AMD Radeon RX 5700 XT | |
| MSI RTX 2060 Gaming Z 6G | |
| AMD Radeon RX 5700 | |
| Sapphire AMD Radeon RX 5600 XT | |
| Zotac GeForce GTX 1660 Ti 6 GB | |
| KFA 2 GeForce GTX 1660 Super | |
| PNY GeForce GTX 1660 | |
| XFX AMD Radeon RX 590 OC+ 8 GB | |
| Sapphire NITRO+ RX 570 8 GB | |
| KFA2 GeForce GTX 1650 EX One Click Plus | |
| Gainward GeForce GTX 1650 4 GB | |
| Unigine Valley 1.0 | |
| 1920x1080 Extreme HD DirectX AA:x8 | |
| KFA2 GeForce RTX 2060 Super | |
| AMD Radeon RX 5700 XT | |
| AMD Radeon RX 5700 | |
| MSI RTX 2060 Gaming Z 6G | |
| Sapphire AMD Radeon RX 5600 XT | |
| KFA 2 GeForce GTX 1660 Super | |
| Zotac GeForce GTX 1660 Ti 6 GB | |
| PNY GeForce GTX 1660 | |
| XFX AMD Radeon RX 590 OC+ 8 GB | |
| Sapphire NITRO+ RX 570 8 GB | |
| KFA2 GeForce GTX 1650 EX One Click Plus | |
| Gainward GeForce GTX 1650 4 GB | |
| 1920x1080 Extreme HD Preset OpenGL AA:x8 | |
| KFA2 GeForce RTX 2060 Super | |
| AMD Radeon RX 5700 XT | |
| MSI RTX 2060 Gaming Z 6G | |
| AMD Radeon RX 5700 | |
| Sapphire AMD Radeon RX 5600 XT | |
| Zotac GeForce GTX 1660 Ti 6 GB | |
| KFA 2 GeForce GTX 1660 Super | |
| PNY GeForce GTX 1660 | |
| XFX AMD Radeon RX 590 OC+ 8 GB | |
| KFA2 GeForce GTX 1650 EX One Click Plus | |
| Sapphire NITRO+ RX 570 8 GB | |
| Gainward GeForce GTX 1650 4 GB | |
| LuxMark v2.0 64Bit | |
| Room GPUs-only | |
| KFA2 GeForce RTX 2060 Super | |
| MSI RTX 2060 Gaming Z 6G | |
| KFA 2 GeForce GTX 1660 Super | |
| Zotac GeForce GTX 1660 Ti 6 GB | |
| AMD Radeon RX 5700 XT | |
| PNY GeForce GTX 1660 | |
| XFX AMD Radeon RX 590 OC+ 8 GB | |
| AMD Radeon RX 5700 | |
| Sapphire AMD Radeon RX 5600 XT | |
| Sapphire NITRO+ RX 570 8 GB | |
| Gainward GeForce GTX 1650 4 GB | |
| KFA2 GeForce GTX 1650 EX One Click Plus | |
| Sala GPUs-only | |
| KFA2 GeForce RTX 2060 Super | |
| AMD Radeon RX 5700 XT | |
| MSI RTX 2060 Gaming Z 6G | |
| AMD Radeon RX 5700 | |
| Sapphire AMD Radeon RX 5600 XT | |
| KFA 2 GeForce GTX 1660 Super | |
| Zotac GeForce GTX 1660 Ti 6 GB | |
| XFX AMD Radeon RX 590 OC+ 8 GB | |
| PNY GeForce GTX 1660 | |
| Sapphire NITRO+ RX 570 8 GB | |
| KFA2 GeForce GTX 1650 EX One Click Plus | |
| Gainward GeForce GTX 1650 4 GB | |
| SiSoft Sandra 2016 | |
| Image Processing | |
| KFA2 GeForce RTX 2060 Super | |
| AMD Radeon RX 5700 XT | |
| MSI RTX 2060 Gaming Z 6G | |
| AMD Radeon RX 5700 | |
| Zotac GeForce GTX 1660 Ti 6 GB | |
| KFA 2 GeForce GTX 1660 Super | |
| PNY GeForce GTX 1660 | |
| Sapphire AMD Radeon RX 5600 XT | |
| Gainward GeForce GTX 1650 4 GB | |
| KFA2 GeForce GTX 1650 EX One Click Plus | |
| GP Cryptography (Higher Security AES256+SHA2-512) | |
| KFA2 GeForce RTX 2060 Super | |
| MSI RTX 2060 Gaming Z 6G | |
| PNY GeForce GTX 1660 | |
| KFA 2 GeForce GTX 1660 Super | |
| Zotac GeForce GTX 1660 Ti 6 GB | |
| KFA2 GeForce GTX 1650 EX One Click Plus | |
| Sapphire NITRO+ RX 570 8 GB | |
| Gainward GeForce GTX 1650 4 GB | |
| GP Financial Analysis (FP High/Double Precision) | |
| Sapphire NITRO+ RX 570 8 GB | |
| KFA2 GeForce RTX 2060 Super | |
| MSI RTX 2060 Gaming Z 6G | |
| Zotac GeForce GTX 1660 Ti 6 GB | |
| PNY GeForce GTX 1660 | |
| KFA 2 GeForce GTX 1660 Super | |
| KFA2 GeForce GTX 1650 EX One Click Plus | |
| Gainward GeForce GTX 1650 4 GB | |
| AMD Radeon RX 5700 XT | |
| AMD Radeon RX 5700 | |
| Sapphire AMD Radeon RX 5600 XT | |
| 3DMark 06 Standard Score | 44842 puntos | |
| 3DMark Vantage P Result | 47363 puntos | |
| 3DMark 11 Performance | 14069 puntos | |
| 3DMark Ice Storm Standard Score | 164494 puntos | |
| 3DMark Cloud Gate Standard Score | 39148 puntos | |
| 3DMark Fire Strike Score | 9209 puntos | |
| 3DMark Fire Strike Extreme Score | 4368 puntos | |
| 3DMark Time Spy Score | 3927 puntos | |
ayuda | ||
Puntos de referencia de los juegos
El aumento de rendimiento que la KFA2 GeForce GTX 1650 EX Plus exhibió en los puntos de referencia sintéticos se traslada a los puntos de referencia de los juegos. En general, el nuevo modelo es más rápido que la versión anterior de la GTX 1650. Esto no es sorprendente porque el nuevo modelo viene con una VRAM más rápida. La diferencia de rendimiento entre la KFA2 GeForce GTX 1650 y la AMD Radeon RX 570 también es menor. Cuanto más alta es la resolución y la configuración de los gráficos, más lucha tiene la GTX 1650 por conseguir velocidades de cuadro jugables en los títulos actuales. La reducción de los ajustes de los gráficos suele dar lugar a un notable aumento del rendimiento. Todo esto demuestra que 4 GB de VRAM no van a llegar muy lejos en estos días.
Sin embargo, la KFA2 GeForce GTX 1650 EX Plus es adecuada para juegos de 1080p, siempre que se pueda vivir con unos ajustes de gráficos ligeramente reducidos. Aquí, los usuarios deben examinar cada título individualmente, porque ciertos juegos como FIFA 20 pueden funcionar incluso a 2160p.
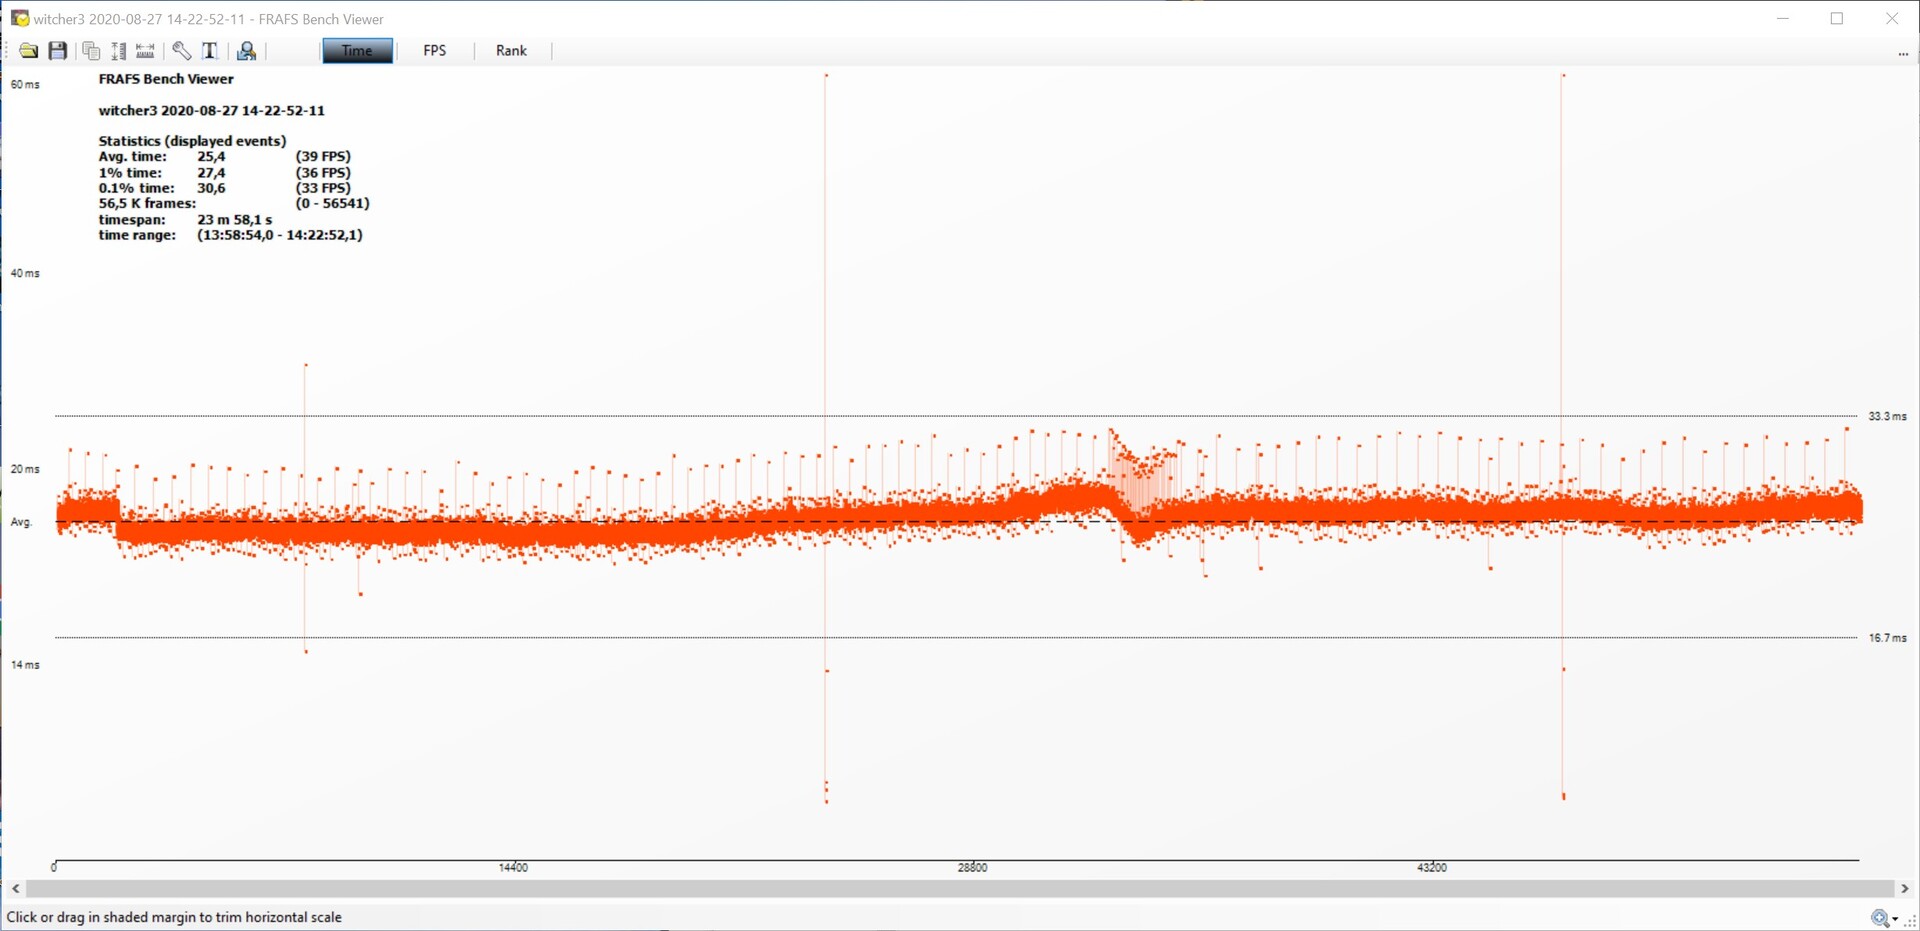
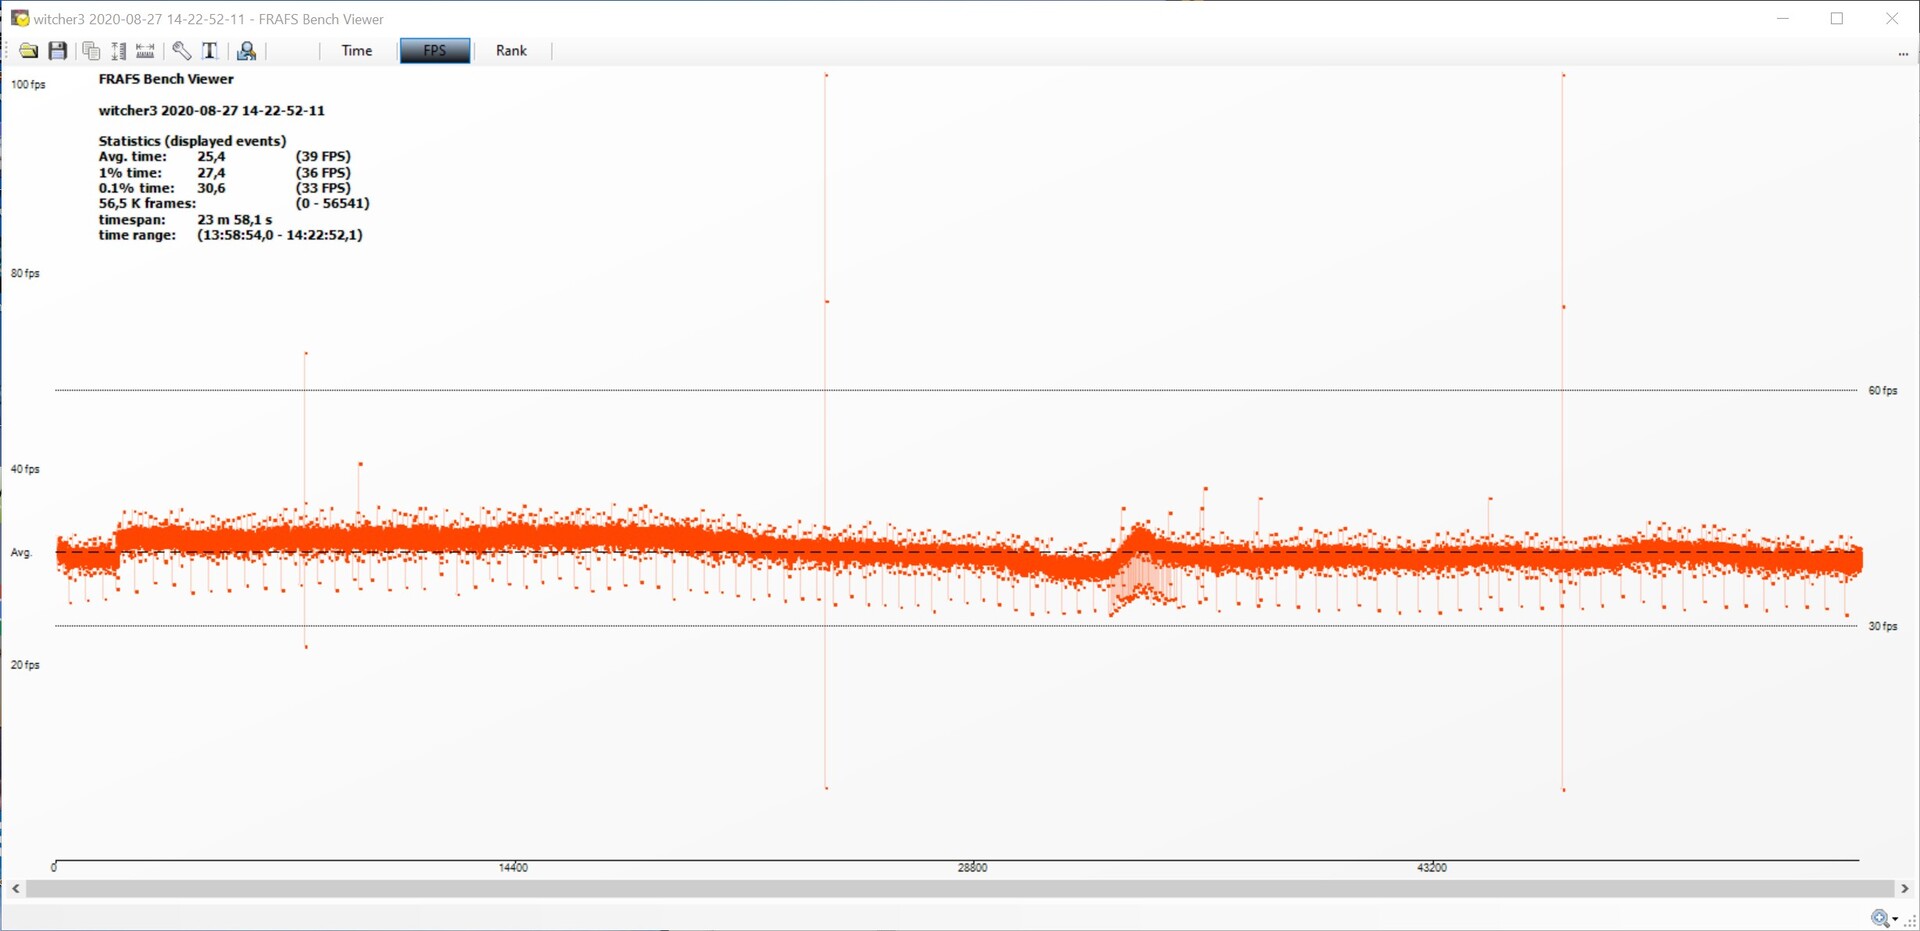
Al mirar el gráfico de velocidad de cuadro, que muestra los resultados de nuestra prueba de esfuerzo en el juego con The Witcher 3 (ultra preestablecido), se puede ver que el refrigerador de doble ventilador no tiene problemas para mantener la KFA2 GeForce GTX 1650 EX Plus refrigerada. Hubo una ligera caída en el rendimiento en una ocasión, después de la cual el rendimiento volvió rápidamente a un nivel normal. Los usuarios no deberían experimentar ninguna caída significativa en el rendimiento bajo carga. No hubo problemas con el rendimiento del tiempo de cuadro.
Puedes averiguar cómo se compara la KFA2 GeForce GTX 1650 EX Plus con otras tarjetas gráficas en nuestra página de Comparativa de GPU .
The Witcher 3 - Velocidades de fotogramas en los ajustes más altos
| Far Cry 5 - 1920x1080 Ultra Preset AA:T | |
| AMD Radeon RX 5700 XT | |
| KFA2 GeForce RTX 2060 Super | |
| Sapphire AMD Radeon RX 5600 XT | |
| Nvidia GeForce RTX 2060 Super | |
| AMD Radeon RX 5700 XT | |
| MSI RTX 2060 Gaming Z 6G | |
| KFA 2 GeForce GTX 1660 Super | |
| Zotac GeForce GTX 1660 Ti 6 GB | |
| AMD Radeon RX 5700 | |
| PNY GeForce GTX 1660 | |
| XFX AMD Radeon RX 590 OC+ 8 GB | |
| Sapphire NITRO+ RX 570 8 GB | |
| KFA2 GeForce GTX 1650 EX One Click Plus | |
| Gainward GeForce GTX 1650 4 GB | |
| The Witcher 3 - 1920x1080 Ultra Graphics & Postprocessing (HBAO+) | |
| AMD Radeon RX 5700 XT | |
| AMD Radeon RX 5700 XT | |
| KFA2 GeForce RTX 2060 Super | |
| AMD Radeon RX 5700 | |
| Nvidia GeForce RTX 2060 Super | |
| Sapphire AMD Radeon RX 5600 XT | |
| MSI RTX 2060 Gaming Z 6G | |
| Zotac GeForce GTX 1660 Ti 6 GB | |
| KFA 2 GeForce GTX 1660 Super | |
| PNY GeForce GTX 1660 | |
| XFX AMD Radeon RX 590 OC+ 8 GB | |
| Gainward GeForce GTX 1650 4 GB | |
| Sapphire NITRO+ RX 570 8 GB | |
| KFA2 GeForce GTX 1650 EX One Click Plus | |
| Apex Legends - 1920x1080 Maximum Settings AA:TS AF:16x | |
| Nvidia GeForce RTX 2060 Super | |
| AMD Radeon RX 5700 XT | |
| KFA2 GeForce RTX 2060 Super | |
| AMD Radeon RX 5700 | |
| MSI RTX 2060 Gaming Z 6G | |
| Sapphire AMD Radeon RX 5600 XT | |
| KFA 2 GeForce GTX 1660 Super | |
| Zotac GeForce GTX 1660 Ti 6 GB | |
| PNY GeForce GTX 1660 | |
| XFX AMD Radeon RX 590 OC+ 8 GB | |
| Sapphire NITRO+ RX 570 8 GB | |
| KFA2 GeForce GTX 1650 EX One Click Plus | |
| Gainward GeForce GTX 1650 4 GB | |
| Far Cry New Dawn - 1920x1080 Ultra Preset | |
| AMD Radeon RX 5700 XT | |
| KFA2 GeForce RTX 2060 Super | |
| MSI RTX 2060 Gaming Z 6G | |
| KFA 2 GeForce GTX 1660 Super | |
| Sapphire AMD Radeon RX 5600 XT | |
| Nvidia GeForce RTX 2060 Super | |
| Zotac GeForce GTX 1660 Ti 6 GB | |
| AMD Radeon RX 5700 | |
| PNY GeForce GTX 1660 | |
| AMD Radeon RX 5700 XT | |
| XFX AMD Radeon RX 590 OC+ 8 GB | |
| Sapphire NITRO+ RX 570 8 GB | |
| KFA2 GeForce GTX 1650 EX One Click Plus | |
| Gainward GeForce GTX 1650 4 GB | |
| Metro Exodus - 1920x1080 Ultra Quality AF:16x | |
| AMD Radeon RX 5700 XT | |
| Nvidia GeForce RTX 2060 Super | |
| AMD Radeon RX 5700 | |
| KFA2 GeForce RTX 2060 Super | |
| Sapphire AMD Radeon RX 5600 XT | |
| MSI RTX 2060 Gaming Z 6G | |
| Zotac GeForce GTX 1660 Ti 6 GB | |
| KFA 2 GeForce GTX 1660 Super | |
| PNY GeForce GTX 1660 | |
| XFX AMD Radeon RX 590 OC+ 8 GB | |
| Sapphire NITRO+ RX 570 8 GB | |
| KFA2 GeForce GTX 1650 EX One Click Plus | |
| Gainward GeForce GTX 1650 4 GB | |
| X-Plane 11.11 - 1920x1080 high (fps_test=3) | |
| KFA 2 GeForce GTX 1660 Super | |
| PNY GeForce GTX 1660 | |
| KFA2 GeForce RTX 2060 Super | |
| KFA2 GeForce GTX 1650 EX One Click Plus | |
| Nvidia GeForce RTX 2060 Super | |
| AMD Radeon RX 5700 XT | |
| Sapphire AMD Radeon RX 5600 XT | |
| AMD Radeon RX 5700 XT | |
| AMD Radeon RX 5700 | |
| FIFA 20 - 1920x1080 Ultra Preset AA:4xMS | |
| AMD Radeon RX 5700 | |
| AMD Radeon RX 5700 XT | |
| XFX AMD Radeon RX 590 OC+ 8 GB | |
| Sapphire AMD Radeon RX 5600 XT | |
| Nvidia GeForce RTX 2060 Super | |
| PNY GeForce GTX 1660 | |
| KFA 2 GeForce GTX 1660 Super | |
| Sapphire NITRO+ RX 570 8 GB | |
| Gainward GeForce GTX 1650 4 GB | |
| KFA2 GeForce GTX 1650 EX One Click Plus | |
| Borderlands 3 - 1920x1080 Badass Overall Quality (DX11) | |
| AMD Radeon RX 5700 XT | |
| Nvidia GeForce RTX 2060 Super | |
| AMD Radeon RX 5700 | |
| Sapphire AMD Radeon RX 5600 XT | |
| KFA 2 GeForce GTX 1660 Super | |
| PNY GeForce GTX 1660 | |
| XFX AMD Radeon RX 590 OC+ 8 GB | |
| Sapphire NITRO+ RX 570 8 GB | |
| Gainward GeForce GTX 1650 4 GB | |
| GRID 2019 - 1920x1080 Ultra High Preset | |
| AMD Radeon RX 5700 XT | |
| AMD Radeon RX 5700 | |
| Nvidia GeForce RTX 2060 Super | |
| Sapphire AMD Radeon RX 5600 XT | |
| KFA 2 GeForce GTX 1660 Super | |
| PNY GeForce GTX 1660 | |
| XFX AMD Radeon RX 590 OC+ 8 GB | |
| Sapphire NITRO+ RX 570 8 GB | |
| KFA2 GeForce GTX 1650 EX One Click Plus | |
| Gainward GeForce GTX 1650 4 GB | |
| Need for Speed Heat - 1920x1080 Ultra Preset | |
| Nvidia GeForce RTX 2060 Super | |
| AMD Radeon RX 5700 XT | |
| AMD Radeon RX 5700 | |
| Sapphire AMD Radeon RX 5600 XT | |
| KFA 2 GeForce GTX 1660 Super | |
| PNY GeForce GTX 1660 | |
| XFX AMD Radeon RX 590 OC+ 8 GB | |
| Gainward GeForce GTX 1650 4 GB | |
| KFA2 GeForce GTX 1650 EX One Click Plus | |
| Star Wars Jedi Fallen Order - 1920x1080 Epic Preset | |
| Nvidia GeForce RTX 2060 Super | |
| AMD Radeon RX 5700 XT | |
| AMD Radeon RX 5700 | |
| Sapphire AMD Radeon RX 5600 XT | |
| PNY GeForce GTX 1660 | |
| XFX AMD Radeon RX 590 OC+ 8 GB | |
| KFA 2 GeForce GTX 1660 Super | |
| KFA2 GeForce GTX 1650 EX One Click Plus | |
| Gainward GeForce GTX 1650 4 GB | |
| Total War: Three Kingdoms - 1920x1080 Ultra (incl textures) | |
| Nvidia GeForce RTX 2060 Super | |
| AMD Radeon RX 5700 | |
| AMD Radeon RX 5700 XT | |
| Sapphire AMD Radeon RX 5600 XT | |
| KFA 2 GeForce GTX 1660 Super | |
| PNY GeForce GTX 1660 | |
| XFX AMD Radeon RX 590 OC+ 8 GB | |
| Gainward GeForce GTX 1650 4 GB | |
| KFA2 GeForce GTX 1650 EX One Click Plus | |
| Final Fantasy XV Benchmark - 1920x1080 High Quality | |
| KFA2 GeForce RTX 2060 Super | |
| Nvidia GeForce RTX 2060 Super | |
| MSI RTX 2060 Gaming Z 6G | |
| AMD Radeon RX 5700 XT | |
| Zotac GeForce GTX 1660 Ti 6 GB | |
| AMD Radeon RX 5700 | |
| XFX AMD Radeon RX 590 OC+ 8 GB | |
| KFA2 GeForce GTX 1650 EX One Click Plus | |
| Gainward GeForce GTX 1650 4 GB | |
| Sapphire NITRO+ RX 570 8 GB | |
| Call of Duty Modern Warfare 2019 - 1920x1080 Maximum Settings AA:T2X Filmic SM | |
| AMD Radeon RX 5700 XT | |
| Nvidia GeForce RTX 2060 Super | |
| AMD Radeon RX 5700 | |
| Sapphire AMD Radeon RX 5600 XT | |
| KFA 2 GeForce GTX 1660 Super | |
| PNY GeForce GTX 1660 | |
| XFX AMD Radeon RX 590 OC+ 8 GB | |
| Sapphire NITRO+ RX 570 8 GB | |
| KFA2 GeForce GTX 1650 EX One Click Plus | |
| Gainward GeForce GTX 1650 4 GB | |
| Red Dead Redemption 2 - 1920x1080 Maximum Settings | |
| AMD Radeon RX 5700 XT | |
| Nvidia GeForce RTX 2060 Super | |
| AMD Radeon RX 5700 | |
| Sapphire AMD Radeon RX 5600 XT | |
| KFA 2 GeForce GTX 1660 Super | |
| PNY GeForce GTX 1660 | |
| XFX AMD Radeon RX 590 OC+ 8 GB | |
| KFA2 GeForce GTX 1650 EX One Click Plus | |
| Gainward GeForce GTX 1650 4 GB | |
| F1 2020 - 1920x1080 Ultra High Preset AA:T AF:16x | |
| AMD Radeon RX 5700 XT | |
| AMD Radeon RX 5700 | |
| Sapphire AMD Radeon RX 5600 XT | |
| Nvidia GeForce RTX 2060 Super | |
| XFX AMD Radeon RX 590 OC+ 8 GB | |
| KFA 2 GeForce GTX 1660 Super | |
| PNY GeForce GTX 1660 | |
| KFA2 GeForce GTX 1650 EX One Click Plus | |
| Death Stranding - 1920x1080 Very High Preset | |
| AMD Radeon RX 5700 XT | |
| AMD Radeon RX 5700 | |
| Sapphire AMD Radeon RX 5600 XT | |
| Nvidia GeForce RTX 2060 Super | |
| KFA 2 GeForce GTX 1660 Super | |
| PNY GeForce GTX 1660 | |
| XFX AMD Radeon RX 590 OC+ 8 GB | |
| XFX AMD Radeon RX 590 OC+ 8 GB | |
| KFA2 GeForce GTX 1650 EX One Click Plus | |
| Horizon Zero Dawn - 1920x1080 Ultimate Quality | |
| AMD Radeon RX 5700 XT | |
| AMD Radeon RX 5700 | |
| Sapphire AMD Radeon RX 5600 XT | |
| Nvidia GeForce RTX 2060 Super | |
| KFA 2 GeForce GTX 1660 Super | |
| PNY GeForce GTX 1660 | |
| XFX AMD Radeon RX 590 OC+ 8 GB | |
| KFA2 GeForce GTX 1650 EX One Click Plus | |
| bajo | medio | alto | ultra | QHD | 4K | |
|---|---|---|---|---|---|---|
| The Witcher 3 (2015) | 216 | 128 | 70.1 | 40.4 | 23.6 | |
| Dota 2 Reborn (2015) | 156.7 | 114.3 | 112.6 | 106.9 | 59.1 | |
| Final Fantasy XV Benchmark (2018) | 108 | 55.3 | 41.2 | 28.9 | 15.8 | |
| X-Plane 11.11 (2018) | 123 | 110 | 89.6 | 66.9 | ||
| Far Cry 5 (2018) | 135 | 69 | 63 | 59 | 40 | 19 |
| Strange Brigade (2018) | 245 | 94.4 | 74 | 62.2 | 44.7 | 25.7 |
| Apex Legends (2019) | 144 | 111 | 76 | 71.3 | 50.4 | 27 |
| Far Cry New Dawn (2019) | 120 | 68 | 63 | 58 | 42 | 21 |
| Metro Exodus (2019) | 107 | 48 | 35.2 | 27.7 | 21.3 | 12.1 |
| Total War: Three Kingdoms (2019) | 202.1 | 68.5 | 41.5 | 26.4 | 15.7 | 15 |
| FIFA 20 (2019) | 237 | 215 | 192 | 137 | 107 | 69.9 |
| GRID 2019 (2019) | 155 | 86 | 70 | 45 | 32 | 18 |
| Call of Duty Modern Warfare 2019 (2019) | 118 | 78 | 65 | 54 | 37 | 21 |
| Need for Speed Heat (2019) | 114 | 64.4 | 53.6 | 39 | 17.7 | 17.1 |
| Star Wars Jedi Fallen Order (2019) | 77.7 | 65.5 | 54.9 | 36.3 | 17 | |
| Red Dead Redemption 2 (2019) | 111 | 54 | 34 | 22 | ||
| Hunt Showdown (2020) | 153 | 60.8 | 46.7 | 29.3 | 25.7 | |
| Doom Eternal (2020) | 116 | 80.4 | 61.4 | |||
| Gears Tactics (2020) | 252.9 | 86.7 | 56 | 40.1 | 27.8 | 15 |
| Valorant (2020) | 341.7 | 291.8 | 260.1 | 176.6 | 82.8 | |
| F1 2020 (2020) | 219 | 115 | 88.1 | 60.3 | 42.9 | 23.4 |
| Death Stranding (2020) | 98.2 | 58.7 | 54.4 | 52.7 | 35.6 | 17.3 |
| Horizon Zero Dawn (2020) | 99 | 55 | 46 | 36 | 26 | 15 |
| Flight Simulator 2020 (2020) | 76.7 | 35.6 | 25.3 | 17 | 12.3 | 5 |
| Serious Sam 4 (2020) | 138.7 | 57.5 | 43.3 | 17.8 | 13.7 | 9.9 |
| Mafia Definitive Edition (2020) | 103.8 | 49.7 | 45.2 | 29 | 14.5 | |
| Star Wars Squadrons (2020) | 312 | 146 | 123 | 114 | 72.9 | 39.6 |
| FIFA 21 (2020) | 231 | 224 | 206 | 184 | 145 | 86.3 |
| Watch Dogs Legion (2020) | 92.9 | 56 | 47.6 | 21.2 | 14.3 | 8.02 |
Emisiones de la KFA2 GeForce GTX 1650 EX Plus (1-Click OC)
Cualquiera que quiera conseguir una GTX 1650 probablemente esté preocupado por el consumo de energía. El TGP de 90 vatios y un conector de alimentación adicional no hacen que la comparación con la GTX 1650 estándar sin un conector de 6 pines parezca muy favorable. Sin embargo, en realidad, la KFA2 GeForce GTX 1650 EX Plus no tiene ninguna desventaja. El modelo más antiguo tiene un consumo de energía muy similar en el sistema que estamos usando actualmente.
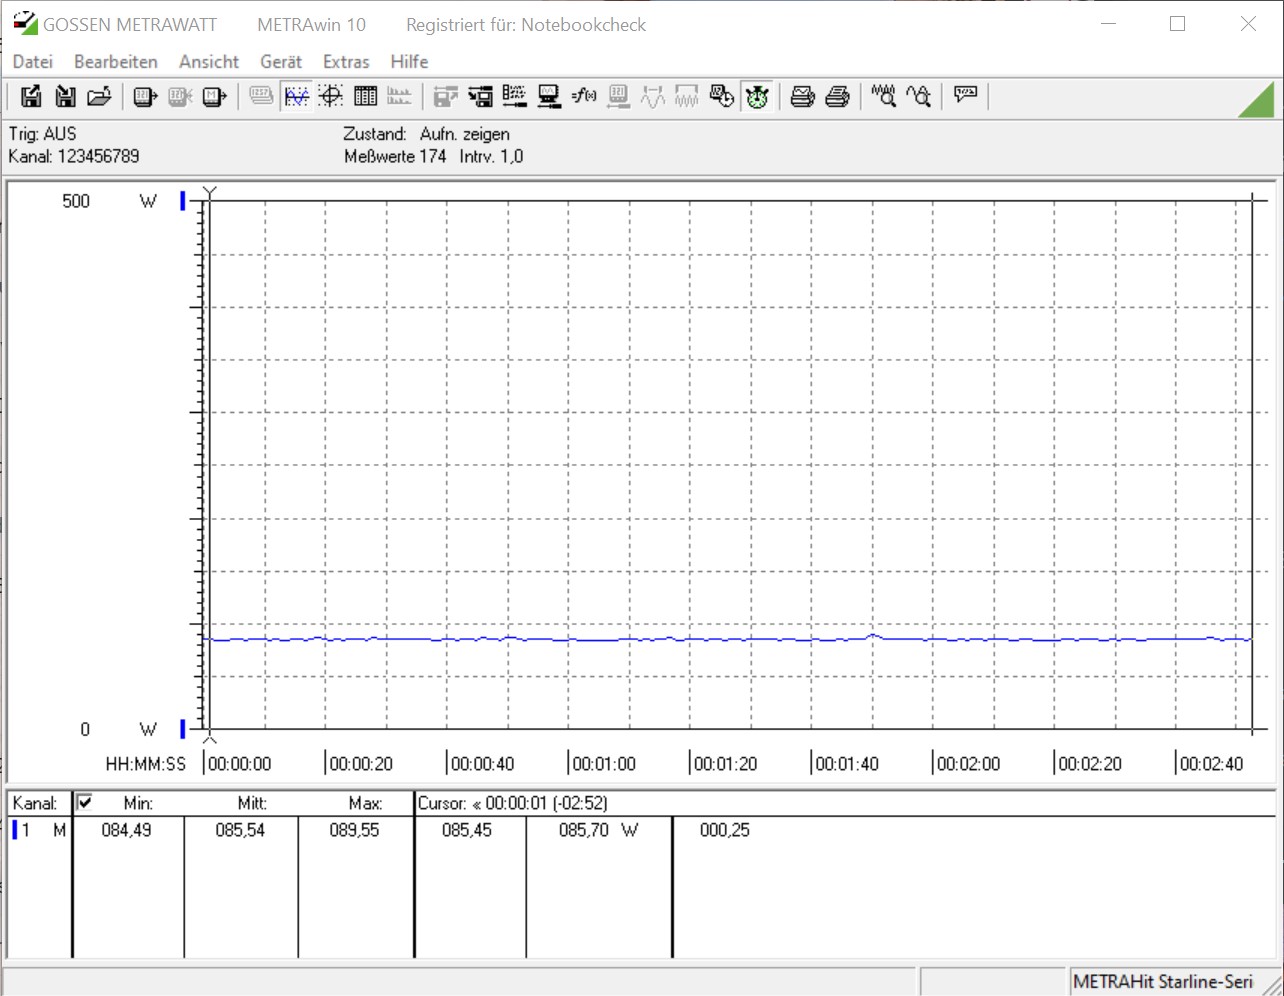
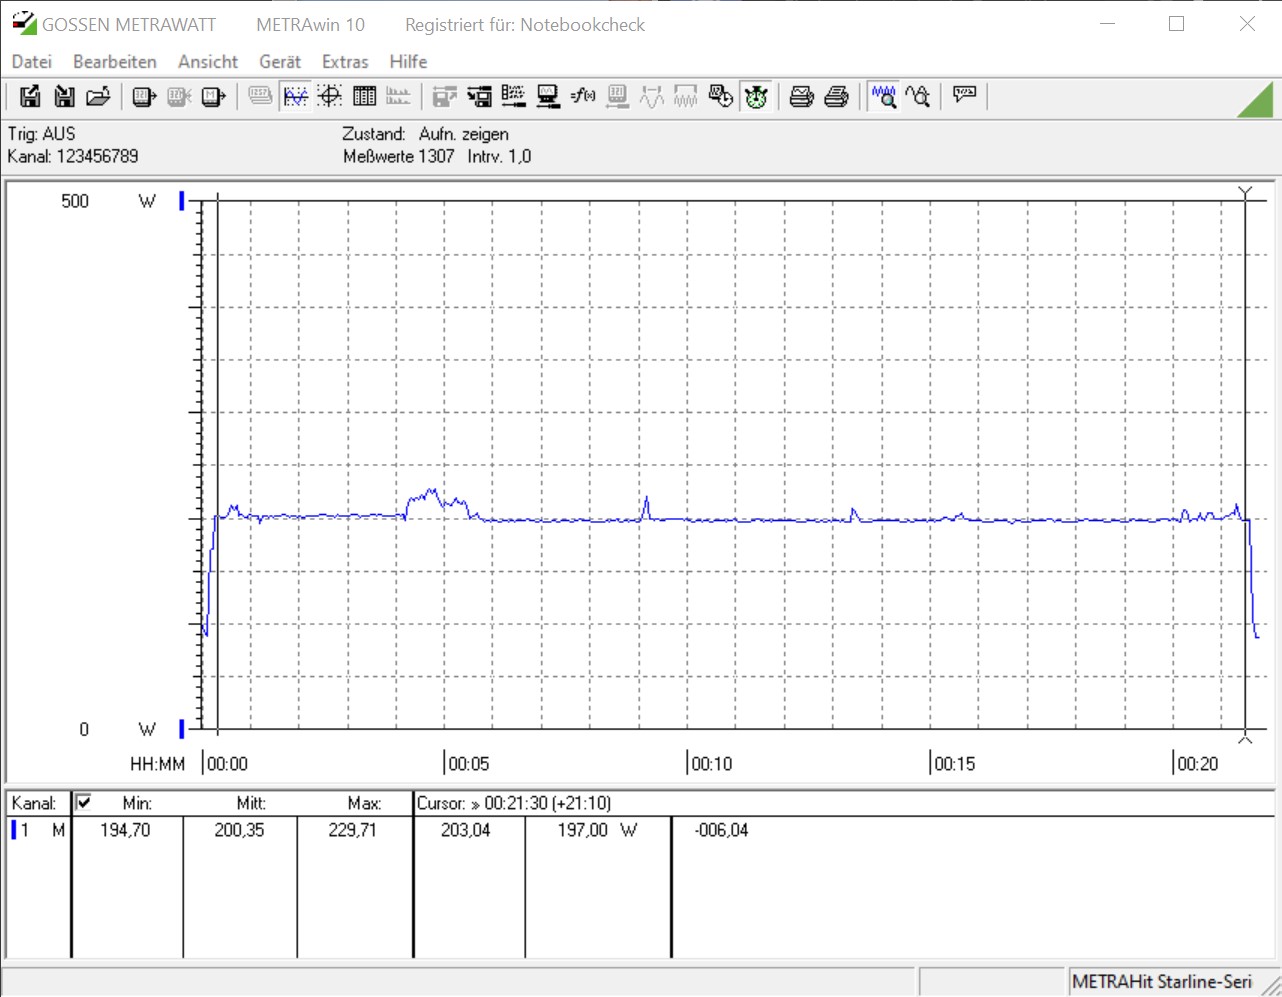
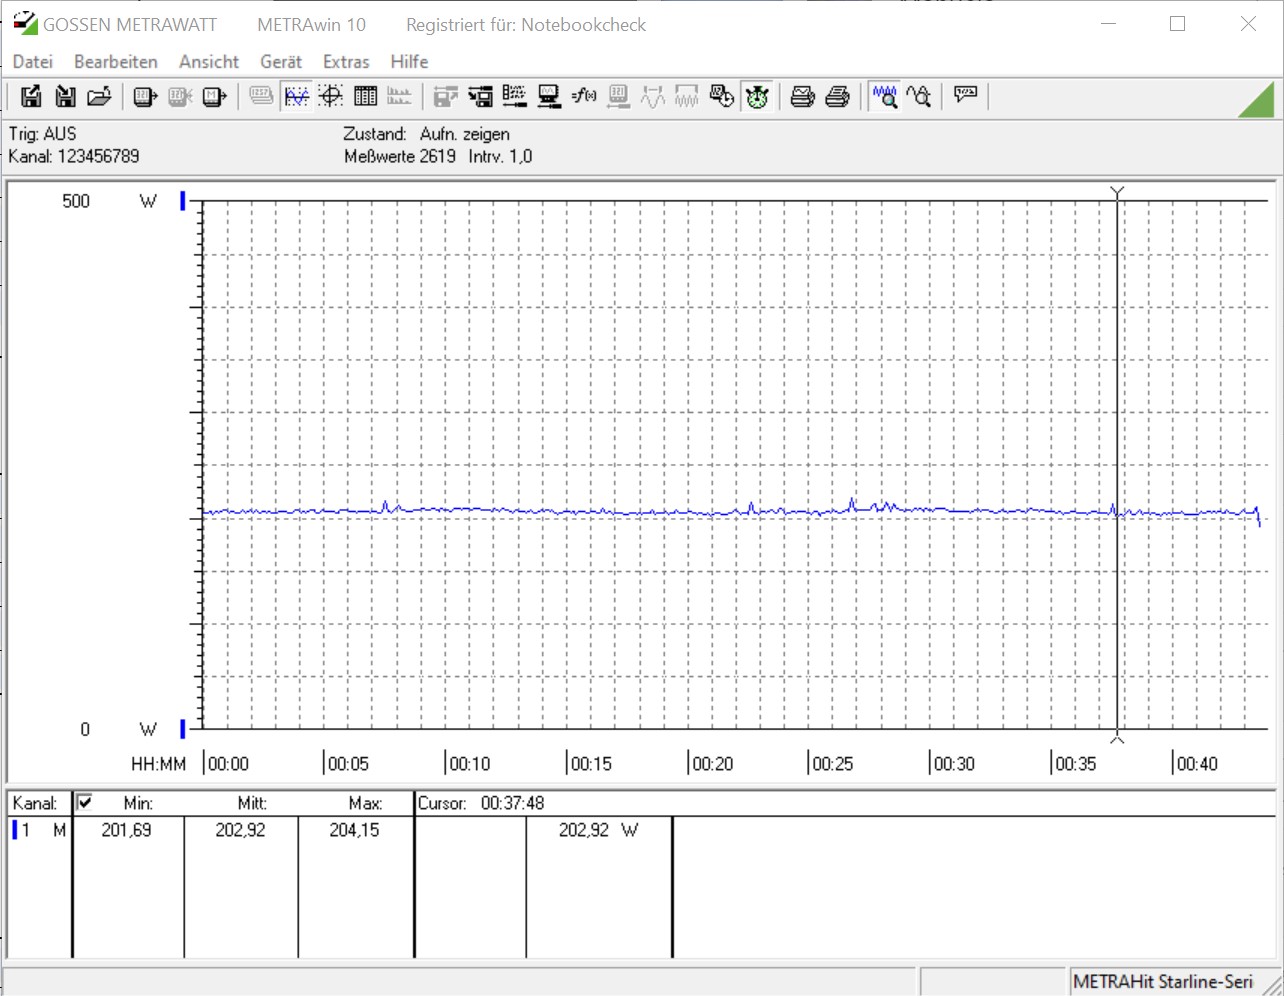
En reposo, el consumo de energía de nuestro sistema asciende a 85 vatios con cualquiera de las dos versiones de la GTX 1650. Cuando estábamos jugando o probando el sistema, el consumo de energía alcanzó un poco más de 200 vatios, lo que es un buen resultado. El AMD Radeon RX 570, que es marginalmente más rápido en los puntos de referencia de los juegos, requiere mucha más energía. Esto es una prueba de que la tecnología está avanzando.
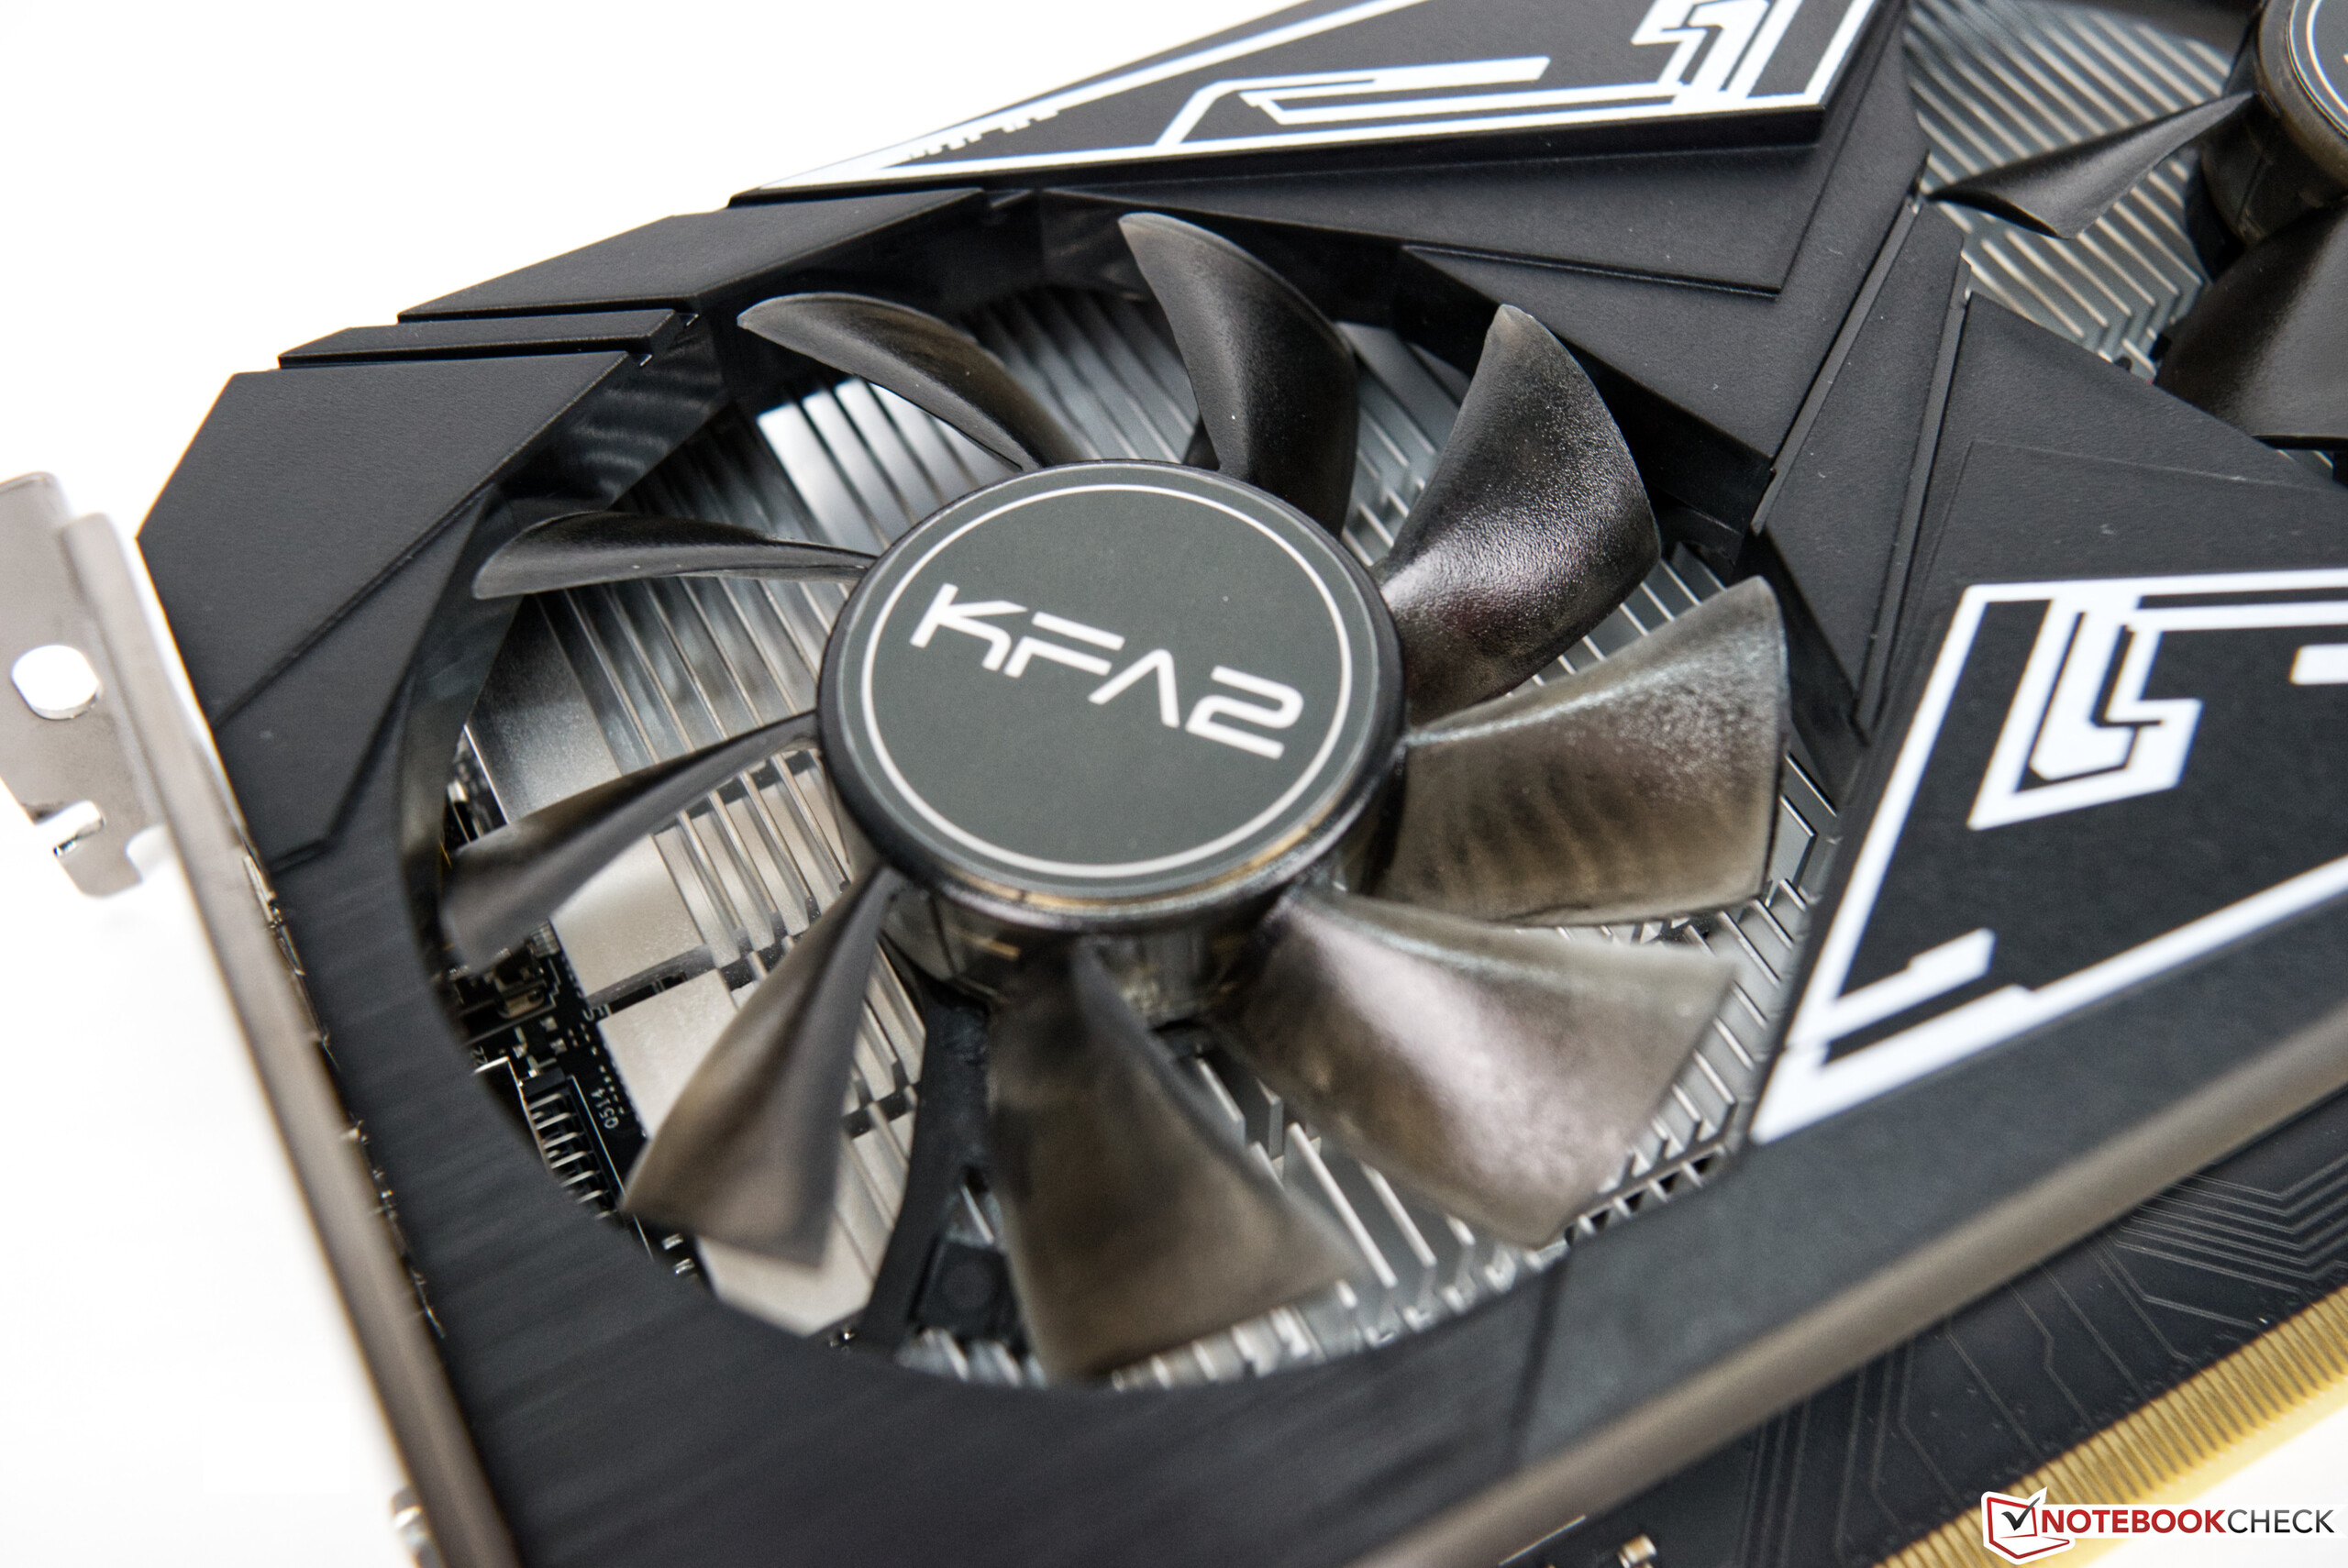
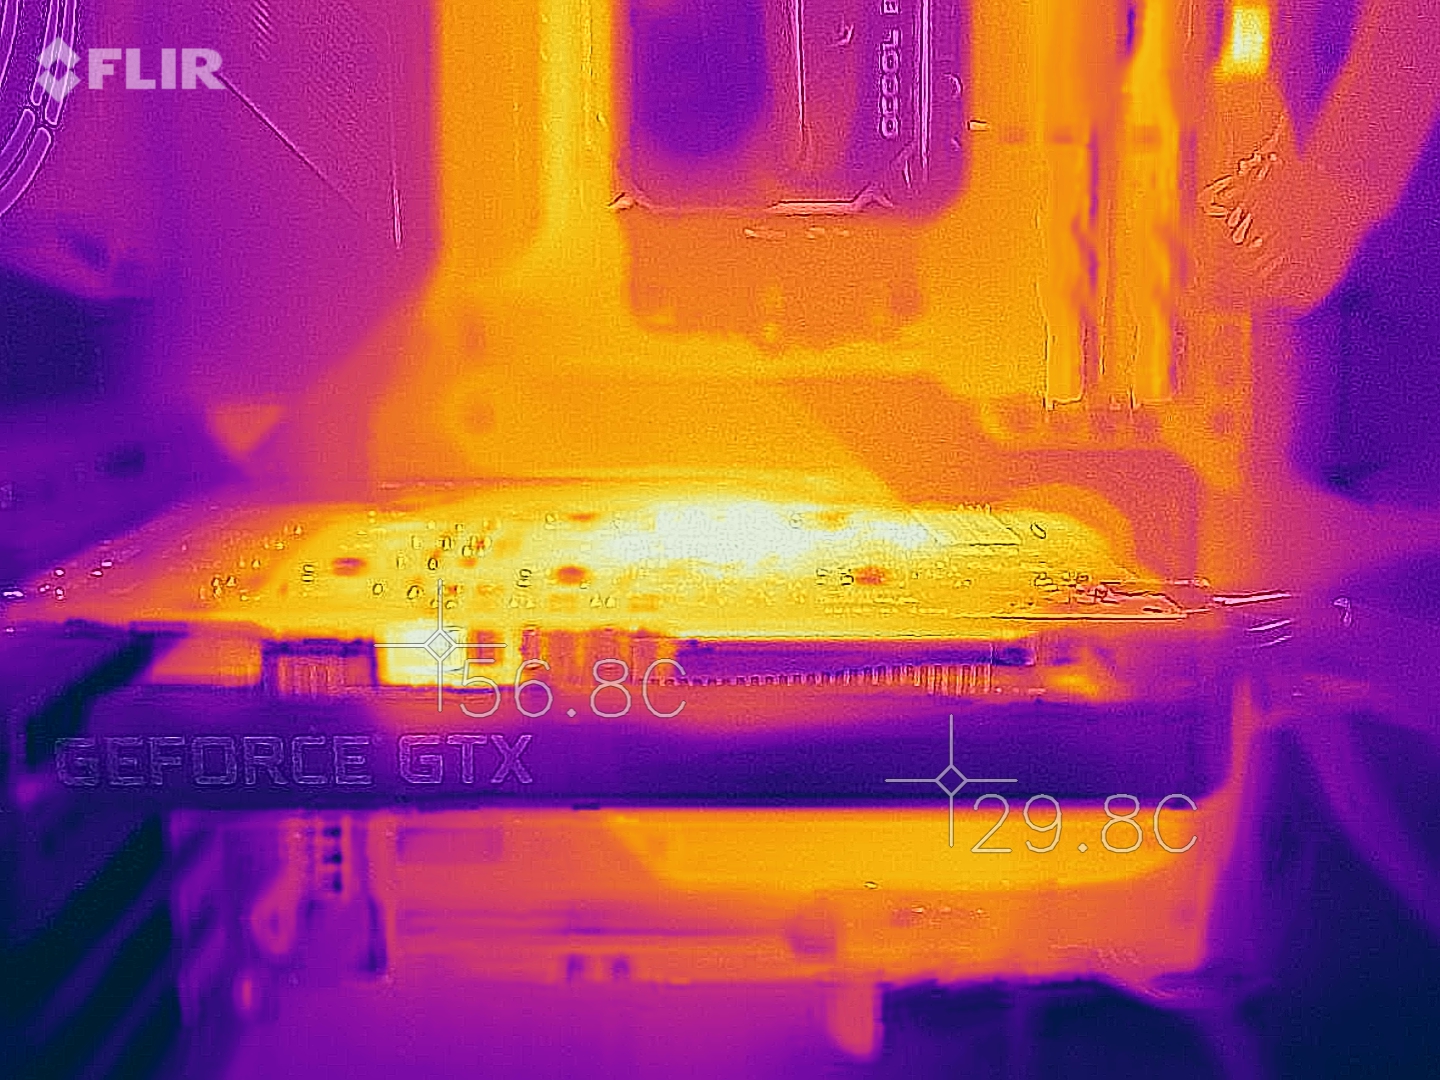
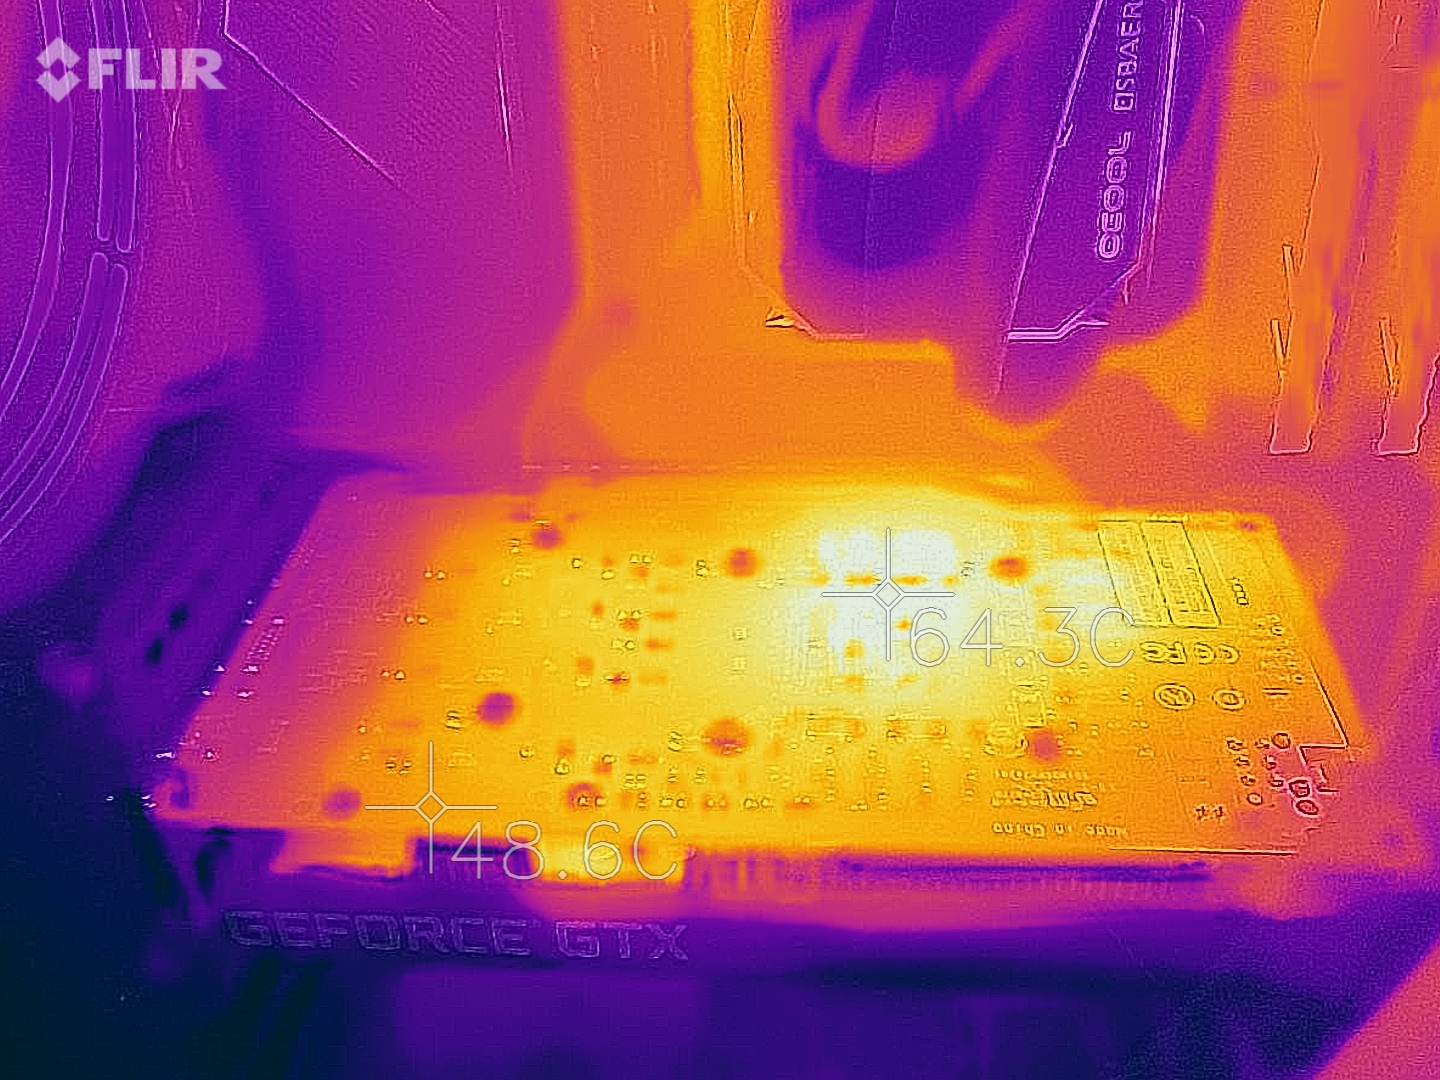
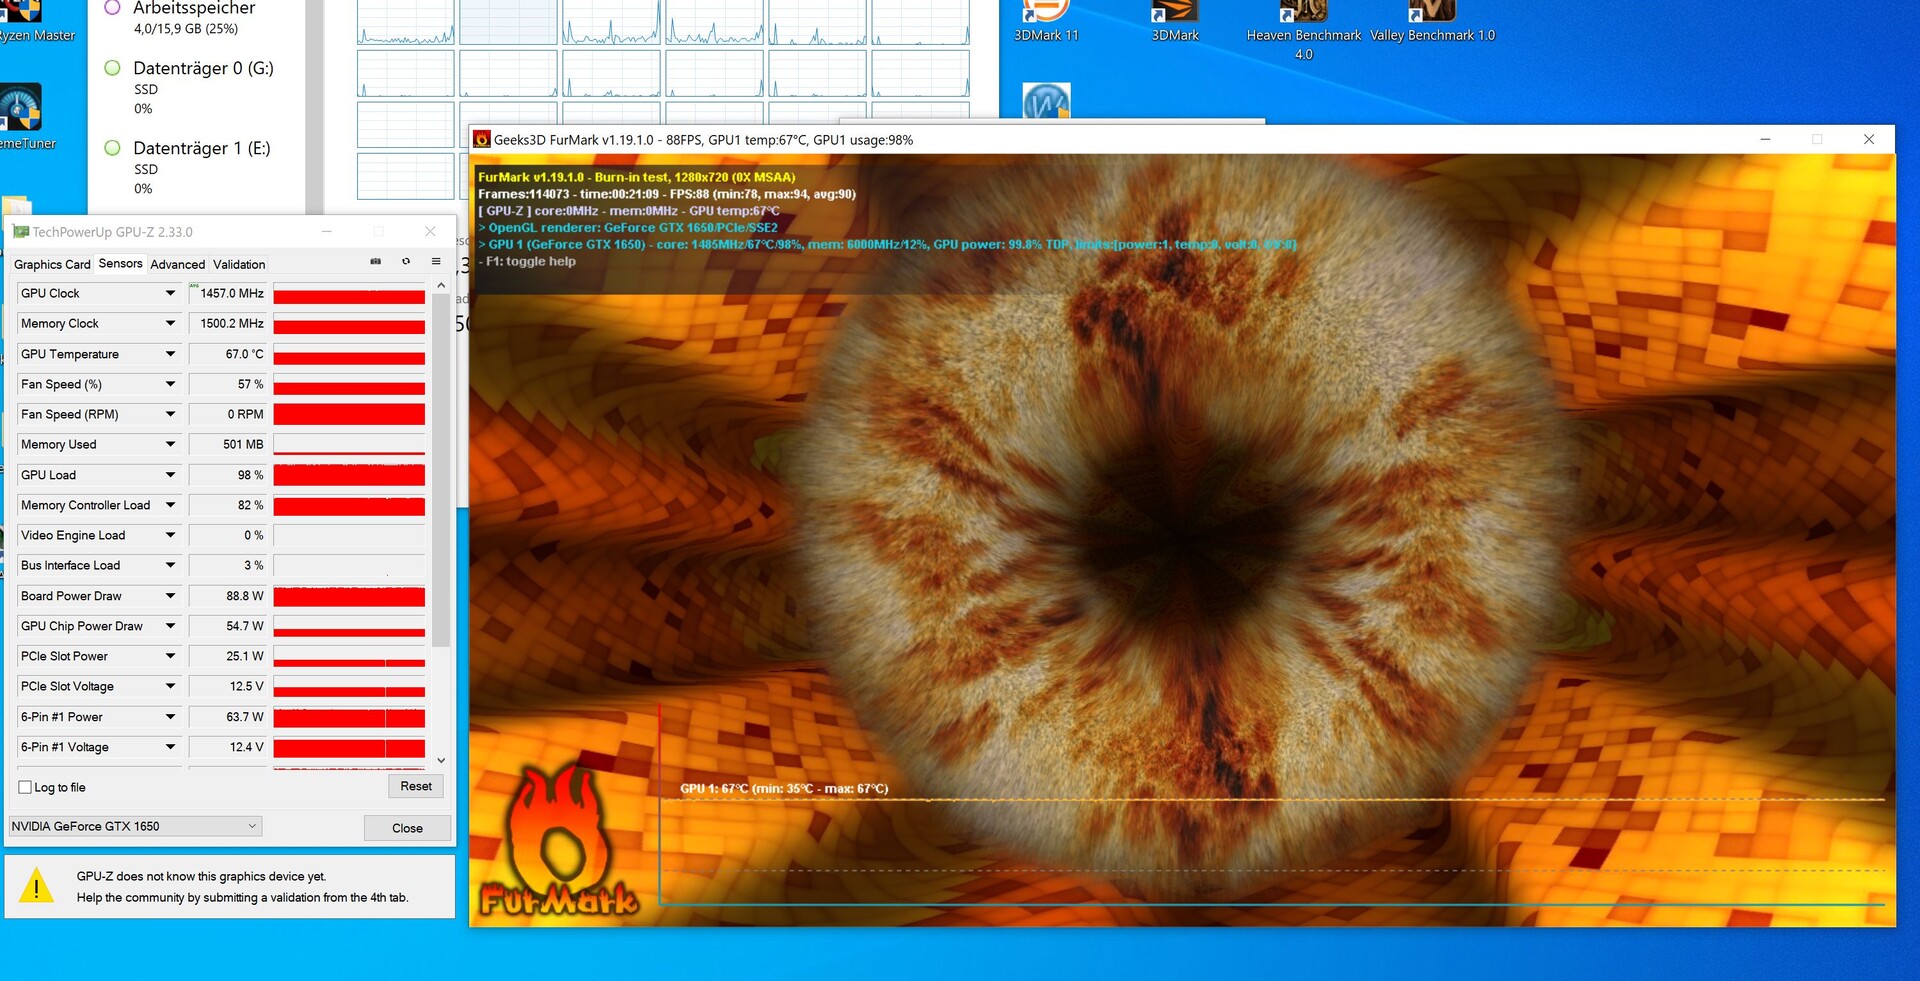
No hubo problemas térmicos con la KFA2 GeForce GTX 1650 EX Plus. Durante la prueba de esfuerzo, las temperaturas alcanzaron un pico de 67 °C y ambos ventiladores axiales funcionaron a un 57 por ciento de su velocidad máxima. Sin embargo, pudimos escuchar un zumbido silencioso que provenía de la caja. No lo describiríamos como molesto.
| Power Consumption | |
| 1920x1080 The Witcher 3 ultra (external Monitor) | |
| AMD Radeon RX 5700 XT (Idle: 83.2 W) | |
| XFX AMD Radeon RX 590 OC+ 8 GB (Idle: 85.9 W) | |
| AMD Radeon RX 5700 XT (Idle: 69.8 W) | |
| XFX AMD Radeon RX 590 OC+ 8 GB | |
| KFA2 GeForce RTX 2060 Super (81.7 fps, Idle: 93.8 W) | |
| Nvidia GeForce RTX 2060 Super (Idle: 86.7 W) | |
| AMD Radeon RX 5700 (Idle: 77.9 W) | |
| Sapphire NITRO+ RX 570 8 GB (Idle: 85.5 W) | |
| Nvidia GeForce RTX 2060 Super (82.7 fps, Idle: 77.12 W) | |
| AMD Radeon RX 5700 (84.2 fps, Idle: 64.5 W) | |
| MSI RTX 2060 Gaming Z 6G (Idle: 74.66 W) | |
| Sapphire AMD Radeon RX 5600 XT (Idle: 112 W) | |
| Sapphire NITRO+ RX 570 8 GB (Idle: 72.61 W) | |
| KFA 2 GeForce GTX 1660 Super (Idle: 84.76 W) | |
| PNY GeForce GTX 1660 (Idle: 79.88 W) | |
| Zotac GeForce GTX 1660 Ti 6 GB (Idle: 68.3 W) | |
| Gainward GeForce GTX 1650 4 GB (Idle: 82.4 W) | |
| KFA2 GeForce GTX 1650 EX One Click Plus (Idle: 85.5 W) | |
| Gainward GeForce GTX 1650 4 GB (Idle: 64.63 W) | |
| 1280x720 FurMark 1.19 GPU Stress Test (external Monitor) | |
| XFX AMD Radeon RX 590 OC+ 8 GB (Idle: 85.9 W) | |
| XFX AMD Radeon RX 590 OC+ 8 GB | |
| AMD Radeon RX 5700 XT (Idle: 83.2 W) | |
| AMD Radeon RX 5700 XT (239 fps, Idle: 69.8 W) | |
| Sapphire NITRO+ RX 570 8 GB (Idle: 85.5 W) | |
| Sapphire AMD Radeon RX 5600 XT (Idle: 112 W) | |
| KFA2 GeForce RTX 2060 Super (234 fps, Idle: 93.8 W) | |
| Nvidia GeForce RTX 2060 Super (Idle: 86.7 W) | |
| Sapphire NITRO+ RX 570 8 GB (Idle: 72.61 W) | |
| AMD Radeon RX 5700 (Idle: 77.9 W) | |
| MSI RTX 2060 Gaming Z 6G (Idle: 74.66 W) | |
| Nvidia GeForce RTX 2060 Super (237 fps, Idle: 77.12 W) | |
| AMD Radeon RX 5700 (207 fps, Idle: 64.5 W) | |
| PNY GeForce GTX 1660 (Idle: 79.88 W) | |
| KFA 2 GeForce GTX 1660 Super (Idle: 84.76 W) | |
| Zotac GeForce GTX 1660 Ti 6 GB (Idle: 68.3 W) | |
| Gainward GeForce GTX 1650 4 GB (Idle: 82.4 W) | |
| KFA2 GeForce GTX 1650 EX One Click Plus (Idle: 85.5 W) | |
| Gainward GeForce GTX 1650 4 GB (Idle: 64.63 W, Idle: 64.63 W) | |
* ... más pequeño es mejor
Overclocking - 10 a 15 % más de rendimiento
Desafortunadamente, el objetivo de potencia de la KFA2 GeForce GTX 1650 EX Plus no se puede elevar más allá de 90 vatios. En el Sintonizador Xtreme de KFA2, los usuarios pueden activar la función OC de 1-Click, que aumenta la velocidad central en 30 MHz. Sin embargo, no hay un aumento observable en el rendimiento.
Cuando se sobrecocina manualmente, la velocidad se puede aumentar en 220 MHz y la frecuencia de la memoria en 1200 MHz. La GPU era estable con estos overclocks y realizamos dos pruebas para medir el rendimiento. Dependiendo de la aplicación, los usuarios pueden esperar ver de un 10 a un 15 % más de rendimiento. Sin embargo, la GeForce GTX 1660 sigue ofreciendo un nivel de rendimiento más alto.
Pro
Contra
Veredicto - La mejor GeForce GTX 1650
La KFA2 GeForce GTX 1650 EX Plus es una versión mejor de la GeForce GTX 1650. Debido a la escasa disponibilidad de la VRAM GDDR5, la GPU de nivel básico basada en Turing tuvo que usar la VRAM GDDR6 más rápida. En combinación con un aumento en el número de unidades de mapeo de texturas, la GPU ofrece un pequeño aumento en el rendimiento. En los benchmarks de juegos puros, la KFA2 GeForce GTX 1650 a veces es capaz de igualar a la AMD Radeon RX 570. 4 GB de VRAM no es mucho, pero, dado el nivel de rendimiento ofrecido, es suficiente. La GPU puede ejecutar juegos modernos a 1080p con una configuración de gráficos reducida.
La KFA2 GeForce GTX 1650 EX Plus es una tarjeta gráfica de bajo precio, que es una opción perfecta para un cierto tipo de jugador.
Con todo, la KFA2 GeForce GTX 1650 EX Plus deja una impresión muy sólida. La solución de refrigeración no se agobia y no es muy ruidosa. Los precios comienzan en 130 euros (~ $154 dólares). Aquellos que estén contentos con este nivel de rendimiento y puedan vivir con el hecho de que la GPU viene con un conector de alimentación de 6 pines deberían echar un vistazo mucho más de cerca a la KFA2 GeForce GTX 1650 EX Plus.