Review de la PC de escritorio Zotac MEK MINI con Core i7 y GeForce RTX 2070 Super
")
")
")
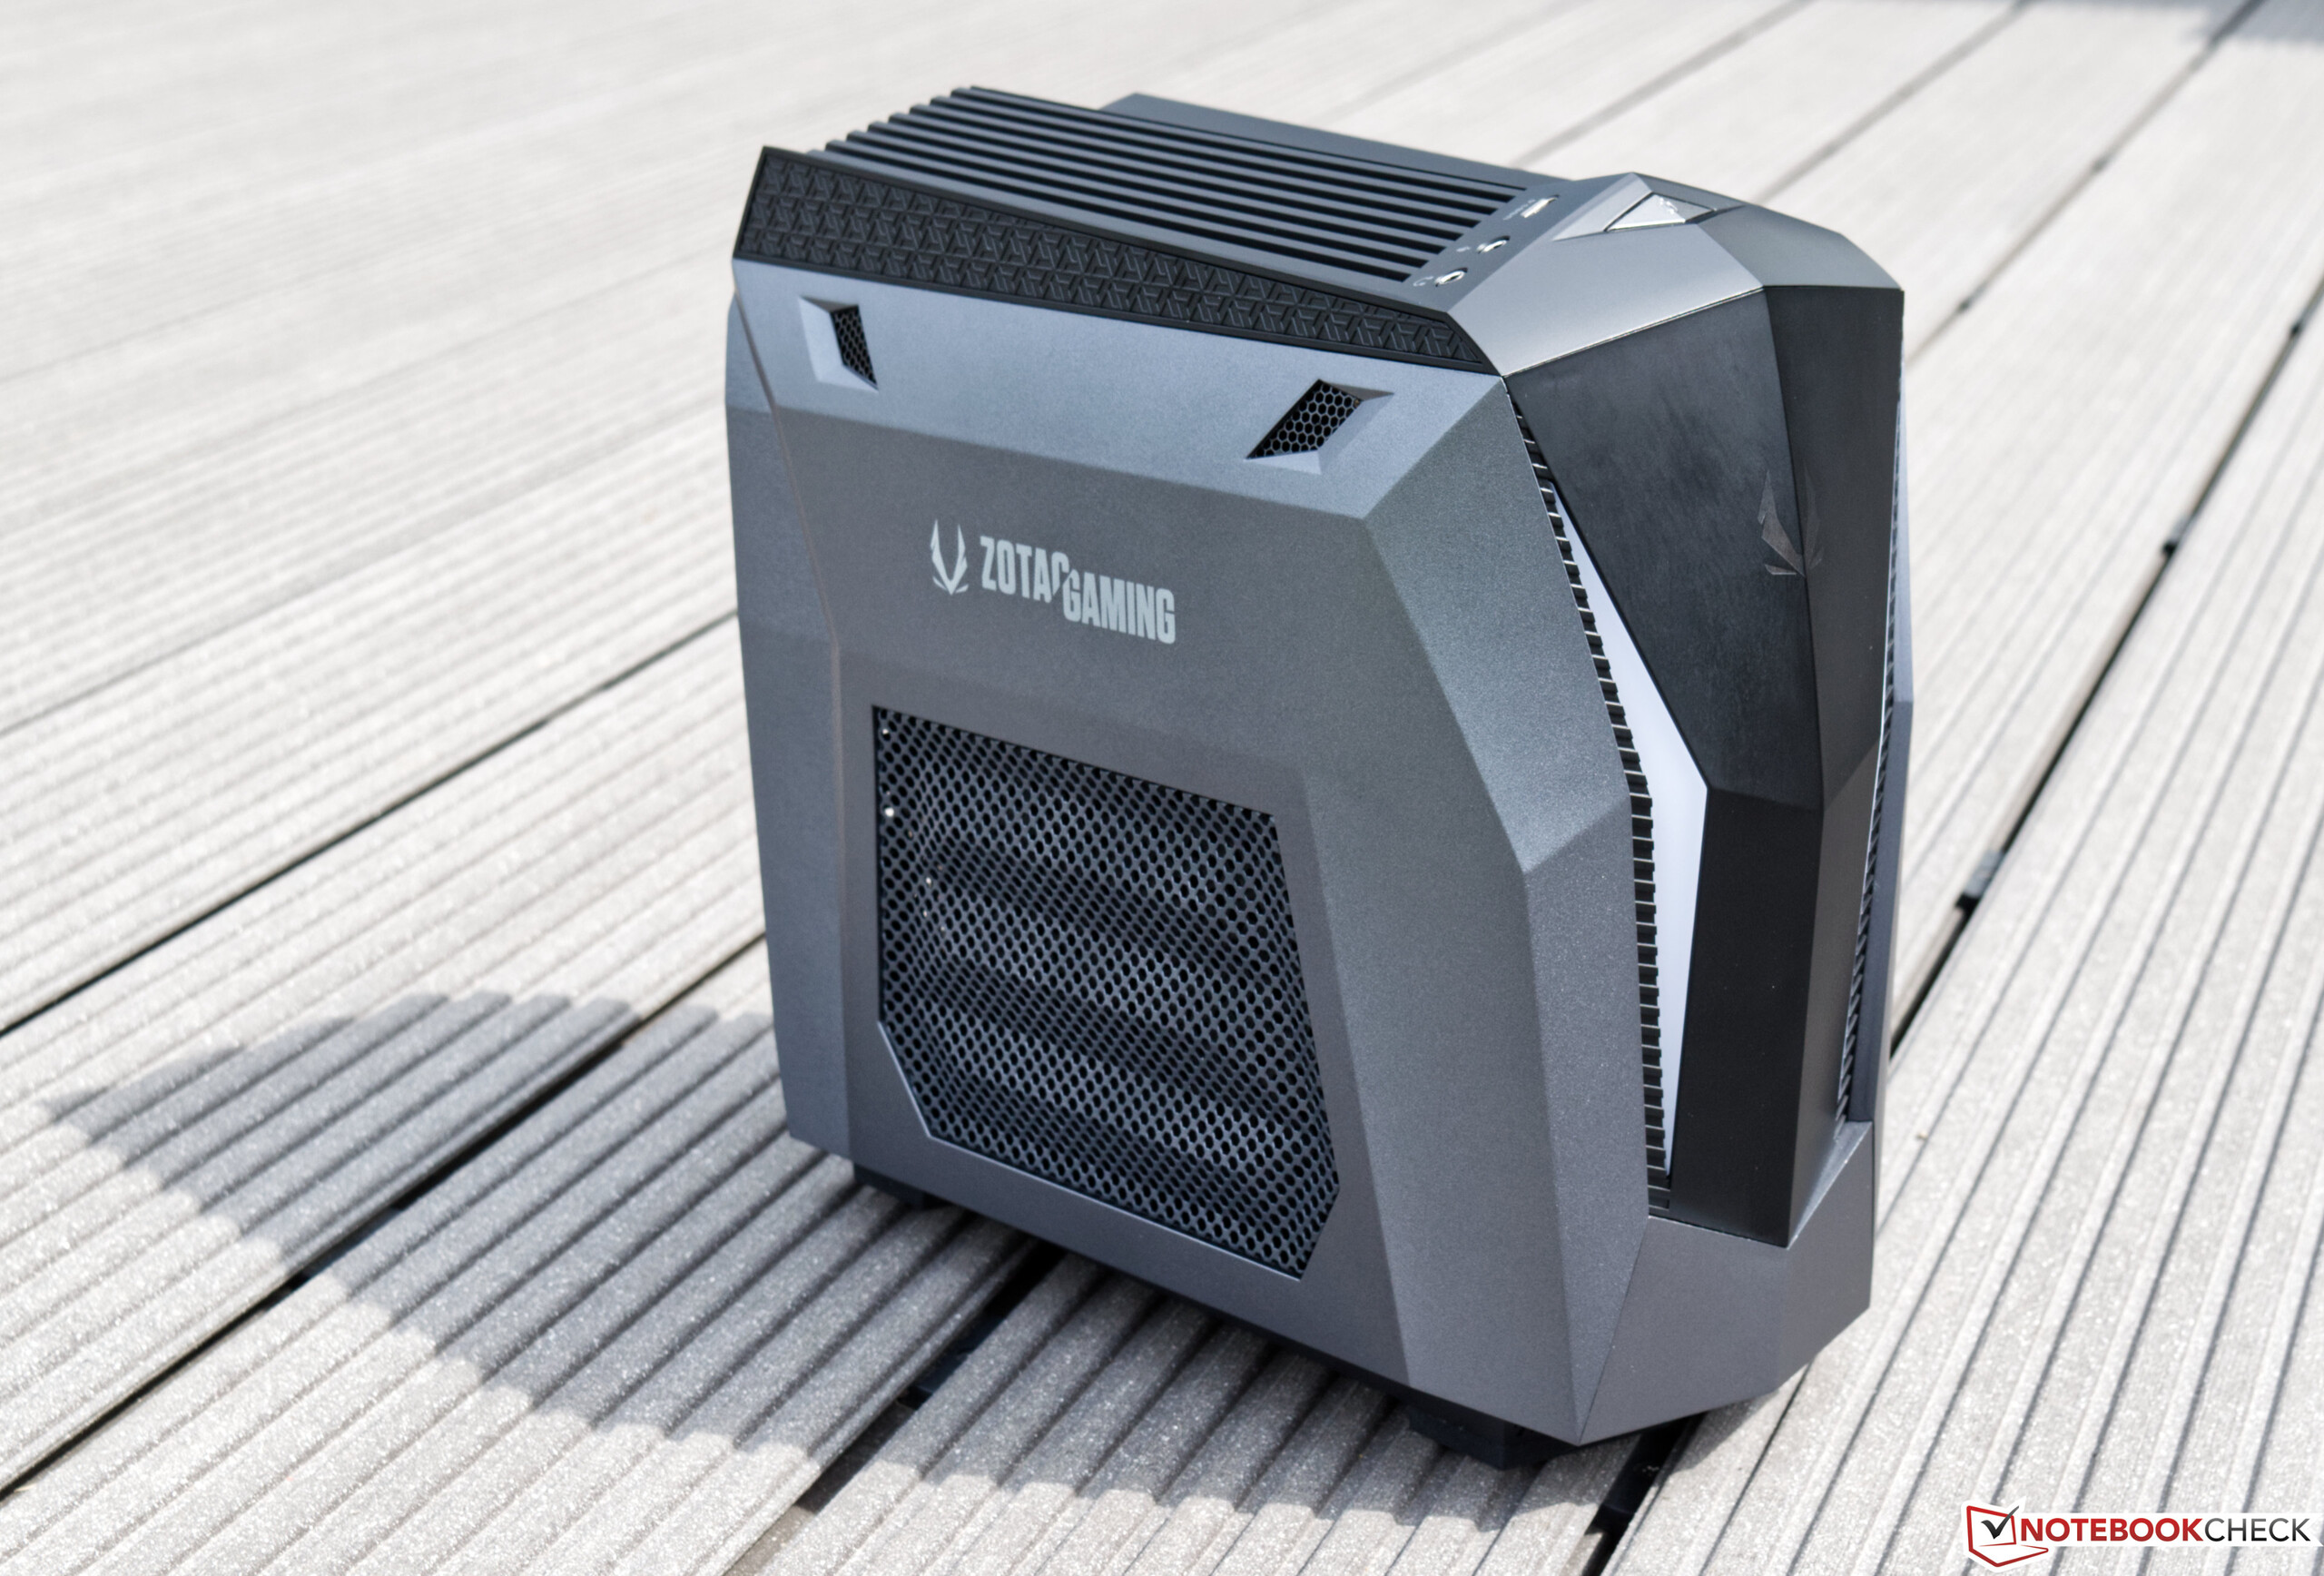
El Zotac MEK MINI, que se presentó al público por primera vez en Computex 2018, se desarrolló a partir de un estudio conceptual. En ese momento, aún sin las Supertarjetas RTX y basado en la octava generación de procesadores Intel Core, el PC de juegos, que sólo tiene 9,2 litros de tamaño, celebró su debut. En la nueva edición, Zotac le ha dado al ordenador compacto una pequeña mejora de rendimiento con la 9ª generación de CPUs Core de Intel y las tarjetas RTX Super de Nvidia.
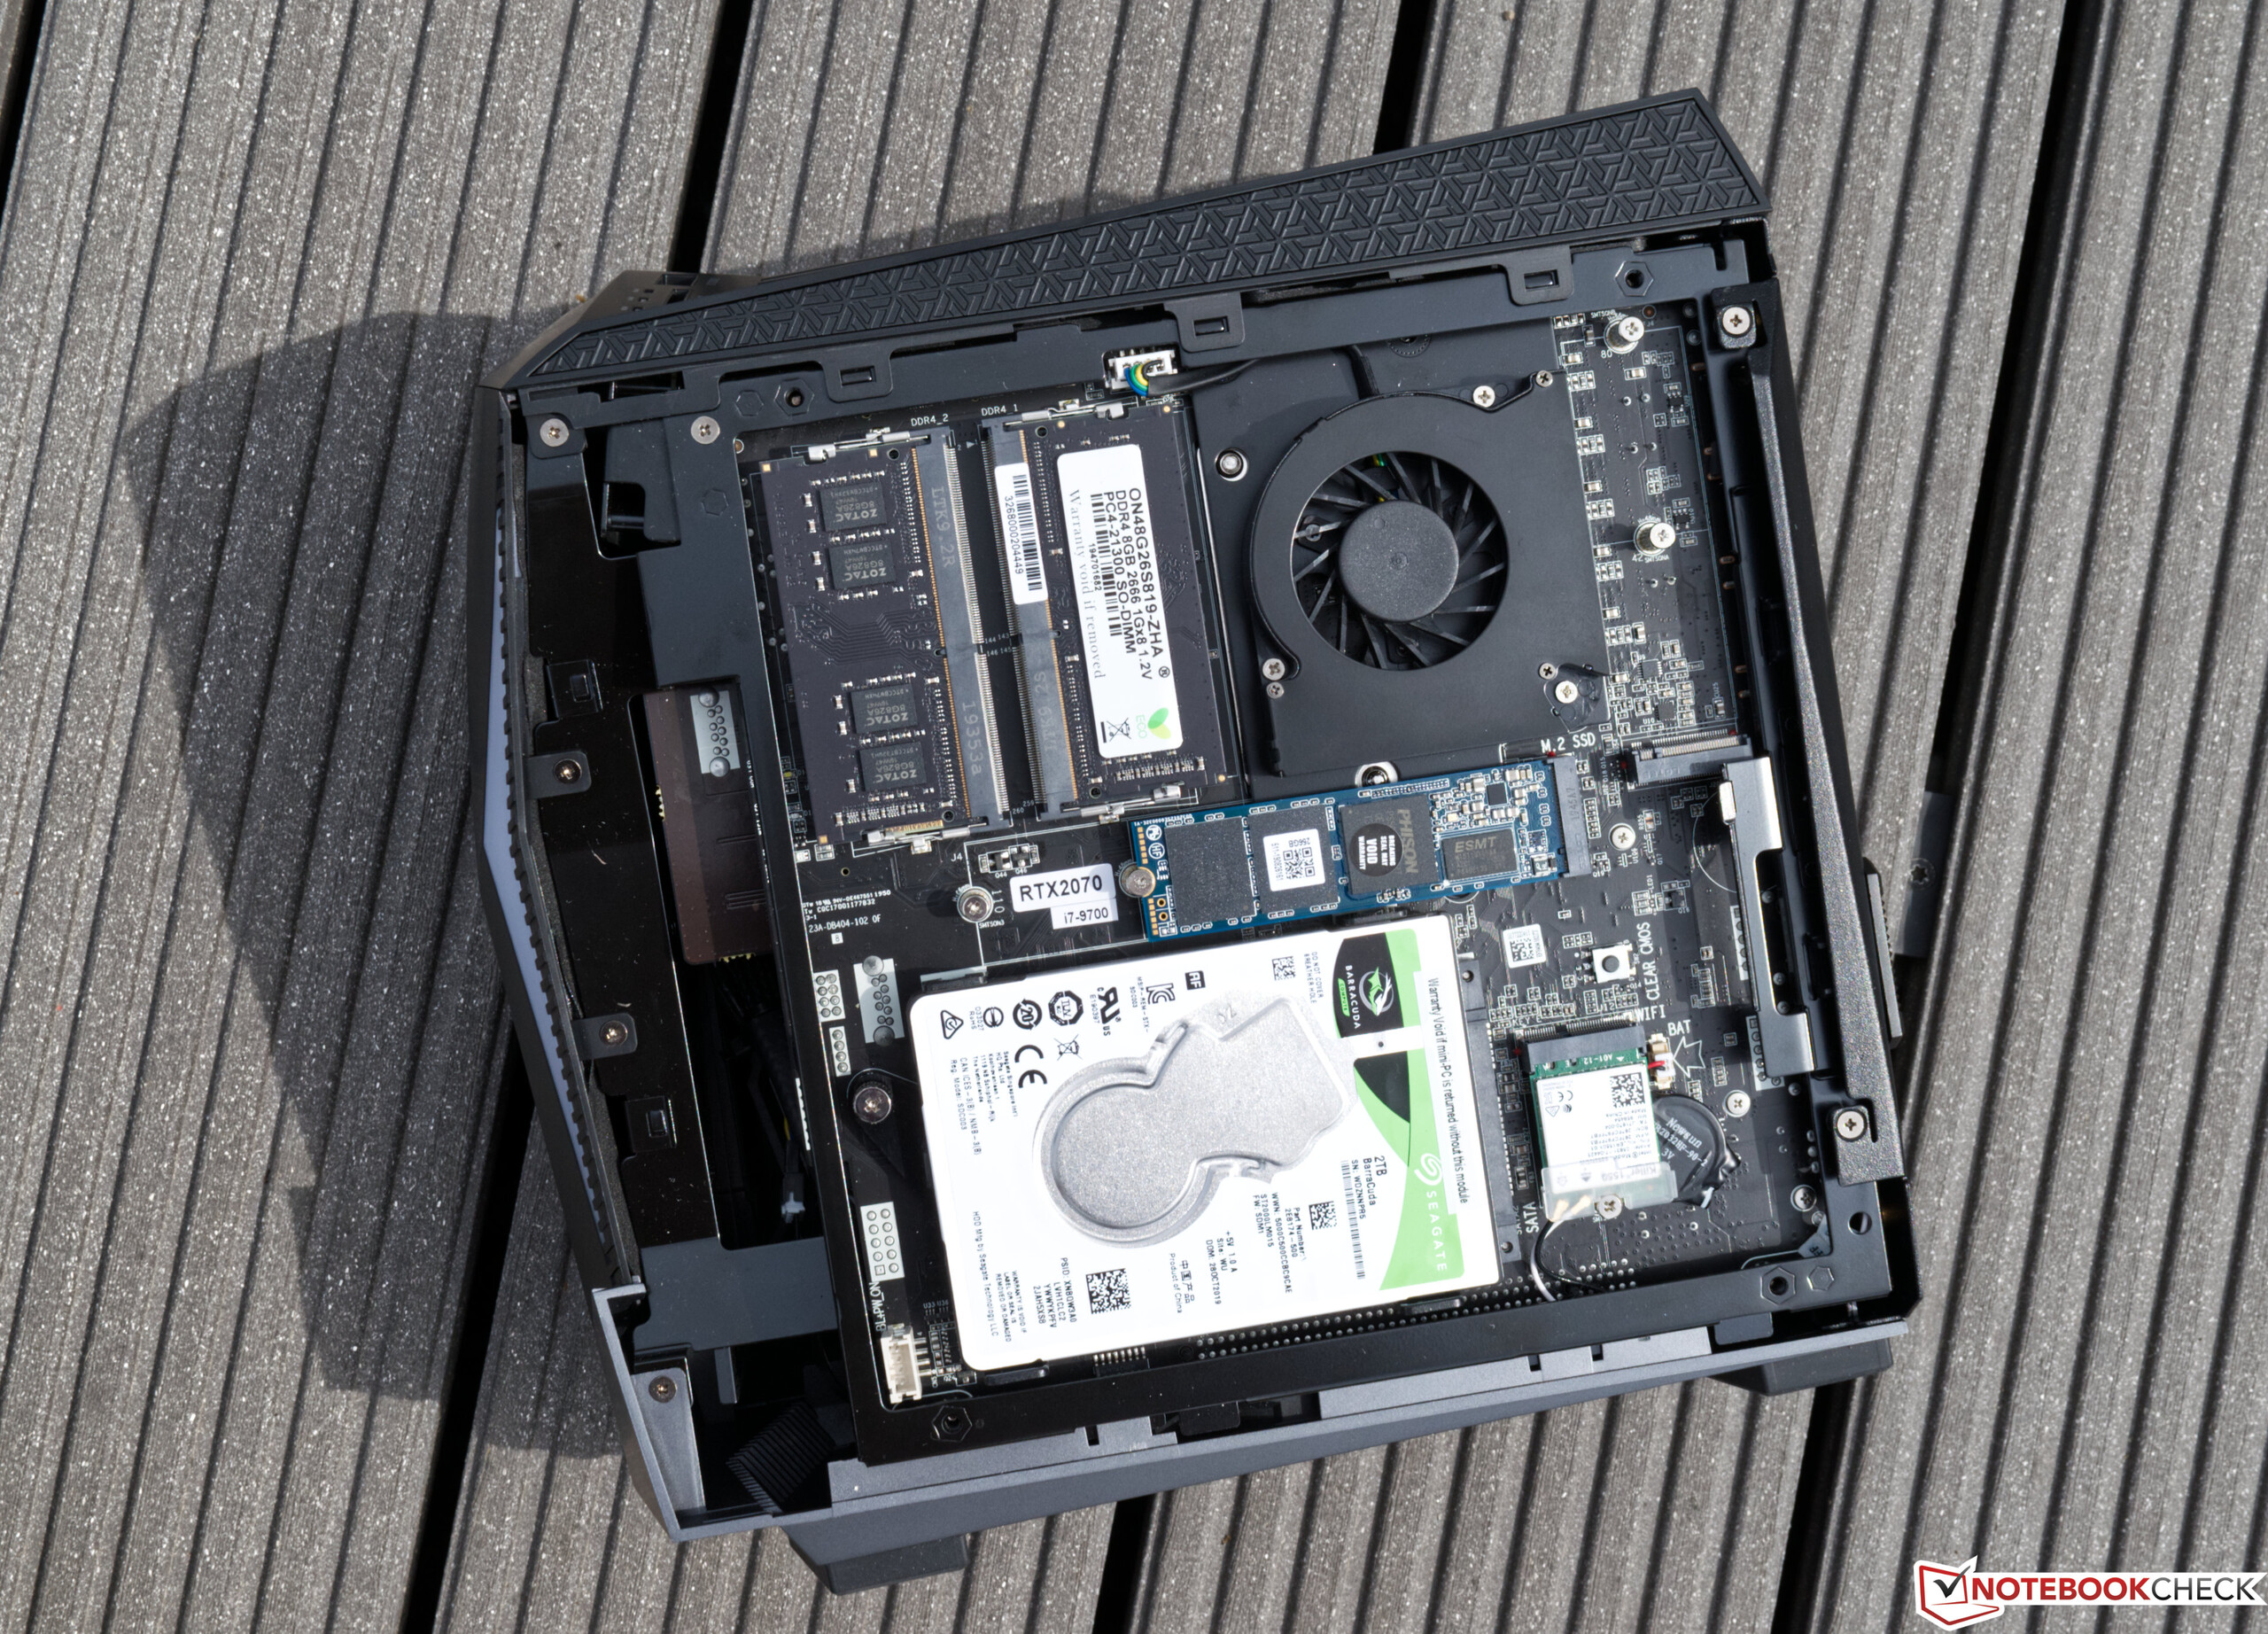
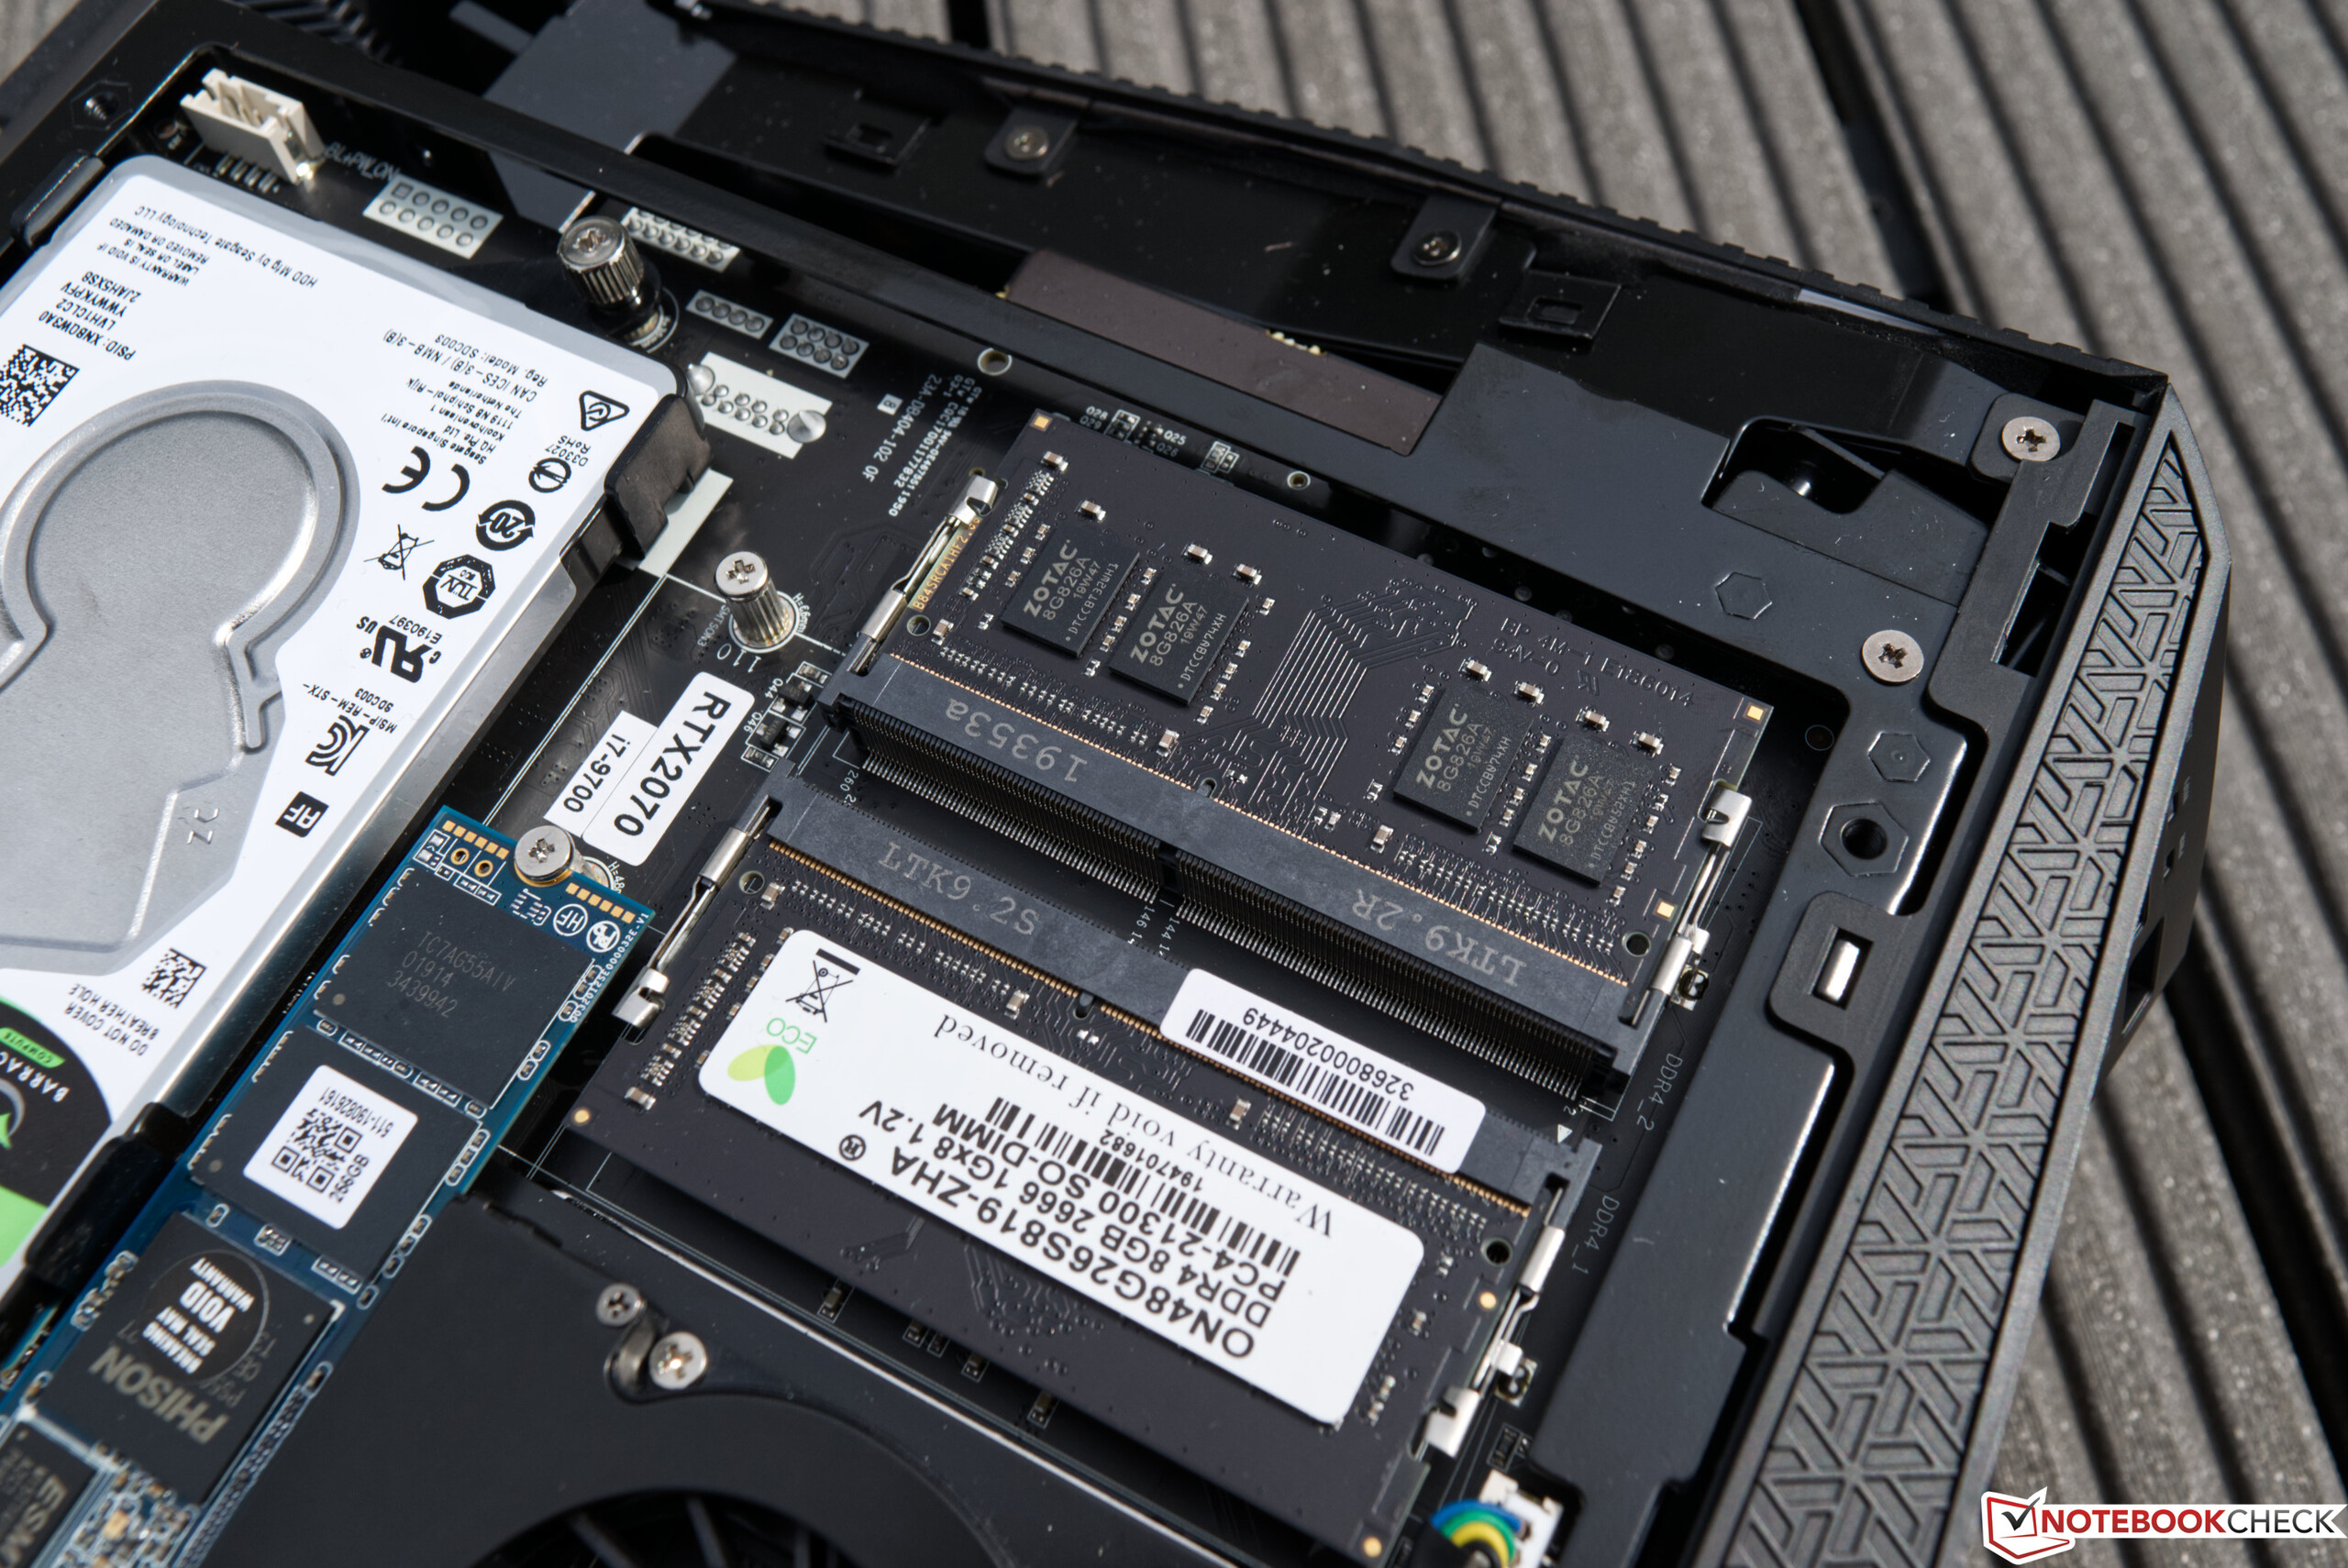
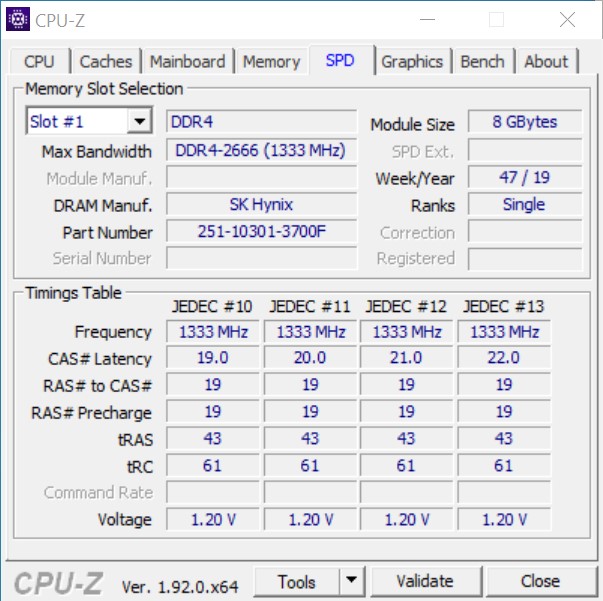
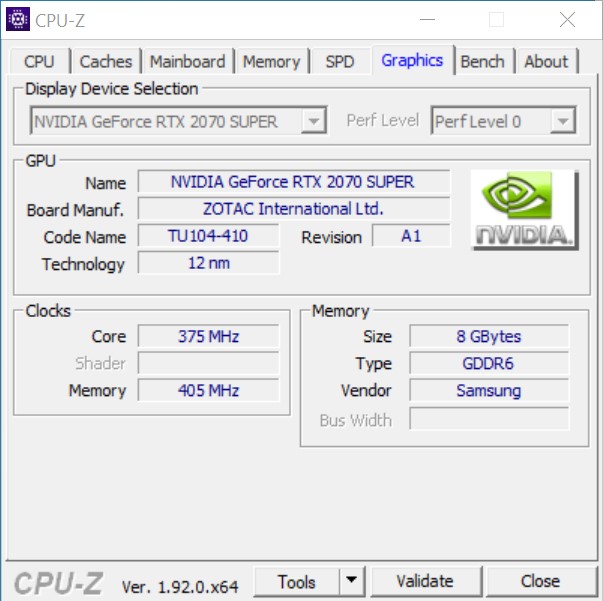
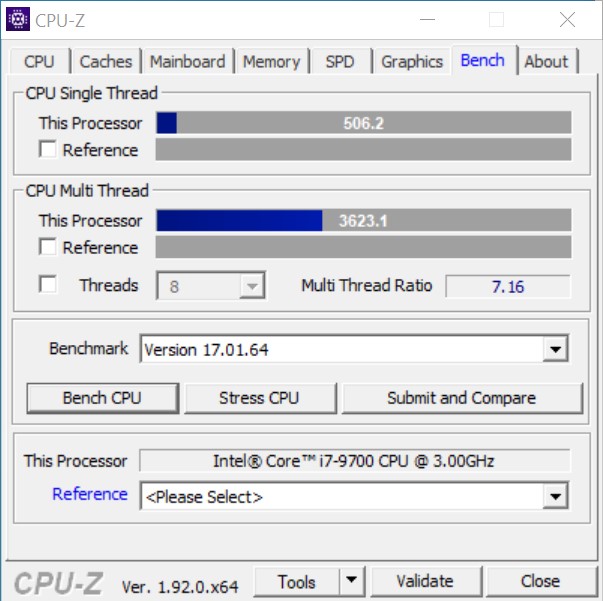
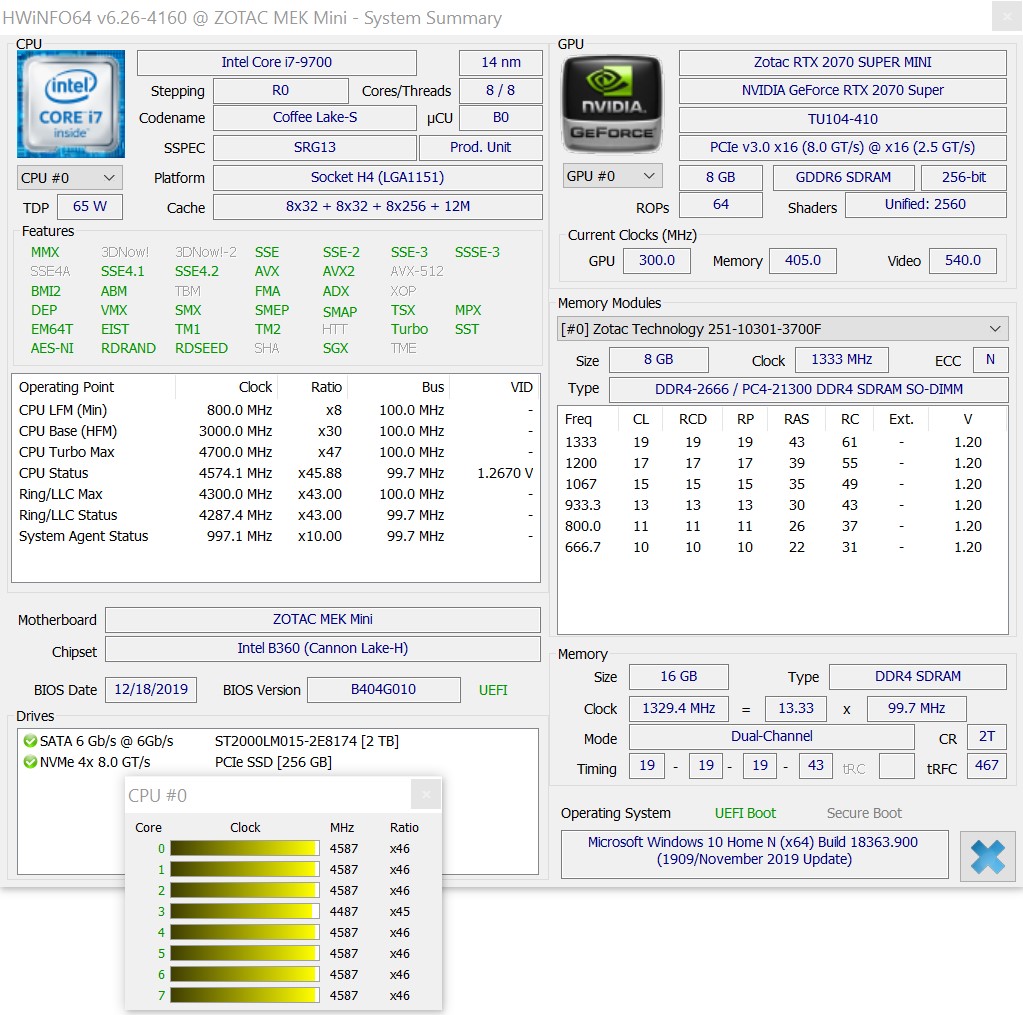
Para nuestra prueba, tenemos el más rápido de los dos modelos disponibles de Zotac MEK MINI. Está basado en un Intel Core i7-9700 y una GeForce RTX 2070 Super, que también viene de la propia Zotac como una variante mini. Estos son componentes de escritorio, que pueden incluso ser actualizados con un poco de habilidad. Además, los compradores obtienen 16 GB de RAM DDR4 y una combinación de almacenamiento de SSD (240 GB) y HDD (2 TB). De esta manera, el dispositivo está completamente listo para funcionar y no tiene que estar equipado con los componentes más necesarios como en un sistema barebone. En el momento de la prueba, nuestra muestra de revisión cuesta casi 1.500 Euros (~$1.683). La versión más barata del MEK MINI tiene actualmente un precio de 1.100 Euros (~$1.234). Sin embargo, hay que hacer algunos compromisos en términos de rendimiento y almacenamiento.
Zotac MEK MINI en detalle
| Fabricante / Descripción | Zotac MEK MINI RTX 2070 Super | Zotac MEK Mini RTX 2060 Super |
|---|---|---|
| Precio (en el momento de la prueba) | 1,500 Euros | 1,100 Euros |
| Tamaño | 260,8 x 136 x 258,8 mm (ancho x profundidad x altura) 9,18 L | 260,8 x 136 x 258,8 mm (ancho x profundidad x altura) 9,18 L |
| CPU | Intel Core i7-9700 | Intel Core i5-9400F |
| GPU | Nvidia GeForce RTX 2070 Super | Nvidia GeForce RTX 2060 Super |
| RAM | 16 GB (2x 8 GB DDR4 2666) | 16 GB (2x 8 GB DDR4 2666) |
| SSD | 1x 240 GB M.2 SSD | 1x 240 GB M.2 SSD |
| HDD | 1x 2 TB 2.5 pulgadas HDD | 1x 1 TB 2.5 pulgadas HDD |
| Fuente de alimentación | 2x 330 W | 2x 230 W |
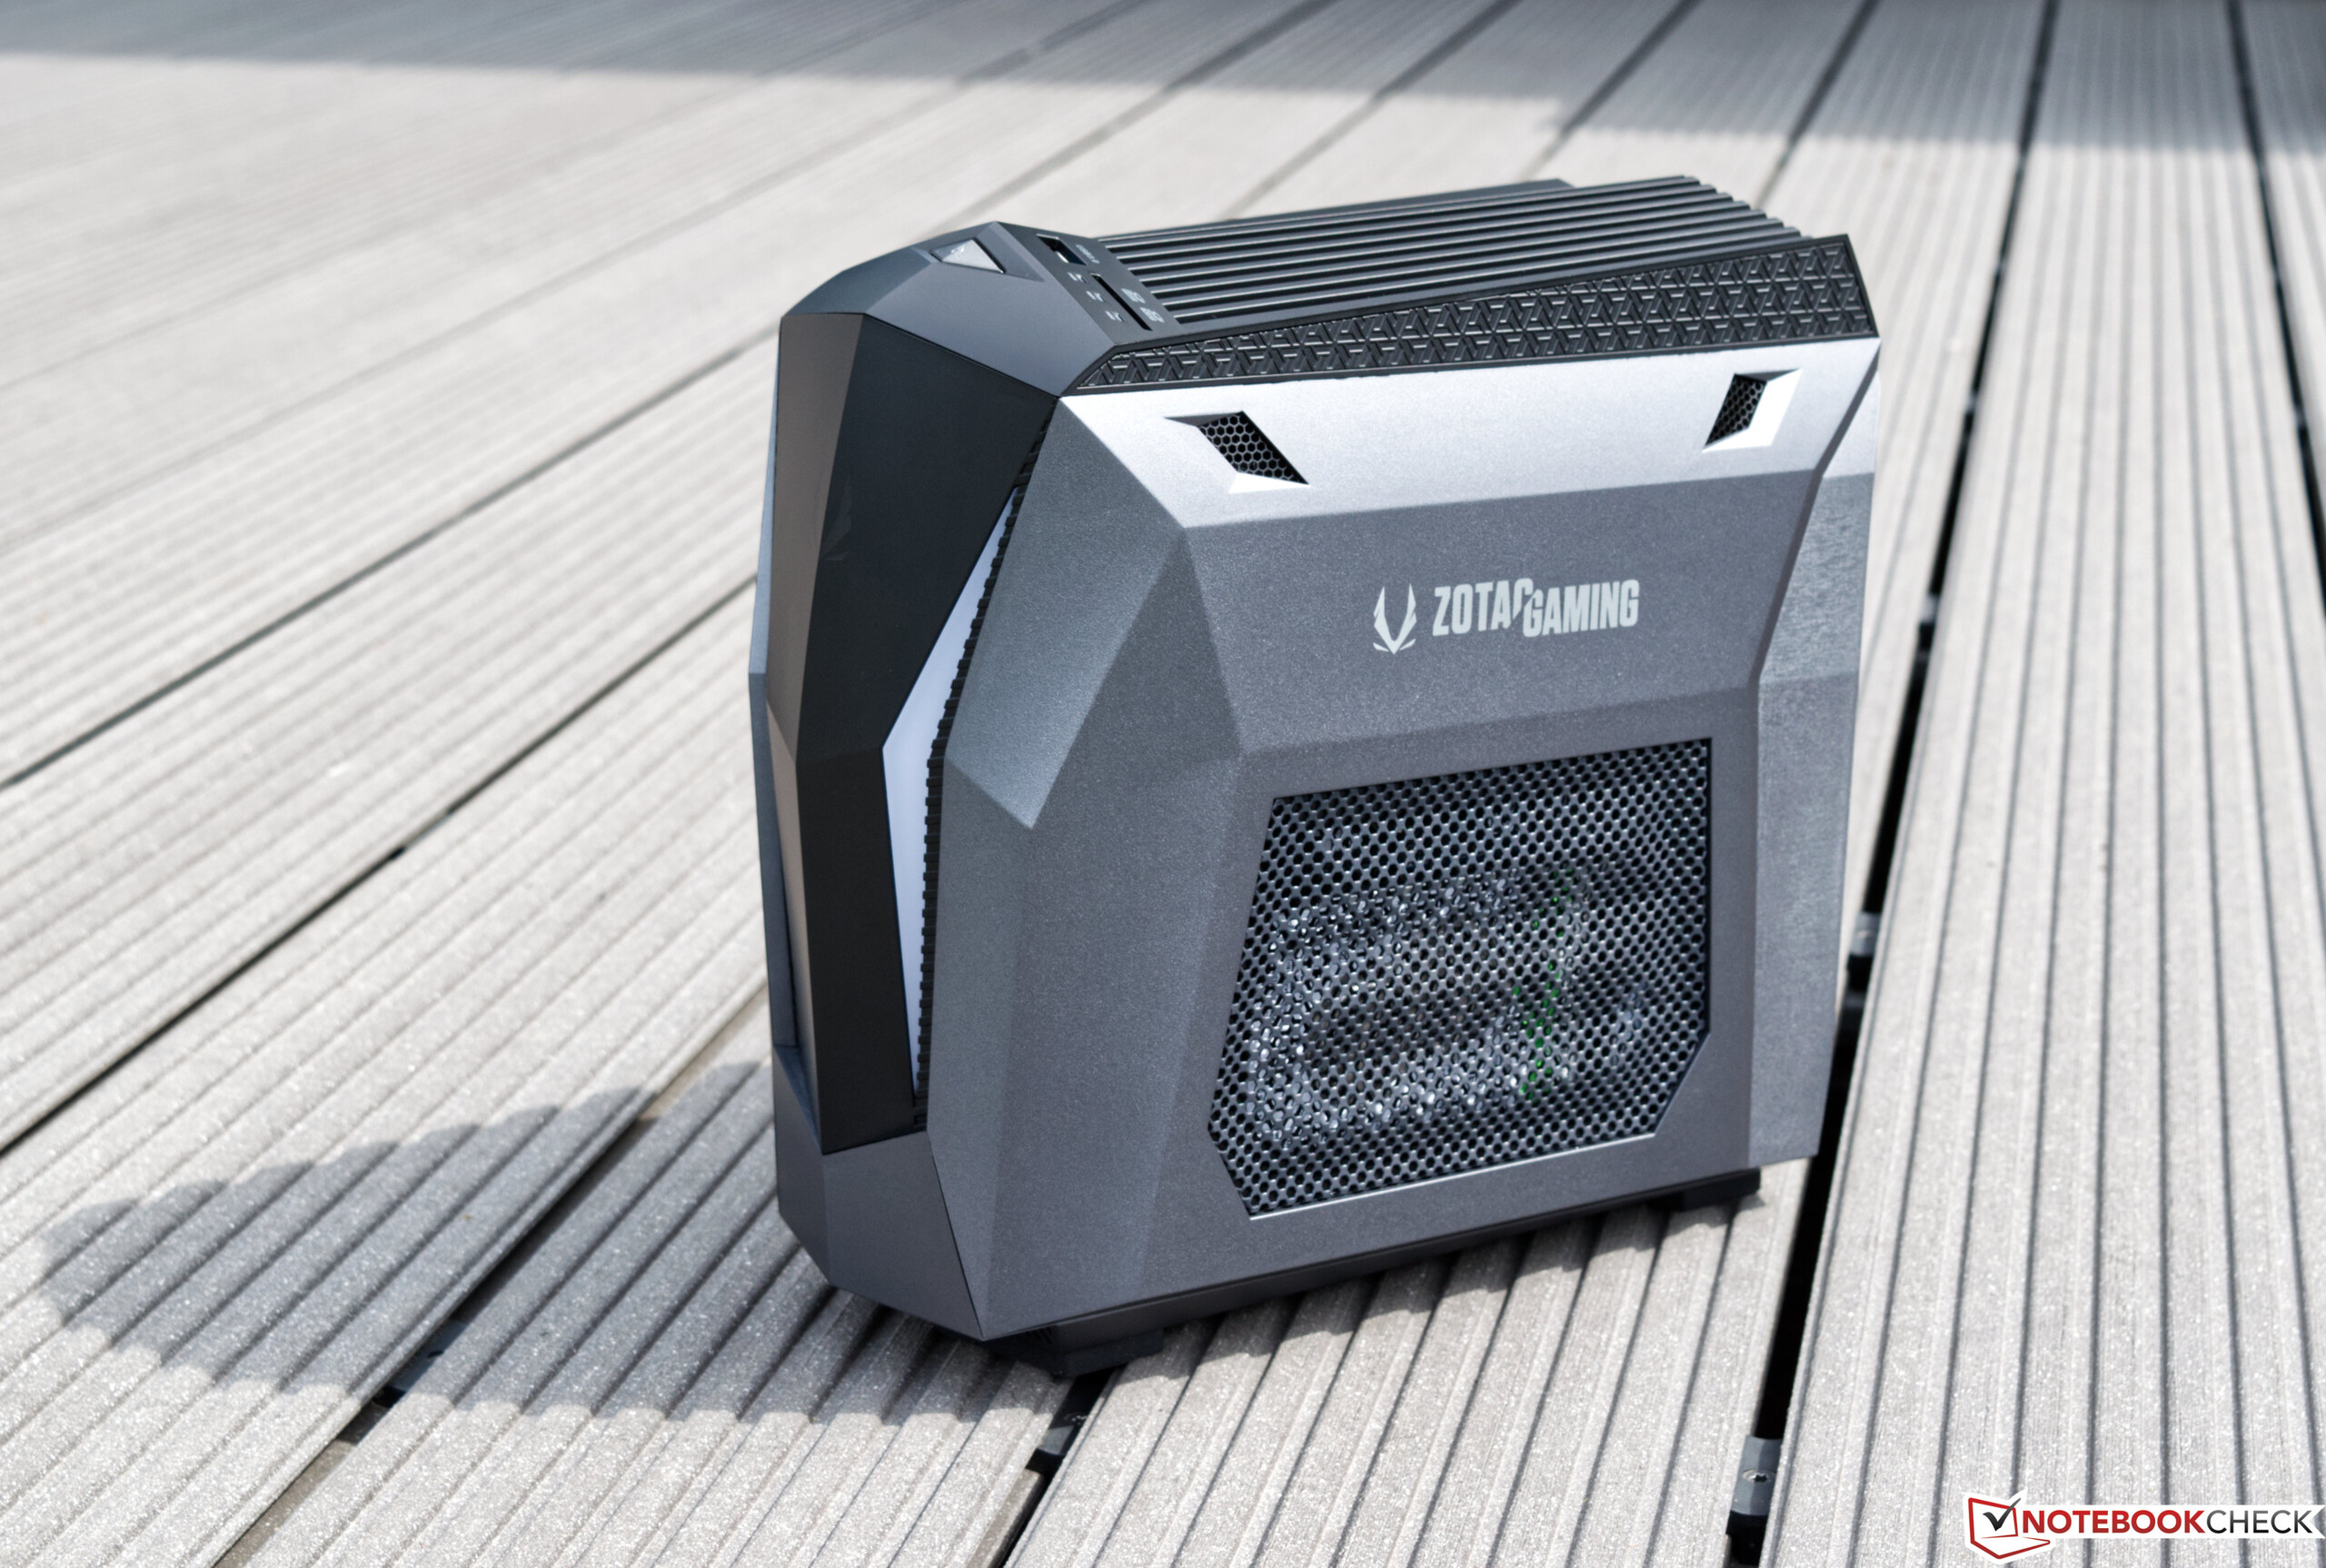
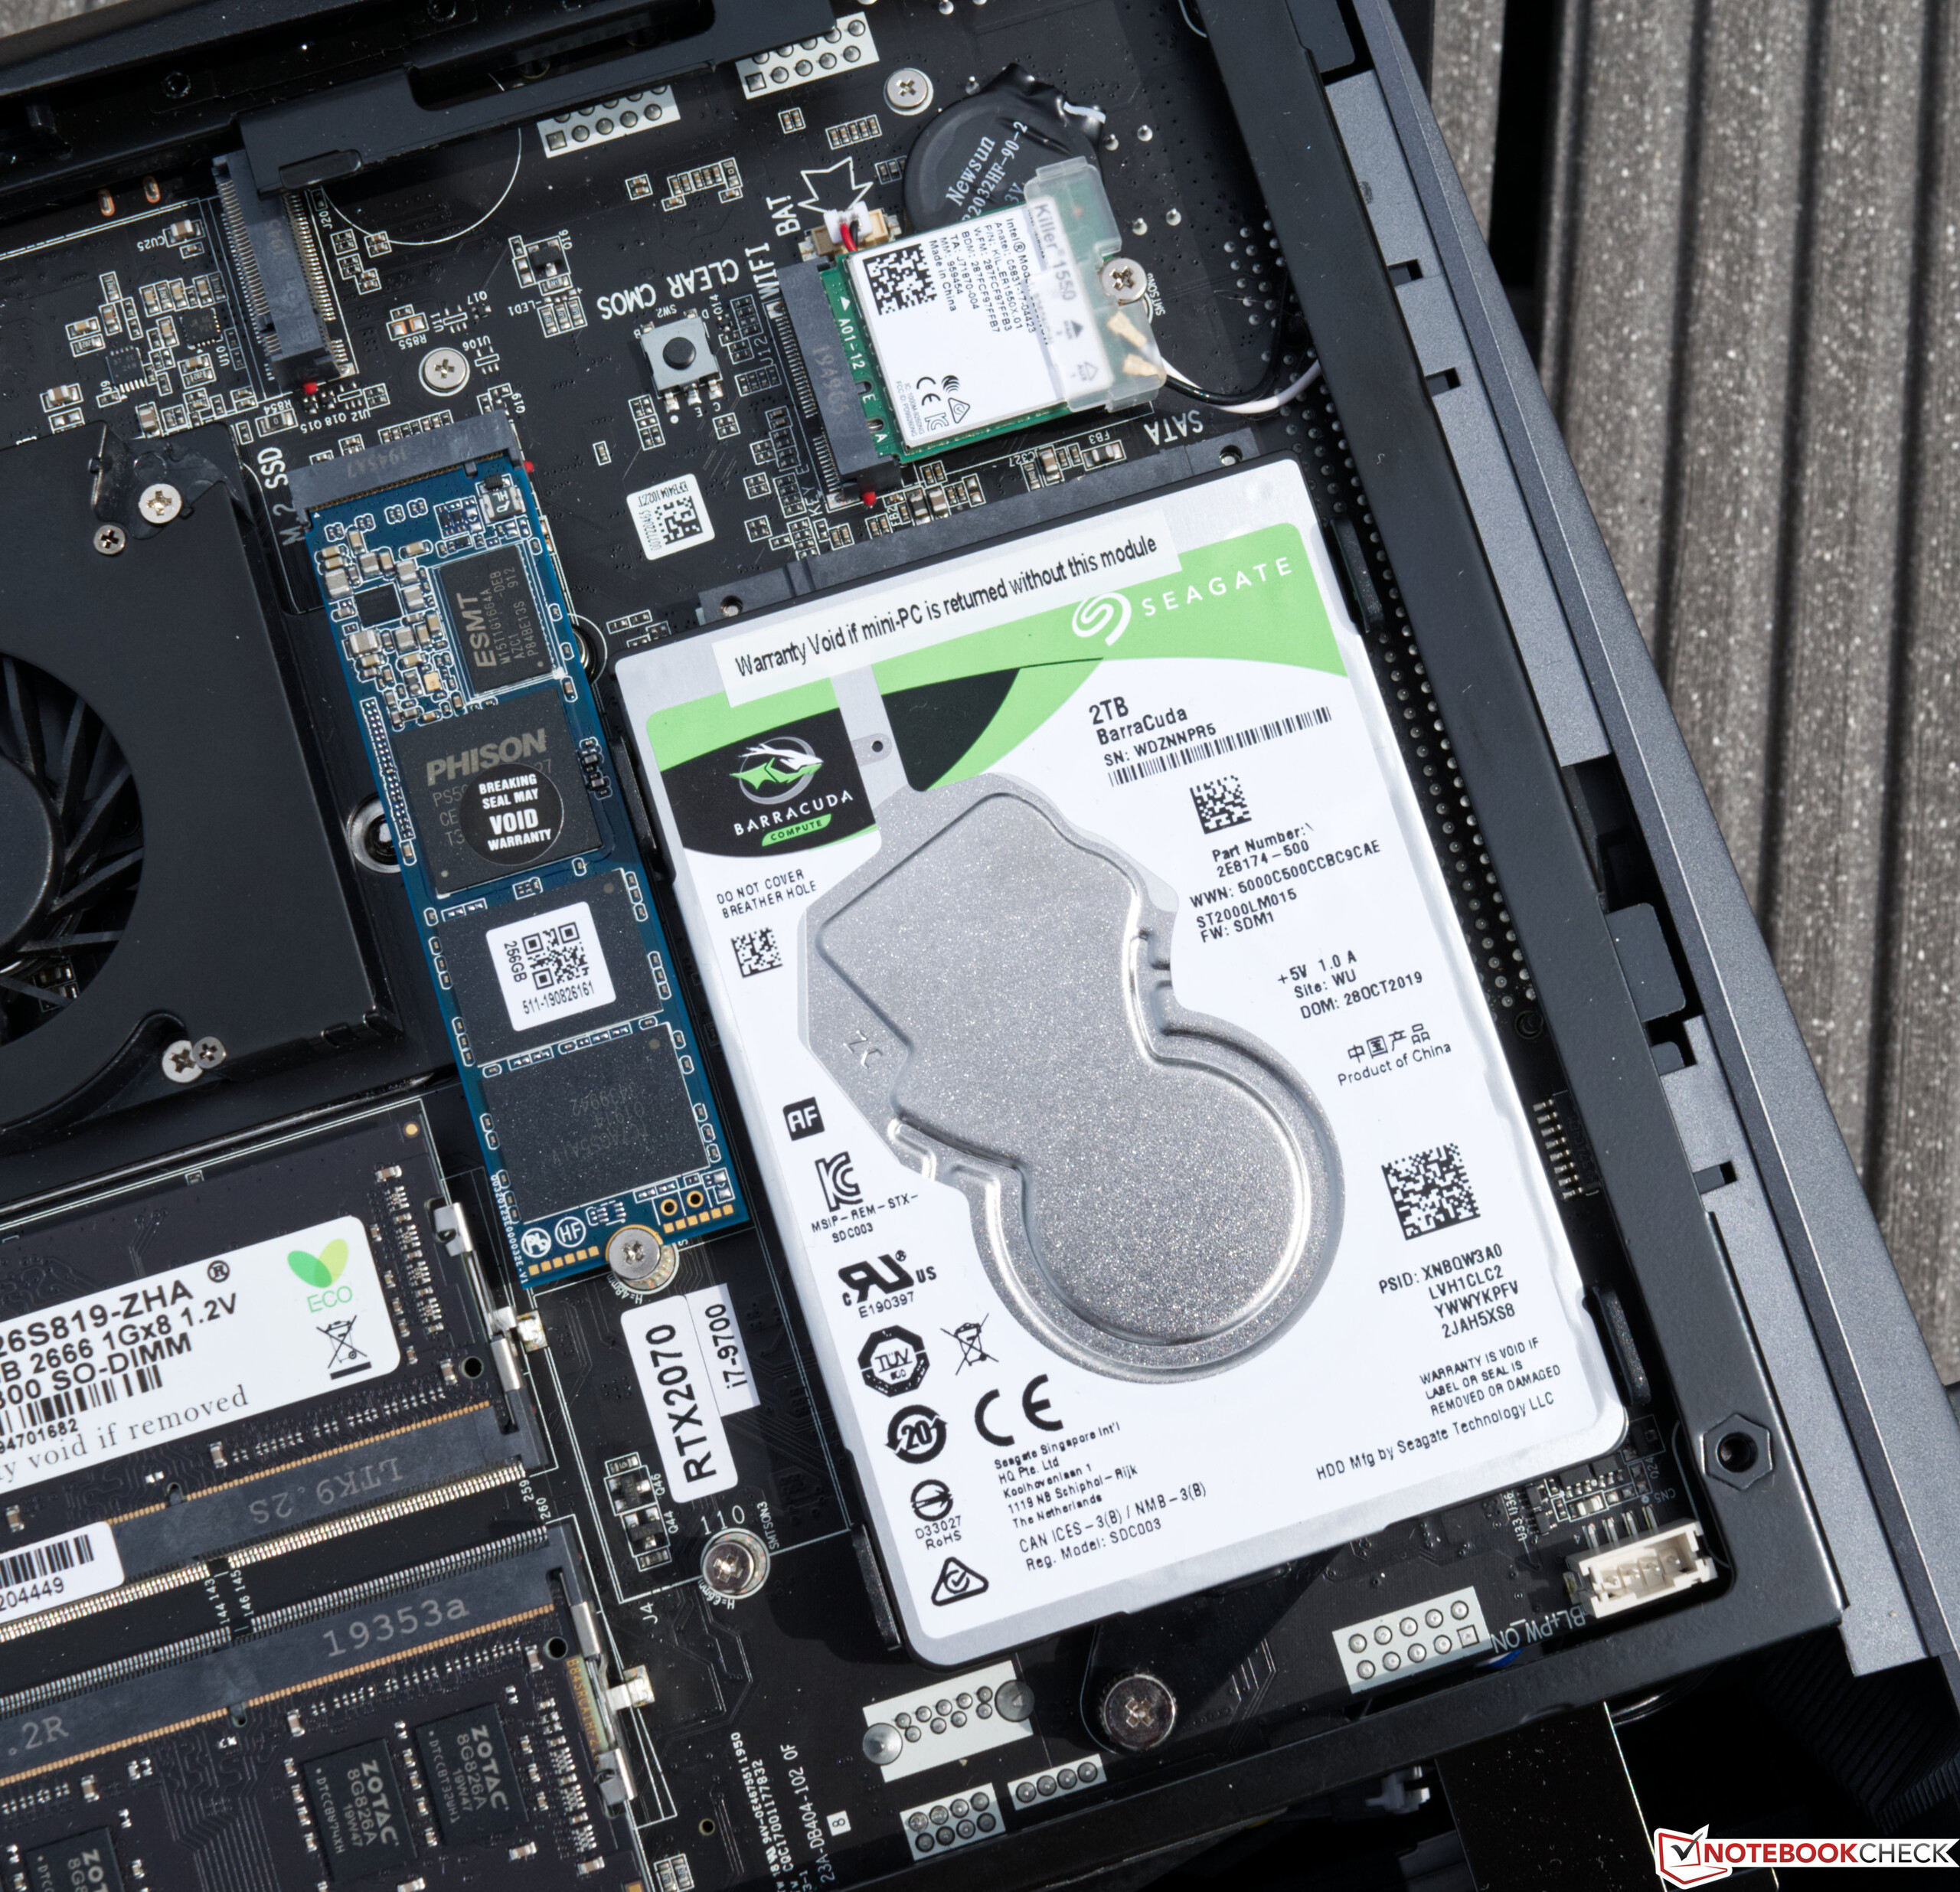
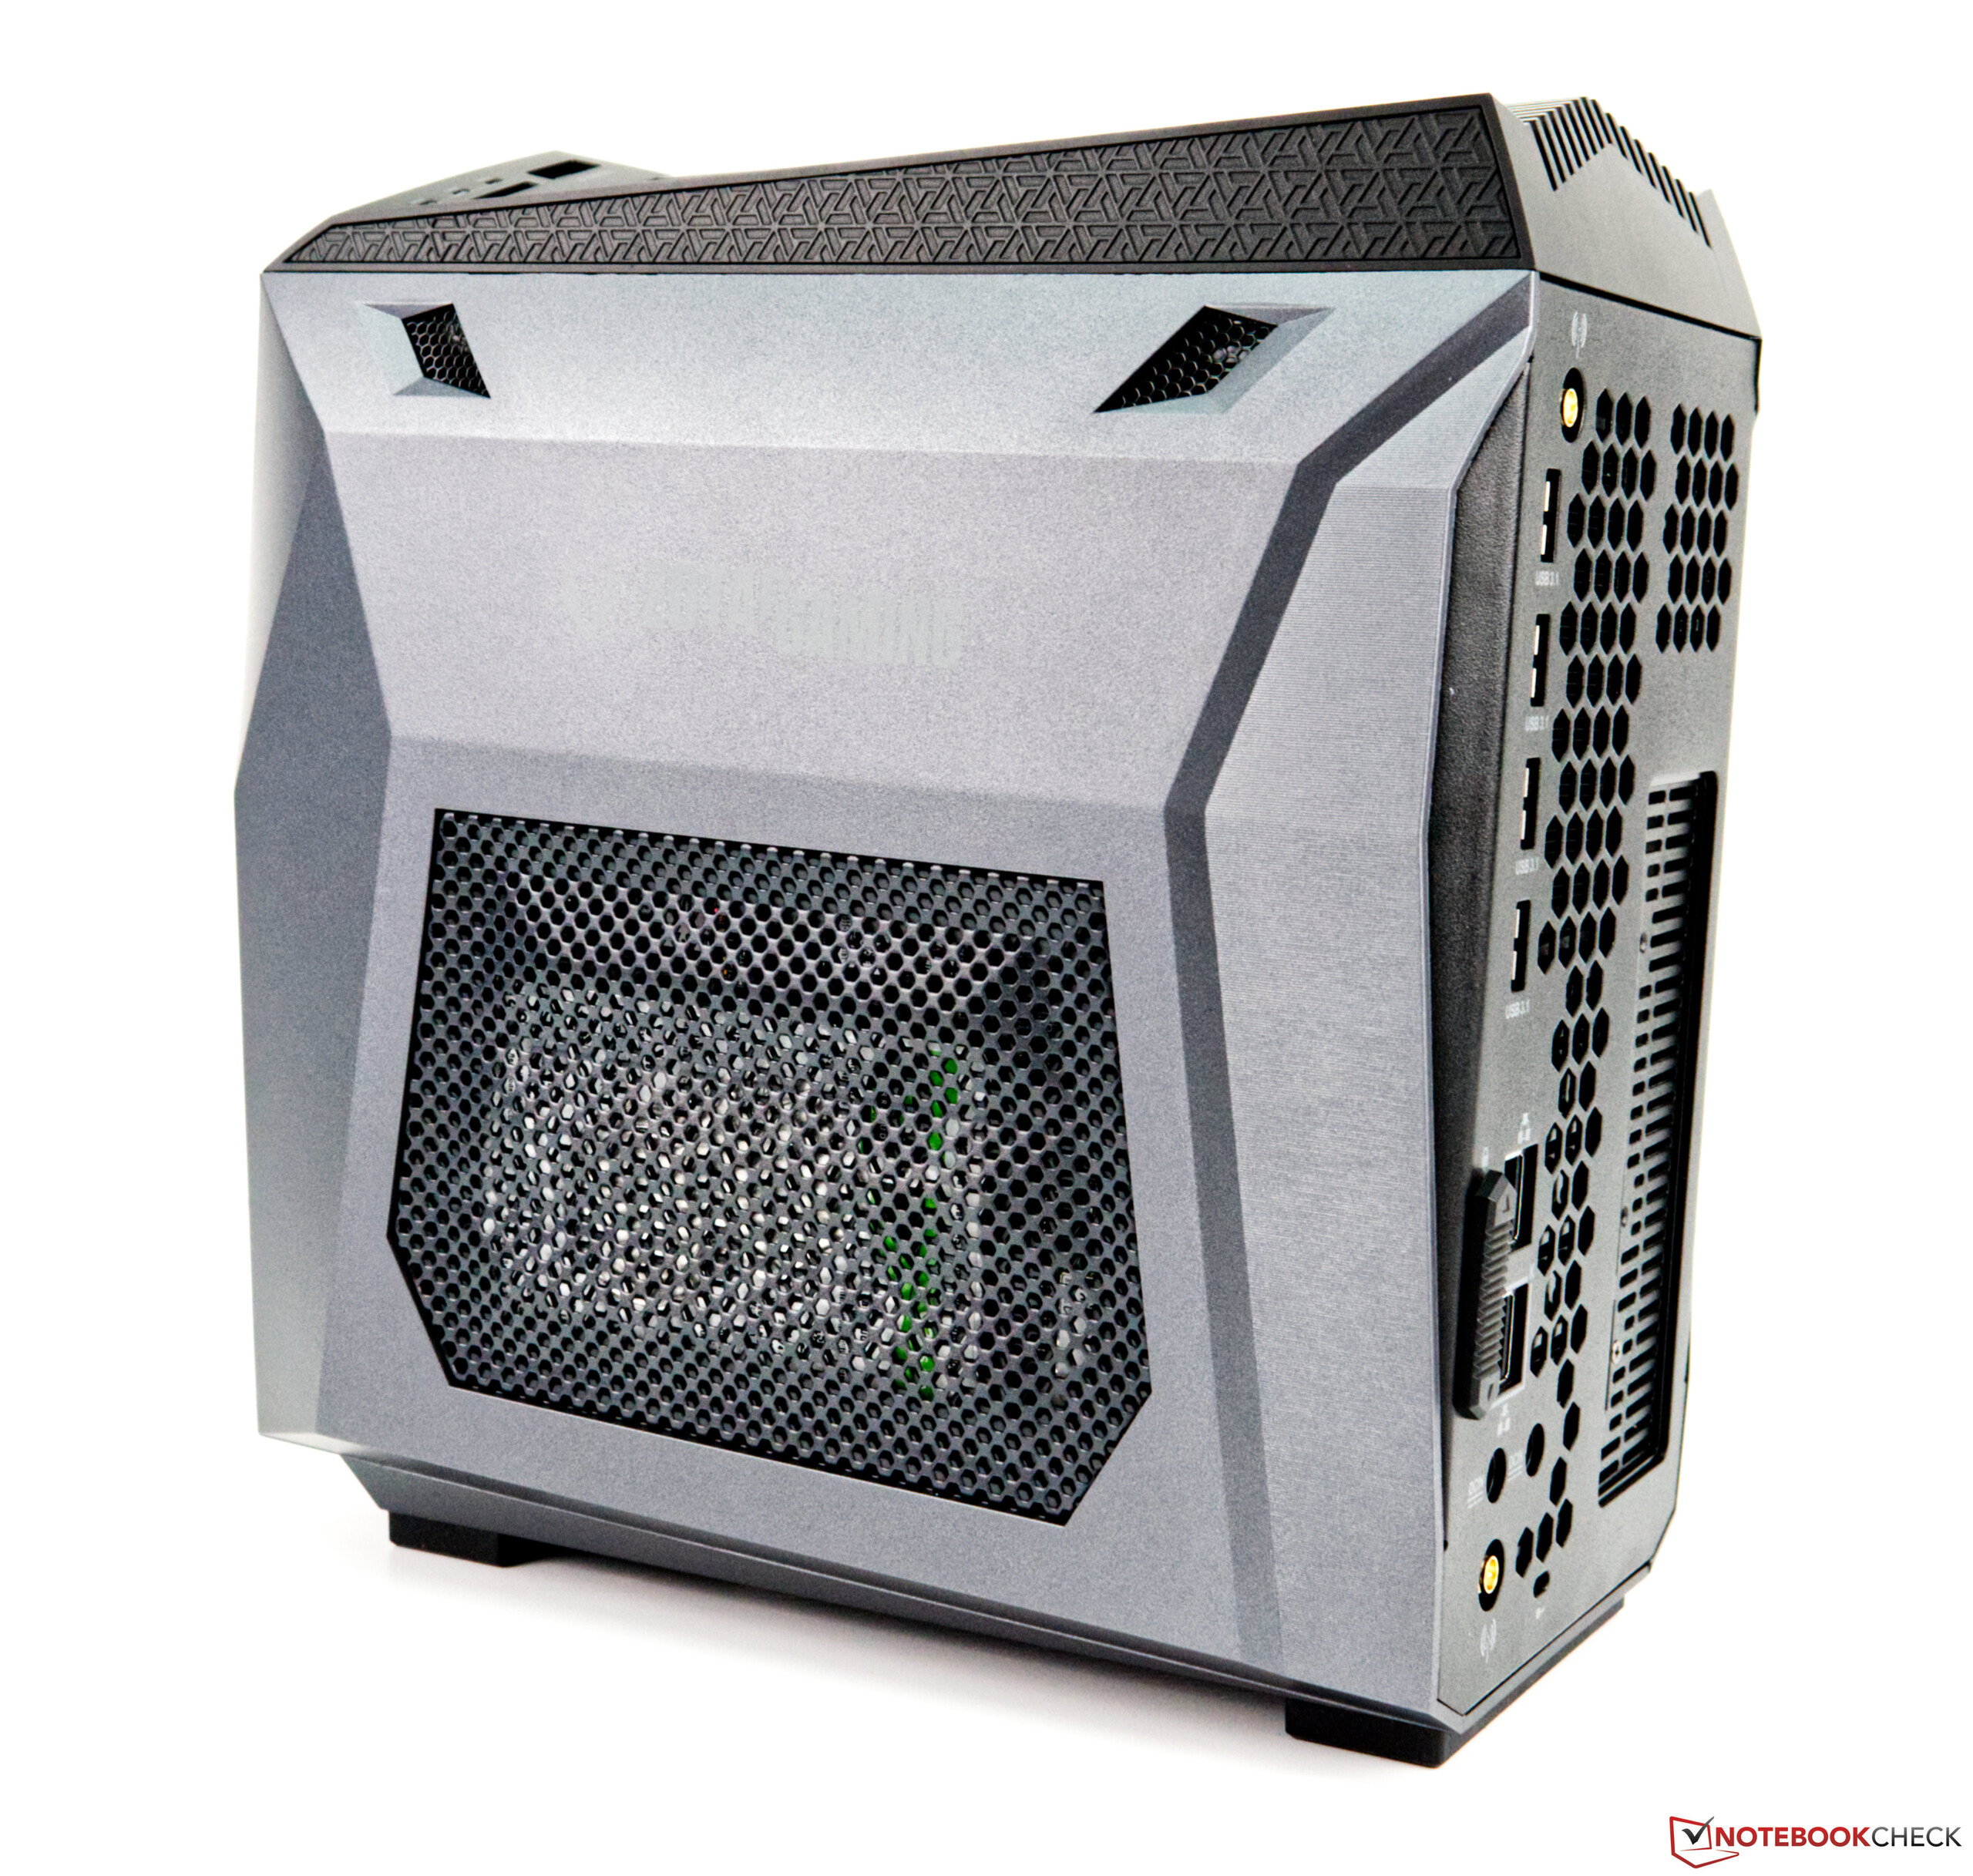
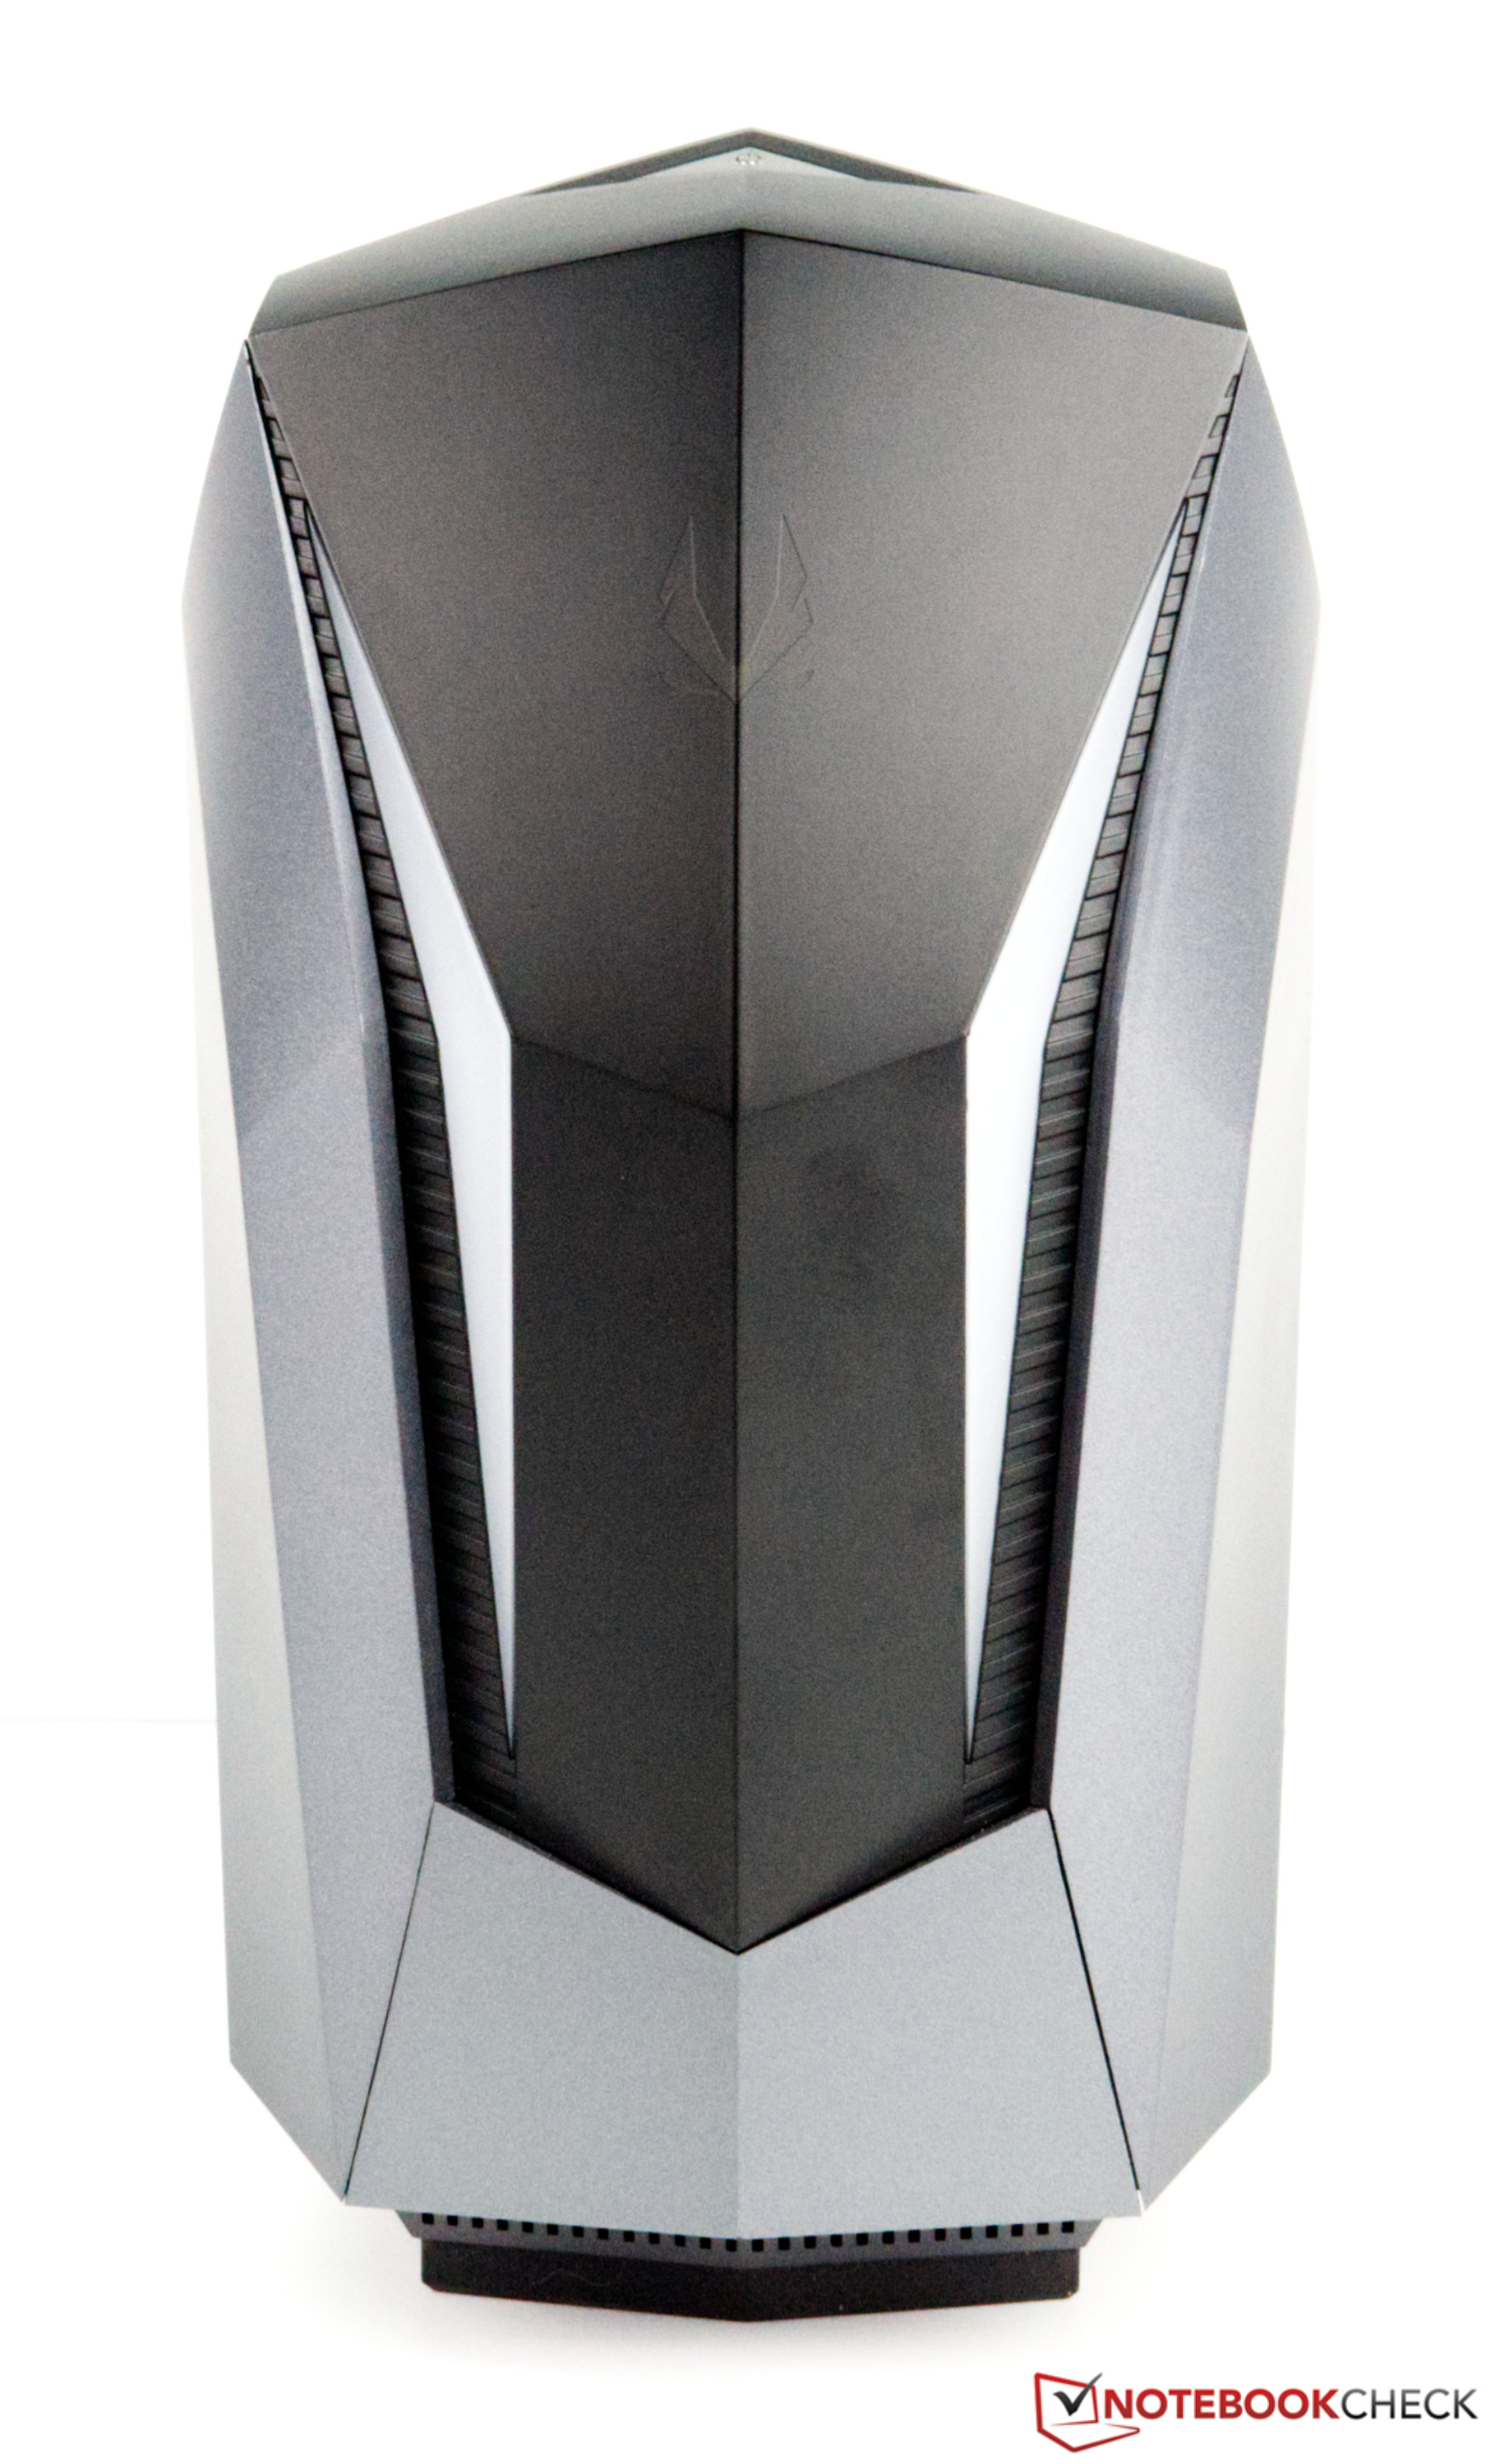
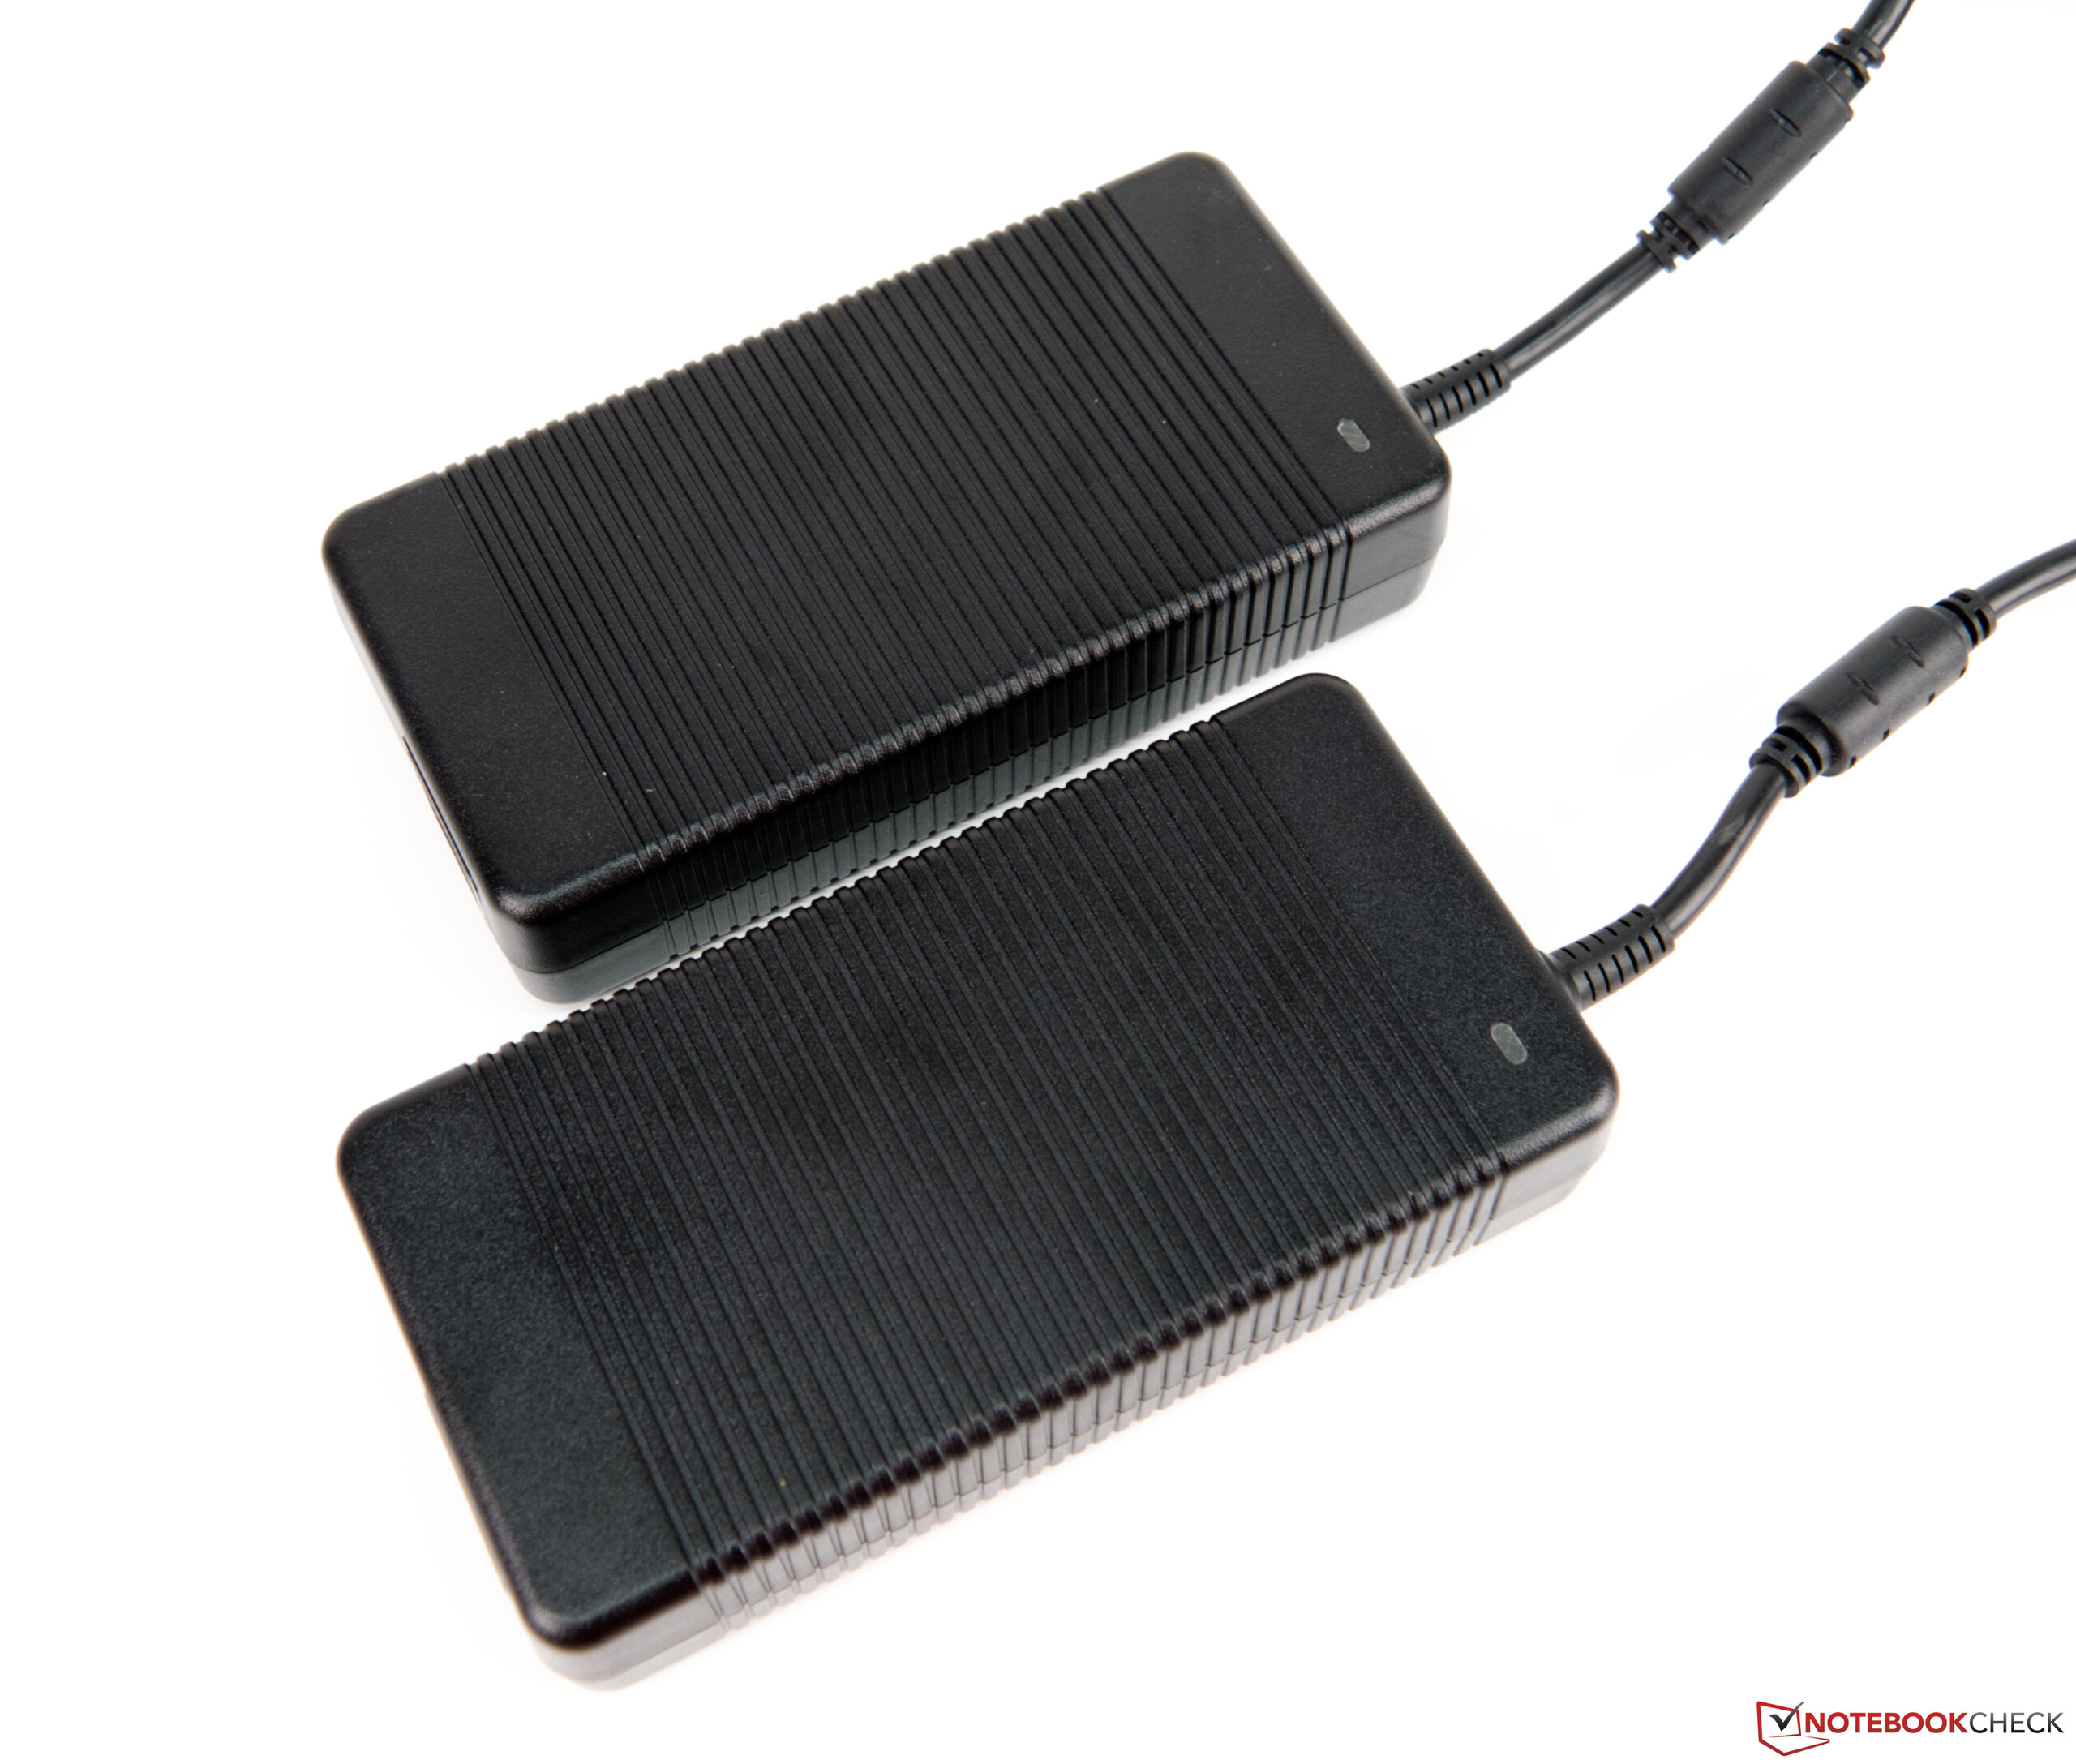
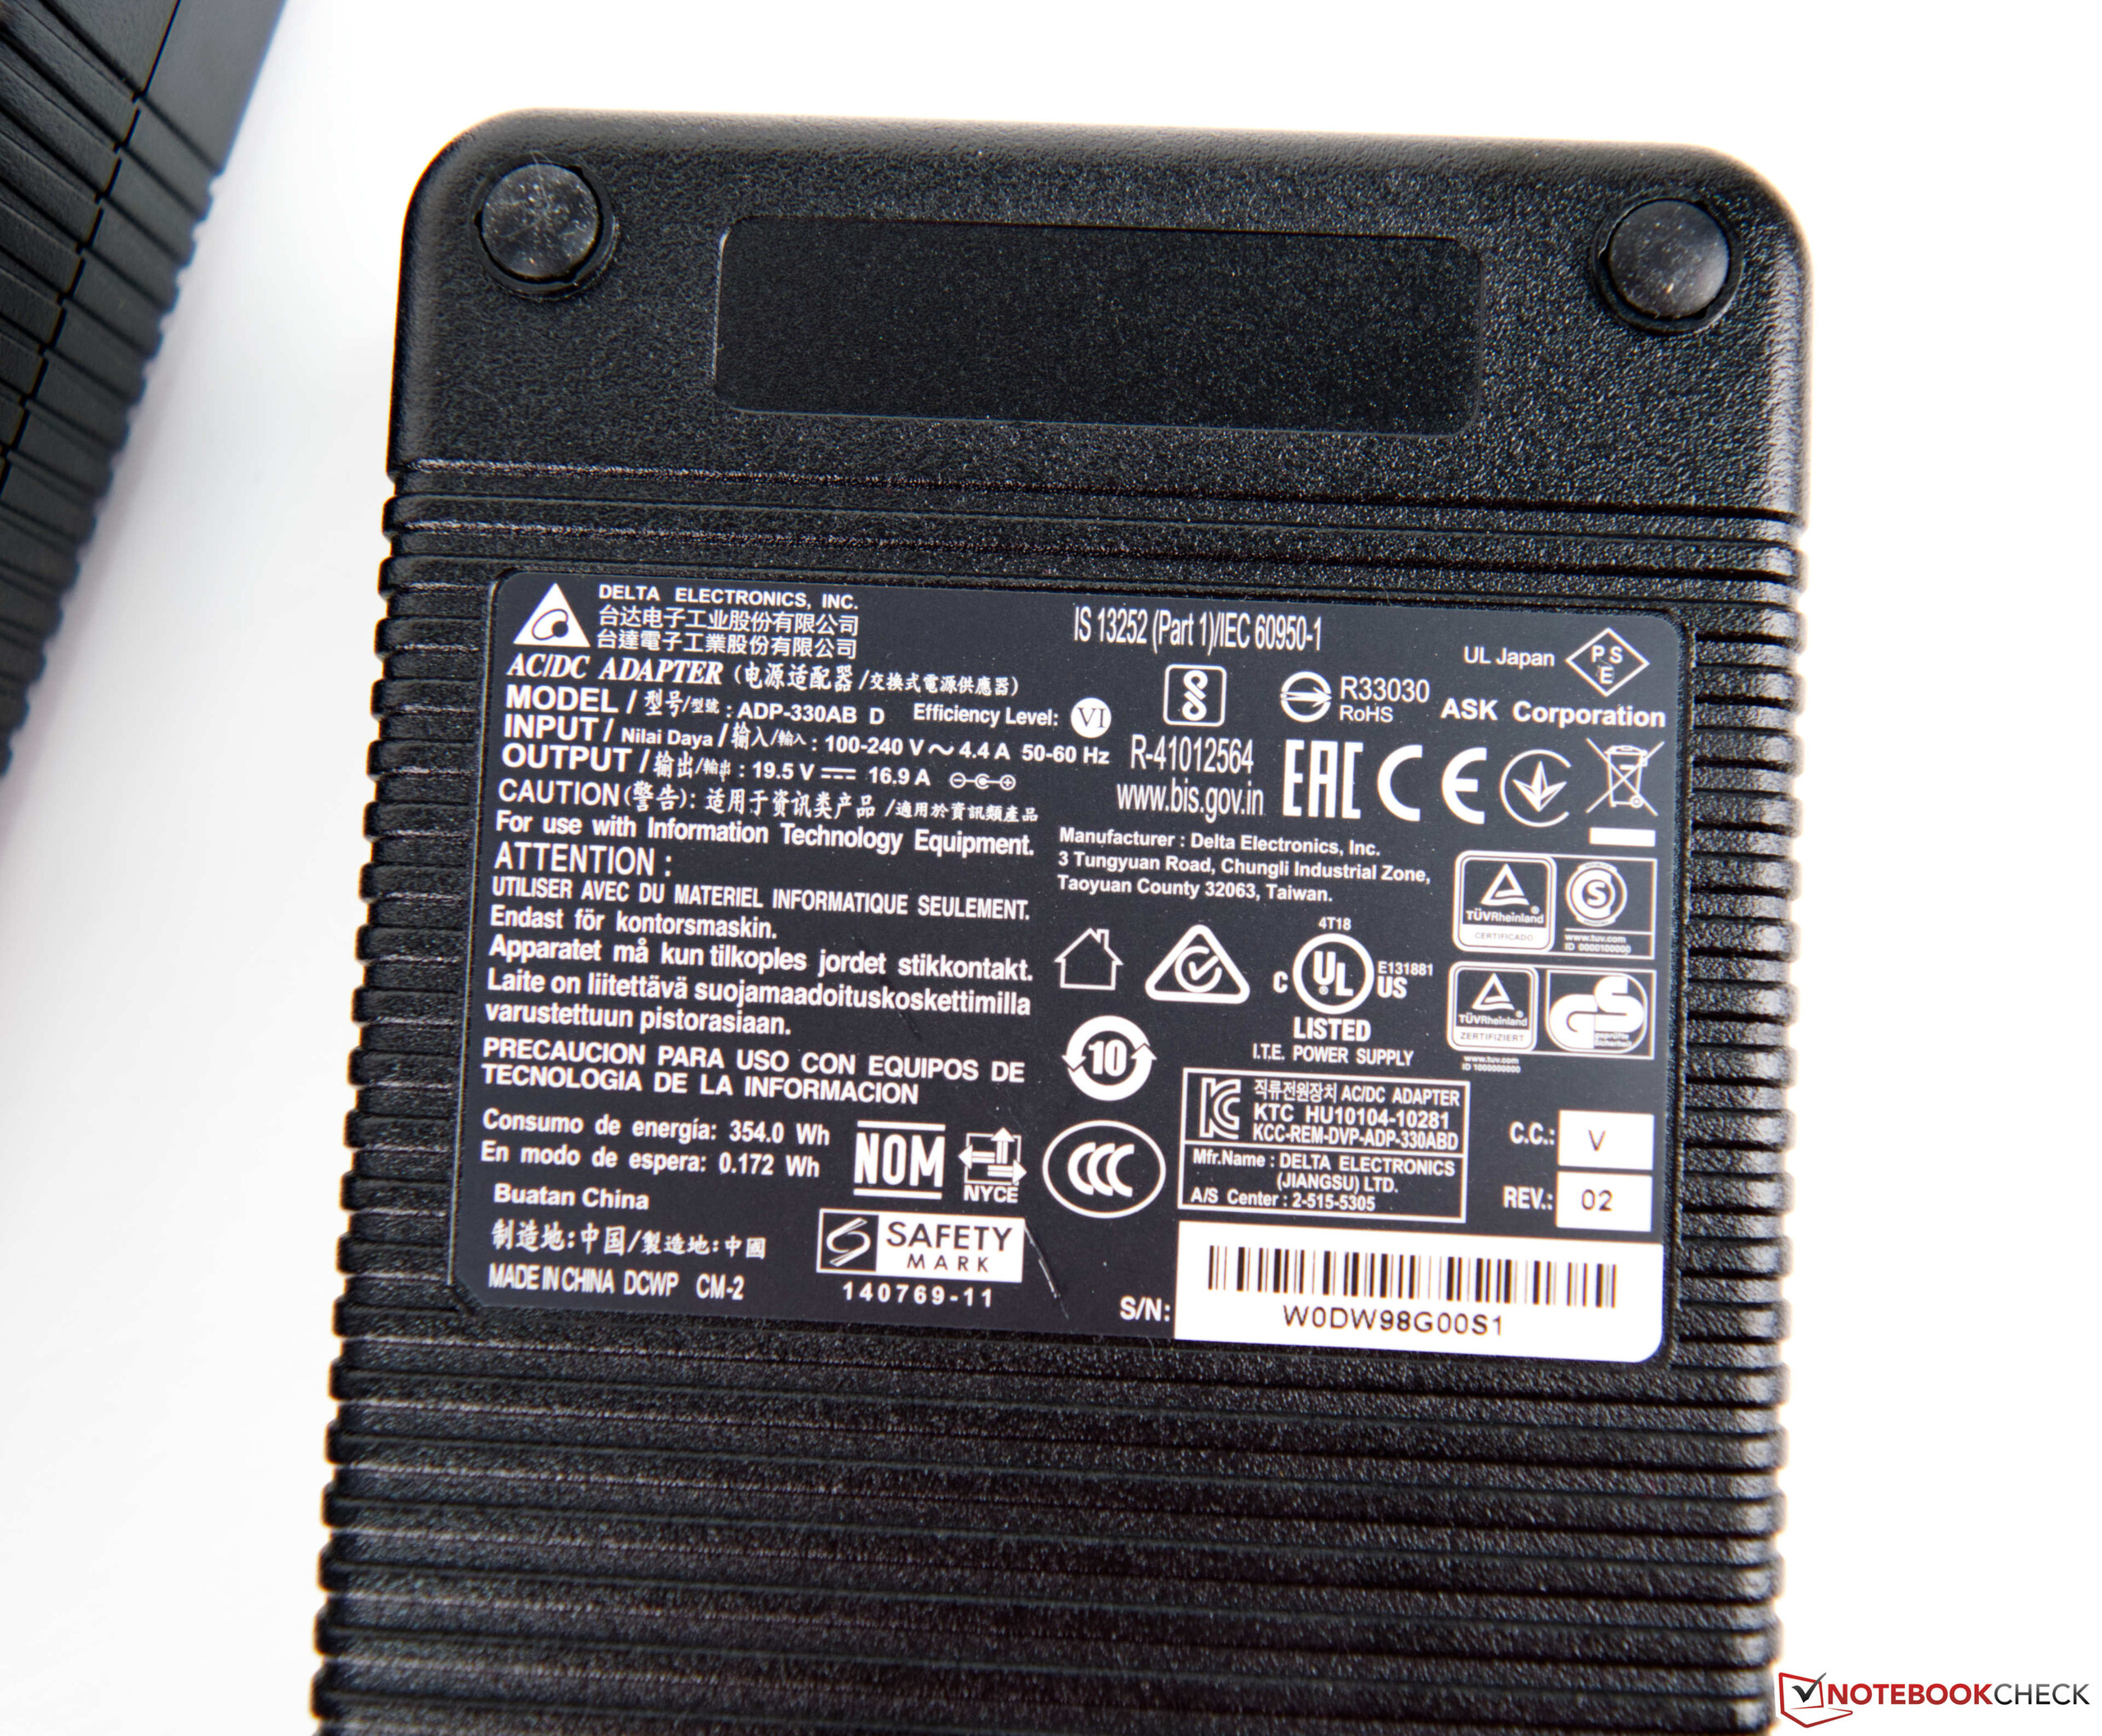
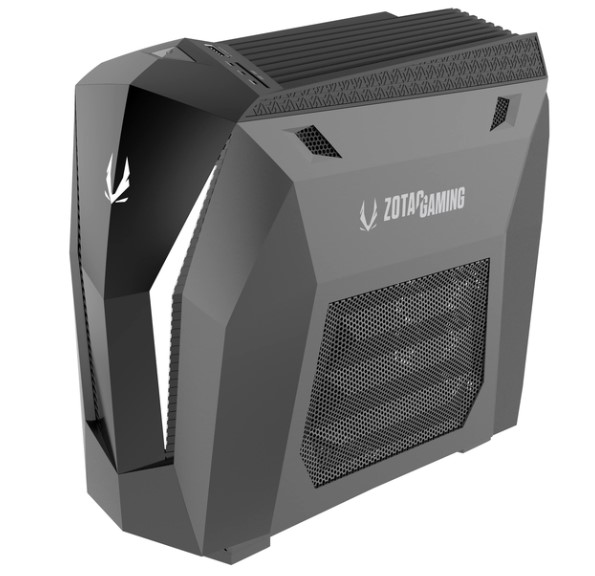
Las dimensiones externas son muy pequeñas, 136 x 259 x 261 milímetros (ancho x alto x fondo) si consideramos que se trata de un PC de juegos. Sin embargo, el fabricante hace un poco de trampa aquí ya que no hay una fuente de alimentación incorporada en la caja. Esta se encuentra en el exterior y también se requiere en una implementación doble. Nuestro modelo viene con dos fuentes de alimentación de 330 vatios, y la versión algo más débil del MEK MINI necesita 2x 230 vatios. Ópticamente, el dispositivo parece moderno, y se puede aspirar suficiente aire fresco para enfriar los componentes instalados a través de las rejillas de ventilación laterales. Visto de frente, la cubierta lateral derecha puede ser removida fácil y rápidamente sin herramientas para acceder a la memoria RAM o al almacenamiento. Pero aquellos que quieran retirar rápidamente la tarjeta gráfica se llevarán una desagradable sorpresa, ya que para ello es necesario desmontar casi todo el dispositivo.
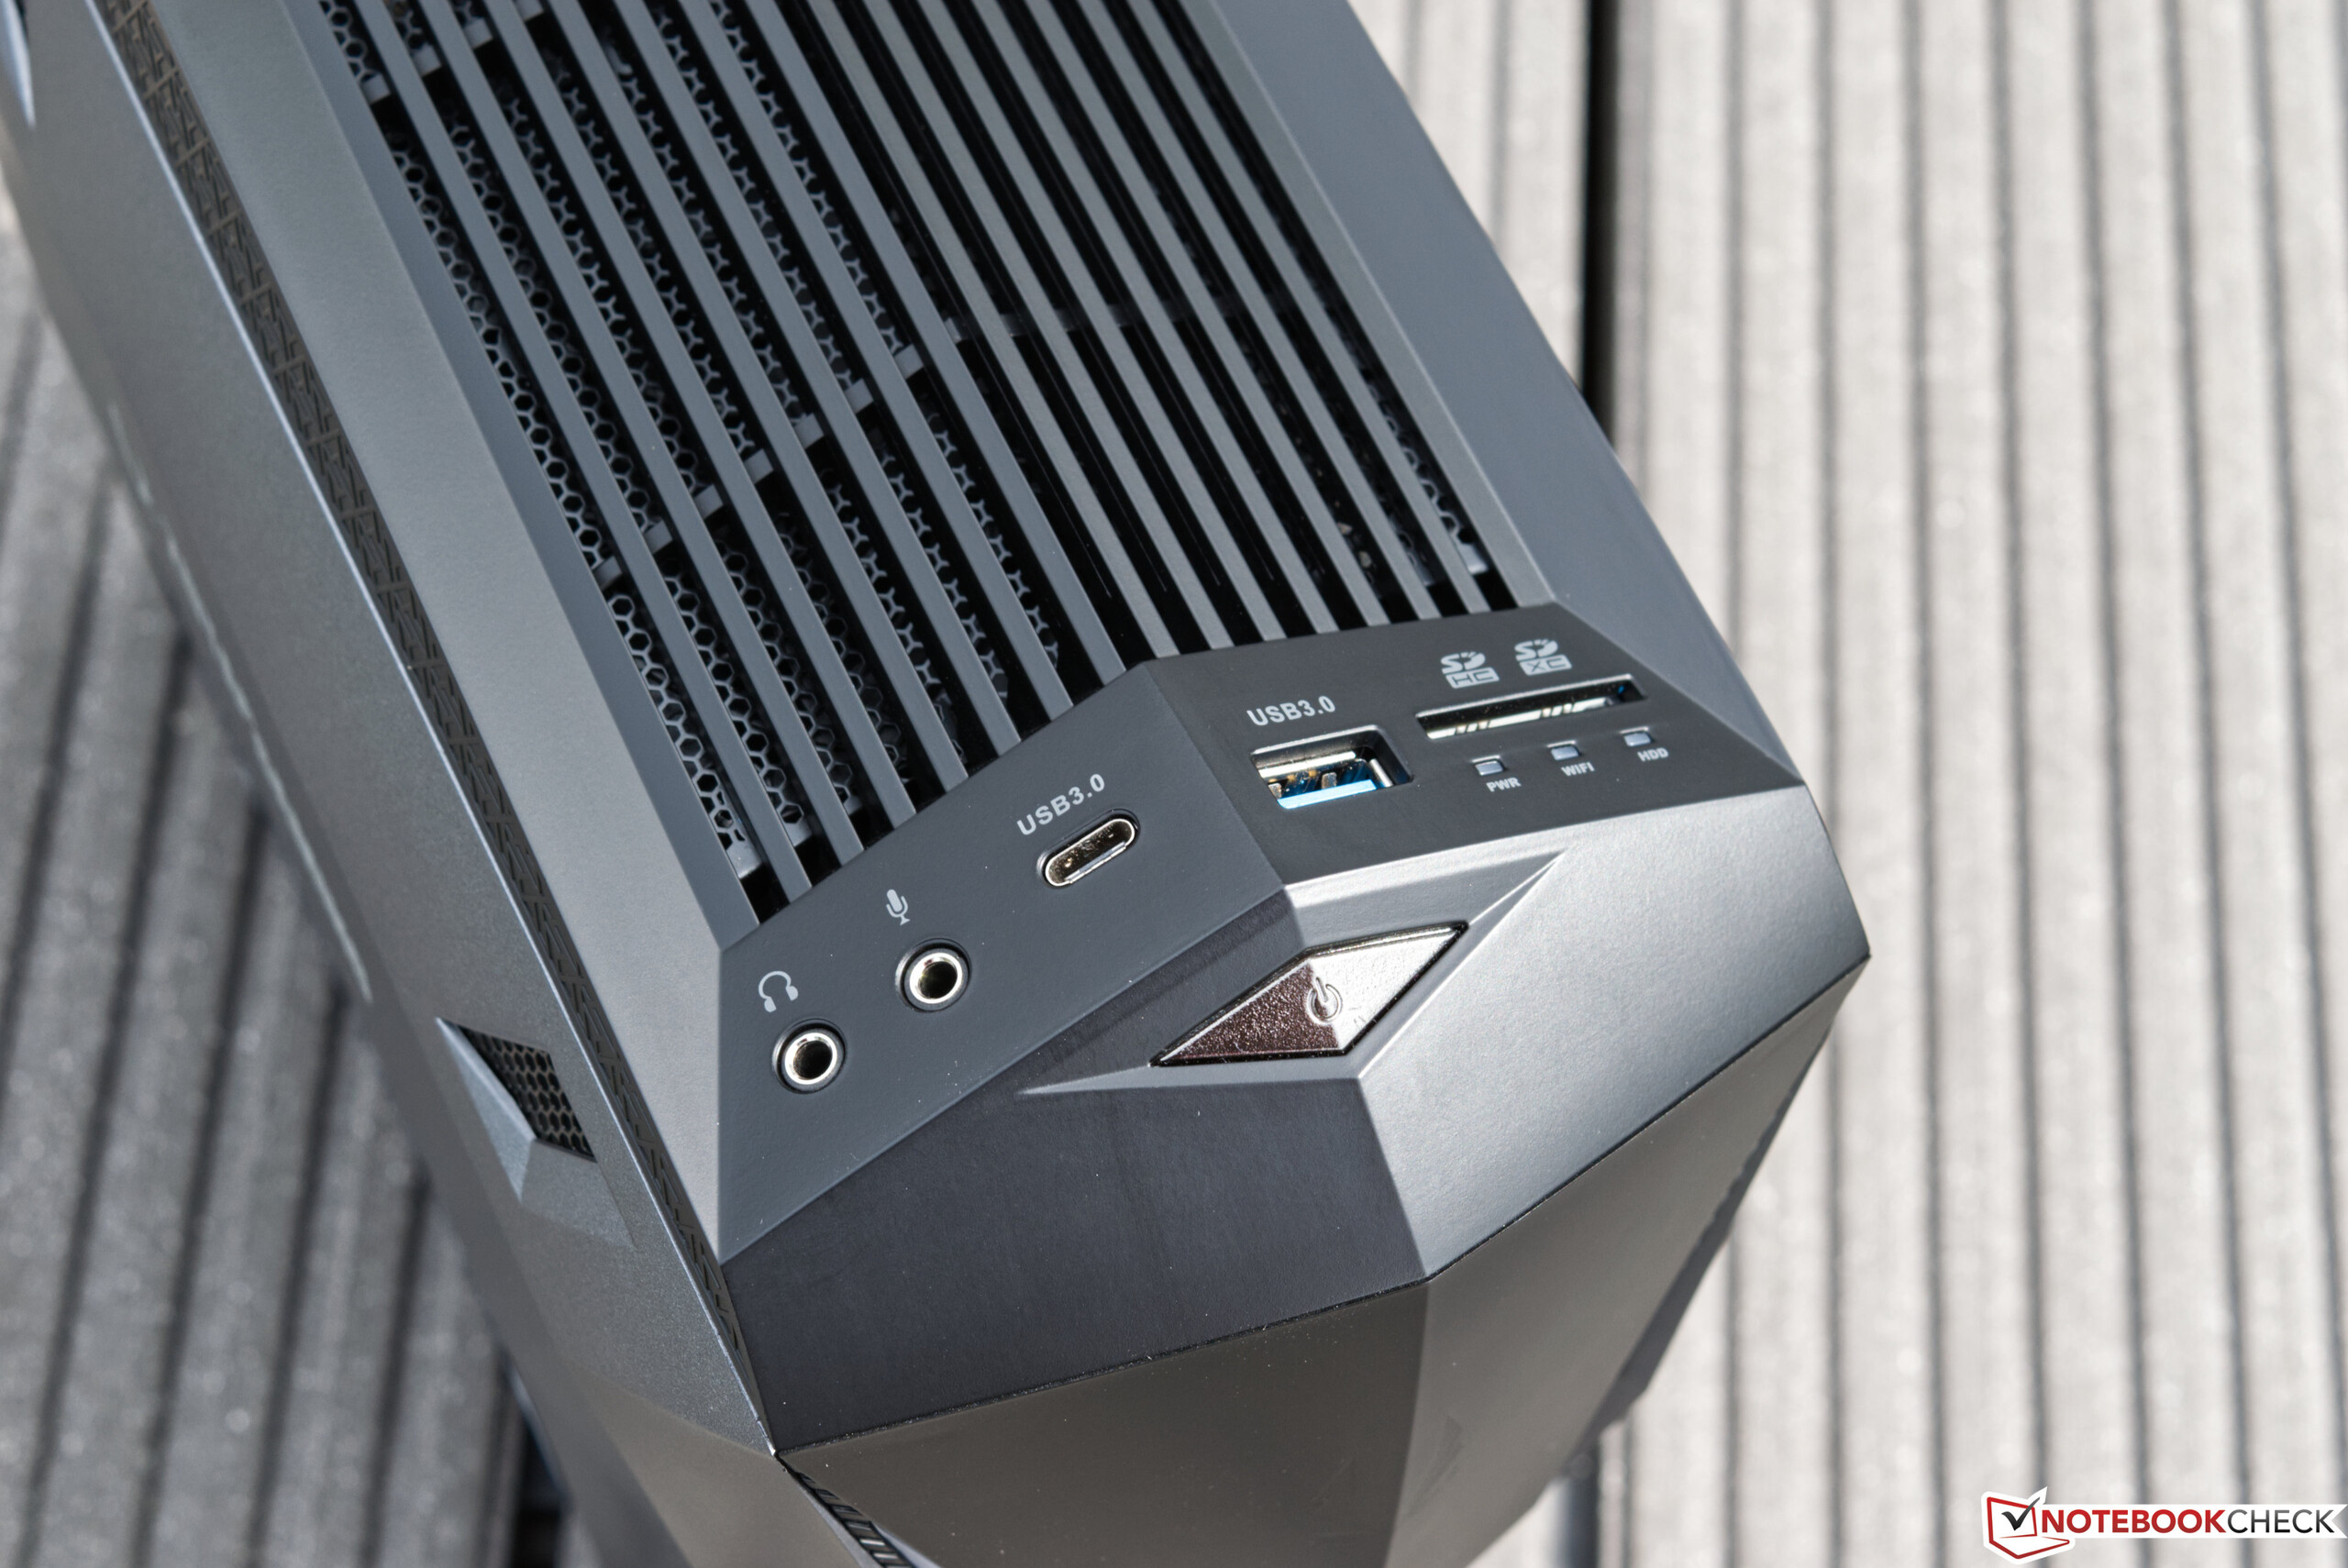
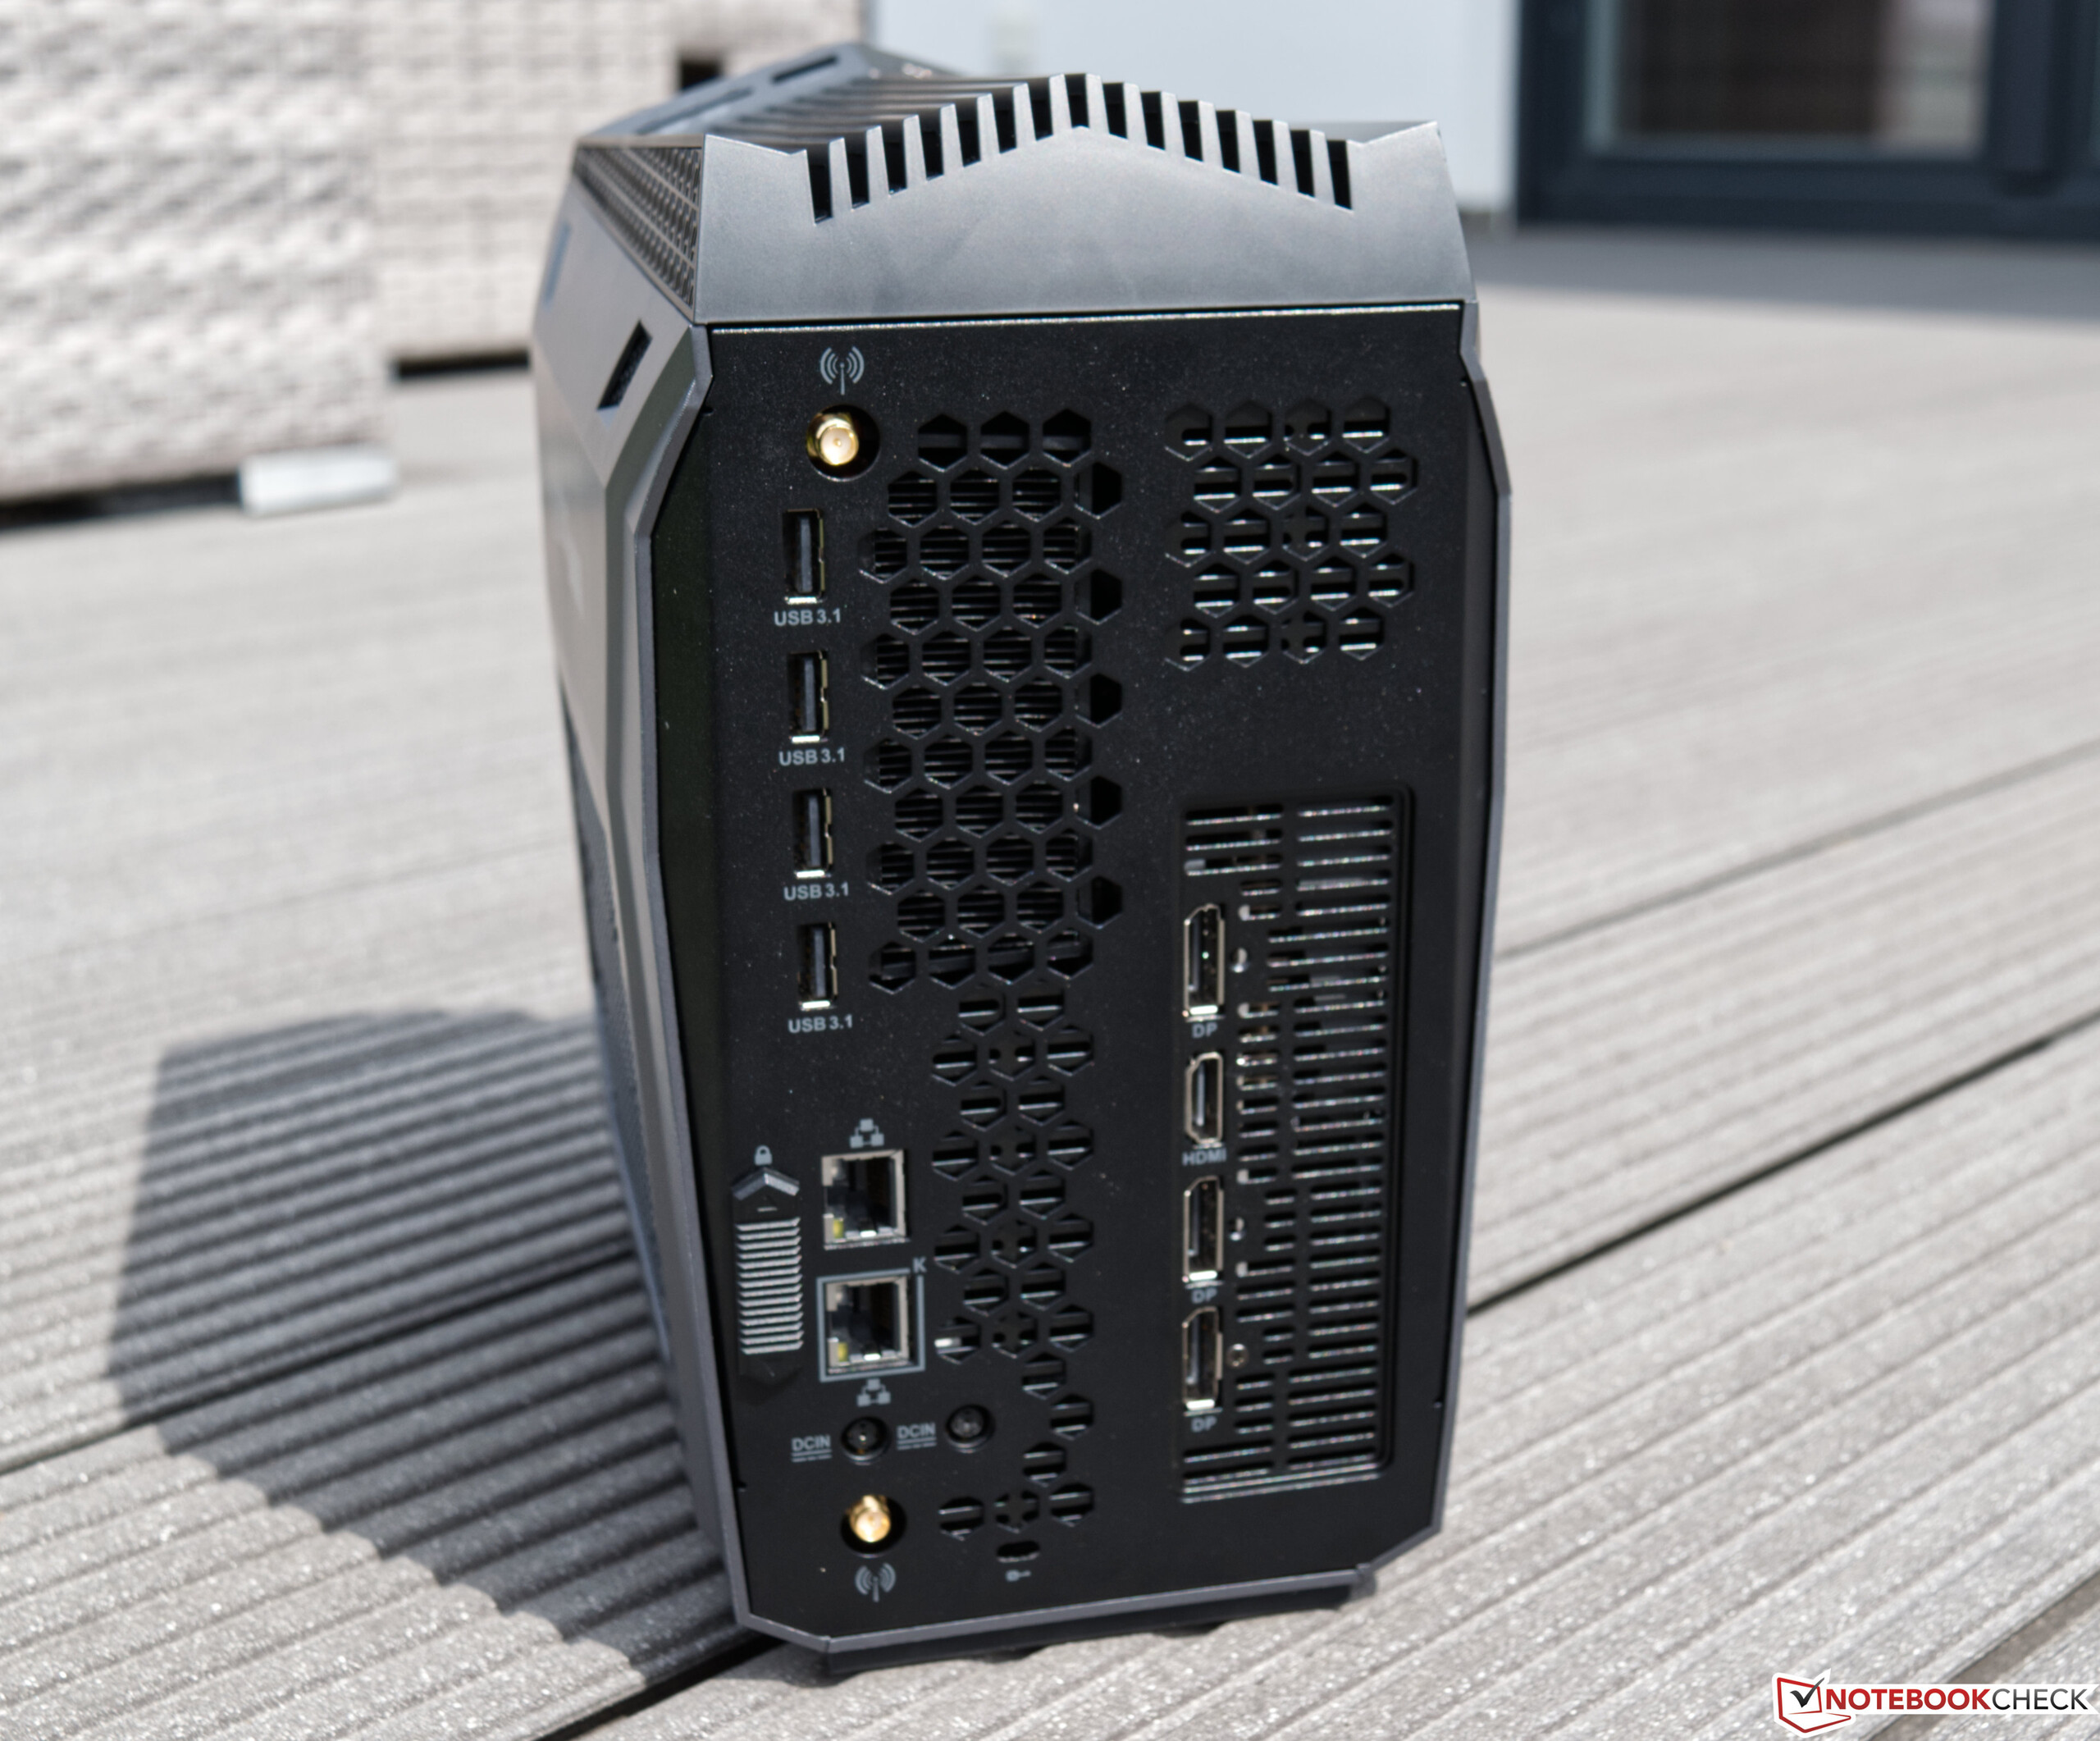
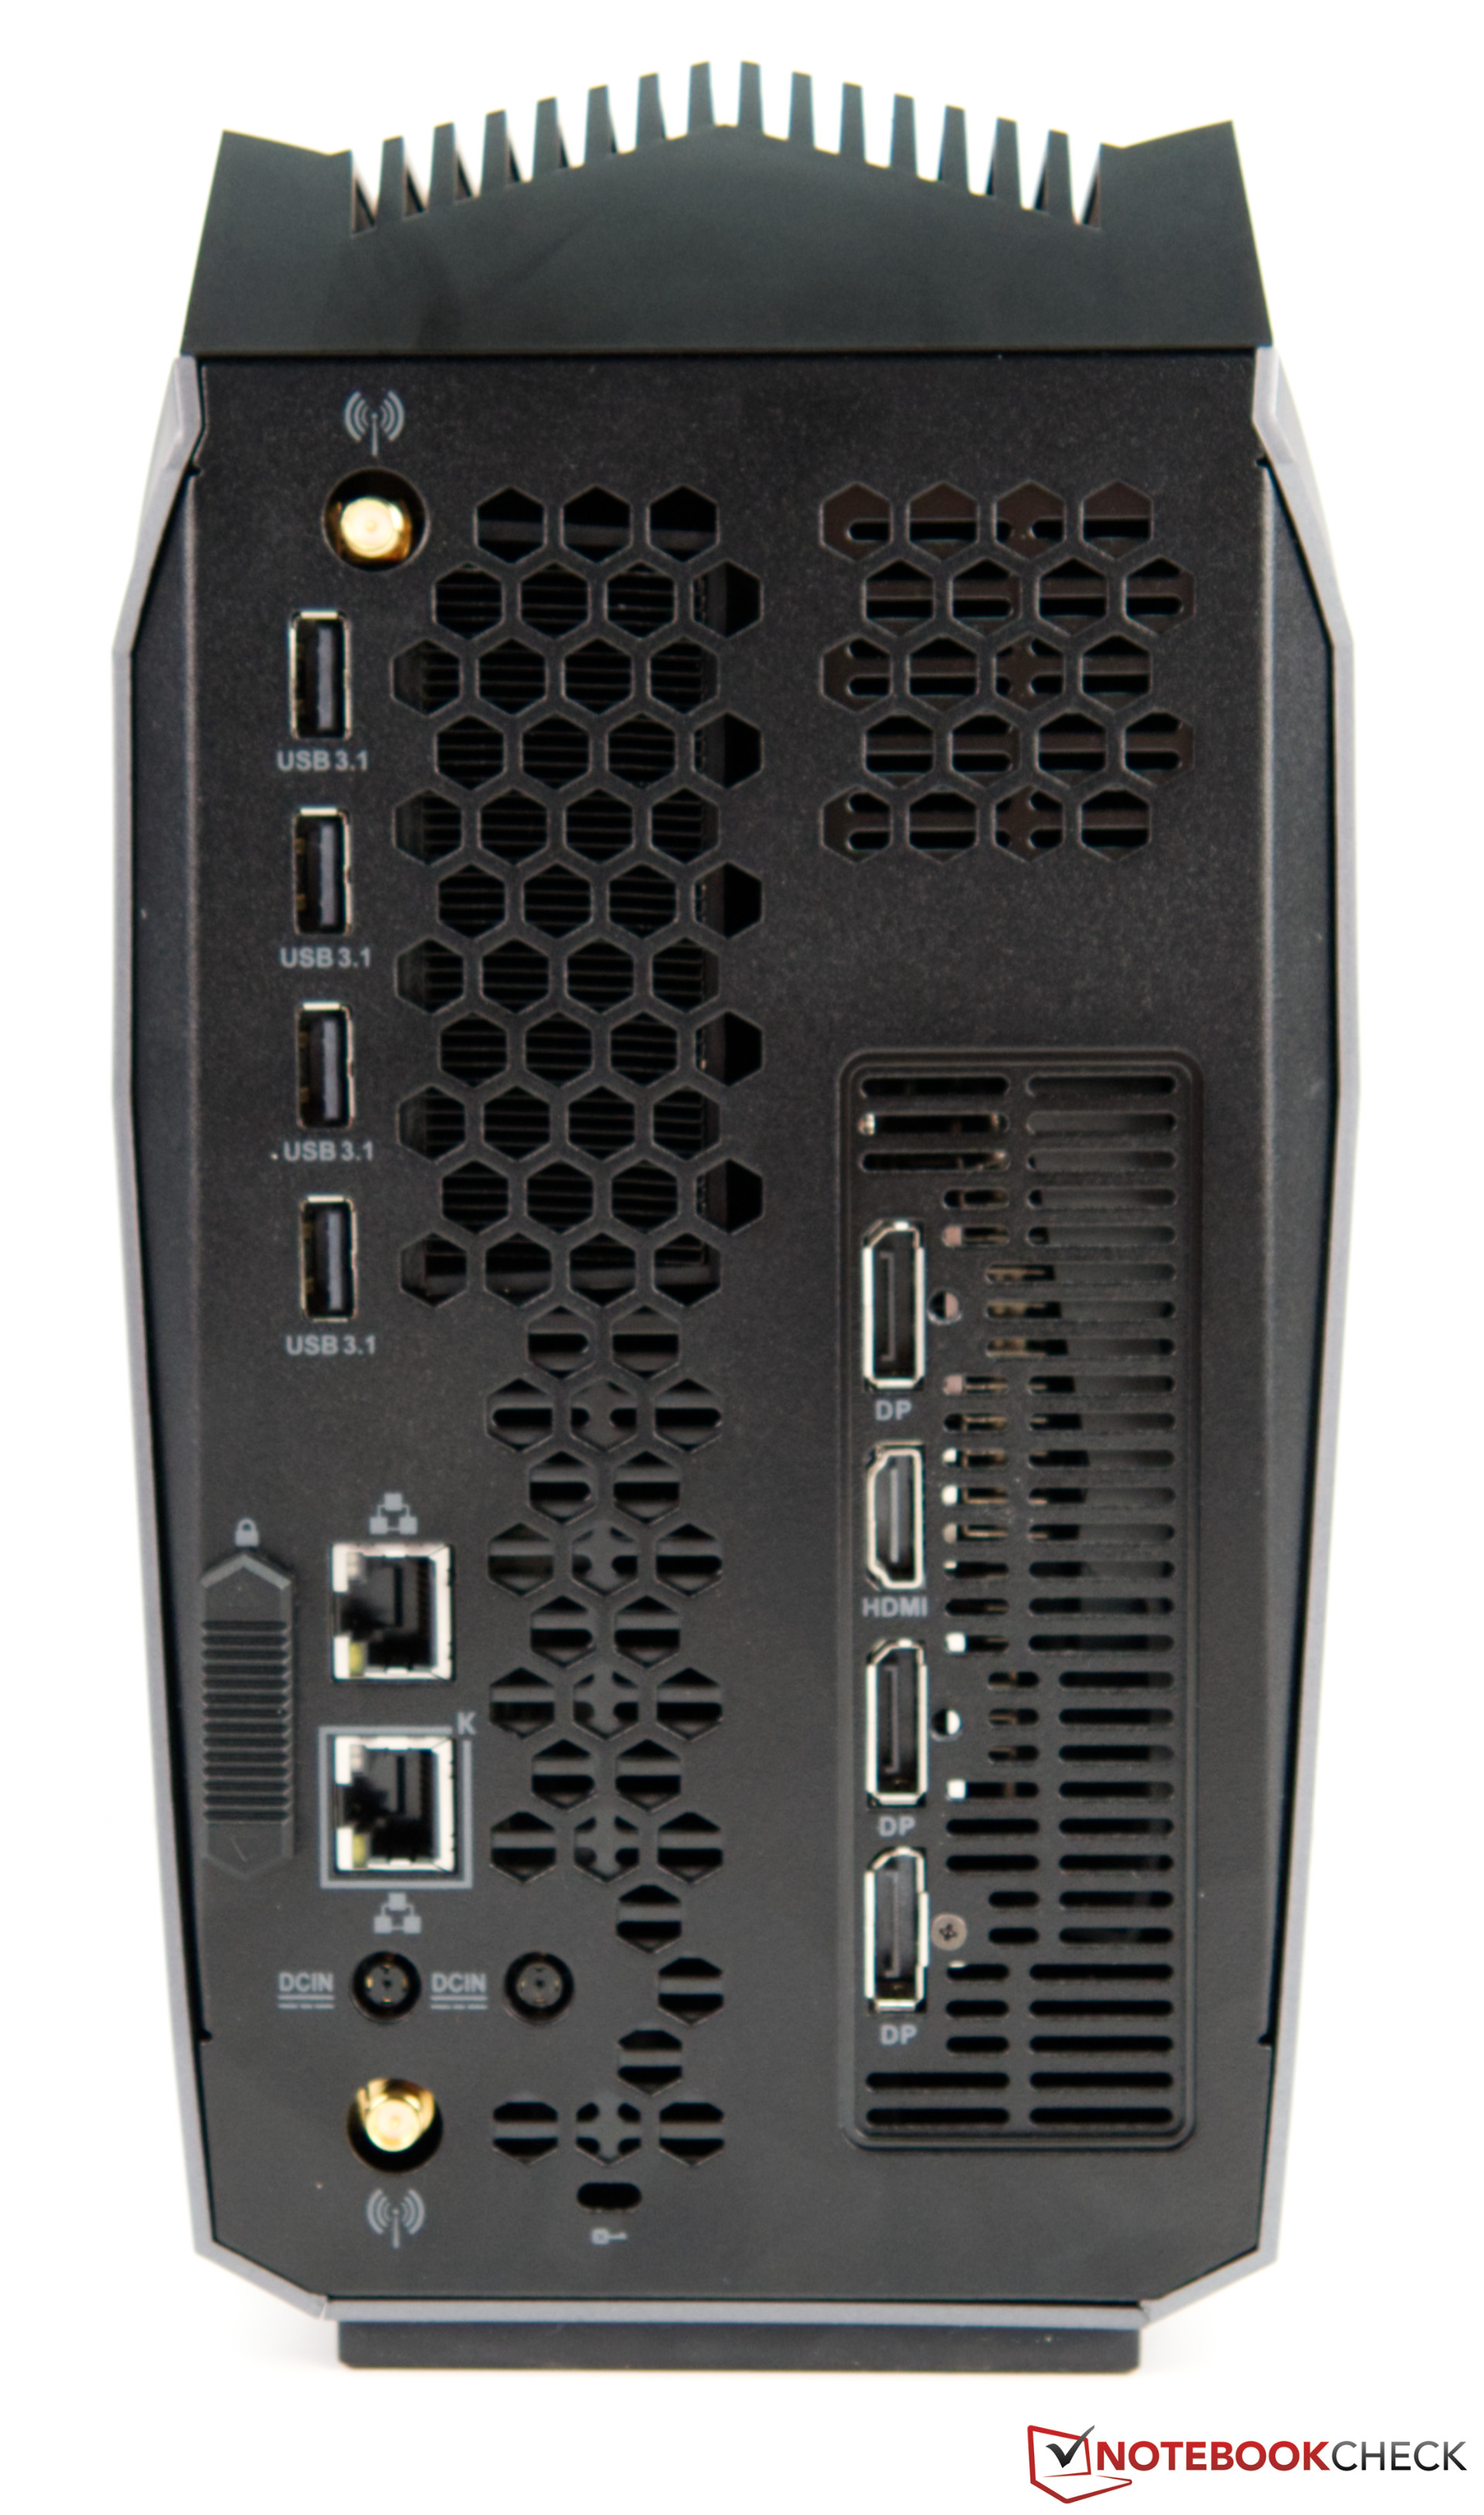
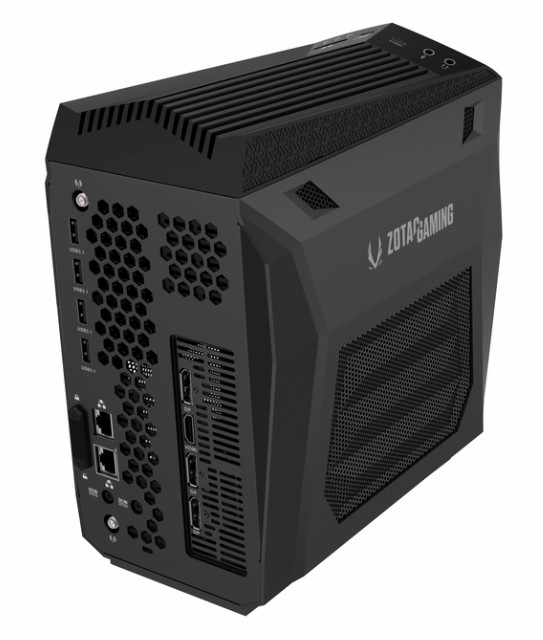
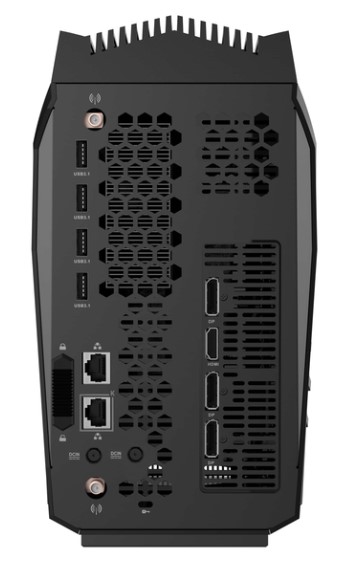
Cuando se trata de los puertos, incluyen todo lo que tu corazón desea. La mayoría de las conexiones externas se encuentran en la parte posterior. Pero también puedes insertar rápidamente una memoria USB o una tarjeta SD en la parte superior de la parte delantera.
Puntos de referencia del procesador
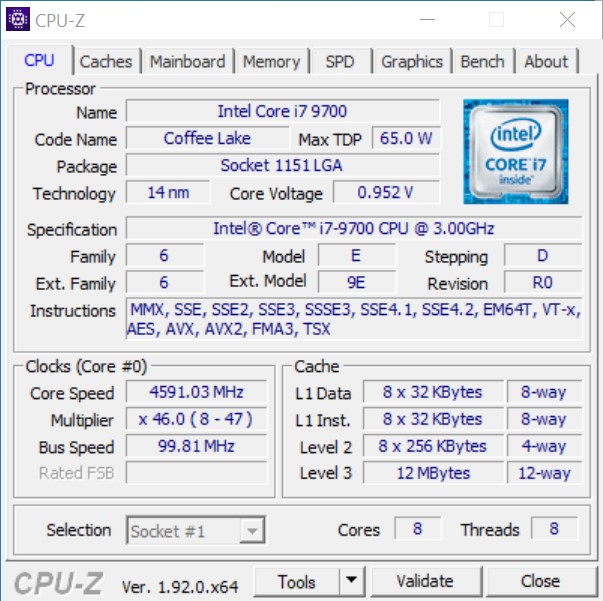
El Intel Core i7-9700 es un procesador de octa octavo núcleo con un TDP de 65 vatios. La velocidad del reloj base es de 3,0 GHz, y la máxima velocidad de aumento se especifica en 4,7 GHz. En nuestra muestra de prueba, el Core i7-9700 alcanza un resultado que era de esperar. Es más rápido que el Intel Core i5-9600K y ligeramente más lento que el Intel Core i7-9700K. Ya que Zotac ofrece el MEK MINI en la configuración más barata con un Intel Core i5-9400F, también lo hemos incluido en la comparación. Como resultado, el rendimiento esperado con el modelo más barato puede ser deducido aquí.
Para más comparaciones y puntos de referencia, le indicamos nuestra tabla de comparación de CPU.
| Cinebench R10 | |
| Rendering Single CPUs 64Bit | |
| Intel Core i9-10900K, Intel Core i9-10900K | |
| AMD Ryzen 9 3950X, AMD Ryzen 9 3950X | |
| Corsair One i160, Intel Core i9-9900K | |
| Zotac MEK Mini (RTX 2070 Super), Intel Core i7-9700 | |
| Intel Core i7-9700K, AMD Radeon RX Vega 64, Intel Core i7-9700K | |
| Intel Core i5-10600K, Intel Core i5-10600K | |
| Intel Core i5-9600K, AMD Radeon RX Vega 64, Intel Core i5-9600K | |
| Intel Core i3 9100F, Intel Core i3-9100F | |
| Intel Core i5 9400F, Intel Core i5-9400F | |
| Rendering Multiple CPUs 64Bit | |
| AMD Ryzen 9 3950X, AMD Ryzen 9 3950X | |
| Intel Core i9-10900K, Intel Core i9-10900K | |
| Corsair One i160, Intel Core i9-9900K | |
| Intel Core i7-9700K, AMD Radeon RX Vega 64, Intel Core i7-9700K | |
| Intel Core i5-10600K, Intel Core i5-10600K | |
| Zotac MEK Mini (RTX 2070 Super), Intel Core i7-9700 | |
| Intel Core i5 9400F, Intel Core i5-9400F | |
| Intel Core i5-9600K, AMD Radeon RX Vega 64, Intel Core i5-9600K | |
| Intel Core i3 9100F, Intel Core i3-9100F | |
| Blender - v2.79 BMW27 CPU | |
| Intel Core i3 9100F, Intel Core i3-9100F | |
| Intel Core i5 9400F, Intel Core i5-9400F | |
| Intel Core i5-9600K, AMD Radeon RX Vega 64, Intel Core i5-9600K | |
| Zotac MEK Mini (RTX 2070 Super), Intel Core i7-9700 | |
| Intel Core i7-9700K, AMD Radeon RX Vega 64, Intel Core i7-9700K | |
| Intel Core i5-10600K, Intel Core i5-10600K | |
| Corsair One i160, Intel Core i9-9900K | |
| Intel Core i9-10900K, Intel Core i9-10900K | |
| AMD Ryzen 9 3950X, AMD Ryzen 9 3950X | |
| Geekbench 5.5 | |
| Multi-Core | |
| AMD Ryzen 9 3950X, AMD Ryzen 9 3950X | |
| Intel Core i9-10900K, Intel Core i9-10900K | |
| Intel Core i7-9700K, AMD Radeon RX Vega 64, Intel Core i7-9700K | |
| Intel Core i5-10600K, Intel Core i5-10600K | |
| Zotac MEK Mini (RTX 2070 Super), Intel Core i7-9700 | |
| Intel Core i5-9600K, AMD Radeon RX Vega 64, Intel Core i5-9600K | |
| Intel Core i5 9400F, Intel Core i5-9400F | |
| Intel Core i3 9100F, Intel Core i3-9100F | |
| Single-Core | |
| Intel Core i9-10900K, Intel Core i9-10900K | |
| Zotac MEK Mini (RTX 2070 Super), Intel Core i7-9700 | |
| AMD Ryzen 9 3950X, AMD Ryzen 9 3950X | |
| Intel Core i7-9700K, AMD Radeon RX Vega 64, Intel Core i7-9700K | |
| Intel Core i5-10600K, Intel Core i5-10600K | |
| Intel Core i5-9600K, AMD Radeon RX Vega 64, Intel Core i5-9600K | |
| Intel Core i3 9100F, Intel Core i3-9100F | |
| Intel Core i5 9400F, Intel Core i5-9400F | |
| Geekbench 4.4 | |
| 64 Bit Single-Core Score | |
| Intel Core i9-10900K, Intel Core i9-10900K | |
| Intel Core i7-9700K, AMD Radeon RX Vega 64, Intel Core i7-9700K | |
| Corsair One i160, Intel Core i9-9900K | |
| Intel Core i5-9600K, AMD Radeon RX Vega 64, Intel Core i5-9600K | |
| Intel Core i5-10600K, Intel Core i5-10600K | |
| Zotac MEK Mini (RTX 2070 Super), Intel Core i7-9700 | |
| AMD Ryzen 9 3950X, AMD Ryzen 9 3950X | |
| Intel Core i5 9400F, Intel Core i5-9400F | |
| Intel Core i3 9100F, Intel Core i3-9100F | |
| 64 Bit Multi-Core Score | |
| AMD Ryzen 9 3950X, AMD Ryzen 9 3950X | |
| Intel Core i9-10900K, Intel Core i9-10900K | |
| Corsair One i160, Intel Core i9-9900K | |
| Intel Core i7-9700K, AMD Radeon RX Vega 64, Intel Core i7-9700K | |
| Intel Core i5-10600K, Intel Core i5-10600K | |
| Zotac MEK Mini (RTX 2070 Super), Intel Core i7-9700 | |
| Intel Core i5-9600K, AMD Radeon RX Vega 64, Intel Core i5-9600K | |
| Intel Core i5 9400F, Intel Core i5-9400F | |
| Intel Core i3 9100F, Intel Core i3-9100F | |
| 3DMark 11 - 1280x720 Performance Physics | |
| Intel Core i9-10900K, Intel Core i9-10900K | |
| AMD Ryzen 9 3950X, AMD Ryzen 9 3950X | |
| Corsair One i160, Intel Core i9-9900K | |
| Intel Core i7-9700K, AMD Radeon RX Vega 64, Intel Core i7-9700K | |
| Intel Core i5-10600K, Intel Core i5-10600K | |
| Zotac MEK Mini (RTX 2070 Super), Intel Core i7-9700 | |
| Intel Core i5-9600K, AMD Radeon RX Vega 64, Intel Core i5-9600K | |
| Intel Core i5 9400F, Intel Core i5-9400F | |
| Intel Core i3 9100F, Intel Core i3-9100F | |
| HWBOT x265 Benchmark v2.2 - 4k Preset | |
| Intel Core i9-10900K, Intel Core i9-10900K | |
| Corsair One i160, Intel Core i9-9900K | |
| AMD Ryzen 9 3950X, AMD Ryzen 9 3950X | |
| Intel Core i7-9700K, AMD Radeon RX Vega 64, Intel Core i7-9700K | |
| Intel Core i5-10600K, Intel Core i5-10600K | |
| Zotac MEK Mini (RTX 2070 Super), Intel Core i7-9700 | |
| Intel Core i5 9400F, Intel Core i5-9400F | |
| Intel Core i5-9600K, AMD Radeon RX Vega 64, Intel Core i5-9600K | |
| Intel Core i3 9100F, Intel Core i3-9100F | |
* ... más pequeño es mejor
El Zotac MEK MINI en el multilazo Cinebench R15
Debido al diseño muy compacto, es muy interesante cómo el Intel Core i7-9700 se desempeña en el Cinebench R15 multi-loop. Después de la primera ejecución, en la que el Turbo aún podía ser utilizado completamente, el rendimiento se reduce un poco. Sin embargo, a un promedio de 1.226 puntos, el rendimiento sigue siendo alto.
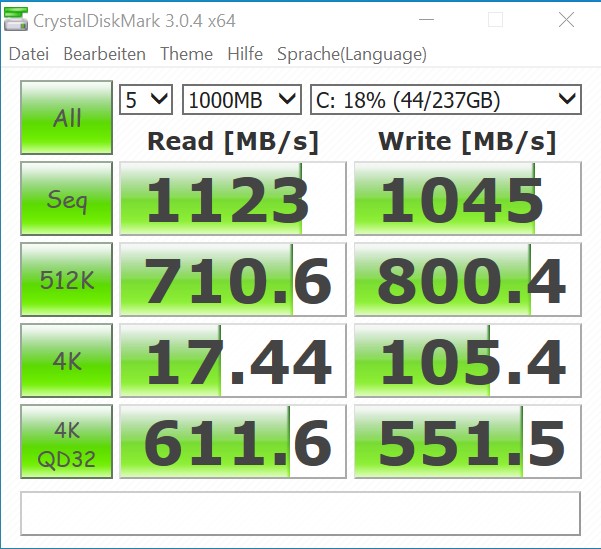
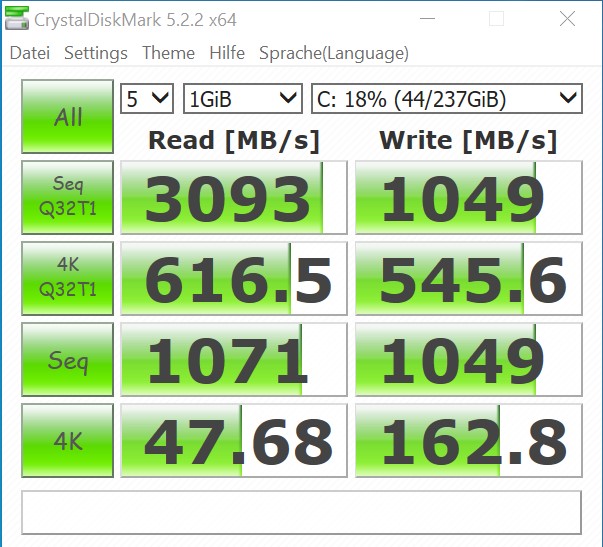
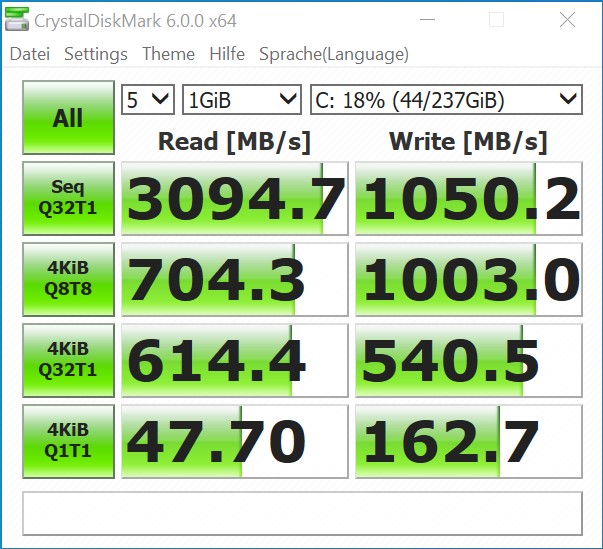
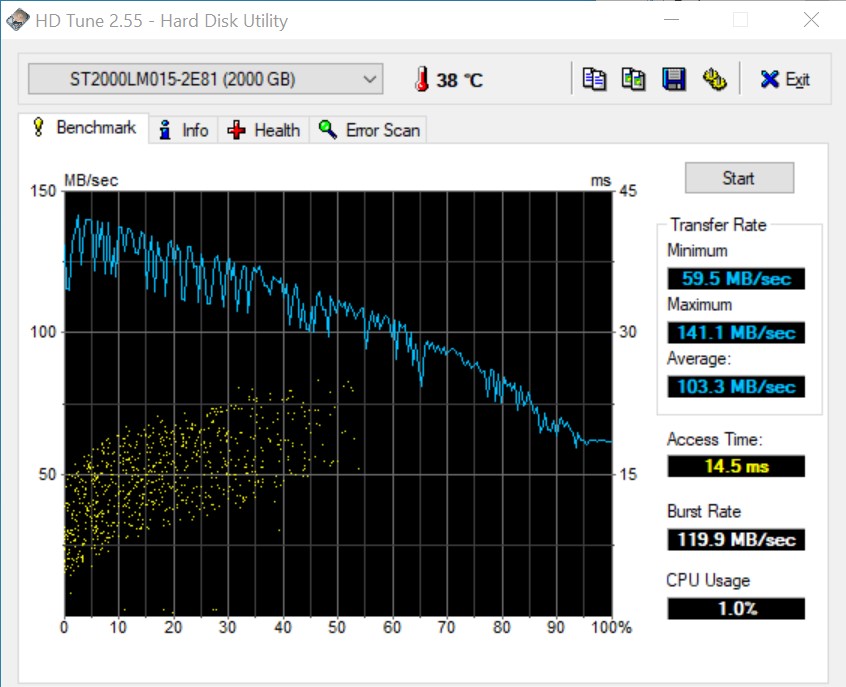
Rendimiento de la aplicación
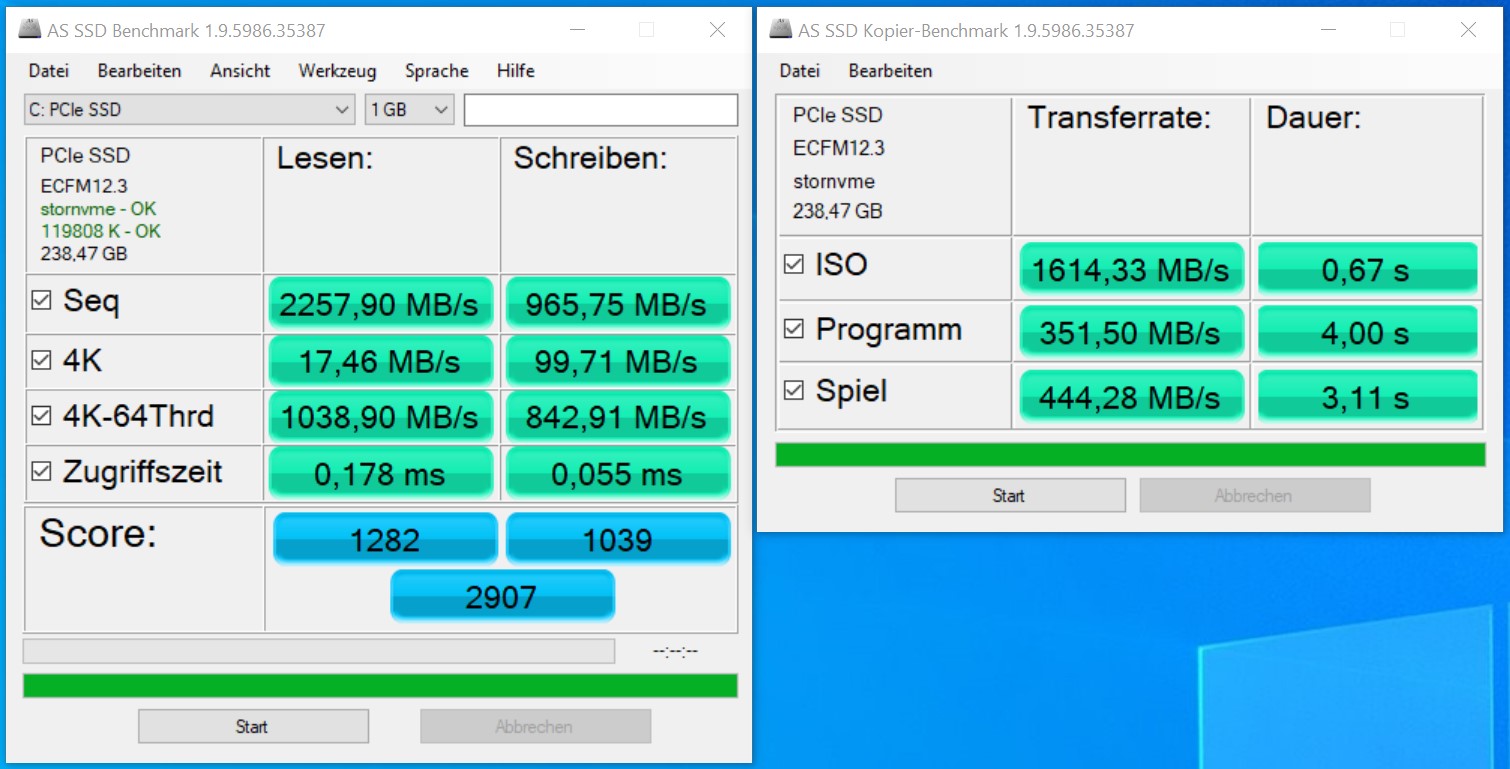
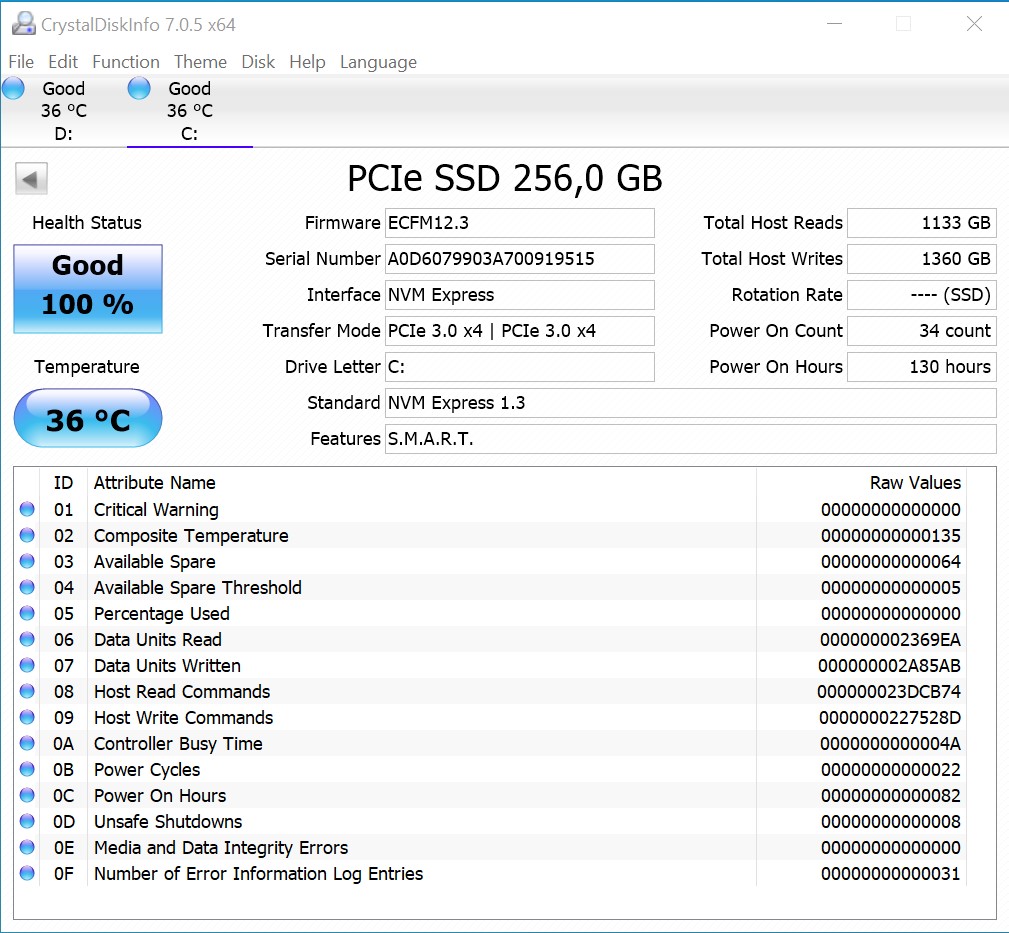
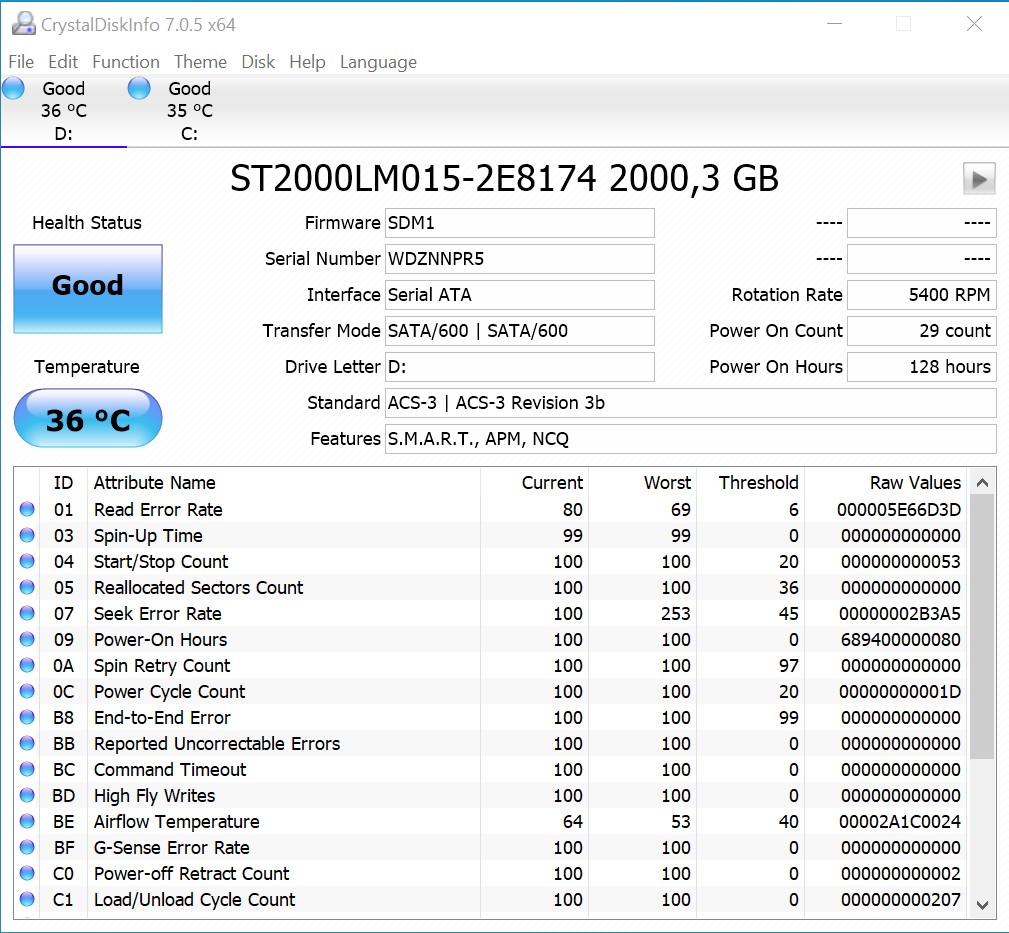
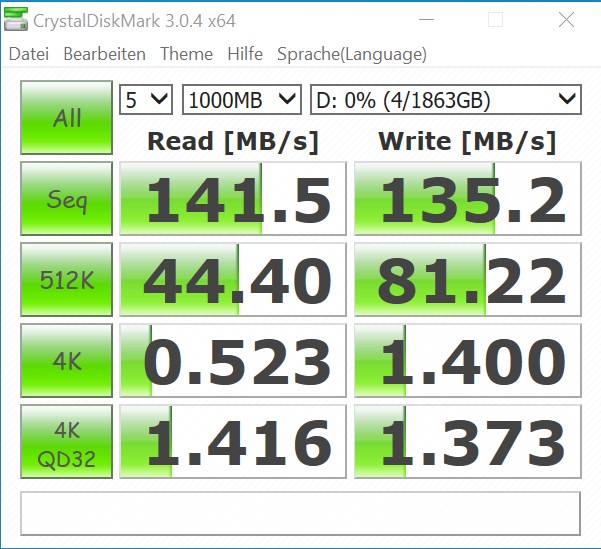
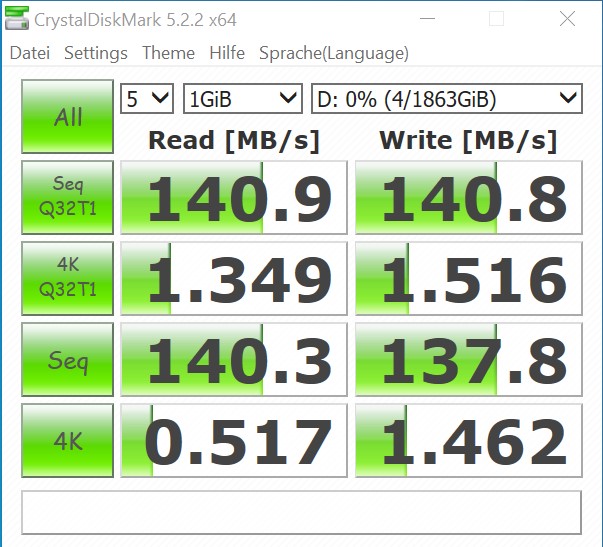
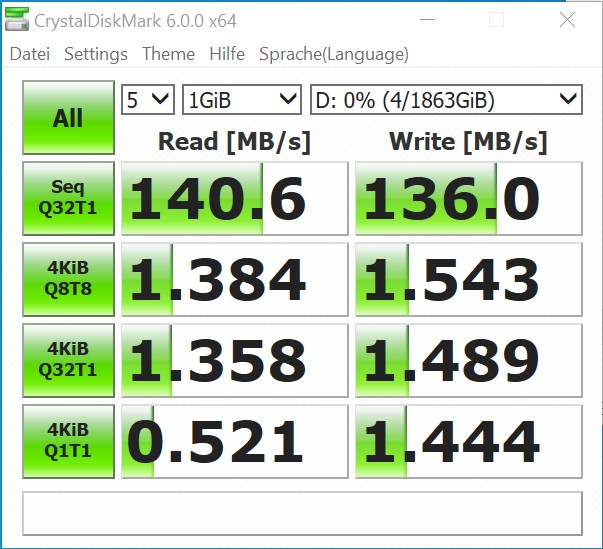
El MEK MINI alcanza buenos valores en nuestros benchmarks de aplicación, aunque los otros dispositivos de comparación ofrecen mejores resultados; esto se debe a que en algunos casos se utilizó una tarjeta gráfica mucho más potente. Sin embargo, el trabajo con el MEK MINI durante el período de prueba fue agradable. Debido al uso de un SSD y un HDD, el sistema está listo para su uso muy rápidamente y ofrece, sin embargo, suficiente espacio de almacenamiento en el HDD de 2 TB. Si no hay suficiente espacio para usted, puede reemplazar el dispositivo de almacenamiento existente o instalar otro SSD M.2.
El 3D y el rendimiento de los juegos
La Nvidia GeForce RTX 2070 Super, incorporada, que se utiliza aquí en forma de una variante de escritorio completa, proporciona un buen rendimiento 3D. Más precisamente, el modelo incorporado es una versión mini, que el fabricante Zotac también ofrece en el mercado minorista. Cuando se miran los resultados, queda claro que la versión mini del RTX 2070 Super funciona más o menos a la misma velocidad que la Founders Edition de Nvidia. El modelo de KFA2, que también revisamos, es más rápido. Sin embargo, no podemos confirmar una diferencia de rendimiento notable. Por consiguiente, si quieres comprar un MEK MINI, puedes disfrutar de los juegos modernos con resolución QHD y máximos detalles. Si prefieres resoluciones aún más altas, tendrás que vivir con niveles de detalle más bajos para poder generar velocidades de cuadro jugables. Una resolución de 1080p debería ser preferida con el MEK MINI algo más barato que viene con el RTX 2060 Super.
Si lo estás considerando y quieres cambiar la tarjeta gráfica, debes tener en cuenta que, en primer lugar, el tamaño es un factor decisivo; en segundo lugar, la máxima disipación de potencia especificada por el TDP de 250 vatios no debe ser superada para la tarjeta gráfica.
Puede encontrar más comparaciones y puntos de referencia en nuestra tabla comparativa de GPU.
| Borderlands 3 - 1920x1080 Badass Overall Quality (DX11) | |
| Medio NVIDIA GeForce RTX 2070 Super (Desktop) (74.3 - 86, n=5) | |
| Nvidia GeForce RTX 2070 Super | |
| KFA2 GeForce RTX 2070 Super Work The Frames | |
| Zotac MEK Mini (RTX 2070 Super) | |
| Medio NVIDIA GeForce RTX 2070 (Desktop) (70.9 - 74.4, n=2) | |
| Medio NVIDIA GeForce RTX 2060 Super (Desktop) (68.6 - 74.1, n=4) | |
| The Witcher 3 - 1920x1080 Ultra Graphics & Postprocessing (HBAO+) | |
| Medio NVIDIA GeForce RTX 2070 Super (Desktop) (95.6 - 109.6, n=6) | |
| KFA2 GeForce RTX 2070 Super Work The Frames | |
| Nvidia GeForce RTX 2070 Super | |
| Zotac MEK Mini (RTX 2070 Super) | |
| Medio NVIDIA GeForce RTX 2060 Super (Desktop) (79 - 91.1, n=5) | |
| Medio NVIDIA GeForce RTX 2070 (Desktop) (40.9 - 95, n=5) | |
| bajo | medio | alto | ultra | QHD | 4K | |
|---|---|---|---|---|---|---|
| BioShock Infinite (2013) | 374.6 | 334.9 | 314.5 | 184.2 | ||
| The Witcher 3 (2015) | 335 | 268 | 169 | 95.6 | 65.5 | |
| Dota 2 Reborn (2015) | 147.3 | 134 | 128.7 | 120.4 | 120 | |
| Rise of the Tomb Raider (2016) | 311 | 200 | 169 | 142 | 67 | |
| Final Fantasy XV Benchmark (2018) | 170 | 128 | 96.9 | 41.6 | ||
| X-Plane 11.11 (2018) | 122 | 110 | 91.1 | 79.4 | ||
| Far Cry 5 (2018) | 144 | 122 | 116 | 109 | 93 | 53 |
| Shadow of the Tomb Raider (2018) | 140 | 127 | 122 | 114 | 82 | 44 |
| Forza Horizon 4 (2018) | 202 | 174 | 172 | 153 | 125 | 84 |
| Far Cry New Dawn (2019) | 120 | 93 | 90 | 80 | 83 | 55 |
| Metro Exodus (2019) | 177 | 112 | 87.2 | 68.4 | 54.9 | 36 |
| F1 2019 (2019) | 245 | 215 | 169 | 146 | 115 | 71 |
| Control (2019) | 235 | 114 | 88 | 56.9 | 29.2 | |
| Borderlands 3 (2019) | 129 | 111 | 91.1 | 74.3 | 53.7 | 29.5 |
Emisiones
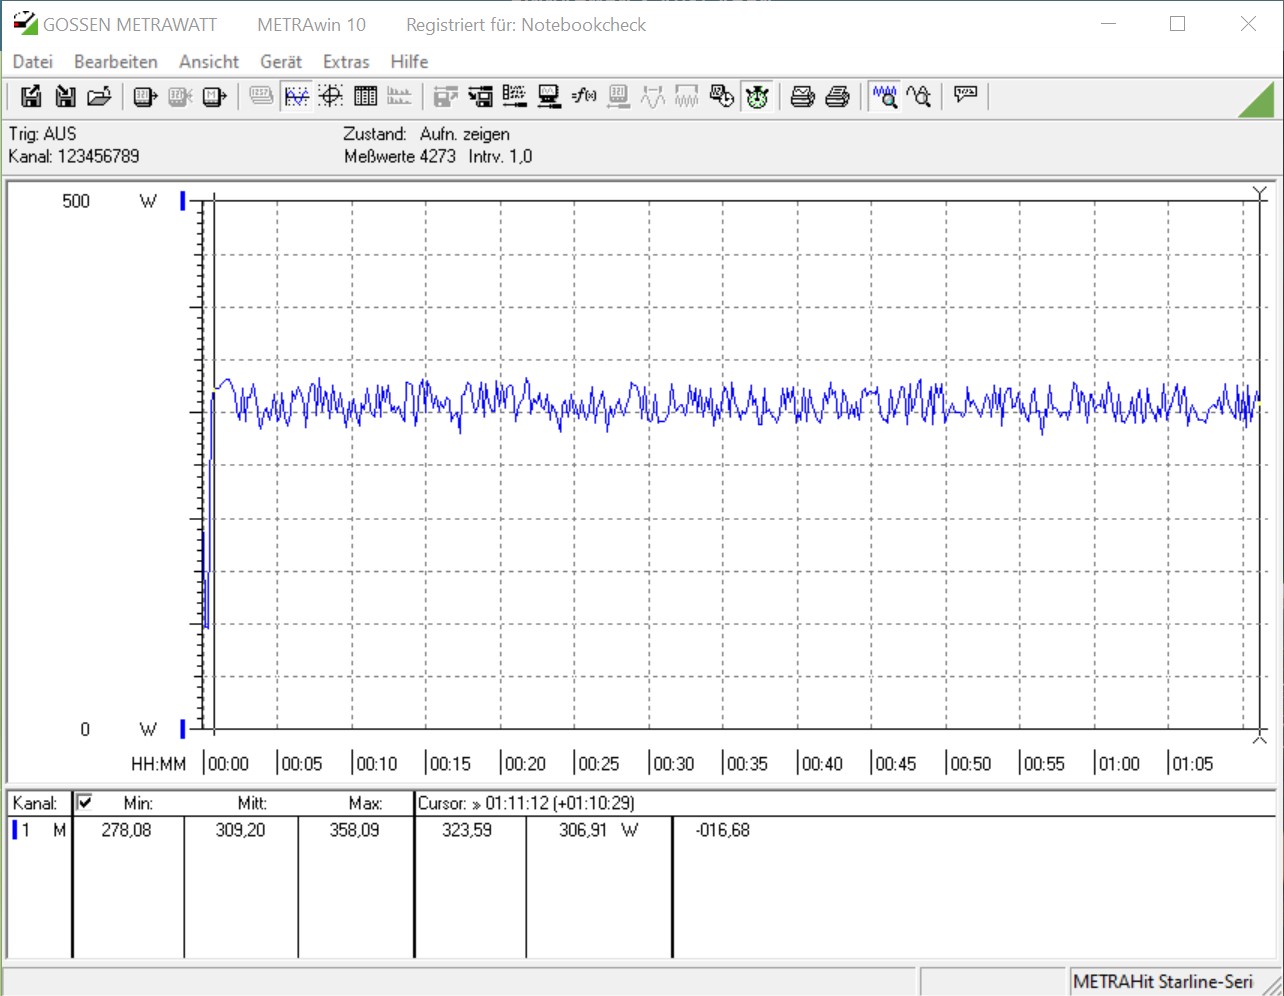
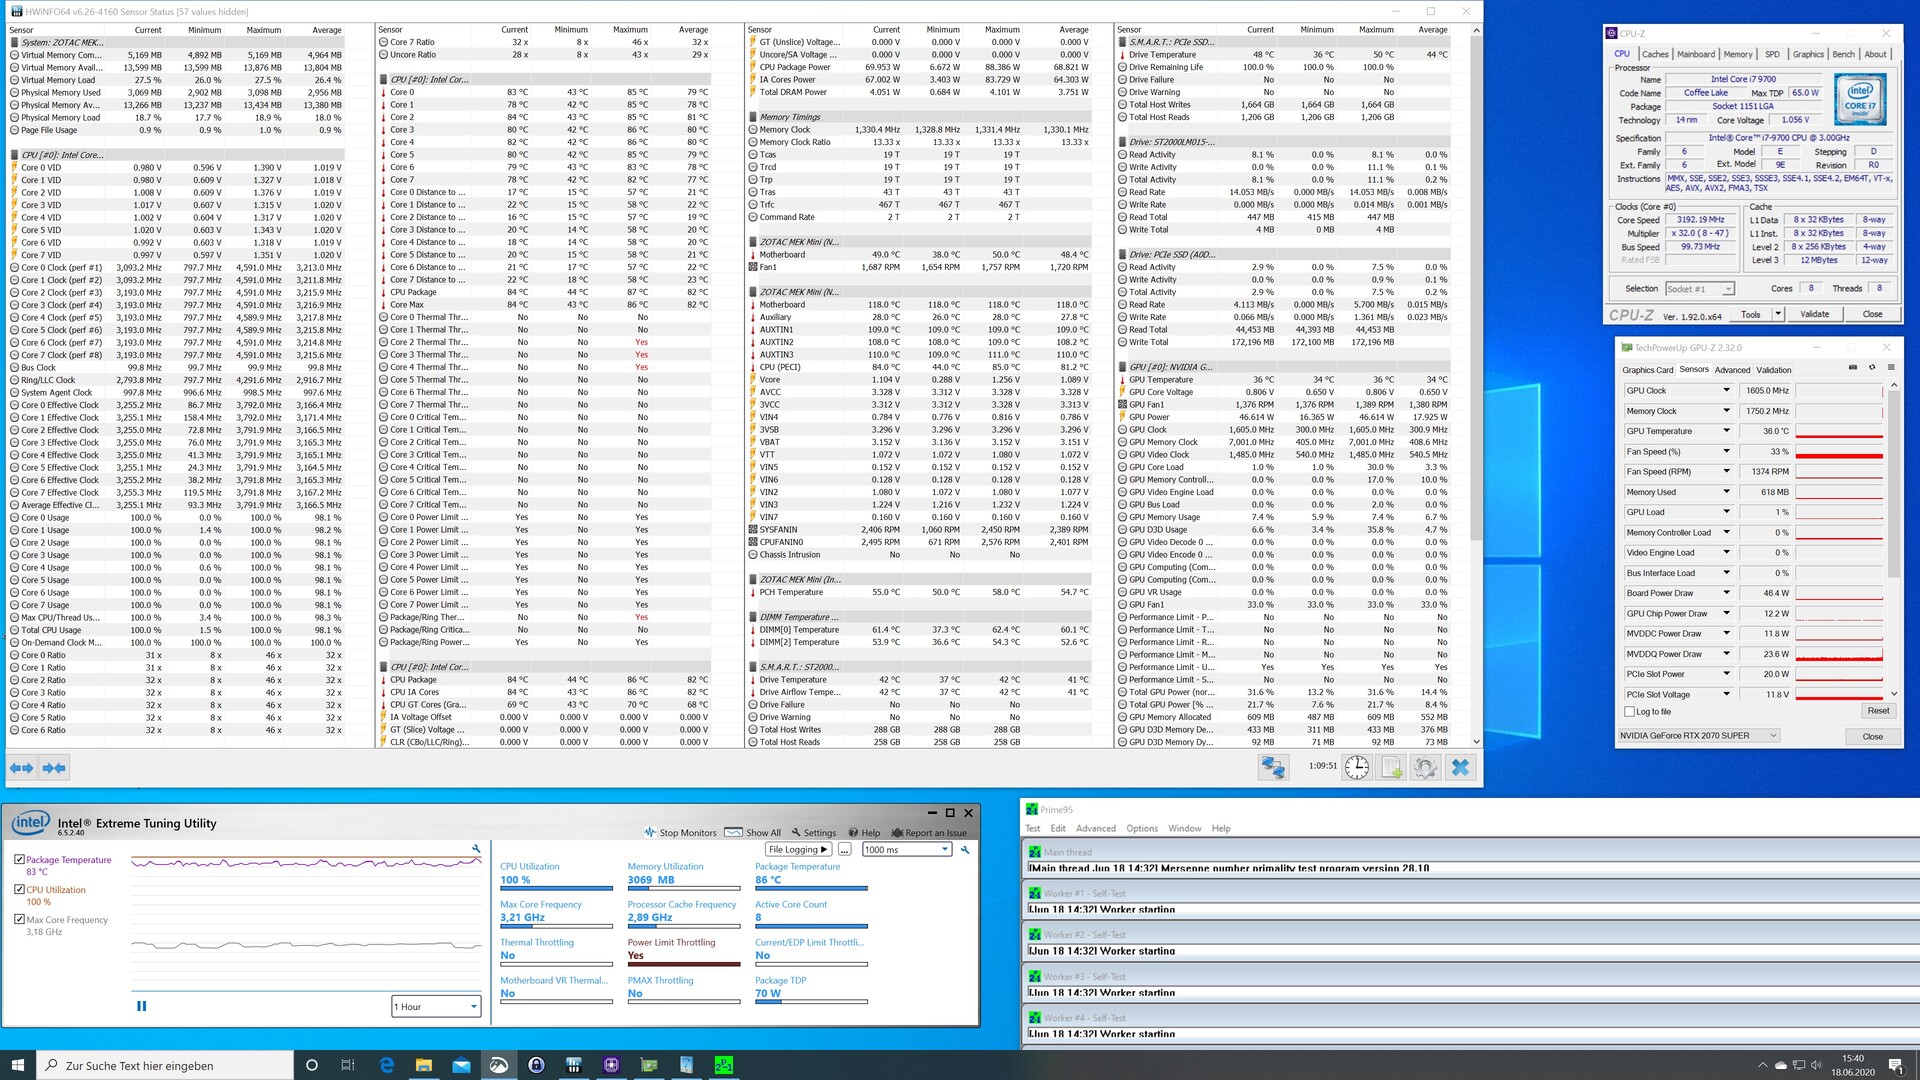
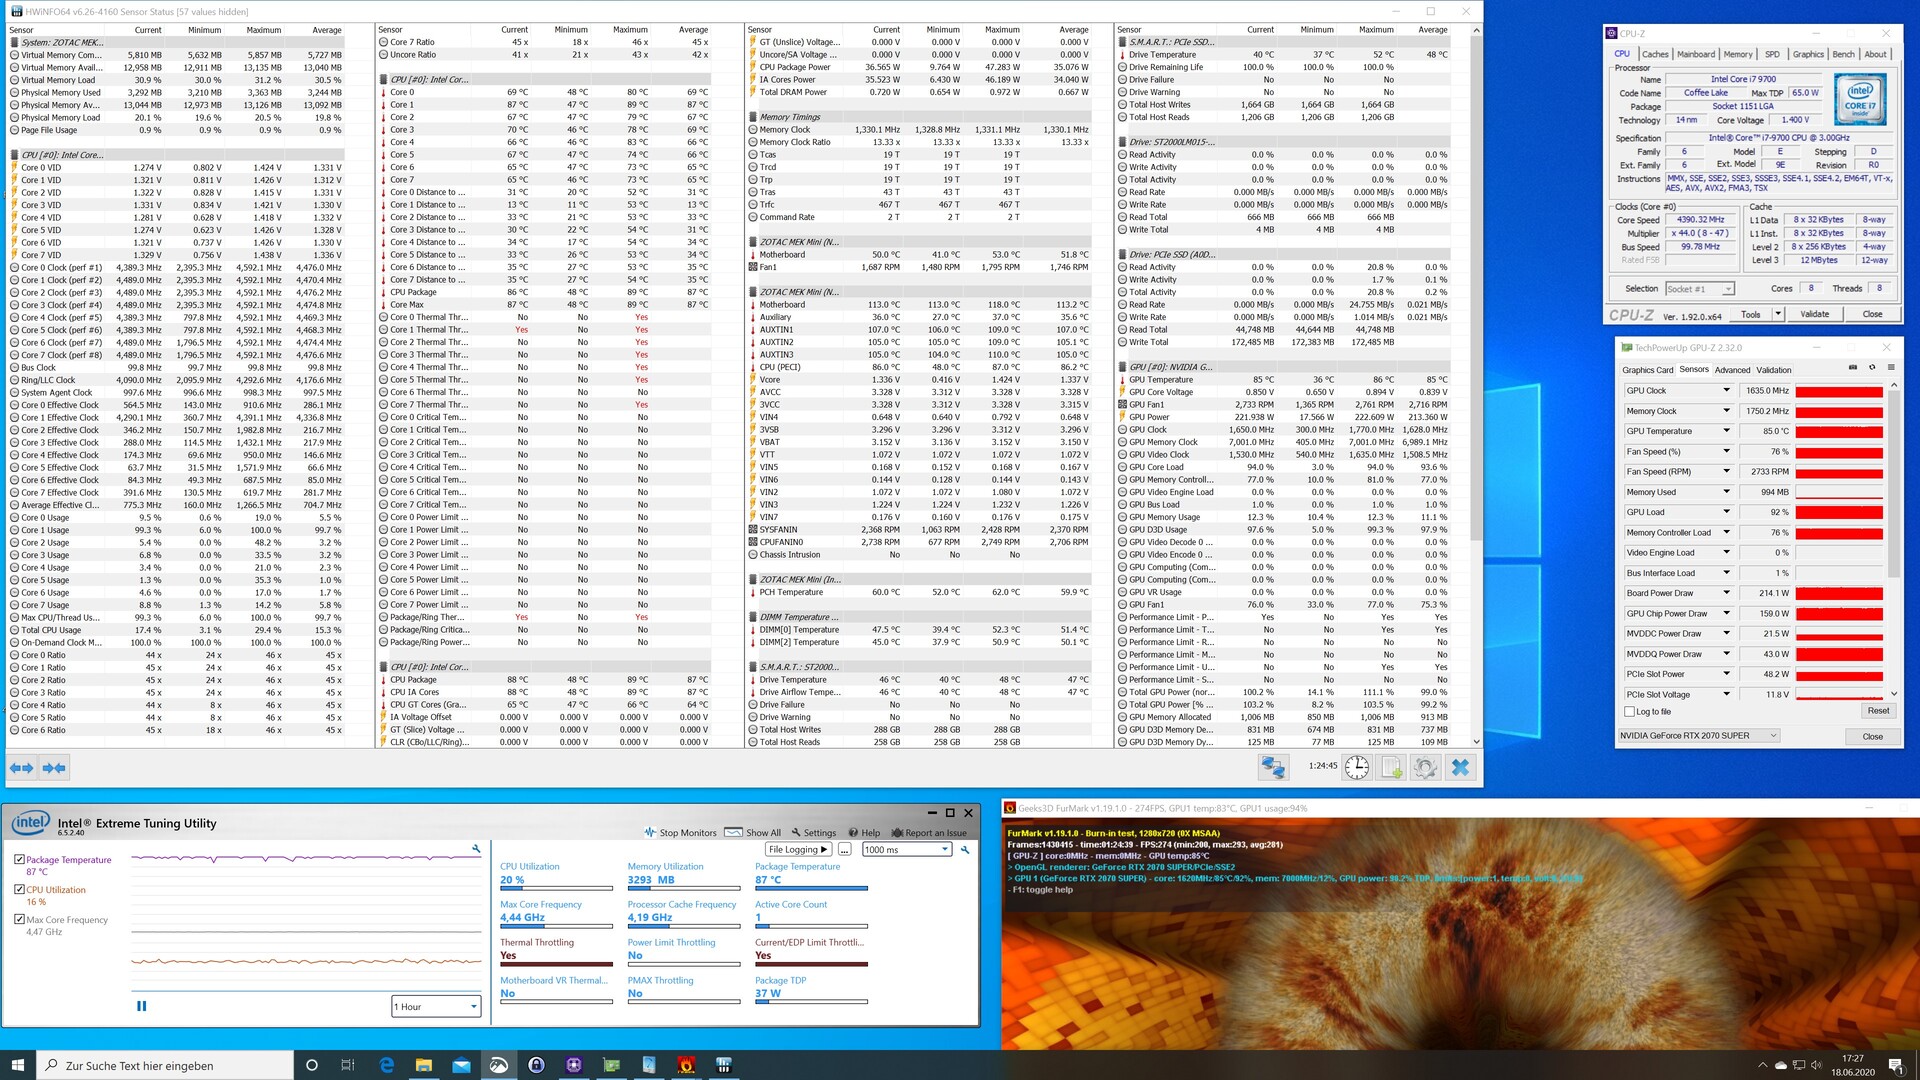
El Zotac MEK MINI en la prueba de esfuerzo
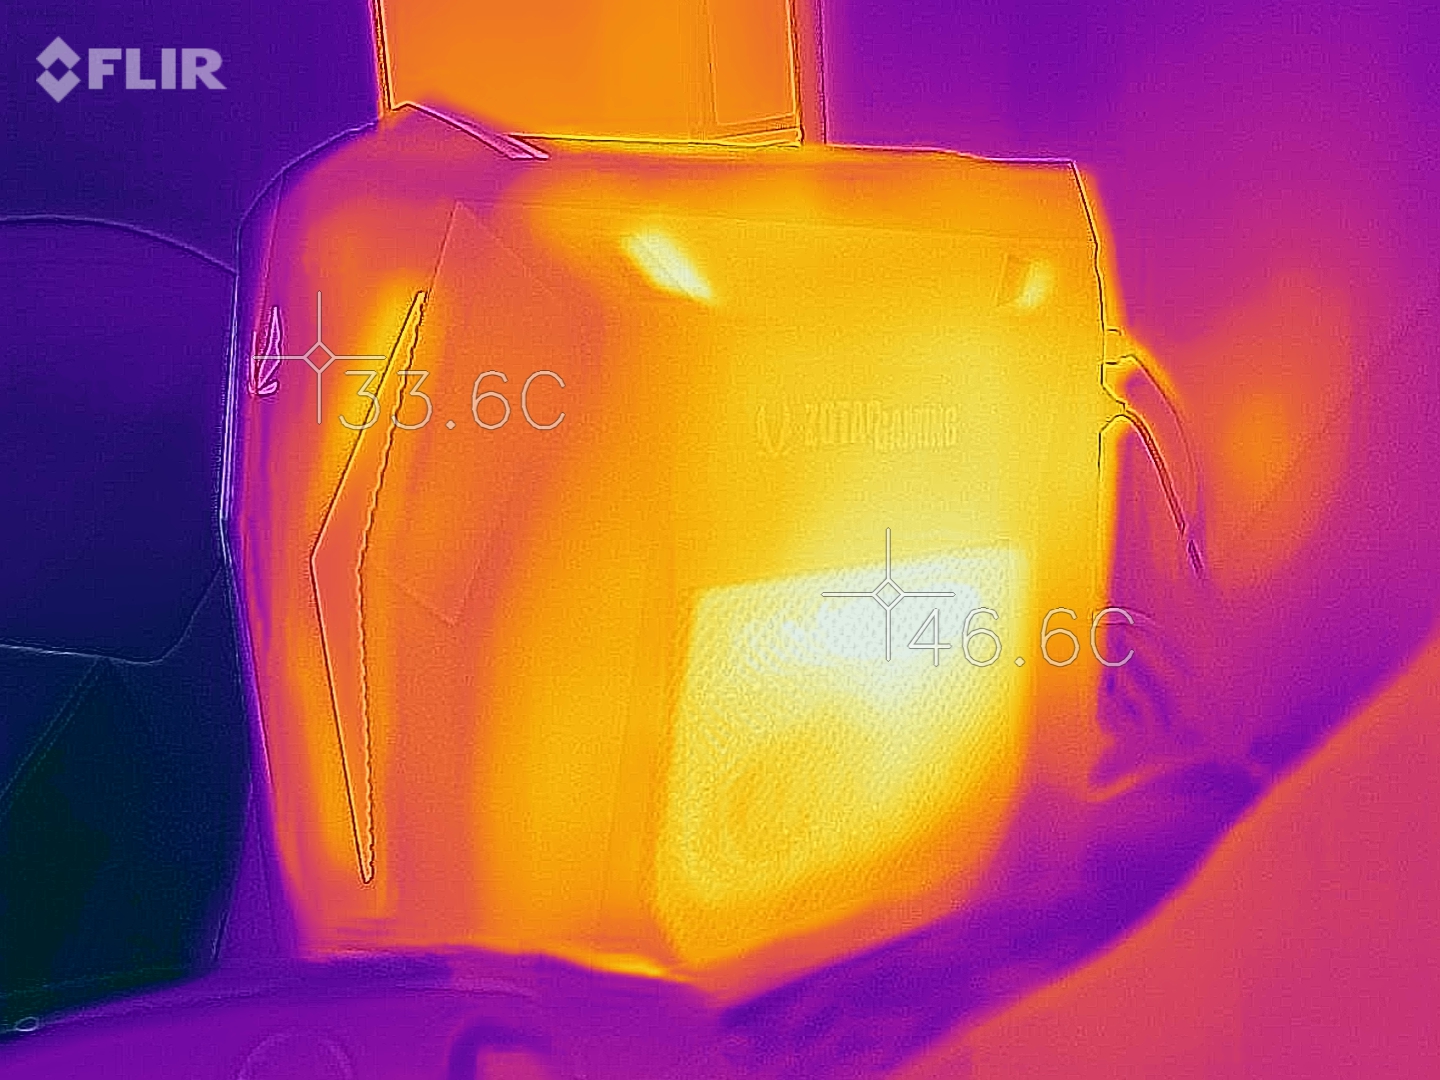
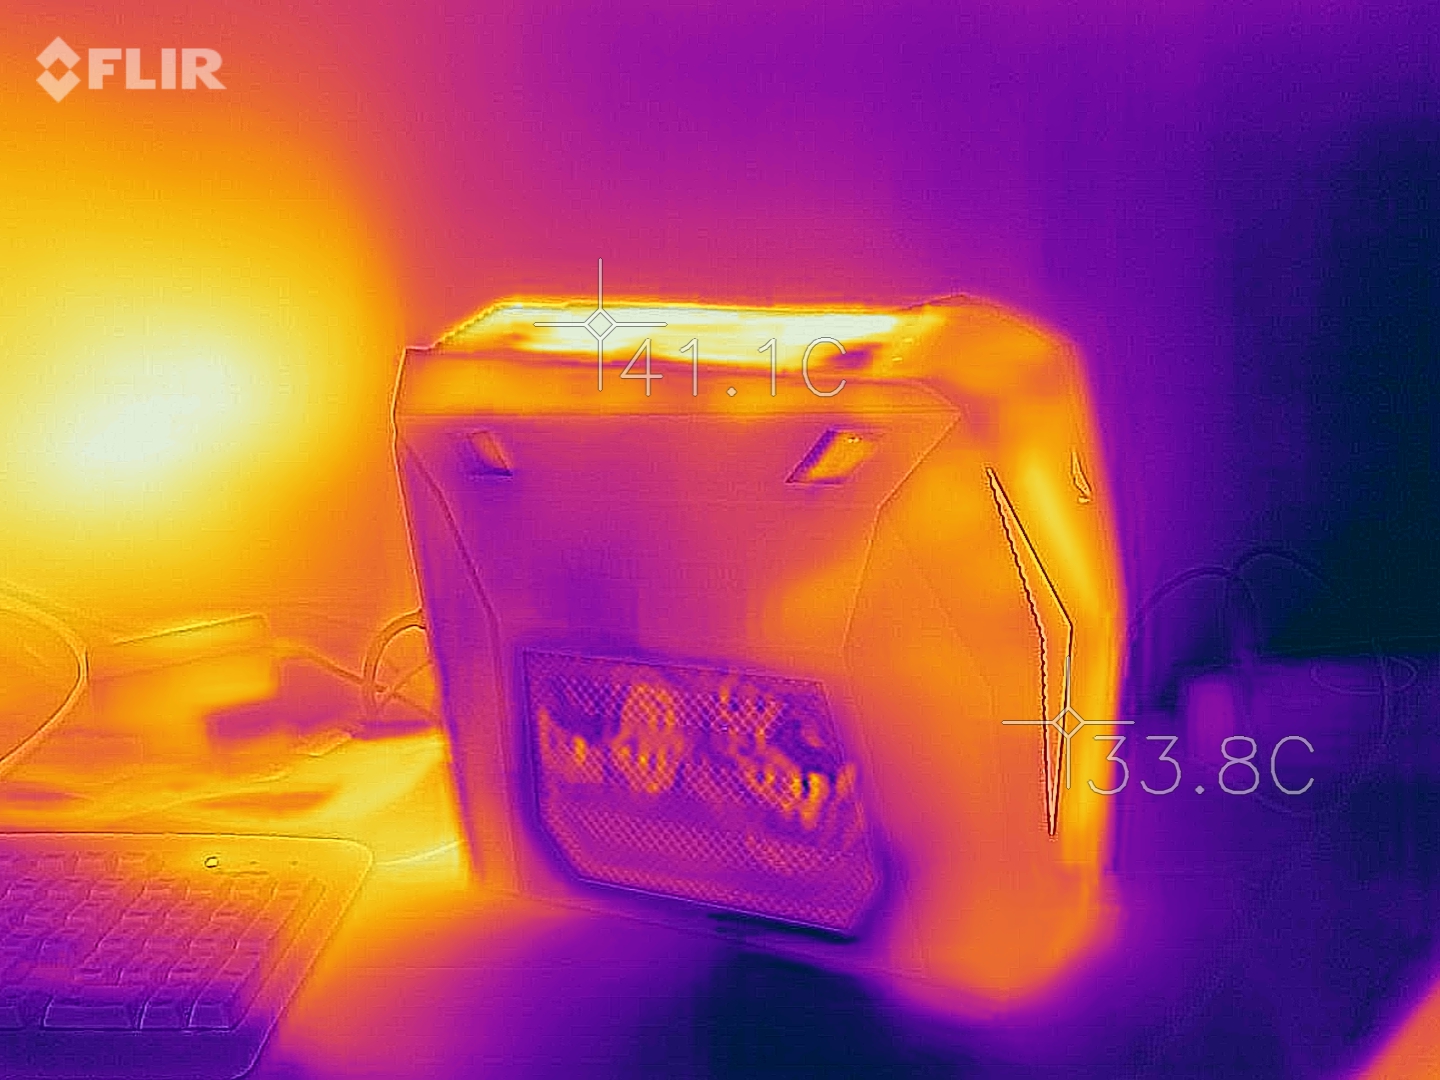
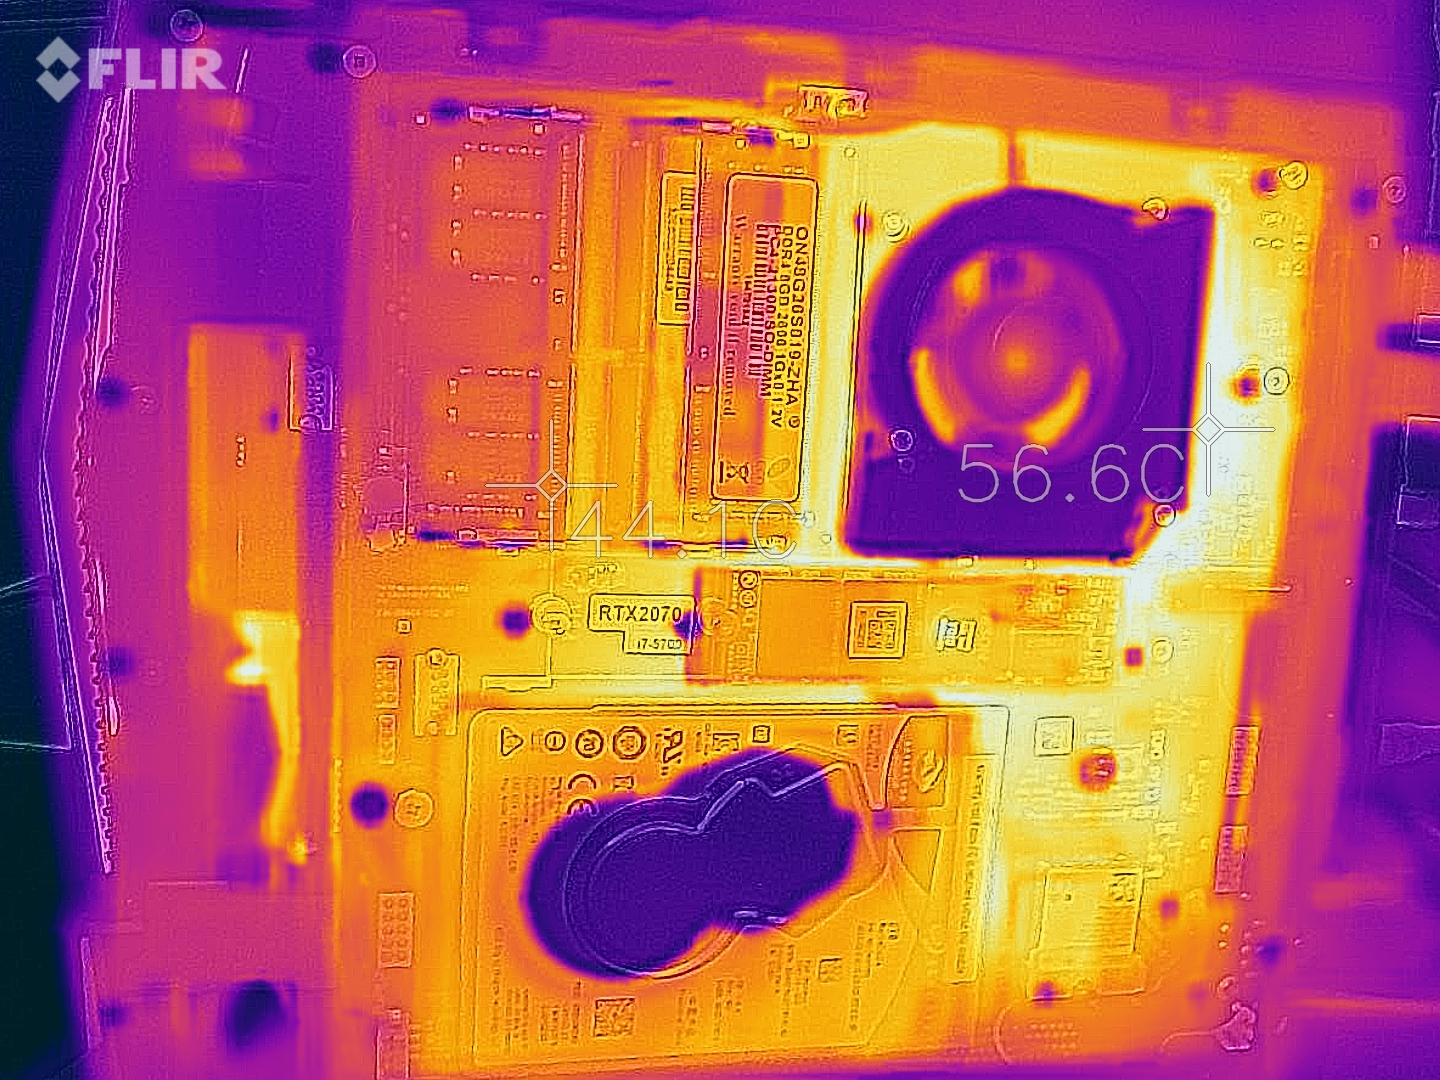
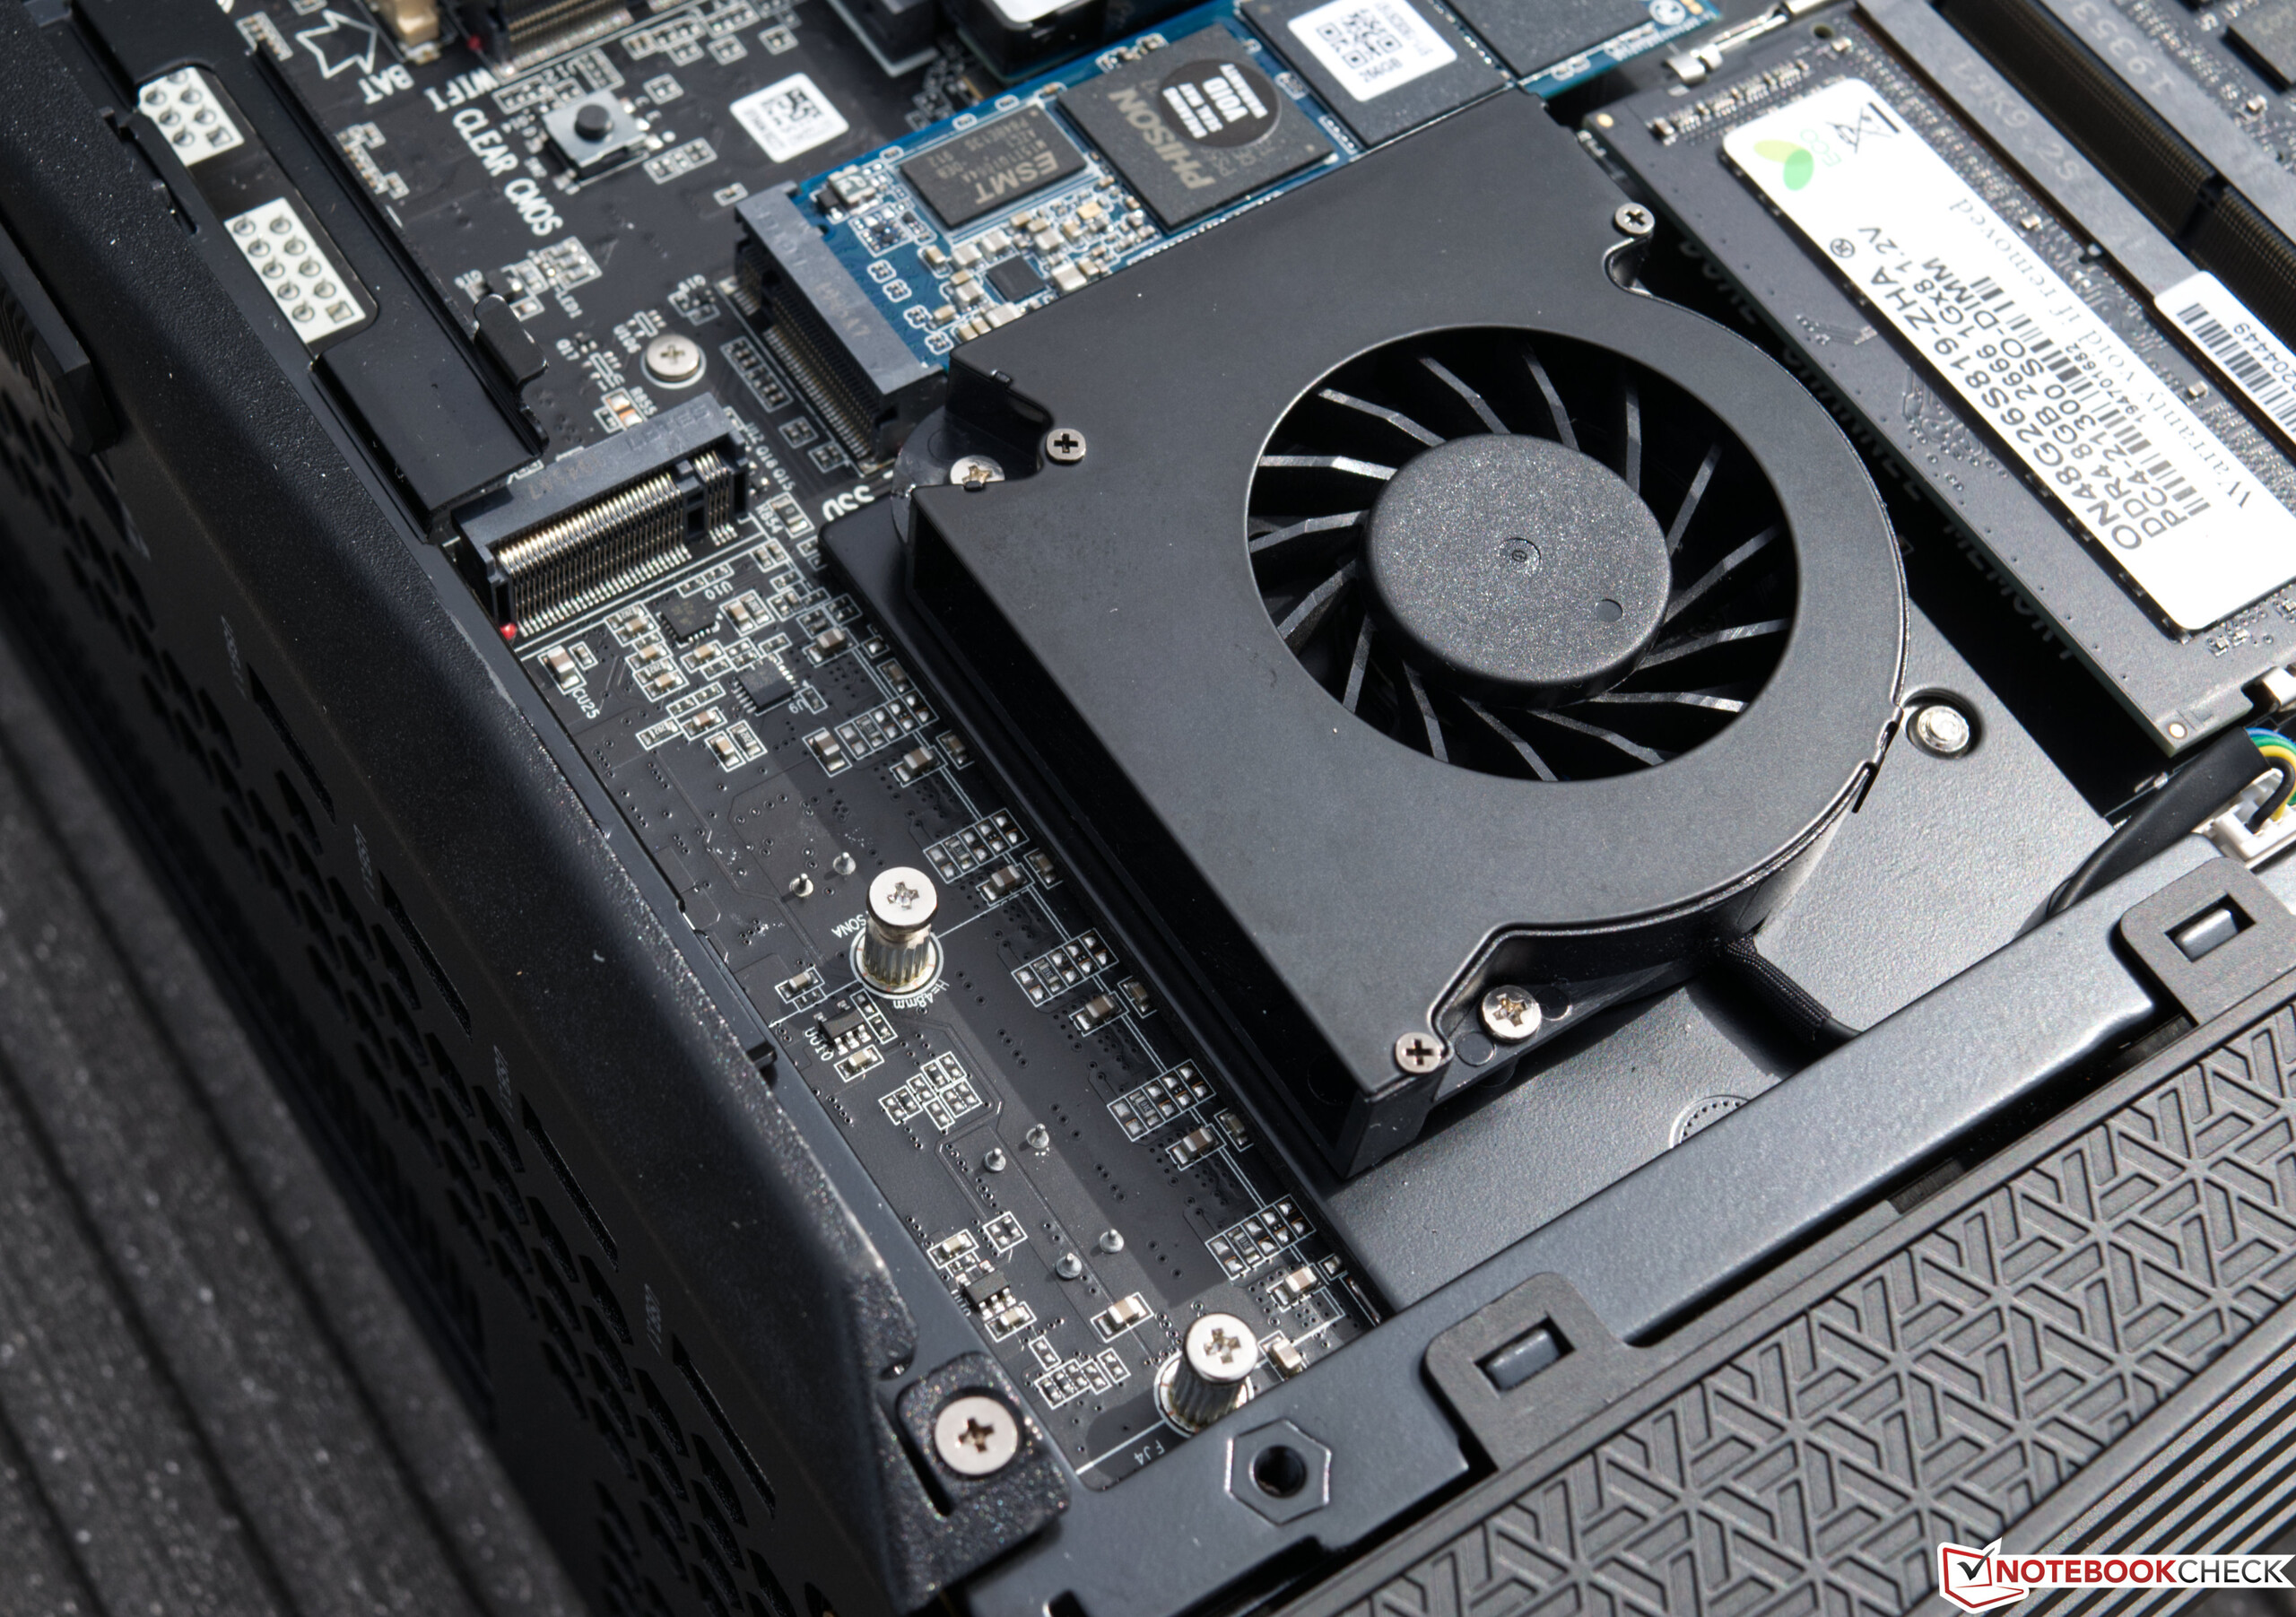
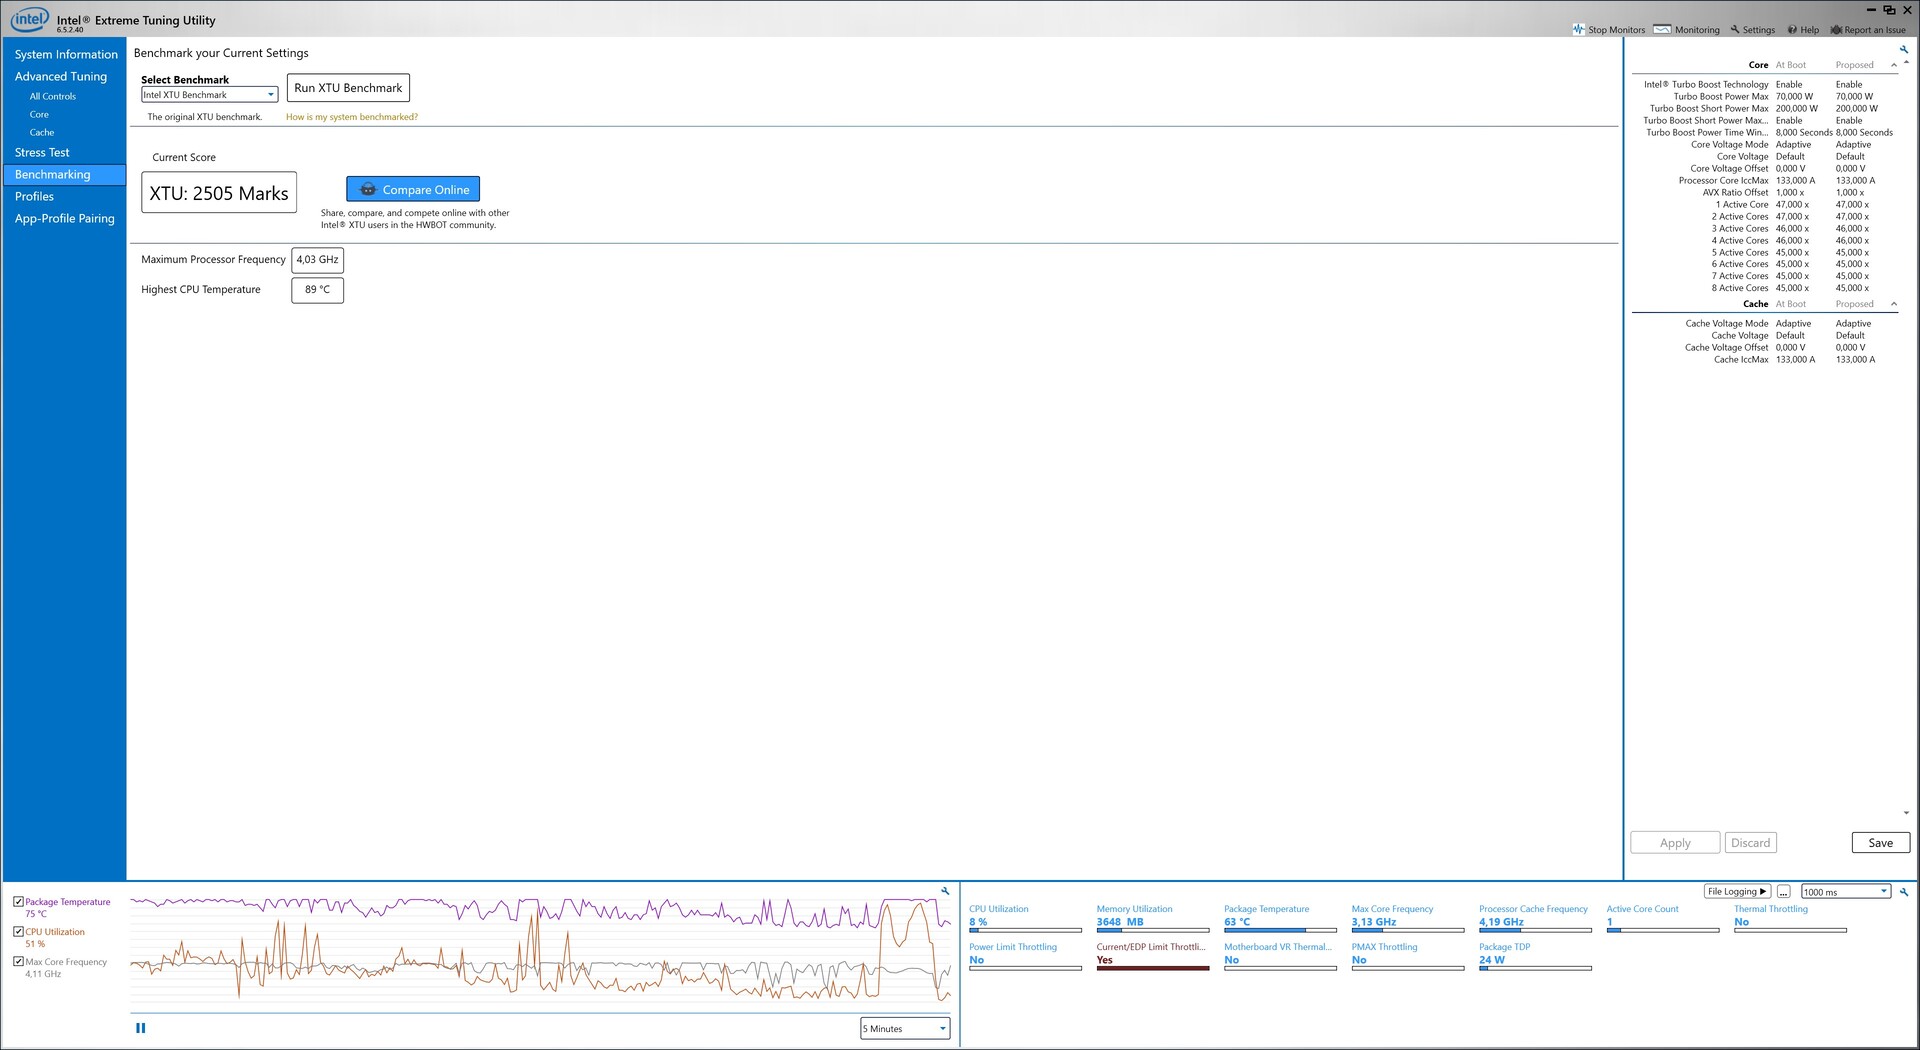
Al igual que otros mini PCs, Zotac también utiliza el efecto chimenea cuando se trata de enfriar. El aire frío es aspirado por la parte inferior y los lados y luego es empujado de nuevo hacia afuera por la parte superior y posterior. Sin embargo, el Intel Core i7-9700 alcanza una temperatura de 89 °C (192 °F) en la prueba de esfuerzo. El sistema de refrigeración llega a sus límites en este escenario extremo, lo que también se refleja en el volumen total del sistema. Observamos 53,8 dB(A) en la prueba de esfuerzo. Como resultado, el dispositivo es claramente audible aunque los ventiladores se ralenticen rápidamente tras la finalización de la prueba. El volumen medido fue de sólo 49,77 dB(A) durante el juego. Estos son valores que, por lo demás, sólo se ven en los portátiles para juegos. Debido al rendimiento en este pequeño caso, desafortunadamente tienes que vivir con una mayor emisión de ruido.
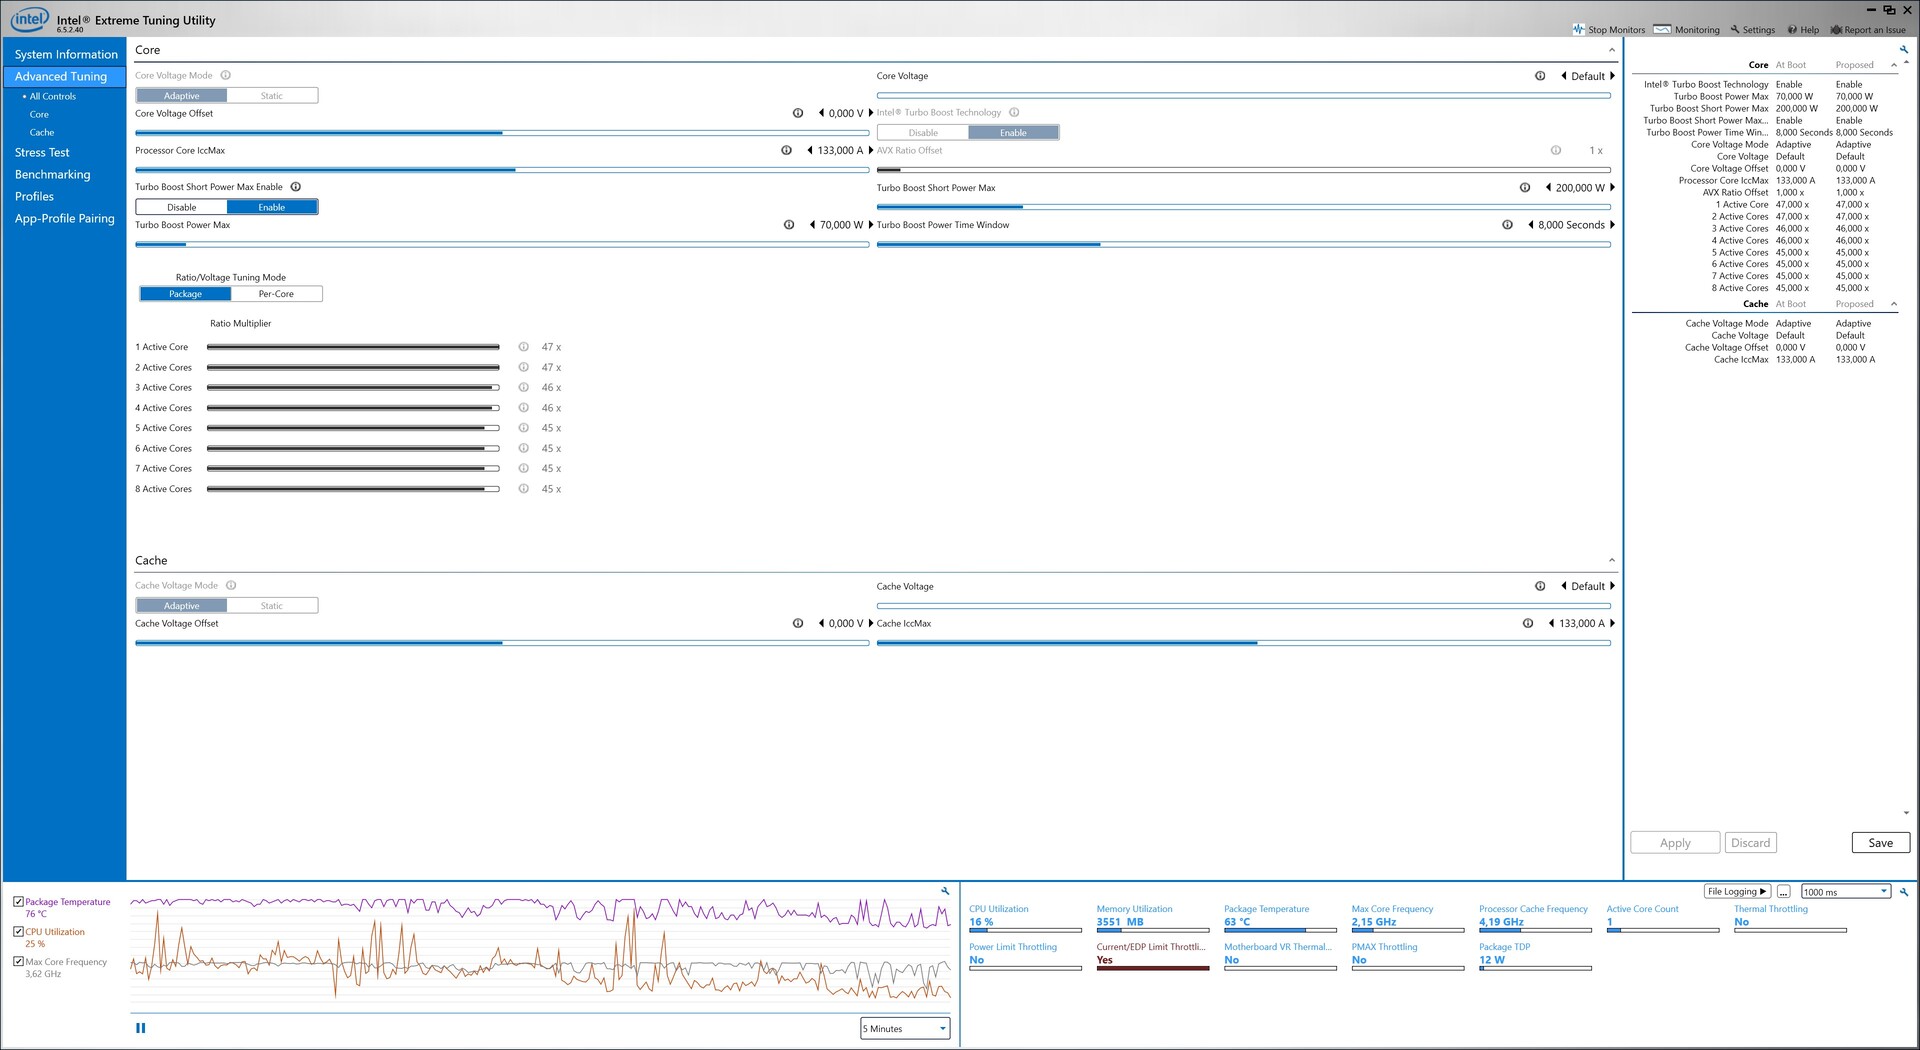
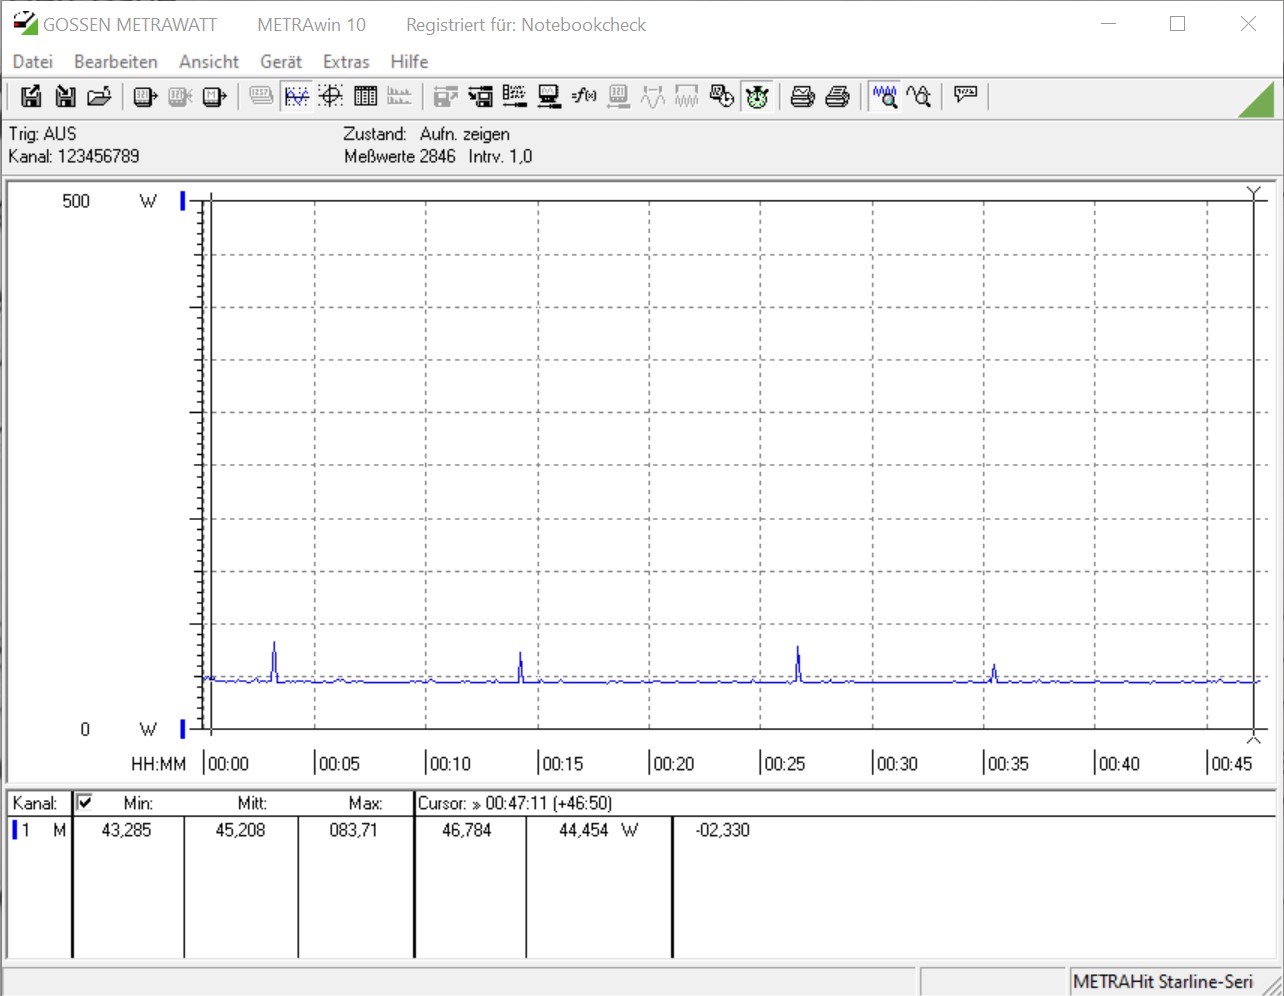
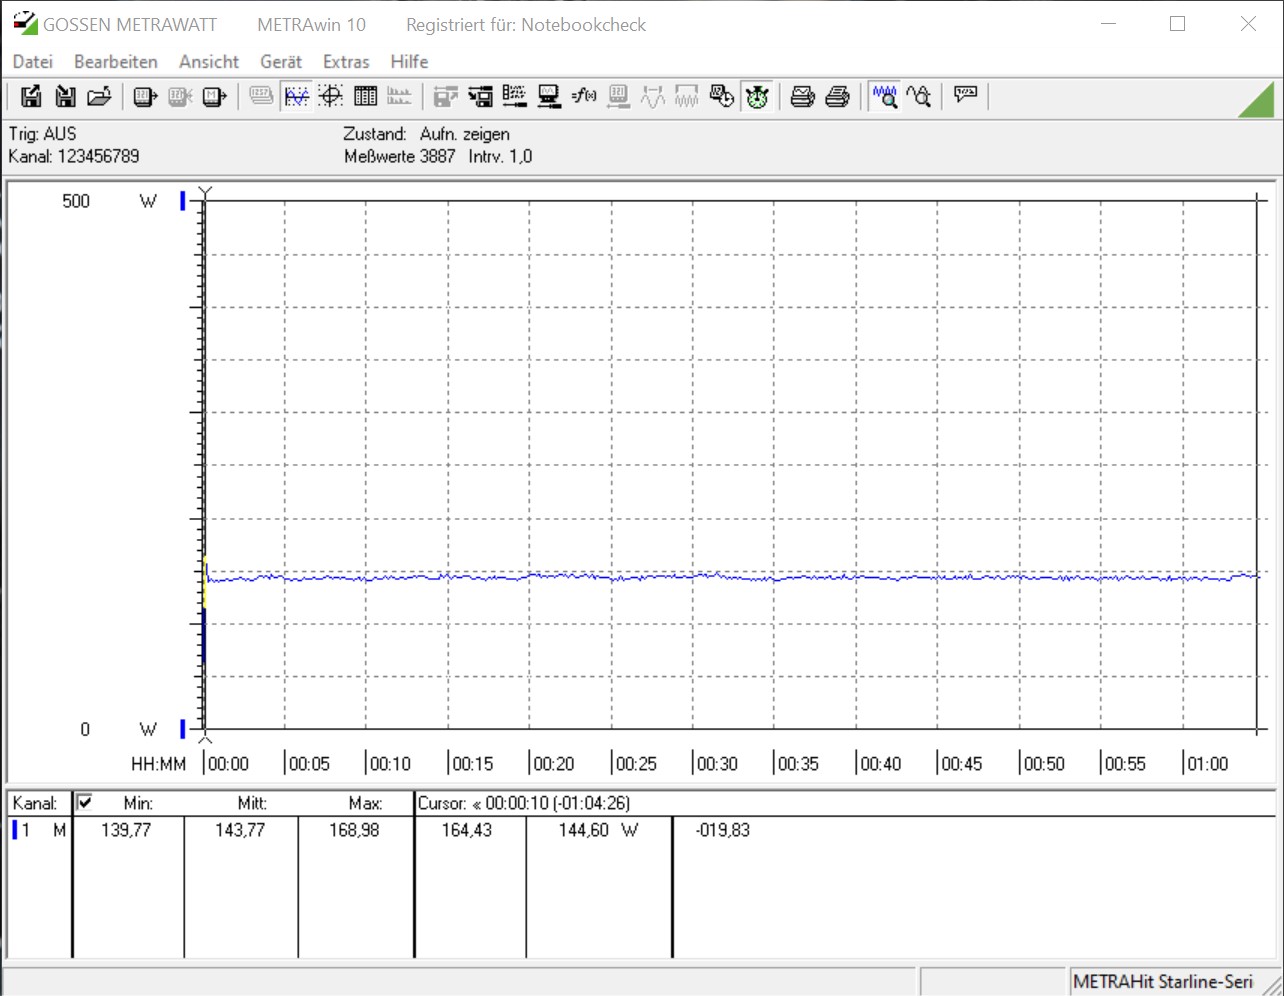
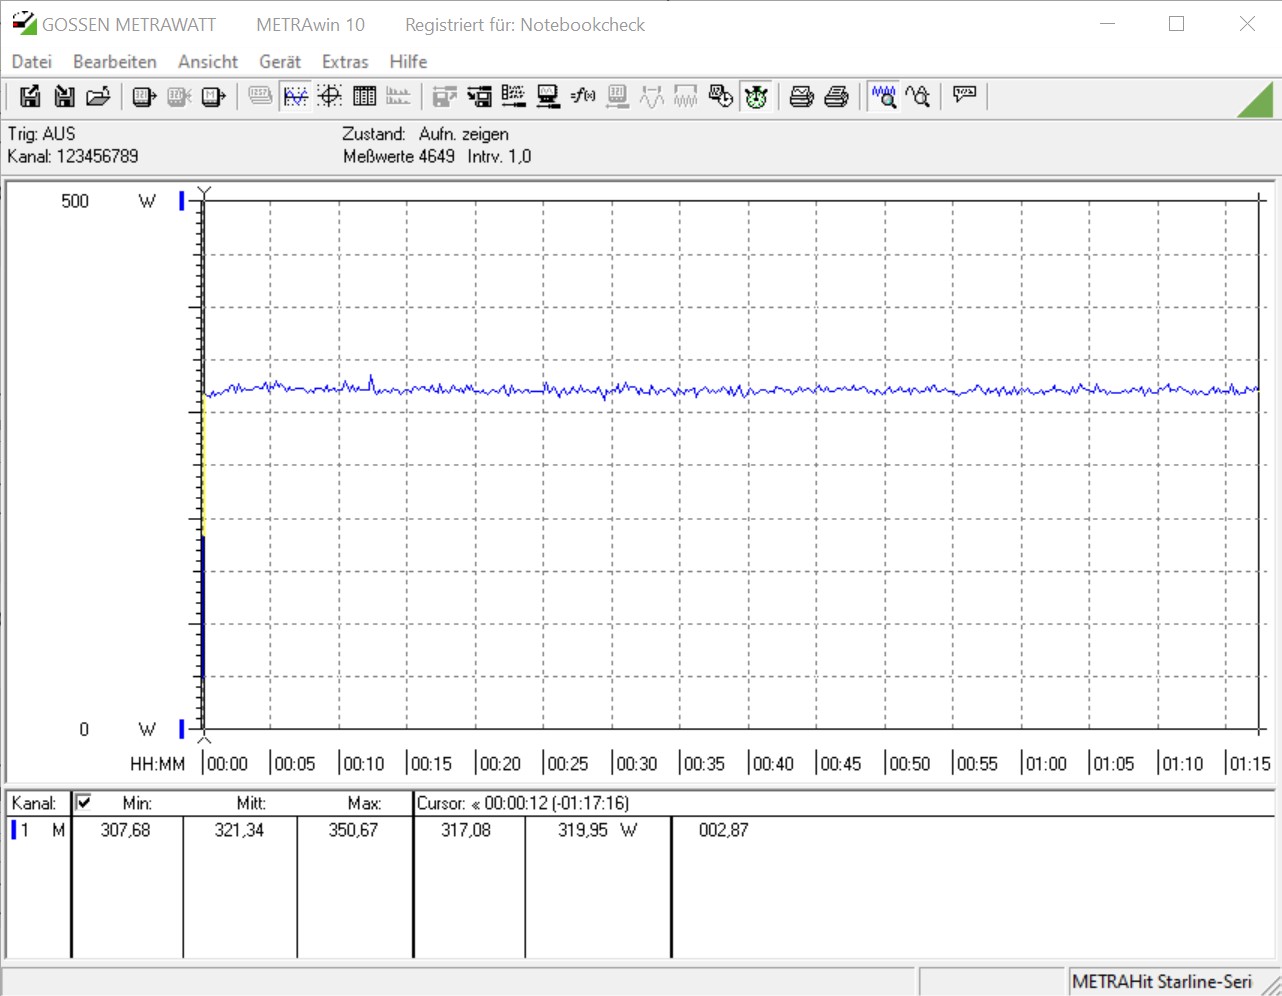
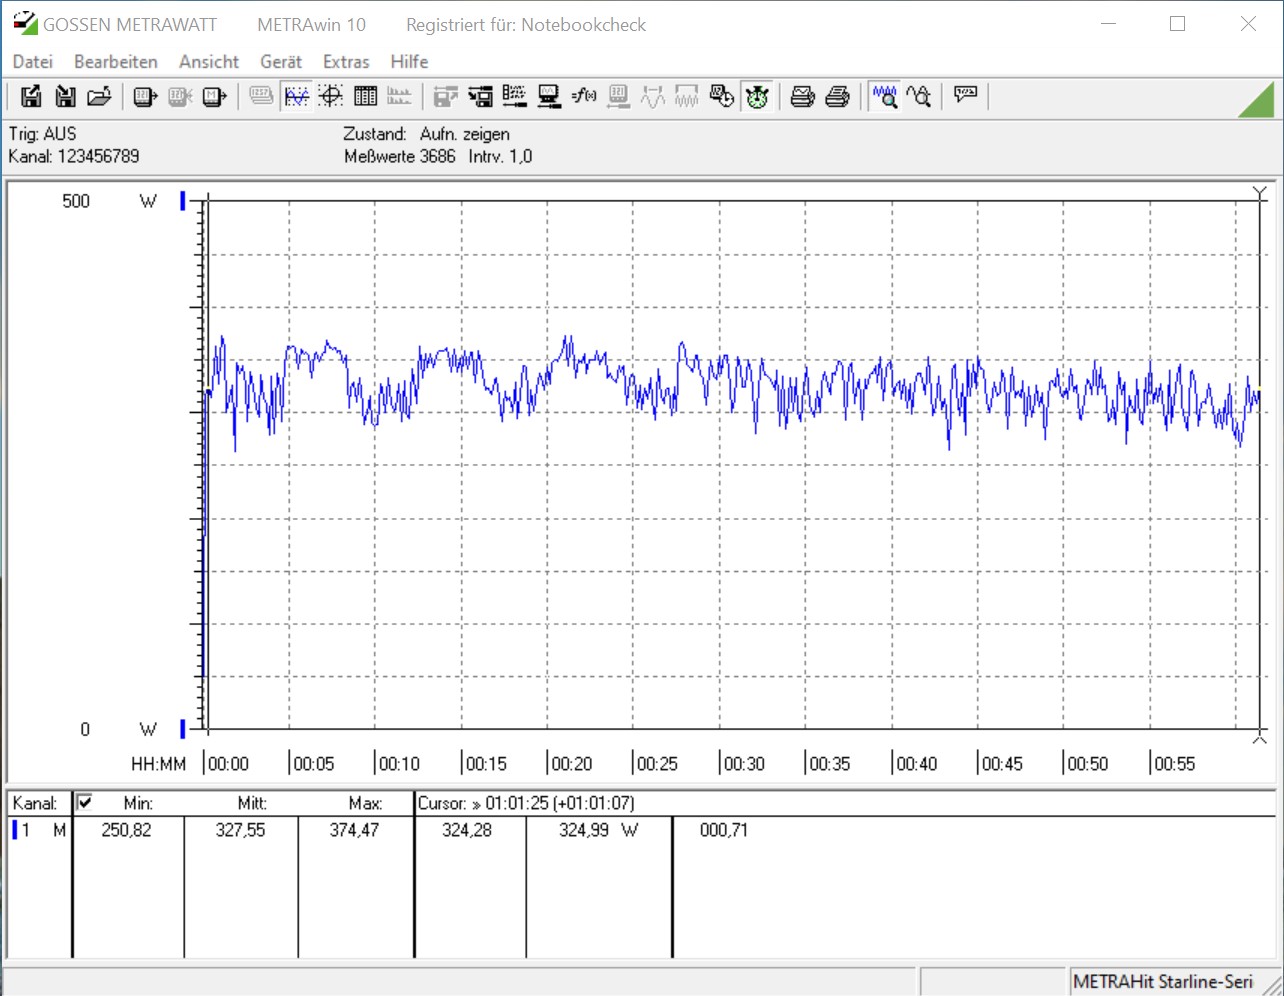
En cuanto al consumo de energía, el Zotac MEK MINI obtiene puntos con un consumo moderado en nuestras pruebas. El sistema necesita unos buenos 45 vatios en uso inactivo. Sin embargo, esto aumenta hasta 327 vatios de media en la prueba de esfuerzo. En los valores máximos, incluso medimos 374 vatios, lo que no es un problema para las dos fuentes de alimentación de 330 vatios, sin embargo. A 309 vatios cuando se juega, el sistema es sólo mínimamente más eficiente en cuanto a energía que en la prueba de esfuerzo.
Al mirar la tabla de comparación, debe tenerse en cuenta que aquí se utilizaron diferentes CPU y GPU, que se especifican en parte con un TDP significativamente más alto.
| Power Consumption | |
| 1920x1080 The Witcher 3 ultra (external Monitor) | |
| AMD Ryzen 9 3950X (Idle: 95 W) | |
| Intel Core i9-10900K (Idle: 52.3 W) | |
| Intel Core i5-10600K (Idle: 52.2 W) | |
| Intel Core i5 9400F (Idle: 57 W) | |
| Nvidia GeForce RTX 2070 Super (Idle: 92.6 W) | |
| KFA2 GeForce RTX 2070 Super Work The Frames (Idle: 94 W) | |
| Intel Core i3 9100F (Idle: 56 W) | |
| Intel Core i7-9700K, AMD Radeon RX Vega 64 | |
| Intel Core i5-9600K, AMD Radeon RX Vega 64 | |
| Corsair One i160 (Idle: 51.5 W) | |
| Nvidia GeForce RTX 2070 Super (96.8 fps, Idle: 80.5 W) | |
| Zotac MEK Mini (RTX 2070 Super) (Idle: 45.2 W) | |
| Prime95 V2810 Stress (external Monitor) | |
| Intel Core i9-10900K (Idle: 52.3 W) | |
| Intel Core i7-9700K, AMD Radeon RX Vega 64 | |
| Intel Core i5-10600K (Idle: 52.2 W) | |
| AMD Ryzen 9 3950X (Idle: 95 W) | |
| Intel Core i5-9600K, AMD Radeon RX Vega 64 | |
| Zotac MEK Mini (RTX 2070 Super) (Idle: 45.2 W) | |
| Intel Core i3 9100F (Idle: 56 W) | |
| Intel Core i5 9400F (Idle: 57 W) | |
| Cinebench R15 Multi (external Monitor) | |
| Intel Core i9-10900K (Idle: 52.3 W) | |
| AMD Ryzen 9 3950X (Idle: 95 W) | |
| Intel Core i7-9700K, AMD Radeon RX Vega 64 | |
| Intel Core i5-10600K (Idle: 52.2 W) | |
| Zotac MEK Mini (RTX 2070 Super) (Idle: 45.2 W) | |
| Intel Core i5-9600K, AMD Radeon RX Vega 64 | |
| Intel Core i5 9400F (Idle: 57 W) | |
| Intel Core i3 9100F (Idle: 56 W) | |
| Temperatures - CPU Temperature Prime95 | |
| Intel Core i9-10900K | |
| AMD Ryzen 9 3950X | |
| Zotac MEK Mini (RTX 2070 Super) | |
| Intel Core i3 9100F | |
| Intel Core i5-10600K | |
| Intel Core i5 9400F | |
* ... más pequeño es mejor
Pro
Contra
Veredicto - Una actuación fuerte que no obtendrá ningún punto de estilo
Con el MEK MINI de Zotac, los compradores obtienen un paquete completamente despreocupado que está listo para ser usado directamente de la caja. A diferencia de varios PCs barebone, que aún tienen que ser equipados con RAM, almacenamiento y una tarjeta gráfica, el modelo de Zotac viene en forma de MEK MINI. Como ya se ha mencionado, el sistema está disponible en dos configuraciones básicas. A grandes rasgos, se puede decir que el modelo menos costoso está más bien dirigido a los jugadores que juegan principalmente en 1080p, mientras que el modelo superior ofrece suficiente rendimiento para jugar en 1440p.
El MEK MINI fue capaz de obtener puntos en nuestra prueba con un sólido trabajo y rendimiento de juego, y la falta de volumen en la caja no afecta negativamente a la pequeña potencia en términos de rendimiento. Al contrario, el volumen del sistema, que es claramente audible bajo carga, ayuda a su rendimiento. Normalmente sólo alcanzamos estas tasas en nuestras mediciones con portátiles para juegos.
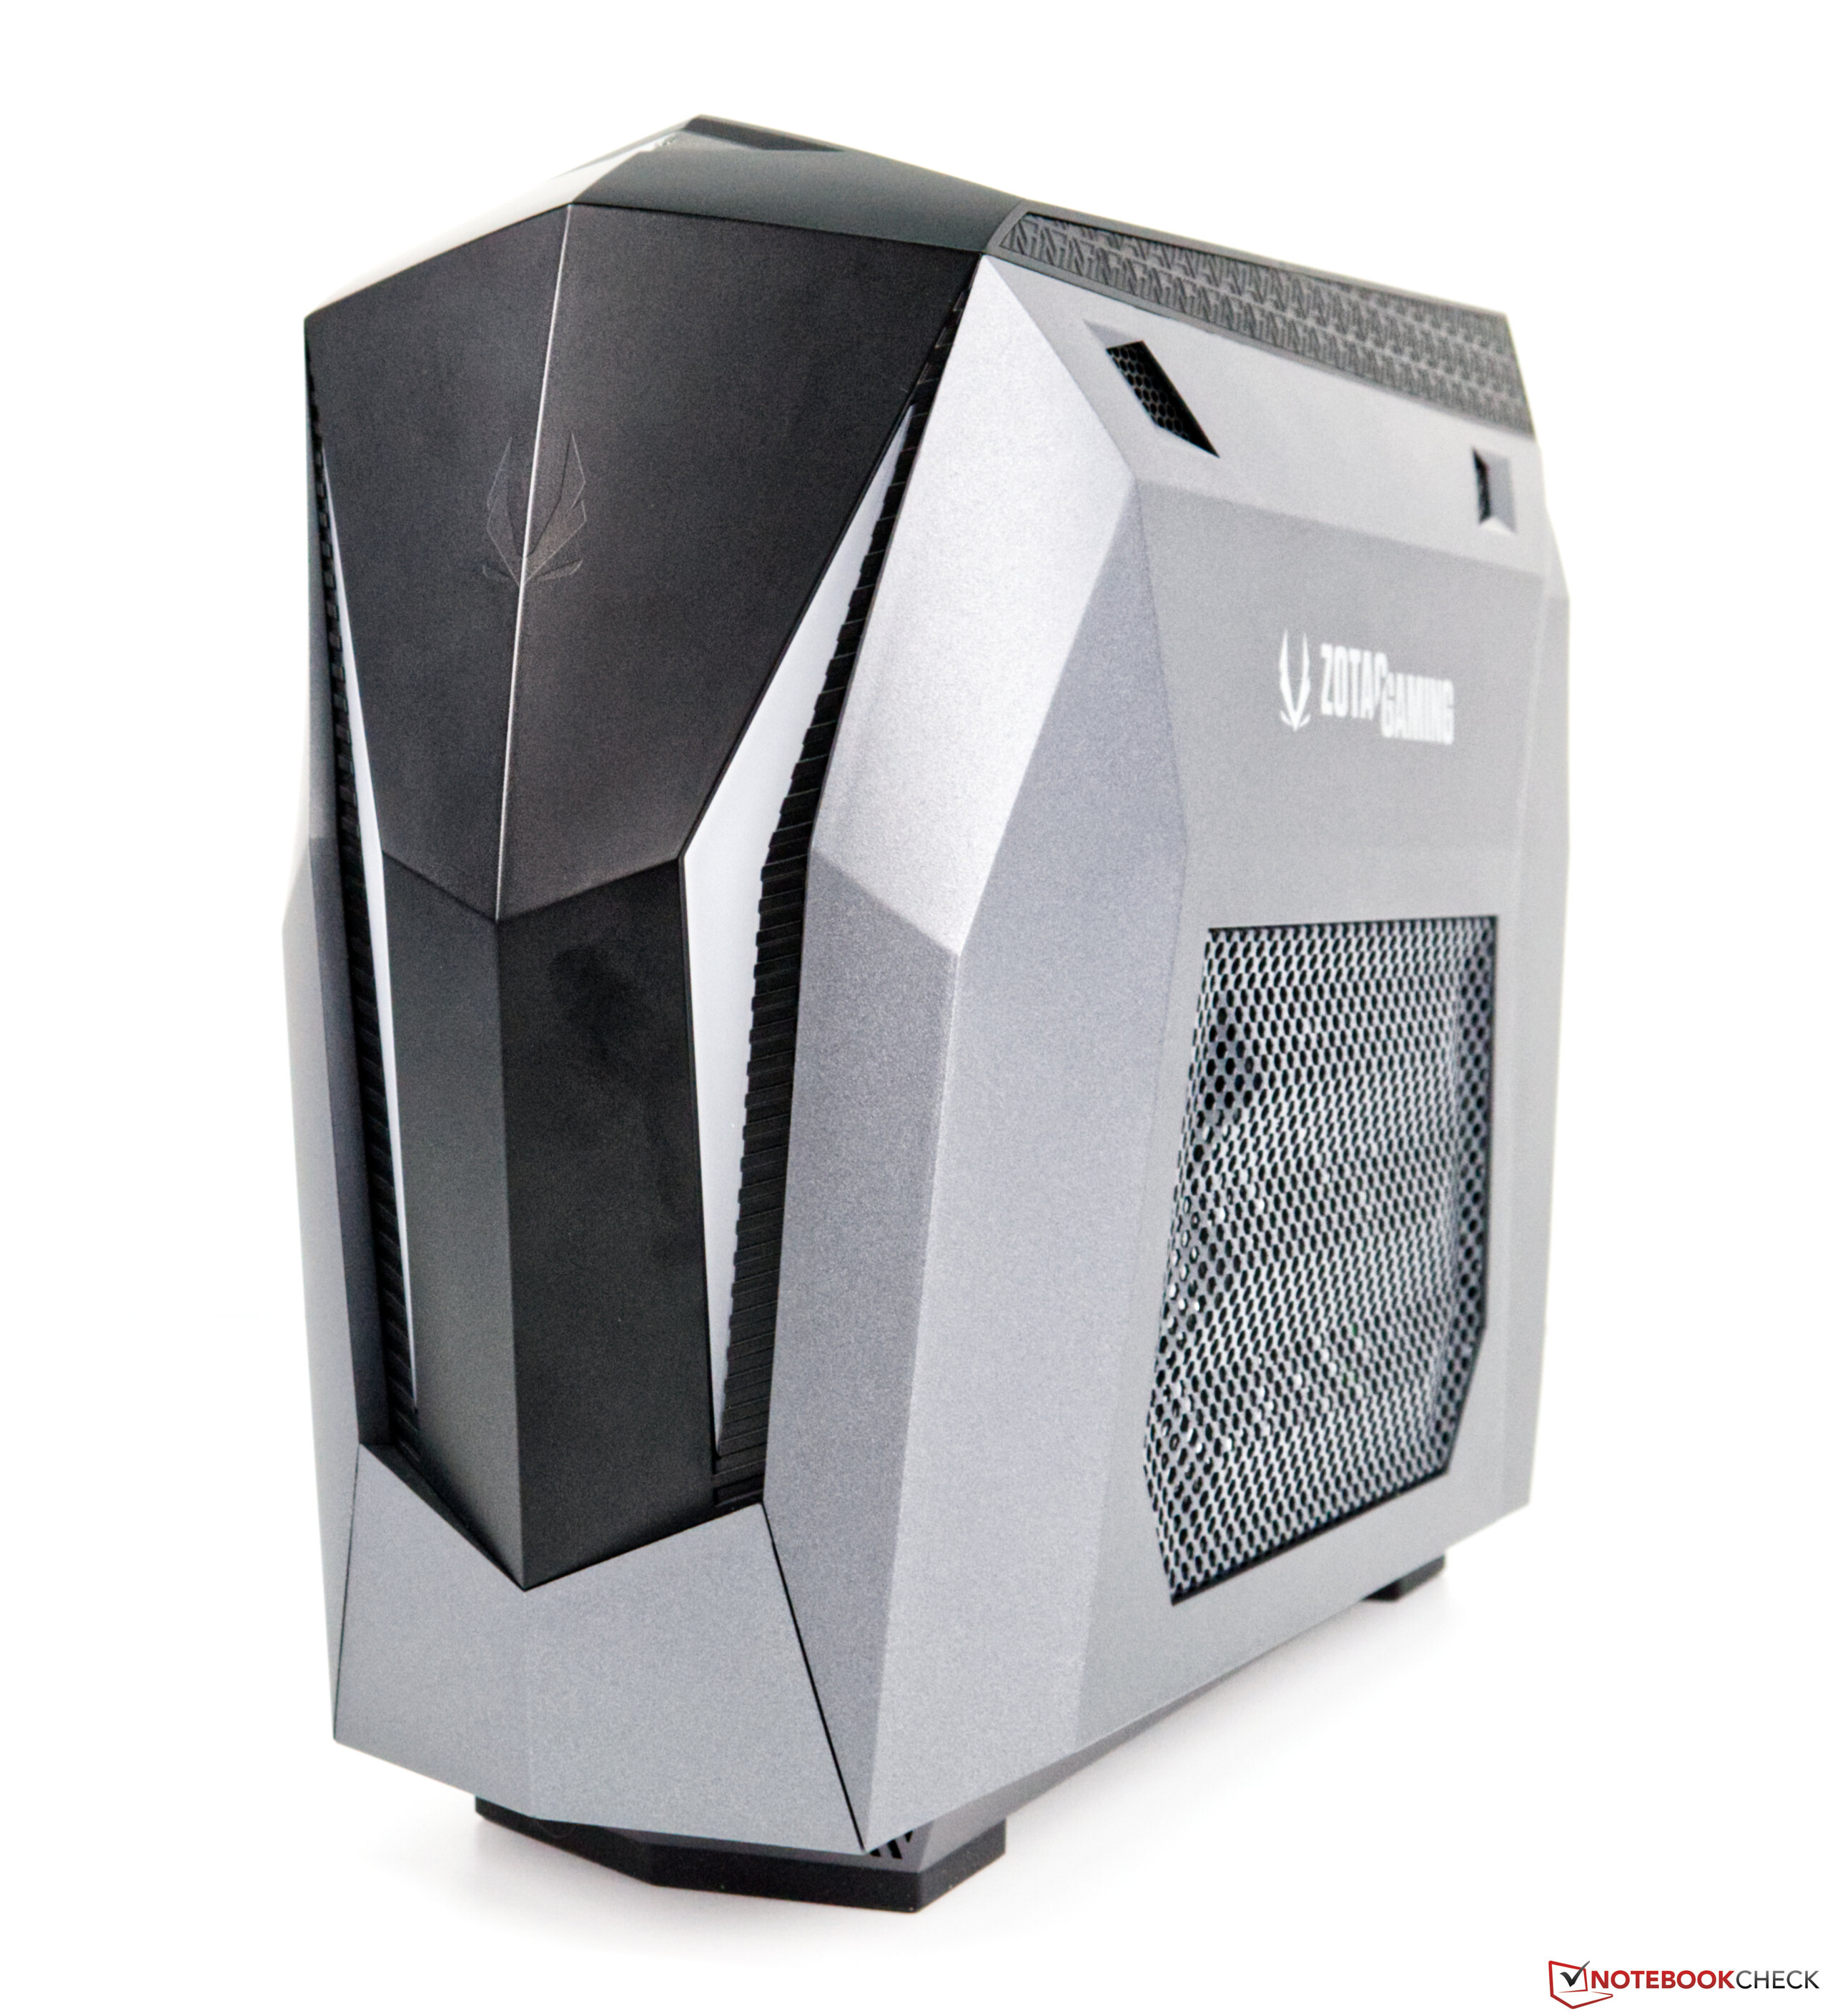
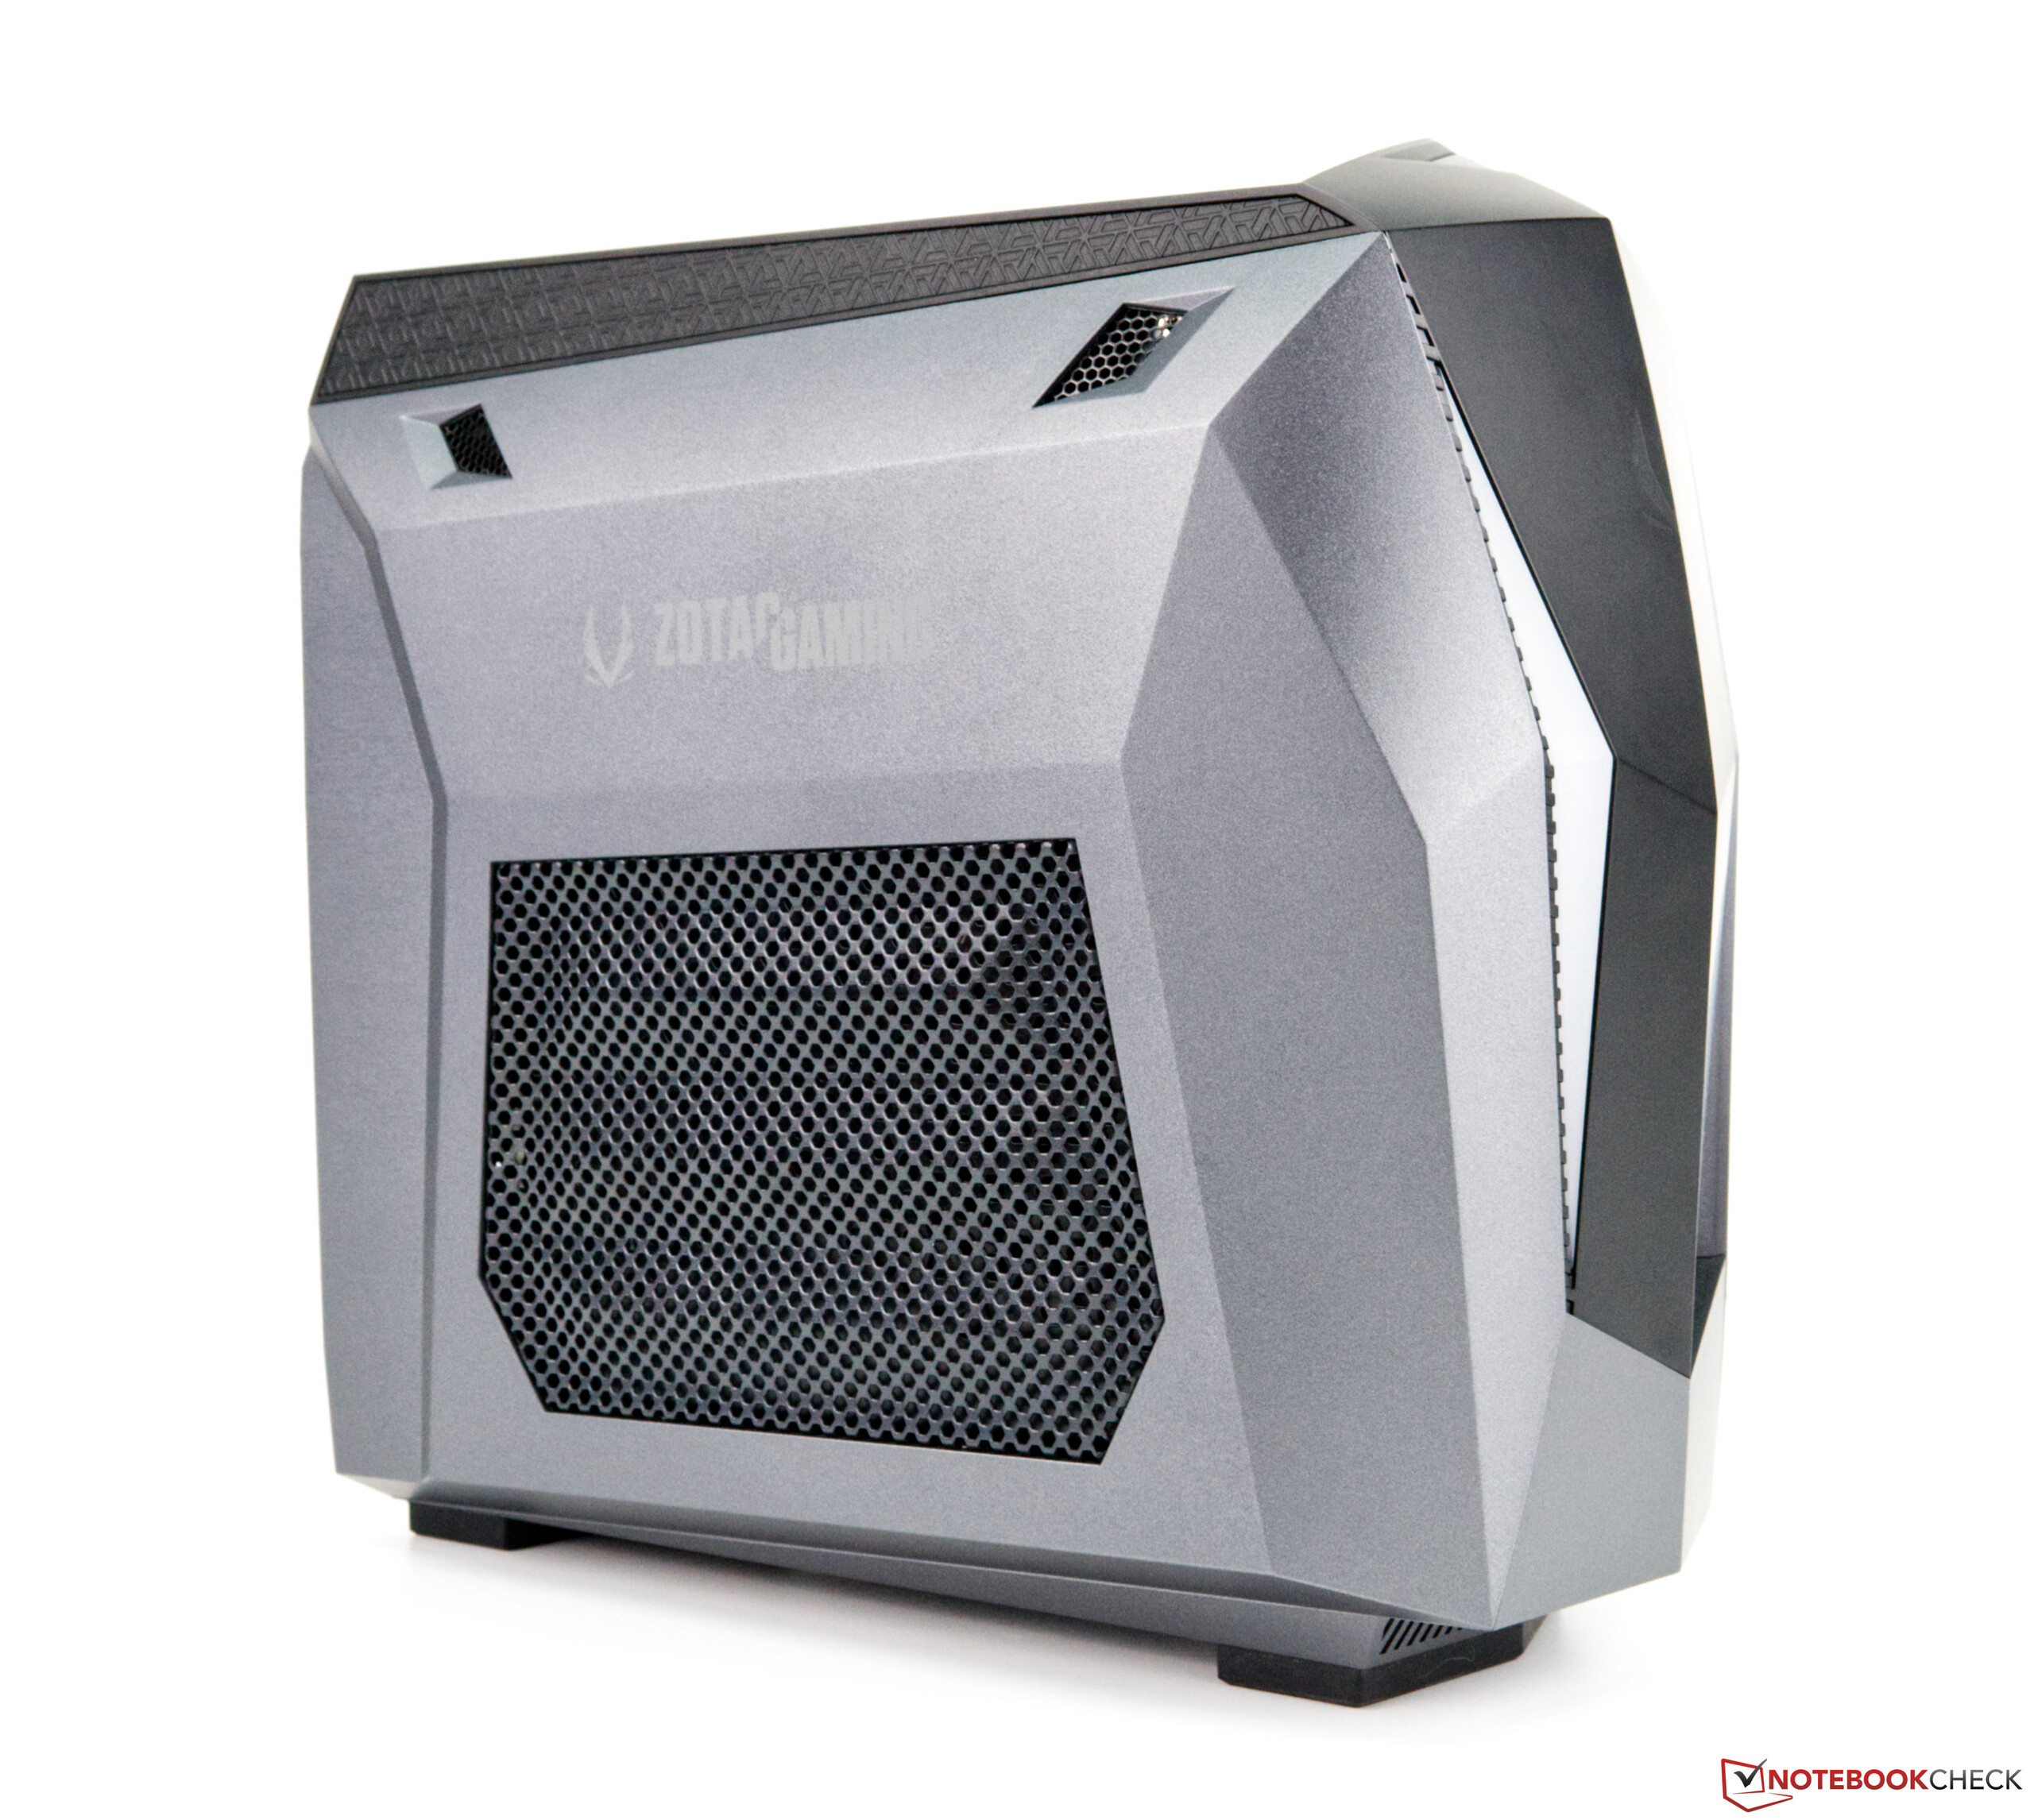
El MEK MINI está visualmente bien hecho y ofrece un muy buen rendimiento de juego a pesar de sus dimensiones compactas.
Por supuesto, tampoco hay que descuidar el aspecto, porque el pequeño PC atrae rápidamente la atención con su discreta iluminación RGB en la parte delantera. La caja de 9,18 litros, que es principalmente de plástico, tiene un diseño visualmente atractivo; sin embargo, la capacidad de mantenimiento del PC se resiente un poco porque casi todo el dispositivo tiene que ser desmontado para llegar a la tarjeta gráfica. Habría sido mucho más fácil si las dos tapas laterales se pudieran quitar fácilmente. Esto funciona bastante bien en el lado derecho para acceder a la RAM y al almacenamiento.
En resumen, sin embargo, se puede decir que Zotac ha mantenido la coherencia con el MEK MINI y ha vuelto a ofrecer, junto con los modelos ZBOX, un PC pre-construido adecuado para los juegos que utiliza componentes de escritorio completos para la CPU y la GPU. Además, el fabricante proporciona dos útiles programas, Spectra y Firestorm, para ajustar los ventiladores de la tarjeta gráfica o controlar el sistema de iluminación del frontal. El precio del modelo superior sigue estando dentro de un rango razonable, a poco menos de 1.500 Euros (~$1.683), aunque hay que aceptar un pequeño recargo en el precio en comparación con una construcción a medida.
Price comparison
