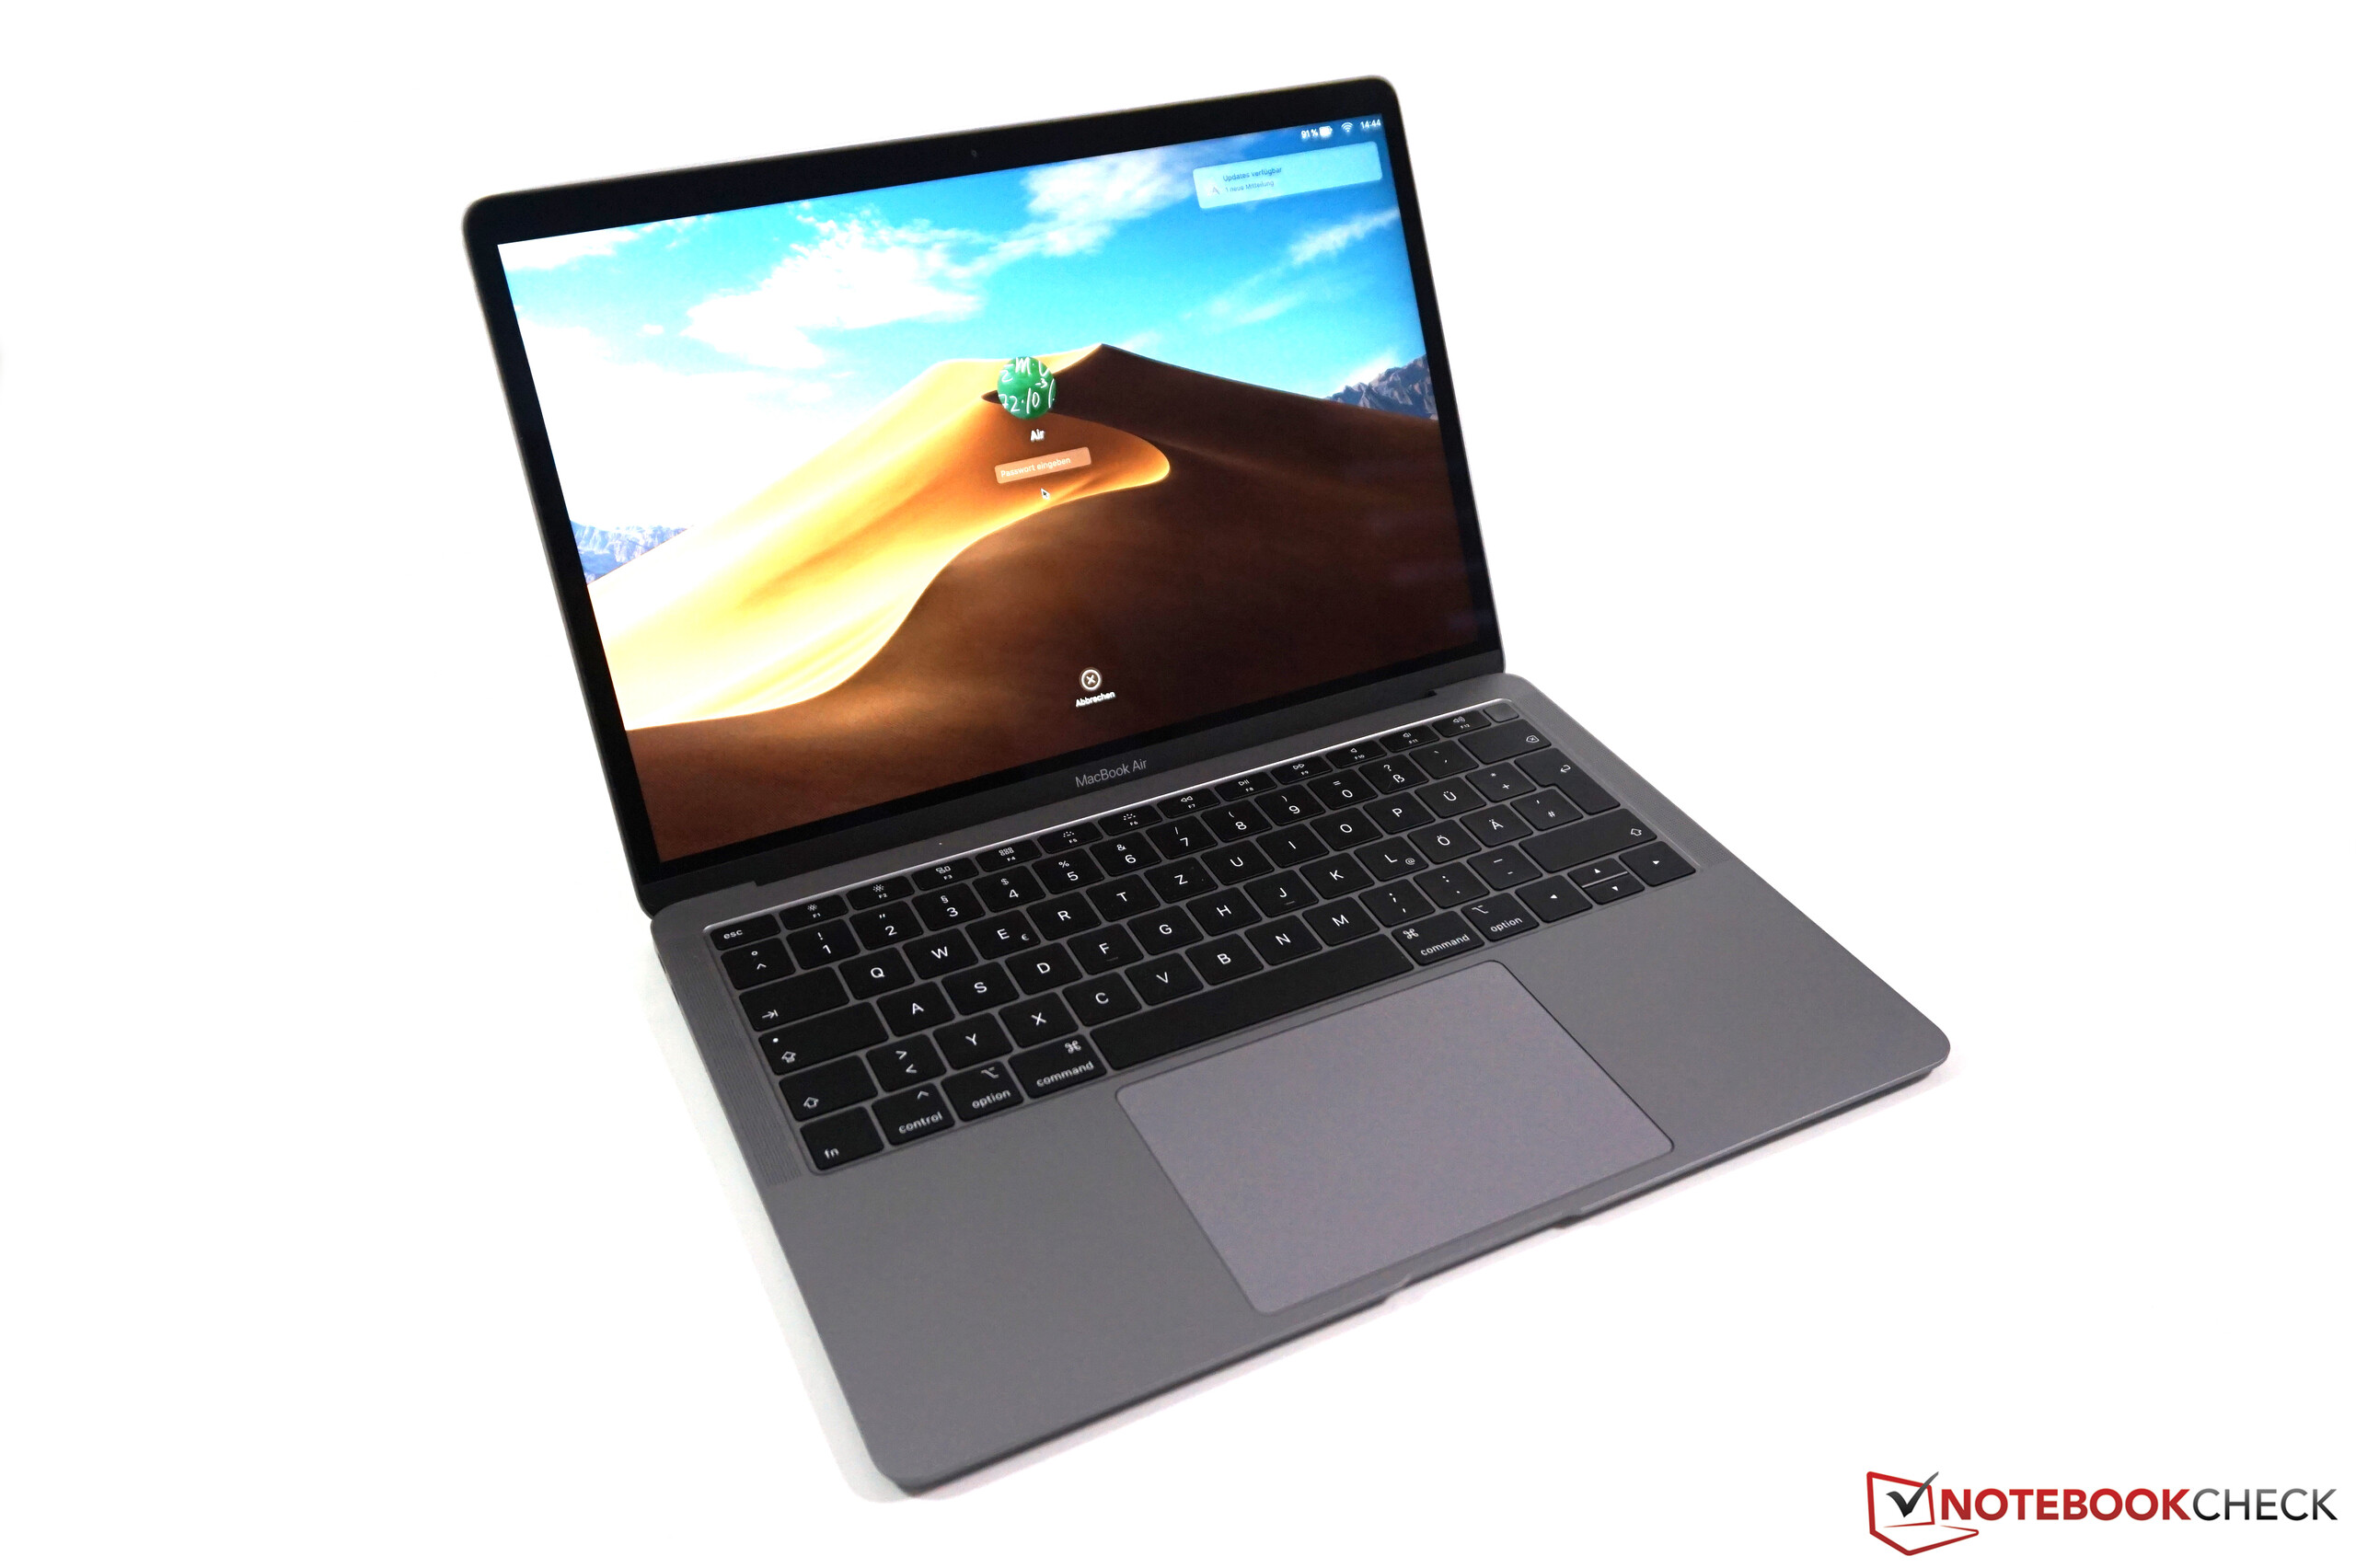
Review del Apple Macbook Air 2019: Ahora con True Tone, pero el ventilador sigue siendo molesto
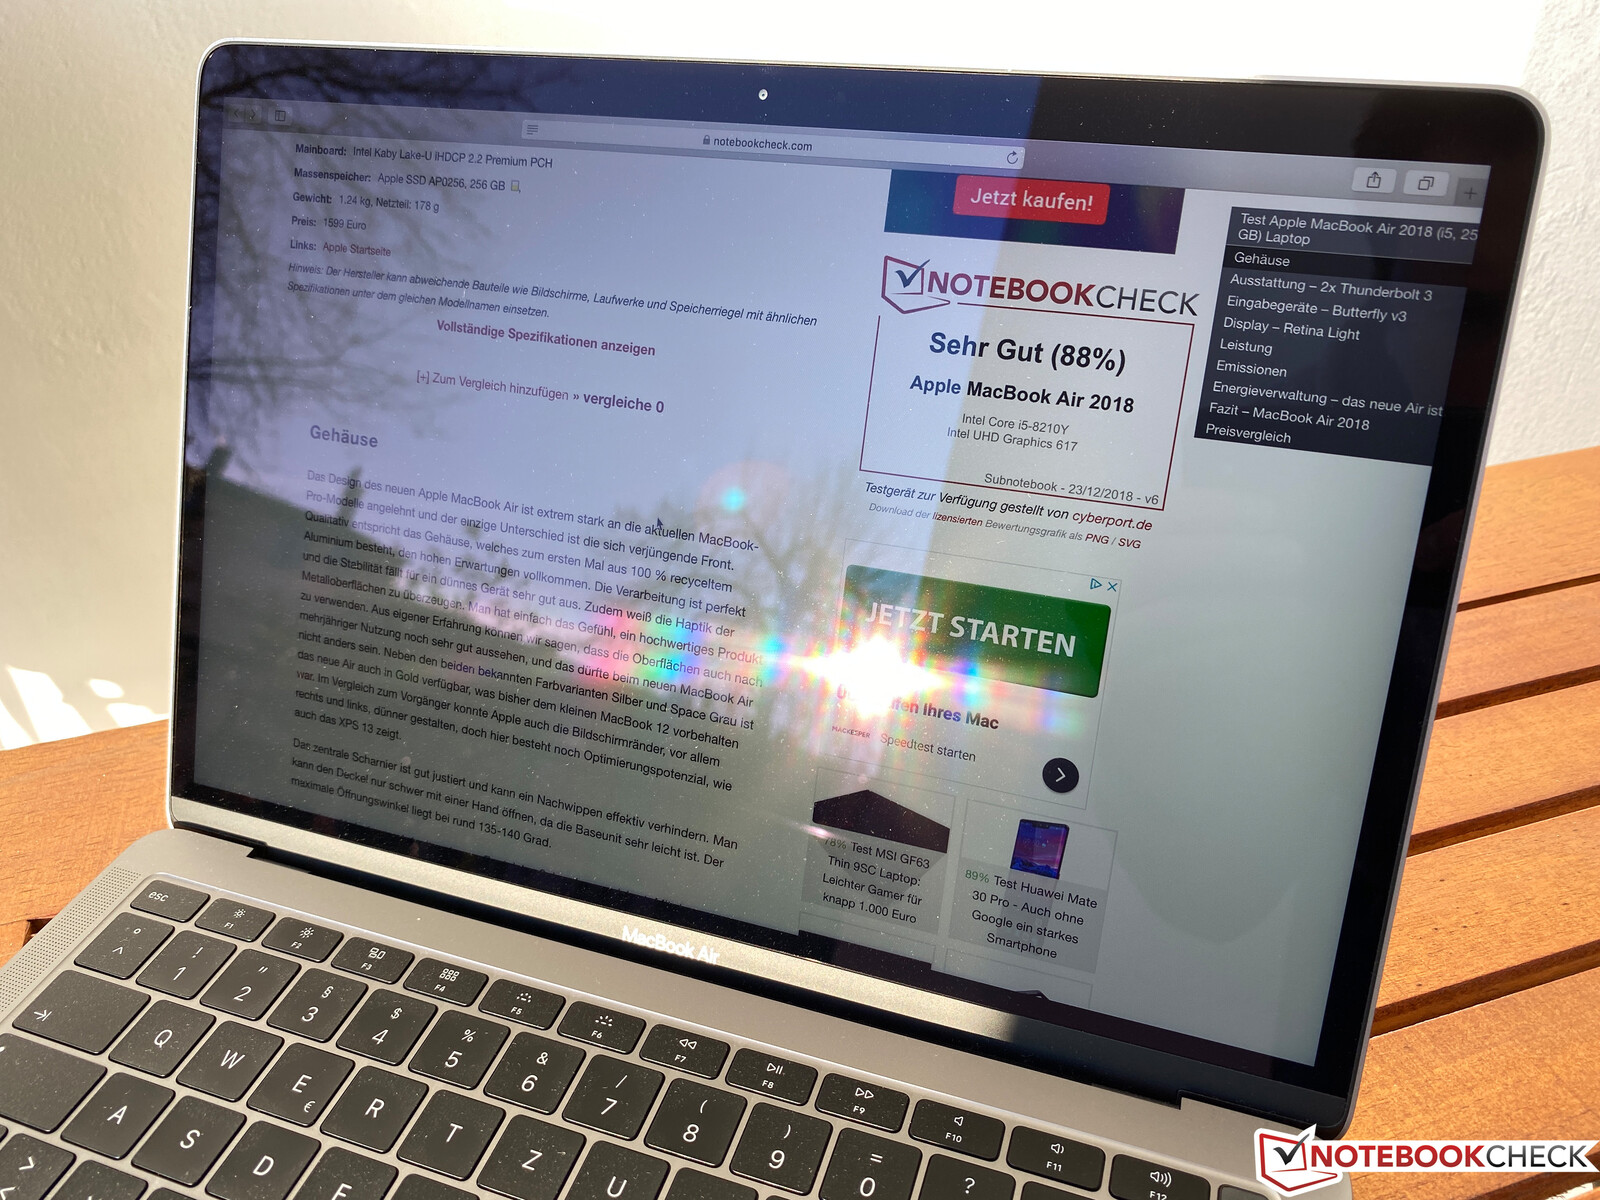
El MacBook Air sigue siendo el portátil más compacto de Apple, pero el MacBook Pro 13 es un poco más grueso y pesado. El modelo 2019 del Air también es 100 euros (~110 dólares) más barato que antes y empieza en 1249 euros (~1380) en la tienda oficial de Apple. Nuestra unidad de prueba es el SKU con 256 GB de almacenamiento por 1499 euros (~1657 dólares). Sin embargo, otros minoristas en línea a menudo venden este modelo por sólo 1299 Euros (~$1436).
Ni el chasis ni el procesador han cambiado, así que por favor eche un vistazo a nuestra revisión anterior del modelo 2018 para más información:
Valoración | Fecha | Modelo | Peso | Altura | Tamaño | Resolución | Precio |
|---|---|---|---|---|---|---|---|
| 85.6 % v7 (old) | 02/2020 | Apple Macbook Air 2019 i5-8210Y, UHD Graphics 617 | 1.3 kg | 15.6 mm | 13.30" | 2560x1600 | |
| 88 % v6 (old) | 02/2019 | Dell XPS 13 9380 2019 i5-8265U, UHD Graphics 620 | 1.2 kg | 11.6 mm | 13.30" | 3840x2160 | |
| 86 % v7 (old) | 07/2019 | Lenovo ThinkBook 13s-20R90071GE i5-8265U, UHD Graphics 620 | 1.3 kg | 15.9 mm | 13.30" | 1920x1080 | |
| 85.4 % v7 (old) | 01/2019 | Microsoft Surface Laptop 2-LQN-00004 i5-8250U, UHD Graphics 620 | 1.3 kg | 14.5 mm | 13.50" | 2256x1504 | |
| 88.1 % v6 (old) | 07/2017 | Apple MacBook Pro 13 2017 i5-7360U, Iris Plus Graphics 640 | 1.4 kg | 14.9 mm | 13.30" | 2560x1600 |
Comunicación - MacBook Air sin Wi-Fi 6
El MacBook Air es compatible con todos los estándares WLAN habituales, incluido el 802.11ac, pero lamentablemente no con el Wi-Fi 6. La velocidad de transferencia sigue siendo decente, entre 550 y 600 Mbps, y está a la par de la de sus rivales. Tampoco hemos notado ningún problema de conexión. Al igual que el modelo anterior, el dispositivo sólo es compatible con el antiguo estándar Bluetooth 4.2.
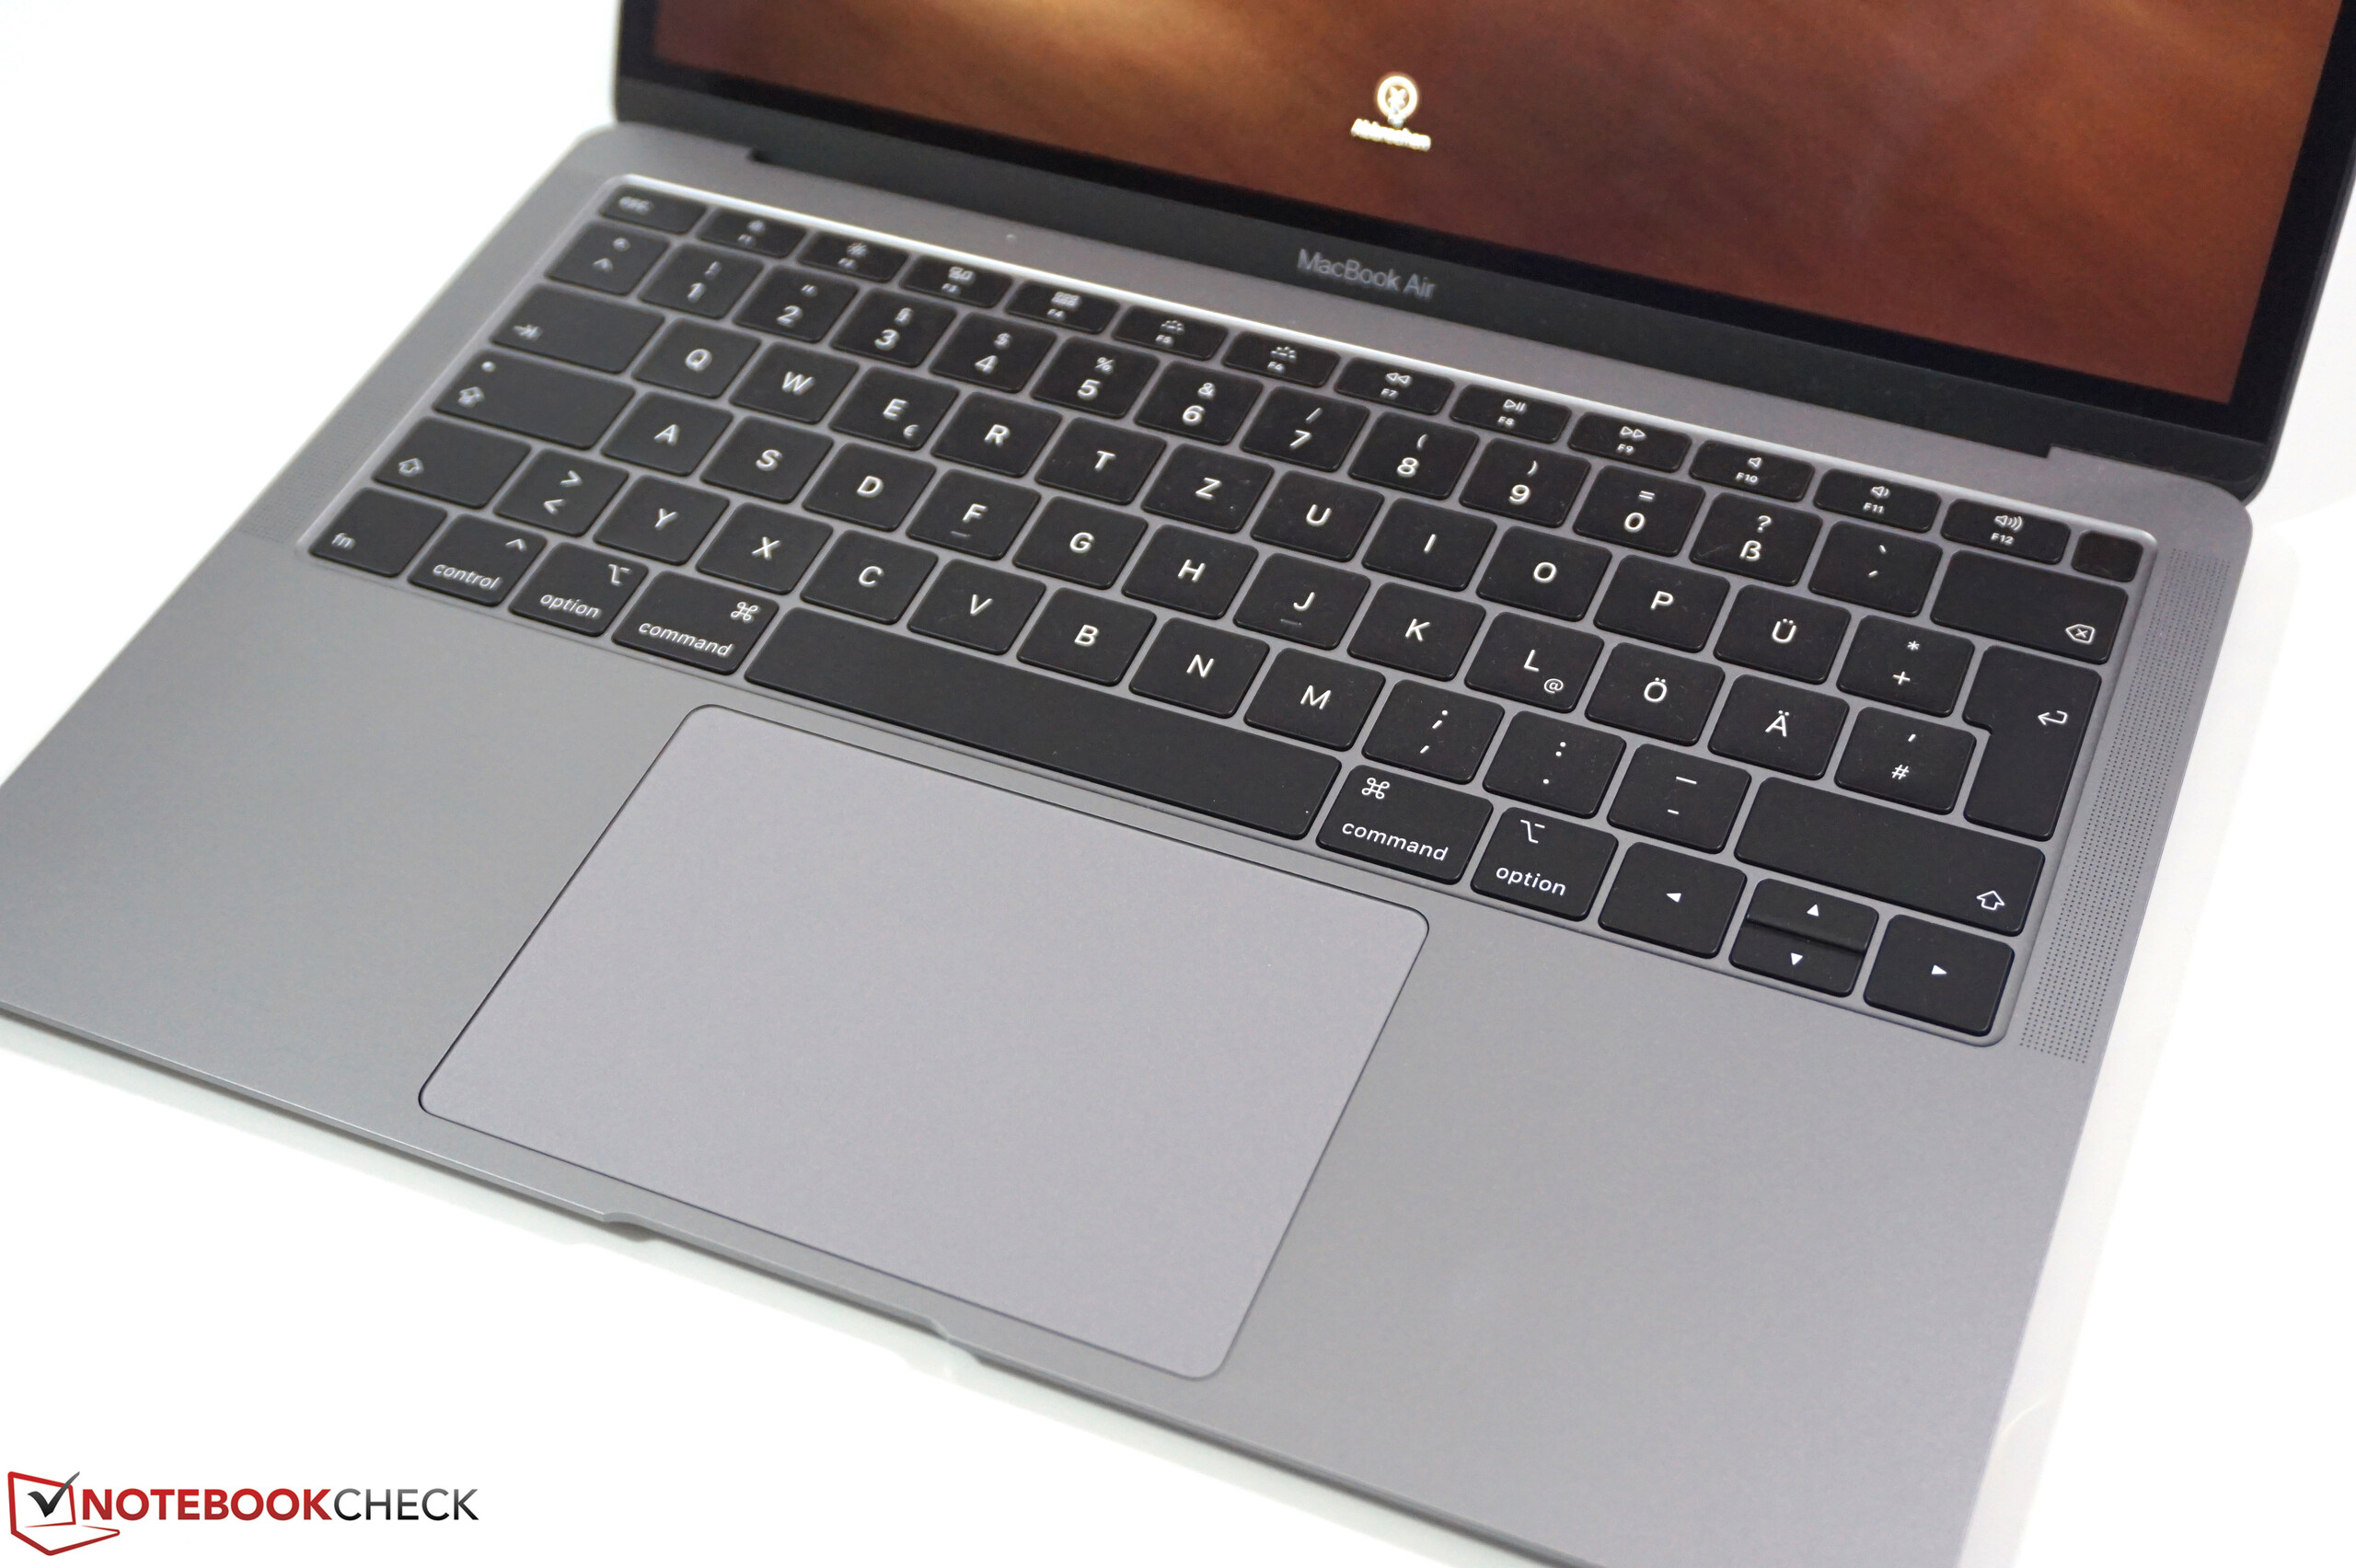
Dispositivos de entrada - MacBook Air todavía con Butterfly
Apple ha cambiado ligeramente el teclado del MacBook Air, pero básicamente sigue siendo el mismo teclado familiar de Mariposa con su muy preciso, pero muy poco profundo recorrido de teclas. Apple ha reemplazado el teclado del nuevo MacBook Pro 16 y también hay indicios de que el próximo MacBook Pro 13 recibirá la nueva entrada. Sin embargo, la altura del chasis es más importante para el MacBook Air, por lo que no estamos seguros de si el próximo modelo recibirá el nuevo teclado (que requiere más altura z). En este momento, el MacBook Air es también el último portátil de Apple con teclas de función físicas.

Pantalla - MacBook Air con True Tone y sRGB
La pantalla es uno de los pocos componentes con nuevas características para el modelo 2019. Después de que el MacBook Air 2018 2018 tuviera inicialmente problemas para alcanzar la luminancia anunciada de 400 Nits, Apple ofreció más tarde una actualización de software para mejorar un poco la situación (informamos). Esto ya no es un problema y nuestra unidad de prueba es más brillante que 400 Nits en algunos de los puntos de medición (393 Nits de media). Gracias a la alta resolución, se obtienen imágenes nítidas y la impresión general de la imagen es subjetivamente muy buena.
La verdadera novedad es la compatibilidad con True Tone, por lo que el MacBook Air puede ajustar automáticamente la temperatura del color en función del entorno. Esta es una buena característica y te acostumbrarás a ella muy rápidamente. Sin embargo, debes desactivar el Tono Verdadero si necesitas colores precisos (como la edición de imágenes).
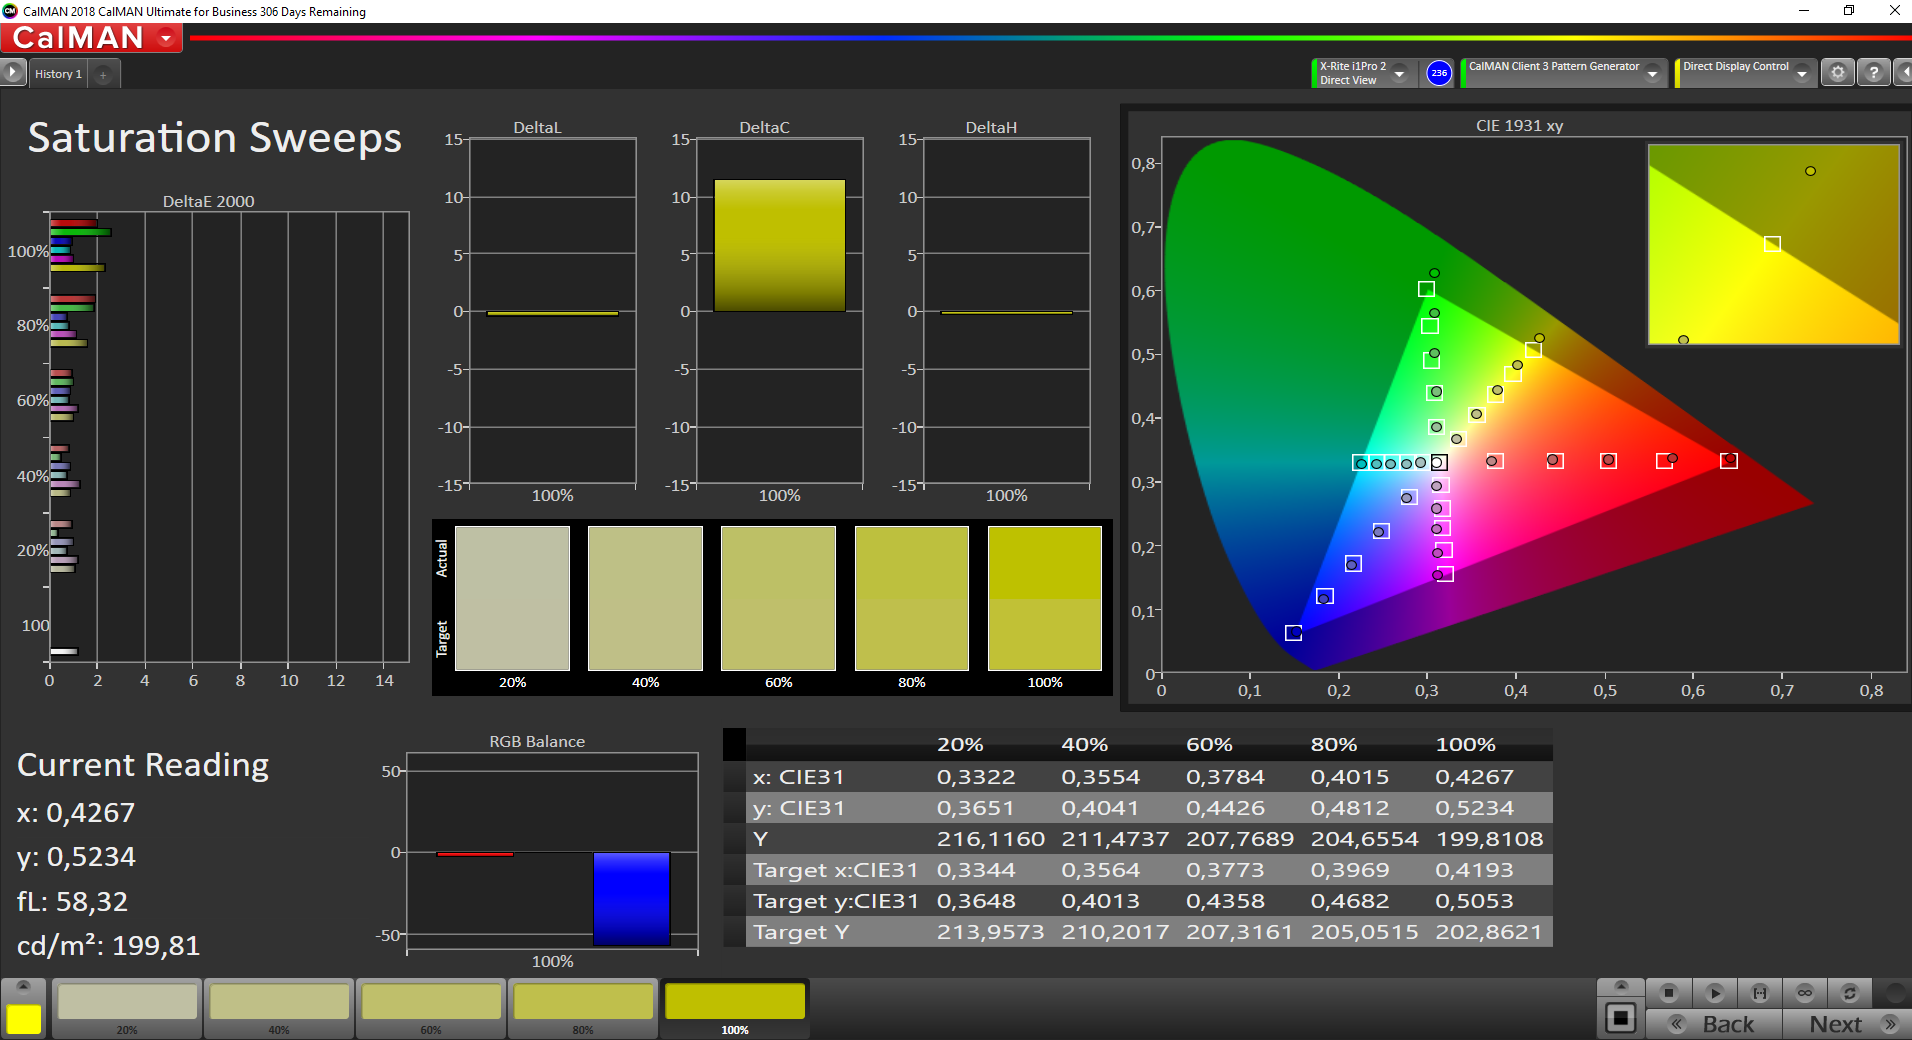
A pesar de la compatibilidad con True Tone, la pantalla sigue sin ser idéntica a la del MacBook Pro de 13", que admite la gama de colores P3 más amplia, mientras que el MacBook Air apunta al estándar RGB más pequeño.
| |||||||||||||||||||||||||
iluminación: 88 %
Brillo con batería: 421 cd/m²
Contraste: 1238:1 (Negro: 0.34 cd/m²)
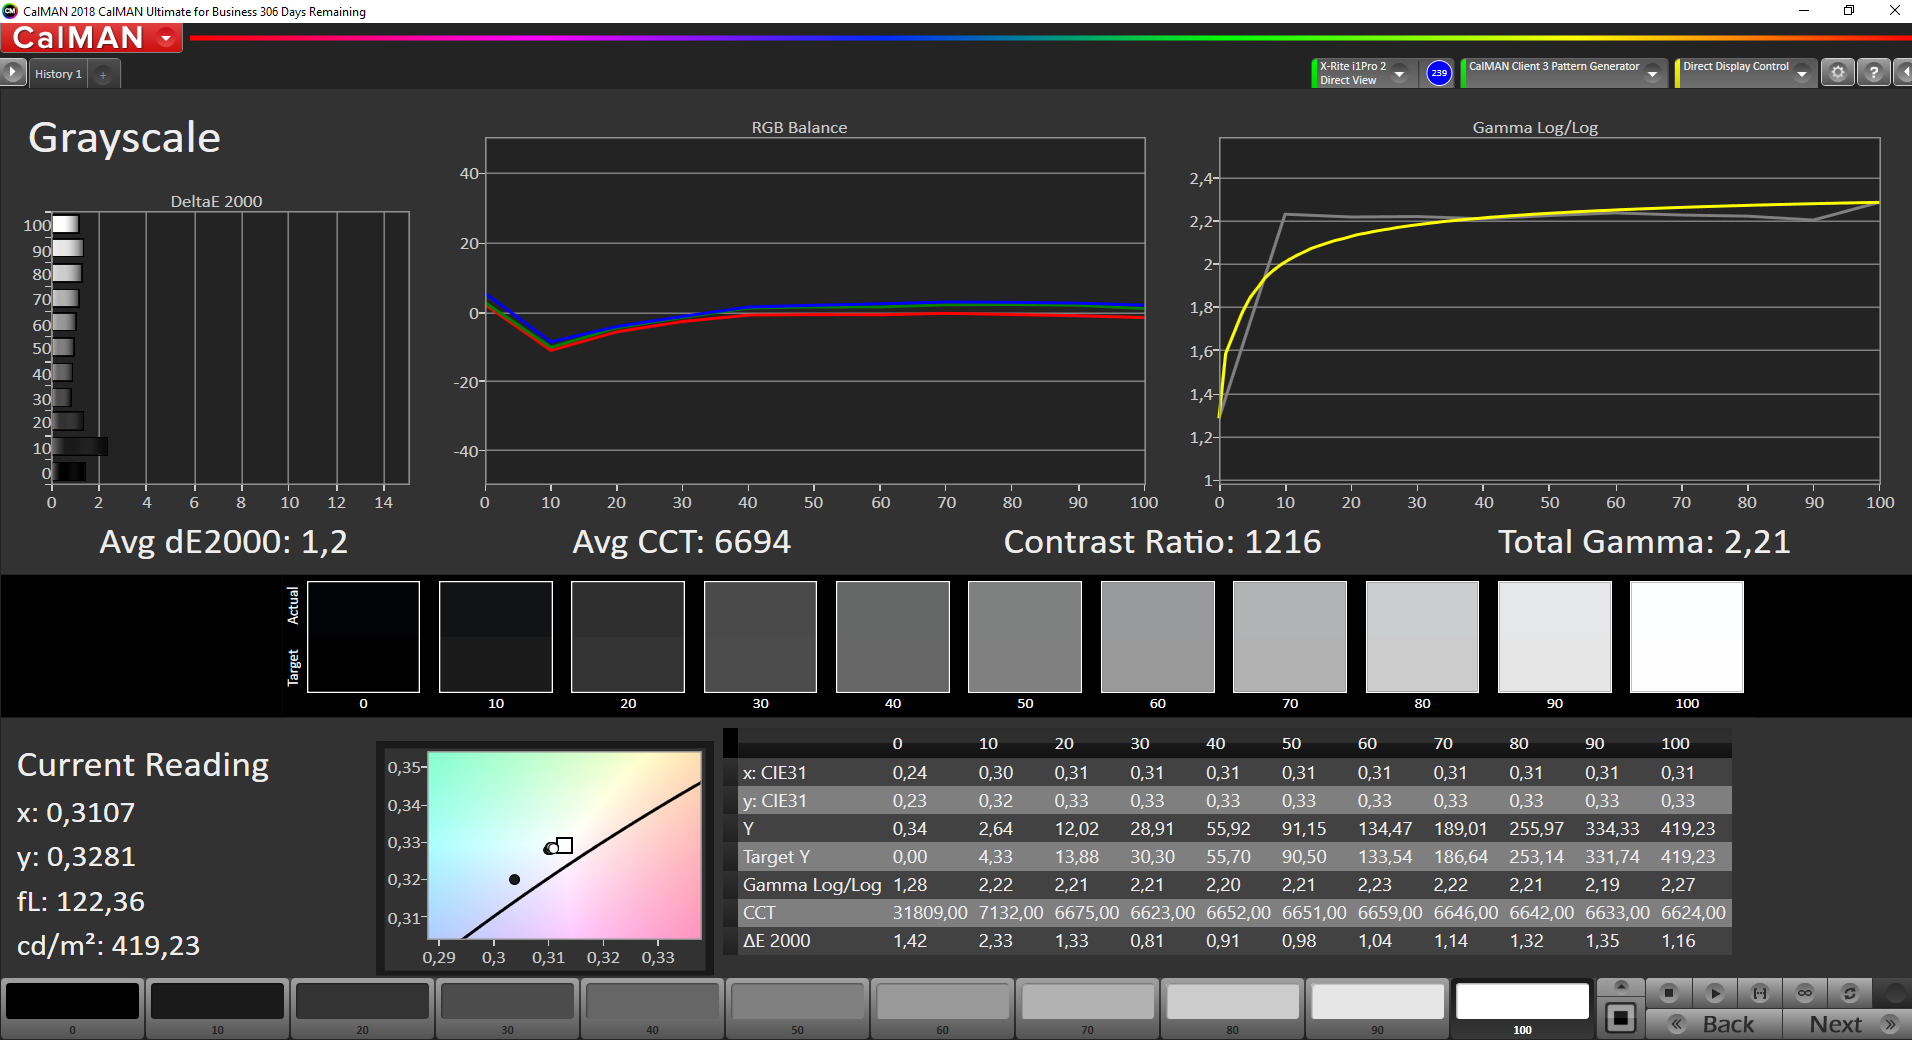
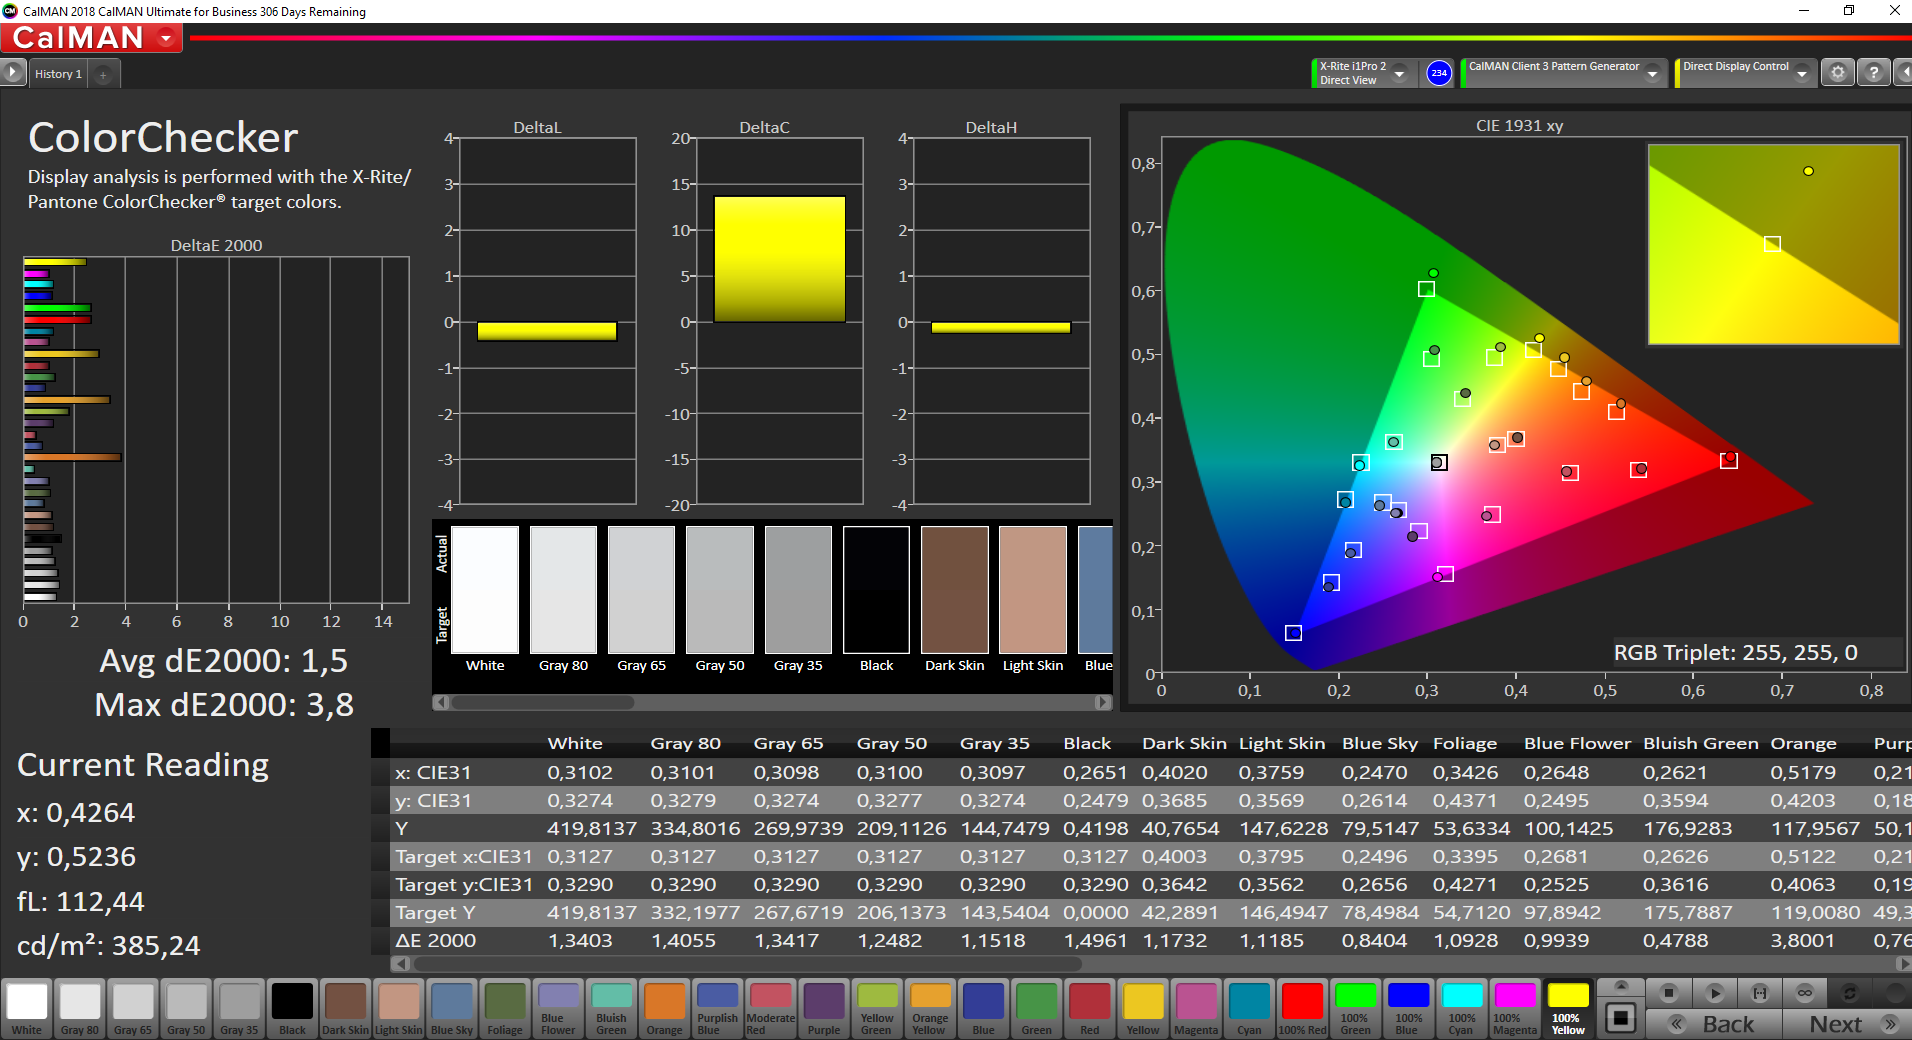
ΔE ColorChecker Calman: 1.5 | ∀{0.5-29.43 Ø4.71}
ΔE Greyscale Calman: 1.2 | ∀{0.09-98 Ø4.96}
94.6% sRGB (Argyll 1.6.3 3D)
61.3% AdobeRGB 1998 (Argyll 1.6.3 3D)
69.1% AdobeRGB 1998 (Argyll 3D)
94.7% sRGB (Argyll 3D)
67.4% Display P3 (Argyll 3D)
Gamma: 2.21
CCT: 6694 K
| Apple Macbook Air 2019 APPA041, IPS, 2560x1600, 13.3" | Dell XPS 13 9380 2019 ID: AUO 282B B133ZAN Dell: 90NTH, IPS, 3840x2160, 13.3" | Lenovo ThinkBook 13s-20R90071GE N133HCE-EN2, a-Si IPS LED, 1920x1080, 13.3" | Microsoft Surface Laptop 2-LQN-00004 VVX14T092N00, IPS, 2256x1504, 13.5" | Apple MacBook Pro 13 2017 APPA033, IPS, 2560x1600, 13.3" | |
|---|---|---|---|---|---|
| Display | -4% | 1% | 0% | 26% | |
| Display P3 Coverage (%) | 67.4 | 64.7 -4% | 67 -1% | 68 1% | 99.2 47% |
| sRGB Coverage (%) | 94.7 | 93.1 -2% | 99.1 5% | 94.7 0% | 99.9 5% |
| AdobeRGB 1998 Coverage (%) | 69.1 | 65.3 -5% | 69.2 0% | 69.2 0% | 87.1 26% |
| Response Times | -30% | 4% | -60% | 1% | |
| Response Time Grey 50% / Grey 80% * (ms) | 42.4 ? | 58 ? -37% | 40.4 ? 5% | 69.2 ? -63% | 42.8 ? -1% |
| Response Time Black / White * (ms) | 29.6 ? | 36 ? -22% | 28.8 ? 3% | 46.4 ? -57% | 28.8 ? 3% |
| PWM Frequency (Hz) | 111100 ? | 25000 ? | |||
| Screen | -55% | -36% | -40% | 3% | |
| Brightness middle (cd/m²) | 421 | 404 -4% | 319 -24% | 392 -7% | 588 40% |
| Brightness (cd/m²) | 393 | 389 -1% | 309 -21% | 390 -1% | 561 43% |
| Brightness Distribution (%) | 88 | 85 -3% | 92 5% | 89 1% | 92 5% |
| Black Level * (cd/m²) | 0.34 | 0.37 -9% | 0.28 18% | 0.24 29% | 0.45 -32% |
| Contrast (:1) | 1238 | 1092 -12% | 1139 -8% | 1633 32% | 1307 6% |
| Colorchecker dE 2000 * | 1.5 | 3.72 -148% | 2.4 -60% | 3.2 -113% | 1.7 -13% |
| Colorchecker dE 2000 max. * | 3.8 | 7.38 -94% | 6.3 -66% | 6.3 -66% | 3.5 8% |
| Greyscale dE 2000 * | 1.2 | 4.44 -270% | 3.8 -217% | 4.5 -275% | 1.9 -58% |
| Gamma | 2.21 100% | 2.34 94% | 2.16 102% | 2.2 100% | 2.33 94% |
| CCT | 6694 97% | 7095 92% | 7335 89% | 7556 86% | 6738 96% |
| Color Space (Percent of AdobeRGB 1998) (%) | 61.3 | 60 -2% | 63.5 4% | 63.9 4% | 77.92 27% |
| Color Space (Percent of sRGB) (%) | 94.6 | 93 -2% | 99.1 5% | 95 0% | 99.94 6% |
| Colorchecker dE 2000 calibrated * | 2.06 | 0.6 | 1.4 | ||
| Media total (Programa/Opciones) | -30% /
-41% | -10% /
-23% | -33% /
-34% | 10% /
7% |
* ... más pequeño es mejor
Tiempos de respuesta del display
| ↔ Tiempo de respuesta de Negro a Blanco | ||
|---|---|---|
| 29.6 ms ... subida ↗ y bajada ↘ combinada | ↗ 16 ms subida | 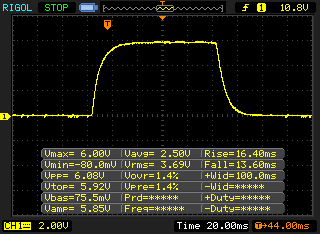 |
| ↘ 13.6 ms bajada | ||
| La pantalla mostró tiempos de respuesta relativamente lentos en nuestros tests pero podría ser demasiado lenta para los jugones. En comparación, todos los dispositivos de prueba van de ##min### (mínimo) a 240 (máximo) ms. » 79 % de todos los dispositivos son mejores. Eso quiere decir que el tiempo de respuesta es peor que la media (19.8 ms) de todos los dispositivos testados. | ||
| ↔ Tiempo de respuesta 50% Gris a 80% Gris | ||
| 42.4 ms ... subida ↗ y bajada ↘ combinada | ↗ 21.2 ms subida | 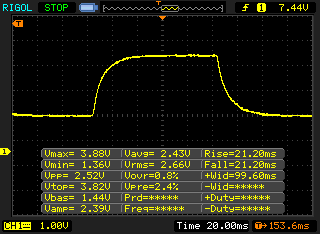 |
| ↘ 21.2 ms bajada | ||
| La pantalla mostró tiempos de respuesta lentos en nuestros tests y podría ser demasiado lenta para los jugones. En comparación, todos los dispositivos de prueba van de ##min### (mínimo) a 636 (máximo) ms. » 70 % de todos los dispositivos son mejores. Eso quiere decir que el tiempo de respuesta es peor que la media (31 ms) de todos los dispositivos testados. | ||
Parpadeo de Pantalla / PWM (Pulse-Width Modulation)
| Parpadeo de Pantalla / PWM detectado | 111100 Hz | ≤ 66 % de brillo | 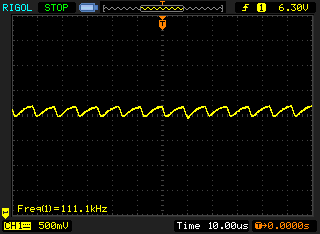 |
La retroiluminación del display parpadea a 111100 Hz (seguramente usa PWM - Pulse-Width Modulation) a un brillo del 66 % e inferior. Sobre este nivel de brillo no debería darse parpadeo / PWM. La frecuencia de 111100 Hz es bastante alta, por lo que la mayoría de gente sensible al parpadeo no debería ver parpadeo o tener fatiga visual. Comparación: 52 % de todos los dispositivos testados no usaron PWM para atenuar el display. Si se usó, medimos una media de 7757 (mínimo: 5 - máxmo: 343500) Hz. | |||
El MacBook Air ya está bien calibrado fuera de la caja. Hemos comprobado la pantalla con el software profesional CalMAN y el espectrofotómetro X-Rite i1 Pro2, y no hay ningún color. La mayoría de los colores también están por debajo de la importante marca de 3, sólo dos valores (marrón/naranja) son ligeramente superiores. El panel también soporta casi toda la gama sRGB, por lo que puedes editar las imágenes en este espacio de color.
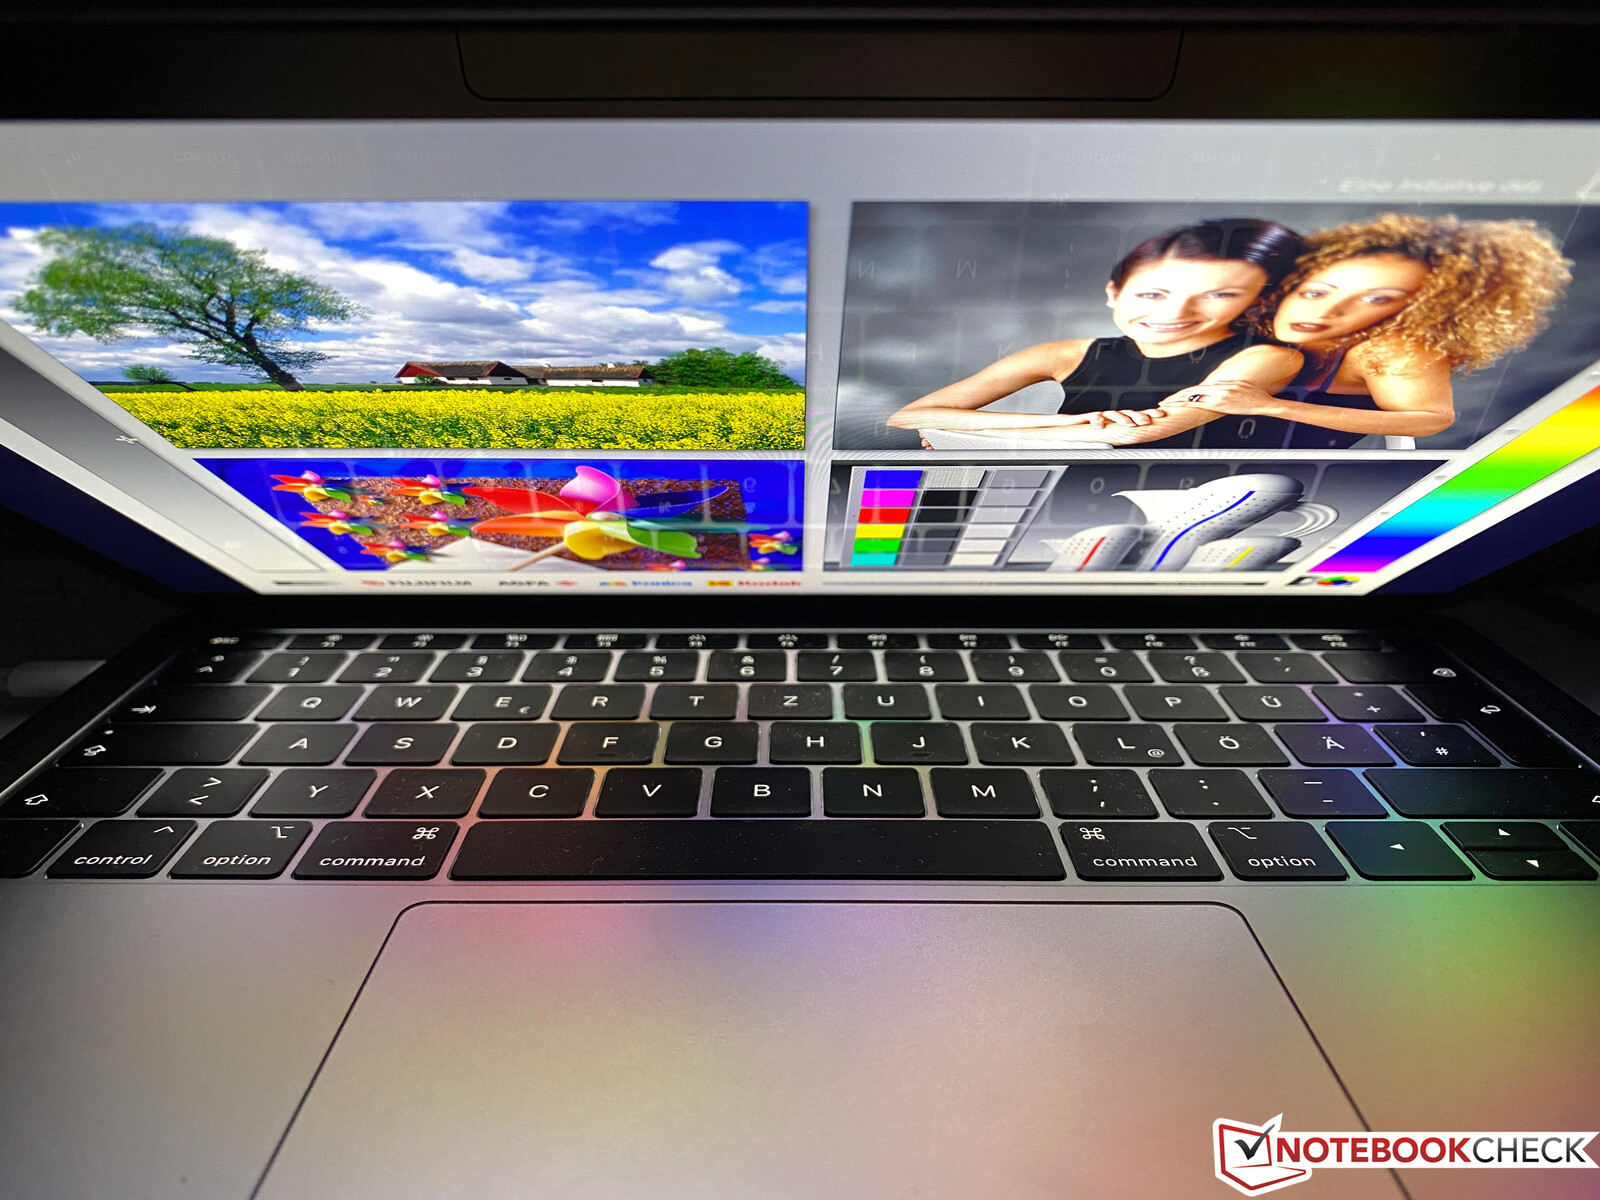
En el exterior, el MacBook Air funciona bastante bien a pesar de la superficie brillante. Incluso las fuentes de luz directa sólo crean un reflejo comparativamente pequeño (ver imagen exterior). La estabilidad del ángulo de visión de la pantalla IPS es excelente.

Rendimiento - El MacBook Air sigue con el lento Y-CPU
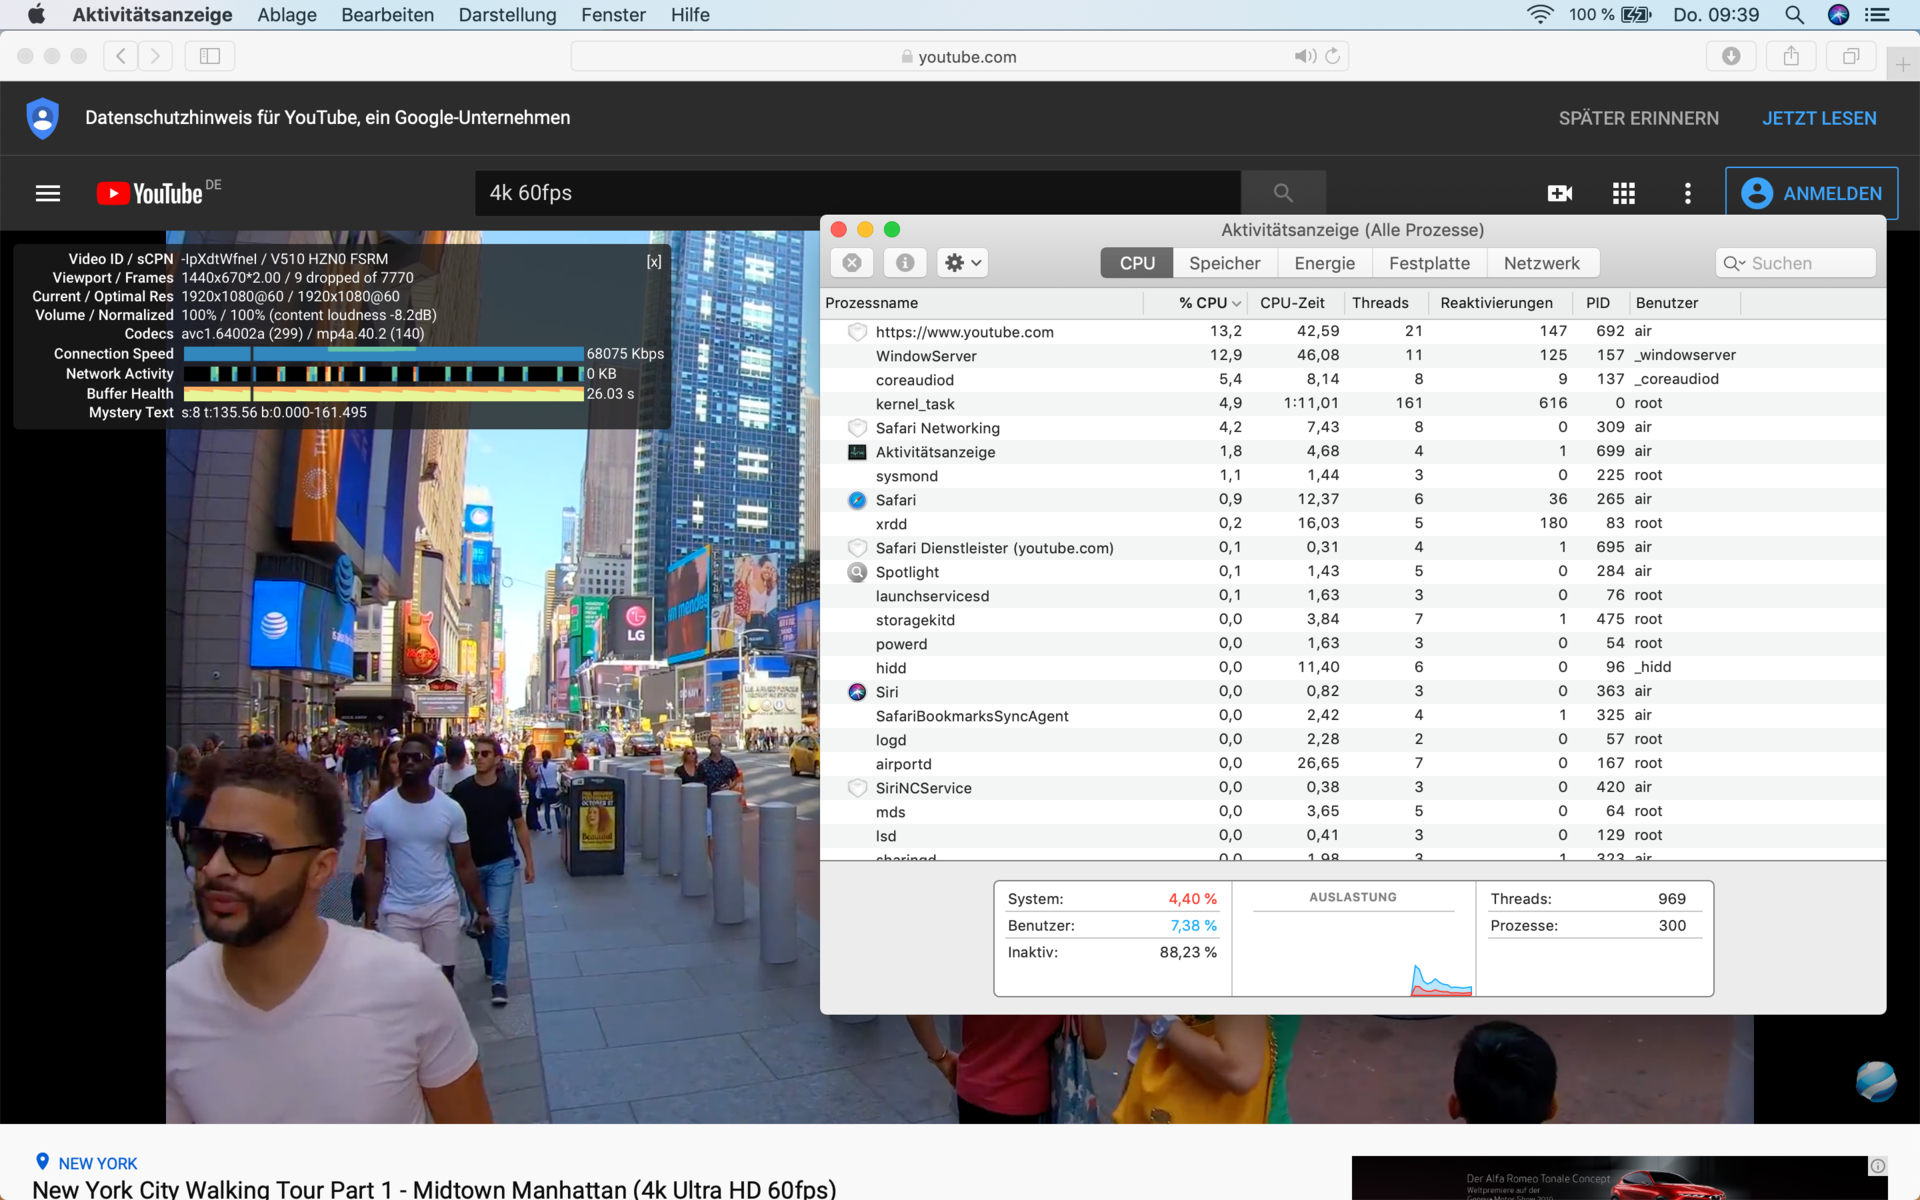
El rendimiento no ha cambiado, porque Apple sigue usando el Core i5-8210Y. La designación Core i5 sugiere un cierto nivel de rendimiento, aunque no es así. La "Y" detrás del 8210 indica un procesador de ultra bajo voltaje con un TDP de 4,5W (o 7W cTDP arriba, respectivamente), por lo que puede ser enfriado pasivamente como en este caso. Esto significa que el MBA no es adecuado para tareas más exigentes o multitarea. La reproducción de vídeo (también en alta resolución) por otro lado no es un problema gracias al decodificador de vídeo integrado de UHD Graphics. A continuación, hemos enumerado todos los puntajes de nuestros puntos de referencia para el MBA 2019, pero también recomendamos revisar nuestra review del MacBook Air 2018. El rendimiento es por lo menos muy estable después de una pequeña caída inicial.
| Jetstream 2 - 2.0 Total | |
| Media de la clase Subnotebook (117 - 479, n=28, últimos 2 años) | |
| Apple Macbook Air 2019 | |
| Medio Intel Core i5-8210Y (n=1) | |
| Blender - v2.79 BMW27 CPU | |
| Apple Macbook Air 2019 | |
| Medio Intel Core i5-8210Y (n=1) | |
| Lenovo ThinkBook 13s-20R90071GE | |
| Media de la clase Subnotebook (159 - 2271, n=58, últimos 2 años) | |
* ... más pequeño es mejor

| bajo | medio | alto | ultra | |
|---|---|---|---|---|
| Dota 2 Reborn (2015) | 67.2 | 28.2 | 14.6 | 13.6 |
| X-Plane 11.11 (2018) | 20.2 | 14.1 | 12.8 |
Emisiones y energía
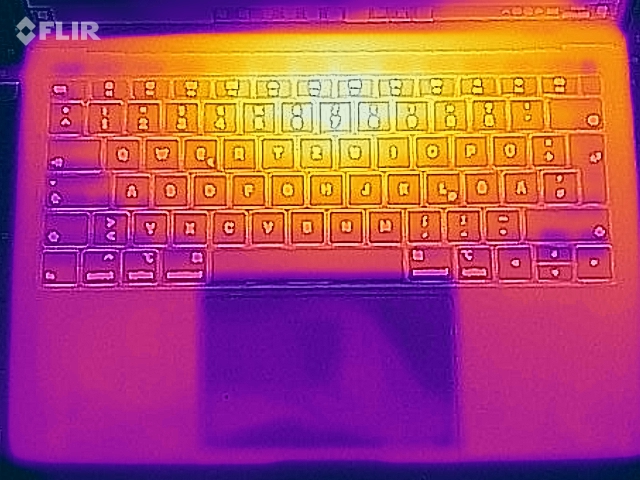
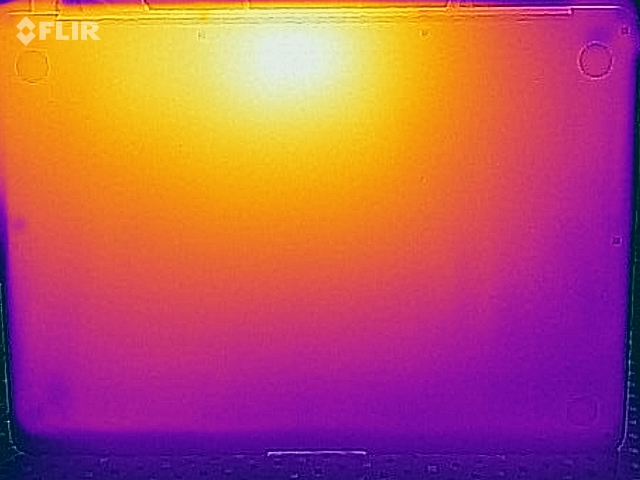
Ruido del sistema - El fanático del MBA es molesto
Probablemente el mayor problema del MacBook Air es la refrigeración. El propio procesador se enfría de forma pasiva. Hay un ventilador dentro del chasis, pero no está conectado directamente al disipador de calor de la CPU. Este ventilador sólo se supone que mejora la circulación del aire dentro de la carcasa y ayuda a disipar el aire caliente.
Para ser justos, el ventilador se desactiva a menudo cuando se realizan tareas simples. Sin embargo, una vez que empiezas a estresar un poco más la CPU, lo que puede ser tan simple como ejecutar varias pestañas en el Safari, el ventilador aumentará su velocidad lentamente y sin problemas. En escenarios de carga más intensos (como la instalación de aplicaciones) o con temperaturas ambientales más altas, el nivel de ruido alcanza rápidamente hasta 41 dB(A), igual que el modelo anterior. Además, la frecuencia comienza a ser molesta desde 37-38 dB(A). Considerando el muy bajo rendimiento, esto no es realmente aceptable, y también da lugar a una deducción de puntos en esta subclasificación.
Ruido
| Ocioso |
| 29.5 / 29.5 / 29.5 dB(A) |
| Carga |
| 34 / 41 dB(A) |
 | ||
30 dB silencioso 40 dB(A) audible 50 dB(A) ruidosamente alto |
||
min: | ||
| Apple Macbook Air 2019 UHD Graphics 617, i5-8210Y, Apple SSD AP0256 | Dell XPS 13 9380 2019 UHD Graphics 620, i5-8265U, SK hynix PC401 HFS256GD9TNG | Lenovo ThinkBook 13s-20R90071GE UHD Graphics 620, i5-8265U, SK hynix BC501 HFM512GDHTNG-8310A | Microsoft Surface Laptop 2-LQN-00004 UHD Graphics 620, i5-8250U, SK Hynix BC501 NVMe 256 GB | Apple MacBook Pro 13 2019 i5 4TB3 Iris Plus Graphics 655, i5-8279U, Apple SSD AP0512 | |
|---|---|---|---|---|---|
| Noise | 0% | 4% | 7% | 1% | |
| apagado / medio ambiente * (dB) | 29.5 | 30.4 -3% | 28.8 2% | 28.7 3% | 29 2% |
| Idle Minimum * (dB) | 29.5 | 30.4 -3% | 28.8 2% | 28.7 3% | 29 2% |
| Idle Average * (dB) | 29.5 | 30.4 -3% | 28.8 2% | 28.7 3% | 29 2% |
| Idle Maximum * (dB) | 29.5 | 30.4 -3% | 29.7 -1% | 28.7 3% | 29 2% |
| Load Average * (dB) | 34 | 31.7 7% | 30.7 10% | 30 12% | 33.9 -0% |
| Load Maximum * (dB) | 41 | 38.1 7% | 38.3 7% | 32.9 20% | 41.8 -2% |
* ... más pequeño es mejor
Temperatura
(±) La temperatura máxima en la parte superior es de 43.1 °C / 110 F, frente a la media de 35.9 °C / 97 F, que oscila entre 21.4 y 59 °C para la clase Subnotebook.
(±) El fondo se calienta hasta un máximo de 41 °C / 106 F, frente a la media de 39.2 °C / 103 F
(+) En reposo, la temperatura media de la parte superior es de 24.4 °C / 76# F, frente a la media del dispositivo de 30.8 °C / 87 F.
(+) El reposamanos y el panel táctil están a una temperatura inferior a la de la piel, con un máximo de 28.7 °C / 83.7 F y, por tanto, son fríos al tacto.
(±) La temperatura media de la zona del reposamanos de dispositivos similares fue de 28.2 °C / 82.8 F (-0.5 °C / -0.9 F).
Apple Macbook Air 2019 análisis de audio
(±) | la sonoridad del altavoz es media pero buena (75.8 dB)
Graves 100 - 315 Hz
(±) | lubina reducida - en promedio 8.9% inferior a la mediana
(±) | la linealidad de los graves es media (11.6% delta a frecuencia anterior)
Medios 400 - 2000 Hz
(+) | medios equilibrados - a sólo 3% de la mediana
(+) | los medios son lineales (5.1% delta a la frecuencia anterior)
Altos 2 - 16 kHz
(+) | máximos equilibrados - a sólo 2.9% de la mediana
(+) | los máximos son lineales (4.7% delta a la frecuencia anterior)
Total 100 - 16.000 Hz
(+) | el sonido global es lineal (14.3% de diferencia con la mediana)
En comparación con la misma clase
» 28% de todos los dispositivos probados de esta clase eran mejores, 6% similares, 66% peores
» El mejor tuvo un delta de 5%, la media fue 18%, el peor fue ###max##%
En comparación con todos los dispositivos probados
» 18% de todos los dispositivos probados eran mejores, 4% similares, 78% peores
» El mejor tuvo un delta de 4%, la media fue 23%, el peor fue ###max##%
Dell XPS 13 9380 2019 análisis de audio
(-) | altavoces no muy altos (#70 dB)
Graves 100 - 315 Hz
(-) | casi sin bajos - de media 20.4% inferior a la mediana
(±) | la linealidad de los graves es media (9.4% delta a frecuencia anterior)
Medios 400 - 2000 Hz
(±) | medias más altas - de media 6.9% más altas que la mediana
(±) | la linealidad de los medios es media (10.2% delta respecto a la frecuencia anterior)
Altos 2 - 16 kHz
(+) | máximos equilibrados - a sólo 3.6% de la mediana
(+) | los máximos son lineales (5% delta a la frecuencia anterior)
Total 100 - 16.000 Hz
(±) | la linealidad del sonido global es media (26.6% de diferencia con la mediana)
En comparación con la misma clase
» 88% de todos los dispositivos probados de esta clase eran mejores, 1% similares, 10% peores
» El mejor tuvo un delta de 5%, la media fue 18%, el peor fue ###max##%
En comparación con todos los dispositivos probados
» 82% de todos los dispositivos probados eran mejores, 3% similares, 15% peores
» El mejor tuvo un delta de 4%, la media fue 23%, el peor fue ###max##%
Funcionamiento de la batería
La duración de la batería del compacto MacBook Air es muy buena y está claramente por delante de la competencia de Windows. Nuestra práctica prueba de WLAN con una luminancia ajustada de 150 Nits funciona durante unas 11,5 horas. Si se utiliza el máximo brillo, este resultado desciende a 7 horas, lo que sigue siendo decente.
Pro
Contra
Veredicto - MacBook Air parece anticuado

Not much has changed in the 2019 version of MacBook Air. The display now handles the advertised luminance and the added True Tone support is certainly a benefit. There aren't many criticisms of the display overall, but the MacBook Pro panels are better thanks to the increased colour gamut.
The biggest problem is still the slow processor in combination with the annoying fan (under load). Performance can't keep up with the competition, and you shouldn't expect limitations when running more demanding applications or multitasking. However, for simple things like writing emails, Skype, common web browsing or playing high-resolution video, there is no problem.
The 2018 model of MacBook Air wasn't very innovative to begin with, and the notebook seems outdated in some ways. On its own, MacBook Air is certainly a good subnotebook, but Apple's own MacBook Pro 13 is a better alternative for a similar price.
The entry-level MacBook Pro 13 (2x TB3, revision coming soon) is a serious contender for MacBook Air. The case is a little thicker in the front, but you'll hardly notice the difference in practice. In return, you get much more performance (and therefore better equipped for years to come) for a slightly higher price.
Apple Macbook Air 2019
- 04/08/2020 v7 (old)
Andreas Osthoff
Price comparison
