Revisión del Schenker Vision 16 Pro 2023: 1.paquete ligero y potente de 6 kg con portátil RTX 4070
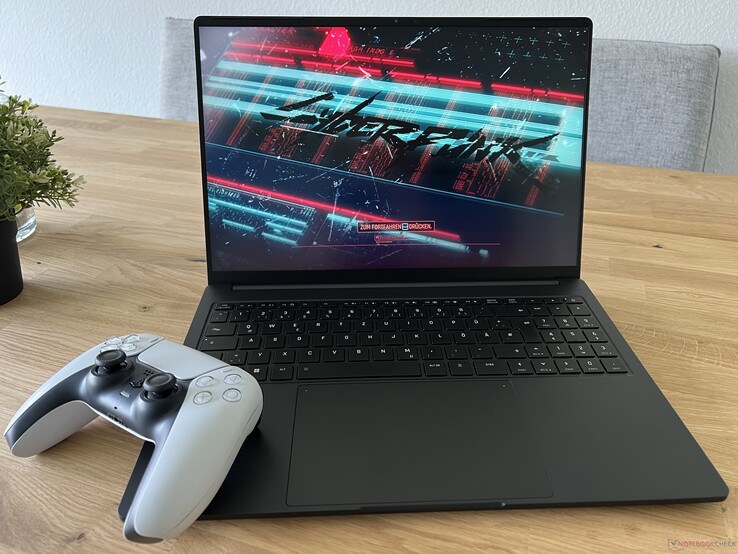
Schenker ha actualizado el Vision 16 Pro para 2023, ofreciendo de nuevo un portátil de 16 pulgadas extremadamente ligero con un rendimiento muy alto. El procesador se ha actualizado al actual Intel Core i7-13700H Raptor Lake de Intel, y como tarjeta gráfica se puede elegir la nueva GeForce RTX 4060 para portátiles o elPortátil RTX 4070cada una con un TGP máximo de 95 vatios. Además de esas dos actualizaciones, también hay algunas mejoras en el sistema de refrigeración (nuevos ventiladores), y además del procesador, la GPU ahora también utiliza refrigeración por metal líquido para una transferencia de calor óptima.
El precio del nuevo modelo con Core i7-13700H, GeForce RTX 4060 Laptop, 16 GB de RAM, y un SSD de 500 GB parte de los 2.099 Euros (~$2361). Nuestra configuración de pruebas con el portátil más rápido RTX 4070, 32 GB de RAM, y un SSD de 1 TB así como Windows 11 preinstalado cuesta unos 2.600 Euros, lo que también corresponde al precio del predecesor.
Posibles contendientes en la comparación
Valoración | Fecha | Modelo | Peso | Altura | Tamaño | Resolución | Precio |
|---|---|---|---|---|---|---|---|
| 88.6 % v7 (old) | 07/2023 | Schenker VISION 16 Pro (M23) i7-13700H, GeForce RTX 4070 Laptop GPU | 1.6 kg | 17.1 mm | 16.00" | 2560x1600 | |
| 88.8 % v7 (old) | 05/2023 | Samsung Galaxy Book3 Ultra 16, i9-13900H RTX 4070 i9-13900H, GeForce RTX 4070 Laptop GPU | 1.8 kg | 16.8 mm | 16.00" | 2880x1800 | |
| 88.8 % v7 (old) | 07/2023 | MSI Stealth 16 Studio A13VG i7-13700H, GeForce RTX 4070 Laptop GPU | 2 kg | 19.95 mm | 16.00" | 2560x1600 | |
| 90.3 % v7 (old) | 04/2023 | Dell XPS 15 9530 RTX 4070 i7-13700H, GeForce RTX 4070 Laptop GPU | 1.9 kg | 18 mm | 15.60" | 3456x2160 | |
| 86.1 % v7 (old) | 06/2023 | Asus ProArt Studiobook 16 OLED H7604 i9-13980HX, GeForce RTX 4070 Laptop GPU | 2.4 kg | 23.9 mm | 16.00" | 3200x2000 | |
| 93.7 % v7 (old) | 03/2023 | Apple MacBook Pro 16 2023 M2 Max M2 Max, M2 Max 38-Core GPU | 2.2 kg | 16.8 mm | 16.20" | 3456x2234 |
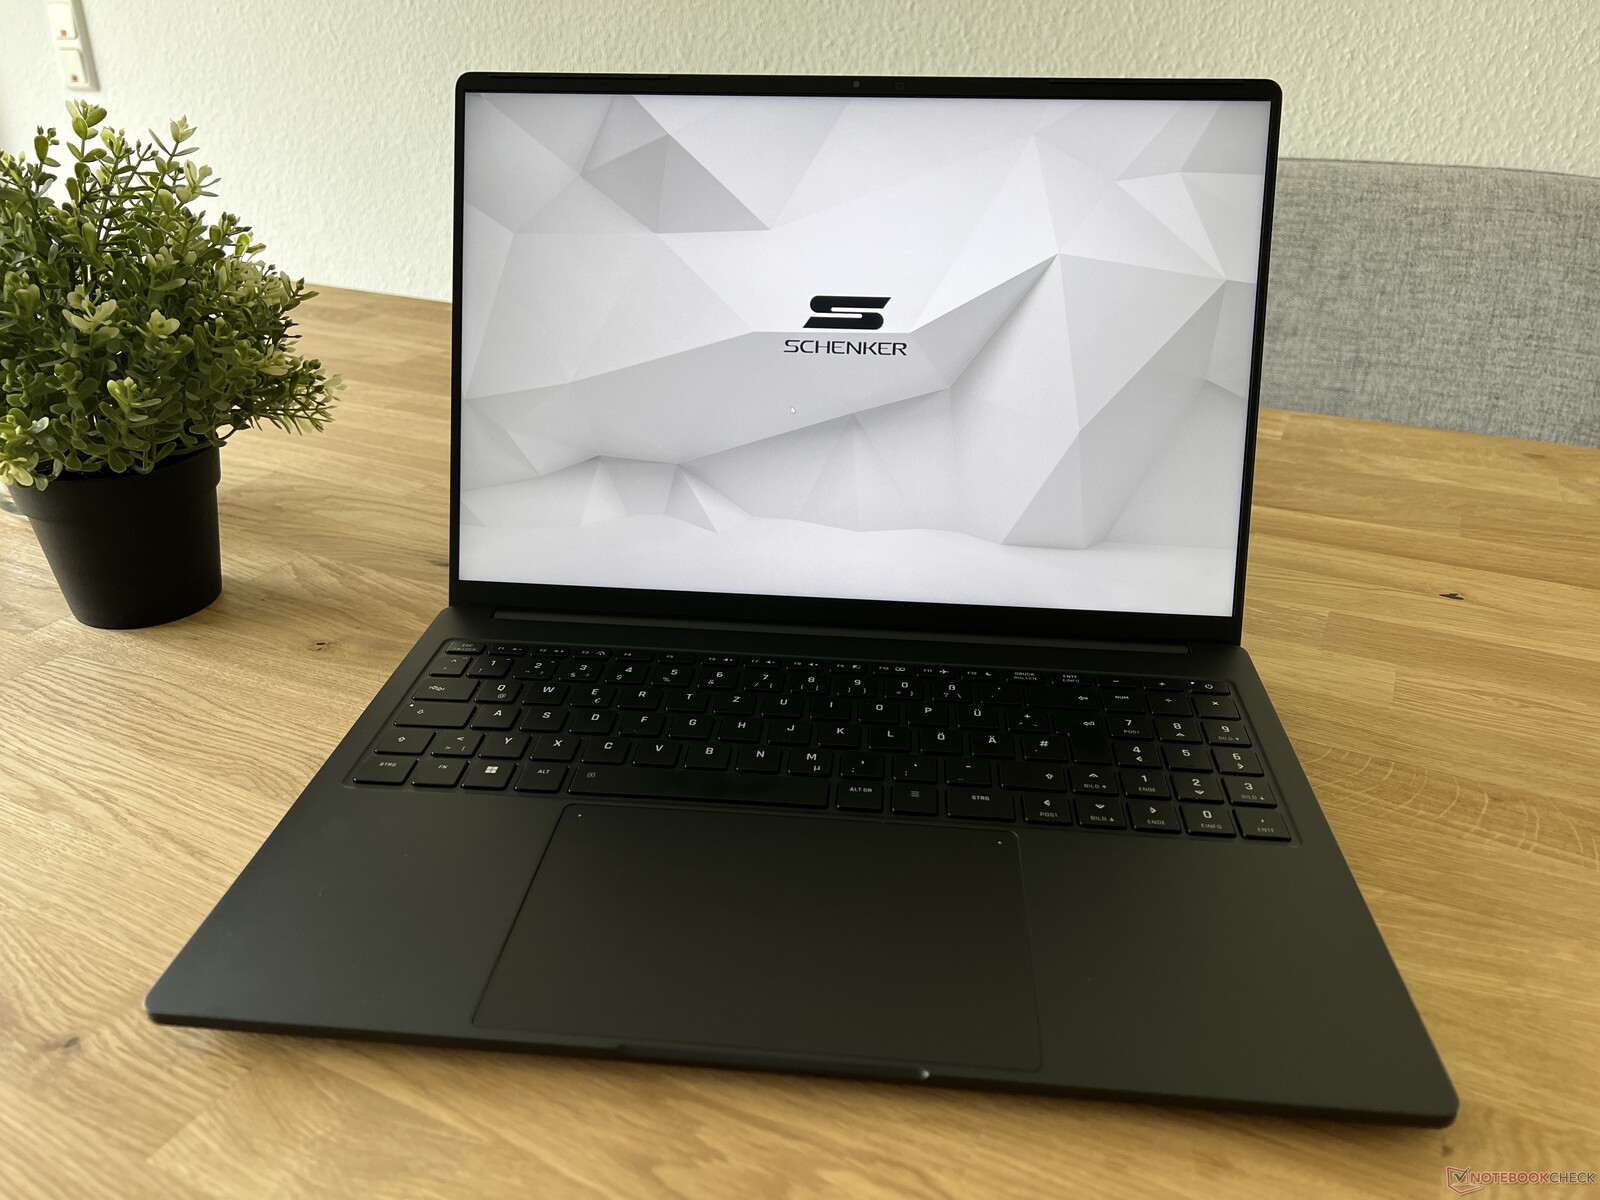
Carcasa - Ligera carcasa de magnesio de 1,6 kg (~3,5 lb)
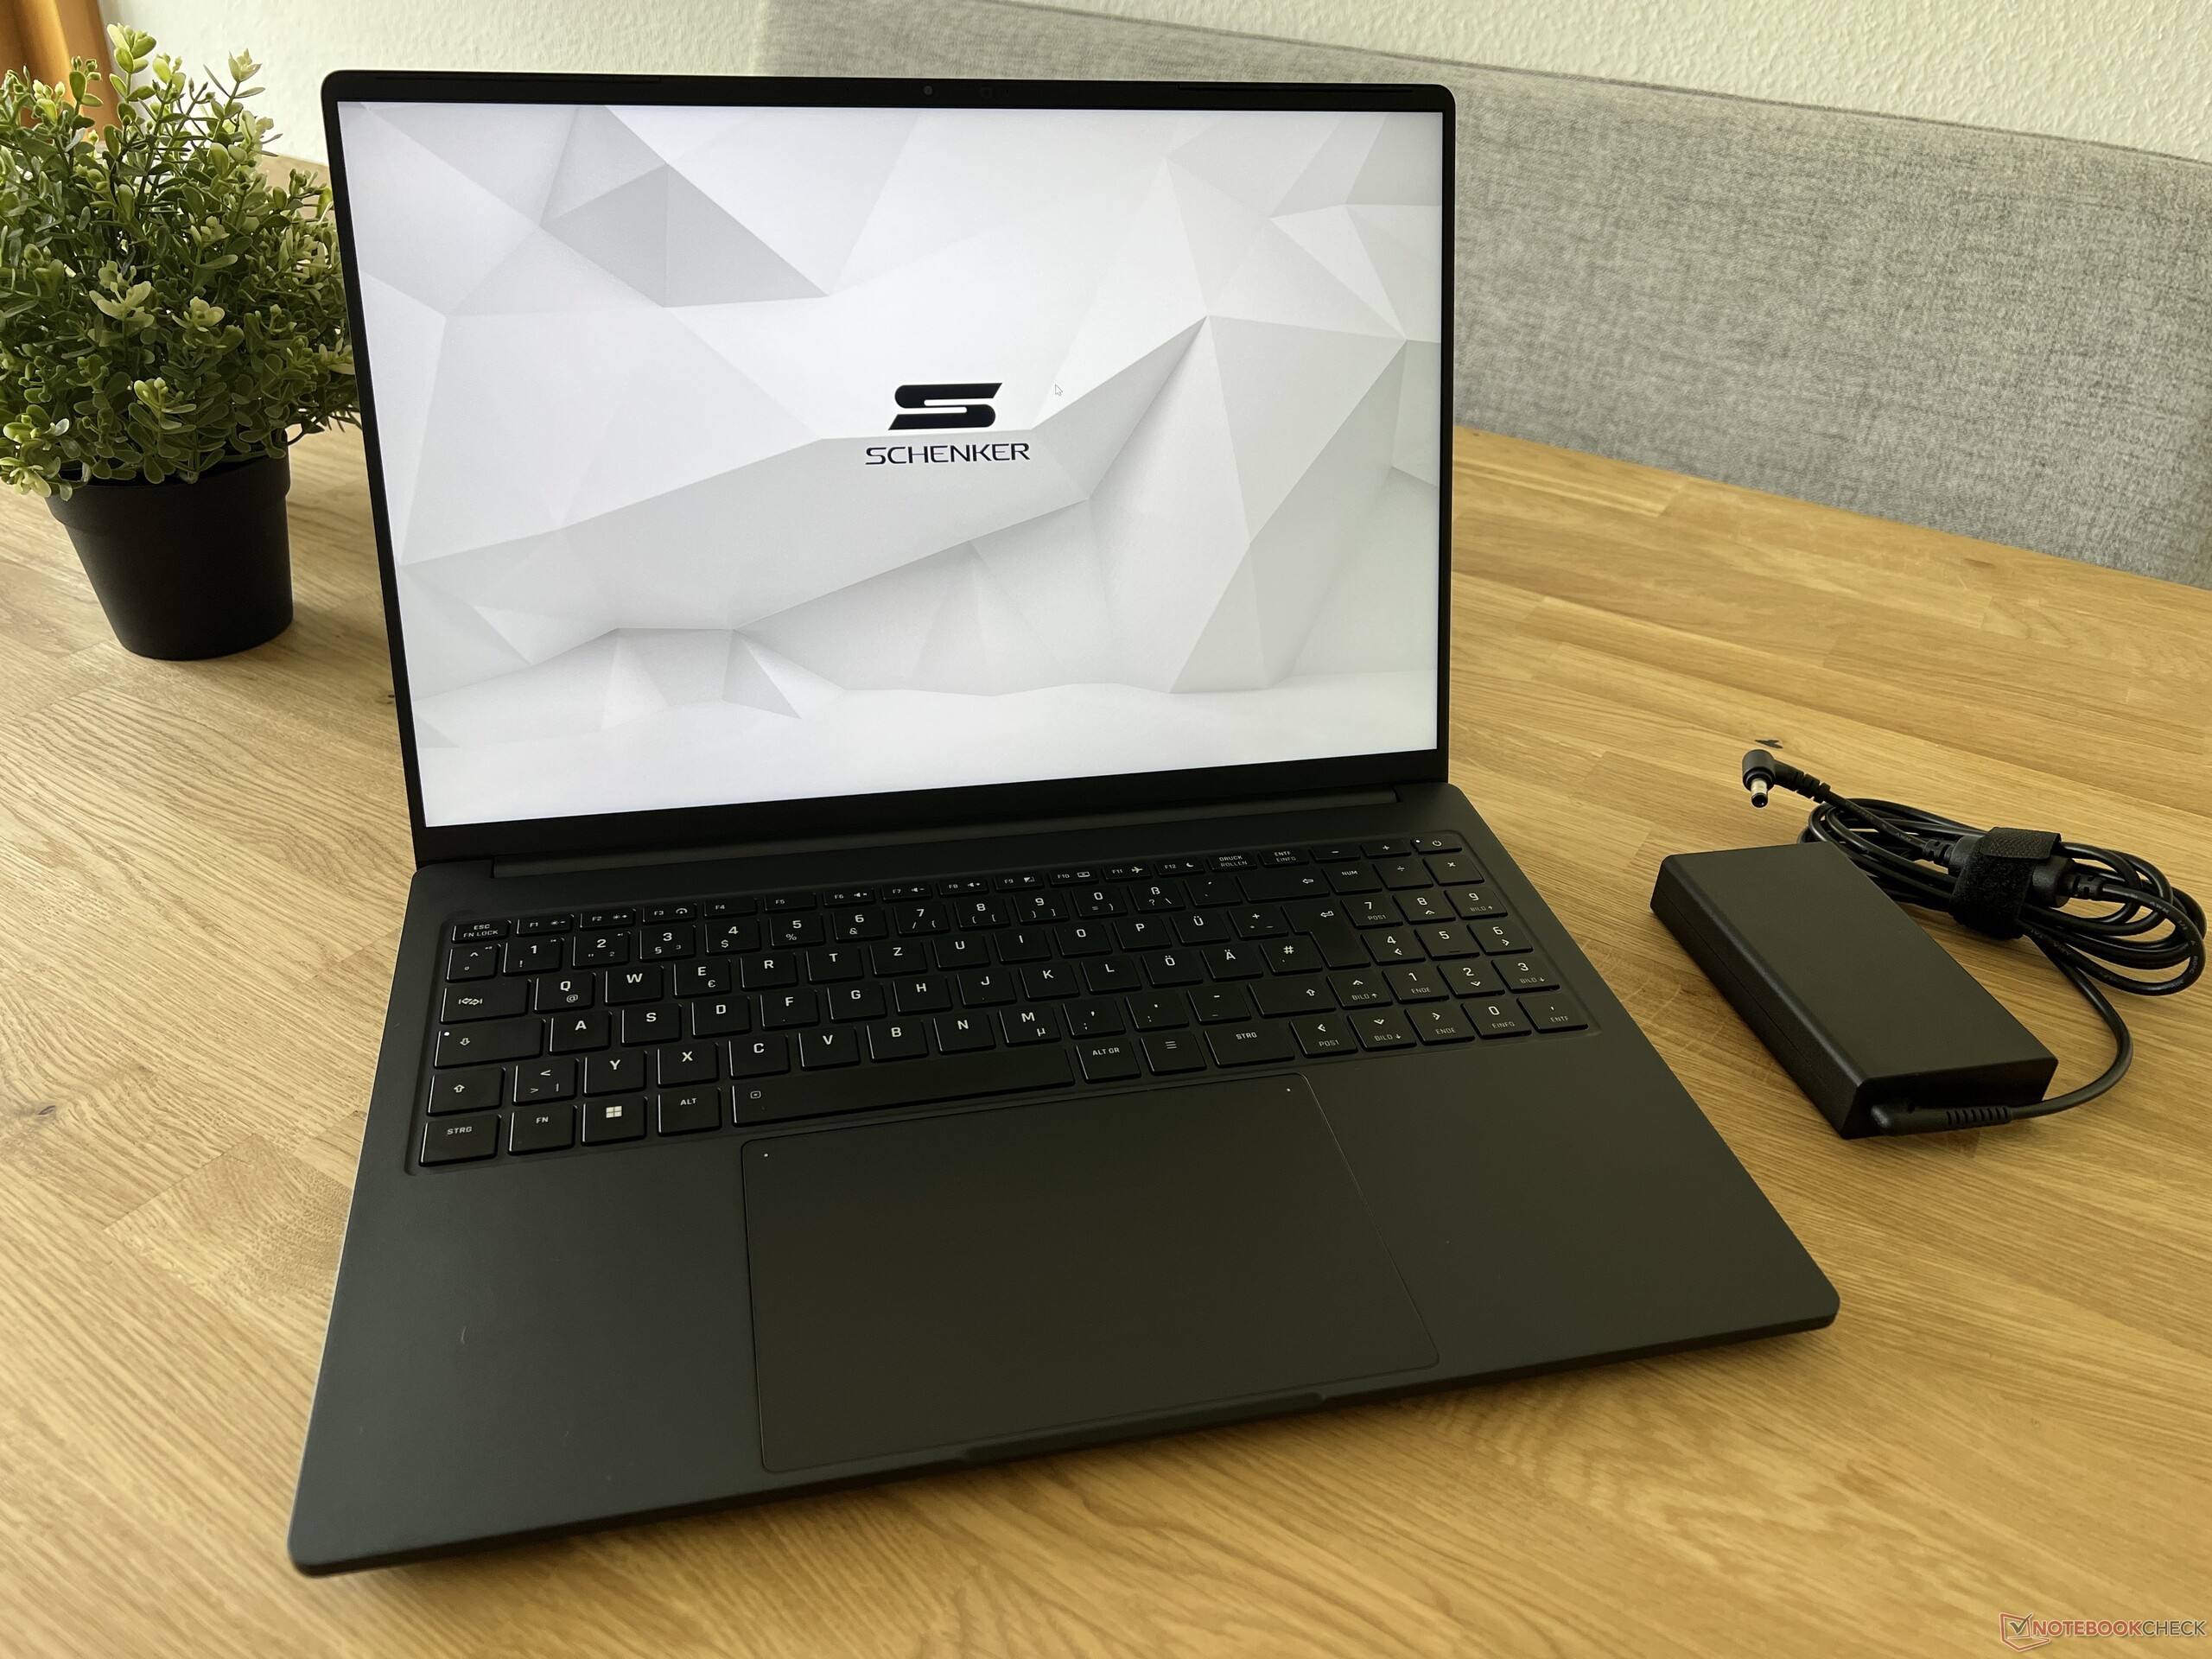
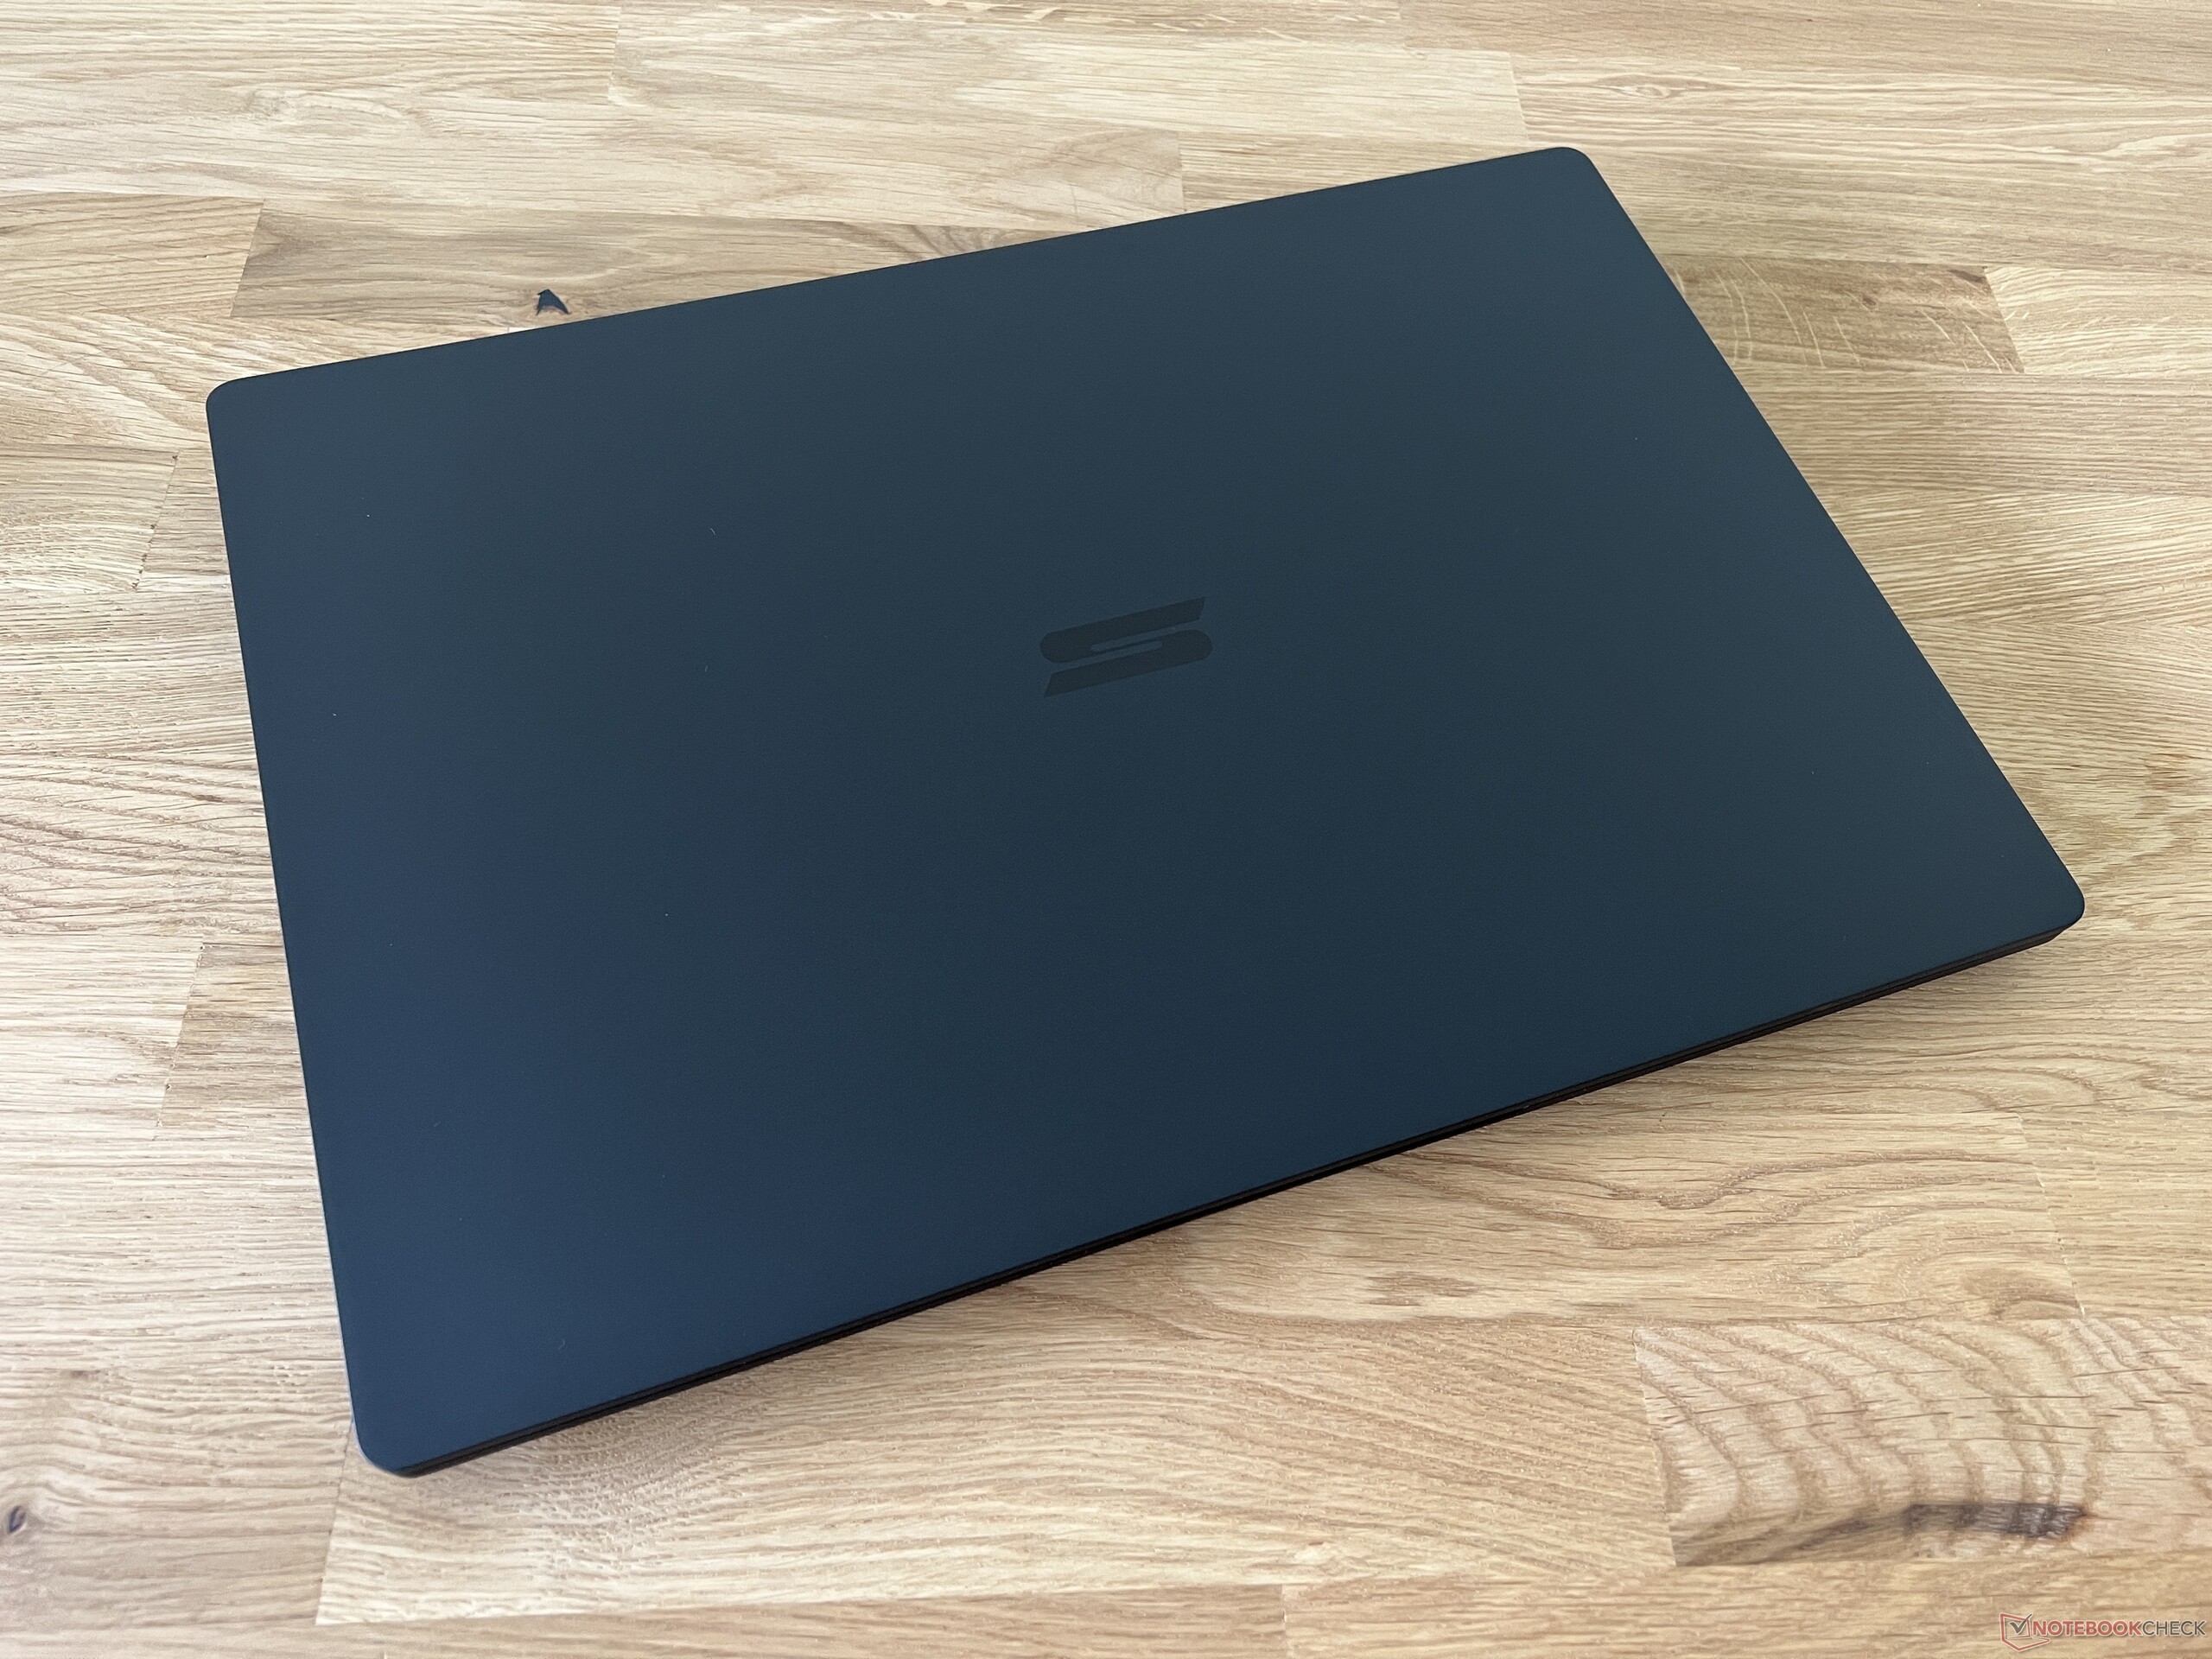
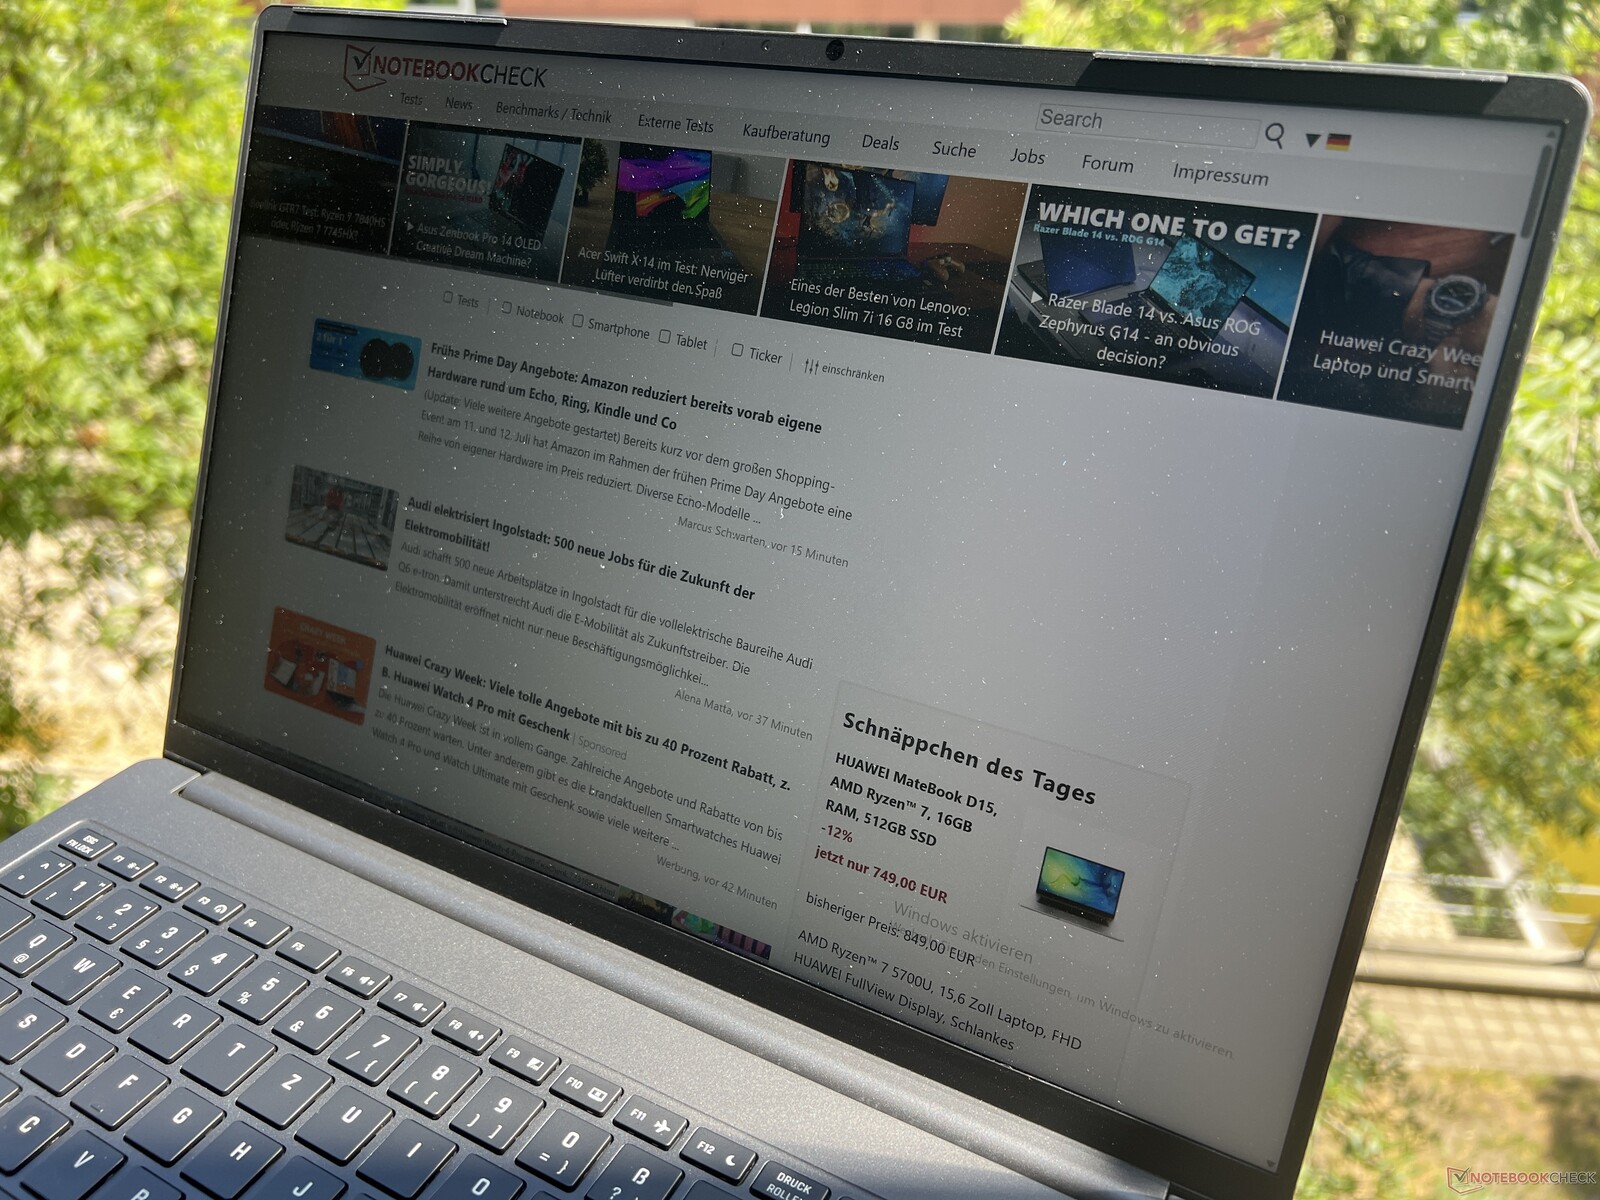
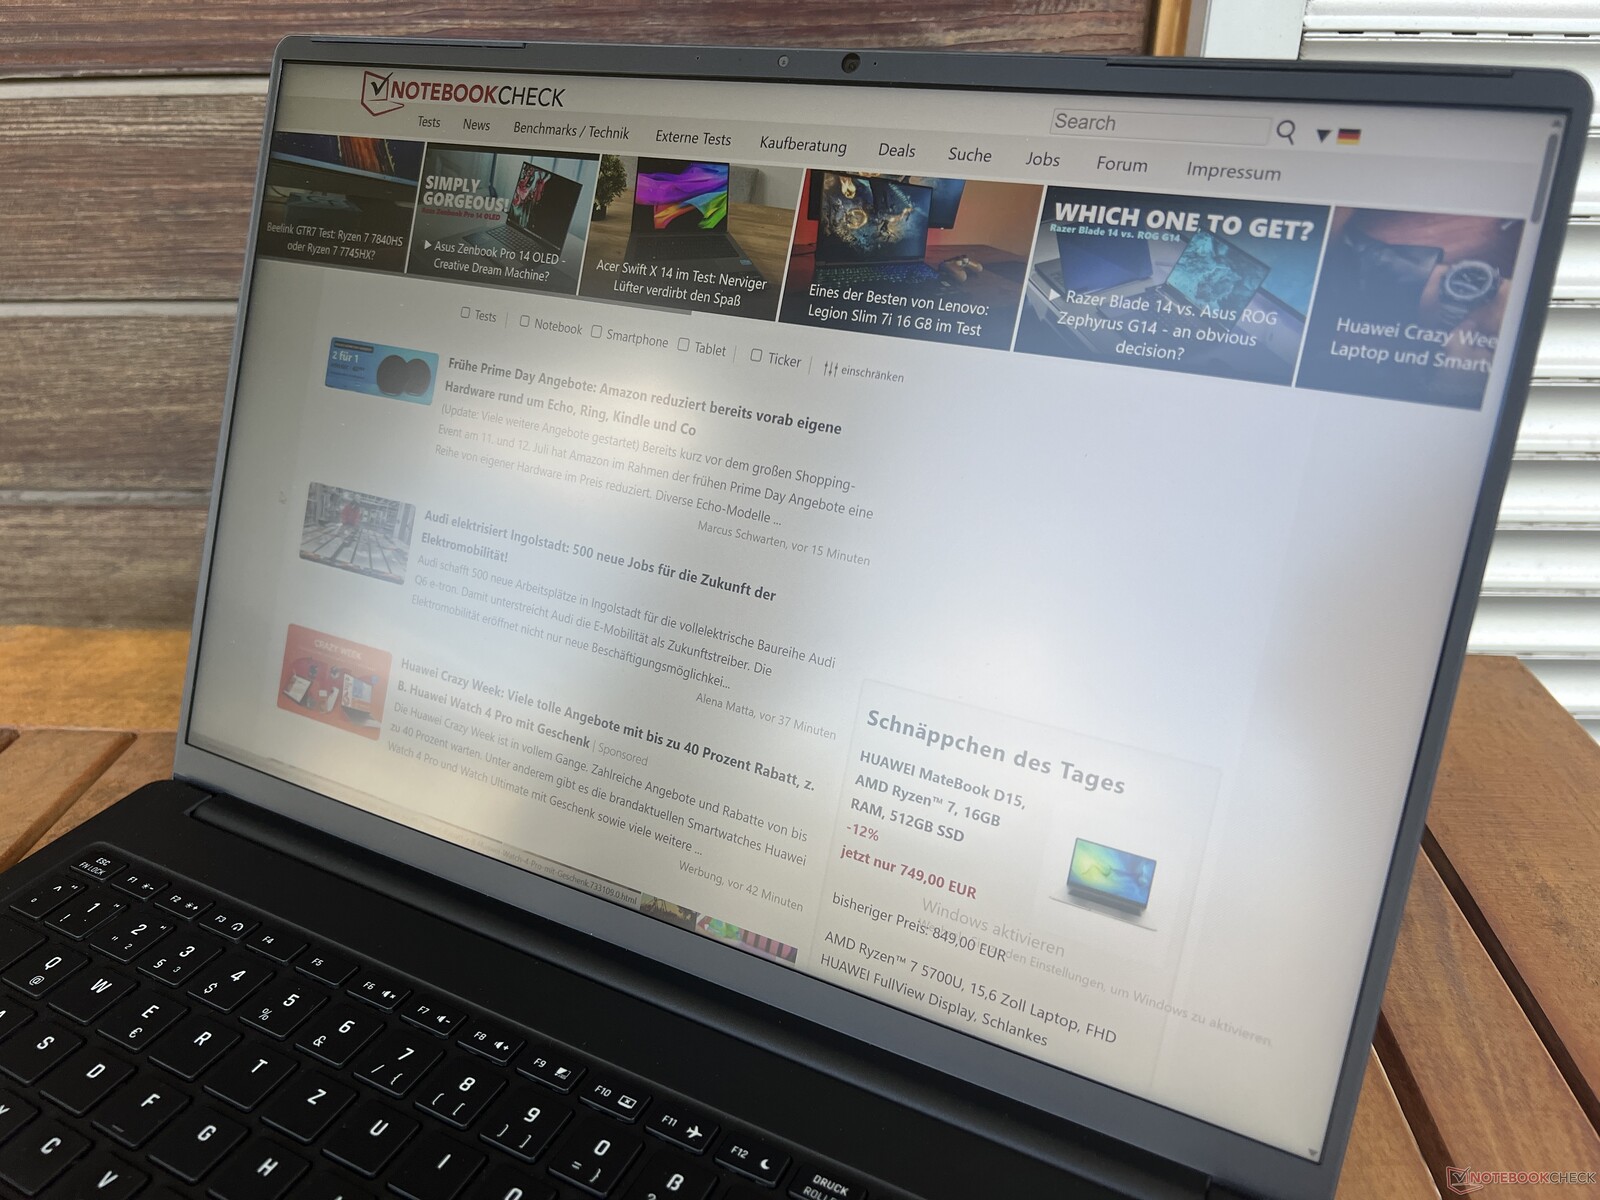
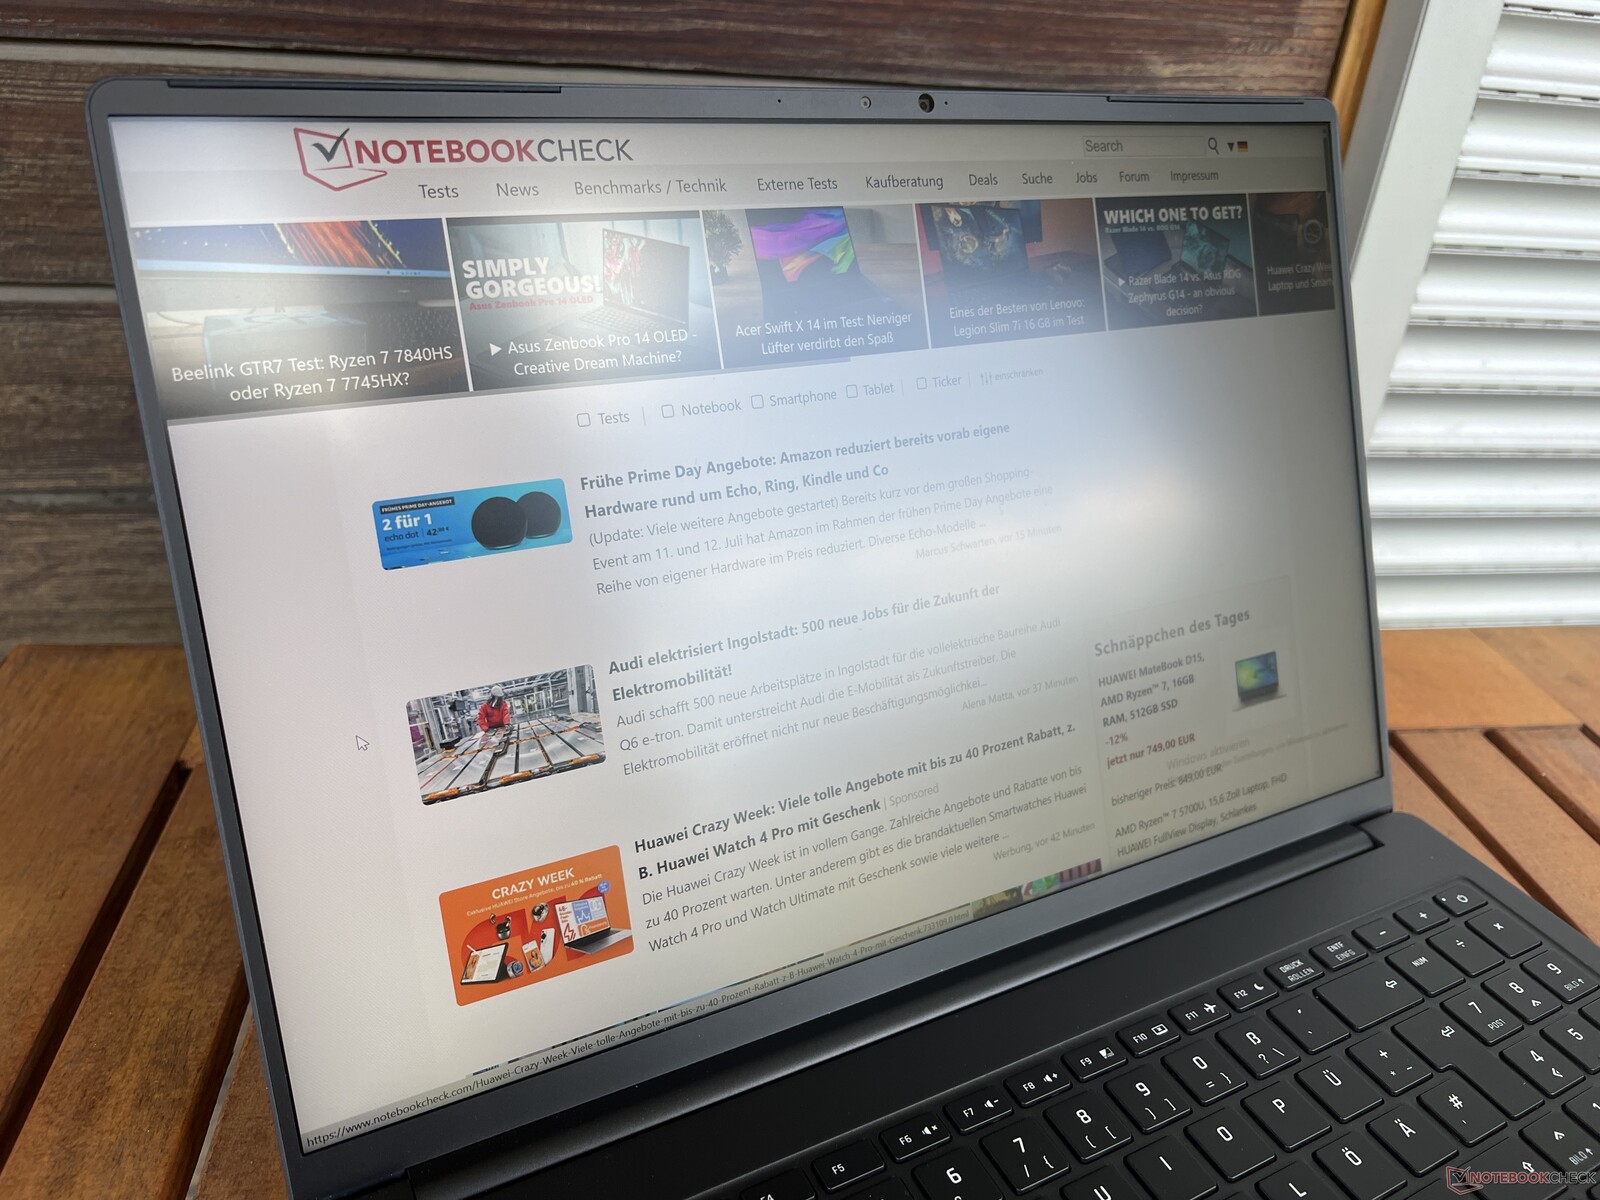
Desde el año pasado, Schenker no ha cambiado nada en la carcasa, y esta vez tenemos la versión negra en nuestra prueba. Al carecer de contrastes, parece mucho más discreta que la versión plateada. Con apenas 1.6 kg, la carcasa de magnesio (unidad base y tapa de pantalla) sigue siendo extremadamente ligera para un portátil rápido de 16 pulgadas. La unidad base es muy robusta, y sólo se puede presionar mínimamente el centro del teclado, sin que esto cause ningún problema en el funcionamiento diario. La delgada tapa de la pantalla es ligeramente más flexible, y las bisagras siguen permitiendo cierto tambaleo visible.
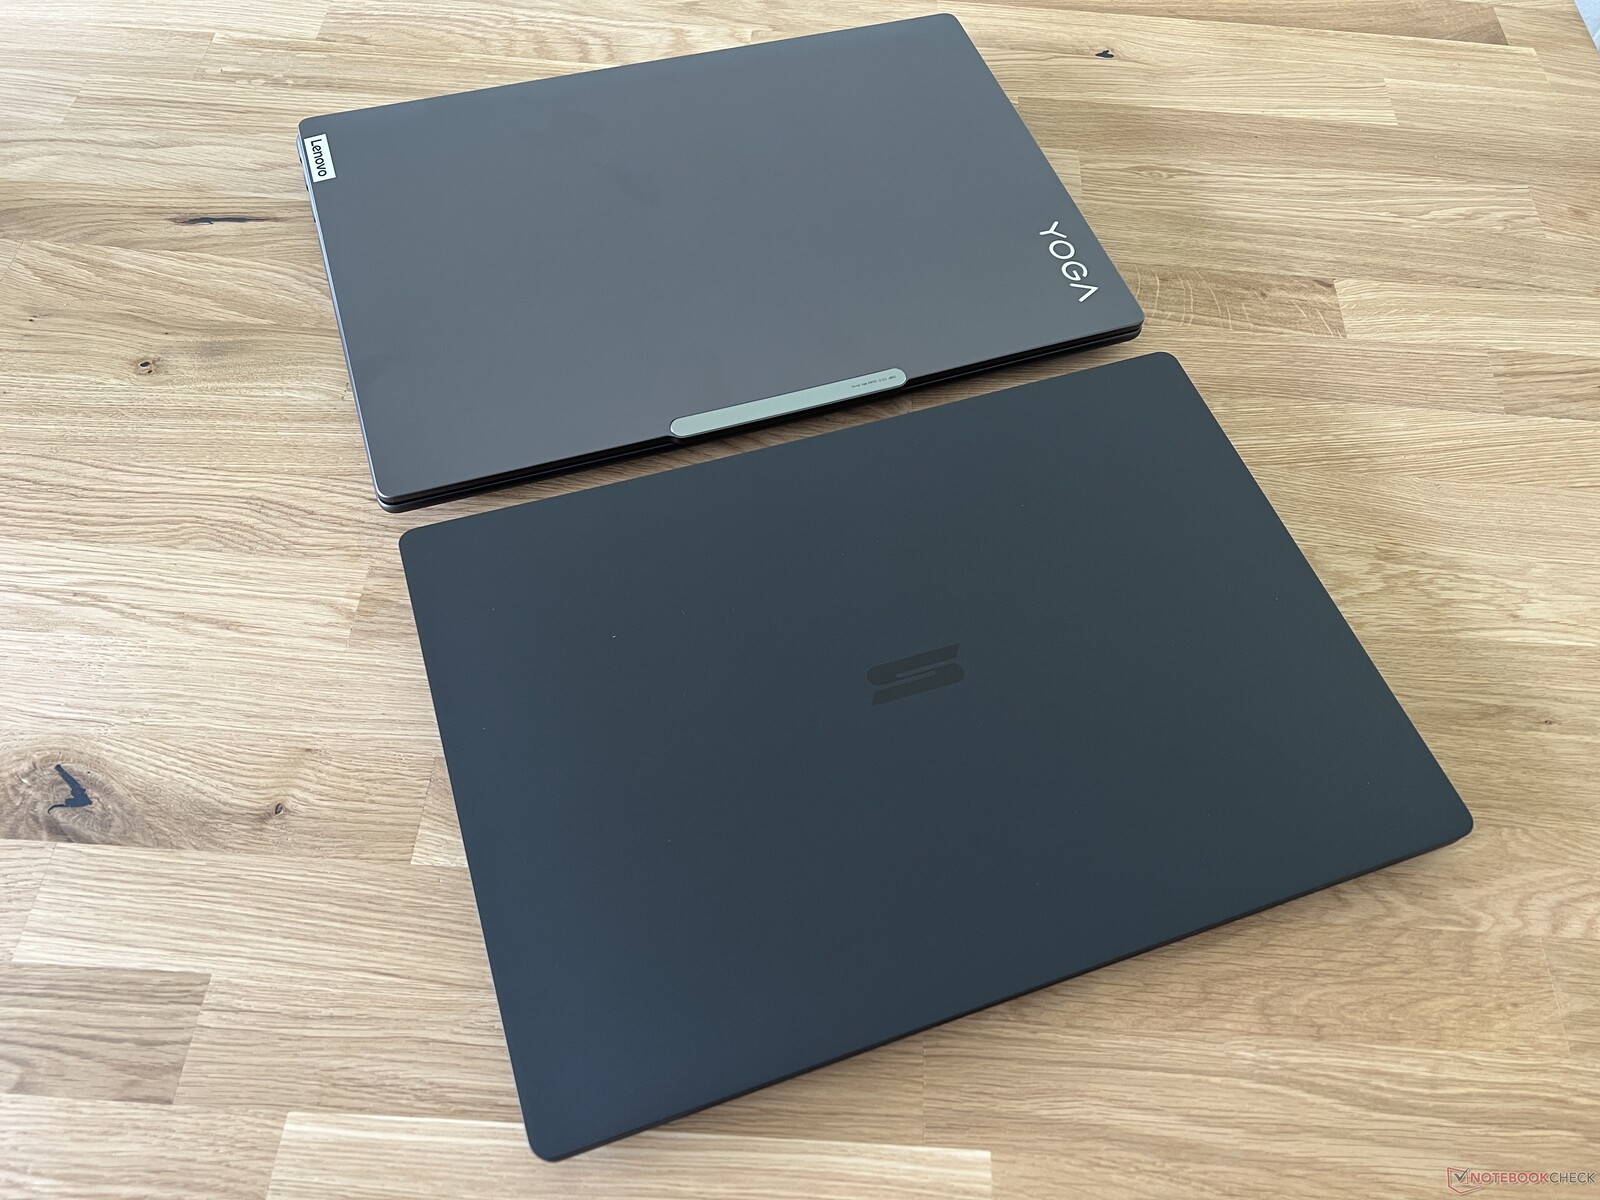
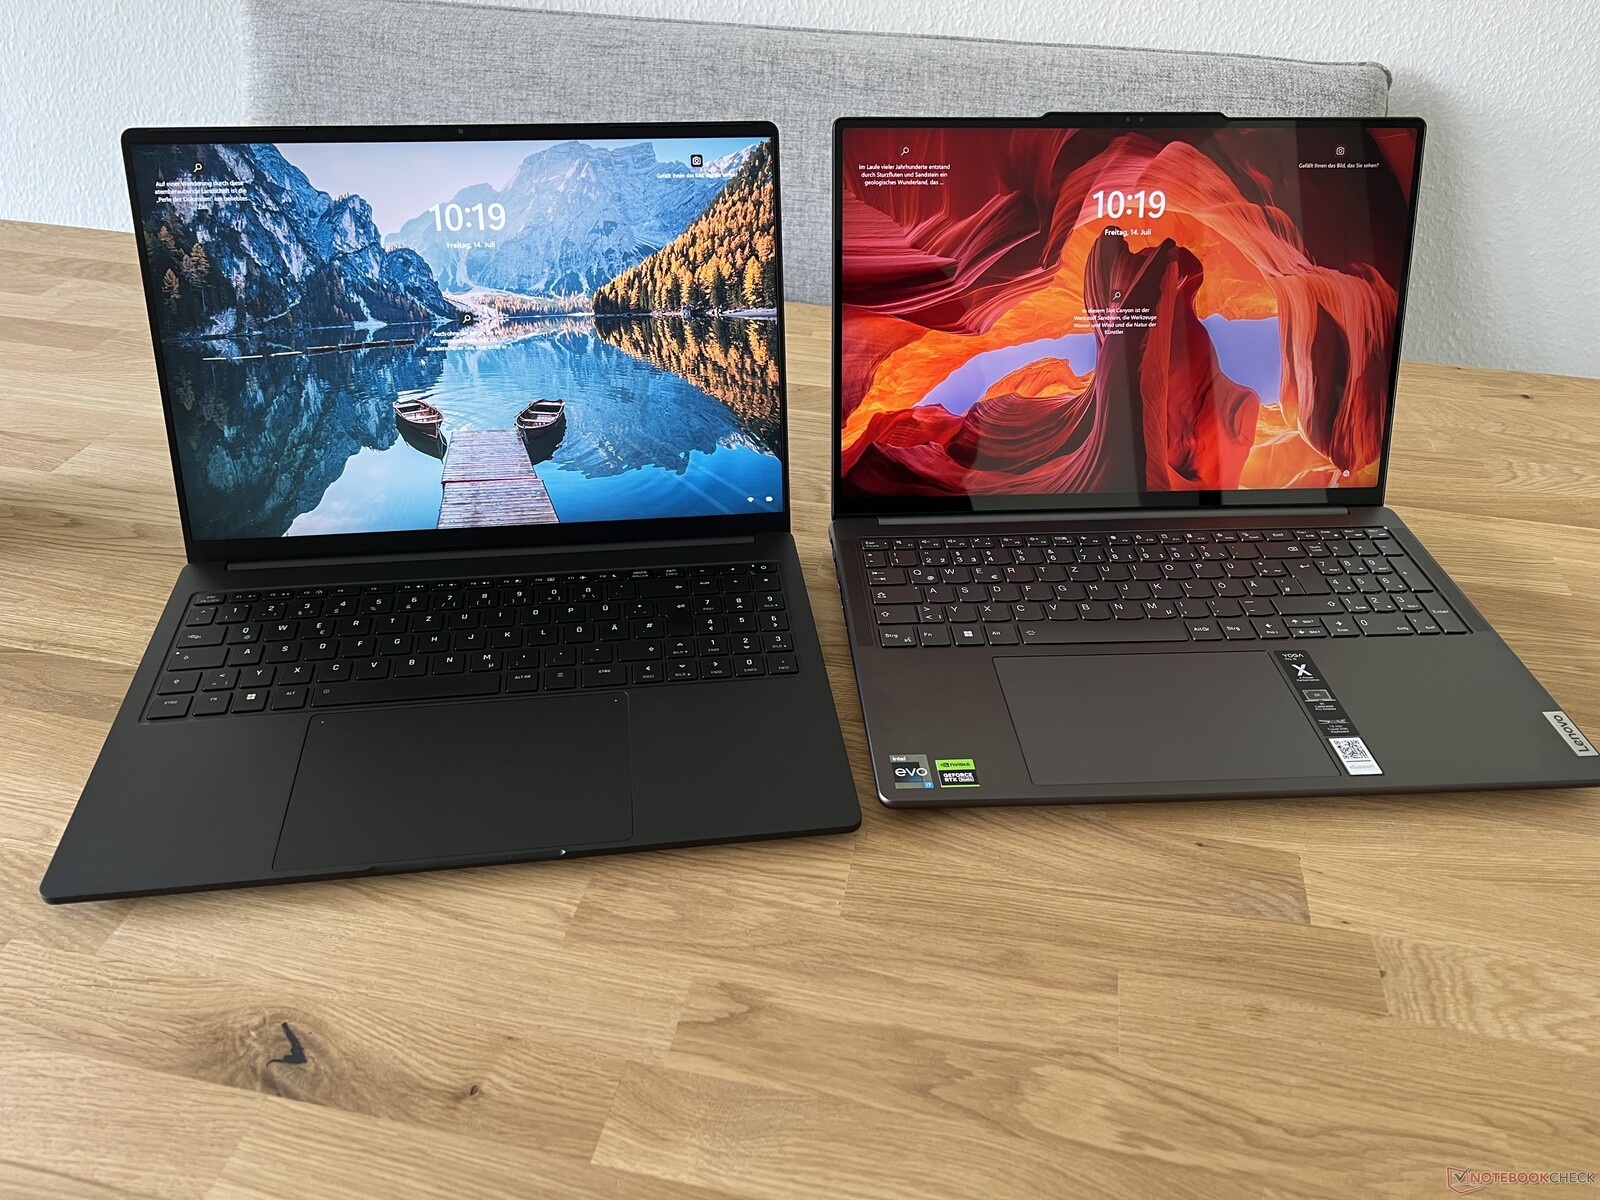
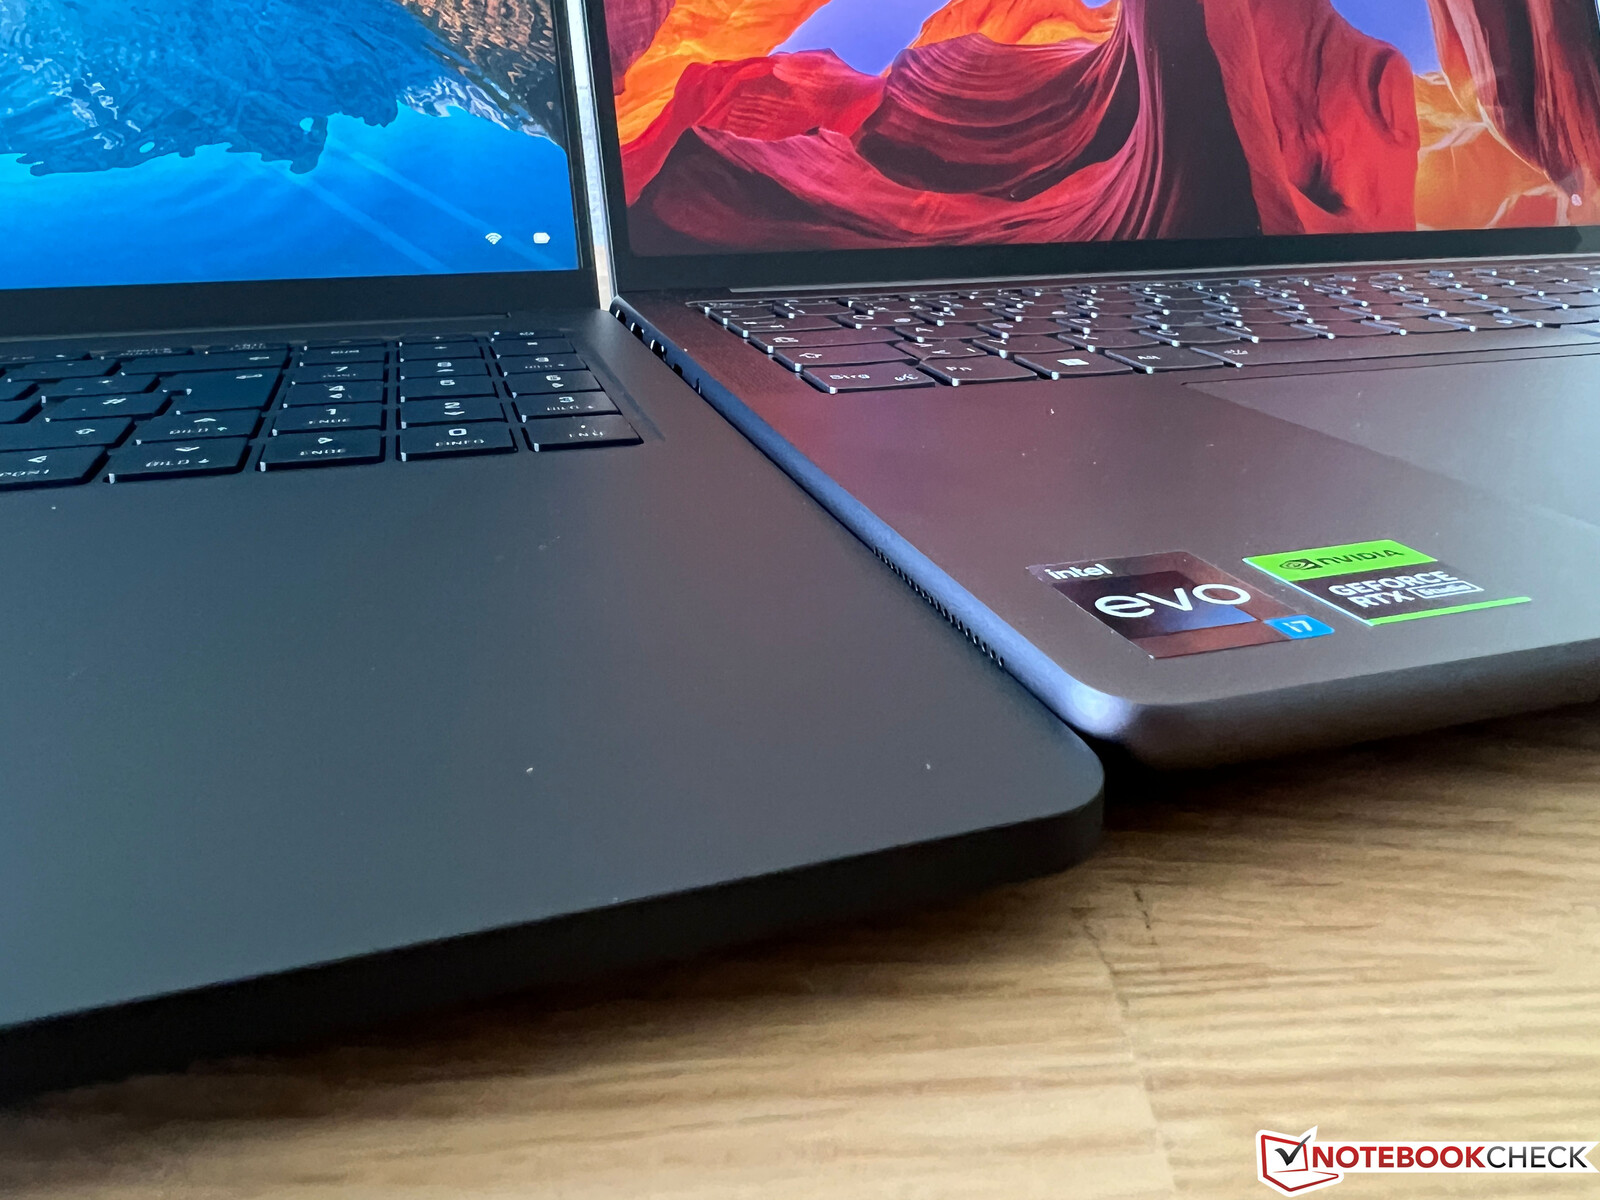
En la comparación de tamaño, el Vision 16 Pro es también el portátil más compacto y al mismo tiempo más ligero con diferencia. También tomamos algunas fotos comparativas con el nuevo Lenovo Yoga Pro 9 16, que también estamos probando actualmente. Sus huellas son prácticamente idénticas, pero se puede ver la diferencia en la altura sobre todo de la unidad base.
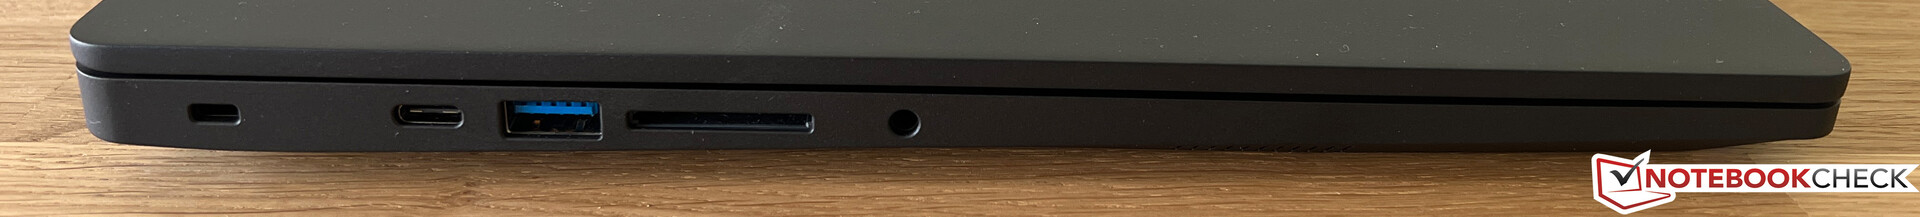
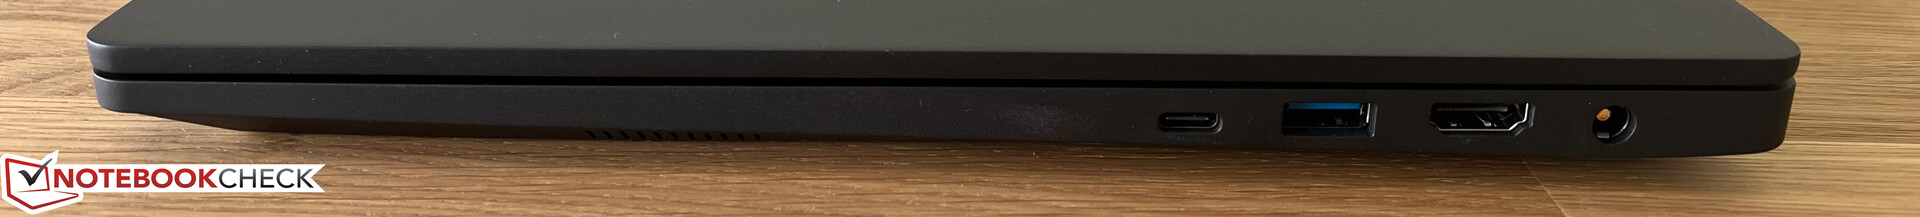
Equipo - Thunderbolt y lector de tarjetas
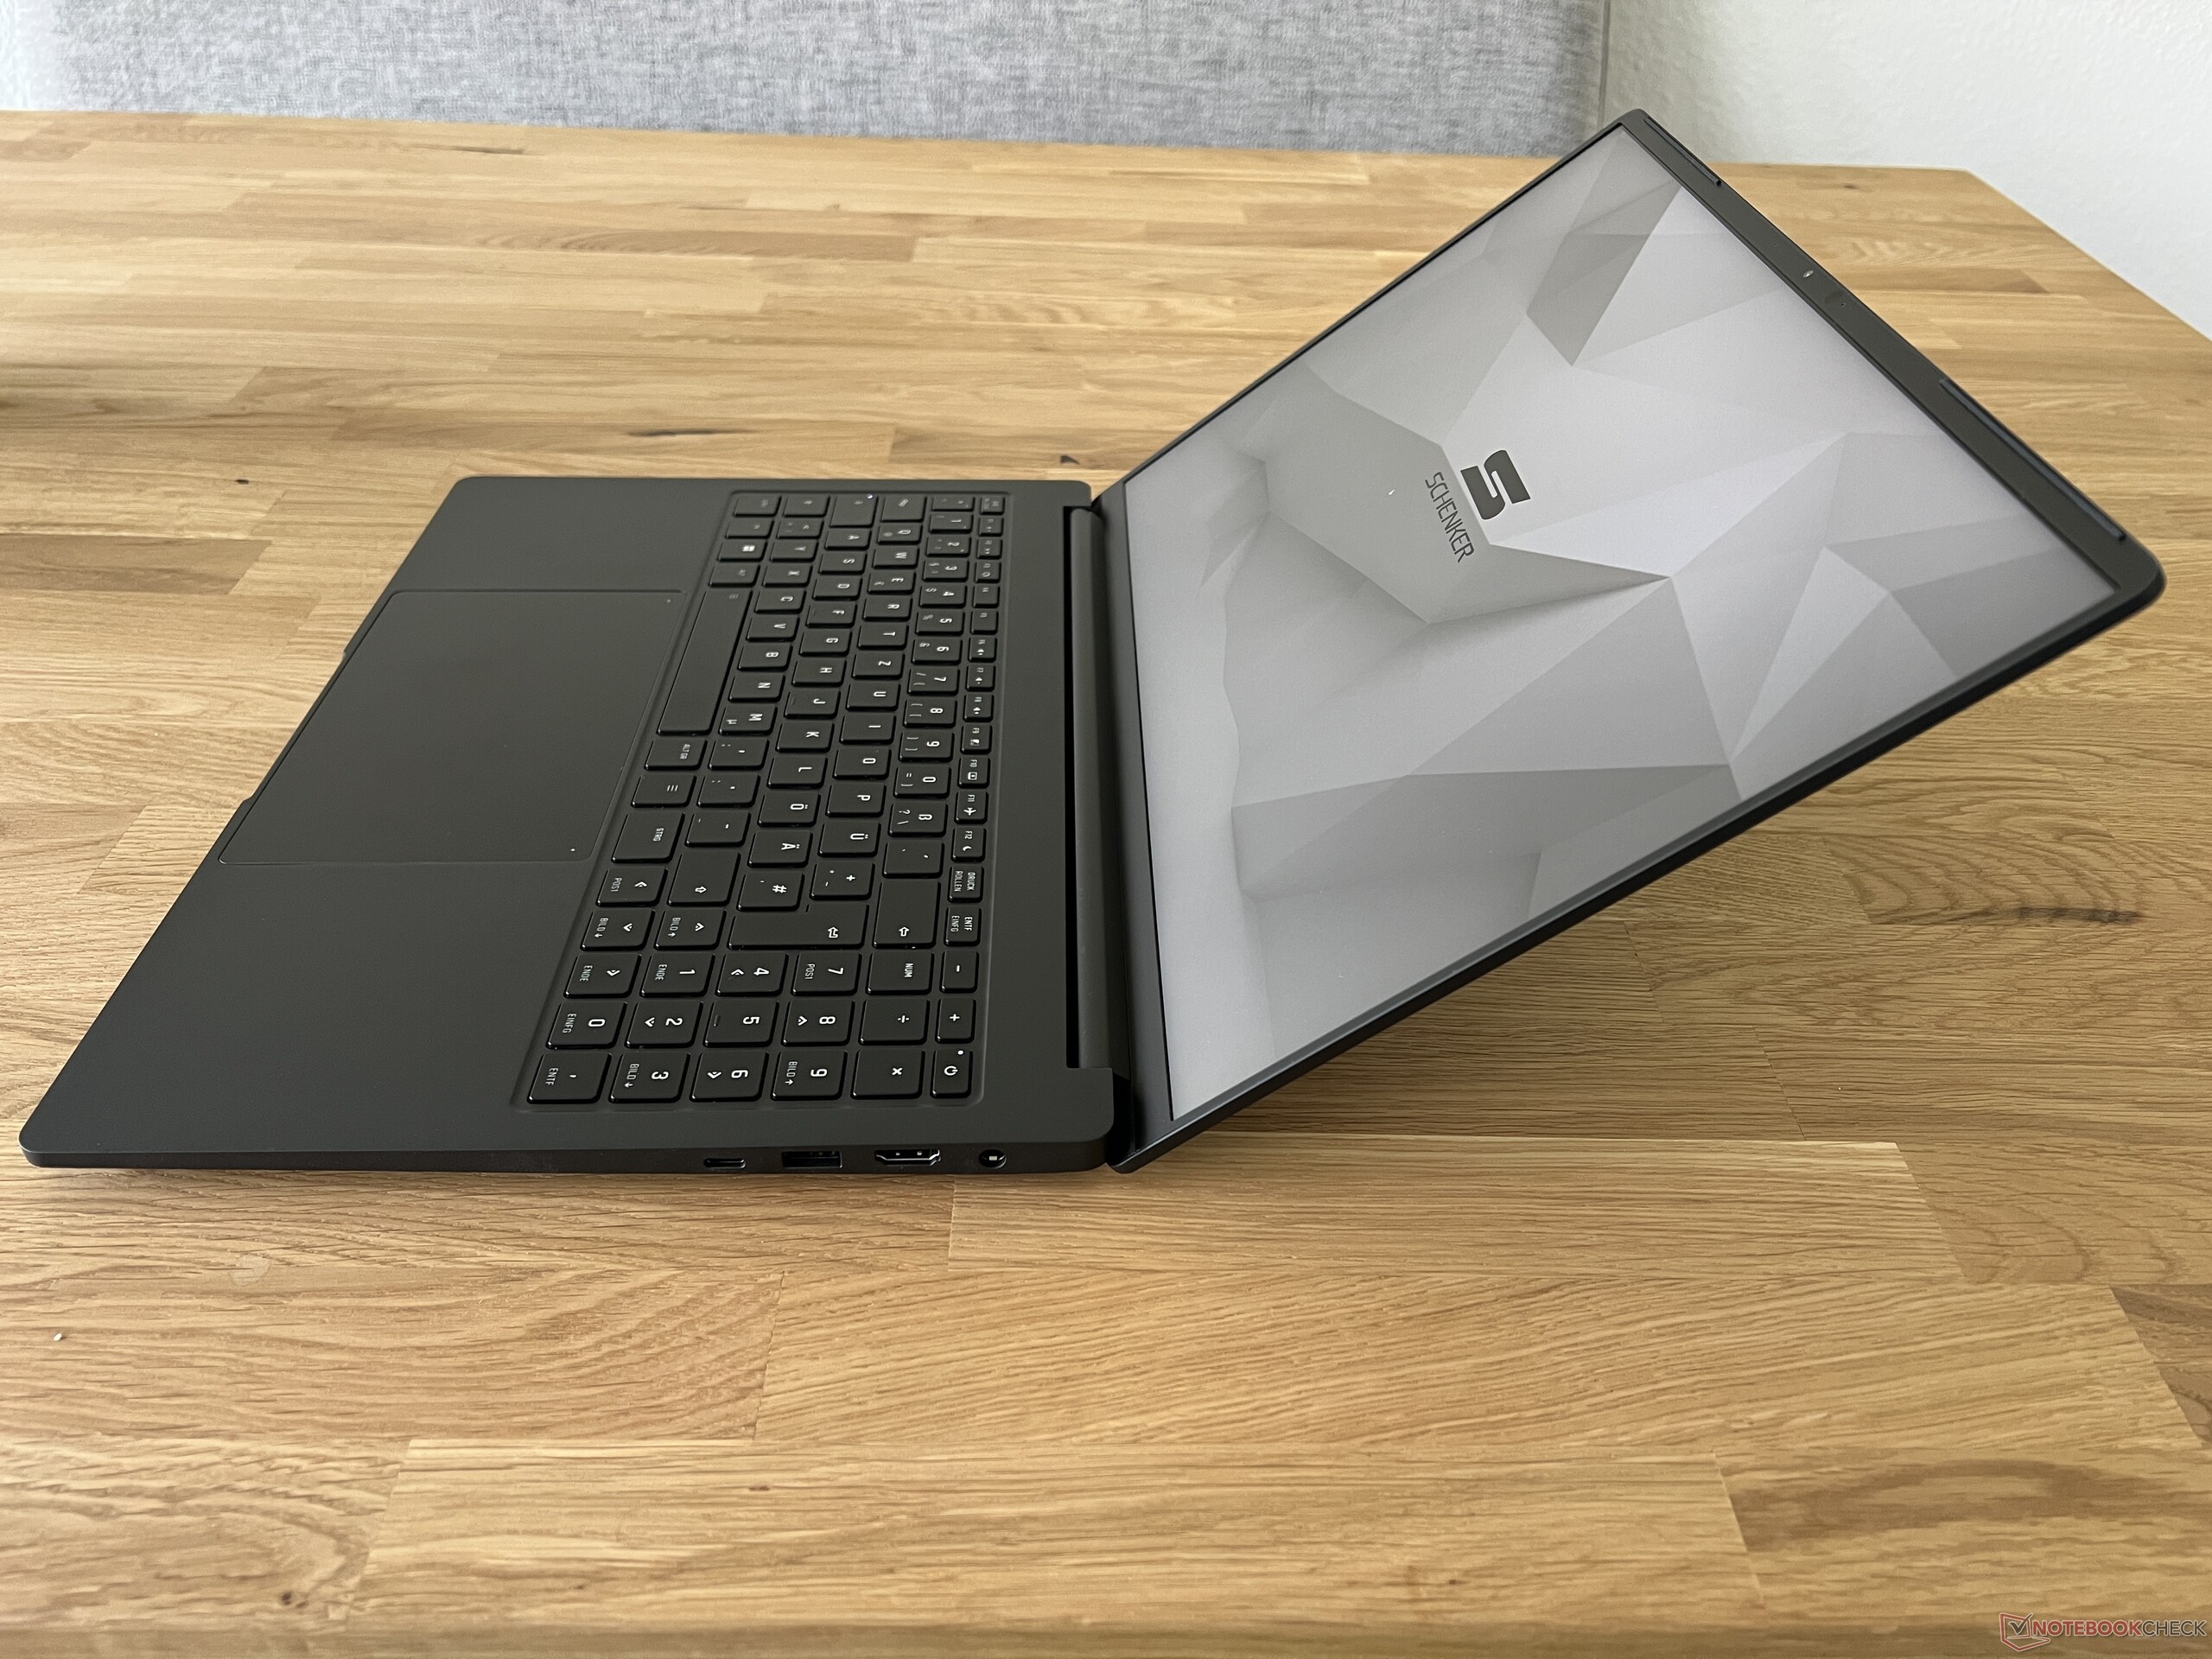
A pesar de su delgada carcasa, el Vision 16 Pro ofrece todas las conexiones importantes, incluyendo Thunderbolt 4 y 2x USB-A, haciendo innecesarios los adaptadores en la práctica. Las conexiones se distribuyen por ambos lados y están situadas en la zona trasera. Por el camino, también puedes cargar el portátil por USB-C (mín. 65 vatios, máx. 100 vatios). Comparado con el del modelo del año pasado, el lector de tarjetas se ha vuelto significativamente más lento, lo que probamos con dos tarjetas SD. También hay que aceptar algunos ligeros compromisos en el módulo WLAN, ya que la configuración de antena del Vision 16 Pro no admite redes de 6 GHz (Wi-Fi 6E). Se sigue utilizando el módulo AX201 de Intel (Wi-Fi 6), y las velocidades de transferencia son muy buenas. La webcam 1080p crea grabaciones decentes en condiciones de luz razonables. Además, también hay un módulo IR para el reconocimiento facial a través de Windows Hello.
| SD Card Reader | |
| average JPG Copy Test (av. of 3 runs) | |
| Apple MacBook Pro 16 2023 M2 Max (Angelbird AV Pro V60) | |
| MSI Stealth 16 Studio A13VG | |
| Dell XPS 15 9530 RTX 4070 (Toshiba Exceria Pro SDXC 64 GB UHS-II) | |
| Media de la clase Multimedia (23 - 531, n=39, últimos 2 años) | |
| Schenker Vision 16 Pro RTX 3070 Ti (AV Pro V60) | |
| Samsung Galaxy Book3 Ultra 16, i9-13900H RTX 4070 (AV Pro SD microSD 128 GB V60) | |
| Asus ProArt Studiobook 16 OLED H7604 (Angelibird AV Pro V60) | |
| Schenker VISION 16 Pro (M23) (Angelbird AV Pro V60) | |
| maximum AS SSD Seq Read Test (1GB) | |
| Apple MacBook Pro 16 2023 M2 Max (Angelbird AV Pro V60) | |
| Media de la clase Multimedia (37.3 - 1455, n=38, últimos 2 años) | |
| Dell XPS 15 9530 RTX 4070 (Toshiba Exceria Pro SDXC 64 GB UHS-II) | |
| MSI Stealth 16 Studio A13VG | |
| Samsung Galaxy Book3 Ultra 16, i9-13900H RTX 4070 (AV Pro SD microSD 128 GB V60) | |
| Asus ProArt Studiobook 16 OLED H7604 (Angelibird AV Pro V60) | |
| Schenker Vision 16 Pro RTX 3070 Ti (AV Pro V60) | |
| Schenker VISION 16 Pro (M23) (Angelbird AV Pro V60) | |
| Networking | |
| Schenker VISION 16 Pro (M23) | |
| iperf3 transmit AXE11000 | |
| iperf3 receive AXE11000 | |
| Samsung Galaxy Book3 Ultra 16, i9-13900H RTX 4070 | |
| iperf3 transmit AXE11000 | |
| iperf3 receive AXE11000 | |
| iperf3 transmit AXE11000 6GHz | |
| iperf3 receive AXE11000 6GHz | |
| MSI Stealth 16 Studio A13VG | |
| iperf3 transmit AXE11000 | |
| iperf3 receive AXE11000 | |
| iperf3 transmit AXE11000 6GHz | |
| iperf3 receive AXE11000 6GHz | |
| Dell XPS 15 9530 RTX 4070 | |
| iperf3 transmit AXE11000 | |
| iperf3 receive AXE11000 | |
| Asus ProArt Studiobook 16 OLED H7604 | |
| iperf3 transmit AXE11000 | |
| iperf3 receive AXE11000 | |
| Apple MacBook Pro 16 2023 M2 Max | |
| iperf3 transmit AXE11000 6GHz | |
| iperf3 receive AXE11000 6GHz | |
| Schenker Vision 16 Pro RTX 3070 Ti | |
| iperf3 transmit AXE11000 | |
| iperf3 receive AXE11000 | |

 GeForce RTX 4070 Laptop GPU, i7-13700H, Samsung 990 Pro 1 TB")
 GeForce RTX 4070 Laptop GPU, i7-13700H, Samsung 990 Pro 1 TB")
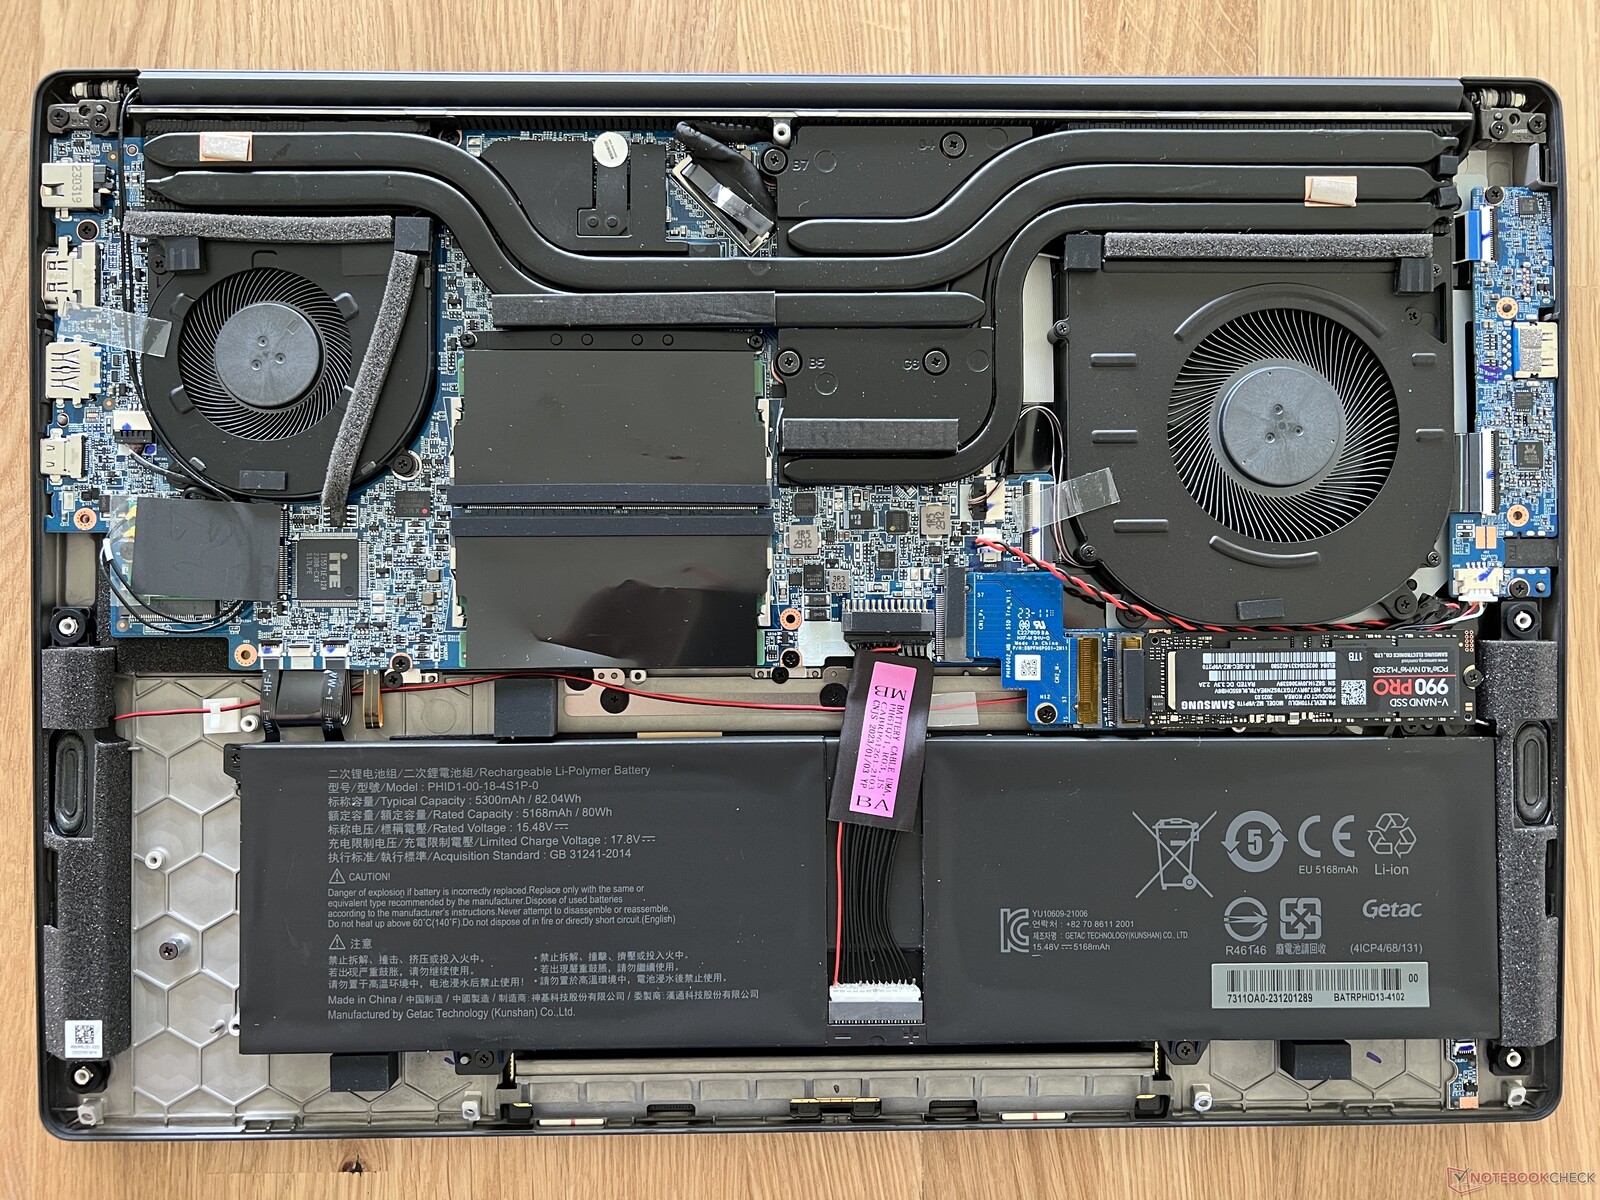
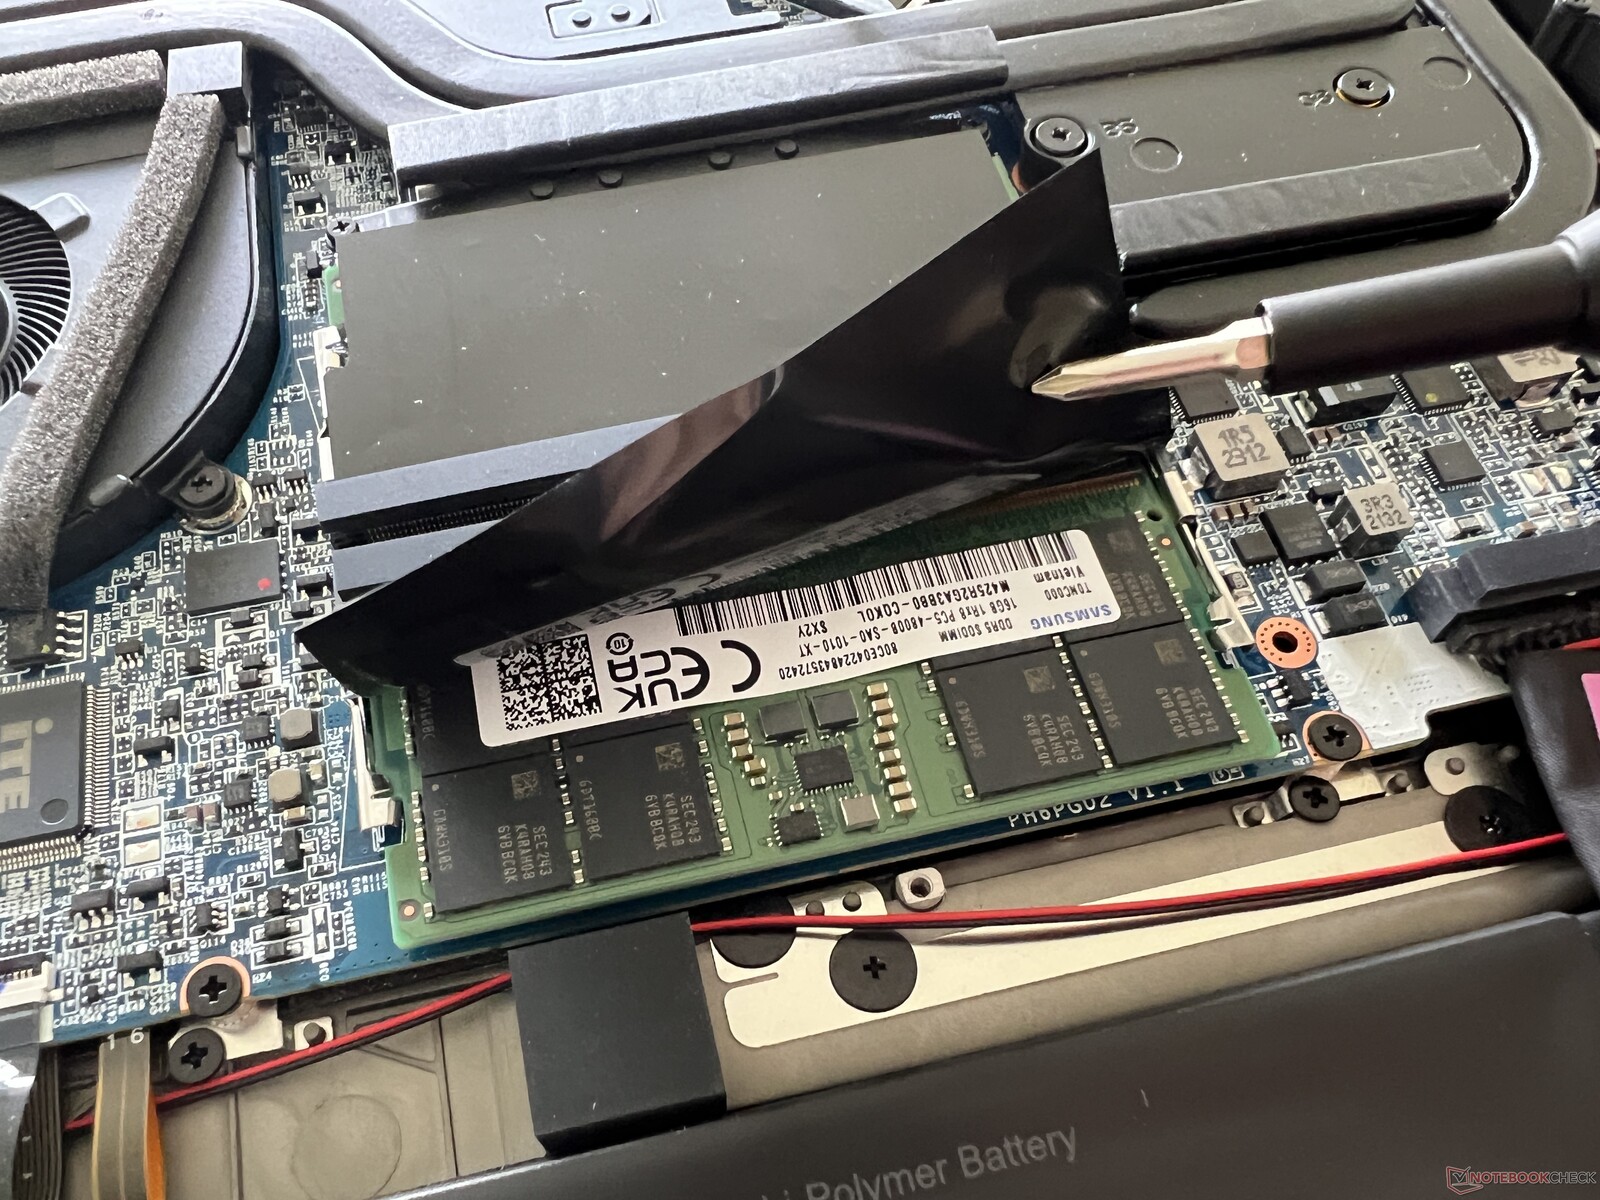
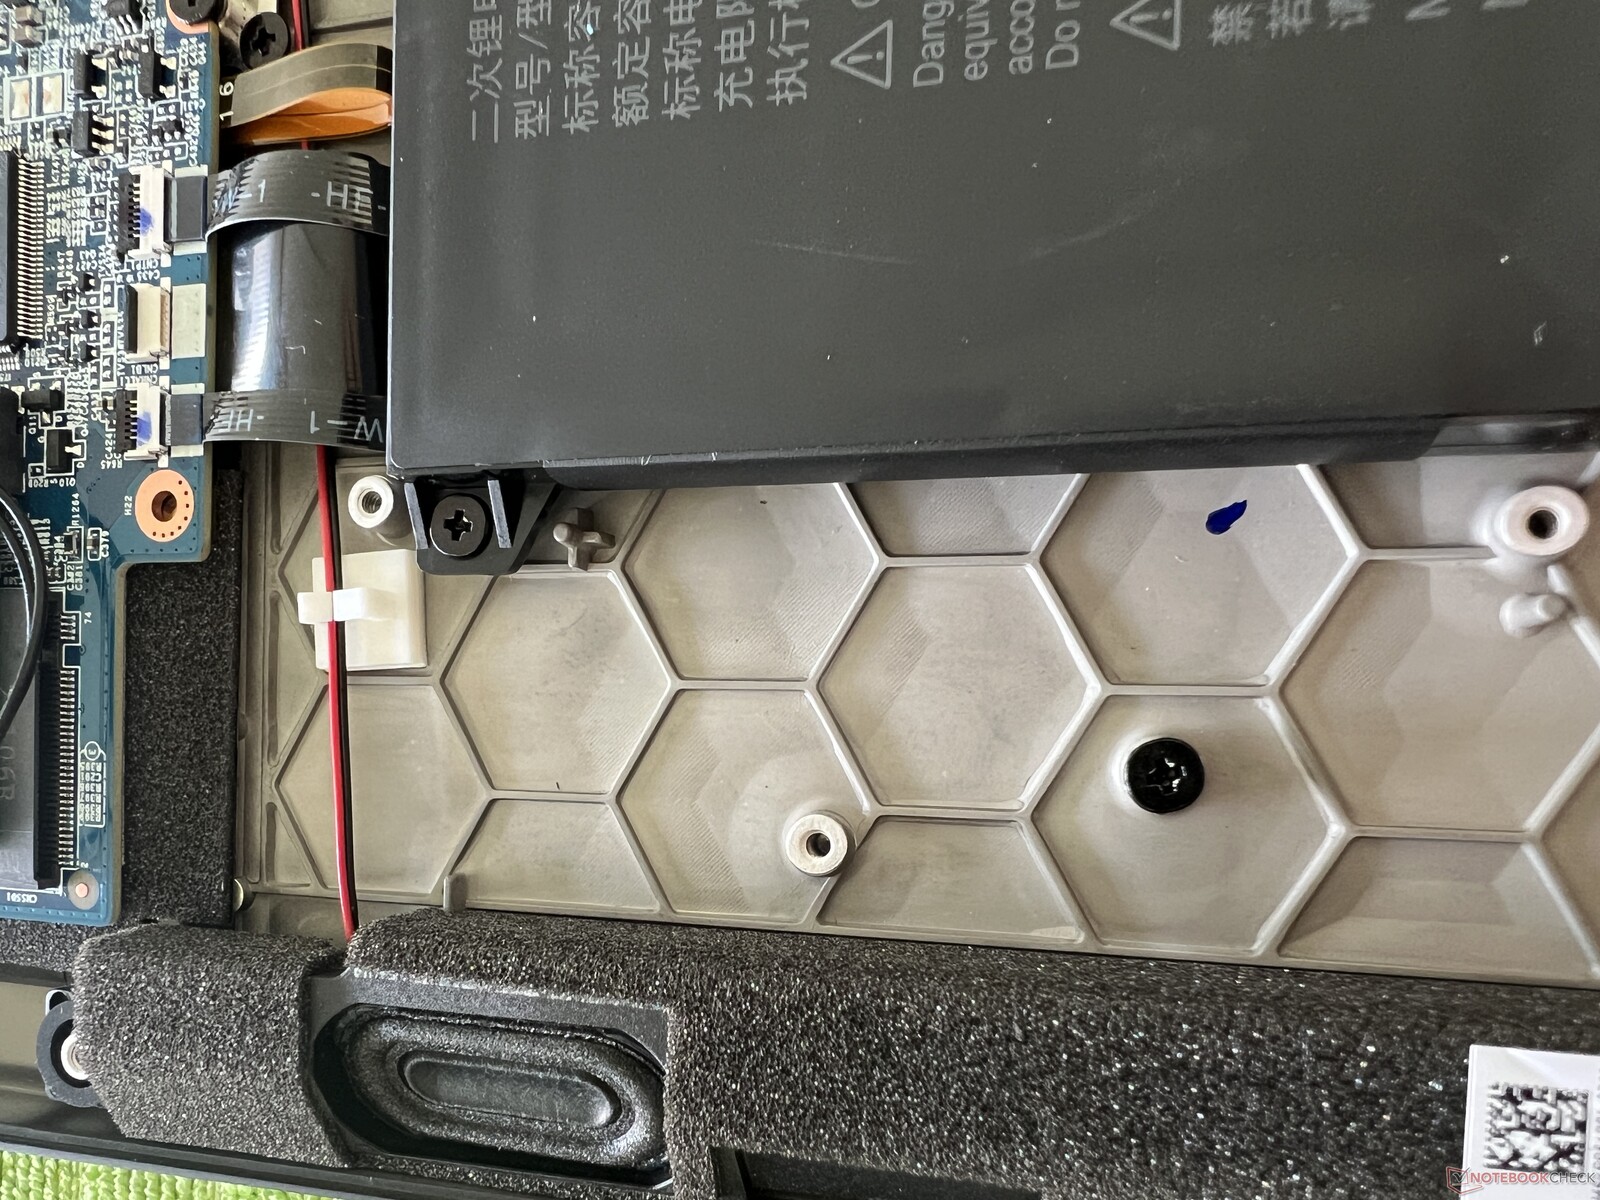
Mantenimiento
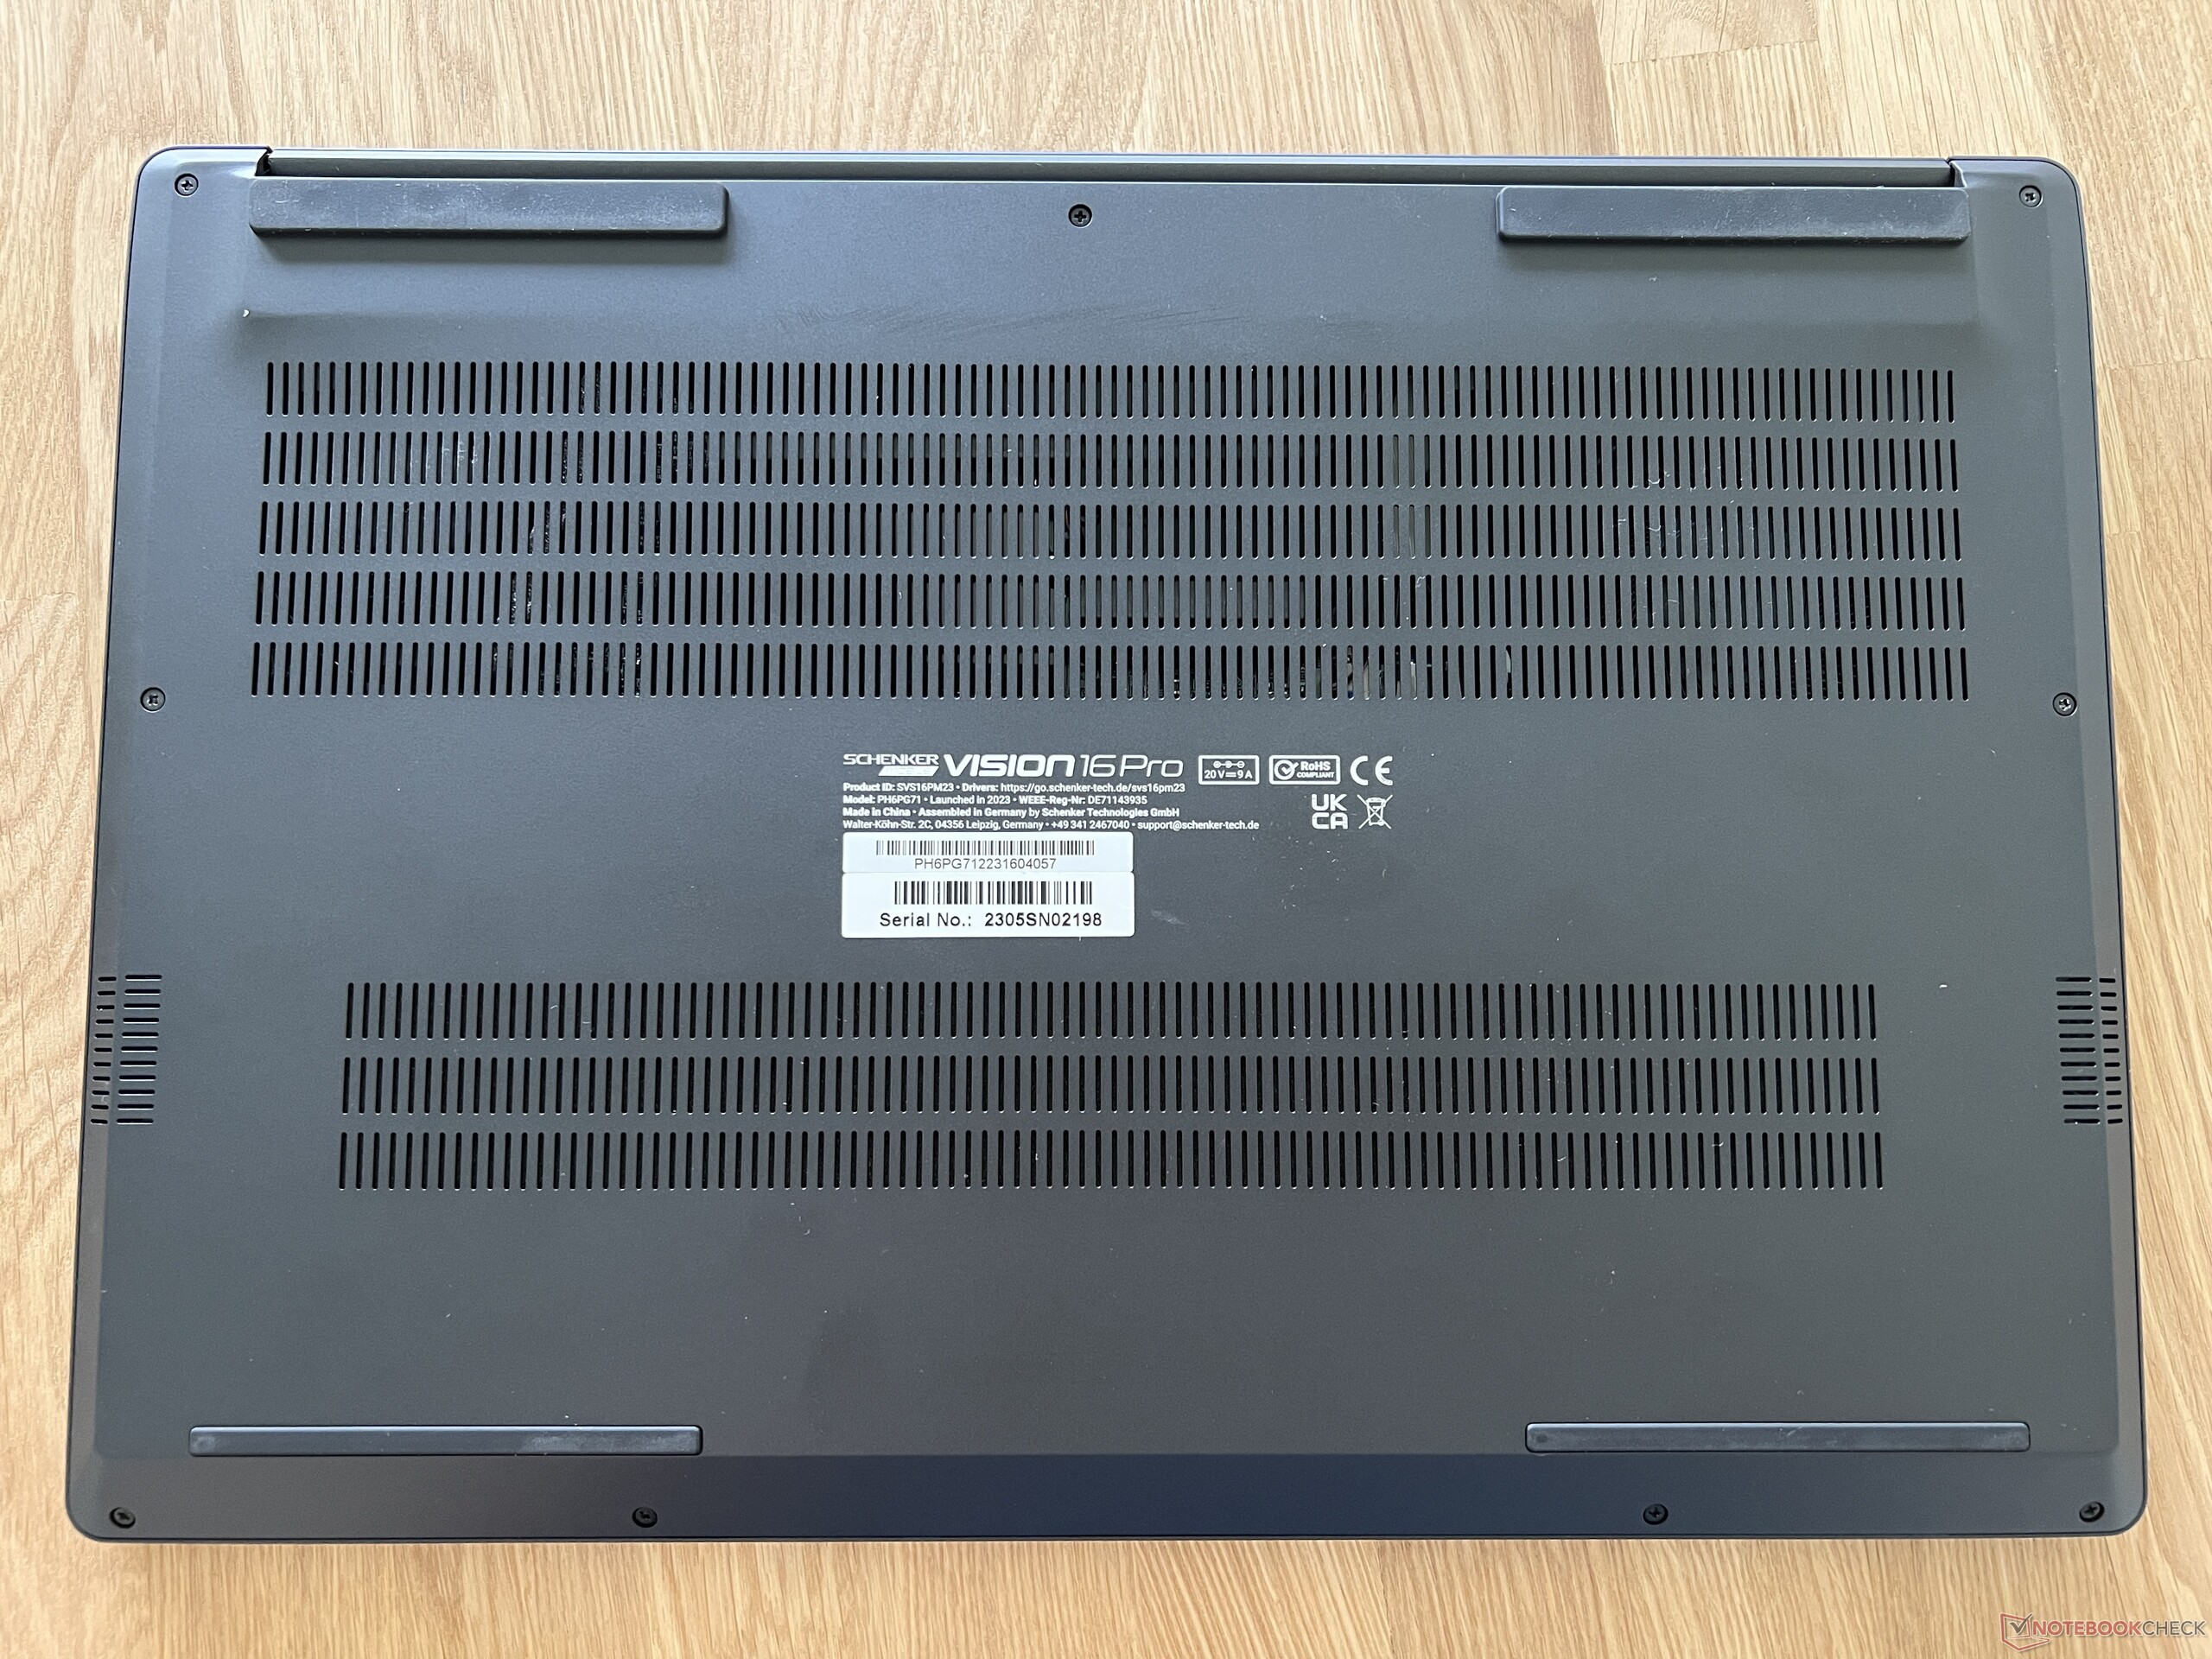
La parte inferior de la carcasa está asegurada con algunos tornillos Phillips normales y se puede quitar fácilmente. En el interior, se puede ver que, aparte de un ligero cambio en la colocación de los tubos de calor, la configuración es básicamente idéntica. Los usuarios tienen acceso a los dos ventiladores, las ranuras SO-DIMM y las dos ranuras para las SSD M.2 2280, aunque sólo se admite una segunda SSD de un solo lado.
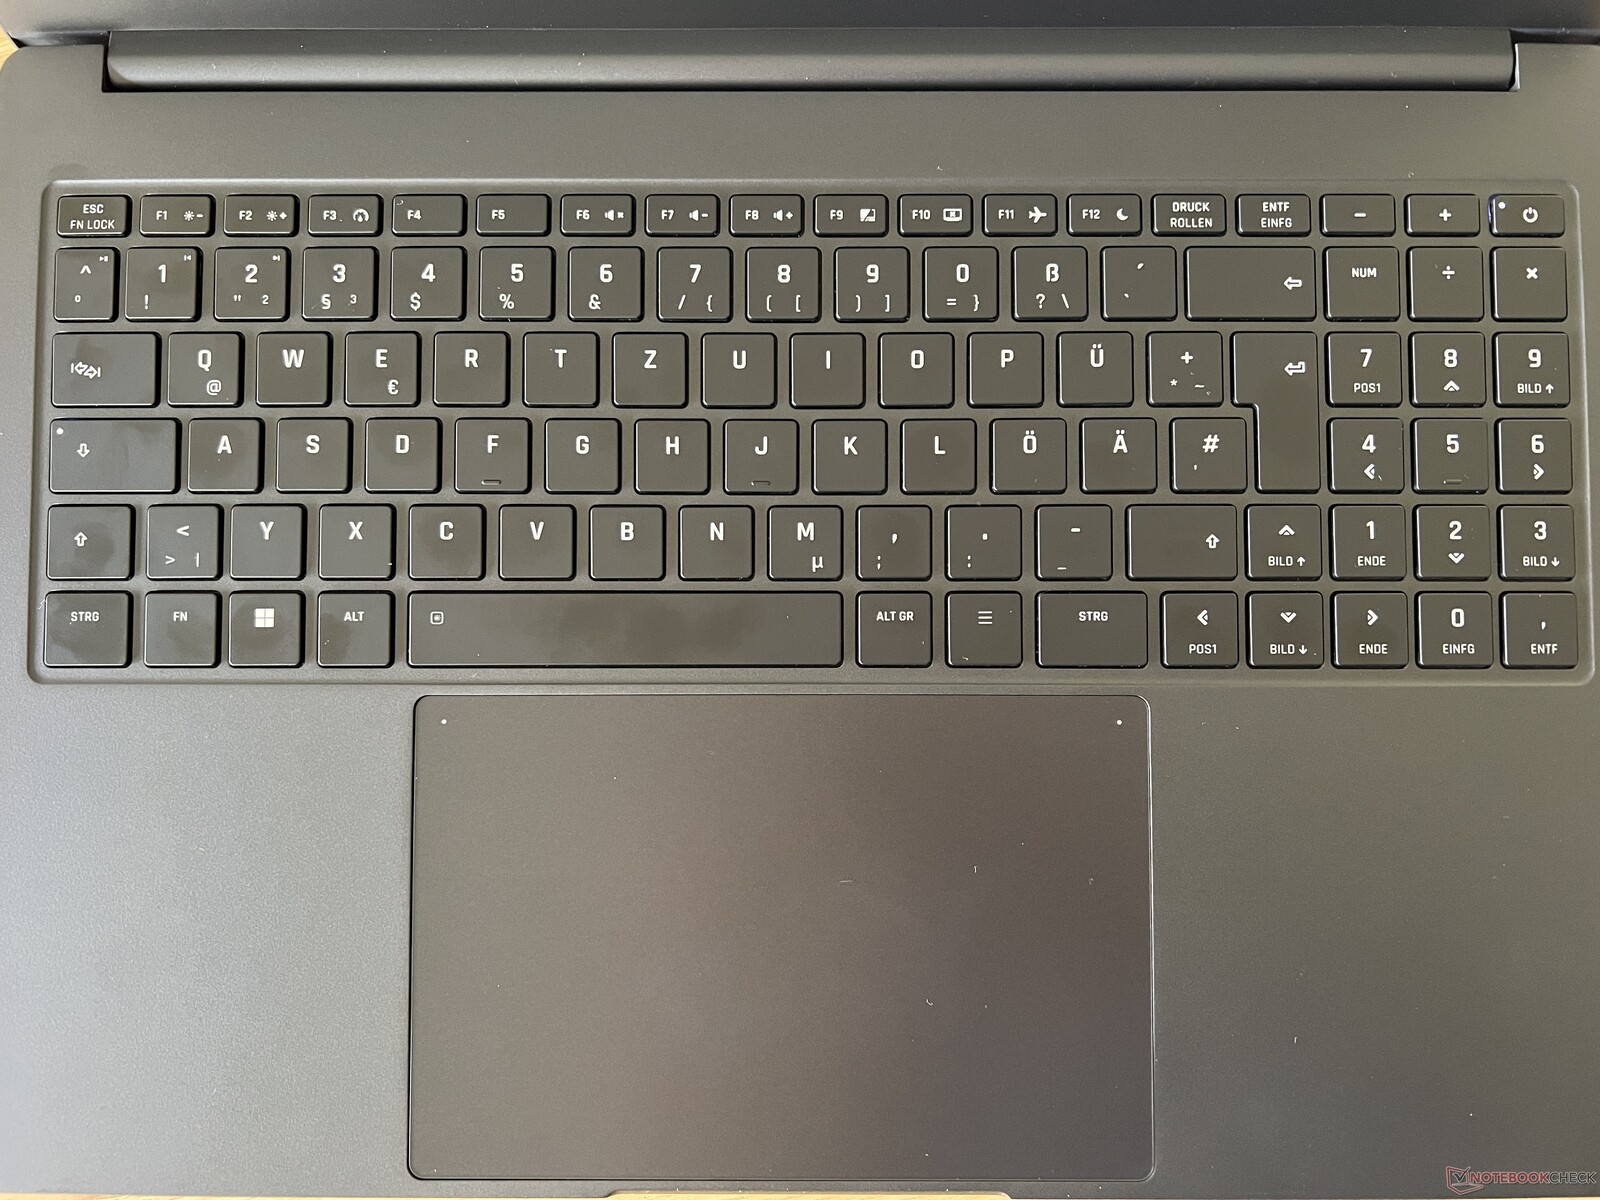
Dispositivos de entrada - ClickPad grande y bloque numérico
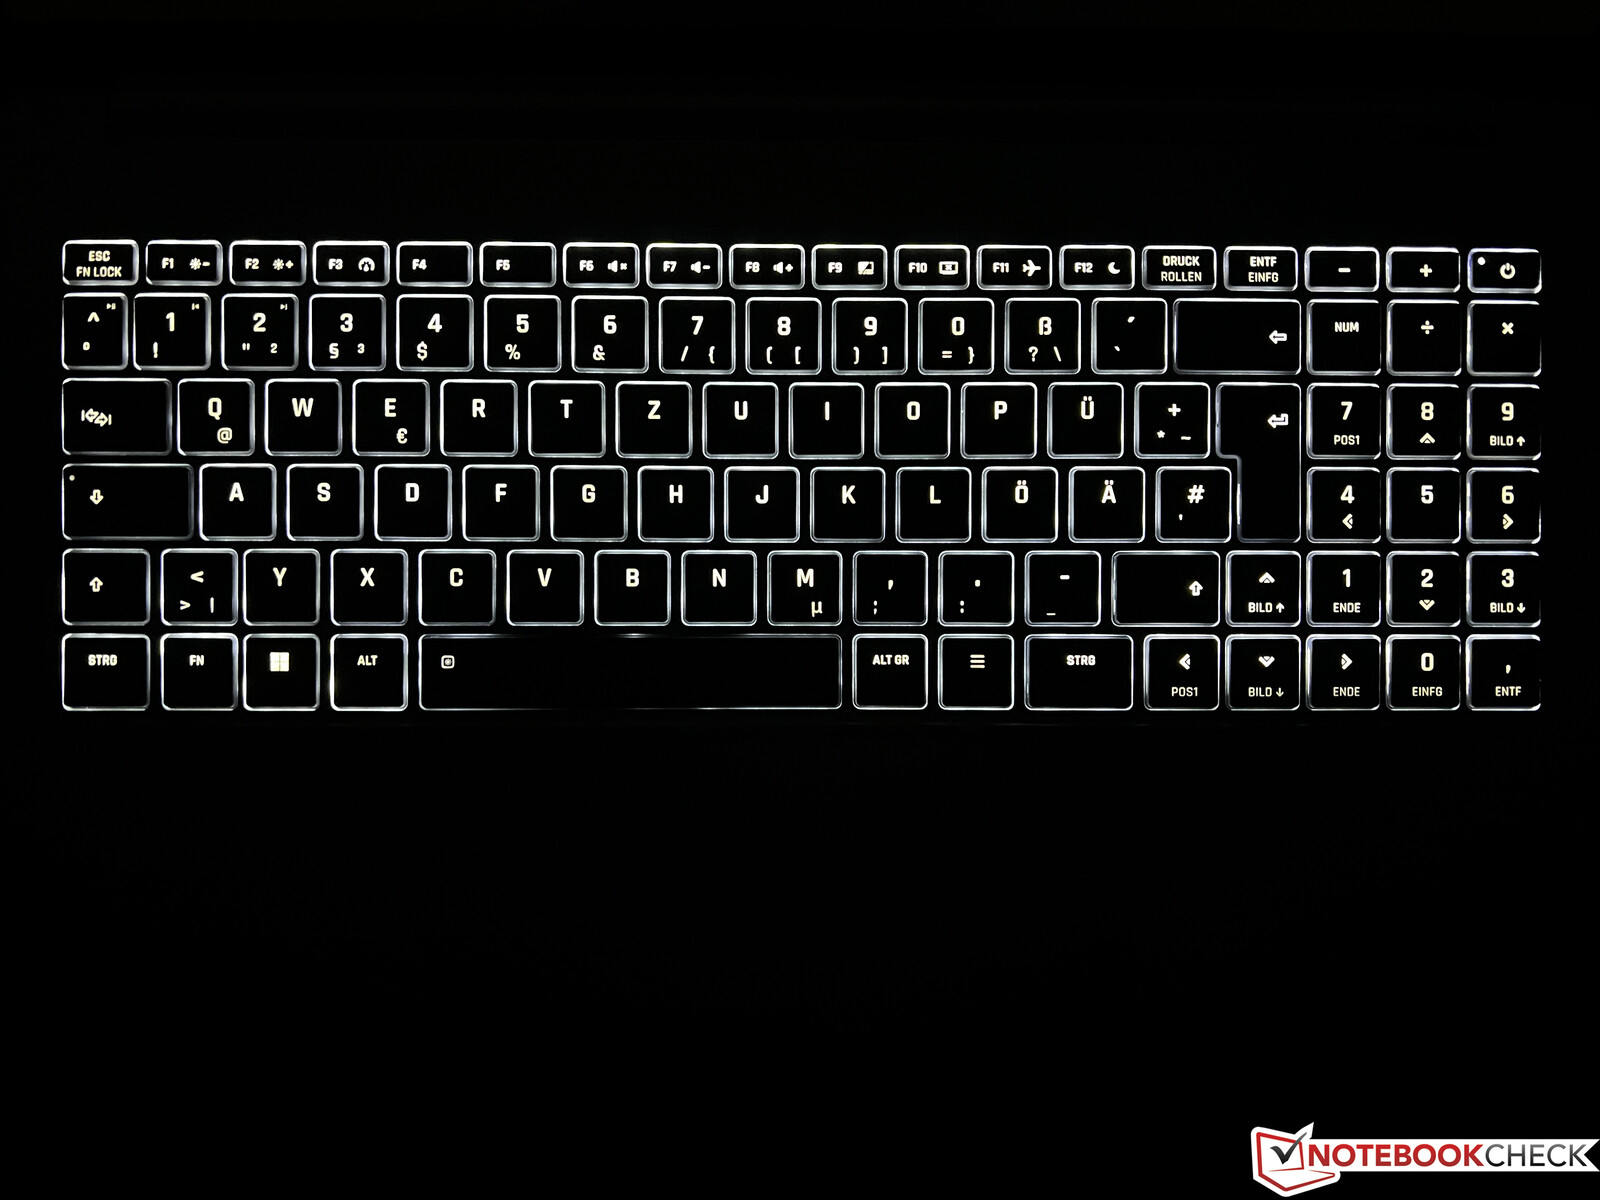
El teclado de tamaño normal ofrece un bloque numérico dedicado que incluye teclas de flecha grandes, pero eso también significa que no hay tecla Intro adicional y que el tamaño de la tecla Mayúsculas es reducido. En general, el teclado es muy preciso y cómodo, y la pulsación de las teclas también es cómodamente silenciosa; sólo las teclas Espacio y Enter son ligeramente más ruidosas. En entornos oscuros, la iluminación blanca de dos niveles del teclado es de gran ayuda. El enorme ClickPad de cristal (15,4 x 10 cm, ~6 x 4 in) se maneja con facilidad y ofrece mucho espacio para gestos y movimientos del cursor. Sólo los ruidos de clic son un poco altos.
Pantalla - Panel WQHD con 240 Hz
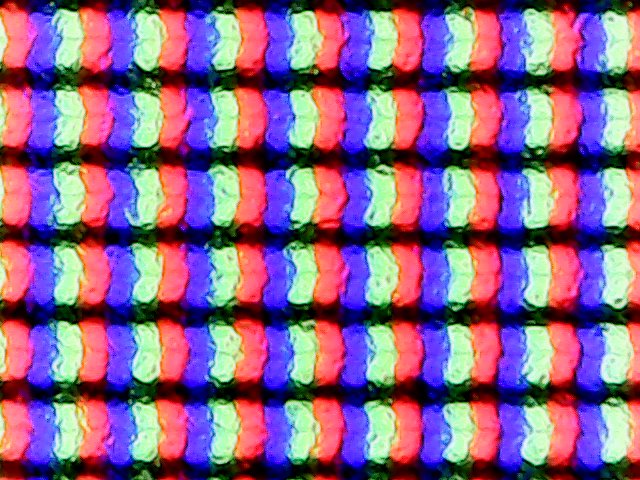
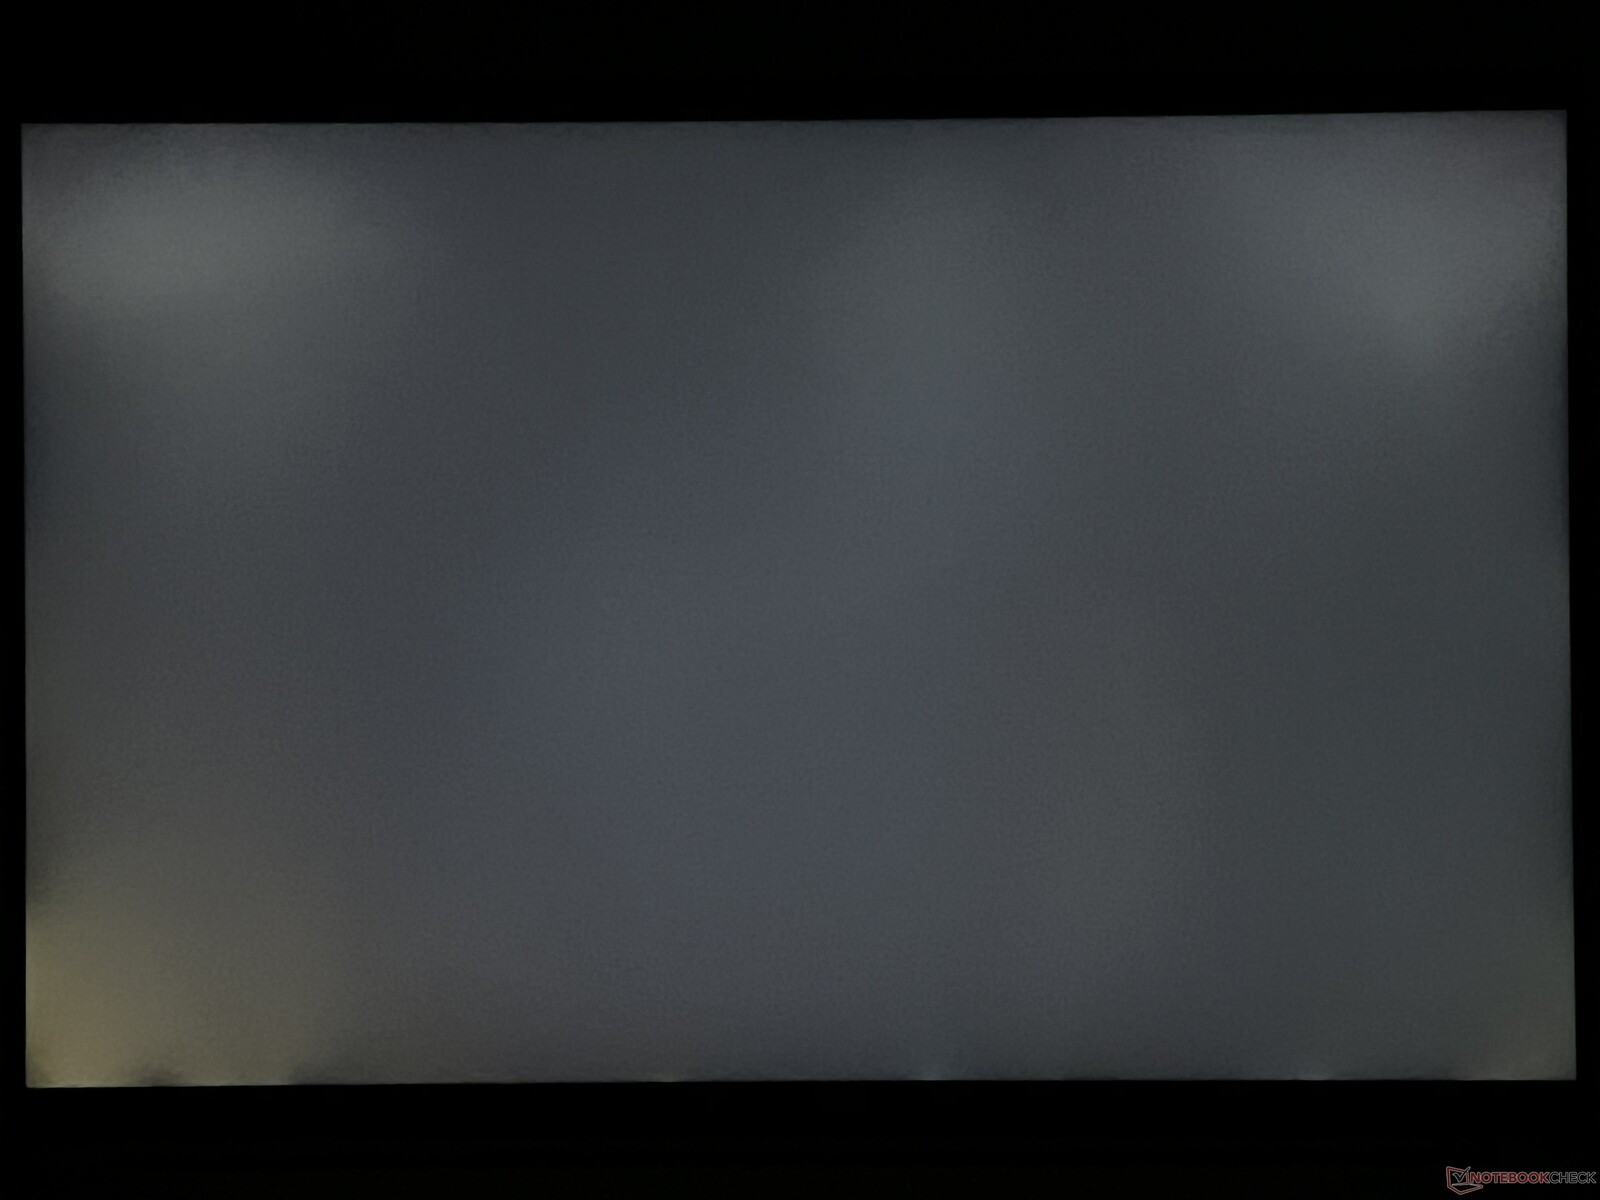
La pantalla no ha cambiado y sigue siendo un panel WQHD mate con una resolución de 2.560 x 1.600 píxeles y una frecuencia de refresco de 240 Hz. La impresión subjetiva de la imagen es muy buena, ya que incluso las áreas brillantes se muestran sin granulado. El brillo del panel (NE160QDM-NZ1) está especificado en 350 cd/m², y nuestro panel incluso lo supera ligeramente con una media de 370 cd/m². El valor de negro es de unos decentes 0,3 cd/m², lo que lleva a una buena relación de contraste de más de 1.200:1.
La frecuencia de refresco de 240 Hz crea una impresión muy suave con los movimientos, y los tiempos de respuesta también son rápidos. Los halos de luz sólo son visibles en las imágenes oscuras a pleno brillo, pero esto no será un problema en la práctica. No se usa PWM.
| |||||||||||||||||||||||||
iluminación: 88 %
Brillo con batería: 384 cd/m²
Contraste: 1280:1 (Negro: 0.3 cd/m²)
ΔE ColorChecker Calman: 3.4 | ∀{0.5-29.43 Ø4.71}
calibrated: 1.3
ΔE Greyscale Calman: 3.4 | ∀{0.09-98 Ø4.96}
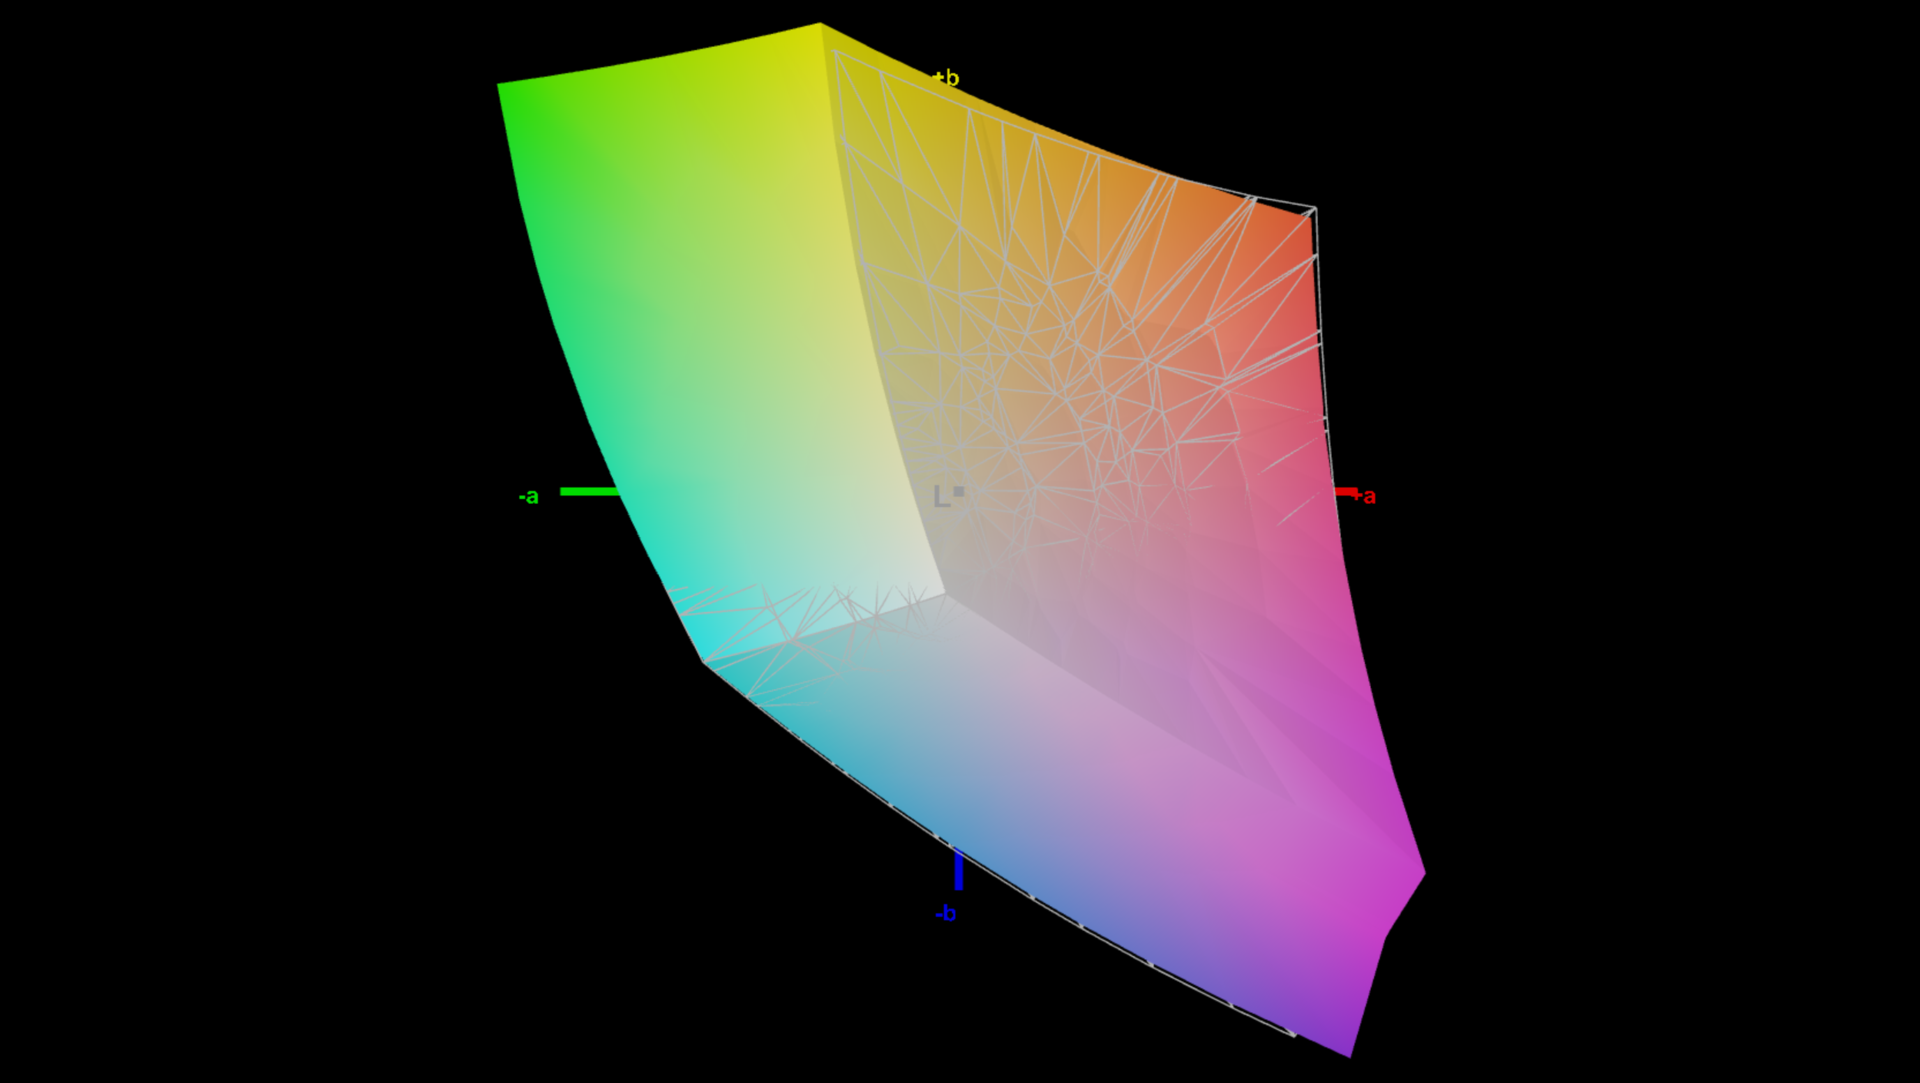
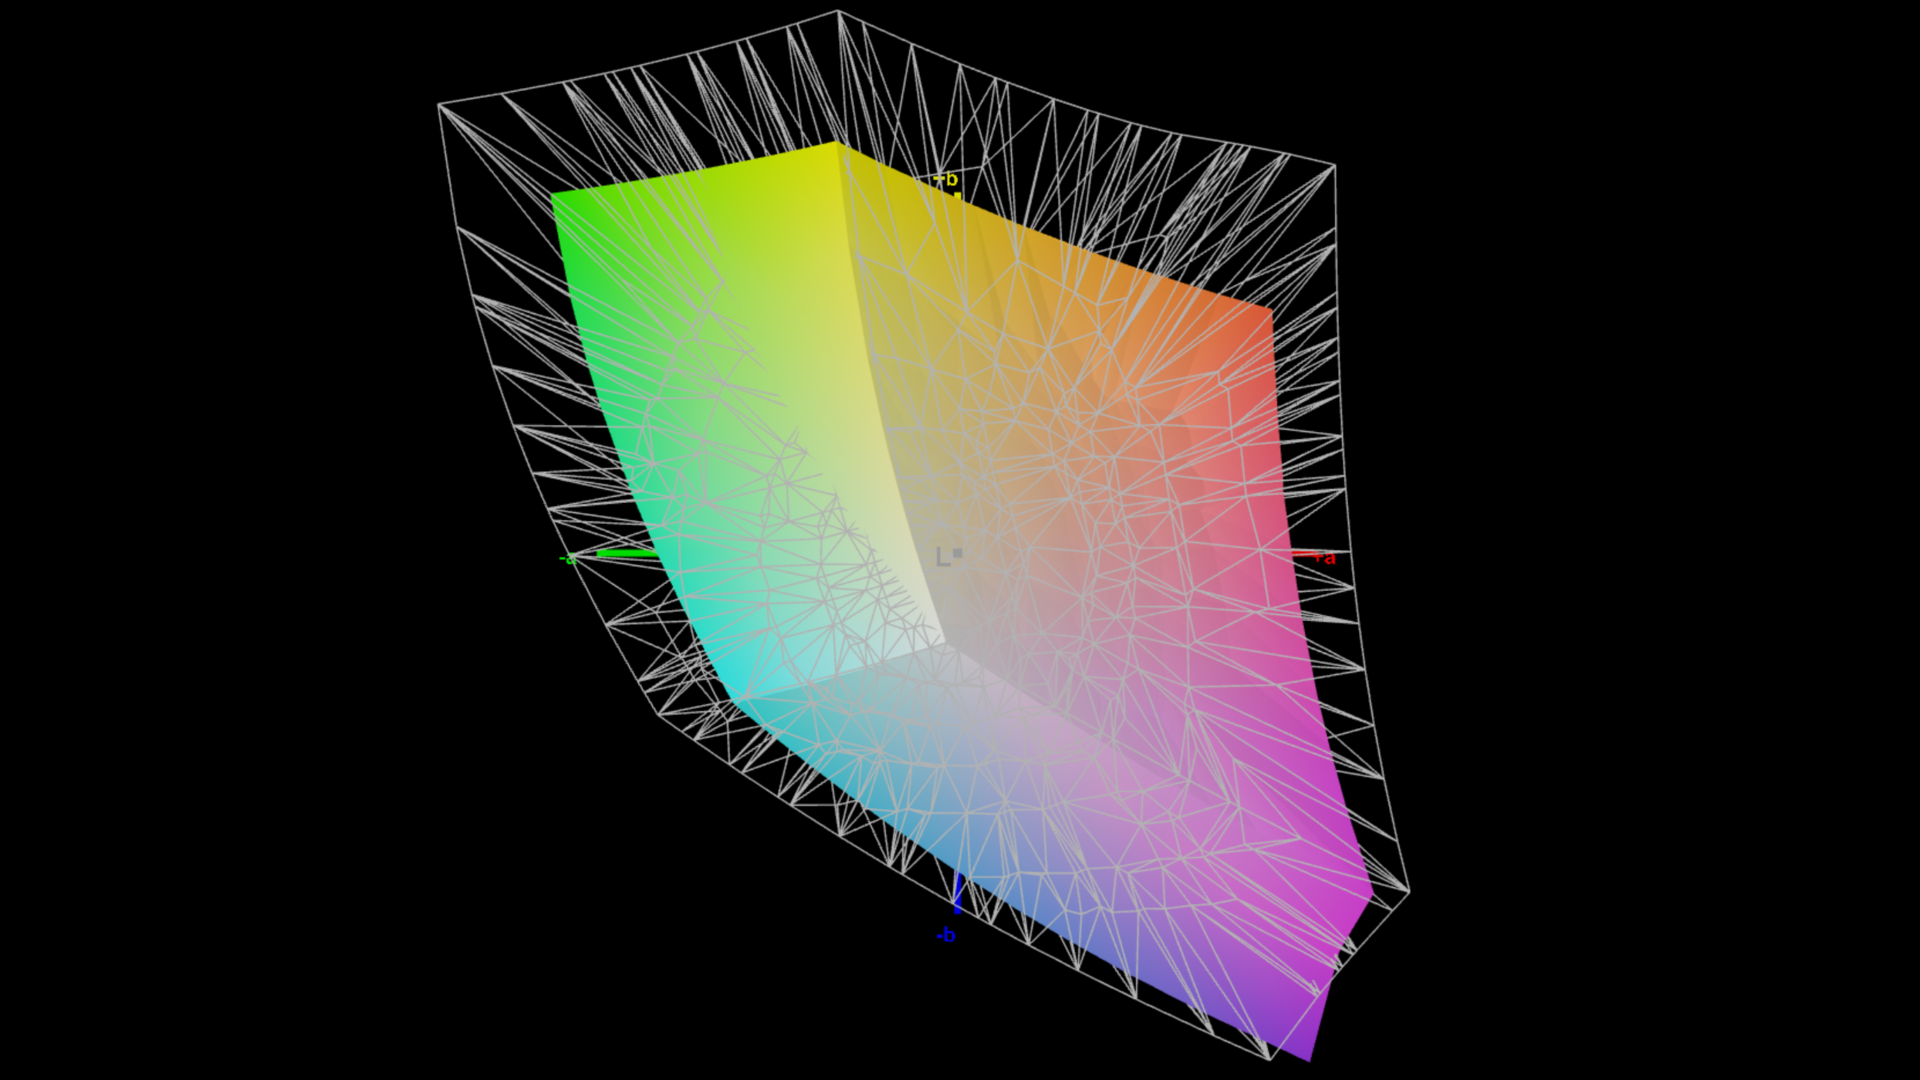
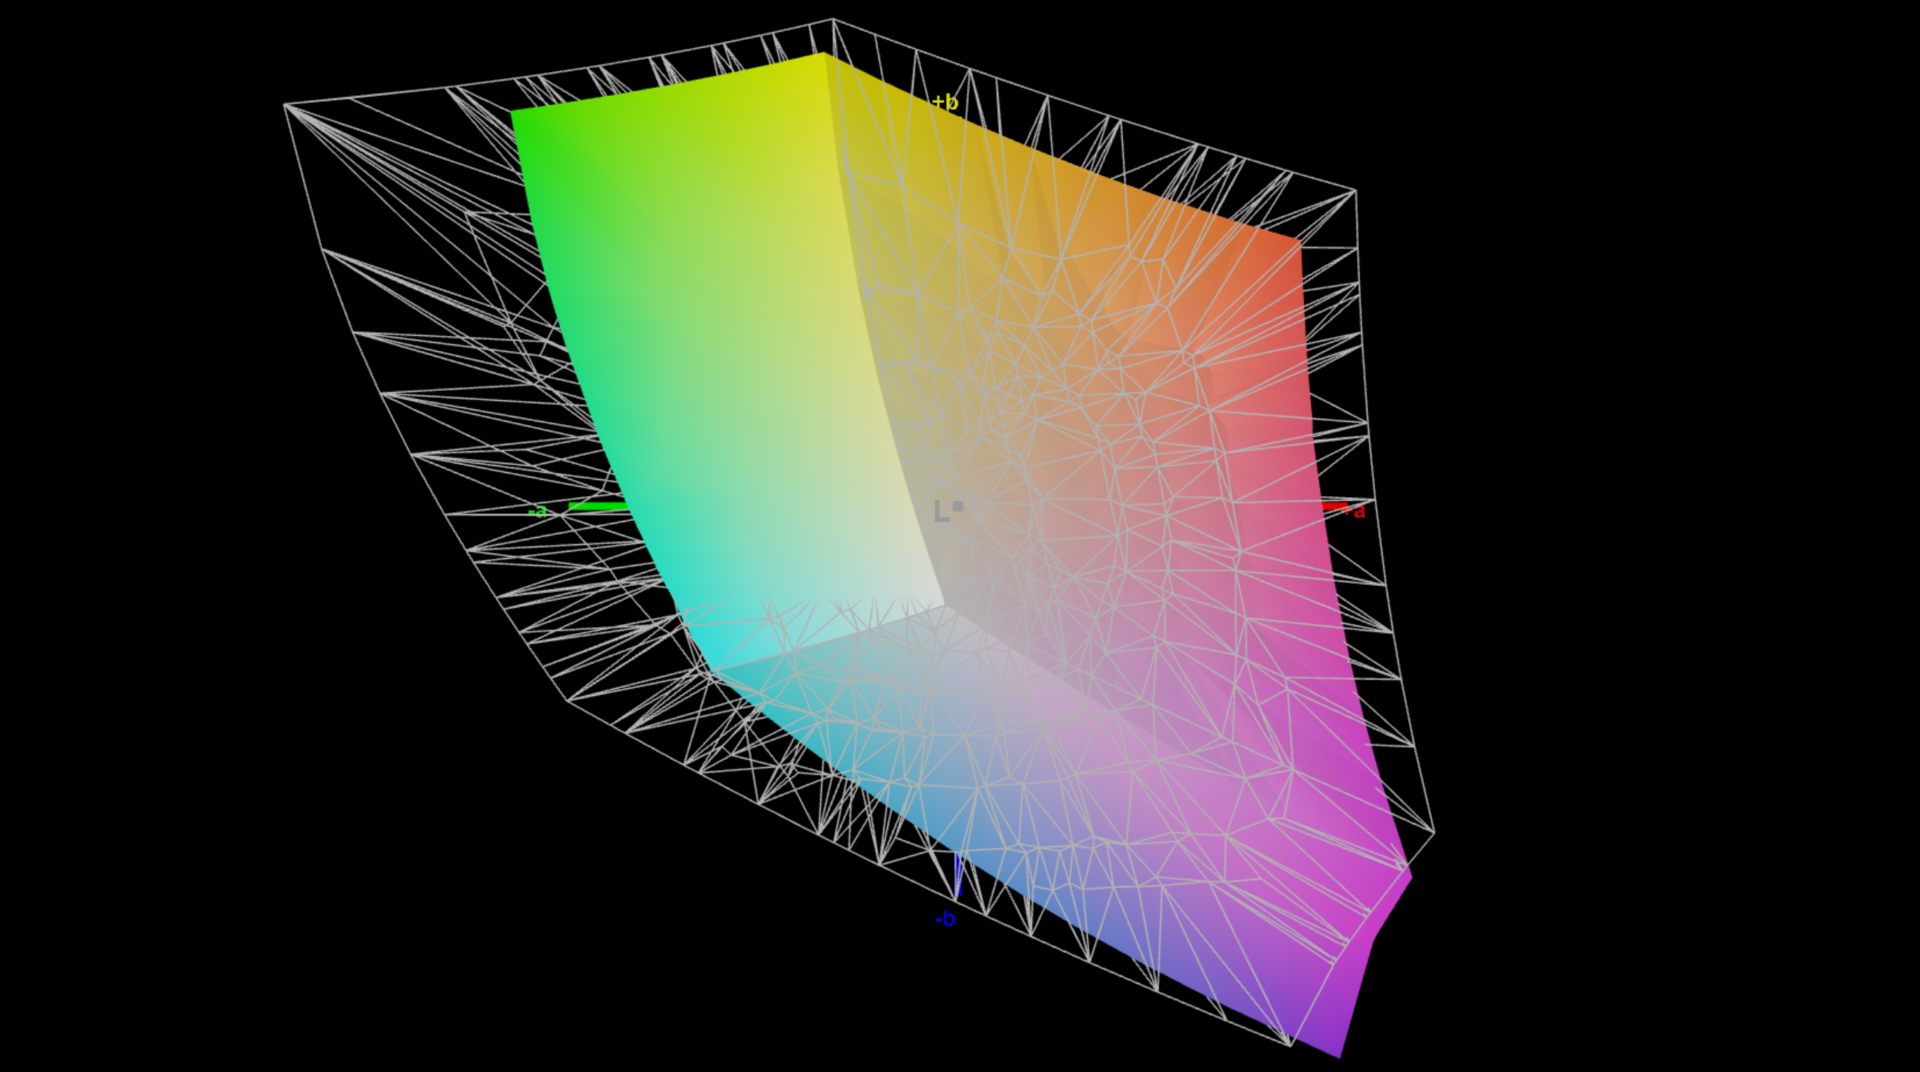
70% AdobeRGB 1998 (Argyll 3D)
98.8% sRGB (Argyll 3D)
68.8% Display P3 (Argyll 3D)
Gamma: 2.16
CCT: 7462 K
| Schenker VISION 16 Pro (M23) NE160QDM-NZ1, IPS, 2560x1600, 16" | Samsung Galaxy Book3 Ultra 16, i9-13900H RTX 4070 Samsung SDC4185 ATNA60CL03-0, OLED / AMOLED, 2880x1800, 16" | MSI Stealth 16 Studio A13VG AUO26A9, IPS, 2560x1600, 16" | Dell XPS 15 9530 RTX 4070 Samsung 156XG01, OLED, 3456x2160, 15.6" | Asus ProArt Studiobook 16 OLED H7604 ATNA60BX01-1, OLED, 3200x2000, 16" | Apple MacBook Pro 16 2023 M2 Max Mini-LED, 3456x2234, 16.2" | Schenker Vision 16 Pro RTX 3070 Ti N160QDM-NZ1, IPS, 2560x1600, 16" | |
|---|---|---|---|---|---|---|---|
| Display | 26% | 21% | 29% | 25% | 24% | -1% | |
| Display P3 Coverage (%) | 68.8 | 95.3 39% | 96.4 40% | 99.8 45% | 99.6 45% | 99 44% | 68.7 0% |
| sRGB Coverage (%) | 98.8 | 99.1 0% | 99.7 1% | 100 1% | 100 1% | 100 1% | 96.7 -2% |
| AdobeRGB 1998 Coverage (%) | 70 | 97.4 39% | 84.8 21% | 98.4 41% | 89.4 28% | 88.5 26% | 70 0% |
| Response Times | 80% | 50% | 82% | 93% | -486% | -5% | |
| Response Time Grey 50% / Grey 80% * (ms) | 13.7 ? | 2 ? 85% | 4.4 ? 68% | 1.68 ? 88% | 0.59 ? 96% | 80.5 ? -488% | 14.3 ? -4% |
| Response Time Black / White * (ms) | 8.1 ? | 2 ? 75% | 5.6 ? 31% | 1.94 ? 76% | 0.79 ? 90% | 47.2 ? -483% | 8.6 ? -6% |
| PWM Frequency (Hz) | 250 ? | 239 | 240 ? | 14880 ? | |||
| Screen | 21% | -16% | 0% | 159% | 4950% | -14% | |
| Brightness middle (cd/m²) | 384 | 403 5% | 424 10% | 389.5 1% | 349 -9% | 504 31% | 364 -5% |
| Brightness (cd/m²) | 371 | 408 10% | 411 11% | 392 6% | 350 -6% | 487 31% | 347 -6% |
| Brightness Distribution (%) | 88 | 98 11% | 88 0% | 98 11% | 95 8% | 94 7% | 89 1% |
| Black Level * (cd/m²) | 0.3 | 0.37 -23% | 0.02 93% | 0.001 100% | 0.3 -0% | ||
| Contrast (:1) | 1280 | 1146 -10% | 17450 1263% | 504000 39275% | 1213 -5% | ||
| Colorchecker dE 2000 * | 3.4 | 2.63 23% | 3.04 11% | 4.95 -46% | 2.1 38% | 1.5 56% | 3.3 3% |
| Colorchecker dE 2000 max. * | 9.2 | 4.07 56% | 7.5 18% | 8.65 6% | 5.5 40% | 3.3 64% | 6.6 28% |
| Colorchecker dE 2000 calibrated * | 1.3 | 3.04 -134% | 1.53 -18% | 2.1 -62% | 2.5 -92% | ||
| Greyscale dE 2000 * | 3.4 | 2.69 21% | 4.34 -28% | 2 41% | 1.2 65% | 2.1 38% | 5.2 -53% |
| Gamma | 2.16 102% | 2.48 89% | 2.32 95% | 2.27 97% | 2.19 100% | 2.25 98% | 2.14 103% |
| CCT | 7462 87% | 6907 94% | 6952 93% | 6265 104% | 6545 99% | 6882 94% | 6331 103% |
| Media total (Programa/Opciones) | 42% /
33% | 18% /
1% | 37% /
21% | 92% /
121% | 1496% /
2977% | -7% /
-10% |
* ... más pequeño es mejor
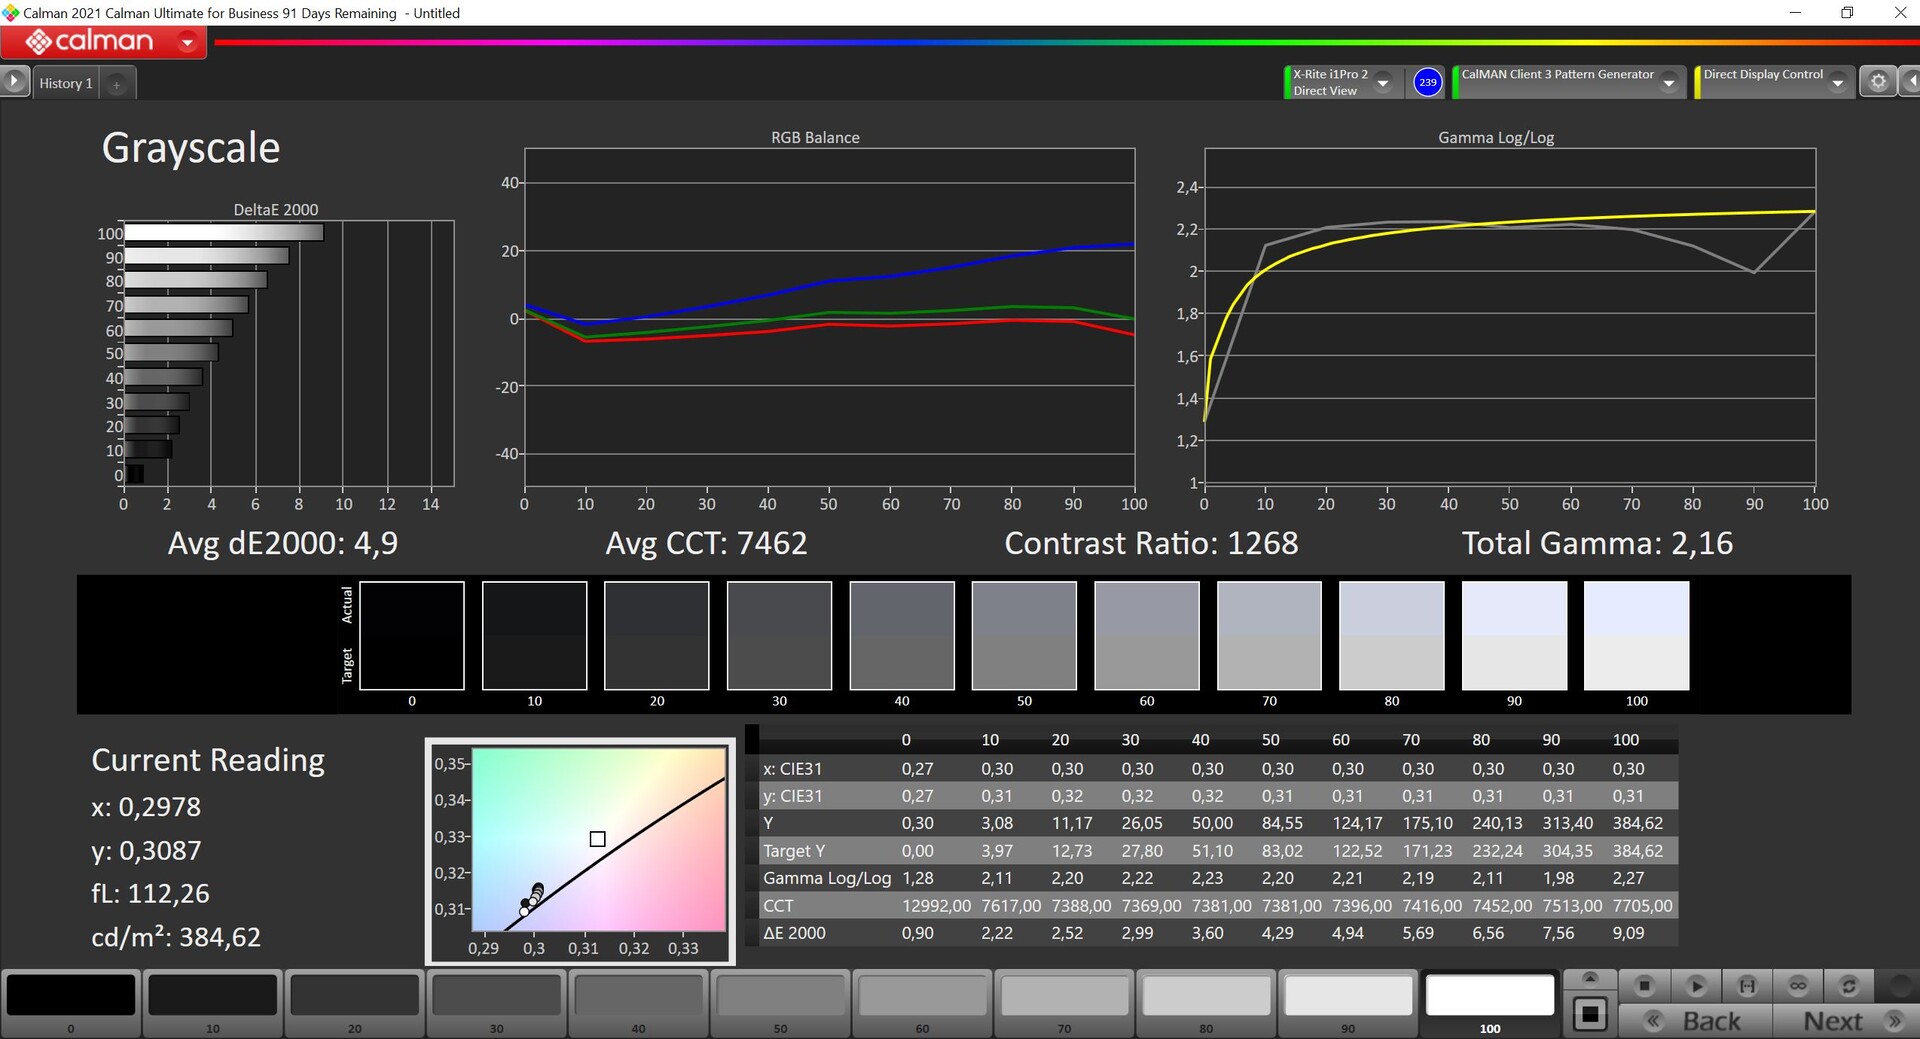
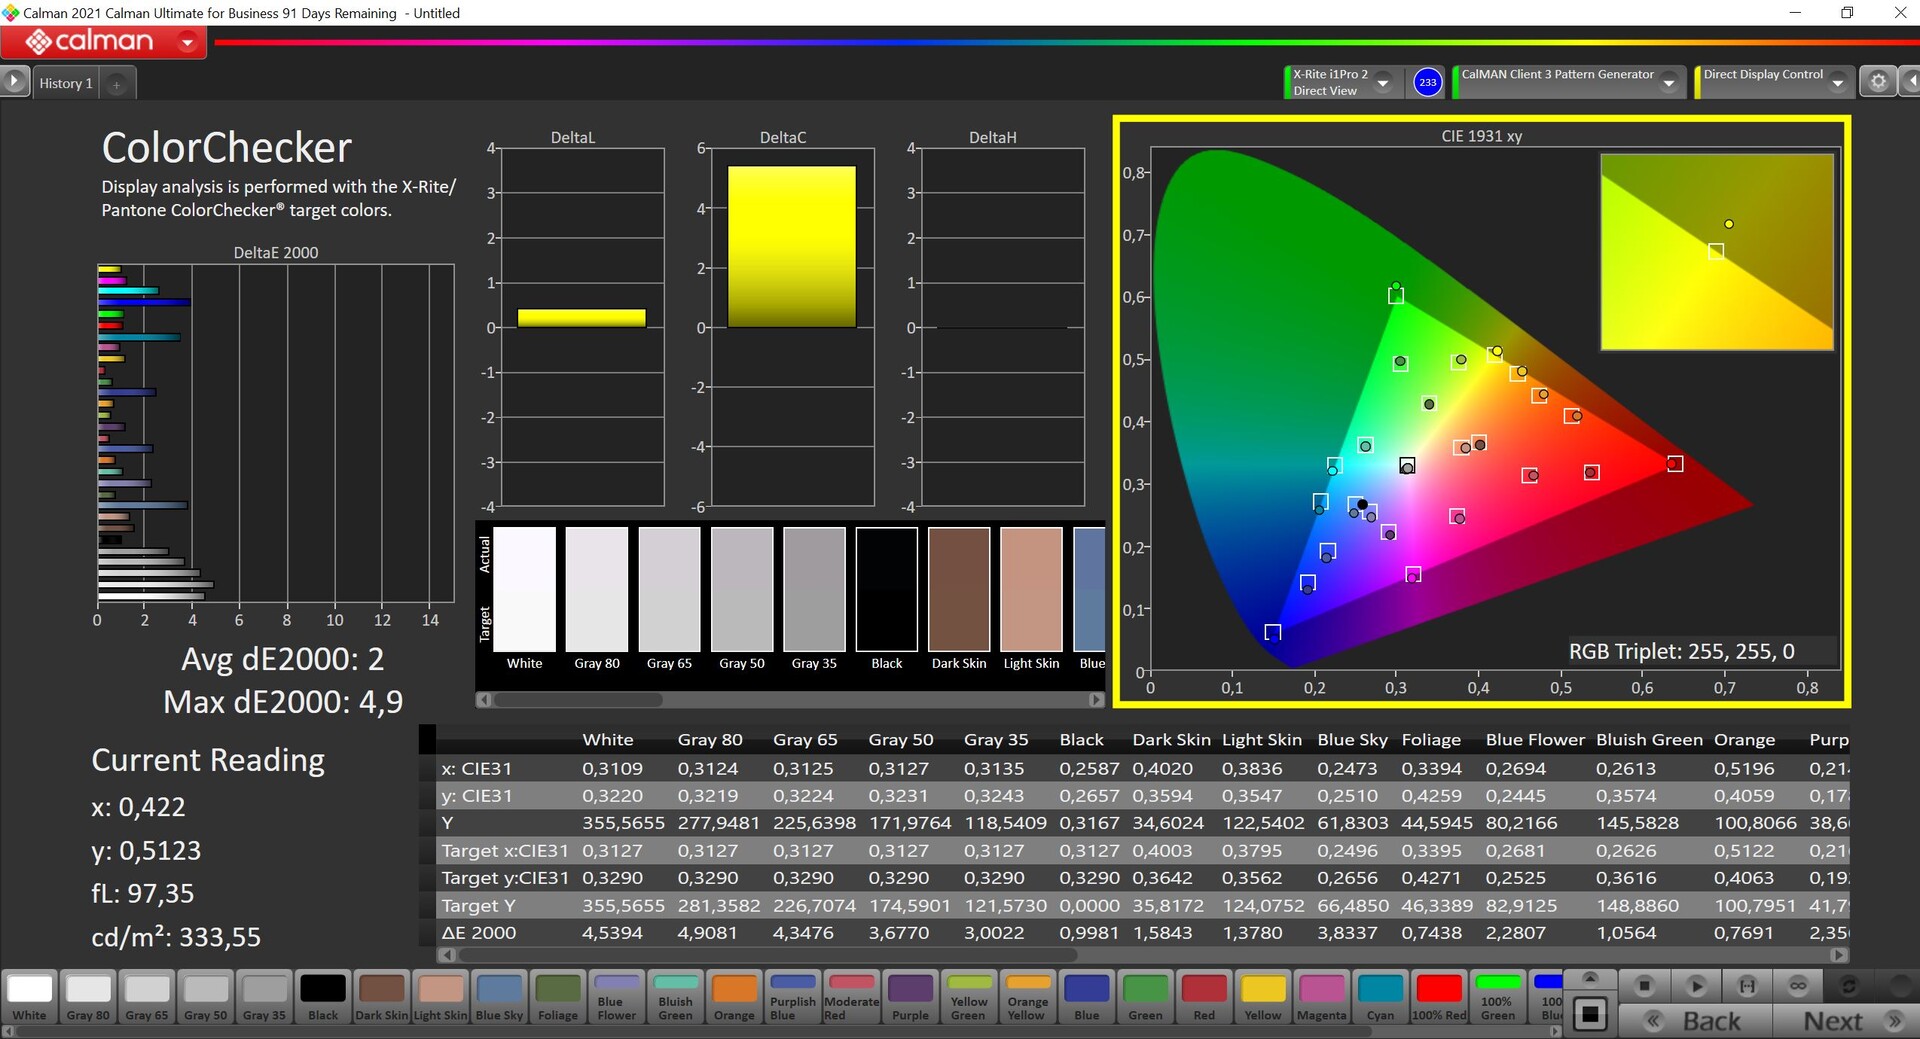
Medimos el panel en el estado de entrega con el software profesional CalMAN. Schenker ofrece la descarga de un perfil calibrado en el Centro de Control, que se descarga automáticamente usando el número de serie. Aunque esto mejora la situación y también elimina el tinte de color, también reduce ligeramente el brillo máximo en unos 30 cd/m². Esta no es realmente una solución perfecta, como veremos en breve, pero aquellos que no puedan calibrar su panel (o descargar nuestro perfil calibrado desde el enlace anterior) seguirán obteniendo una mejora notable aquí.
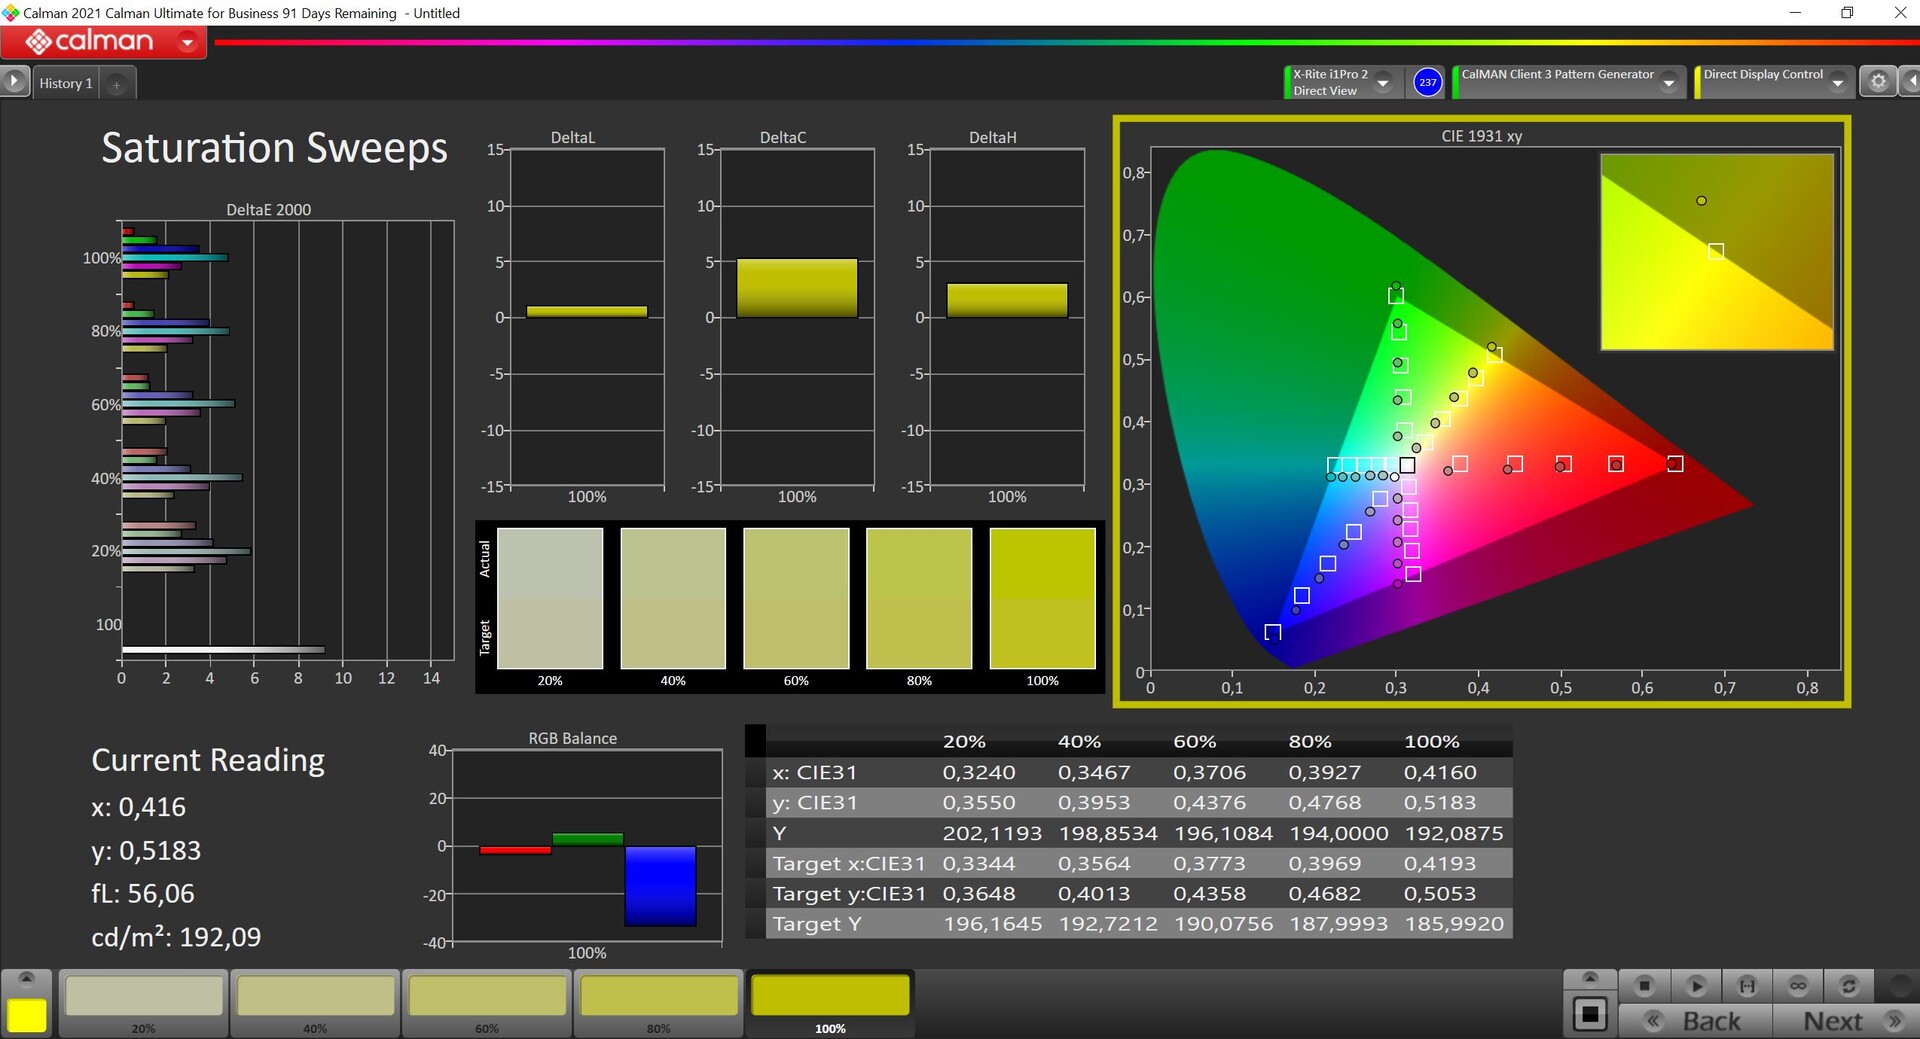
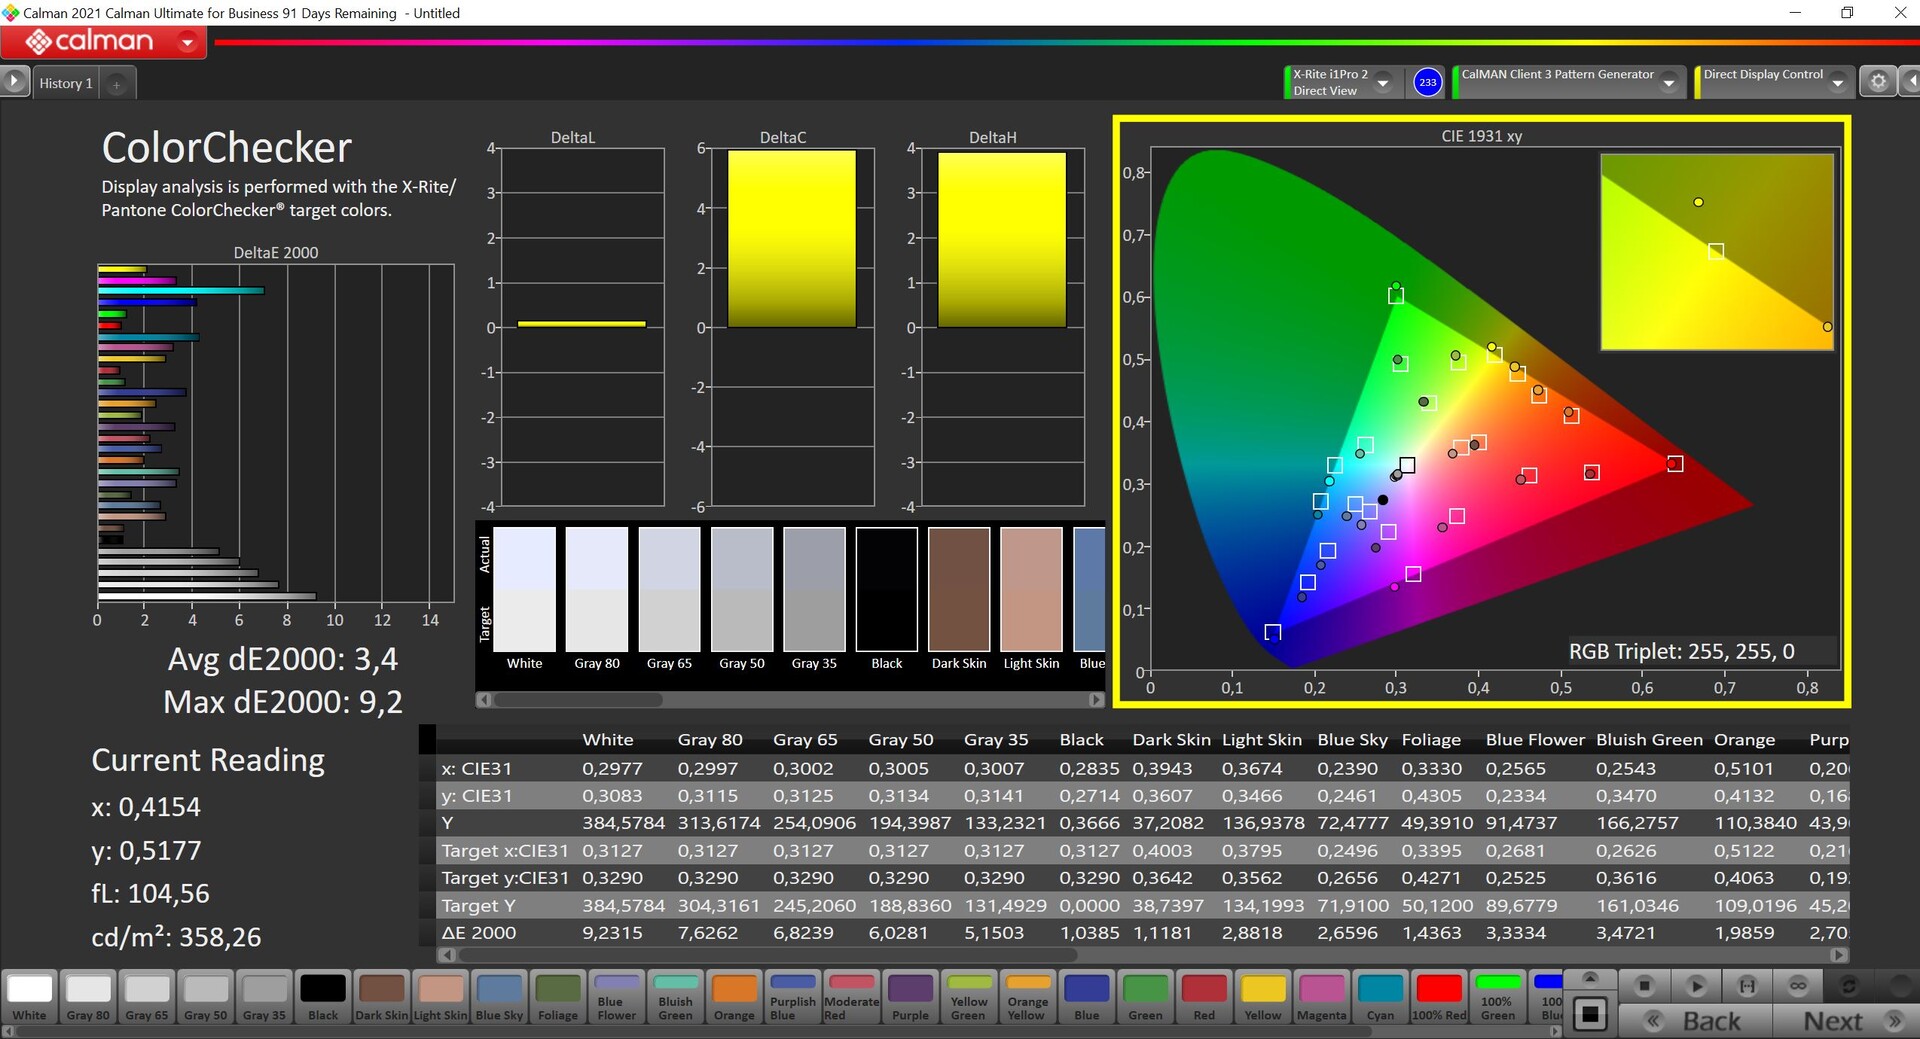
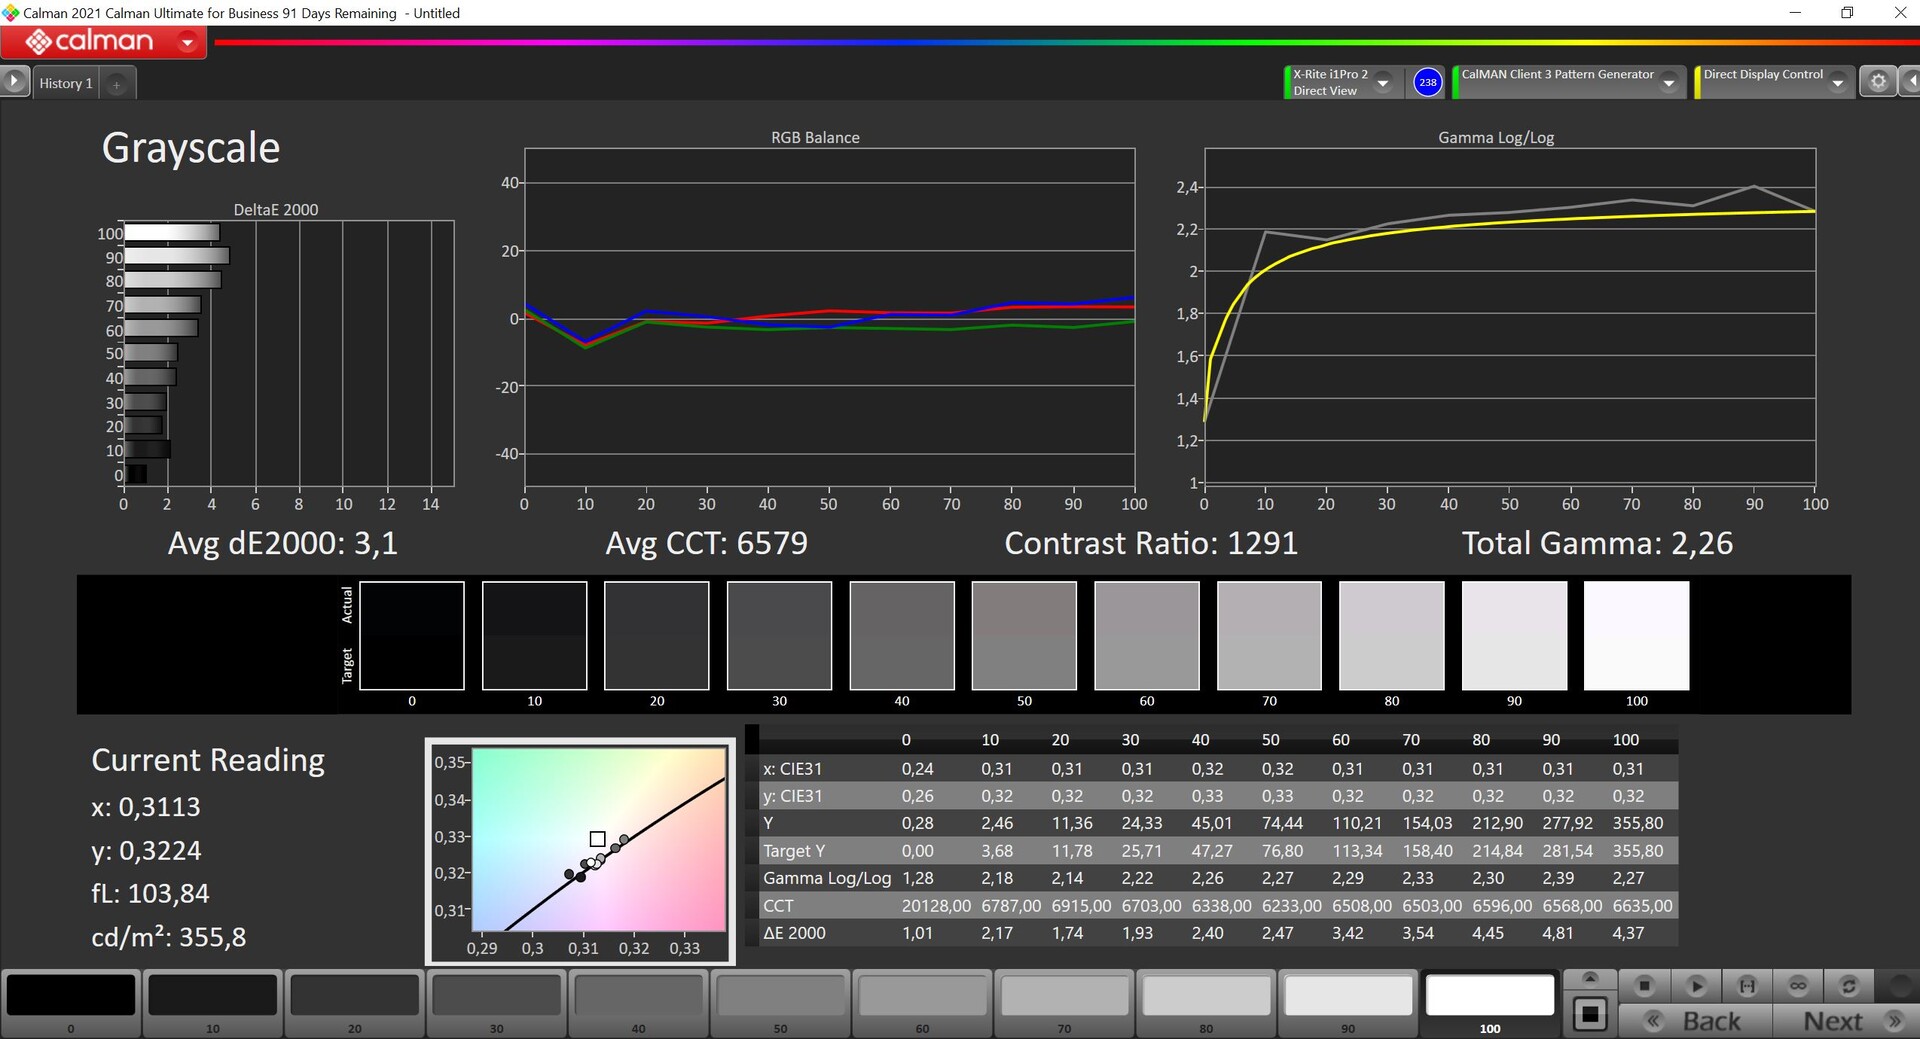
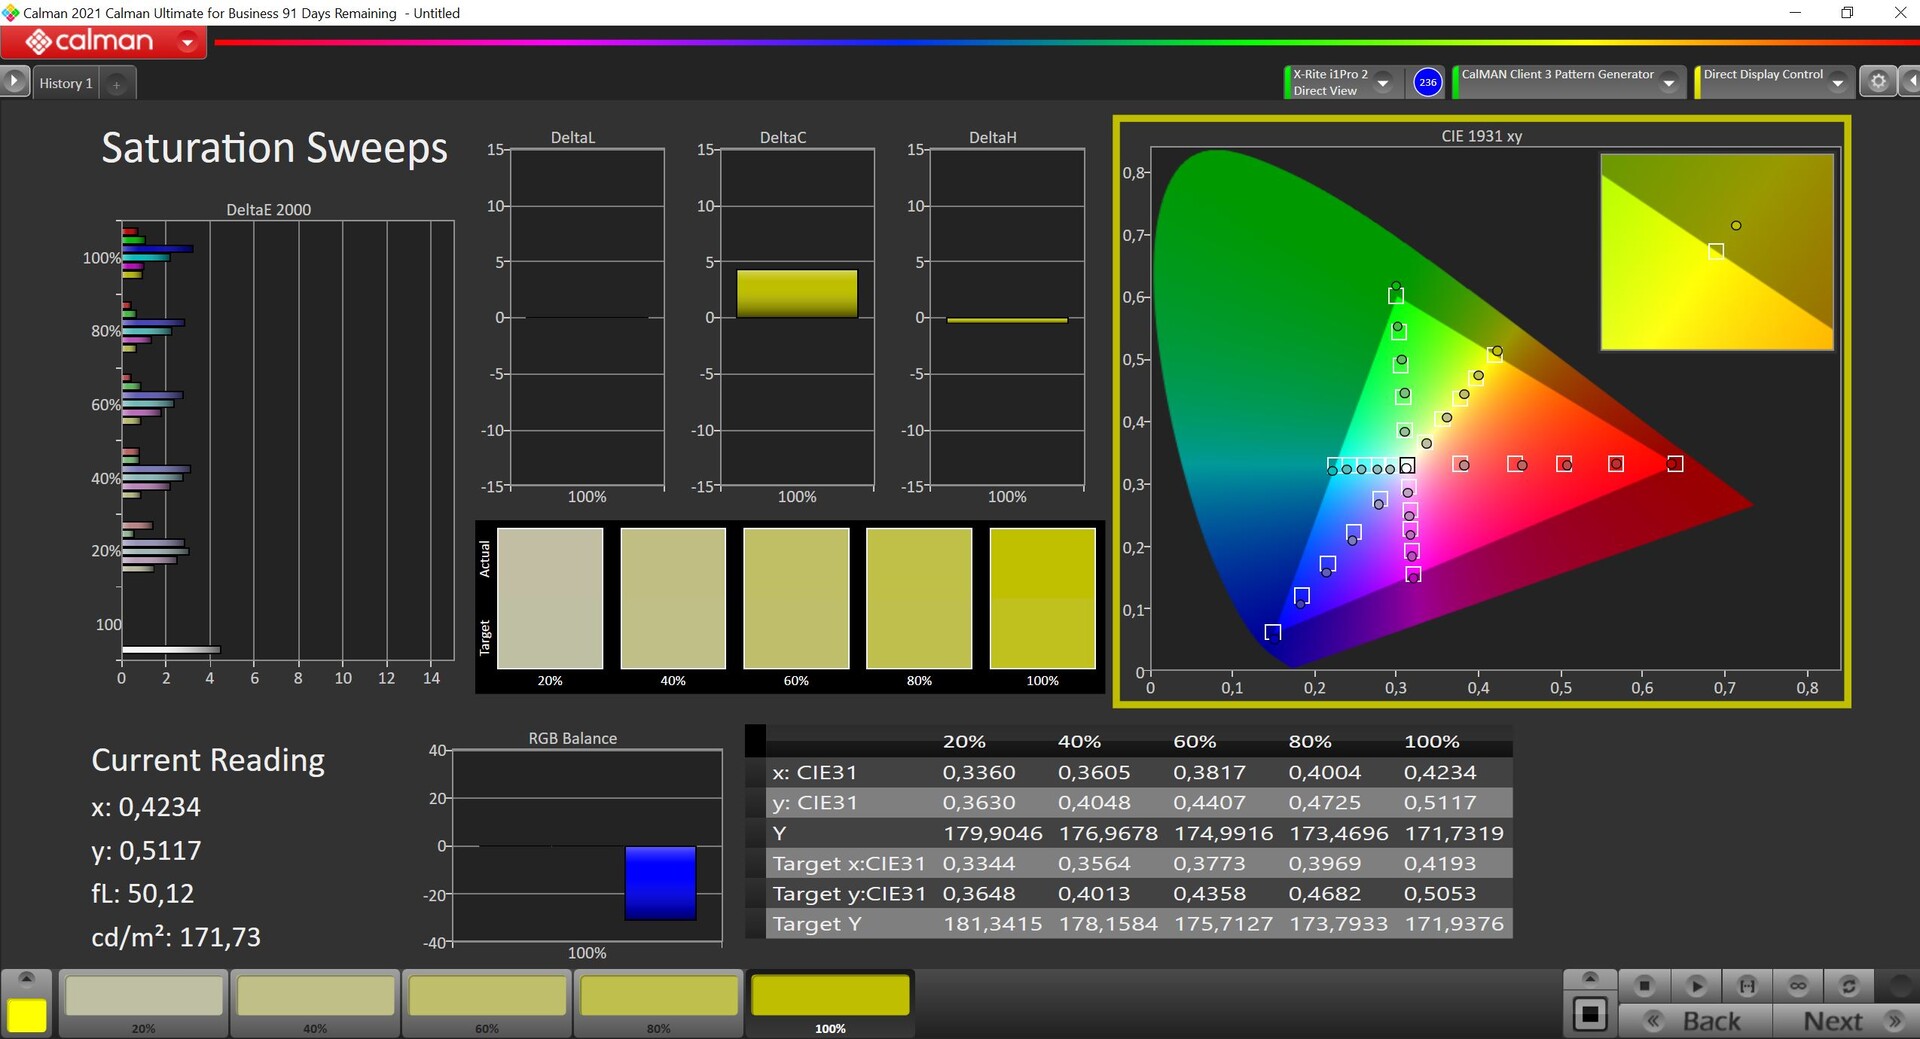
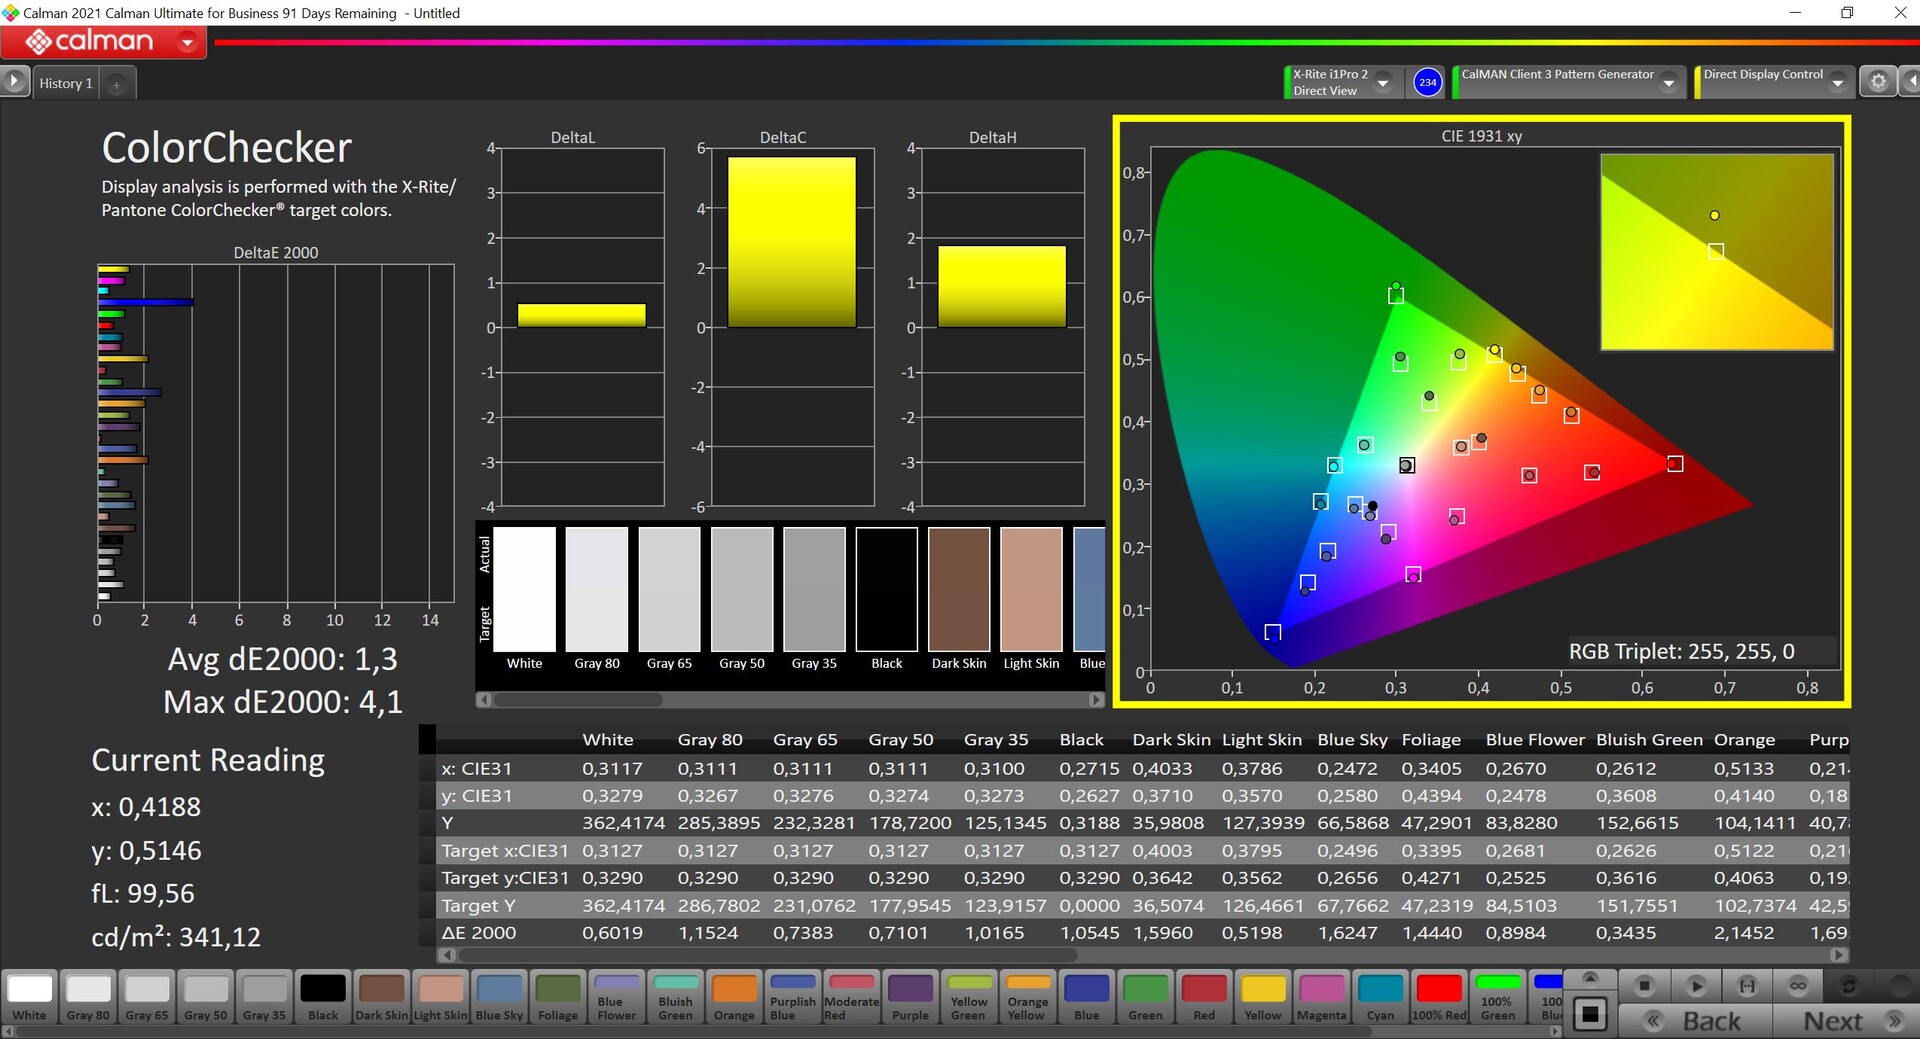
Con nuestra propia calibración, conseguimos mejorar aún más la pantalla: la escala de grises está ahora al nivel de referencia y, en particular, las desviaciones de color son aún menores. Sin embargo, sigue habiendo algunos valores atípicos en los tonos de color azul, donde las desviaciones están mínimamente por encima del importante límite objetivo de 3. Pero, en general, el panel sigue siendo bastante adecuado para el procesamiento de imágenes en el pequeño espacio de color sRGB, que prácticamente se cubre por completo.


Tiempos de respuesta del display
| ↔ Tiempo de respuesta de Negro a Blanco | ||
|---|---|---|
| 8.1 ms ... subida ↗ y bajada ↘ combinada | ↗ 3.8 ms subida | 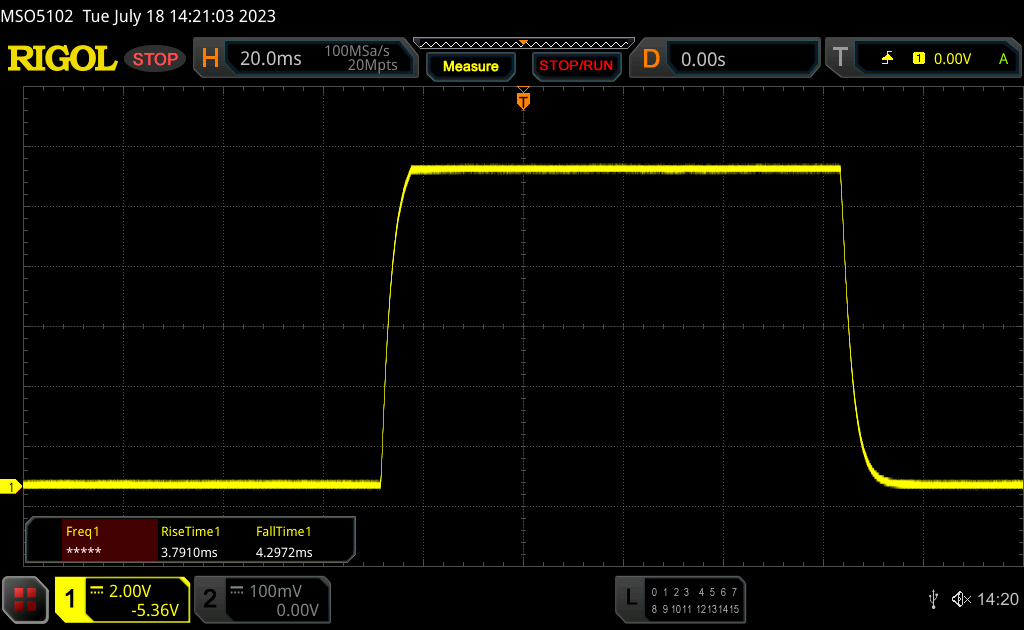 |
| ↘ 4.3 ms bajada | ||
| La pantalla mostró tiempos de respuesta rápidos en nuestros tests y debería ser adecuada para juegos. En comparación, todos los dispositivos de prueba van de ##min### (mínimo) a 240 (máximo) ms. » 24 % de todos los dispositivos son mejores. Esto quiere decir que el tiempo de respuesta medido es mejor que la media (19.8 ms) de todos los dispositivos testados. | ||
| ↔ Tiempo de respuesta 50% Gris a 80% Gris | ||
| 13.7 ms ... subida ↗ y bajada ↘ combinada | ↗ 6.7 ms subida | 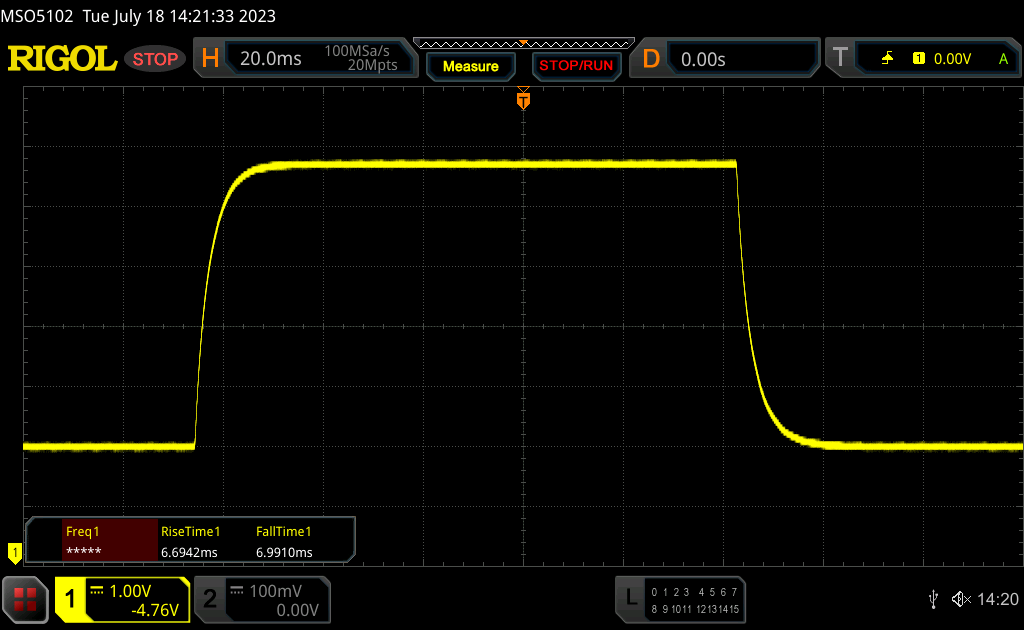 |
| ↘ 7 ms bajada | ||
| La pantalla mostró buenos tiempos de respuesta en nuestros tests pero podría ser demasiado lenta para los jugones competitivos. En comparación, todos los dispositivos de prueba van de ##min### (mínimo) a 636 (máximo) ms. » 28 % de todos los dispositivos son mejores. Esto quiere decir que el tiempo de respuesta medido es mejor que la media (31 ms) de todos los dispositivos testados. | ||
Parpadeo de Pantalla / PWM (Pulse-Width Modulation)
| Parpadeo de Pantalla / PWM no detectado | 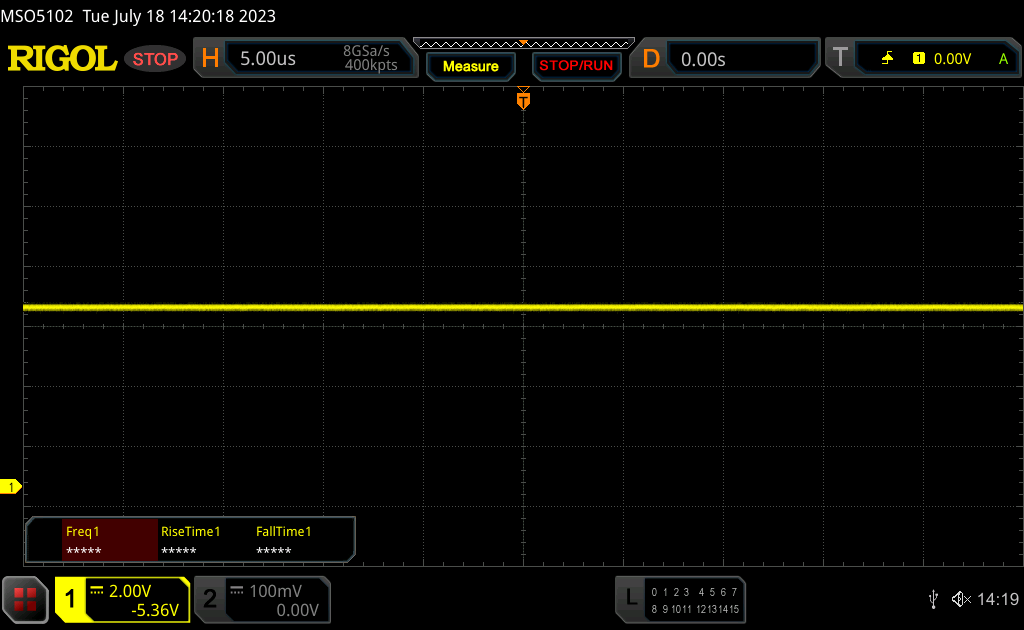 | ||
Comparación: 52 % de todos los dispositivos testados no usaron PWM para atenuar el display. Si se usó, medimos una media de 7757 (mínimo: 5 - máxmo: 343500) Hz. | |||
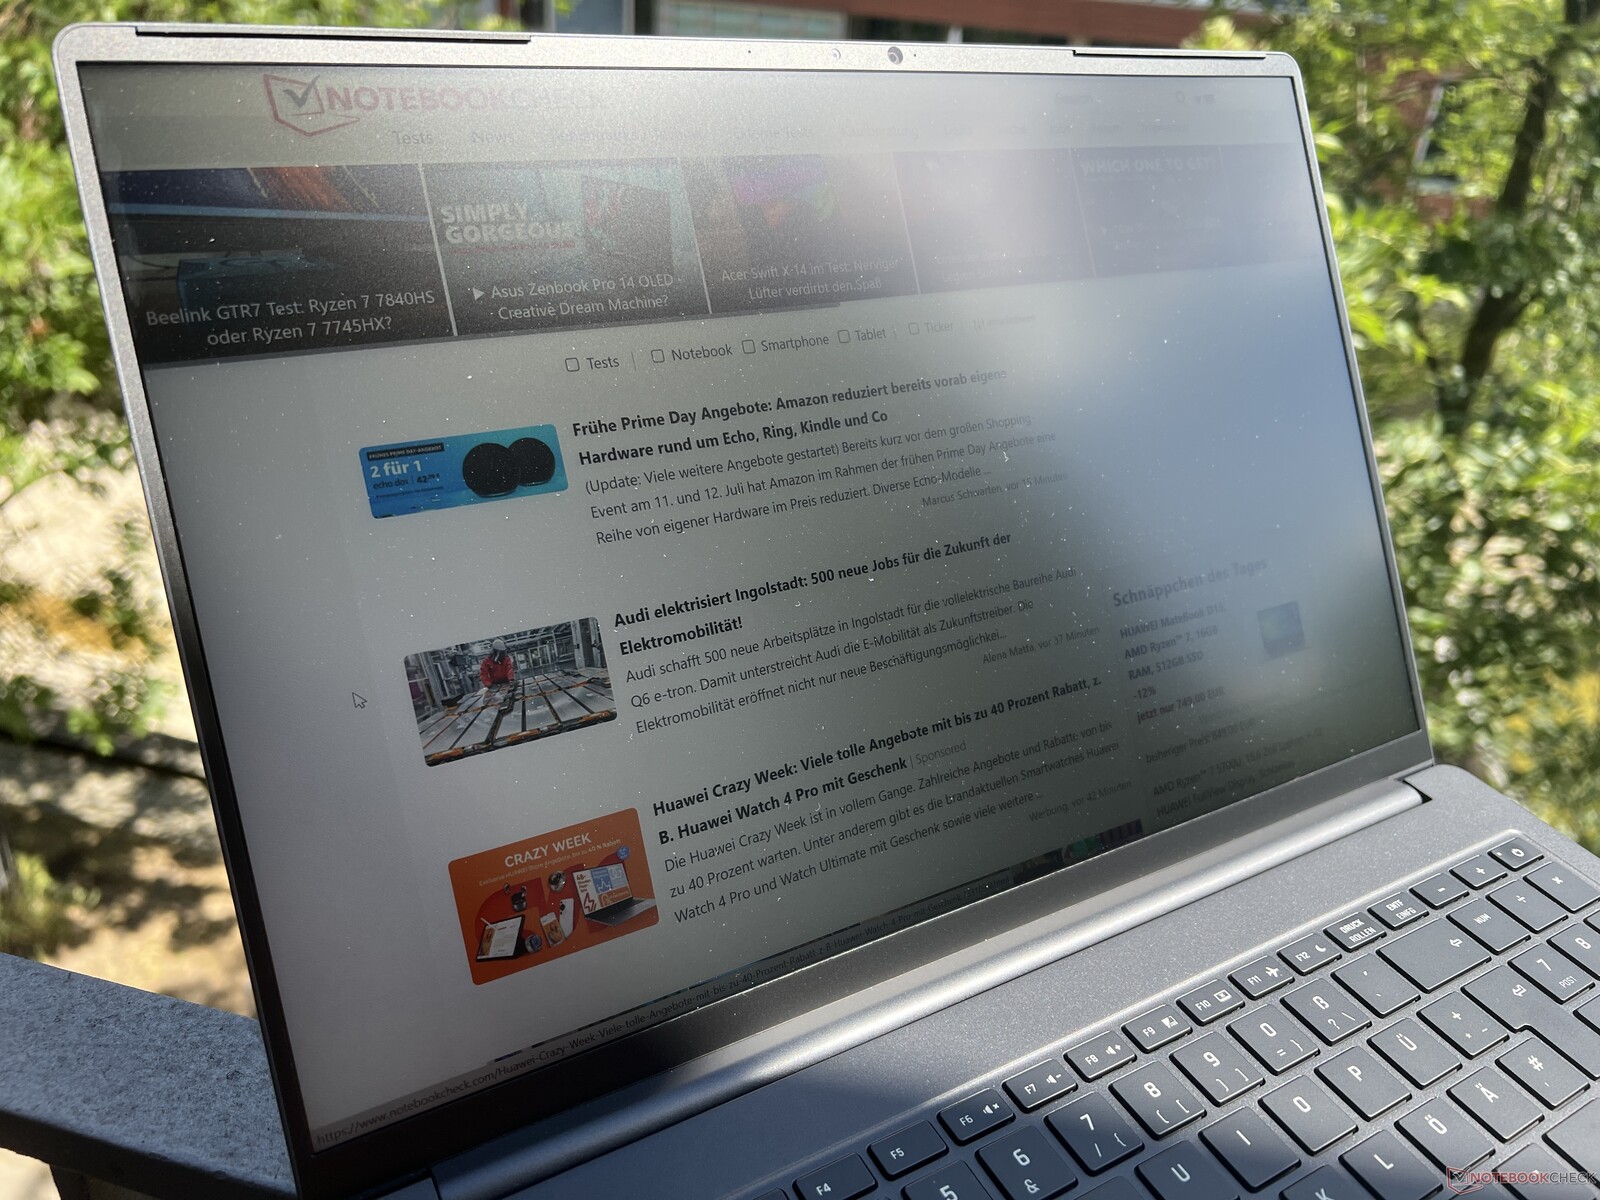
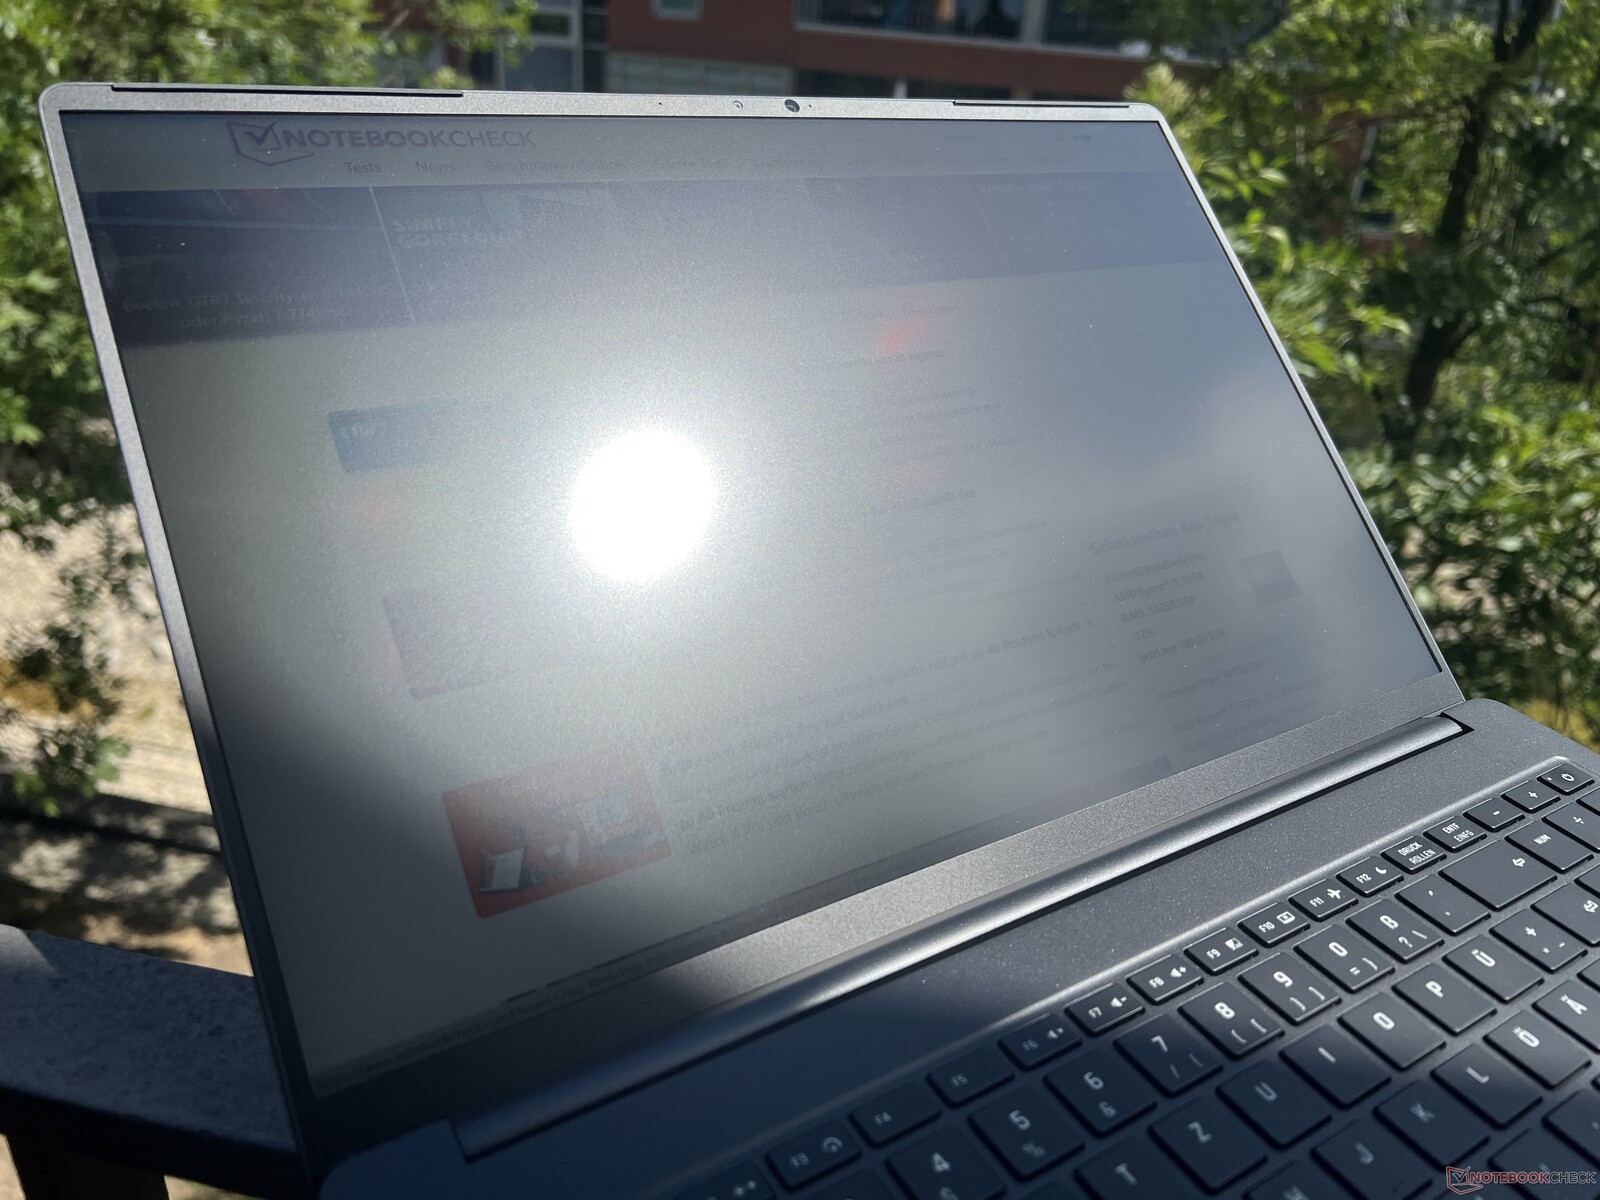

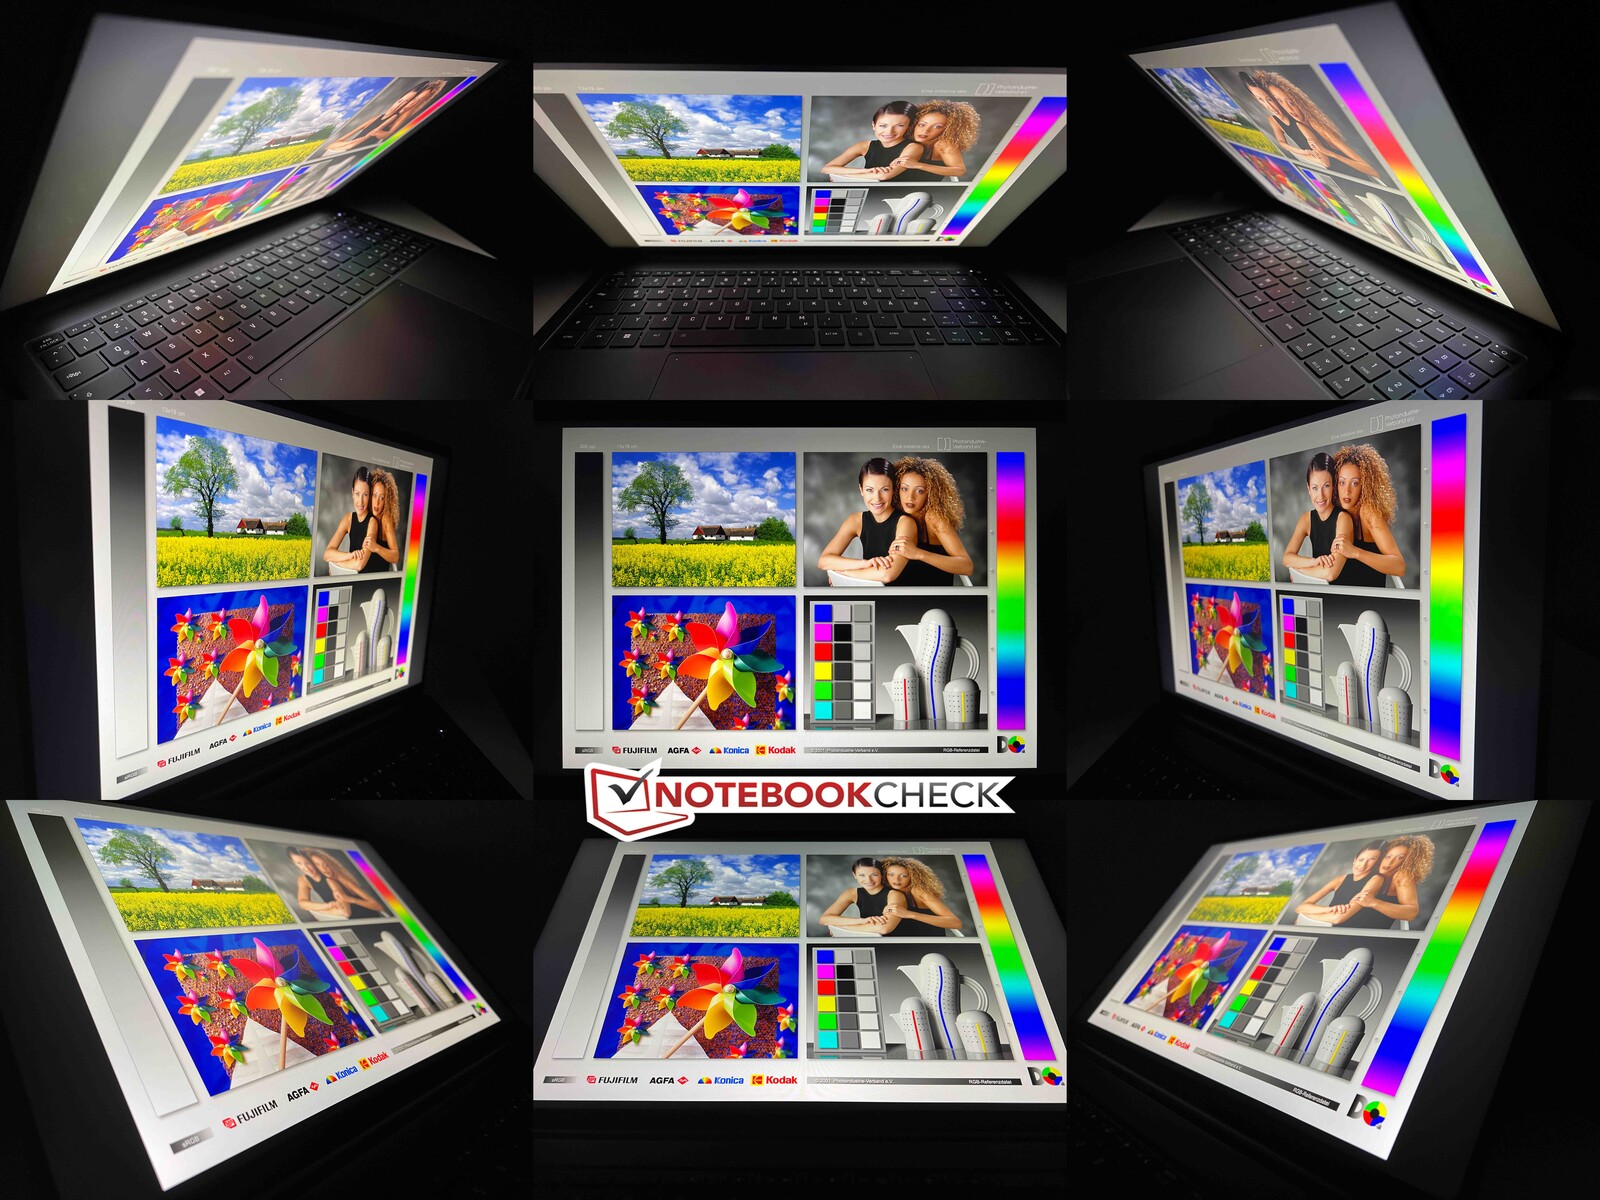
Siempre que se eviten los reflejos de fuentes de luz directa, el Vision 16 Pro también puede utilizarse en entornos luminosos sin problemas. La estabilidad del ángulo de visión es buena en general, pero se aprecia un aclaramiento y una reducción del contraste cuando se mira desde un ángulo superior.
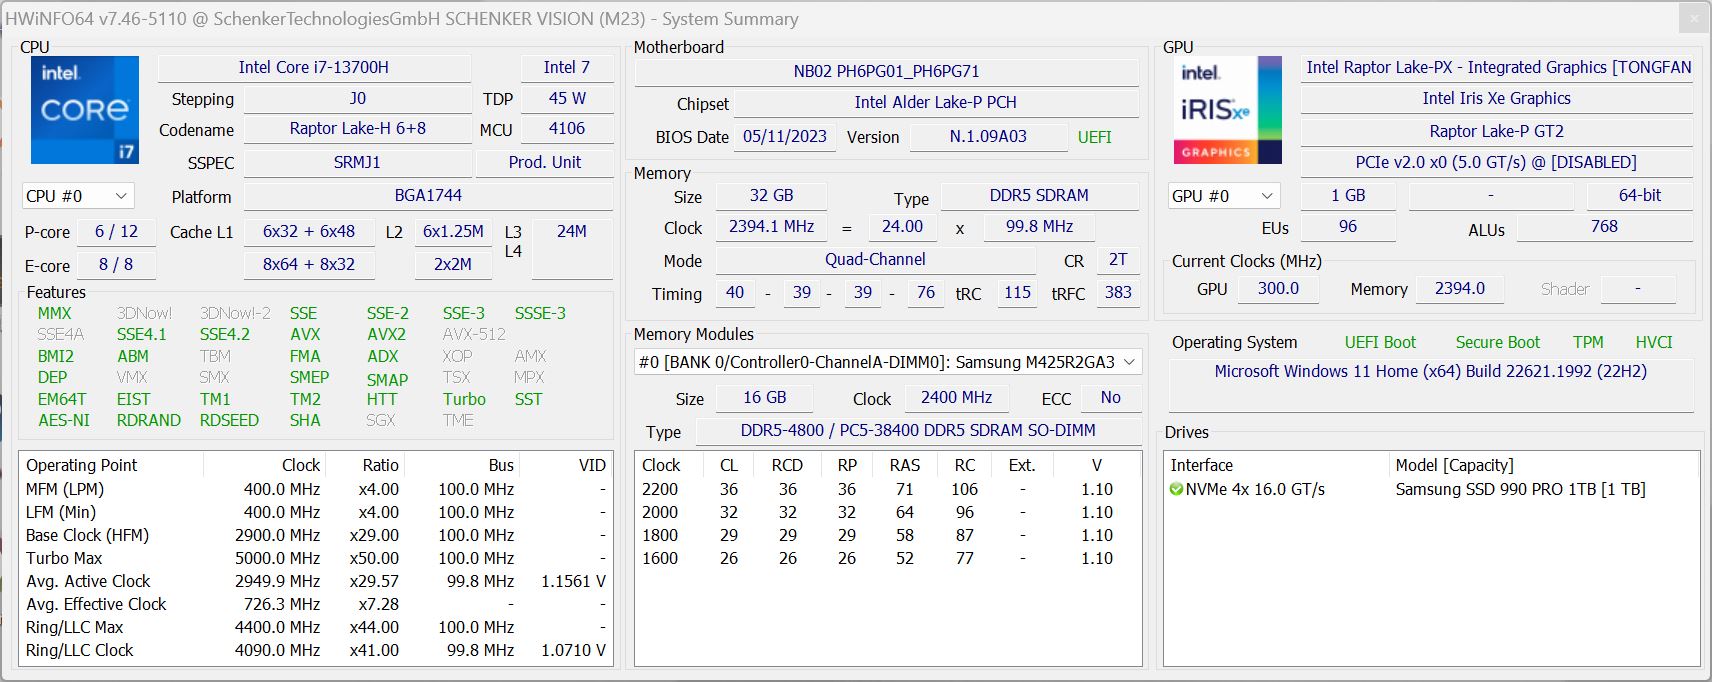
Rendimiento - Portátil RTX 4070 con 95 vatios
Condiciones de la prueba
Schenker ofrece varios perfiles de energía en el Centro de Control, pero a diferencia del predecesor, ya no hay perfil manual, que te permitiría configurar los límites TDP del procesador. Volvimos a hacer las pruebas y mediciones en el modo Rendimiento Enthusiast, que fija los valores TDP del procesador en 60/45 vatios (o 55/35 vatios cuando la dGPU está activada). La GPU es capaz de consumir 95 vatios (70W TGP + 25W Dynamic Boost) aquí, y en el modo Enthusiast Balanced es de 85 vatios (60 + 25W).
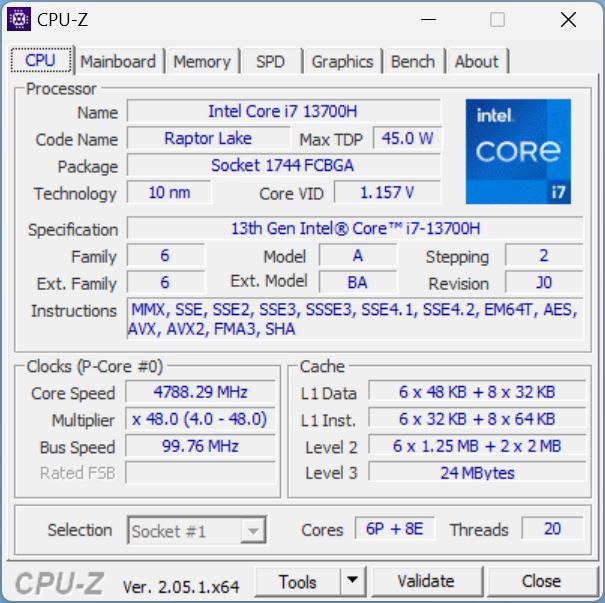
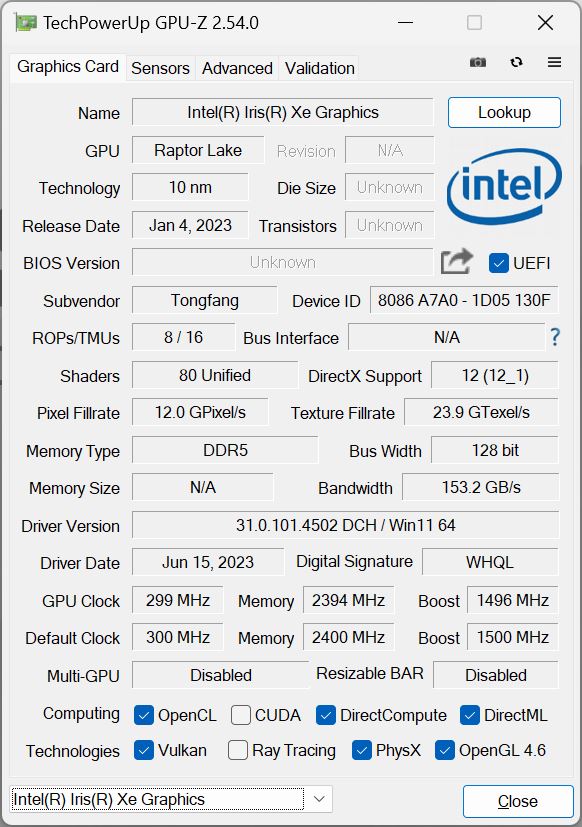
Procesador - Core i7-13700H
El Core i7-13700H de la actual generación Raptor Lake de Intel es el sucesor directo del Core i7-12700H, y no hay cambios aparte de algunos ligeros aumentos en las velocidades máximas de reloj. El Vision 16 Pro es uno de los pocos dispositivos sin límites de energía extremadamente altos de más de 100 vatios. Esto tiene algunas ventajas en el funcionamiento diario, ya que las temperaturas no se disparan tan rápidamente, y tampoco hay una caída tan pronunciada del rendimiento bajo carga constante. Por otro lado, el rendimiento multinúcleo bajo carga corta también es inferior al de los competidores y sólo ligeramente superior al del modelo antiguo. En modo Turbo, el modelo antiguo era incluso significativamente más rápido. En funcionamiento con batería, el consumo de energía está limitado a 36 vatios, lo que hace que el rendimiento multinúcleo caiga un 20% sin cargador. Puedes encontrar más pruebas de CPU en nuestra sección técnica.
Cinebench R15 Multi Constant Load Test
Cinebench R23: Multi Core | Single Core
Cinebench R20: CPU (Multi Core) | CPU (Single Core)
Cinebench R15: CPU Multi 64Bit | CPU Single 64Bit
Blender: v2.79 BMW27 CPU
7-Zip 18.03: 7z b 4 | 7z b 4 -mmt1
Geekbench 5.5: Multi-Core | Single-Core
HWBOT x265 Benchmark v2.2: 4k Preset
LibreOffice : 20 Documents To PDF
R Benchmark 2.5: Overall mean
| CPU Performance rating | |
| Asus ProArt Studiobook 16 OLED H7604 | |
| MSI Stealth 16 Studio A13VG | |
| Apple MacBook Pro 16 2023 M2 Max -6! | |
| Dell XPS 15 9530 RTX 4070 | |
| Media de la clase Multimedia | |
| Schenker VISION 16 Pro (M23) | |
| Medio Intel Core i7-13700H | |
| Schenker Vision 16 Pro RTX 3070 Ti | |
| Samsung Galaxy Book3 Ultra 16, i9-13900H RTX 4070 | |
| Cinebench R23 / Multi Core | |
| Asus ProArt Studiobook 16 OLED H7604 | |
| MSI Stealth 16 Studio A13VG | |
| Media de la clase Multimedia (4861 - 33362, n=75, últimos 2 años) | |
| Dell XPS 15 9530 RTX 4070 | |
| Medio Intel Core i7-13700H (5890 - 20034, n=29) | |
| Apple MacBook Pro 16 2023 M2 Max | |
| Schenker VISION 16 Pro (M23) | |
| Samsung Galaxy Book3 Ultra 16, i9-13900H RTX 4070 | |
| Schenker Vision 16 Pro RTX 3070 Ti | |
| Cinebench R23 / Single Core | |
| Asus ProArt Studiobook 16 OLED H7604 | |
| Media de la clase Multimedia (1128 - 2459, n=67, últimos 2 años) | |
| Schenker VISION 16 Pro (M23) | |
| MSI Stealth 16 Studio A13VG | |
| Dell XPS 15 9530 RTX 4070 | |
| Schenker Vision 16 Pro RTX 3070 Ti | |
| Medio Intel Core i7-13700H (1323 - 1914, n=29) | |
| Apple MacBook Pro 16 2023 M2 Max | |
| Samsung Galaxy Book3 Ultra 16, i9-13900H RTX 4070 | |
| Cinebench R20 / CPU (Multi Core) | |
| Asus ProArt Studiobook 16 OLED H7604 | |
| MSI Stealth 16 Studio A13VG | |
| Media de la clase Multimedia (1887 - 12912, n=58, últimos 2 años) | |
| Dell XPS 15 9530 RTX 4070 | |
| Medio Intel Core i7-13700H (2322 - 7674, n=29) | |
| Schenker VISION 16 Pro (M23) | |
| Schenker Vision 16 Pro RTX 3070 Ti | |
| Samsung Galaxy Book3 Ultra 16, i9-13900H RTX 4070 | |
| Apple MacBook Pro 16 2023 M2 Max | |
| Cinebench R20 / CPU (Single Core) | |
| Asus ProArt Studiobook 16 OLED H7604 | |
| Schenker VISION 16 Pro (M23) | |
| Media de la clase Multimedia (425 - 853, n=58, últimos 2 años) | |
| MSI Stealth 16 Studio A13VG | |
| Schenker Vision 16 Pro RTX 3070 Ti | |
| Dell XPS 15 9530 RTX 4070 | |
| Medio Intel Core i7-13700H (508 - 741, n=29) | |
| Apple MacBook Pro 16 2023 M2 Max | |
| Samsung Galaxy Book3 Ultra 16, i9-13900H RTX 4070 | |
| Cinebench R15 / CPU Multi 64Bit | |
| Asus ProArt Studiobook 16 OLED H7604 | |
| MSI Stealth 16 Studio A13VG | |
| Schenker Vision 16 Pro RTX 3070 Ti | |
| Schenker Vision 16 Pro RTX 3070 Ti | |
| Dell XPS 15 9530 RTX 4070 | |
| Media de la clase Multimedia (856 - 5224, n=62, últimos 2 años) | |
| Medio Intel Core i7-13700H (905 - 2982, n=29) | |
| Schenker VISION 16 Pro (M23) | |
| Samsung Galaxy Book3 Ultra 16, i9-13900H RTX 4070 | |
| Apple MacBook Pro 16 2023 M2 Max | |
| Cinebench R15 / CPU Single 64Bit | |
| Asus ProArt Studiobook 16 OLED H7604 | |
| Media de la clase Multimedia (184.8 - 326, n=60, últimos 2 años) | |
| Schenker VISION 16 Pro (M23) | |
| MSI Stealth 16 Studio A13VG | |
| Dell XPS 15 9530 RTX 4070 | |
| Schenker Vision 16 Pro RTX 3070 Ti | |
| Medio Intel Core i7-13700H (213 - 278, n=29) | |
| Apple MacBook Pro 16 2023 M2 Max | |
| Samsung Galaxy Book3 Ultra 16, i9-13900H RTX 4070 | |
| Blender / v2.79 BMW27 CPU | |
| Schenker Vision 16 Pro RTX 3070 Ti | |
| Media de la clase Multimedia (100 - 557, n=59, últimos 2 años) | |
| Samsung Galaxy Book3 Ultra 16, i9-13900H RTX 4070 | |
| Medio Intel Core i7-13700H (169 - 555, n=29) | |
| Schenker VISION 16 Pro (M23) | |
| Dell XPS 15 9530 RTX 4070 | |
| MSI Stealth 16 Studio A13VG | |
| Asus ProArt Studiobook 16 OLED H7604 | |
| 7-Zip 18.03 / 7z b 4 | |
| Asus ProArt Studiobook 16 OLED H7604 | |
| MSI Stealth 16 Studio A13VG | |
| Schenker VISION 16 Pro (M23) | |
| Medio Intel Core i7-13700H (27322 - 76344, n=29) | |
| Dell XPS 15 9530 RTX 4070 | |
| Media de la clase Multimedia (26062 - 130368, n=56, últimos 2 años) | |
| Schenker Vision 16 Pro RTX 3070 Ti | |
| Samsung Galaxy Book3 Ultra 16, i9-13900H RTX 4070 | |
| 7-Zip 18.03 / 7z b 4 -mmt1 | |
| Asus ProArt Studiobook 16 OLED H7604 | |
| Schenker VISION 16 Pro (M23) | |
| MSI Stealth 16 Studio A13VG | |
| Dell XPS 15 9530 RTX 4070 | |
| Media de la clase Multimedia (3666 - 7545, n=57, últimos 2 años) | |
| Medio Intel Core i7-13700H (4825 - 6238, n=29) | |
| Schenker Vision 16 Pro RTX 3070 Ti | |
| Samsung Galaxy Book3 Ultra 16, i9-13900H RTX 4070 | |
| Geekbench 5.5 / Multi-Core | |
| Asus ProArt Studiobook 16 OLED H7604 | |
| Apple MacBook Pro 16 2023 M2 Max | |
| Dell XPS 15 9530 RTX 4070 | |
| MSI Stealth 16 Studio A13VG | |
| Media de la clase Multimedia (4652 - 20422, n=57, últimos 2 años) | |
| Schenker VISION 16 Pro (M23) | |
| Medio Intel Core i7-13700H (6165 - 14215, n=29) | |
| Schenker Vision 16 Pro RTX 3070 Ti | |
| Samsung Galaxy Book3 Ultra 16, i9-13900H RTX 4070 | |
| Geekbench 5.5 / Single-Core | |
| Asus ProArt Studiobook 16 OLED H7604 | |
| Apple MacBook Pro 16 2023 M2 Max | |
| Media de la clase Multimedia (805 - 2974, n=57, últimos 2 años) | |
| Dell XPS 15 9530 RTX 4070 | |
| Schenker VISION 16 Pro (M23) | |
| MSI Stealth 16 Studio A13VG | |
| Schenker Vision 16 Pro RTX 3070 Ti | |
| Medio Intel Core i7-13700H (1362 - 1919, n=29) | |
| Samsung Galaxy Book3 Ultra 16, i9-13900H RTX 4070 | |
| HWBOT x265 Benchmark v2.2 / 4k Preset | |
| Asus ProArt Studiobook 16 OLED H7604 | |
| MSI Stealth 16 Studio A13VG | |
| Media de la clase Multimedia (5.26 - 36.1, n=57, últimos 2 años) | |
| Dell XPS 15 9530 RTX 4070 | |
| Schenker VISION 16 Pro (M23) | |
| Medio Intel Core i7-13700H (6.72 - 21.2, n=29) | |
| Samsung Galaxy Book3 Ultra 16, i9-13900H RTX 4070 | |
| Schenker Vision 16 Pro RTX 3070 Ti | |
| LibreOffice / 20 Documents To PDF | |
| Samsung Galaxy Book3 Ultra 16, i9-13900H RTX 4070 | |
| MSI Stealth 16 Studio A13VG | |
| Media de la clase Multimedia (23.9 - 146.7, n=58, últimos 2 años) | |
| Medio Intel Core i7-13700H (31.3 - 62.4, n=29) | |
| Schenker VISION 16 Pro (M23) | |
| Asus ProArt Studiobook 16 OLED H7604 | |
| Dell XPS 15 9530 RTX 4070 | |
| Schenker Vision 16 Pro RTX 3070 Ti | |
| R Benchmark 2.5 / Overall mean | |
| Samsung Galaxy Book3 Ultra 16, i9-13900H RTX 4070 | |
| Medio Intel Core i7-13700H (0.4308 - 0.607, n=29) | |
| Media de la clase Multimedia (0.3604 - 0.947, n=57, últimos 2 años) | |
| Schenker Vision 16 Pro RTX 3070 Ti | |
| MSI Stealth 16 Studio A13VG | |
| Dell XPS 15 9530 RTX 4070 | |
| Schenker VISION 16 Pro (M23) | |
| Asus ProArt Studiobook 16 OLED H7604 | |
* ... más pequeño es mejor
AIDA64: FP32 Ray-Trace | FPU Julia | CPU SHA3 | CPU Queen | FPU SinJulia | FPU Mandel | CPU AES | CPU ZLib | FP64 Ray-Trace | CPU PhotoWorxx
| Performance rating | |
| Asus ProArt Studiobook 16 OLED H7604 | |
| MSI Stealth 16 Studio A13VG | |
| Media de la clase Multimedia | |
| Schenker VISION 16 Pro (M23) | |
| Dell XPS 15 9530 RTX 4070 | |
| Medio Intel Core i7-13700H | |
| Samsung Galaxy Book3 Ultra 16, i9-13900H RTX 4070 | |
| Schenker Vision 16 Pro RTX 3070 Ti | |
| AIDA64 / FP32 Ray-Trace | |
| Asus ProArt Studiobook 16 OLED H7604 | |
| MSI Stealth 16 Studio A13VG | |
| Media de la clase Multimedia (2214 - 50388, n=54, últimos 2 años) | |
| Samsung Galaxy Book3 Ultra 16, i9-13900H RTX 4070 | |
| Dell XPS 15 9530 RTX 4070 | |
| Medio Intel Core i7-13700H (4986 - 18908, n=29) | |
| Schenker VISION 16 Pro (M23) | |
| Schenker Vision 16 Pro RTX 3070 Ti | |
| AIDA64 / FPU Julia | |
| Asus ProArt Studiobook 16 OLED H7604 | |
| Media de la clase Multimedia (12867 - 201874, n=55, últimos 2 años) | |
| MSI Stealth 16 Studio A13VG | |
| Schenker VISION 16 Pro (M23) | |
| Medio Intel Core i7-13700H (25360 - 92359, n=29) | |
| Dell XPS 15 9530 RTX 4070 | |
| Schenker Vision 16 Pro RTX 3070 Ti | |
| Samsung Galaxy Book3 Ultra 16, i9-13900H RTX 4070 | |
| AIDA64 / CPU SHA3 | |
| Asus ProArt Studiobook 16 OLED H7604 | |
| MSI Stealth 16 Studio A13VG | |
| Media de la clase Multimedia (626 - 8623, n=55, últimos 2 años) | |
| Samsung Galaxy Book3 Ultra 16, i9-13900H RTX 4070 | |
| Medio Intel Core i7-13700H (1339 - 4224, n=29) | |
| Schenker VISION 16 Pro (M23) | |
| Dell XPS 15 9530 RTX 4070 | |
| Schenker Vision 16 Pro RTX 3070 Ti | |
| AIDA64 / CPU Queen | |
| Asus ProArt Studiobook 16 OLED H7604 | |
| MSI Stealth 16 Studio A13VG | |
| Dell XPS 15 9530 RTX 4070 | |
| Schenker VISION 16 Pro (M23) | |
| Medio Intel Core i7-13700H (59324 - 107159, n=29) | |
| Schenker Vision 16 Pro RTX 3070 Ti | |
| Samsung Galaxy Book3 Ultra 16, i9-13900H RTX 4070 | |
| Media de la clase Multimedia (13483 - 181505, n=42, últimos 2 años) | |
| AIDA64 / FPU SinJulia | |
| Asus ProArt Studiobook 16 OLED H7604 | |
| MSI Stealth 16 Studio A13VG | |
| Schenker VISION 16 Pro (M23) | |
| Medio Intel Core i7-13700H (4800 - 11050, n=29) | |
| Media de la clase Multimedia (886 - 28794, n=55, últimos 2 años) | |
| Dell XPS 15 9530 RTX 4070 | |
| Schenker Vision 16 Pro RTX 3070 Ti | |
| Samsung Galaxy Book3 Ultra 16, i9-13900H RTX 4070 | |
| AIDA64 / FPU Mandel | |
| Asus ProArt Studiobook 16 OLED H7604 | |
| MSI Stealth 16 Studio A13VG | |
| Media de la clase Multimedia (6395 - 105740, n=54, últimos 2 años) | |
| Samsung Galaxy Book3 Ultra 16, i9-13900H RTX 4070 | |
| Medio Intel Core i7-13700H (12321 - 45118, n=29) | |
| Dell XPS 15 9530 RTX 4070 | |
| Schenker VISION 16 Pro (M23) | |
| Schenker Vision 16 Pro RTX 3070 Ti | |
| AIDA64 / CPU AES | |
| Asus ProArt Studiobook 16 OLED H7604 | |
| MSI Stealth 16 Studio A13VG | |
| Medio Intel Core i7-13700H (28769 - 151254, n=29) | |
| Schenker VISION 16 Pro (M23) | |
| Media de la clase Multimedia (8171 - 126790, n=55, últimos 2 años) | |
| Dell XPS 15 9530 RTX 4070 | |
| Schenker Vision 16 Pro RTX 3070 Ti | |
| Samsung Galaxy Book3 Ultra 16, i9-13900H RTX 4070 | |
| AIDA64 / CPU ZLib | |
| Asus ProArt Studiobook 16 OLED H7604 | |
| MSI Stealth 16 Studio A13VG | |
| Samsung Galaxy Book3 Ultra 16, i9-13900H RTX 4070 | |
| Media de la clase Multimedia (143.8 - 2022, n=55, últimos 2 años) | |
| Schenker VISION 16 Pro (M23) | |
| Medio Intel Core i7-13700H (389 - 1215, n=29) | |
| Dell XPS 15 9530 RTX 4070 | |
| Schenker Vision 16 Pro RTX 3070 Ti | |
| AIDA64 / FP64 Ray-Trace | |
| Asus ProArt Studiobook 16 OLED H7604 | |
| MSI Stealth 16 Studio A13VG | |
| Media de la clase Multimedia (1014 - 26875, n=55, últimos 2 años) | |
| Dell XPS 15 9530 RTX 4070 | |
| Medio Intel Core i7-13700H (2540 - 10135, n=29) | |
| Schenker VISION 16 Pro (M23) | |
| Schenker Vision 16 Pro RTX 3070 Ti | |
| Samsung Galaxy Book3 Ultra 16, i9-13900H RTX 4070 | |
| AIDA64 / CPU PhotoWorxx | |
| Media de la clase Multimedia (8187 - 88154, n=55, últimos 2 años) | |
| Asus ProArt Studiobook 16 OLED H7604 | |
| Samsung Galaxy Book3 Ultra 16, i9-13900H RTX 4070 | |
| MSI Stealth 16 Studio A13VG | |
| Schenker VISION 16 Pro (M23) | |
| Dell XPS 15 9530 RTX 4070 | |
| Schenker Vision 16 Pro RTX 3070 Ti | |
| Medio Intel Core i7-13700H (12872 - 52727, n=29) | |
Rendimiento del sistema
Los resultados de las pruebas en los benchmarks sintéticos son muy buenos, pero los dispositivos de comparación están muy cerca y no habrá diferencias notables en el funcionamiento diario. Se trata simplemente de ordenadores muy sensibles con componentes modernos. No encontramos ningún problema de estabilidad durante nuestras pruebas.
CrossMark: Overall | Productivity | Creativity | Responsiveness
| PCMark 10 / Score | |
| Media de la clase Multimedia (4325 - 10386, n=53, últimos 2 años) | |
| Asus ProArt Studiobook 16 OLED H7604 | |
| Medio Intel Core i7-13700H, NVIDIA GeForce RTX 4070 Laptop GPU (7158 - 7956, n=8) | |
| Schenker VISION 16 Pro (M23) | |
| MSI Stealth 16 Studio A13VG | |
| Dell XPS 15 9530 RTX 4070 | |
| Samsung Galaxy Book3 Ultra 16, i9-13900H RTX 4070 | |
| PCMark 10 / Essentials | |
| Dell XPS 15 9530 RTX 4070 | |
| Asus ProArt Studiobook 16 OLED H7604 | |
| Schenker VISION 16 Pro (M23) | |
| Medio Intel Core i7-13700H, NVIDIA GeForce RTX 4070 Laptop GPU (10252 - 11449, n=8) | |
| Media de la clase Multimedia (8025 - 11664, n=52, últimos 2 años) | |
| MSI Stealth 16 Studio A13VG | |
| Samsung Galaxy Book3 Ultra 16, i9-13900H RTX 4070 | |
| PCMark 10 / Productivity | |
| Media de la clase Multimedia (7323 - 18233, n=52, últimos 2 años) | |
| Asus ProArt Studiobook 16 OLED H7604 | |
| Schenker VISION 16 Pro (M23) | |
| Medio Intel Core i7-13700H, NVIDIA GeForce RTX 4070 Laptop GPU (8501 - 10769, n=8) | |
| MSI Stealth 16 Studio A13VG | |
| Dell XPS 15 9530 RTX 4070 | |
| Samsung Galaxy Book3 Ultra 16, i9-13900H RTX 4070 | |
| PCMark 10 / Digital Content Creation | |
| Medio Intel Core i7-13700H, NVIDIA GeForce RTX 4070 Laptop GPU (10358 - 12908, n=8) | |
| MSI Stealth 16 Studio A13VG | |
| Schenker VISION 16 Pro (M23) | |
| Dell XPS 15 9530 RTX 4070 | |
| Asus ProArt Studiobook 16 OLED H7604 | |
| Media de la clase Multimedia (3651 - 16240, n=52, últimos 2 años) | |
| Samsung Galaxy Book3 Ultra 16, i9-13900H RTX 4070 | |
| CrossMark / Overall | |
| Asus ProArt Studiobook 16 OLED H7604 | |
| Apple MacBook Pro 16 2023 M2 Max | |
| Schenker VISION 16 Pro (M23) | |
| Dell XPS 15 9530 RTX 4070 | |
| Medio Intel Core i7-13700H, NVIDIA GeForce RTX 4070 Laptop GPU (1768 - 2073, n=6) | |
| Media de la clase Multimedia (866 - 2728, n=61, últimos 2 años) | |
| MSI Stealth 16 Studio A13VG | |
| Schenker Vision 16 Pro RTX 3070 Ti | |
| Samsung Galaxy Book3 Ultra 16, i9-13900H RTX 4070 | |
| CrossMark / Productivity | |
| Asus ProArt Studiobook 16 OLED H7604 | |
| Schenker VISION 16 Pro (M23) | |
| Medio Intel Core i7-13700H, NVIDIA GeForce RTX 4070 Laptop GPU (1645 - 2006, n=6) | |
| Media de la clase Multimedia (931 - 2489, n=61, últimos 2 años) | |
| Dell XPS 15 9530 RTX 4070 | |
| MSI Stealth 16 Studio A13VG | |
| Apple MacBook Pro 16 2023 M2 Max | |
| Schenker Vision 16 Pro RTX 3070 Ti | |
| Samsung Galaxy Book3 Ultra 16, i9-13900H RTX 4070 | |
| CrossMark / Creativity | |
| Apple MacBook Pro 16 2023 M2 Max | |
| Asus ProArt Studiobook 16 OLED H7604 | |
| Media de la clase Multimedia (907 - 3465, n=61, últimos 2 años) | |
| Dell XPS 15 9530 RTX 4070 | |
| Medio Intel Core i7-13700H, NVIDIA GeForce RTX 4070 Laptop GPU (1936 - 2137, n=6) | |
| Schenker VISION 16 Pro (M23) | |
| MSI Stealth 16 Studio A13VG | |
| Schenker Vision 16 Pro RTX 3070 Ti | |
| Samsung Galaxy Book3 Ultra 16, i9-13900H RTX 4070 | |
| CrossMark / Responsiveness | |
| Asus ProArt Studiobook 16 OLED H7604 | |
| Schenker VISION 16 Pro (M23) | |
| Medio Intel Core i7-13700H, NVIDIA GeForce RTX 4070 Laptop GPU (1451 - 2202, n=6) | |
| MSI Stealth 16 Studio A13VG | |
| Dell XPS 15 9530 RTX 4070 | |
| Media de la clase Multimedia (605 - 2024, n=61, últimos 2 años) | |
| Apple MacBook Pro 16 2023 M2 Max | |
| Schenker Vision 16 Pro RTX 3070 Ti | |
| Samsung Galaxy Book3 Ultra 16, i9-13900H RTX 4070 | |
| PCMark 10 Score | 7368 puntos | |
ayuda | ||
| AIDA64 / Memory Copy | |
| Media de la clase Multimedia (11299 - 132135, n=55, últimos 2 años) | |
| Asus ProArt Studiobook 16 OLED H7604 | |
| Samsung Galaxy Book3 Ultra 16, i9-13900H RTX 4070 | |
| MSI Stealth 16 Studio A13VG | |
| Dell XPS 15 9530 RTX 4070 | |
| Schenker VISION 16 Pro (M23) | |
| Schenker Vision 16 Pro RTX 3070 Ti | |
| Medio Intel Core i7-13700H (24334 - 78081, n=29) | |
| AIDA64 / Memory Read | |
| Media de la clase Multimedia (11624 - 174586, n=55, últimos 2 años) | |
| Asus ProArt Studiobook 16 OLED H7604 | |
| MSI Stealth 16 Studio A13VG | |
| Schenker VISION 16 Pro (M23) | |
| Samsung Galaxy Book3 Ultra 16, i9-13900H RTX 4070 | |
| Dell XPS 15 9530 RTX 4070 | |
| Schenker Vision 16 Pro RTX 3070 Ti | |
| Medio Intel Core i7-13700H (23681 - 79656, n=29) | |
| AIDA64 / Memory Write | |
| Samsung Galaxy Book3 Ultra 16, i9-13900H RTX 4070 | |
| Media de la clase Multimedia (11755 - 134998, n=55, últimos 2 años) | |
| Asus ProArt Studiobook 16 OLED H7604 | |
| MSI Stealth 16 Studio A13VG | |
| Medio Intel Core i7-13700H (22986 - 99898, n=29) | |
| Dell XPS 15 9530 RTX 4070 | |
| Schenker VISION 16 Pro (M23) | |
| Schenker Vision 16 Pro RTX 3070 Ti | |
| AIDA64 / Memory Latency | |
| Media de la clase Multimedia (7 - 535, n=54, últimos 2 años) | |
| Samsung Galaxy Book3 Ultra 16, i9-13900H RTX 4070 | |
| Medio Intel Core i7-13700H (82.4 - 136.8, n=29) | |
| Schenker Vision 16 Pro RTX 3070 Ti | |
| MSI Stealth 16 Studio A13VG | |
| Dell XPS 15 9530 RTX 4070 | |
| Asus ProArt Studiobook 16 OLED H7604 | |
| Schenker VISION 16 Pro (M23) | |
* ... más pequeño es mejor
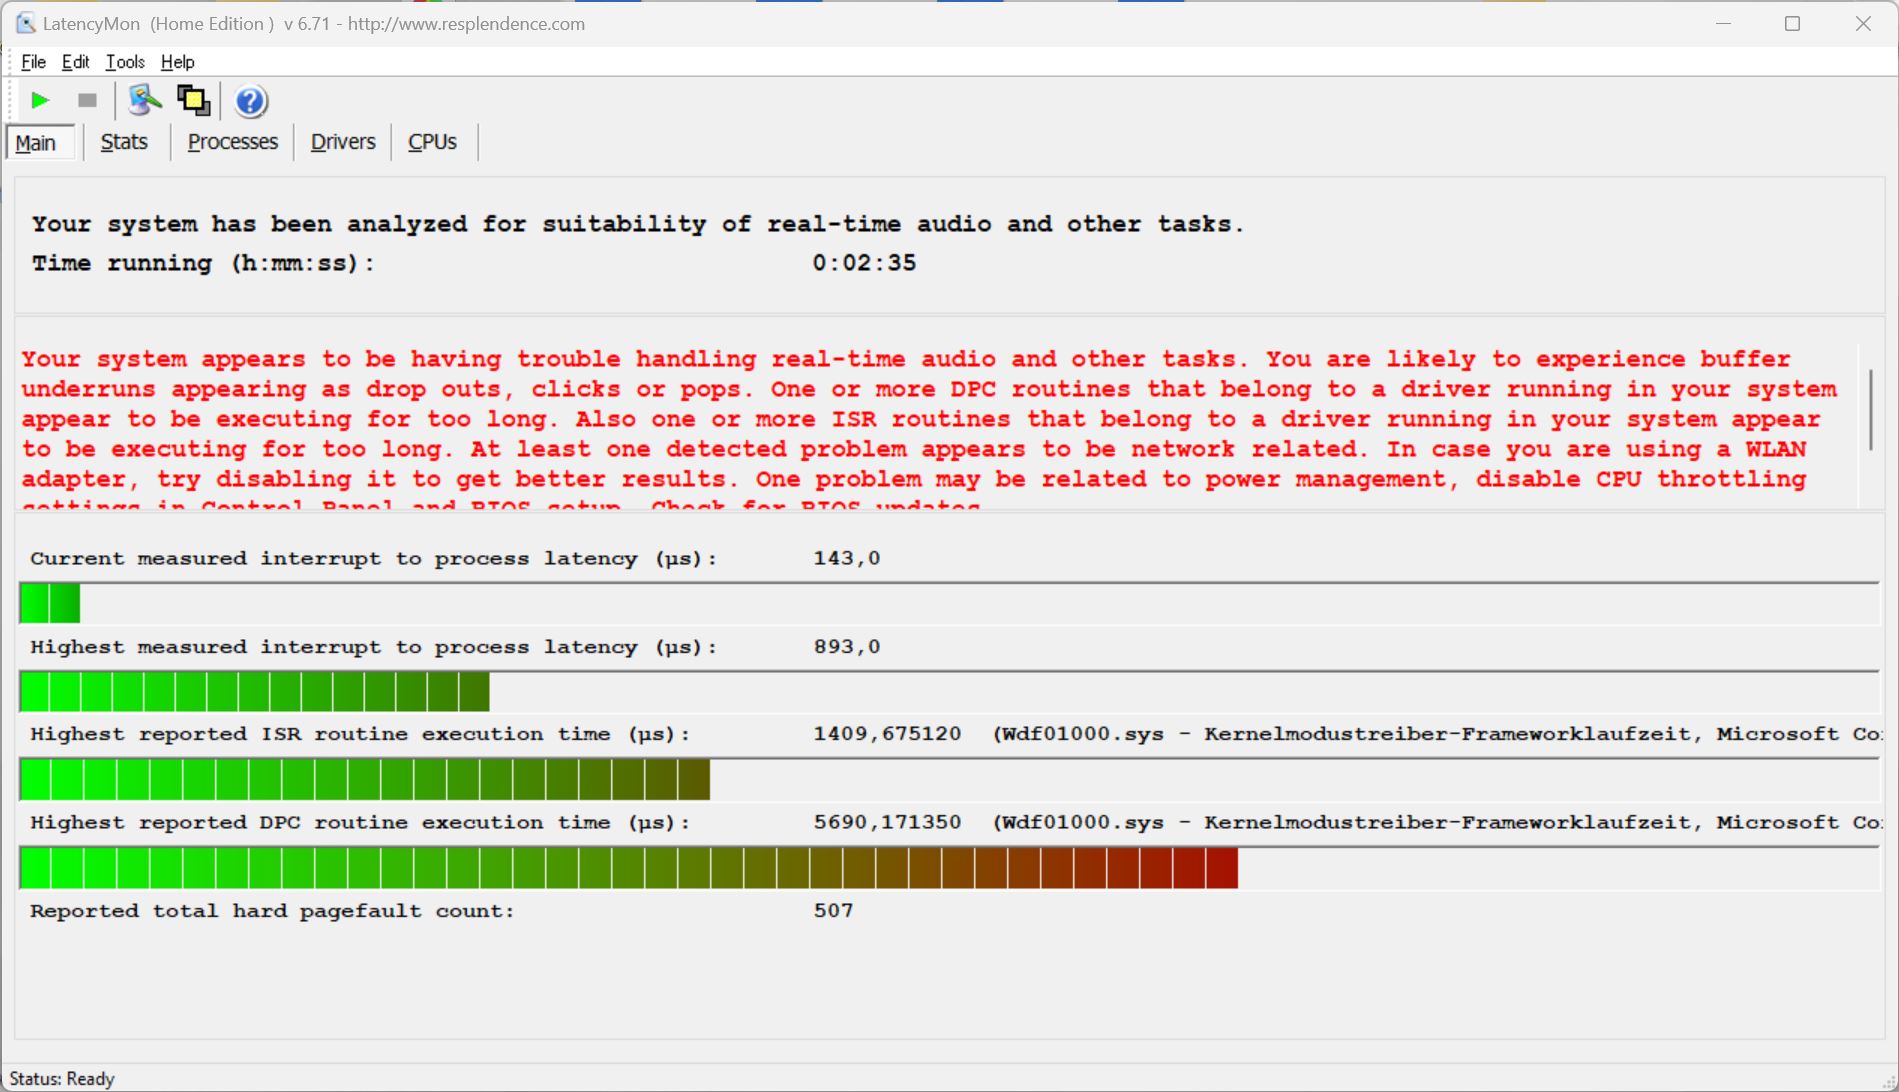
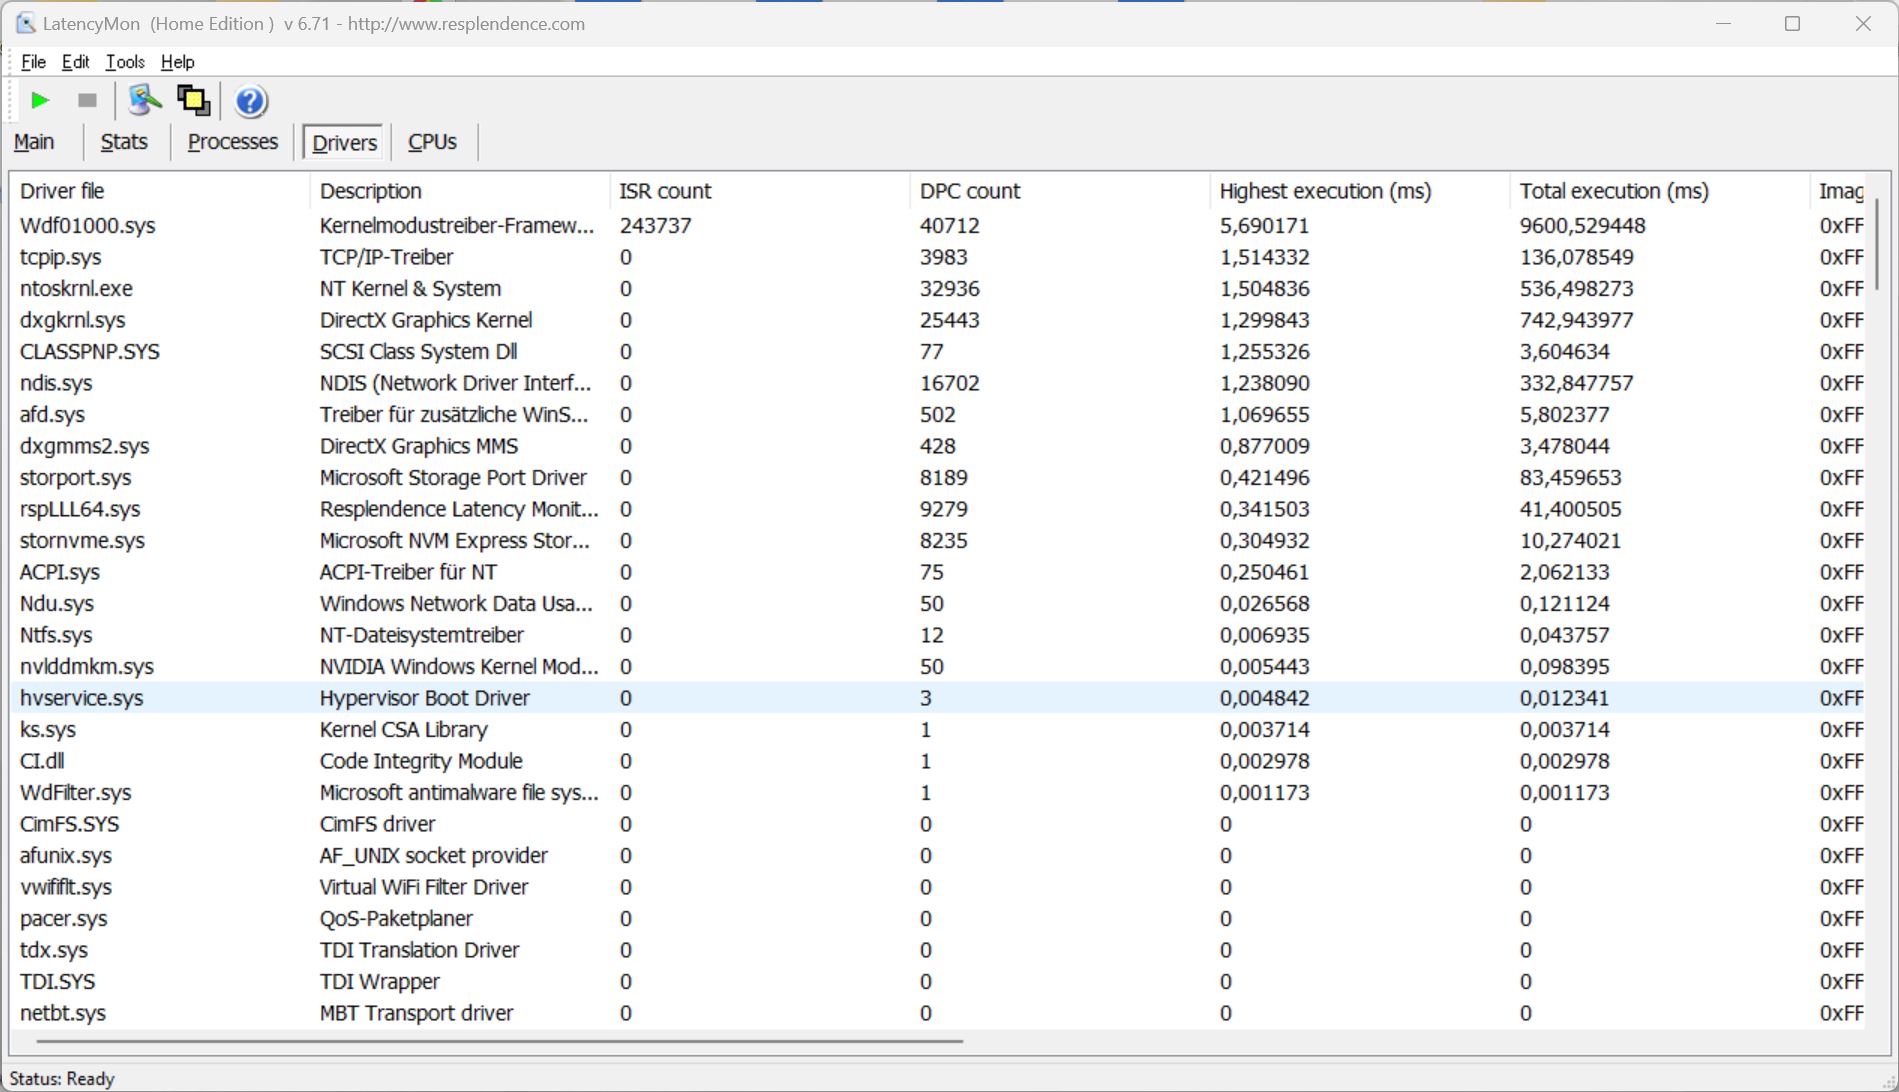
Latencias del CPD
En nuestra prueba de latencia estandarizada (con navegación por Internet, reproducción de YouTube en 4K y carga de la CPU), con la versión actual de la BIOS en el momento de la prueba, nuestra unidad de pruebas muestra algunas ligeras limitaciones para utilizarla en aplicaciones de audio en tiempo real.
| DPC Latencies / LatencyMon - interrupt to process latency (max), Web, Youtube, Prime95 | |
| MSI Stealth 16 Studio A13VG | |
| Samsung Galaxy Book3 Ultra 16, i9-13900H RTX 4070 | |
| Asus ProArt Studiobook 16 OLED H7604 | |
| Dell XPS 15 9530 RTX 4070 | |
| Schenker VISION 16 Pro (M23) | |
| Schenker Vision 16 Pro RTX 3070 Ti | |
* ... más pequeño es mejor
Solución de almacenamiento
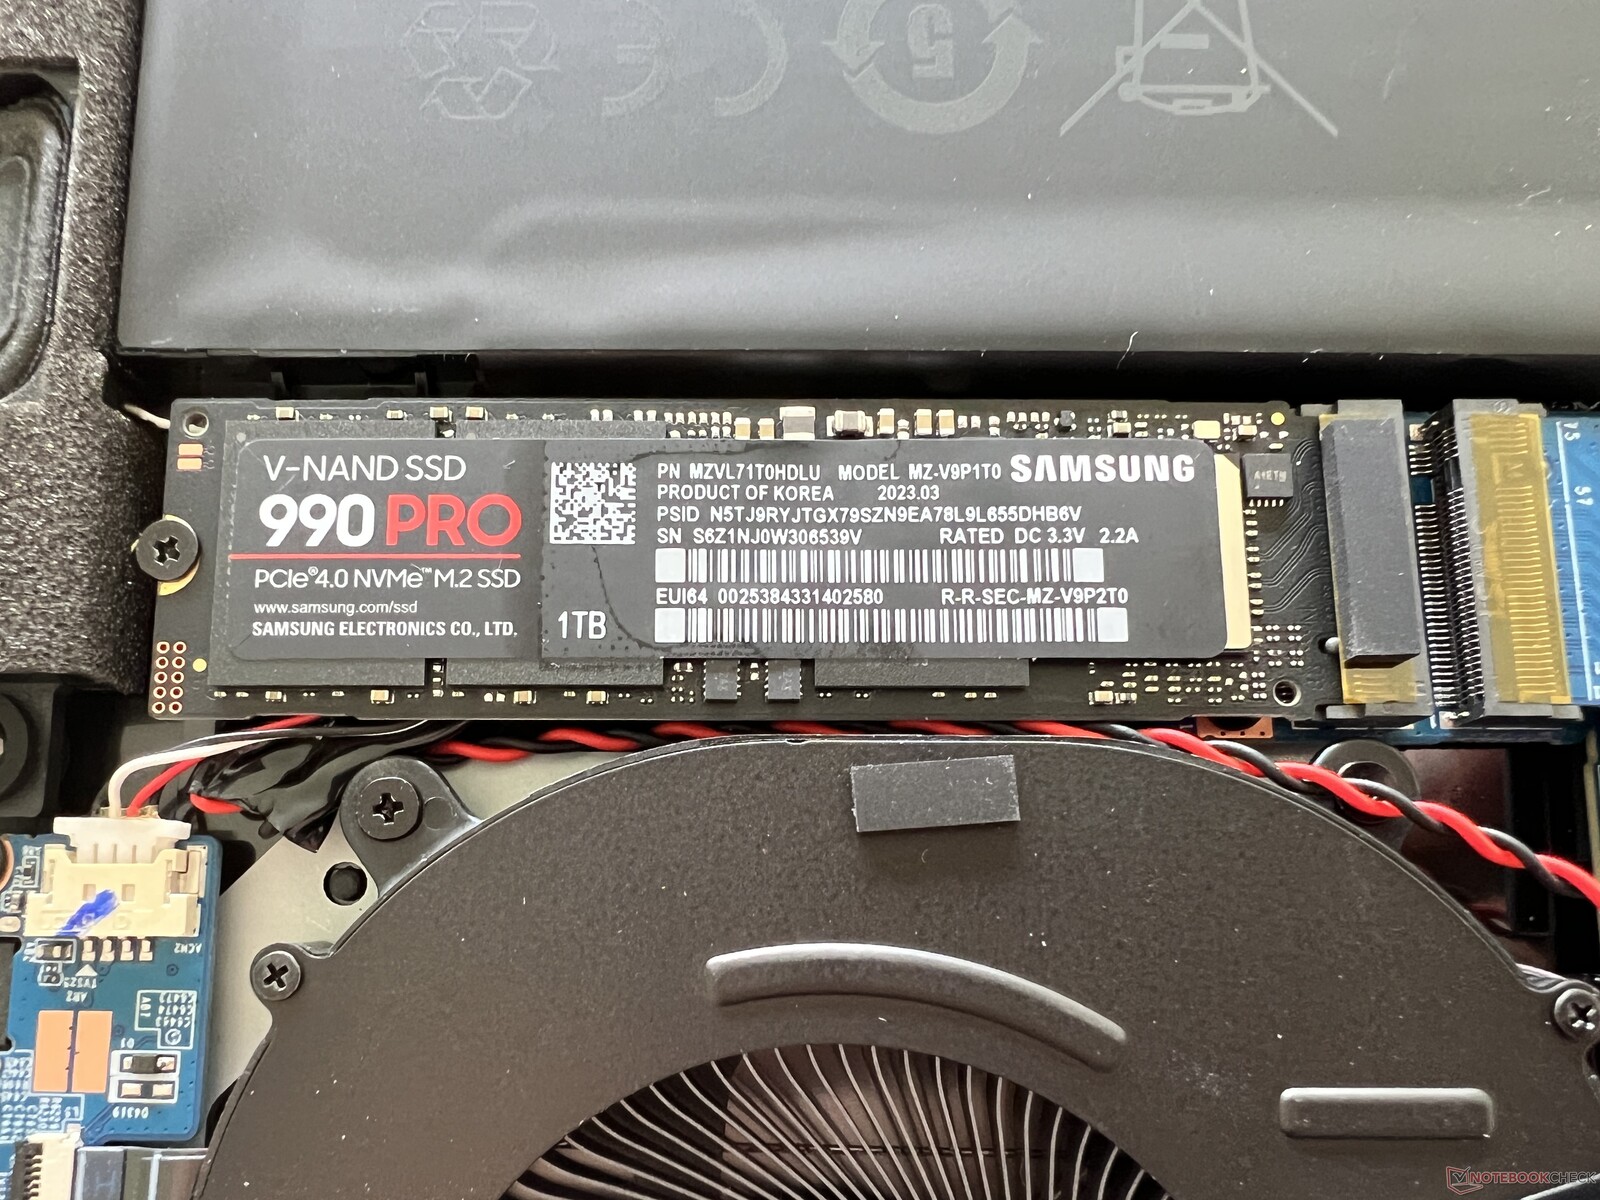
El Vision 16 Pro ofrece dos rápidas ranuras PCIe 4.0 para SSDs, con la segunda ranura junto a la batería sólo capaz de albergar un SSD de una cara. Nuestra unidad de pruebas usa la versión de 1 TB del Samsung 990 Pro, y tras el primer arranque, quedan 870 GB de almacenamiento a disposición del usuario. Las tasas de transferencia del SSD son muy altas, y el rendimiento también permanece completamente estable incluso tras cargas largas, lo que no es en absoluto un hecho con los SSDs de alto rendimiento actuales. Puedes encontrar más pruebas de SSD aquí.

* ... más pequeño es mejor
Disk Throttling: DiskSpd Read Loop, Queue Depth 8
Tarjeta gráfica - RTX 4070 Portátil
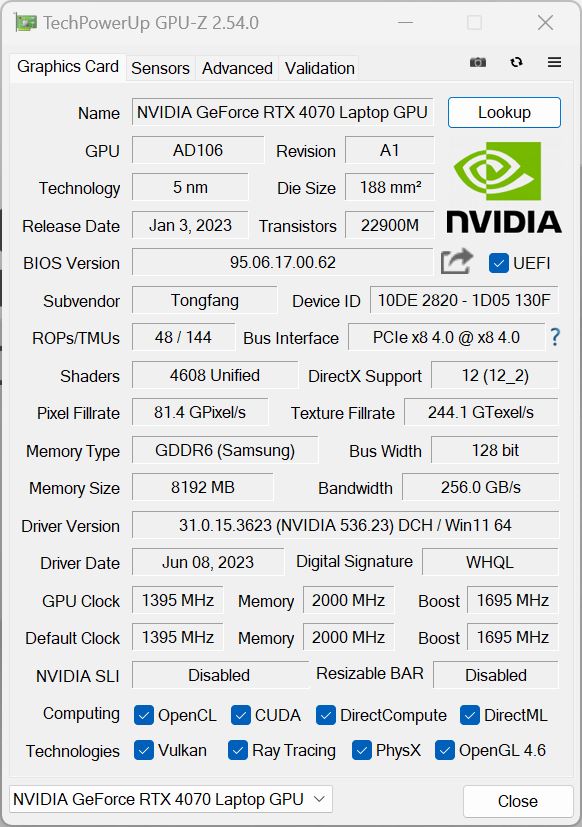
Como ya ocurría en el modelo del año pasado, se utiliza una GPU Nvidia actual con un TGP máximo de 95 vatios (70W TGP + 25W Dynamic Boost de la CPU), pero este año, la nueva RTX 4070 para portátilesse utiliza. Sin embargo, elPortátil RTX 4080que es la sucesora directa de la RTX 3080 no hay interruptor MUX en el portátil multimedia, por lo que el cambio de gráficos se realiza regularmente a través de Optimus.
Con un máximo de 95 vatios, es una versión rápida del portátil RTX 4070, ya que se acerca al máximo de 105 vatios que suele consumir el 4070 al jugar. Sólo en algunas pruebas sintéticas como FurMark, el consumo puede ser mayor, pero esto no juega ningún papel en la práctica. Esto también se puede ver fácilmente en el 3DMarks, donde el Schenker Vision 16 Pro prácticamente termina al mismo nivel con el ProArt Studiobook 16 que especifica un TGP de 130 vatios para el portátil RTX 4070. En comparación con el Vision 16 Procon la RTX 3070 Tihay un aumento de velocidad de alrededor del 25-30%.
Nuestra unidad de pruebas pasa el test de estrés Time Spy al 98.2% sin problemas, pero el consumo de energía de la GPU se reduce a 36 vatios en funcionamiento con batería. Sin cargador, el rendimiento de la GPU es un 40% inferior. Puedes encontrar más pruebas de rendimiento de la GPU aquí.
| 3DMark 11 Performance | 32729 puntos | |
| 3DMark Fire Strike Score | 24151 puntos | |
| 3DMark Time Spy Score | 11566 puntos | |
ayuda | ||
| Blender / v3.3 Classroom METAL | |
| Apple MacBook Pro 16 2023 M2 Max | |
| Media de la clase Multimedia (17.8 - 68, n=5, últimos 2 años) | |
| Blender / v3.3 Classroom OPTIX/RTX | |
| Media de la clase Multimedia (12 - 105, n=22, últimos 2 años) | |
| Dell XPS 15 9530 RTX 4070 | |
| Schenker Vision 16 Pro RTX 3070 Ti | |
| Samsung Galaxy Book3 Ultra 16, i9-13900H RTX 4070 | |
| MSI Stealth 16 Studio A13VG | |
| Schenker VISION 16 Pro (M23) | |
| Asus ProArt Studiobook 16 OLED H7604 | |
| Medio NVIDIA GeForce RTX 4070 Laptop GPU (18 - 30, n=68) | |
| Blender / v3.3 Classroom CUDA | |
| Media de la clase Multimedia (20 - 186, n=22, últimos 2 años) | |
| Dell XPS 15 9530 RTX 4070 | |
| Schenker Vision 16 Pro RTX 3070 Ti | |
| Samsung Galaxy Book3 Ultra 16, i9-13900H RTX 4070 | |
| MSI Stealth 16 Studio A13VG | |
| Asus ProArt Studiobook 16 OLED H7604 | |
| Schenker VISION 16 Pro (M23) | |
| Medio NVIDIA GeForce RTX 4070 Laptop GPU (32 - 50, n=67) | |
| Blender / v3.3 Classroom CPU | |
| Schenker Vision 16 Pro RTX 3070 Ti | |
| Samsung Galaxy Book3 Ultra 16, i9-13900H RTX 4070 | |
| Media de la clase Multimedia (134.5 - 1042, n=63, últimos 2 años) | |
| Schenker VISION 16 Pro (M23) | |
| Dell XPS 15 9530 RTX 4070 | |
| Apple MacBook Pro 16 2023 M2 Max | |
| MSI Stealth 16 Studio A13VG | |
| Medio NVIDIA GeForce RTX 4070 Laptop GPU (158 - 440, n=67) | |
| Asus ProArt Studiobook 16 OLED H7604 | |
* ... más pequeño es mejor
Rendimiento en juegos
El rendimiento CPU comparativamente bajo puede tener un efecto negativo en el rendimiento de juego, ya que a veces el rendimiento Vision 16 Pro cae aquí, comparado con el de otros portátiles con la RTX 4070 Laptop. Pero básicamente, el rendimiento es completamente suficiente para jugar también a juegos modernos como Cyberpunk 2077 o Star Wars: Jedi Survivor sin problemas en resolución QHD, y también se mantiene estable durante sesiones de juego más largas.
| The Witcher 3 - 1920x1080 Ultra Graphics & Postprocessing (HBAO+) | |
| MSI Stealth 16 Studio A13VG | |
| Asus ProArt Studiobook 16 OLED H7604 | |
| Schenker VISION 16 Pro (M23) | |
| Schenker Vision 16 Pro RTX 3070 Ti | |
| Samsung Galaxy Book3 Ultra 16, i9-13900H RTX 4070 | |
| Dell XPS 15 9530 RTX 4070 | |
| Media de la clase Multimedia (11 - 121, n=8, últimos 2 años) | |
The Witcher 3 FPS Chart
| bajo | medio | alto | ultra | QHD | |
|---|---|---|---|---|---|
| GTA V (2015) | 170 | 156.9 | 96.5 | 80.6 | |
| The Witcher 3 (2015) | 226 | 105.4 | |||
| Dota 2 Reborn (2015) | 178.4 | 161.3 | 152.4 | 143.8 | |
| Final Fantasy XV Benchmark (2018) | 175.3 | 143.2 | 109 | 81.6 | |
| X-Plane 11.11 (2018) | 154.8 | 138.4 | 109.7 | ||
| Far Cry 5 (2018) | 168 | 134 | 127 | 120 | 108 |
| Strange Brigade (2018) | 362 | 270 | 223 | 196.7 | 131.6 |
| F1 2021 (2021) | 339 | 276 | 234 | 133.1 | 104.3 |
| Cyberpunk 2077 1.6 (2022) | 106 | 102 | 101 | 82 | 52 |
| F1 22 (2022) | 220 | 183 | 72.6 | 47 | |
| Star Wars Jedi Survivor (2023) | 84 | 76 | 72 | 67 | 44 |
Emisiones - Ventiladores ruidosos a plena potencia
Emisiones sonoras
Puedes configurar en la BIOS si los dos ventiladores deben funcionar constantemente a baja velocidad o no, lo que tiene la ventaja de que los picos de carga se pueden manejar mejor. Aunque esta opción estaba activada en nuestra unidad de pruebas, los ventiladores permanecieron quietos en muchos casos, incluso en el modo de rendimiento más rápido. Los ventiladores sólo se hacen claramente audibles bajo carga, cuando la GPU juega un papel más importante debido al mayor consumo de energía. Con unos 53 dB(A) en juegos y en el test de estrés, el Vision 16 Pro es casi tan ruidoso como su predecesor en modo Turbo. Listamos las mediciones de los diferentes modos en la siguiente tabla:
| Aplicación | Silencioso | Rendimiento equilibrado | Rendimiento entusiasta |
|---|---|---|---|
| 3DMark 06 | 37,7 dB(A) | 47,2 dB(A) | 47,2 dB(A) |
| Witcher 3 | 37.7 dB(A) | 49,9 dB(A) | 53,1 dB(A) |
| Prueba de esfuerzo | 40,6 dB(A) | 49,9 dB(A) | 53,1 dB(A) |
Particularmente en el funcionamiento diario y también con algunos juegos antiguos o no tan exigentes, merece la pena cambiar al modo Silencioso (ya sea a través del Centro de Control o usando la tecla F3), ya que el rendimiento seguirá siendo suficiente y los ventiladores permanecerán significativamente más silenciosos con unos 38 a 40 dB(A). No notamos ningún otro ruido electrónico en nuestra unidad de pruebas.
Ruido
| Ocioso |
| 25.9 / 25.9 / 32 dB(A) |
| Carga |
| 47.2 / 53.1 dB(A) |
 | ||
30 dB silencioso 40 dB(A) audible 50 dB(A) ruidosamente alto |
||
min: | ||
| Schenker VISION 16 Pro (M23) GeForce RTX 4070 Laptop GPU, i7-13700H, Samsung 990 Pro 1 TB | Samsung Galaxy Book3 Ultra 16, i9-13900H RTX 4070 GeForce RTX 4070 Laptop GPU, i9-13900H, Samsung PM9A1 MZVL21T0HCLR | MSI Stealth 16 Studio A13VG GeForce RTX 4070 Laptop GPU, i7-13700H, Micron 3400 2TB MTFDKBA2T0TFH | Dell XPS 15 9530 RTX 4070 GeForce RTX 4070 Laptop GPU, i7-13700H, SK hynix PC801 HFS001TEJ9X101N | Asus ProArt Studiobook 16 OLED H7604 GeForce RTX 4070 Laptop GPU, i9-13980HX, Phison EM2804TBMTCB47 | Apple MacBook Pro 16 2023 M2 Max M2 Max 38-Core GPU, M2 Max, Apple SSD AP2048Z | Schenker Vision 16 Pro RTX 3070 Ti GeForce RTX 3070 Ti Laptop GPU, i7-12700H, Samsung SSD 980 Pro 1TB MZ-V8P1T0BW | |
|---|---|---|---|---|---|---|---|
| Noise | 6% | 13% | 20% | 4% | 18% | 11% | |
| apagado / medio ambiente * (dB) | 25.9 | 25.2 3% | 24 7% | 23.1 11% | 24.5 5% | 23.9 8% | 22.9 12% |
| Idle Minimum * (dB) | 25.9 | 25.2 3% | 24 7% | 23.1 11% | 24.5 5% | 23.9 8% | 24.3 6% |
| Idle Average * (dB) | 25.9 | 25.2 3% | 24 7% | 23.1 11% | 24.5 5% | 23.9 8% | 24.3 6% |
| Idle Maximum * (dB) | 32 | 31.3 2% | 24 25% | 24.2 24% | 24.5 23% | 23.9 25% | 24.3 24% |
| Load Average * (dB) | 47.2 | 38.8 18% | 34.81 26% | 27.1 43% | 47.6 -1% | 36.6 22% | 38.5 18% |
| Witcher 3 ultra * (dB) | 53.1 | 44.05 17% | 40.1 24% | 55.9 -5% | 35.1 34% | 51 4% | |
| Load Maximum * (dB) | 53.1 | 51.2 4% | 51.57 3% | 44.6 16% | 56.7 -7% | 43.2 19% | 51 4% |
* ... más pequeño es mejor
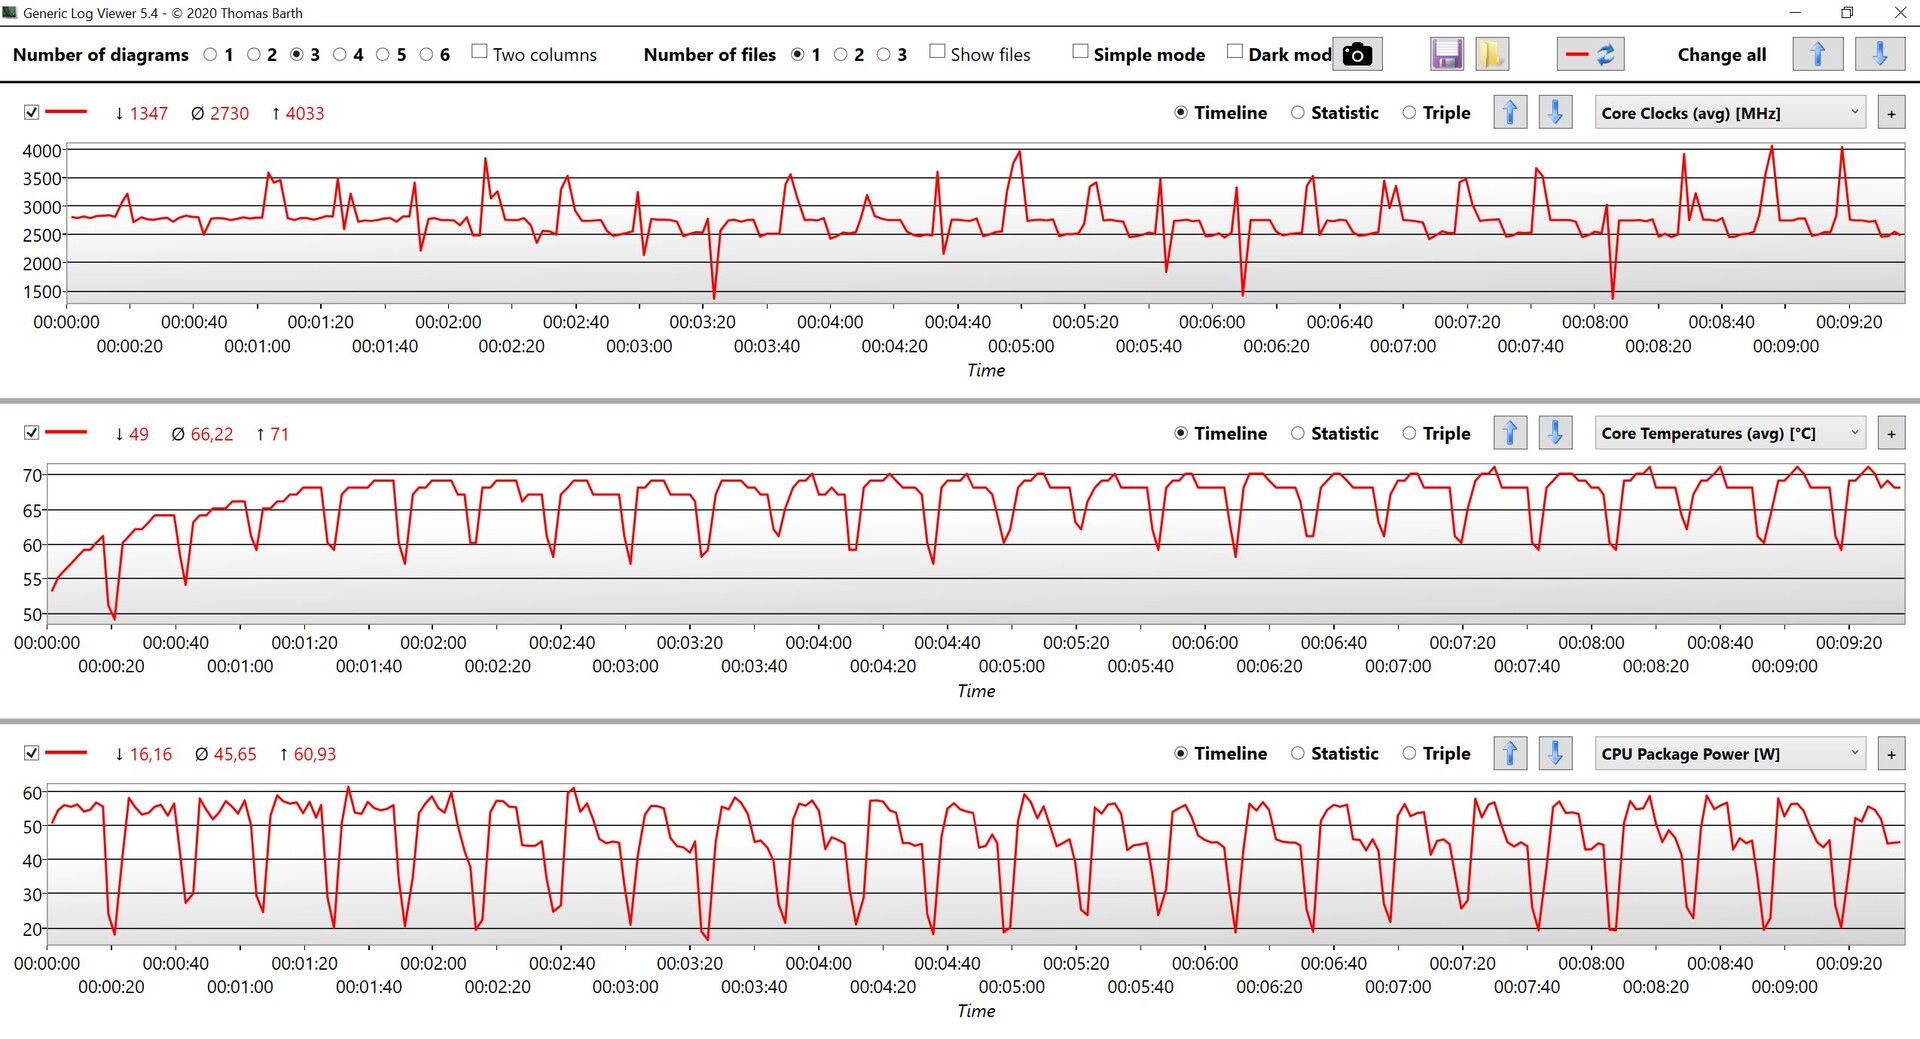
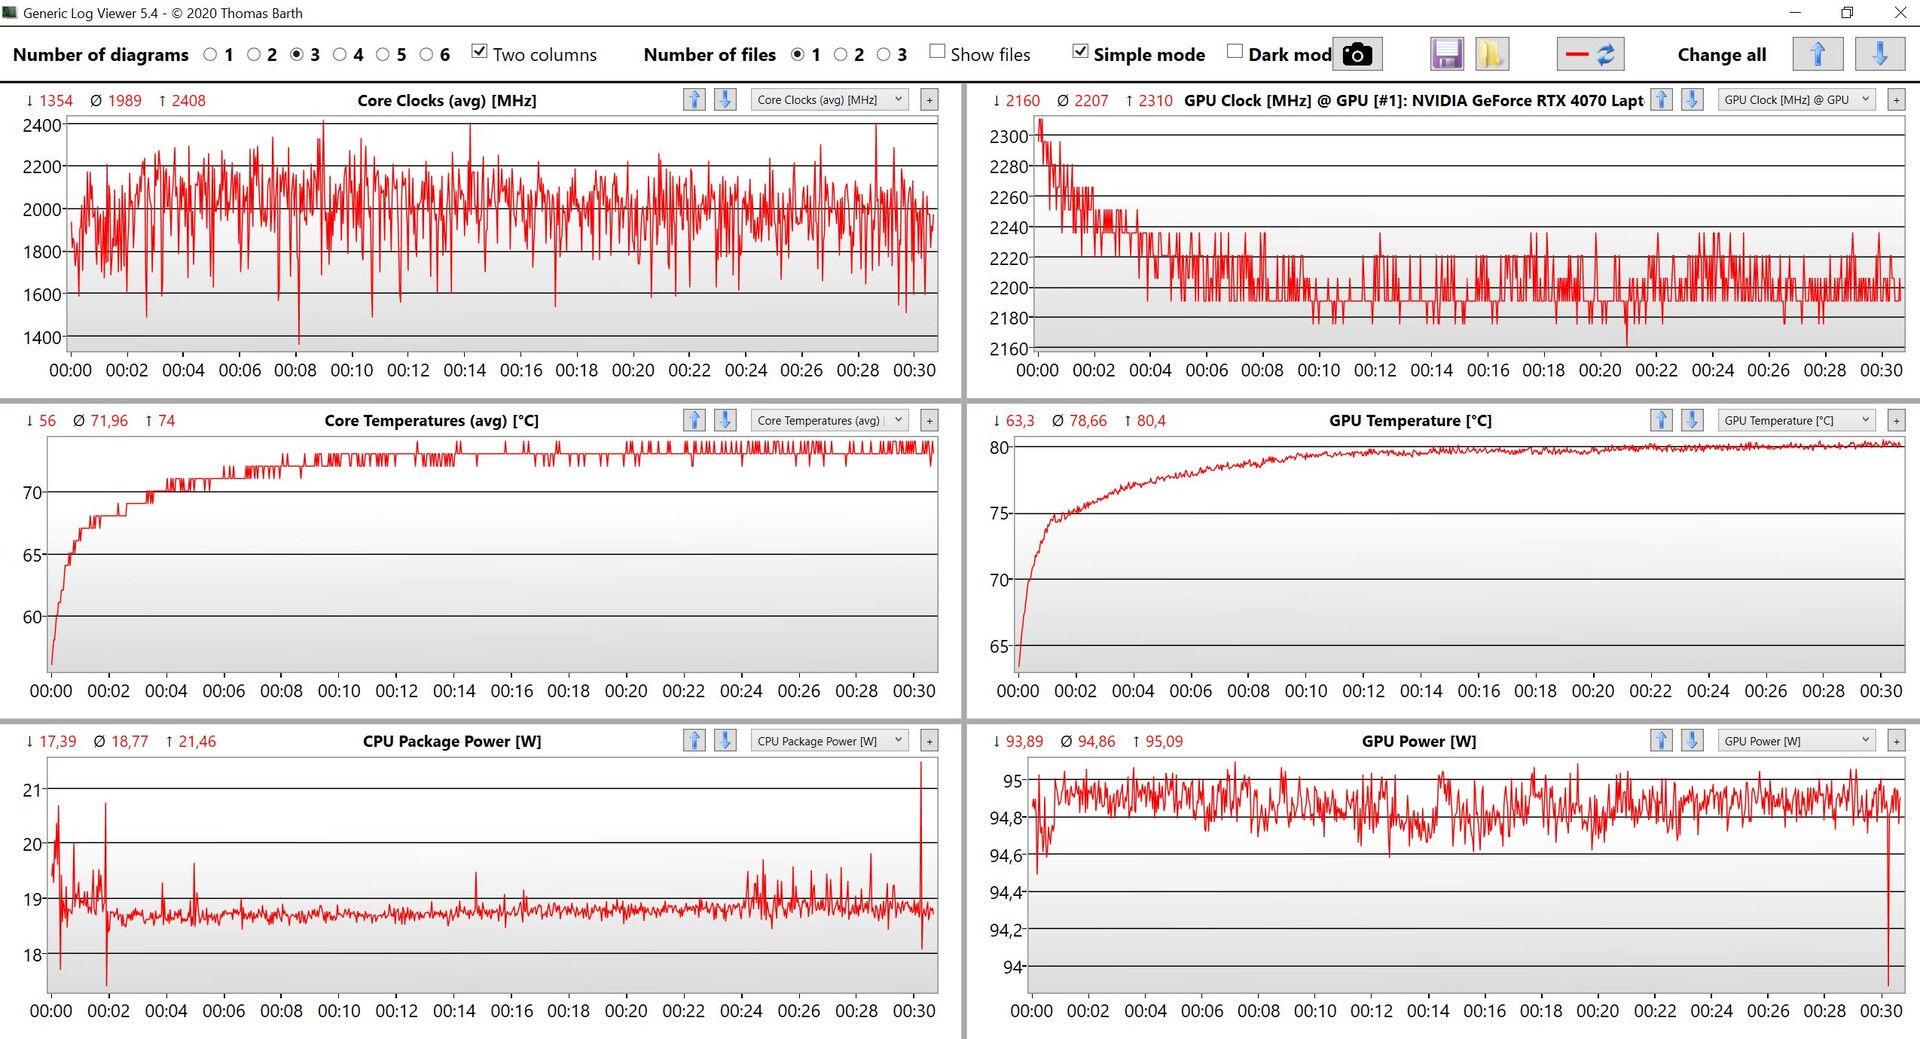
Temperaturas
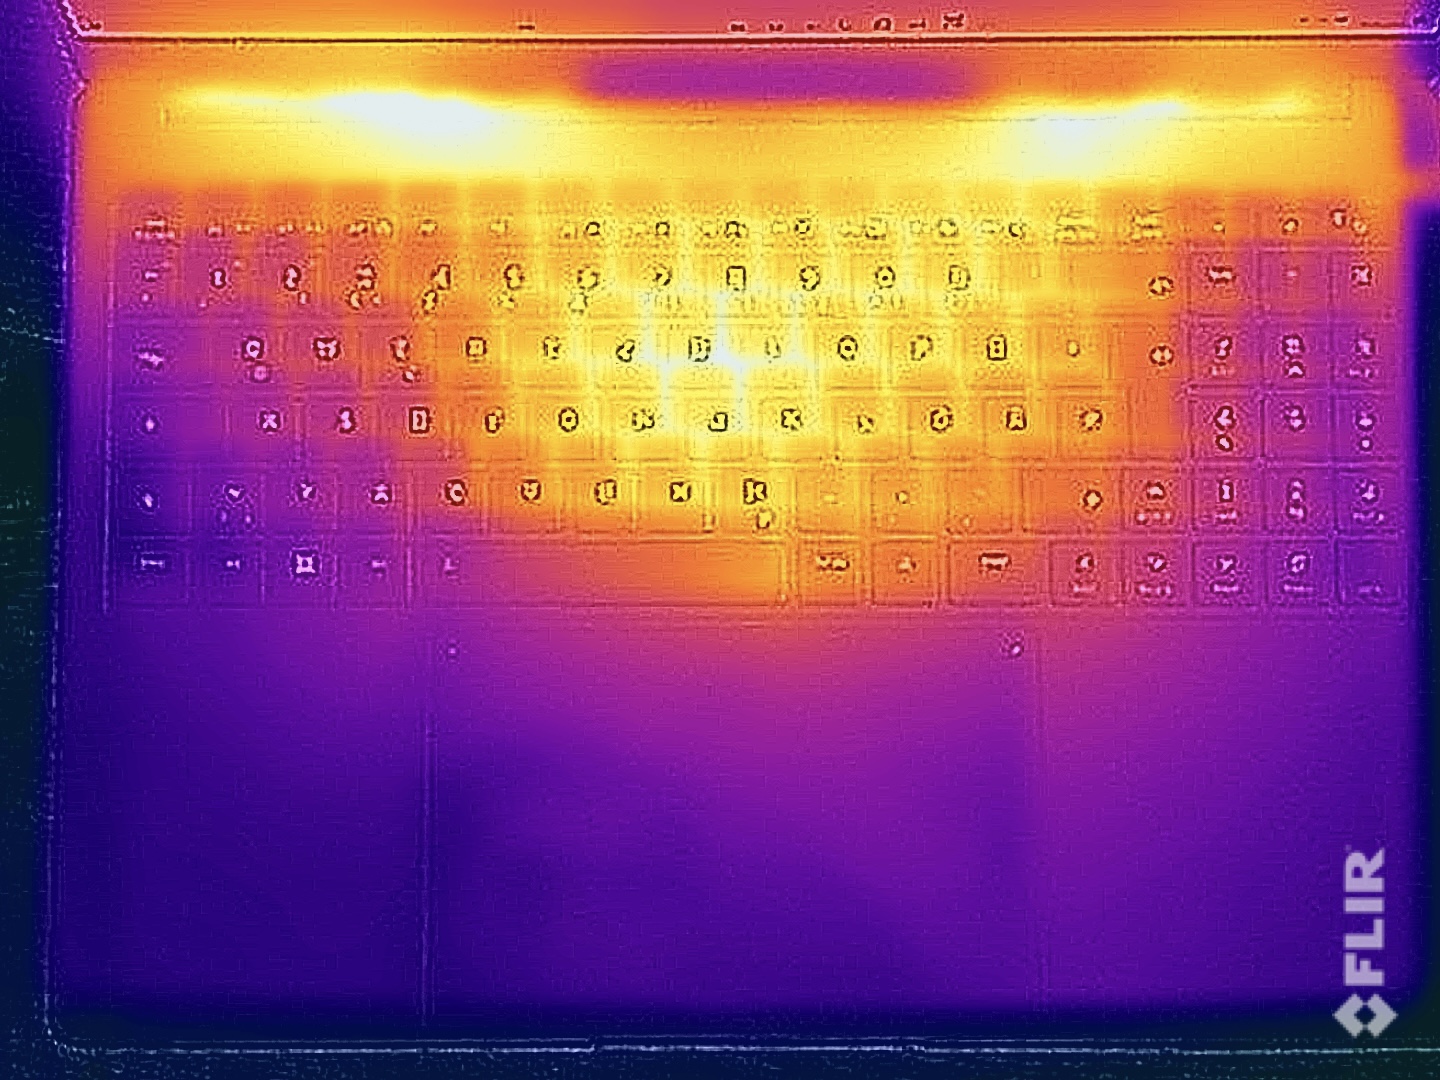
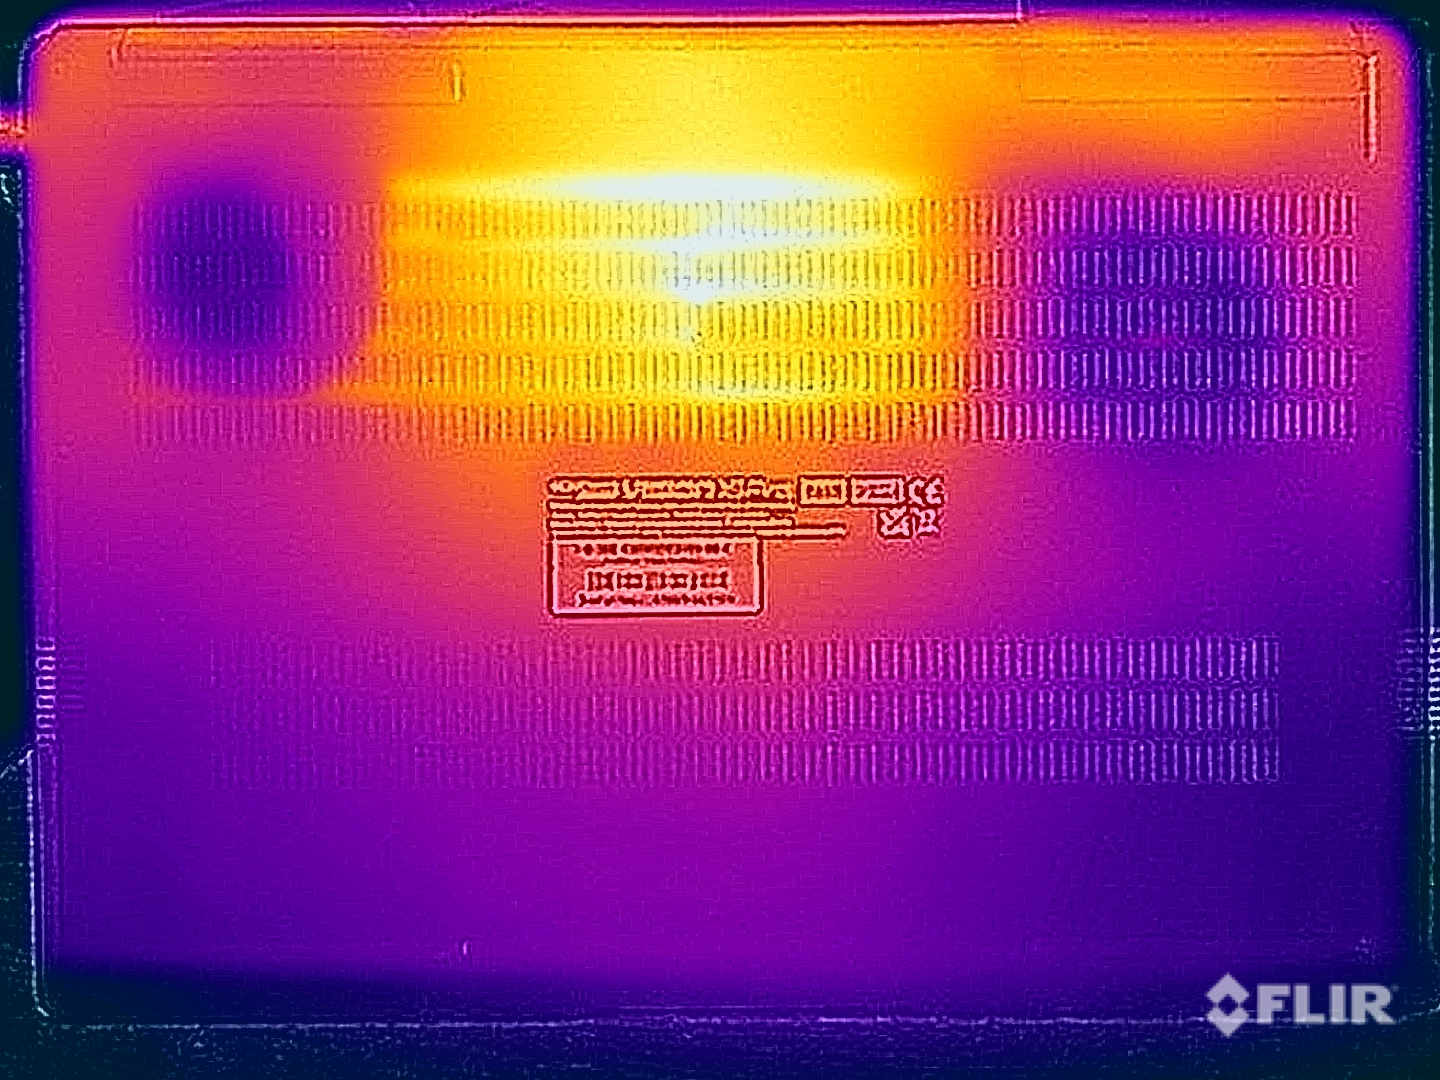
Aunque no hay problemas de temperatura en el funcionamiento cotidiano, no debes colocar el dispositivo sobre tus rodillas cuando juegues o los componentes estén sometidos a una carga elevada. En el caso extremo, medimos temperaturas superiores a 50 °C (122 °F) en la zona central de la parte inferior. El área central del teclado también se calienta a más de 45 °C (113 °F), lo que se nota al escribir. Pero las típicas teclas WASD permanecen bastante más frías, lo que ayuda durante los juegos. El cargador, considerablemente más compacto, sólo se calienta marginalmente más que el del modelo antiguo, y no hay problemas con una temperatura máxima de 44 °C (111 °F).
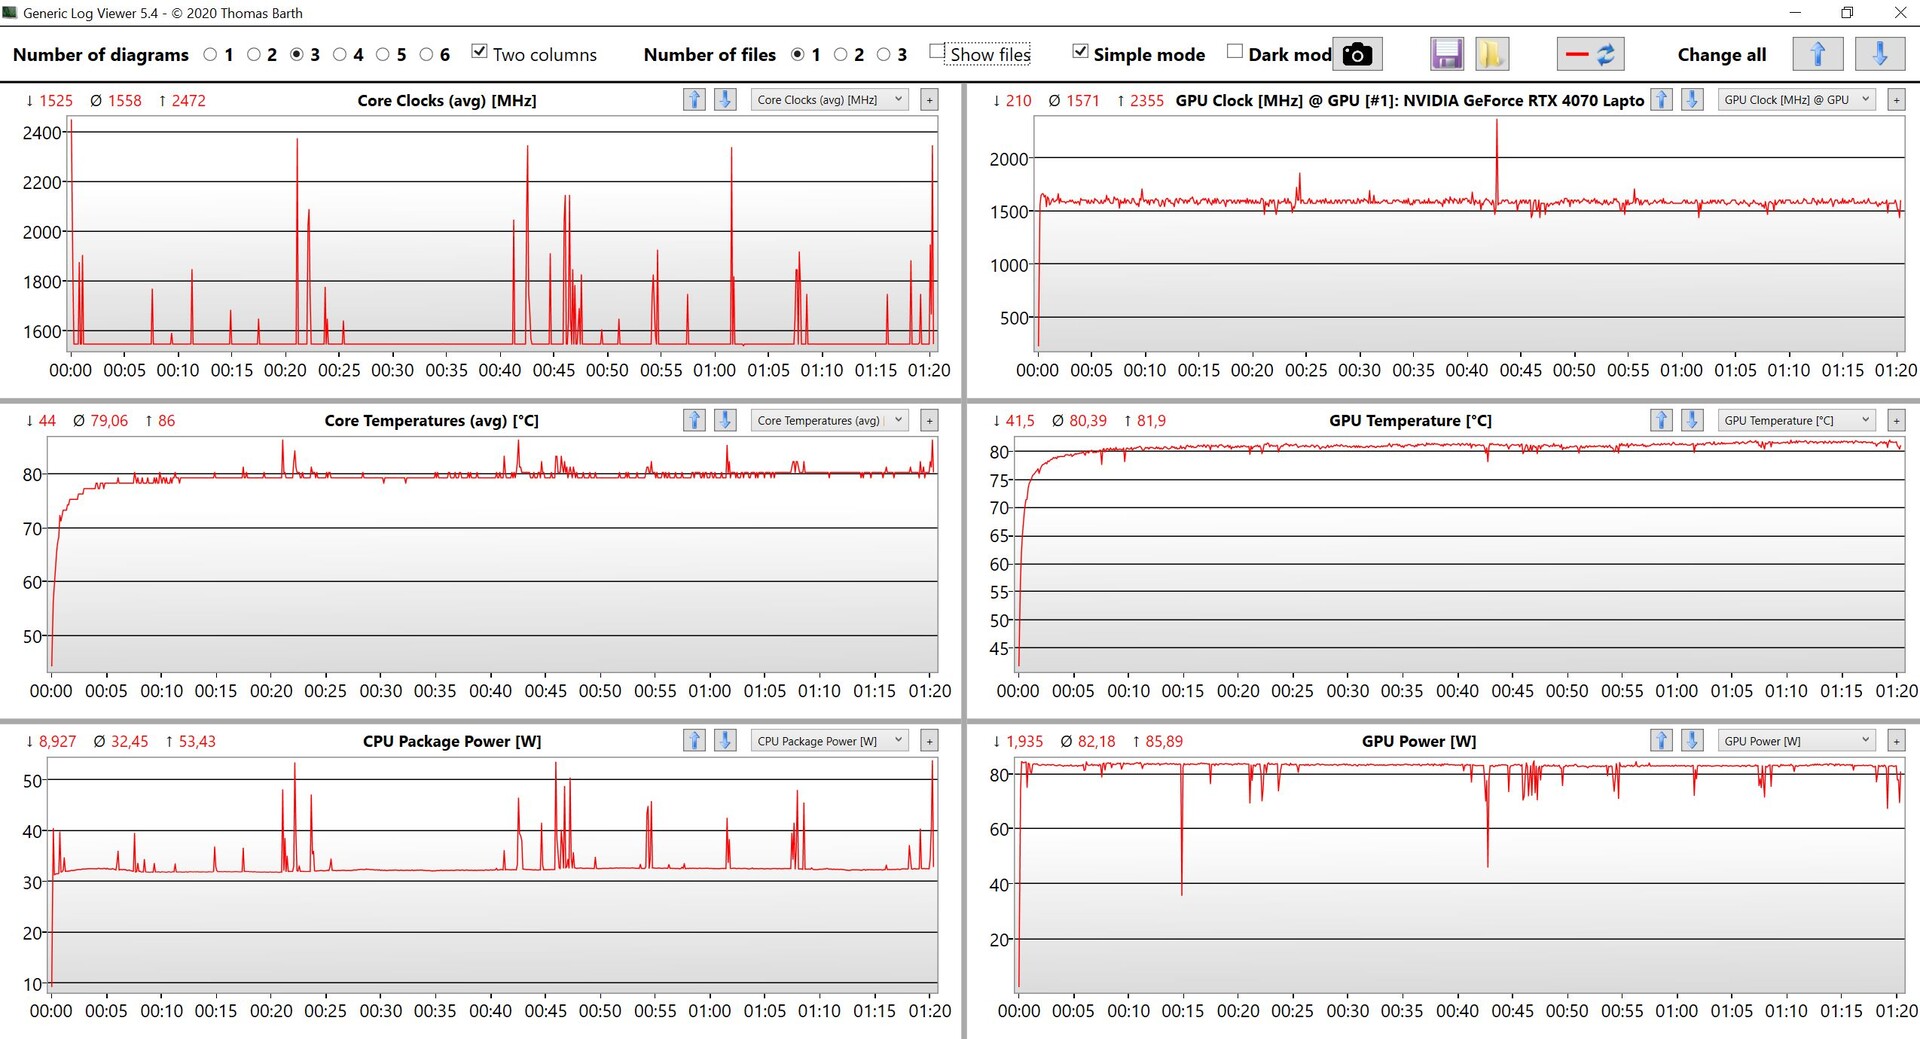
Durante la prueba de estrés, se da prioridad a la tarjeta gráfica, ya que funciona de forma estable a unos 82 vatios. El procesador, por otro lado, se nivela rápidamente a unos 32 vatios. En general, es un resultado decente para un dispositivo tan delgado.
(-) La temperatura máxima en la parte superior es de 46.7 °C / 116 F, frente a la media de 36.8 °C / 98 F, que oscila entre 21 y 71 °C para la clase Multimedia.
(-) El fondo se calienta hasta un máximo de 54.1 °C / 129 F, frente a la media de 39.1 °C / 102 F
(+) En reposo, la temperatura media de la parte superior es de 24.7 °C / 76# F, frente a la media del dispositivo de 31.3 °C / 88 F.
(±) Jugando a The Witcher 3, la temperatura media de la parte superior es de 37.7 °C / 100 F, frente a la media del dispositivo de 31.3 °C / 88 F.
(+) El reposamanos y el panel táctil están a una temperatura inferior a la de la piel, con un máximo de 28 °C / 82.4 F y, por tanto, son fríos al tacto.
(±) La temperatura media de la zona del reposamanos de dispositivos similares fue de 28.7 °C / 83.7 F (+0.7 °C / 1.3 F).
| Schenker VISION 16 Pro (M23) Intel Core i7-13700H, NVIDIA GeForce RTX 4070 Laptop GPU | Samsung Galaxy Book3 Ultra 16, i9-13900H RTX 4070 Intel Core i9-13900H, NVIDIA GeForce RTX 4070 Laptop GPU | MSI Stealth 16 Studio A13VG Intel Core i7-13700H, NVIDIA GeForce RTX 4070 Laptop GPU | Dell XPS 15 9530 RTX 4070 Intel Core i7-13700H, NVIDIA GeForce RTX 4070 Laptop GPU | Asus ProArt Studiobook 16 OLED H7604 Intel Core i9-13980HX, NVIDIA GeForce RTX 4070 Laptop GPU | Apple MacBook Pro 16 2023 M2 Max Apple M2 Max, Apple M2 Max 38-Core GPU | Schenker Vision 16 Pro RTX 3070 Ti Intel Core i7-12700H, NVIDIA GeForce RTX 3070 Ti Laptop GPU | |
|---|---|---|---|---|---|---|---|
| Heat | -10% | -32% | -8% | -9% | 15% | 1% | |
| Maximum Upper Side * (°C) | 46.7 | 45.9 2% | 60 -28% | 45.6 2% | 44.1 6% | 44.2 5% | 50.8 -9% |
| Maximum Bottom * (°C) | 54.1 | 50.9 6% | 61 -13% | 42 22% | 48 11% | 42.9 21% | 46.3 14% |
| Idle Upper Side * (°C) | 26.5 | 31.6 -19% | 38.2 -44% | 34.4 -30% | 32.7 -23% | 22.4 15% | 27.2 -3% |
| Idle Bottom * (°C) | 26.8 | 34.2 -28% | 37.7 -41% | 33.2 -24% | 34.9 -30% | 22.3 17% | 26.6 1% |
* ... más pequeño es mejor
Altavoces
Nada ha cambiado en el sistema de altavoces, y en particular las frecuencias altas son muy precisas. En general, el rendimiento también es decente aquí, pero el Vision 16 Pro sigue sin poder alcanzar el excelente rendimiento delMacBook Pro 16.
Schenker VISION 16 Pro (M23) análisis de audio
(±) | la sonoridad del altavoz es media pero buena (77.6 dB)
Graves 100 - 315 Hz
(±) | lubina reducida - en promedio 14.7% inferior a la mediana
(-) | los graves no son lineales (15% delta a la frecuencia anterior)
Medios 400 - 2000 Hz
(+) | medios equilibrados - a sólo 3.1% de la mediana
(+) | los medios son lineales (4.6% delta a la frecuencia anterior)
Altos 2 - 16 kHz
(+) | máximos equilibrados - a sólo 1.3% de la mediana
(+) | los máximos son lineales (4.1% delta a la frecuencia anterior)
Total 100 - 16.000 Hz
(+) | el sonido global es lineal (13.1% de diferencia con la mediana)
En comparación con la misma clase
» 26% de todos los dispositivos probados de esta clase eran mejores, 5% similares, 69% peores
» El mejor tuvo un delta de 5%, la media fue 17%, el peor fue ###max##%
En comparación con todos los dispositivos probados
» 13% de todos los dispositivos probados eran mejores, 3% similares, 84% peores
» El mejor tuvo un delta de 4%, la media fue 23%, el peor fue ###max##%
Apple MacBook Pro 16 2023 M2 Max análisis de audio
(+) | los altavoces pueden reproducir a un volumen relativamente alto (#86.1 dB)
Graves 100 - 315 Hz
(+) | buen bajo - sólo 3.9% lejos de la mediana
(+) | el bajo es lineal (5.7% delta a la frecuencia anterior)
Medios 400 - 2000 Hz
(+) | medios equilibrados - a sólo 1.2% de la mediana
(+) | los medios son lineales (1.5% delta a la frecuencia anterior)
Altos 2 - 16 kHz
(+) | máximos equilibrados - a sólo 2.5% de la mediana
(+) | los máximos son lineales (1.7% delta a la frecuencia anterior)
Total 100 - 16.000 Hz
(+) | el sonido global es lineal (4.9% de diferencia con la mediana)
En comparación con la misma clase
» 0% de todos los dispositivos probados de esta clase eran mejores, 0% similares, 99% peores
» El mejor tuvo un delta de 5%, la media fue 17%, el peor fue ###max##%
En comparación con todos los dispositivos probados
» 0% de todos los dispositivos probados eran mejores, 0% similares, 100% peores
» El mejor tuvo un delta de 4%, la media fue 23%, el peor fue ###max##%
Gestión de la energía: mayor duración de la batería
Consumo de energía
En nuestras mediciones del consumo, el nuevo modelo 2023 resulta ligeramente más eficiente en todo, siendo sólo el consumo máximo de 173 vatios prácticamente idéntico. Pero este valor cae rápidamente a unos 150 vatios (también mientras se juega), por lo que el cargador de 180 vatios incluido es de tamaño suficiente. Por cierto, ahora no sólo es significativamente más compacto, sino también mucho más ligero (489 frente a 811 gramos, 17,2 frente a 28,6 oz).
| Off / Standby | |
| Ocioso | |
| Carga |
|
Clave:
min: | |
| Schenker VISION 16 Pro (M23) i7-13700H, GeForce RTX 4070 Laptop GPU, Samsung 990 Pro 1 TB, IPS, 2560x1600, 16" | Samsung Galaxy Book3 Ultra 16, i9-13900H RTX 4070 i9-13900H, GeForce RTX 4070 Laptop GPU, Samsung PM9A1 MZVL21T0HCLR, OLED / AMOLED, 2880x1800, 16" | MSI Stealth 16 Studio A13VG i7-13700H, GeForce RTX 4070 Laptop GPU, Micron 3400 2TB MTFDKBA2T0TFH, IPS, 2560x1600, 16" | Dell XPS 15 9530 RTX 4070 i7-13700H, GeForce RTX 4070 Laptop GPU, SK hynix PC801 HFS001TEJ9X101N, OLED, 3456x2160, 15.6" | Asus ProArt Studiobook 16 OLED H7604 i9-13980HX, GeForce RTX 4070 Laptop GPU, Phison EM2804TBMTCB47, OLED, 3200x2000, 16" | Apple MacBook Pro 16 2023 M2 Max M2 Max, M2 Max 38-Core GPU, Apple SSD AP2048Z, Mini-LED, 3456x2234, 16.2" | Schenker Vision 16 Pro RTX 3070 Ti i7-12700H, GeForce RTX 3070 Ti Laptop GPU, Samsung SSD 980 Pro 1TB MZ-V8P1T0BW, IPS, 2560x1600, 16" | Medio NVIDIA GeForce RTX 4070 Laptop GPU | Media de la clase Multimedia | |
|---|---|---|---|---|---|---|---|---|---|
| Power Consumption | 28% | -28% | -38% | -53% | -3% | -12% | -50% | 20% | |
| Idle Minimum * (Watt) | 8.6 | 4.3 50% | 11 -28% | 20 -133% | 12.8 -49% | 5.2 40% | 9 -5% | 13.2 ? -53% | 5.69 ? 34% |
| Idle Average * (Watt) | 12 | 4.6 62% | 18 -50% | 20.7 -73% | 19.9 -66% | 16.5 -38% | 13.3 -11% | 18.2 ? -52% | 10.2 ? 15% |
| Idle Maximum * (Watt) | 12.4 | 11.4 8% | 19 -53% | 22.4 -81% | 20.3 -64% | 16.8 -35% | 14.3 -15% | 24.6 ? -98% | 12.5 ? -1% |
| Load Average * (Watt) | 80 | 97 -21% | 91 -14% | 77.1 4% | 131.4 -64% | 113 -41% | 107 -34% | 97 ? -21% | 65.4 ? 18% |
| Witcher 3 ultra * (Watt) | 147.7 | 100.9 32% | 130 12% | 95.4 35% | 196.5 -33% | 92 38% | 155.2 -5% | ||
| Load Maximum * (Watt) | 173.1 | 107 38% | 228 -32% | 133.4 23% | 246.8 -43% | 145 16% | 172 1% | 221 ? -28% | 112.9 ? 35% |
* ... más pequeño es mejor
Power Consumption The Witcher 3 / Stress Test
Power Consumption With External Monitor
Duración de la batería
En correspondencia con los valores de consumo ligeramente más eficientes, la duración de la batería también resulta ligeramente mejor. Con un brillo ajustado de 150 cd/m² (correspondiente al 39% del brillo máximo de nuestra unidad de pruebas), nuestro test WLAN dura algo más de 7.5 horas tanto con 60 Hz como con 240 Hz, lo que hace al Vision 16 Pro 2023 significativamente más competitivo. Sólo el MacBook Pro 16 juega en una liga diferente, durando casi 15 horas aquí. El test de vídeo a 150 cd/m² también dura casi 8 horas.
Con el brillo máximo de display, la frecuencia de refresco sí marca la diferencia, ya que el test WLAN a 240 Hz apenas dura 6 horas, mientras que a 60 Hz sigue durando más de 7 horas. Nos gustaría que, como en el Vision 14 más pequeño, Schenker también ofreciese una versión del Vision 16 Pro con una batería mayor, eliminando la ranura M.2 secundaria.
| Schenker VISION 16 Pro (M23) i7-13700H, GeForce RTX 4070 Laptop GPU, 80 Wh | Samsung Galaxy Book3 Ultra 16, i9-13900H RTX 4070 i9-13900H, GeForce RTX 4070 Laptop GPU, 76 Wh | MSI Stealth 16 Studio A13VG i7-13700H, GeForce RTX 4070 Laptop GPU, 99.9 Wh | Dell XPS 15 9530 RTX 4070 i7-13700H, GeForce RTX 4070 Laptop GPU, 86 Wh | Asus ProArt Studiobook 16 OLED H7604 i9-13980HX, GeForce RTX 4070 Laptop GPU, 90 Wh | Apple MacBook Pro 16 2023 M2 Max M2 Max, M2 Max 38-Core GPU, 99.6 Wh | Schenker Vision 16 Pro RTX 3070 Ti i7-12700H, GeForce RTX 3070 Ti Laptop GPU, 80 Wh | Media de la clase Multimedia | |
|---|---|---|---|---|---|---|---|---|
| Duración de Batería | -4% | 28% | 9% | -22% | 72% | -15% | 67% | |
| H.264 (h) | 7.8 | 9 15% | 7.7 -1% | 6 -23% | 18.7 140% | 6.1 -22% | 16.8 ? 115% | |
| WiFi v1.3 (h) | 7.8 | 8 3% | 7.8 0% | 8 3% | 5.6 -28% | 14.8 90% | 6 -23% | 12.2 ? 56% |
| Load (h) | 1.3 | 0.9 -31% | 2.4 85% | 1.5 15% | 1.1 -15% | 1.1 -15% | 1.3 0% | 1.7 ? 31% |
Pro
Contra
Veredicto - Vision 16 Pro sigue siendo impresionantemente ligero y delgado
Mientras que el nuevo modelo 2023 del Vision 16 Pro incluye las esperadas actualizaciones con un procesador Intel Raptor Lake y el nuevo portátil Nvidia GeForce RTX 4070, también hay algunos ajustes adicionales en los perfiles de potencia. El Vision 16 Pro es uno de los raros casos, en los que el procesador de 45 vatios también funciona realmente a ese valor sin que el límite de potencia a corto plazo sea absurdamente alto. Esto significa que el rendimiento permanece bastante constante y las temperaturas no saltan tan rápido, pero al mismo tiempo el rendimiento también es ligeramente inferior particularmente en pruebas cortas. Sin embargo, esto no juega ningún papel en el funcionamiento diario. Por otro lado, no entendemos por qué Schenker ha eliminado el modo manual o Turbo que permitía ajustar los valores TDP de la CPU. En el modelo anterior, esto también te permitía aumentar el rendimiento de la CPU notablemente.
Con el mismo TGP máximo de 95 vatios, la nueva GeForce RTX 4070 Laptop ofrece en torno a un 25-30% más de rendimiento que la antigua RTX 3070 Ti, pero no hay una sucesora directa de la antigua RTX 3080. Aparte de eso, hay pocos motivos de queja sobre el rendimiento en general, y las tasas de transferencia del veloz SSD PCIe 4.0 también se mantienen constantes. Aunque no entendemos por qué ahora hay un lector de tarjetas significativamente más lento.
El Schenker Vision 16 Pro ofrece mucho rendimiento en una carcasa muy delgada y ligera también en la versión 2023. A pesar de ello, no hay compromisos en las conexiones ni en las opciones de mantenimiento.
La pantalla IPS mate con 240 Hz ofrece subjetivamente una buena calidad de imagen, y con el perfil calibrado incluido de Schenker también puedes remediar el tinte de color, pero la baja cobertura del espacio de color y la falta de soporte HDR siguen siendo desventajas. Pero al menos no se usa PWM.
Las opciones de pantalla son también las mayores ventajas de los competidores, que a menudo ofrecen paneles OLED o MiniLED. Si esto es siempre mejor (palabra clave: PWM) es cuestionable, pero la impresión subjetiva de imagen es ligeramente mejor y hay ventajas en el espacio de color y HDR. El rendimiento puro de CPU (multi-core) también es a menudo mejor con los competidores, pero particularmente en el rendimiento gráfico, el Vision 16 Pro no tiene que esconderse detrás de los dispositivos de comparación Asus ProArt Studiobook 16 o MSI Stealth 16 Studio. Particularmente elDell XPS 15con la versión de 50 vatios del portátil RTX 4070 queda significativamente por detrás en este aspecto.
Precio y disponibilidad
El nuevo Vision 16 Pro M23 puede configurarse en Bestware a partir de 2.099 euros (~$2,361). Para nuestra configuración de prueba con actualizaciones al Portátil RTX 4070y más RAM y almacenamiento SSD, tienes que pagar unos 2.600 Euros (~$2.924).
Schenker VISION 16 Pro (M23)
- 07/18/2023 v7 (old)
Andreas Osthoff
Transparencia
La selección de los dispositivos que se van a reseñar corre a cargo de nuestro equipo editorial. La muestra de prueba fue proporcionada al autor en calidad de préstamo por el fabricante o el minorista a los efectos de esta reseña. El prestamista no tuvo ninguna influencia en esta reseña, ni el fabricante recibió una copia de la misma antes de su publicación. No había ninguna obligación de publicar esta reseña. Como empresa de medios independiente, Notebookcheck no está sujeta a la autoridad de fabricantes, minoristas o editores.
Así es como prueba Notebookcheck
Cada año, Notebookcheck revisa de forma independiente cientos de portátiles y smartphones utilizando procedimientos estandarizados para asegurar que todos los resultados son comparables. Hemos desarrollado continuamente nuestros métodos de prueba durante unos 20 años y hemos establecido los estándares de la industria en el proceso. En nuestros laboratorios de pruebas, técnicos y editores experimentados utilizan equipos de medición de alta calidad. Estas pruebas implican un proceso de validación en varias fases. Nuestro complejo sistema de clasificación se basa en cientos de mediciones y puntos de referencia bien fundamentados, lo que mantiene la objetividad.Price comparison

