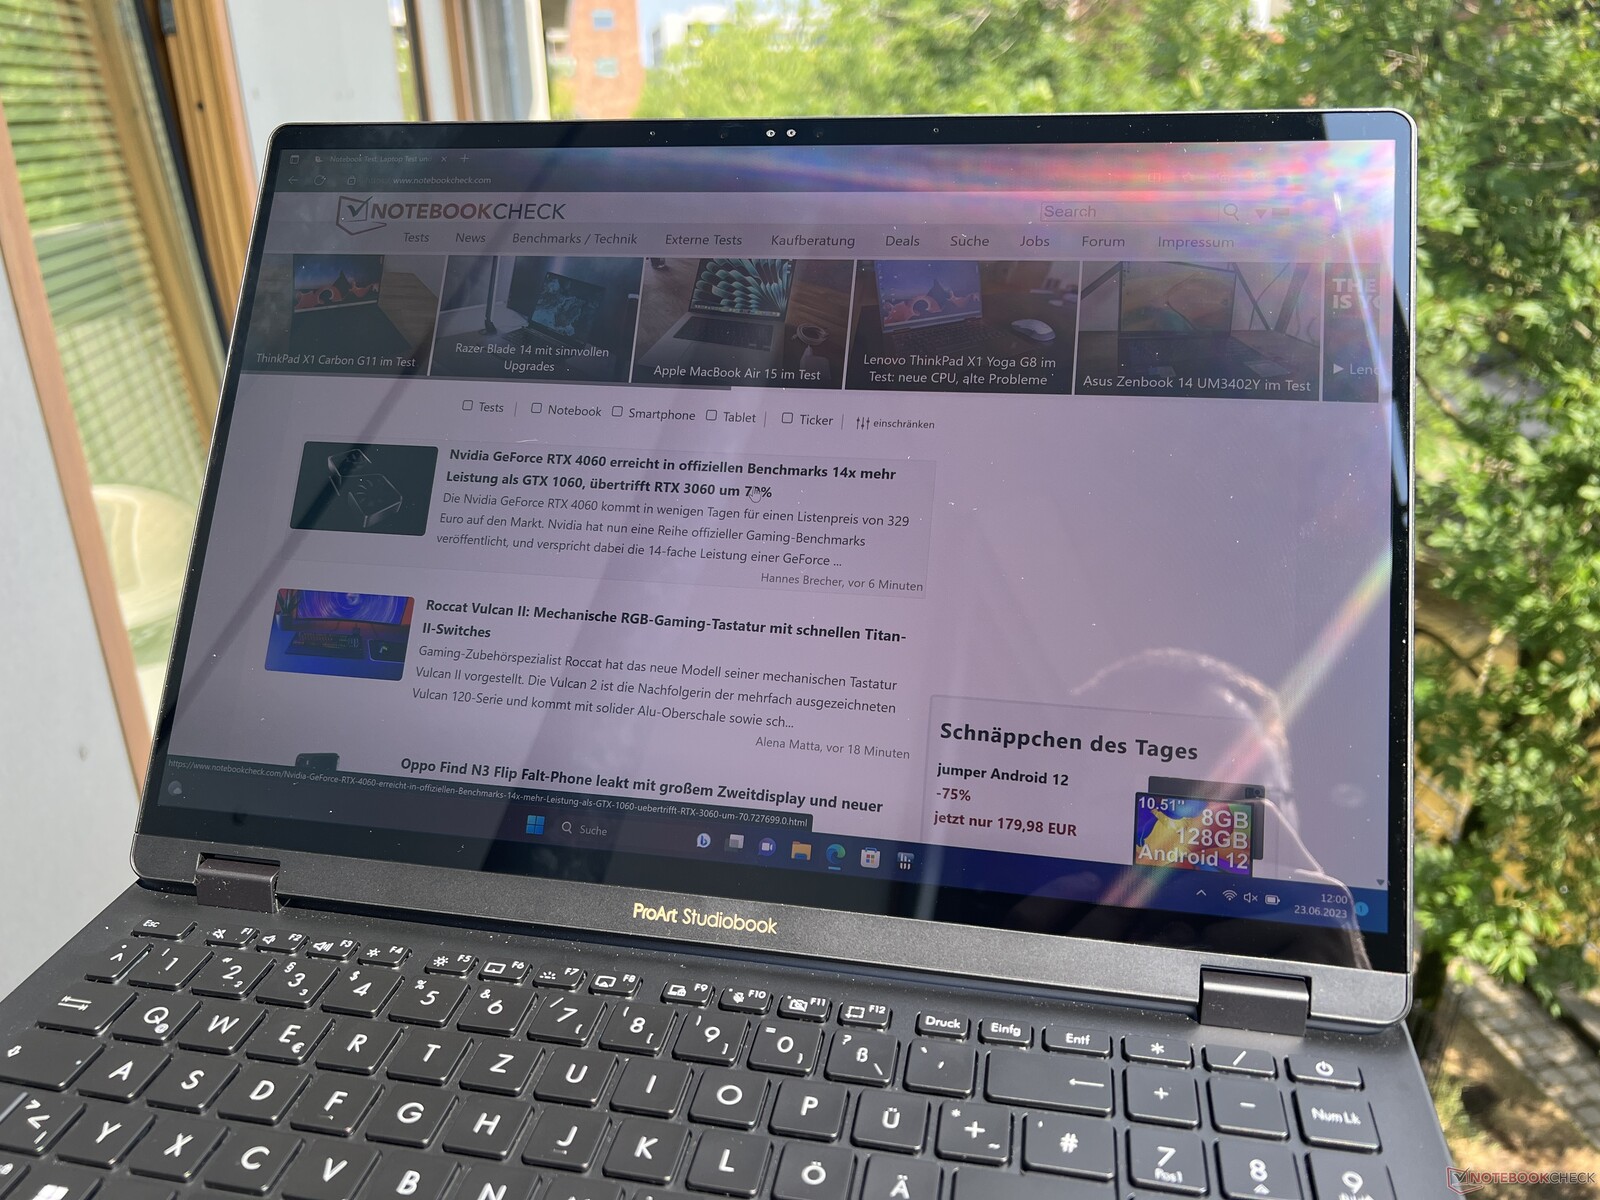
Análisis del Asus ProArt Studiobook 16 OLED: Portátil multimedia con un rendimiento extremo de la CPU
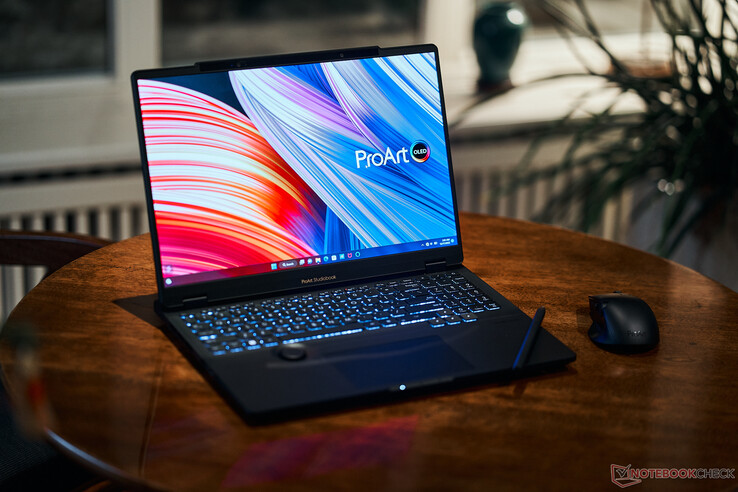
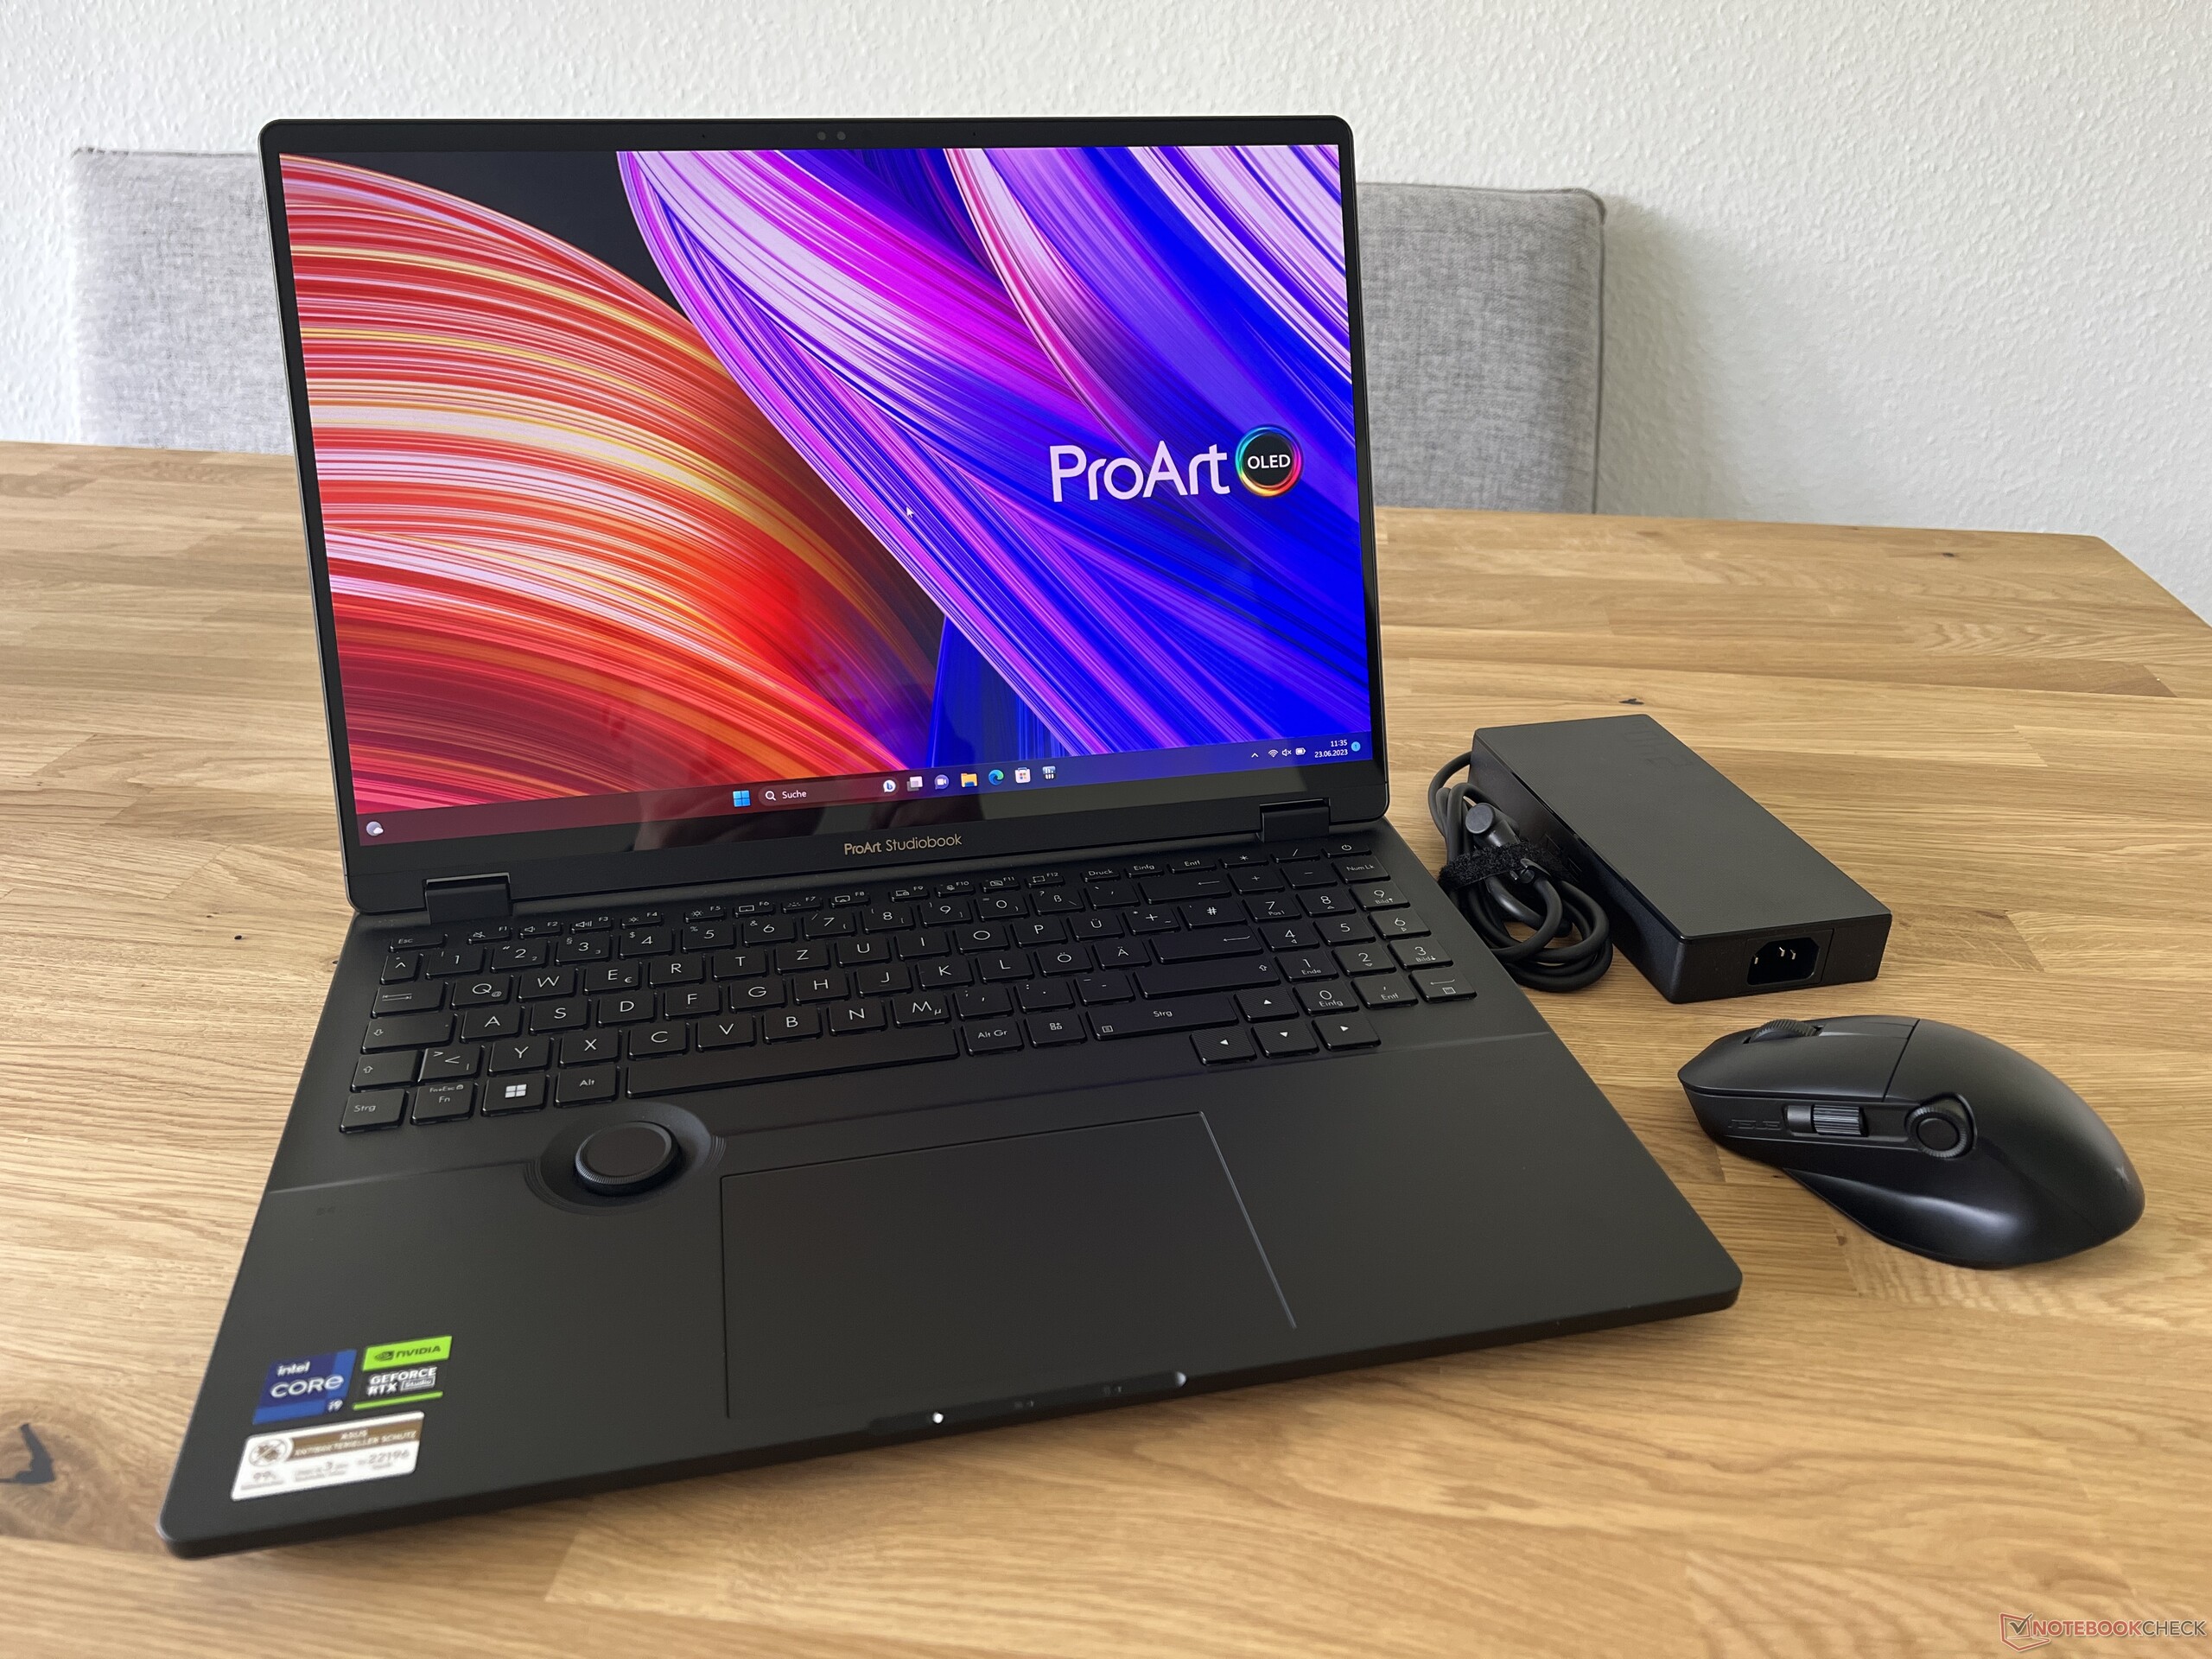
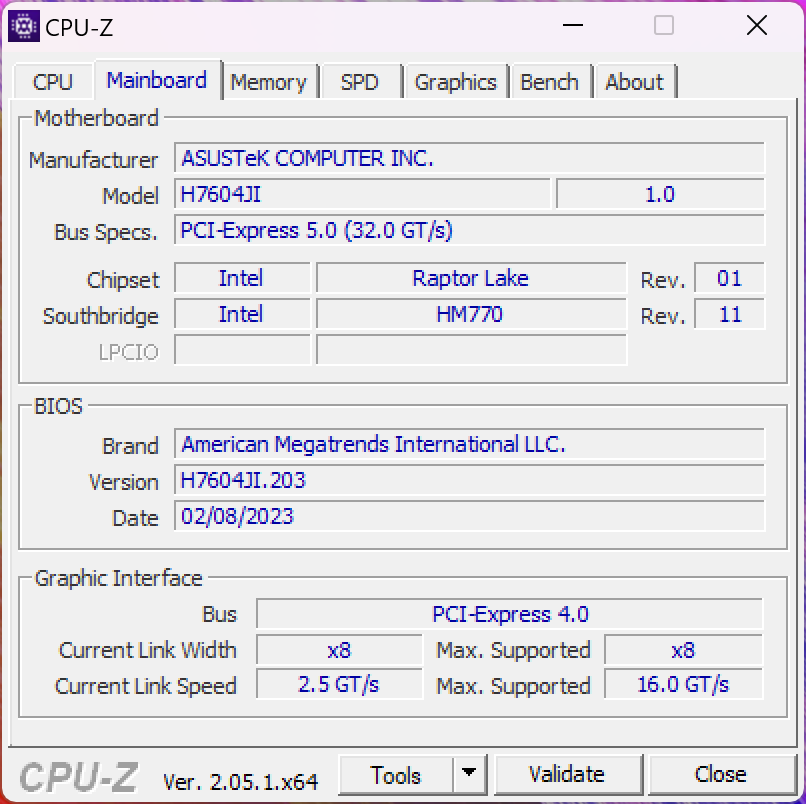
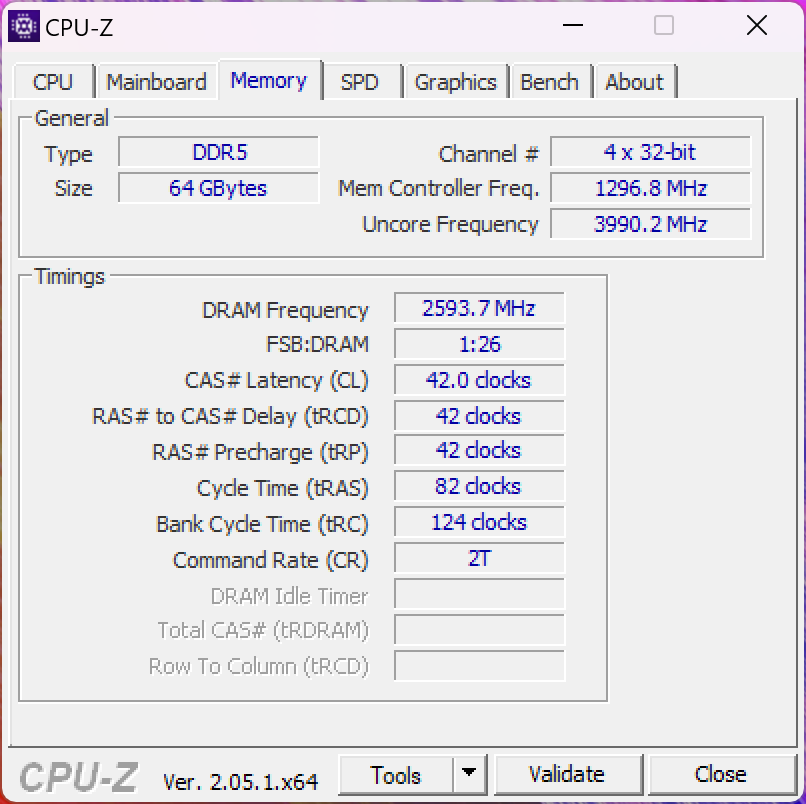
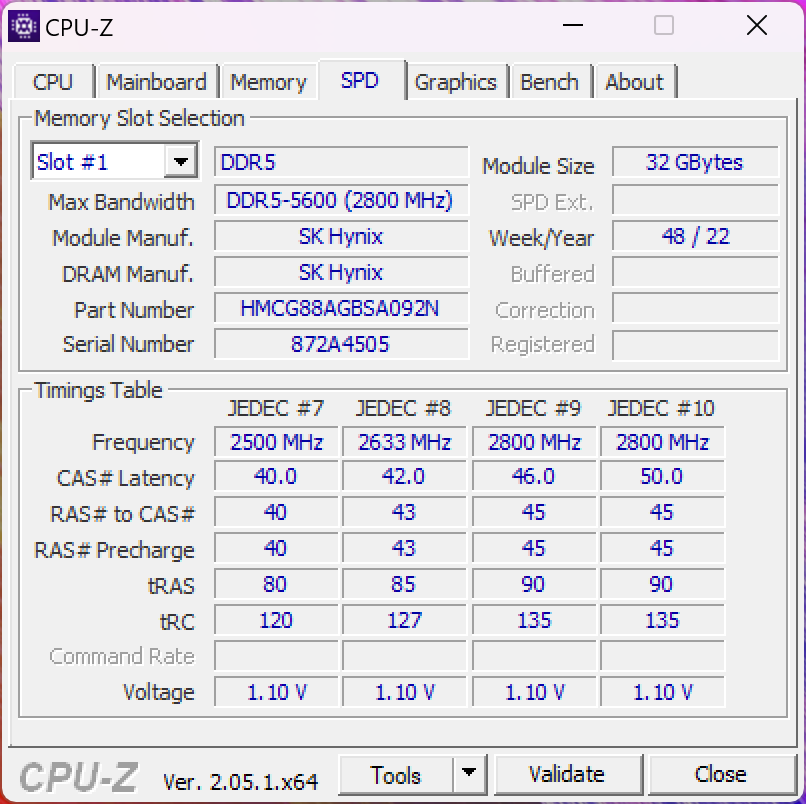
Asus se dirige principalmente a los usuarios creativos con el ProArt Studiobook 16 y ofrece una función de entrada adicional en el DialPad. El actual Studiobook 16 OLED 2023 utiliza el procesador móvil más rápido de Intel, elCore i9-13980HXen combinación con el nuevo GeForce RTX 4070 para portátiles.la pantalla también ha cambiado, ya que la OLED 4K se ha cambiado por un modelo de pantalla táctil 3K con 120 Hz. Nuestro dispositivo de pruebas es el modelo de gama alta con 64 GB RAM y un SSD PCIe de 4 TB por 3999 euros (4380 dólares). Como alternativa, también hay una variante con el Portátil RTX 4070, 32 GB de RAM y un SSD de 2 TB por 3499 EUR (3800 US$) o un Portátil RTX 4060con 32 GB de RAM y un SSD de 1 TB por 2.999 euros (3300 dólares).
Posibles contendientes en la comparación
Valoración | Fecha | Modelo | Peso | Altura | Tamaño | Resolución | Precio |
|---|---|---|---|---|---|---|---|
| 86.1 % v7 (old) | 06/2023 | Asus ProArt Studiobook 16 OLED H7604 i9-13980HX, GeForce RTX 4070 Laptop GPU | 2.4 kg | 23.9 mm | 16.00" | 3200x2000 | |
| 86.2 % v7 (old) | 03/2023 | Gigabyte AERO 16 OLED BSF i9-13900H, GeForce RTX 4070 Laptop GPU | 2.1 kg | 18 mm | 16.00" | 3840x2400 | |
| 89.4 % v7 (old) | 04/2023 | Samsung Galaxy Book3 Ultra 16 i7-13700H, GeForce RTX 4050 Laptop GPU | 1.8 kg | 16.5 mm | 16.00" | 2880x1800 | |
| 89.2 % v7 (old) | 04/2023 | MSI Stealth 17 Studio A13VH-014 i9-13900H, GeForce RTX 4080 Laptop GPU | 3 kg | 21.3 mm | 17.30" | 3840x2160 | |
| 93.7 % v7 (old) | 03/2023 | Apple MacBook Pro 16 2023 M2 Max M2 Max, M2 Max 38-Core GPU | 2.2 kg | 16.8 mm | 16.20" | 3456x2234 | |
| 88 % v7 (old) | 04/2023 | Asus Zephyrus Duo 16 GX650PY-NM006W R9 7945HX, GeForce RTX 4090 Laptop GPU | 2.7 kg | 29.7 mm | 16.00" | 2560x1600 |
Caso - ProArt es restringido
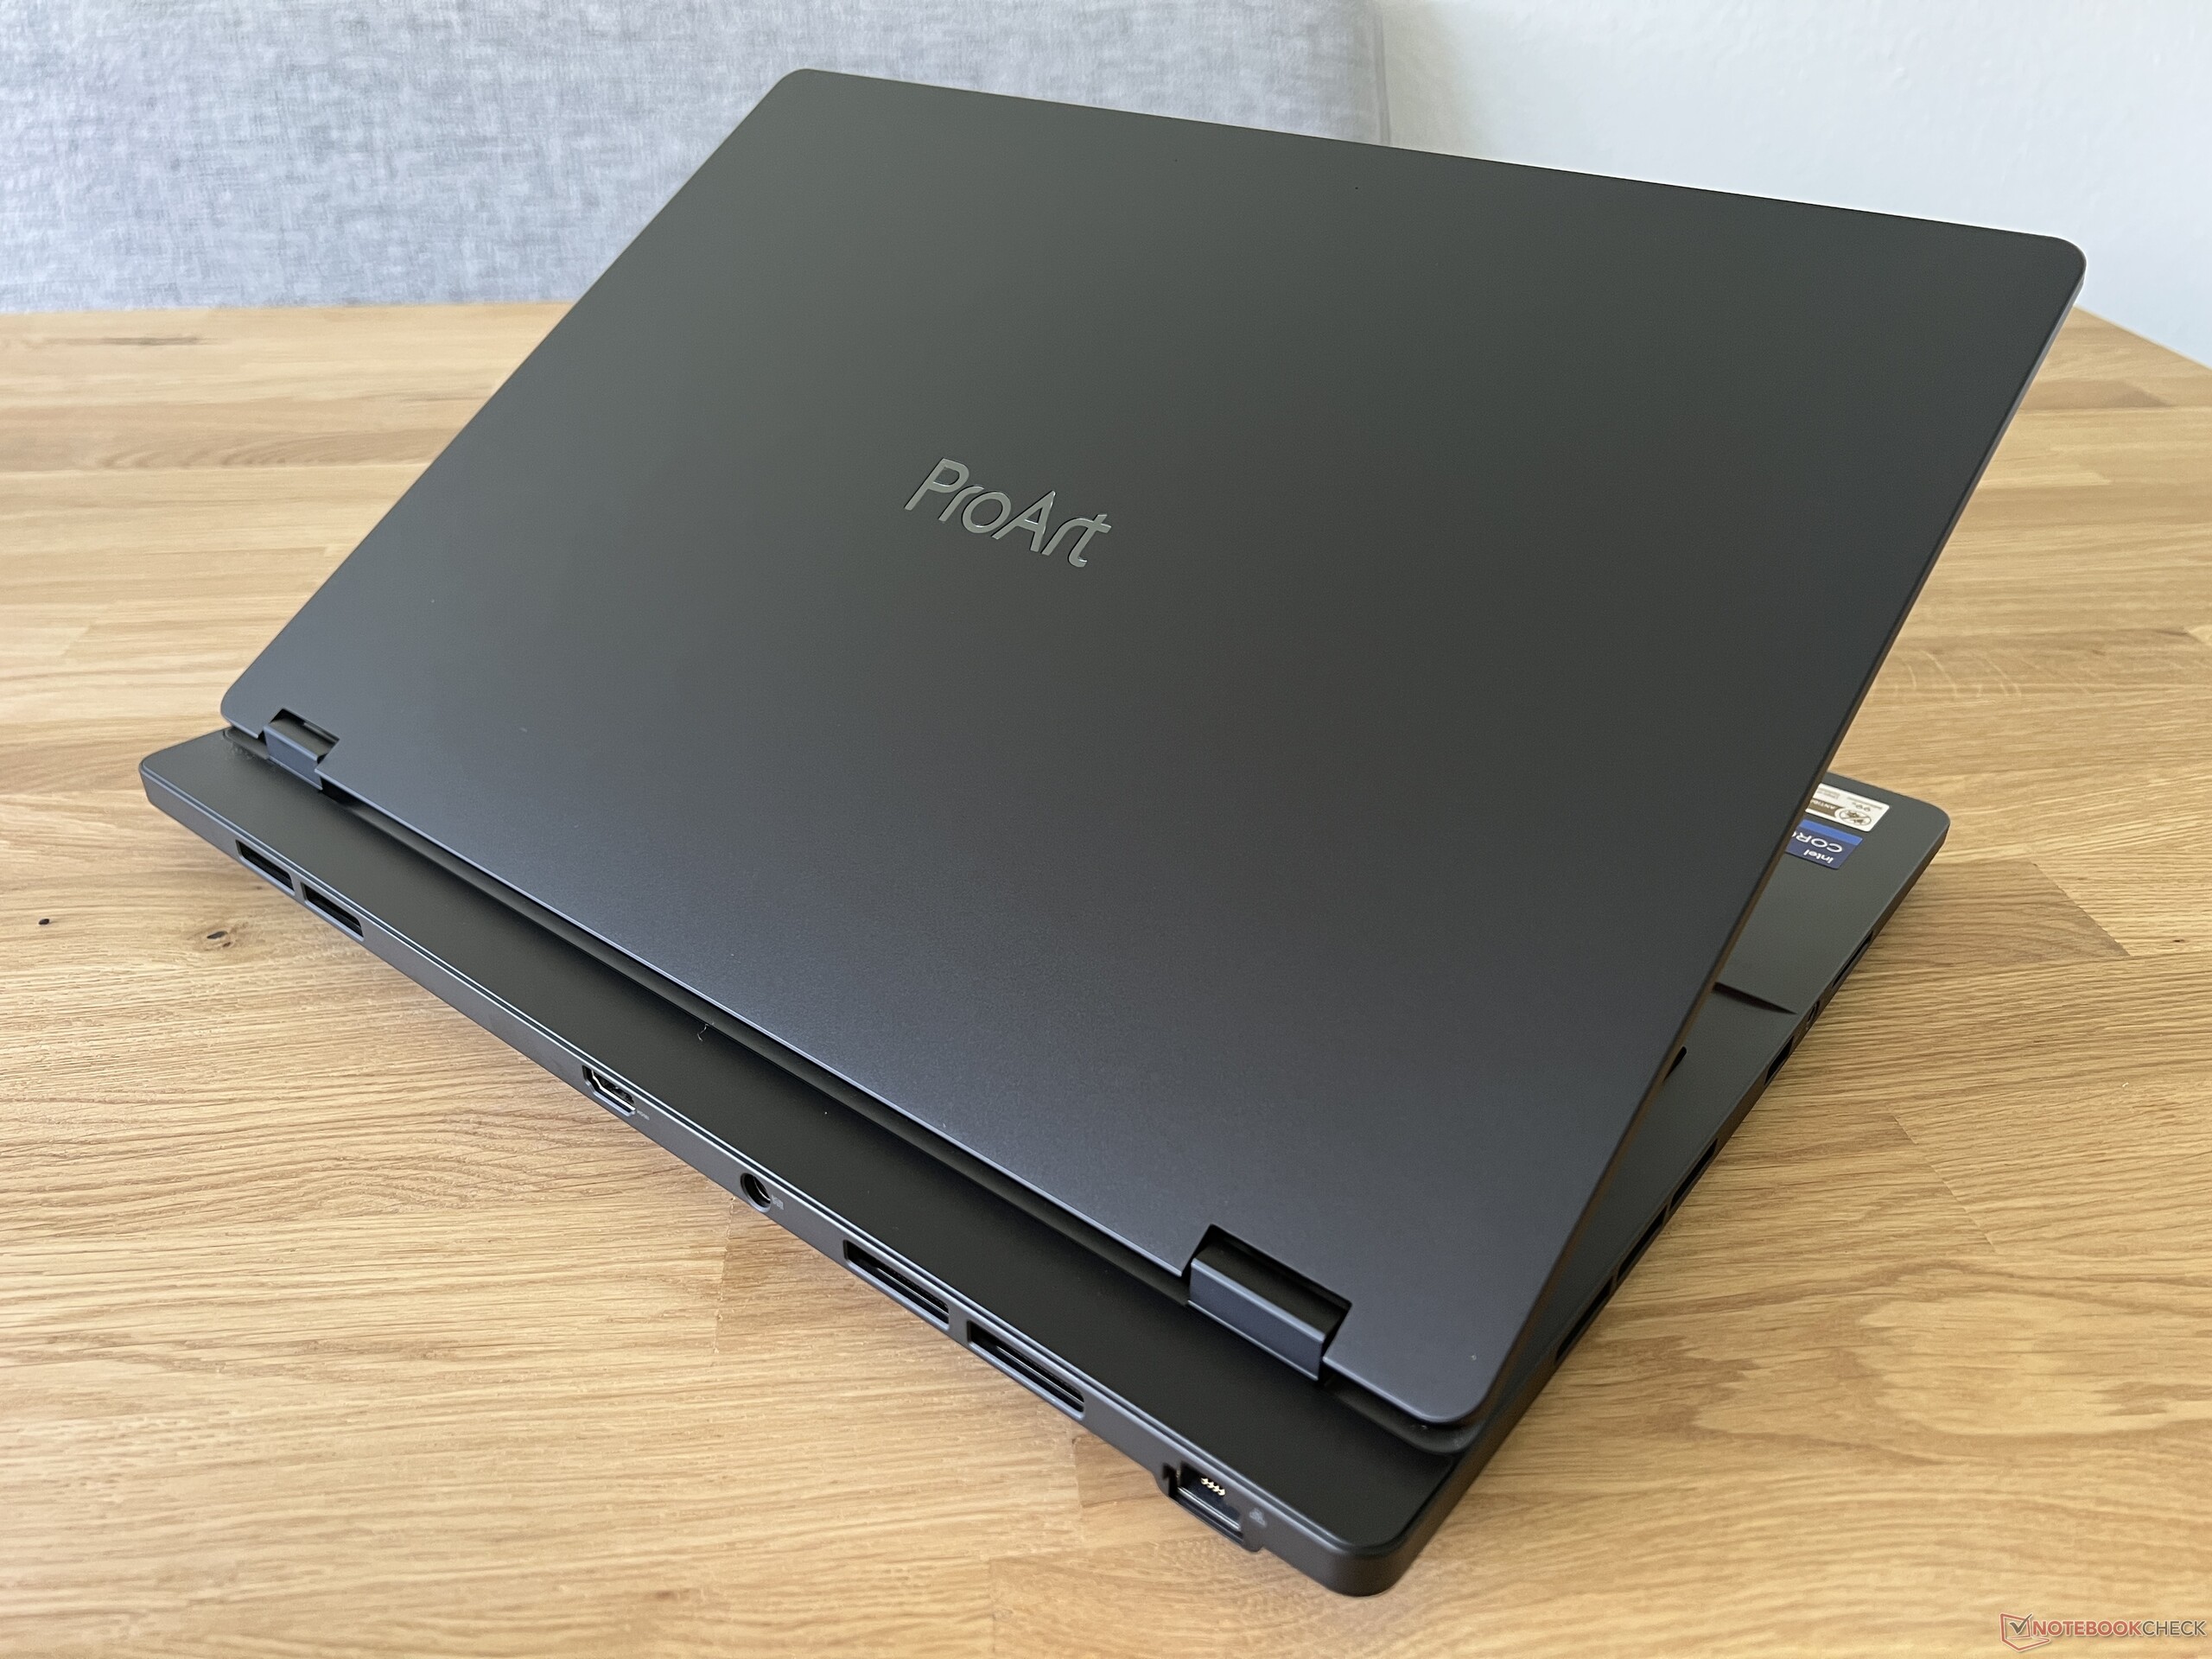
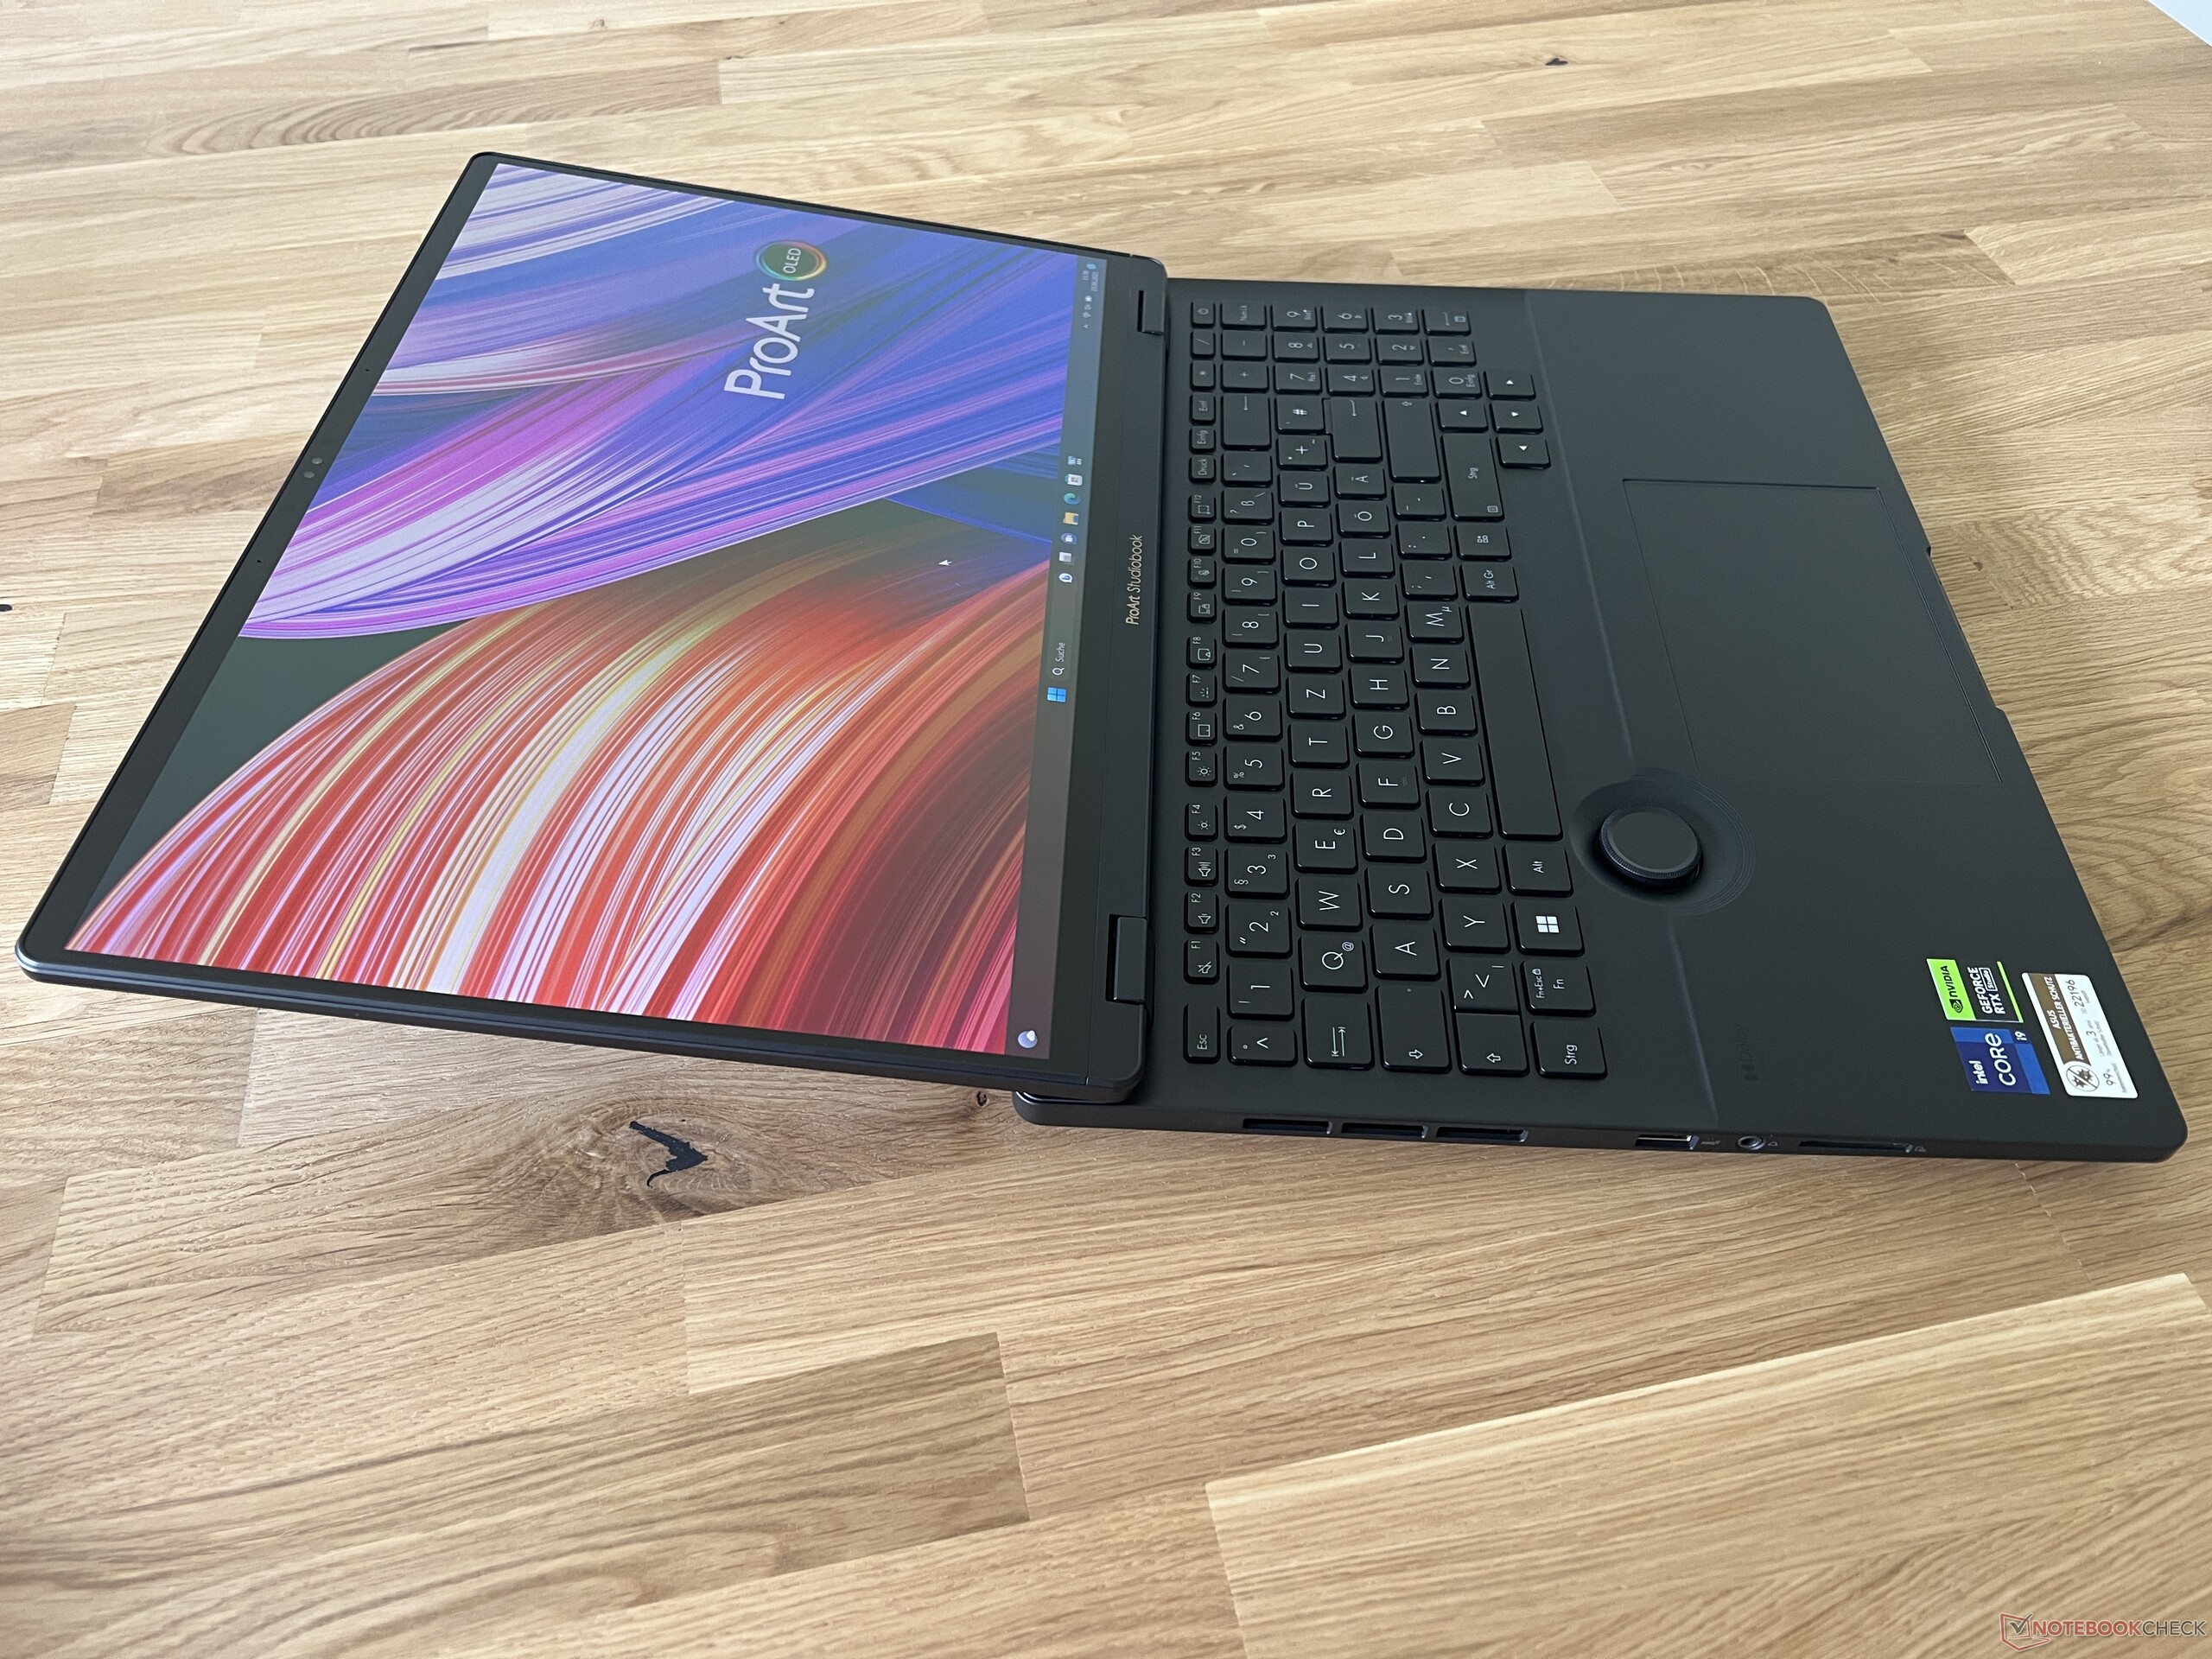
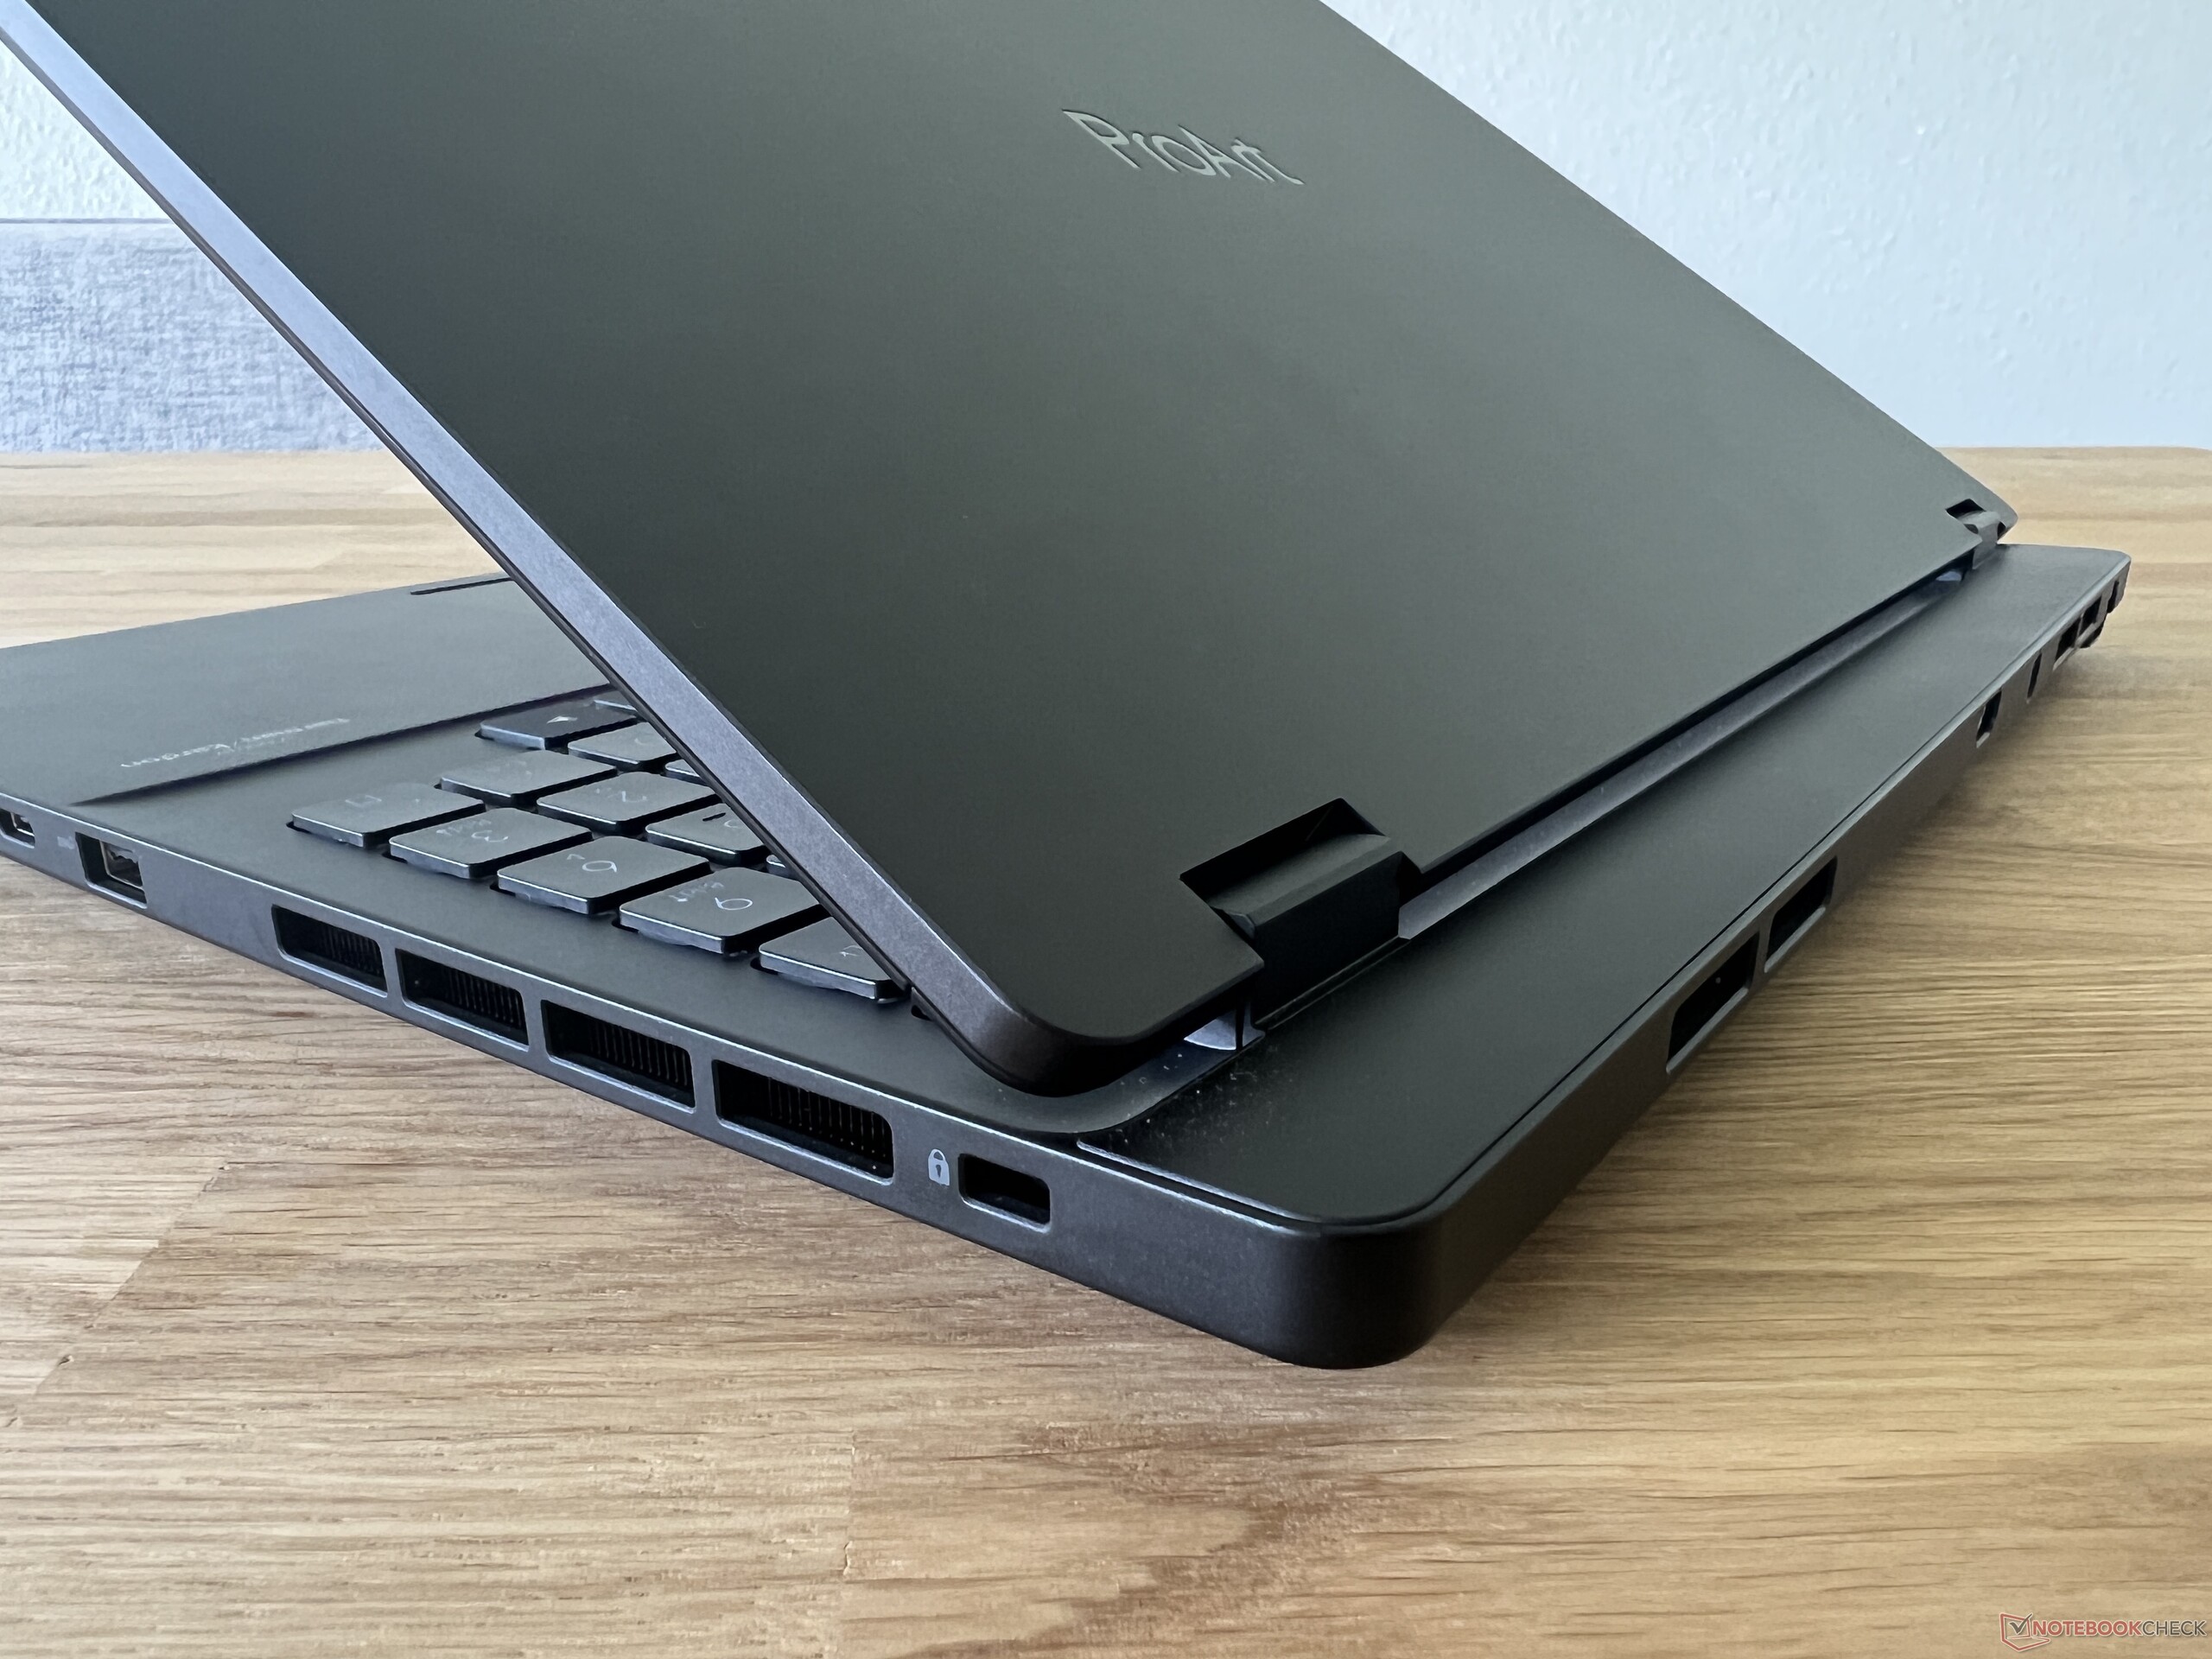
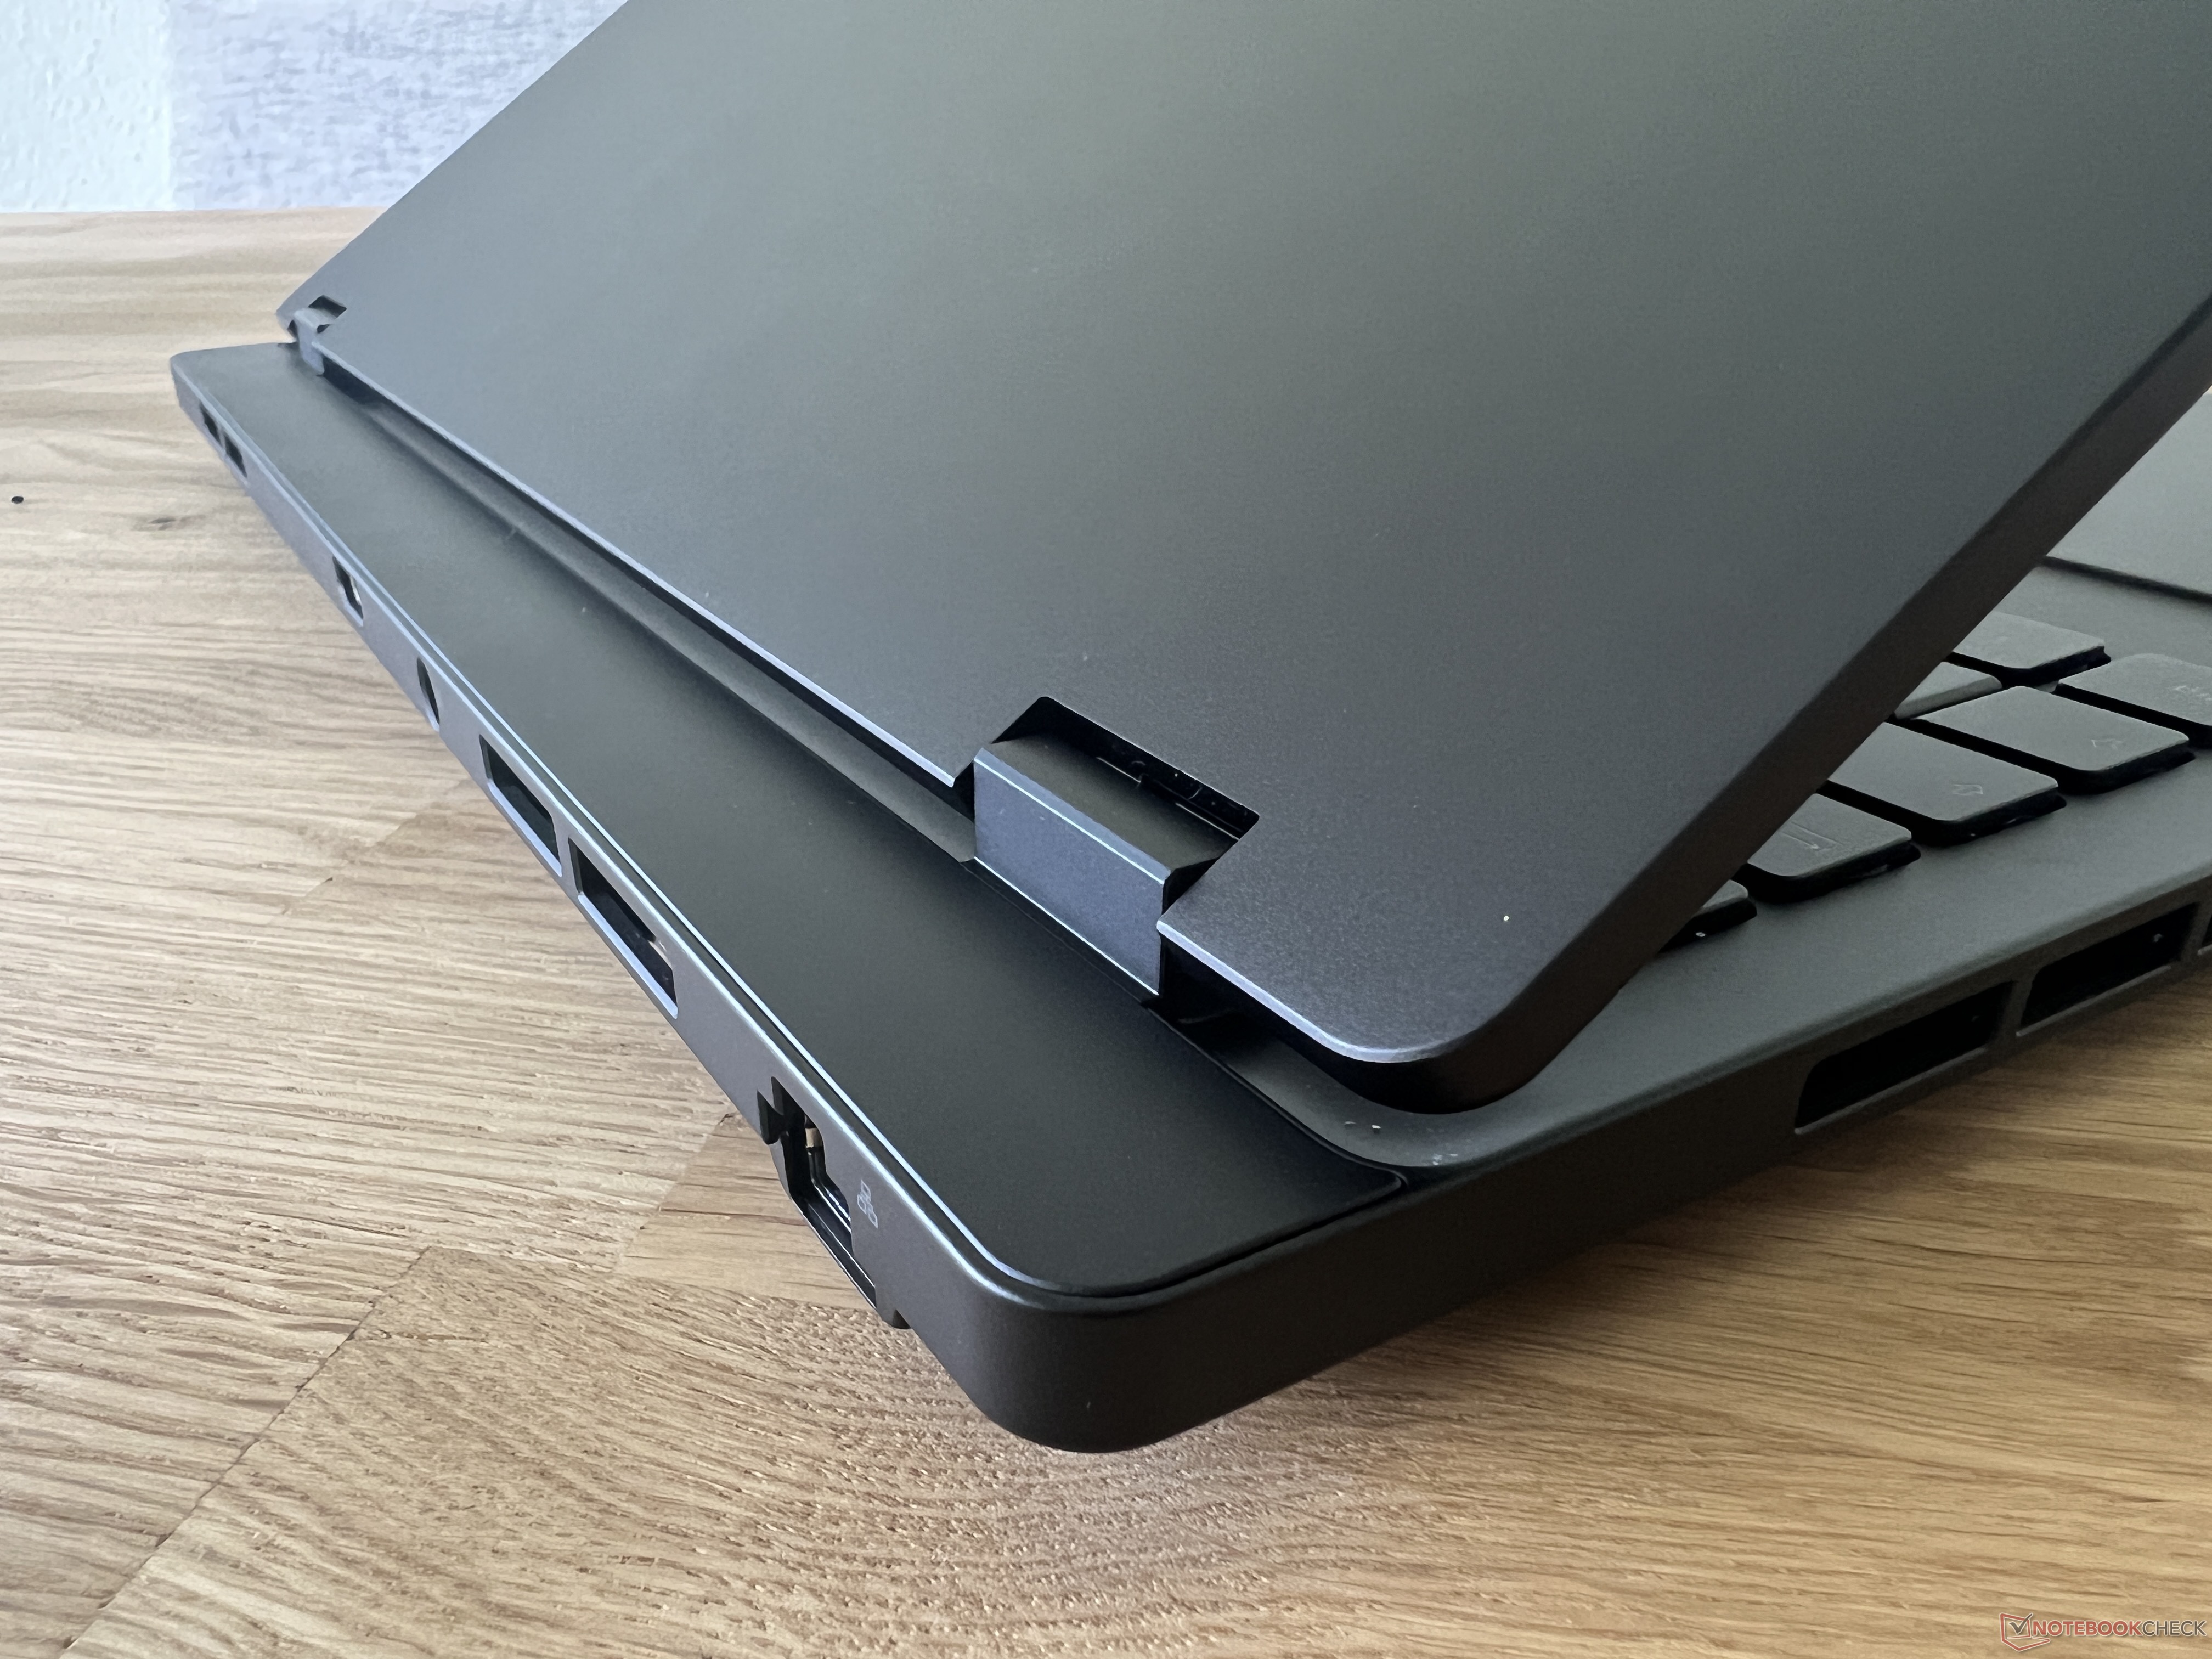
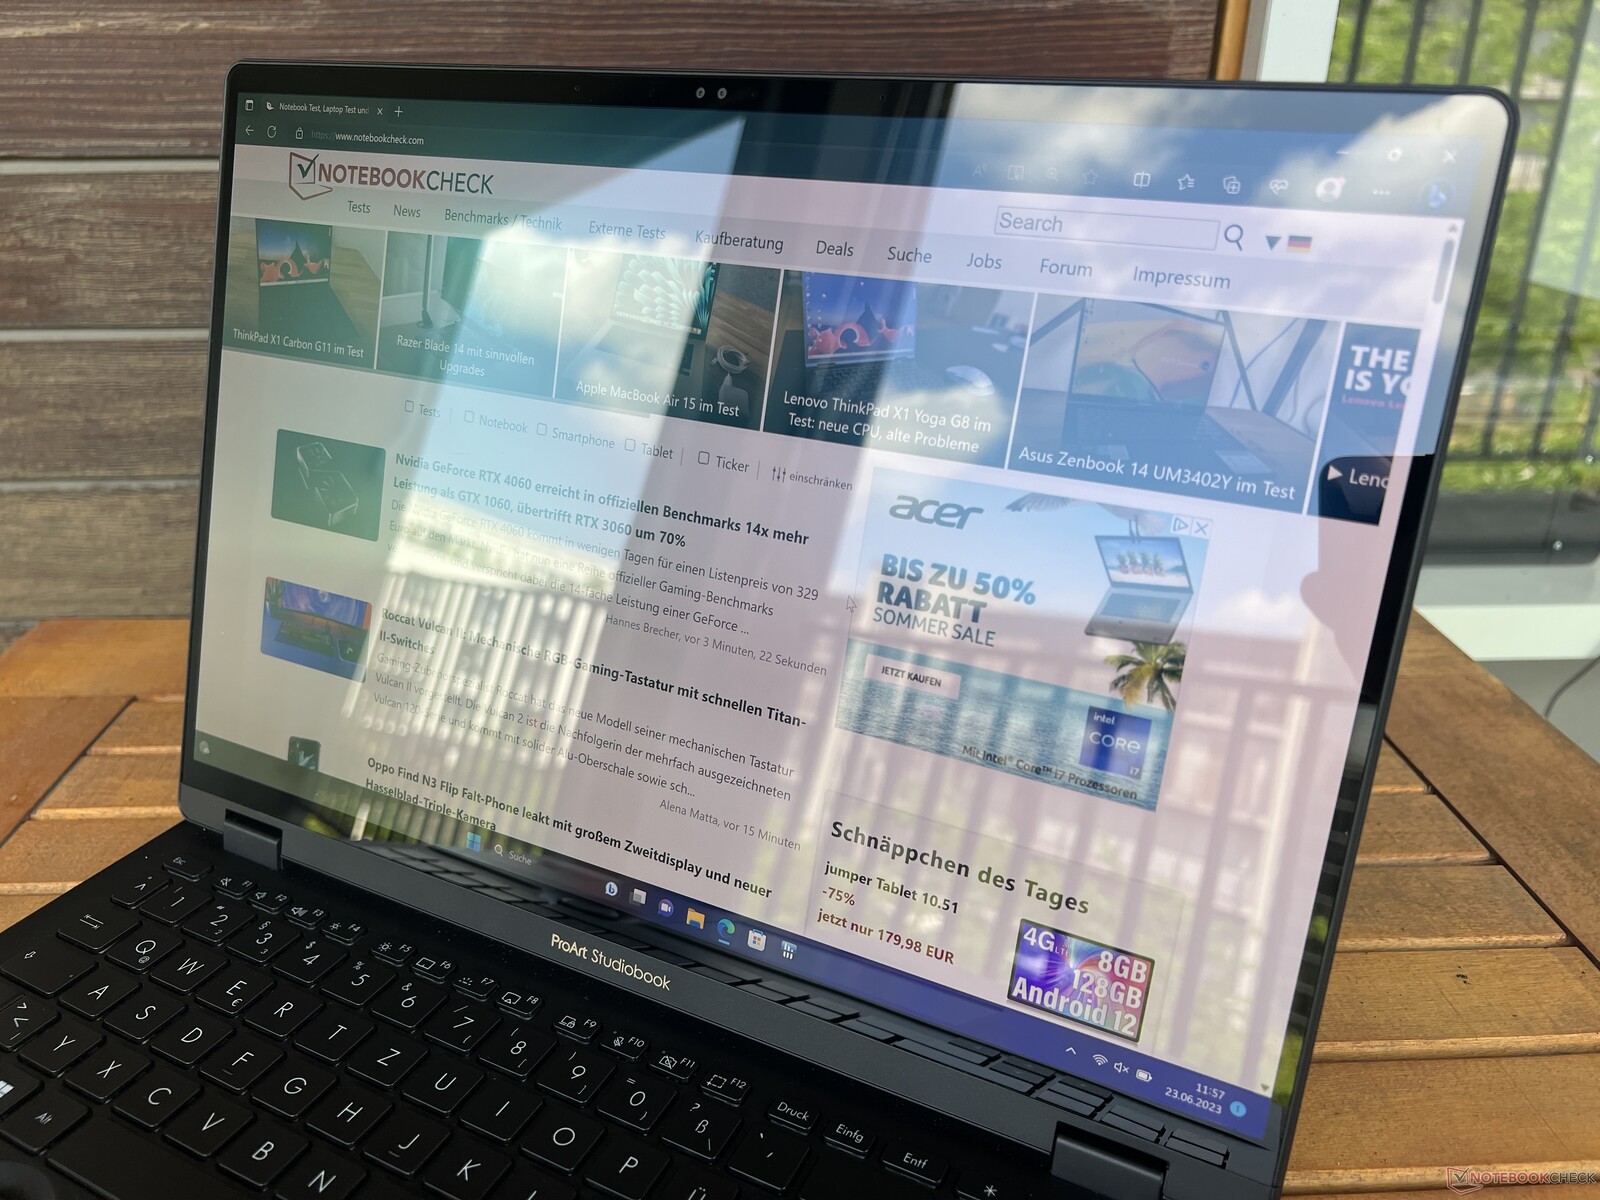
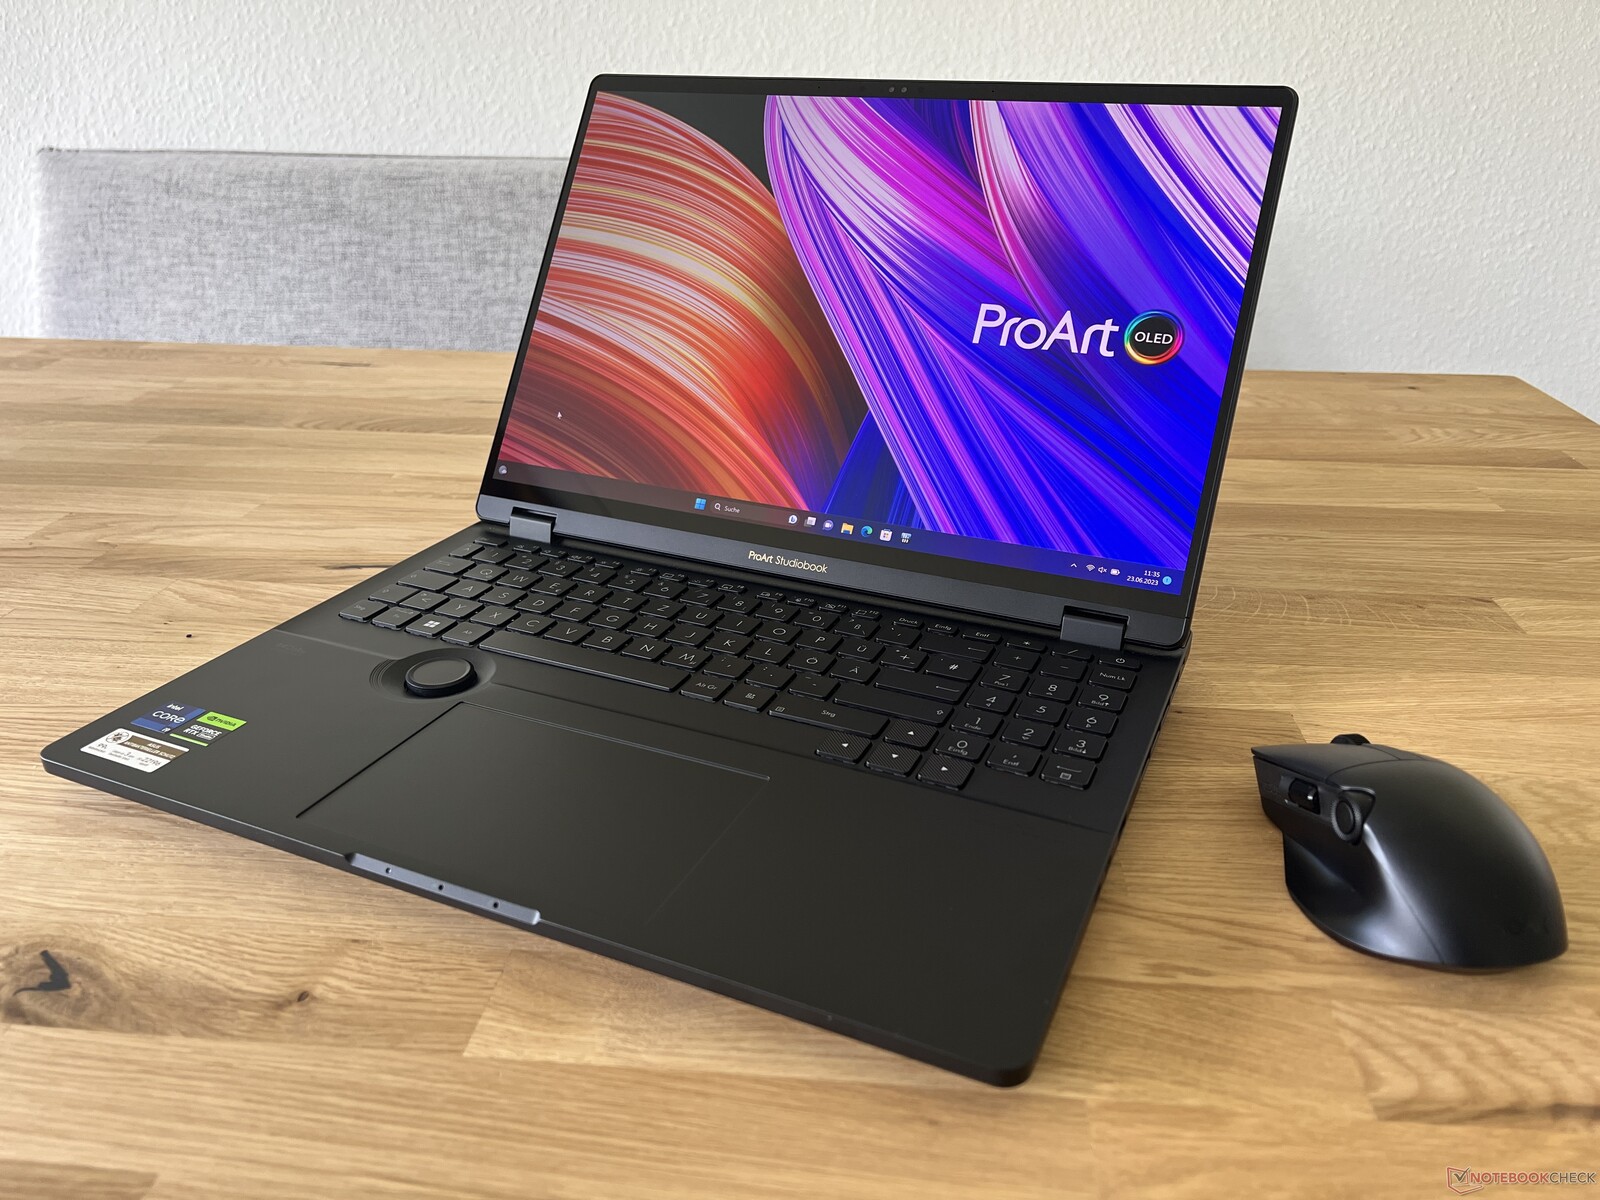
Asus usa plástico negro para el ProArt Studiobook 16, que parece de bastante alta calidad. El único problema son las superficies lisas, que son muy susceptibles a las huellas dactilares. En general, el diseño es muy sobrio y aparte del logo ProArt en la tapa no hay otros acentos visuales. Nada más abrir la tapa, llama la atención el gran DialPad situado bajo el teclado. La tapa queda ligeramente por delante de la unidad base, pero esto también permite un ángulo máximo de apertura de casi 180 grados
La estabilidad es excelente, tanto de la unidad base como de la tapa. No se emiten chirridos bajo esfuerzos de torsión y tampoco se abolla nada. Las bisagras están bien ajustadas: evitan eficazmente el tambaleo y mantienen la pantalla firmemente en su sitio. Sólo en ángulos muy pequeños (menos de 20 grados) la tapa se cierra sola debido al peso.
Con algo menos de 2,5 kg, el Studiobook no es ligero y, debido a su tamaño, tampoco es especialmente portátil. El portátil cabe en mochilas grandes, pero naturalmente ocupa mucho espacio al ser de 16 pulgadas. También es el portátil de 16 pulgadas más grande del grupo de comparación y tampoco es mucho más pequeño que los dispositivos de 17 pulgadas. El portátil también es bastante grueso, con unos 2,5 cm, y sólo es superado por elZephyrus Duocon su segunda pantalla. Para la fuente de alimentación de 240 vatios, tendrás que tener en cuenta 740 gramos adicionales para el transporte.
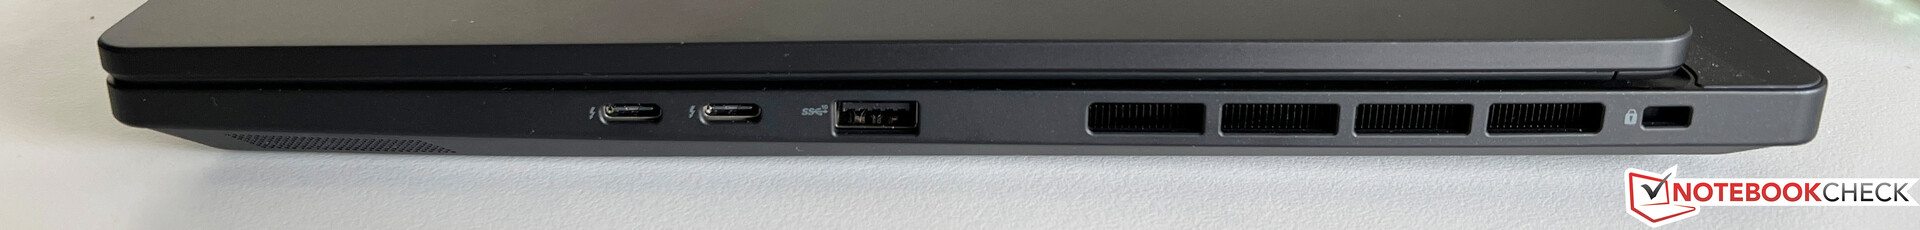
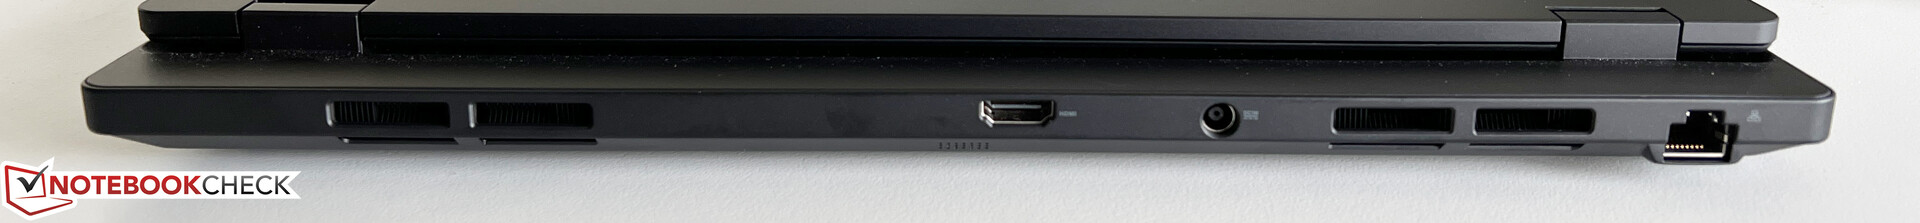
Equipos - Thunderbolt 4 y HDMI 2.1
Los puertos están distribuidos por las zonas frontales de ambos lados y la parte trasera. La mayoría de los puertos USB están en la parte frontal derecha, que puede abarrotarse cuando está totalmente ocupada. Por otro lado, Asus ha colocado la toma de corriente, el puerto Ethernet y la salida HDMI en la parte trasera, donde no estorban.
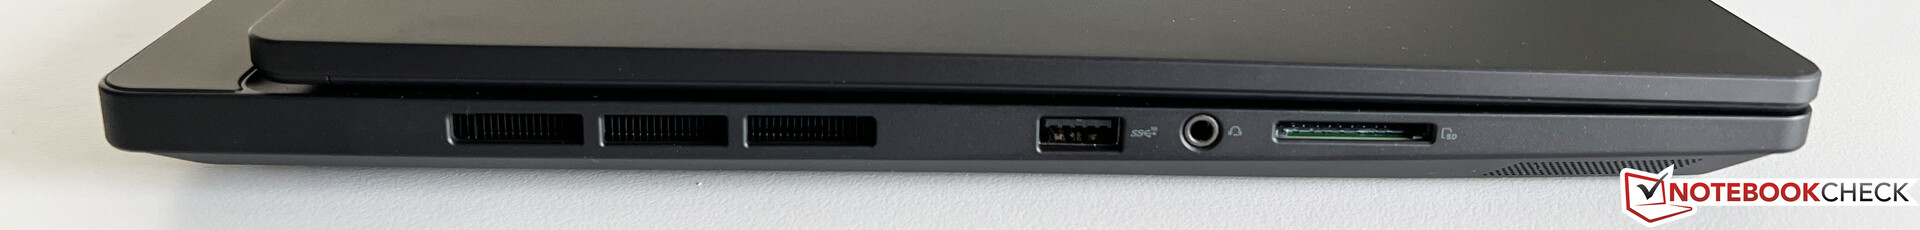
Lector de tarjetas SD
A la izquierda se encuentra el lector de tarjetas SD completo, que sólo alcanza velocidades de transferencia medias con nuestra tarjeta de referencia (Angelbird AV Pro V60). Aquí se puede hacer mucho más, como demuestra la competencia.
| SD Card Reader | |
| average JPG Copy Test (av. of 3 runs) | |
| Apple MacBook Pro 16 2023 M2 Max (Angelbird AV Pro V60) | |
| Asus Zephyrus Duo 16 GX650PY-NM006W (Angelbird AV Pro V60) | |
| Gigabyte AERO 16 OLED BSF | |
| Media de la clase Multimedia (23 - 531, n=43, últimos 2 años) | |
| Samsung Galaxy Book3 Ultra 16 (AV PRO microSD 128 GB V60) | |
| Asus ProArt Studiobook 16 OLED H7604 (Angelibird AV Pro V60) | |
| MSI Stealth 17 Studio A13VH-014 | |
| maximum AS SSD Seq Read Test (1GB) | |
| Asus Zephyrus Duo 16 GX650PY-NM006W (Angelbird AV Pro V60) | |
| Apple MacBook Pro 16 2023 M2 Max (Angelbird AV Pro V60) | |
| Media de la clase Multimedia (27.9 - 1455, n=42, últimos 2 años) | |
| Gigabyte AERO 16 OLED BSF | |
| Asus ProArt Studiobook 16 OLED H7604 (Angelibird AV Pro V60) | |
| Samsung Galaxy Book3 Ultra 16 (AV PRO microSD 128 GB V60) | |
| MSI Stealth 17 Studio A13VH-014 | |
Comunicación
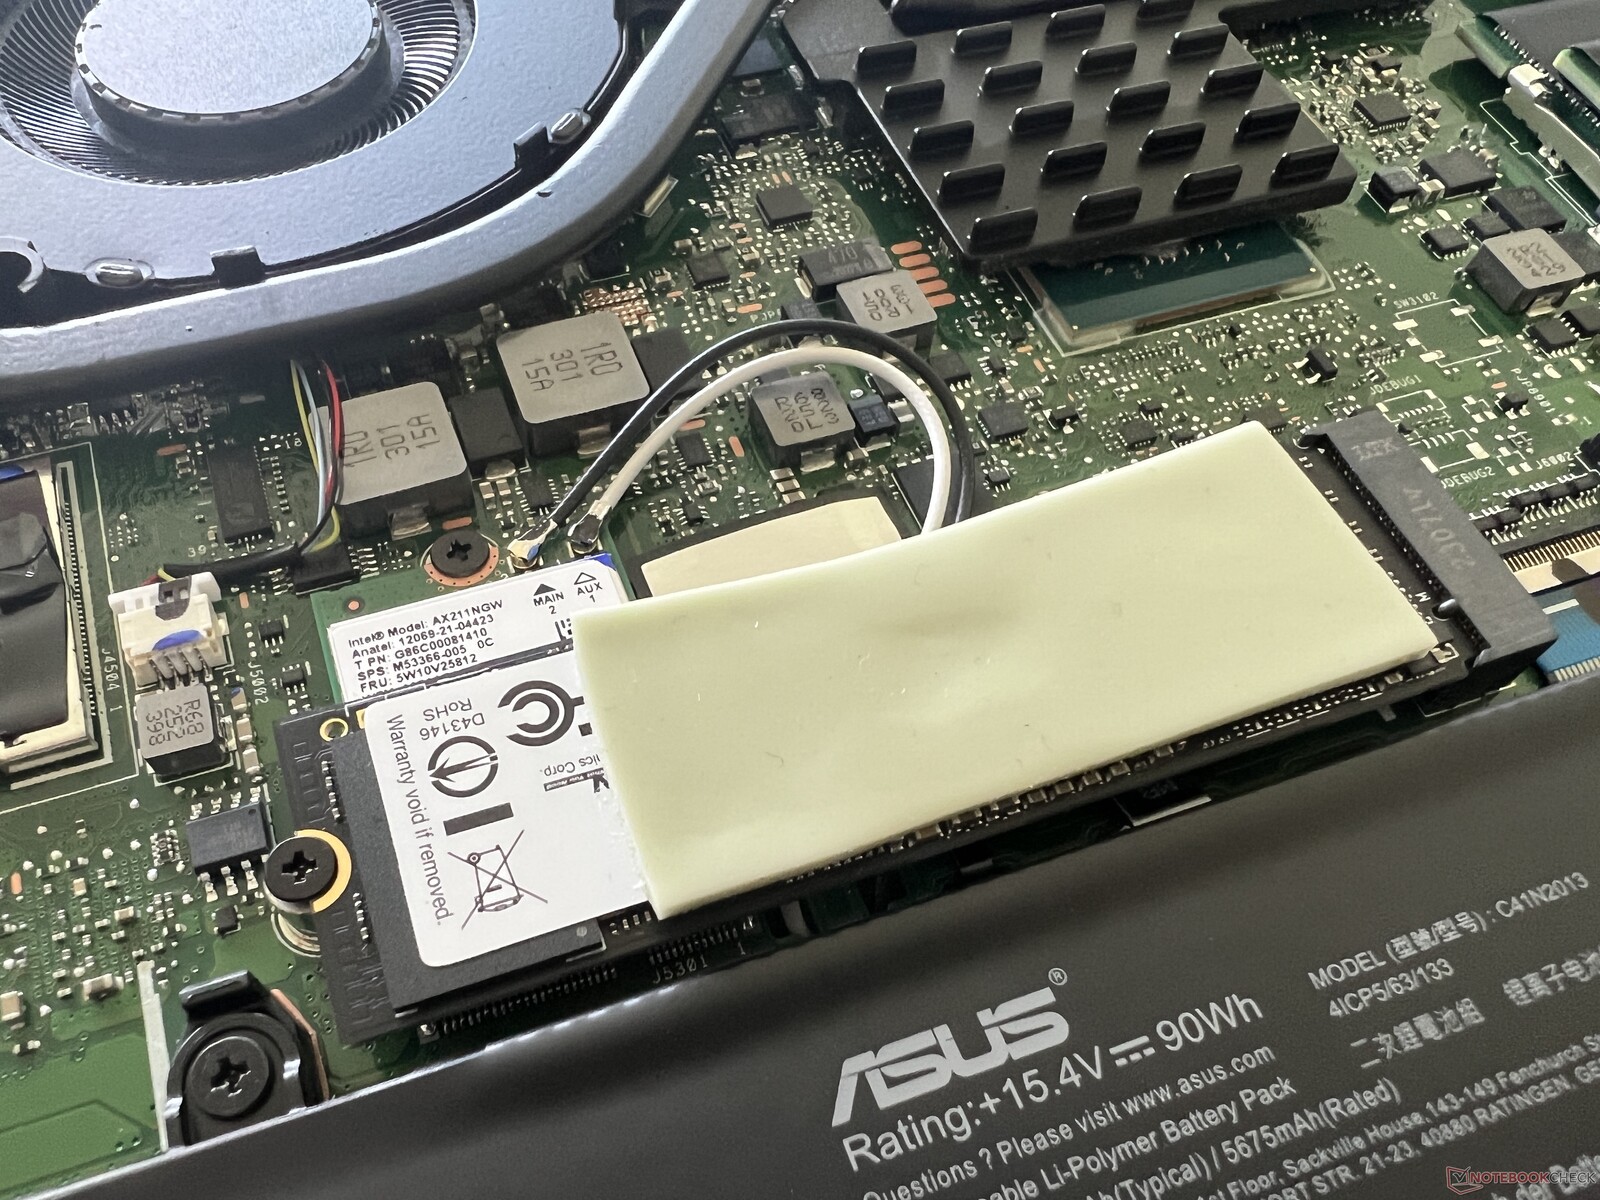
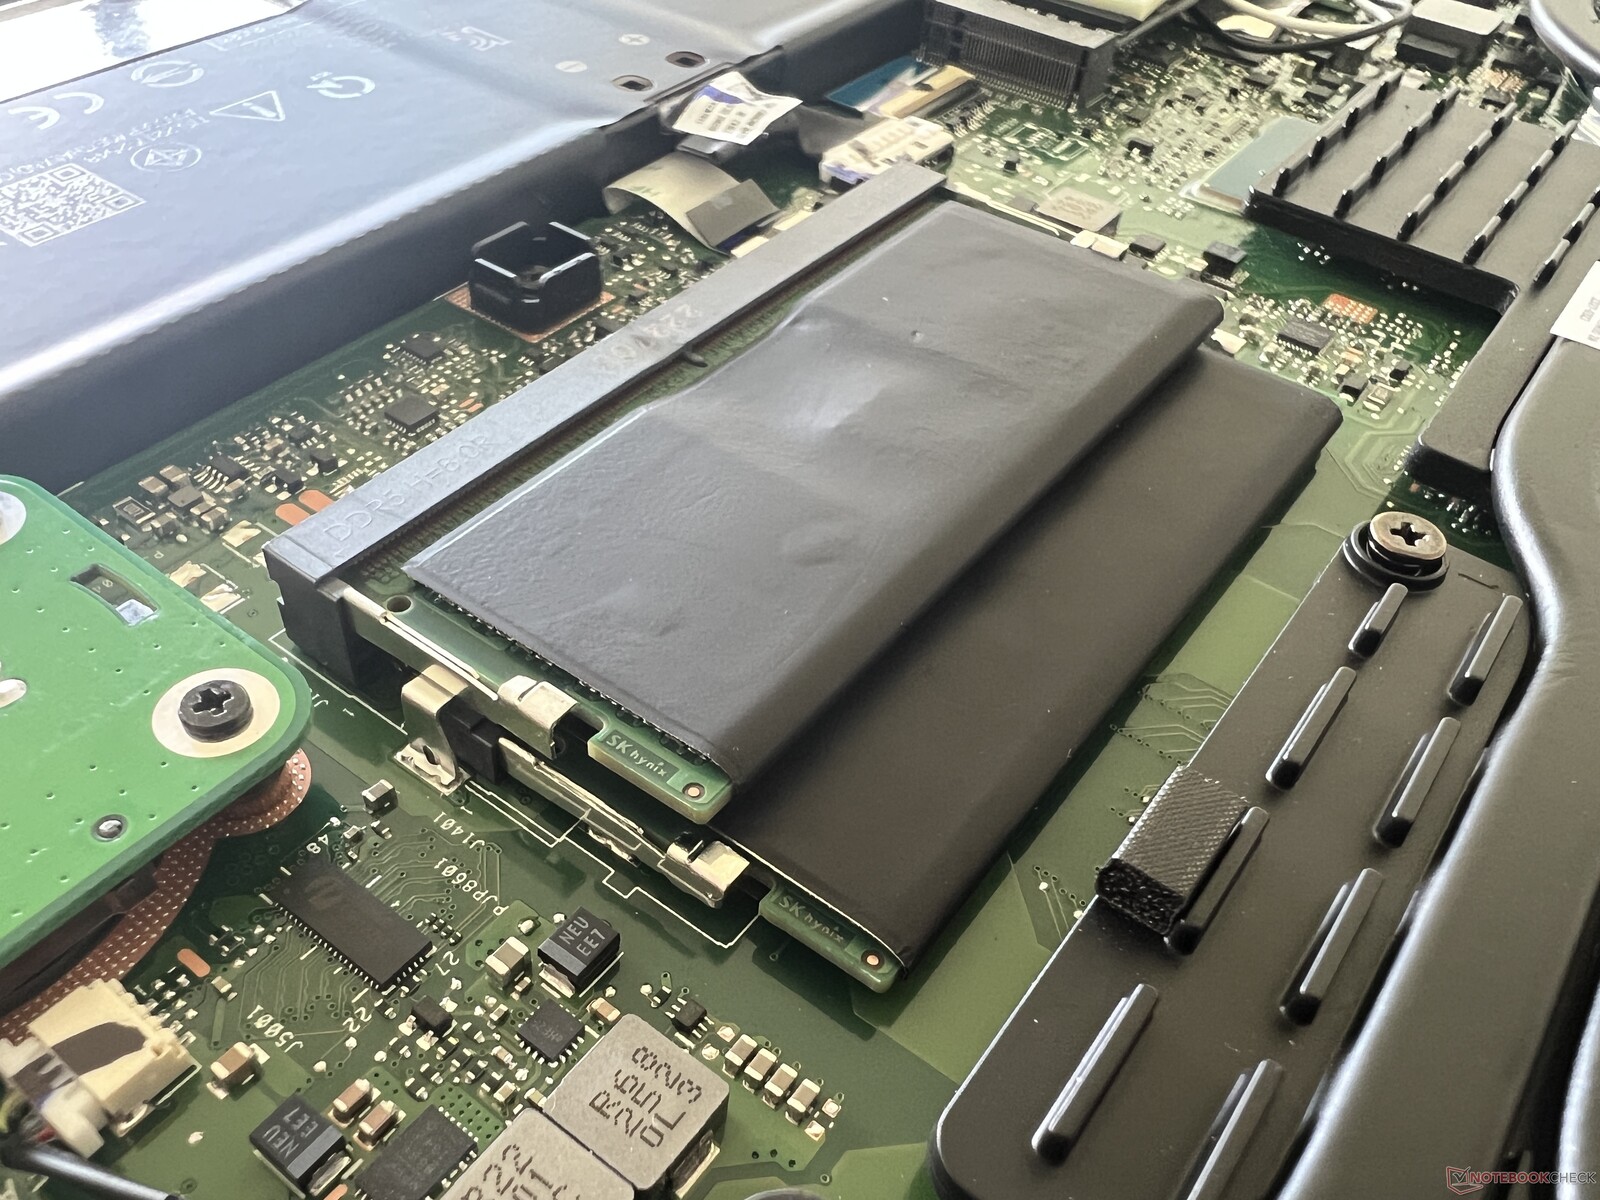
Asus instala el moderno módulo WLAN AX211 de Intel, que está situado bajo el SSD primario y puede reemplazarse. En tándem con nuestro router de referencia de Asus, las tasas de transferencia son muy altas y estables. No experimentamos ningún problema de estabilidad WLAN durante nuestro análisis. Un puerto Ethernet de 2.5 Gbit/s para redes cableadas también está disponible en la trasera.
| Networking | |
| Asus ProArt Studiobook 16 OLED H7604 | |
| iperf3 transmit AXE11000 | |
| iperf3 receive AXE11000 | |
| Gigabyte AERO 16 OLED BSF | |
| iperf3 transmit AXE11000 6GHz | |
| iperf3 receive AXE11000 6GHz | |
| Samsung Galaxy Book3 Ultra 16 | |
| iperf3 transmit AXE11000 | |
| iperf3 receive AXE11000 | |
| MSI Stealth 17 Studio A13VH-014 | |
| iperf3 transmit AXE11000 | |
| iperf3 receive AXE11000 | |
| iperf3 transmit AXE11000 6GHz | |
| iperf3 receive AXE11000 6GHz | |
| Apple MacBook Pro 16 2023 M2 Max | |
| iperf3 transmit AXE11000 6GHz | |
| iperf3 receive AXE11000 6GHz | |
| Asus Zephyrus Duo 16 GX650PY-NM006W | |
| iperf3 transmit AXE11000 6GHz | |
| iperf3 receive AXE11000 6GHz | |
Cámara web
La webcam 1080p saca fotos decentes en buenas condiciones de luz, pero también están algo distorsionadas. También lleva instalado un módulo IR que admite el reconocimiento facial a través de Windows Hello.


Accesorios
Nuestro dispositivo de prueba venía con el Asus Pen 2.0 y el ratón inalámbrico ProArt MD300, cuyo precio de venta al público es de 180 dólares. Al igual que el portátil, el ratón tiene un pequeño DialPad instalado en el lateral. Su uso depende del software que se utilice. Es un poco molesto que tengas que instalar ArmoryCrate para ajustar la configuración del ratón y que no puedas hacerlo en el ProArt Creator Hub. En las pruebas, el ratón funcionó perfectamente y los clics fueron muy precisos, pero también ruidosos. Los botones silenciosos de los ratones Logitech, por ejemplo, son mucho más silenciosos.
Mantenimiento
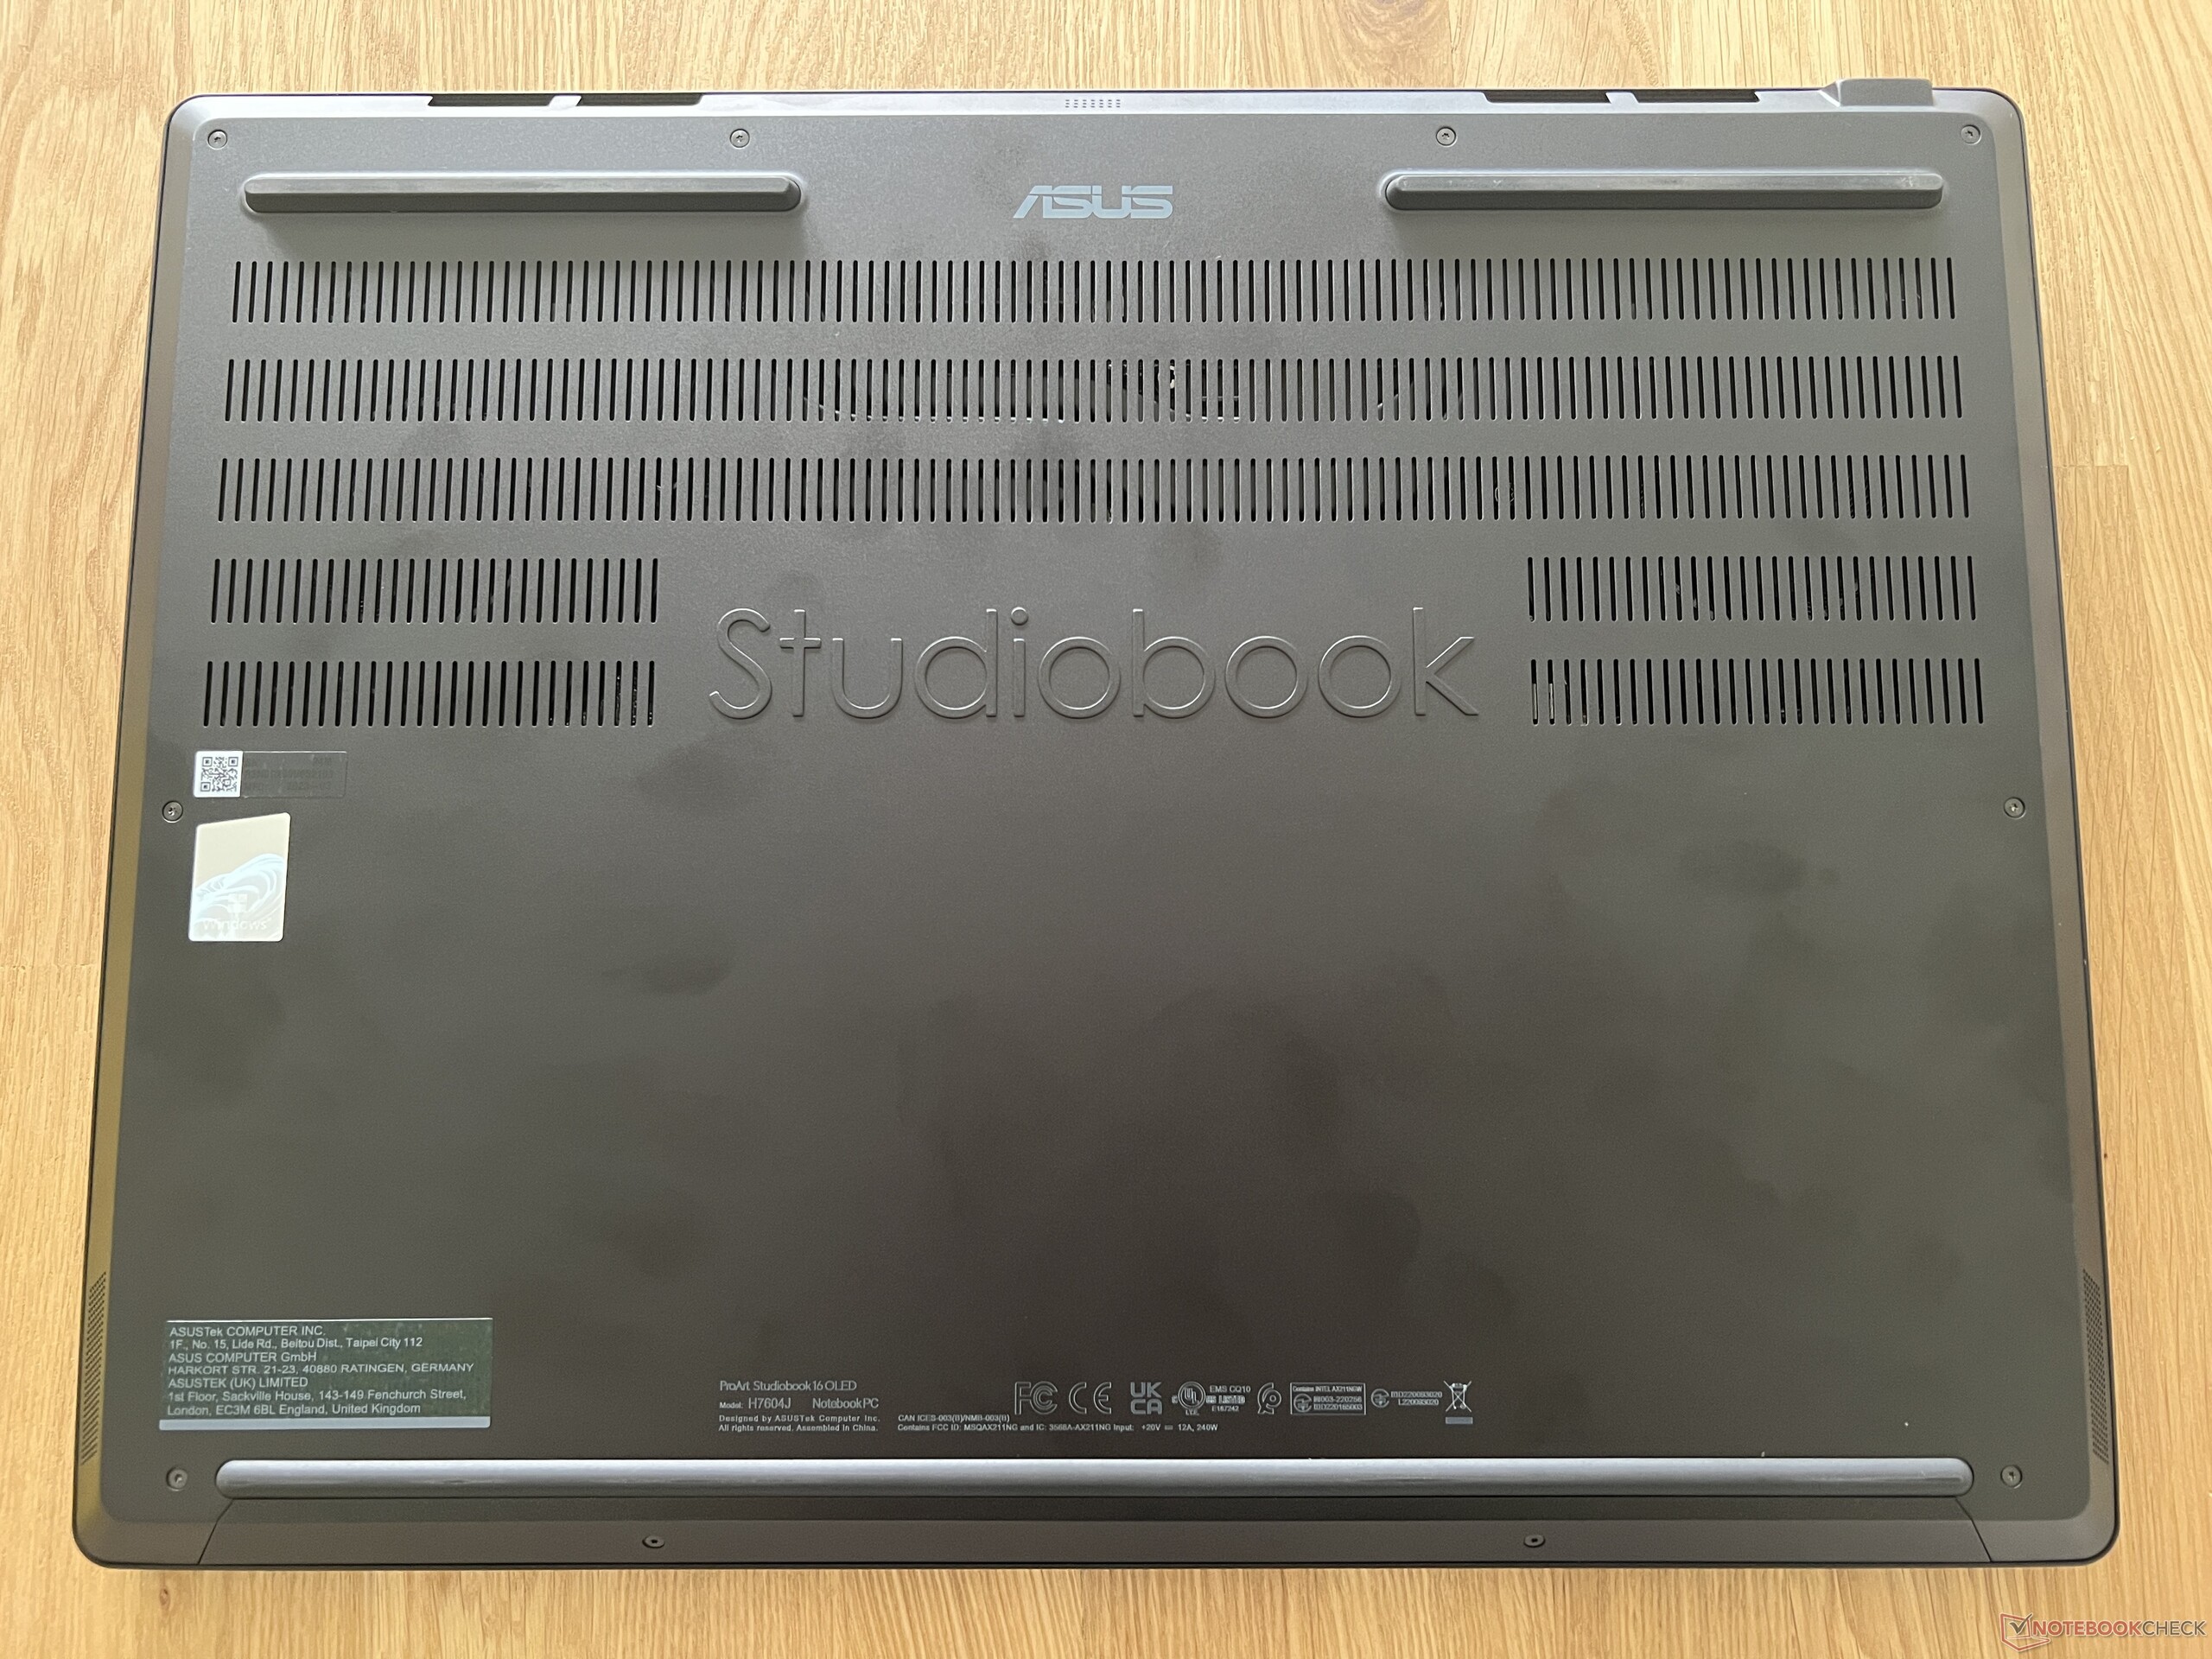
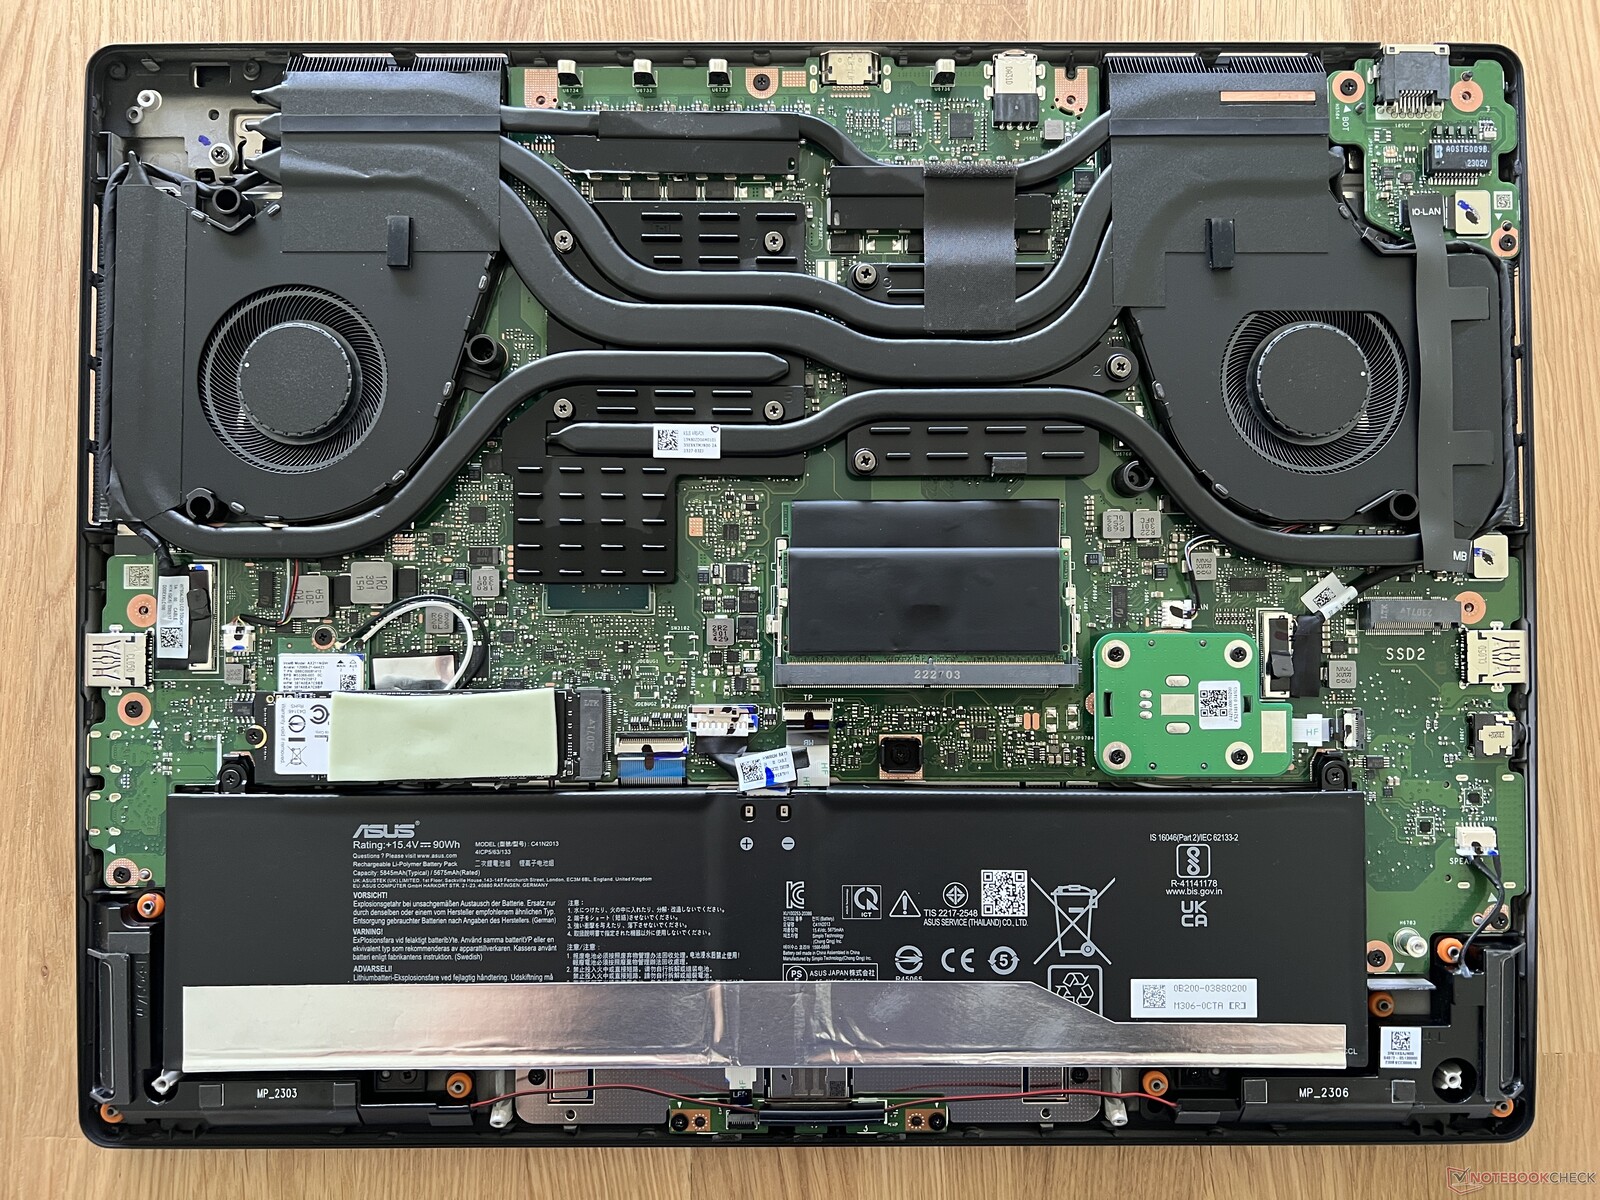
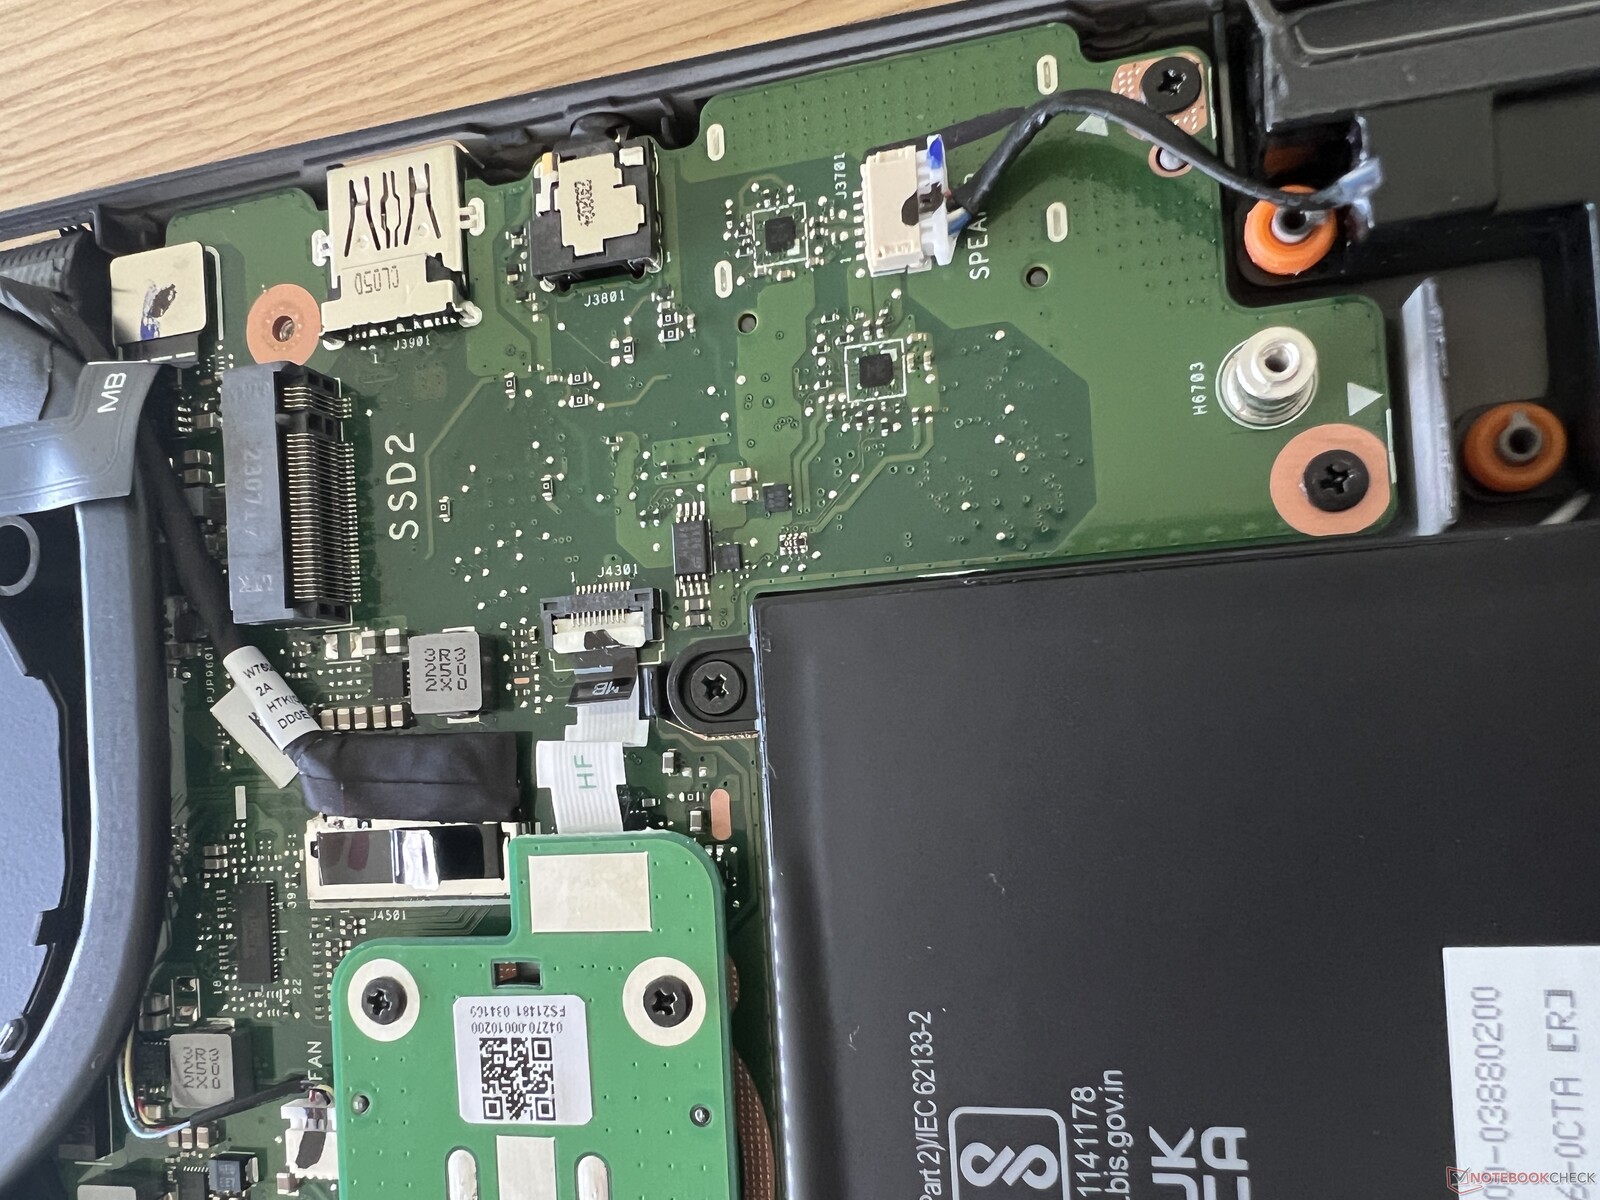
La tapa inferior de la carcasa está asegurada con 10 tornillos Torx (T5) y sigue estando muy apretada después de quitar estos tornillos. La forma más fácil de hacer palanca para abrir la cubierta es en las salidas traseras del ventilador. En el interior domina el gran sistema de refrigeración, y las opciones de mantenimiento también son muy buenas, desde el módulo WLAN (debajo del SSD primario), dos ranuras SO DIMM hasta las dos ranuras M.2 2280 para SSDs. Lo que también llama la atención aquí es cuánto espacio ocupa el DialPad adicional
Dispositivos de entrada - DialPad y teclado numérico
Teclado
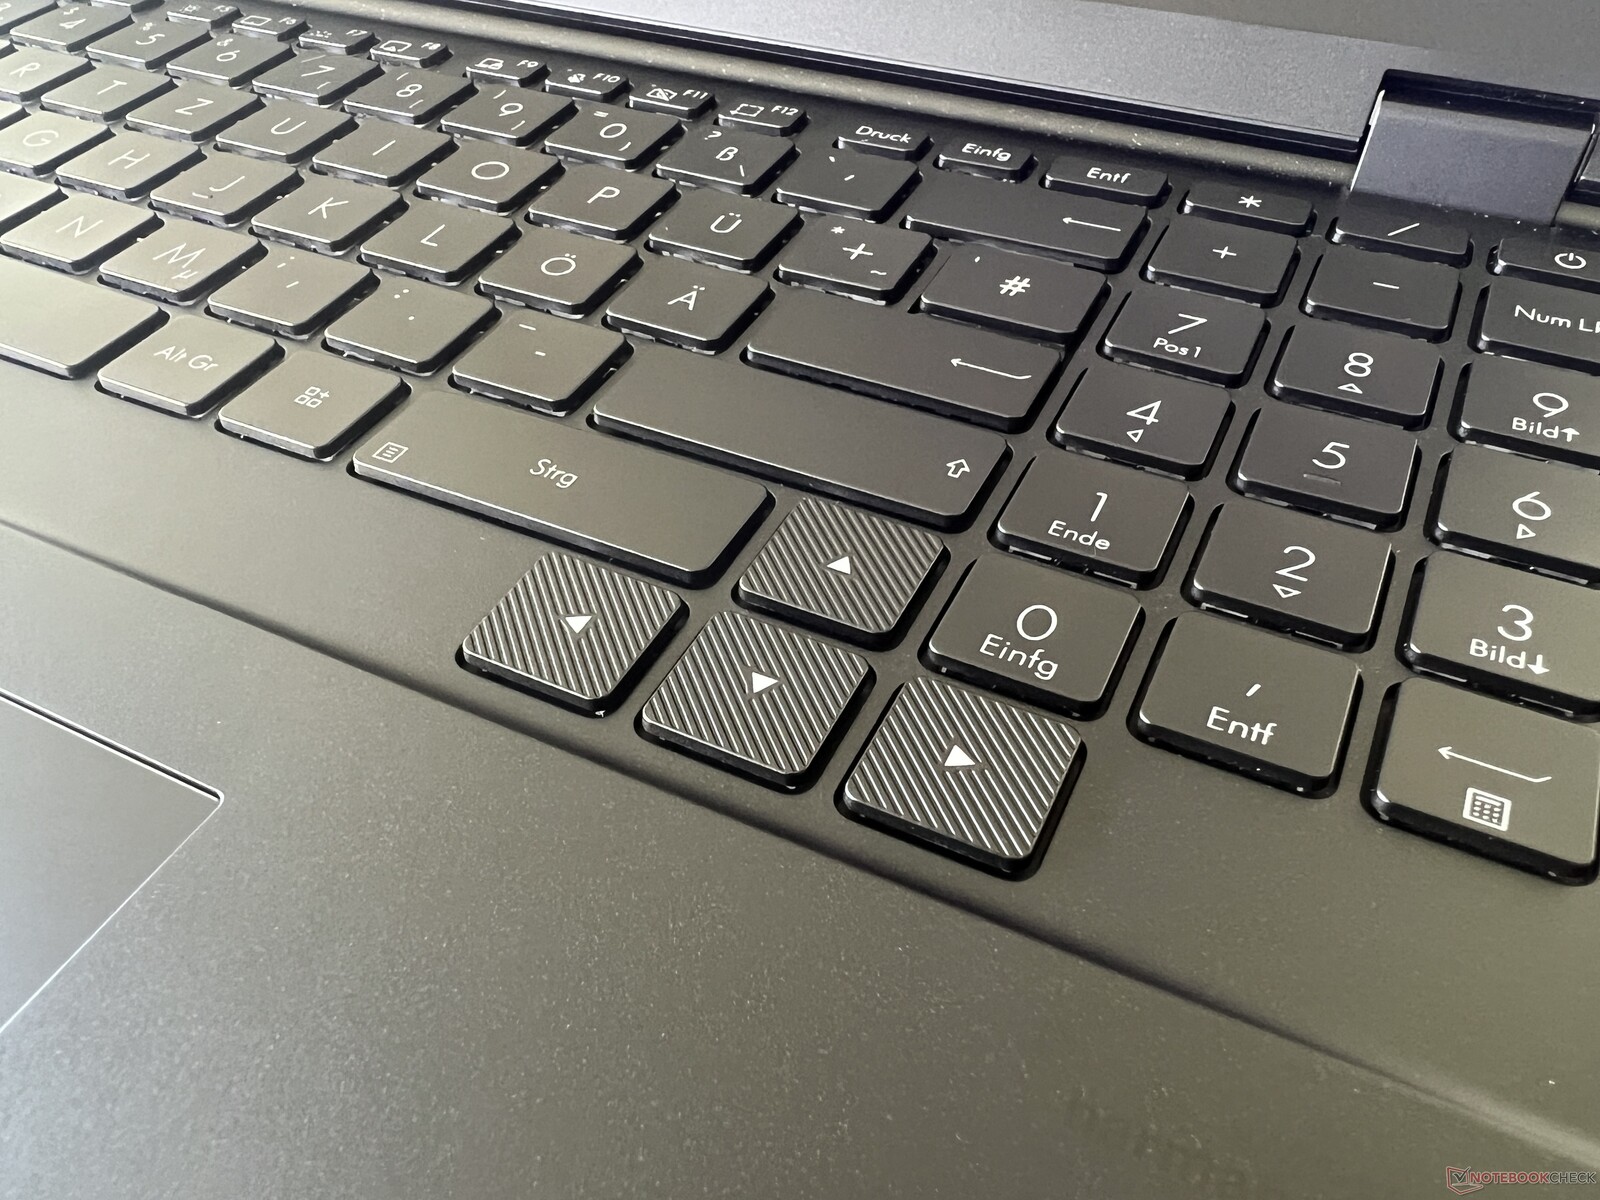
El teclado tiene un recorrido de 1,4 mm y un teclado numérico dedicado. La sensación al teclear es decente, pero las pulsaciones no son las más silenciosas y la barra espaciadora en particular es bastante ruidosa. También cuesta un poco acostumbrarse a la disposición, porque las teclas de dirección son grandes, pero están desplazadas hacia abajo. La tecla Intro de una sola fila tampoco es perfecta. Hay una iluminación blanca de tres niveles, pero no se activa automáticamente mediante un sensor.
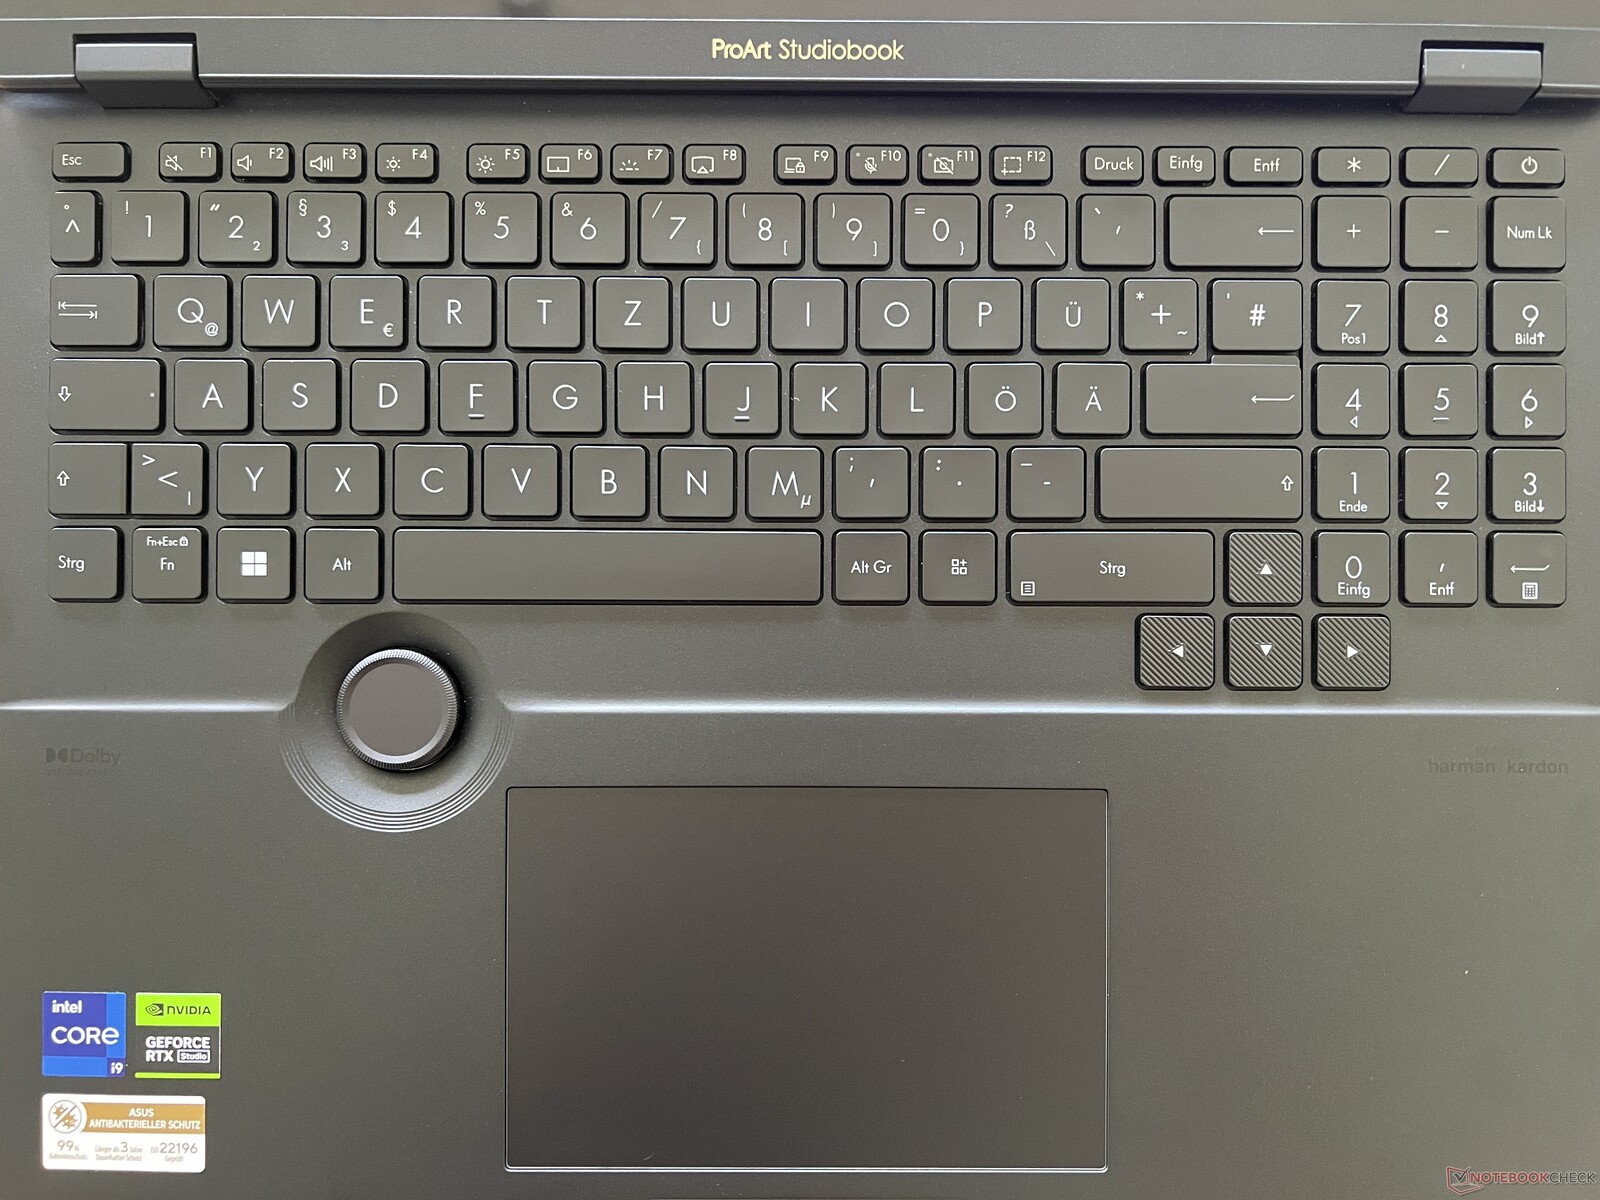
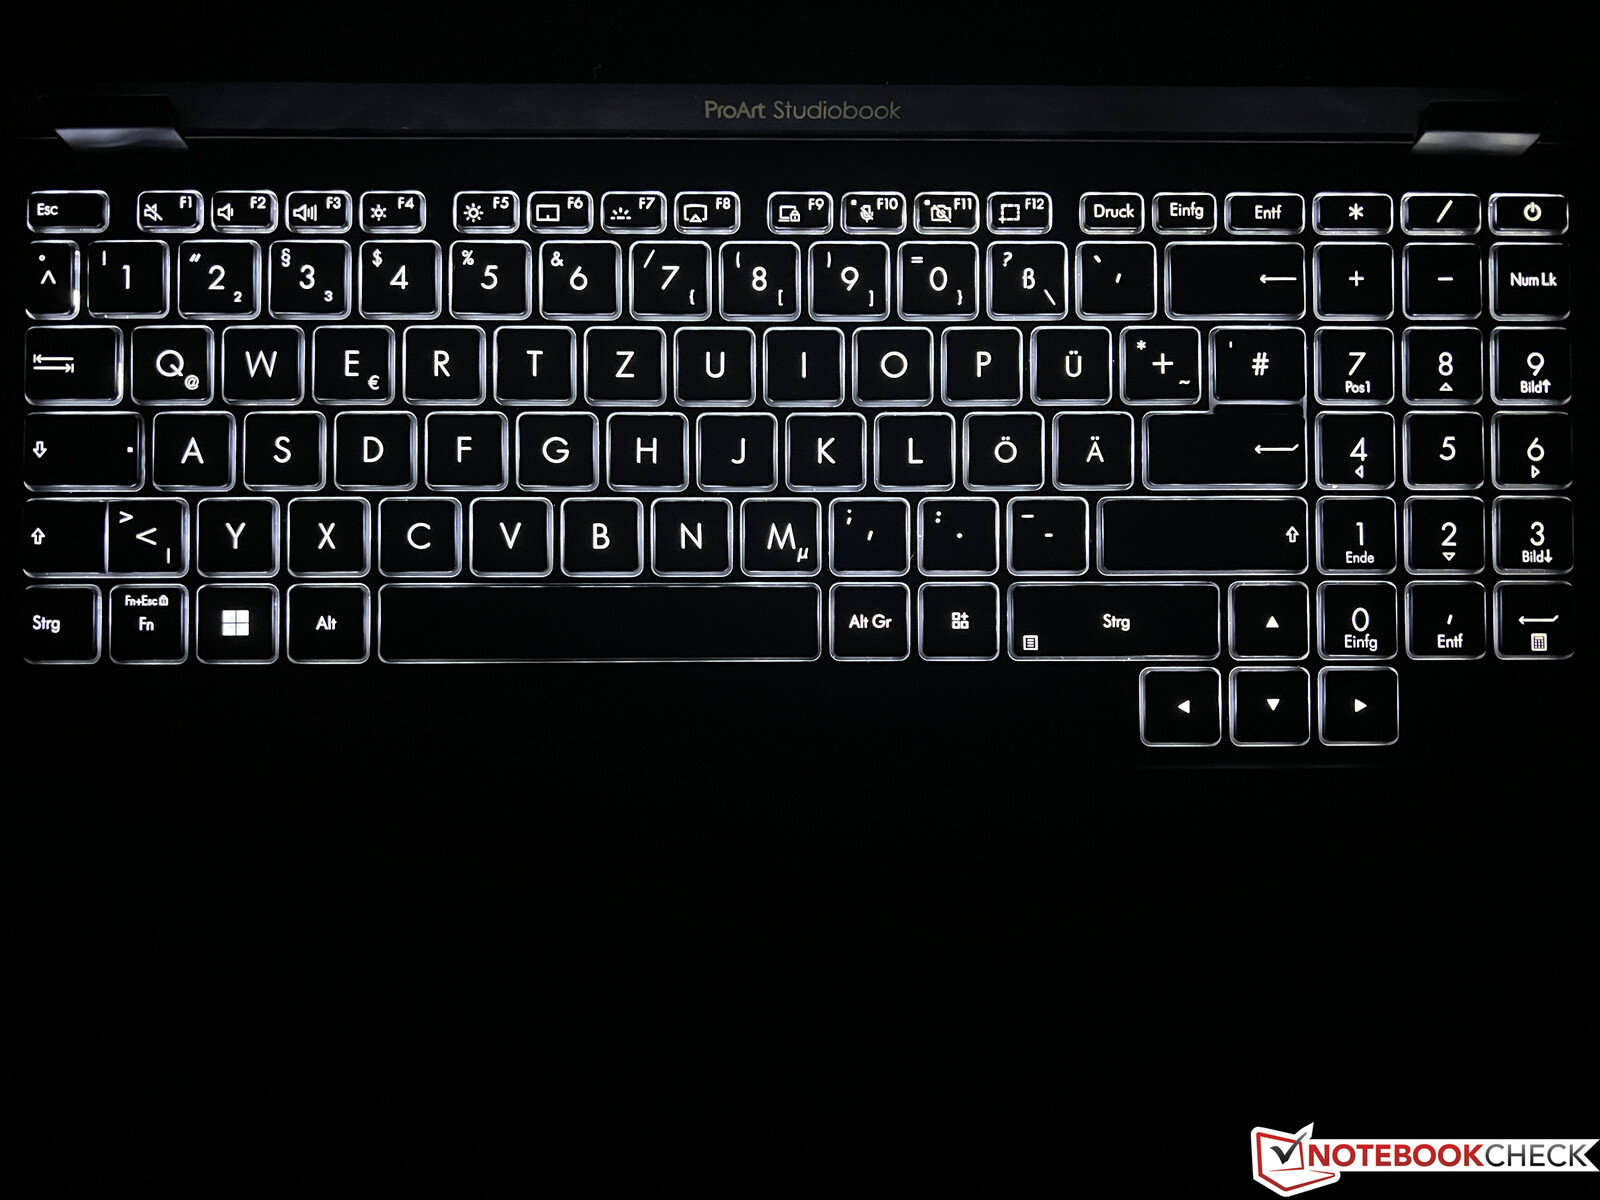
Panel táctil
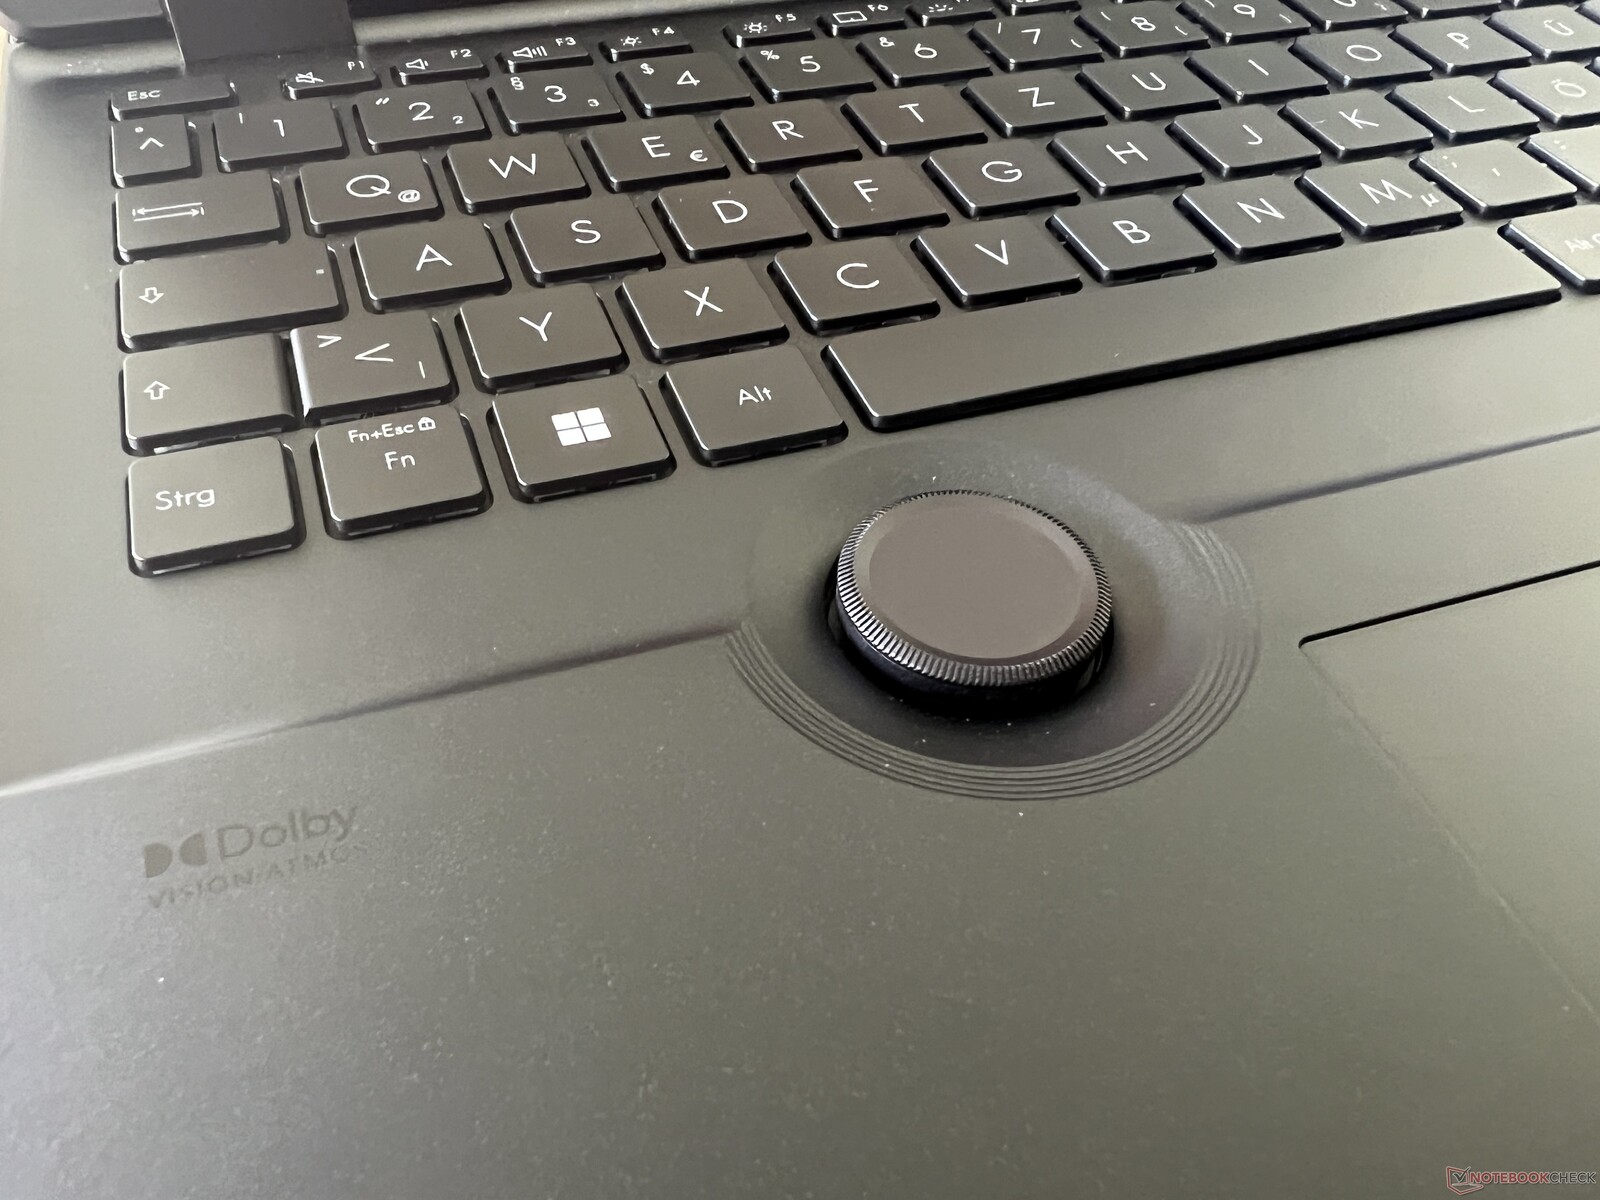
El gran touchpad funciona de forma excelente y se puede pulsar en todas partes, lo que se caracteriza por un rico y silencioso ruido de clic. La característica especial es el DialPad, un gran pulsador giratorio entre el touchpad y el teclado. La implementación con las apps de Adobe funciona bien, pero la combinación de ratón y teclas suele ser más rápida. En el uso normal de escritorio, el brillo y el volumen también se pueden ajustar a través del DialPad, pero esto es mucho más rápido a través de las teclas especiales normales o las teclas F.
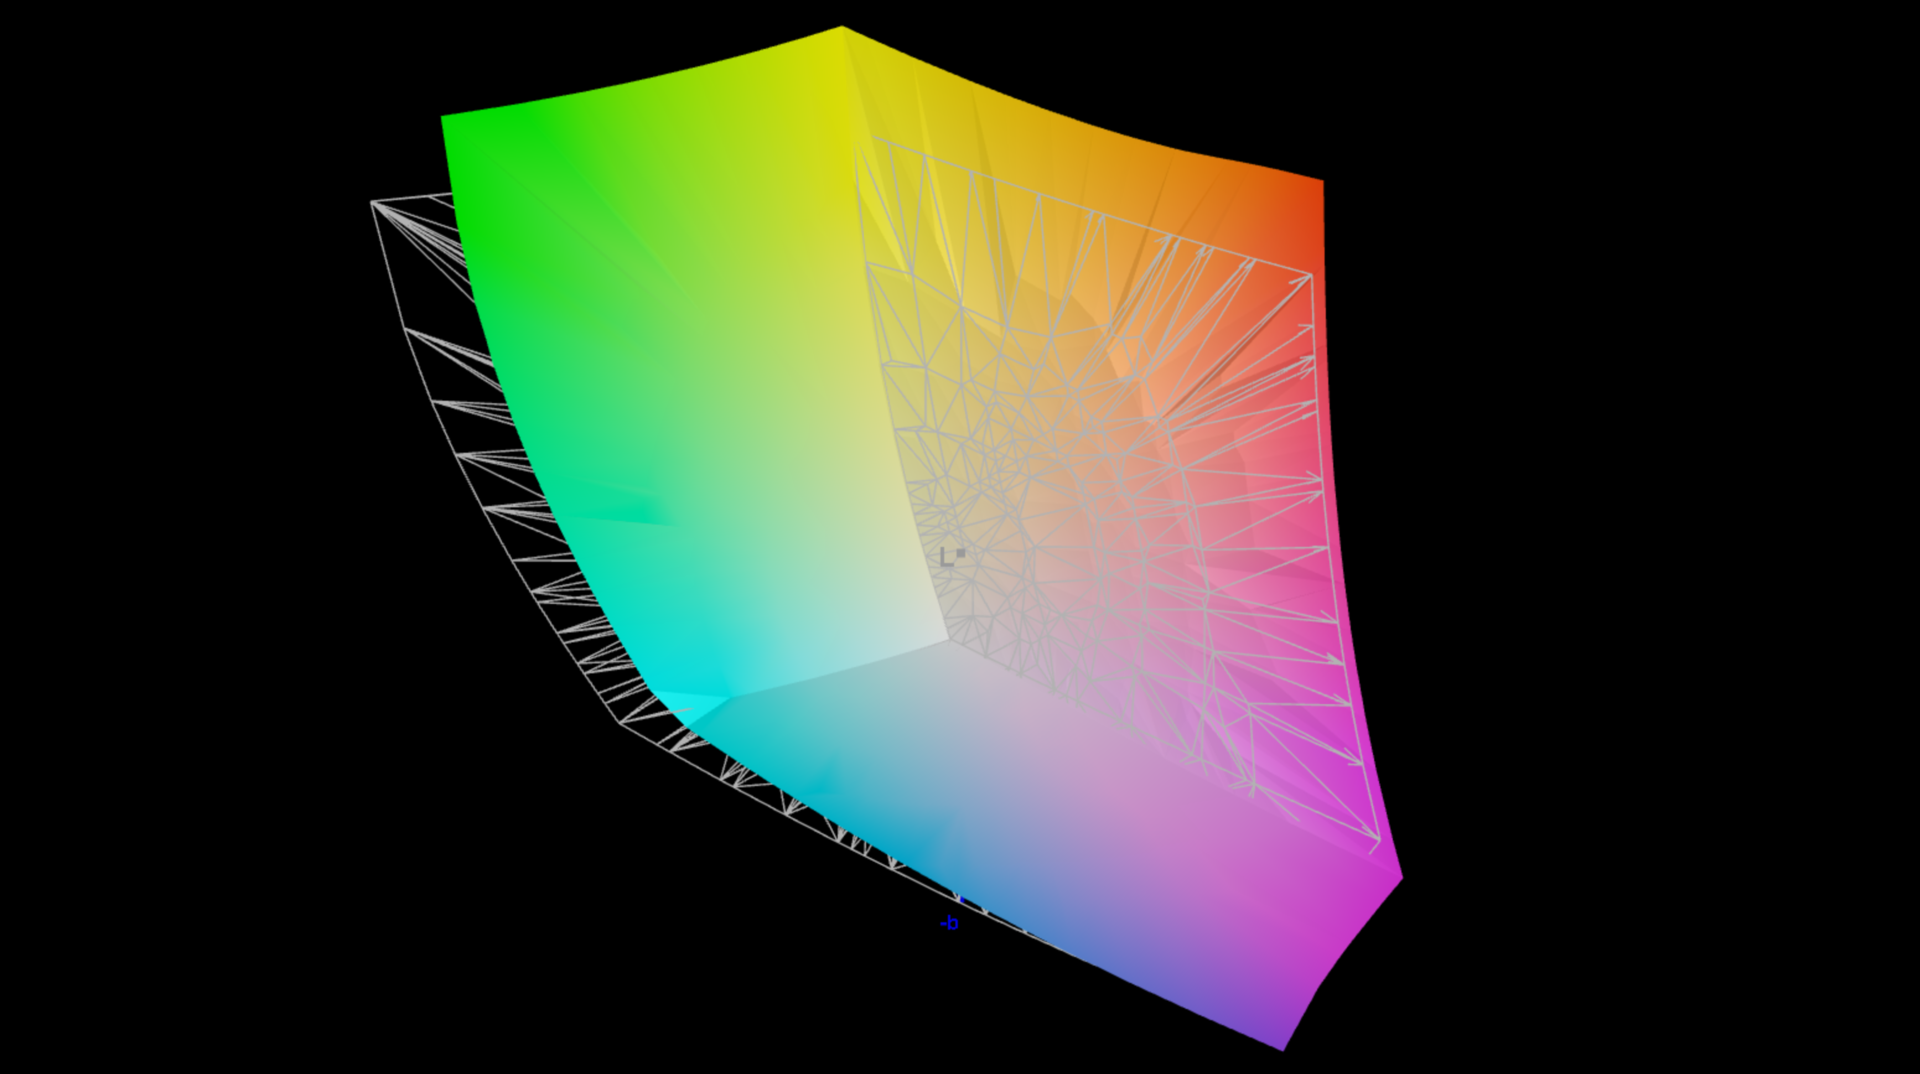
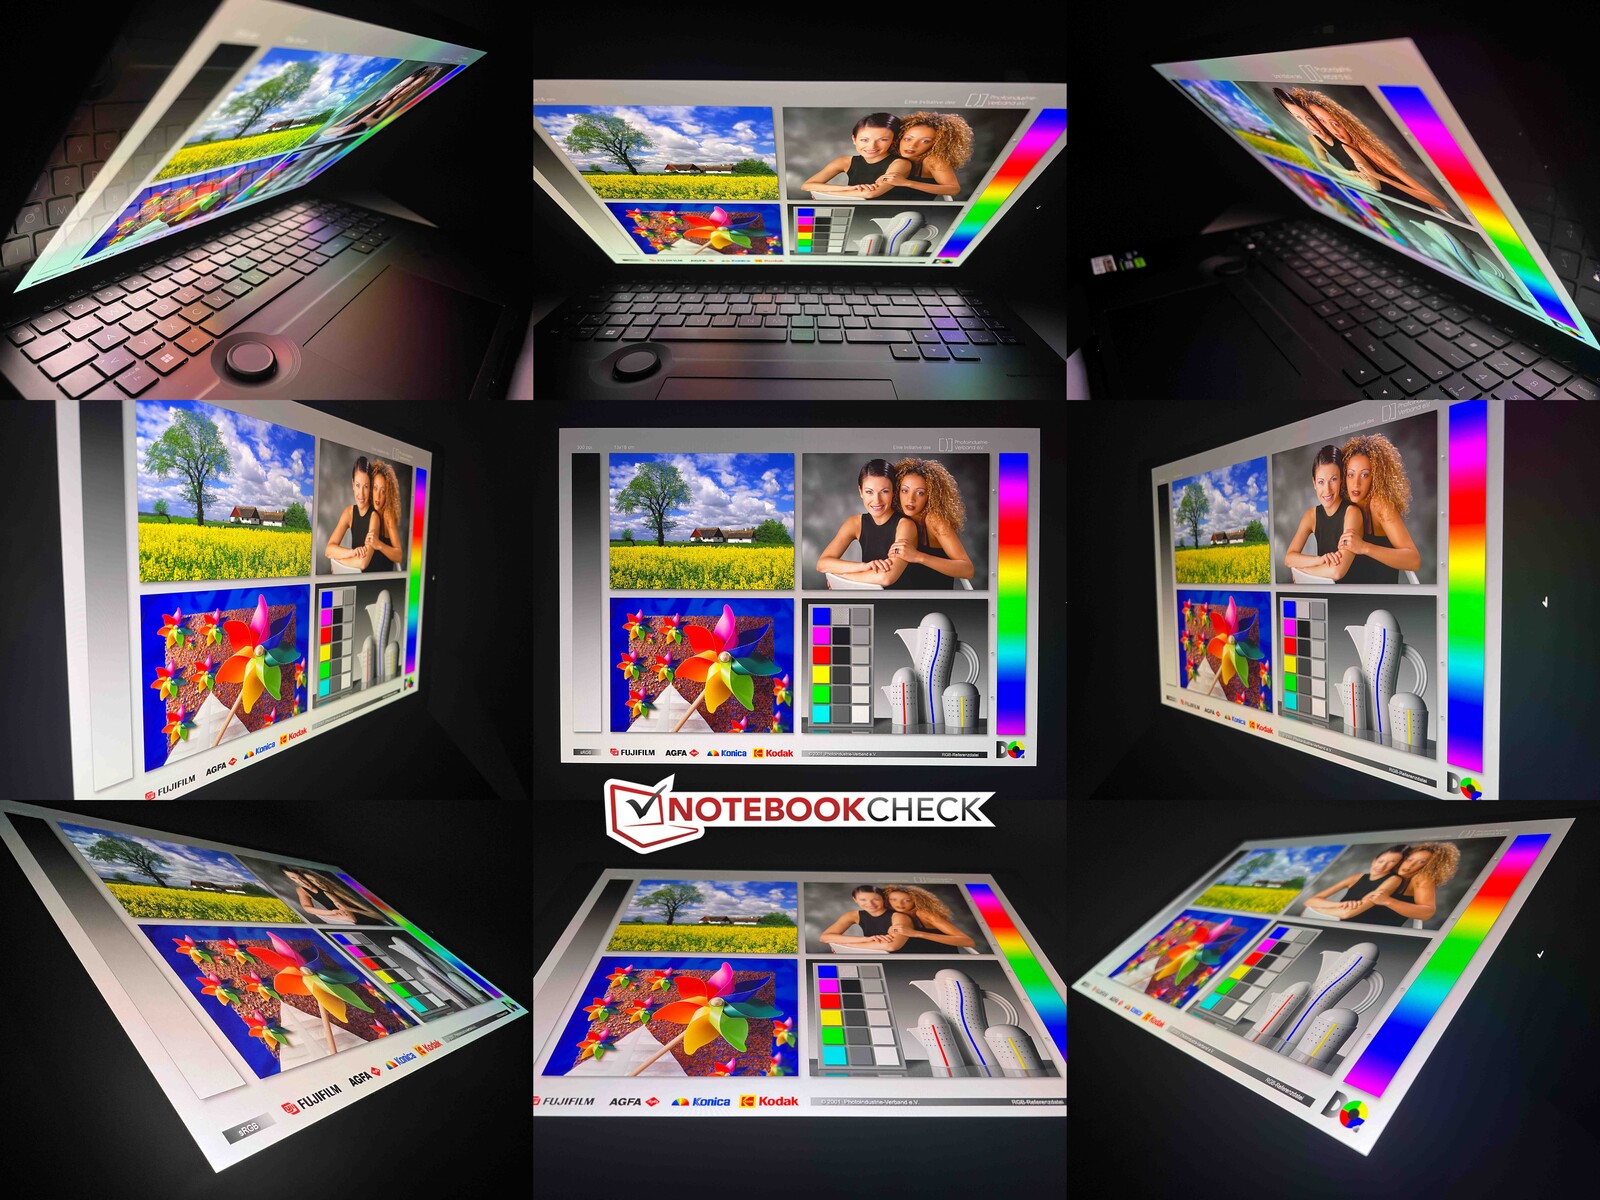
Pantalla: panel OLED a 120 Hz
Asus está actualmente totalmente comprometida con las pantallas OLED y el Studiobook no es una excepción. A diferencia del predecesor con su pantalla OLED 4K, aquí se usa una pantalla táctil OLED con 3.200 x 2.000 pixels y una frecuencia superior de 120 Hz. La calidad de imagen subjetiva es muy buena, pero como en el recientemente analizado ZenBook Pro 14, las áreas brillantes parecen algo granuladas al mirarlas de cerca, lo que se debe a la capa táctil. El brillo no se ajusta automáticamente a la luz ambiente.
Determinamos un brillo medio de 350 cd/m² en modo SDR normal, pero gracias al valor de negro extremadamente bajo de los paneles OLED, el contraste es muy alto. En modo HDR, el máximo es de casi 580 cd/m² en una sección de imagen pequeña y de unos 480 cd/m² en una imagen casi completamente blanca. Sin embargo, el modo HDR tiene que activarse primero manualmente en los ajustes de Windows, después de lo cual ya no se pueden utilizar los perfiles de color. No hay halos en los paneles OLED.
| |||||||||||||||||||||||||
iluminación: 95 %
Brillo con batería: 346 cd/m²
Contraste: 17450:1 (Negro: 0.02 cd/m²)
ΔE ColorChecker Calman: 2.1 | ∀{0.5-29.43 Ø4.72}
calibrated: 2.1
ΔE Greyscale Calman: 1.2 | ∀{0.09-98 Ø4.97}
89.4% AdobeRGB 1998 (Argyll 3D)
100% sRGB (Argyll 3D)
99.6% Display P3 (Argyll 3D)
Gamma: 2.19
CCT: 6545 K
| Asus ProArt Studiobook 16 OLED H7604 ATNA60BX01-1, OLED, 3200x2000, 16" | Gigabyte AERO 16 OLED BSF Samsung SDC4191 (ATNA60YV09-0, OLED, 3840x2400, 16" | Samsung Galaxy Book3 Ultra 16 Samsung ATNA60CL03-0, AMOLED, 2880x1800, 16" | MSI Stealth 17 Studio A13VH-014 AUO41A2 B173ZAN06.C, Mini LED, 3840x2160, 17.3" | Apple MacBook Pro 16 2023 M2 Max Mini-LED, 3456x2234, 16.2" | Asus Zephyrus Duo 16 GX650PY-NM006W NE160QDM-NM4, MiniLED, 2560x1600, 16" | |
|---|---|---|---|---|---|---|
| Display | 3% | 3% | -1% | -1% | 1% | |
| Display P3 Coverage (%) | 99.6 | 99.9 0% | 99.9 0% | 92 -8% | 99 -1% | 99.4 0% |
| sRGB Coverage (%) | 100 | 100 0% | 100 0% | 99.1 -1% | 100 0% | 100 0% |
| AdobeRGB 1998 Coverage (%) | 89.4 | 96.4 8% | 96.3 8% | 94.07 5% | 88.5 -1% | 90.8 2% |
| Response Times | -195% | 18% | -3871% | -9710% | -2391% | |
| Response Time Grey 50% / Grey 80% * (ms) | 0.59 ? | 2 ? -239% | 0.49 ? 17% | 46.4 ? -7764% | 80.5 ? -13544% | 15.2 ? -2476% |
| Response Time Black / White * (ms) | 0.79 ? | 1.98 ? -151% | 0.65 ? 18% | 0.62 ? 22% | 47.2 ? -5875% | 19 ? -2305% |
| PWM Frequency (Hz) | 240 ? | 60 | 240 ? | 2400 | 14880 ? | 12000 ? |
| Screen | -9% | -15% | -12% | 370% | -15% | |
| Brightness middle (cd/m²) | 349 | 389.97 12% | 400 15% | 397.29 14% | 504 44% | 712 104% |
| Brightness (cd/m²) | 350 | 395 13% | 399 14% | 392 12% | 487 39% | 703 101% |
| Brightness Distribution (%) | 95 | 97 2% | 93 -2% | 93 -2% | 94 -1% | 95 0% |
| Black Level * (cd/m²) | 0.02 | 0.03 -50% | 0.03 -50% | 0.02 -0% | 0.001 95% | 0.07 -250% |
| Contrast (:1) | 17450 | 12999 -26% | 13333 -24% | 19865 14% | 504000 2788% | 10171 -42% |
| Colorchecker dE 2000 * | 2.1 | 2 5% | 2.3 -10% | 2.52 -20% | 1.5 29% | 1.7 19% |
| Colorchecker dE 2000 max. * | 5.5 | 4.1 25% | 4.15 25% | 3.91 29% | 3.3 40% | 4 27% |
| Colorchecker dE 2000 calibrated * | 2.1 | 1.68 20% | 1.66 21% | 2.52 -20% | 1.2 43% | |
| Greyscale dE 2000 * | 1.2 | 2.23 -86% | 2.7 -125% | 2.78 -132% | 2.1 -75% | 2.8 -133% |
| Gamma | 2.19 100% | 2.41 91% | 2.266 97% | 2.63 84% | 2.25 98% | 2.21 100% |
| CCT | 6545 99% | 6323 103% | 7047 92% | 6412 101% | 6882 94% | 6978 93% |
| Media total (Programa/Opciones) | -67% /
-33% | 2% /
-7% | -1295% /
-561% | -3114% /
-1266% | -802% /
-351% |
* ... más pequeño es mejor
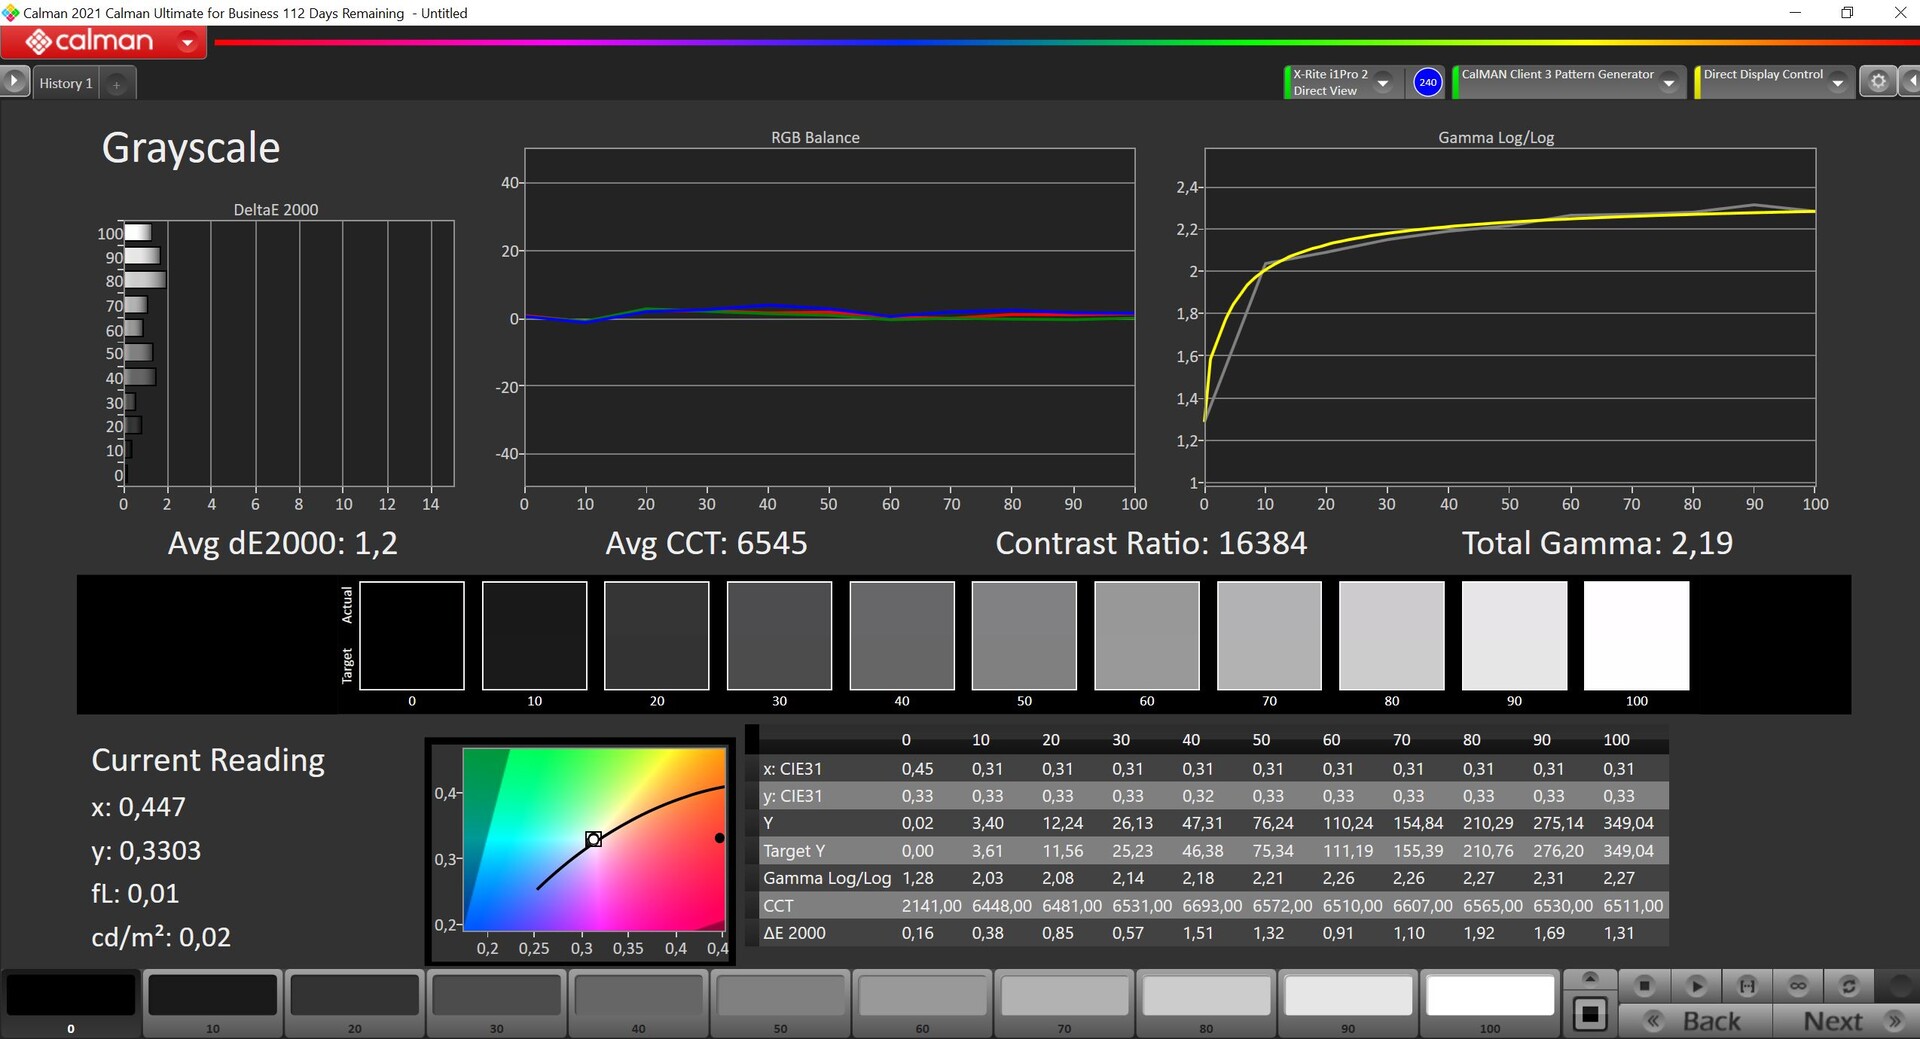
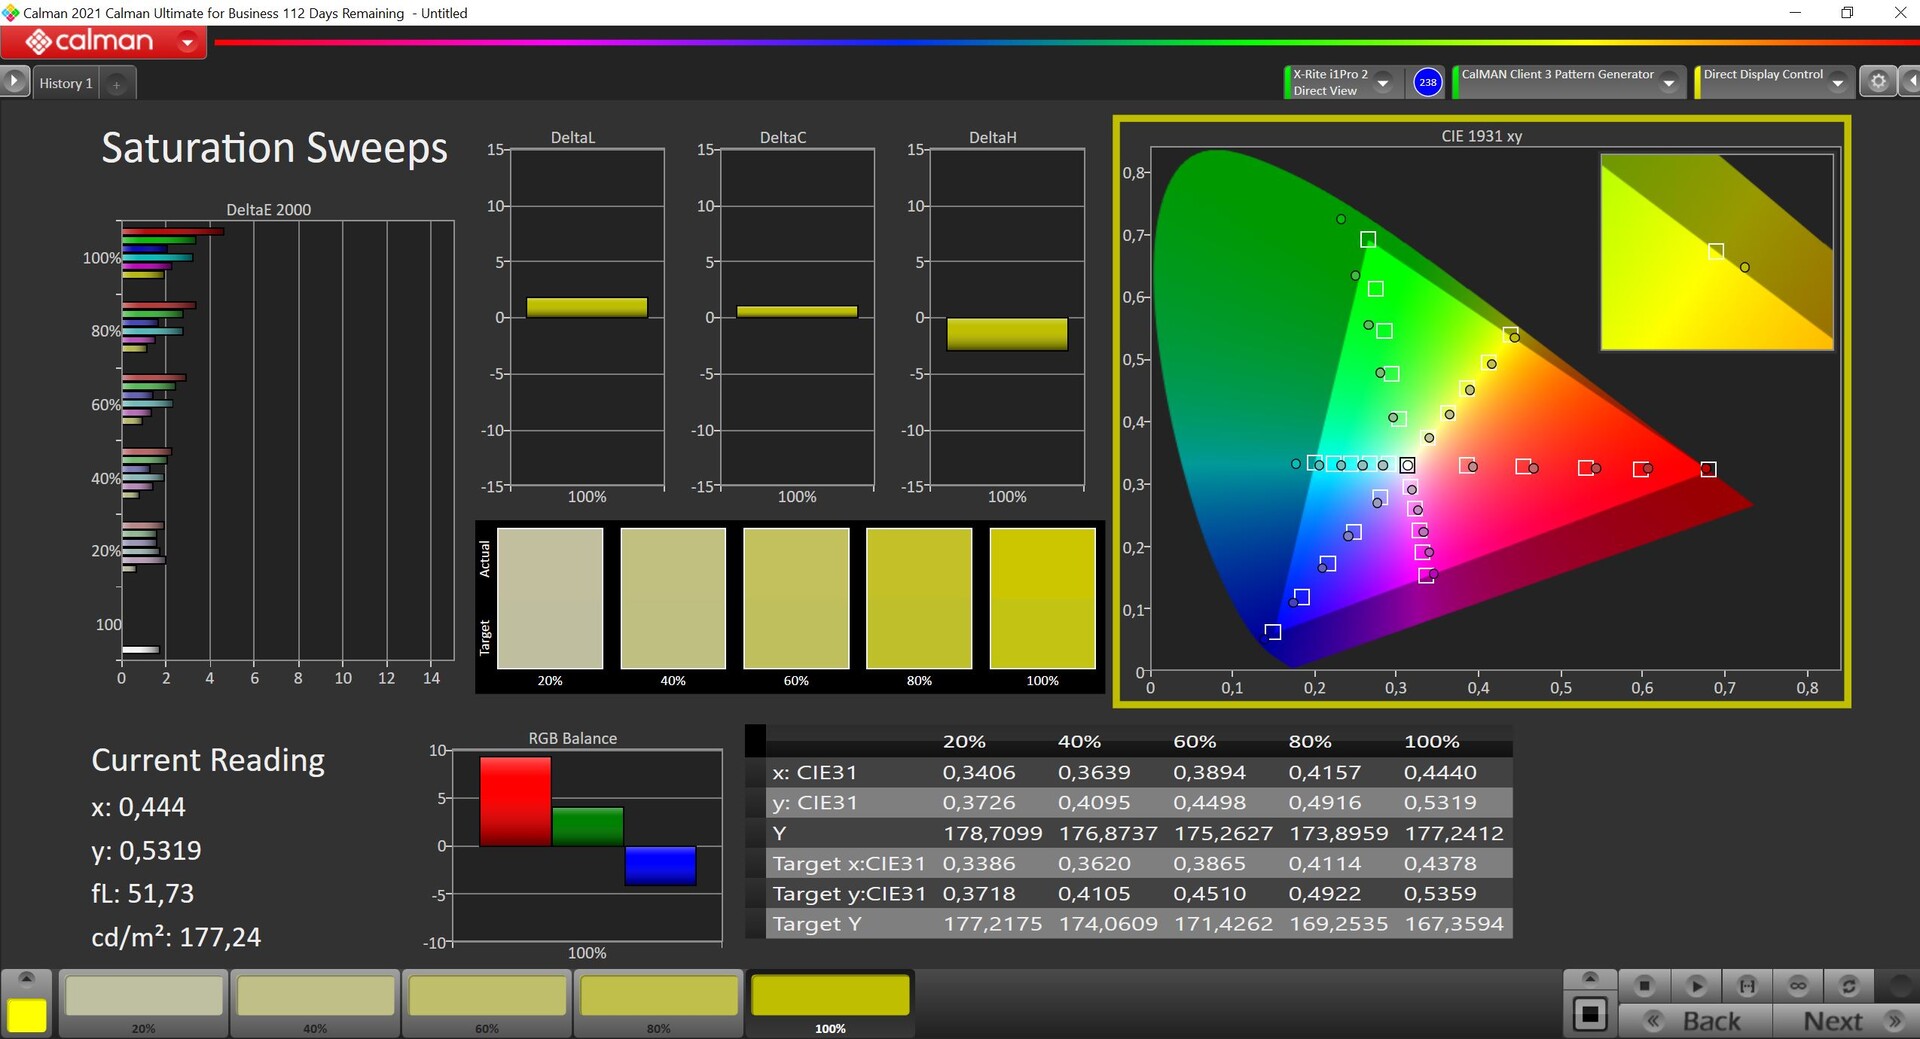
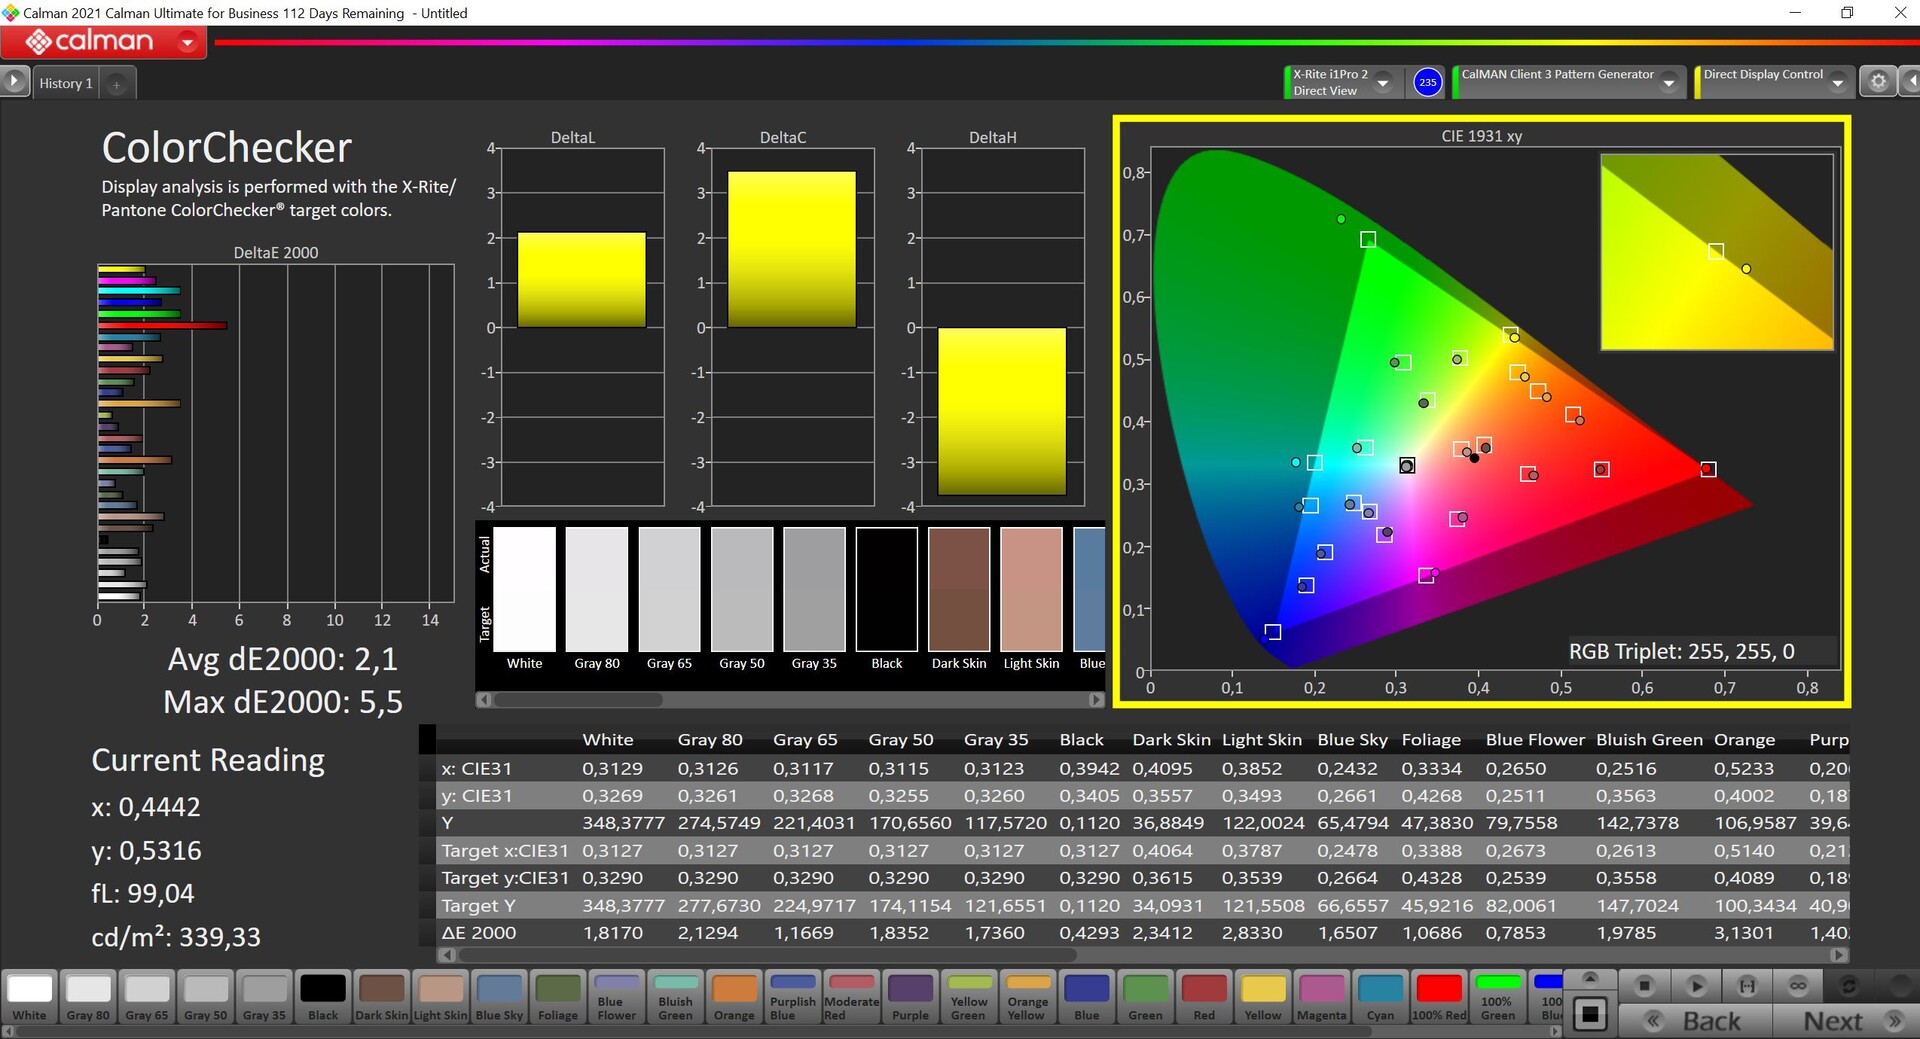
Como es habitual, hay varios perfiles de color en el software MyAsus, donde 'Nativo' está preestablecido por defecto. Aquí, los colores están algo sobresaturados, lo que debería resultar en una imagen algo más potente en la práctica. El perfil más preciso es DisplayP3, que también usamos para nuestras mediciones con el software profesional CalMAN (X-Rite i1 Pro 2). Básicamente, los resultados ya son muy buenos y no hay problemas en términos de dominante de color o temperatura de color, aunque algunos colores individuales están por encima de la importante desviación de 3. No pudimos corregir esto con nuestra propia calibración, por lo que no ofrecemos un perfil para descargar en este caso concreto. El espacio de color P3 está completamente cubierto.
Tiempos de respuesta del display
| ↔ Tiempo de respuesta de Negro a Blanco | ||
|---|---|---|
| 0.79 ms ... subida ↗ y bajada ↘ combinada | ↗ 0.34 ms subida | 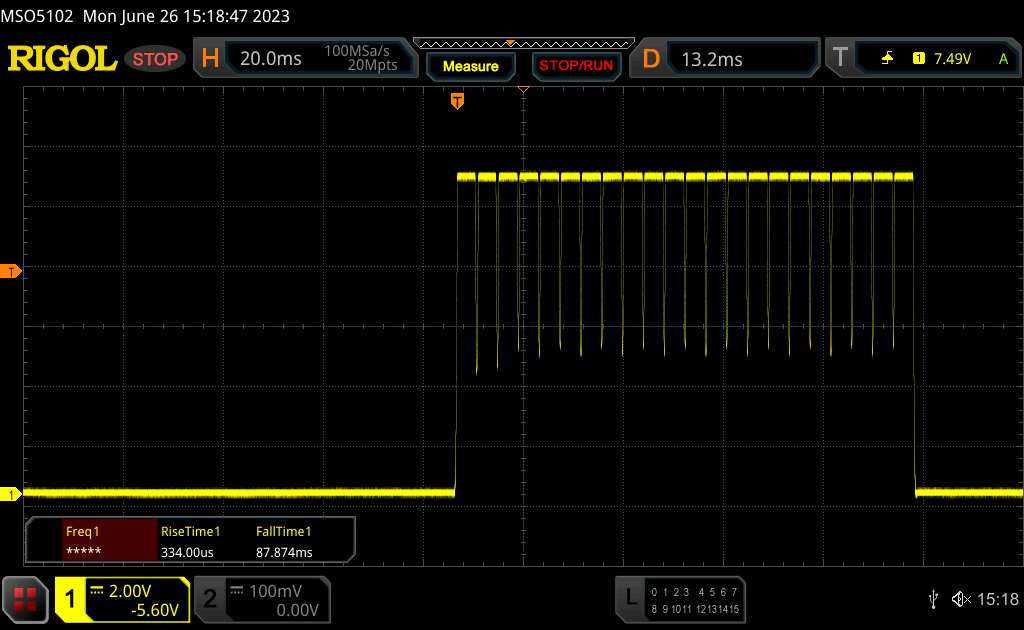 |
| ↘ 0.45 ms bajada | ||
| La pantalla mostró tiempos de respuesta muy rápidos en nuestros tests y debería ser adecuada para juegos frenéticos. En comparación, todos los dispositivos de prueba van de ##min### (mínimo) a 240 (máximo) ms. » 2 % de todos los dispositivos son mejores. Esto quiere decir que el tiempo de respuesta medido es mejor que la media (19.9 ms) de todos los dispositivos testados. | ||
| ↔ Tiempo de respuesta 50% Gris a 80% Gris | ||
| 0.59 ms ... subida ↗ y bajada ↘ combinada | ↗ 0.29 ms subida | 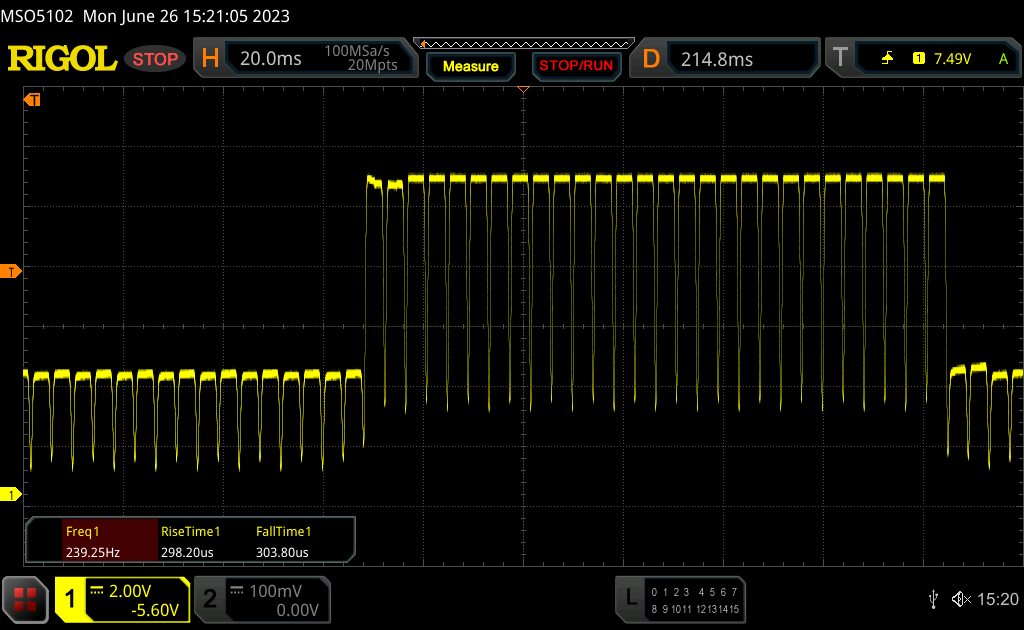 |
| ↘ 0.3 ms bajada | ||
| La pantalla mostró tiempos de respuesta muy rápidos en nuestros tests y debería ser adecuada para juegos frenéticos. En comparación, todos los dispositivos de prueba van de ##min### (mínimo) a 636 (máximo) ms. » 1 % de todos los dispositivos son mejores. Esto quiere decir que el tiempo de respuesta medido es mejor que la media (31.1 ms) de todos los dispositivos testados. | ||
Parpadeo de Pantalla / PWM (Pulse-Width Modulation)
| Parpadeo de Pantalla / PWM detectado | 240 Hz | ≤ 100 % de brillo | 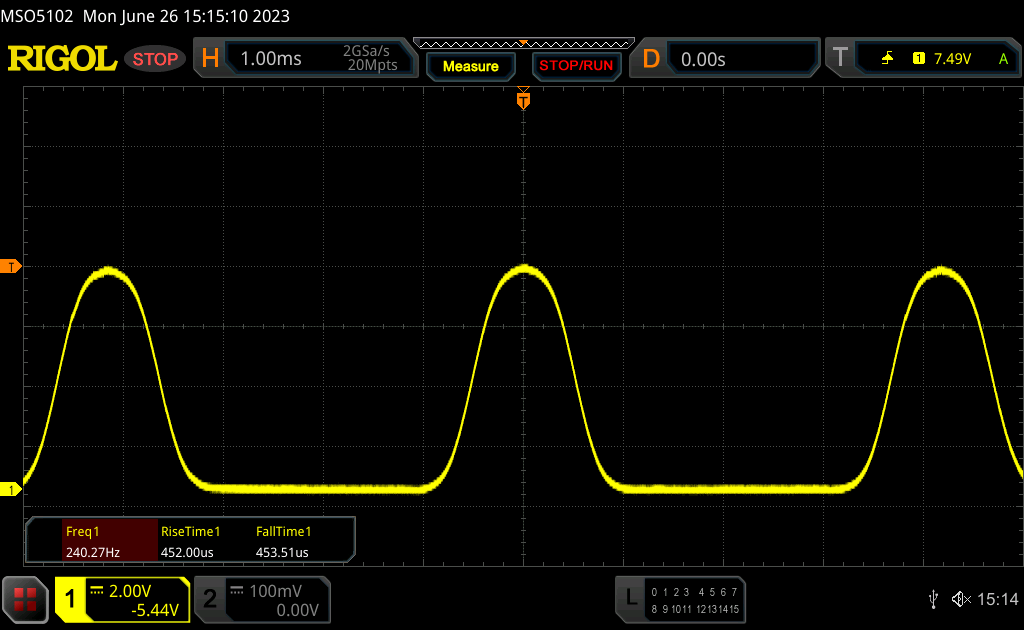 |
La retroiluminación del display parpadea a 240 Hz (seguramente usa PWM - Pulse-Width Modulation) a un brillo del 100 % e inferior. Sobre este nivel de brillo no debería darse parpadeo / PWM. La frecuencia de 240 Hz es relativamente baja, por lo que la gente sensible debería ver parpadeos y padecer fatiga visual por la pantalla (usado al brillo indicado a continuación). Comparación: 52 % de todos los dispositivos testados no usaron PWM para atenuar el display. Si se usó, medimos una media de 7784 (mínimo: 5 - máxmo: 343500) Hz. | |||
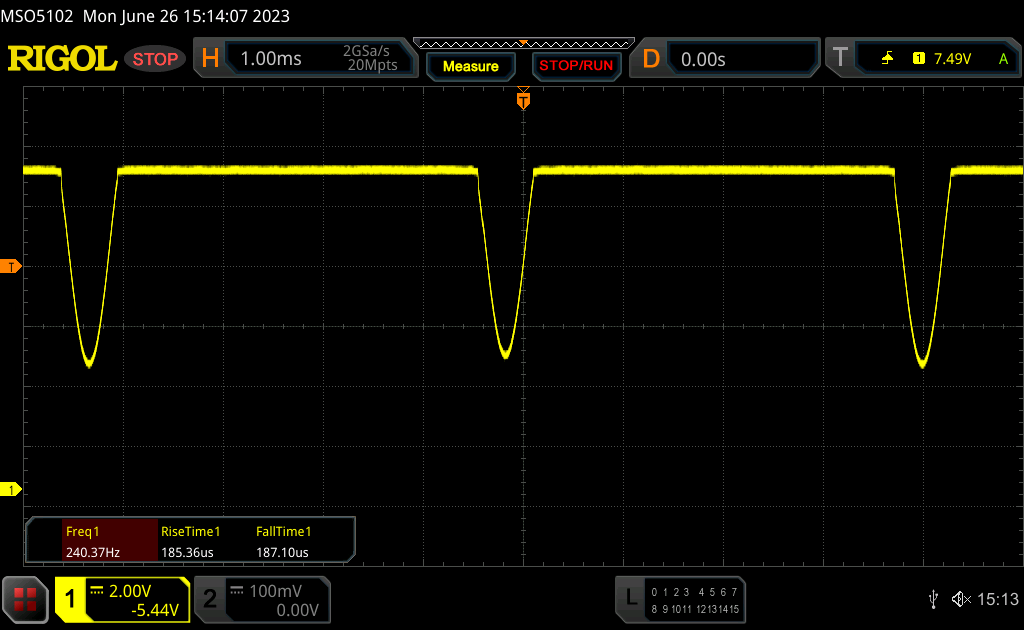
La atenuación DC se utiliza en el rango de luminosidad de 100 a 60%, y el clásico parpadeo PWM a 240 Hz por debajo de ese valor. En cuanto el brillo cae por debajo del 60%, aparece un aviso de que la atenuación DC ya no está disponible. Como alternativa, la llamada atenuación OLED sin parpadeo está disponible en el software MyAsus, que examinamos en nuestro análisis del Zenbook S 13 OLED. De hecho, es un añadido útil, pero también es engorroso tener que pasar por el software todo el tiempo.
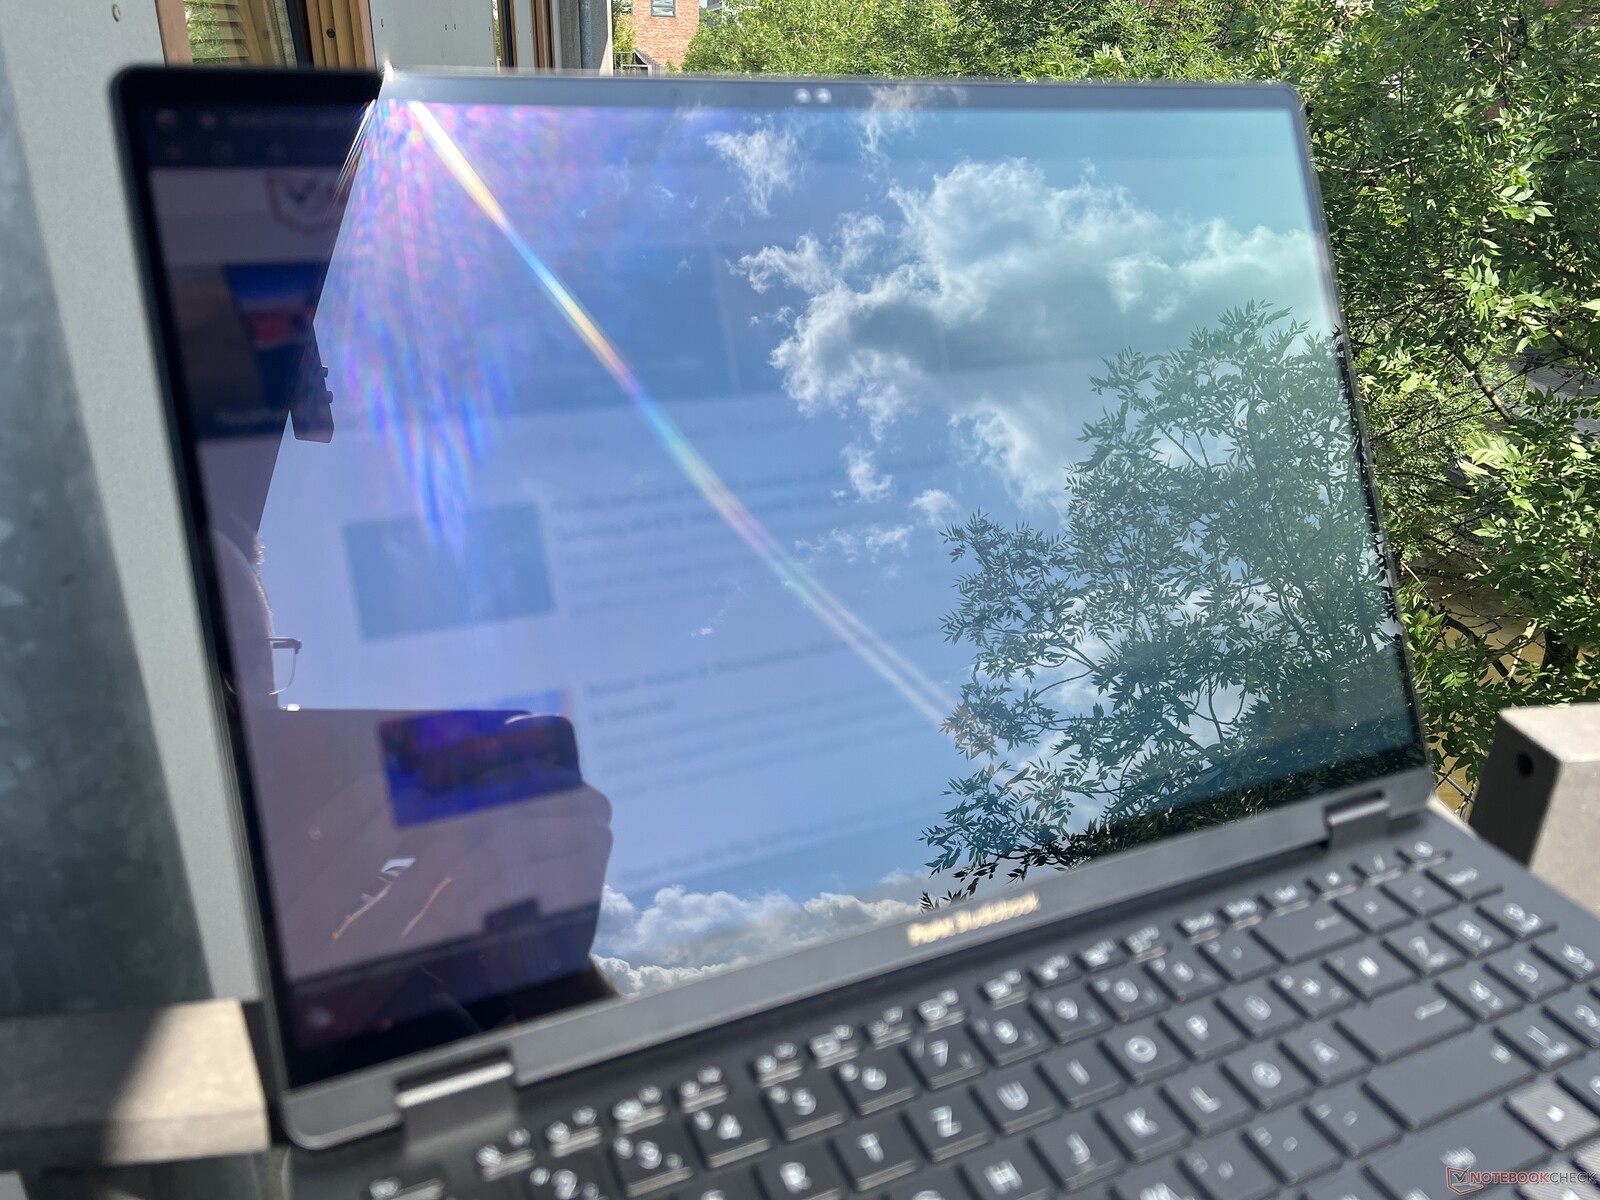
La pantalla táctil es muy reflectante en exteriores, por lo que debes evitar los reflejos de ventanas o fuentes de luz tanto en interiores como en exteriores. Esto no es fácil, especialmente cuando brilla el sol. La estabilidad del ángulo de visión es muy buena en general. Sólo en ángulos muy extremos aparece el típico tinte azul OLED.
Rendimiento - Raptor Lake-HX & Ada Lovelace
Condiciones de ensayo
Hay varios perfiles de energía disponibles en el ProArt Creator Hub preinstalado, que hemos enumerado en la tabla siguiente. Realizamos las mediciones y pruebas comparativas principalmente en modo Rendimiento , pero también examinamos los efectos de los otros dos modos en algunas secciones.
| Perfil energético | Carga de la CPU | Carga de la GPU | Prueba de esfuerzo | Volumen máx. del ventilador |
|---|---|---|---|---|
| Estándar | 157/80 vatios | 90 vatios | CPU: 30 vatios GPU: 80 vatios |
47,6 dB(A) |
| Rendimiento | 170/130 vatios | 130 vatios | CPU: 55 vatios GPU: 105 vatios |
56,7 dB(A) |
| Velocidad máxima | 170/130 vatios | 130 vatios | CPU: 64 vatios 95 vatios |
58,9 dB(A) |
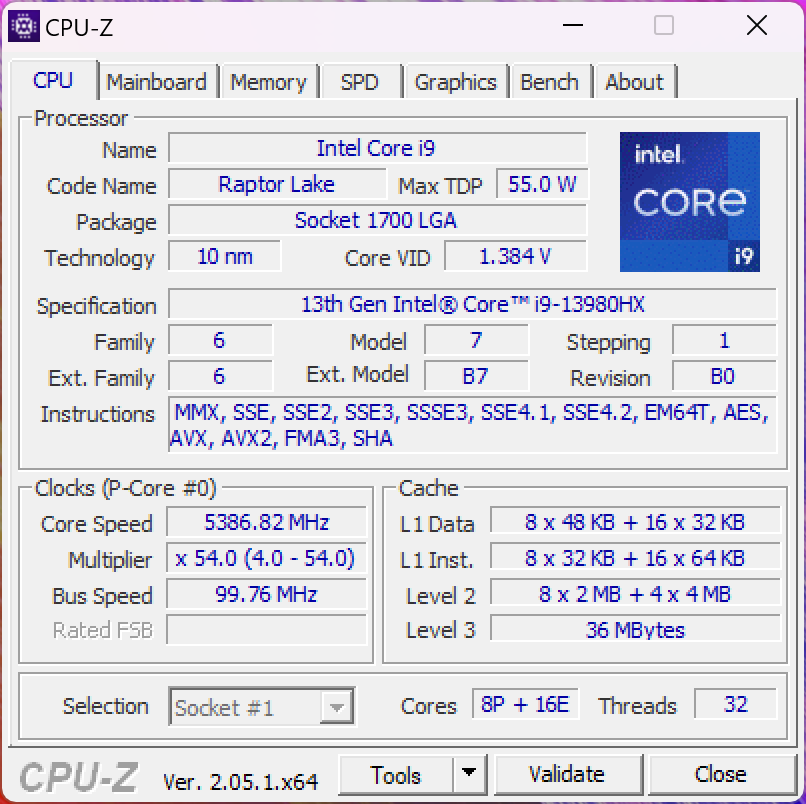
Procesador - Core i9-13980HX
Como procesador se utiliza el actual modelo de gama alta de Intel de la serie Raptor Lake para portátiles, el Core i9-13980HX. Este ofrece 8 núcleos de rendimiento rápido y 16 núcleos de eficiencia, por lo que el chip es capaz de procesar un total de 32 hilos simultáneamente. En el Studiobook, el procesador consume hasta ~170 vatios y se estabiliza en 130 vatios tras unos minutos de carga sostenida. En portátiles grandes para juegos, la CPU funciona un poco más rápido, pero comparado con el grupo de comparación con CPUs Intel normales o el Apple M2 Max, el Studiobook tiene una gran ventaja. En términos de rendimiento mononúcleo, el Core i9 también está por delante del nuevo AMD Ryzen 9 7945HX, pero este último ofrece incluso más rendimiento en las pruebas multinúcleo a la vez que trabaja de forma más eficiente.
Lejos del zócalo, no queda mucho por ver de las capacidades de rendimiento del portátil ya que la CPU sólo puede consumir aquí unos escasos 34/26 vatios. En la multiprueba CB R23, sólo obtiene 11.576 puntos, lo que corresponde a un déficit del 63%. El StudioBook es, por tanto, más lento con batería que elMacBook Pro 16 con su M2 Maxdonde no hay reducción de rendimiento con batería. Más pruebas de CPU están disponibles en nuestra sección de tecnología.
Cinebench R15 Multi Sustained Load
Cinebench R23: Multi Core | Single Core
Cinebench R20: CPU (Multi Core) | CPU (Single Core)
Cinebench R15: CPU Multi 64Bit | CPU Single 64Bit
Blender: v2.79 BMW27 CPU
7-Zip 18.03: 7z b 4 | 7z b 4 -mmt1
Geekbench 5.5: Multi-Core | Single-Core
HWBOT x265 Benchmark v2.2: 4k Preset
LibreOffice : 20 Documents To PDF
R Benchmark 2.5: Overall mean
| CPU Performance rating | |
| Asus Zephyrus Duo 16 GX650PY-NM006W | |
| Asus ProArt Studiobook 16 OLED H7604 | |
| Medio Intel Core i9-13980HX | |
| Apple MacBook Pro 16 2023 M2 Max -6! | |
| MSI Stealth 17 Studio A13VH-014 | |
| Gigabyte AERO 16 OLED BSF | |
| Media de la clase Multimedia | |
| Samsung Galaxy Book3 Ultra 16 | |
| Cinebench R23 / Multi Core | |
| Asus Zephyrus Duo 16 GX650PY-NM006W | |
| Asus ProArt Studiobook 16 OLED H7604 | |
| Medio Intel Core i9-13980HX (28301 - 33052, n=11) | |
| MSI Stealth 17 Studio A13VH-014 | |
| Gigabyte AERO 16 OLED BSF | |
| Media de la clase Multimedia (4861 - 33362, n=80, últimos 2 años) | |
| Samsung Galaxy Book3 Ultra 16 | |
| Apple MacBook Pro 16 2023 M2 Max | |
| Cinebench R23 / Single Core | |
| Asus ProArt Studiobook 16 OLED H7604 | |
| Medio Intel Core i9-13980HX (1825 - 2169, n=9) | |
| Asus Zephyrus Duo 16 GX650PY-NM006W | |
| Media de la clase Multimedia (1128 - 2459, n=72, últimos 2 años) | |
| Gigabyte AERO 16 OLED BSF | |
| MSI Stealth 17 Studio A13VH-014 | |
| Samsung Galaxy Book3 Ultra 16 | |
| Apple MacBook Pro 16 2023 M2 Max | |
| Cinebench R20 / CPU (Multi Core) | |
| Asus Zephyrus Duo 16 GX650PY-NM006W | |
| Asus ProArt Studiobook 16 OLED H7604 | |
| Medio Intel Core i9-13980HX (10353 - 12437, n=10) | |
| MSI Stealth 17 Studio A13VH-014 | |
| Gigabyte AERO 16 OLED BSF | |
| Media de la clase Multimedia (1887 - 12912, n=63, últimos 2 años) | |
| Samsung Galaxy Book3 Ultra 16 | |
| Apple MacBook Pro 16 2023 M2 Max | |
| Cinebench R20 / CPU (Single Core) | |
| Asus ProArt Studiobook 16 OLED H7604 | |
| Medio Intel Core i9-13980HX (717 - 825, n=10) | |
| Asus Zephyrus Duo 16 GX650PY-NM006W | |
| Media de la clase Multimedia (425 - 853, n=63, últimos 2 años) | |
| MSI Stealth 17 Studio A13VH-014 | |
| Samsung Galaxy Book3 Ultra 16 | |
| Gigabyte AERO 16 OLED BSF | |
| Apple MacBook Pro 16 2023 M2 Max | |
| Cinebench R15 / CPU Multi 64Bit | |
| Asus Zephyrus Duo 16 GX650PY-NM006W | |
| Medio Intel Core i9-13980HX (4358 - 5172, n=11) | |
| Asus ProArt Studiobook 16 OLED H7604 | |
| MSI Stealth 17 Studio A13VH-014 | |
| Gigabyte AERO 16 OLED BSF | |
| Media de la clase Multimedia (856 - 5224, n=67, últimos 2 años) | |
| Samsung Galaxy Book3 Ultra 16 | |
| Apple MacBook Pro 16 2023 M2 Max | |
| Cinebench R15 / CPU Single 64Bit | |
| Asus ProArt Studiobook 16 OLED H7604 | |
| Asus Zephyrus Duo 16 GX650PY-NM006W | |
| Medio Intel Core i9-13980HX (289 - 312, n=11) | |
| MSI Stealth 17 Studio A13VH-014 | |
| Media de la clase Multimedia (184.8 - 326, n=65, últimos 2 años) | |
| Samsung Galaxy Book3 Ultra 16 | |
| Gigabyte AERO 16 OLED BSF | |
| Apple MacBook Pro 16 2023 M2 Max | |
| Blender / v2.79 BMW27 CPU | |
| Media de la clase Multimedia (100 - 557, n=64, últimos 2 años) | |
| Samsung Galaxy Book3 Ultra 16 | |
| Gigabyte AERO 16 OLED BSF | |
| MSI Stealth 17 Studio A13VH-014 | |
| Medio Intel Core i9-13980HX (97 - 136, n=10) | |
| Asus ProArt Studiobook 16 OLED H7604 | |
| Asus Zephyrus Duo 16 GX650PY-NM006W | |
| 7-Zip 18.03 / 7z b 4 | |
| Asus Zephyrus Duo 16 GX650PY-NM006W | |
| Asus ProArt Studiobook 16 OLED H7604 | |
| Medio Intel Core i9-13980HX (104616 - 129804, n=10) | |
| MSI Stealth 17 Studio A13VH-014 | |
| Gigabyte AERO 16 OLED BSF | |
| Samsung Galaxy Book3 Ultra 16 | |
| Media de la clase Multimedia (29095 - 130368, n=61, últimos 2 años) | |
| 7-Zip 18.03 / 7z b 4 -mmt1 | |
| Asus Zephyrus Duo 16 GX650PY-NM006W | |
| Asus ProArt Studiobook 16 OLED H7604 | |
| Medio Intel Core i9-13980HX (6230 - 7163, n=10) | |
| MSI Stealth 17 Studio A13VH-014 | |
| Media de la clase Multimedia (3666 - 7545, n=62, últimos 2 años) | |
| Gigabyte AERO 16 OLED BSF | |
| Samsung Galaxy Book3 Ultra 16 | |
| Geekbench 5.5 / Multi-Core | |
| Medio Intel Core i9-13980HX (18475 - 22200, n=10) | |
| Asus ProArt Studiobook 16 OLED H7604 | |
| Asus Zephyrus Duo 16 GX650PY-NM006W | |
| Apple MacBook Pro 16 2023 M2 Max | |
| Gigabyte AERO 16 OLED BSF | |
| MSI Stealth 17 Studio A13VH-014 | |
| Media de la clase Multimedia (4652 - 20422, n=61, últimos 2 años) | |
| Samsung Galaxy Book3 Ultra 16 | |
| Geekbench 5.5 / Single-Core | |
| Asus ProArt Studiobook 16 OLED H7604 | |
| Asus Zephyrus Duo 16 GX650PY-NM006W | |
| Medio Intel Core i9-13980HX (1796 - 2139, n=10) | |
| MSI Stealth 17 Studio A13VH-014 | |
| Apple MacBook Pro 16 2023 M2 Max | |
| Media de la clase Multimedia (805 - 2974, n=61, últimos 2 años) | |
| Gigabyte AERO 16 OLED BSF | |
| Samsung Galaxy Book3 Ultra 16 | |
| HWBOT x265 Benchmark v2.2 / 4k Preset | |
| Asus Zephyrus Duo 16 GX650PY-NM006W | |
| Medio Intel Core i9-13980HX (27 - 33.4, n=9) | |
| Asus ProArt Studiobook 16 OLED H7604 | |
| MSI Stealth 17 Studio A13VH-014 | |
| Gigabyte AERO 16 OLED BSF | |
| Media de la clase Multimedia (5.26 - 36.1, n=62, últimos 2 años) | |
| Samsung Galaxy Book3 Ultra 16 | |
| LibreOffice / 20 Documents To PDF | |
| Asus Zephyrus Duo 16 GX650PY-NM006W | |
| Gigabyte AERO 16 OLED BSF | |
| MSI Stealth 17 Studio A13VH-014 | |
| Media de la clase Multimedia (23.9 - 146.7, n=63, últimos 2 años) | |
| Samsung Galaxy Book3 Ultra 16 | |
| Asus ProArt Studiobook 16 OLED H7604 | |
| Medio Intel Core i9-13980HX (35 - 51.4, n=10) | |
| R Benchmark 2.5 / Overall mean | |
| Gigabyte AERO 16 OLED BSF | |
| Samsung Galaxy Book3 Ultra 16 | |
| Media de la clase Multimedia (0.3604 - 0.947, n=62, últimos 2 años) | |
| MSI Stealth 17 Studio A13VH-014 | |
| Asus Zephyrus Duo 16 GX650PY-NM006W | |
| Medio Intel Core i9-13980HX (0.3793 - 0.4462, n=10) | |
| Asus ProArt Studiobook 16 OLED H7604 | |
* ... más pequeño es mejor
AIDA64: FP32 Ray-Trace | FPU Julia | CPU SHA3 | CPU Queen | FPU SinJulia | FPU Mandel | CPU AES | CPU ZLib | FP64 Ray-Trace | CPU PhotoWorxx
| Performance rating | |
| Asus ProArt Studiobook 16 OLED H7604 | |
| Medio Intel Core i9-13980HX | |
| Gigabyte AERO 16 OLED BSF | |
| MSI Stealth 17 Studio A13VH-014 | |
| Media de la clase Multimedia | |
| Samsung Galaxy Book3 Ultra 16 | |
| AIDA64 / FP32 Ray-Trace | |
| Asus ProArt Studiobook 16 OLED H7604 | |
| Medio Intel Core i9-13980HX (21332 - 29553, n=9) | |
| MSI Stealth 17 Studio A13VH-014 | |
| Gigabyte AERO 16 OLED BSF | |
| Media de la clase Multimedia (2214 - 50388, n=59, últimos 2 años) | |
| Samsung Galaxy Book3 Ultra 16 | |
| AIDA64 / FPU Julia | |
| Asus ProArt Studiobook 16 OLED H7604 | |
| Medio Intel Core i9-13980HX (108001 - 148168, n=9) | |
| MSI Stealth 17 Studio A13VH-014 | |
| Gigabyte AERO 16 OLED BSF | |
| Media de la clase Multimedia (12867 - 201874, n=60, últimos 2 años) | |
| Samsung Galaxy Book3 Ultra 16 | |
| AIDA64 / CPU SHA3 | |
| Asus ProArt Studiobook 16 OLED H7604 | |
| Medio Intel Core i9-13980HX (5264 - 7142, n=9) | |
| MSI Stealth 17 Studio A13VH-014 | |
| Gigabyte AERO 16 OLED BSF | |
| Media de la clase Multimedia (653 - 8623, n=60, últimos 2 años) | |
| Samsung Galaxy Book3 Ultra 16 | |
| AIDA64 / CPU Queen | |
| Medio Intel Core i9-13980HX (126758 - 143409, n=9) | |
| Asus ProArt Studiobook 16 OLED H7604 | |
| Samsung Galaxy Book3 Ultra 16 | |
| MSI Stealth 17 Studio A13VH-014 | |
| Gigabyte AERO 16 OLED BSF | |
| Media de la clase Multimedia (13483 - 181505, n=48, últimos 2 años) | |
| AIDA64 / FPU SinJulia | |
| Medio Intel Core i9-13980HX (13785 - 17117, n=9) | |
| Asus ProArt Studiobook 16 OLED H7604 | |
| MSI Stealth 17 Studio A13VH-014 | |
| Gigabyte AERO 16 OLED BSF | |
| Media de la clase Multimedia (1240 - 28794, n=60, últimos 2 años) | |
| Samsung Galaxy Book3 Ultra 16 | |
| AIDA64 / FPU Mandel | |
| Asus ProArt Studiobook 16 OLED H7604 | |
| Medio Intel Core i9-13980HX (53398 - 73758, n=9) | |
| MSI Stealth 17 Studio A13VH-014 | |
| Gigabyte AERO 16 OLED BSF | |
| Media de la clase Multimedia (6395 - 105740, n=59, últimos 2 años) | |
| Samsung Galaxy Book3 Ultra 16 | |
| AIDA64 / CPU AES | |
| Gigabyte AERO 16 OLED BSF | |
| Asus ProArt Studiobook 16 OLED H7604 | |
| Medio Intel Core i9-13980HX (105169 - 136520, n=9) | |
| MSI Stealth 17 Studio A13VH-014 | |
| Samsung Galaxy Book3 Ultra 16 | |
| Media de la clase Multimedia (13243 - 126790, n=60, últimos 2 años) | |
| AIDA64 / CPU ZLib | |
| Asus ProArt Studiobook 16 OLED H7604 | |
| Medio Intel Core i9-13980HX (1513 - 2039, n=9) | |
| MSI Stealth 17 Studio A13VH-014 | |
| Gigabyte AERO 16 OLED BSF | |
| Samsung Galaxy Book3 Ultra 16 | |
| Media de la clase Multimedia (167.2 - 2022, n=60, últimos 2 años) | |
| AIDA64 / FP64 Ray-Trace | |
| Medio Intel Core i9-13980HX (11431 - 16325, n=9) | |
| Asus ProArt Studiobook 16 OLED H7604 | |
| MSI Stealth 17 Studio A13VH-014 | |
| Gigabyte AERO 16 OLED BSF | |
| Media de la clase Multimedia (1014 - 26875, n=60, últimos 2 años) | |
| Samsung Galaxy Book3 Ultra 16 | |
| AIDA64 / CPU PhotoWorxx | |
| MSI Stealth 17 Studio A13VH-014 | |
| Media de la clase Multimedia (12860 - 88154, n=60, últimos 2 años) | |
| Asus ProArt Studiobook 16 OLED H7604 | |
| Samsung Galaxy Book3 Ultra 16 | |
| Medio Intel Core i9-13980HX (37069 - 52949, n=9) | |
| Gigabyte AERO 16 OLED BSF | |
Rendimiento del sistema
El rendimiento del sistema es excelente, tanto en las pruebas sintéticas como en la práctica. Tampoco se encontraron problemas durante las pruebas.
CrossMark: Overall | Productivity | Creativity | Responsiveness
| PCMark 10 / Score | |
| Asus Zephyrus Duo 16 GX650PY-NM006W | |
| Gigabyte AERO 16 OLED BSF | |
| Media de la clase Multimedia (4325 - 10386, n=57, últimos 2 años) | |
| Asus ProArt Studiobook 16 OLED H7604 | |
| Medio Intel Core i9-13980HX, NVIDIA GeForce RTX 4070 Laptop GPU (n=1) | |
| MSI Stealth 17 Studio A13VH-014 | |
| Samsung Galaxy Book3 Ultra 16 | |
| PCMark 10 / Essentials | |
| Asus Zephyrus Duo 16 GX650PY-NM006W | |
| Gigabyte AERO 16 OLED BSF | |
| Asus ProArt Studiobook 16 OLED H7604 | |
| Medio Intel Core i9-13980HX, NVIDIA GeForce RTX 4070 Laptop GPU (n=1) | |
| Samsung Galaxy Book3 Ultra 16 | |
| Media de la clase Multimedia (8025 - 11664, n=56, últimos 2 años) | |
| MSI Stealth 17 Studio A13VH-014 | |
| PCMark 10 / Productivity | |
| Asus Zephyrus Duo 16 GX650PY-NM006W | |
| Media de la clase Multimedia (7323 - 18233, n=56, últimos 2 años) | |
| MSI Stealth 17 Studio A13VH-014 | |
| Asus ProArt Studiobook 16 OLED H7604 | |
| Medio Intel Core i9-13980HX, NVIDIA GeForce RTX 4070 Laptop GPU (n=1) | |
| Gigabyte AERO 16 OLED BSF | |
| Samsung Galaxy Book3 Ultra 16 | |
| PCMark 10 / Digital Content Creation | |
| Asus Zephyrus Duo 16 GX650PY-NM006W | |
| Gigabyte AERO 16 OLED BSF | |
| MSI Stealth 17 Studio A13VH-014 | |
| Asus ProArt Studiobook 16 OLED H7604 | |
| Medio Intel Core i9-13980HX, NVIDIA GeForce RTX 4070 Laptop GPU (n=1) | |
| Media de la clase Multimedia (3651 - 16240, n=56, últimos 2 años) | |
| Samsung Galaxy Book3 Ultra 16 | |
| CrossMark / Overall | |
| Asus ProArt Studiobook 16 OLED H7604 | |
| Medio Intel Core i9-13980HX, NVIDIA GeForce RTX 4070 Laptop GPU (n=1) | |
| Asus Zephyrus Duo 16 GX650PY-NM006W | |
| Apple MacBook Pro 16 2023 M2 Max | |
| Gigabyte AERO 16 OLED BSF | |
| Media de la clase Multimedia (866 - 2728, n=66, últimos 2 años) | |
| MSI Stealth 17 Studio A13VH-014 | |
| Samsung Galaxy Book3 Ultra 16 | |
| CrossMark / Productivity | |
| Asus ProArt Studiobook 16 OLED H7604 | |
| Medio Intel Core i9-13980HX, NVIDIA GeForce RTX 4070 Laptop GPU (n=1) | |
| Asus Zephyrus Duo 16 GX650PY-NM006W | |
| Gigabyte AERO 16 OLED BSF | |
| Media de la clase Multimedia (931 - 2489, n=66, últimos 2 años) | |
| MSI Stealth 17 Studio A13VH-014 | |
| Apple MacBook Pro 16 2023 M2 Max | |
| Samsung Galaxy Book3 Ultra 16 | |
| CrossMark / Creativity | |
| Apple MacBook Pro 16 2023 M2 Max | |
| Asus ProArt Studiobook 16 OLED H7604 | |
| Medio Intel Core i9-13980HX, NVIDIA GeForce RTX 4070 Laptop GPU (n=1) | |
| Asus Zephyrus Duo 16 GX650PY-NM006W | |
| Media de la clase Multimedia (907 - 3465, n=66, últimos 2 años) | |
| Gigabyte AERO 16 OLED BSF | |
| MSI Stealth 17 Studio A13VH-014 | |
| Samsung Galaxy Book3 Ultra 16 | |
| CrossMark / Responsiveness | |
| Gigabyte AERO 16 OLED BSF | |
| Asus ProArt Studiobook 16 OLED H7604 | |
| Medio Intel Core i9-13980HX, NVIDIA GeForce RTX 4070 Laptop GPU (n=1) | |
| Asus Zephyrus Duo 16 GX650PY-NM006W | |
| MSI Stealth 17 Studio A13VH-014 | |
| Media de la clase Multimedia (605 - 2024, n=66, últimos 2 años) | |
| Samsung Galaxy Book3 Ultra 16 | |
| Apple MacBook Pro 16 2023 M2 Max | |
| PCMark 10 Score | 7491 puntos | |
ayuda | ||
| AIDA64 / Memory Copy | |
| Media de la clase Multimedia (21158 - 132135, n=60, últimos 2 años) | |
| Asus ProArt Studiobook 16 OLED H7604 | |
| MSI Stealth 17 Studio A13VH-014 | |
| Samsung Galaxy Book3 Ultra 16 | |
| Medio Intel Core i9-13980HX (62189 - 80776, n=9) | |
| Gigabyte AERO 16 OLED BSF | |
| AIDA64 / Memory Read | |
| Media de la clase Multimedia (19699 - 174586, n=60, últimos 2 años) | |
| Asus ProArt Studiobook 16 OLED H7604 | |
| Medio Intel Core i9-13980HX (62624 - 89096, n=9) | |
| MSI Stealth 17 Studio A13VH-014 | |
| Samsung Galaxy Book3 Ultra 16 | |
| Gigabyte AERO 16 OLED BSF | |
| AIDA64 / Memory Write | |
| Samsung Galaxy Book3 Ultra 16 | |
| Media de la clase Multimedia (17733 - 134998, n=60, últimos 2 años) | |
| MSI Stealth 17 Studio A13VH-014 | |
| Asus ProArt Studiobook 16 OLED H7604 | |
| Medio Intel Core i9-13980HX (59912 - 79917, n=9) | |
| Gigabyte AERO 16 OLED BSF | |
| AIDA64 / Memory Latency | |
| Media de la clase Multimedia (7 - 535, n=59, últimos 2 años) | |
| Samsung Galaxy Book3 Ultra 16 | |
| Gigabyte AERO 16 OLED BSF | |
| MSI Stealth 17 Studio A13VH-014 | |
| Medio Intel Core i9-13980HX (79.4 - 93.2, n=9) | |
| Asus ProArt Studiobook 16 OLED H7604 | |
* ... más pequeño es mejor
Latencia del CPD
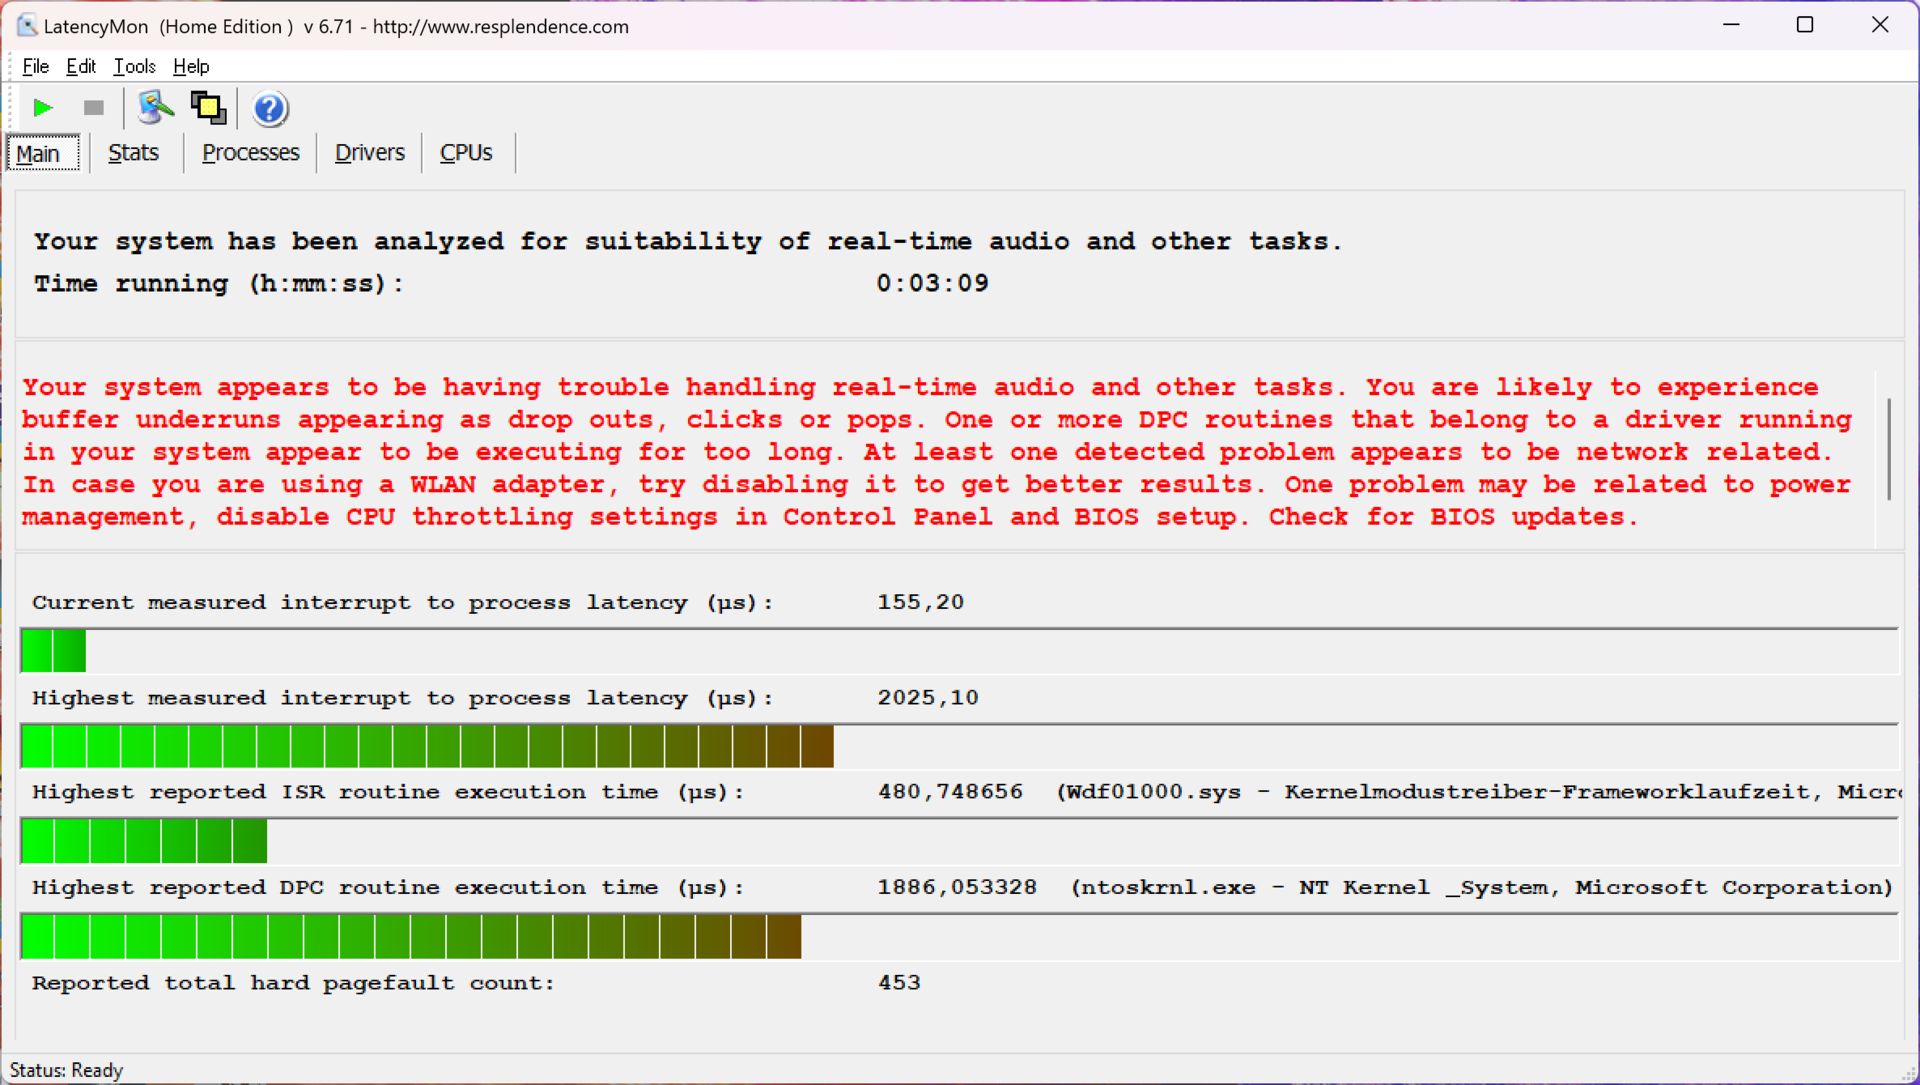
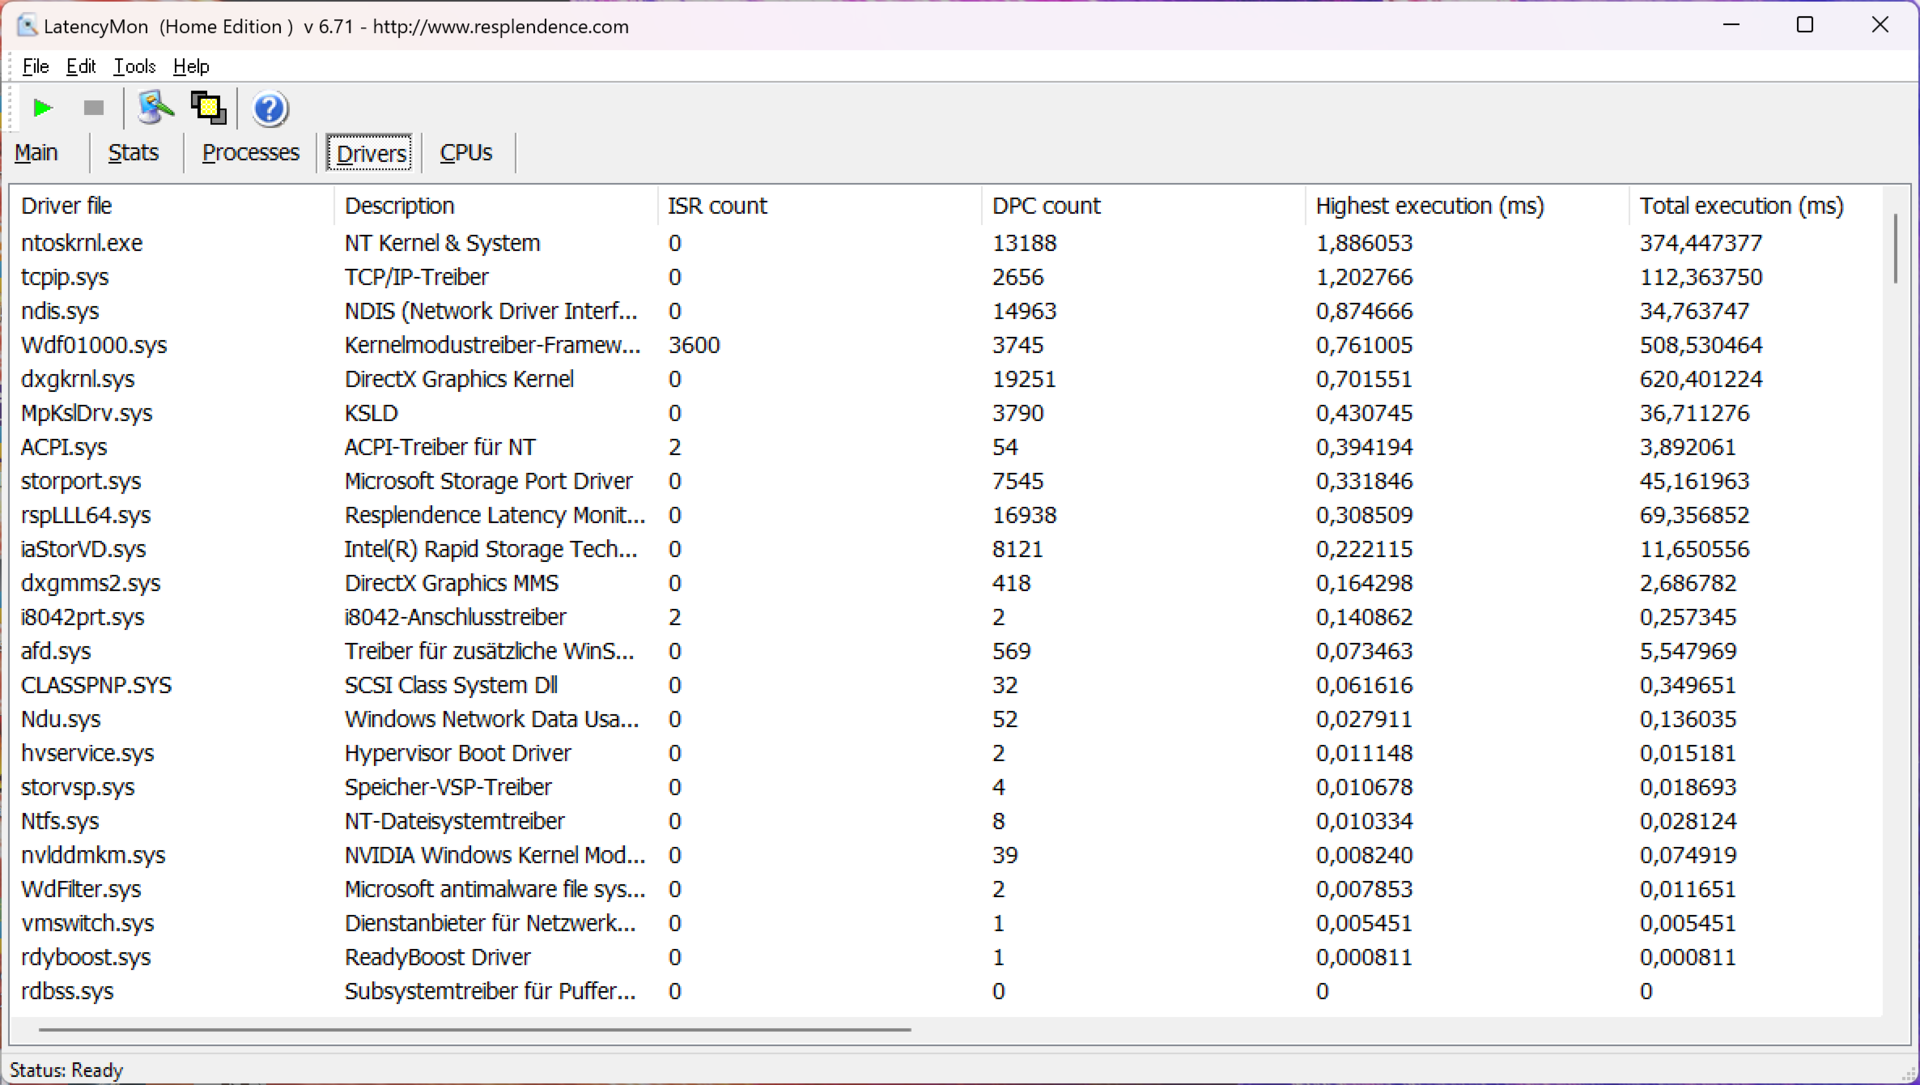
El Studiobook no es especialmente adecuado para aplicaciones de audio en tiempo real. En nuestra prueba de latencia estandarizada se produjeron altas latencias con la versión actual de la BIOS.
| DPC Latencies / LatencyMon - interrupt to process latency (max), Web, Youtube, Prime95 | |
| Asus Zephyrus Duo 16 GX650PY-NM006W | |
| Samsung Galaxy Book3 Ultra 16 | |
| MSI Stealth 17 Studio A13VH-014 | |
| Asus ProArt Studiobook 16 OLED H7604 | |
| Gigabyte AERO 16 OLED BSF | |
* ... más pequeño es mejor
Dispositivos de almacenamiento
En nuestro dispositivo de pruebas se usa un veloz SSD PCIe 4.0 de Phison, que ofrece una enorme capacidad de almacenamiento de 4 TB. De ellos, 3.63 TB siguen disponibles tras el primer arranque. La unidad es muy rápida, con tasas de transferencia de más de 7 GB/s y, sobre todo, el rendimiento puede mantenerse constantemente, incluso bajo carga permanente. Esto no es en absoluto estándar. Además, el Studiobook 16 ofrece otra ranura M.2 2280, que también está conectada a través de la rápida interfaz PCIe 4.0. Más benchmarks de SSD están listadosaquí.

* ... más pequeño es mejor
Sustained Read Performance: DiskSpd Read Loop, Queue Depth 8
Gráficos
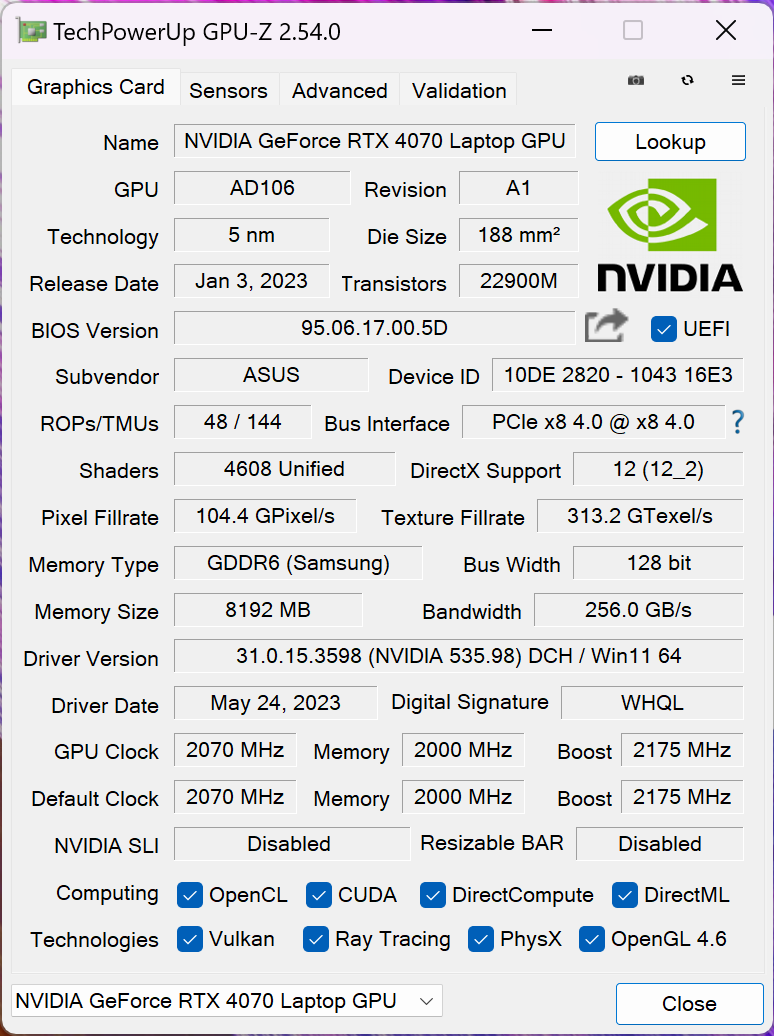
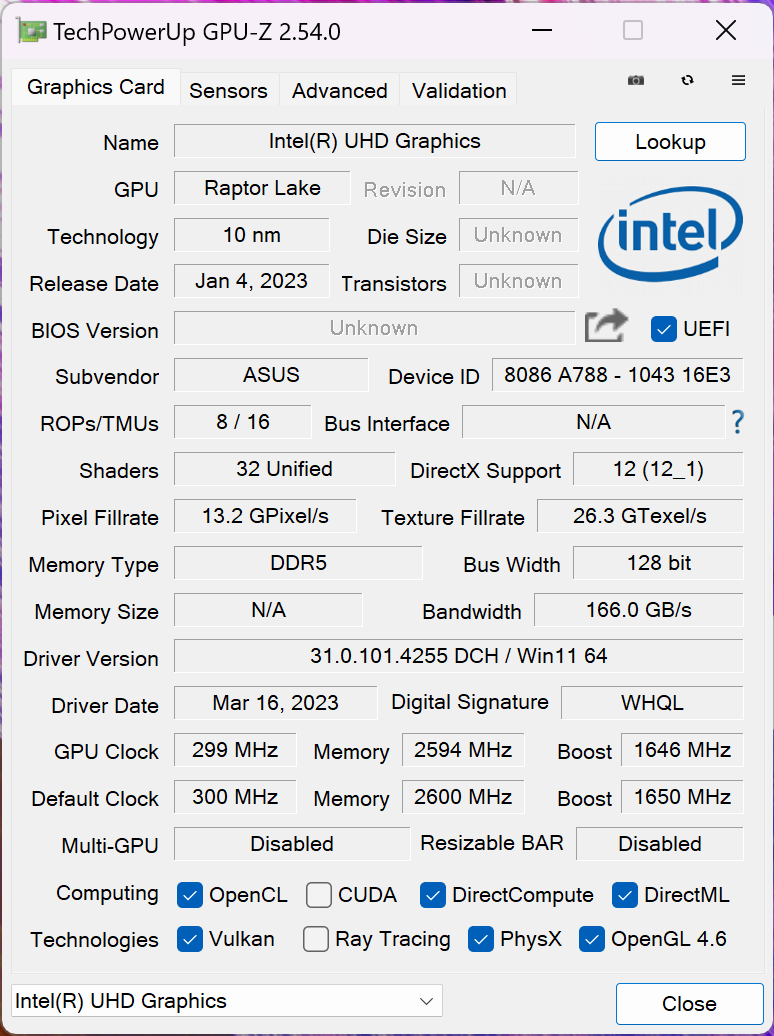
Además de la GPU integrada del procesador (UHD Graphics), también está instalada la veloz Nvidia GeForce RTX 4070 Laptop. La conmutación de gráficos se realiza a través de Optimus, pero no hay Advanced Optimus o un interruptor MUX. Con un TGP máximo de 130 vatios, este es uno de los modelos de portátiles 4070 más rápidos, pero esta cifra es un poco engañosa. Como vimos en nuestro primer análisis de las nuevas GPU portátiles, este valor puede alcanzarse en pruebas sintéticas como FurMark, pero en juegos se limita a unos 105-110 vatios porque la GPU alcanza aquí su reloj máximo
En los benchmarks, la RTX 4070 está al nivel esperado por detrás de laRTX 4080 portátil y la 4090 Portátilcomparado con el antiguo Studiobook 16 con su RTX 3070 Ti,la ventaja del 7-15% no es tan grande, por lo que una actualización no merece la pena aquí. El rendimiento GPU se mantiene estable bajo carga permanente, pero el rendimiento es alrededor de un 40% inferior en modo batería (TGP máx. 40 vatios). Hay más pruebas de GPU disponibles en aquí.
| 3DMark 11 Performance | 35000 puntos | |
| 3DMark Fire Strike Score | 25949 puntos | |
| 3DMark Time Spy Score | 12384 puntos | |
ayuda | ||
| Blender / v3.3 Classroom OPTIX/RTX | |
| Media de la clase Multimedia (12 - 105, n=24, últimos 2 años) | |
| Samsung Galaxy Book3 Ultra 16 | |
| Asus ProArt StudioBook 16 H7600ZW | |
| Schenker XMG Pro 15 (E23) | |
| Asus ProArt Studiobook 16 OLED H7604 | |
| Medio NVIDIA GeForce RTX 4070 Laptop GPU (18 - 30, n=68) | |
| Gigabyte AERO 16 OLED BSF | |
| MSI Stealth 17 Studio A13VH-014 | |
| Asus Zephyrus Duo 16 GX650PY-NM006W | |
| Blender / v3.3 Classroom CUDA | |
| Samsung Galaxy Book3 Ultra 16 | |
| Media de la clase Multimedia (20 - 186, n=24, últimos 2 años) | |
| Asus ProArt StudioBook 16 H7600ZW | |
| Schenker XMG Pro 15 (E23) | |
| Asus ProArt Studiobook 16 OLED H7604 | |
| Medio NVIDIA GeForce RTX 4070 Laptop GPU (32 - 50, n=67) | |
| Gigabyte AERO 16 OLED BSF | |
| MSI Stealth 17 Studio A13VH-014 | |
| Asus Zephyrus Duo 16 GX650PY-NM006W | |
| Blender / v3.3 Classroom METAL | |
| Apple MacBook Pro 16 2023 M2 Max | |
| Media de la clase Multimedia (17.8 - 68, n=5, últimos 2 años) | |
| Blender / v3.3 Classroom CPU | |
| Media de la clase Multimedia (134.5 - 1042, n=67, últimos 2 años) | |
| Samsung Galaxy Book3 Ultra 16 | |
| Apple MacBook Pro 16 2023 M2 Max | |
| Gigabyte AERO 16 OLED BSF | |
| Medio NVIDIA GeForce RTX 4070 Laptop GPU (158 - 440, n=67) | |
| Asus ProArt StudioBook 16 H7600ZW | |
| MSI Stealth 17 Studio A13VH-014 | |
| Schenker XMG Pro 15 (E23) | |
| Asus ProArt Studiobook 16 OLED H7604 | |
| Asus Zephyrus Duo 16 GX650PY-NM006W | |
* ... más pequeño es mejor
Rendimiento en juegos
El rendimiento de juego del Studiobook 16 es muy bueno e incluso se puede jugar a títulos modernos en resolución QHD sin problemas. Sólo el trazado de rayos suele requerir un aumento de escala para jugar con fluidez. Un buen ejemplo aquí es Cyberpunk 2077, donde sólo 26 FPS son posibles con el preajuste Ray Tracing Ultra, pero esto se convierte en 84 FPS con DLSS (incluyendo Frame Generation). Por supuesto, el aumento de velocidad puede variar dependiendo del título y Cyberpunk es un título emblemático para DLSS. El rendimiento de juego se mantiene estable durante las sesiones más largas, pero la ventaja general sobre el viejo libro de estudio con su RTX 3070 Ti es mínima.
Witcher 3 FPS Chart
| bajo | medio | alto | ultra | QHD | |
|---|---|---|---|---|---|
| GTA V (2015) | 183.4 | 179 | 123 | 94.5 | |
| The Witcher 3 (2015) | 249 | 107.1 | |||
| Dota 2 Reborn (2015) | 215 | 192.8 | 184.4 | 171.6 | |
| Final Fantasy XV Benchmark (2018) | 162.4 | 114.7 | 85.2 | ||
| X-Plane 11.11 (2018) | 181.6 | 164.3 | 131.1 | ||
| Far Cry 5 (2018) | 187 | 162 | 154 | 145 | 117 |
| Strange Brigade (2018) | 315 | 162.1 | 150.6 | 142.7 | 95.3 |
| Shadow of the Tomb Raider (2018) | 153 | 103 | |||
| F1 2021 (2021) | 441 | 336 | 264 | 149.8 | 110.9 |
| Cyberpunk 2077 1.6 (2022) | 129 | 113 | 96 | 87 | 54 |
| F1 22 (2022) | 138.5 | 133.8 | 111.2 | 59.4 | 42.4 |
| Call of Duty Modern Warfare 2 2022 (2022) | 102 | 72 |
Emisiones - Más alto, más alto, Studiobook
Ruido
Los dos ventiladores suelen permanecer silenciosos durante las tareas cotidianas, pero rápidamente se vuelven ruidosos en cuanto la CPU o la GPU entran en tensión. Hemos listado los valores en la siguiente tabla, pero generalmente recomendamos auriculares o cascos cuando se juega. Puedes omitir el modo Full Speed aquí, ya que sólo se vuelve más ruidoso y no hay ninguna ventaja de rendimiento. No se detectaron otros ruidos electrónicos, como el zumbido de la bobina
| Perfil energético | 3DMark 06 | Witcher 3 | Cyberpoint 2077 | Prueba de estrés |
|---|---|---|---|---|
| Por defecto | 43,6dB(A) | 43,6dB(A) | 47,6dB(A) | 47,6dB(A) |
| Rendimiento | 43,6dB(A) | 43,6dB(A) | 47,6dB(A) | 47,6dB(A) |
| Velocidad máxima | 58,9dB(A) | 58,9dB(A) | 58,9dB(A) | 58,9dB(A) |
Ruido
| Ocioso |
| 24.5 / 24.5 / 24.5 dB(A) |
| Carga |
| 47.6 / 56.7 dB(A) |
 | ||
30 dB silencioso 40 dB(A) audible 50 dB(A) ruidosamente alto |
||
min: | ||
| Asus ProArt Studiobook 16 OLED H7604 GeForce RTX 4070 Laptop GPU, i9-13980HX, Phison EM2804TBMTCB47 | Gigabyte AERO 16 OLED BSF GeForce RTX 4070 Laptop GPU, i9-13900H, Gigabyte AG470S1TB-SI B10 | Samsung Galaxy Book3 Ultra 16 GeForce RTX 4050 Laptop GPU, i7-13700H, Samsung PM9A1 MZVL2512HCJQ | MSI Stealth 17 Studio A13VH-014 GeForce RTX 4080 Laptop GPU, i9-13900H, Samsung PM9A1 MZVL22T0HBLB | Apple MacBook Pro 16 2023 M2 Max M2 Max 38-Core GPU, M2 Max, Apple SSD AP2048Z | Asus Zephyrus Duo 16 GX650PY-NM006W GeForce RTX 4090 Laptop GPU, R9 7945HX, SK hynix PC801 HFS002TEJ9X101N | |
|---|---|---|---|---|---|---|
| Noise | -3% | 6% | 9% | 13% | -9% | |
| apagado / medio ambiente * (dB) | 24.5 | 23 6% | 25 -2% | 24 2% | 23.9 2% | 23.9 2% |
| Idle Minimum * (dB) | 24.5 | 23 6% | 26 -6% | 24 2% | 23.9 2% | 23.9 2% |
| Idle Average * (dB) | 24.5 | 23 6% | 27 -10% | 24 2% | 23.9 2% | 32.9 -34% |
| Idle Maximum * (dB) | 24.5 | 33.64 -37% | 28 -14% | 24 2% | 23.9 2% | 36.5 -49% |
| Load Average * (dB) | 47.6 | 51.49 -8% | 40 16% | 34.49 28% | 36.6 23% | 42.9 10% |
| Witcher 3 ultra * (dB) | 55.9 | 55.27 1% | 39 30% | 48.29 14% | 35.1 37% | 51.2 8% |
| Load Maximum * (dB) | 56.7 | 55.24 3% | 41 28% | 49.66 12% | 43.2 24% | 56 1% |
* ... más pequeño es mejor
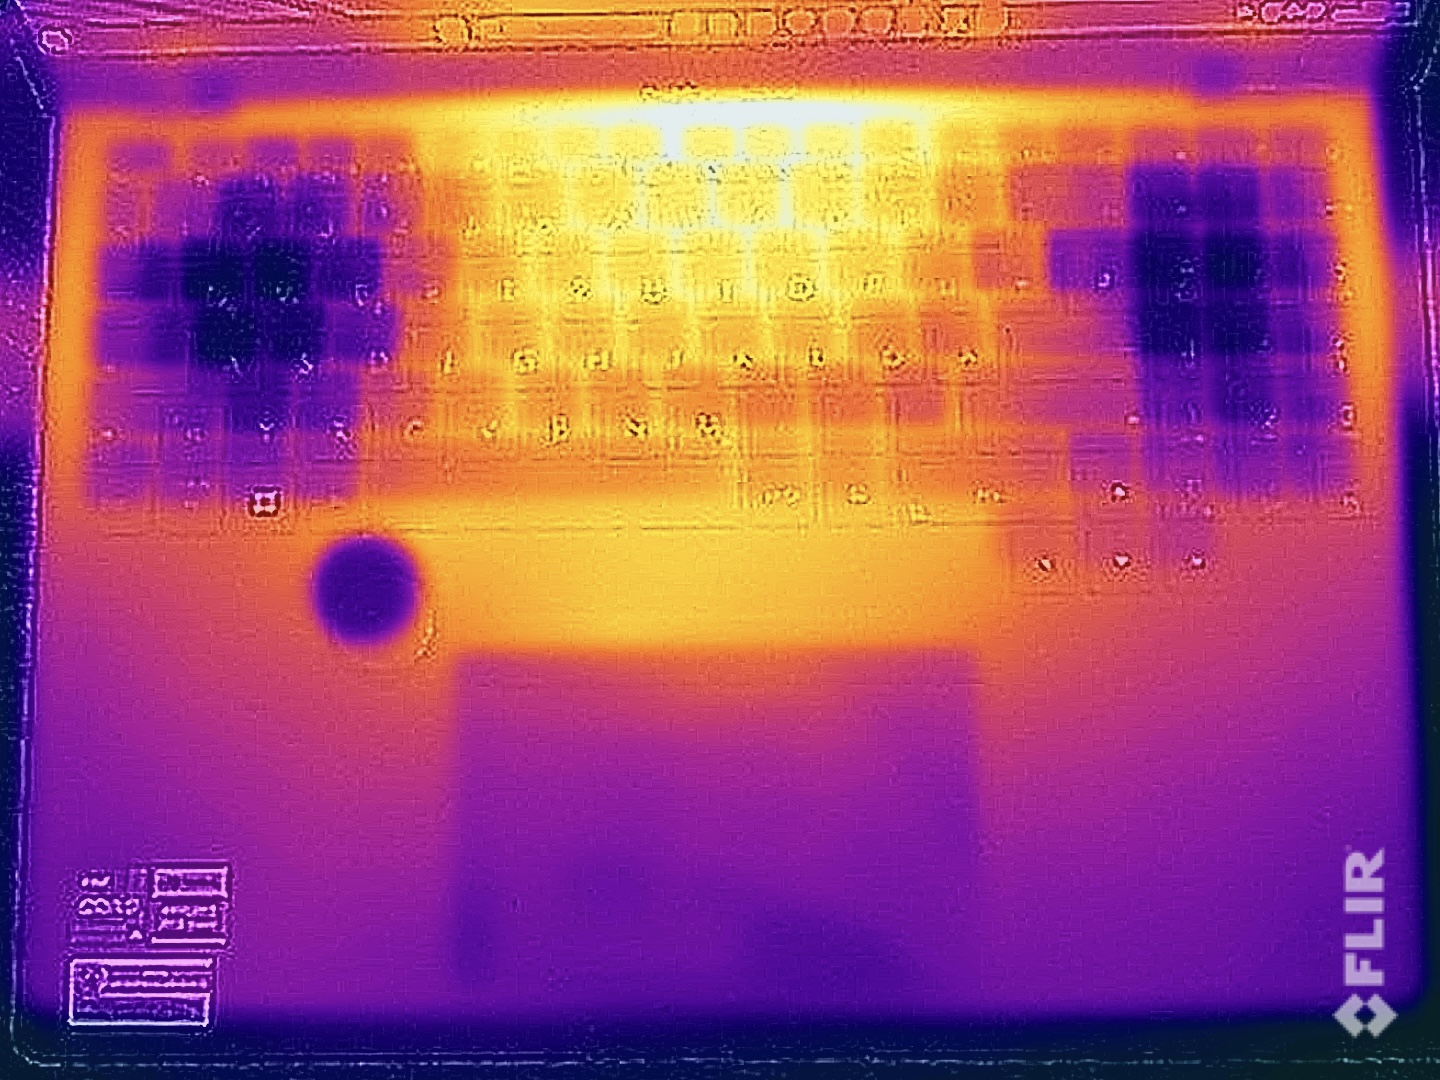
Temperatura
Las temperaturas superficiales no son problemáticas en general, pero los potentes componentes del portátil se hacen notar rápidamente, incluso en inactivo. Como los ventiladores no están en marcha, medimos más de 30 °C. Bajo carga, la parte superior de la unidad base se mantiene bastante cómoda con un máximo de 45 °C y no hay restricciones al teclear. El lado inferior alcanza un máximo de algo menos de 48 °C en el centro, por lo que teóricamente puedes poner el dispositivo sobre el regazo (pero es poco probable dado el tamaño).
Los dos componentes se nivelan muy rápidamente en el test de estrés, por lo que la tarjeta gráfica es la preferida por el sistema y trabaja con unos 105 vatios, mientras que el procesador sigue con ~55 vatios. No se registró ninguna reducción de rendimiento directamente después de la prueba de estrés.
(±) La temperatura máxima en la parte superior es de 44.1 °C / 111 F, frente a la media de 36.8 °C / 98 F, que oscila entre 21 y 71 °C para la clase Multimedia.
(-) El fondo se calienta hasta un máximo de 48 °C / 118 F, frente a la media de 39.1 °C / 102 F
(+) En reposo, la temperatura media de la parte superior es de 31 °C / 88# F, frente a la media del dispositivo de 31.3 °C / 88 F.
(±) Jugando a The Witcher 3, la temperatura media de la parte superior es de 34.9 °C / 95 F, frente a la media del dispositivo de 31.3 °C / 88 F.
(+) Los reposamanos y el panel táctil alcanzan como máximo la temperatura de la piel (32.3 °C / 90.1 F) y, por tanto, no están calientes.
(-) La temperatura media de la zona del reposamanos de dispositivos similares fue de 28.7 °C / 83.7 F (-3.6 °C / -6.4 F).
| Asus ProArt Studiobook 16 OLED H7604 Intel Core i9-13980HX, NVIDIA GeForce RTX 4070 Laptop GPU | Gigabyte AERO 16 OLED BSF Intel Core i9-13900H, NVIDIA GeForce RTX 4070 Laptop GPU | Samsung Galaxy Book3 Ultra 16 Intel Core i7-13700H, NVIDIA GeForce RTX 4050 Laptop GPU | MSI Stealth 17 Studio A13VH-014 Intel Core i9-13900H, NVIDIA GeForce RTX 4080 Laptop GPU | Apple MacBook Pro 16 2023 M2 Max Apple M2 Max, Apple M2 Max 38-Core GPU | Asus Zephyrus Duo 16 GX650PY-NM006W AMD Ryzen 9 7945HX, NVIDIA GeForce RTX 4090 Laptop GPU | |
|---|---|---|---|---|---|---|
| Heat | 18% | 18% | -1% | 20% | 7% | |
| Maximum Upper Side * (°C) | 44.1 | 41 7% | 41 7% | 47 -7% | 44.2 -0% | 44.2 -0% |
| Maximum Bottom * (°C) | 48 | 47 2% | 44 8% | 54 -13% | 42.9 11% | 46.8 2% |
| Idle Upper Side * (°C) | 32.7 | 23 30% | 23 30% | 30 8% | 22.4 31% | 29.2 11% |
| Idle Bottom * (°C) | 34.9 | 23 34% | 26 26% | 32 8% | 22.3 36% | 30.2 13% |
* ... más pequeño es mejor
Altavoces
El sistema de sonido consta de cuatro altavoces que ofrecen una buena calidad de sonido. Aunque no es suficiente para competir con el MacBook Pro 16ya que le falta un poco de presión, en general es satisfactorio. El rendimiento es suficiente para vídeos y algo de música de fondo, y de todos modos no se oye mucho por los altavoces durante los juegos debido a los ruidosos ventiladores.
Asus ProArt Studiobook 16 OLED H7604 análisis de audio
(+) | los altavoces pueden reproducir a un volumen relativamente alto (#84 dB)
Graves 100 - 315 Hz
(±) | lubina reducida - en promedio 14.1% inferior a la mediana
(±) | la linealidad de los graves es media (9.5% delta a frecuencia anterior)
Medios 400 - 2000 Hz
(+) | medios equilibrados - a sólo 1.9% de la mediana
(+) | los medios son lineales (3.8% delta a la frecuencia anterior)
Altos 2 - 16 kHz
(+) | máximos equilibrados - a sólo 4.2% de la mediana
(+) | los máximos son lineales (3.9% delta a la frecuencia anterior)
Total 100 - 16.000 Hz
(+) | el sonido global es lineal (11.2% de diferencia con la mediana)
En comparación con la misma clase
» 17% de todos los dispositivos probados de esta clase eran mejores, 4% similares, 80% peores
» El mejor tuvo un delta de 5%, la media fue 17%, el peor fue ###max##%
En comparación con todos los dispositivos probados
» 7% de todos los dispositivos probados eran mejores, 2% similares, 91% peores
» El mejor tuvo un delta de 4%, la media fue 24%, el peor fue ###max##%
Apple MacBook Pro 16 2023 M2 Max análisis de audio
(+) | los altavoces pueden reproducir a un volumen relativamente alto (#86.1 dB)
Graves 100 - 315 Hz
(+) | buen bajo - sólo 3.9% lejos de la mediana
(+) | el bajo es lineal (5.7% delta a la frecuencia anterior)
Medios 400 - 2000 Hz
(+) | medios equilibrados - a sólo 1.2% de la mediana
(+) | los medios son lineales (1.5% delta a la frecuencia anterior)
Altos 2 - 16 kHz
(+) | máximos equilibrados - a sólo 2.5% de la mediana
(+) | los máximos son lineales (1.7% delta a la frecuencia anterior)
Total 100 - 16.000 Hz
(+) | el sonido global es lineal (4.9% de diferencia con la mediana)
En comparación con la misma clase
» 0% de todos los dispositivos probados de esta clase eran mejores, 0% similares, 99% peores
» El mejor tuvo un delta de 5%, la media fue 17%, el peor fue ###max##%
En comparación con todos los dispositivos probados
» 0% de todos los dispositivos probados eran mejores, 0% similares, 100% peores
» El mejor tuvo un delta de 4%, la media fue 24%, el peor fue ###max##%
Gestión de energía - StudioBook con batería de corta duración
Consumo de energía
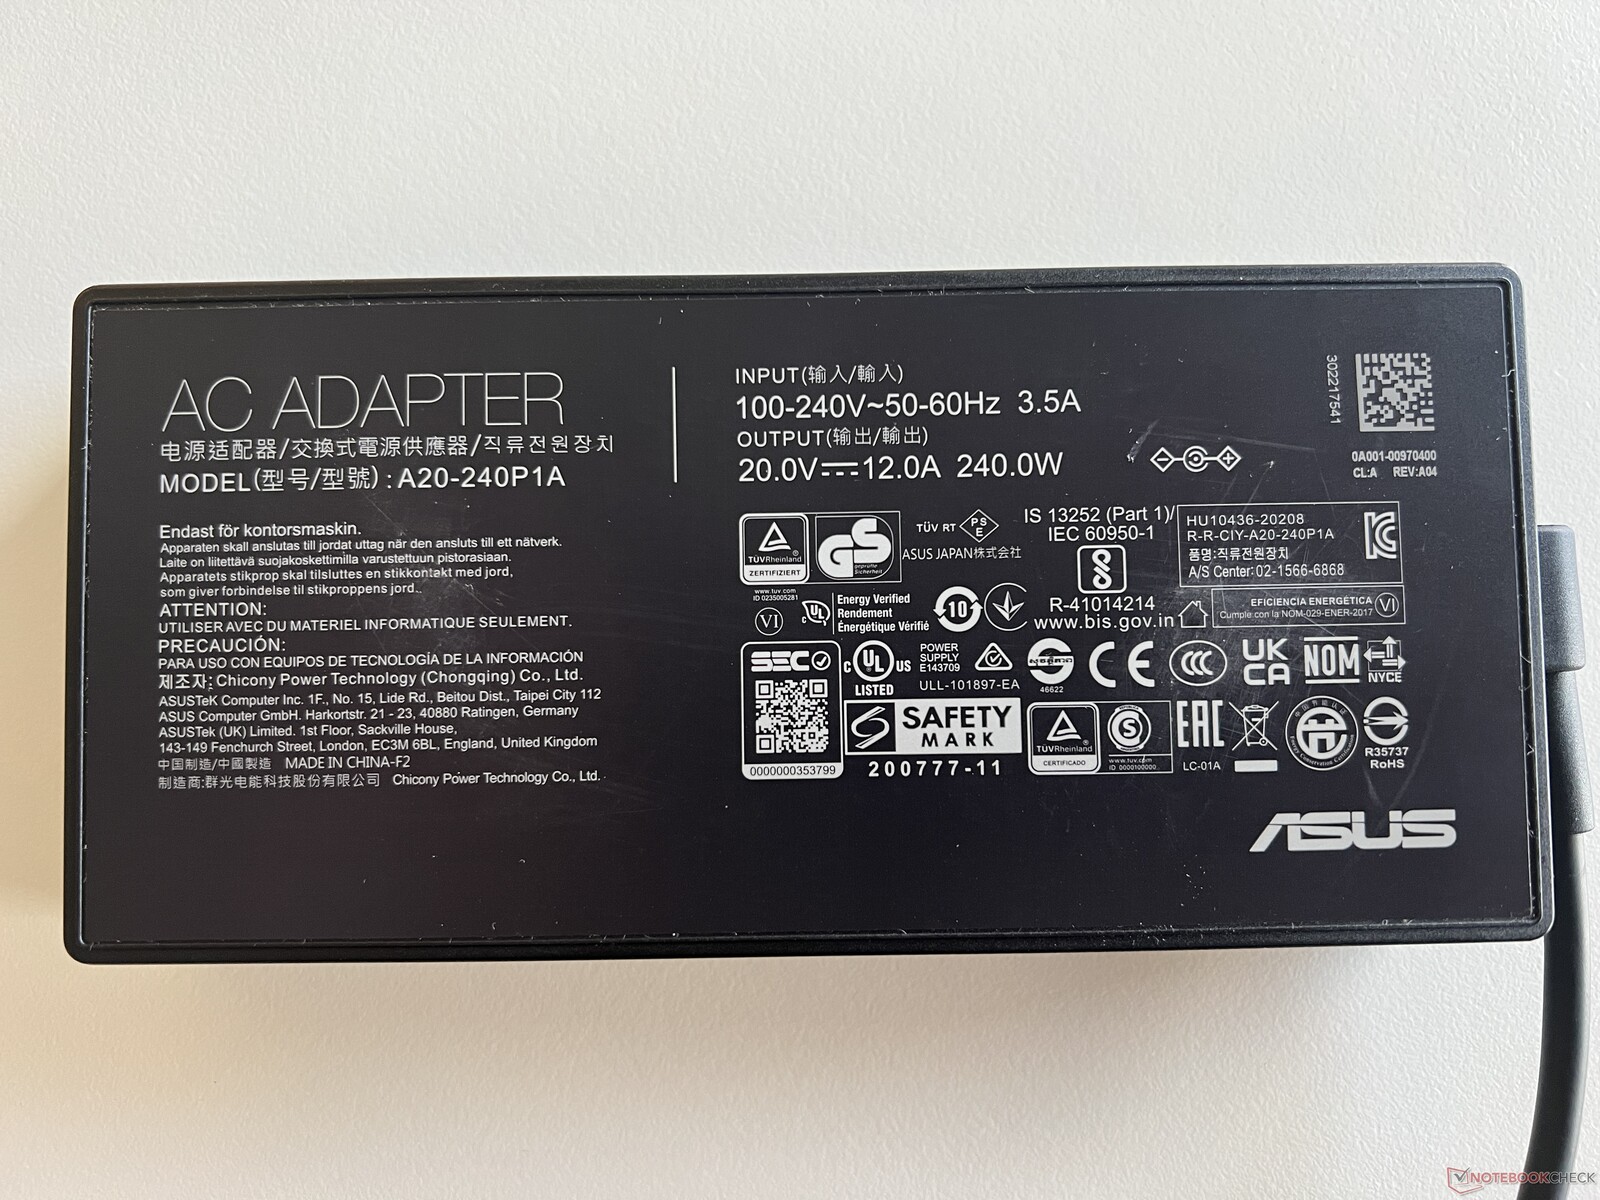
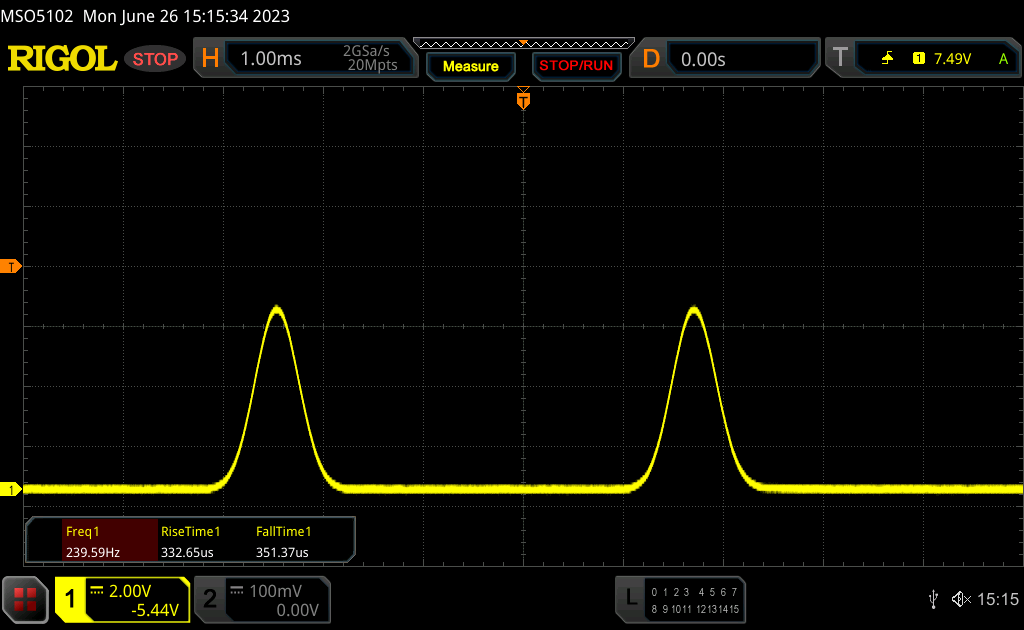
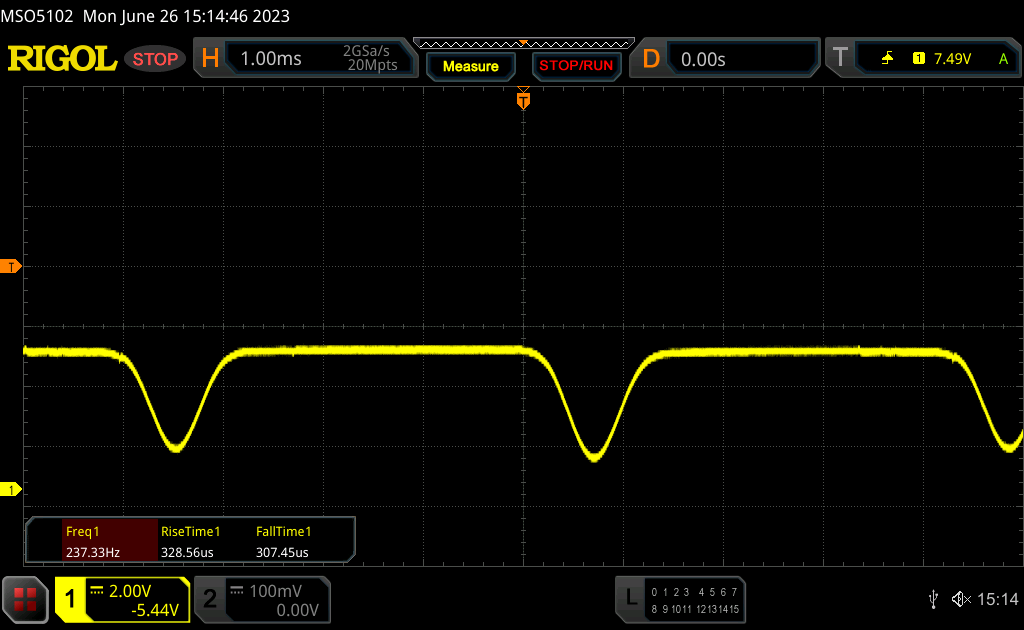
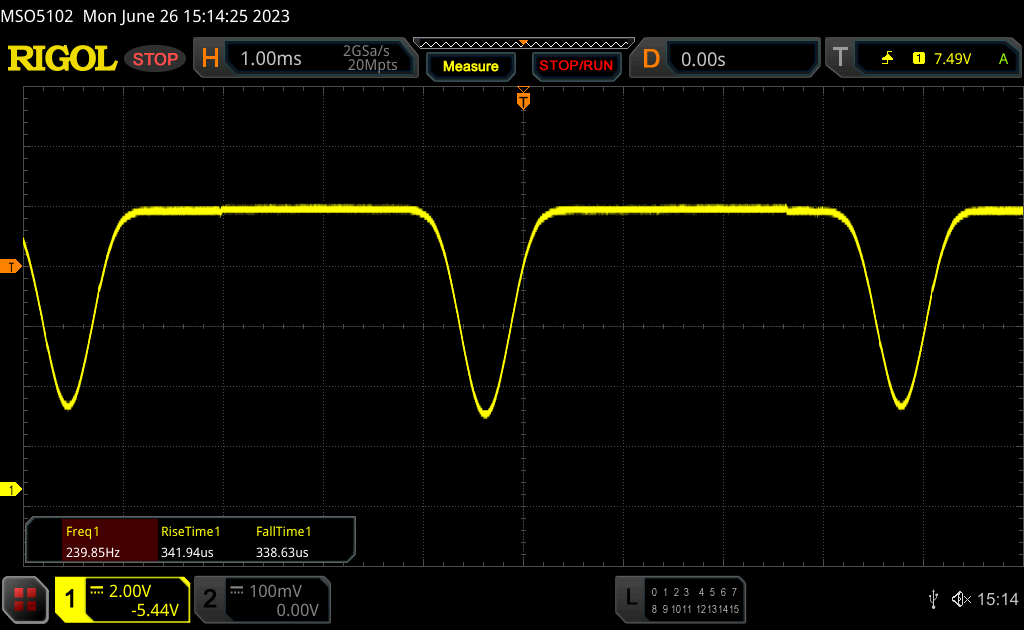
Debido únicamente al gran panel OLED y al procesador HX, la eficiencia del Studiobook 16 no es particularmente buena. Medimos entre 12-21 vatios en reposo, dependiendo del brillo, aunque ocasionalmente alcanza hasta 36 vatios en modo HDR. Bajo carga, no hay sorpresas: sube a unos 200 vatios durante los juegos y se estabiliza en unos 210 vatios tras los ~247 vatios iniciales en el test de estrés. La fuente de alimentación de 240 vatios incluida es, por tanto, de tamaño suficiente.
| Off / Standby | |
| Ocioso | |
| Carga |
|
Clave:
min: | |
| Asus ProArt Studiobook 16 OLED H7604 i9-13980HX, GeForce RTX 4070 Laptop GPU, Phison EM2804TBMTCB47, OLED, 3200x2000, 16" | Gigabyte AERO 16 OLED BSF i9-13900H, GeForce RTX 4070 Laptop GPU, Gigabyte AG470S1TB-SI B10, OLED, 3840x2400, 16" | Samsung Galaxy Book3 Ultra 16 i7-13700H, GeForce RTX 4050 Laptop GPU, Samsung PM9A1 MZVL2512HCJQ, AMOLED, 2880x1800, 16" | MSI Stealth 17 Studio A13VH-014 i9-13900H, GeForce RTX 4080 Laptop GPU, Samsung PM9A1 MZVL22T0HBLB, Mini LED, 3840x2160, 17.3" | Apple MacBook Pro 16 2023 M2 Max M2 Max, M2 Max 38-Core GPU, Apple SSD AP2048Z, Mini-LED, 3456x2234, 16.2" | Asus Zephyrus Duo 16 GX650PY-NM006W R9 7945HX, GeForce RTX 4090 Laptop GPU, SK hynix PC801 HFS002TEJ9X101N, MiniLED, 2560x1600, 16" | Medio NVIDIA GeForce RTX 4070 Laptop GPU | Media de la clase Multimedia | |
|---|---|---|---|---|---|---|---|---|
| Power Consumption | 18% | 61% | 10% | 34% | -35% | 4% | 50% | |
| Idle Minimum * (Watt) | 12.8 | 11.8 8% | 3 77% | 13.9 -9% | 5.2 59% | 19.2 -50% | 13.2 ? -3% | 5.69 ? 56% |
| Idle Average * (Watt) | 19.9 | 16.1 19% | 5 75% | 20 -1% | 16.5 17% | 29.7 -49% | 18.2 ? 9% | 10.1 ? 49% |
| Idle Maximum * (Watt) | 20.3 | 17 16% | 11 46% | 20.6 -1% | 16.8 17% | 30.8 -52% | 24.6 ? -21% | 12.3 ? 39% |
| Load Average * (Watt) | 131.4 | 100.6 23% | 72 45% | 77 41% | 113 14% | 126 4% | 97 ? 26% | 65.3 ? 50% |
| Witcher 3 ultra * (Watt) | 196.5 | 158 20% | 69.7 65% | 162 18% | 92 53% | 258 -31% | ||
| Load Maximum * (Watt) | 246.8 | 192 22% | 108 56% | 216 12% | 145 41% | 330 -34% | 221 ? 10% | 112.5 ? 54% |
* ... más pequeño es mejor
Power consumption Witcher 3 / Stress test
Power consumption with an external monitor
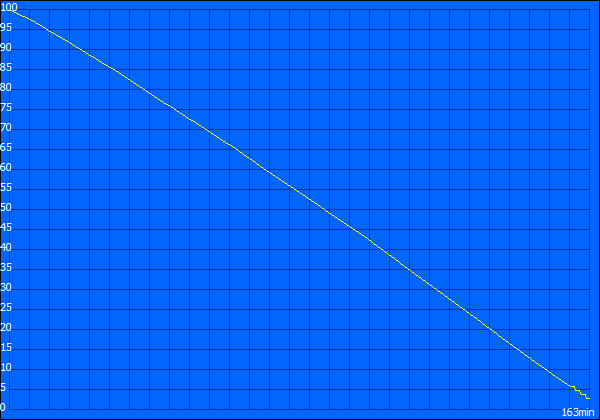
Duración de la batería
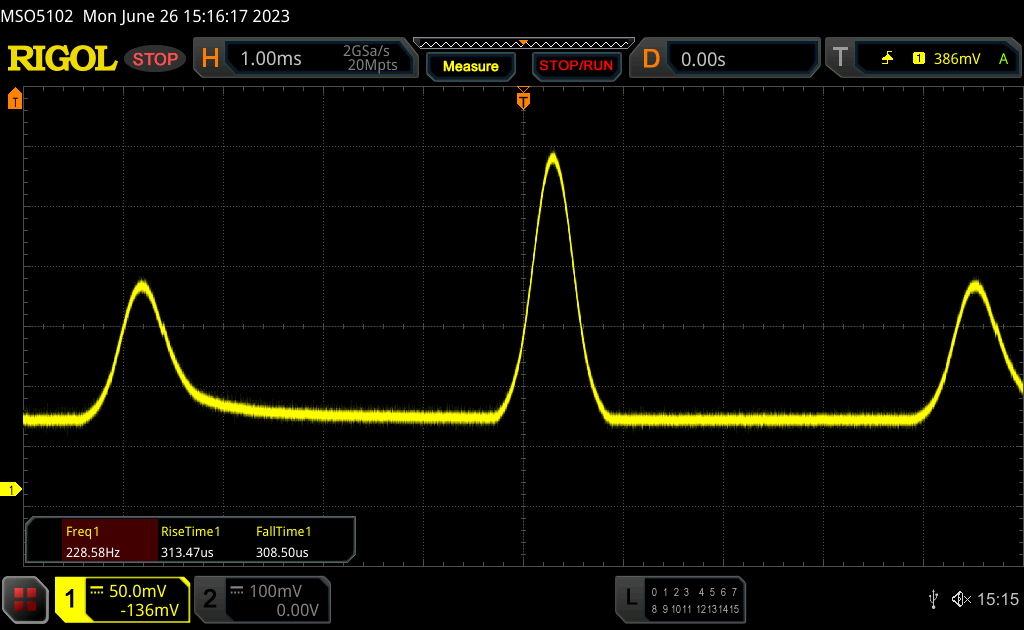
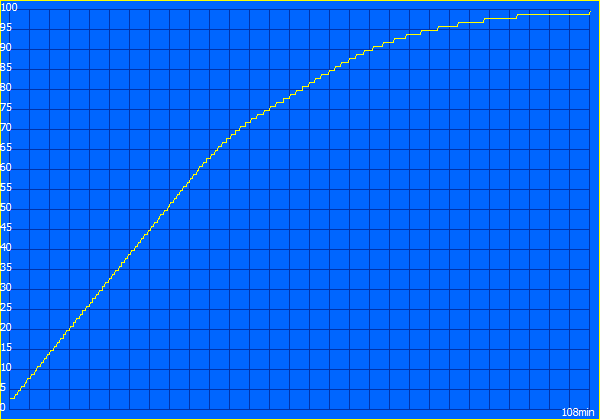
A la vista de los índices de consumo, no es de extrañar que la duración de la batería no sea especialmente buena a pesar de la batería de 90 Wh. Por defecto, el portátil cambia al modo de 60 Hz en cuanto lo desenchufas. A pesar de ello, registramos apenas 5,5 horas en el test WLAN a 150 cd/m² (120 Hz: 5 horas) y unas 4,5 horas a brillo máximo (120 Hz: ~3,5 horas). El test de vídeo dura algo menos de 6 horas. Un vídeo HDR a brillo máximo agota la batería tras ~2:40 horas y alrededor de una hora bajo carga a pesar del rendimiento reducido.
| Asus ProArt Studiobook 16 OLED H7604 i9-13980HX, GeForce RTX 4070 Laptop GPU, 90 Wh | Gigabyte AERO 16 OLED BSF i9-13900H, GeForce RTX 4070 Laptop GPU, 88 Wh | Samsung Galaxy Book3 Ultra 16 i7-13700H, GeForce RTX 4050 Laptop GPU, 76 Wh | MSI Stealth 17 Studio A13VH-014 i9-13900H, GeForce RTX 4080 Laptop GPU, 99 Wh | Apple MacBook Pro 16 2023 M2 Max M2 Max, M2 Max 38-Core GPU, 99.6 Wh | Asus Zephyrus Duo 16 GX650PY-NM006W R9 7945HX, GeForce RTX 4090 Laptop GPU, 90 Wh | Media de la clase Multimedia | |
|---|---|---|---|---|---|---|---|
| Duración de Batería | 49% | 86% | 13% | 125% | -25% | 113% | |
| H.264 (h) | 6 | 7.4 23% | 13.4 123% | 5.6 -7% | 18.7 212% | 3.8 -37% | 16.4 ? 173% |
| WiFi v1.3 (h) | 5.6 | 7.5 34% | 9.6 71% | 5.6 0% | 14.8 164% | 4 -29% | 12 ? 114% |
| Load (h) | 1.1 | 2.1 91% | 1.8 64% | 1.6 45% | 1.1 0% | 1 -9% | 1.675 ? 52% |
| Witcher 3 ultra (h) | 2.6 |
Pro
Contra
Veredicto - Studiobook 16 con puntos débiles en los detalles
El nuevo 2023 ProArt Studiobook 16 OLED ofrece mucho rendimiento y es un buen portátil para usuarios creativos en general, aunque hay algunos puntos débiles en los detalles. En primer lugar, el Core i9-13980HXcomo procesador móvil más rápido de Intel, ofrece mucha potencia de CPU, pero sigue quedando por detrás del AMD Ryzen 9 7945HX en términos de rendimiento y eficiencia multinúcleo. En comparación con el Core i9-12900H del modelo antiguo, por otro lado, ofrece bastante más rendimiento. Sin embargo, esto no se aplica a la tarjeta gráfica, ya que la RTX 4070 portátil es sólo ligeramente más rápida que la RTX 3070 Tipor lo que la actualización no merece la pena. Otros puntos criticables son la refrigeración convencional y el ruido del ventilador en particular, ya que el dispositivo se vuelve rápidamente muy ruidoso. Al menos las temperaturas se mantienen dentro de los límites.
El display OLED ha cambiado del panel 4K con 60 Hz a una pantalla táctil de 120 Hz con una resolución ligeramente inferior. La calidad de imagen es fundamentalmente muy buena, pero como otras pantallas táctiles OLED de Asus, las áreas brillantes parecen ligeramente granuladas. También hay ligeras desviaciones de color que no pudimos corregir con nuestro propio calibrado. La pantalla OLED también tiene un impacto negativo en la duración de la batería. La característica software contra el parpadeo PWM es buena, pero hay que hacer ajustes vía software cada vez, lo que es engorroso.
Mucha potencia, pero también ventiladores ruidosos: El ProArt Studiobook 16 es sin duda un dispositivo rápido y el DialPad puede añadir valor para los usuarios creativos. Sin embargo, el OLED de 120 Hz no convence del todo.
Además de la pantalla táctil, el Studiobook 16 ofrece de nuevo el DialPad adicional, que funciona particularmente bien con las apps de Adobe y también puede ofrecer un valor añadido aquí. Las capacidades HDR siguen siendo limitadas, pero esto se debe a Windows. HDR tiene que ser activado manualmente y los perfiles de color no están disponibles. Además, los paneles mini LED tienen ventaja en lo que respecta al brillo máximo. Aunque el MacBook Pro 16 ofrece un rendimiento de CPU significativamente menor (al menos en funcionamiento con red eléctrica), sigue siendo una muy buena elección para usuarios creativos y ofrece una duración de batería significativamente mayor en el uso diario. Aún más rendimiento ofrece el ROG Zephyrus Duo 16que está catalogado como gamer, pero también es interesante para creadores de contenidos gracias a la segunda pantalla.
Precio y disponibilidad
Una variante del Asus ProArt Studiobook 16 OLED (CPU Intel Core i9-13980HX, GPU Nvidia Geforce RTX 4070, 32 GB DDR5 SO-DIMM RAM, 1 TB SSD) está disponible a través de Amazon EE.UU. por 2499,99 dólares.
Los precios son a fecha de 29.06.23 y están sujetos a cambios.
Asus ProArt Studiobook 16 OLED H7604
- 06/27/2023 v7 (old)
Andreas Osthoff
Transparencia
La selección de los dispositivos que se van a reseñar corre a cargo de nuestro equipo editorial. La muestra de prueba fue proporcionada al autor en calidad de préstamo por el fabricante o el minorista a los efectos de esta reseña. El prestamista no tuvo ninguna influencia en esta reseña, ni el fabricante recibió una copia de la misma antes de su publicación. No había ninguna obligación de publicar esta reseña. Como empresa de medios independiente, Notebookcheck no está sujeta a la autoridad de fabricantes, minoristas o editores.
Así es como prueba Notebookcheck
Cada año, Notebookcheck revisa de forma independiente cientos de portátiles y smartphones utilizando procedimientos estandarizados para asegurar que todos los resultados son comparables. Hemos desarrollado continuamente nuestros métodos de prueba durante unos 20 años y hemos establecido los estándares de la industria en el proceso. En nuestros laboratorios de pruebas, técnicos y editores experimentados utilizan equipos de medición de alta calidad. Estas pruebas implican un proceso de validación en varias fases. Nuestro complejo sistema de clasificación se basa en cientos de mediciones y puntos de referencia bien fundamentados, lo que mantiene la objetividad.Price comparison

