Samsung Galaxy Book3 Ultra 16 con RTX 4070 en análisis: Alto rendimiento gráfico en un portátil profesional
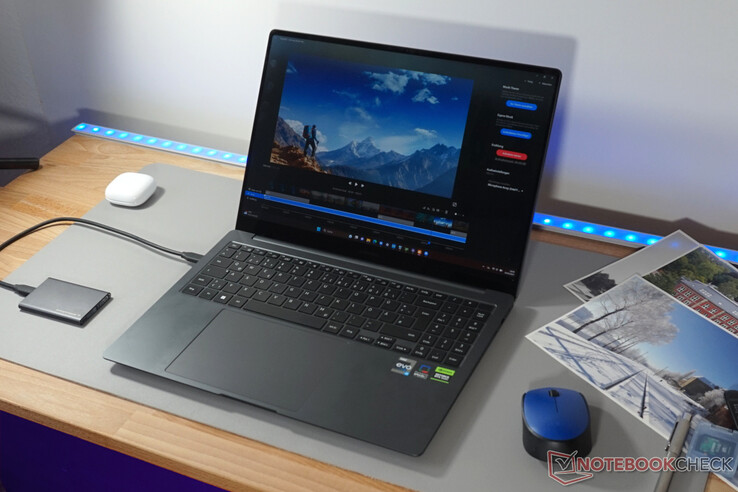
Con el Galaxy Book3 Ultra, Samsung se aventura en el segmento de los portátiles multimedia de alto rendimiento. Equipado opcionalmente con una Nvidia GeForce RTX 4050 o RTX 4070, se centra en el procesamiento de vídeo e imágenes de alto nivel. Al mismo tiempo, el portátil es delgado, discreto y casi 1 kg más ligero que un portátil para juegos equipado de forma similar.
Gracias al consumo de energía fuertemente reducido, basta con un pequeño sistema de refrigeración, que también ocupa menos espacio. En el siguiente análisis, veremos hasta qué punto se ve afectado el rendimiento gráfico cuando el sistema tiene que conformarse con menos de 100 vatios en lugar de 250 o 300 vatios. Además, queda por ver hasta qué punto Samsung ha sido capaz de limitar las emisiones de calor y el ruido de los ventiladores en el reducido espacio disponible.
Hace poco analizamos el Samsung Galaxy Book3 Ultracon la RTX 4050. Un competidor para tareas comparables y con hardware comparable es, por ejemplo, el Gigabyte AERO 16 OLED. Pero un vistazo al mejor equipado y más caro MSI Stealth 17 Studio tampoco hace daño. Y un MacBook Pro con un chip M2 debería estar más o menos a la par en términos de precio y rendimiento, aunque una comparación entre Windows y Mac es similar a comparar manzanas y naranjas.
Posibles contendientes en la comparación
Valoración | Fecha | Modelo | Peso | Altura | Tamaño | Resolución | Precio |
|---|---|---|---|---|---|---|---|
| 88.8 % v7 (old) | 05/2023 | Samsung Galaxy Book3 Ultra 16, i9-13900H RTX 4070 i9-13900H, GeForce RTX 4070 Laptop GPU | 1.8 kg | 16.8 mm | 16.00" | 2880x1800 | |
| 90.3 % v7 (old) | 04/2023 | Dell XPS 15 9530 RTX 4070 i7-13700H, GeForce RTX 4070 Laptop GPU | 1.9 kg | 18 mm | 15.60" | 3456x2160 | |
| 89.2 % v7 (old) | 04/2023 | MSI Stealth 17 Studio A13VH-014 i9-13900H, GeForce RTX 4080 Laptop GPU | 3 kg | 21.3 mm | 17.30" | 3840x2160 | |
| 89 % v7 (old) | 02/2023 | Asus ProArt StudioBook 16 H7600ZW i9-12900H, GeForce RTX 3070 Ti Laptop GPU | 2.4 kg | 19.9 mm | 16.00" | 3840x2400 | |
| 86.2 % v7 (old) | 03/2023 | Gigabyte AERO 16 OLED BSF i9-13900H, GeForce RTX 4070 Laptop GPU | 2.1 kg | 18 mm | 16.00" | 3840x2400 | |
| 89.4 % v7 (old) | 04/2023 | Samsung Galaxy Book3 Ultra 16 i7-13700H, GeForce RTX 4050 Laptop GPU | 1.8 kg | 16.5 mm | 16.00" | 2880x1800 |
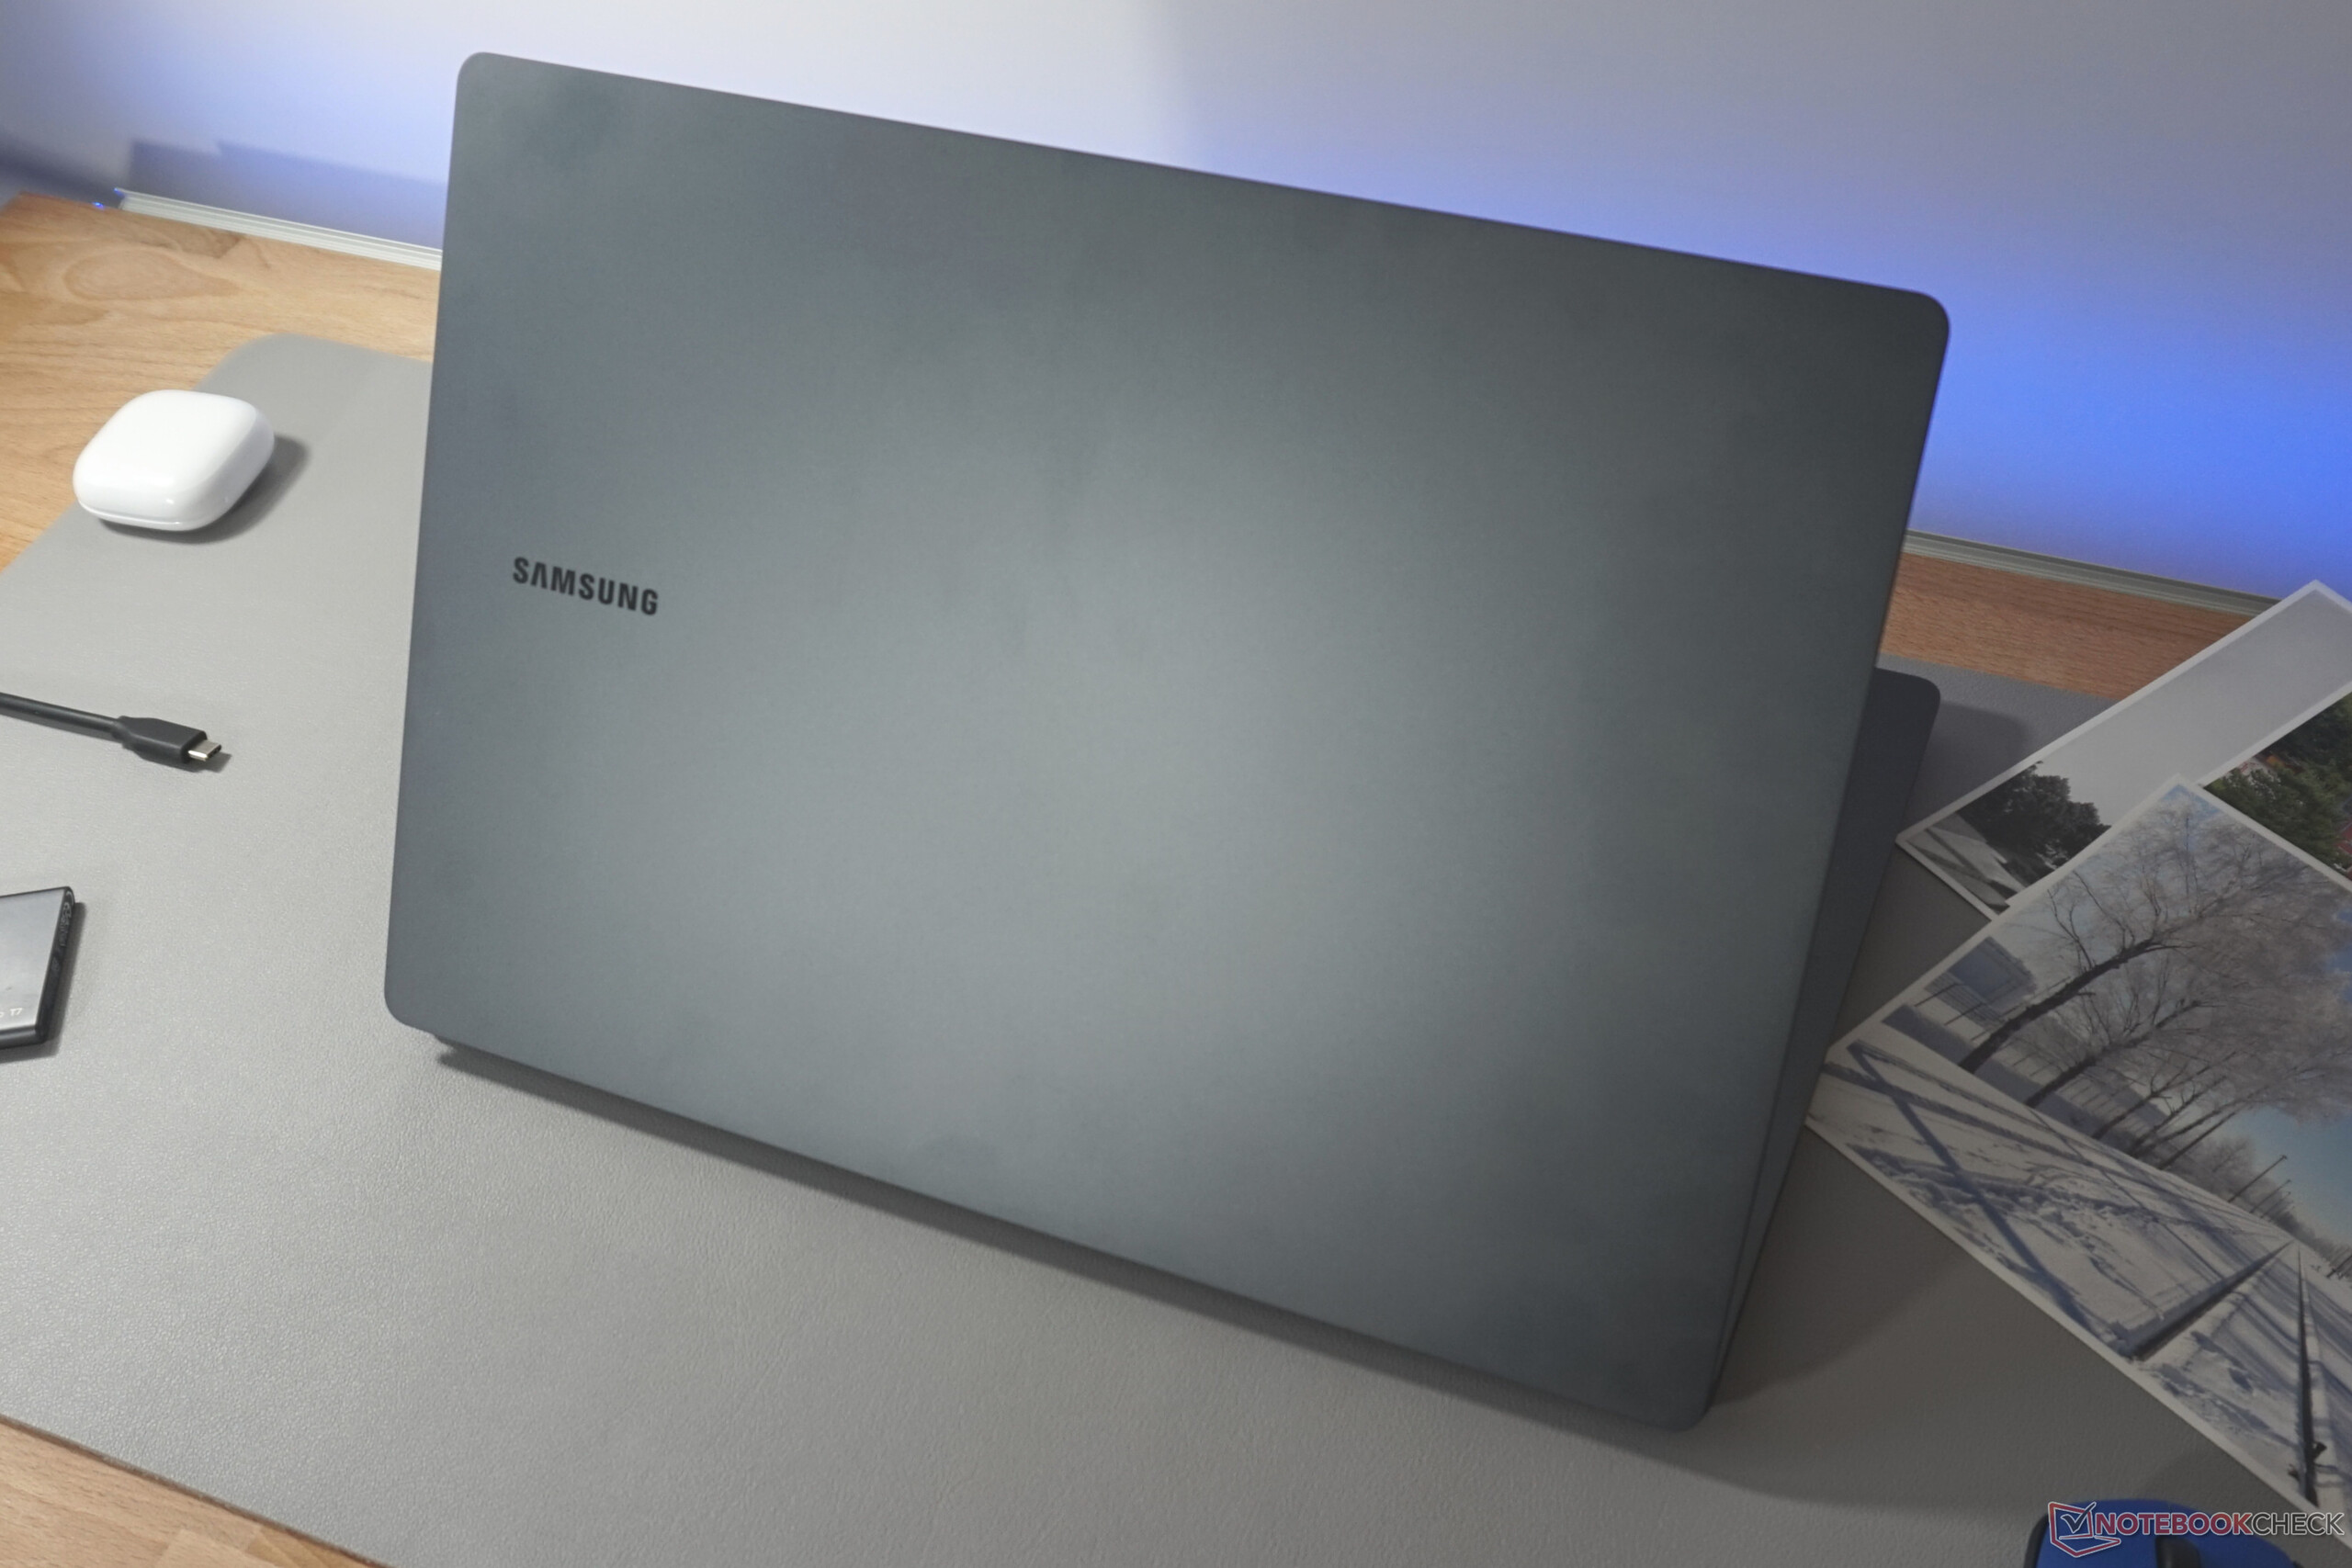
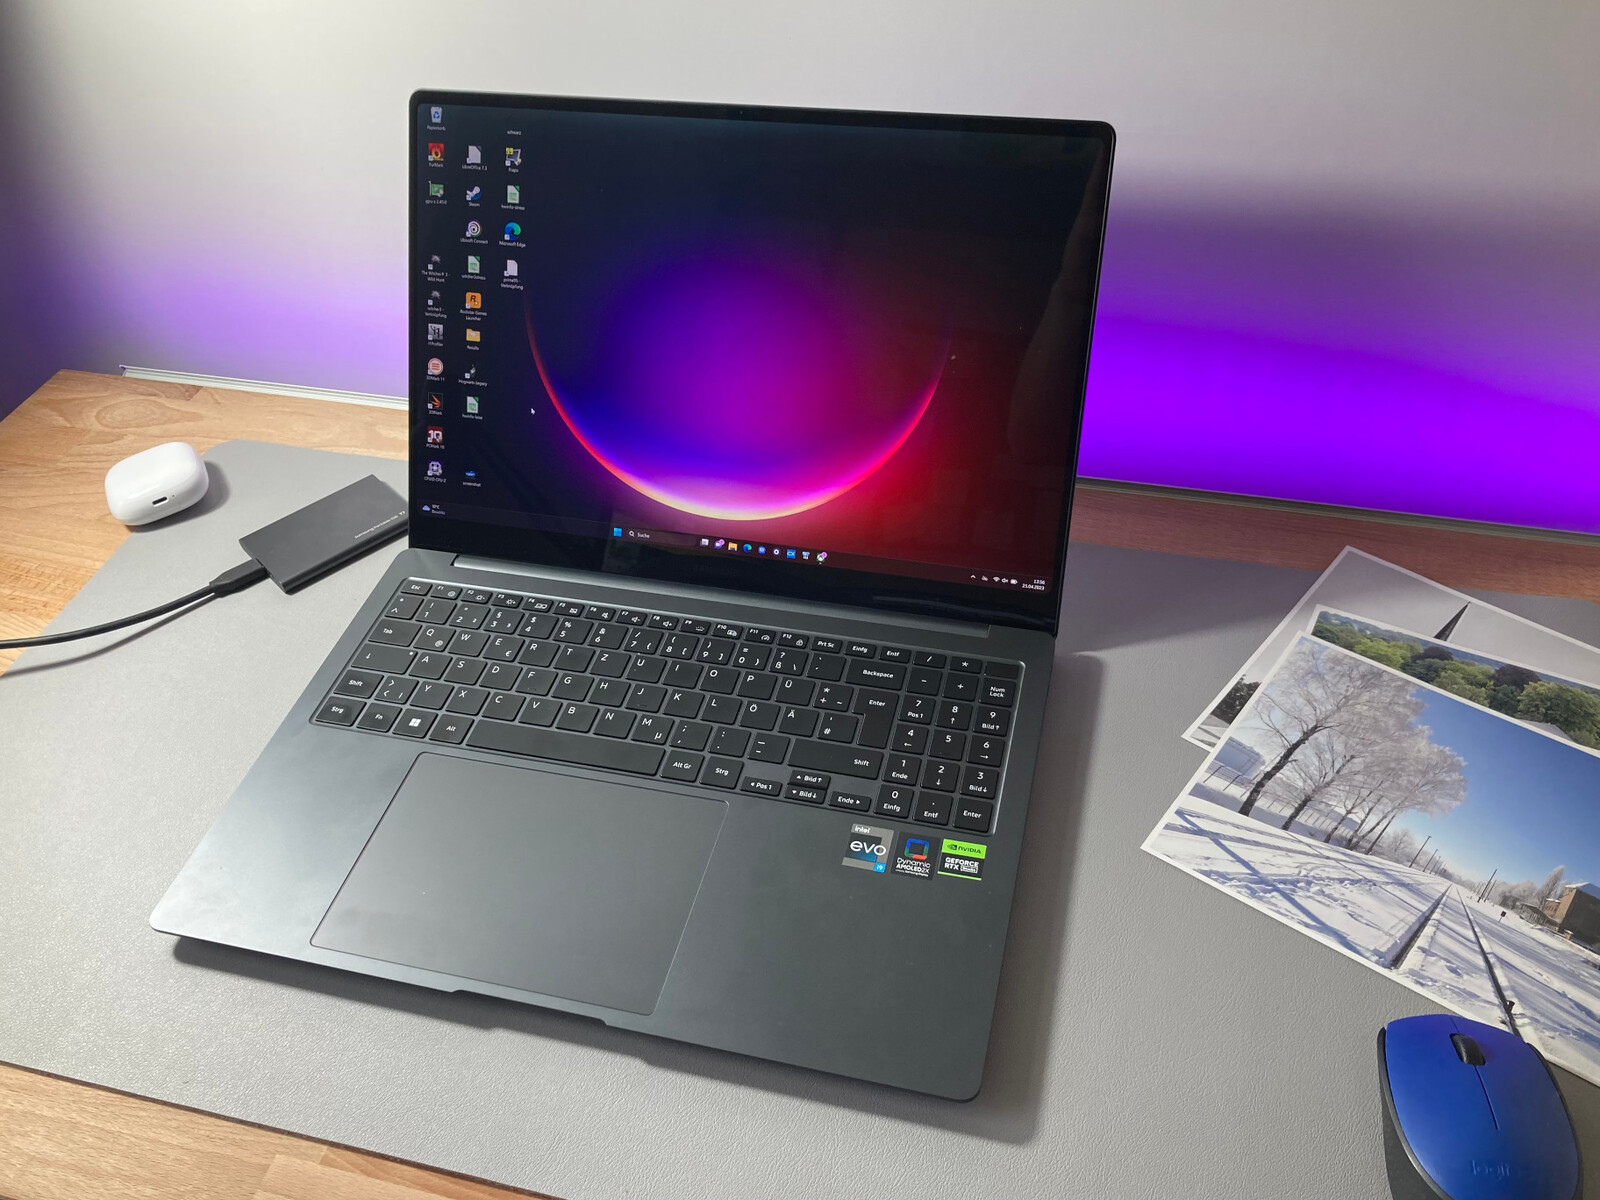
Estuche - Extremadamente fino Galaxy Book
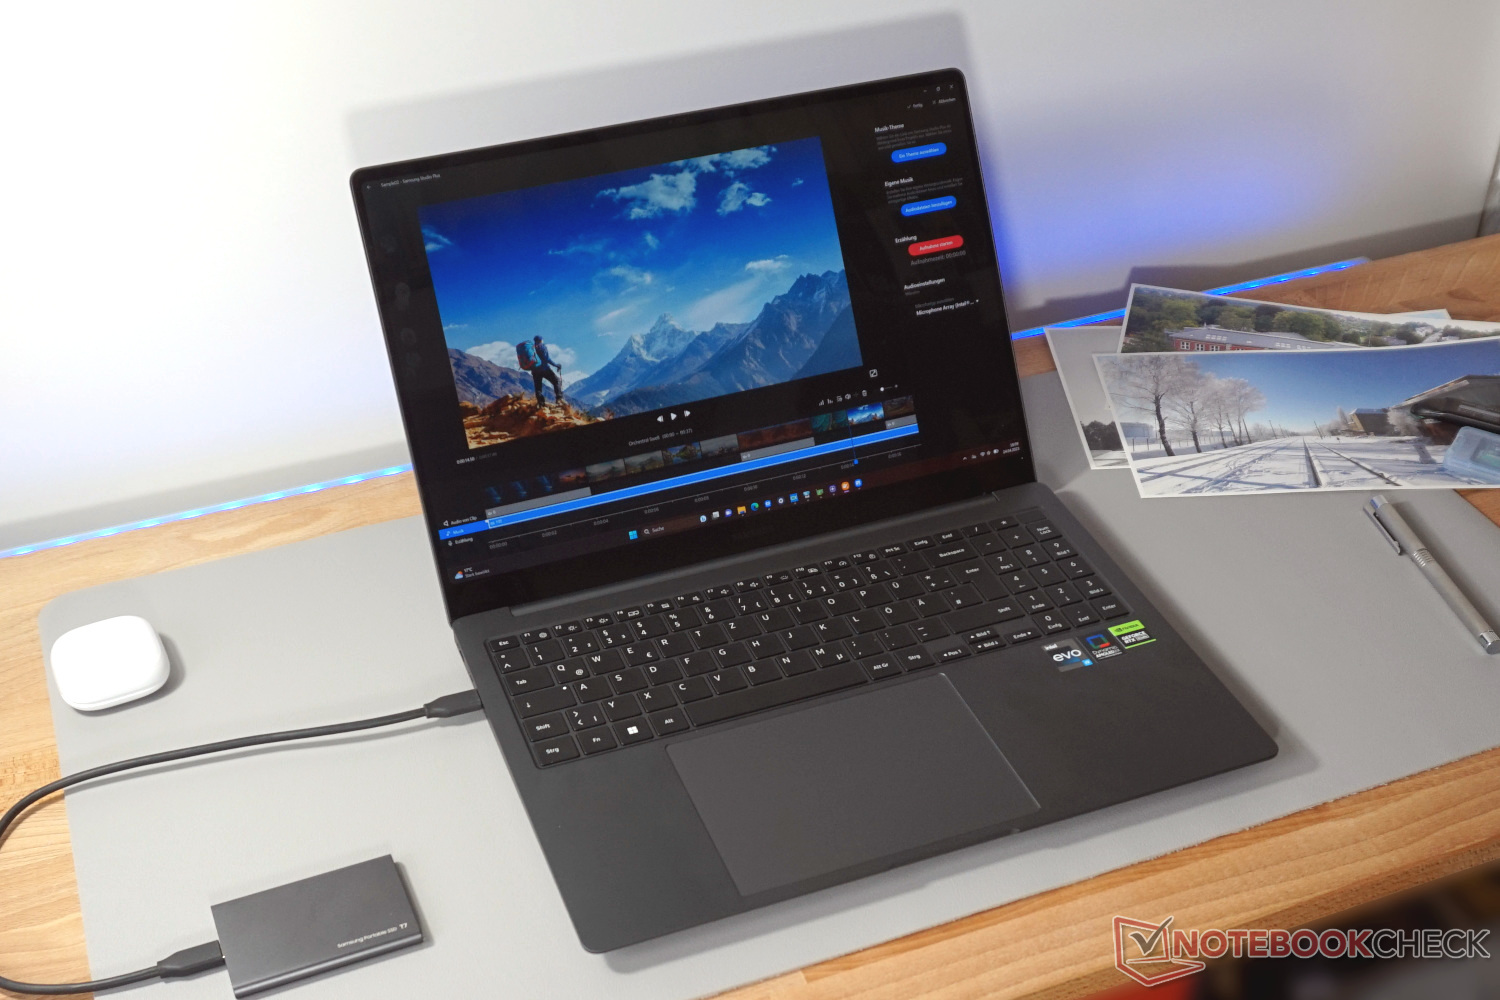
El gris oscuro del Galaxy Book Ultra tiene un aspecto sobrio y discreto. La parte inferior y el marco del teclado, ambos de plástico, apenas se distinguen de la tapa metálica de la pantalla, al menos visualmente. Todo parece encajar a la perfección, y no se encuentran huecos.
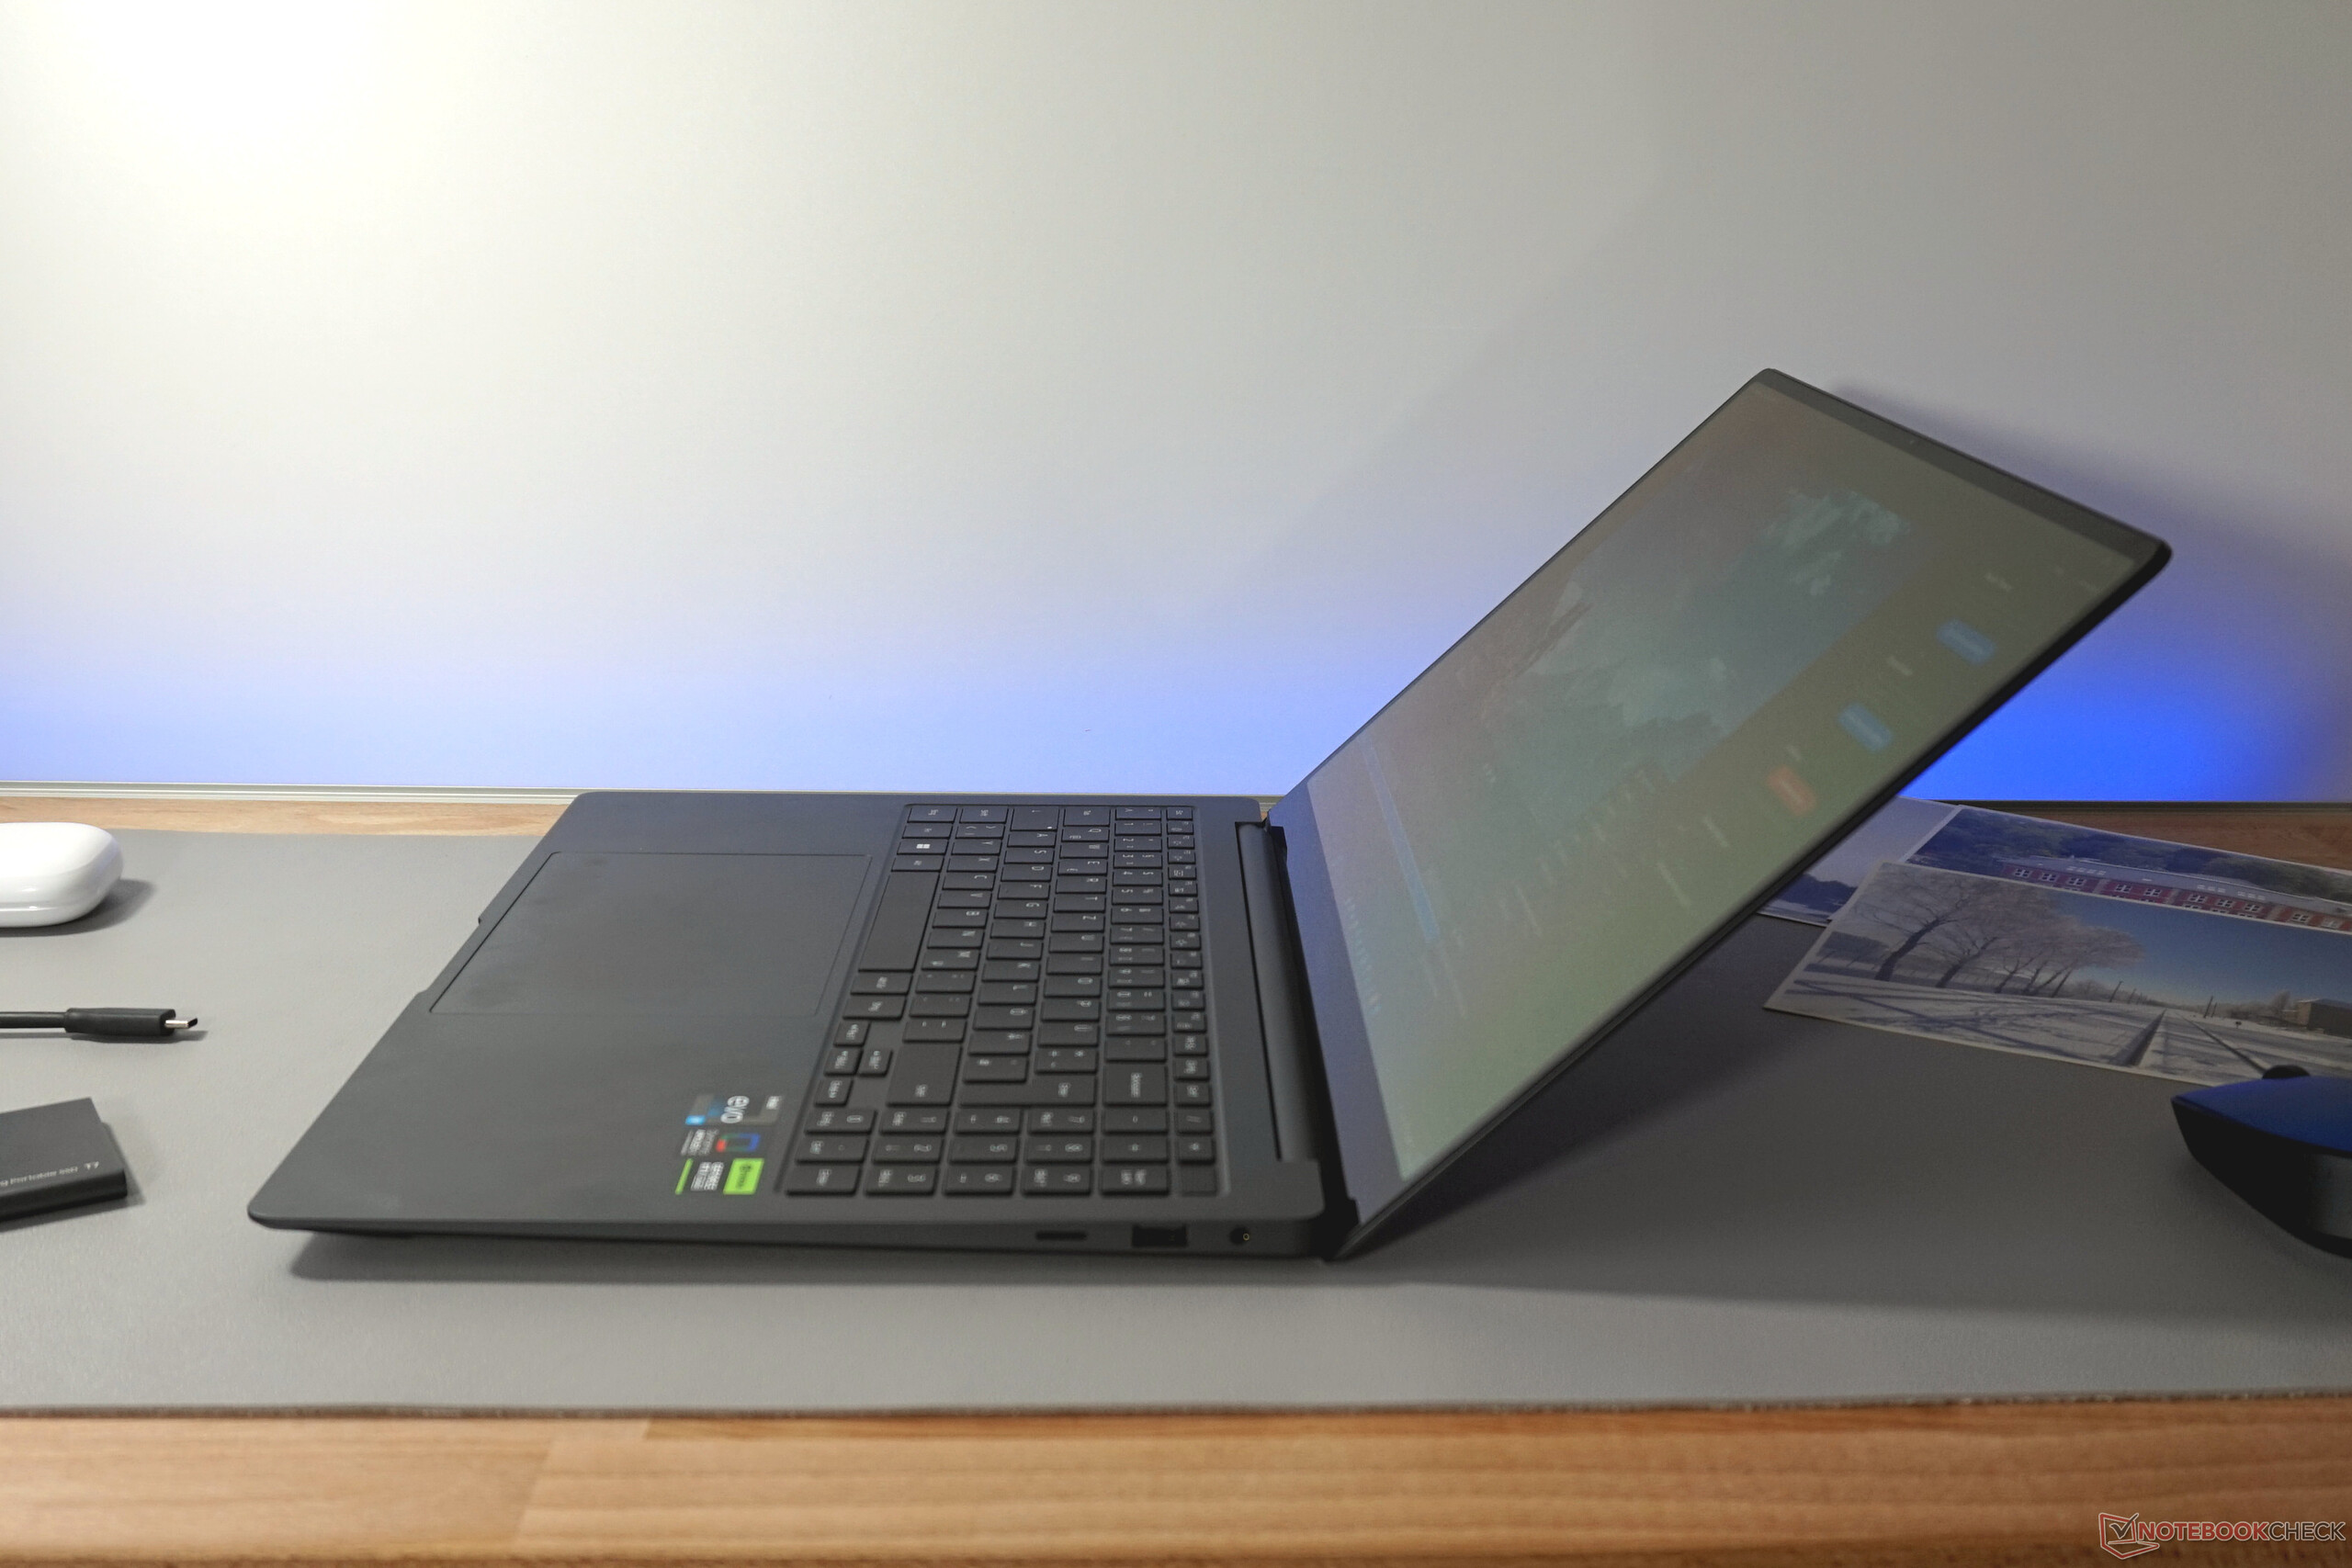
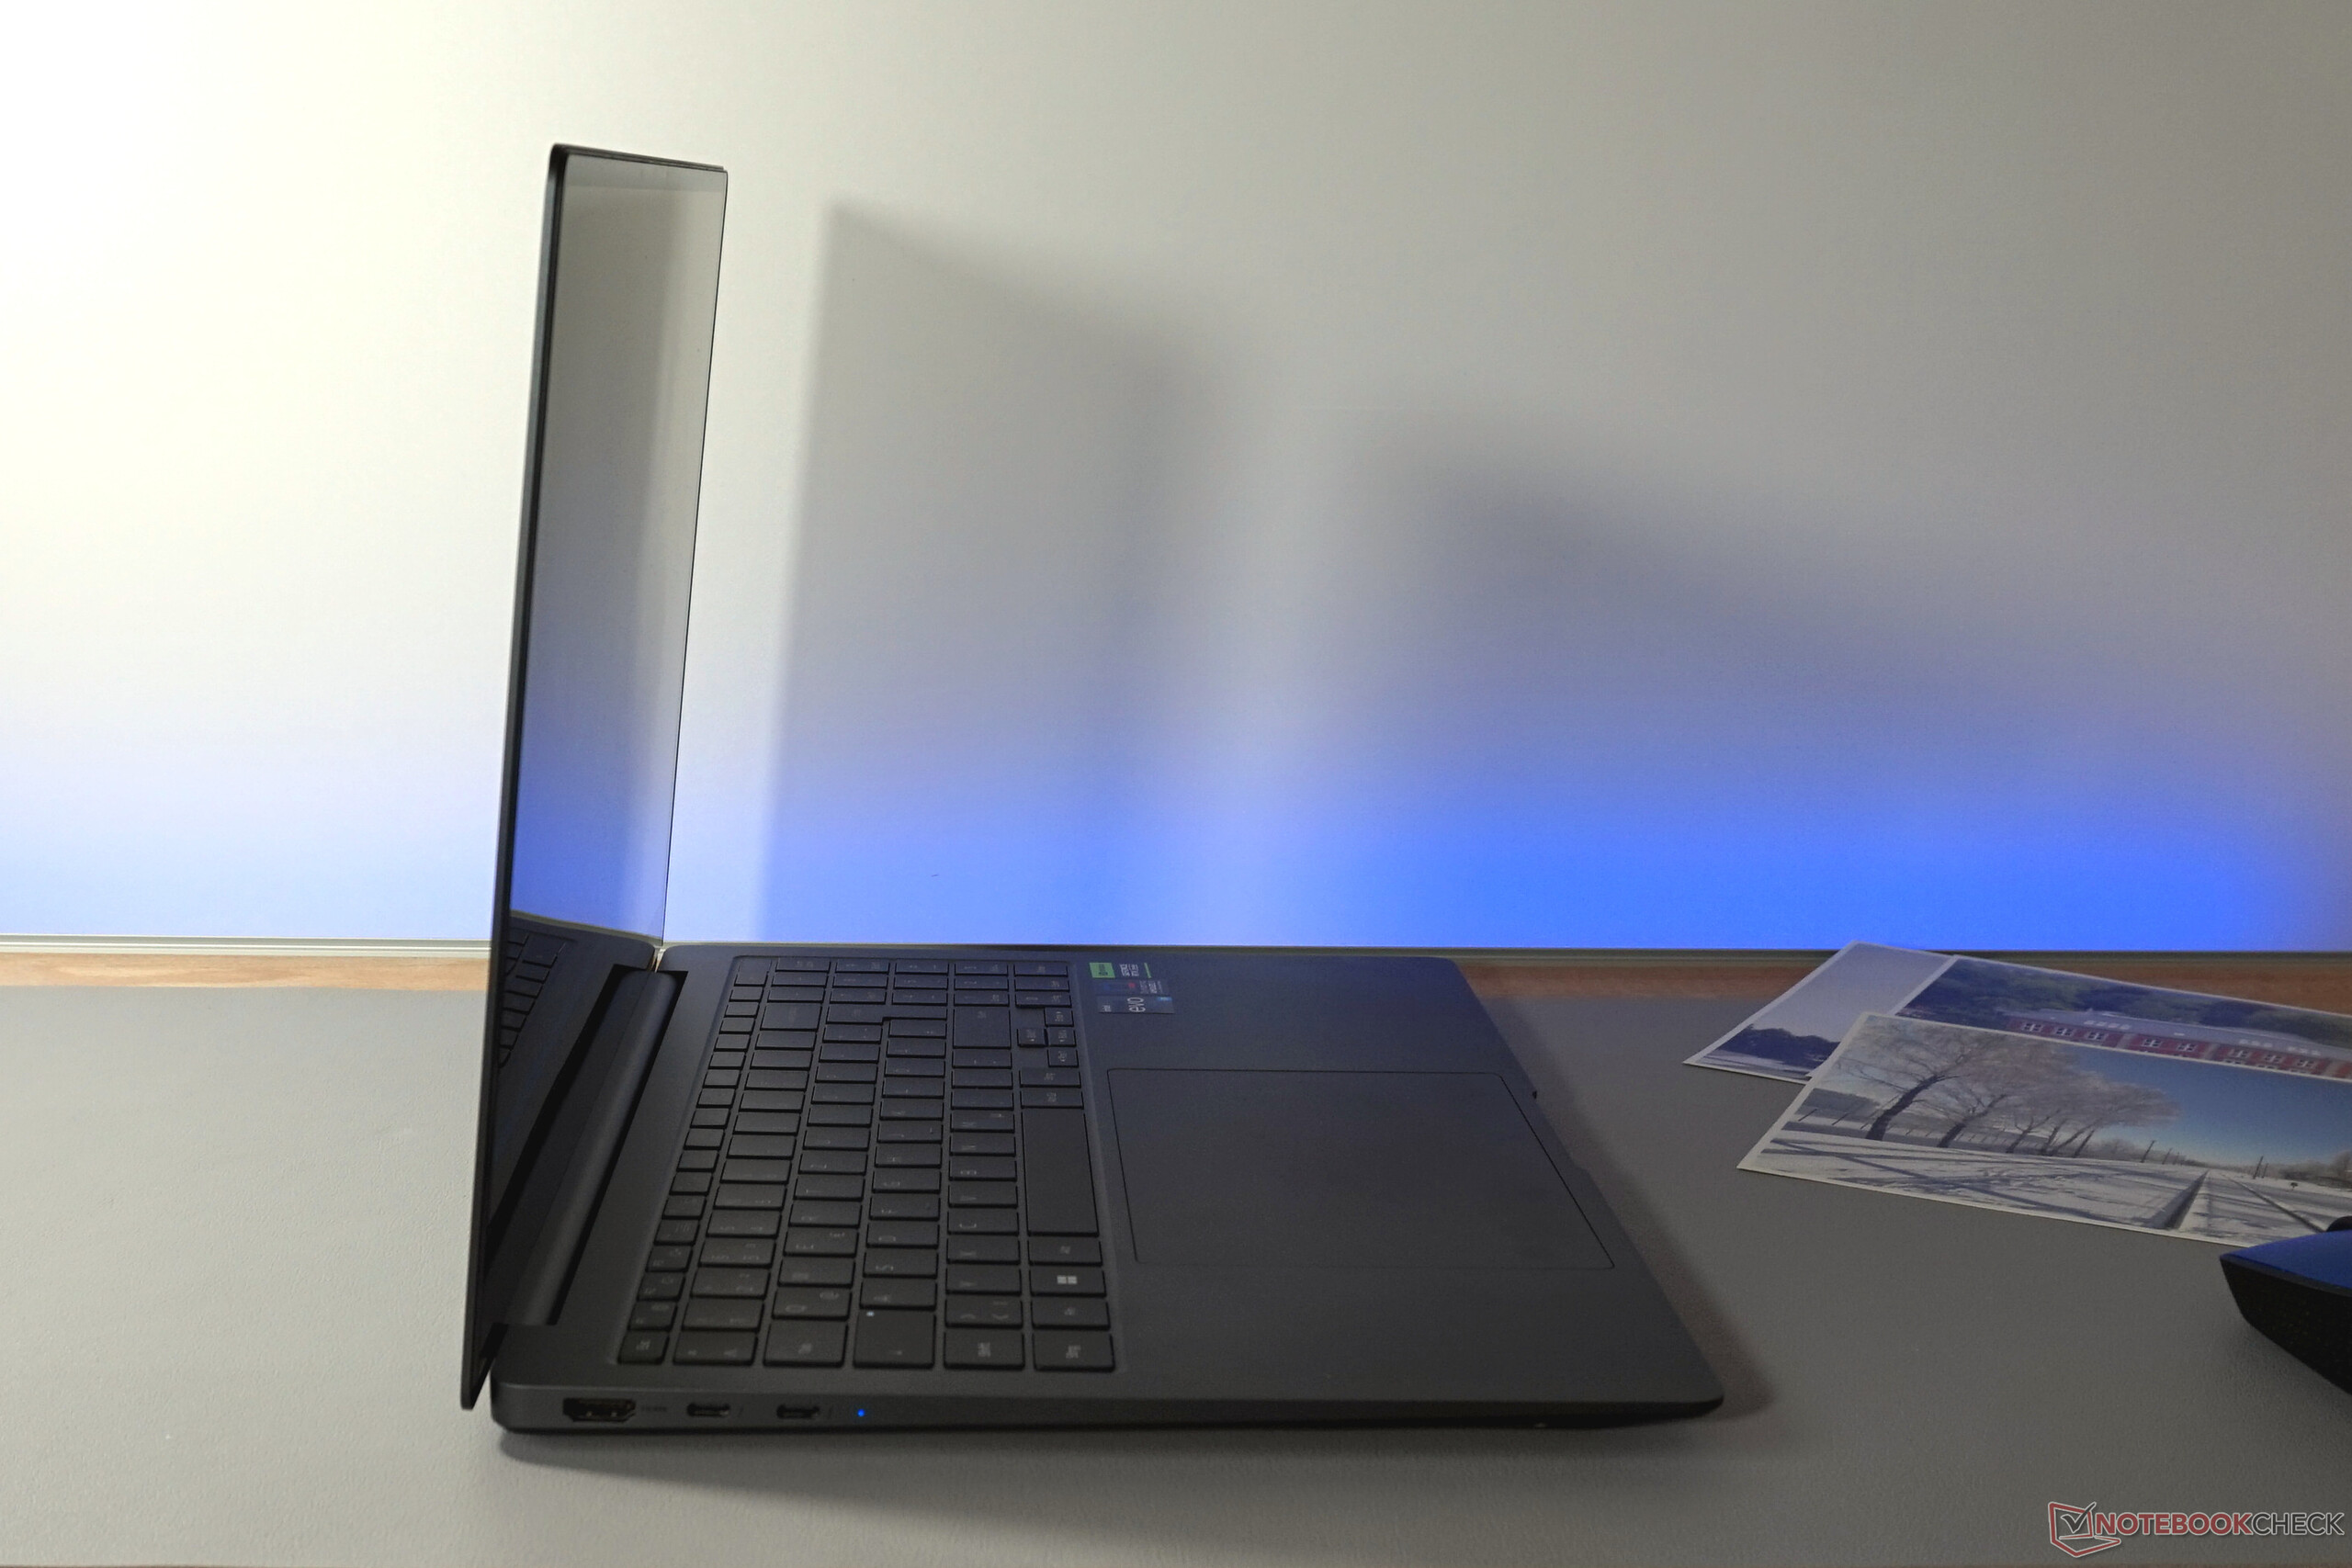
La rigidez torsional es alta. La carcasa, muy plana, sólo se dobla mínimamente. La pantalla, que puede abrirse fácilmente con una mano gracias a su peso y hasta 135°, también parece extremadamente sólida. Sólo las bisagras se tambalean un poco demasiado.
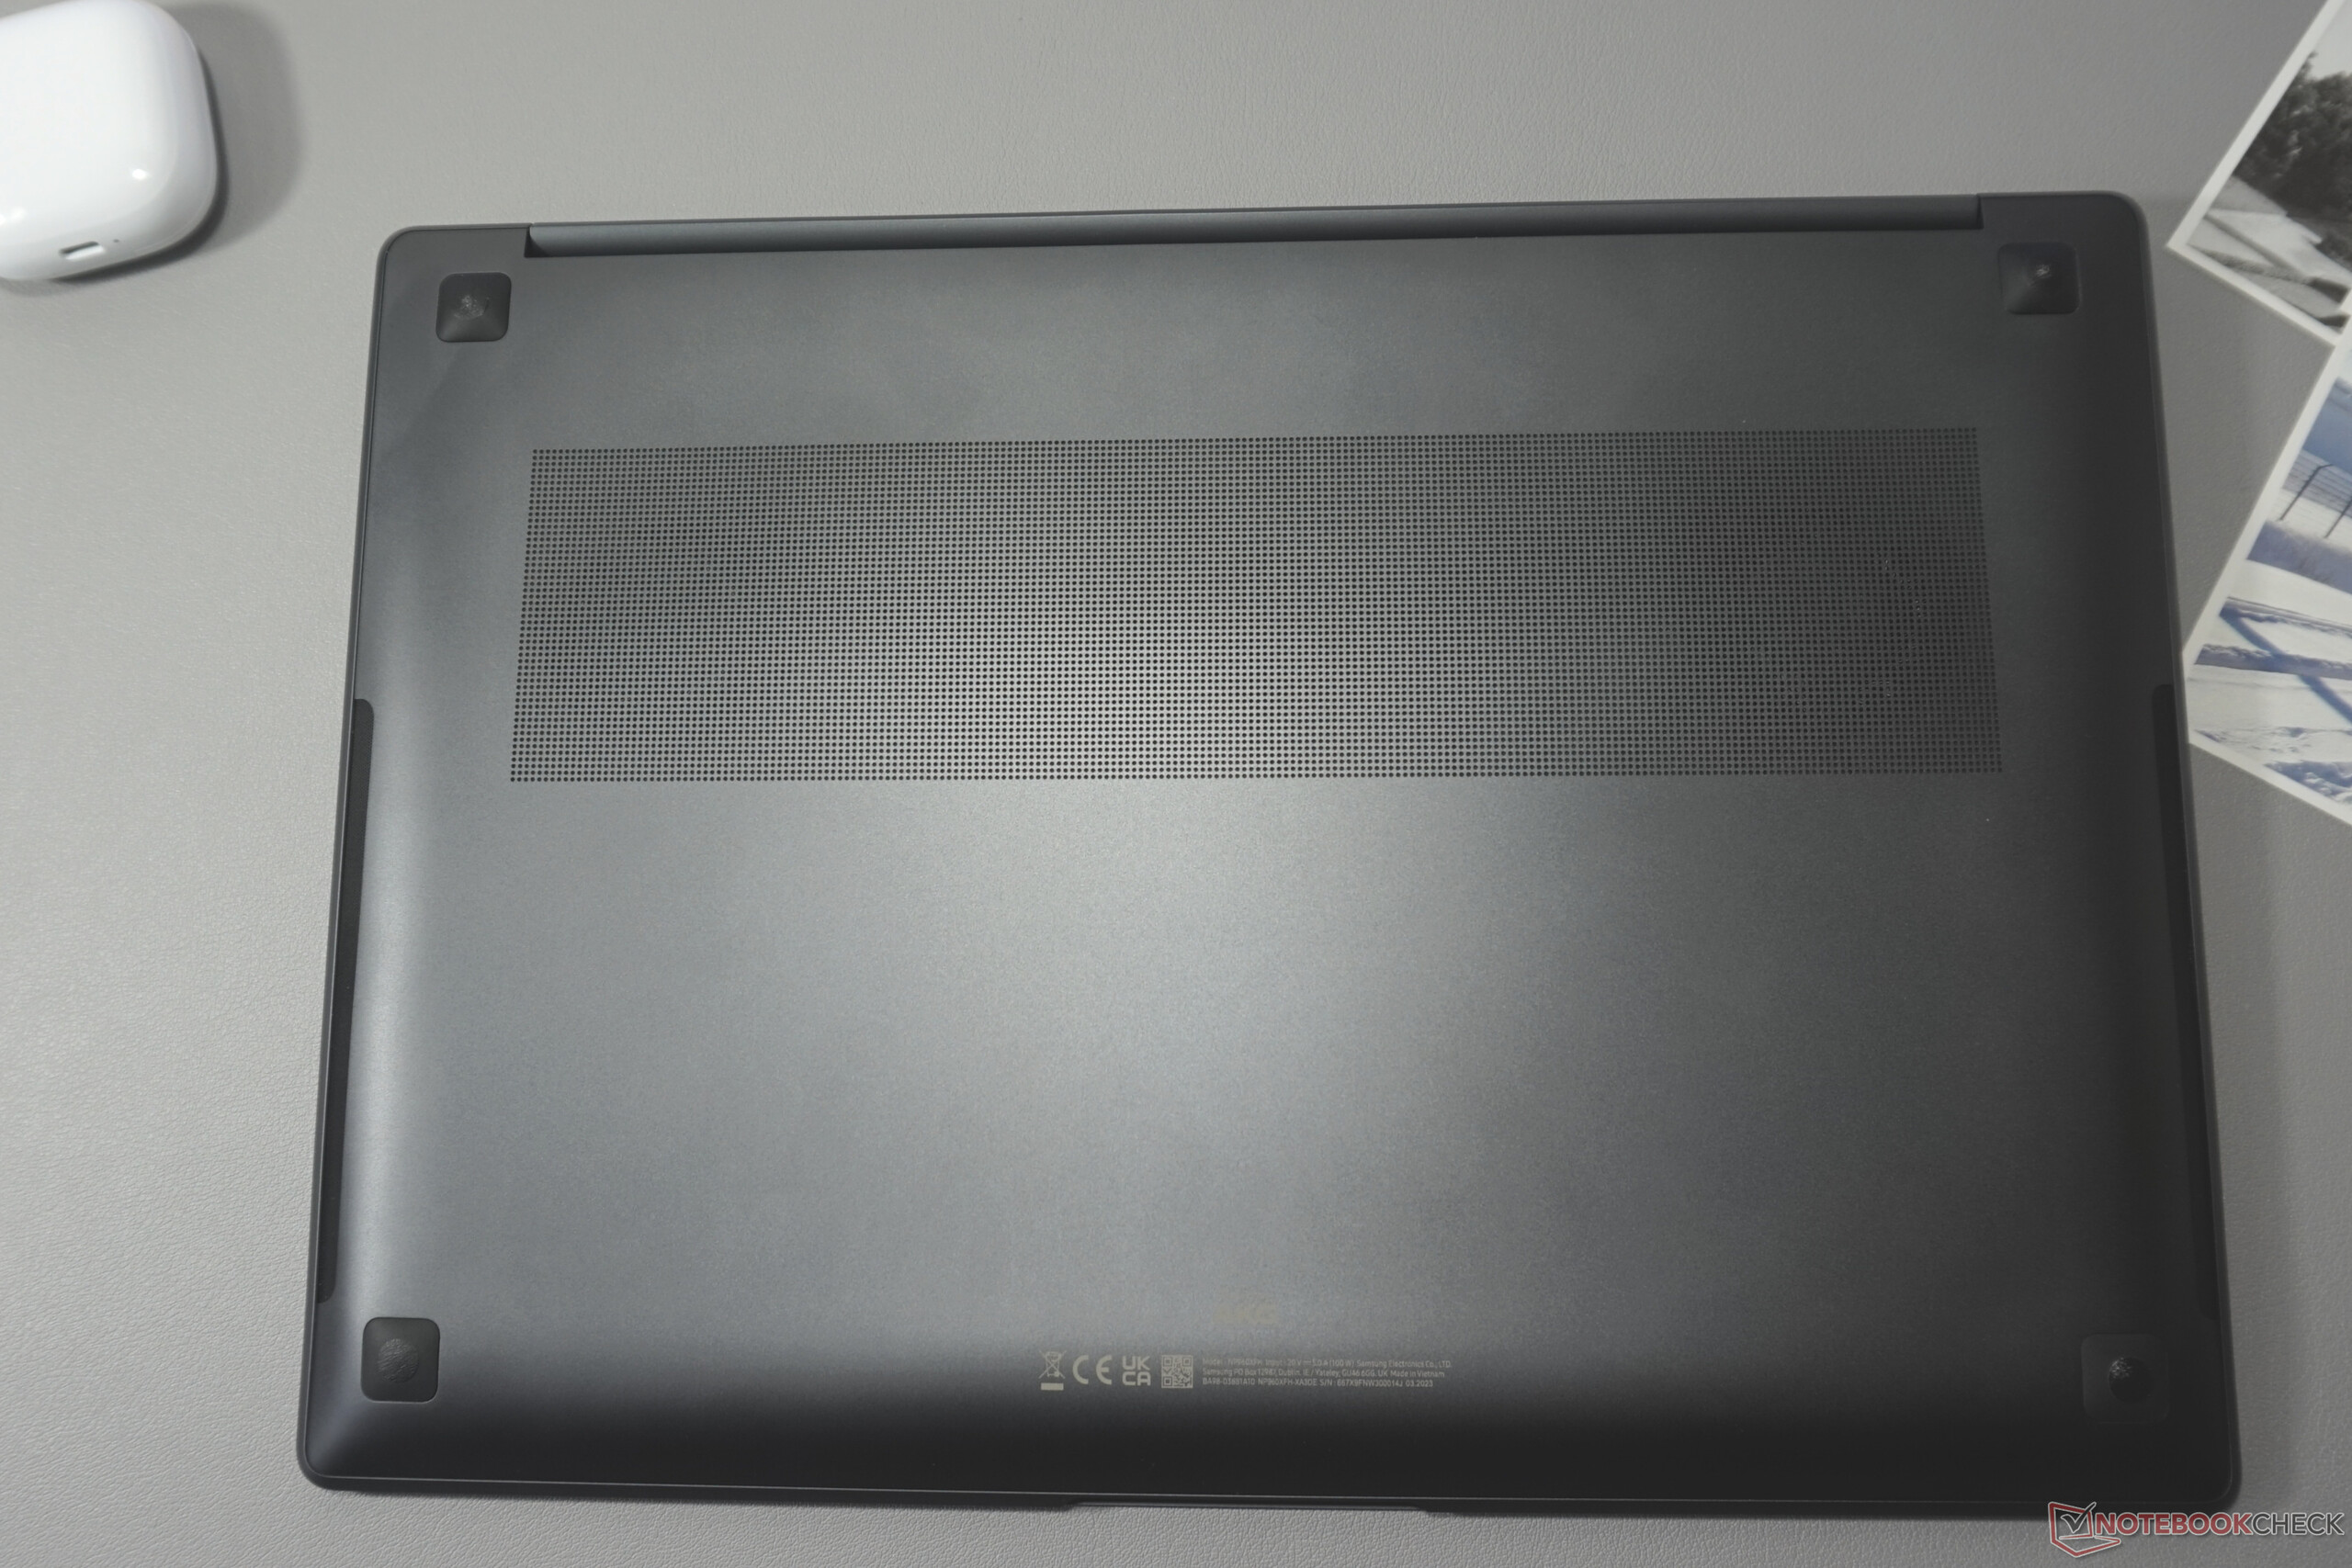
Lo que realmente llama la atención es la falta de ranuras de ventilación más grandes. El intercambio de aire sólo es posible a través de la placa base y a través de las rejillas muy sutiles de los laterales.
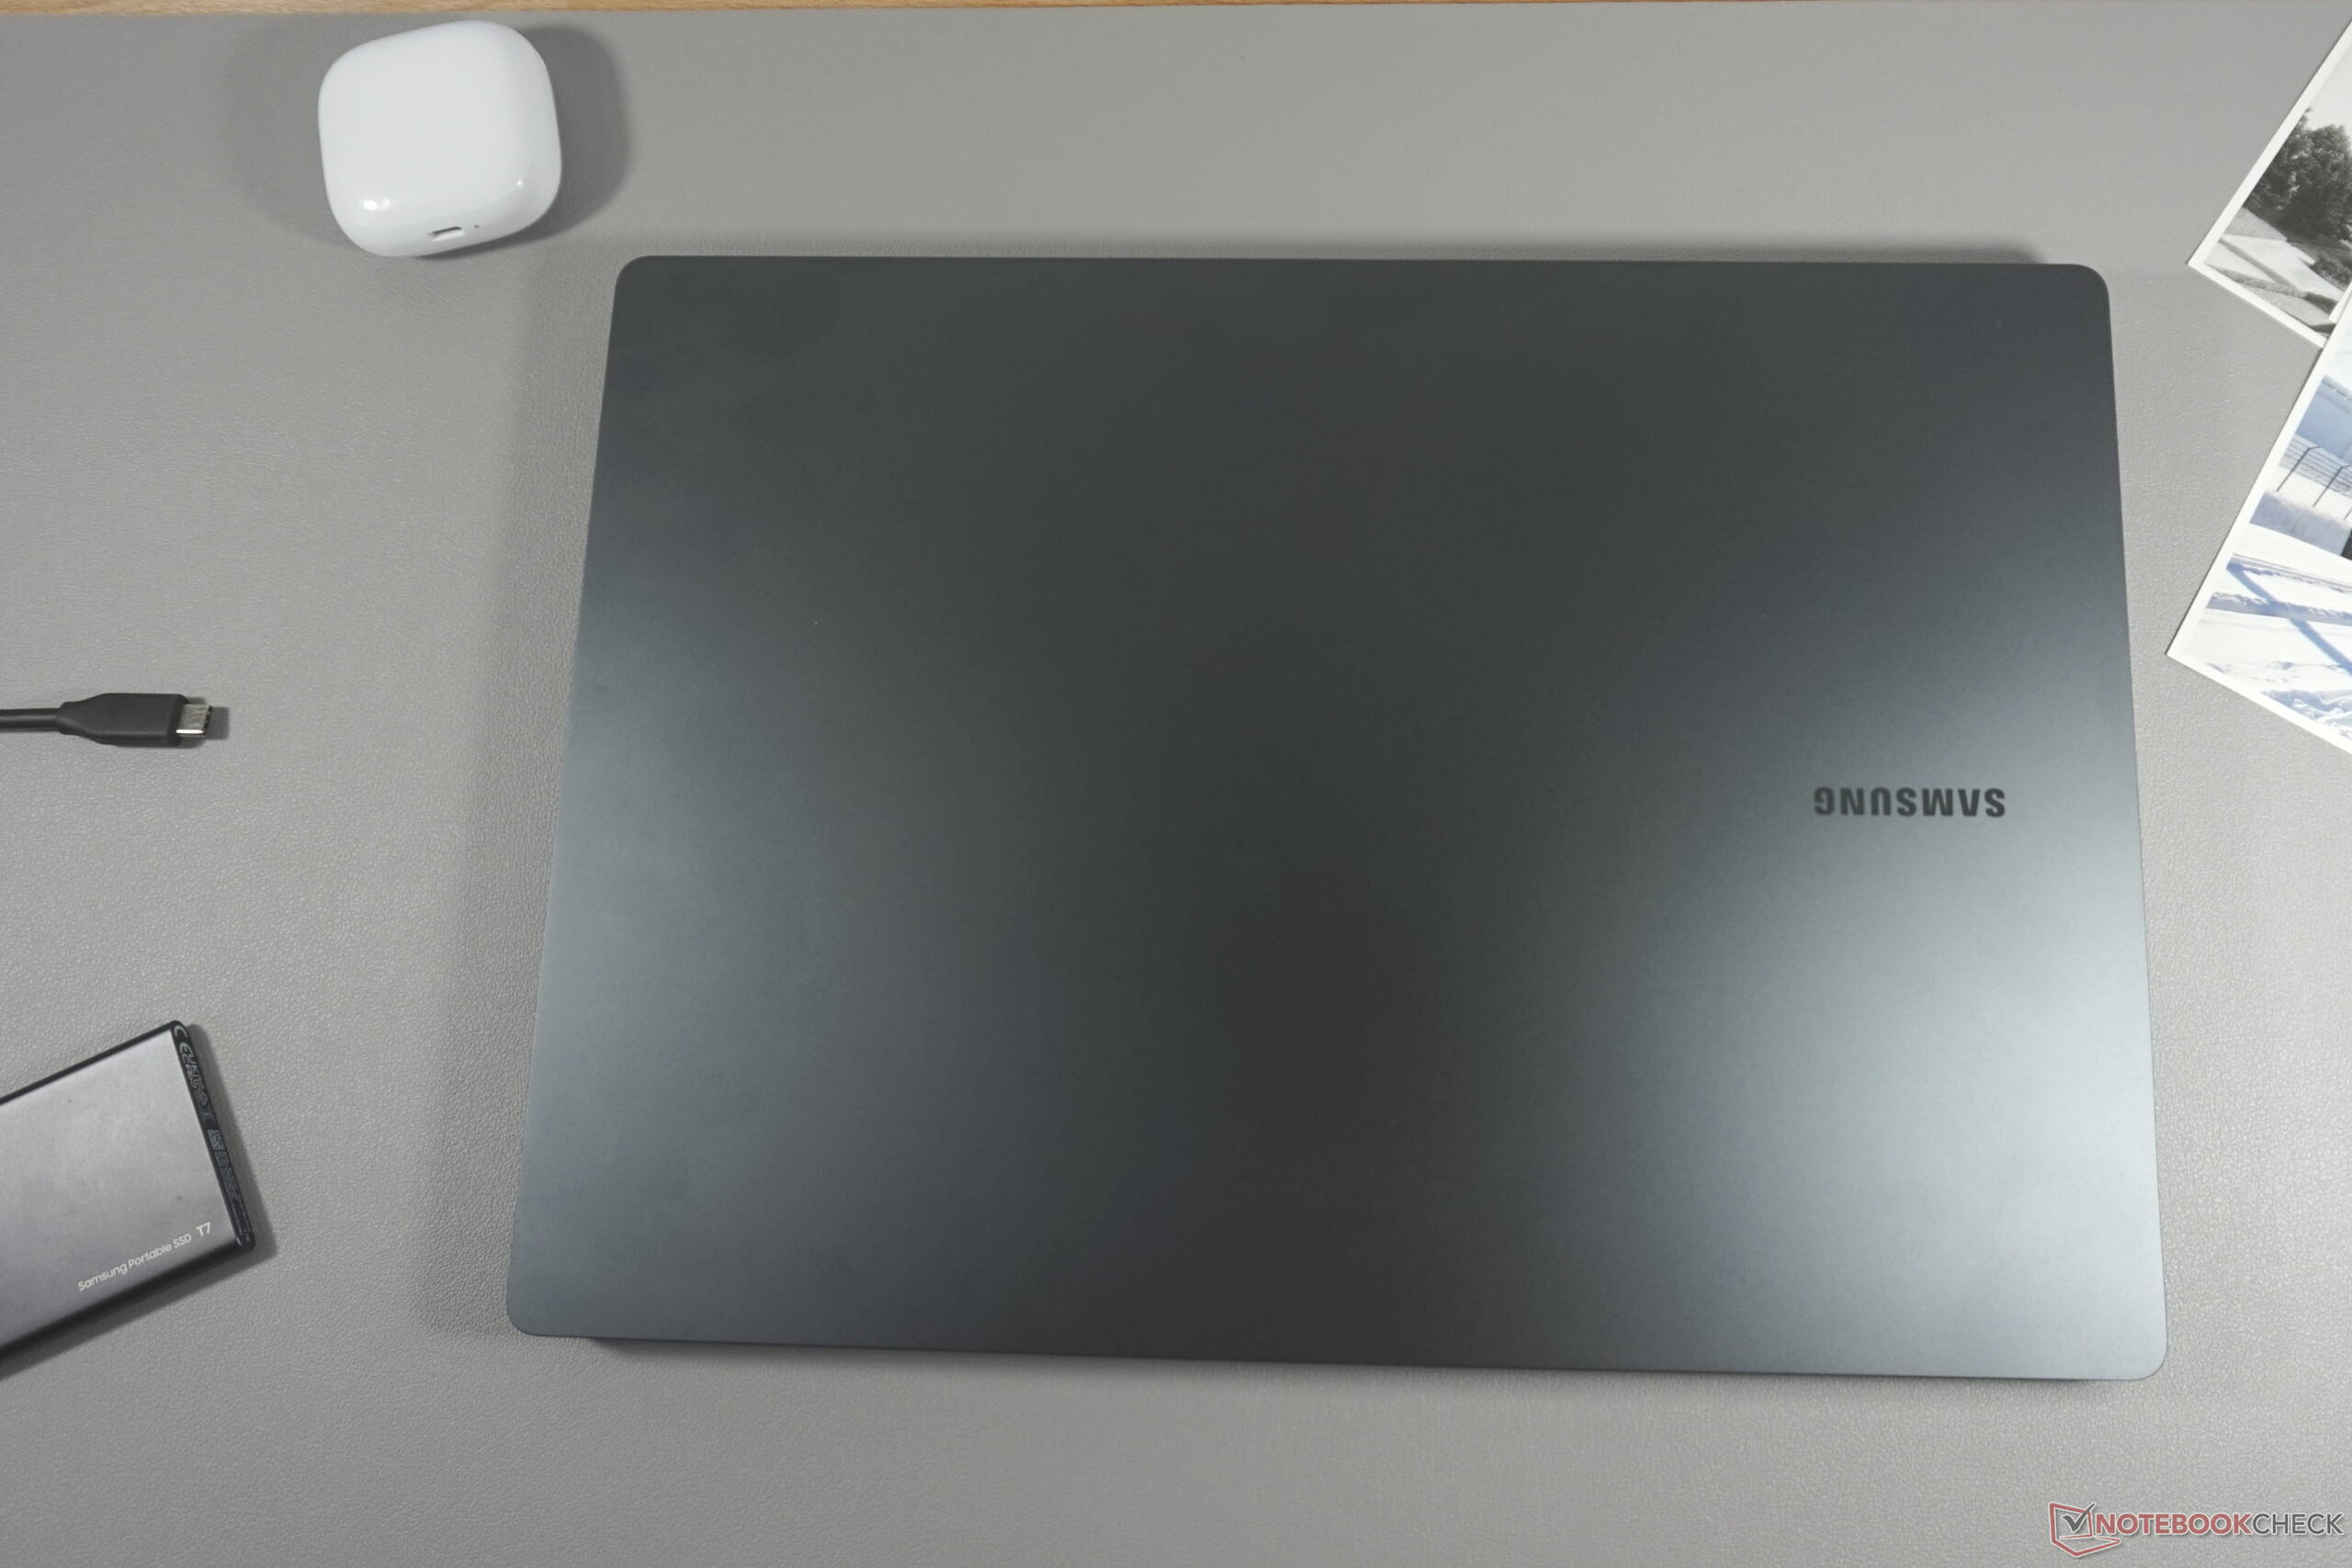
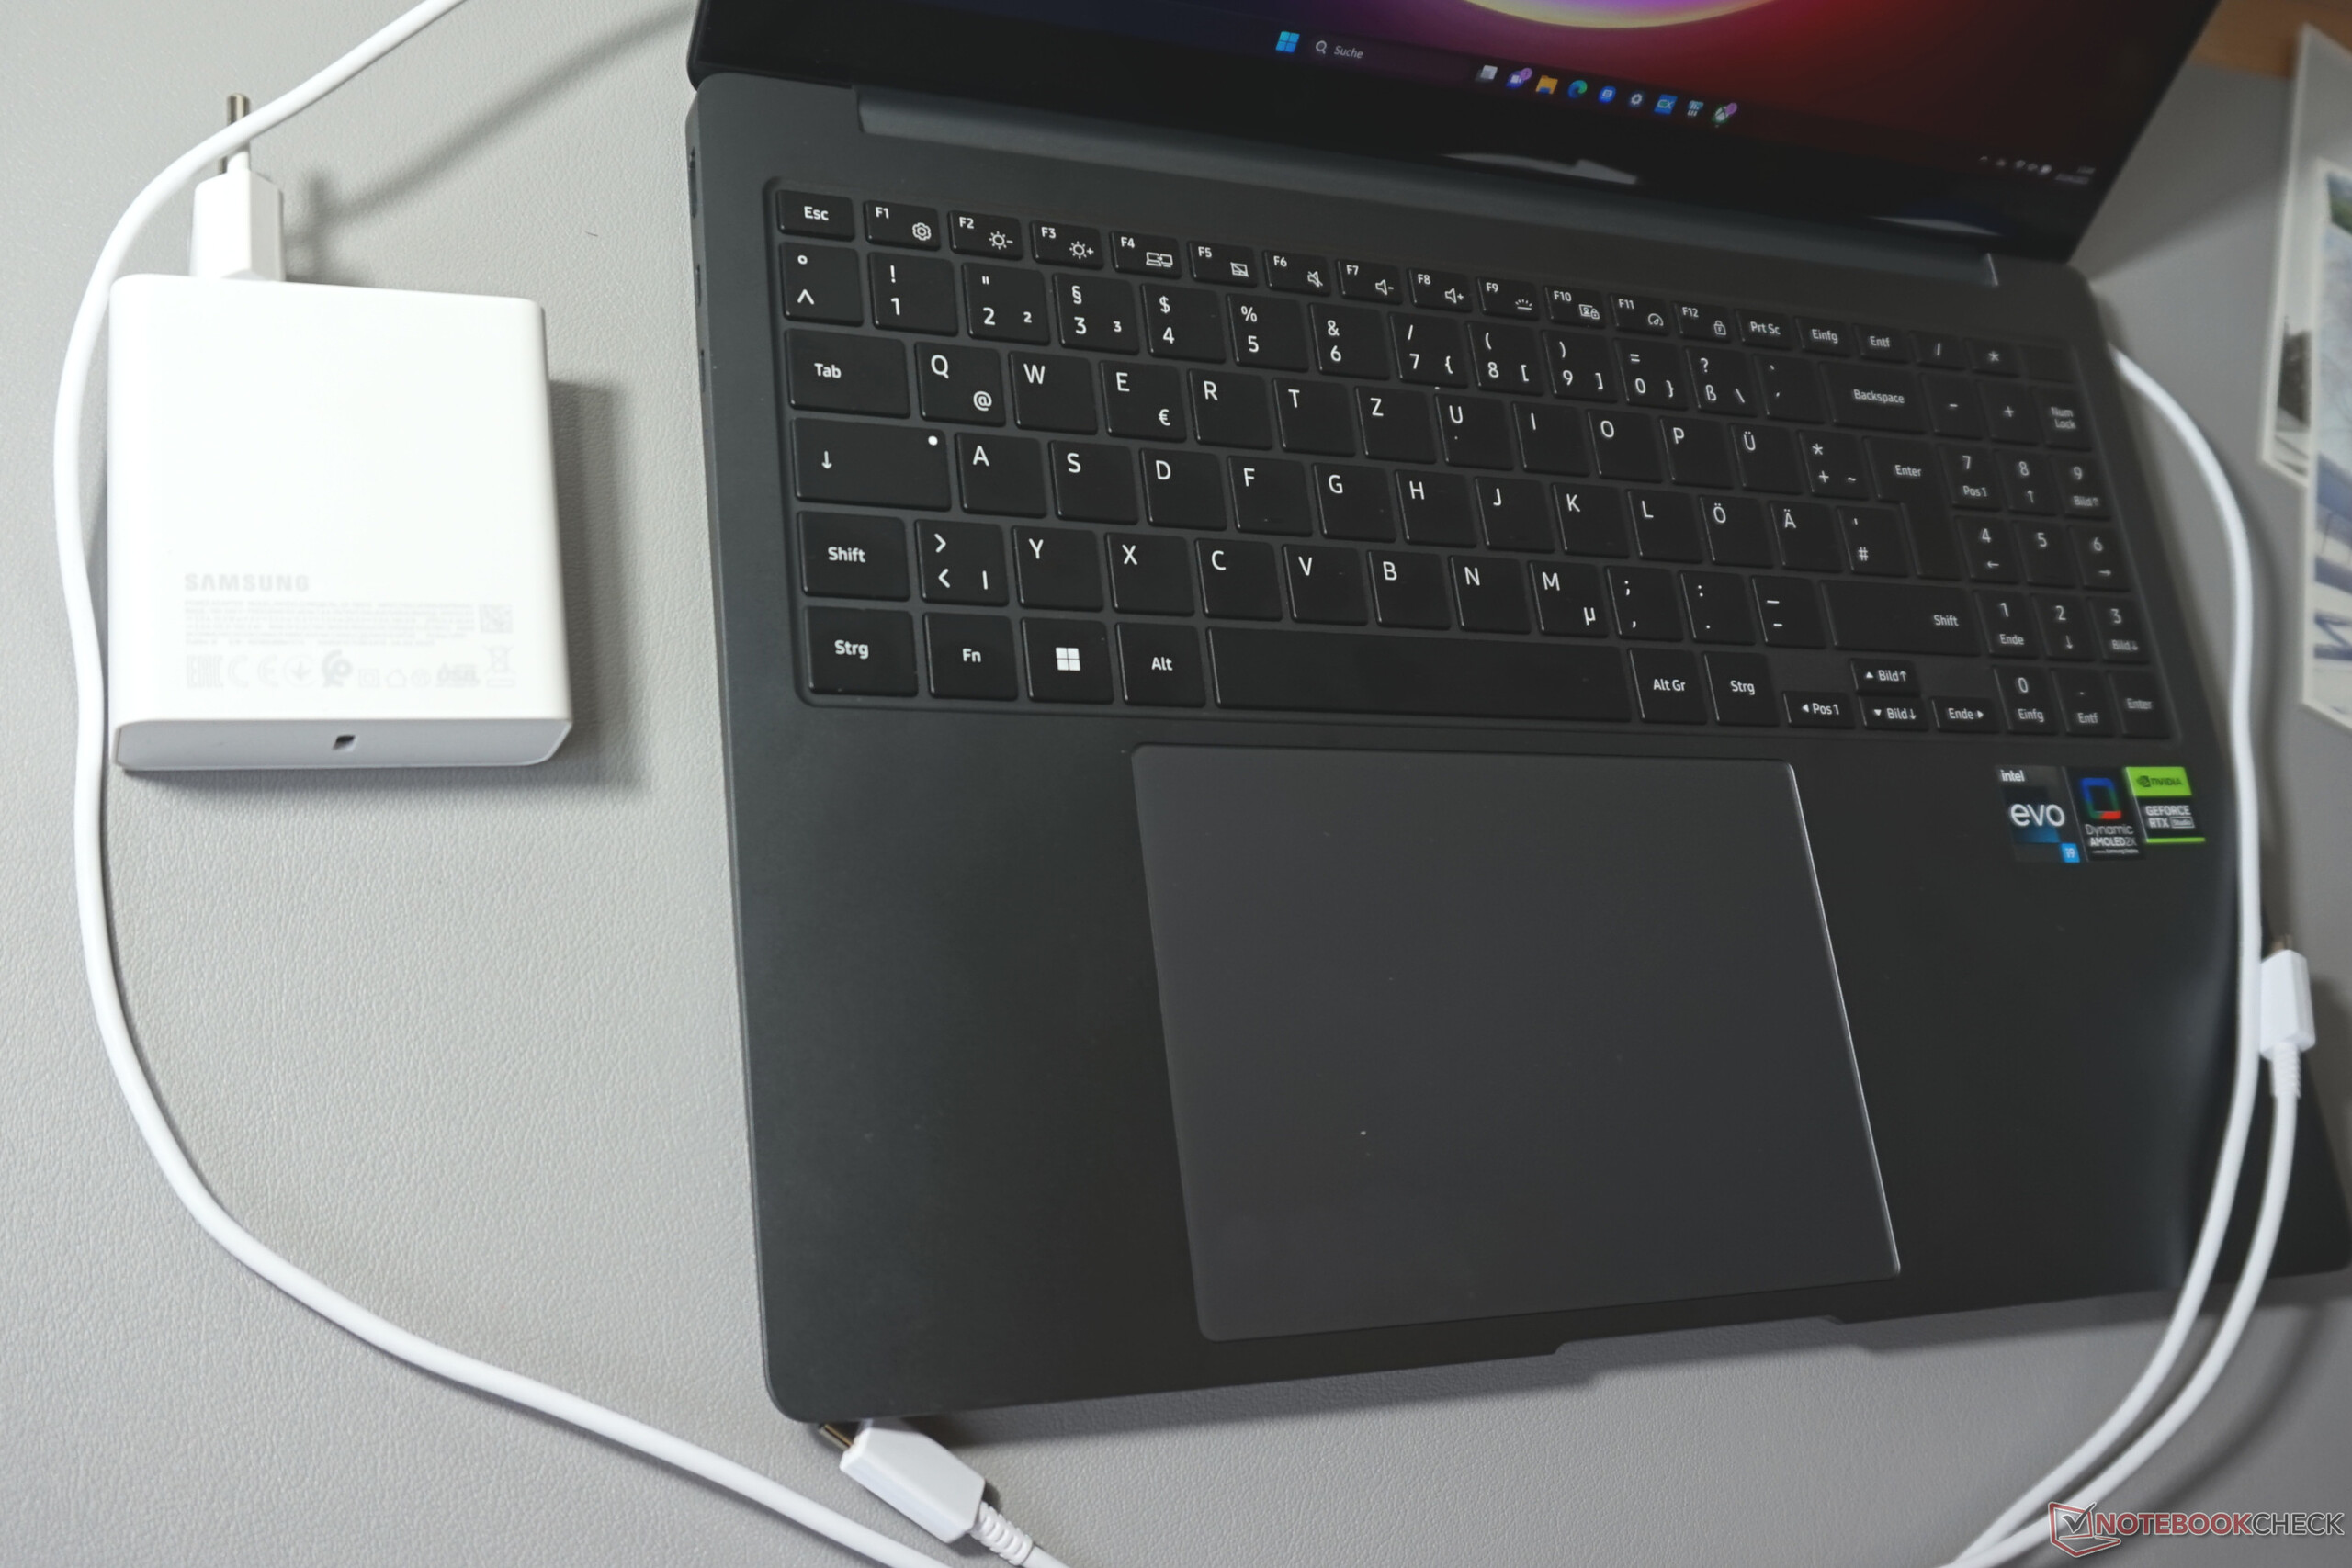
El grosor de 16,8 mm (nuestro valor medido) es difícil de superar. Esta medida es aún más notable si se tiene en cuenta la solidez del hardware. En este sentido, el Galaxy Book3 Ultra también tiene un peso bastante contenido.
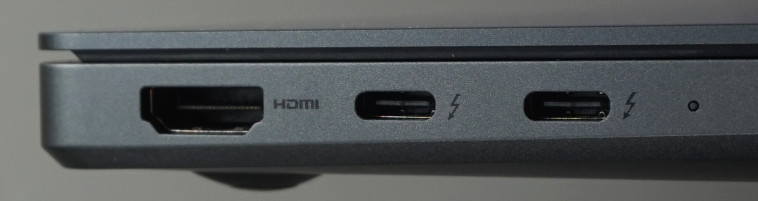
Equipo - Dos TB4, no mucho más
La gama y el número de puertos parecen minimalistas, pero coinciden con la carcasa, igualmente minimalista. Al menos los más importantes están a bordo. Hay un puerto HDMI y dos puertos Thunderbolt 4 al lado, por lo que todas las salidas de vídeo están justo al lado. También hay una ranura para tarjetas, un USB-A para ratón o impresora y una toma de audio.
La gama y el número de puertos parecen minimalistas, pero encajan con la carcasa igualmente minimalista. Al menos los más importantes están a bordo. Hay un puerto HDMI y dos puertos Thunderbolt 4 al lado, por lo que todas las salidas de vídeo están justo al lado. También hay una ranura para tarjetas, un USB-A para ratón o impresora y la toma de audio.
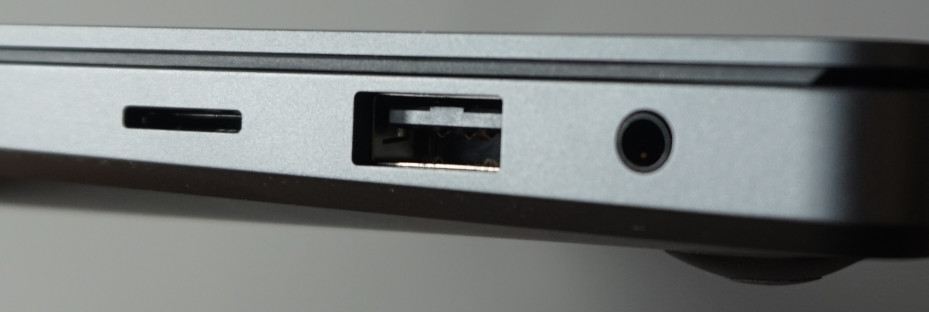
Lector de tarjetas SD
Las velocidades de transferencia a través de nuestra tarjeta de referencia AV PRO microSD 128 GB V60 no son sorprendentes. La mayoría de sus rivales también alcanzan alrededor de 80 MB/s. La Gigabyte AERO 16 y el Dell XPS 15 9530 demuestran que aquí se puede hacer mucho mejor. Esto ahorra unos minutos al copiar una tarjeta llena, pero no más.
| SD Card Reader | |
| average JPG Copy Test (av. of 3 runs) | |
| Gigabyte AERO 16 OLED BSF | |
| Dell XPS 15 9530 RTX 4070 (Toshiba Exceria Pro SDXC 64 GB UHS-II) | |
| Media de la clase Multimedia (23 - 531, n=43, últimos 2 años) | |
| Samsung Galaxy Book3 Ultra 16, i9-13900H RTX 4070 (AV Pro SD microSD 128 GB V60) | |
| Samsung Galaxy Book3 Ultra 16 (AV PRO microSD 128 GB V60) | |
| Asus ProArt StudioBook 16 H7600ZW (AV PRO microSD 128 GB V60) | |
| MSI Stealth 17 Studio A13VH-014 | |
| maximum AS SSD Seq Read Test (1GB) | |
| Media de la clase Multimedia (27.9 - 1455, n=42, últimos 2 años) | |
| Gigabyte AERO 16 OLED BSF | |
| Dell XPS 15 9530 RTX 4070 (Toshiba Exceria Pro SDXC 64 GB UHS-II) | |
| Samsung Galaxy Book3 Ultra 16, i9-13900H RTX 4070 (AV Pro SD microSD 128 GB V60) | |
| Samsung Galaxy Book3 Ultra 16 (AV PRO microSD 128 GB V60) | |
| Asus ProArt StudioBook 16 H7600ZW (AV PRO microSD 128 GB V60) | |
| MSI Stealth 17 Studio A13VH-014 | |
Comunicación
La falta de un puerto LAN no se echará necesariamente de menos. Al menos cerca del router, el Samsung Galaxy Book3 transmite más de 1 Gbit/s sin cable. Nuestros valores medidos caen dentro del rango medio para portátiles multimedia y para el módulo WLAN Intel AX211 usado.
Sólo cuando transmite a 6 GHz vía Wi-Fi 6E el módulo no alcanza la velocidad esperada a pesar de las repetidas pruebas. Sin embargo, este no fue el caso durante la recepción, por lo que podemos descartar un error de hardware.
Cámara web
Para un portátil tan compacto, la webcam Full HD ofrece resultados bastante decentes. Las imágenes parecen de alta calidad con luz suficiente. No se observaron desviaciones de color ni ruido de imagen. Sólo en una habitación poco iluminada o en penumbra surge ruido de imagen y la tasa de frames también parece disminuir.
El micrófono de doble array rinde bastante bien en lo que se refiere a su idoneidad para la videotelefonía. Capta la voz desde distintas direcciones y a varias distancias sin cambios en el volumen. Aunque las voces suenan limpias en su mayor parte, también suenan un poco distorsionadas a veces. Sin embargo, esto sólo se nota si se le presta mucha atención.


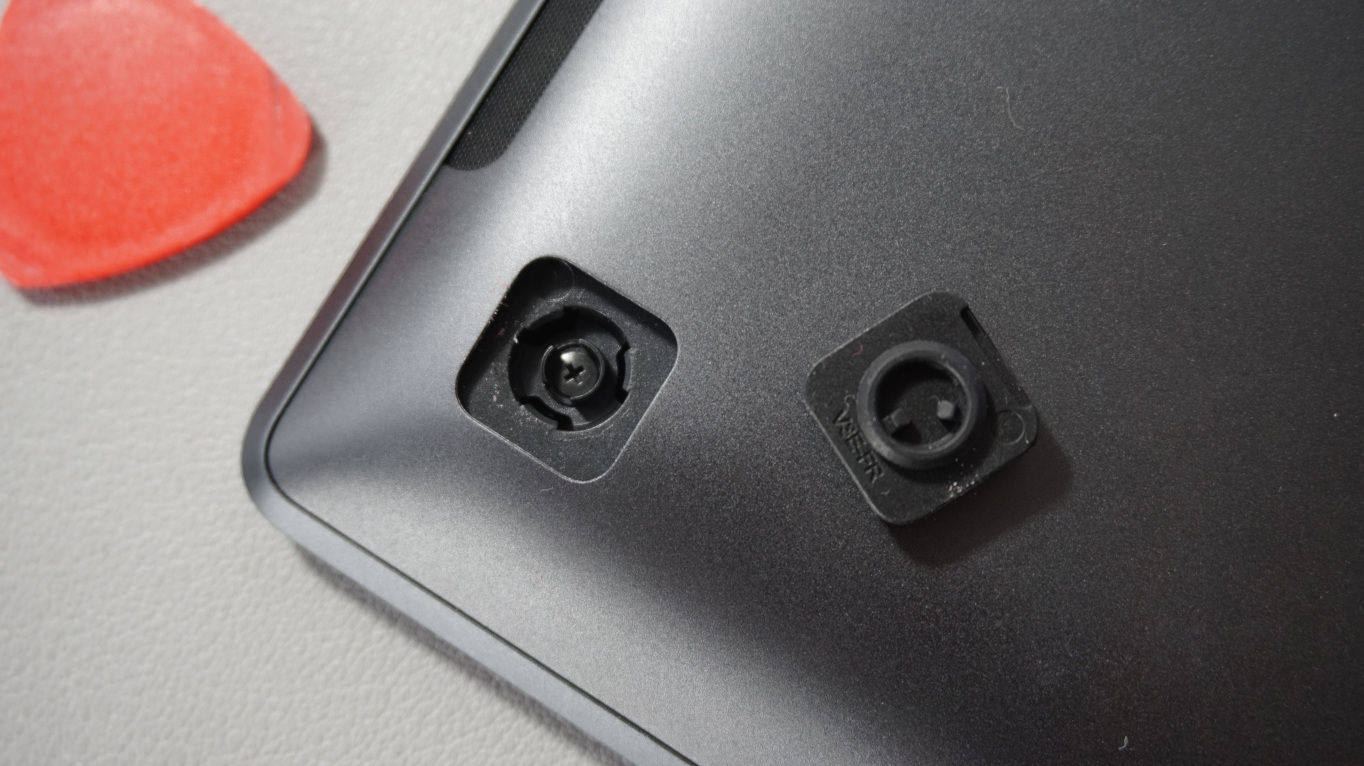
Mantenimiento
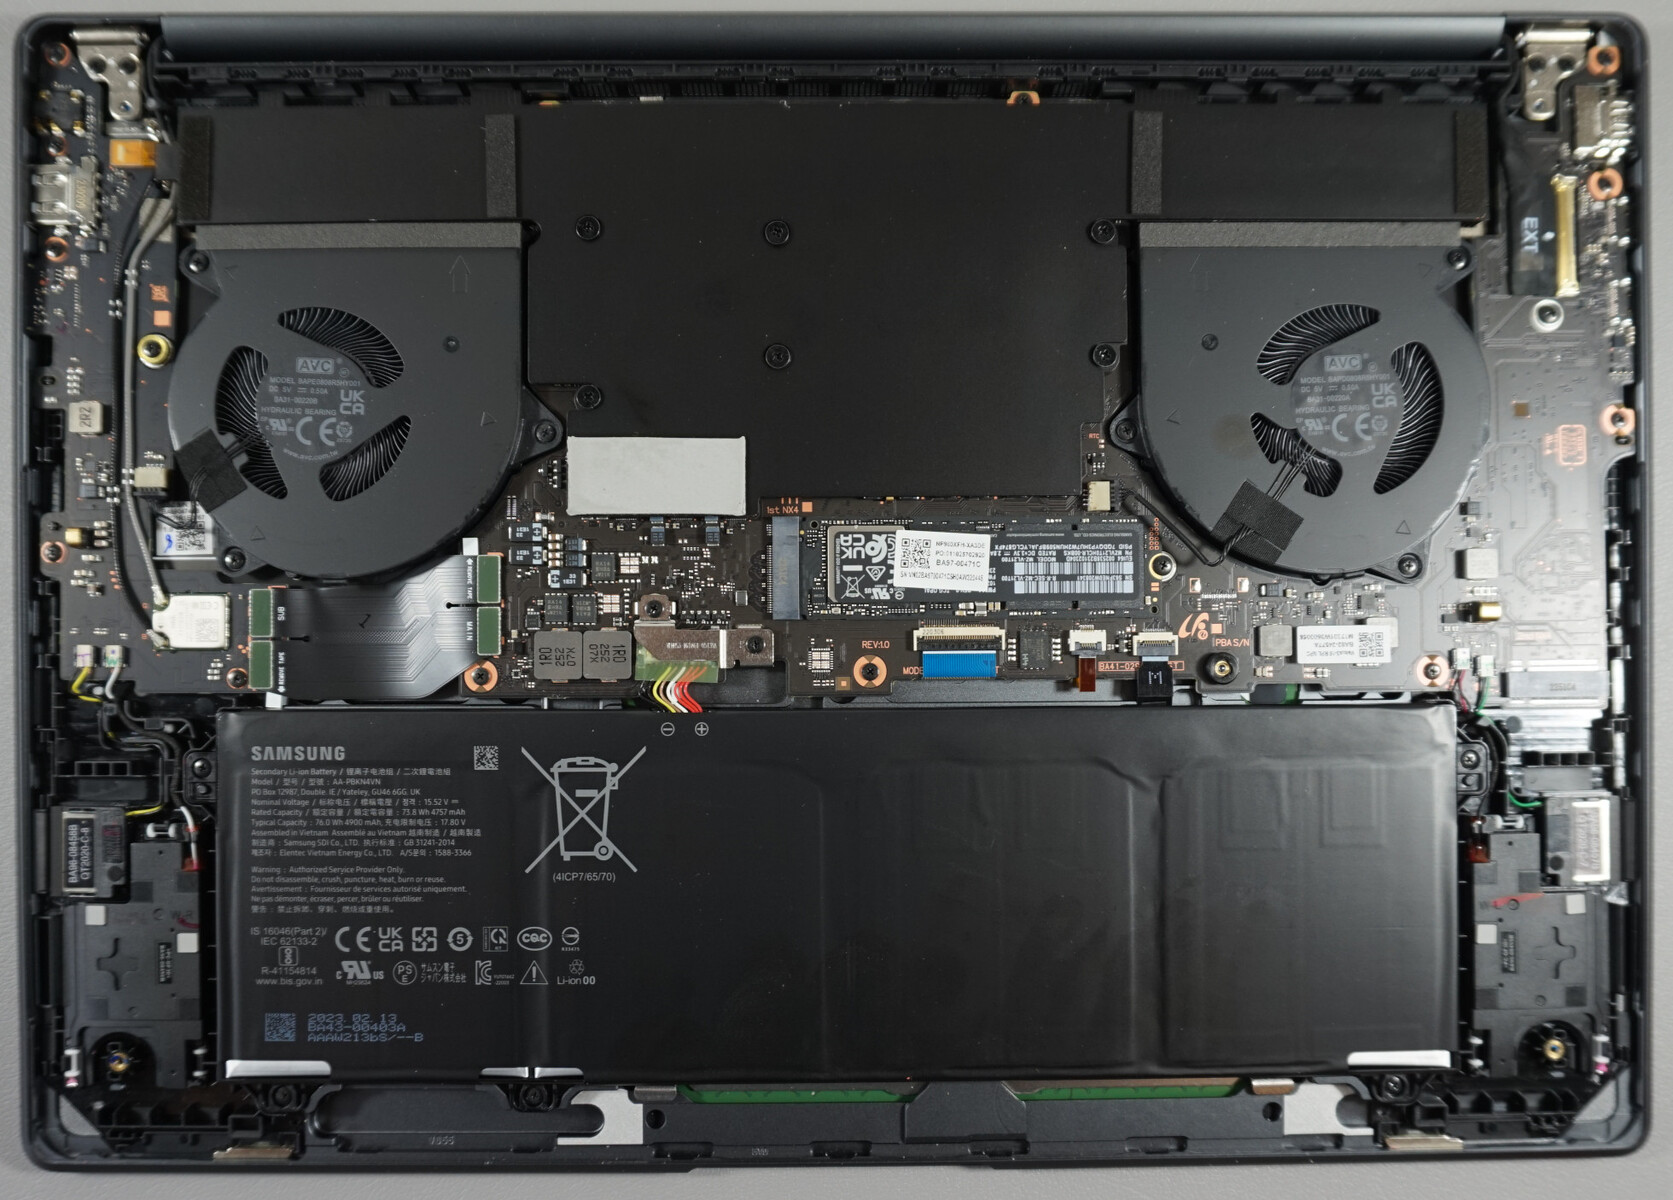
Sólo hay que desenroscar cuatro tornillos Phillips para retirar la placa base. Estos se encuentran debajo de los pies de goma encajados, que se pueden quitar sin daños con un poco de delicadeza.
Esto hace que parezca un portátil fácil de abrir, pero no lo es en absoluto. Innumerables clips de plástico sujetan firmemente la placa base. También hay un mecanismo en el centro de la placa base que también está conectado al sistema de refrigeración por medio de una almohadilla térmica. El mecanismo sólo puede abrirse tras aflojar y doblar completamente la placa base, y resulta igualmente complicado a la hora de volver a montar el portátil.
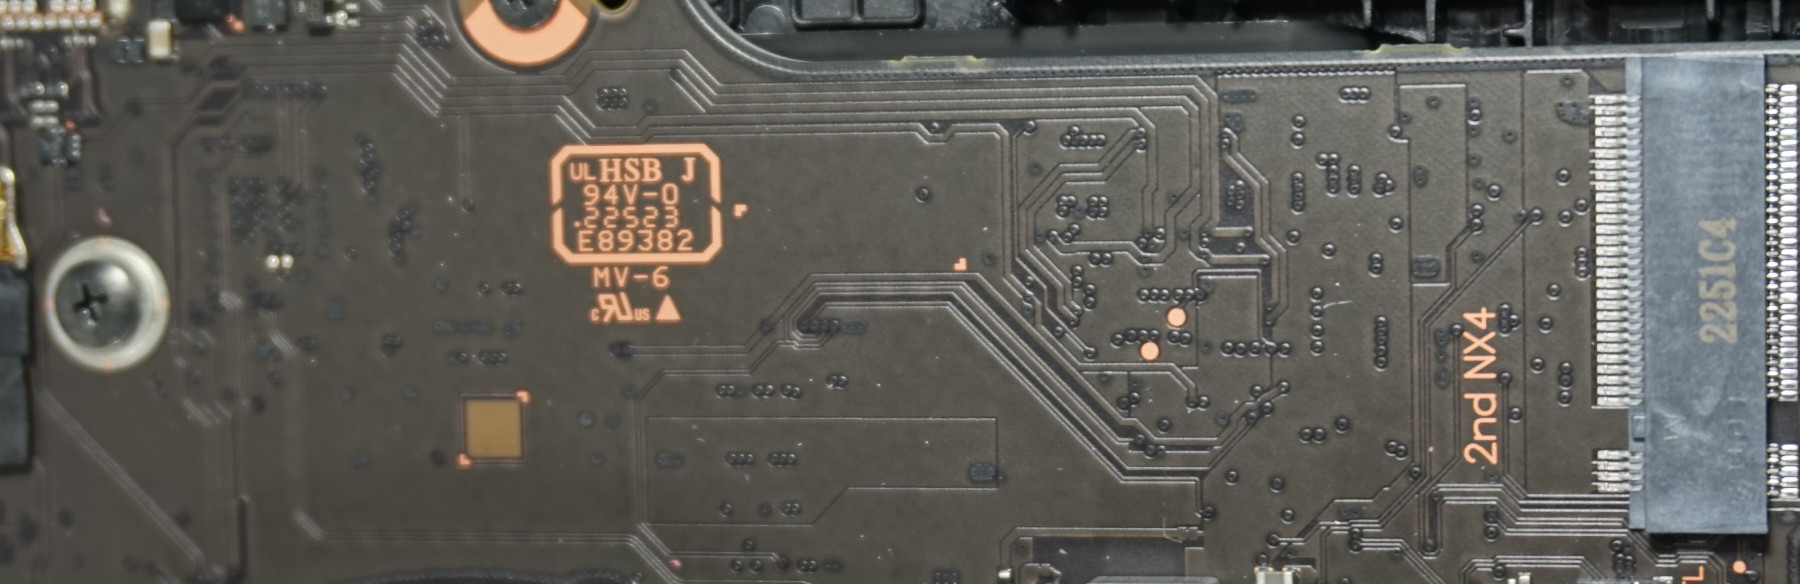
Los que sean persistentes y tengan cuidado de no doblar ni romper nada encontrarán una ranura M.2 libre con PCIe 4 para ampliar el almacenamiento. El SSD principal y la batería también se pueden cambiar. Los ventiladores pueden limpiarse fácilmente.
La RAM y el módulo WLAN, por otro lado, están soldados. Con todo, esto apenas importa, ya que Samsung ha hecho la apertura extremadamente engorrosa.
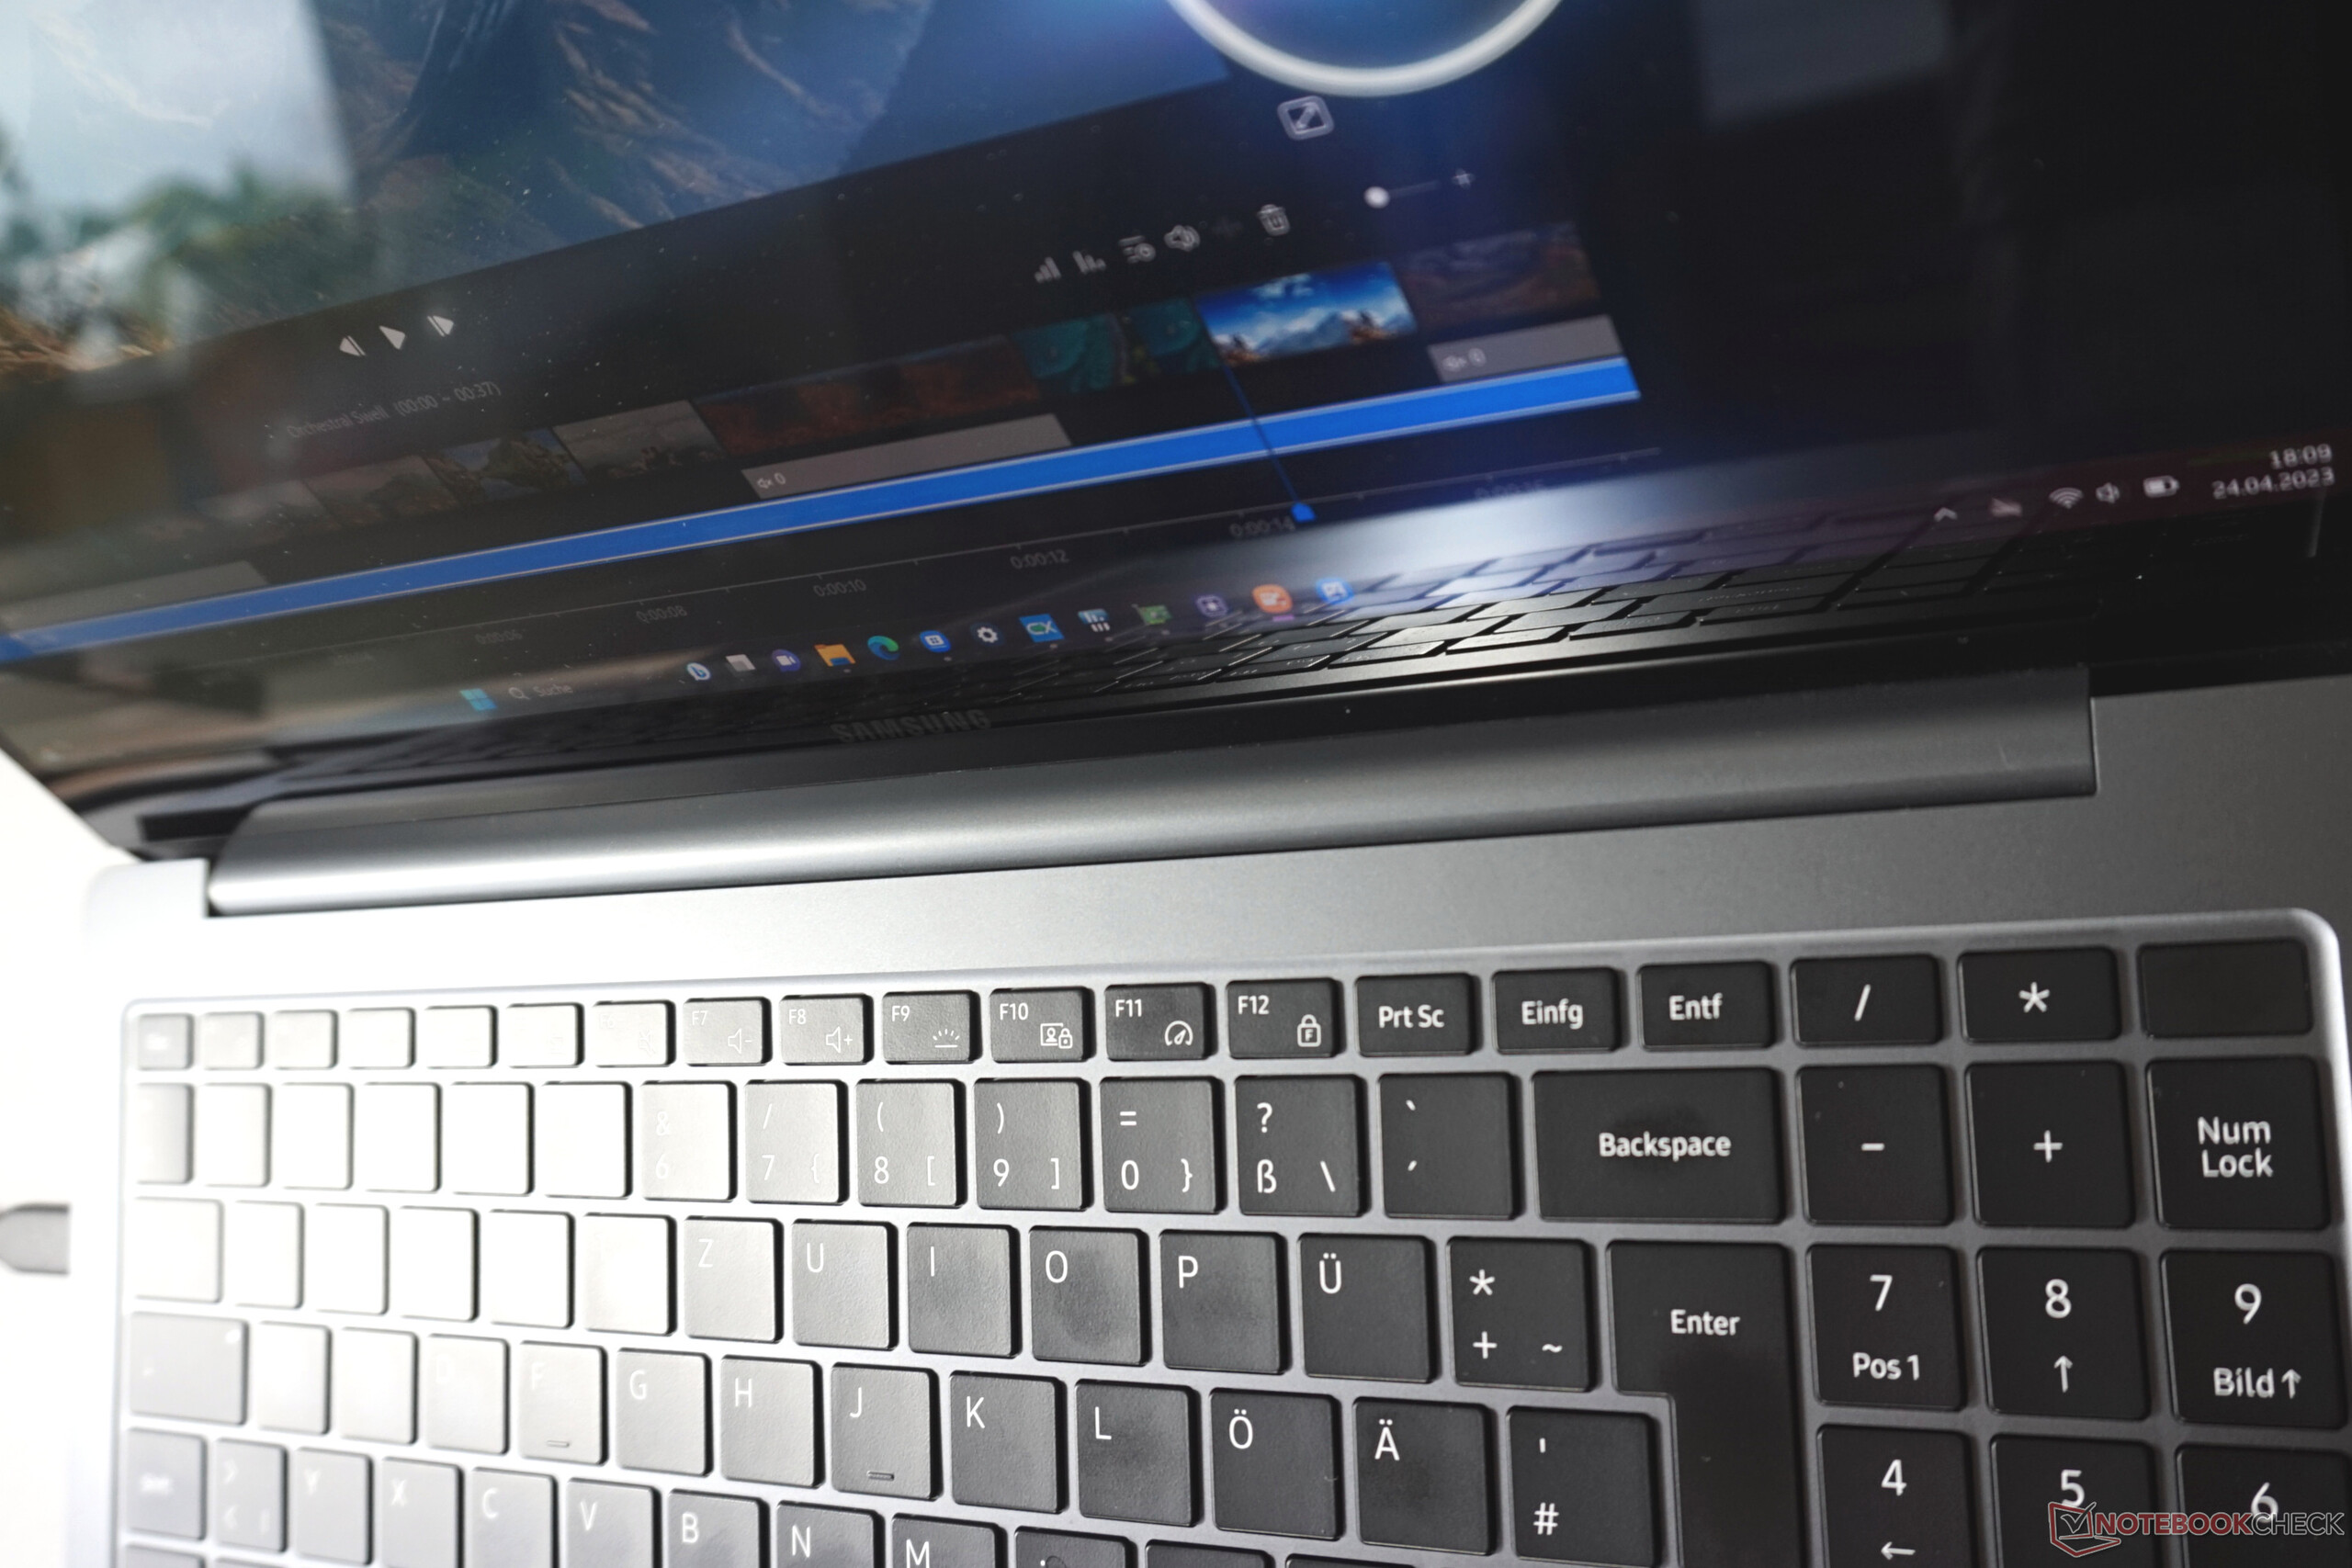
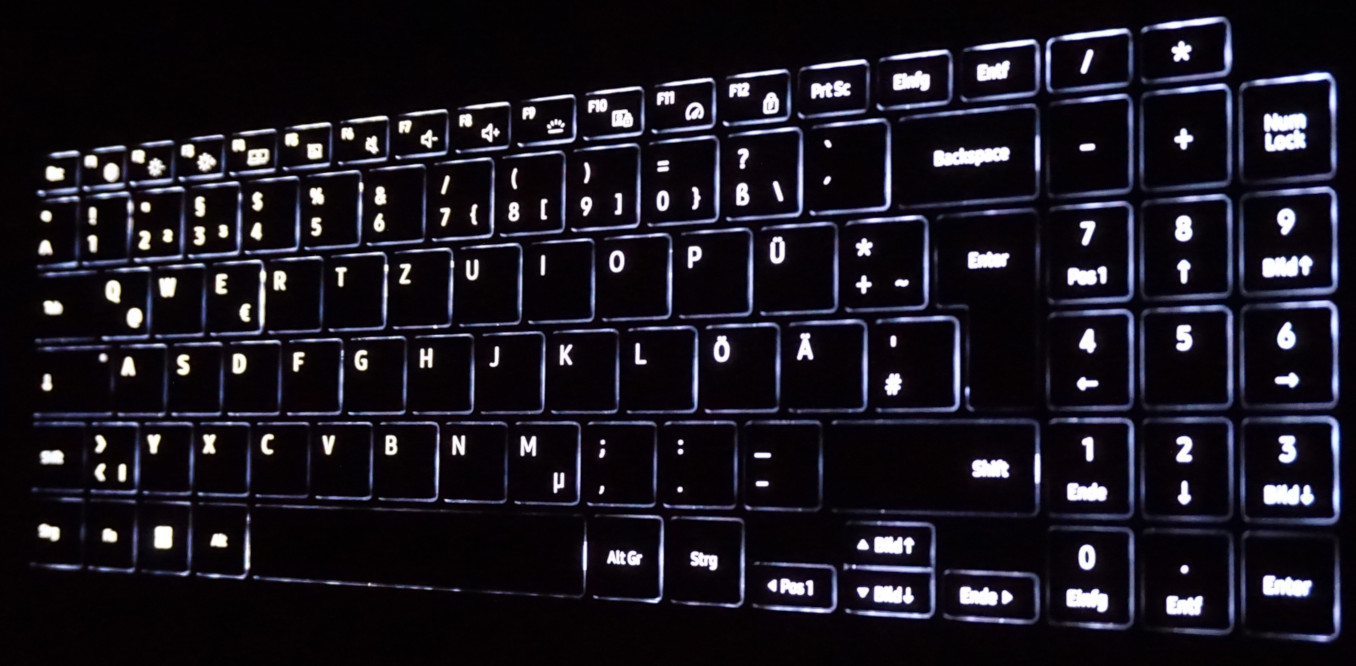
Dispositivos de entrada - Portátil creador con un gran extra
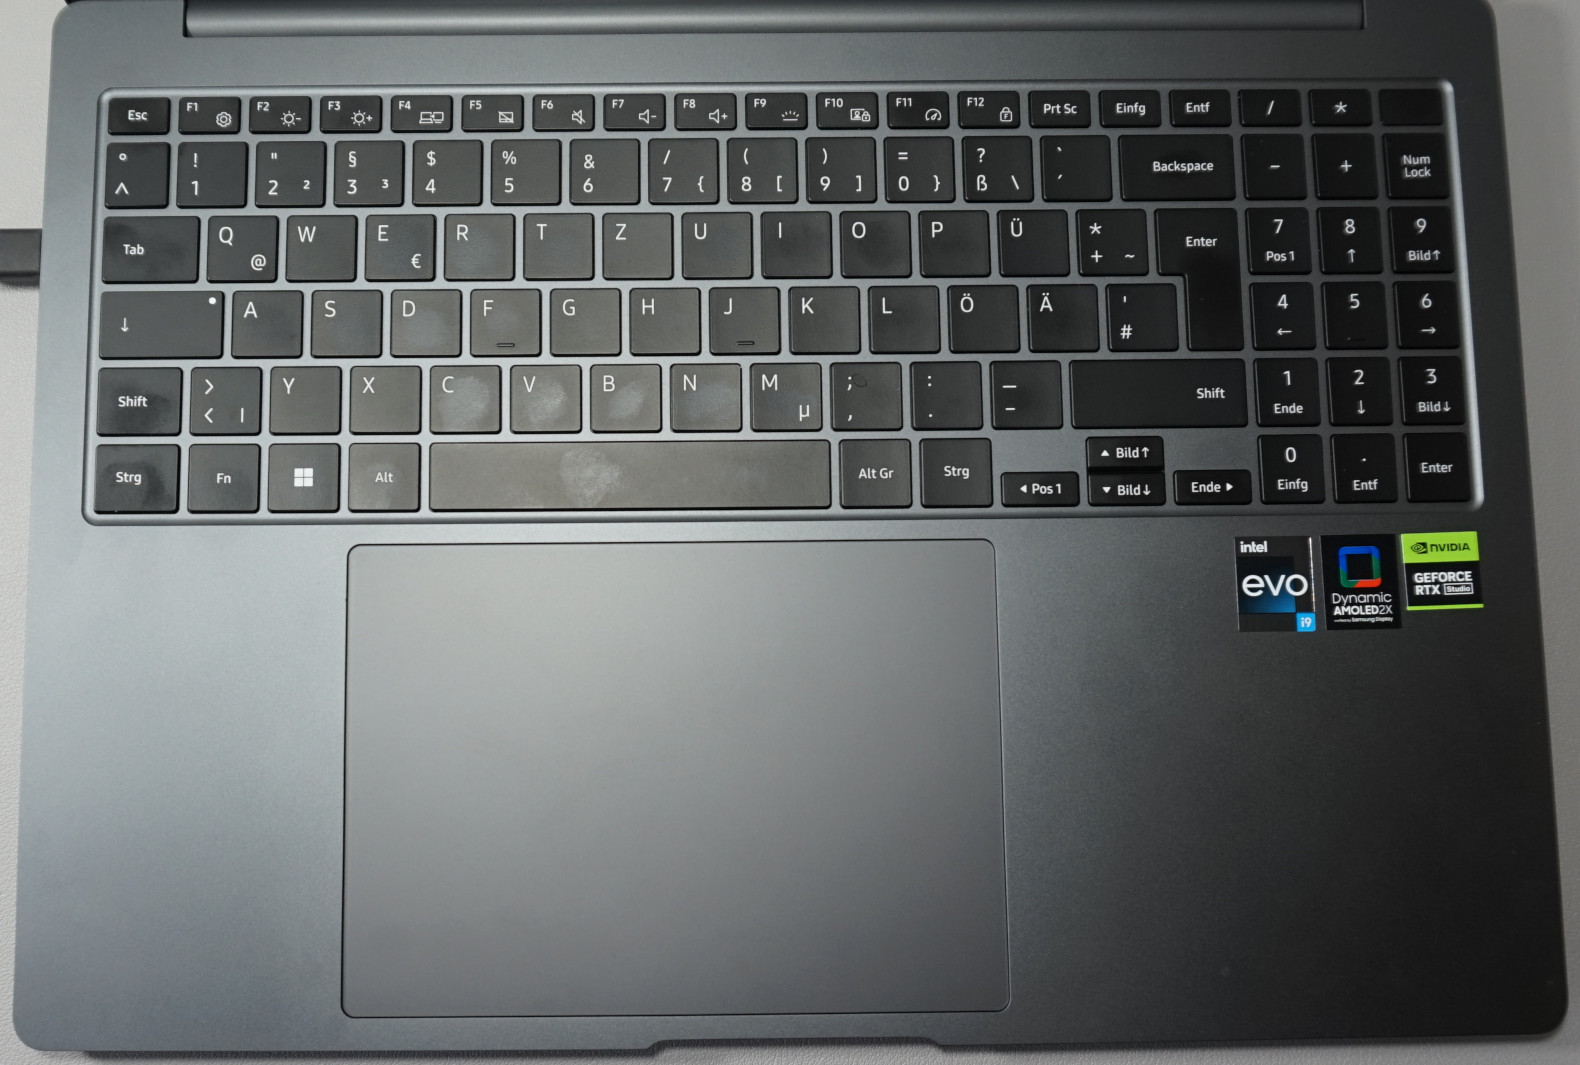
Las ajustadas dimensiones del portátil dejan poco espacio para jugar, por lo que el recorrido de las teclas es de sólo 1 mm, pero esto apenas estropea nuestra impresión general positiva del teclado. Una estructura de superficie antideslizante y una contrapresión agradablemente firme aseguran una buena dinámica de tecleo. Samsung también ha hecho un uso excelente del espacio disponible en las 16 pulgadas. El bloque numérico tiene un tamaño normal y gracias al pequeño espacio hasta las teclas de flecha, éstas se pueden sentir sin contacto visual. Esto facilita, entre otras cosas, el trabajo en tablas.
Lo más destacado, sin embargo, es el touchpad sobredimensionado. Mide 15 x 10 cm, lo que es significativamente mayor que en un típico portátil de negocios. Los controles son precisos, el recorrido de las teclas está bien dosificado, y el manejo con varios dedos también funciona sin problemas. Sin embargo, cuesta un poco acostumbrarse, ya que rozamos repetidamente el touchpad con la mano mientras tecleábamos. Las entradas tienen éxito en su mayor parte, pero a veces pueden ser imprecisas o involuntarias con dos dedos.
No obstante, el touchpad tiene buen aspecto y debería hacer obsoleto el ratón adicional en caso necesario.
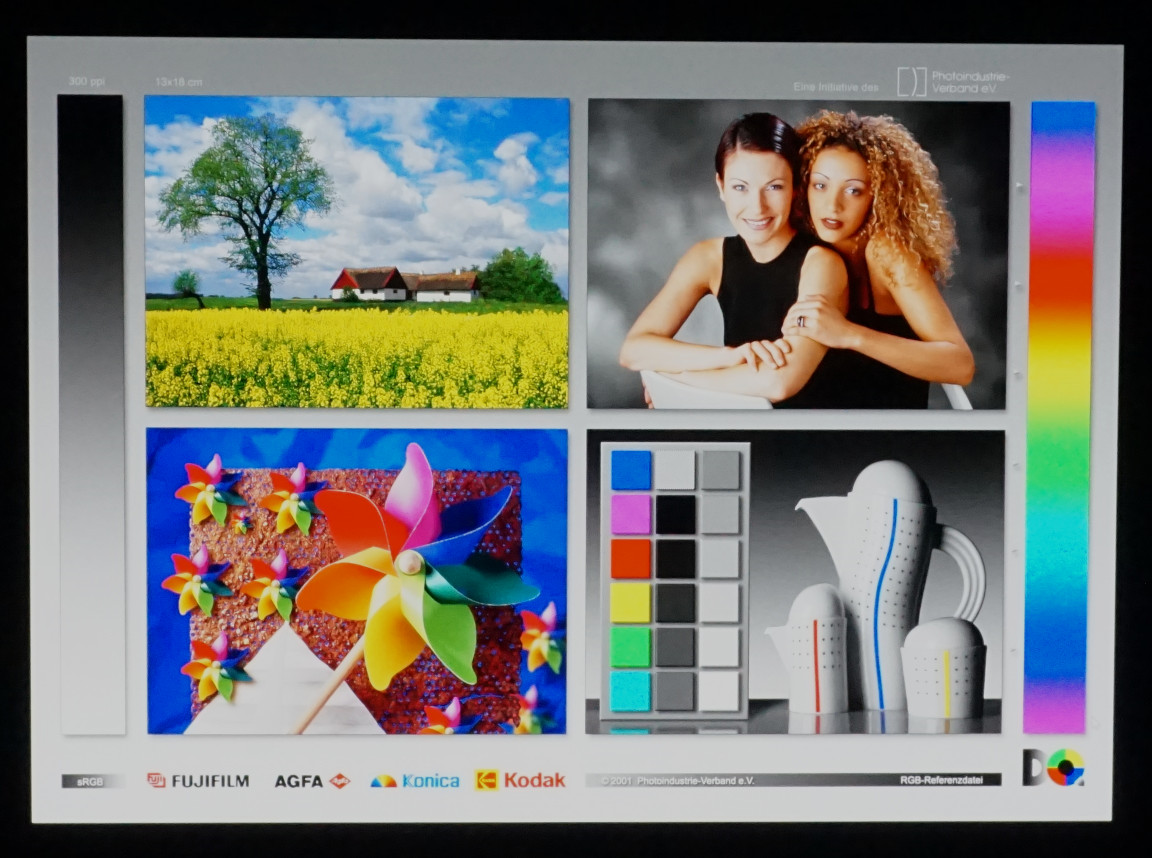
Pantalla - OLED y 3K en el Galaxy Book3 Ultra
Una resolución 3K, que en este caso significa 2.880 x 1.800 píxeles, una pantalla OLED, 120 Hz y certificación HDR se adaptan bien al propósito del portátil. Gracias a los 5 millones de píxeles, las fotos digitales de alta resolución se muestran muy bien. La mayor frecuencia de imagen también cumple los requisitos para una reproducción y edición de vídeo óptimas.
Además, la pantalla OLED aporta su granito de arena a los buenos valores de imagen. El negro profundo garantiza muy buenos contrastes y hace que los colores parezcan más vivos. Además, la certificación Vesa Display HDR 500 anuncia la reproducción óptima de contenidos HDR. La pantalla brillante también ayuda a conseguir una muy buena representación del contenido visualizado. Al no haber grano en la superficie, las imágenes y los vídeos aparecen siempre brillantes. Sin embargo, hay que aceptar fuertes reflejos de superficies brillantes en el fondo.
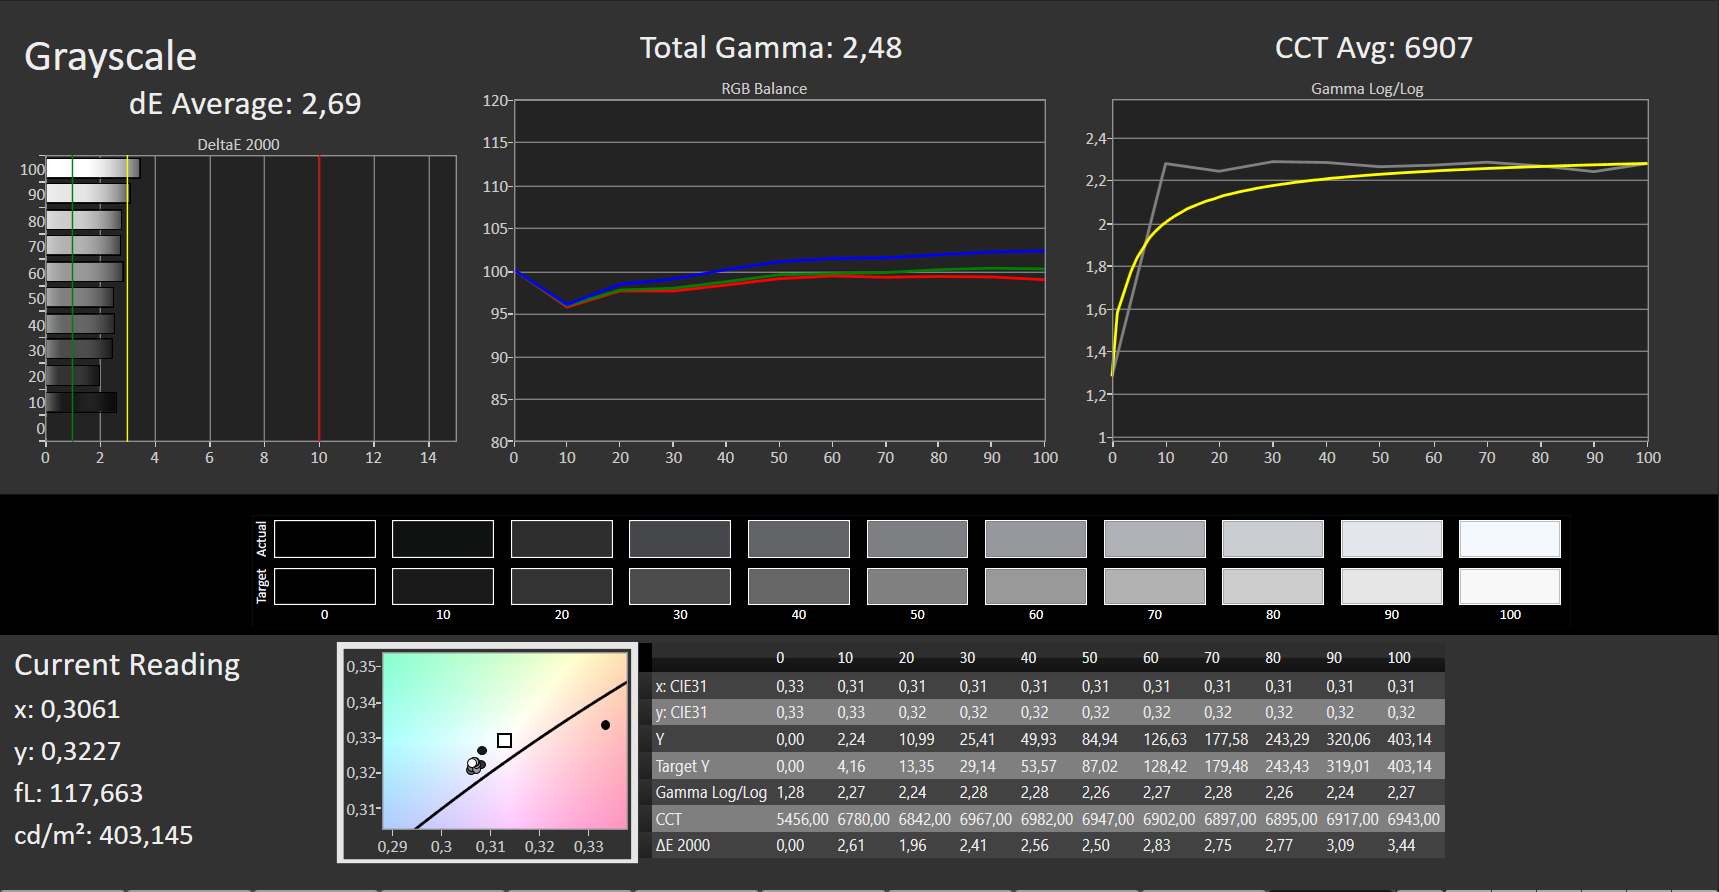
Medimos un buen brillo medio de 408 cd/m². Los dispositivos rivales con pantallas OLED no alcanzan este nivel de brillo. Se observa un ligero oscurecimiento cuando se desenchufa el adaptador de corriente, pero el brillo sigue siendo aceptable con 340 cd/m².
No hay que temer el sangrado de pantalla. Los píxeles autoiluminados se apagan cuando aparece el negro, lo que da como resultado el valor de negro perfecto del panel.
| |||||||||||||||||||||||||
iluminación: 98 %
Brillo con batería: 343 cd/m²
Contraste: ∞:1 (Negro: 0 cd/m²)
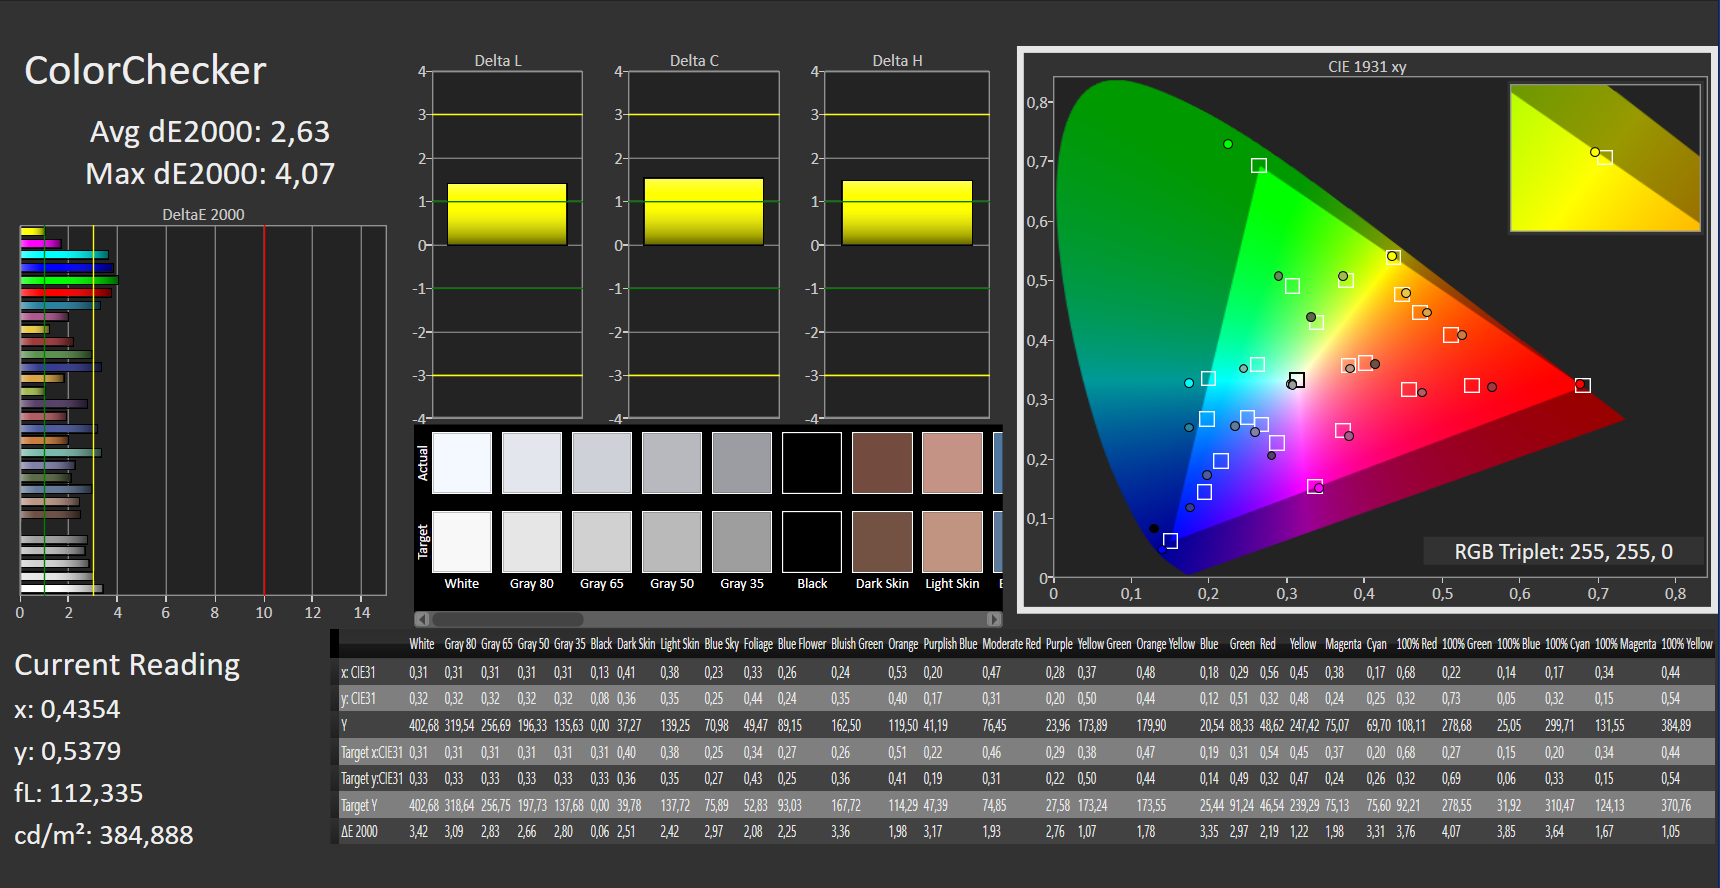
ΔE ColorChecker Calman: 2.63 | ∀{0.5-29.43 Ø4.72}
ΔE Greyscale Calman: 2.69 | ∀{0.09-98 Ø4.97}
97.4% AdobeRGB 1998 (Argyll 3D)
99.1% sRGB (Argyll 3D)
95.3% Display P3 (Argyll 3D)
Gamma: 2.48
CCT: 6907 K
| Samsung Galaxy Book3 Ultra 16, i9-13900H RTX 4070 Samsung SDC4185 ATNA60CL03-0, OLED / AMOLED, 2880x1800, 16" | Dell XPS 15 9530 RTX 4070 Samsung 156XG01, OLED, 3456x2160, 15.6" | MSI Stealth 17 Studio A13VH-014 AUO41A2 B173ZAN06.C, Mini LED, 3840x2160, 17.3" | Asus ProArt StudioBook 16 H7600ZW Samsung ATNA60YV02, OLED, 3840x2400, 16" | Gigabyte AERO 16 OLED BSF Samsung SDC4191 (ATNA60YV09-0, OLED, 3840x2400, 16" | Samsung Galaxy Book3 Ultra 16 Samsung ATNA60CL03-0, AMOLED, 2880x1800, 16" | |
|---|---|---|---|---|---|---|
| Display | 2% | -2% | 2% | 2% | 2% | |
| Display P3 Coverage (%) | 95.3 | 99.8 5% | 92 -3% | 99.6 5% | 99.9 5% | 99.9 5% |
| sRGB Coverage (%) | 99.1 | 100 1% | 99.1 0% | 100 1% | 100 1% | 100 1% |
| AdobeRGB 1998 Coverage (%) | 97.4 | 98.4 1% | 94.07 -3% | 96.5 -1% | 96.4 -1% | 96.3 -1% |
| Response Times | 10% | -1076% | -398% | 1% | 71% | |
| Response Time Grey 50% / Grey 80% * (ms) | 2 ? | 1.68 ? 16% | 46.4 ? -2220% | 1.6 ? 20% | 2 ? -0% | 0.49 ? 75% |
| Response Time Black / White * (ms) | 2 ? | 1.94 ? 3% | 0.62 ? 69% | 18.32 ? -816% | 1.98 ? 1% | 0.65 ? 67% |
| PWM Frequency (Hz) | 250 ? | 239 | 2400 | 60 ? | 60 | 240 ? |
| Screen | -30% | -1% | -8% | 6% | 1% | |
| Brightness middle (cd/m²) | 403 | 389.5 -3% | 397.29 -1% | 370 -8% | 389.97 -3% | 400 -1% |
| Brightness (cd/m²) | 408 | 392 -4% | 392 -4% | 374 -8% | 395 -3% | 399 -2% |
| Brightness Distribution (%) | 98 | 98 0% | 93 -5% | 98 0% | 97 -1% | 93 -5% |
| Black Level * (cd/m²) | 0.02 | 0.03 | 0.03 | |||
| Colorchecker dE 2000 * | 2.63 | 4.95 -88% | 2.52 4% | 2.97 -13% | 2 24% | 2.3 13% |
| Colorchecker dE 2000 max. * | 4.07 | 8.65 -113% | 3.91 4% | 4.38 -8% | 4.1 -1% | 4.15 -2% |
| Greyscale dE 2000 * | 2.69 | 2 26% | 2.78 -3% | 2.9 -8% | 2.23 17% | 2.7 -0% |
| Gamma | 2.48 89% | 2.27 97% | 2.63 84% | 2.13 103% | 2.41 91% | 2.266 97% |
| CCT | 6907 94% | 6265 104% | 6412 101% | 6636 98% | 6323 103% | 7047 92% |
| Colorchecker dE 2000 calibrated * | 1.53 | 2.52 | 2.15 | 1.68 | 1.66 | |
| Contrast (:1) | 19865 | 12999 | 13333 | |||
| Media total (Programa/Opciones) | -6% /
-14% | -360% /
-197% | -135% /
-76% | 3% /
4% | 25% /
14% |
* ... más pequeño es mejor
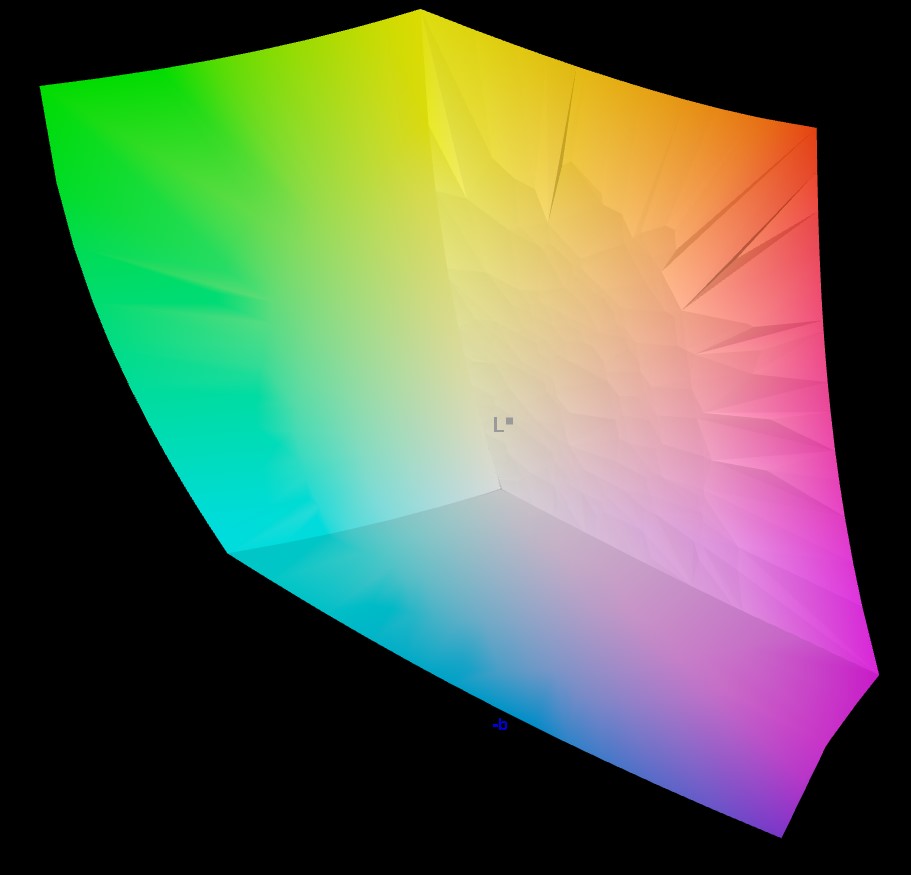
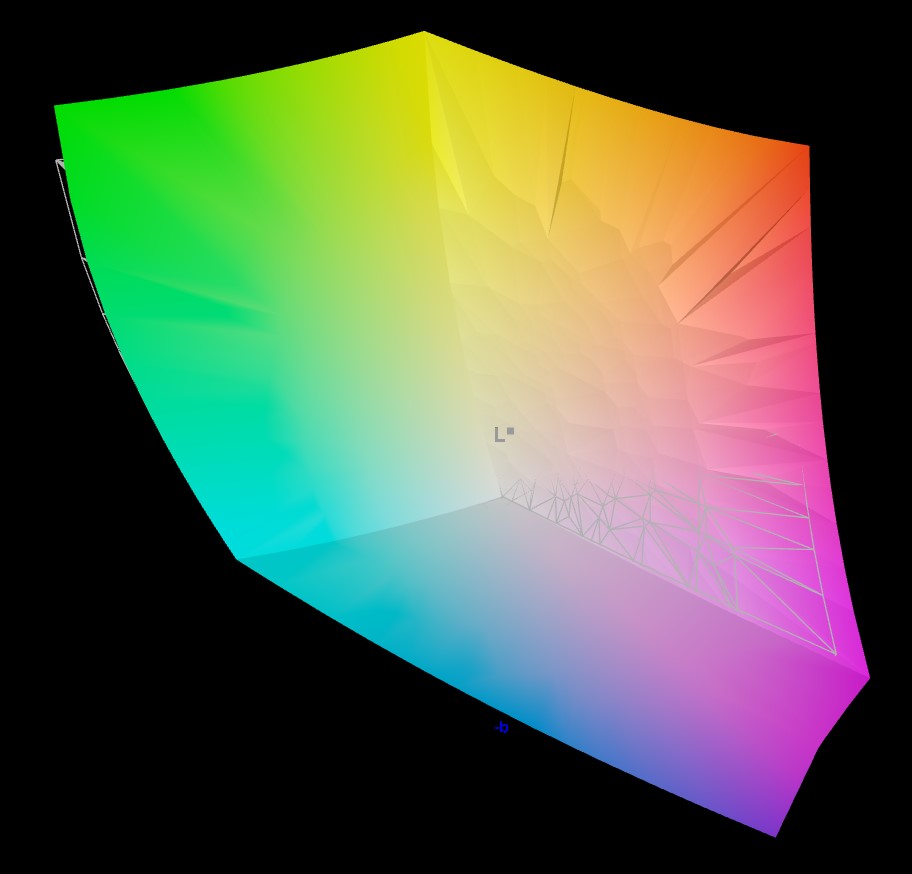
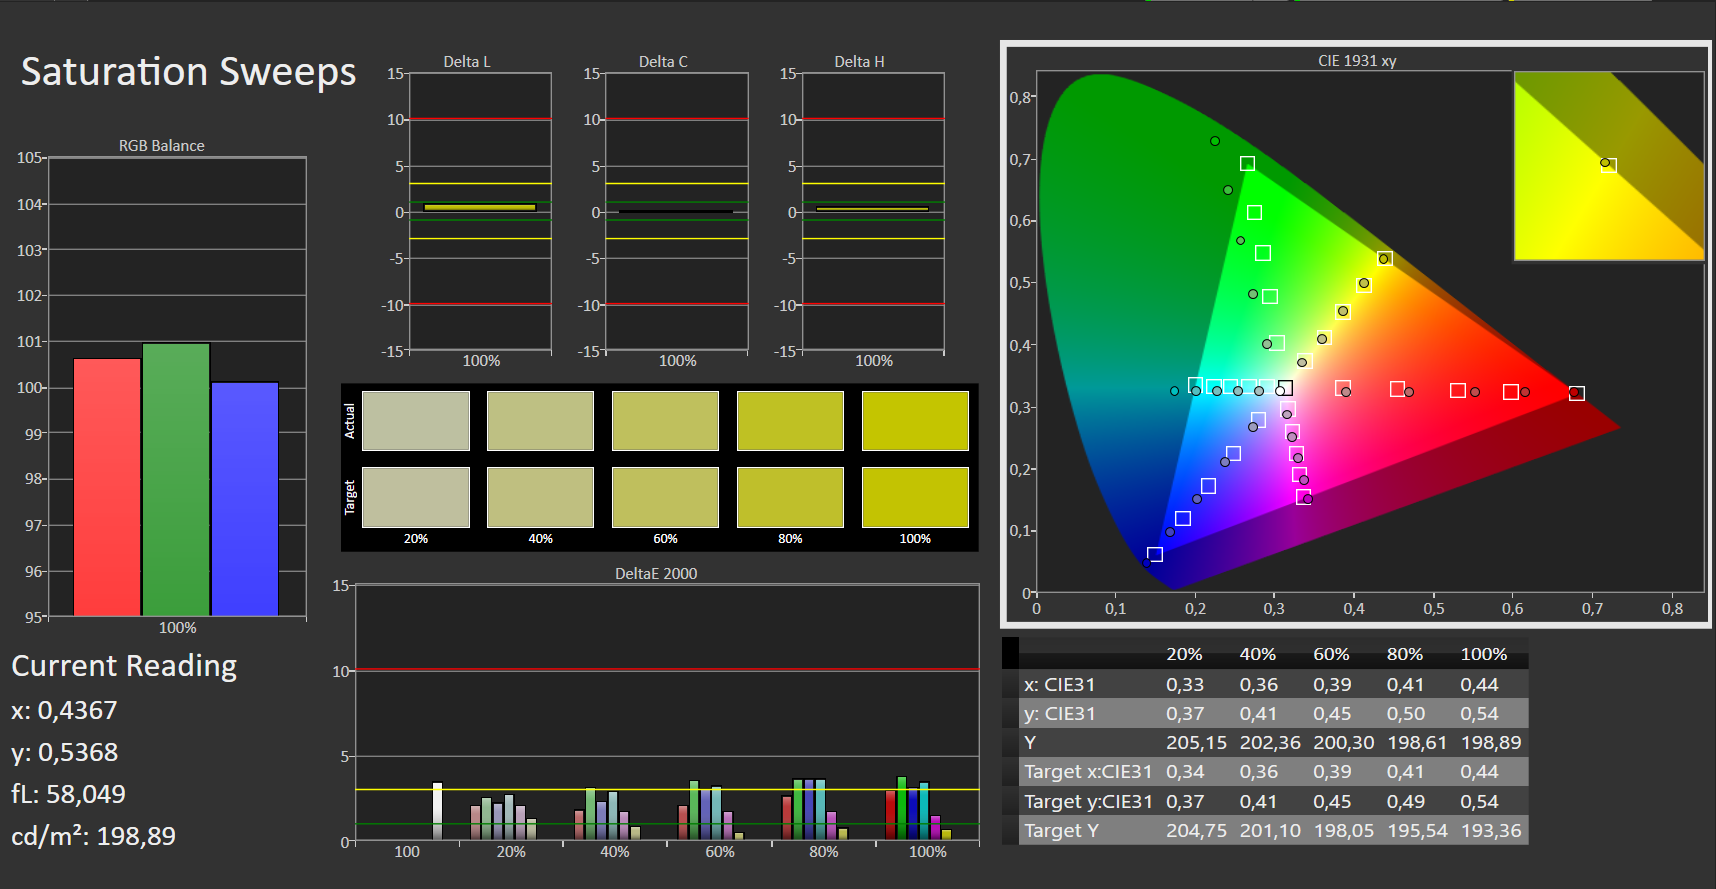
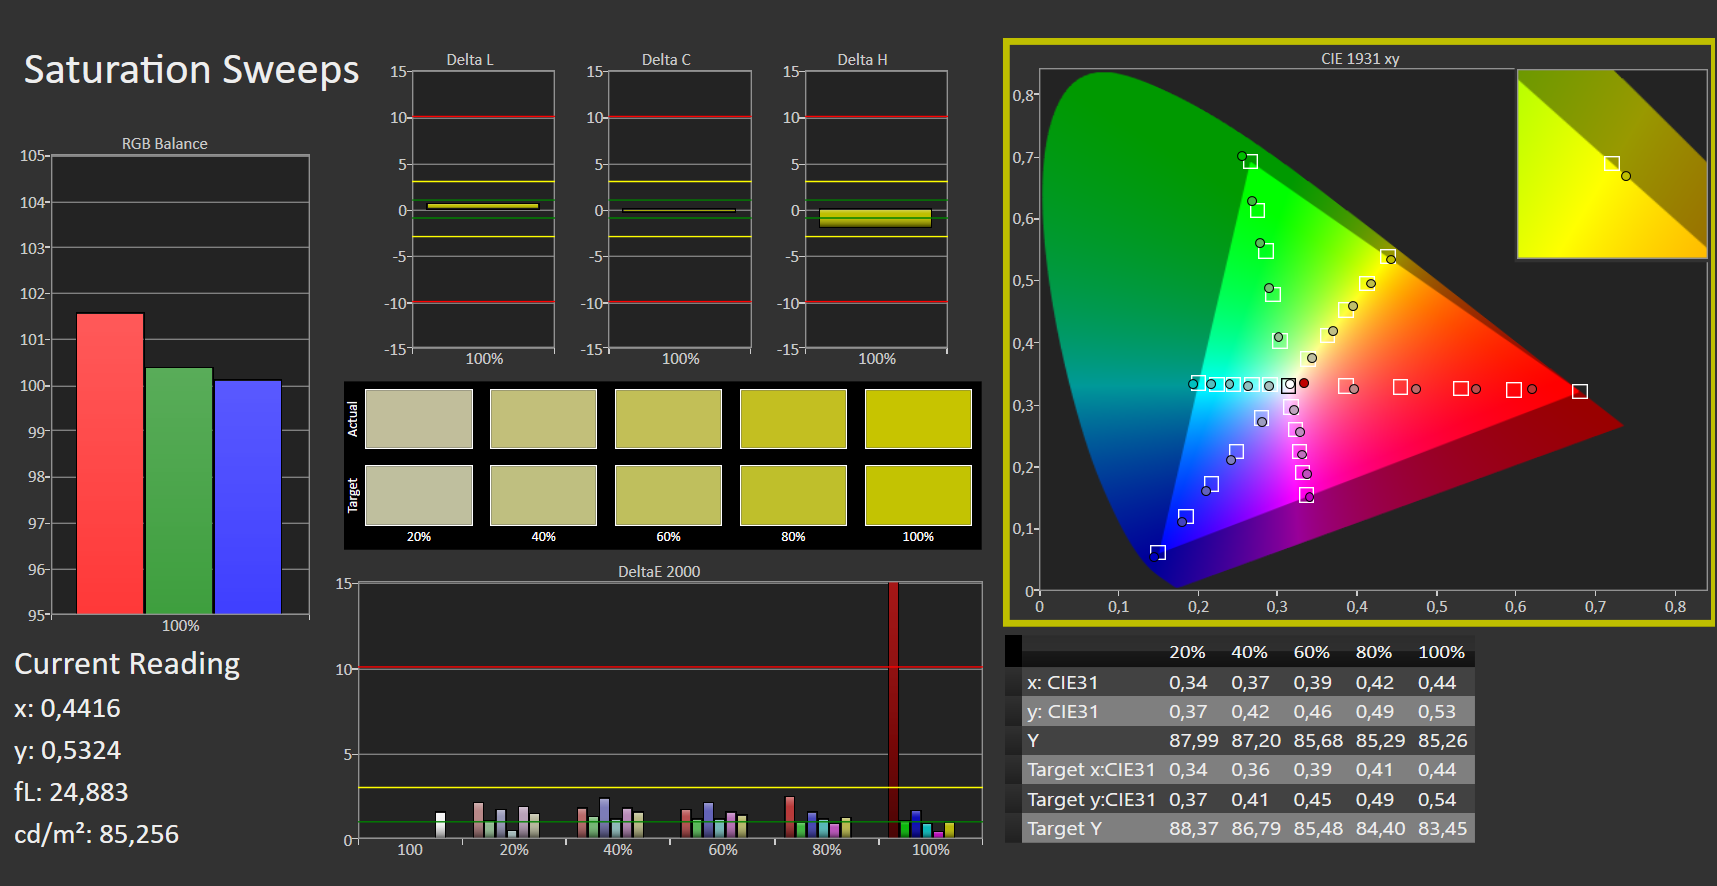
El espacio de color P3 de la pantalla, que suele utilizarse en la edición de vídeo profesional, no se reproduce a la perfección. La pantalla OLED no puede mostrar completamente los tonos amarillos y naranjas requeridos. El hecho de que Samsung especifique una cobertura del 120 por ciento es porque simplemente incluye colores que ni siquiera existen en el espacio de color.
Por otro lado, medimos uno de los mejores índices de cobertura para AdobeRGB, que se usa principalmente para la edición profesional de imágenes, entre los contendientes de la lista. Sólo el Dell XPS 9530, que también está equipado con una pantalla OLED de Samsung, rinde un poco mejor.
Sin embargo, como casi siempre trabajamos en el espacio de color sRGB, la pantalla es perfectamente adecuada para la creación y edición de medios sin necesidad de calibración adicional.

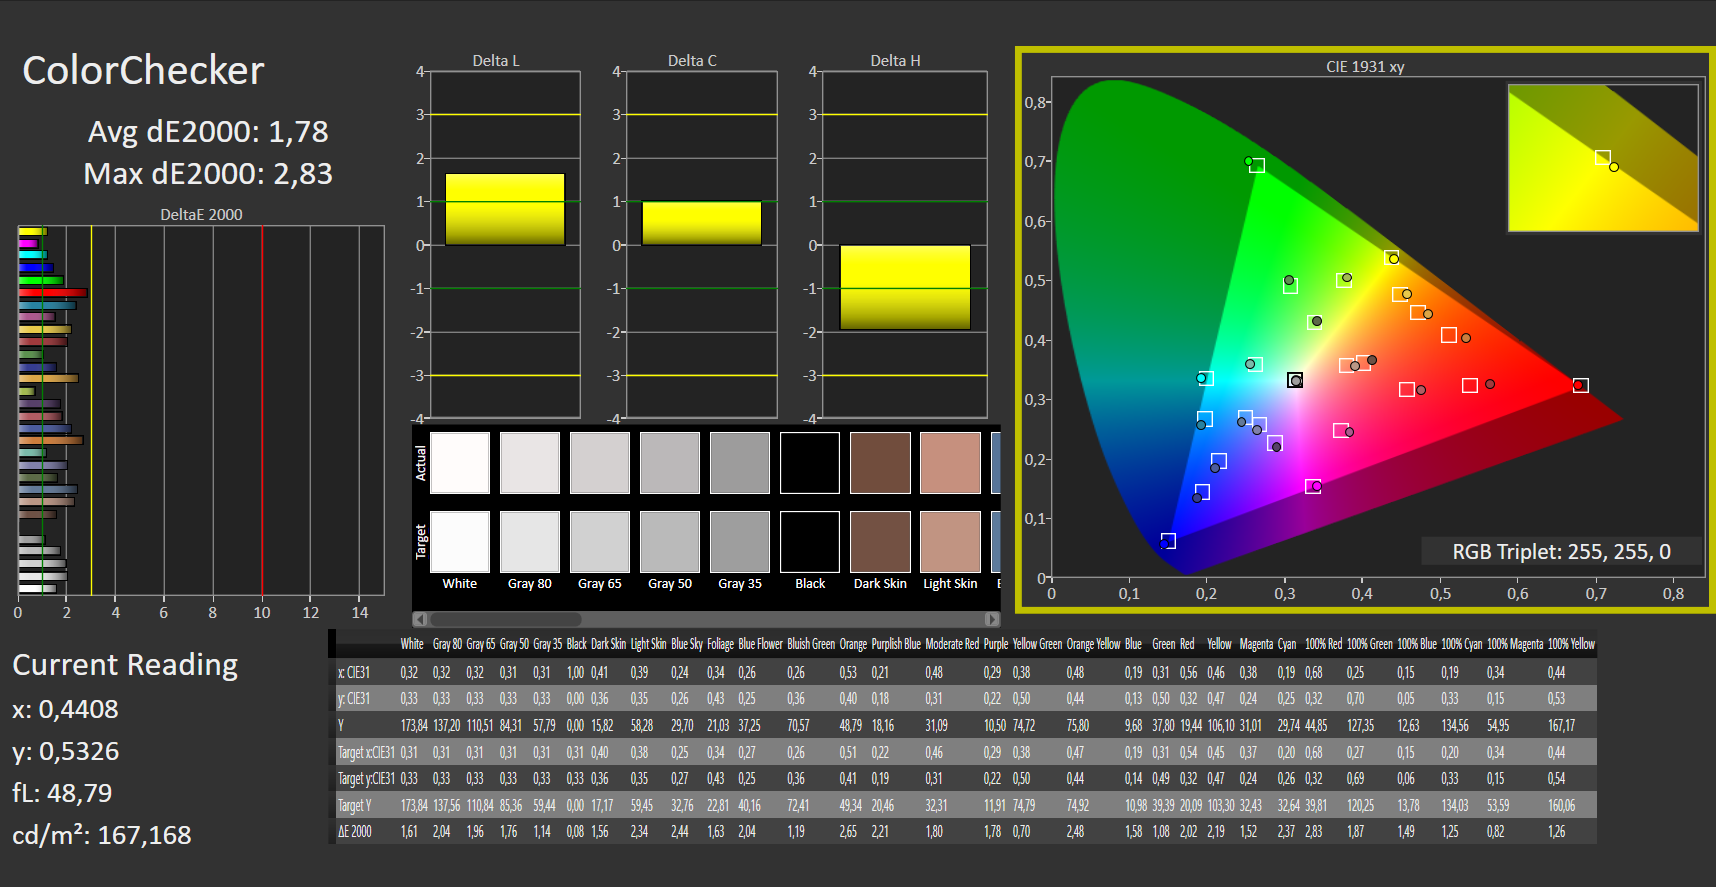
El software incluido de Samsung permite la selección directa de diferentes perfiles de color. Incluso en el modo nativo de la pantalla OLED, la desviación media de color que determinamos es prácticamente imperceptible. Sin embargo, un ojo entrenado podría notar discrepancias en algunos tonos de color.
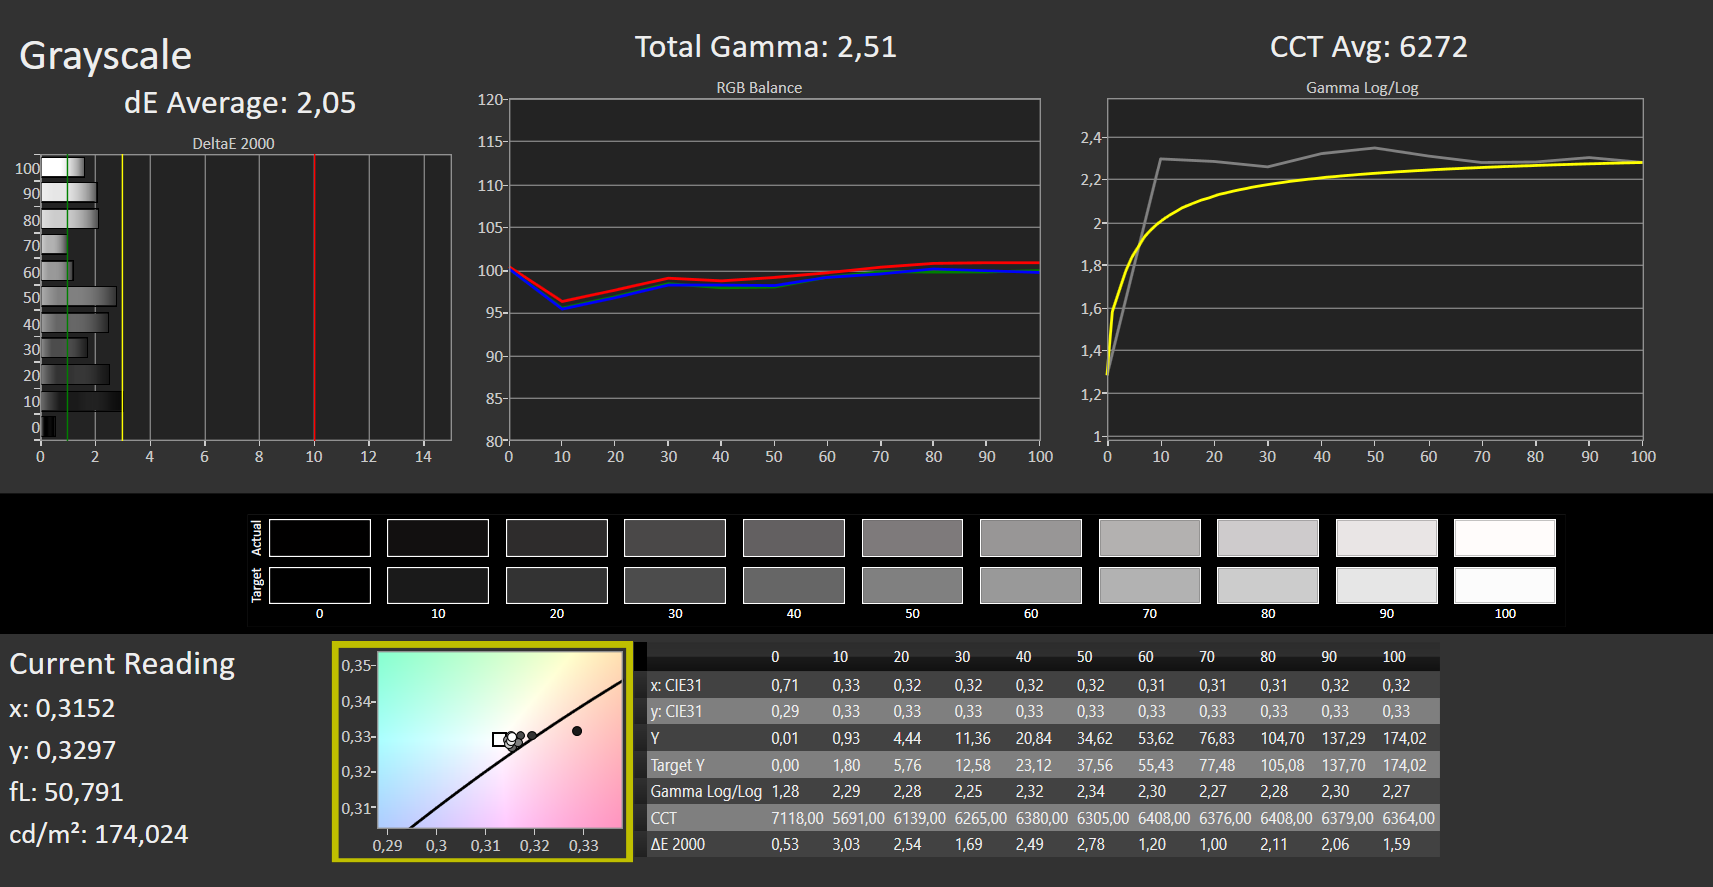
Si, por el contrario, se selecciona el perfil Display-P3, que modifica visiblemente la pantalla, todas las desviaciones se sitúan en un nivel muy bajo y ya no deberían ser perceptibles. Por tanto, la representación del color es casi perfecta sin calibración.
Tiempos de respuesta del display
| ↔ Tiempo de respuesta de Negro a Blanco | ||
|---|---|---|
| 2 ms ... subida ↗ y bajada ↘ combinada | ↗ 1 ms subida |  |
| ↘ 1 ms bajada | ||
| La pantalla mostró tiempos de respuesta muy rápidos en nuestros tests y debería ser adecuada para juegos frenéticos. En comparación, todos los dispositivos de prueba van de ##min### (mínimo) a 240 (máximo) ms. » 11 % de todos los dispositivos son mejores. Esto quiere decir que el tiempo de respuesta medido es mejor que la media (19.9 ms) de todos los dispositivos testados. | ||
| ↔ Tiempo de respuesta 50% Gris a 80% Gris | ||
| 2 ms ... subida ↗ y bajada ↘ combinada | ↗ 1 ms subida |  |
| ↘ 1 ms bajada | ||
| La pantalla mostró tiempos de respuesta muy rápidos en nuestros tests y debería ser adecuada para juegos frenéticos. En comparación, todos los dispositivos de prueba van de ##min### (mínimo) a 636 (máximo) ms. » 10 % de todos los dispositivos son mejores. Esto quiere decir que el tiempo de respuesta medido es mejor que la media (31.1 ms) de todos los dispositivos testados. | ||
Parpadeo de Pantalla / PWM (Pulse-Width Modulation)
| Parpadeo de Pantalla / PWM detectado | 250 Hz | ≤ 70 % de brillo |    |
La retroiluminación del display parpadea a 250 Hz (seguramente usa PWM - Pulse-Width Modulation) a un brillo del 70 % e inferior. Sobre este nivel de brillo no debería darse parpadeo / PWM. La frecuencia de 250 Hz es relativamente baja, por lo que la gente sensible debería ver parpadeos y padecer fatiga visual por la pantalla (usado al brillo indicado a continuación). Comparación: 52 % de todos los dispositivos testados no usaron PWM para atenuar el display. Si se usó, medimos una media de 7784 (mínimo: 5 - máxmo: 343500) Hz. | |||
Como es habitual en los paneles OLED, detectamos parpadeos de imagen inducidos por PWM. La frecuencia de 240 Hz está en un rango que puede ser perceptible para personas sensibles. Los sensores de las cámaras tampoco tienen problemas para mostrar este efecto.
Sin embargo, el efecto es mucho menos pronunciado que en un monitor clásico con retroiluminación LED. En un panel de este tipo, las zonas más grandes se desactivan. En una pantalla OLED, en cambio, siempre es sólo un área muy pequeña de píxeles la que se vuelve negra durante un breve espacio de tiempo. Esto sirve, entre otras cosas, para aumentar la vida útil de la pantalla.
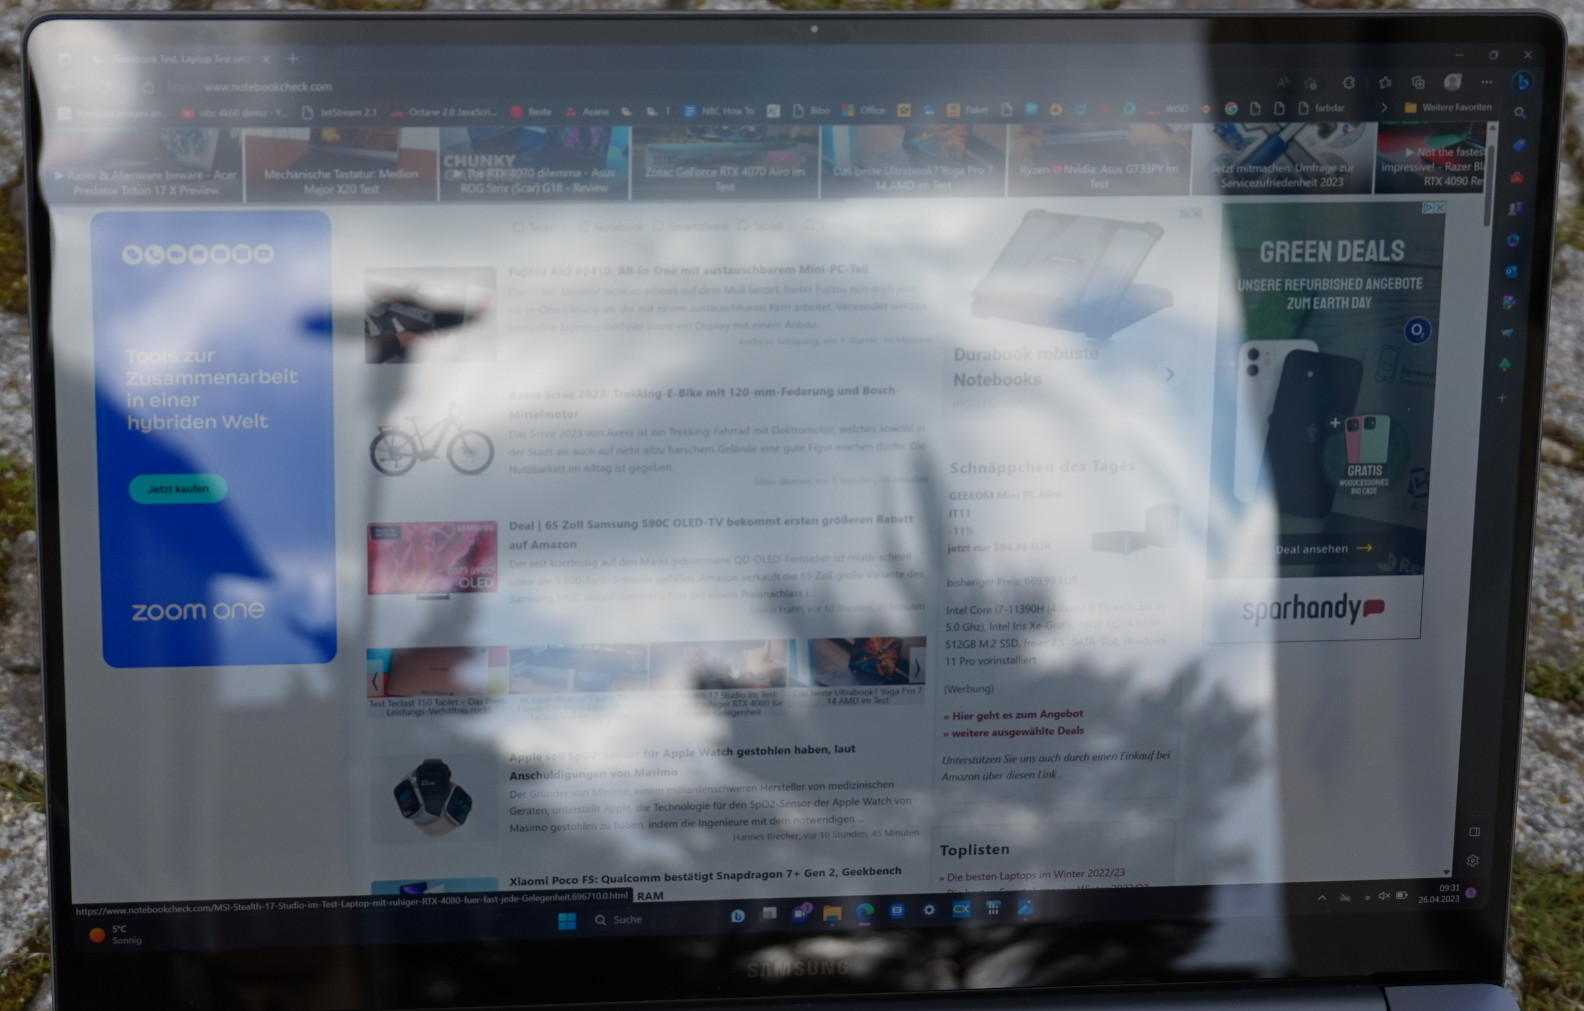
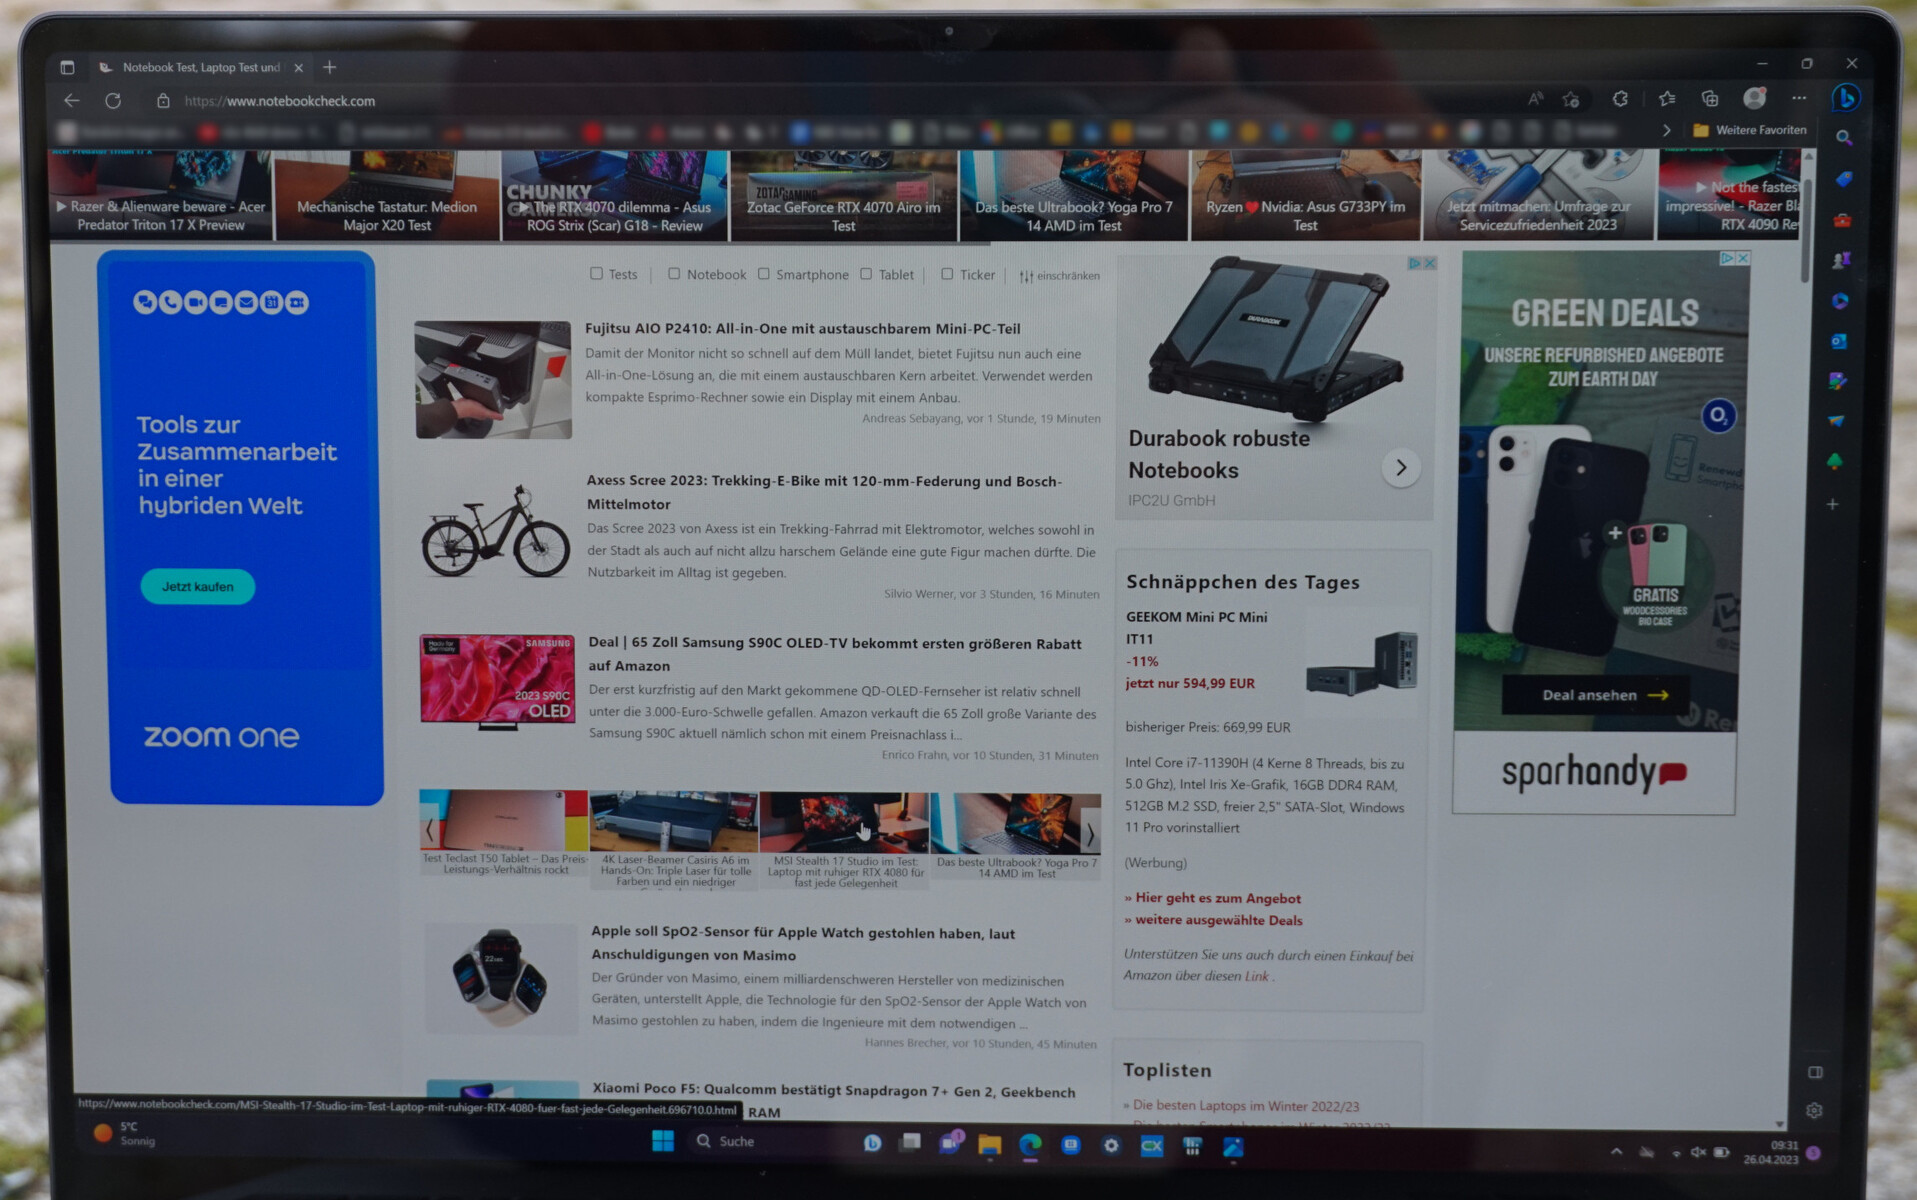
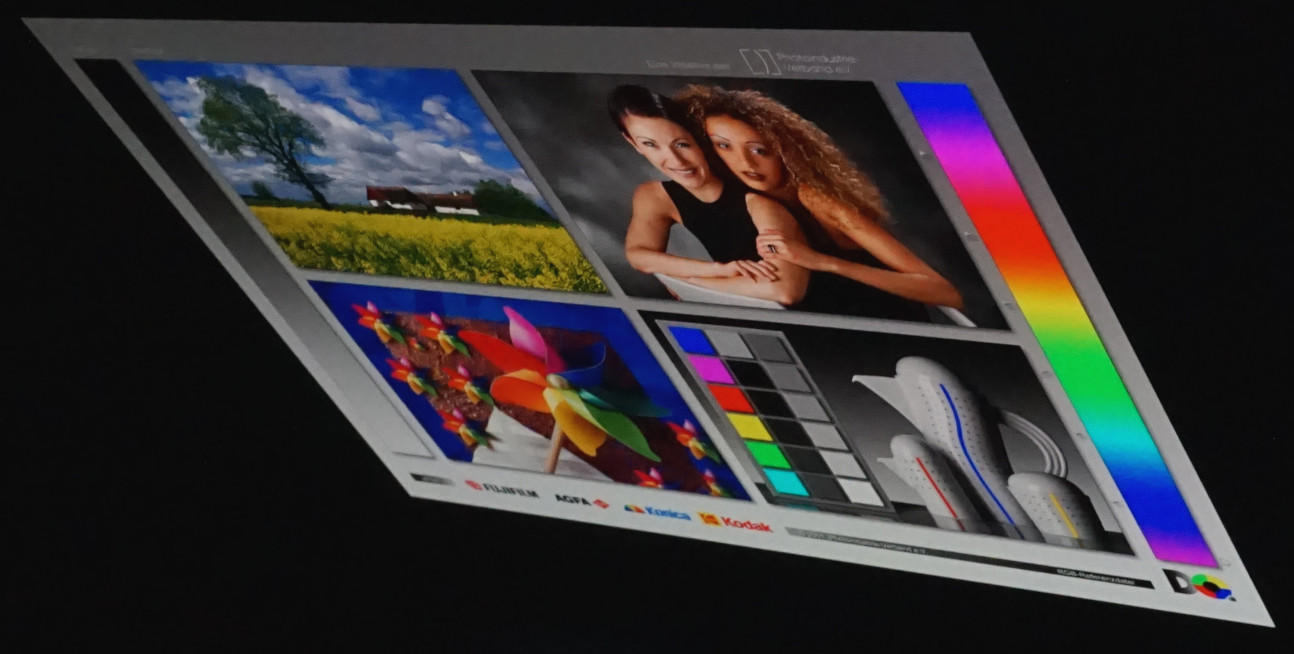
A pesar del brillo suficiente, la pantalla brillante impide su uso en exteriores. Incluso en días nublados se producen fuertes reflejos que dificultan la visualización de la pantalla.
Sólo a la sombra y a contraluz se reconocen bien el texto y las imágenes.
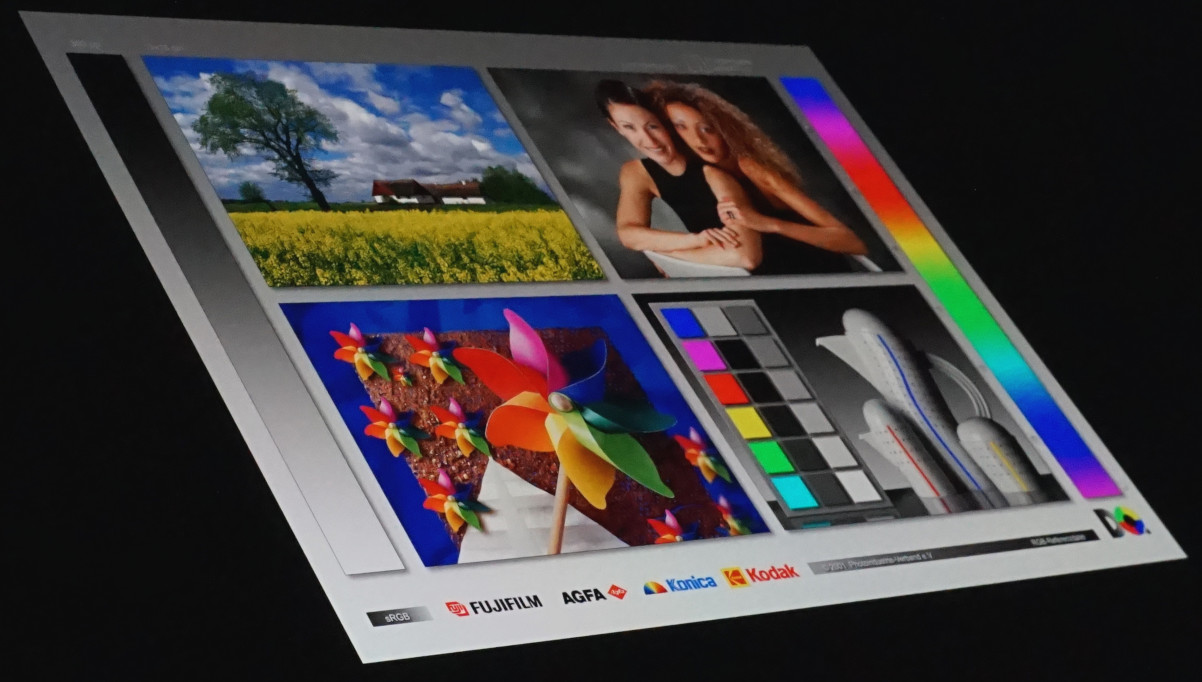
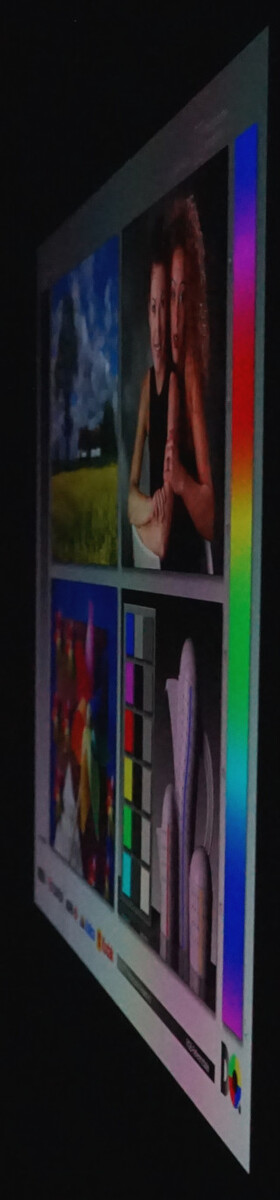
Las desviaciones en la reproducción del color sólo pueden observarse desde ángulos de visión extremadamente pronunciados. El brillo y la reproducción del color siguen siendo impecables dentro del campo de visión habitual y más allá de los 45°.
Rendimiento - La eficiencia es el objetivo del Galaxy Book3 Ultra
El potente hardware le permite trabajar con rapidez, incluso con aplicaciones complejas y multitarea intensiva. El procesador Intel Core Intel Core i9-13900H rara vez se ve desafiado del todo en tareas sencillas, al igual que la RTX 4070la tarjeta gráfica en particular sólo alcanza sus límites en los títulos de juego actuales debido al consumo de energía muy limitado. No obstante, observamos tasas de frames jugables casi consistentes al máximo nivel de detalle.
Sin embargo, el sistema está predestinado a la edición de imagen y vídeo. el renderizado 3D tampoco plantea mayores problemas. El Galaxy Book3 Ultra puede funcionar muy silenciosamente, pero luego pierde algo de rendimiento. El comportamiento en modo batería también es notable, ya que el rendimiento 3D sigue siendo alto. Por tanto, la edición de vídeo sobre la marcha parece factible.
La configuración más pequeña con elIntel Core i7-13700H y la Nvidia GeForce RTX 4050 requiere algunos compromisos más. Es probable que se note una clara diferencia de velocidad en tareas particularmente complejas. Si de hecho quieres jugar a un juego de vez en cuando, la variante más potente sería naturalmente más ventajosa.
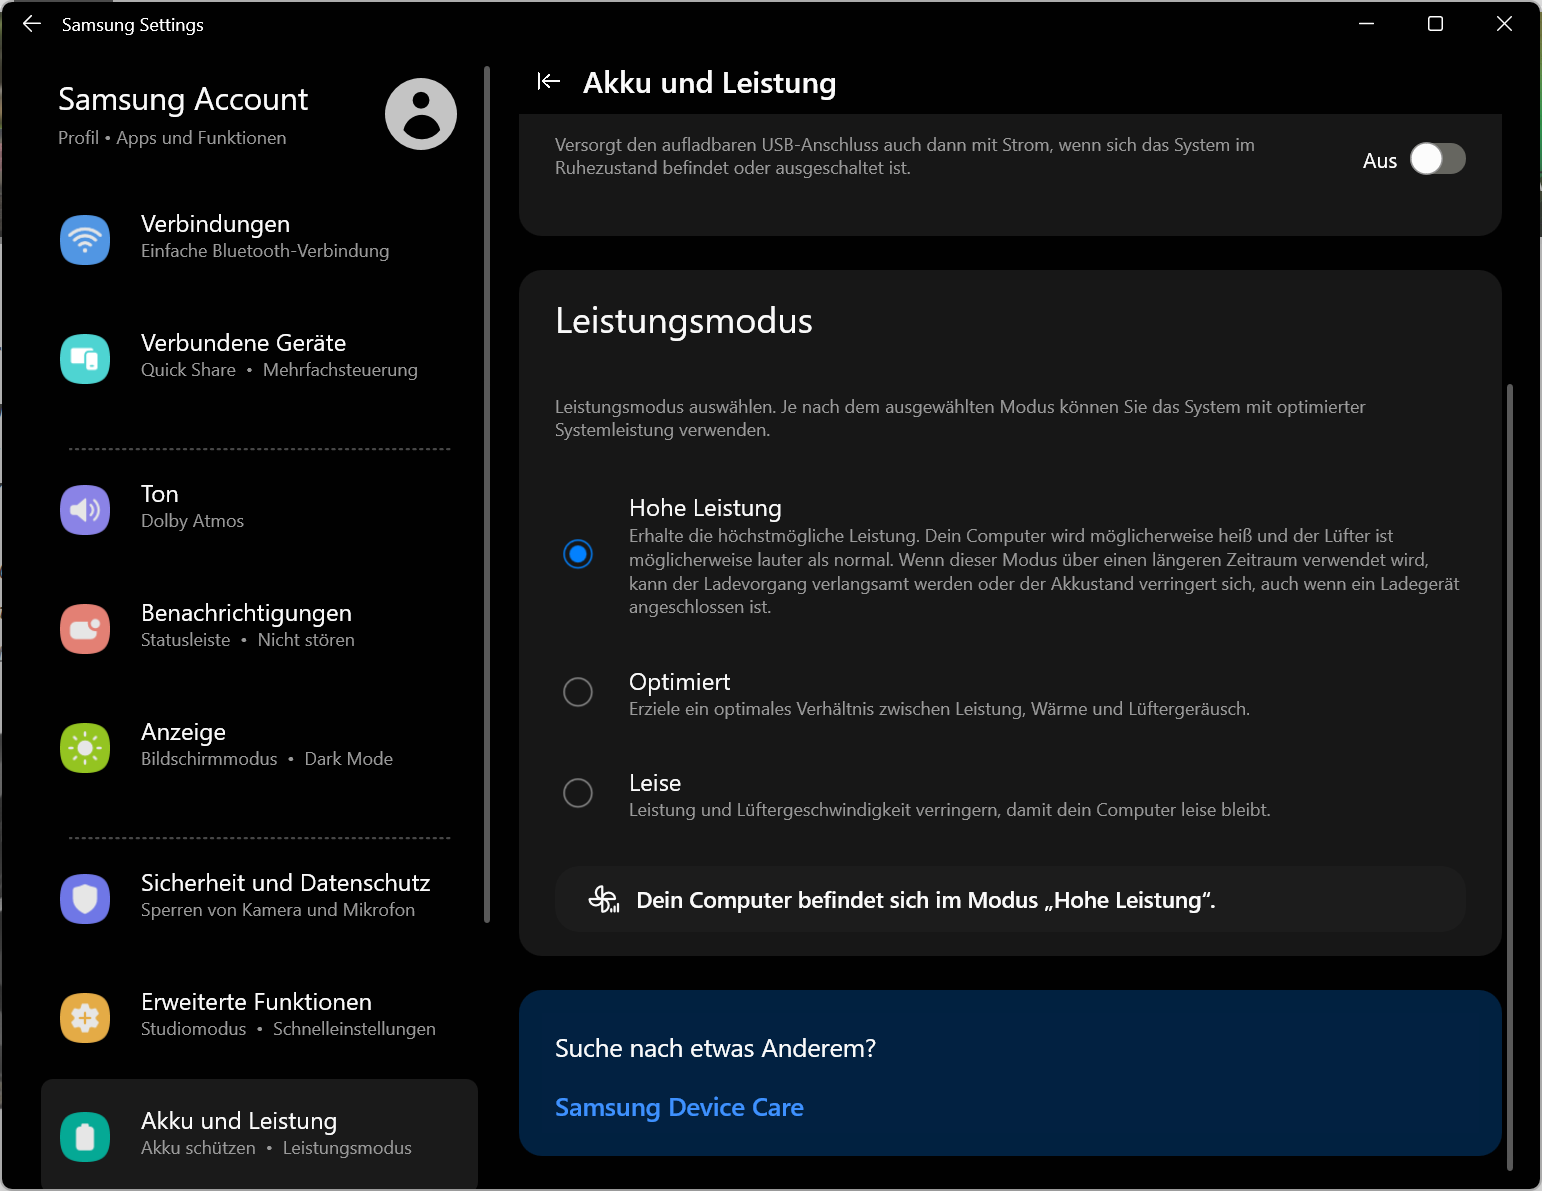
Condiciones de ensayo
El Samsung Galaxy Book3 utiliza el software incluido "Samsung Settings" para configurar algunos de los ajustes básicos y el comportamiento del portátil. Hay tres perfiles de rendimiento disponibles para elegir, que también se pueden configurar mediante "Fn "+ "F11".
Seleccionamos el modo de Alto Rendimiento para nuestros benchmarks. Se presta poca atención al desarrollo de calor y ruido. En cualquier caso, este último está muy por debajo del nivel que suelen exhibir los portátiles para juegos.
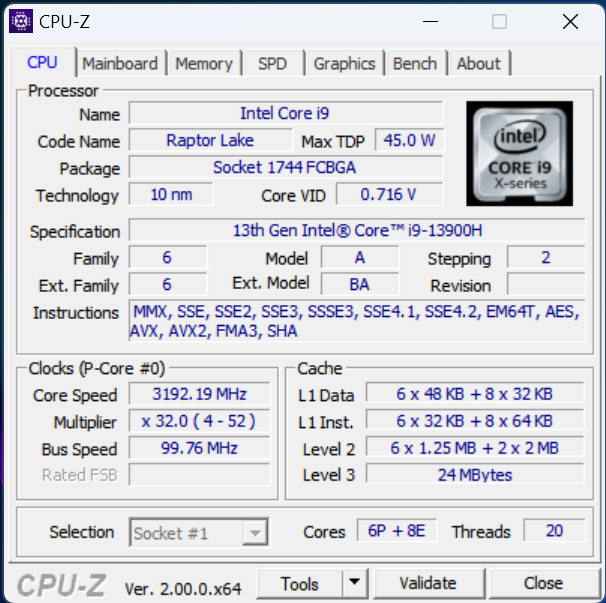
Procesador
El Intel Core i9-13900Hpertenece al segmento de gama alta y es superado por pocos procesadores móviles. Con 14 núcleos, 20 hilos, 24 MB de caché L3 y un elevado pico de reloj, es sin duda capaz de procesar tareas complejas. En el delgado Galaxy Book, sin embargo, la CPU tiene que conformarse con un reducido consumo de energía de un máximo de 75 W. Como resultado, queda muy por detrás de un Intel Core i9-12900Hde la generación anterior, por ejemplo, pero es mucho más económica.
El Apple M2 Pro 10 Core demuestra que las cosas se pueden hacer de forma aún más eficiente. Sólo necesita 27 W para una puntuación marginalmente peor en la prueba de resistencia Cinebench R15. No obstante, el i9 del portátil Creator de Samsung está a buen nivel cuando tienes en cuenta el espacio limitado y las opciones de refrigeración.
La comparación con elGalaxy Book3 Ultra con el Intel Core i7-13700H muestra que la CPU es más potente bajo carga a corto plazo. El portátil "más pequeño" de los dos rinde significativamente mejor en nuestra evaluación de CPU en varias mediciones. Parece que el i7 se las arregla mejor con un menor consumo de energía que el i9. Las CPUs casi idénticas difieren principalmente en la velocidad de reloj máxima alcanzable, que no puede aprovecharse durante un menor consumo de energía. Por ejemplo, medimos una velocidad de reloj máxima de 3,7 GHz en Cinebench R23. Teóricamente, es posible alcanzar hasta 5,4 GHz.
Por otro lado, el procesador i9 más rápido puede volver a imponerse en la prueba de resistencia Cinebench R15 cuando se necesita potencia de cálculo durante periodos de tiempo más largos. Las ventajas de la refrigeración más potente, pero también más ruidosa (comparada con la variante i7) se hacen entonces evidentes.
El uso del modo Optimizado puede resultar en algunas dinámicas inusuales. Durante fracciones de segundo, se permiten 75 W, igual que en modo Silencioso e incluso en funcionamiento con batería. En cambio, el consumo durante periodos más largos se limita a 45 W. En modo Silencio , este valor baja a 30 W.
Los modos de rendimiento también están disponibles en funcionamiento con batería. PL1, que fija el consumo de energía hasta 32 segundos, se reduce entonces en 10 W. En cambio, en modo Silencio se mantiene en 30 W, lo que en realidad es suficiente, como se verá más adelante.
Encontrará más pruebas y valores comparativos en nuestra Lista de pruebas de CPU.
Cinebench R15 Multi Sustained Load
Cinebench R23: Multi Core | Single Core
Cinebench R20: CPU (Multi Core) | CPU (Single Core)
Cinebench R15: CPU Multi 64Bit | CPU Single 64Bit
Blender: v2.79 BMW27 CPU
7-Zip 18.03: 7z b 4 | 7z b 4 -mmt1
Geekbench 5.5: Multi-Core | Single-Core
HWBOT x265 Benchmark v2.2: 4k Preset
LibreOffice : 20 Documents To PDF
R Benchmark 2.5: Overall mean
| CPU Performance rating | |
| Asus ProArt StudioBook 16 H7600ZW | |
| MSI Stealth 17 Studio A13VH-014 | |
| Gigabyte AERO 16 OLED BSF | |
| Medio Intel Core i9-13900H | |
| Media de la clase Multimedia | |
| Dell XPS 15 9530 RTX 4070 | |
| Samsung Galaxy Book3 Ultra 16 | |
| Apple MacBook Pro 14 2023 M2 Pro Entry -5! | |
| Lenovo ThinkPad T14 G3-21AJS00400 | |
| Samsung Galaxy Book3 Ultra 16, i9-13900H RTX 4070 | |
| Samsung Galaxy Book Pro 15 NP950XDB-KC5US | |
| Cinebench R20 / CPU (Multi Core) | |
| MSI Stealth 17 Studio A13VH-014 | |
| Asus ProArt StudioBook 16 H7600ZW | |
| Gigabyte AERO 16 OLED BSF | |
| Medio Intel Core i9-13900H (4935 - 7716, n=25) | |
| Media de la clase Multimedia (1887 - 12912, n=63, últimos 2 años) | |
| Dell XPS 15 9530 RTX 4070 | |
| Samsung Galaxy Book3 Ultra 16 | |
| Samsung Galaxy Book3 Ultra 16, i9-13900H RTX 4070 | |
| Lenovo ThinkPad T14 G3-21AJS00400 | |
| Apple MacBook Pro 14 2023 M2 Pro Entry | |
| Samsung Galaxy Book Pro 15 NP950XDB-KC5US | |
| Cinebench R20 / CPU (Single Core) | |
| Asus ProArt StudioBook 16 H7600ZW | |
| Media de la clase Multimedia (425 - 853, n=63, últimos 2 años) | |
| Medio Intel Core i9-13900H (428 - 792, n=25) | |
| Dell XPS 15 9530 RTX 4070 | |
| Lenovo ThinkPad T14 G3-21AJS00400 | |
| MSI Stealth 17 Studio A13VH-014 | |
| Samsung Galaxy Book3 Ultra 16 | |
| Gigabyte AERO 16 OLED BSF | |
| Samsung Galaxy Book Pro 15 NP950XDB-KC5US | |
| Apple MacBook Pro 14 2023 M2 Pro Entry | |
| Samsung Galaxy Book3 Ultra 16, i9-13900H RTX 4070 | |
| Cinebench R15 / CPU Multi 64Bit | |
| MSI Stealth 17 Studio A13VH-014 | |
| Gigabyte AERO 16 OLED BSF | |
| Asus ProArt StudioBook 16 H7600ZW | |
| Medio Intel Core i9-13900H (2061 - 3100, n=26) | |
| Dell XPS 15 9530 RTX 4070 | |
| Media de la clase Multimedia (856 - 5224, n=67, últimos 2 años) | |
| Samsung Galaxy Book3 Ultra 16 | |
| Samsung Galaxy Book3 Ultra 16, i9-13900H RTX 4070 | |
| Lenovo ThinkPad T14 G3-21AJS00400 | |
| Apple MacBook Pro 14 2023 M2 Pro Entry | |
| Samsung Galaxy Book Pro 15 NP950XDB-KC5US | |
| Cinebench R15 / CPU Single 64Bit | |
| MSI Stealth 17 Studio A13VH-014 | |
| Media de la clase Multimedia (184.8 - 326, n=65, últimos 2 años) | |
| Asus ProArt StudioBook 16 H7600ZW | |
| Dell XPS 15 9530 RTX 4070 | |
| Medio Intel Core i9-13900H (211 - 297, n=26) | |
| Samsung Galaxy Book3 Ultra 16 | |
| Lenovo ThinkPad T14 G3-21AJS00400 | |
| Gigabyte AERO 16 OLED BSF | |
| Apple MacBook Pro 14 2023 M2 Pro Entry | |
| Samsung Galaxy Book3 Ultra 16, i9-13900H RTX 4070 | |
| Samsung Galaxy Book Pro 15 NP950XDB-KC5US | |
| 7-Zip 18.03 / 7z b 4 | |
| Asus ProArt StudioBook 16 H7600ZW | |
| MSI Stealth 17 Studio A13VH-014 | |
| Gigabyte AERO 16 OLED BSF | |
| Medio Intel Core i9-13900H (45045 - 79032, n=25) | |
| Samsung Galaxy Book3 Ultra 16 | |
| Dell XPS 15 9530 RTX 4070 | |
| Media de la clase Multimedia (29095 - 130368, n=61, últimos 2 años) | |
| Samsung Galaxy Book3 Ultra 16, i9-13900H RTX 4070 | |
| Lenovo ThinkPad T14 G3-21AJS00400 | |
| Samsung Galaxy Book Pro 15 NP950XDB-KC5US | |
| 7-Zip 18.03 / 7z b 4 -mmt1 | |
| Asus ProArt StudioBook 16 H7600ZW | |
| MSI Stealth 17 Studio A13VH-014 | |
| Dell XPS 15 9530 RTX 4070 | |
| Medio Intel Core i9-13900H (3665 - 6600, n=25) | |
| Media de la clase Multimedia (3666 - 7545, n=62, últimos 2 años) | |
| Lenovo ThinkPad T14 G3-21AJS00400 | |
| Gigabyte AERO 16 OLED BSF | |
| Samsung Galaxy Book3 Ultra 16 | |
| Samsung Galaxy Book Pro 15 NP950XDB-KC5US | |
| Samsung Galaxy Book3 Ultra 16, i9-13900H RTX 4070 | |
| HWBOT x265 Benchmark v2.2 / 4k Preset | |
| Asus ProArt StudioBook 16 H7600ZW | |
| MSI Stealth 17 Studio A13VH-014 | |
| Gigabyte AERO 16 OLED BSF | |
| Media de la clase Multimedia (5.26 - 36.1, n=62, últimos 2 años) | |
| Medio Intel Core i9-13900H (14.1 - 22.3, n=25) | |
| Dell XPS 15 9530 RTX 4070 | |
| Samsung Galaxy Book3 Ultra 16 | |
| Samsung Galaxy Book3 Ultra 16, i9-13900H RTX 4070 | |
| Lenovo ThinkPad T14 G3-21AJS00400 | |
| Samsung Galaxy Book Pro 15 NP950XDB-KC5US | |
| LibreOffice / 20 Documents To PDF | |
| Samsung Galaxy Book3 Ultra 16, i9-13900H RTX 4070 | |
| Gigabyte AERO 16 OLED BSF | |
| Samsung Galaxy Book Pro 15 NP950XDB-KC5US | |
| MSI Stealth 17 Studio A13VH-014 | |
| Media de la clase Multimedia (23.9 - 146.7, n=63, últimos 2 años) | |
| Samsung Galaxy Book3 Ultra 16 | |
| Medio Intel Core i9-13900H (34.4 - 82.8, n=25) | |
| Asus ProArt StudioBook 16 H7600ZW | |
| Dell XPS 15 9530 RTX 4070 | |
| Lenovo ThinkPad T14 G3-21AJS00400 | |
| R Benchmark 2.5 / Overall mean | |
| Samsung Galaxy Book3 Ultra 16, i9-13900H RTX 4070 | |
| Samsung Galaxy Book Pro 15 NP950XDB-KC5US | |
| Gigabyte AERO 16 OLED BSF | |
| Samsung Galaxy Book3 Ultra 16 | |
| Lenovo ThinkPad T14 G3-21AJS00400 | |
| Media de la clase Multimedia (0.3604 - 0.947, n=62, últimos 2 años) | |
| Medio Intel Core i9-13900H (0.4052 - 0.723, n=25) | |
| Dell XPS 15 9530 RTX 4070 | |
| Asus ProArt StudioBook 16 H7600ZW | |
| MSI Stealth 17 Studio A13VH-014 | |
* ... más pequeño es mejor
AIDA64: FP32 Ray-Trace | FPU Julia | CPU SHA3 | CPU Queen | FPU SinJulia | FPU Mandel | CPU AES | CPU ZLib | FP64 Ray-Trace | CPU PhotoWorxx
| Performance rating | |
| Asus ProArt StudioBook 16 H7600ZW | |
| Gigabyte AERO 16 OLED BSF | |
| MSI Stealth 17 Studio A13VH-014 | |
| Media de la clase Multimedia | |
| Medio Intel Core i9-13900H | |
| Samsung Galaxy Book3 Ultra 16 | |
| Dell XPS 15 9530 RTX 4070 | |
| Samsung Galaxy Book3 Ultra 16, i9-13900H RTX 4070 | |
| AIDA64 / FP32 Ray-Trace | |
| MSI Stealth 17 Studio A13VH-014 | |
| Gigabyte AERO 16 OLED BSF | |
| Media de la clase Multimedia (2214 - 50388, n=59, últimos 2 años) | |
| Asus ProArt StudioBook 16 H7600ZW | |
| Medio Intel Core i9-13900H (6788 - 19557, n=25) | |
| Samsung Galaxy Book3 Ultra 16, i9-13900H RTX 4070 | |
| Samsung Galaxy Book3 Ultra 16 | |
| Dell XPS 15 9530 RTX 4070 | |
| AIDA64 / FPU Julia | |
| MSI Stealth 17 Studio A13VH-014 | |
| Asus ProArt StudioBook 16 H7600ZW | |
| Gigabyte AERO 16 OLED BSF | |
| Media de la clase Multimedia (12867 - 201874, n=60, últimos 2 años) | |
| Medio Intel Core i9-13900H (22551 - 95579, n=25) | |
| Samsung Galaxy Book3 Ultra 16 | |
| Dell XPS 15 9530 RTX 4070 | |
| Samsung Galaxy Book3 Ultra 16, i9-13900H RTX 4070 | |
| AIDA64 / CPU SHA3 | |
| MSI Stealth 17 Studio A13VH-014 | |
| Asus ProArt StudioBook 16 H7600ZW | |
| Gigabyte AERO 16 OLED BSF | |
| Media de la clase Multimedia (653 - 8623, n=60, últimos 2 años) | |
| Medio Intel Core i9-13900H (2491 - 4270, n=25) | |
| Samsung Galaxy Book3 Ultra 16, i9-13900H RTX 4070 | |
| Samsung Galaxy Book3 Ultra 16 | |
| Dell XPS 15 9530 RTX 4070 | |
| AIDA64 / CPU Queen | |
| Asus ProArt StudioBook 16 H7600ZW | |
| Medio Intel Core i9-13900H (65121 - 120936, n=25) | |
| Dell XPS 15 9530 RTX 4070 | |
| Samsung Galaxy Book3 Ultra 16 | |
| MSI Stealth 17 Studio A13VH-014 | |
| Gigabyte AERO 16 OLED BSF | |
| Samsung Galaxy Book3 Ultra 16, i9-13900H RTX 4070 | |
| Media de la clase Multimedia (13483 - 181505, n=48, últimos 2 años) | |
| AIDA64 / FPU SinJulia | |
| MSI Stealth 17 Studio A13VH-014 | |
| Gigabyte AERO 16 OLED BSF | |
| Asus ProArt StudioBook 16 H7600ZW | |
| Medio Intel Core i9-13900H (6108 - 11631, n=25) | |
| Media de la clase Multimedia (1240 - 28794, n=60, últimos 2 años) | |
| Samsung Galaxy Book3 Ultra 16 | |
| Dell XPS 15 9530 RTX 4070 | |
| Samsung Galaxy Book3 Ultra 16, i9-13900H RTX 4070 | |
| AIDA64 / FPU Mandel | |
| MSI Stealth 17 Studio A13VH-014 | |
| Asus ProArt StudioBook 16 H7600ZW | |
| Gigabyte AERO 16 OLED BSF | |
| Media de la clase Multimedia (6395 - 105740, n=59, últimos 2 años) | |
| Medio Intel Core i9-13900H (11283 - 48474, n=25) | |
| Samsung Galaxy Book3 Ultra 16, i9-13900H RTX 4070 | |
| Samsung Galaxy Book3 Ultra 16 | |
| Dell XPS 15 9530 RTX 4070 | |
| AIDA64 / CPU AES | |
| Asus ProArt StudioBook 16 H7600ZW | |
| Gigabyte AERO 16 OLED BSF | |
| Medio Intel Core i9-13900H (3691 - 149377, n=25) | |
| MSI Stealth 17 Studio A13VH-014 | |
| Samsung Galaxy Book3 Ultra 16 | |
| Media de la clase Multimedia (13243 - 126790, n=60, últimos 2 años) | |
| Dell XPS 15 9530 RTX 4070 | |
| Samsung Galaxy Book3 Ultra 16, i9-13900H RTX 4070 | |
| AIDA64 / CPU ZLib | |
| MSI Stealth 17 Studio A13VH-014 | |
| Gigabyte AERO 16 OLED BSF | |
| Asus ProArt StudioBook 16 H7600ZW | |
| Medio Intel Core i9-13900H (789 - 1254, n=25) | |
| Samsung Galaxy Book3 Ultra 16 | |
| Media de la clase Multimedia (167.2 - 2022, n=60, últimos 2 años) | |
| Samsung Galaxy Book3 Ultra 16, i9-13900H RTX 4070 | |
| Dell XPS 15 9530 RTX 4070 | |
| AIDA64 / FP64 Ray-Trace | |
| MSI Stealth 17 Studio A13VH-014 | |
| Asus ProArt StudioBook 16 H7600ZW | |
| Gigabyte AERO 16 OLED BSF | |
| Media de la clase Multimedia (1014 - 26875, n=60, últimos 2 años) | |
| Medio Intel Core i9-13900H (3655 - 10716, n=25) | |
| Samsung Galaxy Book3 Ultra 16 | |
| Dell XPS 15 9530 RTX 4070 | |
| Samsung Galaxy Book3 Ultra 16, i9-13900H RTX 4070 | |
| AIDA64 / CPU PhotoWorxx | |
| MSI Stealth 17 Studio A13VH-014 | |
| Media de la clase Multimedia (12860 - 88154, n=60, últimos 2 años) | |
| Samsung Galaxy Book3 Ultra 16, i9-13900H RTX 4070 | |
| Samsung Galaxy Book3 Ultra 16 | |
| Gigabyte AERO 16 OLED BSF | |
| Dell XPS 15 9530 RTX 4070 | |
| Asus ProArt StudioBook 16 H7600ZW | |
| Medio Intel Core i9-13900H (10871 - 50488, n=25) | |
Rendimiento del sistema
El limitado consumo de energía apenas se nota durante el uso normal. En comparación con los modelos más potentes, el inicio de los programas se retrasa ligeramente. Comparado con un portátil de negocios rápido, por otro lado, el Samsung Galaxy Book3 Ultra tiene ventaja. Los muchos núcleos de la CPU y el soporte proporcionado por el chip gráfico dedicado pueden aprovecharse al máximo aquí.
El trabajo rápido y la multitarea no causan problemas al sistema. Además, no hay que pasar por alto el factor eficiencia. El Gigabyte AERO 16 OLED Gigabyte AERO 16 OLEDtiene una ventaja del 40 al 50% en la mayoría de pruebas. Sin embargo, necesita consumir el doble de energía para mantenerse por delante.
El rendimiento de la CPU del portátil tiene su eco en el rendimiento del sistema: el más pequeñoSamsung Galaxy Book3 Ultratambién muestra mejores índices aquí. Sin embargo, el i7-13700Hsigue demostrando que puede manejar la limitación de 75W mucho mejor que el i9-13900H.
CrossMark: Overall | Productivity | Creativity | Responsiveness
| PCMark 10 / Score | |
| Asus ProArt StudioBook 16 H7600ZW | |
| Gigabyte AERO 16 OLED BSF | |
| Media de la clase Multimedia (4325 - 10386, n=57, últimos 2 años) | |
| Medio Intel Core i9-13900H, NVIDIA GeForce RTX 4070 Laptop GPU (5855 - 8538, n=8) | |
| MSI Stealth 17 Studio A13VH-014 | |
| Dell XPS 15 9530 RTX 4070 | |
| Samsung Galaxy Book3 Ultra 16 | |
| Lenovo ThinkPad T14 G3-21AJS00400 | |
| Samsung Galaxy Book3 Ultra 16, i9-13900H RTX 4070 | |
| Samsung Galaxy Book Pro 15 NP950XDB-KC5US | |
| PCMark 10 / Essentials | |
| Asus ProArt StudioBook 16 H7600ZW | |
| Dell XPS 15 9530 RTX 4070 | |
| Gigabyte AERO 16 OLED BSF | |
| Medio Intel Core i9-13900H, NVIDIA GeForce RTX 4070 Laptop GPU (8835 - 11940, n=8) | |
| Samsung Galaxy Book3 Ultra 16 | |
| Media de la clase Multimedia (8025 - 11664, n=56, últimos 2 años) | |
| MSI Stealth 17 Studio A13VH-014 | |
| Samsung Galaxy Book Pro 15 NP950XDB-KC5US | |
| Lenovo ThinkPad T14 G3-21AJS00400 | |
| Samsung Galaxy Book3 Ultra 16, i9-13900H RTX 4070 | |
| PCMark 10 / Productivity | |
| Media de la clase Multimedia (7323 - 18233, n=56, últimos 2 años) | |
| Asus ProArt StudioBook 16 H7600ZW | |
| MSI Stealth 17 Studio A13VH-014 | |
| Medio Intel Core i9-13900H, NVIDIA GeForce RTX 4070 Laptop GPU (7967 - 10991, n=8) | |
| Gigabyte AERO 16 OLED BSF | |
| Samsung Galaxy Book3 Ultra 16 | |
| Dell XPS 15 9530 RTX 4070 | |
| Lenovo ThinkPad T14 G3-21AJS00400 | |
| Samsung Galaxy Book3 Ultra 16, i9-13900H RTX 4070 | |
| Samsung Galaxy Book Pro 15 NP950XDB-KC5US | |
| PCMark 10 / Digital Content Creation | |
| Gigabyte AERO 16 OLED BSF | |
| Medio Intel Core i9-13900H, NVIDIA GeForce RTX 4070 Laptop GPU (7738 - 13575, n=8) | |
| Asus ProArt StudioBook 16 H7600ZW | |
| MSI Stealth 17 Studio A13VH-014 | |
| Dell XPS 15 9530 RTX 4070 | |
| Media de la clase Multimedia (3651 - 16240, n=56, últimos 2 años) | |
| Samsung Galaxy Book3 Ultra 16 | |
| Samsung Galaxy Book3 Ultra 16, i9-13900H RTX 4070 | |
| Lenovo ThinkPad T14 G3-21AJS00400 | |
| Samsung Galaxy Book Pro 15 NP950XDB-KC5US | |
| CrossMark / Overall | |
| Asus ProArt StudioBook 16 H7600ZW | |
| Dell XPS 15 9530 RTX 4070 | |
| Gigabyte AERO 16 OLED BSF | |
| Media de la clase Multimedia (866 - 2728, n=66, últimos 2 años) | |
| Medio Intel Core i9-13900H, NVIDIA GeForce RTX 4070 Laptop GPU (1104 - 1974, n=7) | |
| Apple MacBook Pro 14 2023 M2 Pro Entry | |
| MSI Stealth 17 Studio A13VH-014 | |
| Samsung Galaxy Book3 Ultra 16 | |
| Lenovo ThinkPad T14 G3-21AJS00400 | |
| Samsung Galaxy Book3 Ultra 16, i9-13900H RTX 4070 | |
| CrossMark / Productivity | |
| Asus ProArt StudioBook 16 H7600ZW | |
| Gigabyte AERO 16 OLED BSF | |
| Dell XPS 15 9530 RTX 4070 | |
| Media de la clase Multimedia (931 - 2489, n=66, últimos 2 años) | |
| Medio Intel Core i9-13900H, NVIDIA GeForce RTX 4070 Laptop GPU (1058 - 1914, n=7) | |
| MSI Stealth 17 Studio A13VH-014 | |
| Apple MacBook Pro 14 2023 M2 Pro Entry | |
| Lenovo ThinkPad T14 G3-21AJS00400 | |
| Samsung Galaxy Book3 Ultra 16 | |
| Samsung Galaxy Book3 Ultra 16, i9-13900H RTX 4070 | |
| CrossMark / Creativity | |
| Apple MacBook Pro 14 2023 M2 Pro Entry | |
| Dell XPS 15 9530 RTX 4070 | |
| Media de la clase Multimedia (907 - 3465, n=66, últimos 2 años) | |
| Asus ProArt StudioBook 16 H7600ZW | |
| Medio Intel Core i9-13900H, NVIDIA GeForce RTX 4070 Laptop GPU (1178 - 2254, n=7) | |
| Gigabyte AERO 16 OLED BSF | |
| MSI Stealth 17 Studio A13VH-014 | |
| Samsung Galaxy Book3 Ultra 16 | |
| Lenovo ThinkPad T14 G3-21AJS00400 | |
| Samsung Galaxy Book3 Ultra 16, i9-13900H RTX 4070 | |
| CrossMark / Responsiveness | |
| Gigabyte AERO 16 OLED BSF | |
| Asus ProArt StudioBook 16 H7600ZW | |
| Medio Intel Core i9-13900H, NVIDIA GeForce RTX 4070 Laptop GPU (1037 - 1952, n=7) | |
| Dell XPS 15 9530 RTX 4070 | |
| MSI Stealth 17 Studio A13VH-014 | |
| Media de la clase Multimedia (605 - 2024, n=66, últimos 2 años) | |
| Samsung Galaxy Book3 Ultra 16 | |
| Apple MacBook Pro 14 2023 M2 Pro Entry | |
| Lenovo ThinkPad T14 G3-21AJS00400 | |
| Samsung Galaxy Book3 Ultra 16, i9-13900H RTX 4070 | |
| PCMark 10 Score | 5855 puntos | |
ayuda | ||
| AIDA64 / Memory Copy | |
| Media de la clase Multimedia (21158 - 132135, n=60, últimos 2 años) | |
| MSI Stealth 17 Studio A13VH-014 | |
| Samsung Galaxy Book3 Ultra 16 | |
| Samsung Galaxy Book3 Ultra 16, i9-13900H RTX 4070 | |
| Gigabyte AERO 16 OLED BSF | |
| Dell XPS 15 9530 RTX 4070 | |
| Asus ProArt StudioBook 16 H7600ZW | |
| Medio Intel Core i9-13900H (37448 - 74486, n=25) | |
| AIDA64 / Memory Read | |
| Media de la clase Multimedia (19699 - 174586, n=60, últimos 2 años) | |
| MSI Stealth 17 Studio A13VH-014 | |
| Samsung Galaxy Book3 Ultra 16, i9-13900H RTX 4070 | |
| Dell XPS 15 9530 RTX 4070 | |
| Samsung Galaxy Book3 Ultra 16 | |
| Gigabyte AERO 16 OLED BSF | |
| Asus ProArt StudioBook 16 H7600ZW | |
| Medio Intel Core i9-13900H (41599 - 75433, n=25) | |
| AIDA64 / Memory Write | |
| Samsung Galaxy Book3 Ultra 16 | |
| Samsung Galaxy Book3 Ultra 16, i9-13900H RTX 4070 | |
| Media de la clase Multimedia (17733 - 134998, n=60, últimos 2 años) | |
| MSI Stealth 17 Studio A13VH-014 | |
| Gigabyte AERO 16 OLED BSF | |
| Dell XPS 15 9530 RTX 4070 | |
| Medio Intel Core i9-13900H (36152 - 88505, n=25) | |
| Asus ProArt StudioBook 16 H7600ZW | |
| AIDA64 / Memory Latency | |
| Media de la clase Multimedia (7 - 535, n=59, últimos 2 años) | |
| Samsung Galaxy Book3 Ultra 16, i9-13900H RTX 4070 | |
| Samsung Galaxy Book3 Ultra 16 | |
| Gigabyte AERO 16 OLED BSF | |
| MSI Stealth 17 Studio A13VH-014 | |
| Asus ProArt StudioBook 16 H7600ZW | |
| Medio Intel Core i9-13900H (75.8 - 102.3, n=25) | |
| Dell XPS 15 9530 RTX 4070 | |
* ... más pequeño es mejor
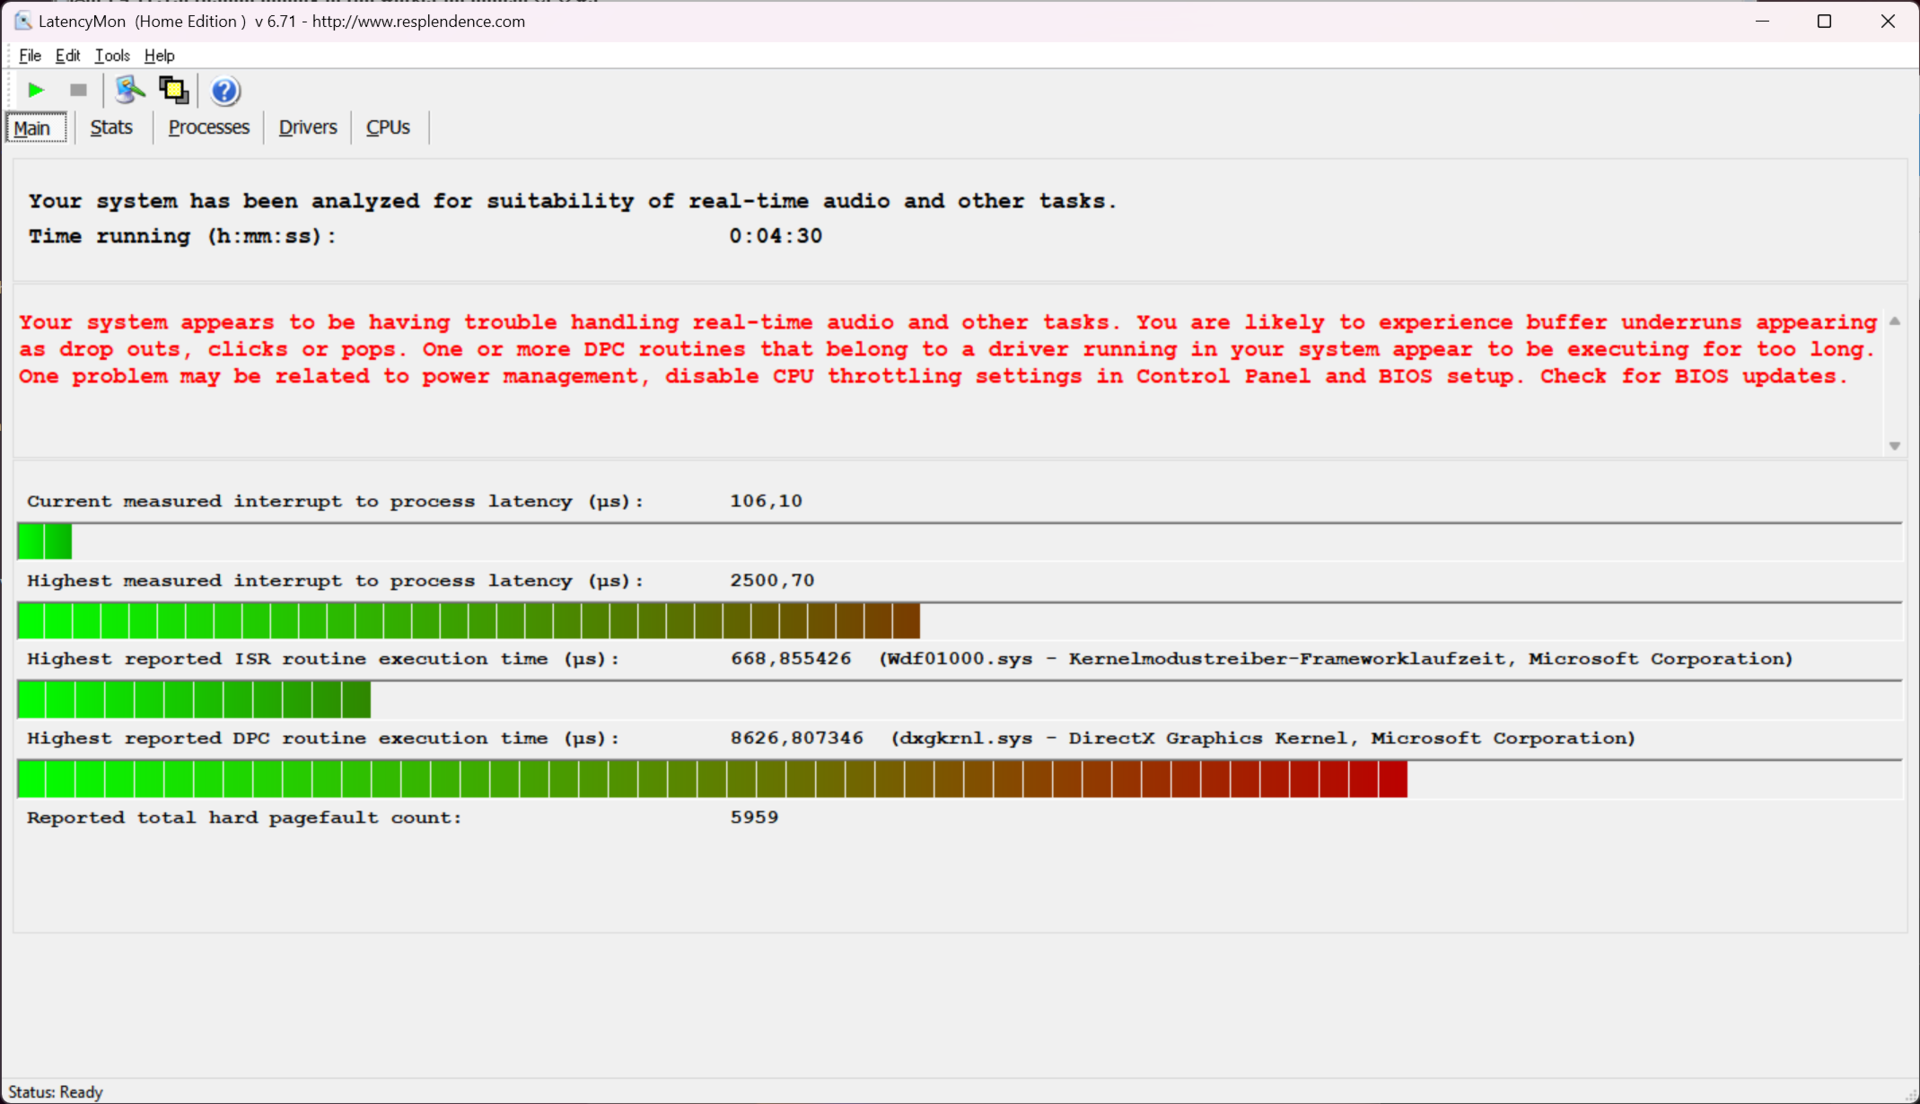
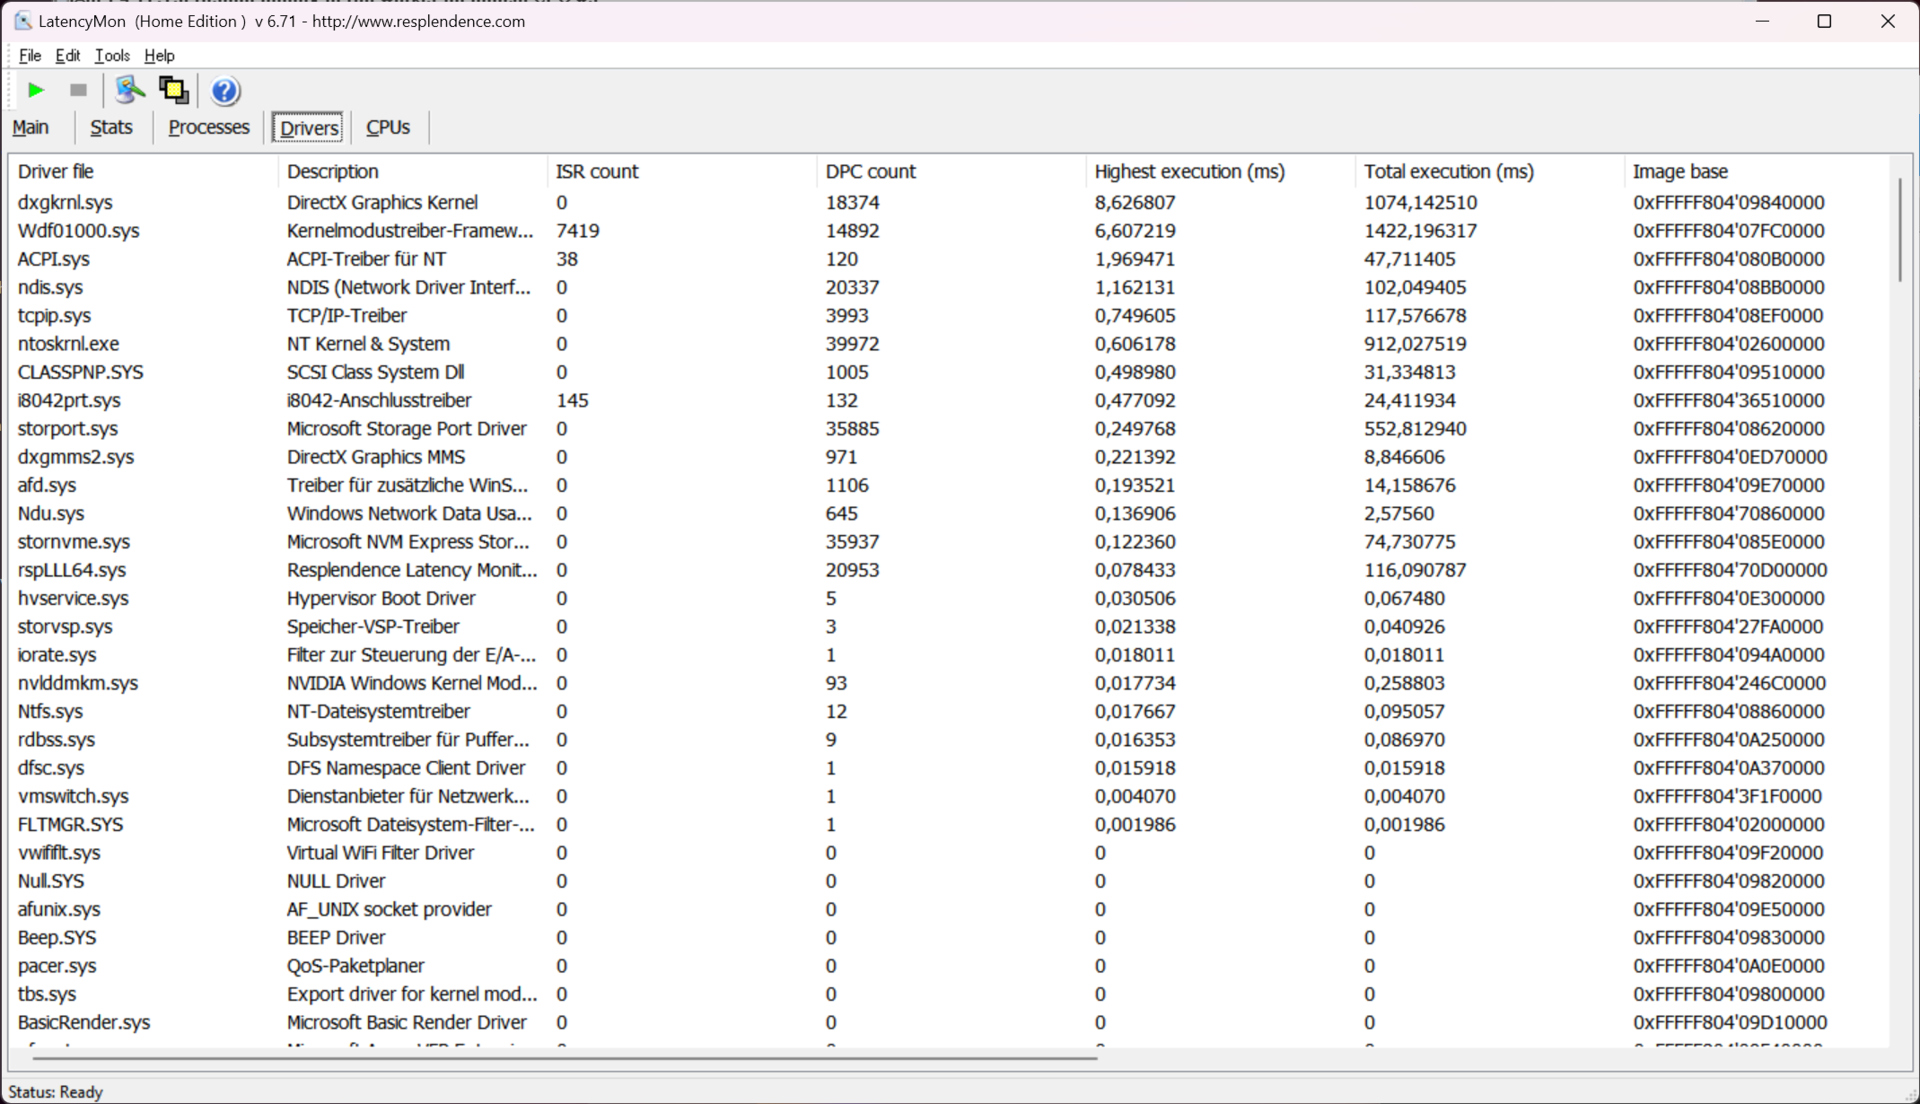
Latencia del CPD
La latencia que medimos con LatencyMon indica problemas con el controlador gráfico Nvidia Studio. Sin embargo, el marco de controladores en modo kernel también muestra retrasos medibles. Así que el sistema no es adecuado para el procesamiento de audio en tiempo real. El ajuste del software, así como futuras actualizaciones, podrían conducir a mejoras considerables.
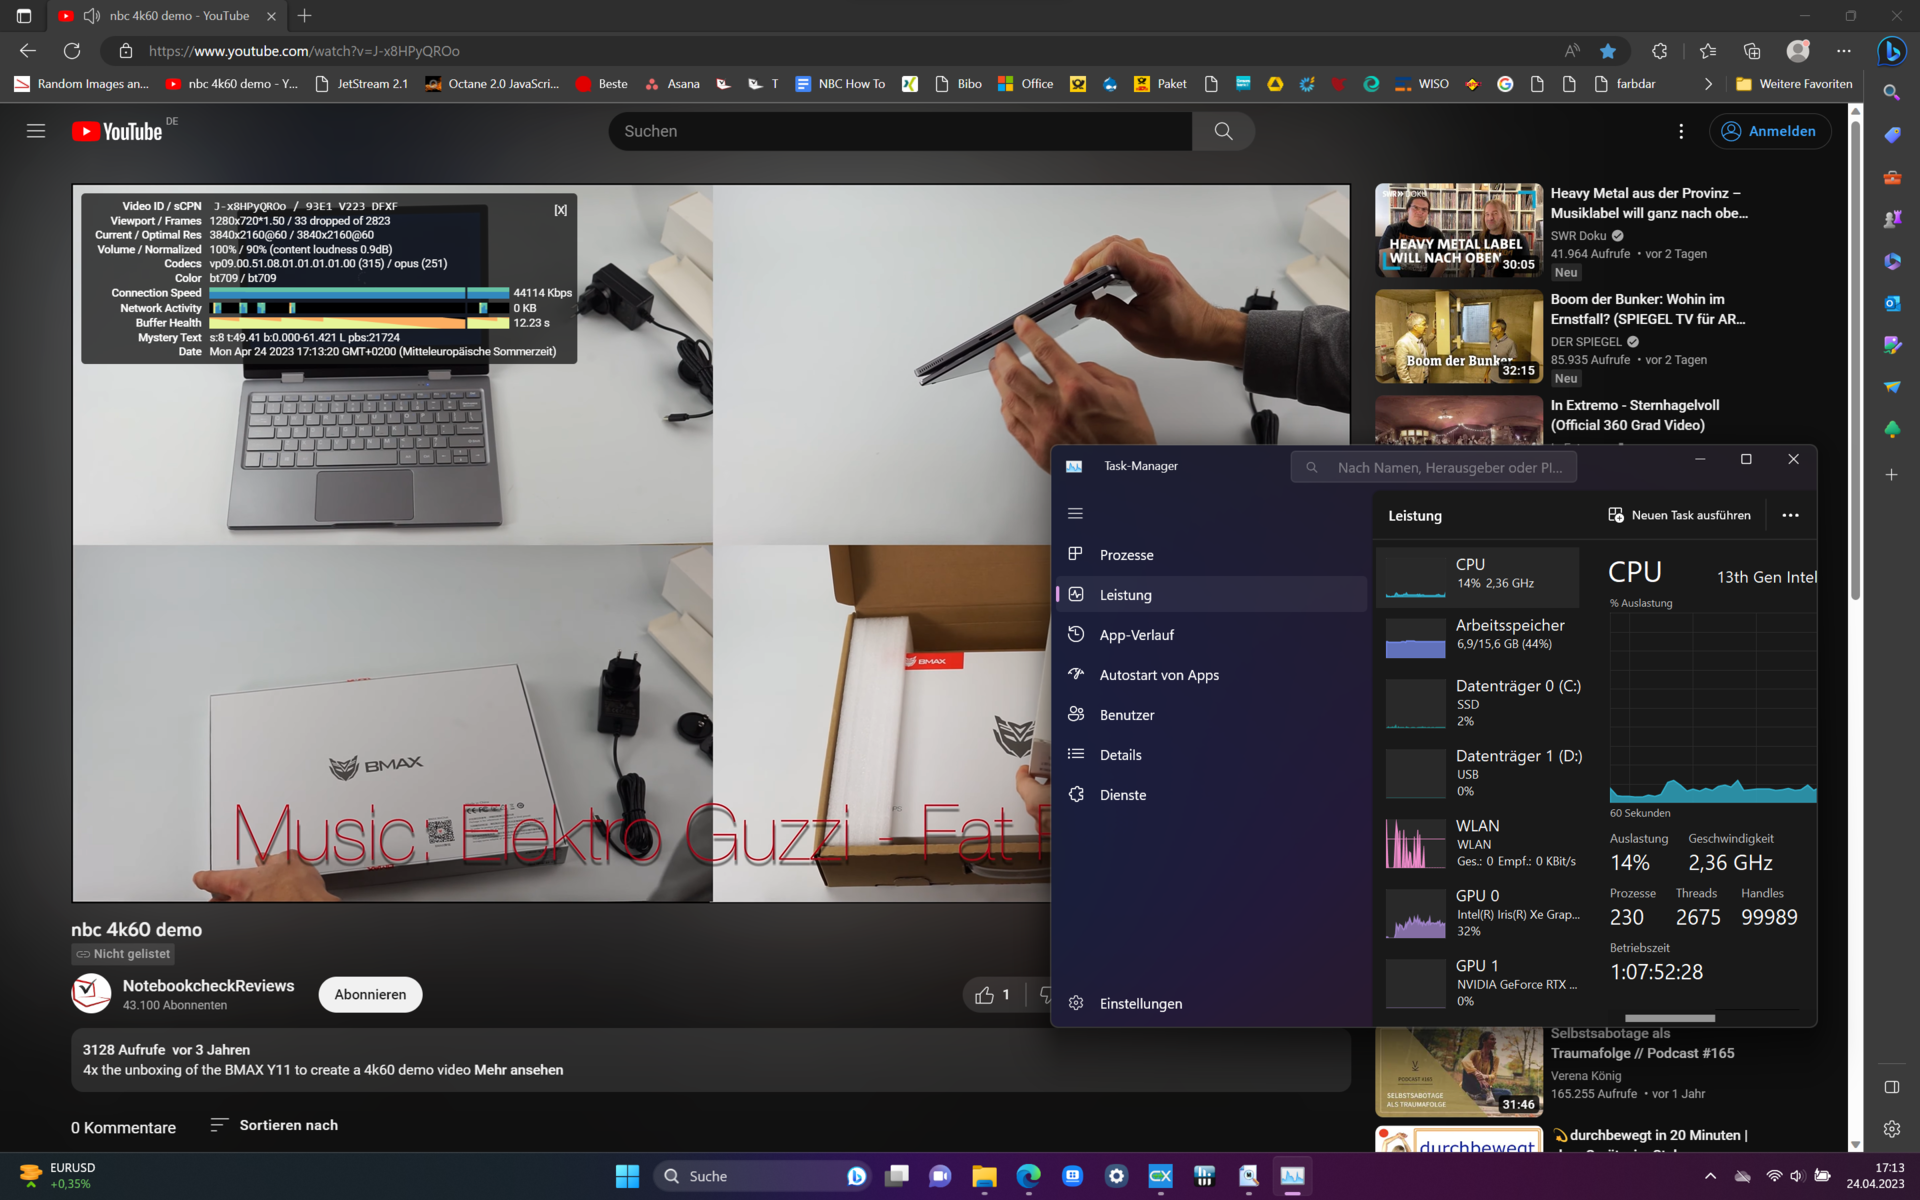
56 frames perdidos también es un valor por debajo de la media para la reproducción de vídeo 4K en YouTube, especialmente para un portátil multimedia con esta configuración. Una actualización de drivers en el futuro debería enmendar esto. En el momento del análisis, Nvidia Studio 531.61 era el último controlador de tarjeta gráfica instalado.
| DPC Latencies / LatencyMon - interrupt to process latency (max), Web, Youtube, Prime95 | |
| Samsung Galaxy Book3 Ultra 16 | |
| MSI Stealth 17 Studio A13VH-014 | |
| Samsung Galaxy Book3 Ultra 16, i9-13900H RTX 4070 | |
| Asus ProArt StudioBook 16 H7600ZW | |
| Dell XPS 15 9530 RTX 4070 | |
| Gigabyte AERO 16 OLED BSF | |
* ... más pequeño es mejor
Dispositivos de almacenamiento
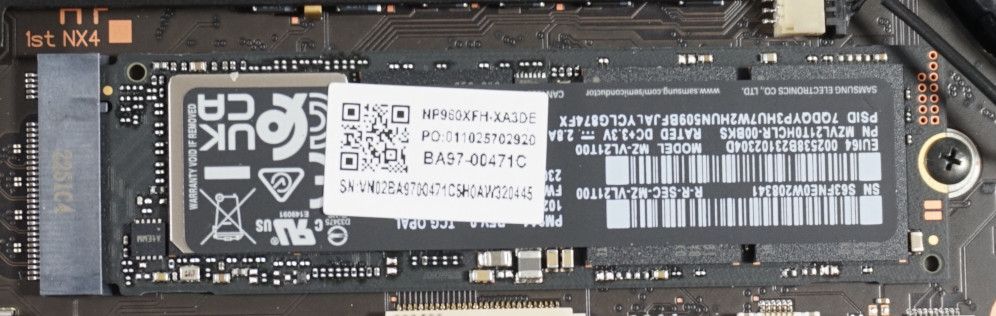
El SSD M.2 no depara sorpresas. Como era de esperar, es un modelo Samsung que alcanza regularmente los valores encontrados aquí en nuestras mediciones. La velocidad máxima está por encima de las capacidades del PCIe 3, pero no puede competir con los mejores SSDs PCIe 4.
Para las tareas que tiene que manejar el Galaxy Book3 Ultra, el SSD no debería resultar un cuello de botella en ningún momento. Además, las velocidades de acceso se mantienen a un alto nivel bajo carga sostenida - todo lo contrario que el dispositivo de almacenamiento idéntico del Asus ProArt StudioBook 16, que se ve forzado a limitar severamente la tasa de datos para evitar el sobrecalentamiento.
Como mucho, el espacio del disco duro podría escasear rápidamente cuando se edita mucho material en bruto. Si la placa base no fuera tan difícil de quitar, una actualización sería fácil. Afortunadamente, los dos puertos Thunderbolt 4 pueden utilizarse para unidades SSD externas.

* ... más pequeño es mejor
Sustained Read Performance: DiskSpd Read Loop, Queue Depth 8
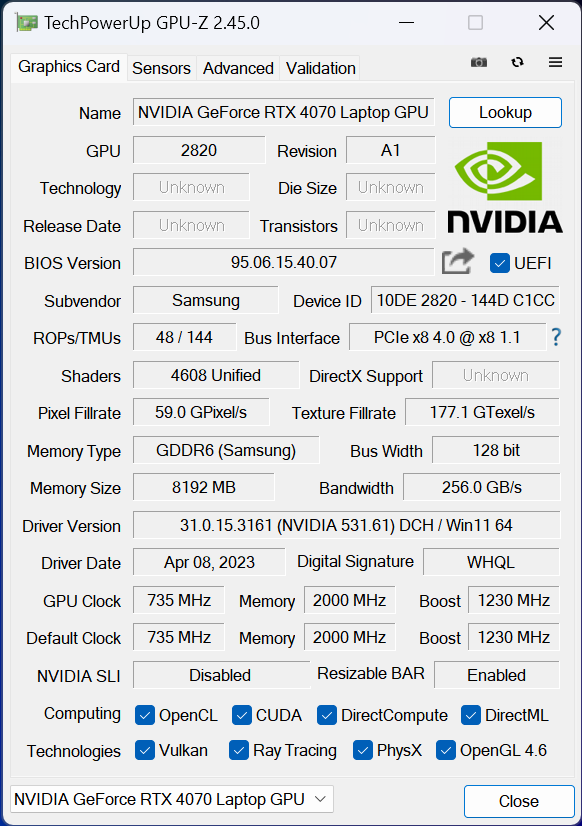
Tarjeta gráfica
El Nvidia GeForce RTX 4070 es normalmente irreprochable. Maneja los juegos actuales al máximo nivel de detalle y más allá del Full HD. Se mantiene regularmente cerca de los 100 fps. En un Medion Erazer Major X20por ejemplo, puede consumir 115 W para estos valores de rendimiento, incluso 140 W cuando Boost está activado.
En el portátil Samsung Creator, en cambio, el consumo se limita a 35 W y a 60 W con Boost. Como muestran las métricas de Witcher 3, los 60 vatios se utilizan completamente bajo cargas altas, mientras que la CPU casi parece subempleada con un consumo inferior a 15 W. La tarjeta gráfica no está ajustada para cargas permanentes al máximo nivel.
Por otro lado, los resultados de la Galaxy Book Ultra en Blender no están lejos del valor medio de la RTX 4070. La tarea principal, crear y editar contenido gráfico, la maneja muy bien el portátil.
Se pueden encontrar más valores medidos, fps y datos en nuestra Lista de pruebas GPU.
| 3DMark 11 Performance | 25500 puntos | |
| 3DMark Cloud Gate Standard Score | 34191 puntos | |
| 3DMark Fire Strike Score | 18076 puntos | |
| 3DMark Time Spy Score | 8692 puntos | |
ayuda | ||
* ... más pequeño es mejor
Rendimiento en juegos
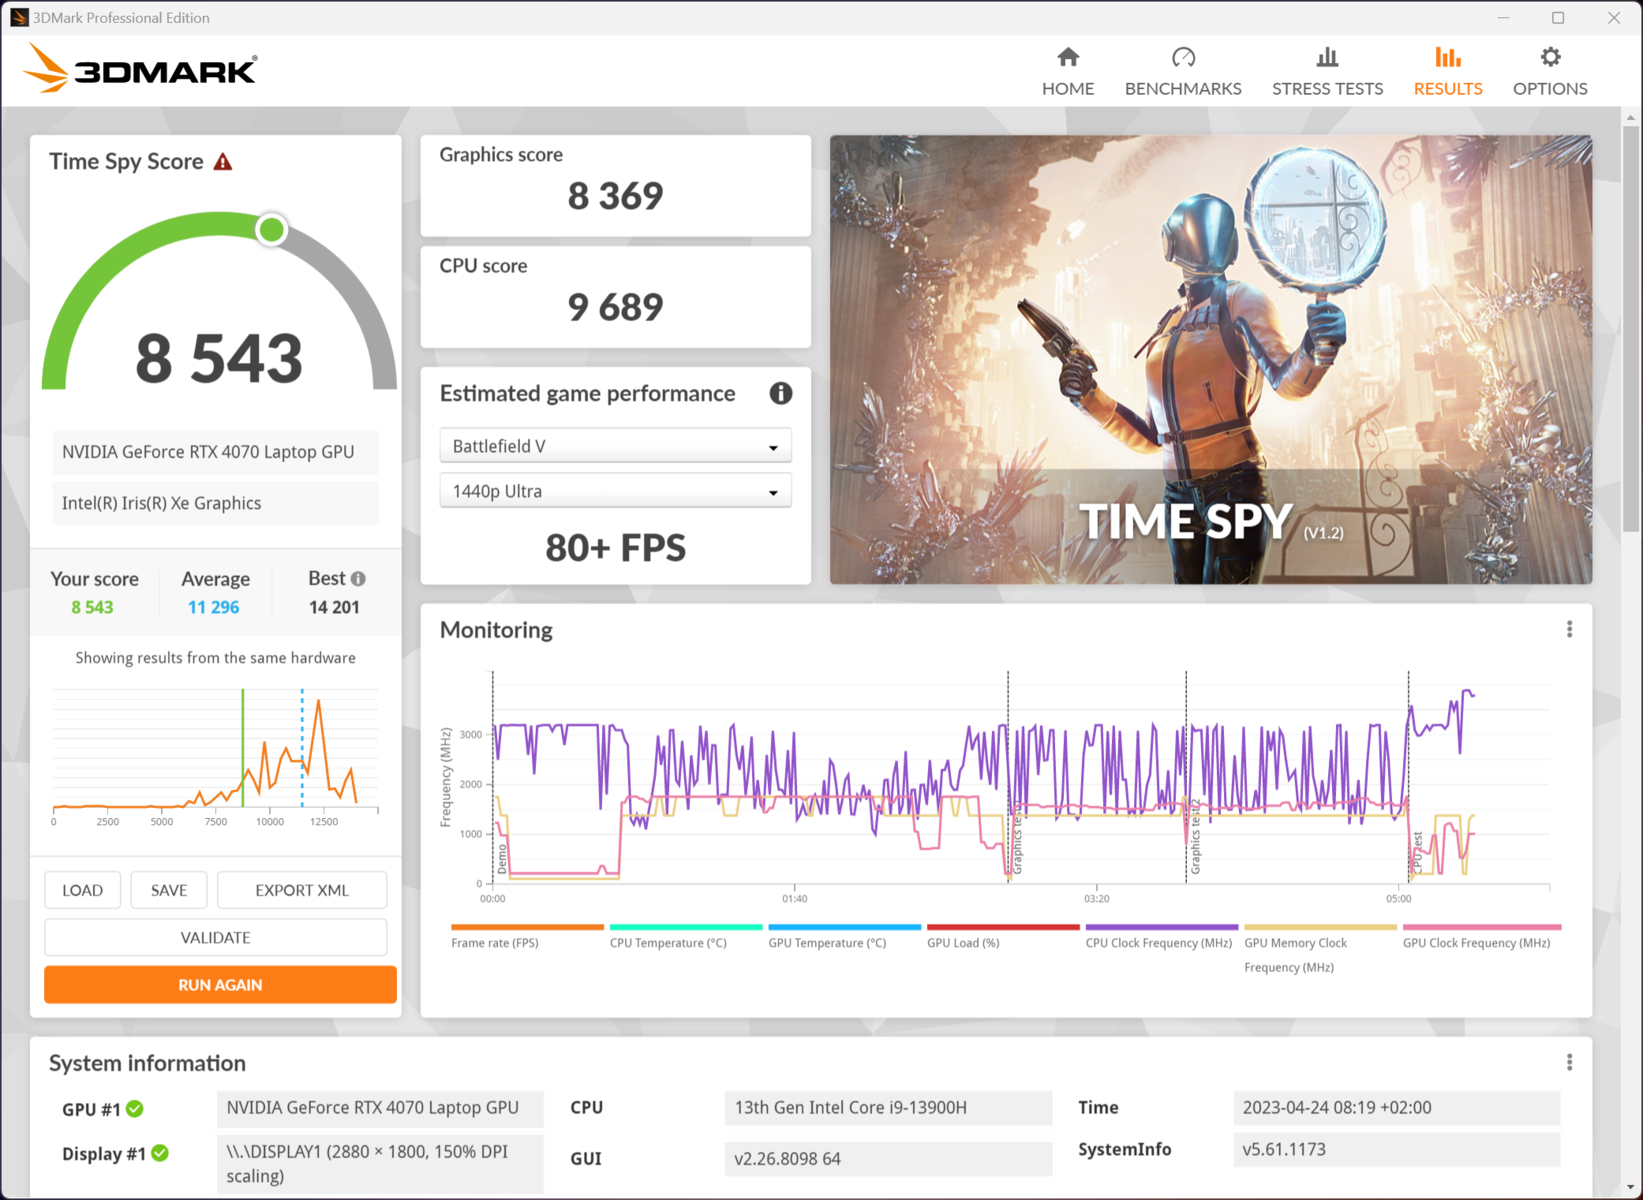

Los juegos no son en absoluto la principal competencia del Galaxy Book. ElRTX 4070alcanza regularmente sus límites aquí porque es incapaz de disipar mucho calor en el delgado portátil y también está limitada a 60 W de consumo de energía. Una comparación con portátiles equipados de forma similar sería, por tanto, injusta. Por otro lado, el consumo de energía está regularmente por debajo de los 100 W, incluso bajo carga. En un portátil para juegos como el Medion Erazer Major X20se sitúa entre 200 y 300 W.
Un HP Victus 16 con una Nvidia GeForce RTX 3060 tiene tasas de consumo similares cuando el rendimiento está al máximo, por lo que el portátil de Samsung para creativos está más o menos a la par en términos de juego. Sin embargo, este último alcanza estos valores en un chasis mucho más delgado con la mitad de energía. Con algunas salvedades, se puede jugar a los últimos títulos, pero el portátil sencillamente no está diseñado para ello debido a la falta de refrigeración y el limitado consumo de energía.
El reloj de fps en Witcher 3 se mantiene siempre estable. 77 frames de media es un valor respetable. Que esto permanezca constante habla de la suficiente refrigeración de los componentes. Como tal, el portátil de Samsung debería ser capaz de procesar tareas informáticas más extensas a niveles estables.
Witcher 3 FPS chart
| bajo | medio | alto | ultra | QHD | |
|---|---|---|---|---|---|
| GTA V (2015) | 150.1 | 74.7 | 64.5 | ||
| The Witcher 3 (2015) | 161 | 71 | |||
| Dota 2 Reborn (2015) | 99.7 | 97.4 | |||
| Final Fantasy XV Benchmark (2018) | 82 | 60.2 | |||
| X-Plane 11.11 (2018) | 72.2 | ||||
| Far Cry 5 (2018) | 98 | 92 | 79 | ||
| Strange Brigade (2018) | 173.9 | 148.7 | 106.2 | ||
| Cyberpunk 2077 1.6 (2022) | 71 | 65 | 42 | ||
| F1 22 (2022) | 109 | 54 | 36 | ||
| Hogwarts Legacy (2023) | 57 | 41 | 35 |
Emisiones - Cuaderno creador silencioso y caliente
Ruido
Mientras el hardware no se sobrecargue, el Galaxy Book3 Ultra permanece completamente silencioso. Aparece un ruido moderado del ventilador durante el mayor desarrollo de calor, que se mantiene en un rango muy tolerable de menos de 40 dB.
Sólo bajo carga máxima el ventilador es realmente ruidoso. Más de 50 dB no es un valor en el que puedas esperar trabajar completamente concentrado. Esto se puede cambiar con el modo Silencioso. Aunque el rendimiento del sistema también cae notablemente, medimos una media de 8 dB menos, que es casi la mitad del volumen.
Ventiladores más grandes y un sistema de refrigeración ligeramente más voluminoso podrían haber mejorado los resultados significativamente, pero habrían hecho el portátil más grande en general. El MSI Stealth 17 Studio, por ejemplo, con tasas de rendimiento significativamente más altas, lo demuestra de forma impresionante. Sin embargo, es más pesado y considerablemente más grueso.
Ruido
| Ocioso |
| 25.2 / 25.2 / 31.3 dB(A) |
| Carga |
| 38.8 / 51.2 dB(A) |
 | ||
30 dB silencioso 40 dB(A) audible 50 dB(A) ruidosamente alto |
||
min: | ||
| Samsung Galaxy Book3 Ultra 16, i9-13900H RTX 4070 GeForce RTX 4070 Laptop GPU, i9-13900H, Samsung PM9A1 MZVL21T0HCLR | Dell XPS 15 9530 RTX 4070 GeForce RTX 4070 Laptop GPU, i7-13700H, SK hynix PC801 HFS001TEJ9X101N | MSI Stealth 17 Studio A13VH-014 GeForce RTX 4080 Laptop GPU, i9-13900H, Samsung PM9A1 MZVL22T0HBLB | Asus ProArt StudioBook 16 H7600ZW GeForce RTX 3070 Ti Laptop GPU, i9-12900H, Samsung PM9A1 MZVL21T0HCLR | Gigabyte AERO 16 OLED BSF GeForce RTX 4070 Laptop GPU, i9-13900H, Gigabyte AG470S1TB-SI B10 | Samsung Galaxy Book3 Ultra 16 GeForce RTX 4050 Laptop GPU, i7-13700H, Samsung PM9A1 MZVL2512HCJQ | |
|---|---|---|---|---|---|---|
| Noise | 15% | 9% | 19% | -4% | 3% | |
| apagado / medio ambiente * (dB) | 25.2 | 23.1 8% | 24 5% | 19.55 22% | 23 9% | 25 1% |
| Idle Minimum * (dB) | 25.2 | 23.1 8% | 24 5% | 20.07 20% | 23 9% | 26 -3% |
| Idle Average * (dB) | 25.2 | 23.1 8% | 24 5% | 20.07 20% | 23 9% | 27 -7% |
| Idle Maximum * (dB) | 31.3 | 24.2 23% | 24 23% | 20.07 36% | 33.64 -7% | 28 11% |
| Load Average * (dB) | 38.8 | 27.1 30% | 34.49 11% | 34.53 11% | 51.49 -33% | 40 -3% |
| Load Maximum * (dB) | 51.2 | 44.6 13% | 49.66 3% | 49.21 4% | 55.24 -8% | 41 20% |
| Witcher 3 ultra * (dB) | 40.1 | 48.29 | 49.1 | 55.27 | 39 |
* ... más pequeño es mejor
Temperatura
El Galaxy Book3 se calienta en casi todas las ocasiones. Incluso un poco de navegación basta para calentar la parte inferior hasta el punto de que apoyar el portátil en el regazo resulta incómodo.
Si se requiere el máximo rendimiento, el teclado se calienta mucho. Registramos temperaturas más altas en la parte inferior, por lo que un soporte para el portátil, por ejemplo, es aconsejable cuando se renderizan archivos de vídeo más grandes.
(-) La temperatura máxima en la parte superior es de 45.9 °C / 115 F, frente a la media de 36.8 °C / 98 F, que oscila entre 21 y 71 °C para la clase Multimedia.
(-) El fondo se calienta hasta un máximo de 50.9 °C / 124 F, frente a la media de 39.1 °C / 102 F
(+) En reposo, la temperatura media de la parte superior es de 29.7 °C / 85# F, frente a la media del dispositivo de 31.3 °C / 88 F.
(-) Jugando a The Witcher 3, la temperatura media de la parte superior es de 39.2 °C / 103 F, frente a la media del dispositivo de 31.3 °C / 88 F.
(±) El reposamanos y el touchpad pueden calentarse mucho al tacto con un máximo de 37.2 °C / 99 F.
(-) La temperatura media de la zona del reposamanos de dispositivos similares fue de 28.7 °C / 83.7 F (-8.5 °C / -15.3 F).
| Samsung Galaxy Book3 Ultra 16, i9-13900H RTX 4070 Intel Core i9-13900H, NVIDIA GeForce RTX 4070 Laptop GPU | Dell XPS 15 9530 RTX 4070 Intel Core i7-13700H, NVIDIA GeForce RTX 4070 Laptop GPU | Gigabyte AERO 16 OLED BSF Intel Core i9-13900H, NVIDIA GeForce RTX 4070 Laptop GPU | MSI Stealth 17 Studio A13VH-014 Intel Core i9-13900H, NVIDIA GeForce RTX 4080 Laptop GPU | Samsung Galaxy Book3 Ultra 16 Intel Core i7-13700H, NVIDIA GeForce RTX 4050 Laptop GPU | Asus ProArt StudioBook 16 H7600ZW Intel Core i9-12900H, NVIDIA GeForce RTX 3070 Ti Laptop GPU | |
|---|---|---|---|---|---|---|
| Heat | 3% | 20% | 1% | 19% | 11% | |
| Maximum Upper Side * (°C) | 45.9 | 45.6 1% | 41 11% | 47 -2% | 41 11% | 41.6 9% |
| Maximum Bottom * (°C) | 50.9 | 42 17% | 47 8% | 54 -6% | 44 14% | 41.4 19% |
| Idle Upper Side * (°C) | 31.6 | 34.4 -9% | 23 27% | 30 5% | 23 27% | 31.8 -1% |
| Idle Bottom * (°C) | 34.2 | 33.2 3% | 23 33% | 32 6% | 26 24% | 29.2 15% |
* ... más pequeño es mejor
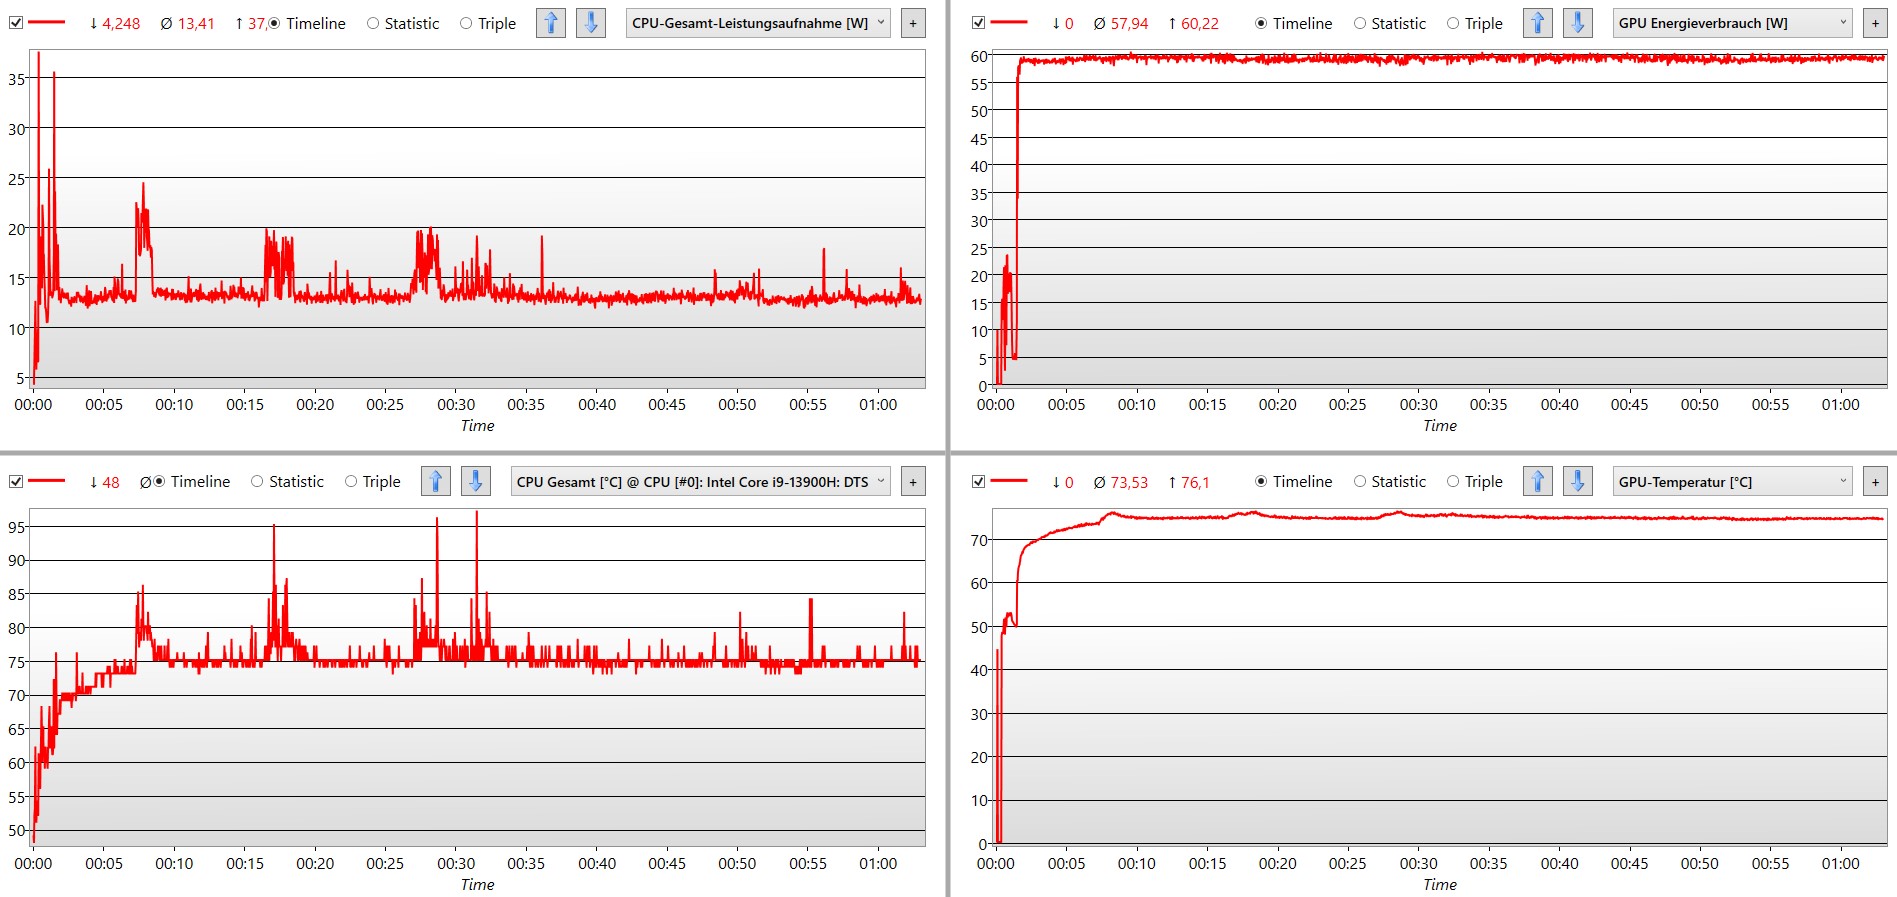
Pruebas de resistencia
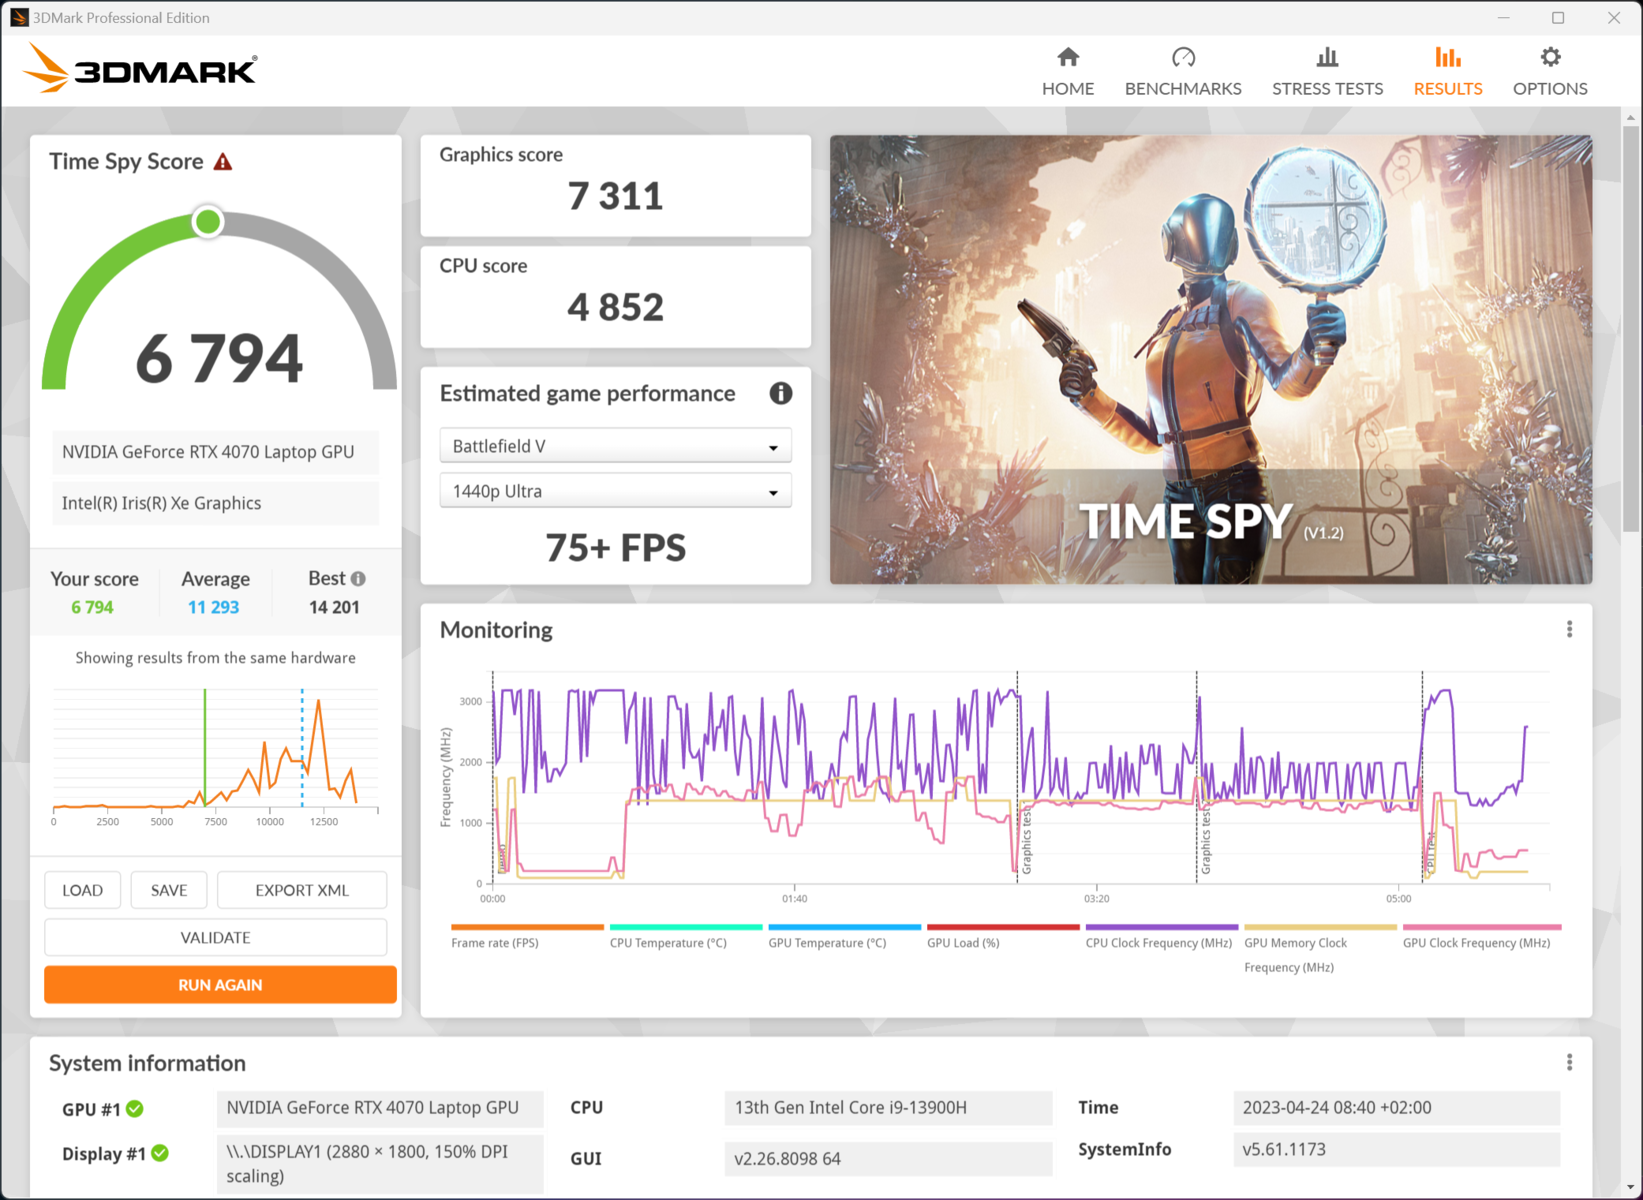
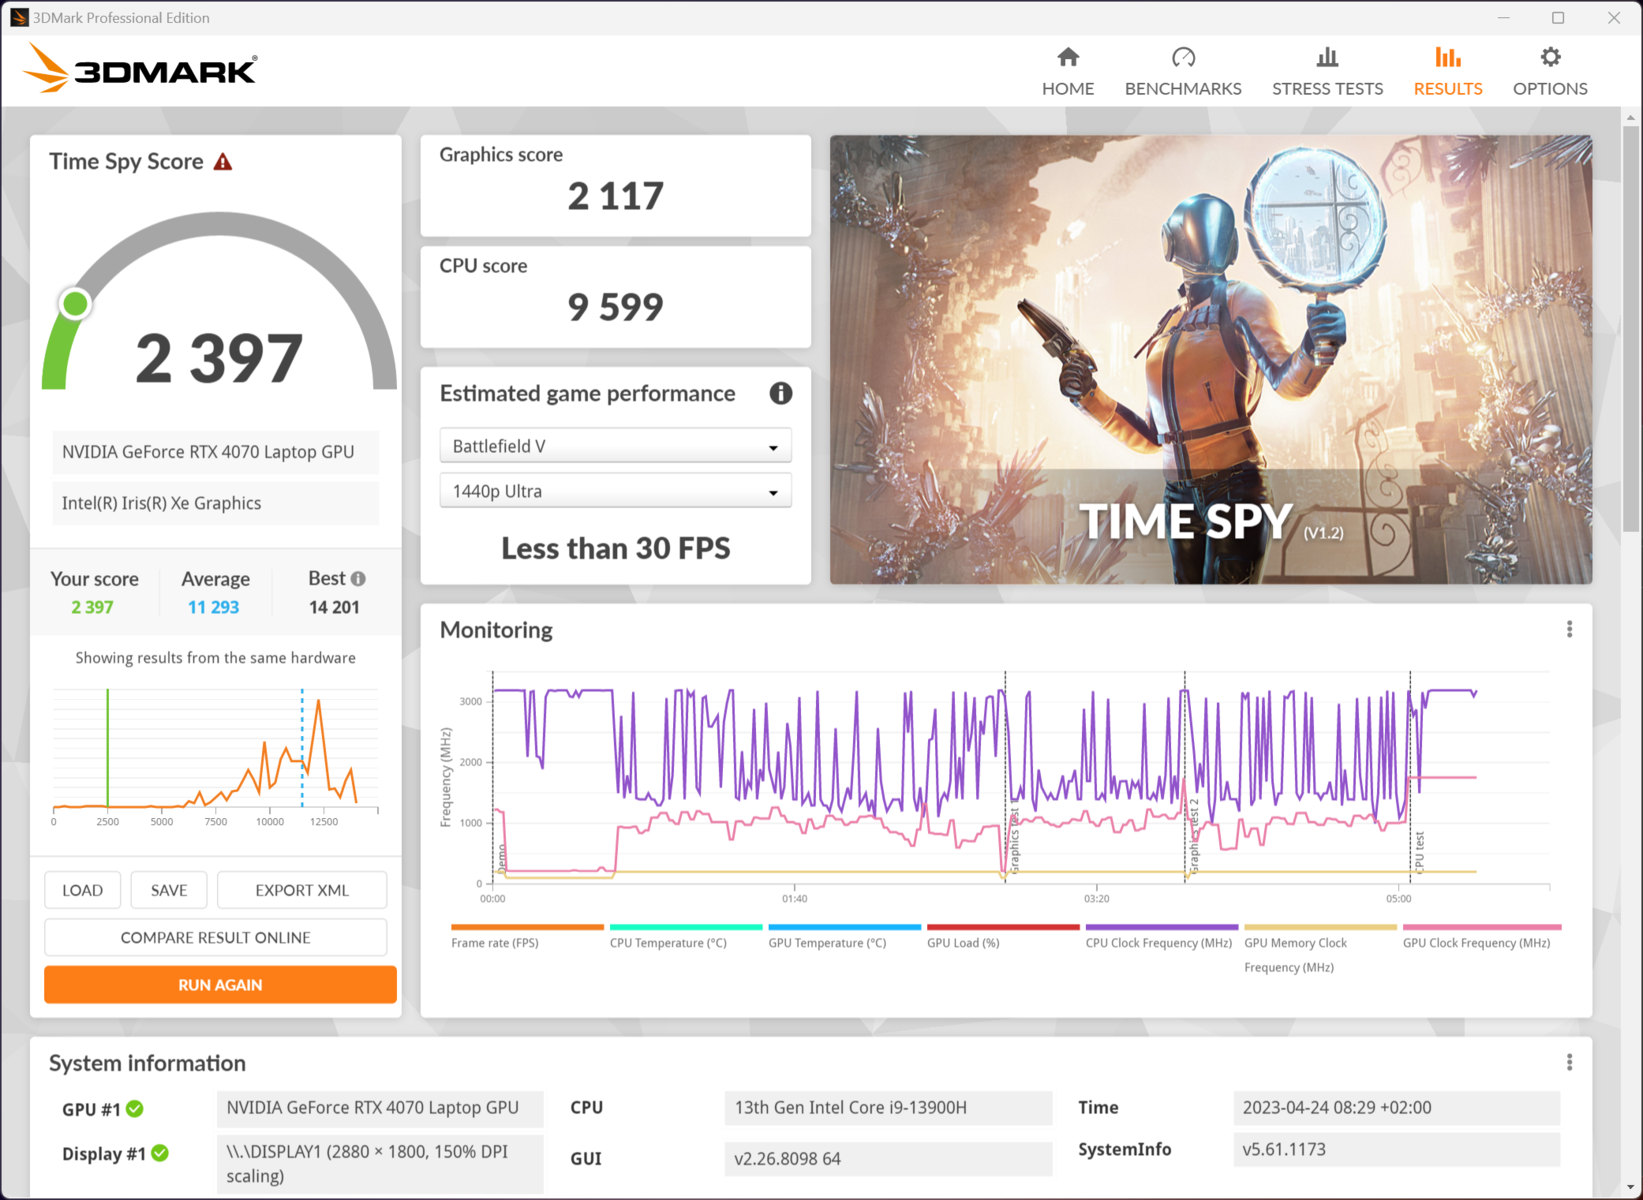
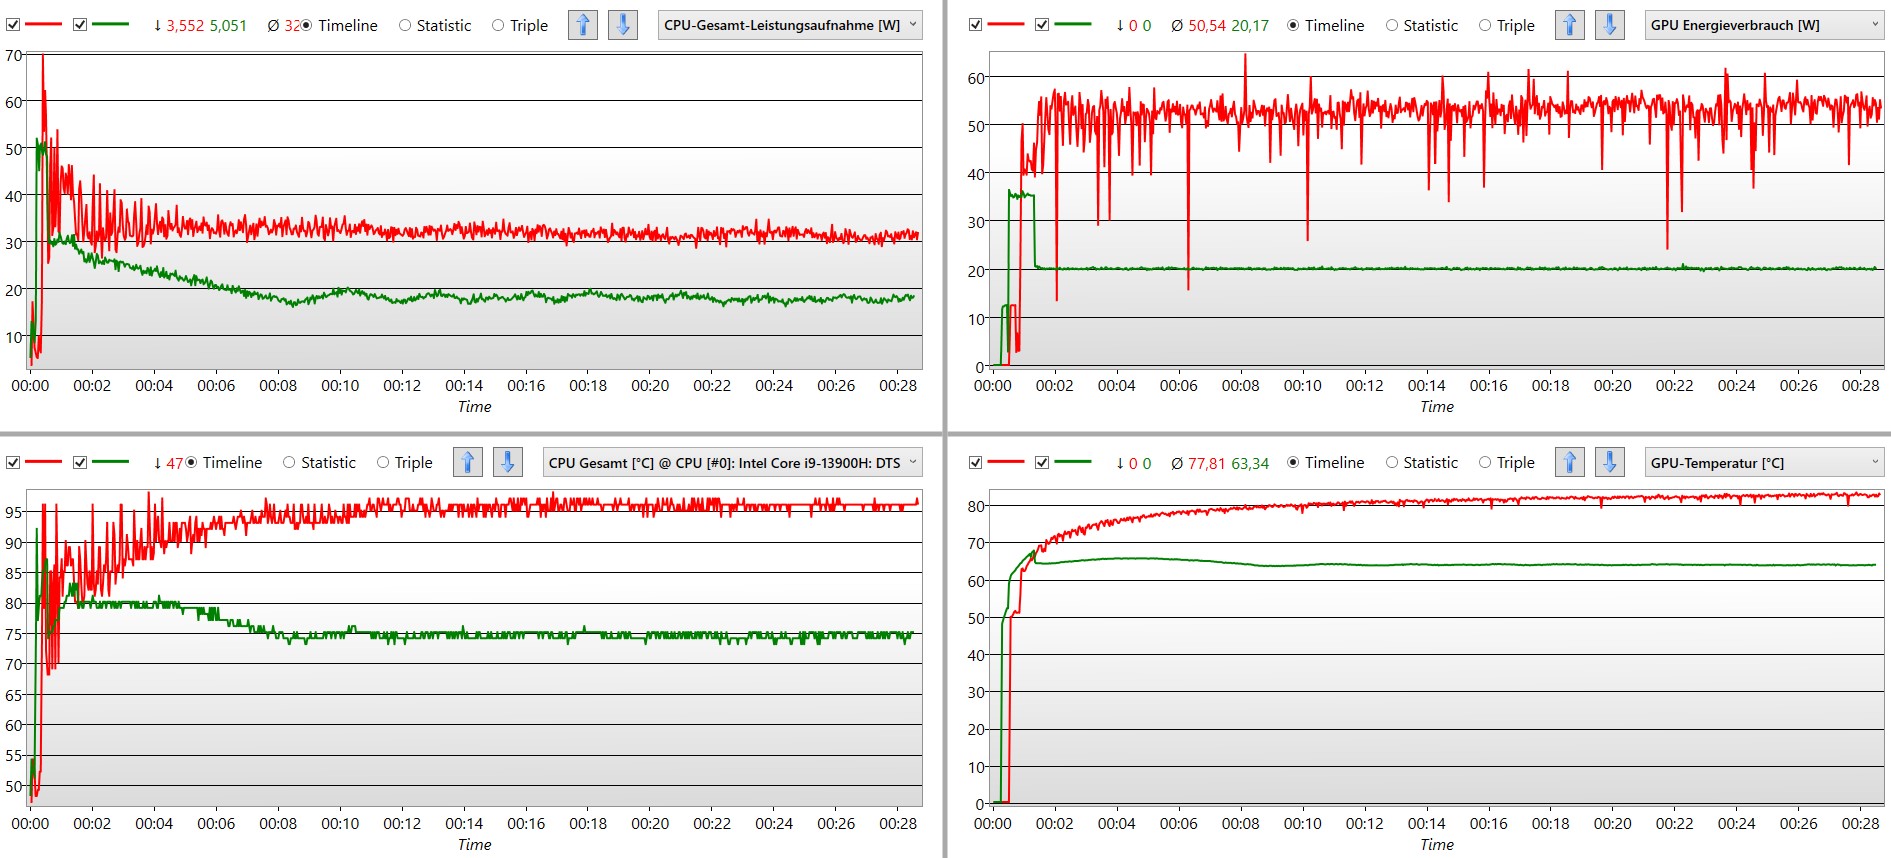
Bajo carga máxima, el procesador soporta algo menos de 30 W a largo plazo. La tarjeta gráfica, por otro lado, permanece relativamente estable a un nivel alto de algo menos de 50 W. El hecho de que el Galaxy Book3 Ultra se caliente tanto queda demostrado por las curvas de temperatura de la CPU y la GPU. Aunque se mantienen casi niveladas tras unos 10 minutos, alcanzan la friolera de 95 y 80 °C, respectivamente. Junto con el pequeño sistema de refrigeración, esto resulta en una carcasa muy caliente. No obstante, el portátil logra utilizar los 100 W permitidos por la fuente de alimentación durante largos periodos de tiempo.
Se pueden observar cambios significativos en el modo silencioso . No sólo caen bruscamente las emisiones de ruido; el consumo de energía de la CPU y la GPU baja de 90 a unos 40 W. Las temperaturas de los componentes también se mantienen a un nivel mucho más tolerable. Aunque hay pérdidas de rendimiento significativas, especialmente en el rendimiento gráfico, el modo parece ser adecuado para el trabajo silencioso permanente a pesar de las mayores exigencias informáticas.
Altavoces
Los altavoces estéreo de AKG sólo pueden estar parcialmente a la altura de las expectativas que la marca alimenta con razón. Graves potentes y medios detallados con gran calidad de sonido hacen que la musica, desde el rock hasta el electro, suene bien. Sin embargo, como ocurre con muchos modelos, a los medios bajos les vendría bien un poco más de potencia. En general, la mezcla es absolutamente buena, especialmente para la transmisión de vídeo.
Por desgracia, observamos una fuerte sobrecarga en los agudos, que también se aprecia claramente en la tabla de frecuencias.
Samsung Galaxy Book3 Ultra 16, i9-13900H RTX 4070 análisis de audio
(+) | los altavoces pueden reproducir a un volumen relativamente alto (#85.7 dB)
Graves 100 - 315 Hz
(-) | casi sin bajos - de media 15.8% inferior a la mediana
(-) | los graves no son lineales (16.6% delta a la frecuencia anterior)
Medios 400 - 2000 Hz
(+) | medios equilibrados - a sólo 2.9% de la mediana
(+) | los medios son lineales (3.8% delta a la frecuencia anterior)
Altos 2 - 16 kHz
(+) | máximos equilibrados - a sólo 4.7% de la mediana
(±) | la linealidad de los máximos es media (9.5% delta a frecuencia anterior)
Total 100 - 16.000 Hz
(+) | el sonido global es lineal (13.8% de diferencia con la mediana)
En comparación con la misma clase
» 30% de todos los dispositivos probados de esta clase eran mejores, 4% similares, 65% peores
» El mejor tuvo un delta de 5%, la media fue 17%, el peor fue ###max##%
En comparación con todos los dispositivos probados
» 15% de todos los dispositivos probados eran mejores, 4% similares, 81% peores
» El mejor tuvo un delta de 4%, la media fue 24%, el peor fue ###max##%
Apple MacBook Pro 16 2021 M1 Pro análisis de audio
(+) | los altavoces pueden reproducir a un volumen relativamente alto (#84.7 dB)
Graves 100 - 315 Hz
(+) | buen bajo - sólo 3.8% lejos de la mediana
(+) | el bajo es lineal (5.2% delta a la frecuencia anterior)
Medios 400 - 2000 Hz
(+) | medios equilibrados - a sólo 1.3% de la mediana
(+) | los medios son lineales (2.1% delta a la frecuencia anterior)
Altos 2 - 16 kHz
(+) | máximos equilibrados - a sólo 1.9% de la mediana
(+) | los máximos son lineales (2.7% delta a la frecuencia anterior)
Total 100 - 16.000 Hz
(+) | el sonido global es lineal (4.6% de diferencia con la mediana)
En comparación con la misma clase
» 0% de todos los dispositivos probados de esta clase eran mejores, 0% similares, 100% peores
» El mejor tuvo un delta de 5%, la media fue 17%, el peor fue ###max##%
En comparación con todos los dispositivos probados
» 0% de todos los dispositivos probados eran mejores, 0% similares, 100% peores
» El mejor tuvo un delta de 4%, la media fue 24%, el peor fue ###max##%
Gestión de la energía - Portátil creador de gran resistencia
Consumo de energía
El Galaxy Book es extremadamente económico a baja carga. A pesar de la pantalla grande y relativamente brillante, el consumo de energía se mantiene por debajo de 10 W para la mayoría de las tareas sencillas. Muchos rivales con hardware tan potente consumen el doble.
Bajo carga, el suministro máximo posible del adaptador de corriente, que da 100 W por USB-C, se usa al máximo. Como muestran nuestras mediciones en la prueba de estrés, el portátil puede absorber y usar esta potencia durante largos periodos de tiempo. Bajo tales cargas, sin embargo, no es probable que sea posible cargar la batería. Al menos no observamos un drenaje de la batería en el test de estrés.
| Off / Standby | |
| Ocioso | |
| Carga |
|
Clave:
min: | |
| Samsung Galaxy Book3 Ultra 16, i9-13900H RTX 4070 i9-13900H, GeForce RTX 4070 Laptop GPU, Samsung PM9A1 MZVL21T0HCLR, OLED / AMOLED, 2880x1800, 16" | Dell XPS 15 9530 RTX 4070 i7-13700H, GeForce RTX 4070 Laptop GPU, SK hynix PC801 HFS001TEJ9X101N, OLED, 3456x2160, 15.6" | MSI Stealth 17 Studio A13VH-014 i9-13900H, GeForce RTX 4080 Laptop GPU, Samsung PM9A1 MZVL22T0HBLB, Mini LED, 3840x2160, 17.3" | Asus ProArt StudioBook 16 H7600ZW i9-12900H, GeForce RTX 3070 Ti Laptop GPU, Samsung PM9A1 MZVL21T0HCLR, OLED, 3840x2400, 16" | Gigabyte AERO 16 OLED BSF i9-13900H, GeForce RTX 4070 Laptop GPU, Gigabyte AG470S1TB-SI B10, OLED, 3840x2400, 16" | Samsung Galaxy Book3 Ultra 16 i7-13700H, GeForce RTX 4050 Laptop GPU, Samsung PM9A1 MZVL2512HCJQ, AMOLED, 2880x1800, 16" | Medio NVIDIA GeForce RTX 4070 Laptop GPU | Media de la clase Multimedia | |
|---|---|---|---|---|---|---|---|---|
| Power Consumption | -135% | -130% | -132% | -102% | 14% | -145% | -26% | |
| Idle Minimum * (Watt) | 4.3 | 20 -365% | 13.9 -223% | 12.6 -193% | 11.8 -174% | 3 30% | 13.2 ? -207% | 5.69 ? -32% |
| Idle Average * (Watt) | 4.6 | 20.7 -350% | 20 -335% | 17.41 -278% | 16.1 -250% | 5 -9% | 18.2 ? -296% | 10.1 ? -120% |
| Idle Maximum * (Watt) | 11.4 | 22.4 -96% | 20.6 -81% | 23.12 -103% | 17 -49% | 11 4% | 24.6 ? -116% | 12.3 ? -8% |
| Load Average * (Watt) | 97 | 77.1 21% | 77 21% | 117.5 -21% | 100.6 -4% | 72 26% | 97 ? -0% | 65.3 ? 33% |
| Witcher 3 ultra * (Watt) | 100.9 | 95.4 5% | 162 -61% | 172.6 -71% | 158 -57% | 69.7 31% | ||
| Load Maximum * (Watt) | 107 | 133.4 -25% | 216 -102% | 241.36 -126% | 192 -79% | 108 -1% | 221 ? -107% | 112.5 ? -5% |
* ... más pequeño es mejor
Power consumption Witcher 3 / Stress test
Power consumption with an external monitor
Duración de la batería
Como ya indican los bajos índices de consumo de energía con poca carga, el portátil ofrece tiempos de ejecución muy respetables. A pesar de la batería de 76 Wh, que es bastante pequeña comparada con la competencia, demuestra ser extremadamente duradera al reproducir vídeos en Full HD y durante la navegación intensa. La variante más débil del Galaxy Book3 Ultra 16 incluso ofrece unas cuantas horas más.
9 horas en la prueba de vídeo y 8 horas en navegación web son más que impresionantes. La pantalla OLED tiene naturalmente un gran impacto en la duración. Conseguimos una autonomía de menos de 6 horas con el brillo al máximo. Por otro lado, si se activa el Modo Oscuro en el navegador web o se fuerza para todas las webs, el portátil puede exprimir dos horas adicionales de navegación, es decir, algo más de 10 horas.
| Samsung Galaxy Book3 Ultra 16, i9-13900H RTX 4070 i9-13900H, GeForce RTX 4070 Laptop GPU, 76 Wh | Dell XPS 15 9530 RTX 4070 i7-13700H, GeForce RTX 4070 Laptop GPU, 86 Wh | MSI Stealth 17 Studio A13VH-014 i9-13900H, GeForce RTX 4080 Laptop GPU, 99 Wh | Asus ProArt StudioBook 16 H7600ZW i9-12900H, GeForce RTX 3070 Ti Laptop GPU, 90 Wh | Gigabyte AERO 16 OLED BSF i9-13900H, GeForce RTX 4070 Laptop GPU, 88 Wh | Samsung Galaxy Book3 Ultra 16 i7-13700H, GeForce RTX 4050 Laptop GPU, 76 Wh | Media de la clase Multimedia | |
|---|---|---|---|---|---|---|---|
| Duración de Batería | 34% | 3% | 1% | 36% | 56% | 73% | |
| H.264 (h) | 9 | 5.6 -38% | 9.7 8% | 7.4 -18% | 13.4 49% | 16.4 ? 82% | |
| WiFi v1.3 (h) | 8 | 8 0% | 5.6 -30% | 7.5 -6% | 7.5 -6% | 9.6 20% | 12 ? 50% |
| Load (h) | 0.9 | 1.5 67% | 1.6 78% | 0.9 0% | 2.1 133% | 1.8 100% | 1.675 ? 86% |
| Witcher 3 ultra (h) | 2.6 | 1.3 |
Pro
Contra
Veredicto - Galaxy Book Ultra diseñado para la creación de contenidos
Samsung da en la diana con el Galaxy Book3 Ultra 16: el portátil ofrece mucho rendimiento y la pantalla perfecta para el trabajo creativo. La carcasa delgada y discreta hace que el portátil parezca una herramienta de trabajo profesional en todos los sentidos, y esta impresión sólo se ve reforzada por nuestras mediciones y pruebas de rendimiento. Las tres salidas de vídeo, el acertado touchpad y el funcionamiento silencioso bajo carga encajan perfectamente en el conjunto.
El Galaxy Book3 Ultra lo ofrece todo para las tareas creativas. La pantalla, el rendimiento del sistema y la calidad de construcción están muy en sintonía. Sin embargo, hay que sacrificar el máximo rendimiento por una carcasa delgada.
Al mismo tiempo, la fuerte reducción en el suministro de energía a la CPU y la GPU garantiza un fuerte enfoque puramente en el procesamiento y renderizado de vídeo e imágenes. El Galaxy Book3 no rinde bien en juegos, aunque pudimos jugar a los últimos juegos con los ajustes más altos. Sin embargo, la RTX 4070 aquí funciona más al nivel de una RTX 3060aunque es mucho más económica y silenciosa.
Y hay algunos inconvenientes. El portátil creador se calienta cuando se le presiona durante largos periodos de tiempo. Durante tareas menos exigentes, la parte inferior y el teclado también se calientan notablemente, un poco demasiado. La ranura microSD podría haber sido un lector de tarjetas en toda regla. Además, los altavoces suenan de forma excelente. Sin embargo, el hecho de que saturen a altas frecuencias no debería ocurrir a este nivel.
En cuanto a su enfoque en el procesamiento multimedia, el portátil Samsung es el competidor más cercano a un MacBook Proaunque Mac y Windows sólo puedan compararse hasta cierto punto. Por otro lado, si se necesita más rendimiento gráfico, lo que probablemente implique una carcasa más grande y un mayor consumo de energía, el igualmente silencioso MSI Stealth 17 Studio o Gigabyte AERO 16 OLED son buenas alternativas.
Precio y disponibilidad
En EE.UU., nuestra configuración analizada del Samsung Galaxy Book3 Ultra 16 con i9-13900H y RTX 4070 está disponible a través de la página de producto de Samsung por 2999,99 dólares.
Los compradores interesados de otros países pueden seleccionar su ubicación en aquí (si procede) y escribir Book3 Ultra 16 en la barra de búsqueda para comprobar la disponibilidad.
Los precios corresponden al 09.05.2023 y están sujetos a cambios.
Samsung Galaxy Book3 Ultra 16, i9-13900H RTX 4070
- 04/27/2023 v7 (old)
Mario Petzold
Transparencia
La selección de los dispositivos que se van a reseñar corre a cargo de nuestro equipo editorial. La muestra de prueba fue proporcionada al autor en calidad de préstamo por el fabricante o el minorista a los efectos de esta reseña. El prestamista no tuvo ninguna influencia en esta reseña, ni el fabricante recibió una copia de la misma antes de su publicación. No había ninguna obligación de publicar esta reseña. Como empresa de medios independiente, Notebookcheck no está sujeta a la autoridad de fabricantes, minoristas o editores.
Así es como prueba Notebookcheck
Cada año, Notebookcheck revisa de forma independiente cientos de portátiles y smartphones utilizando procedimientos estandarizados para asegurar que todos los resultados son comparables. Hemos desarrollado continuamente nuestros métodos de prueba durante unos 20 años y hemos establecido los estándares de la industria en el proceso. En nuestros laboratorios de pruebas, técnicos y editores experimentados utilizan equipos de medición de alta calidad. Estas pruebas implican un proceso de validación en varias fases. Nuestro complejo sistema de clasificación se basa en cientos de mediciones y puntos de referencia bien fundamentados, lo que mantiene la objetividad.Price comparison

