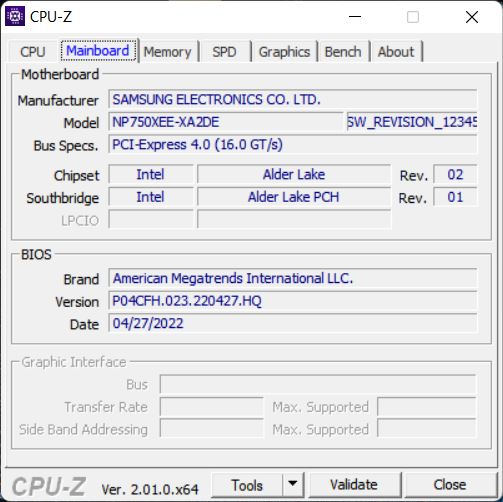
Samsung Galaxy Book2 15 - El portátil multimedia con Arc A350M no impresiona
El Samsung Galaxy Book2 15 es un nuevo portátil multimedia equipado con los últimos componentes de Intel. Además de un procesador de la serie P Alder Lake de última generación, el fabricante coreano ha incluido la Arc A350M, una tarjeta gráfica discreta de nivel básico de Intel. Con un precio de venta al público de 1.299 euros (1.300 dólares), también cuenta con una pantalla IPS mate, 16 GB de RAM y 512 GB de SSD PCIe.
Posibles contendientes en la comparación
Valoración | Fecha | Modelo | Peso | Altura | Tamaño | Resolución | Precio |
|---|---|---|---|---|---|---|---|
| 79.8 % v7 (old) | 08/2022 | Samsung Galaxy Book2 15 i7-1260P, A350M | 1.6 kg | 15 mm | 15.60" | 1920x1080 | |
| 83.5 % v7 (old) | 07/2022 | Dell Inspiron 15 Plus i5-11400H, GeForce RTX 3050 4GB Laptop GPU | 1.9 kg | 19 mm | 15.60" | 1920x1080 | |
| 80.6 % v7 (old) | 11/2021 | Asus Vivobook 15 K513EQ i7-1165G7, GeForce MX350 | 1.6 kg | 17.9 mm | 15.60" | 1920x1080 | |
| 85.6 % v7 (old) | 03/2022 | Lenovo ThinkBook 15p G2 ITH 21B1000YGE i7-11800H, GeForce RTX 3050 Ti Laptop GPU | 1.9 kg | 20 mm | 15.60" | 3840x2160 | |
| 81.2 % v7 (old) | 06/2021 | HP Pavilion 15-eg i7-1165G7, GeForce MX450 | 1.7 kg | 17.9 mm | 15.60" | 1920x1080 | |
| 82 % v7 (old) | 07/2021 | Samsung Galaxy Book NP750XDA i5-1135G7, Iris Xe G7 80EUs | 1.6 kg | 16 mm | 15.60" | 1920x1080 |
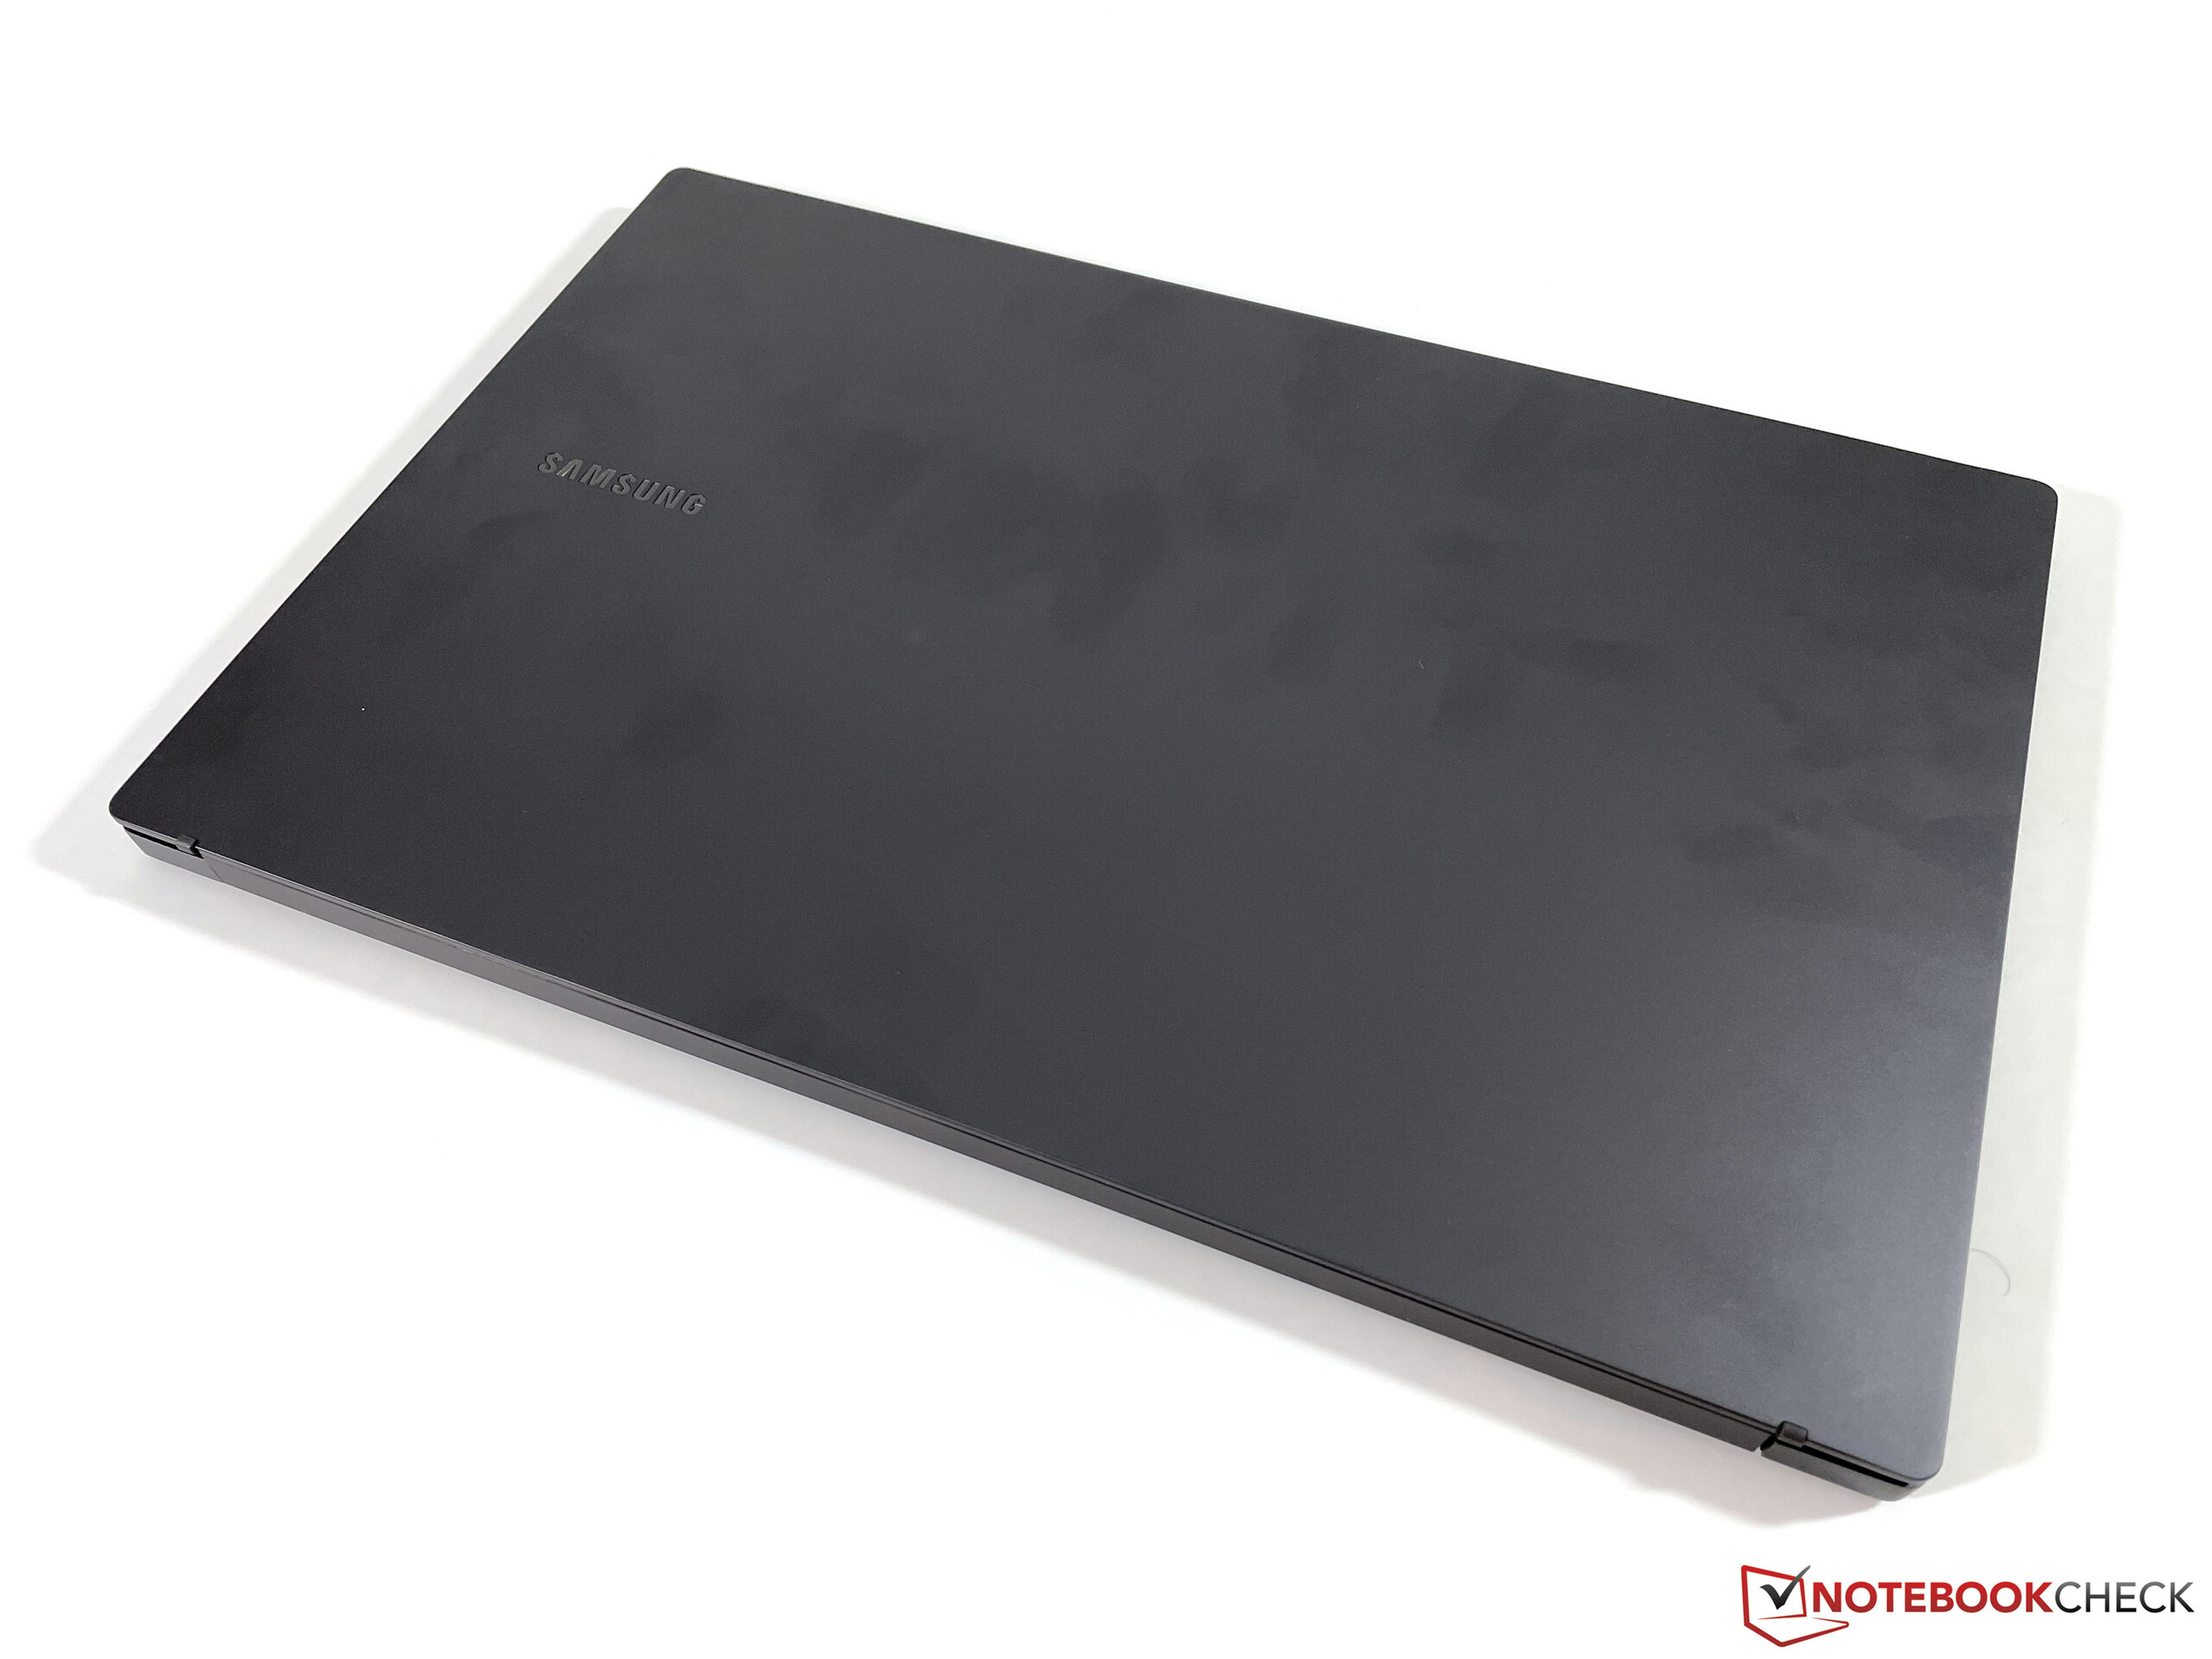
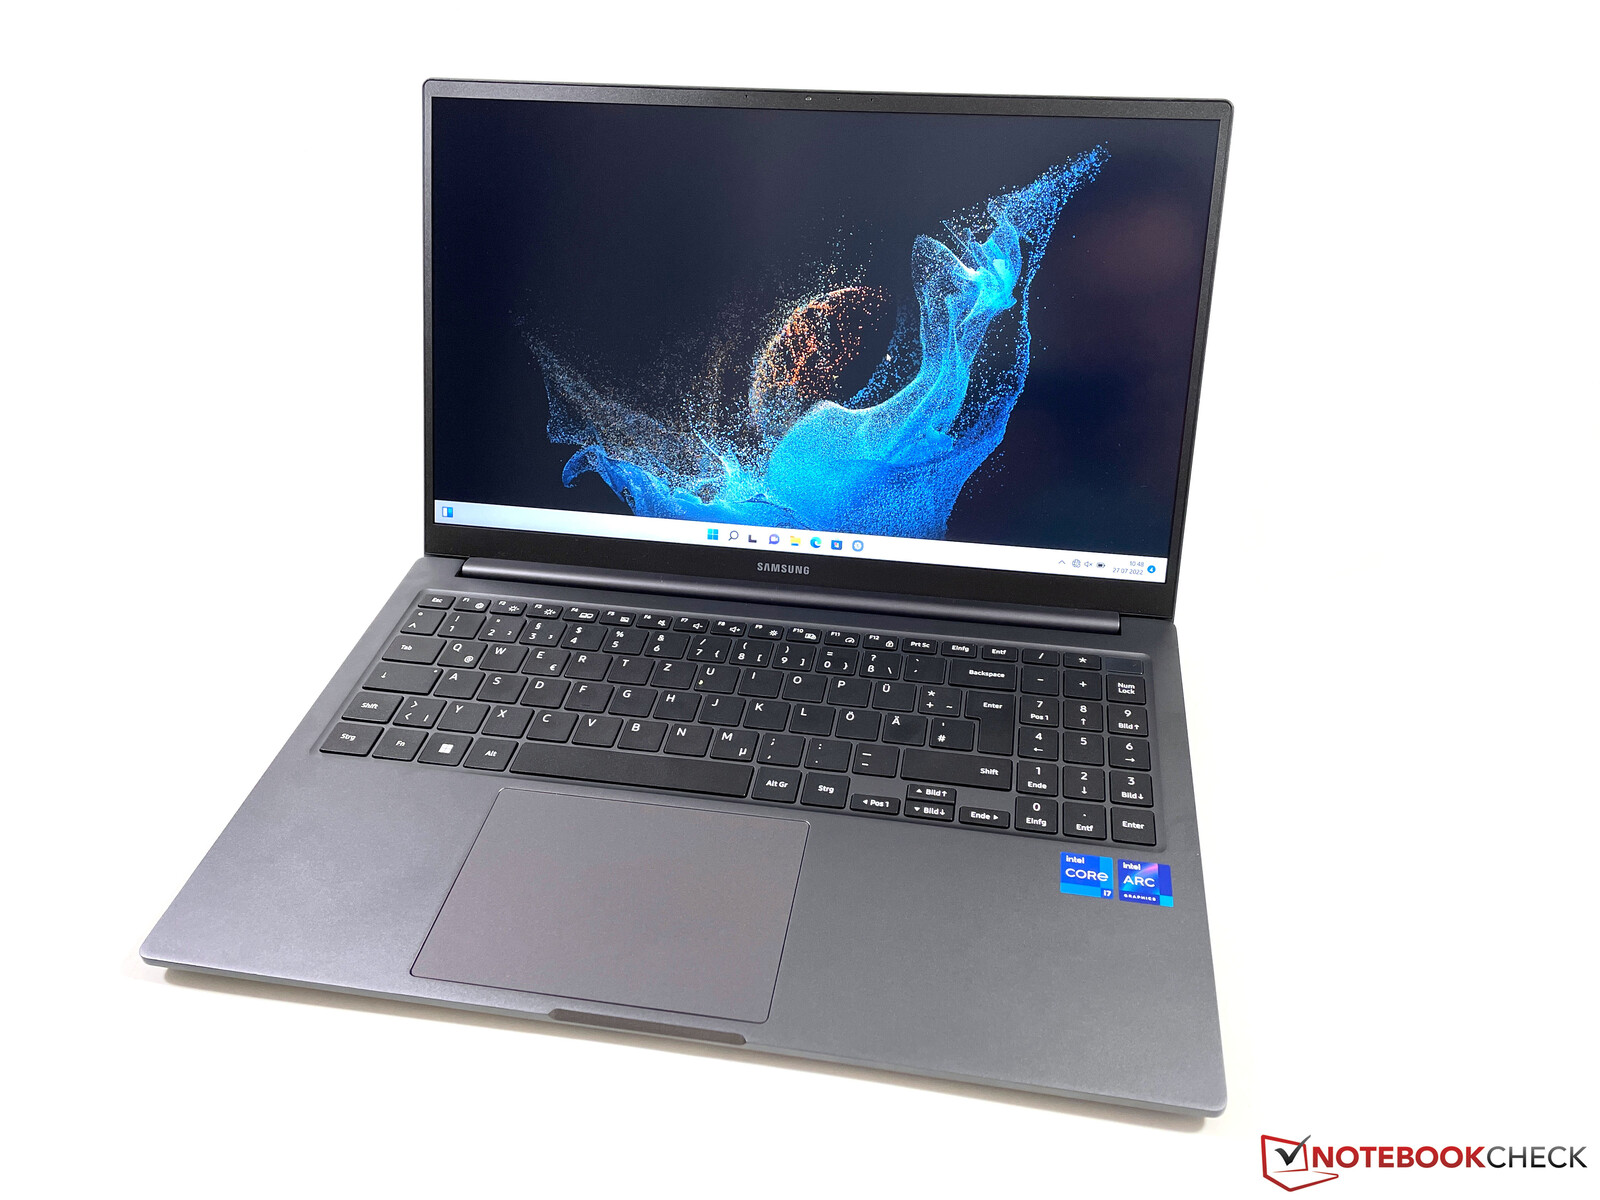
Caja - Muchos chirridos
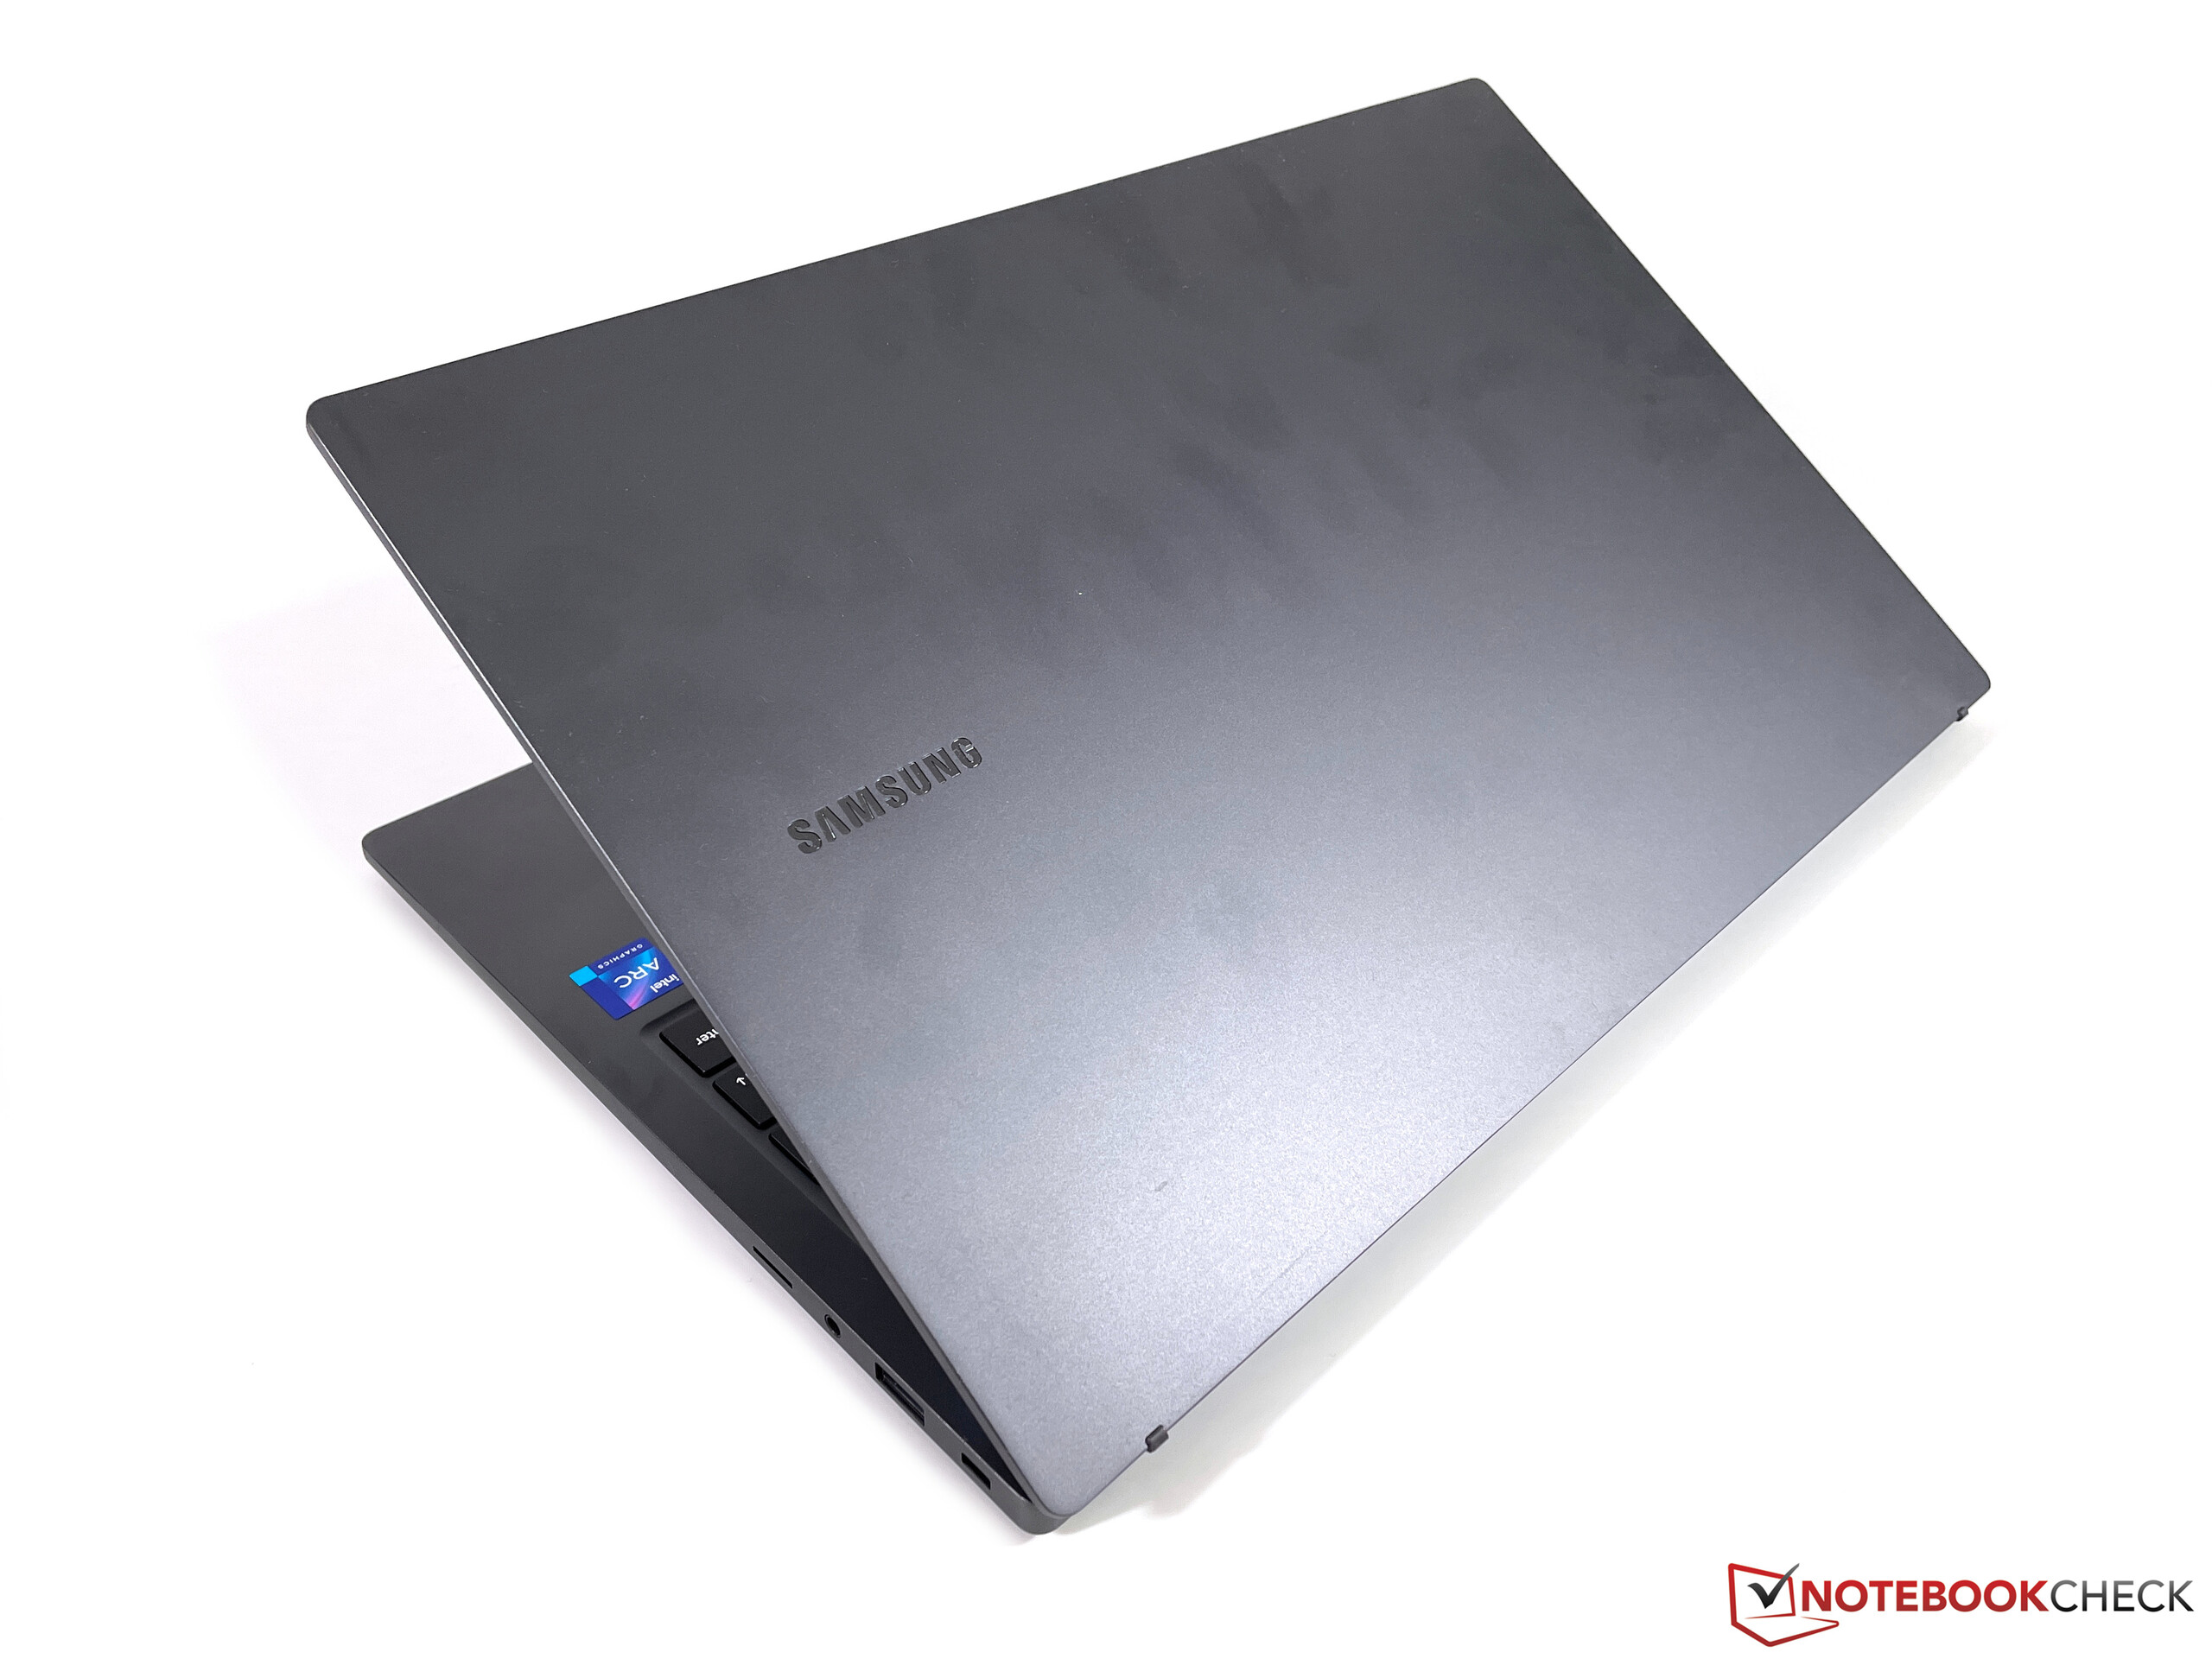
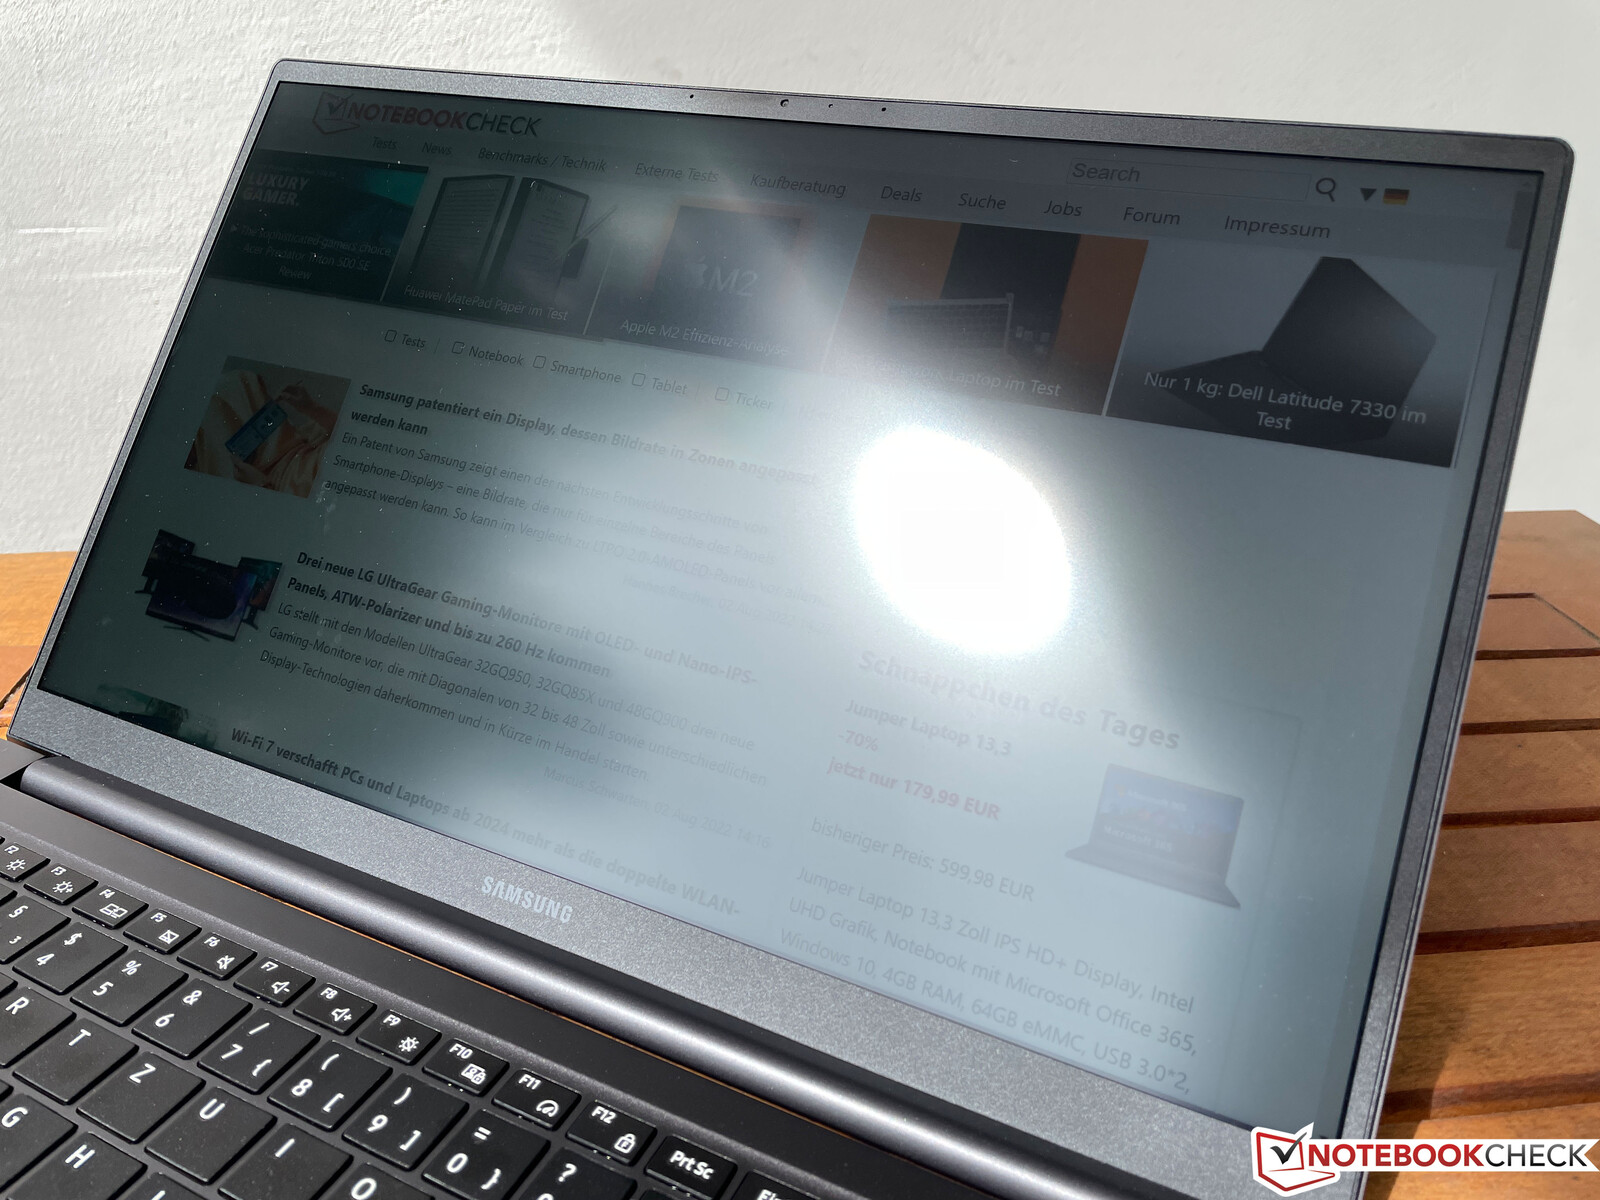
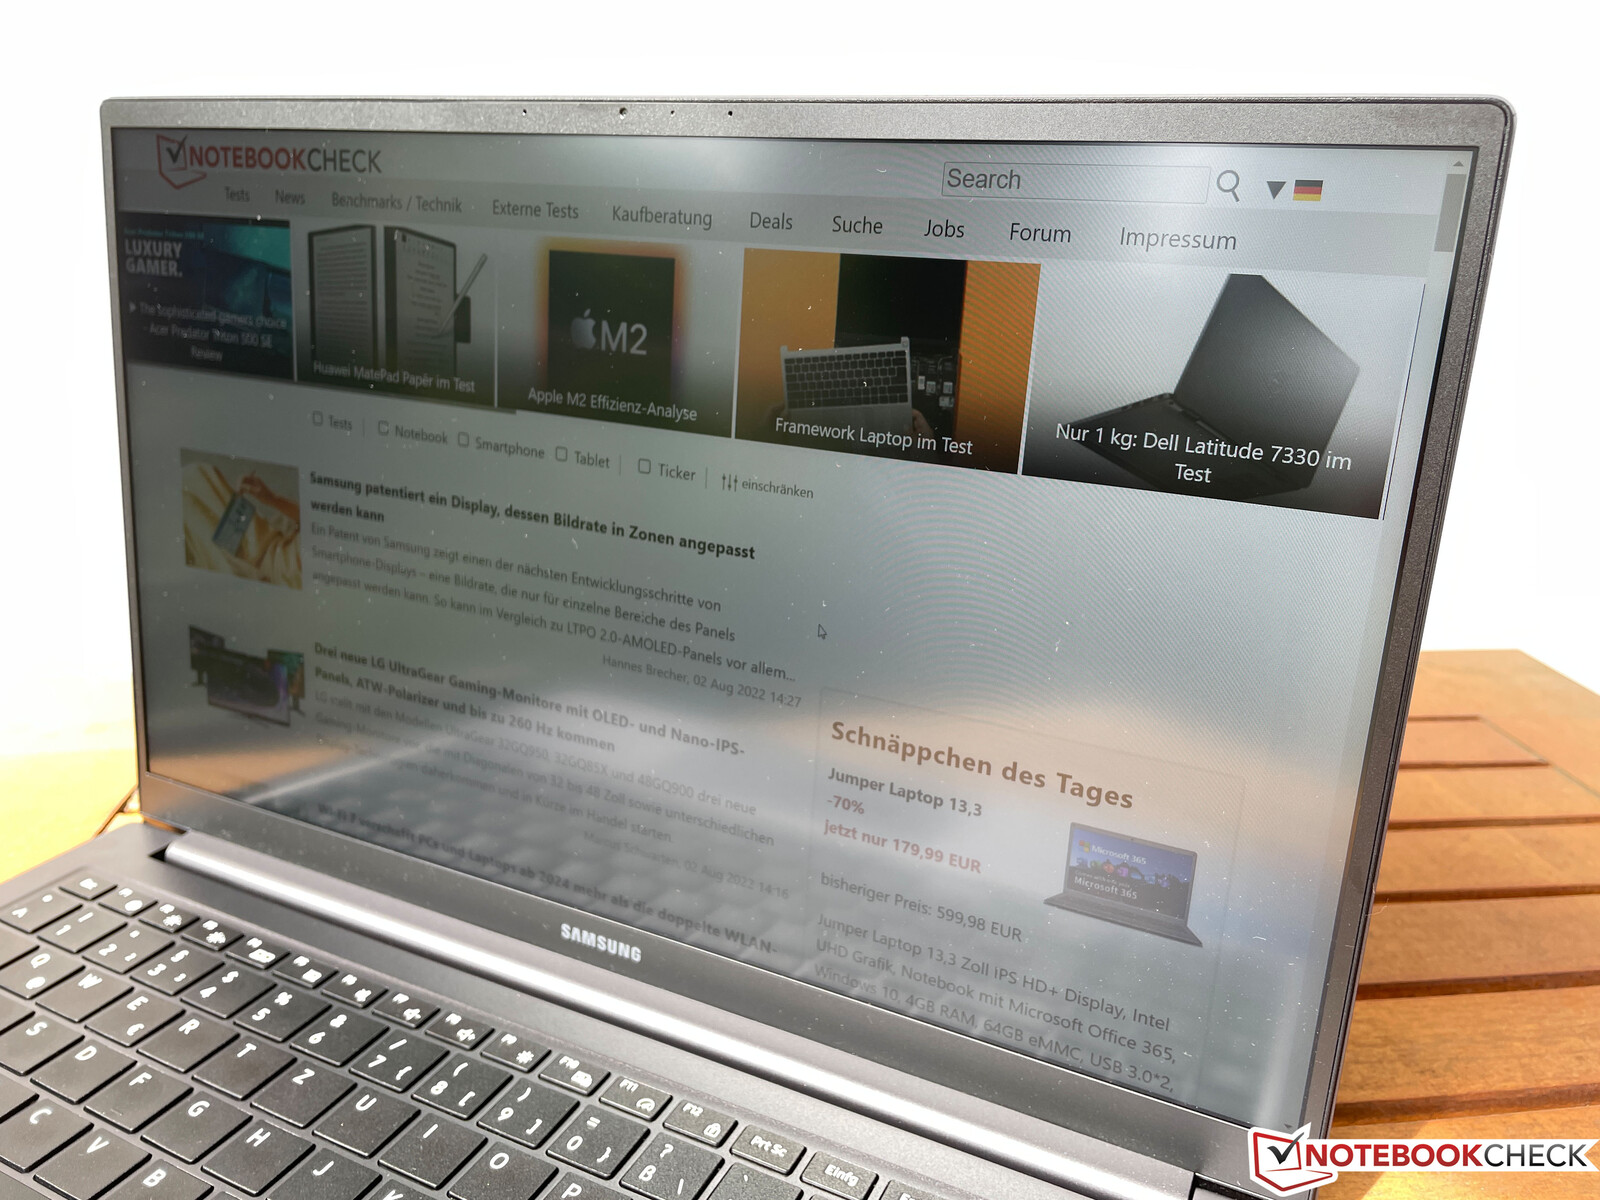
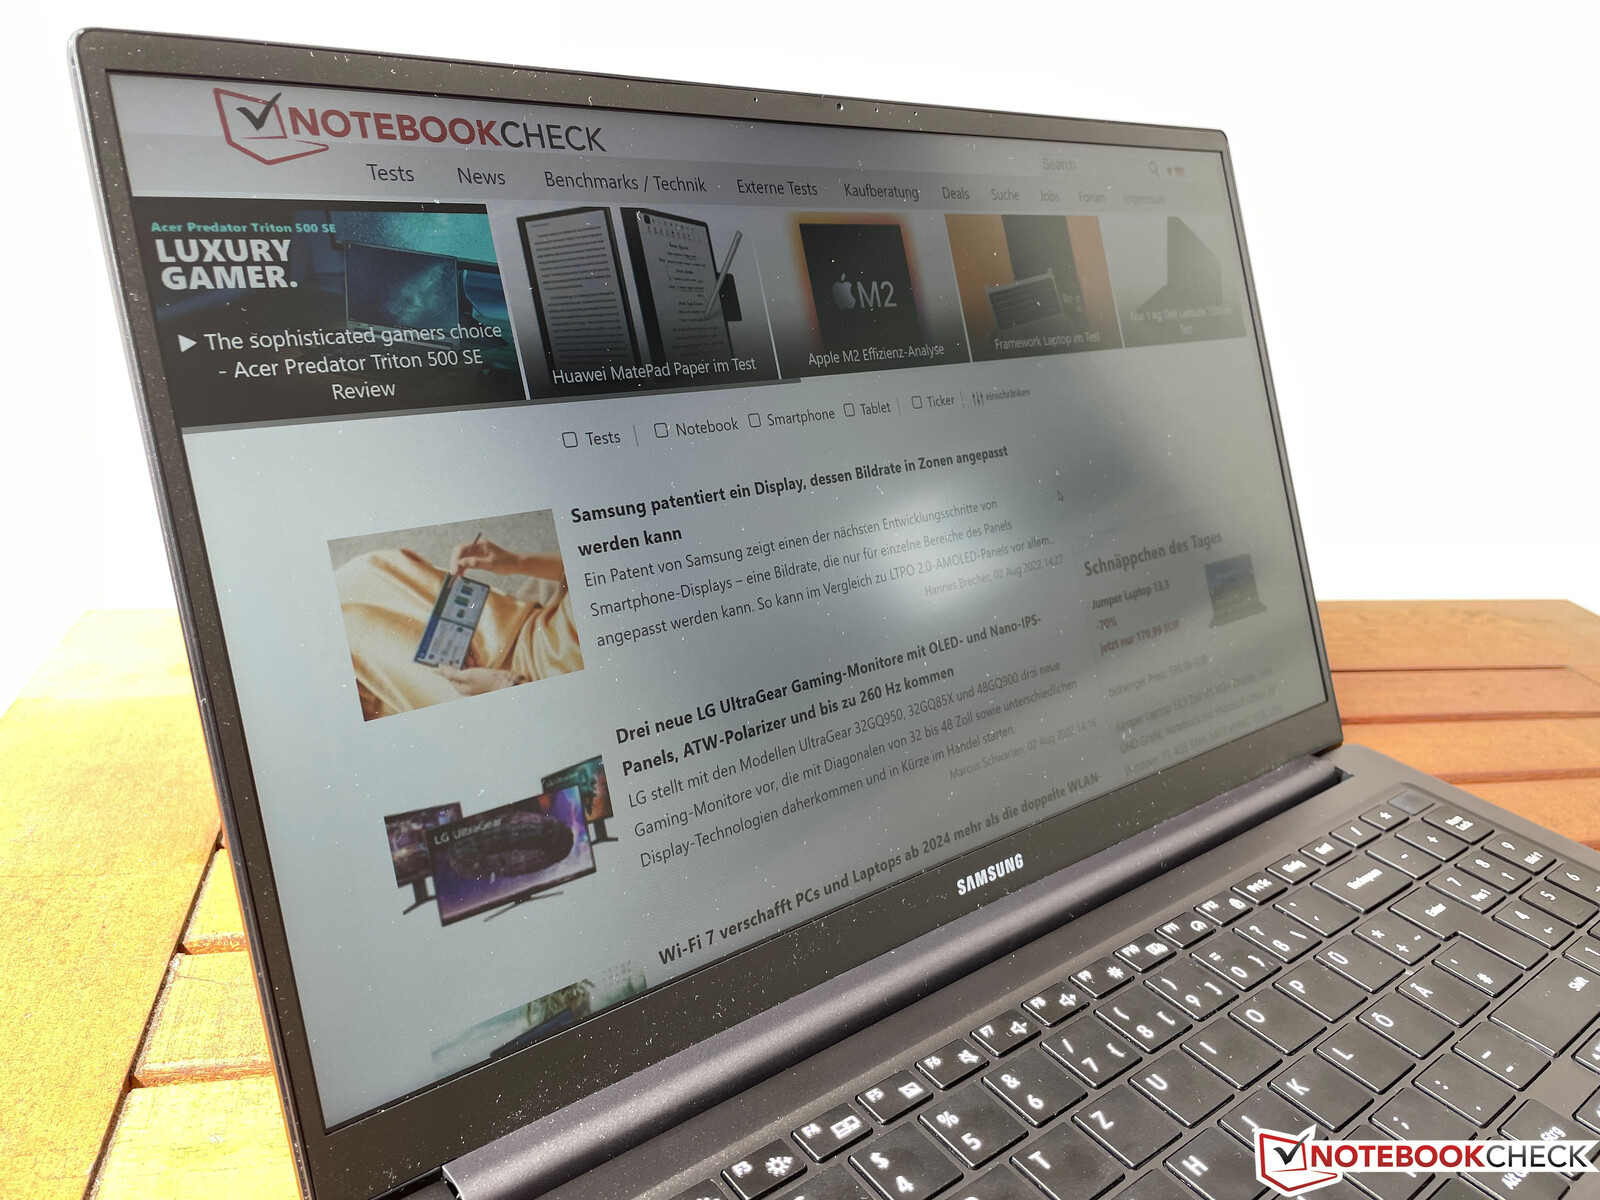
El Samsung Galaxy Book2 15 usa el mismo chasis que su predecesor, pero ahora sólo está disponible en un esquema de color grafito. El dispositivo tiene un aspecto muy limpio, sin elementos llamativos. Y sus superficies lisas son bastante sensibles a las huellas dactilares. Sin embargo, el portátil de 15.6 pulgadas, que está hecho de plástico y aluminio, no impresiona en términos de calidad. Nuestro modelo de pruebas hace ruidos desagradables. El área de la tapa en particular se ve muy afectada por este problema, pero la unidad base tampoco se salva.
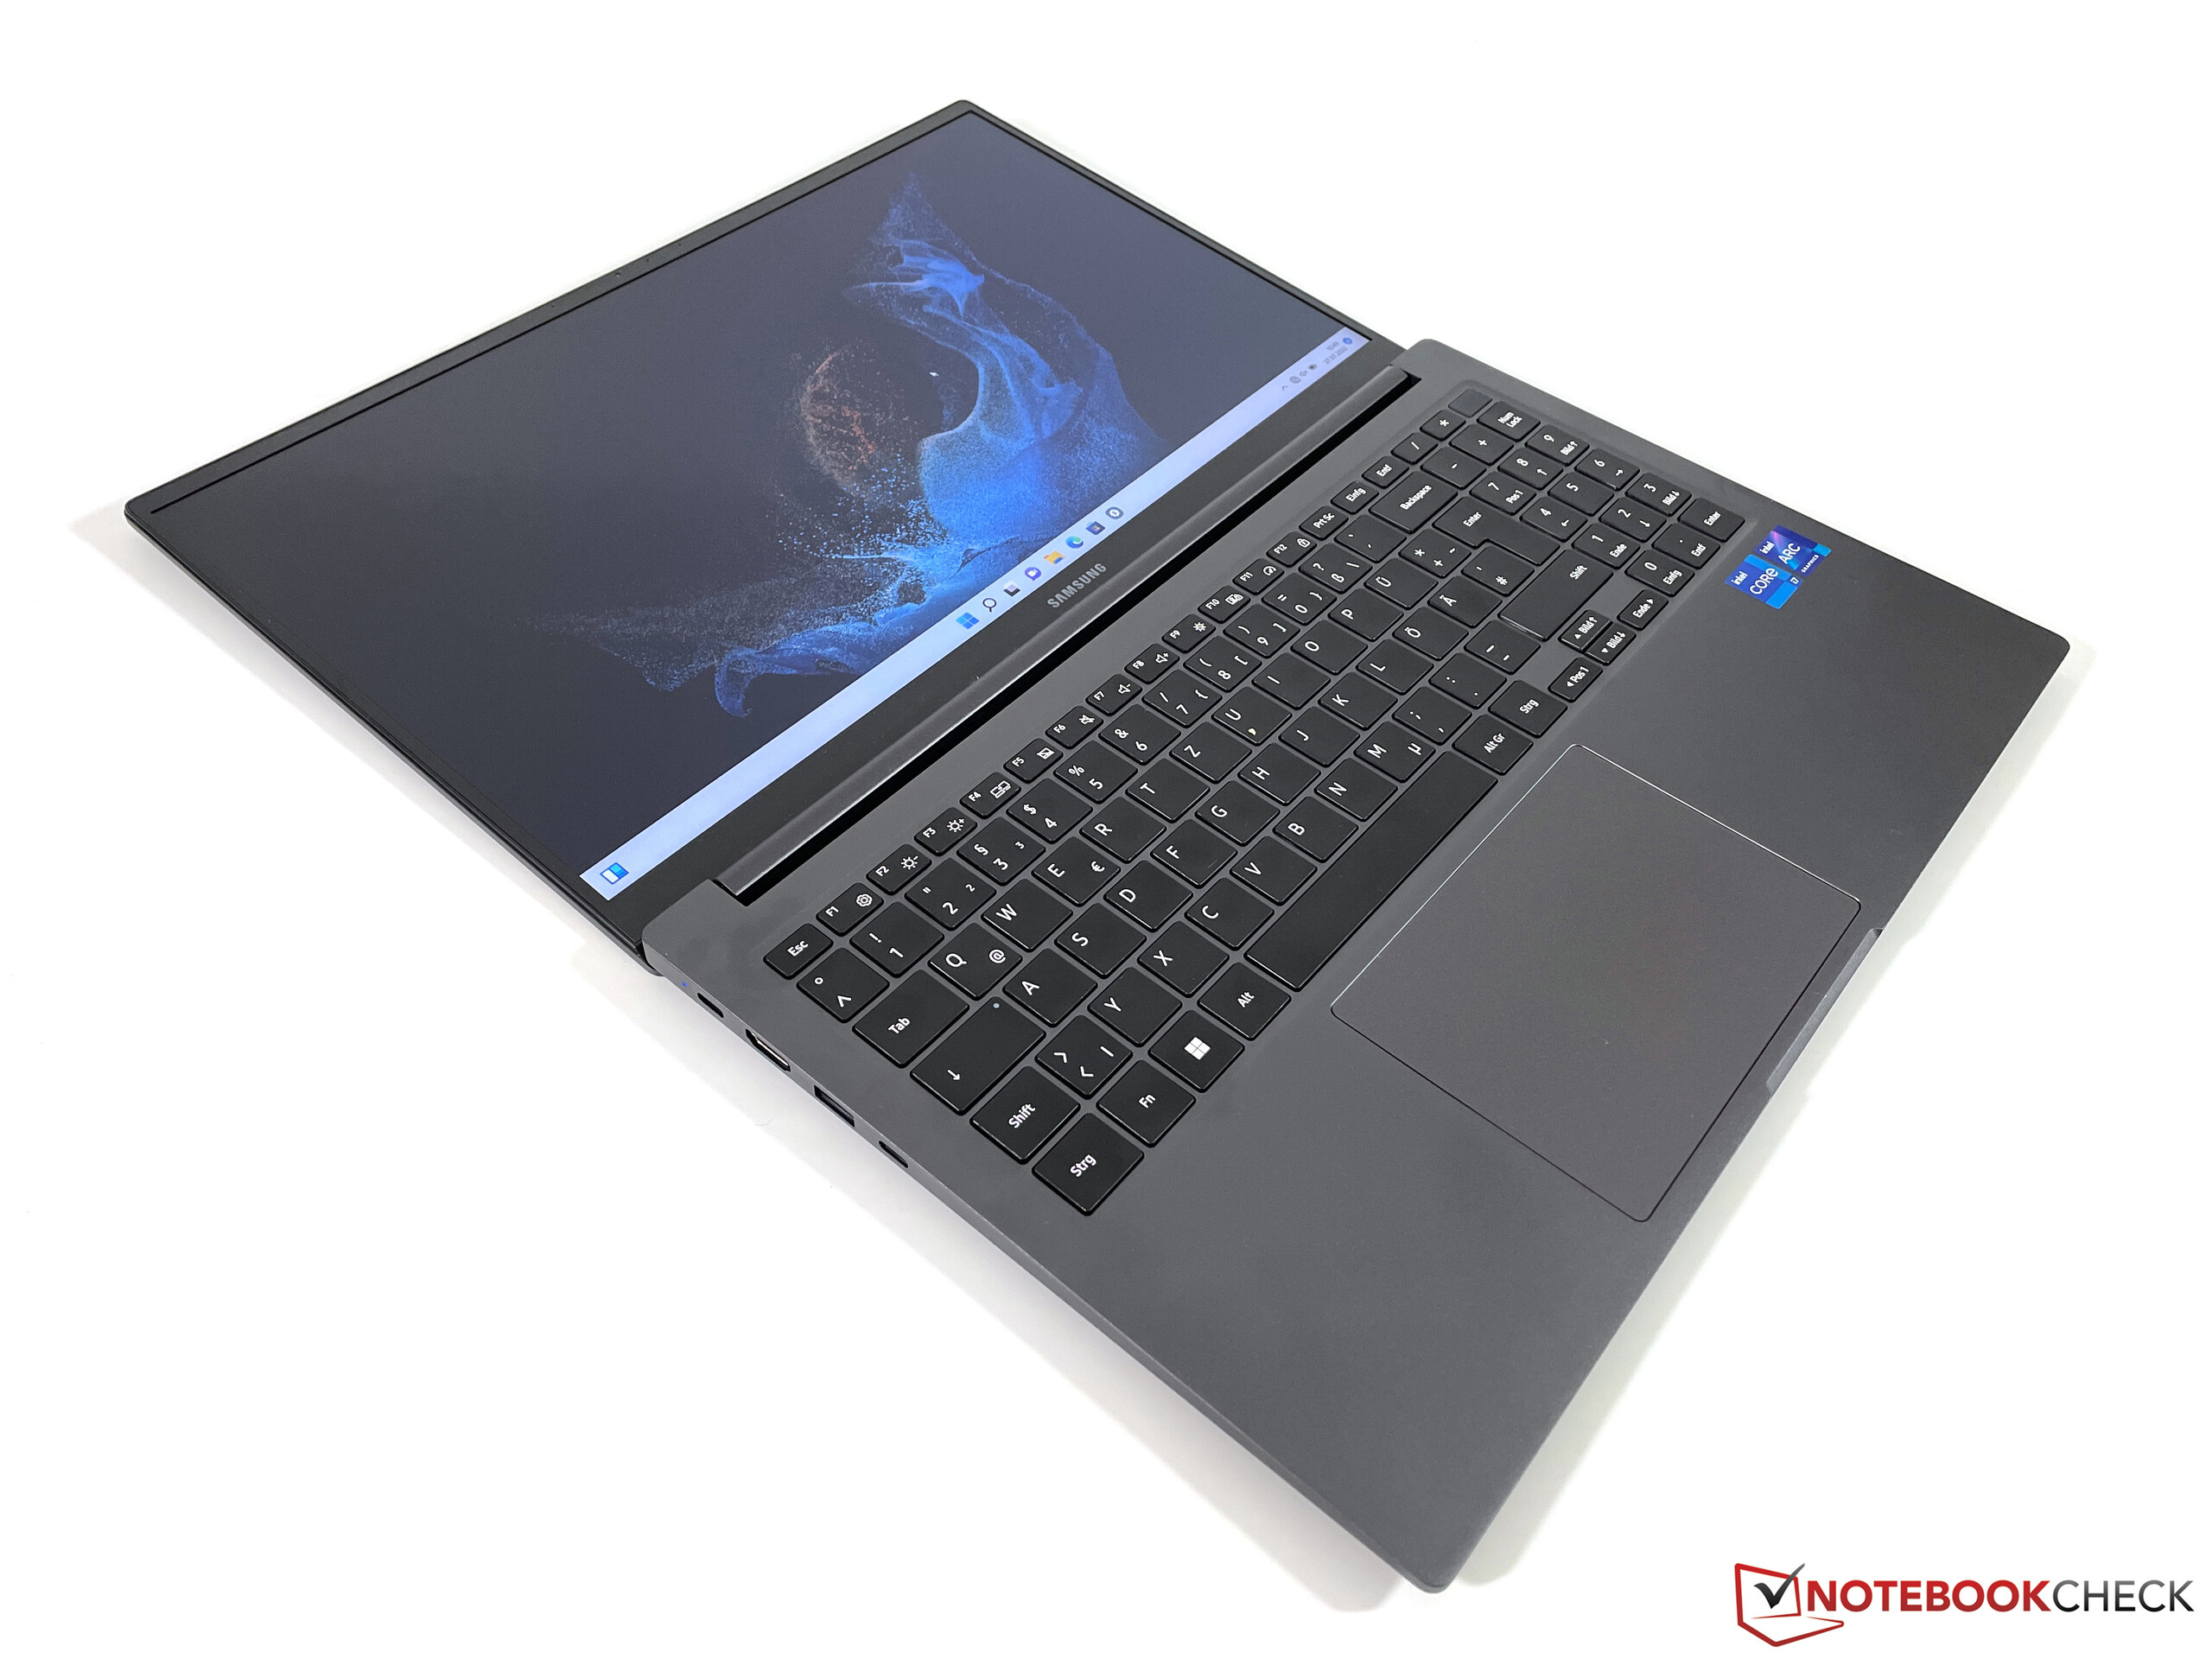
También tenemos un problema con su nivel de robustez. Por ejemplo, el teclado se flexiona notablemente cuando se presiona y también podemos distorsionar fácilmente la imagen de la pantalla. Además, aunque la bisagra de la pantalla permite abrirla hasta un ángulo de 180º, también muestra una cantidad significativa de tambaleo. En general, el portátil no parece en absoluto un producto con un precio de lista de 1.300 euros (1.300 dólares).
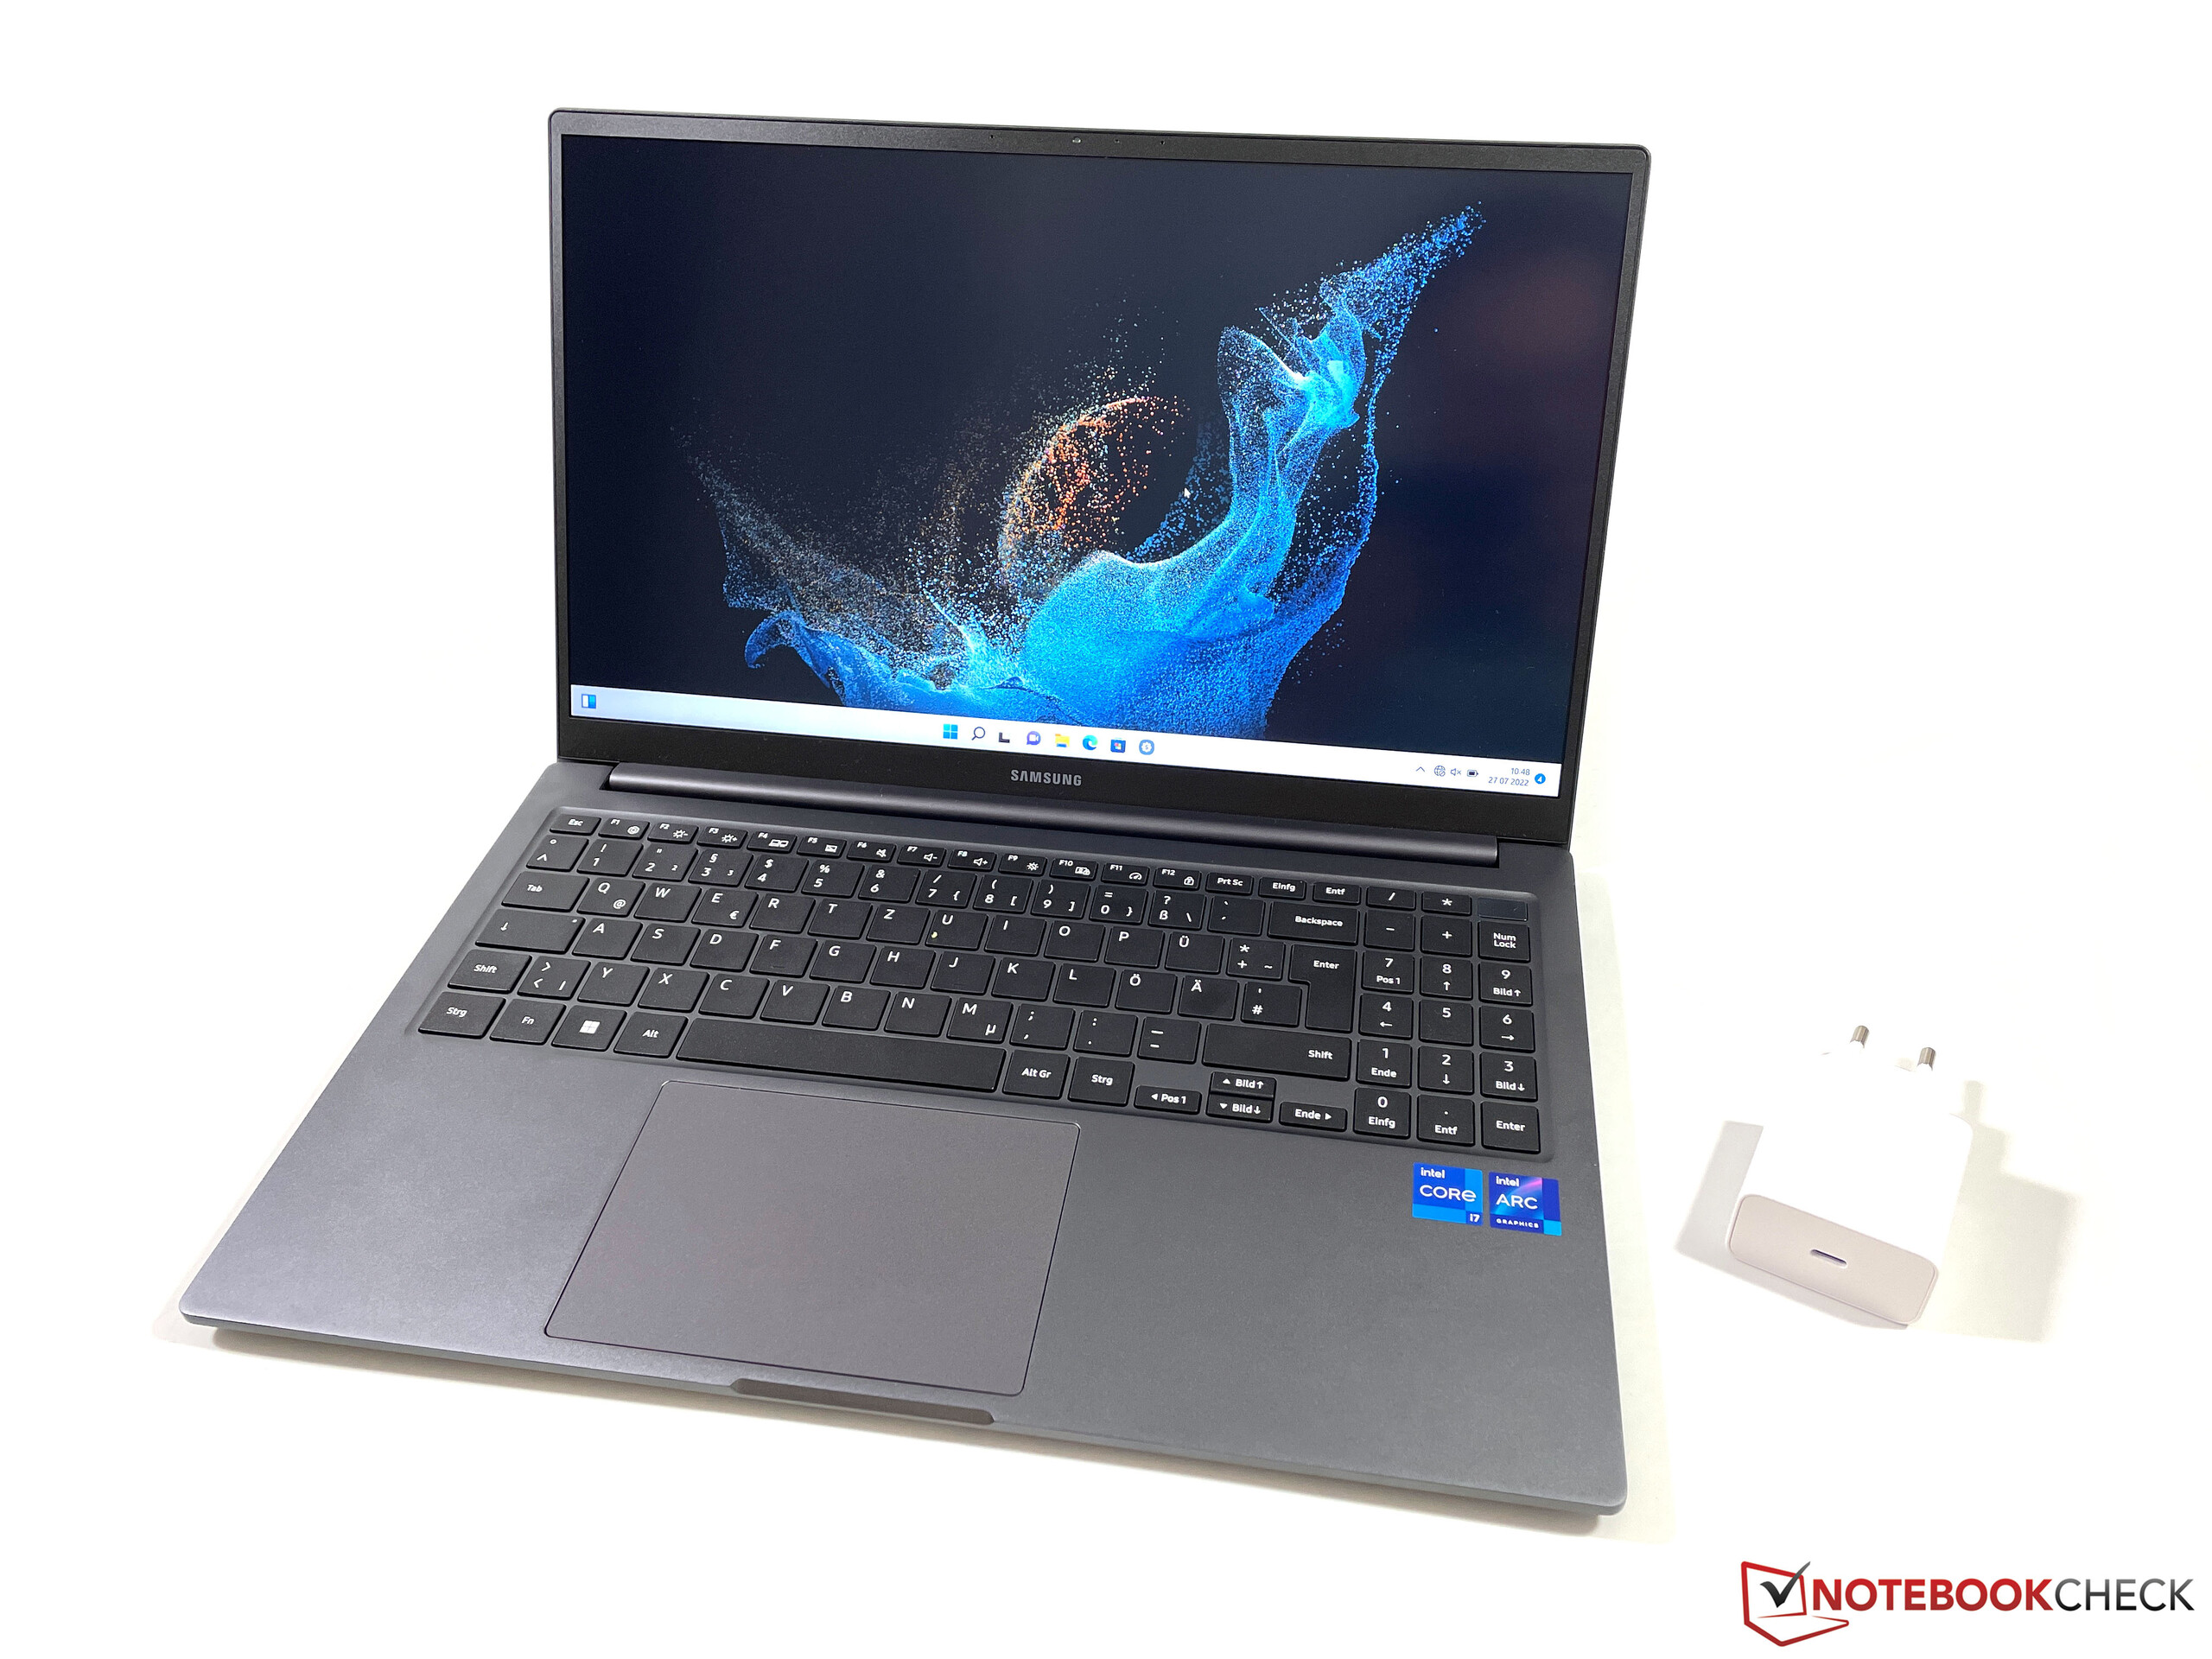

Con un peso ligeramente inferior a 1,6 kg, el Galaxy Book2 es uno de los portátiles más ligeros y compactos entre los dispositivos de nuestra comparación. Samsung envía el dispositivo con un cargador de pared compacto de 65 vatios que sólo pesa 183 g con el cable USB-C.
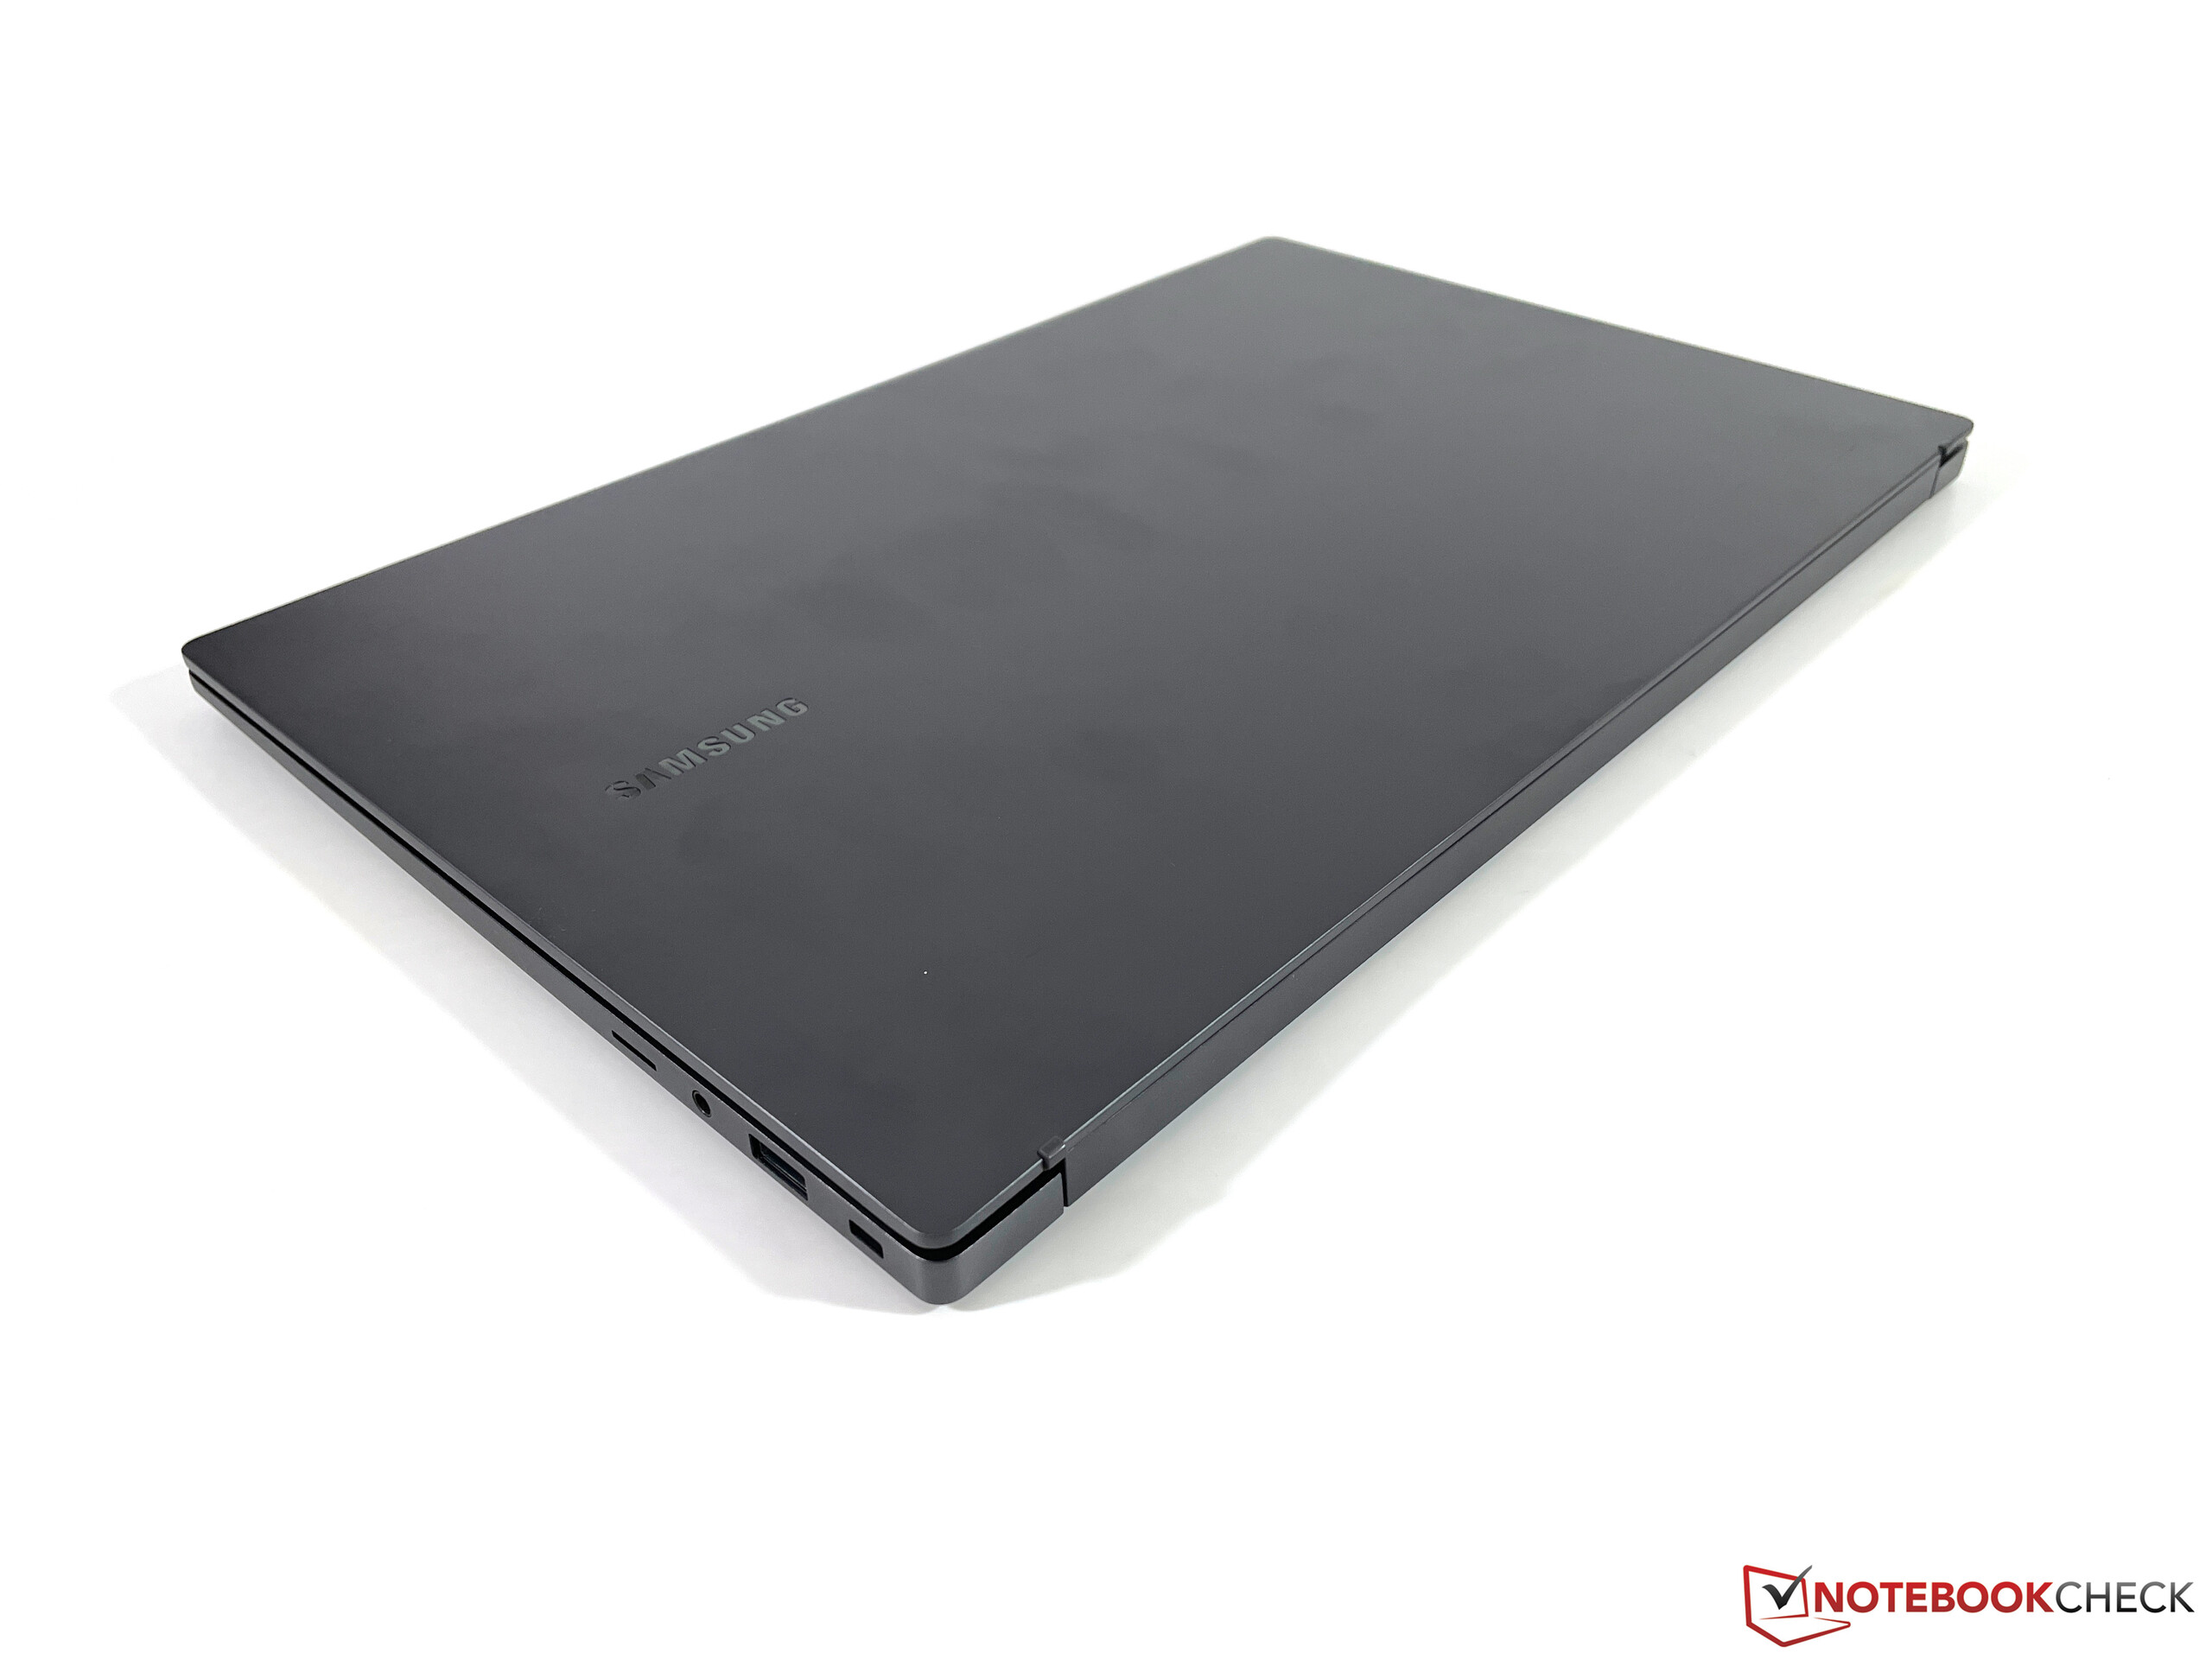
Conectividad: compatibilidad con Wi-Fi 6
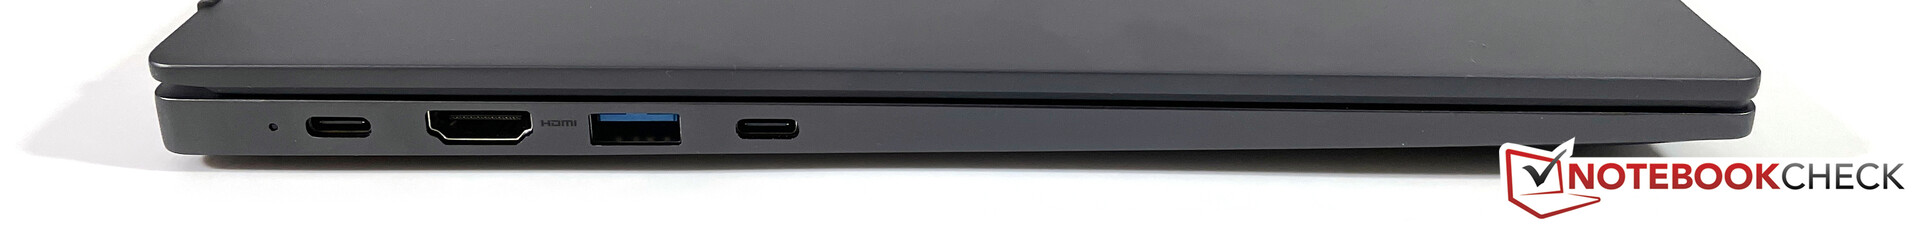
El portátil tiene una buena selección de puertos USB-C modernos, puertos USB-A normales y una salida HDMI. Esto quiere decir que estarás bien usando el portátil sin un hub o adaptador externo. Sin embargo, Samsung no incluye USB 4 o Thunderbolt, lo que limita el uso del dispositivo con estaciones de acoplamiento.
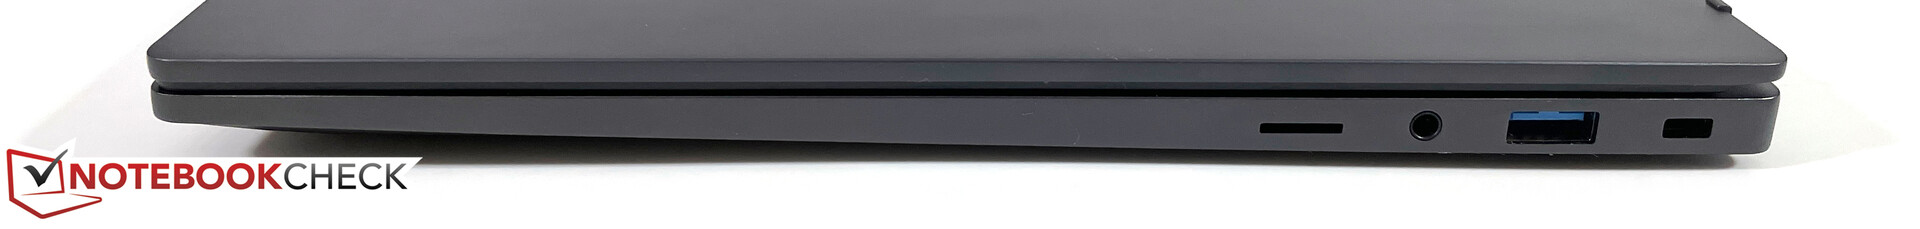
Lector de tarjetas SD
A la derecha, hay un lector de tarjetas microSD que se conecta internamente mediante USB 2.0. En consecuencia, el lector de tarjetas sólo pudo transferir datos a velocidades de hasta 26 MB/s con nuestra tarjeta de referencia (Angelbird AV Pro V60).
| SD Card Reader | |
| average JPG Copy Test (av. of 3 runs) | |
| Media de la clase Multimedia (23 - 531, n=37, últimos 2 años) | |
| HP Pavilion 15-eg (AV PRO microSD 128 GB V60) | |
| Samsung Galaxy Book NP750XDA (AV PRO microSD 128 GB V60) | |
| Asus Vivobook 15 K513EQ (AV Pro V60) | |
| Samsung Galaxy Book2 15 (Angelbird AV Pro V60) | |
| Dell Inspiron 15 Plus (AV PRO microSD 128 GB V60) | |
| Lenovo ThinkBook 15p G2 ITH 21B1000YGE (AV Pro V60) | |
| maximum AS SSD Seq Read Test (1GB) | |
| Media de la clase Multimedia (37.3 - 1455, n=36, últimos 2 años) | |
| HP Pavilion 15-eg (AV PRO microSD 128 GB V60) | |
| Asus Vivobook 15 K513EQ (AV Pro V60) | |
| Samsung Galaxy Book NP750XDA (AV PRO microSD 128 GB V60) | |
| Lenovo ThinkBook 15p G2 ITH 21B1000YGE (AV Pro V60) | |
| Samsung Galaxy Book2 15 (Angelbird AV Pro V60) | |
Comunicación
Aunque Samsung no incluyó un módulo Wi-Fi 6E (6 GHz), el portátil sigue viniendo con el Intel AX201, que es un excelente módulo Wi-Fi que soporta Wi-Fi 6 (802.11ax, 2x2). Durante las pruebas con nuestro router de referencia ASUS, las tasas de transferencia de datos fueron extraordinarias, en torno a 1,6 Gbit/s, y también muy estables. El portátil también soporta Bluetooth 5.1 pero no tiene un módulo LTE o 5G.
Cámara web
La cámara web situada en la parte superior del bisel sólo utiliza un sensor de 720p. Aunque cumple con su cometido, la calidad de imagen no es muy buena ni siquiera en condiciones de buena iluminación. No hay una cubierta mecánica para la webcam ni una cámara IR para la autenticación facial de Windows Hello.


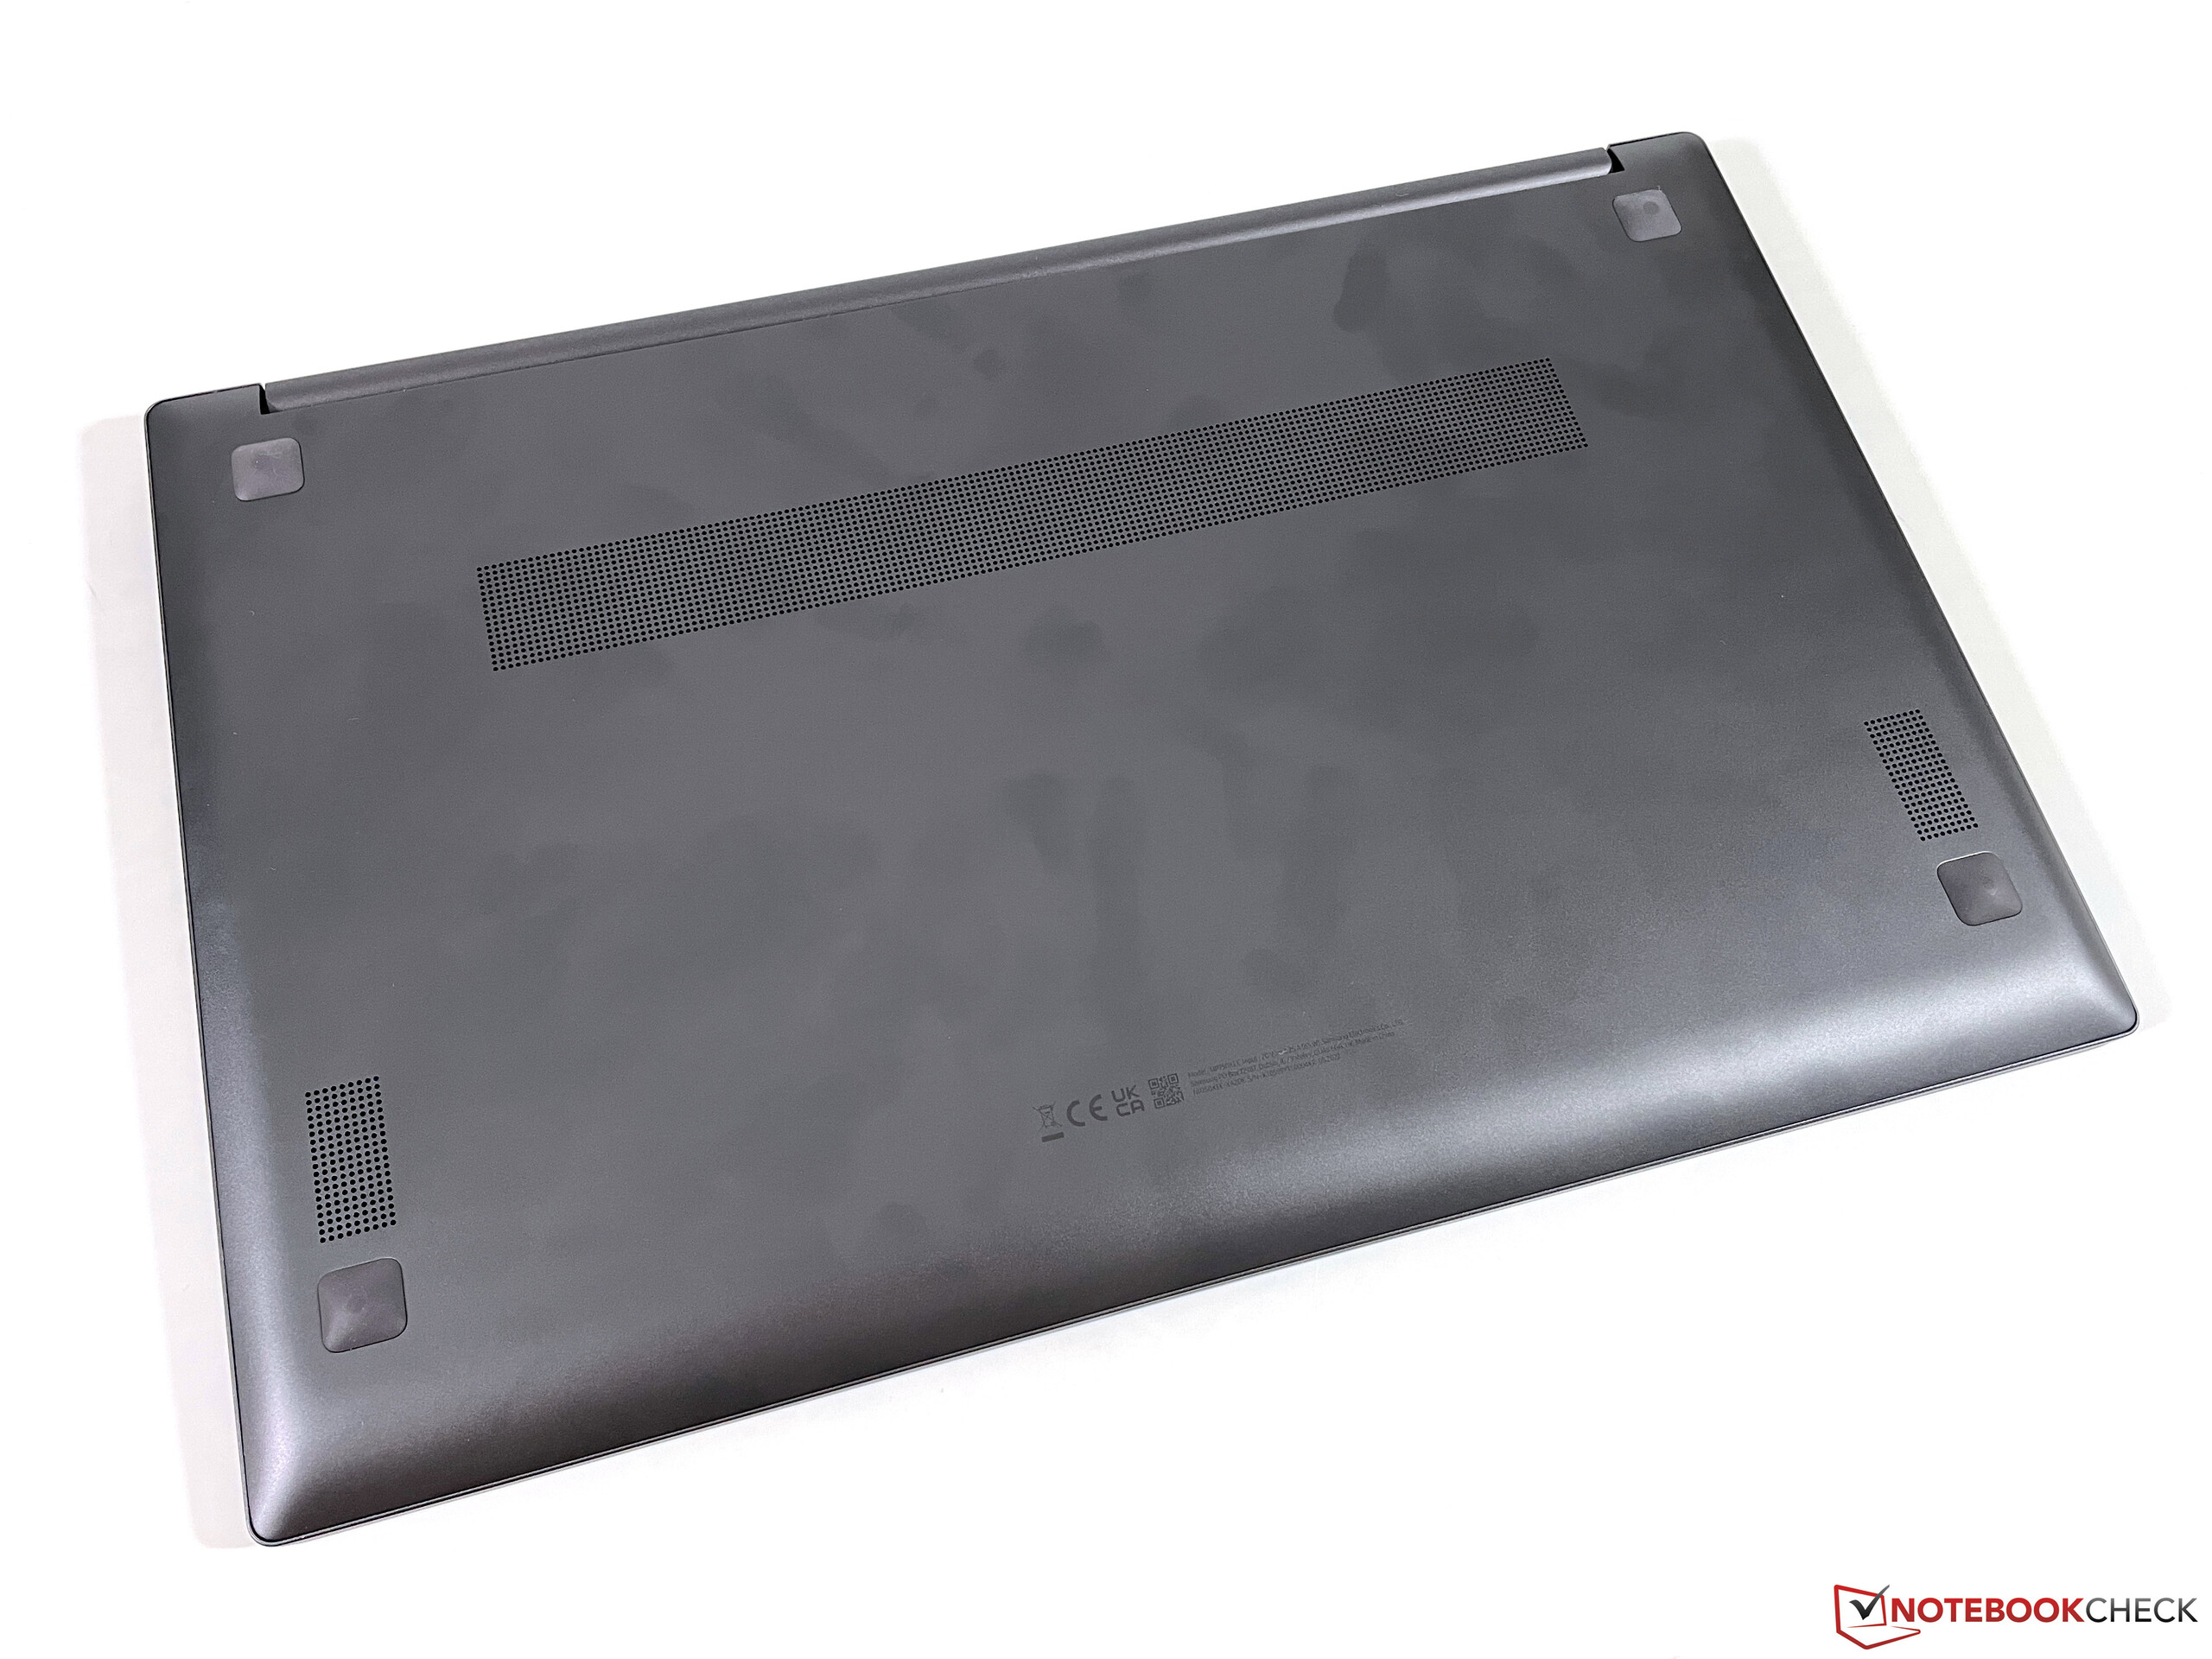
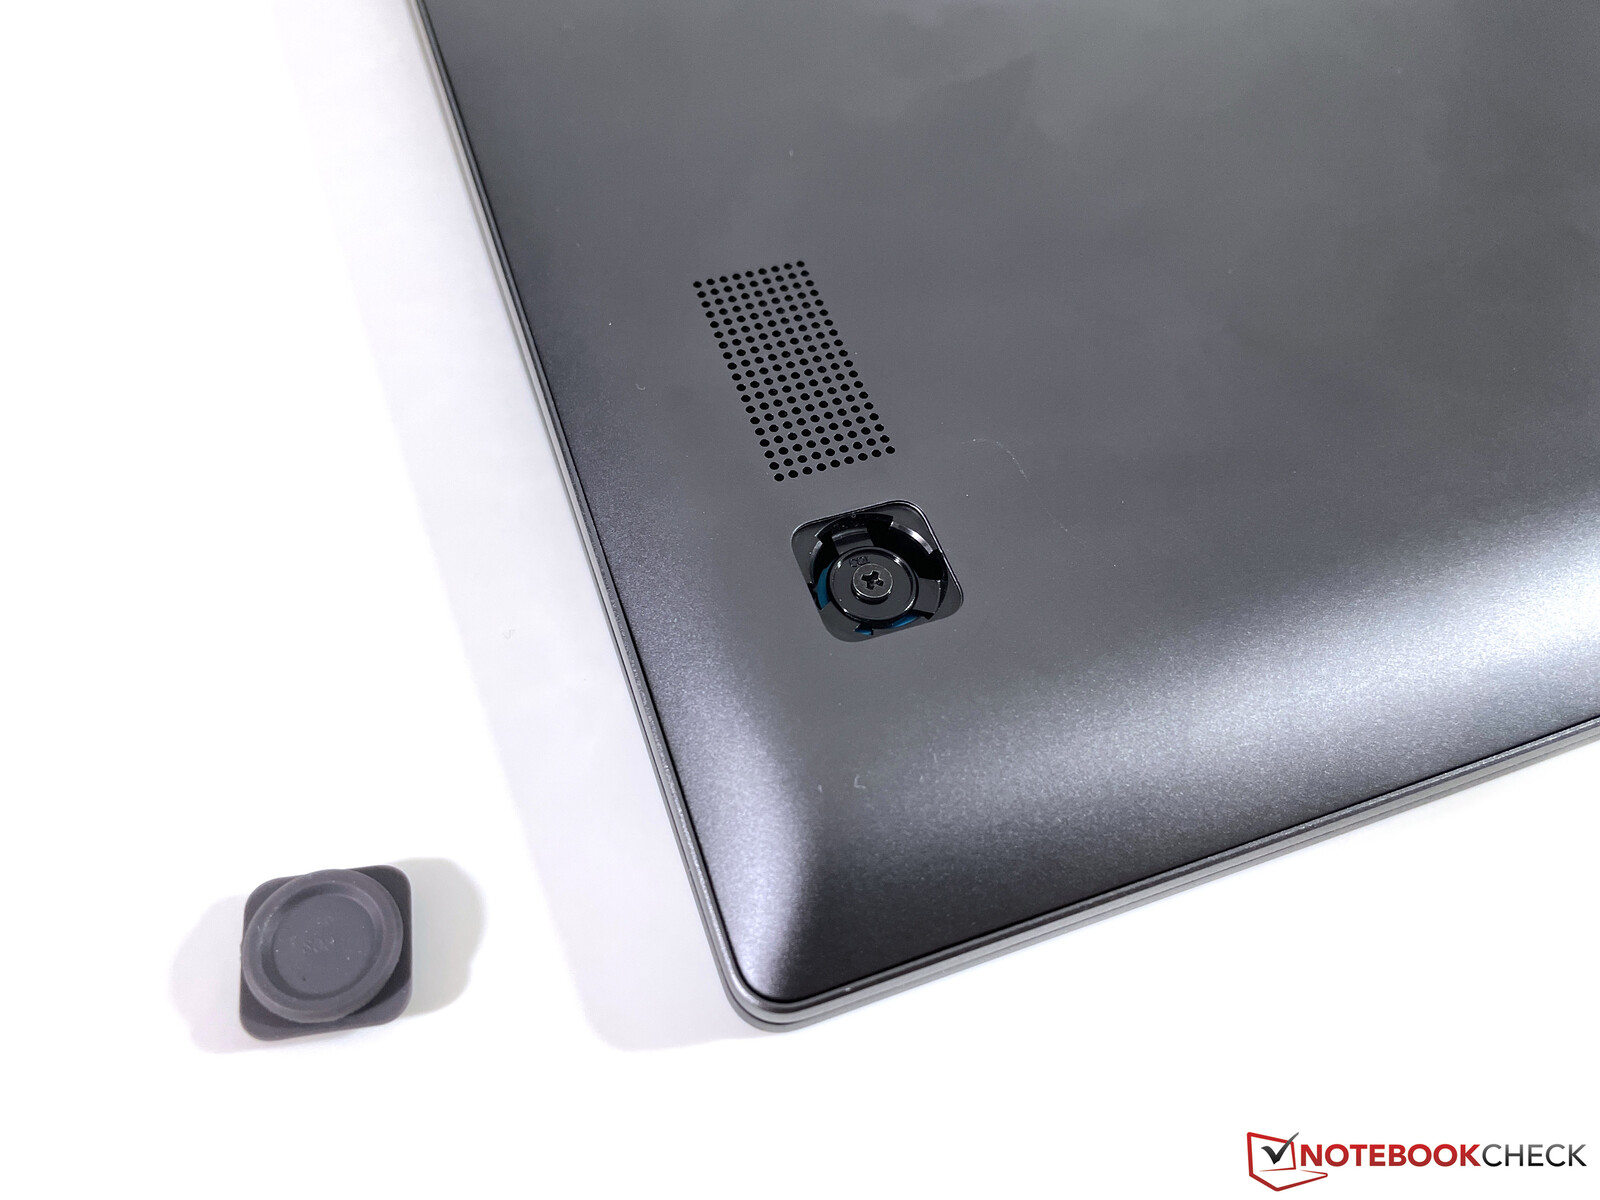
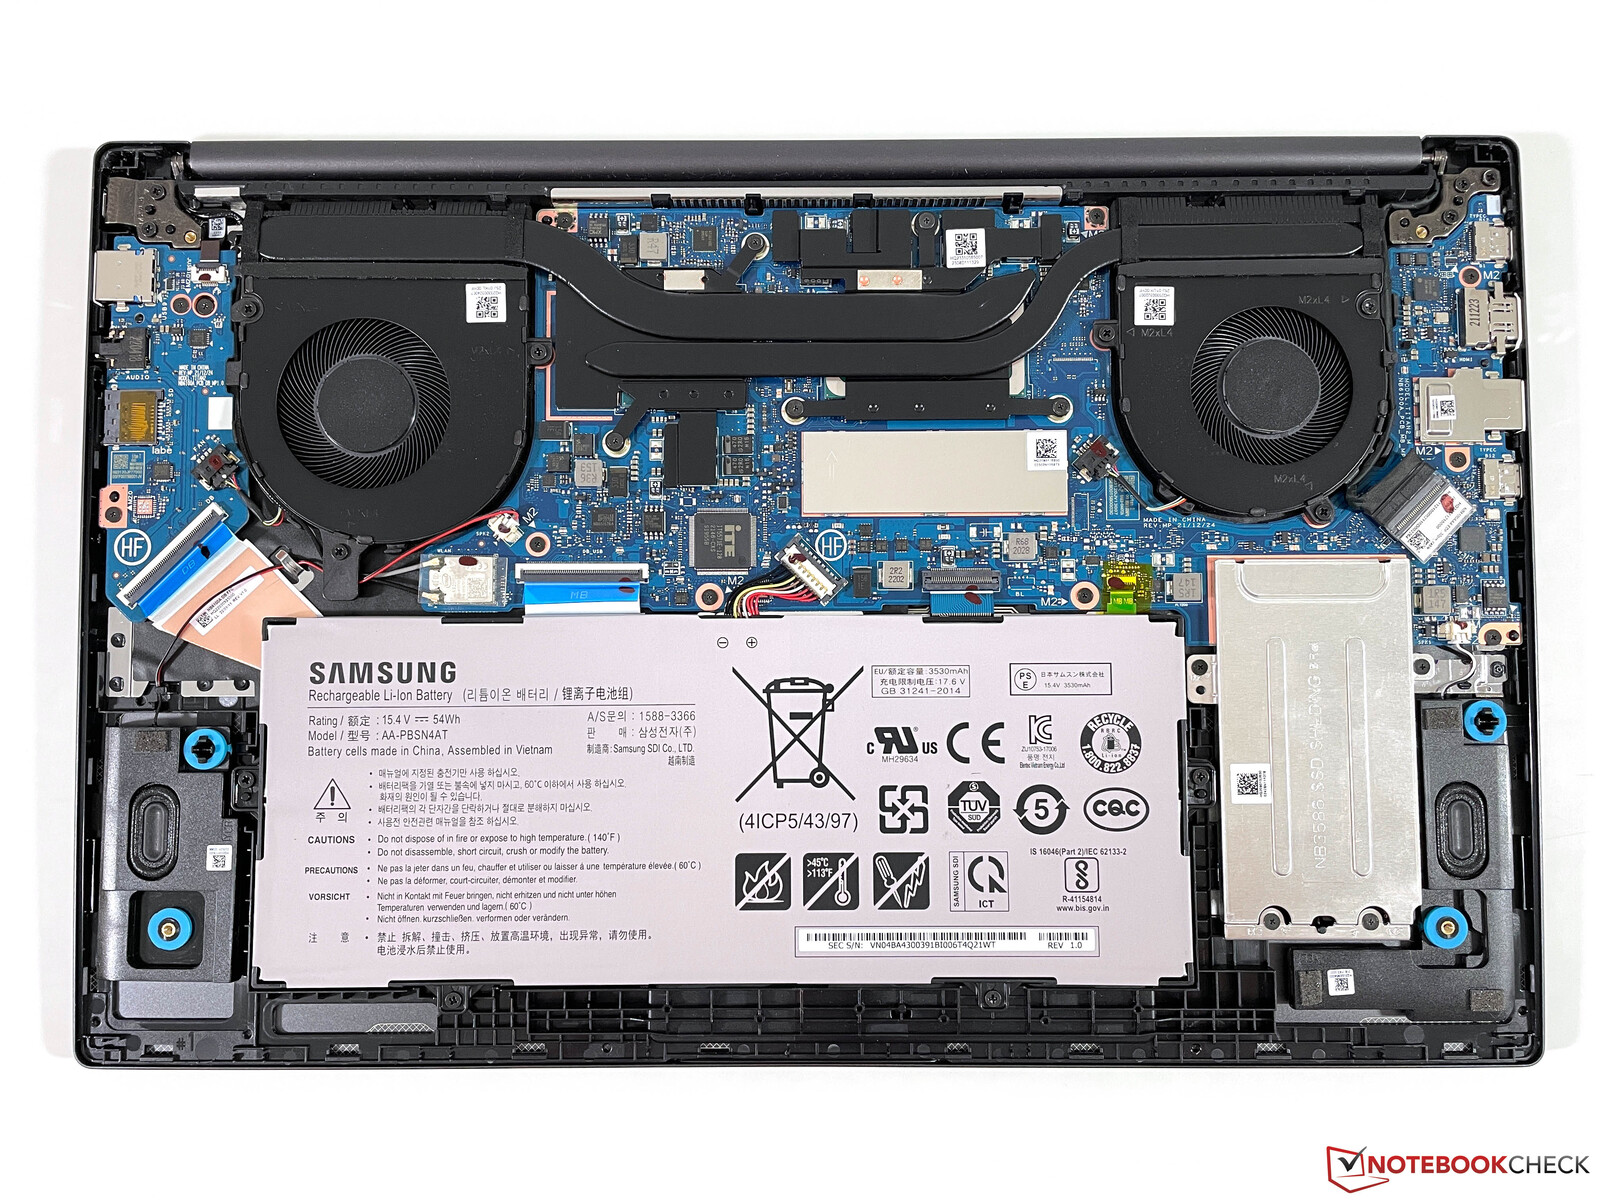
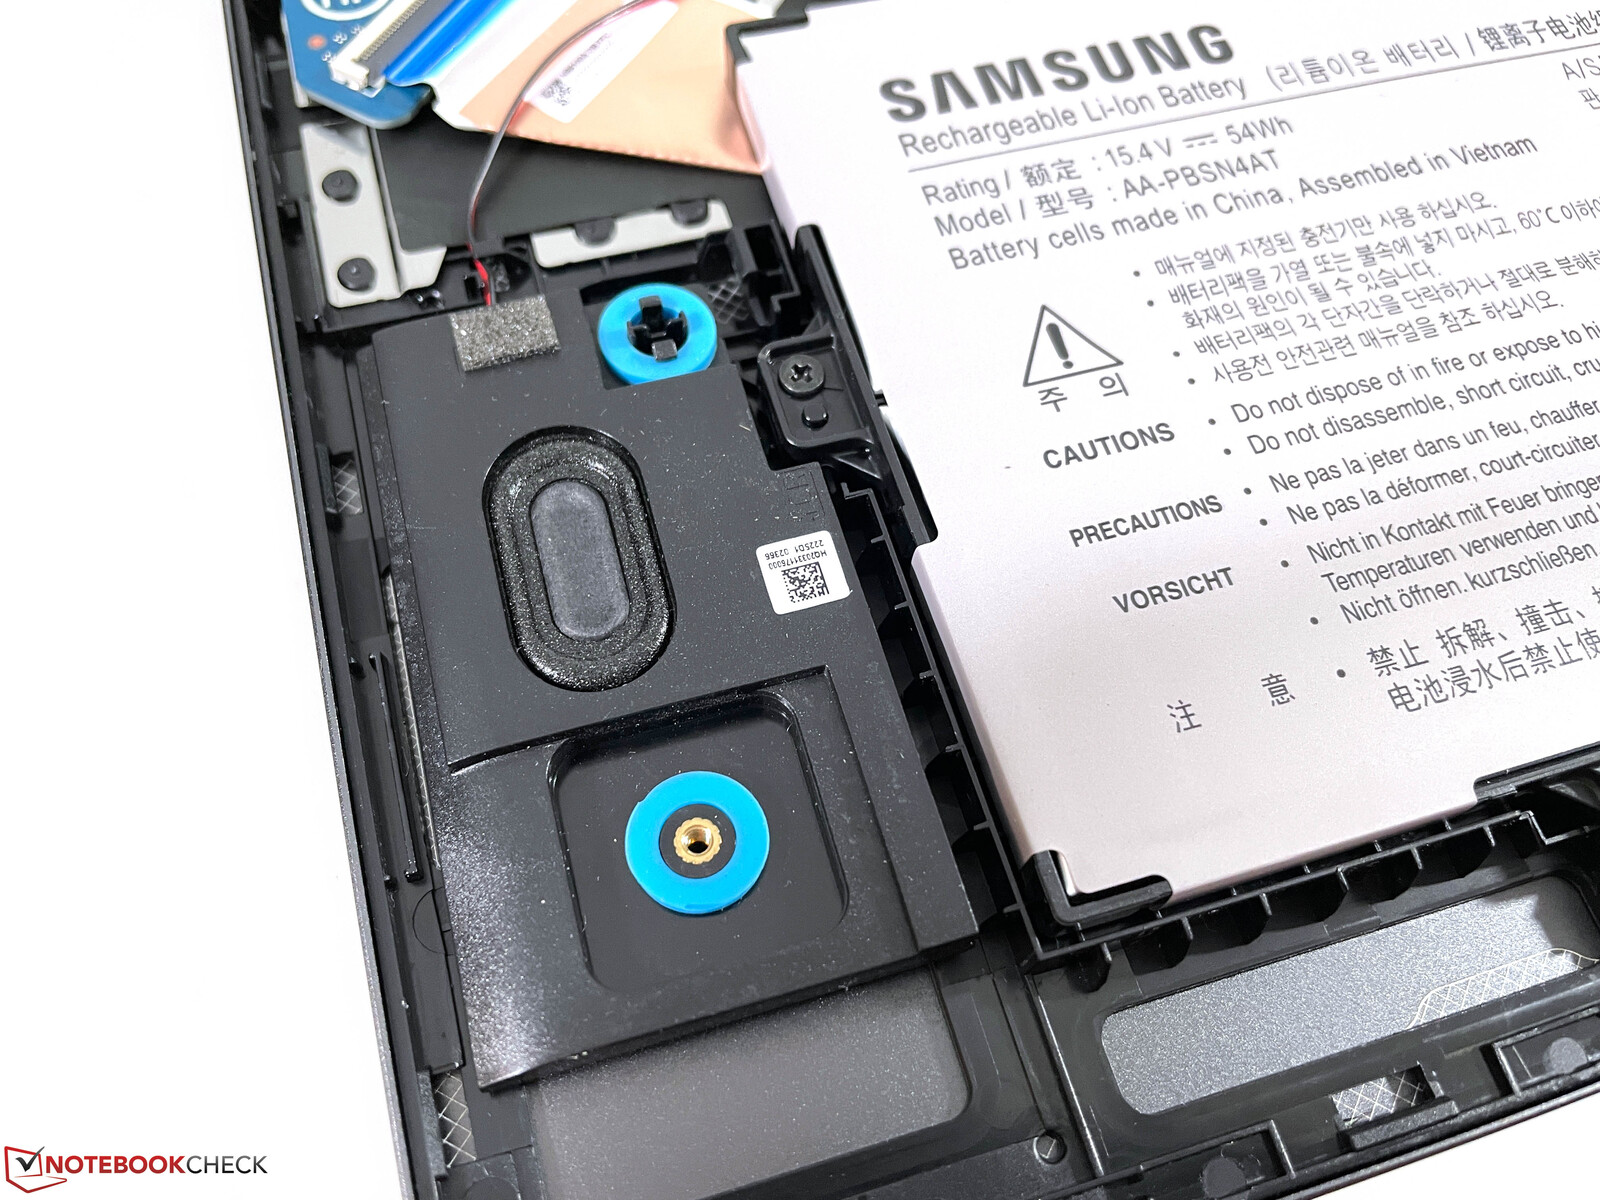
Mantenimiento
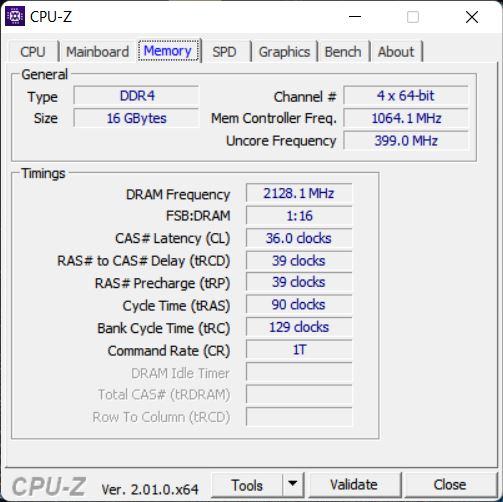
La cubierta inferior es relativamente fácil de quitar porque Samsung ha escondido los cuatro tornillos Phillips bajo pies de goma que están enchufados en lugar de pegados. Dentro del portátil, tendrás acceso a los ventiladores, el módulo Wi-Fi y dos ranuras SSD (bajo una cubierta adicional). La memoria RAM integrada (LPDDR4x-4266) está soldada y no se puede ampliar.
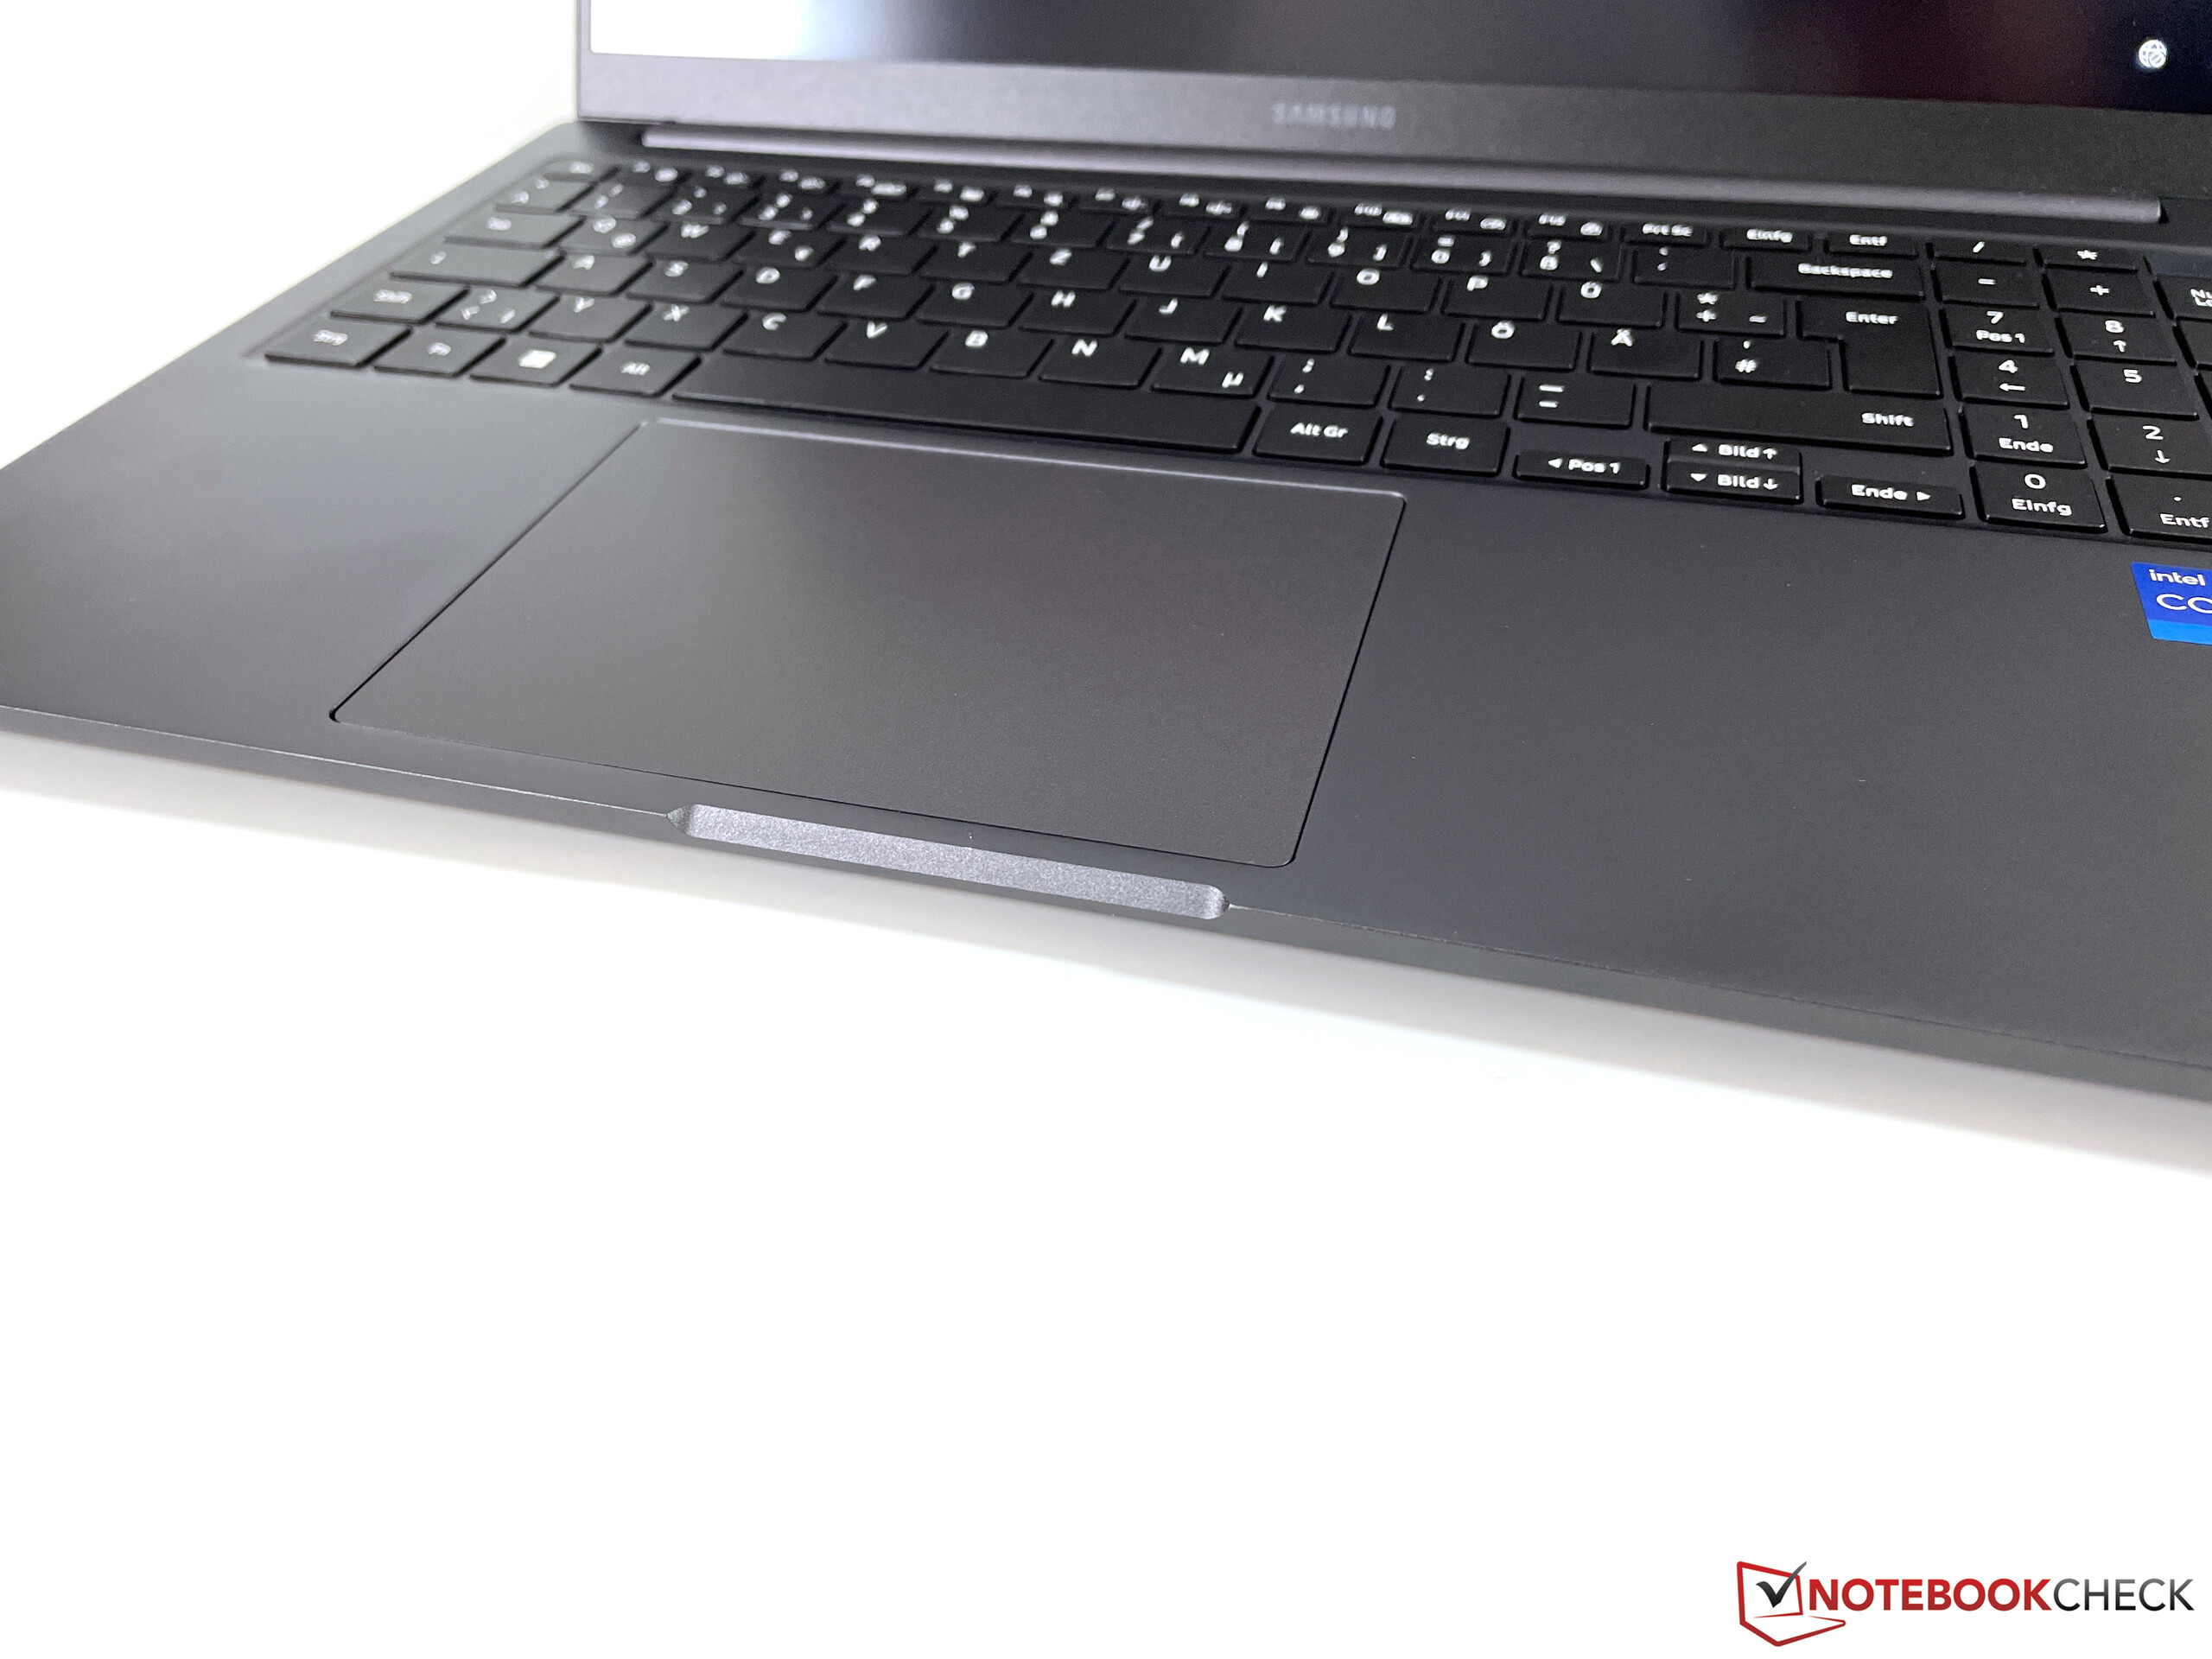
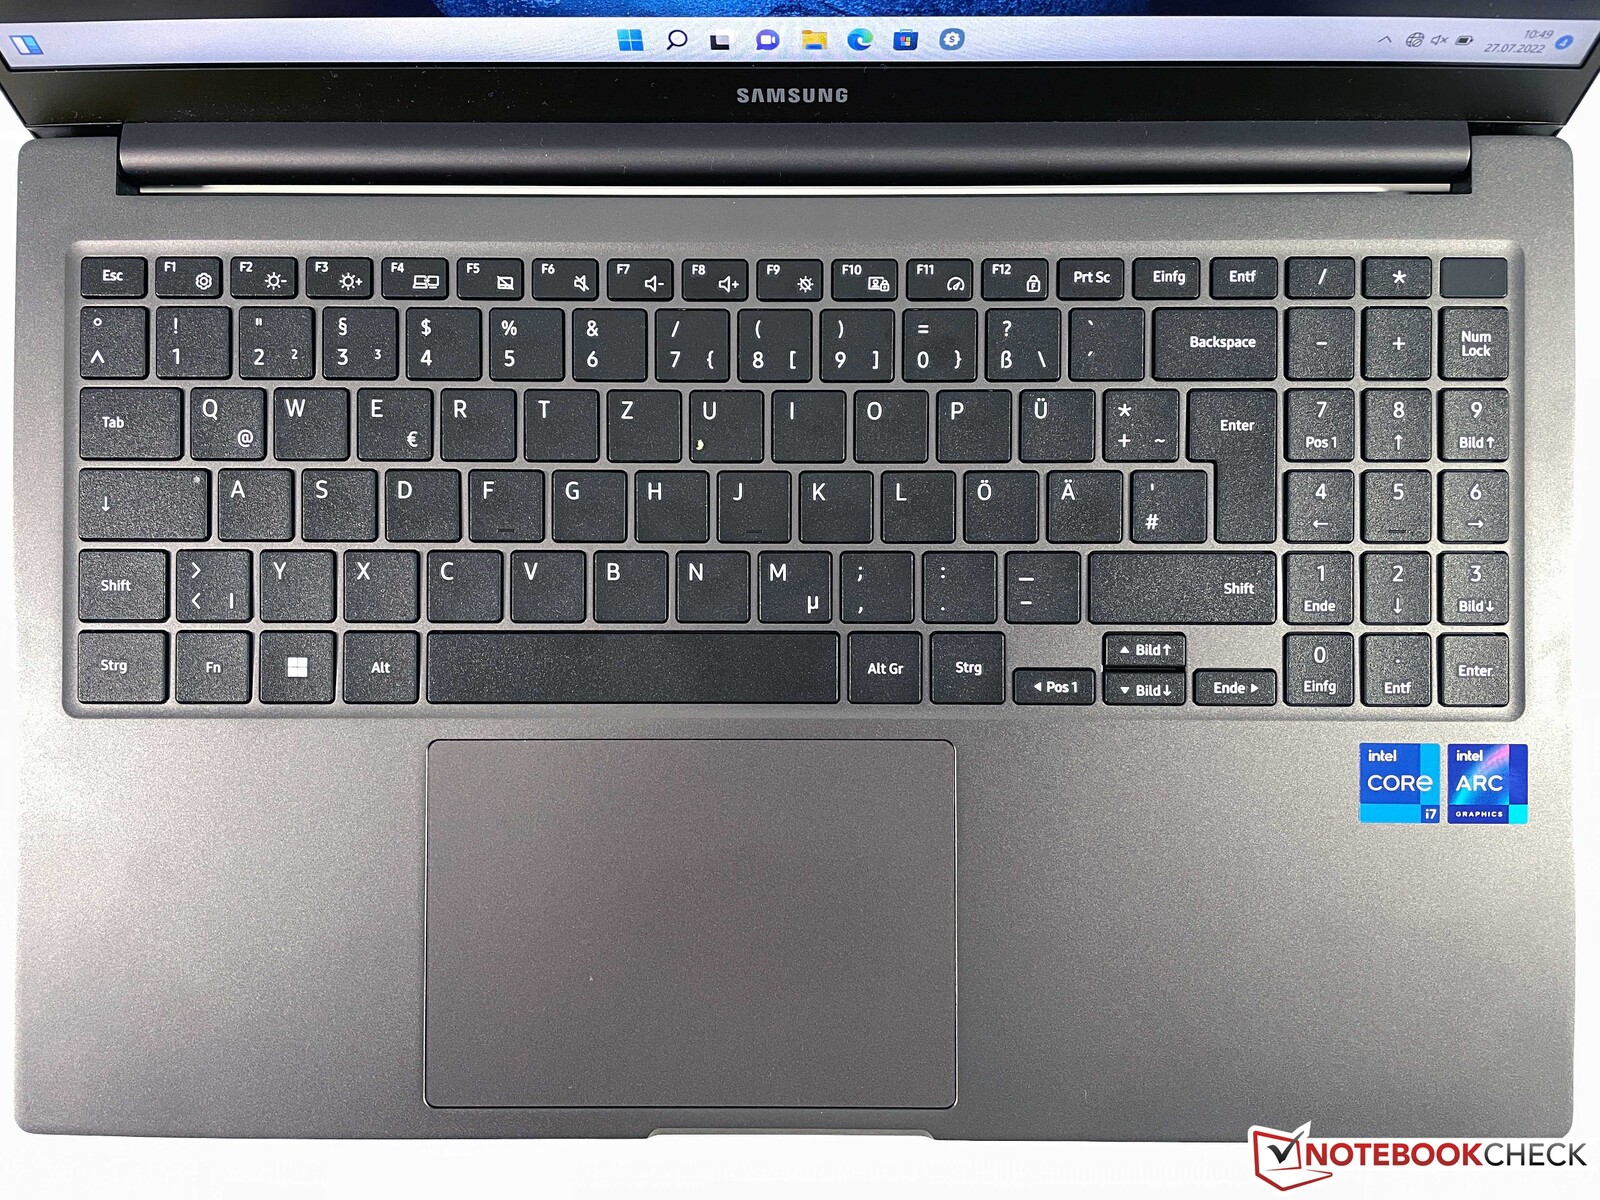
Dispositivos de entrada - Sin teclado retroiluminado
El teclado chiclet negro con teclado numérico dedicado ofrece un recorrido muy poco profundo al que cuesta acostumbrarse inicialmente. Su respuesta será muy precisa una vez que te hayas familiarizado con el teclado, y las pulsaciones tampoco son muy ruidosas. Sin embargo, las teclas de dirección son muy pequeñas. Según las especificaciones, se supone que hay un escáner de huellas dactilares en el botón de encendido en la parte superior derecha, pero no es el caso en nuestra unidad de revisión
Otro problema del teclado es la falta de retroiluminación. Esto también difiere de la información proporcionada en la hoja de especificaciones oficial. La aplicación de Samsung tiene incluso un ajustador para el nivel de retroiluminación, pero no cambió nada en nuestra unidad de pruebas
El suave clickpad funciona sin problemas, pero el ruido de clic es definitivamente demasiado fuerte y parece barato. El clickpad es capaz de reconocer correctamente los gestos con hasta cuatro dedos.
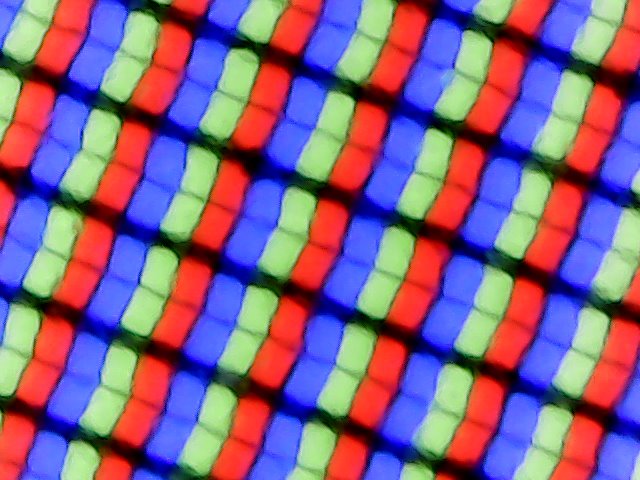
Pantalla - Samsung ha utilizado un panel IPS barato
Similar al modelo anteriorel Galaxy Book2 sigue utilizando una pantalla IPS Full HD mate con un ratio 16:9, pero el panel está ahora fabricado por la empresa BOE. Con una media de 325 cd/m², el nuevo panel es ligeramente más brillante que el anterior, pero tiene un peor nivel de negro (0,4), lo que da como resultado una relación de contraste de sólo 843:1. Además, la pantalla también tiene un tinte azul visible y la calidad de imagen subjetiva general no es buena. Los colores parecen apagados en comparación y la imagen parece algo lavada, pero al menos las zonas brillantes no parecen granuladas.
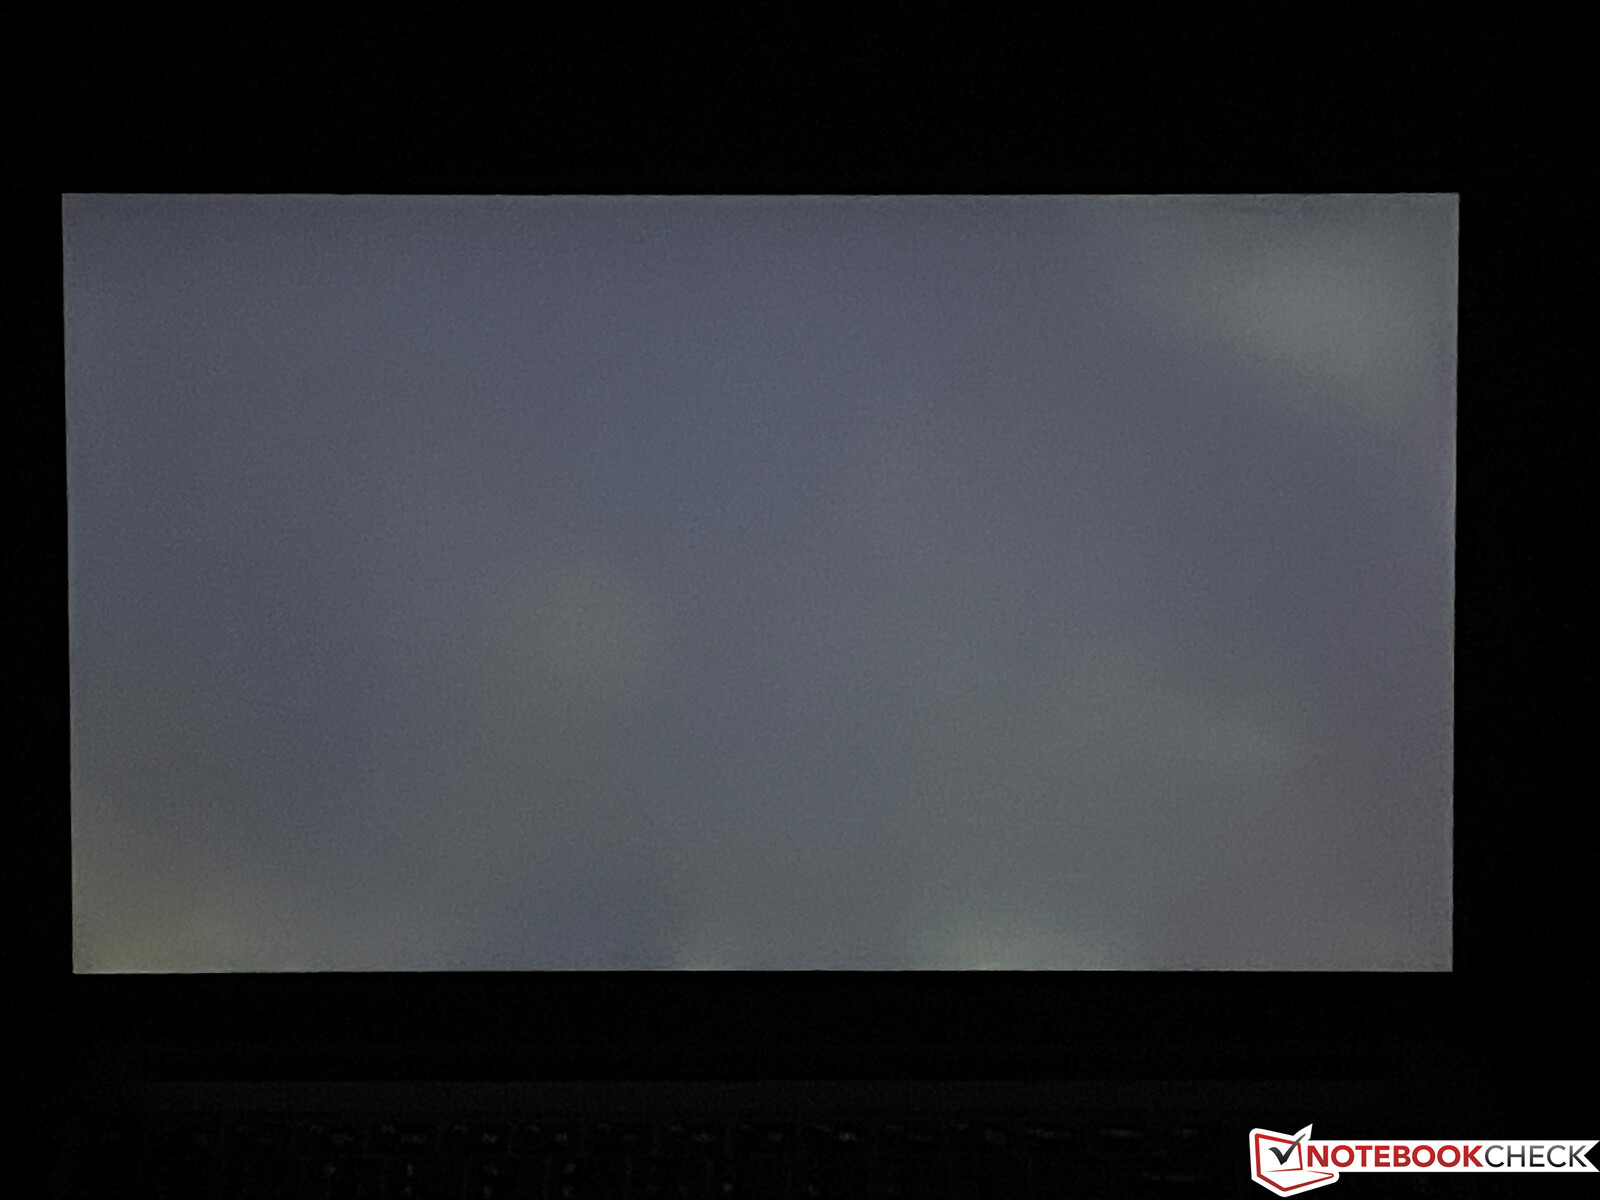
El panel tiene tiempos de respuesta típicos y un ángulo de visión notablemente amplio. Tampoco detectamos ningún parpadeo PWM. Sin embargo, hay un notable brillo IPS hacia los bordes cuando la pantalla muestra imágenes oscuras.
| |||||||||||||||||||||||||
iluminación: 89 %
Brillo con batería: 337 cd/m²
Contraste: 843:1 (Negro: 0.4 cd/m²)
ΔE ColorChecker Calman: 4.7 | ∀{0.5-29.43 Ø4.71}
calibrated: 2.8
ΔE Greyscale Calman: 5.4 | ∀{0.09-98 Ø4.96}
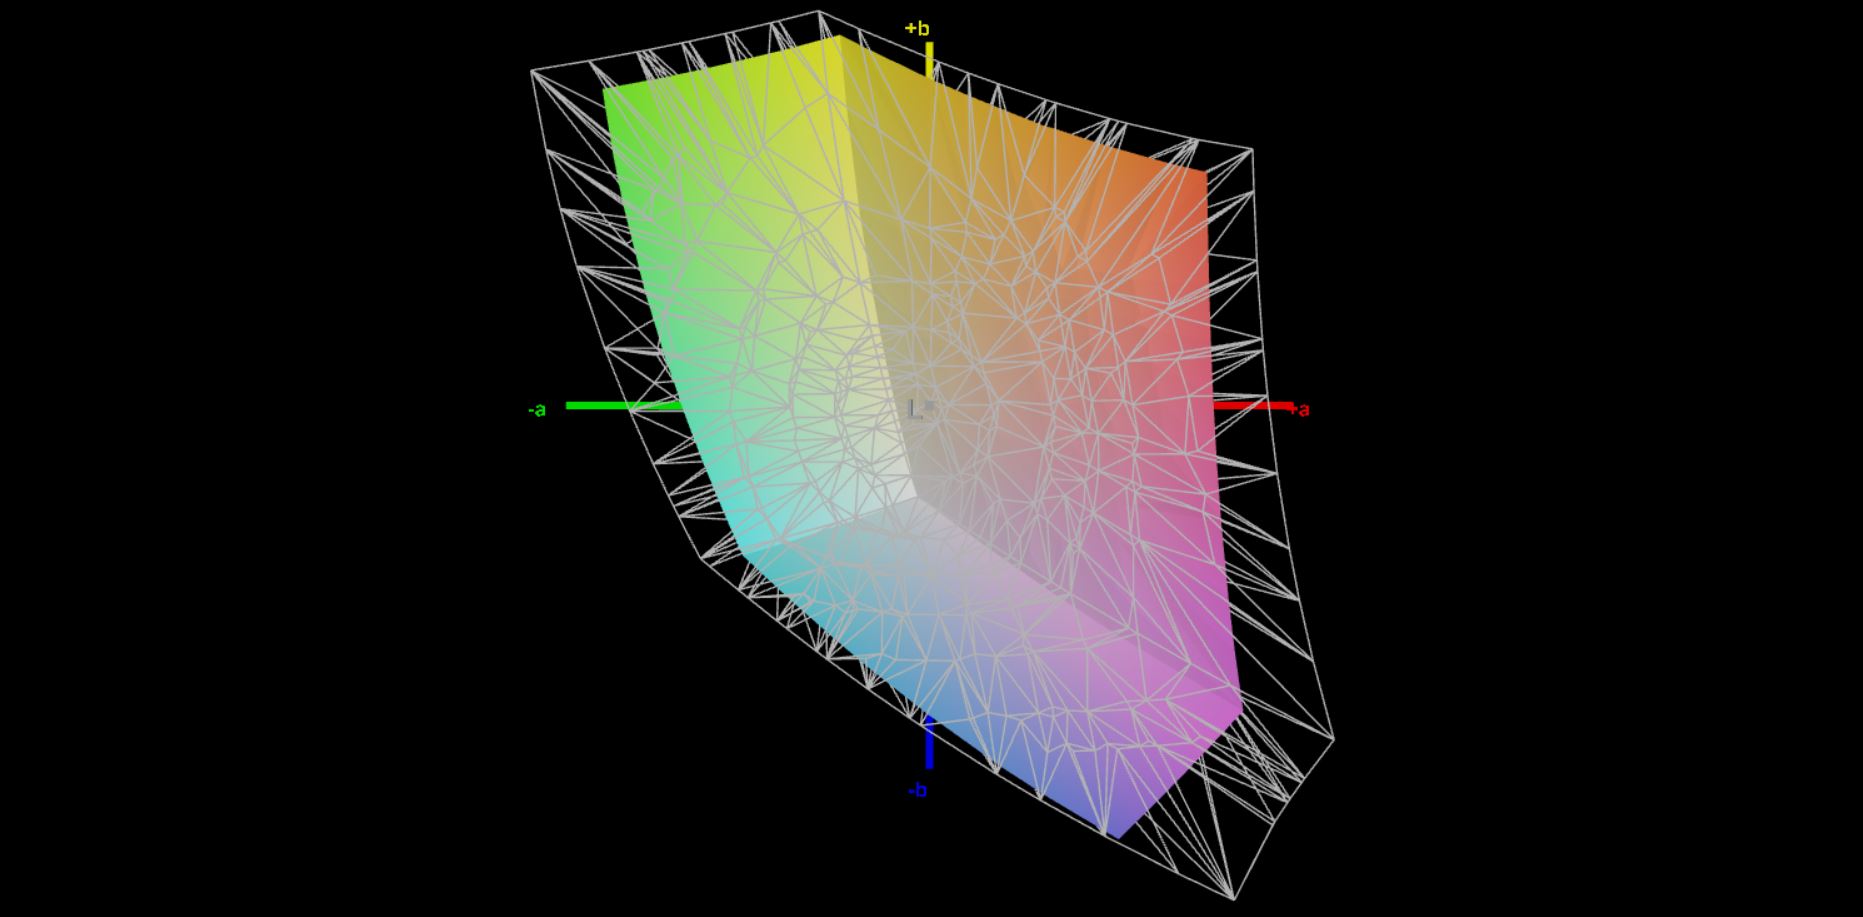
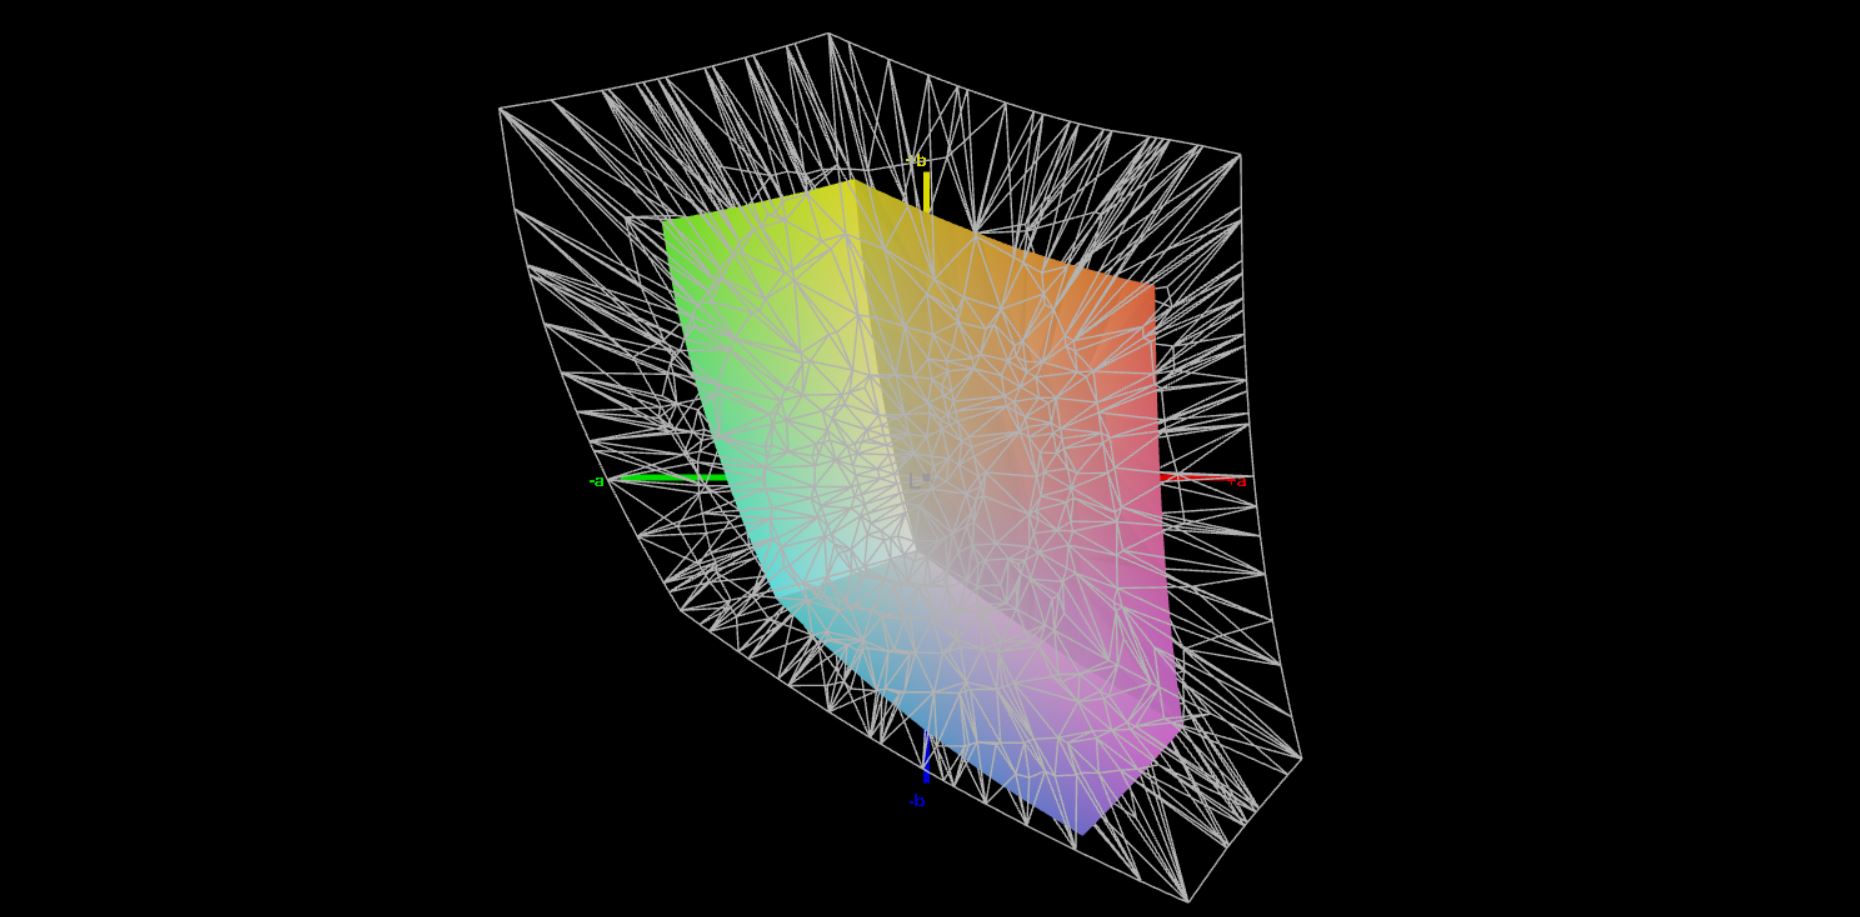
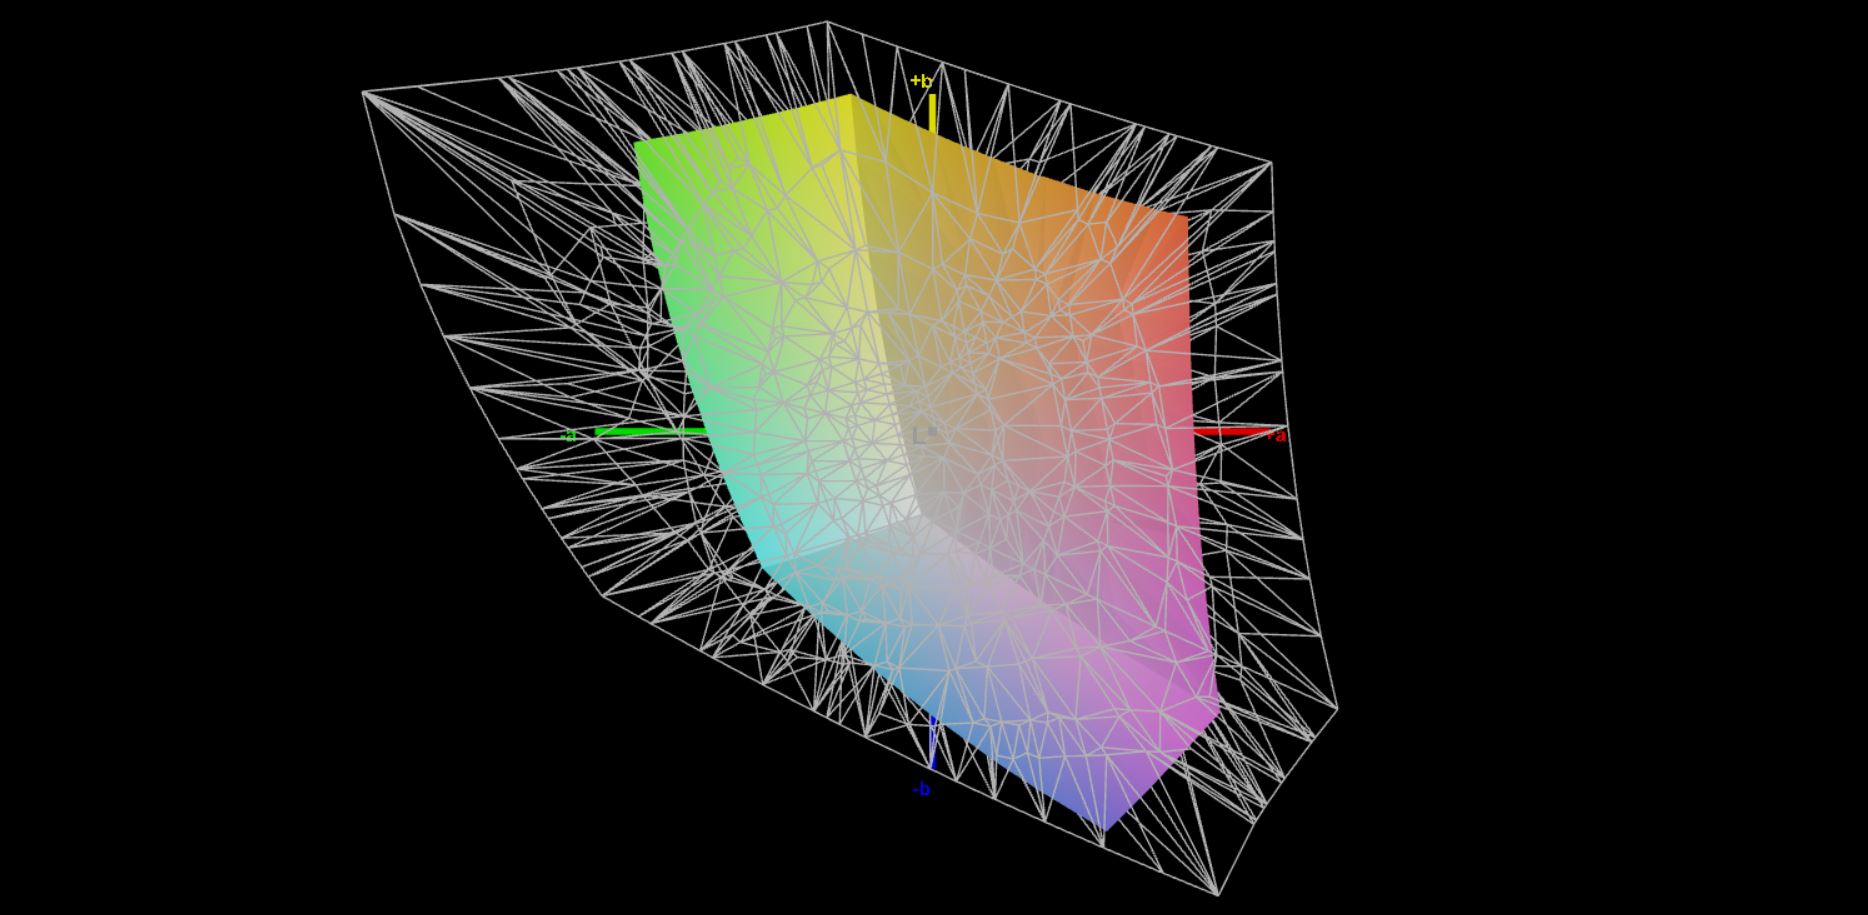
51.3% AdobeRGB 1998 (Argyll 3D)
74.8% sRGB (Argyll 3D)
49.6% Display P3 (Argyll 3D)
Gamma: 2.07
CCT: 7727 K
| Samsung Galaxy Book2 15 NE156FHM-NS0, IPS, 1920x1080, 15.6" | Dell Inspiron 15 Plus Dell INSPIRON LGD06A6, IPS, 1920x1080, 15.6" | Asus Vivobook 15 K513EQ Samsung ATNA56YX03-0, OLED, 1920x1080, 15.6" | Lenovo ThinkBook 15p G2 ITH 21B1000YGE LEN156UHD, IPS, 3840x2160, 15.6" | HP Pavilion 15-eg Chi Mei CMN1523, IPS, 1920x1080, 15.6" | Samsung Galaxy Book NP750XDA CEC PANDA LM156LF5L03, IPS, 1920x1080, 15.6" | |
|---|---|---|---|---|---|---|
| Display | 27% | 77% | 70% | -14% | ||
| Display P3 Coverage (%) | 49.6 | 64.1 29% | 99.9 101% | 90.2 82% | 42.9 -14% | |
| sRGB Coverage (%) | 74.8 | 92.8 24% | 100 34% | 100 34% | 64 -14% | |
| AdobeRGB 1998 Coverage (%) | 51.3 | 66.2 29% | 99.9 95% | 100 95% | 44.4 -13% | |
| Response Times | 8% | 91% | -66% | 18% | 11% | |
| Response Time Grey 50% / Grey 80% * (ms) | 32.3 ? | 31.6 ? 2% | 2.2 ? 93% | 66 ? -104% | 22.8 ? 29% | 29 ? 10% |
| Response Time Black / White * (ms) | 25 ? | 21.6 ? 14% | 2.9 ? 88% | 32 ? -28% | 23.6 ? 6% | 22 ? 12% |
| PWM Frequency (Hz) | 59.5 ? | 26320 ? | ||||
| Screen | 5% | 37% | 43% | 2% | 5% | |
| Brightness middle (cd/m²) | 337 | 298 -12% | 384.5 14% | 542 61% | 294.3 -13% | 325 -4% |
| Brightness (cd/m²) | 325 | 285 -12% | 388 19% | 496 53% | 251 -23% | 297 -9% |
| Brightness Distribution (%) | 89 | 86 -3% | 98 10% | 73 -18% | 76 -15% | 86 -3% |
| Black Level * (cd/m²) | 0.4 | 0.4 -0% | 0.31 23% | 0.26 35% | 0.445 -11% | |
| Contrast (:1) | 843 | 745 -12% | 1748 107% | 1132 34% | 730 -13% | |
| Colorchecker dE 2000 * | 4.7 | 3.68 22% | 2.53 46% | 3.7 21% | 4.08 13% | 3.48 26% |
| Colorchecker dE 2000 max. * | 15.7 | 7.39 53% | 6.16 61% | 5.8 63% | 19.49 -24% | 8.07 49% |
| Colorchecker dE 2000 calibrated * | 2.8 | 2.61 7% | 1.1 61% | 3.7 -32% | ||
| Greyscale dE 2000 * | 5.4 | 5.3 2% | 1.6 70% | 4.4 19% | 3 44% | 5.27 2% |
| Gamma | 2.07 106% | 2.102 105% | 2.24 98% | 2.38 92% | 2.21 100% | 2.41 91% |
| CCT | 7727 84% | 6143 106% | 6464 101% | 7116 91% | 6616 98% | 7769 84% |
| Color Space (Percent of AdobeRGB 1998) (%) | 44 | |||||
| Color Space (Percent of sRGB) (%) | 70 | |||||
| Media total (Programa/Opciones) | 13% /
10% | 68% /
57% | 16% /
34% | 2% /
1% | 8% /
6% |
* ... más pequeño es mejor
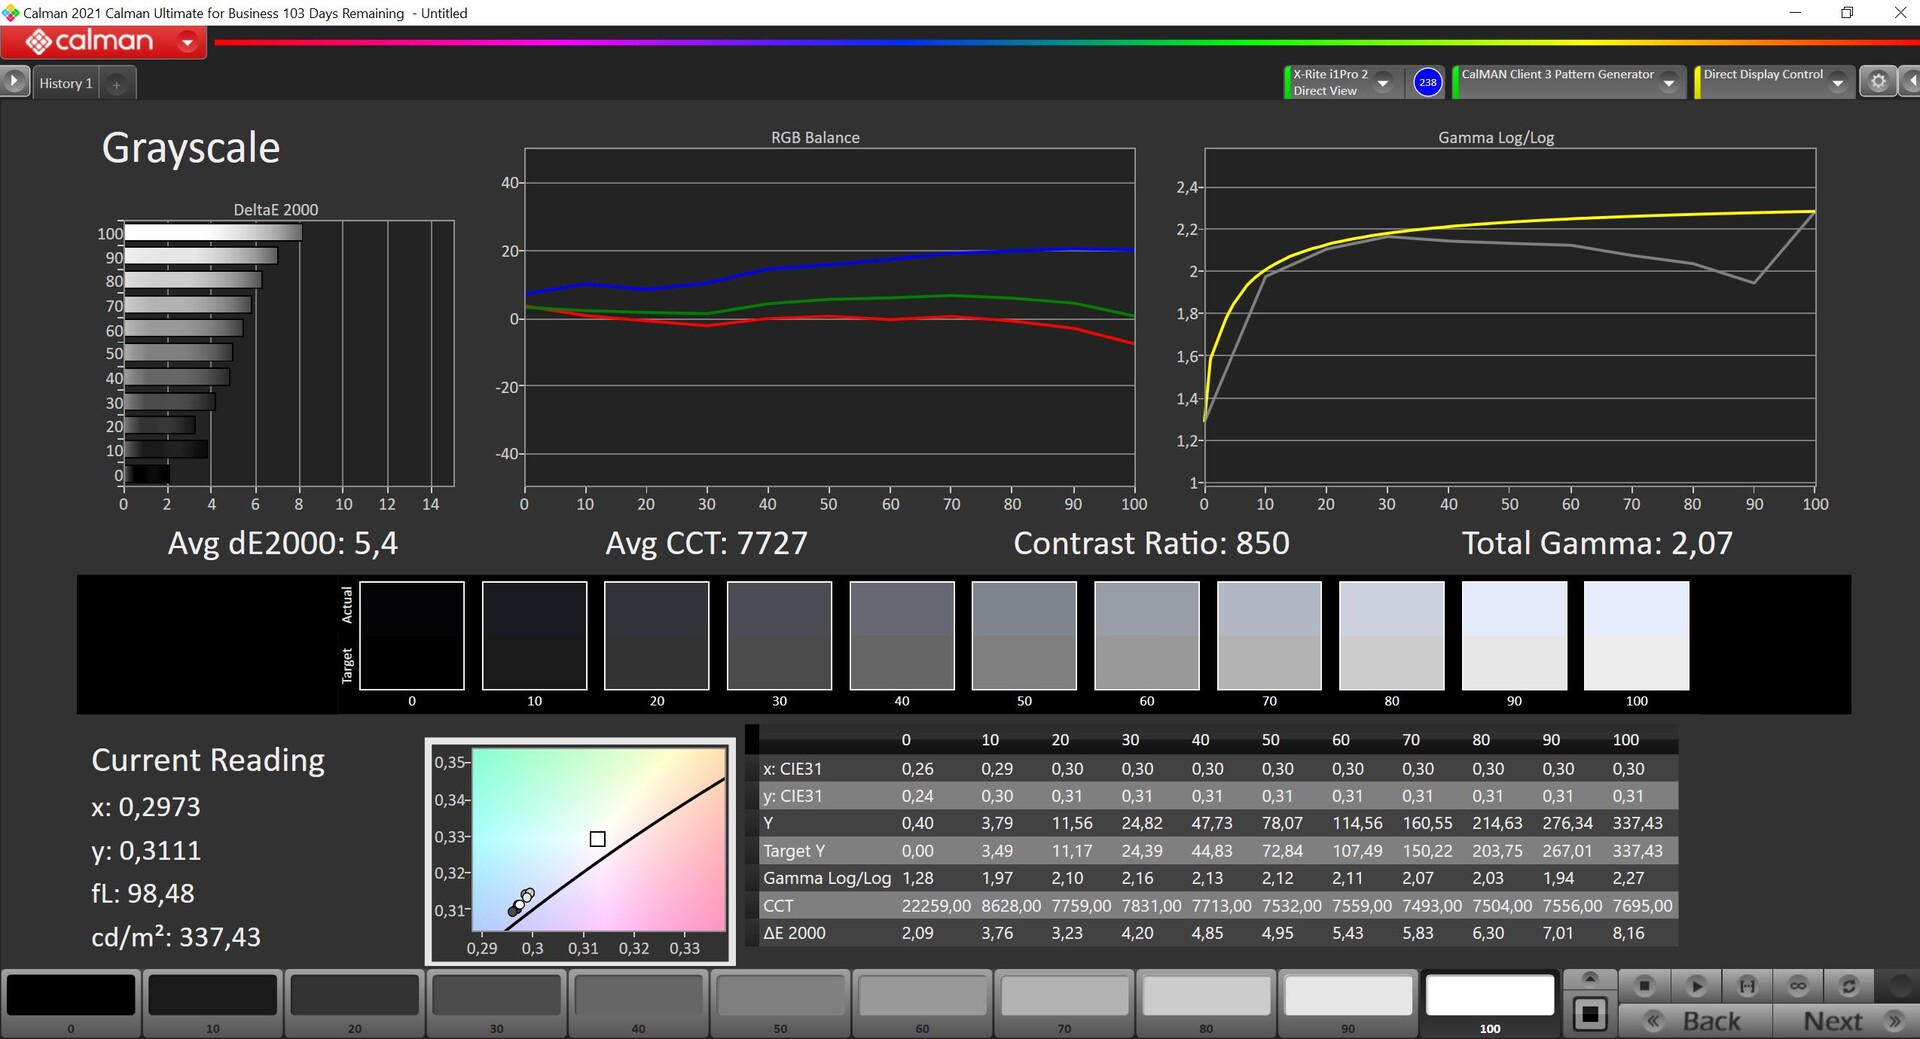
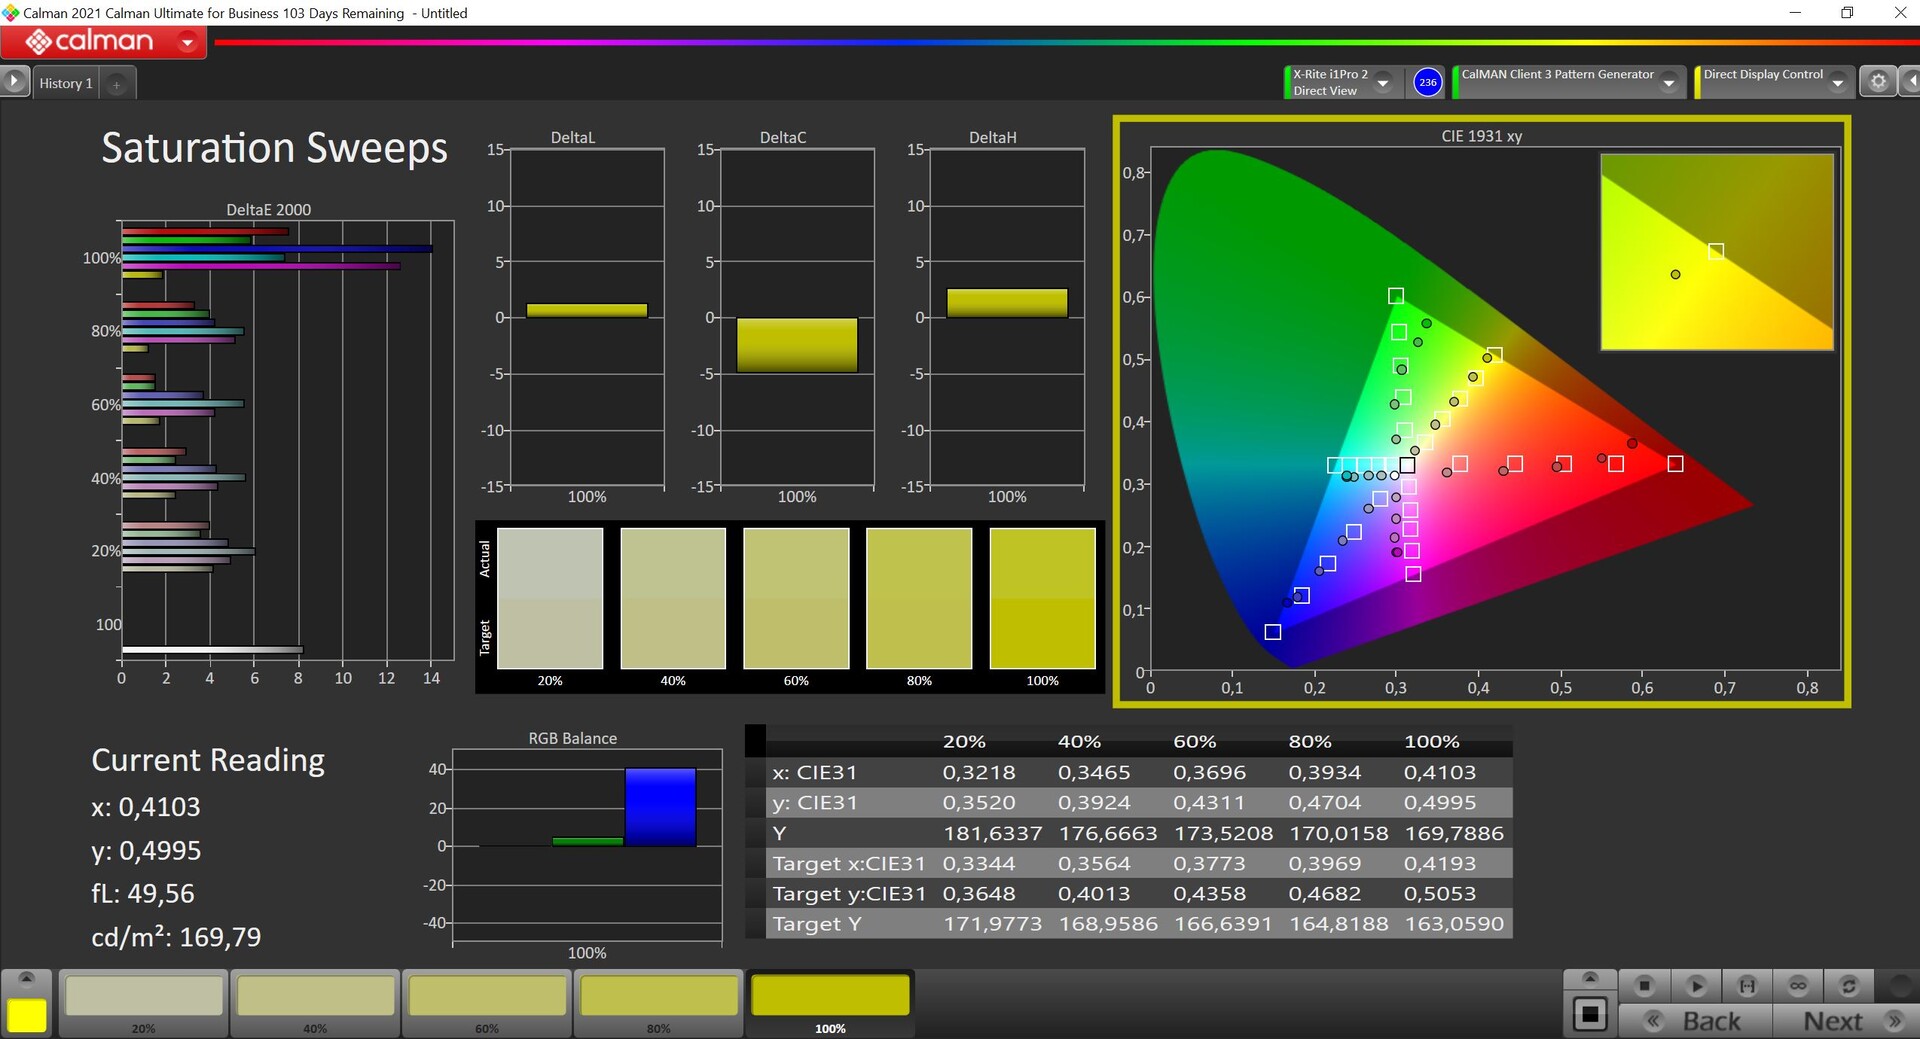
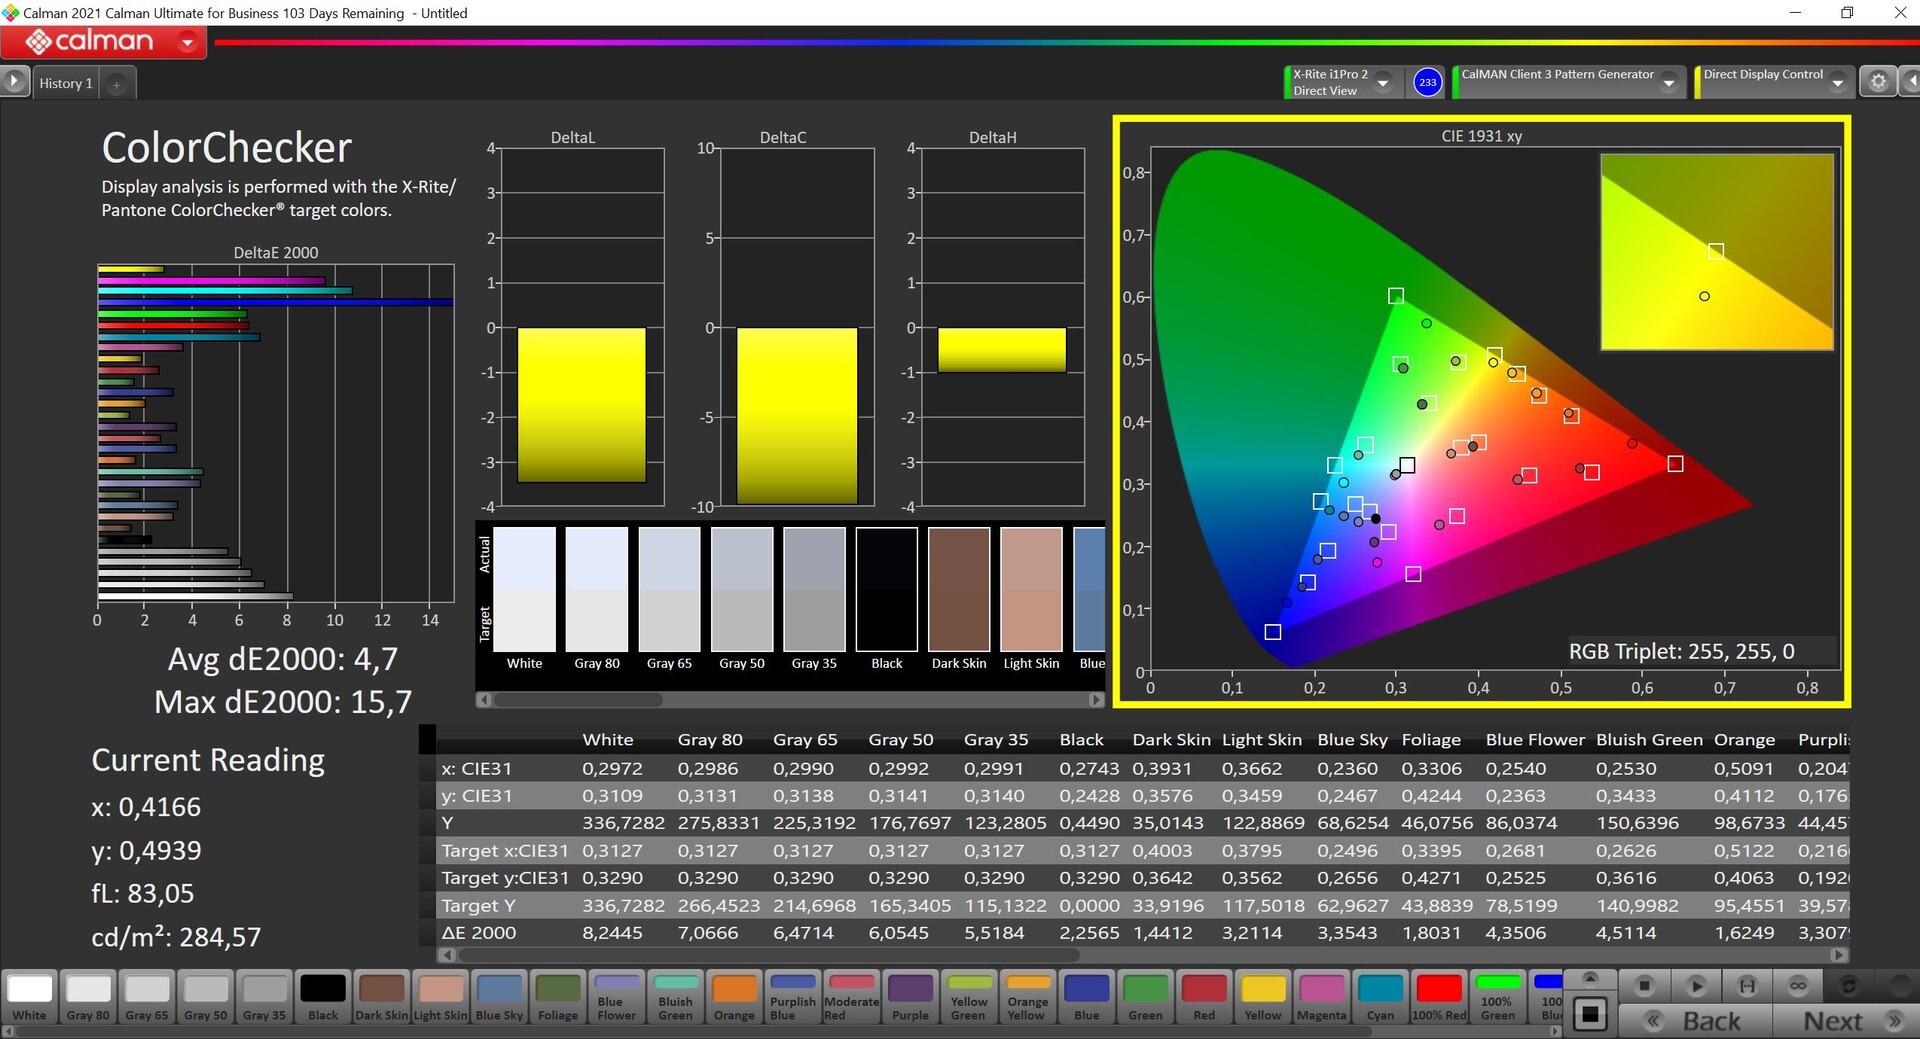
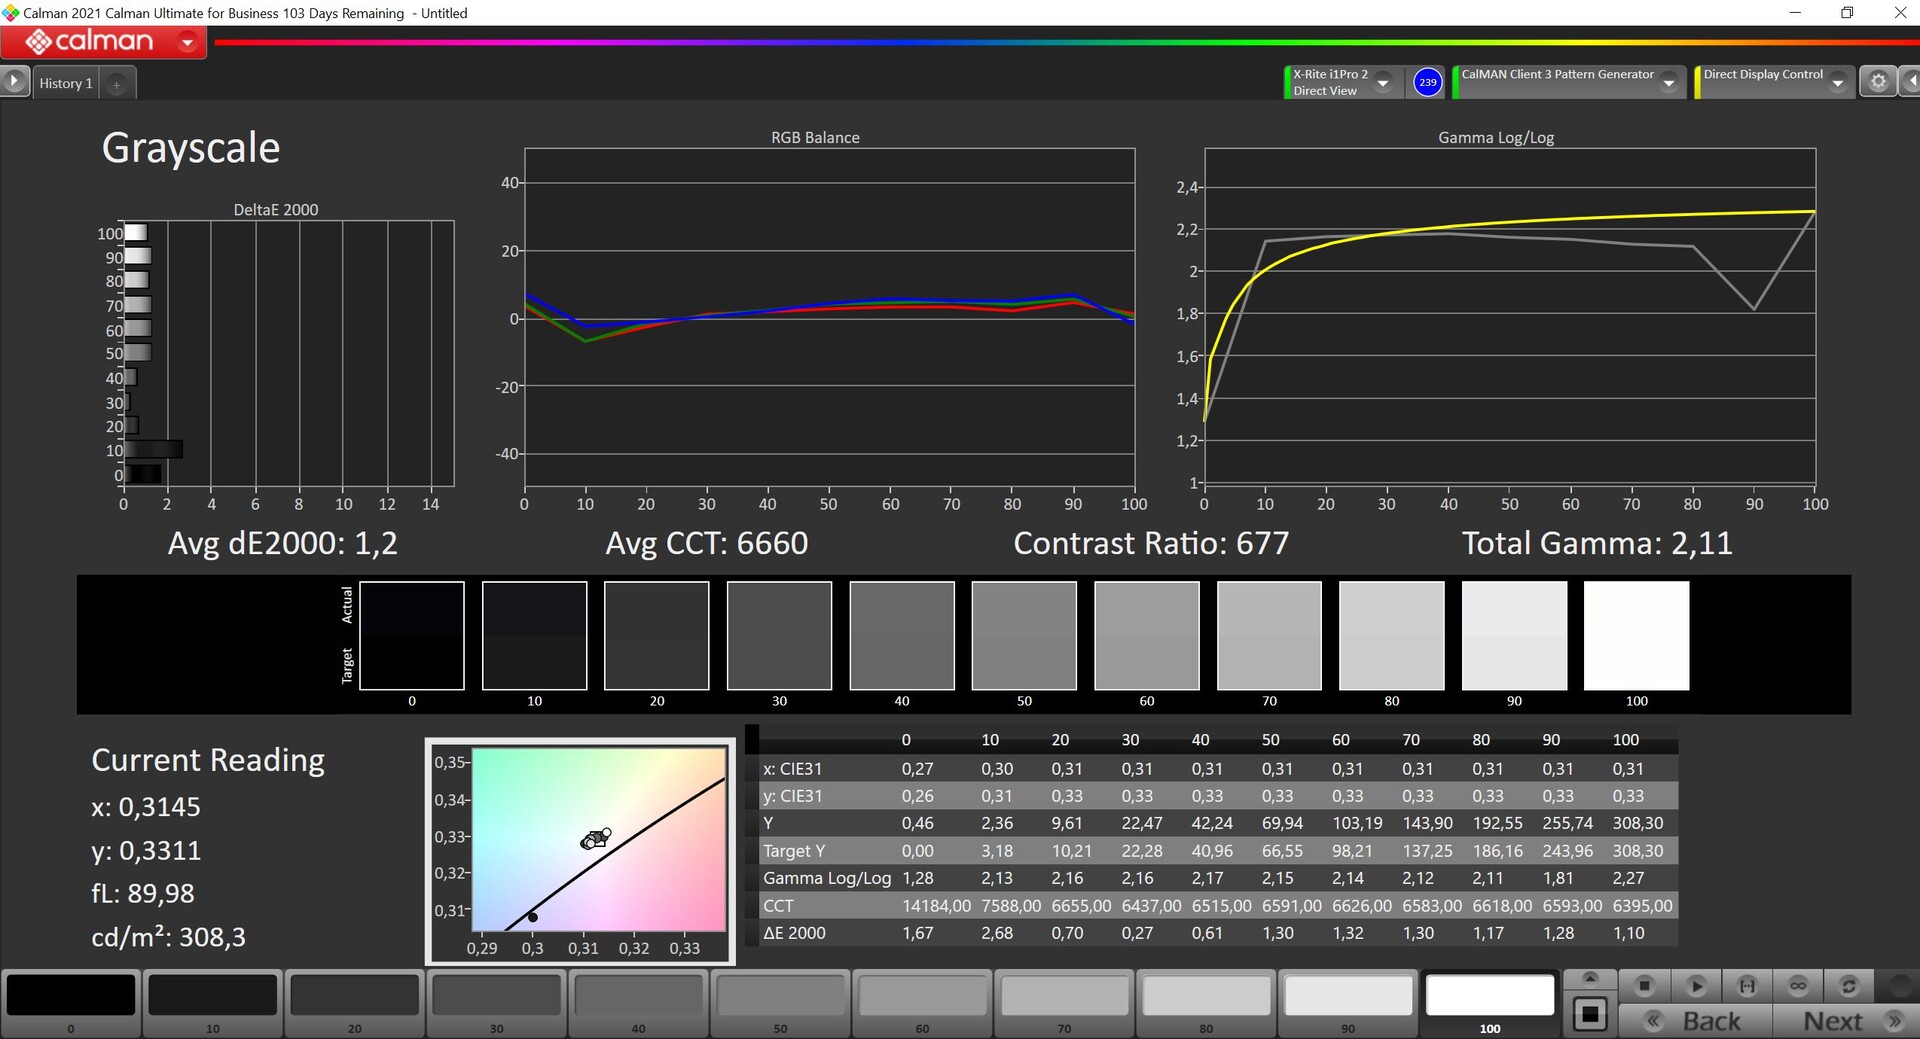
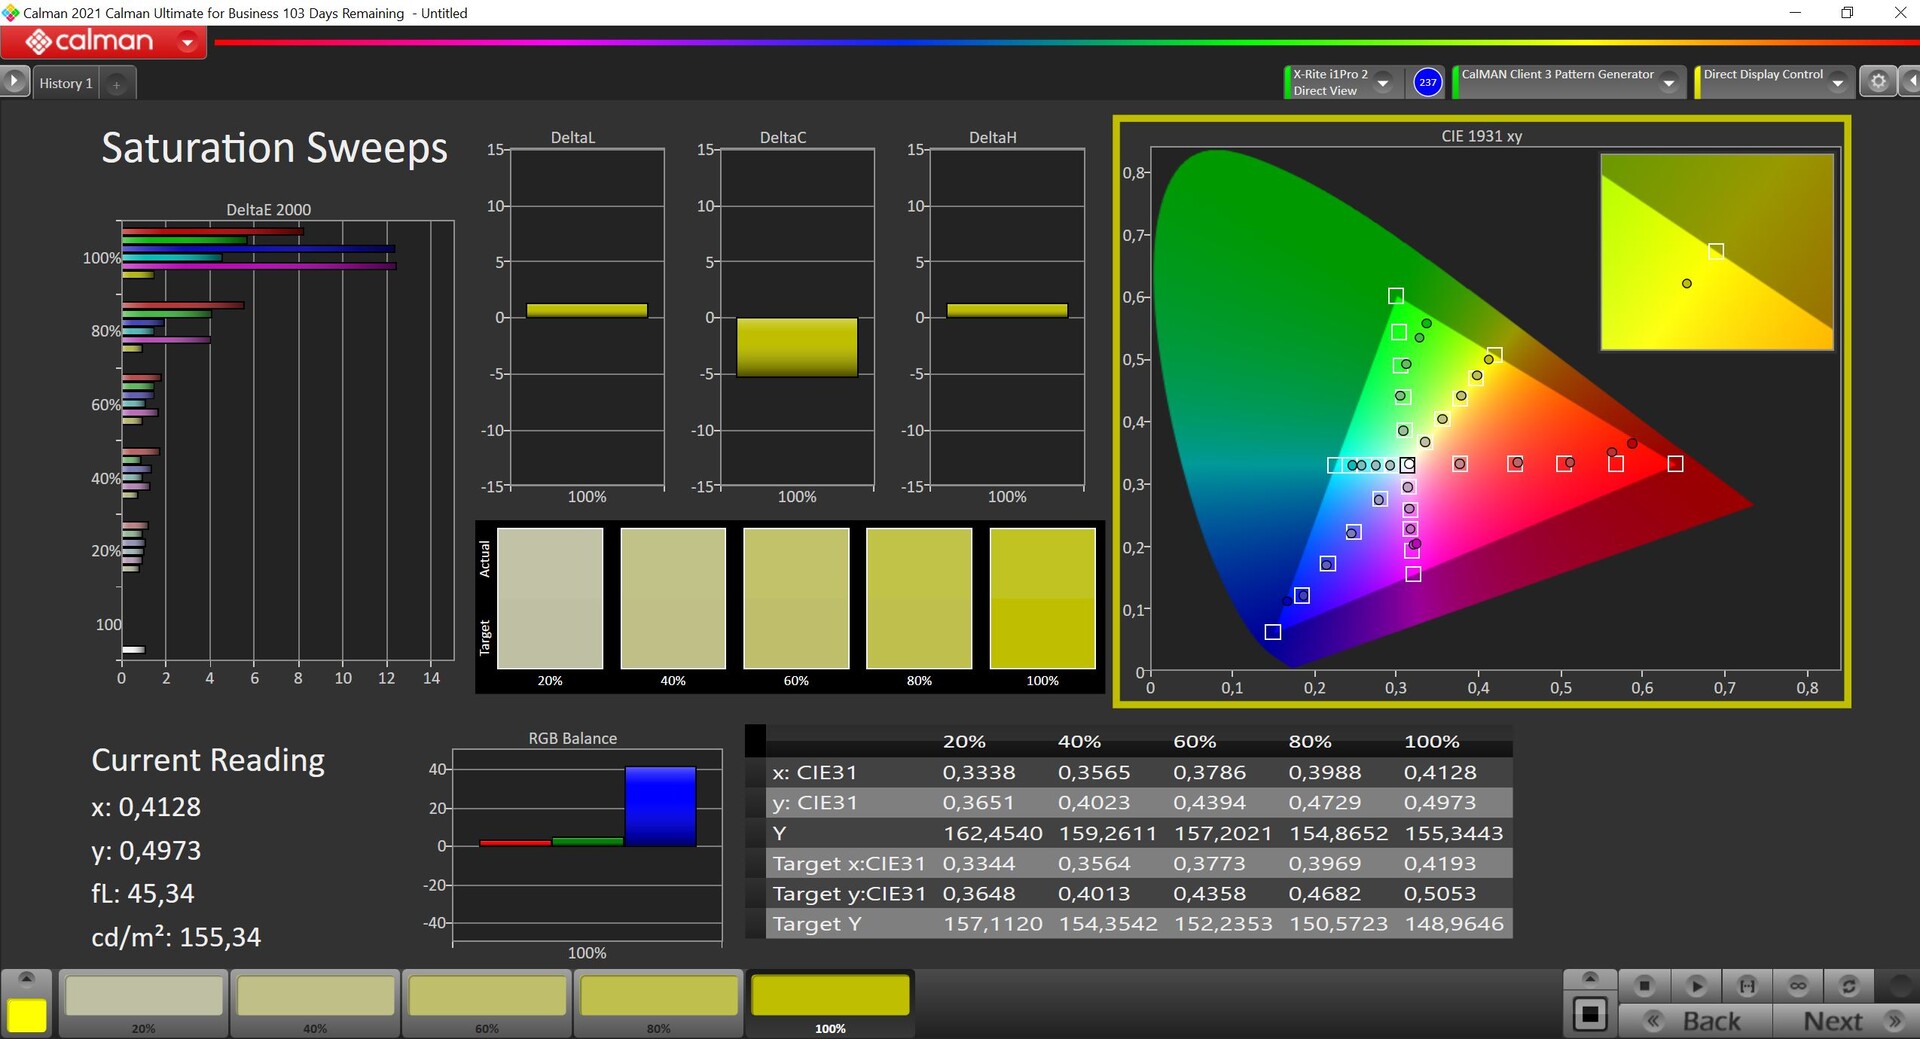
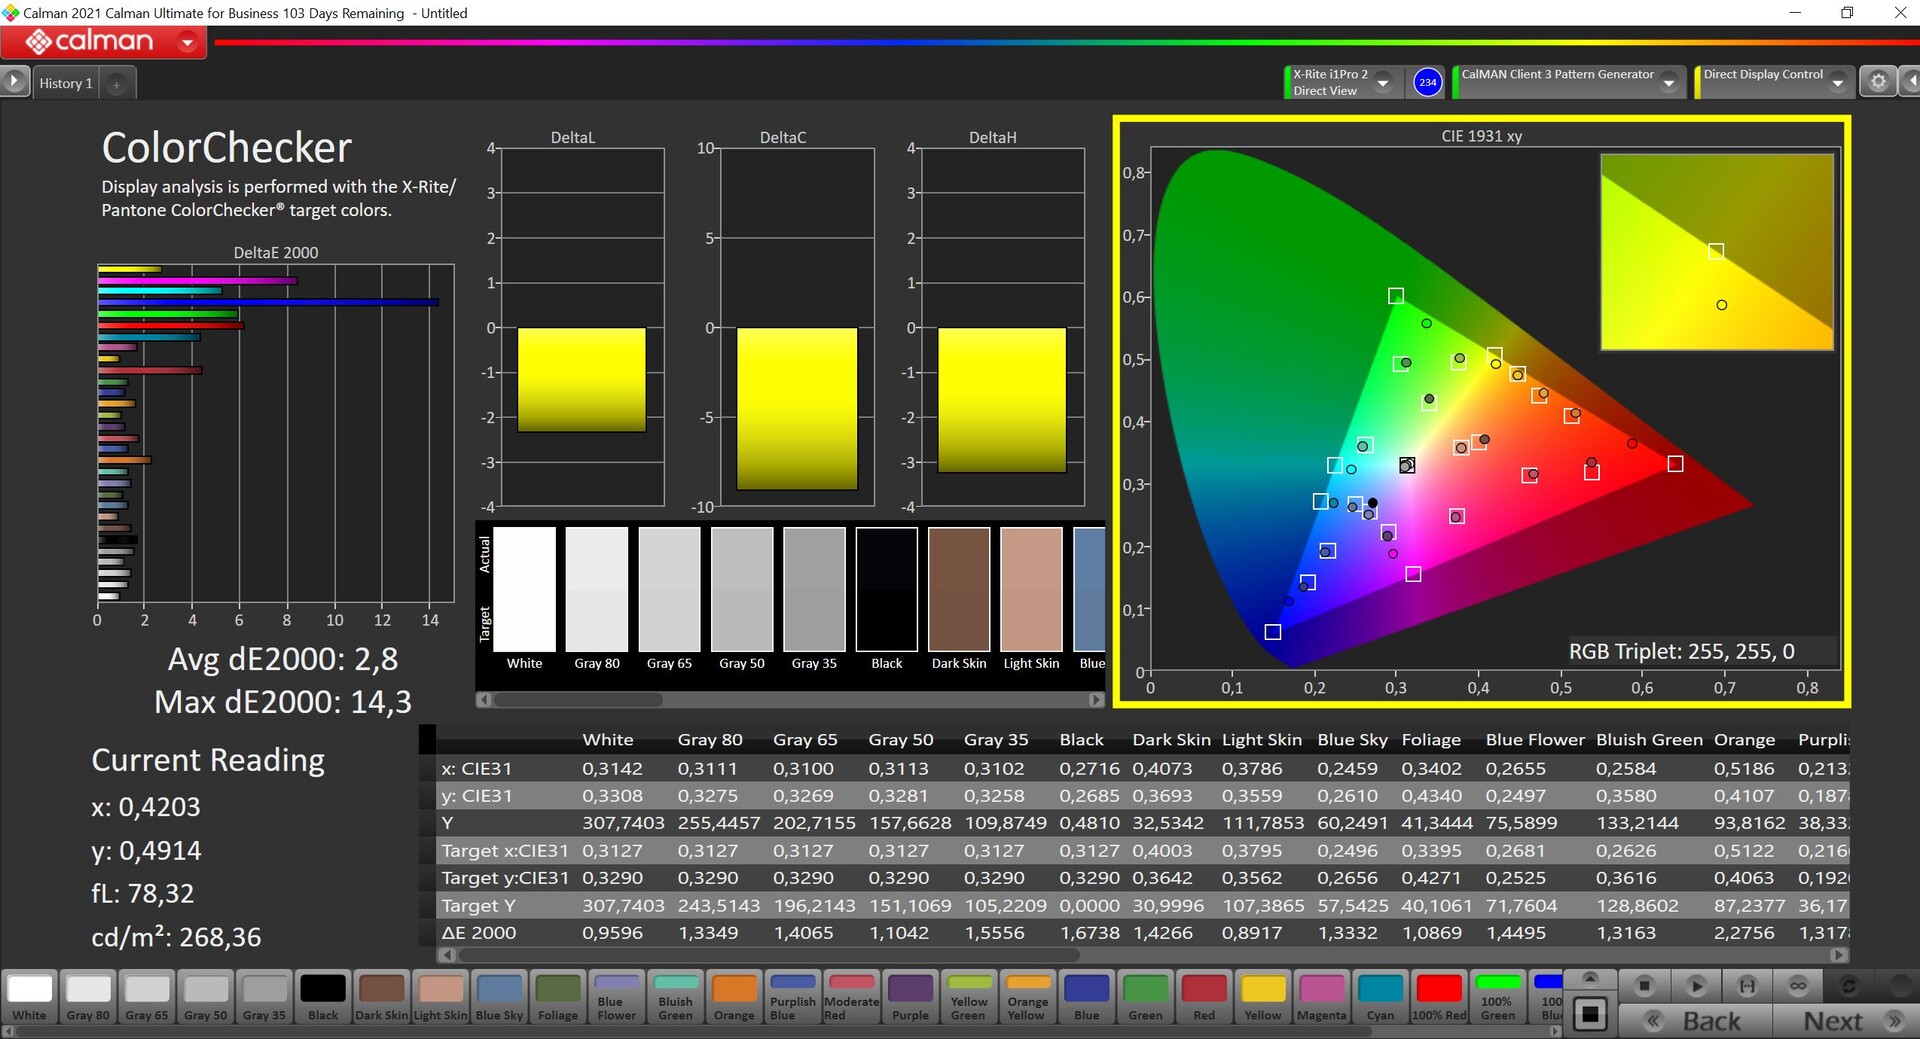
Nuestro análisis con el software profesional CalMAN (X-Rite i1 Pro 2) verificó que el panel tiene un tinte azul y una temperatura de color ciertamente demasiado fría. En particular, la desviación de color demuestra que la pantalla IPS es barata. Aunque pudimos superar el tinte azul a través de la calibración (el perfil está disponible como descarga gratuita arriba), esto también redujo el brillo máximo de la pantalla en aproximadamente 30 cd/m² y no alivió la alta desviación de color. Junto con la escasa cobertura de la gama de colores (sólo el 75% de sRGB), este panel es inadecuado para la edición de fotos y vídeos.
Tiempos de respuesta del display
| ↔ Tiempo de respuesta de Negro a Blanco | ||
|---|---|---|
| 25 ms ... subida ↗ y bajada ↘ combinada | ↗ 13.3 ms subida | 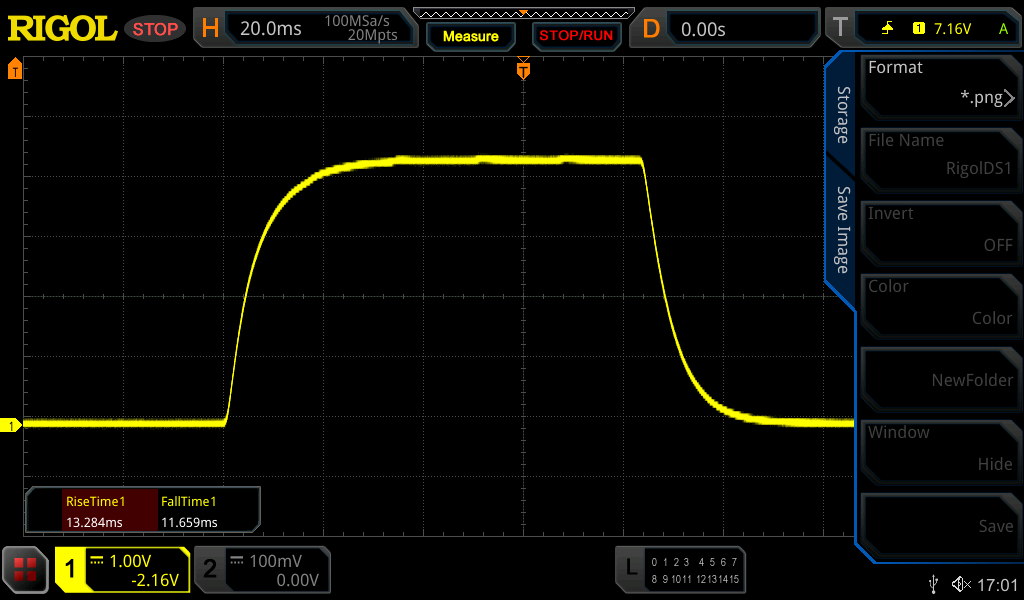 |
| ↘ 11.7 ms bajada | ||
| La pantalla mostró tiempos de respuesta relativamente lentos en nuestros tests pero podría ser demasiado lenta para los jugones. En comparación, todos los dispositivos de prueba van de ##min### (mínimo) a 240 (máximo) ms. » 59 % de todos los dispositivos son mejores. Eso quiere decir que el tiempo de respuesta es peor que la media (19.8 ms) de todos los dispositivos testados. | ||
| ↔ Tiempo de respuesta 50% Gris a 80% Gris | ||
| 32.3 ms ... subida ↗ y bajada ↘ combinada | ↗ 14.8 ms subida | 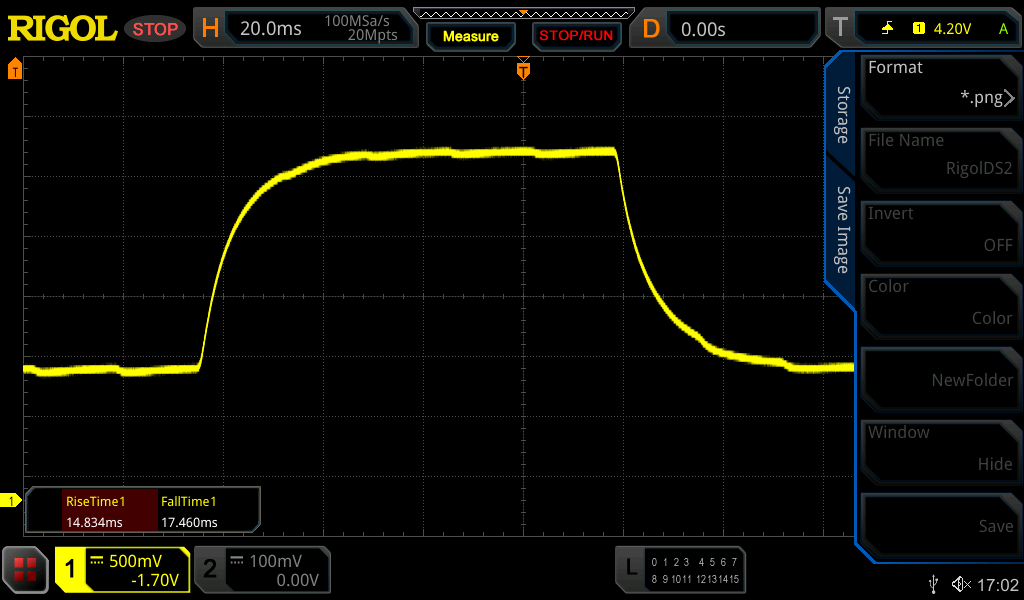 |
| ↘ 17.5 ms bajada | ||
| La pantalla mostró tiempos de respuesta lentos en nuestros tests y podría ser demasiado lenta para los jugones. En comparación, todos los dispositivos de prueba van de ##min### (mínimo) a 636 (máximo) ms. » 44 % de todos los dispositivos son mejores. Eso quiere decir que el tiempo de respuesta es similar al dispositivo testado medio (31 ms). | ||
Parpadeo de Pantalla / PWM (Pulse-Width Modulation)
| Parpadeo de Pantalla / PWM no detectado | 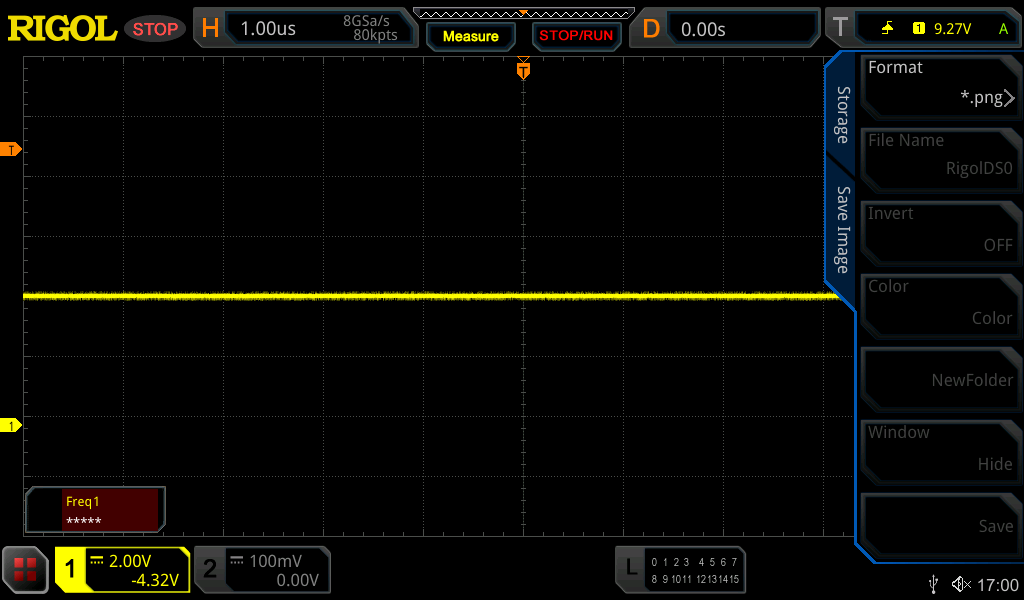 | ||
Comparación: 52 % de todos los dispositivos testados no usaron PWM para atenuar el display. Si se usó, medimos una media de 7754 (mínimo: 5 - máxmo: 343500) Hz. | |||
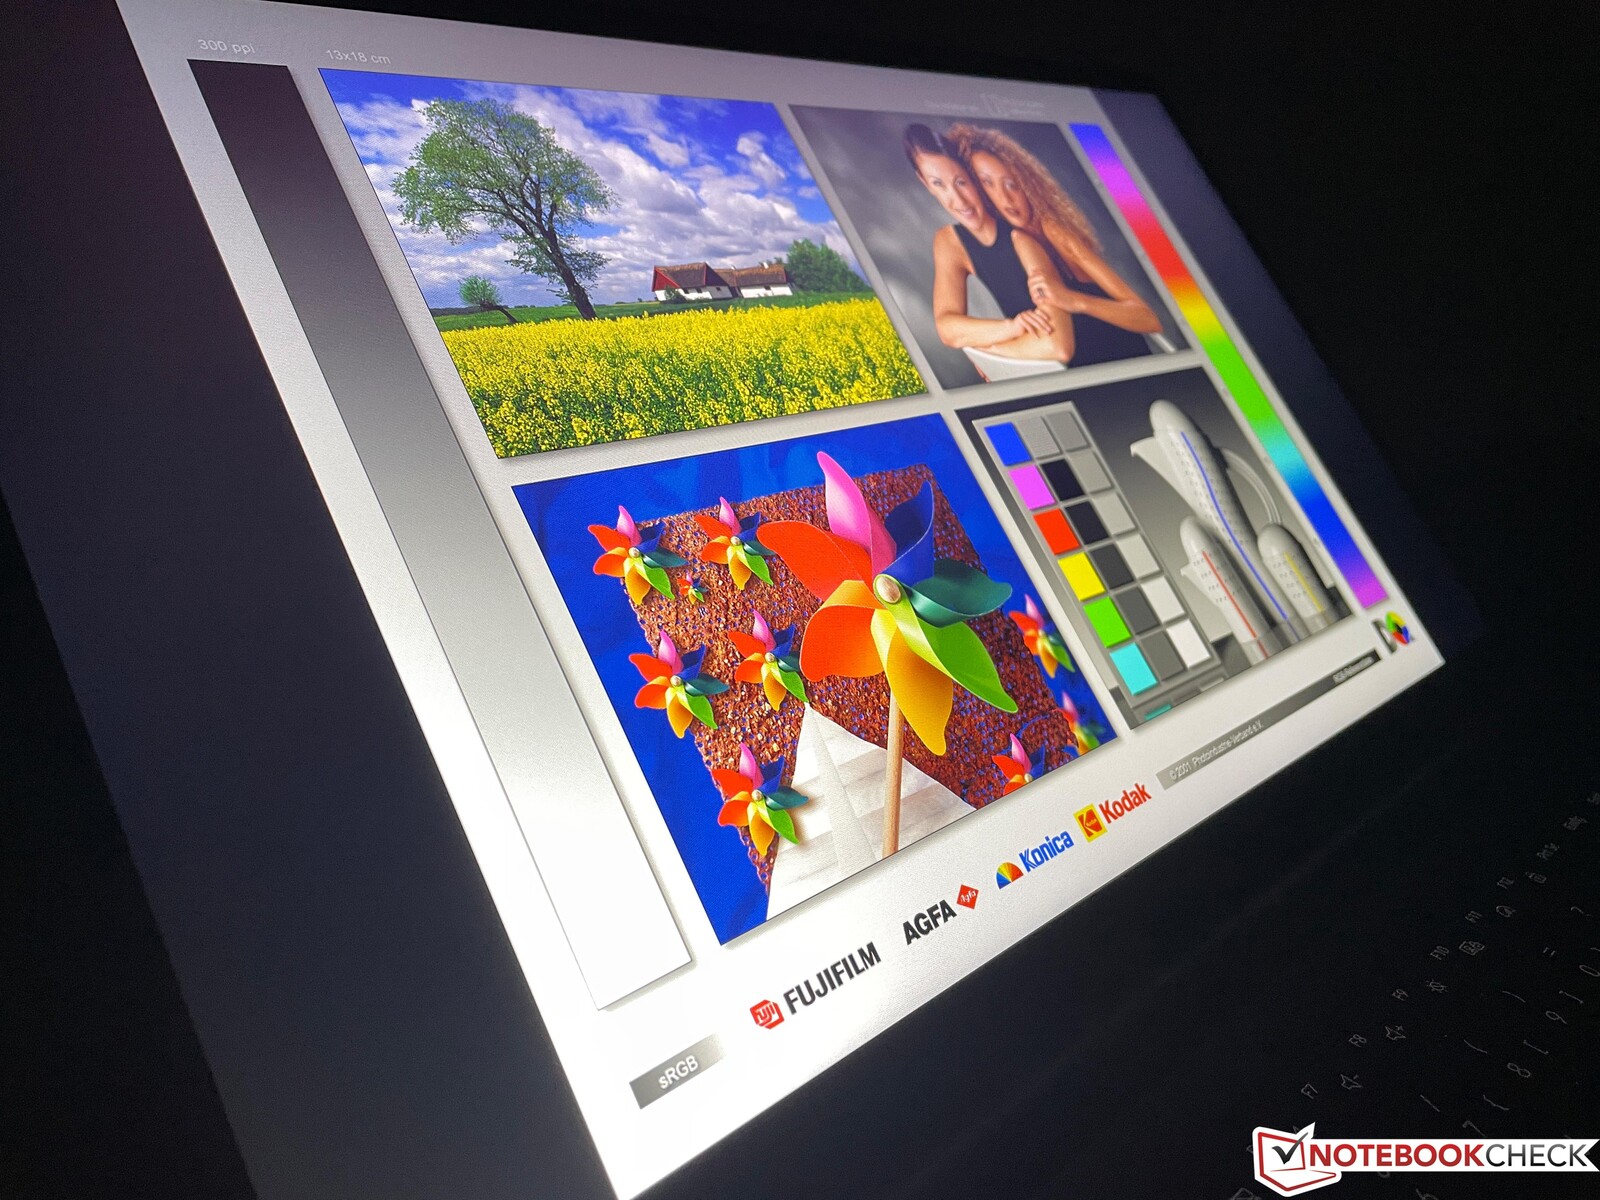
Gracias a su pantalla mate, el Galaxy Book2 15 es bastante cómodo de usar en exteriores, siempre y cuando se evite tener reflejos directos de fuentes de luz en la pantalla.
Rendimiento - Alder Lake-P con 20 vatios
Condiciones de la prueba
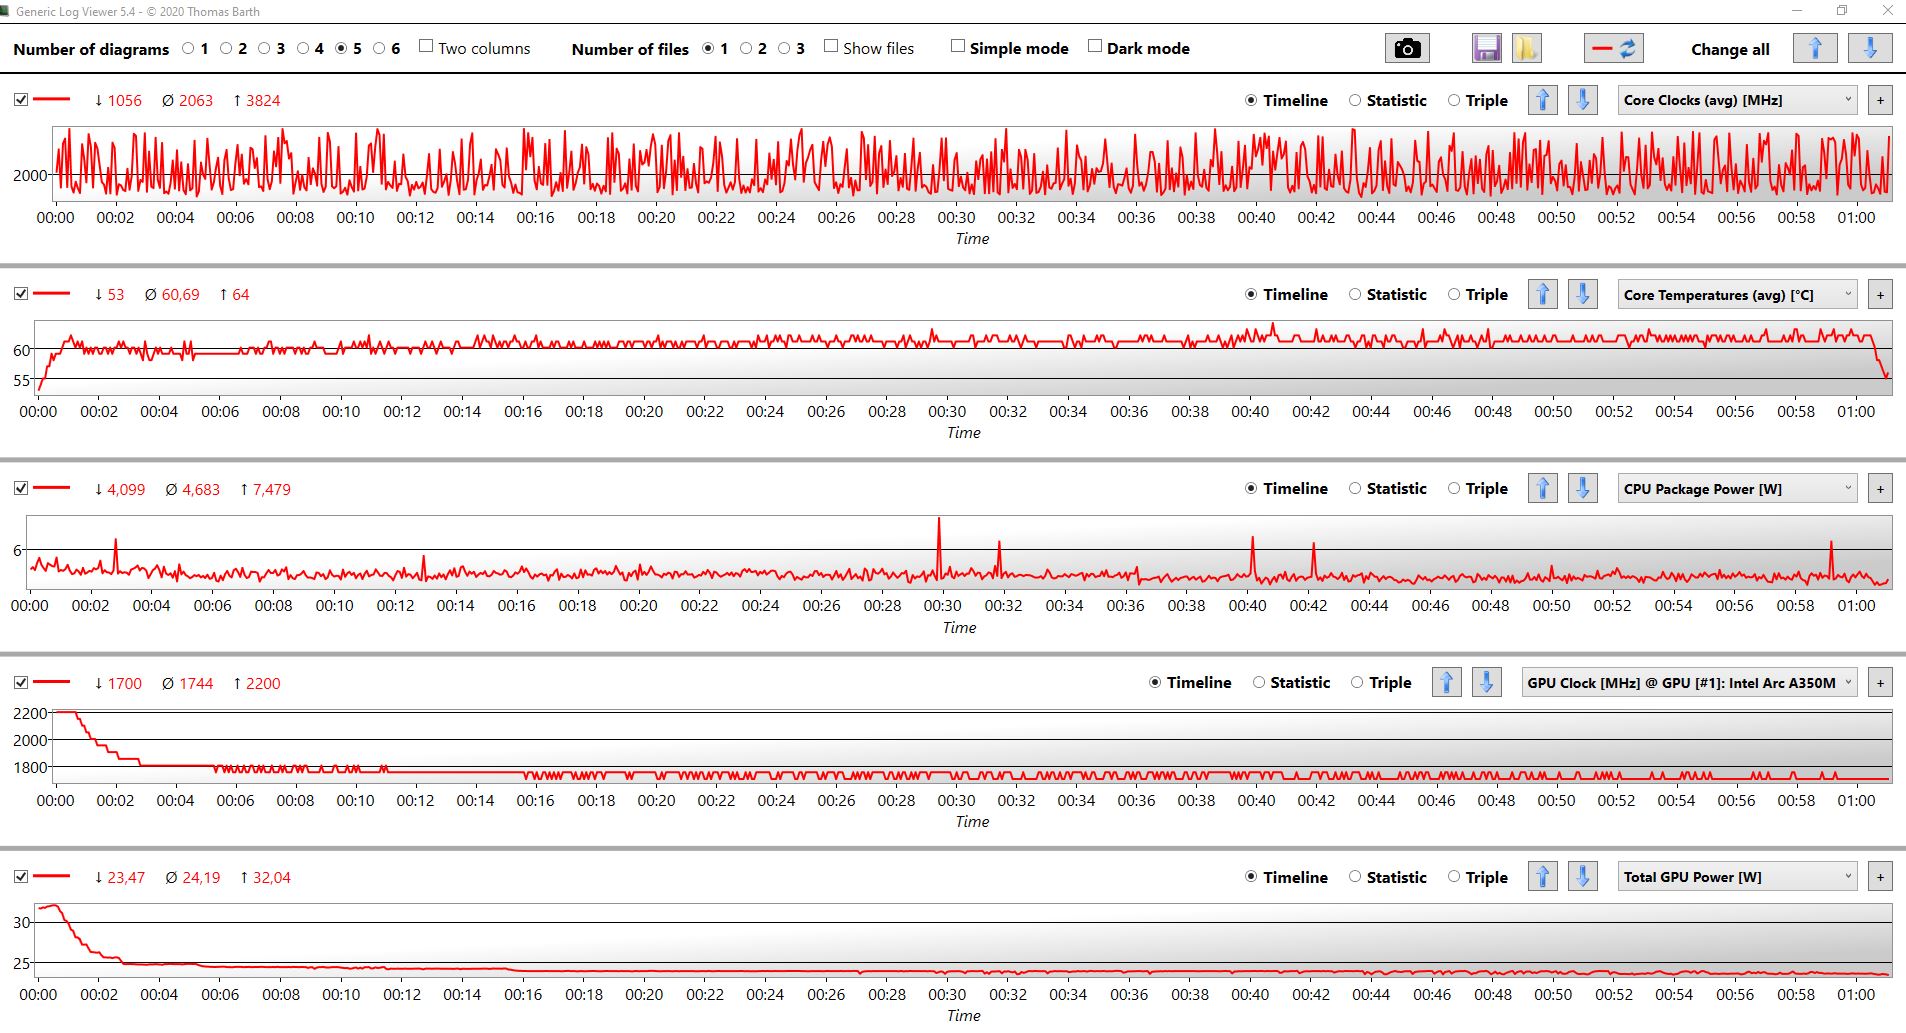
Samsung ofrece tres modos de energía diferentes que puedes seleccionar en la app Samsung Settings o pulsando Fn+F11 en el portátil. En la siguiente tabla, hemos listado los valores TDP del procesador y la tarjeta gráfica bajo carga constante para cada uno de los modos. Fundamentalmente, tanto la CPU como la GPU pudieron aprovechar los valores TDP más altos al principio de las pruebas, pero sólo durante un periodo muy corto.
| Silencioso | Optimizado | Alto rendimiento | |
|---|---|---|---|
| Carga de la CPU | 11,5 vatios | 17 vatios | 20 vatios |
| Carga de la GPU | 14 vatios | 20 vatios | 25 vatios |
| Prueba de estrés | CPU: 10 vatiosGPU : 13 vatios |
CPU: 8 vatiosGPU : 17 vatios |
CPU: 10 vatiosGPU :20 vatios |
Cuando miras estos valores y tienes en cuenta que el Core i7-1260P es un chip Alder Lake-P con un TDP nominal de 28 vatios, es bastante decepcionante que el sistema se quede muy por debajo de este TDP nominal incluso cuando sólo está bajo carga de CPU y está funcionando en modo de alto rendimiento. Ejecutamos las siguientes pruebas y mediciones en modo de alto rendimiento para al menos obtener el mejor rendimiento que el portátil puede ofrecer.
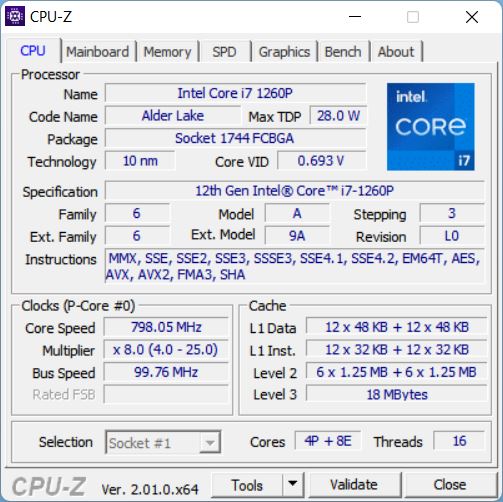
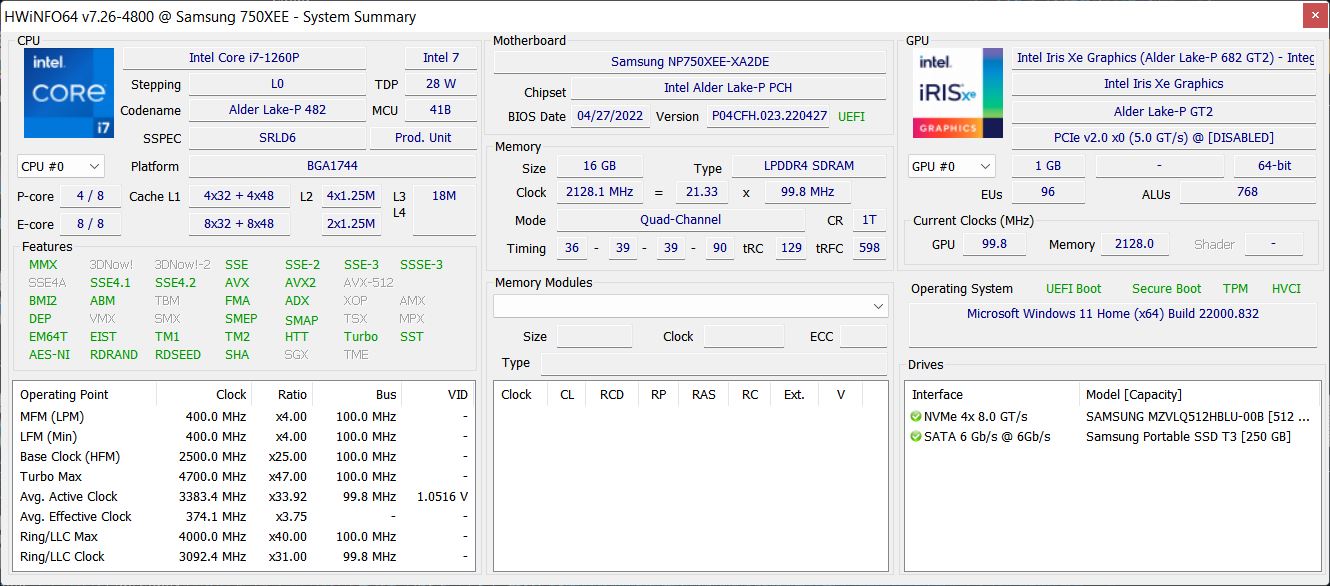
Procesador - Core i7-1260P
El Core i7-1260Pforma parte de la actual familia Alder Lake de Intel, que utiliza una arquitectura híbrida que combina núcleos de rendimiento y eficiencia. El Core i7-1260P cuenta con cuatro núcleos de rendimiento de alta velocidad (8 hilos) y ocho núcleos de eficiencia (8 hilos), lo que significa que es capaz de ejecutar hasta 16 hilos en paralelo. Intel limita el consumo máximo de los chips Alder Lake-P a 64 vatios. Pero, como ya hemos visto, los propios chips ni siquiera alcanzan su velocidad de reloj máxima con esa cantidad de energía. No obstante, los nuevos chips siguen rindiendo muy bien con un uso elevado de energía, aunque no sean los más eficientes.
Viendo los valores de TDP del Samsung Galaxy Book2 15, ya puedes imaginar que su procesador va a rendir bastante peor. En cualquier caso, la gestión de energía sigue necesitando cierta optimización porque los resultados pueden fluctuar drásticamente. Por ejemplo, obtuvimos puntuaciones entre unos 7.800 y 10.200 puntos en Cinebench R23 Multi sin ninguna diferencia en el procedimiento. Además, nos dimos cuenta de que el procesador sólo parece ser capaz de aprovechar los 35 vatios completos cuando se ejecutan benchmarks actuales como Cinebench R23 y R20. Incluso entonces, el rendimiento sigue fluctuando con frecuencia.
Cinebench R15 Multi Loop
Como era de esperar, el rendimiento de un solo núcleo es muy bueno. Con la energía de la batería, su rendimiento también fluctúa significativamente con un consumo de energía de 13-20 vatios. En general, se puede esperar un déficit de alrededor del 30%. Hay más pruebas de rendimiento de la CPU disponibles en esta página.
Cinebench R23: Multi Core | Single Core
Cinebench R20: CPU (Multi Core) | CPU (Single Core)
Cinebench R15: CPU Multi 64Bit | CPU Single 64Bit
Blender: v2.79 BMW27 CPU
7-Zip 18.03: 7z b 4 | 7z b 4 -mmt1
Geekbench 5.5: Multi-Core | Single-Core
HWBOT x265 Benchmark v2.2: 4k Preset
LibreOffice : 20 Documents To PDF
R Benchmark 2.5: Overall mean
| CPU Performance rating | |
| Media de la clase Multimedia | |
| Lenovo Yoga 9i 14 2022 i7-1260P | |
| Lenovo ThinkBook 15p G2 ITH 21B1000YGE | |
| Samsung Galaxy Book2 15 | |
| Medio Intel Core i7-1260P | |
| Dell Inspiron 15 Plus | |
| Asus Vivobook 15 K513EQ -2! | |
| HP Pavilion 15-eg -2! | |
| Samsung Galaxy Book NP750XDA -2! | |
| Cinebench R23 / Multi Core | |
| Media de la clase Multimedia (4861 - 33362, n=74, últimos 2 años) | |
| Lenovo ThinkBook 15p G2 ITH 21B1000YGE | |
| Lenovo Yoga 9i 14 2022 i7-1260P | |
| Samsung Galaxy Book2 15 | |
| Medio Intel Core i7-1260P (3173 - 12150, n=27) | |
| Dell Inspiron 15 Plus | |
| Asus Vivobook 15 K513EQ | |
| HP Pavilion 15-eg | |
| Cinebench R23 / Single Core | |
| Media de la clase Multimedia (1128 - 2459, n=66, últimos 2 años) | |
| Lenovo Yoga 9i 14 2022 i7-1260P | |
| Samsung Galaxy Book2 15 | |
| Medio Intel Core i7-1260P (1155 - 1812, n=25) | |
| HP Pavilion 15-eg | |
| Lenovo ThinkBook 15p G2 ITH 21B1000YGE | |
| Asus Vivobook 15 K513EQ | |
| Dell Inspiron 15 Plus | |
| Cinebench R20 / CPU (Multi Core) | |
| Media de la clase Multimedia (1887 - 12912, n=57, últimos 2 años) | |
| Lenovo ThinkBook 15p G2 ITH 21B1000YGE | |
| Lenovo Yoga 9i 14 2022 i7-1260P | |
| Samsung Galaxy Book2 15 | |
| Medio Intel Core i7-1260P (1234 - 4748, n=25) | |
| Dell Inspiron 15 Plus | |
| Asus Vivobook 15 K513EQ | |
| Samsung Galaxy Book NP750XDA | |
| HP Pavilion 15-eg | |
| Cinebench R20 / CPU (Single Core) | |
| Media de la clase Multimedia (425 - 853, n=57, últimos 2 años) | |
| Samsung Galaxy Book2 15 | |
| Lenovo Yoga 9i 14 2022 i7-1260P | |
| Medio Intel Core i7-1260P (448 - 698, n=25) | |
| Lenovo ThinkBook 15p G2 ITH 21B1000YGE | |
| HP Pavilion 15-eg | |
| Asus Vivobook 15 K513EQ | |
| Dell Inspiron 15 Plus | |
| Samsung Galaxy Book NP750XDA | |
| Cinebench R15 / CPU Multi 64Bit | |
| Media de la clase Multimedia (856 - 5224, n=61, últimos 2 años) | |
| Lenovo ThinkBook 15p G2 ITH 21B1000YGE | |
| Lenovo Yoga 9i 14 2022 i7-1260P | |
| Medio Intel Core i7-1260P (549 - 2034, n=29) | |
| Samsung Galaxy Book2 15 | |
| Dell Inspiron 15 Plus | |
| Asus Vivobook 15 K513EQ | |
| Samsung Galaxy Book NP750XDA | |
| HP Pavilion 15-eg | |
| Cinebench R15 / CPU Single 64Bit | |
| Media de la clase Multimedia (184.8 - 326, n=59, últimos 2 años) | |
| Samsung Galaxy Book2 15 | |
| Lenovo Yoga 9i 14 2022 i7-1260P | |
| Medio Intel Core i7-1260P (165.4 - 260, n=27) | |
| Lenovo ThinkBook 15p G2 ITH 21B1000YGE | |
| Asus Vivobook 15 K513EQ | |
| HP Pavilion 15-eg | |
| Dell Inspiron 15 Plus | |
| Samsung Galaxy Book NP750XDA | |
| Samsung Galaxy Book NP750XDA | |
| Blender / v2.79 BMW27 CPU | |
| HP Pavilion 15-eg | |
| Samsung Galaxy Book NP750XDA | |
| Asus Vivobook 15 K513EQ | |
| Dell Inspiron 15 Plus | |
| Medio Intel Core i7-1260P (264 - 906, n=26) | |
| Samsung Galaxy Book2 15 | |
| Lenovo Yoga 9i 14 2022 i7-1260P | |
| Lenovo ThinkBook 15p G2 ITH 21B1000YGE | |
| Media de la clase Multimedia (100 - 557, n=58, últimos 2 años) | |
| 7-Zip 18.03 / 7z b 4 | |
| Media de la clase Multimedia (26062 - 130368, n=55, últimos 2 años) | |
| Lenovo ThinkBook 15p G2 ITH 21B1000YGE | |
| Lenovo ThinkBook 15p G2 ITH 21B1000YGE | |
| Lenovo Yoga 9i 14 2022 i7-1260P | |
| Samsung Galaxy Book2 15 | |
| Medio Intel Core i7-1260P (16146 - 47064, n=25) | |
| Dell Inspiron 15 Plus | |
| Asus Vivobook 15 K513EQ | |
| Samsung Galaxy Book NP750XDA | |
| HP Pavilion 15-eg | |
| 7-Zip 18.03 / 7z b 4 -mmt1 | |
| Media de la clase Multimedia (3666 - 7545, n=56, últimos 2 años) | |
| Lenovo ThinkBook 15p G2 ITH 21B1000YGE | |
| Lenovo ThinkBook 15p G2 ITH 21B1000YGE | |
| Samsung Galaxy Book2 15 | |
| HP Pavilion 15-eg | |
| Asus Vivobook 15 K513EQ | |
| Medio Intel Core i7-1260P (4064 - 5791, n=25) | |
| Lenovo Yoga 9i 14 2022 i7-1260P | |
| Dell Inspiron 15 Plus | |
| Samsung Galaxy Book NP750XDA | |
| Geekbench 5.5 / Multi-Core | |
| Media de la clase Multimedia (4652 - 20422, n=56, últimos 2 años) | |
| Lenovo Yoga 9i 14 2022 i7-1260P | |
| Lenovo ThinkBook 15p G2 ITH 21B1000YGE | |
| Medio Intel Core i7-1260P (3866 - 10570, n=25) | |
| Samsung Galaxy Book2 15 | |
| Samsung Galaxy Book NP750XDA | |
| Dell Inspiron 15 Plus | |
| Geekbench 5.5 / Single-Core | |
| Media de la clase Multimedia (805 - 2974, n=56, últimos 2 años) | |
| Lenovo Yoga 9i 14 2022 i7-1260P | |
| Samsung Galaxy Book2 15 | |
| Medio Intel Core i7-1260P (1436 - 1786, n=25) | |
| Lenovo ThinkBook 15p G2 ITH 21B1000YGE | |
| Samsung Galaxy Book NP750XDA | |
| Dell Inspiron 15 Plus | |
| HWBOT x265 Benchmark v2.2 / 4k Preset | |
| Media de la clase Multimedia (5.26 - 36.1, n=56, últimos 2 años) | |
| Lenovo ThinkBook 15p G2 ITH 21B1000YGE | |
| Lenovo Yoga 9i 14 2022 i7-1260P | |
| Samsung Galaxy Book2 15 | |
| Medio Intel Core i7-1260P (3.45 - 13.6, n=26) | |
| Dell Inspiron 15 Plus | |
| Asus Vivobook 15 K513EQ | |
| HP Pavilion 15-eg | |
| Samsung Galaxy Book NP750XDA | |
| LibreOffice / 20 Documents To PDF | |
| Samsung Galaxy Book NP750XDA | |
| Dell Inspiron 15 Plus | |
| Media de la clase Multimedia (23.9 - 146.7, n=57, últimos 2 años) | |
| Medio Intel Core i7-1260P (40.2 - 65.7, n=25) | |
| Lenovo Yoga 9i 14 2022 i7-1260P | |
| Asus Vivobook 15 K513EQ | |
| HP Pavilion 15-eg | |
| Samsung Galaxy Book2 15 | |
| Lenovo ThinkBook 15p G2 ITH 21B1000YGE | |
| R Benchmark 2.5 / Overall mean | |
| Samsung Galaxy Book NP750XDA | |
| Dell Inspiron 15 Plus | |
| Asus Vivobook 15 K513EQ | |
| HP Pavilion 15-eg | |
| Lenovo ThinkBook 15p G2 ITH 21B1000YGE | |
| Medio Intel Core i7-1260P (0.4559 - 0.727, n=25) | |
| Lenovo Yoga 9i 14 2022 i7-1260P | |
| Samsung Galaxy Book2 15 | |
| Media de la clase Multimedia (0.3604 - 0.947, n=56, últimos 2 años) | |
* ... más pequeño es mejor
AIDA64: FP32 Ray-Trace | FPU Julia | CPU SHA3 | CPU Queen | FPU SinJulia | FPU Mandel | CPU AES | CPU ZLib | FP64 Ray-Trace | CPU PhotoWorxx
| Performance rating | |
| Media de la clase Multimedia | |
| Lenovo ThinkBook 15p G2 ITH 21B1000YGE | |
| Dell Inspiron 15 Plus | |
| Medio Intel Core i7-1260P | |
| Samsung Galaxy Book2 15 | |
| Asus Vivobook 15 K513EQ | |
| HP Pavilion 15-eg | |
| Samsung Galaxy Book NP750XDA -9! | |
| AIDA64 / FP32 Ray-Trace | |
| Media de la clase Multimedia (2214 - 50388, n=53, últimos 2 años) | |
| Lenovo ThinkBook 15p G2 ITH 21B1000YGE | |
| Dell Inspiron 15 Plus | |
| Asus Vivobook 15 K513EQ | |
| Medio Intel Core i7-1260P (2176 - 10898, n=26) | |
| HP Pavilion 15-eg | |
| Samsung Galaxy Book2 15 | |
| AIDA64 / FPU Julia | |
| Media de la clase Multimedia (12867 - 201874, n=54, últimos 2 años) | |
| Lenovo ThinkBook 15p G2 ITH 21B1000YGE | |
| Dell Inspiron 15 Plus | |
| Medio Intel Core i7-1260P (11015 - 56906, n=26) | |
| Asus Vivobook 15 K513EQ | |
| HP Pavilion 15-eg | |
| Samsung Galaxy Book2 15 | |
| AIDA64 / CPU SHA3 | |
| Lenovo ThinkBook 15p G2 ITH 21B1000YGE | |
| Media de la clase Multimedia (626 - 8623, n=54, últimos 2 años) | |
| Dell Inspiron 15 Plus | |
| Asus Vivobook 15 K513EQ | |
| HP Pavilion 15-eg | |
| Medio Intel Core i7-1260P (669 - 2709, n=26) | |
| Samsung Galaxy Book2 15 | |
| AIDA64 / CPU Queen | |
| Lenovo ThinkBook 15p G2 ITH 21B1000YGE | |
| Media de la clase Multimedia (13483 - 181505, n=41, últimos 2 años) | |
| Samsung Galaxy Book2 15 | |
| Medio Intel Core i7-1260P (42571 - 82493, n=26) | |
| Dell Inspiron 15 Plus | |
| HP Pavilion 15-eg | |
| Asus Vivobook 15 K513EQ | |
| AIDA64 / FPU SinJulia | |
| Lenovo ThinkBook 15p G2 ITH 21B1000YGE | |
| Media de la clase Multimedia (886 - 28794, n=54, últimos 2 años) | |
| Dell Inspiron 15 Plus | |
| Samsung Galaxy Book2 15 | |
| Medio Intel Core i7-1260P (2901 - 6975, n=26) | |
| Asus Vivobook 15 K513EQ | |
| HP Pavilion 15-eg | |
| AIDA64 / FPU Mandel | |
| Media de la clase Multimedia (6395 - 105740, n=53, últimos 2 años) | |
| Lenovo ThinkBook 15p G2 ITH 21B1000YGE | |
| Dell Inspiron 15 Plus | |
| Asus Vivobook 15 K513EQ | |
| Medio Intel Core i7-1260P (5950 - 26376, n=26) | |
| HP Pavilion 15-eg | |
| Samsung Galaxy Book2 15 | |
| AIDA64 / CPU AES | |
| Lenovo ThinkBook 15p G2 ITH 21B1000YGE | |
| Dell Inspiron 15 Plus | |
| Asus Vivobook 15 K513EQ | |
| Media de la clase Multimedia (8171 - 126790, n=54, últimos 2 años) | |
| HP Pavilion 15-eg | |
| Medio Intel Core i7-1260P (16041 - 92356, n=26) | |
| Samsung Galaxy Book2 15 | |
| AIDA64 / CPU ZLib | |
| Media de la clase Multimedia (143.8 - 2022, n=54, últimos 2 años) | |
| Lenovo ThinkBook 15p G2 ITH 21B1000YGE | |
| Samsung Galaxy Book2 15 | |
| Medio Intel Core i7-1260P (259 - 771, n=26) | |
| Dell Inspiron 15 Plus | |
| Asus Vivobook 15 K513EQ | |
| HP Pavilion 15-eg | |
| Samsung Galaxy Book NP750XDA | |
| AIDA64 / FP64 Ray-Trace | |
| Media de la clase Multimedia (1014 - 26875, n=54, últimos 2 años) | |
| Lenovo ThinkBook 15p G2 ITH 21B1000YGE | |
| Dell Inspiron 15 Plus | |
| Asus Vivobook 15 K513EQ | |
| Medio Intel Core i7-1260P (1237 - 5858, n=26) | |
| HP Pavilion 15-eg | |
| Samsung Galaxy Book2 15 | |
| AIDA64 / CPU PhotoWorxx | |
| Media de la clase Multimedia (8187 - 88154, n=54, últimos 2 años) | |
| Samsung Galaxy Book2 15 | |
| HP Pavilion 15-eg | |
| Medio Intel Core i7-1260P (13261 - 43652, n=26) | |
| Lenovo ThinkBook 15p G2 ITH 21B1000YGE | |
| Asus Vivobook 15 K513EQ | |
| Dell Inspiron 15 Plus | |
Rendimiento del sistema
A pesar de los bajos valores de TDP del Core i7-1260P, el Galaxy Book2 15 sigue siendo un portátil de gran respuesta gracias en parte a su SSD PCIe. No encontramos ningún problema durante nuestro análisis. Los resultados de las pruebas sintéticas son buenos. No obstante, vamos a ser algo cautelosos aquí porque el controlador para la nueva GPU Arc A350M Está muy optimizado para los benchmarks.
| PCMark 10 / Score | |
| Media de la clase Multimedia (4325 - 10386, n=52, últimos 2 años) | |
| Lenovo ThinkBook 15p G2 ITH 21B1000YGE | |
| HP Pavilion 15-eg | |
| Medio Intel Core i7-1260P, Intel Arc A350M (5486 - 5609, n=2) | |
| Samsung Galaxy Book2 15 | |
| Dell Inspiron 15 Plus | |
| Asus Vivobook 15 K513EQ | |
| Samsung Galaxy Book NP750XDA | |
| PCMark 10 / Essentials | |
| Media de la clase Multimedia (8025 - 11664, n=51, últimos 2 años) | |
| Samsung Galaxy Book2 15 | |
| HP Pavilion 15-eg | |
| Medio Intel Core i7-1260P, Intel Arc A350M (9411 - 9997, n=2) | |
| Lenovo ThinkBook 15p G2 ITH 21B1000YGE | |
| Asus Vivobook 15 K513EQ | |
| Samsung Galaxy Book NP750XDA | |
| Dell Inspiron 15 Plus | |
| PCMark 10 / Productivity | |
| Media de la clase Multimedia (7323 - 18233, n=51, últimos 2 años) | |
| HP Pavilion 15-eg | |
| Asus Vivobook 15 K513EQ | |
| Lenovo ThinkBook 15p G2 ITH 21B1000YGE | |
| Dell Inspiron 15 Plus | |
| Medio Intel Core i7-1260P, Intel Arc A350M (6714 - 6728, n=2) | |
| Samsung Galaxy Book2 15 | |
| Samsung Galaxy Book NP750XDA | |
| PCMark 10 / Digital Content Creation | |
| Media de la clase Multimedia (3651 - 16240, n=51, últimos 2 años) | |
| Lenovo ThinkBook 15p G2 ITH 21B1000YGE | |
| Medio Intel Core i7-1260P, Intel Arc A350M (6677 - 7562, n=2) | |
| Samsung Galaxy Book2 15 | |
| HP Pavilion 15-eg | |
| Dell Inspiron 15 Plus | |
| Samsung Galaxy Book NP750XDA | |
| Asus Vivobook 15 K513EQ | |
| PCMark 10 Score | 5486 puntos | |
ayuda | ||
| AIDA64 / Memory Copy | |
| Media de la clase Multimedia (11299 - 132135, n=54, últimos 2 años) | |
| Samsung Galaxy Book2 15 | |
| Medio Intel Core i7-1260P (25125 - 71544, n=25) | |
| Lenovo ThinkBook 15p G2 ITH 21B1000YGE | |
| HP Pavilion 15-eg | |
| Asus Vivobook 15 K513EQ | |
| Dell Inspiron 15 Plus | |
| AIDA64 / Memory Read | |
| Media de la clase Multimedia (11624 - 174586, n=54, últimos 2 años) | |
| Samsung Galaxy Book2 15 | |
| Medio Intel Core i7-1260P (24983 - 72065, n=25) | |
| Lenovo ThinkBook 15p G2 ITH 21B1000YGE | |
| HP Pavilion 15-eg | |
| Asus Vivobook 15 K513EQ | |
| Dell Inspiron 15 Plus | |
| AIDA64 / Memory Write | |
| Media de la clase Multimedia (11755 - 134998, n=54, últimos 2 años) | |
| Samsung Galaxy Book2 15 | |
| Medio Intel Core i7-1260P (23512 - 66799, n=25) | |
| HP Pavilion 15-eg | |
| Lenovo ThinkBook 15p G2 ITH 21B1000YGE | |
| Asus Vivobook 15 K513EQ | |
| Dell Inspiron 15 Plus | |
| AIDA64 / Memory Latency | |
| Media de la clase Multimedia (7 - 535, n=53, últimos 2 años) | |
| Dell Inspiron 15 Plus | |
| Asus Vivobook 15 K513EQ | |
| Medio Intel Core i7-1260P (77.9 - 118.4, n=21) | |
| Lenovo ThinkBook 15p G2 ITH 21B1000YGE | |
| HP Pavilion 15-eg | |
| Samsung Galaxy Book NP750XDA | |
| Samsung Galaxy Book2 15 | |
* ... más pequeño es mejor
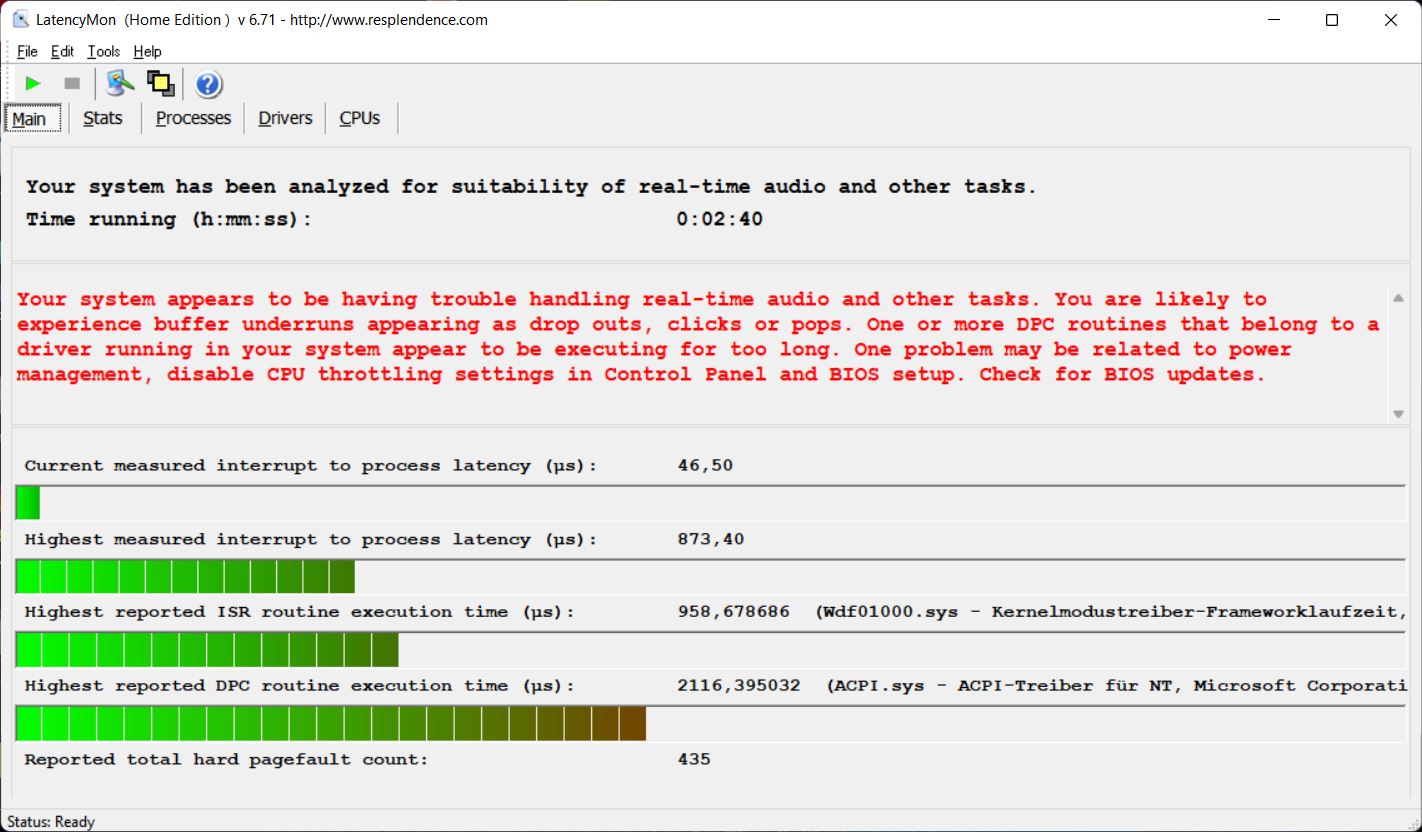
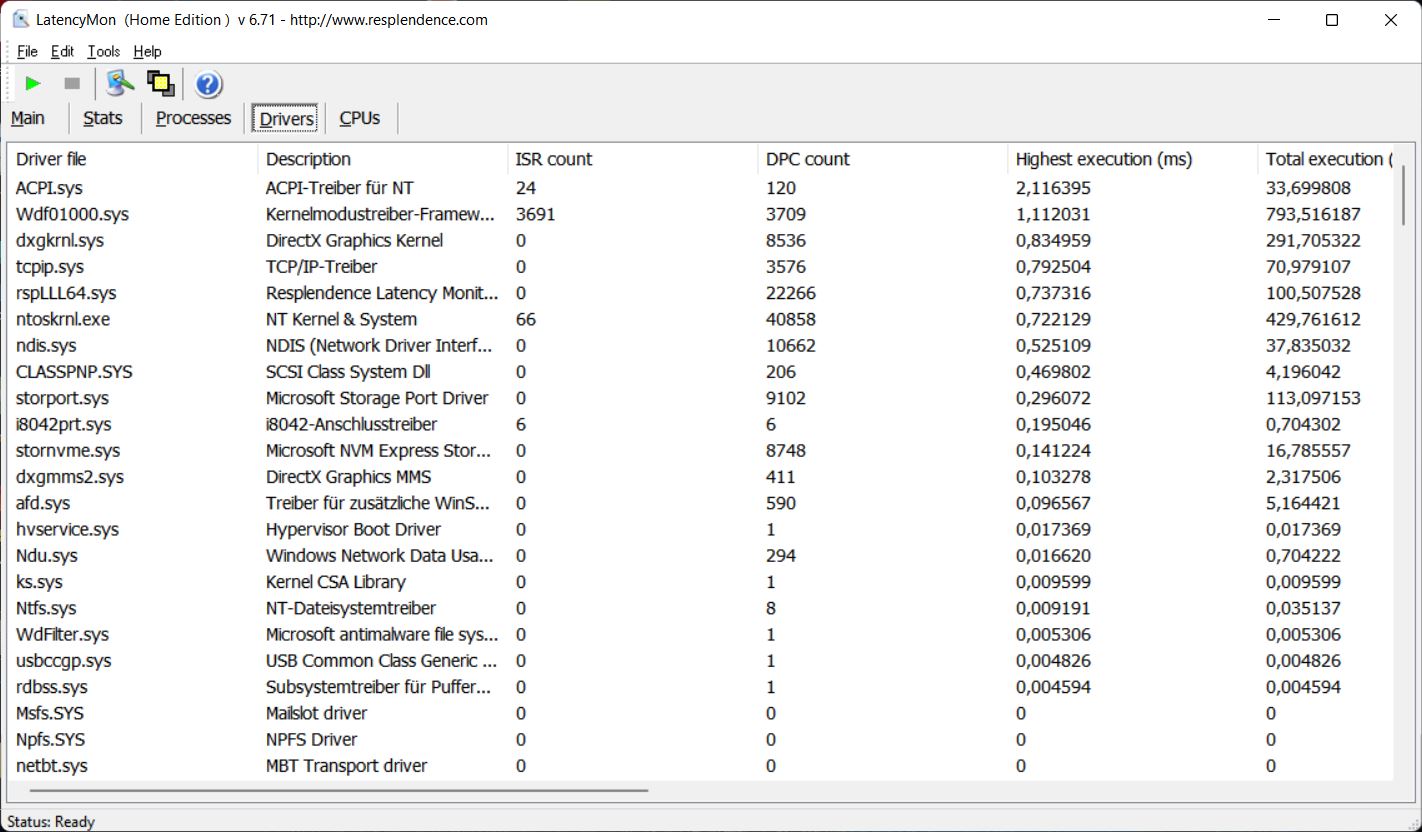
Latencia del CPD
En nuestra prueba de latencia estandarizada (navegación por Internet, reproducción de vídeo 4K en YouTube, carga de la CPU), el Galaxy Book2 mostró algunas limitaciones en la versión actual de la BIOS y, por tanto, no es óptimo para ejecutar aplicaciones de audio en tiempo real.
| DPC Latencies / LatencyMon - interrupt to process latency (max), Web, Youtube, Prime95 | |
| Asus Vivobook 15 K513EQ | |
| HP Pavilion 15-eg | |
| Dell Inspiron 15 Plus | |
| Samsung Galaxy Book NP750XDA | |
| Samsung Galaxy Book2 15 | |
| Lenovo ThinkBook 15p G2 ITH 21B1000YGE | |
* ... más pequeño es mejor
Dispositivos de almacenamiento
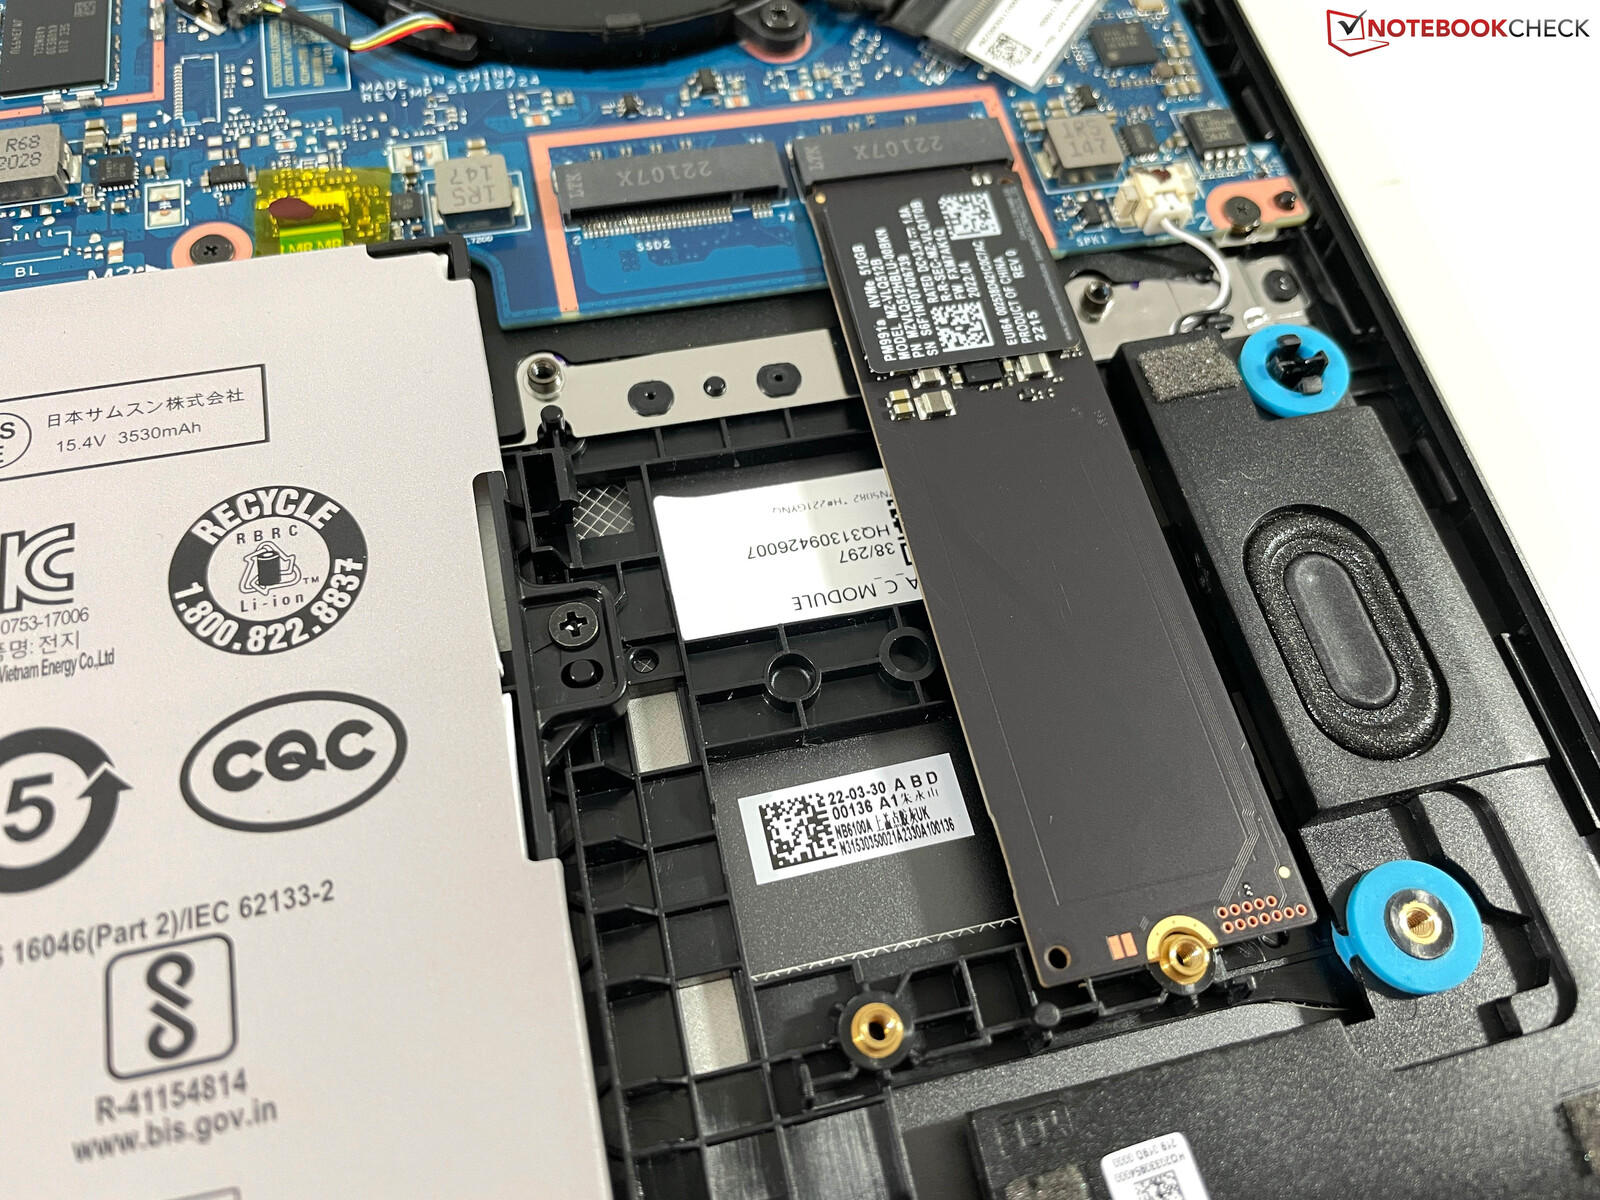
Como era de esperar, Samsung puso su propio SSD en el portátil. El PM991 tiene una capacidad de almacenamiento de 512 GB, de los cuales 413 GB están disponibles tras la configuración inicial. Durante nuestras pruebas, el SSD PCIe 3.0 x4 consiguió ofrecer tasas de transferencia de hasta unos 2 GB/s. Aunque el Galaxy Book2 no va a batir ningún récord con esto, la unidad es lo suficientemente buena para el uso diario y su rendimiento se mantiene estable. Gracias a la segunda ranura para SSD, la capacidad de almacenamiento del portátil puede ampliarse fácilmente según las necesidades. Haz clic en aquí para ver más pruebas comparativas de SSD.

* ... más pequeño es mejor
Disk Throttling: DiskSpd Read Loop, Queue Depth 8
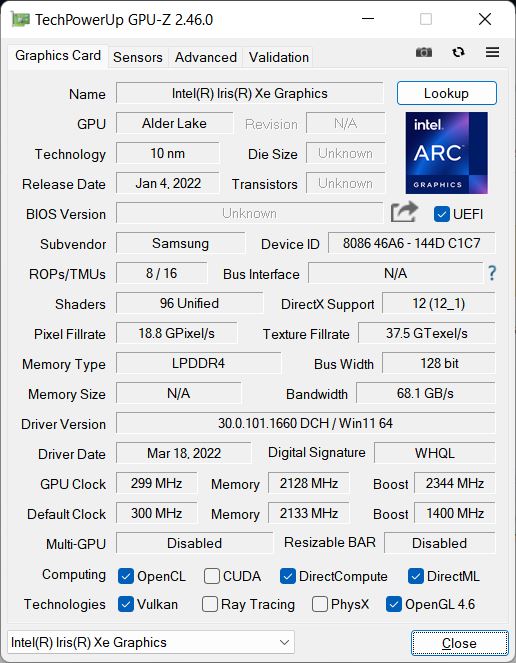
Tarjeta gráfica
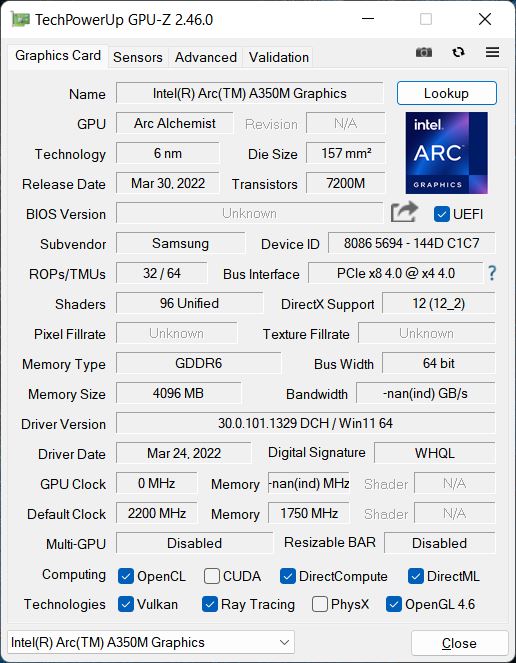
El Arc A350M es la nueva GPU básica de la gama de Intel que ofrece 6 núcleos Xe y 6 unidades de trazado de rayos con una velocidad de reloj máxima de 1.150 MHz. La Arc A350M puede ser configurada por los fabricantes para consumir entre 25 y 35 vatios de energía y tiene 4 GB de VRAM GDDR6 (64 bits).
En nuestras pruebas, la GPU alcanzó un consumo máximo de 35 vatios, pero rápidamente se estabilizó en 25-28 vatios. Hasta ahora, sólo habíamos observado este comportamiento en CPUs, mientras que las GPUs suelen tener un consumo de energía estable. Como resultado, la GPU no ofrece un rendimiento estable y falló la prueba de estrés de Time Spy con una puntuación del 92,9%.
En las pruebas sintéticas, el Arc A350M suele ofrecer buenos resultados y a menudo rinde mejor que otros productos de la competencia, como el NvidiaGeForce MX550y la AMD integradaRadeon 680M integrada. Esto es algo que ya hemos visto en nuestro análisis detallado de la GPU. Con la batería, el rendimiento de la GPU no es estable porque su consumo de energía fluctúa entre 14 y 32 vatios. Puedes encontrar más pruebas y benchmarks de la GPU en nuestra página de comparación.
| 3DMark 06 Standard Score | 31625 puntos | |
| 3DMark Vantage P Result | 31023 puntos | |
| 3DMark 11 Performance | 10123 puntos | |
| 3DMark Cloud Gate Standard Score | 26328 puntos | |
| 3DMark Fire Strike Score | 6009 puntos | |
| 3DMark Time Spy Score | 2976 puntos | |
ayuda | ||
Rendimiento de los juegos
En las pruebas de juego reales, no queda mucho del buen rendimiento visto en las pruebas sintéticas. El Arc A350M casi siempre quedó por detrás del Nvidia GeForce MX550 y, a veces, incluso se comportó peor que el integrado AMD Radeon 680M integrada. En algunos casos, esta nueva GPU dedicada ni siquiera rindió mucho mejor que las versiones más rápidas de la Iris Xe Graphics G7 integrada con 96 EUs.
| F1 2021 | |
| 1920x1080 Medium Preset AA:T AF:16x | |
| Asus Zenbook S 13 OLED | |
| Lenovo IdeaCentre AIO 3 24IAP7 | |
| Samsung Galaxy Book2 15 | |
| Medio Intel Arc A350M (n=1) | |
| 1920x1080 High Preset AA:T AF:16x | |
| Asus Zenbook S 13 OLED | |
| Lenovo IdeaCentre AIO 3 24IAP7 | |
| Samsung Galaxy Book2 15 | |
| Medio Intel Arc A350M (n=1) | |
Nuestro bucle Witcher 3 mostró que la GPU no era capaz de mantener su rendimiento inicial, pero no mostró más fluctuaciones de rendimiento posteriormente. Es difícil jugar a juegos con la batería porque el portátil experimenta constantemente caídas de FPS.
Witcher 3 FPS graph
| bajo | medio | alto | ultra | |
|---|---|---|---|---|
| GTA V (2015) | 134.5 | 109.3 | 36.5 | 14.7 |
| The Witcher 3 (2015) | 120 | 76 | 41 | 18.4 |
| Dota 2 Reborn (2015) | 102.9 | 83.5 | 63.9 | 62.1 |
| Final Fantasy XV Benchmark (2018) | 59.3 | 29.8 | 20.7 | |
| X-Plane 11.11 (2018) | 33.9 | 29.4 | 25.8 | |
| Far Cry 5 (2018) | 65 | 39 | 37 | 35 |
| Strange Brigade (2018) | 138 | 59.8 | 47.4 | 40.9 |
| F1 2021 (2021) | 166.6 | 63.8 | 52.2 | 21.1 |
| Farming Simulator 22 (2021) | 121 | 63 | 47 | 43 |
| God of War (2022) | 22 | 18 | 15 | 11 |
| GRID Legends (2022) | 78 | 56 | 41 | 28 |
| Cyberpunk 2077 1.6 (2022) | 27.4 | 18.5 | 16.2 | 11.6 |
| Ghostwire Tokyo (2022) | 32.2 | 30.6 | 29.6 | 29.2 |
Emisiones - Ventiladores ruidosos
Emisiones acústicas
Los dos ventiladores a veces empiezan a funcionar sin razón aparente mientras el portátil está en reposo. Además, pueden acelerar hasta la velocidad máxima (determinada en base al modo de energía seleccionado) en unos pocos segundos más o menos, independientemente de la carga. En el modo de alto rendimiento, el ruido del ventilador alcanzó unos muy audibles 47,5 dB(A). En los modos Optimizado y Silencioso, los niveles máximos fueron de 41,3 dB(A) y 37,2 dB(A) respectivamente. No notamos ningún otro ruido de la electrónica.
Ruido
| Ocioso |
| 24.3 / 24.3 / 29.8 dB(A) |
| Carga |
| 47.5 / 47.5 dB(A) |
 | ||
30 dB silencioso 40 dB(A) audible 50 dB(A) ruidosamente alto |
||
min: | ||
| Samsung Galaxy Book2 15 A350M, i7-1260P, Samsung PM991 MZVLQ512HBLU | Dell Inspiron 15 Plus GeForce RTX 3050 4GB Laptop GPU, i5-11400H, Micron 2450 512GB MTFDKBA512TFK | Asus Vivobook 15 K513EQ GeForce MX350, i7-1165G7, Intel SSD 660p SSDPEKNW512G8 | Lenovo ThinkBook 15p G2 ITH 21B1000YGE GeForce RTX 3050 Ti Laptop GPU, i7-11800H, Samsung PM9A1 MZVL21T0HCLR | HP Pavilion 15-eg GeForce MX450, i7-1165G7, Samsung PM991 MZVLQ1T0HALB | Samsung Galaxy Book NP750XDA Iris Xe G7 80EUs, i5-1135G7, Lite-On CL1-8D512 | |
|---|---|---|---|---|---|---|
| Noise | -5% | 8% | 4% | 7% | 1% | |
| apagado / medio ambiente * (dB) | 24.3 | 26 -7% | 23.4 4% | 26.15 -8% | 25.4 -5% | 26 -7% |
| Idle Minimum * (dB) | 24.3 | 26 -7% | 23.6 3% | 26.15 -8% | 25.6 -5% | 26 -7% |
| Idle Average * (dB) | 24.3 | 28 -15% | 23.6 3% | 26.15 -8% | 25.6 -5% | 26 -7% |
| Idle Maximum * (dB) | 29.8 | 32 -7% | 23.6 21% | 26.15 12% | 25.6 14% | 26 13% |
| Load Average * (dB) | 47.5 | 47 1% | 41 14% | 33.34 30% | 39.2 17% | 43.3 9% |
| Witcher 3 ultra * (dB) | 47.5 | 46 3% | 42.9 10% | 44.64 6% | 39.1 18% | |
| Load Maximum * (dB) | 47.5 | 48 -1% | 47 1% | 45.79 4% | 41.5 13% | 45.7 4% |
* ... más pequeño es mejor
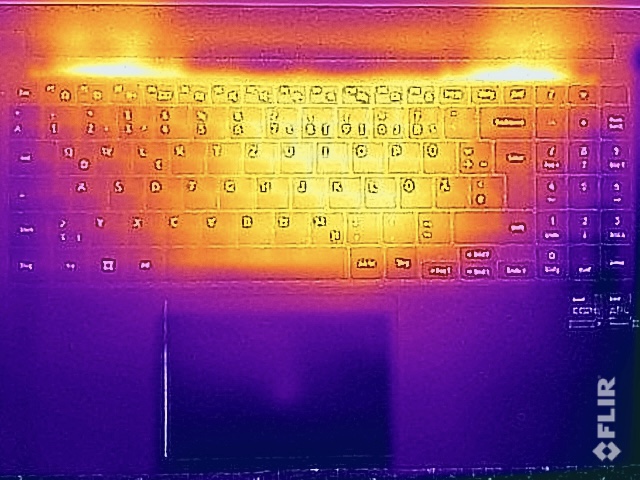
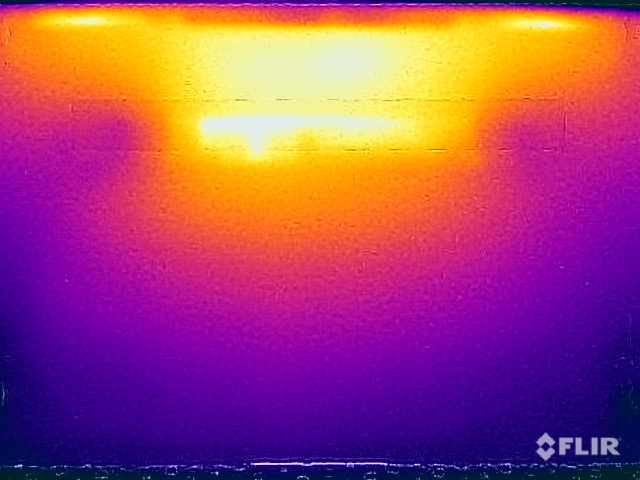
Temperatura
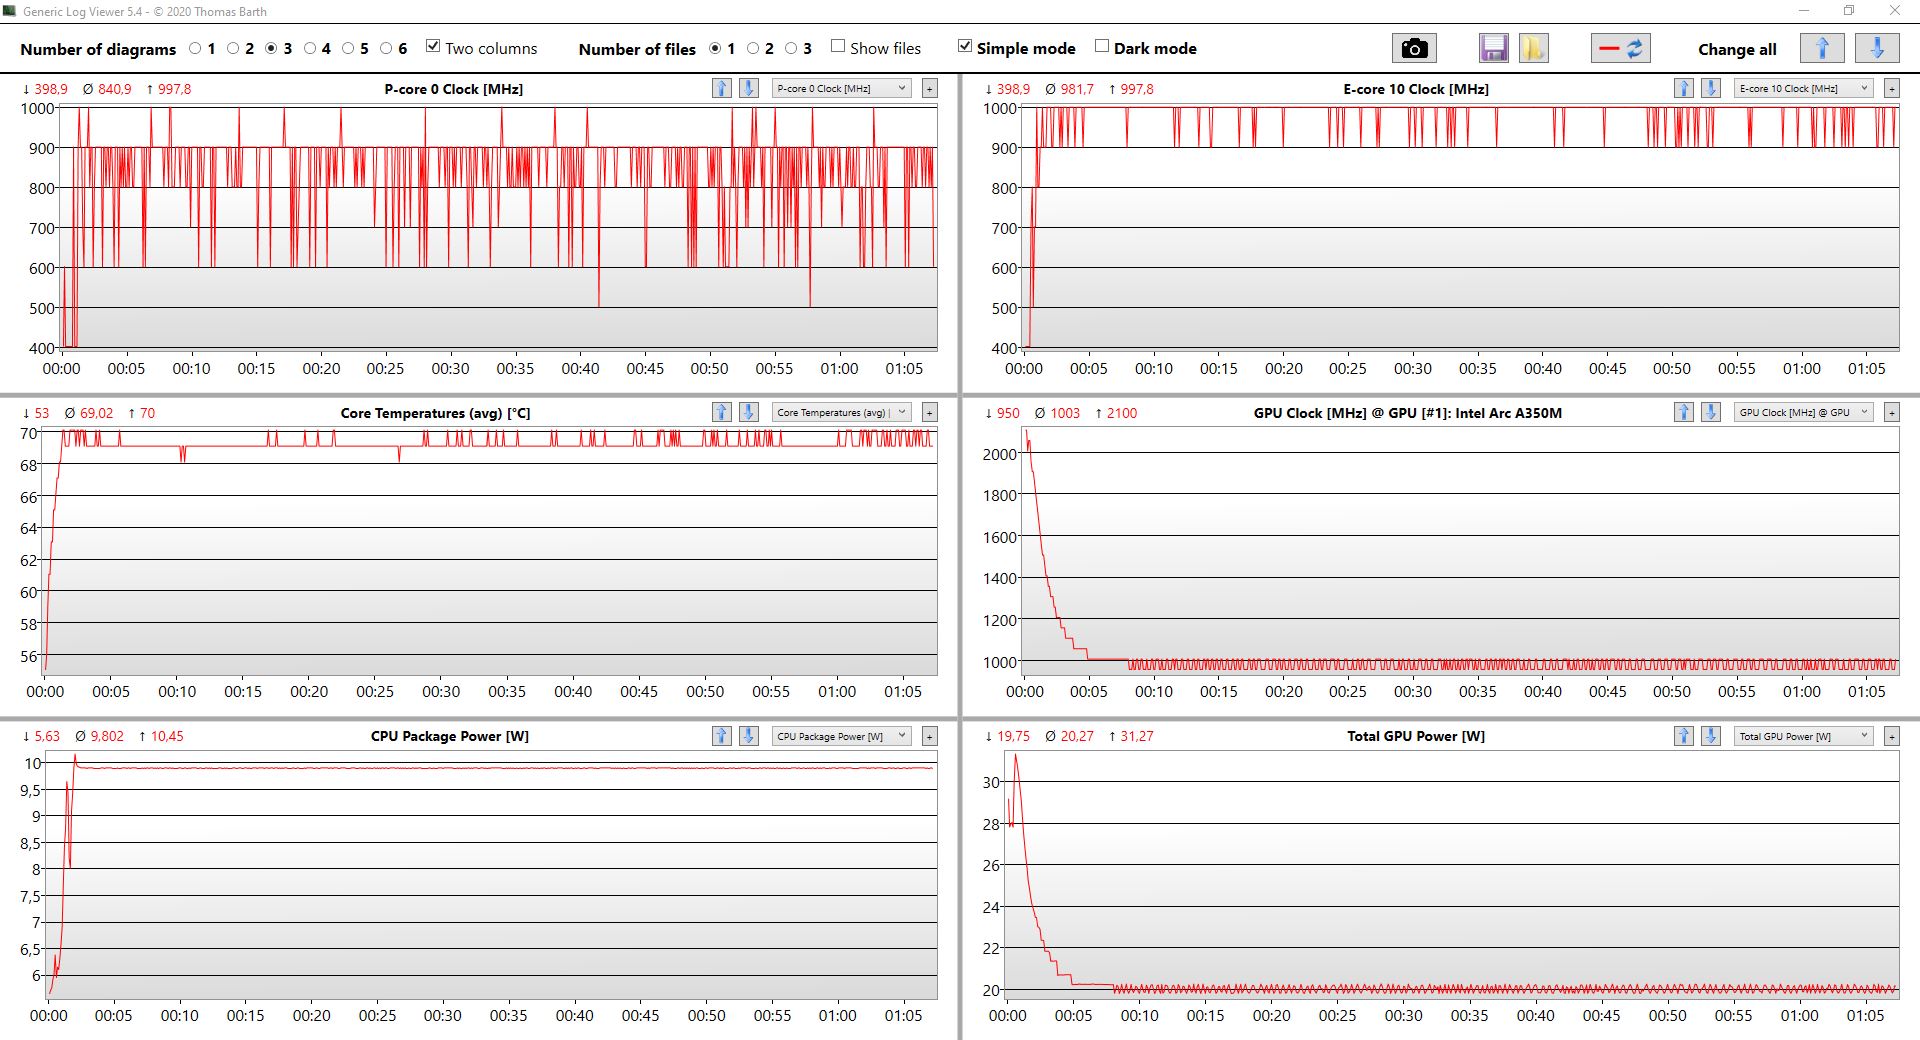
El portátil no tiene ningún problema térmico. Todo el chasis se mantiene fresco cuando el dispositivo realiza tareas menos exigentes. Incluso a plena carga, sólo medimos una temperatura superficial máxima de 47°C en un punto caliente de la parte inferior, situado en el centro hacia la parte trasera. No obstante, puedes colocar el dispositivo sobre tu regazo cuando se calienta tanto. Durante la prueba de estrés, tanto la CPU como la GPU experimentaron una importante ralentización porque su consumo de energía se limitó a sólo 10 y 20 vatios respectivamente.
(±) La temperatura máxima en la parte superior es de 44.6 °C / 112 F, frente a la media de 36.8 °C / 98 F, que oscila entre 21 y 71 °C para la clase Multimedia.
(-) El fondo se calienta hasta un máximo de 47.5 °C / 118 F, frente a la media de 39.1 °C / 102 F
(+) En reposo, la temperatura media de la parte superior es de 25 °C / 77# F, frente a la media del dispositivo de 31.3 °C / 88 F.
(±) Jugando a The Witcher 3, la temperatura media de la parte superior es de 36.1 °C / 97 F, frente a la media del dispositivo de 31.3 °C / 88 F.
(+) El reposamanos y el panel táctil están a una temperatura inferior a la de la piel, con un máximo de 27.5 °C / 81.5 F y, por tanto, son fríos al tacto.
(±) La temperatura media de la zona del reposamanos de dispositivos similares fue de 28.7 °C / 83.7 F (+1.2 °C / 2.2 F).
| Samsung Galaxy Book2 15 Intel Core i7-1260P, Intel Arc A350M | Dell Inspiron 15 Plus Intel Core i5-11400H, NVIDIA GeForce RTX 3050 4GB Laptop GPU | Asus Vivobook 15 K513EQ Intel Core i7-1165G7, NVIDIA GeForce MX350 | Lenovo ThinkBook 15p G2 ITH 21B1000YGE Intel Core i7-11800H, NVIDIA GeForce RTX 3050 Ti Laptop GPU | HP Pavilion 15-eg Intel Core i7-1165G7, NVIDIA GeForce MX450 | Samsung Galaxy Book NP750XDA Intel Core i5-1135G7, Intel Iris Xe Graphics G7 80EUs | |
|---|---|---|---|---|---|---|
| Heat | -26% | -12% | -13% | -7% | -4% | |
| Maximum Upper Side * (°C) | 44.6 | 50 -12% | 48.8 -9% | 42.8 4% | 44 1% | 46.5 -4% |
| Maximum Bottom * (°C) | 47.5 | 51 -7% | 42 12% | 48.6 -2% | 53.4 -12% | 44.8 6% |
| Idle Upper Side * (°C) | 25.8 | 38 -47% | 30 -16% | 36 -40% | 27.4 -6% | 27.8 -8% |
| Idle Bottom * (°C) | 26.1 | 36 -38% | 35 -34% | 29.2 -12% | 28.8 -10% | 28.3 -8% |
* ... más pequeño es mejor
Altavoces
Los dos altavoces estéreo sólo ofrecen un rendimiento medio y suenan muy finos y algo metálicos en comparación con los portátiles multimedia de gama alta. Son lo suficientemente buenos para vídeos ocasionales o un poco de música de fondo, pero es posible que quieras usar altavoces externos o un par de auriculares si buscas una mejor calidad de audio.
Samsung Galaxy Book2 15 análisis de audio
(±) | la sonoridad del altavoz es media pero buena (76.1 dB)
Graves 100 - 315 Hz
(-) | casi sin bajos - de media 18.5% inferior a la mediana
(±) | la linealidad de los graves es media (12% delta a frecuencia anterior)
Medios 400 - 2000 Hz
(+) | medios equilibrados - a sólo 4.2% de la mediana
(±) | la linealidad de los medios es media (7.2% delta respecto a la frecuencia anterior)
Altos 2 - 16 kHz
(+) | máximos equilibrados - a sólo 3.9% de la mediana
(+) | los máximos son lineales (6.2% delta a la frecuencia anterior)
Total 100 - 16.000 Hz
(±) | la linealidad del sonido global es media (18.3% de diferencia con la mediana)
En comparación con la misma clase
» 56% de todos los dispositivos probados de esta clase eran mejores, 7% similares, 38% peores
» El mejor tuvo un delta de 5%, la media fue 17%, el peor fue ###max##%
En comparación con todos los dispositivos probados
» 40% de todos los dispositivos probados eran mejores, 8% similares, 52% peores
» El mejor tuvo un delta de 4%, la media fue 23%, el peor fue ###max##%
Lenovo ThinkBook 15p G2 ITH 21B1000YGE análisis de audio
(-) | altavoces no muy altos (#68.4 dB)
Graves 100 - 315 Hz
(-) | casi sin bajos - de media 15.3% inferior a la mediana
(-) | los graves no son lineales (16.1% delta a la frecuencia anterior)
Medios 400 - 2000 Hz
(+) | medios equilibrados - a sólo 1.9% de la mediana
(+) | los medios son lineales (6.2% delta a la frecuencia anterior)
Altos 2 - 16 kHz
(+) | máximos equilibrados - a sólo 2.5% de la mediana
(±) | la linealidad de los máximos es media (7.4% delta a frecuencia anterior)
Total 100 - 16.000 Hz
(±) | la linealidad del sonido global es media (17% de diferencia con la mediana)
En comparación con la misma clase
» 46% de todos los dispositivos probados de esta clase eran mejores, 7% similares, 46% peores
» El mejor tuvo un delta de 5%, la media fue 17%, el peor fue ###max##%
En comparación con todos los dispositivos probados
» 31% de todos los dispositivos probados eran mejores, 8% similares, 61% peores
» El mejor tuvo un delta de 4%, la media fue 23%, el peor fue ###max##%
Gestión de la energía: portátil multimedia con buena duración de la batería
Consumo de energía
En reposo, el Galaxy Book2 es muy eficiente para un dispositivo de 15 pulgadas y sólo requiere 8,5 vatios con el brillo máximo de la pantalla. Bajo carga, puedes esperar un uso de energía de unos 55-60 vatios, lo que significa que el cargador de pared de 65 vatios es apenas adecuado para el portátil.
| Off / Standby | |
| Ocioso | |
| Carga |
|
Clave:
min: | |
| Samsung Galaxy Book2 15 i7-1260P, A350M, Samsung PM991 MZVLQ512HBLU, IPS, 1920x1080, 15.6" | Dell Inspiron 15 Plus i5-11400H, GeForce RTX 3050 4GB Laptop GPU, Micron 2450 512GB MTFDKBA512TFK, IPS, 1920x1080, 15.6" | Asus Vivobook 15 K513EQ i7-1165G7, GeForce MX350, Intel SSD 660p SSDPEKNW512G8, OLED, 1920x1080, 15.6" | Lenovo ThinkBook 15p G2 ITH 21B1000YGE i7-11800H, GeForce RTX 3050 Ti Laptop GPU, Samsung PM9A1 MZVL21T0HCLR, IPS, 3840x2160, 15.6" | HP Pavilion 15-eg i7-1165G7, GeForce MX450, Samsung PM991 MZVLQ1T0HALB, IPS, 1920x1080, 15.6" | Samsung Galaxy Book NP750XDA i5-1135G7, Iris Xe G7 80EUs, Lite-On CL1-8D512, IPS, 1920x1080, 15.6" | Medio Intel Arc A350M | Media de la clase Multimedia | |
|---|---|---|---|---|---|---|---|---|
| Power Consumption | -82% | 2% | -113% | -17% | 16% | -17% | -42% | |
| Idle Minimum * (Watt) | 4 | 9 -125% | 3.7 7% | 10.69 -167% | 4.9 -23% | 3.5 12% | 5.25 ? -31% | 5.66 ? -42% |
| Idle Average * (Watt) | 7.8 | 11 -41% | 6.3 19% | 17.85 -129% | 7.9 -1% | 8 -3% | 7.7 ? 1% | 10.2 ? -31% |
| Idle Maximum * (Watt) | 8.5 | 15 -76% | 9.7 -14% | 18.67 -120% | 14.2 -67% | 9.4 -11% | 9.15 ? -8% | 12.5 ? -47% |
| Load Average * (Watt) | 59.1 | 97 -64% | 59 -0% | 98.17 -66% | 64.3 -9% | 37.8 36% | 72.1 ? -22% | 65.2 ? -10% |
| Witcher 3 ultra * (Watt) | 56.7 | 100.1 -77% | 51.4 9% | 100 -76% | 55.6 2% | 36.7 35% | ||
| Load Maximum * (Watt) | 62.4 | 129 -107% | 67.7 -8% | 135.55 -117% | 65.4 -5% | 45 28% | 76.7 ? -23% | 113.5 ? -82% |
* ... más pequeño es mejor
Power Consumption - The Witcher 3 / Stress test
Power Consumption - External monitor
Duración de la batería
Al igual que su predecesor, el nuevo Galaxy Book2 tiene una buena autonomía gracias a su batería de 54 Wh. El anterior Galaxy Book es el único dispositivo de nuestra comparativa que podía aguantar más tiempo sin cargarse. En nuestra prueba Wi-Fi, el portátil duró entre 6 y 8 horas dependiendo del brillo de la pantalla. Incluso pudo reproducir vídeos a 150 cd/m² (equivalente al 45% del brillo máximo de nuestra unidad de pruebas) durante casi 10,5 horas. La carga completa tarda unas dos horas con el dispositivo encendido; la batería se llena al 80% tras unos 65 minutos de carga.
| Samsung Galaxy Book2 15 i7-1260P, A350M, 54 Wh | Dell Inspiron 15 Plus i5-11400H, GeForce RTX 3050 4GB Laptop GPU, 56 Wh | Asus Vivobook 15 K513EQ i7-1165G7, GeForce MX350, 42 Wh | Lenovo ThinkBook 15p G2 ITH 21B1000YGE i7-11800H, GeForce RTX 3050 Ti Laptop GPU, 57 Wh | HP Pavilion 15-eg i7-1165G7, GeForce MX450, 41 Wh | Samsung Galaxy Book NP750XDA i5-1135G7, Iris Xe G7 80EUs, 54 Wh | Media de la clase Multimedia | |
|---|---|---|---|---|---|---|---|
| Duración de Batería | -24% | -20% | -44% | -20% | 15% | 40% | |
| H.264 (h) | 10.6 | 4.5 -58% | 17.1 ? 61% | ||||
| WiFi v1.3 (h) | 8.2 | 5.9 -28% | 6 -27% | 3.8 -54% | 6.6 -20% | 10.1 23% | 12.2 ? 49% |
| Load (h) | 1.5 | 1.2 -20% | 1.3 -13% | 1.2 -20% | 1.2 -20% | 1.6 7% | 1.664 ? 11% |
| Witcher 3 ultra (h) | 2 |
Pro
Contra
Veredicto - Galaxy Book2 adolece de una pantalla débil y de un pobre rendimiento en juegos

Con una CPU Core i7 Alder Lake-P de última generación y la nueva GPU Arc A350M, el nuevo Galaxy Book2 15 promete ofrecer un rendimiento decente. Por desgracia, no es el caso. El procesador está prácticamente limitado a 20 vatios de entrada, lo que significa que un procesador de la serie U habría sido una mejor elección para el portátil. El rendimiento de la CPU ha mejorado significativamente en comparación con el anterior Galaxy Book. Dicho esto, el procesador Tiger Lake del predecesor ya rendía muy por debajo de su potencial real. Aunque la nueva tarjeta gráfica Intel A350M rindió bien en los benchmarks sintéticos, la última iGPU de AMD suele ser tan rápida o incluso más que la GPU Intel dedicada en los juegos reales. A pesar del escaso rendimiento del portátil, los dos ventiladores de su interior son muy ruidosos, y su gestión de la energía aún tiene margen de mejora porque el sistema puede mostrar a veces enormes fluctuaciones de rendimiento
Otro problema es la pobre pantalla. Samsung ha optado por utilizar un panel IPS mate muy barato que no utiliza PWM, pero eso es todo en términos de aspectos positivos. Nuestra impresión subjetiva es que la calidad de la imagen es muy pobre: los colores aparecen lavados y la imagen simplemente no tiene un contraste muy alto. Además, el panel tiene una alta desviación de color y sólo consigue cubrir el 75% del ya pequeño espacio de color sRGB. Esta pantalla puede ser aceptable en un portátil de oficina que cuesta 500-600 euros, pero no en un producto que se vende por unos 1.300 euros.
Precio y disponibilidad
En la configuración de revisión, el Galaxy Book2 cuesta unos 1.230 euros (1.230 dólares). Todavía no está disponible en Norteamérica. Sin embargo, todavía se puede pedir a Cyberportque amablemente nos ha enviado la unidad de prueba.
Samsung Galaxy Book2 15
- 08/23/2022 v7 (old)
Andreas Osthoff
Price comparison

