Análisis del portátil HP Pavilion 15 (2021): Combo Intel de 11ª generación y GeForce MX450
Han pasado dos años desde la última vez que analizamos un HP Pavilion 15 estándar y mucho ha cambiado desde entonces. HP ha actualizado el diseño del chasis, así como la CPU Whiskey Lake-U de 8ª generación y la GPU GeForce MX250 a la 11ª generación Tiger Lake-U y la MX450, respectivamente. El nombre Pavilion lleva algunos de los portátiles más asequibles de HP en contraste con la serie Envy de gama alta y la serie insignia Spectre.
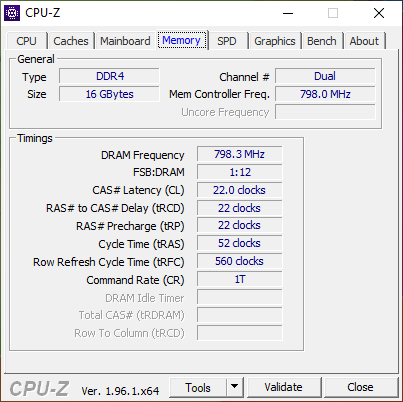
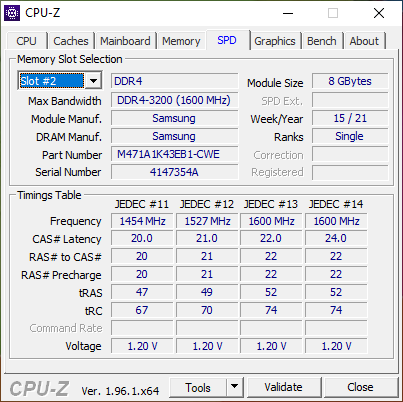
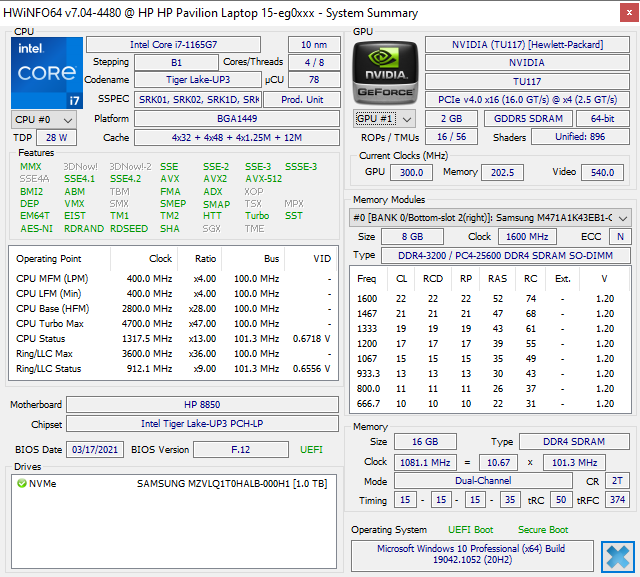
El sistema que estamos viendo hoy se ha configurado completamente con la CPU Core i7-1165G7, 16 GB de RAM, 1 TB de SSD PCIe y gráficos Nvidia dedicados por unos 1100 dólares. Sus especificaciones son, por lo tanto, más altas que las de un típico Ultrabook económico, especialmente en términos de gráficos, ya que muchos de esta categoría no tienen ninguna opción Nvidia.
Entre los competidores del Pavilion 15 se encuentran otros portátiles multimedia básicos de 15,6 pulgadas como elDell Inspiron 15 5502,Lenovo IdeaPad 5 15, Honor MagicBook 15oAsus VivoBook S15 S533EQ
Más análisis de HP:
potential competitors in comparison
Valoración | Fecha | Modelo | Peso | Altura | Tamaño | Resolución | Precio |
|---|---|---|---|---|---|---|---|
| 81.2 % v7 (old) | 06/2021 | HP Pavilion 15-eg i7-1165G7, GeForce MX450 | 1.7 kg | 17.9 mm | 15.60" | 1920x1080 | |
| 75.4 % v7 (old) | 03/2020 | HP Pavilion Gaming 15-ec0002ng R5 3550H, GeForce GTX 1050 Mobile | 2.3 kg | 23.5 mm | 15.60" | 1920x1080 | |
| 78.2 % v7 (old) | 12/2020 | Dell Inspiron 15 5000 5502 i3-1115G4, UHD Graphics Xe G4 48EUs | 1.6 kg | 17.9 mm | 15.60" | 1920x1080 | |
| 83 % v7 (old) | 07/2020 | Lenovo IdeaPad 5 15IIL05 i5-1035G1, GeForce MX350 | 1.7 kg | 17.9 mm | 15.60" | 1920x1080 | |
| 83 % v7 (old) | 08/2020 | HP Envy 15-ep0098nr i7-10750H, GeForce RTX 2060 Max-Q | 2 kg | 19 mm | 15.60" | 3840x2160 | |
| 83.4 % v7 (old) | 12/2020 | Asus VivoBook S15 S533EQ-BQ002T i7-1165G7, GeForce MX350 | 1.8 kg | 16.1 mm | 15.60" | 1920x1080 |
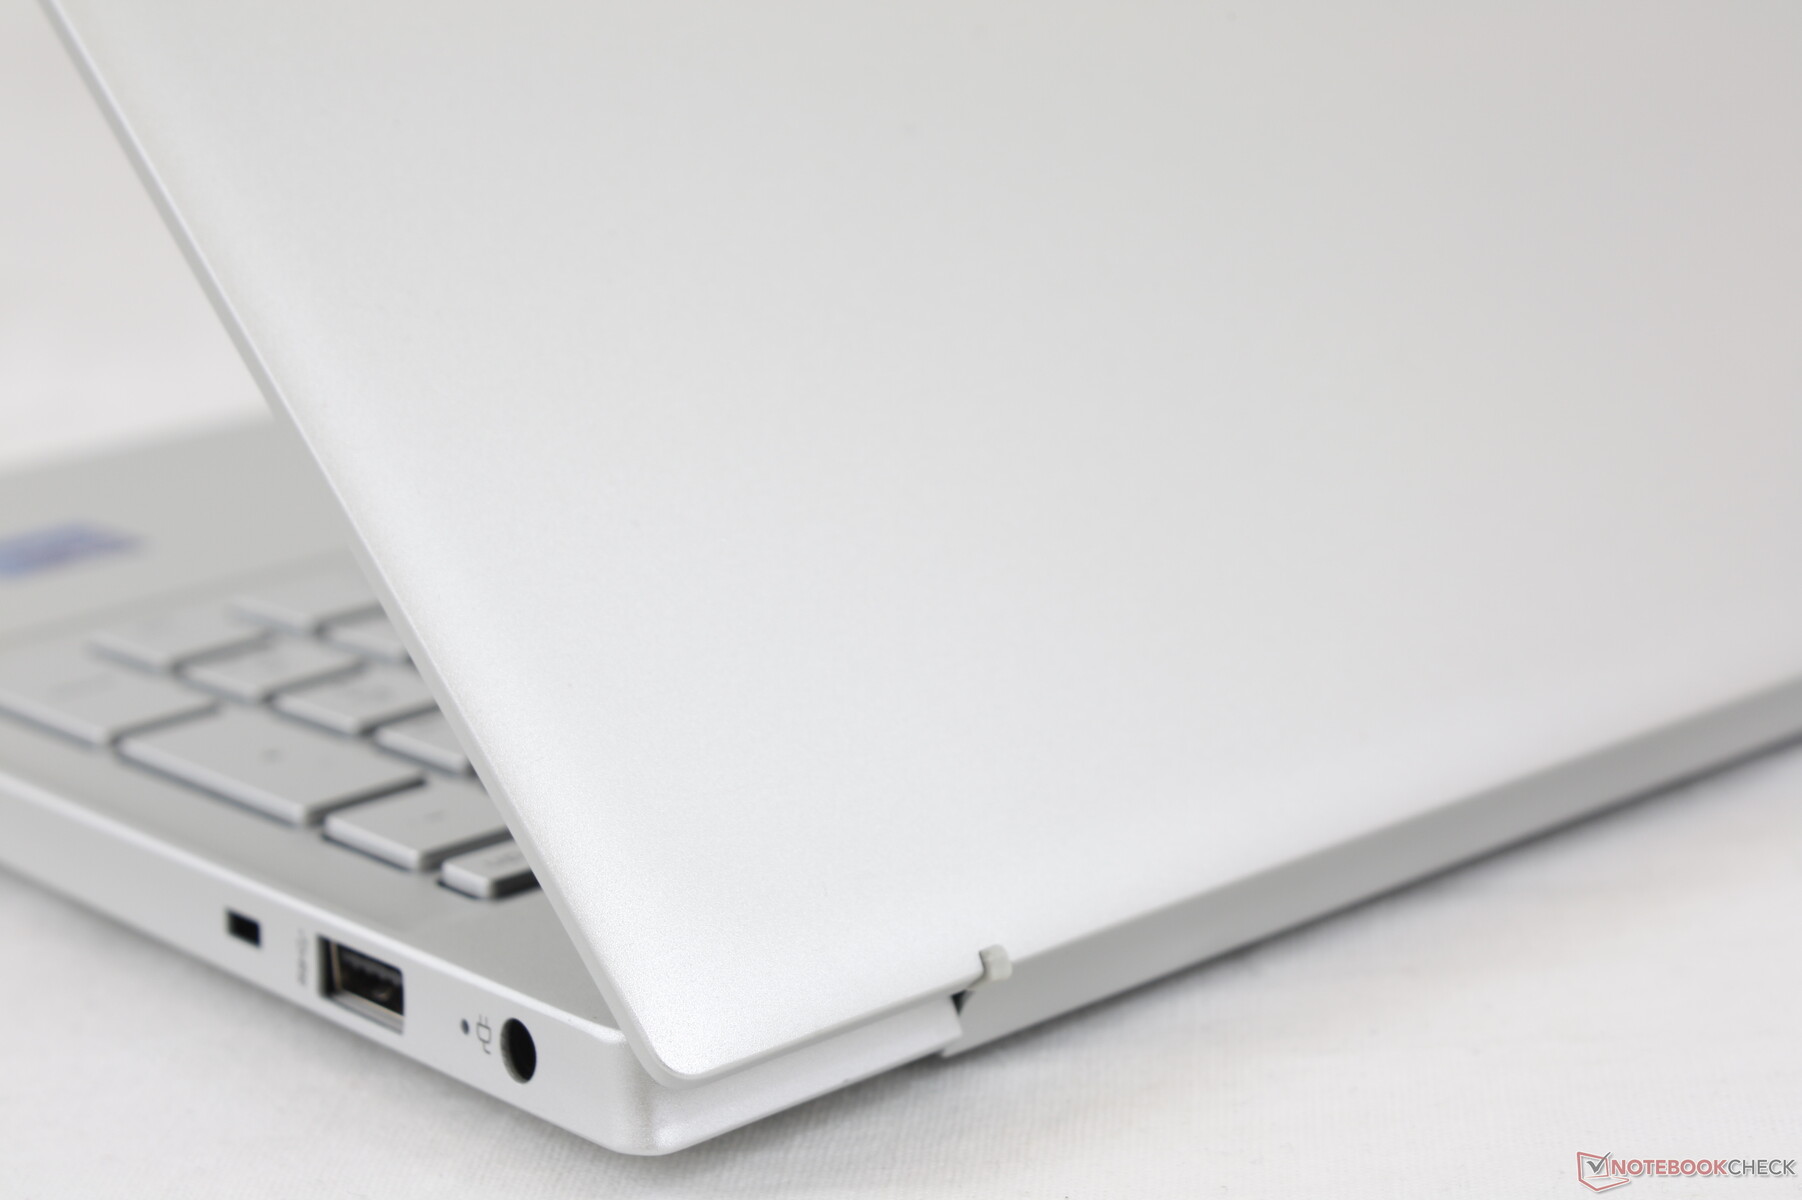
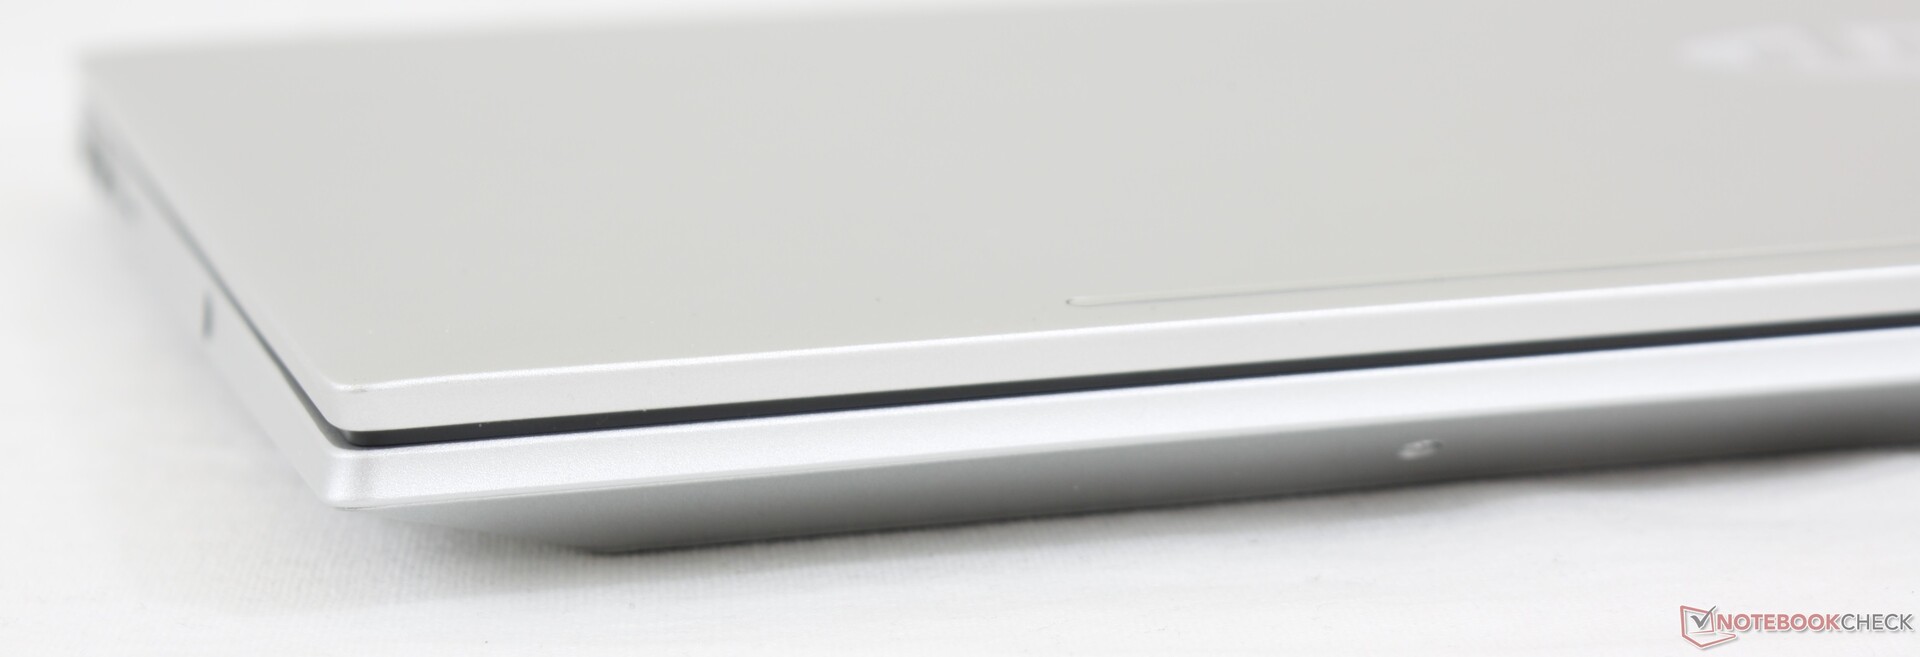
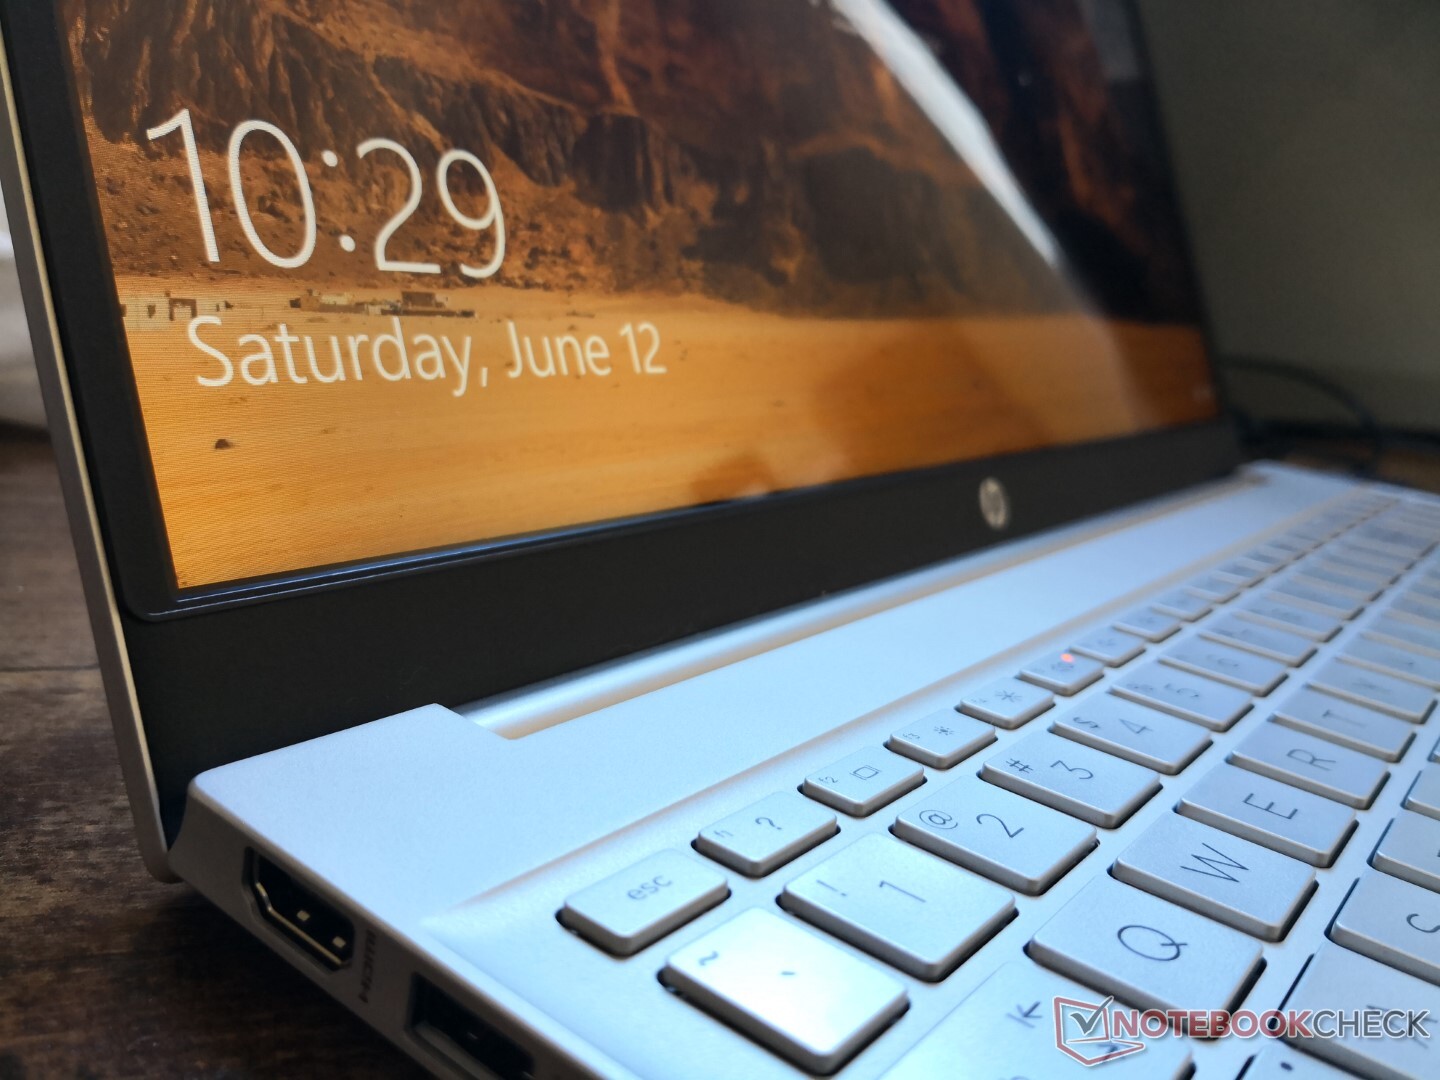
Caso - Un paso lateral en la calidad
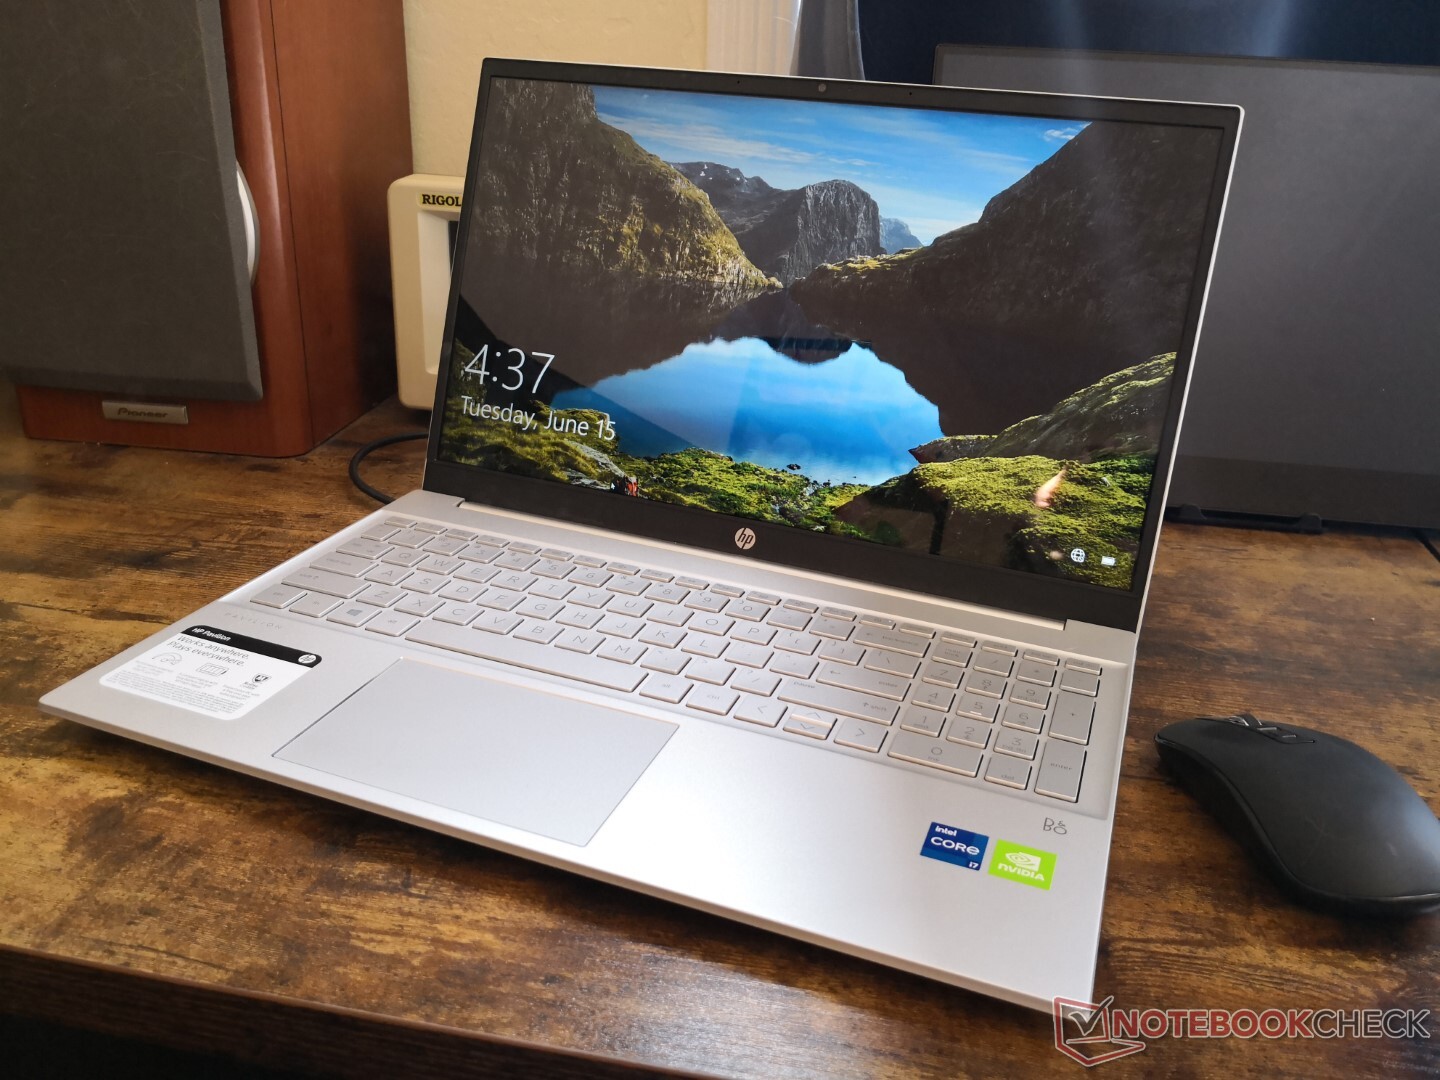
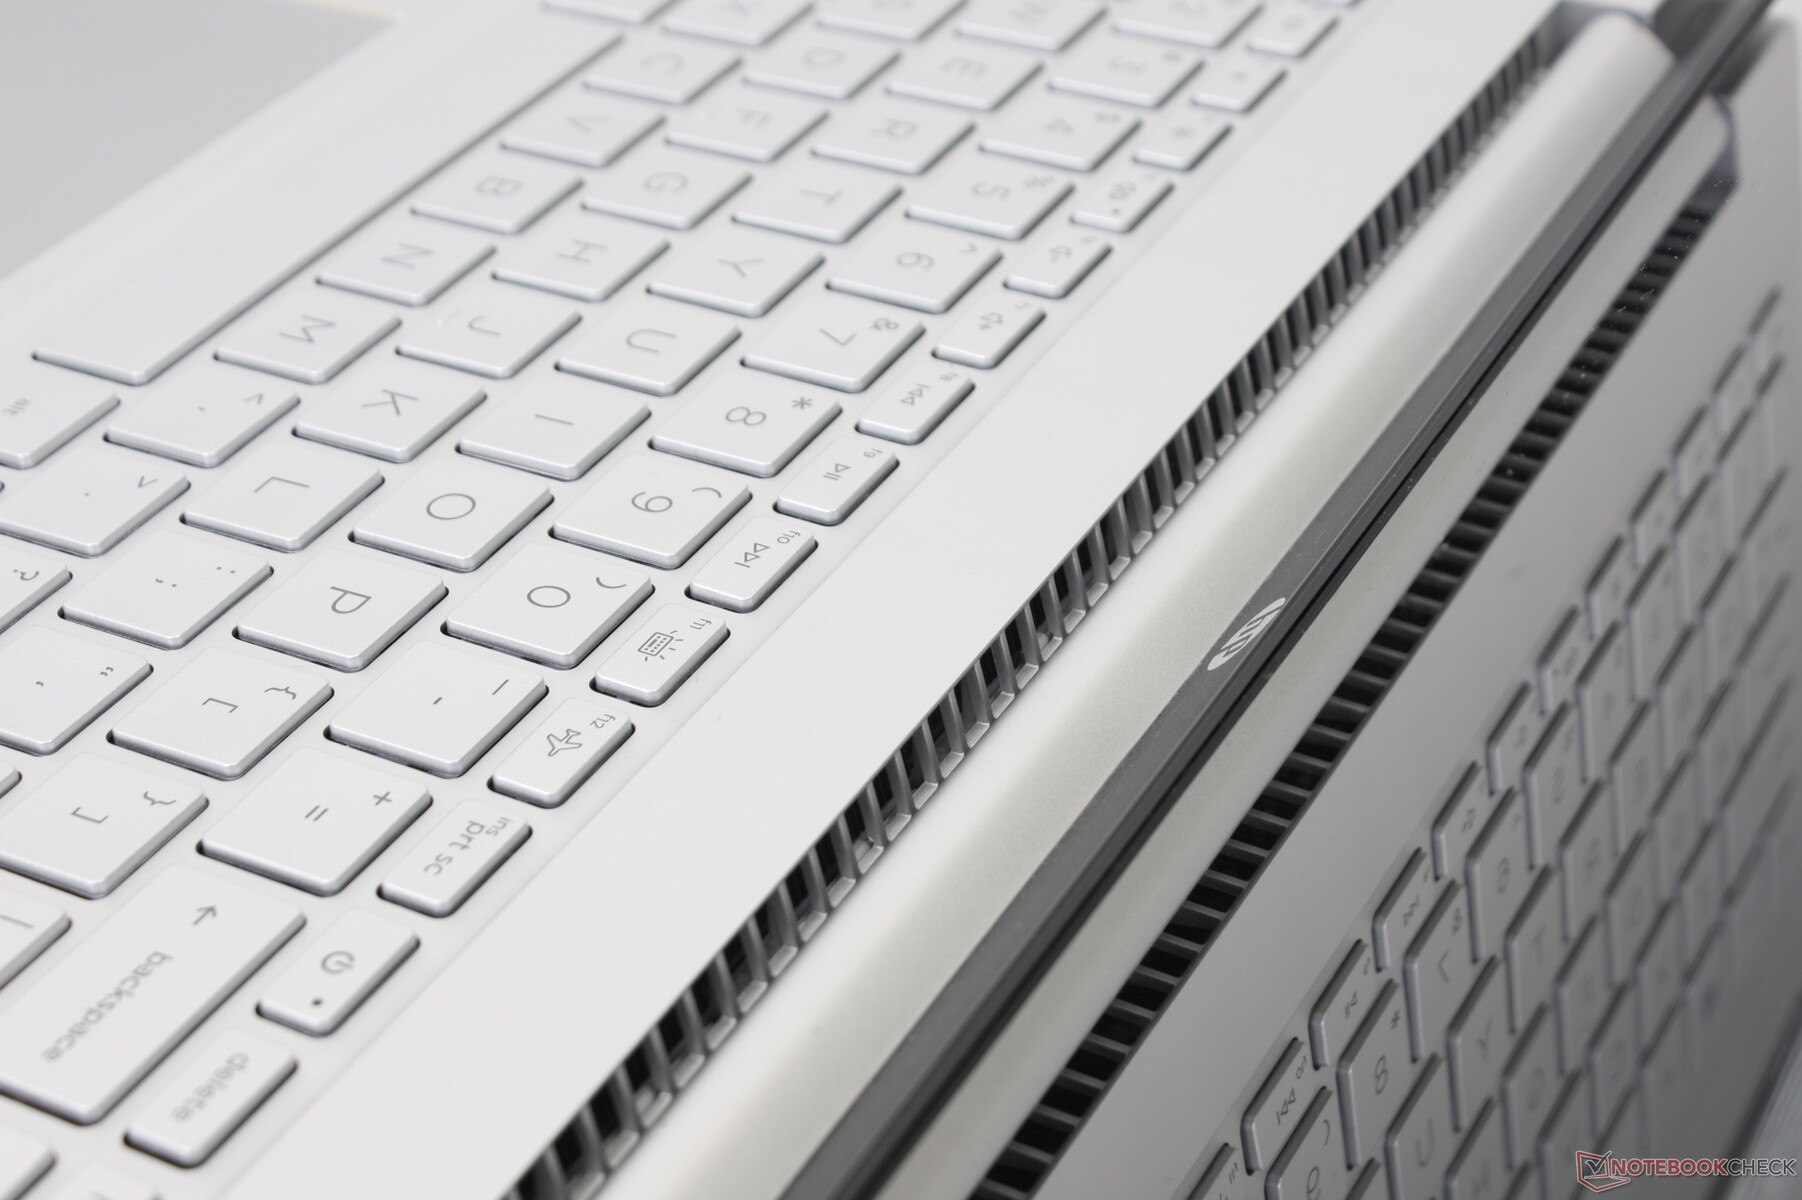
En comparación con el antiguo diseño de 2019, el modelo de 2021 tiene unos biseles superior e inferior más estrechos para que ocupe menos espacio, al tiempo que utiliza los mismos materiales metálicos y plásticos. Las rejillas de los altavoces a lo largo de la parte superior del teclado han desaparecido para dar un aspecto más simplista. Es una impresión mate básica sin los llamativos adornos cromados ni los bordes afilados tipo MacBook del Spectre o el Envy, respectivamente. Que se vea mejor que un Asus VivoBook o un Lenovo IdeaPad de la competencia depende de las preferencias del usuario
La rigidez del chasis es débil alrededor de la tapa y las esquinas frontales de la base, donde el sistema es más susceptible de torcerse. Es sólo un poco mejor que el mencionado VivoBook o IdeaPad, pero no lo suficiente como para marcar la diferencia a largo plazo.
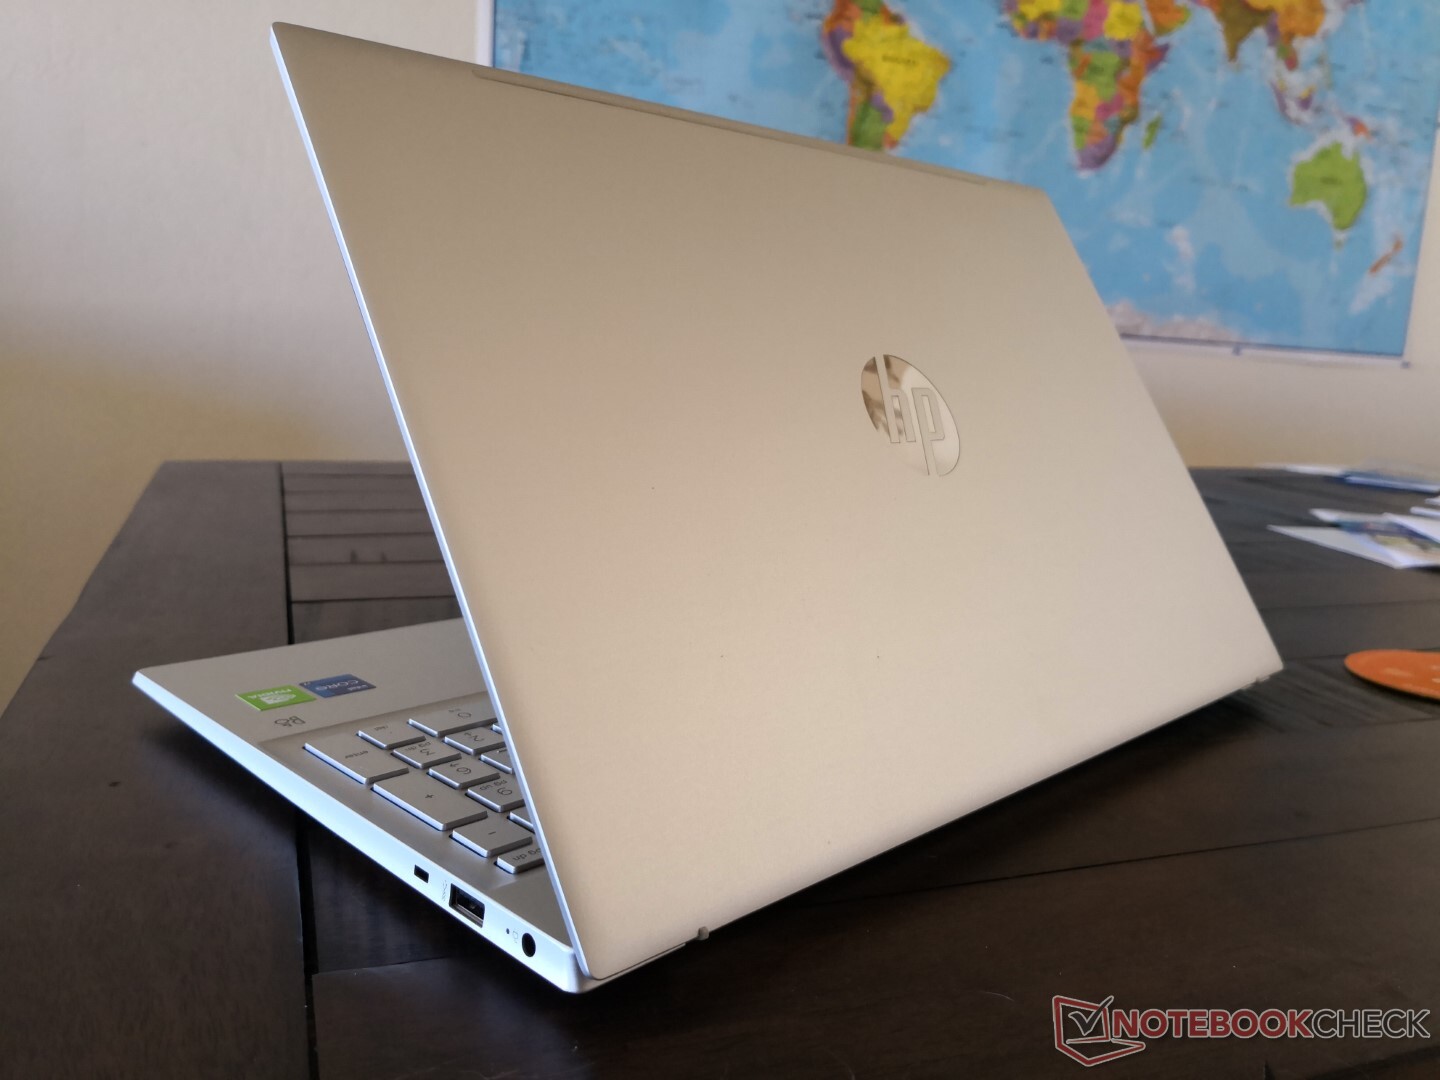
Como portátil económico, el Pavilion 15 no pretende ser el más delgado o ligero de su categoría; sólo tiene que ser "suficientemente bueno" frente a la competencia. El tamaño y el peso son, por tanto, muy similares a los de los portátiles económicos de 15,6 pulgadas de otros fabricantes, como el Asus VivoBook S15 o Lenovo IdeaPad 5 15. Pasando al más elegante HP Envy 15 o Spectre x360 15 en realidad será aún más pesado ya que esos sistemas tienen marcos de metal más fuertes en lugar de plástico.
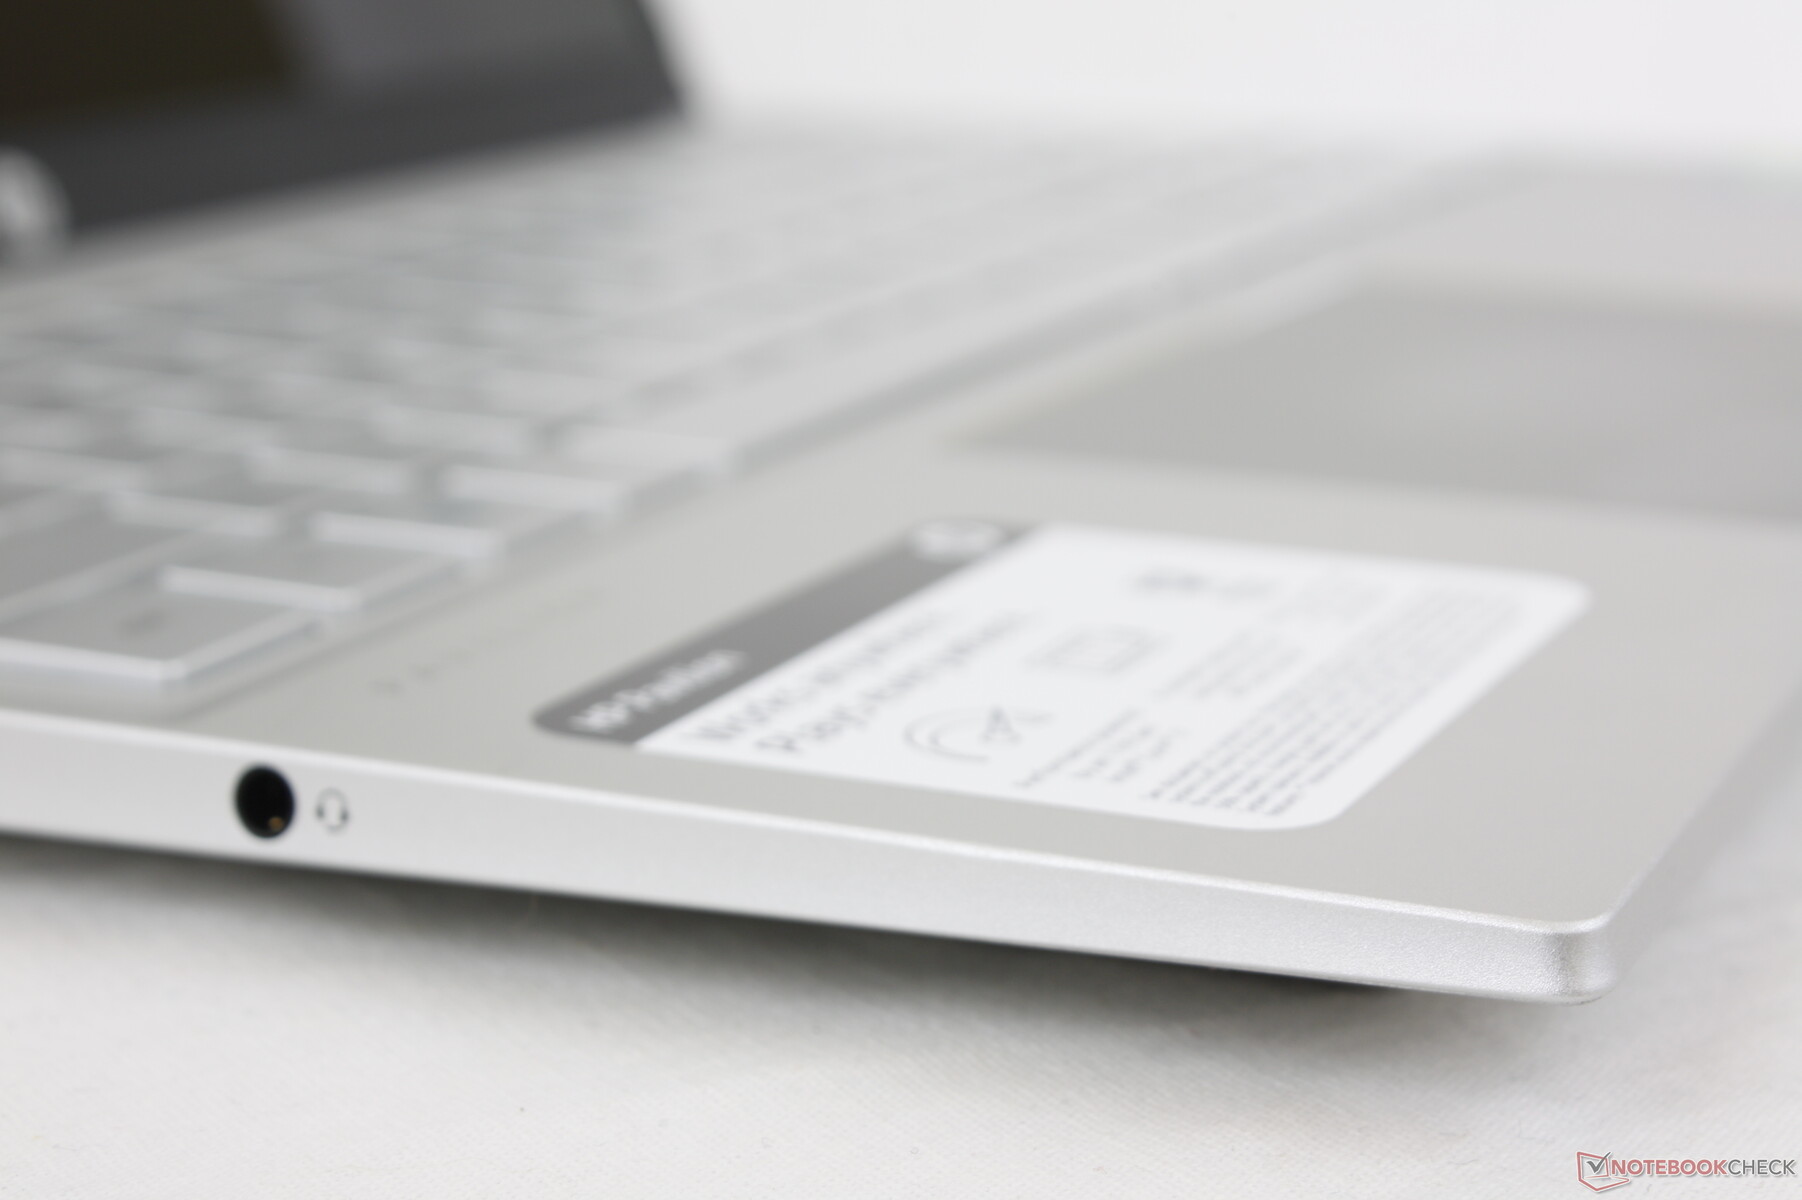
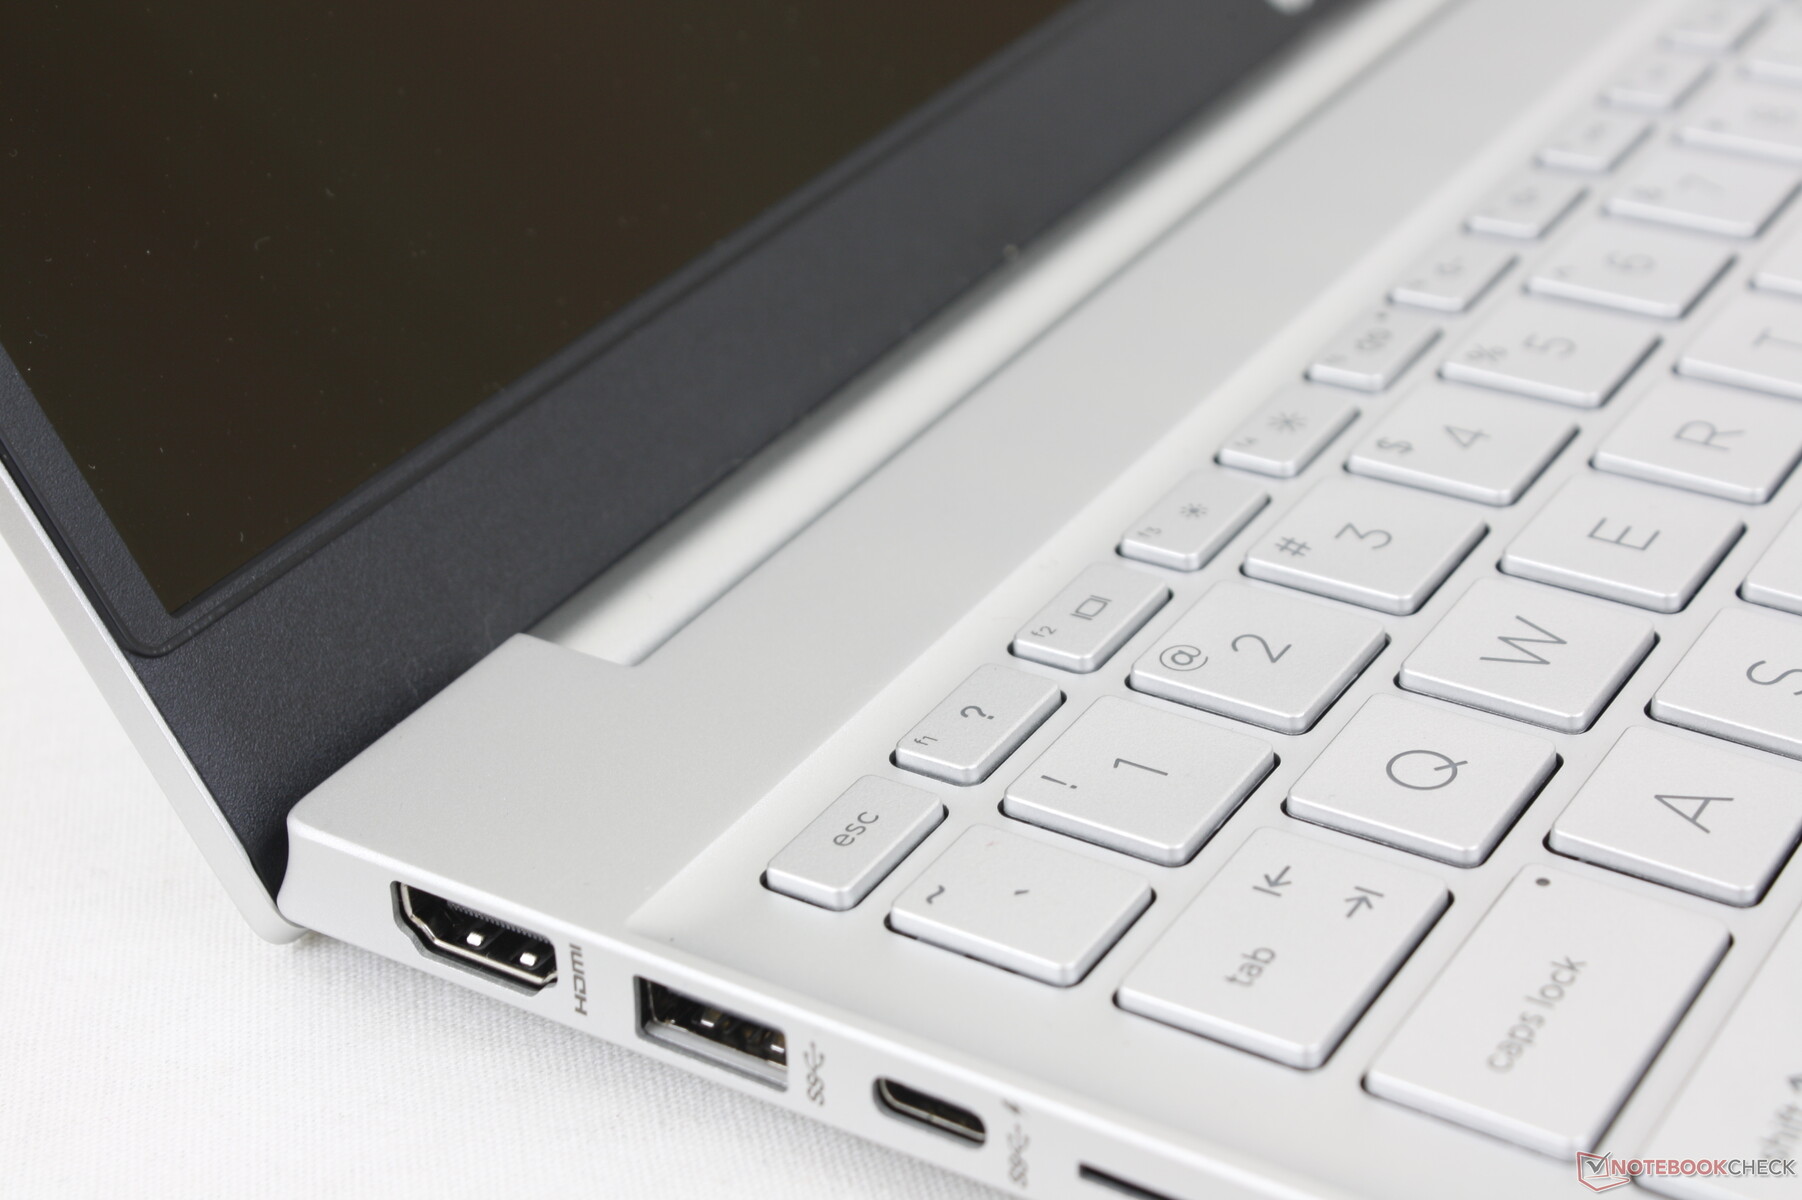
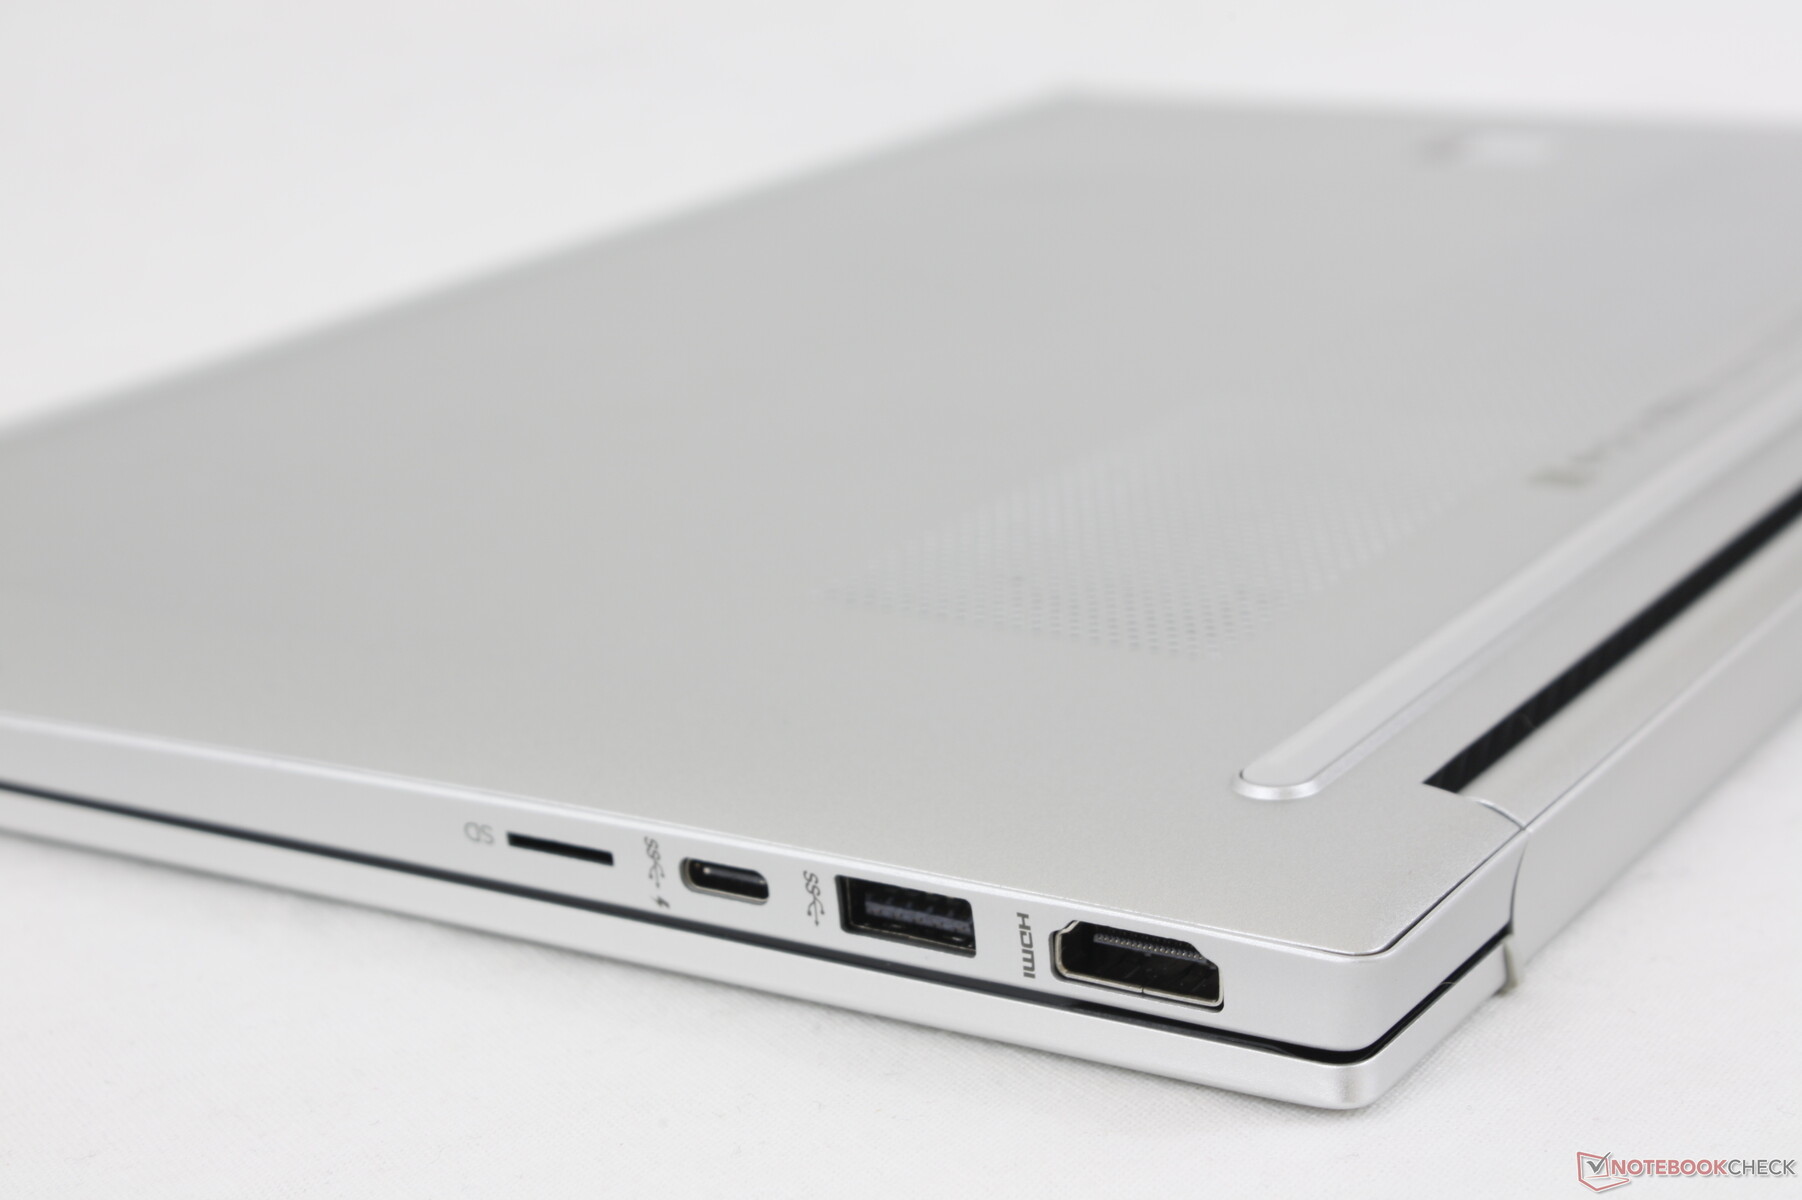
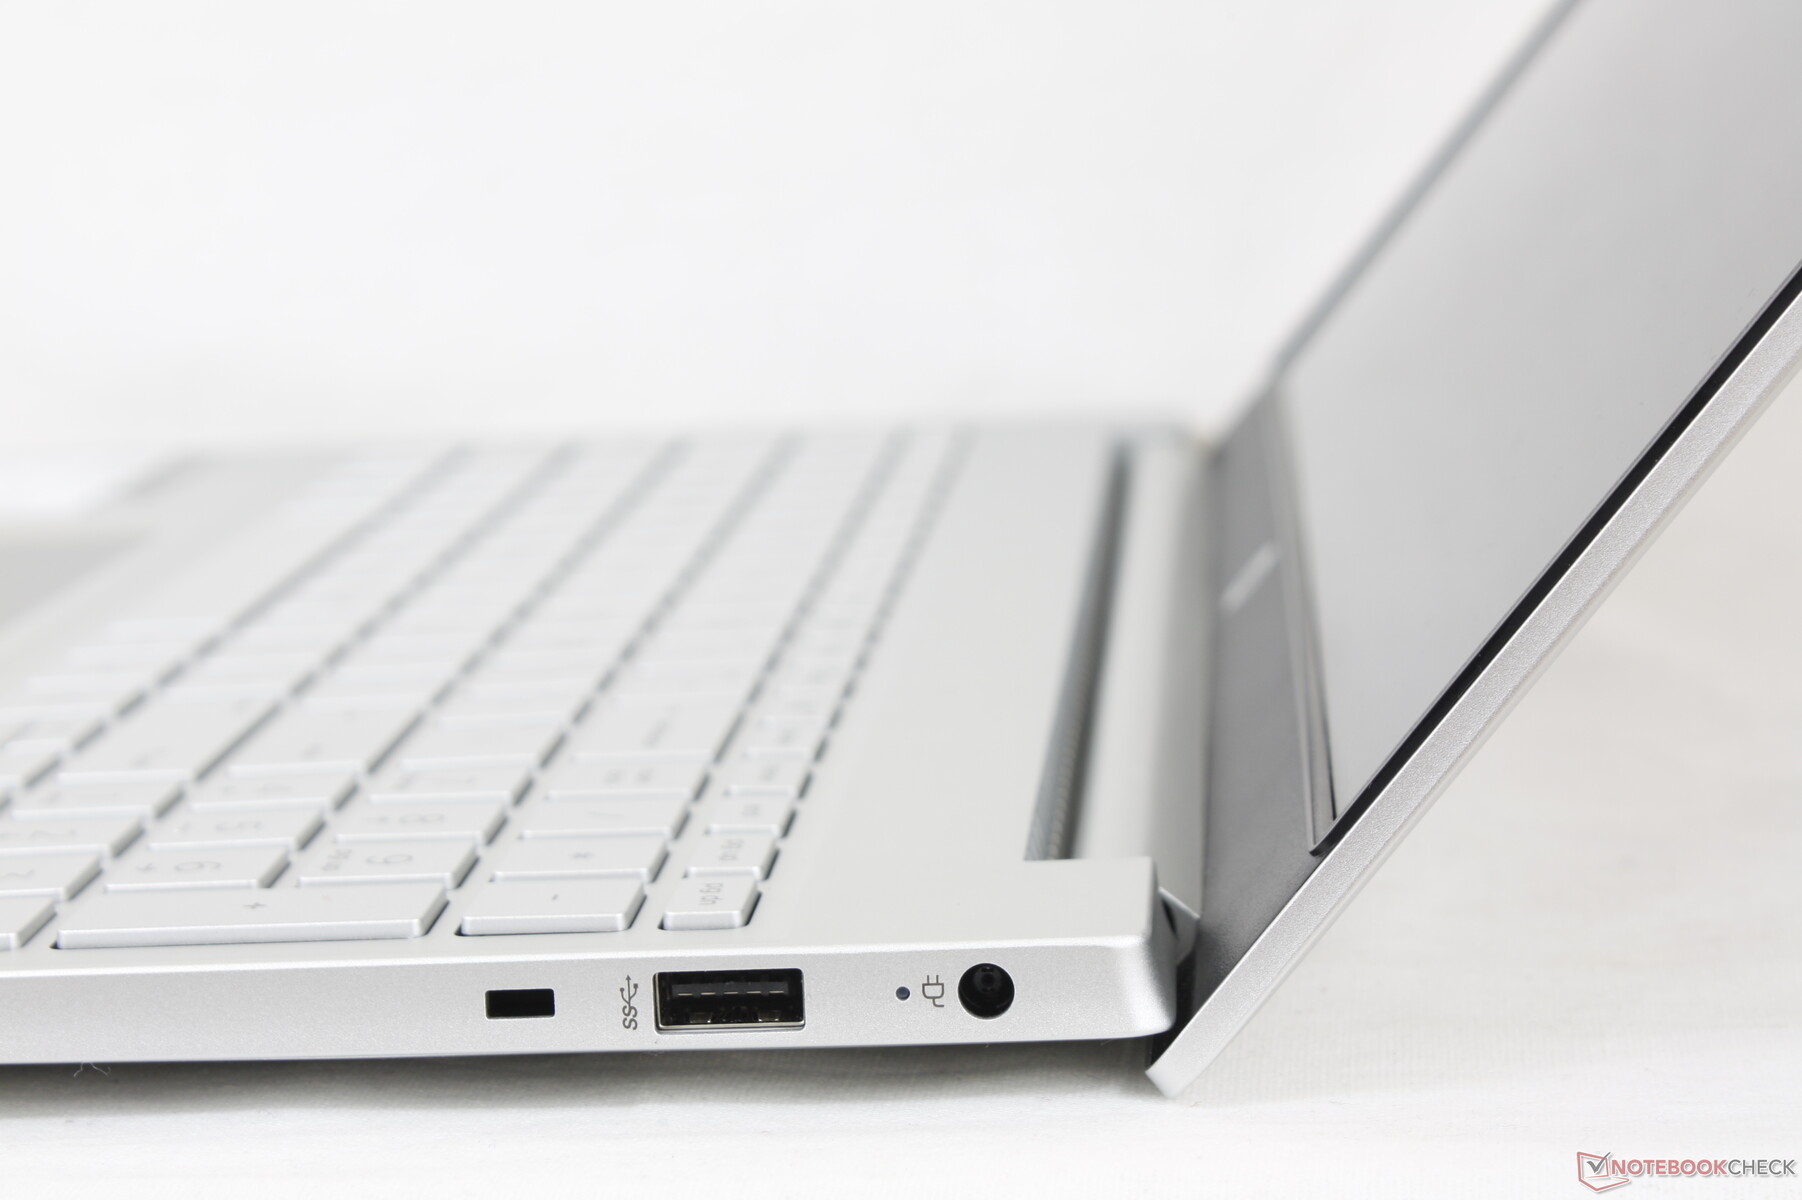
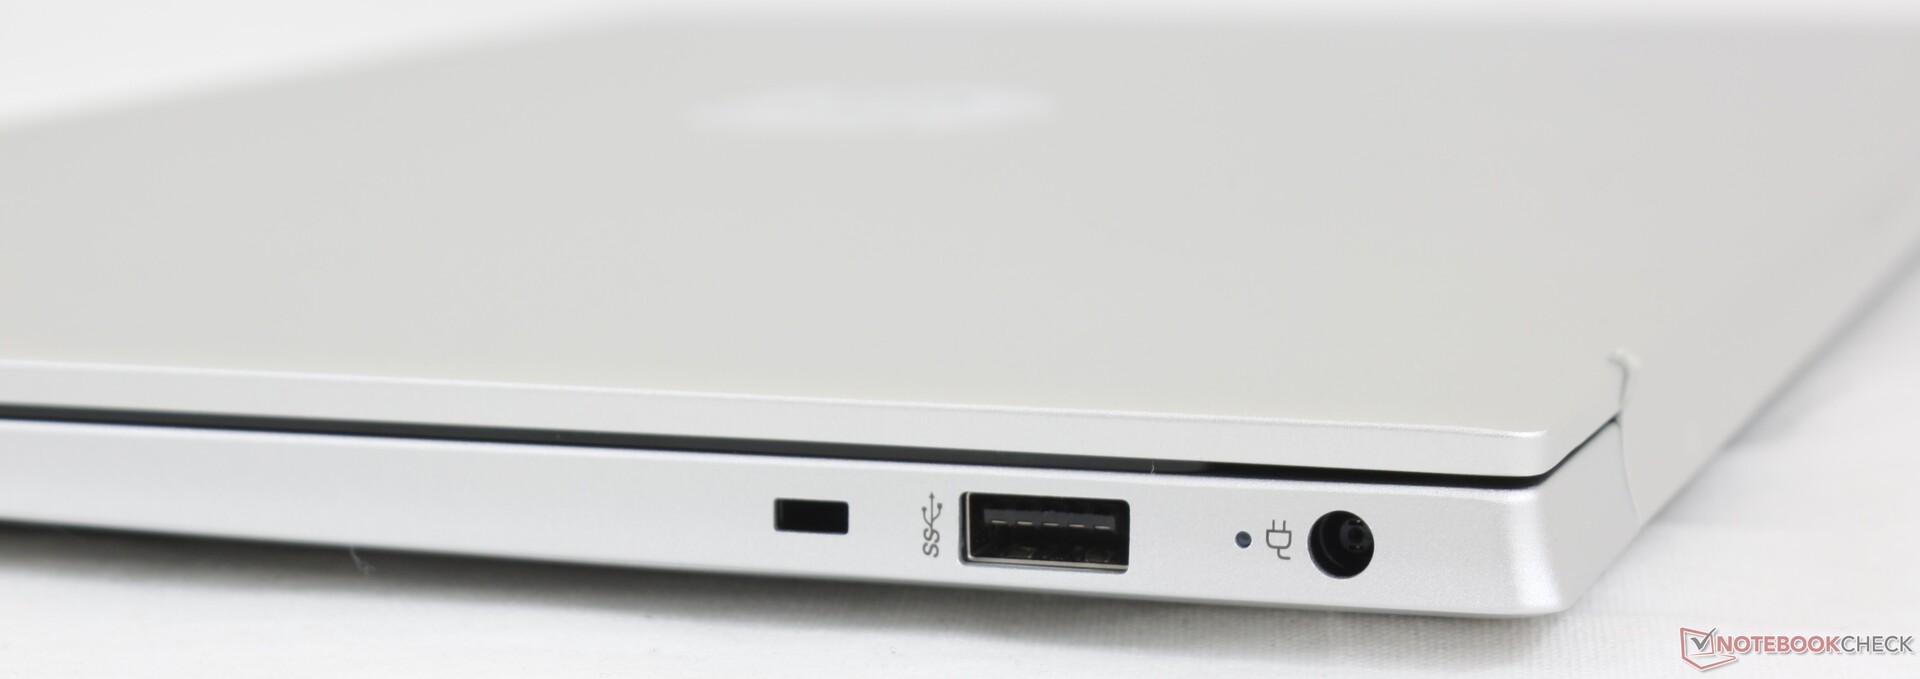
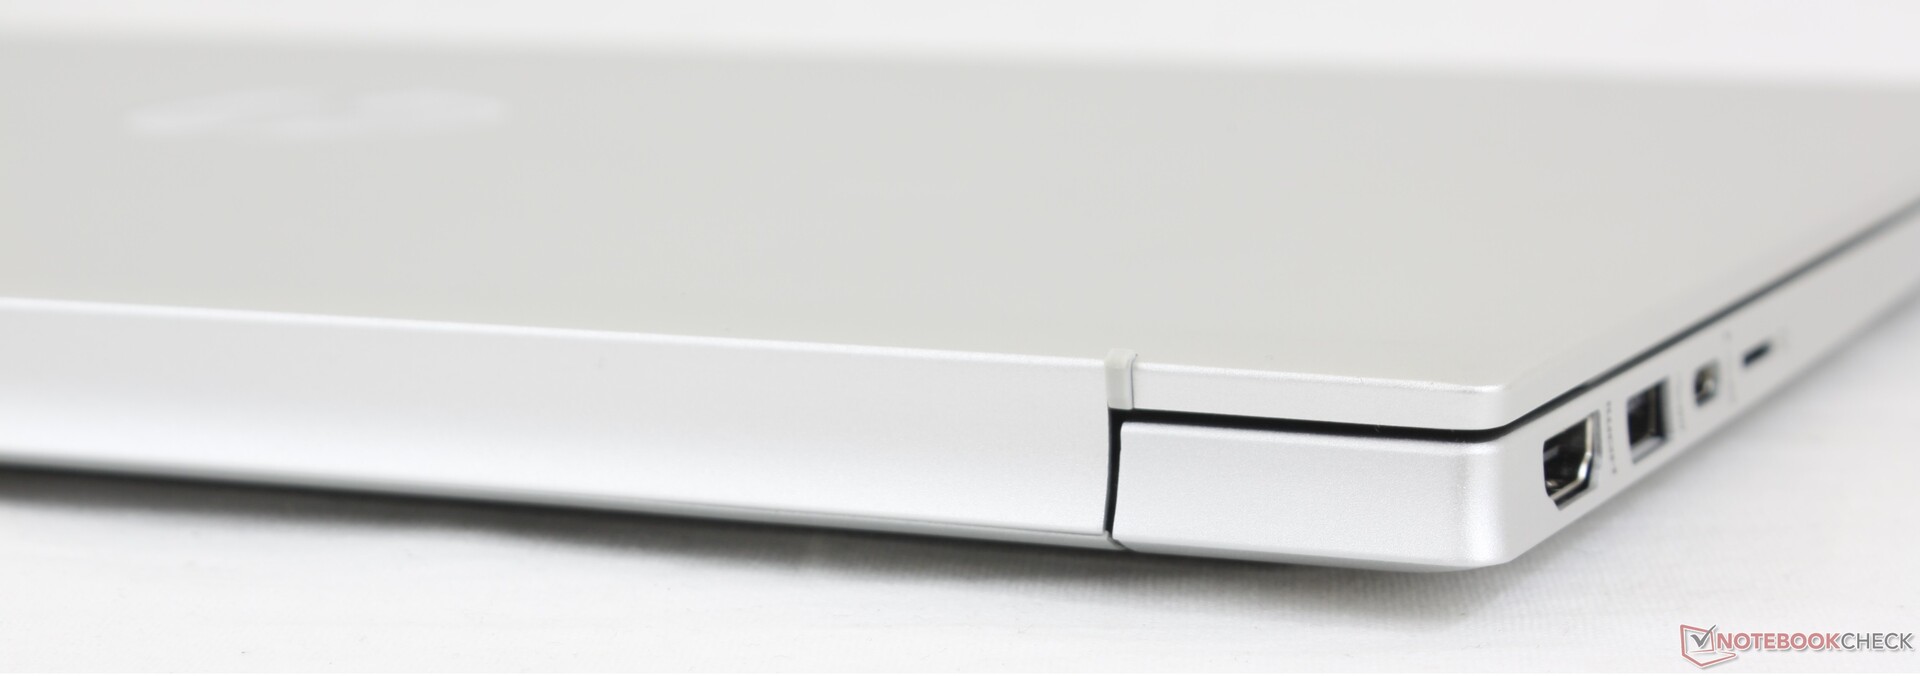
Conectividad - No más RJ-45
Las opciones de puerto son decentes para el tamaño. Nos sorprende ver HDMI 2.0 en vez de 1.4, lo que significa que el sistema soporta adecuadamente monitores externos de hasta 4K a 60 FPS. No hay soporte Thunderbolt, empero, ya que HP quiere que los usuarios se actualicen a las series Envy o Spectre, más caras, en su lugar.
DisplayPort a través de USB-C parece estar roto en nuestra unidad como se muestra aquí. La imagen en el monitor externo se movía y se mostraba incorrectamente sin importar la configuración. Incluso probamos diferentes monitores y portátiles, pero los resultados no cambiaban. Esto parece limitarse al puerto USB-C, ya que la salida de vídeo a través de HDMI funciona sin problemas.
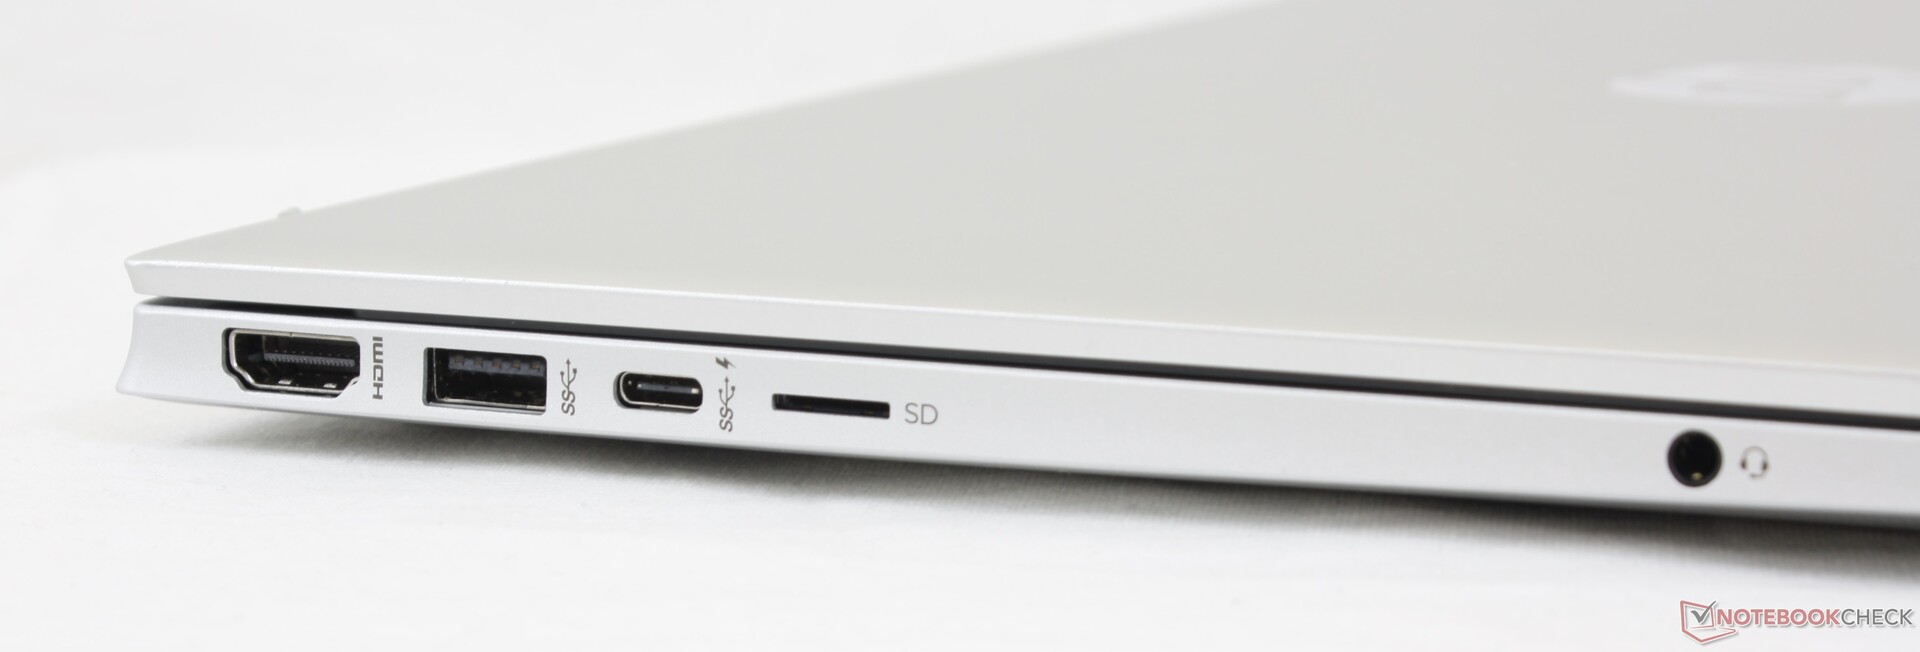
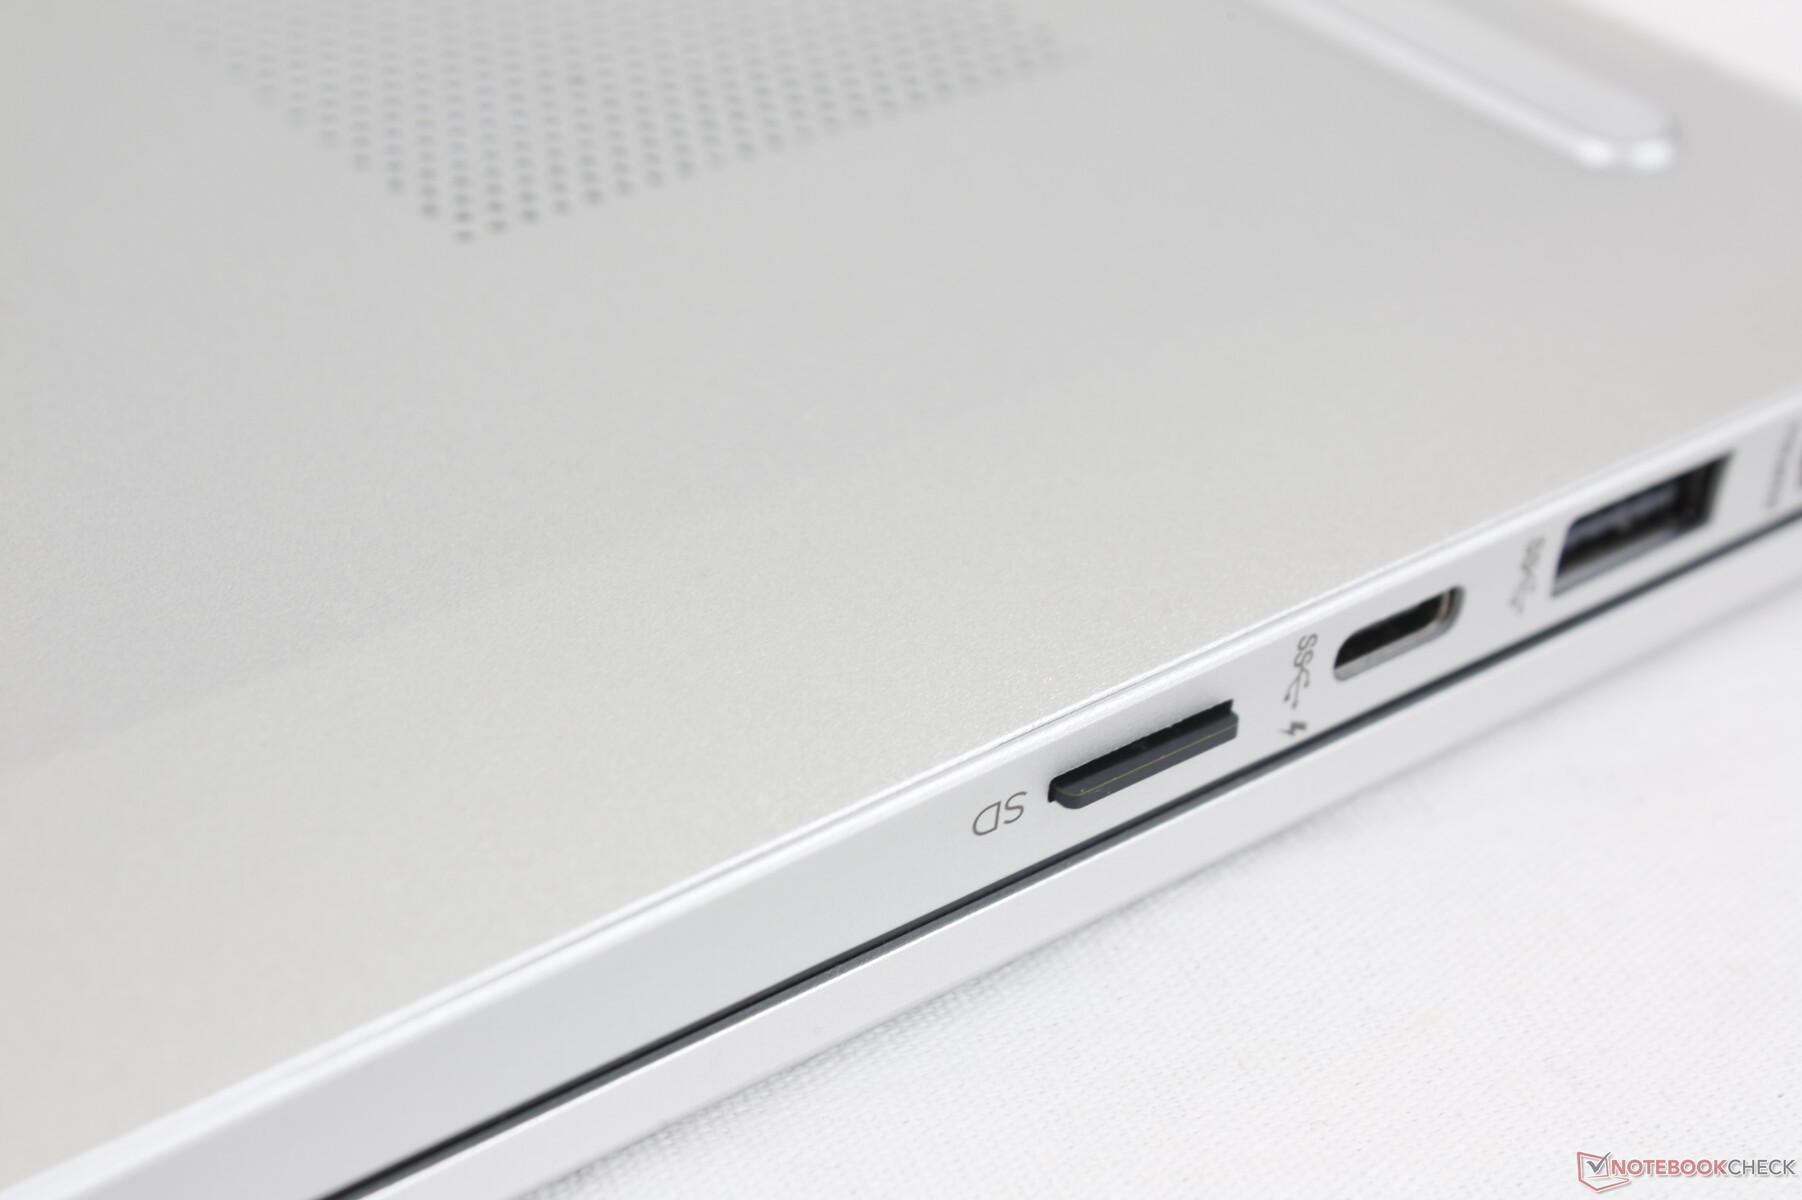
Lector de tarjetas SD
La velocidad de transferencia desde el lector MicroSD con resorte es relativamente rápida, con unos 70 MB/s. Mover 1 GB de fotos desde nuestra tarjeta de prueba UHS-II al escritorio lleva unos 15 segundos, en comparación con casi el doble en la antigua Pavilion 15 Gaming.
| SD Card Reader | |
| average JPG Copy Test (av. of 3 runs) | |
| HP Envy 15-ep0098nr (Toshiba Exceria Pro M501 UHS-II) | |
| HP Pavilion 15-eg (AV PRO microSD 128 GB V60) | |
| HP Pavilion Gaming 15-ec0002ng (Toshiba Exceria Pro SDXC 64 GB UHS-II) | |
| Asus VivoBook S15 S533EQ-BQ002T (Toshiba Exceria Pro M501 microSDXC 64GB) | |
| Lenovo IdeaPad 5 15IIL05 (Toshiba Exceria Pro SDXC 64 GB UHS-II) | |
| Dell Inspiron 15 5000 5502 (Toshiba Exceria Pro M501 microSDXC 32GB) | |
| maximum AS SSD Seq Read Test (1GB) | |
| HP Envy 15-ep0098nr (Toshiba Exceria Pro M501 UHS-II) | |
| HP Pavilion 15-eg (AV PRO microSD 128 GB V60) | |
| HP Pavilion Gaming 15-ec0002ng (Toshiba Exceria Pro SDXC 64 GB UHS-II) | |
| Lenovo IdeaPad 5 15IIL05 (Toshiba Exceria Pro SDXC 64 GB UHS-II) | |
| Dell Inspiron 15 5000 5502 (Toshiba Exceria Pro M501 microSDXC 32GB) | |
| Asus VivoBook S15 S533EQ-BQ002T (Toshiba Exceria Pro M501 microSDXC 64GB) | |
Comunicación
El Intel AX201 viene de serie con conectividad Wi-Fi 6 y Bluetooth 5.1 como en la mayoría de los otros portátiles Tiger Lake-U. La conexión es estable y sin problemas cuando se empareja con nuestro router de prueba Netgear RAX200.
Cámara web
La calidad de la cámara no ha cambiado de una generación a otra. Al menos nos gustaría ver un interruptor de apagado de la cámara o un obturador de privacidad como en la mayoría de los portátiles de hoy en día. No hay cámara IR para el soporte de Windows Hello.


Mantenimiento
Los portátiles HP Pavilion son tradicionalmente difíciles de abrir y aquí no es diferente. El panel inferior esconde cuatro tornillos debajo de las patas de goma para disuadir al usuario final de realizar el mantenimiento. Incluso después de quitar todos los tornillos, nos pareció difícil quitar el panel sin dañar el chasis. Las actualizaciones del usuario final como la RAM y el almacenamiento y por lo tanto más difícil de lo que debe ser.
Accesorios y garantía
En la caja no hay más extras que el adaptador de CA tipo barril y la documentación. Se aplica una garantía limitada del fabricante de un año.
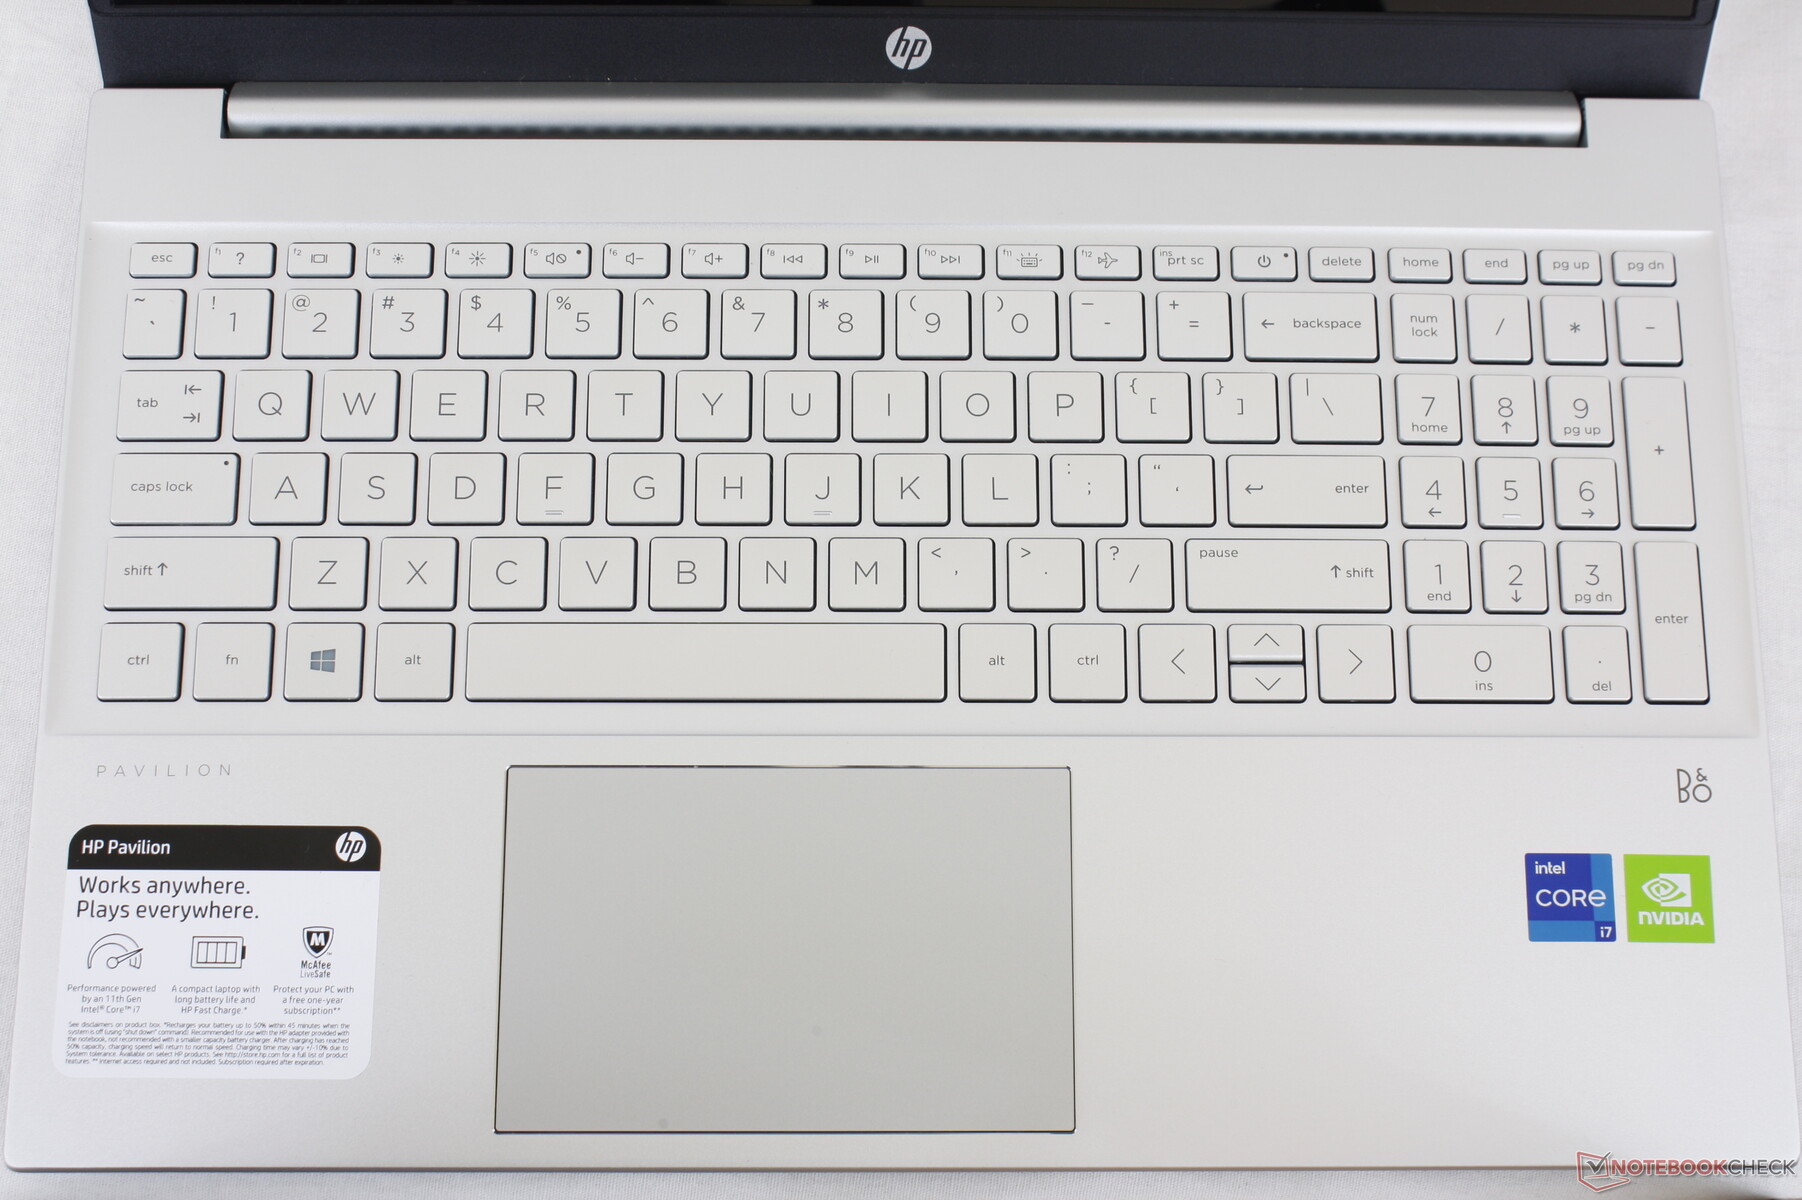
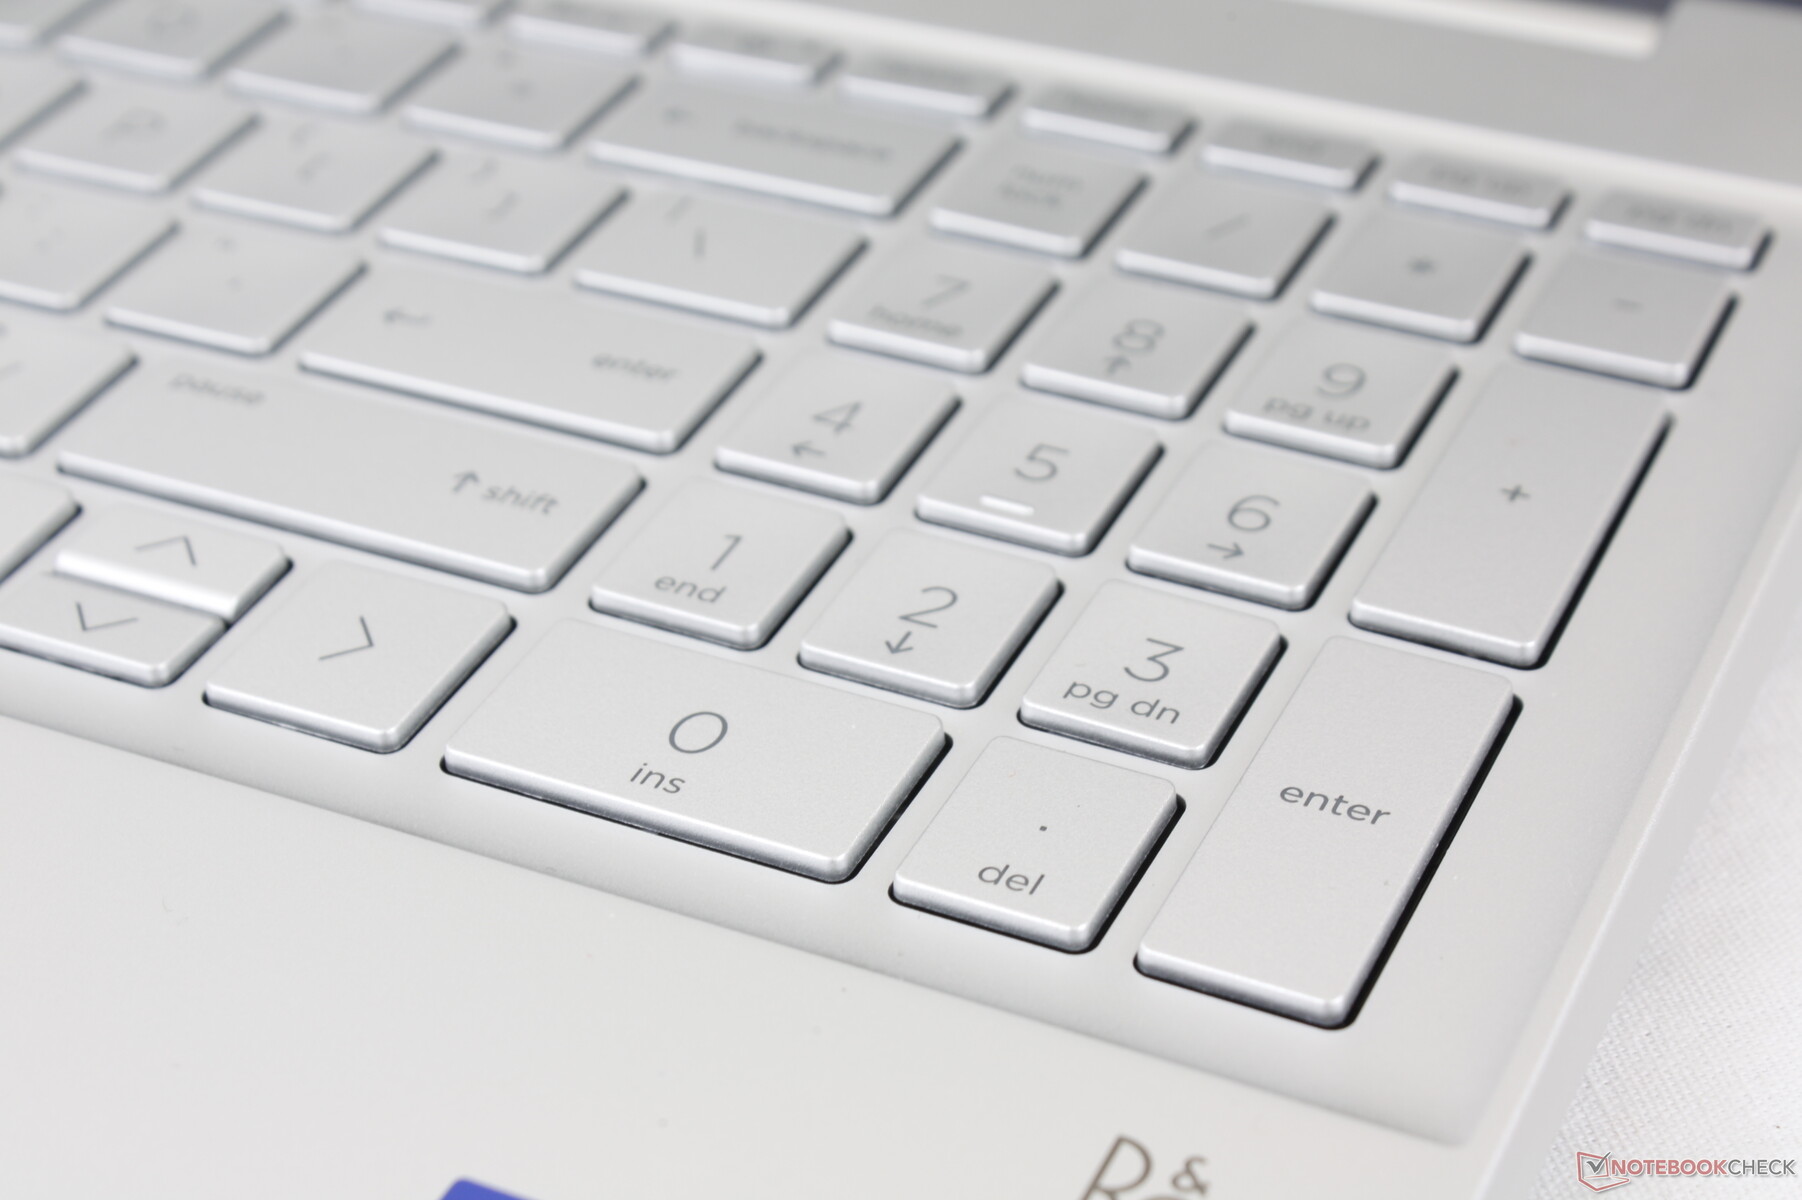
Dispositivos de entrada - Teclado sorprendentemente cómodo
Teclado
La disposición del teclado ha cambiado ligeramente respecto al modelo de 2019. El botón de encendido, por ejemplo, es ahora una tecla normal del teclado en lugar de estar fuera de la esquina izquierda. Por lo demás, la experiencia de escritura sigue siendo en gran medida la misma. La respuesta es sorprendentemente firme y con buen recorrido para ser mejor que las teclas más esponjosas y ligeras del Asus VivoBook o el Lenovo IdeaPad.
Las teclas del NumPad ofrecen una respuesta similar a la de las teclas QWERTY para una buena sensación de uniformidad. Es una pena que las teclas del NumPad sean más estrechas y, por tanto, más estrechas para los dedos grandes.
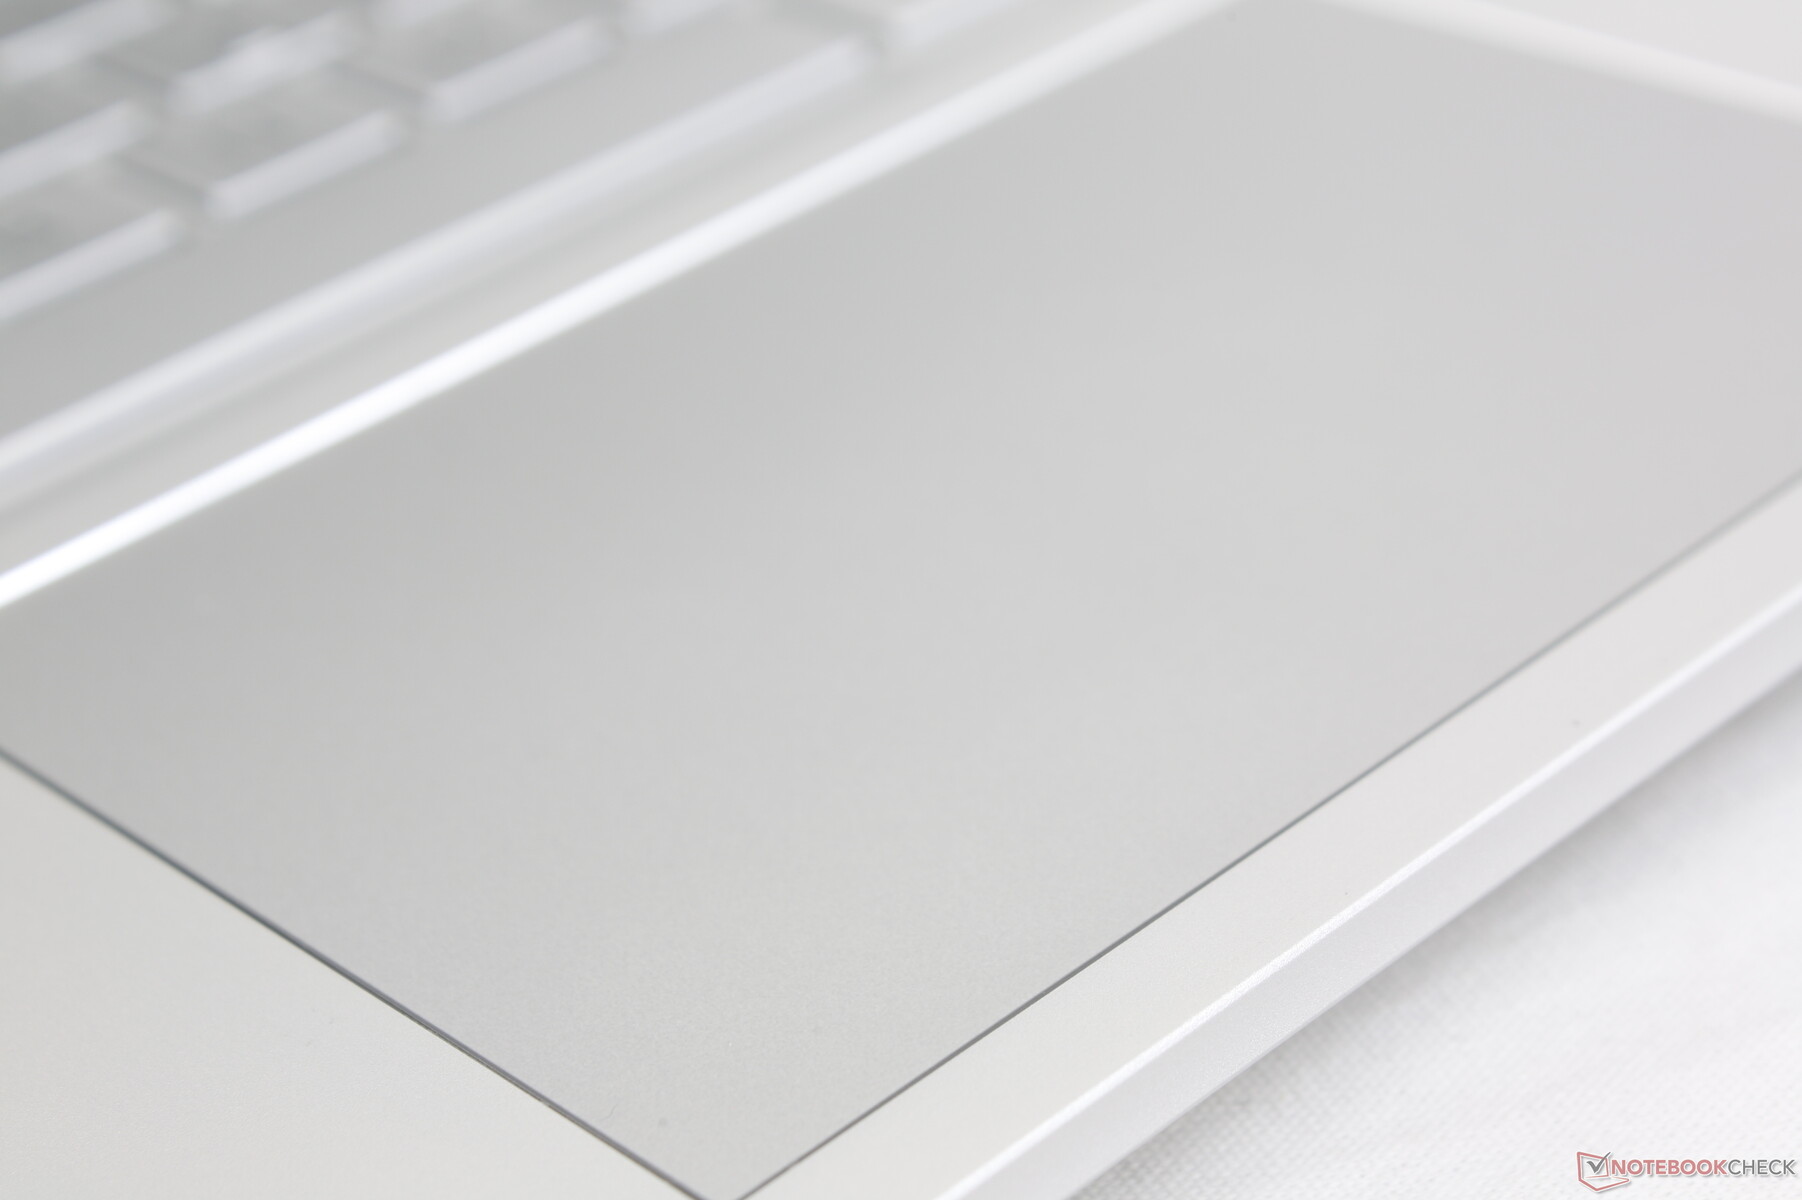
Panel táctil
El clickpad de Precision es relativamente grande, de 11,5 x 7,4 cm, para ser esencialmente el mismo que el clickpad del más caro Envy 15 Creator. La tracción es suave cuando se desliza a velocidades medias y rápidas, mientras que a velocidades más lentas se produce una adherencia moderada que ayuda a la precisión. Por otro lado, hacer clic en el clickpad es poco profundo y esponjoso para una experiencia incómoda sin un ratón externo.

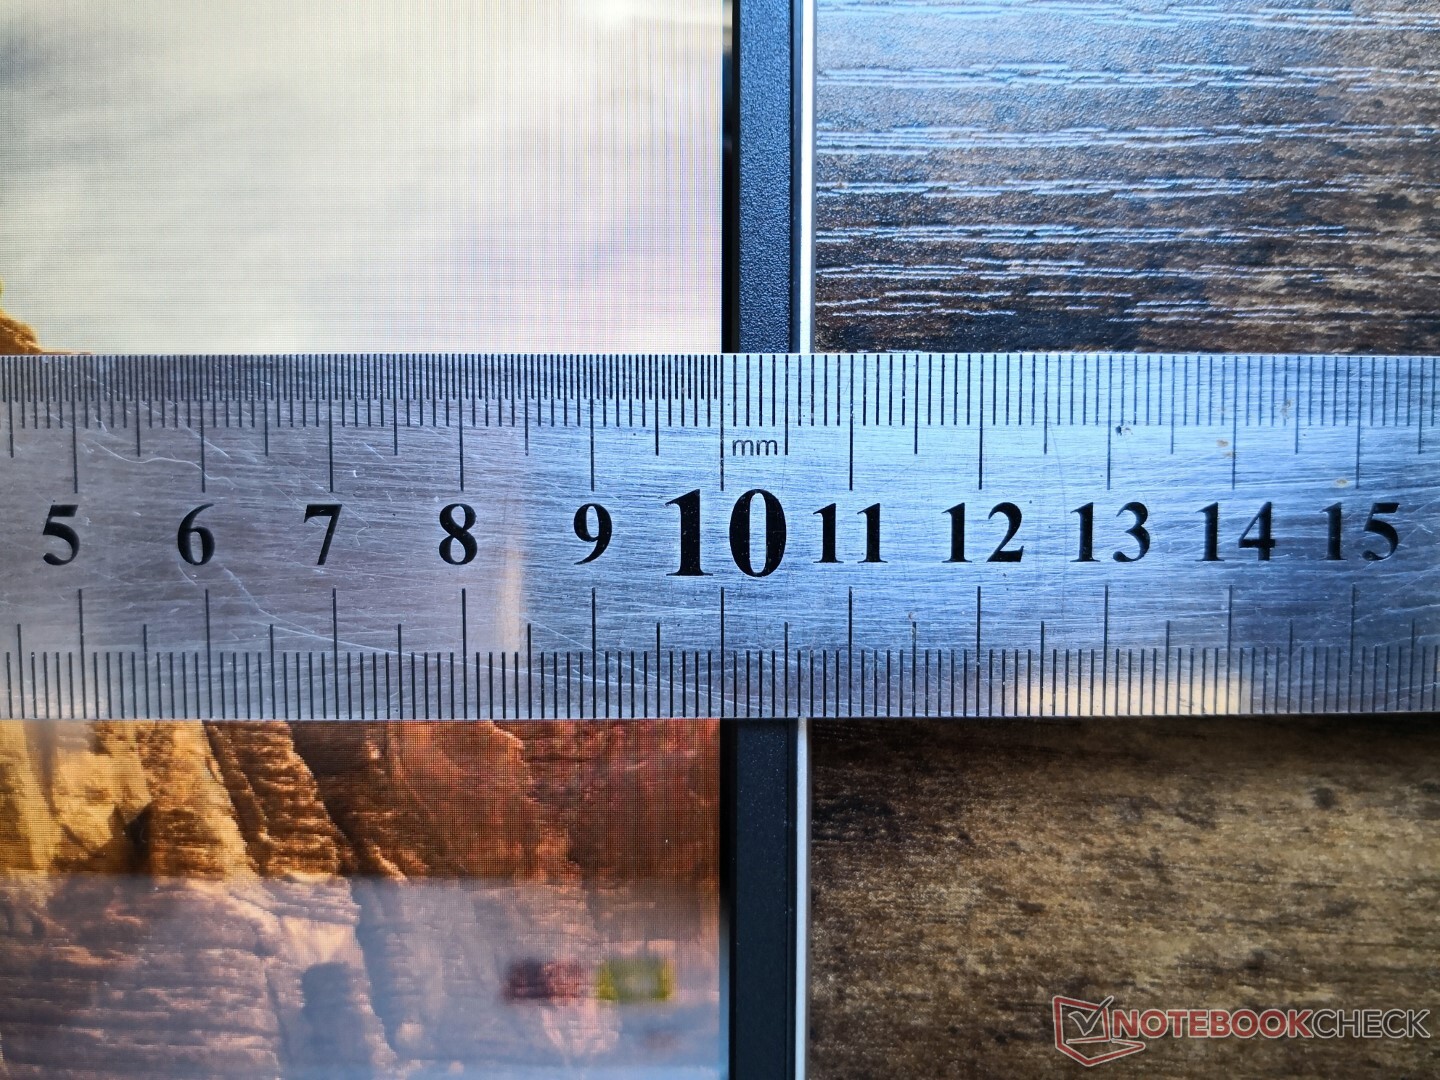
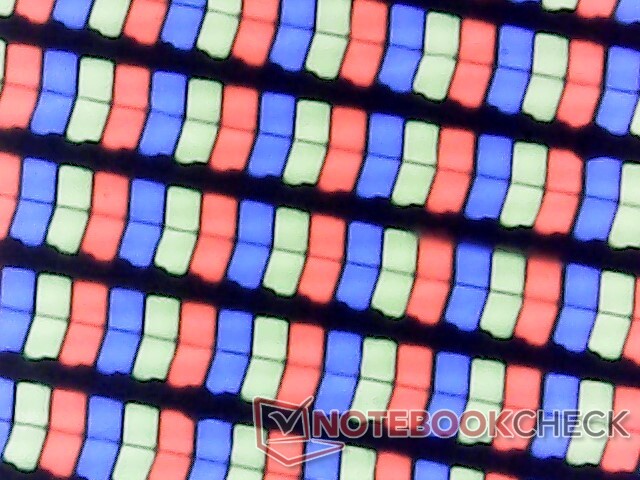
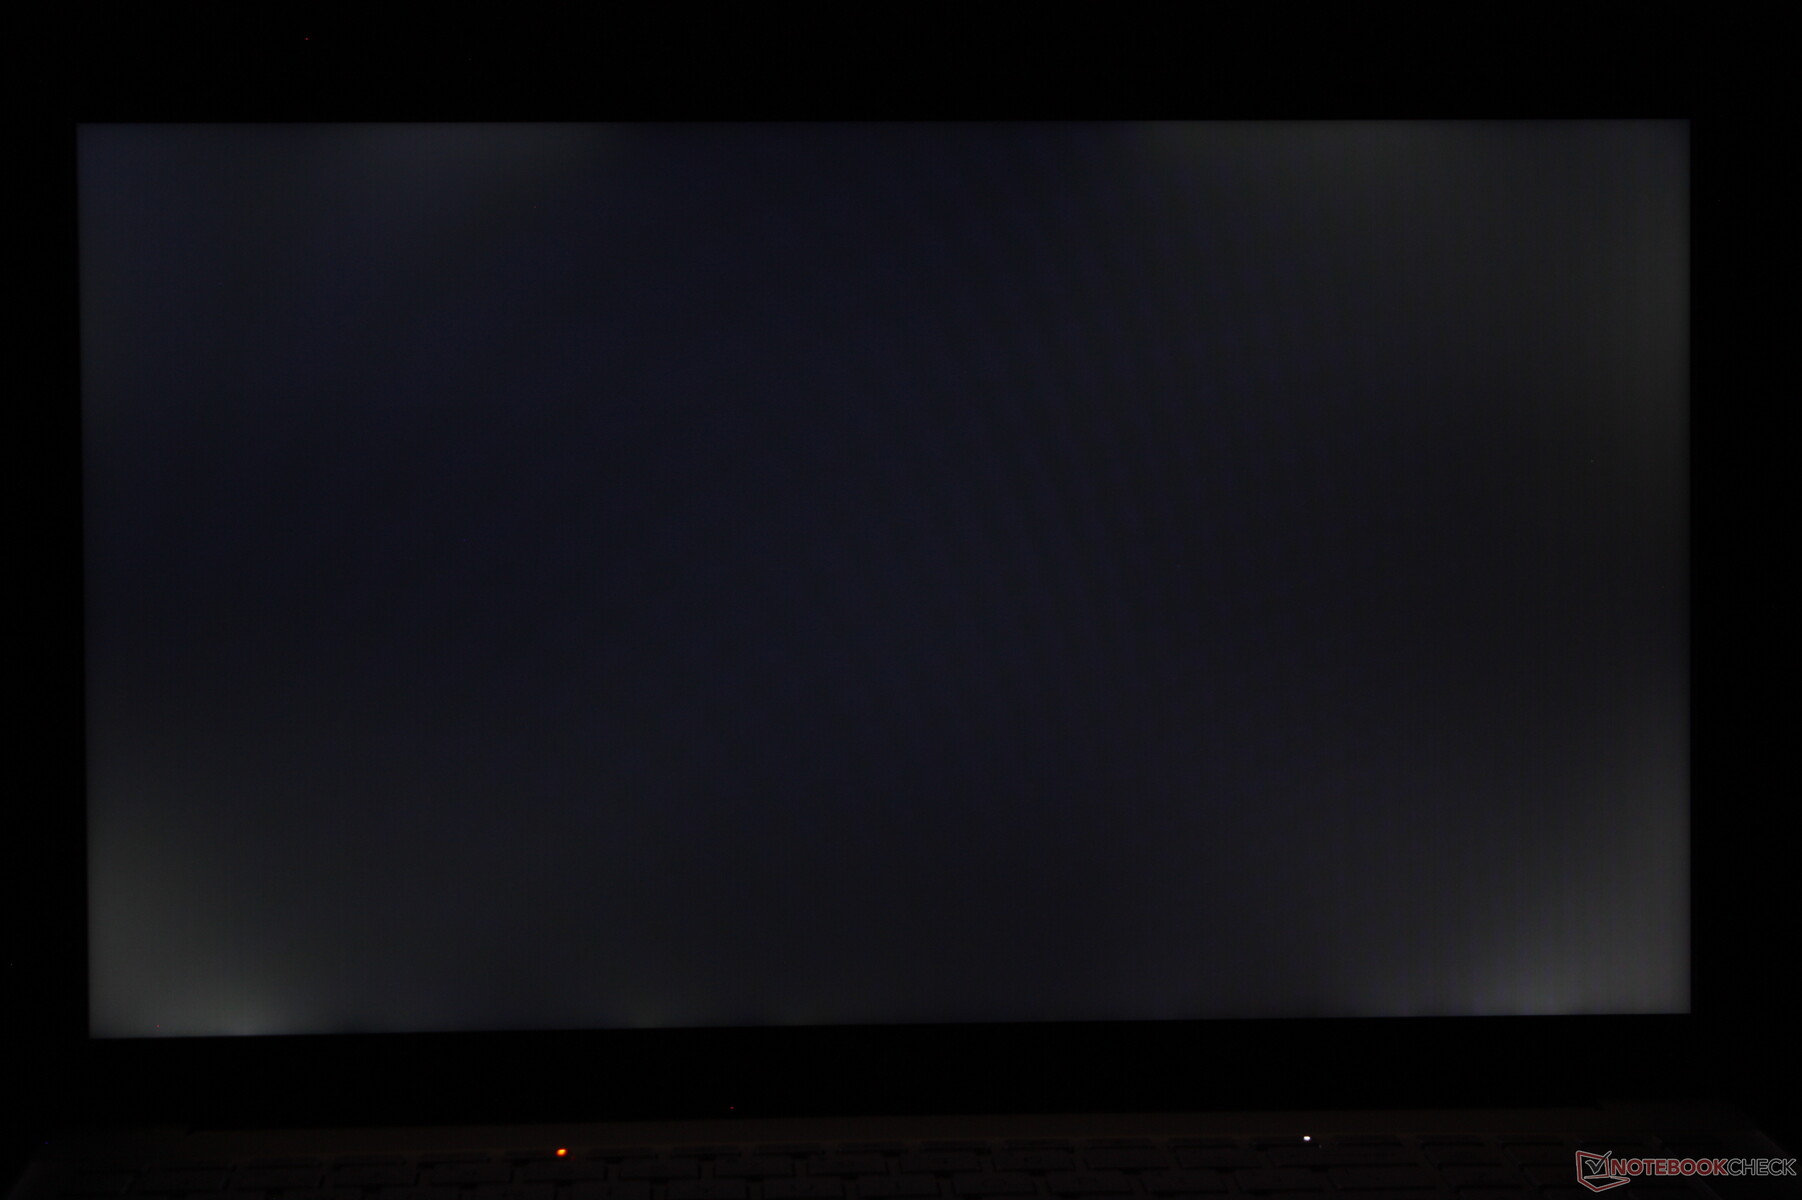
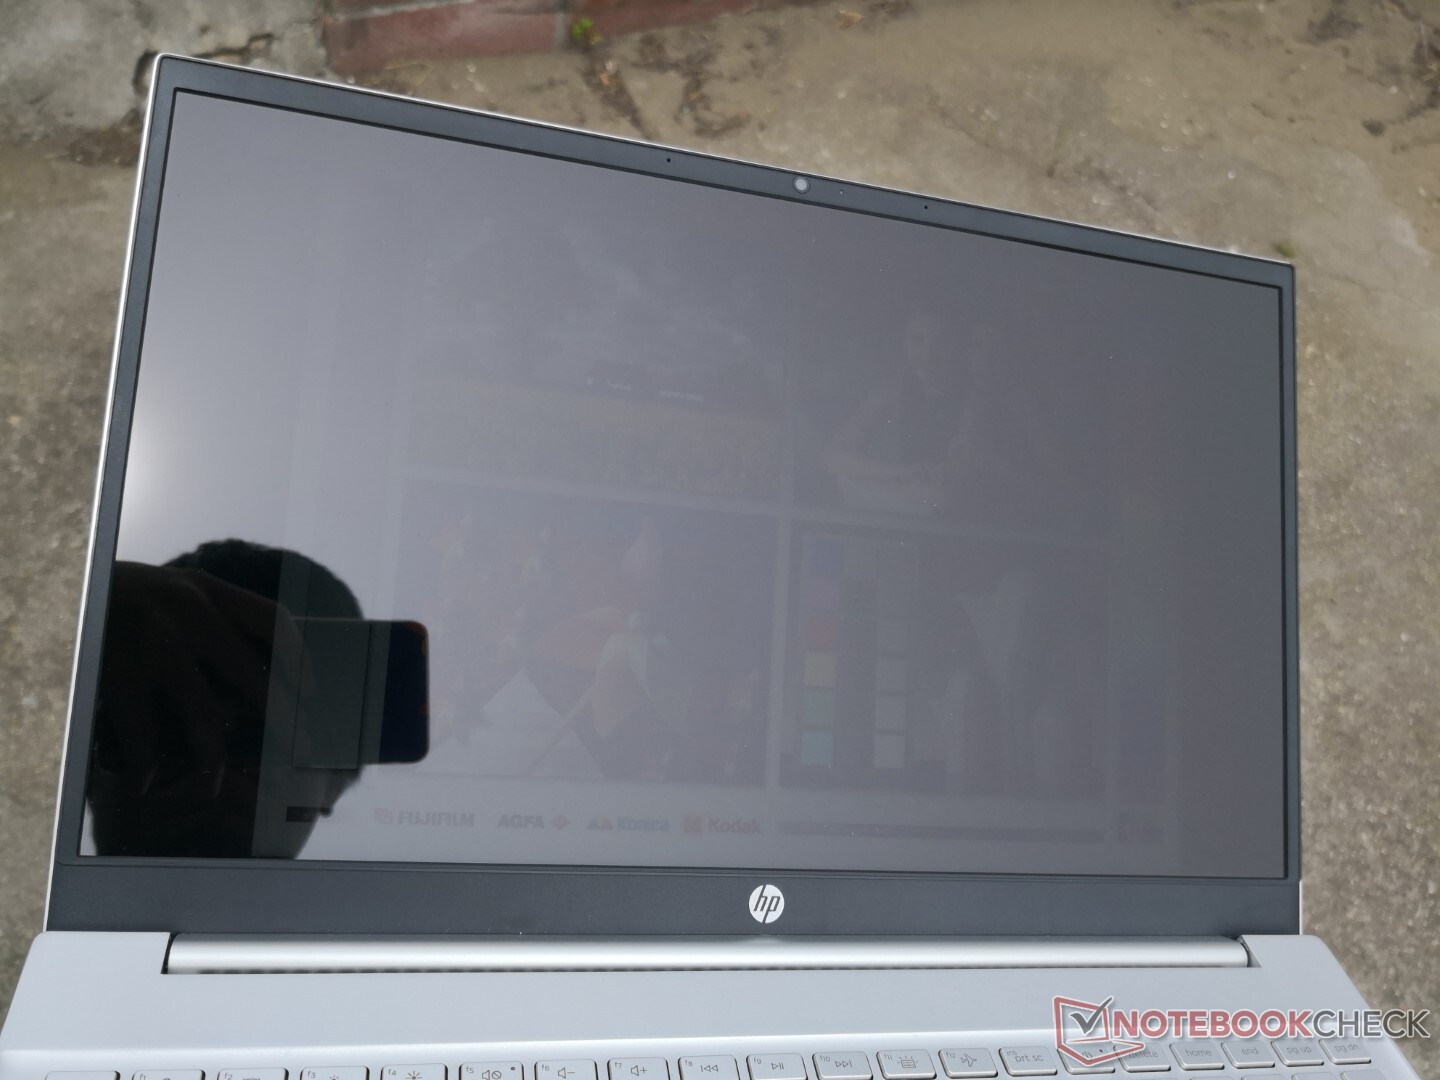
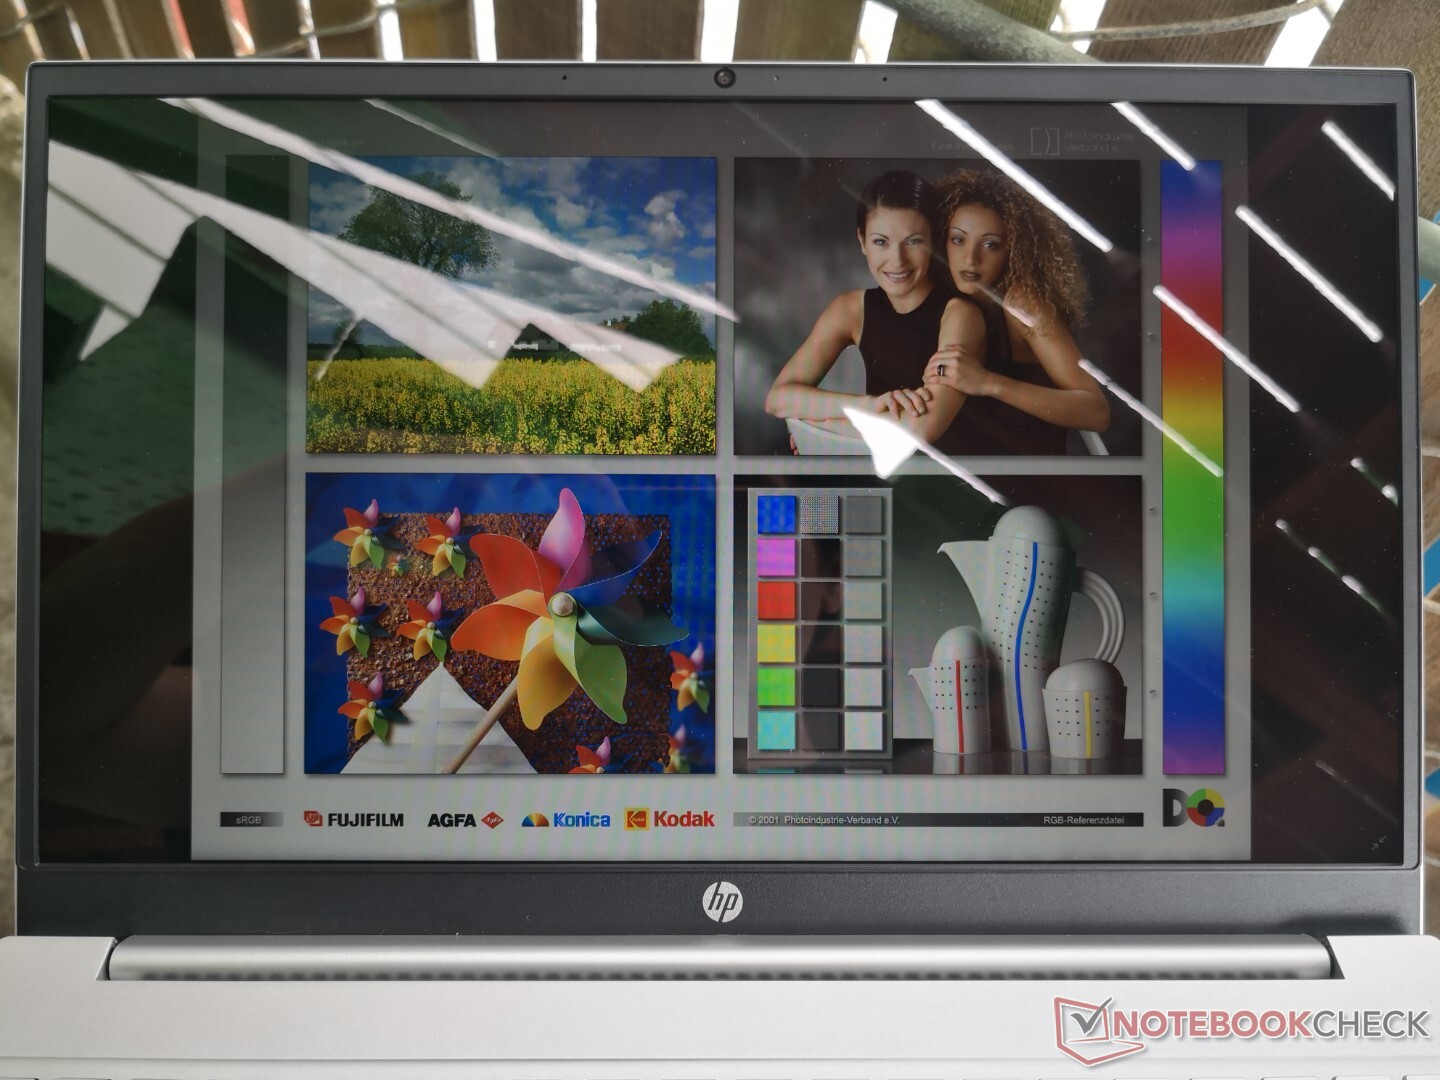
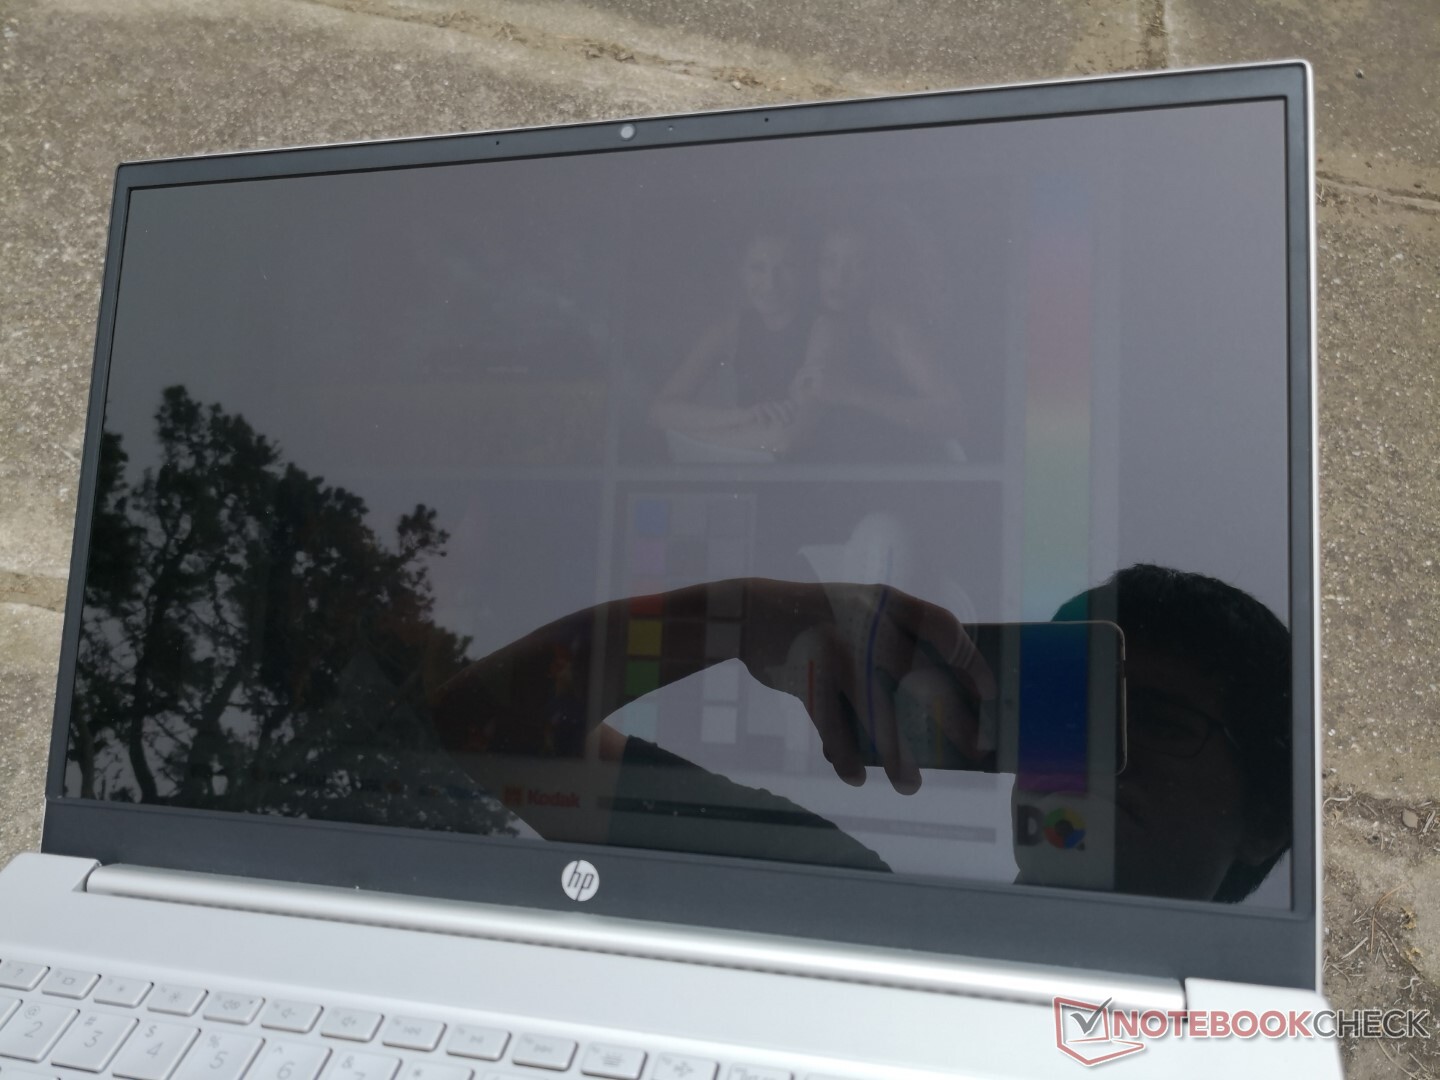
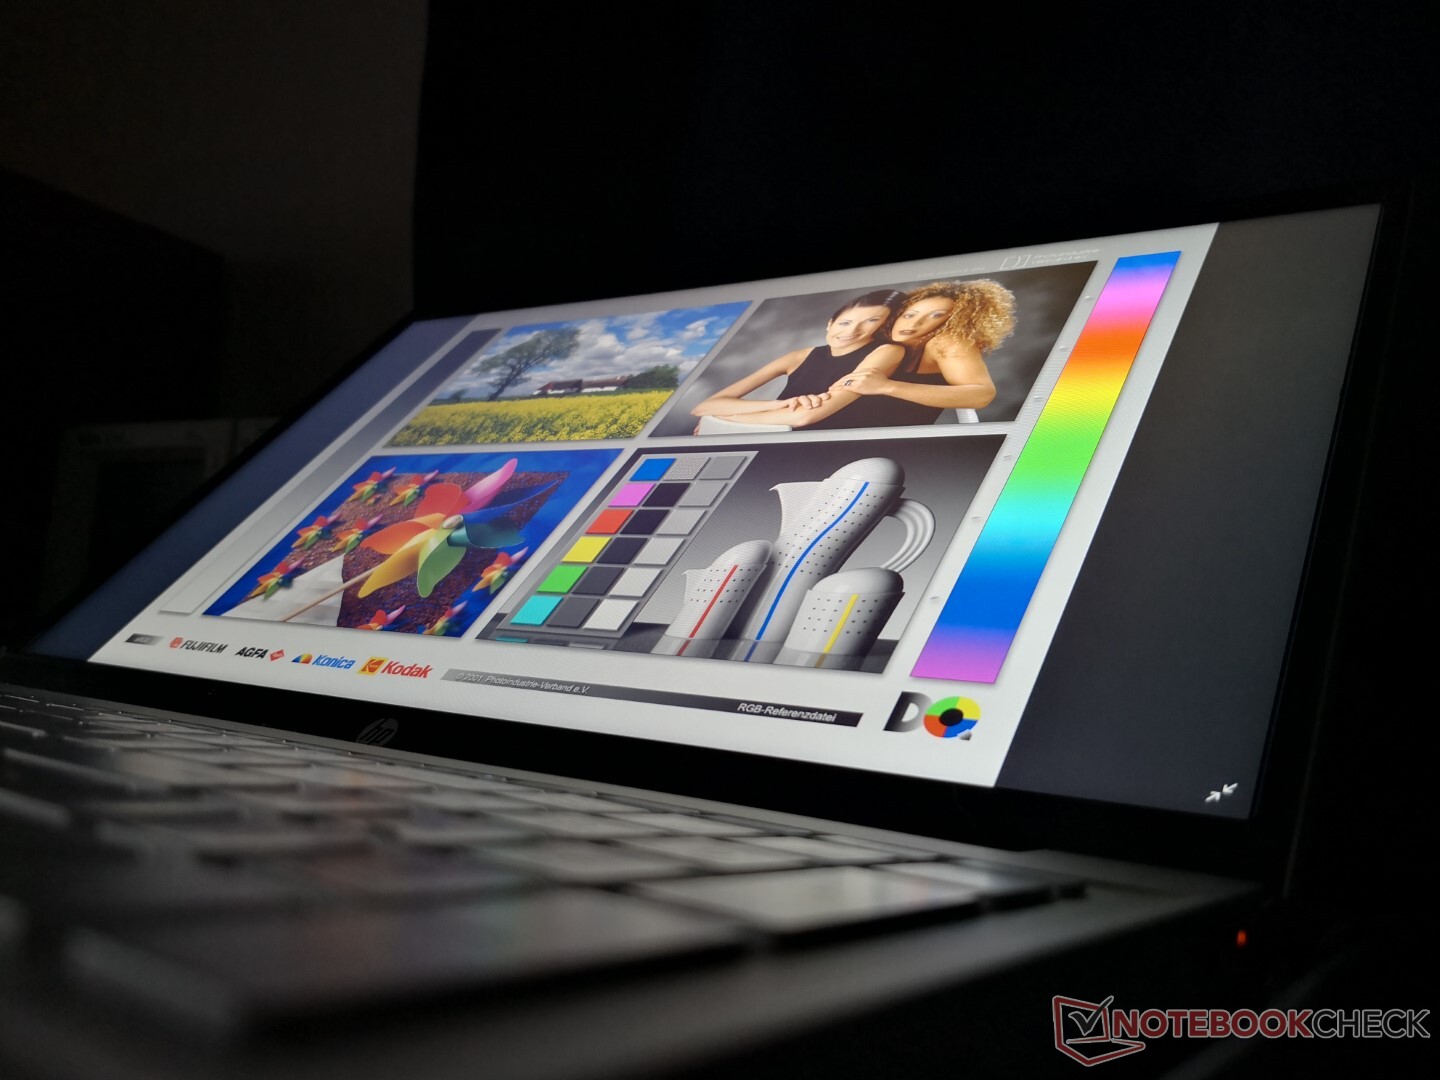
Pantalla: nítida, pero no brillante
La pantalla es a la vez buena y decepcionante. Es buena en el sentido de que el ratio de contraste es relativamente alto para un portátil económico, con más de 1000:1, y que las imágenes son nítidas gracias a la superposición brillante. Los tiempos de respuesta también son decentes para reducir el ghosting al jugar. Por desgracia, la decepcionante luz de fondo y los limitados colores impiden que la pantalla sea sobresaliente en todos los aspectos. Hay que contar con algunos reflejos incluso en interiores.
| |||||||||||||||||||||||||
iluminación: 76 %
Brillo con batería: 294.3 cd/m²
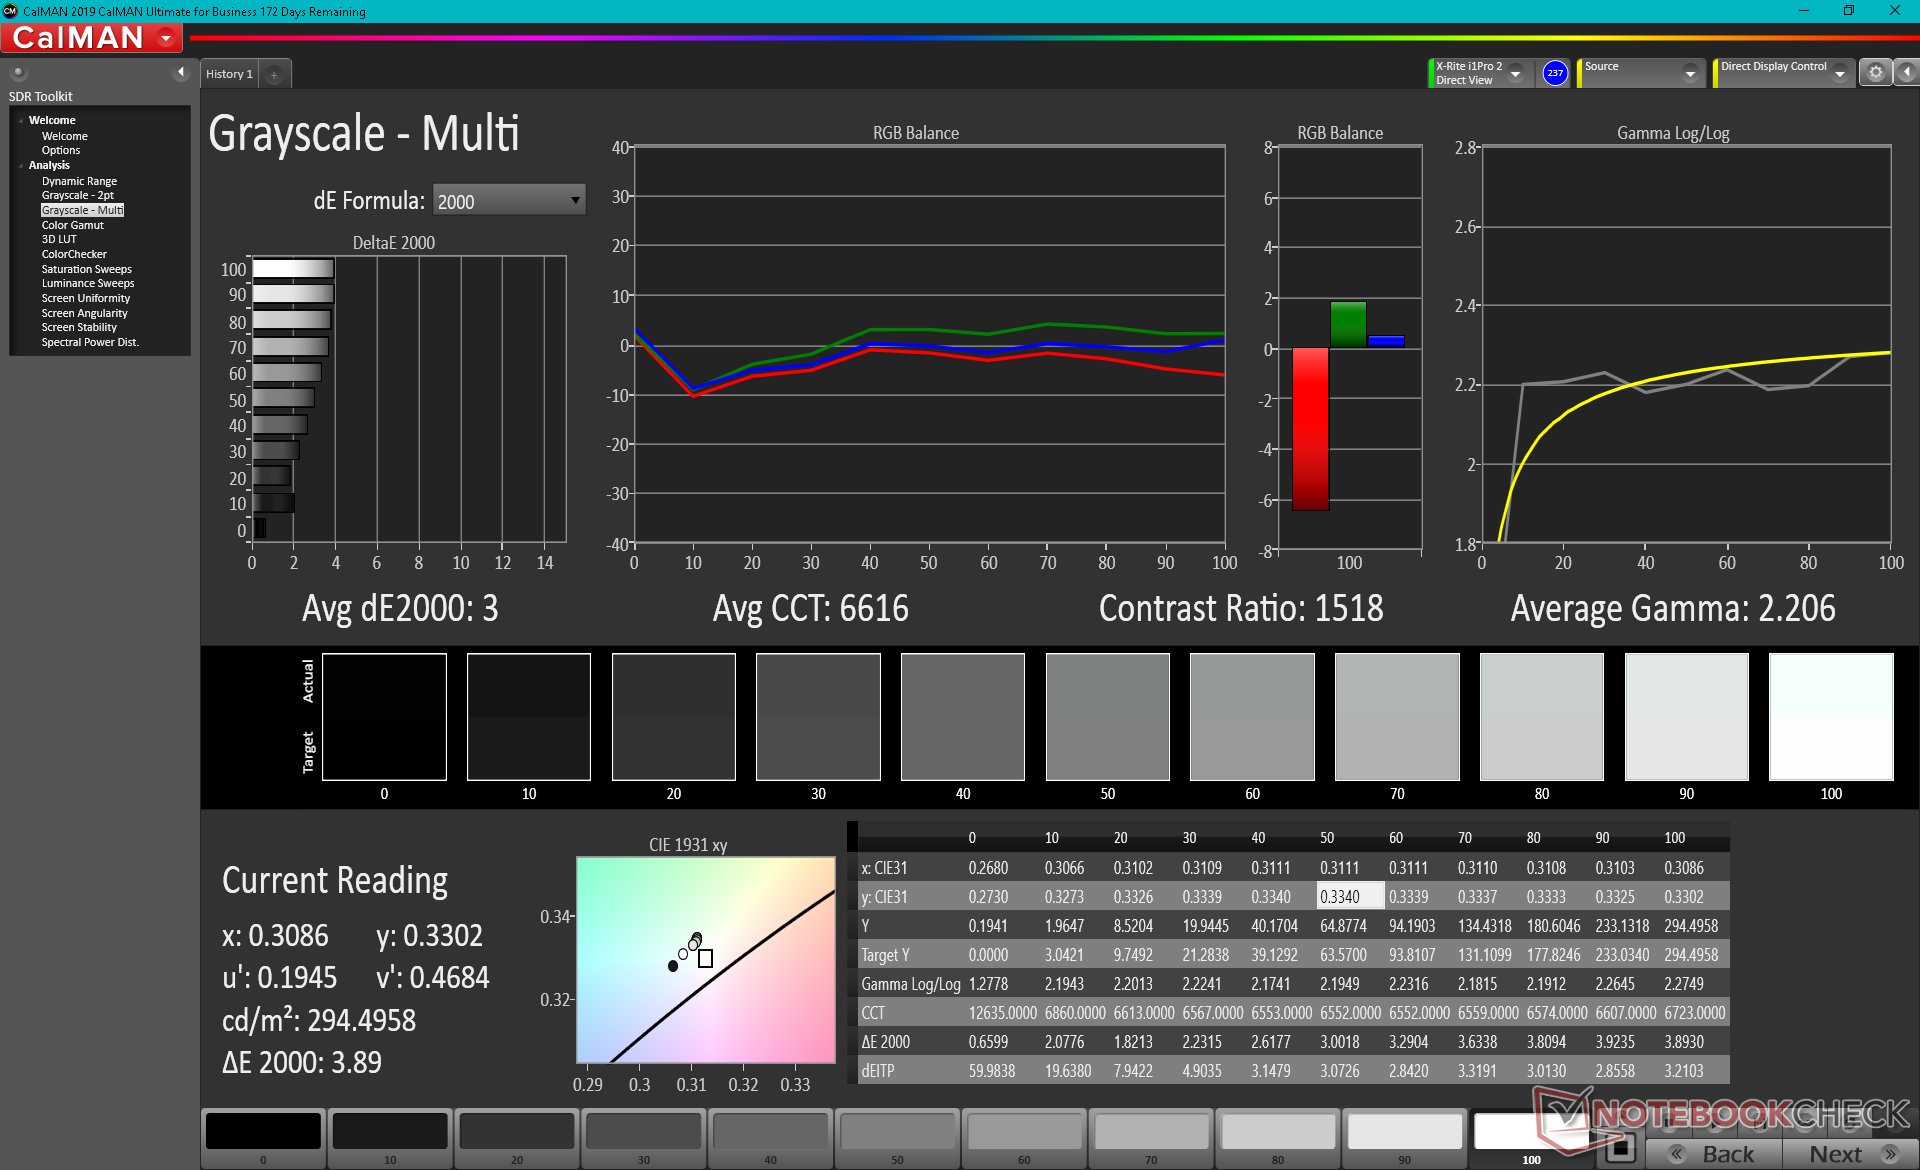
Contraste: 1132:1 (Negro: 0.26 cd/m²)
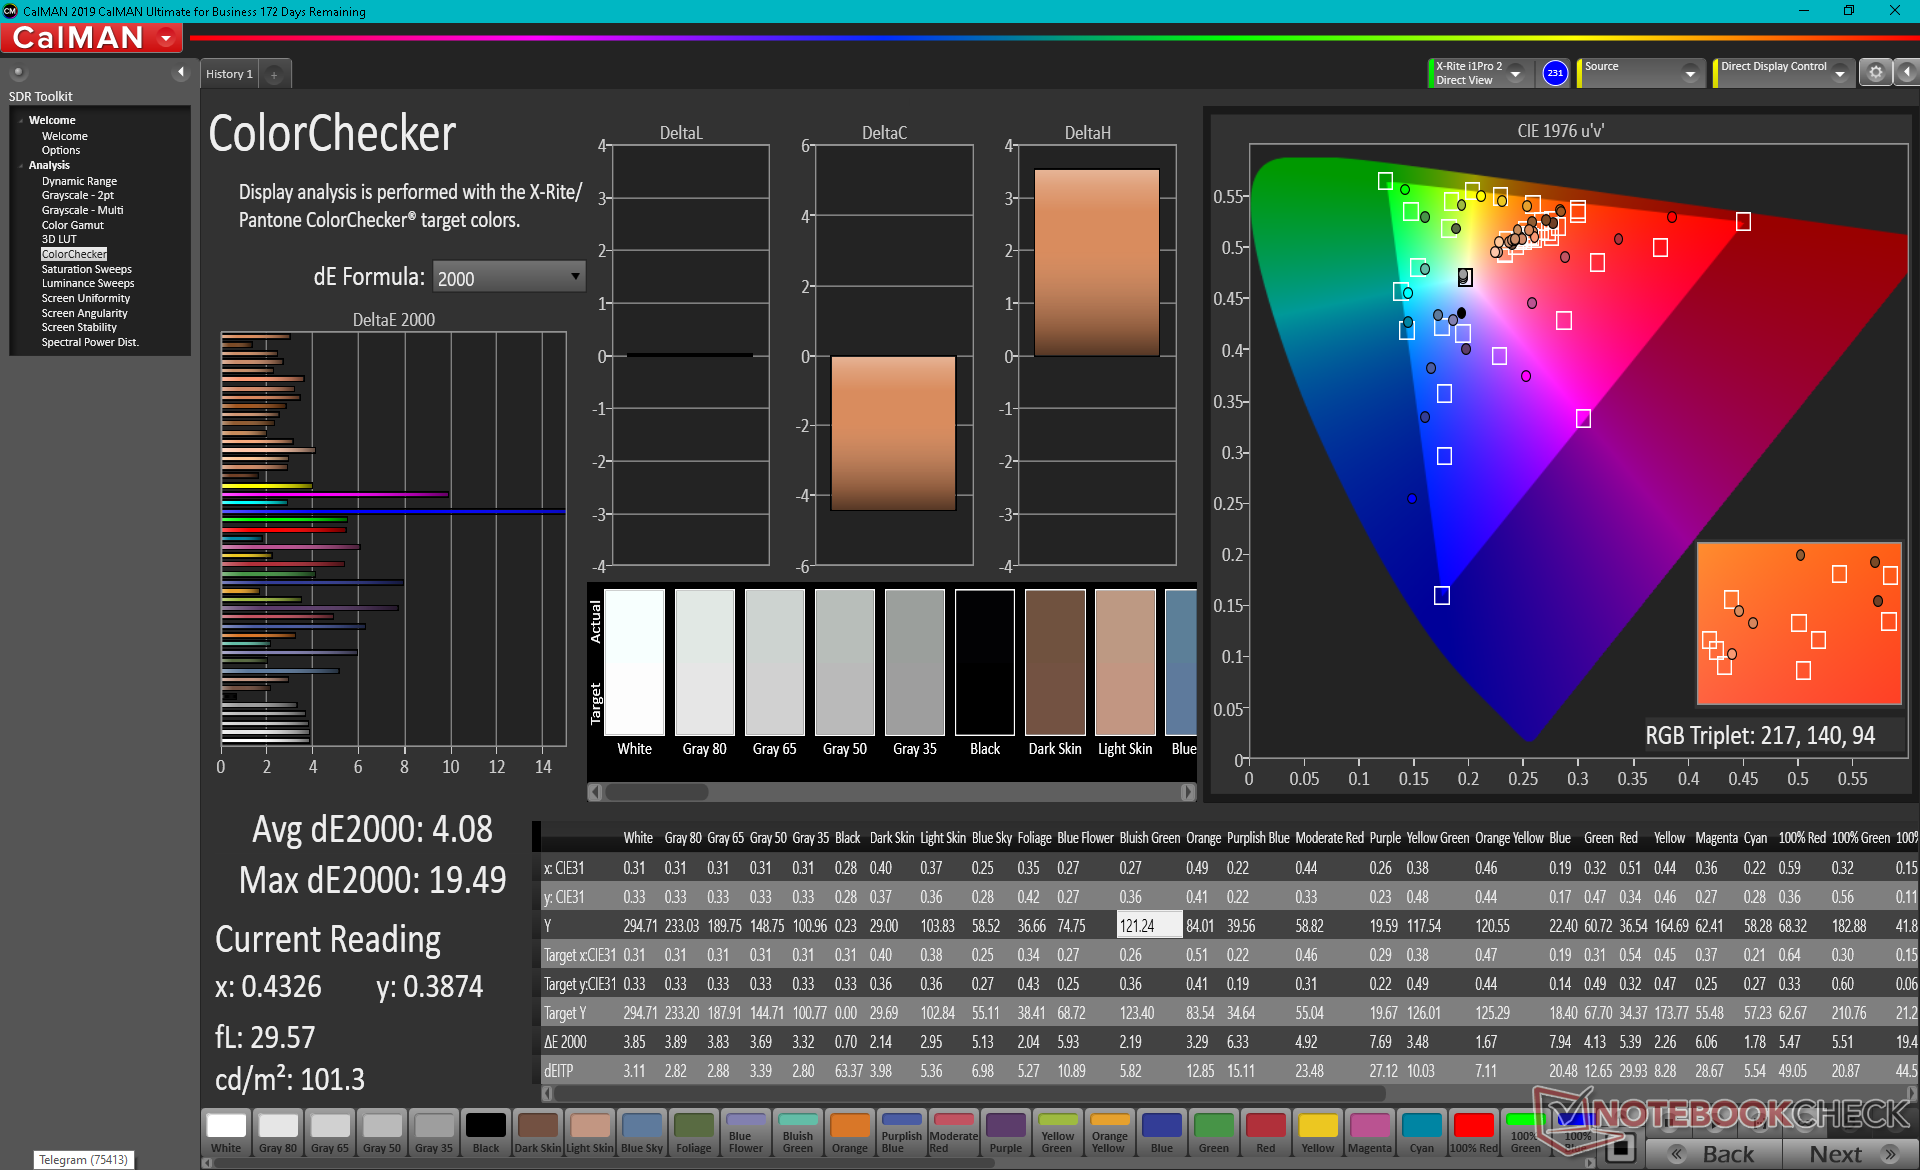
ΔE ColorChecker Calman: 4.08 | ∀{0.5-29.43 Ø4.71}
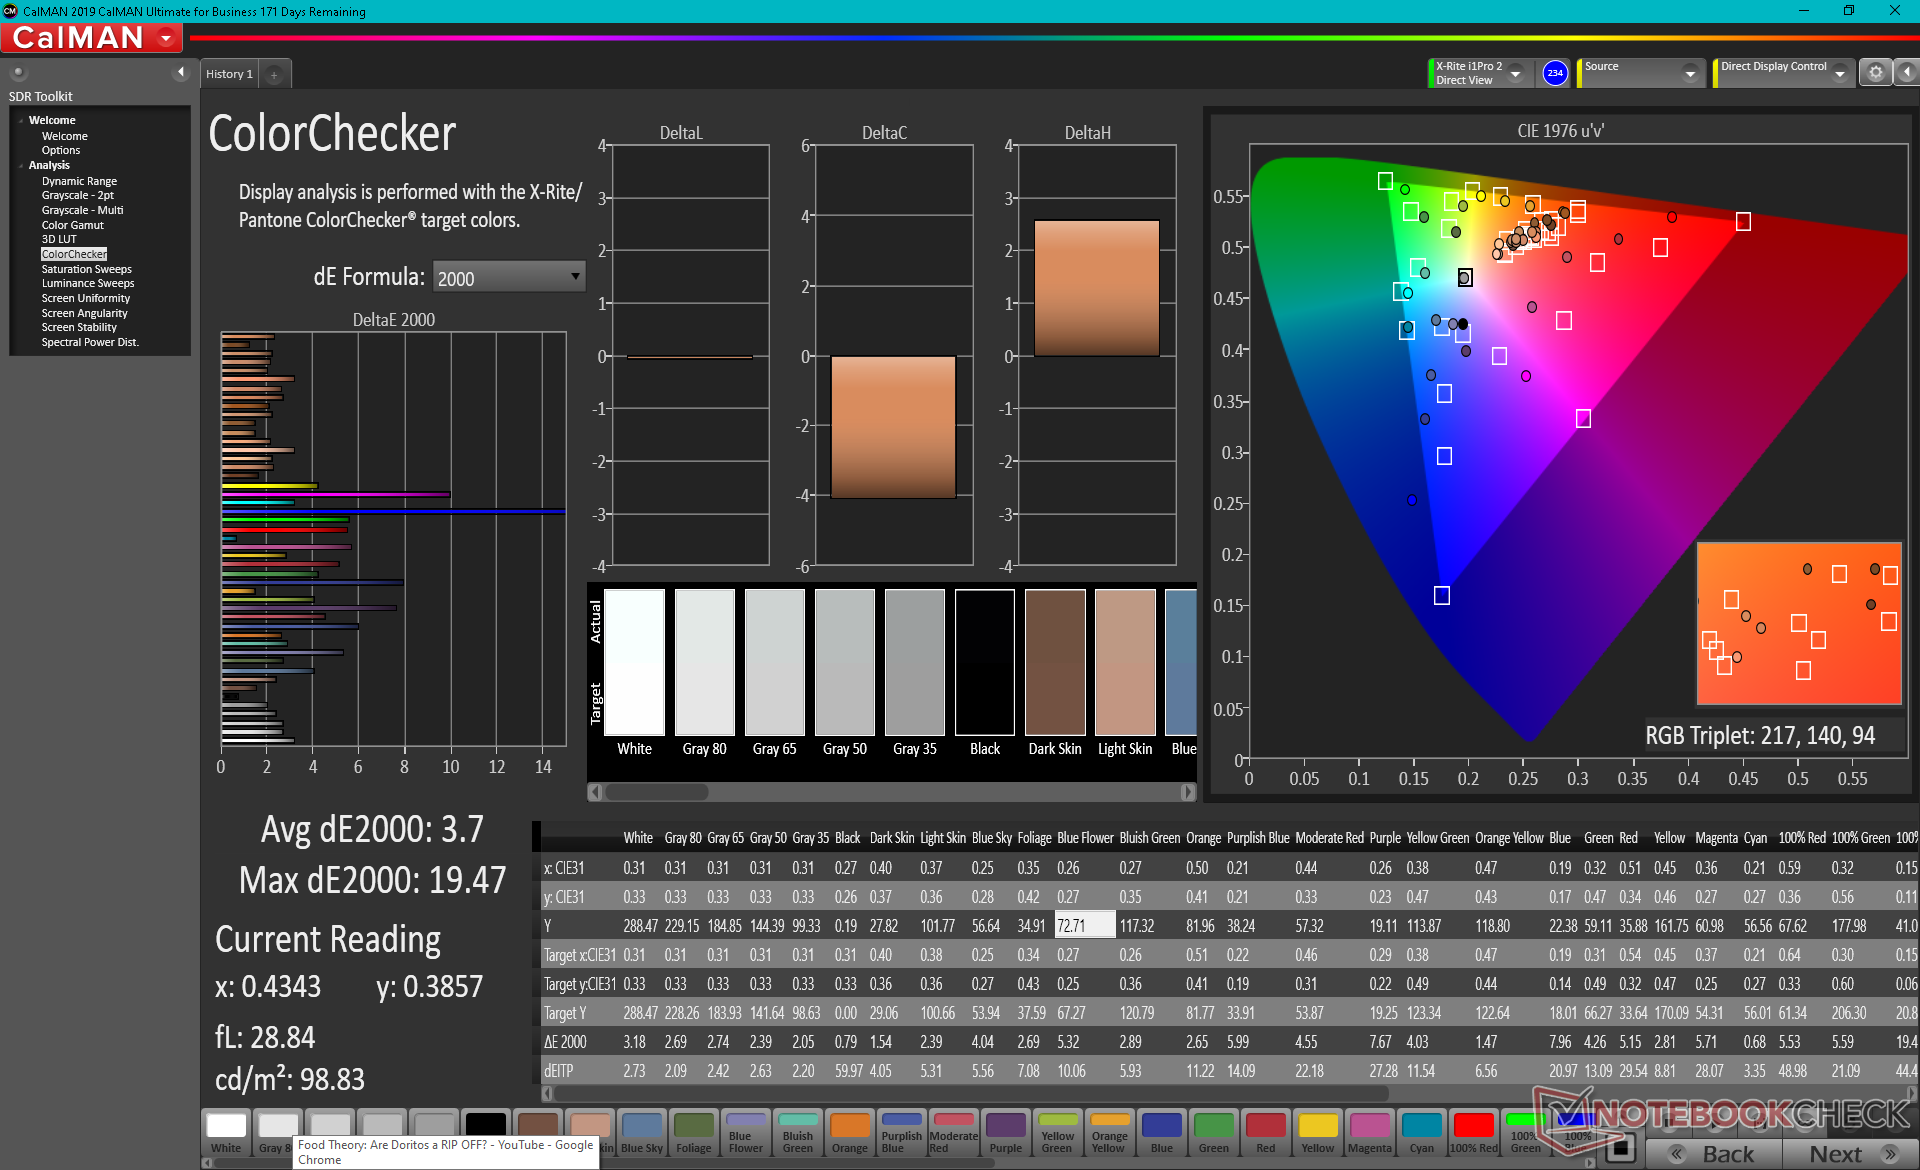
calibrated: 3.7
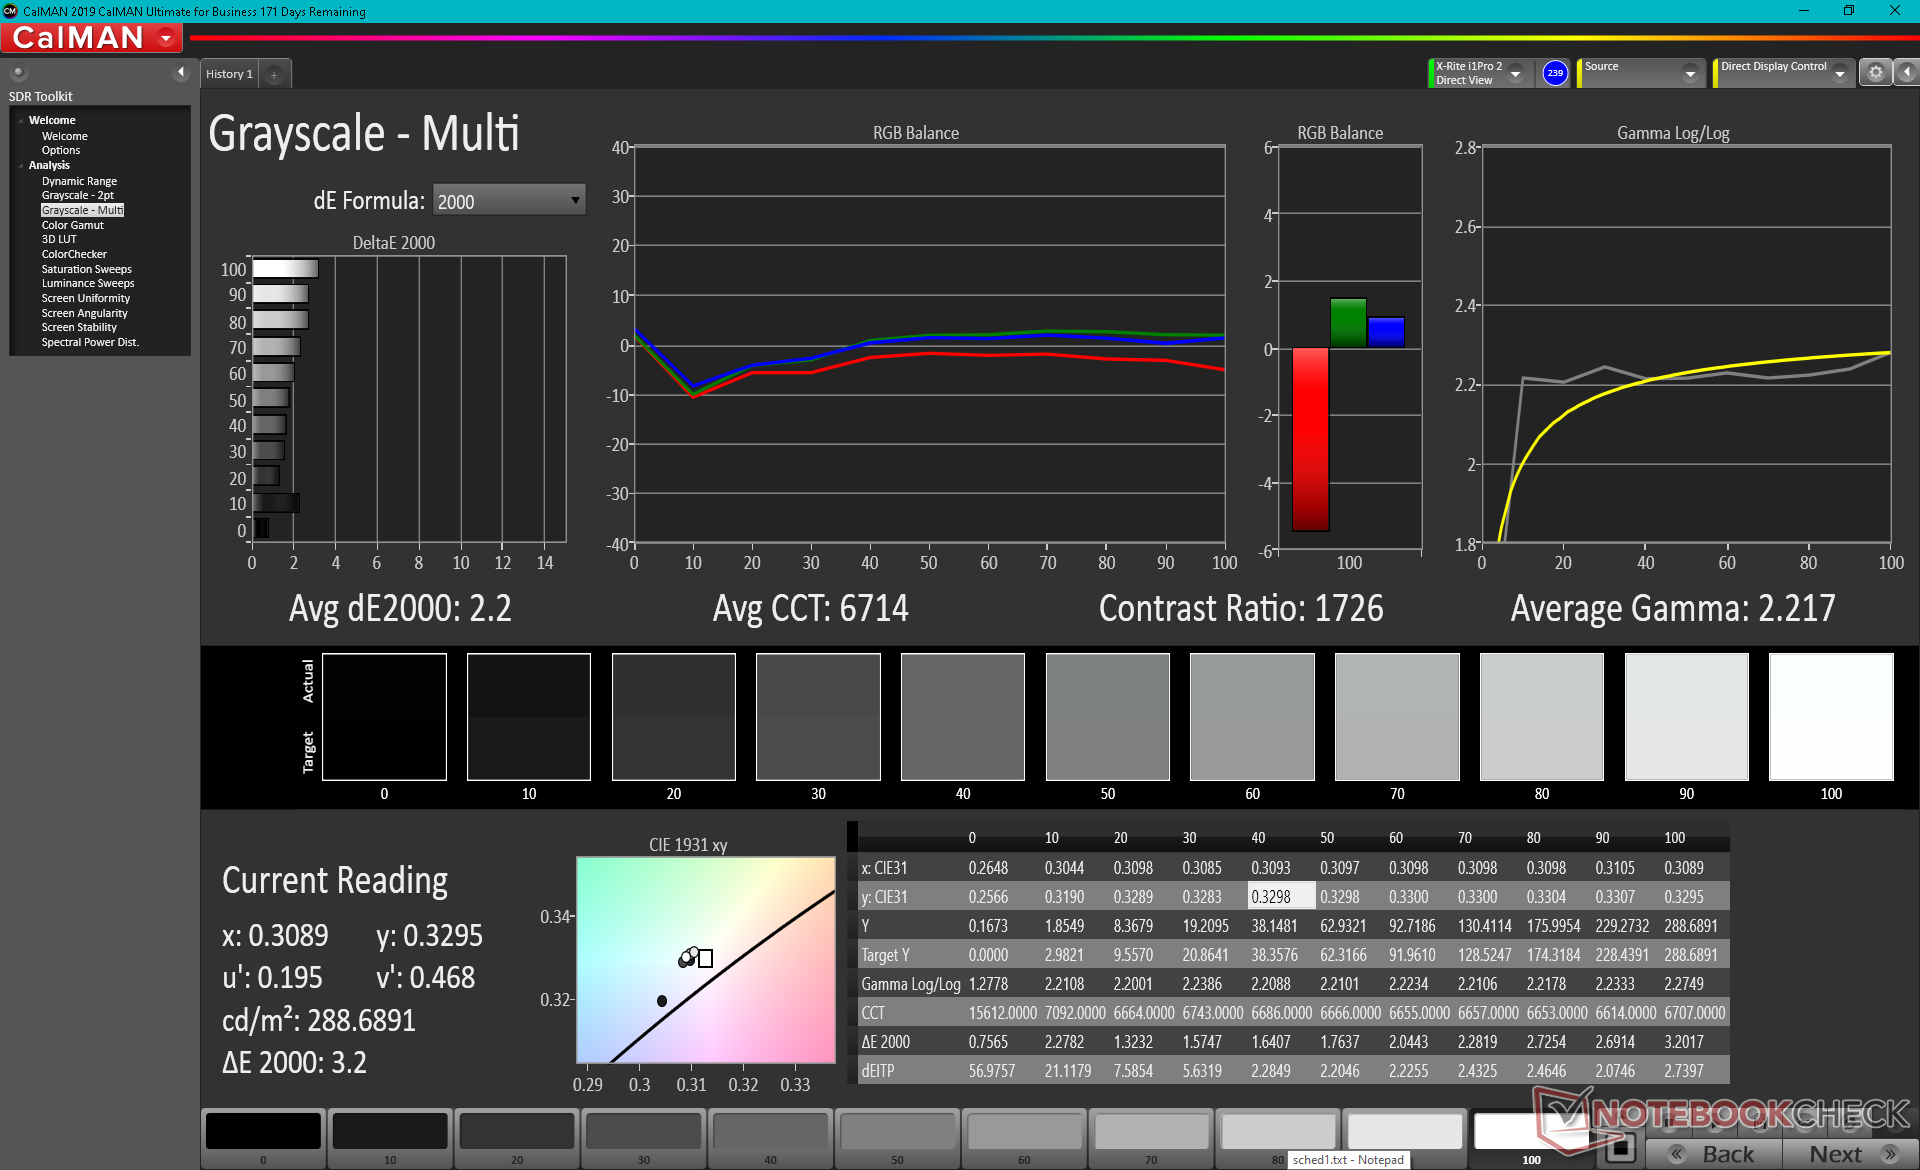
ΔE Greyscale Calman: 3 | ∀{0.09-98 Ø4.96}
44.4% AdobeRGB 1998 (Argyll 3D)
64% sRGB (Argyll 3D)
42.9% Display P3 (Argyll 3D)
Gamma: 2.21
CCT: 6616 K
| HP Pavilion 15-eg Chi Mei CMN1523, IPS, 15.6", 1920x1080 | HP Pavilion Gaming 15-ec0002ng Chi Mei N156HGA-EA3, TN LED, 15.6", 1920x1080 | Dell Inspiron 15 5000 5502 BOE NV15N3D, IPS, 15.6", 1920x1080 | Lenovo IdeaPad 5 15IIL05 AU Optronics B156HAN02.1, IPS, 15.6", 1920x1080 | HP Envy 15-ep0098nr Samsung SDC4145, AMOLED, 15.6", 3840x2160 | Asus VivoBook S15 S533EQ-BQ002T Panda LM156LF-5L04, IPS, 15.6", 1920x1080 | |
|---|---|---|---|---|---|---|
| Display | -4% | -8% | -12% | 96% | -9% | |
| Display P3 Coverage (%) | 42.9 | 41.22 -4% | 39.42 -8% | 37.63 -12% | 88.5 106% | 39.01 -9% |
| sRGB Coverage (%) | 64 | 61.8 -3% | 58.7 -8% | 56.5 -12% | 100 56% | 58.5 -9% |
| AdobeRGB 1998 Coverage (%) | 44.4 | 42.62 -4% | 40.73 -8% | 38.88 -12% | 99.9 125% | 40.33 -9% |
| Response Times | -29% | -77% | -49% | 93% | -41% | |
| Response Time Grey 50% / Grey 80% * (ms) | 22.8 ? | 44 ? -93% | 45.6 ? -100% | 42 ? -84% | 0.8 ? 96% | 38 ? -67% |
| Response Time Black / White * (ms) | 23.6 ? | 15 ? 36% | 36.4 ? -54% | 27 ? -14% | 2.7 ? 89% | 27 ? -14% |
| PWM Frequency (Hz) | 26320 ? | 250 ? | 1020 ? | 242.7 ? | ||
| Screen | -59% | -10% | -9% | 17% | -13% | |
| Brightness middle (cd/m²) | 294.3 | 233 -21% | 233.1 -21% | 340 16% | 374.3 27% | 287 -2% |
| Brightness (cd/m²) | 251 | 211 -16% | 226 -10% | 325 29% | 379 51% | 261 4% |
| Brightness Distribution (%) | 76 | 82 8% | 90 18% | 88 16% | 91 20% | 84 11% |
| Black Level * (cd/m²) | 0.26 | 0.405 -56% | 0.21 19% | 0.27 -4% | 0.51 -96% | |
| Contrast (:1) | 1132 | 575 -49% | 1110 -2% | 1259 11% | 563 -50% | |
| Colorchecker dE 2000 * | 4.08 | 8.22 -101% | 5.69 -39% | 6.62 -62% | 5.47 -34% | 4.72 -16% |
| Colorchecker dE 2000 max. * | 19.49 | 18.6 5% | 20.62 -6% | 21.05 -8% | 8.22 58% | 17.94 8% |
| Colorchecker dE 2000 calibrated * | 3.7 | 5.12 -38% | 4.71 -27% | 4.61 -25% | 3.74 -1% | |
| Greyscale dE 2000 * | 3 | 10.13 -238% | 3.3 -10% | 4.61 -54% | 2.3 23% | 2.2 27% |
| Gamma | 2.21 100% | 2.27 97% | 2.35 94% | 2.74 80% | 2.09 105% | 2.51 88% |
| CCT | 6616 98% | 11323 57% | 6749 96% | 6262 104% | 6340 103% | 6758 96% |
| Color Space (Percent of AdobeRGB 1998) (%) | 39 | 37.1 | 36 | 87.8 | 37 | |
| Color Space (Percent of sRGB) (%) | 62 | 58 | 56 | 100 | 58 | |
| Media total (Programa/Opciones) | -31% /
-41% | -32% /
-19% | -23% /
-16% | 69% /
49% | -21% /
-16% |
* ... más pequeño es mejor
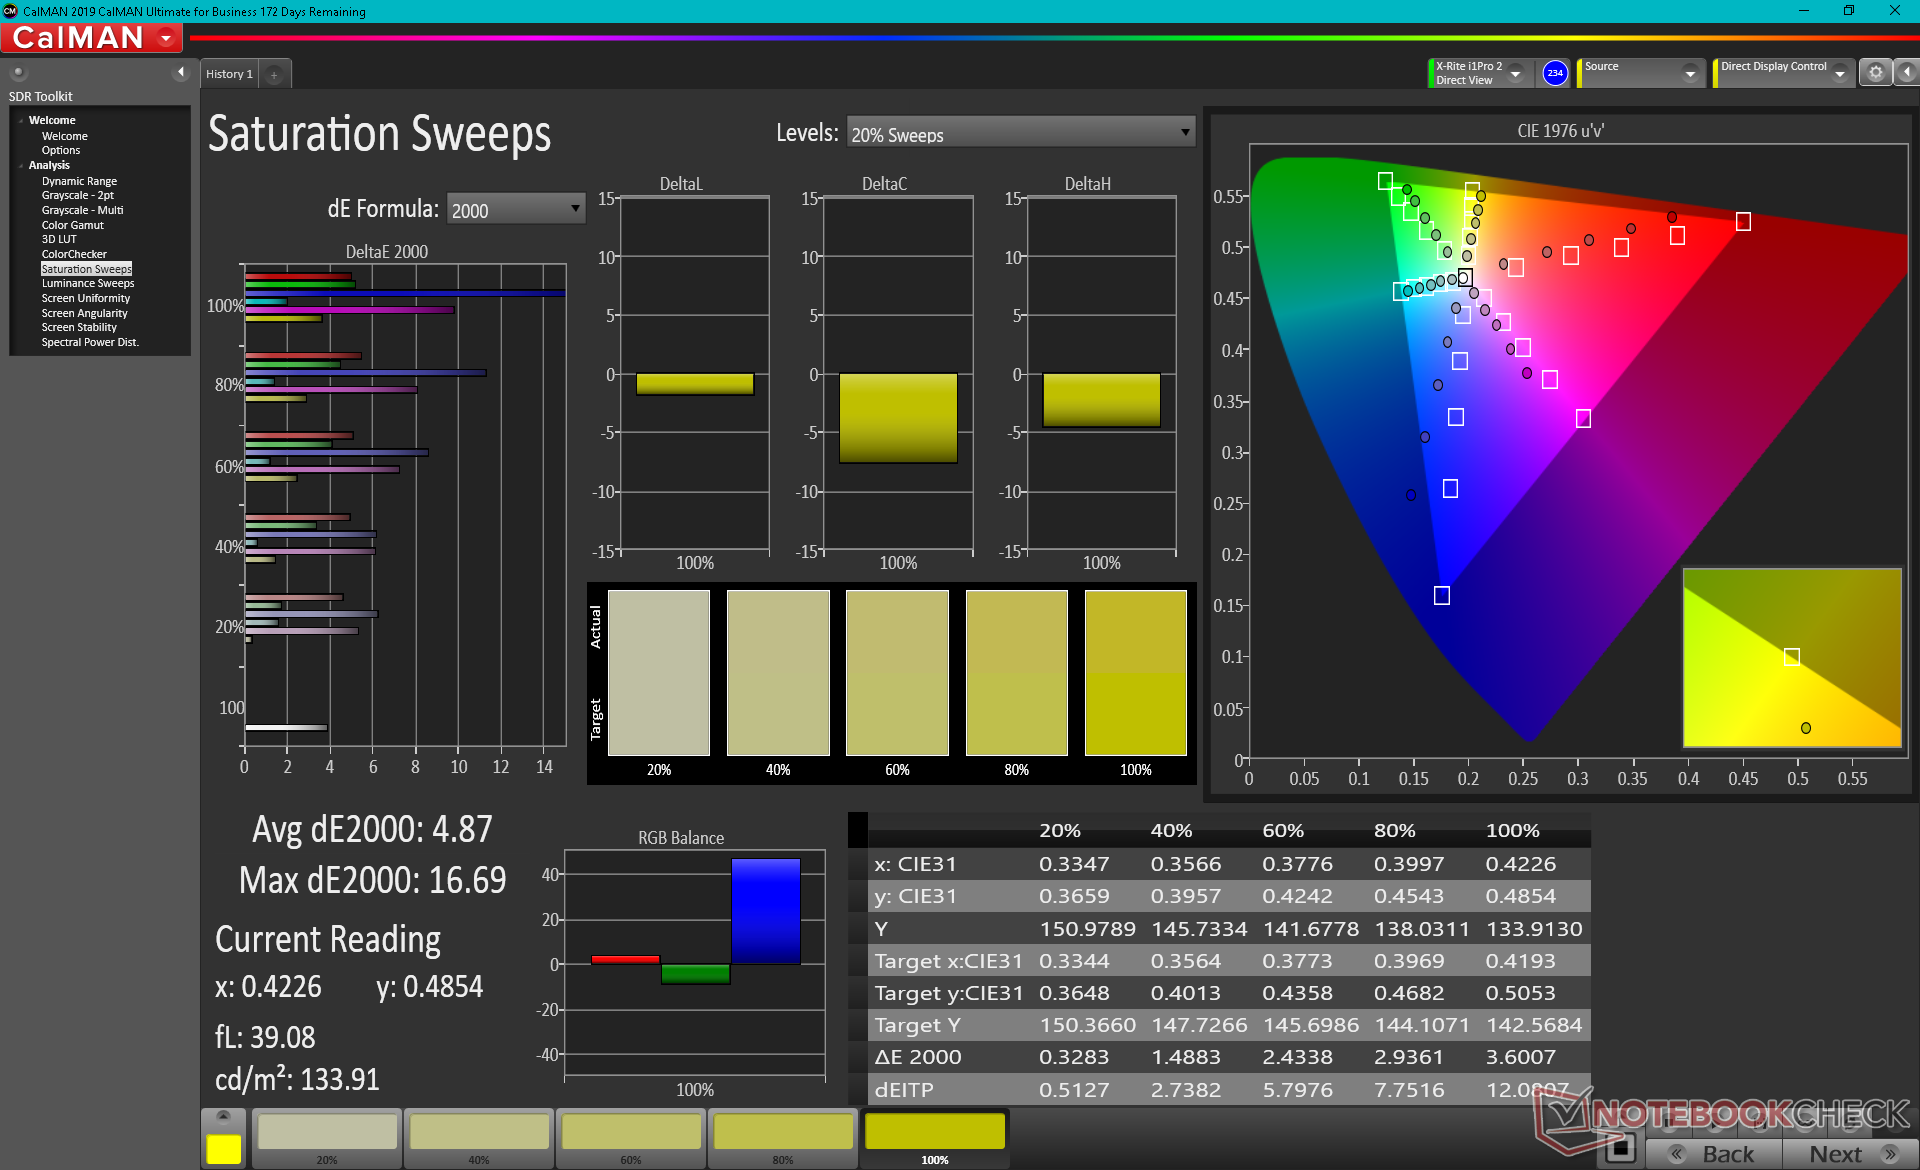
La cobertura de color se limita a sólo el 64% de sRGB para representar una pantalla de nivel básico. Hoy en día, la mayoría de los portátiles de gama media y alta prometen al menos un 90% de cobertura sRGB para obtener colores más intensos.
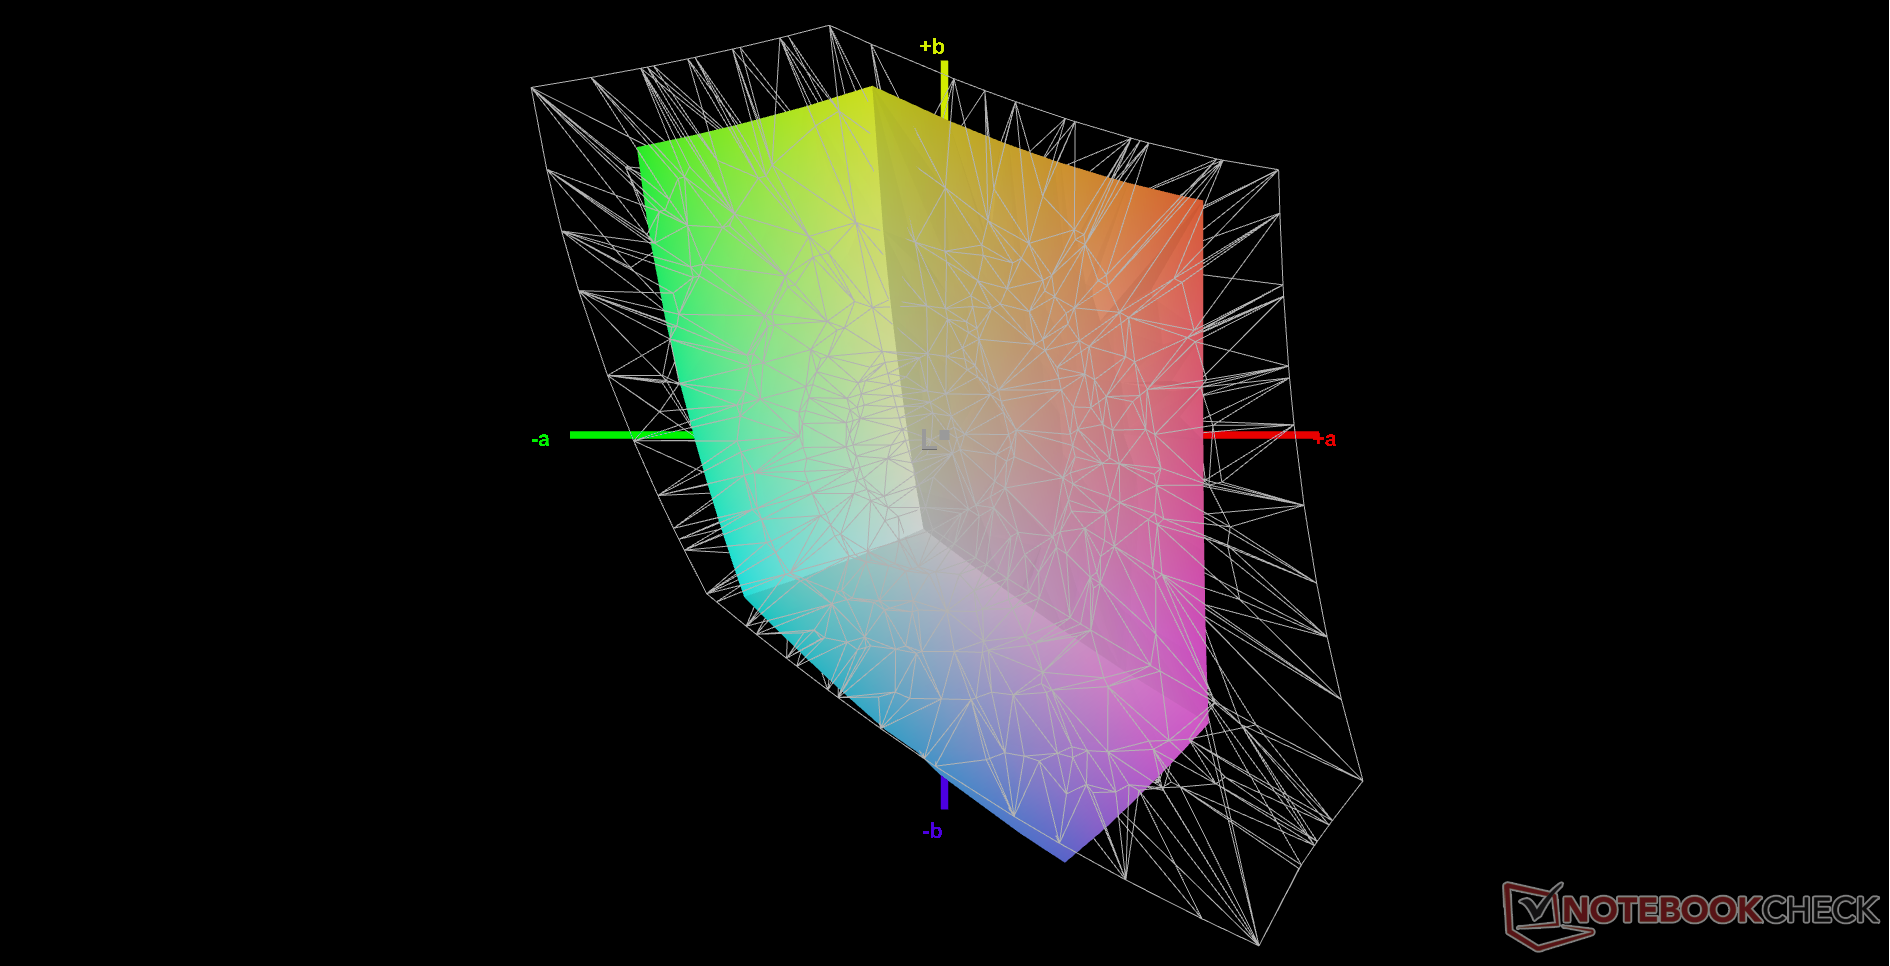
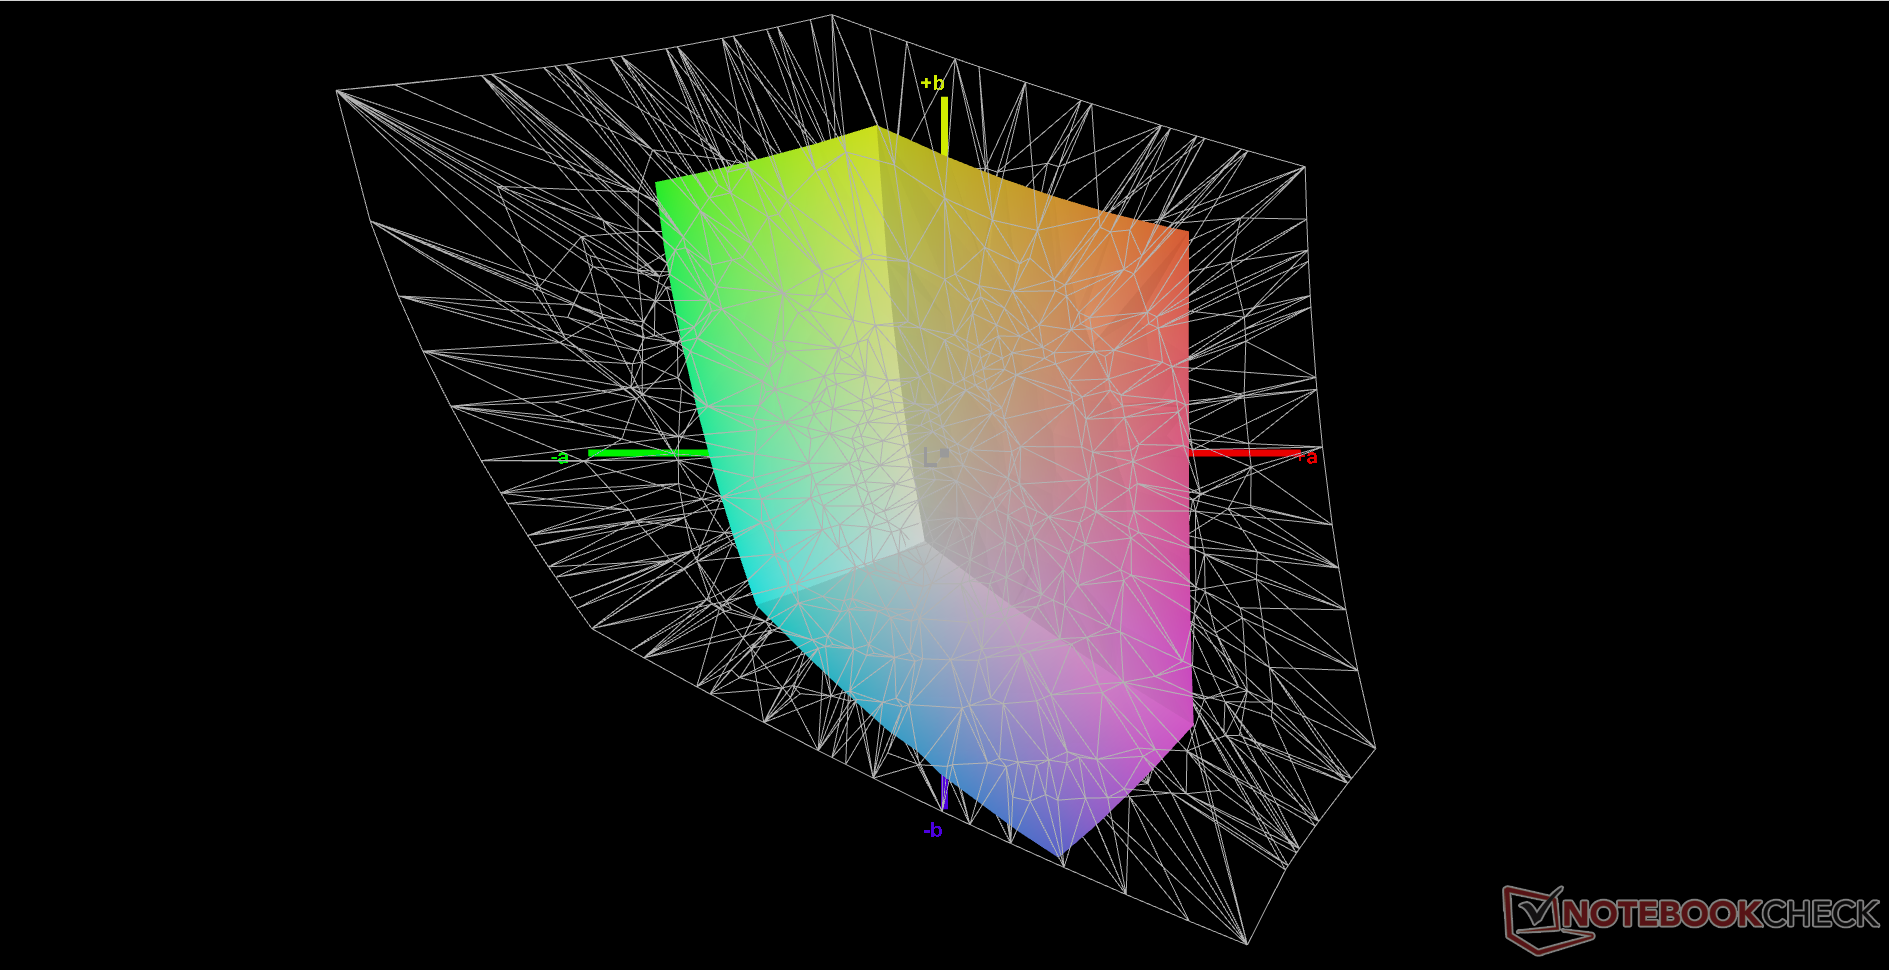
Los resultados del colorímetro X-Rite son mixtos. Mientras que la escala de grises y la gamma son decentes, ciertos colores como el azul y el magenta están muy desviados con altos valores deltaE de 19,5 y 9,9, respectivamente. Estos dos colores seguirían siendo más imprecisos que cualquier otro color con un gran margen incluso después de la calibración. Aunque está perfectamente bien para la navegación web, el vídeo o los juegos, los editores gráficos pueden querer conectar un monitor externo o considerar un portátil de gama alta con colores más precisos. Después de todo, se supone que este es un portátil económico de HP.

Tiempos de respuesta del display
| ↔ Tiempo de respuesta de Negro a Blanco | ||
|---|---|---|
| 23.6 ms ... subida ↗ y bajada ↘ combinada | ↗ 13.6 ms subida | 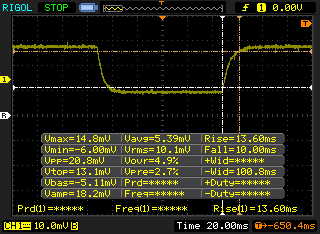 |
| ↘ 10 ms bajada | ||
| La pantalla mostró buenos tiempos de respuesta en nuestros tests pero podría ser demasiado lenta para los jugones competitivos. En comparación, todos los dispositivos de prueba van de ##min### (mínimo) a 240 (máximo) ms. » 54 % de todos los dispositivos son mejores. Eso quiere decir que el tiempo de respuesta es peor que la media (19.8 ms) de todos los dispositivos testados. | ||
| ↔ Tiempo de respuesta 50% Gris a 80% Gris | ||
| 22.8 ms ... subida ↗ y bajada ↘ combinada | ↗ 10 ms subida | 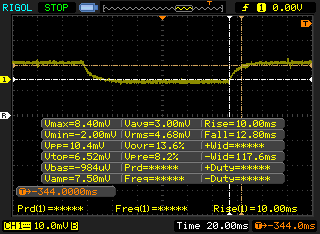 |
| ↘ 12.8 ms bajada | ||
| La pantalla mostró buenos tiempos de respuesta en nuestros tests pero podría ser demasiado lenta para los jugones competitivos. En comparación, todos los dispositivos de prueba van de ##min### (mínimo) a 636 (máximo) ms. » 34 % de todos los dispositivos son mejores. Esto quiere decir que el tiempo de respuesta medido es mejor que la media (31 ms) de todos los dispositivos testados. | ||
Parpadeo de Pantalla / PWM (Pulse-Width Modulation)
| Parpadeo de Pantalla / PWM detectado | 26320 Hz | ≤ 43 % de brillo | 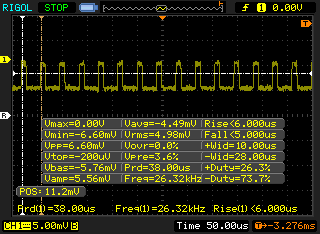 |
La retroiluminación del display parpadea a 26320 Hz (seguramente usa PWM - Pulse-Width Modulation) a un brillo del 43 % e inferior. Sobre este nivel de brillo no debería darse parpadeo / PWM. La frecuencia de 26320 Hz es bastante alta, por lo que la mayoría de gente sensible al parpadeo no debería ver parpadeo o tener fatiga visual. Comparación: 52 % de todos los dispositivos testados no usaron PWM para atenuar el display. Si se usó, medimos una media de 7754 (mínimo: 5 - máxmo: 343500) Hz. | |||
La visibilidad en exteriores es pobre debido al abrumador resplandor. La tenue luz de fondo es incapaz de superar tanto la superposición brillante como la luz ambiental natural para una pantalla lavada. Si la visibilidad en exteriores es una preocupación, entonces es posible que desee invertir en un convertible Spectre que ofrece opciones de visualización mucho más brillantes.
Rendimiento - GeForce MX450 Powerhouse
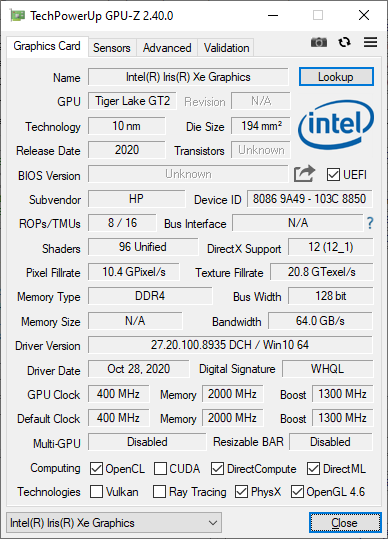
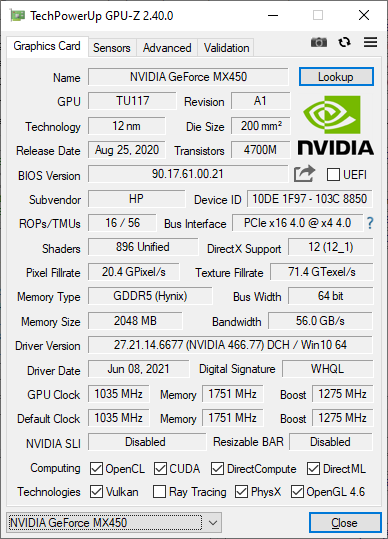
Aunque el Core i7-1165G7 se ha vuelto omnipresente, es la GPU GeForce MX450 la que separa al Pavilion 15 de la mayoría de los demás Ultrabooks. Los portátiles con CPUs Tiger Lake suelen carecer de opciones de gráficos discretos, ya que la GPU integrada Intel Iris Xe compite directamente con la serie GeForce MX.
Las opciones AMD Ryzen están disponibles por precios más bajos con opciones similares de pantalla, RAM y almacenamiento. Sin embargo, carecen de la GPU GeForce MX y de la conexión inalámbrica AX201 Wi-Fi 6 de las SKU de Intel.
Nuestra unidad se configuró en modo de alto rendimiento antes de ejecutar cualquier prueba de rendimiento para obtener las puntuaciones más altas posibles.
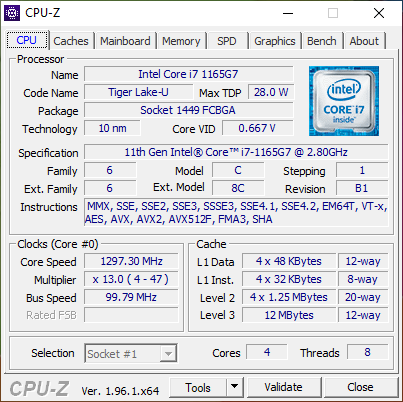
Procesador - Potencia Turbo Boost limitada
El rendimiento de un solo hilo está ligeramente por encima de la media Core i7-1165G7 de nuestra base de datos en unos pocos puntos porcentuales, mientras que el rendimiento multihilo está ligeramente por debajo. El rendimiento general es algo escaso, ya que las puntuaciones de CineBench son comparables a las del antiguo y más barato Core i5-1035G1 aunque sabemos que el Core i7-1165G7 es capaz de mucho más. El ADATA Xeniapor ejemplo, ofrece un rendimiento multihilo entre un 25 y un 30 por ciento más rápido que nuestro HP a pesar de que ambos sistemas llevan el mismo procesador.
Cinebench R23: Multi Core | Single Core
Cinebench R15: CPU Multi 64Bit | CPU Single 64Bit
Blender: v2.79 BMW27 CPU
7-Zip 18.03: 7z b 4 -mmt1 | 7z b 4
Geekbench 5.5: Single-Core | Multi-Core
HWBOT x265 Benchmark v2.2: 4k Preset
LibreOffice : 20 Documents To PDF
R Benchmark 2.5: Overall mean
| Cinebench R20 / CPU (Multi Core) | |
| HP Envy x360 15-eu0097nr | |
| HP Envy 15-ep0098nr | |
| Tuxedo Aura 15 Gen1 | |
| ADATA XPG Xenia Xe | |
| Honor MagicBook 15 4500U | |
| Medio Intel Core i7-1165G7 (1060 - 2657, n=81) | |
| HP Pavilion 15-eg | |
| Lenovo IdeaPad 5 15IIL05 | |
| HP Pavilion Gaming 15-ec0002ng | |
| Lenovo Ideapad S340-15IIL | |
| Honor MagicBook 15 i5 1135G7 | |
| HP Pavilion x360 15-dq0065cl | |
| Dell Inspiron 15 5000 5502 | |
| Cinebench R20 / CPU (Single Core) | |
| ADATA XPG Xenia Xe | |
| HP Pavilion 15-eg | |
| Medio Intel Core i7-1165G7 (442 - 589, n=81) | |
| Honor MagicBook 15 i5 1135G7 | |
| Dell Inspiron 15 5000 5502 | |
| HP Envy x360 15-eu0097nr | |
| Tuxedo Aura 15 Gen1 | |
| Lenovo Ideapad S340-15IIL | |
| Honor MagicBook 15 4500U | |
| Lenovo IdeaPad 5 15IIL05 | |
| HP Envy 15-ep0098nr | |
| HP Pavilion x360 15-dq0065cl | |
| HP Pavilion Gaming 15-ec0002ng | |
| Cinebench R23 / Multi Core | |
| HP Envy x360 15-eu0097nr | |
| Tuxedo Aura 15 Gen1 | |
| ADATA XPG Xenia Xe | |
| Medio Intel Core i7-1165G7 (2525 - 6862, n=64) | |
| HP Pavilion 15-eg | |
| Honor MagicBook 15 i5 1135G7 | |
| Cinebench R23 / Single Core | |
| ADATA XPG Xenia Xe | |
| HP Pavilion 15-eg | |
| Medio Intel Core i7-1165G7 (1110 - 1539, n=59) | |
| Honor MagicBook 15 i5 1135G7 | |
| HP Envy x360 15-eu0097nr | |
| Tuxedo Aura 15 Gen1 | |
| Cinebench R15 / CPU Multi 64Bit | |
| HP Envy x360 15-eu0097nr | |
| HP Envy 15-ep0098nr | |
| Tuxedo Aura 15 Gen1 | |
| ADATA XPG Xenia Xe | |
| Honor MagicBook 15 4500U | |
| Honor MagicBook 15 i5 1135G7 | |
| Medio Intel Core i7-1165G7 (553 - 1027, n=86) | |
| Lenovo IdeaPad 5 15IIL05 | |
| HP Pavilion Gaming 15-ec0002ng | |
| HP Pavilion 15-eg | |
| Lenovo Ideapad S340-15IIL | |
| HP Pavilion x360 15-dq0065cl | |
| Dell Inspiron 15 5000 5502 | |
| Cinebench R15 / CPU Single 64Bit | |
| ADATA XPG Xenia Xe | |
| HP Pavilion 15-eg | |
| Medio Intel Core i7-1165G7 (115 - 230, n=78) | |
| Honor MagicBook 15 i5 1135G7 | |
| HP Envy 15-ep0098nr | |
| Dell Inspiron 15 5000 5502 | |
| Tuxedo Aura 15 Gen1 | |
| HP Envy x360 15-eu0097nr | |
| Lenovo Ideapad S340-15IIL | |
| HP Pavilion x360 15-dq0065cl | |
| Honor MagicBook 15 4500U | |
| Lenovo IdeaPad 5 15IIL05 | |
| HP Pavilion Gaming 15-ec0002ng | |
| Blender / v2.79 BMW27 CPU | |
| Dell Inspiron 15 5000 5502 | |
| Honor MagicBook 15 i5 1135G7 | |
| Medio Intel Core i7-1165G7 (468 - 1138, n=80) | |
| Lenovo IdeaPad 5 15IIL05 | |
| HP Pavilion 15-eg | |
| Honor MagicBook 15 4500U | |
| ADATA XPG Xenia Xe | |
| Tuxedo Aura 15 Gen1 | |
| HP Envy 15-ep0098nr | |
| HP Envy x360 15-eu0097nr | |
| 7-Zip 18.03 / 7z b 4 -mmt1 | |
| HP Pavilion 15-eg | |
| ADATA XPG Xenia Xe | |
| Medio Intel Core i7-1165G7 (4478 - 5507, n=80) | |
| Dell Inspiron 15 5000 5502 | |
| HP Envy x360 15-eu0097nr | |
| HP Envy 15-ep0098nr | |
| Tuxedo Aura 15 Gen1 | |
| Lenovo IdeaPad 5 15IIL05 | |
| Honor MagicBook 15 4500U | |
| Honor MagicBook 15 i5 1135G7 | |
| 7-Zip 18.03 / 7z b 4 | |
| HP Envy x360 15-eu0097nr | |
| Tuxedo Aura 15 Gen1 | |
| HP Envy 15-ep0098nr | |
| ADATA XPG Xenia Xe | |
| Honor MagicBook 15 4500U | |
| Medio Intel Core i7-1165G7 (15347 - 27405, n=80) | |
| HP Pavilion 15-eg | |
| Lenovo IdeaPad 5 15IIL05 | |
| Honor MagicBook 15 i5 1135G7 | |
| Dell Inspiron 15 5000 5502 | |
| Geekbench 5.5 / Single-Core | |
| ADATA XPG Xenia Xe | |
| Medio Intel Core i7-1165G7 (1302 - 1595, n=77) | |
| Honor MagicBook 15 i5 1135G7 | |
| Dell Inspiron 15 5000 5502 | |
| HP Envy 15-ep0098nr | |
| Lenovo IdeaPad 5 15IIL05 | |
| Honor MagicBook 15 4500U | |
| HP Envy x360 15-eu0097nr | |
| Tuxedo Aura 15 Gen1 | |
| HP Pavilion Gaming 15-ec0002ng | |
| Geekbench 5.5 / Multi-Core | |
| HP Envy x360 15-eu0097nr | |
| Tuxedo Aura 15 Gen1 | |
| HP Envy 15-ep0098nr | |
| Honor MagicBook 15 4500U | |
| ADATA XPG Xenia Xe | |
| Medio Intel Core i7-1165G7 (3078 - 5926, n=77) | |
| Honor MagicBook 15 i5 1135G7 | |
| Lenovo IdeaPad 5 15IIL05 | |
| HP Pavilion Gaming 15-ec0002ng | |
| Dell Inspiron 15 5000 5502 | |
| HWBOT x265 Benchmark v2.2 / 4k Preset | |
| HP Envy x360 15-eu0097nr | |
| HP Envy 15-ep0098nr | |
| Tuxedo Aura 15 Gen1 | |
| ADATA XPG Xenia Xe | |
| Honor MagicBook 15 4500U | |
| HP Pavilion 15-eg | |
| Lenovo IdeaPad 5 15IIL05 | |
| Medio Intel Core i7-1165G7 (1.39 - 8.47, n=80) | |
| Honor MagicBook 15 i5 1135G7 | |
| Dell Inspiron 15 5000 5502 | |
| LibreOffice / 20 Documents To PDF | |
| Honor MagicBook 15 4500U | |
| Dell Inspiron 15 5000 5502 | |
| HP Envy x360 15-eu0097nr | |
| Tuxedo Aura 15 Gen1 | |
| Lenovo IdeaPad 5 15IIL05 | |
| Honor MagicBook 15 i5 1135G7 | |
| Medio Intel Core i7-1165G7 (21.5 - 88.1, n=78) | |
| HP Envy 15-ep0098nr | |
| ADATA XPG Xenia Xe | |
| HP Pavilion 15-eg | |
| R Benchmark 2.5 / Overall mean | |
| Lenovo IdeaPad 5 15IIL05 | |
| Dell Inspiron 15 5000 5502 | |
| Honor MagicBook 15 4500U | |
| Honor MagicBook 15 i5 1135G7 | |
| HP Envy 15-ep0098nr | |
| Tuxedo Aura 15 Gen1 | |
| Medio Intel Core i7-1165G7 (0.552 - 1.002, n=80) | |
| HP Envy x360 15-eu0097nr | |
| ADATA XPG Xenia Xe | |
| HP Pavilion 15-eg | |
Cinebench R23: Multi Core | Single Core
Cinebench R15: CPU Multi 64Bit | CPU Single 64Bit
Blender: v2.79 BMW27 CPU
7-Zip 18.03: 7z b 4 -mmt1 | 7z b 4
Geekbench 5.5: Single-Core | Multi-Core
HWBOT x265 Benchmark v2.2: 4k Preset
LibreOffice : 20 Documents To PDF
R Benchmark 2.5: Overall mean
* ... más pequeño es mejor
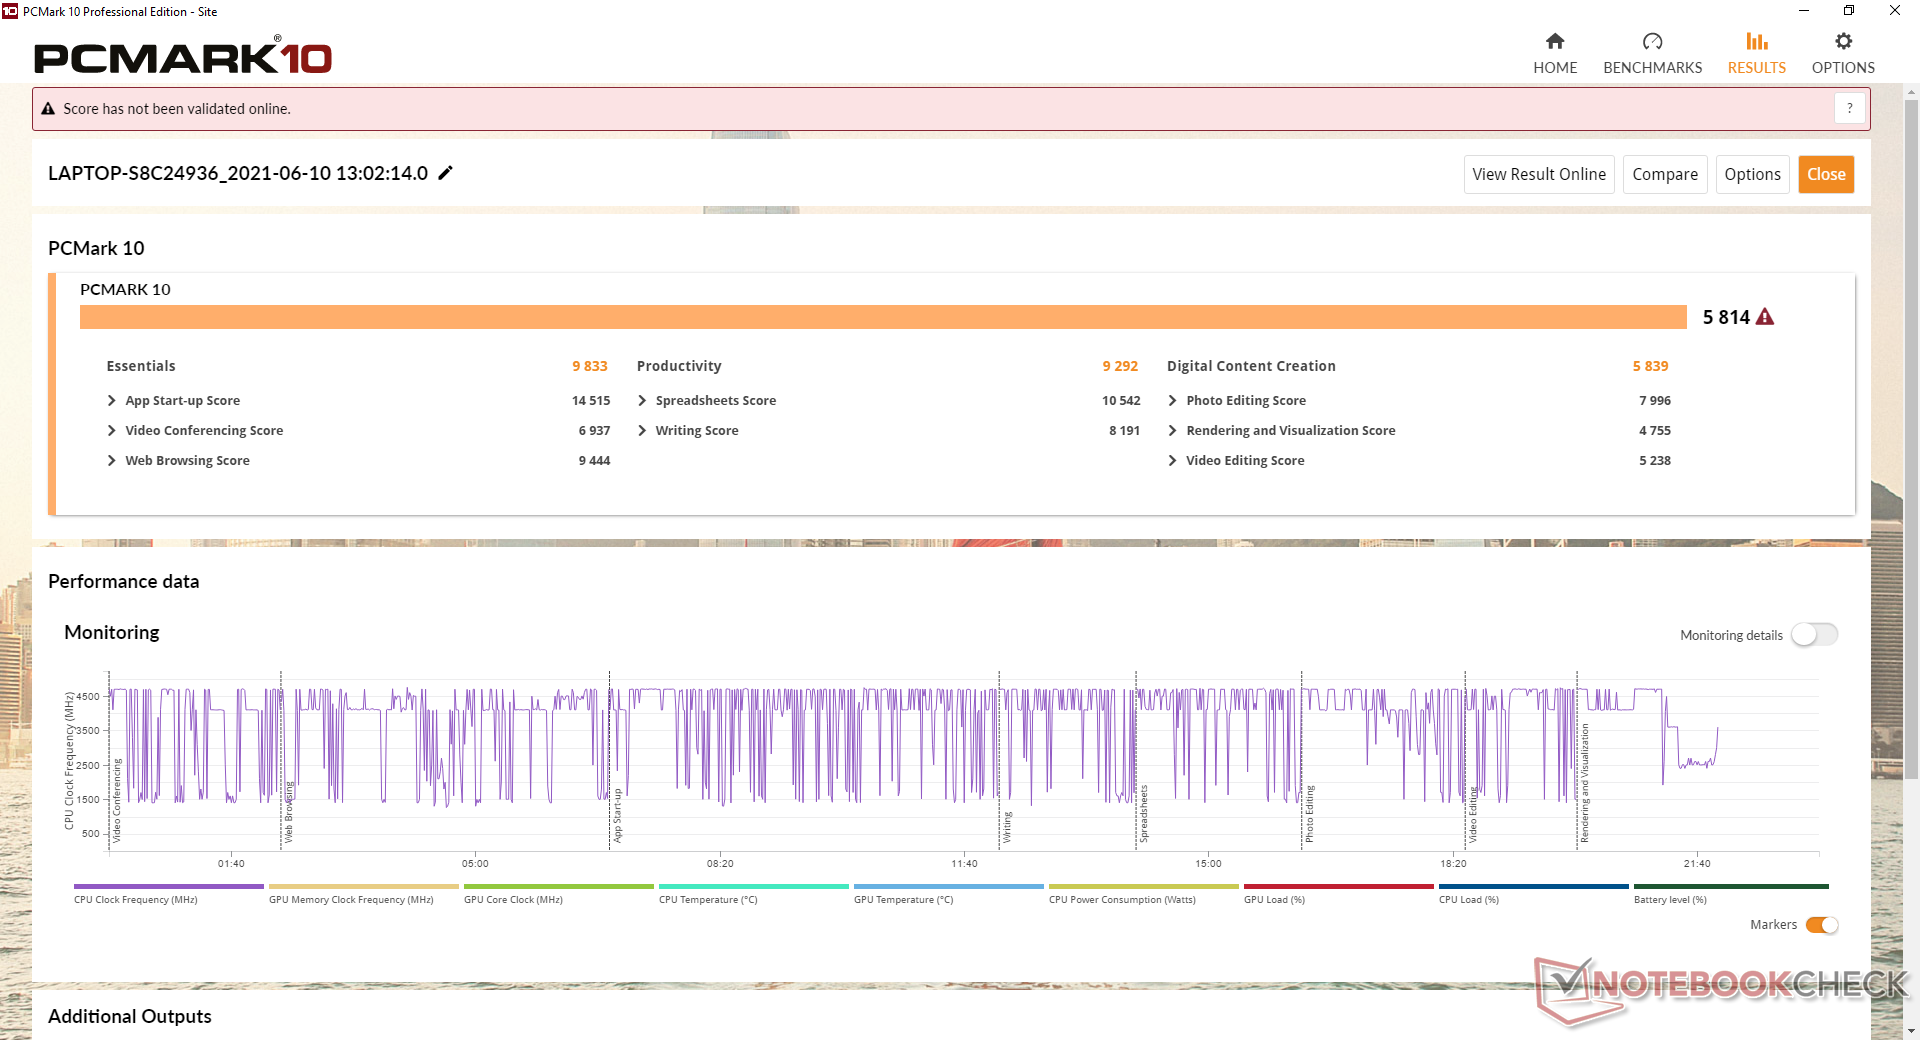
Rendimiento del sistema
| PCMark 10 / Score | |
| HP Pavilion 15-eg | |
| HP Envy 15-ep0098nr | |
| Medio Intel Core i7-1165G7, NVIDIA GeForce MX450 (4823 - 5814, n=9) | |
| Asus VivoBook S15 S533EQ-BQ002T | |
| ADATA XPG Xenia Xe | |
| Lenovo IdeaPad 5 15IIL05 | |
| HP Pavilion Gaming 15-ec0002ng | |
| Dell Inspiron 15 5000 5502 | |
| PCMark 10 / Essentials | |
| ADATA XPG Xenia Xe | |
| HP Pavilion 15-eg | |
| HP Envy 15-ep0098nr | |
| Medio Intel Core i7-1165G7, NVIDIA GeForce MX450 (8088 - 9955, n=9) | |
| Asus VivoBook S15 S533EQ-BQ002T | |
| Dell Inspiron 15 5000 5502 | |
| Lenovo IdeaPad 5 15IIL05 | |
| HP Pavilion Gaming 15-ec0002ng | |
| PCMark 10 / Productivity | |
| HP Pavilion 15-eg | |
| Medio Intel Core i7-1165G7, NVIDIA GeForce MX450 (7826 - 9292, n=9) | |
| Asus VivoBook S15 S533EQ-BQ002T | |
| HP Envy 15-ep0098nr | |
| ADATA XPG Xenia Xe | |
| Lenovo IdeaPad 5 15IIL05 | |
| Dell Inspiron 15 5000 5502 | |
| HP Pavilion Gaming 15-ec0002ng | |
| PCMark 10 / Digital Content Creation | |
| HP Envy 15-ep0098nr | |
| HP Pavilion 15-eg | |
| Asus VivoBook S15 S533EQ-BQ002T | |
| Medio Intel Core i7-1165G7, NVIDIA GeForce MX450 (4812 - 5878, n=9) | |
| ADATA XPG Xenia Xe | |
| HP Pavilion Gaming 15-ec0002ng | |
| Lenovo IdeaPad 5 15IIL05 | |
| Dell Inspiron 15 5000 5502 | |
| PCMark 10 Score | 5814 puntos | |
ayuda | ||
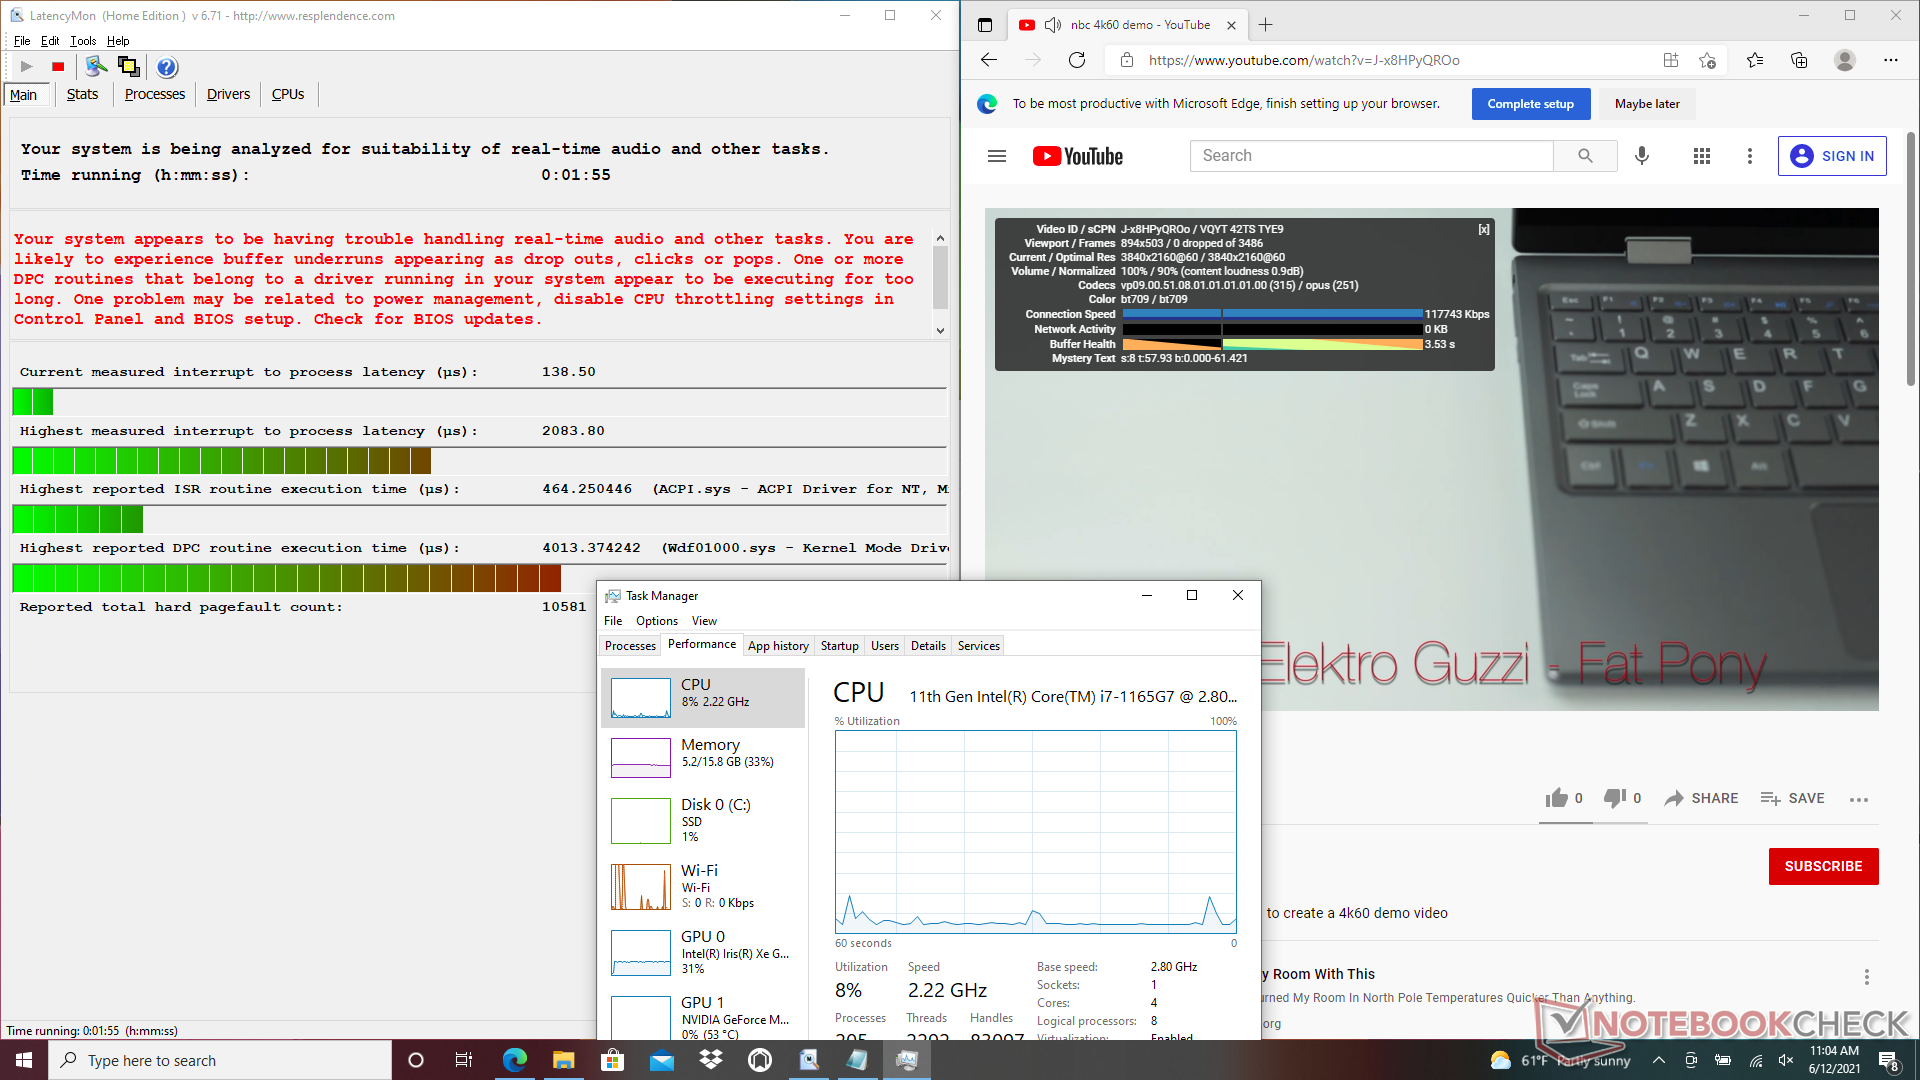
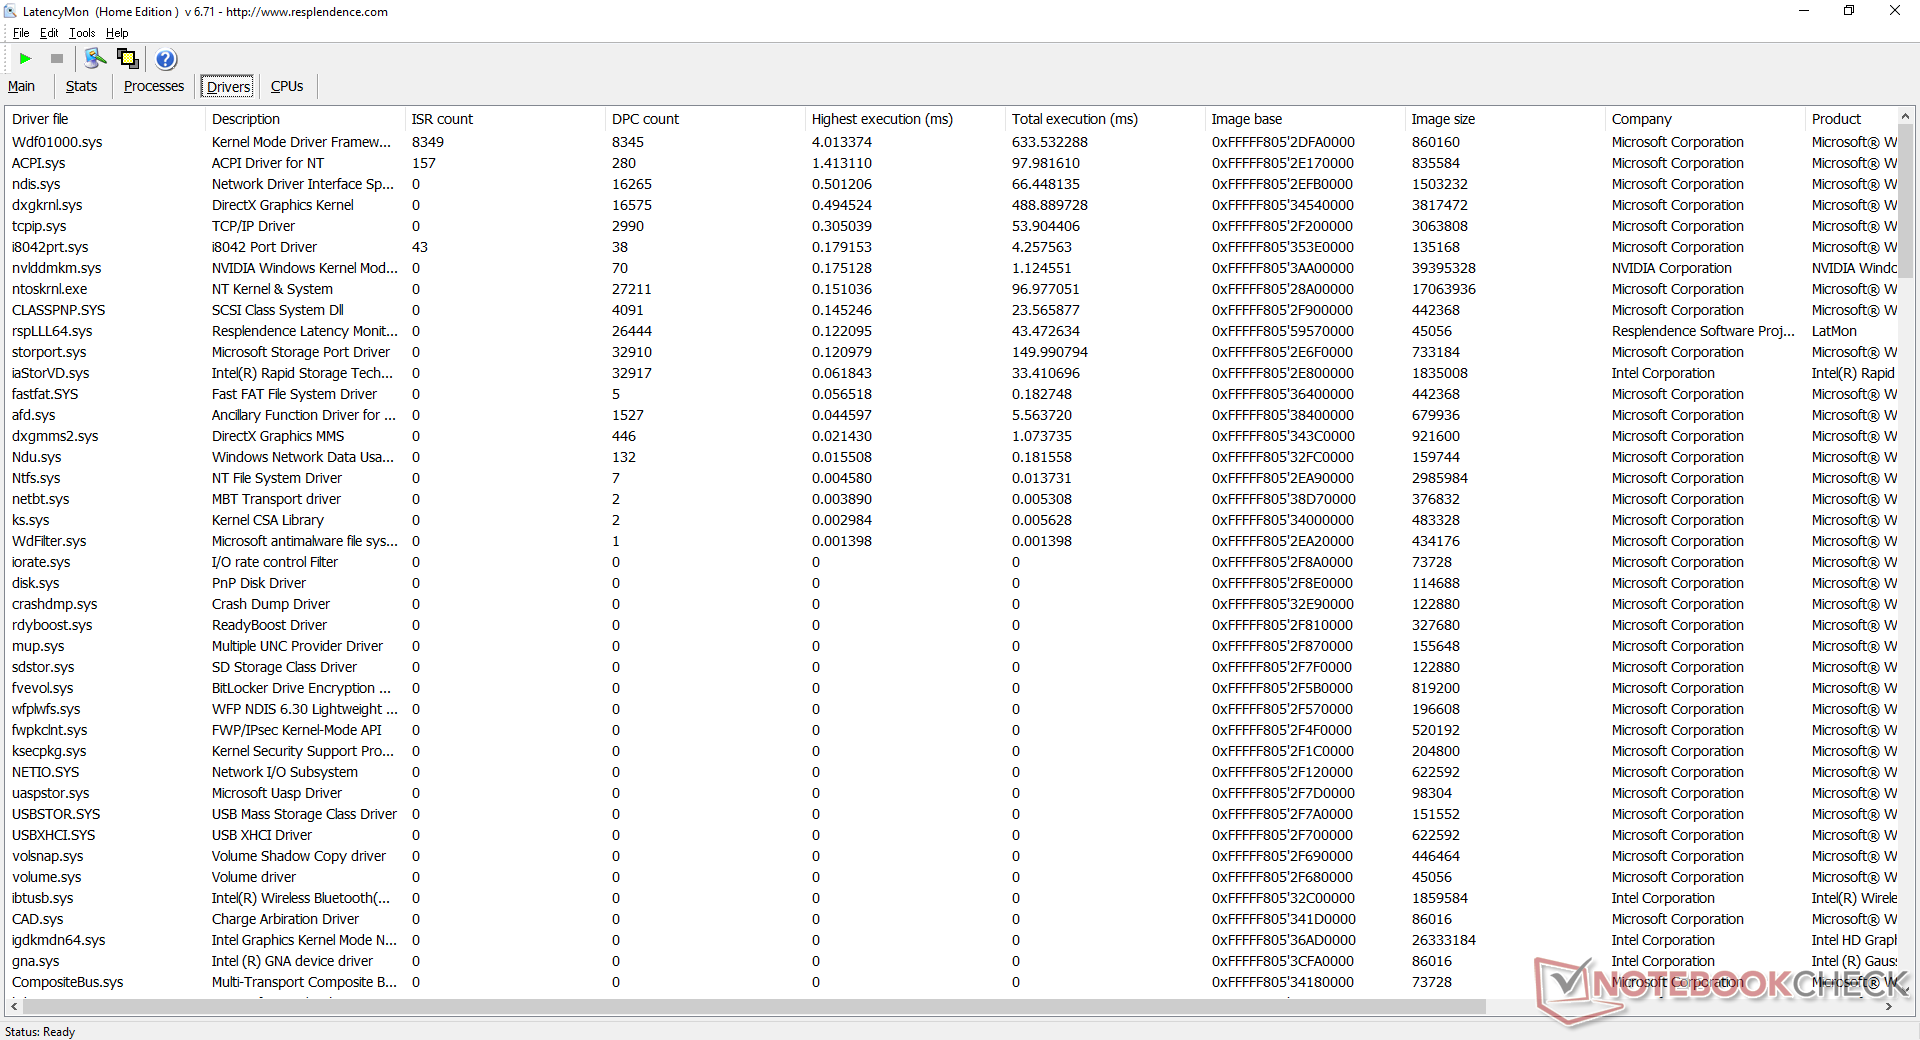
Latencia del CPD
LatencyMon muestra problemas de latencia del CPD al abrir varias pestañas del navegador en nuestra página web. La reproducción de vídeo 4K a 60 FPS es, por lo demás, fluida y sin pérdida de fotogramas.
| DPC Latencies / LatencyMon - interrupt to process latency (max), Web, Youtube, Prime95 | |
| HP Envy 15-ep0098nr | |
| HP Pavilion 15-eg | |
| Dell Inspiron 15 5000 5502 | |
| Lenovo IdeaPad 5 15IIL05 | |
| Asus VivoBook S15 S533EQ-BQ002T | |
* ... más pequeño es mejor
Dispositivos de almacenamiento
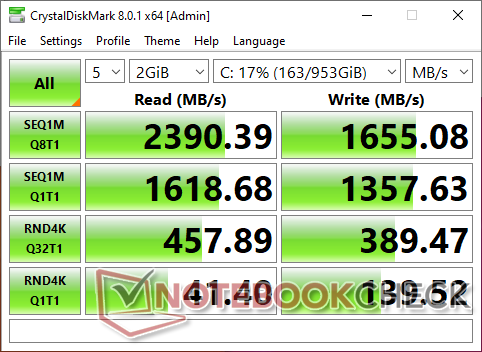
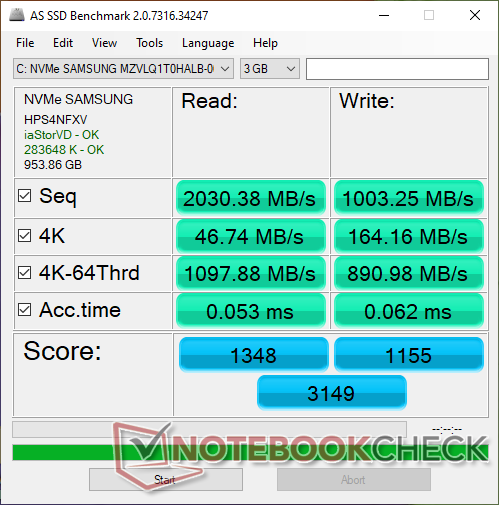
Nuestra unidad viene con un SSD NVMe de gama media PCIe 3.0 x4 de 1 TB Samsung PM991. El fabricante anuncia tasas de lectura y escritura secuenciales de 2300 MB/s y 1350 MB/s, respectivamente, lo que podemos confirmar. Es una unidad rápida en comparación con las competidoras Intel 660p o Toshiba BG4 que suelen encontrarse en otros portátiles económicos.
HP no ofrece opciones de almacenamiento interno secundario.
| HP Pavilion 15-eg Samsung PM991 MZVLQ1T0HALB | HP Pavilion Gaming 15-ec0002ng Intel SSD 660p SSDPEKNW512G8 | Dell Inspiron 15 5000 5502 Toshiba BG4 KBG40ZNS128G | Lenovo IdeaPad 5 15IIL05 SK hynix BC511 HFM512GDHTNI-87A0B | HP Envy 15-ep0098nr Intel Optane Memory H10 with Solid State Storage 32GB + 512GB HBRPEKNX0202A(L/H) | Asus VivoBook S15 S533EQ-BQ002T Intel SSD 660p 1TB SSDPEKNW010T8 | |
|---|---|---|---|---|---|---|
| AS SSD | -61% | -73% | -21% | -40% | -13% | |
| Seq Read (MB/s) | 2030 | 1623 -20% | 1142 -44% | 1625 -20% | 1005 -50% | 1754 -14% |
| Seq Write (MB/s) | 1003 | 891 -11% | 199.8 -80% | 860 -14% | 436.8 -56% | 1567 56% |
| 4K Read (MB/s) | 46.74 | 48.06 3% | 39.5 -15% | 52.1 11% | 51.5 10% | 53 13% |
| 4K Write (MB/s) | 164.2 | 102.1 -38% | 165.7 1% | 131.3 -20% | 88 -46% | 167.9 2% |
| 4K-64 Read (MB/s) | 1098 | 325.6 -70% | 461.2 -58% | 797 -27% | 517 -53% | 586 -47% |
| 4K-64 Write (MB/s) | 891 | 94.1 -89% | 203 -77% | 769 -14% | 839 -6% | 858 -4% |
| Access Time Read * (ms) | 0.053 | 0.171 -223% | 0.124 -134% | 0.063 -19% | 0.088 -66% | 0.097 -83% |
| Access Time Write * (ms) | 0.062 | 0.048 23% | 0.181 -192% | 0.032 48% | 0.151 -144% | 0.038 39% |
| Score Read (Points) | 1348 | 536 -60% | 615 -54% | 1012 -25% | 669 -50% | 815 -40% |
| Score Write (Points) | 1155 | 285 -75% | 389 -66% | 986 -15% | 970 -16% | 1182 2% |
| Score Total (Points) | 3149 | 1077 -66% | 1284 -59% | 2492 -21% | 1972 -37% | 2421 -23% |
| Copy ISO MB/s (MB/s) | 1583 | 566 -64% | 216.8 -86% | 638 -60% | 1173 -26% | 1477 -7% |
| Copy Program MB/s (MB/s) | 682 | 223.8 -67% | 163 -76% | 290.2 -57% | 769 13% | 495.3 -27% |
| Copy Game MB/s (MB/s) | 1428 | 104.3 -93% | 176 -88% | 525 -63% | 1045 -27% | 719 -50% |
| CrystalDiskMark 5.2 / 6 | -15% | -34% | -3% | 5% | 25% | |
| Write 4K (MB/s) | 141.6 | 136.9 -3% | 138.5 -2% | 159.7 13% | 100.2 -29% | 214.4 51% |
| Read 4K (MB/s) | 42.61 | 57 34% | 41.98 -1% | 48.31 13% | 112.8 165% | 58.5 37% |
| Write Seq (MB/s) | 1337 | 968 -28% | 213.5 -84% | 1038 -22% | 537 -60% | 1678 26% |
| Read Seq (MB/s) | 1575 | 1631 4% | 1289 -18% | 1158 -26% | 1270 -19% | 1648 5% |
| Write 4K Q32T1 (MB/s) | 397.8 | 237 -40% | 157.8 -60% | 493.9 24% | 480.6 21% | 644 62% |
| Read 4K Q32T1 (MB/s) | 454.2 | 337.1 -26% | 448.9 -1% | 522 15% | 364.9 -20% | 600 32% |
| Write Seq Q32T1 (MB/s) | 1648 | 963 -42% | 210.5 -87% | 1028 -38% | 1224 -26% | 1760 7% |
| Read Seq Q32T1 (MB/s) | 2388 | 1863 -22% | 1853 -22% | 2280 -5% | 2635 10% | 1853 -22% |
| Media total (Programa/Opciones) | -38% /
-44% | -54% /
-59% | -12% /
-15% | -18% /
-23% | 6% /
1% |
* ... más pequeño es mejor

Disk Throttling: DiskSpd Read Loop, Queue Depth 8
Rendimiento de la GPU
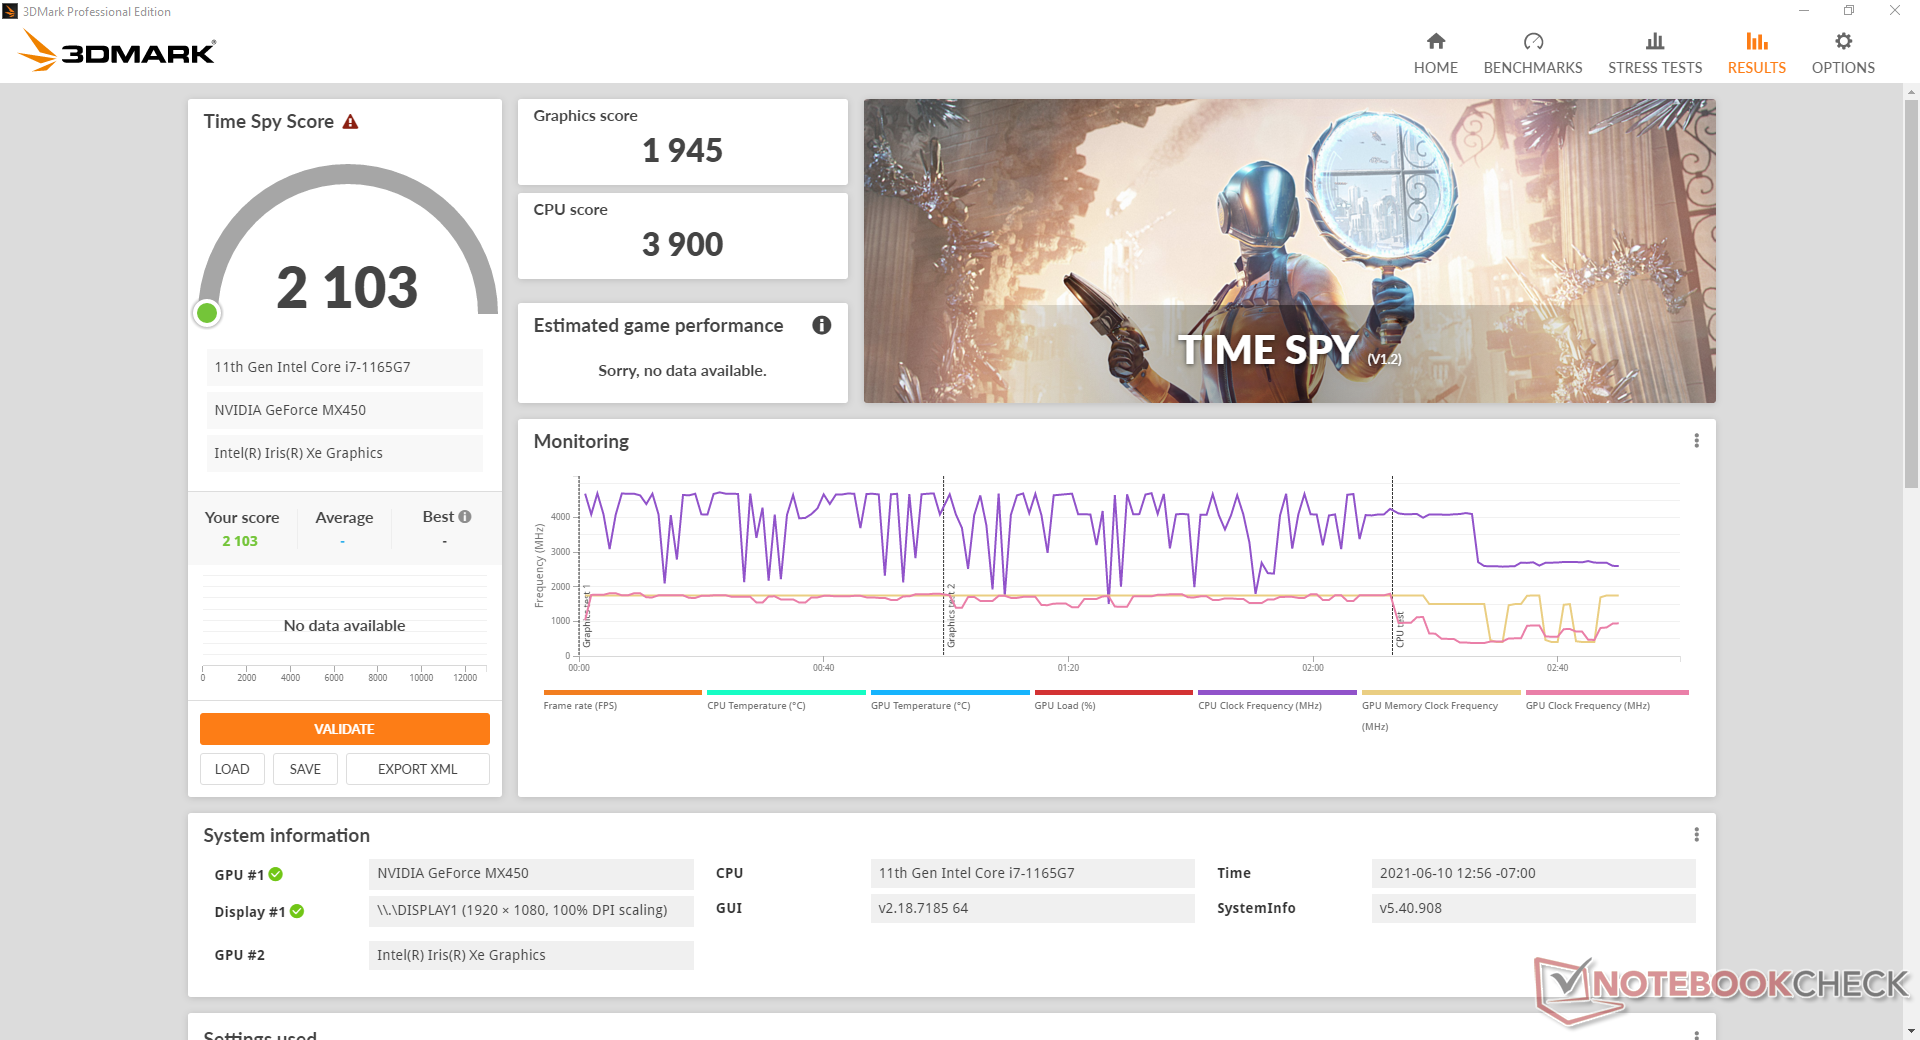
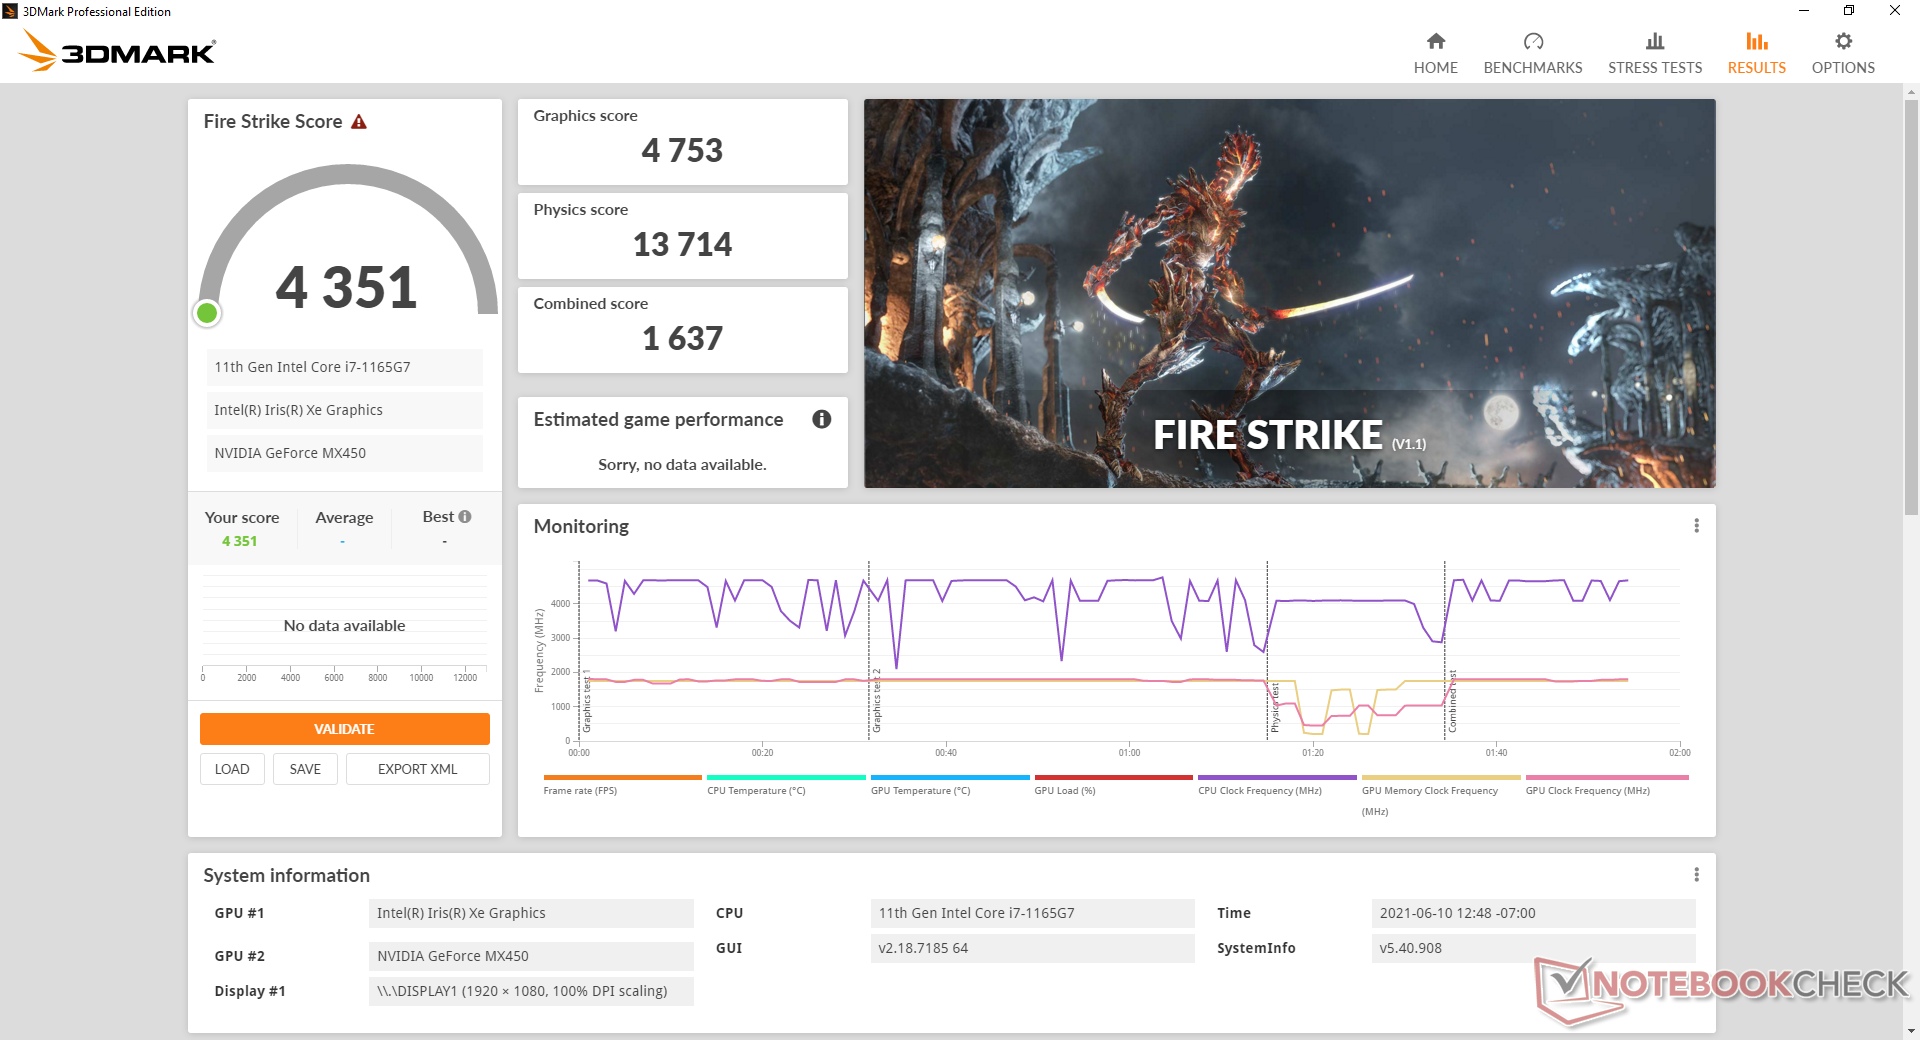
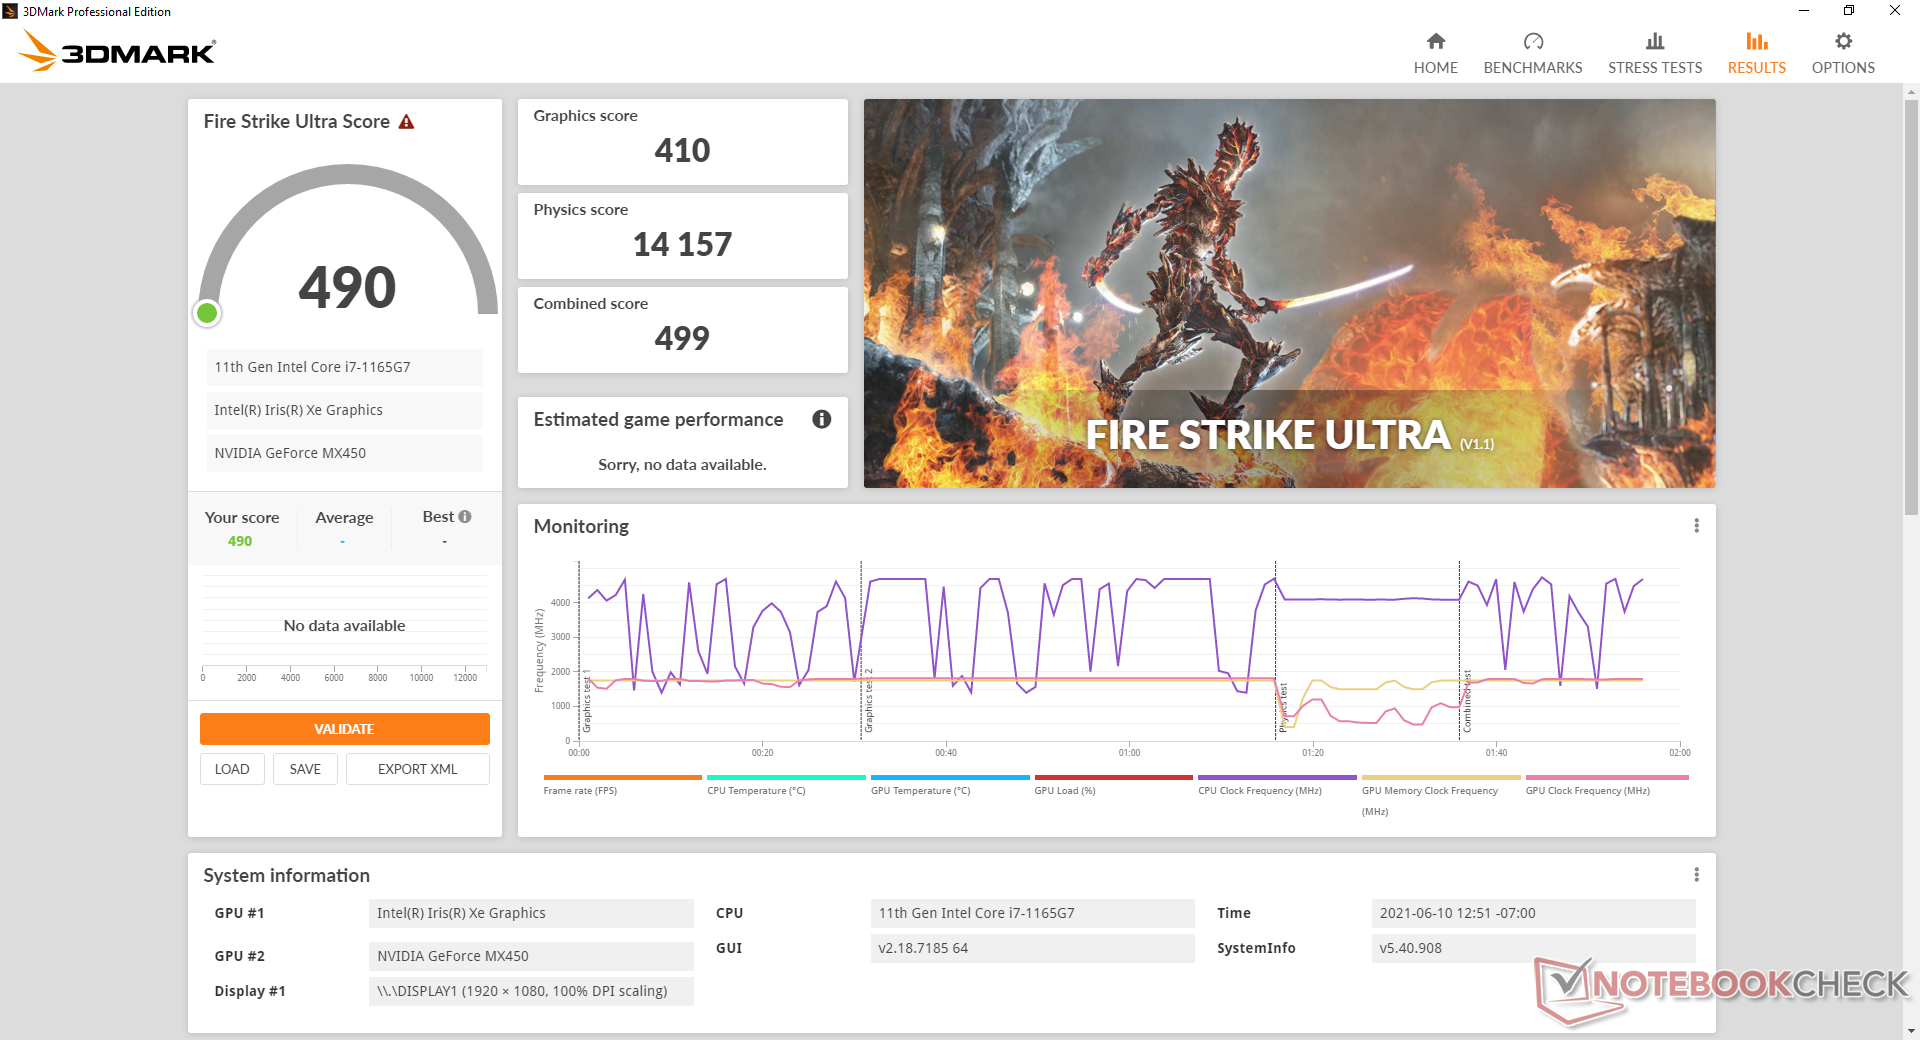
El rendimiento gráfico es comparable al de los Iris Xe 96 EUs en los peores escenarios. Sin embargo, la mayoría de las veces, el GeForce MX450 superará con creces la solución integrada de Intel, especialmente en los juegos. Por ejemplo, al ejecutar DOTA 2 Reborn con los ajustes máximos de 1080p, las frecuencias de cuadro de nuestro sistema Pavilion son dos veces más rápidas que las de cualquier portátil Iris Xe, aunque sus puntuaciones en 3DMark sean relativamente parecidas. El hecho de que la CPU y la GPU estén separadas significa que ninguno de los dos procesadores estará tan limitado por el rendimiento del otro.
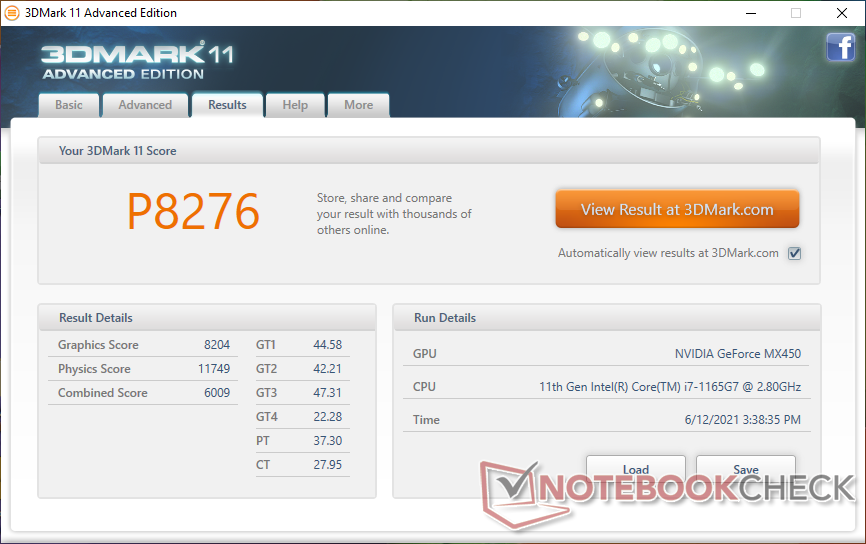
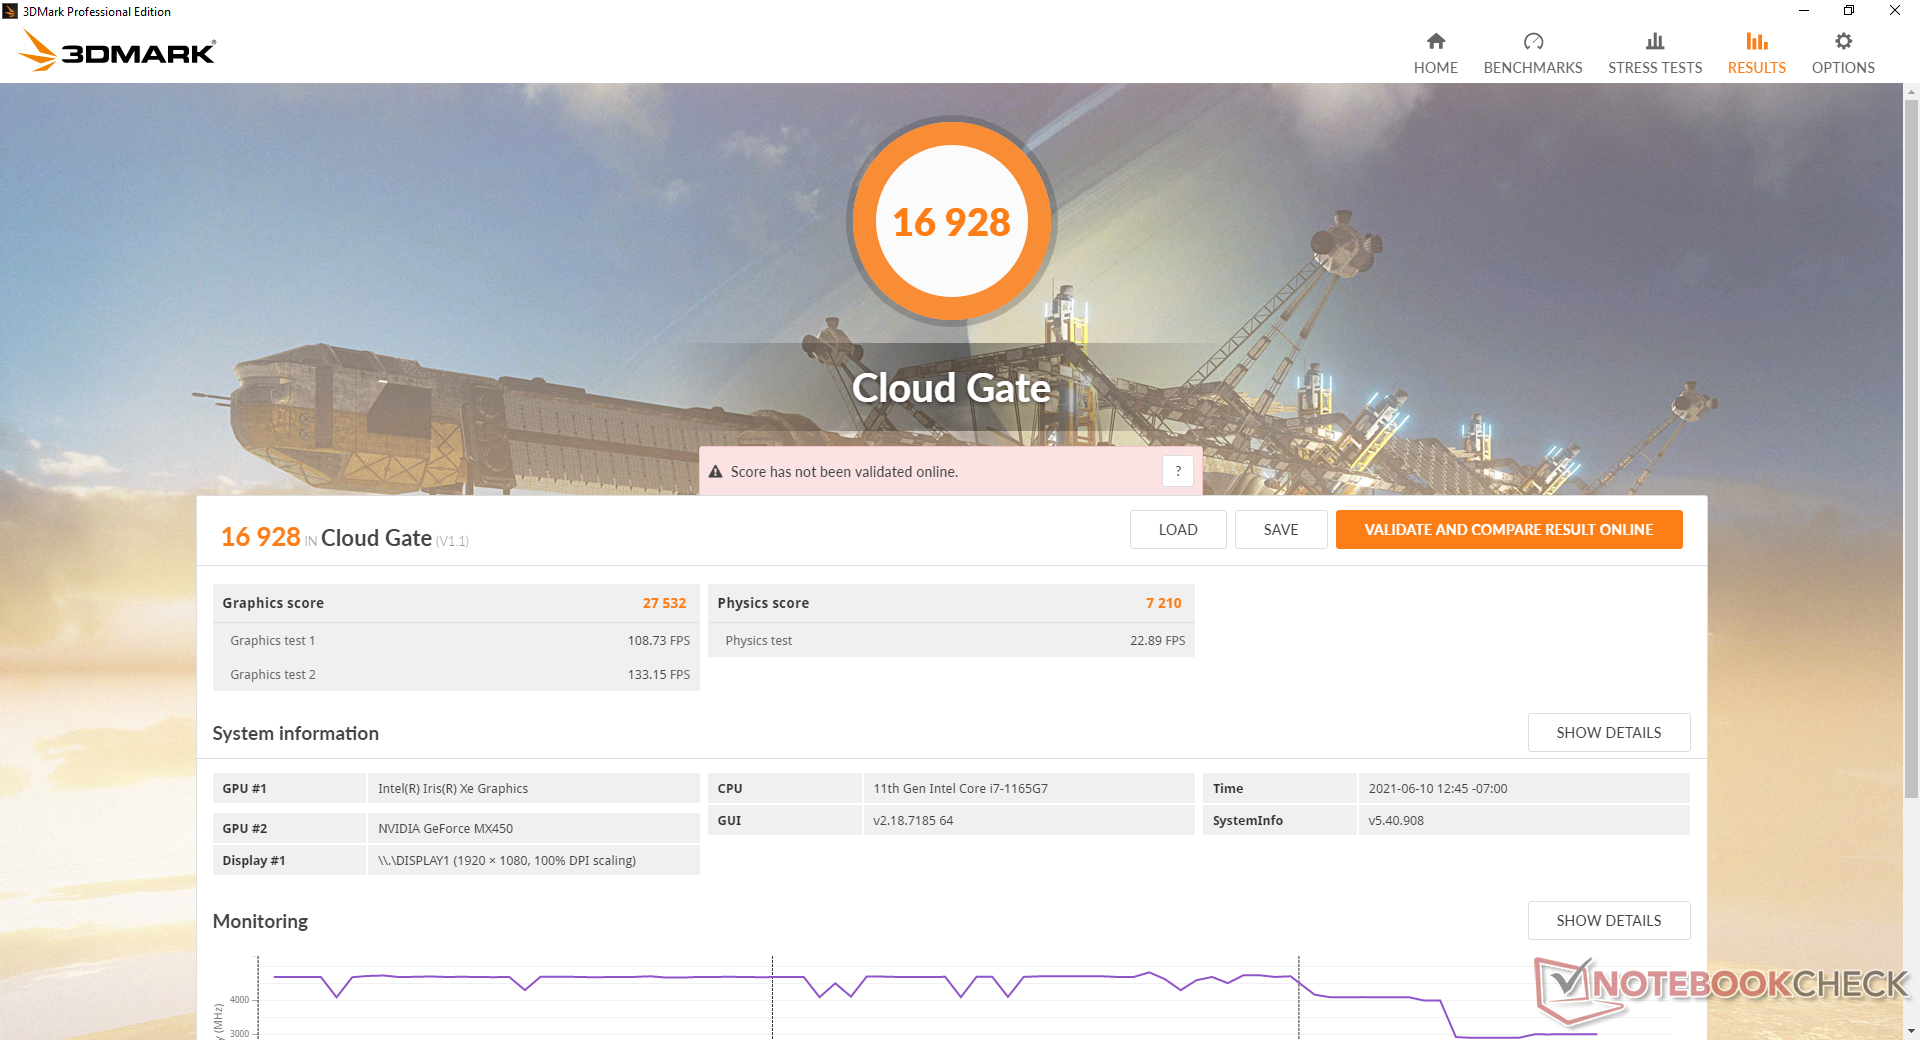
| 3DMark 11 Performance | 8276 puntos | |
| 3DMark Cloud Gate Standard Score | 16928 puntos | |
| 3DMark Fire Strike Score | 4351 puntos | |
| 3DMark Time Spy Score | 2103 puntos | |
ayuda | ||
Las tasas de fotogramas se mantienen estables cuando están en reposo en Witcher 3 lo que sugiere que no se interrumpe la actividad de fondo durante el juego. Sin embargo, la tasa de fotogramas inicial de 69 FPS cae con bastante rapidez tras unos segundos debido al limitado potencial de Turbo del sistema.
Witcher 3 FPS Chart
| bajo | medio | alto | ultra | |
|---|---|---|---|---|
| GTA V (2015) | 154 | 141 | 51.5 | 22.8 |
| The Witcher 3 (2015) | 121.4 | 69.7 | 39.7 | 23.6 |
| Dota 2 Reborn (2015) | 139 | 117 | 95.6 | 87.7 |
| Final Fantasy XV Benchmark (2018) | 51.5 | 25.5 | 16.2 | |
| X-Plane 11.11 (2018) | 87.3 | 76.6 | 66 |
Emissions
Ruido del sistema - Silencioso en general
El ruido general del ventilador es bastante similar al del Asus VivoBook S15. El sistema es silencioso en reposo o con cargas bajas, mientras que las cargas de juego inducen un ruido de ventilador de entre 39 dB(A) y 42 dB(A). Los dos ventiladores son algo agudos, por lo que se nota mucho cuando empiezan a funcionar. Por suerte, los ventiladores no pulsan a menudo y se apagan relativamente rápido tras terminar cualquier programa exigente.
Podemos notar un leve gemido de la bobina cuando colocamos un oído cerca de las teclas del teclado.
| HP Pavilion 15-eg GeForce MX450, i7-1165G7, Samsung PM991 MZVLQ1T0HALB | HP Pavilion Gaming 15-ec0002ng GeForce GTX 1050 Mobile, R5 3550H, Intel SSD 660p SSDPEKNW512G8 | Dell Inspiron 15 5000 5502 UHD Graphics Xe G4 48EUs, i3-1115G4, Toshiba BG4 KBG40ZNS128G | Lenovo IdeaPad 5 15IIL05 GeForce MX350, i5-1035G1, SK hynix BC511 HFM512GDHTNI-87A0B | HP Envy 15-ep0098nr GeForce RTX 2060 Max-Q, i7-10750H, Intel Optane Memory H10 with Solid State Storage 32GB + 512GB HBRPEKNX0202A(L/H) | Asus VivoBook S15 S533EQ-BQ002T GeForce MX350, i7-1165G7, Intel SSD 660p 1TB SSDPEKNW010T8 | |
|---|---|---|---|---|---|---|
| Noise | -13% | 2% | -15% | -26% | 1% | |
| apagado / medio ambiente * (dB) | 25.4 | 30.3 -19% | 27.5 -8% | 30.7 -21% | 26.4 -4% | 25 2% |
| Idle Minimum * (dB) | 25.6 | 30.3 -18% | 27.9 -9% | 30.7 -20% | 32.2 -26% | 25 2% |
| Idle Average * (dB) | 25.6 | 30.3 -18% | 27.9 -9% | 30.7 -20% | 32.2 -26% | 25 2% |
| Idle Maximum * (dB) | 25.6 | 31 -21% | 27.9 -9% | 30.7 -20% | 32.2 -26% | 25 2% |
| Load Average * (dB) | 39.2 | 39.3 -0% | 28.1 28% | 43.4 -11% | 48.3 -23% | 39.5 -1% |
| Witcher 3 ultra * (dB) | 39.1 | 42.9 -10% | 43.2 -10% | 53.7 -37% | 39.3 -1% | |
| Load Maximum * (dB) | 41.5 | 43.3 -4% | 34.8 16% | 43.7 -5% | 58.8 -42% | 41.6 -0% |
* ... más pequeño es mejor
Ruido
| Ocioso |
| 25.6 / 25.6 / 25.6 dB(A) |
| Carga |
| 39.2 / 41.5 dB(A) |
 | ||
30 dB silencioso 40 dB(A) audible 50 dB(A) ruidosamente alto |
||
min: | ||
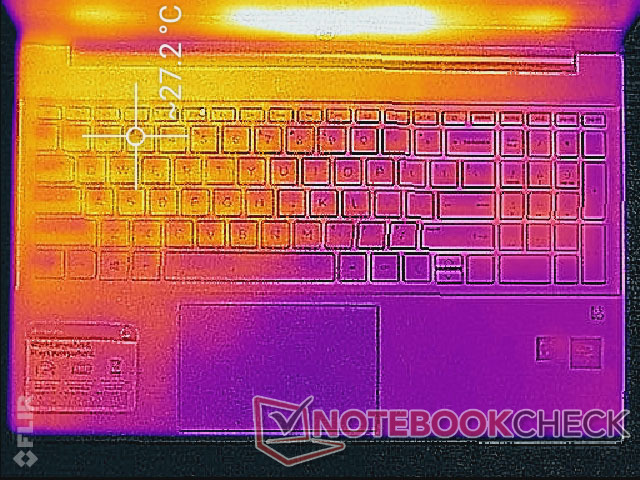
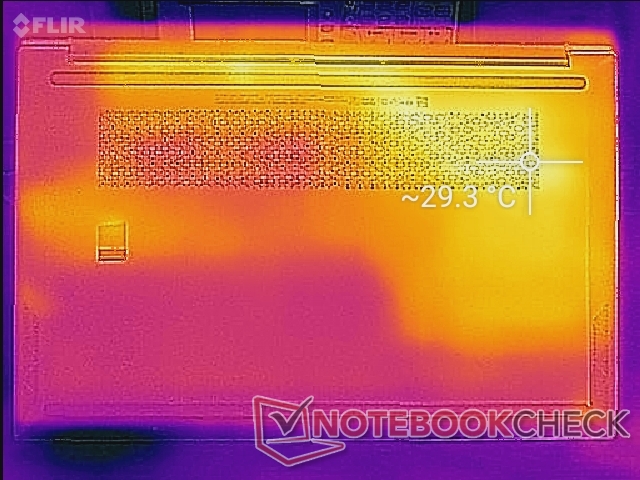
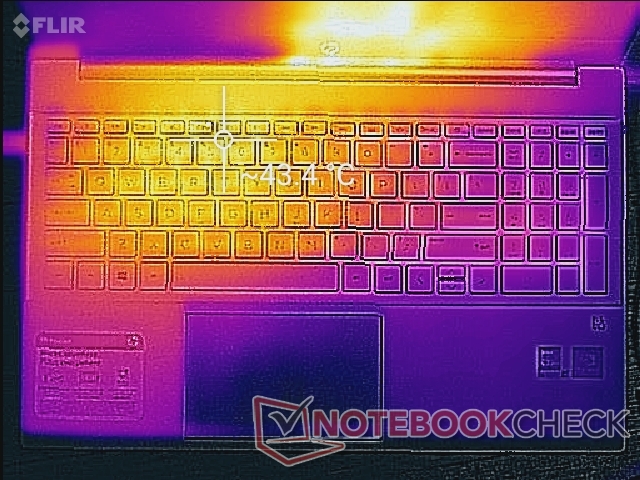
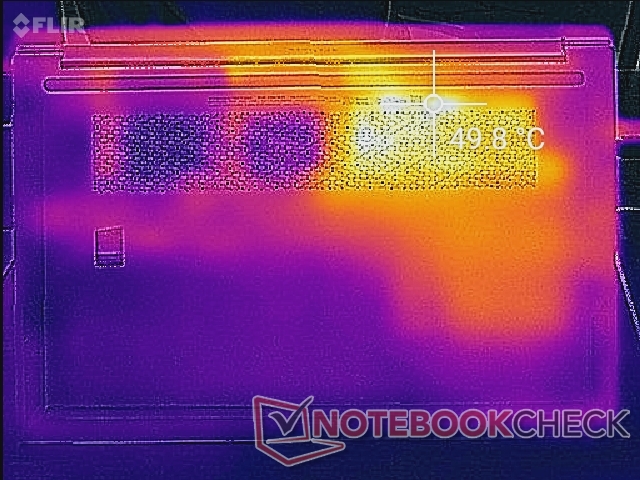
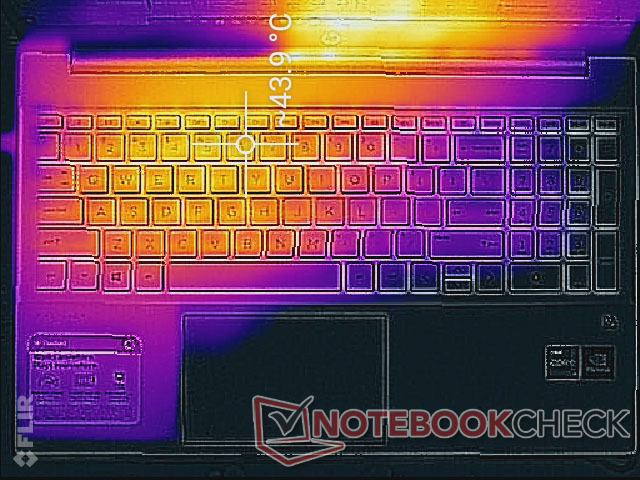
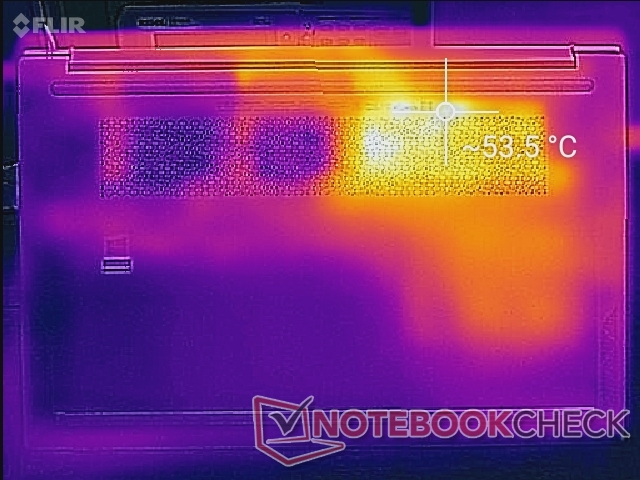
Temperatura
Las temperaturas de la superficie siempre serán más cálidas en la mitad izquierda del sistema que en la derecha, simplemente por cómo están colocados los ventiladores y los tubos de calor en el interior. Los puntos calientes pueden llegar a ser tan cálidos como 44 C y 54 C en la cubierta del teclado y la superficie inferior, respectivamente, para ser un poco más cálido que lo que registramos en el Pavilion 15 Gaming o el ADATA XPG Xenia. La salida de calor general es mayor que la de la mayoría de portátiles que funcionan sólo con CPUs Tiger Lake-U ya que nuestro Pavilion incluye gráficos discretos.
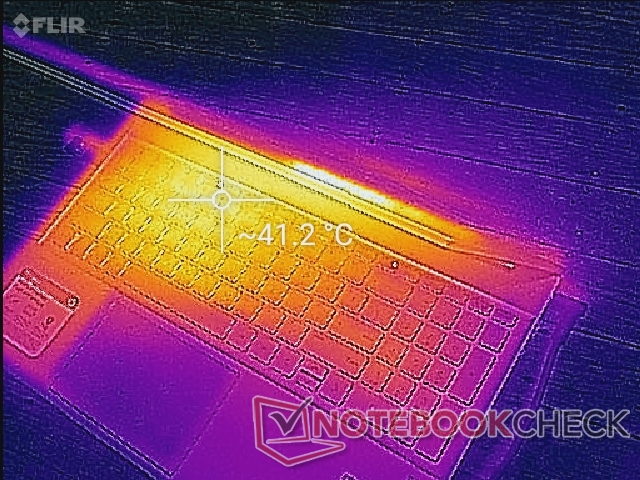
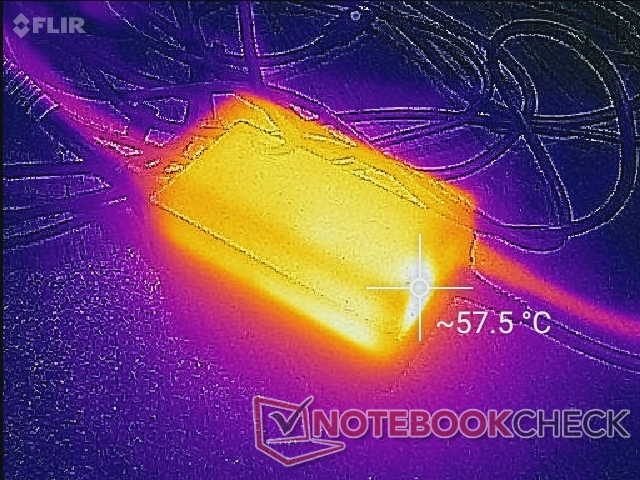
(±) La temperatura máxima en la parte superior es de 44 °C / 111 F, frente a la media de 36.8 °C / 98 F, que oscila entre 21 y 71 °C para la clase Multimedia.
(-) El fondo se calienta hasta un máximo de 53.4 °C / 128 F, frente a la media de 39.1 °C / 102 F
(+) En reposo, la temperatura media de la parte superior es de 26.1 °C / 79# F, frente a la media del dispositivo de 31.3 °C / 88 F.
(±) Jugando a The Witcher 3, la temperatura media de la parte superior es de 34.8 °C / 95 F, frente a la media del dispositivo de 31.3 °C / 88 F.
(+) El reposamanos y el panel táctil están a una temperatura inferior a la de la piel, con un máximo de 31.8 °C / 89.2 F y, por tanto, son fríos al tacto.
(-) La temperatura media de la zona del reposamanos de dispositivos similares fue de 28.7 °C / 83.7 F (-3.1 °C / -5.5 F).
Prueba de esfuerzo
Cuando se ejecuta Prime95 para estresar la CPU, las velocidades de reloj se disparan hasta el rango de 3,2 a 3,7 GHz durante los primeros 20 segundos más o menos a una temperatura de núcleo tostada de 96 C. Después, la velocidad de reloj cae al rango de 2,0 a 2,5 GHz para mantener una temperatura de núcleo más fría de 75 C. el ADATA XPG Xenia, que viene con la misma CPU Core i7-1165G7, se estabiliza a velocidades de reloj más altas y temperaturas de 3,2 GHz y 81 C, respectivamente. El potencial del Turbo Boost de la CPU es, por tanto, más limitado de lo que nos gusta en nuestro HP Pavilion
Las temperaturas de la CPU y la GPU se estabilizarían en 67 C y 72 C, respectivamente, cuando se ejecuta Witcher 3 que son rangos normales para los portátiles alimentados por GeForce MX
Funcionar con la energía de la batería limitará el rendimiento. Una prueba 3DMark 11 con baterías arrojaría unas puntuaciones de Física y Gráficos de 8926 y 7074 puntos, respectivamente, en comparación con los 11749 y 8204 puntos cuando está conectado a la red eléctrica.
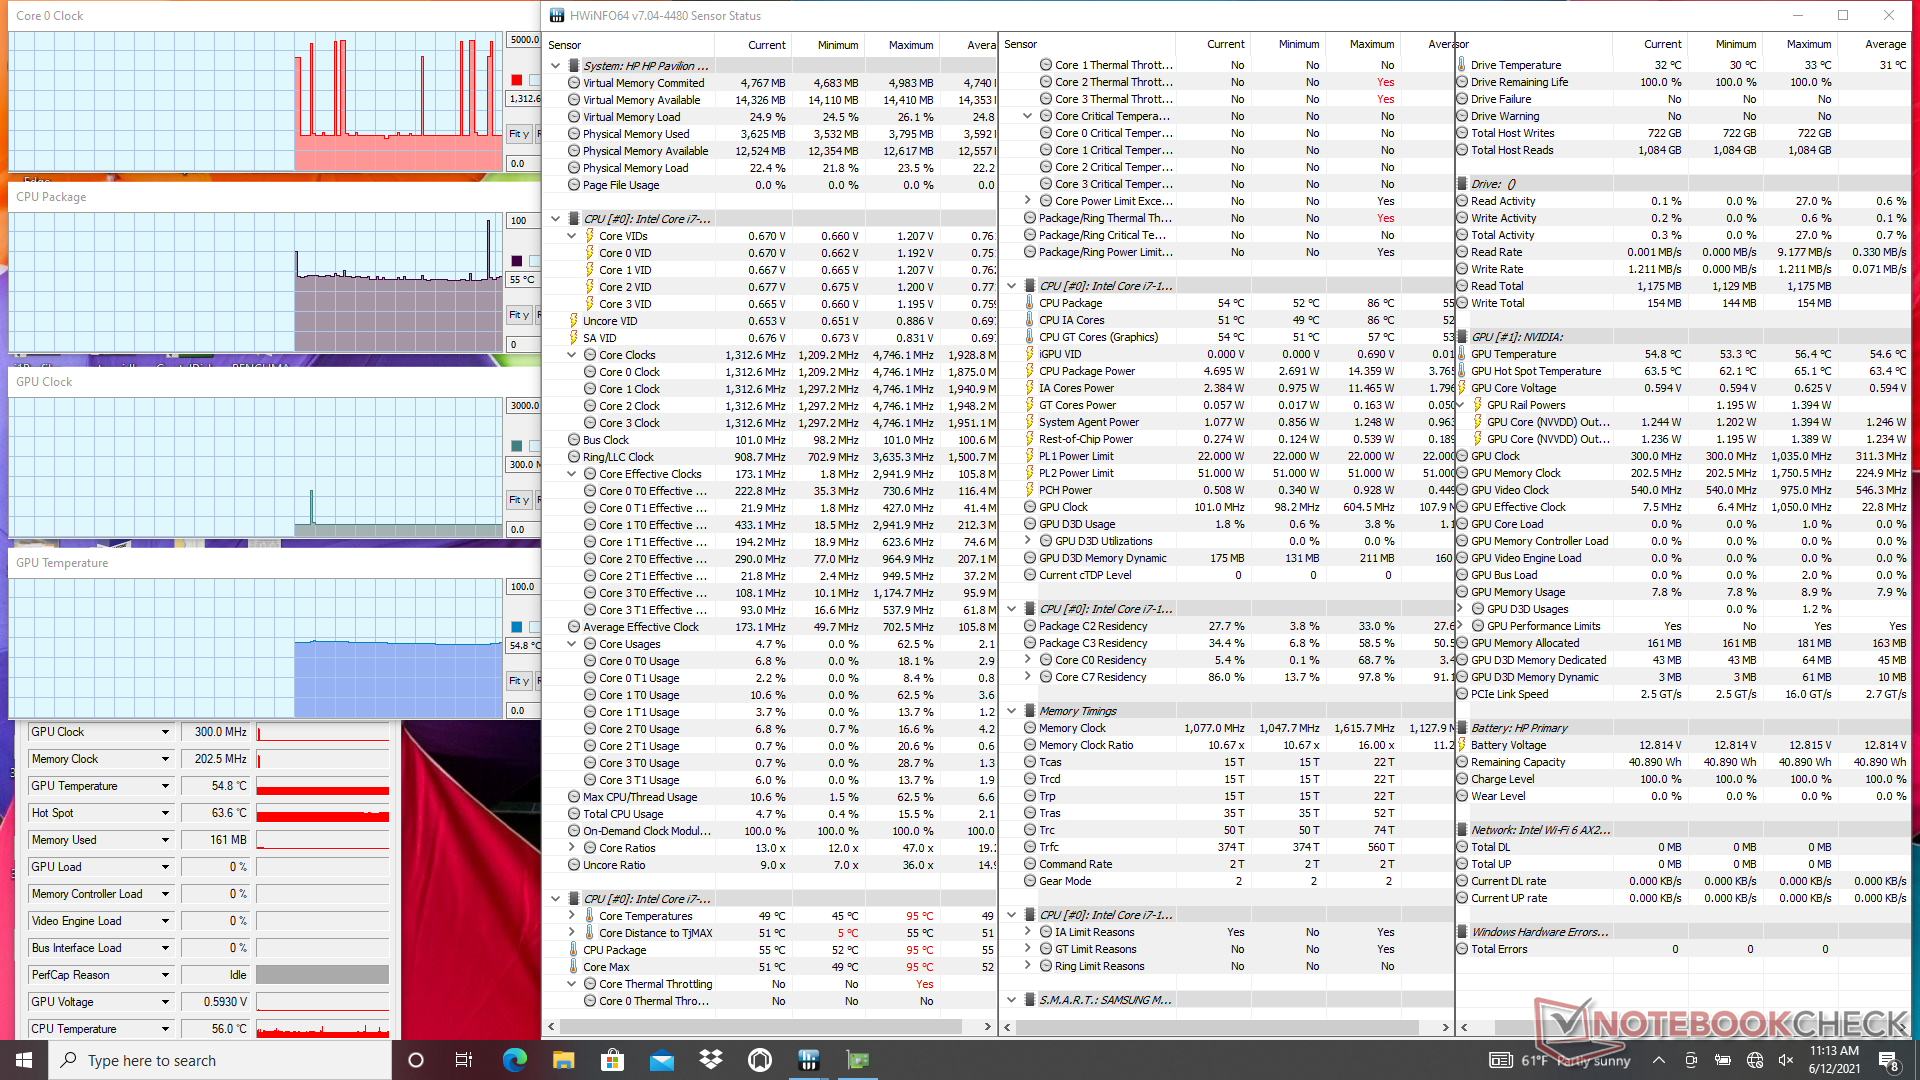
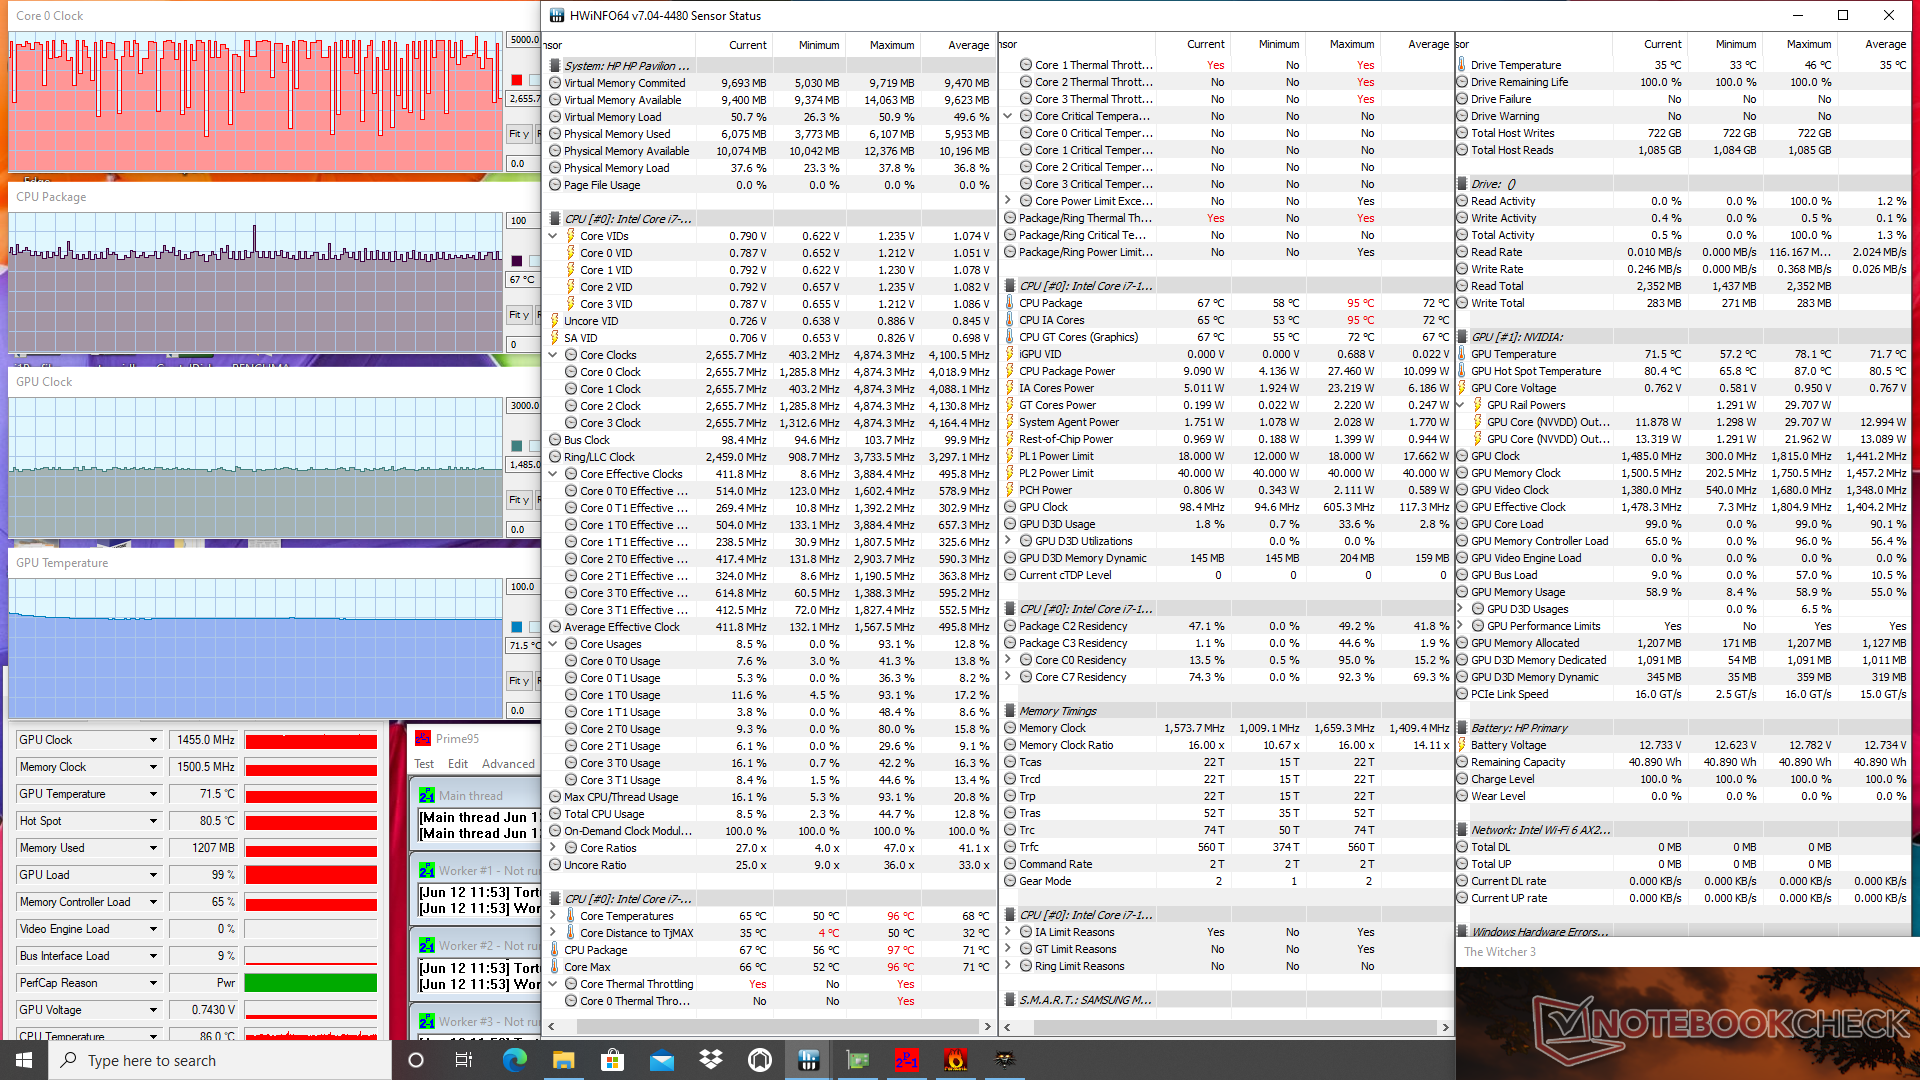
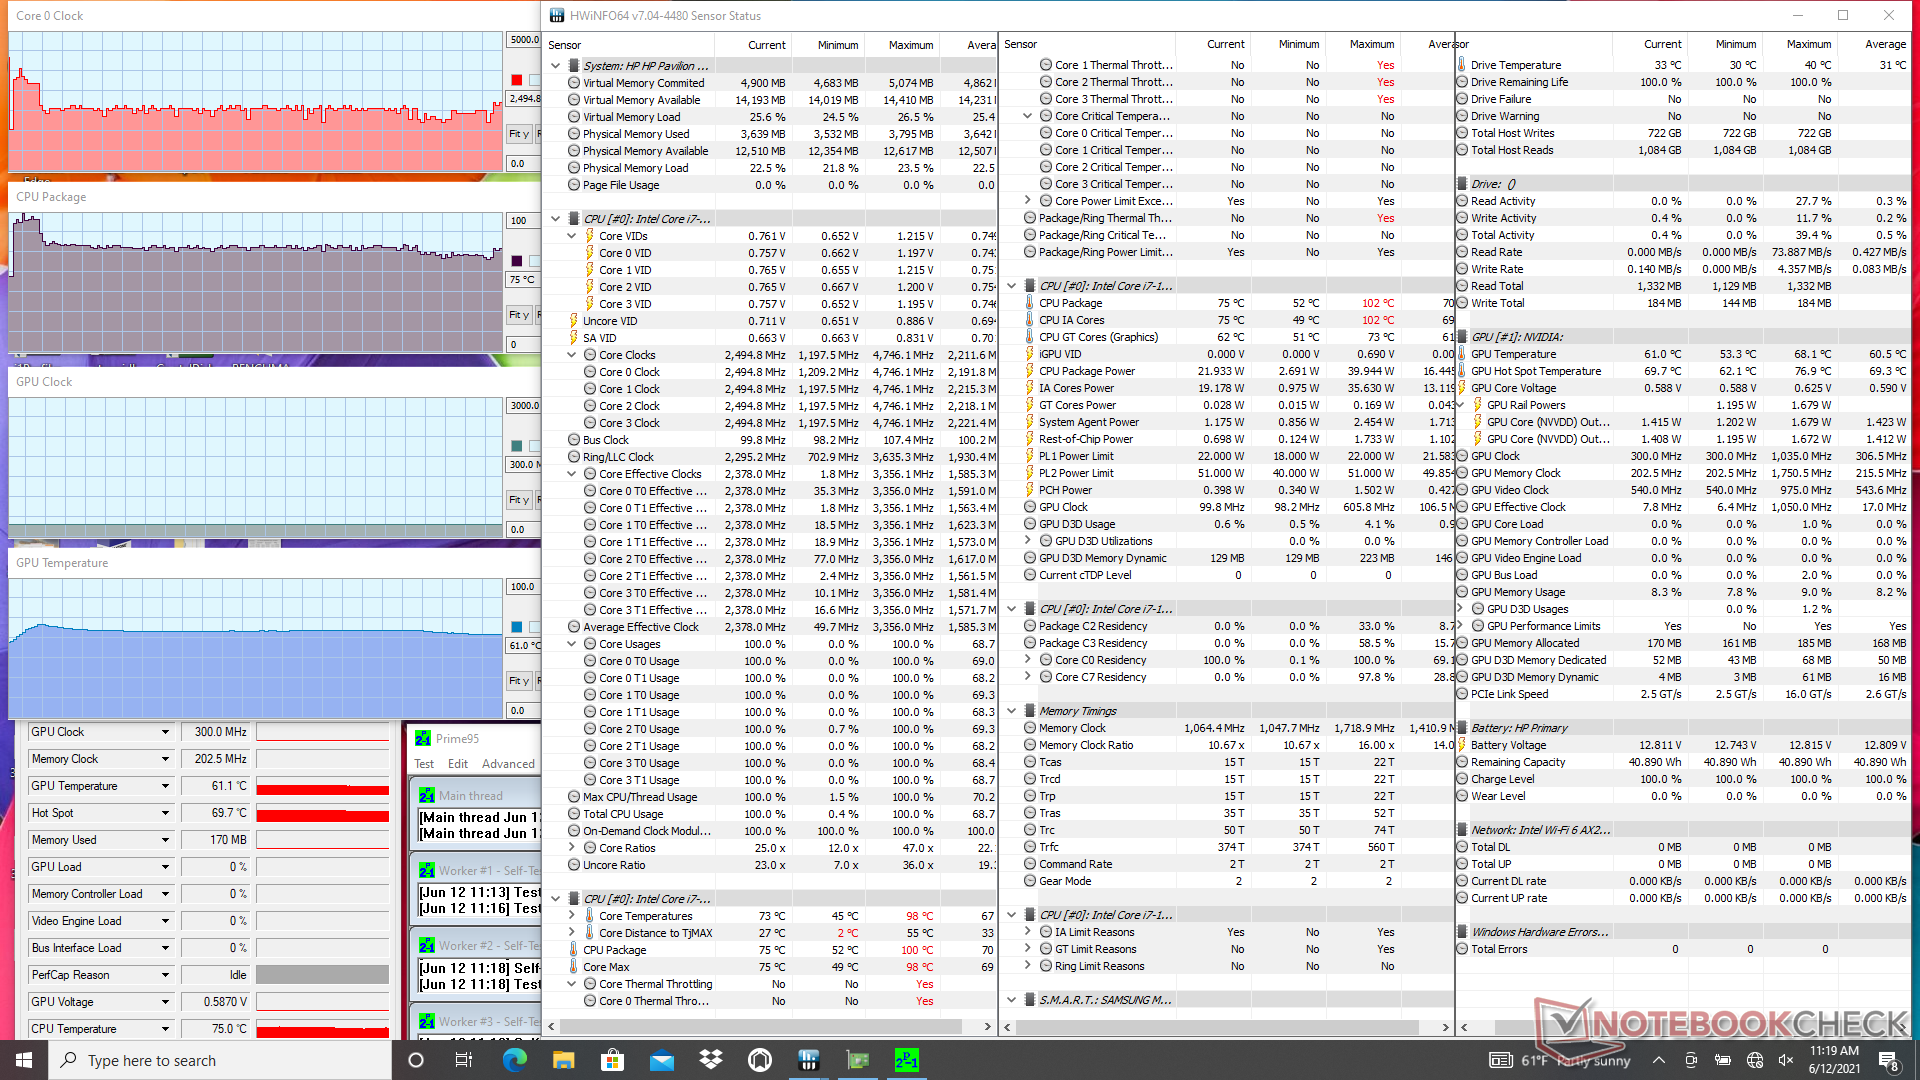
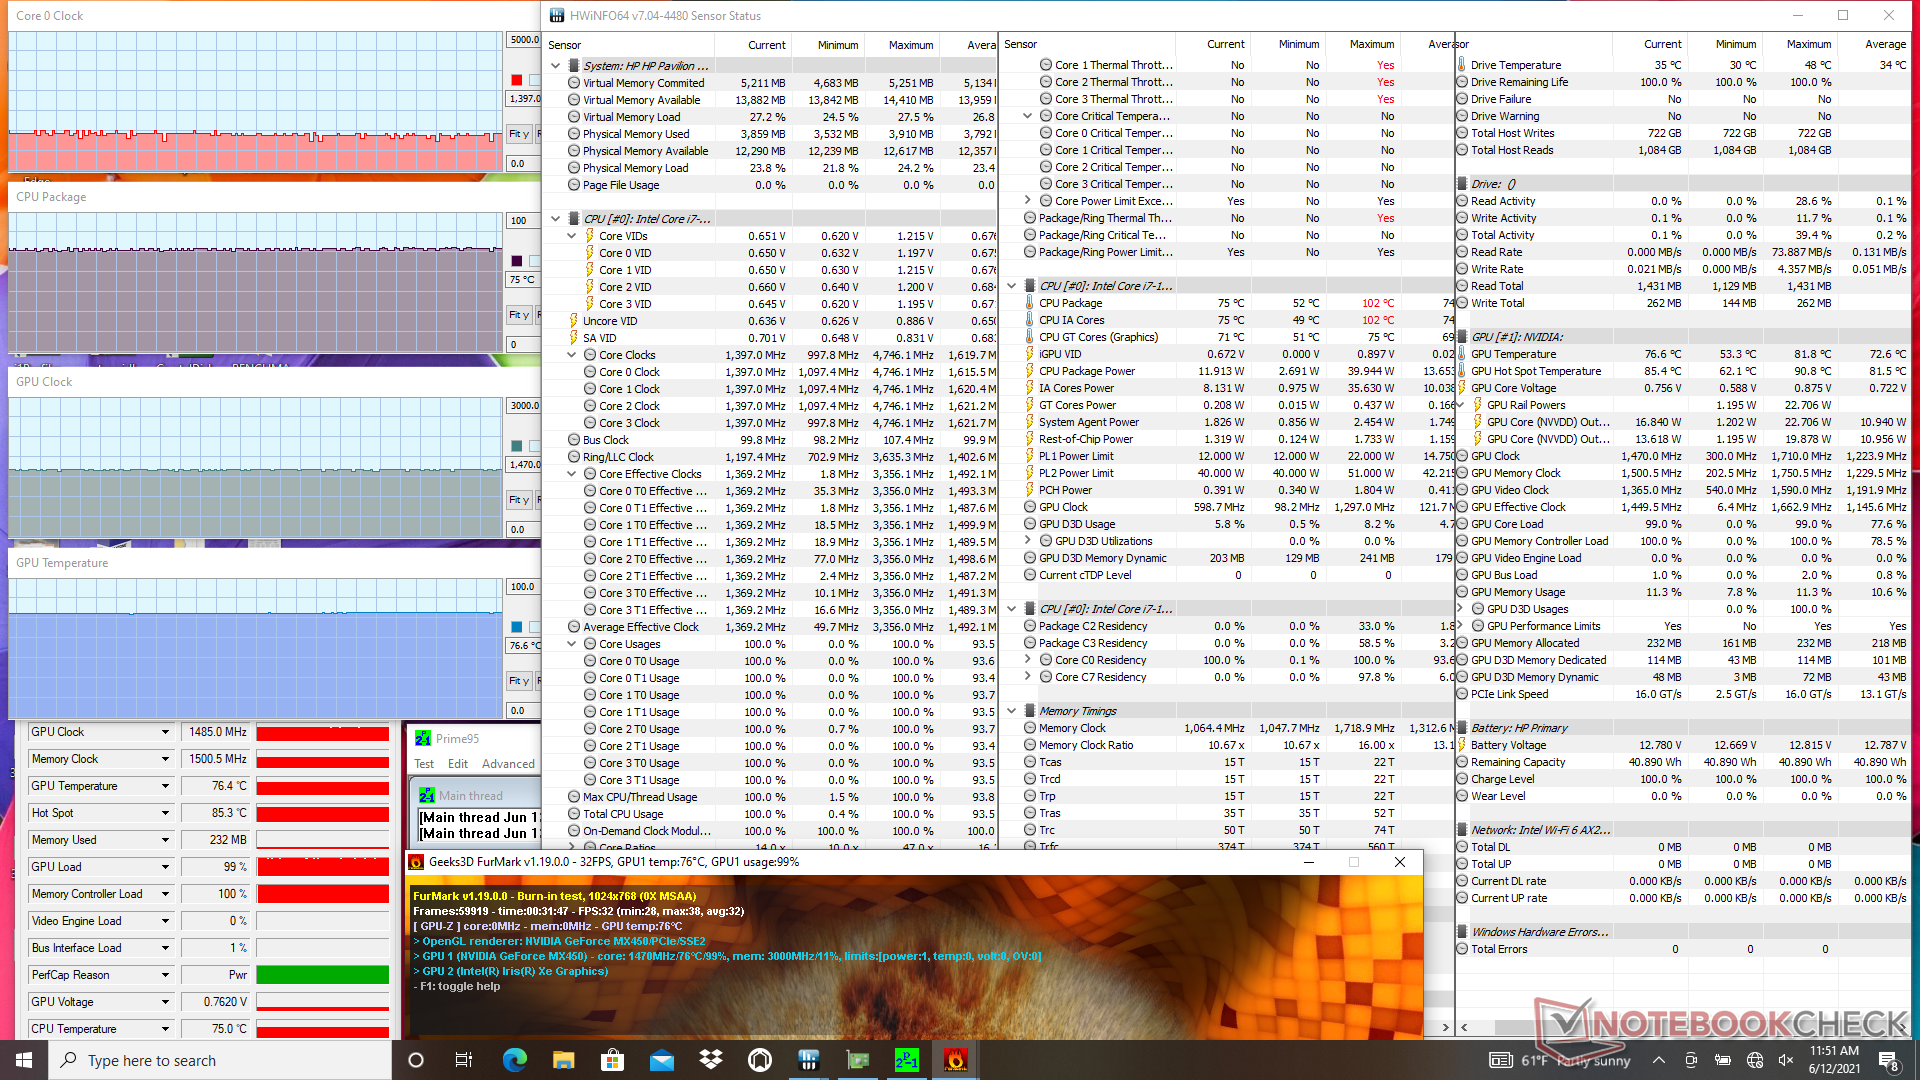
| Relojde la CPU(GHz) | Reloj dela GPU(MHz) | Temperatura media de la CPU (°C) | Temperaturamediade la GPU (°C) | |
| Sistema en reposo | 55 | 55 | ||
| EstrésPrime95 | 2,0 - 2,5 | -- | 75 | 61 |
| Estrés de Prime95+ FurMark | 1,1 - 1,4 | 1470 | 75 | 77 |
| Witcher 3 Estrés | 1,1 - 4,9 | 1485 | 67 | 72 |
Altavoces

Los altavoces estéreo de B&O están por encima de la media, con una atenuación de los graves en torno a los 250 Hz. La amplia curva de ruido rosa muestra que las frecuencias de agudos no se han sobredimensionado para evitar la calidad metálica de la mayoría de los altavoces baratos.
HP Pavilion 15-eg análisis de audio
(±) | la sonoridad del altavoz es media pero buena (81.3 dB)
Graves 100 - 315 Hz
(-) | casi sin bajos - de media 18% inferior a la mediana
(±) | la linealidad de los graves es media (12.8% delta a frecuencia anterior)
Medios 400 - 2000 Hz
(+) | medios equilibrados - a sólo 2.8% de la mediana
(+) | los medios son lineales (4% delta a la frecuencia anterior)
Altos 2 - 16 kHz
(+) | máximos equilibrados - a sólo 1% de la mediana
(+) | los máximos son lineales (3% delta a la frecuencia anterior)
Total 100 - 16.000 Hz
(+) | el sonido global es lineal (13.2% de diferencia con la mediana)
En comparación con la misma clase
» 27% de todos los dispositivos probados de esta clase eran mejores, 5% similares, 68% peores
» El mejor tuvo un delta de 5%, la media fue 17%, el peor fue ###max##%
En comparación con todos los dispositivos probados
» 14% de todos los dispositivos probados eran mejores, 3% similares, 84% peores
» El mejor tuvo un delta de 4%, la media fue 23%, el peor fue ###max##%
ADATA XPG Xenia Xe análisis de audio
(±) | la sonoridad del altavoz es media pero buena (79.8 dB)
Graves 100 - 315 Hz
(±) | lubina reducida - en promedio 14.5% inferior a la mediana
(±) | la linealidad de los graves es media (10.6% delta a frecuencia anterior)
Medios 400 - 2000 Hz
(+) | medios equilibrados - a sólo 2.6% de la mediana
(+) | los medios son lineales (3.8% delta a la frecuencia anterior)
Altos 2 - 16 kHz
(+) | máximos equilibrados - a sólo 3.2% de la mediana
(+) | los máximos son lineales (4% delta a la frecuencia anterior)
Total 100 - 16.000 Hz
(+) | el sonido global es lineal (12.9% de diferencia con la mediana)
En comparación con la misma clase
» 26% de todos los dispositivos probados de esta clase eran mejores, 4% similares, 70% peores
» El mejor tuvo un delta de 5%, la media fue 17%, el peor fue ###max##%
En comparación con todos los dispositivos probados
» 12% de todos los dispositivos probados eran mejores, 3% similares, 85% peores
» El mejor tuvo un delta de 4%, la media fue 23%, el peor fue ###max##%
Energy Management
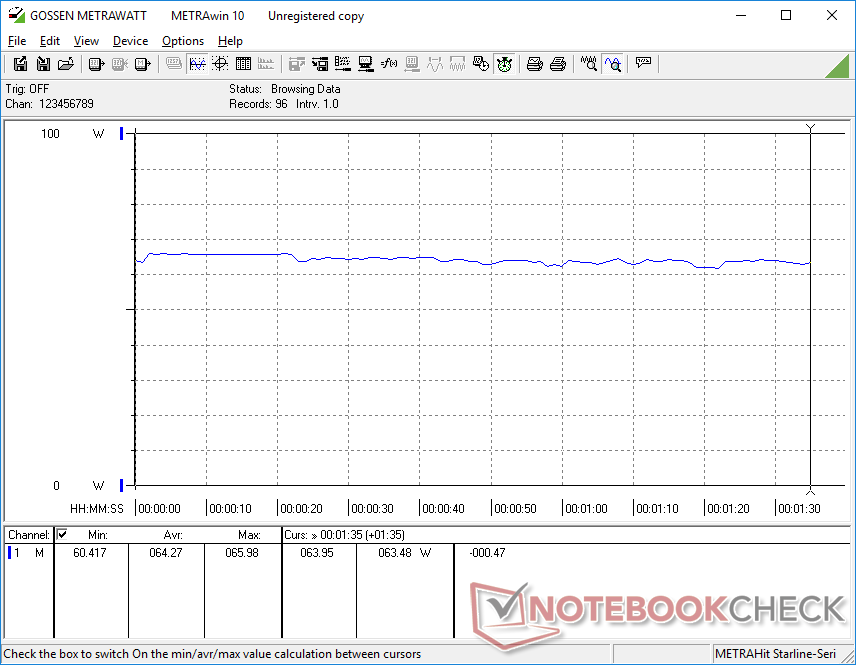
Consumo de energía: más exigente que Iris Xe
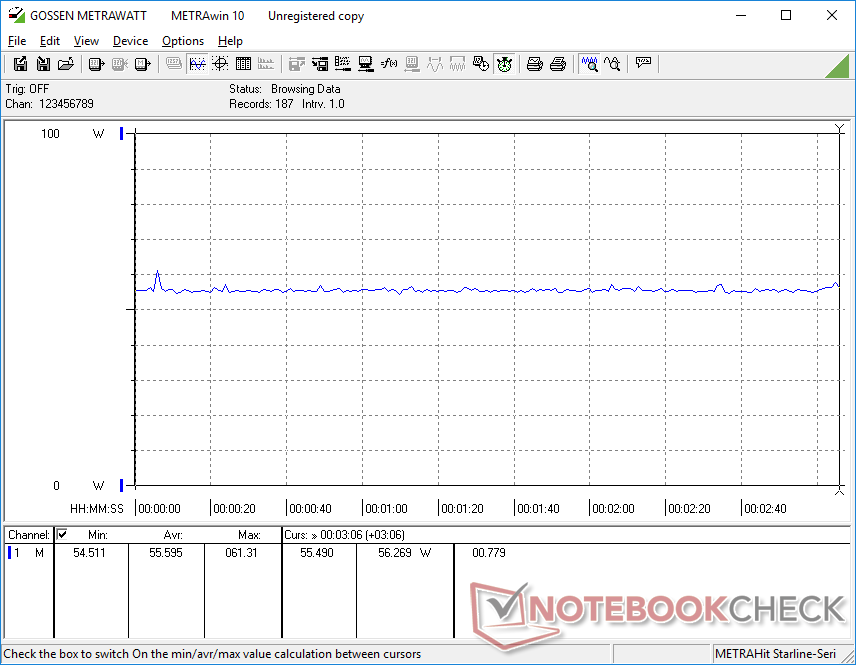
El funcionamiento en vacío en el escritorio con el ajuste de brillo más bajo consume sólo 4,9 W, mientras que el ajuste de brillo máximo exige unos 3 W más. Activar la GPU discreta de Nvidia a través de Optimus aumentaría el consumo del sistema a 14 W, varios vatios más que otros portátiles Tiger Lake-U sin la misma opción de GPU. Se recomienda utilizar la GPU Intel integrada si no se necesita la potencia extra de la MX450.
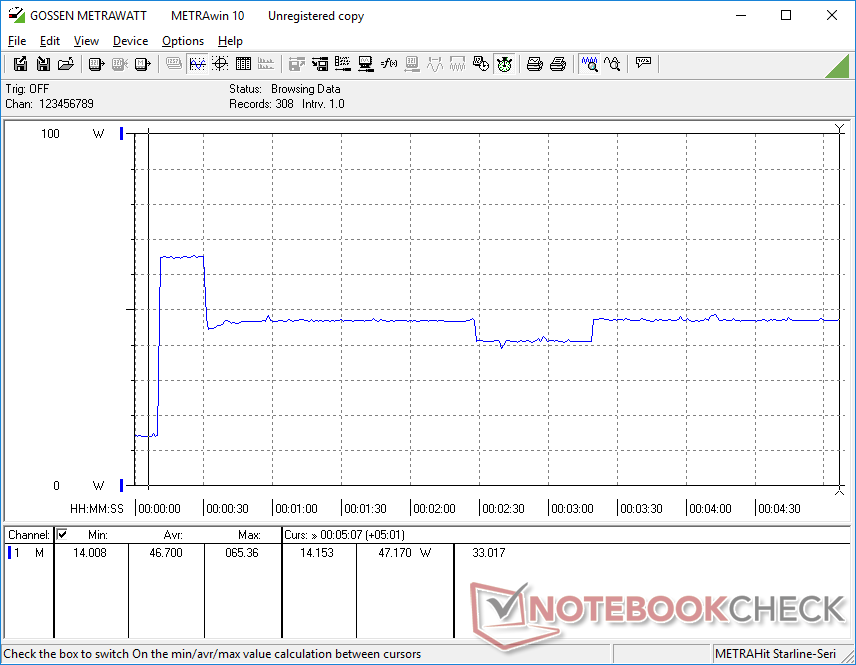
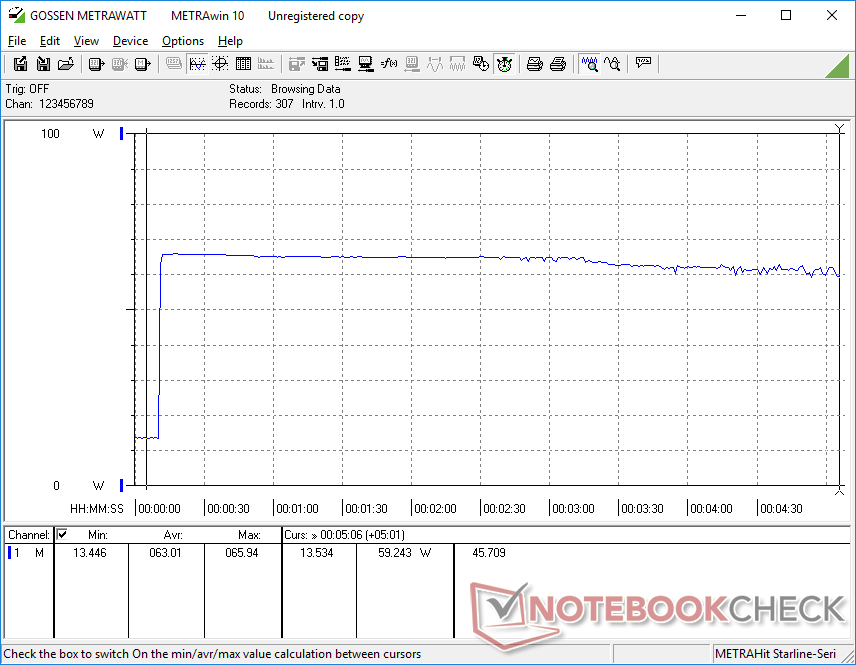
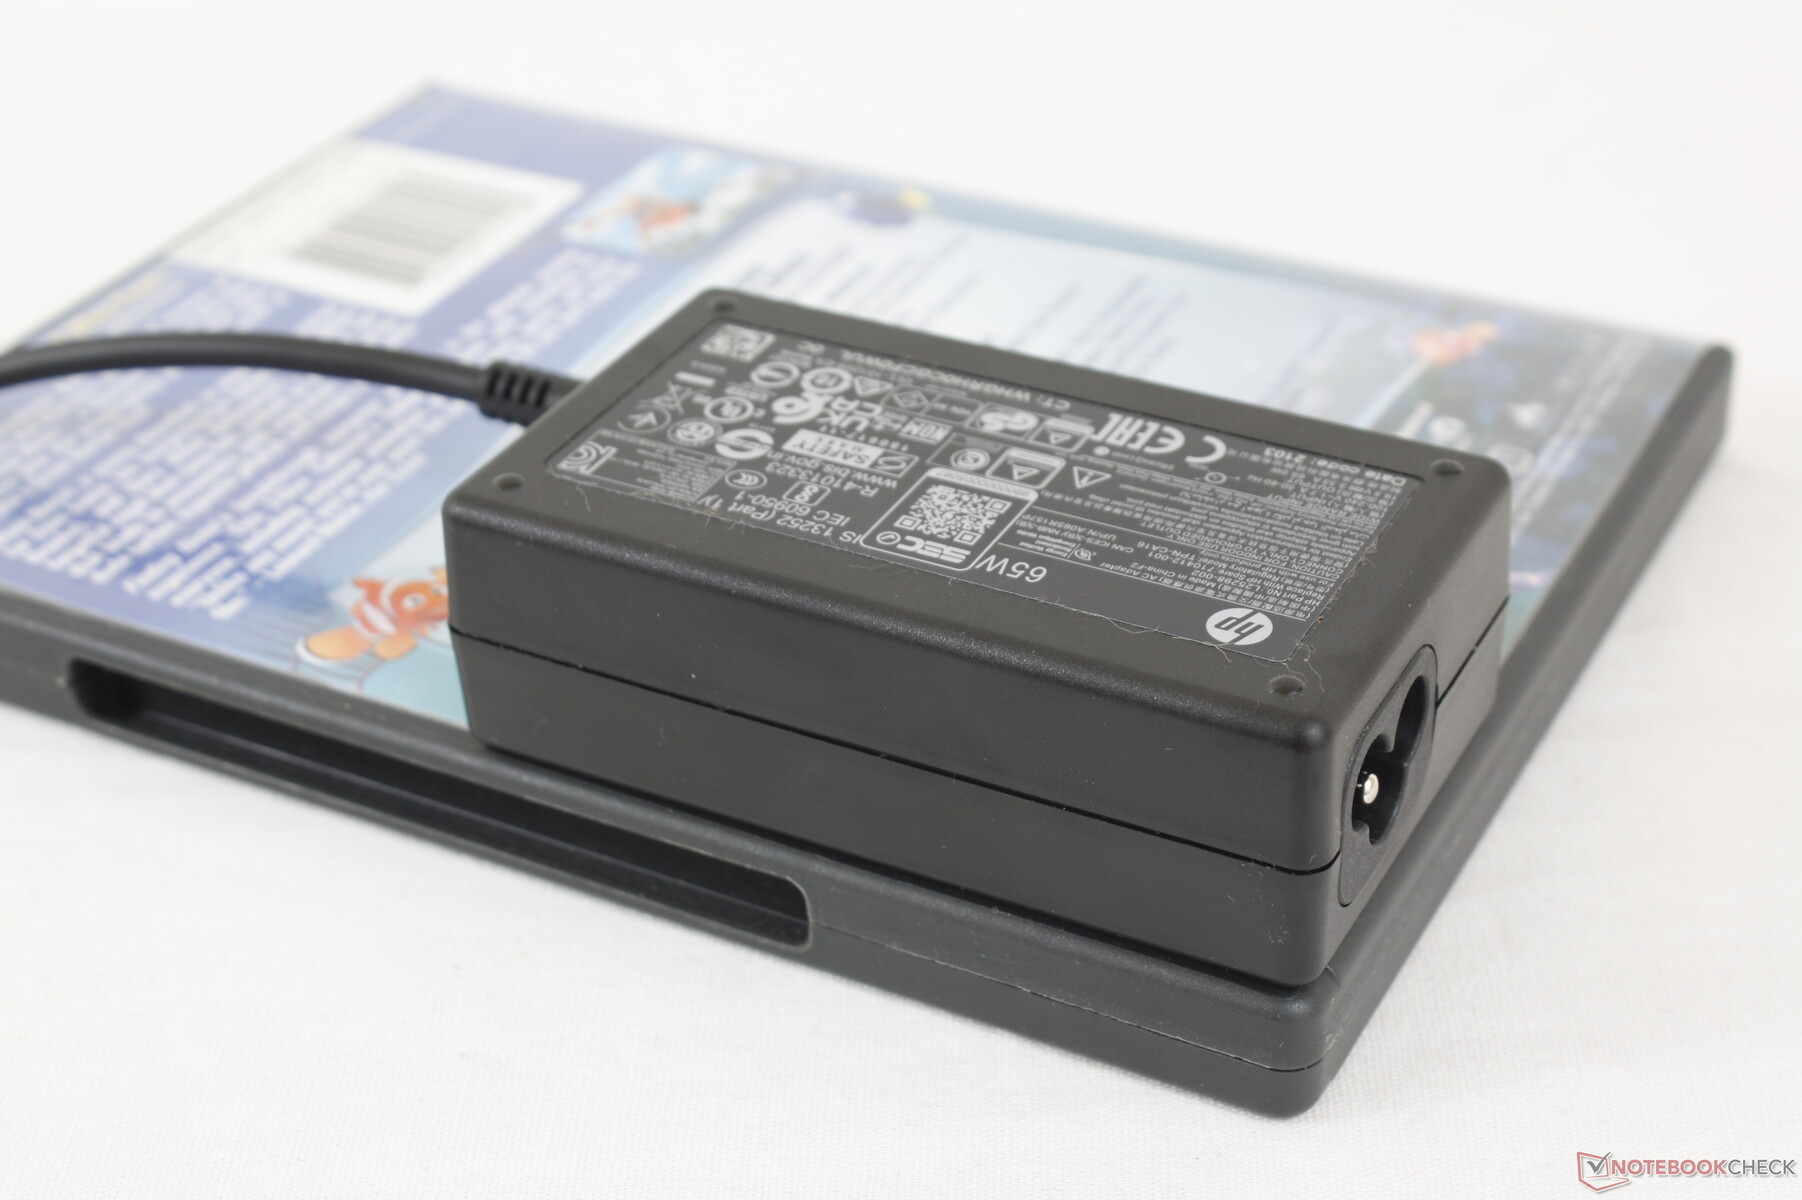
Los juegos exigen entre 55 W y 65 W del pequeño (~8,9 x 5 x 2,8 cm) adaptador de CA de 65 W. El adaptador incluido es, por tanto, apenas suficiente para hacer funcionar el portátil a su máximo rendimiento, por lo que habríamos estado más cómodos con un adaptador de CA más grande de 80 W en su lugar. Es de esperar que el Pavilion 15 se cargue más lentamente si se juega o se ejecutan otras cargas altas.
| Off / Standby | |
| Ocioso | |
| Carga |
|
Clave:
min: | |
| HP Pavilion 15-eg i7-1165G7, GeForce MX450, Samsung PM991 MZVLQ1T0HALB, IPS, 1920x1080, 15.6" | HP Pavilion Gaming 15-ec0002ng R5 3550H, GeForce GTX 1050 Mobile, Intel SSD 660p SSDPEKNW512G8, TN LED, 1920x1080, 15.6" | Dell Inspiron 15 5000 5502 i3-1115G4, UHD Graphics Xe G4 48EUs, Toshiba BG4 KBG40ZNS128G, IPS, 1920x1080, 15.6" | Lenovo IdeaPad 5 15IIL05 i5-1035G1, GeForce MX350, SK hynix BC511 HFM512GDHTNI-87A0B, IPS, 1920x1080, 15.6" | HP Envy 15-ep0098nr i7-10750H, GeForce RTX 2060 Max-Q, Intel Optane Memory H10 with Solid State Storage 32GB + 512GB HBRPEKNX0202A(L/H), AMOLED, 3840x2160, 15.6" | Asus VivoBook S15 S533EQ-BQ002T i7-1165G7, GeForce MX350, Intel SSD 660p 1TB SSDPEKNW010T8, IPS, 1920x1080, 15.6" | |
|---|---|---|---|---|---|---|
| Power Consumption | -6% | 30% | -1% | -99% | 20% | |
| Idle Minimum * (Watt) | 4.9 | 1.9 61% | 4.3 12% | 4.9 -0% | 9.2 -88% | 3 39% |
| Idle Average * (Watt) | 7.9 | 7.2 9% | 7.1 10% | 9.1 -15% | 14.5 -84% | 6.4 19% |
| Idle Maximum * (Watt) | 14.2 | 9.6 32% | 7.2 49% | 11.6 18% | 18 -27% | 7.9 44% |
| Load Average * (Watt) | 64.3 | 74 -15% | 24.8 61% | 65 -1% | 110.9 -72% | 59 8% |
| Witcher 3 ultra * (Watt) | 55.6 | 75 -35% | 59 -6% | 125.5 -126% | 48 14% | |
| Load Maximum * (Watt) | 65.4 | 124 -90% | 54.3 17% | 65.3 -0% | 194.6 -198% | 68 -4% |
* ... más pequeño es mejor
Duración de la batería
La capacidad de la batería es pequeña, como la de todos los portátiles básicos de Pavilion. En consecuencia, la duración media es de apenas 6,5 horas de uso real de la WLAN. Los modelos Envy o Spectre de gama alta del mismo fabricante pueden durar varias horas más en condiciones similares.
La carga desde el vacío hasta la capacidad total tarda aproximadamente 1,5 horas. Los usuarios también pueden recargar el portátil con adaptadores USB-C de terceros.
| HP Pavilion 15-eg i7-1165G7, GeForce MX450, 41 Wh | HP Pavilion Gaming 15-ec0002ng R5 3550H, GeForce GTX 1050 Mobile, 52.5 Wh | Dell Inspiron 15 5000 5502 i3-1115G4, UHD Graphics Xe G4 48EUs, 53 Wh | Lenovo IdeaPad 5 15IIL05 i5-1035G1, GeForce MX350, 70 Wh | HP Envy 15-ep0098nr i7-10750H, GeForce RTX 2060 Max-Q, 83 Wh | Asus VivoBook S15 S533EQ-BQ002T i7-1165G7, GeForce MX350, 50 Wh | |
|---|---|---|---|---|---|---|
| Duración de Batería | 27% | 96% | 73% | 8% | 27% | |
| Reader / Idle (h) | 15 | 26.7 78% | 23.2 55% | 15 0% | ||
| WiFi v1.3 (h) | 6.6 | 8.4 27% | 9 36% | 11.4 73% | 6 -9% | 8.4 27% |
| Load (h) | 1.2 | 3.3 175% | 2.3 92% | 1.6 33% |
Pro
Contra
Veredicto - Buen rendimiento, precio elevado
El 2021 Pavilion 15 está en una situación difícil. Si valora la consistencia del rendimiento de GeForce MX en lugar de Iris Xeentonces puede encontrar algún valor en nuestra configuración Pavilion. Este sistema jugará mejor que cualquier portátil que funcione sólo con gráficos Iris Xe, como el Asus VivoBook S15 o ADATA XPG Xenia.
Por otra parte, el punto de precio de $ 1000 a $ 1100 es muy similar a la mayor Pavilion Gaming 15 con CPUs Core-H significativamente más rápidas y gráficos GeForce GTX 1650 o incluso un Core i5 básico Dell XPS 15 que ofrece un diseño y una pantalla superiores. Nuestro Pavilion SKU no es el mejor si buscas maximizar el rendimiento o la calidad por el coste. La difícil capacidad de mantenimiento, la limitada gama de colores y la falta de Thunderbolt son difíciles de perdonar una vez que alcanzas ese punto de precio de cuatro dígitos.
El Pavilion 15 completamente configurado no es particularmente malo, pero tampoco sobresale en ninguna categoría. Los usuarios pueden hacerlo mejor en el punto de precio de más de $1000 USD.
Las unidades inferiores con el Ryzen 7 4700U se venden entre 300 y 400 dólares más baratas que nuestra unidad de análisis, lo que es mucho más razonable para un sistema de clase Pavilion. Si no necesitas la potencia gráfica extra de la GPU Nvidia, entonces los modelos más baratos de AMD o Iris Xe serán suficientes.
Además, recomendamos a los usuarios comprobar la salida de vídeo del puerto USB-C. Experimentamos problemas de salida de vídeo en nuestra unidad de pruebas que podrían impedir que el portátil usara monitores externos USB-C.
Precio y disponibilidad
HP Pavilion 15-eg
- 06/15/2021 v7 (old)
Allen Ngo
Price comparison

