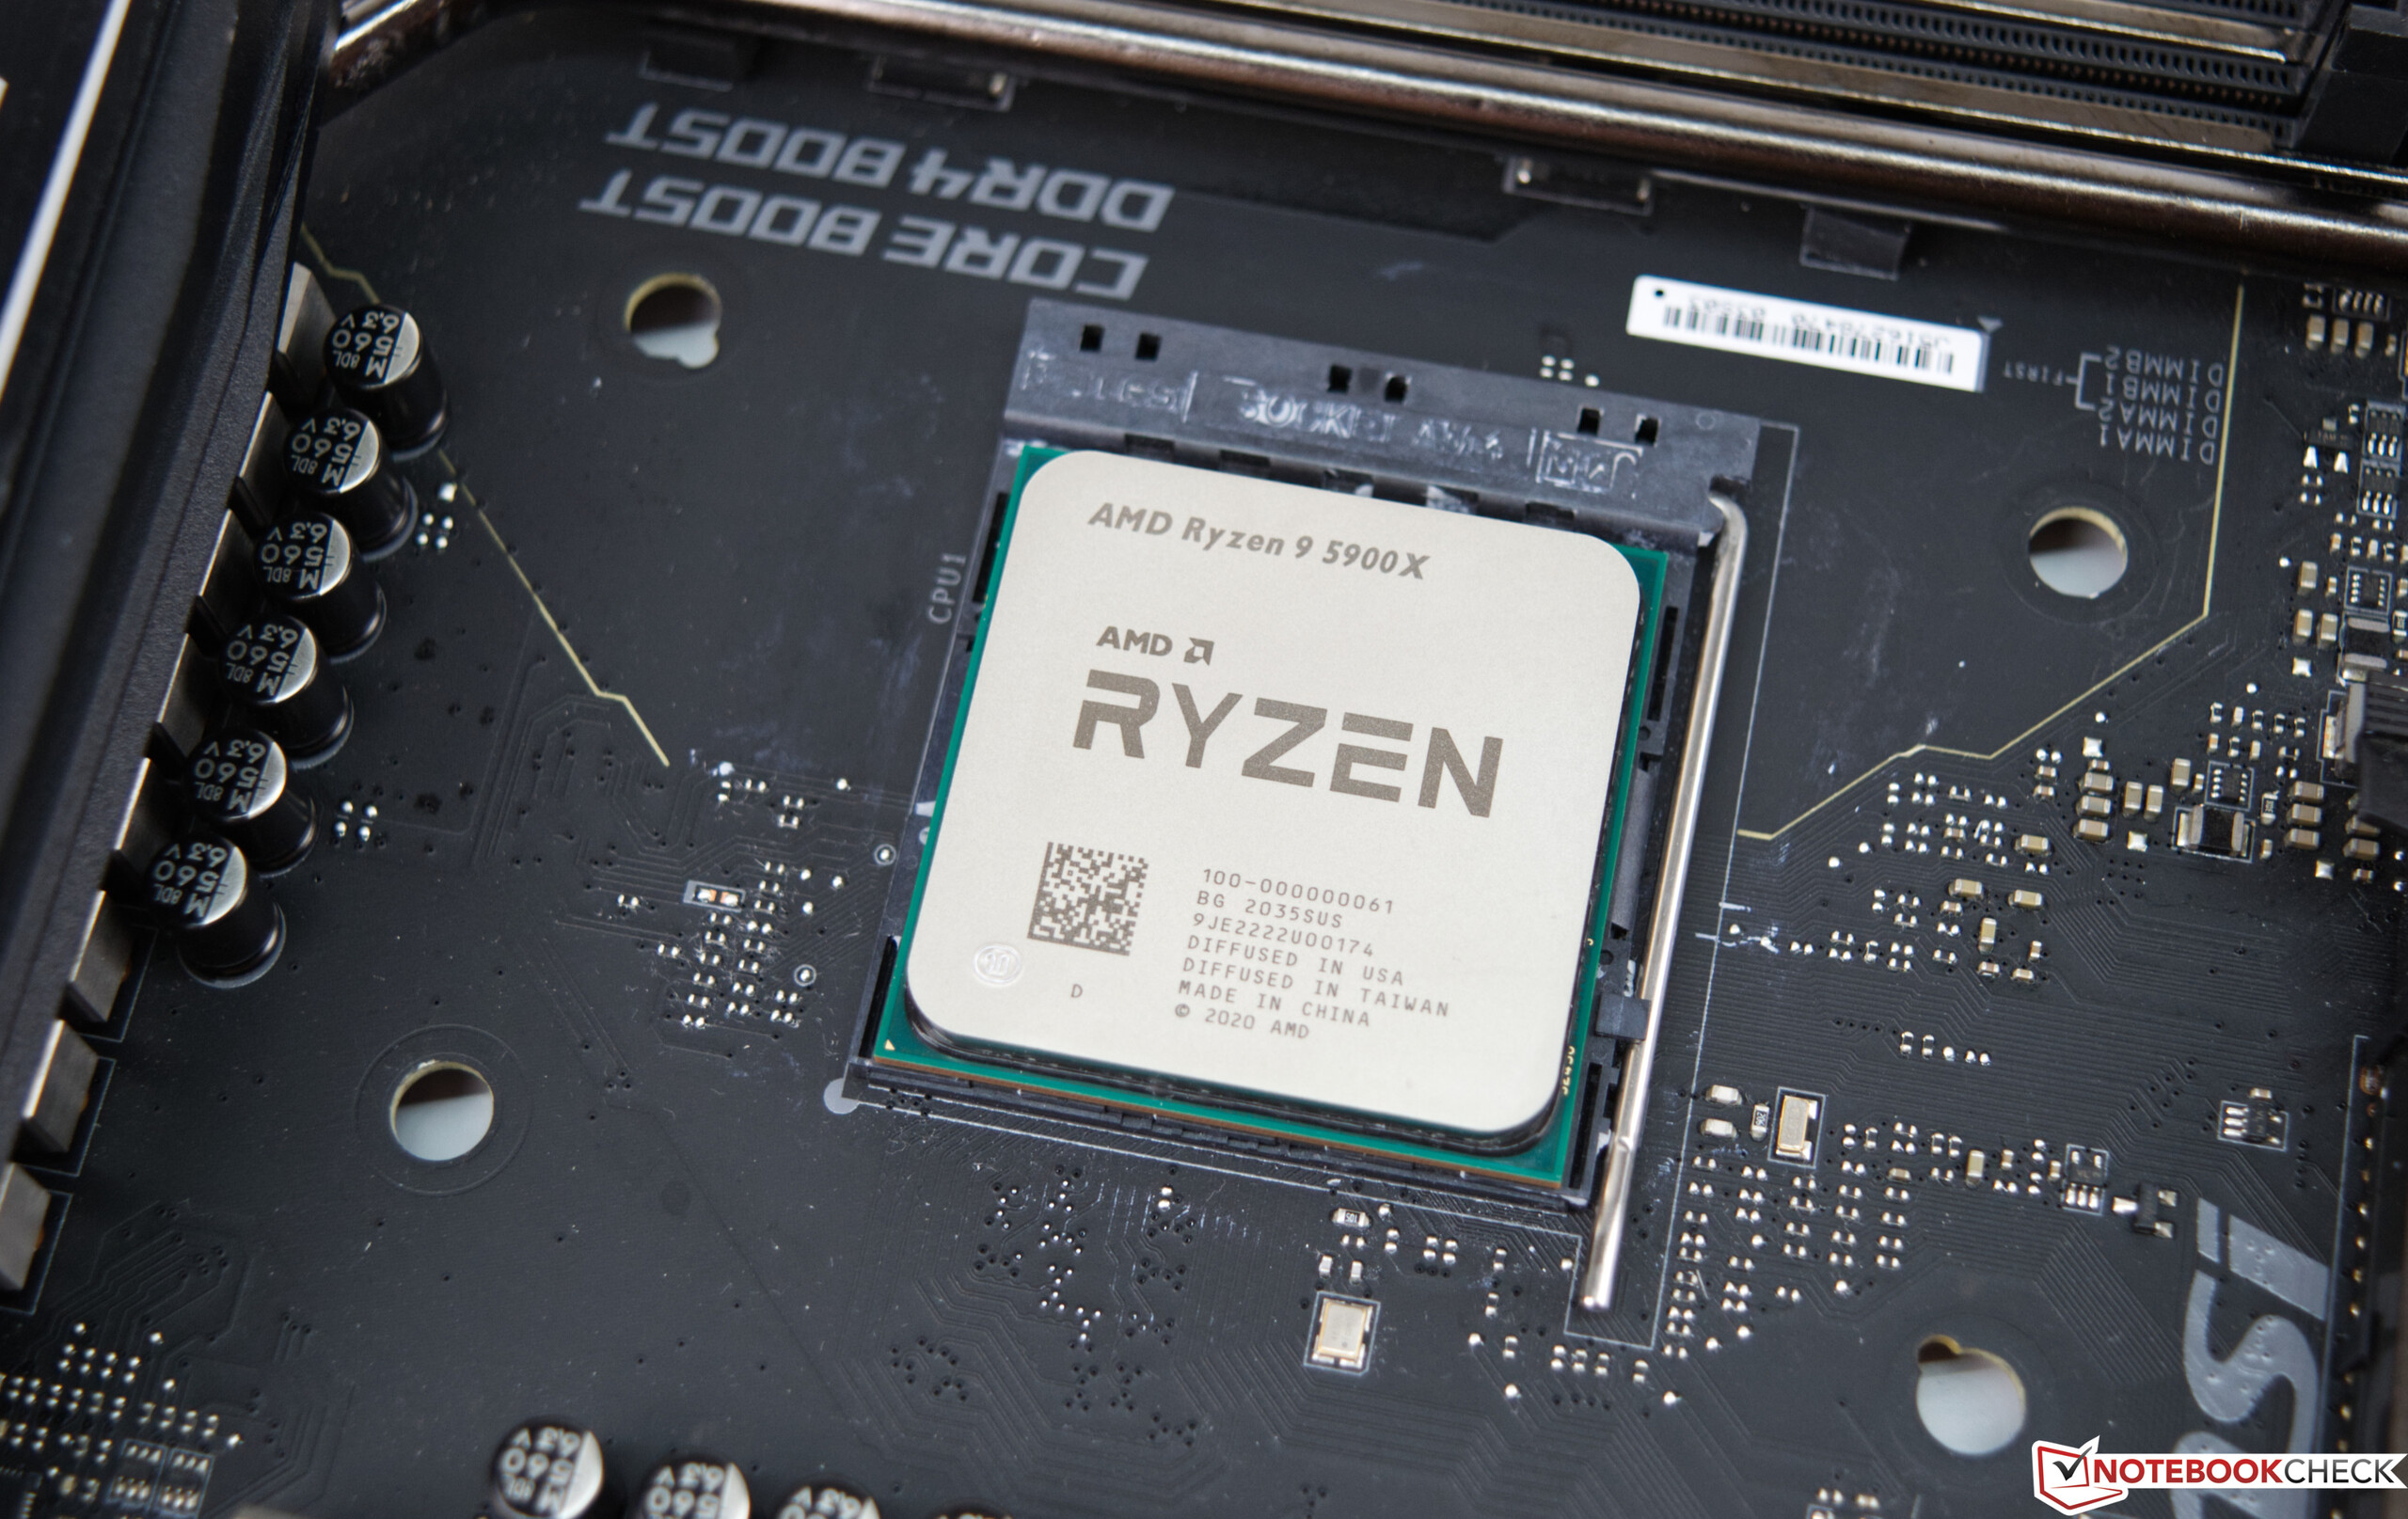
AMD Ryzen 9 5900X y AMD Ryzen 7 5800X en review: AMD destrona a Intel como la CPU de juego más rápida

El inicio de la serie Ryzen 3000 de AMD trajo nueva vida al mercado de las CPU. Por primera vez se podía conseguir una CPU de 16 núcleos que cabía en un enchufe AM4. En cuanto al rendimiento, estas nuevas CPU daban vueltas alrededor de los procesadores de Intel en escenarios de múltiples núcleos donde estaban muy por delante de la competencia. Sin embargo, el rendimiento de un solo núcleo seguía siendo un punto delicado, e Intel continuó vendiendo la CPU para juegos más rápida disponible y se las arregló para elevar ese nivel aún más con el Intel Core i9-10900K sacrificando la eficiencia energética por un rendimiento extra de un solo núcleo. AMD, a cambio, continuó optimizando su arquitectura Zen 3, que aporta unidades de carga y almacenamiento actualizadas que, combinadas con la caché, son mucho más potentes que antes. Sobre el papel, se supone que el Zen 3 ofrece un IPC un 19% más alto que el Zen 2. Al menos en parte responsable de este aumento de rendimiento son la notable mejora del ancho de banda y las latencias más bajas. El Infinity Fabric, el conector entre los dados de la CPU y el dado de E/S, funciona hasta los 2.000 MHz, lo que resulta en una velocidad óptima de la RAM de 4.000 MHz.
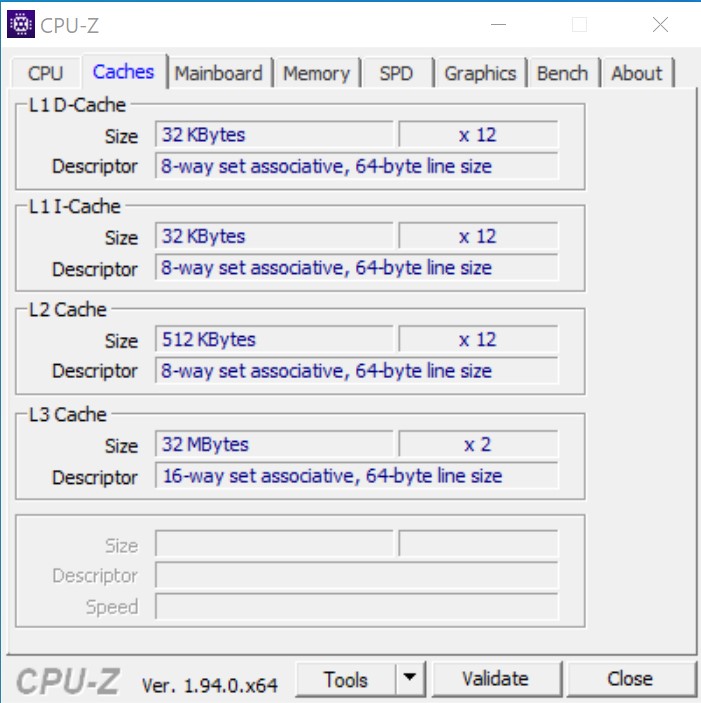
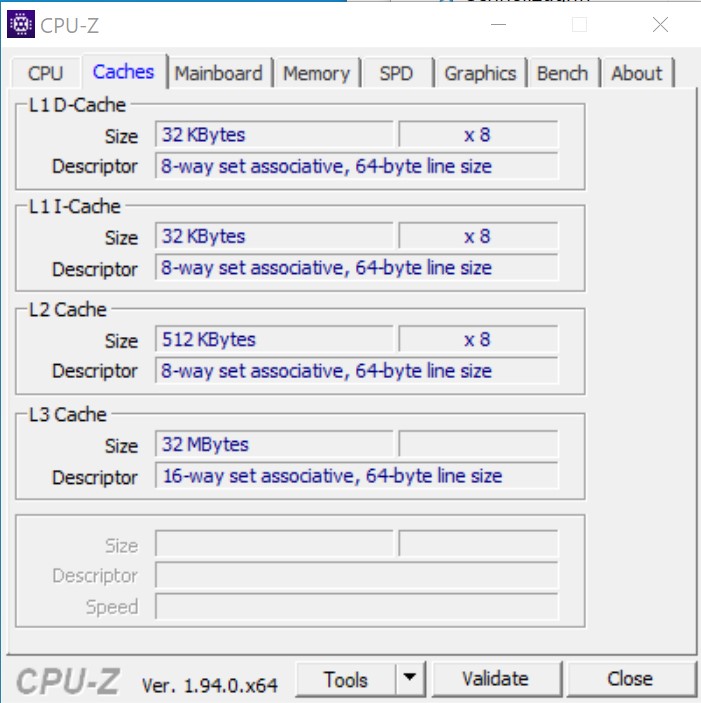
Visualmente, no hay muchos cambios en los dados de la CPU. Un Zen 3 CCX ahora contiene ocho núcleos donde antes sólo había cuatro. Cada núcleo tiene acceso a 32 MB de caché L3. El dado de E/S permaneció sin cambios y, a diferencia de los dados de CPU de 7 nm, sigue siendo fabricado en un proceso de 12 nm. El siguiente paso en la evolución de la litografía, el proceso de fabricación de 5 nm, se espera que llegue con el Zen 4.
A diferencia de Intel, AMD no tuvo que aumentar los índices de TDP en una cantidad significativa, y por lo tanto las nuevas CPU de Vermeer son compatibles con los actuales chipsets de la serie 500. En comparación con el Core i9-10900K de Intel, el consumo de energía de hasta 250 W de la nueva CPU de AMD es significativamente más eficiente en cuanto a energía.
Las CPU de escritorio Ryzen
| Modelo | Cores/Threads | Velocidad Base | Velocidad Turbo | Cache L3 | TDP | PVR en el lanzamiento |
|---|---|---|---|---|---|---|
| Ryzen 9 5950X | 16/32 | 3.4 GHz | 4.9 GHz | 64 MB | 105 W | $799 |
| Ryzen 9 3950X | 16/32 | 3.5 GHz | 4.7 GHz | 64 MB | 105 W | $749 |
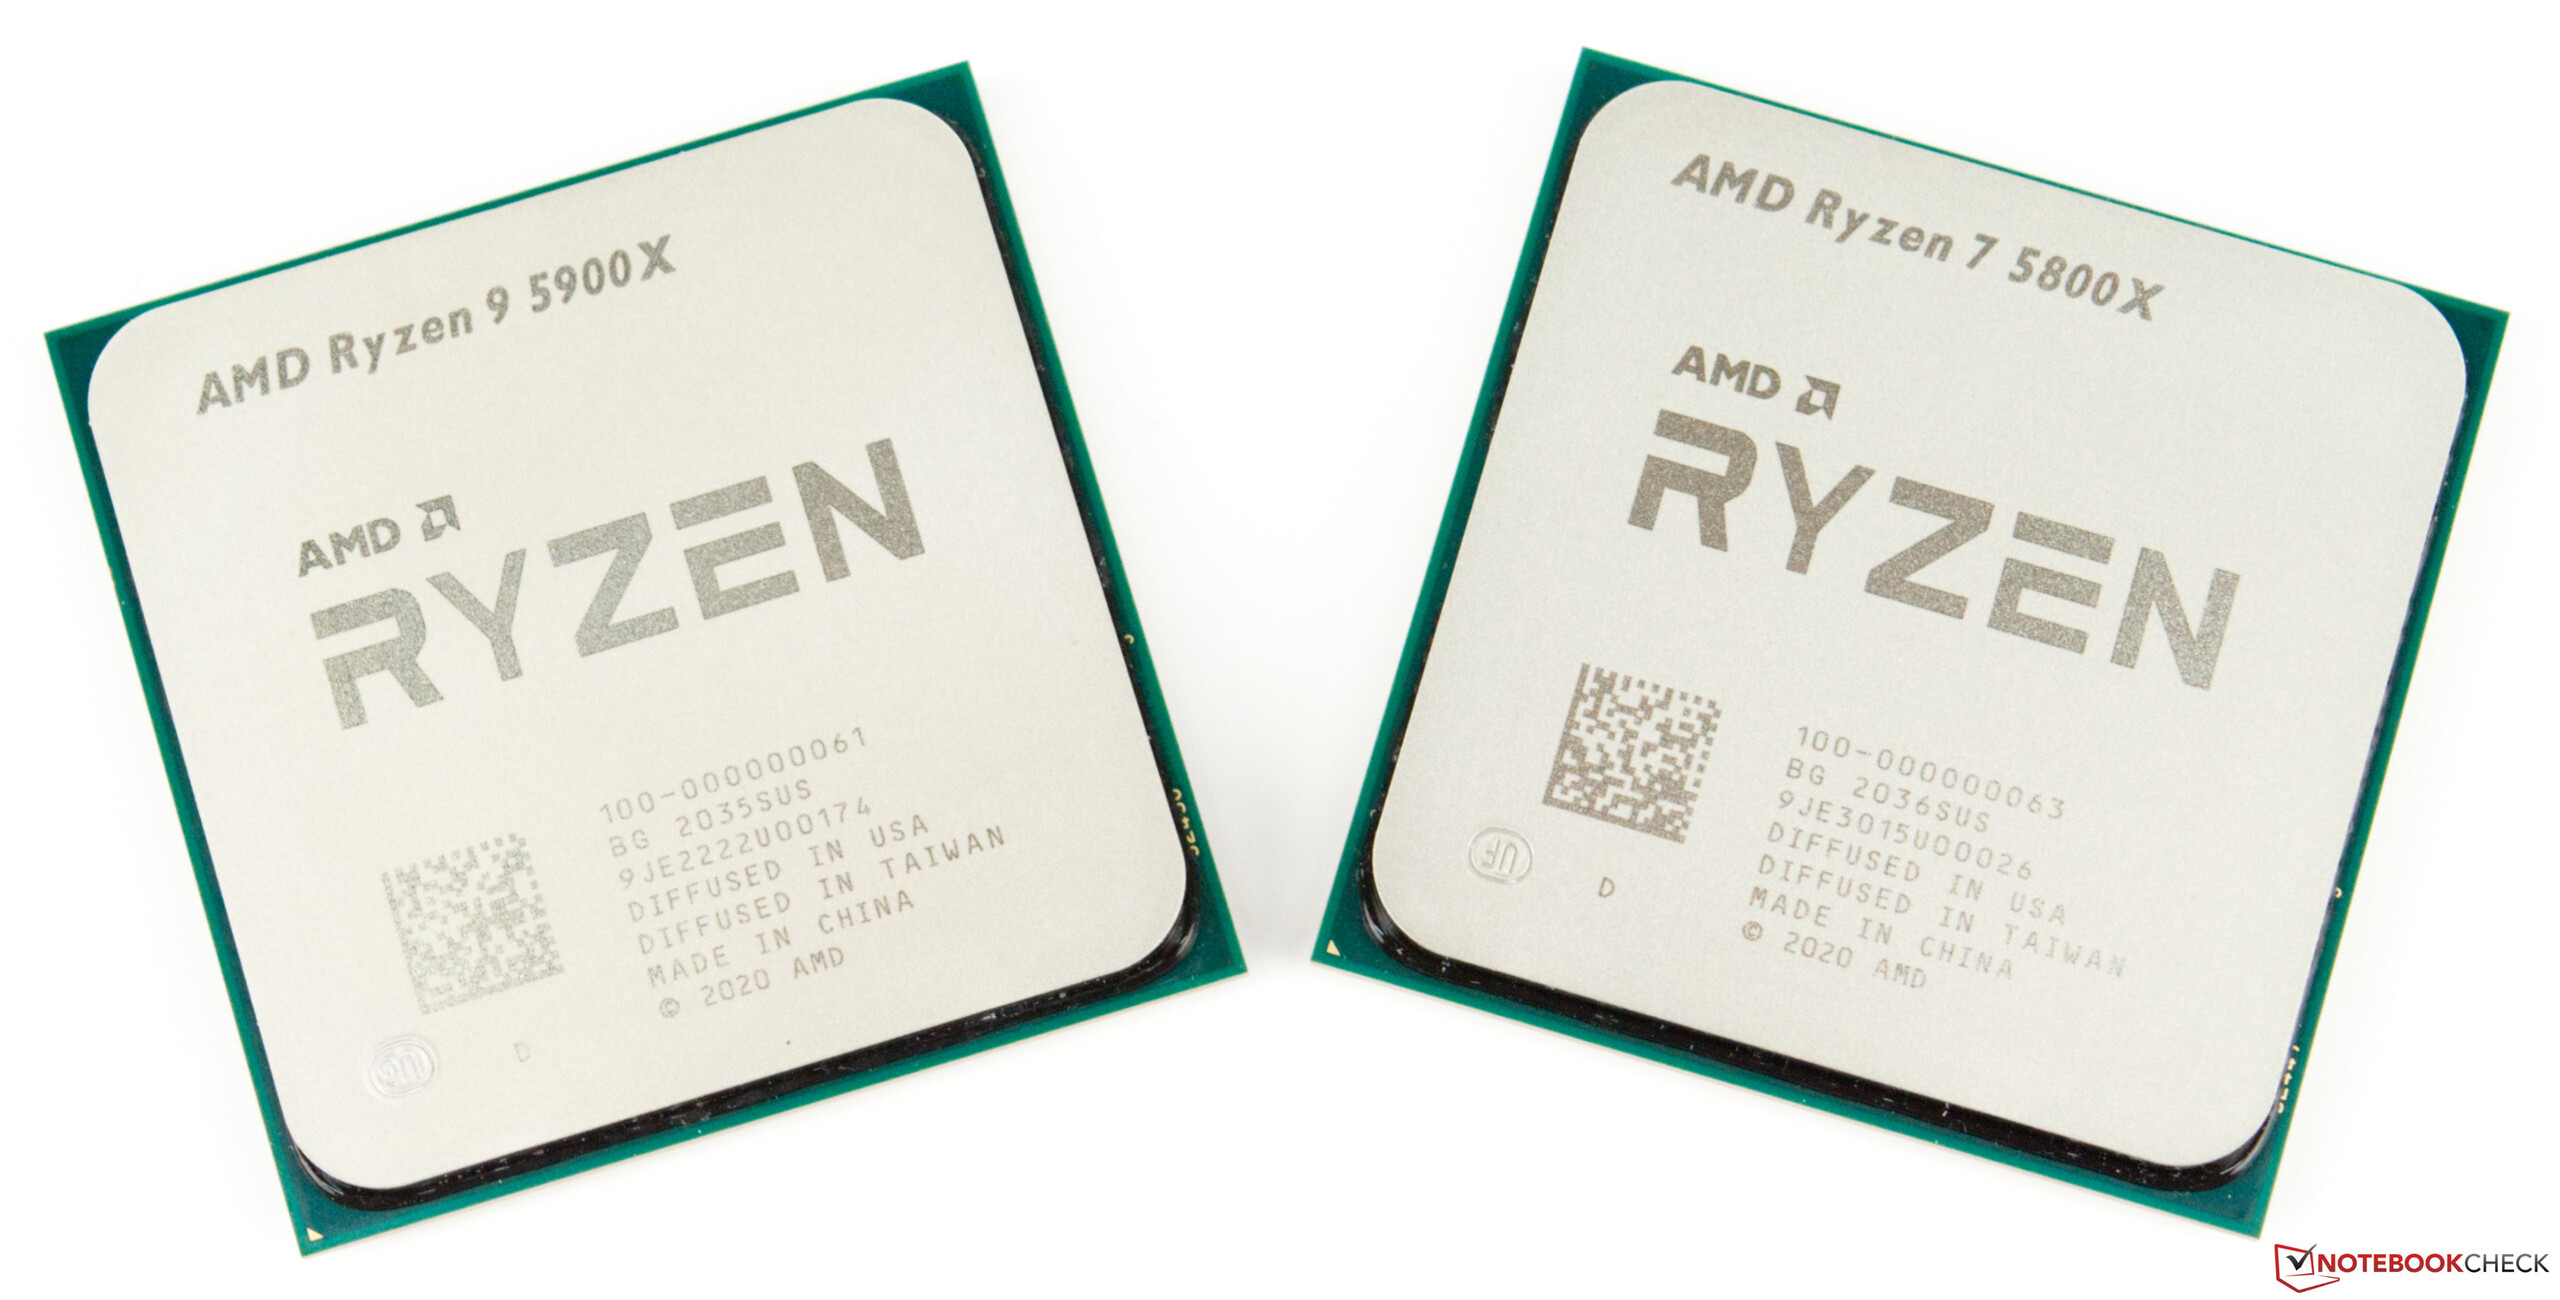
| Ryzen 9 5900X | 12/24 | 3.7 GHz | 4.8 GHz | 64 MB | 105 W | $549 |
| Ryzen 9 3900XT | 12/24 | 3.8 GHz | 4.7 GHz | 64 MB | 105 W | $499 |
| Ryzen 9 3900X | 12/24 | 3.8 GHz | 4.6 GHz | 64 MB | 105 W | $499 |
| Ryzen 7 5800X | 8/16 | 3.8 GHz | 4.7 GHz | 32 MB | 105 W | $449 |
| Ryzen 7 3800XT | 8/16 | 3.9 GHz | 4.7 GHz | 32 MB | 105 W | $399 |
| Ryzen 7 3800X | 8/16 | 3.9 GHz | 4.5 GHz | 32 MB | 105 W | $399 |
| Ryzen 7 3700X | 8/16 | 3.6 GHz | 4.4 GHz | 32 MB | 65 W | $329 |
| Ryzen 5 5600X | 6/12 | 3.7 GHz | 4.6 GHz | 32 MB | 65 W | $299 |
| Ryzen 5 3600XT | 6/12 | 3.8 GHz | 4.5 GHz | 32 MB | 95 W | $249 |
| Ryzen 5 3600X | 6/12 | 3.8 GHz | 4.4 GHz | 32 MB | 95 W | $229 |
| Ryzen 5 3600 | 6/12 | 3.6 GHz | 4.2 GHz | 32 MB | 65 W | $199 |
Detalles del sistema de pruebas
Utilizamos el siguiente sistema para ejecutar todos los puntos de referencia y pruebas en esta review:
- Raijintek Pean Benchtable
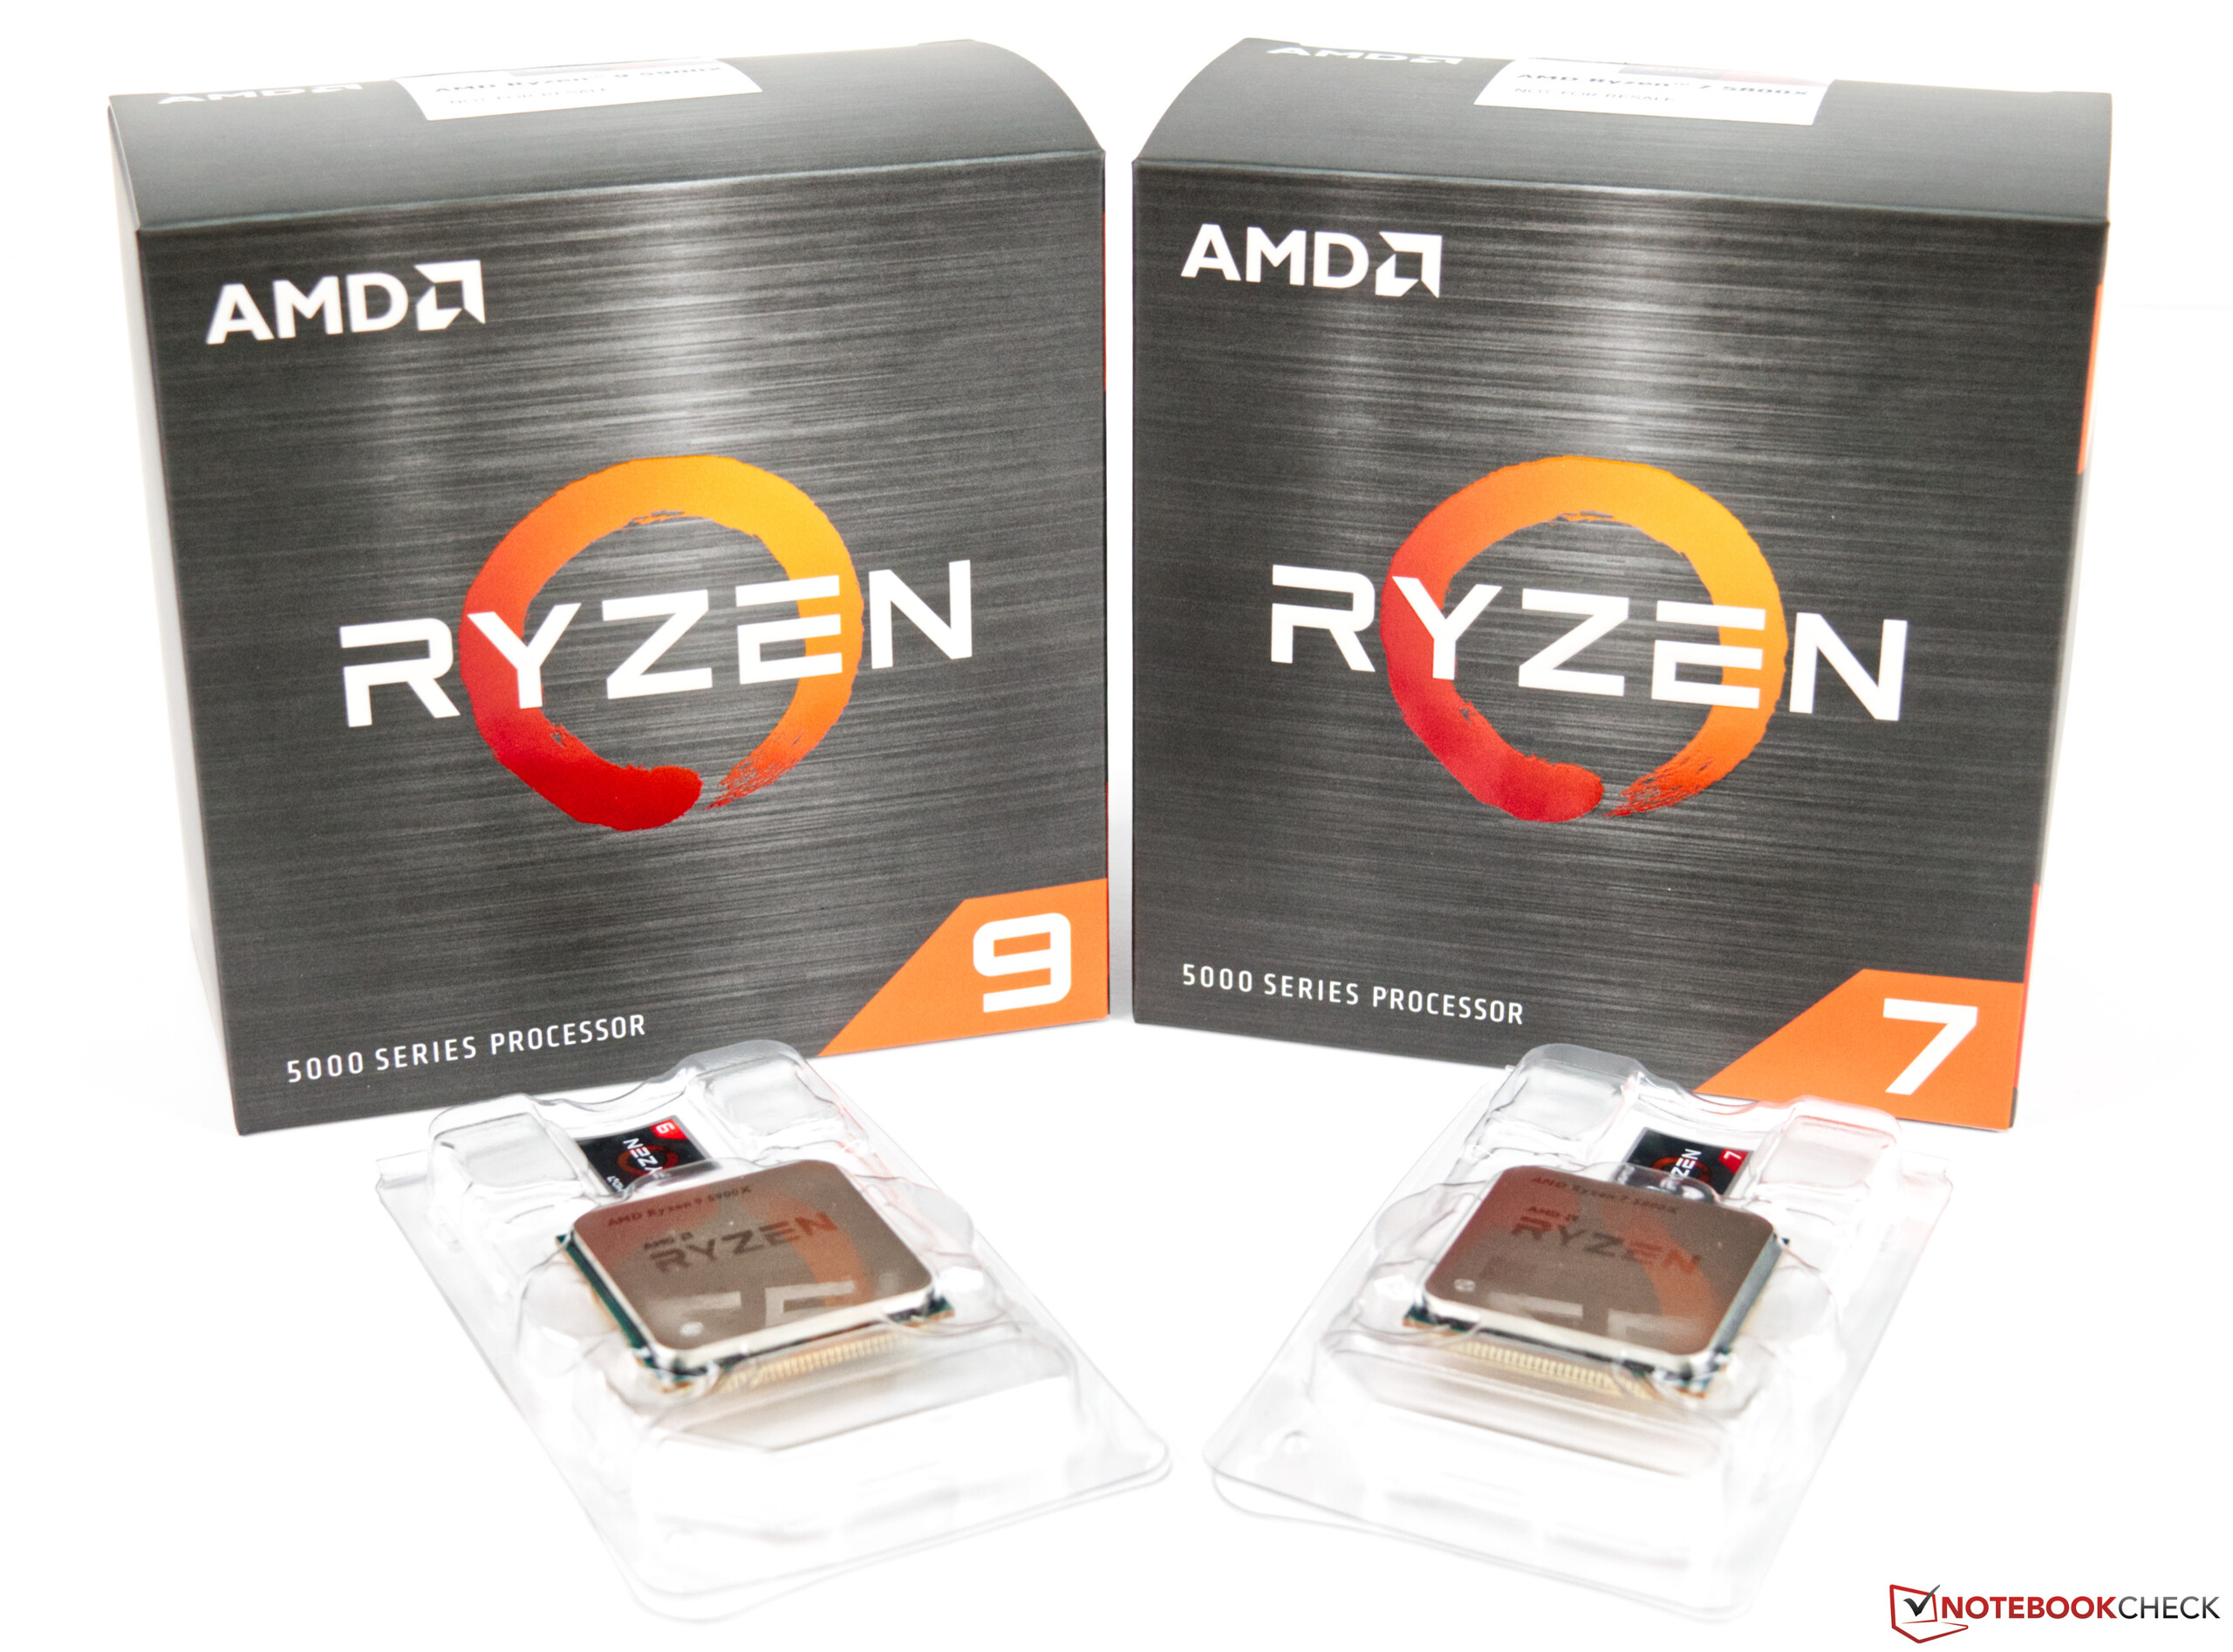
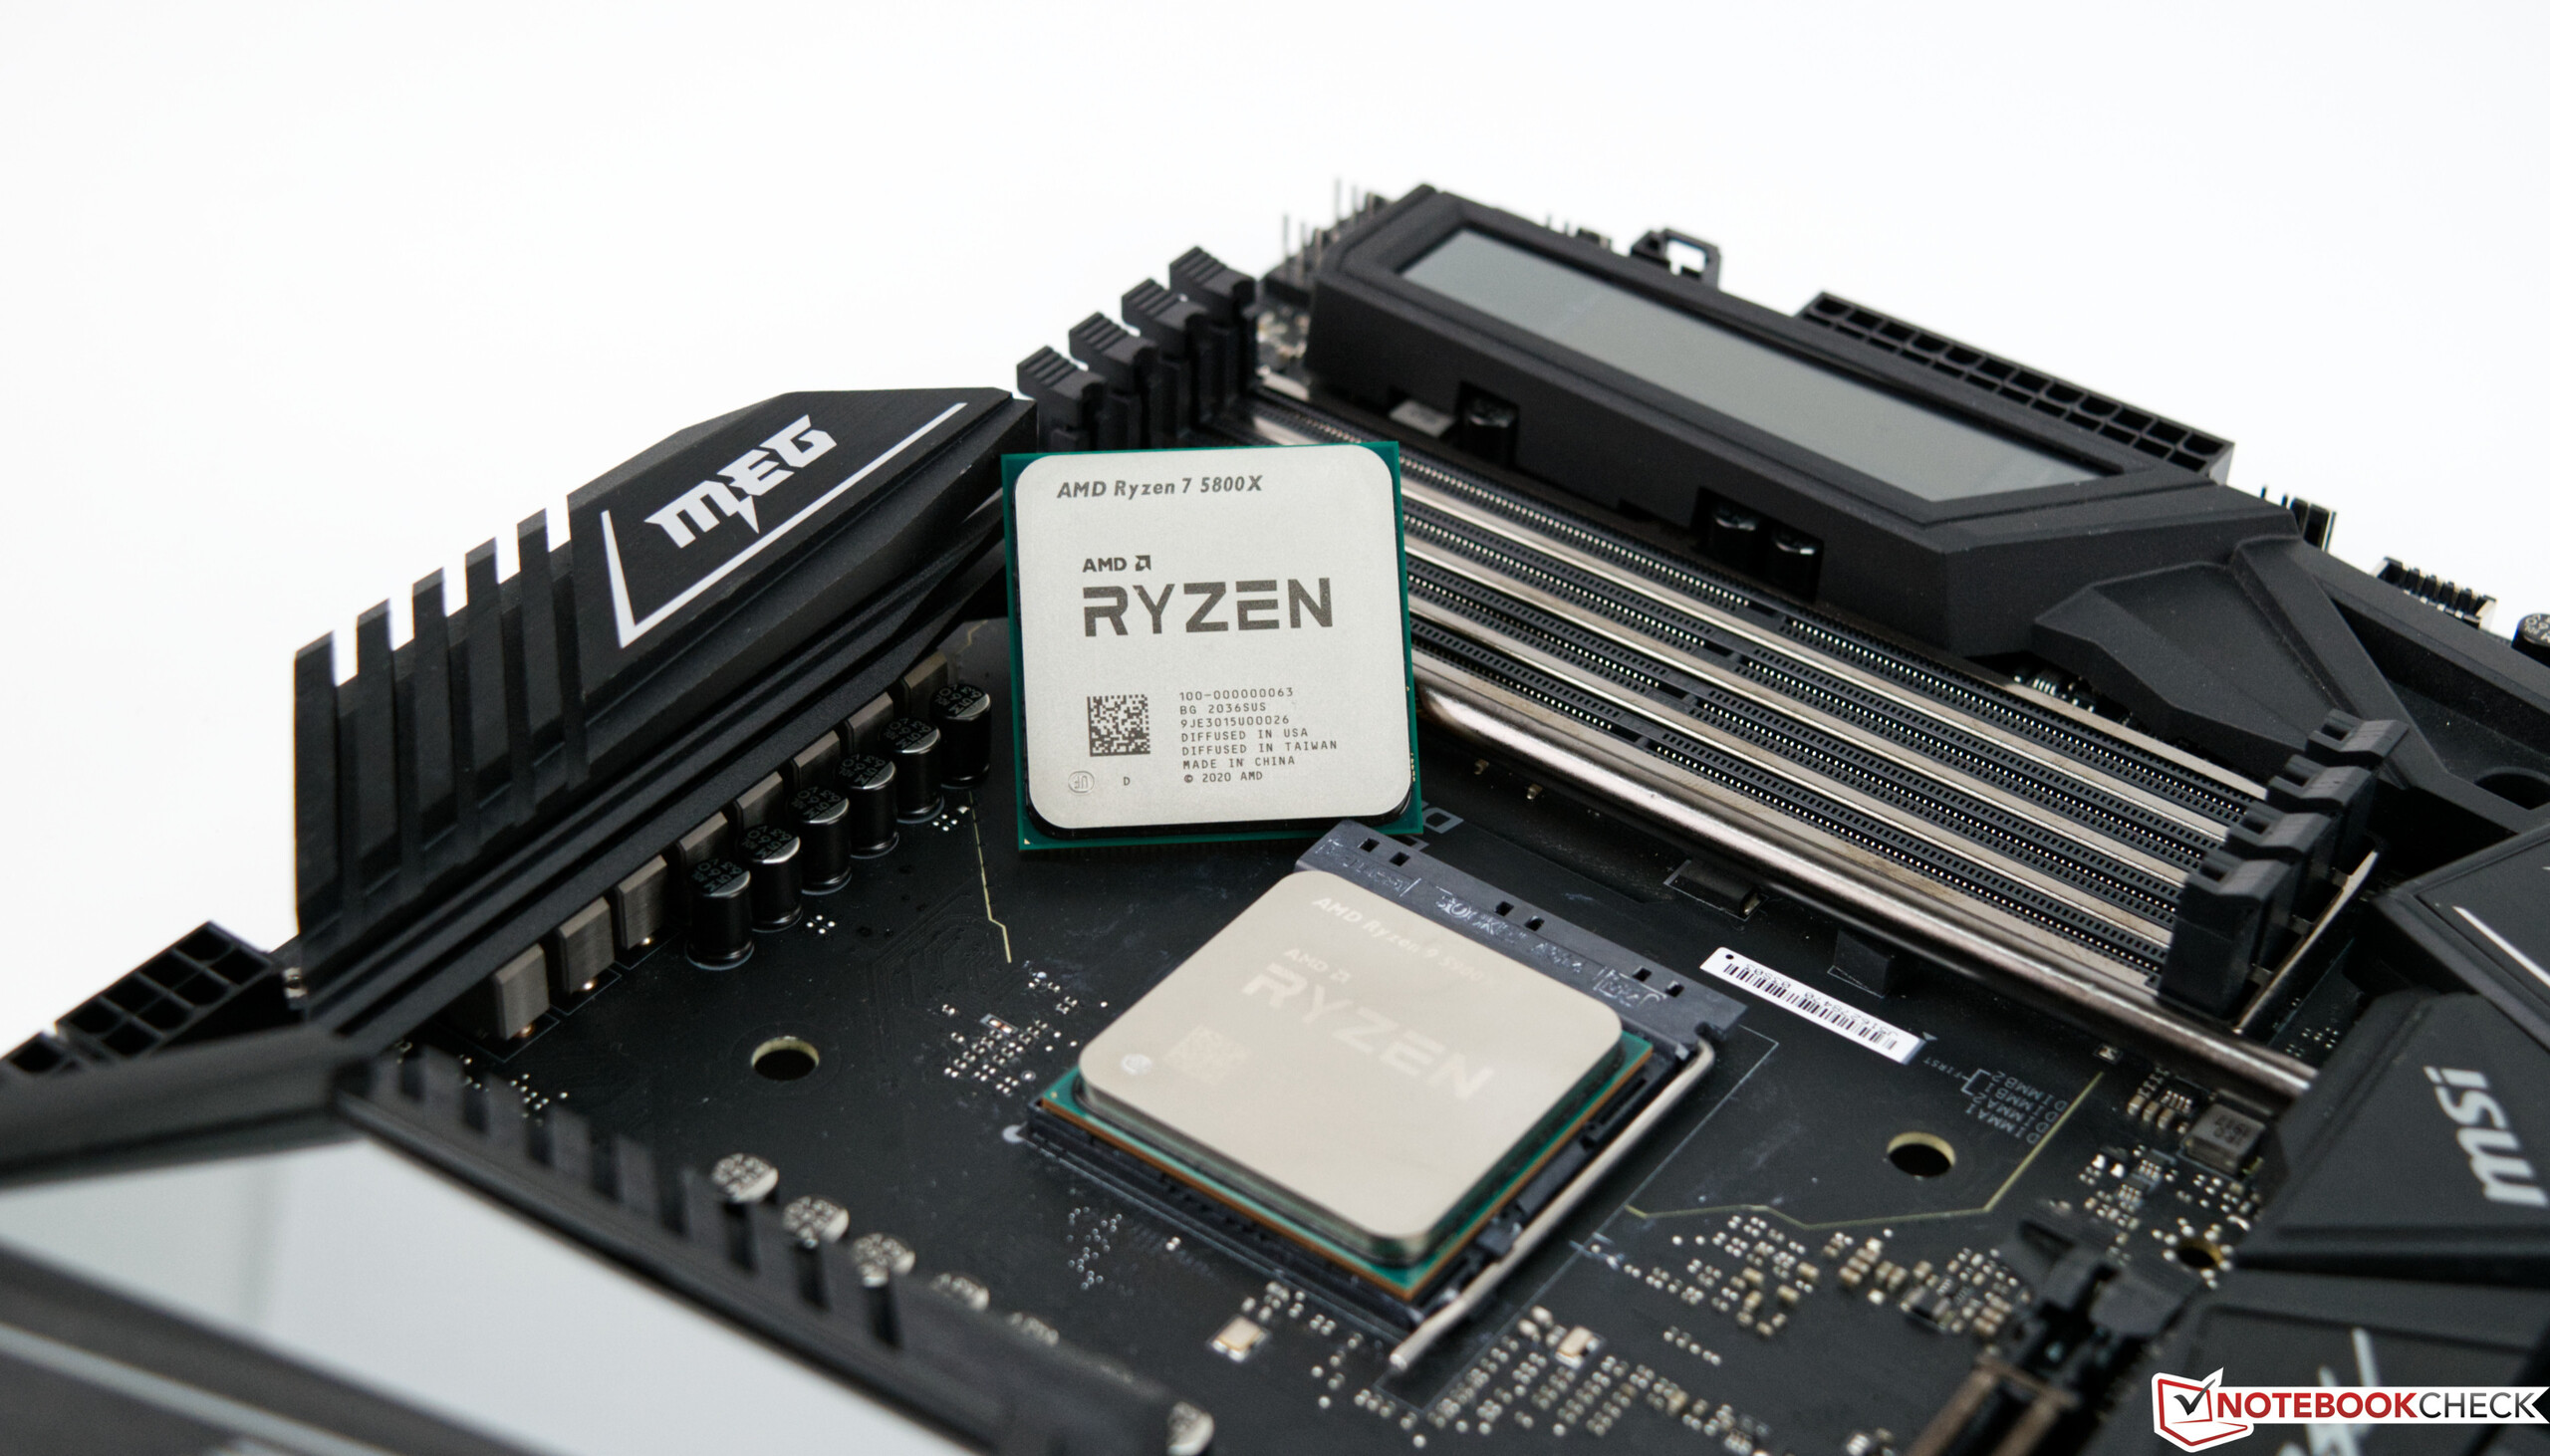
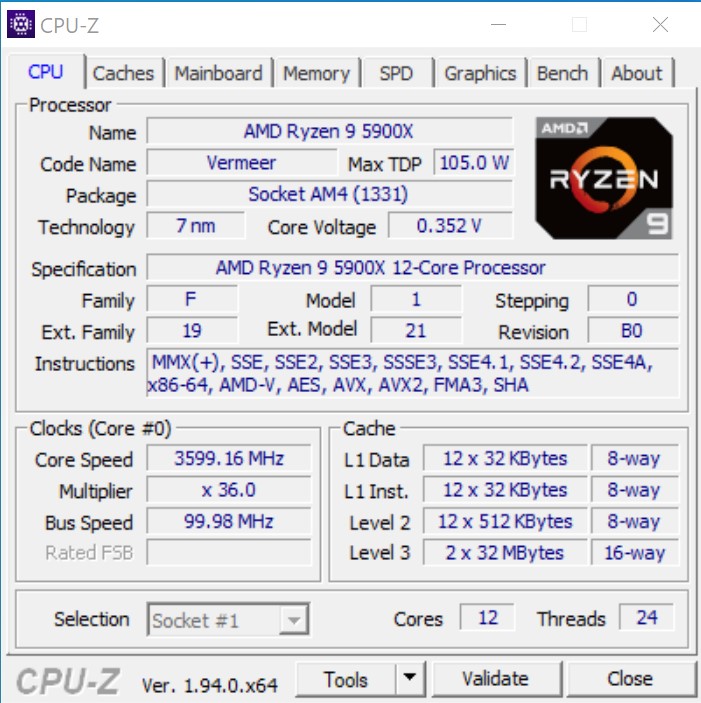
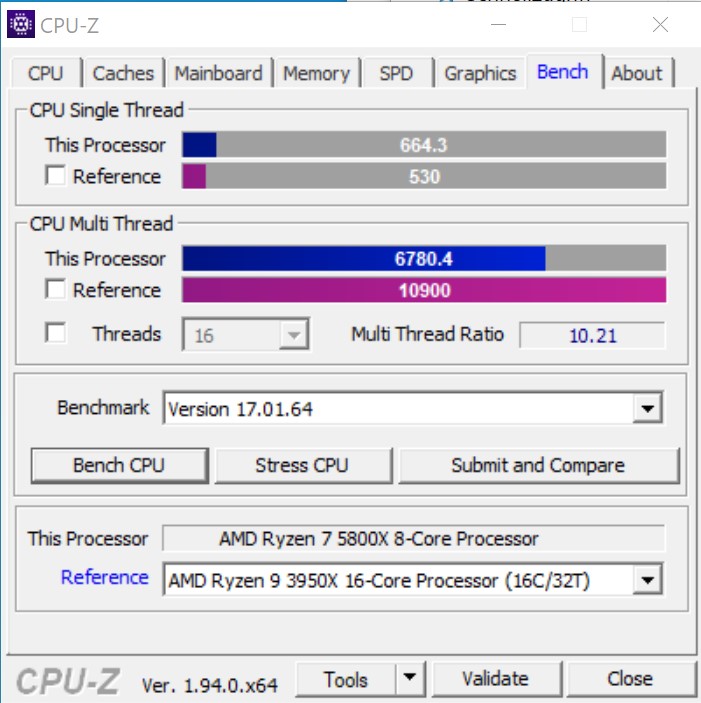
- AMD Ryzen 9 5900X, AMD Ryzen 7 5800X
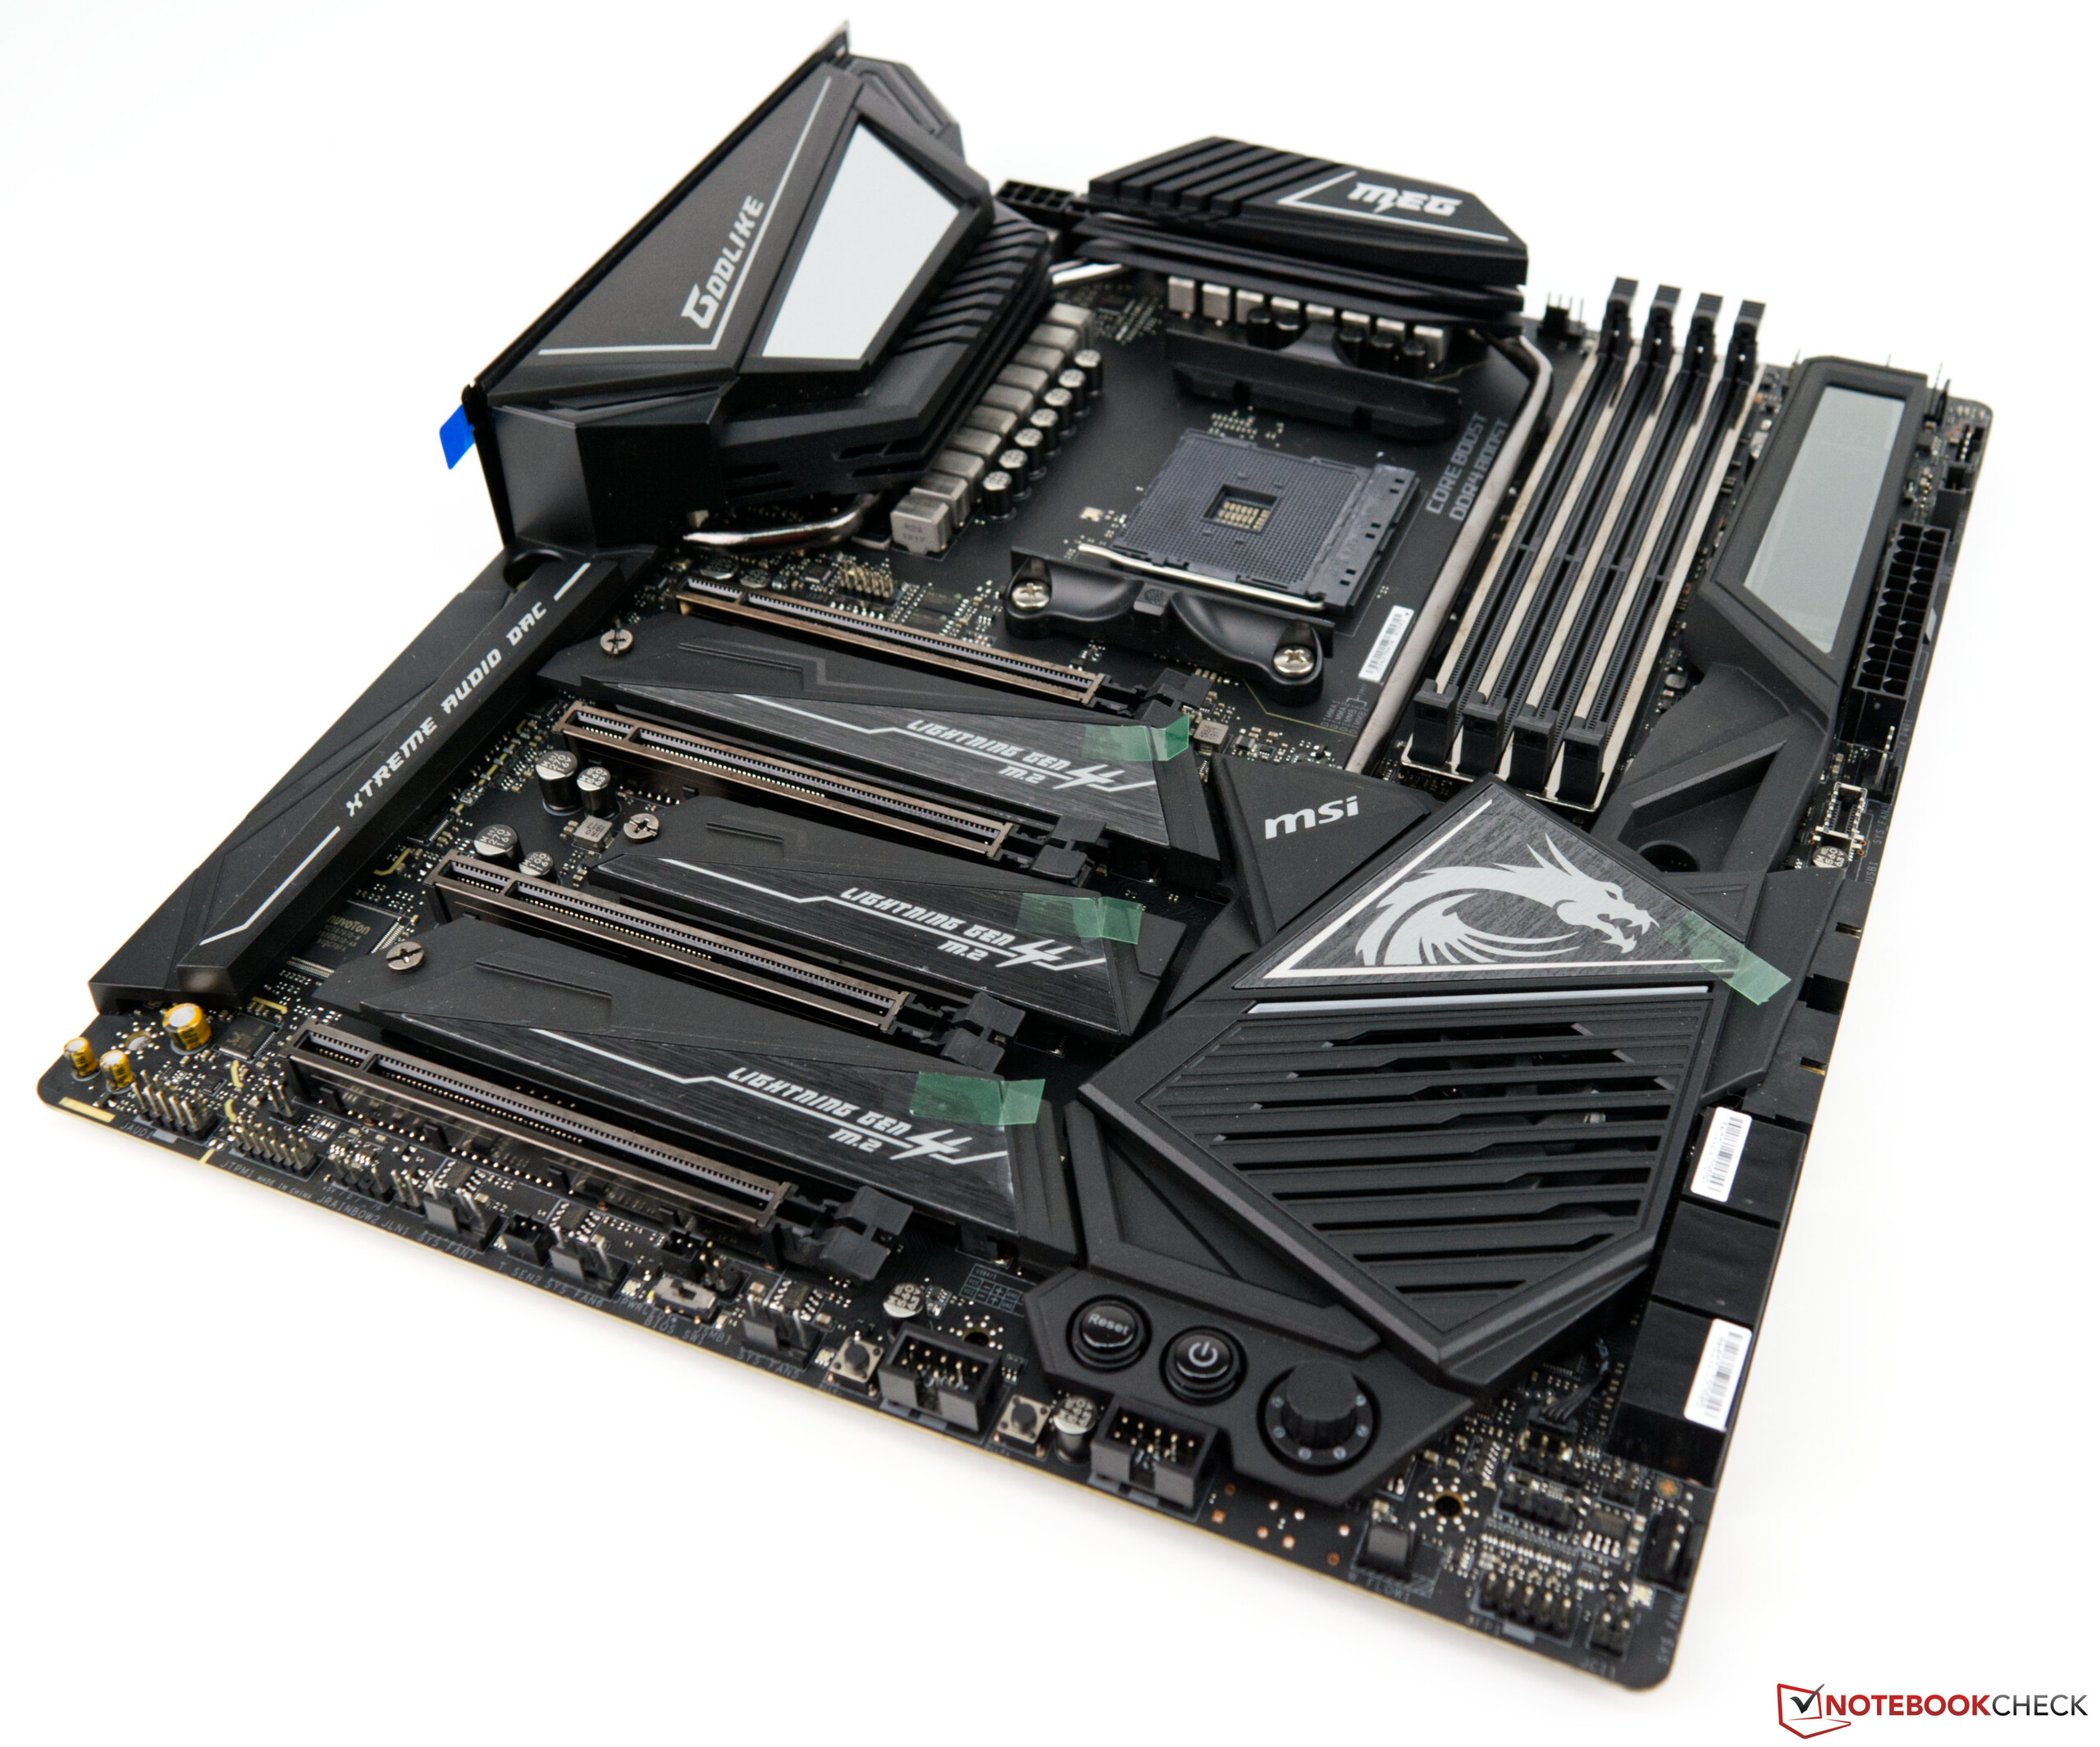
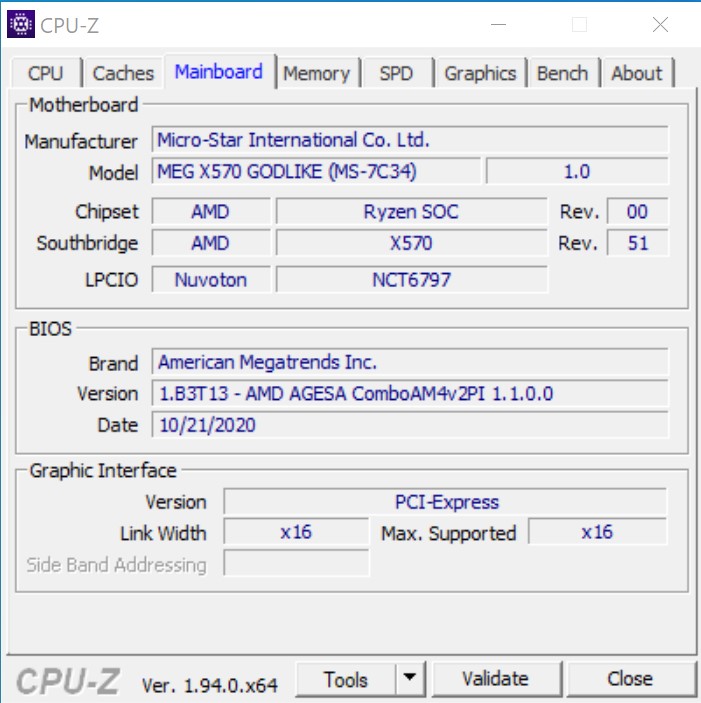
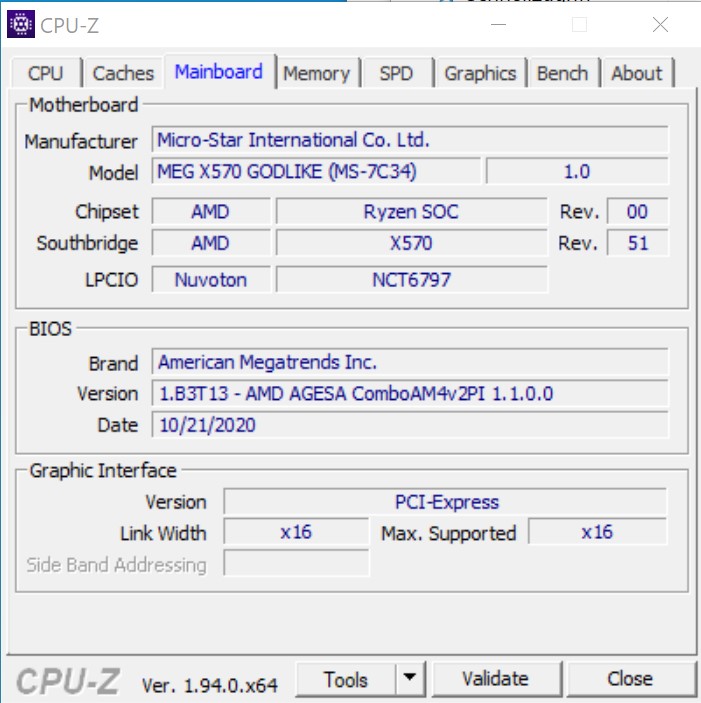
- MSI MEG X570 Godlike
- Alphacool Eisbear 280 AiO
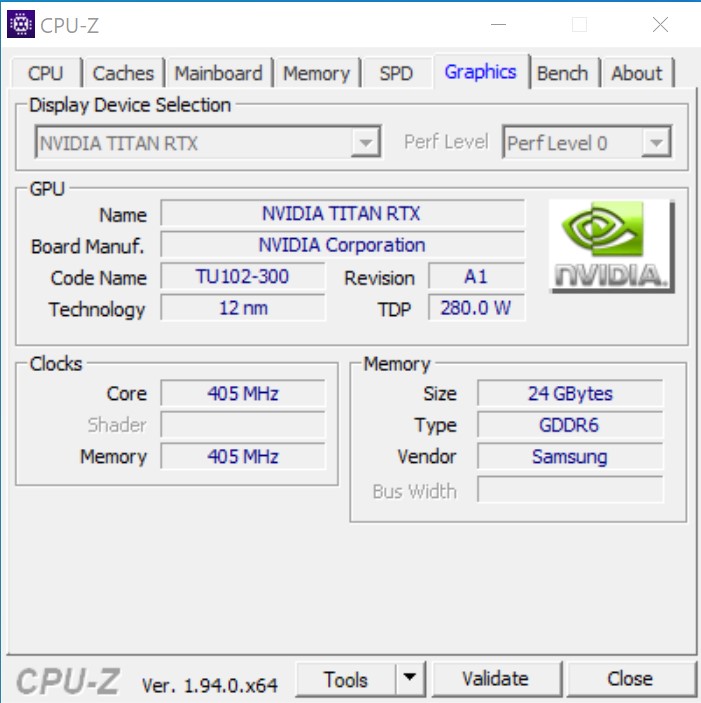
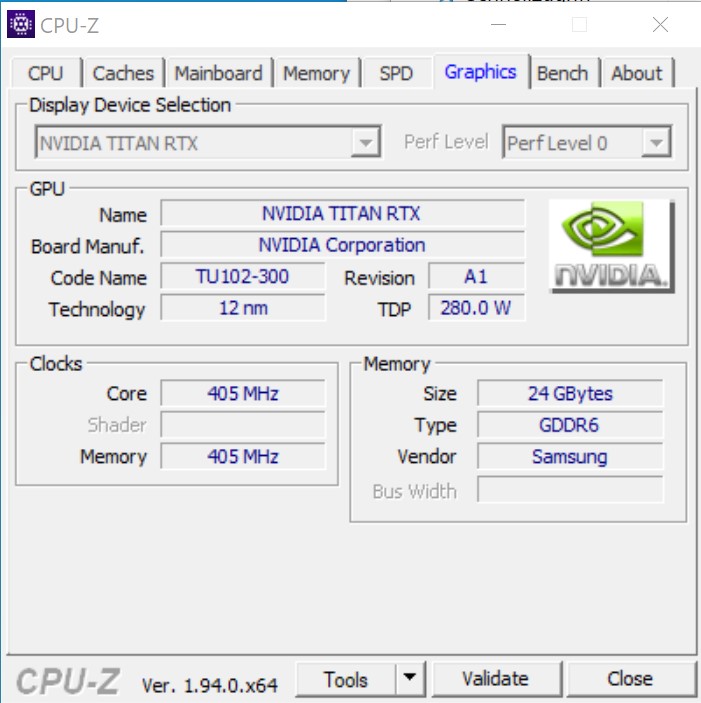
- Nvidia Titan RTX
Fuente de alimentación del Corsair HX 1200i
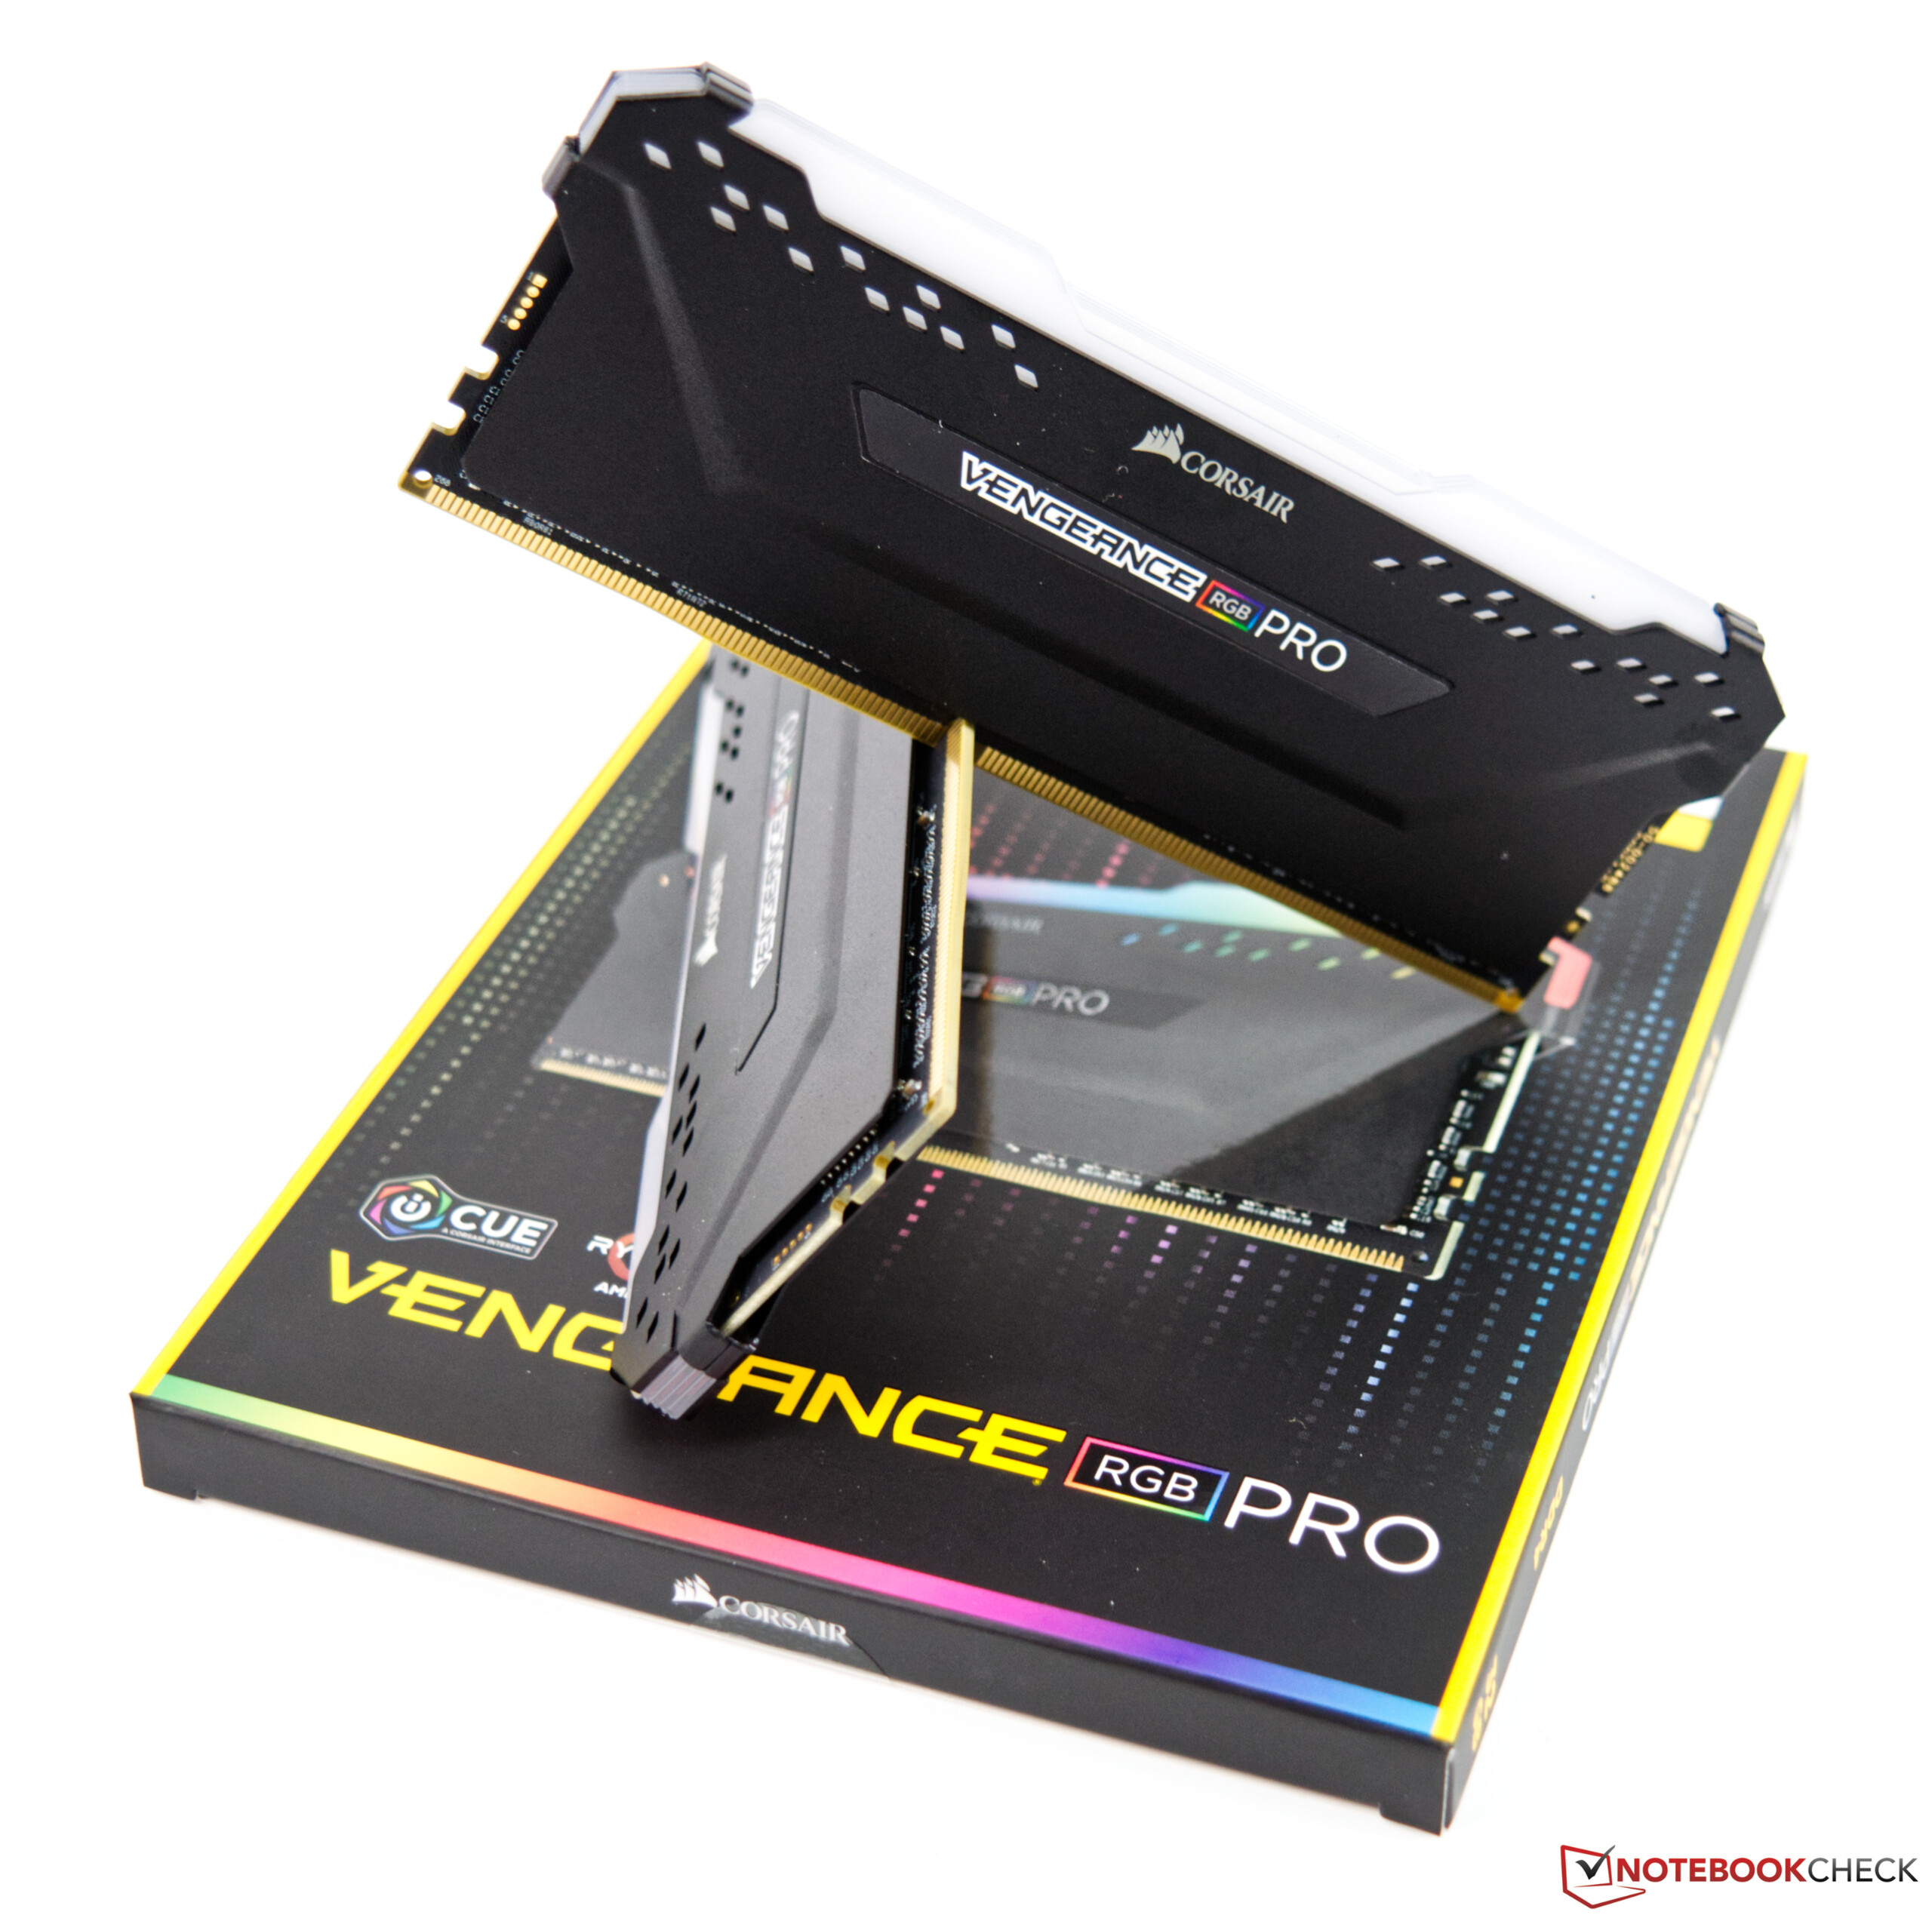
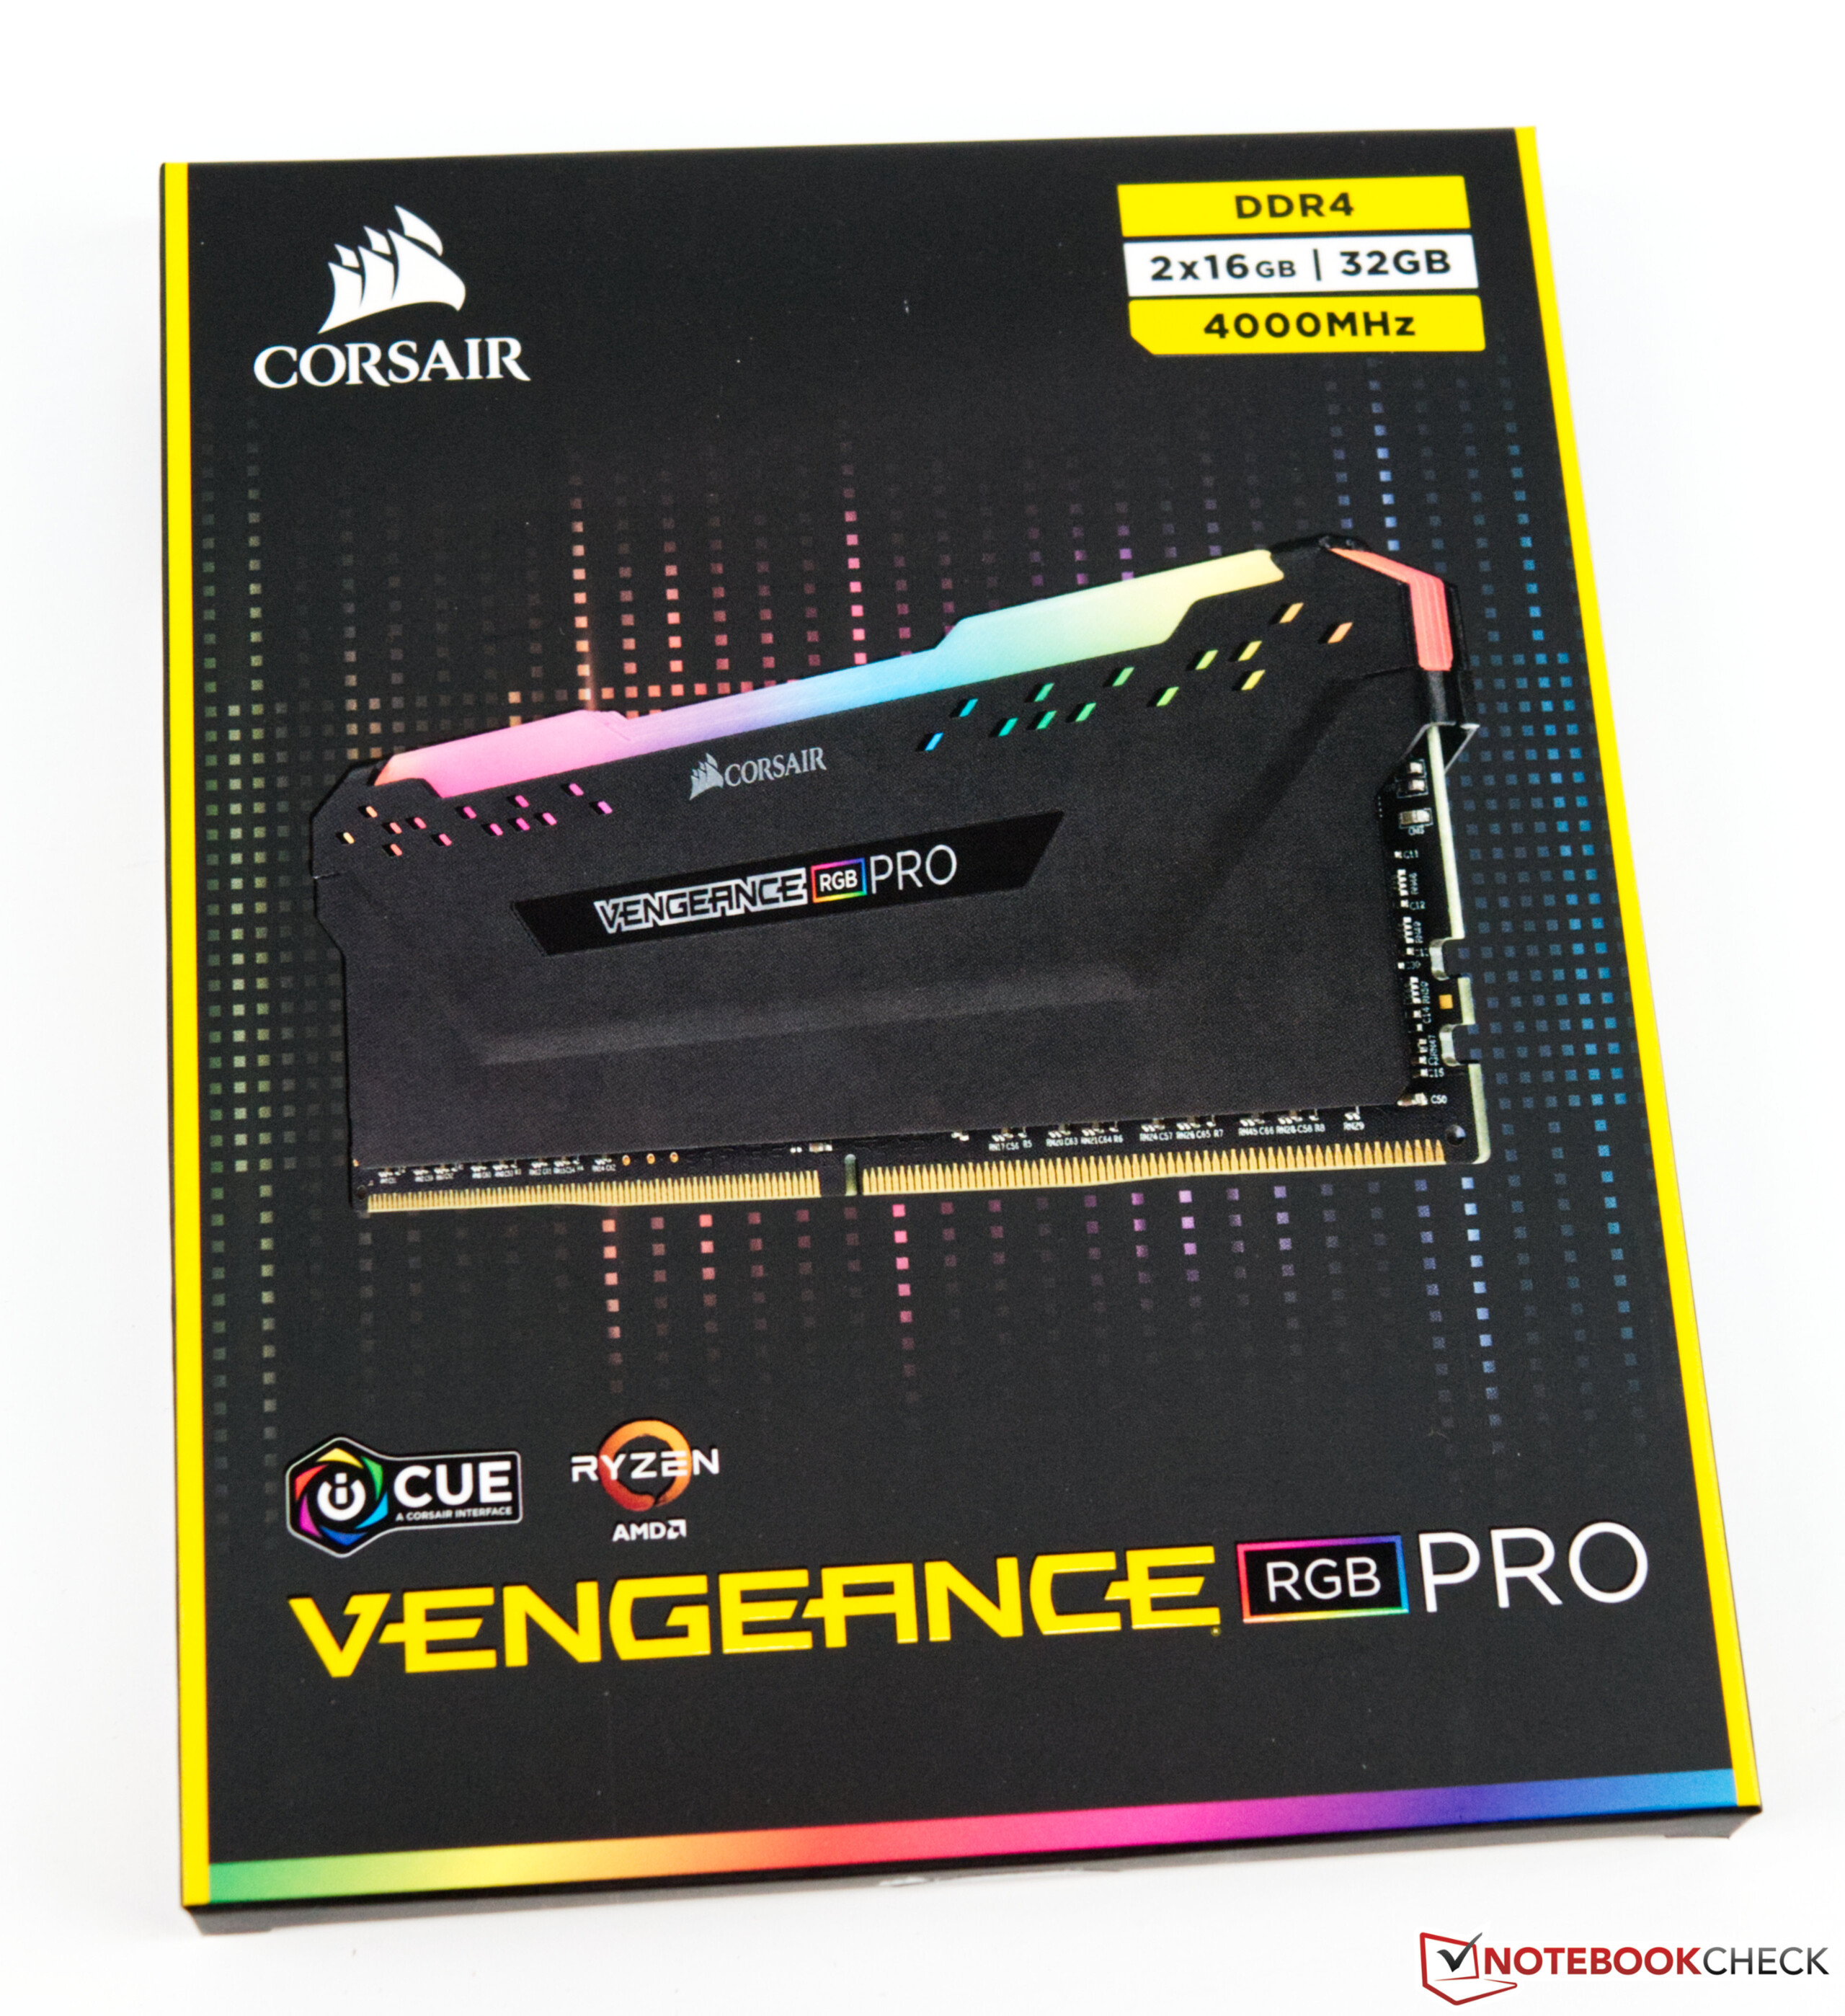
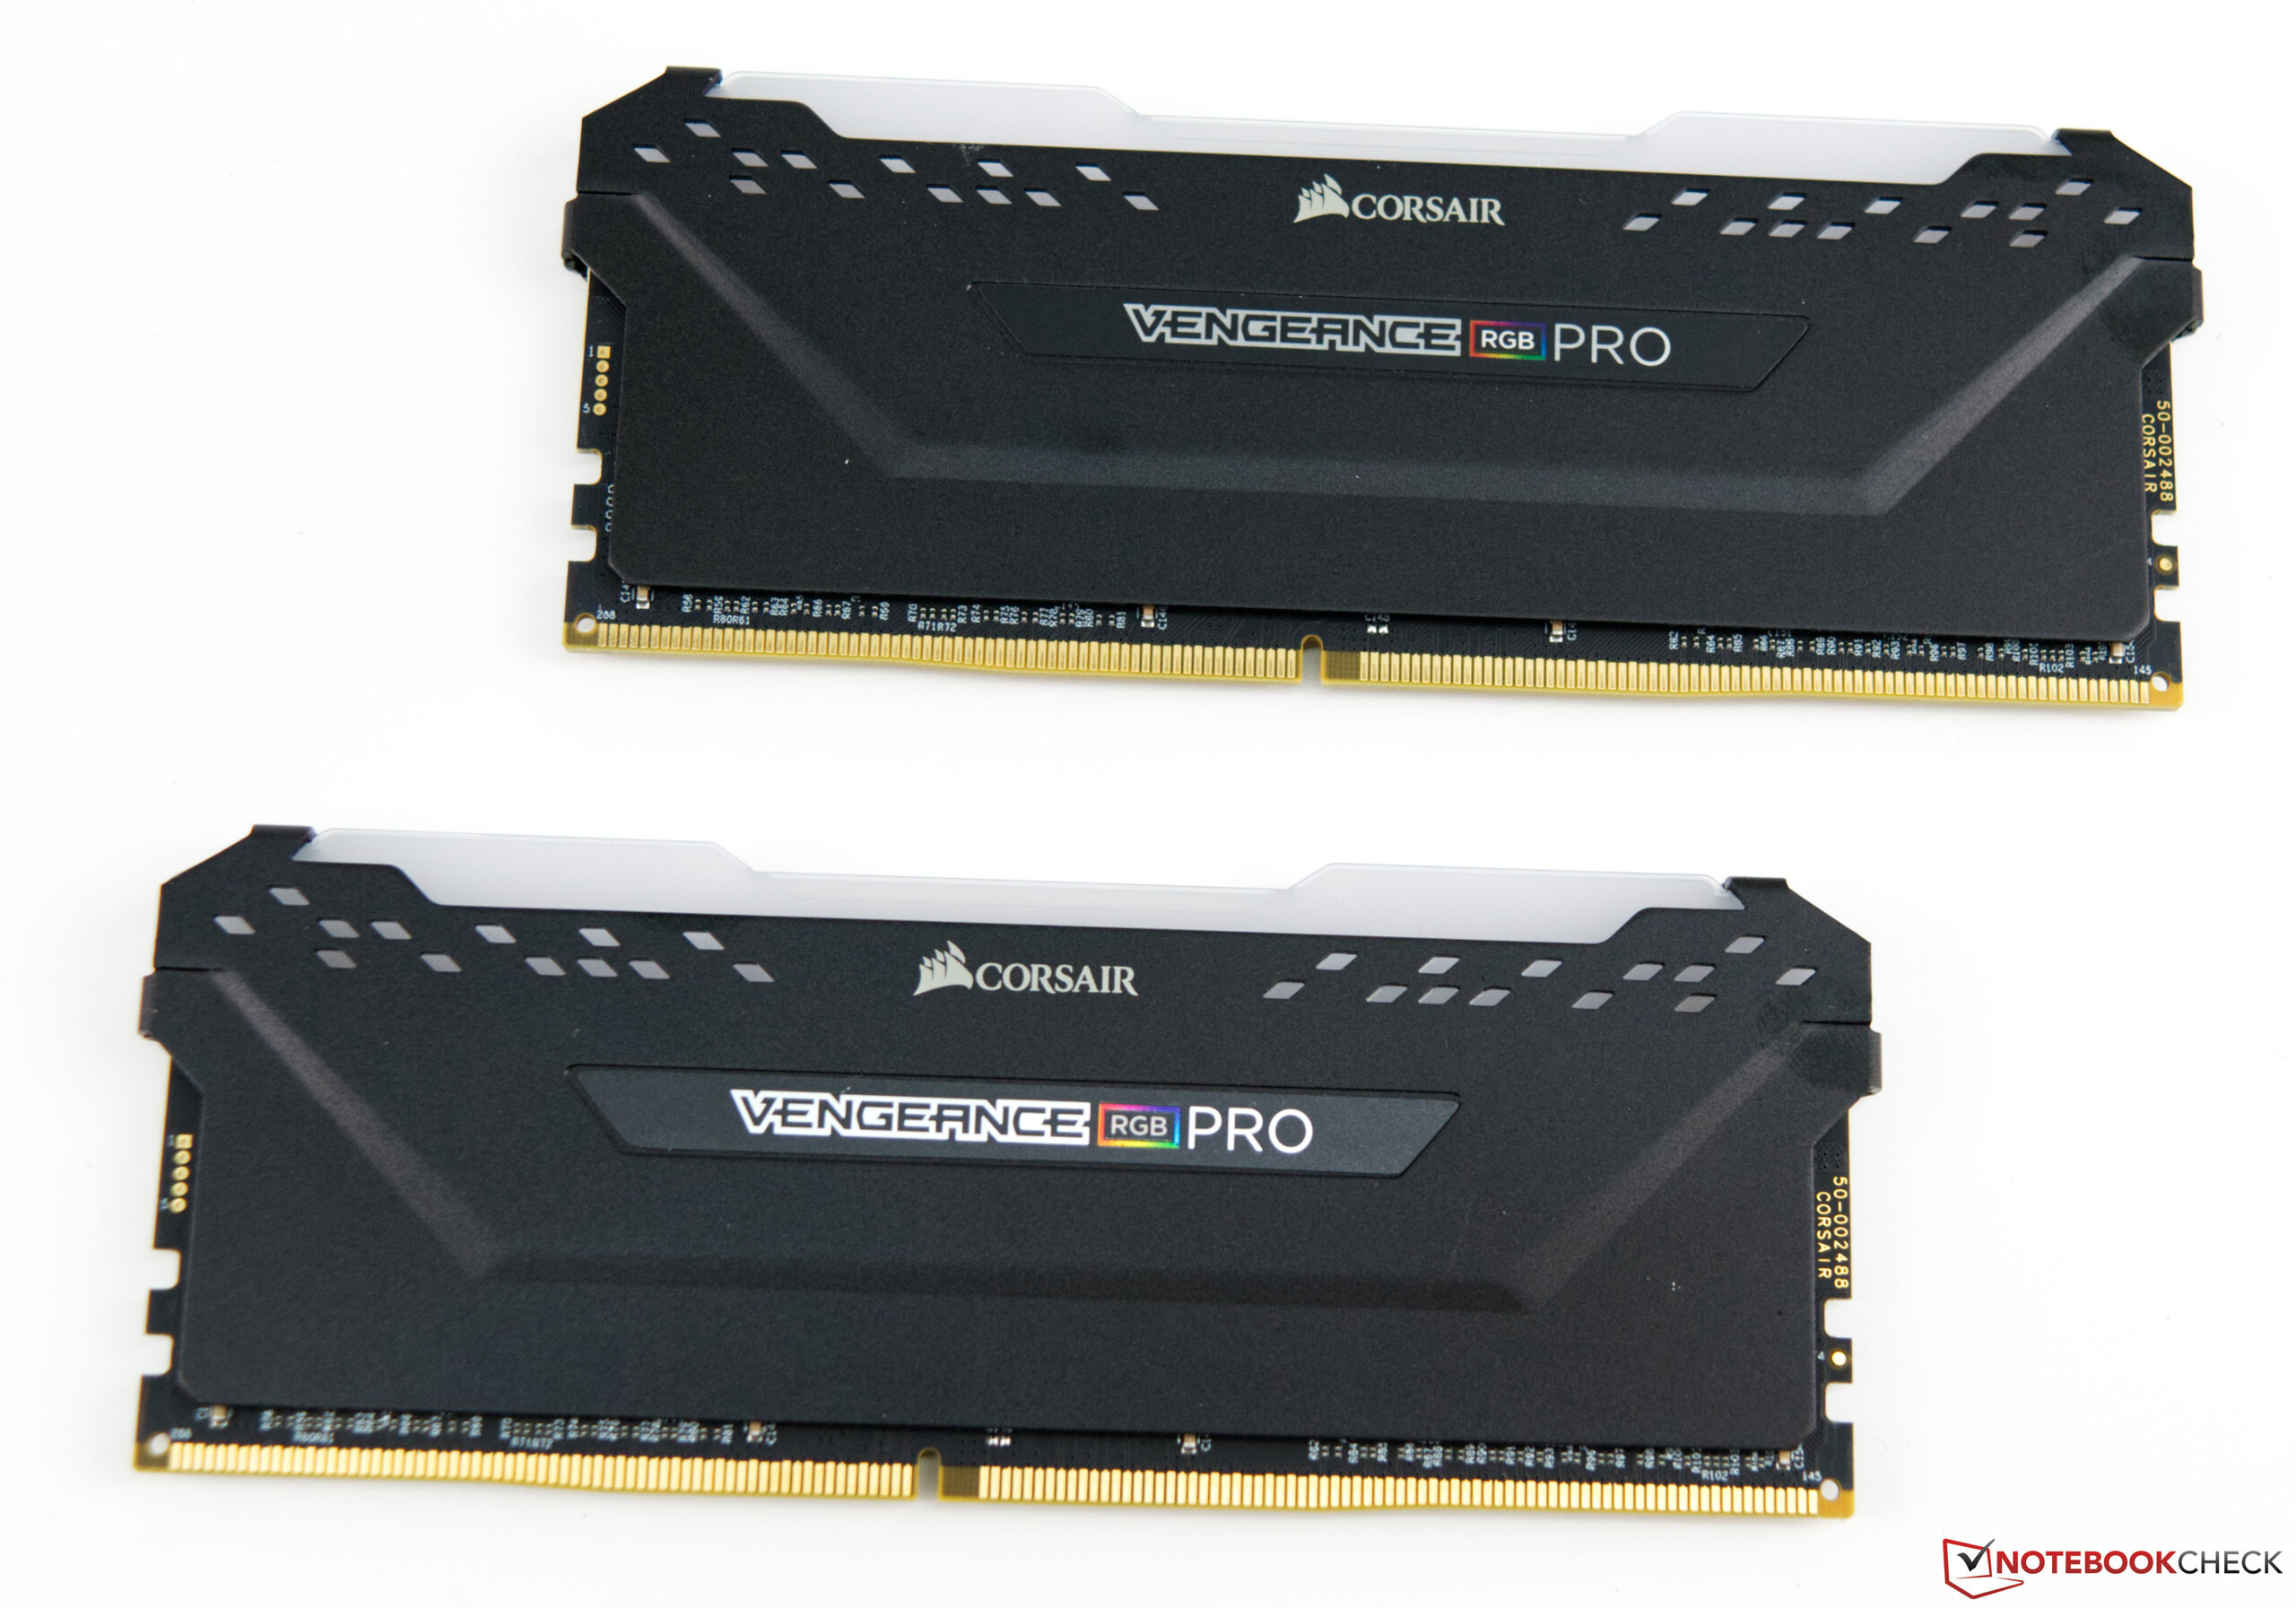
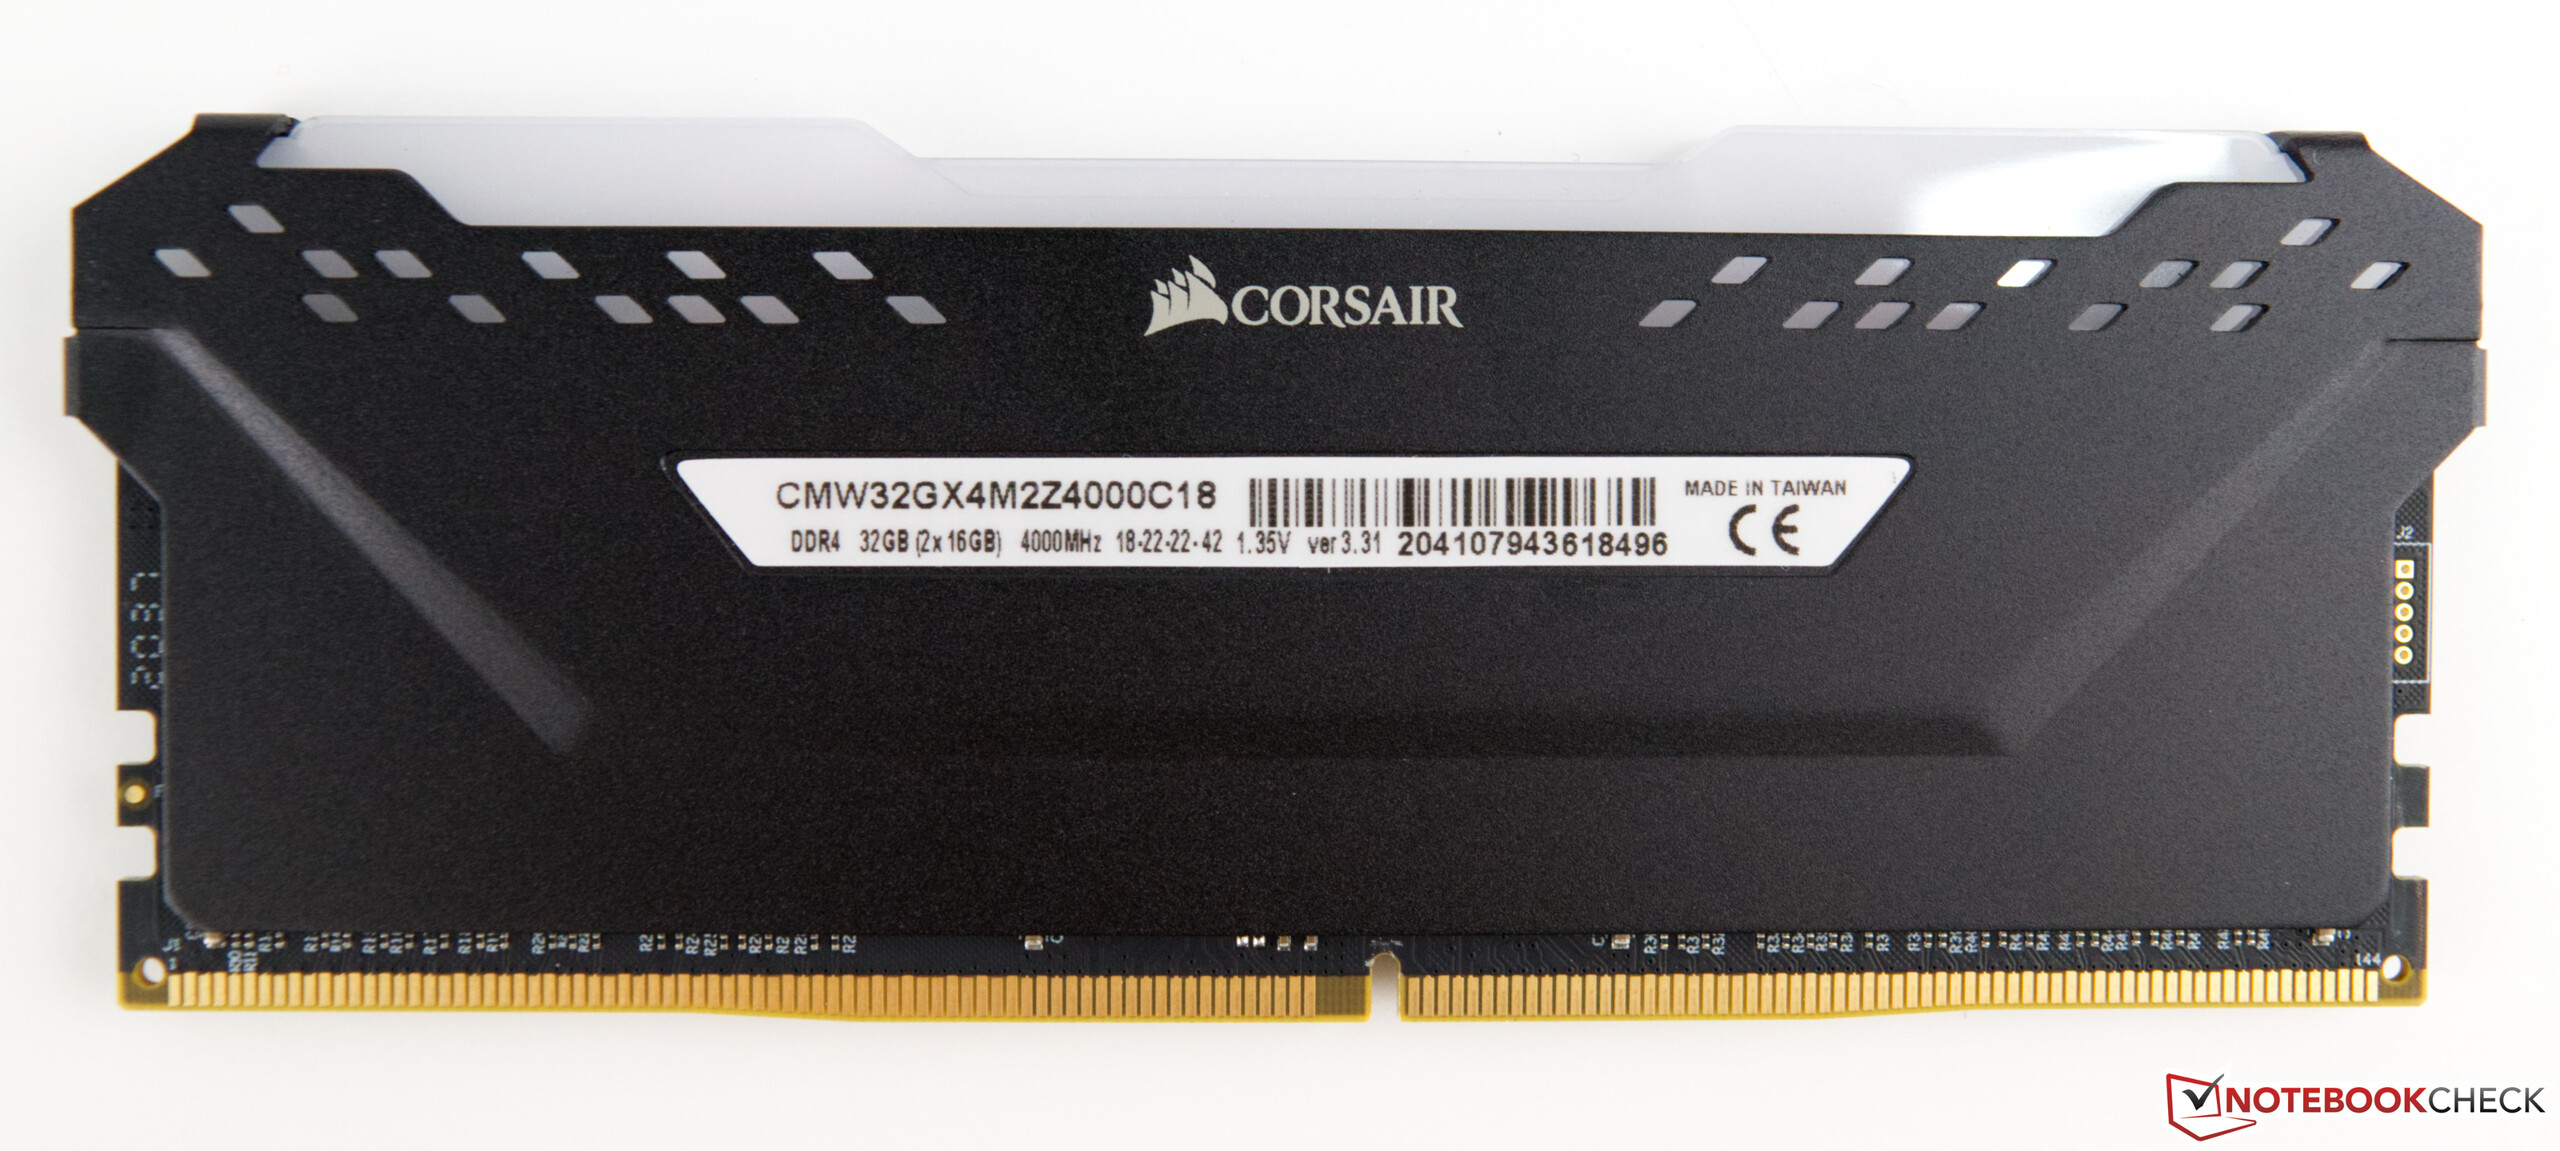
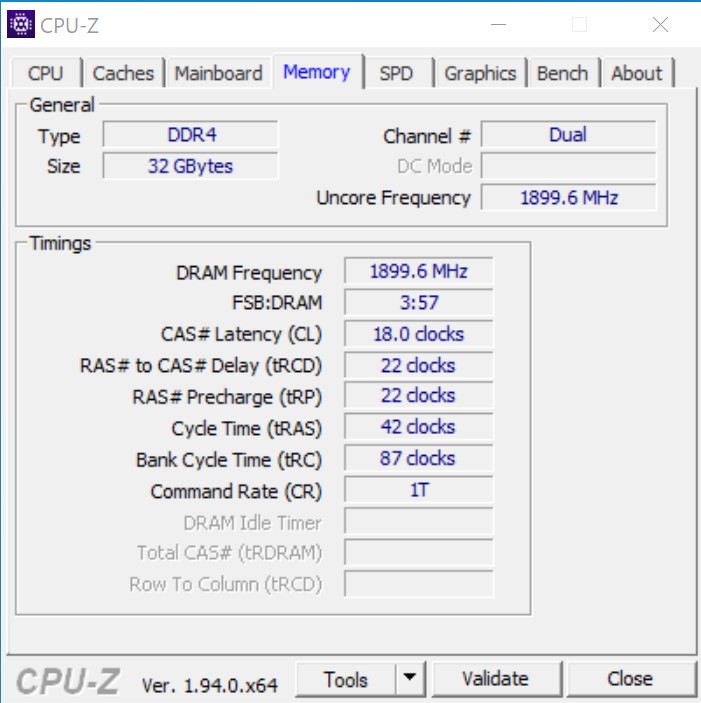
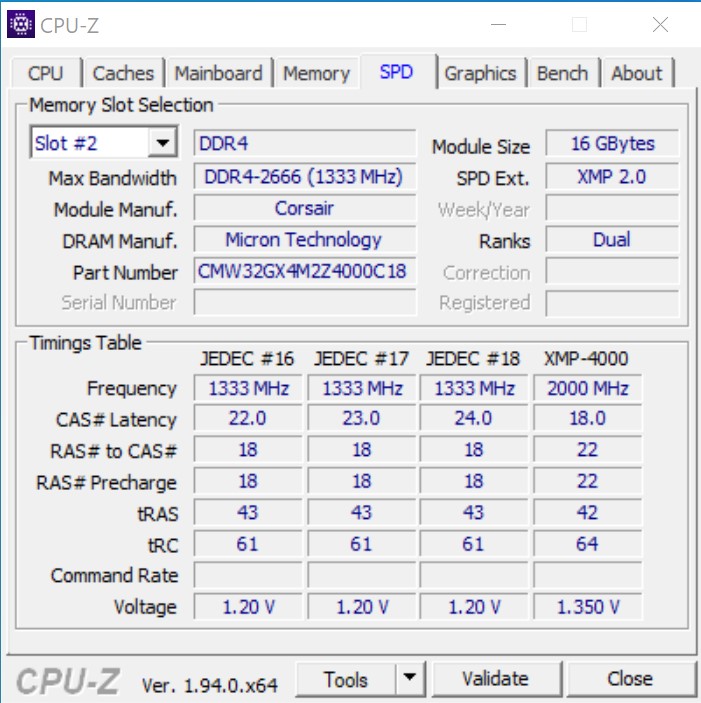
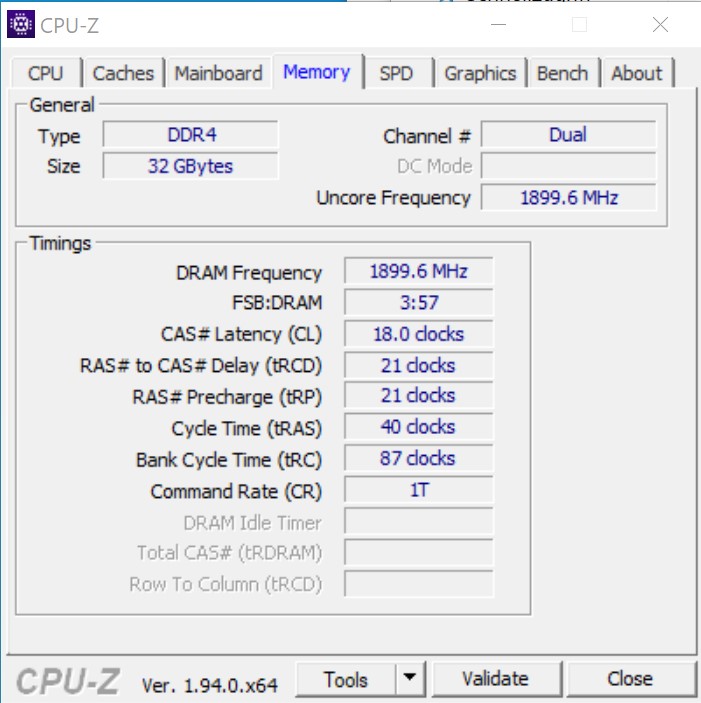
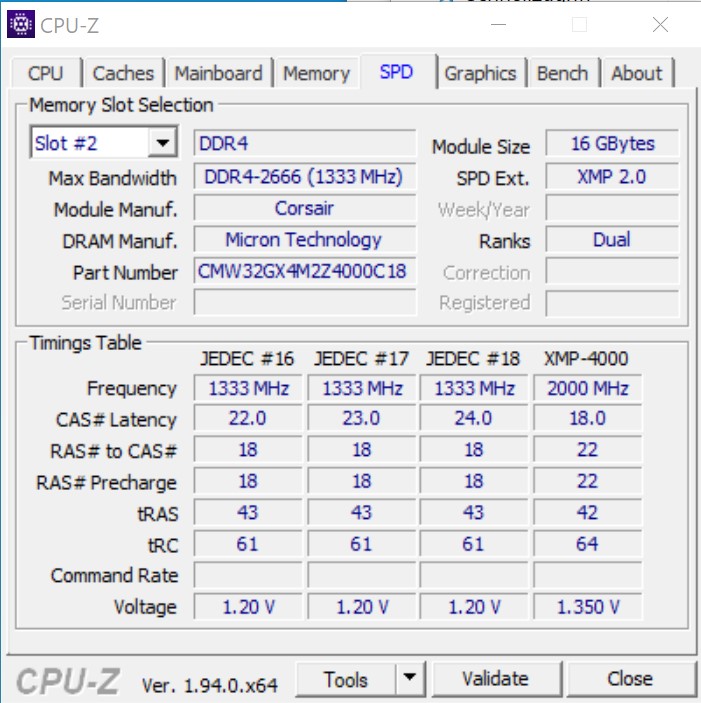
- Kit de memoria Corsair Vengeance RGB Pro DDR4-4000 2 x 16 GB
- Intel Optane 905P 480GB PCIe SSD
- Microsoft Windows 10 Professional 64-Bit (Version 2004)
Nos gustaría agradecer a Caseking por proporcionarnos el Raijintek Pean, que incluso contenía un grabado láser individual, así como a AMD por la placa base, que era parte del kit de prensa Zen 2 que AMD envió con sus anteriores procesadores Ryzen 9 3900X y Ryzen 7 3700X. Nuestro refrigerador preferido fue un Alphacool Eisbear 280, que fue proporcionado por Alphacool. Además, queremos agradecer a Corsair por apoyarnos y proporcionarnos RAM.
Puntos de referencia del procesador
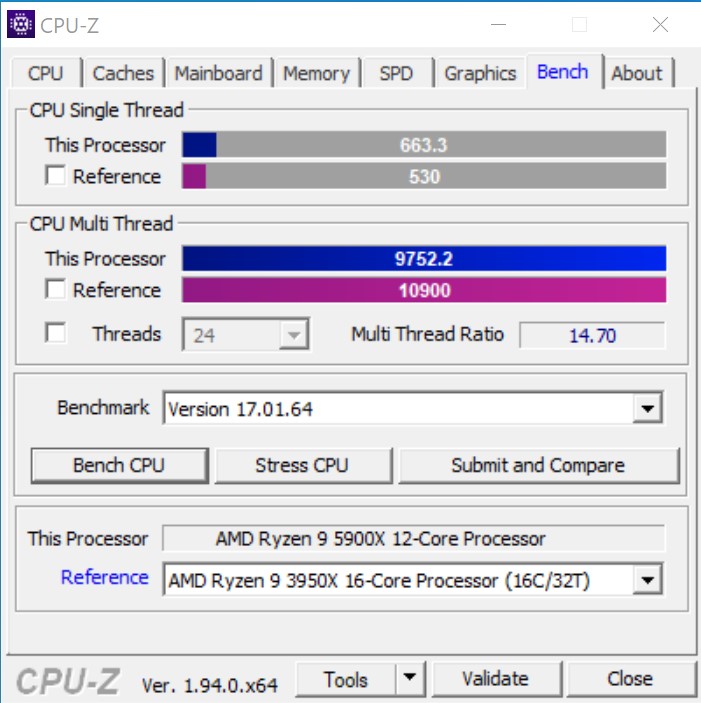
Los beneficios de la arquitectura Zen 3 actualizada de AMD fueron inmediatamente perceptibles en nuestros puntos de referencia de la CPU. El rendimiento comparativamente pobre de AMD en un solo hilo ya no se debe a mejoras significativas en el rendimiento de un solo núcleo. El resultado: El Core i9-10900K de Intel se quedó atrás en un 20% respecto al Ryzen 9 5900X de AMD. Incluso el más lento Ryzen 7 5800X de 8 núcleos no tuvo problemas para seguir el ritmo del procesador de 10 núcleos de Intel, y su rendimiento multi-core también fue a menudo superior. Comparado con sus propios predecesores y competidores, el Ryzen 9 5800X se las arregló fácilmente para mantenerse al ritmo del Ryzen 9 3950X. El nuevo CPU insignia, el AMD Ryzen 9 5950X, se revisará por separado junto con la nueva oferta de entrada de AMD, el Ryzen 5 5600X.
Los puntos de referencia adicionales se pueden encontrar aquí.
AMD Ryzen 9 5900X
AMD Ryzen 7 5800X

| Cinebench R10 | |
| Rendering Single CPUs 64Bit | |
| AMD Ryzen 7 5800X | |
| AMD Ryzen 9 5900X | |
| Intel Core i9-10900K | |
| AMD Ryzen 9 3950X | |
| AMD Ryzen 9 3900X | |
| AMD Ryzen 3 3300X | |
| AMD Ryzen 7 3700X | |
| Rendering Multiple CPUs 64Bit | |
| AMD Ryzen 9 5900X | |
| AMD Ryzen 9 3950X | |
| AMD Ryzen 7 5800X | |
| Intel Core i9-10900K | |
| AMD Ryzen 9 3900X | |
| AMD Ryzen 7 3700X | |
| AMD Ryzen 3 3300X | |
| Blender - v2.79 BMW27 CPU | |
| AMD Ryzen 3 3300X | |
| AMD Ryzen 7 5800X | |
| AMD Ryzen 7 3700X | |
| Intel Core i9-10900K | |
| AMD Ryzen 9 3900X | |
| AMD Ryzen 9 5900X | |
| AMD Ryzen 9 3950X | |
| WinRAR - Result | |
| AMD Ryzen 7 5800X | |
| AMD Ryzen 9 5900X | |
| Intel Core i9-10900K | |
| AMD Ryzen 9 3900X | |
| AMD Ryzen 7 3700X | |
| AMD Ryzen 9 3950X | |
| AMD Ryzen 3 3300X | |
| Geekbench 4.4 | |
| 64 Bit Single-Core Score | |
| AMD Ryzen 7 5800X | |
| AMD Ryzen 9 5900X | |
| Intel Core i9-10900K | |
| AMD Ryzen 9 3900X | |
| AMD Ryzen 7 3700X | |
| AMD Ryzen 3 3300X | |
| AMD Ryzen 9 3950X | |
| 64 Bit Multi-Core Score | |
| AMD Ryzen 9 5900X | |
| AMD Ryzen 9 3950X | |
| AMD Ryzen 7 5800X | |
| AMD Ryzen 9 3900X | |
| Intel Core i9-10900K | |
| AMD Ryzen 7 3700X | |
| AMD Ryzen 3 3300X | |
| 3DMark 11 - 1280x720 Performance Physics | |
| AMD Ryzen 9 5900X | |
| AMD Ryzen 7 5800X | |
| Intel Core i9-10900K | |
| AMD Ryzen 9 3950X | |
| AMD Ryzen 9 3900X | |
| AMD Ryzen 7 3700X | |
| AMD Ryzen 3 3300X | |
| HWBOT x265 Benchmark v2.2 - 4k Preset | |
| AMD Ryzen 9 5900X | |
| Intel Core i9-10900K | |
| AMD Ryzen 9 3900X | |
| AMD Ryzen 7 5800X | |
| AMD Ryzen 9 3950X | |
| AMD Ryzen 7 3700X | |
| AMD Ryzen 3 3300X | |
| R Benchmark 2.5 - Overall mean | |
| AMD Ryzen 9 3900X | |
| AMD Ryzen 3 3300X | |
| Intel Core i9-10900K | |
| AMD Ryzen 9 3950X | |
| AMD Ryzen 9 5900X | |
| AMD Ryzen 7 5800X | |
| LibreOffice - 20 Documents To PDF | |
| Intel Core i9-10900K | |
| AMD Ryzen 9 3900X | |
| AMD Ryzen 9 3950X | |
| AMD Ryzen 3 3300X | |
| AMD Ryzen 9 5900X | |
| AMD Ryzen 7 5800X | |
| WebXPRT 3 - Overall | |
| AMD Ryzen 7 5800X | |
| AMD Ryzen 9 5900X | |
| Intel Core i9-10900K | |
| AMD Ryzen 9 3950X | |
| AMD Ryzen 3 3300X | |
| Mozilla Kraken 1.1 - Total | |
| AMD Ryzen 3 3300X | |
| Intel Core i9-10900K | |
| AMD Ryzen 9 3950X | |
| AMD Ryzen 9 5900X | |
| AMD Ryzen 7 5800X | |
| 3DMark | |
| 3840x2160 Fire Strike Ultra Physics | |
| AMD Ryzen 9 5900X | |
| AMD Ryzen 9 3950X | |
| AMD Ryzen 7 5800X | |
| Intel Core i9-10900K | |
| AMD Ryzen 9 3900X | |
| AMD Ryzen 7 3700X | |
| AMD Ryzen 3 3300X | |
| 1920x1080 Fire Strike Physics | |
| AMD Ryzen 9 5900X | |
| AMD Ryzen 9 3950X | |
| AMD Ryzen 7 5800X | |
| Intel Core i9-10900K | |
| AMD Ryzen 9 3900X | |
| AMD Ryzen 7 3700X | |
| AMD Ryzen 3 3300X | |
| 2560x1440 Time Spy CPU | |
| Intel Core i9-10900K | |
| AMD Ryzen 9 5900X | |
| AMD Ryzen 9 3950X | |
| AMD Ryzen 9 3900X | |
| AMD Ryzen 7 5800X | |
| AMD Ryzen 7 3700X | |
| AMD Ryzen 3 3300X | |
* ... más pequeño es mejor
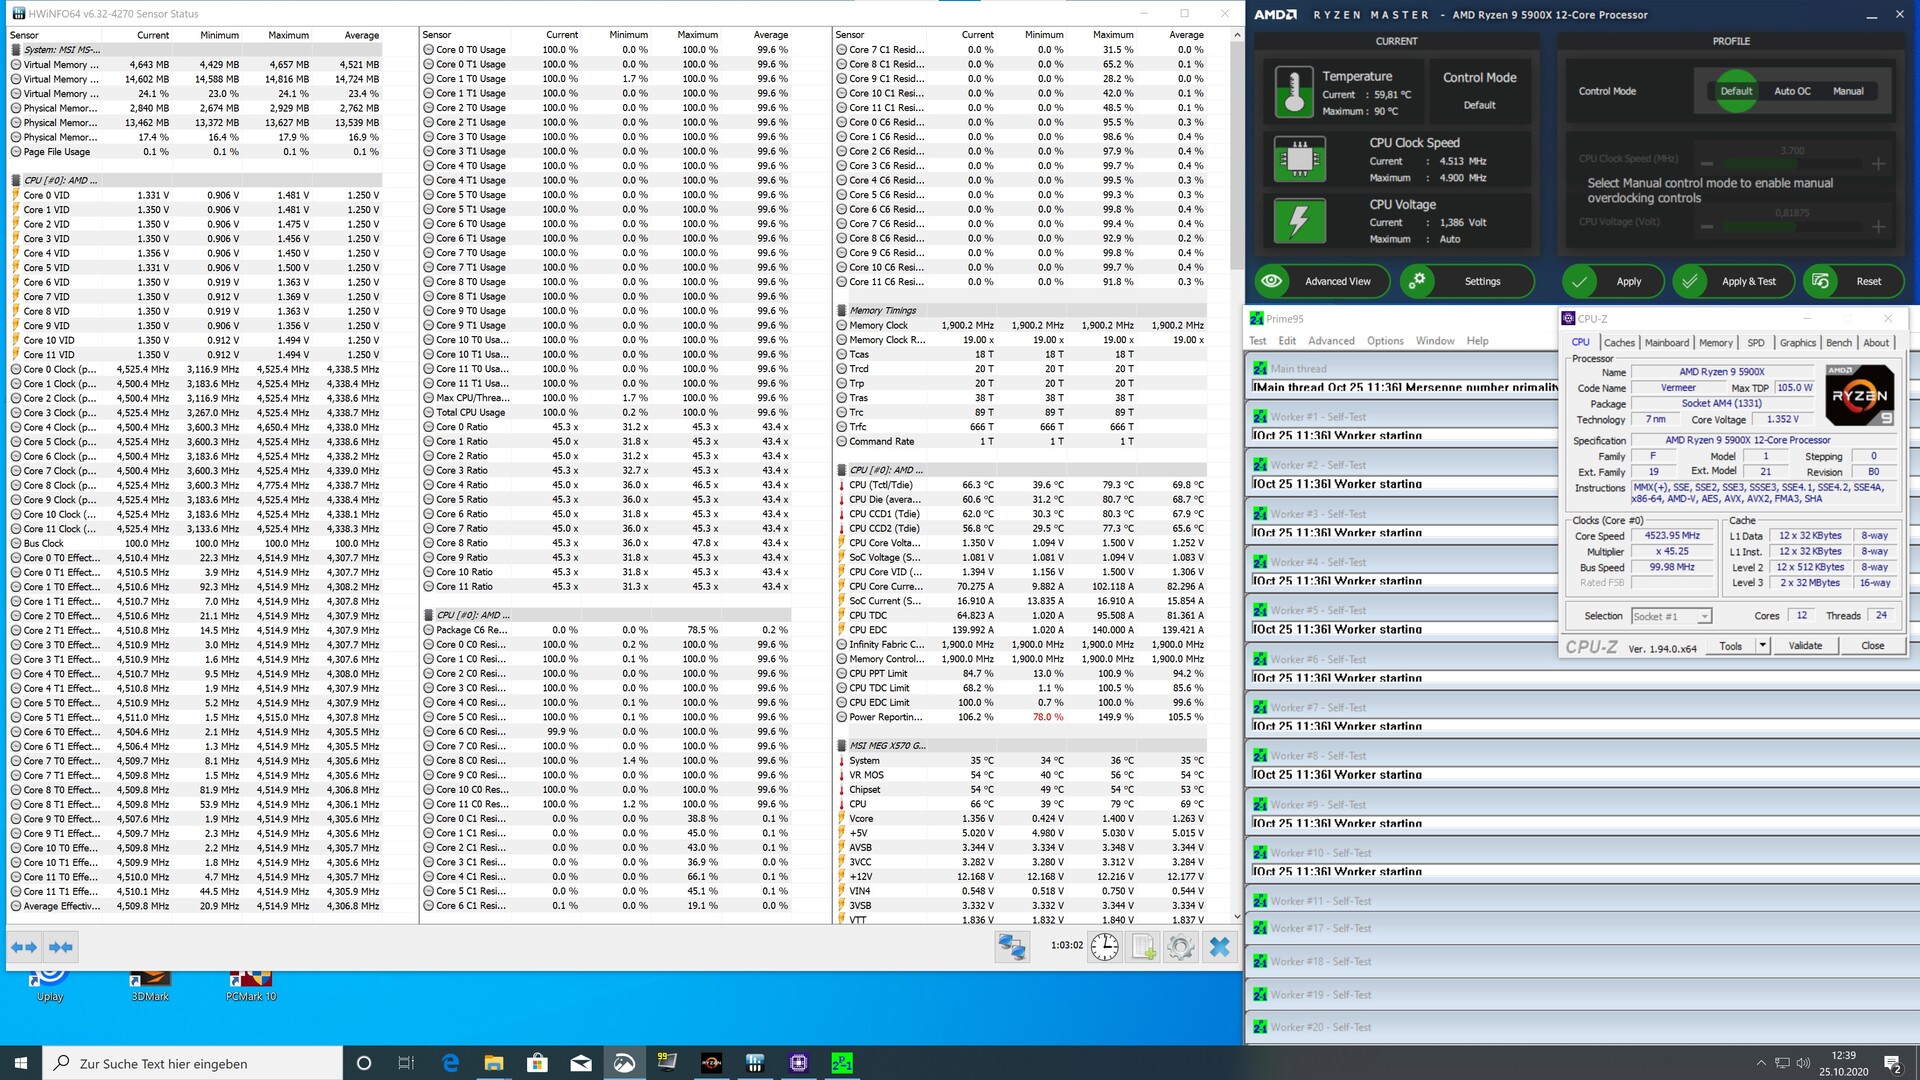
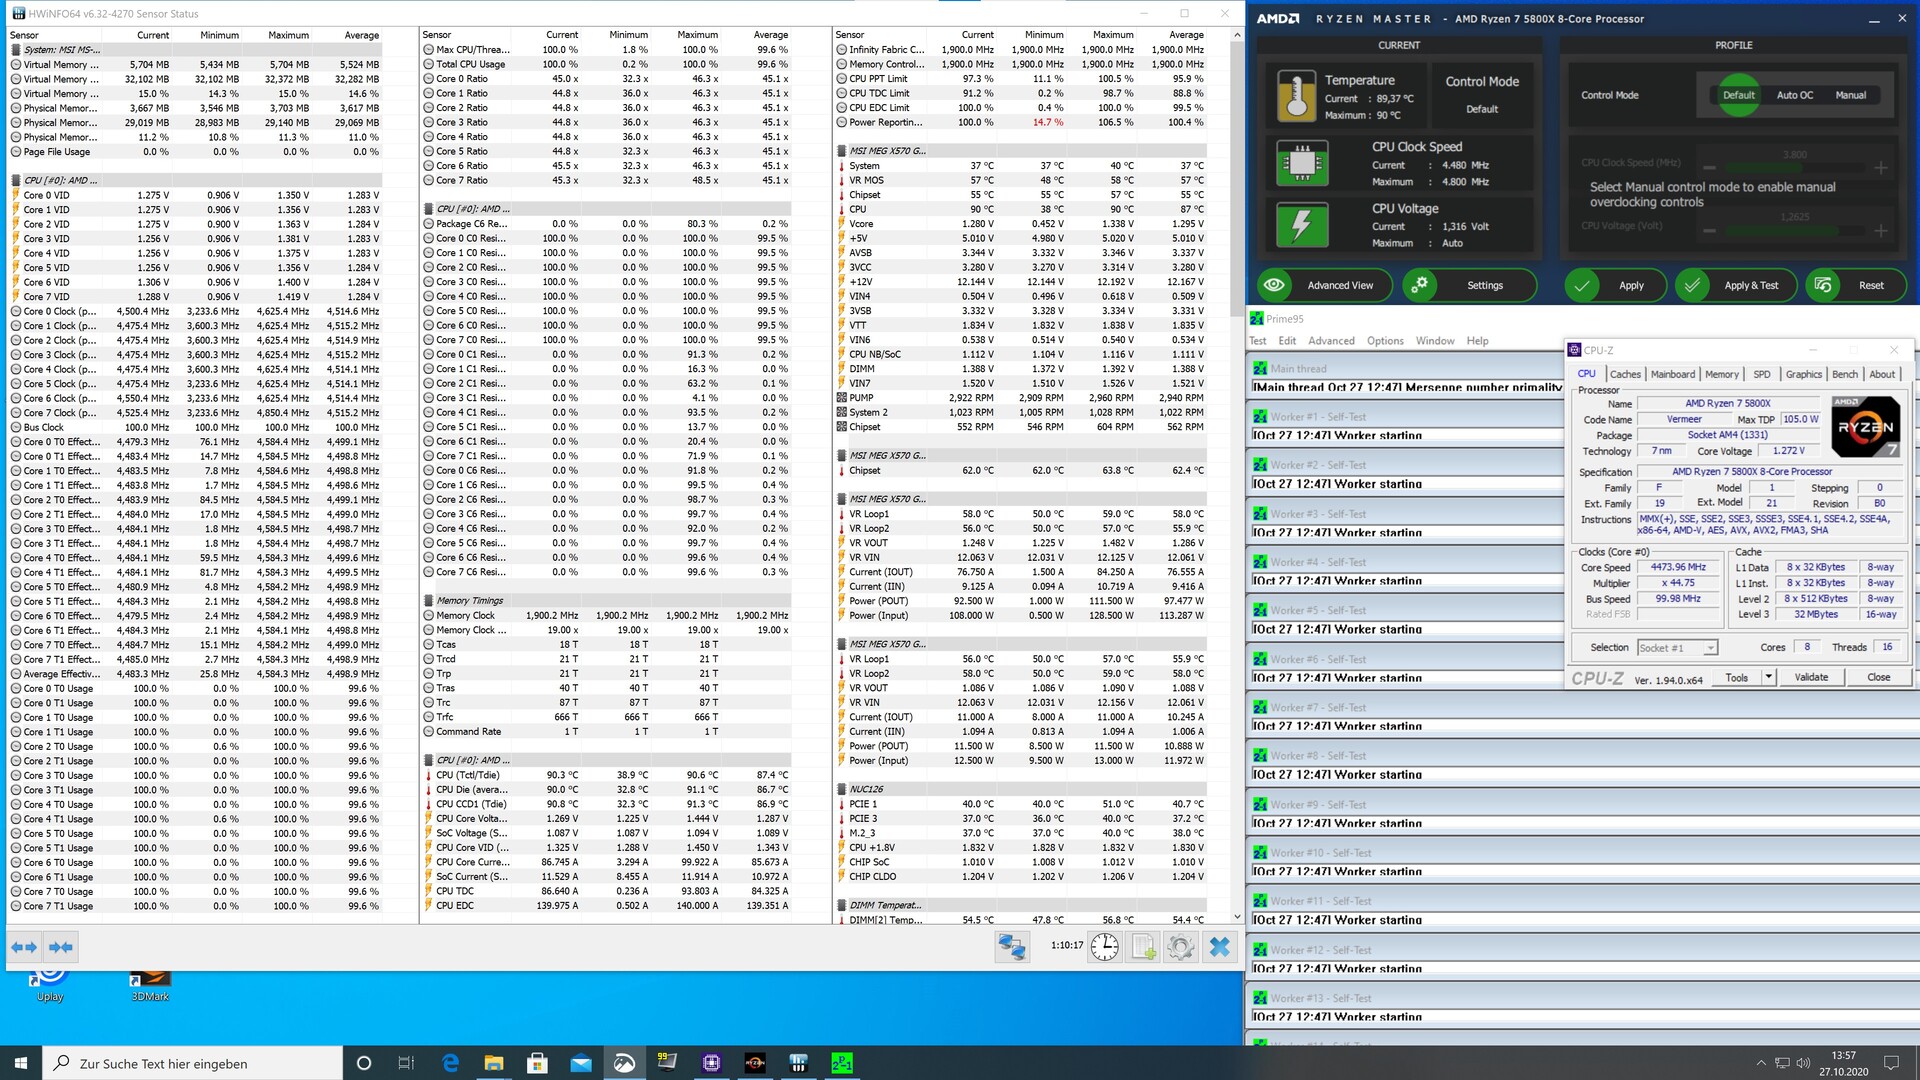
Prueba de carga sostenida ejecutando nuestro bucle CineBench R15
Ni el Ryzen 9 5900X ni el Ryzen 7 5800X tuvieron problemas con el bucle multihilo de nuestro CineBench R15. El AiO combinado con el radiador de 280 mm se las arregló para mantener las CPU frías en todo momento.
Rendimiento de los juegos de Vermeer
Hasta ahora, Intel hizo la CPU de juegos más rápida disponible. Gracias al nuevo Ryzen serie 5000, este honor ahora es para AMD. Comencemos con los benchmarks sintéticos: ambos, el Ryzen 9 5900X y el Ryzen 7 5800X lograron superar a sus respectivos predecesores. Sin embargo, el procesador Comet Lake S de Intel sigue superando a las CPU de AMD por márgenes de un solo dígito.
Esto cambia por completo cuando miramos los benchmarks de nuestros juegos. El Zen 3 se las arregla para superar al Intel Core i9-10900K de Intel hasta en un 20%. Cuanto mayor sea la resolución y los detalles, menor será la diferencia entre los dos competidores. Sin embargo, nuestras dos muestras de revisión se desempeñaron excepcionalmente bien cuando se emparejaron con la Nvidia Titan RTX. La diferencia con respecto a los anteriores procesadores Ryzen serie 3000 es inmensa, y entre el 10 y el 40 % dependiendo del juego.
| 3DMark 11 - 1280x720 Performance GPU | |
| Intel Core i7-10700K | |
| Intel Core i9-10900K | |
| AMD Ryzen 7 5800X | |
| AMD Ryzen 7 3800XT | |
| AMD Ryzen 3 3300X | |
| AMD Ryzen 9 5900X | |
| AMD Ryzen 3 3100 | |
| AMD Ryzen 9 3950X | |
| AMD Ryzen 5 1600 | |
| AMD Ryzen 3 3100 | |
| AMD Ryzen 9 3900X | |
| AMD Ryzen 7 2700X | |
| 3DMark | |
| 2560x1440 Time Spy Graphics | |
| AMD Ryzen 9 5900X | |
| AMD Ryzen 7 3800XT | |
| AMD Ryzen 7 5800X | |
| AMD Ryzen 3 3300X | |
| Intel Core i9-10900K | |
| AMD Ryzen 9 3900X | |
| AMD Ryzen 5 1600 | |
| AMD Ryzen 3 3100 | |
| Intel Core i7-10700K | |
| AMD Ryzen 9 3950X | |
| AMD Ryzen 7 2700X | |
| 1280x720 Sky Diver Graphics | |
| Intel Core i7-10700K | |
| Intel Core i9-10900K | |
| AMD Ryzen 9 5900X | |
| AMD Ryzen 7 5800X | |
| AMD Ryzen 9 3900X | |
| AMD Ryzen 9 3950X | |
| AMD Ryzen 7 3800XT | |
| AMD Ryzen 3 3300X | |
| AMD Ryzen 7 2700X | |
| AMD Ryzen 5 1600 | |
| AMD Ryzen 3 3100 | |
| 1280x720 Cloud Gate Standard Graphics | |
| Intel Core i7-10700K | |
| Intel Core i9-10900K | |
| AMD Ryzen 7 5800X | |
| AMD Ryzen 9 5900X | |
| AMD Ryzen 9 3900X | |
| AMD Ryzen 9 3950X | |
| AMD Ryzen 7 3800XT | |
| AMD Ryzen 3 3300X | |
| AMD Ryzen 3 3100 | |
| AMD Ryzen 5 1600 | |
| AMD Ryzen 7 2700X | |
| 1920x1080 Fire Strike Graphics | |
| Intel Core i7-10700K | |
| AMD Ryzen 7 5800X | |
| Intel Core i9-10900K | |
| AMD Ryzen 3 3100 | |
| AMD Ryzen 3 3100 | |
| AMD Ryzen 3 3300X | |
| AMD Ryzen 7 3800XT | |
| AMD Ryzen 7 2700X | |
| AMD Ryzen 9 3900X | |
| AMD Ryzen 9 5900X | |
| AMD Ryzen 5 1600 | |
| AMD Ryzen 9 3950X | |
| Unigine Heaven 4.0 | |
| Extreme Preset DX11 | |
| AMD Ryzen 9 5900X | |
| AMD Ryzen 7 5800X | |
| AMD Ryzen 9 3900X | |
| AMD Ryzen 7 2700X | |
| Extreme Preset OpenGL | |
| AMD Ryzen 7 5800X | |
| AMD Ryzen 9 5900X | |
| AMD Ryzen 9 3900X | |
| AMD Ryzen 7 2700X | |
| Unigine Valley 1.0 | |
| 1920x1080 Extreme HD Preset OpenGL AA:x8 | |
| AMD Ryzen 9 5900X | |
| AMD Ryzen 7 5800X | |
| AMD Ryzen 9 3900X | |
| AMD Ryzen 7 2700X | |
| 1920x1080 Extreme HD DirectX AA:x8 | |
| AMD Ryzen 9 5900X | |
| AMD Ryzen 7 5800X | |
| AMD Ryzen 9 3900X | |
| AMD Ryzen 7 2700X | |
| Unigine Superposition | |
| 1280x720 720p Low | |
| AMD Ryzen 7 5800X | |
| AMD Ryzen 9 5900X | |
| AMD Ryzen 9 3900X | |
| 1920x1080 1080p Extreme | |
| AMD Ryzen 9 5900X | |
| AMD Ryzen 7 5800X | |
| AMD Ryzen 9 3900X | |
| 7680x4320 8k Optimized | |
| AMD Ryzen 9 5900X | |
| AMD Ryzen 7 5800X | |
| AMD Ryzen 9 3900X | |
| Borderlands 3 | |
| 1280x720 Very Low Overall Quality (DX11) | |
| AMD Ryzen 9 5900X, NVIDIA Titan RTX | |
| AMD Ryzen 7 5800X, NVIDIA Titan RTX | |
| Intel Core i9-10900K, NVIDIA Titan RTX | |
| Intel Core i7-10700K, NVIDIA Titan RTX | |
| AMD Ryzen 9 3900X, NVIDIA Titan RTX | |
| AMD Ryzen 9 3950X, NVIDIA Titan RTX | |
| AMD Ryzen 7 3800XT, NVIDIA Titan RTX | |
| AMD Ryzen 3 3300X, NVIDIA Titan RTX | |
| AMD Ryzen 3 3100, NVIDIA Titan RTX | |
| AMD Ryzen 5 1600, NVIDIA Titan RTX | |
| 1920x1080 Badass Overall Quality (DX11) | |
| AMD Ryzen 9 5900X, NVIDIA Titan RTX | |
| Intel Core i9-10900K, NVIDIA Titan RTX | |
| Intel Core i7-10700K, NVIDIA Titan RTX | |
| AMD Ryzen 7 3800XT, NVIDIA Titan RTX | |
| AMD Ryzen 7 5800X, NVIDIA Titan RTX | |
| AMD Ryzen 9 3900X, NVIDIA Titan RTX | |
| AMD Ryzen 9 3950X, NVIDIA Titan RTX | |
| AMD Ryzen 3 3300X, NVIDIA Titan RTX | |
| AMD Ryzen 3 3100, NVIDIA Titan RTX | |
| AMD Ryzen 5 1600, NVIDIA Titan RTX | |
| The Witcher 3 | |
| 1024x768 Low Graphics & Postprocessing | |
| AMD Ryzen 9 5900X, NVIDIA Titan RTX | |
| AMD Ryzen 7 5800X, NVIDIA Titan RTX | |
| Intel Core i9-10900K, NVIDIA Titan RTX | |
| Intel Core i7-10700K, NVIDIA Titan RTX | |
| AMD Ryzen 9 3900X, NVIDIA Titan RTX | |
| AMD Ryzen 7 3800XT, NVIDIA Titan RTX | |
| AMD Ryzen 9 3950X, NVIDIA Titan RTX | |
| AMD Ryzen 3 3300X, NVIDIA Titan RTX | |
| AMD Ryzen 5 1600, NVIDIA Titan RTX | |
| AMD Ryzen 3 3100, NVIDIA Titan RTX | |
| 1920x1080 Ultra Graphics & Postprocessing (HBAO+) | |
| Intel Core i7-10700K, NVIDIA Titan RTX | |
| AMD Ryzen 9 5900X, NVIDIA Titan RTX | |
| Intel Core i9-10900K, NVIDIA Titan RTX | |
| AMD Ryzen 7 3800XT, NVIDIA Titan RTX | |
| AMD Ryzen 7 5800X, NVIDIA Titan RTX | |
| AMD Ryzen 9 3900X, NVIDIA Titan RTX | |
| AMD Ryzen 5 1600, NVIDIA Titan RTX | |
| AMD Ryzen 9 3950X, NVIDIA Titan RTX | |
| AMD Ryzen 3 3300X, NVIDIA Titan RTX | |
| AMD Ryzen 3 3100, NVIDIA Titan RTX | |
| Shadow of the Tomb Raider | |
| 1280x720 Lowest Preset | |
| AMD Ryzen 7 5800X, NVIDIA Titan RTX | |
| AMD Ryzen 9 5900X, NVIDIA Titan RTX | |
| Intel Core i9-10900K, NVIDIA Titan RTX | |
| AMD Ryzen 9 3950X, NVIDIA Titan RTX | |
| AMD Ryzen 7 3800XT, NVIDIA Titan RTX | |
| AMD Ryzen 9 3900X, NVIDIA Titan RTX | |
| AMD Ryzen 3 3300X, NVIDIA Titan RTX | |
| AMD Ryzen 3 3100, NVIDIA Titan RTX | |
| AMD Ryzen 5 1600, NVIDIA Titan RTX | |
| 1920x1080 Highest Preset AA:T | |
| AMD Ryzen 7 5800X, NVIDIA Titan RTX | |
| AMD Ryzen 9 5900X, NVIDIA Titan RTX | |
| Intel Core i9-10900K, NVIDIA Titan RTX | |
| AMD Ryzen 7 3800XT, NVIDIA Titan RTX | |
| AMD Ryzen 9 3950X, NVIDIA Titan RTX | |
| AMD Ryzen 3 3300X, NVIDIA Titan RTX | |
| AMD Ryzen 9 3900X, NVIDIA Titan RTX | |
| AMD Ryzen 3 3100, NVIDIA Titan RTX | |
| AMD Ryzen 5 1600, NVIDIA Titan RTX | |
| Strange Brigade | |
| 1280x720 lowest AF:1 | |
| AMD Ryzen 7 5800X, NVIDIA Titan RTX | |
| AMD Ryzen 9 5900X, NVIDIA Titan RTX | |
| Intel Core i7-10700K, NVIDIA Titan RTX | |
| AMD Ryzen 9 3900X, NVIDIA Titan RTX | |
| 1920x1080 ultra AA:ultra AF:16 | |
| AMD Ryzen 9 5900X, NVIDIA Titan RTX | |
| AMD Ryzen 7 5800X, NVIDIA Titan RTX | |
| Intel Core i7-10700K, NVIDIA Titan RTX | |
| AMD Ryzen 9 3900X, NVIDIA Titan RTX | |
| GTA V | |
| 1024x768 Lowest Settings possible | |
| Intel Core i7-10700K, NVIDIA Titan RTX | |
| AMD Ryzen 9 5900X, NVIDIA Titan RTX | |
| AMD Ryzen 7 5800X, NVIDIA Titan RTX | |
| 1920x1080 Highest AA:4xMSAA + FX AF:16x | |
| AMD Ryzen 9 5900X, NVIDIA Titan RTX | |
| AMD Ryzen 7 5800X, NVIDIA Titan RTX | |
| Intel Core i7-10700K, NVIDIA Titan RTX | |
Ryzen 9 5900X con Nvidia Titan RTX
| bajo | medio | alto | ultra | QHD | 4K | |
|---|---|---|---|---|---|---|
| GTA V (2015) | 187 | 186 | 184 | 128 | 115 | 134 |
| The Witcher 3 (2015) | 617 | 437 | 276 | 141 | 104 | |
| Dota 2 Reborn (2015) | 232.6 | 208.7 | 199.4 | 180.3 | 172.1 | |
| Final Fantasy XV Benchmark (2018) | 225 | 182 | 139 | 105 | 63.6 | |
| X-Plane 11.11 (2018) | 177 | 158 | 130 | 111 | ||
| Far Cry 5 (2018) | 212 | 184 | 173 | 161 | 136 | 81 |
| Strange Brigade (2018) | 607 | 352 | 287 | 243 | 183 | 110 |
| Shadow of the Tomb Raider (2018) | 225 | 183 | 177 | 166 | 120 | 66.3 |
| Far Cry New Dawn (2019) | 176 | 152 | 147 | 131 | 121 | 84 |
| Metro Exodus (2019) | 241 | 173 | 133 | 106 | 84.9 | 54.9 |
| Borderlands 3 (2019) | 229 | 187 | 144 | 118 | 84.7 | 46.7 |
| Crysis Remastered (2020) | 273 | 74.5 | 212 | 115 | 90.9 | 48.9 |
| Dirt 5 (2020) | 187 | 128 | 106 | 95.9 | 79.5 | 57 |
| Assassin´s Creed Valhalla (2020) | 137 | 104 | 88 | 80 | 66 | 43 |
| Call of Duty Black Ops Cold War (2020) | 254 | 238 | 162 | 144 | 87.6 | 52.9 |
| Yakuza Like a Dragon (2020) | 119 | 117 | 116 | 111 | 100 | 55.2 |
| Immortals Fenyx Rising (2020) | 136 | 106 | 93 | 71 | 64 | 48 |
| Cyberpunk 2077 1.0 (2020) | 109 | 103 | 93.2 | 82.3 | 58.4 | 30.9 |
| Hitman 3 (2021) | 271 | 222 | 210 | 202 | 145 | 82 |
| Outriders (2021) | 136 | 162 | 158 | 156 | 119 | 64 |
| Resident Evil Village (2021) | 304 | 264 | 241 | 212 | 142 | 74.2 |
| Mass Effect Legendary Edition (2021) | 106 | 113 | 107 | 106 | ||
| Days Gone (2021) | 190 | 181 | 174 | 141 | 108 | 64.9 |
| Monster Hunter Stories 2 (2021) | 144 | 144 | 144 | 144 | 144 | |
| F1 2021 (2021) | 451 | 388 | 331 | 165 | 126 | 74.3 |
| Deathloop (2021) | 128 | 125 | 124 | 119 | 91.6 | 51.8 |
| New World (2021) | 180 | 139 | 131 | 123 | 101 | 54.5 |
| Alan Wake Remastered (2021) | 93.1 | 88.3 | 88.4 | 88.5 | ||
| Far Cry 6 (2021) | 143 | 106 | 95.8 | 94.7 | 80.9 | 52.8 |
| Back 4 Blood (2021) | 294 | 270 | 255 | 182 | 101 | |
| Guardians of the Galaxy (2021) | 135 | 134 | 134 | 133 | 131 | 82 |
| Riders Republic (2021) | 221 | 179 | 152 | 143 | 109 | 65 |
| Call of Duty Vanguard (2021) | 113 | 153 | 144 | 133 | 100 | 59.6 |
| Forza Horizon 5 (2021) | 237 | 161 | 148 | 96 | 84 | 62 |
| Battlefield 2042 (2021) | 99.3 | 139 | 129 | 117 | 93.6 | 60.2 |
| Farming Simulator 22 (2021) | 279 | 221 | 186 | 164 | 163 | 122 |
| Halo Infinite (2021) | 144 | 125 | 119 | 95.5 | 68.8 | |
| God of War (2022) | 174 | 149 | 124 | 89 | 72.8 | 48.9 |
| Rainbow Six Extraction (2022) | 264 | 225 | 223 | 179 | 130 | 70 |
| Dying Light 2 (2022) | 169 | 110 | 93.6 | 66.5 | 37.1 | |
| GRID Legends (2022) | 215.9 | 195.2 | 172.8 | 132.5 | 112.2 | 78.6 |
| Elden Ring (2022) | 59.9 | 59.9 | 59.7 | 59.9 | 59.9 | 59.6 |
| Cyberpunk 2077 1.6 (2022) | 78.9 | 78.7 | 78.6 | 78.3 | 66.2 | 32.8 |
| Elex 2 (2022) | 111 | 105 | 98 | 95.4 | 81.2 | 47.7 |
| Ghostwire Tokyo (2022) | 205 | 196.8 | 203 | 202 | 141 | 73.3 |
| Tiny Tina's Wonderlands (2022) | 245 | 201 | 151.3 | 124.3 | 92.4 | 50.4 |
| Vampire Bloodhunt (2022) | 391 | 267 | 252 | 244 | 173.2 | 93.6 |
Ryzen 7 5800X con Nvidia Titan RTX
| bajo | medio | alto | ultra | QHD | 4K | |
|---|---|---|---|---|---|---|
| GTA V (2015) | 187 | 187 | 184 | 123 | 112 | 125 |
| The Witcher 3 (2015) | 602 | 431 | 274 | 139 | 102 | |
| Dota 2 Reborn (2015) | 242.5 | 213.8 | 204 | 186.8 | 175.6 | |
| Final Fantasy XV Benchmark (2018) | 225 | 184 | 140 | 106 | 63.1 | |
| X-Plane 11.11 (2018) | 178 | 158 | 128 | 109 | ||
| Far Cry 5 (2018) | 207 | 177 | 168 | 158 | 134 | 79 |
| Strange Brigade (2018) | 662 | 352 | 288 | 242 | 183 | 110 |
| Shadow of the Tomb Raider (2018) | 230 | 193 | 183 | 170 | 121 | 66.3 |
| Far Cry New Dawn (2019) | 166 | 145 | 140 | 124 | 115 | 82 |
| Metro Exodus (2019) | 251 | 172 | 133 | 106 | 84.7 | 54.9 |
| Borderlands 3 (2019) | 221 | 183 | 141 | 116 | 83.8 | 46.3 |
Rendimiento de la aplicación
Considerando que los nuevos procesadores de Vermeer son las CPU más rápidas actualmente disponibles, no debería sorprender que el rendimiento de las aplicaciones diarias fuera impecable. Utilizamos un SSD Intel Optane 905p para nuestras pruebas, que contenía el sistema operativo así como algunos puntos de referencia sintéticos.
Al igual que con las pruebas de CPU, nuestras muestras de prueba lograron asegurar los dos primeros puntos en casi todos los benchmarks de aplicaciones. Incluso se las arreglaron para encontrar algún rendimiento extra en la prueba de renderizado. Las mejoras de rendimiento de hasta el 20% no fueron una excepción.
El perverso rey de la colina en PCMark 10, el Ryzen 9 3950X de AMD, fue superado por márgenes significativos. El Core i9-10900K de Intel no tuvo oportunidad de mantenerse y se desempeñó un 11% más lento que el Ryzen 9 5900X de AMD y un ligeramente mejor pero aún notable 8% más lento que el Ryzen 7 5800X de AMD.
* ... más pequeño es mejor
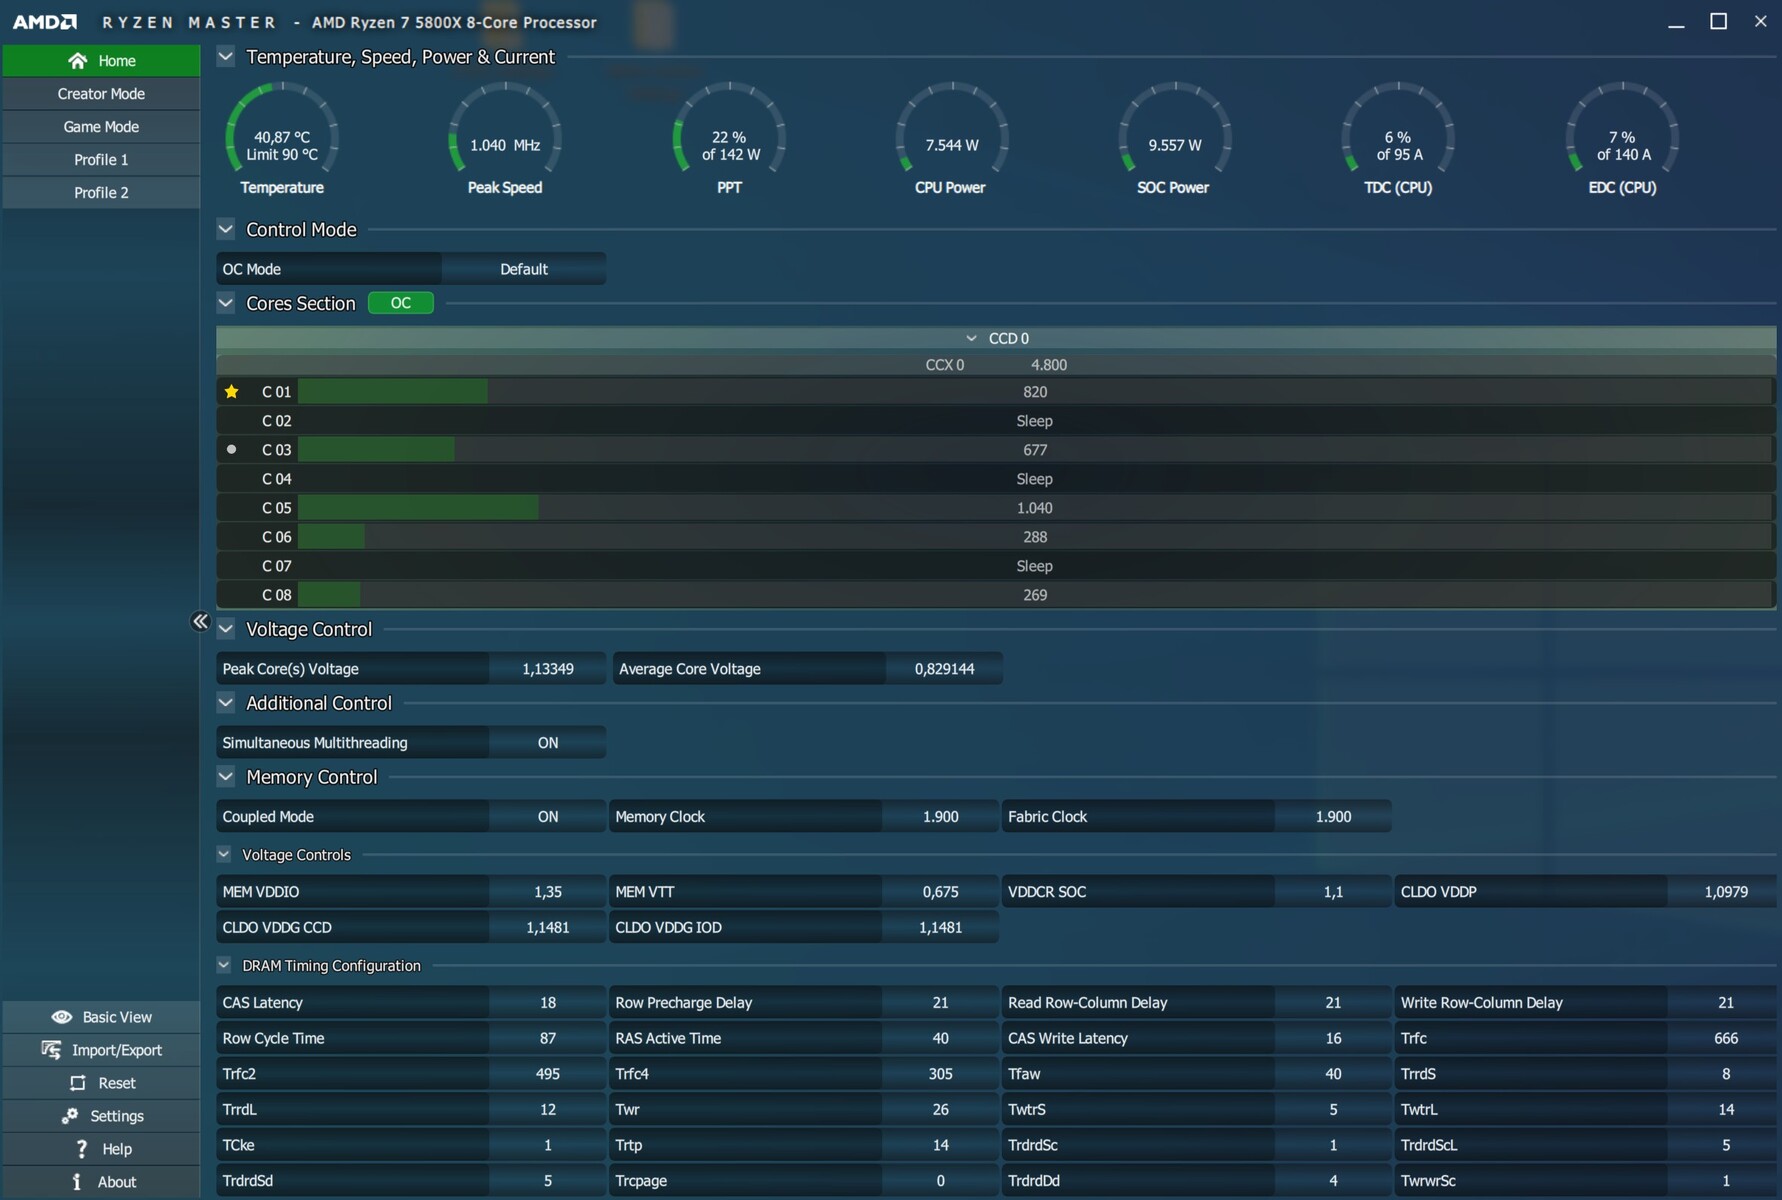
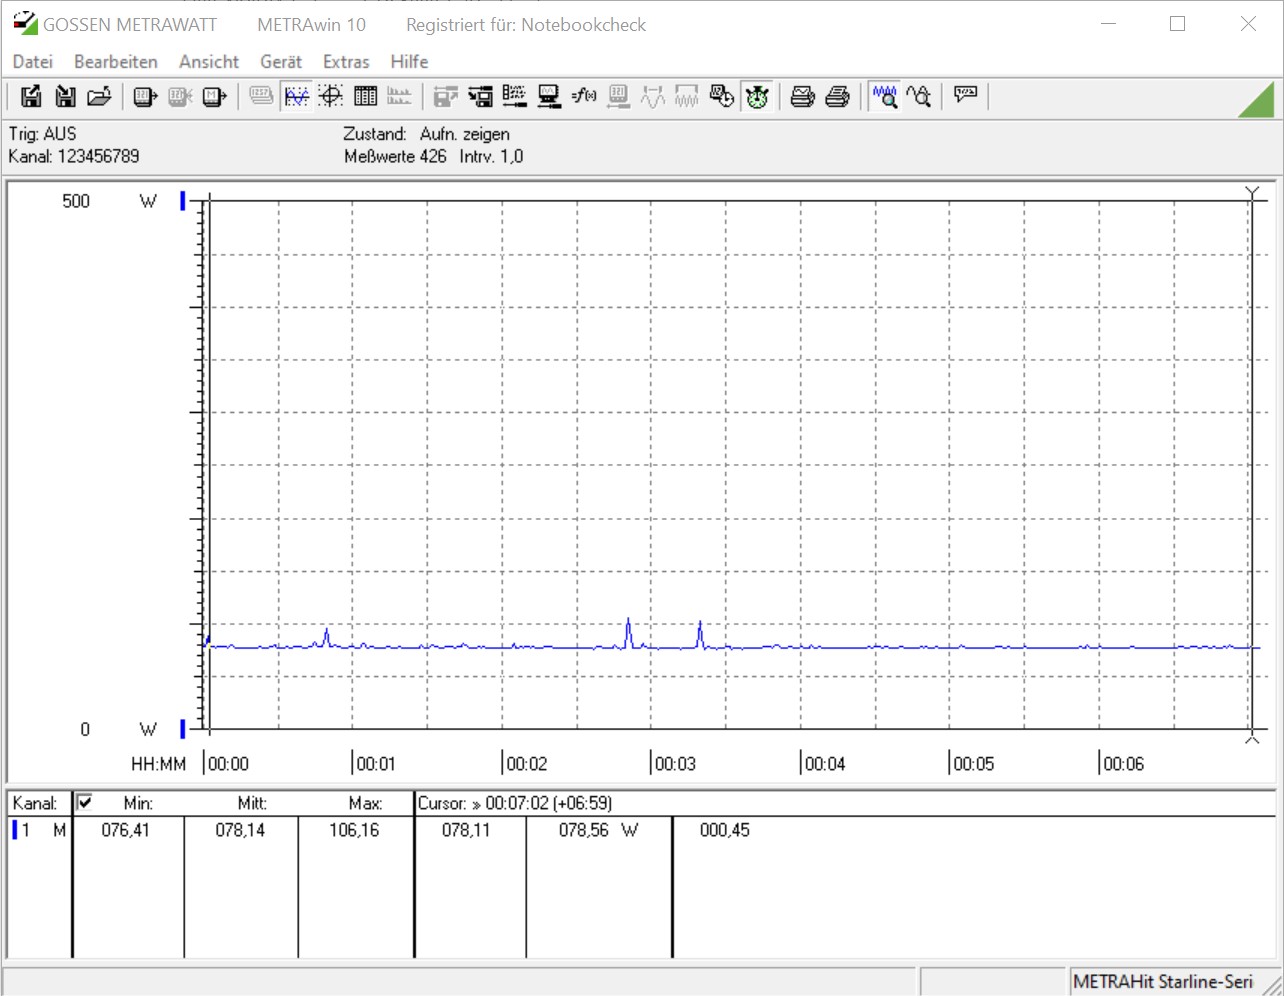
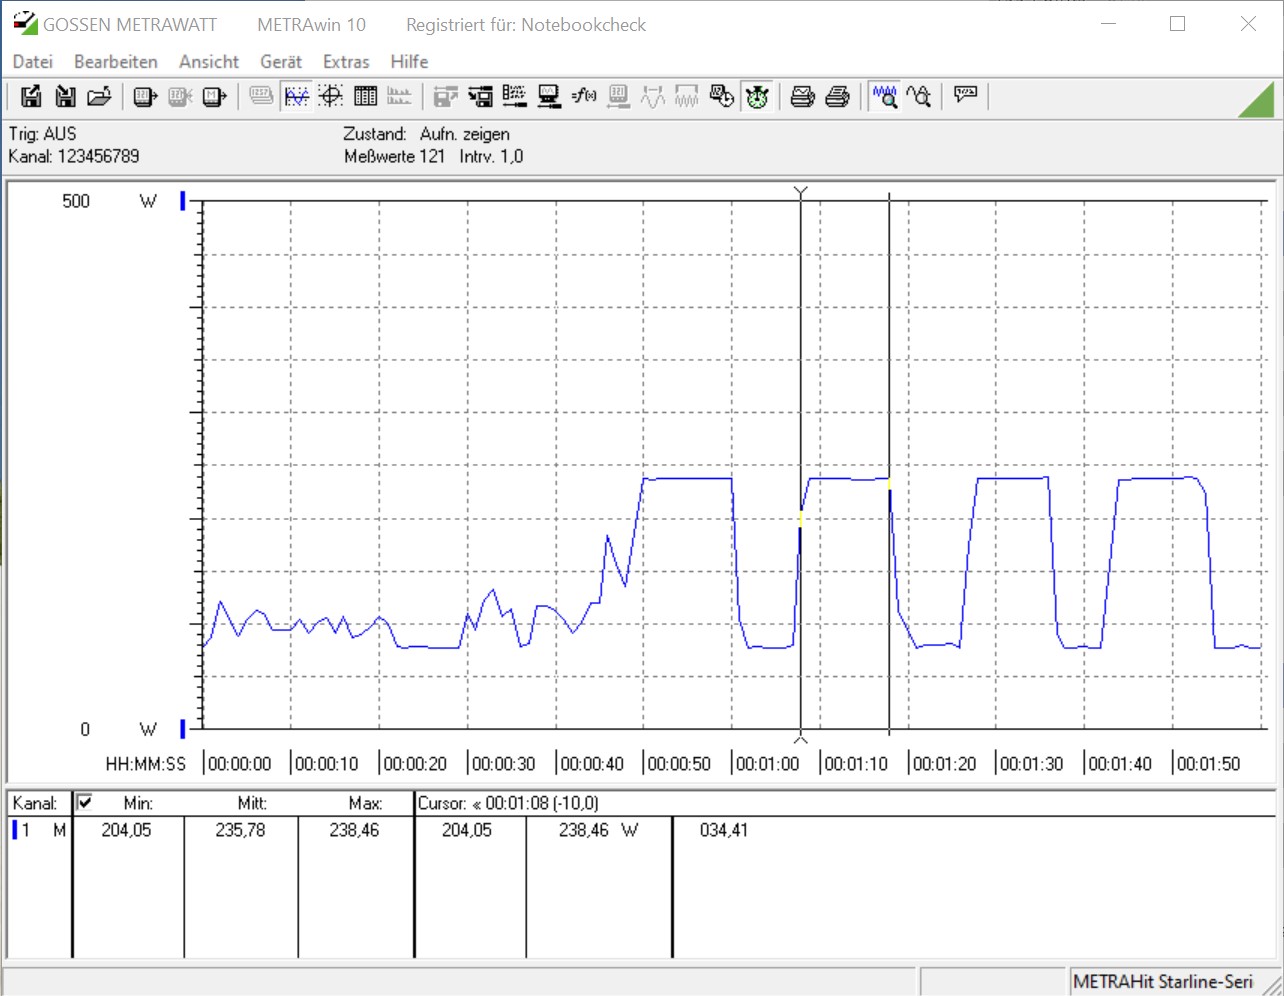
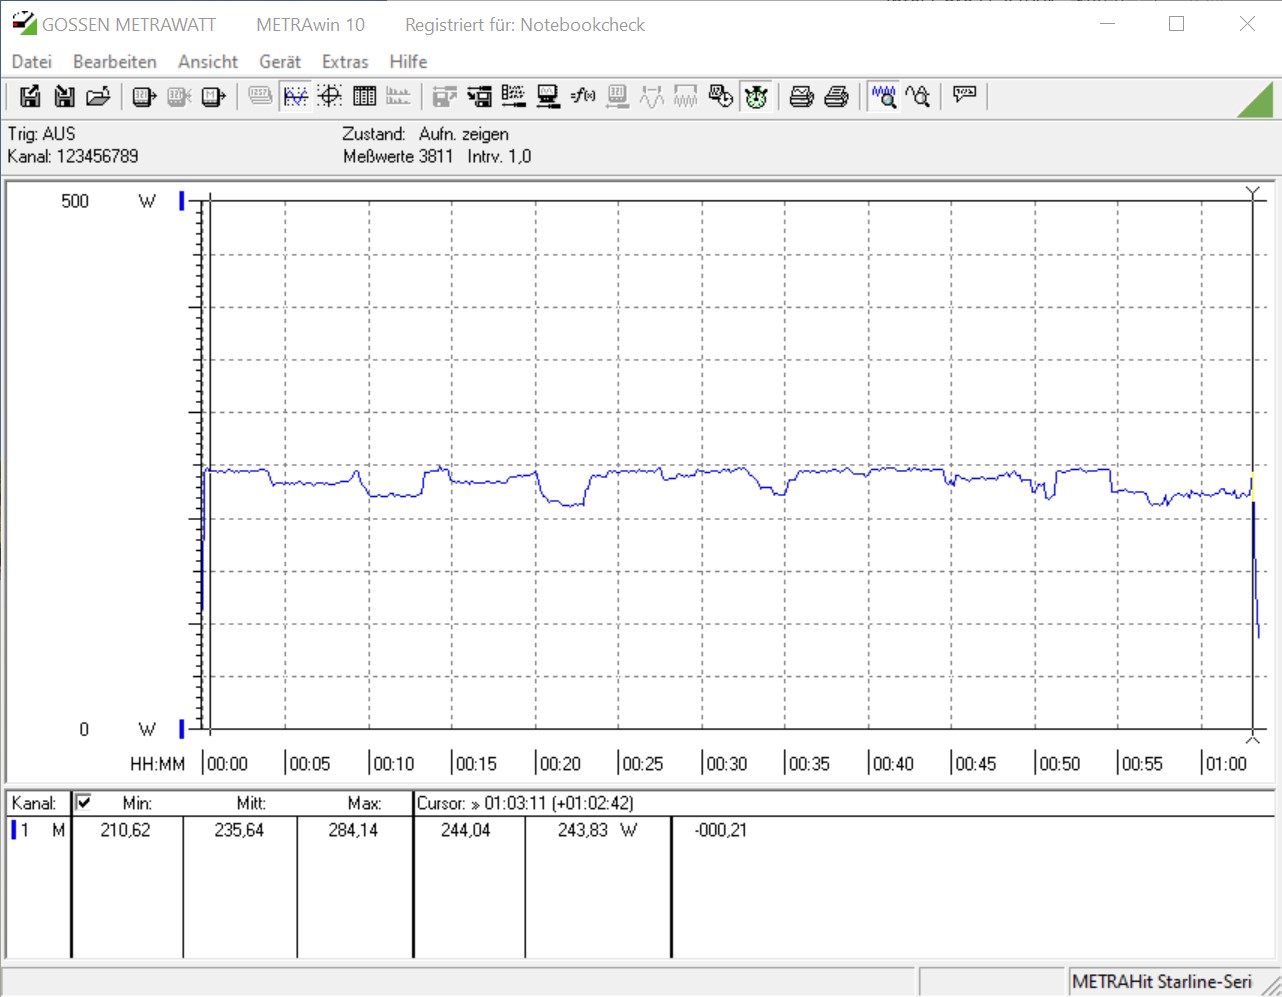
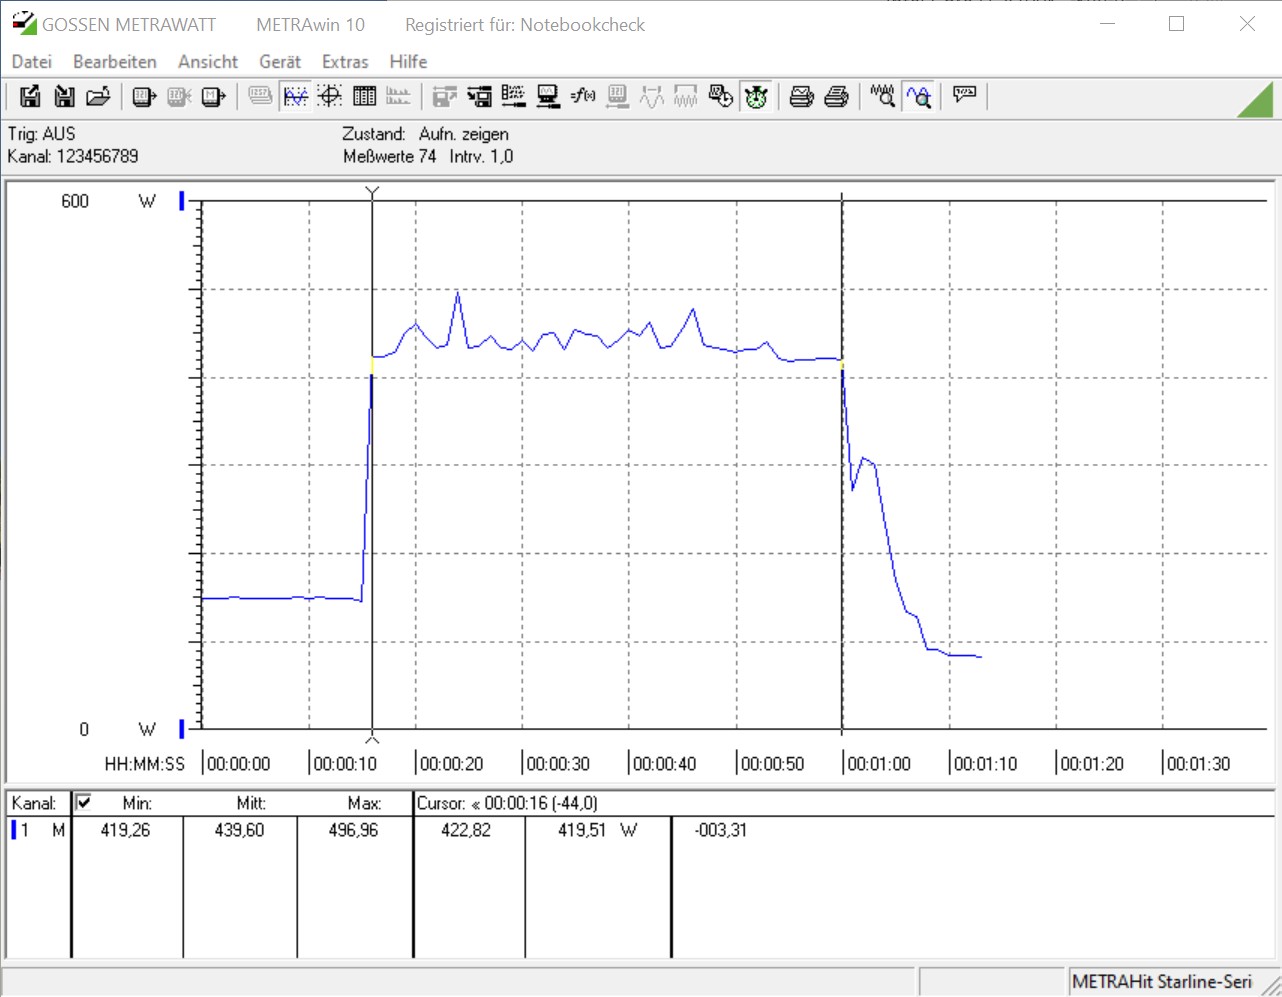
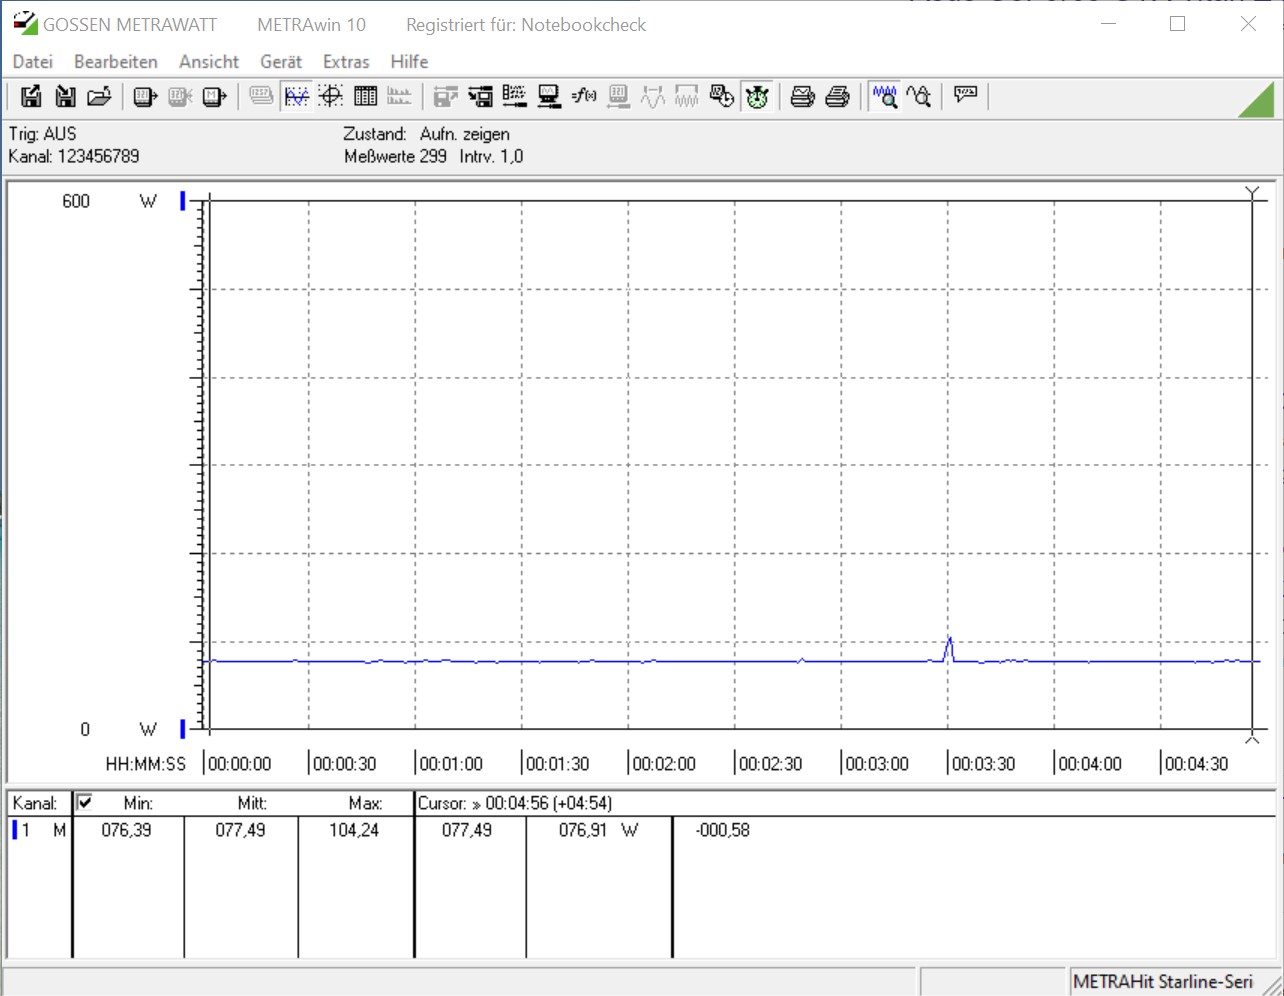
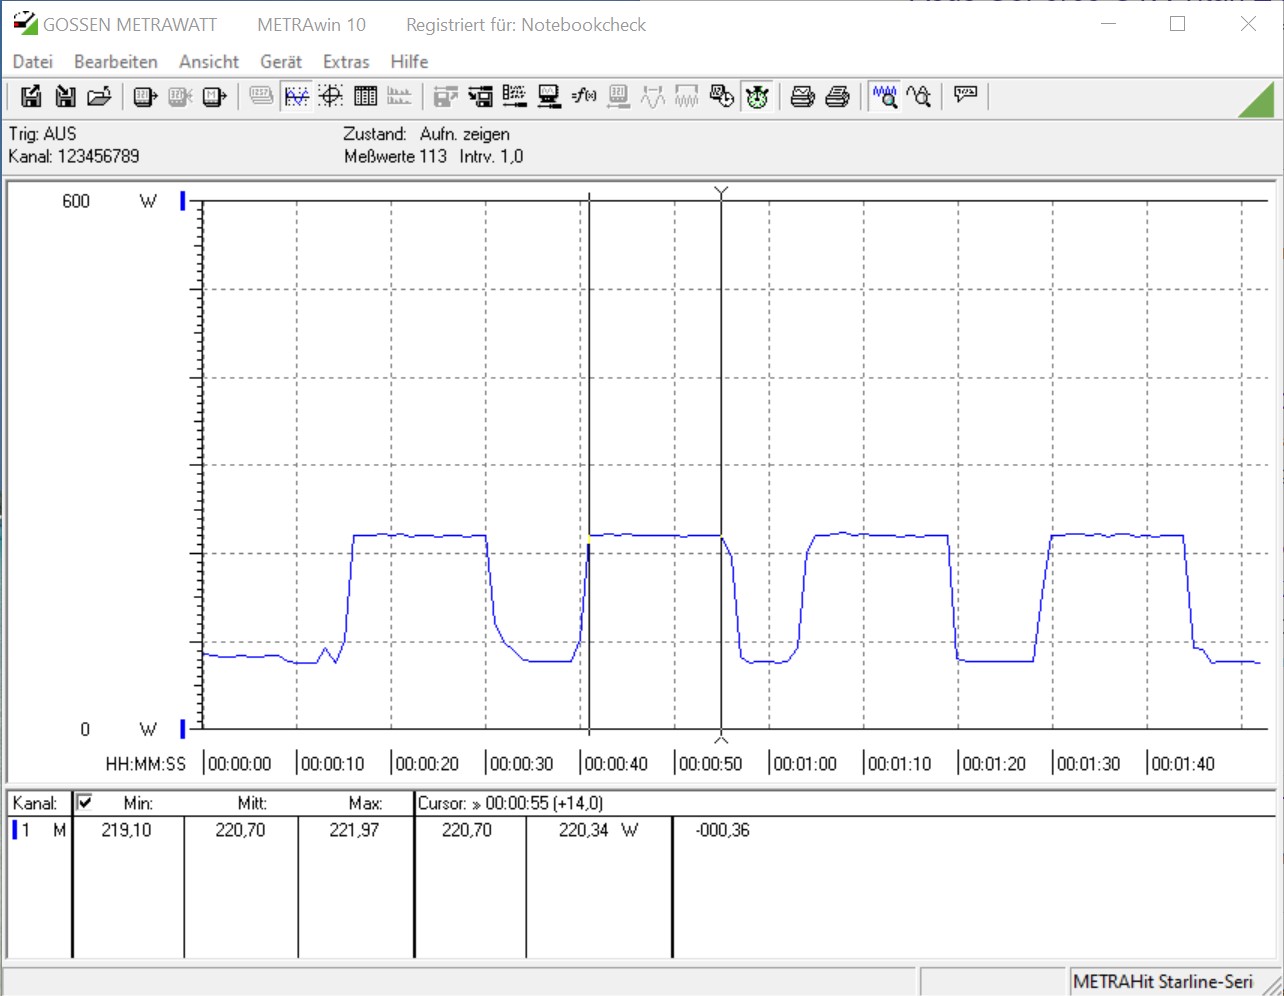
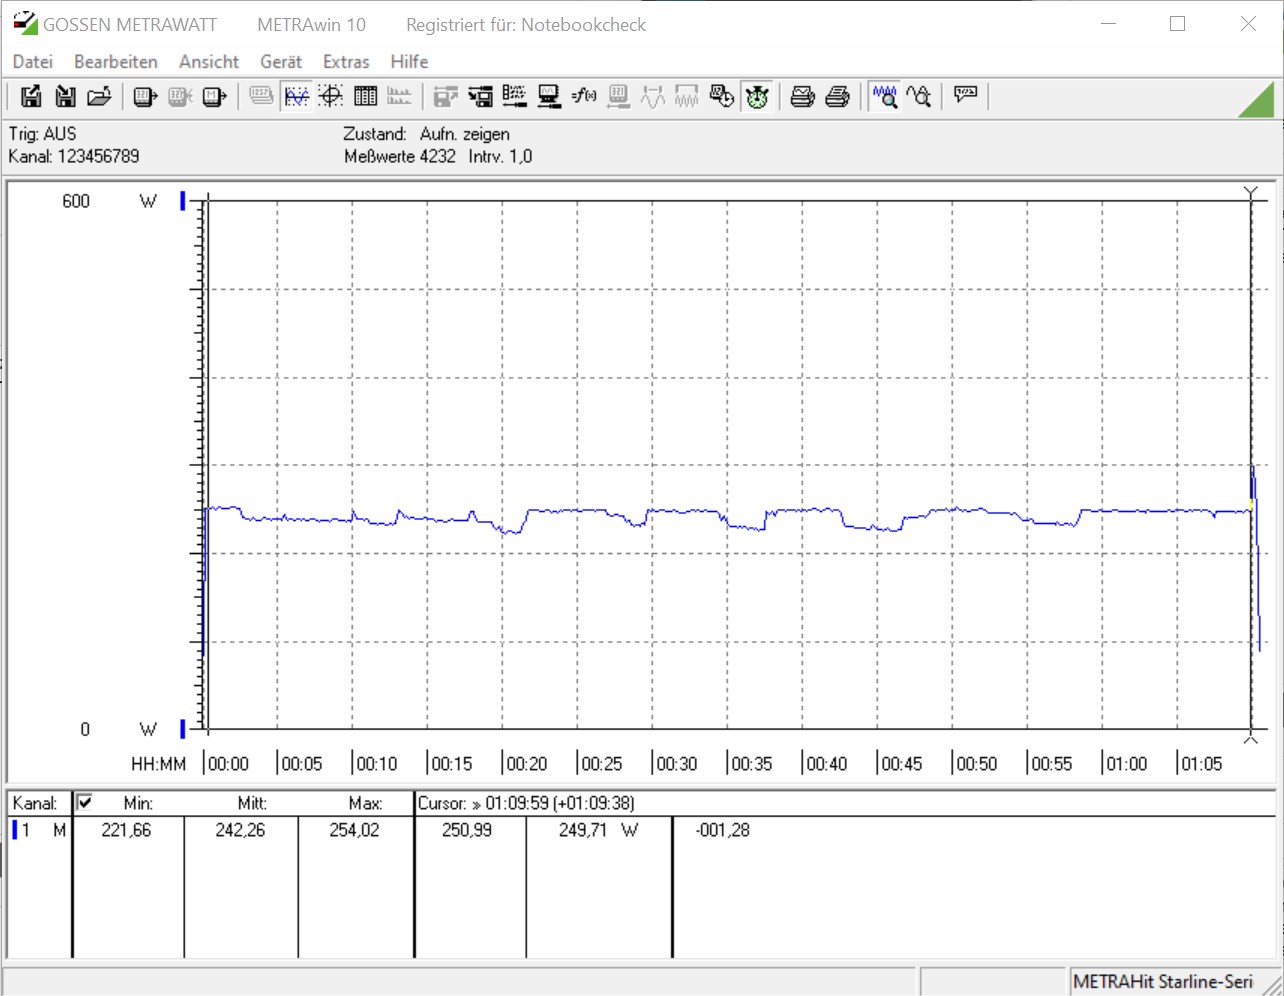
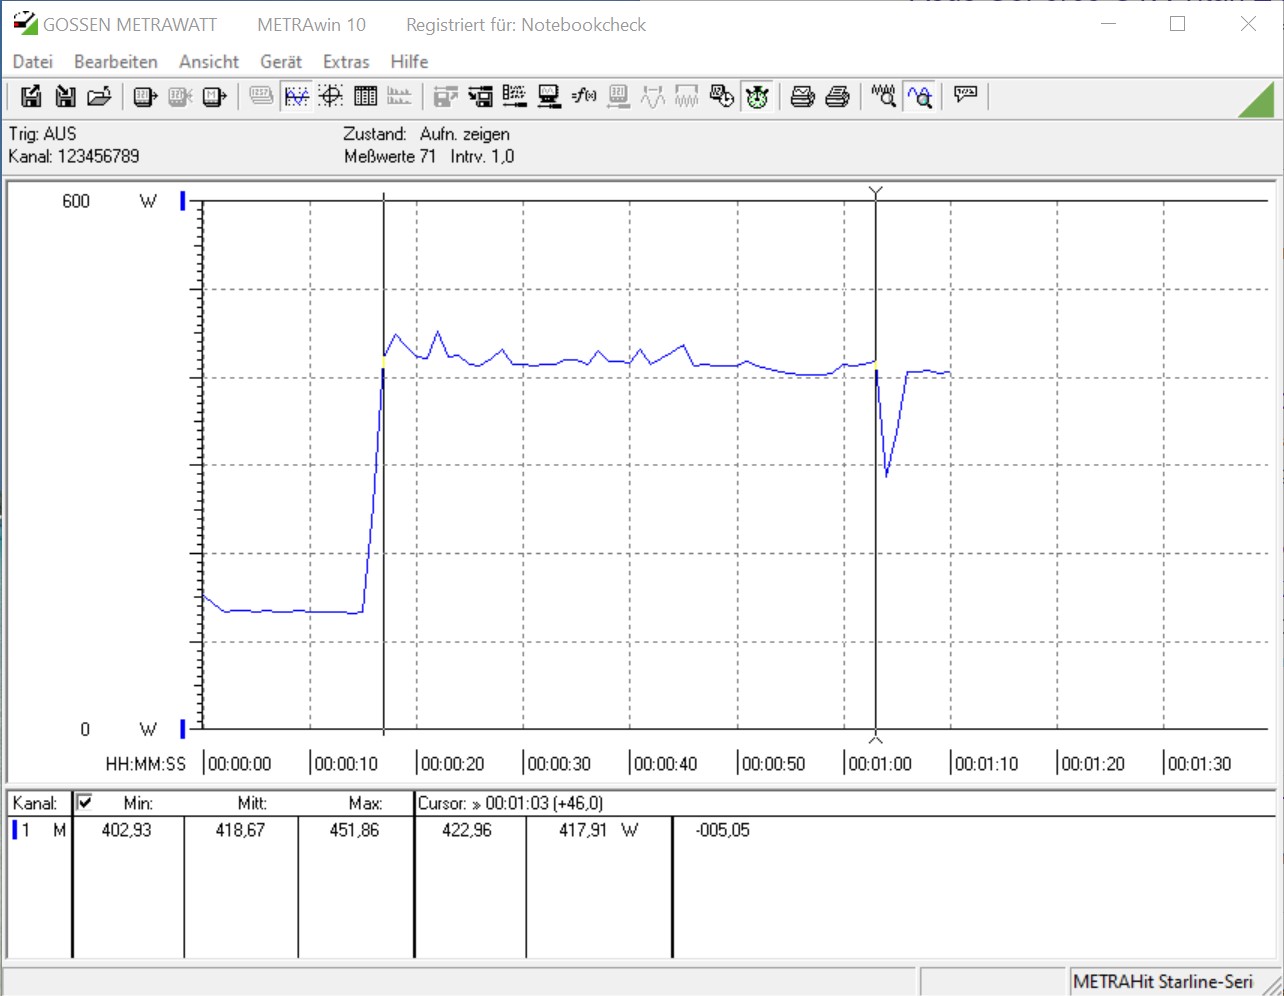
Consumo de energía
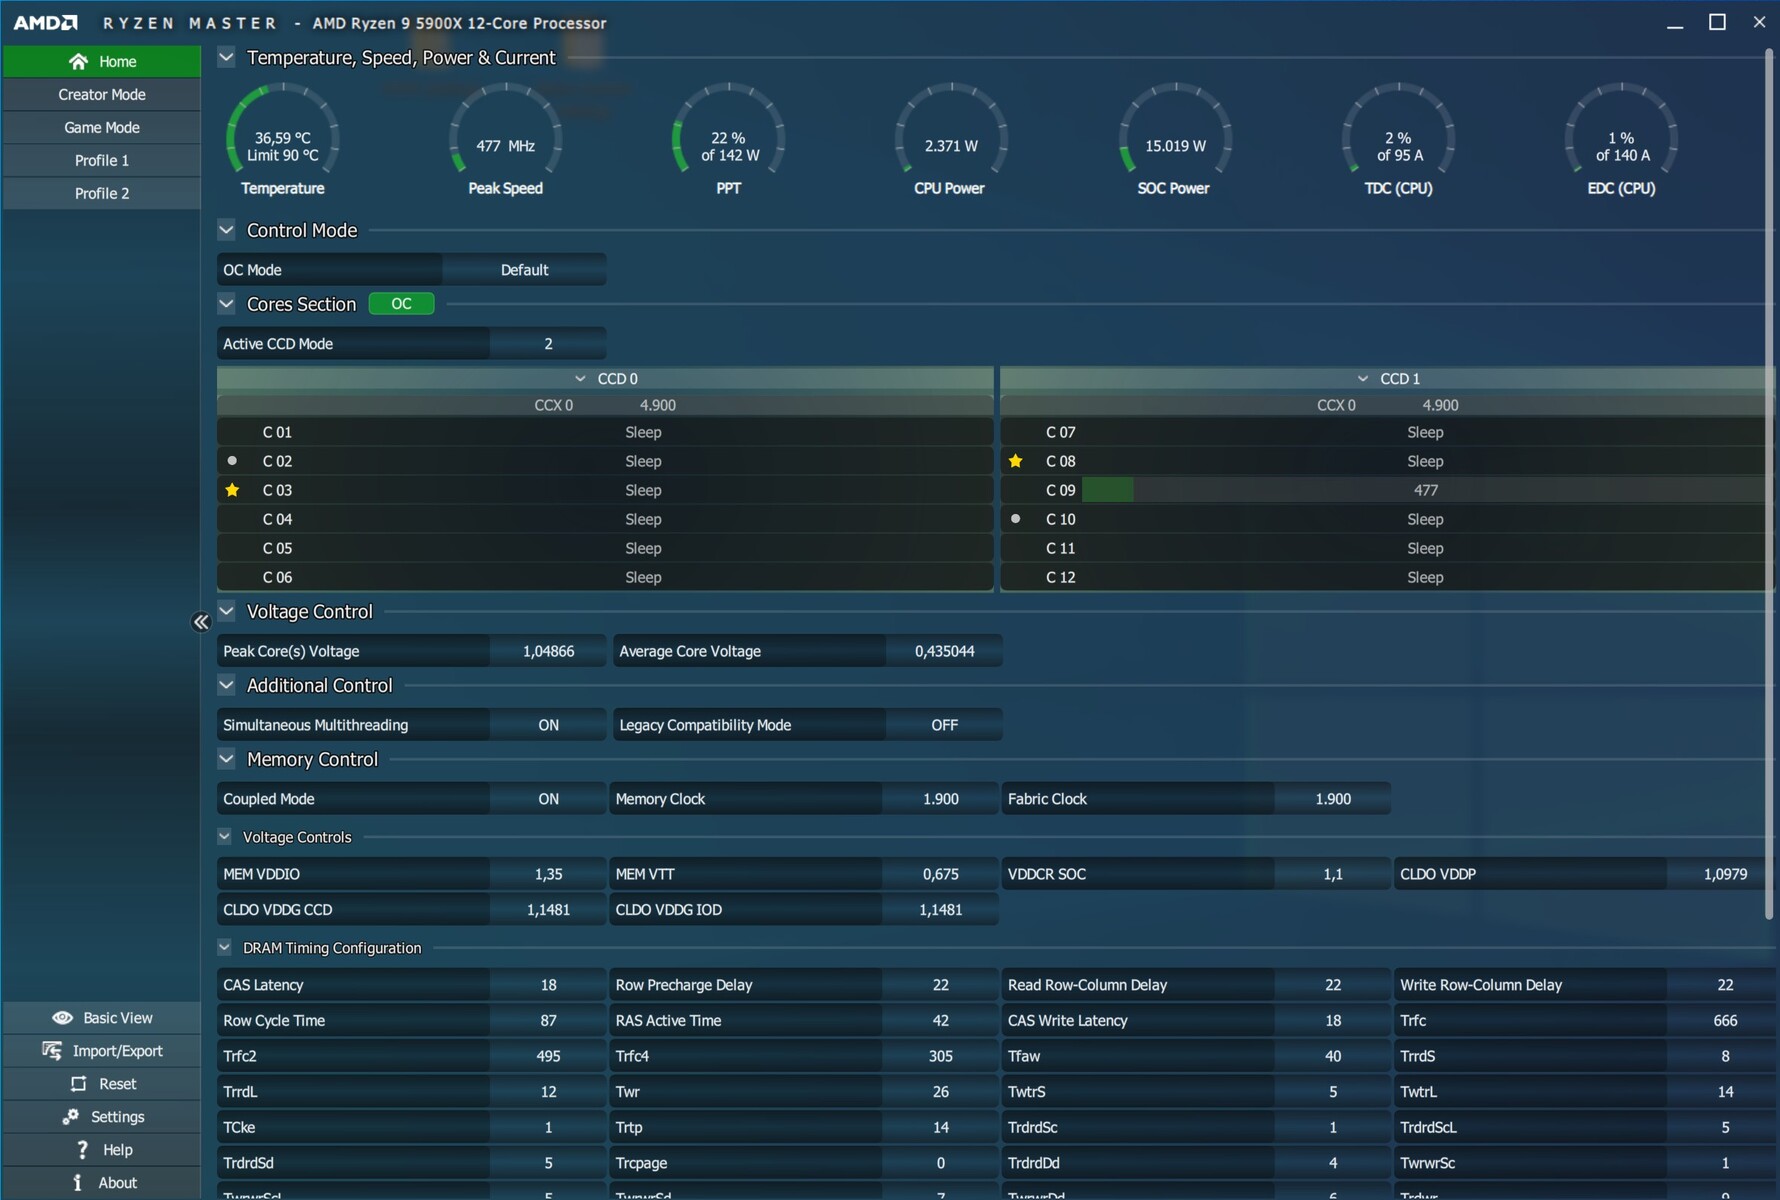
Oficialmente, AMD especifica tanto el Ryzen 9 5900X como el Ryzen 7 5800X con un TDP de 105 W. Sin embargo, ya sabemos por su predecesor que esta especificación oficial no es más que un aproximado, y en el pasado, vimos picos de hasta 142 W. Lo mismo es básicamente cierto para las nuevas CPU Ryzen, ya que se les permite consumir hasta 142 W gracias al PBO2 (Precision Boost 2) con una temperatura tCase de no más de 61,8 °C. El Core i9-10900K está especificado con hasta 250 W. Dado que AMD no creó una nueva especificación de plataforma para acompañar a las CPU de Vermeer, podemos esperar que todas las demás especificaciones relativas al consumo de energía permanezcan inalteradas. Por lo tanto, el Zen 3 debería consumir aproximadamente tanta energía como el Zen 2. Sin embargo, nuestras propias pruebas revelaron que tanto el Ryzen 9 5900X como el Ryzen 7 5800X requieren un poco más de energía que el Ryzen 9 3950X pero menos que el Core i9-10900K. Este último requirió alrededor de un 14% más de energía durante nuestra prueba de esfuerzo y la prueba multi-hilo del CineBench R15. La marea cambió a favor del Core i9-10900K de Intel en nuestros benchmarks de juegos, donde fue alrededor de un 11 % más eficiente en energía que el Ryzen 9 5900X cuando estaba equipado con la misma GPU.
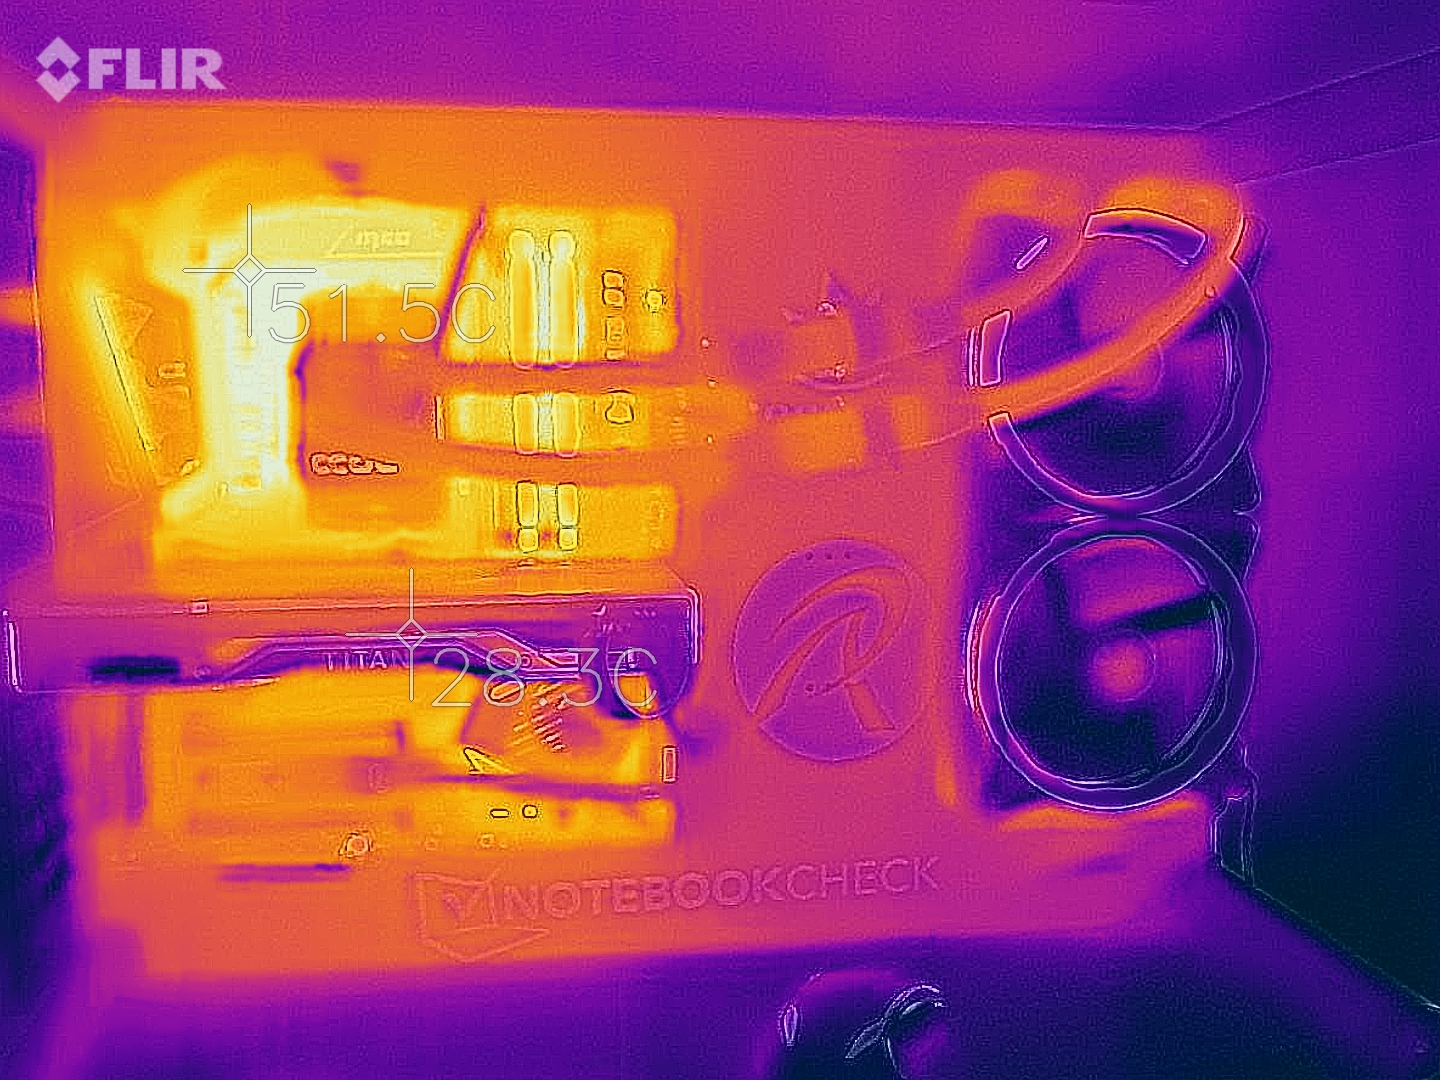
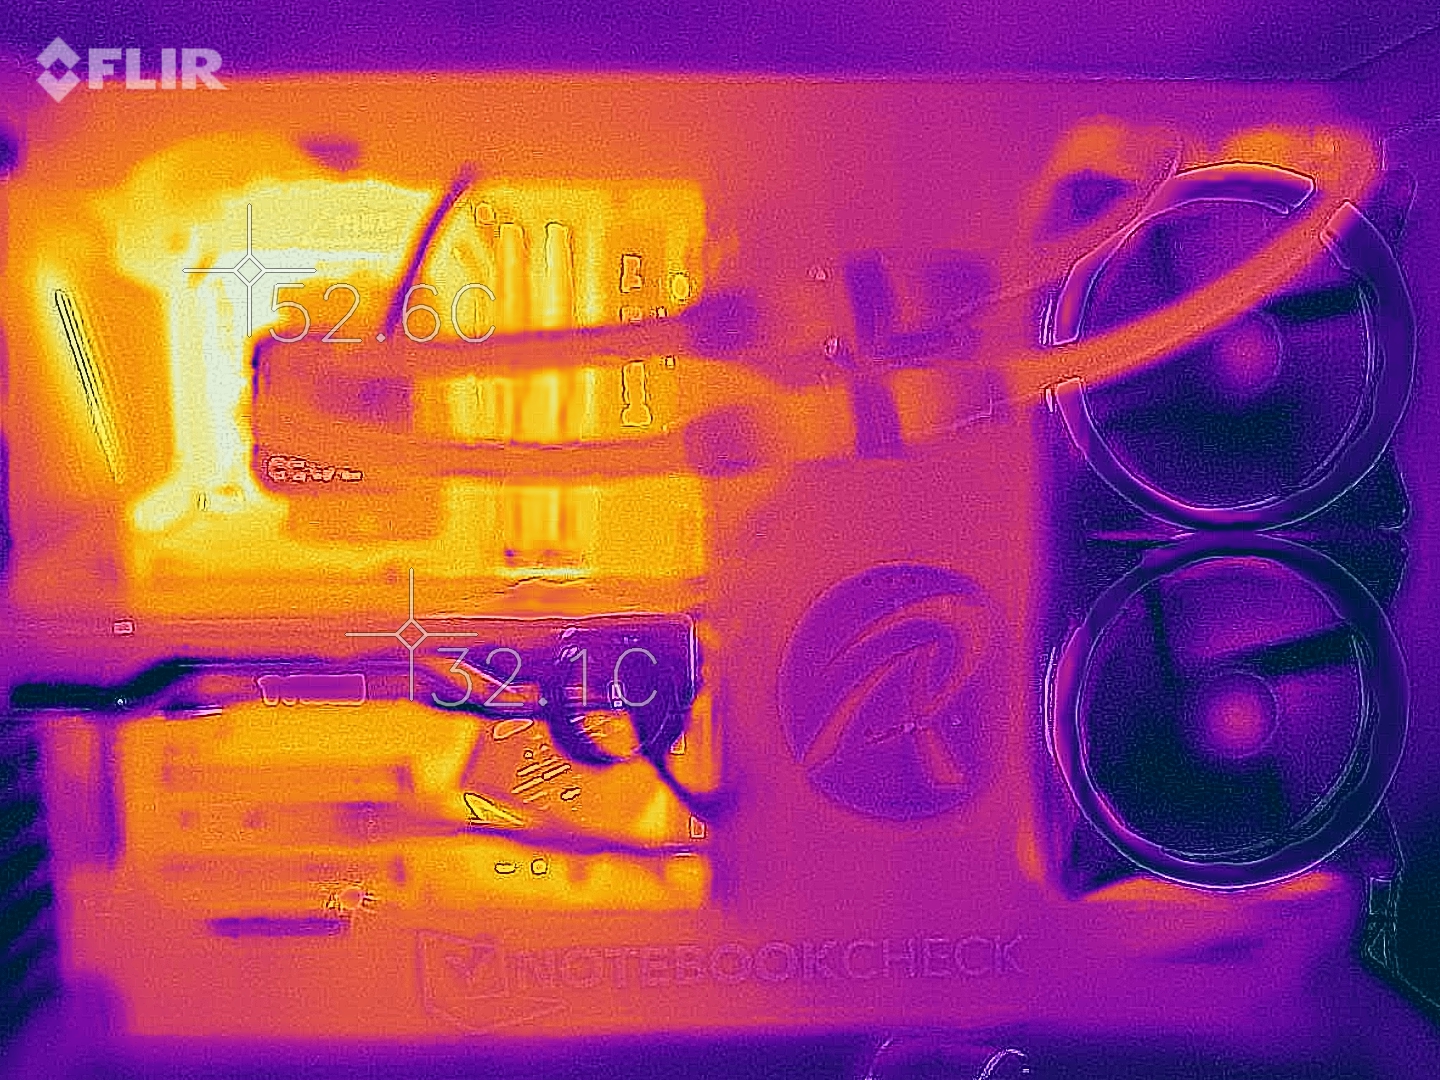
Ninguna de nuestras dos muestras de prueba mostró problemas térmicos durante nuestra prueba de estrés. El Alphacool Eisbear 280 no tuvo problemas para mantener las temperaturas en control en ambas muestras en nuestra mesa de pruebas abierta, aunque debemos señalar que el Ryzen 7 5800X se calentó bastante más que el Ryzen 9 5900X durante nuestras pruebas.
A diferencia del AMD Ryzen 9 3900X, estas CPUs no vienen con una caja refrigeradora. Si opta por un procesador Ryzen de la serie 5000, tendrá que proporcionar un potente refrigerador para la CPU.
Por favor, tenga en cuenta que el consumo de energía como se indica en esta prueba es para todo el sistema sin monitor.
AMD Ryzen 9 5900X
AMD Ryzen 7 5800X
* ... más pequeño es mejor
Overclocking - No lo recomendaría
El overclocking es una forma de exprimir ese pequeño extra de rendimiento de los componentes de uno. Sin embargo, requiere un refrigerador de CPU muy potente, y no ganarás terreno de otra manera.
Como ya hemos establecido en el pasado, los procesadores de Ryzen no son particularmente adecuados para el overclocking, y esto también es cierto para la última generación de Zen 3. Considerando el aumento del voltaje de la CPU y las temperaturas más altas resultantes, no consideraríamos un aumento del rendimiento del 5 % como una compensación que valga la pena. Especialmente considerando que realmente pierdes el rendimiento de un solo núcleo debido al hecho de que el PBO está desactivado cuando se hace overclocking manualmente.
Pro
Contra
Veredicto - AMD tiene la CPU de juego más rápida

La familia Ryzen 5000 de AMD es una continuación perfecta de la historia de éxito de Ryzen de AMD, y por primera vez un procesador Ryzen es la mejor CPU para juegos y supera al anterior reyezuelo, el Core i9-10900K. Y ni siquiera hemos tomado en consideración el nuevo modelo insignia de alta gama, el Ryzen 9 5950X, y hemos basado nuestras opiniones en el AMD Ryzen 9 5900X y el AMD Ryzen 7 5800X. Esperamos que el 5950X suba el listón de la CPU de juego más rápida aún más, esperemos que en no más de unos pocos días.
Hasta entonces podemos concluir que las mejoras del Zen 3 de AMD funcionaron brillantemente bien. AMD no solo logró empacar más núcleos en un solo dado, sino que también rediseñó completamente el CCX para mejorar el IPC. Y no es de extrañar que aquí es donde los nuevos procesadores Ryzen serie 5000 brillan y se las arreglan para superar a la actual CPU insignia de Intel en muchos benchmarks de CPU de un solo núcleo. Además, este rendimiento mejorado de un solo núcleo también se correlaciona directamente con el aumento del rendimiento de varios núcleos, que mejoró significativamente con respecto a la generación Zen 2 de la serie 3000.
El MSRP de AMD de 549 dólares es ligeramente superior al precio de venta de Intel para el Core i9-10900K. El menos potente Ryzen 7 5800X cuesta 100 dólares menos, y a 449 dólares está a un nivel de precios similar al de la competencia de Intel, ofreciendo al mismo tiempo un mayor rendimiento. Otro beneficio es el menor TDP, que puede arreglárselas con un sistema de refrigeración más pequeño que el que funcionaría en el Core i9-10900K. Además, PCI Express 4.0 está actualmente sólo disponible en la plataforma de AMDs. Se espera que las plataformas de Intel tengan soporte para PCIe 4.0 con Rocket Lake en un futuro próximo.
AMD venció a Intel y tiene la CPU de juego más rápida disponible actualmente. El fuerte de Intel, el rendimiento de un solo núcleo, se ha hecho añicos.
Los clientes ahora pueden elegir entre un rápido CPU de 8 núcleos y uno de 12 núcleos aún más rápido. Ambas muestras se comportaron excepcionalmente bien en nuestras pruebas. Sin embargo, si su principal interés es el juego, entonces debe tener en cuenta que el Ryzen 7 5800X ofreció un rendimiento prácticamente idéntico al Ryzen 9 5900X. Los creadores de contenido y los streamers que no quieran tener un PC de streaming dedicado, probablemente se beneficiarán del Ryzen 9 5900X o posiblemente incluso del Ryzen 9 5950X.
