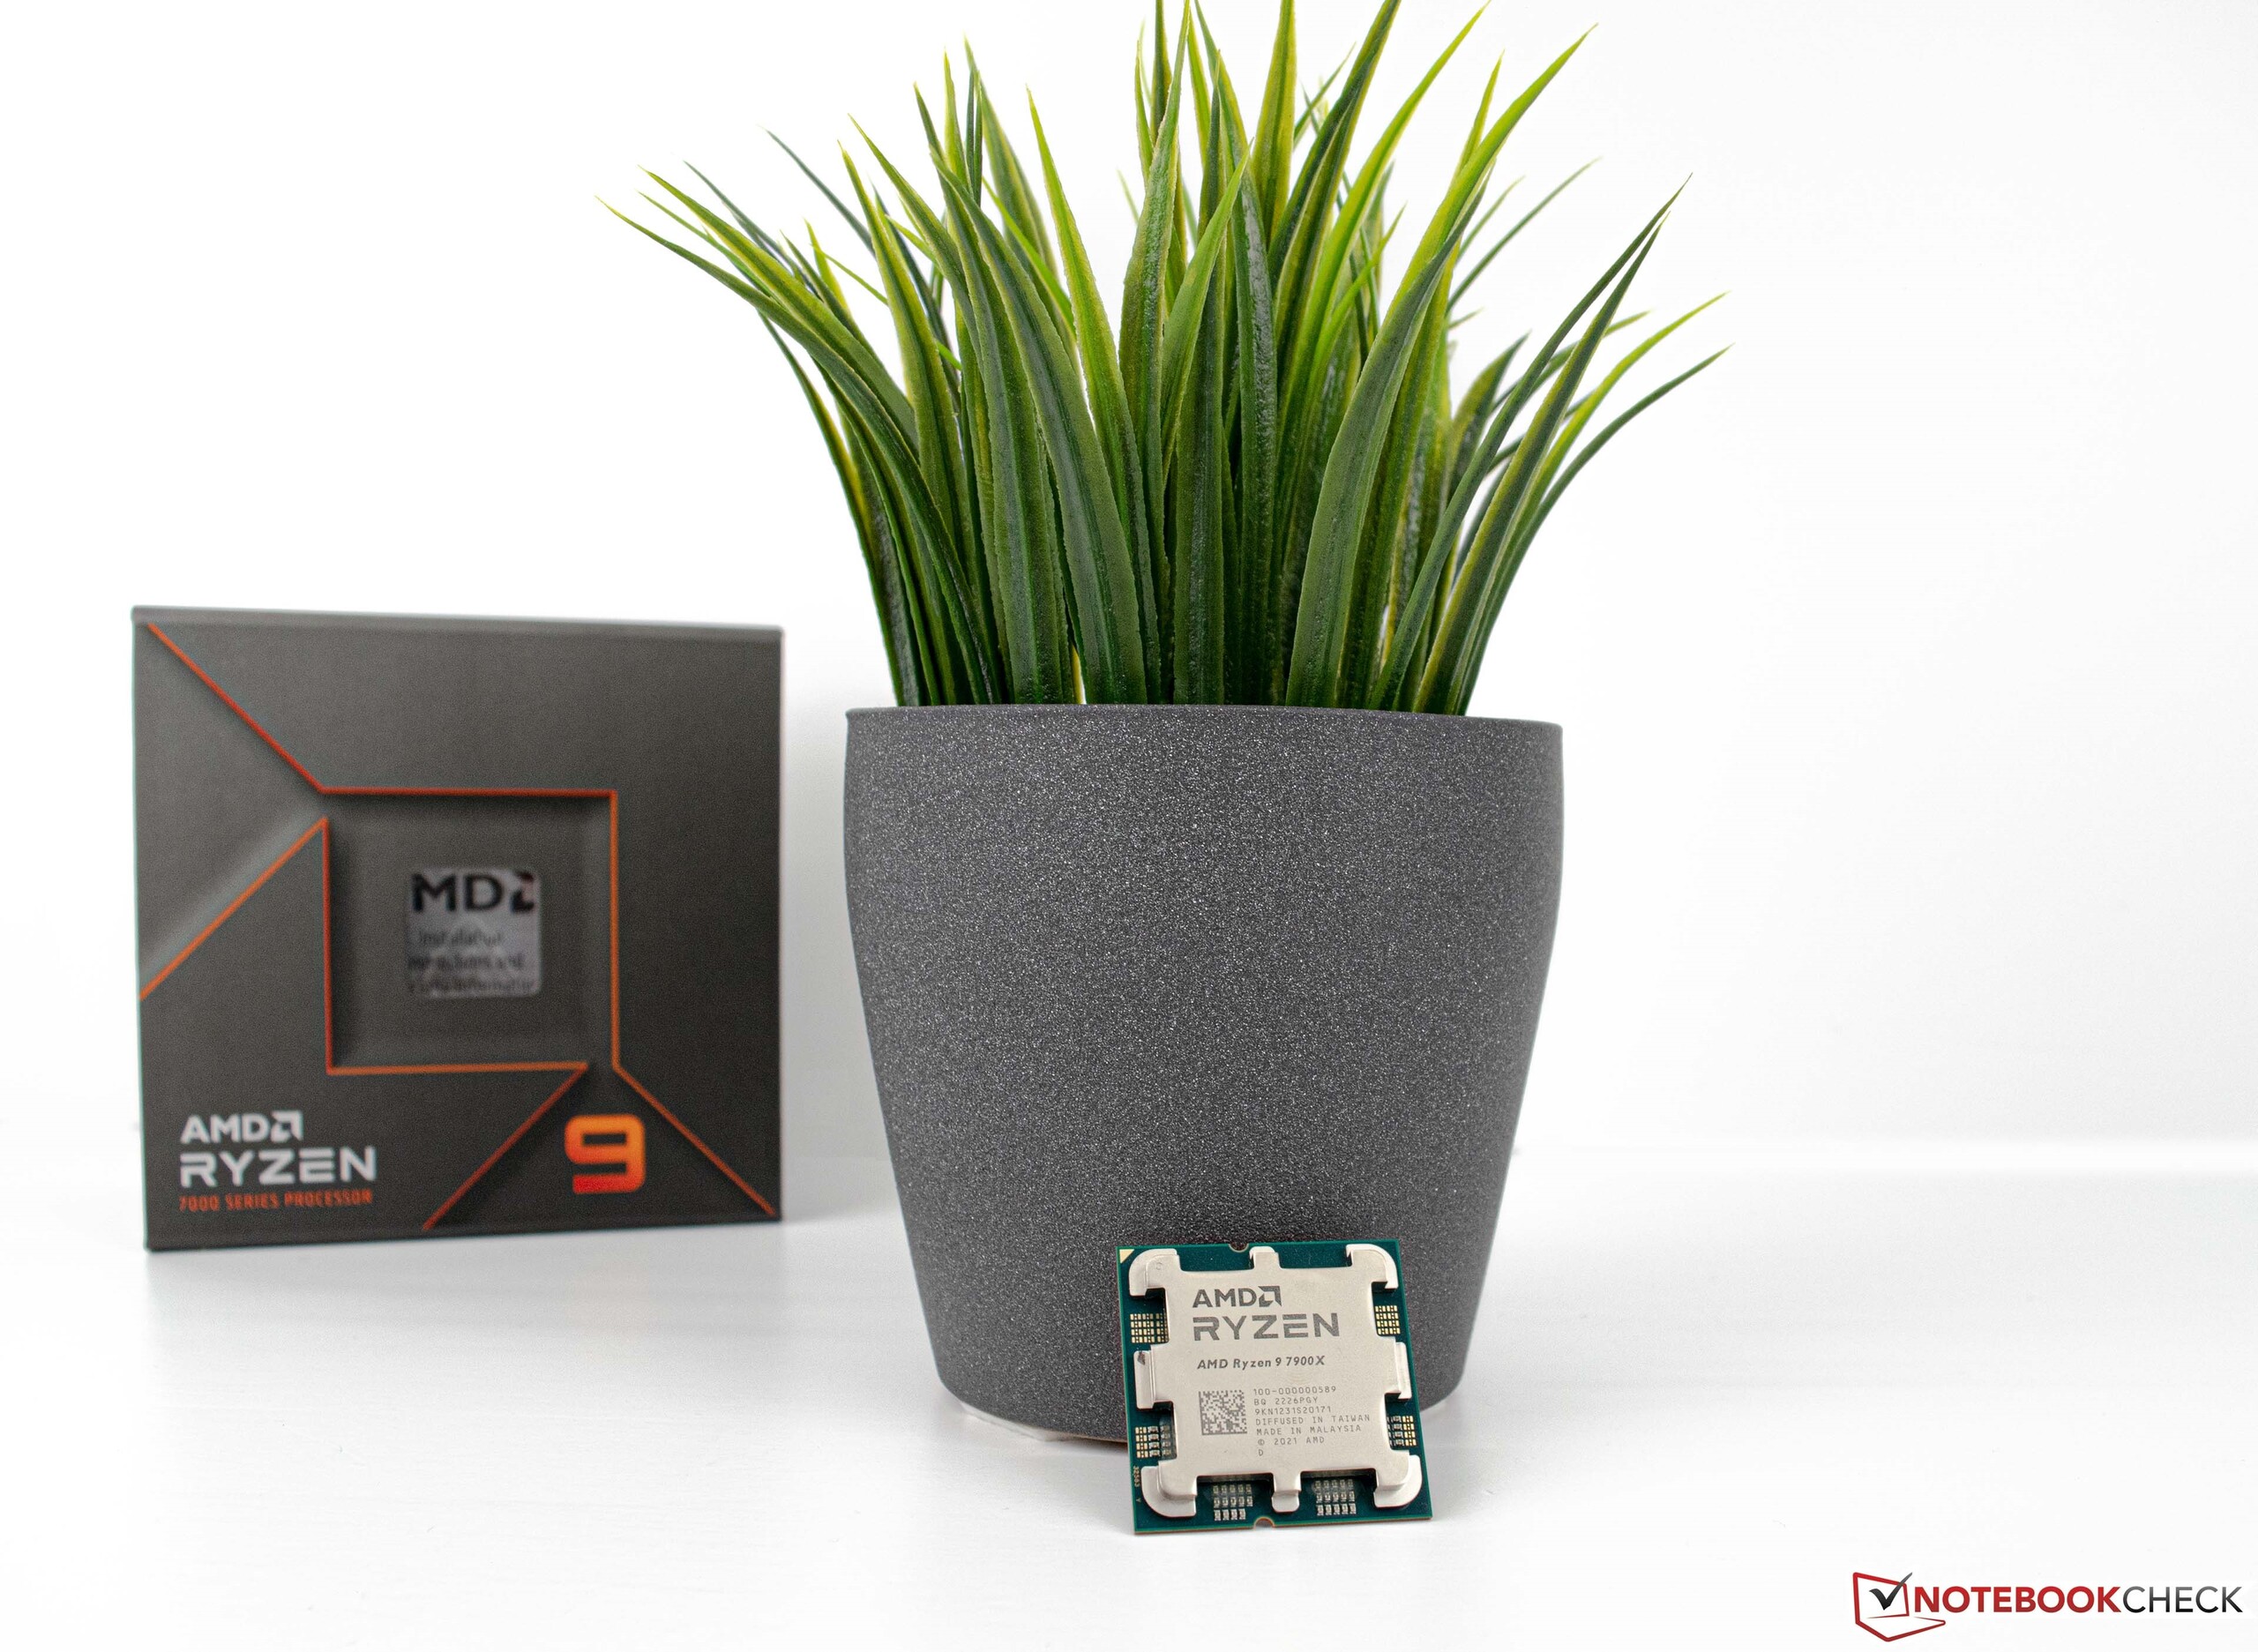
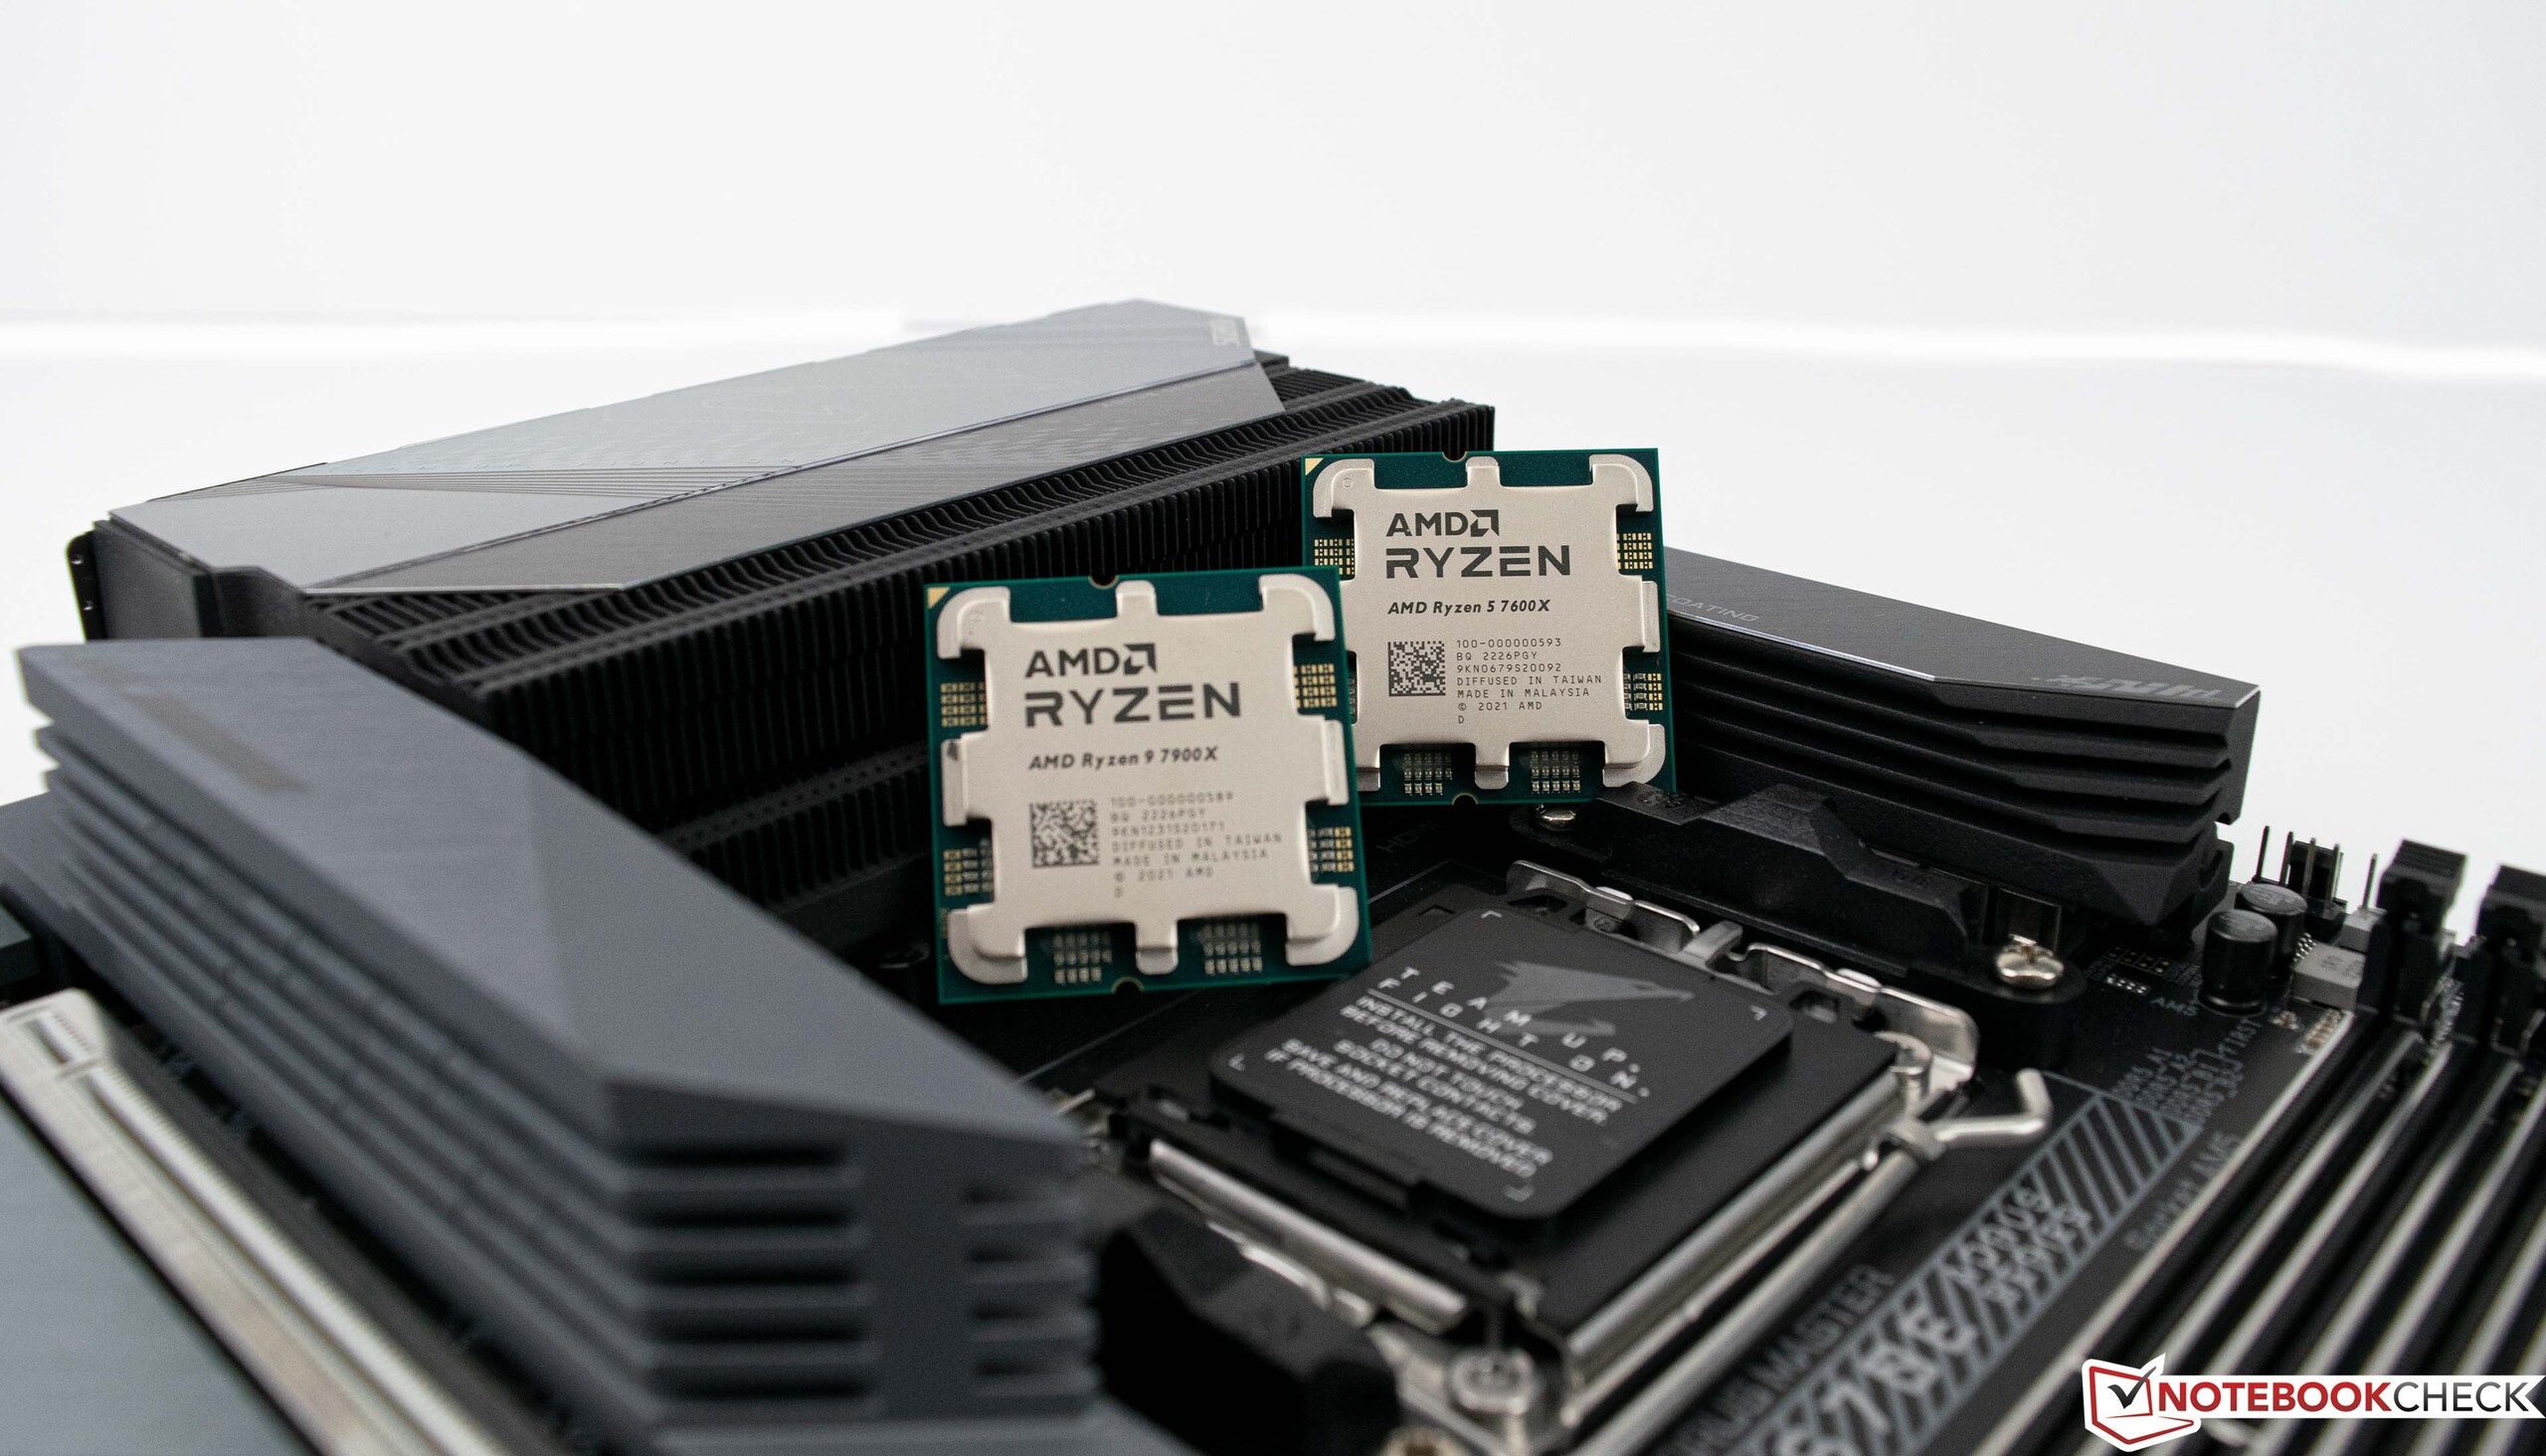
Análisis de AMD Ryzen 9 7900X y AMD Ryzen 5 7600X: ¡De vuelta a la corona de las CPUs para juegos más rápidas con Raphael!
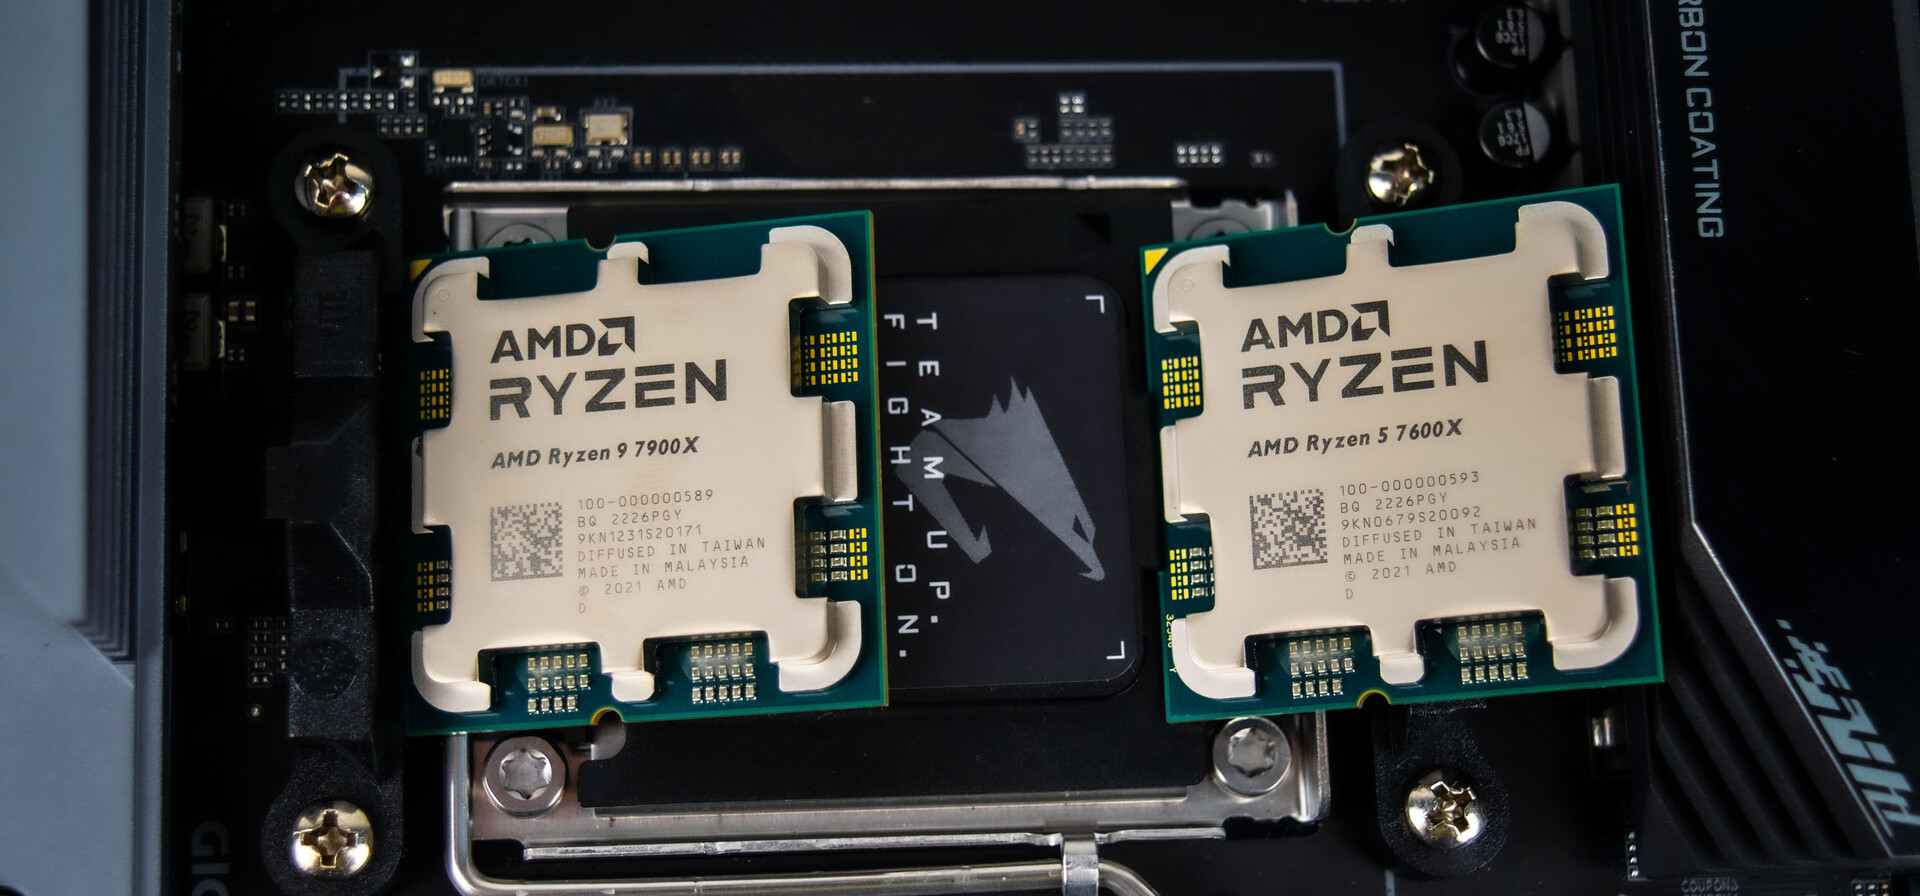
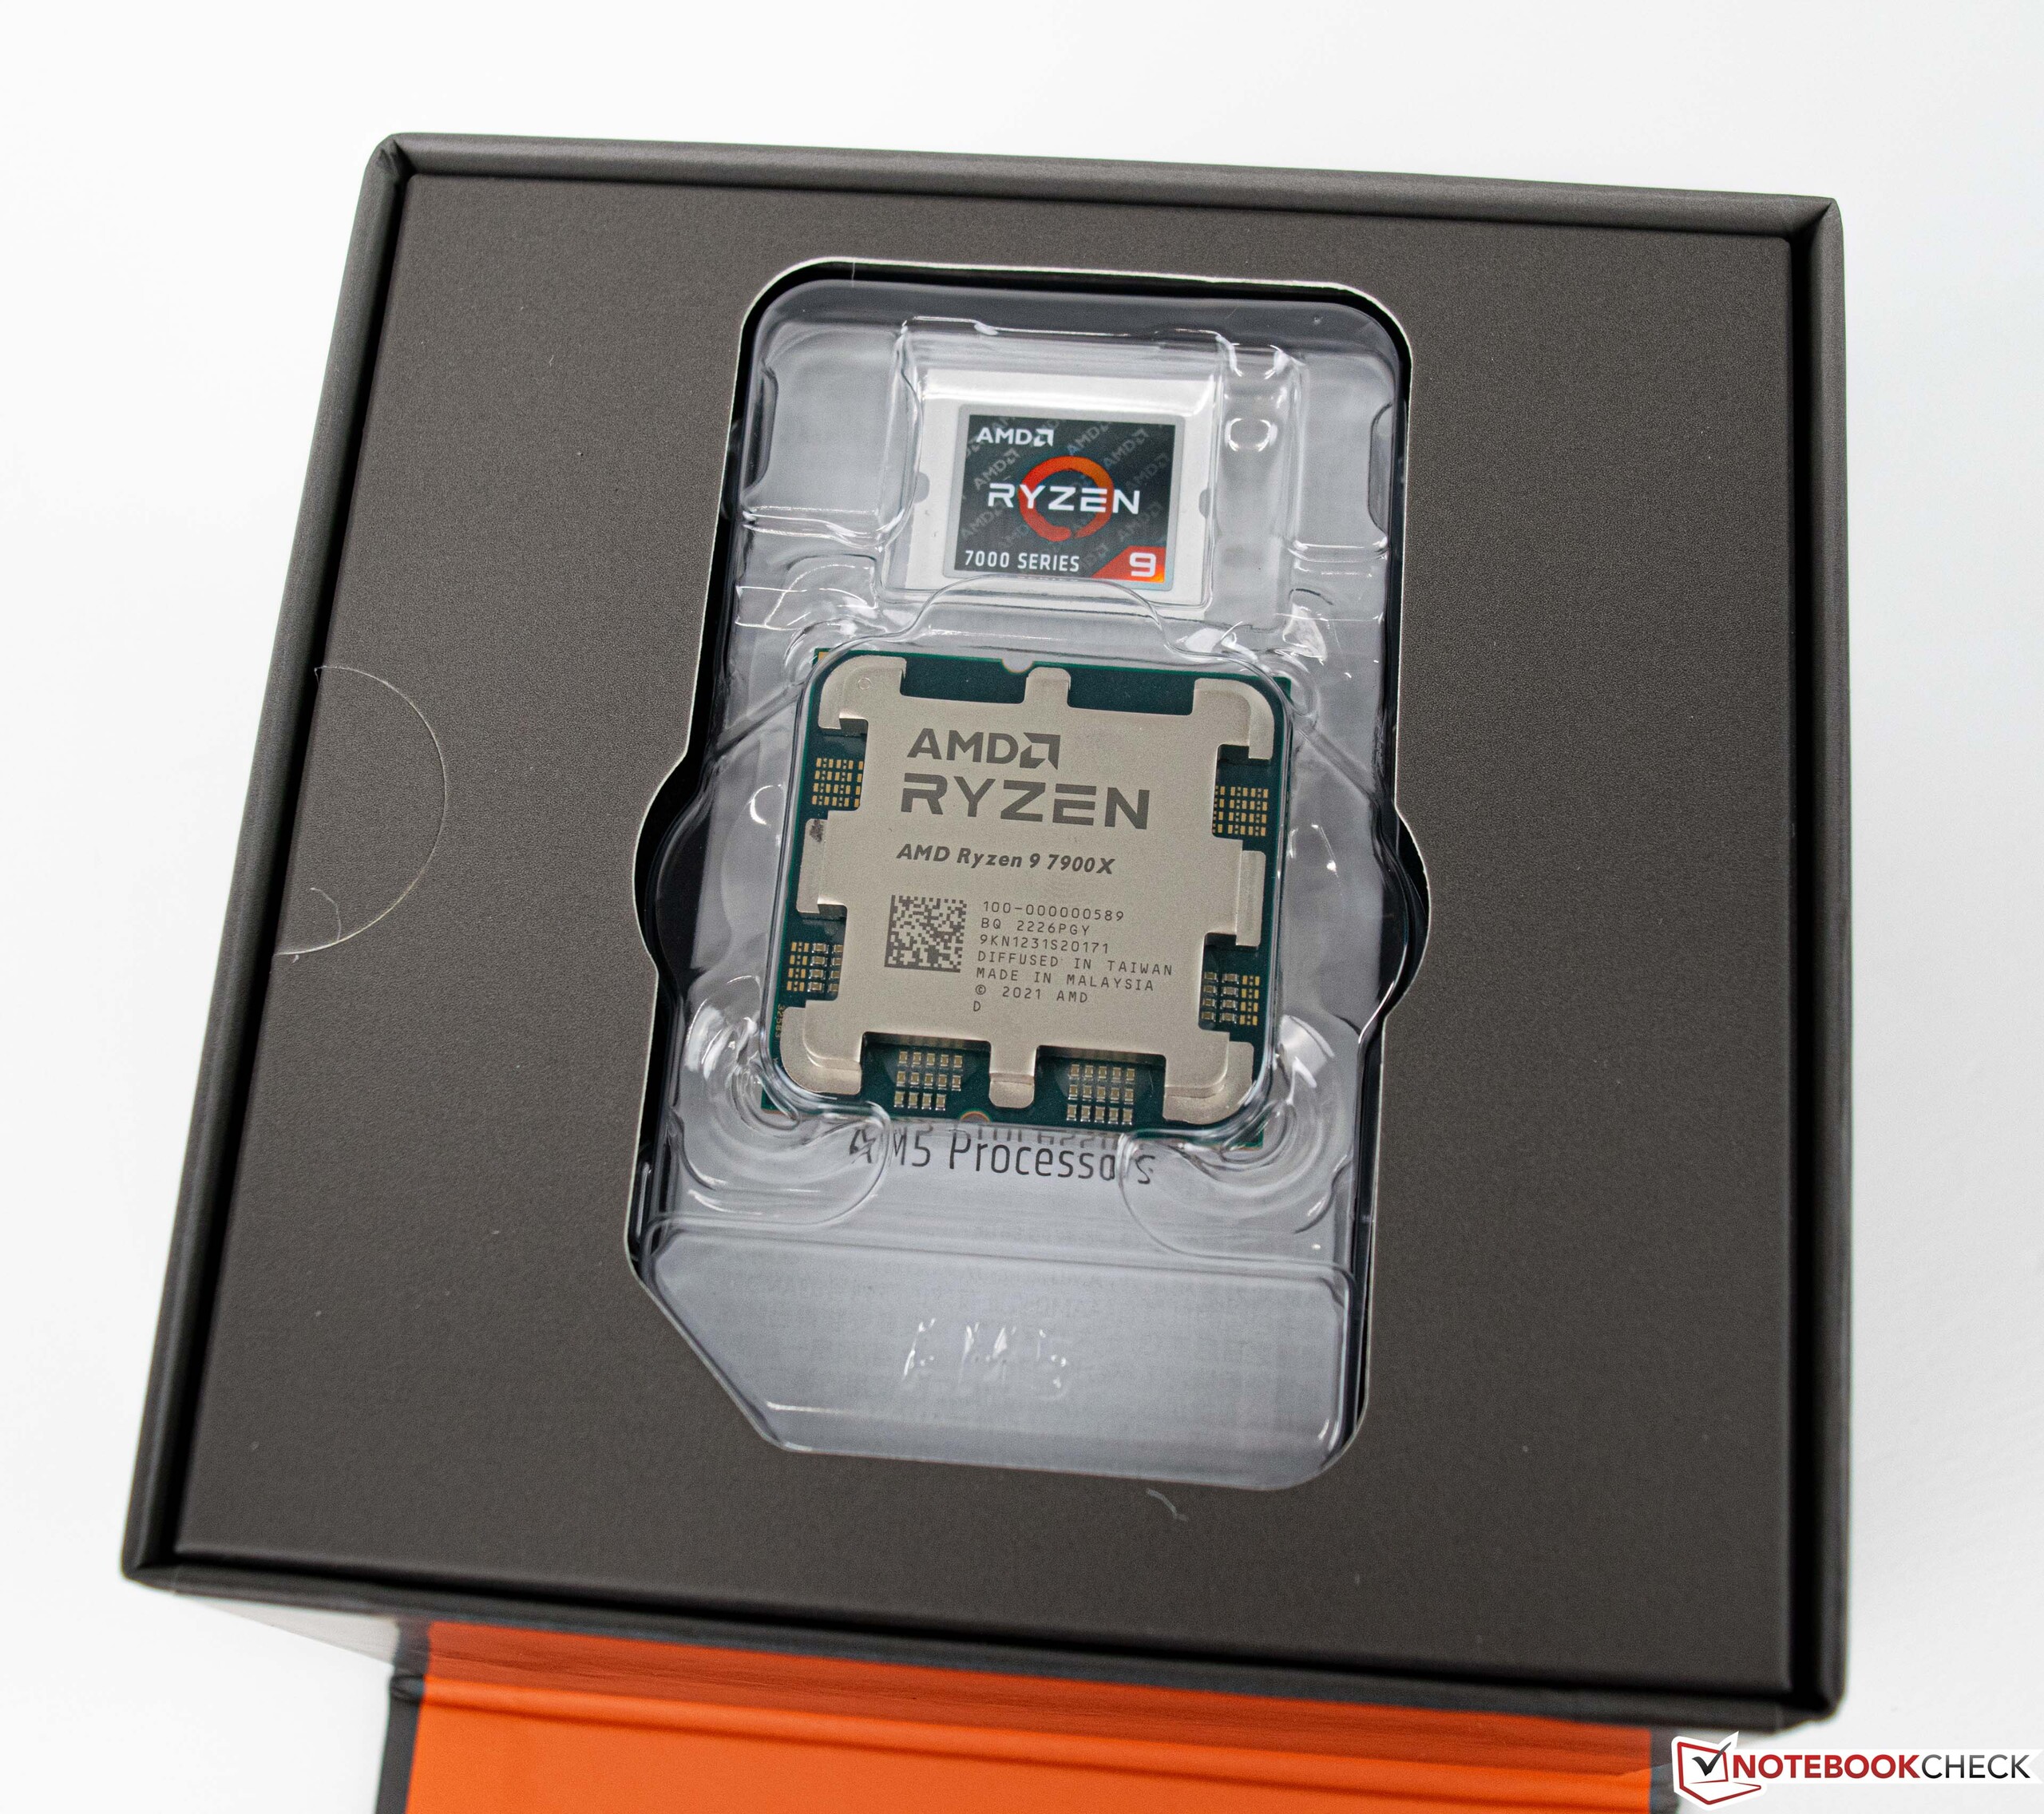
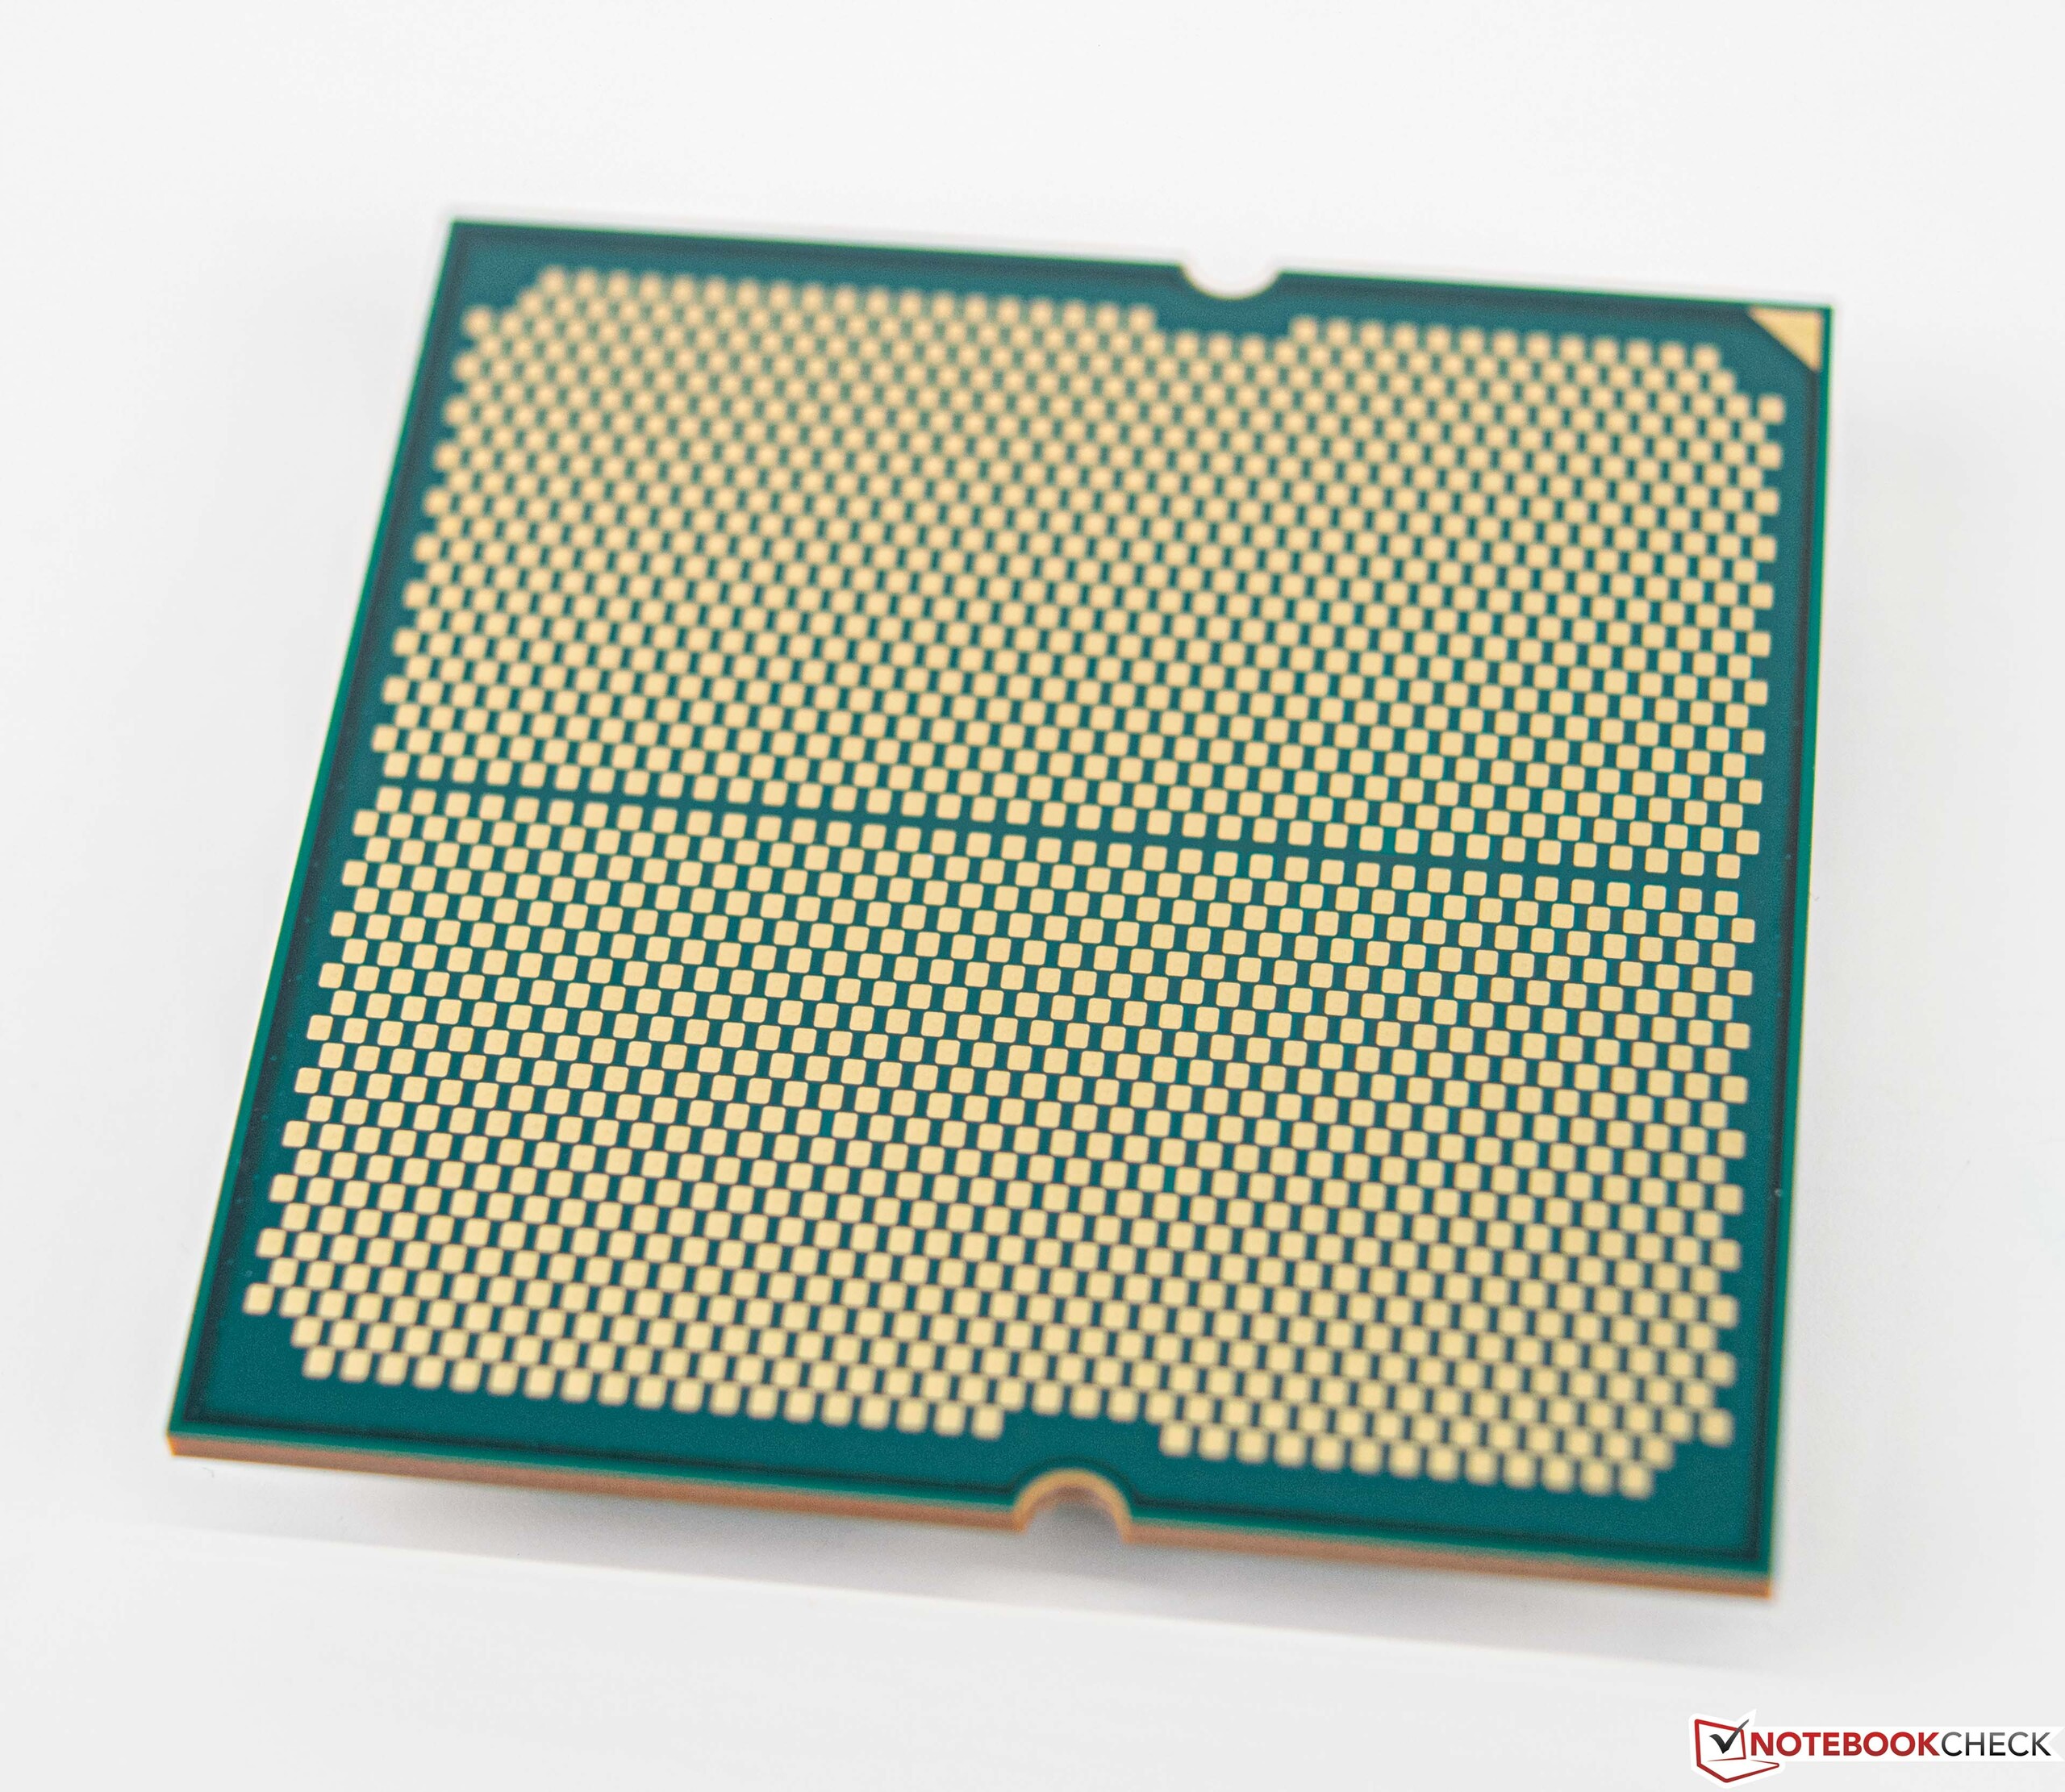
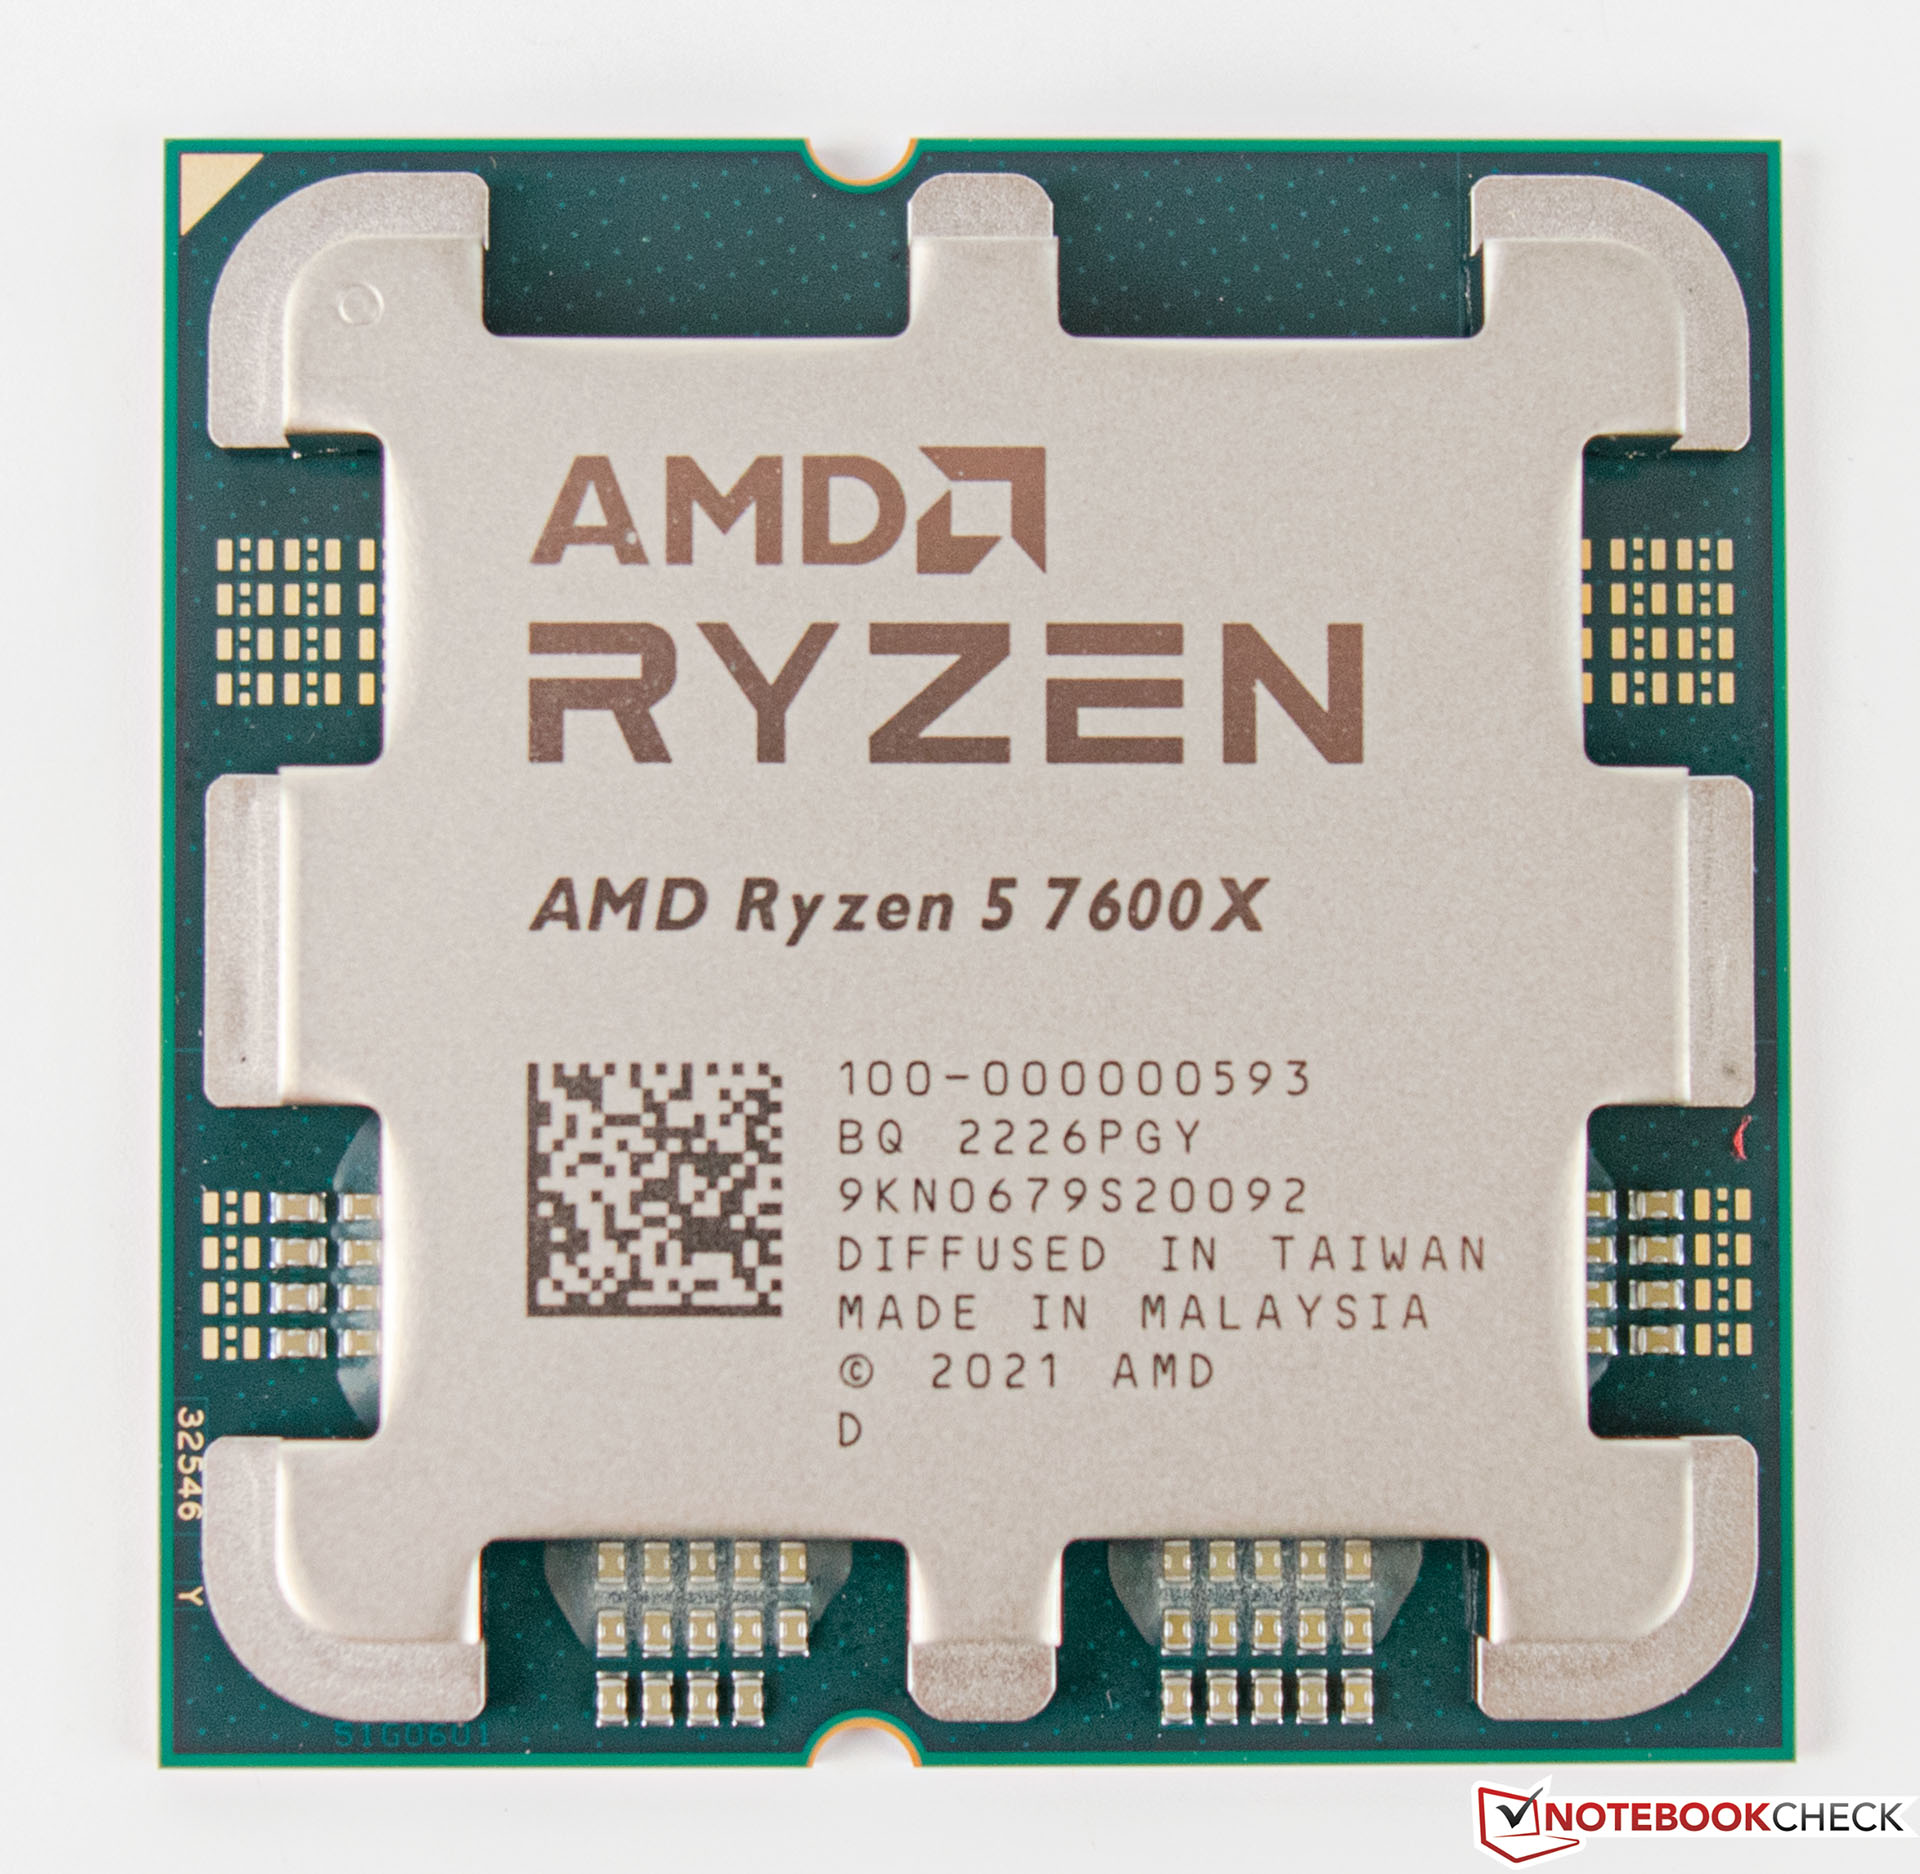
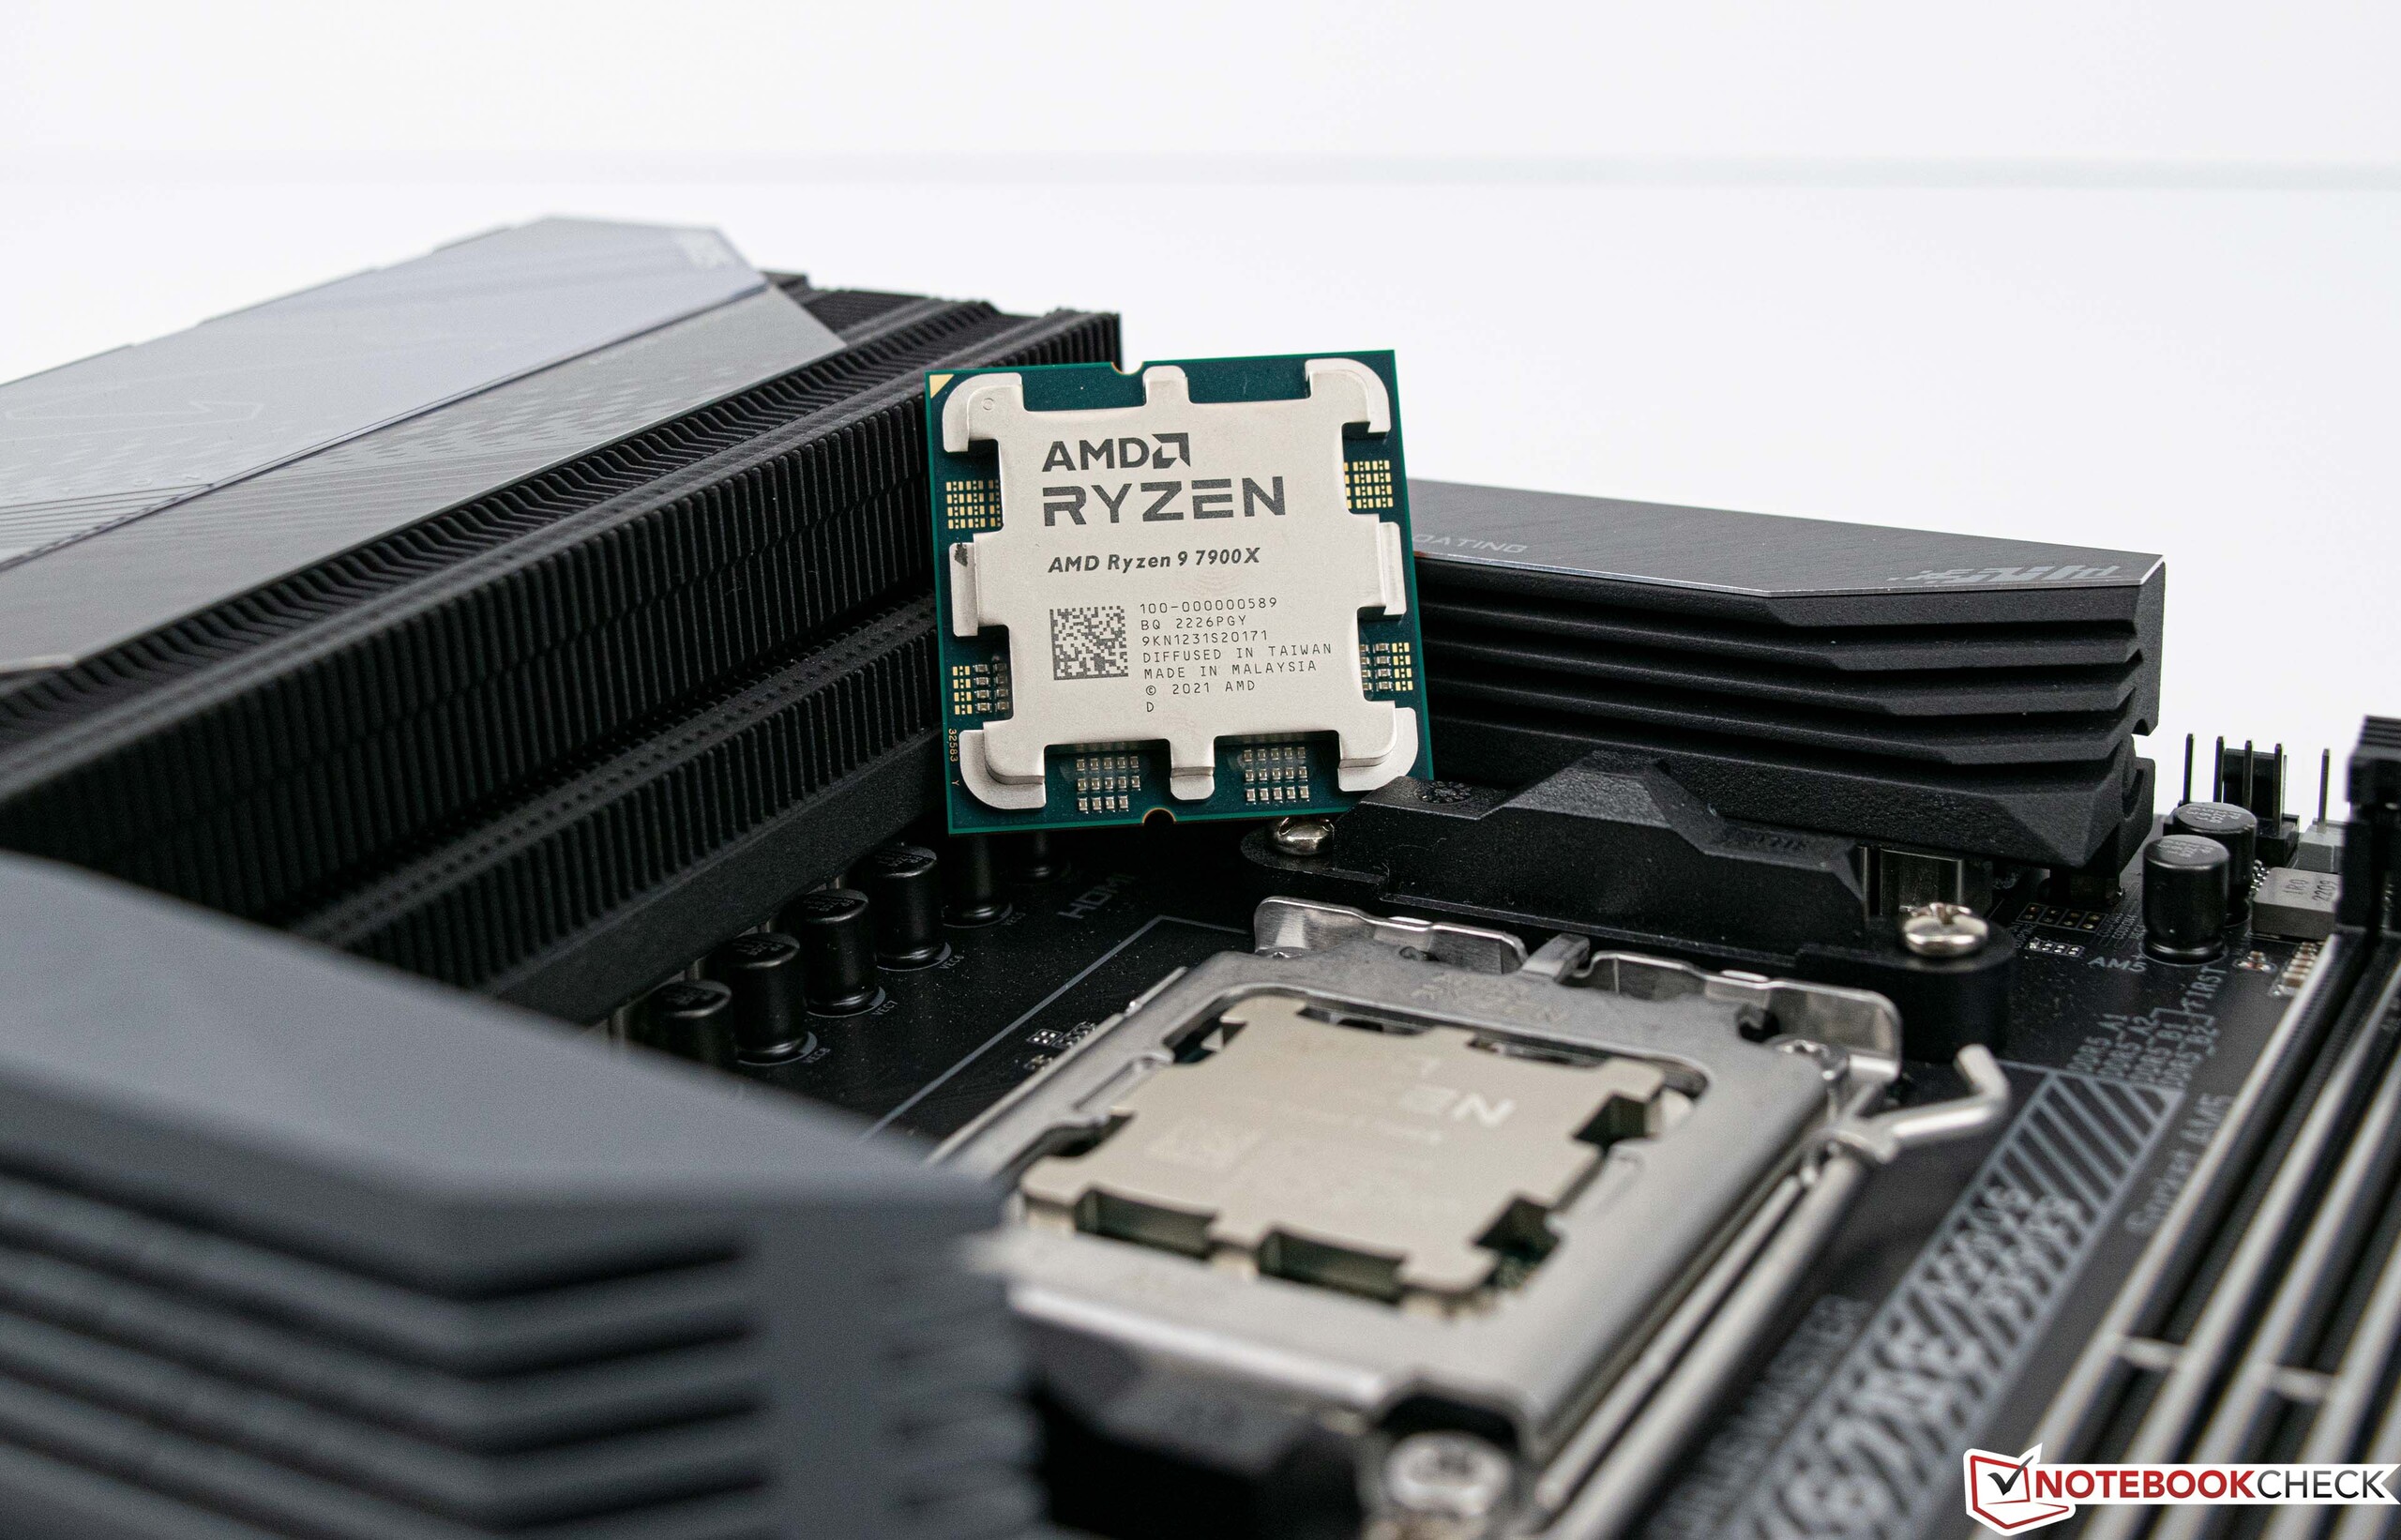
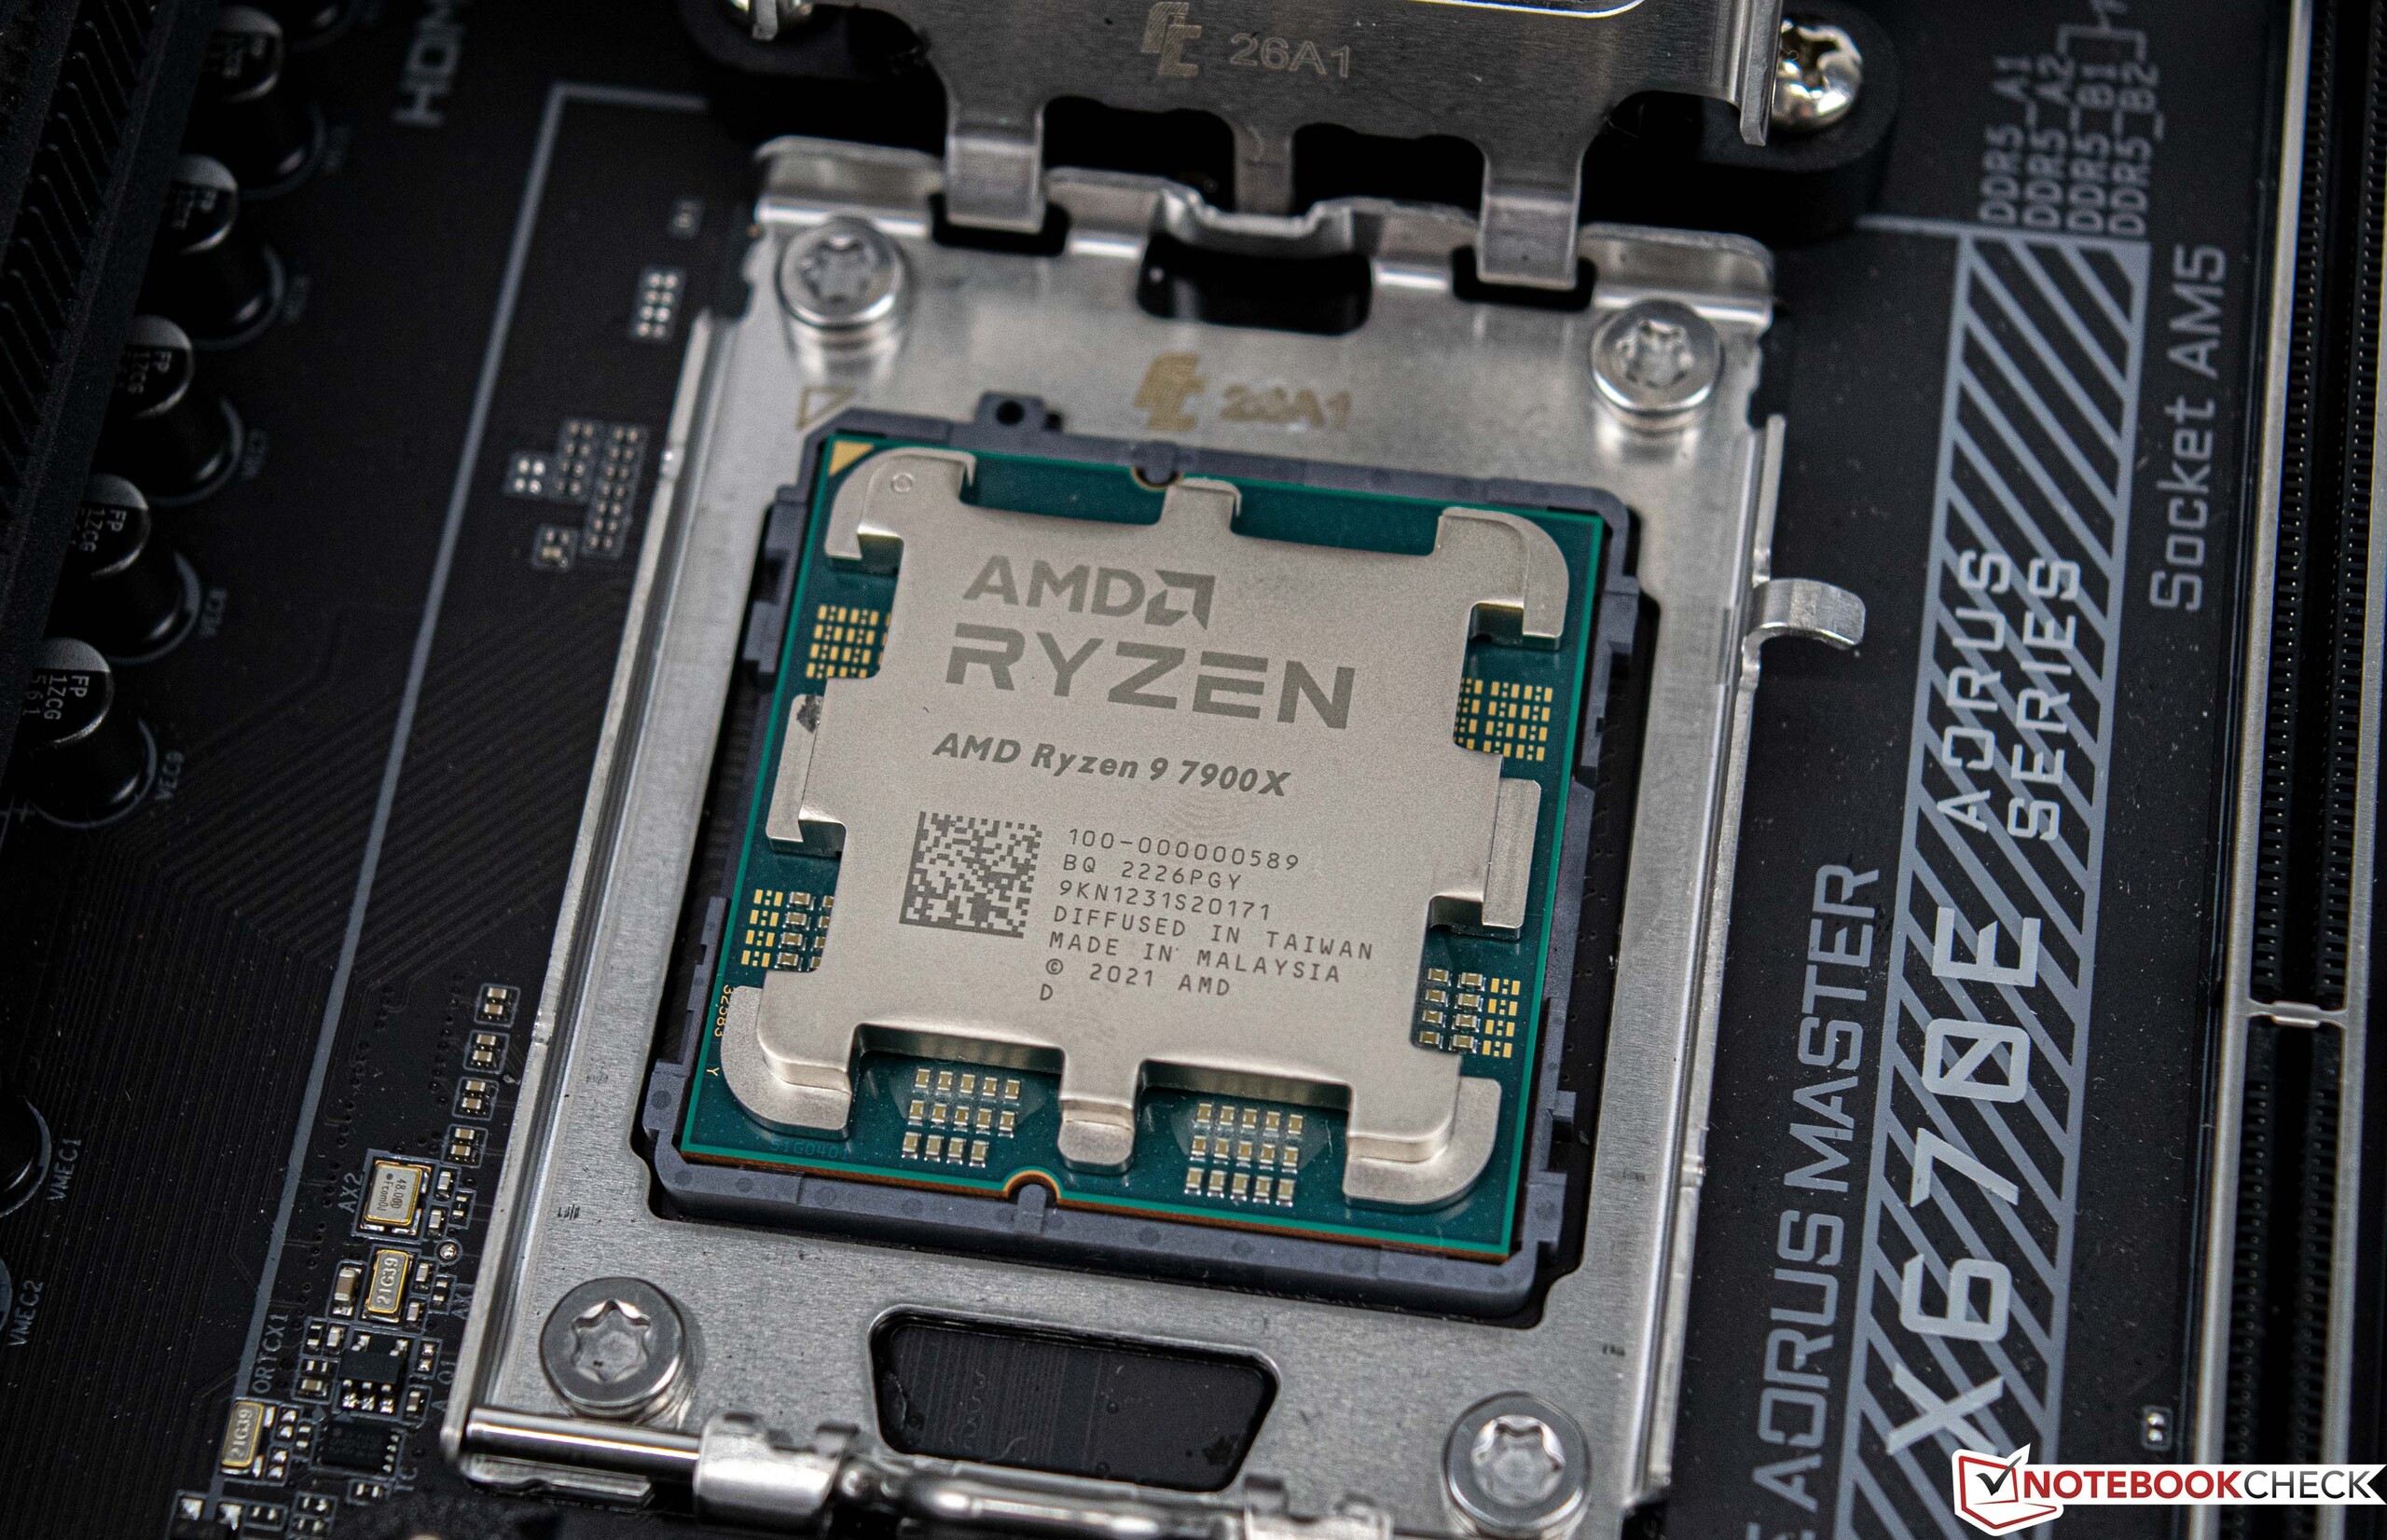
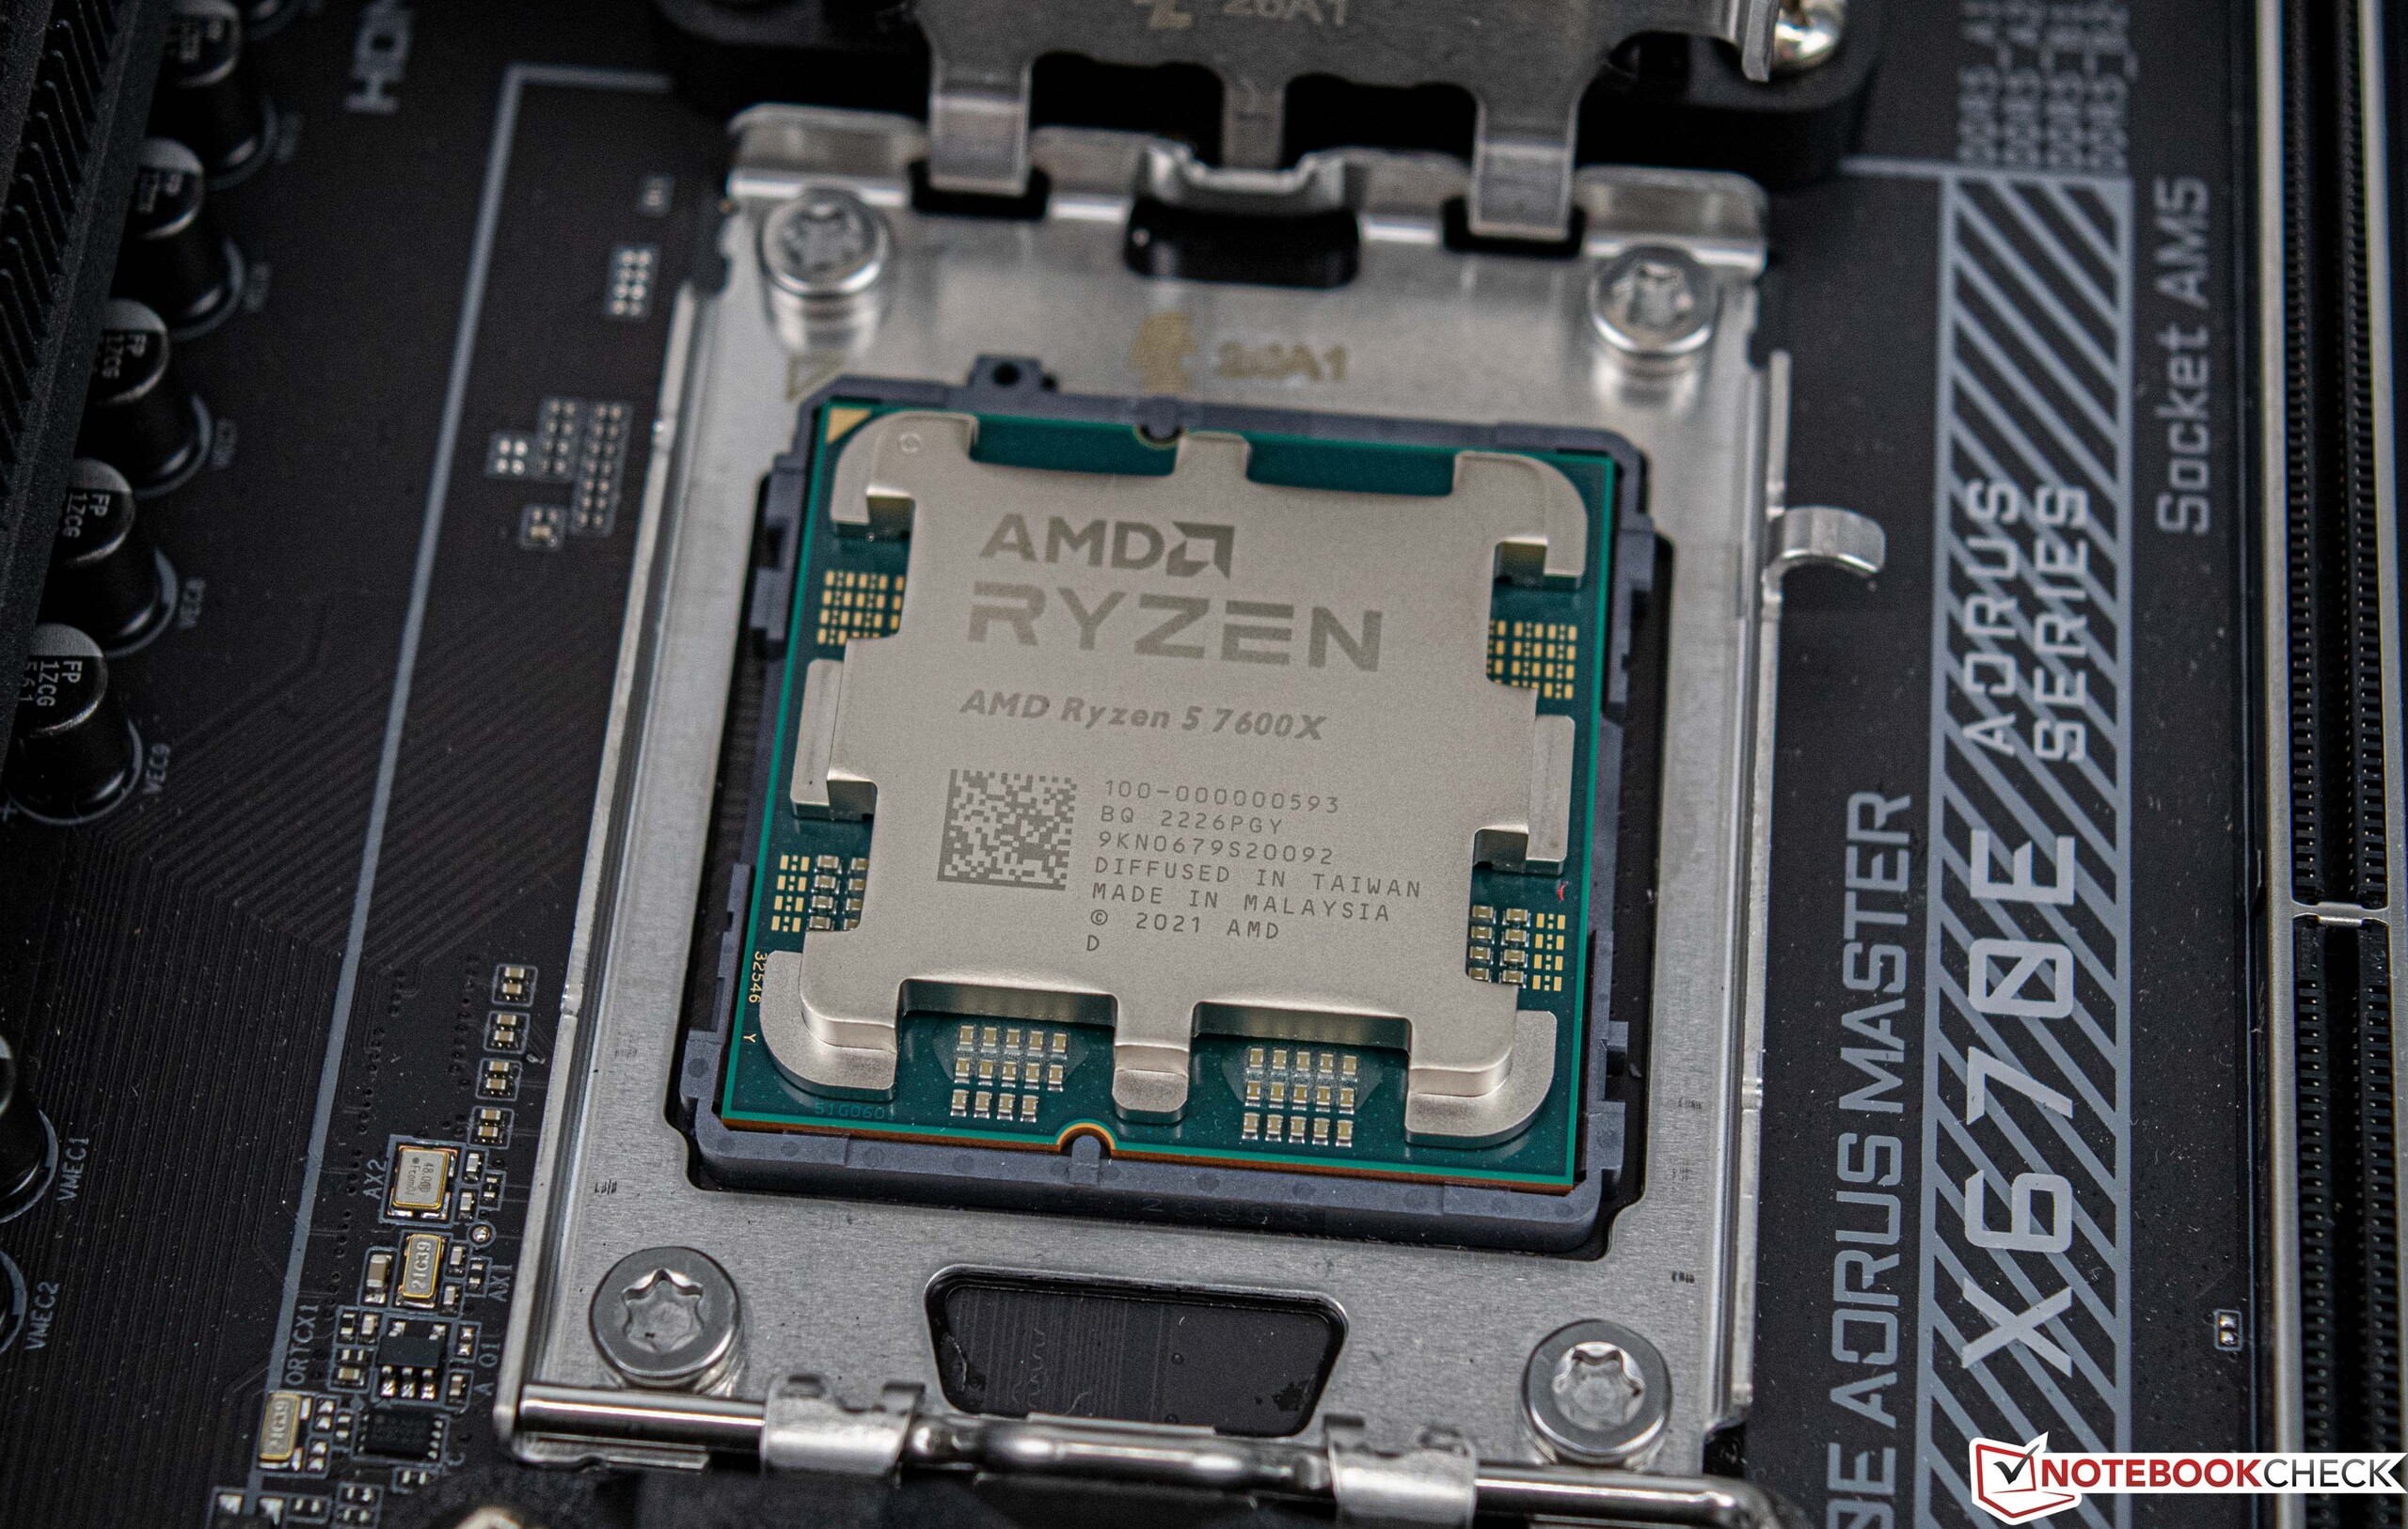
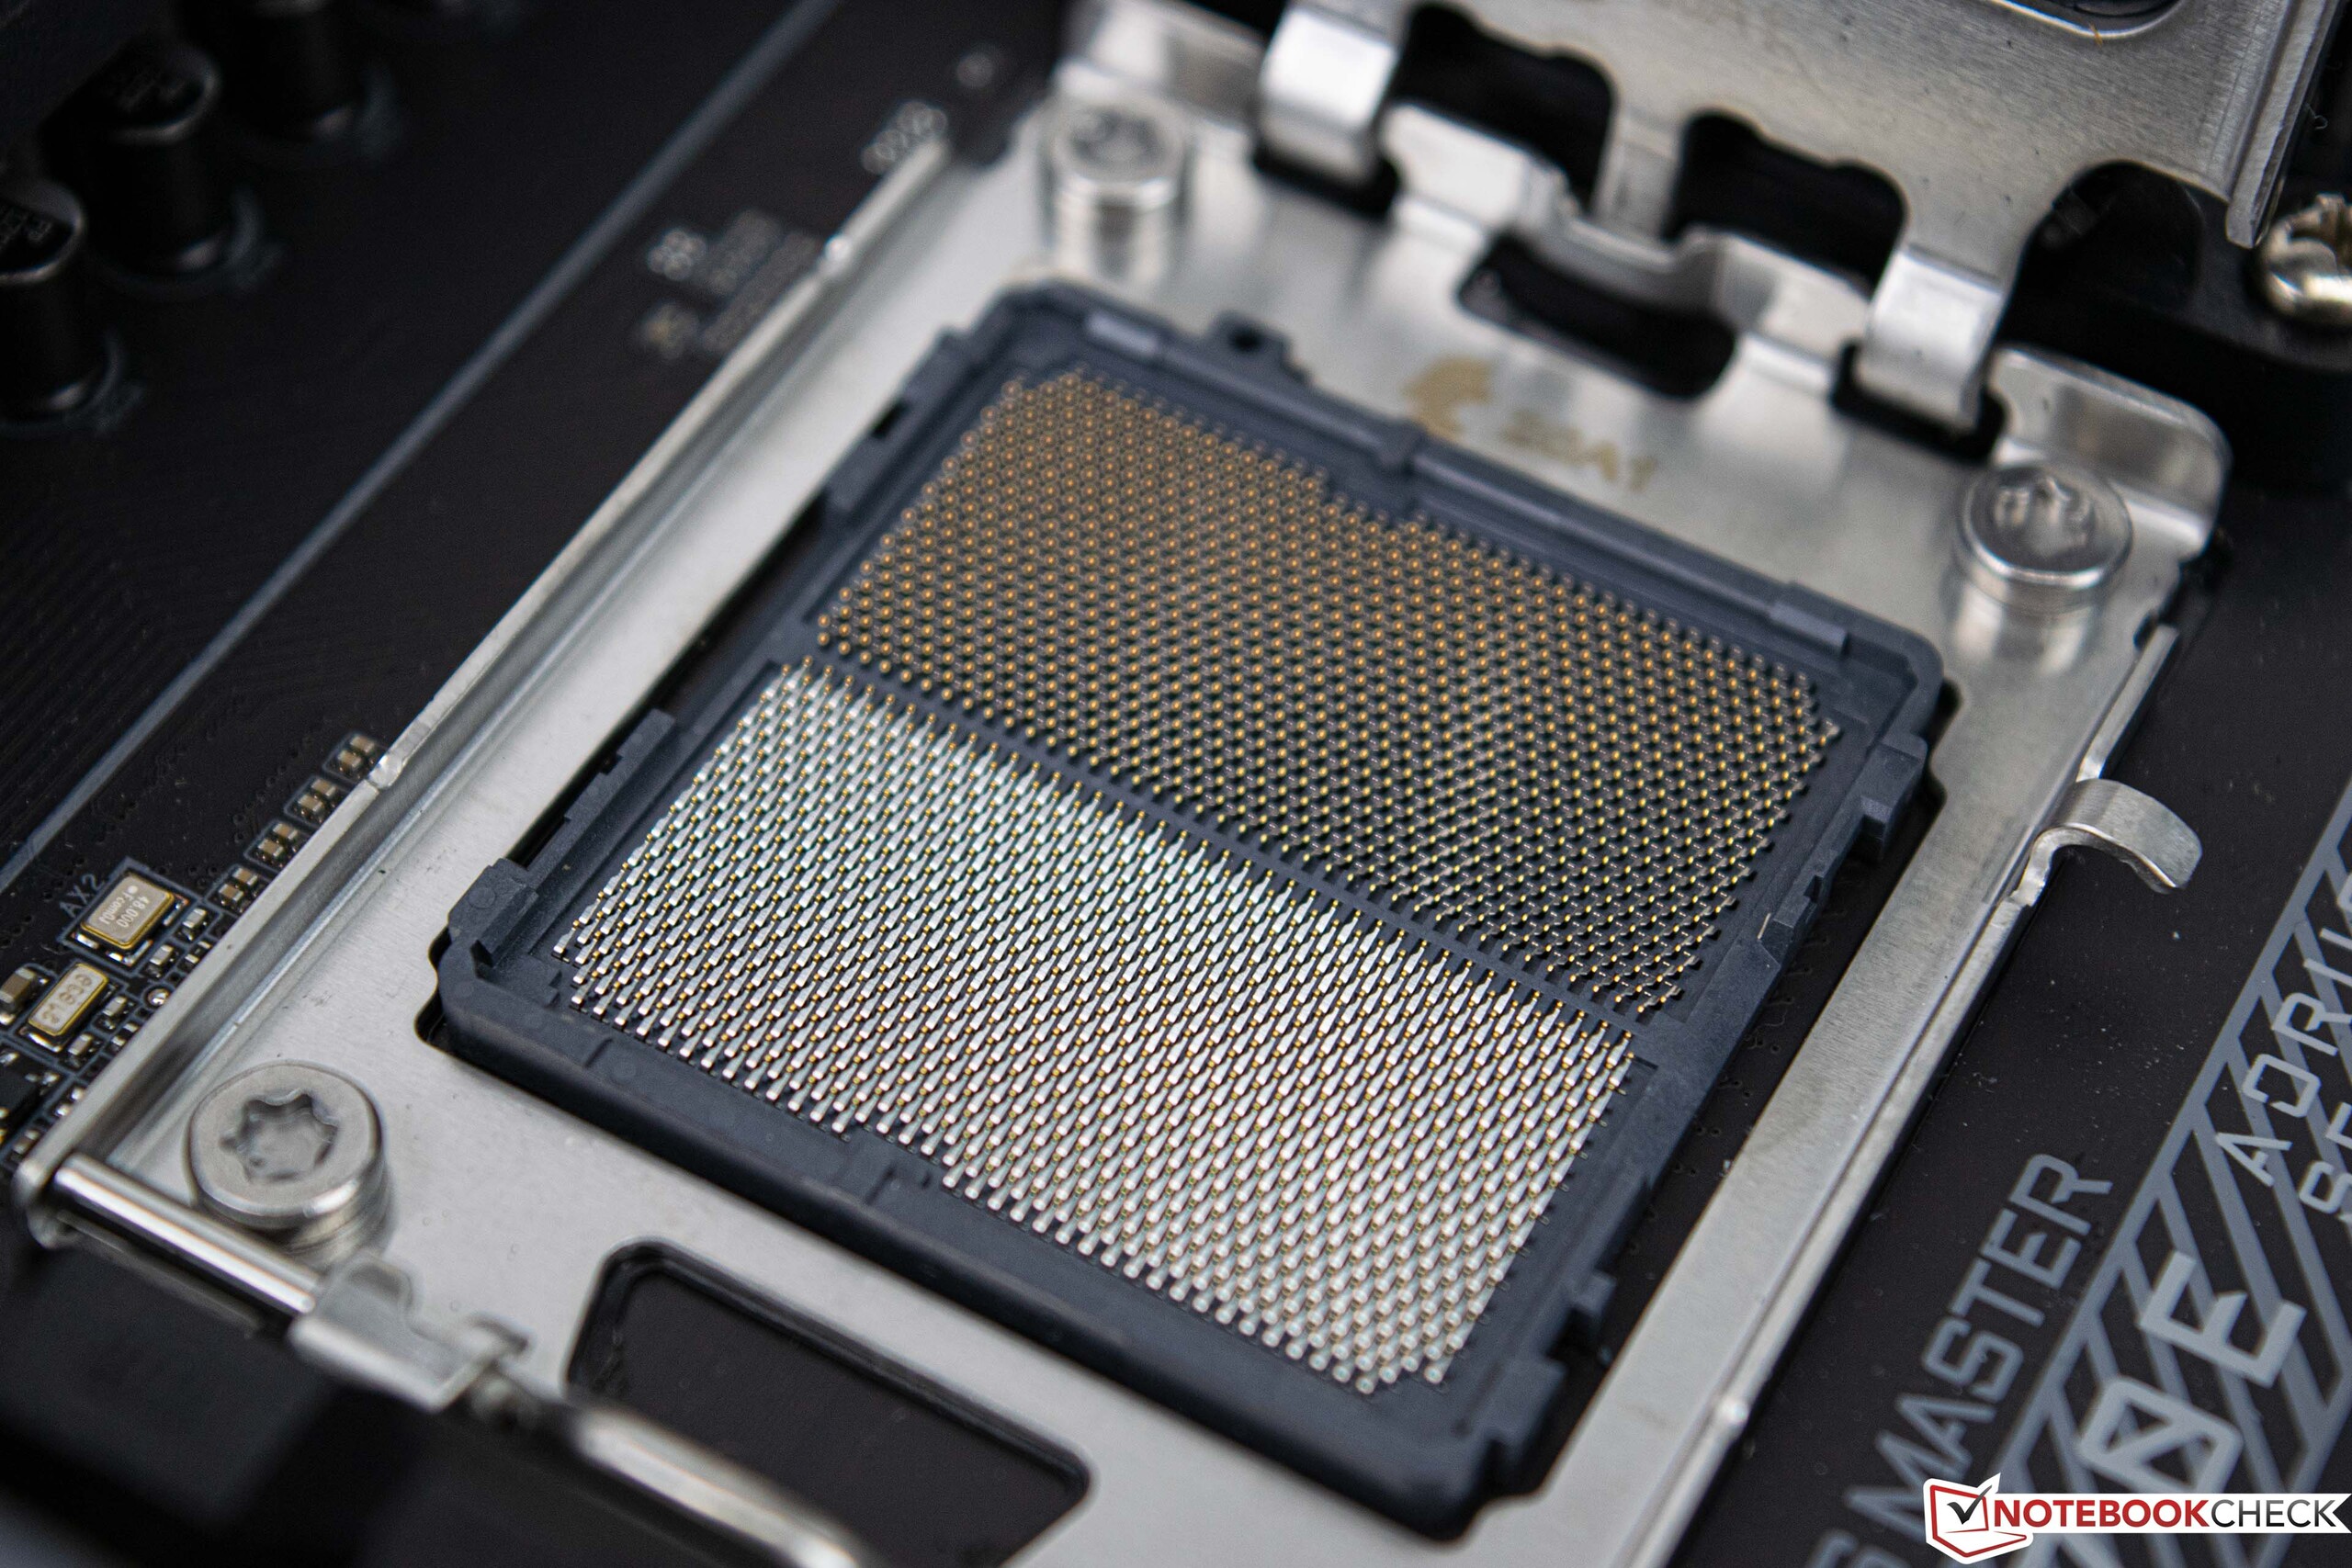
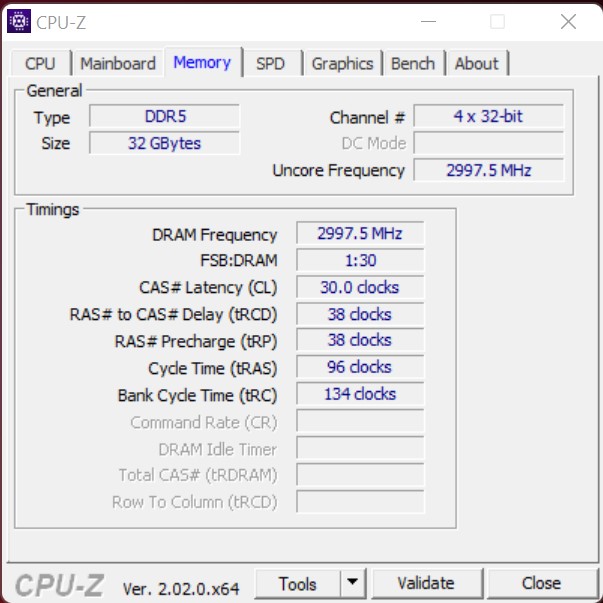
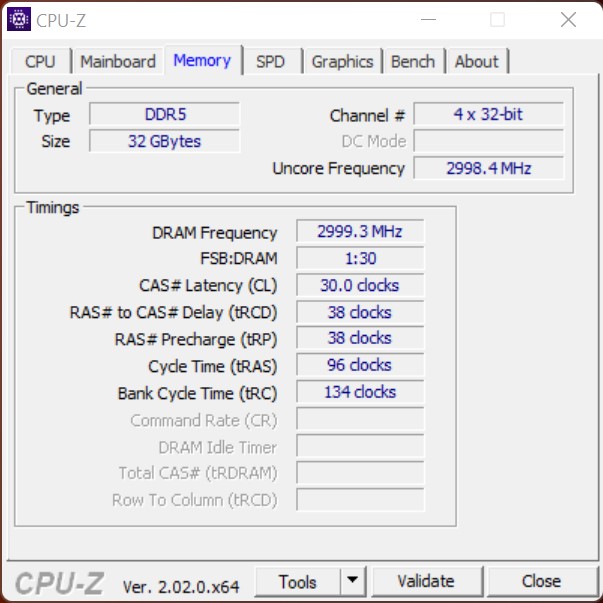
El 08.10.2020, AMD tuvo el último gran lanzamiento en procesadores de escritorio. Hoy, casi dos años después, AMD lanza los nuevos modelos AMD Ryzen 7000. Además de los nuevos procesadores, hay muchas otras innovaciones relacionadas con la placa base y la memoria RAM. El zócalo AM4 se sustituye por el nuevo zócalo AM5 basado en una disposición PGA. Esto significa que Ryzen 7000 no tiene pines, sino sólo superficies de contacto en la parte inferior, 1.718 para ser exactos. Sin embargo, a diferencia de Intel, el uso de DDR5 es obligatorio con Ryzen 7000. No hay compatibilidad con versiones anteriores, lo que debería tenerse en cuenta a la hora de calcular los costes de una actualización.
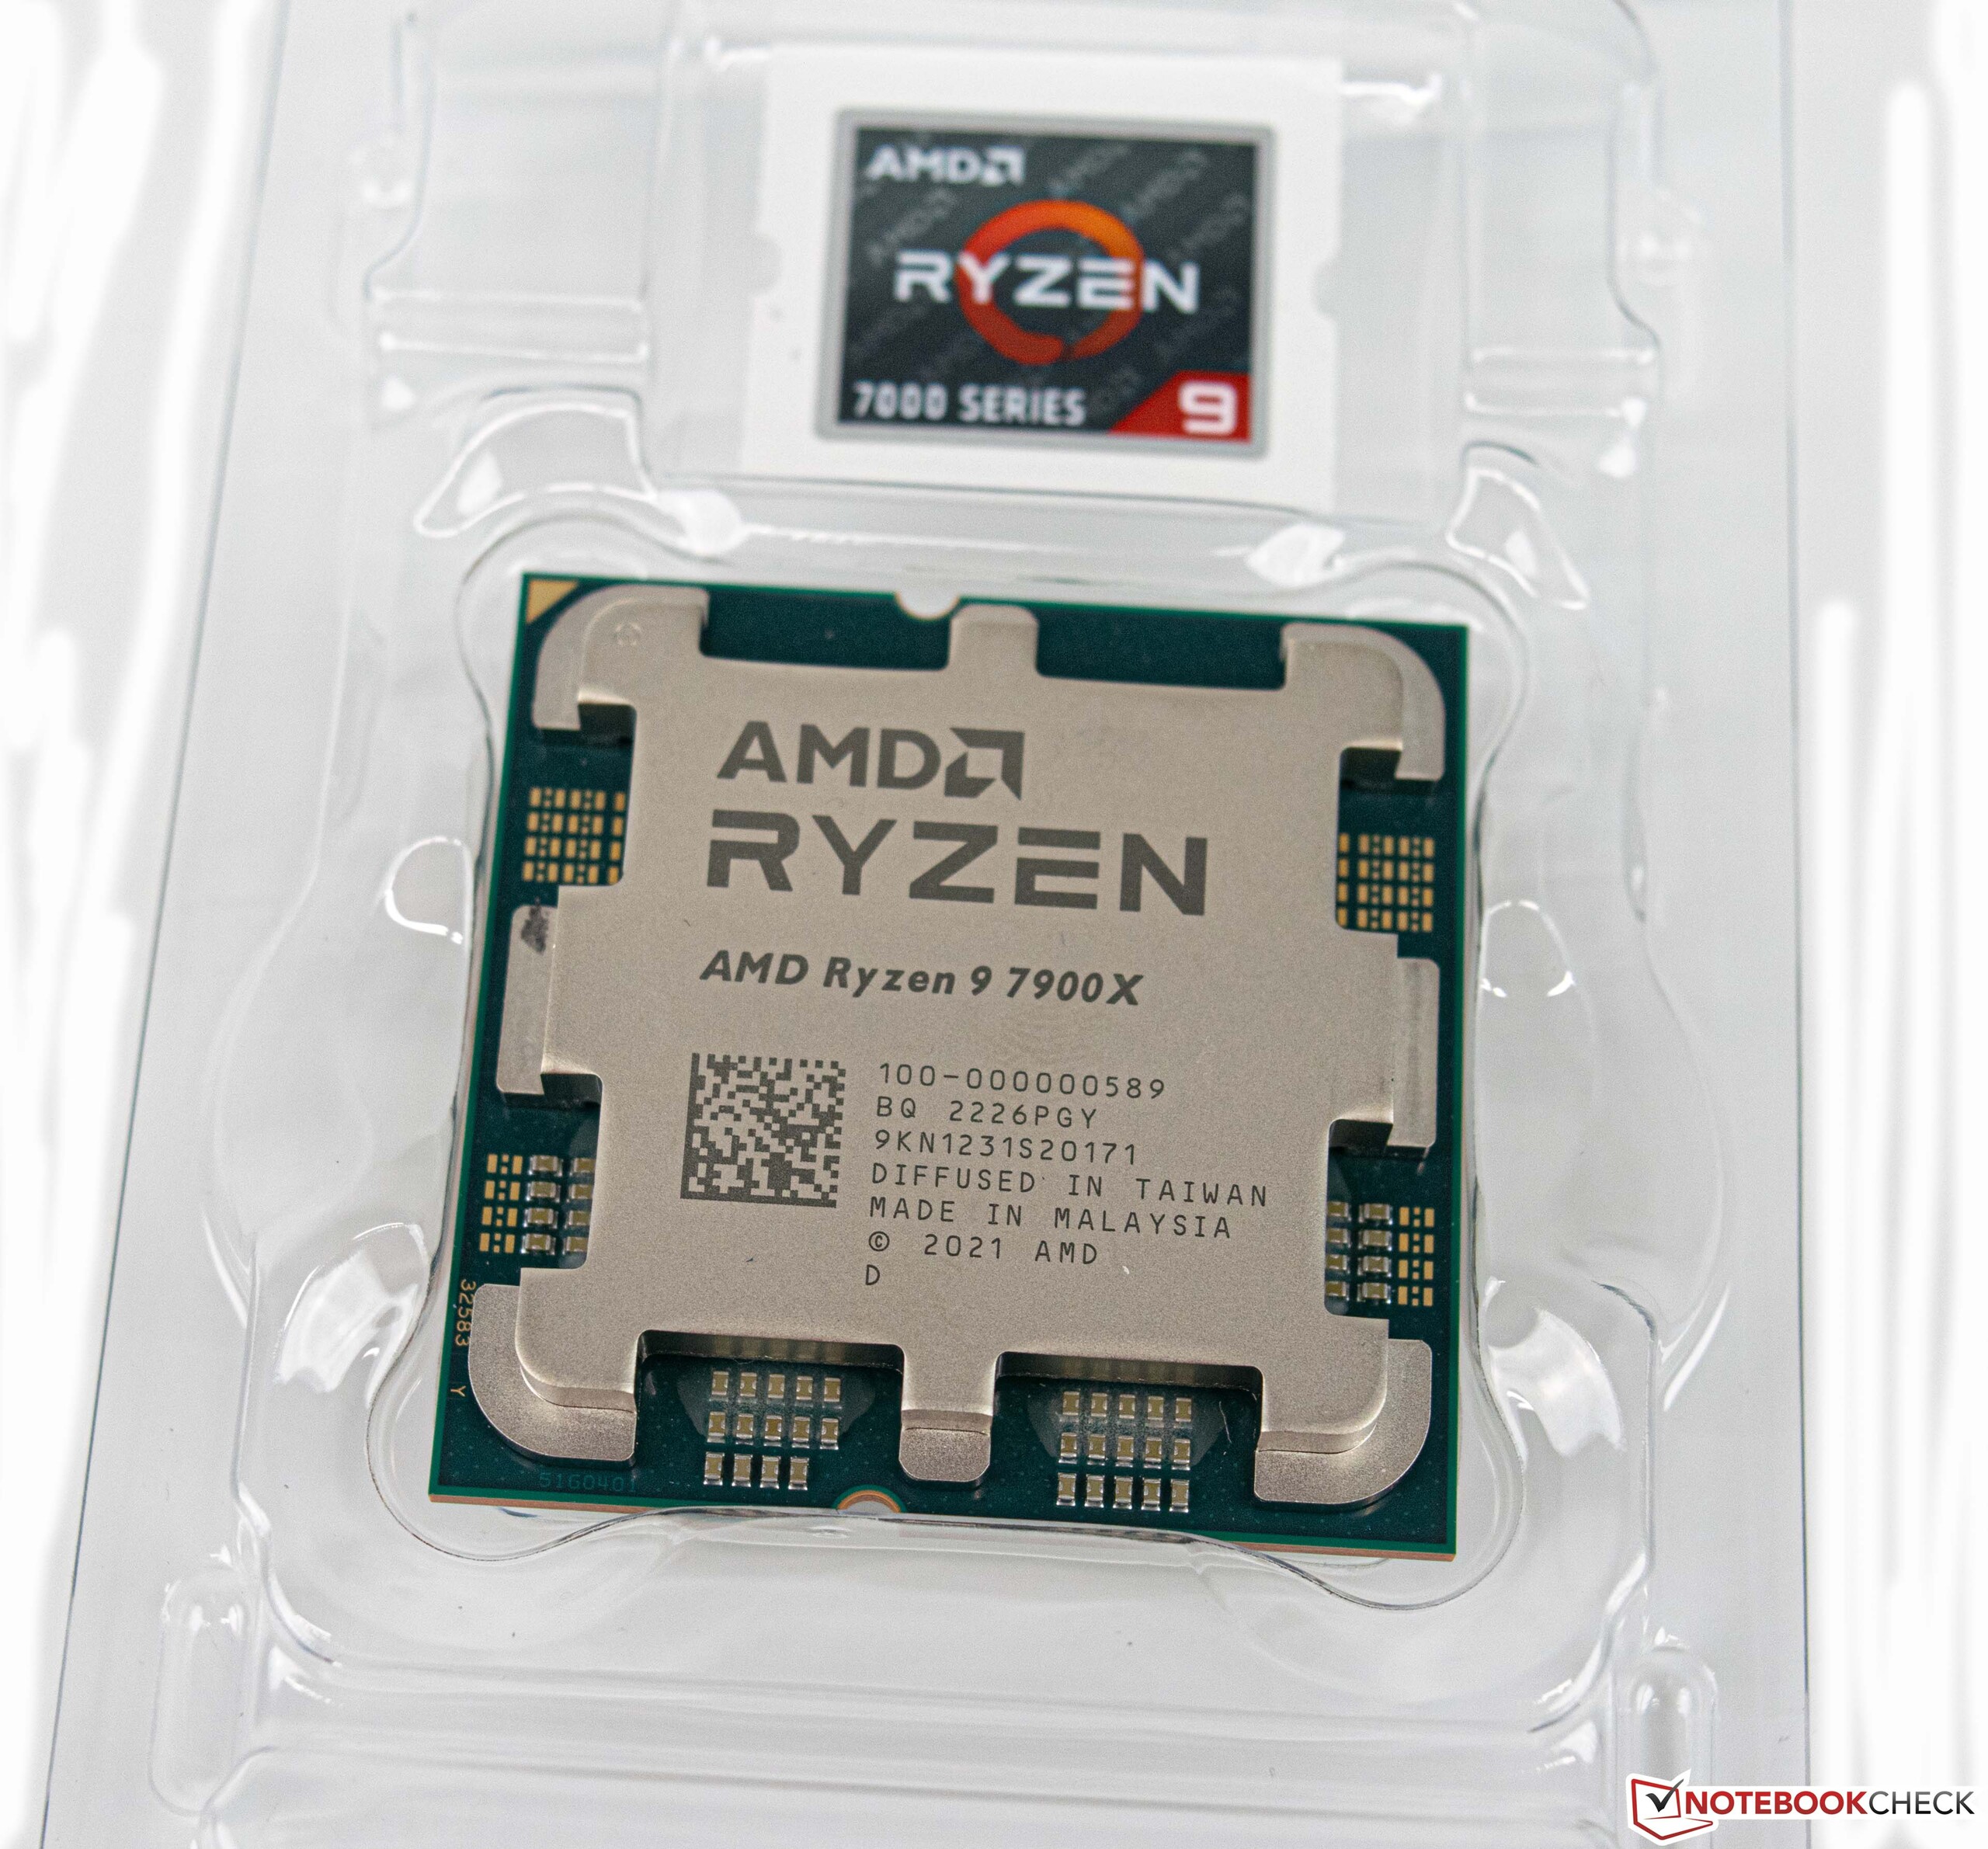
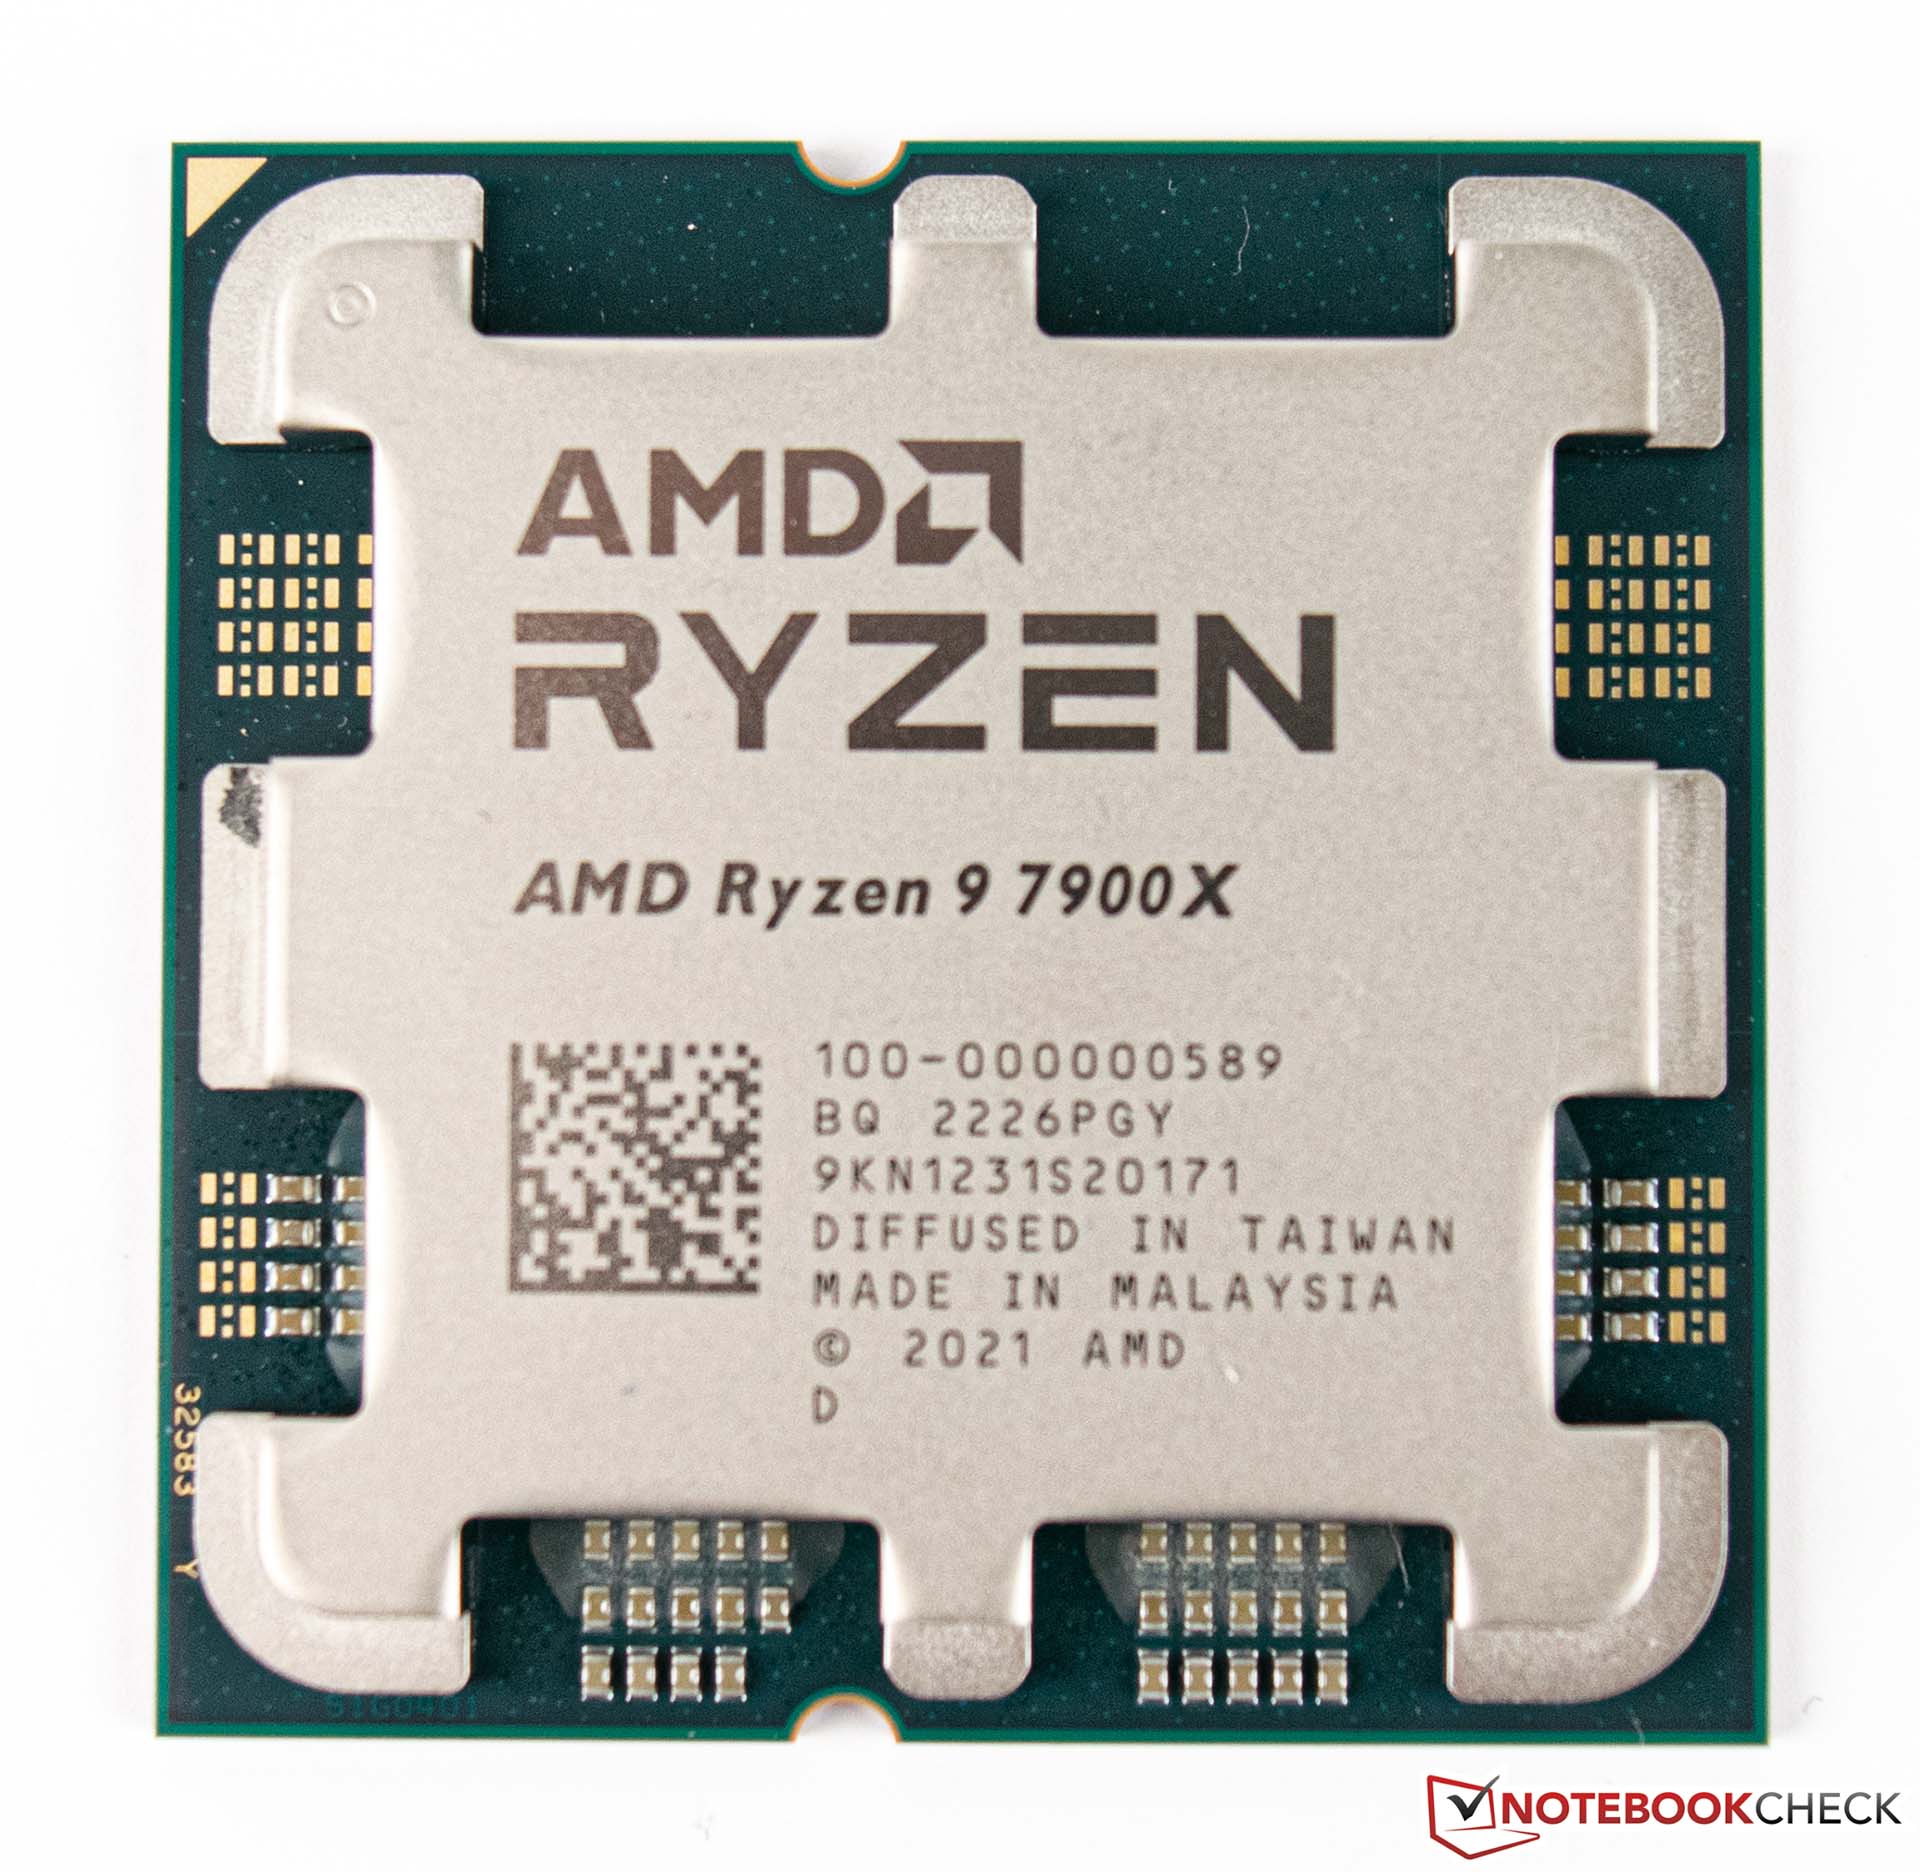
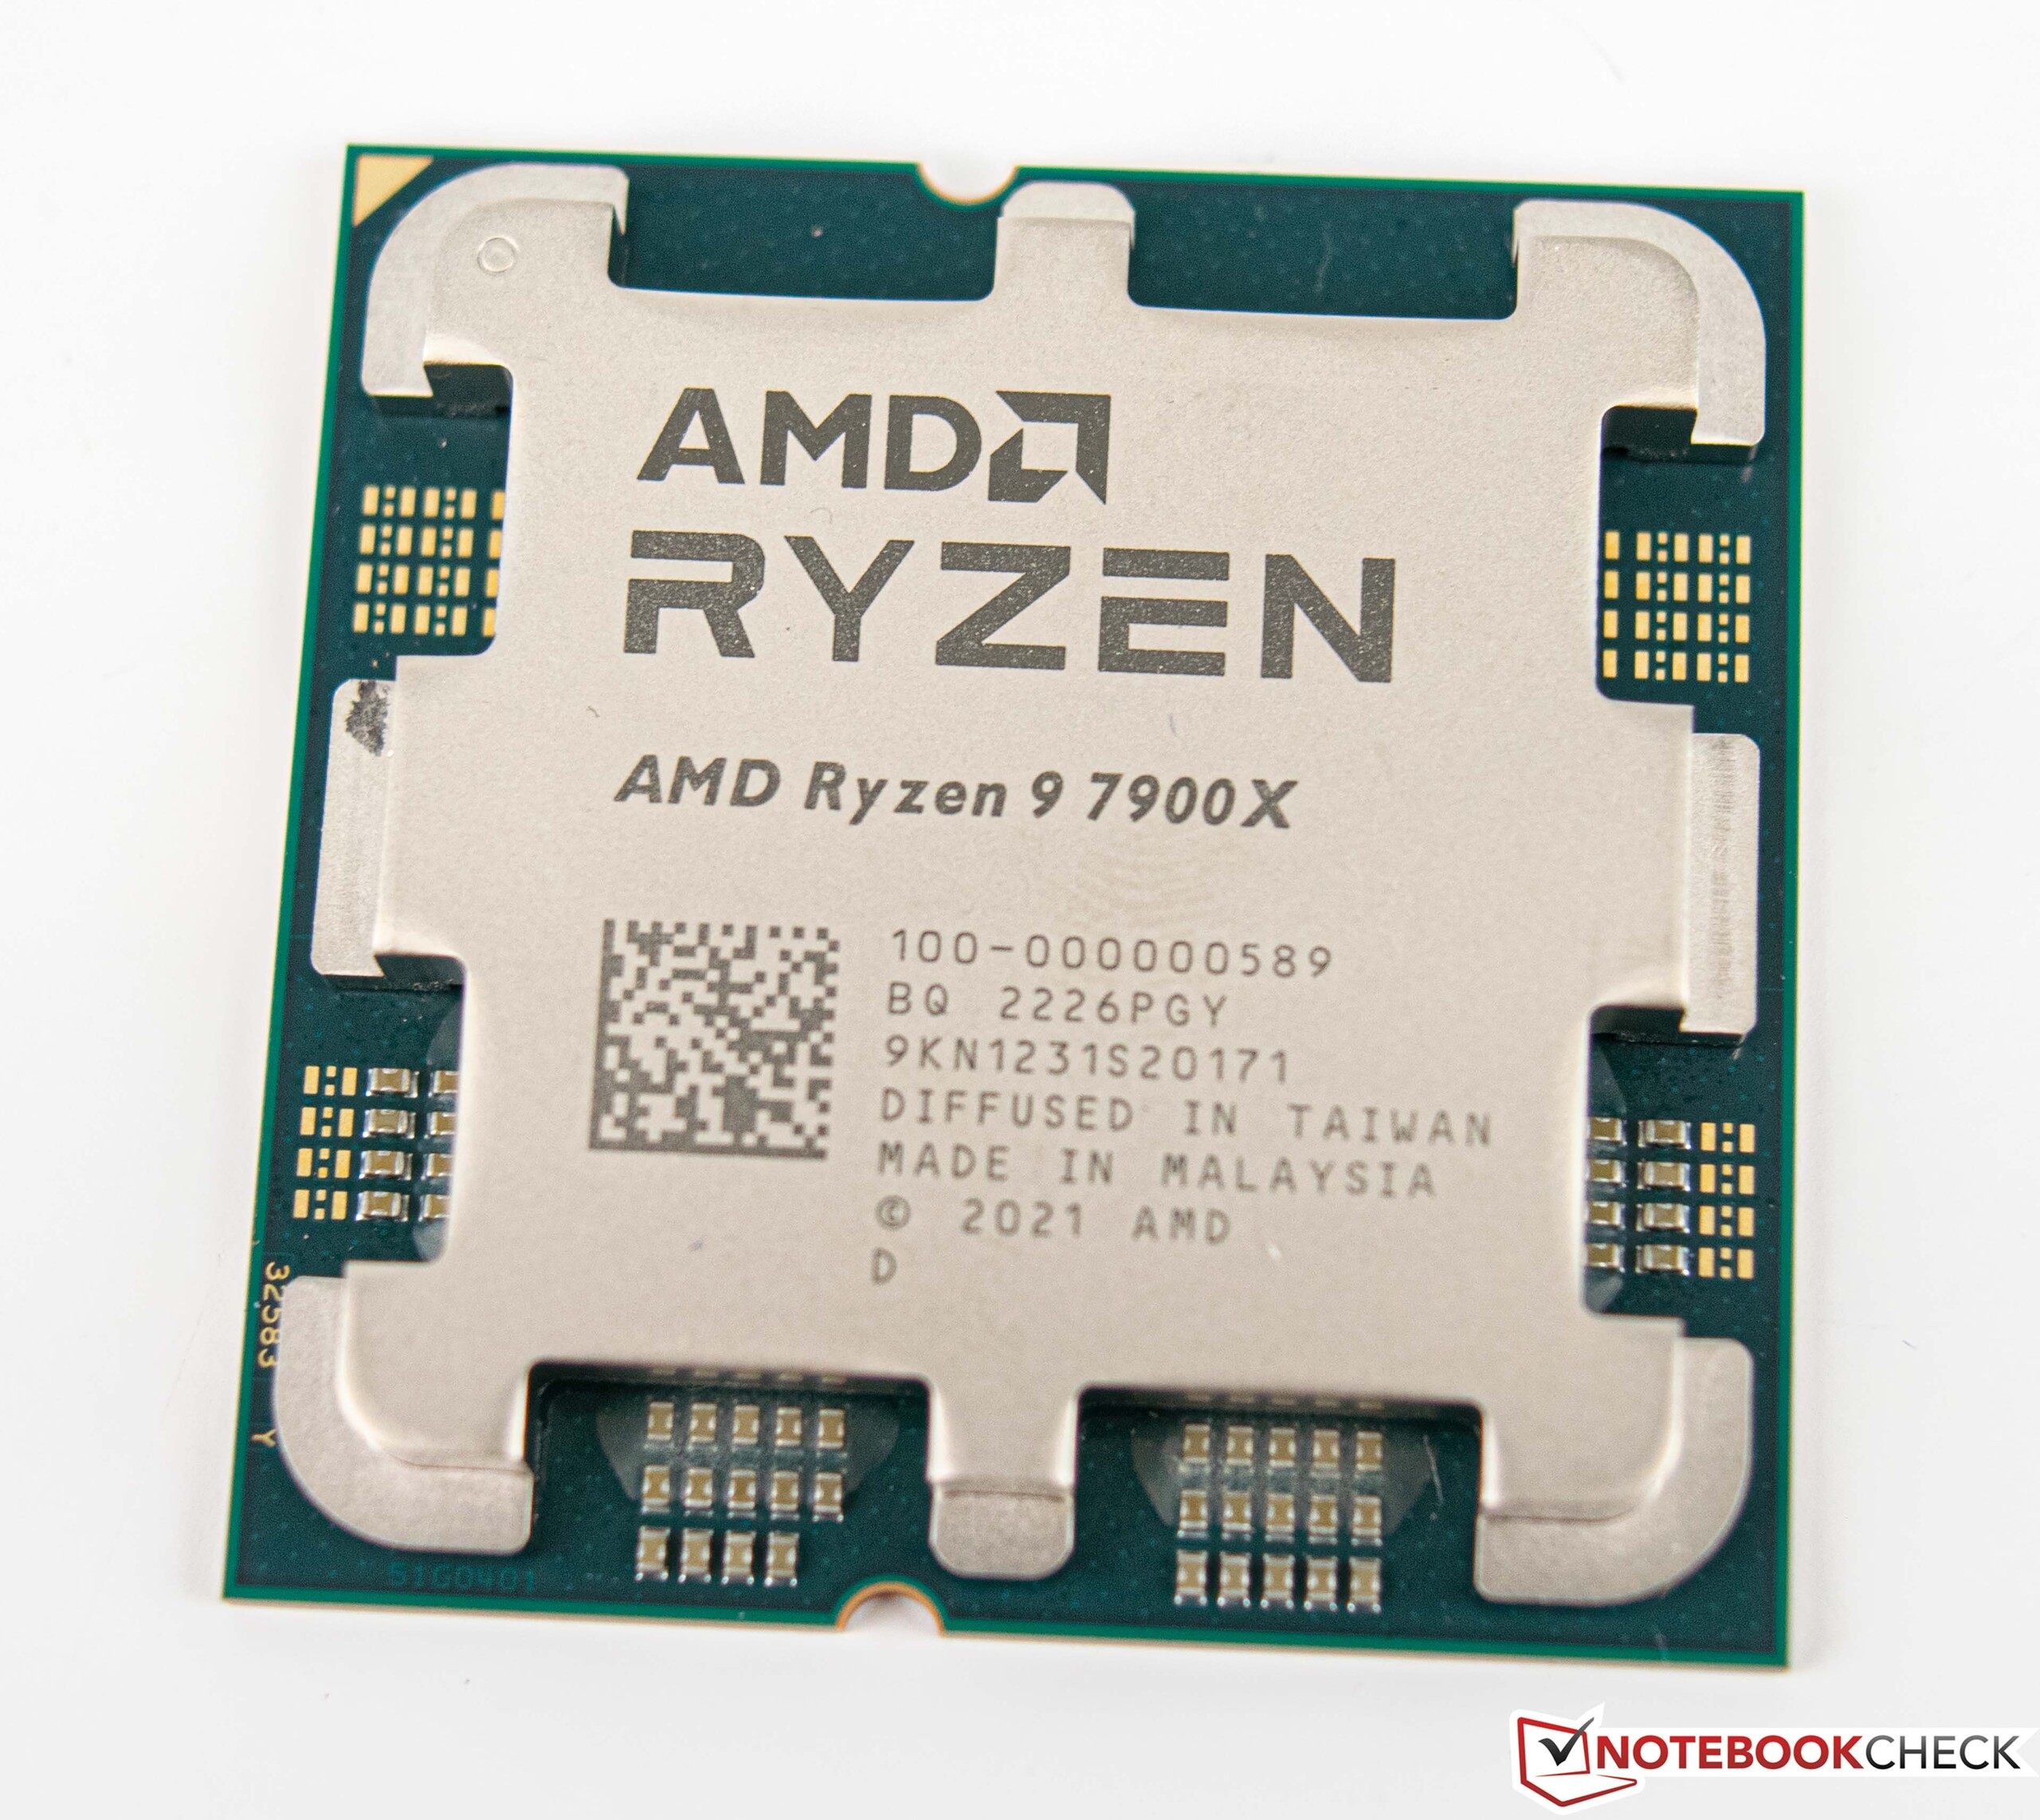
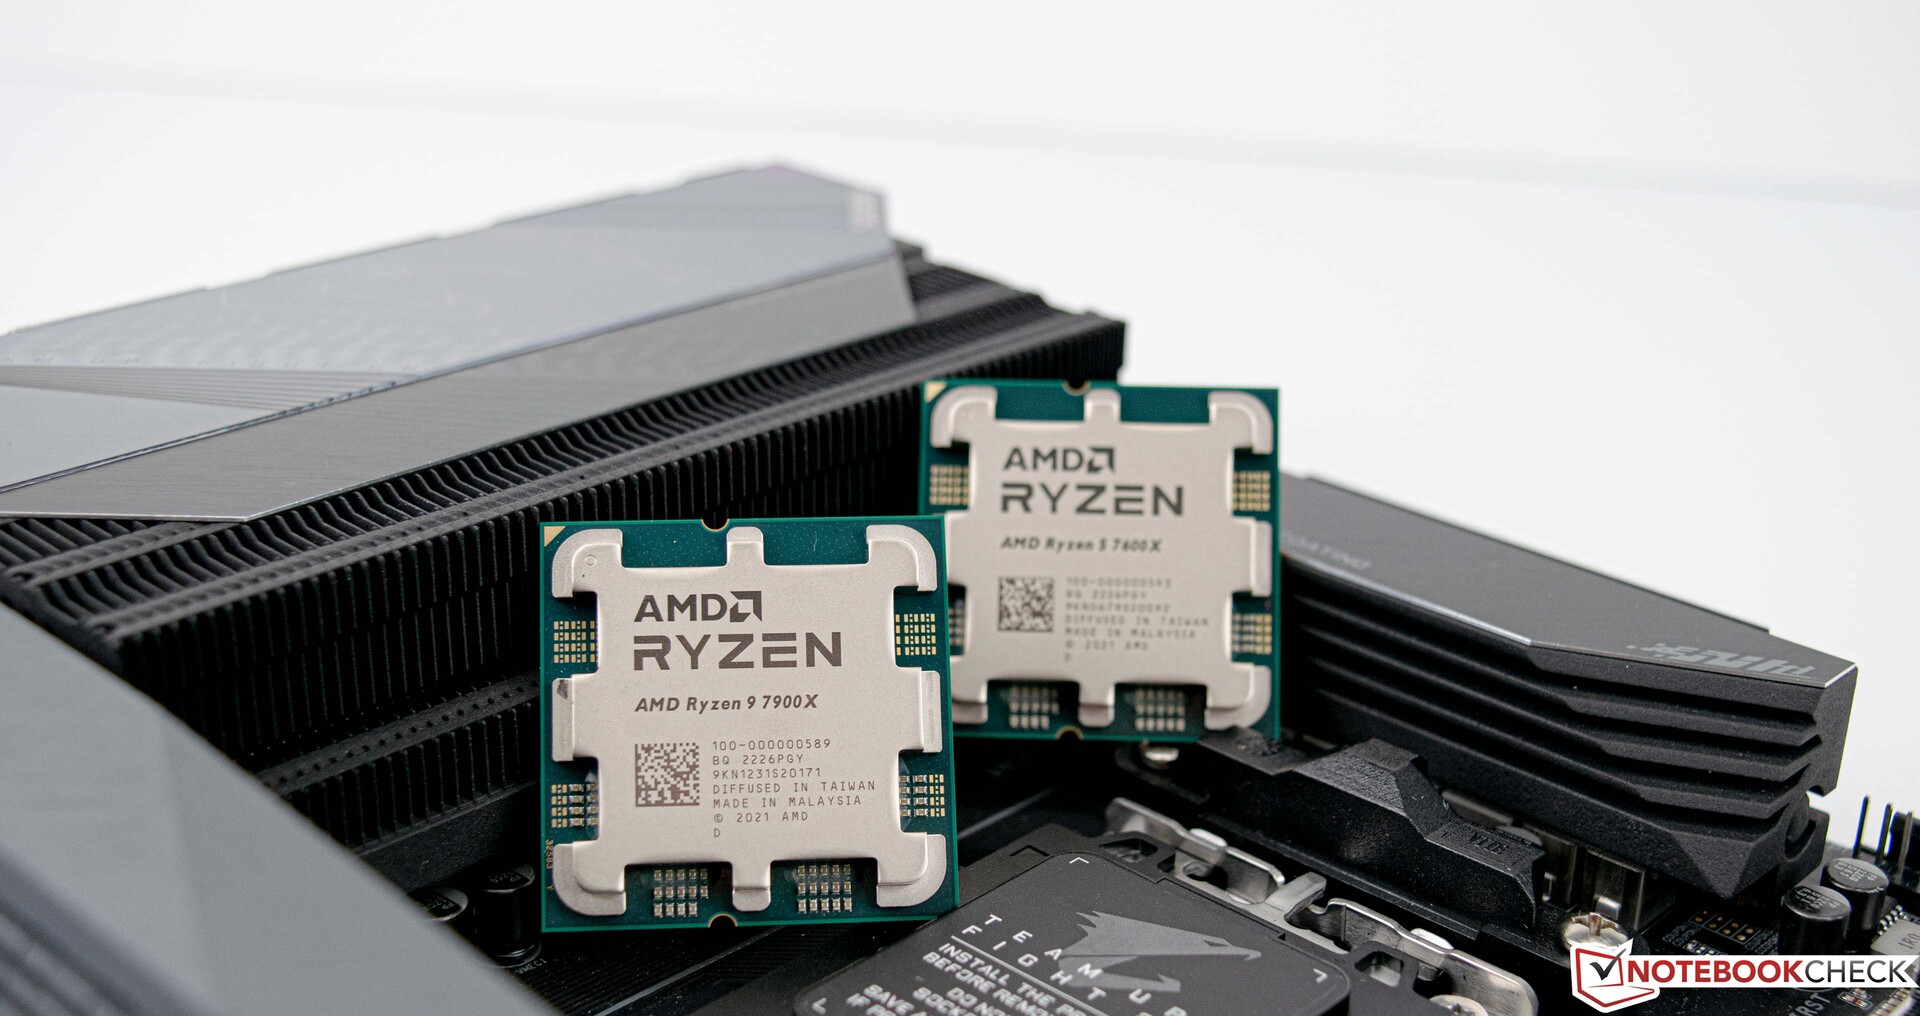
Hay más diferencias visuales en el propio procesador en cuanto al disipador de calor en comparación con los modelos anteriores. Internamente, sin embargo, AMD sigue confiando en el llamado diseño de chiplet, que consiste en dos CCD con ocho núcleos cada uno y un troquel de E/S en el AMD Ryzen 9 7950X. Como es sabido, los dos CCD se comunican a través del Infinity Fabric con el die de E/S, que ahora incluye siempre una iGPU además del nuevo controlador de memoria DDR5.
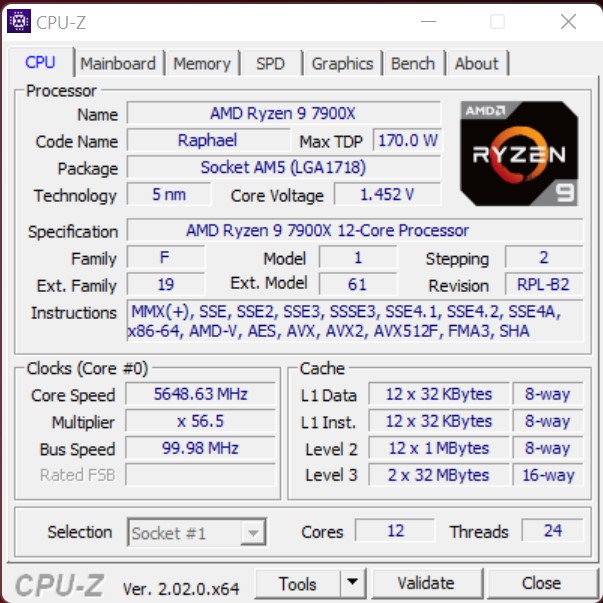
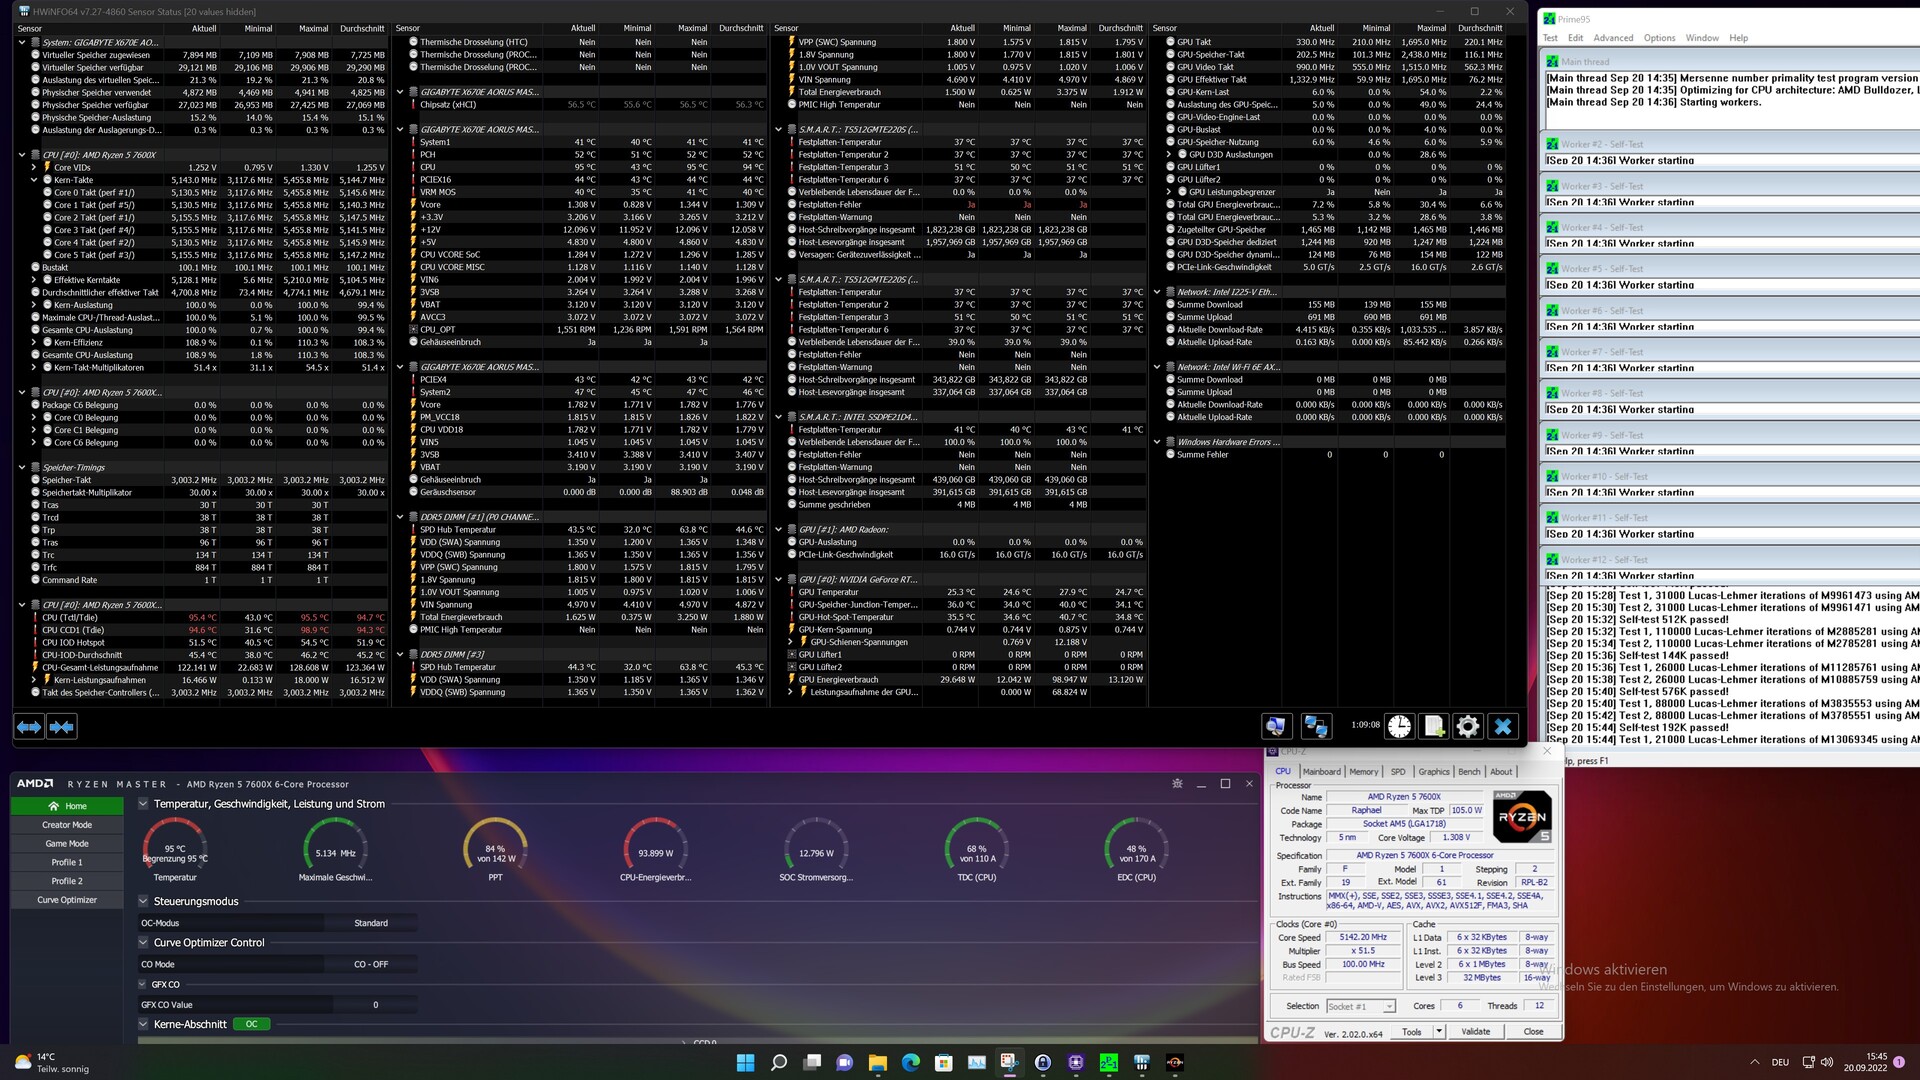
Los nuevos procesadores se fabrican en TSMC y AMD da el siguiente paso con el proceso de 5 nm. De este modo, se pueden alcanzar mayores velocidades de reloj, que AMD también aprovecha muy bien. Hasta 5,7 GHz es posible de fábrica en modo Turbo en el Ryzen 9 7950X. El Ryzen 9 7900X aún tiene 5,6 GHz en su hoja de especificaciones. En este punto, ya podemos decir que estas velocidades de reloj también se alcanzaron en nuestras pruebas. Junto con el mayor IPC y el aumento significativo de la velocidad de reloj, los usuarios pueden esperar un aumento de rendimiento decente.
Sin embargo, la ganancia de rendimiento tiene un inconveniente, porque el TDP de los nuevos modelos Ryzen 9 ha aumentado hasta 170 W. AMD incluso especifica hasta 230 W para todo el paquete (PPT - Package Power Tracking). Sin embargo, eso sigue siendo menos de lo que Intel permite para sus procesadores actuales - hasta 241 W bajo carga.
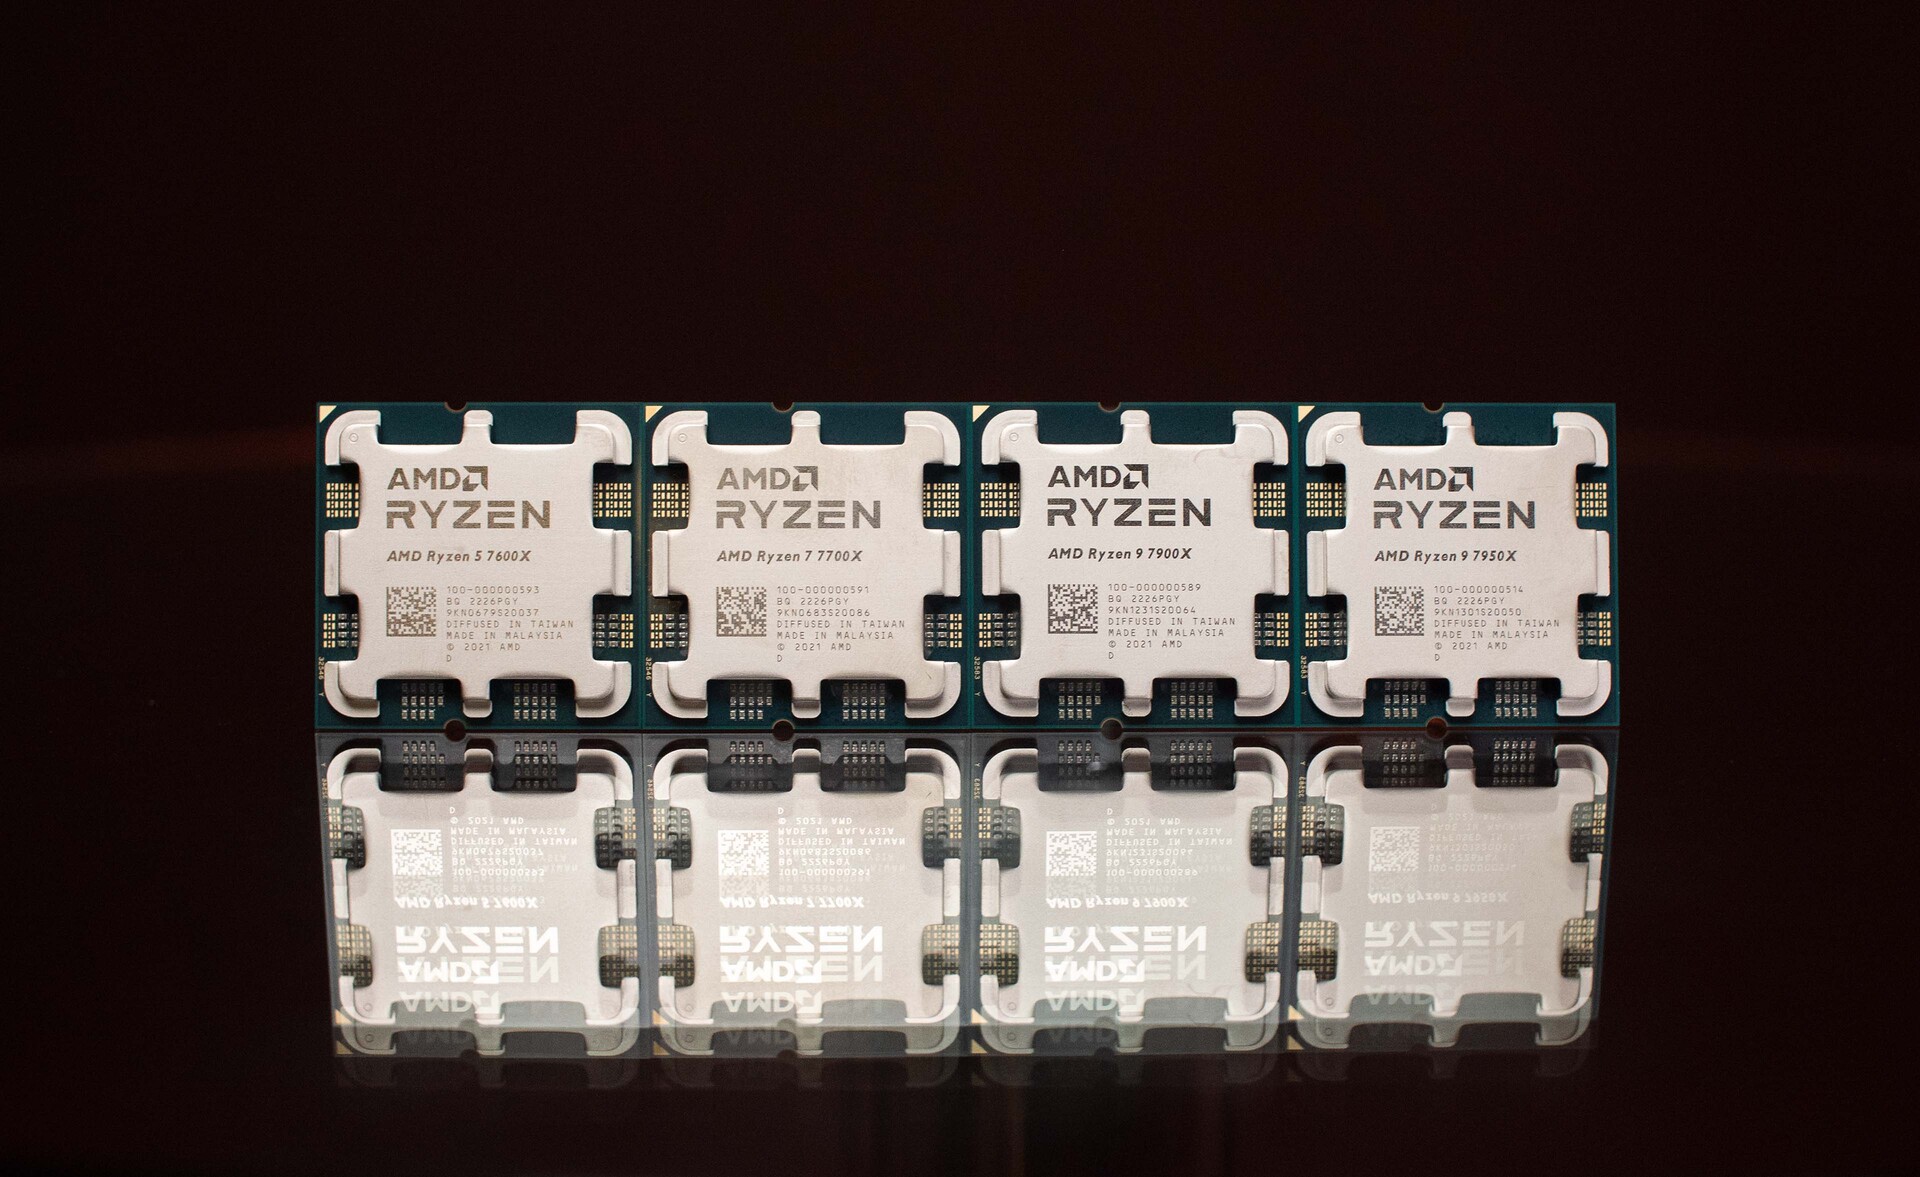
La familia AMD Ryzen 7000 de un vistazo
| Modelo | Núcleos/Hilos | Reloj base | Turbo reloj | Caché L2 | Caché L3 | TDP | PPT | Precio de lanzamiento |
|---|---|---|---|---|---|---|---|---|
| Ryzen 9 7950X | 16/32 | 4,5 GHz | 5,7 GHz | 16x 1 MB | 64 MB | 170 W | 230 W | 699 USD / 849 EUR |
| Ryzen9 7900X | 12/24 | 4,7 GHz | 5,6 GHz | 12x 1 MB | 64 MB | 170 W | 230 W | 549 USD / 669EUR |
| Ryzen 7 7700X | 8/16 | 4,5 GHz | 5,4 GHz | 8x 1 MB | 32 MB | 105 W | 142 W | 399 USD / 479 EUR |
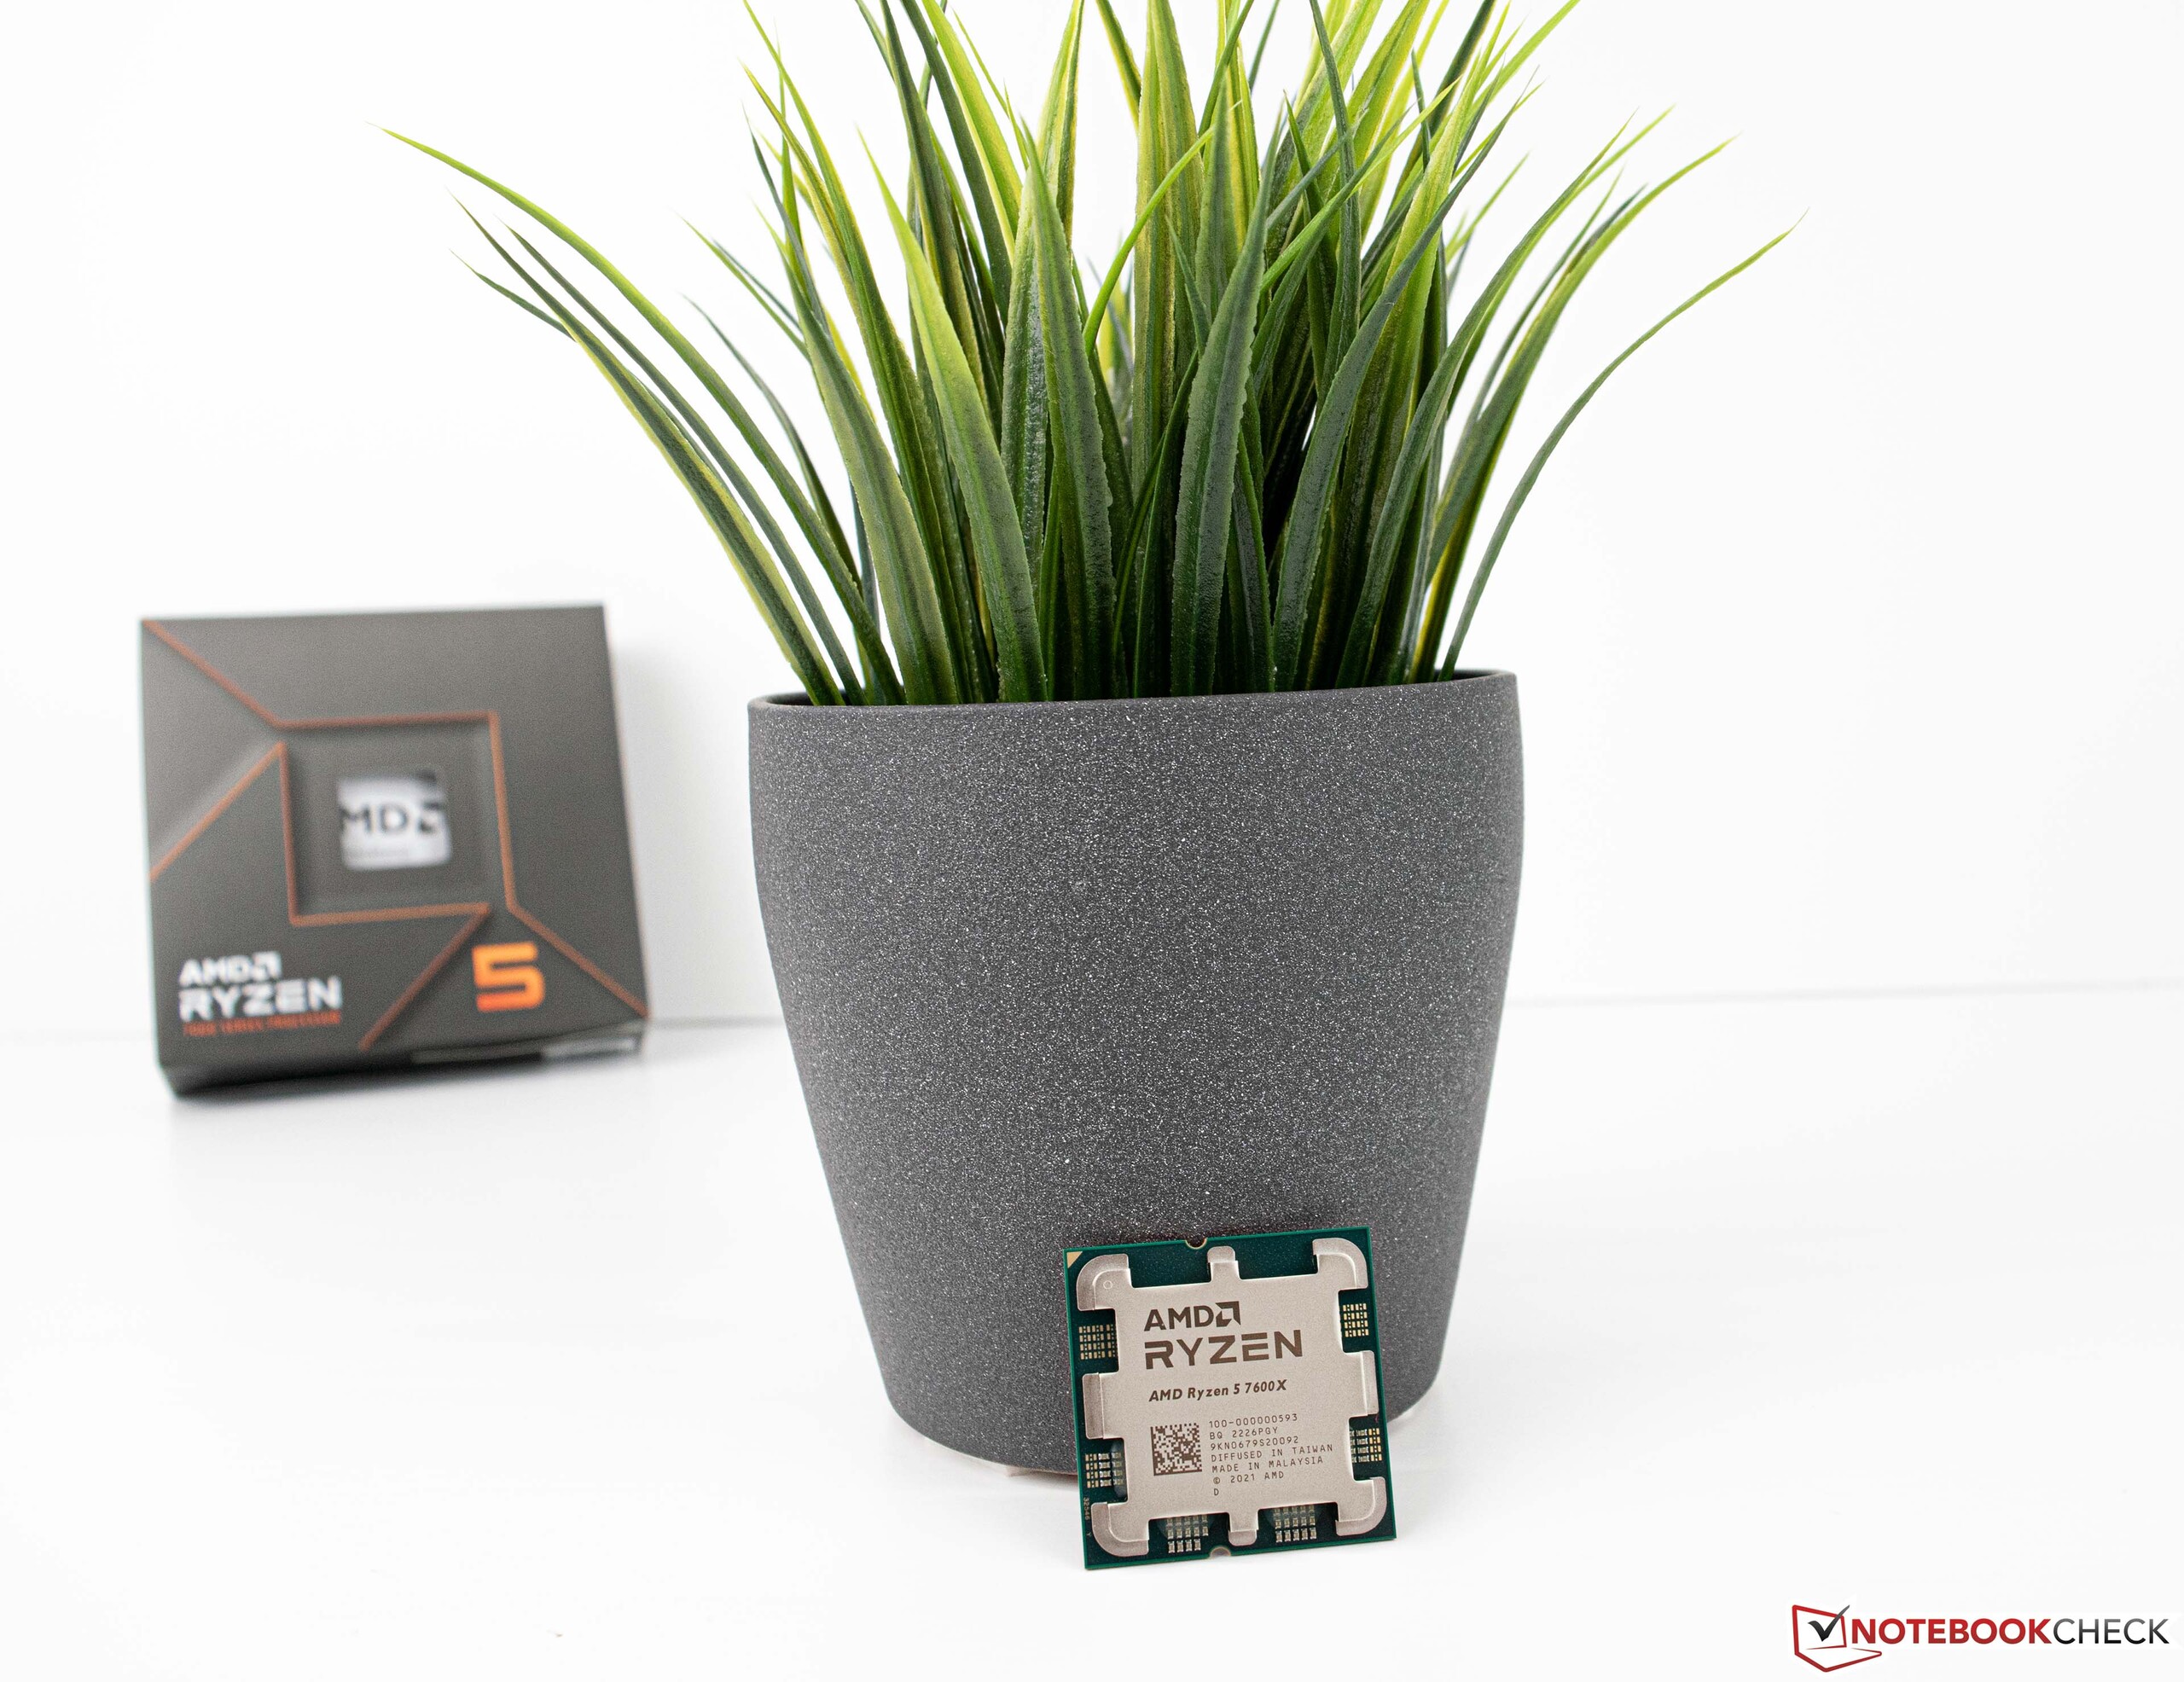
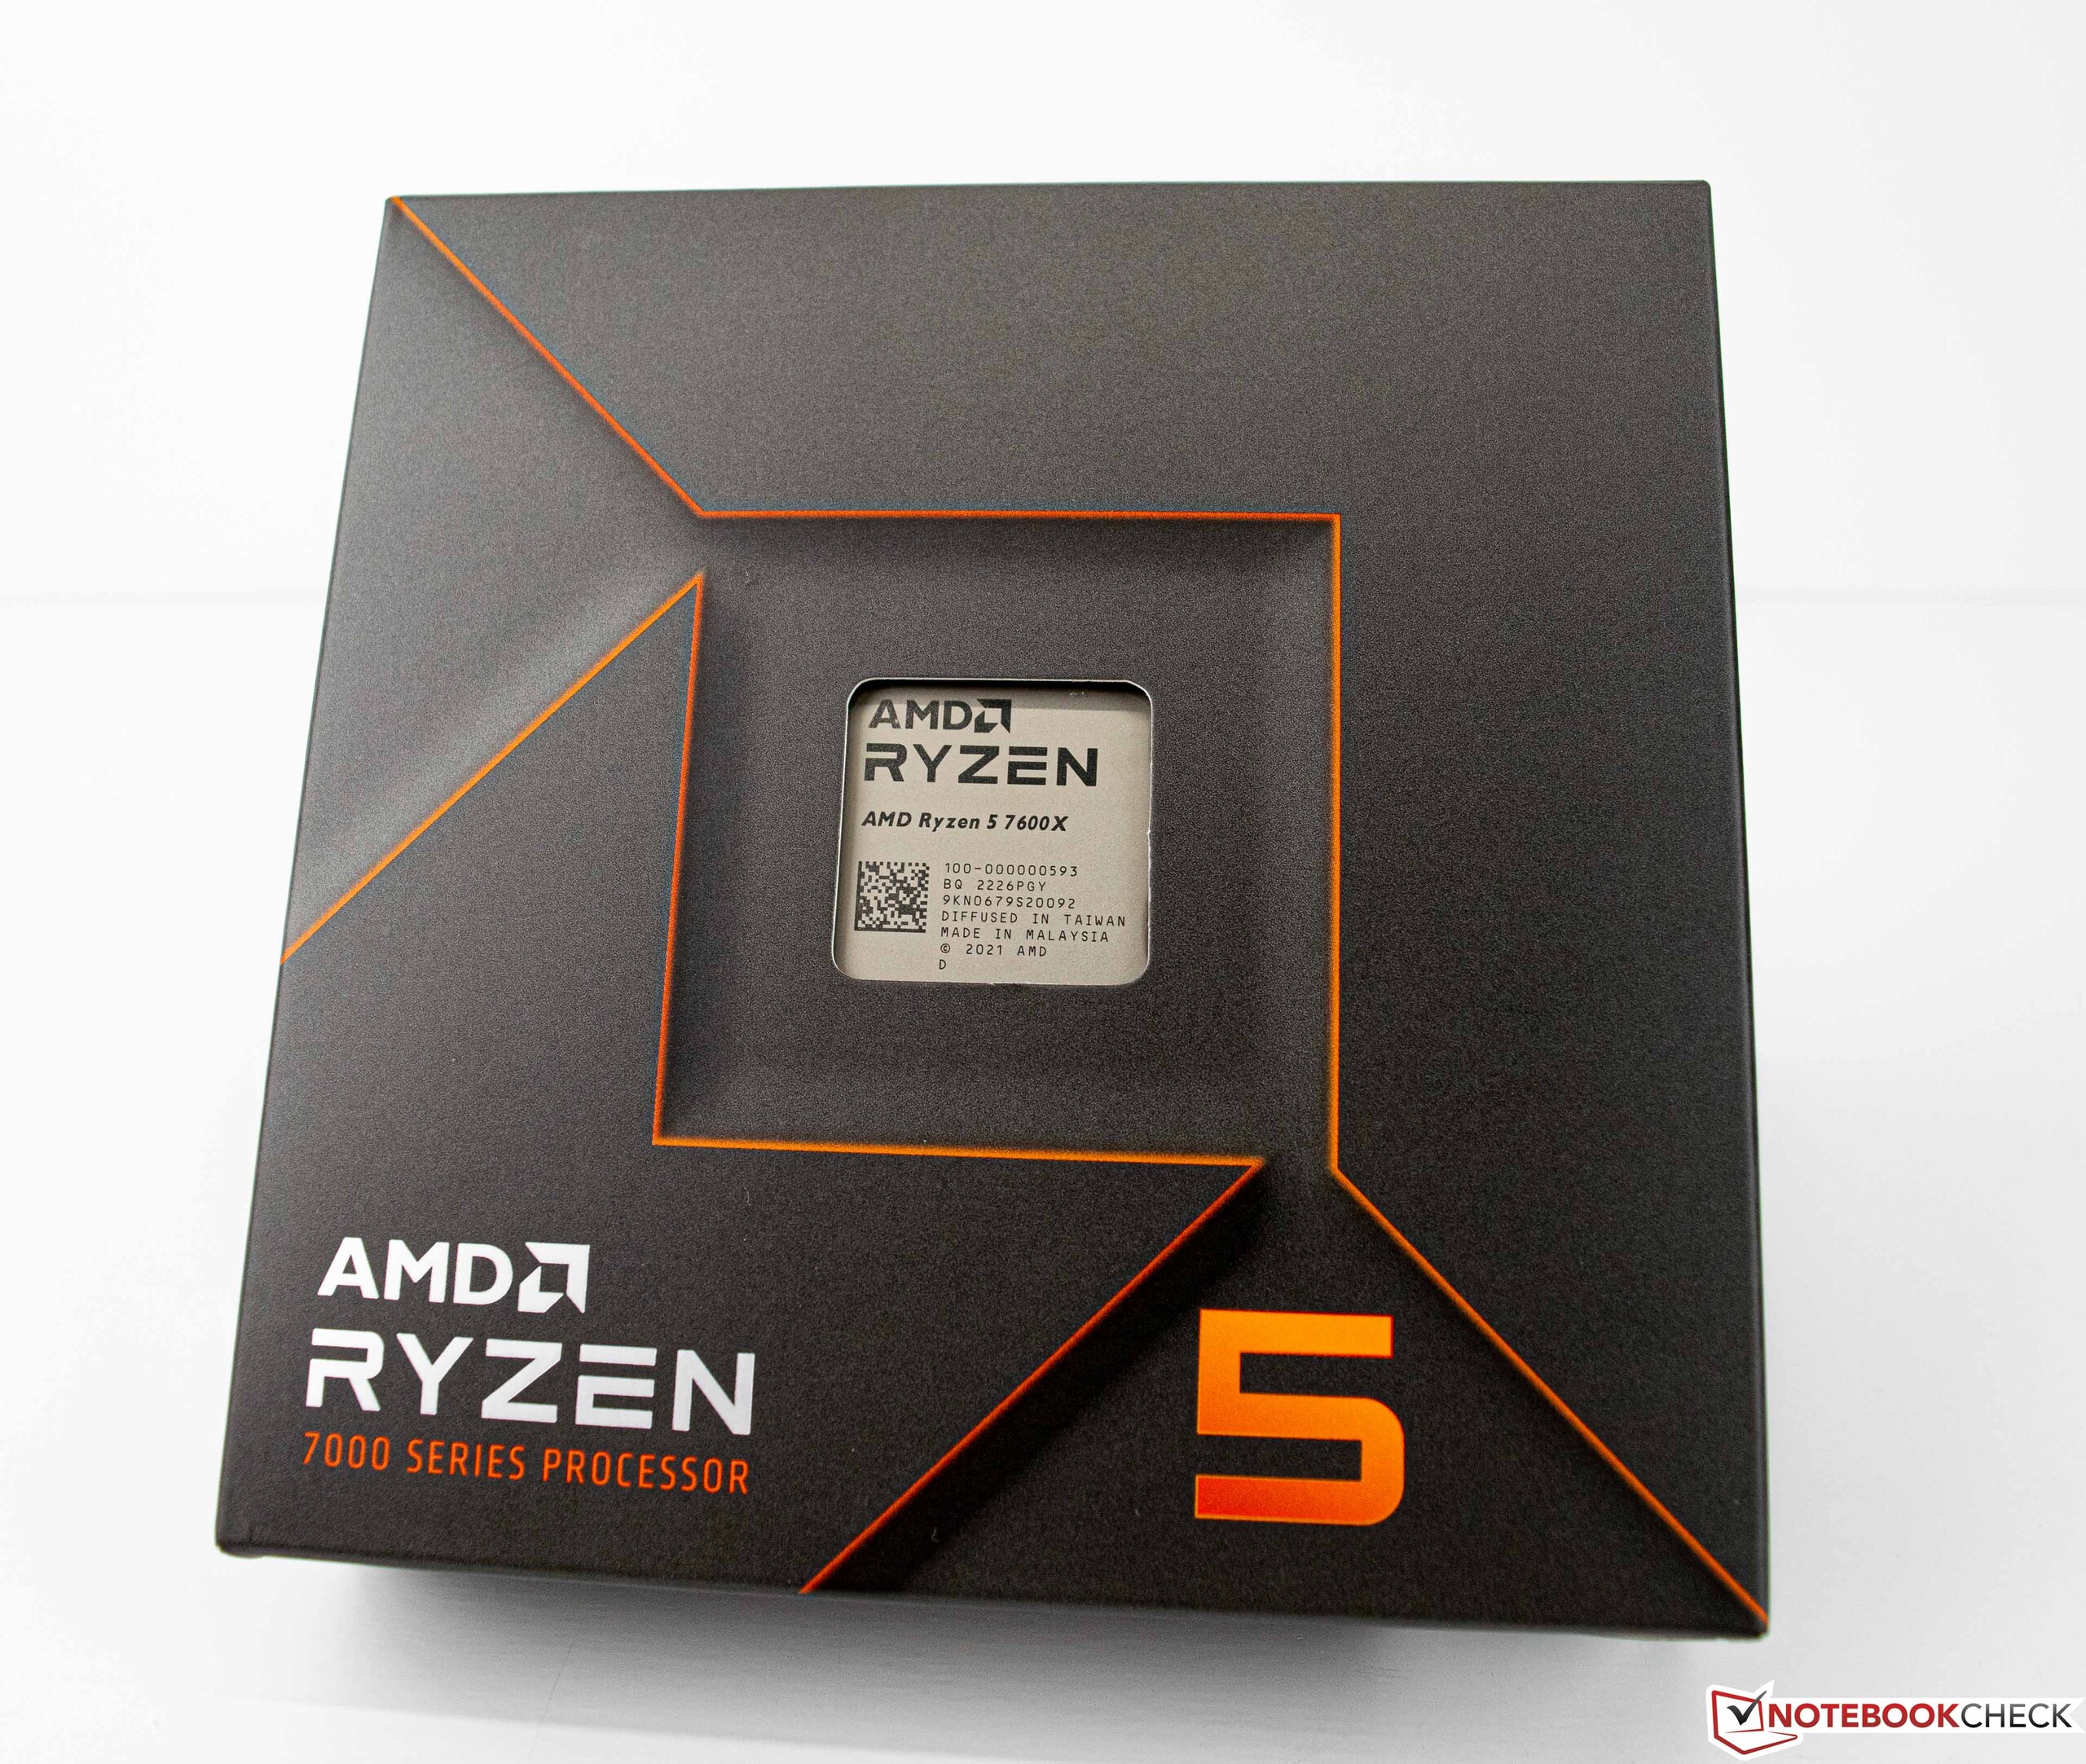
| Ryzen 5 7600X | 6/12 | 4,7 GHz | 5,3 GHz | 6x 1 MB | 32 MB | 105 W | 142 W | 299 USD / 359 EUR |
El sistema de pruebas
Utilizamos el siguiente sistema para los siguientes benchmarks y pruebas
- Mesa de pruebas Raijintek Pean
- AMD Ryzen 9 7900X, AMD Ryzen 5 7600X
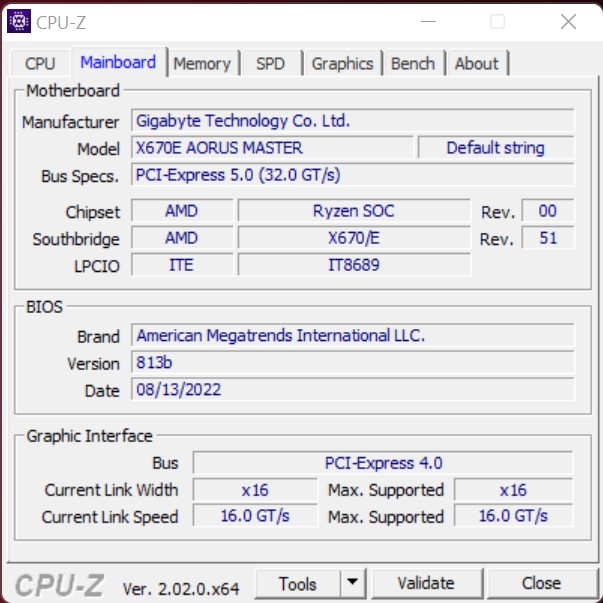
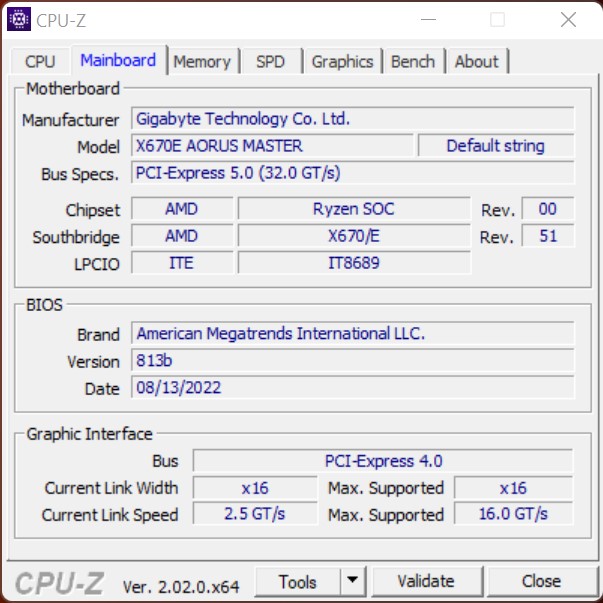
- Gigabyte X670E Aorus Master, BIOS: 813b
- Alphacool Eisbear 280 AiO
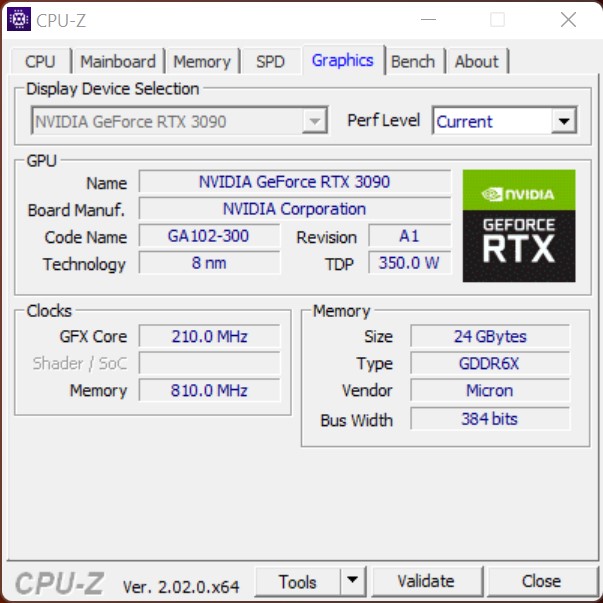
- Nvidia GeForce RTX 3090 Founders Edition
- Fuente de alimentación Corsair HX 1200i
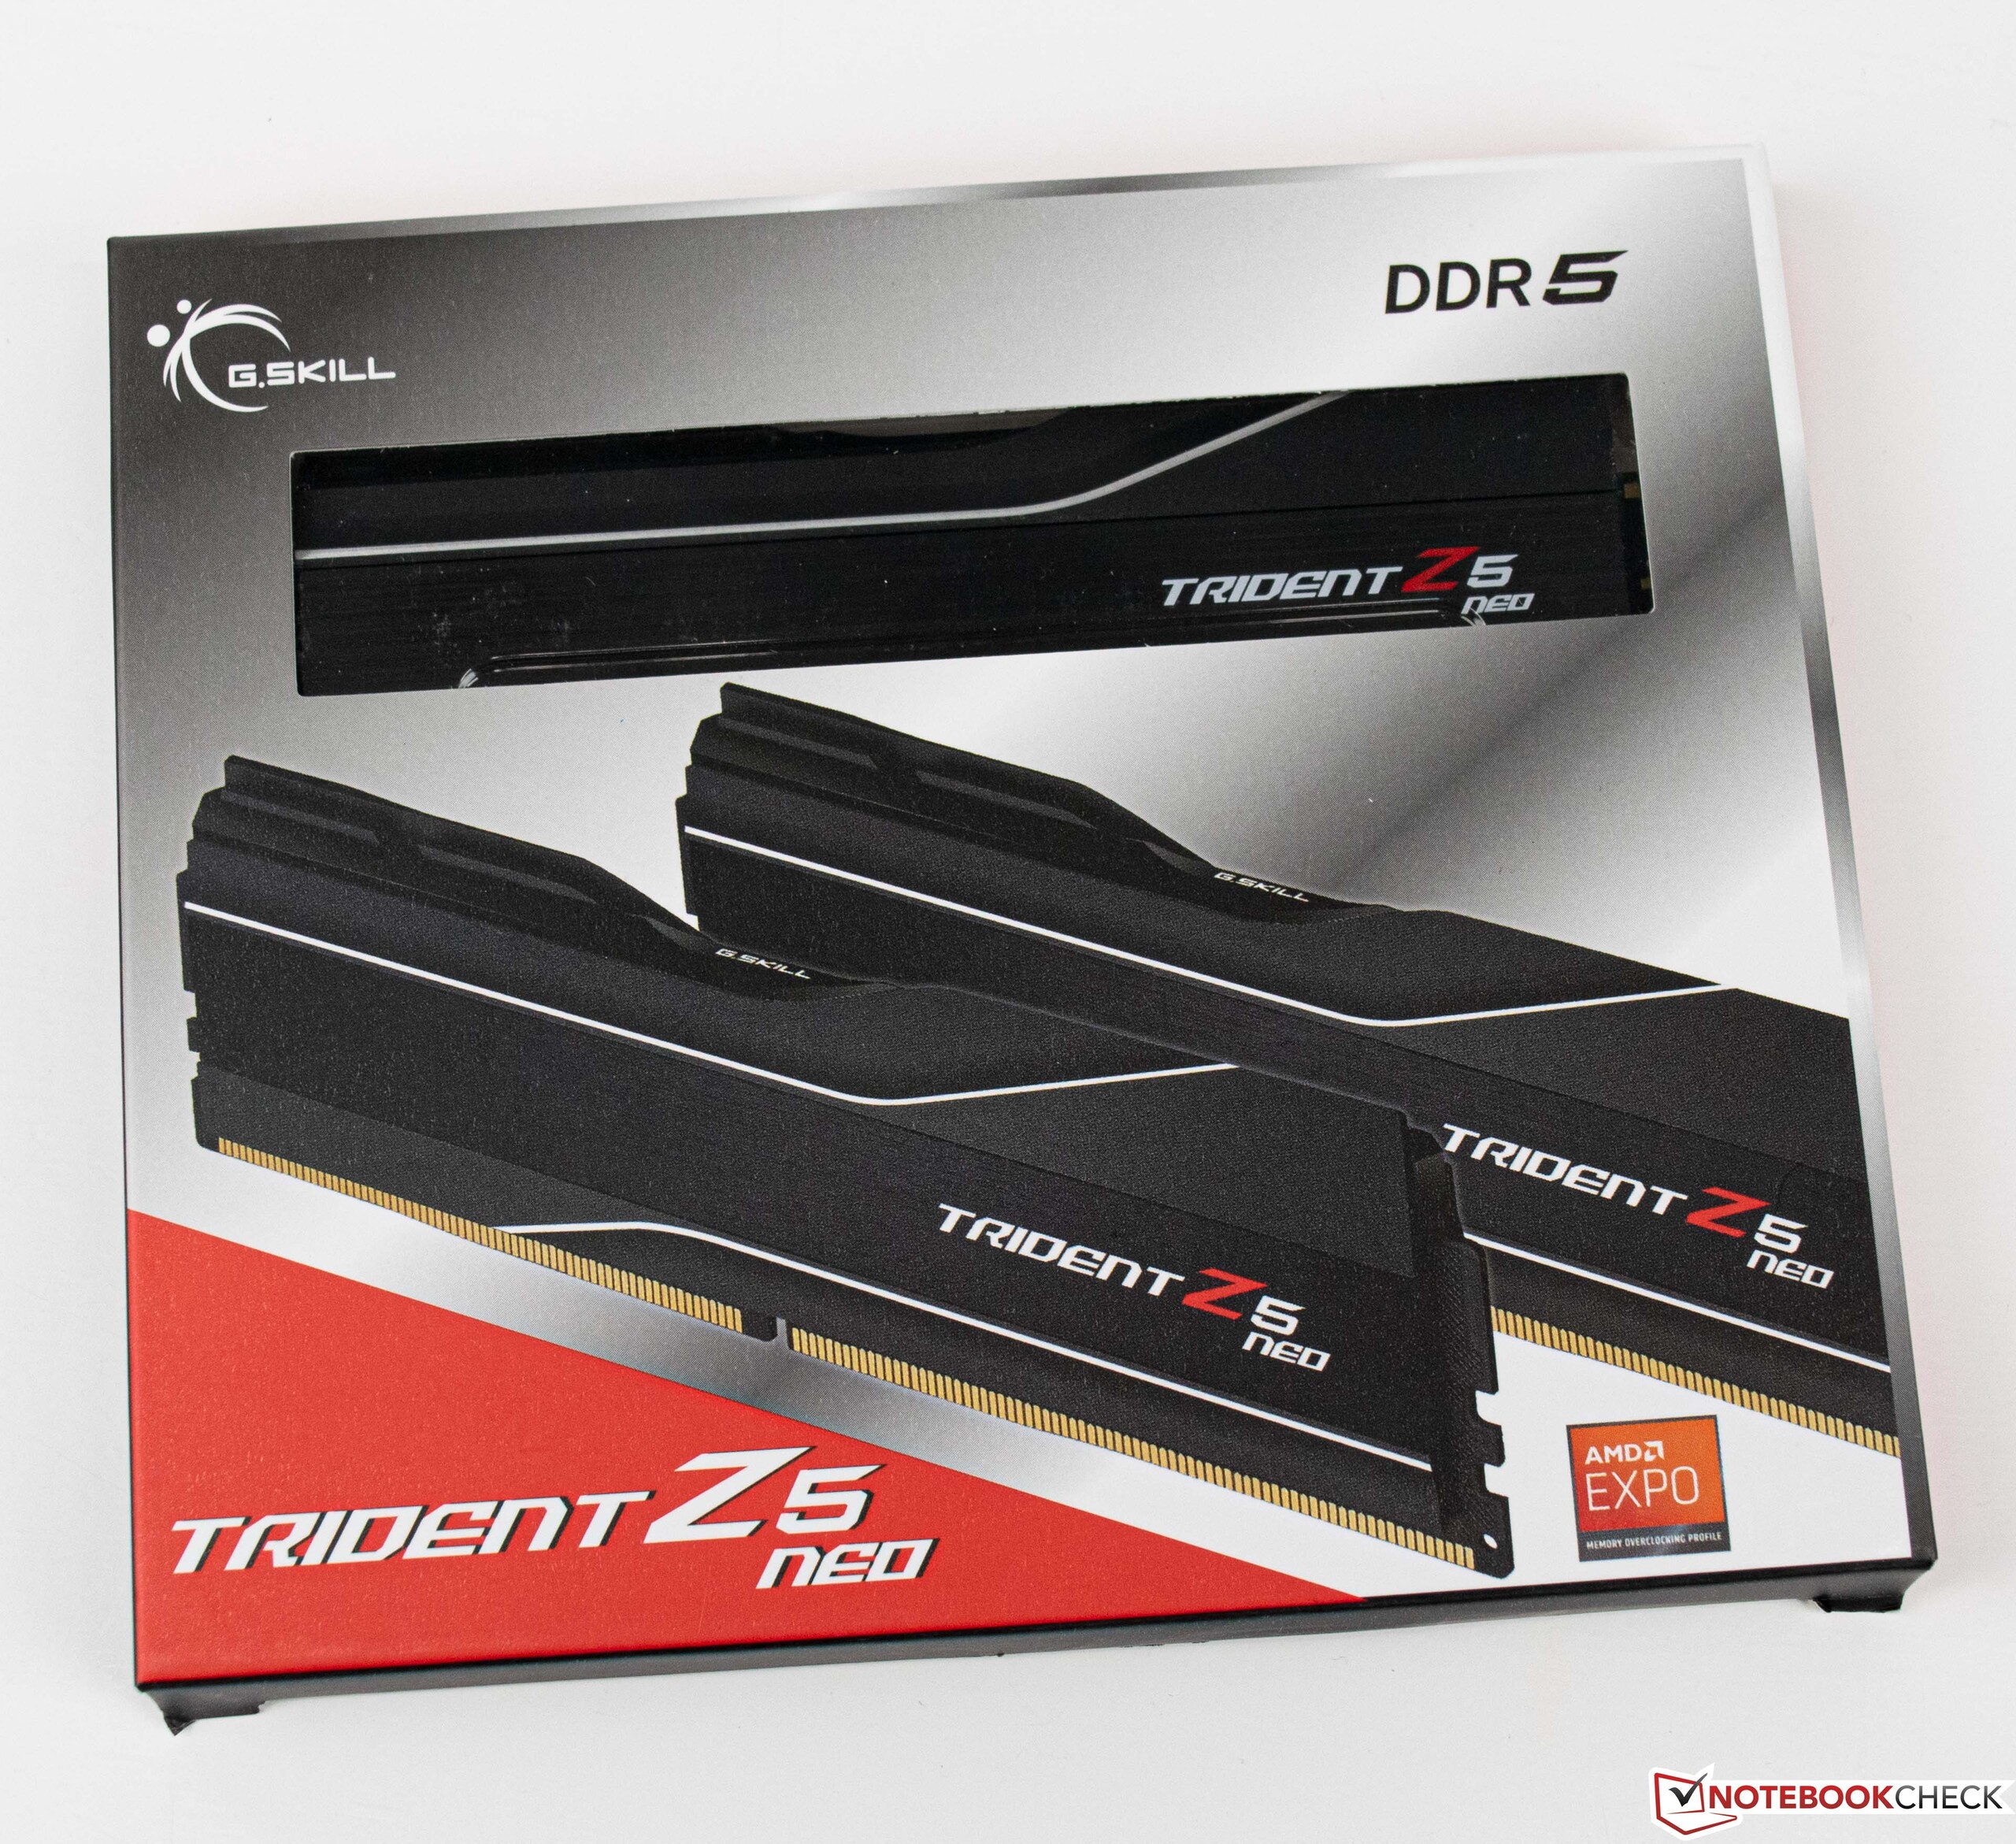
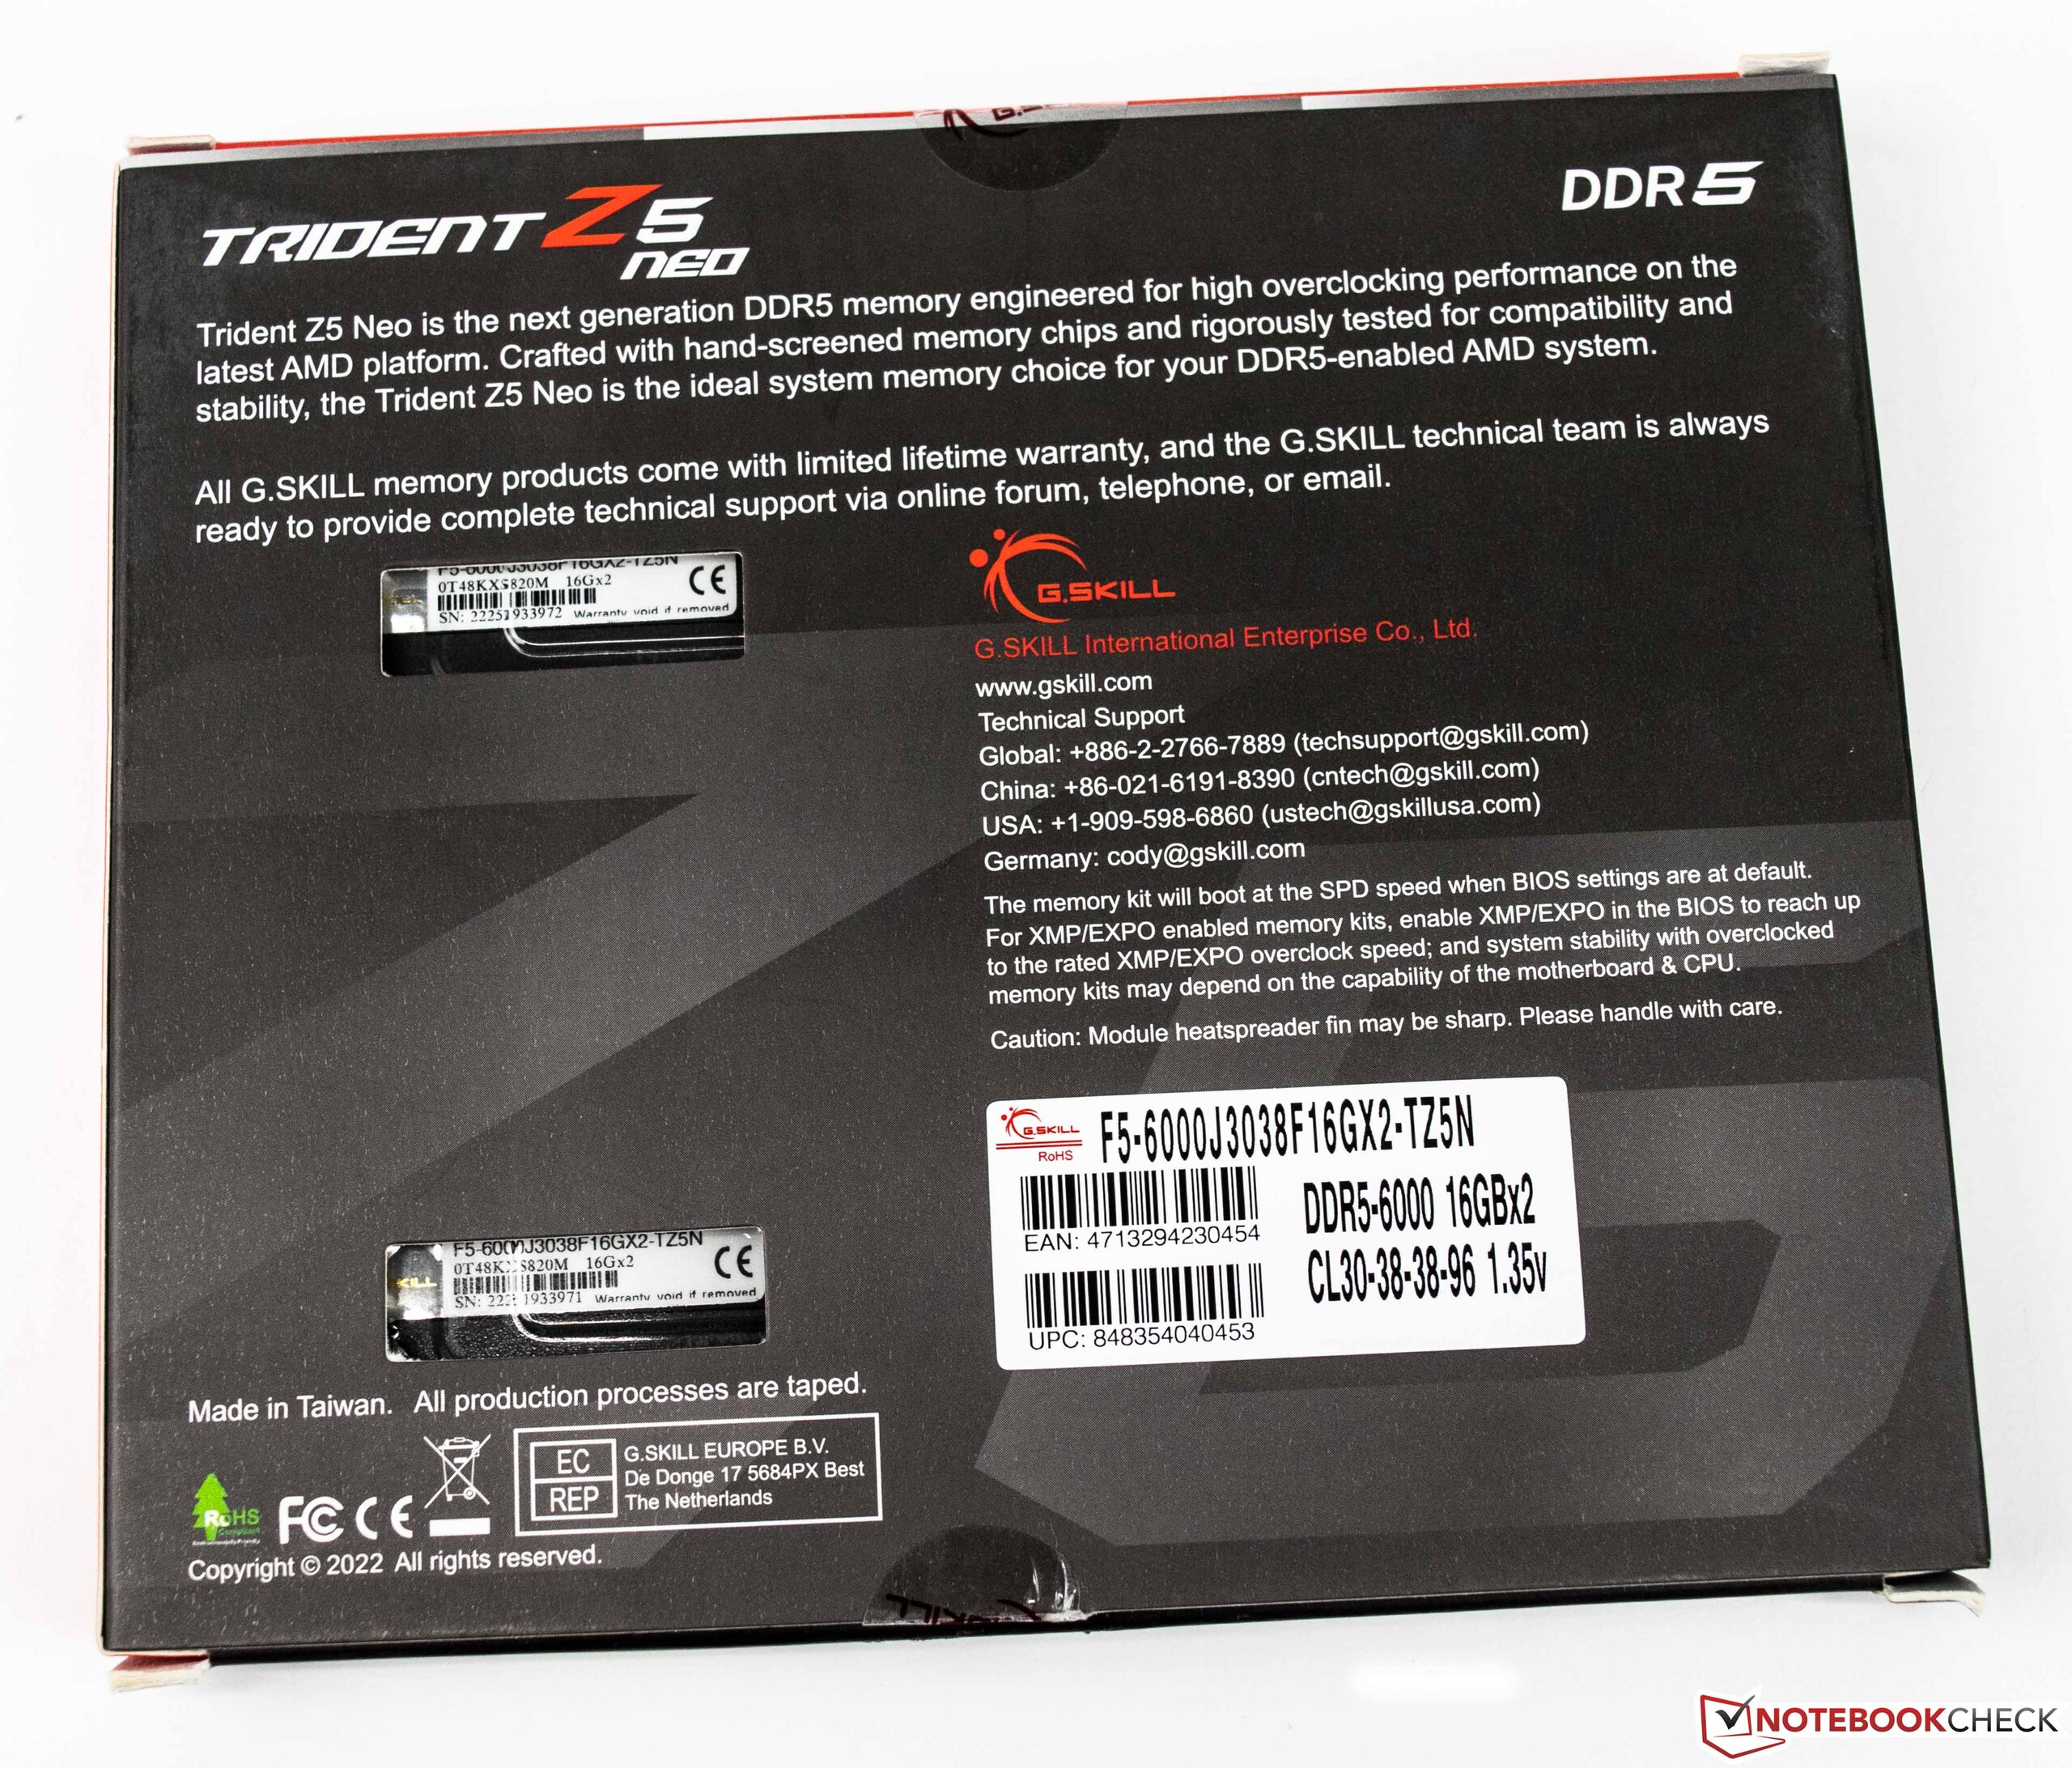
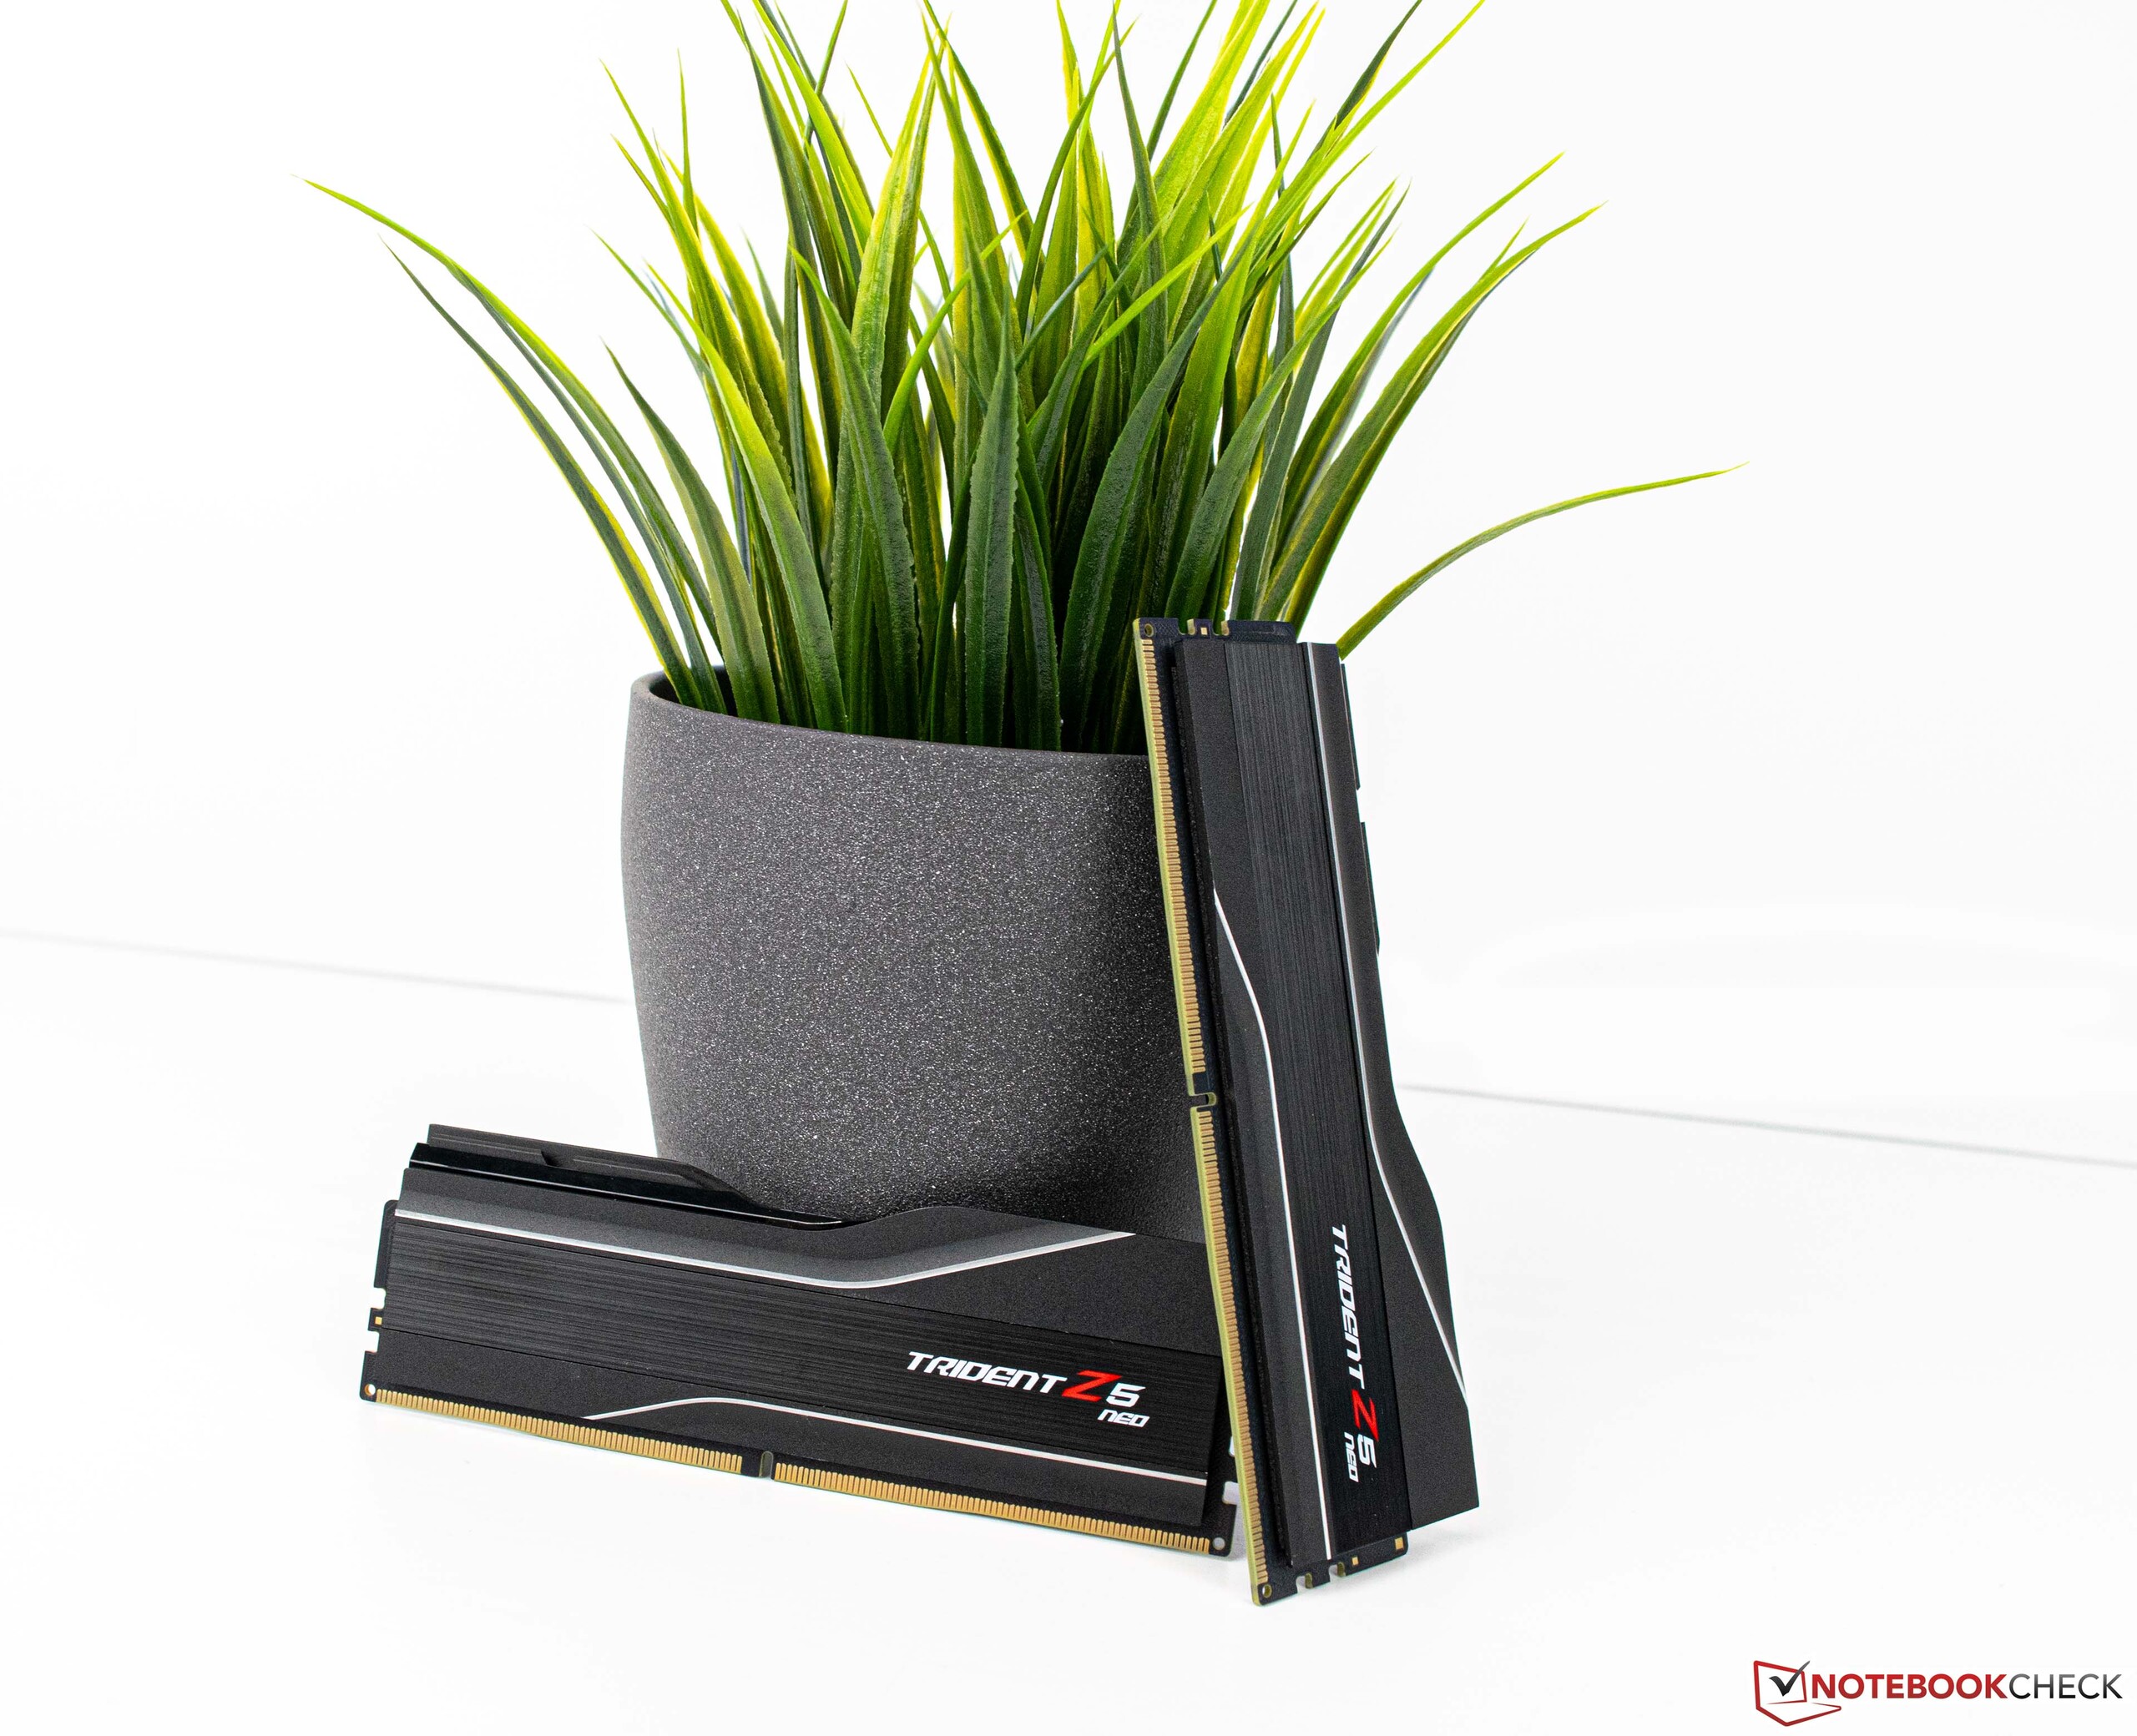
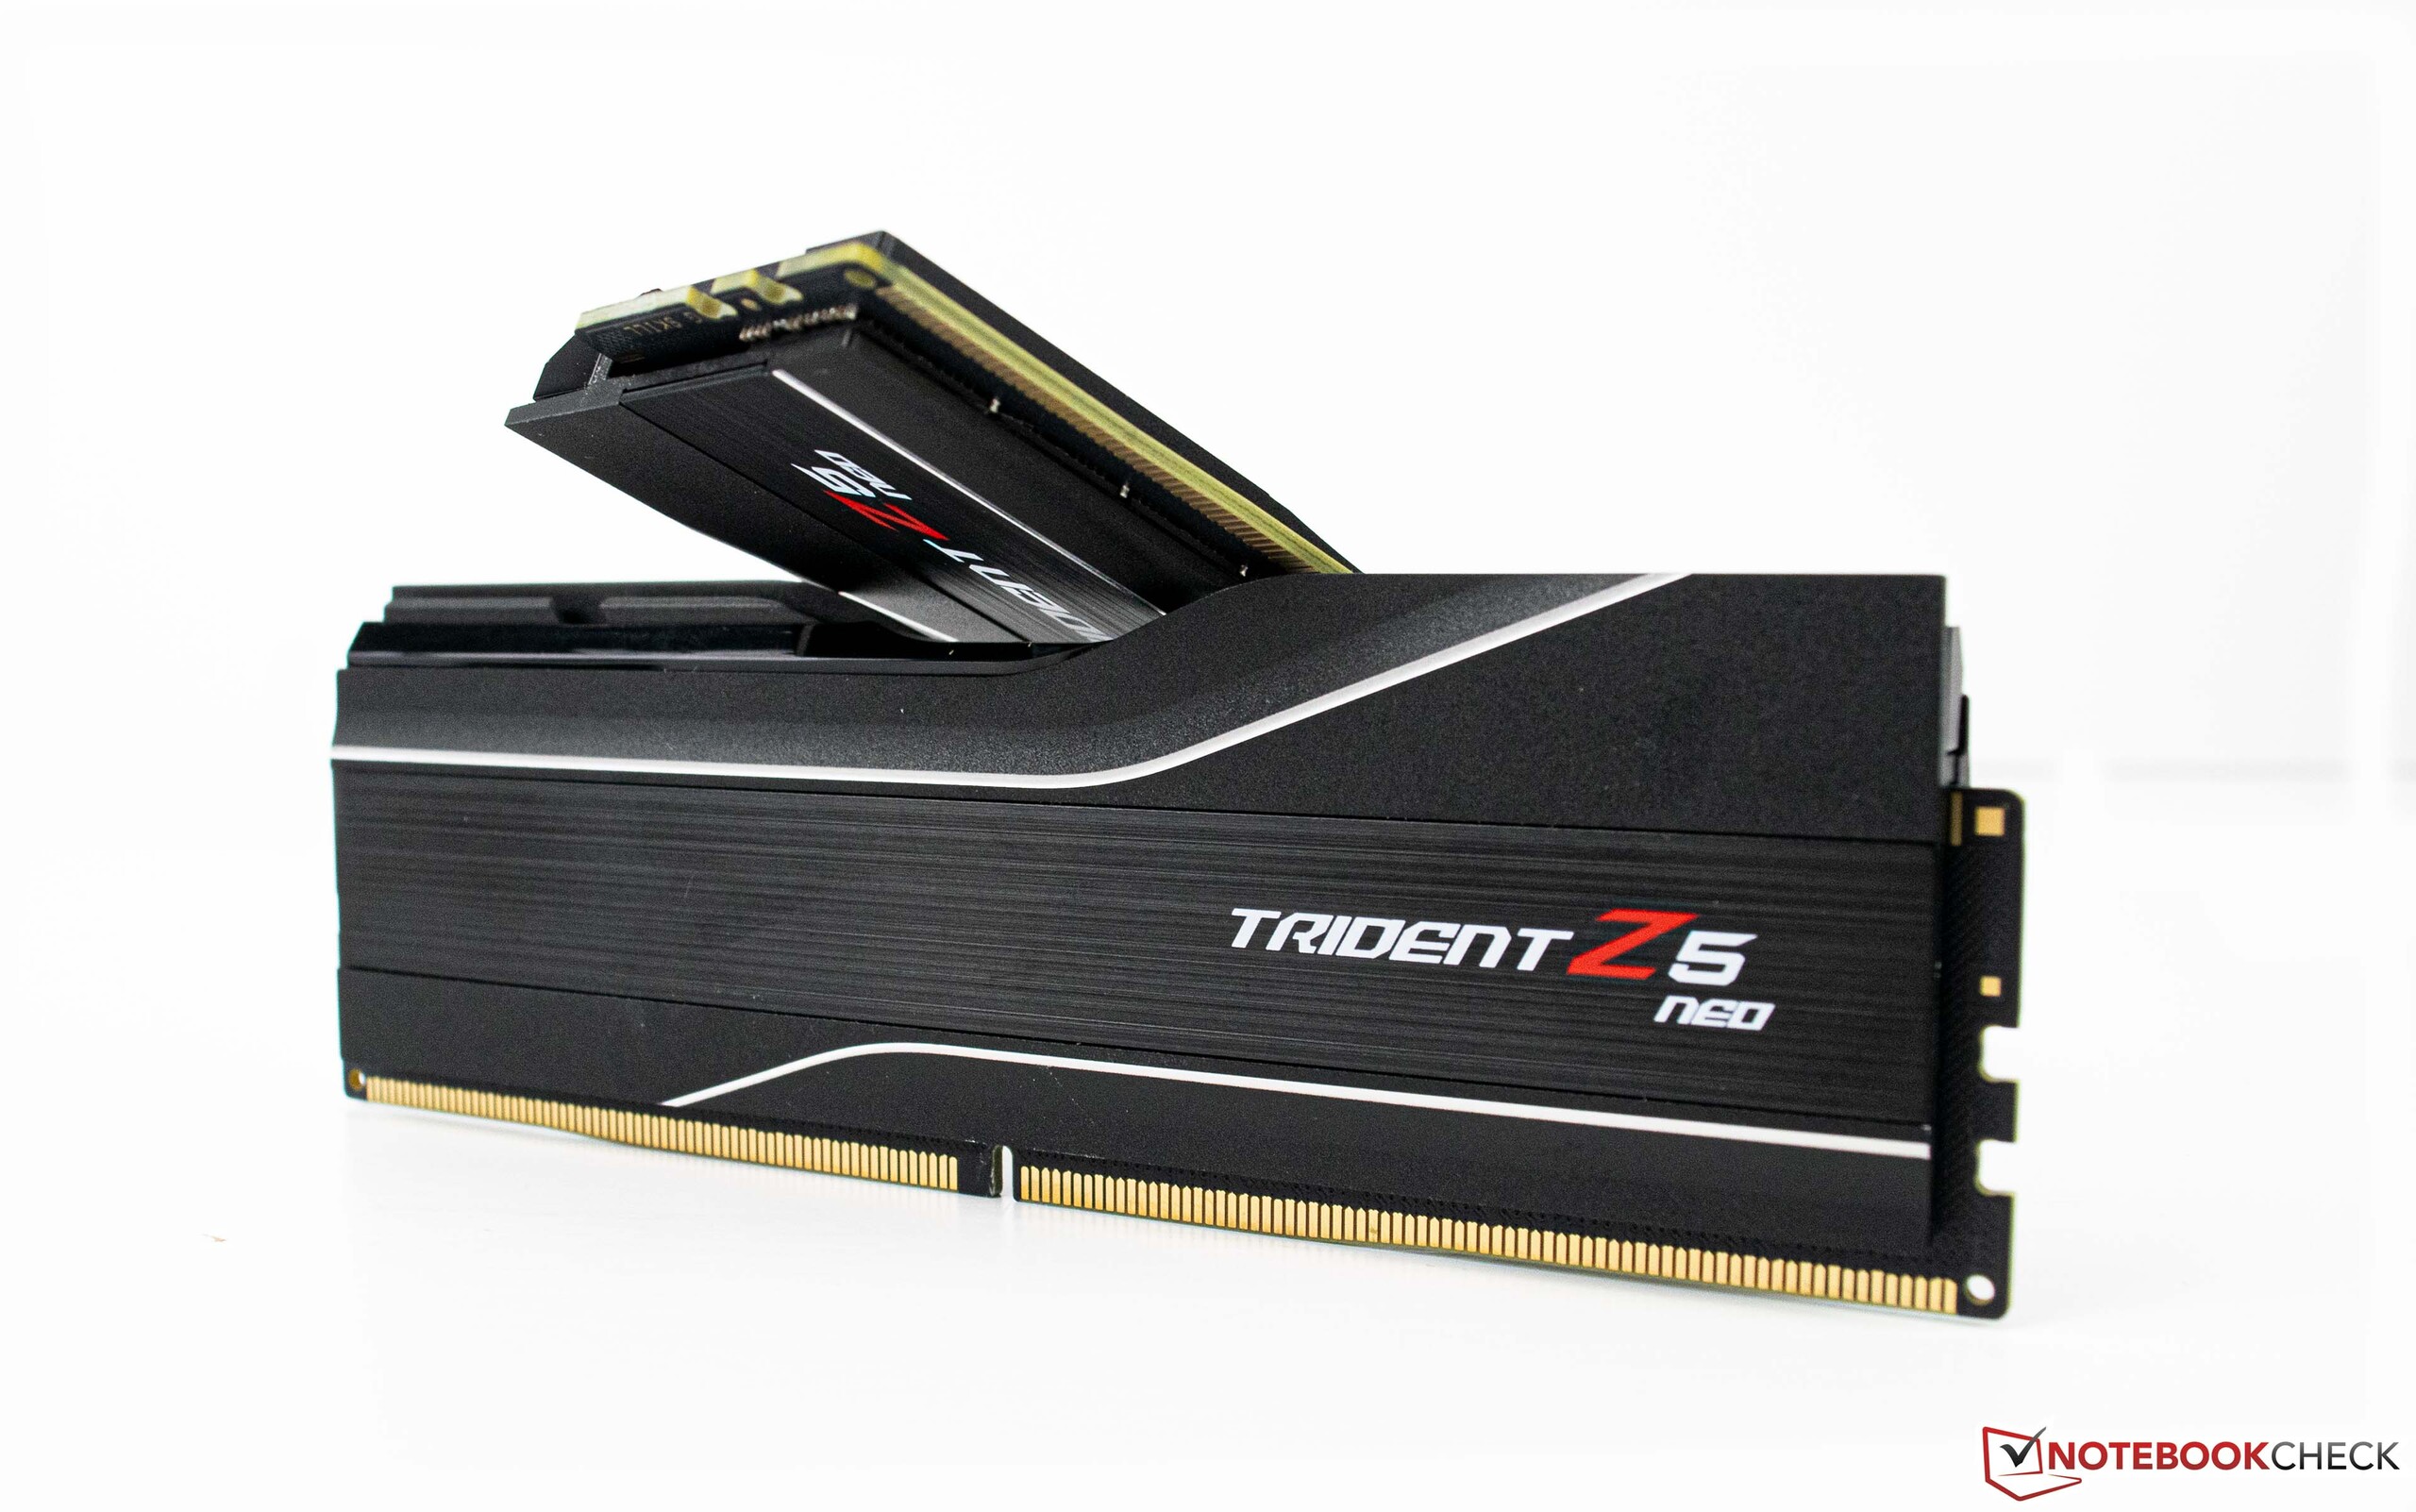
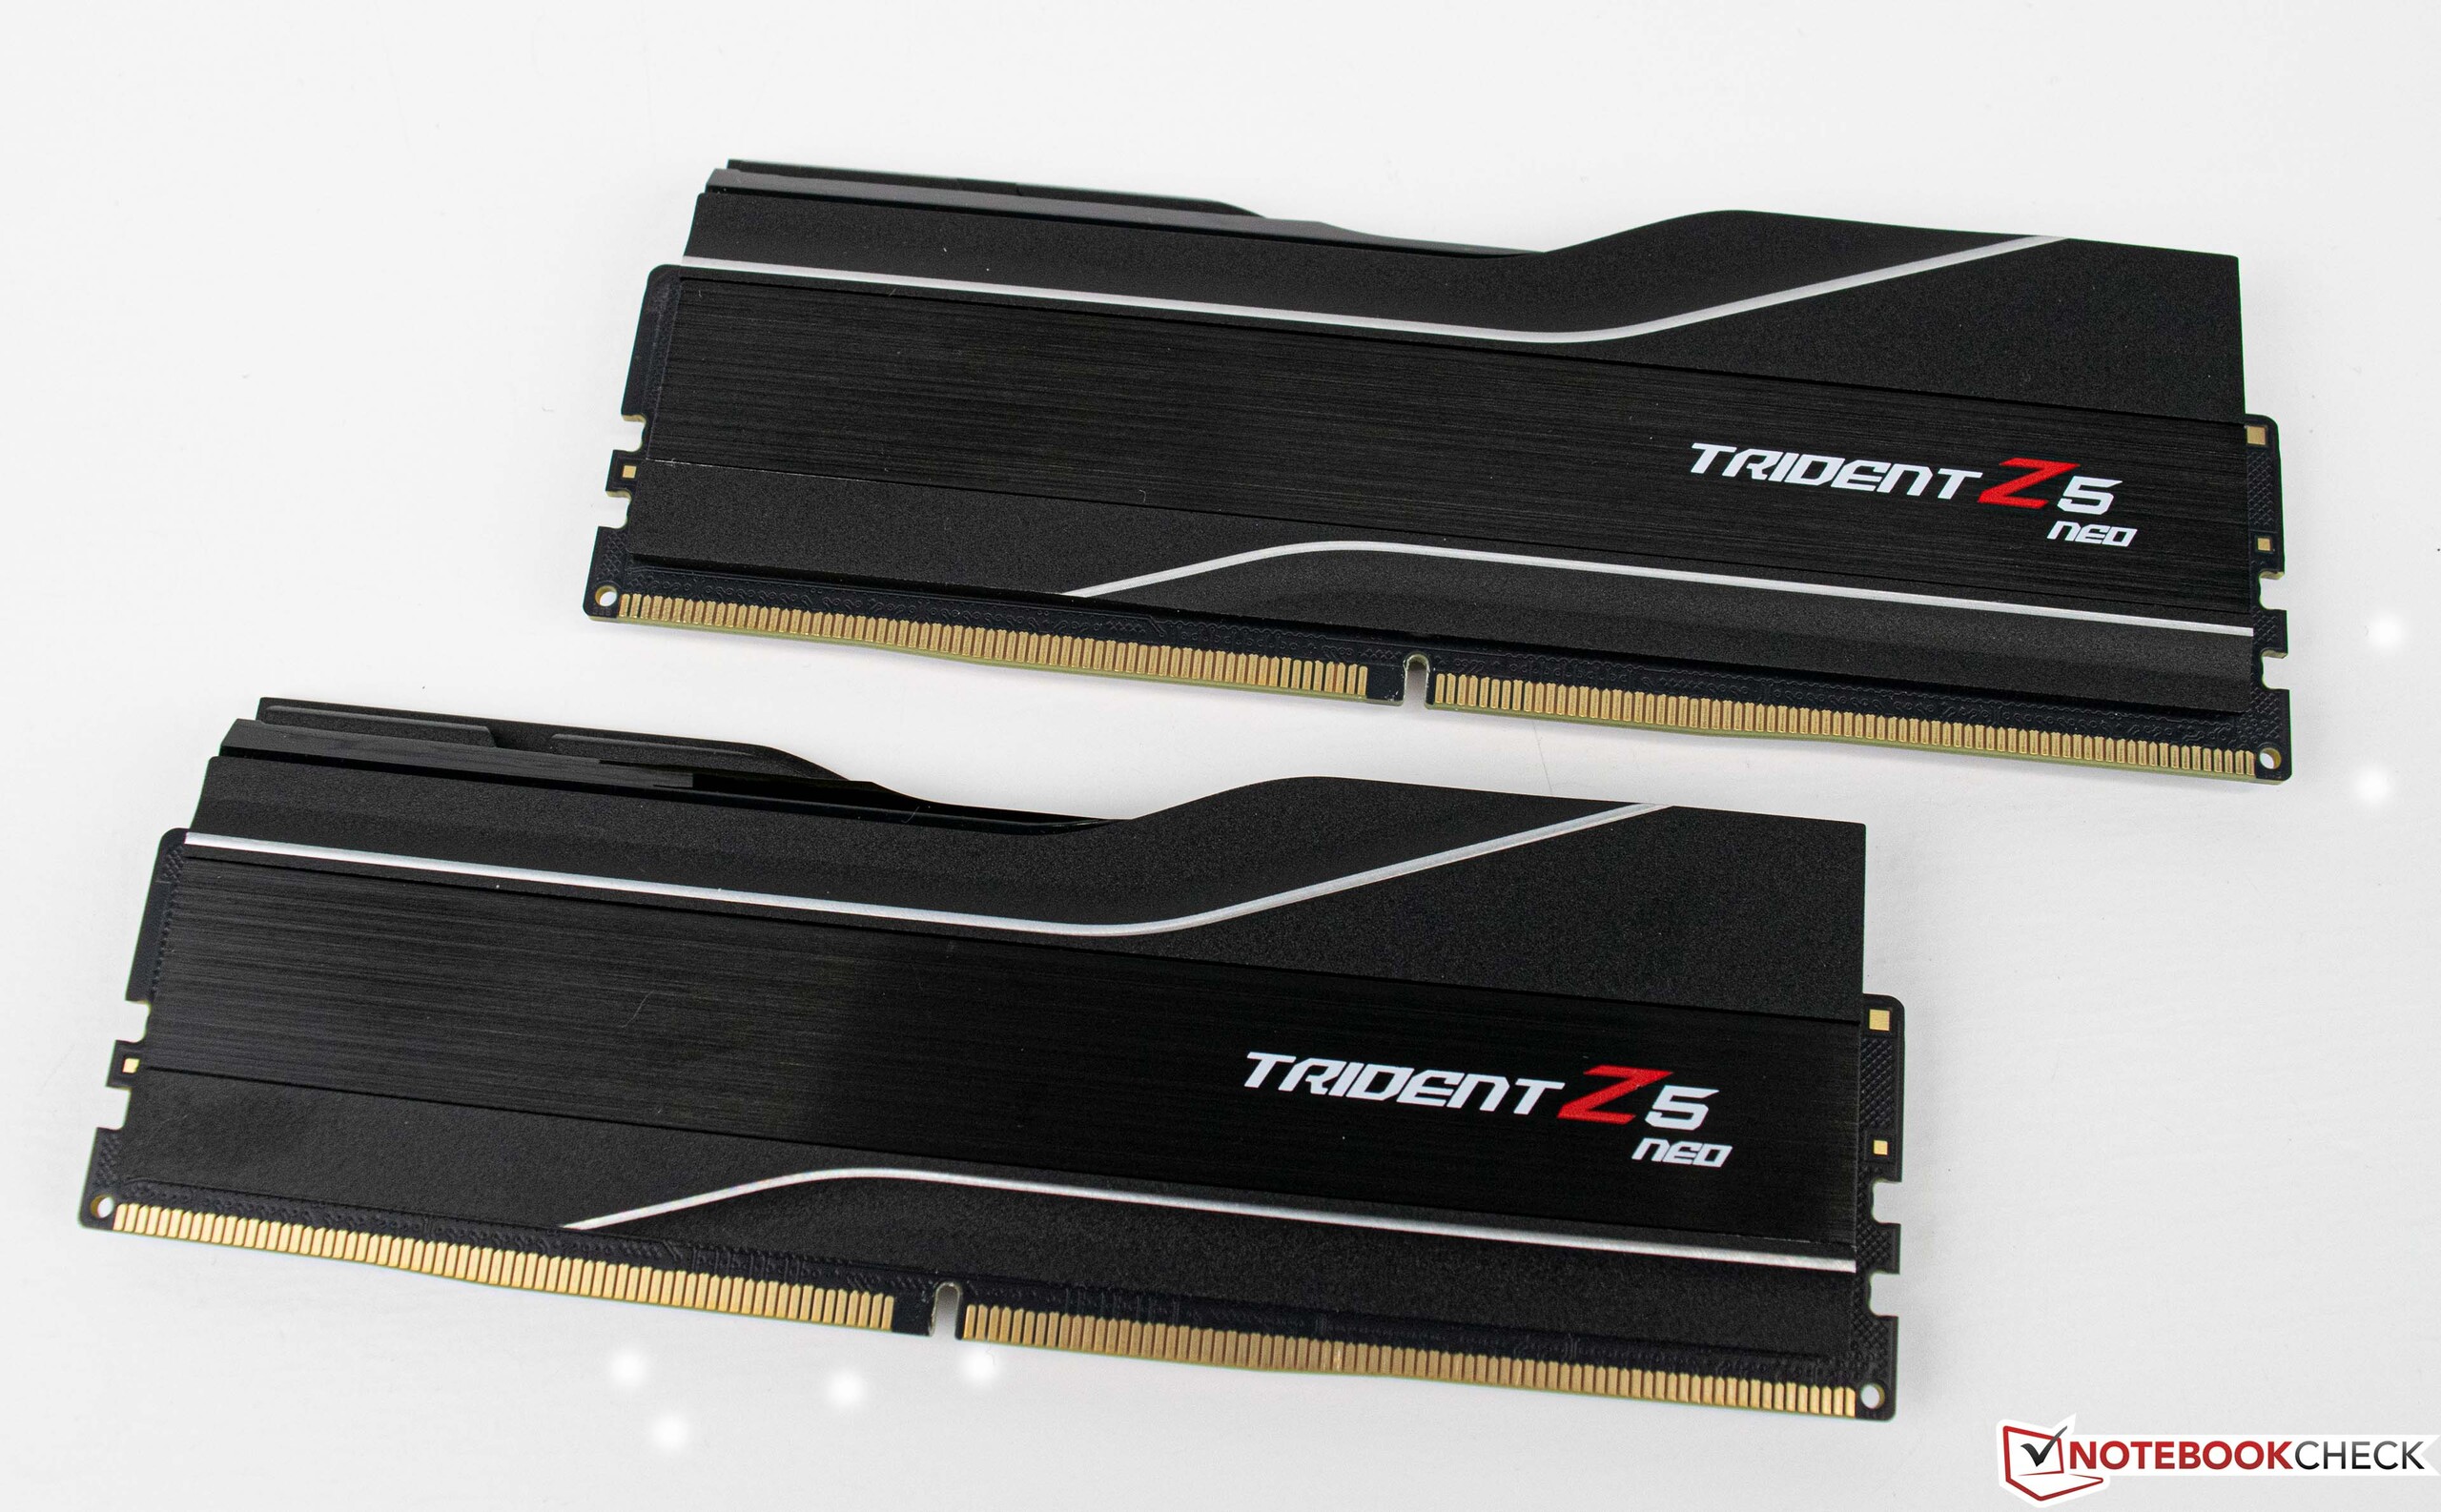
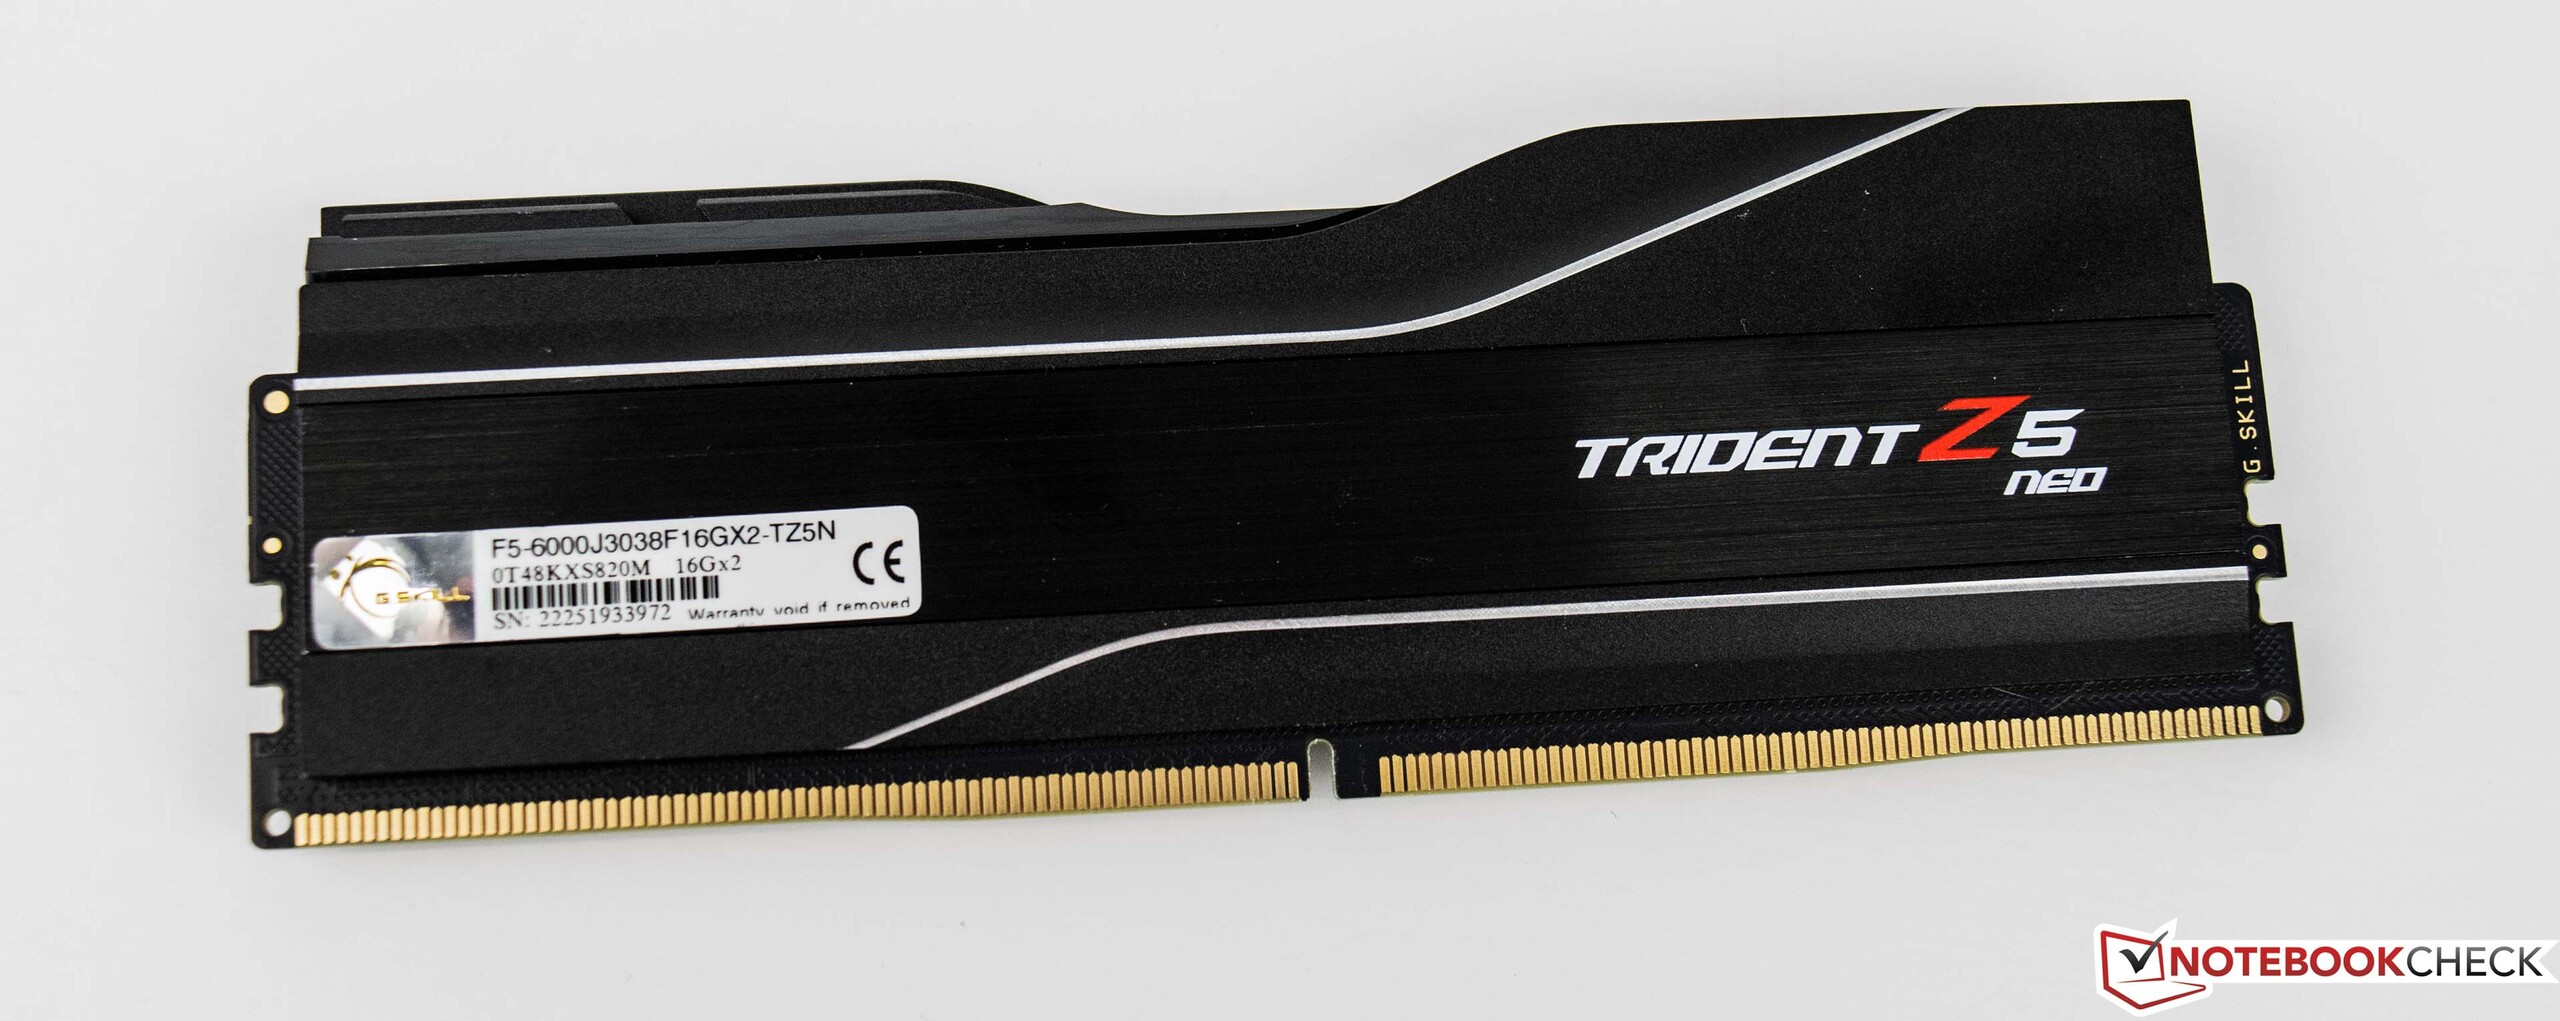
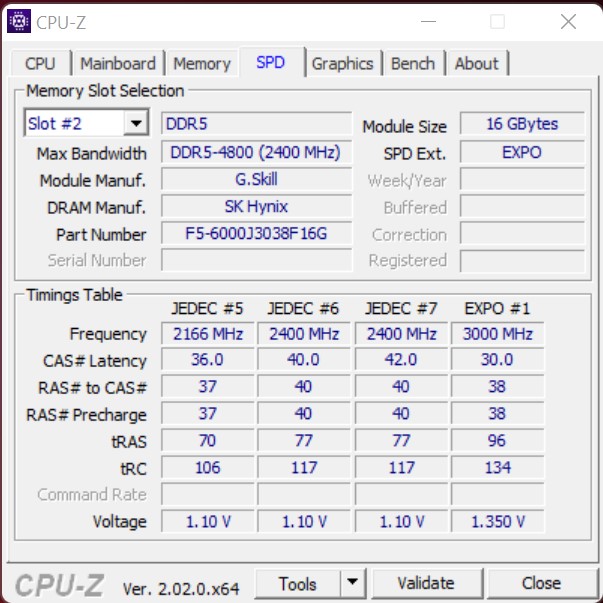
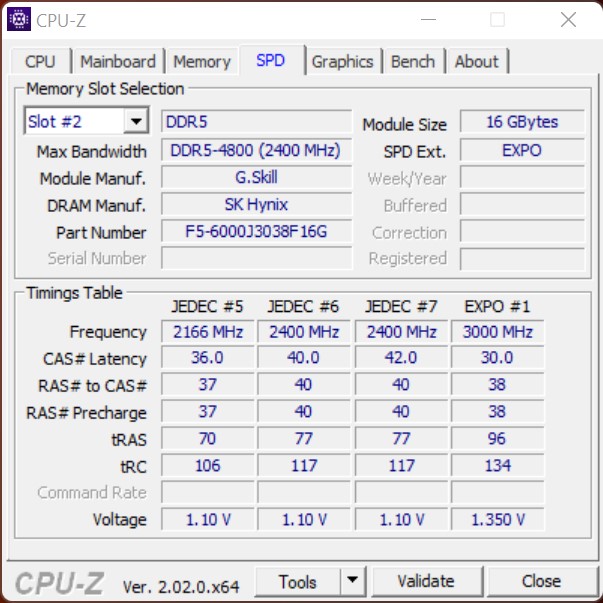
- G.Skill Trident Z5 Neo DDR5-6000 2x 16 GB, EXPO (DDR5-6000 CL30-38-38-96)
- SSD Intel Optane 905P 480 GB PCIe
- 2x Transcend NVMe SSD 512 GB
- Microsoft Windows 11 Professional de 64 bits (versión 21H2)
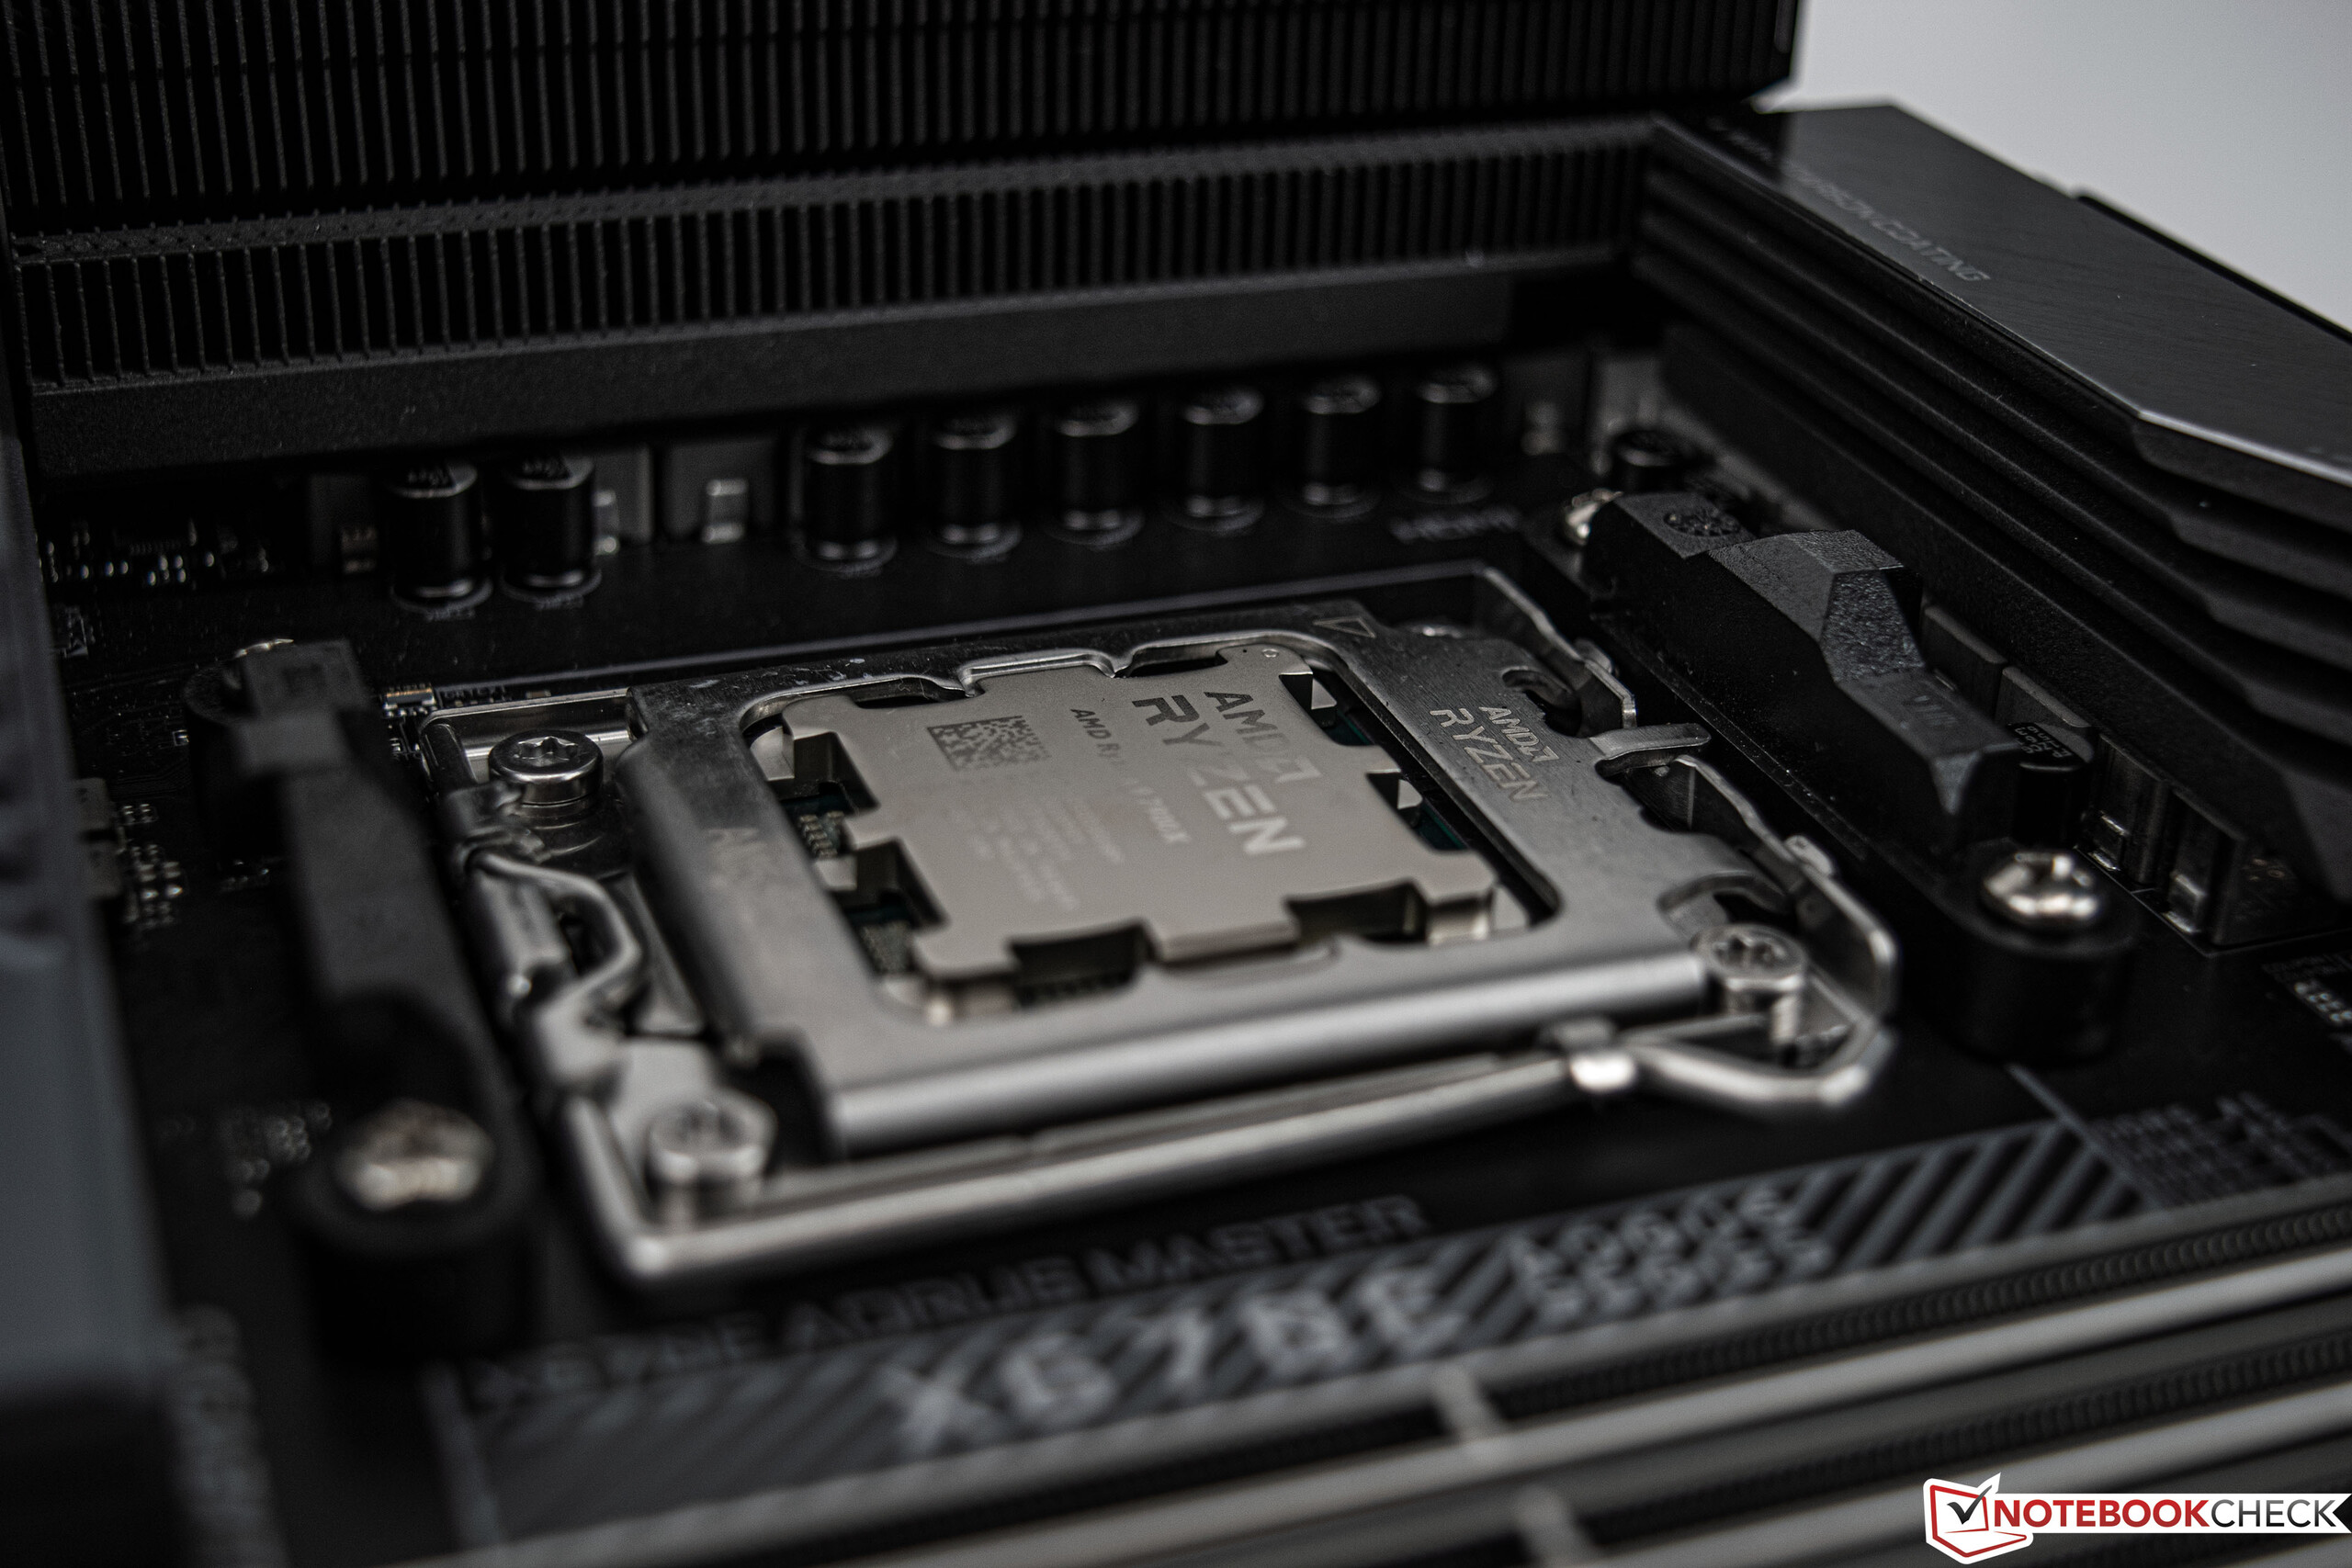

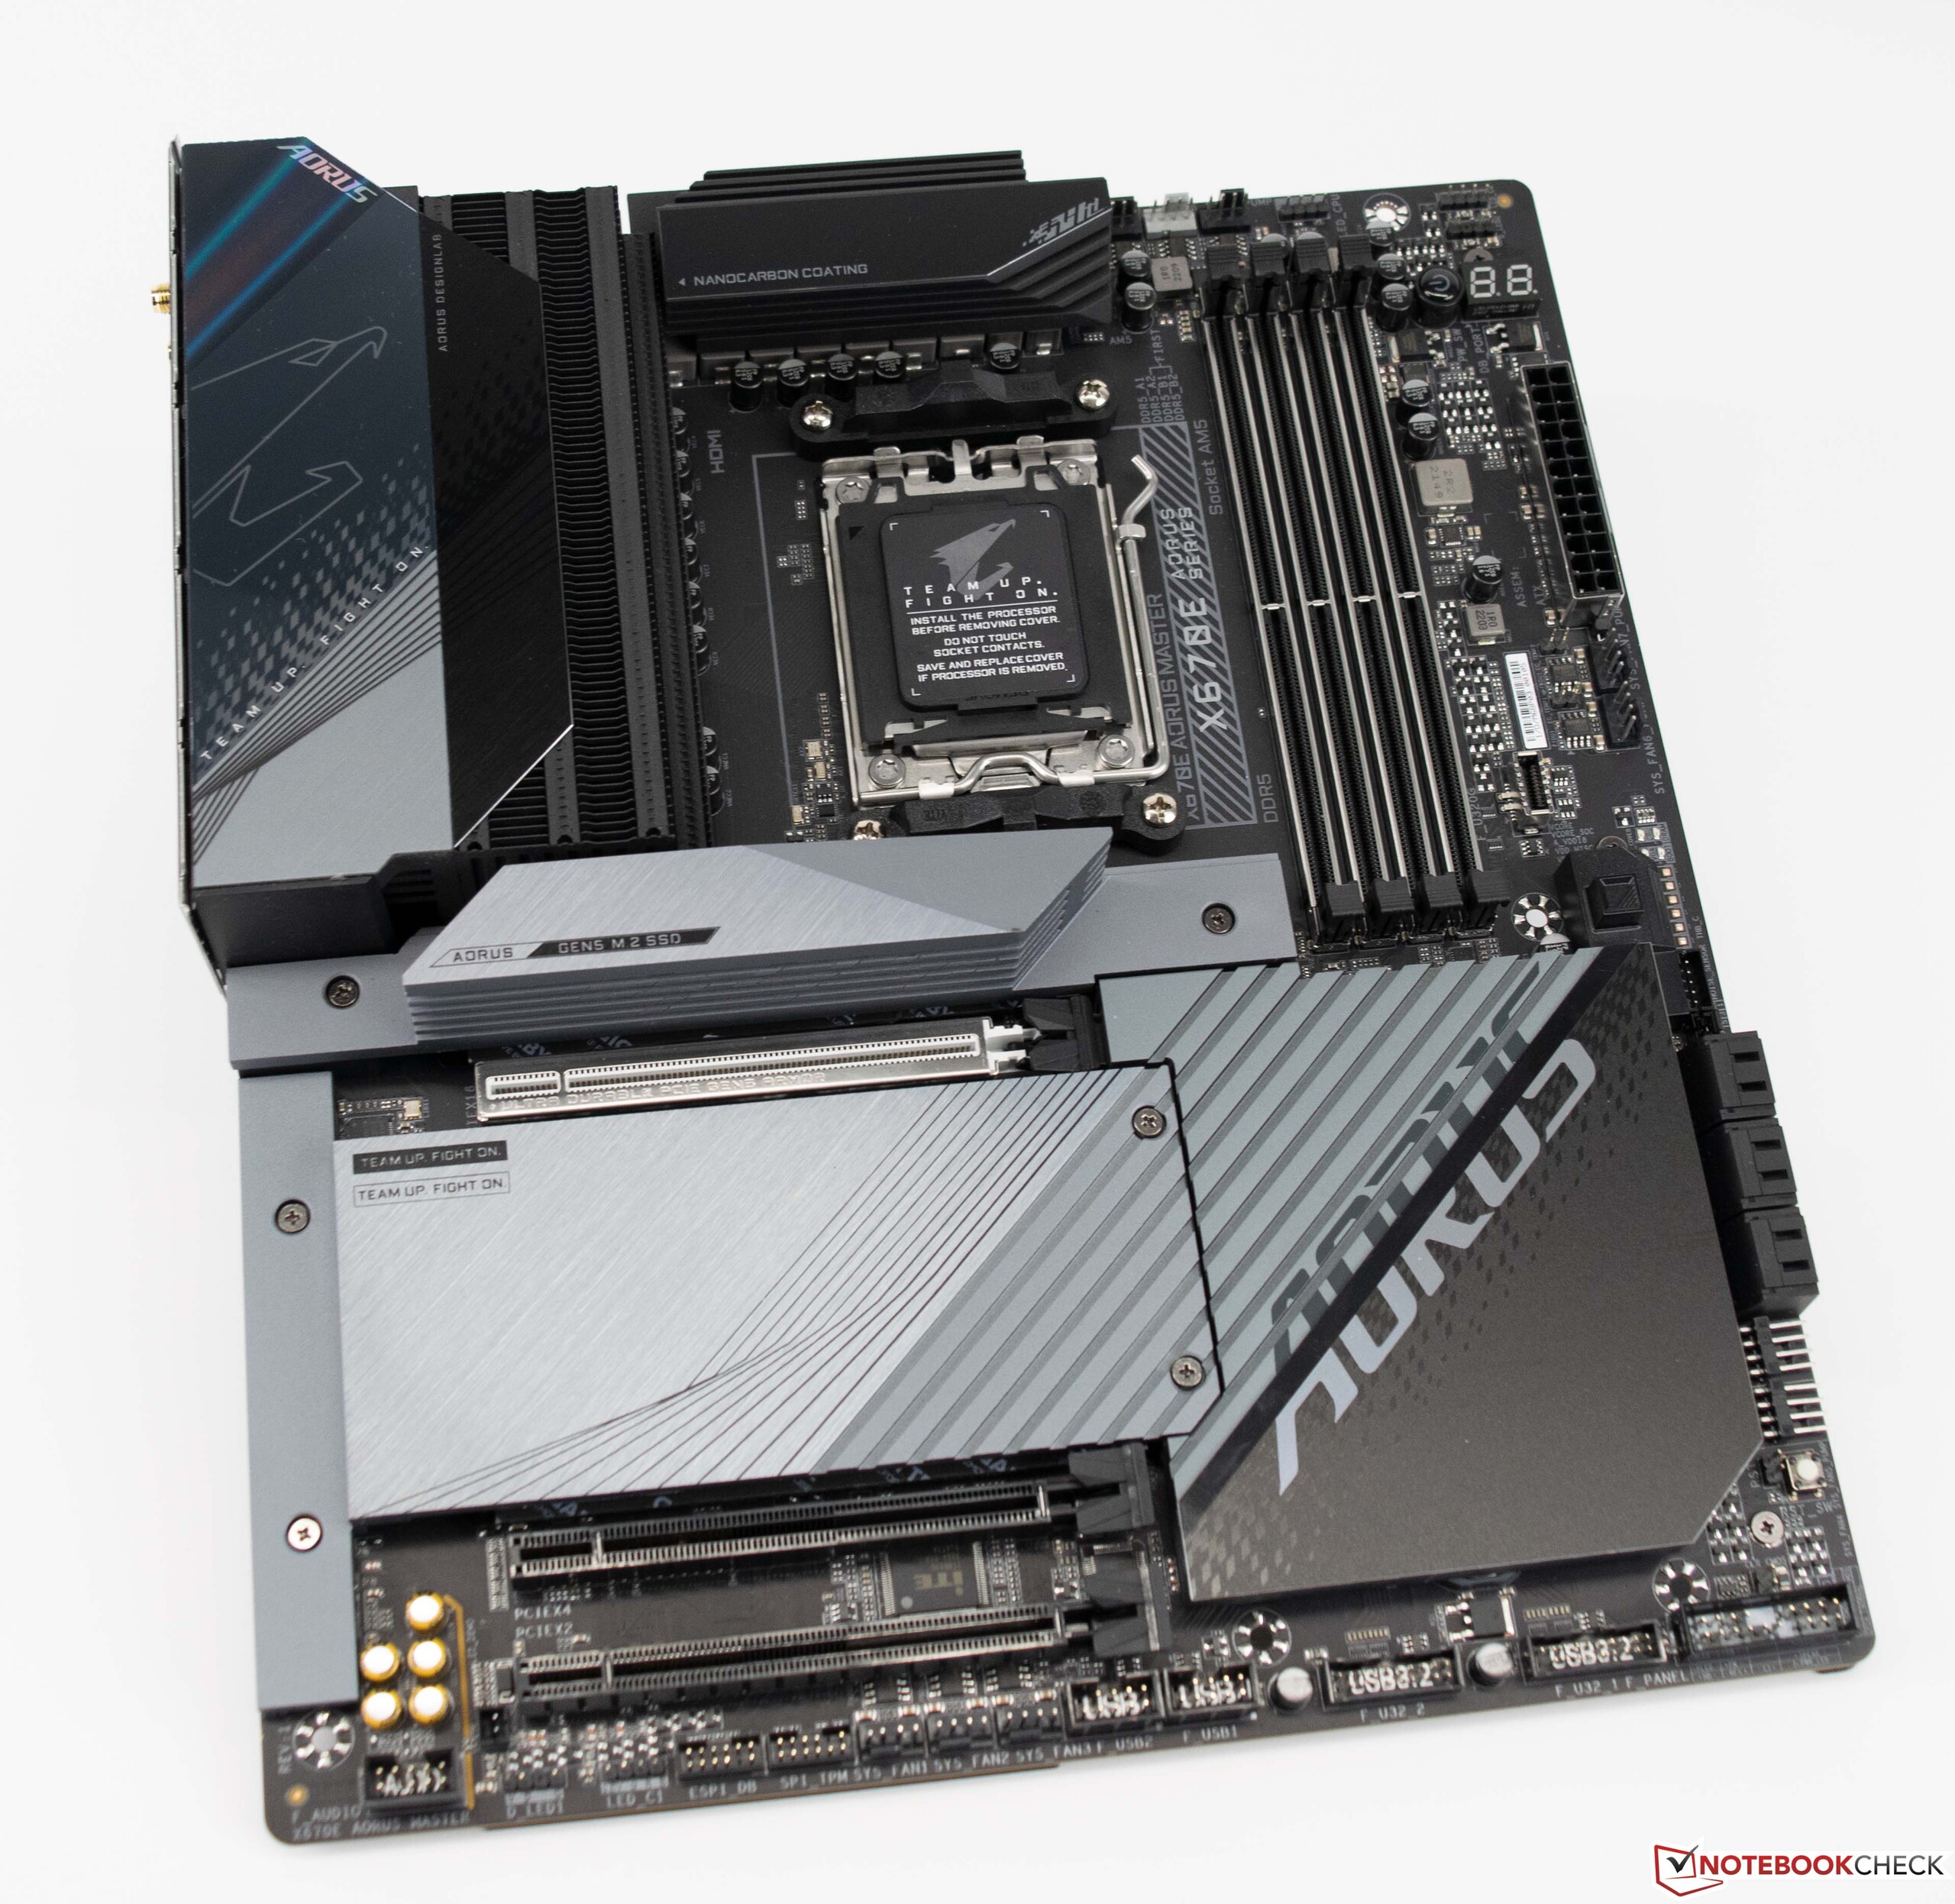
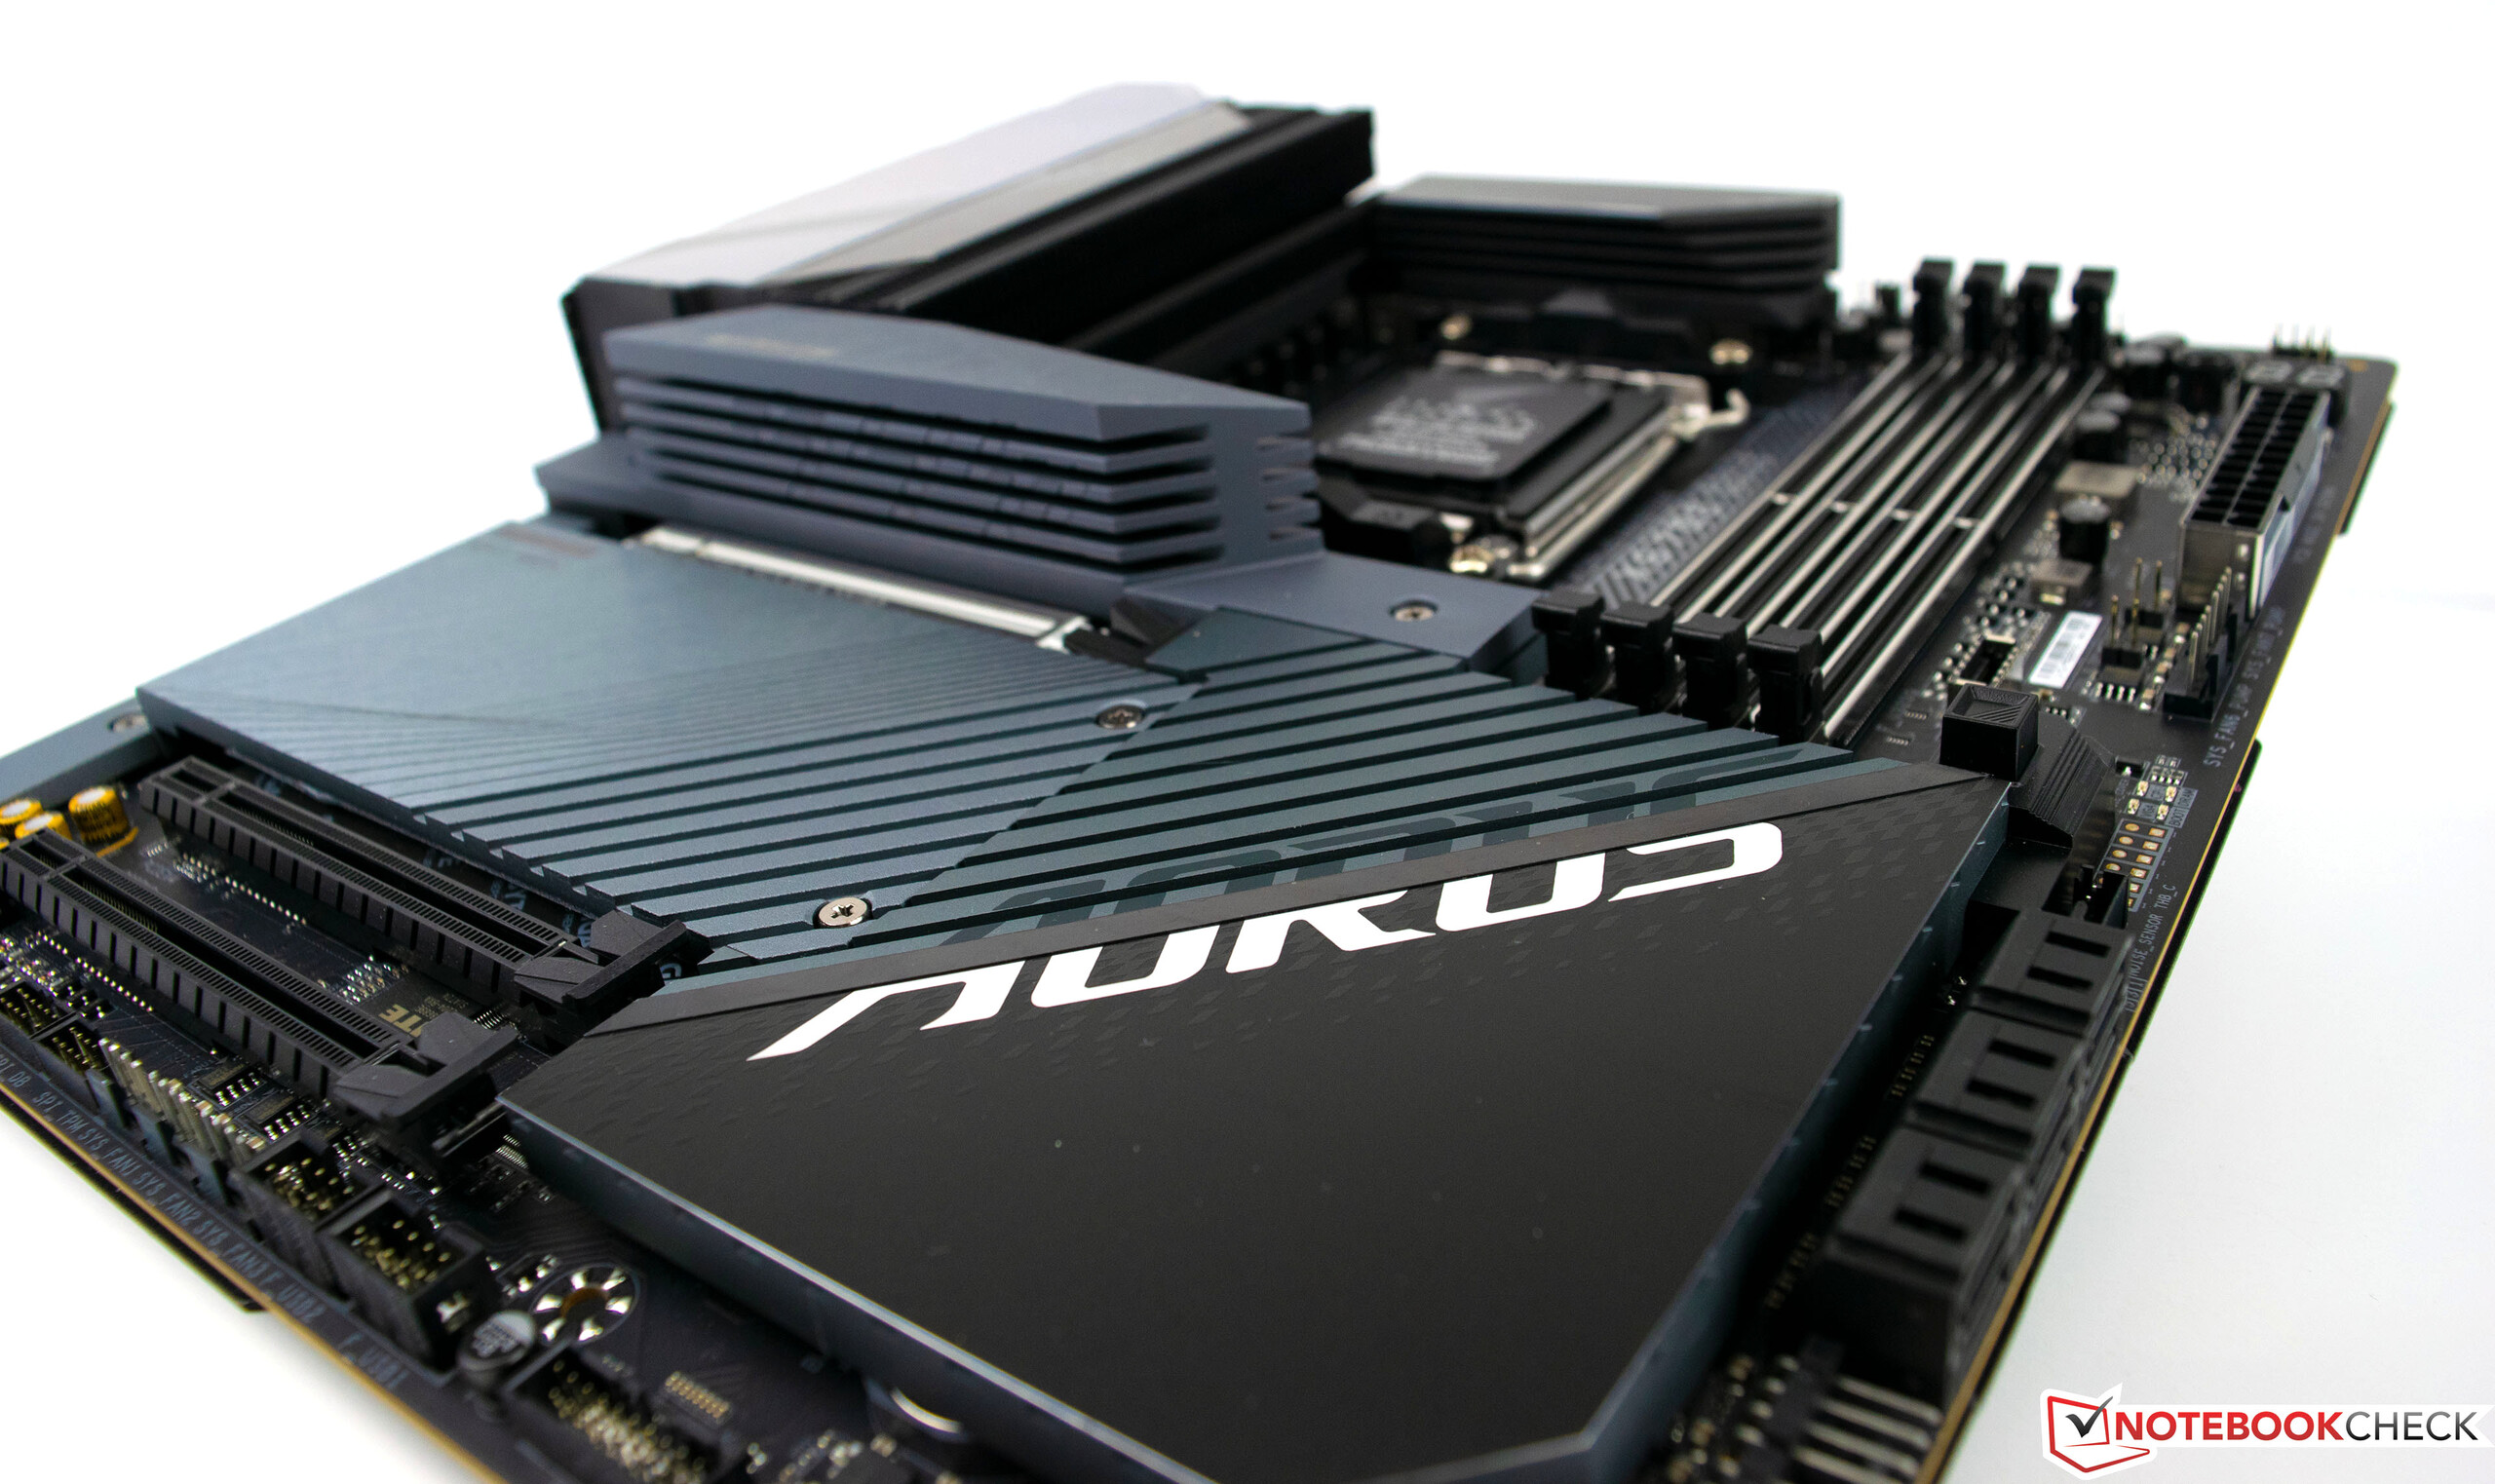
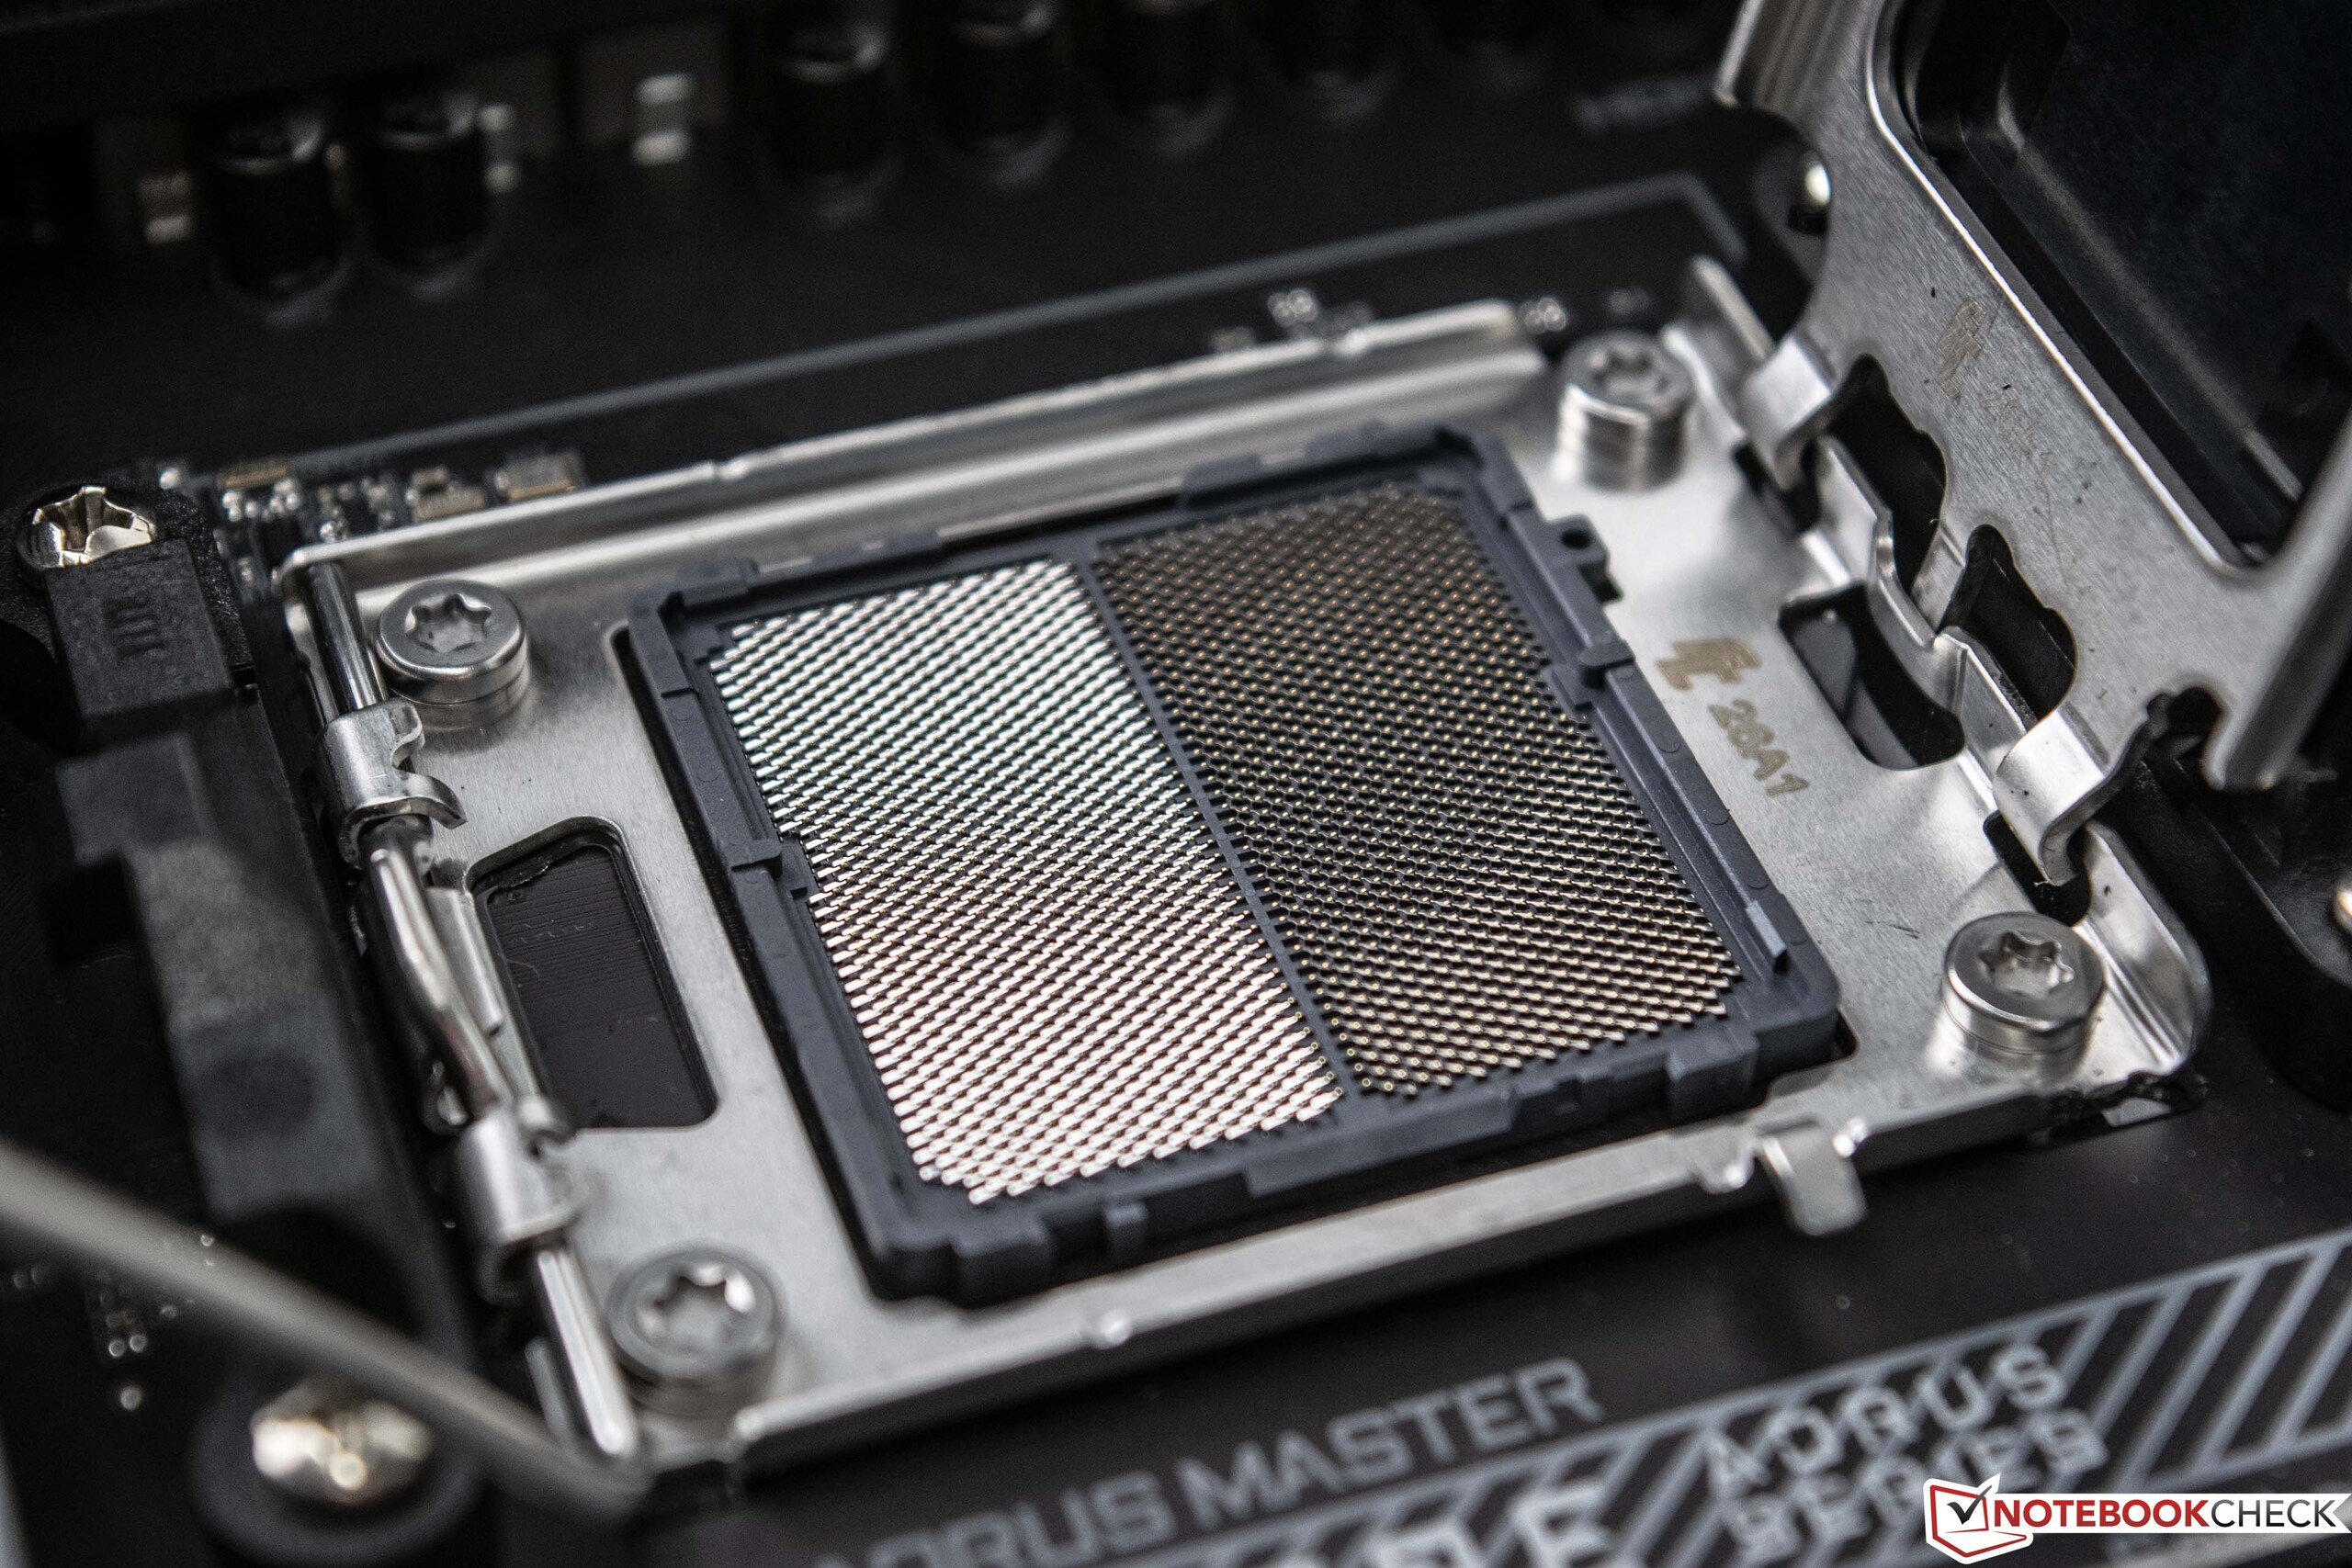
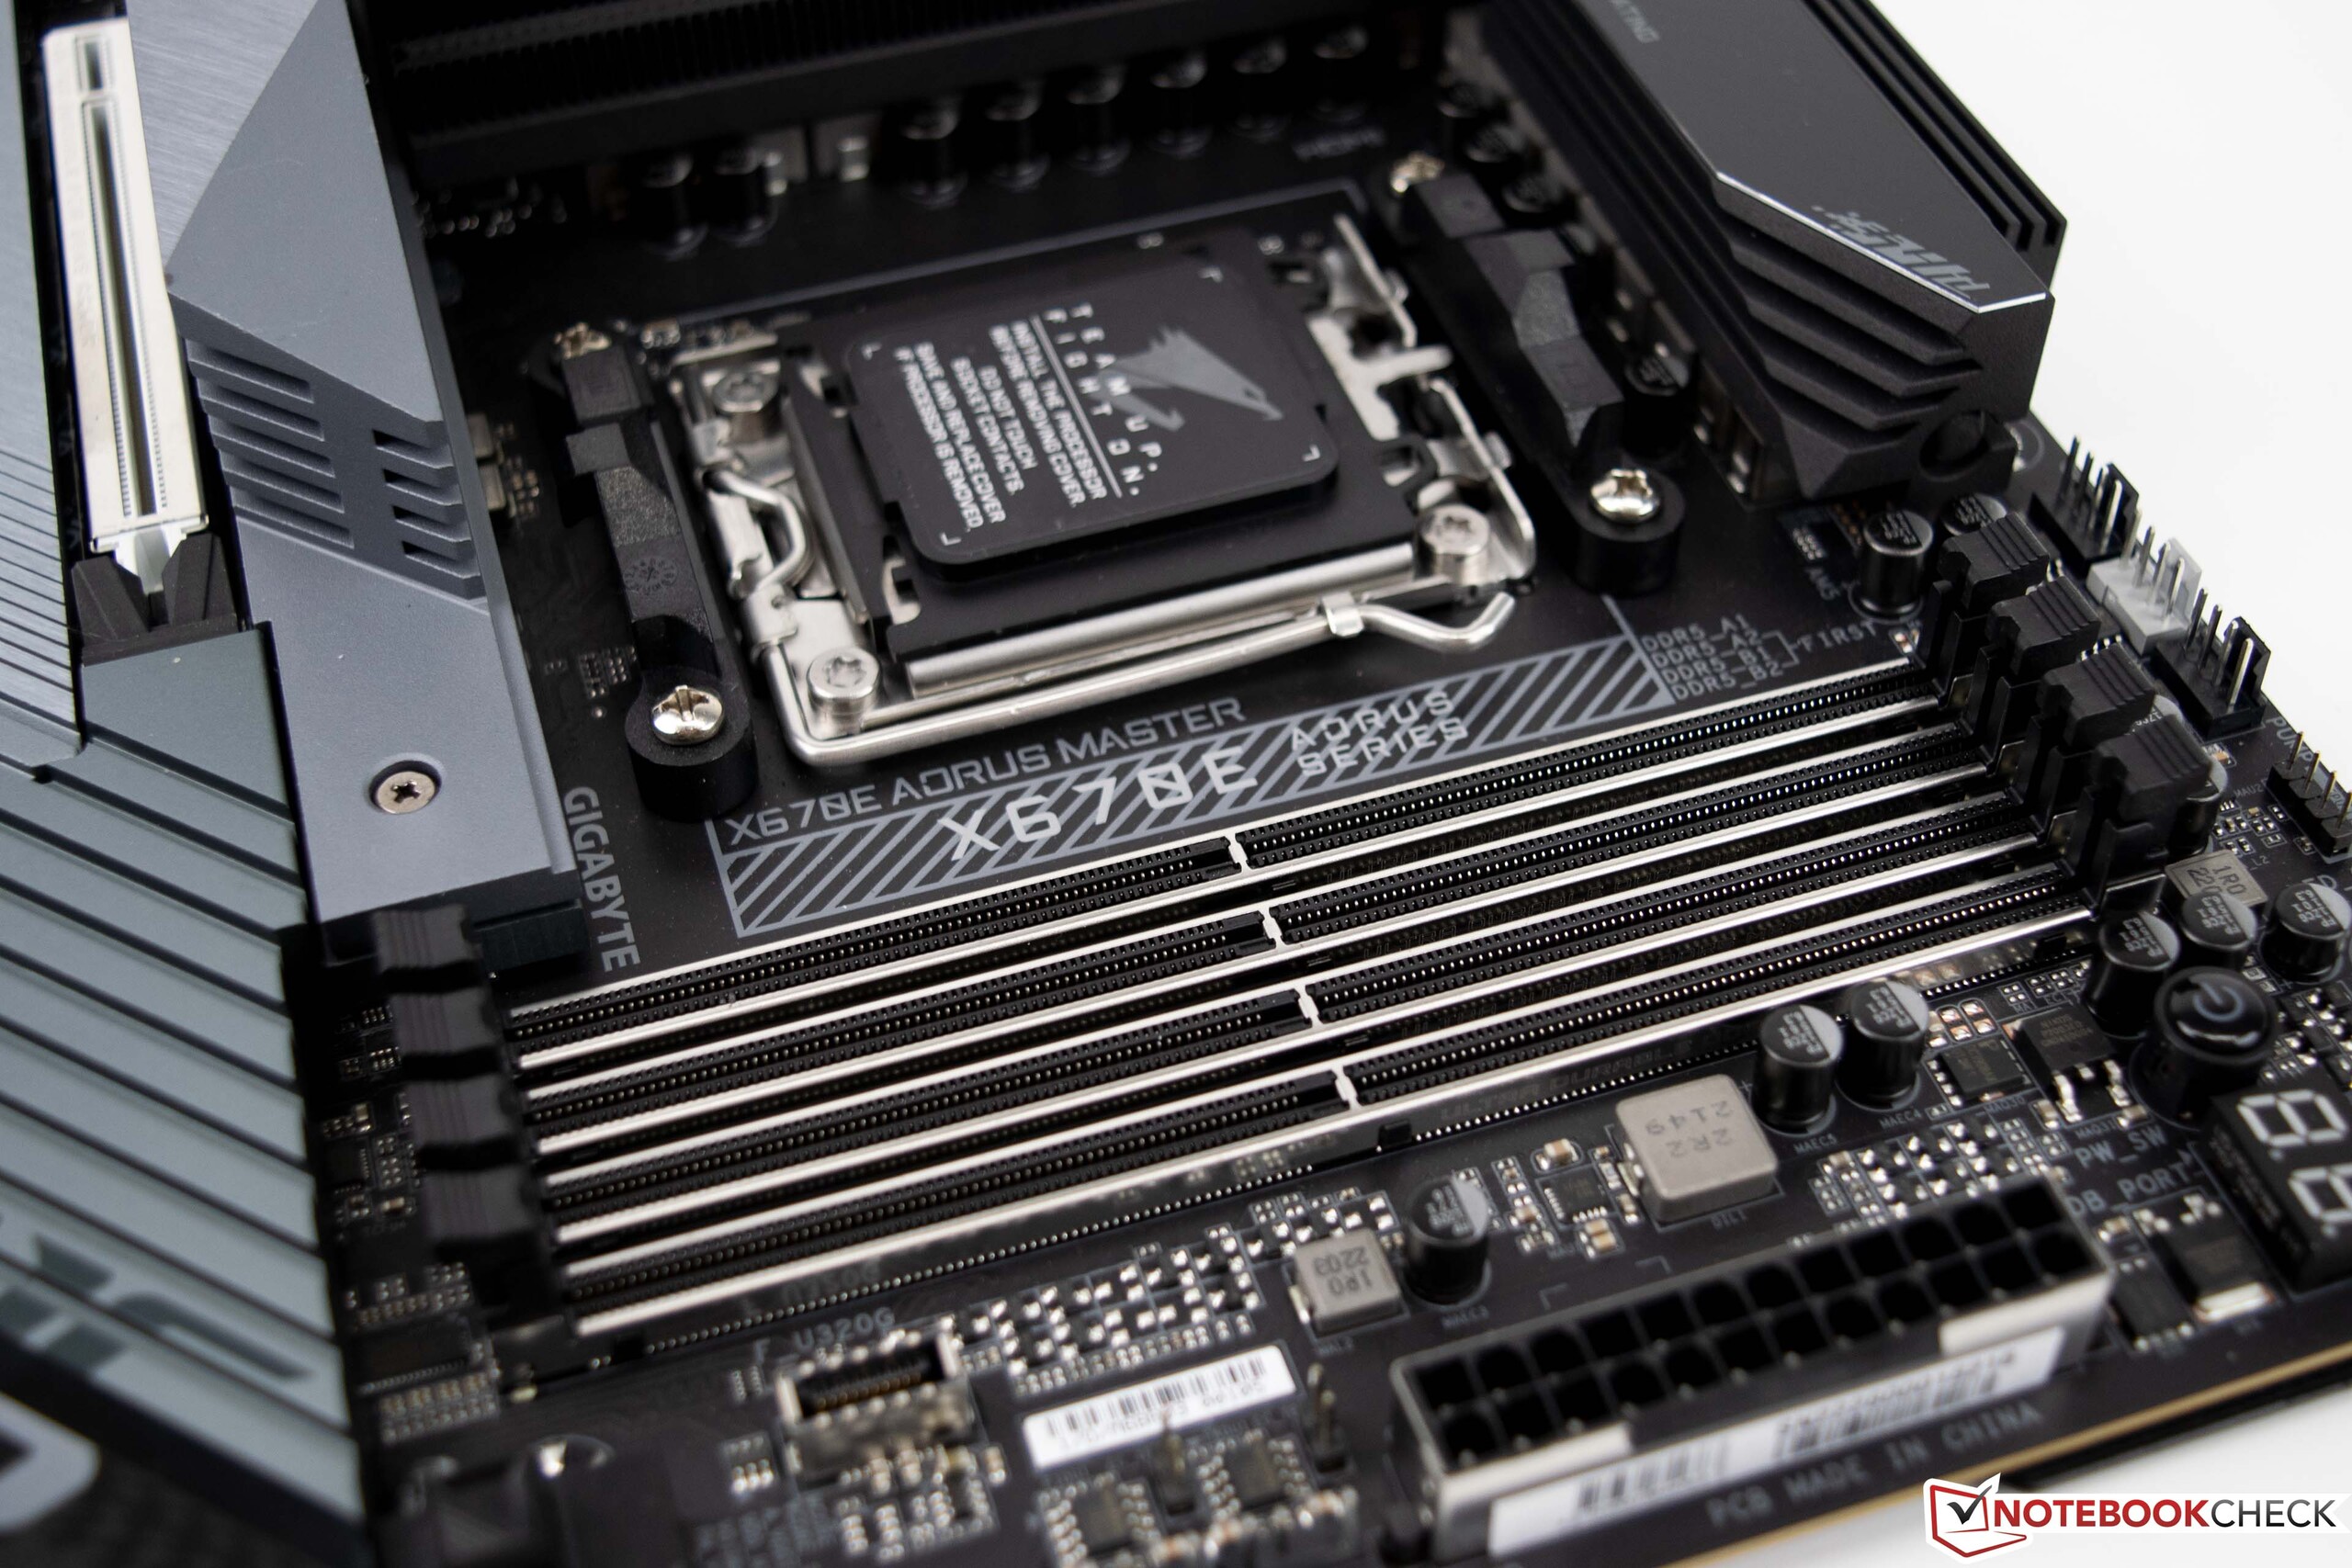
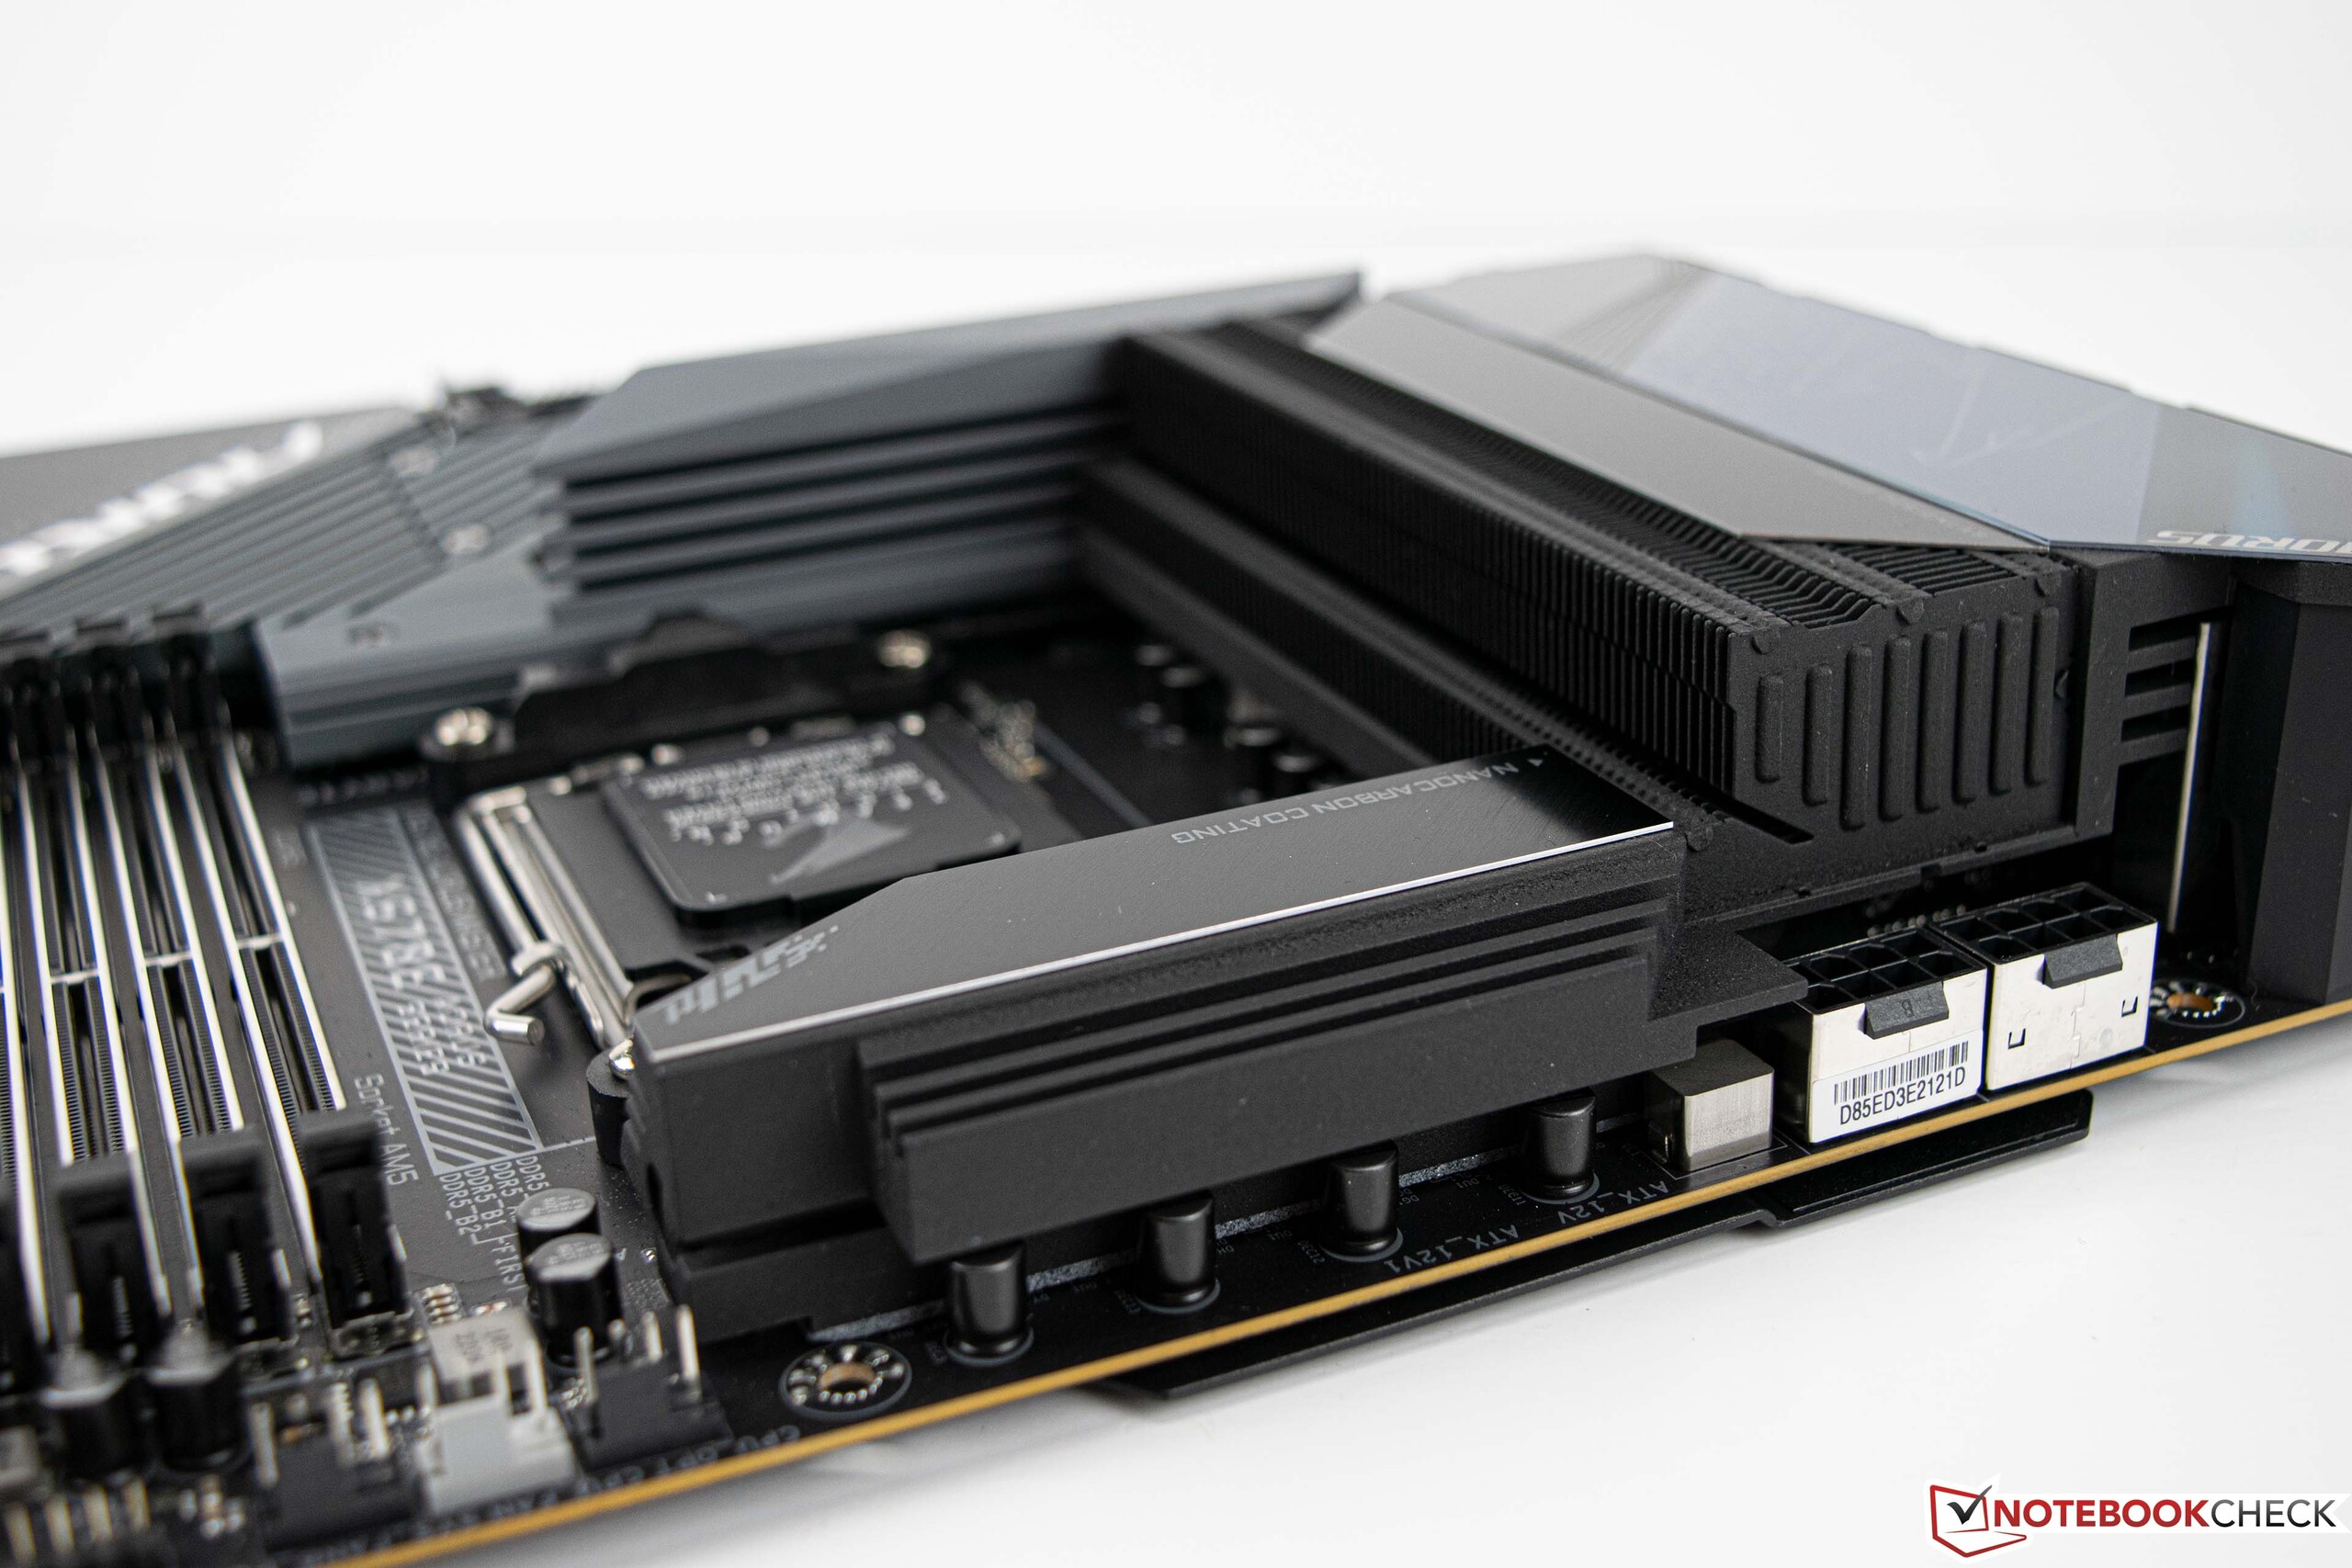
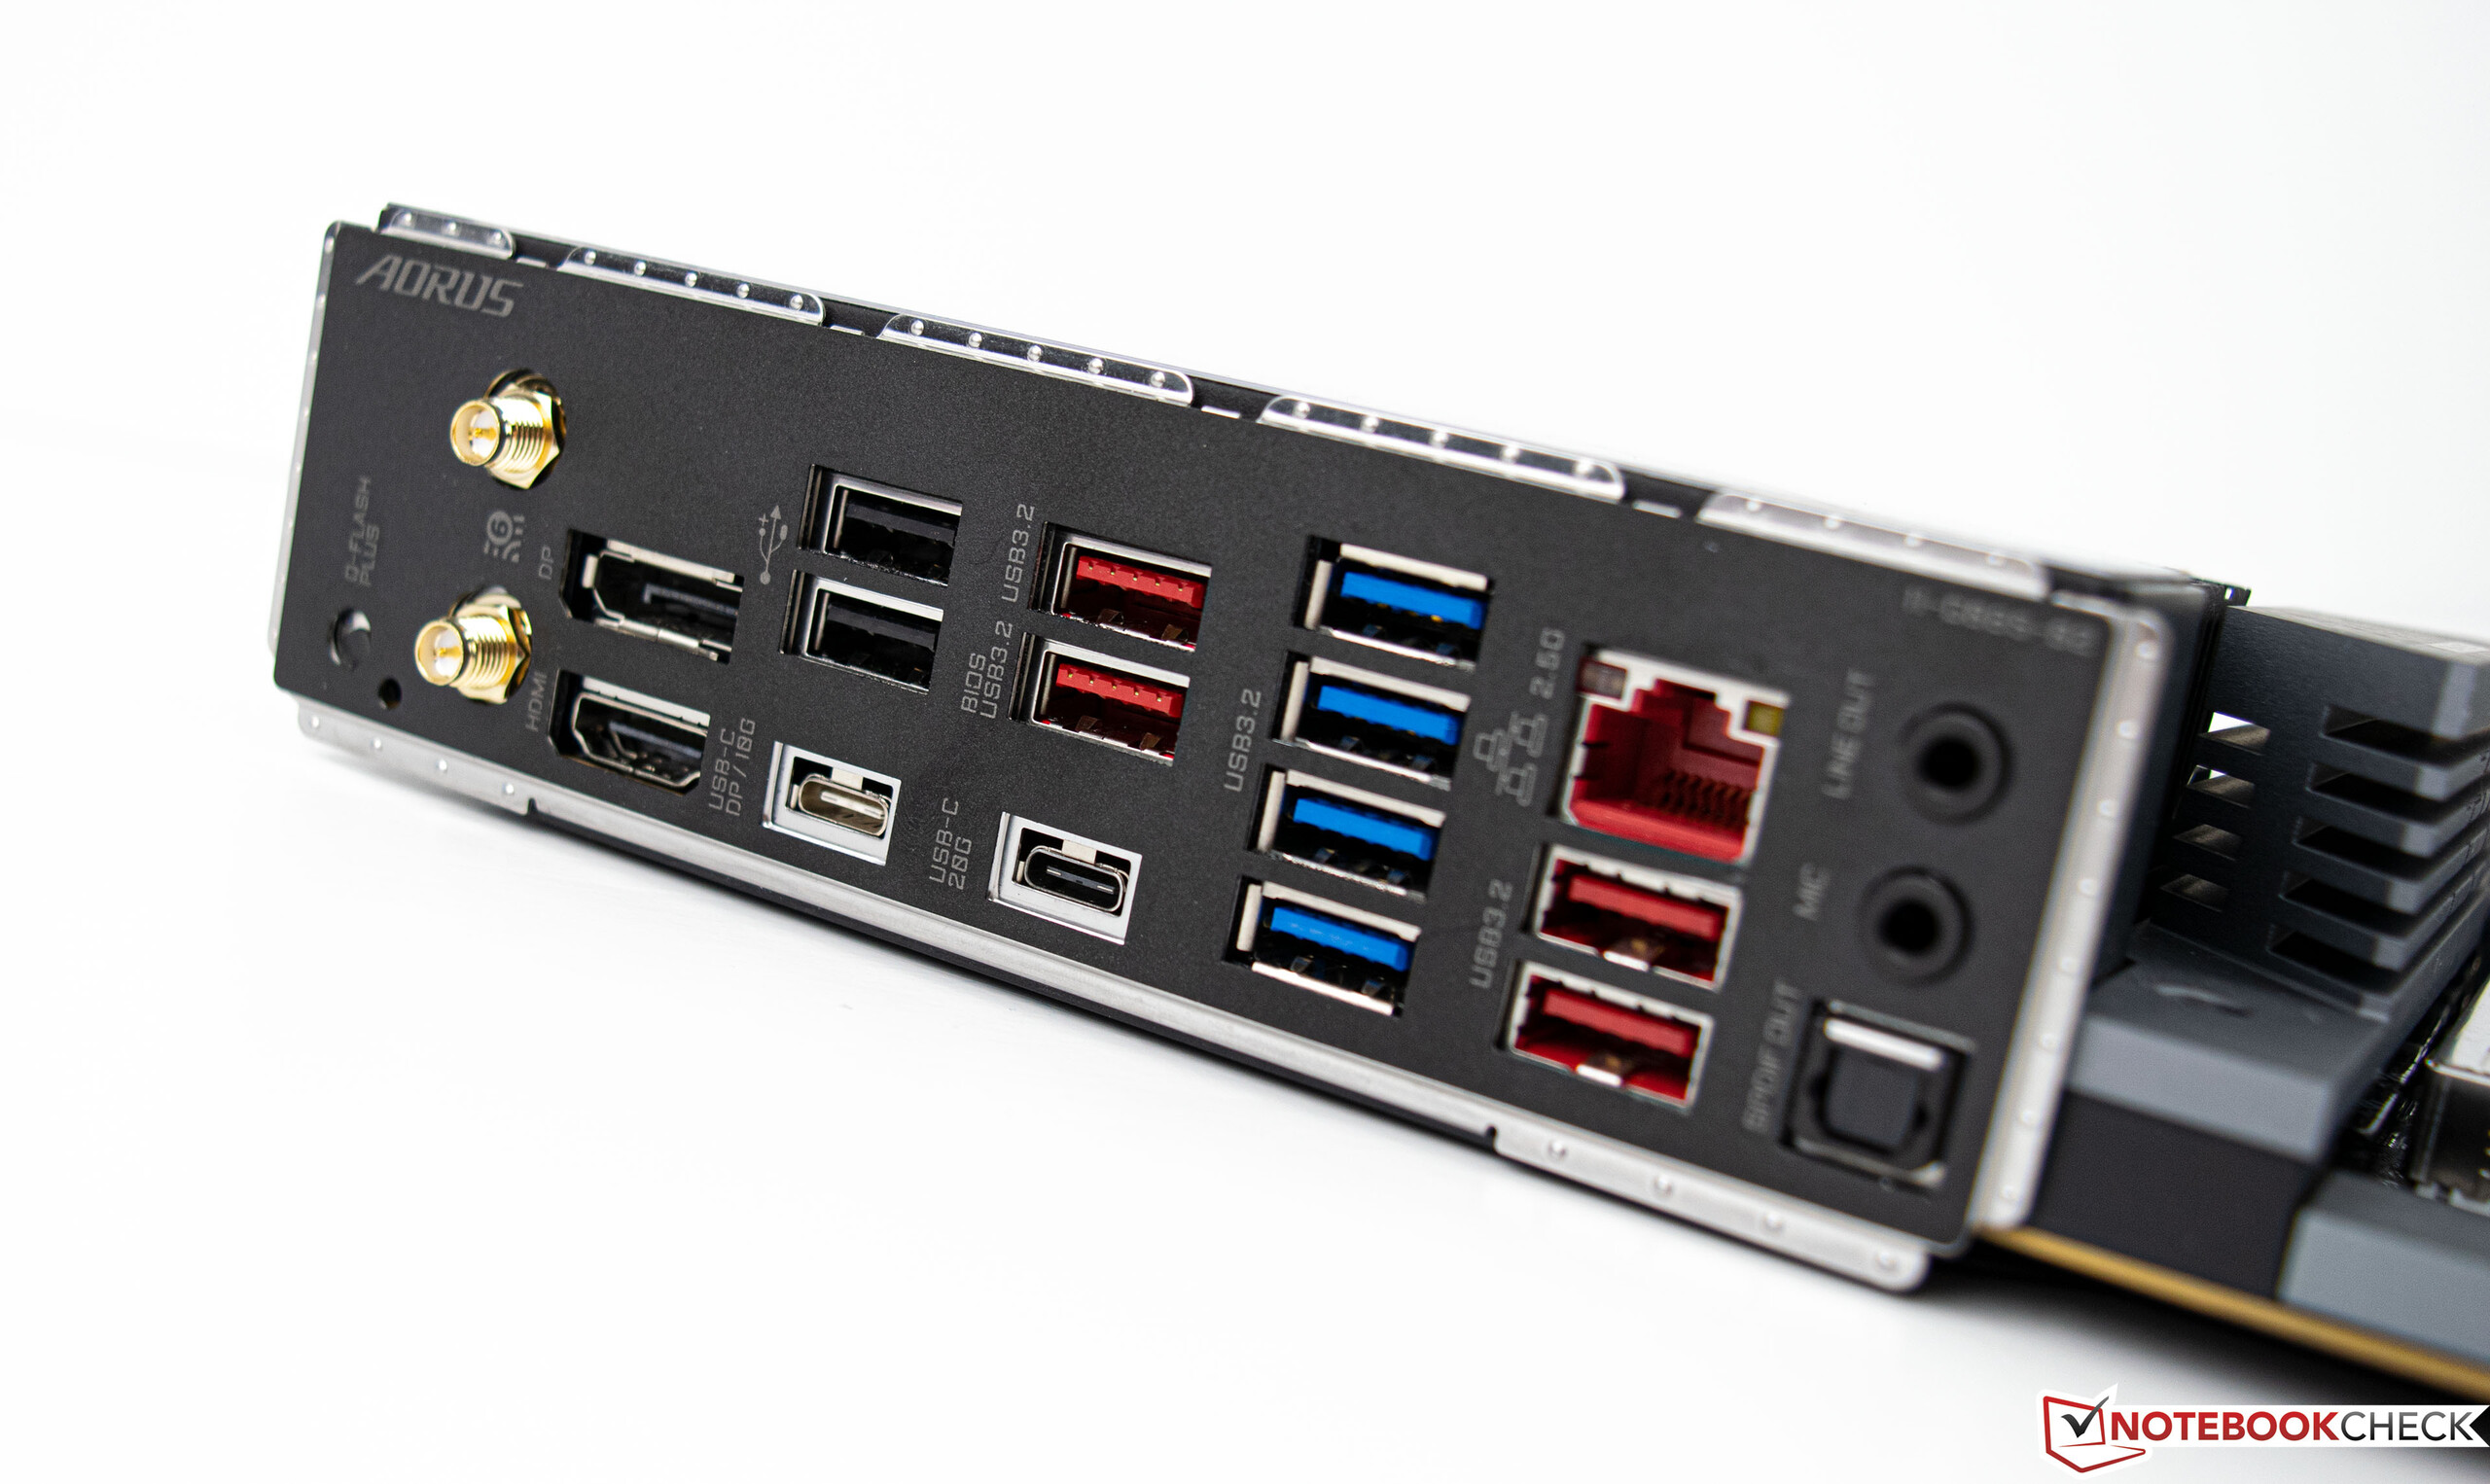
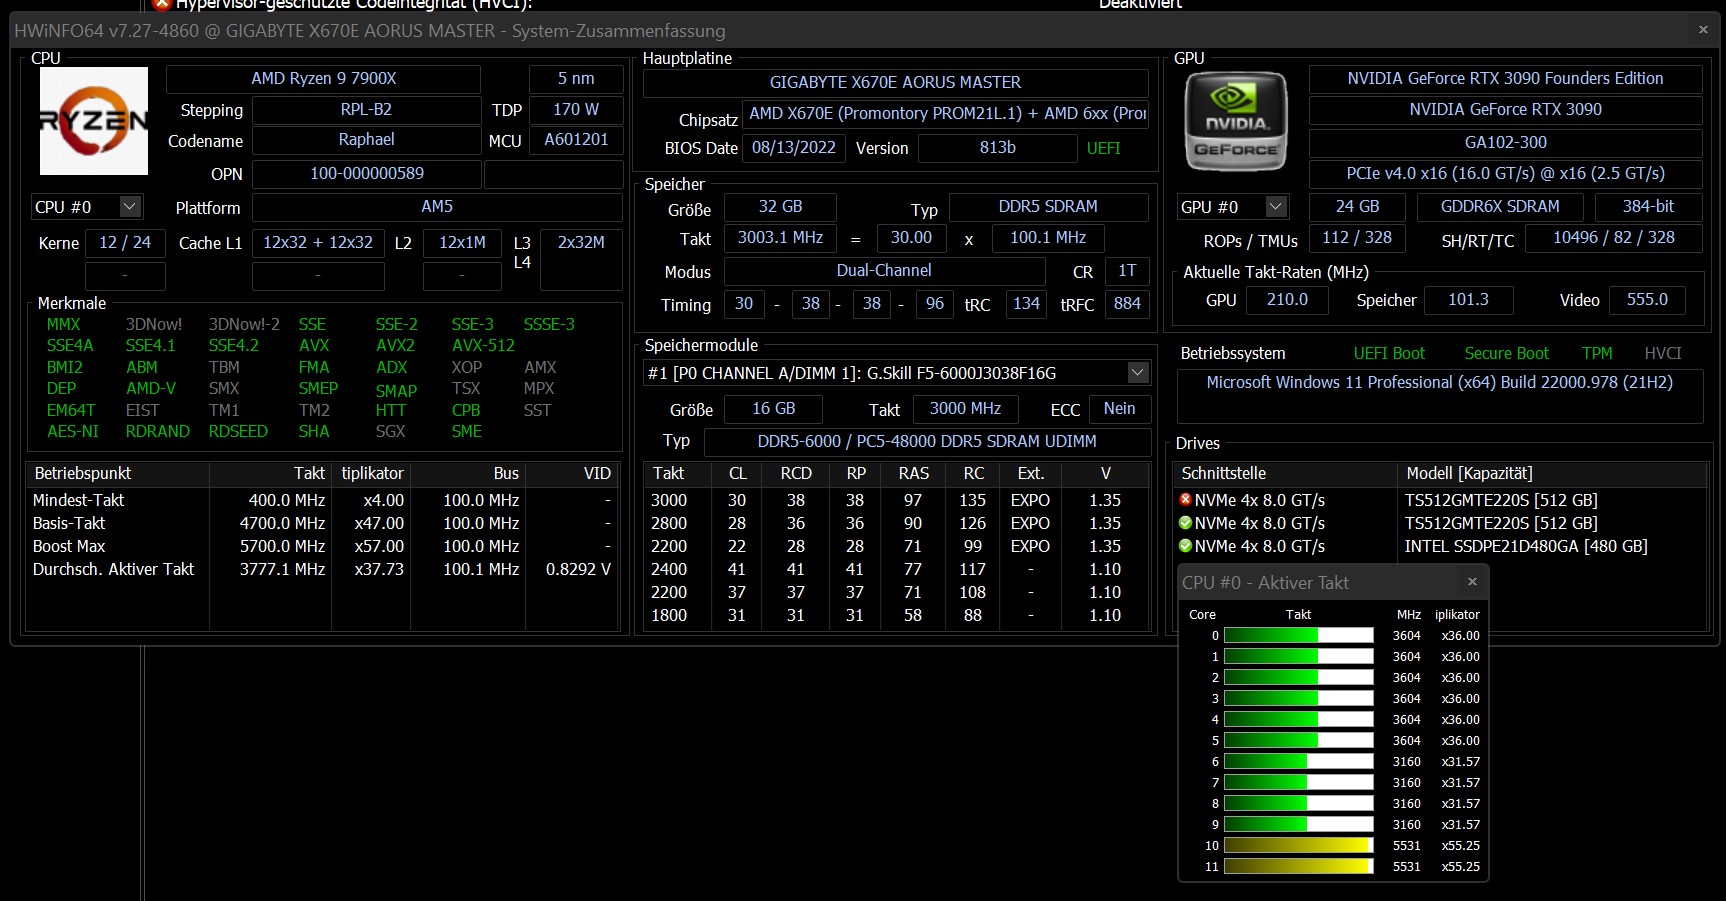
El Gigabyte X670E Aorus Master en detalle
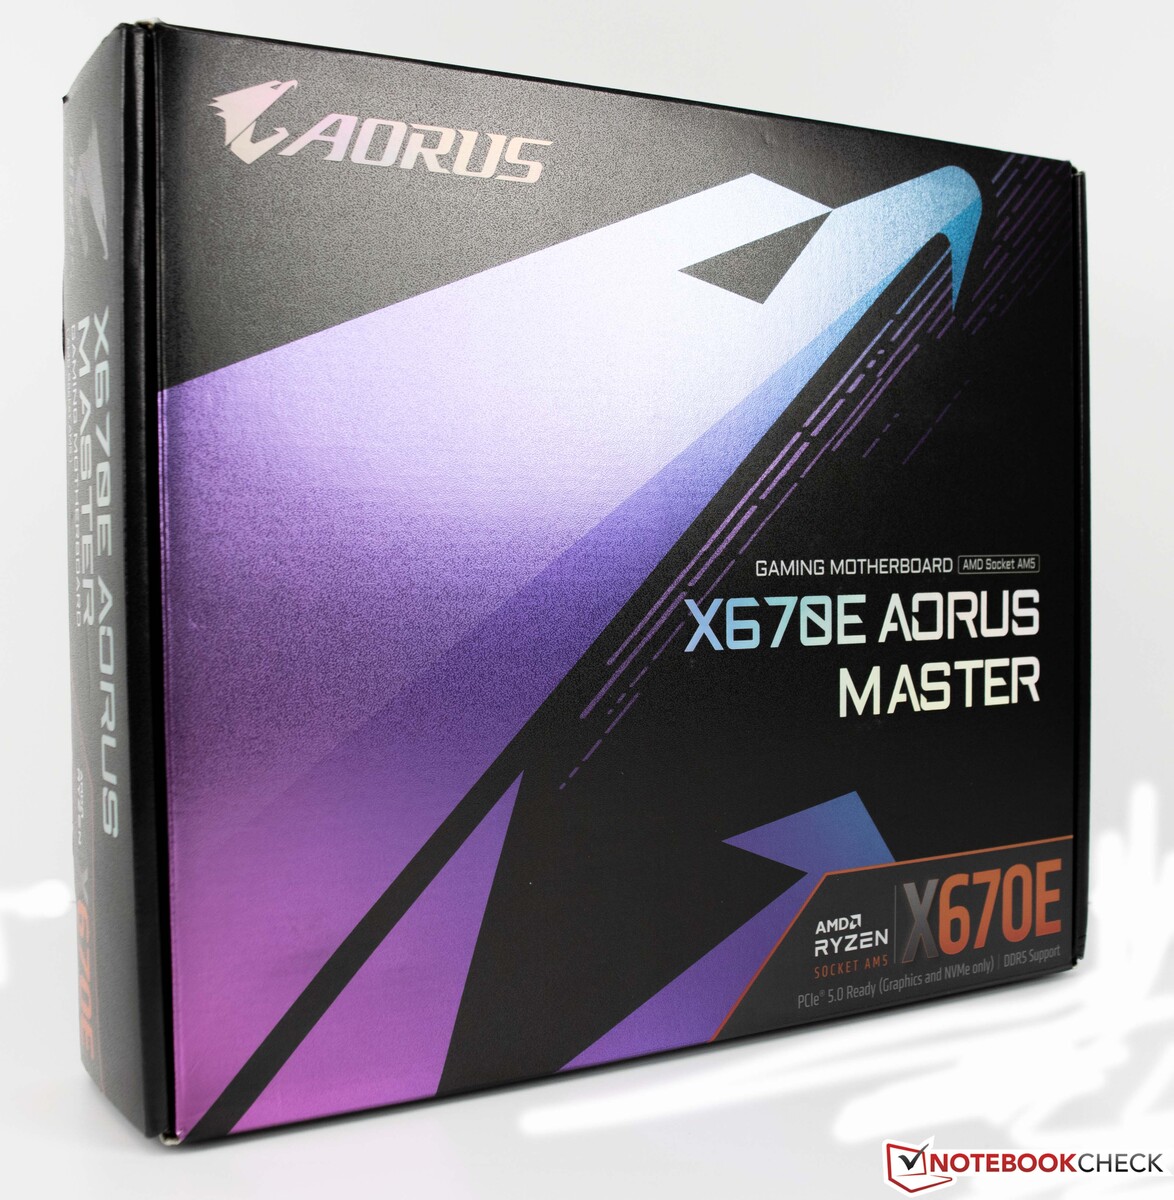
Utilizamos la Gigabyte X670E Aorus Master como base para nuestra prueba. La placa base ofrece todas las nuevas características que vienen con los nuevos procesadores AMD Ryzen. Esto incluye soporte PCIe 5.0, que será utilizado por los futuros SSDs pero también por las tarjetas gráficas.
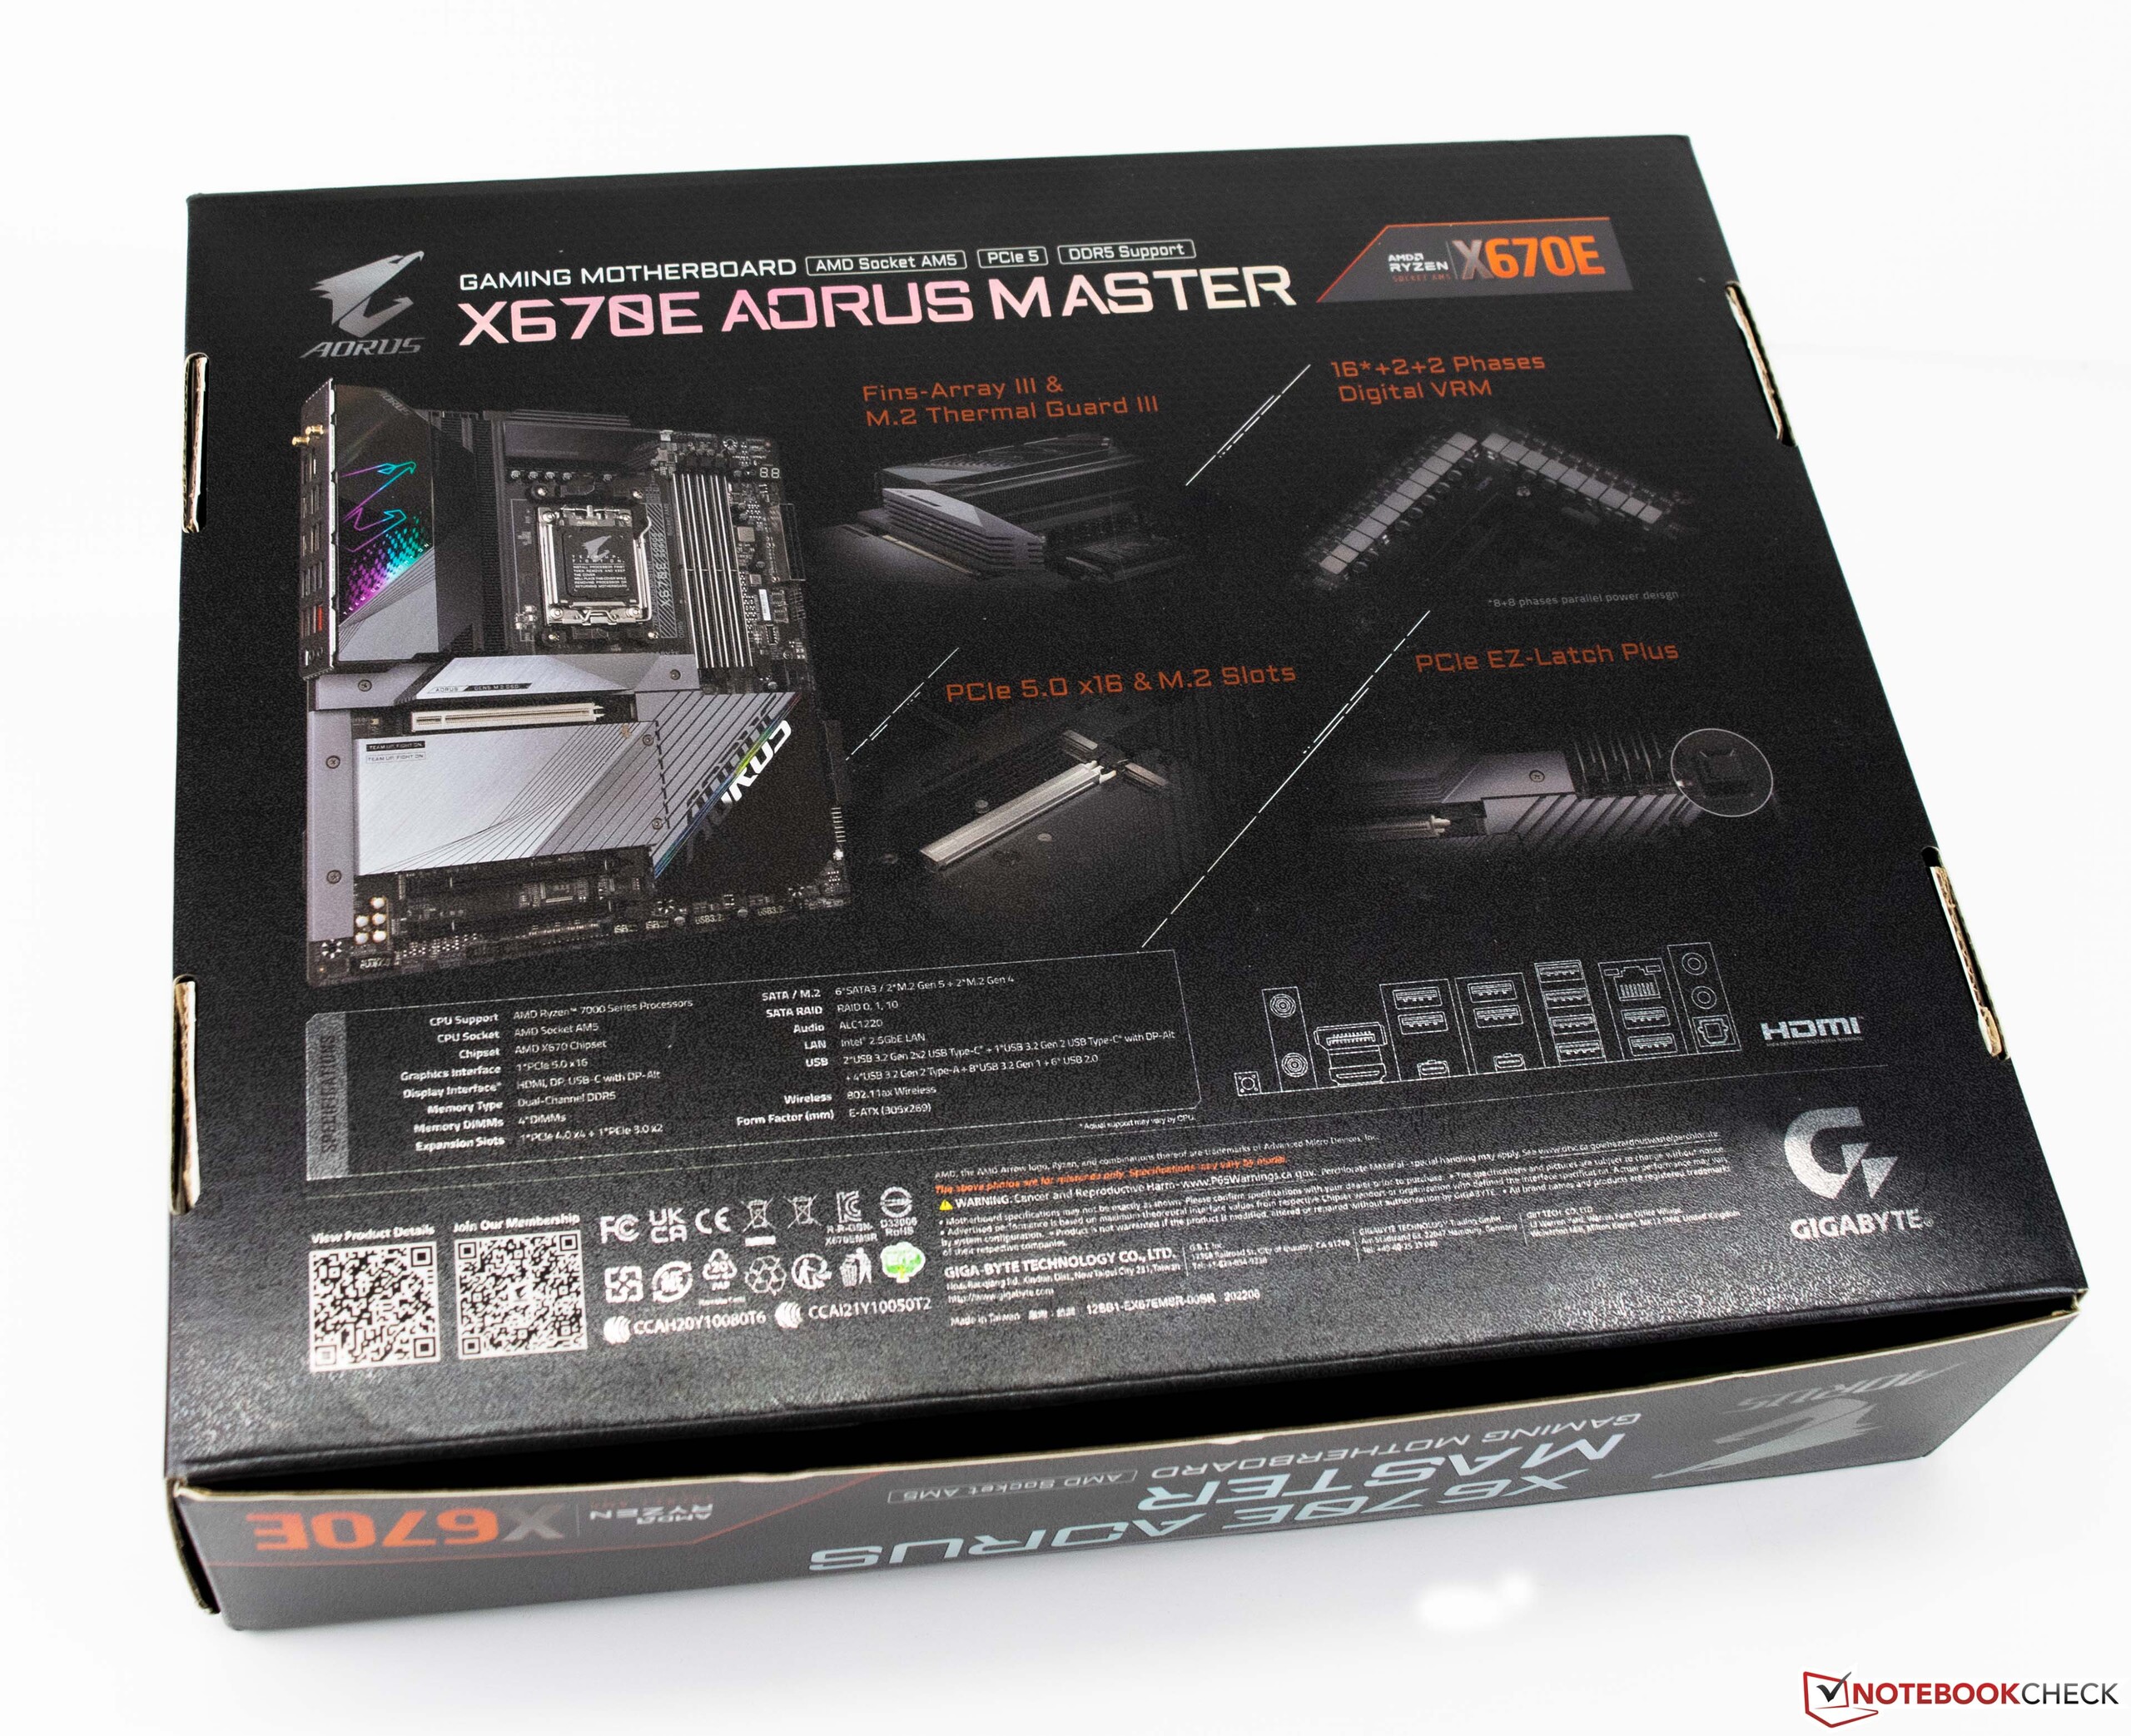
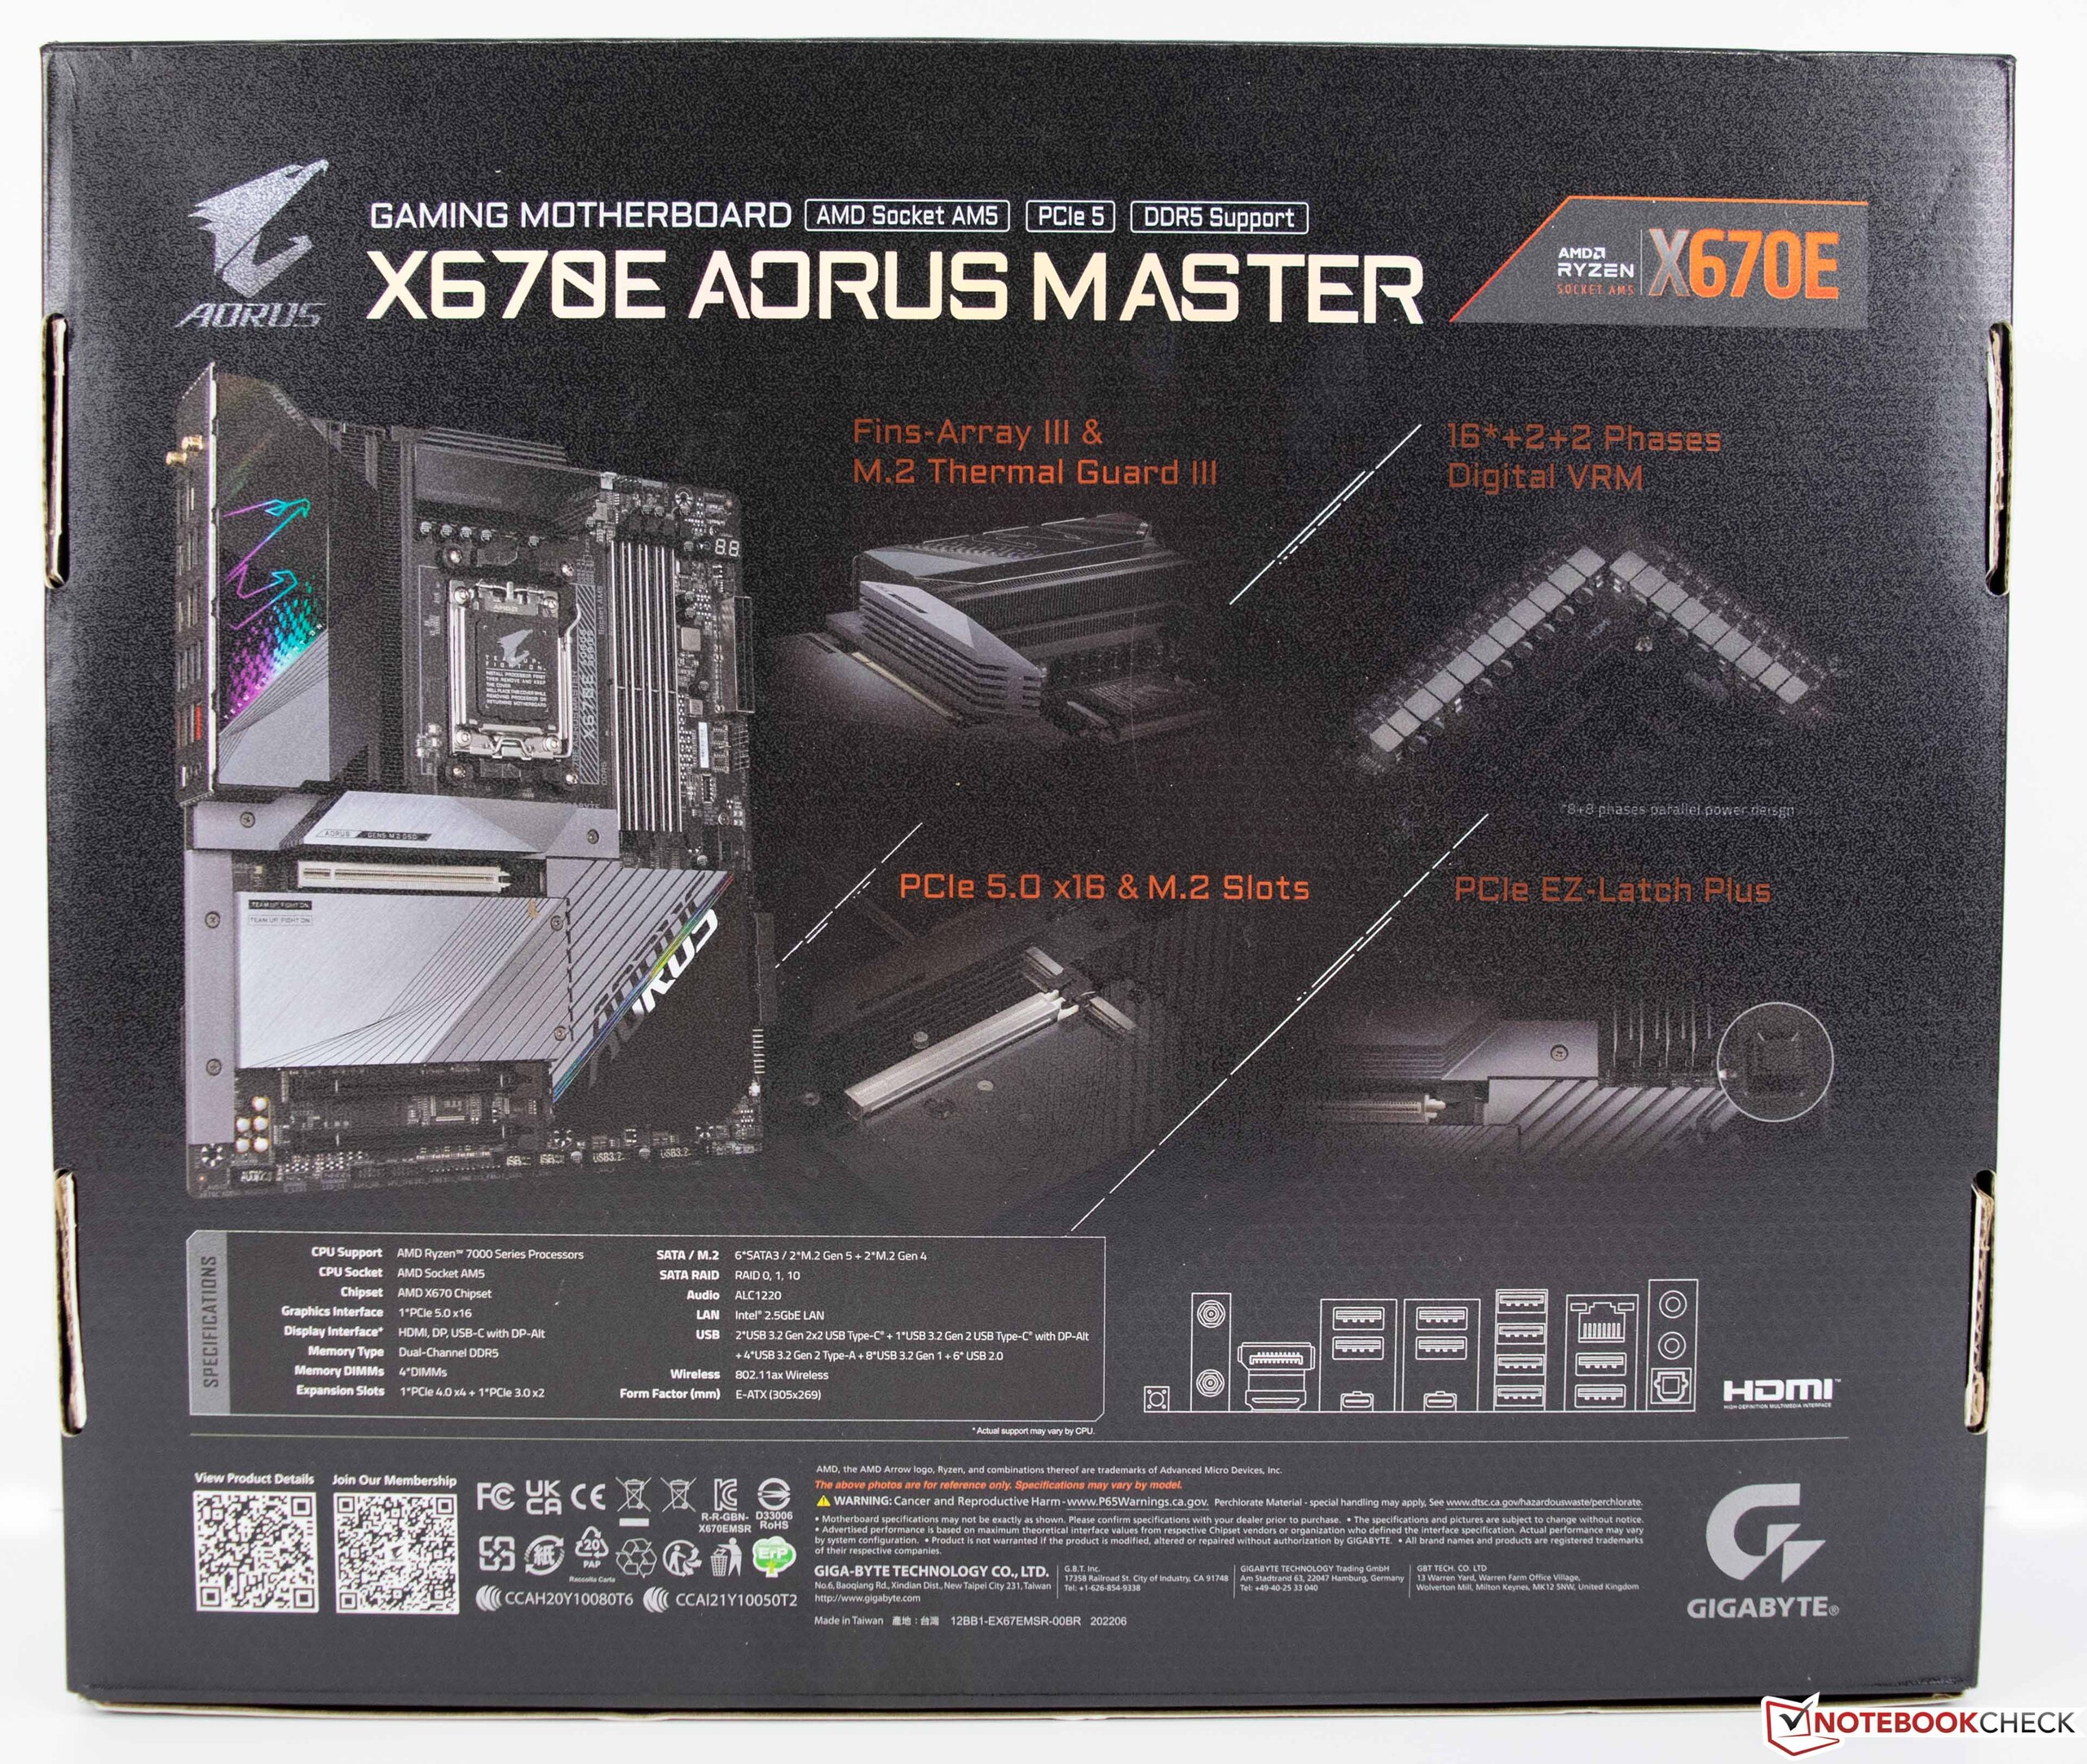
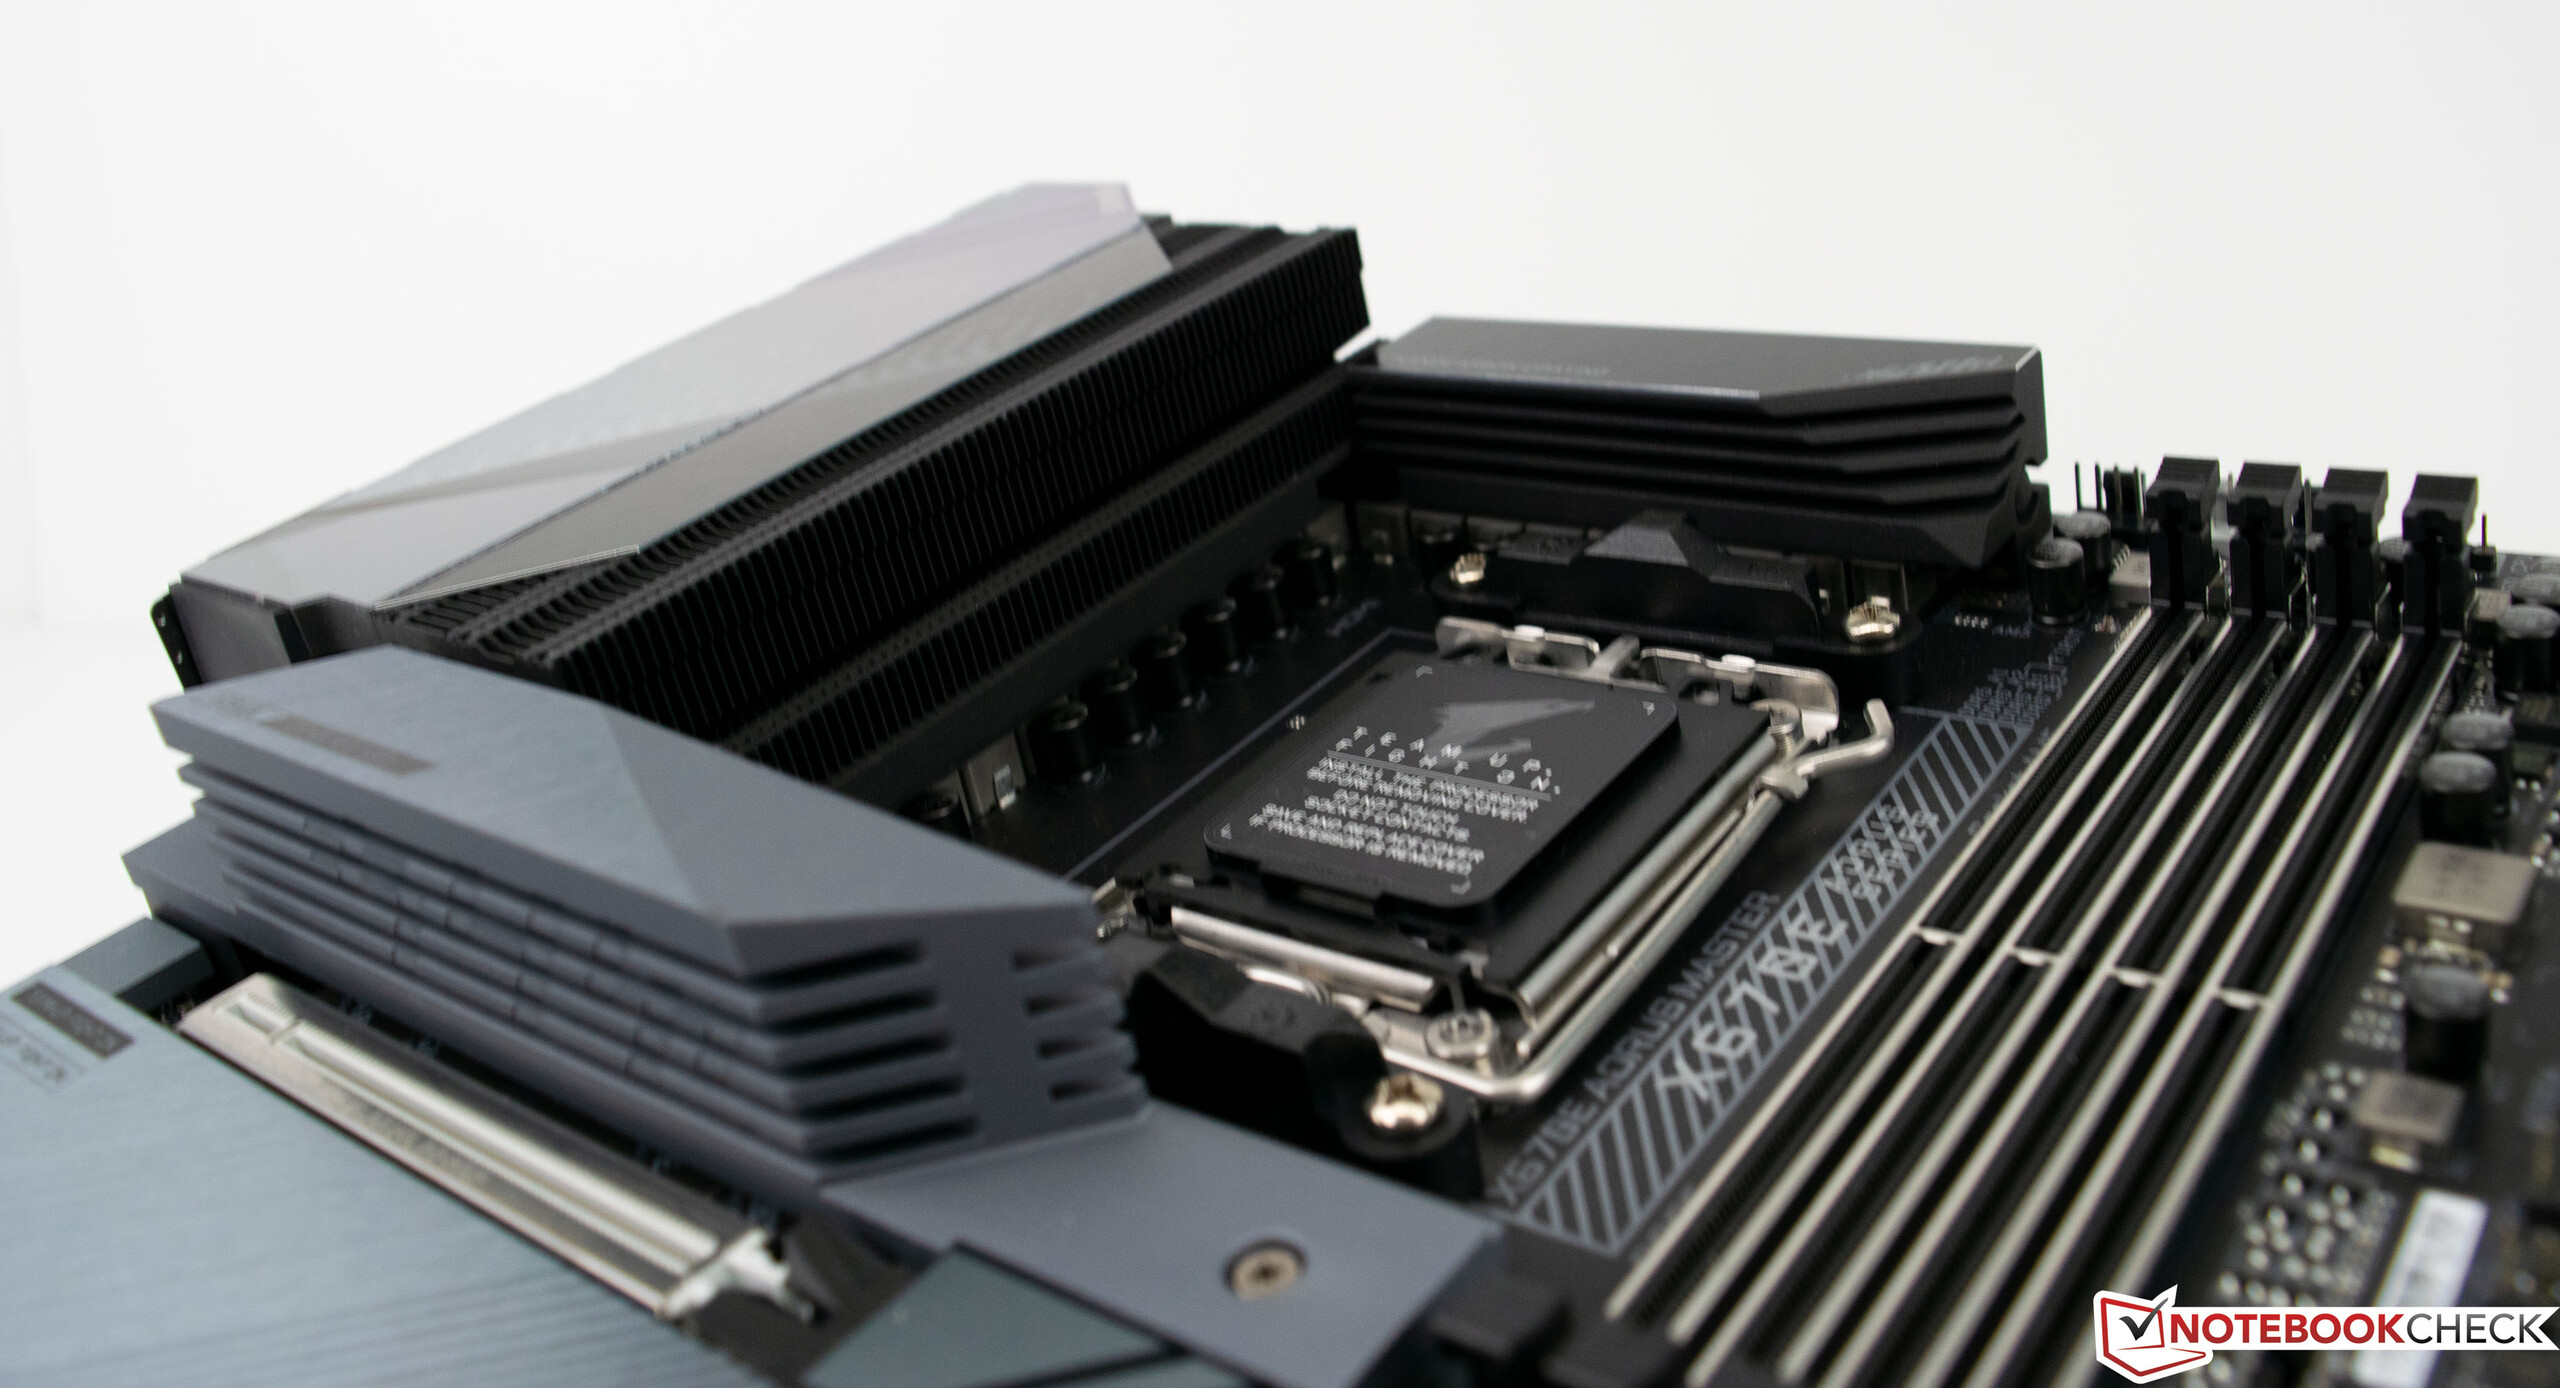
En total, habrá cuatro conjuntos de chips diferentes para el socket AM5, incluyendo X670E, X670, B650E y B650. Sin embargo, las placas más baratas sólo estarán disponibles en las próximas semanas. El buque insignia de Gigabyte ofrece 16+2+2 fases con el chipset X670 Extreme para garantizar una buena alimentación del procesador incluso durante el overclocking extremo. Los convertidores de voltaje están situados bajo un enorme disipador, lo que significa que no tuvimos ningún problema de temperatura incluso bajo carga.
En total, se pueden almacenar hasta cuatro SSD M.2 directamente en la placa base. Sin embargo, sólo la primera ranura M.2 ofrece el nuevo soporte PCIe 5.0. La refrigeración activa del chipset, que era el caso de las placas X570, no está disponible en la Gigabyte X670E Aorus Master. El nuevo zócalo LGA, conocido como AM5, ofrece 1.718 áreas de contacto y es compatible con los antiguos refrigeradores AM4. AMD también habló de la vida útil del nuevo socket AM5 durante la presentación del producto. Se supone que servirá de base hasta al menos 2025.
Puntos de referencia de los procesadores
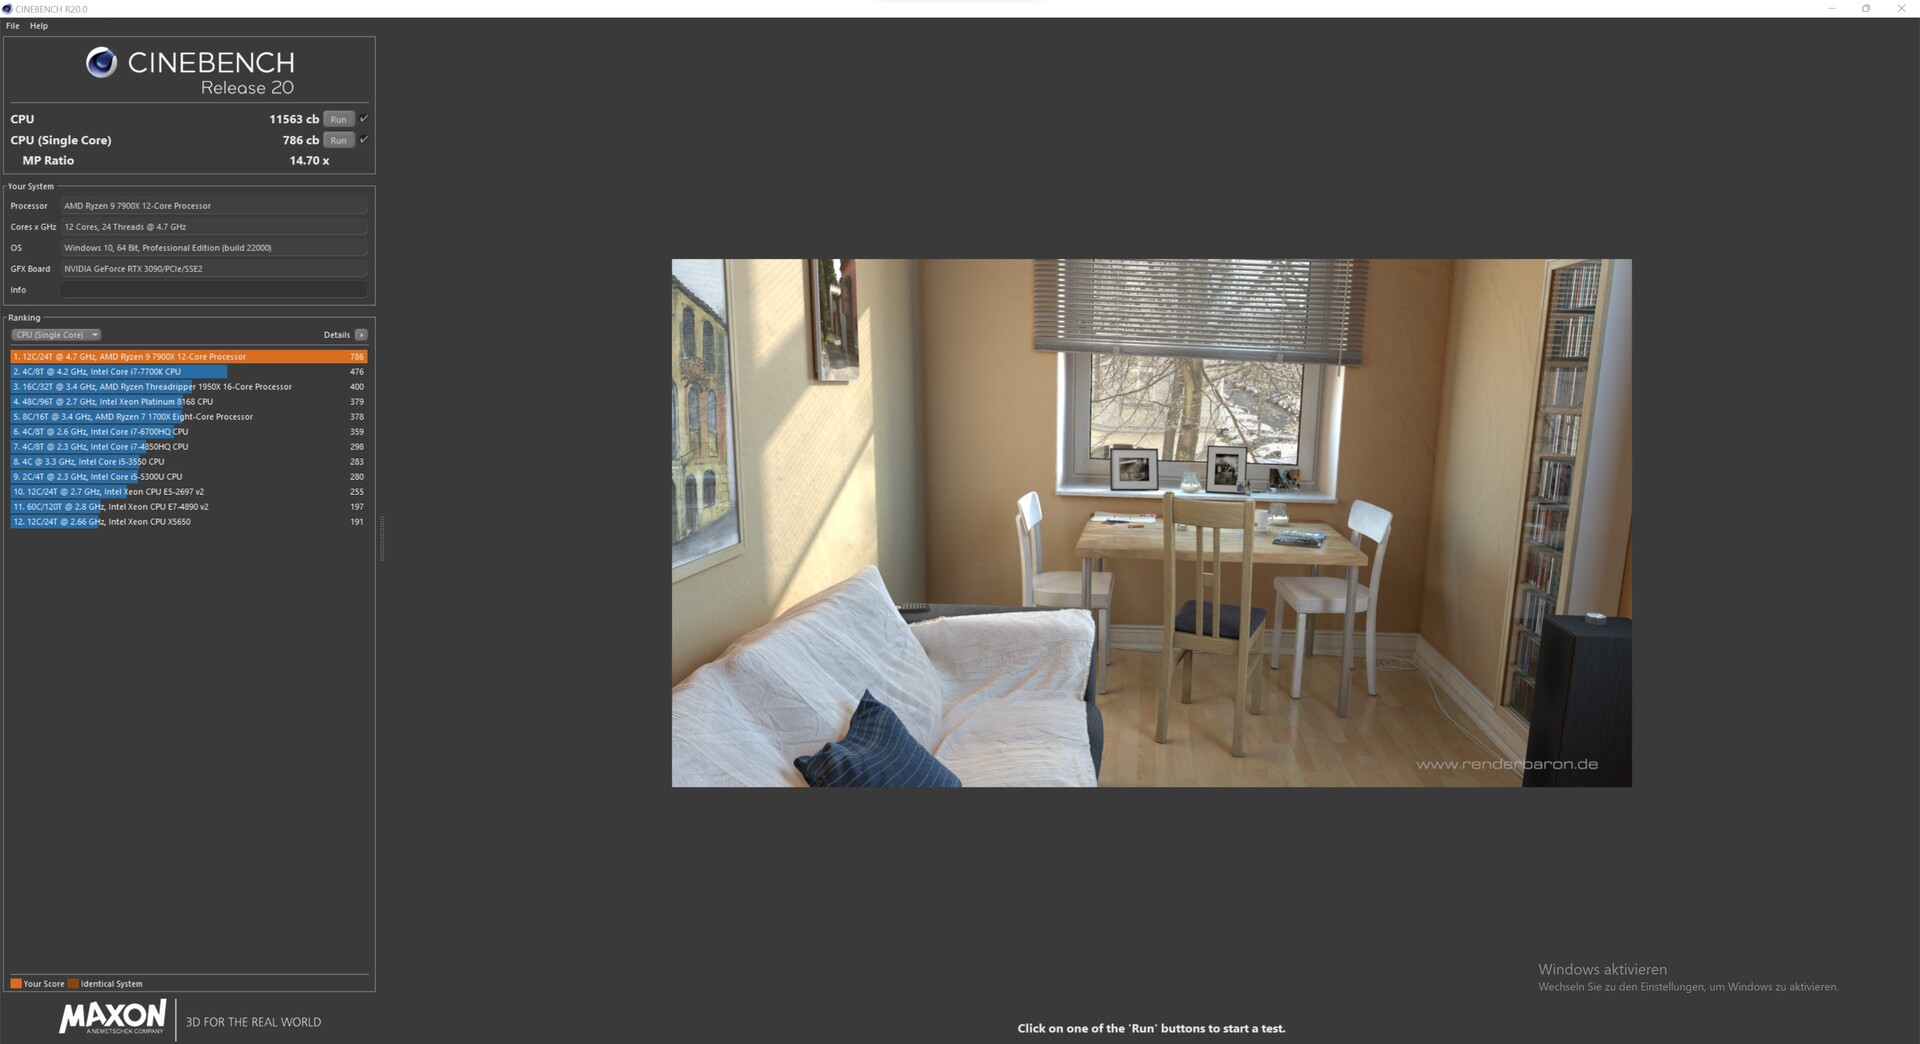
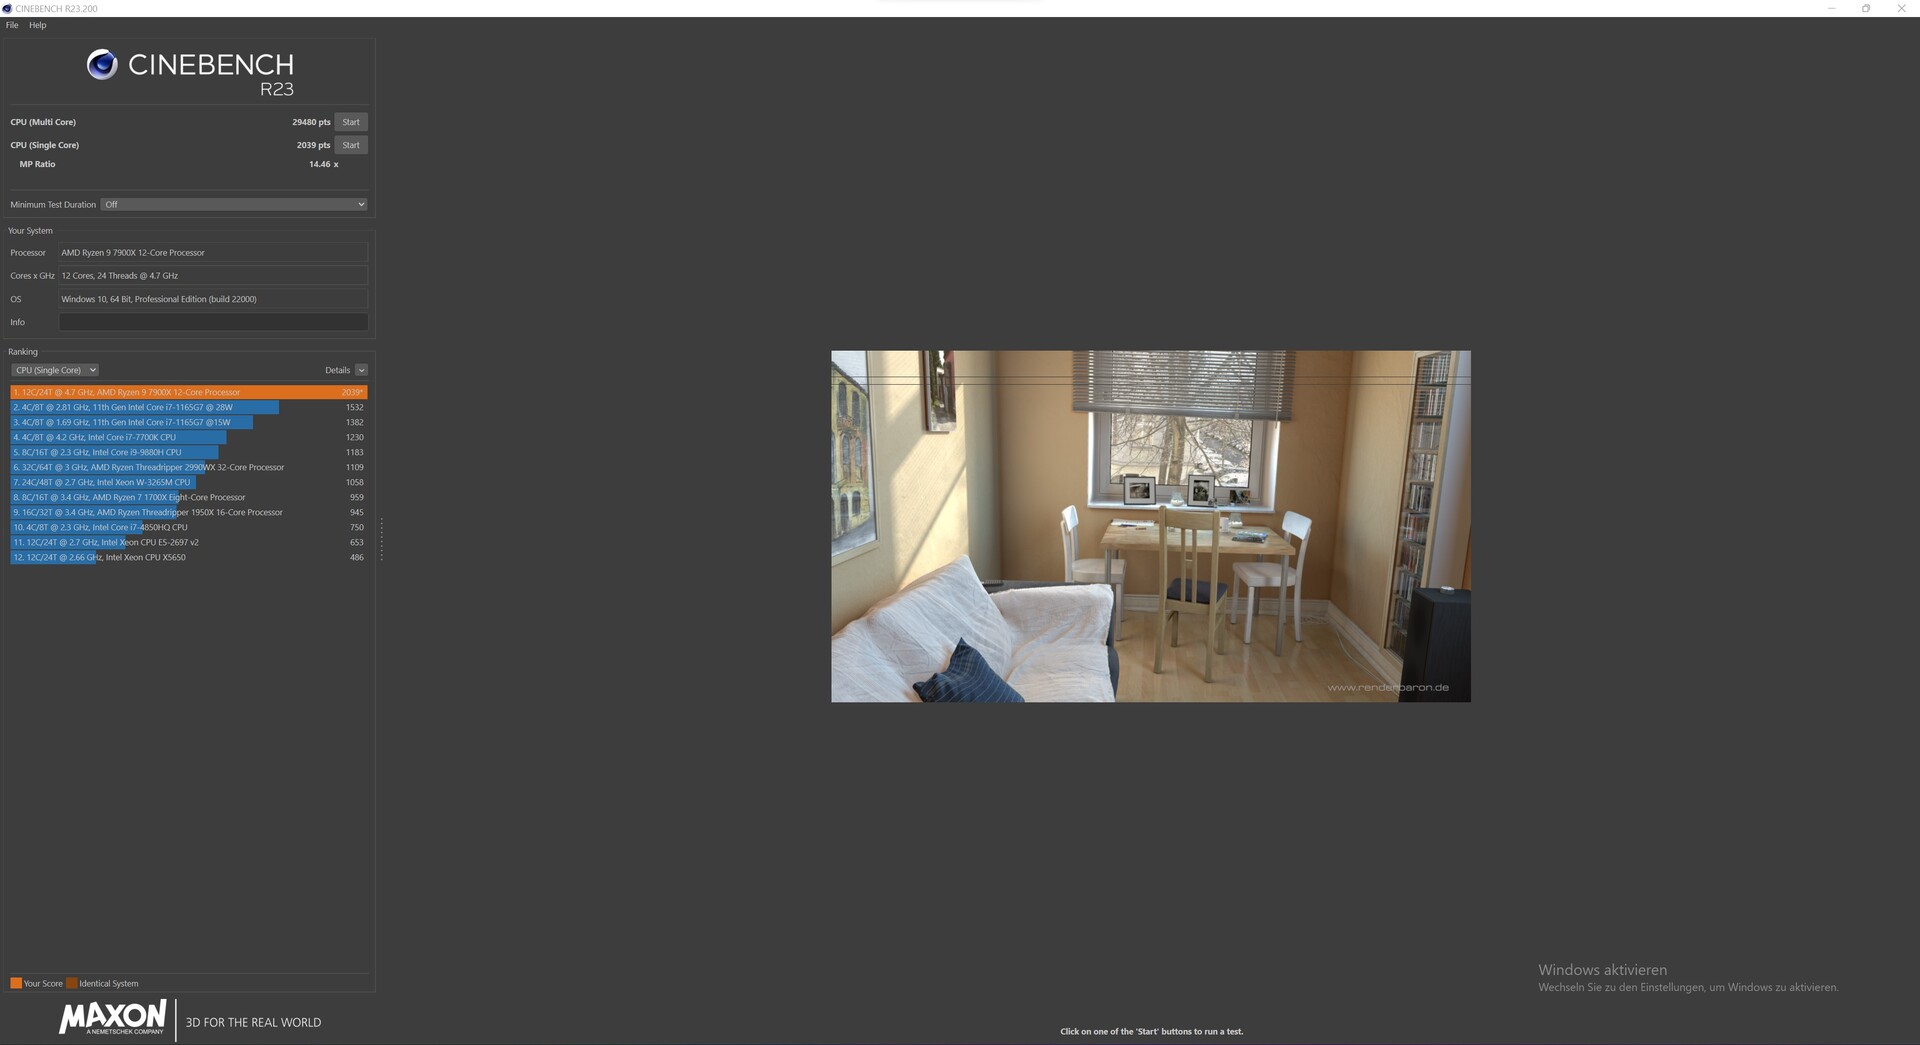
Las especificaciones técnicas de los nuevos procesadores AMD Ryzen 7000 ya prometen mucho, y los nuevos procesadores pueden demostrarlo en acción. En comparación con la generación Ryzen 5000, registramos un aumento de rendimiento del 26% para el AMD Ryzen 9 7900X. El AMD Ryzen 5 7600X puede ganar casi un 20% en la clasificación de rendimiento en comparación con el AMD Ryzen 5 5600X.
En cuanto al AMD Ryzen 9 7900X, es incluso significativamente más rápido que el AMD Ryzen 9 5950X. Pero el nuevo 12-core también puede prevalecer sobre el 16-core en los benchmarks individuales. Por lo tanto, podemos asumir que el AMD Ryzen 9 7950X también puede proporcionar un rendimiento multihilo significativamente mayor. También intentaremos pasar esta muestra por nuestro curso de pruebas en los próximos días para poder mostrar el rendimiento del modelo superior en comparación con la competencia. Hablando de la competencia, el Intel Core i9-12900K tampoco puede seguir el ritmo del AMD Ryzen 9 7900X y tiene que situarse un 9% por detrás de nuestra muestra de pruebas.
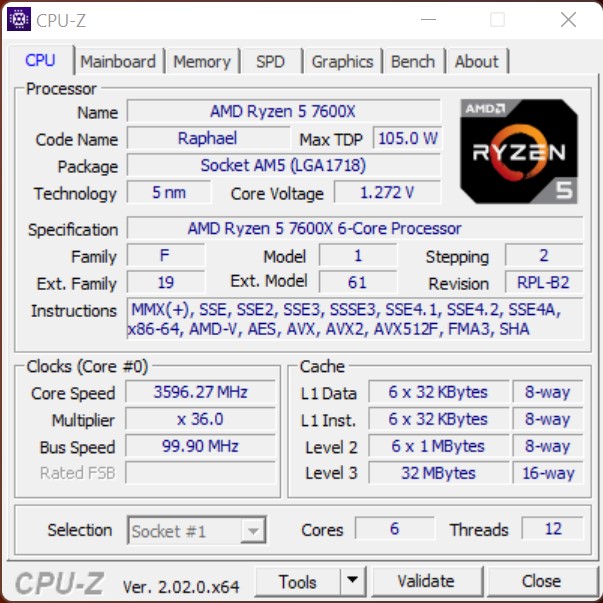
El más pequeño AMD Ryzen 5 7600X tiene un rendimiento similar y puede superar al AMD Ryzen 5 5600X claramente. La ventaja sobre el Intel Core i5-12600K es un poco menor que el de 12 núcleos, en torno al 6%, pero sigue estando ahí.
Queda por ver qué presentará Intel con los nuevos procesadores Raptor Lake. Estos deberían llegar pronto y ya estamos esperando otra batalla.
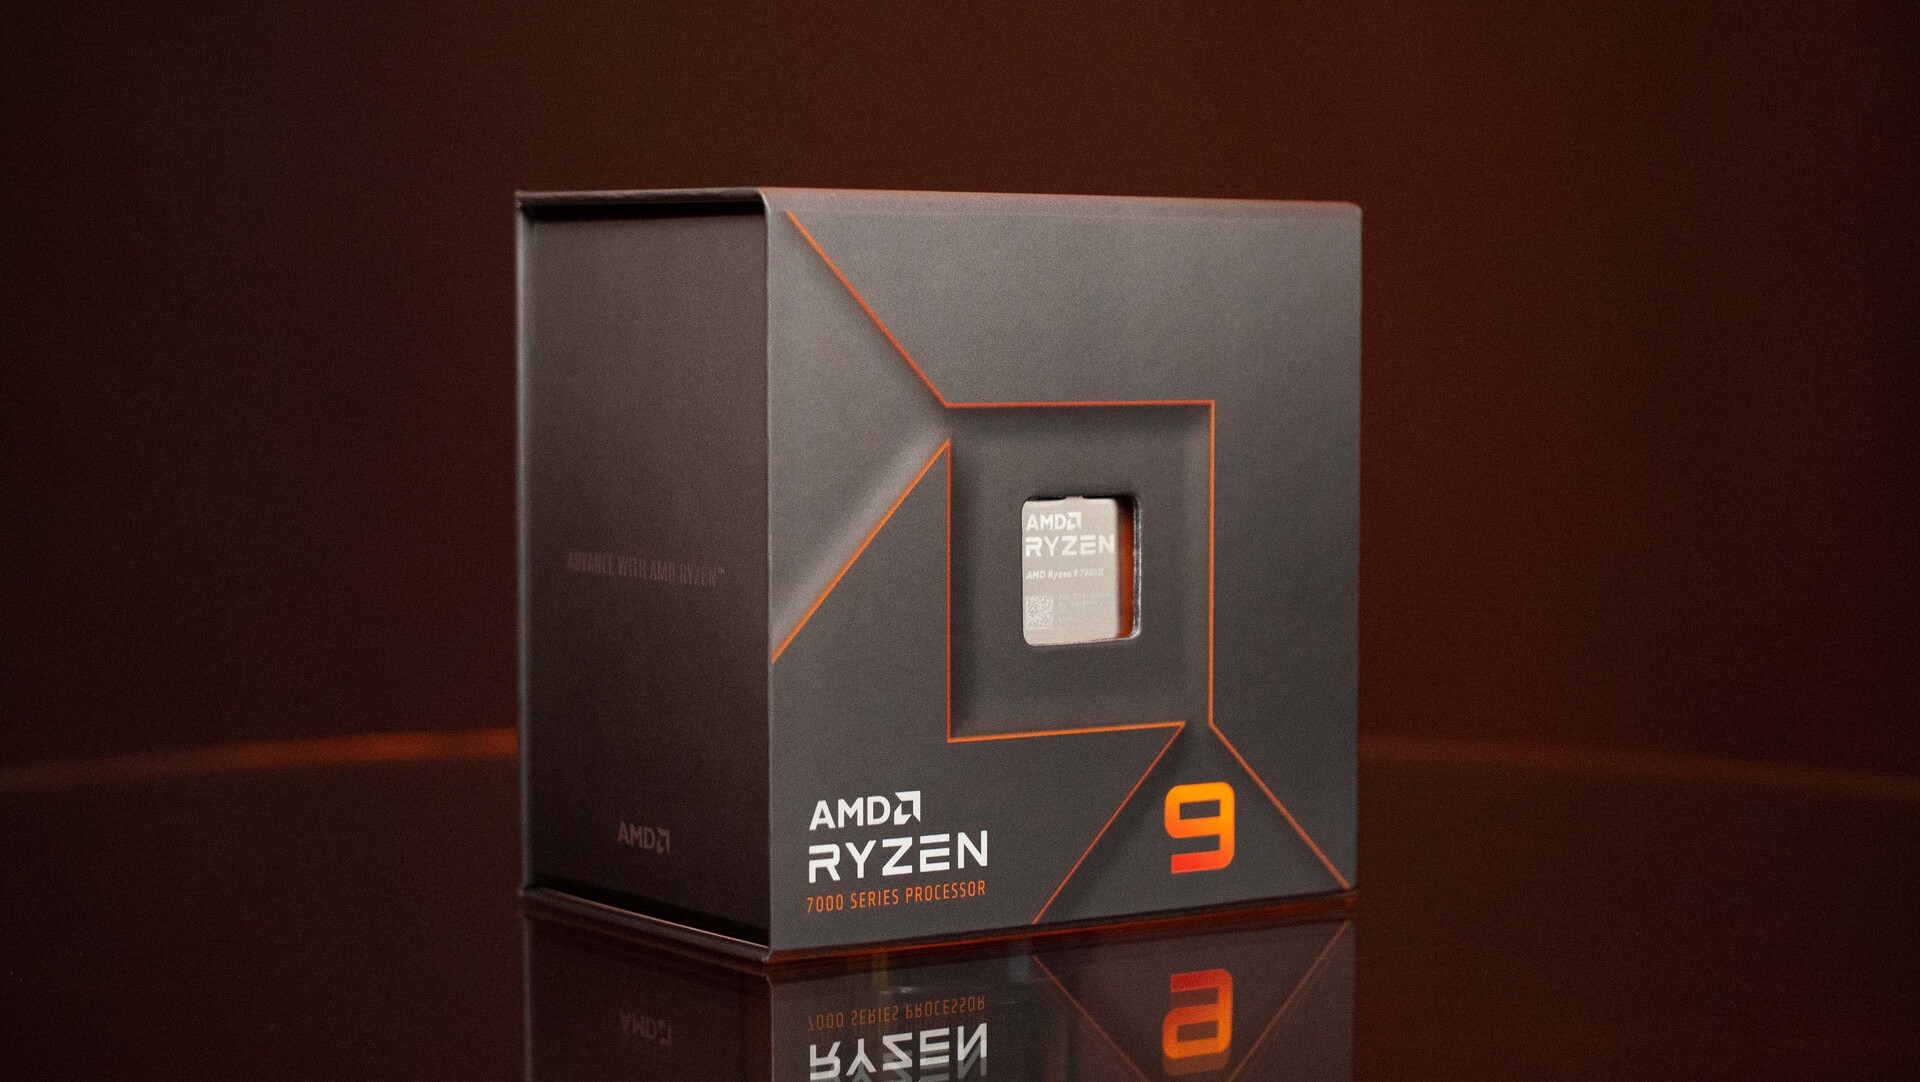
AMD Ryzen 9 7900X

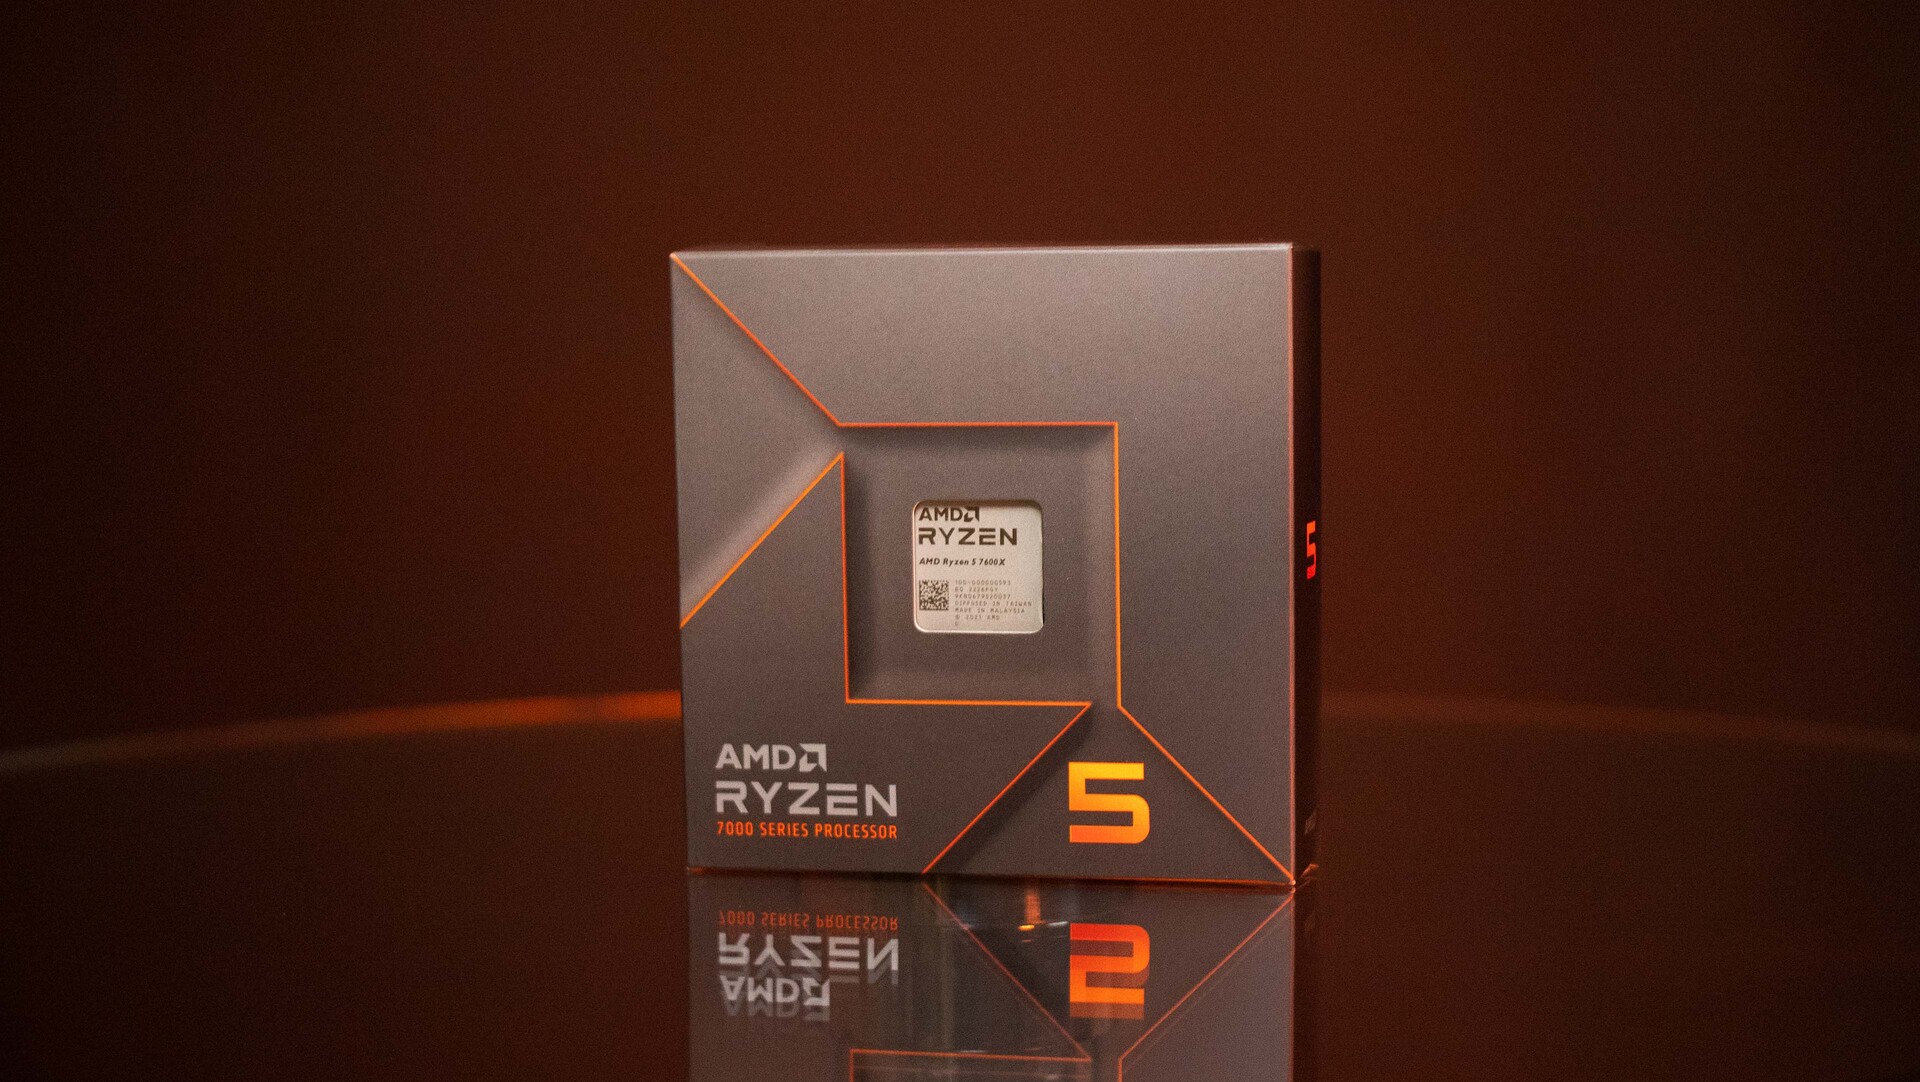
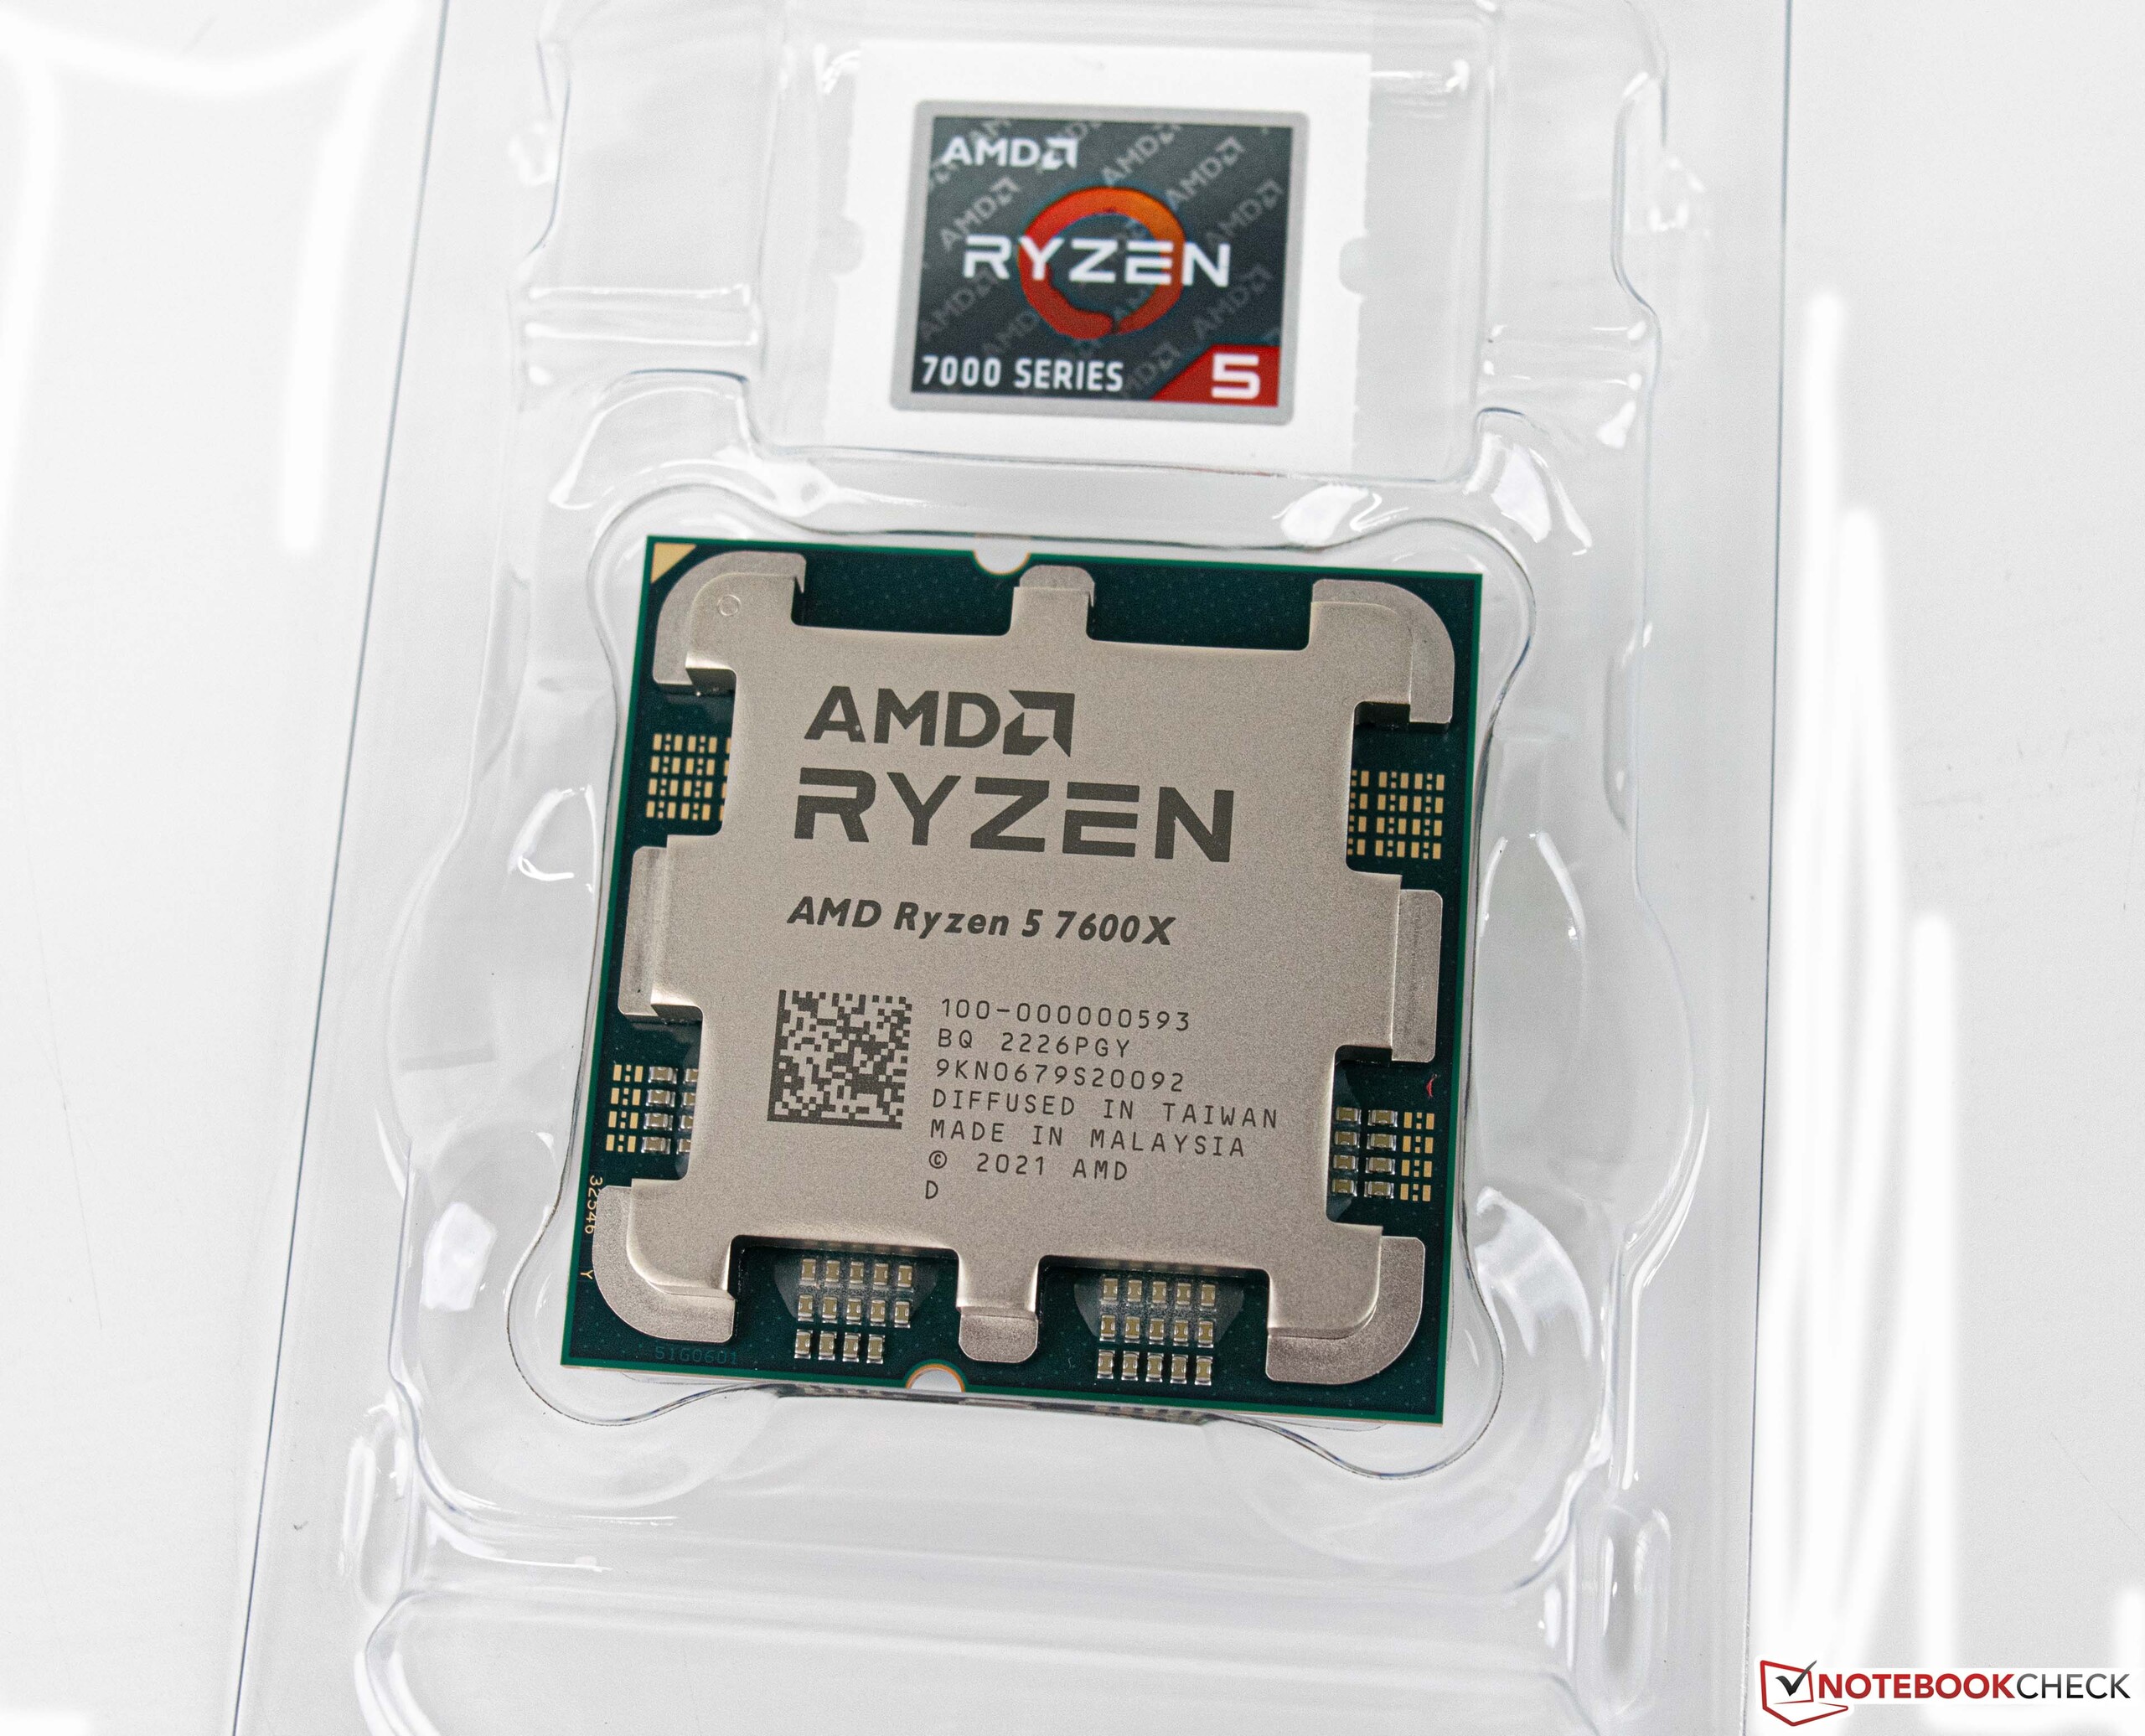
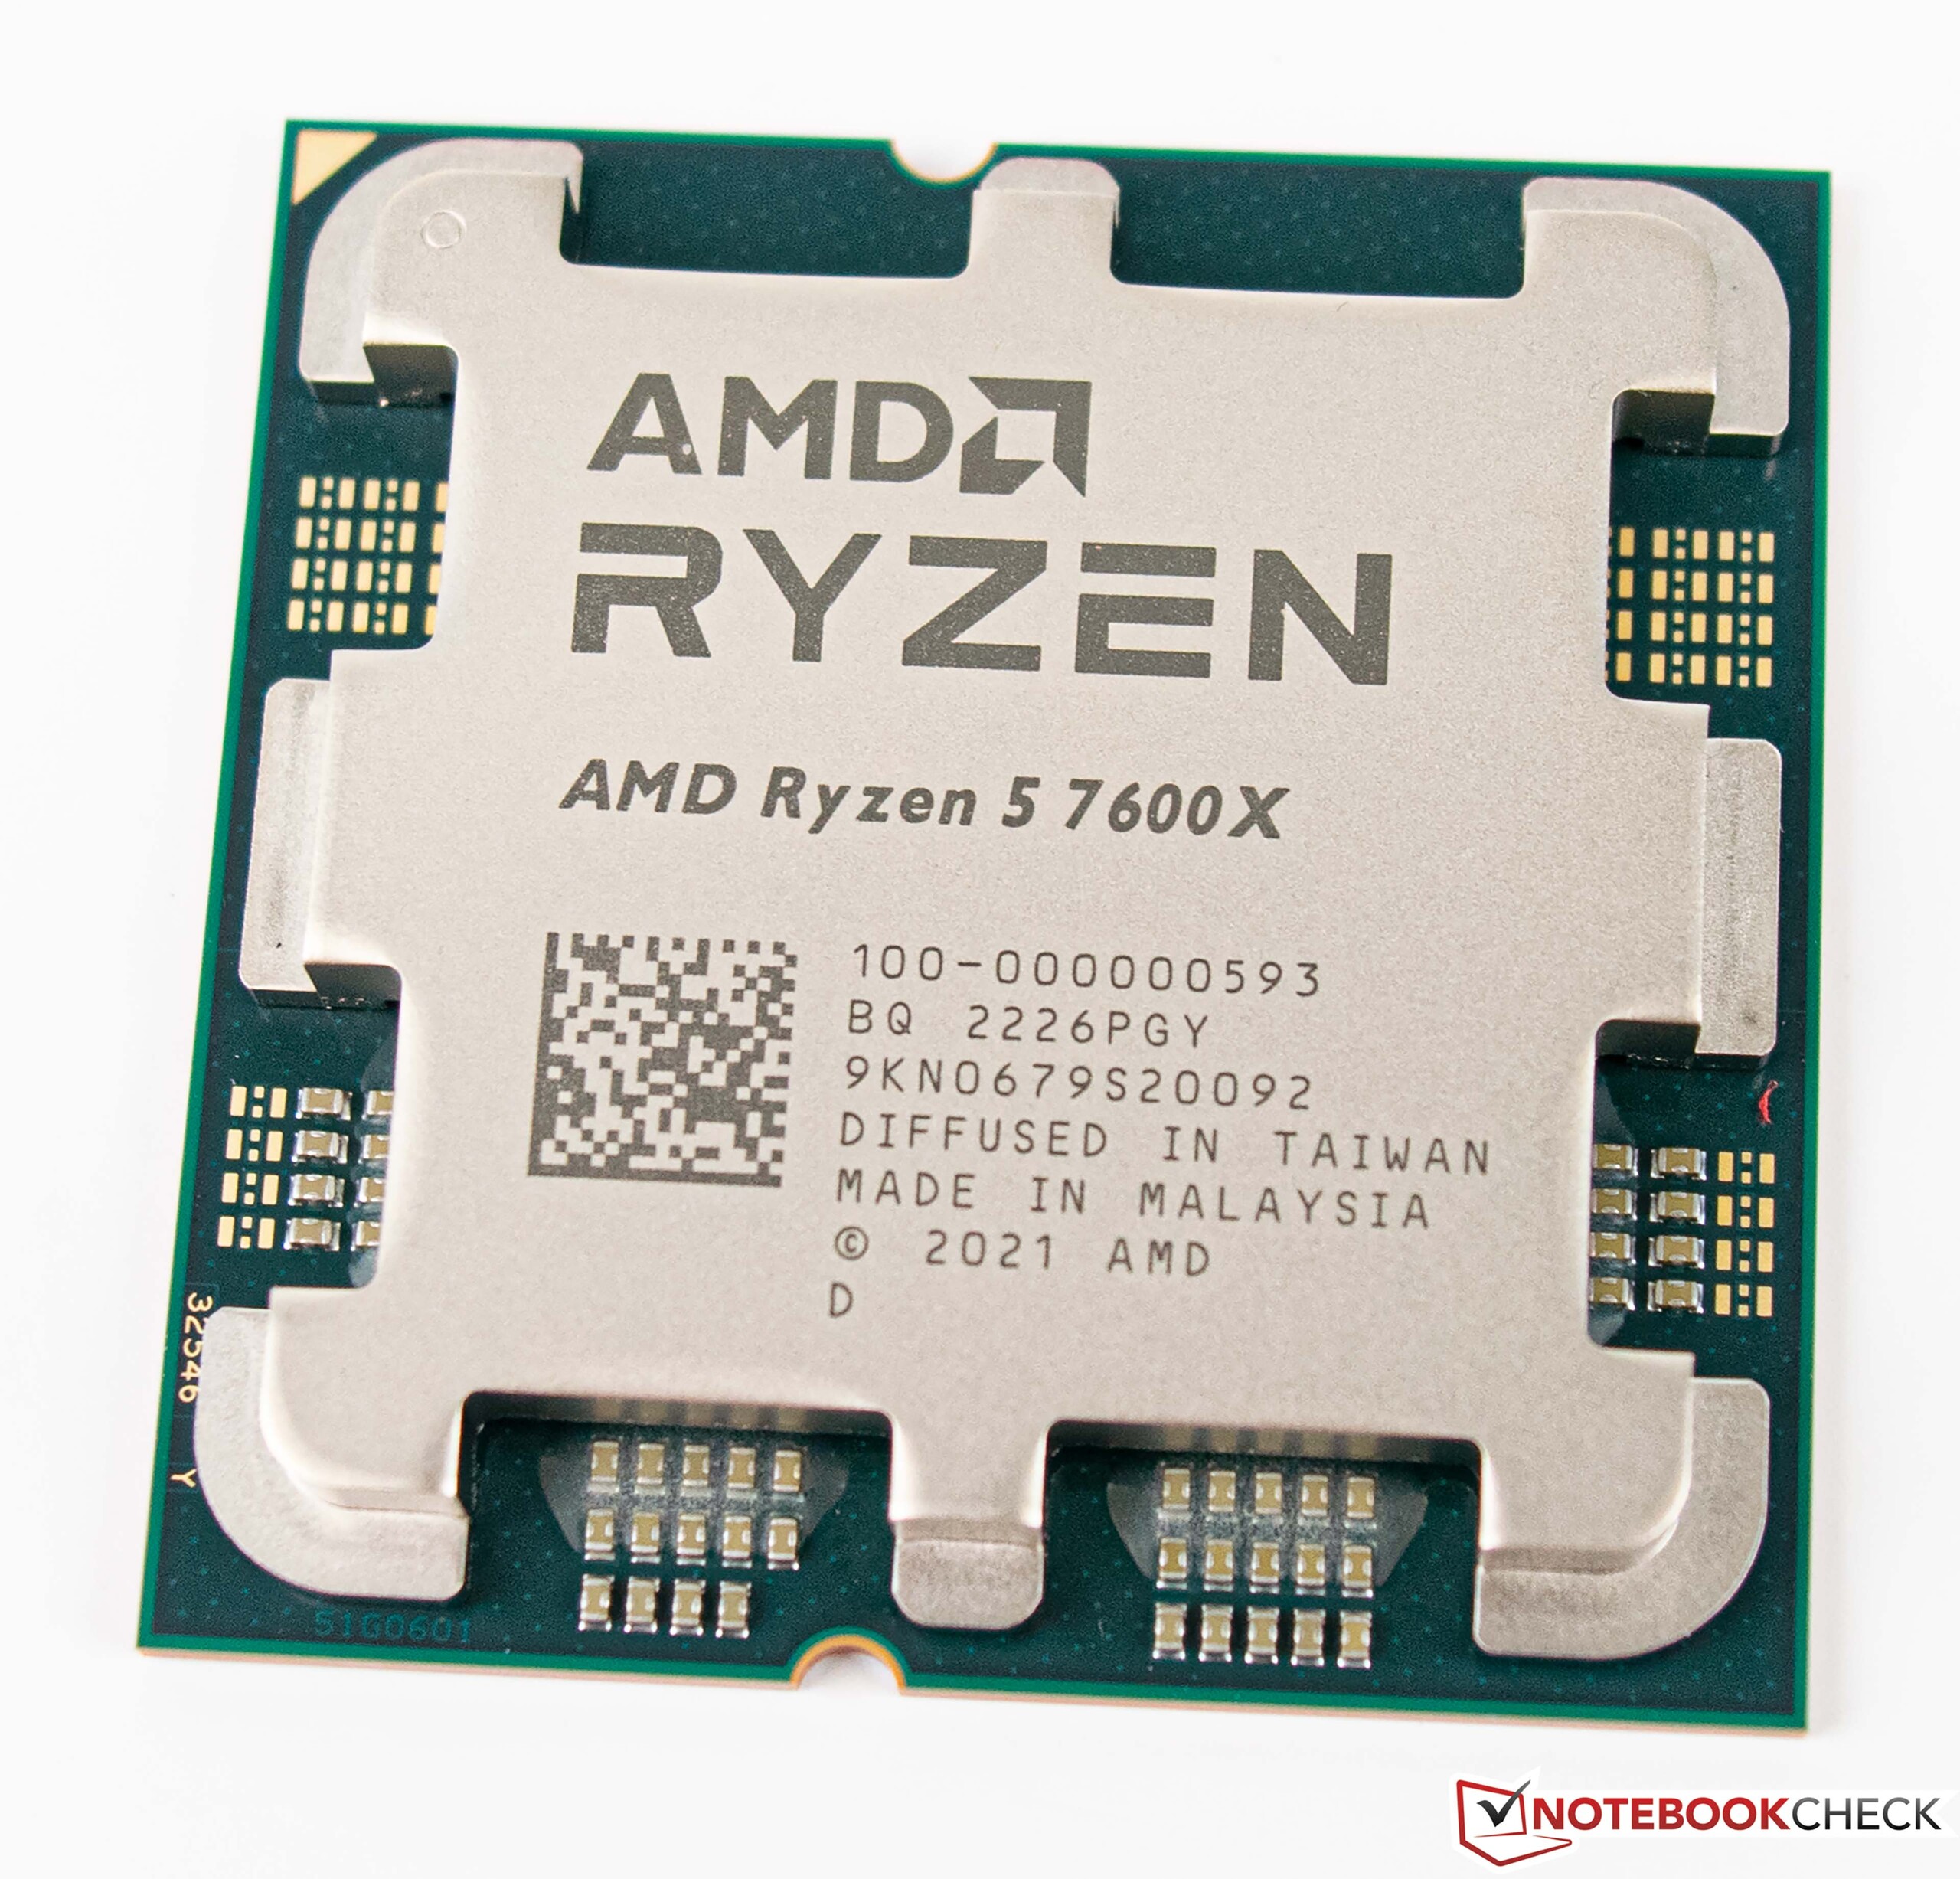
AMD Ryzen 5 7600X
| Performance rating - Percent | |
| AMD Ryzen 9 7900X | |
| Intel Core i9-12900K | |
| AMD Ryzen 9 5950X | |
| AMD Ryzen 5 7600X | |
| AMD Ryzen 9 5900X -2! | |
| Intel Core i5-12600K | |
| AMD Ryzen 5 5600X | |
| Cinebench R10 | |
| Rendering Single CPUs 64Bit | |
| AMD Ryzen 9 7900X | |
| Intel Core i9-12900K | |
| AMD Ryzen 5 7600X | |
| Intel Core i5-12600K | |
| AMD Ryzen 9 5950X | |
| AMD Ryzen 9 5900X | |
| AMD Ryzen 5 5600X | |
| Rendering Multiple CPUs 64Bit | |
| AMD Ryzen 9 7900X | |
| Intel Core i9-12900K | |
| AMD Ryzen 9 5950X | |
| AMD Ryzen 9 5900X | |
| AMD Ryzen 5 7600X | |
| Intel Core i5-12600K | |
| AMD Ryzen 5 5600X | |
| Blender - v2.79 BMW27 CPU | |
| AMD Ryzen 5 5600X | |
| AMD Ryzen 5 7600X | |
| Intel Core i5-12600K | |
| AMD Ryzen 9 5900X | |
| Intel Core i9-12900K | |
| AMD Ryzen 9 5950X | |
| AMD Ryzen 9 7900X | |
| WinRAR - Result | |
| AMD Ryzen 9 7900X | |
| AMD Ryzen 5 7600X | |
| AMD Ryzen 9 5900X | |
| AMD Ryzen 5 5600X | |
| AMD Ryzen 9 5950X | |
| Intel Core i9-12900K | |
| Intel Core i5-12600K | |
| 3DMark 11 - 1280x720 Performance Physics | |
| AMD Ryzen 9 7900X | |
| Intel Core i9-12900K | |
| AMD Ryzen 5 7600X | |
| AMD Ryzen 9 5950X | |
| Intel Core i5-12600K | |
| AMD Ryzen 9 5900X | |
| AMD Ryzen 5 5600X | |
| HWBOT x265 Benchmark v2.2 - 4k Preset | |
| AMD Ryzen 9 7900X | |
| AMD Ryzen 9 5950X | |
| Intel Core i5-12600K | |
| Intel Core i9-12900K | |
| AMD Ryzen 9 5900X | |
| AMD Ryzen 5 7600X | |
| AMD Ryzen 5 5600X | |
| R Benchmark 2.5 - Overall mean | |
| AMD Ryzen 5 5600X | |
| AMD Ryzen 9 5950X | |
| AMD Ryzen 9 5900X | |
| Intel Core i5-12600K | |
| Intel Core i9-12900K | |
| AMD Ryzen 5 7600X | |
| AMD Ryzen 9 7900X | |
| LibreOffice - 20 Documents To PDF | |
| Intel Core i5-12600K | |
| AMD Ryzen 9 5900X | |
| AMD Ryzen 9 5950X | |
| AMD Ryzen 5 5600X | |
| Intel Core i9-12900K | |
| AMD Ryzen 5 7600X | |
| AMD Ryzen 9 7900X | |
| WebXPRT 3 - Overall | |
| AMD Ryzen 9 7900X | |
| AMD Ryzen 5 7600X | |
| Intel Core i9-12900K | |
| Intel Core i5-12600K | |
| AMD Ryzen 9 5950X | |
| AMD Ryzen 5 5600X | |
| AMD Ryzen 9 5900X | |
| Mozilla Kraken 1.1 - Total | |
| AMD Ryzen 5 5600X | |
| AMD Ryzen 9 5900X | |
| AMD Ryzen 9 5950X | |
| Intel Core i5-12600K | |
| Intel Core i9-12900K | |
| AMD Ryzen 5 7600X | |
| AMD Ryzen 9 7900X | |
* ... más pequeño es mejor
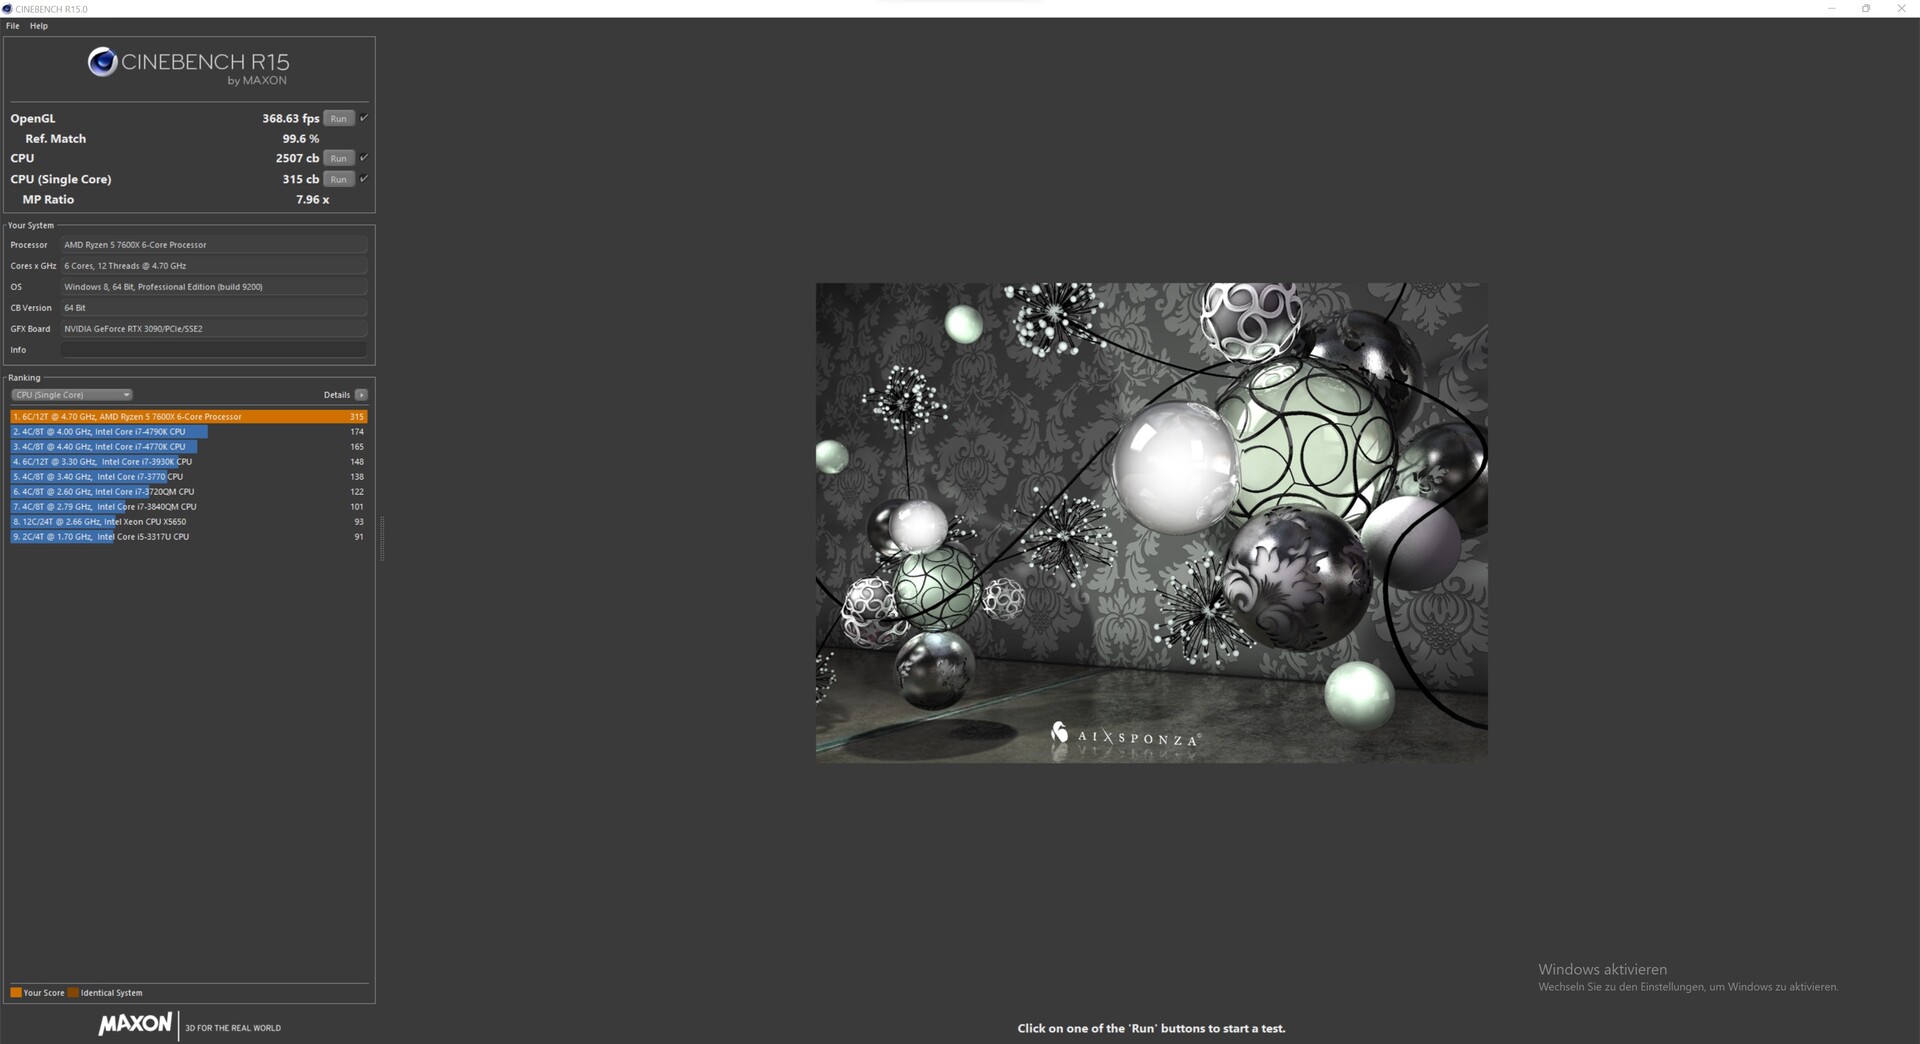


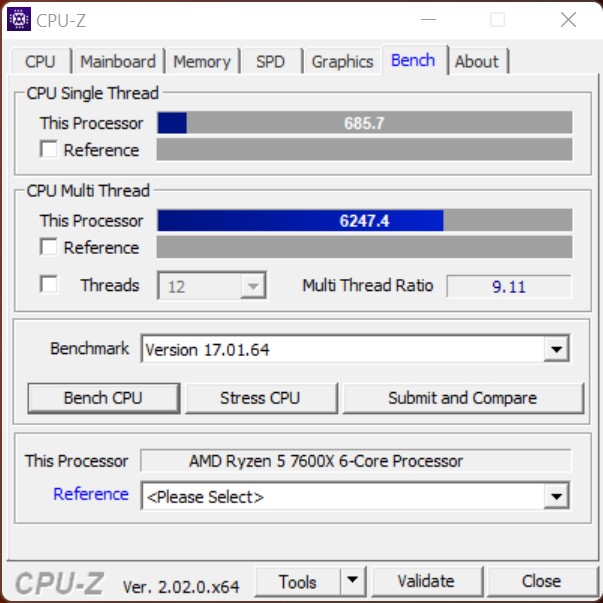
AMD Ryzen 5 7600X + AMD Ryzen 9 7900X vs. Cinebench R15 multi-loop
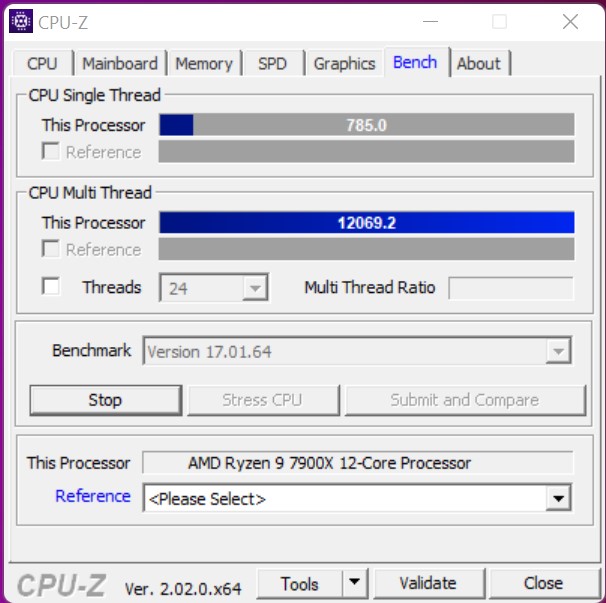
El alto rendimiento multihilo también se puede mantener permanentemente en nuestra configuración de pruebas, como podemos ver en los resultados del bucle múltiple de Cinebench R15. Con una media de 4.785 puntos, el AMD Ryzen 9 7900X termina esta prueba mejor que el AMD Ryzen 9 5950X (4.467 puntos)
El AMD Ryzen 5 7600X no puede mantener el liderazgo del Intel Core i5 12600K aunque la diferencia es excesivamente pequeña, con sólo 100 puntos en las 50 ejecuciones. El Intel Core i9-12900K no juega un gran papel aquí y ni siquiera puede poner al AMD Ryzen 9 7900X bajo presión.
Puntos de referencia sintéticos y rendimiento de las aplicaciones
Los dos nuevos procesadores de AMD marcan claramente la pauta en los benchmarks sintéticos. El AMD Ryzen 9 7900X puede situarse por delante de la competencia con una clara ventaja. AMD sólo tiene que situarse por detrás de Intel en los benchmarks de memoria. Sin embargo, la brecha es sólo en porcentajes de un dígito.
| PCMark 10 - Score | |
| AMD Ryzen 9 7900X | |
| AMD Ryzen 5 7600X | |
| AMD Ryzen 9 5950X | |
| Intel Core i9-12900K | |
| AMD Ryzen 5 5600X | |
| Intel Core i5-12600K | |
| AMD Ryzen 9 5900X | |
| 3DMark 11 - 1280x720 Performance Physics | |
| AMD Ryzen 9 7900X | |
| Intel Core i9-12900K | |
| AMD Ryzen 5 7600X | |
| AMD Ryzen 9 5950X | |
| Intel Core i5-12600K | |
| Intel Core i9-12900K | |
| AMD Ryzen 9 5900X | |
| AMD Ryzen 5 5600X | |
| CrossMark - Overall | |
| AMD Ryzen 9 7900X | |
| AMD Ryzen 5 7600X | |
| Intel Core i5-12600K | |
| AMD Ryzen 9 5900X | |
| AMD Ryzen 9 5950X | |
| AMD Ryzen 5 5600X | |
| AIDA64 / Memory Copy | |
| Intel Core i5-12600K | |
| AMD Ryzen 9 7900X | |
| AMD Ryzen 9 5900X | |
| AMD Ryzen 5 7600X | |
| AMD Ryzen 9 5950X | |
| Desktop-PC | |
| AMD Ryzen 5 5600X | |
| Media de la clase (4514 - 234662, n=2222) | |
| AIDA64 / Memory Read | |
| Intel Core i5-12600K | |
| AMD Ryzen 9 7900X | |
| AMD Ryzen 9 5900X | |
| AMD Ryzen 9 5950X | |
| AMD Ryzen 5 5600X | |
| AMD Ryzen 5 7600X | |
| Media de la clase (4031 - 271066, n=2184) | |
| Desktop-PC | |
| AIDA64 / Memory Write | |
| AMD Ryzen 5 7600X | |
| AMD Ryzen 9 7900X | |
| Intel Core i5-12600K | |
| Media de la clase (3506 - 242868, n=2189) | |
| AMD Ryzen 9 5900X | |
| Desktop-PC | |
| AMD Ryzen 9 5950X | |
| AMD Ryzen 5 5600X | |
| AIDA64 / Memory Latency | |
| Media de la clase (6.1 - 536, n=2250) | |
| Intel Core i5-12600K | |
| AMD Ryzen 9 5950X | |
| AMD Ryzen 5 5600X | |
| AMD Ryzen 5 7600X | |
| AMD Ryzen 9 7900X | |
| Desktop-PC | |
| AMD Ryzen 9 5900X | |
* ... más pequeño es mejor
Puntos de referencia del juego
Pasemos ahora a los benchmarks de juegos. Debido al alto rendimiento de los procesadores Intel en un solo hilo, Intel marcó la pauta aquí durante mucho tiempo y poco a poco se vio presionada por AMD con las CPUs Ryzen 5000. Sólo con el Intel Core i9-12900Kpudo Intel recuperar la corona en este aspecto. Pero ahora hay otro cambio en la cima, porque el Intel Core i9-12900K es ahora superado por los nuevos procesadores AMD Ryzen de la generación 7000. El Core i9-12900K incluso tiene que subordinarse al AMD Ryzen 5 7600X, que es muy impresionante.
Sin embargo, hay que poner en perspectiva que la diferencia de rendimiento se hace más pequeña con el aumento de las resoluciones, ya que entonces depende más del rendimiento de la tarjeta gráfica. No obstante, podemos prescindir en parte de aumentos drásticos de rendimiento a favor de los nuevos procesadores AMD Ryzen a 1080p con detalles máximos.
Gaming performance in direct comparison with Intel
| Performance rating - Percent | |
| AMD Ryzen 9 7900X | |
| AMD Ryzen 5 7600X | |
| Intel Core i9-12900K | |
| Intel Core i5-12600K -2! | |
| F1 22 | |
| 1920x1080 Low Preset AA:T AF:16x | |
| AMD Ryzen 9 7900X | |
| AMD Ryzen 5 7600X | |
| Intel Core i9-12900K | |
| Intel Core i5-12600K | |
| 1920x1080 Ultra High Preset AA:T AF:16x | |
| Intel Core i9-12900K | |
| Intel Core i5-12600K | |
| AMD Ryzen 5 7600X | |
| AMD Ryzen 9 7900X | |
| Cyberpunk 2077 1.6 | |
| 1920x1080 Ultra Preset | |
| AMD Ryzen 9 7900X | |
| Intel Core i5-12600K | |
| AMD Ryzen 5 7600X | |
| Intel Core i9-12900K | |
| 1920x1080 Low Preset | |
| Intel Core i9-12900K | |
| AMD Ryzen 9 7900X | |
| AMD Ryzen 5 7600X | |
| Intel Core i5-12600K | |
| Far Cry 5 | |
| 1920x1080 Ultra Preset AA:T | |
| Intel Core i9-12900K | |
| AMD Ryzen 9 7900X | |
| AMD Ryzen 5 7600X | |
| Intel Core i5-12600K | |
| 1280x720 Low Preset AA:T | |
| AMD Ryzen 9 7900X | |
| AMD Ryzen 5 7600X | |
| Intel Core i9-12900K | |
| Intel Core i5-12600K | |
| X-Plane 11.11 | |
| 1920x1080 high (fps_test=3) | |
| AMD Ryzen 9 7900X | |
| AMD Ryzen 5 7600X | |
| Intel Core i9-12900K | |
| Intel Core i5-12600K | |
| 1280x720 low (fps_test=1) | |
| AMD Ryzen 5 7600X | |
| AMD Ryzen 9 7900X | |
| Intel Core i9-12900K | |
| Intel Core i5-12600K | |
| Final Fantasy XV Benchmark | |
| 1920x1080 High Quality | |
| AMD Ryzen 9 7900X | |
| AMD Ryzen 5 7600X | |
| Intel Core i9-12900K | |
| Intel Core i5-12600K | |
| 1280x720 Lite Quality | |
| AMD Ryzen 9 7900X | |
| Intel Core i9-12900K | |
| AMD Ryzen 5 7600X | |
| Intel Core i5-12600K | |
| Dota 2 Reborn | |
| 1920x1080 ultra (3/3) best looking | |
| AMD Ryzen 9 7900X | |
| AMD Ryzen 5 7600X | |
| Intel Core i9-12900K | |
| Intel Core i5-12600K | |
| 1280x720 min (0/3) fastest | |
| AMD Ryzen 5 7600X | |
| AMD Ryzen 9 7900X | |
| Intel Core i9-12900K | |
| Intel Core i5-12600K | |
| The Witcher 3 | |
| 1920x1080 Ultra Graphics & Postprocessing (HBAO+) | |
| AMD Ryzen 9 7900X | |
| AMD Ryzen 5 7600X | |
| Intel Core i9-12900K | |
| 1024x768 Low Graphics & Postprocessing | |
| AMD Ryzen 9 7900X | |
| AMD Ryzen 5 7600X | |
| Intel Core i9-12900K | |
| GTA V | |
| 1920x1080 Highest AA:4xMSAA + FX AF:16x | |
| AMD Ryzen 9 7900X | |
| AMD Ryzen 5 7600X | |
| Intel Core i9-12900K | |
| Intel Core i5-12600K | |
| 1024x768 Lowest Settings possible | |
| AMD Ryzen 9 7900X | |
| AMD Ryzen 5 7600X | |
| Intel Core i9-12900K | |
| Intel Core i5-12600K | |
Ryzen 9 7900X with Nvidia GeForce RTX 3090
| bajo | medio | alto | ultra | QHD | 4K | |
|---|---|---|---|---|---|---|
| GTA V (2015) | 187.5 | 187.5 | 187.1 | 161.4 | 151.8 | 182.2 |
| The Witcher 3 (2015) | 773 | 586 | 384 | 188.1 | 156.9 | |
| Dota 2 Reborn (2015) | 293.1 | 257 | 250.4 | 231.65 | 216.7 | |
| Final Fantasy XV Benchmark (2018) | 236 | 231 | 190.8 | 146.6 | 88.8 | |
| X-Plane 11.11 (2018) | 225 | 199.2 | 160.9 | 133.5 | ||
| Far Cry 5 (2018) | 244 | 211 | 203 | 186 | 176 | 110 |
| Strange Brigade (2018) | 741 | 479 | 380 | 329 | 249 | 153.1 |
| Shadow of the Tomb Raider (2018) | 314 | 261 | 251 | 234 | 172.2 | 99.6 |
| Far Cry New Dawn (2019) | 200 | 176 | 169 | 151 | 143 | 109 |
| Metro Exodus (2019) | 311 | 223 | 175.2 | 140.1 | 115.8 | 76.6 |
| Borderlands 3 (2019) | 244 | 213 | 190.8 | 164.1 | 131.6 | 75.3 |
| F1 2020 (2020) | 487 | 403 | 374 | 270 | 218 | 138.8 |
| F1 2021 (2021) | 648 | 548 | 441 | 224 | 175.4 | 105.3 |
| Cyberpunk 2077 1.6 (2022) | 214 | 213 | 174 | 173 | 88 | 46 |
| Tiny Tina's Wonderlands (2022) | 364 | 294 | 212 | 168.5 | 124 | 70.8 |
| F1 22 (2022) | 344 | 361 | 321 | 125.1 | 83.8 | 42.4 |
| The Quarry (2022) | 282 | 216 | 177.7 | 144.4 | 103.6 | 58.9 |
Ryzen 5 7600X with Nvidia GeForce RTX 3090
| bajo | medio | alto | ultra | QHD | 4K | |
|---|---|---|---|---|---|---|
| GTA V (2015) | 187.5 | 187.5 | 186.7 | 155.2 | 148 | 181.9 |
| The Witcher 3 (2015) | 710 | 566 | 265 | 186.4 | 158.1 | |
| Dota 2 Reborn (2015) | 301.3 | 260 | 244.9 | 228.5 | 214.5 | |
| Final Fantasy XV Benchmark (2018) | 233 | 227 | 188.4 | 147.1 | 90.6 | |
| X-Plane 11.11 (2018) | 227 | 193.6 | 151.8 | 127.6 | ||
| Far Cry 5 (2018) | 238 | 208 | 196 | 183 | 171 | 111 |
| Strange Brigade (2018) | 819 | 510 | 402 | 354 | 270 | 161.4 |
| Shadow of the Tomb Raider (2018) | 299 | 251 | 241 | 228 | 172 | 99.7 |
| Far Cry New Dawn (2019) | 191 | 168 | 161 | 144 | 138 | 109 |
| Metro Exodus (2019) | 321 | 221 | 173.1 | 138.5 | 115.4 | 76.3 |
| Borderlands 3 (2019) | 232 | 205 | 185 | 161.2 | 130.7 | 75 |
| F1 2020 (2020) | 587 | 460 | 418 | 302 | 238 | 145.4 |
| F1 2021 (2021) | 699 | 562 | 453 | 227 | 175.8 | 105.6 |
| Cyberpunk 2077 1.6 (2022) | 199 | 198 | 174 | 125 | 88 | 46 |
| Tiny Tina's Wonderlands (2022) | 367 | 294 | 211 | 168.3 | 124 | 70.4 |
| F1 22 (2022) | 333 | 352 | 312 | 126.4 | 84.4 | 42.6 |
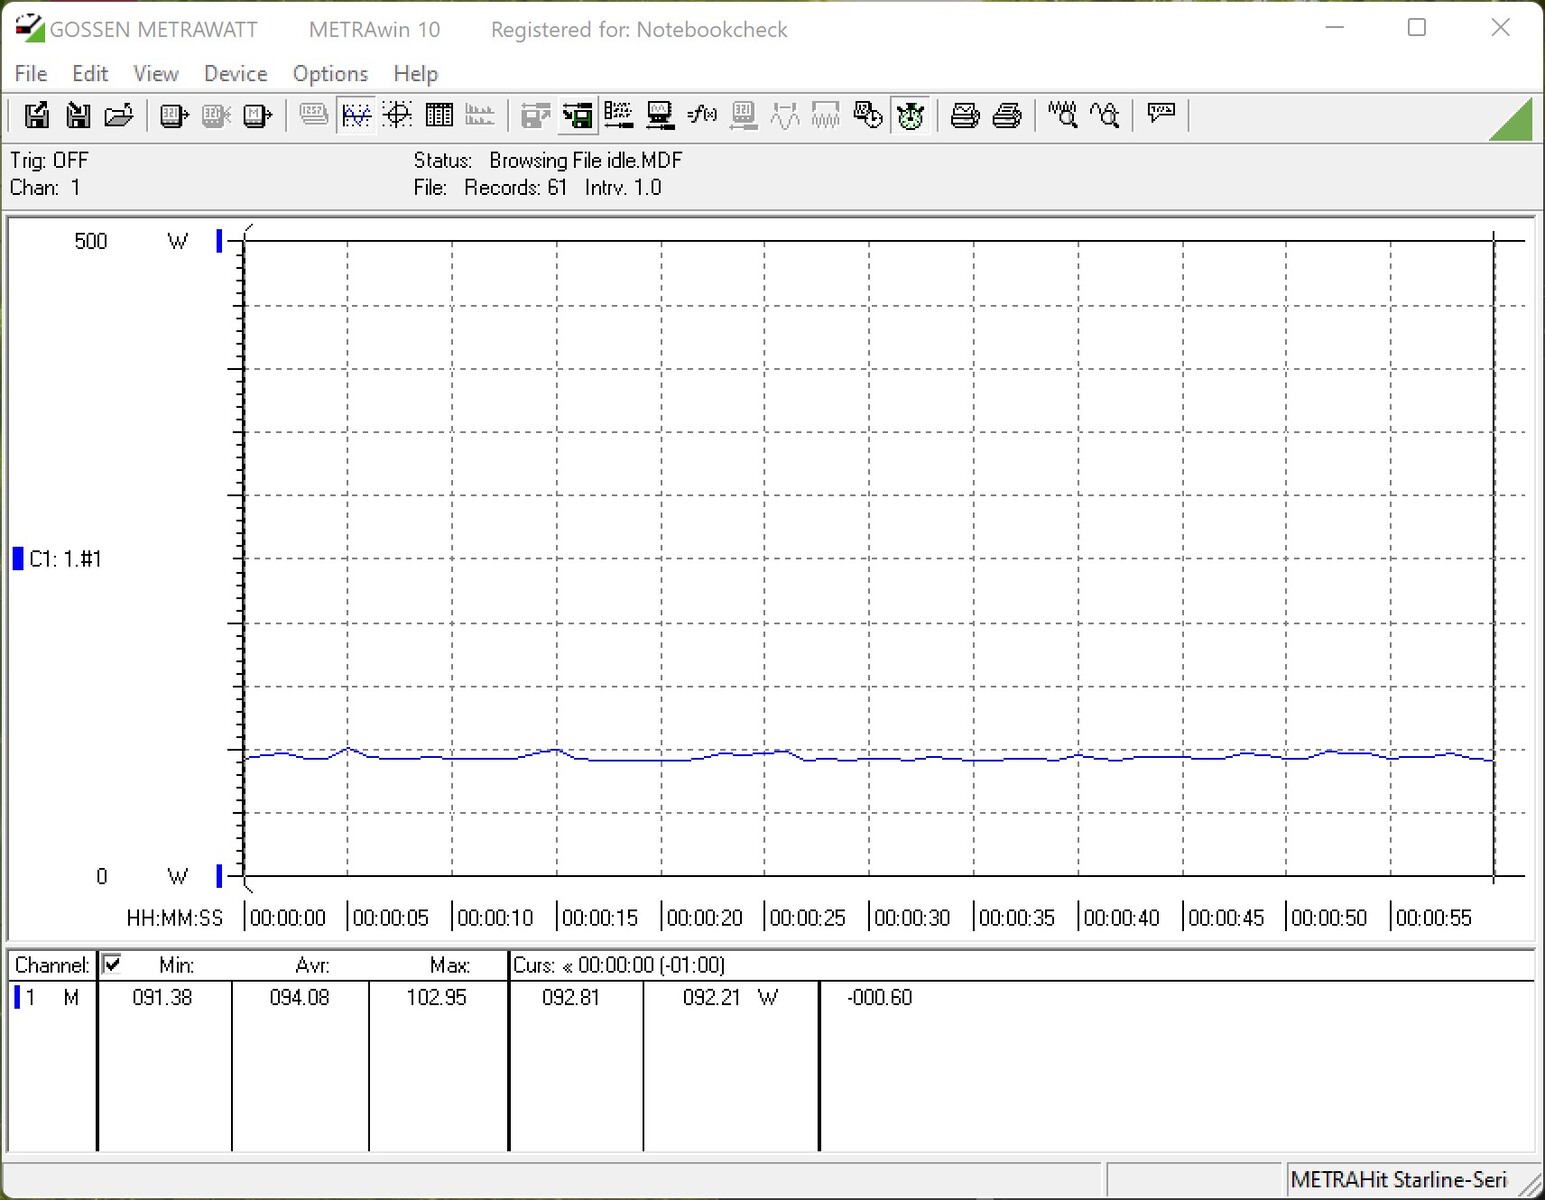
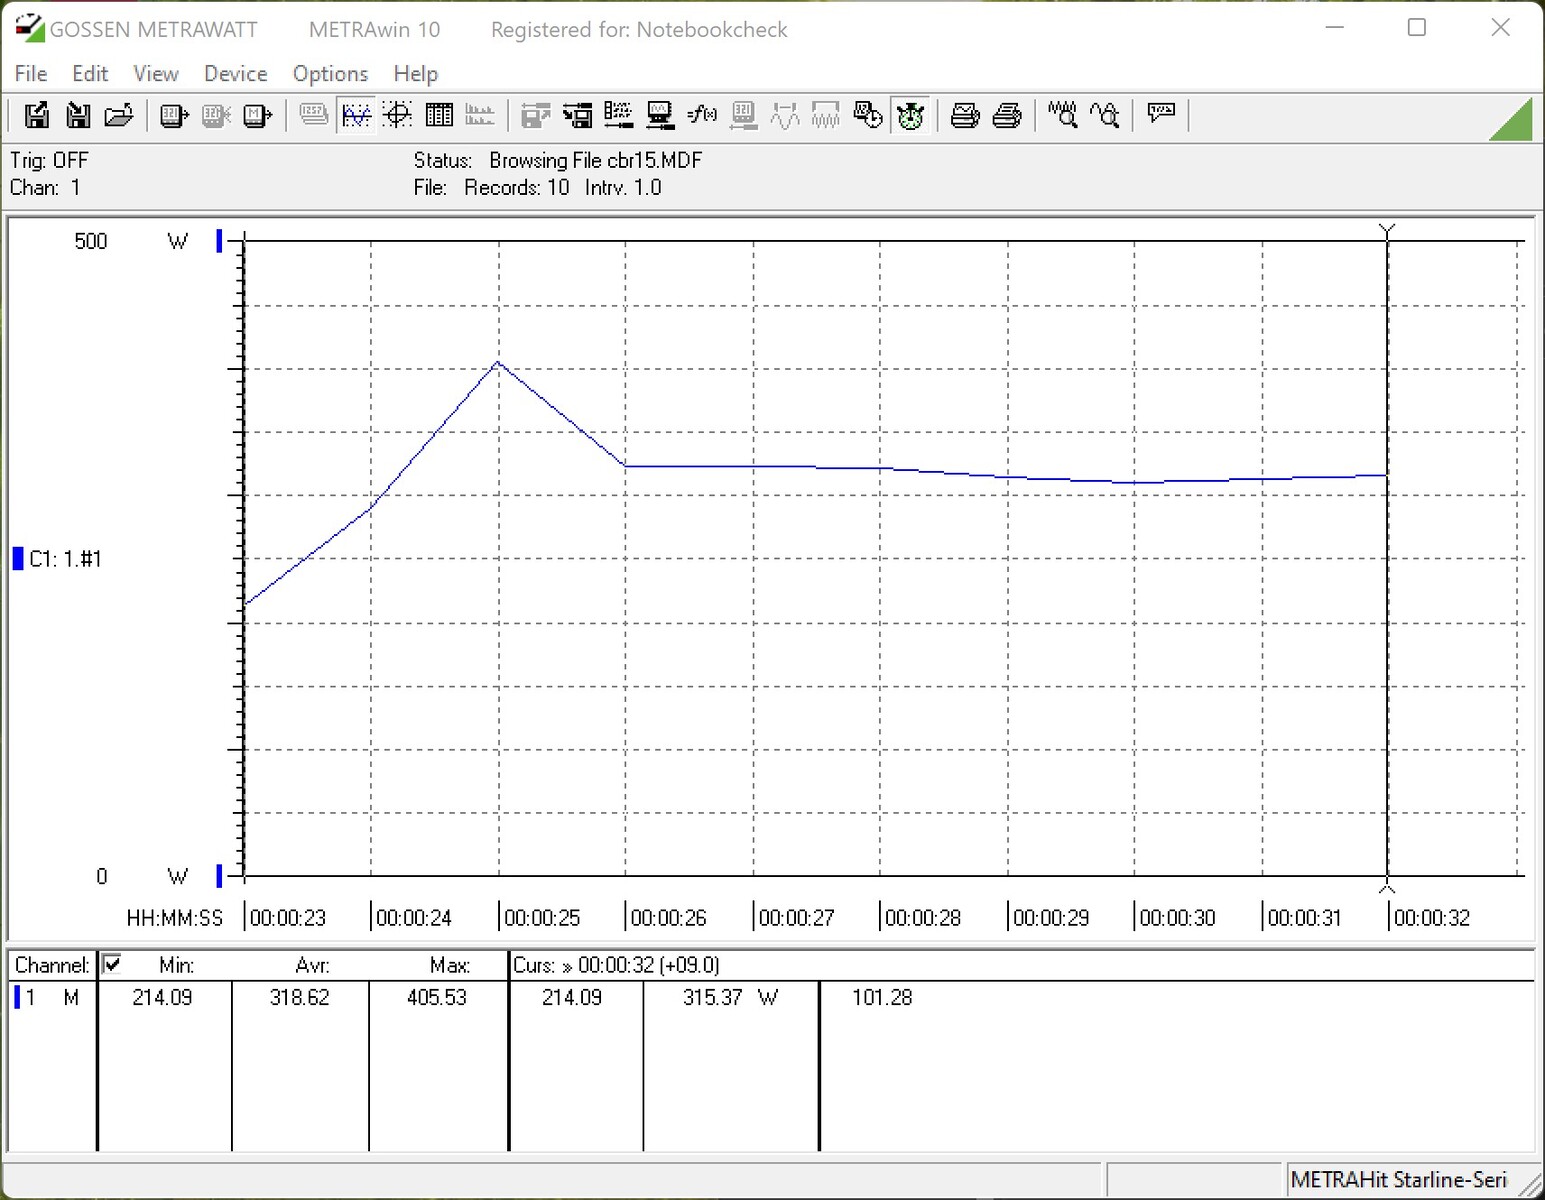
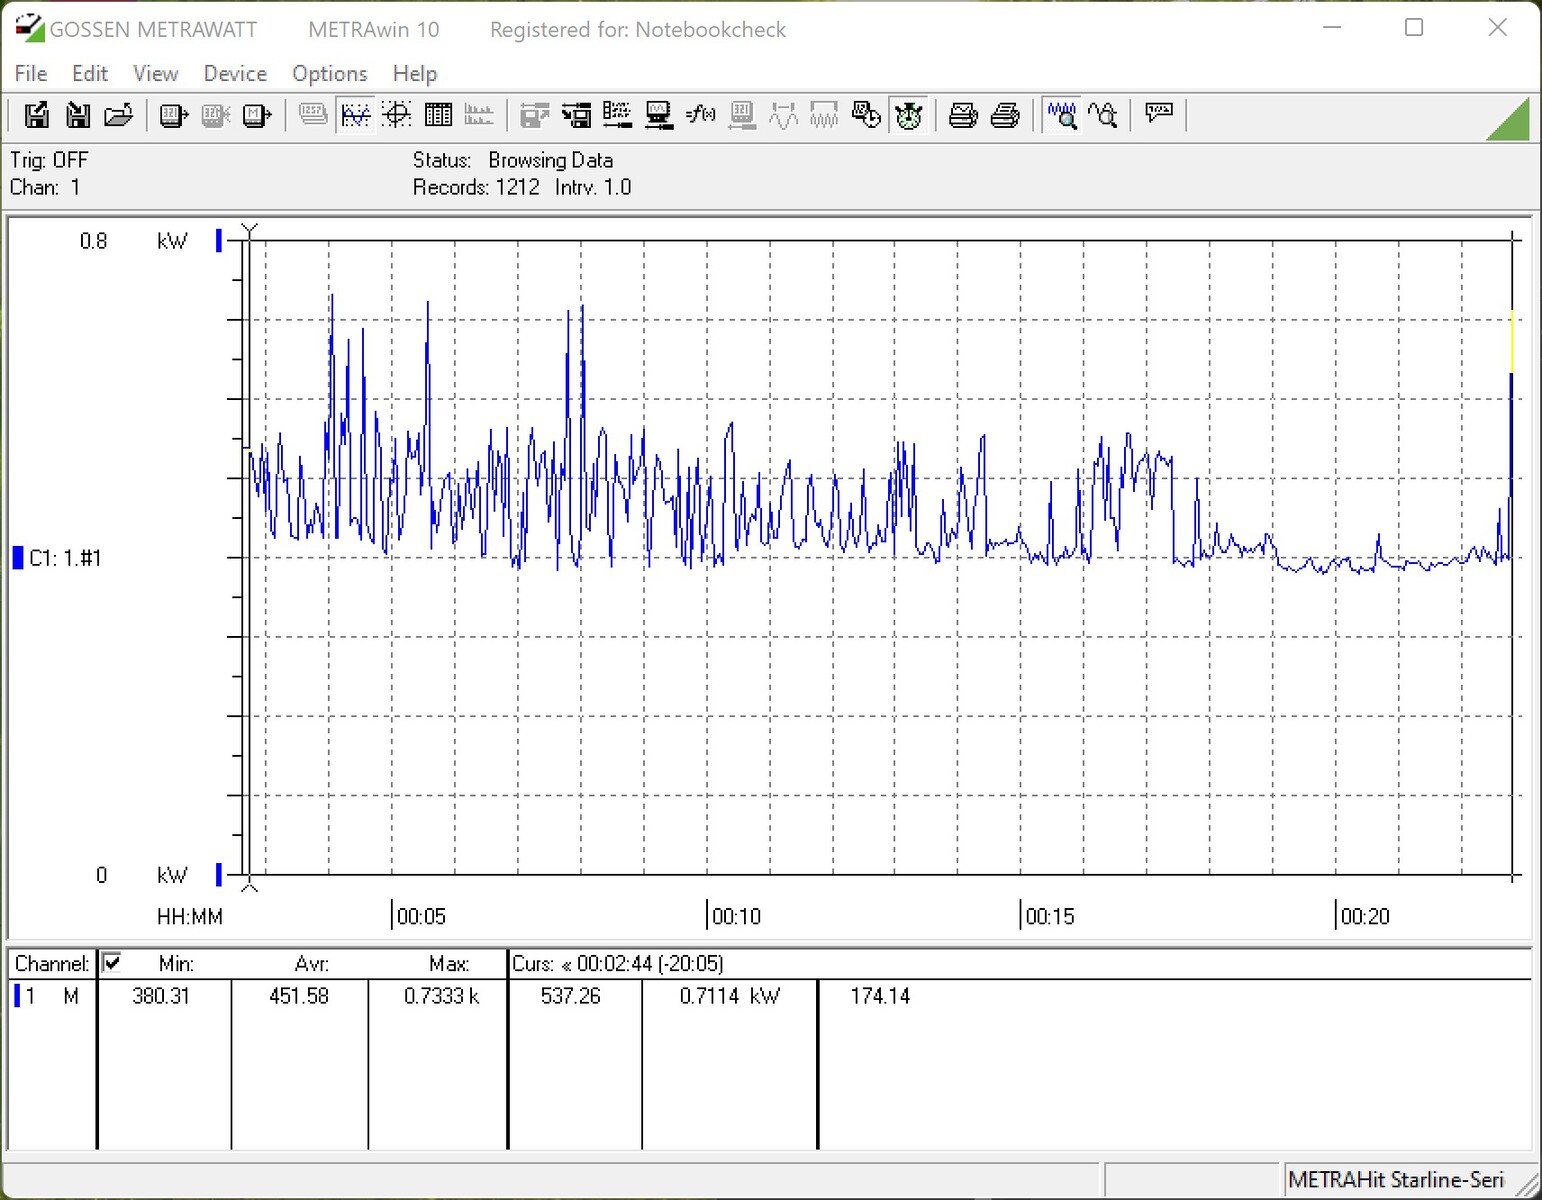
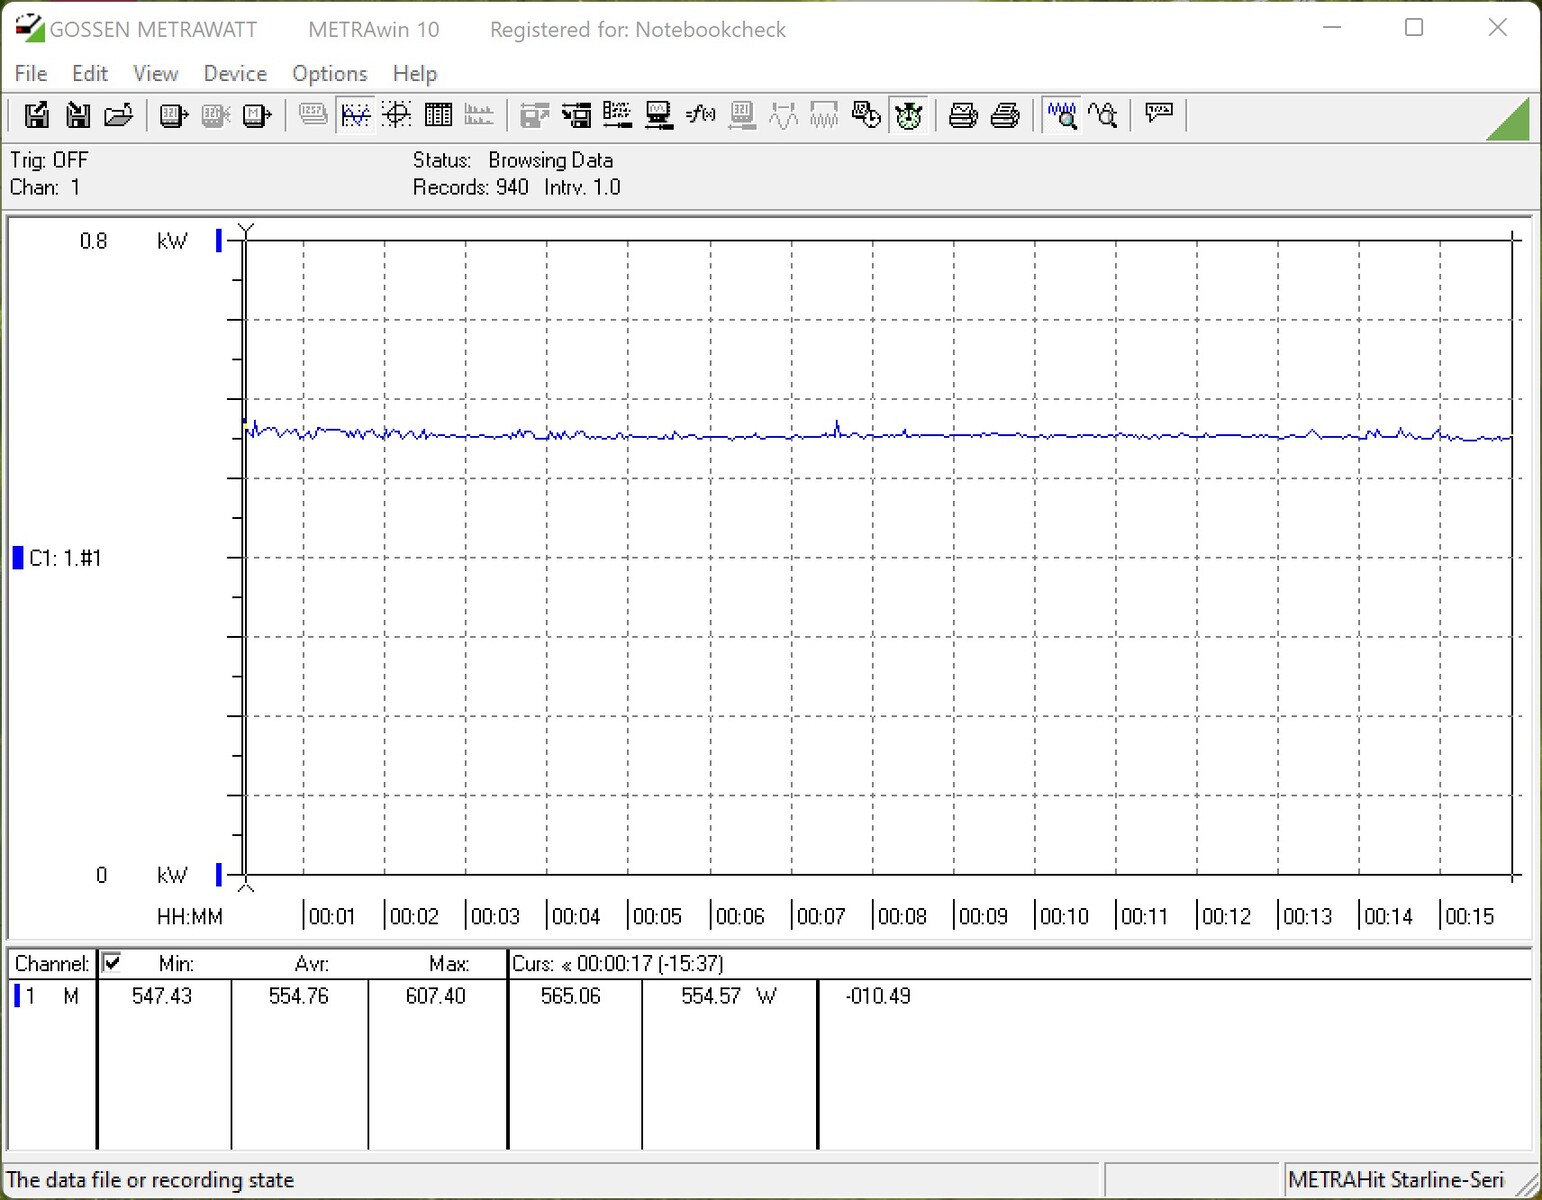
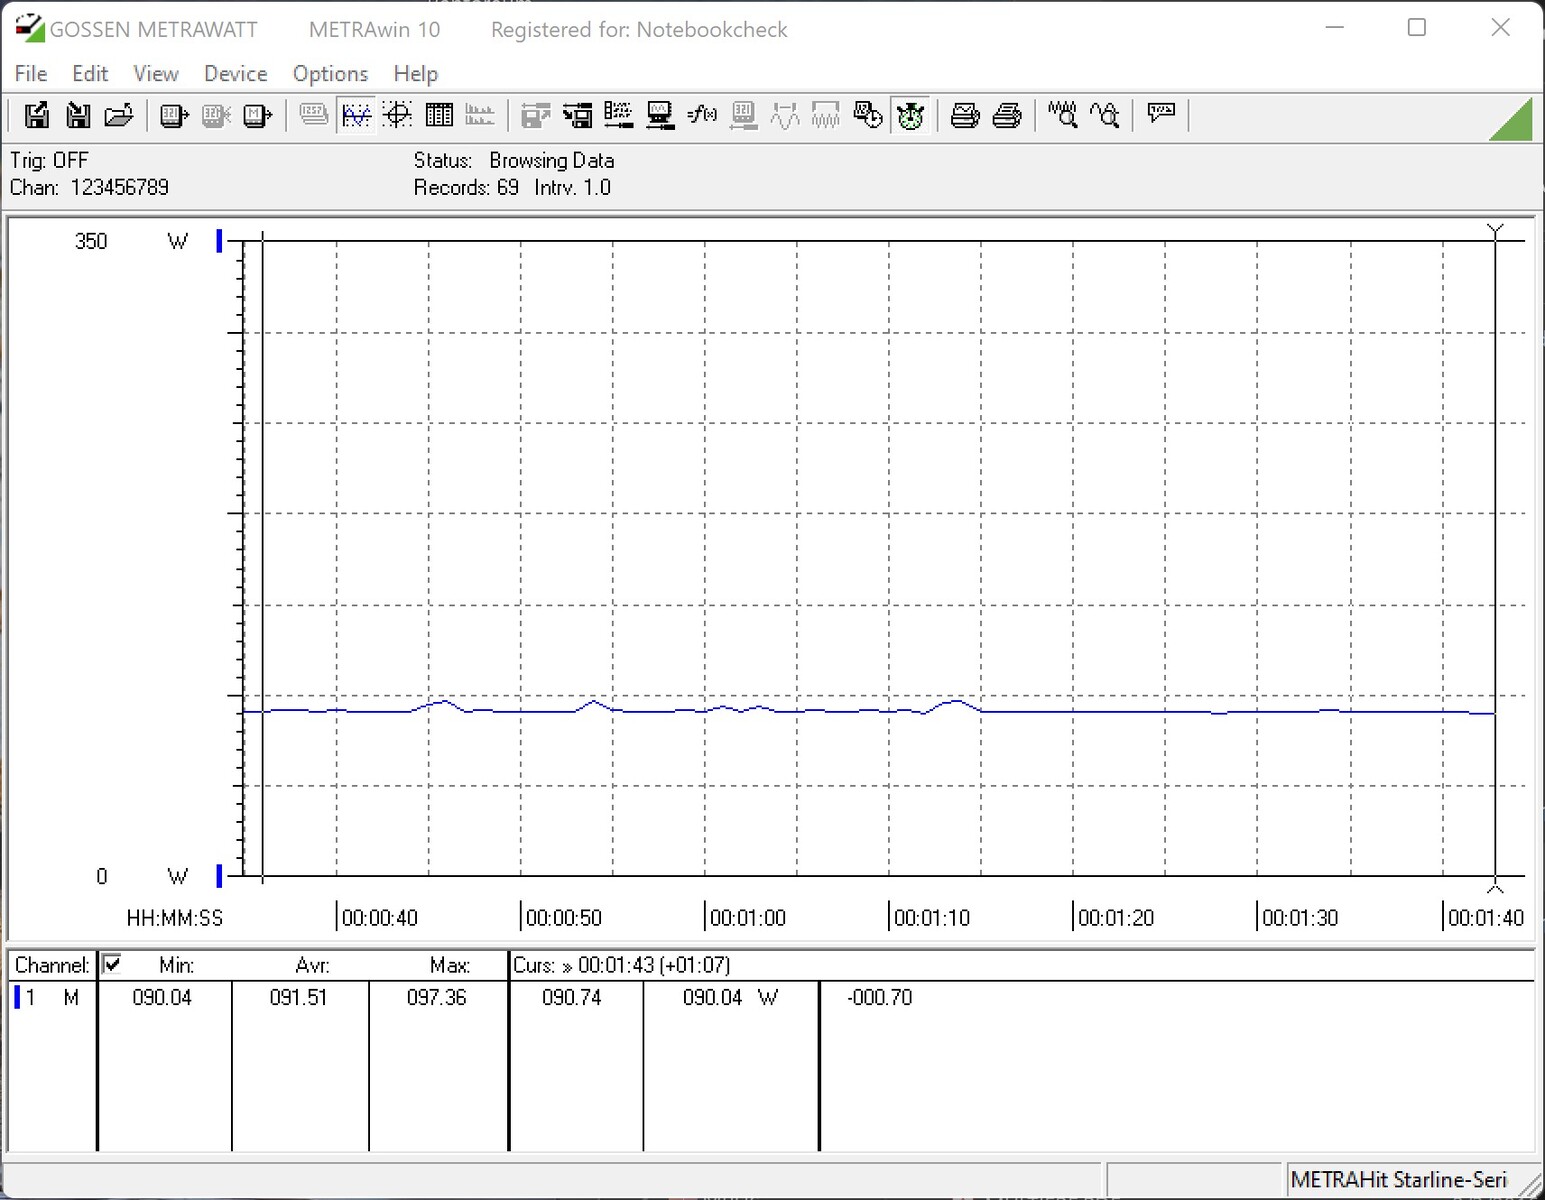
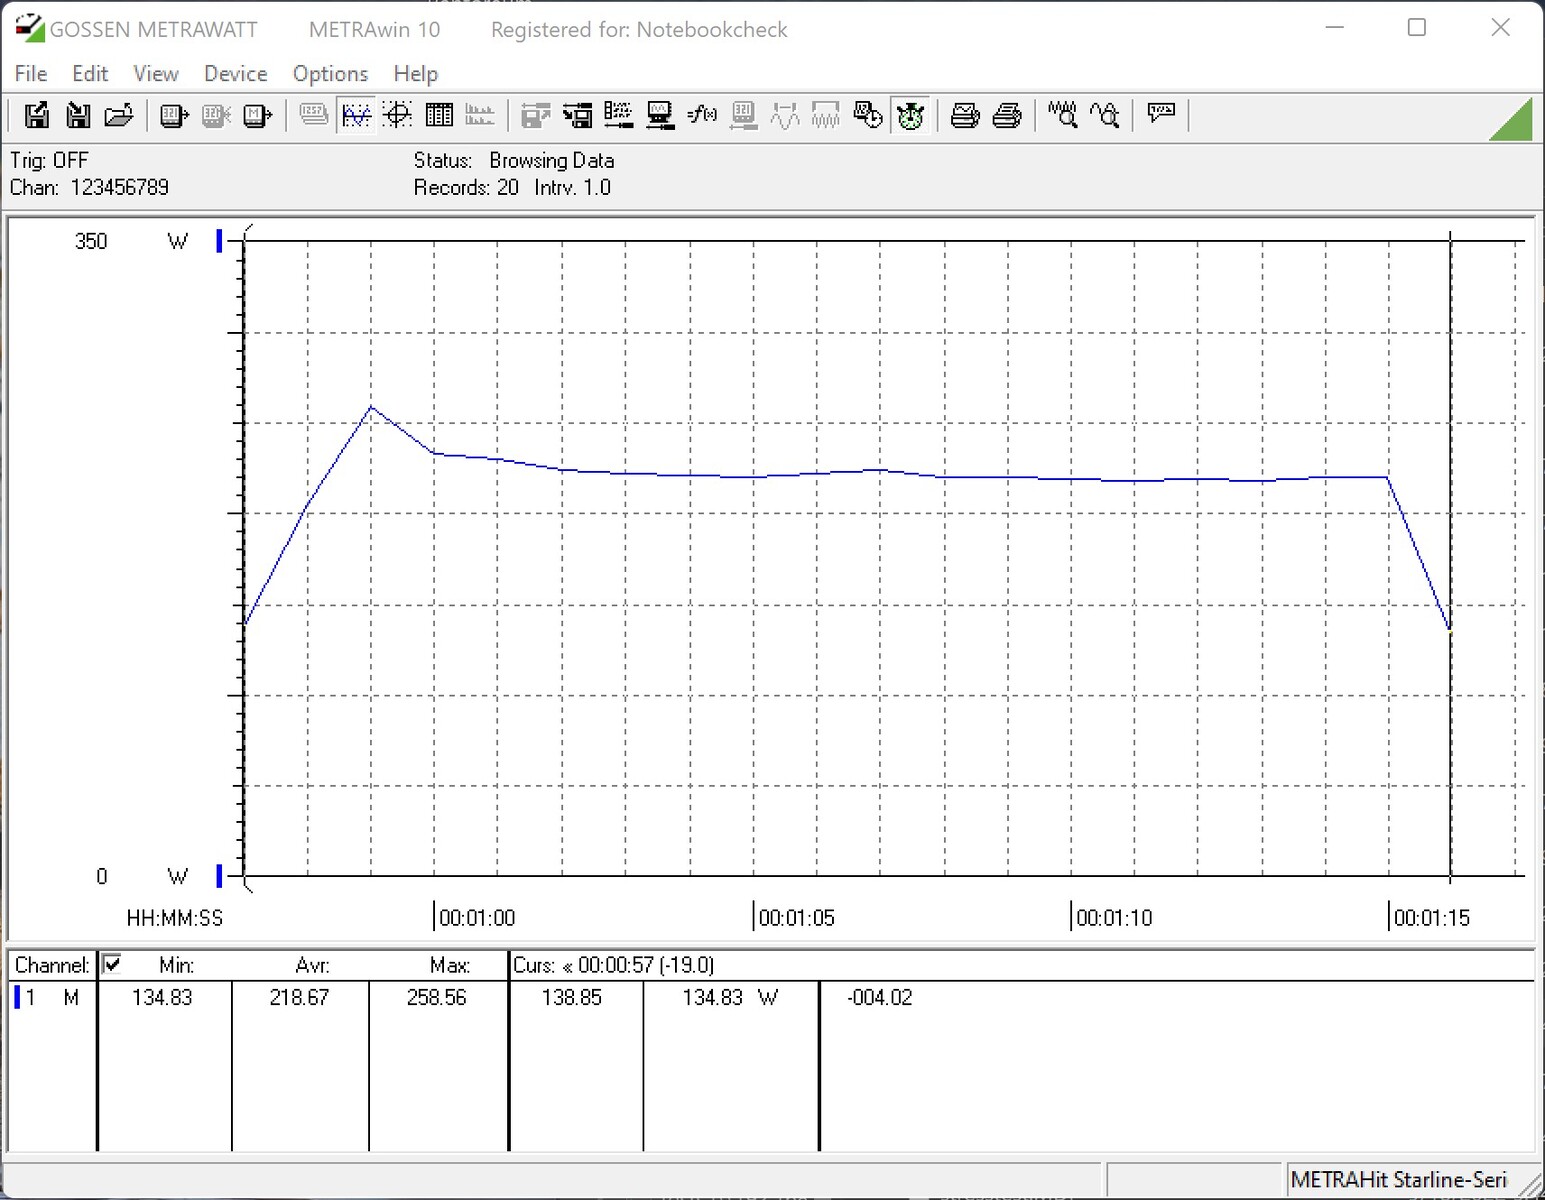
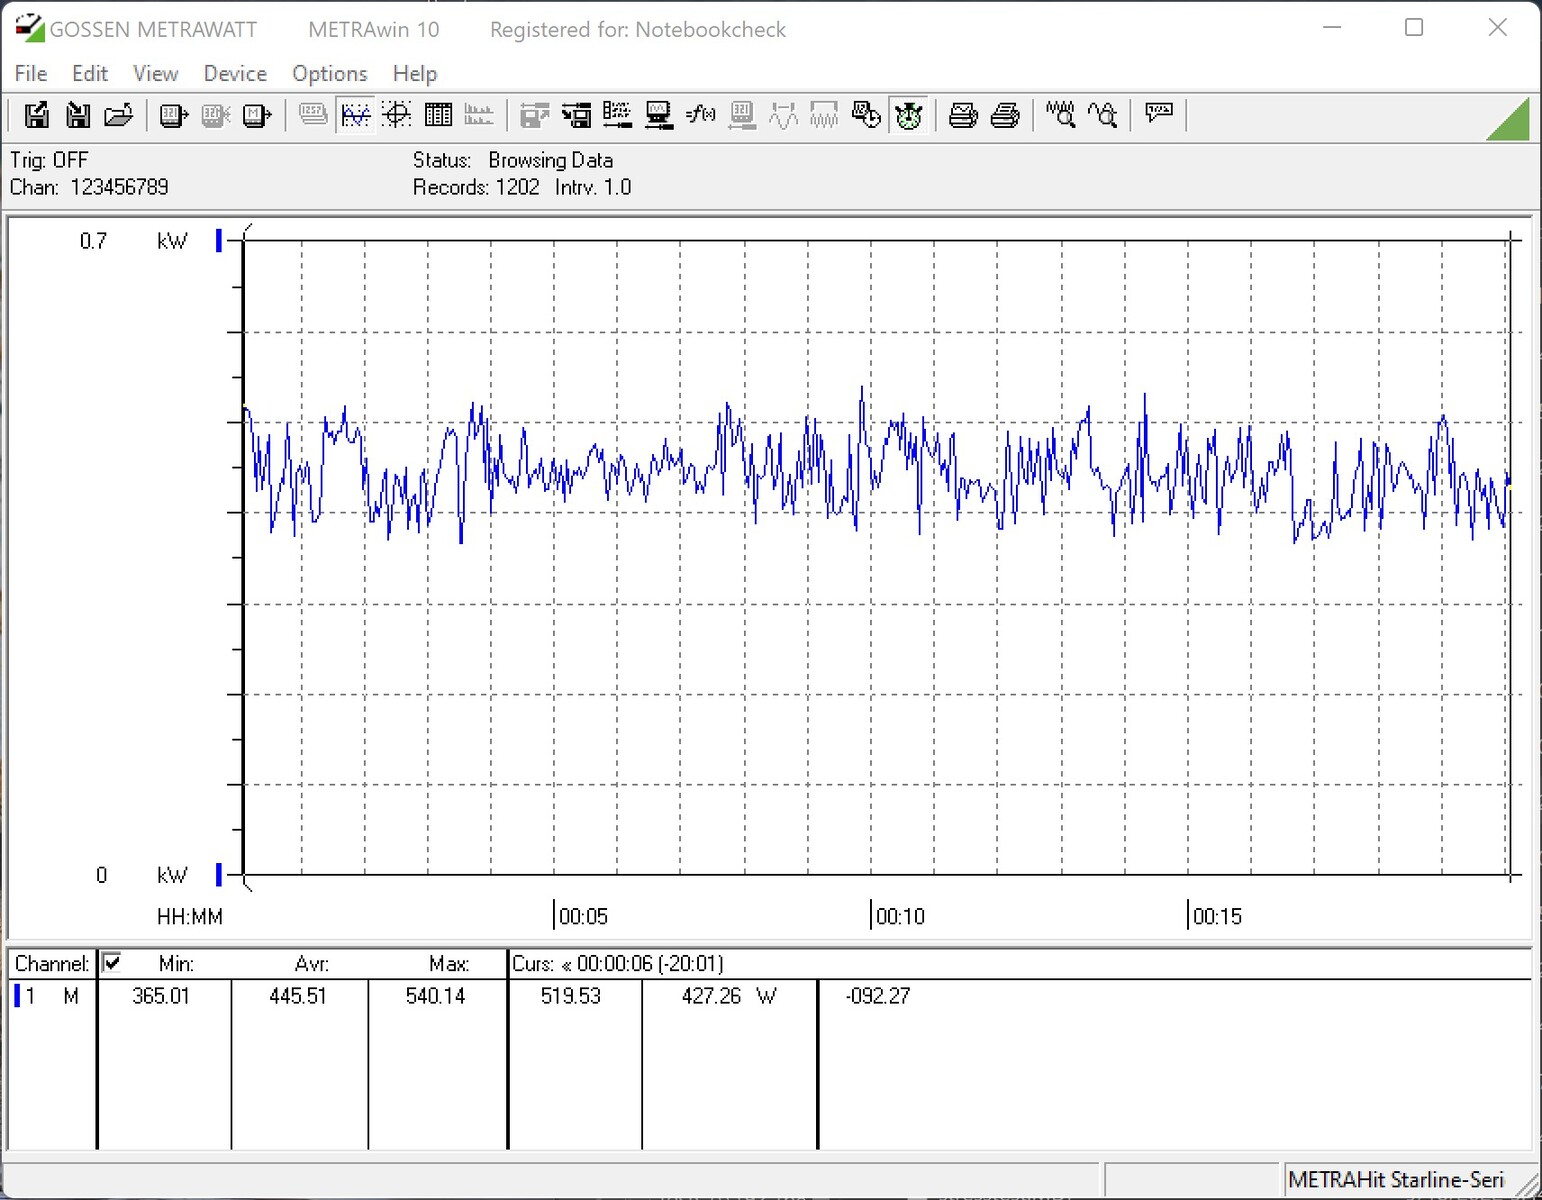
Consumo de energía
El alto rendimiento de los nuevos procesadores AMD Ryzen 7000 va acompañado de un consumo de energía significativamente mayor. Si el AMD Ryzen 9 5900X todavía venía con 105 W (TDP - Thermal Design Power), los modelos Ryzen 9 actuales pueden consumir 170 W. El PPT (Package Power Tracking) aumenta de 142 W a 230 W
Si echamos un vistazo a la comparación bajo carga con el Cinebech R15-Multi, el AMD Ryzen 9 7900X está sólo ligeramente por detrás del Intel Core i9-12900K en la clasificación. No obstante, observamos un rendimiento inferior en comparación con el AMD Ryzen 9 5900Xindicado por un consumo de energía un 33% mayor. Para el AMD Ryzen 5 7600X, sólo notamos un aumento del 26% comparado con el AMD Ryzen 5 5600X. También observamos un aumento de rendimiento similar en la prueba de estrés con Prime95. Con más de 500 W, el consumo de energía durante el juego vuelve a ser significativamente mayor debido a la tarjeta gráfica. Tenemos que calcular unos 350 W sólo para la Nvidia GeForce RTX 3090.
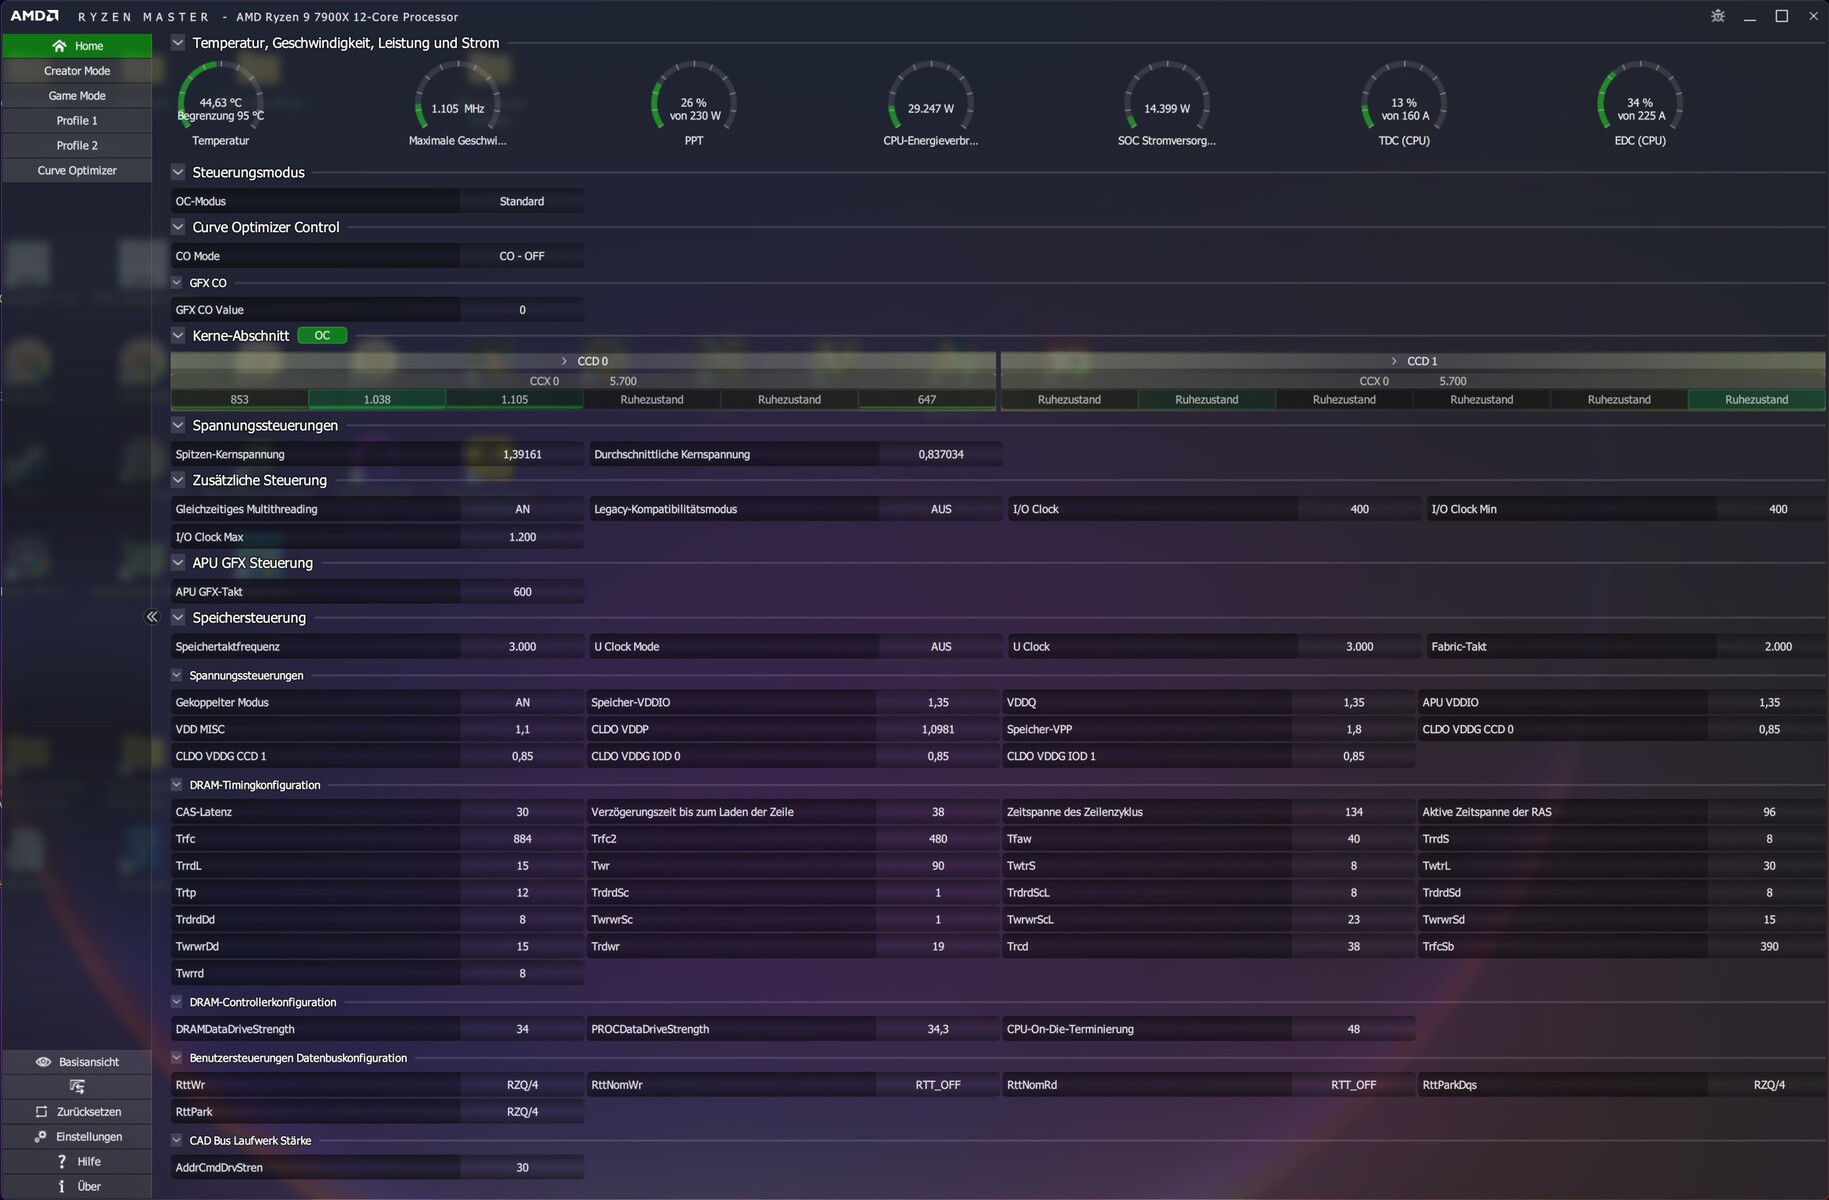
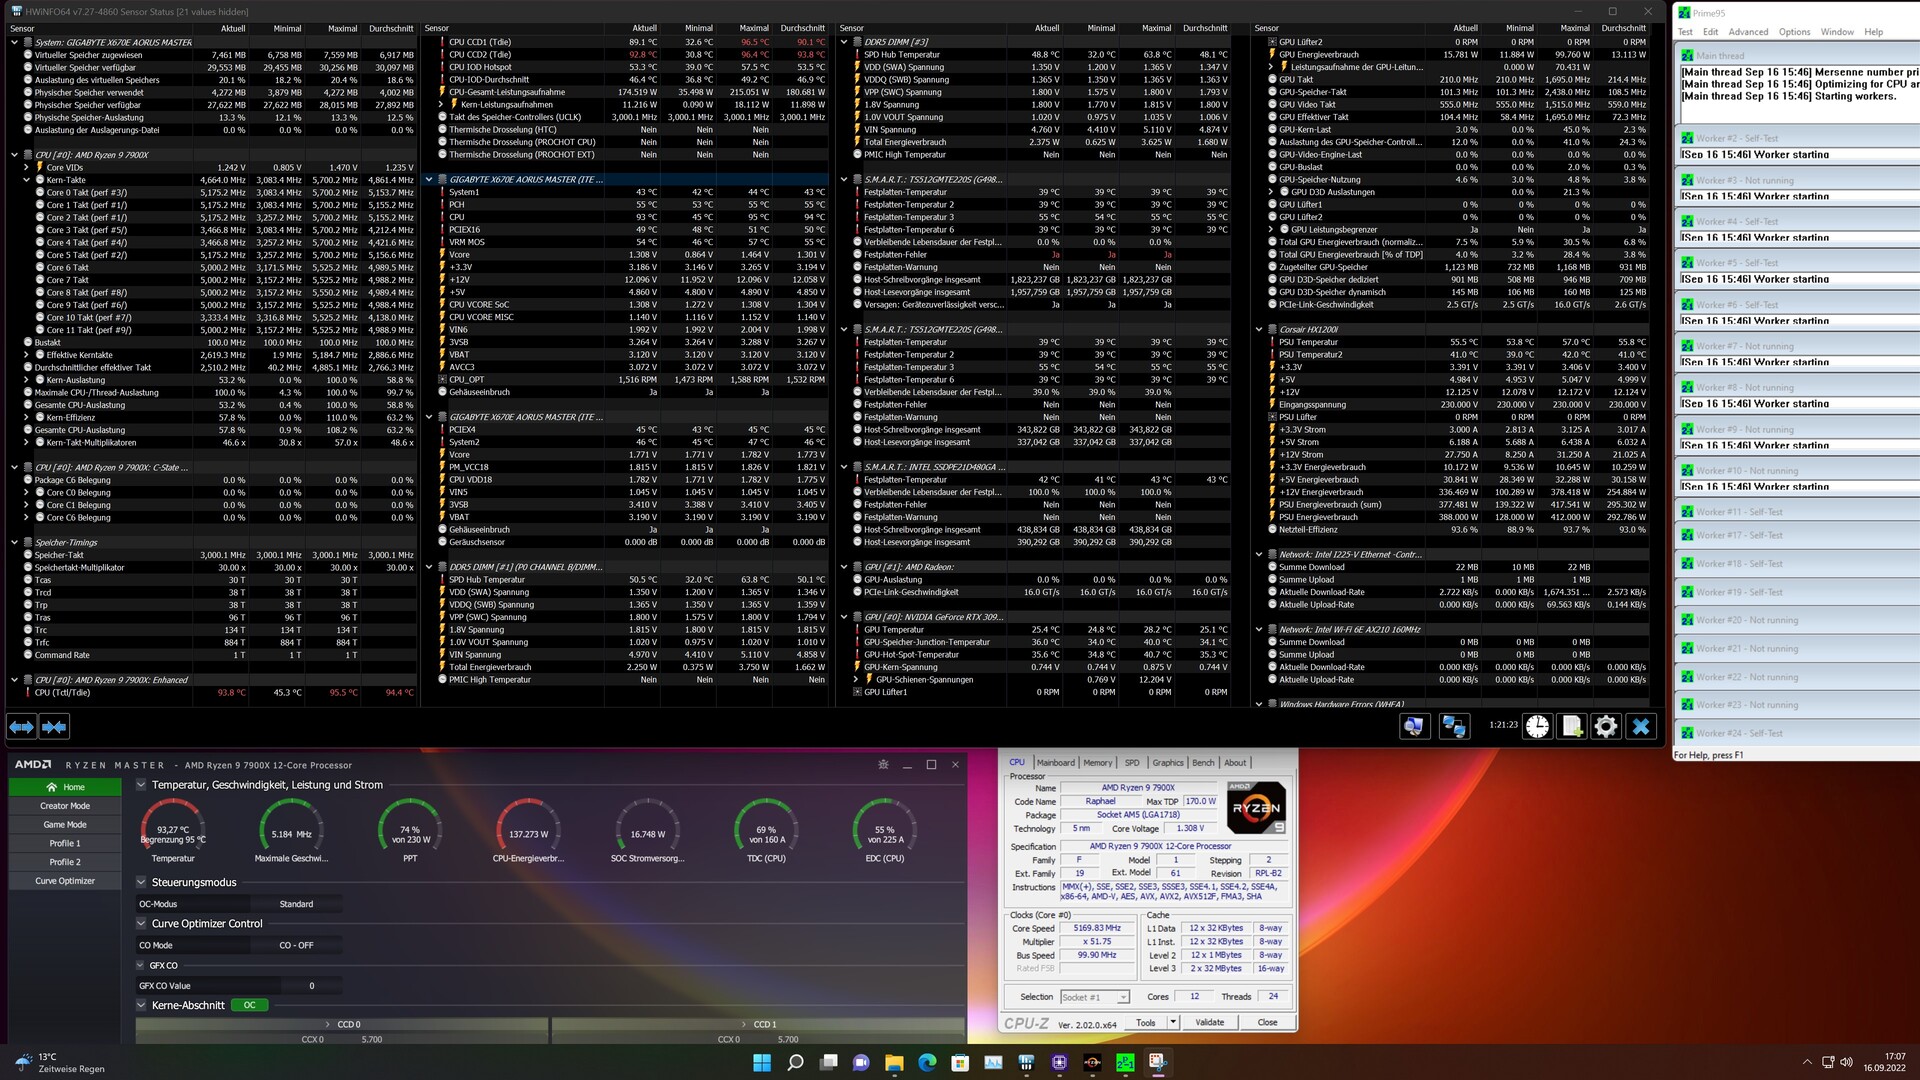
AMD recomienda utilizar una solución de refrigeración adecuada para sus procesadores. Así, deberías usar al menos una solución AiO 240 o 280 cuando ejecutes un AMD Ryzen 9, aunque un buen refrigerador de torre es suficiente para el AMD Ryzen 7 así como para el AMD Ryzen 5. Sin embargo, nuestro test de carga muestra que nuestra solución AiO 280 ya tuvo sus problemas en la configuración abierta. La temperatura máxima de 95 °C que AMD especifica para todos los nuevos procesadores se sigue alcanzando. Nuestra recomendación es usar una solución 360 AiO, independientemente de si se va a instalar Ryzen 9, Ryzen 7 o Ryzen 5 de la serie 7000. Como pista, AMD también proporciona un valor de referencia para las temperaturas, que está entre 70 y 90 °C.
Modo Eco:
AMD utiliza este modo para reducir el TDP, que también puede compararse con las limitaciones PL1 y PL2 de Intel. Así, los procesadores pueden funcionar a 65 W, 105 W o a 170 W sin estrangulamiento.
AMD Ryzen 9 7900X
AMD Ryzen 5 7600X
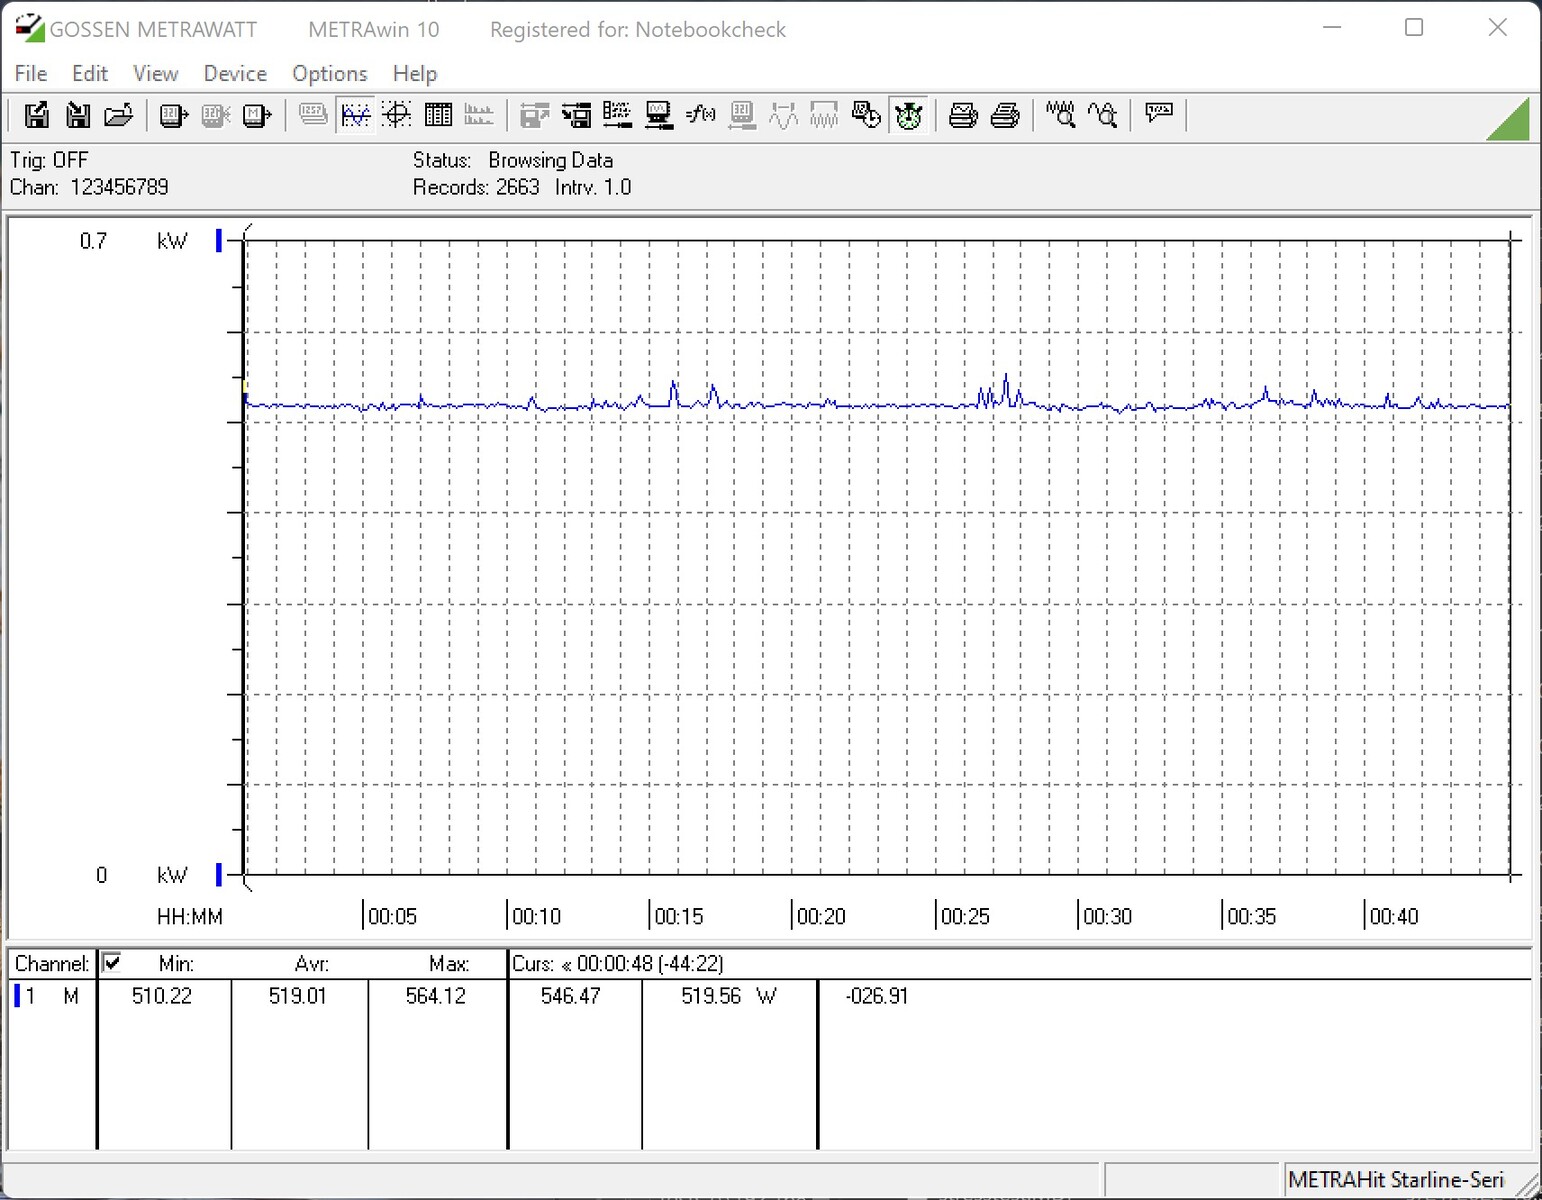
| Power Consumption / Cinebench R15 Multi (external Monitor) | |
| Intel Core i9-12900K (Idle: 70.5 W) | |
| AMD Ryzen 9 7900X | |
| AMD Ryzen 9 5900X (Idle: 78.1 W) | |
| AMD Ryzen 9 5950X (Idle: 78 W) | |
| AMD Ryzen 5 7600X | |
| Intel Core i5-12600K (Idle: 70.45 W) | |
| AMD Ryzen 5 5600X (Idle: 79.23 W) | |
| Power Consumption / Prime95 V2810 Stress (external Monitor) | |
| AMD Ryzen 9 7900X | |
| Intel Core i9-12900K (Idle: 70.5 W) | |
| Intel Core i5-12600K (Idle: 70.45 W) | |
| AMD Ryzen 9 5950X (Idle: 78 W) | |
| AMD Ryzen 9 5900X (Idle: 78.1 W) | |
| AMD Ryzen 5 7600X | |
| AMD Ryzen 5 5600X (Idle: 79.23 W) | |
| Power Consumption / The Witcher 3 ultra (external Monitor) | |
| AMD Ryzen 9 7900X | |
| AMD Ryzen 5 7600X | |
| Nvidia GeForce RTX 3090 Founders Edition (Idle: 91.1 W) | |
| Intel Core i9-12900K (Idle: 70.5 W) | |
| AMD Ryzen 9 5950X (Idle: 78 W) | |
| AMD Ryzen 9 5900X (Idle: 78.1 W) | |
| AMD Ryzen 5 5600X (Idle: 79.23 W) | |
| Intel Core i5-12600K (Idle: 70.45 W) | |
* ... más pequeño es mejor
Power Consumption With External Monitor
Pro
Contra
Conclusión: Extremadamente rápido pero también hambriento de rendimiento
Después de más de cinco años en los que el socket AM4 fue la base de los procesadores Ryzen, AMD presenta ahora el nuevo socket AM5 junto con los nuevos procesadores AMD Ryzen 7000. Nos gusta el cambio de PGA a LGA y el problema de las CPUs con pines rotos al quitar el refrigerador es por fin cosa del pasado. Esto también significa que el estándar DDR4 es historia, porque Ryzen 7000 sólo es compatible con AM5 y DDR5. Este es un paso que Intel ya ha dado con la serie Alder Lake, aunque sigue siendo compatible con DDR4 y DDR5.
En términos de rendimiento, AMD ha vuelto a aumentar significativamente el rendimiento por reloj (IPC). Junto con las velocidades de reloj significativamente más altas que ahora son posibles con la fabricación de 5 nm más pequeña, registramos un aumento del rendimiento de hasta el 30%. No hay grandes cambios bajo el disipador de calor en comparación con el Ryzen 5000. Sigue habiendo dos CCD y un troquel de E/S en la PCB. El troquel de E/S está fabricado en 6 nm y ofrece una iGPU, que no se puede utilizar para aplicaciones 3D con sólo 2 CUs.
Sin embargo, actualmente podemos afirmar que AMD ofrece un mejor rendimiento en juegos que el Core i9-12900K de Intel con el Ryzen 9 7900X y el Ryzen 5 7600X. El Core i9-12900K de Intel, que ya tiene un año, será reemplazado en un futuro próximo, lo que podría volver a cambiar por completo el equilibrio de poder. Sin embargo, eso es sólo un sueño del futuro por ahora y estamos evaluando el aquí y el ahora. Además, aún no hemos analizado el modelo superior de AMD, el AMD Ryzen 9 7950X, en este análisis. Hay aún más potencial para poner a Intel bajo una presión aún mayor.
Los Ryzen 9 7900X y Ryzen 5 7600X de AMD ofrecen un rendimiento fabuloso en todos los aspectos. Además, hay un digno sucesor en el Socket AM5 que erradica los problemas conocidos
Como ocurre a menudo, el cliente tiene que elegir y decidir qué CPU prefiere. Si sólo quiere jugar a juegos, estará muy bien servido con un AMD Ryzen 5 7600X. La CPU de 6 núcleos es rápida y ofrece todas las ventajas de la nueva generación Zen 4. La diferencia de rendimiento con el AMD Ryzen 9 7900X es extremadamente pequeña en los juegos probados. Si buscas una plataforma para el trabajo productivo o eres un creador de contenidos, definitivamente estarás contento con el AMD Ryzen 9 7900X, porque el alto rendimiento multihilo es mejor que el de un AMD Ryzen 9 5950X.
Precios y disponibilidad
Directamente en la tienda de AMD https://www.amd.com/de/direct-buy/de pero los procesadores actuales también se pueden comprar en muchas tiendas online conocidas. AMD cita un MSRP de 669 Euros para el AMD Ryzen 9 7900X. Según AMD, el modelo básico, el AMD Ryzen 5 7600X, cuesta 359 euros.
