Una segunda mirada a Vermeer - Review de AMD Ryzen 9 5950X y AMD Ryzen 5 5600X
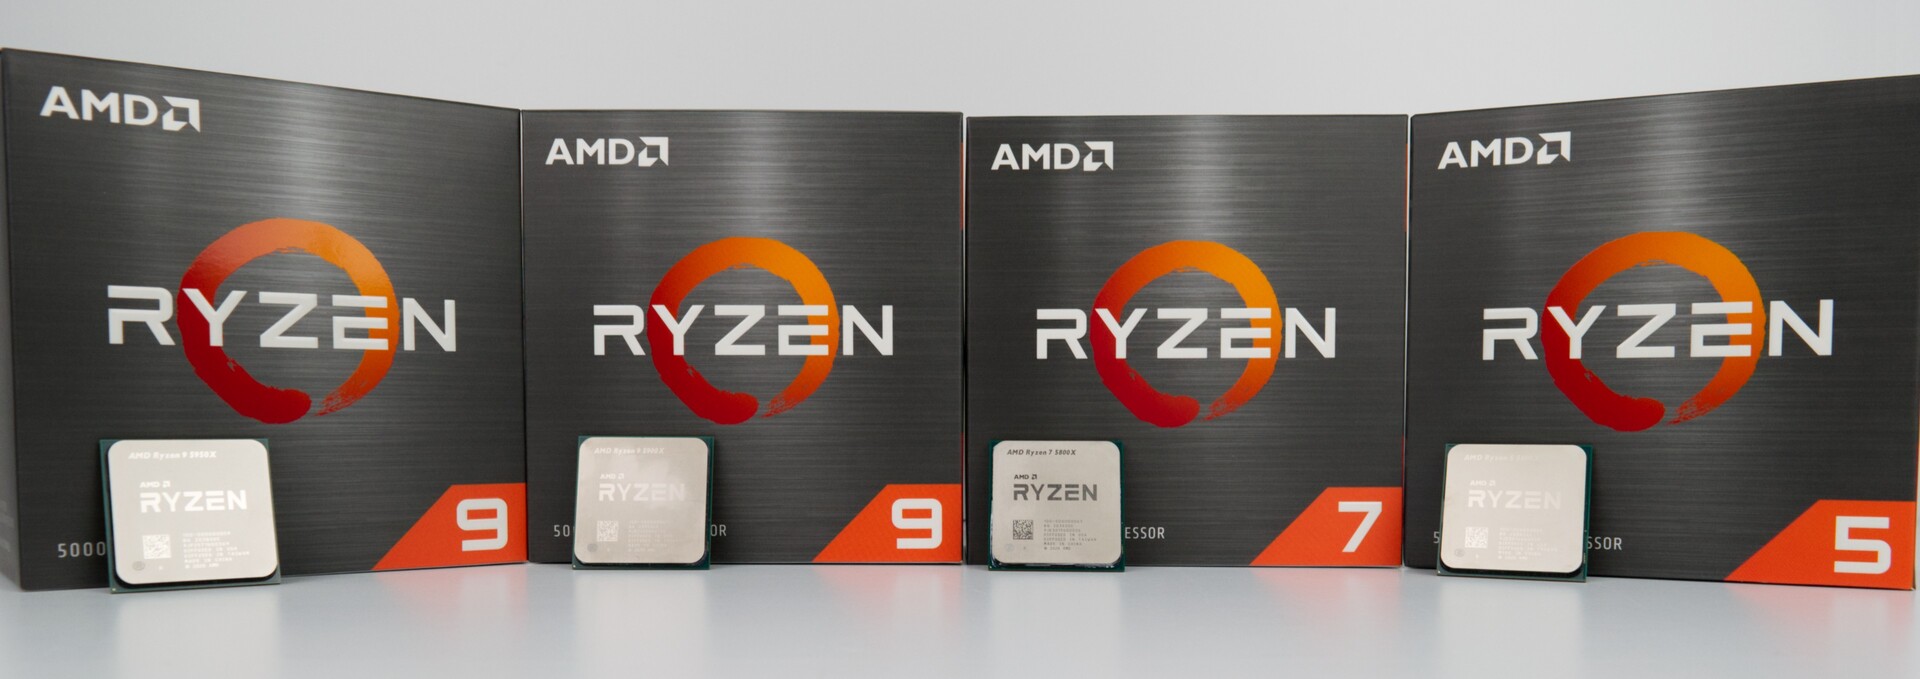
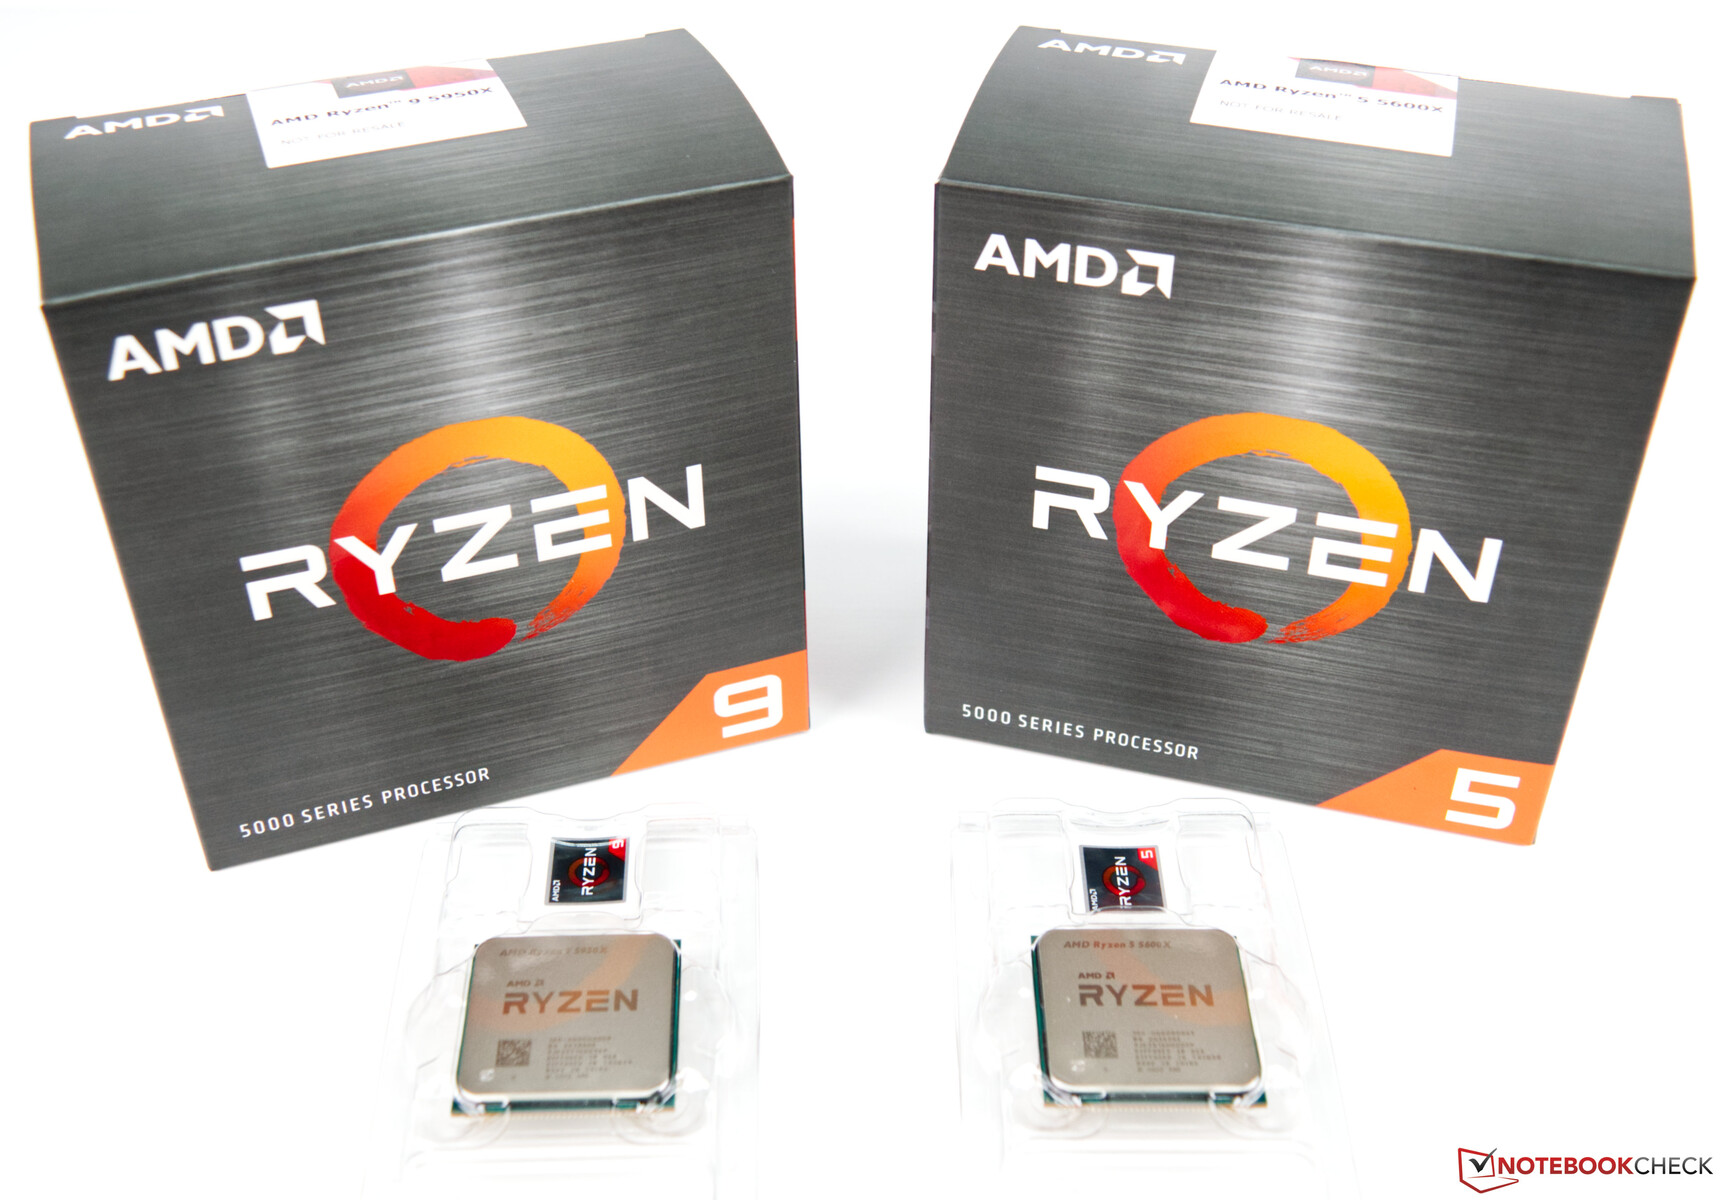
Después de haber evaluado previamente el AMD Ryzen 9 5900X y el AMD Ryzen 7 5800X en profundidad, en esta revisión, echaremos un vistazo al AMD Ryzen 9 5950X y al AMD Ryzen 5 5600X. Con estos procesadores, AMD amplía la parte superior e inferior de la nueva serie de Vermeer en su nueva cartera.
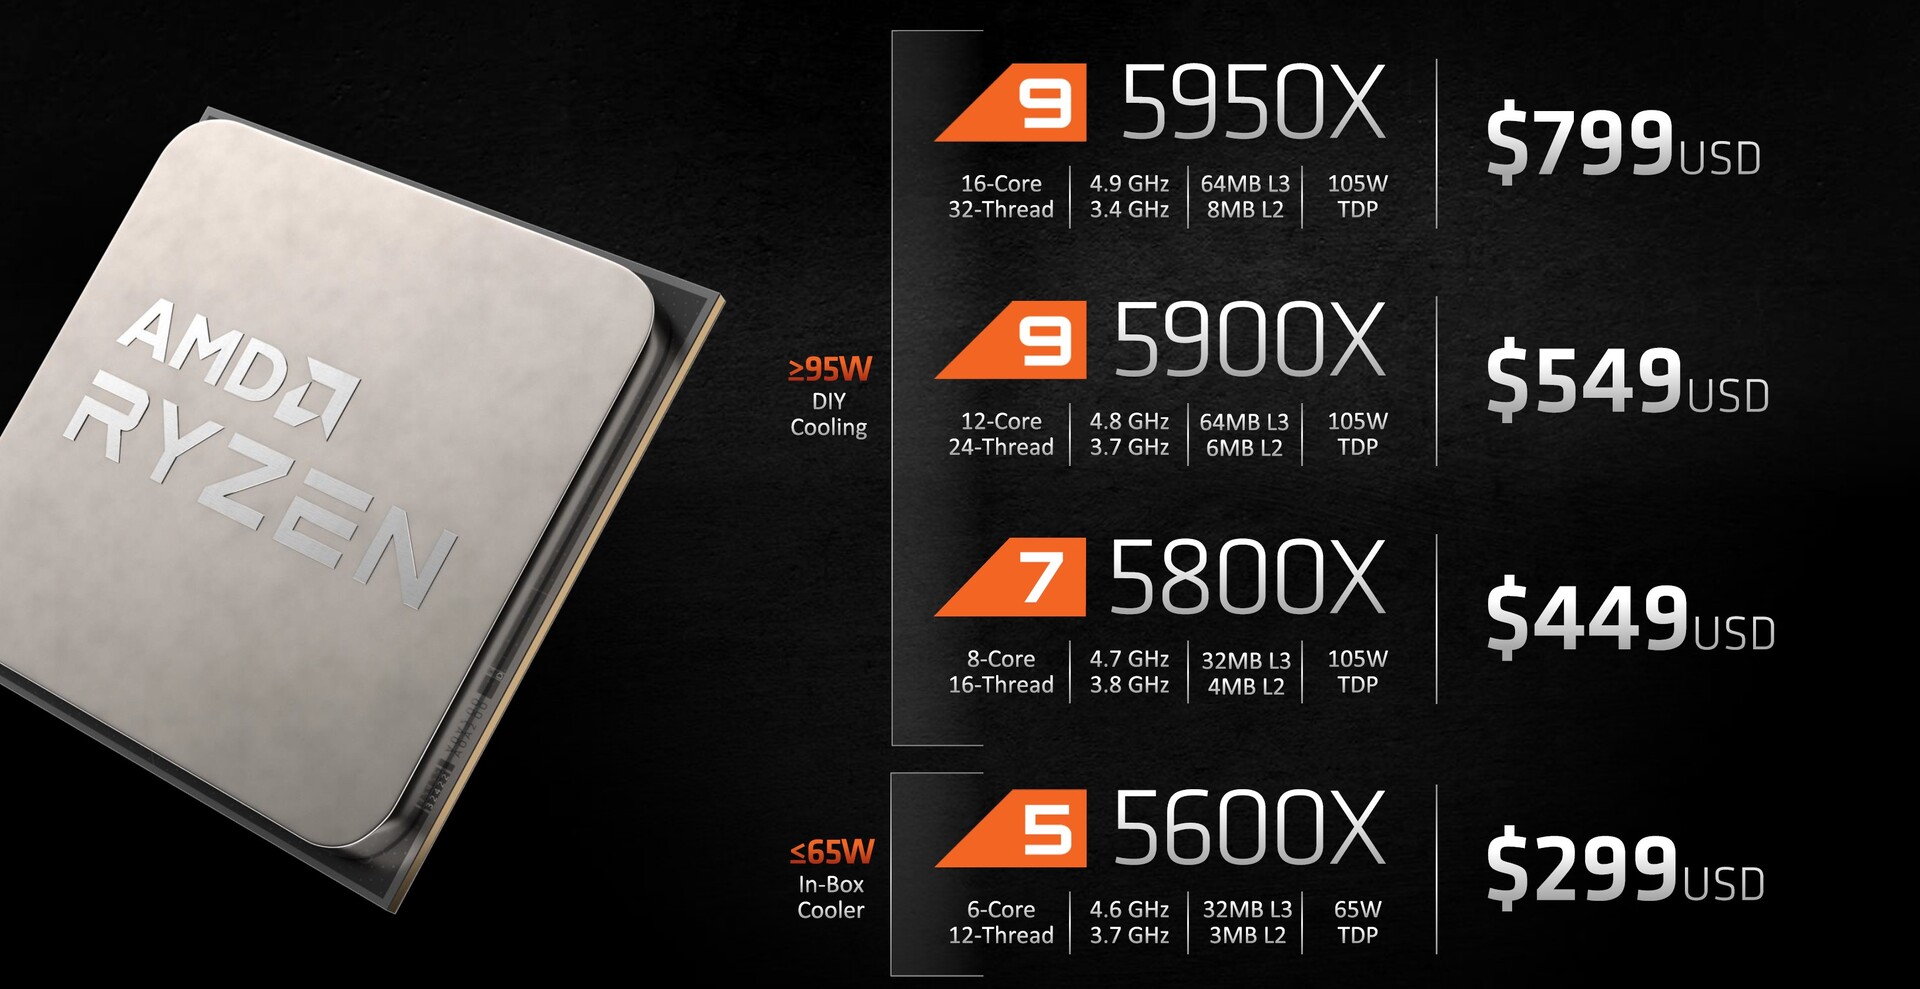
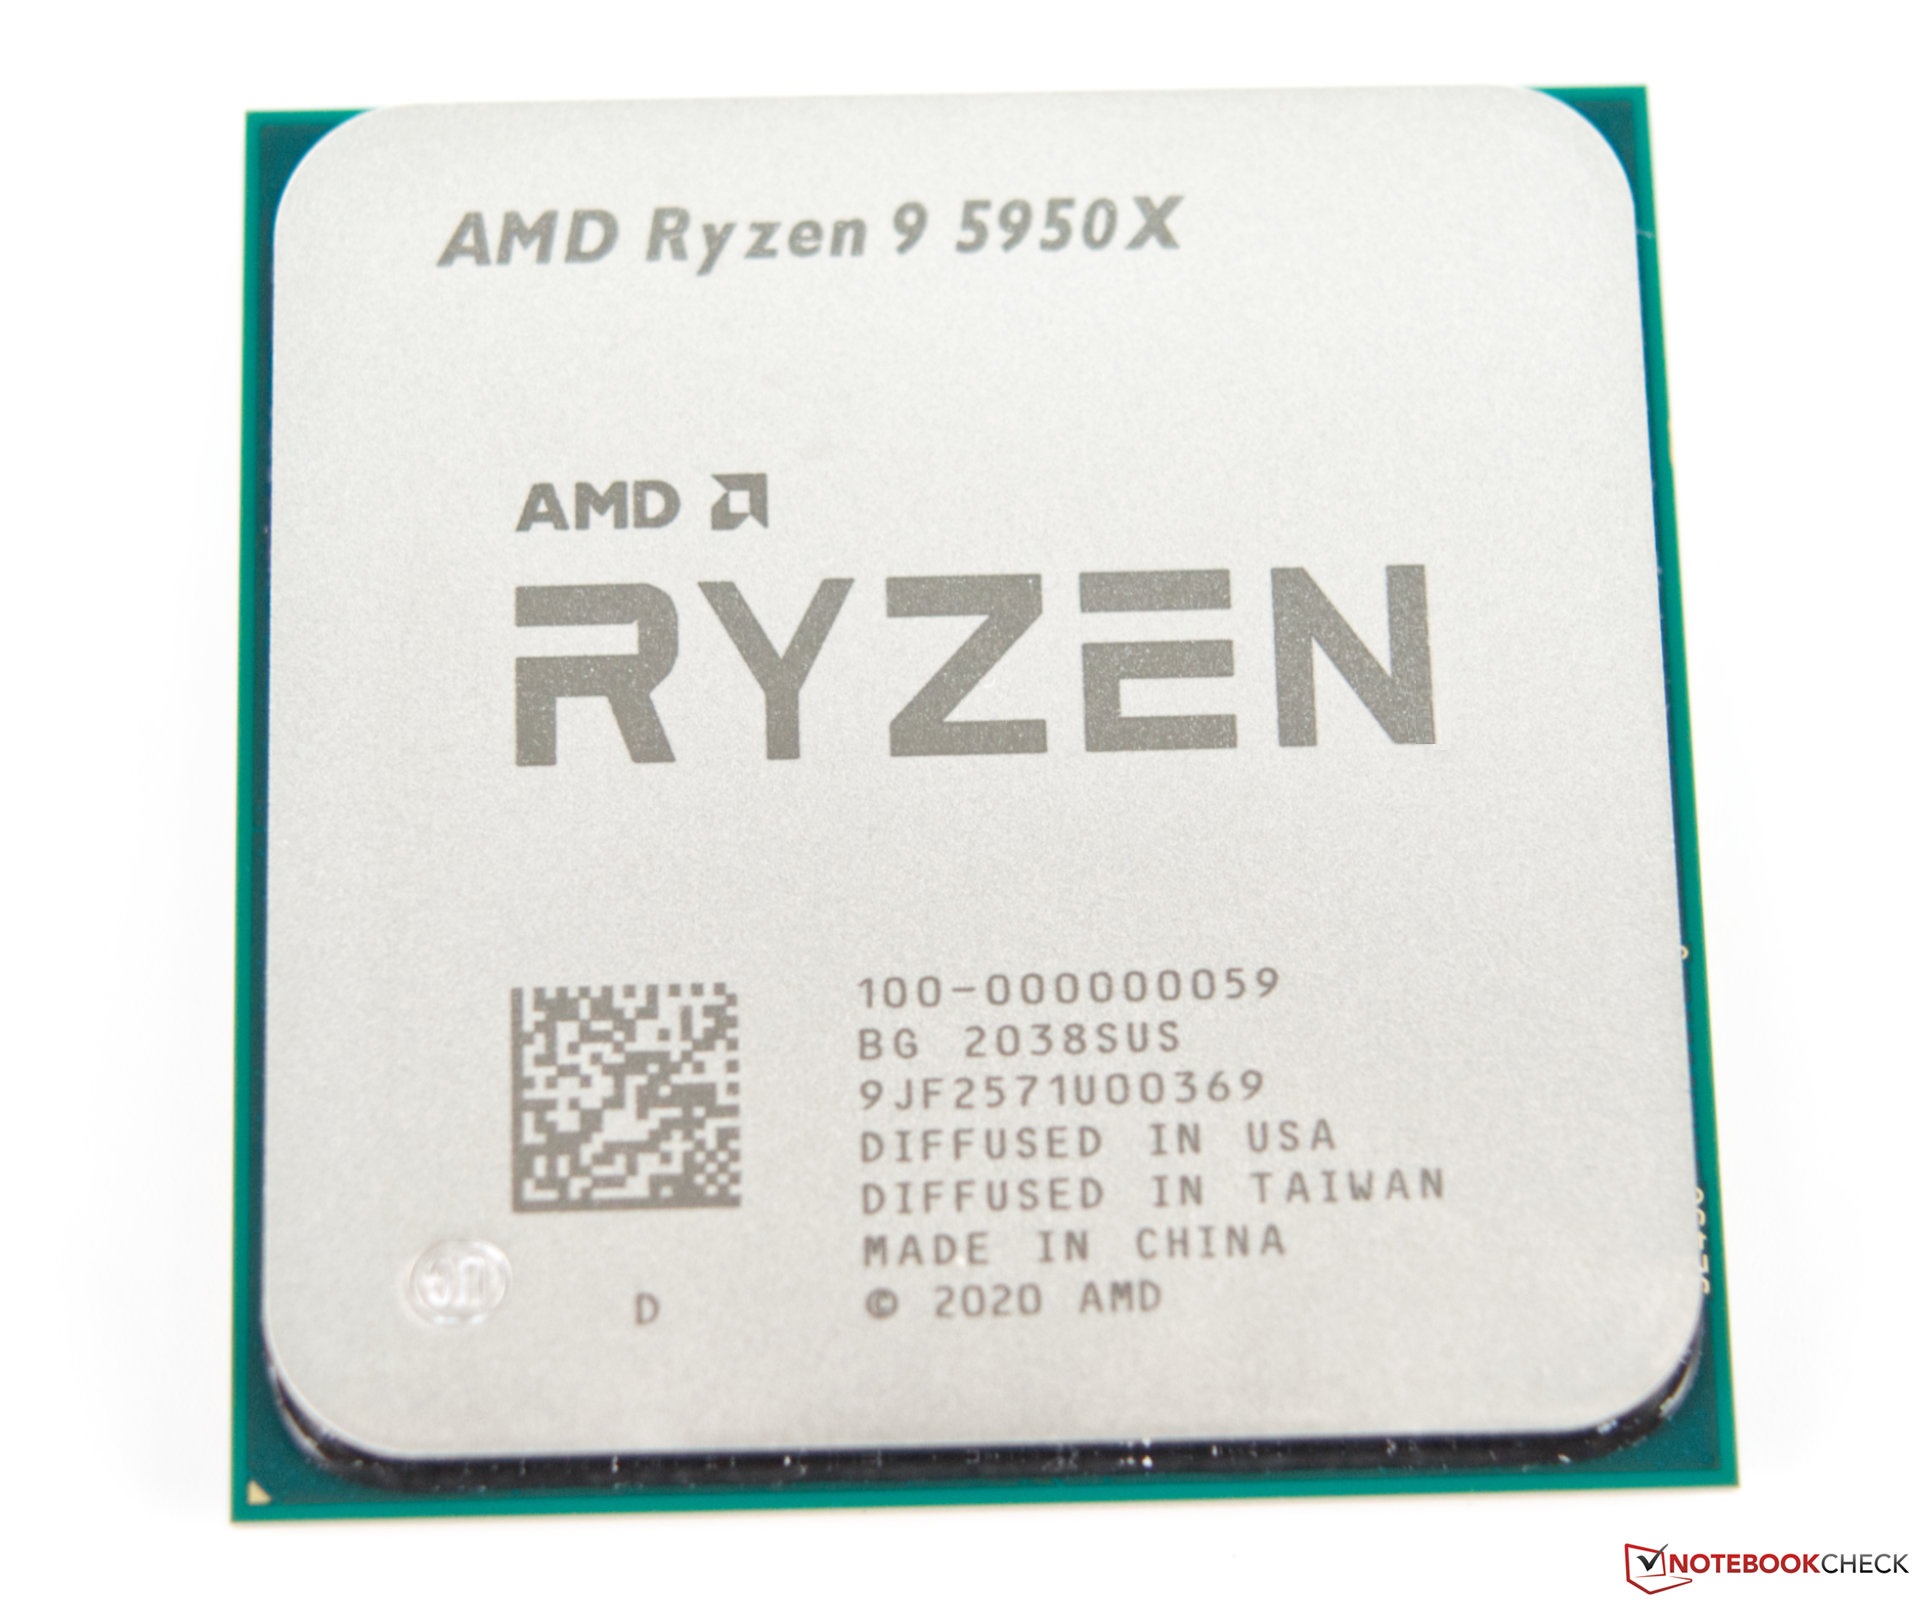
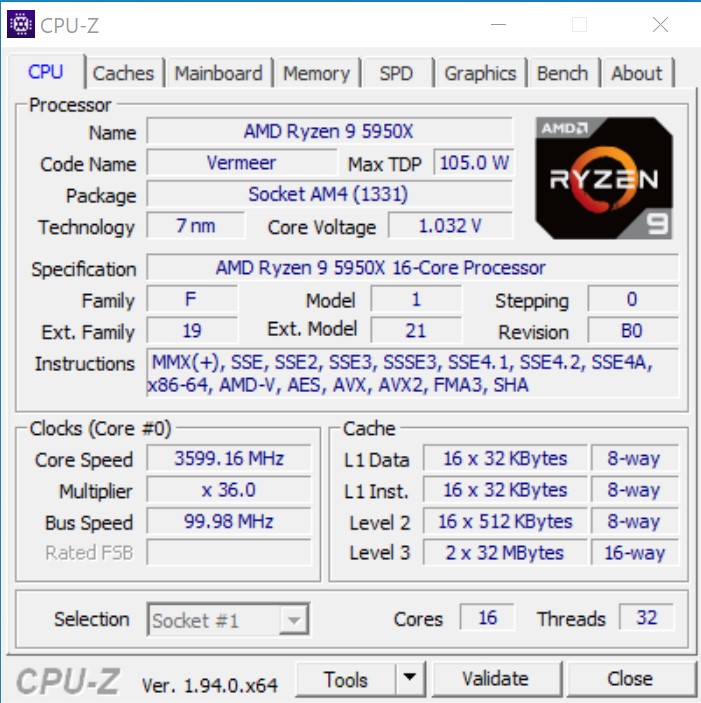
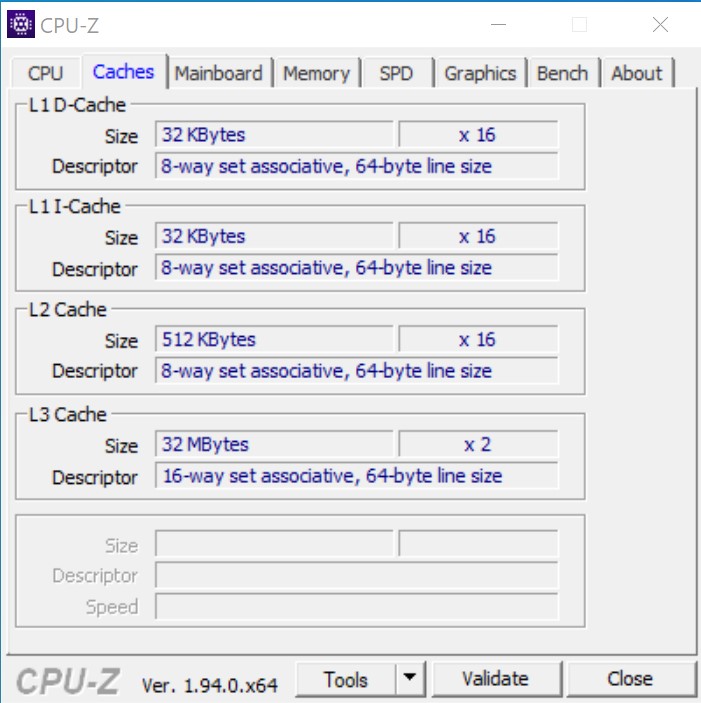
El AMD Ryzen 9 5950X es un sucesor del AMD Ryzen 9 3950X y también ofrece 16 núcleos y 32 hilos. Las numerosas innovaciones de la arquitectura de Vermeer también prometen un salto de rendimiento decente. Al mismo tiempo, el nuevo modelo superior no consume más potencia que su predecesor, ya que AMD también especifica un TDP de 105 vatios. Si este valor también se refleja en la realidad, lo explicaremos más adelante.
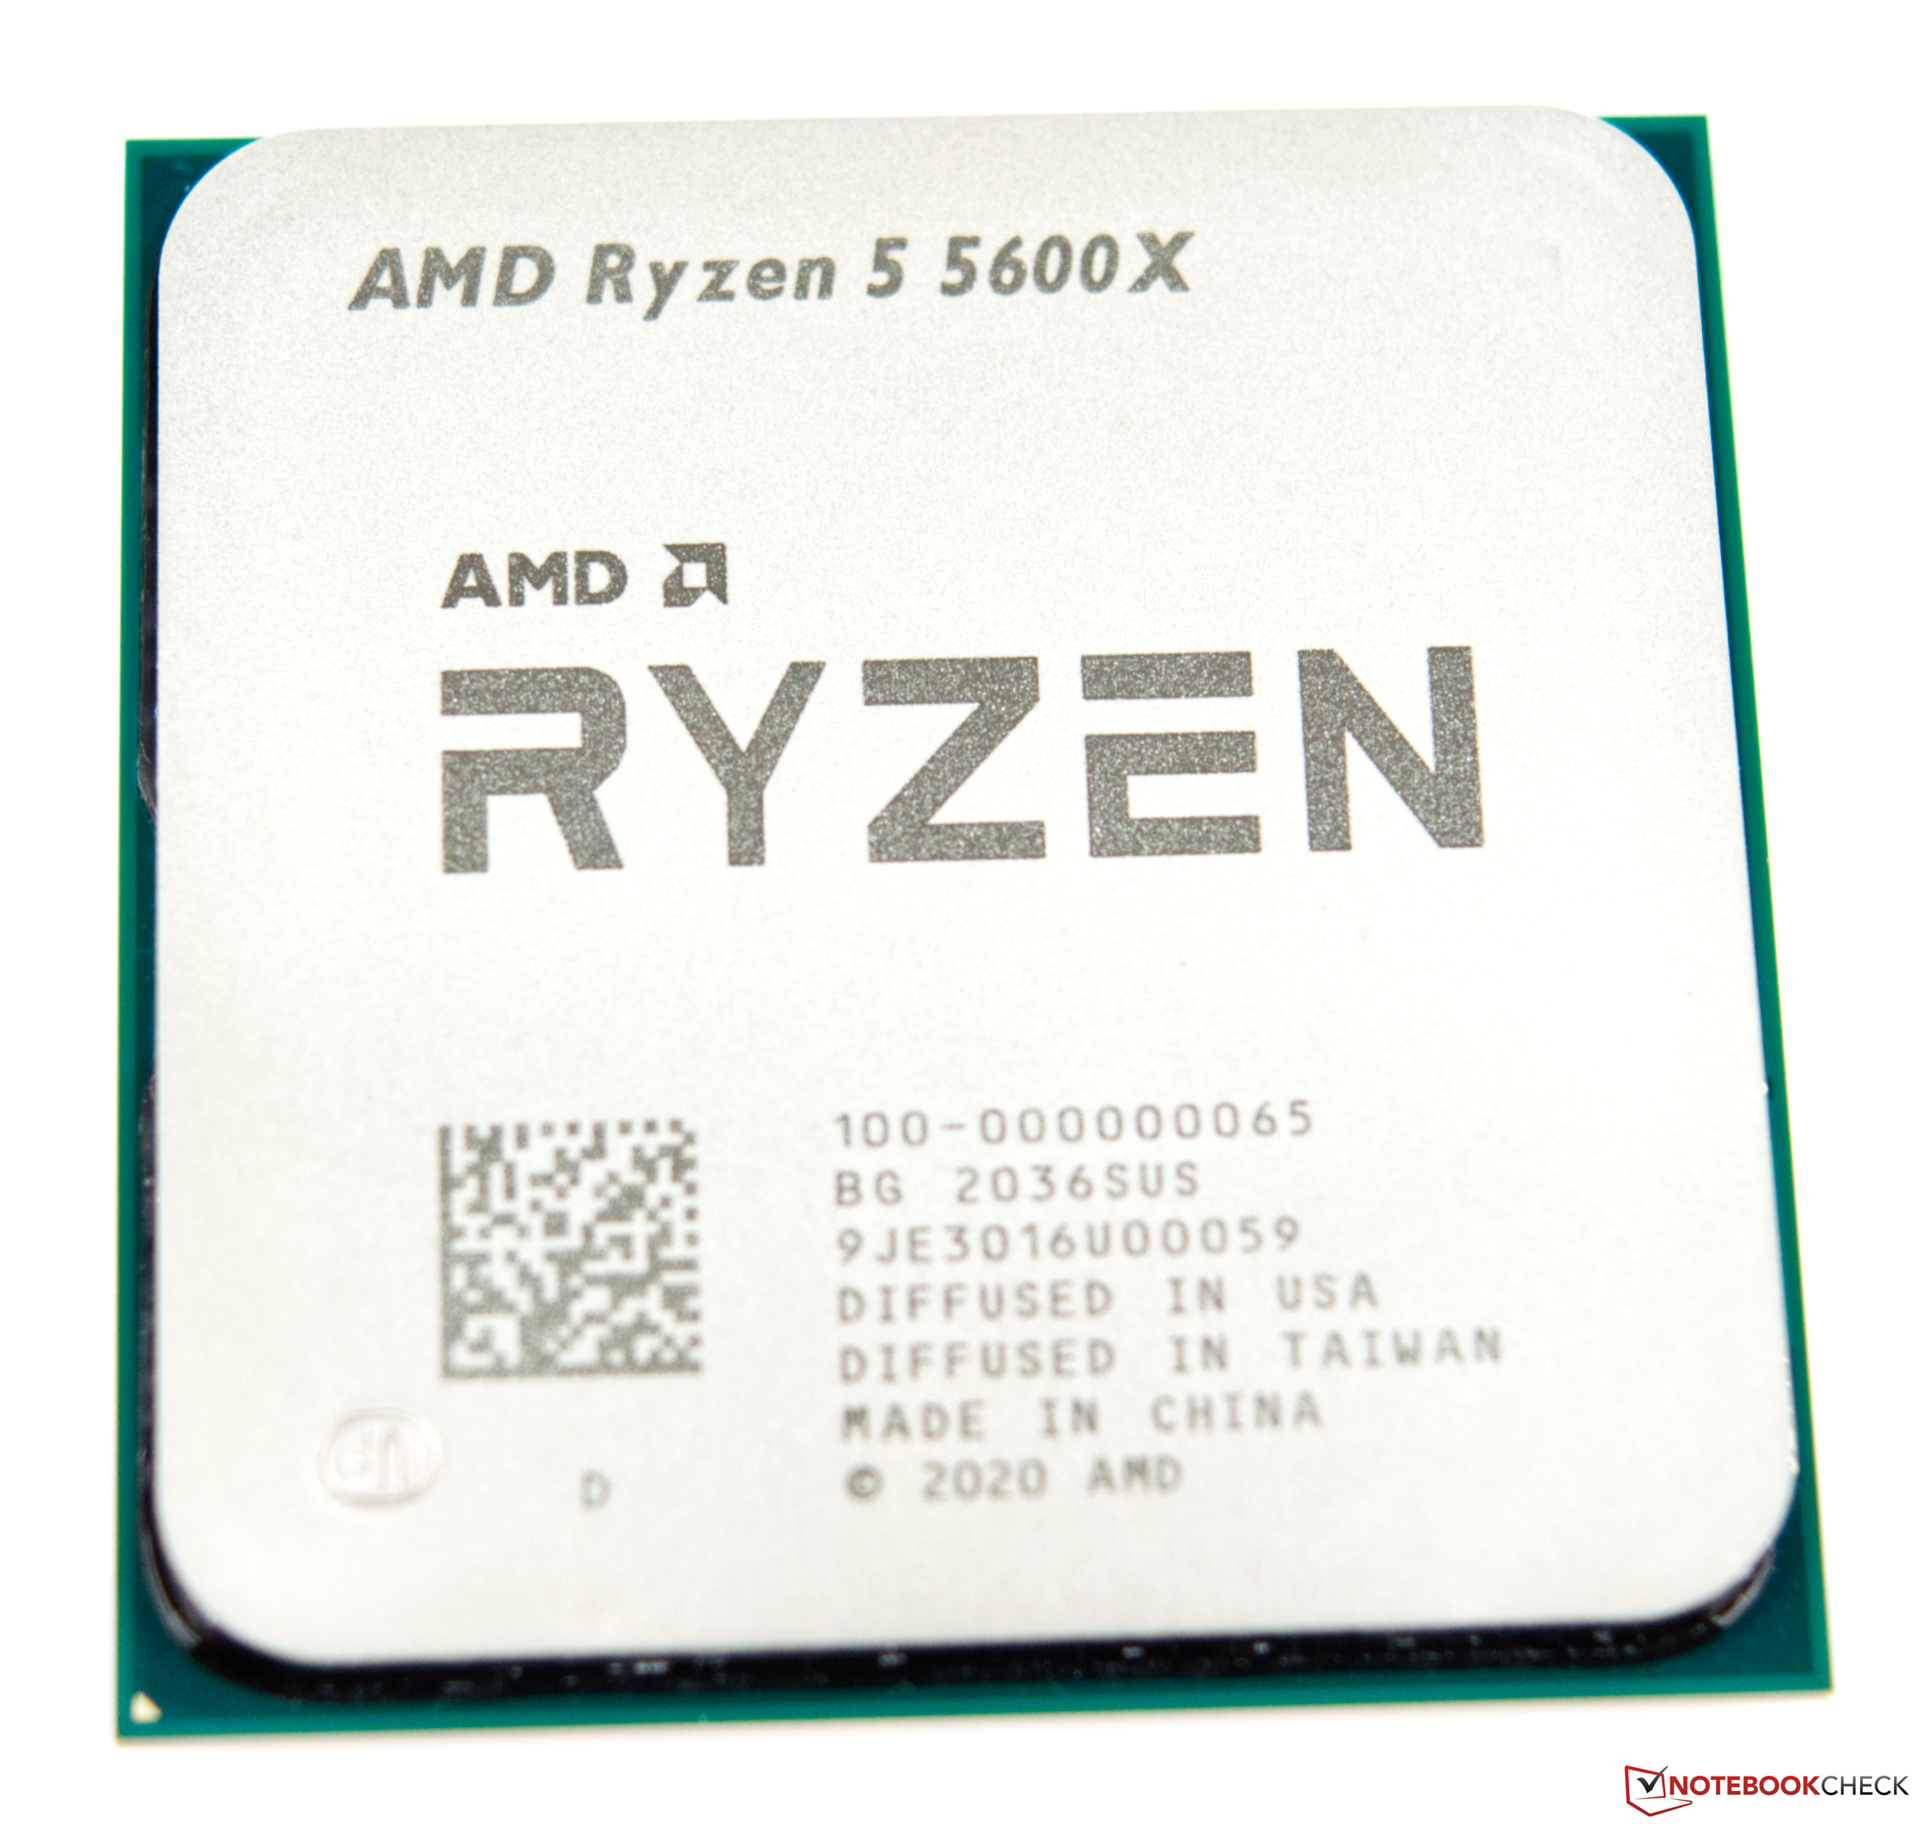
Finalmente, el AMD Ryzen 5 5600X no sólo es el Ryzen más pequeño con 6 núcleos y 12 hilos, sino que con un TDP de 65 vatios, también es el más eficiente, si se comparan las especificaciones puramente técnicas.
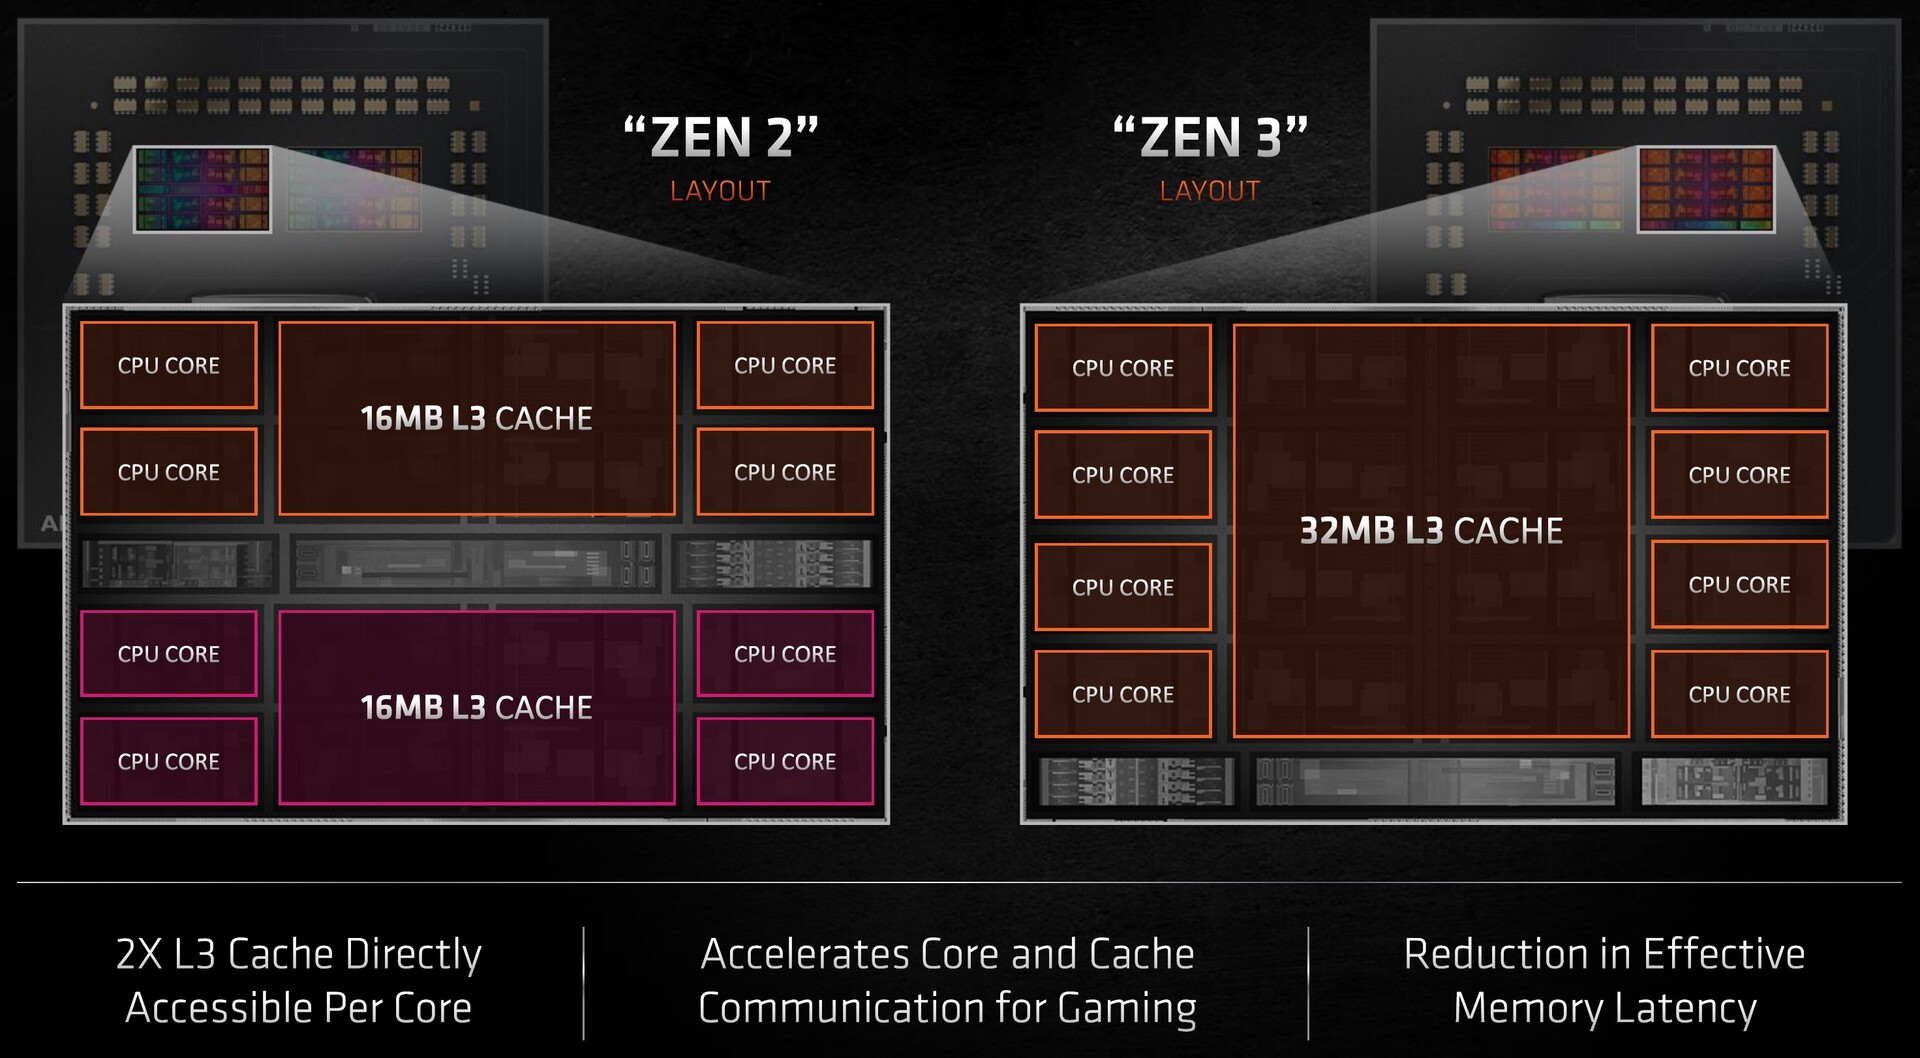
En cuanto a su composición interna, como modelo superior, el Ryzen 9 5950X utiliza 2 CCD con 8 núcleos cada uno. En el Ryzen 5 5600X, sólo 6 núcleos de un CCD están activos. En comparación con Intel (PL2 250 vatios), el modelo superior es también significativamente más eficiente con 142 vatios cuando usa el PL2. Ya hemos evaluado otras innovaciones de la arquitectura Zen-3 en esta prueba.
Visión general de los procesadores AMD Ryzen
| Modelo | Núcleos/Hilos | Velocidad | Velocidad turbo | Caché L3 | TDP | Precio de lanzamiento |
|---|---|---|---|---|---|---|
| Ryzen 9 5950X | 16/32 | 3.4 GHz | 4.9 GHz | 64 MB | 105 Watt | 799 USD |
| Ryzen 9 3950X | 16/32 | 3,5 GHz | 4,7 GHz | 64 MB | 105 Watt | 749 USD |
| Ryzen 9 5900X | 12/24 | 3.7 GHz | 4.8 GHz | 64 MB | 105 Watt | 549 USD |
| Ryzen 9 3900XT | 12/24 | 3,8 GHz | 4,7 GHz | 64 MB | 105 Watt | 499 USD |
| Ryzen 9 3900X | 12/24 | 3,8 GHz | 4,6 GHz | 64 MB | 105 Watt | 499 USD |
| Ryzen 7 5800X | 8/16 | 3.8 GHz | 4.7 GHz | 32 MB | 105 Watt | 449 USD |
| Ryzen 7 3800XT | 8/16 | 3.9 GHz | 4.7 GHz | 32 MB | 105 Watt | 399 USD |
| Ryzen 7 3800X | 8/16 | 3.9 GHz | 4.5 GHz | 32 MB | 105 Watt | 399 USD |
| Ryzen 7 3700X | 8/16 | 3.6 GHz | 4.4 GHz | 32 MB | 65 Watt | 329 USD |
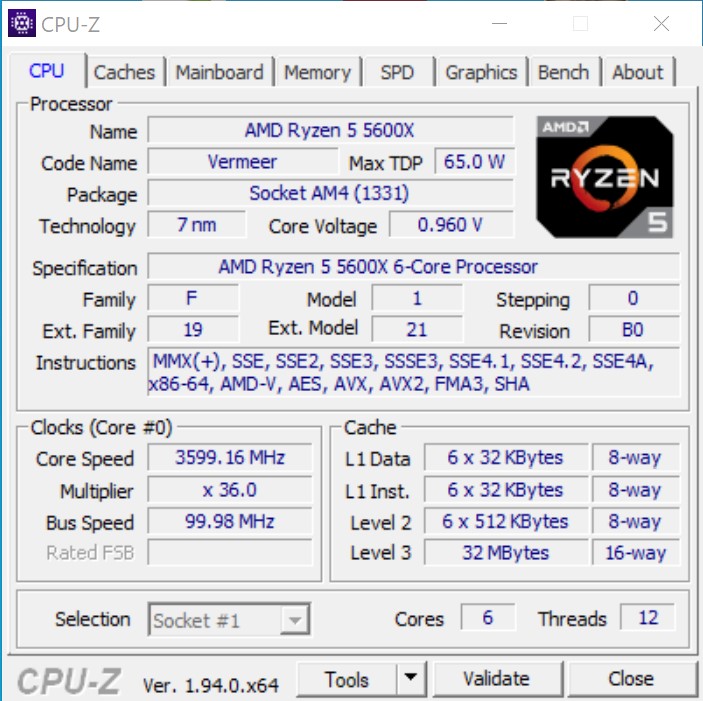
| Ryzen 5 5600X | 6/12 | 3.7 GHz | 4.6 GHz | 32 MB | 65 Watt | 299 USD |
| Ryzen 5 3600XT | 6/12 | 3,8 GHz | 4.5 GHz | 32 MB | 95 Watt | 249 USD |
| Ryzen 5 3600X | 6/12 | 3.8 GHz | 4.4 GHz | 32 MB | 95 Watt | 229 USD |
| Ryzen 5 3600 | 6/12 | 3.6 GHz | 4.2 GHz | 32 MB | 65 Watt | 199 USD |
Visión general de los procesadores AMD Ryzen
Utilizamos el siguiente sistema para los puntos de referencia que se indican a continuación:
- Raijintek Pean Benchtable
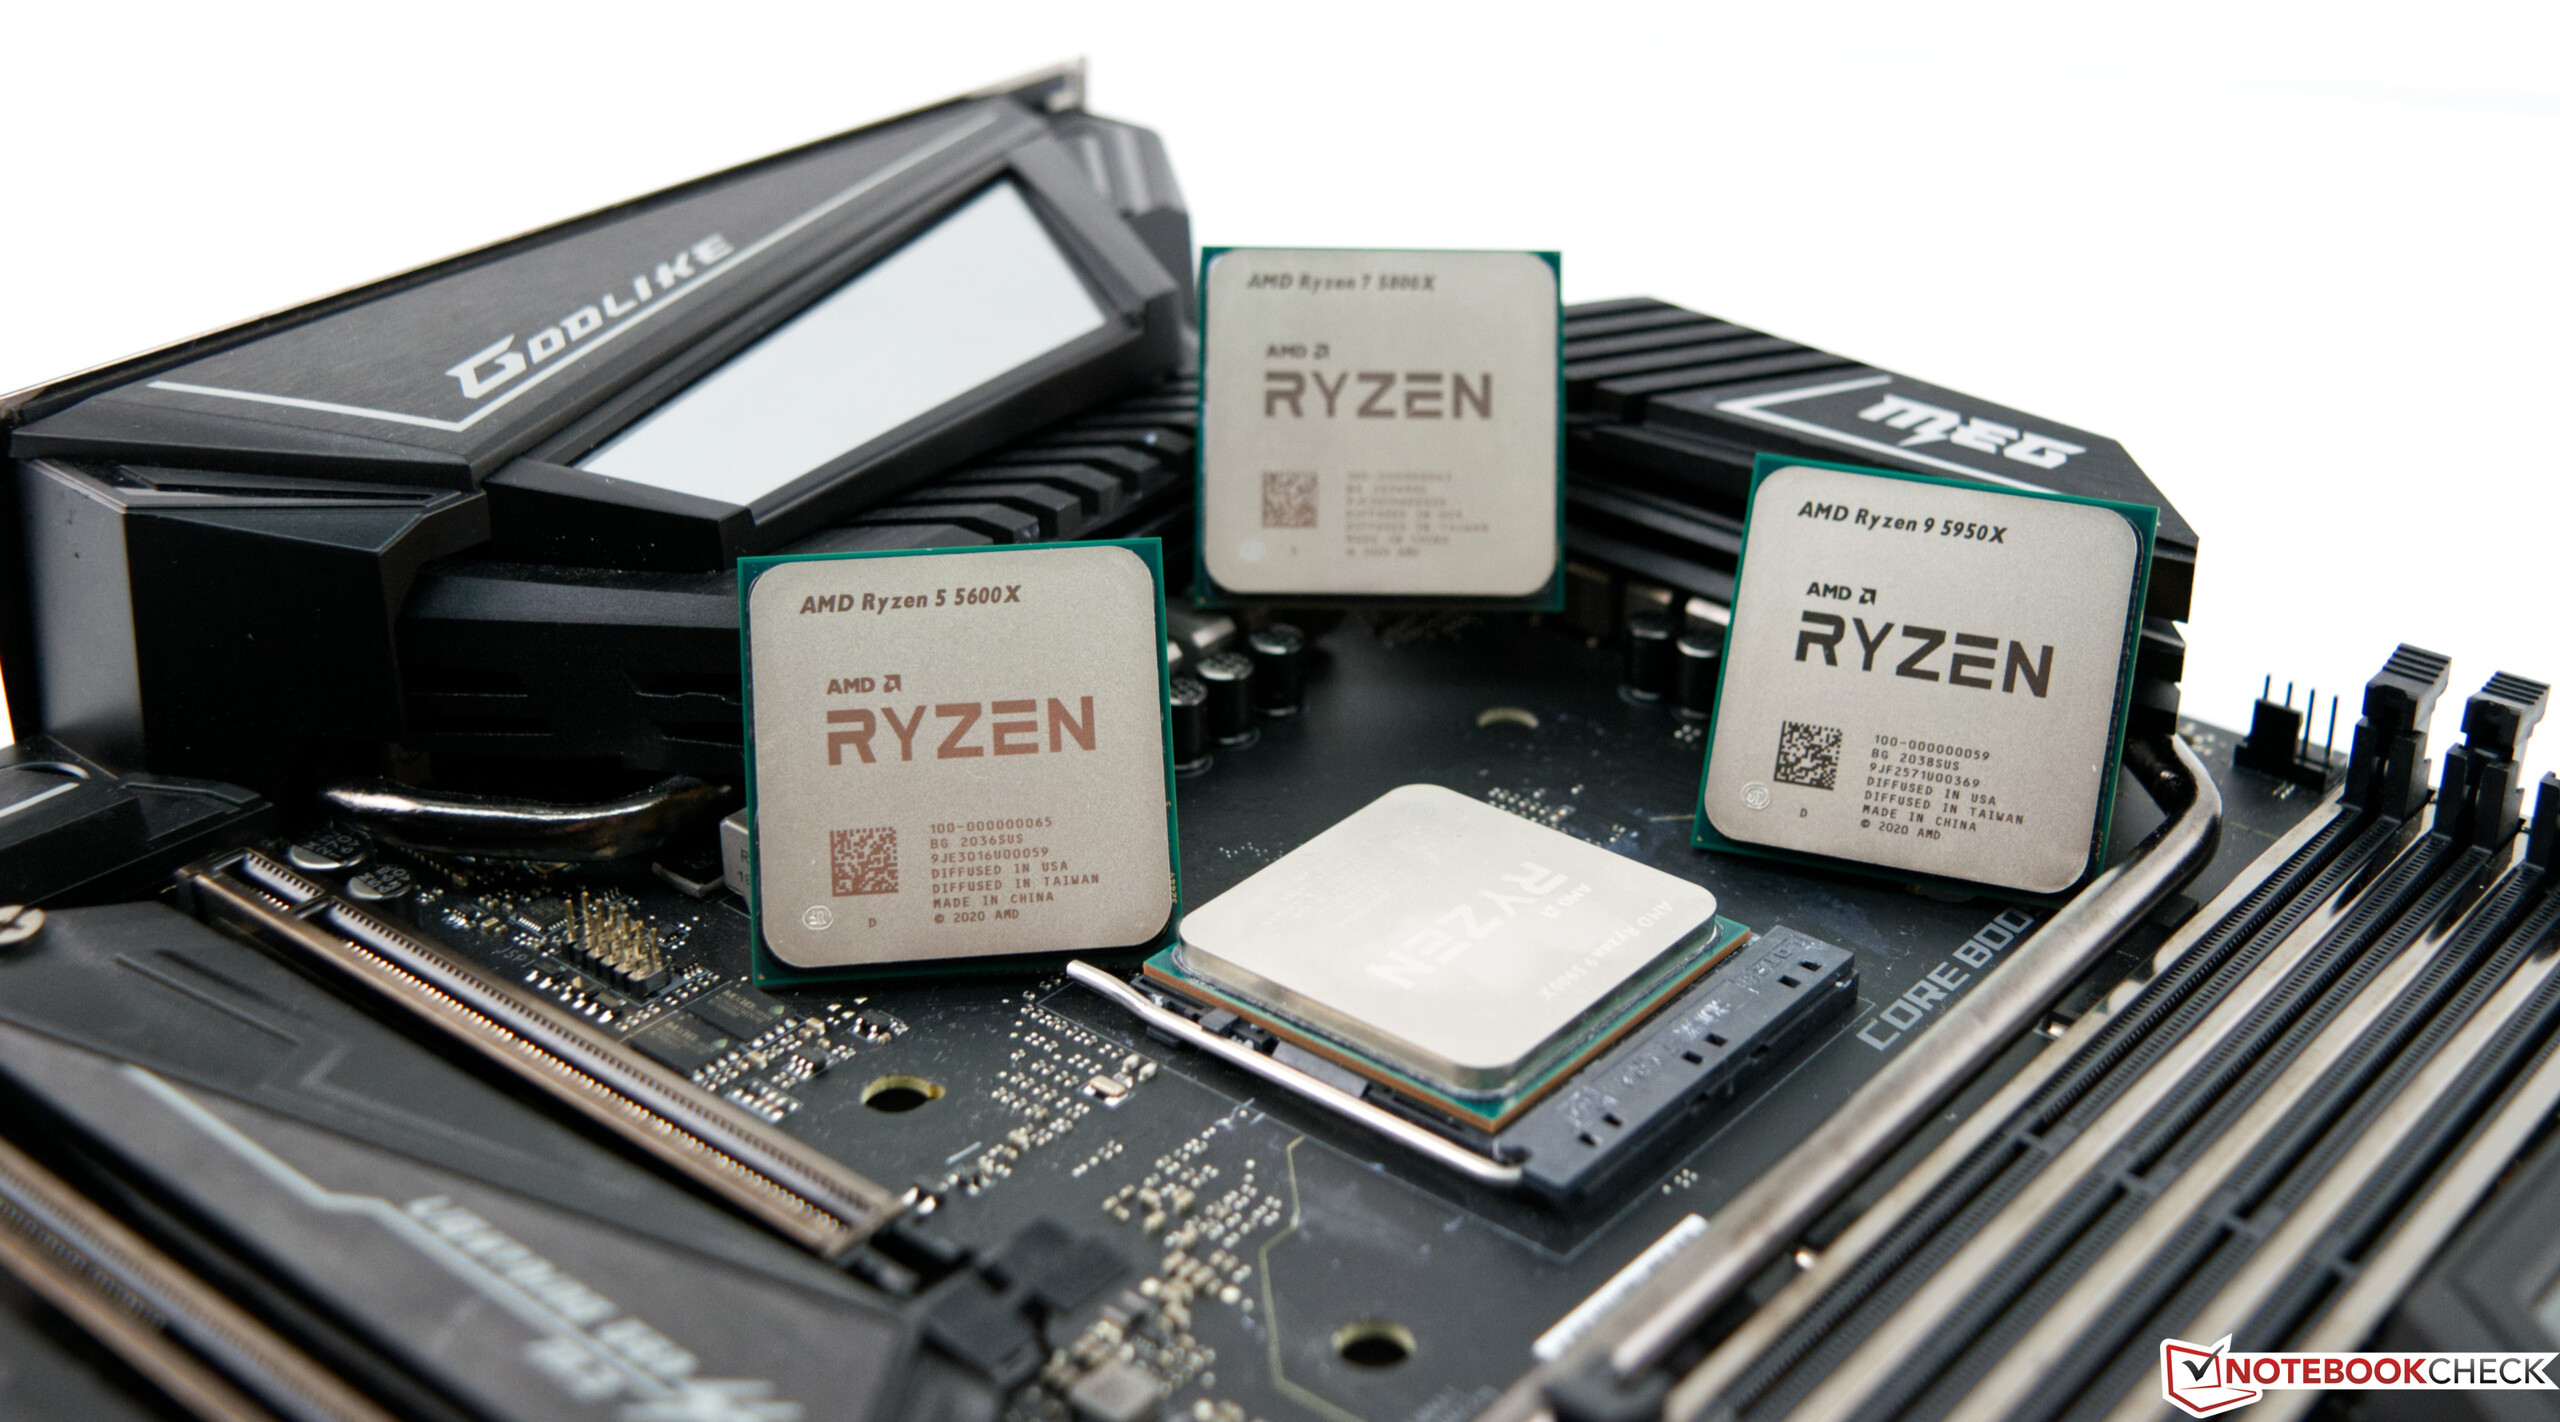
- AMD Ryzen 9 5950X, AMD Ryzen 5 5600X
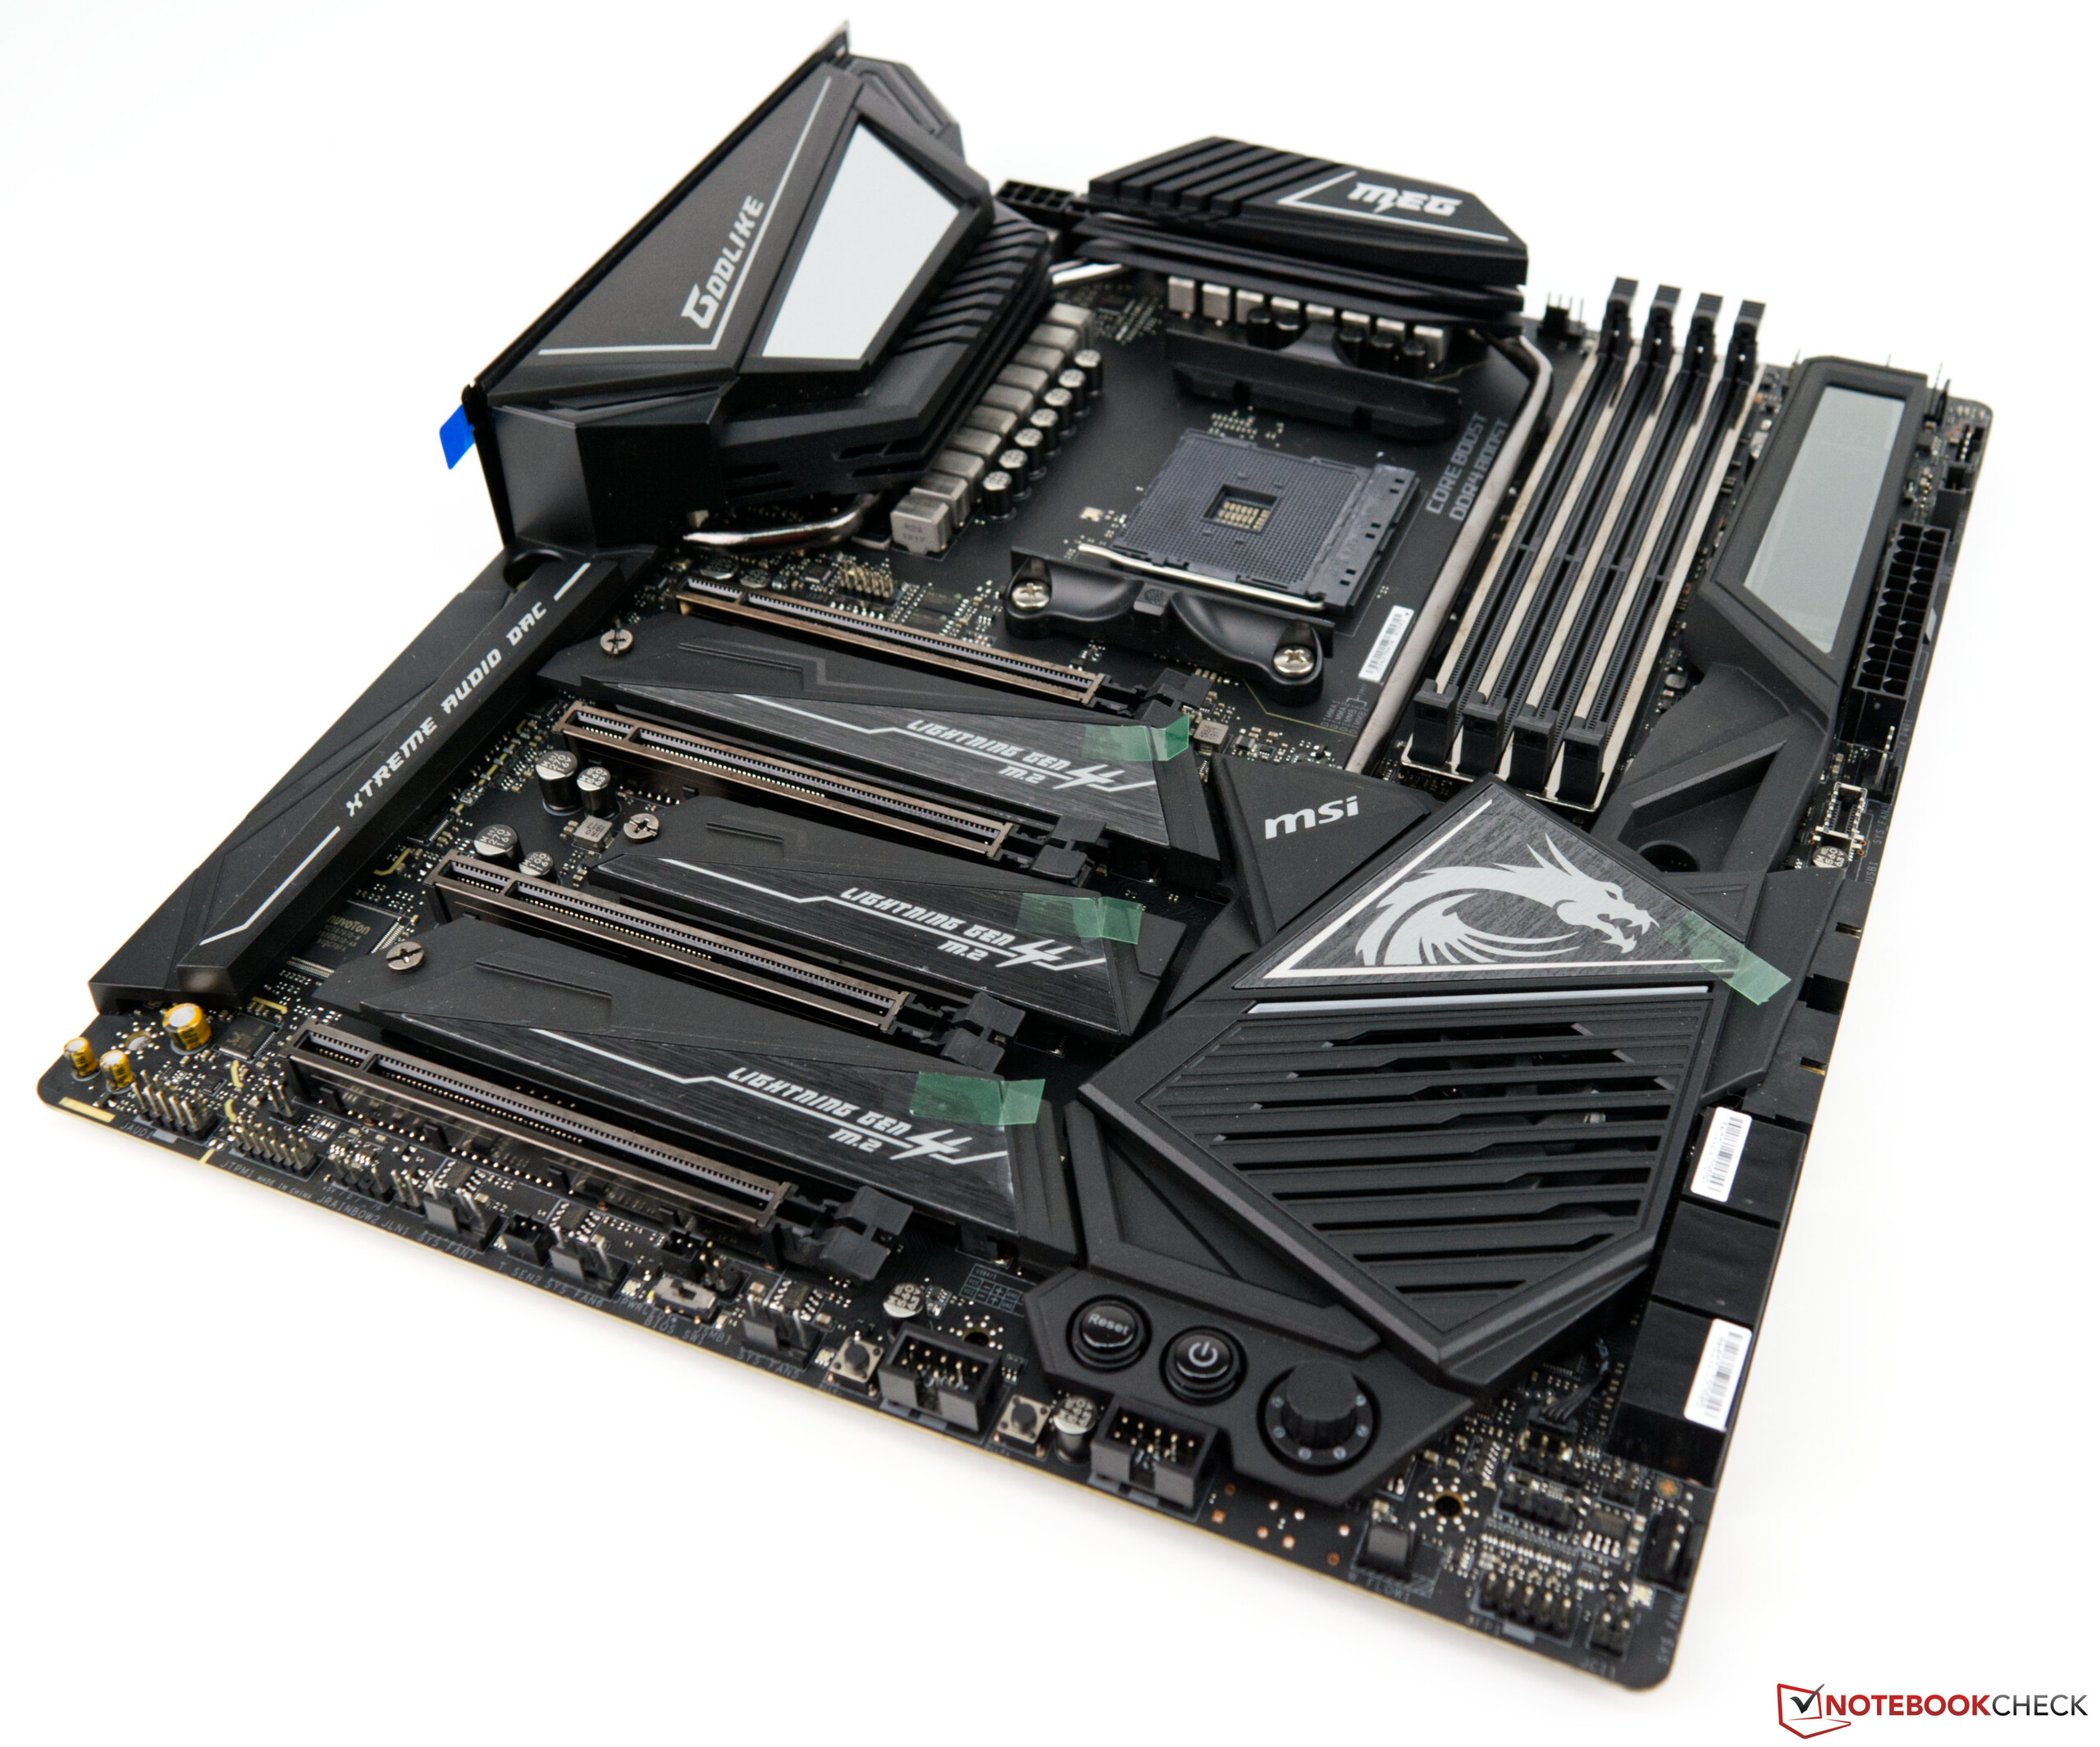
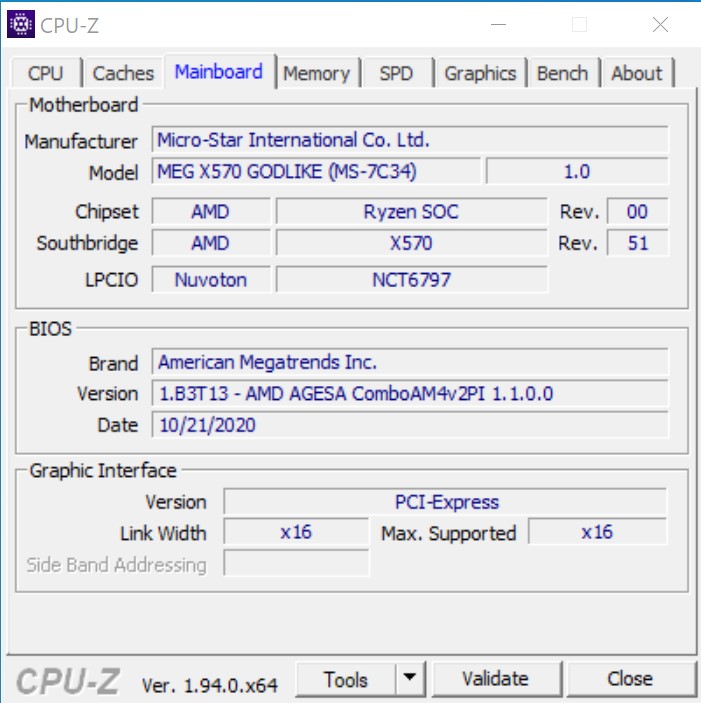
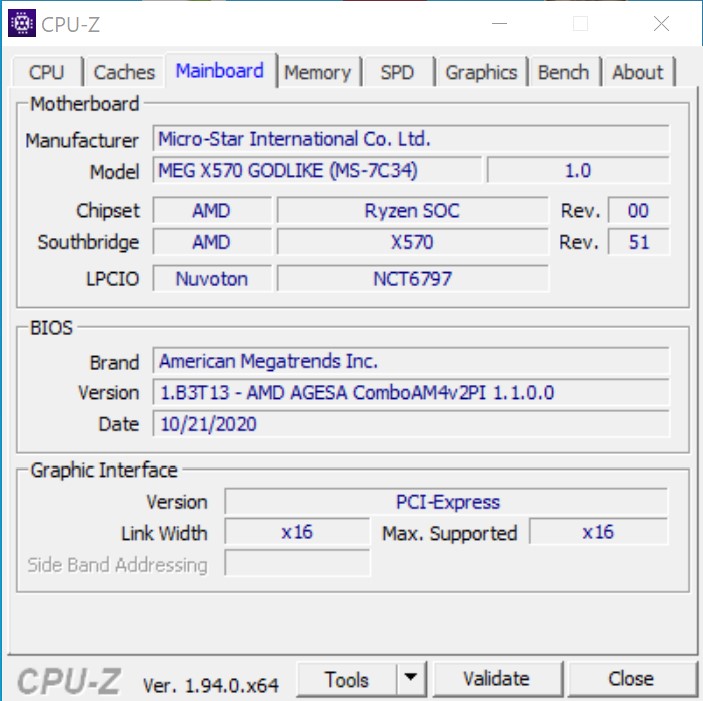
- MSI MEG X570 Godlike
- Alphacool Eisbear 280 AiO
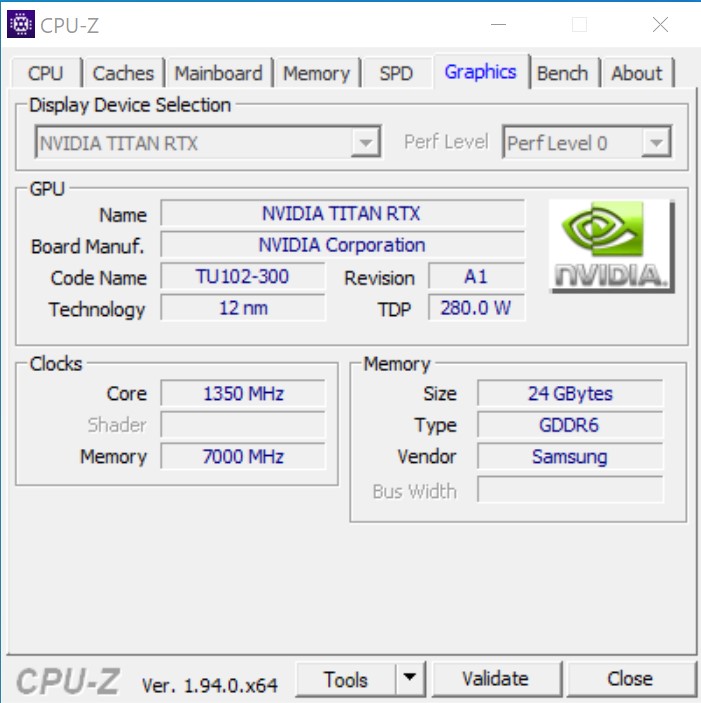
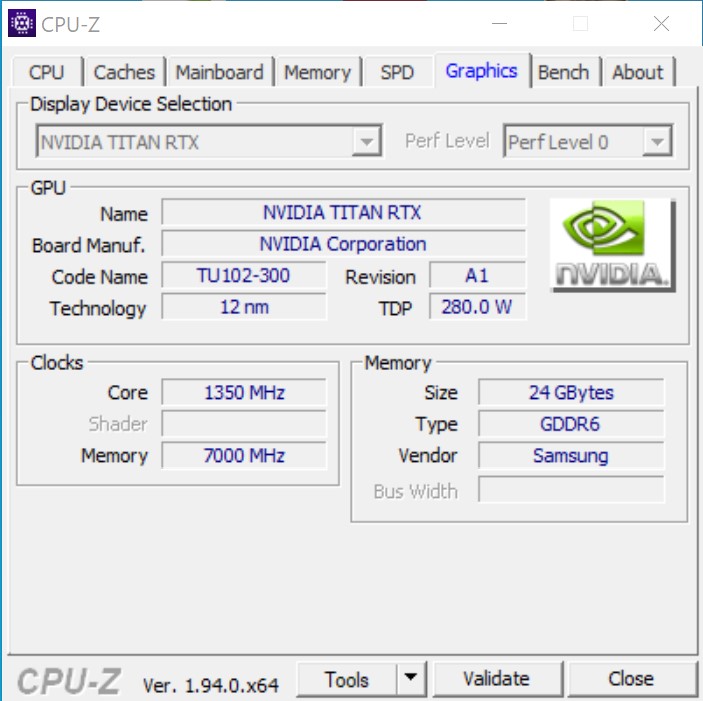
- Nvidia Titan RTX
- Fuente de alimentación del Corsair HX 1200i
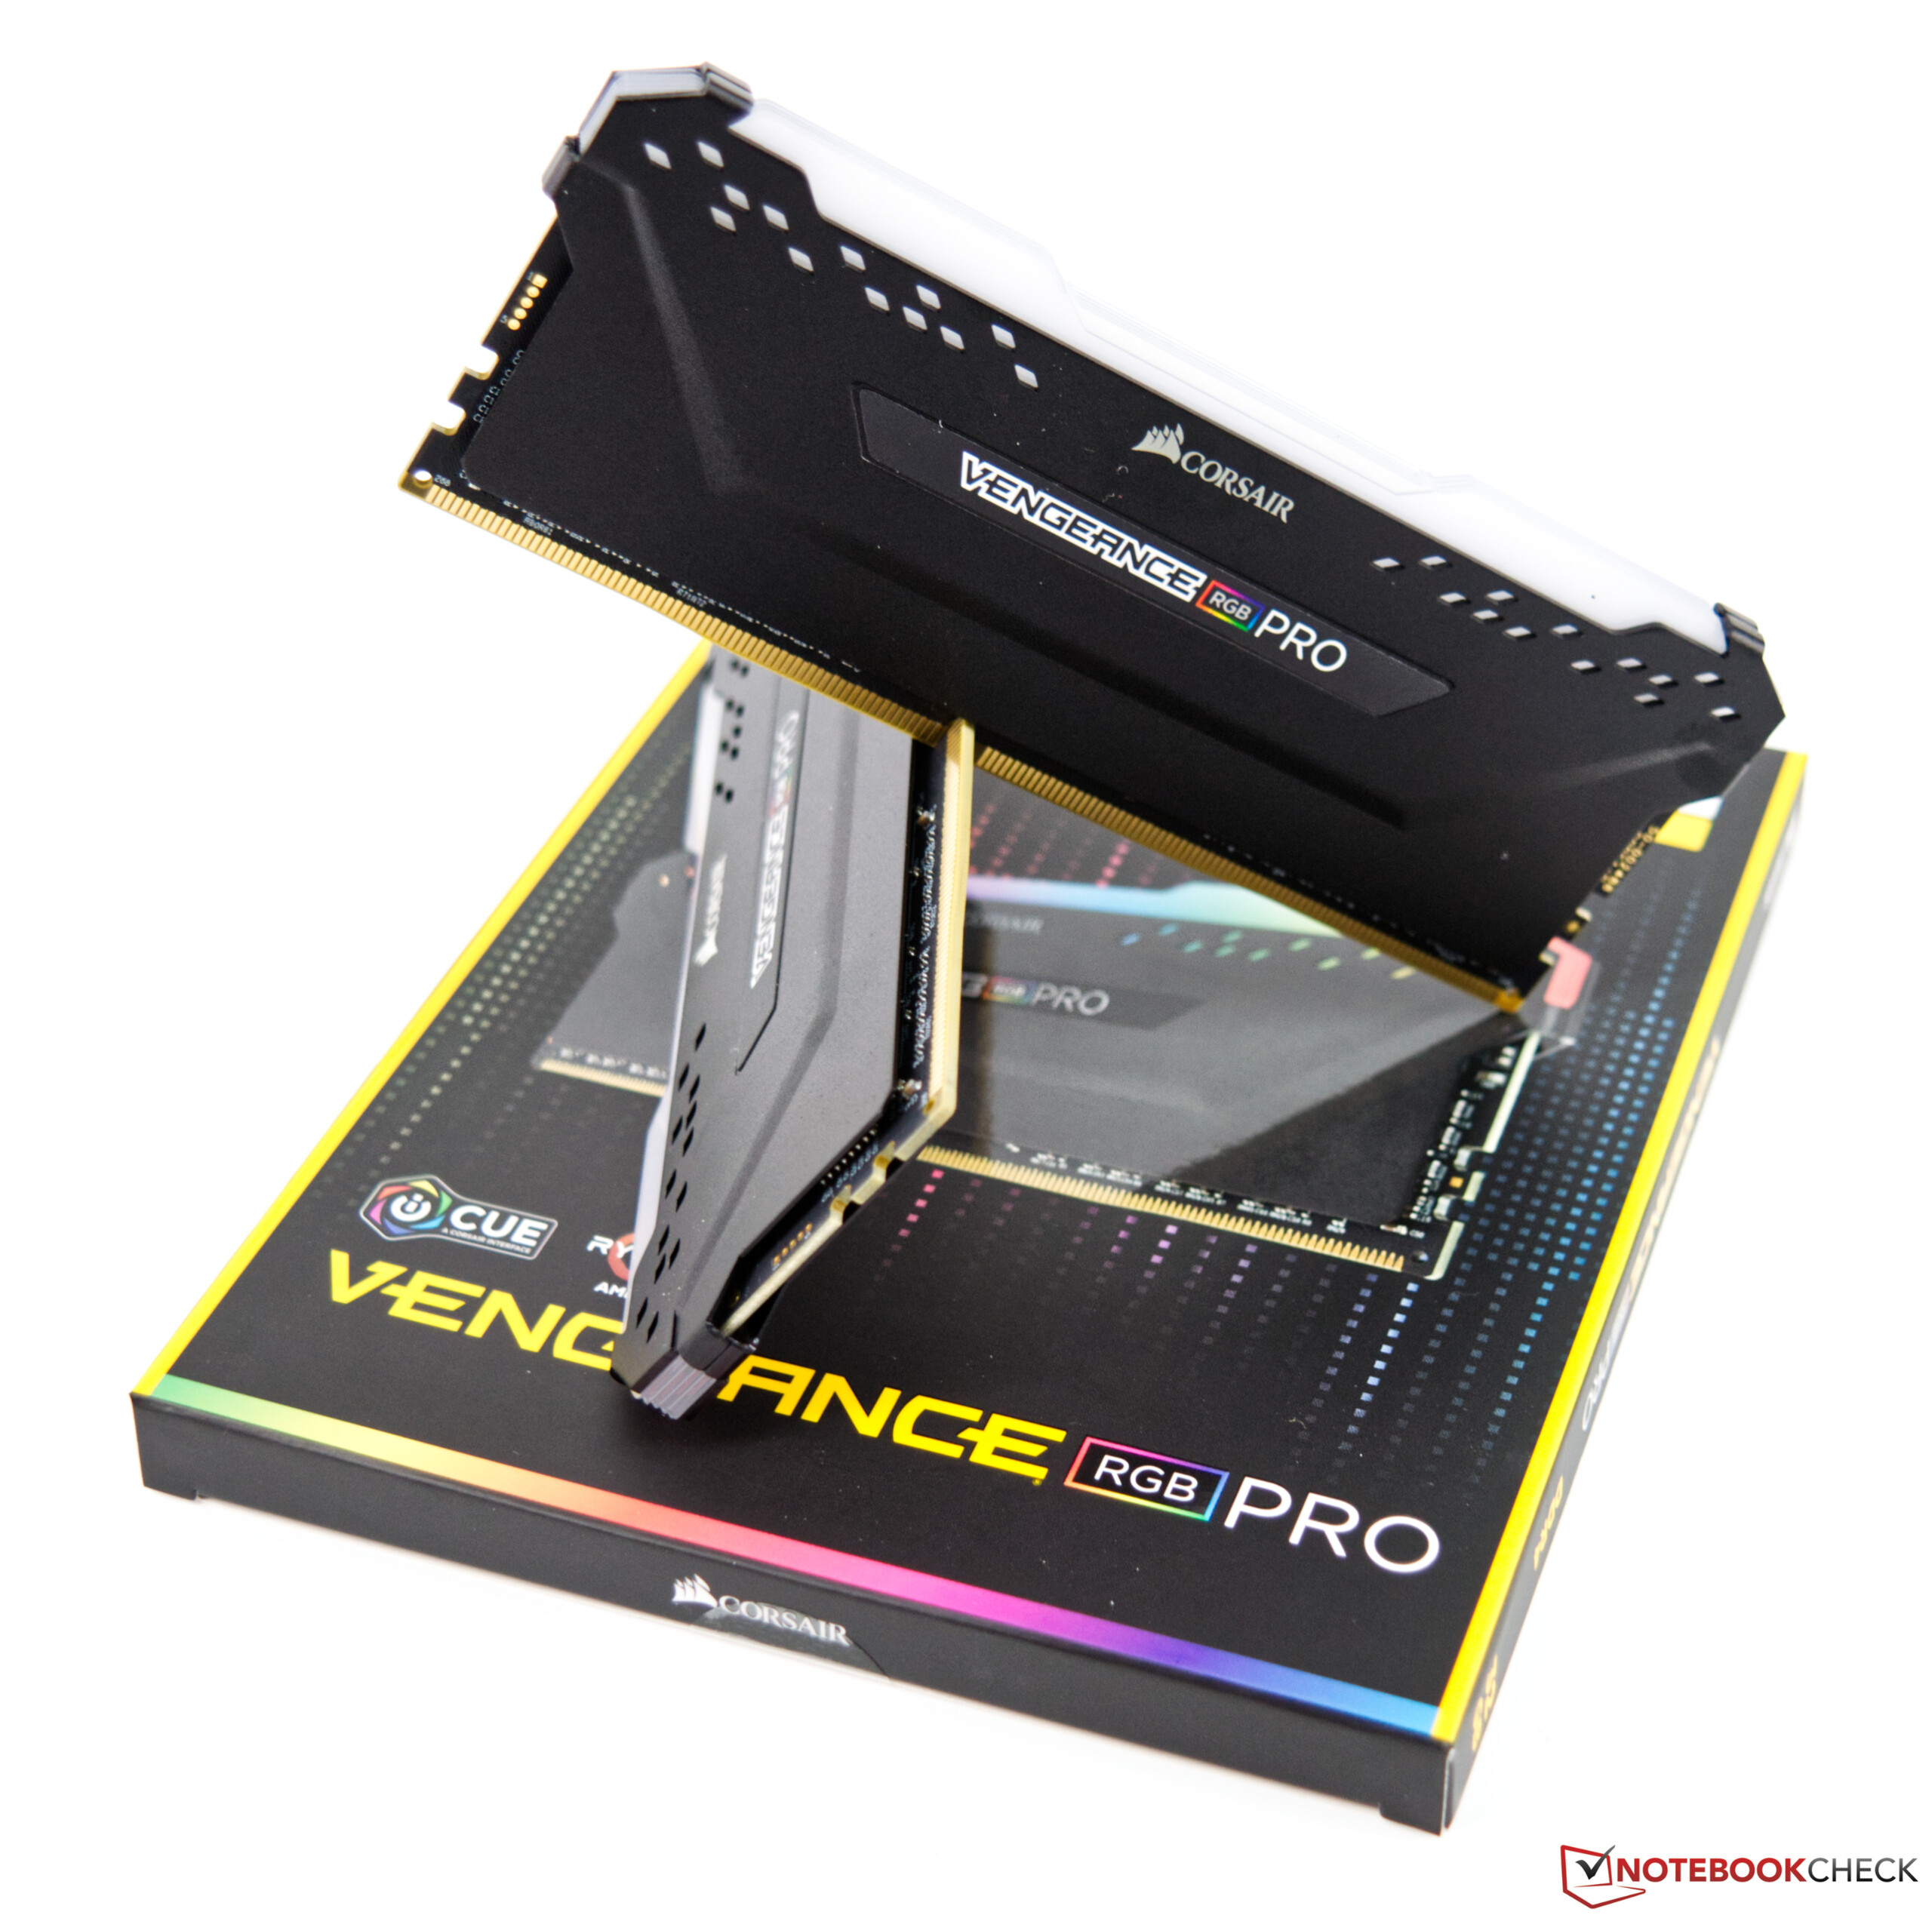
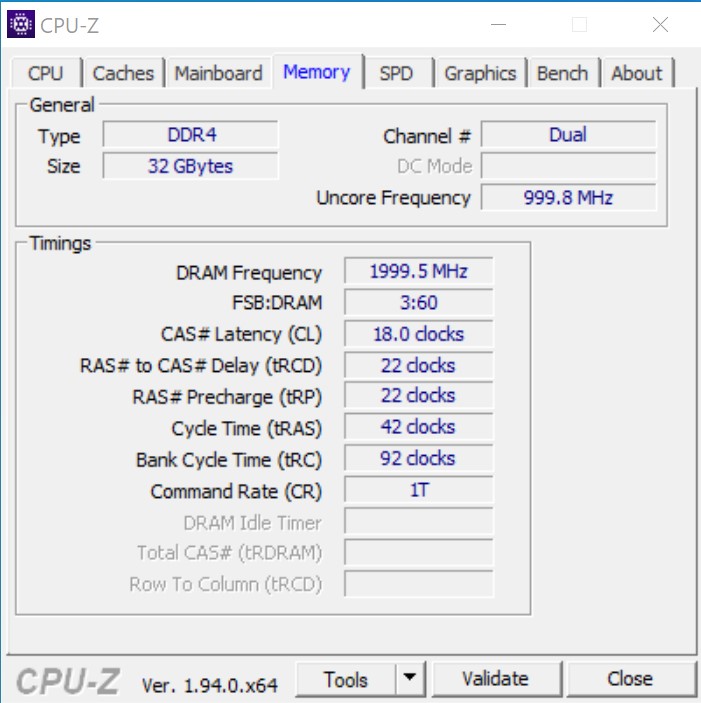
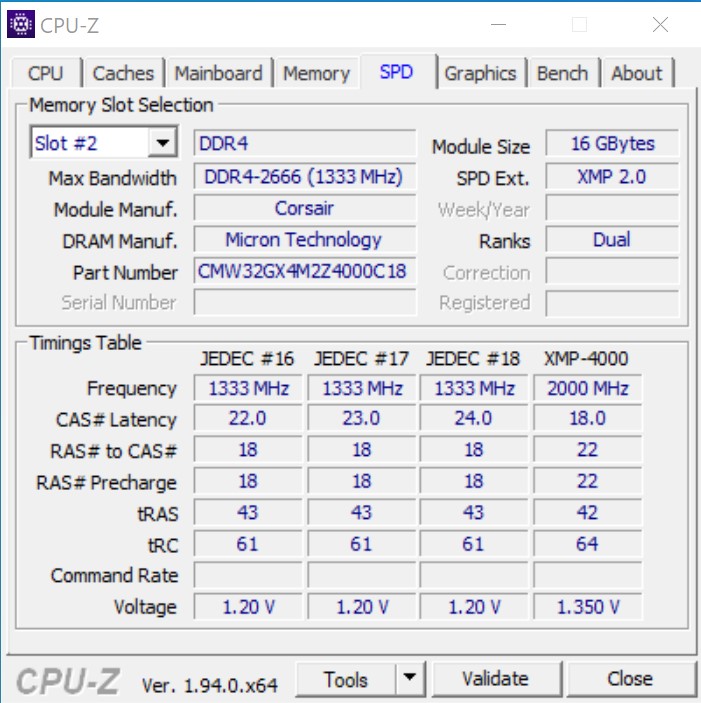
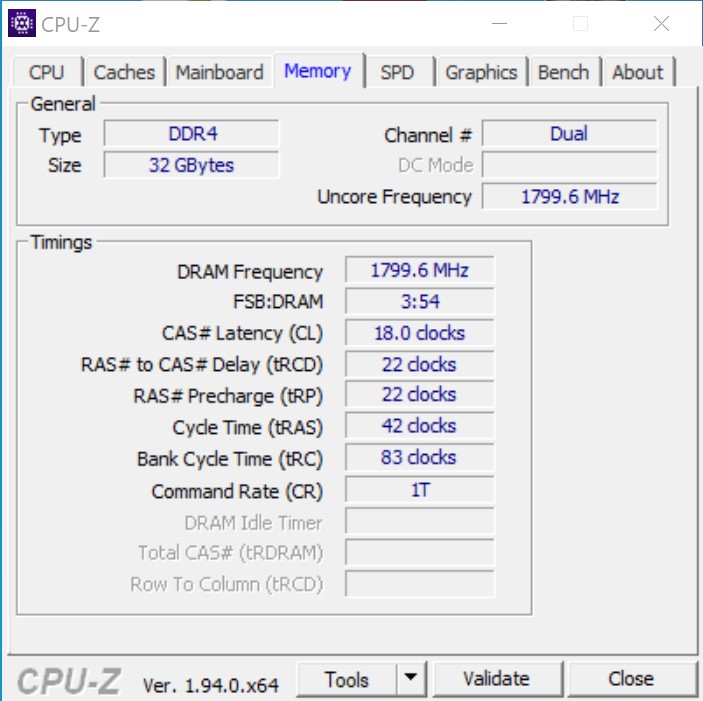
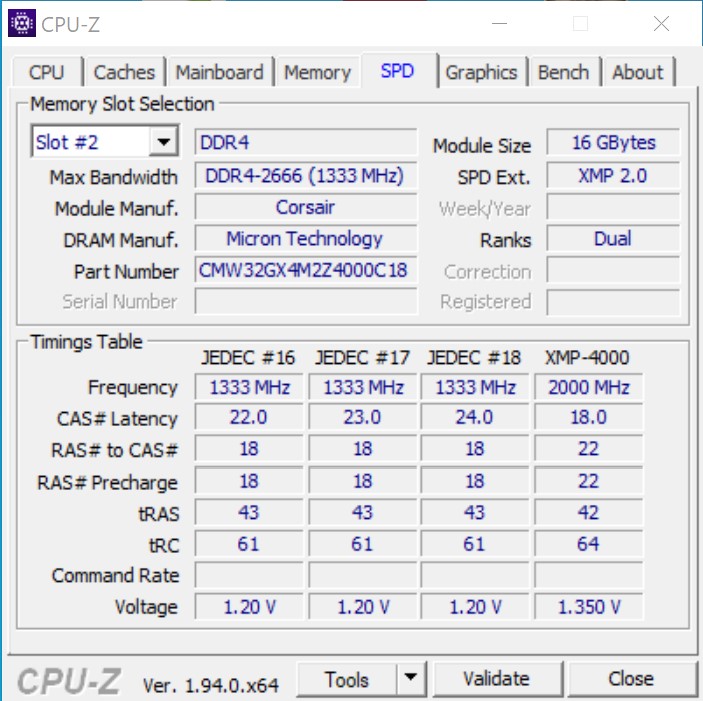
- Corsair Vengeance RGB Pro DDR4-4000 storage kit 2 x 16 GB
- Intel Optane 905P 480GB PCIe SSD
- Microsoft Windows 10 Professional 64-Bit (Version 2004)
En este punto, nos gustaría agradecer a Caseking por prestarnos el Raijintek Pean, que también fue individualizado con grabados láser. AMD Direct proporcionó la placa base, que se incluyó en el kit de prensa del lanzamiento de los procesadores AMD Ryzen 9 3900X y AMD Ryzen 7 3700X Zen 2. Como refrigeración, usamos el Alphacool Eisbear 280 que Alphacool nos proporcionó. También queremos agradecer a Corsair por su apoyo a la memoria de trabajo.


Puntos de referencia del procesador
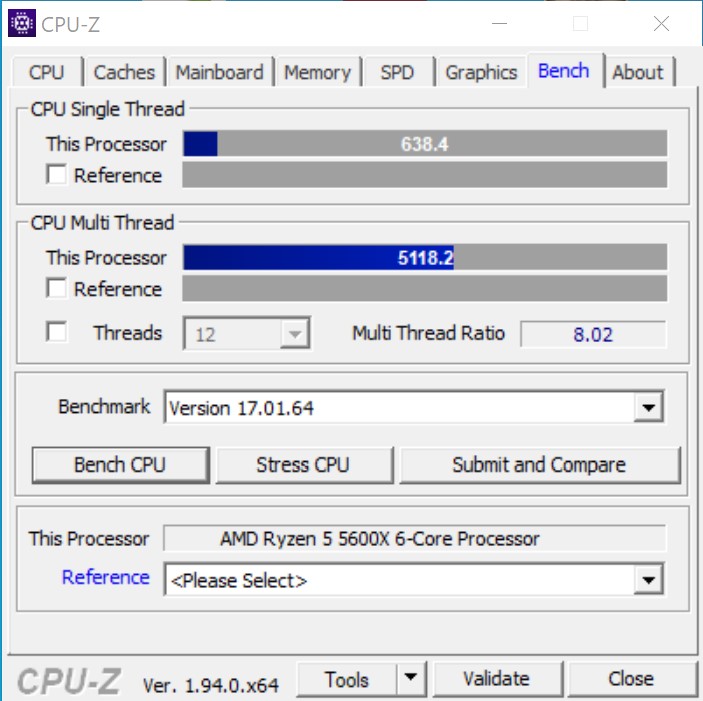
Ya pudimos determinar que las innovaciones de la arquitectura Zen 3 han sido exitosas. Con el procesador de 16 núcleos, AMD está ahora subiendo la apuesta una vez más, no sólo aumentando el rendimiento de los núcleos múltiples. Debido a la mayor potencia, el rendimiento de los núcleos simples también se ha incrementado en comparación con el AMD Ryzen 9 5900X. El procesador no se detiene en 4,9 GHz, sino que a menudo incluso supera el límite de 5 GHz. Como era de esperar, el AMD Ryzen 5 5600X se coloca detrás de sus hermanos mayores. Sin embargo, el rendimiento del procesador de 6 núcleos no debe ser subestimado, ya que a menudo supera incluso al Intel Core i9-10900K en la comparación de un solo núcleo. En el rendimiento multi-core, es casi suficiente para acercarse al AMD Ryzen 7 3700X, aunque éste ofrece dos núcleos más.
Puedes encontrar puntos de referencia adicionales sobre los procesadores aquí.
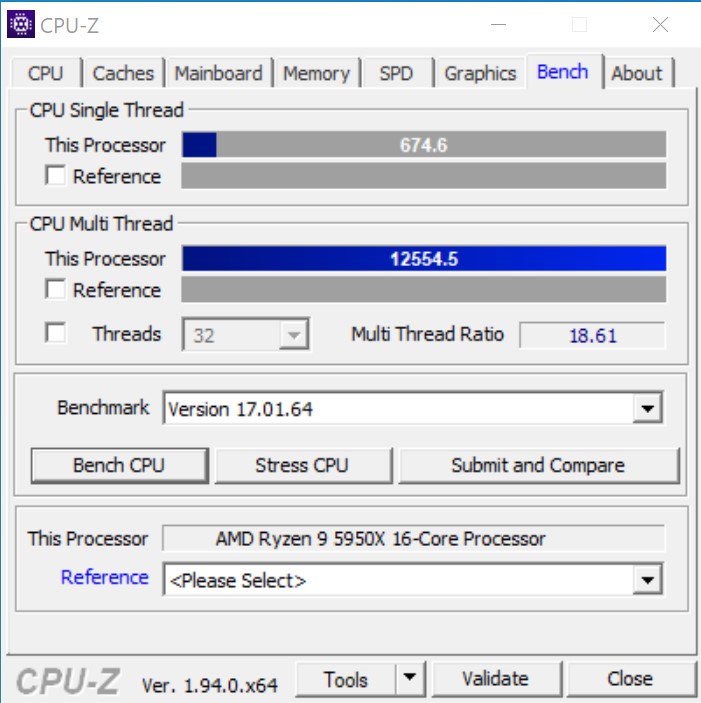
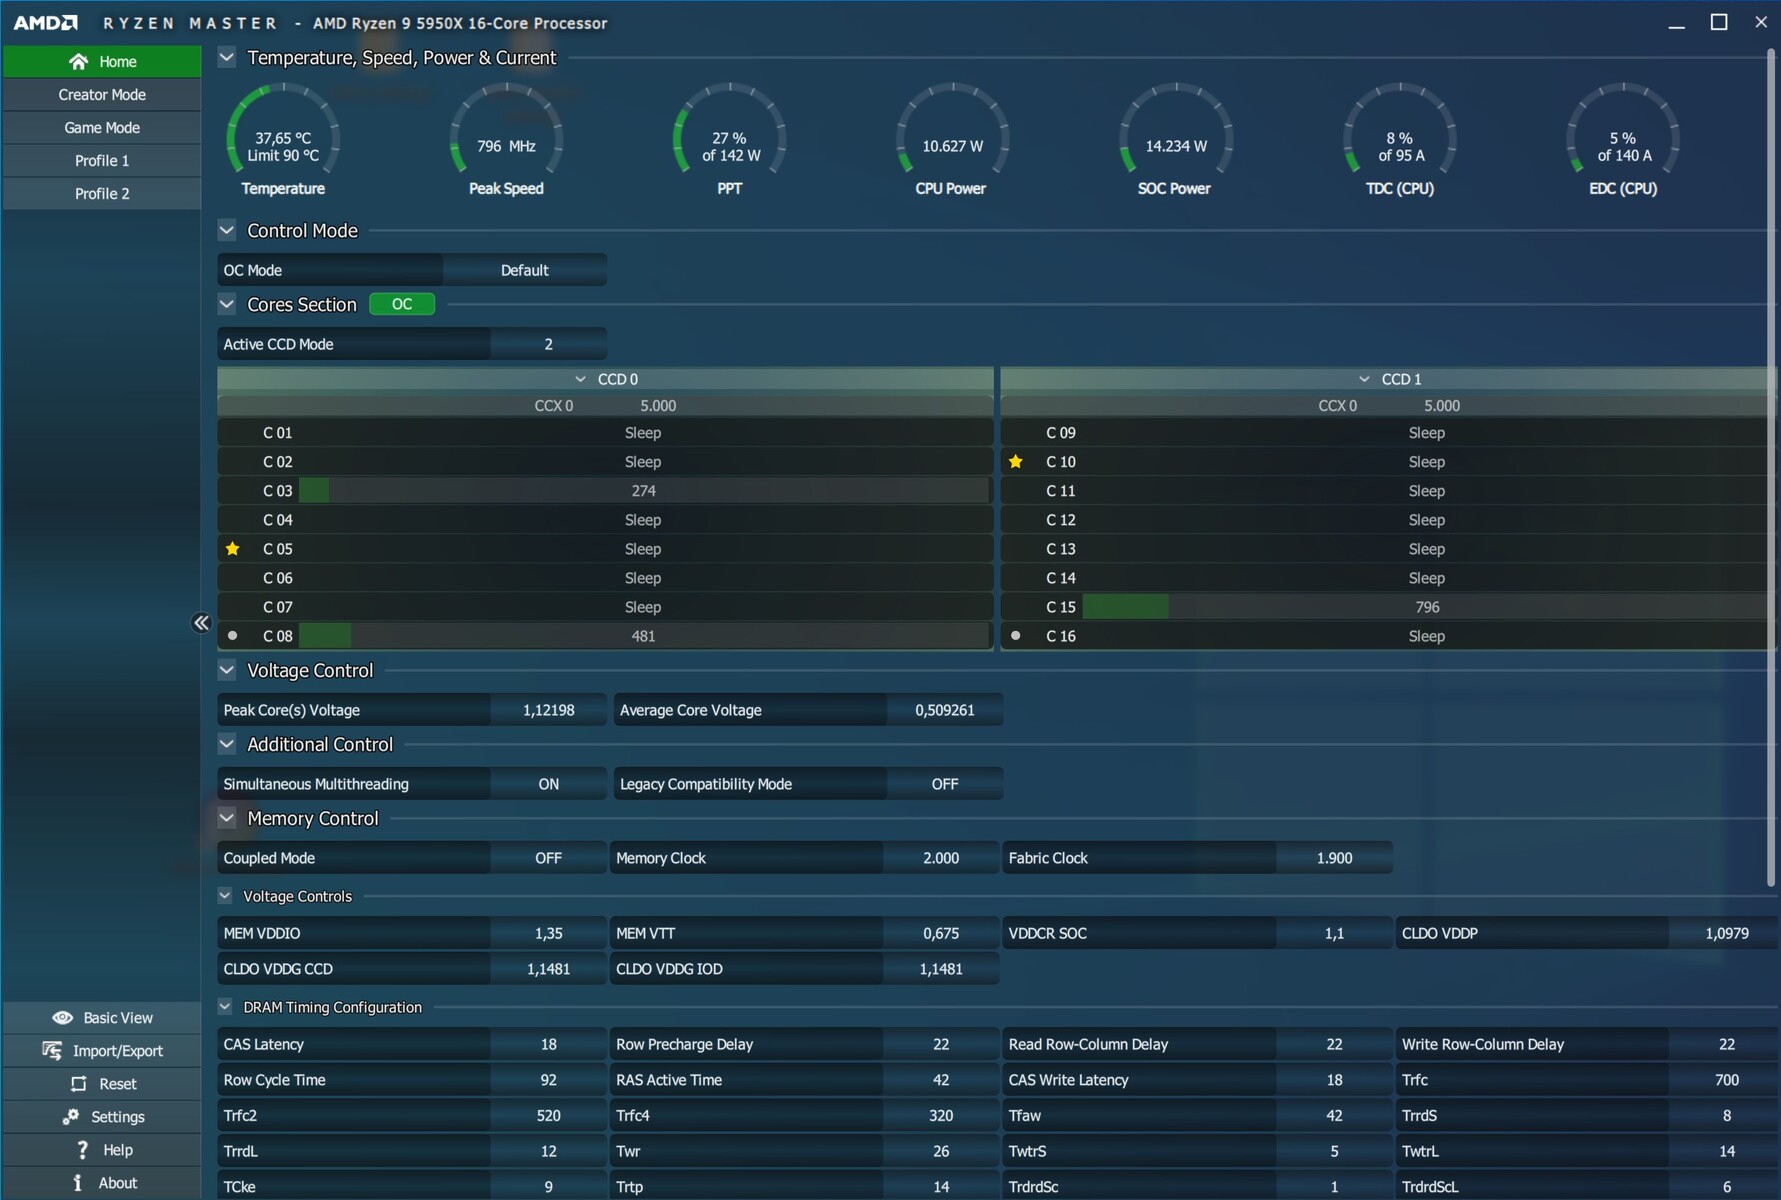
AMD Ryzen 9 5950X
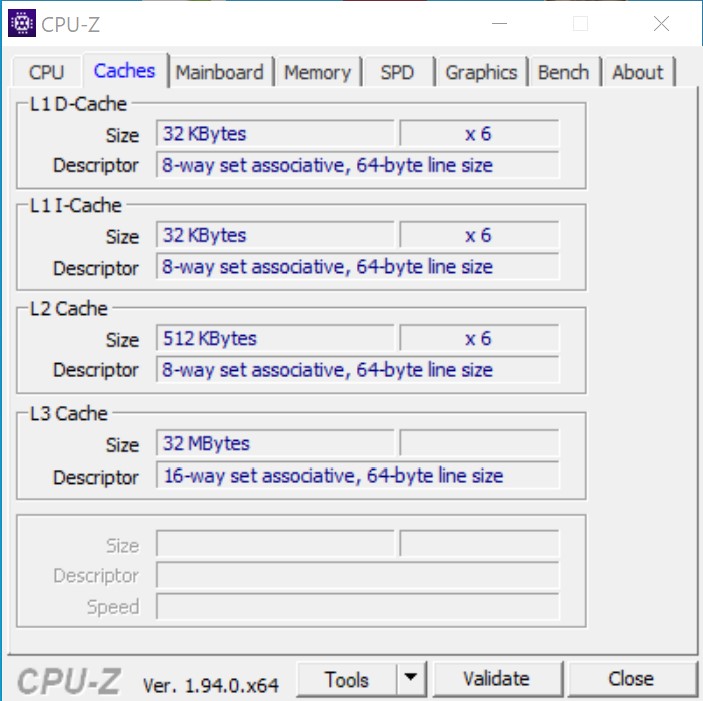
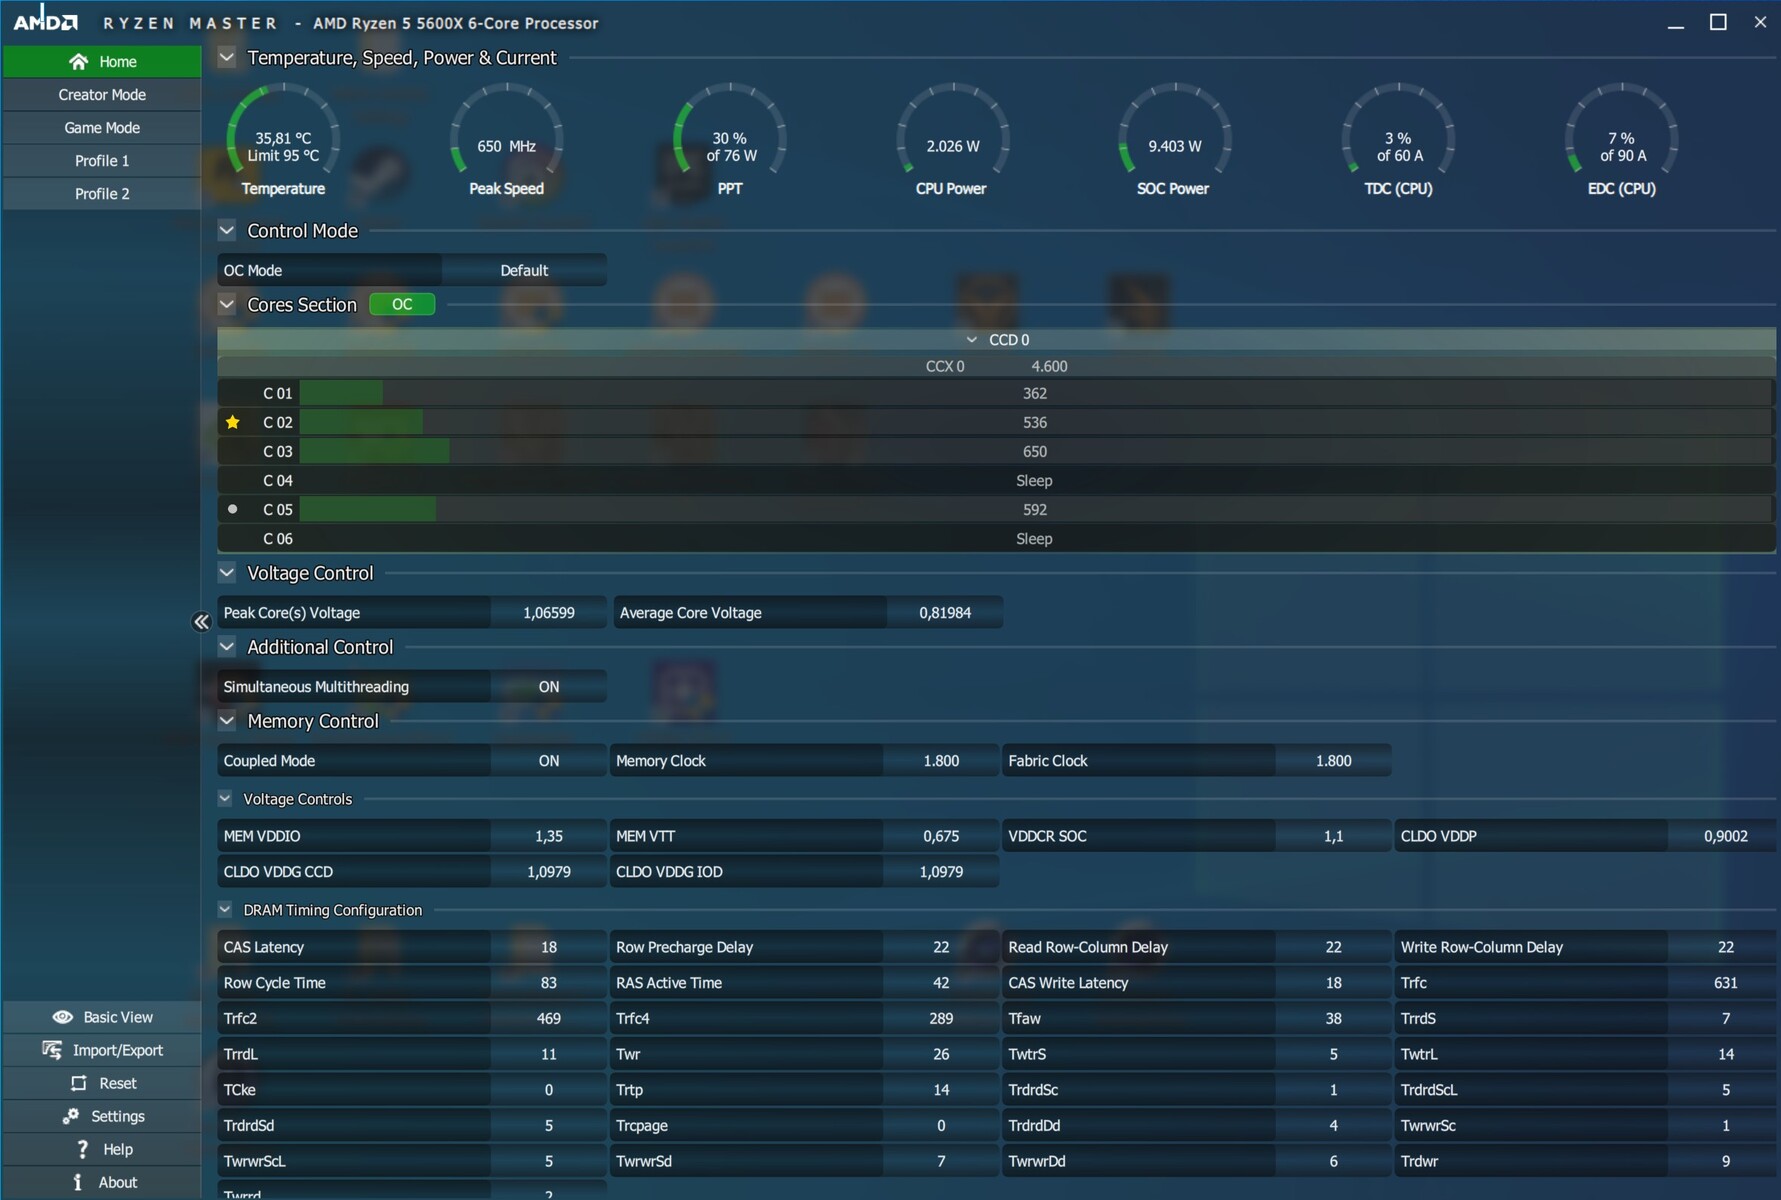
AMD Ryzen 5 5600X
| Blender - v2.79 BMW27 CPU | |
| AMD Ryzen 3 3300X | |
| AMD Ryzen 5 5600X | |
| AMD Ryzen 7 5800X | |
| AMD Ryzen 7 3700X | |
| Intel Core i9-10900K | |
| AMD Ryzen 9 3900X | |
| AMD Ryzen 9 5900X | |
| AMD Ryzen 9 3950X | |
| AMD Ryzen 9 5950X | |
| WinRAR - Result | |
| AMD Ryzen 7 5800X | |
| AMD Ryzen 9 5900X | |
| AMD Ryzen 5 5600X | |
| AMD Ryzen 9 5950X | |
| Intel Core i9-10900K | |
| AMD Ryzen 9 3900X | |
| AMD Ryzen 7 3700X | |
| AMD Ryzen 9 3950X | |
| AMD Ryzen 3 3300X | |
| 3DMark 11 - 1280x720 Performance Physics | |
| AMD Ryzen 9 5950X | |
| AMD Ryzen 9 5900X | |
| AMD Ryzen 7 5800X | |
| Intel Core i9-10900K | |
| AMD Ryzen 9 3950X | |
| AMD Ryzen 5 5600X | |
| AMD Ryzen 9 3900X | |
| AMD Ryzen 7 3700X | |
| AMD Ryzen 3 3300X | |
| HWBOT x265 Benchmark v2.2 - 4k Preset | |
| AMD Ryzen 9 5950X | |
| AMD Ryzen 9 5900X | |
| Intel Core i9-10900K | |
| AMD Ryzen 9 3900X | |
| AMD Ryzen 7 5800X | |
| AMD Ryzen 9 3950X | |
| AMD Ryzen 5 5600X | |
| AMD Ryzen 7 3700X | |
| AMD Ryzen 3 3300X | |
| R Benchmark 2.5 - Overall mean | |
| AMD Ryzen 9 3900X | |
| AMD Ryzen 3 3300X | |
| Intel Core i9-10900K | |
| AMD Ryzen 9 3950X | |
| AMD Ryzen 5 5600X | |
| AMD Ryzen 9 5950X | |
| AMD Ryzen 9 5900X | |
| AMD Ryzen 7 5800X | |
| LibreOffice - 20 Documents To PDF | |
| Intel Core i9-10900K | |
| AMD Ryzen 9 3900X | |
| AMD Ryzen 9 3950X | |
| AMD Ryzen 3 3300X | |
| AMD Ryzen 9 5900X | |
| AMD Ryzen 9 5950X | |
| AMD Ryzen 5 5600X | |
| AMD Ryzen 7 5800X | |
| WebXPRT 3 - Overall | |
| AMD Ryzen 7 5800X | |
| AMD Ryzen 9 5950X | |
| AMD Ryzen 5 5600X | |
| AMD Ryzen 9 5900X | |
| Intel Core i9-10900K | |
| AMD Ryzen 9 3950X | |
| AMD Ryzen 3 3300X | |
| Mozilla Kraken 1.1 - Total | |
| AMD Ryzen 3 3300X | |
| Intel Core i9-10900K | |
| AMD Ryzen 9 3950X | |
| AMD Ryzen 5 5600X | |
| AMD Ryzen 9 5900X | |
| AMD Ryzen 7 5800X | |
| AMD Ryzen 9 5950X | |
* ... más pequeño es mejor
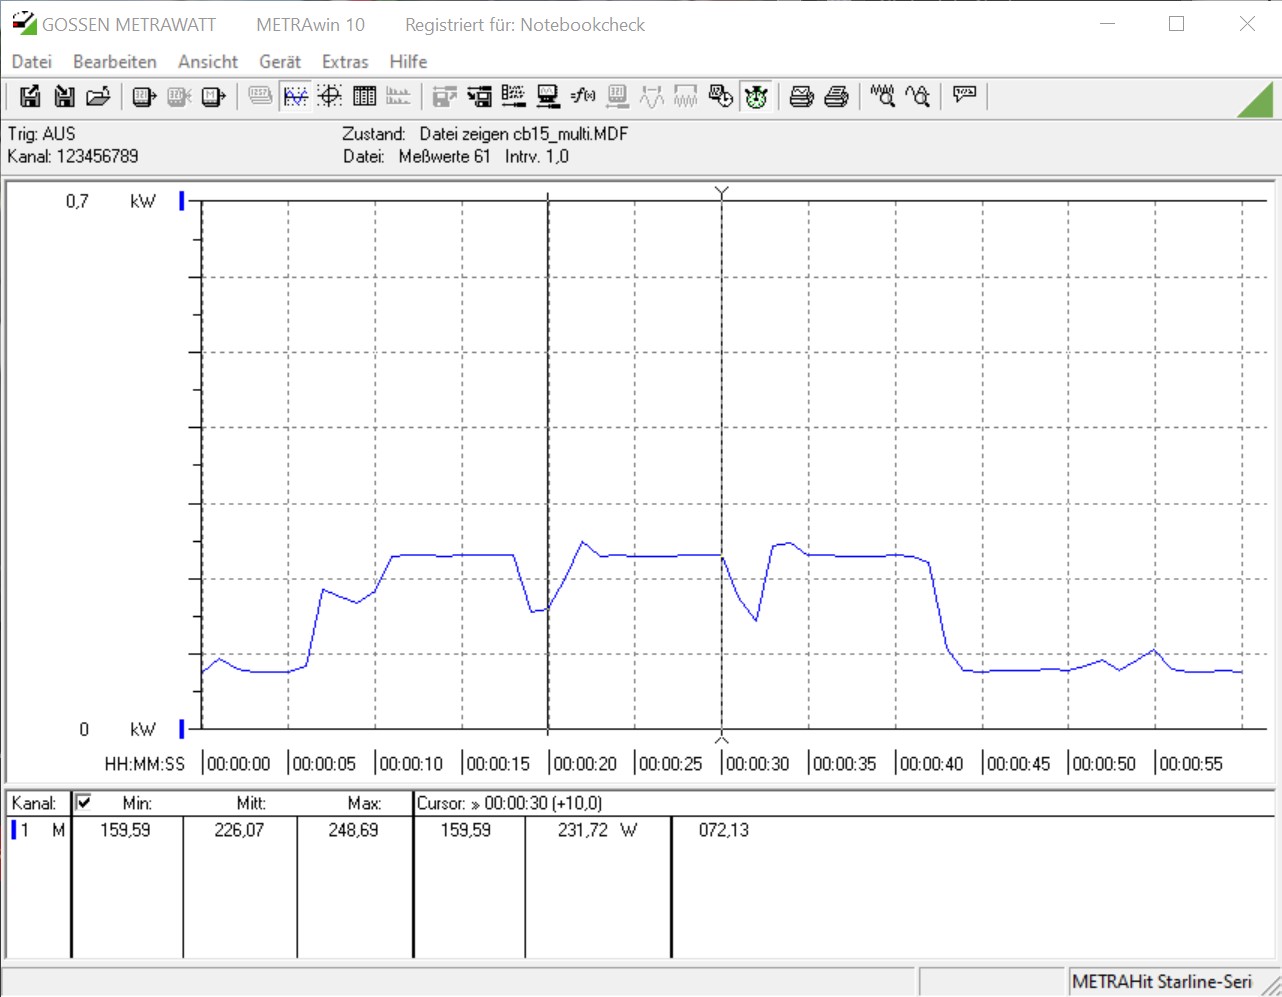
Prueba de carga con el Cinebench R15 Multi Loop
En la prueba de carga con el Cinebench R15 multi loop, ni el AMD Ryzen 9 5950X ni el AMD Ryzen 5 5600X tienen problemas. El AiO incorporado junto con el radiador de 280 milímetros (11 pulgadas) no tienen problemas para enfriar de forma fiable los procesadores. Por cierto, es significativamente más fácil enfriar el AMD Ryzen 5 5600X debido a su menor consumo de energía.
El rendimiento de juego de los procesadores del Ryzen 3000
Desde el 11/5/2020, es oficial que AMD ofrece la CPU de juego más rápida en este momento. Sin embargo, el AMD Ryzen 9 5950X todavía es capaz de exprimir unos cuantos FPS más de la Nvidia Titan RTX en algunos juegos. Sin embargo, esto no hace una diferencia notable para la diversión de los juegos. Con el aumento de la resolución y la calidad de los ajustes, las ventajas de las CPU empiezan a fundirse, de modo que incluso el AMD Ryzen 5 5600X es capaz de seguir el ritmo del AMD Ryzen 9 5950X. Si sólo te preocupa el rendimiento puro de los juegos, actualmente no cometes ningún error si te decides por el procesador de nivel básico. Los creadores de contenido así como los streamers, por ejemplo, son capaces de arreglárselas sin un PC de streaming separado, si eligen el AMD Ryzen 9 5950X. Esto ofrece suficientes recursos para manejar también el streaming online además de los juegos puros.
| 3DMark 11 - 1280x720 Performance GPU | |
| Intel Core i7-10700K | |
| Intel Core i9-10900K | |
| AMD Ryzen 9 5950X | |
| AMD Ryzen 7 5800X | |
| AMD Ryzen 5 5600X | |
| AMD Ryzen 7 3800XT | |
| AMD Ryzen 3 3300X | |
| AMD Ryzen 9 5900X | |
| AMD Ryzen 3 3100 | |
| AMD Ryzen 9 3950X | |
| AMD Ryzen 5 1600 | |
| AMD Ryzen 3 3100 | |
| AMD Ryzen 9 3900X | |
| AMD Ryzen 7 2700X | |
| Unigine Heaven 4.0 | |
| Extreme Preset DX11 | |
| AMD Ryzen 9 5900X | |
| AMD Ryzen 9 5950X | |
| AMD Ryzen 7 5800X | |
| AMD Ryzen 9 3900X | |
| AMD Ryzen 5 5600X | |
| AMD Ryzen 7 2700X | |
| Extreme Preset OpenGL | |
| AMD Ryzen 7 5800X | |
| AMD Ryzen 9 5900X | |
| AMD Ryzen 9 5950X | |
| AMD Ryzen 9 3900X | |
| AMD Ryzen 5 5600X | |
| AMD Ryzen 7 2700X | |
| Unigine Valley 1.0 | |
| 1920x1080 Extreme HD Preset OpenGL AA:x8 | |
| AMD Ryzen 9 5900X | |
| AMD Ryzen 7 5800X | |
| AMD Ryzen 9 5950X | |
| AMD Ryzen 5 5600X | |
| AMD Ryzen 9 3900X | |
| AMD Ryzen 7 2700X | |
| 1920x1080 Extreme HD DirectX AA:x8 | |
| AMD Ryzen 9 5950X | |
| AMD Ryzen 9 5900X | |
| AMD Ryzen 7 5800X | |
| AMD Ryzen 5 5600X | |
| AMD Ryzen 9 3900X | |
| AMD Ryzen 7 2700X | |
| Unigine Superposition | |
| 1280x720 720p Low | |
| AMD Ryzen 7 5800X | |
| AMD Ryzen 5 5600X | |
| AMD Ryzen 9 5950X | |
| AMD Ryzen 9 5900X | |
| AMD Ryzen 9 3900X | |
| 1920x1080 1080p Extreme | |
| AMD Ryzen 9 5900X | |
| AMD Ryzen 7 5800X | |
| AMD Ryzen 9 5950X | |
| AMD Ryzen 5 5600X | |
| AMD Ryzen 9 3900X | |
| 7680x4320 8k Optimized | |
| AMD Ryzen 9 5900X | |
| AMD Ryzen 5 5600X | |
| AMD Ryzen 7 5800X | |
| AMD Ryzen 9 5950X | |
| AMD Ryzen 9 3900X | |
Ryzen 9 5950X con Nvidia Titan RTX
| bajo | medio | alto | ultra | QHD | 4K | |
|---|---|---|---|---|---|---|
| GTA V (2015) | 187 | 186 | 182 | 121 | 113 | 134 |
| The Witcher 3 (2015) | 594 | 420 | 271 | 141 | 102 | |
| Dota 2 Reborn (2015) | 214.5 | 192.3 | 193.3 | 179.2 | 161.6 | |
| Final Fantasy XV Benchmark (2018) | 225 | 183 | 141 | 105 | 63.4 | |
| X-Plane 11.11 (2018) | 168 | 152 | 117 | 101 | ||
| Far Cry 5 (2018) | 201 | 174 | 166 | 154 | 137 | 80 |
| Strange Brigade (2018) | 604 | 350 | 286 | 241 | 183 | 110 |
| Shadow of the Tomb Raider (2018) | 225.1 | 184.2 | 177.9 | 166.1 | 120.1 | 66.4 |
| Far Cry New Dawn (2019) | 165 | 142 | 123 | 115 | 82 | |
| Metro Exodus (2019) | 232 | 172 | 133 | 106 | 86.1 | 56.4 |
| Borderlands 3 (2019) | 217 | 182 | 141 | 117 | 84.4 | 46.6 |
Ryzen 5 5600X con Nvidia Titan RTX
| bajo | medio | alto | ultra | QHD | 4K | |
|---|---|---|---|---|---|---|
| GTA V (2015) | 187 | 186 | 181 | 118 | 109 | 133 |
| The Witcher 3 (2015) | 570 | 413 | 268 | 139 | 101 | |
| Dota 2 Reborn (2015) | 228.9 | 200.7 | 191 | 180 | 168.3 | |
| Final Fantasy XV Benchmark (2018) | 225 | 179 | 138 | 104 | 63.2 | |
| X-Plane 11.11 (2018) | 172 | 156 | 123 | 105 | ||
| Far Cry 5 (2018) | 200 | 171 | 166 | 153 | 135 | 80 |
| Strange Brigade (2018) | 643 | 351 | 286 | 243 | 184 | 110 |
| Shadow of the Tomb Raider (2018) | 217 | 185 | 178 | 165 | 121 | 66.5 |
| Far Cry New Dawn (2019) | 164 | 144 | 136 | 123 | 116 | 81 |
| Metro Exodus (2019) | 236 | 172 | 133 | 107 | 85.4 | 54.6 |
| Borderlands 3 (2019) | 214 | 177 | 138 | 115 | 83.9 | 46.5 |
Rendimiento de la aplicación
Como ya vimos en los puntos de referencia de la CPU, todos los nuevos procesadores de Vermeer tienen una trayectoria muy buena en cuanto a su rendimiento. Esto también se refleja en nuestras pruebas de aplicación y rendimiento. Todo el sistema funciona muy rápido, incluso si la SSD no usa el último estándar PCI Express 4.0. Sin embargo, en el uso diario esto no es una desventaja, ya que el Intel Optane 905P sigue perteneciendo a los SSD PCIe más rápidos.
En el PCMark 10, el AMD Ryzen 9 5950X es capaz de salir adelante y lograr una pequeña ventaja del 4% en comparación con el AMD Ryzen 9 5900X. El más pequeño Ryzen 5 5600X está a la altura de los ojos con el AMD Ryzen 7 5800X, pero claramente mejor que el modelo superior más antiguo, el AMD Ryzen 9 3950X. Los procesadores Intel sólo se encuentran en el medio del campo con una desventaja del 15% en comparación con el Ryzen 9 5950X.
En las pruebas de renderizado, el resultado global parece más mezclado, ya que la tarjeta gráfica es el factor limitante aquí. Sin embargo, es posible ver en algunas pruebas que con un número creciente de núcleos, el rendimiento también aumenta, aunque el número de núcleos de la CPU no importa en algunas cargas de trabajo. Aquí hay que sopesar cuidadosamente lo que es más importante para usted, si no está dispuesto a elegir siempre el modelo superior.
* ... más pequeño es mejor
Consumo de energía
Como ya lo hizo antes con el Ryzen 9 5900X y el Ryzen 7 5800X, AMD también especifica un TDP de 105 vatios para el Ryzen 9 5950X. Con esto, se mantiene dentro de las especificaciones de la plataforma X570, ya que AMD no introdujo un nuevo conjunto de chips con la generación de Vermeer. Sin embargo, al final los 105 vatios no son suficientes, ya que el límite de potencia de la CPU es de 142 vatios, que el procesador de 16 núcleos sí consume bajo carga.
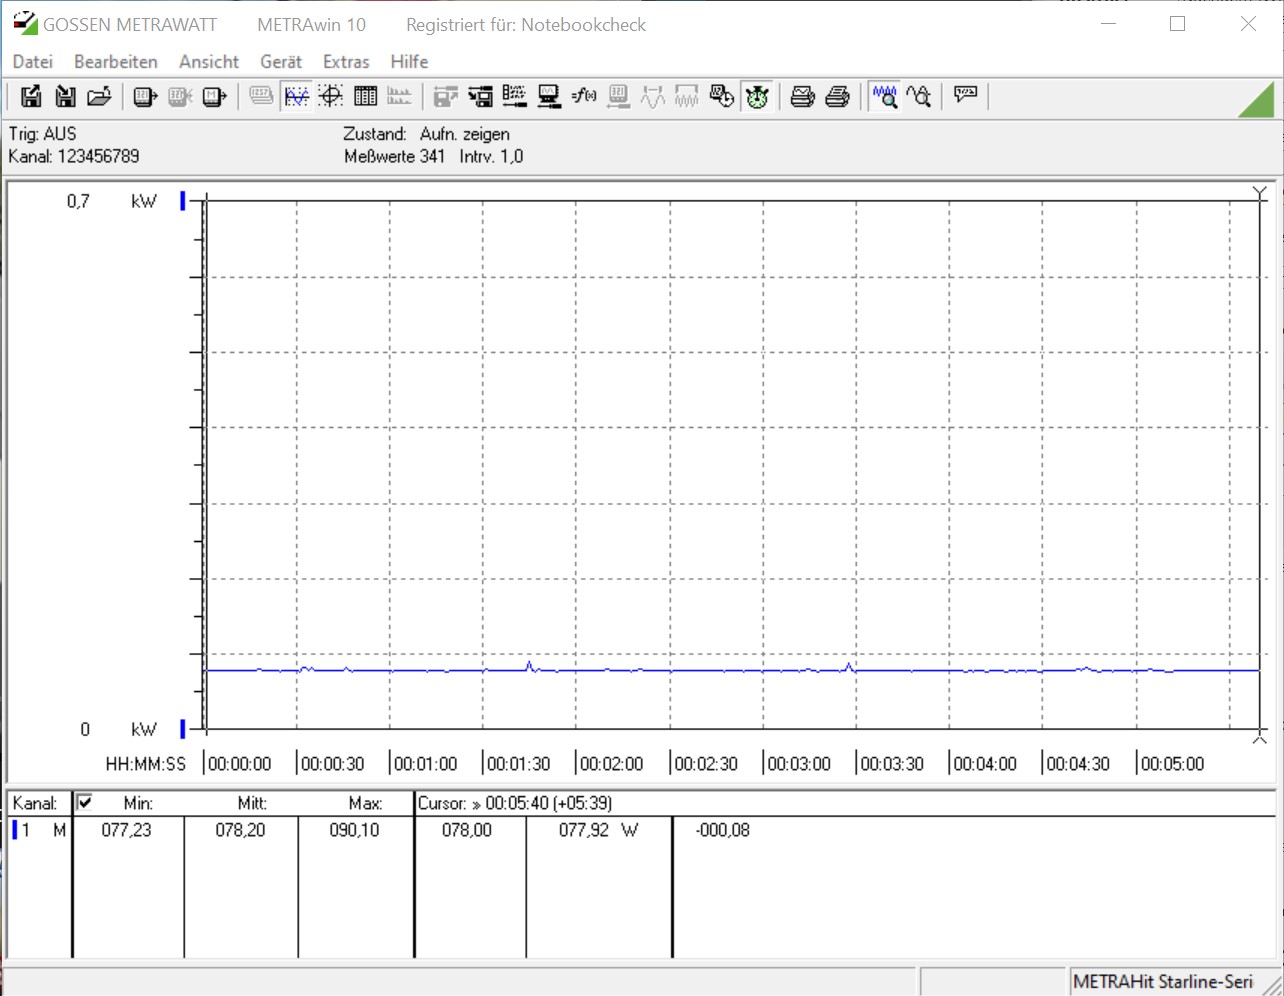
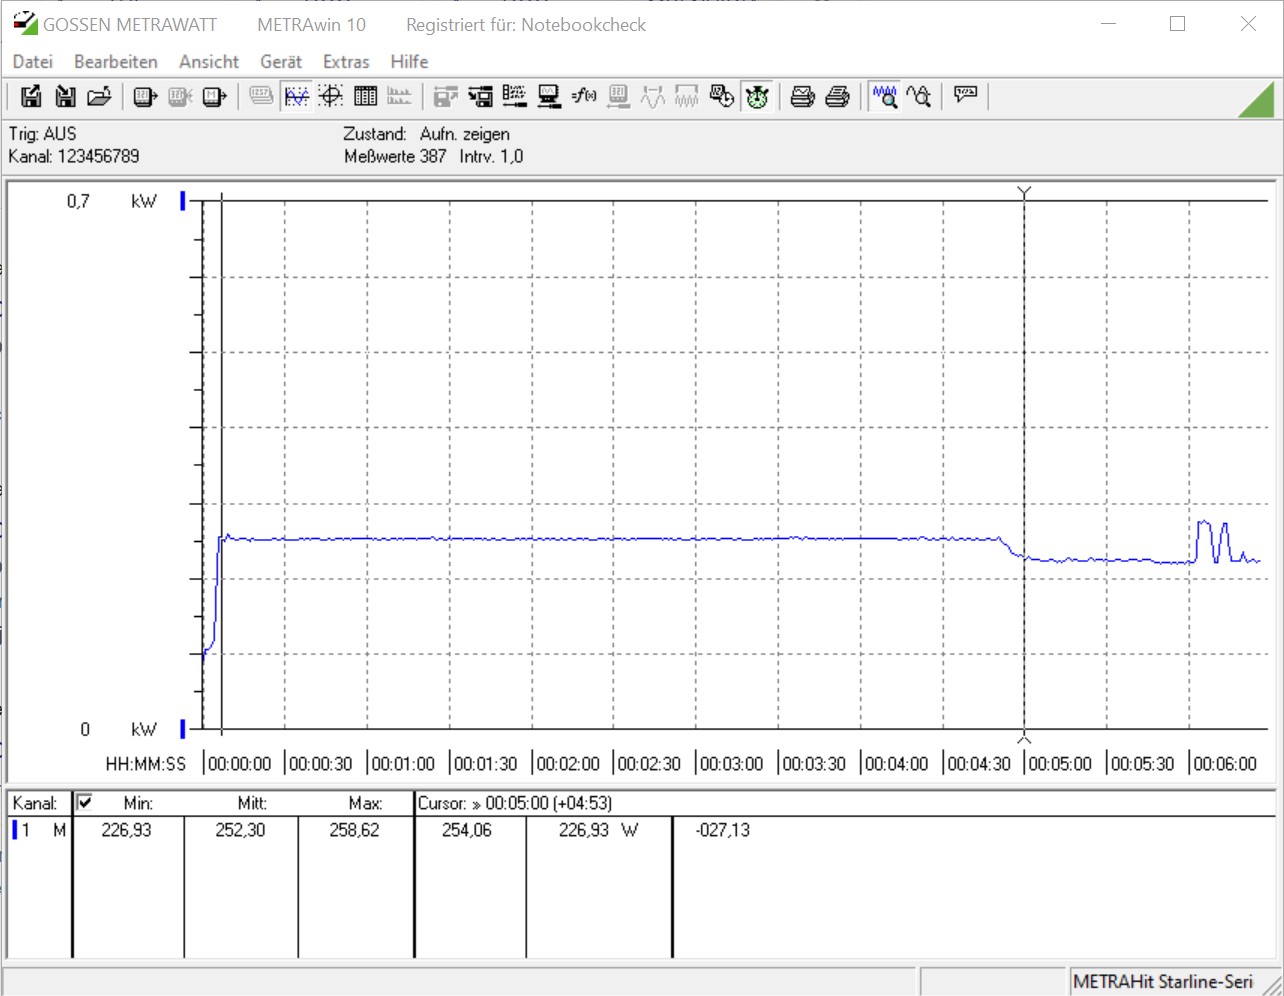
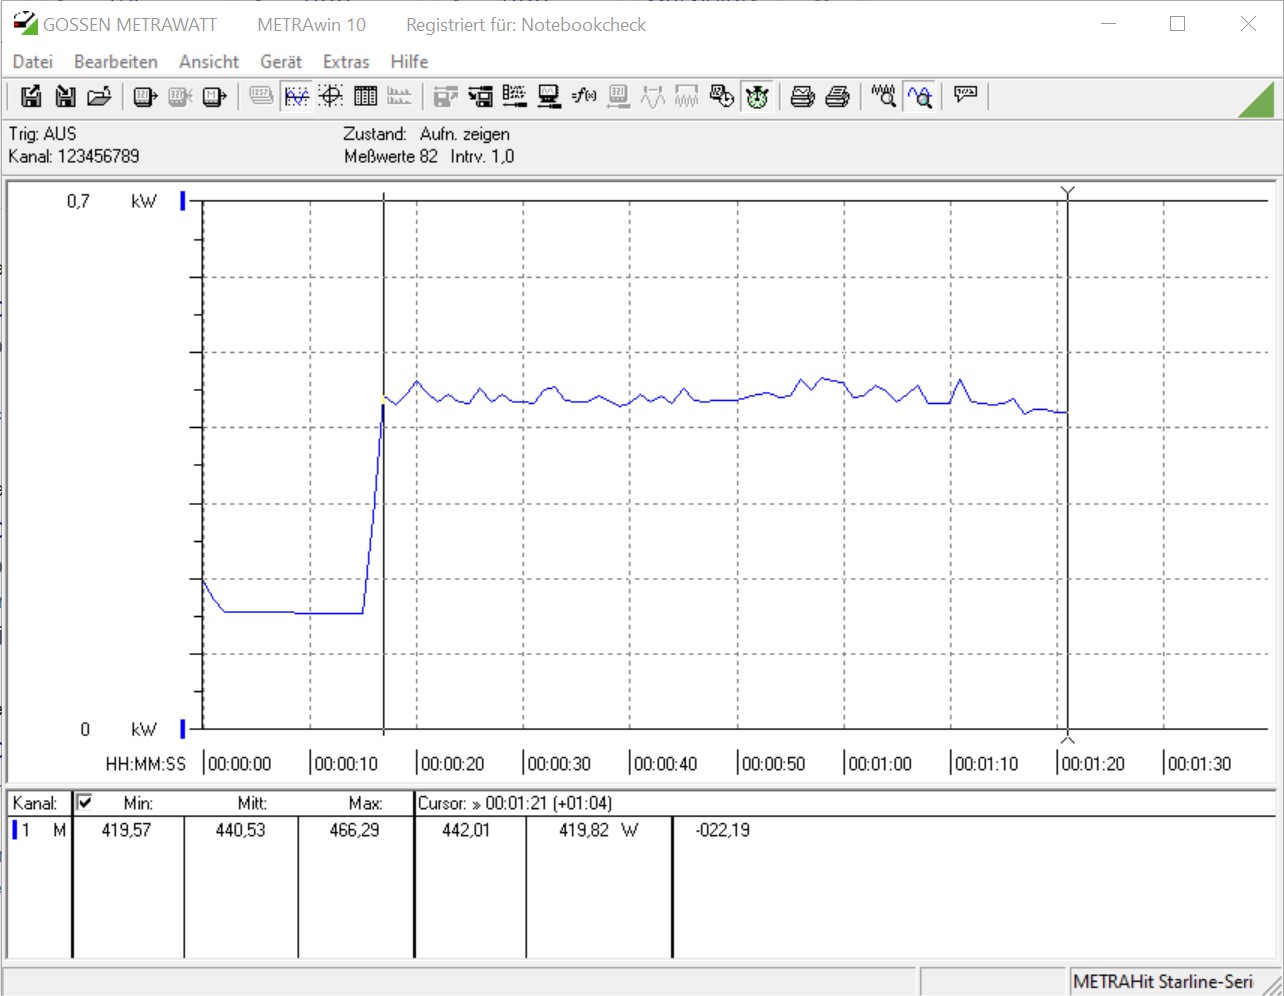
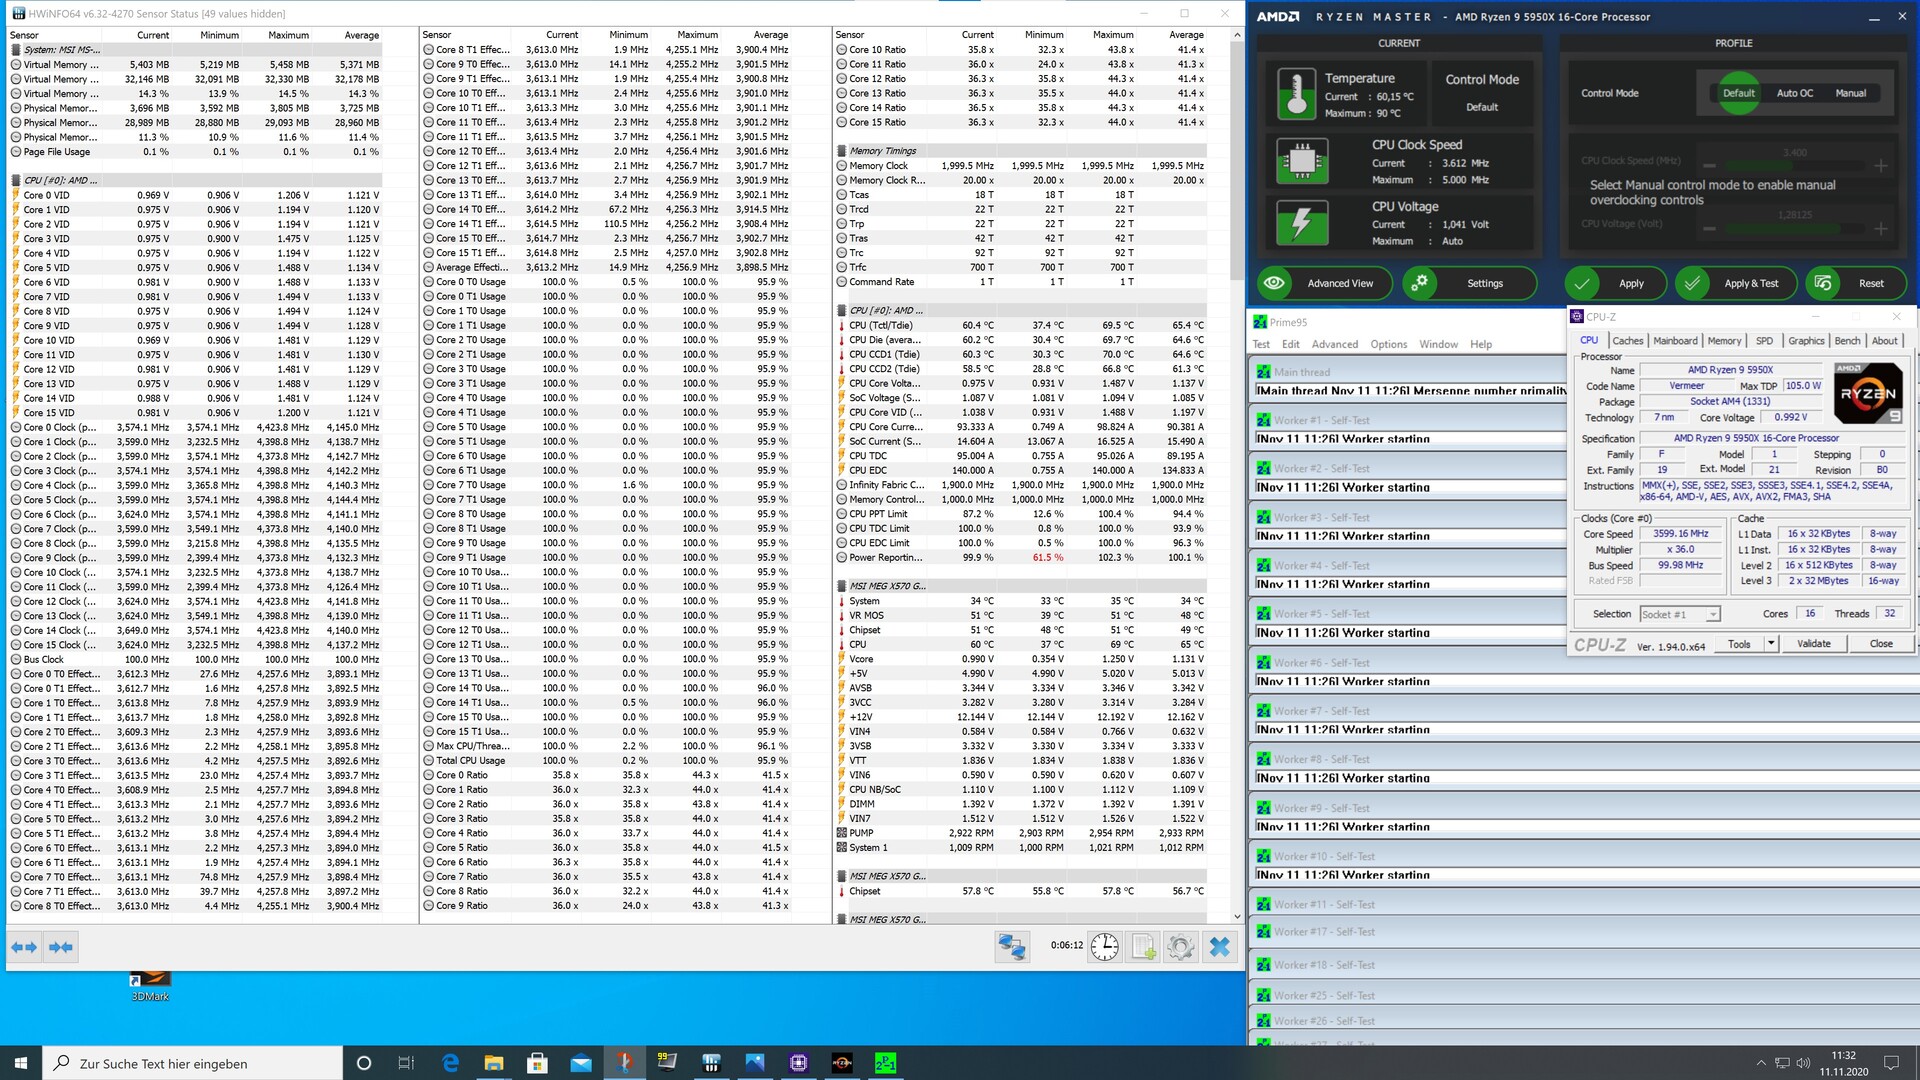
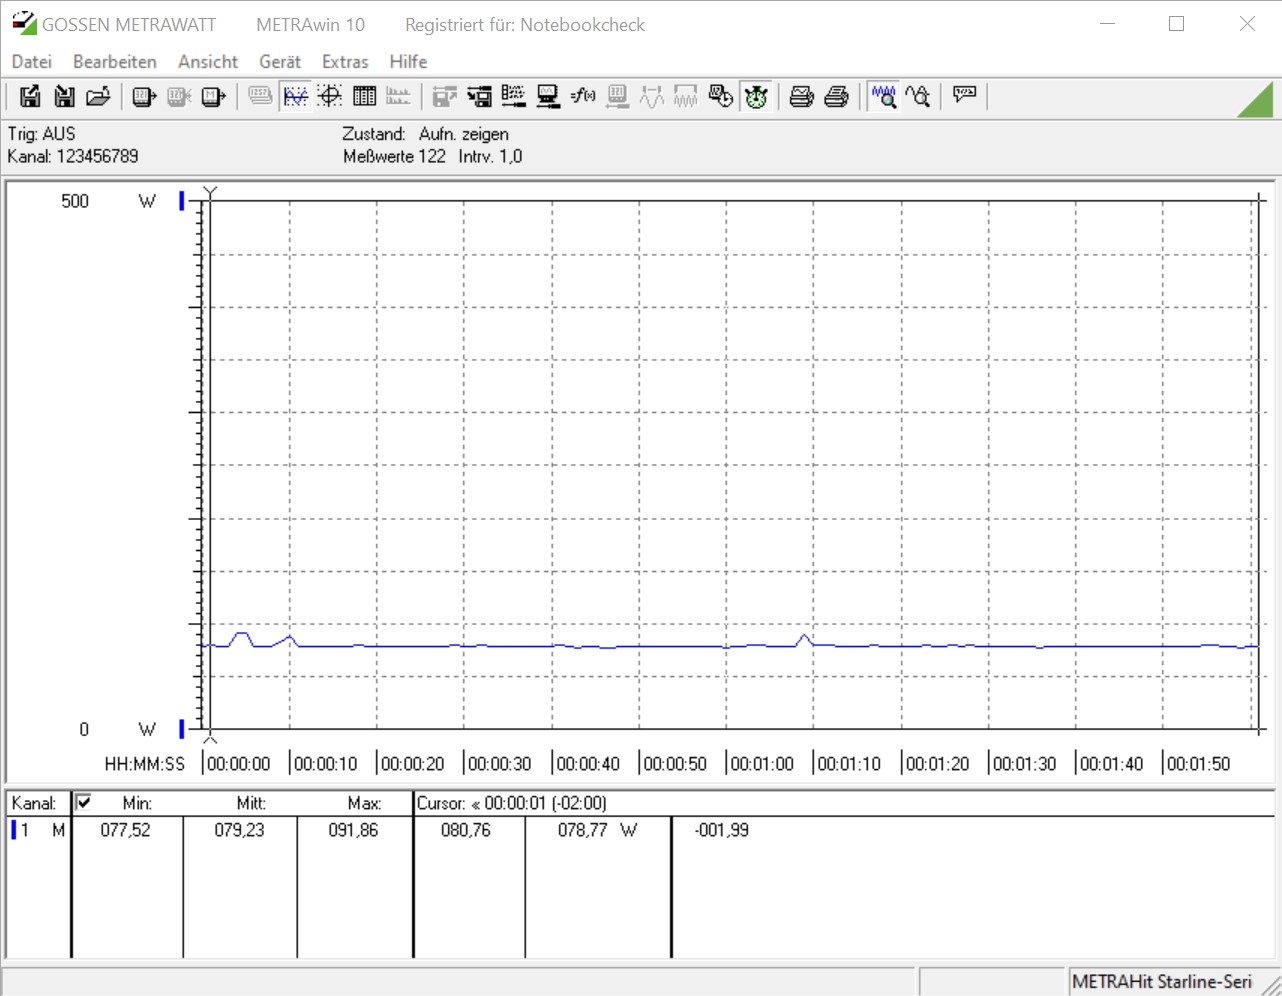
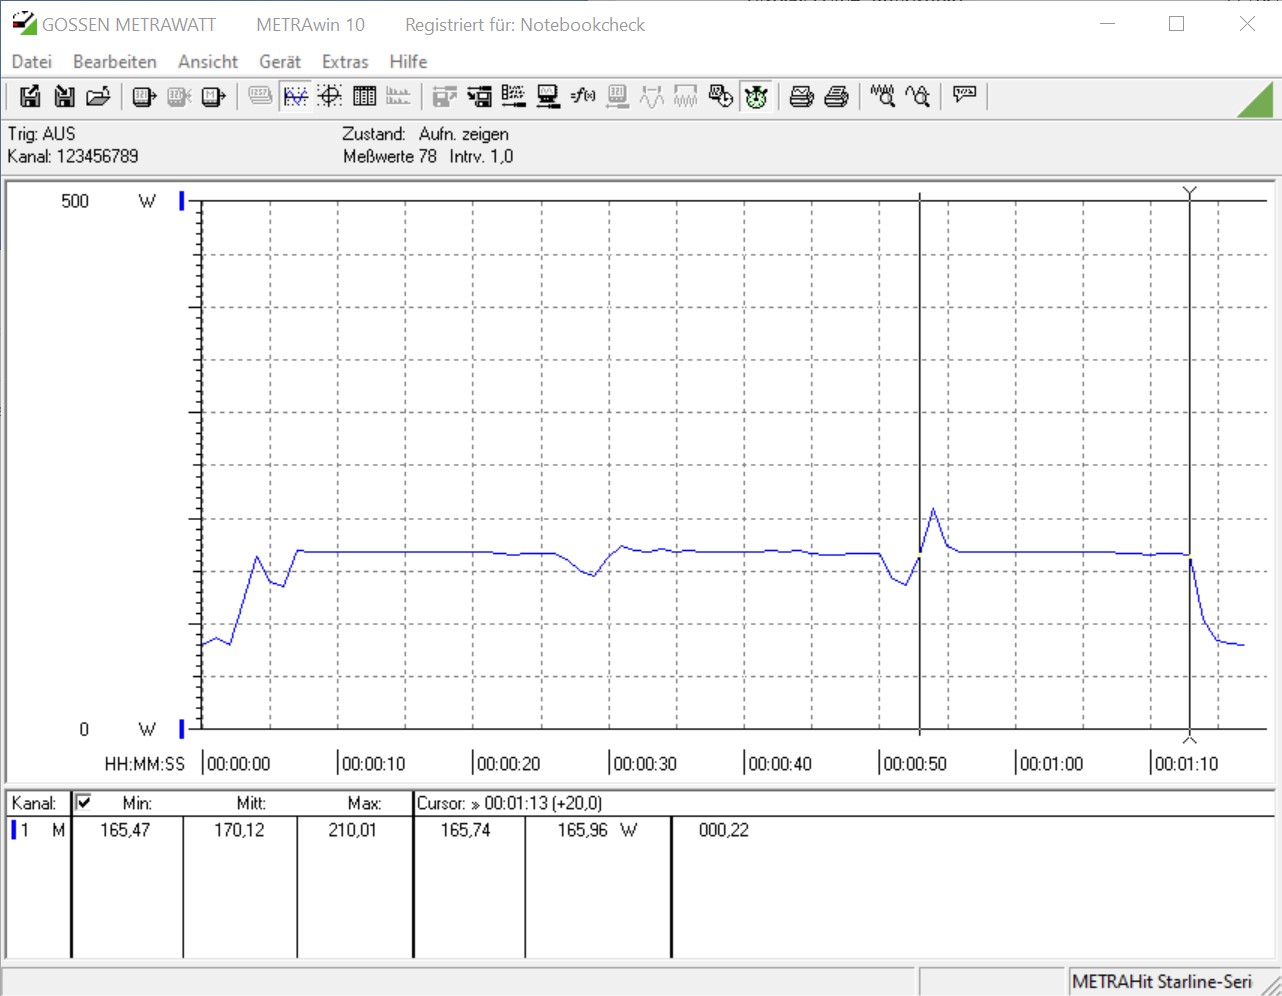
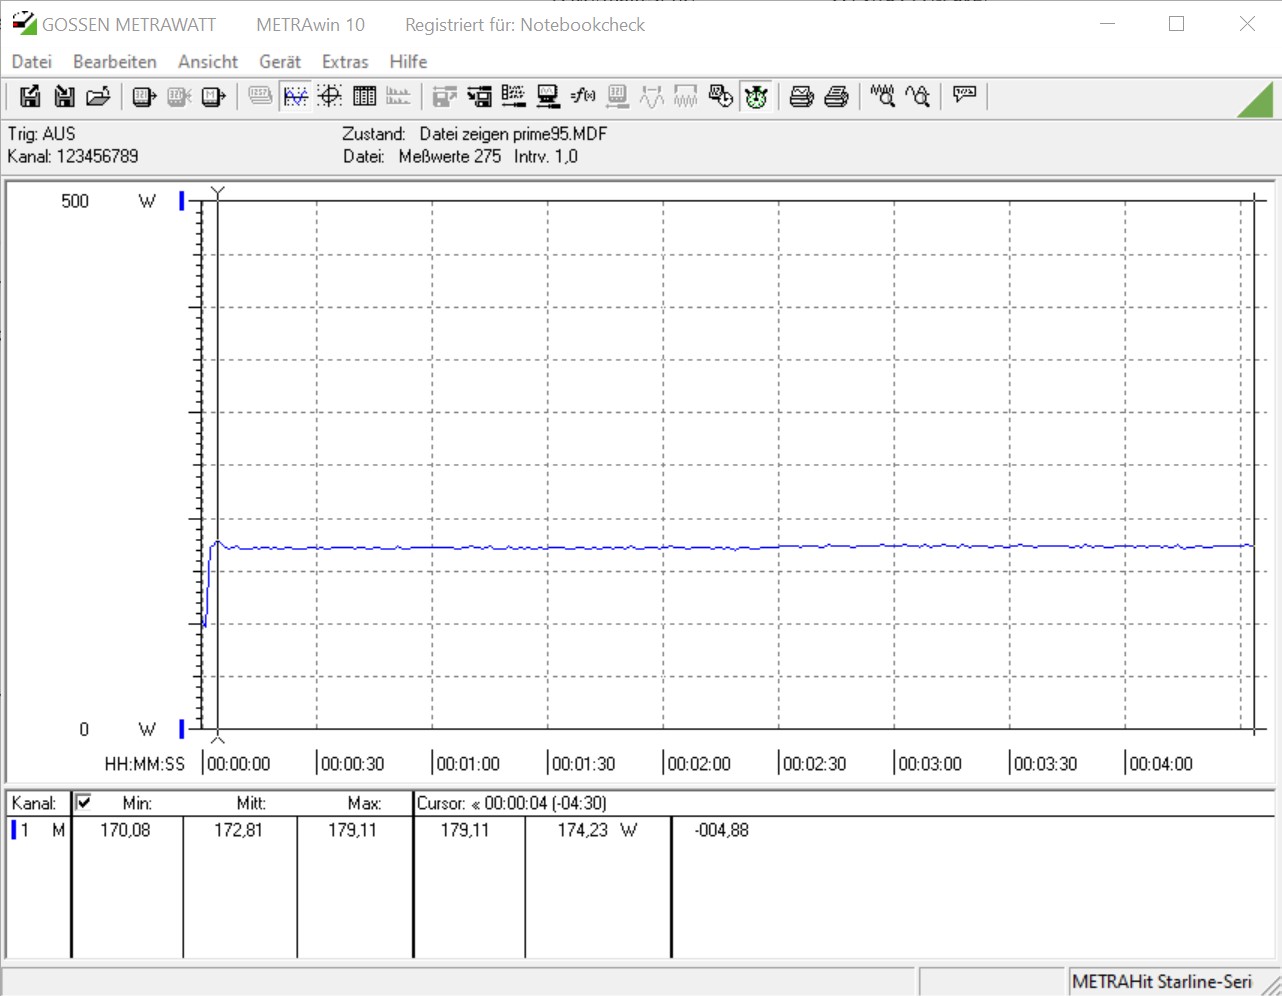
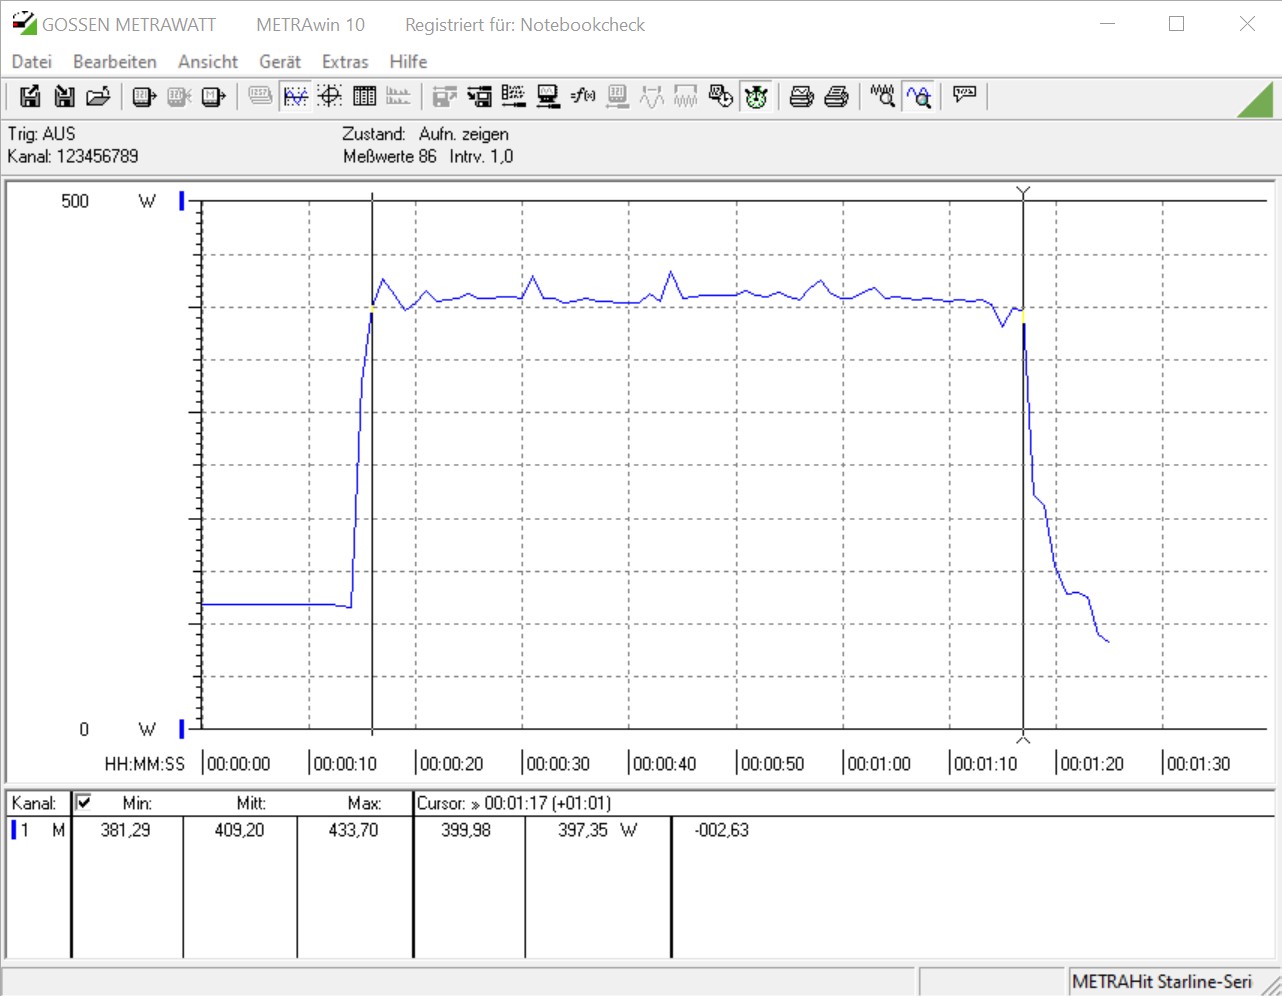
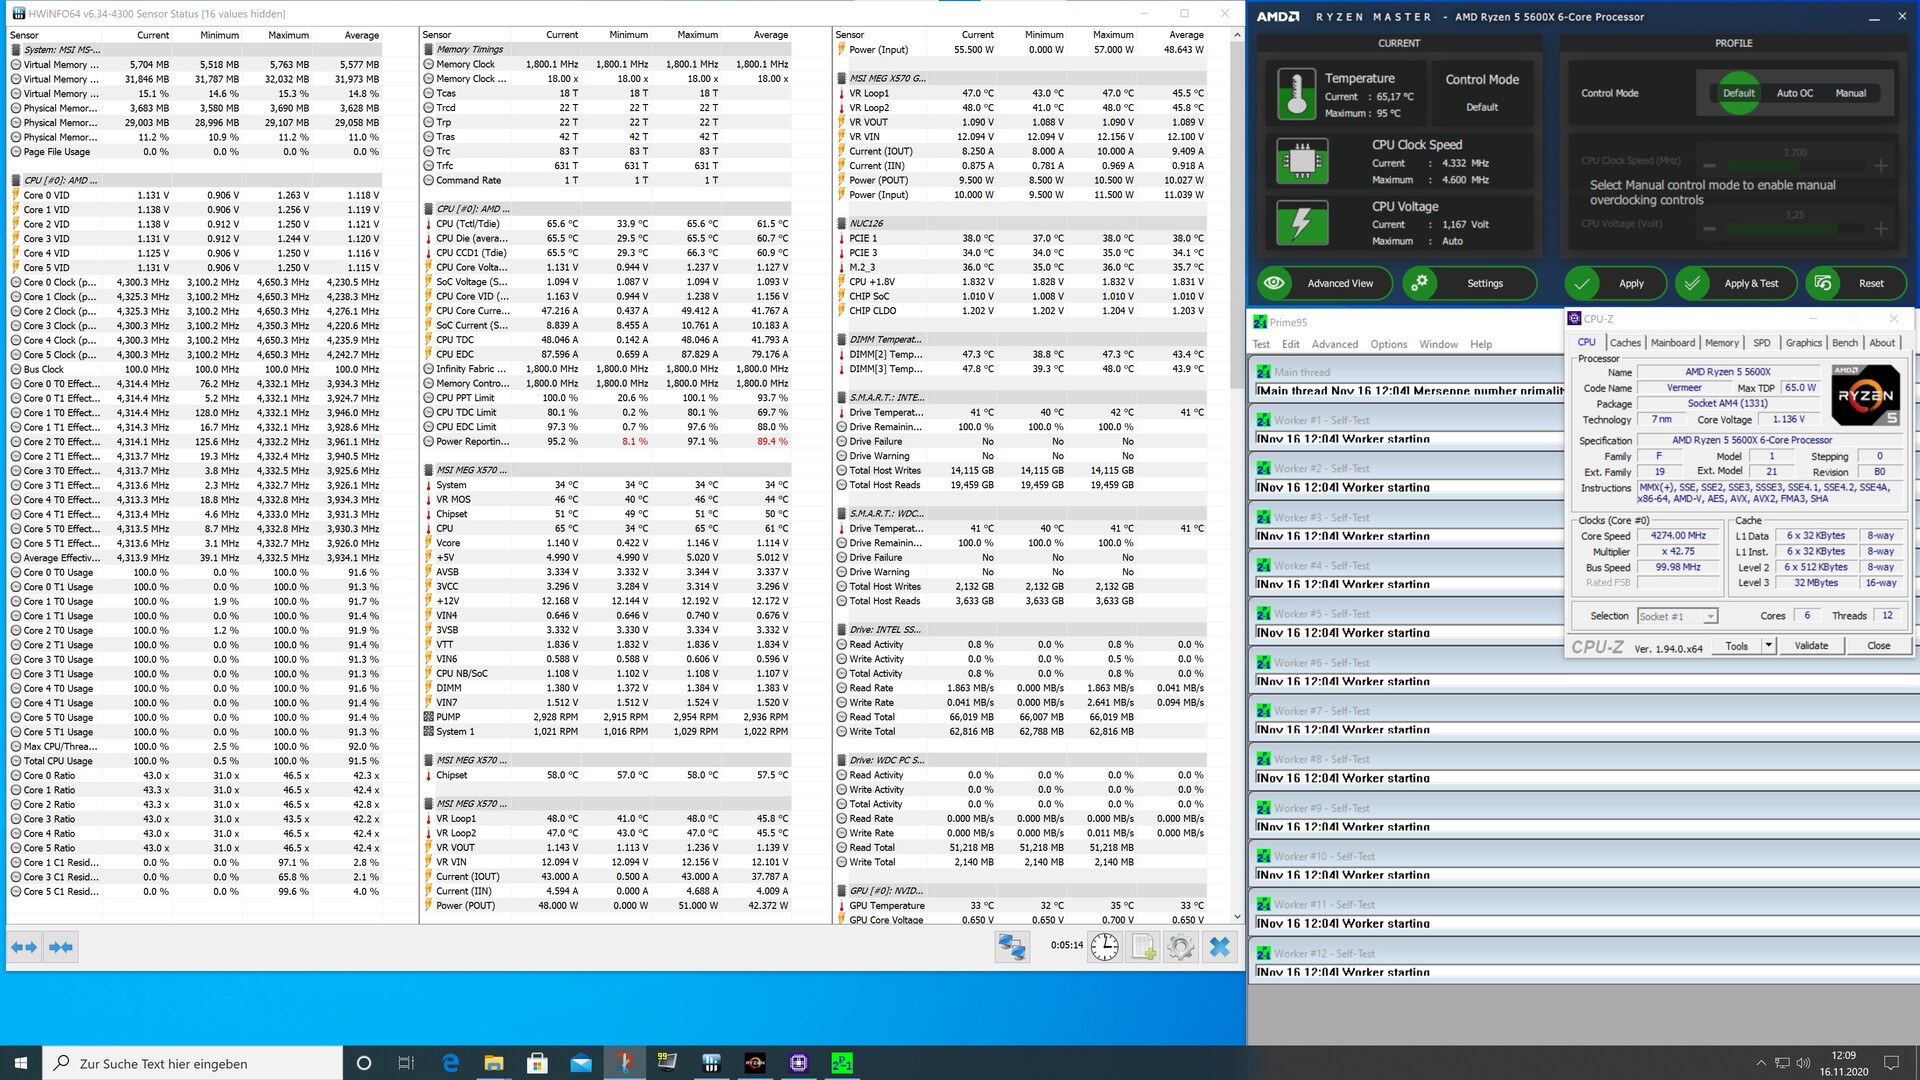
Sin carga, no hay cambios con respecto a las otras dos CPU de Vermeer, y medimos un poco menos de 80 vatios entre la toma de corriente y la fuente de alimentación con nuestro dispositivo de medición. Bajo carga, el consumo aumenta. En la prueba múltiple del Cinebench R15, determinamos 226 vatios para el procesador de 16 núcleos. Con el Ryzen 5 5600X, el consumo del sistema de prueba se sitúa en 170 vatios en la misma prueba. Este es un buen resultado para ambos candidatos. Mientras que el AMD Ryzen 9 5950X lidera el grupo con 440 vatios. Sin embargo, con 439 vatios, nuestro sistema de prueba con el AMD Ryzen 5 5900X no es mucho más frugal. Con el AMD Ryzen 5 5600X, el consumo de energía se reduce ligeramente en unos 30 vatios. Sin embargo, bajo carga completa también tienes que calcular unos 280 vatios para la tarjeta gráfica, que siempre juega un papel importante durante la prueba de juego.
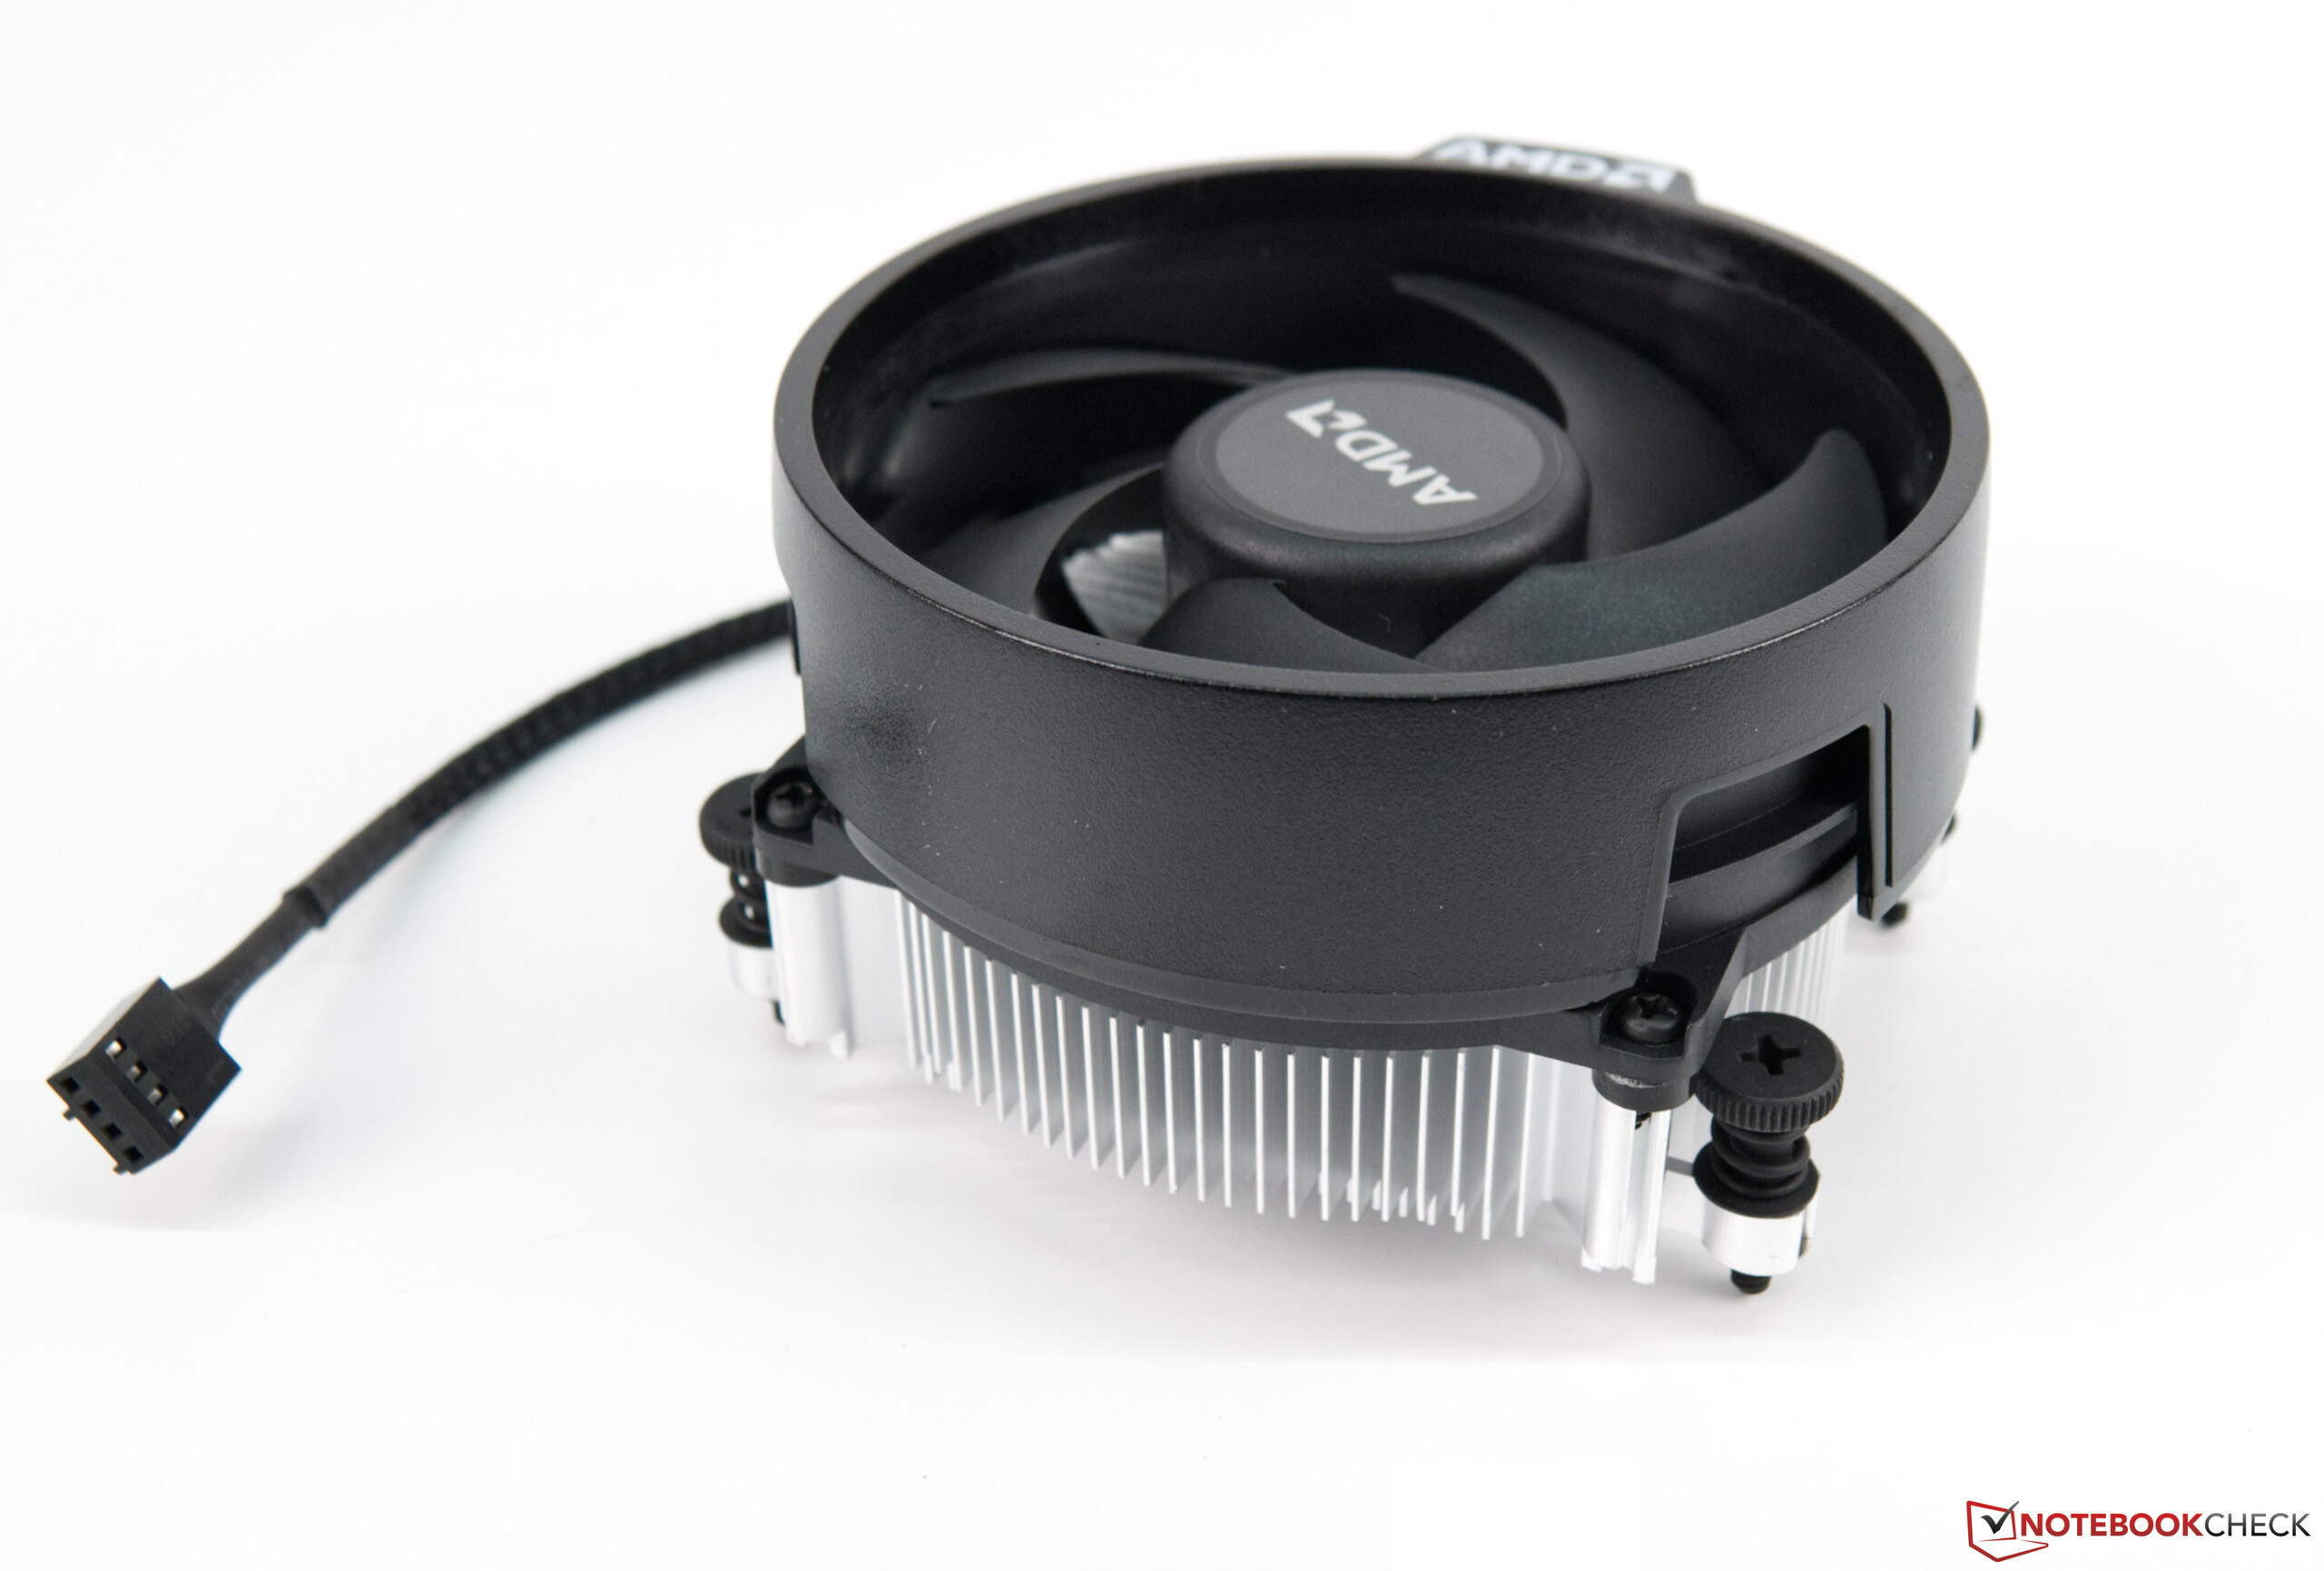
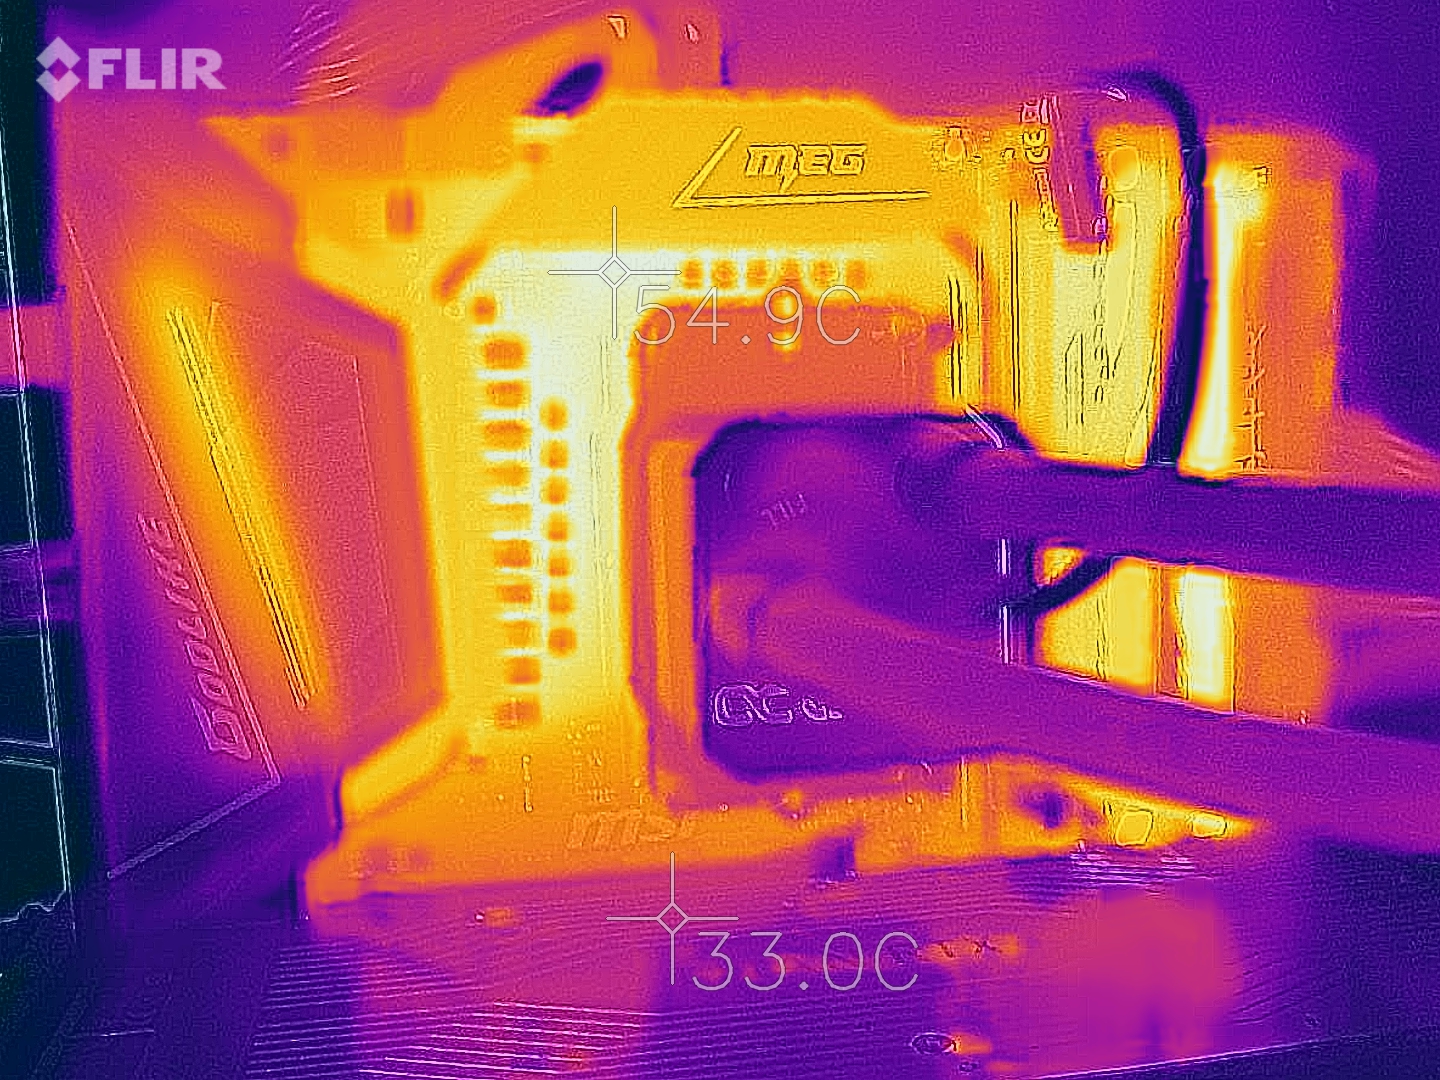
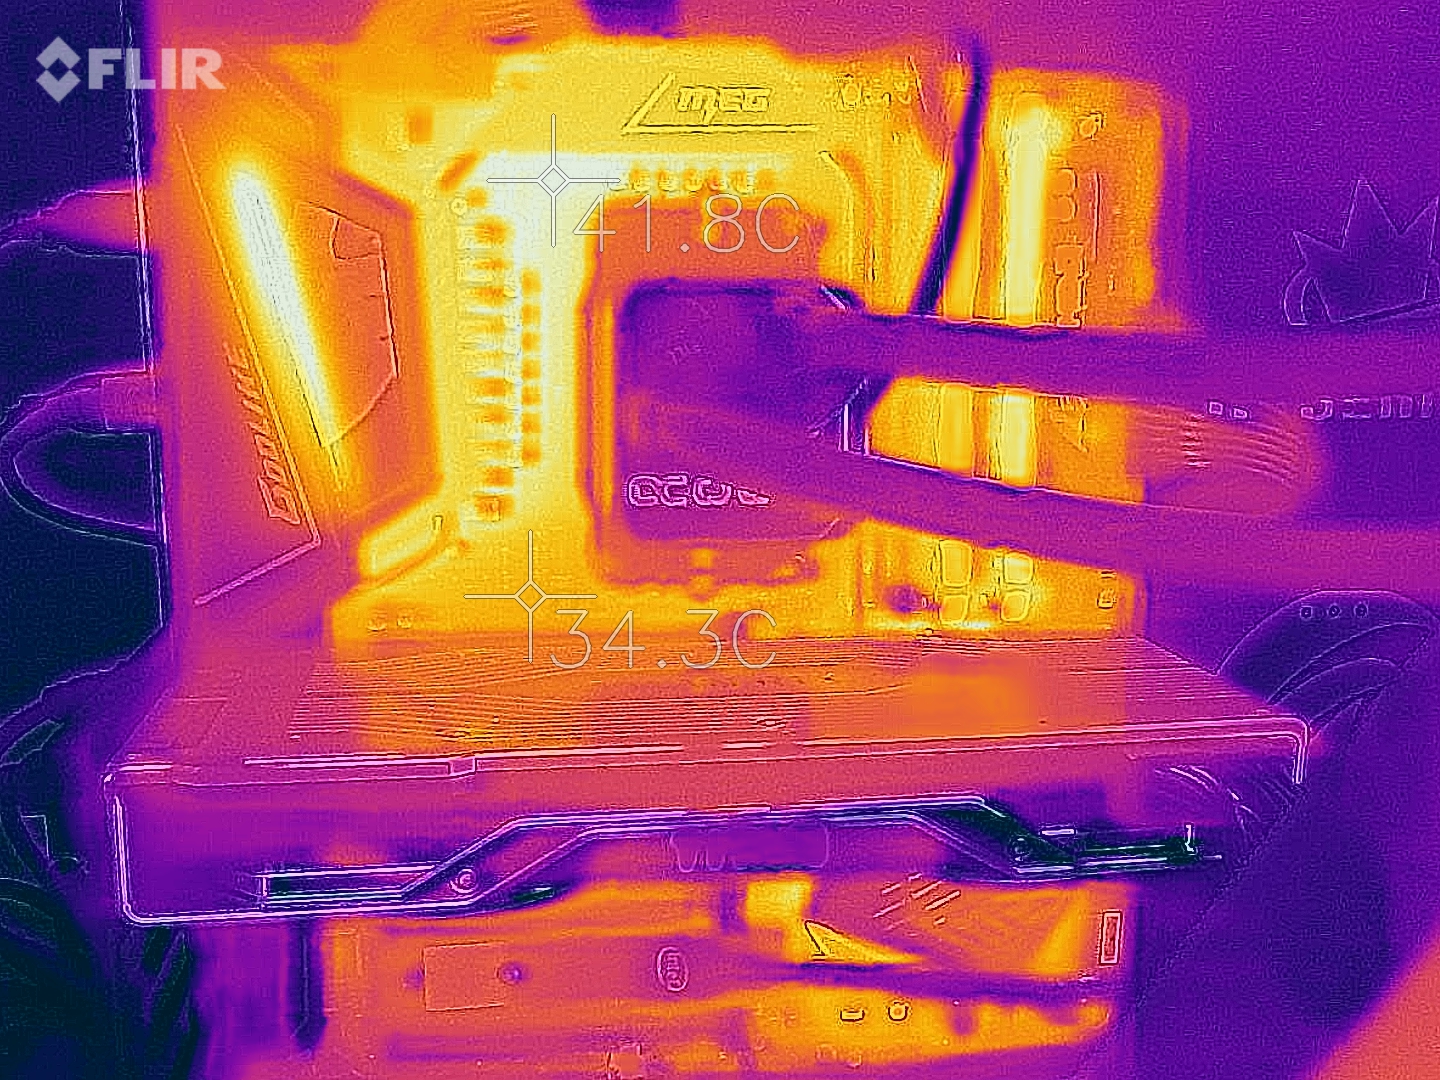
No hay que preocuparse por las temperaturas. En la prueba de estrés, el Ryzen 9 5950X alcanzó apenas 70 °C (158 °F), aunque el Ryzen 5 5600X se mantuvo ligeramente más frío a casi 66 °C (151 °F). Así que el AiO de Alphacool que se utilizó no tiene problemas para mantener el modelo superior frío de forma fiable. AMD incluye una pequeña caja de refrigeración con el Ryzen 5 5600X.
AMD Ryzen 9 5950X
AMD Ryzen 5 5600X
| Power Consumption / The Witcher 3 ultra (external Monitor) | |
| AMD Ryzen 9 5950X, NVIDIA Titan RTX (Idle: 78 W) | |
| AMD Ryzen 9 5900X, NVIDIA Titan RTX (Idle: 78.1 W) | |
| AMD Ryzen 7 2700X, NVIDIA Titan RTX | |
| AMD Ryzen 9 3950X, NVIDIA Titan RTX (Idle: 95 W) | |
| AMD Ryzen 9 3900X, NVIDIA Titan RTX (Idle: 87.4 W) | |
| AMD Ryzen 7 5800X, NVIDIA Titan RTX (Idle: 77.5 W) | |
| AMD Ryzen 7 3800XT, NVIDIA Titan RTX (Idle: 96.1 W) | |
| AMD Ryzen 5 5600X, NVIDIA Titan RTX (Idle: 79.23 W) | |
| AMD Ryzen 5 1600, NVIDIA Titan RTX (Idle: 85.9 W) | |
| Intel Core i7-10700K, NVIDIA Titan RTX (Idle: 67.7 W) | |
| AMD Ryzen 3 3300X, NVIDIA Titan RTX (Idle: 88.8 W) | |
| Intel Core i9-10900K, NVIDIA Titan RTX (Idle: 52.3 W) | |
| AMD Ryzen 3 3100, NVIDIA Titan RTX (Idle: 86 W) | |
| Power Consumption / Prime95 V2810 Stress (external Monitor) | |
| Intel Core i9-10900K, NVIDIA Titan RTX (Idle: 52.3 W) | |
| AMD Ryzen 9 5950X, NVIDIA Titan RTX (Idle: 78 W) | |
| AMD Ryzen 7 5800X, NVIDIA Titan RTX (Idle: 77.5 W) | |
| AMD Ryzen 9 5900X, NVIDIA Titan RTX (Idle: 78.1 W) | |
| Intel Core i7-10700K, NVIDIA Titan RTX (Idle: 67.7 W) | |
| AMD Ryzen 9 3950X, NVIDIA Titan RTX (Idle: 95 W) | |
| AMD Ryzen 9 3900X, NVIDIA Titan RTX (Idle: 87.4 W) | |
| AMD Ryzen 7 3800XT, NVIDIA Titan RTX (Idle: 96.1 W) | |
| AMD Ryzen 5 1600, NVIDIA Titan RTX (Idle: 85.9 W) | |
| AMD Ryzen 5 5600X, NVIDIA Titan RTX (Idle: 79.23 W) | |
| AMD Ryzen 3 3300X, NVIDIA Titan RTX (Idle: 88.8 W) | |
| AMD Ryzen 3 3100, NVIDIA Titan RTX (Idle: 86 W) | |
| Power Consumption / Cinebench R15 Multi (external Monitor) | |
| Intel Core i9-10900K, NVIDIA Titan RTX (Idle: 52.3 W) | |
| AMD Ryzen 9 5900X, NVIDIA Titan RTX (Idle: 78.1 W) | |
| AMD Ryzen 9 5950X, NVIDIA Titan RTX (Idle: 78 W) | |
| AMD Ryzen 7 5800X, NVIDIA Titan RTX (Idle: 77.5 W) | |
| AMD Ryzen 9 3950X, NVIDIA Titan RTX (Idle: 95 W) | |
| AMD Ryzen 9 3900X, NVIDIA Titan RTX (Idle: 87.4 W) | |
| Intel Core i7-10700K, NVIDIA Titan RTX (Idle: 67.7 W) | |
| AMD Ryzen 7 3800XT, NVIDIA Titan RTX (Idle: 96.1 W) | |
| AMD Ryzen 5 5600X, NVIDIA Titan RTX (Idle: 79.23 W) | |
| AMD Ryzen 5 1600, NVIDIA Titan RTX (Idle: 85.9 W) | |
| AMD Ryzen 3 3300X, NVIDIA Titan RTX (Idle: 88.8 W) | |
| AMD Ryzen 3 3100, NVIDIA Titan RTX (Idle: 86 W) | |
| Power Consumption / Cinebench R20 Multi (external Monitor) | |
| AMD Ryzen 9 5950X, NVIDIA Titan RTX (78) | |
| AMD Ryzen 5 5600X, NVIDIA Titan RTX (79.23) | |
| Power Consumption / Cinebench R20 Single (external Monitor) | |
| AMD Ryzen 9 5950X, NVIDIA Titan RTX (78) | |
| AMD Ryzen 5 5600X, NVIDIA Titan RTX (79.23) | |
* ... más pequeño es mejor
Pro
Contra
Veredicto - Muy rápido AMD Ryzen 5000
Después de la primera revisión de la nueva serie Ryzen 5000, ya estábamos positivamente sorprendidos por su rendimiento. La anterior debilidad del rendimiento de un solo núcleo en comparación con Intel es cosa del pasado desde la introducción de la nueva familia Ryzen 5000. Incluso el pequeño Ryzen 5 5600X es capaz de superar fácilmente a un Intel Core i9-10900K. Al mismo tiempo, tenemos que esperar si Intel es capaz de contrarrestar con Rocket Lake en un futuro próximo.
Pero hasta entonces, AMD es capaz de llevar la corona de la CPU de juego más rápida. Ya hemos atestiguado esto para el AMD Ryzen 9 5900X. El AMD Ryzen 9 5950X es incluso capaz de mejorar esto en términos de rendimiento de un solo hilo. Sin embargo, nada más es capaz de mantenerse al nivel del AMD Ryzen 9 5950X en rendimiento de multi-hilo. AMD incluso rebaja claramente el AMD Ryzen 9 3950X.
Mientras que se puede hablar del precio, el modelo superior se encuentra actualmente en 899 Euros (~$1063). Esto es 100 Euros (~$118) más que el precio de venta recomendado en la introducción, lo cual se debe a la actual falta de disponibilidad. Para el modelo de entrada, la disponibilidad no se ve mucho mejor, lo que resulta en precios actuales mucho más altos que el precio de venta recomendado de 299 Euros (~$353). Quienes consideren comprar un nuevo Ryzen 5000 deben planificar a largo plazo en este momento, ya que actualmente es demasiado caro. Una vez que las existencias en las tiendas se recuperen un poco, los precios deberían volver a niveles más razonables. Pero por ahora, hay algún problema con la disponibilidad. Las nuevas tarjetas gráficas AMD Radeon RX 6800 tampoco están disponibles, y las cosas tampoco se ven diferentes para las tarjetas GeForce RTX 3000 de Nvidia.
AMD eleva el listón de la CPU de juegos más potente a un nuevo nivel, y las velocidades especificadas casi siempre se superan significativamente.
Aquellos afortunados que aún puedan agarrar una de las nuevas CPU de Ryzen podrán confirmar el notable aumento de rendimiento. Sin embargo, cada uno tiene que decidir por sí mismo qué CPU es la adecuada para él. Si es puramente una cuestión de juego, el AMD Ryzen 5 5600X es suficiente. Pero si también quieres hacer procesamiento de video, el AMD Ryzen 7 5800X valdría la pena. Y para los creadores de contenidos, vale la pena comprar los modelos Ryzen 9 que también pueden reemplazar una PC de streaming adicional.
