Análisis del Intel Alder Lake-S: ¿Vuelve a tener Intel la CPU más rápida para juegos?
Intel tiene muchos planes conAlder Lake-S. Durante años, Intel fue el estándar de referencia para la CPU más rápida para juegos, hasta que AMD aceleró las cosas con su Ryzen 5000 y se llevó la corona. Para el usuario final, este juego del gato y el ratón tiene muchas ventajas, ya que ayuda a que las mejoras lleguen más rápido a las masas.
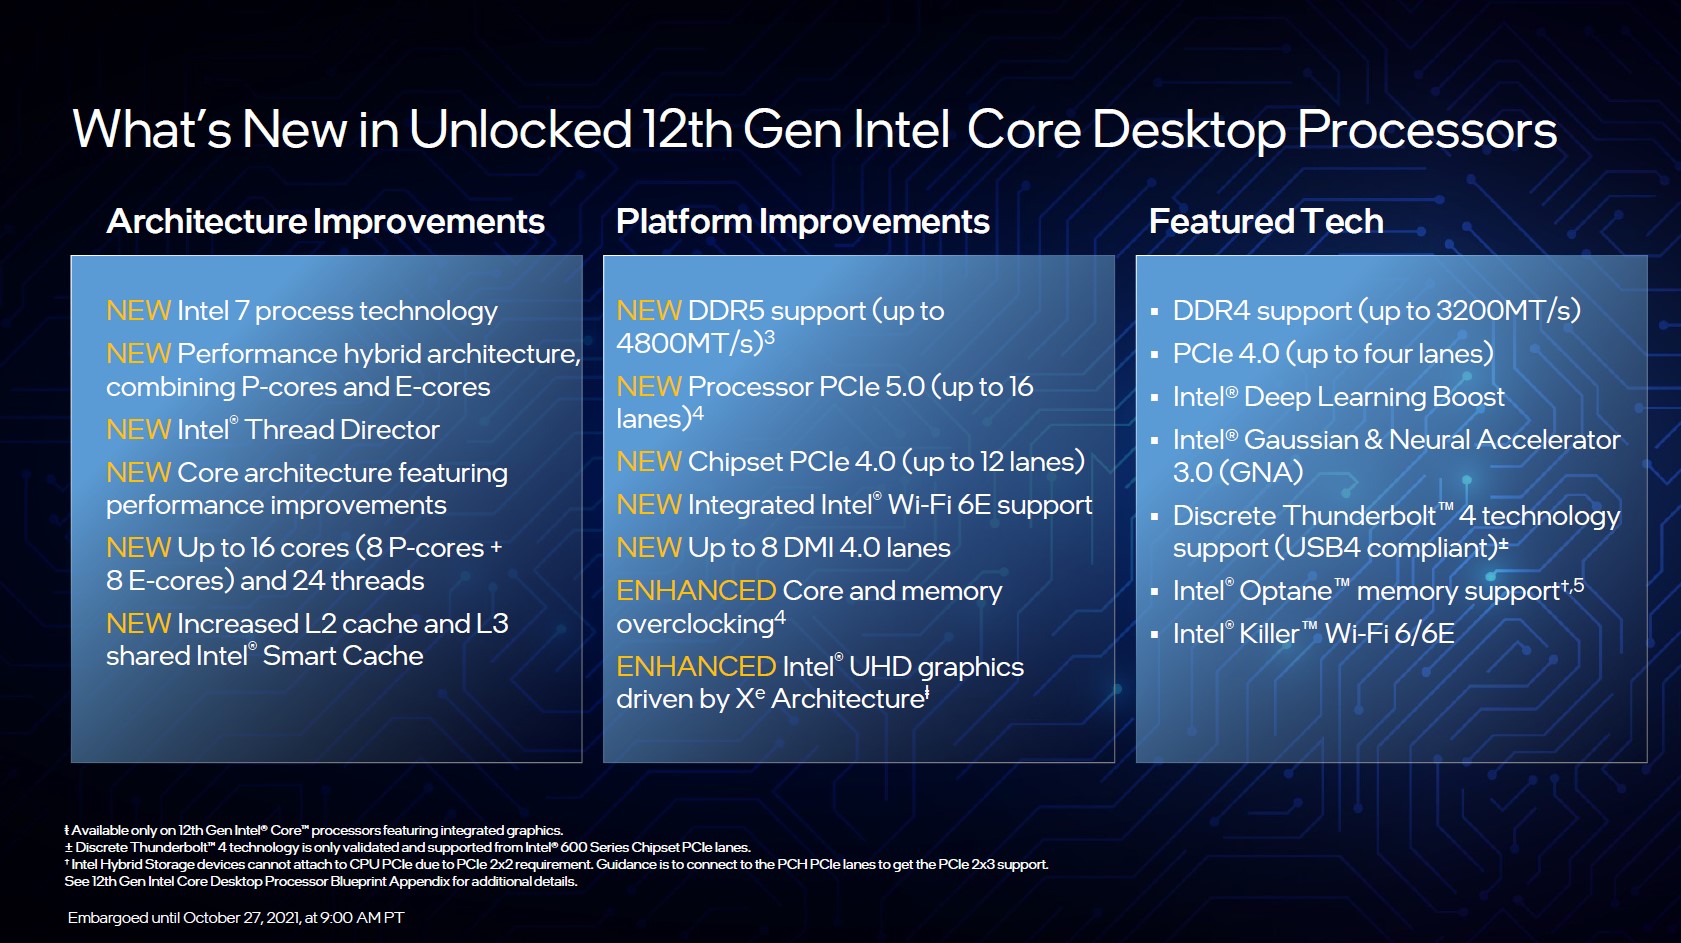
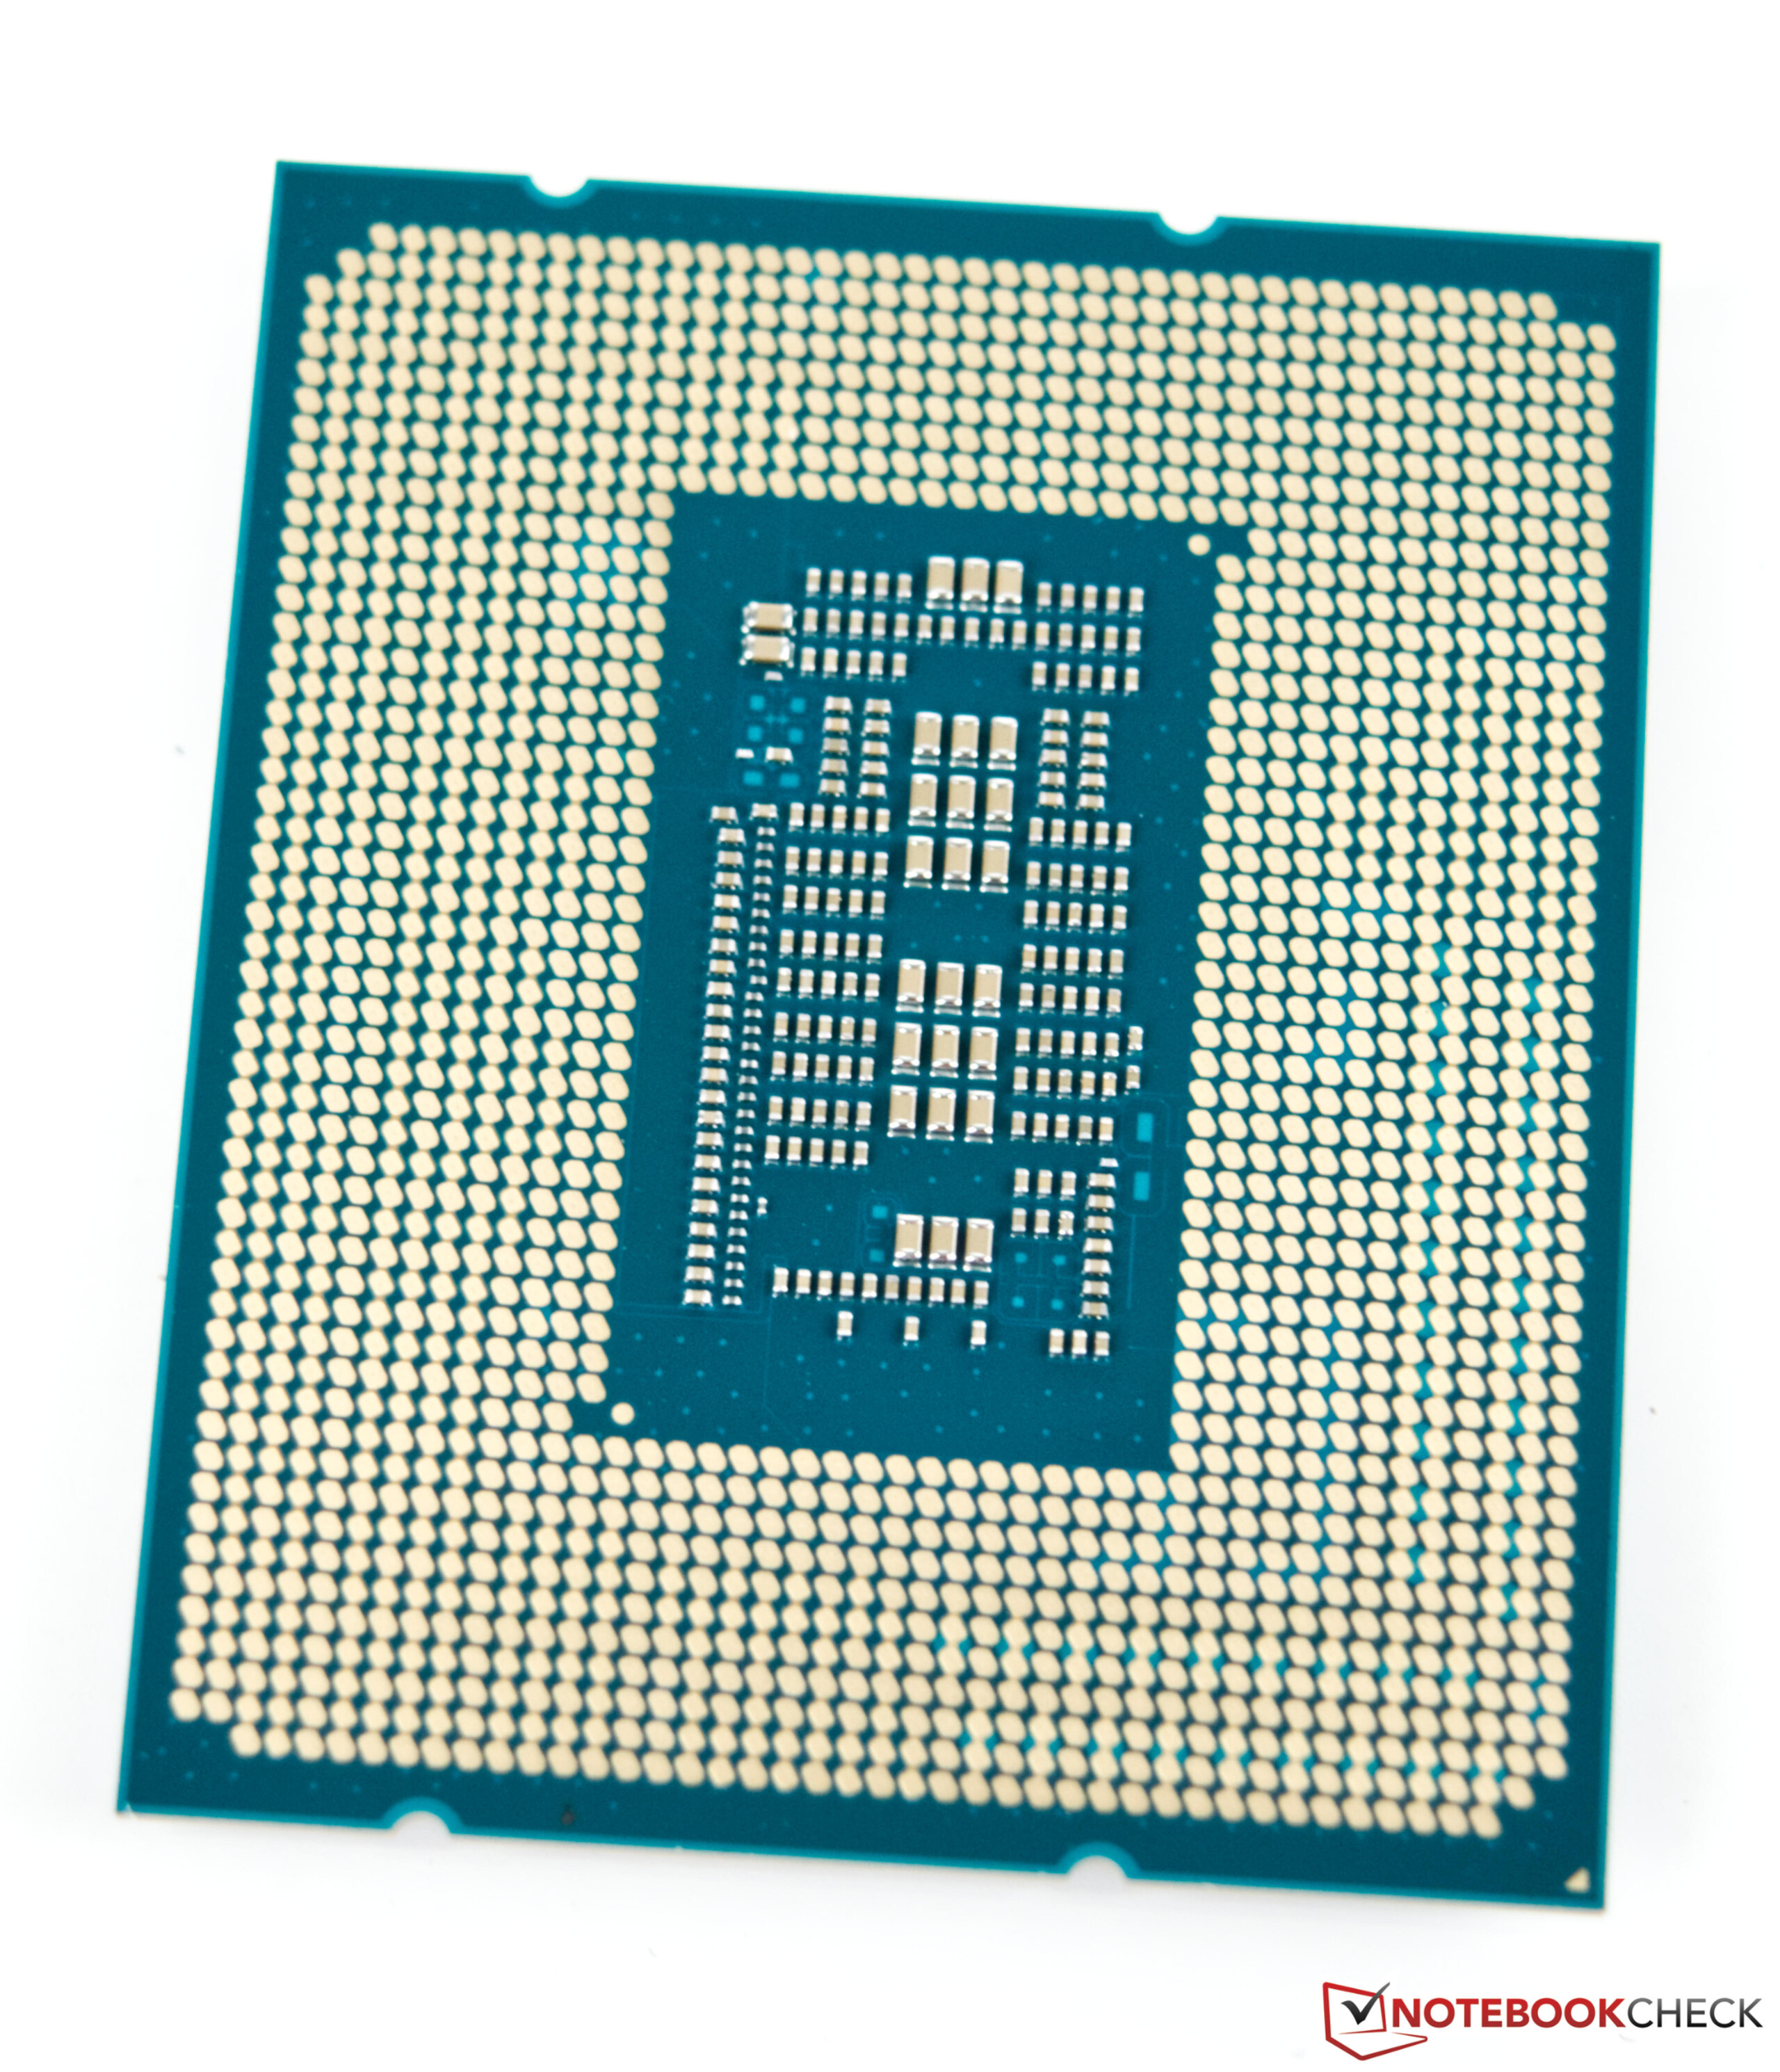
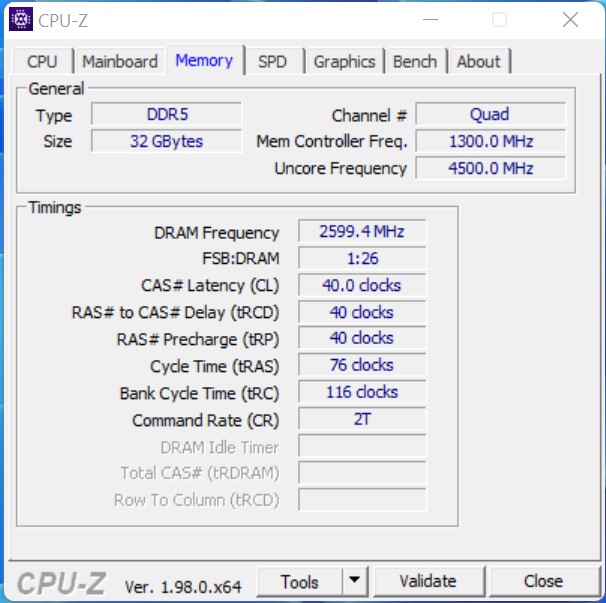
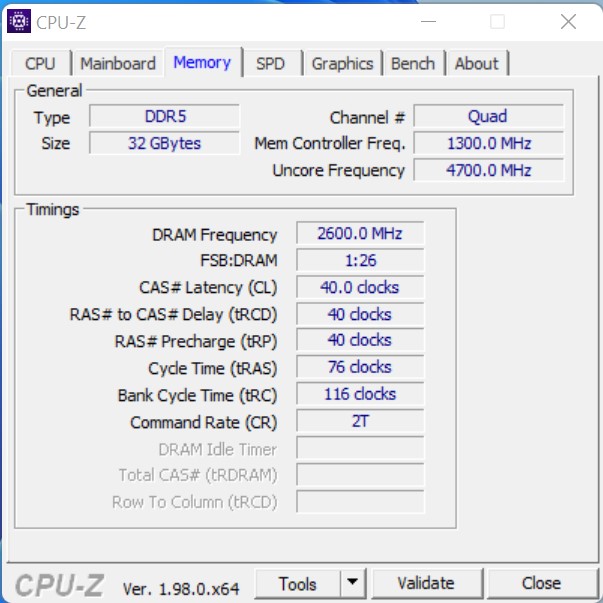
Con los nuevos procesadores para el segmento de sobremesa y la duodécima generación de la serie Core, Intel vuelve a introducir un cambio de plataforma. Tras Comet Lake-S y Rocket Lack-S, LGA1200 ya es historia, y el socket LGA 1700, más grande, toma el relevo. Las mejoras más conocidas son el soporte de DDR5 y PCIe 5.0. Sin embargo, en este momento todavía no hay productos disponibles que puedan utilizar todo este ancho de banda. Esto hace que la inversión en la plataforma sea una inversión que sólo se podrá utilizar en el futuro. Las cosas pintan un poco mejor en la memoria de trabajo. Aquellos que quieran unirse a la nueva tendencia y obtener el mejor rendimiento no podrán evitar la nueva memoria de trabajo DDR5. Pero los procesadores Intel Alder Lake-S también son compatibles con la memoria RAM DDR4. Puedes encontrar a la venta las placas correspondientes también con el nuevo chipset Z690 de gama alta.
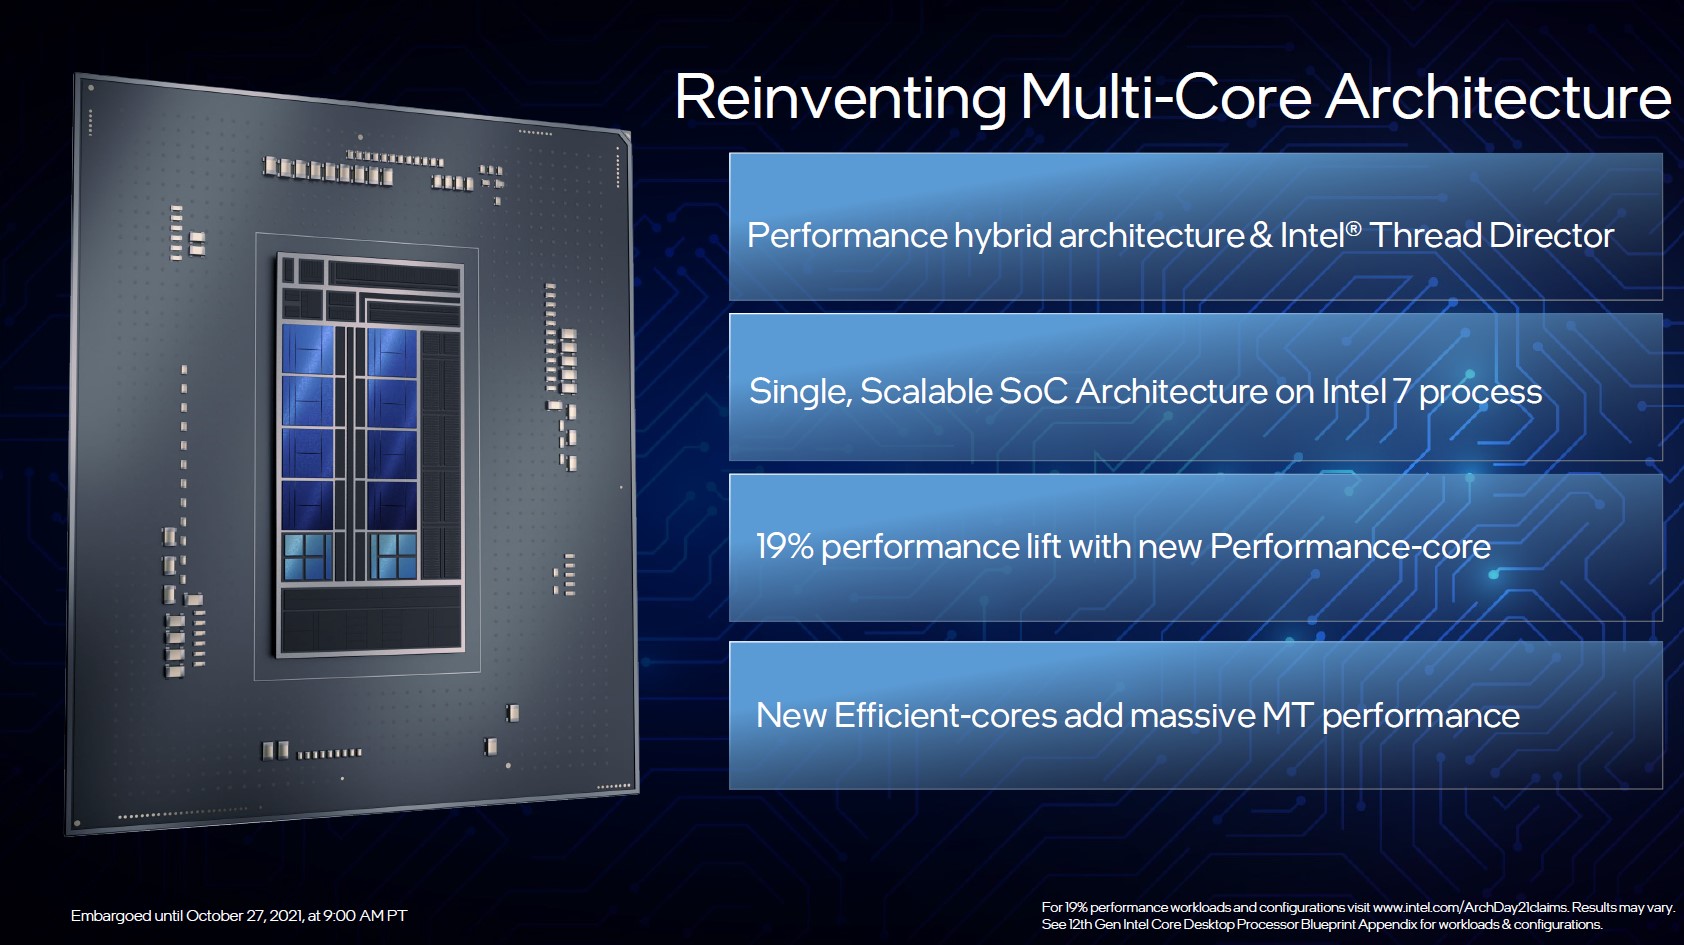
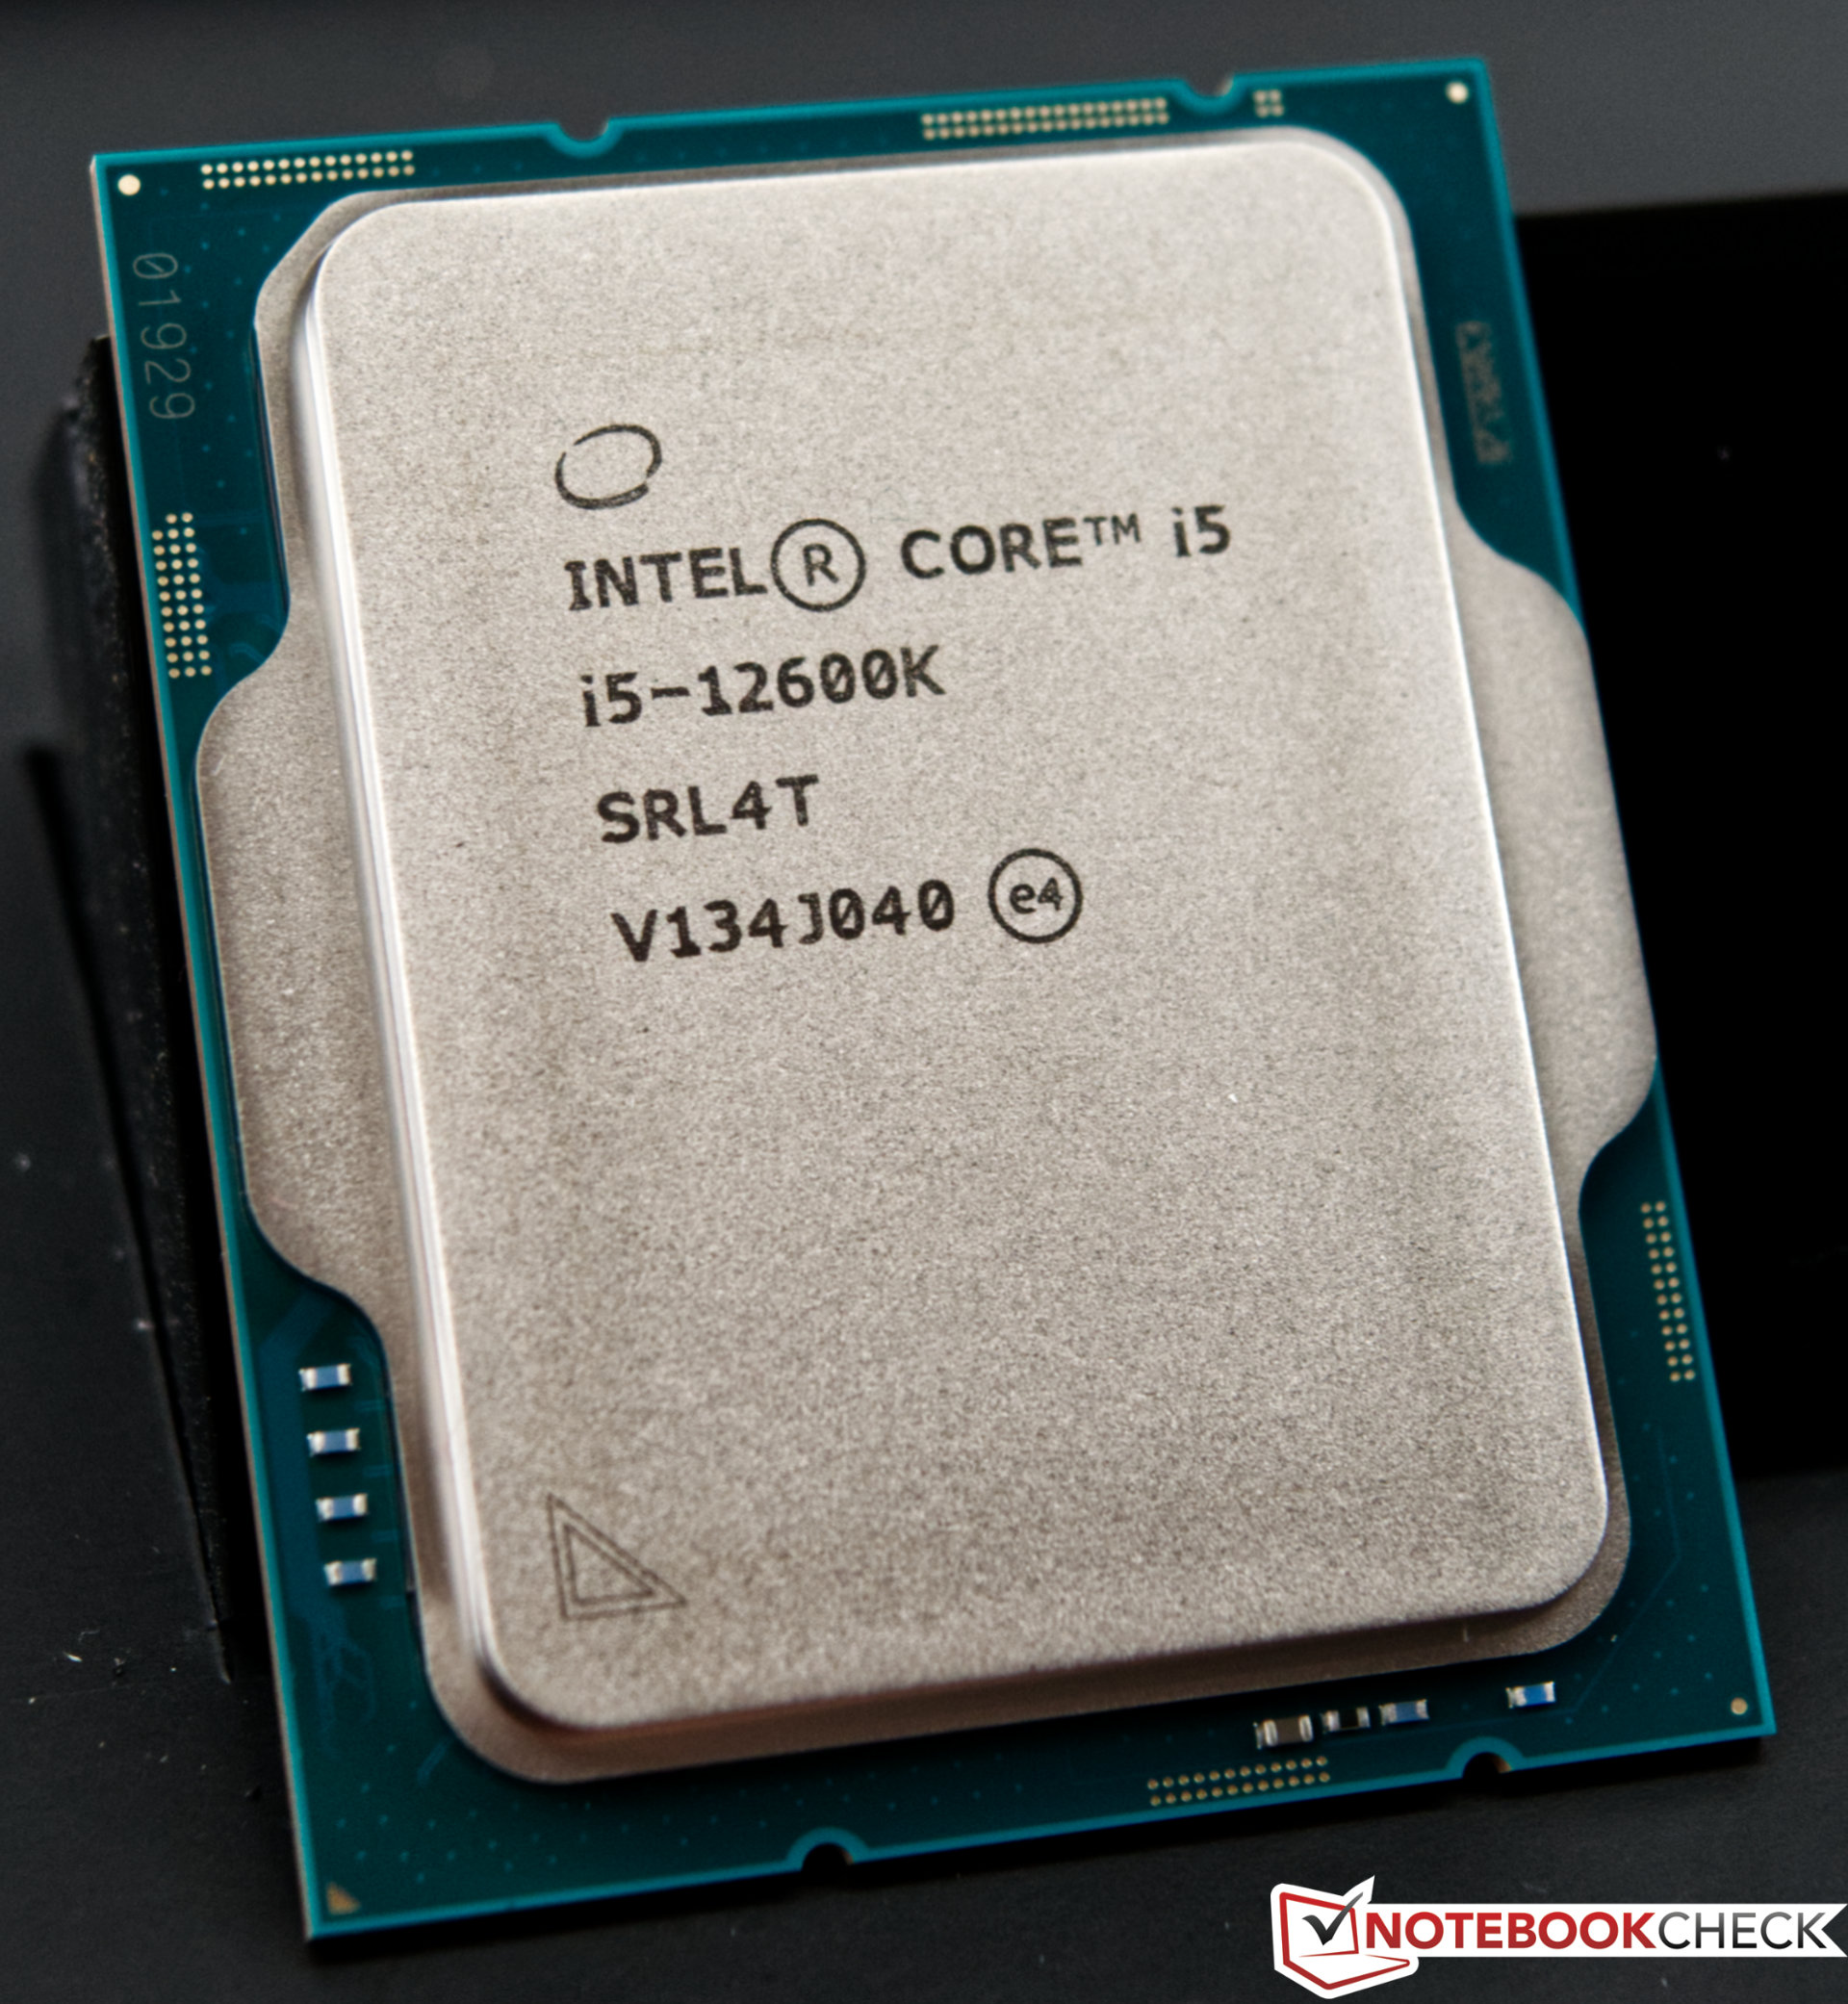
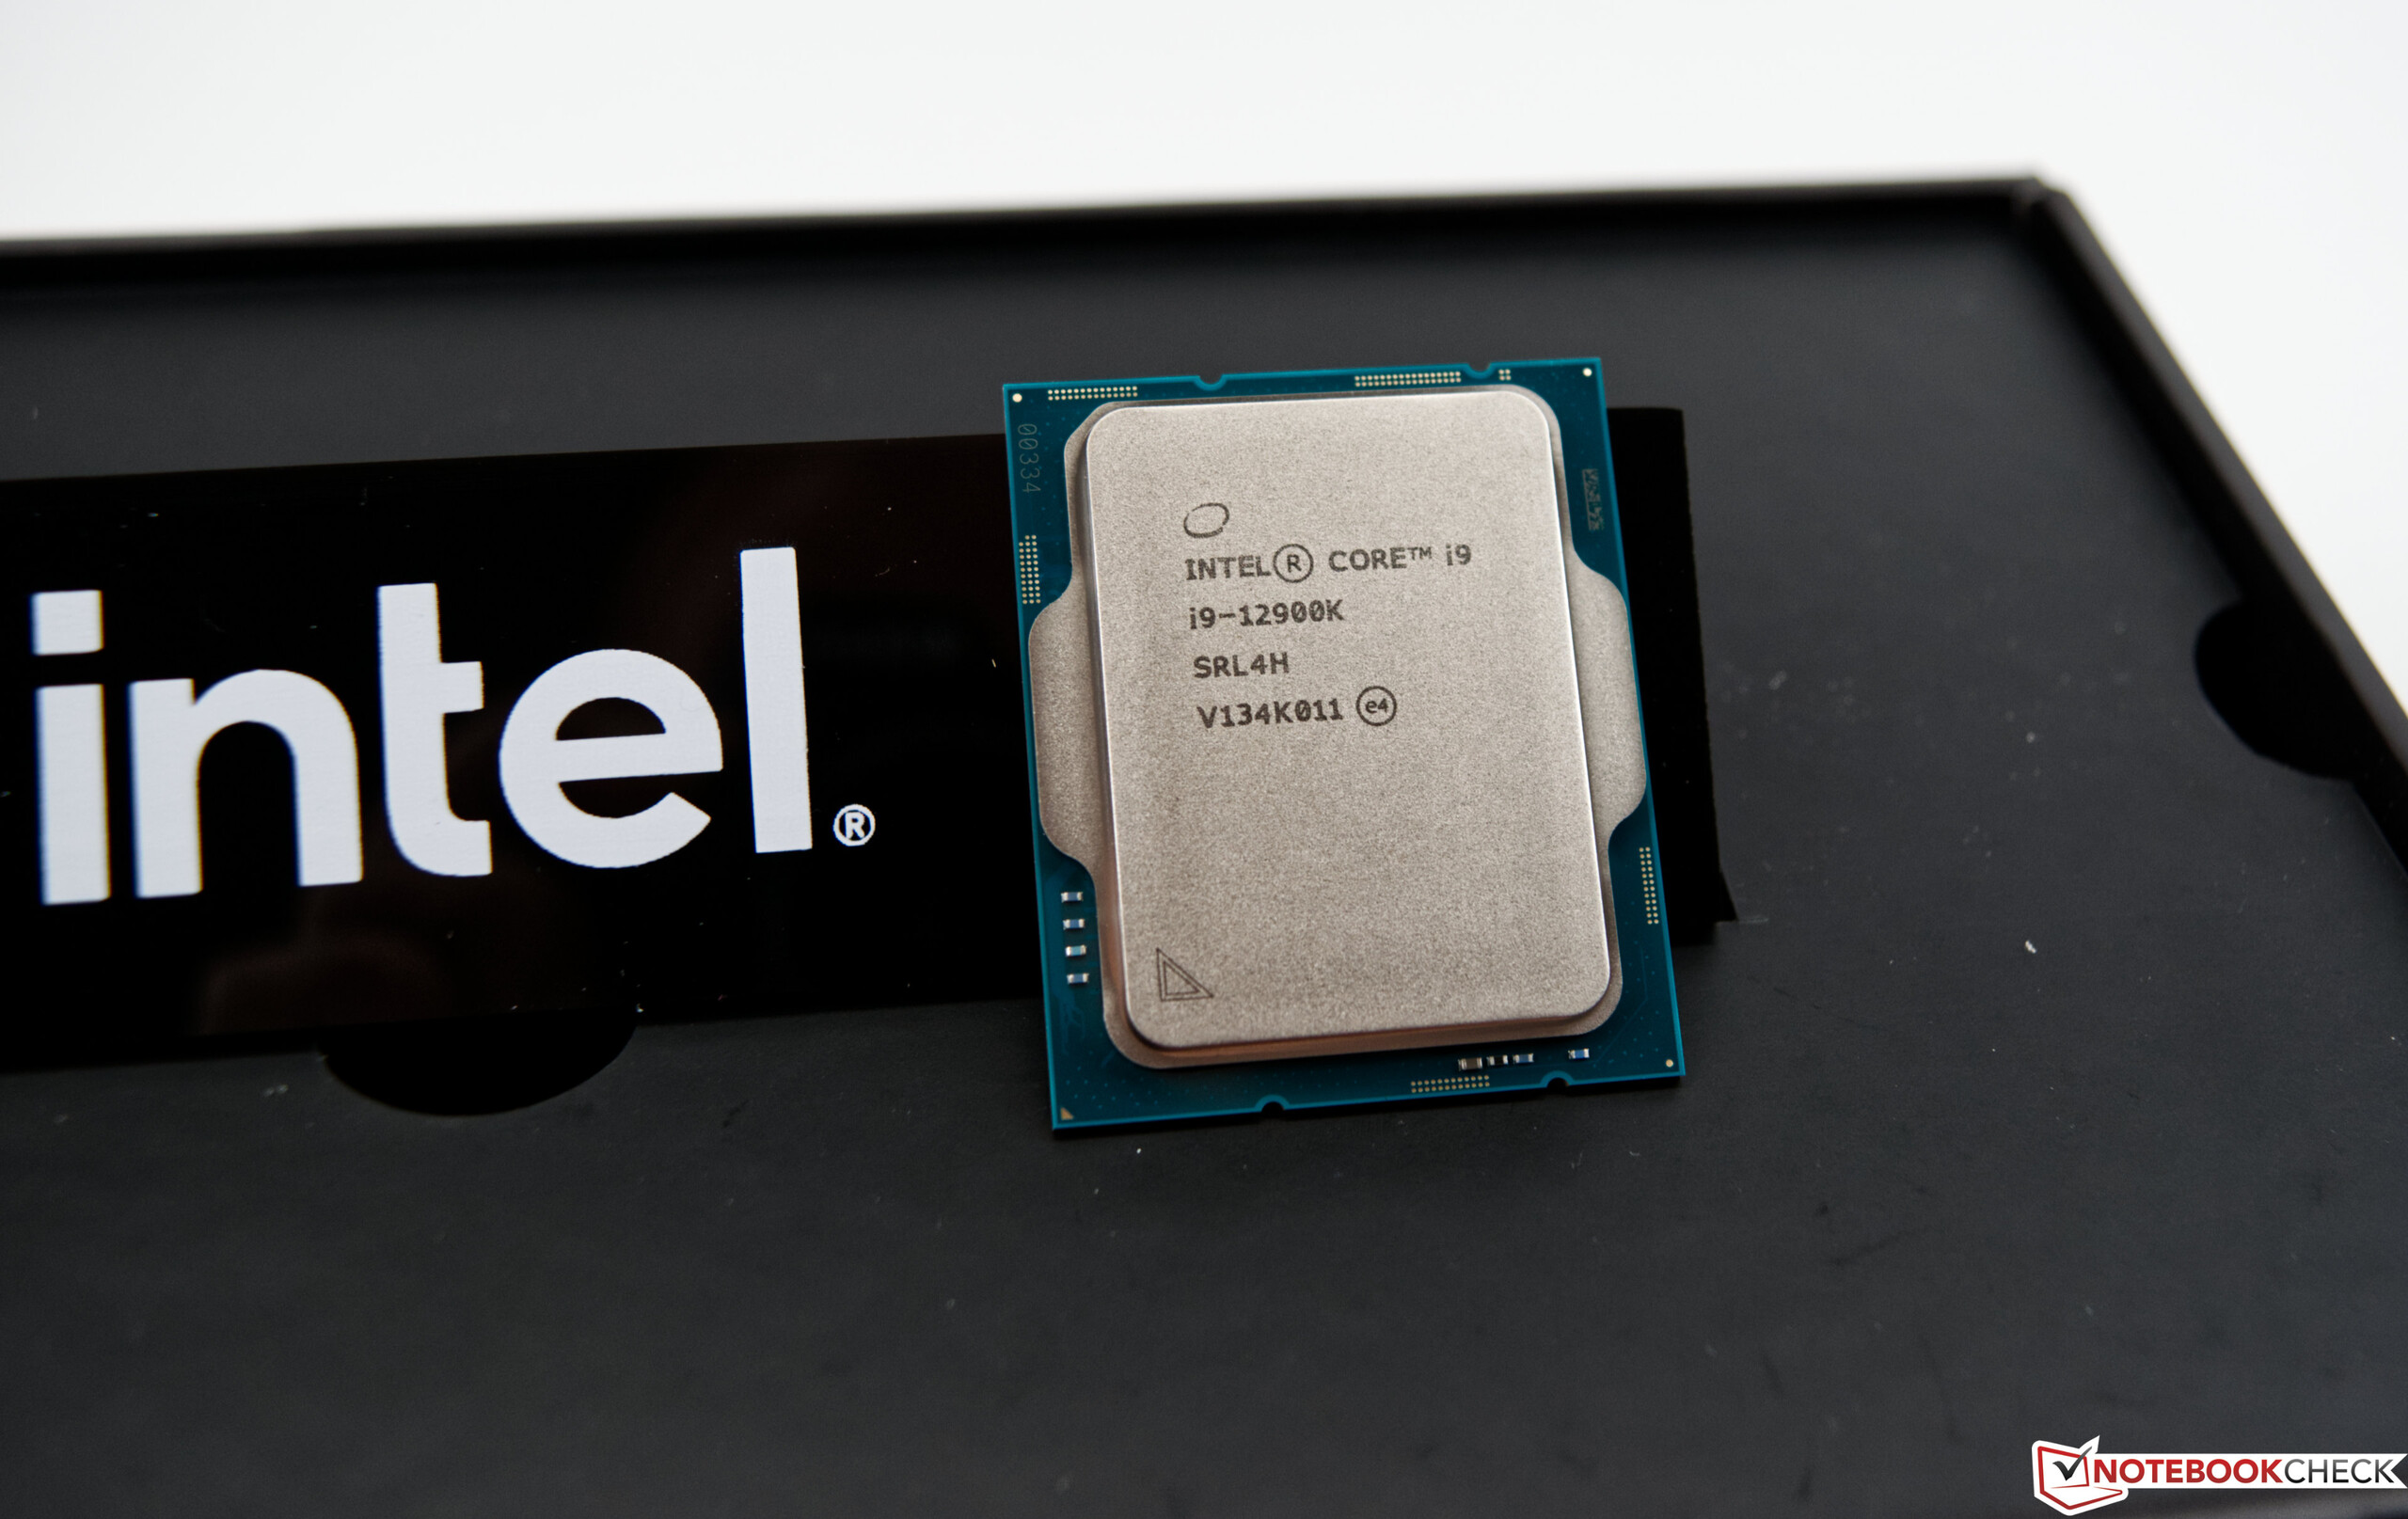
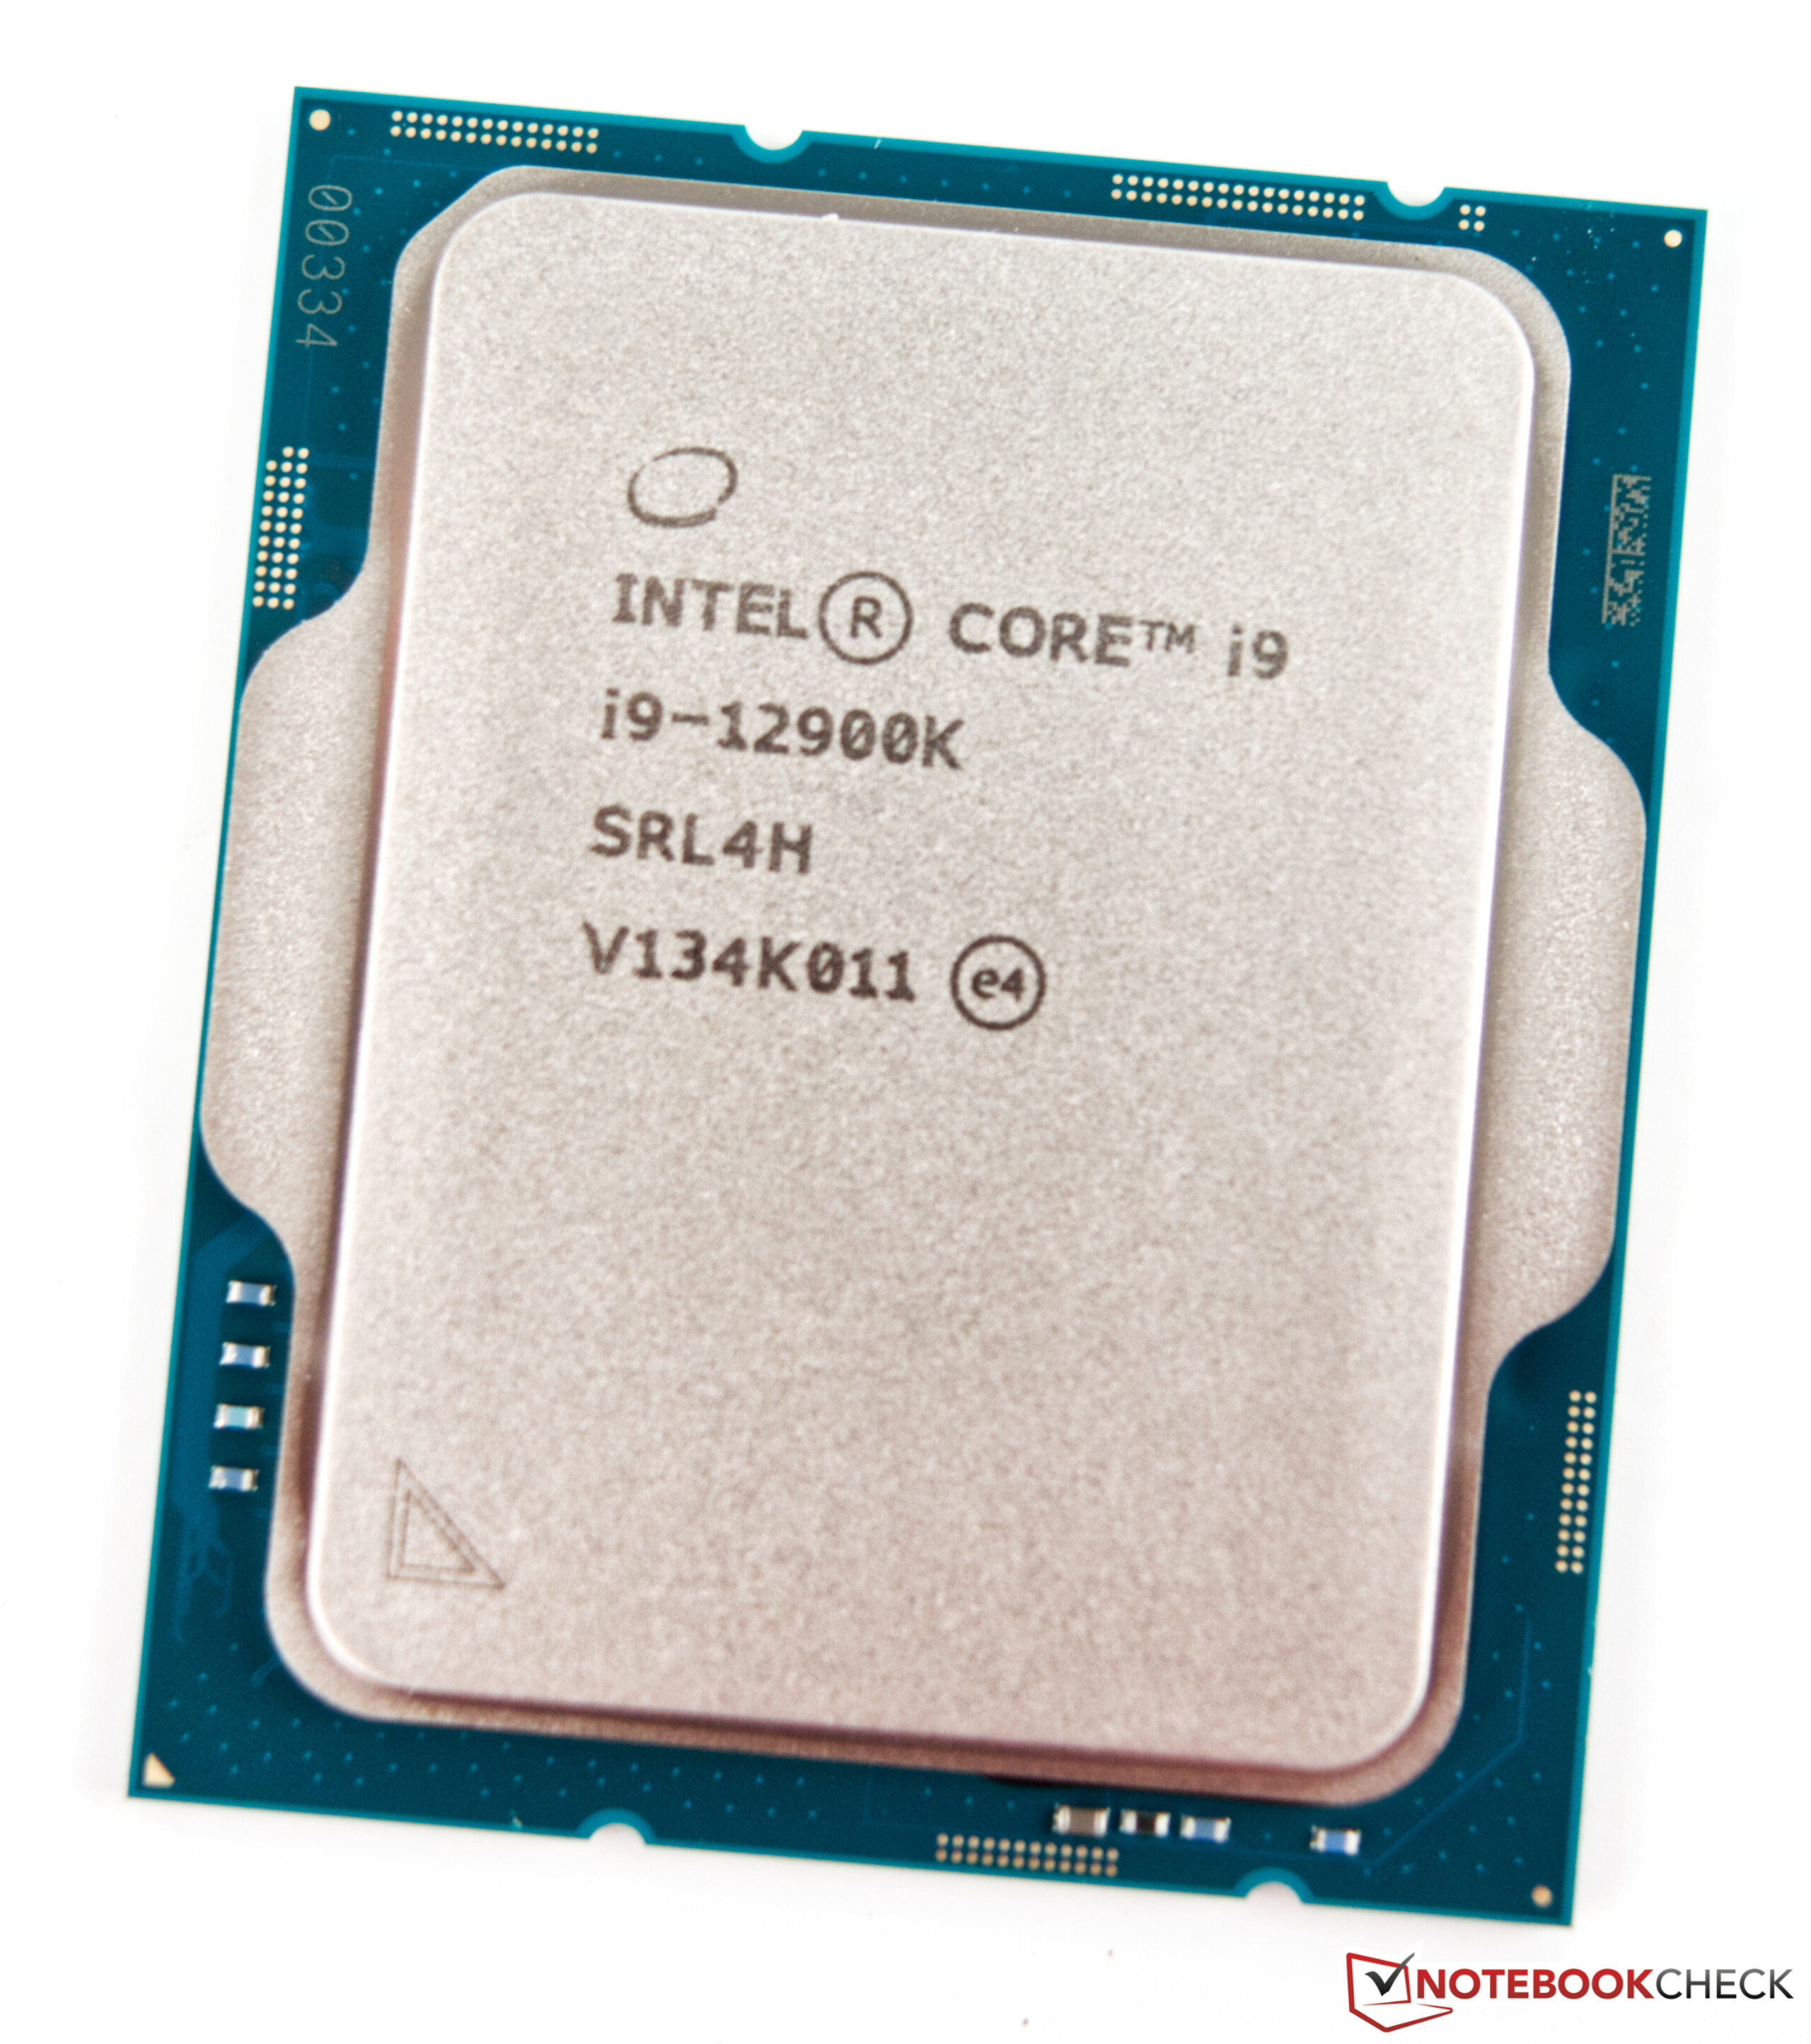
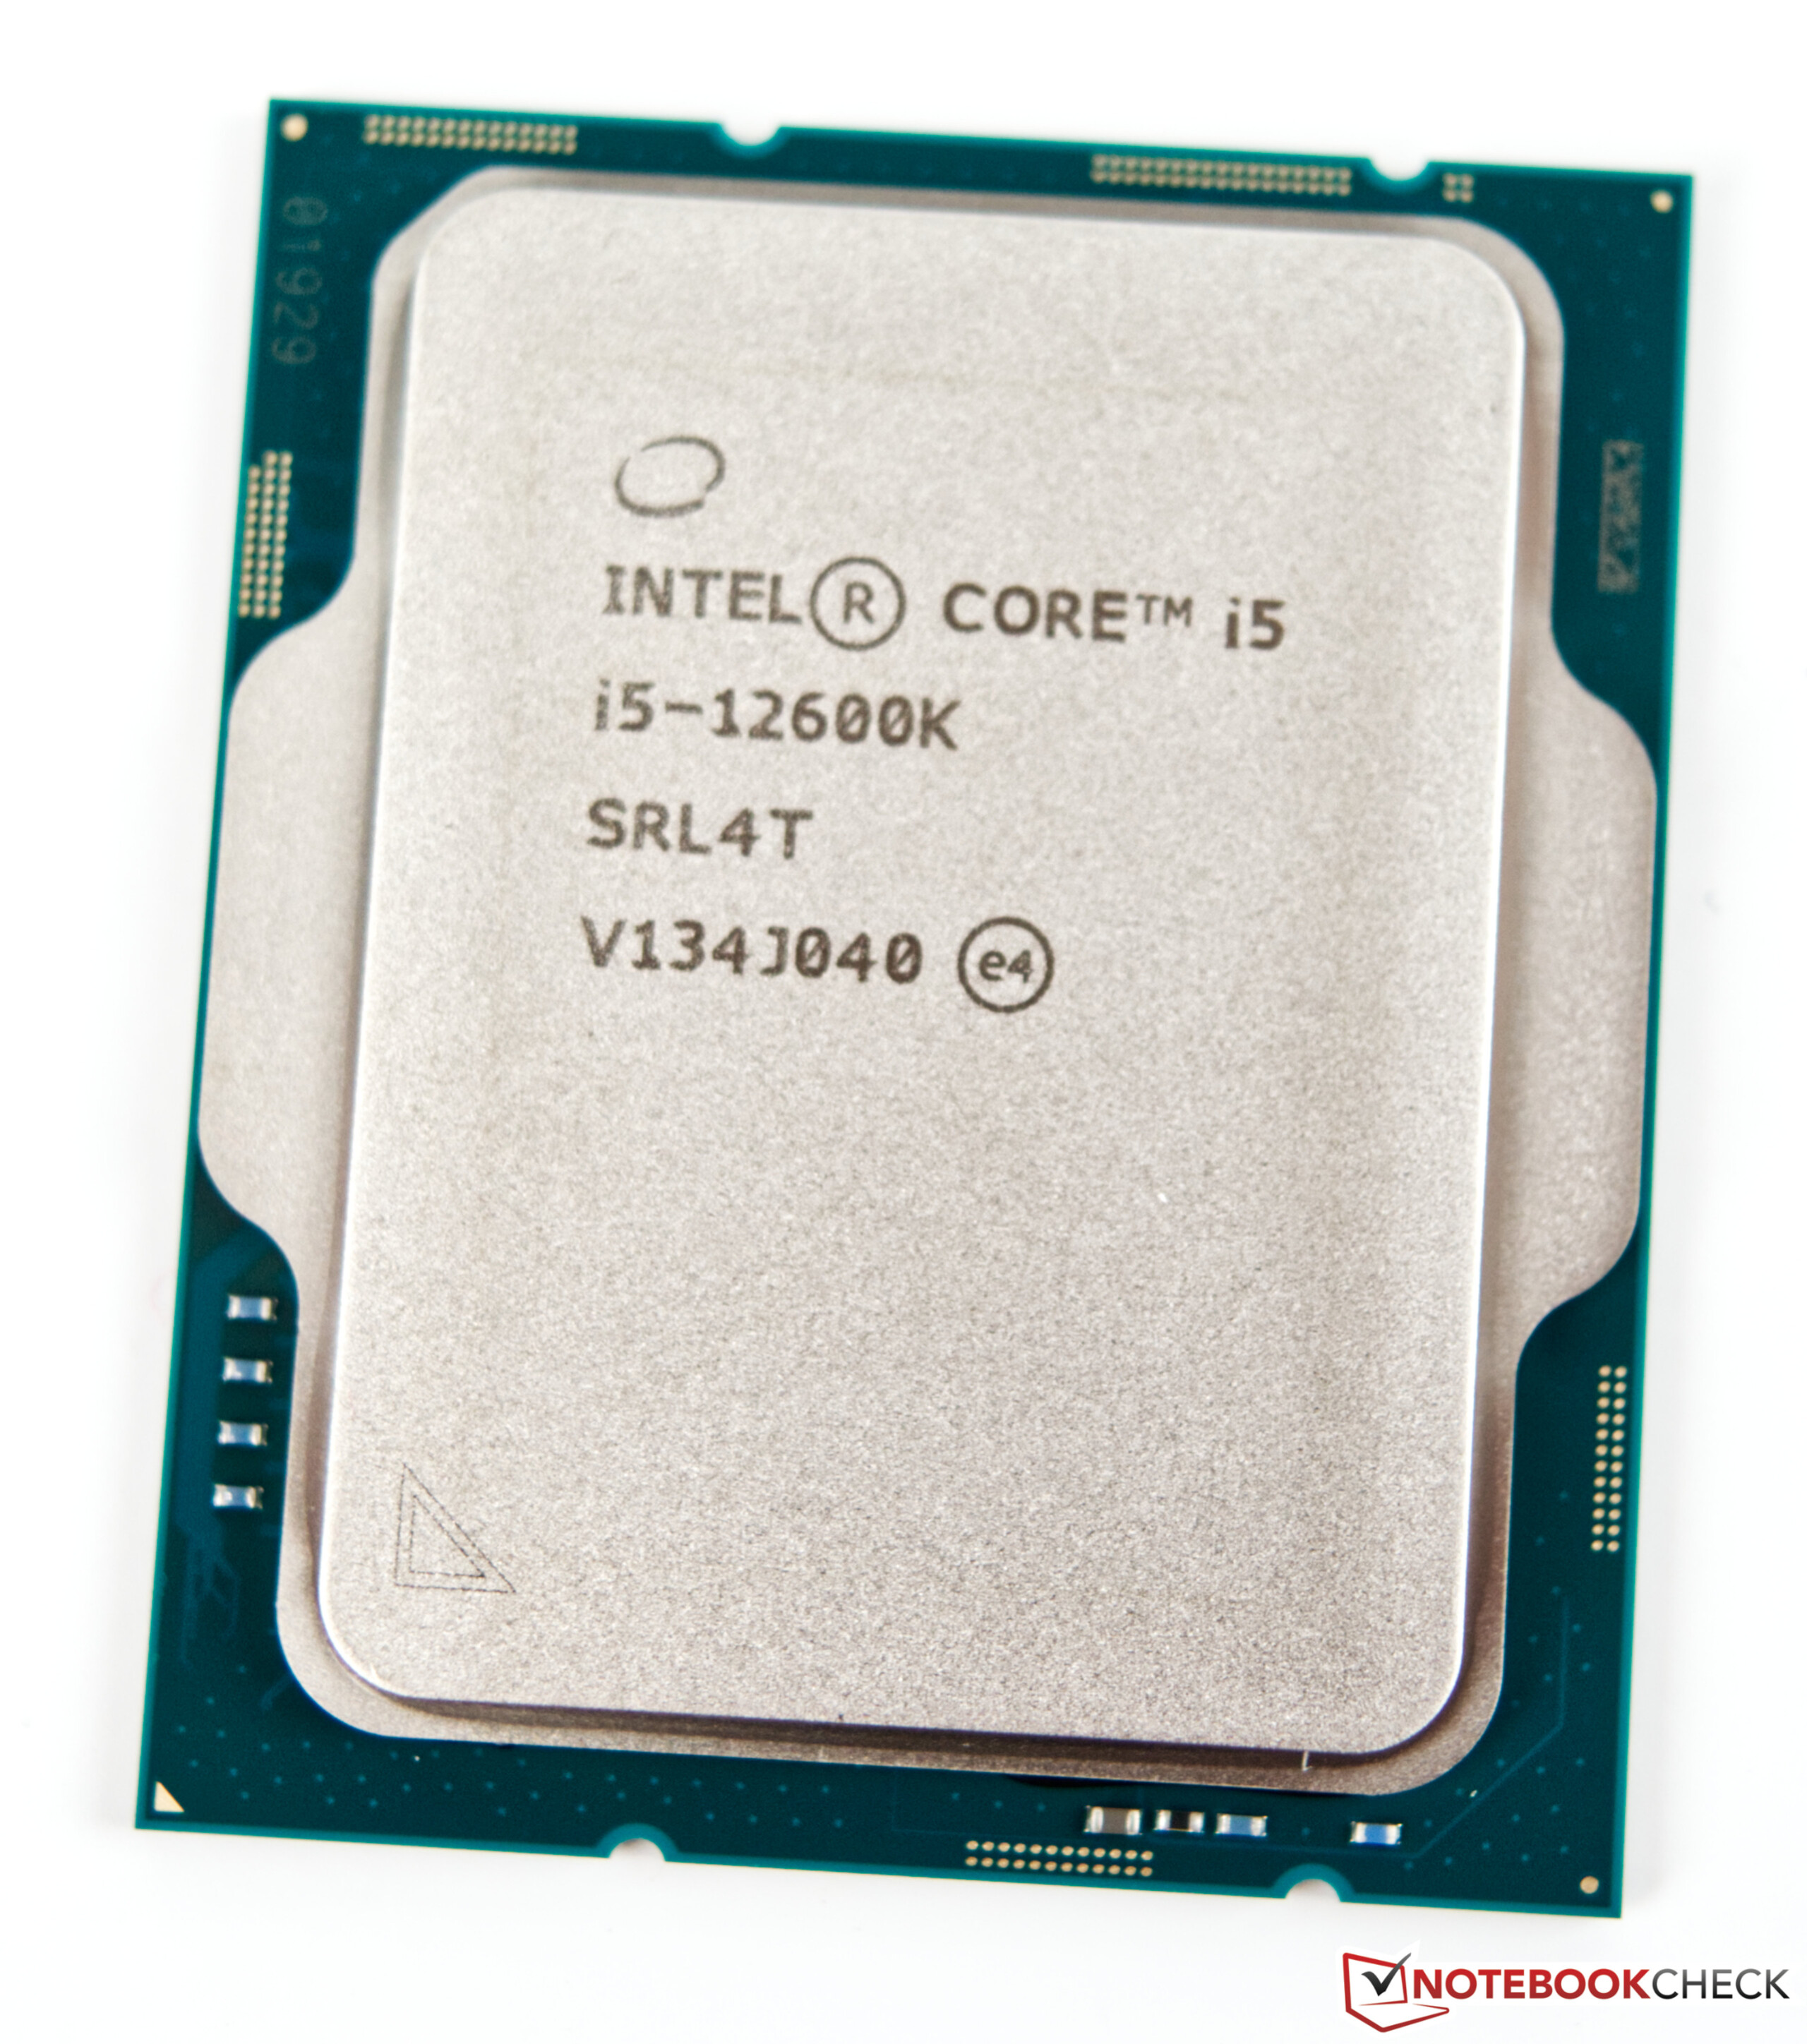
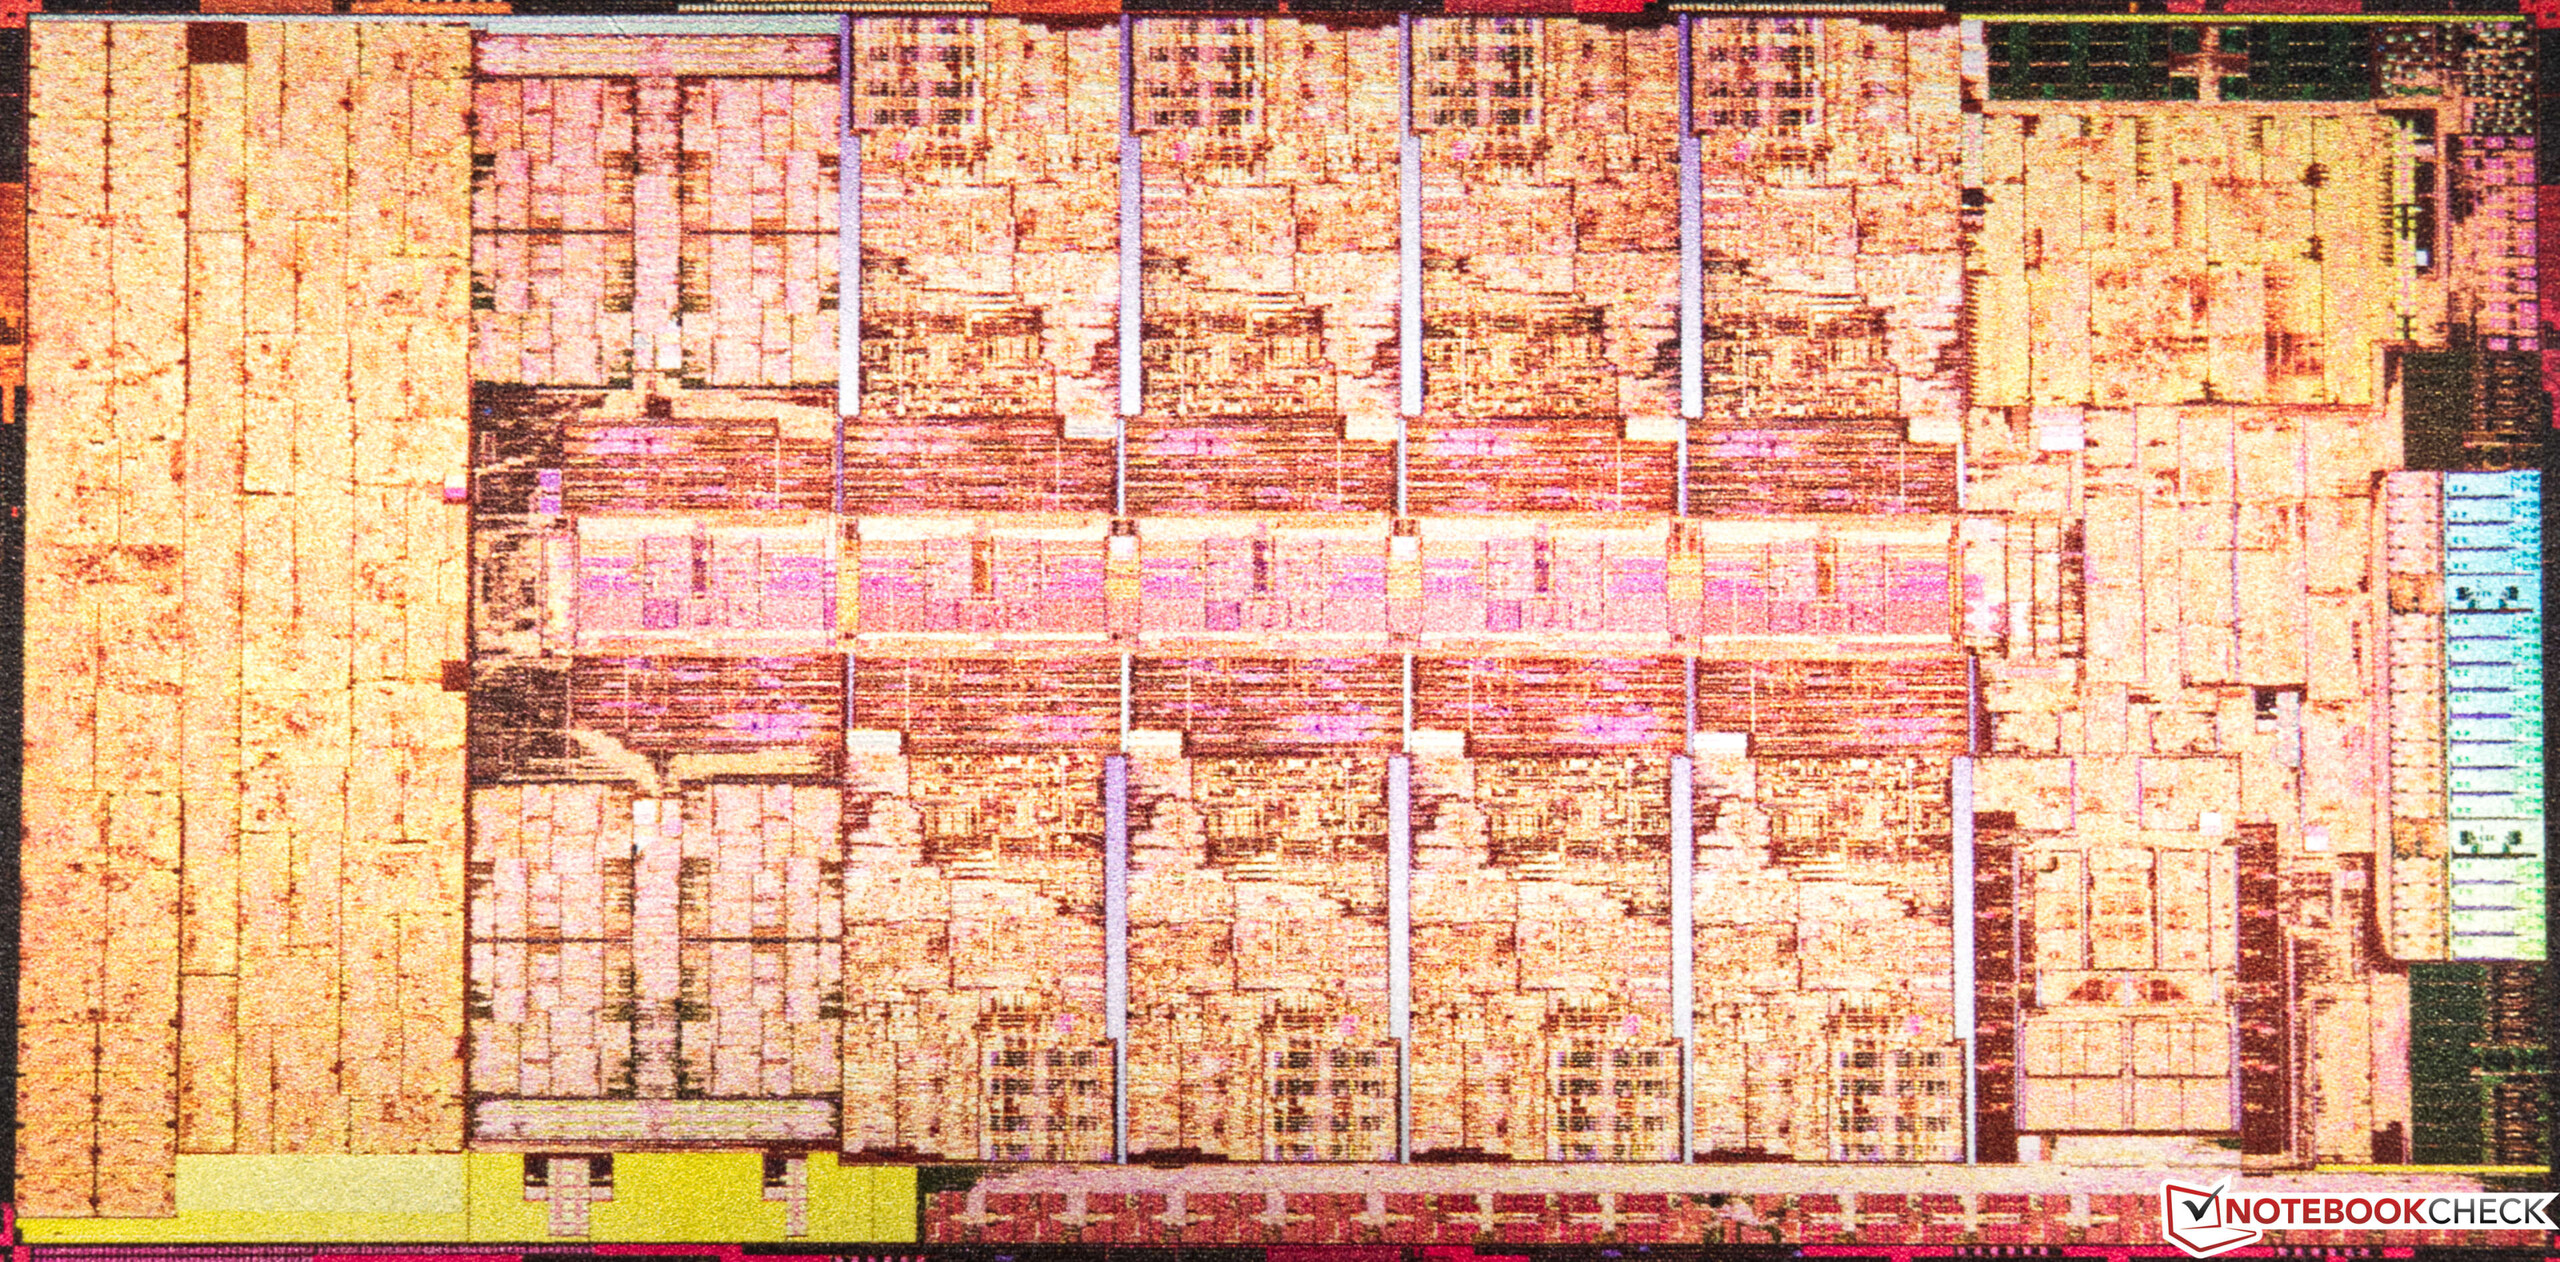
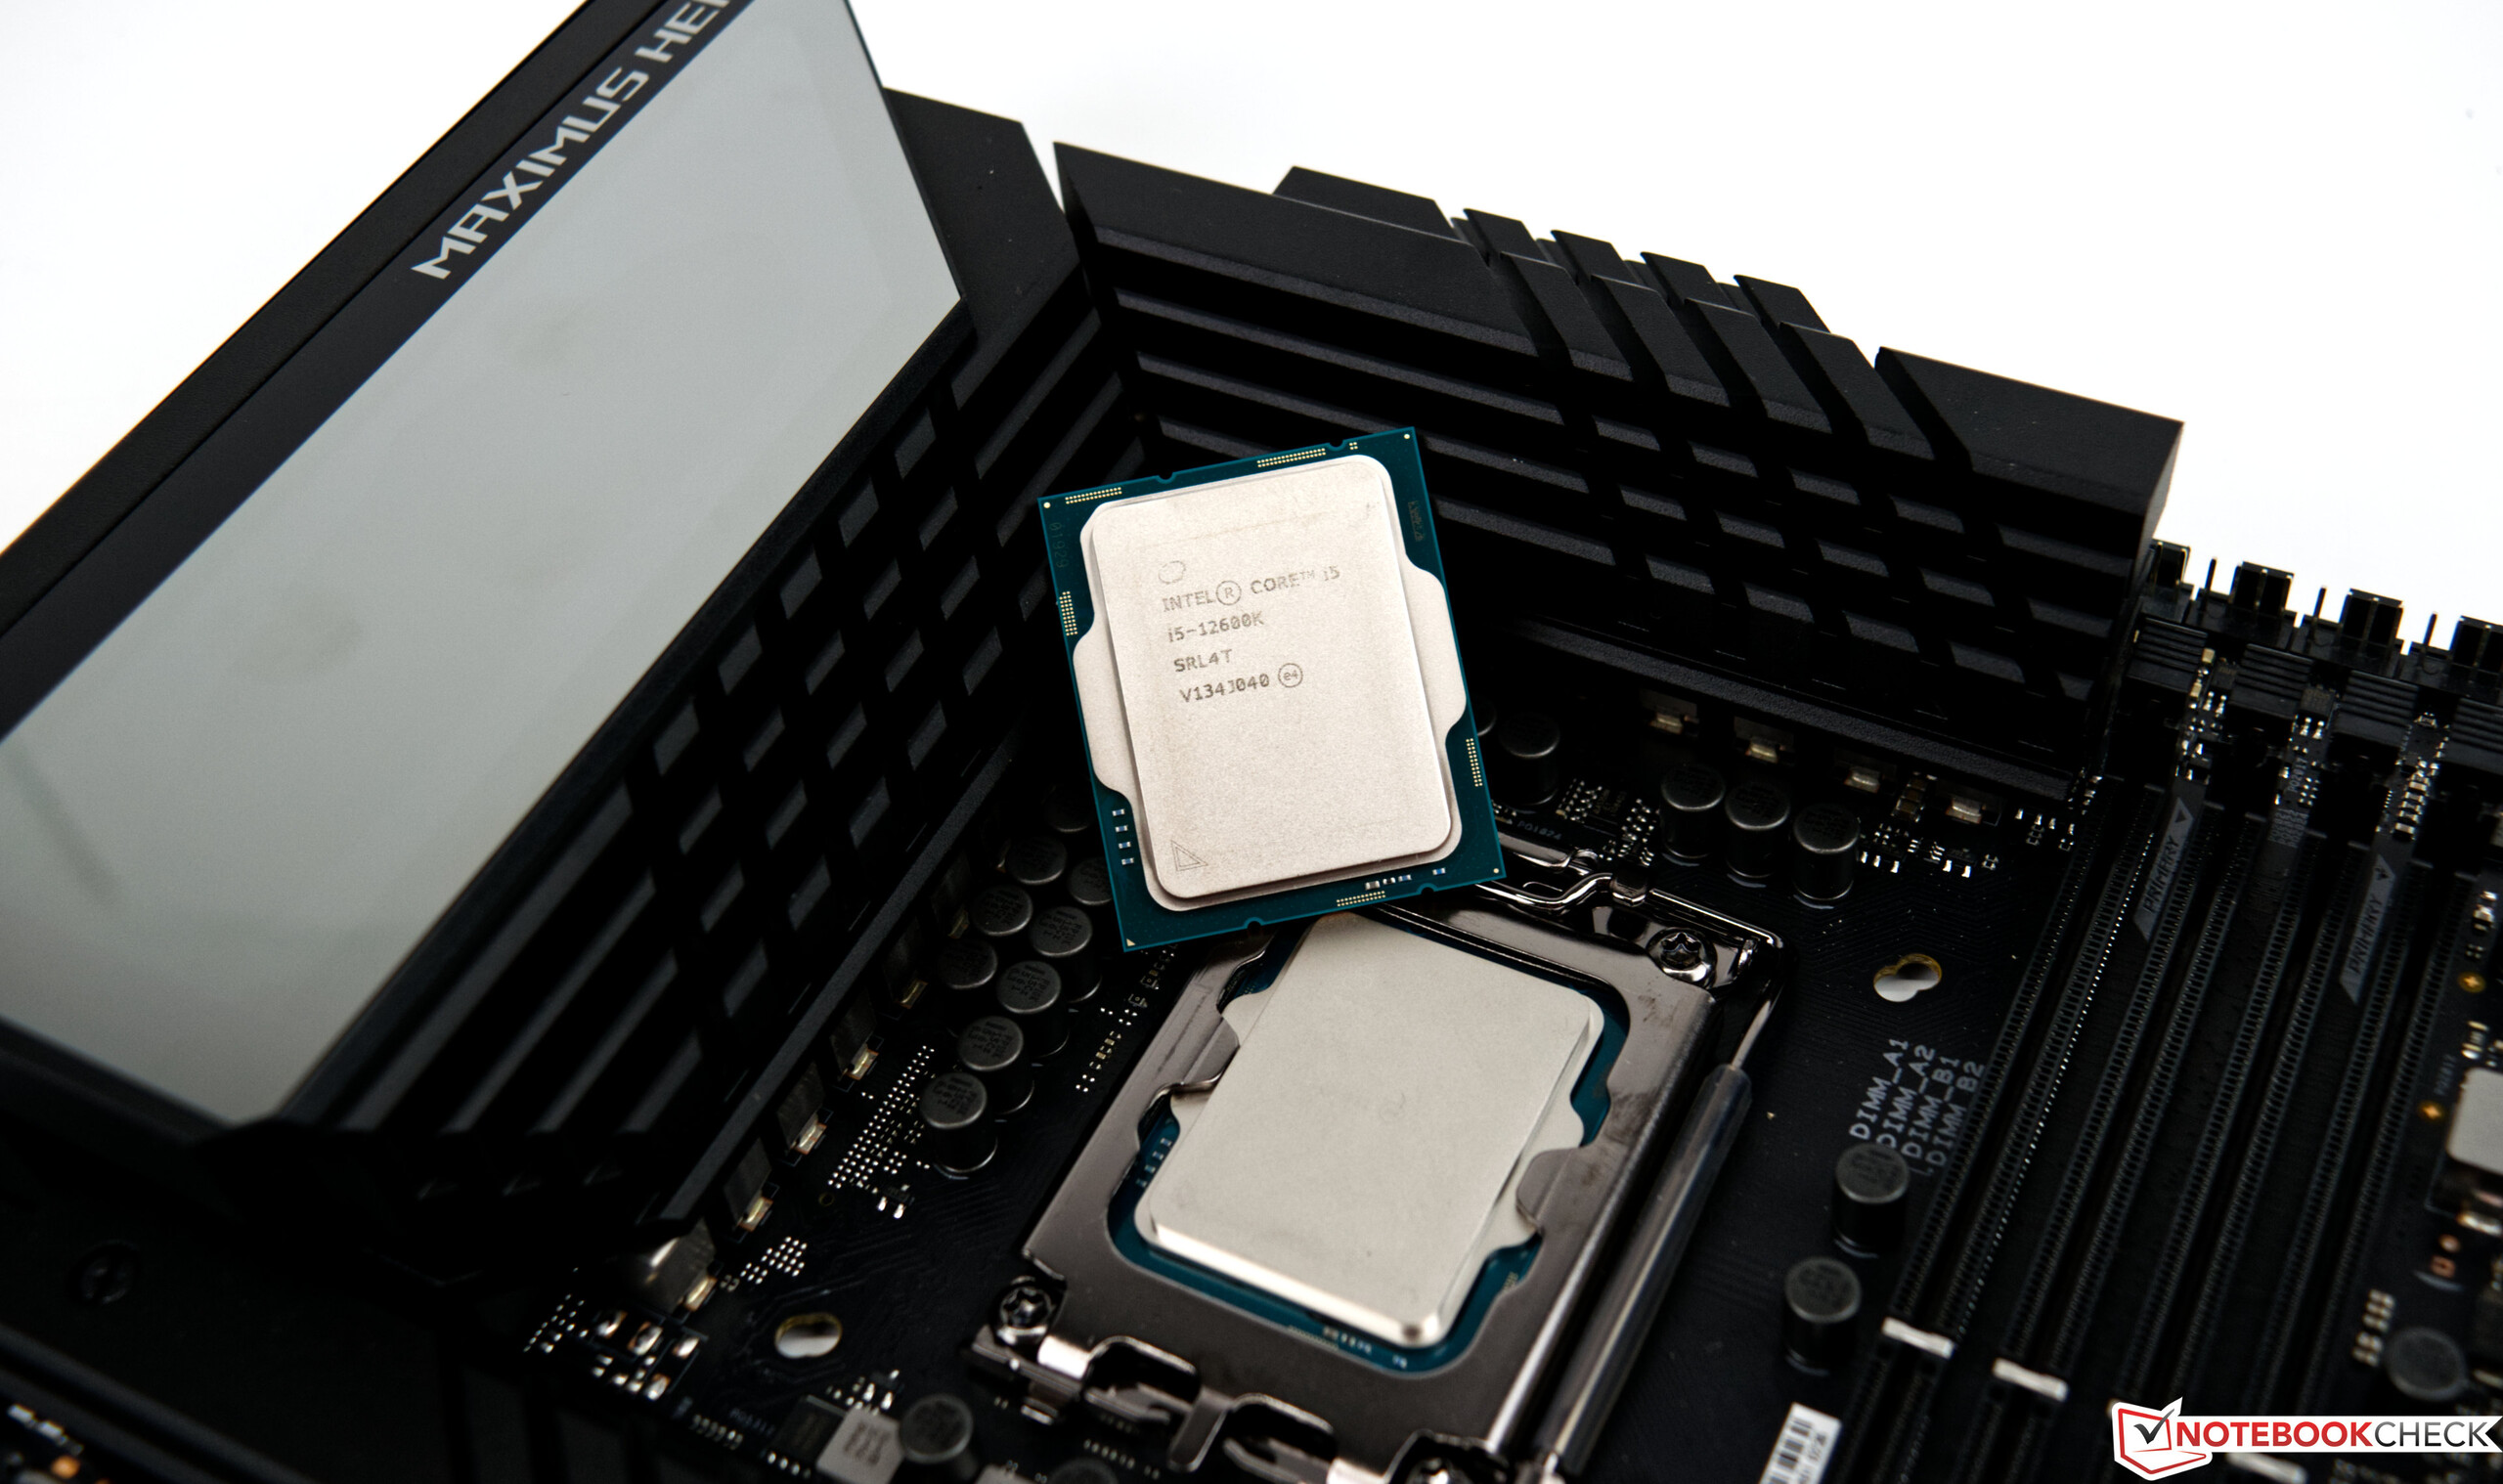
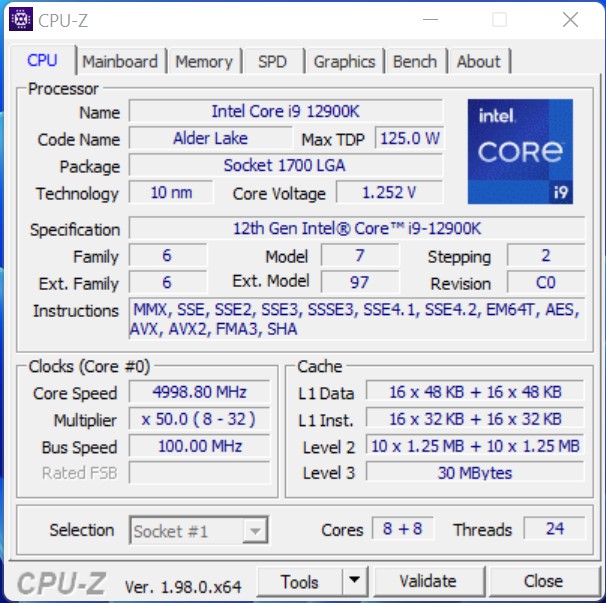
Con Alder Lake-S, Intel da un gran paso adelante que no es sólo una pequeña actualización de Rocket Lake-S. El nuevo diseño se divide en núcleos de rendimiento, los llamados núcleos P, y núcleos de eficiencia energética, los núcleos E. Esto permite al modelo superior manejar 24 hilos, resultantes de 8 núcleos P que incluyen hyperthreading (HT) y 8 núcleos E sin HT. En el Intel Core i5-12600K más pequeño, que también examinamos en este análisis, son 6 núcleos P y 4 núcleos E, lo que resulta en 16 hilos. Se supone que los nuevos núcleos E quitan parte de la carga a los núcleos P, liberándolos para que ofrezcan un rendimiento informático suficiente para las aplicaciones exigentes mientras los núcleos E se encargan de los procesos de fondo. Pero los núcleos E no son en absoluto unidades de cálculo lentas, y su rendimiento está al nivel de Skylake. La gestión óptima de los núcleos corre a cargo del Intel Thread Director. Windows 11 como sistema operativo es un requisito para un uso óptimo.
Hemos recopilado para ti los representantes más importantes de la nueva familia Alder Lake-S en la siguiente lista
Los procesadores Core de la serie Alder Lake-S de un vistazo
| Modelo | Núcleos / Hilos |
Velocidad de reloj P-Core / Turbo | Turbo 3.0 | Velocidad de reloj E-Core / Turbo | Caché L2 + L3 | Gráficos | PBP | MTB | Precio (SRP) |
| Corei9-12900K | 16(8P + 8E) /24 | 3,2 GHz / 5,1 GHz | 5,2 GHz | 2,4 GHz / 3,9 GHz | 14+ 30 MB | UHD770 | 125Vatios | 241Vatios | $ 589 |
| Core i9-12900KF | 16 (8P + 8E) /24 | 3,2 GHz / 5,1 GHz | 5,2 GHz | 2,4 GHz / 3,9 GHz | 14 + 30 MB | - | 125 Vatios | 241 Vatios | $ 564 |
| Core i7-12700K | 12 (8P + 4E) /20 | 3,6 GHz / 4,9 GHz | 5,0 GHz | 2,7 GHz / 3,8 GHz | 12 + 25 MB | UHD 770 | 125 Vatios | 190 Vatios | $ 409 |
| Core i7-12700KF | 12 (8P + 4E) /20 | 3,6 GHz / 4,9 GHz | 5,0 GHz | 2,7 GHz / 3,8 GHz | 12 + 25 MB | - | 125 Vatios | 190 Vatios | $ 384 |
| Corei5-12600K | 10(6P + 4E) /16 | 3,7 GHz / 4,9 GHz | - | 2,8 GHz / 3,6 GHz | 9,5 + 20 MB | UHD770 | 125Vatios | 150Vatios | $ 289 |
| Core i5-12600KF | 10 (6P + 4E) /16 | 3,7 GHz / 4,9 GHz | - | 2,8 GHz / 3,6 GHz | 9,5 + 20 MB | - | 125 Vatios | 150 Vatios | $ 264 |
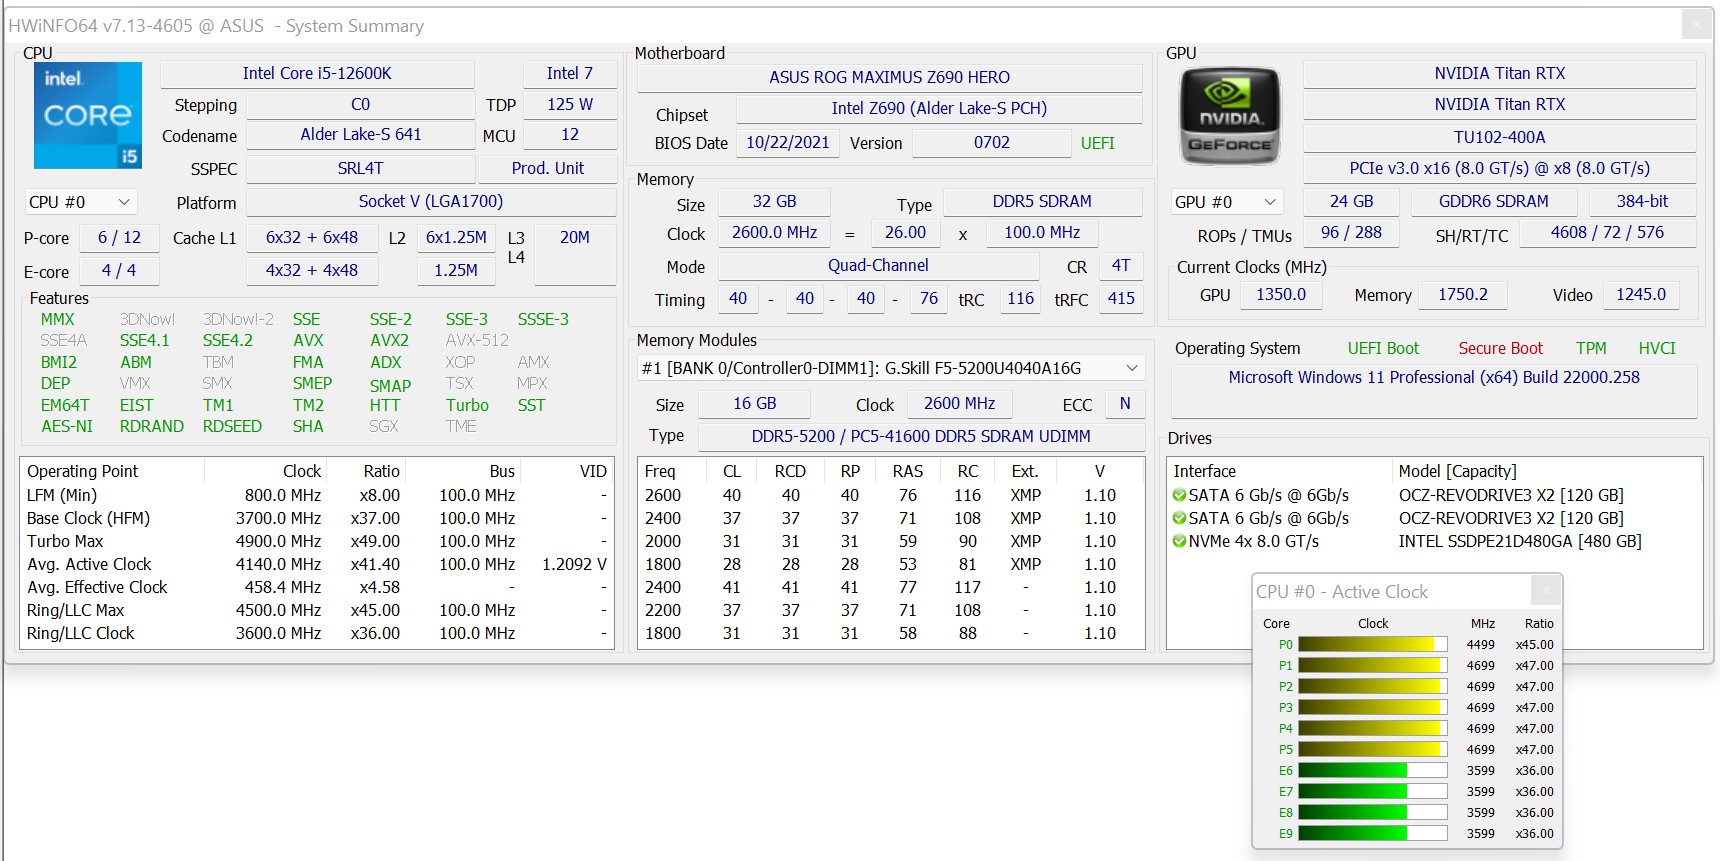
Detalles de nuestro sistema de pruebas
Utilizamos el siguiente sistema para nuestros puntos de referencia y pruebas a continuación:
- Tabla de pruebas del Raijintek Pean
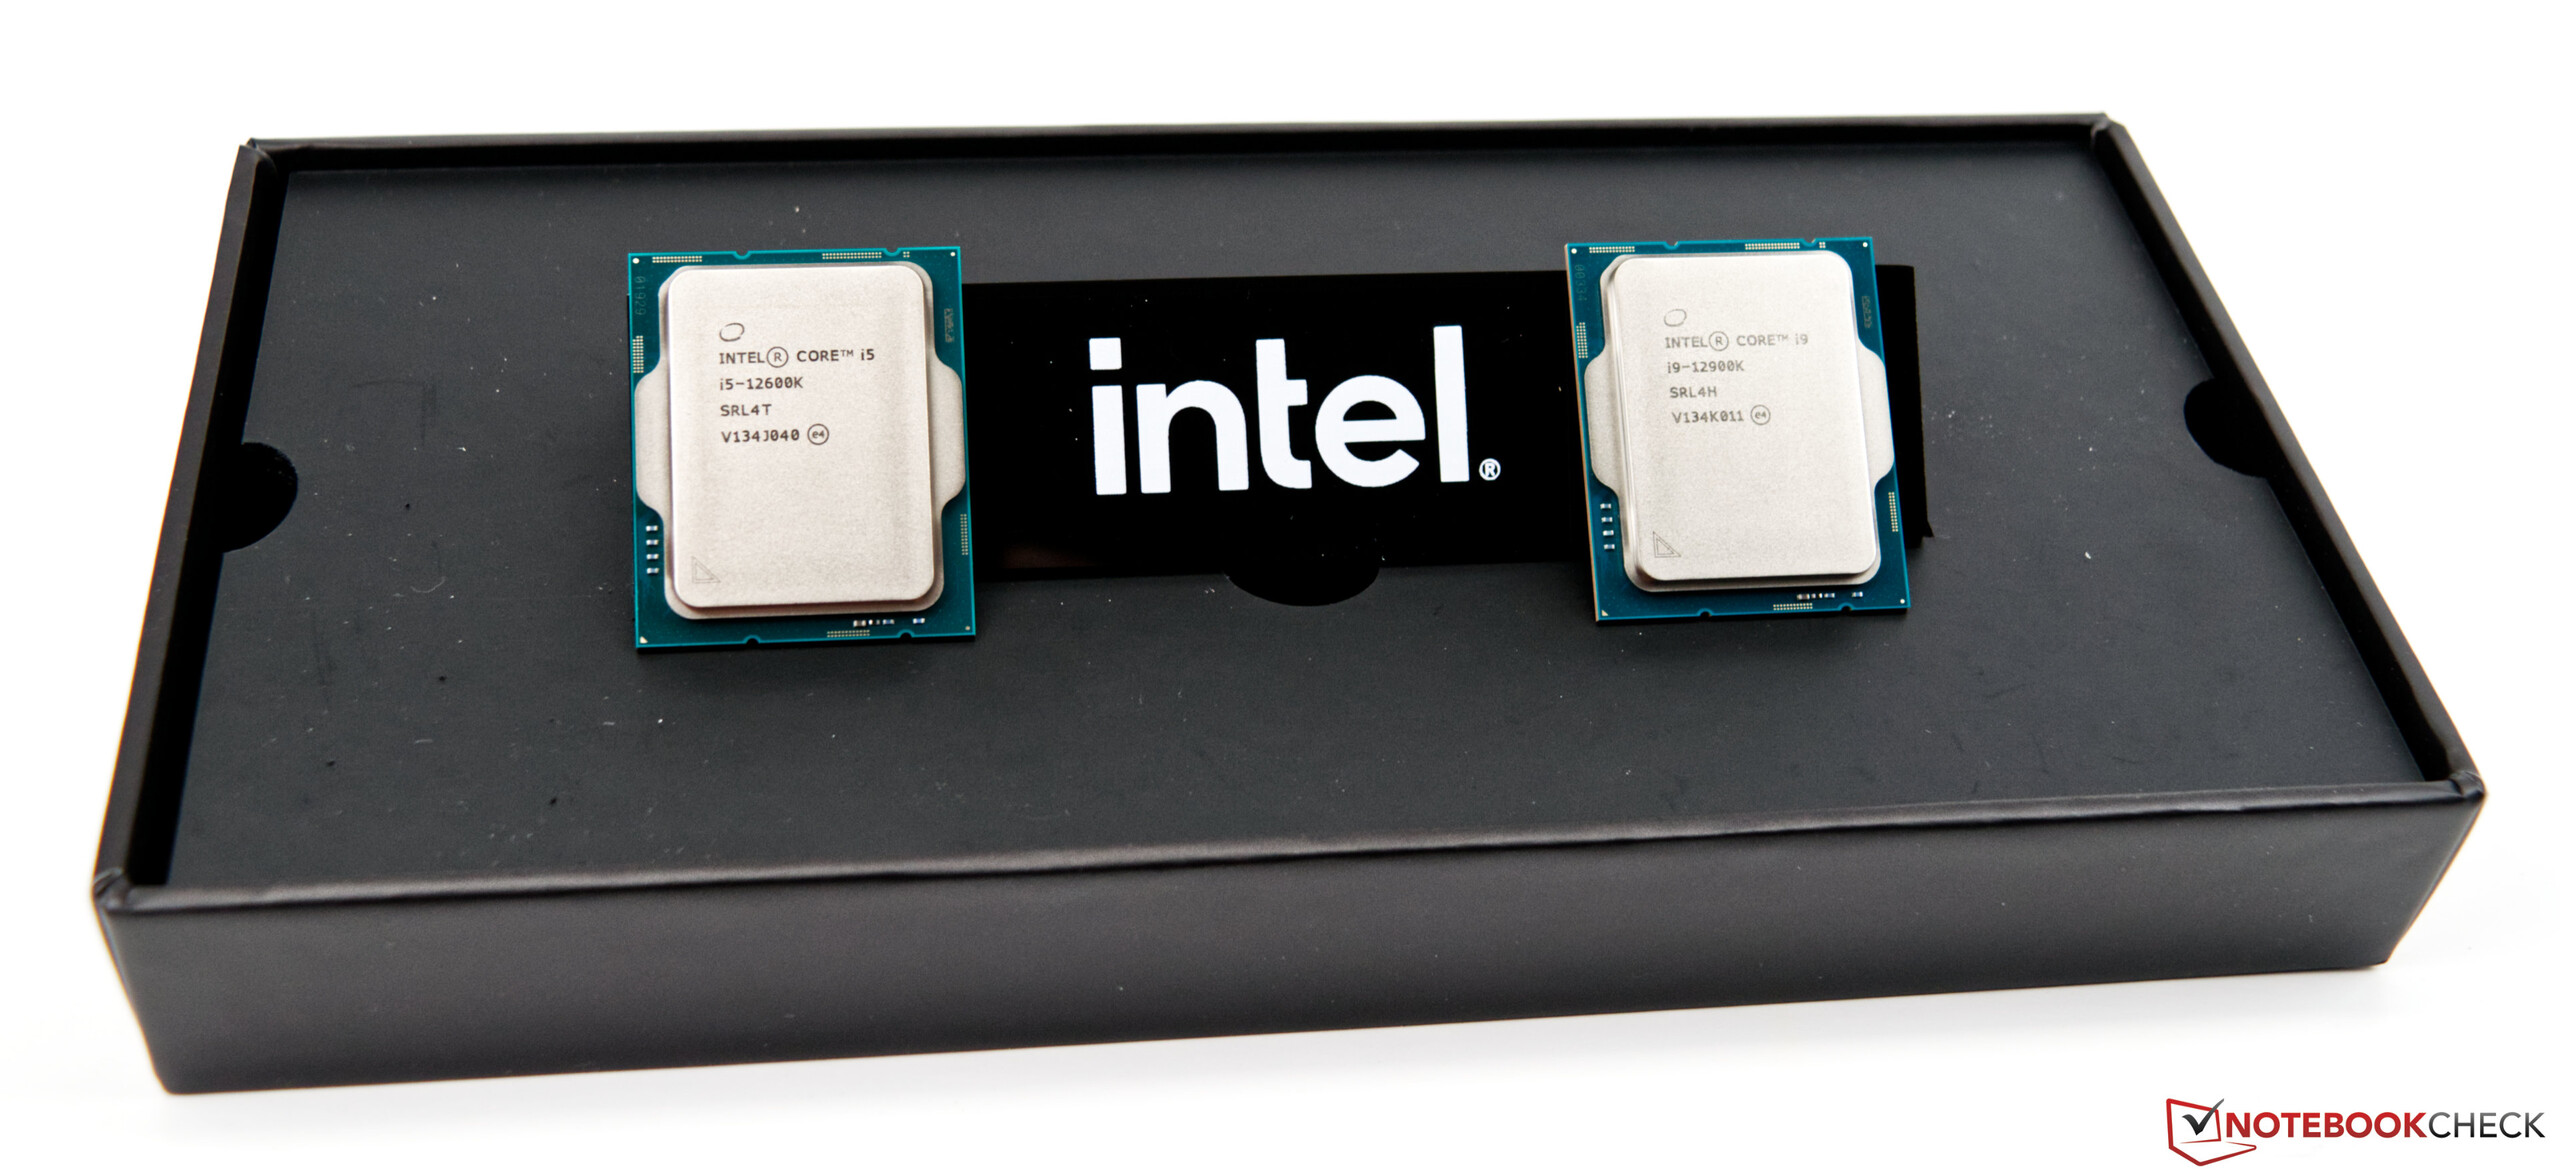
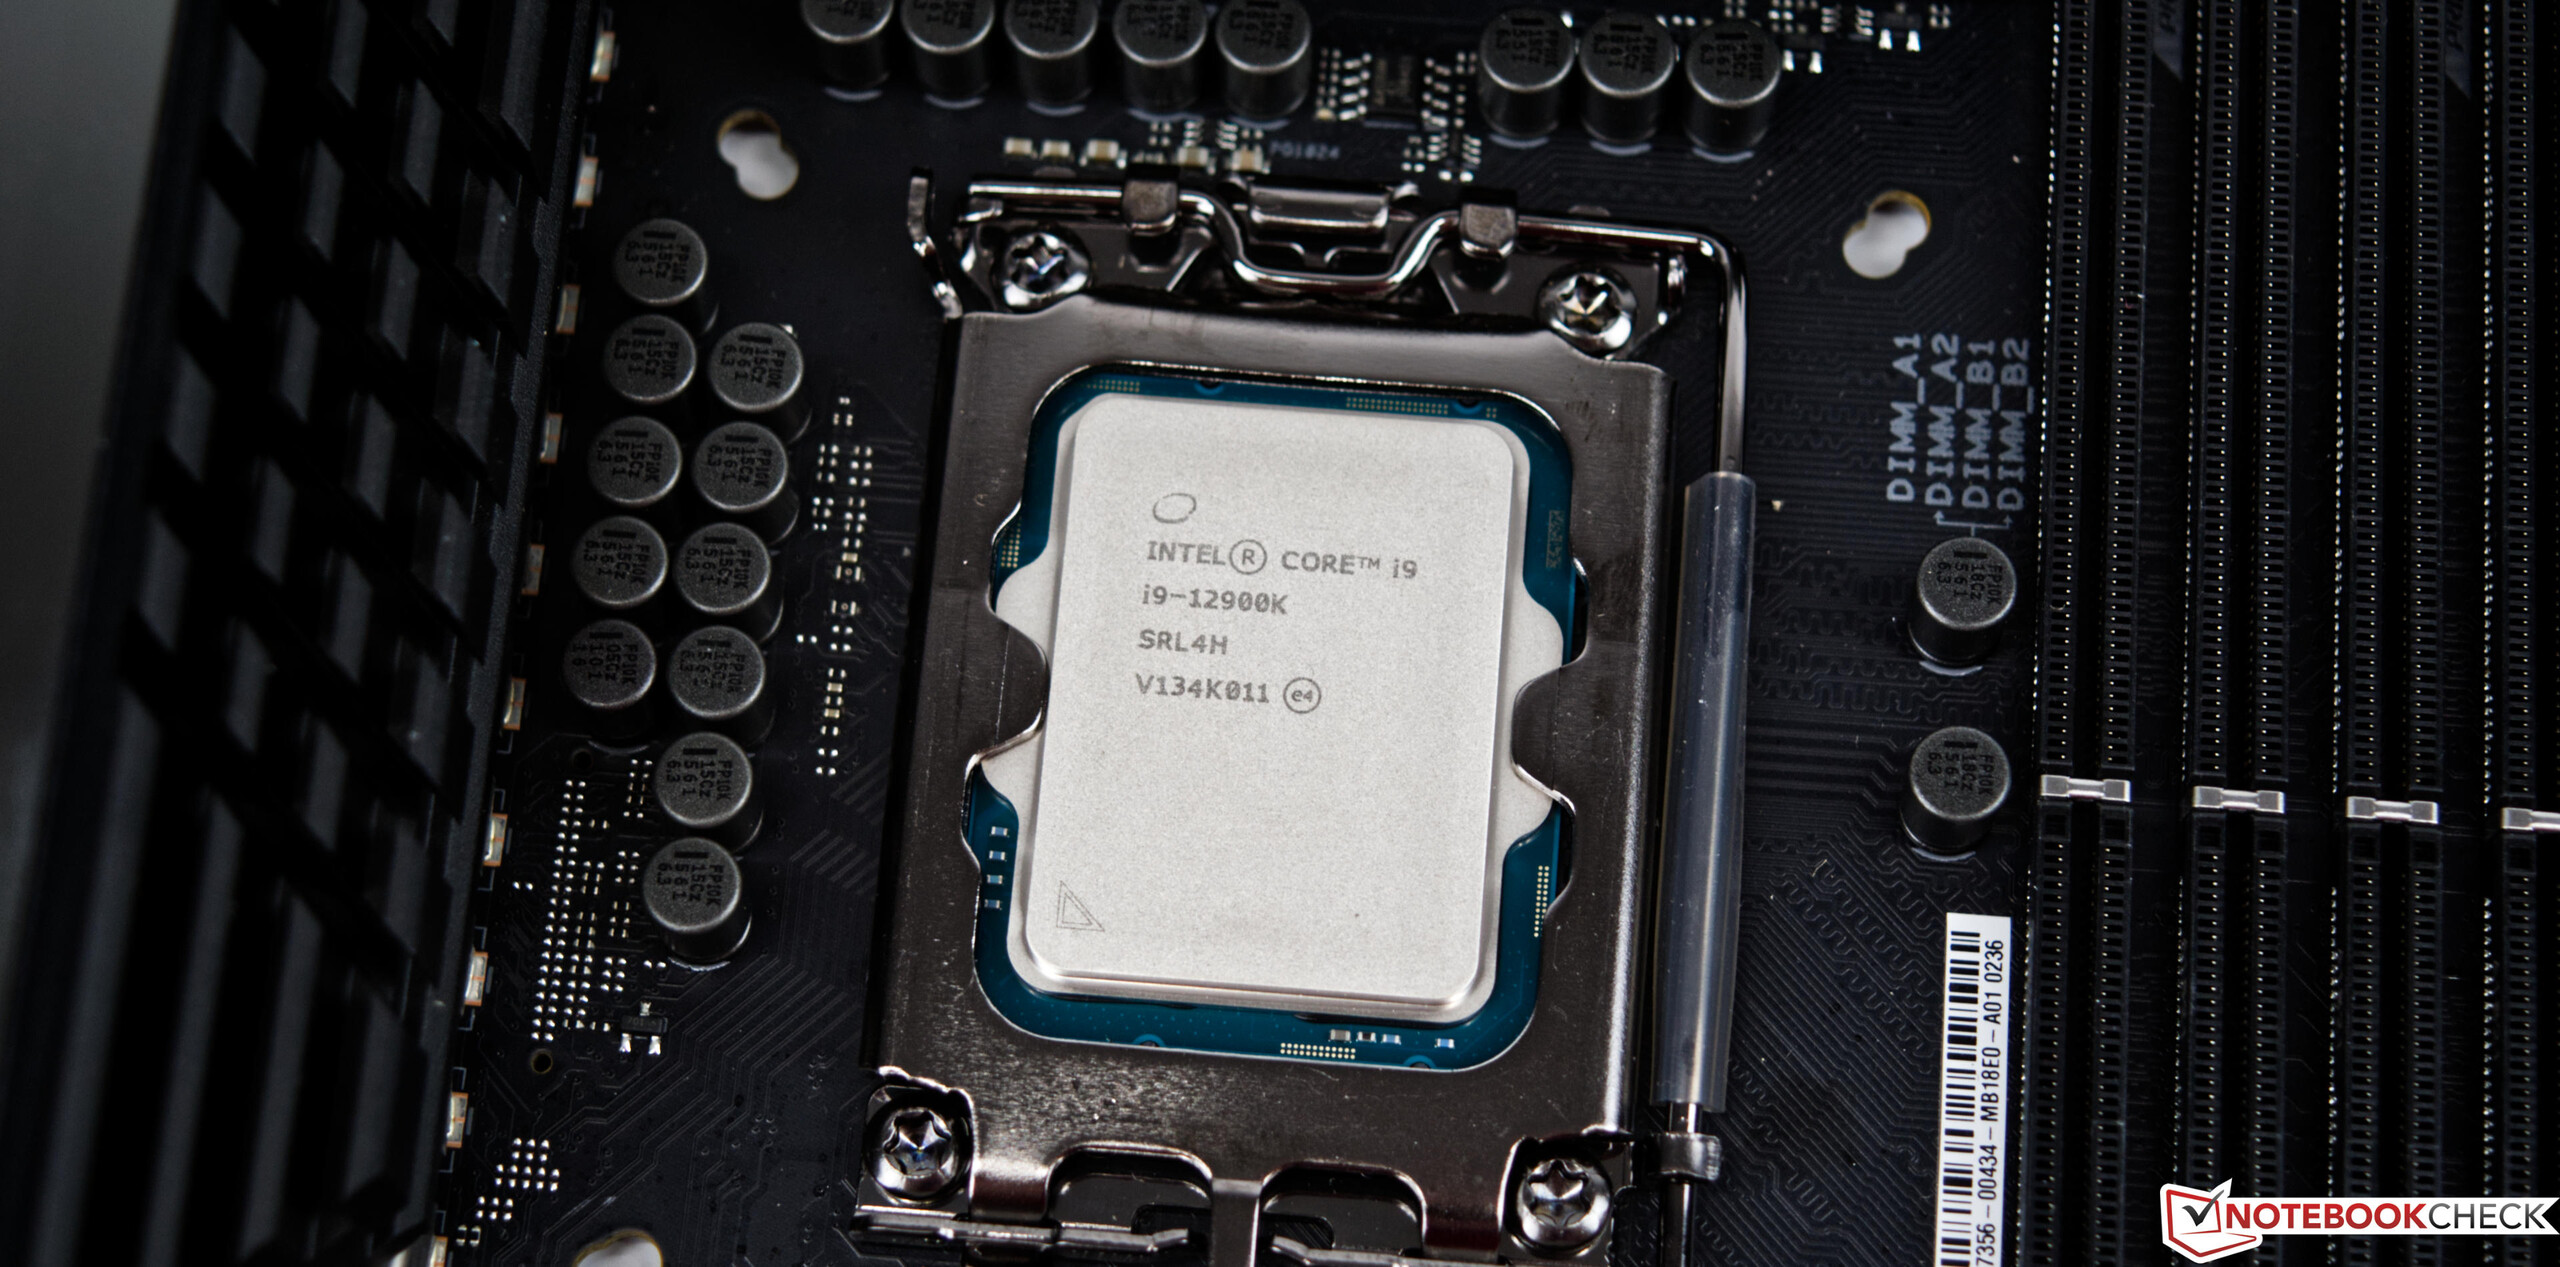
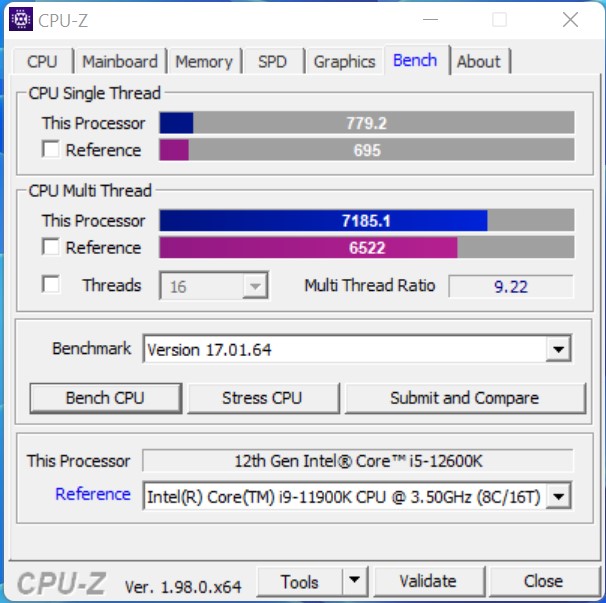
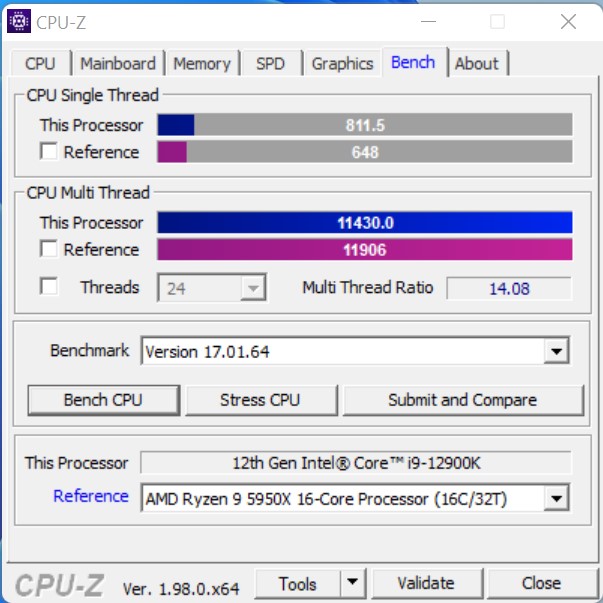
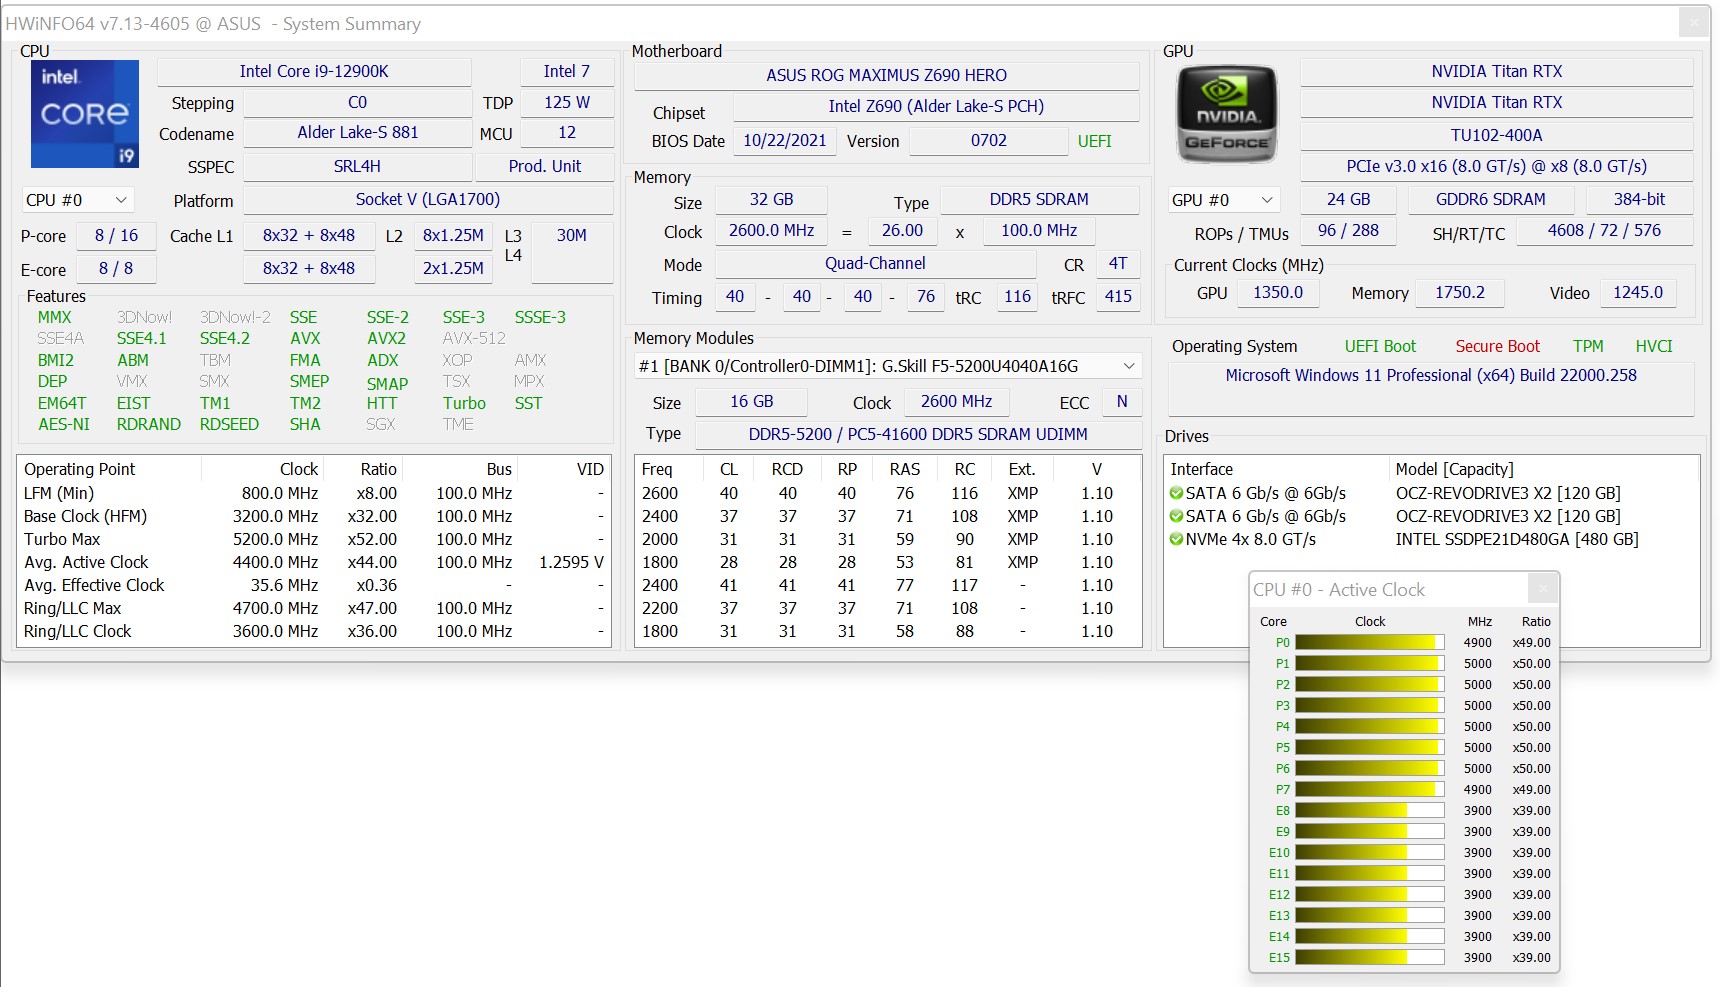
- Intel Core i9-12900K, Intel Core i5-12600K
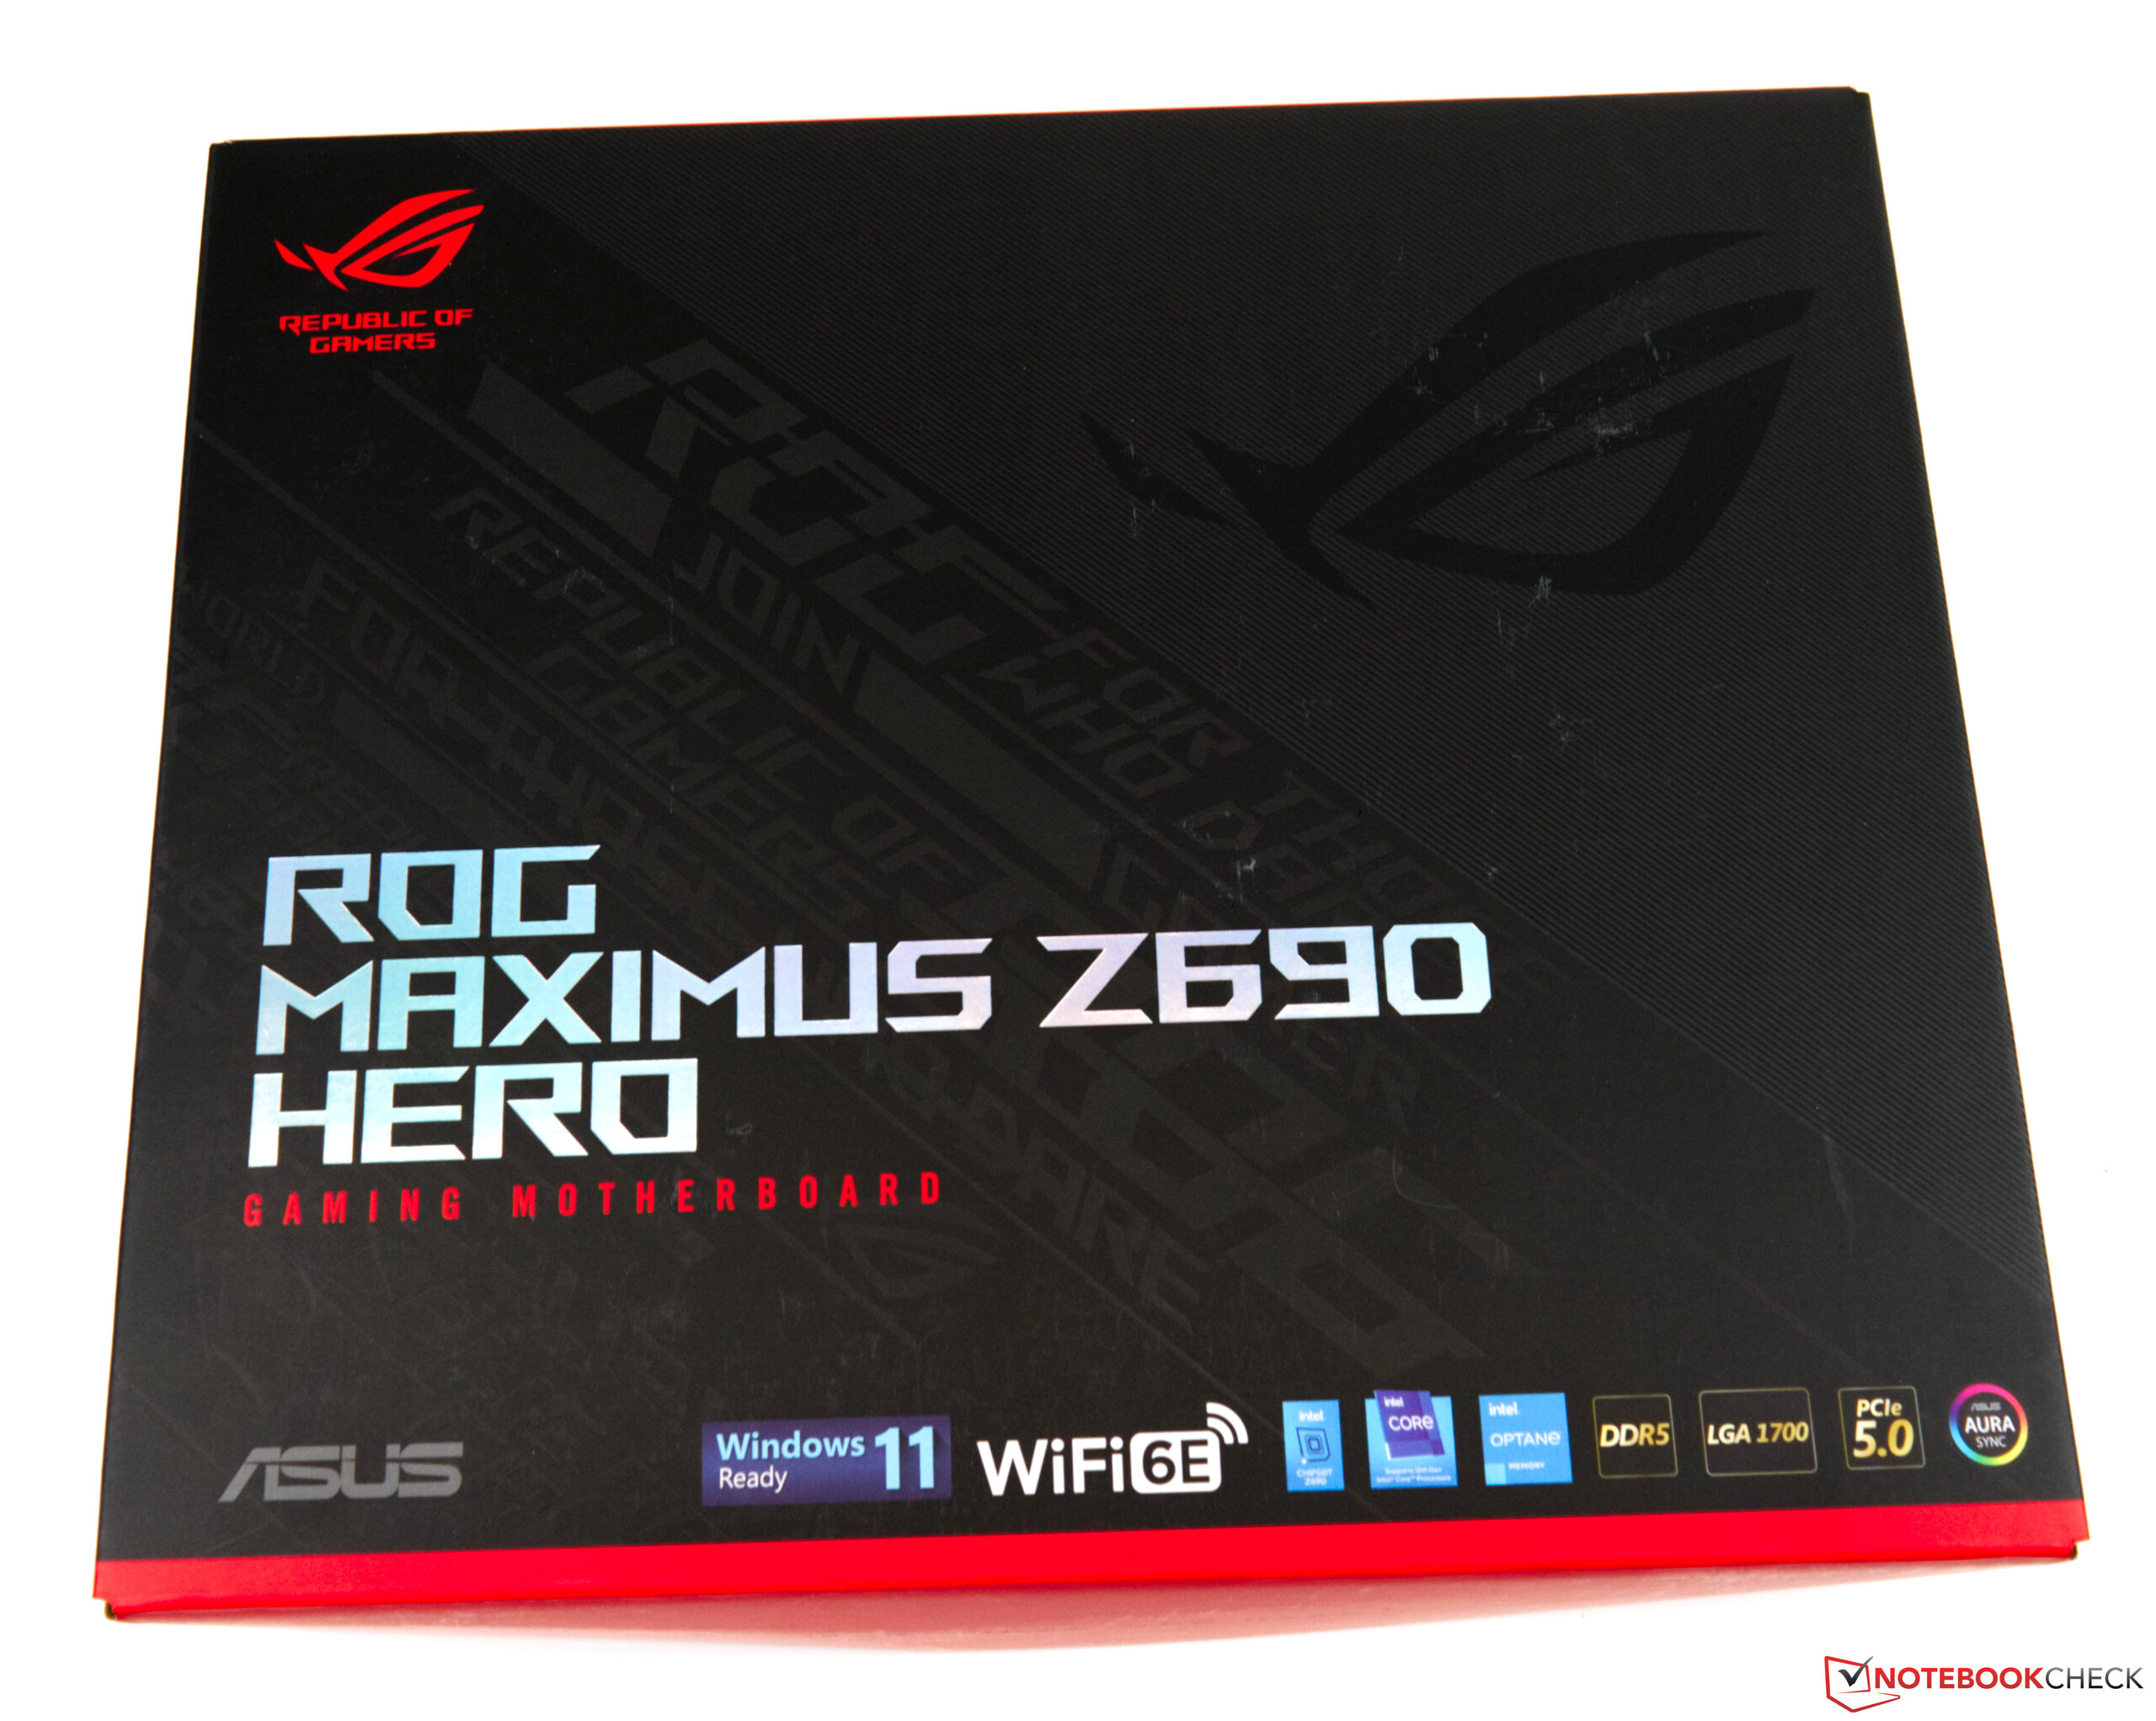
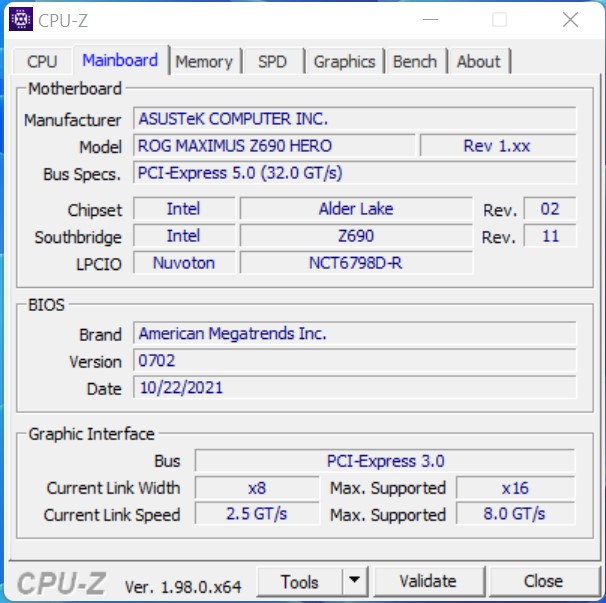
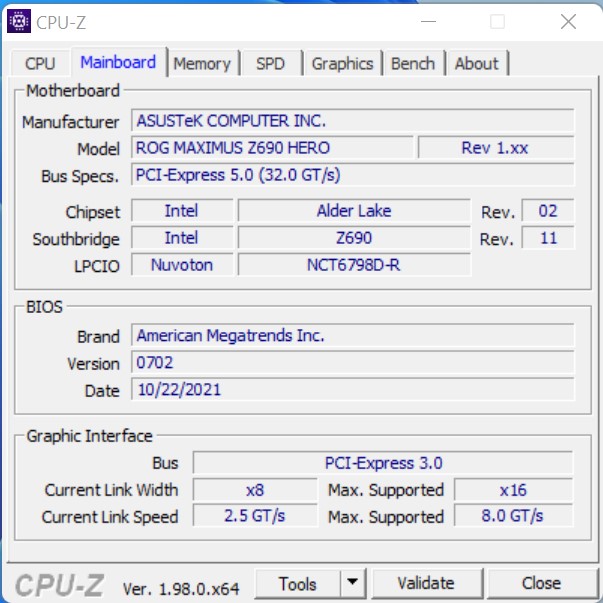
- Asus ROG Maximus Z690 Hero
- Alphacool Eisbear Aurora 280 AiO
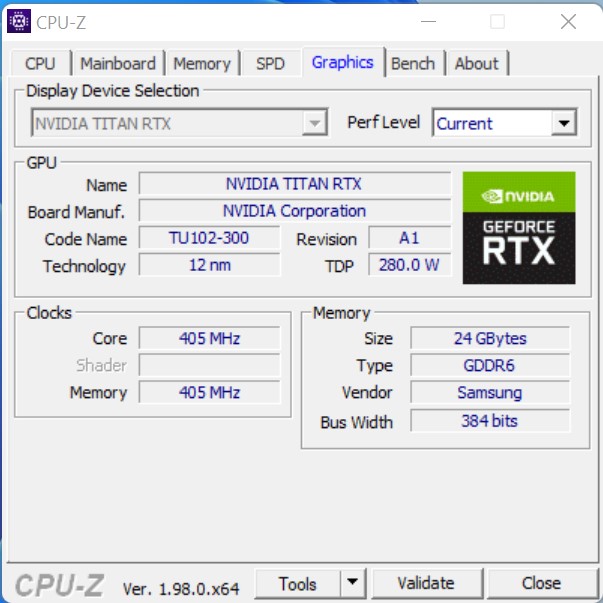
- Nvidia Titan RTX
- Fuente de alimentación Corsair HX 1200X
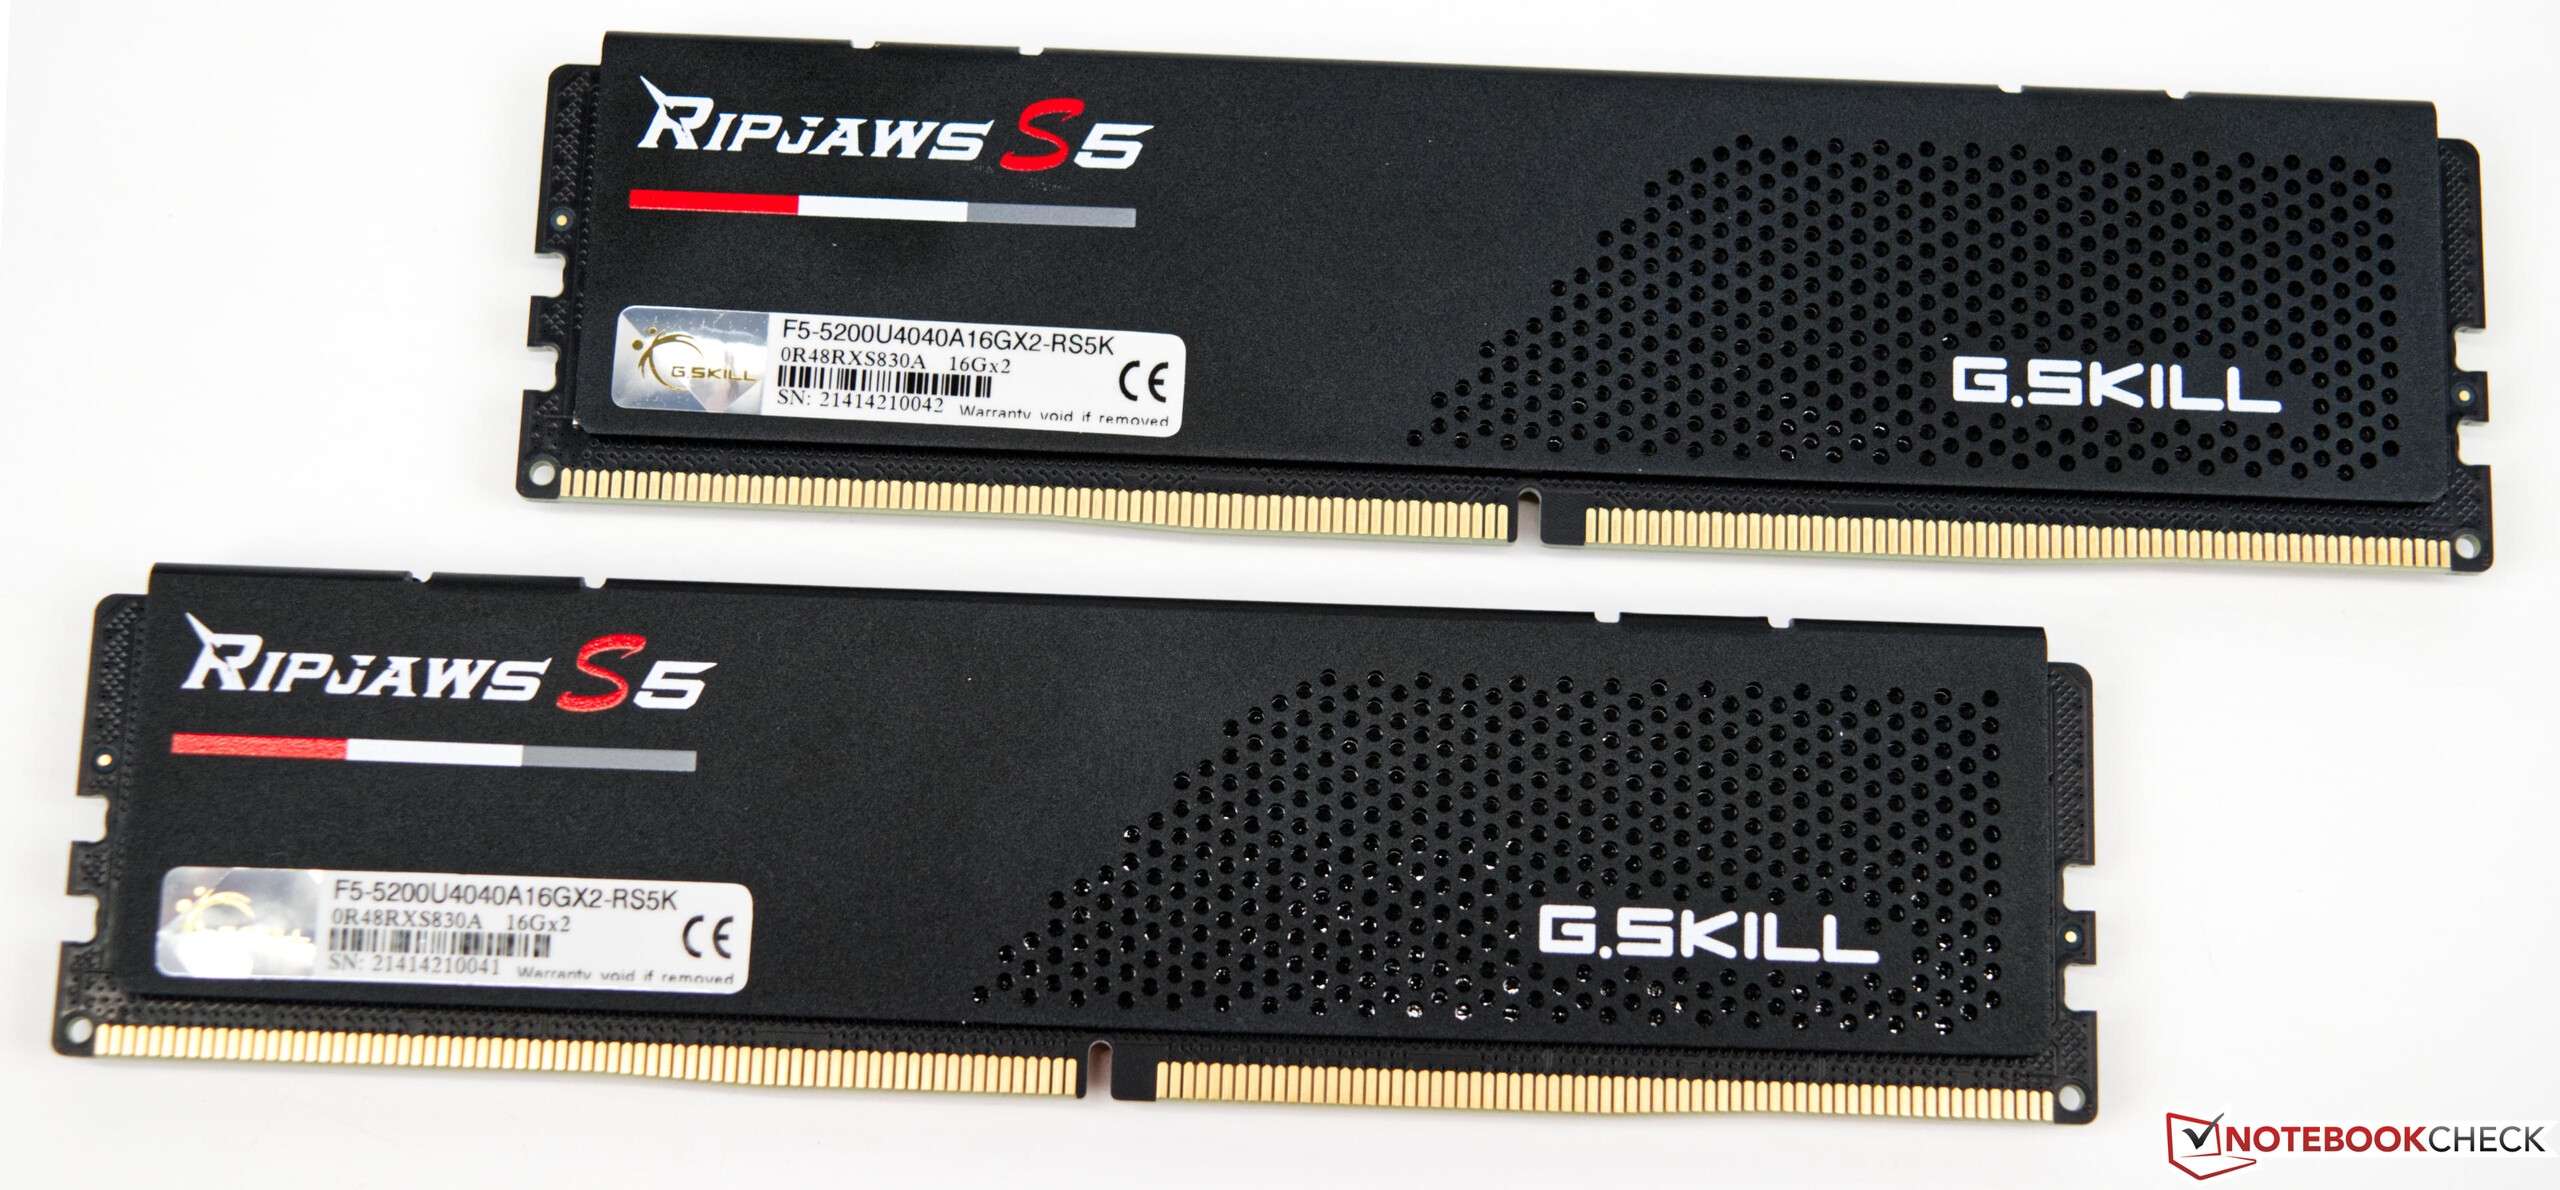
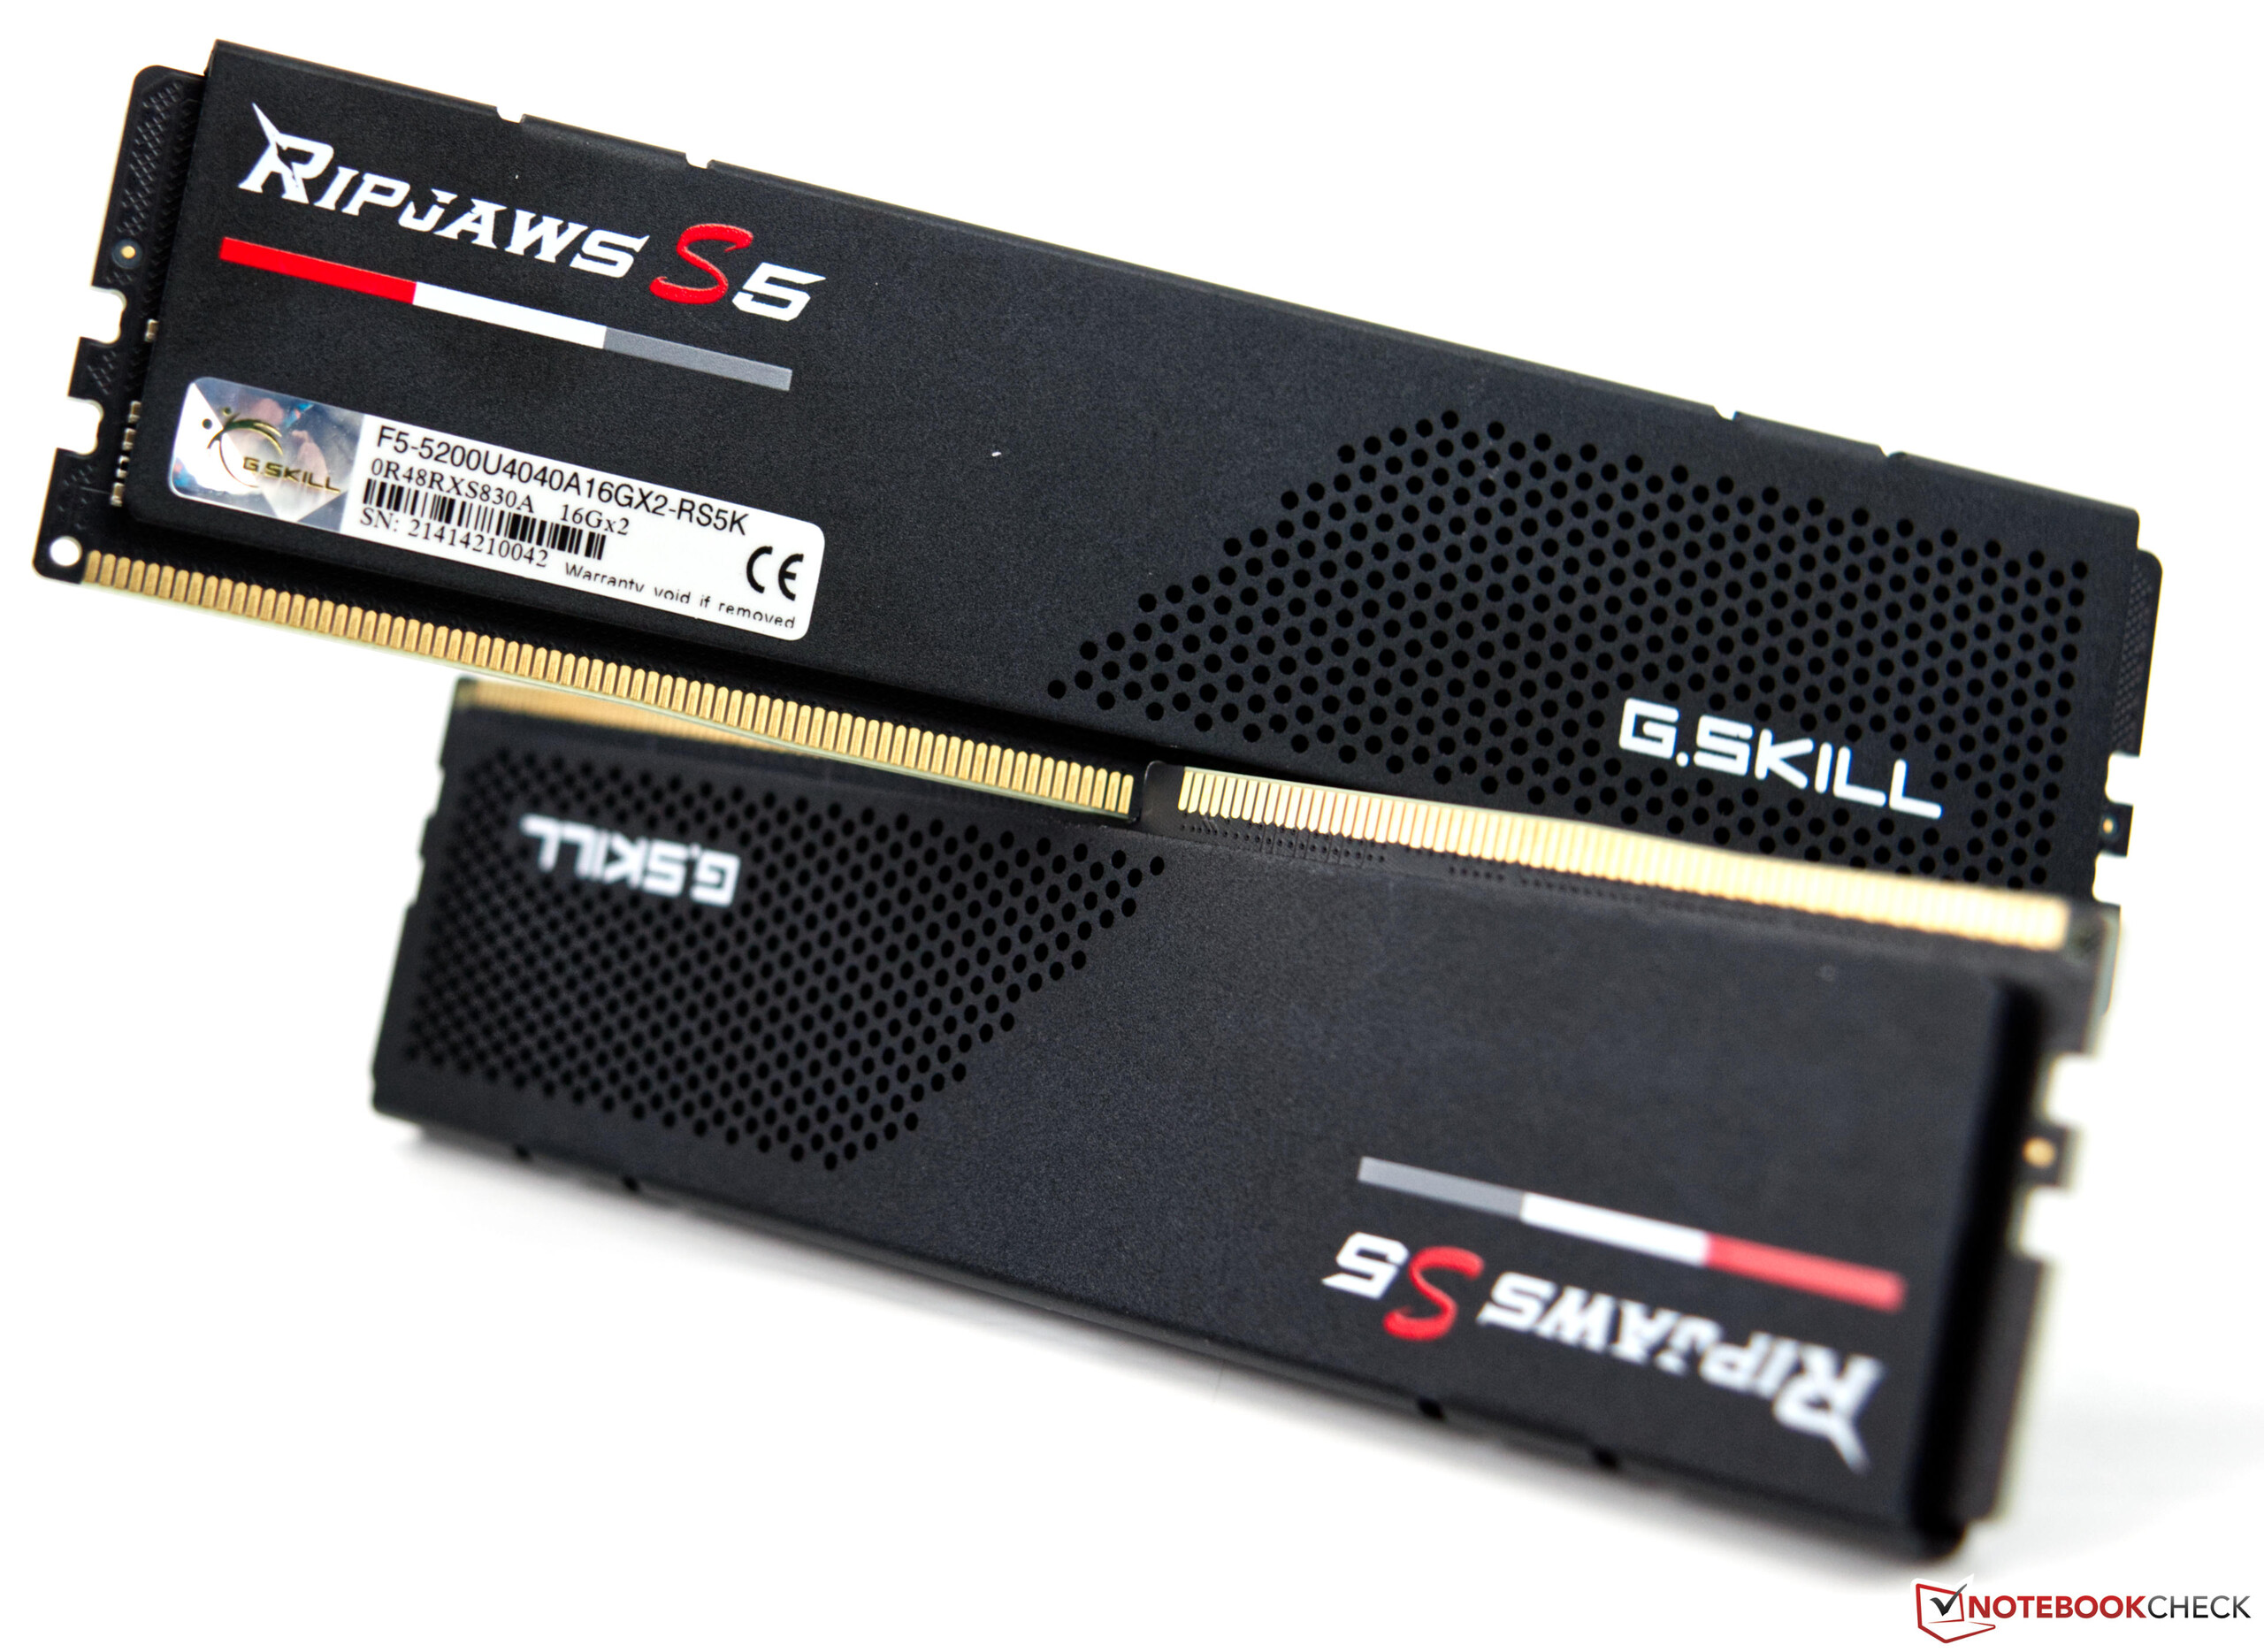
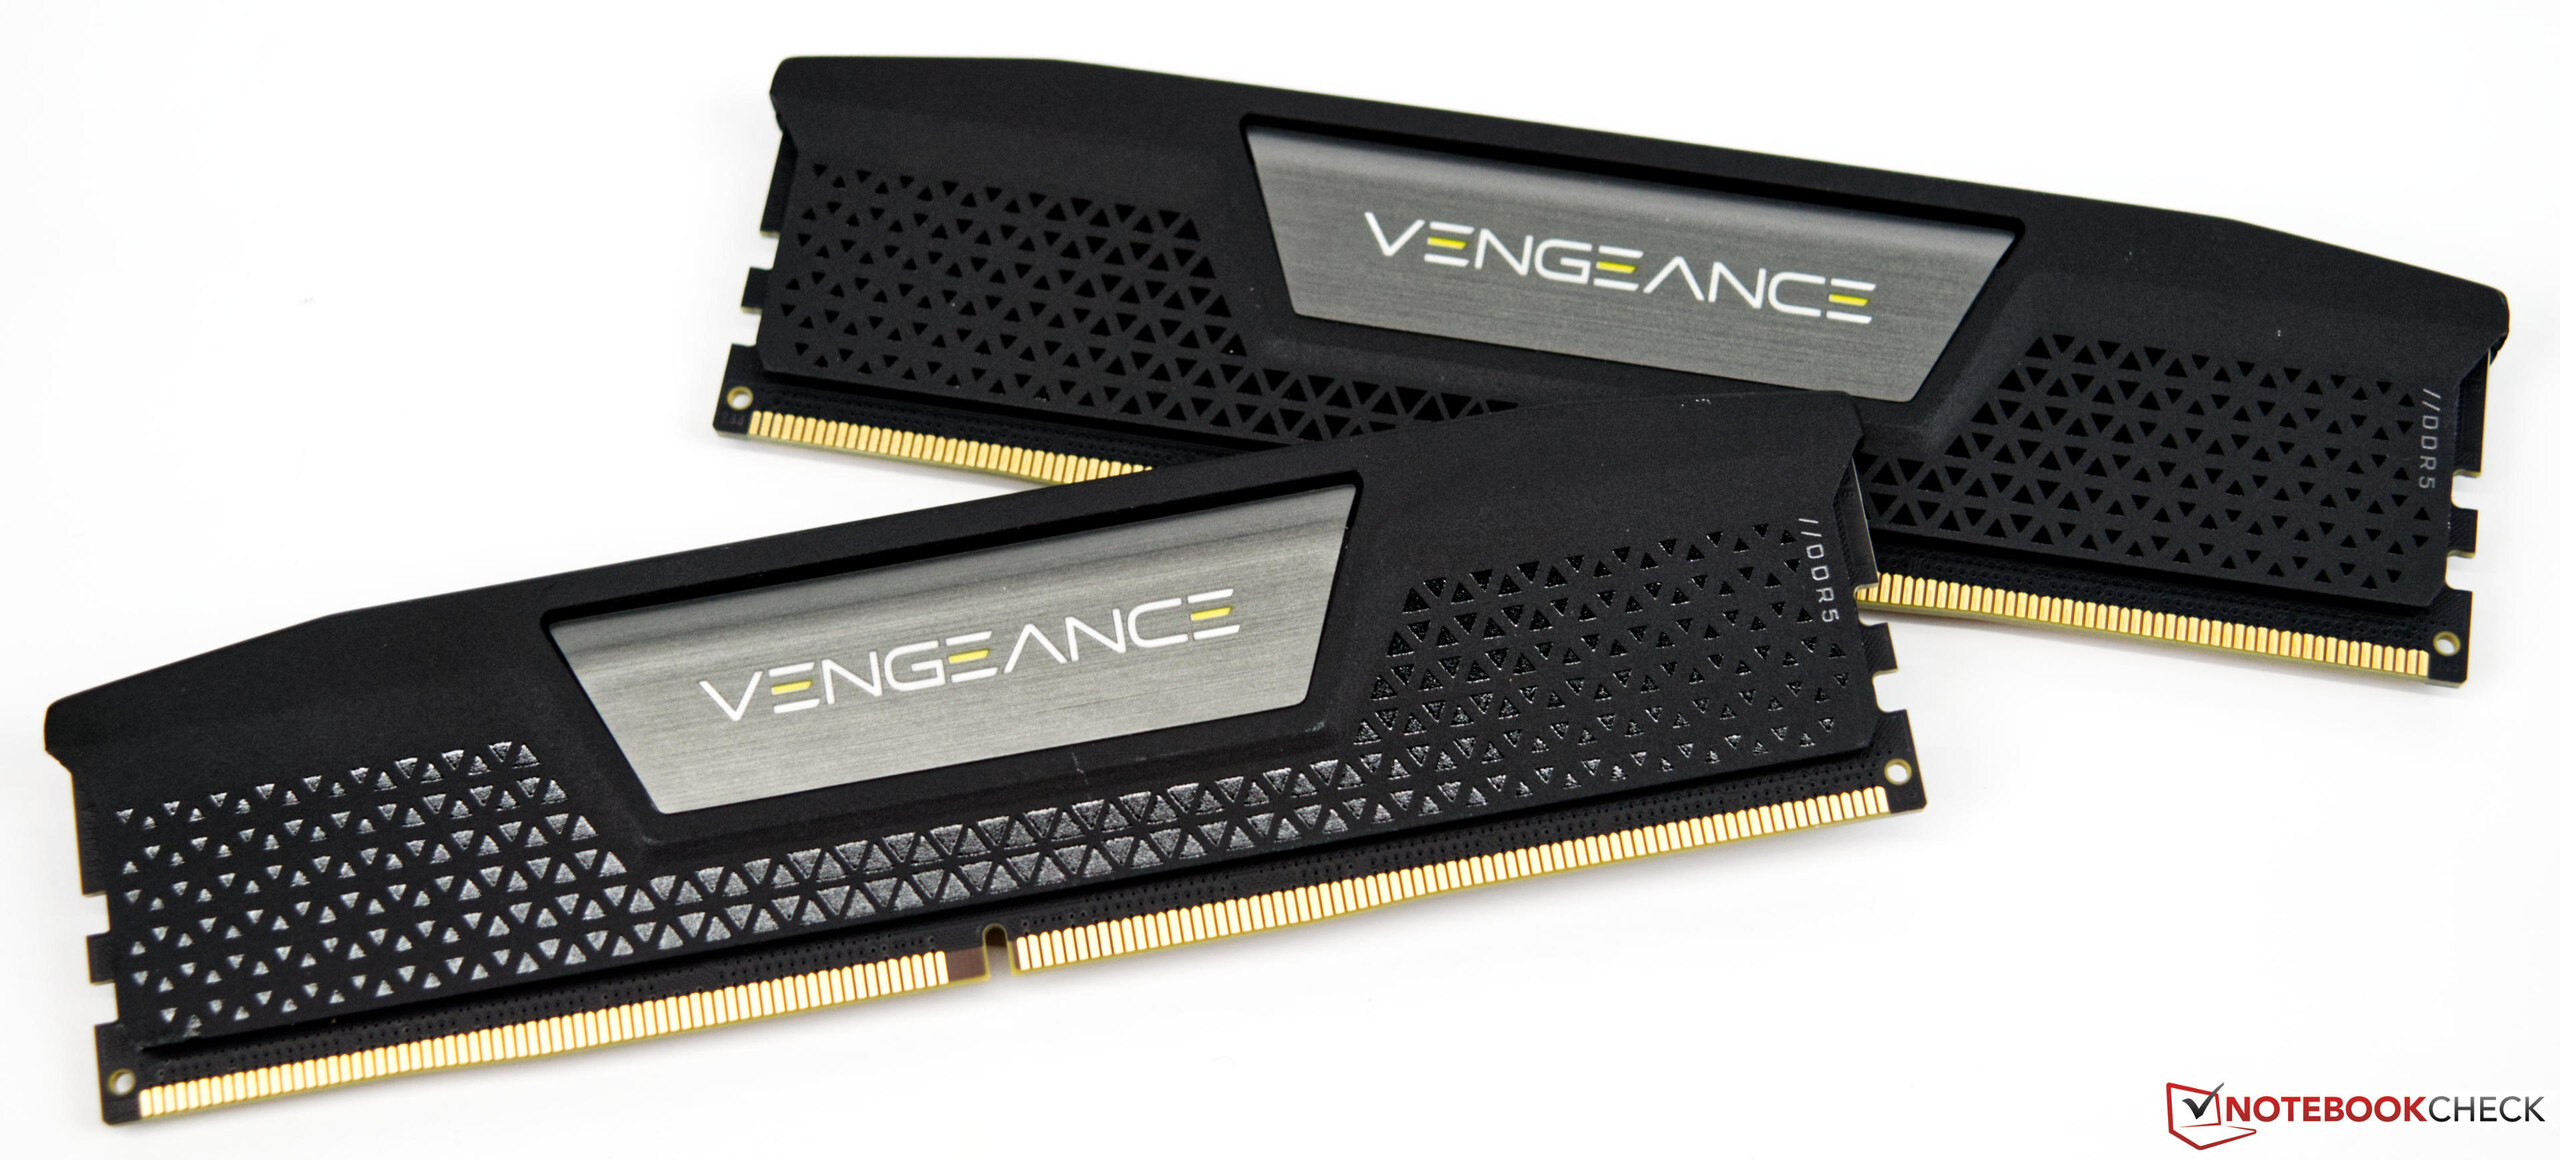
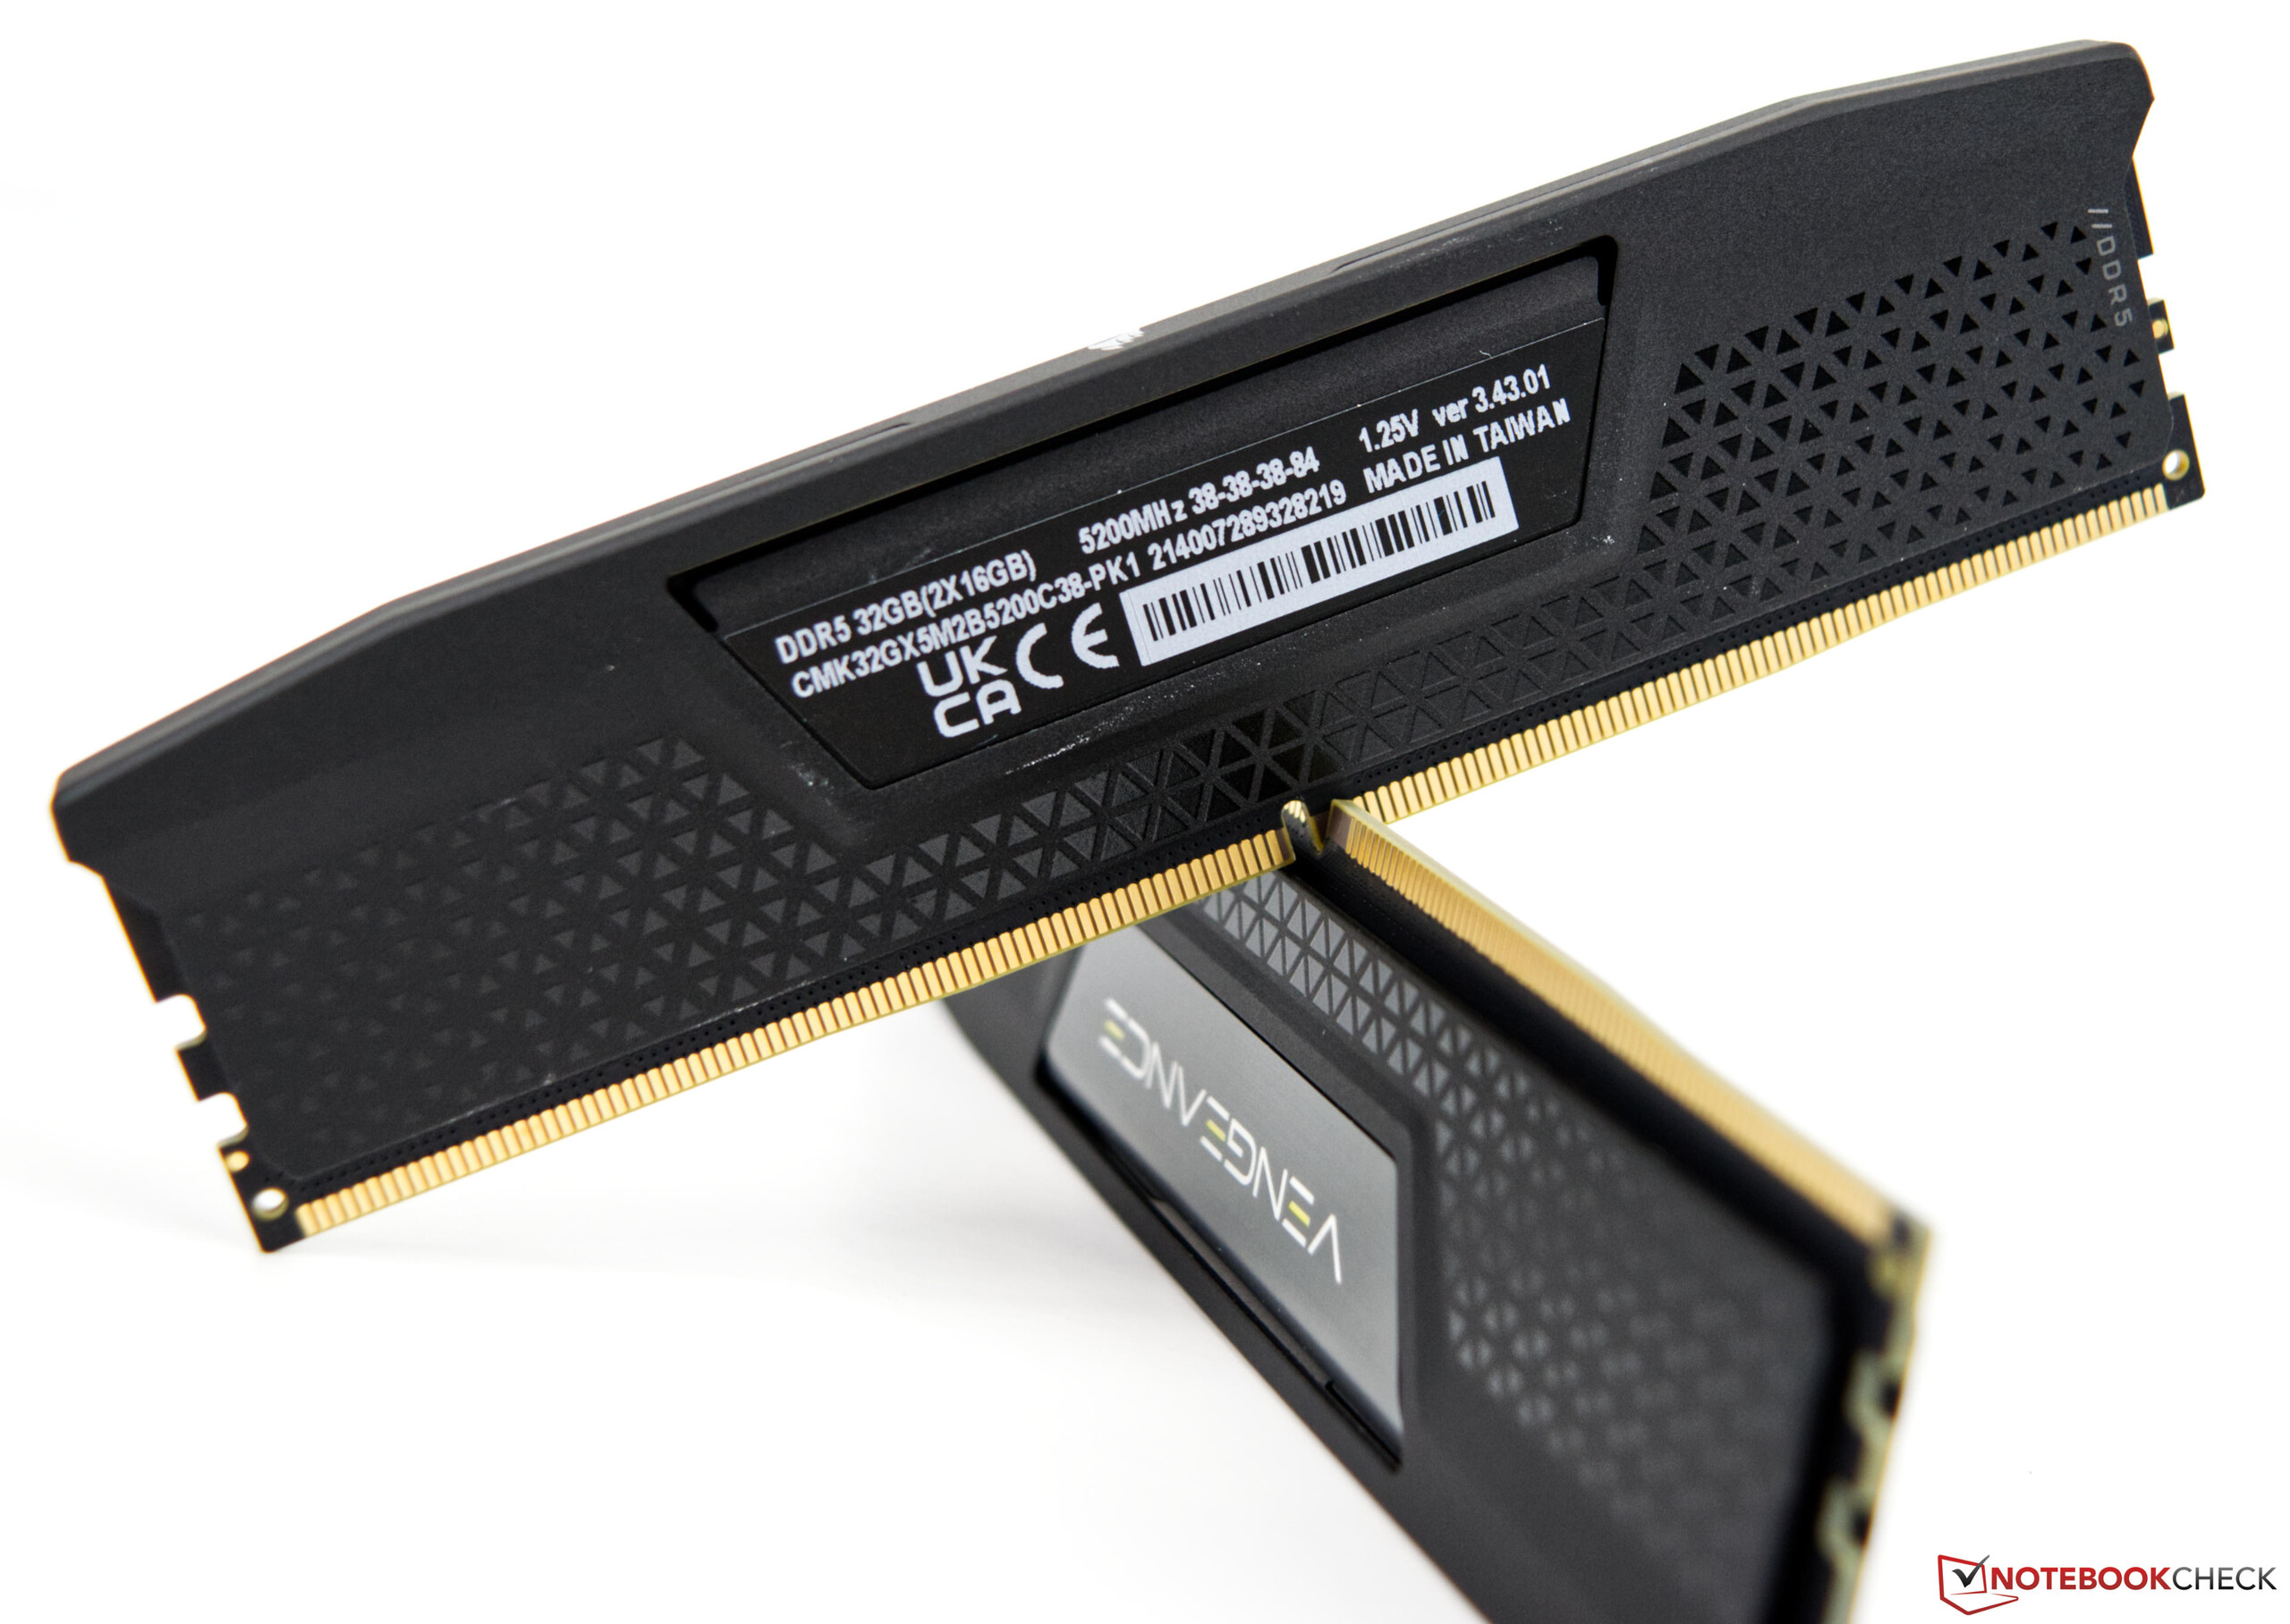
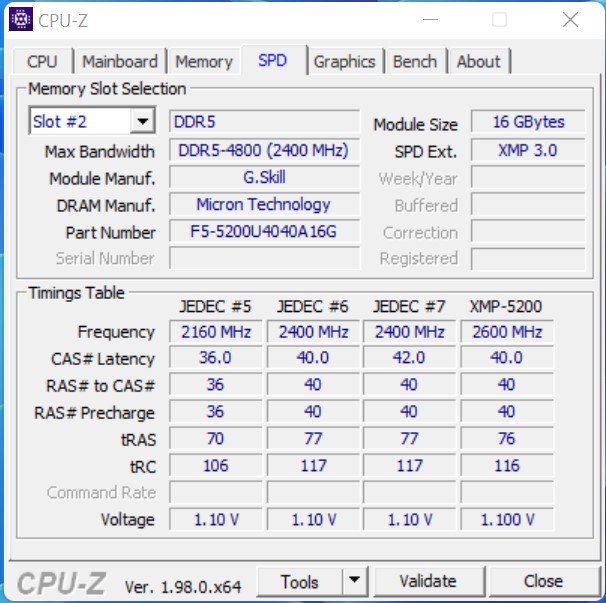
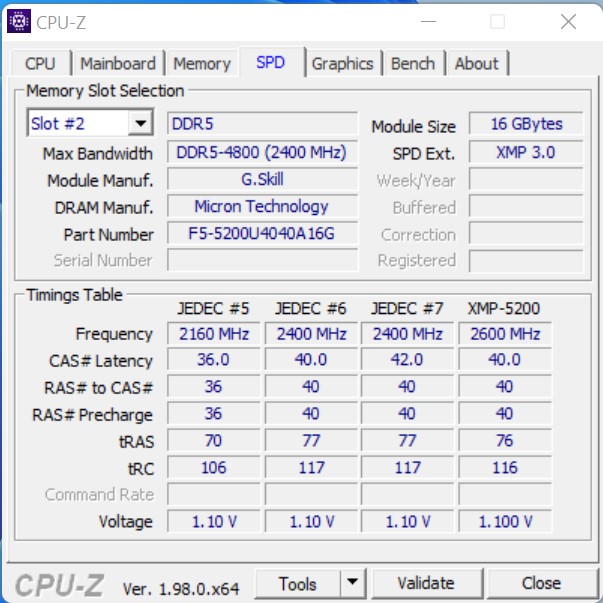
- G.Skill Ripjaws S5 (2x 16GB - DDR5-5200) / Corsair Vengeance (2x 16GB - DDR5-5200)
- Intel Optane 905p (sistema de 480 GB + benchmarks)
- OCZ Revodrive (480 GB para juegos)
- Microsoft Windows 11 Professional 64-Bit (versión 21H2)
Los dos procesadores provienen directamente de Intel. G.Skill y Corsair nos proporcionaron la nueva memoria de trabajo DDR5, y la nueva placa base Z690viene directamente de Asus. Caseking nos apoya con la vitrina Raijintek Pean, y como refrigeración utilizamos la Alphacool Eisbear Aurora 280 AiOque ha puesto a nuestra disposición Alphacool.
Nota importante
Todos los benchmarks fueron ejecutados en un sistema Windows 11 recién instalado. Asus nos proporcionó la versión más actual de la Bios. Lo que es importante saber es que con la configuración estándar PL1 y PL2 son iguales, lo que significa que la CPU siempre puede tomar el máximo rendimiento sin ninguna limitación. Hemos utilizado la configuración estándar para este análisis.
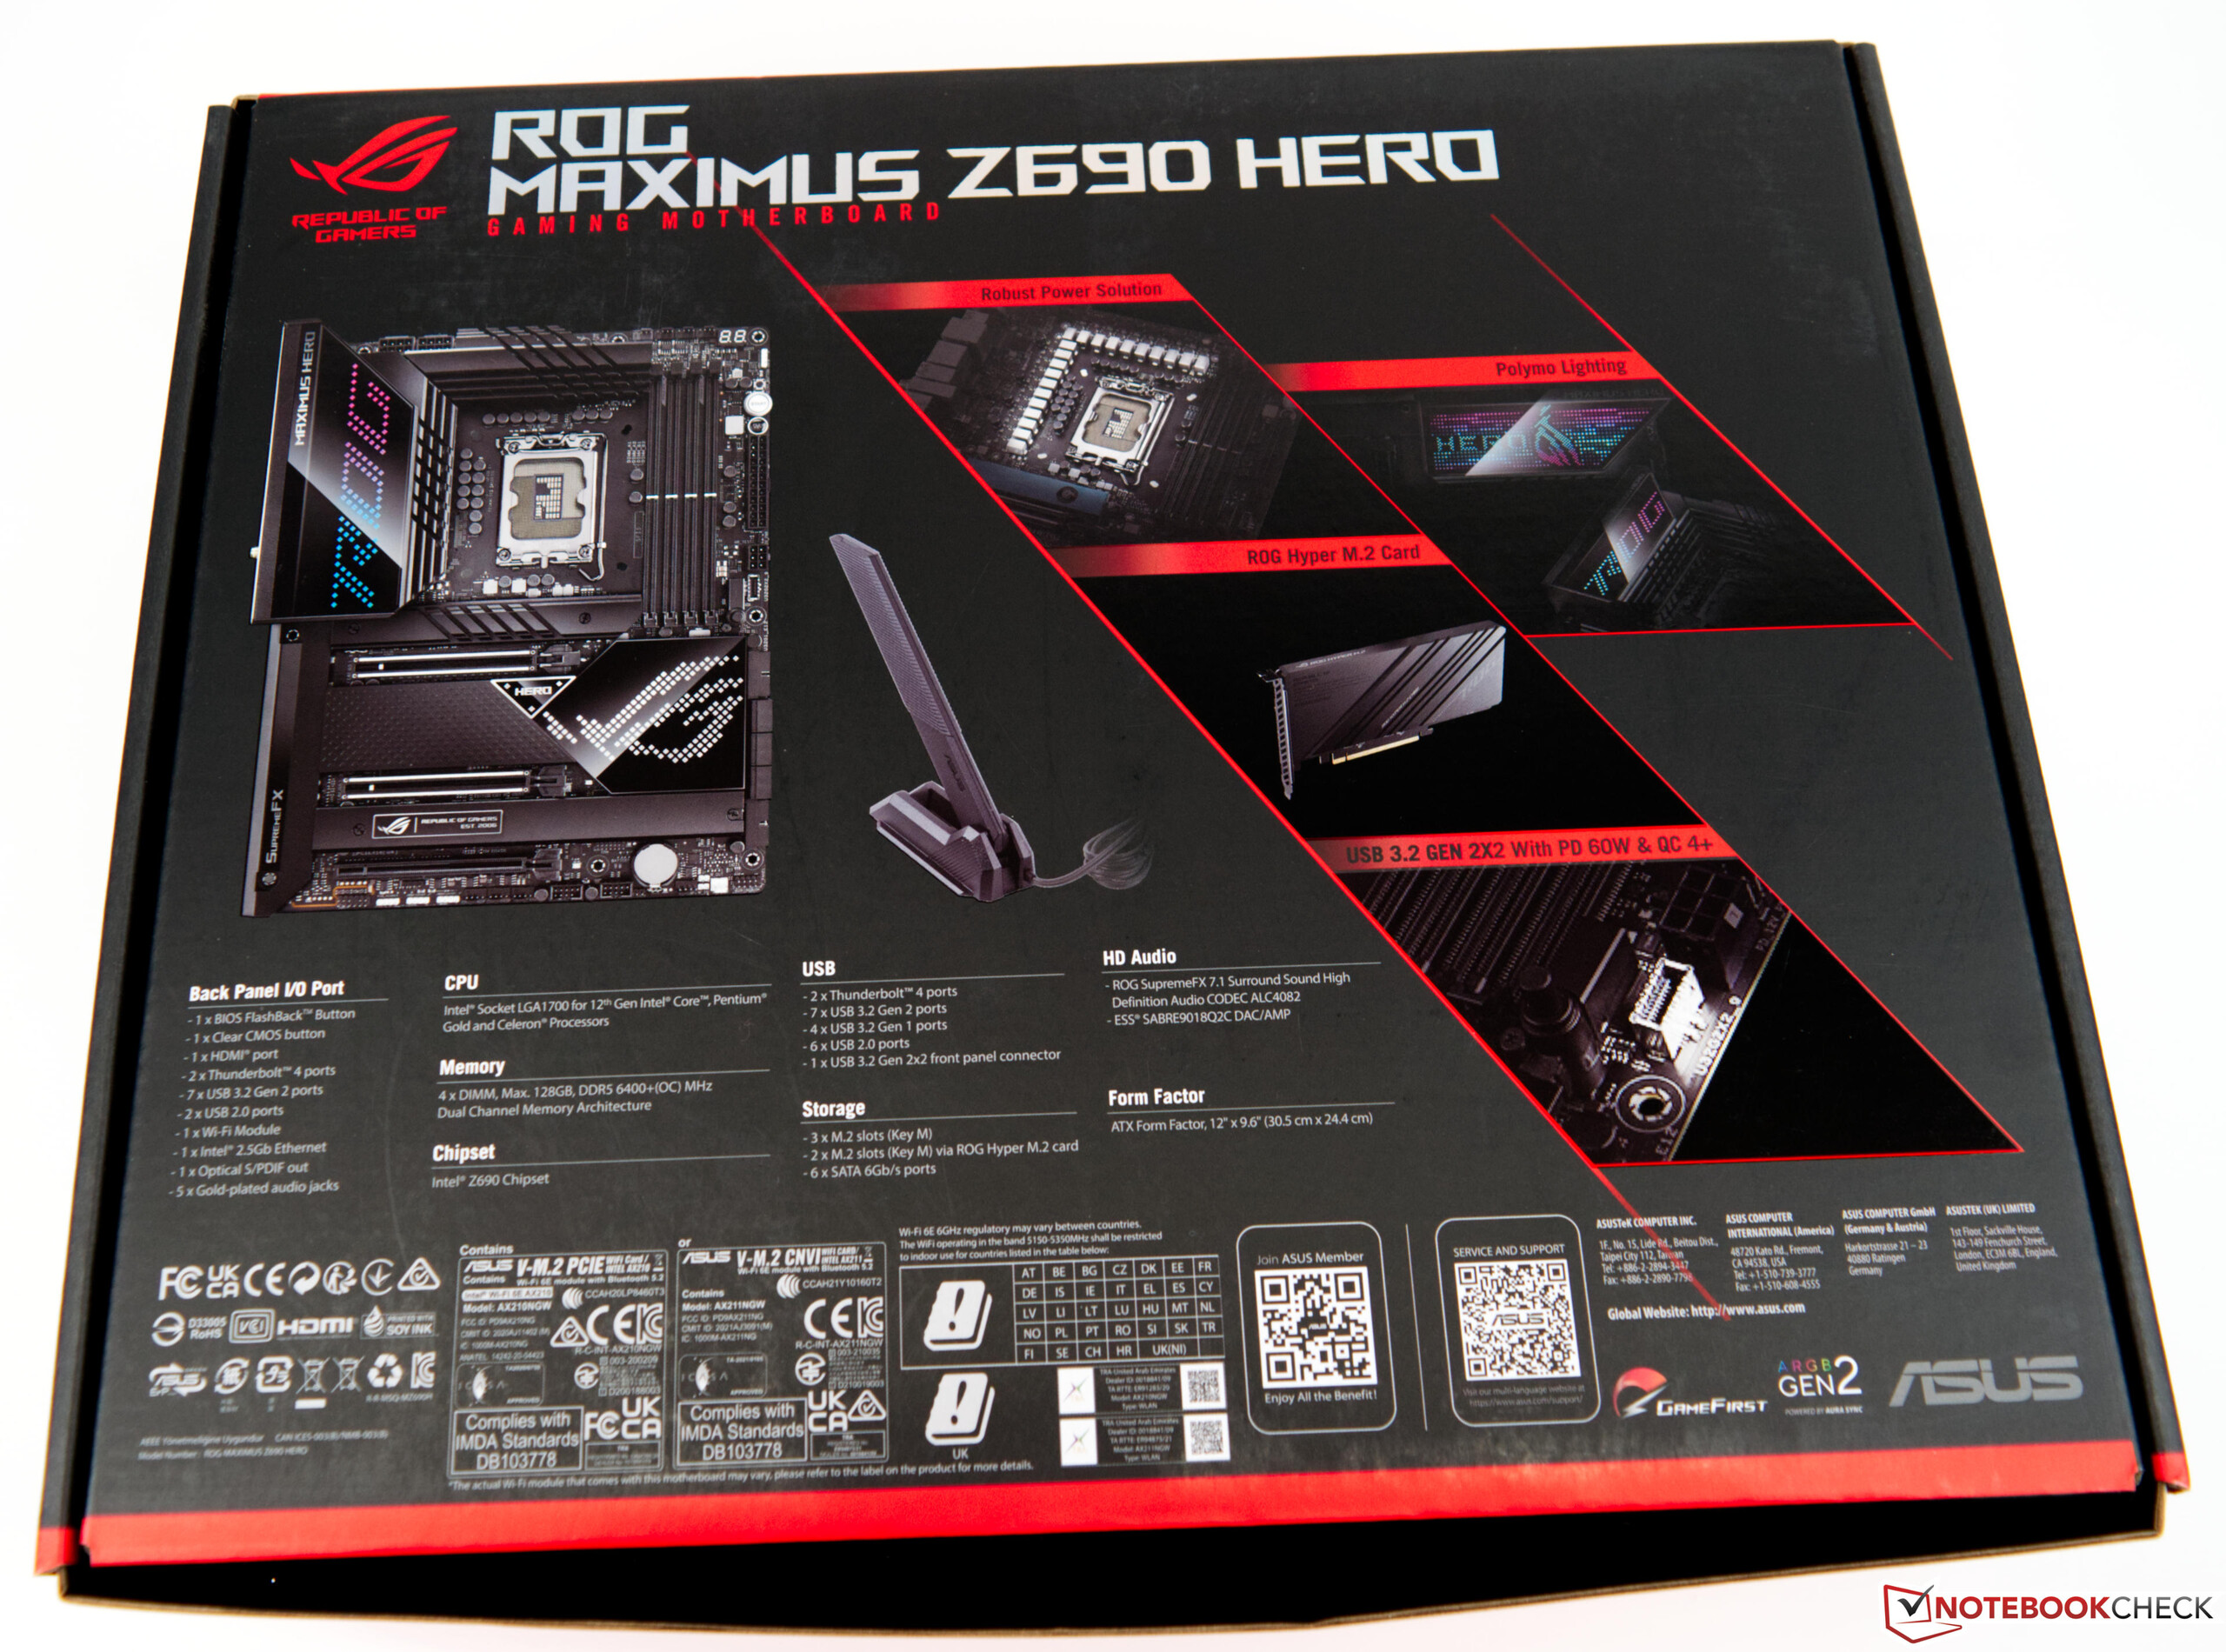
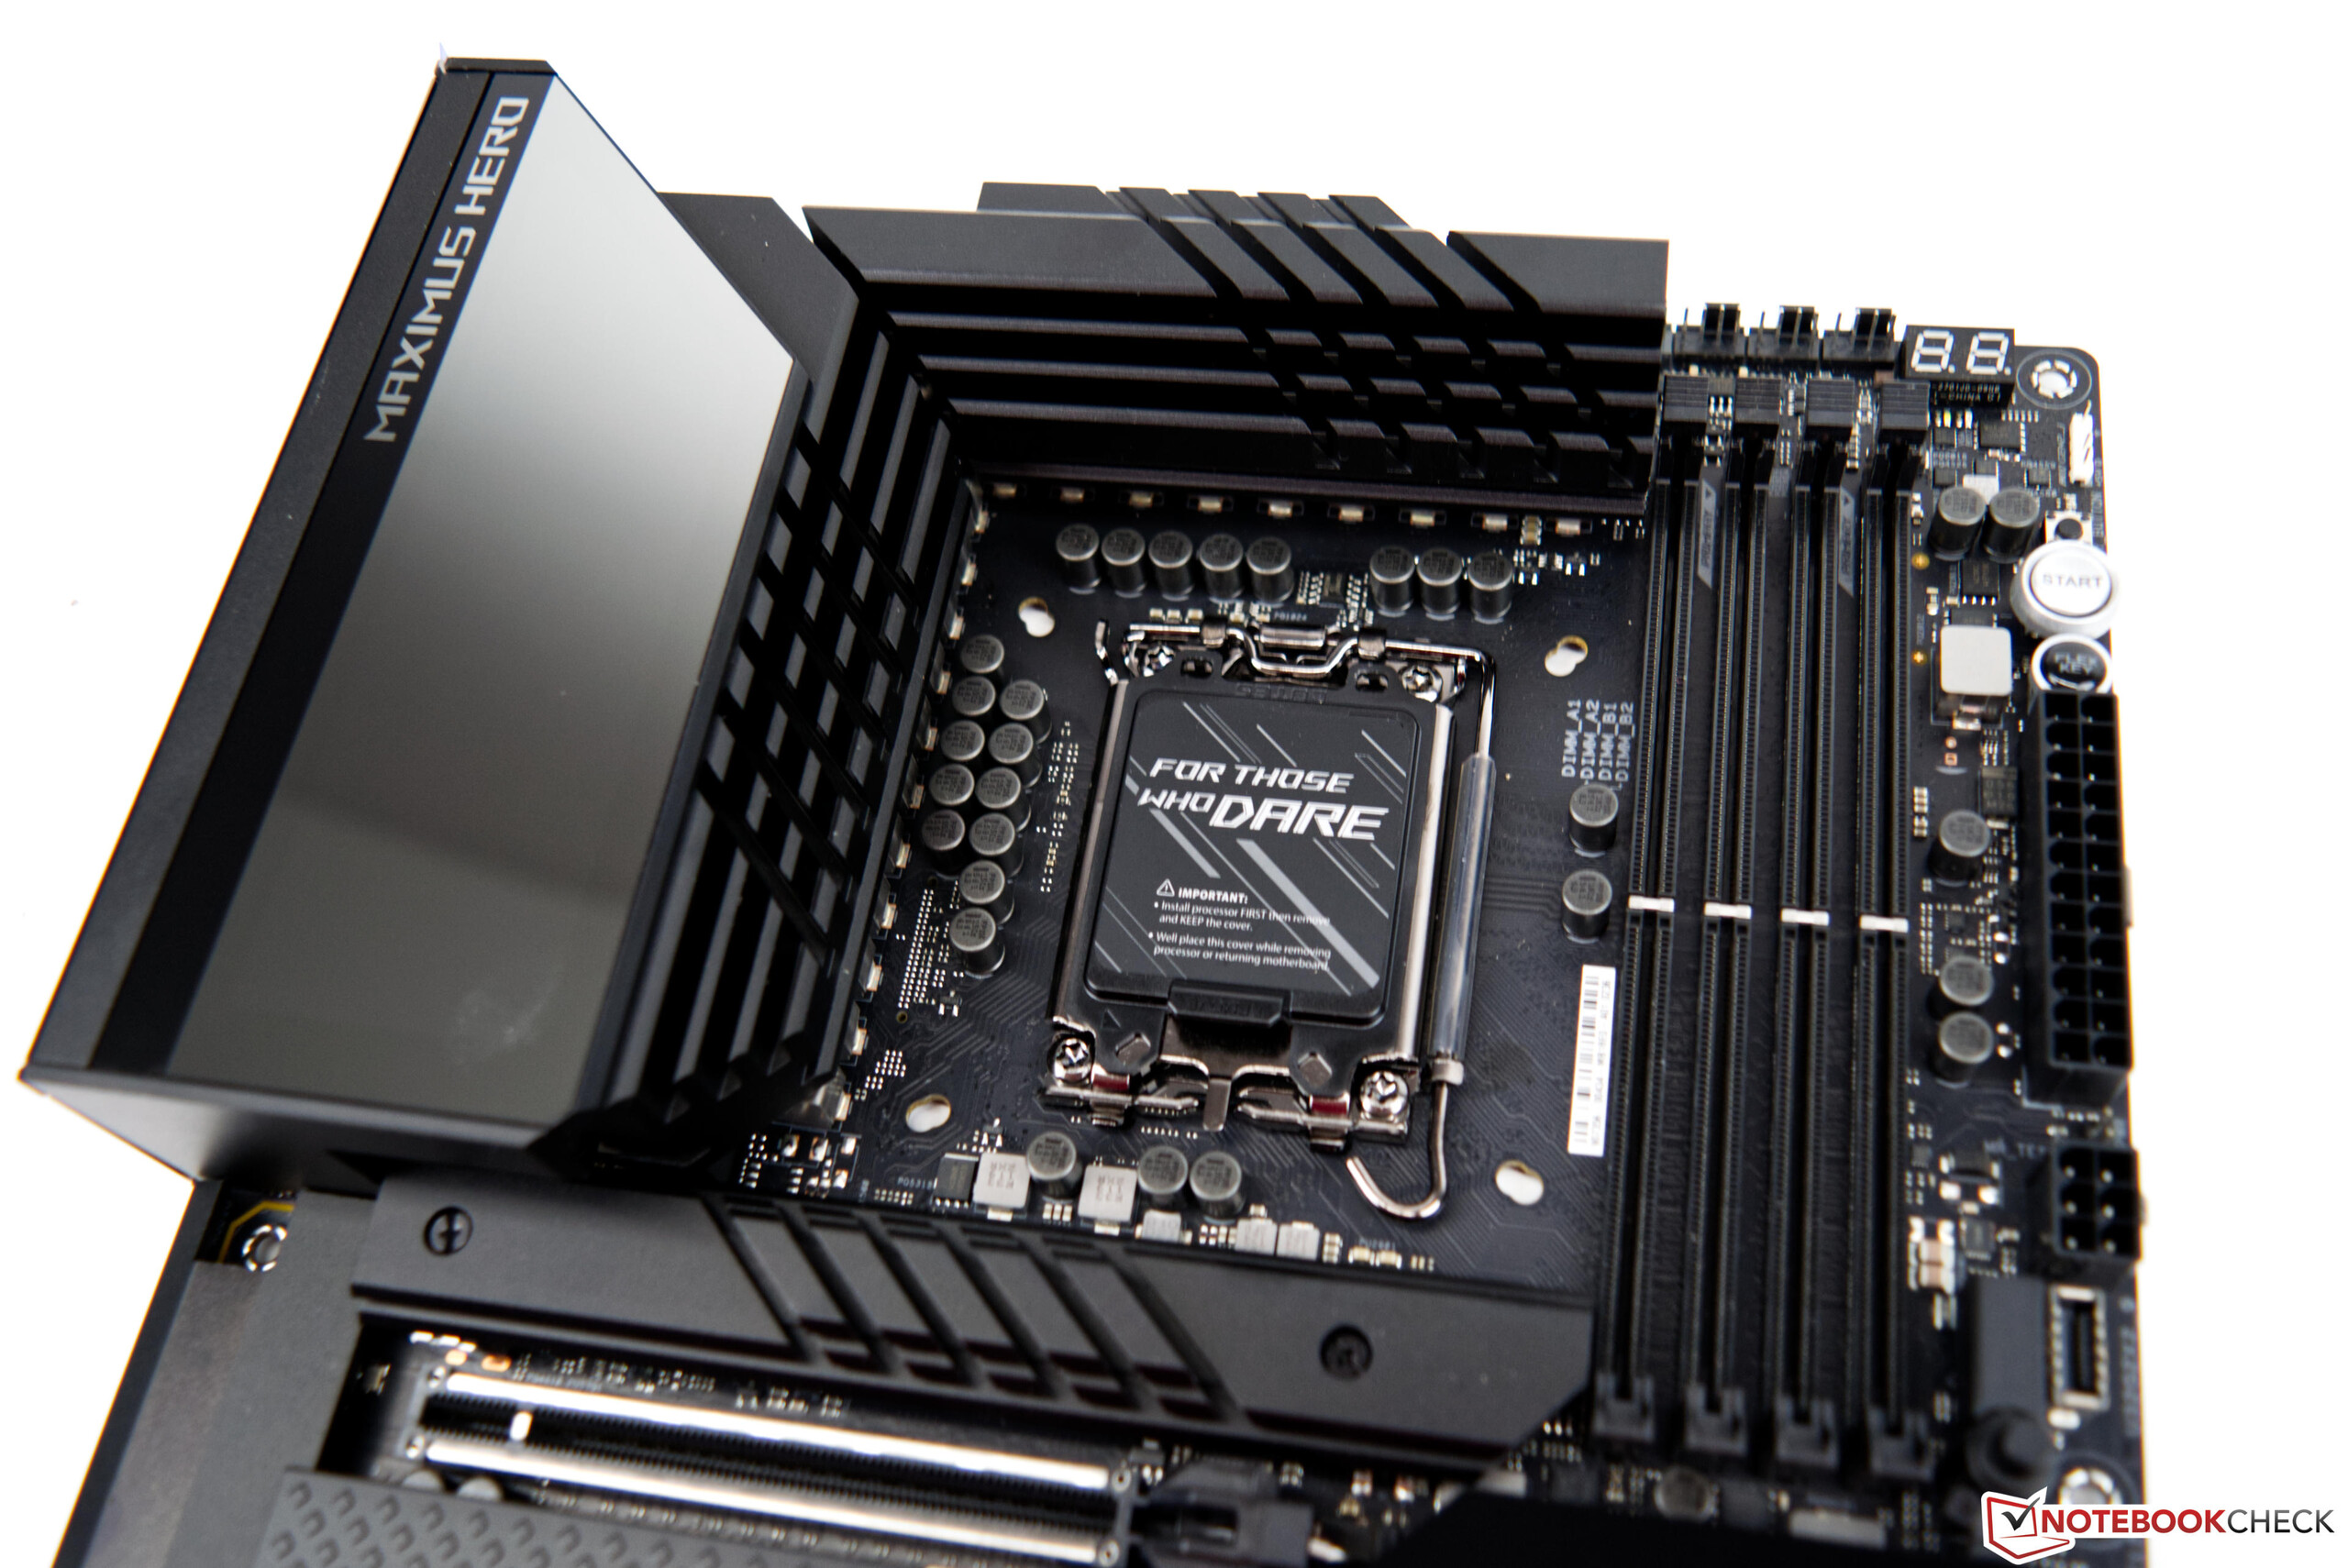
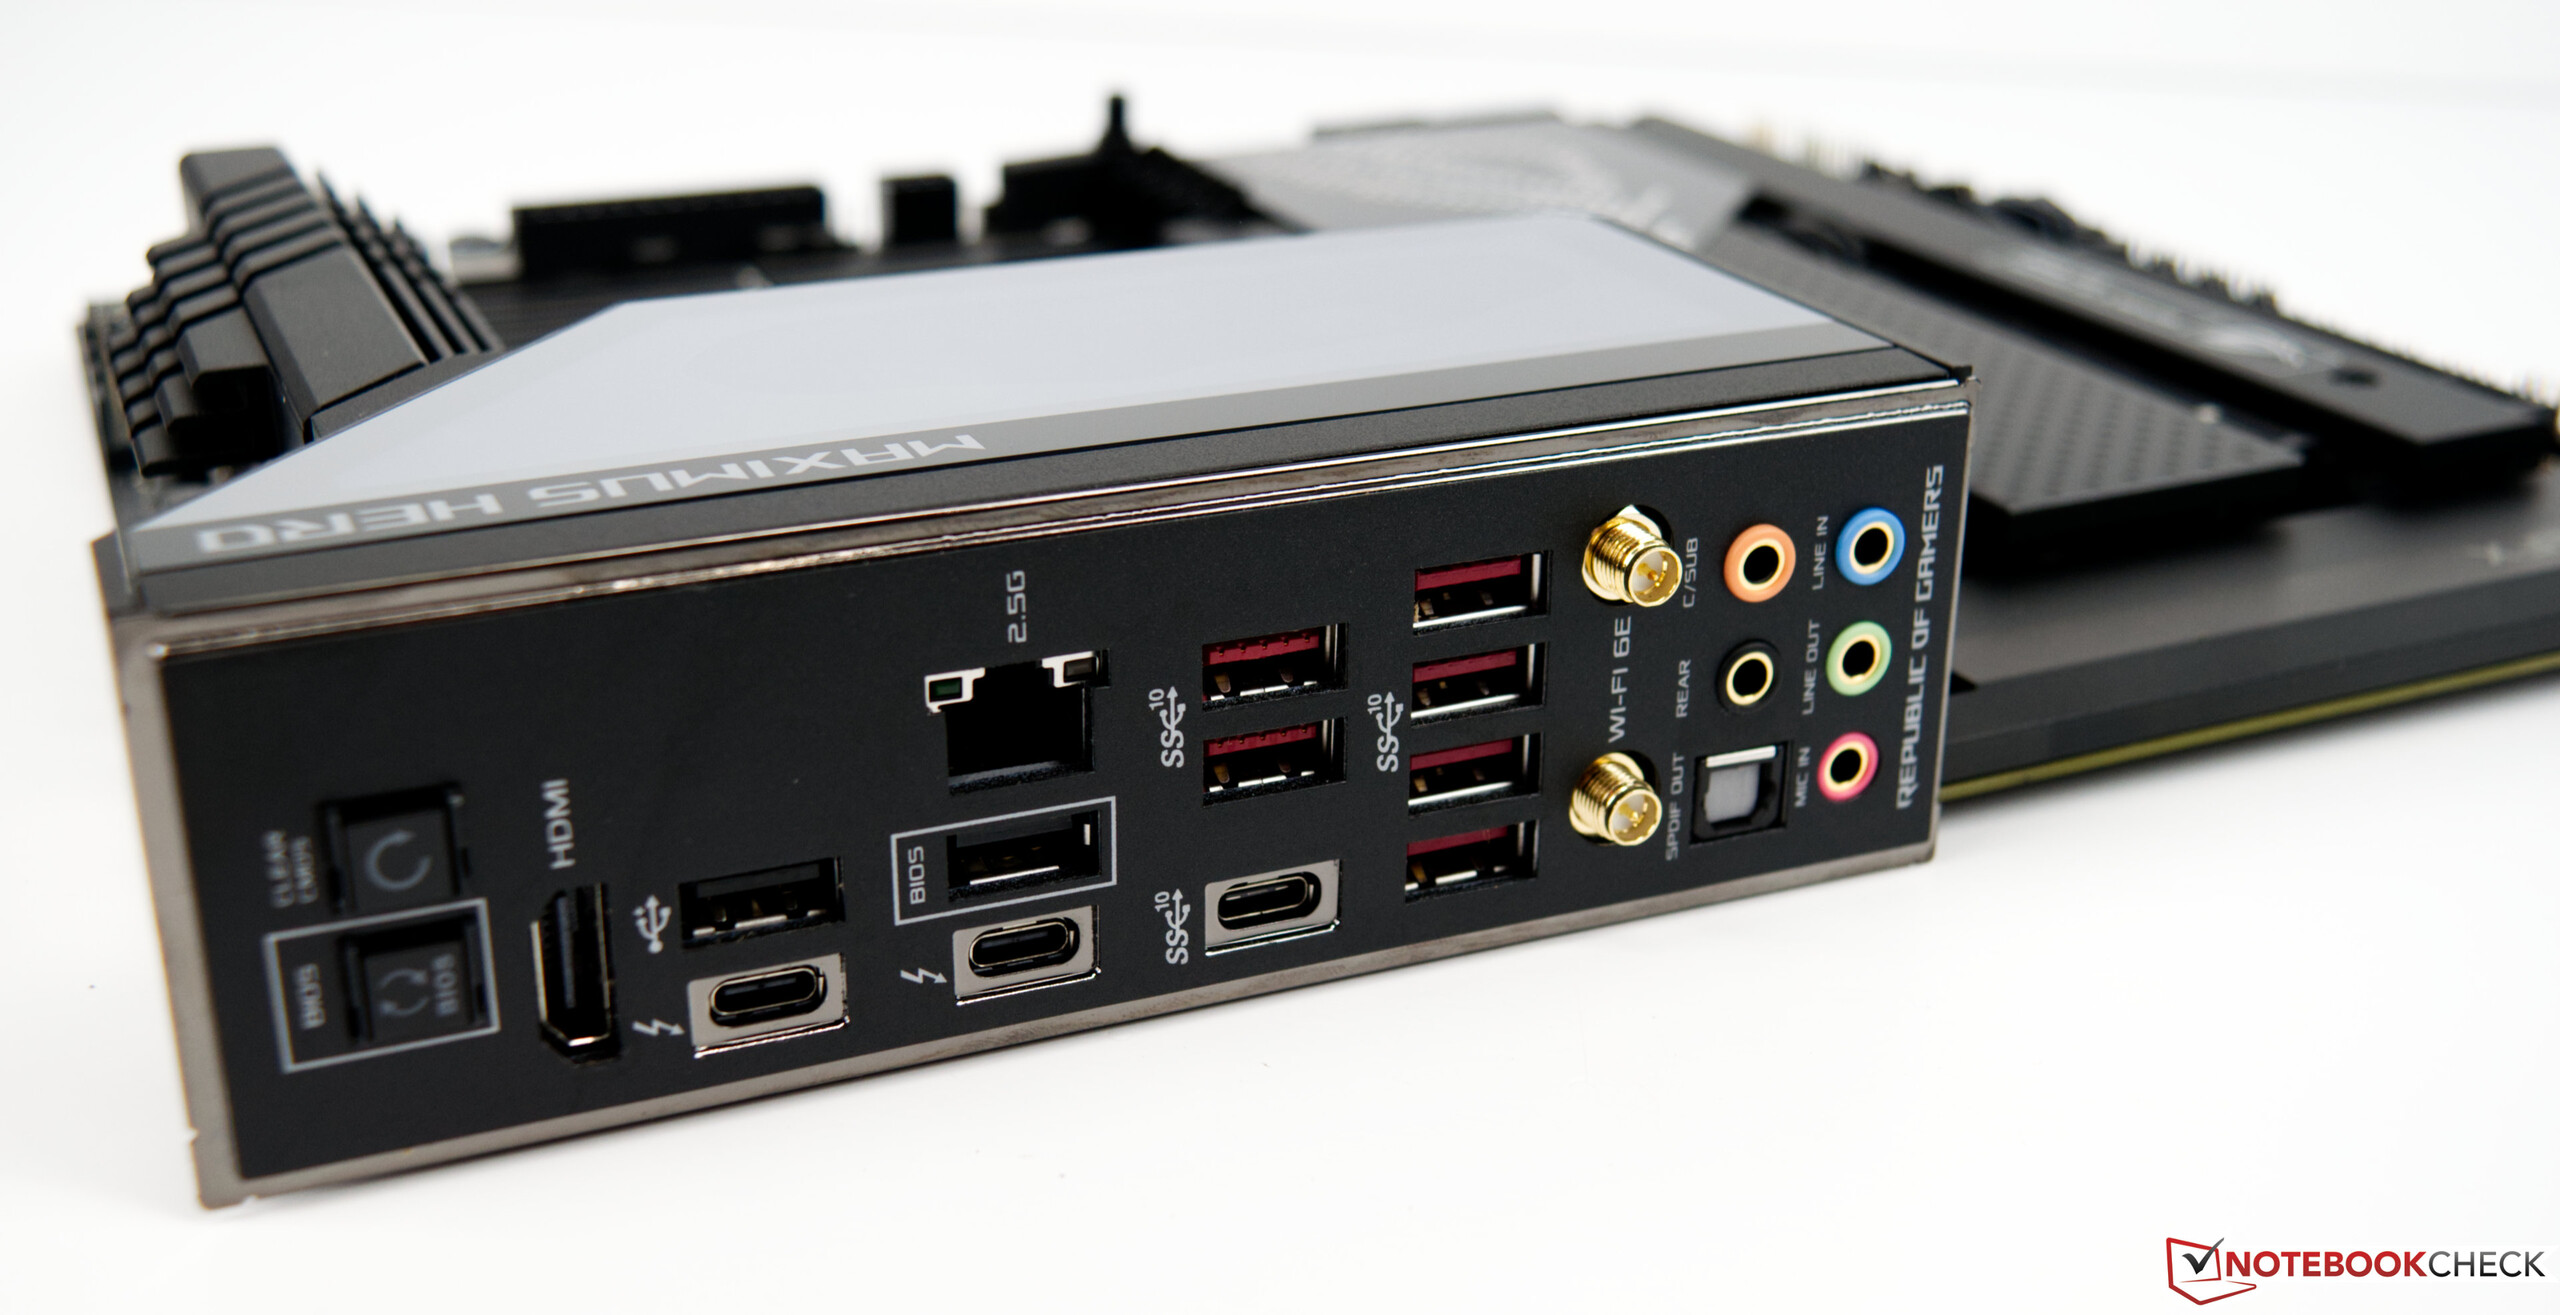
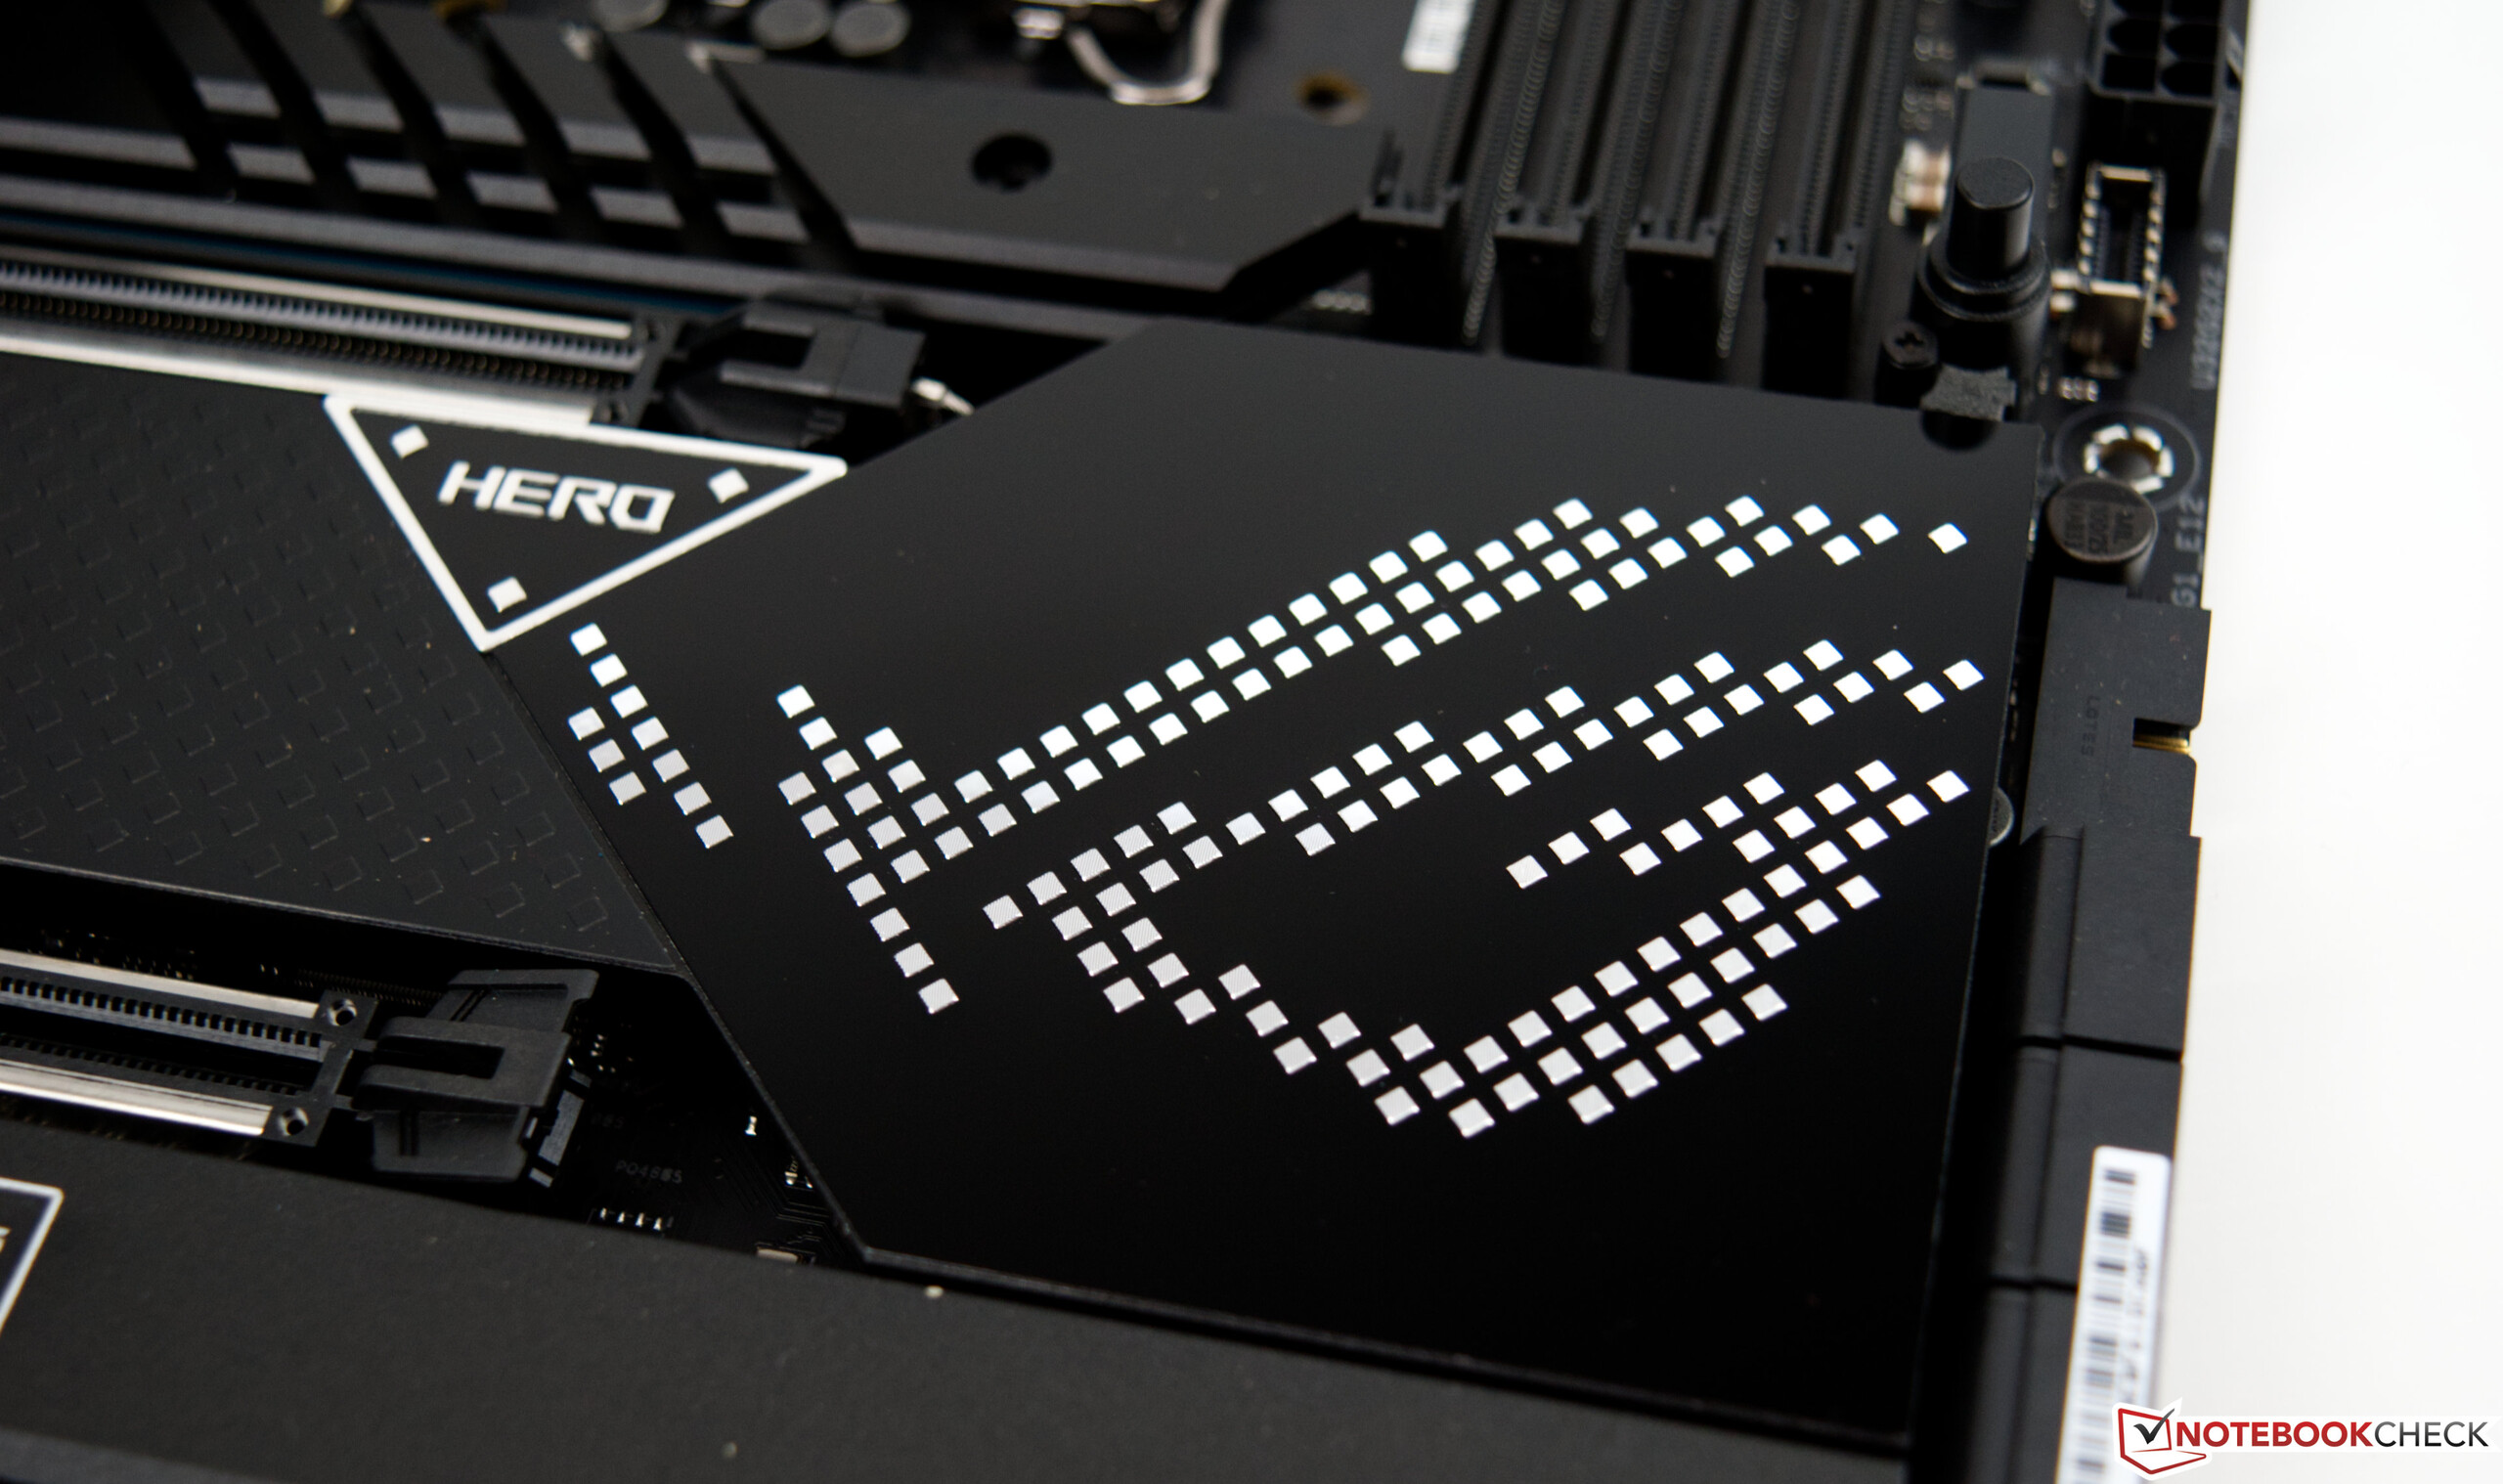
La Asus ROG Maximus Z690 Hero en detalle
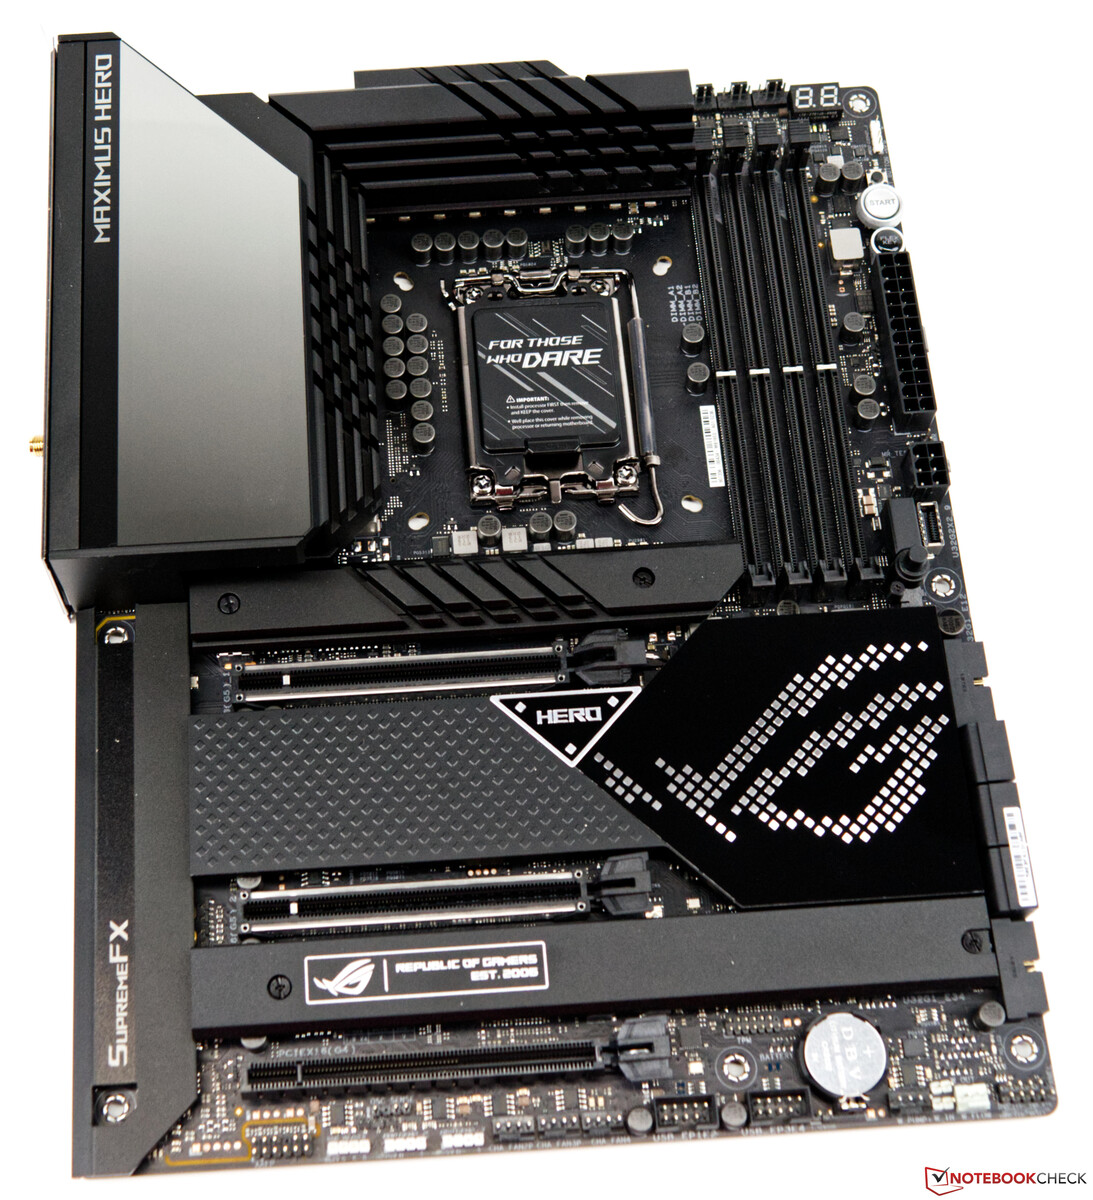
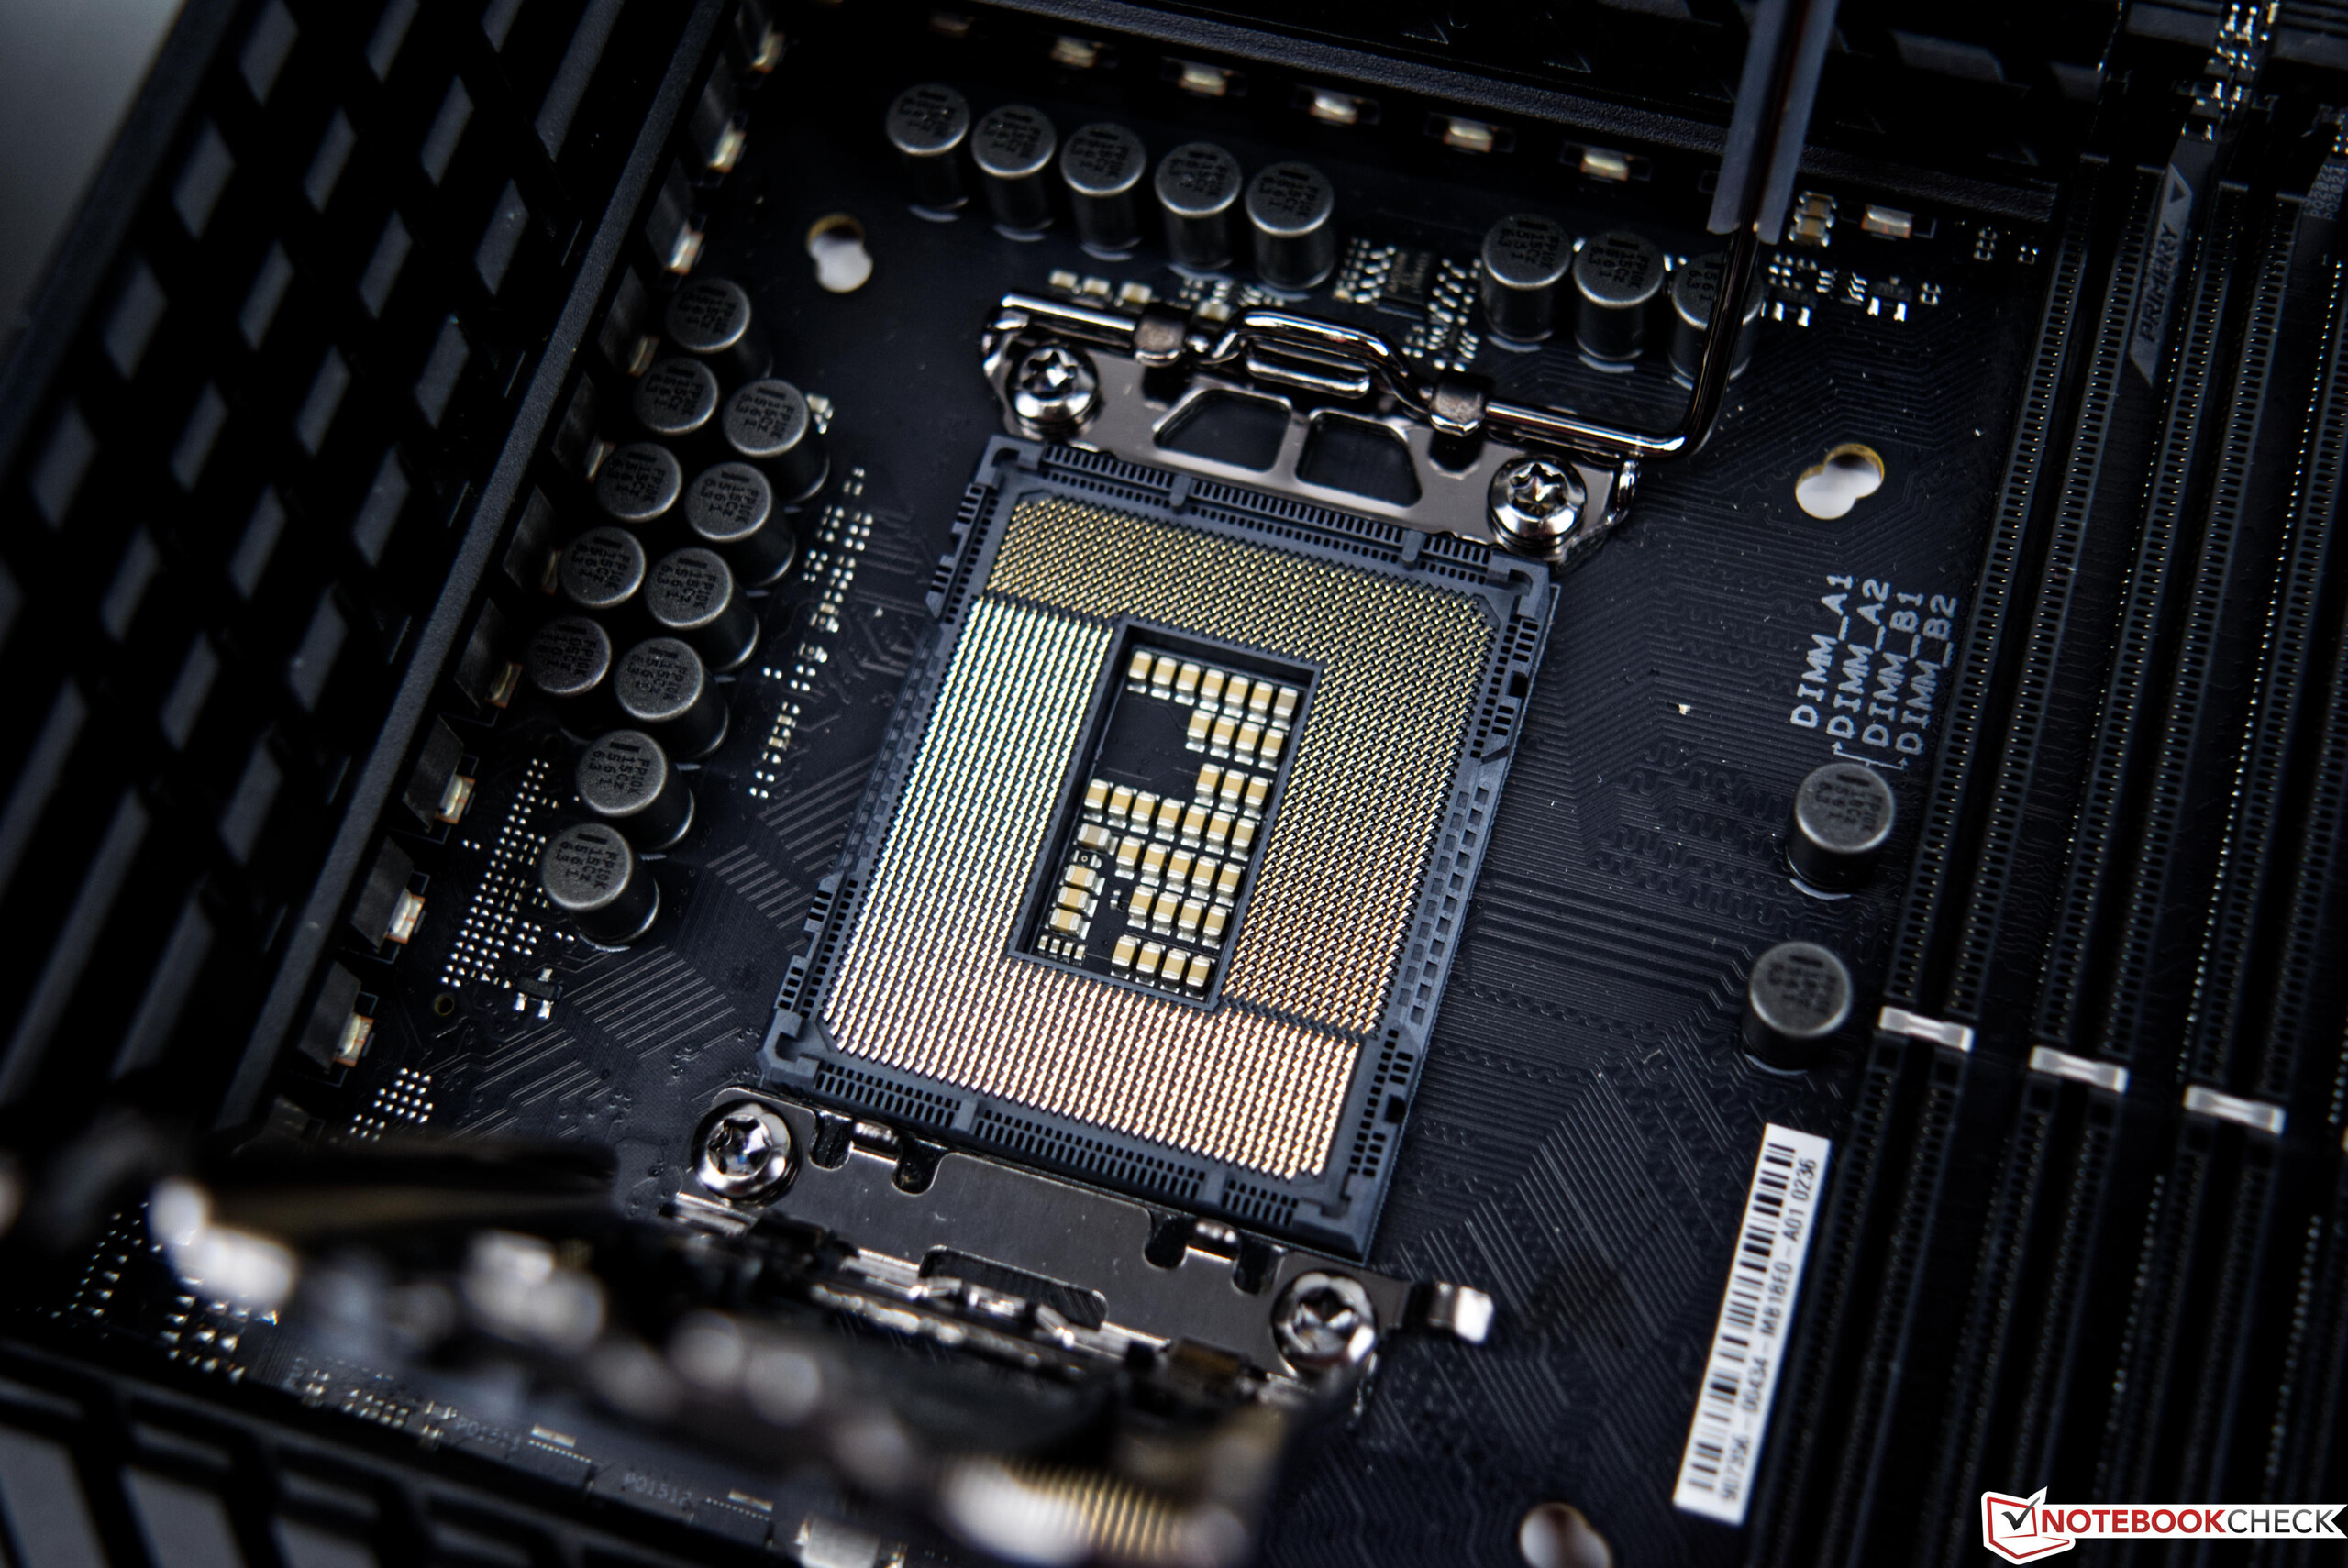
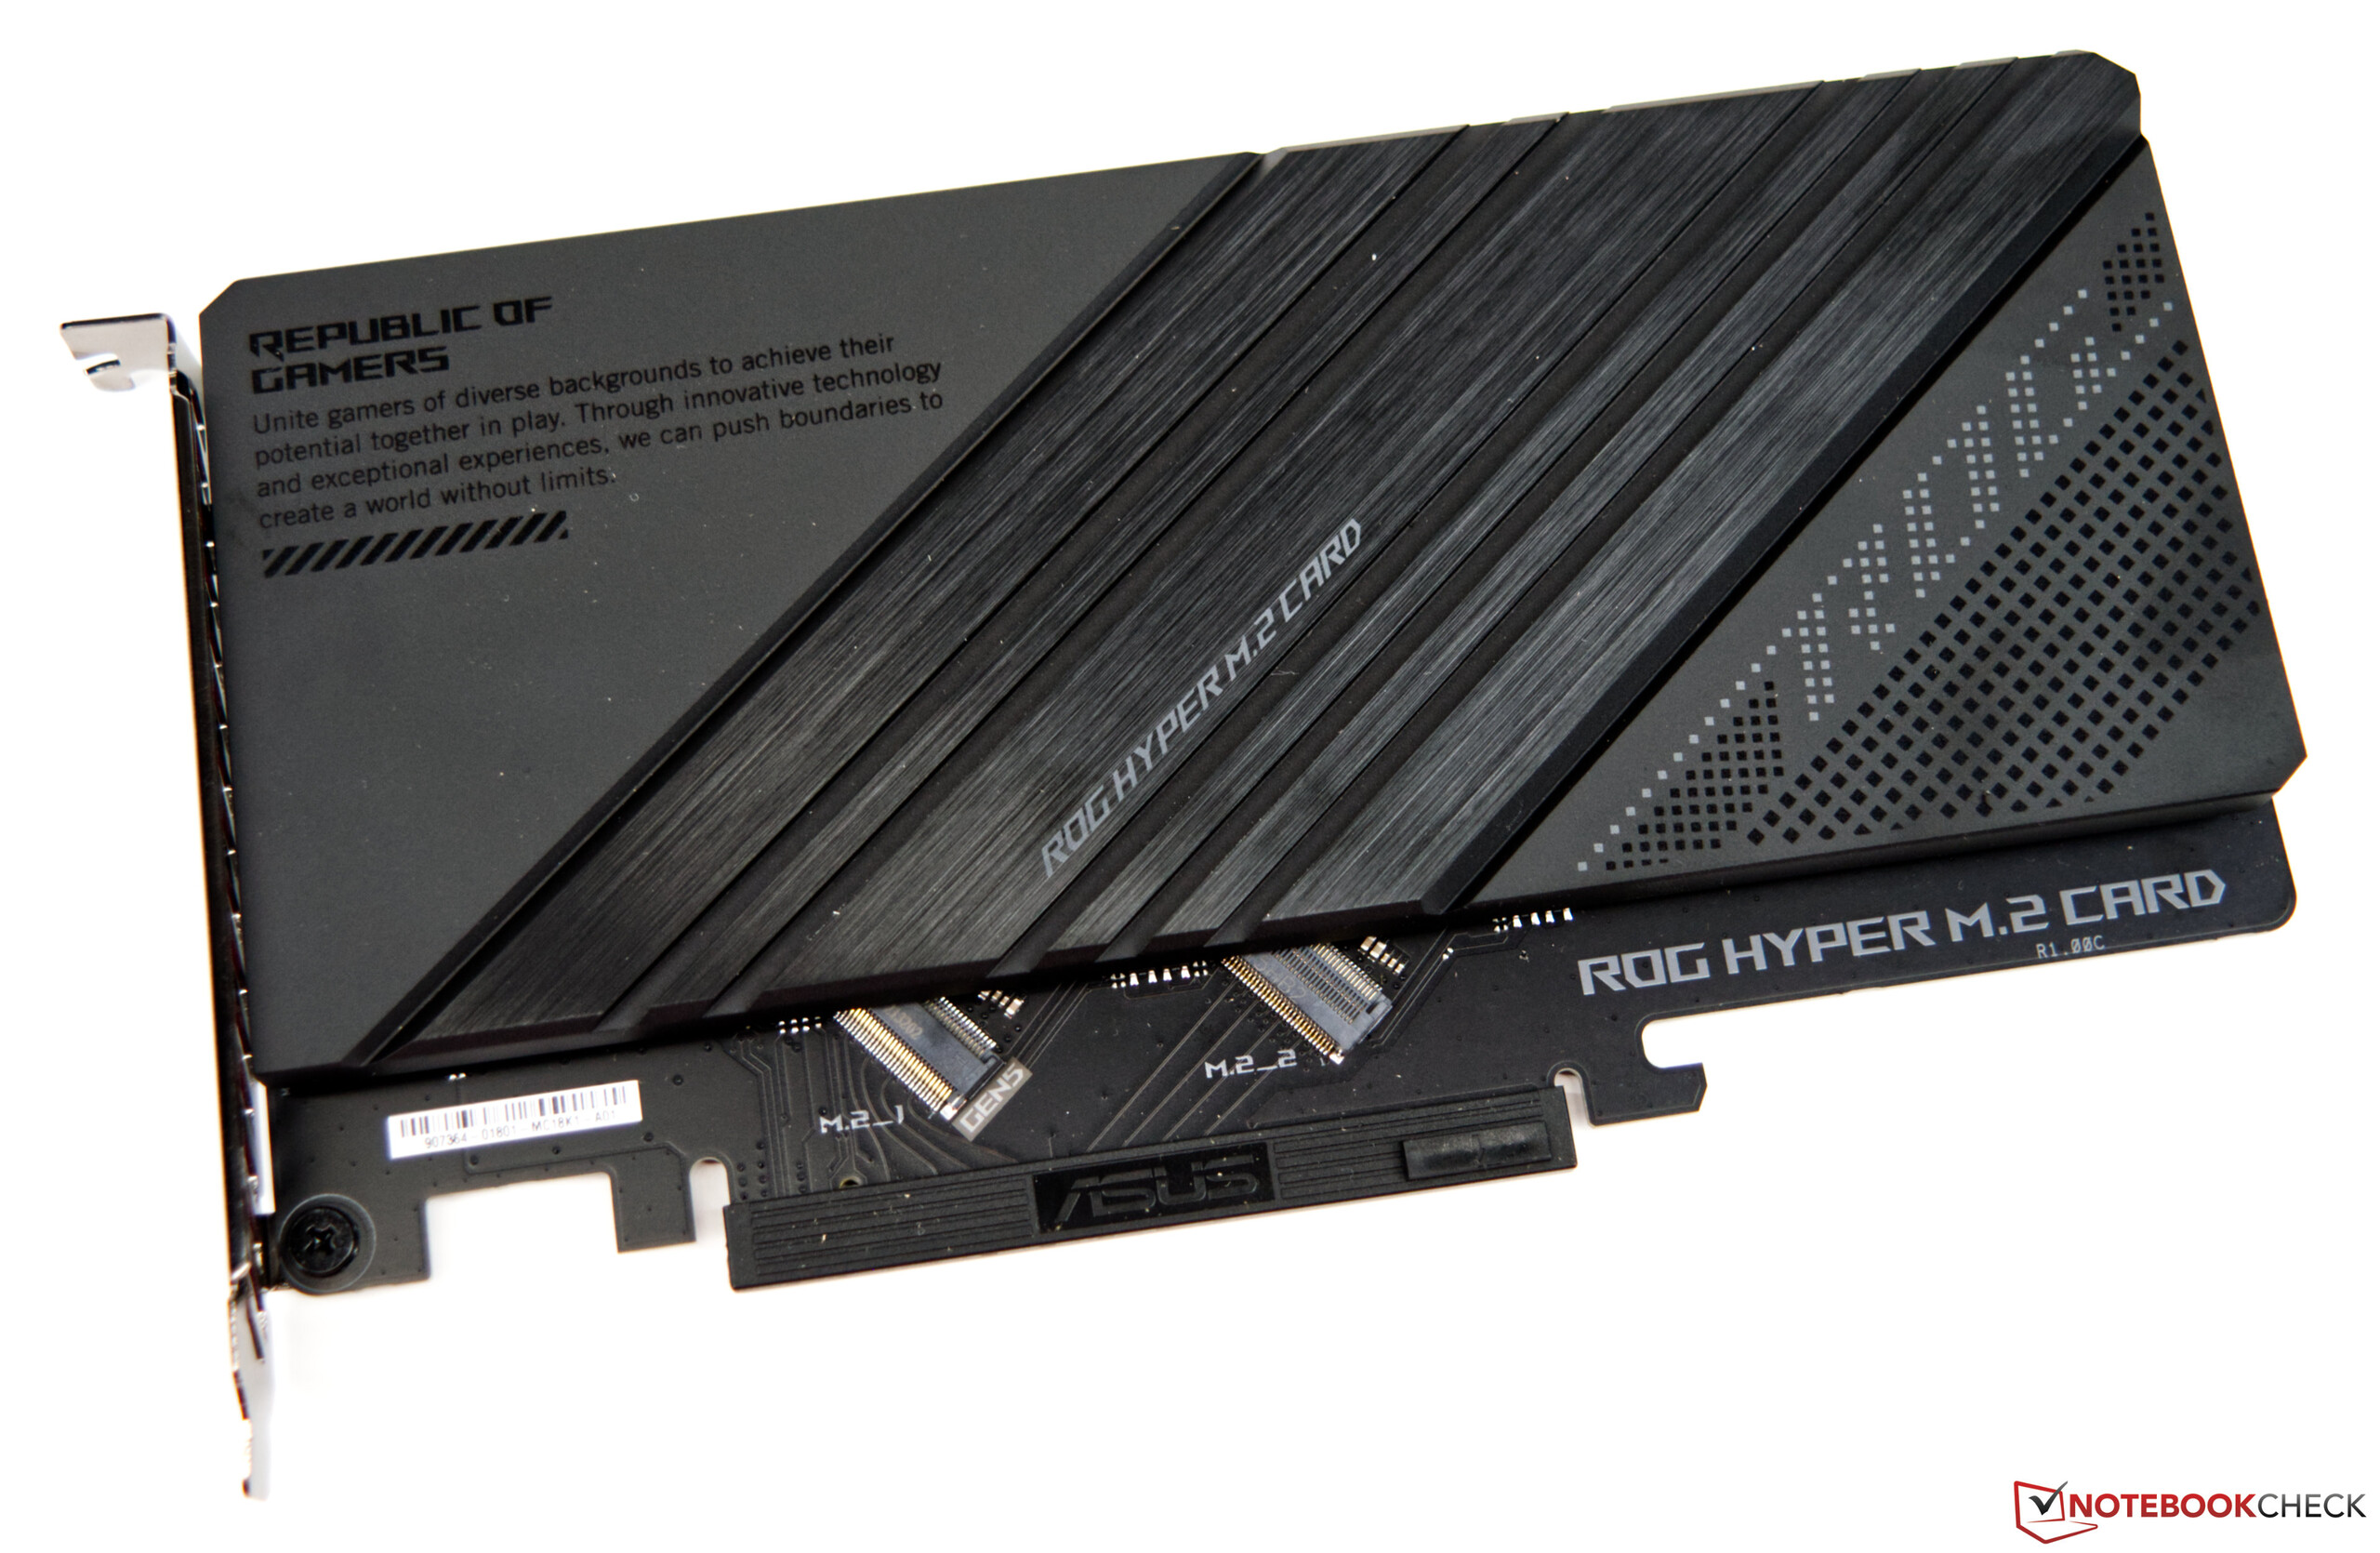
Asus nos ha proporcionado a tiempo la ROG Maximus Z690 HeroAgradecemos a Asus Alemania por este préstamo. La Asus ROG Maximus Z690 Hero tiene un aspecto enorme, lo que se debe al gran sistema de refrigeración. En total, se pueden colocar hasta cinco SSD M.2 en la placa base, pero luego hay que instalar dos de los cinco SSD en una tarjeta Hyper M.2 independiente. Ésta podrá utilizar todo el ancho de banda del soporte Gen 5 y se incluye como accesorio en la caja. El nuevo socket LGA 1700 destaca por su diseño ligeramente alargado. Muchos sistemas de refrigeración LGA 1200 también son compatibles con el nuevo zócalo LGA 1700, pero debes asegurarte de preguntar directamente al fabricante. A veces se ofrecen otros soportes de montaje para el LGA 1700 con el fin de garantizar una presión de contacto óptima sobre la CPU.
Puedes instalar hasta 128 GB de la nueva memoria de trabajo DDR5. El WiFi, la LAN de 2,5 Gbit y un total de 20 puertos USB garantizan una conectividad suficiente.
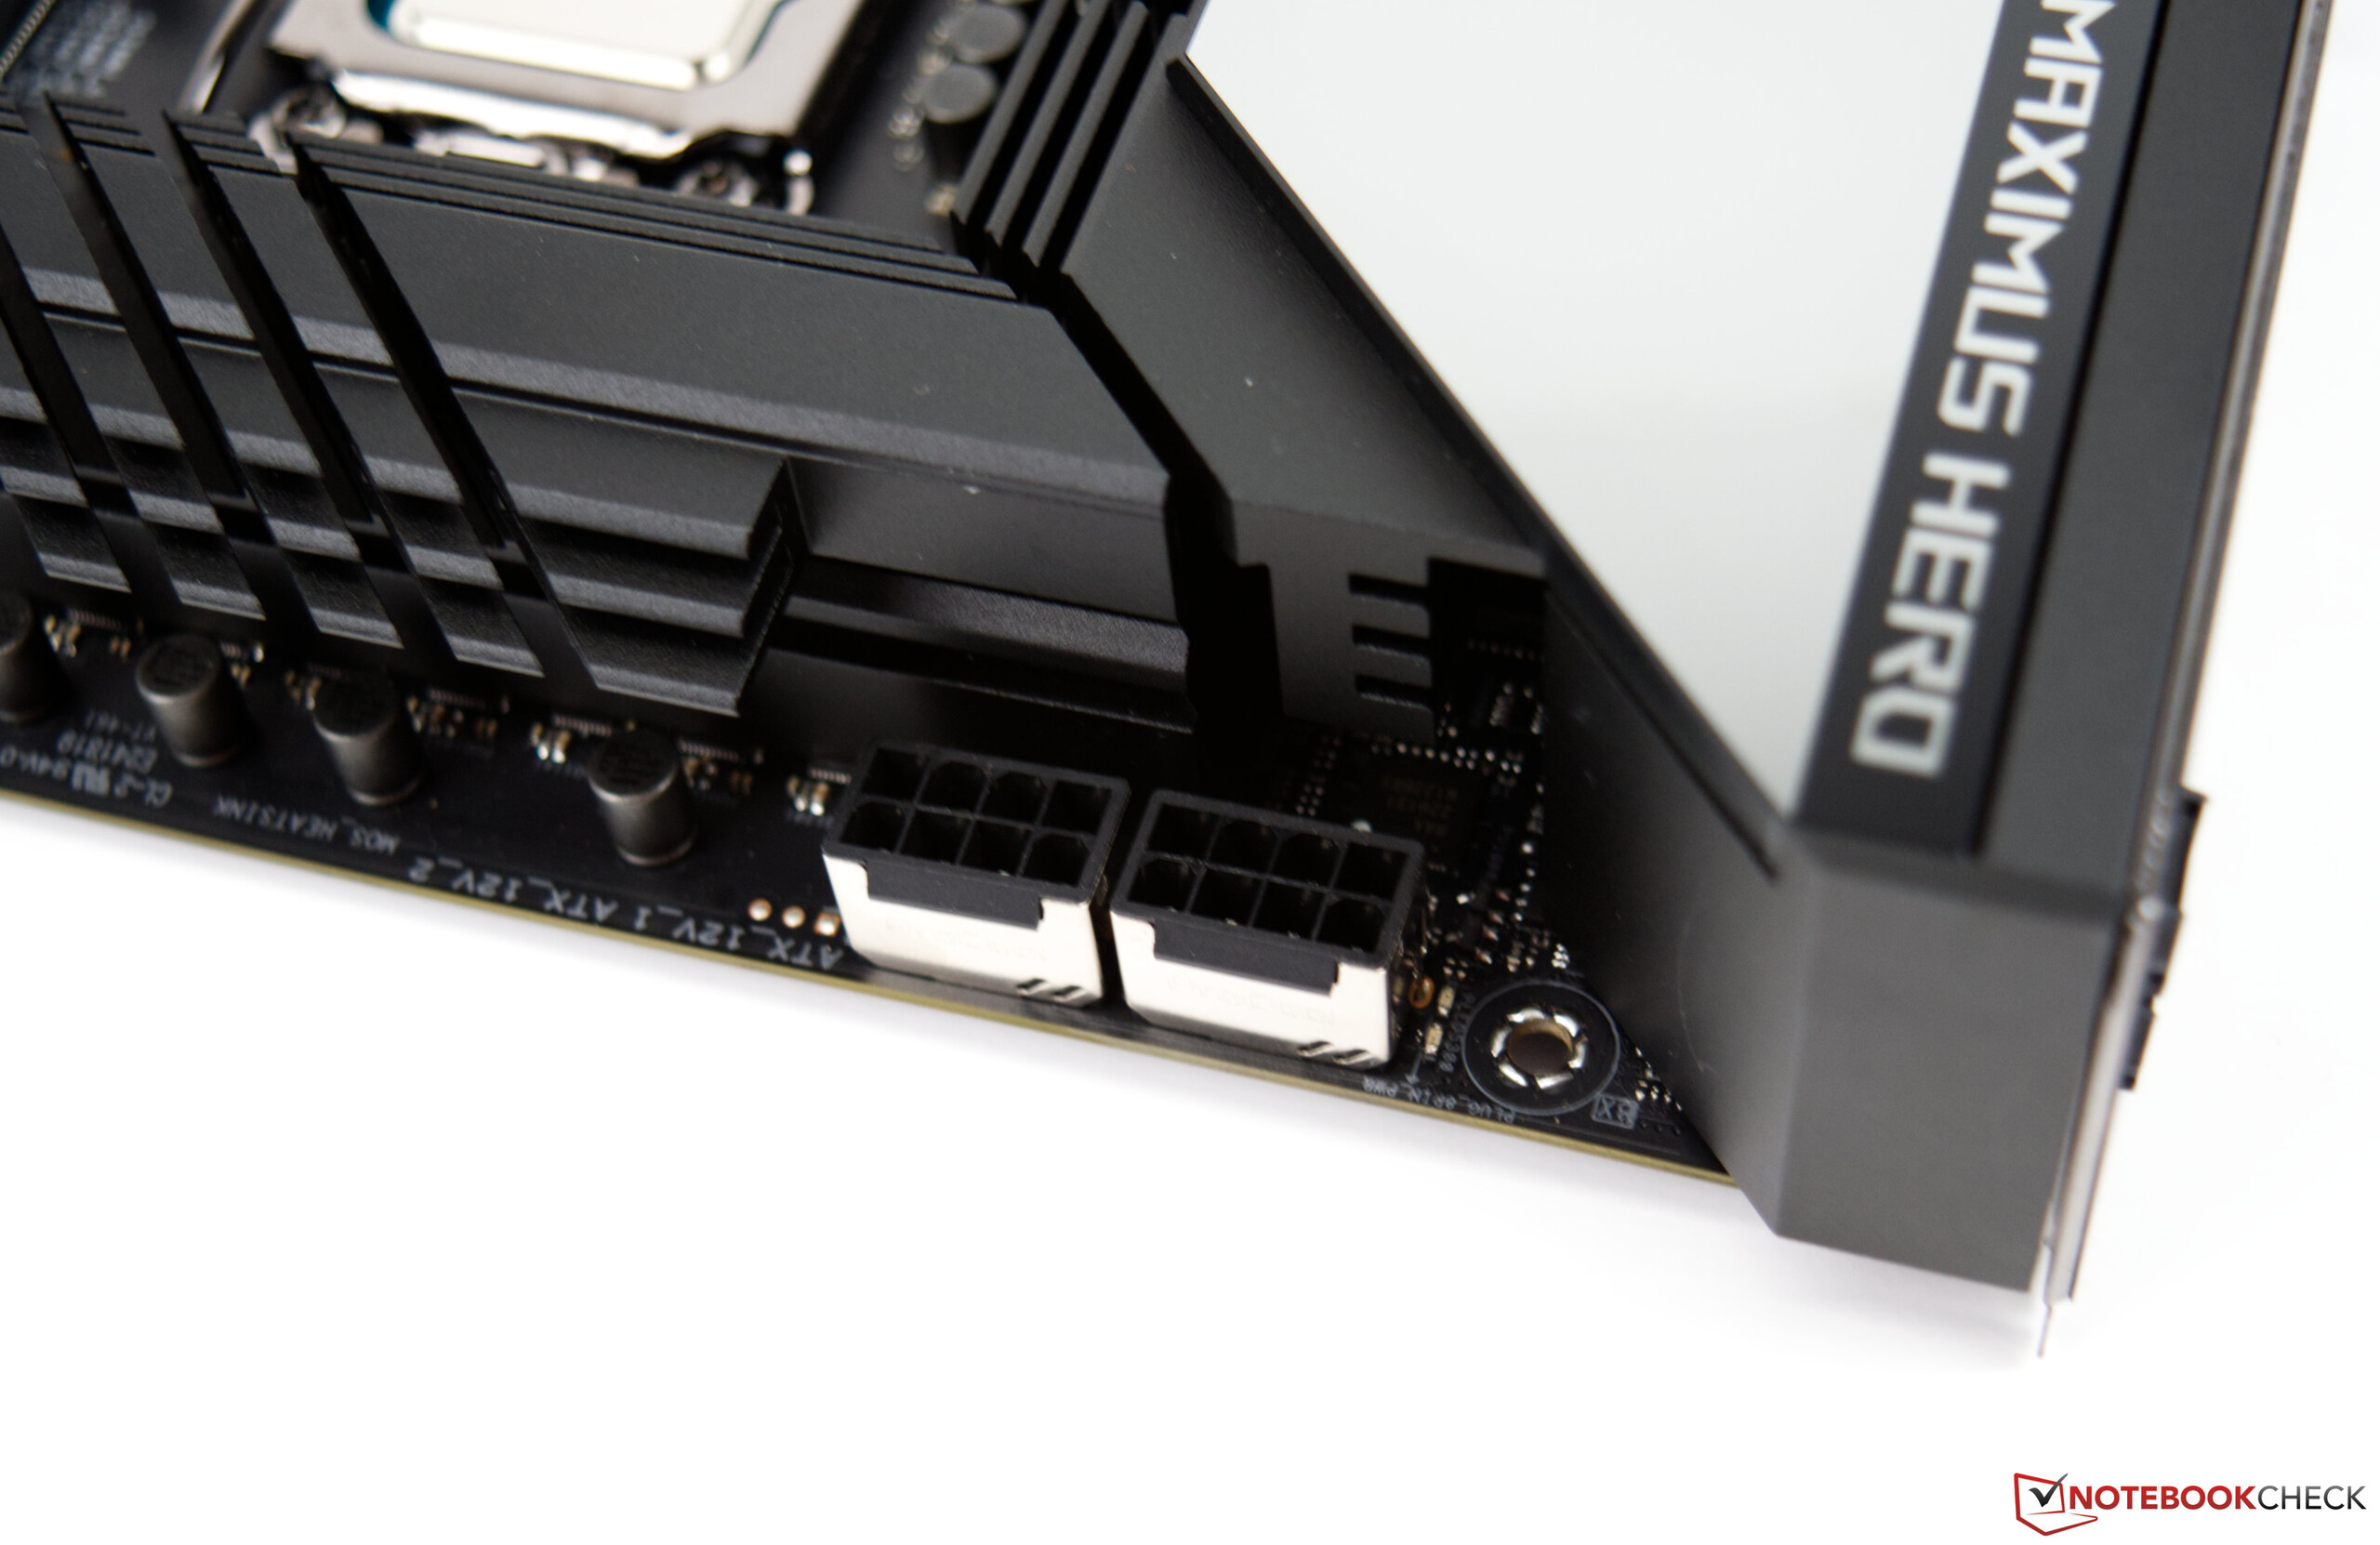
Dos conectores de alimentación de 8 pines situados no muy lejos del zócalo proporcionan energía a la CPU. Los transformadores de voltaje están cubiertos por un bloque de refrigeración muy macizo que incluye un tubo de calor. Además, hay un atractivo panel de iluminación Polymo sobre el escudo de E/S, que es bastante atractivo.
Pruebas de rendimiento de los procesadores
Intel es capaz de mantener la promesa de un aumento significativo del rendimiento encomparación con los procesadores Rocket Lake-S. En la clasificación de rendimiento, que refleja la diferencia de rendimiento en todos los puntos de referencia enumerados, el Intel Core i9-12900K es capaz de situarse claramente en la cima. En comparación con elAMD Ryzen 9 5900Xque también ofrece 24 hilos en total, el nuevo buque insignia de Intel está por delante en 13 puntos porcentuales. Si tomamos elIntel Core i9-11900K como referencia, el Core i9-12900K es un 23% más rápido. Aunque las diferencias varían ligeramente en los distintos benchmarks, esto se debe a la arquitectura de la CPU correspondiente.
Vemos una imagen similar con el Intel Core i5-12600K más pequeño. Si utilizamos el AMD Ryzen 7 5800X como competidor, ya que tiene la misma cantidad de hilos, ambos competidores rinden al mismo nivel en los resultados del benchmark acumulativo. Por otro lado, el procesador Zen3 lo tiene difícil para competir con el potente rendimiento de un solo núcleo de Intel. Pero no hay que descartar a AMD todavía, ya que las CPUs Zen3 llevan ya un año en el mercado y, según algunos rumores, su sucesor ya está en los tacos de salida. Cuando esté disponible, las matrices se fundirán de nuevo y Rocket Lake-S tendrá que volver a demostrar su valía.
Debido a la discusión PL1 = PL2, tomamos Cinebench R23 y realizamos otra ejecución con un valor PL1 limitado a 125 vatios. No hubo cambios en el resultado dignos de mención. Las diferencias fueron mínimas y pueden considerarse dentro de las tolerancias de medición.
Estaba claro que Intel iba a dar un salto importante con el nuevo diseño de los núcleos P y E. Con esto, Intel también es capaz de cerrar la brecha con los procesadores de 12 y 16 núcleos de AMD, lo que no fue posible con el Core i9-11900K.
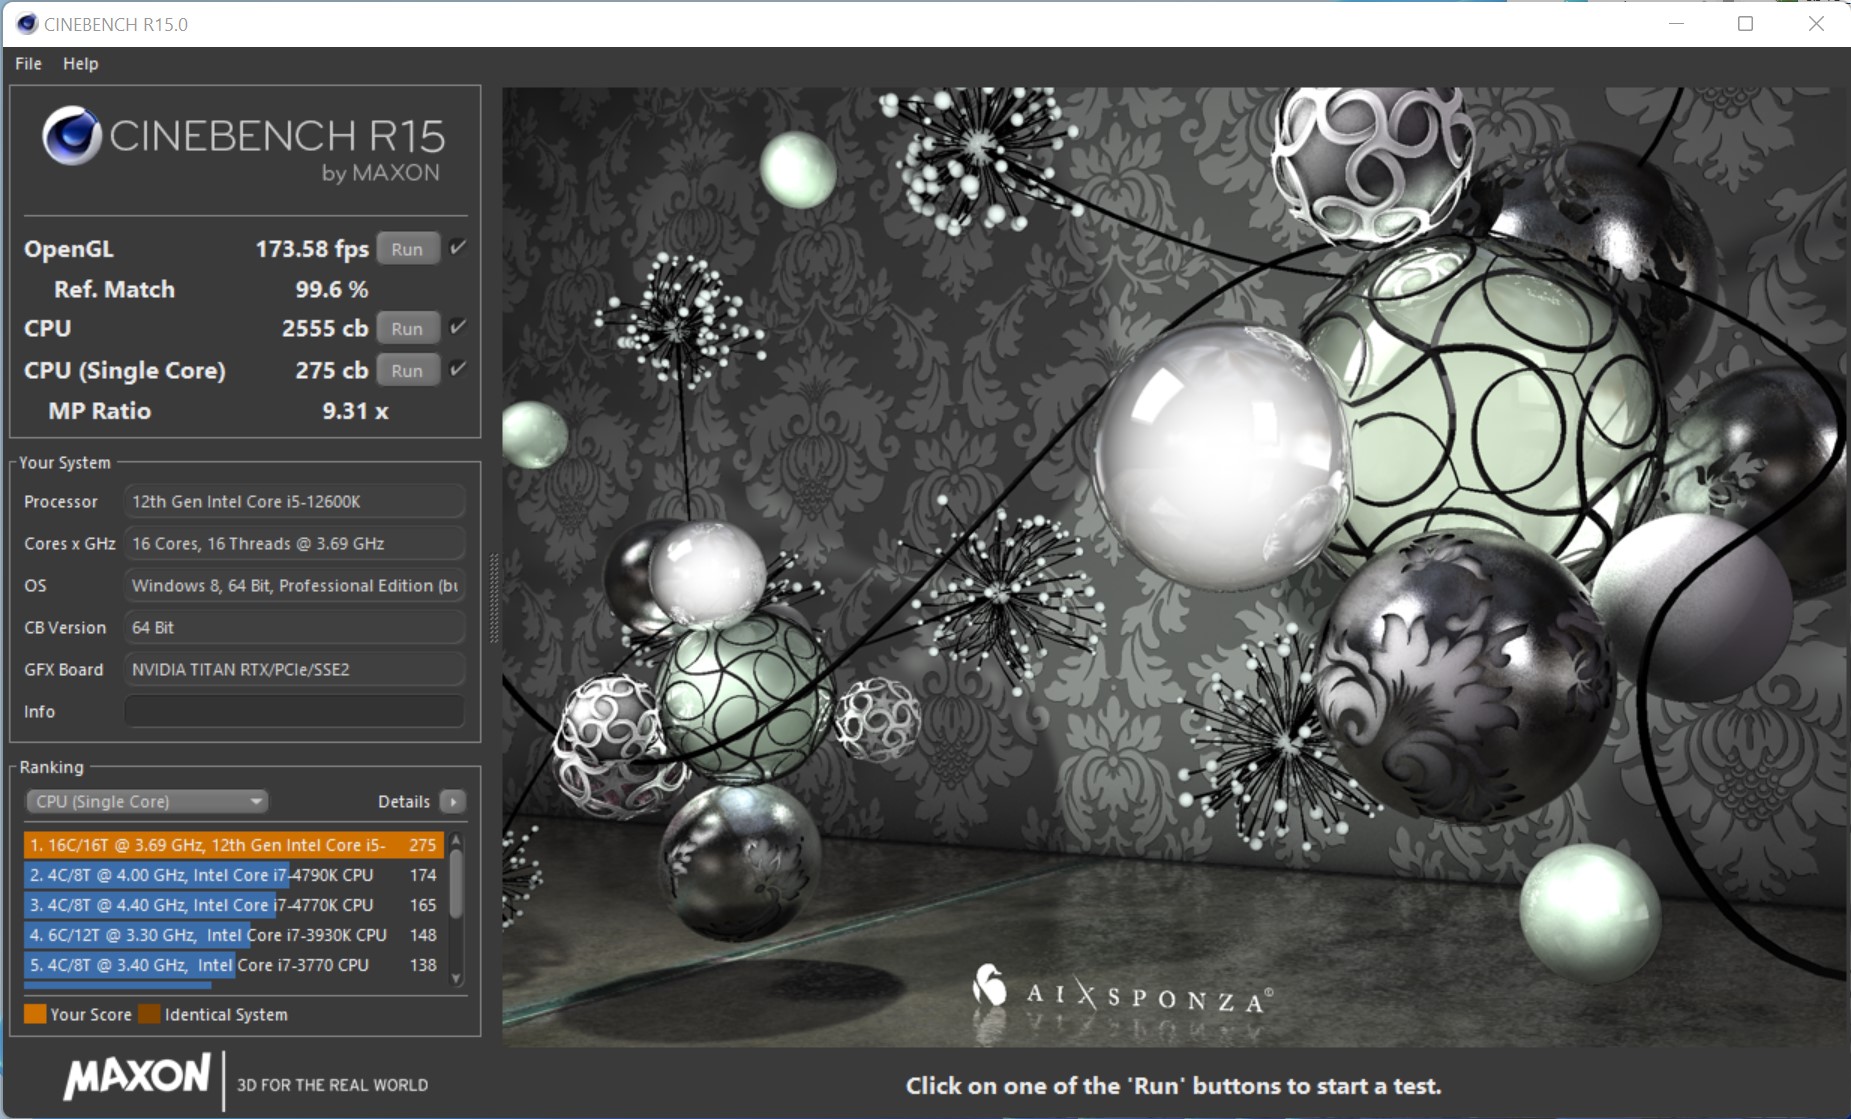
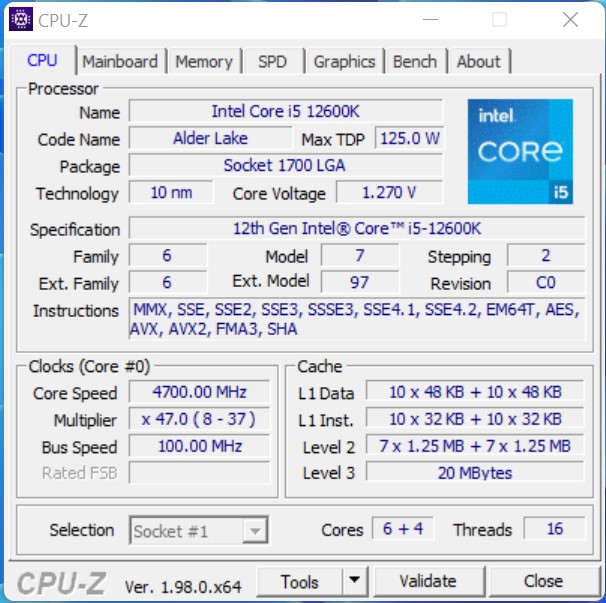
Intel Core i5-12600K

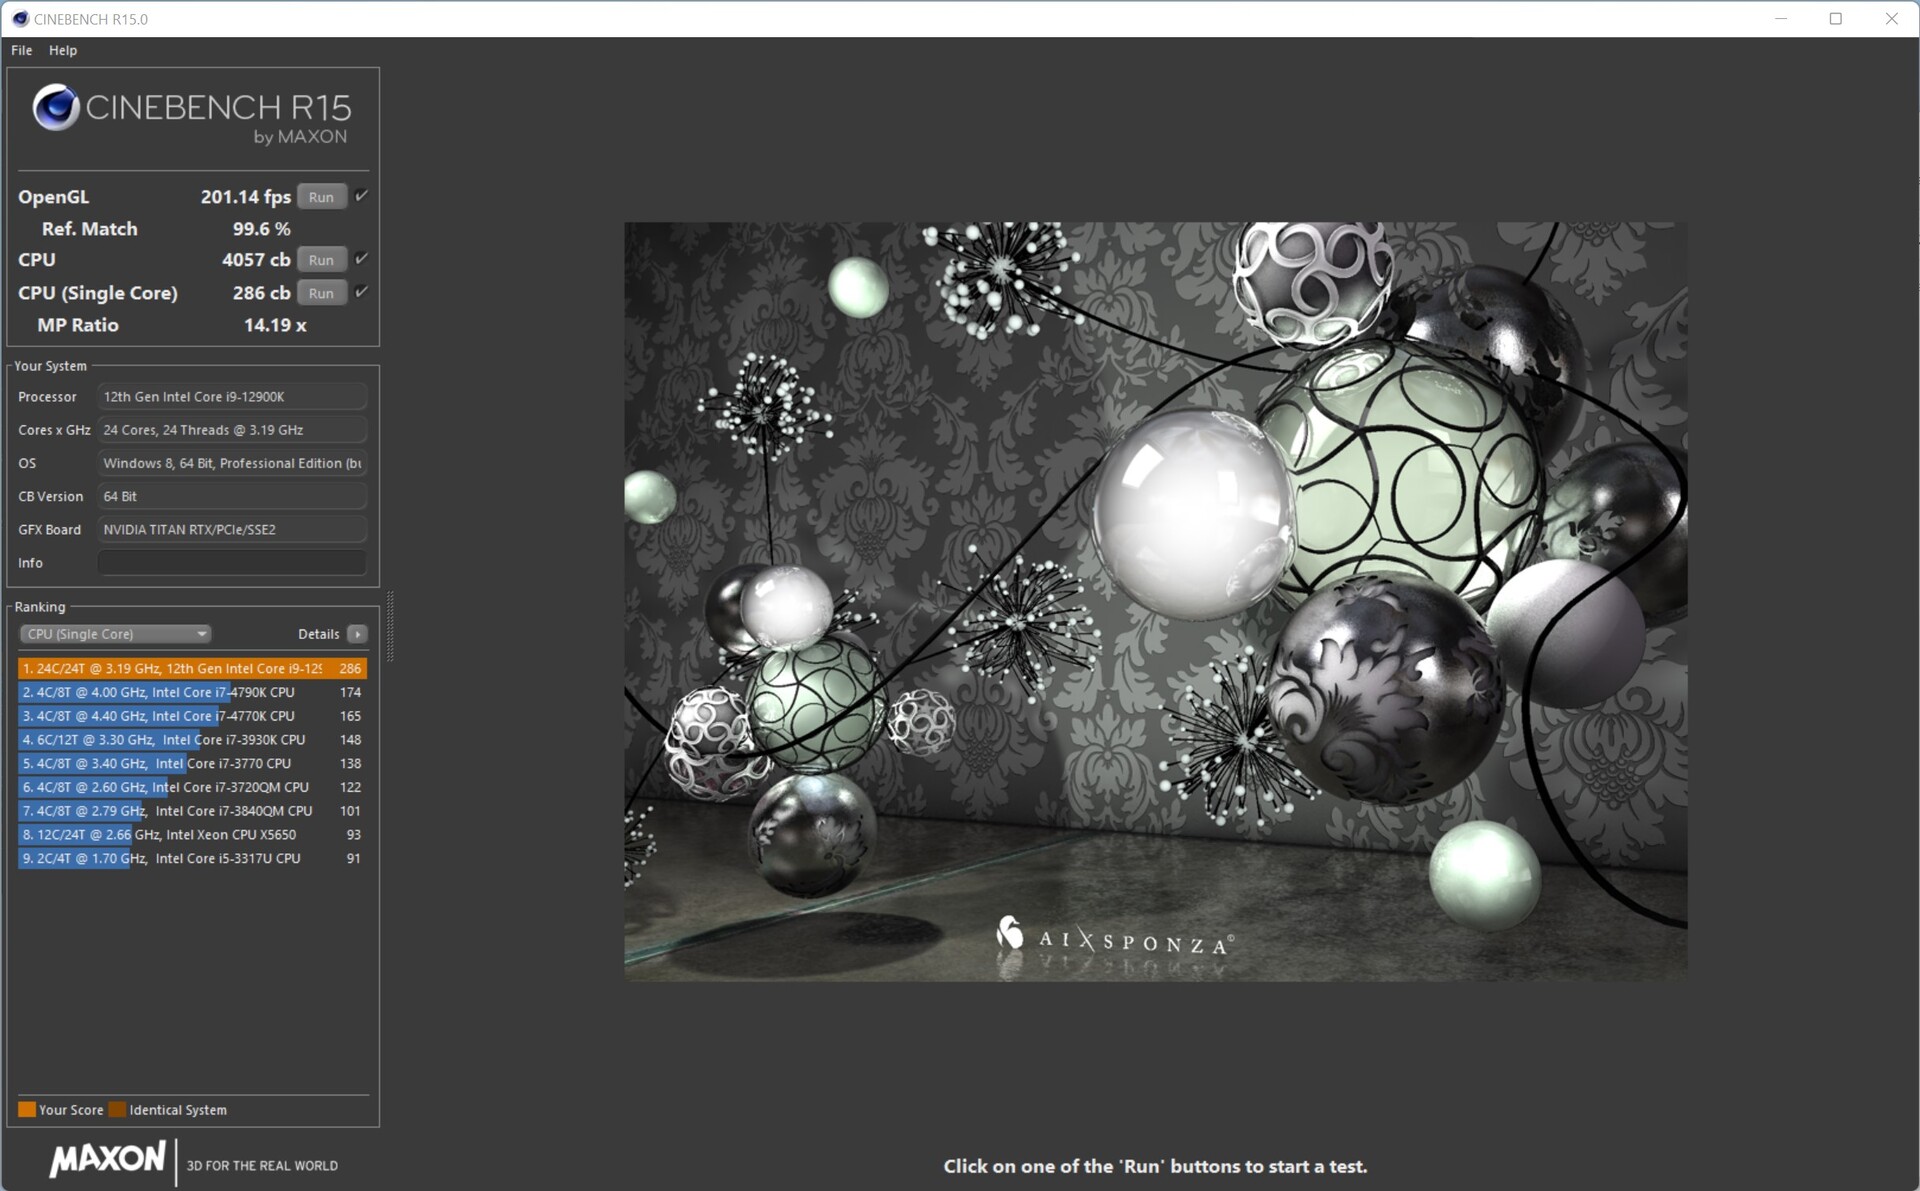
Intel Core i9-12900K
| Performance rating - Percent | |
| Intel Core i9-12900K | |
| AMD Ryzen 9 5950X | |
| Intel Core i5-12600K | |
| AMD Ryzen 9 5900X -2! | |
| AMD Ryzen 7 5800X | |
| Intel Core i9-11900K | |
| Intel Core i9-10900K | |
| AMD Ryzen 5 5600X | |
| Intel Core i5-11600K | |
| Intel Core i5-10600K | |
| Cinebench R15 | |
| CPU Single 64Bit | |
| Intel Core i9-12900K | |
| Intel Core i5-12600K | |
| AMD Ryzen 9 5950X | |
| AMD Ryzen 9 5900X | |
| AMD Ryzen 7 5800X | |
| Intel Core i9-11900K | |
| AMD Ryzen 5 5600X | |
| Intel Core i5-11600K | |
| Intel Core i9-10900K | |
| Intel Core i5-10600K | |
| CPU Multi 64Bit | |
| AMD Ryzen 9 5950X | |
| Intel Core i9-12900K | |
| AMD Ryzen 9 5900X | |
| Intel Core i9-10900K | |
| AMD Ryzen 7 5800X | |
| Intel Core i5-12600K | |
| Intel Core i9-11900K | |
| AMD Ryzen 5 5600X | |
| Intel Core i5-11600K | |
| Intel Core i5-10600K | |
| Cinebench R20 | |
| CPU (Single Core) | |
| Intel Core i9-12900K | |
| Intel Core i5-12600K | |
| Intel Core i9-11900K | |
| AMD Ryzen 9 5950X | |
| AMD Ryzen 9 5900X | |
| AMD Ryzen 7 5800X | |
| AMD Ryzen 5 5600X | |
| Intel Core i5-11600K | |
| Intel Core i9-10900K | |
| Intel Core i5-10600K | |
| CPU (Multi Core) | |
| AMD Ryzen 9 5950X | |
| Intel Core i9-12900K | |
| AMD Ryzen 9 5900X | |
| Intel Core i5-12600K | |
| Intel Core i9-10900K | |
| AMD Ryzen 7 5800X | |
| Intel Core i9-11900K | |
| AMD Ryzen 5 5600X | |
| Intel Core i5-11600K | |
| Intel Core i5-10600K | |
| Cinebench R23 | |
| Single Core | |
| Intel Core i9-12900K | |
| Intel Core i5-12600K | |
| Intel Core i9-11900K | |
| AMD Ryzen 9 5950X | |
| AMD Ryzen 9 5900X | |
| Intel Core i5-11600K | |
| AMD Ryzen 7 5800X | |
| AMD Ryzen 5 5600X | |
| Intel Core i5-10600K | |
| Intel Core i9-10900K | |
| Multi Core | |
| AMD Ryzen 9 5950X | |
| Intel Core i9-12900K | |
| AMD Ryzen 9 5900X | |
| Intel Core i5-12600K | |
| Intel Core i9-10900K | |
| Intel Core i9-11900K | |
| AMD Ryzen 7 5800X | |
| AMD Ryzen 5 5600X | |
| Intel Core i5-11600K | |
| Intel Core i5-10600K | |
| Cinebench R11.5 | |
| CPU Single 64Bit | |
| Intel Core i9-12900K | |
| Intel Core i5-12600K | |
| AMD Ryzen 9 5900X | |
| AMD Ryzen 9 5950X | |
| Intel Core i9-11900K | |
| AMD Ryzen 7 5800X | |
| AMD Ryzen 5 5600X | |
| Intel Core i5-11600K | |
| Intel Core i9-10900K | |
| Intel Core i5-10600K | |
| CPU Multi 64Bit | |
| AMD Ryzen 9 5950X | |
| Intel Core i9-12900K | |
| AMD Ryzen 9 5900X | |
| Intel Core i5-12600K | |
| AMD Ryzen 7 5800X | |
| Intel Core i9-10900K | |
| Intel Core i9-11900K | |
| AMD Ryzen 5 5600X | |
| Intel Core i5-11600K | |
| Intel Core i5-10600K | |
| Cinebench R10 | |
| Rendering Single CPUs 64Bit | |
| Intel Core i9-12900K | |
| Intel Core i5-12600K | |
| Intel Core i9-11900K | |
| AMD Ryzen 9 5950X | |
| AMD Ryzen 7 5800X | |
| Intel Core i5-11600K | |
| AMD Ryzen 9 5900X | |
| AMD Ryzen 5 5600X | |
| Intel Core i9-10900K | |
| Intel Core i5-10600K | |
| Rendering Multiple CPUs 64Bit | |
| Intel Core i9-12900K | |
| AMD Ryzen 9 5950X | |
| AMD Ryzen 9 5900X | |
| Intel Core i5-12600K | |
| AMD Ryzen 7 5800X | |
| Intel Core i9-11900K | |
| Intel Core i9-10900K | |
| AMD Ryzen 5 5600X | |
| Intel Core i5-11600K | |
| Intel Core i5-10600K | |
| Blender - v2.79 BMW27 CPU | |
| Intel Core i5-10600K | |
| Intel Core i5-11600K | |
| AMD Ryzen 5 5600X | |
| AMD Ryzen 7 5800X | |
| Intel Core i9-11900K | |
| Intel Core i5-12600K | |
| Intel Core i9-10900K | |
| AMD Ryzen 9 5900X | |
| Intel Core i9-12900K | |
| AMD Ryzen 9 5950X | |
| wPrime 2.10 | |
| 32m | |
| Intel Core i9-12900K | |
| Intel Core i5-11600K | |
| Intel Core i5-12600K | |
| Intel Core i5-10600K | |
| Intel Core i9-11900K | |
| AMD Ryzen 5 5600X | |
| Intel Core i9-10900K | |
| AMD Ryzen 7 5800X | |
| AMD Ryzen 9 5950X | |
| 1024m | |
| Intel Core i5-12600K | |
| Intel Core i9-12900K | |
| AMD Ryzen 5 5600X | |
| Intel Core i5-10600K | |
| Intel Core i5-11600K | |
| AMD Ryzen 7 5800X | |
| Intel Core i9-11900K | |
| Intel Core i9-10900K | |
| AMD Ryzen 9 5950X | |
| X264 HD Benchmark 4.0 | |
| Pass 1 | |
| Intel Core i9-12900K | |
| AMD Ryzen 7 5800X | |
| AMD Ryzen 9 5950X | |
| AMD Ryzen 9 5900X | |
| Intel Core i5-12600K | |
| AMD Ryzen 5 5600X | |
| Intel Core i9-11900K | |
| Intel Core i5-11600K | |
| Intel Core i9-10900K | |
| Intel Core i5-10600K | |
| Pass 2 | |
| AMD Ryzen 9 5950X | |
| Intel Core i9-12900K | |
| AMD Ryzen 9 5900X | |
| AMD Ryzen 7 5800X | |
| Intel Core i9-10900K | |
| Intel Core i5-12600K | |
| Intel Core i9-11900K | |
| AMD Ryzen 5 5600X | |
| Intel Core i5-11600K | |
| Intel Core i5-10600K | |
| WinRAR - Result | |
| AMD Ryzen 7 5800X | |
| AMD Ryzen 9 5900X | |
| AMD Ryzen 5 5600X | |
| AMD Ryzen 9 5950X | |
| Intel Core i9-12900K | |
| Intel Core i9-10900K | |
| Intel Core i9-11900K | |
| Intel Core i5-11600K | |
| Intel Core i5-10600K | |
| Intel Core i5-12600K | |
| TrueCrypt | |
| AES Mean 100MB | |
| AMD Ryzen 9 5950X | |
| AMD Ryzen 9 5900X | |
| Intel Core i9-12900K | |
| AMD Ryzen 7 5800X | |
| Intel Core i9-10900K | |
| Intel Core i9-11900K | |
| Intel Core i5-12600K | |
| AMD Ryzen 5 5600X | |
| Intel Core i5-11600K | |
| Intel Core i5-10600K | |
| Twofish Mean 100MB | |
| AMD Ryzen 9 5950X | |
| Intel Core i9-12900K | |
| AMD Ryzen 9 5900X | |
| Intel Core i9-10900K | |
| Intel Core i5-12600K | |
| AMD Ryzen 7 5800X | |
| Intel Core i9-11900K | |
| AMD Ryzen 5 5600X | |
| Intel Core i5-11600K | |
| Intel Core i5-10600K | |
| Serpent Mean 100MB | |
| AMD Ryzen 9 5950X | |
| Intel Core i9-12900K | |
| AMD Ryzen 9 5900X | |
| Intel Core i9-10900K | |
| AMD Ryzen 7 5800X | |
| Intel Core i5-12600K | |
| Intel Core i9-11900K | |
| AMD Ryzen 5 5600X | |
| Intel Core i5-11600K | |
| Intel Core i5-10600K | |
| Geekbench 5.5 | |
| Multi-Core | |
| Intel Core i9-12900K | |
| AMD Ryzen 9 5950X | |
| AMD Ryzen 9 5900X | |
| Intel Core i5-12600K | |
| Intel Core i9-10900K | |
| AMD Ryzen 7 5800X | |
| Intel Core i9-11900K | |
| AMD Ryzen 5 5600X | |
| Intel Core i5-11600K | |
| Intel Core i5-10600K | |
| Single-Core | |
| Intel Core i9-12900K | |
| Intel Core i5-12600K | |
| Intel Core i9-11900K | |
| Intel Core i5-11600K | |
| AMD Ryzen 9 5950X | |
| AMD Ryzen 9 5900X | |
| AMD Ryzen 7 5800X | |
| AMD Ryzen 5 5600X | |
| Intel Core i9-10900K | |
| Intel Core i5-10600K | |
| Geekbench 5.0 | |
| 5.0 Multi-Core | |
| Intel Core i9-12900K | |
| AMD Ryzen 9 5950X | |
| AMD Ryzen 9 5900X | |
| Intel Core i5-12600K | |
| Intel Core i9-10900K | |
| AMD Ryzen 7 5800X | |
| Intel Core i9-11900K | |
| AMD Ryzen 5 5600X | |
| Intel Core i5-11600K | |
| Intel Core i5-10600K | |
| 5.0 Single-Core | |
| Intel Core i9-12900K | |
| Intel Core i9-11900K | |
| Intel Core i5-12600K | |
| Intel Core i5-11600K | |
| AMD Ryzen 9 5950X | |
| AMD Ryzen 7 5800X | |
| AMD Ryzen 9 5900X | |
| AMD Ryzen 5 5600X | |
| Intel Core i9-10900K | |
| Intel Core i5-10600K | |
| Geekbench 4.4 | |
| 64 Bit Single-Core Score | |
| Intel Core i9-12900K | |
| Intel Core i5-12600K | |
| Intel Core i9-11900K | |
| Intel Core i5-11600K | |
| AMD Ryzen 7 5800X | |
| AMD Ryzen 9 5900X | |
| AMD Ryzen 9 5950X | |
| AMD Ryzen 5 5600X | |
| Intel Core i9-10900K | |
| Intel Core i5-10600K | |
| 64 Bit Multi-Core Score | |
| Intel Core i9-12900K | |
| AMD Ryzen 9 5950X | |
| AMD Ryzen 9 5900X | |
| Intel Core i5-12600K | |
| AMD Ryzen 7 5800X | |
| Intel Core i9-10900K | |
| Intel Core i9-11900K | |
| AMD Ryzen 5 5600X | |
| Intel Core i5-11600K | |
| Intel Core i5-10600K | |
| 3DMark 11 - 1280x720 Performance Physics | |
| Intel Core i9-12900K | |
| AMD Ryzen 9 5950X | |
| Intel Core i5-12600K | |
| AMD Ryzen 9 5900X | |
| AMD Ryzen 7 5800X | |
| Intel Core i9-10900K | |
| Intel Core i9-11900K | |
| AMD Ryzen 5 5600X | |
| Intel Core i5-11600K | |
| Intel Core i5-10600K | |
| 7-Zip 18.03 | |
| 7z b 4 | |
| AMD Ryzen 9 5950X | |
| Intel Core i9-12900K | |
| AMD Ryzen 9 5900X | |
| AMD Ryzen 7 5800X | |
| Intel Core i9-10900K | |
| Intel Core i5-12600K | |
| Intel Core i9-11900K | |
| AMD Ryzen 5 5600X | |
| Intel Core i5-11600K | |
| Intel Core i5-10600K | |
| 7z b 4 -mmt1 | |
| AMD Ryzen 9 5950X | |
| AMD Ryzen 7 5800X | |
| AMD Ryzen 9 5900X | |
| Intel Core i9-11900K | |
| AMD Ryzen 5 5600X | |
| Intel Core i9-12900K | |
| Intel Core i5-11600K | |
| Intel Core i9-10900K | |
| Intel Core i5-12600K | |
| Intel Core i5-10600K | |
| HWBOT x265 Benchmark v2.2 - 4k Preset | |
| AMD Ryzen 9 5950X | |
| Intel Core i5-12600K | |
| Intel Core i9-12900K | |
| AMD Ryzen 9 5900X | |
| Intel Core i9-10900K | |
| AMD Ryzen 7 5800X | |
| Intel Core i9-11900K | |
| AMD Ryzen 5 5600X | |
| Intel Core i5-11600K | |
| Intel Core i5-10600K | |
| R Benchmark 2.5 - Overall mean | |
| Intel Core i5-10600K | |
| Intel Core i9-10900K | |
| Intel Core i5-11600K | |
| AMD Ryzen 5 5600X | |
| Intel Core i9-11900K | |
| AMD Ryzen 9 5950X | |
| AMD Ryzen 9 5900X | |
| AMD Ryzen 7 5800X | |
| Intel Core i5-12600K | |
| Intel Core i9-12900K | |
| LibreOffice - 20 Documents To PDF | |
| Intel Core i9-10900K | |
| Intel Core i9-11900K | |
| Intel Core i5-12600K | |
| AMD Ryzen 9 5900X | |
| Intel Core i5-10600K | |
| AMD Ryzen 9 5950X | |
| AMD Ryzen 5 5600X | |
| AMD Ryzen 7 5800X | |
| Intel Core i9-12900K | |
| Intel Core i5-11600K | |
| WebXPRT 3 - Overall | |
| Intel Core i9-12900K | |
| AMD Ryzen 7 5800X | |
| Intel Core i5-12600K | |
| AMD Ryzen 9 5950X | |
| AMD Ryzen 5 5600X | |
| AMD Ryzen 9 5900X | |
| Intel Core i5-11600K | |
| Intel Core i9-10900K | |
| Intel Core i5-10600K | |
| Intel Core i9-11900K | |
| Mozilla Kraken 1.1 - Total | |
| Intel Core i5-10600K | |
| Intel Core i9-10900K | |
| Intel Core i5-11600K | |
| AMD Ryzen 5 5600X | |
| AMD Ryzen 9 5900X | |
| AMD Ryzen 7 5800X | |
| AMD Ryzen 9 5950X | |
| Intel Core i9-11900K | |
| Intel Core i5-12600K | |
| Intel Core i9-12900K | |
| 3DMark | |
| 3840x2160 Fire Strike Ultra Physics | |
| Intel Core i9-12900K | |
| AMD Ryzen 9 5950X | |
| AMD Ryzen 9 5900X | |
| AMD Ryzen 7 5800X | |
| Intel Core i5-12600K | |
| Intel Core i9-10900K | |
| Intel Core i9-11900K | |
| AMD Ryzen 5 5600X | |
| Intel Core i5-11600K | |
| Intel Core i5-10600K | |
| 1920x1080 Fire Strike Physics | |
| AMD Ryzen 9 5950X | |
| Intel Core i9-12900K | |
| AMD Ryzen 9 5900X | |
| AMD Ryzen 7 5800X | |
| Intel Core i9-10900K | |
| Intel Core i5-12600K | |
| Intel Core i9-11900K | |
| AMD Ryzen 5 5600X | |
| Intel Core i5-11600K | |
| Intel Core i5-10600K | |
| 2560x1440 Time Spy CPU | |
| Intel Core i9-12900K | |
| Intel Core i9-10900K | |
| Intel Core i5-12600K | |
| AMD Ryzen 9 5950X | |
| Intel Core i9-11900K | |
| AMD Ryzen 9 5900X | |
| AMD Ryzen 7 5800X | |
| Intel Core i5-11600K | |
| AMD Ryzen 5 5600X | |
| Intel Core i5-10600K | |
* ... más pequeño es mejor
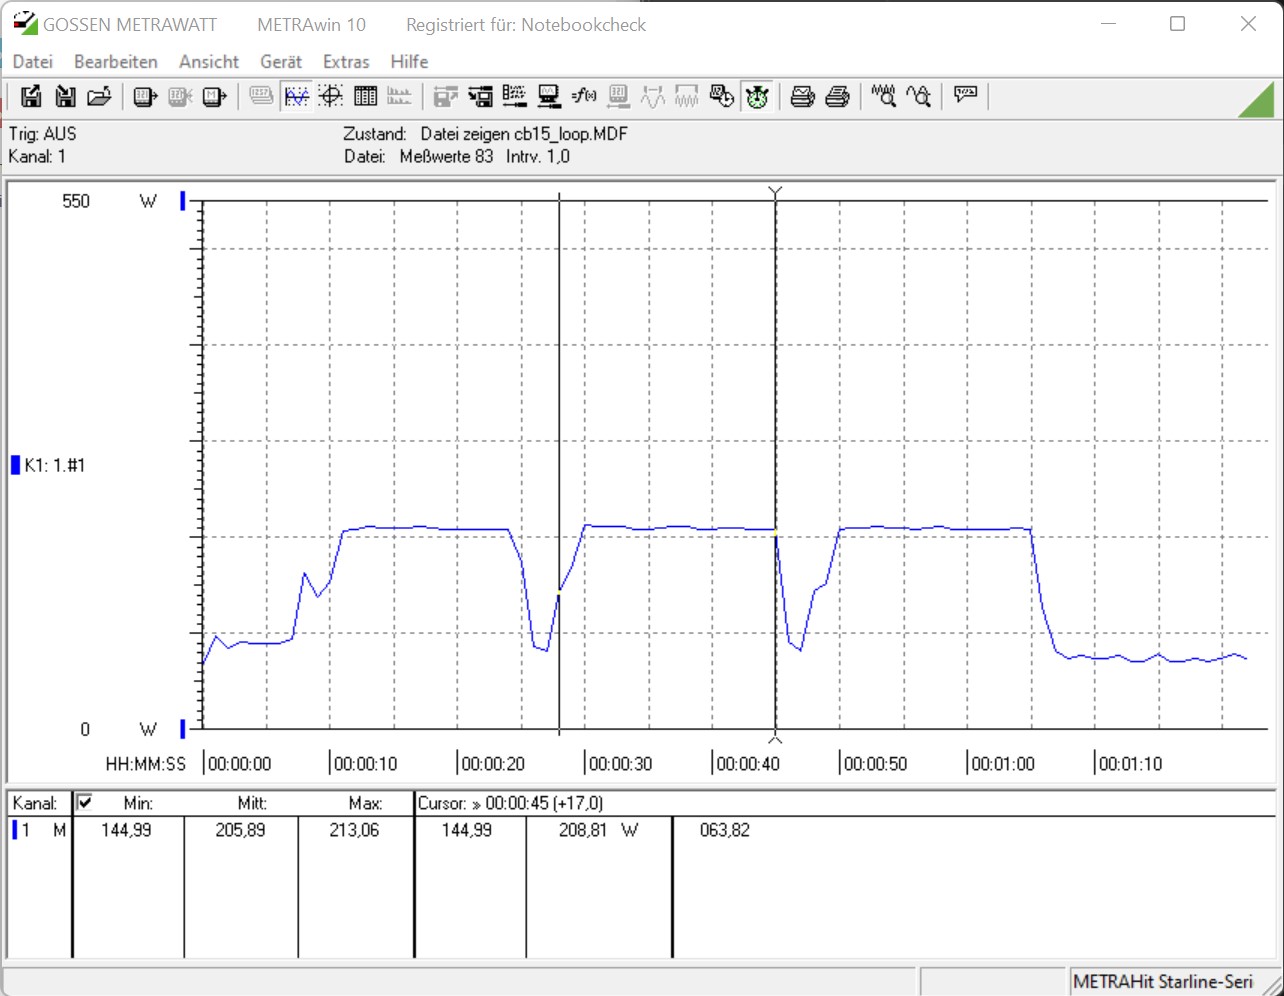
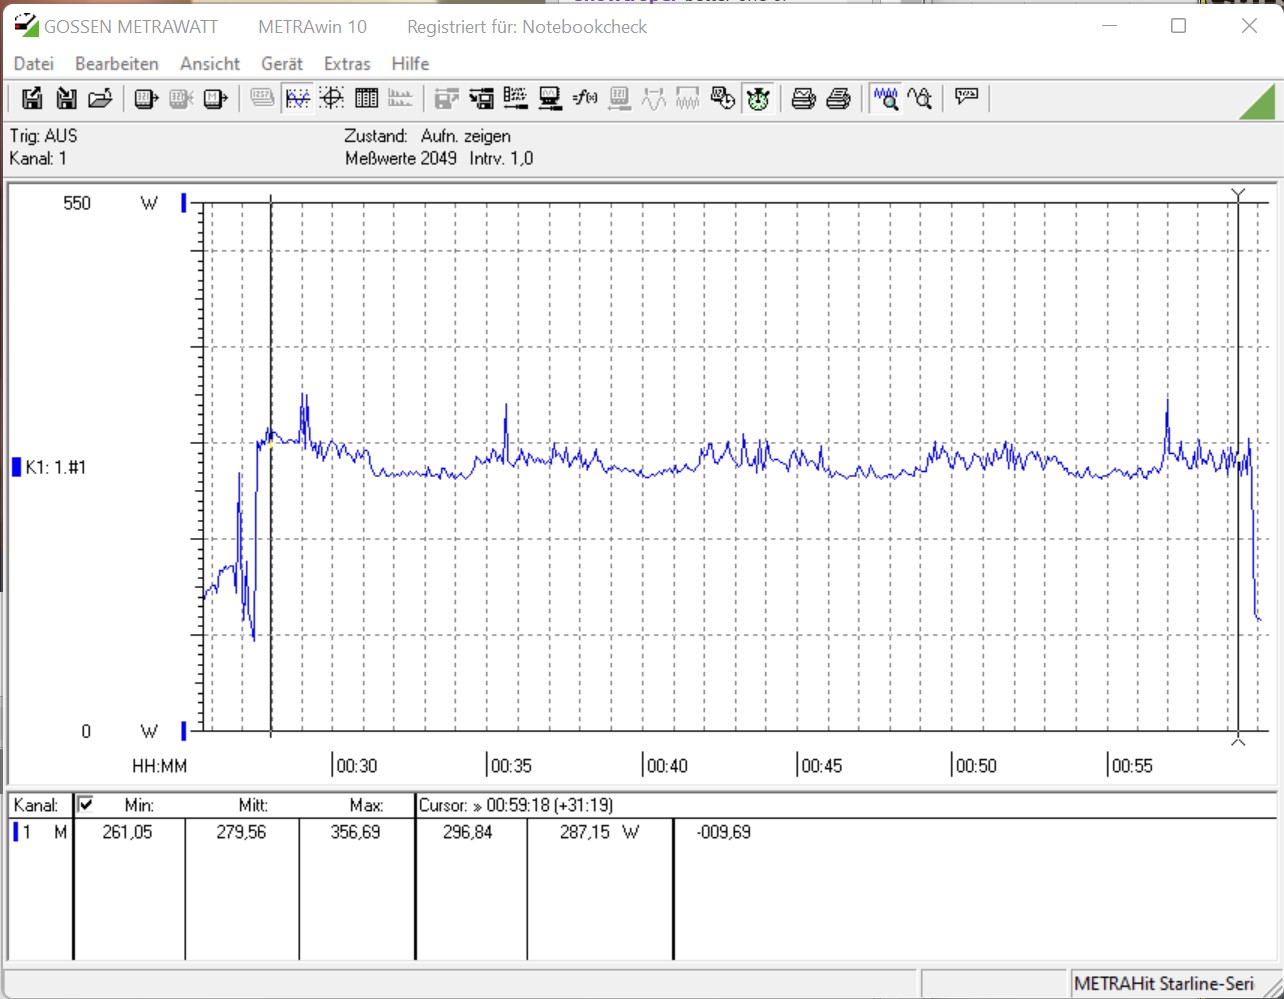
Alder Lake-S vs. Cinebench R15 Multi Loop
Ambas unidades de prueba muestran un rendimiento muy estable en la prueba de carga. En comparación con elIntel Core i9-11900Kel Intel Core i9-12900K es capaz de situarse en el primer puesto de forma continua y sin caídas de rendimiento con una media de 3987 puntos. El Intel Core i5-12600K también es capaz de situarse de forma estable por delante delpredecesorIntel Core i5-11600KRocket Lake-S con una ventaja significativa. La mayor cantidad de núcleos de computación nativos asegura esta diferencia de rendimiento en general
Pruebas sintéticas y rendimiento de las aplicaciones
En los benchmarks sintéticos, los nuevos procesadores Alder Lake-S están por delante. Aparte de unas pocas excepciones en las que se supone que AMD ofrece la mejor plataforma, el Intel Core i9-12900K es capaz de lograr una sólida ventaja. No es sorprendente, pues, que las dos CPUs Alder Lake-S compartan los dos primeros puestos en los dos resultados acumulados del benchmark. Sin embargo, seguimos un poco sorprendidos, ya que no esperábamos el segundo puesto para el Intel Core i5-12600K en la clasificación general.
| Performance rating - Percent | |
| Intel Core i9-12900K | |
| Intel Core i5-12600K | |
| AMD Ryzen 7 5800X | |
| AMD Ryzen 9 5950X | |
| AMD Ryzen 5 5600X | |
| AMD Ryzen 9 5900X | |
| Intel Core i9-11900K | |
| Intel Core i9-10900K | |
| Intel Core i5-11600K | |
| Intel Core i7-10700K | |
| Intel Core i5-10600K | |
| 3DMark | |
| 1920x1080 Fire Strike Physics | |
| AMD Ryzen 9 5950X | |
| Intel Core i9-12900K | |
| AMD Ryzen 9 5900X | |
| AMD Ryzen 7 5800X | |
| Intel Core i9-10900K | |
| Intel Core i5-12600K | |
| Intel Core i9-11900K | |
| AMD Ryzen 5 5600X | |
| Intel Core i7-10700K | |
| Intel Core i5-11600K | |
| Intel Core i5-10600K | |
| 1920x1080 Fire Strike Graphics | |
| Intel Core i5-12600K | |
| Intel Core i9-12900K | |
| Intel Core i7-10700K | |
| Intel Core i5-11600K | |
| AMD Ryzen 7 5800X | |
| Intel Core i9-10900K | |
| Intel Core i9-11900K | |
| AMD Ryzen 9 5950X | |
| AMD Ryzen 5 5600X | |
| Intel Core i5-10600K | |
| AMD Ryzen 9 5900X | |
| Fire Strike Extreme Graphics | |
| Intel Core i5-12600K | |
| Intel Core i9-12900K | |
| Intel Core i5-11600K | |
| AMD Ryzen 5 5600X | |
| Intel Core i7-10700K | |
| Intel Core i9-11900K | |
| AMD Ryzen 9 5950X | |
| AMD Ryzen 7 5800X | |
| Intel Core i9-10900K | |
| AMD Ryzen 9 5900X | |
| Intel Core i5-10600K | |
| 3840x2160 Fire Strike Ultra Graphics | |
| Intel Core i5-12600K | |
| Intel Core i9-12900K | |
| Intel Core i5-11600K | |
| Intel Core i9-11900K | |
| AMD Ryzen 7 5800X | |
| AMD Ryzen 5 5600X | |
| Intel Core i7-10700K | |
| AMD Ryzen 9 5950X | |
| Intel Core i9-10900K | |
| AMD Ryzen 9 5900X | |
| Intel Core i5-10600K | |
| 3DMark 11 | |
| 1280x720 Performance GPU | |
| Intel Core i7-10700K | |
| Intel Core i5-12600K | |
| Intel Core i9-10900K | |
| AMD Ryzen 9 5950X | |
| AMD Ryzen 7 5800X | |
| Intel Core i9-12900K | |
| AMD Ryzen 5 5600X | |
| Intel Core i9-11900K | |
| Intel Core i5-10600K | |
| Intel Core i5-11600K | |
| AMD Ryzen 9 5900X | |
| 1280x720 Performance Physics | |
| Intel Core i9-12900K | |
| AMD Ryzen 9 5950X | |
| Intel Core i5-12600K | |
| AMD Ryzen 9 5900X | |
| AMD Ryzen 7 5800X | |
| Intel Core i9-10900K | |
| Intel Core i9-11900K | |
| AMD Ryzen 5 5600X | |
| Intel Core i7-10700K | |
| Intel Core i5-11600K | |
| Intel Core i5-10600K | |
| PCMark 10 - Score | |
| AMD Ryzen 9 5950X | |
| Intel Core i9-12900K | |
| AMD Ryzen 9 5900X | |
| AMD Ryzen 5 5600X | |
| Intel Core i5-12600K | |
| AMD Ryzen 7 5800X | |
| Intel Core i9-11900K | |
| Intel Core i5-11600K | |
| Intel Core i9-10900K | |
| Intel Core i7-10700K | |
| Intel Core i5-10600K | |
Puntos de referencia para juegos
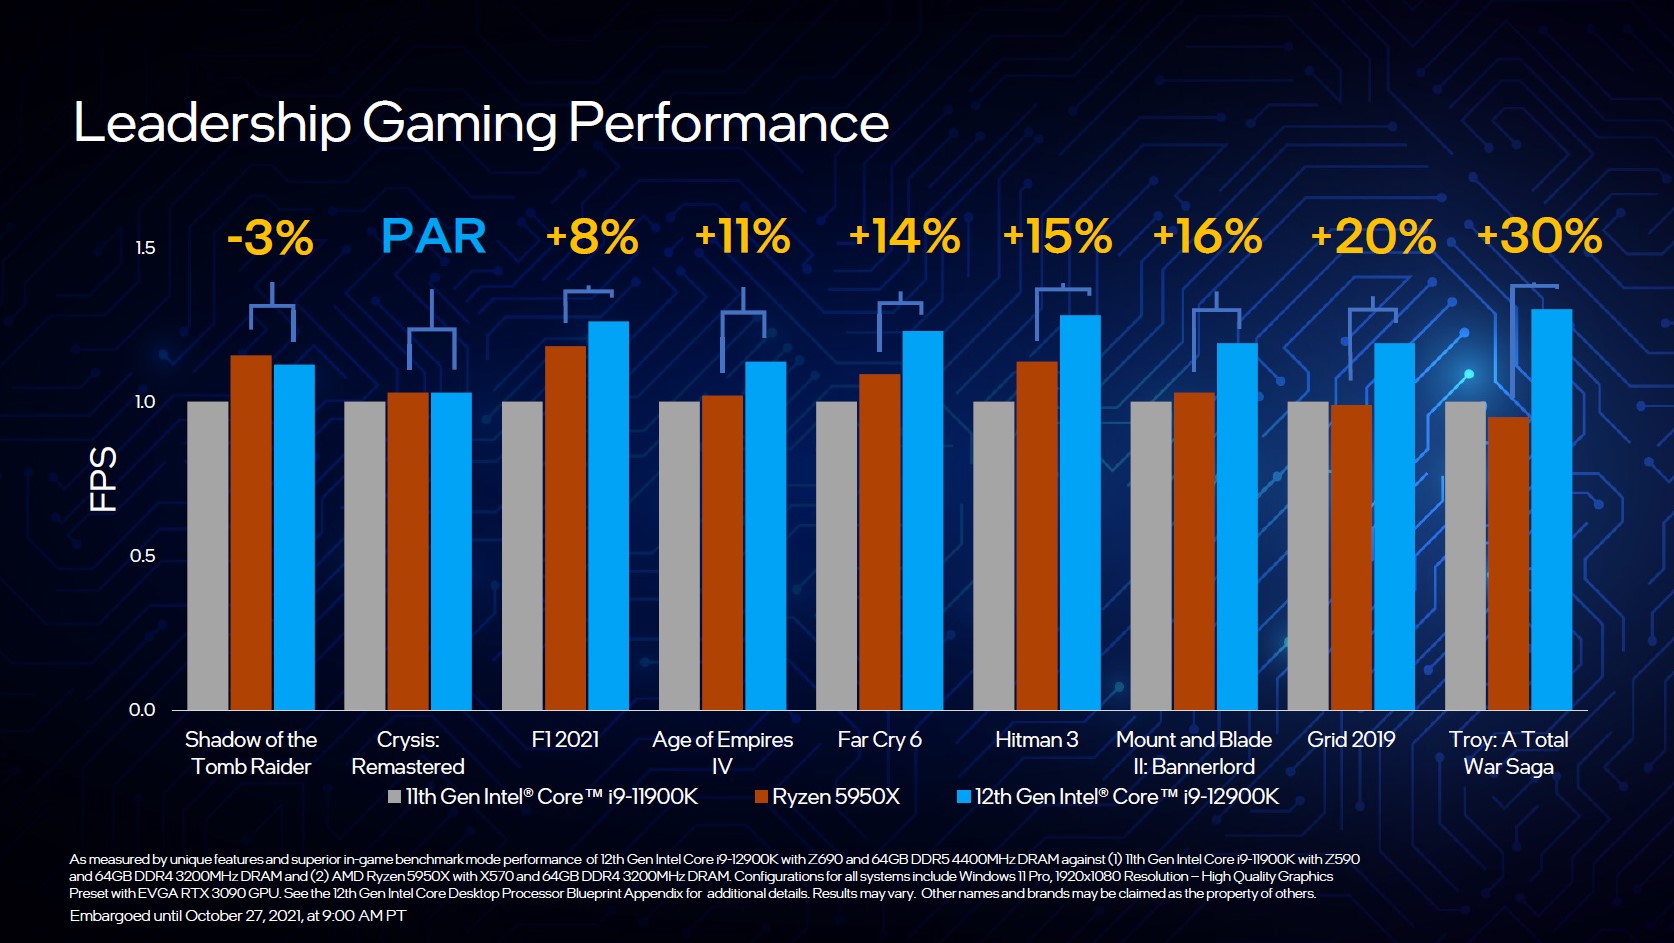
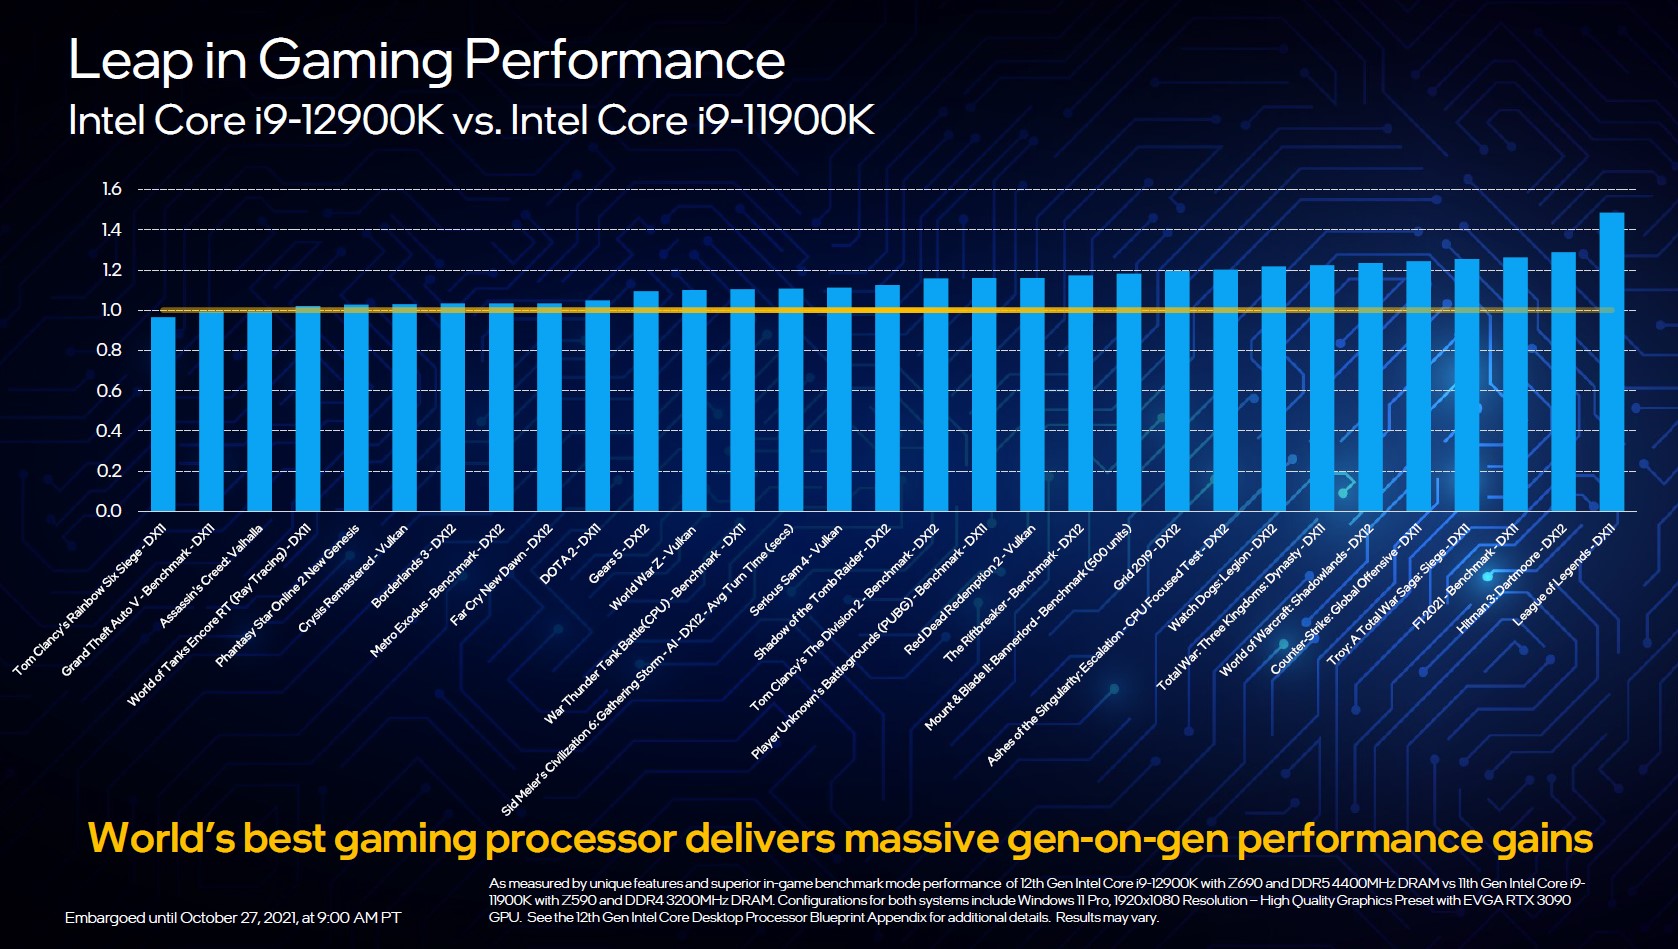
Ahora llegamos a los benchmarks más interesantes y a la disciplina donde los nuevos procesadores Intel Alder Lake-S pueden mostrar realmente sus capacidades. En comparación con Rocket Lake-S, los nuevos procesadores son capaces de aumentar su rendimiento de forma significativa, como se puede ver en los benchmarks de juegos. En la comparación acumulada de los nueve juegos, el Intel Core i9-12900K es capaz de adelantarse al AMD Ryzen 9 5900X. También hay que saber aquí que hay algunos juegos que armonizan mejor con los procesadores Intel y otros que ofrecen el mejor rendimiento con los procesadores AMD. En la competencia interna de los dos procesadores Alder Lake-S, el Intel Core i5-12600K pierde por 8 puntos porcentuales contra el buque insignia, terminando apenas por delante del Intel Core i5-11600Kcon esto.
No obstante, ambos procesadores ofrecen un muy buen rendimiento en juegos. Debido a los numerosos cambios en la plataforma y el sistema operativo, podríamos esperar más mejoras de rendimiento en forma de actualizaciones en el futuro. Pero no hay garantía de ello. El rendimiento en el límite puro de la CPU es muy alto y, dependiendo del juego, también significativamente por delante de los competidores. Sin embargo, hay que tener en cuenta que, aunque Intel tiene la CPU para juegos más rápida de su cartera, la distancia con el procesador Zen3 no puede calificarse de sobresaliente. Además, todos los competidores se acercan más con el aumento de la resolución, por lo que la CPU sólo juega el segundo papel detrás de la GPU como factor determinante para el aumento de los FPS. Aquellos que también transmiten contenido además del juego real se beneficiarán de la mayor cantidad de hilos, lo que también hará que los nuevos modelos sean muy interesantes para los creadores de contenido.
| Performance rating - Percent | |
| Intel Core i9-12900K | |
| AMD Ryzen 9 5900X -2! | |
| AMD Ryzen 7 5800X -2! | |
| AMD Ryzen 9 5950X -2! | |
| AMD Ryzen 5 5600X -2! | |
| Intel Core i9-11900K | |
| Intel Core i5-12600K | |
| Intel Core i5-11600K | |
| Intel Core i9-10900K | |
| Intel Core i7-10700K -4! | |
| Intel Core i5-10600K | |
| Borderlands 3 | |
| 1280x720 Very Low Overall Quality (DX11) | |
| AMD Ryzen 9 5900X | |
| AMD Ryzen 7 5800X | |
| AMD Ryzen 9 5950X | |
| AMD Ryzen 5 5600X | |
| Intel Core i9-12900K | |
| Intel Core i9-11900K | |
| Intel Core i9-10900K | |
| Intel Core i5-11600K | |
| Intel Core i7-10700K | |
| Intel Core i5-12600K | |
| Intel Core i5-10600K | |
| 1920x1080 Badass Overall Quality (DX11) | |
| Intel Core i9-12900K | |
| Intel Core i5-12600K | |
| AMD Ryzen 9 5900X | |
| Intel Core i9-11900K | |
| Intel Core i9-10900K | |
| Intel Core i7-10700K | |
| AMD Ryzen 9 5950X | |
| Intel Core i5-11600K | |
| AMD Ryzen 7 5800X | |
| AMD Ryzen 5 5600X | |
| Intel Core i5-10600K | |
| Far Cry New Dawn | |
| 1280x720 Low Preset | |
| Intel Core i9-12900K | |
| Intel Core i9-11900K | |
| AMD Ryzen 9 5900X | |
| Intel Core i5-12600K | |
| Intel Core i5-11600K | |
| AMD Ryzen 7 5800X | |
| AMD Ryzen 9 5950X | |
| Intel Core i7-10700K | |
| AMD Ryzen 5 5600X | |
| Intel Core i9-10900K | |
| Intel Core i5-10600K | |
| 1920x1080 Ultra Preset | |
| Intel Core i9-12900K | |
| Intel Core i9-11900K | |
| AMD Ryzen 9 5900X | |
| Intel Core i5-11600K | |
| Intel Core i7-10700K | |
| Intel Core i5-12600K | |
| AMD Ryzen 7 5800X | |
| AMD Ryzen 9 5950X | |
| AMD Ryzen 5 5600X | |
| Intel Core i5-10600K | |
| Intel Core i9-10900K | |
| Forza Horizon 4 | |
| 1280x720 Very Low Preset | |
| Intel Core i9-12900K | |
| Intel Core i5-12600K | |
| Intel Core i9-11900K | |
| Intel Core i9-10900K | |
| Intel Core i5-11600K | |
| Intel Core i5-10600K | |
| 1920x1080 Ultra Preset AA:2xMS | |
| Intel Core i9-10900K | |
| Intel Core i9-11900K | |
| Intel Core i5-11600K | |
| Intel Core i5-10600K | |
| Intel Core i9-12900K | |
| Intel Core i5-12600K | |
| Far Cry 5 | |
| 1280x720 Low Preset AA:T | |
| Intel Core i9-12900K | |
| AMD Ryzen 9 5900X | |
| Intel Core i9-11900K | |
| AMD Ryzen 7 5800X | |
| AMD Ryzen 9 5950X | |
| AMD Ryzen 5 5600X | |
| Intel Core i5-12600K | |
| Intel Core i5-11600K | |
| Intel Core i9-10900K | |
| Intel Core i7-10700K | |
| Intel Core i5-10600K | |
| 1920x1080 Ultra Preset AA:T | |
| Intel Core i9-12900K | |
| Intel Core i9-11900K | |
| AMD Ryzen 9 5900X | |
| AMD Ryzen 7 5800X | |
| Intel Core i5-11600K | |
| AMD Ryzen 9 5950X | |
| Intel Core i5-12600K | |
| AMD Ryzen 5 5600X | |
| Intel Core i7-10700K | |
| Intel Core i9-10900K | |
| Intel Core i5-10600K | |
| X-Plane 11.11 | |
| 1280x720 low (fps_test=1) | |
| Intel Core i9-12900K | |
| AMD Ryzen 7 5800X | |
| AMD Ryzen 9 5900X | |
| AMD Ryzen 5 5600X | |
| Intel Core i5-12600K | |
| Intel Core i9-11900K | |
| AMD Ryzen 9 5950X | |
| Intel Core i5-11600K | |
| Intel Core i9-10900K | |
| Intel Core i7-10700K | |
| Intel Core i5-10600K | |
| 1920x1080 high (fps_test=3) | |
| Intel Core i9-12900K | |
| AMD Ryzen 9 5900X | |
| AMD Ryzen 7 5800X | |
| Intel Core i9-11900K | |
| AMD Ryzen 5 5600X | |
| Intel Core i5-12600K | |
| AMD Ryzen 9 5950X | |
| Intel Core i5-11600K | |
| Intel Core i9-10900K | |
| Intel Core i7-10700K | |
| Intel Core i5-10600K | |
| Final Fantasy XV Benchmark | |
| 1280x720 Lite Quality | |
| Intel Core i9-12900K | |
| AMD Ryzen 9 5900X | |
| AMD Ryzen 7 5800X | |
| AMD Ryzen 9 5950X | |
| AMD Ryzen 5 5600X | |
| Intel Core i9-10900K | |
| Intel Core i9-11900K | |
| Intel Core i5-12600K | |
| Intel Core i5-11600K | |
| Intel Core i5-10600K | |
| Intel Core i7-10700K | |
| 1920x1080 High Quality | |
| Intel Core i9-12900K | |
| Intel Core i9-11900K | |
| Intel Core i9-10900K | |
| AMD Ryzen 9 5950X | |
| Intel Core i5-11600K | |
| Intel Core i5-12600K | |
| Intel Core i5-10600K | |
| AMD Ryzen 7 5800X | |
| AMD Ryzen 9 5900X | |
| AMD Ryzen 5 5600X | |
| Intel Core i7-10700K | |
| Dota 2 Reborn | |
| 1280x720 min (0/3) fastest | |
| AMD Ryzen 7 5800X | |
| AMD Ryzen 9 5900X | |
| AMD Ryzen 5 5600X | |
| AMD Ryzen 9 5950X | |
| Intel Core i9-12900K | |
| Intel Core i9-10900K | |
| Intel Core i9-11900K | |
| Intel Core i7-10700K | |
| Intel Core i5-11600K | |
| Intel Core i5-12600K | |
| Intel Core i5-10600K | |
| 1920x1080 ultra (3/3) best looking | |
| Intel Core i9-12900K | |
| AMD Ryzen 7 5800X | |
| AMD Ryzen 9 5900X | |
| AMD Ryzen 5 5600X | |
| AMD Ryzen 9 5950X | |
| Intel Core i5-12600K | |
| Intel Core i9-10900K | |
| Intel Core i9-11900K | |
| Intel Core i5-11600K | |
| Intel Core i7-10700K | |
| Intel Core i5-10600K | |
| The Witcher 3 | |
| 1024x768 Low Graphics & Postprocessing | |
| AMD Ryzen 9 5900X | |
| AMD Ryzen 7 5800X | |
| AMD Ryzen 9 5950X | |
| Intel Core i9-12900K | |
| AMD Ryzen 5 5600X | |
| Intel Core i9-10900K | |
| Intel Core i9-11900K | |
| Intel Core i5-12600K | |
| Intel Core i7-10700K | |
| Intel Core i5-11600K | |
| Intel Core i5-10600K | |
| 1920x1080 Ultra Graphics & Postprocessing (HBAO+) | |
| Intel Core i5-11600K | |
| Intel Core i5-12600K | |
| Intel Core i7-10700K | |
| AMD Ryzen 9 5900X | |
| AMD Ryzen 9 5950X | |
| Intel Core i5-10600K | |
| Intel Core i9-11900K | |
| Intel Core i9-10900K | |
| AMD Ryzen 7 5800X | |
| AMD Ryzen 5 5600X | |
| Intel Core i9-12900K | |
| Shadow of the Tomb Raider | |
| 1280x720 Lowest Preset | |
| AMD Ryzen 7 5800X | |
| AMD Ryzen 9 5950X | |
| AMD Ryzen 9 5900X | |
| Intel Core i9-12900K | |
| AMD Ryzen 5 5600X | |
| Intel Core i9-10900K | |
| Intel Core i9-11900K | |
| Intel Core i5-12600K | |
| Intel Core i5-11600K | |
| Intel Core i5-10600K | |
| 1920x1080 Highest Preset AA:T | |
| AMD Ryzen 7 5800X | |
| Intel Core i9-12900K | |
| Intel Core i9-11900K | |
| AMD Ryzen 9 5950X | |
| AMD Ryzen 9 5900X | |
| Intel Core i9-10900K | |
| AMD Ryzen 5 5600X | |
| Intel Core i5-12600K | |
| Intel Core i5-11600K | |
| Intel Core i5-10600K | |
Intel Core i9-12900K + Nvidia Titan RTX
| bajo | medio | alto | ultra | QHD | 4K | |
|---|---|---|---|---|---|---|
| GTA V (2015) | 187 | 187 | 185 | 135 | 123 | 138 |
| The Witcher 3 (2015) | 589 | 422 | 271 | 139 | 103 | |
| Dota 2 Reborn (2015) | 203.5 | 208.7 | 201.7 | 189.7 | 178.9 | |
| Final Fantasy XV Benchmark (2018) | 227 | 195 | 144 | 108 | 64.1 | |
| X-Plane 11.11 (2018) | 200 | 176 | 137 | 117 | ||
| Far Cry 5 (2018) | 220 | 191 | 178 | 167 | 145 | 83 |
| Strange Brigade (2018) | 593 | 371 | 308 | 266 | 197 | 115 |
| Shadow of the Tomb Raider (2018) | 221 | 192 | 183 | 169 | 124 | 69.3 |
| Forza Horizon 4 (2018) | 293 | 227 | 216 | 178 | 153 | 111 |
| Far Cry New Dawn (2019) | 188 | 162 | 154 | 140 | 129 | 84 |
| Borderlands 3 (2019) | 202 | 172 | 147 | 124 | 89.9 | 49.2 |
| F1 2020 (2020) | 432 | 343 | 303 | 213 | 167 | 101 |
| F1 2021 (2021) | 491 | 383 | 307 | 160 | 121 | 71.9 |
| Far Cry 6 (2021) | 185 | 157 | 142 | 134 | 109 | 64 |
Intel Core i5-12600K + Nvidia Titan RTX
| bajo | medio | alto | ultra | QHD | 4K | |
|---|---|---|---|---|---|---|
| GTA V (2015) | 186 | 185 | 181 | 124 | 115 | 136 |
| The Witcher 3 (2015) | 500 | 406 | 277 | 144 | 107 | |
| Dota 2 Reborn (2015) | 183.7 | 188 | 181.1 | 174.9 | 165.8 | |
| Final Fantasy XV Benchmark (2018) | 218 | 192 | 141 | 107 | 63.6 | |
| X-Plane 11.11 (2018) | 172 | 153 | 119 | 104 | ||
| Far Cry 5 (2018) | 200 | 174 | 165 | 154 | 140 | 81 |
| Strange Brigade (2018) | 489 | 352 | 301 | 262 | 196 | 114 |
| Shadow of the Tomb Raider (2018) | 195 | 176 | 172 | 163 | 124 | 70.1 |
| Forza Horizon 4 (2018) | 263 | 218 | 212 | 178 | 154 | 112 |
| Far Cry New Dawn (2019) | 171 | 147 | 141 | 126 | 121 | 84 |
| Metro Exodus (2019) | 227 | 174 | 135 | 108 | 87.7 | 56.6 |
| Borderlands 3 (2019) | 175 | 155 | 138 | 119 | 90.4 | 49.8 |
| F1 2020 (2020) | 340 | 291 | 288 | 216 | 168 | 103 |
| F1 2021 (2021) | 407 | 367 | 302 | 160 | 122 | 72.6 |
| Far Cry 6 (2021) | 164 | 136 | 129 | 124 | 105 | 64 |
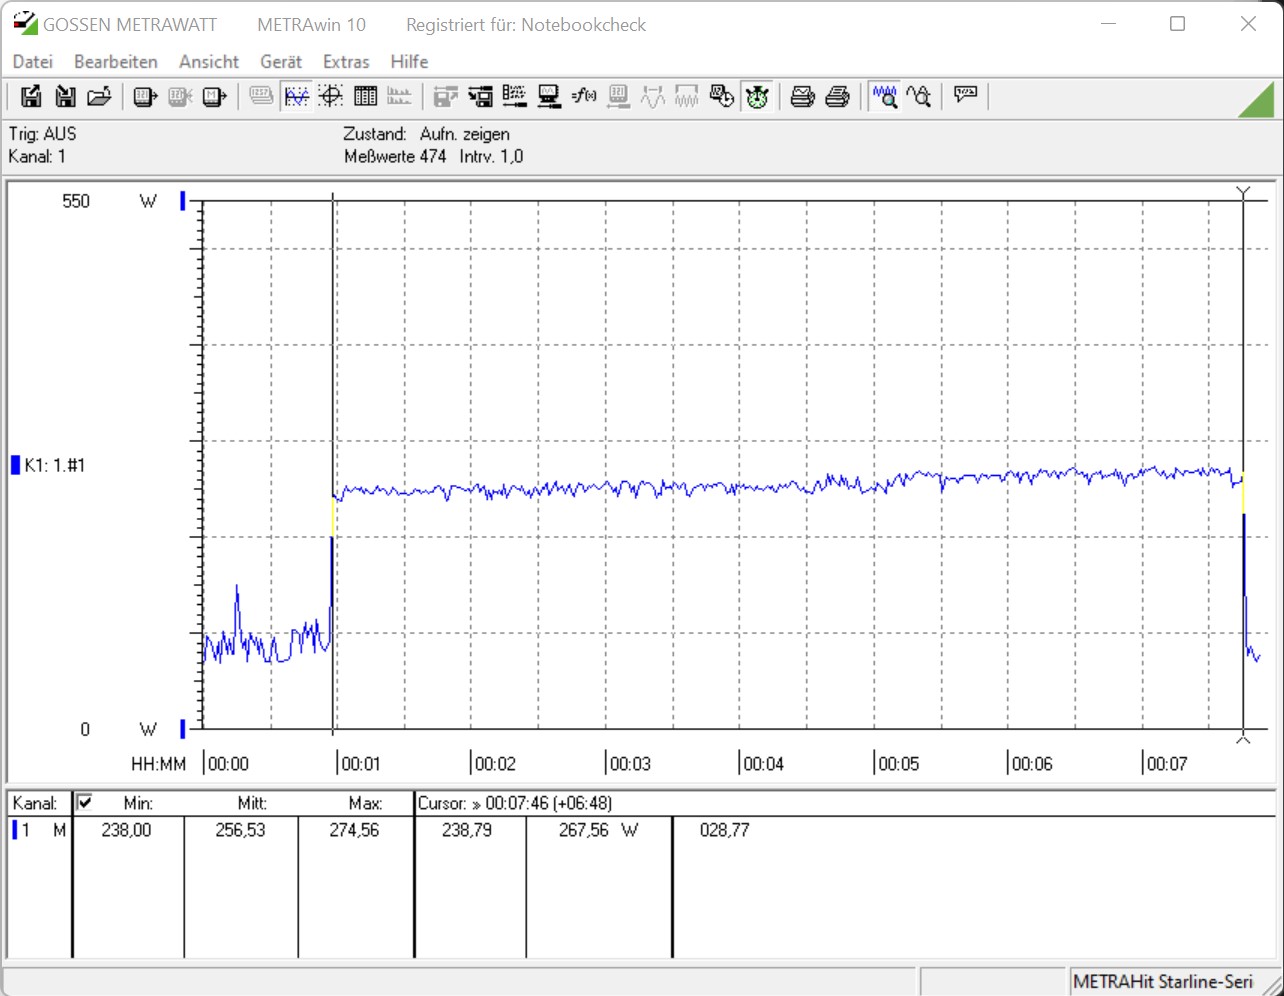
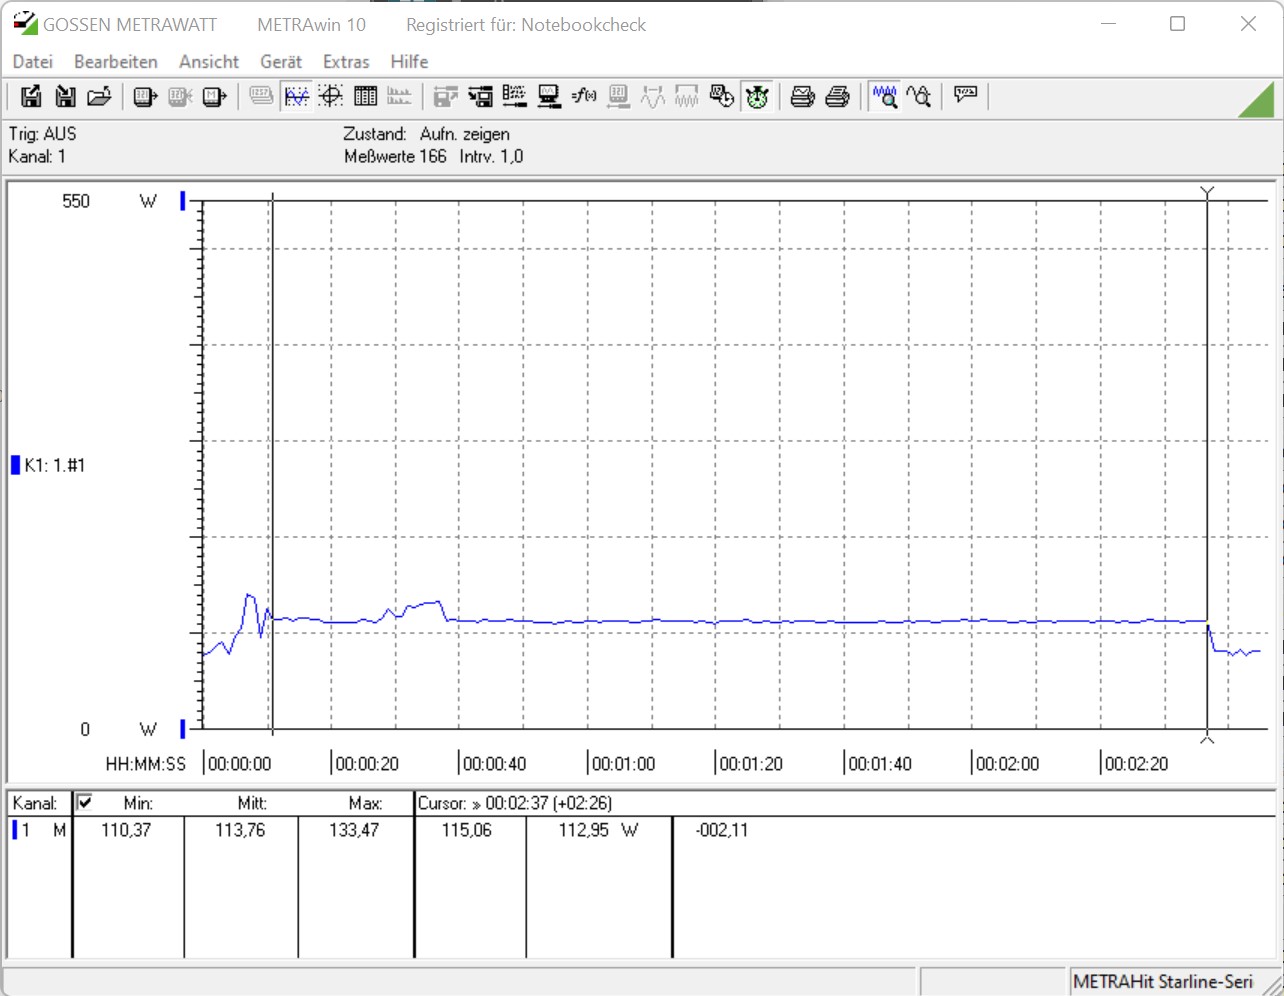
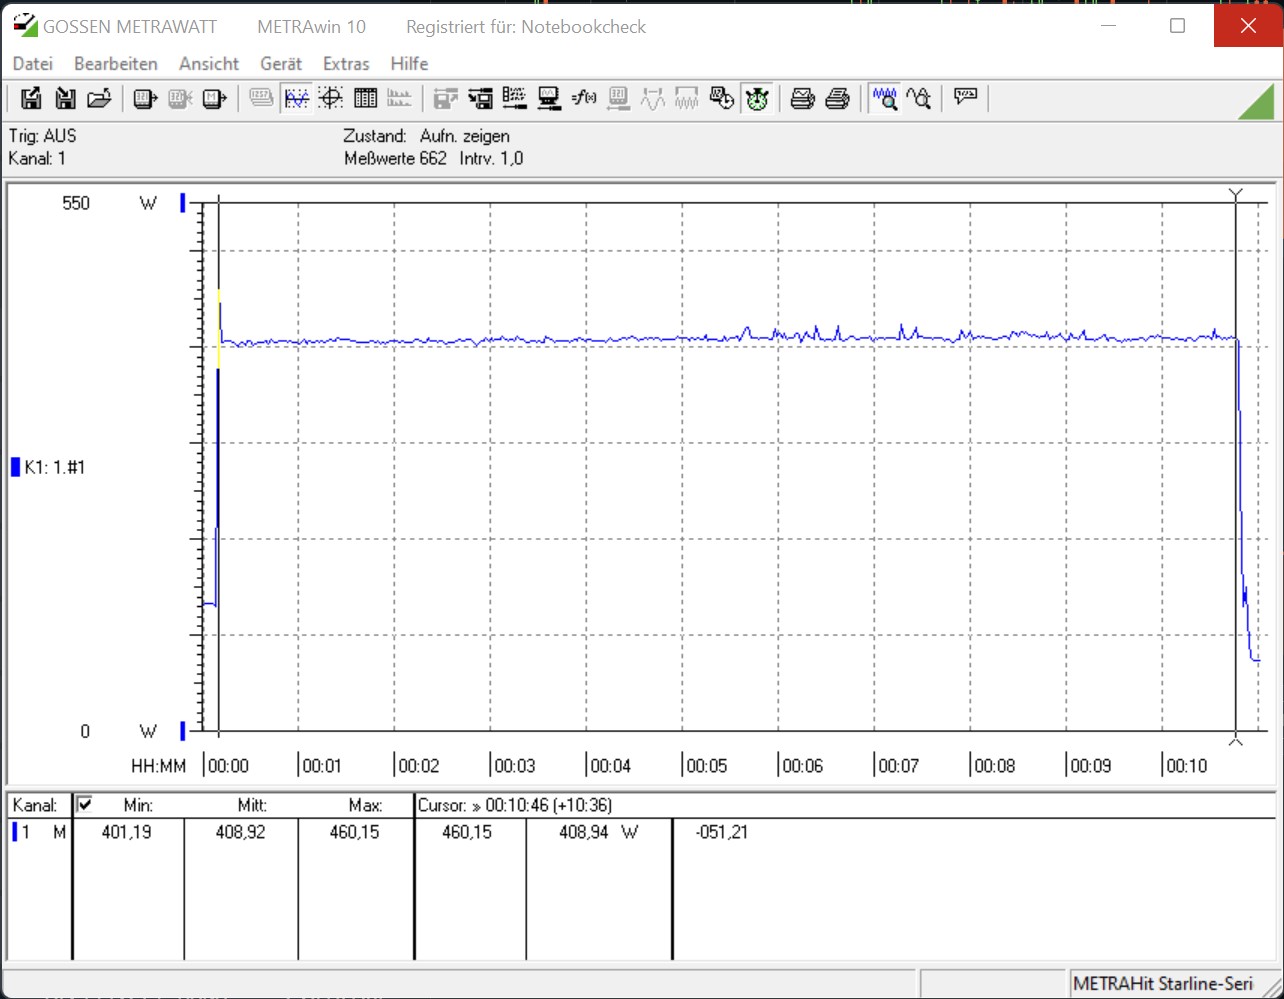
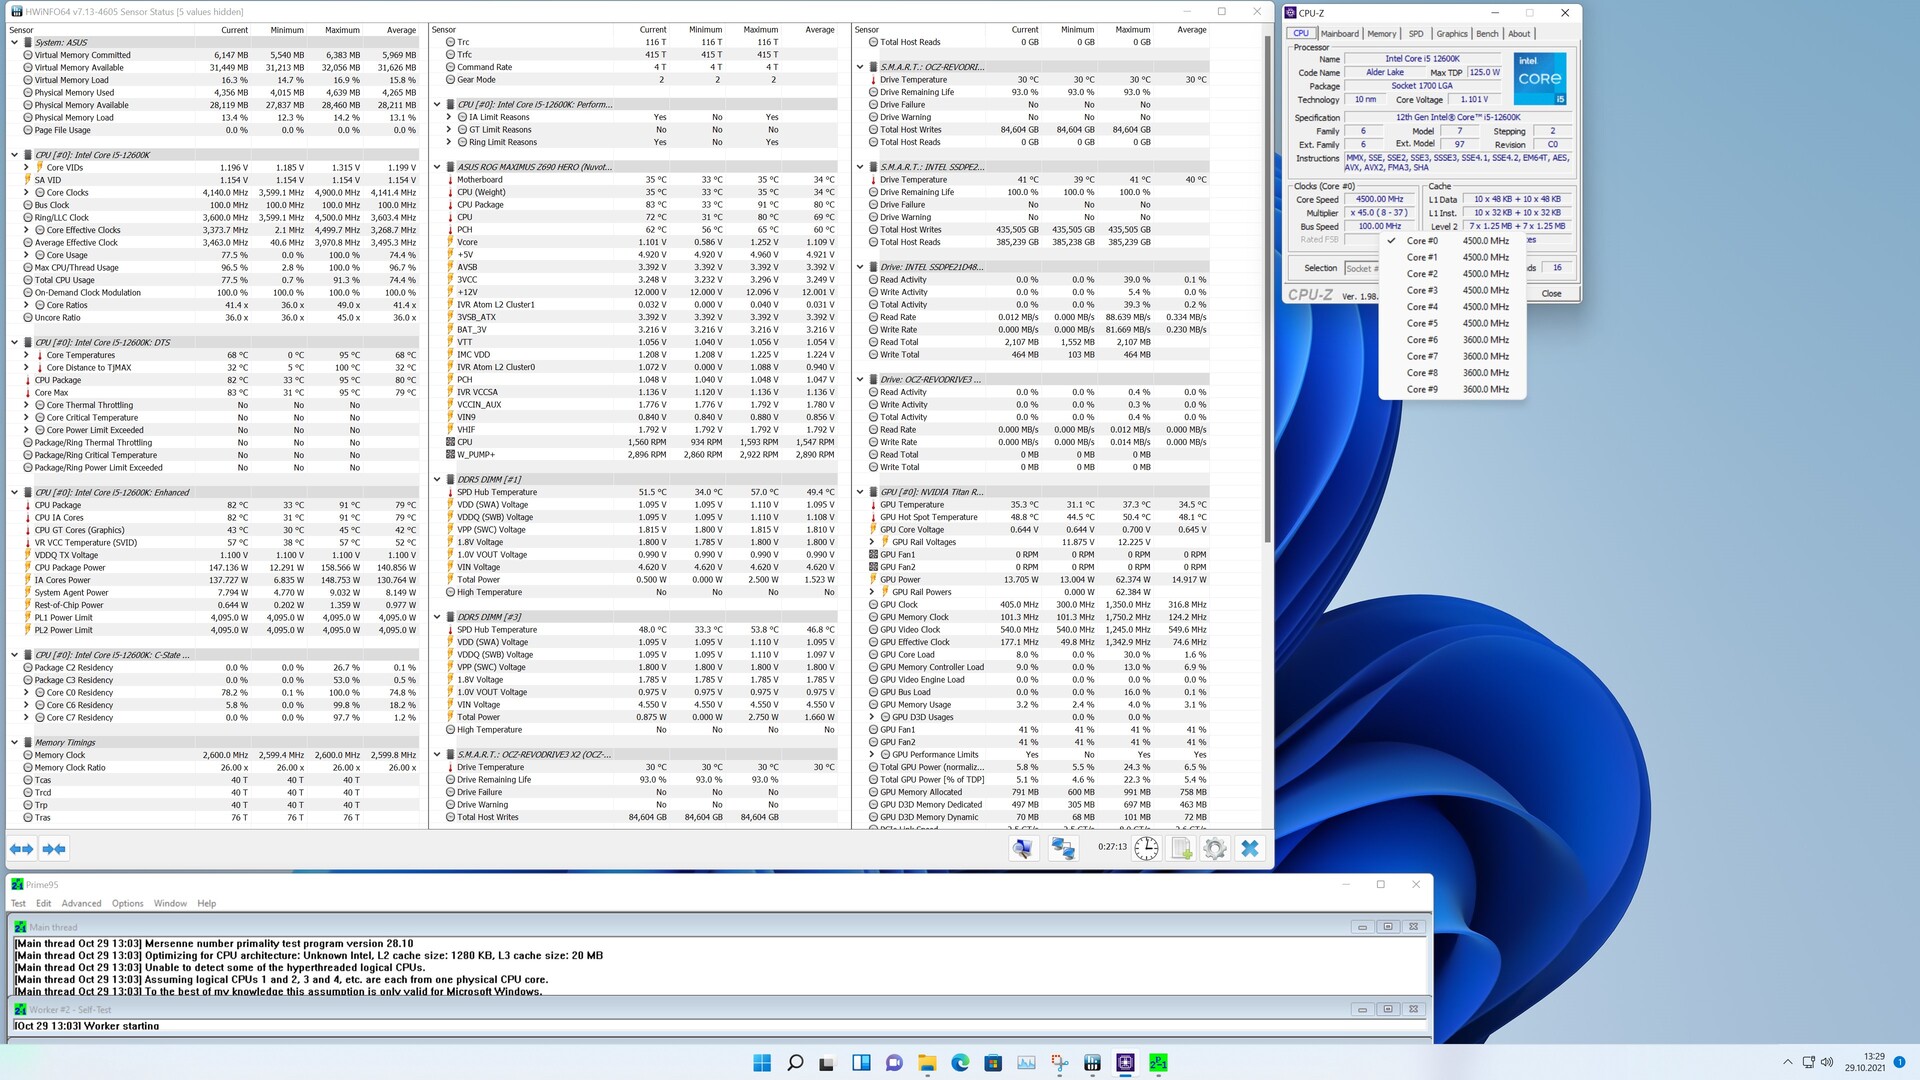
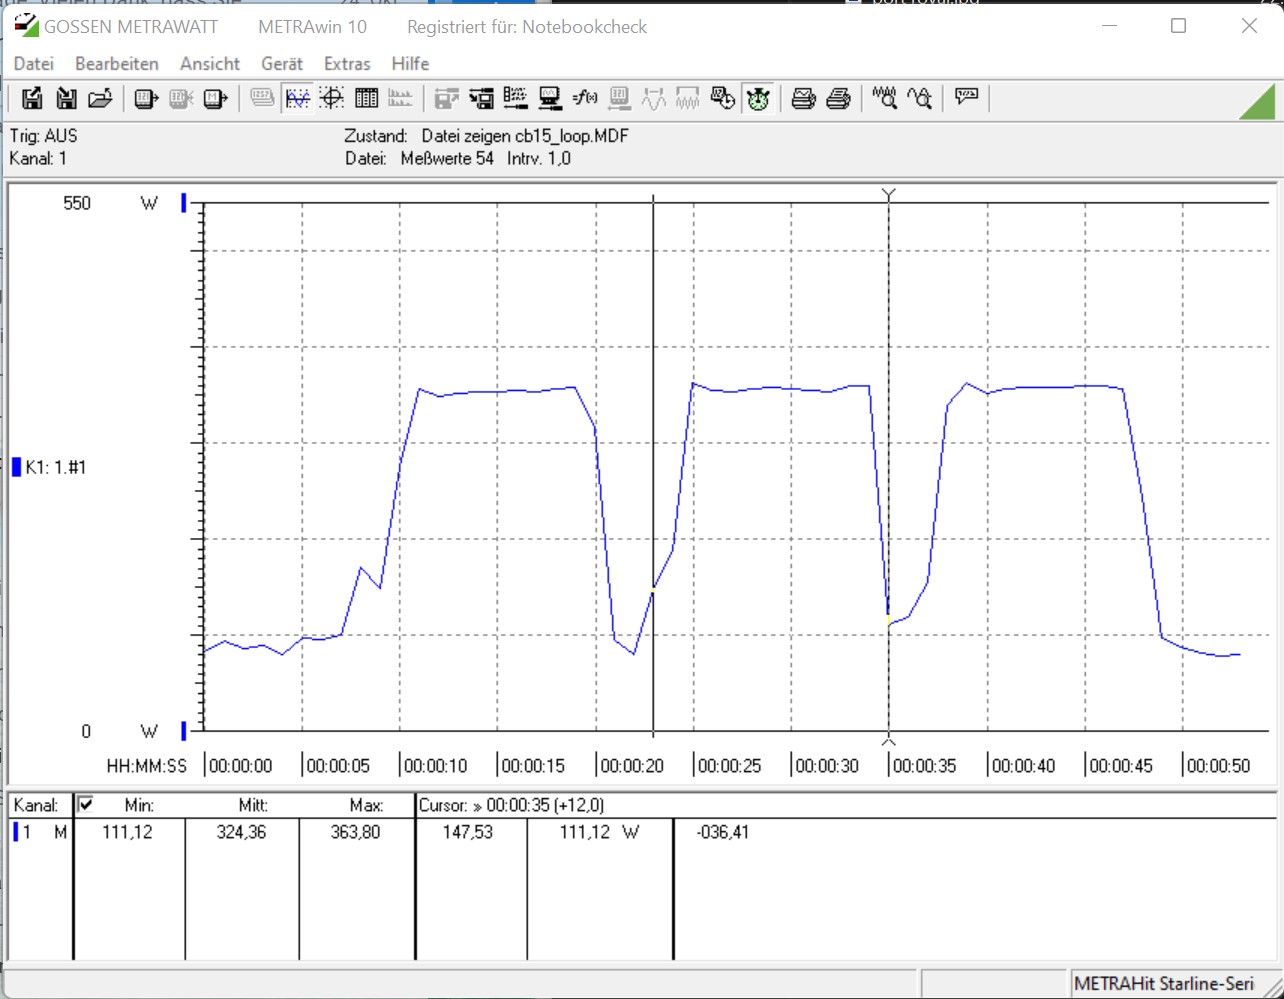
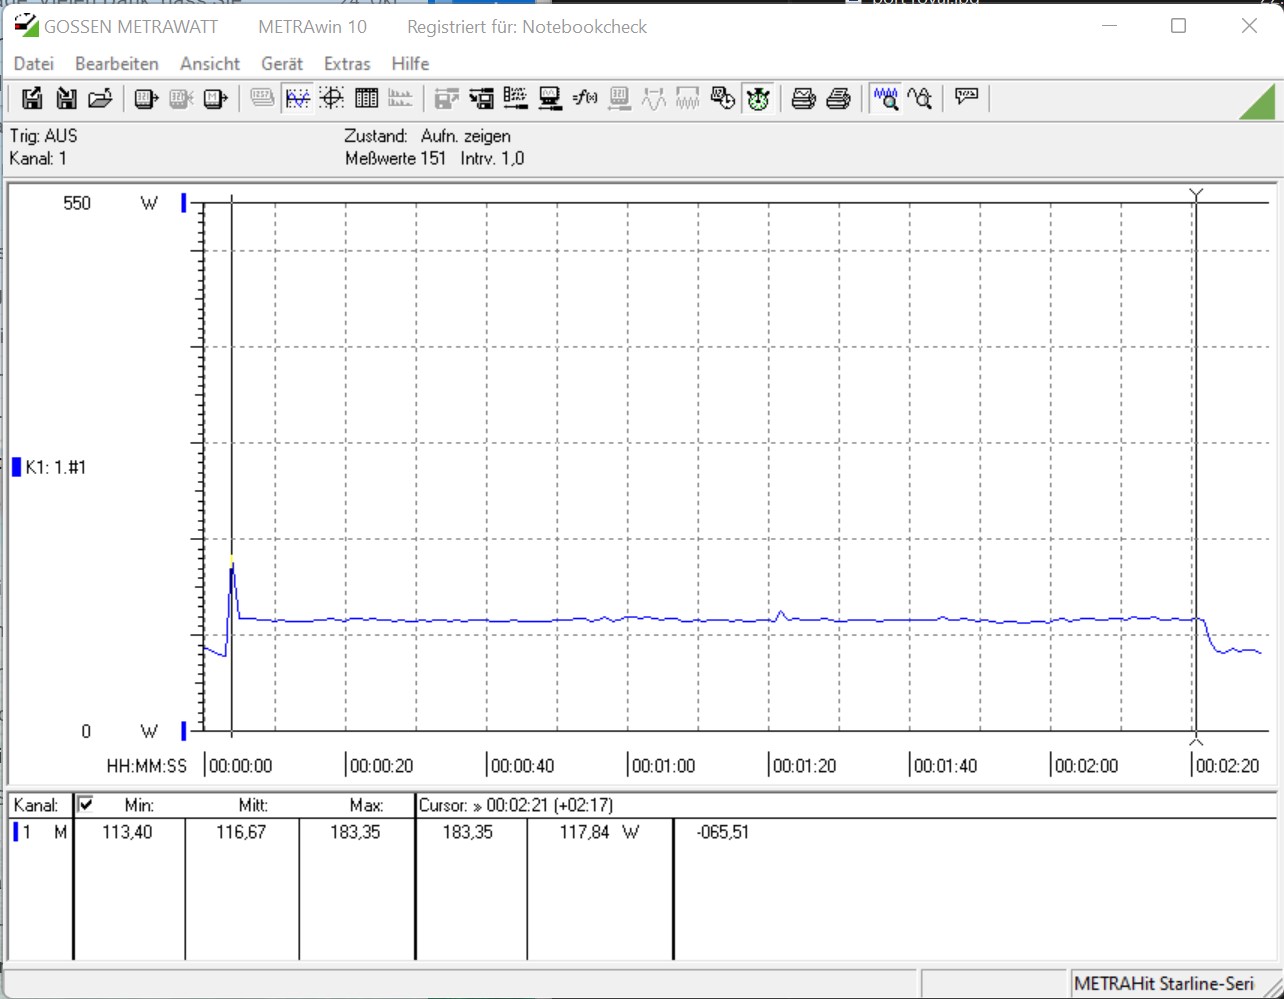
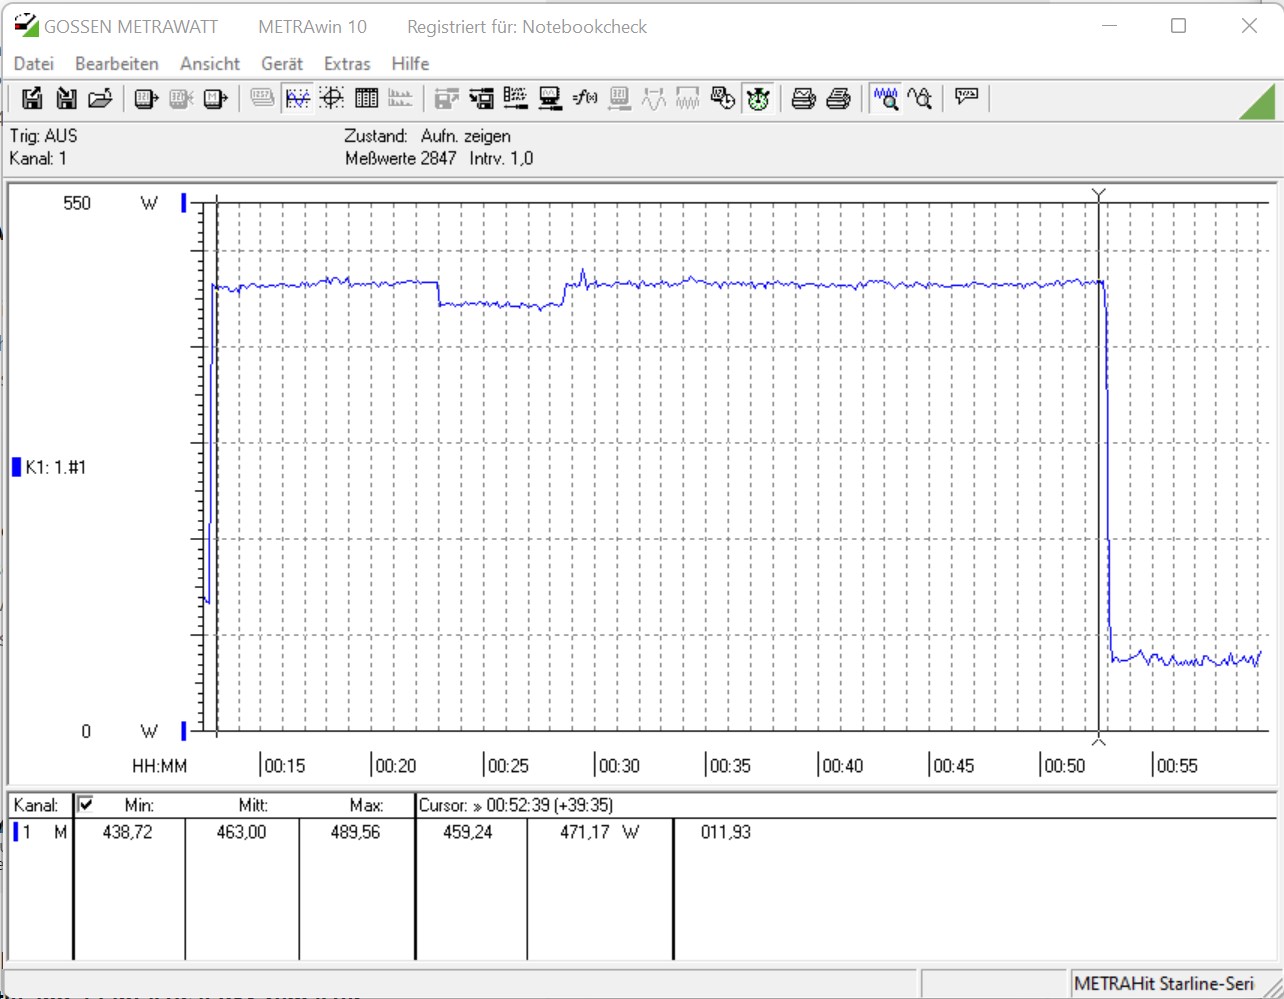
Consumo de energía y temperaturas
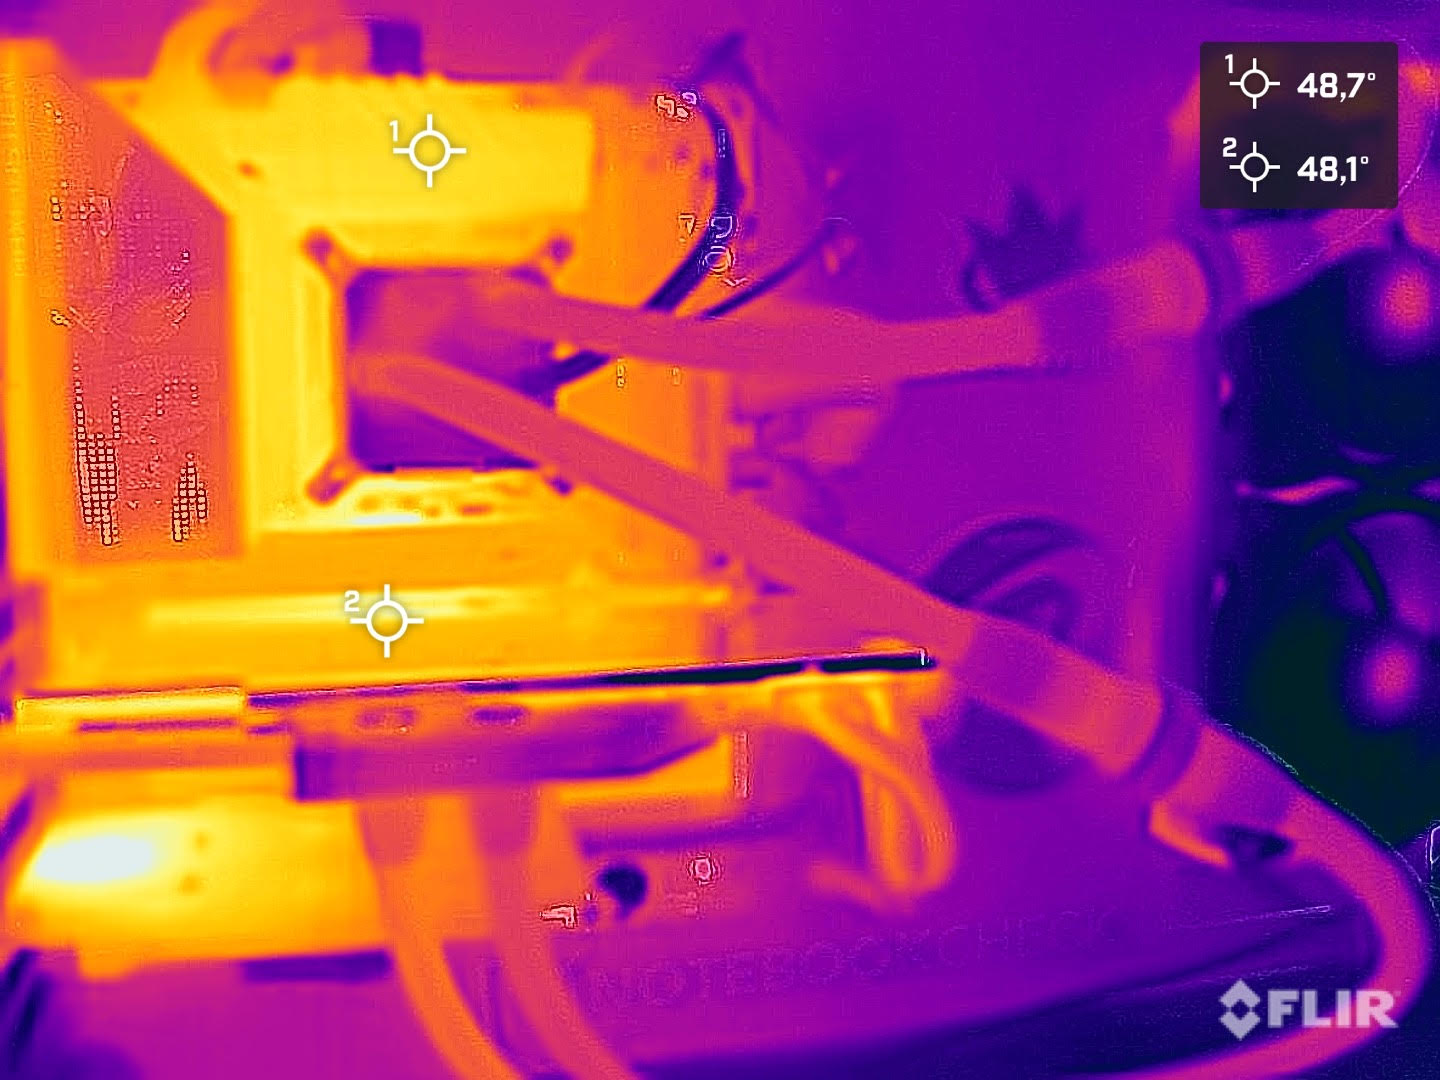
Según las especificaciones técnicas, los procesadores ofrecen un TDP de 125 vatios. Esto se refiere al valor PL1. El valor PL2 especifica la cantidad de vatios de que dispone el procesador a plena carga si se cumplen todos los requisitos. Con un máximo de 241 vatios, el Intel Core i9-12900K es ligeramente más eficiente que el Intel Core i9-11900K. En nuestra prueba, el buque insignia Alder Lake-S fue efectivamente sólo más eficienteque el predecesor en la prueba de estrés Prime95. Sin embargo, nuestras mediciones siguen mostrando algo menos de 280 vatios para todo el sistema. En el test Cinebench R15 Multi, nuestro sistema de pruebas consumió casi un 25% más de energía. Este es un aumento que no puede descartarse sin más. En el Intel Core i5-12600K, el valor PL2 está limitado a 150 vatios, lo que también se refleja en nuestros resultados de medición. En comparación con el Intel Core i5-11600Kel Intel Core i5-12600K es un 7% más eficiente. Sin embargo, la imagen cambia en la prueba de estrés, y el Core i5-12600K consume un 13% más de energía. Los valores medidos durante los juegos se ven incrementados, por supuesto, por la Nvidia Titan RTX. Sin embargo, también podemos ver aquí que la plataforma Alder Lake-S no invita a ahorrar energía.
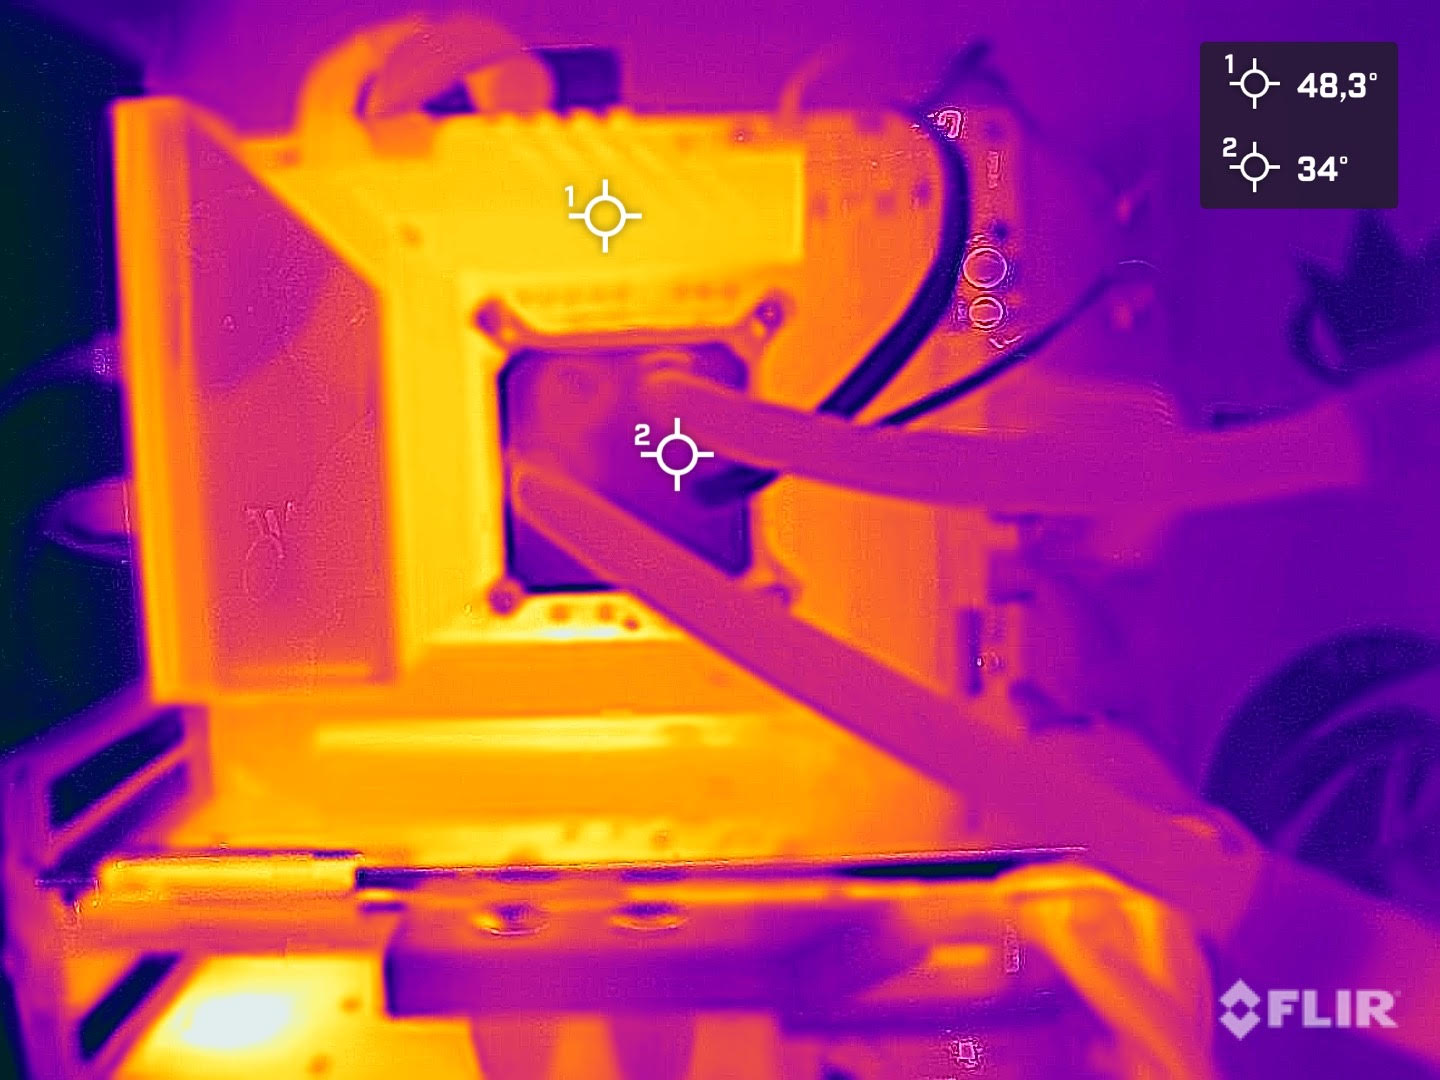
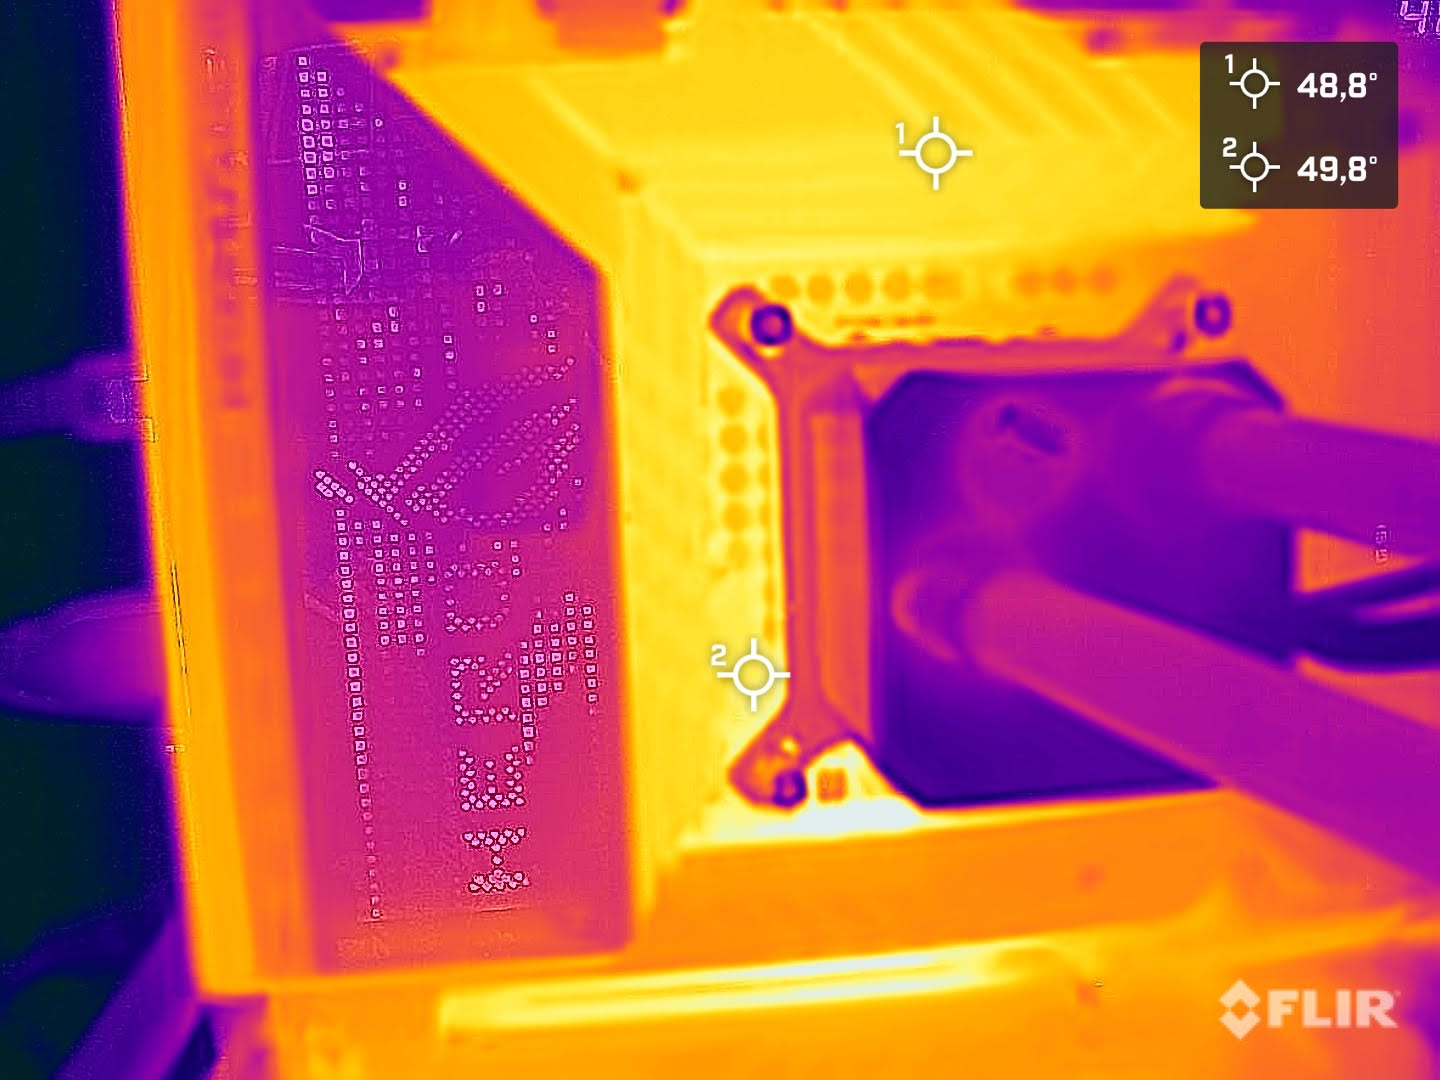
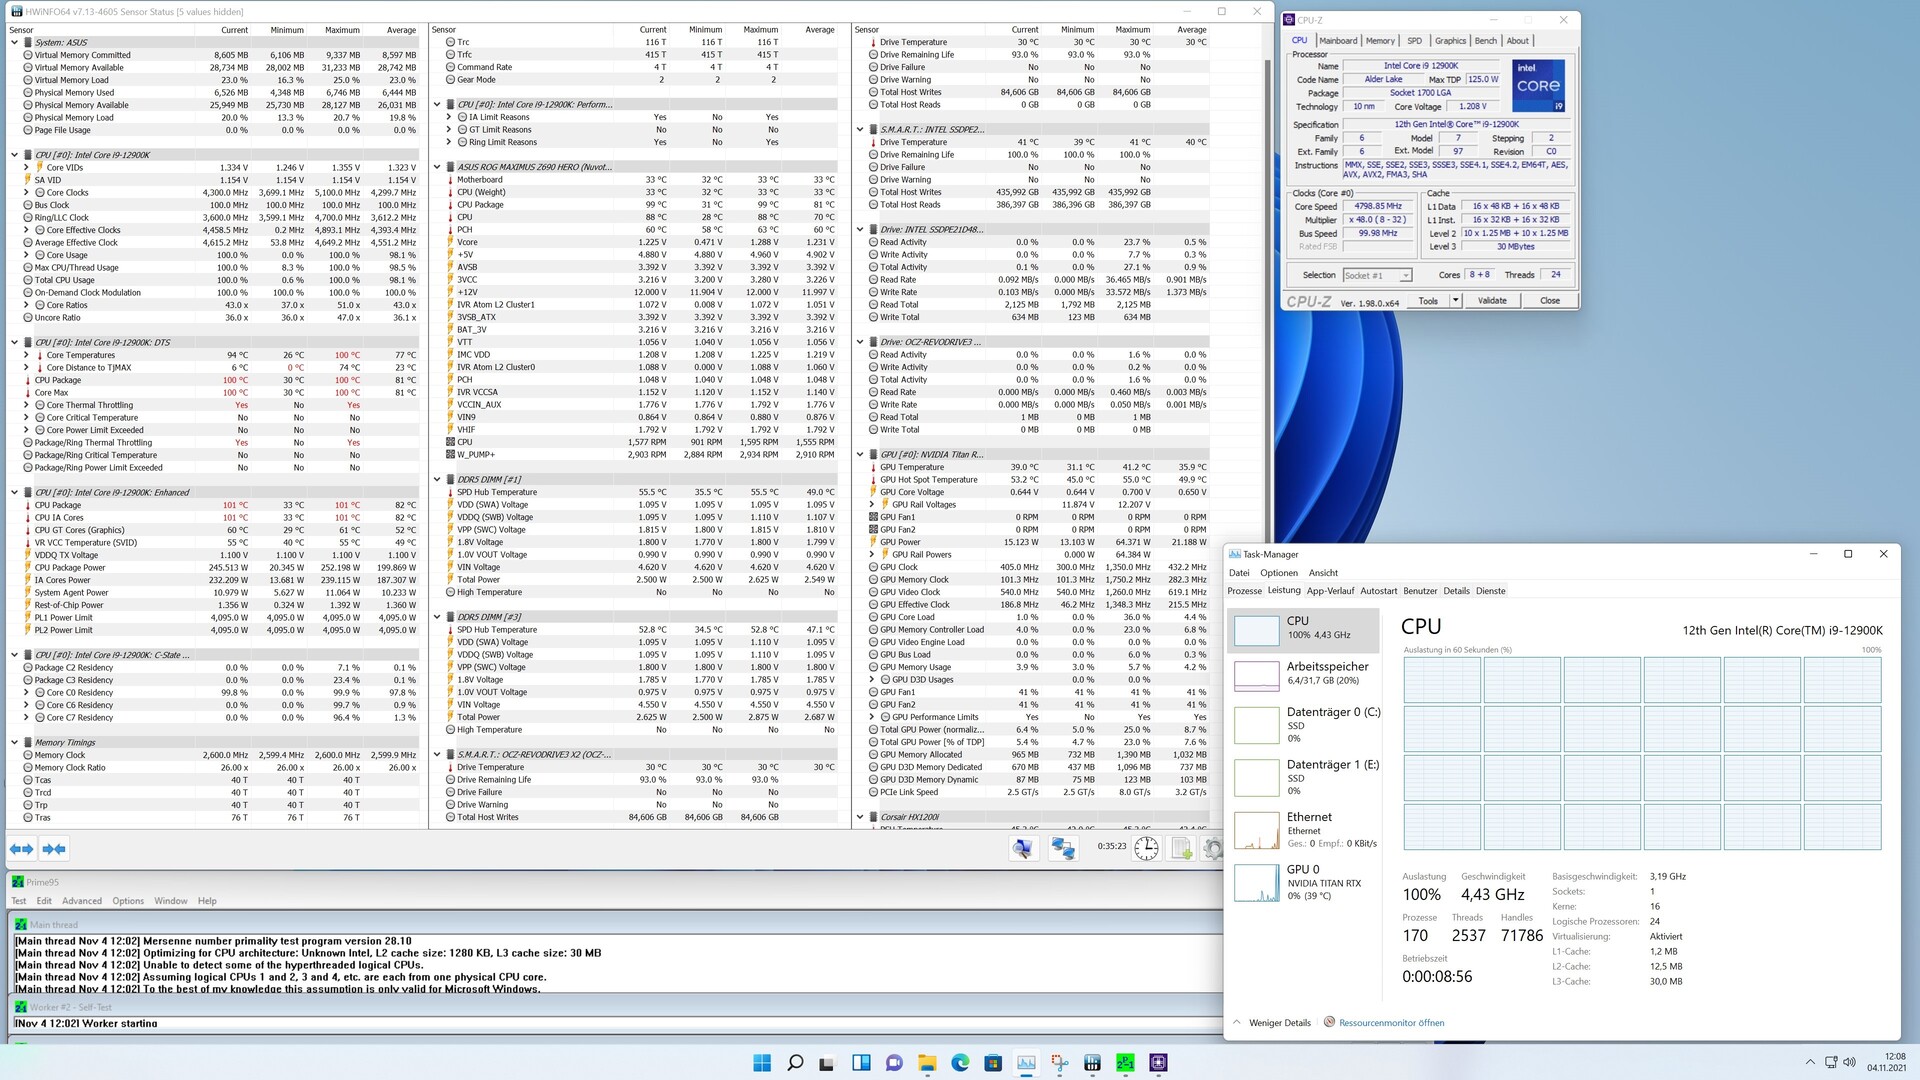
Nuestras temperaturas medidas mostraron que el Intel Core i9-12900K ya alcanzó los 100 °C varios minutos después de iniciar el benchmark Prime95. Continuando con la prueba de estrés, la CPU tuvo que ser ralentizada para no dañarla. Esta es la desventaja del ajuste PL1 = PL2 en la Bios. Sin embargo, no notamos ninguna ralentización bajo carga en el bucle Cinebench R15 Multi. Para excluir una mala instalación del sistema de refrigeración, también lo quitamos y luego lo reinstalamos en un momento dado, pero el resultado posterior fue el mismo. También nos pusimos en contacto con Alphacool para asegurarnos de que no hay incompatibilidad del refrigerador que utilizamos. Según el fabricante, el Alphacool Eisbear Aurora 280 AiO que utilizamos es compatible con el socket LGA 1700. El Intel Core i5-12600K fue ligeramente más fácil de enfriar bajo carga, pero aún así notamos una temperatura máxima de 95 °C (203°F).
Por tanto, quienes quieran utilizar un Intel Core i9-12900K deberán hacerse con un sistema de refrigeración muy potente para sacar el máximo partido al procesador.
| Power Consumption | |
| 1920x1080 The Witcher 3 ultra (external Monitor) | |
| Intel Core i9-12900K (Idle: 70.5 W) | |
| AMD Ryzen 9 5950X (Idle: 78 W) | |
| AMD Ryzen 9 5900X (Idle: 78.1 W) | |
| Intel Core i5-11600K (Idle: 69.49 W) | |
| AMD Ryzen 7 5800X (Idle: 77.5 W) | |
| AMD Ryzen 5 5600X (Idle: 79.23 W) | |
| Intel Core i5-12600K (Idle: 70.45 W) | |
| Intel Core i7-10700K (Idle: 67.7 W) | |
| Intel Core i9-10900K (Idle: 52.3 W) | |
| Intel Core i9-11900K (Idle: 57.3 W) | |
| Intel Core i5-10600K (Idle: 52.2 W) | |
| Prime95 V2810 Stress (external Monitor) | |
| Intel Core i9-11900K (Idle: 57.3 W) | |
| Intel Core i9-12900K (Idle: 70.5 W) | |
| Intel Core i9-10900K (Idle: 52.3 W) | |
| Intel Core i5-12600K (Idle: 70.45 W) | |
| AMD Ryzen 9 5950X (Idle: 78 W) | |
| AMD Ryzen 7 5800X (Idle: 77.5 W) | |
| AMD Ryzen 9 5900X (Idle: 78.1 W) | |
| Intel Core i5-11600K (Idle: 69.49 W) | |
| Intel Core i7-10700K (Idle: 67.7 W) | |
| Intel Core i5-10600K (Idle: 52.2 W) | |
| AMD Ryzen 5 5600X (Idle: 79.23 W) | |
| Cinebench R15 Multi (external Monitor) | |
| Intel Core i9-12900K (Idle: 70.5 W) | |
| Intel Core i9-10900K (Idle: 52.3 W) | |
| Intel Core i9-11900K (Idle: 57.3 W) | |
| AMD Ryzen 9 5900X (Idle: 78.1 W) | |
| AMD Ryzen 9 5950X (Idle: 78 W) | |
| AMD Ryzen 7 5800X (Idle: 77.5 W) | |
| Intel Core i5-11600K (Idle: 69.49 W) | |
| Intel Core i7-10700K (Idle: 67.7 W) | |
| Intel Core i5-12600K (Idle: 70.45 W) | |
| Intel Core i5-10600K (Idle: 52.2 W) | |
| AMD Ryzen 5 5600X (Idle: 79.23 W) | |
| Temperatures - CPU Temperature Prime95 | |
| Intel Core i9-11900K | |
| AMD Ryzen 7 5800X | |
| Intel Core i9-10900K | |
| Intel Core i5-11600K | |
| AMD Ryzen 9 5900X | |
| Intel Core i5-10600K | |
| AMD Ryzen 9 5950X | |
* ... más pequeño es mejor
Pro
Contra
Veredicto - Volver a la cima con un total de 24 hilos

Con Alder Lake-S, Intel consigue tener la CPU para juegos más rápida, al menos por ahora. Pero esto no es todo. Alder Lake-S no es sólo un procesador de última generación mejorado, como hemos visto a menudo. Este no es el caso, ya que la nueva arquitectura incluye muchas mejoras. Muchas de ellas ya las conocemos del área de los móviles, ya que los smartphones y las tabletas ya contienen procesadores con núcleos de rendimiento y eficiencia energética desde hace años. Intel también hace uso de este diseño en su actual línea de ordenadores de sobremesa, aumentando el rendimiento multinúcleo de forma espectacular. De este modo, el Intel Core i9-12900K es capaz de funcionar con un total de 24 hilos en paralelo. Además, el IPC también se ha mejorado significativamente, lo que beneficia enormemente a los juegos
La base subyacente también ha cambiado por completo y una simple actualización de Rocket Lake-S es imposible sin sustituir la placa base. Definitivamente hay que incluir esto en el cálculo de costes. A propósito de los costes, el precio de compra recomendado es de 589 dólares y actualmente está disponible a partir de 659 euros (~762 dólares) en algunos lugares. Dependiendo de la disponibilidad, podría haber algunos aumentos de precio aquí, como en las tarjetas gráficas. El Intel Core i5-12600K, ligeramente más débil pero aún muy rápido, comienza con un precio recomendado de 289 dólares según Intel. Según nuestra investigación inicial, el modelo ya está disponible a partir de 319 euros (~369 dólares) en algunos lugares. Es un precio atractivo que ni siquiera AMD puede superar actualmente. El correspondiente AMD Ryzen 7 5800Xcuesta 379 Euros en este momento. Las cosas parecen un poco diferentes aquí con el modelo superior, donde el AMD Ryzen 9 5900Xes significativamente más asequible a 519 Euros.
El Intel Core i9-12900K es una muy buena CPU para juegos con algunas reservas para el futuro. Con la CPU para juegos más rápida del mercado, Intel puede darse una palmadita en la espalda por ahora.
Sin embargo, para que el Intel Core i9-12900K sea más competitivo, el precio debería bajar, ya que como ya hemos mencionado, definitivamente también hay que invertir en una nueva placa base y en algunas circunstancias también en una nueva memoria de trabajo si tiene que ser DDR5. Pero nos gusta el hecho de que también tienes la opción de seguir usando DDR4. Los fabricantes de placas base ofrecen algunos modelos específicos con RAM DDR4 para ello. Sin embargo, si estos también soportarán Raptor Lake-S, desafortunadamente no se sabe todavía.
Nos decepcionó un poco el consumo de energía. Por supuesto, el rendimiento ha mejorado drásticamente y el correspondiente consumo de energía ligeramente superior se mantiene dentro de los límites. Pero habría sido genial, si este aumento de rendimiento pudiera combinarse con un consumo de energía notablemente menor. Esto también ayudaría a controlar mejor los problemas de refrigeración.
Los que quieran hacerse con él ahora pueden conseguir el Intel Core i5-12600K enAmazon por ~323 dólares y el Intel Core i9-12900K también desde Amazon por ~$1400. Mientras que Newegg lo tiene a 649 dólares, actualmente está agotado.

