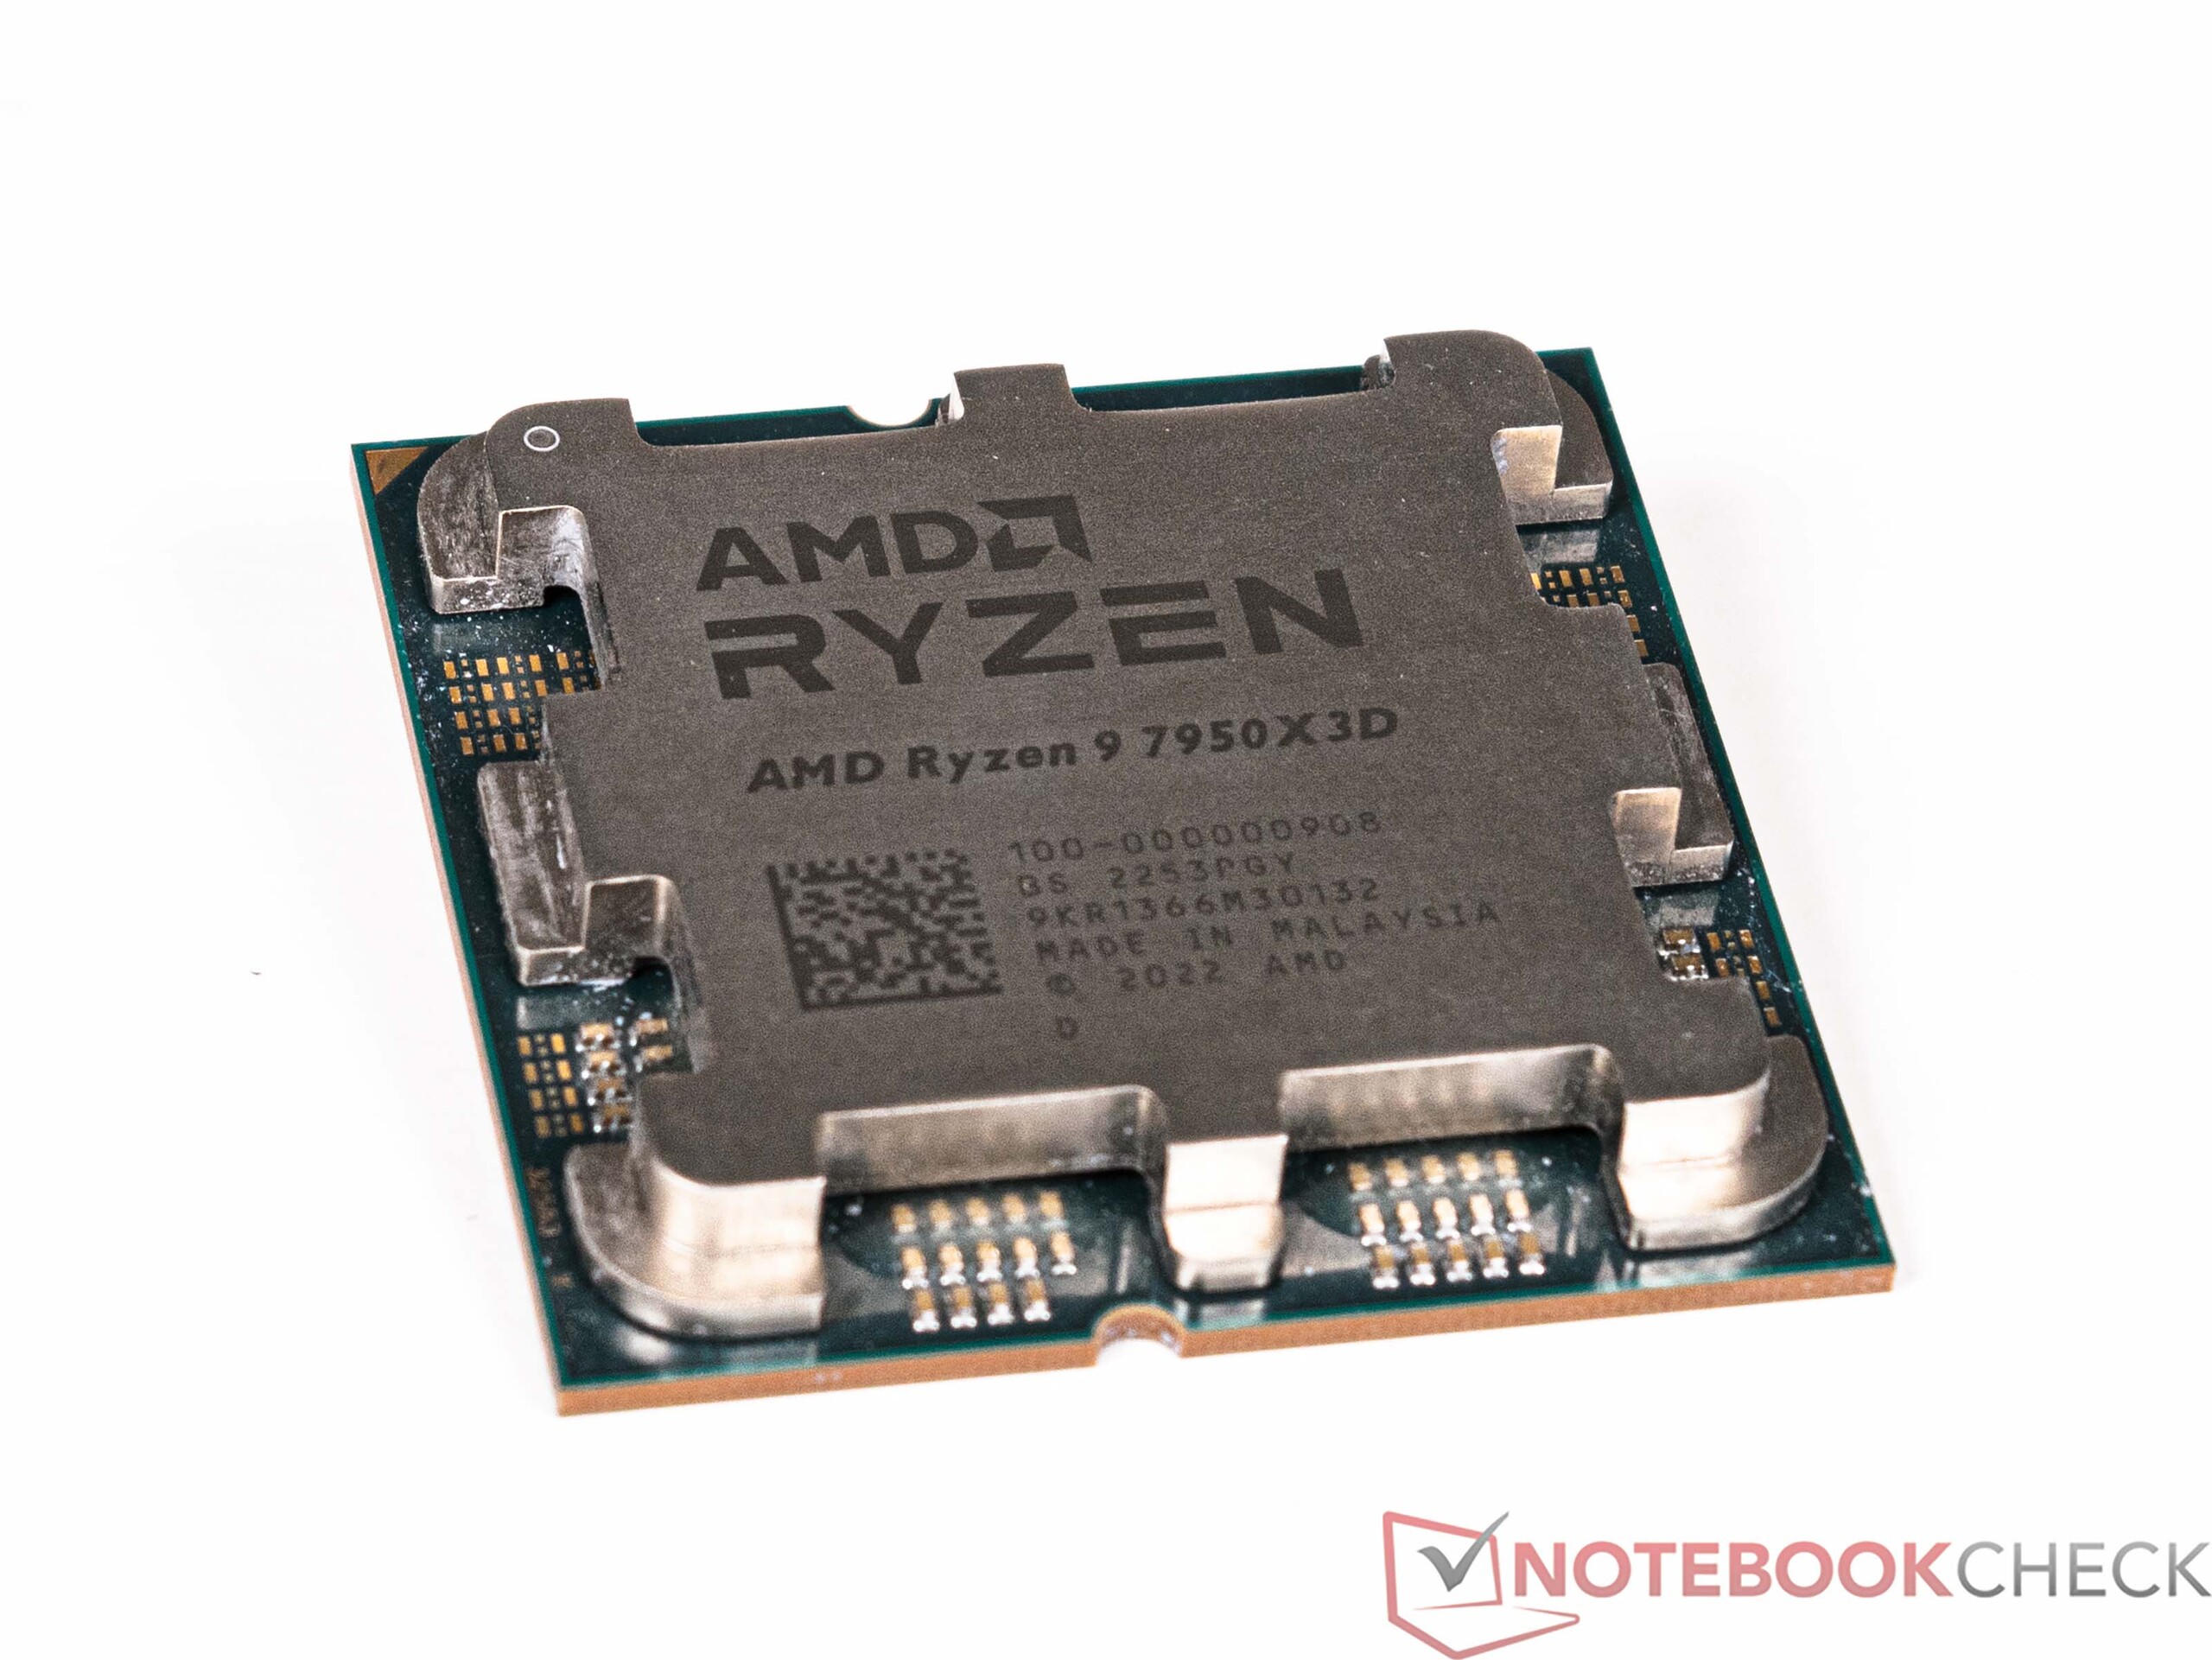
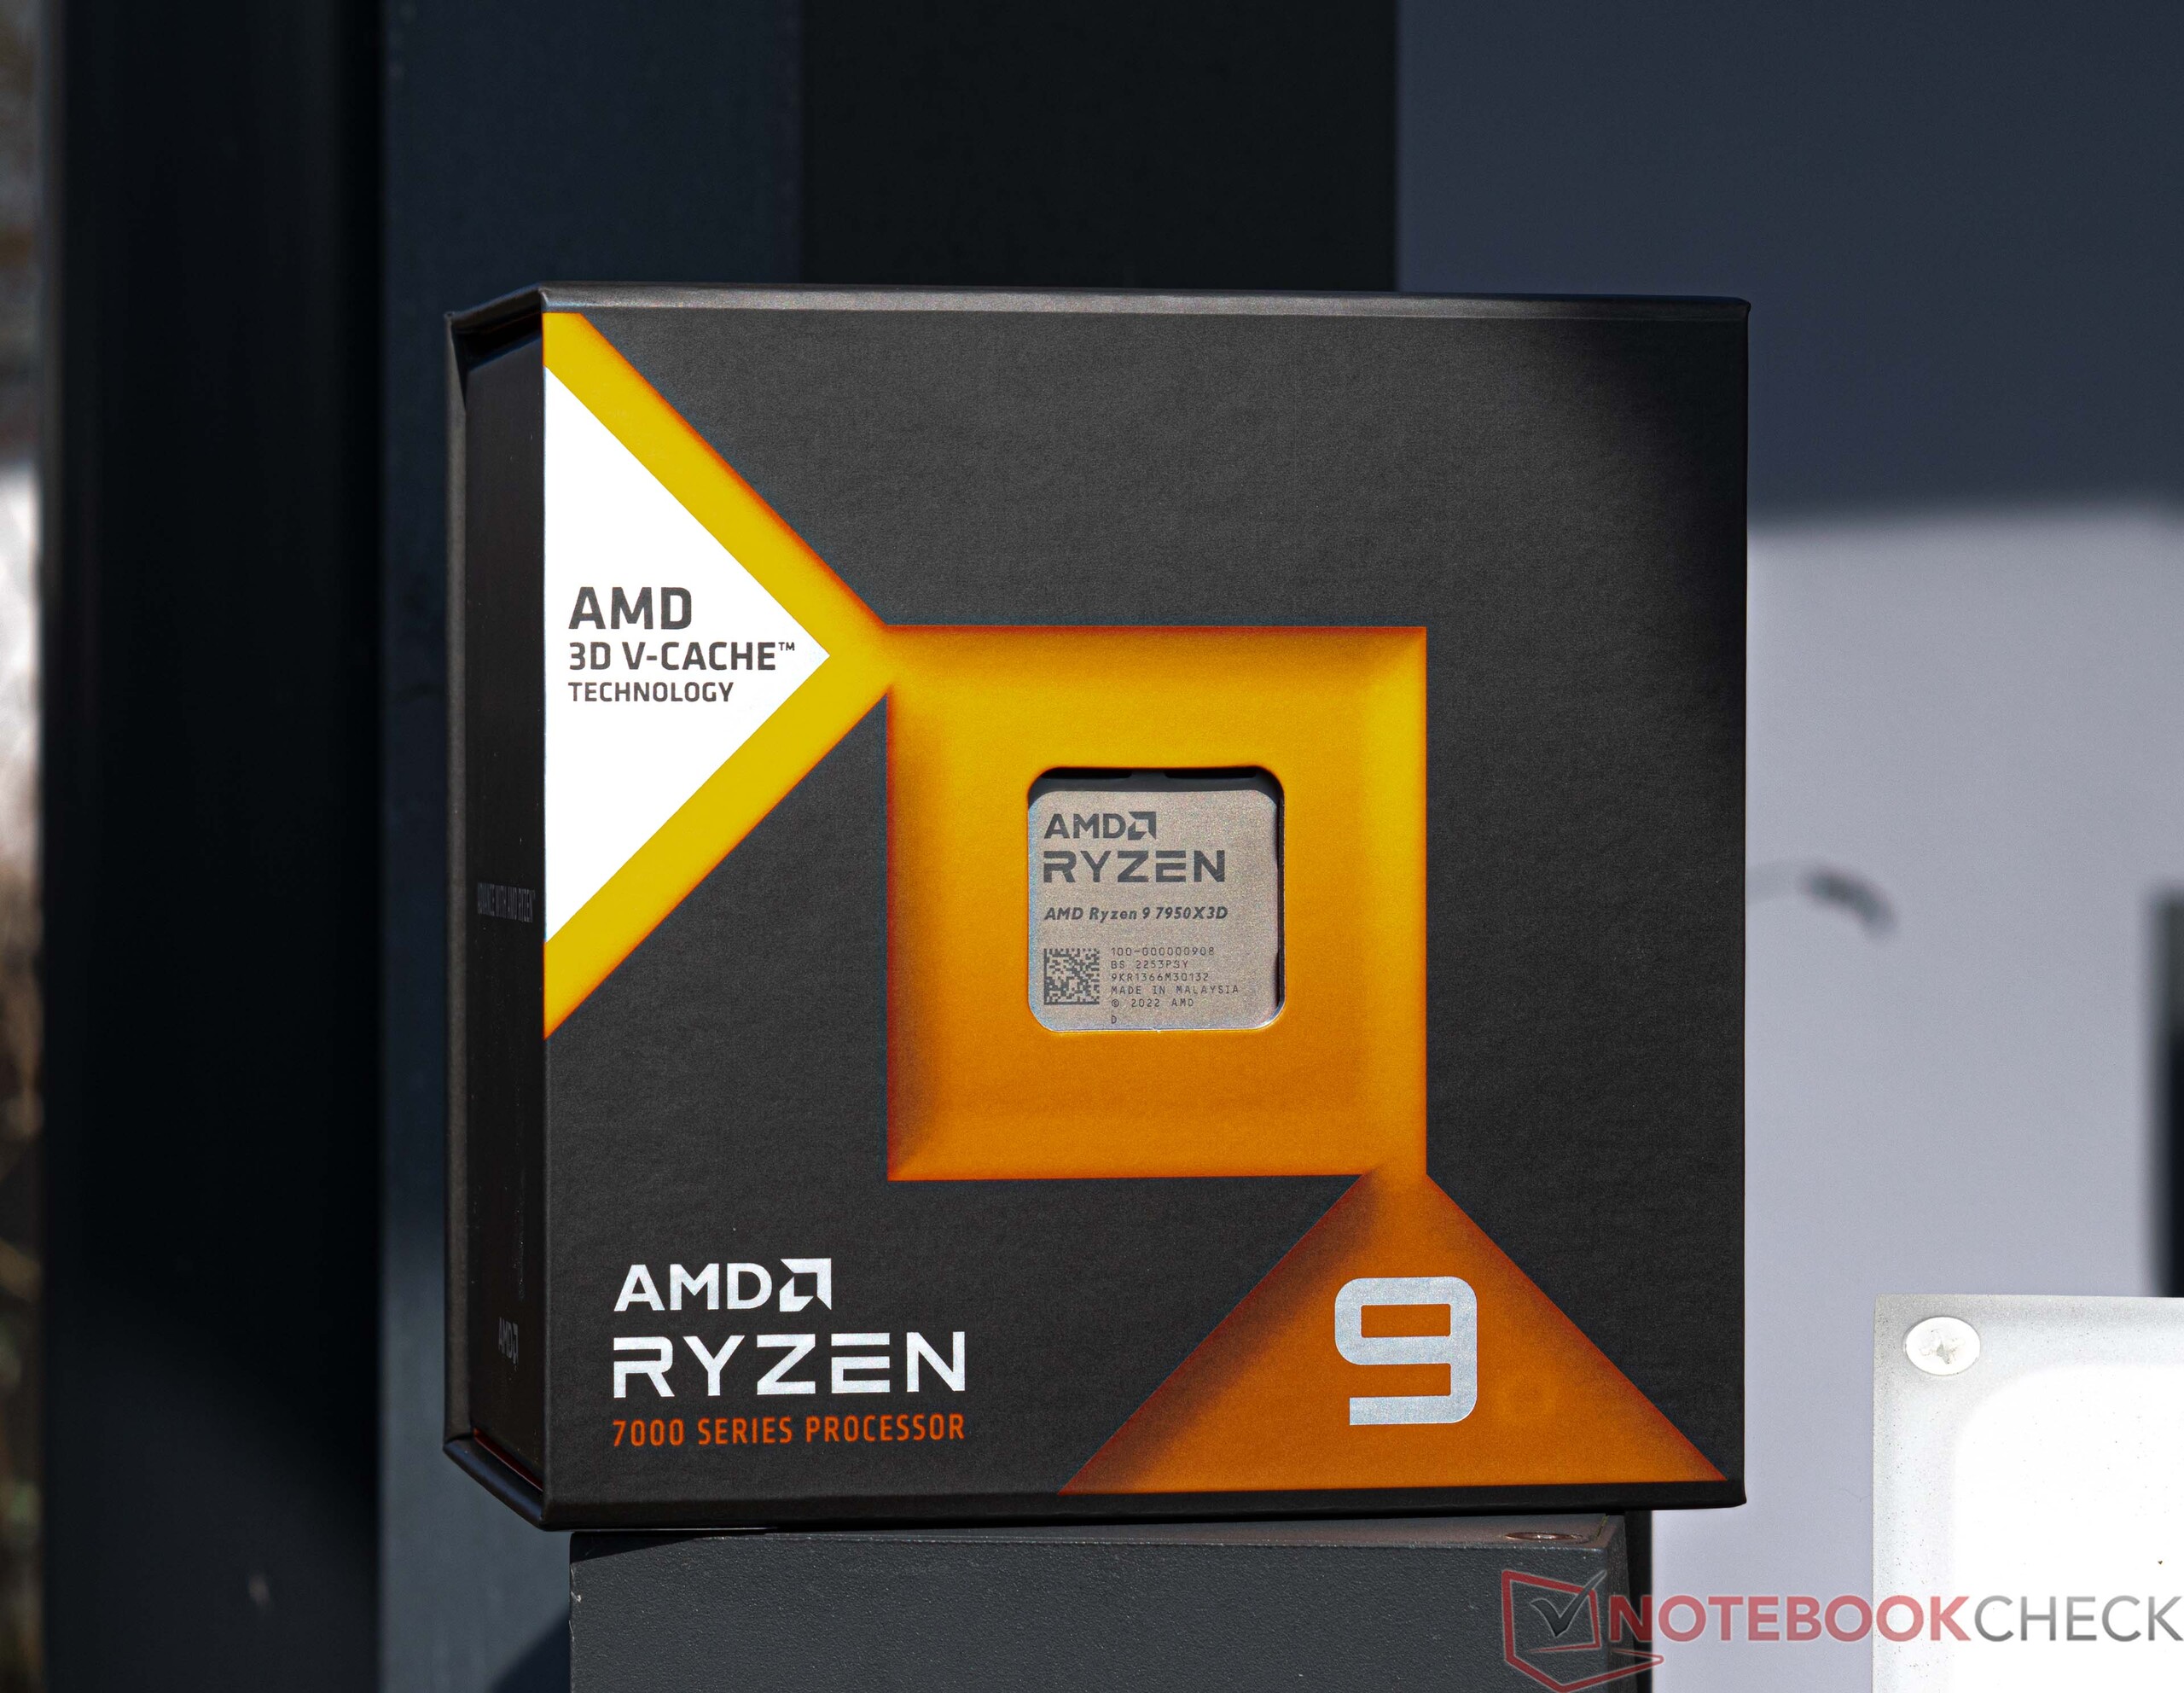
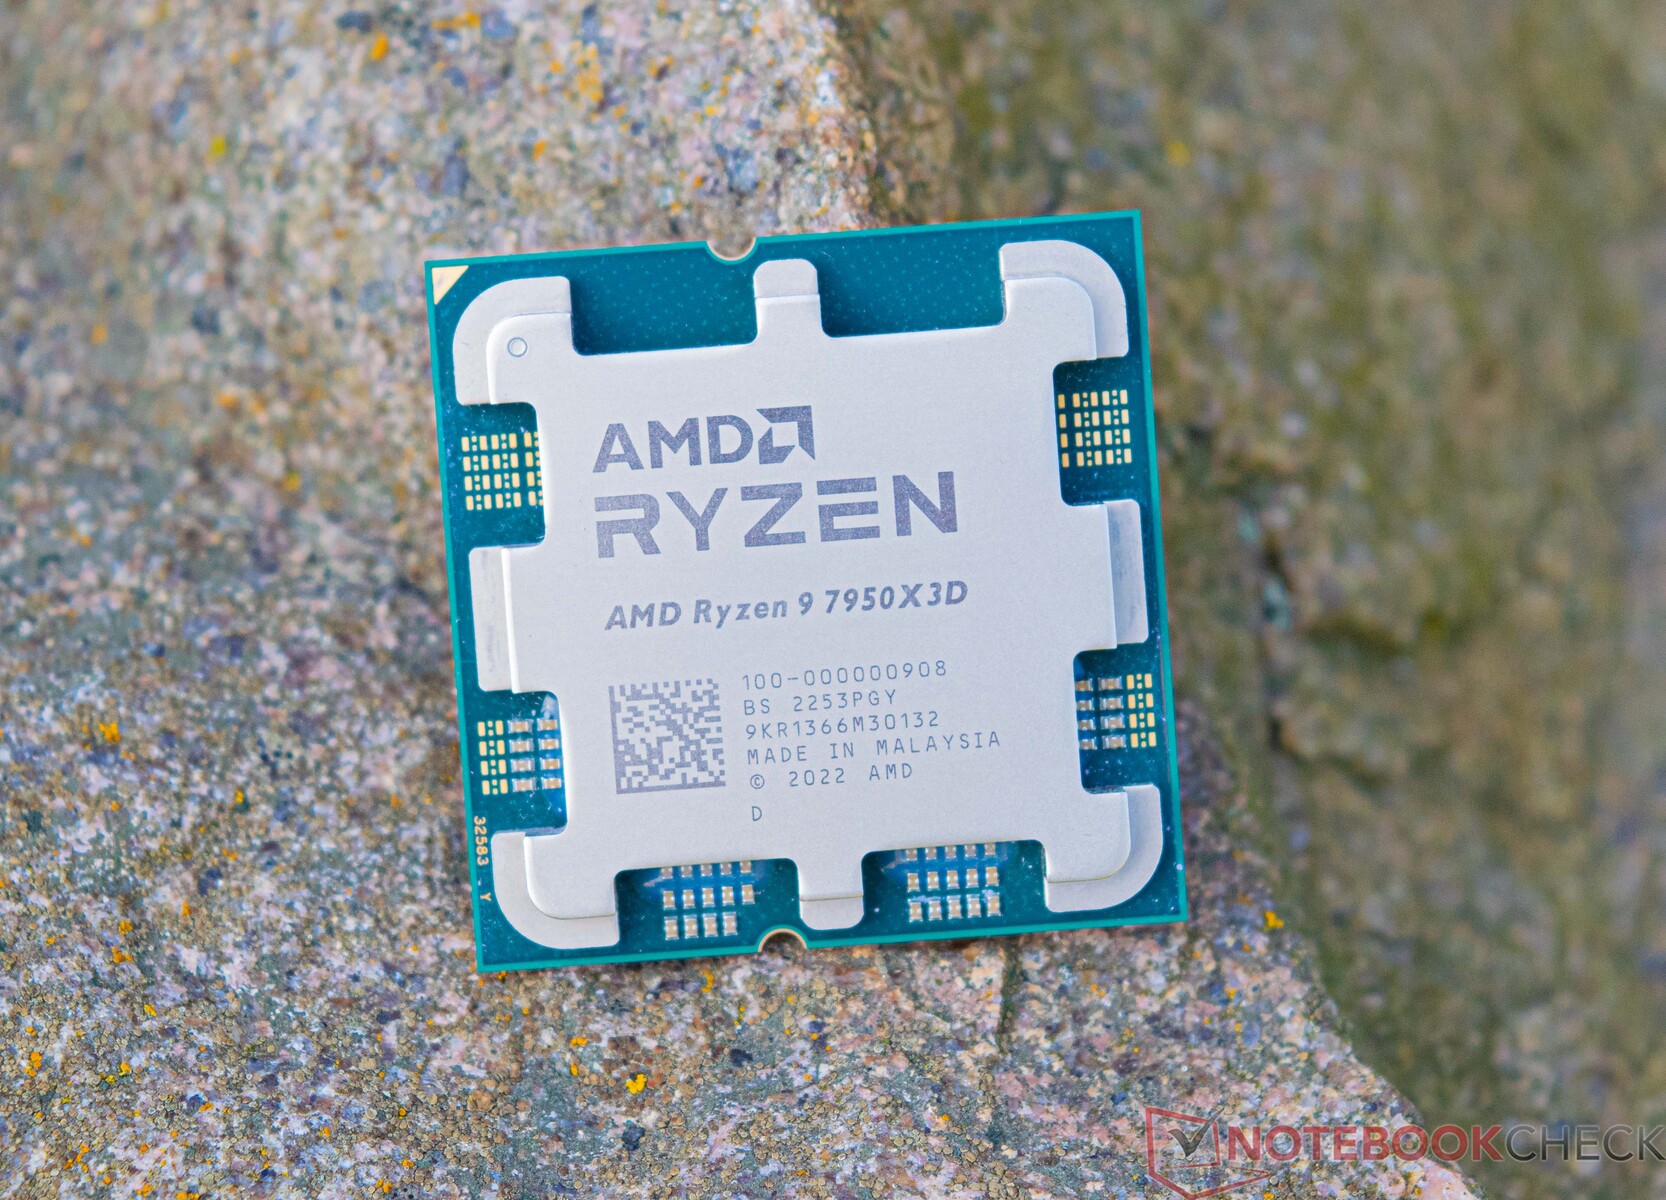
Análisis de la CPU de sobremesa AMD Ryzen 9 7950X3D: Nuevo buque insignia para juegos con 3D V-Cache en socket AM5
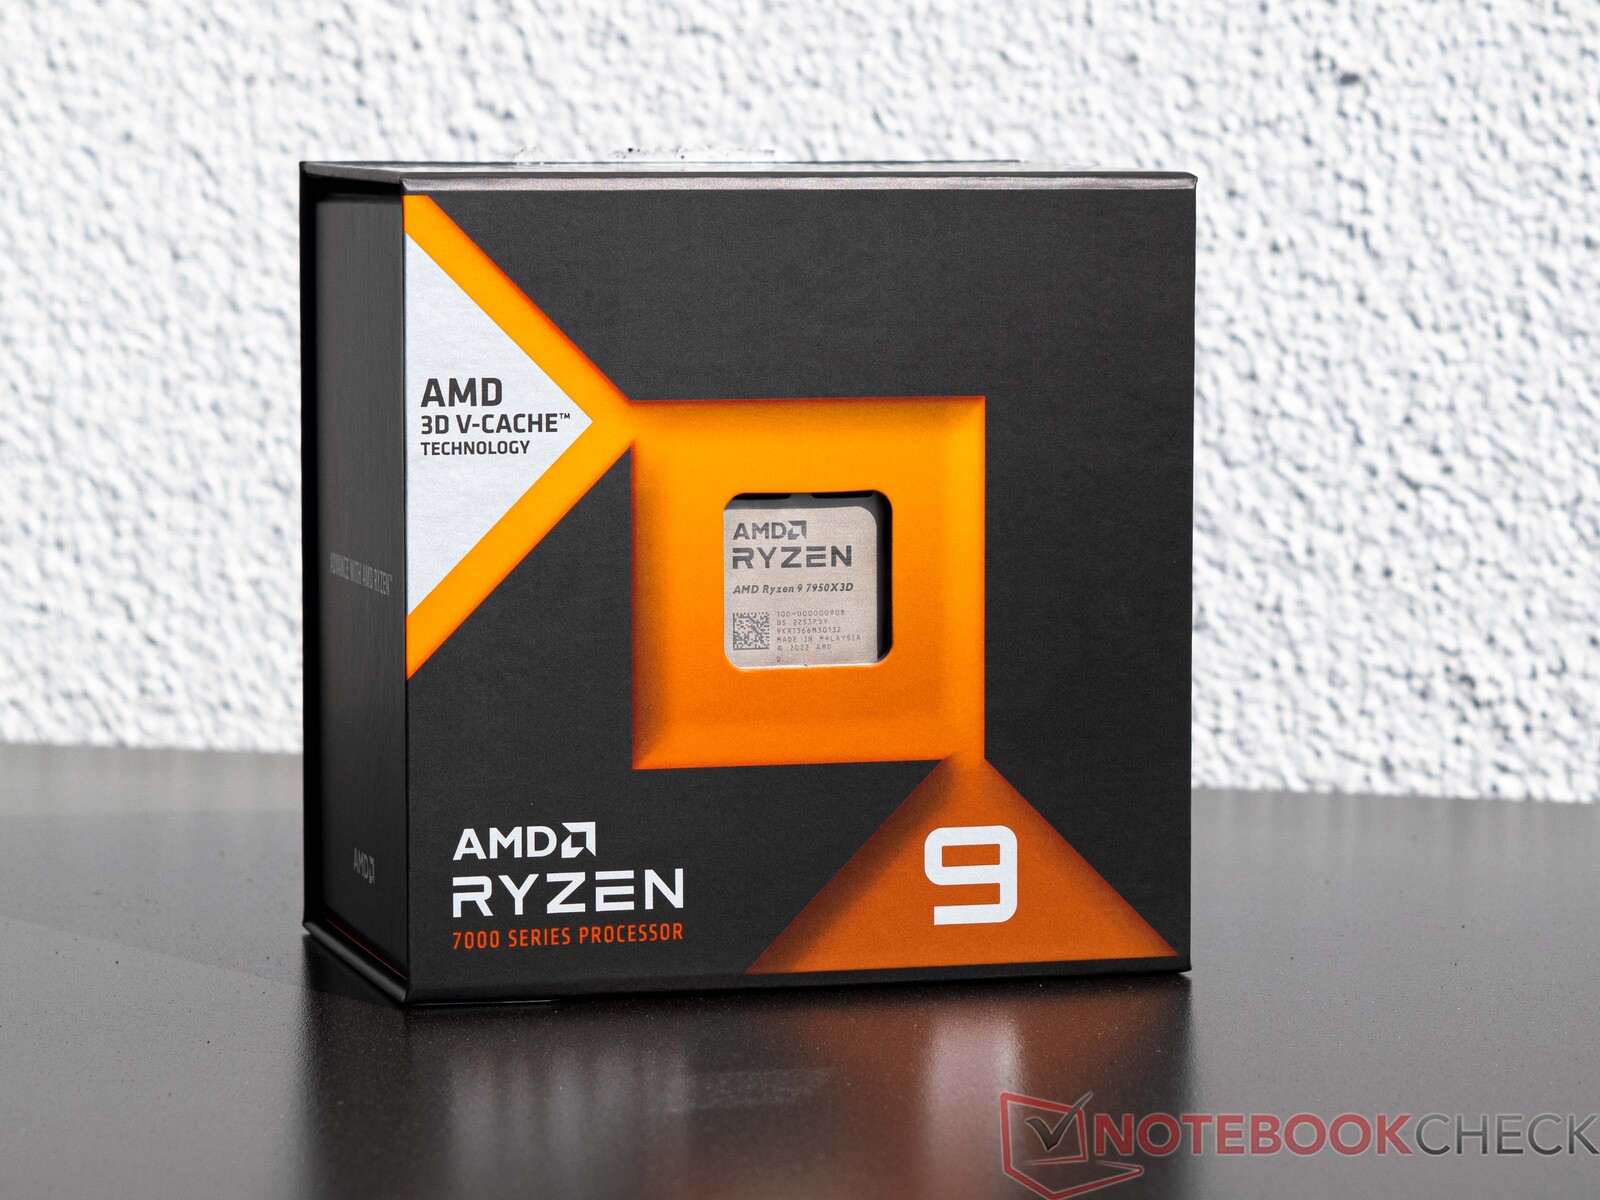
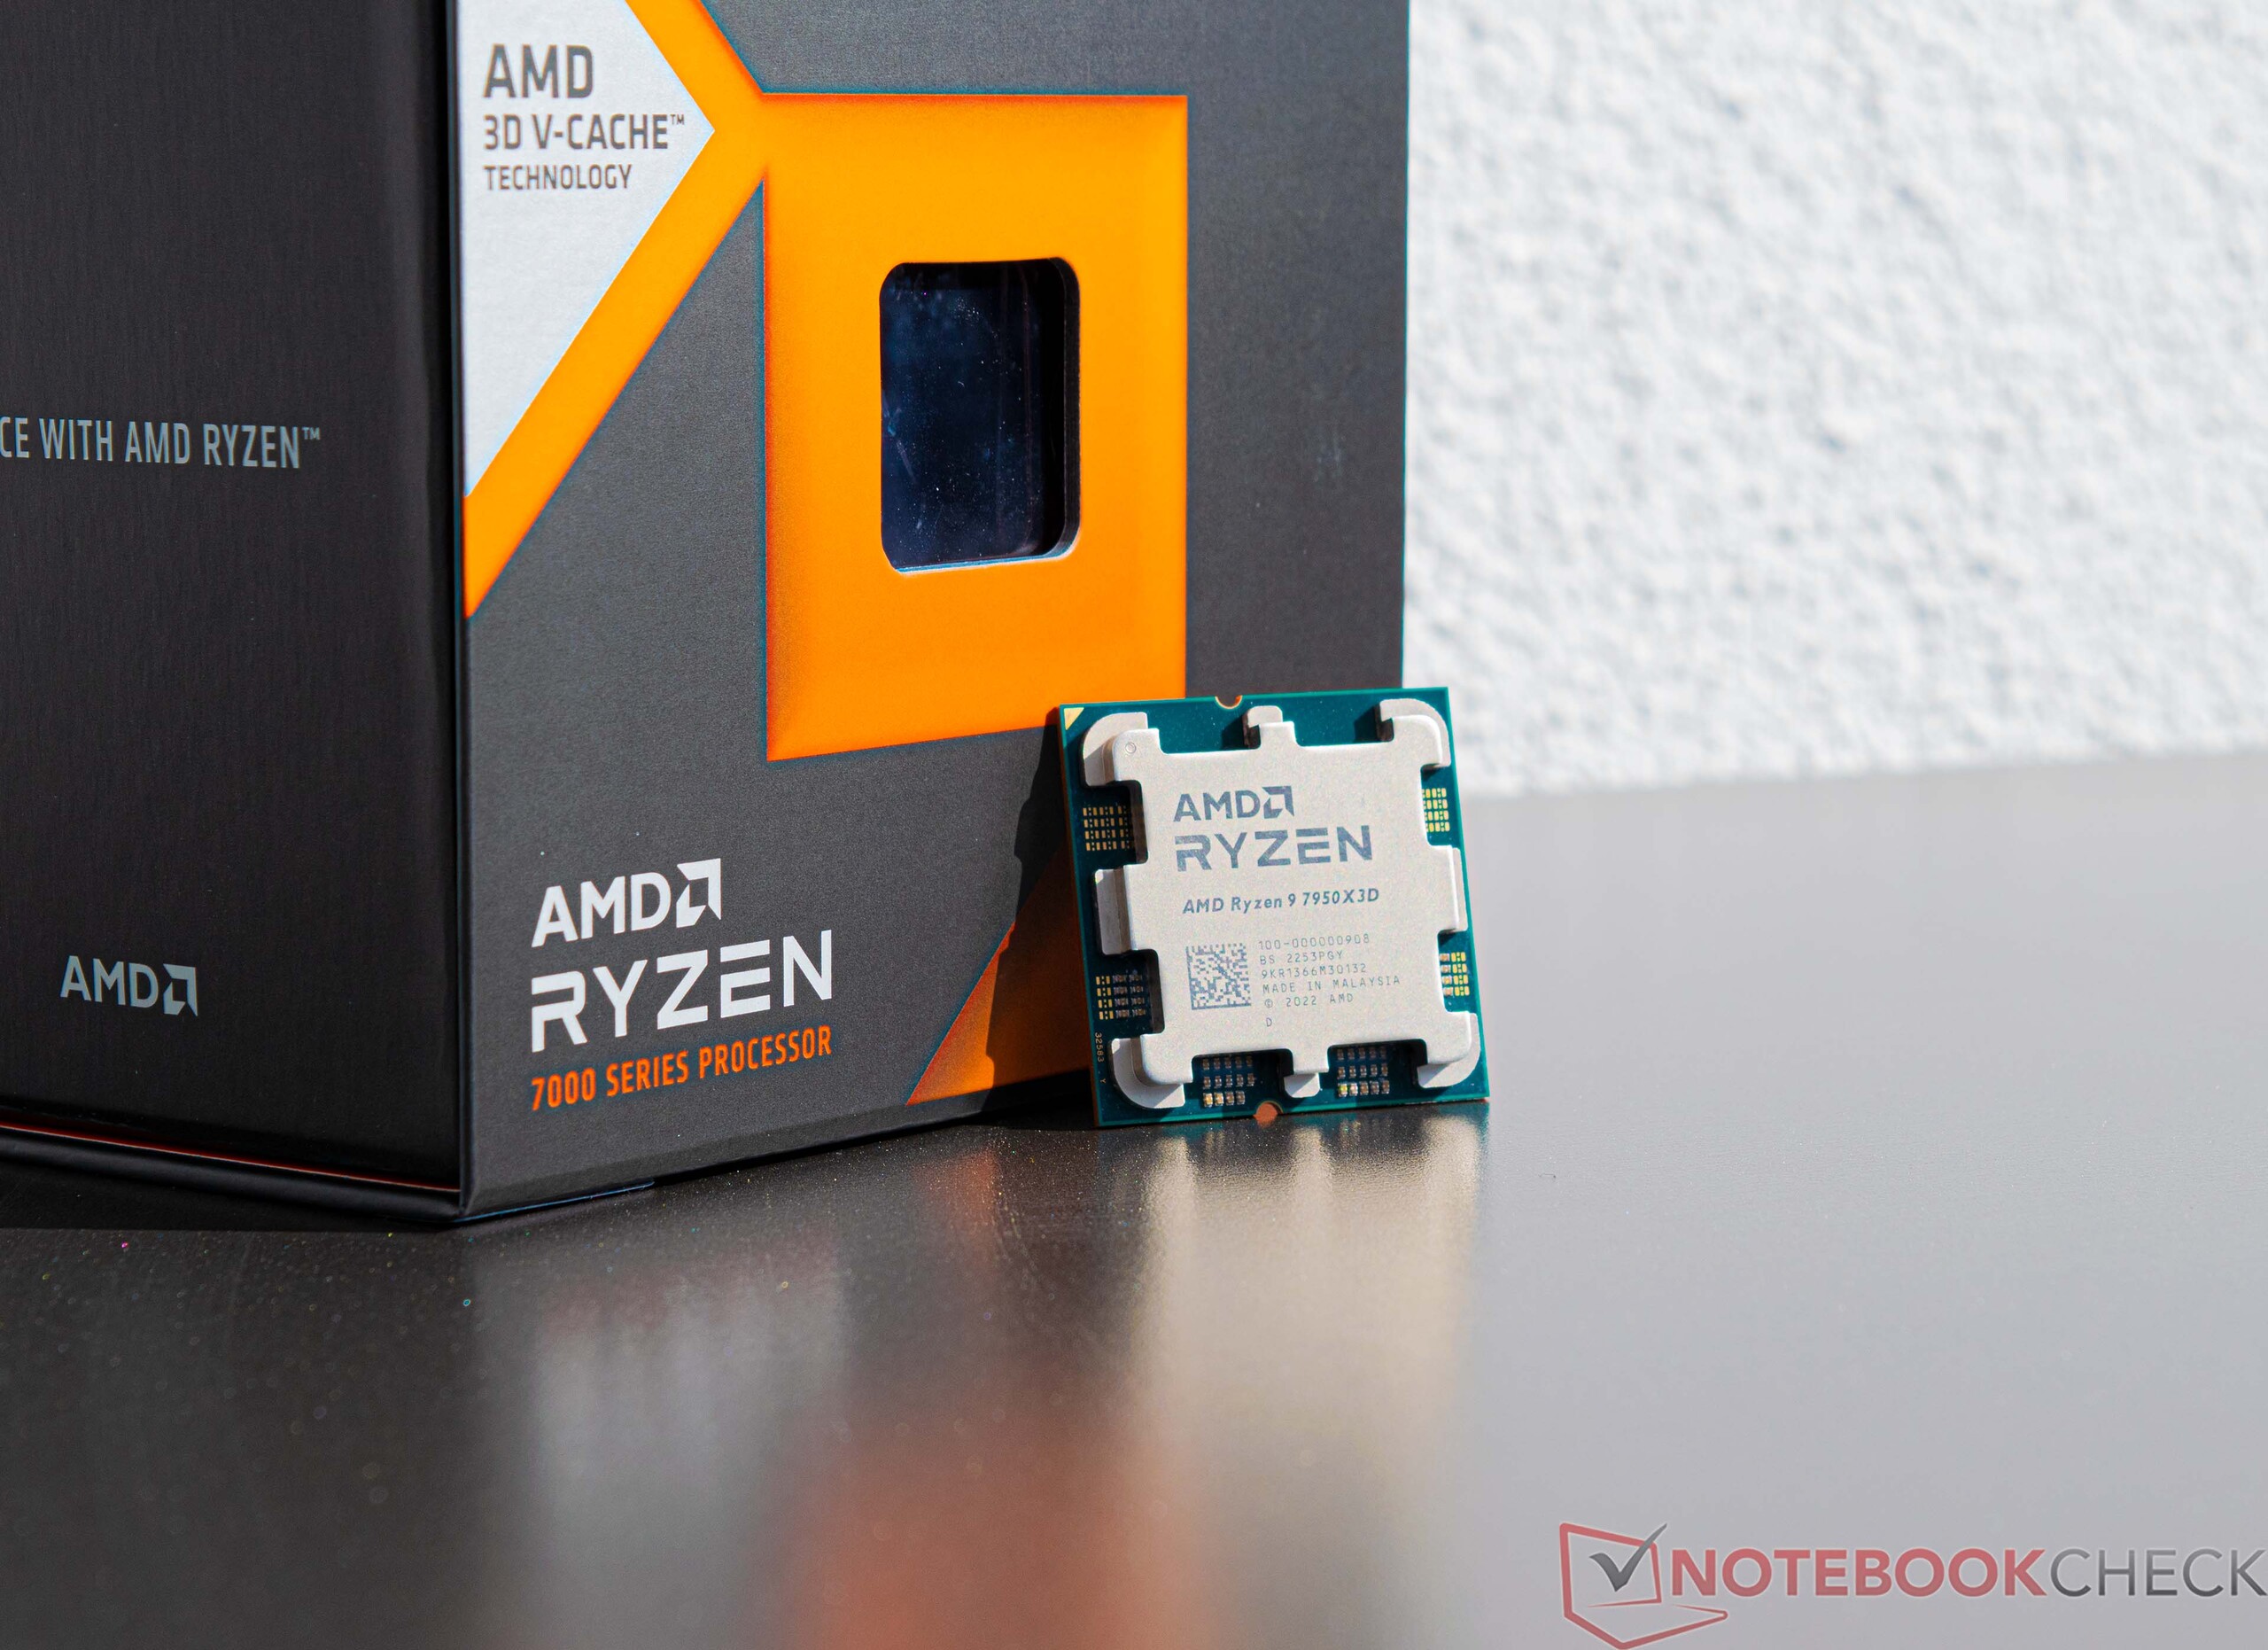
No ha pasado mucho tiempo desde que se presentó la plataforma AM5 para los nuevos procesadores Ryzen 7000 de AMD, hasta que el fabricante ya anunció los modelos X3D para el zócalo AM5 en el CES de Las Vegas en enero. Lo que hace especiales a estos modelos es su 3D V-Cache, que supuestamente garantiza una mejora significativa del rendimiento en los juegos. Ya con el antiguo zócalo AM4, se podía conseguir un muy buen rendimiento en juegos con elAMD Ryzen 7 5800X3D. Pero basado en el zócalo AM4, que era la única CPU que estaba equipado con el 3D V-Cache. Ahora las cosas son diferentes con la nueva plataforma AM5, y a principios de año se anunciaron tres modelos. Empezando por el AMD Ryzen 9 7950X3D junto con el AMD Ryzen 9 7900X3D, se supone que el AMD Ryzen 7 7800X3D le seguirá en abril de 2023. Para la mayoría de los jugadores, el último procesador debería ser el modelo más interesante de la serie, no solo por el precio. La construcción interna de los dos procesadores de 12 y 16 núcleos está diseñada con un solo CCD que incluye la rápida 3D V-Cache. Para entender esto, hay que saber que un CCD une 8 núcleos de CPU como un clúster. En los AMD Ryzen 9 7950X3D y AMD Ryzen 9 7950X hay 2 CCD con 8 núcleos cada uno, lo que hace un total de 16 núcleos disponibles para el usuario. Pero esto también significa que el AMD Ryzen 9 7950X3D sólo ofrece 8 núcleos basados en la rápida 3D V-Cache. El segundo CCD está equipado únicamente con la caché "normal". Para el Ryzen 9 7900X3D más pequeño, que sigue viniendo con 12 núcleos de computación, son correspondientemente 6 núcleos de los 2 CCD los que pueden acceder a 3D V-Cache.
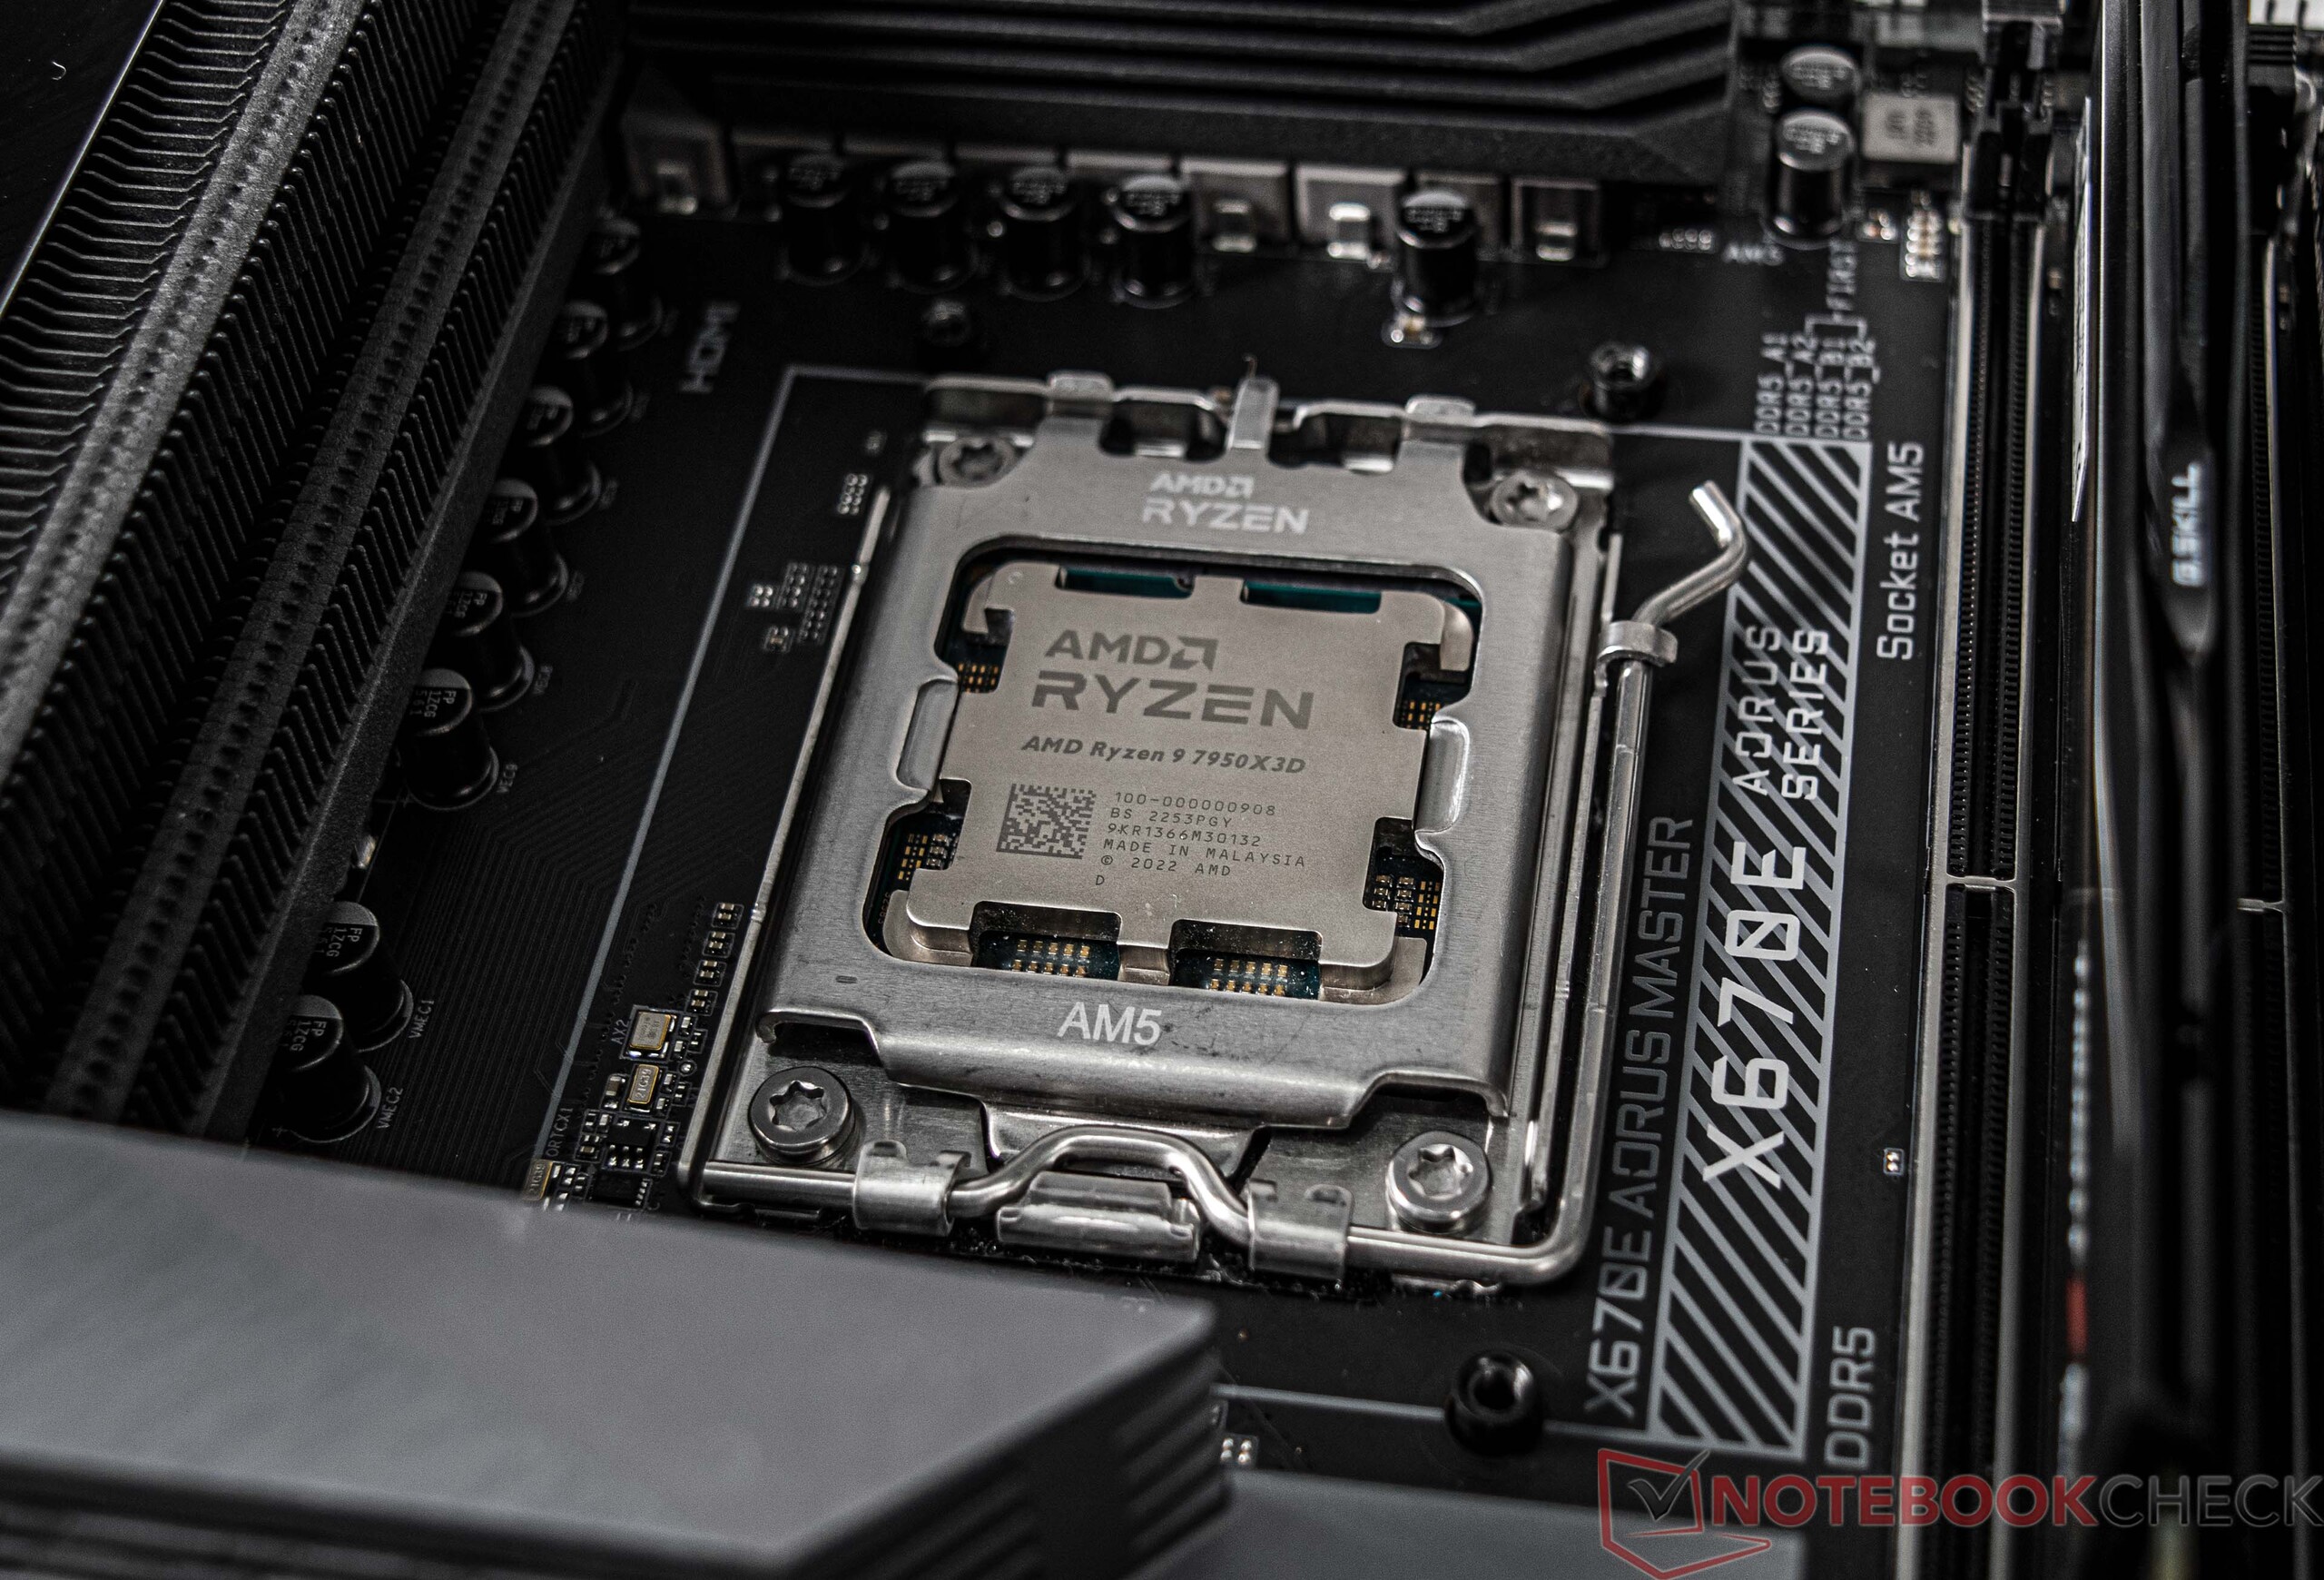
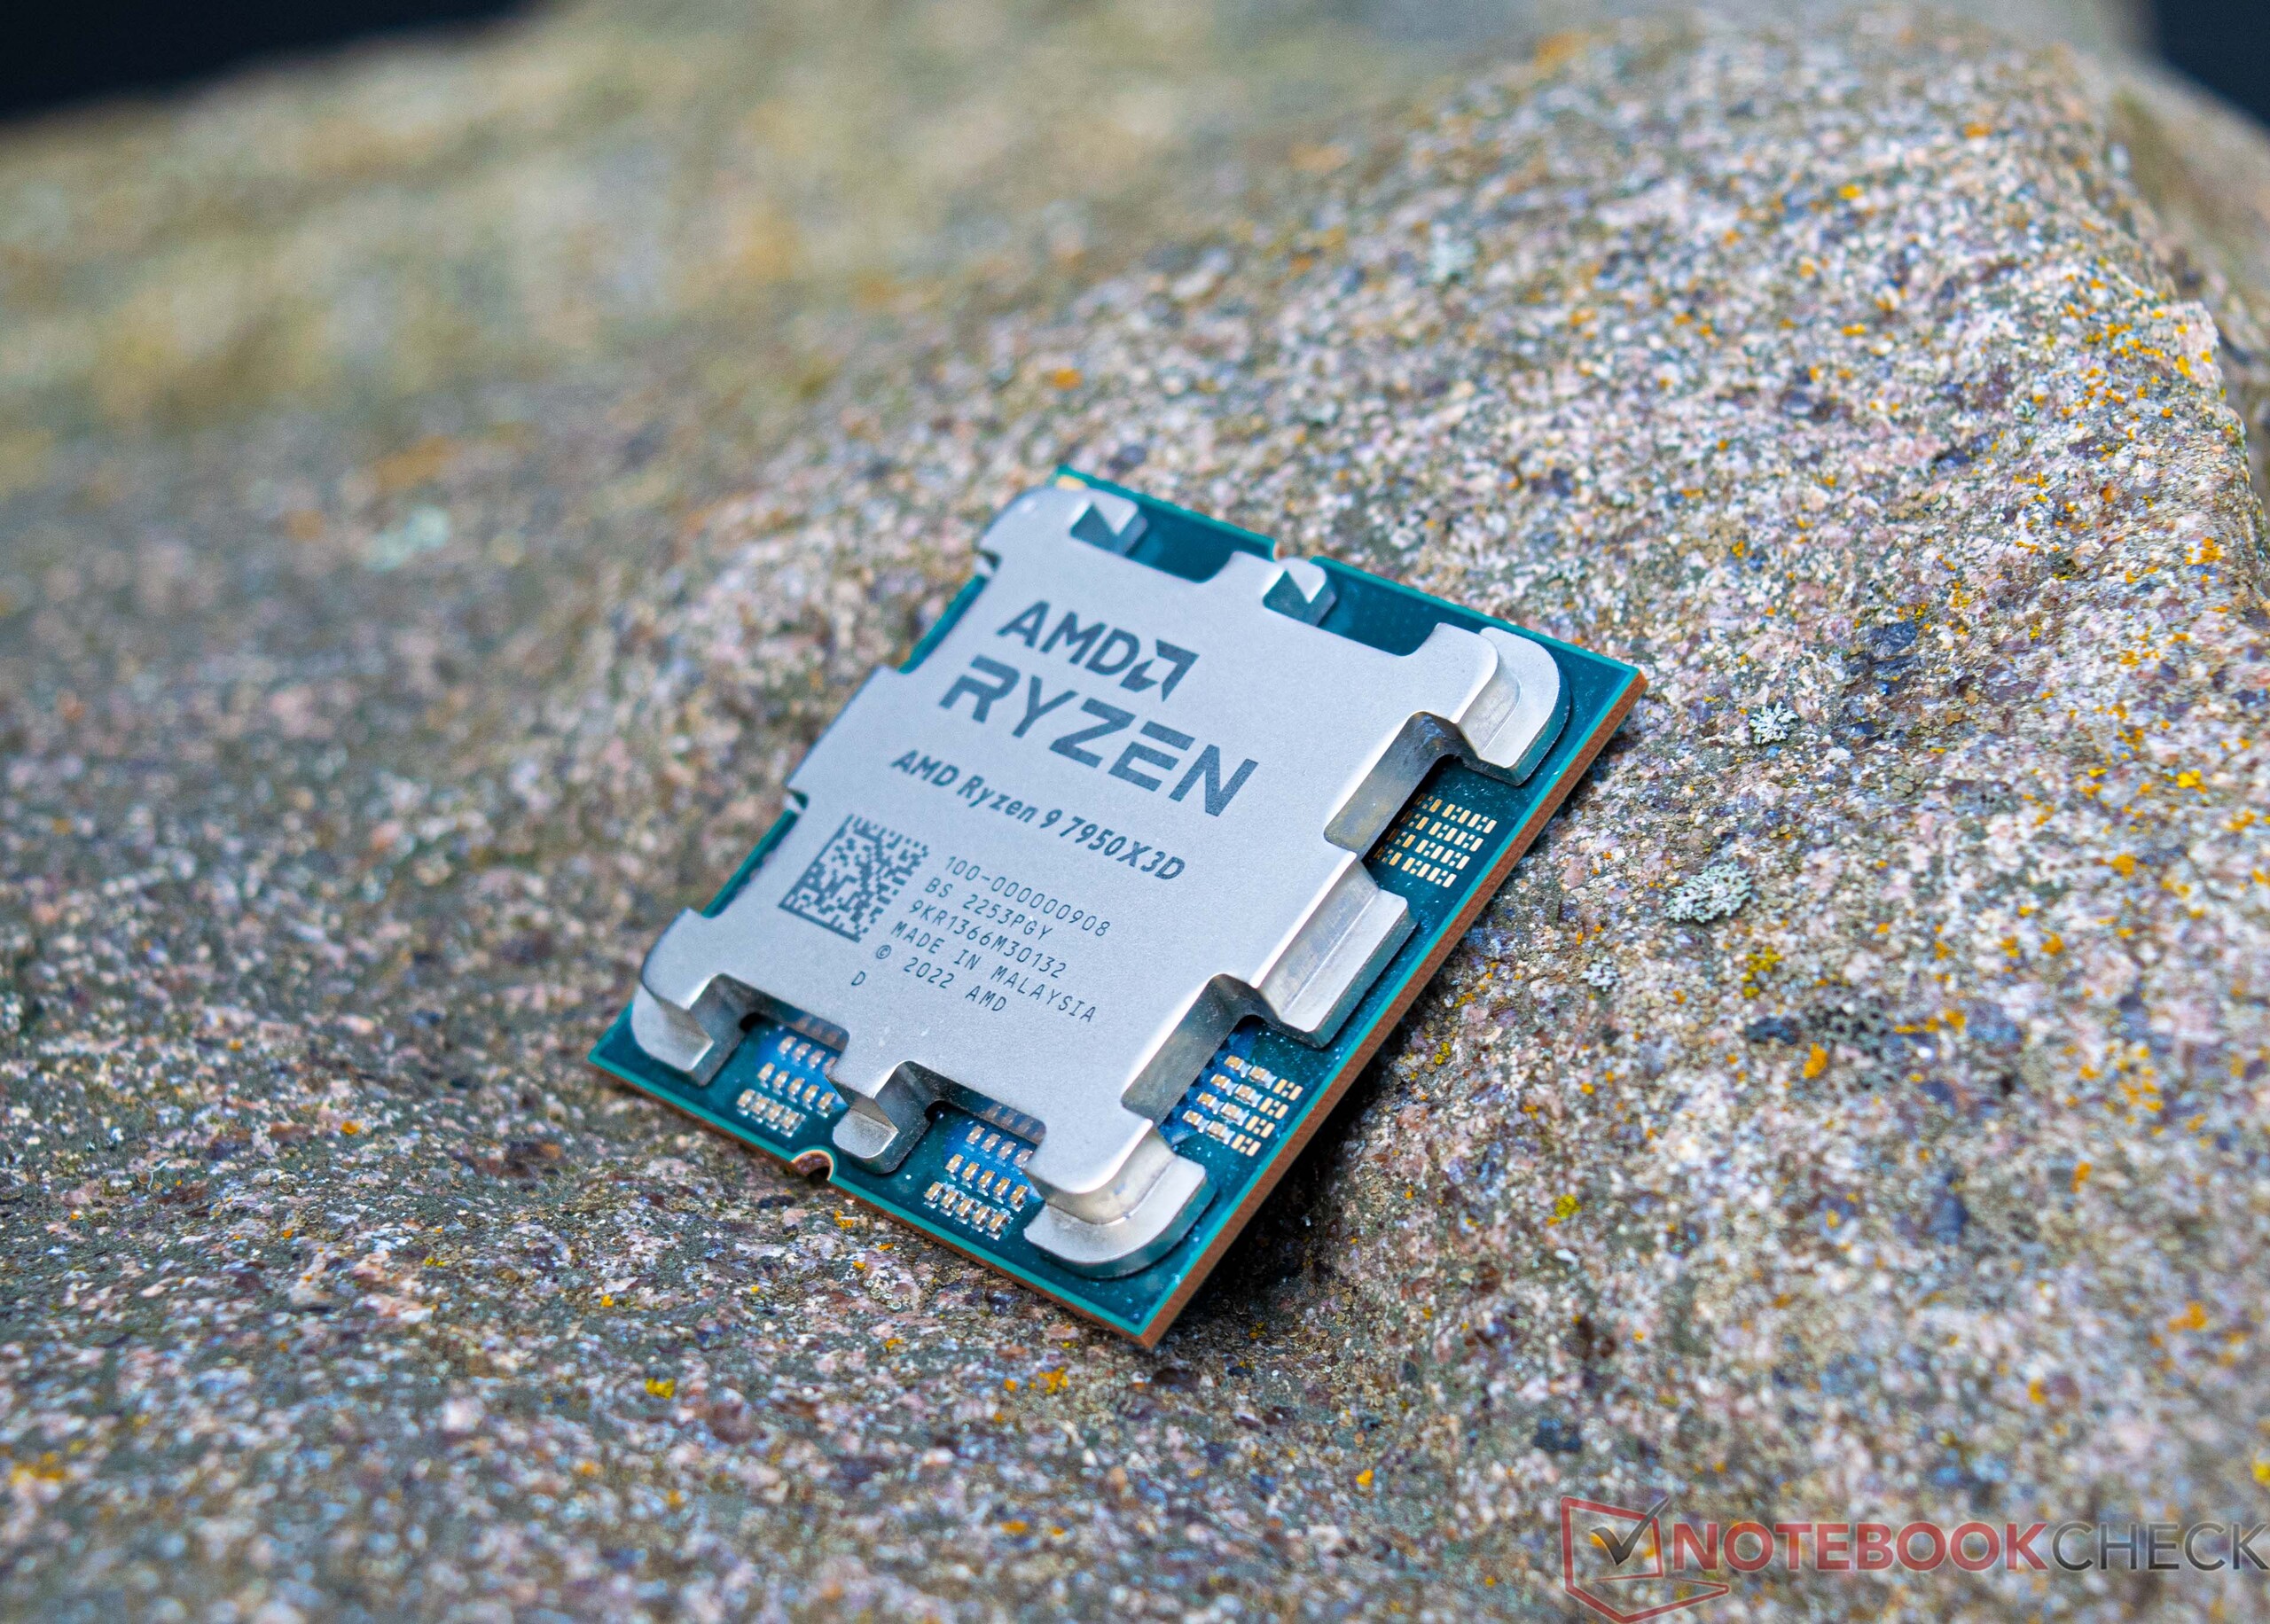
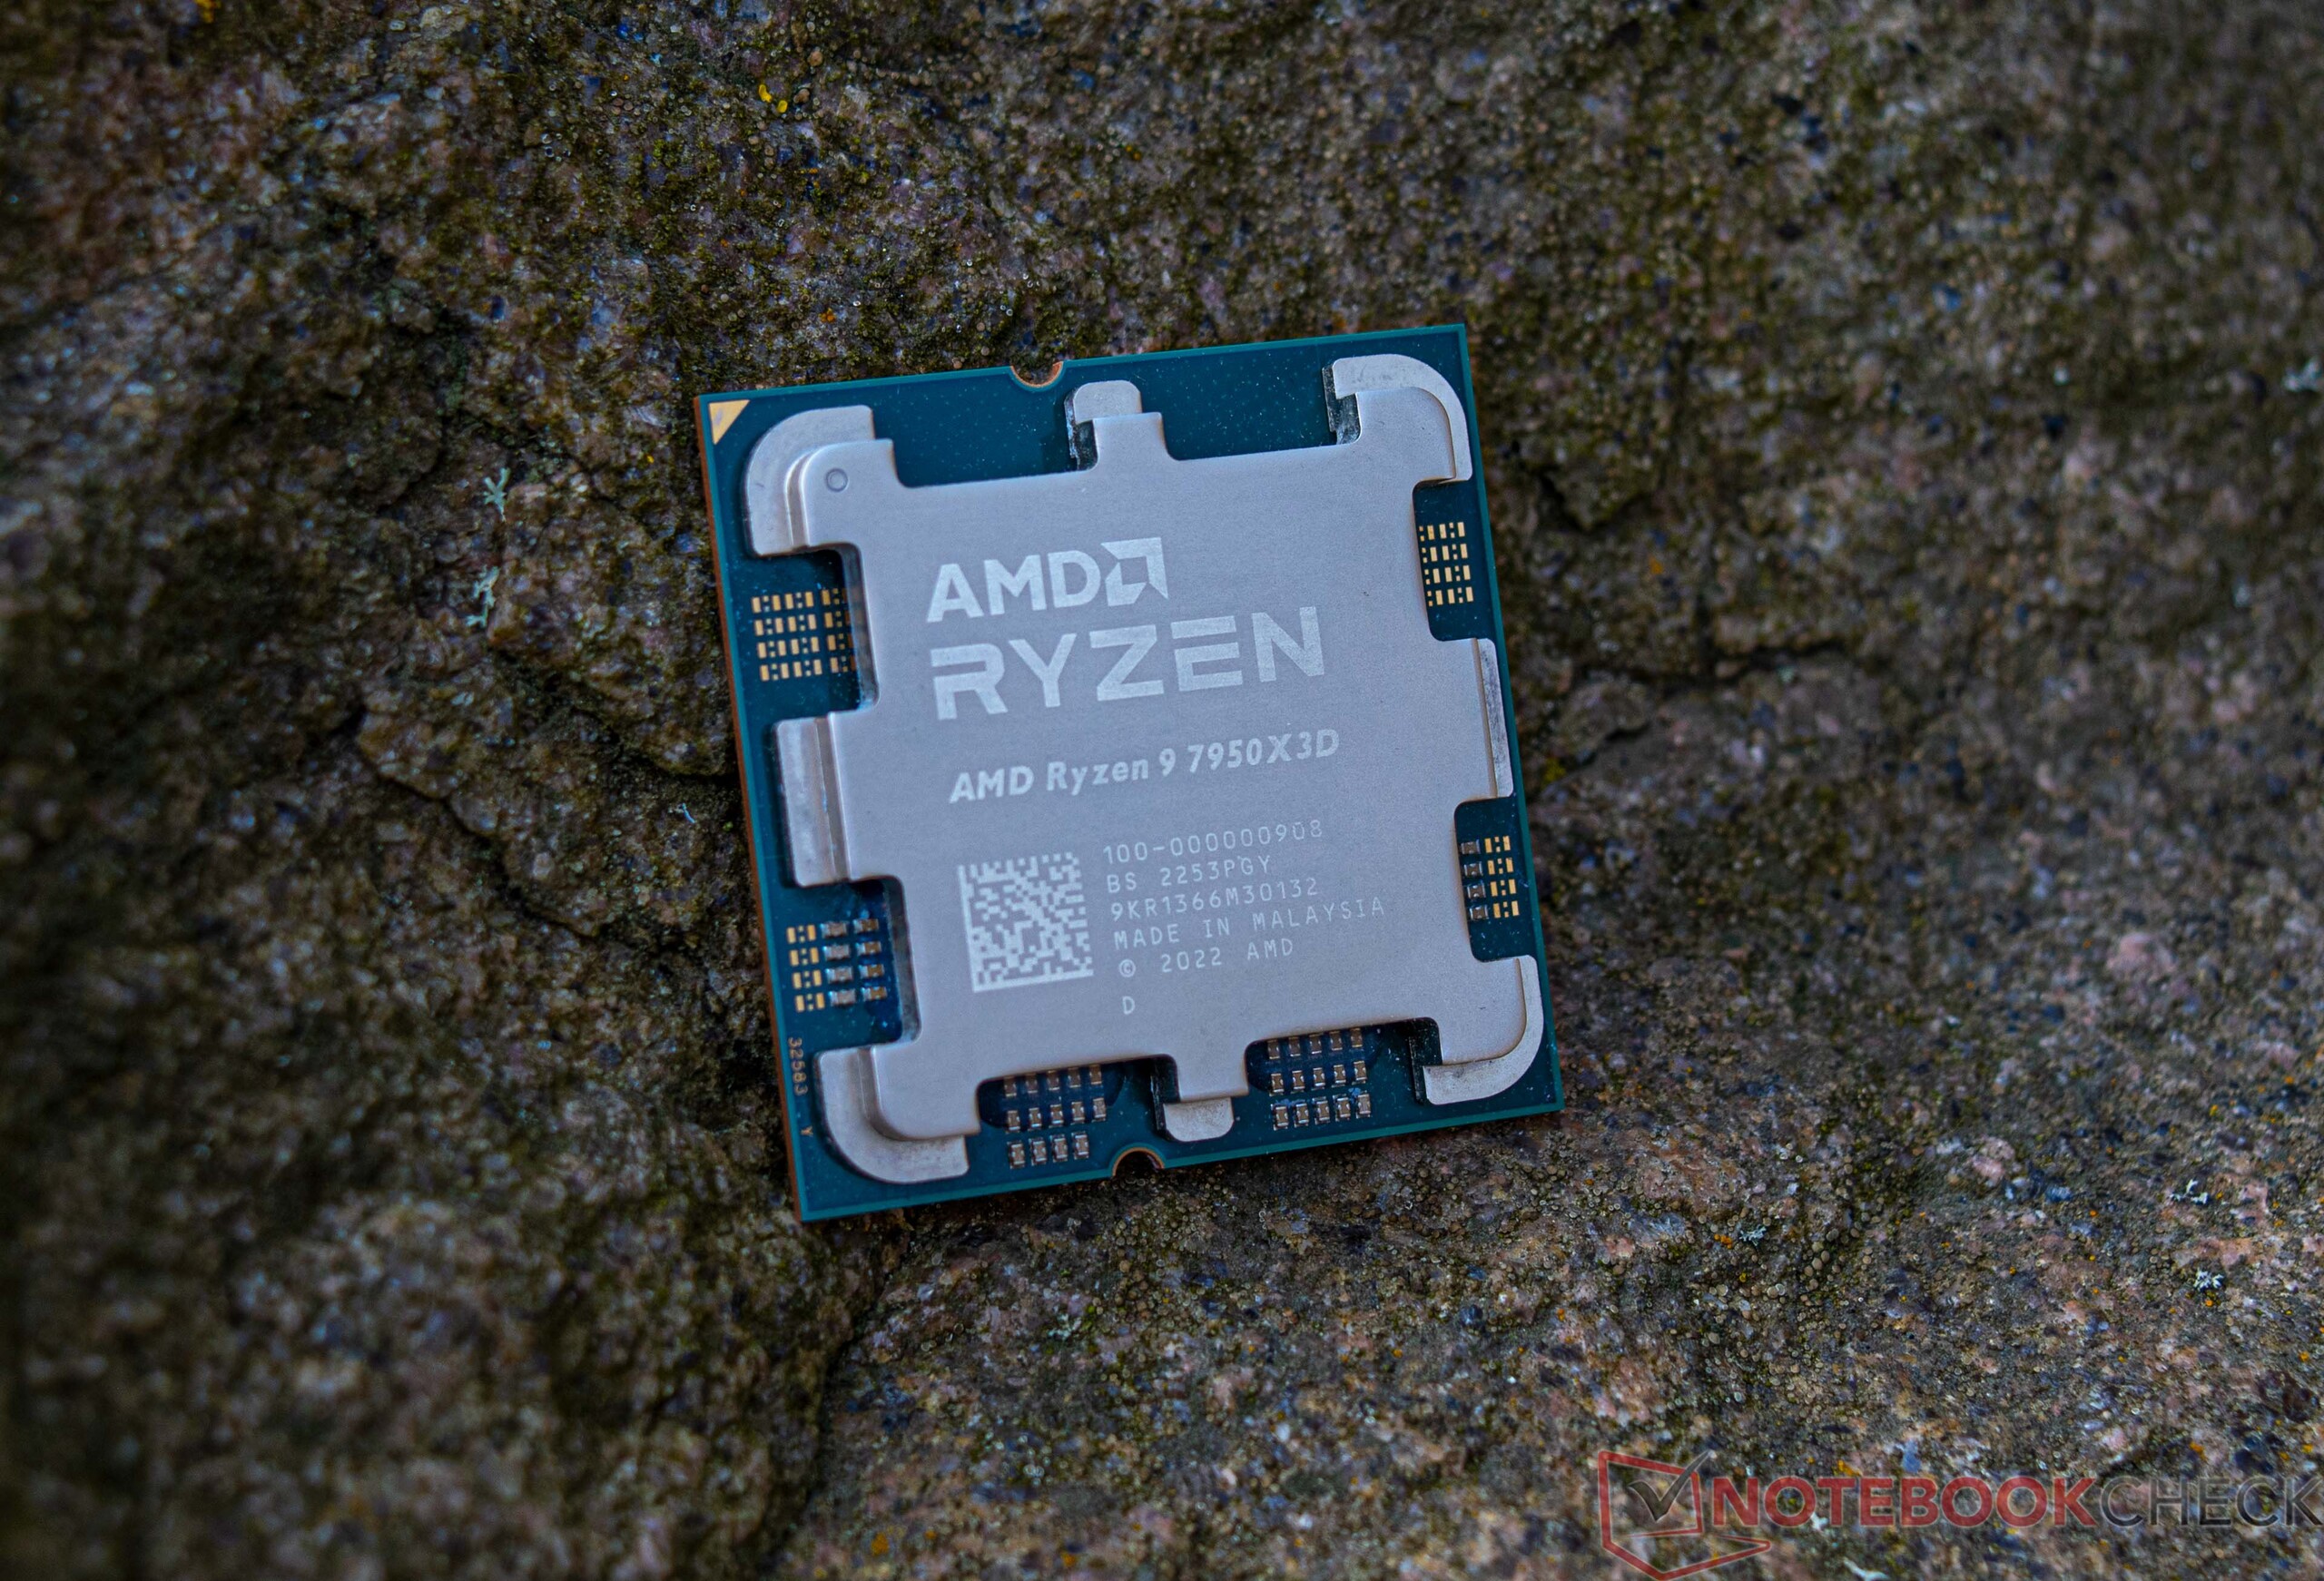
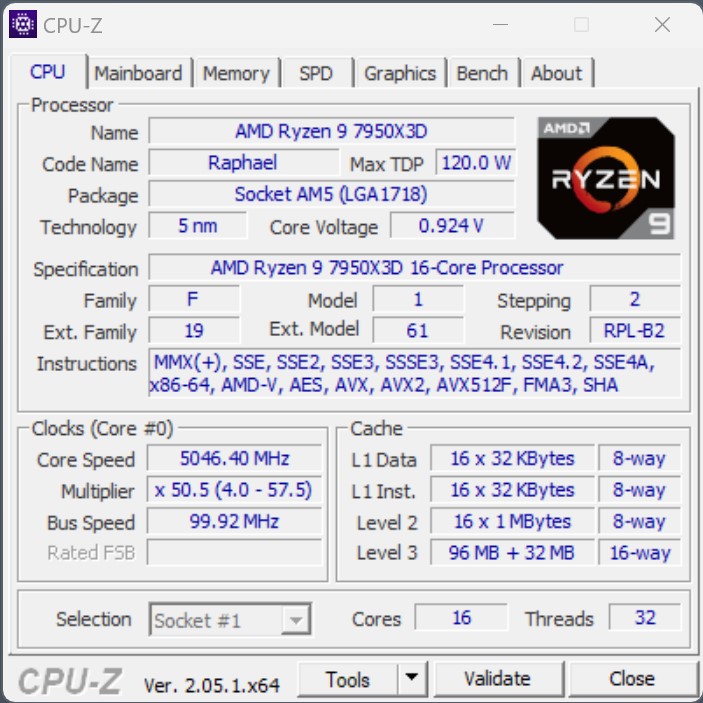
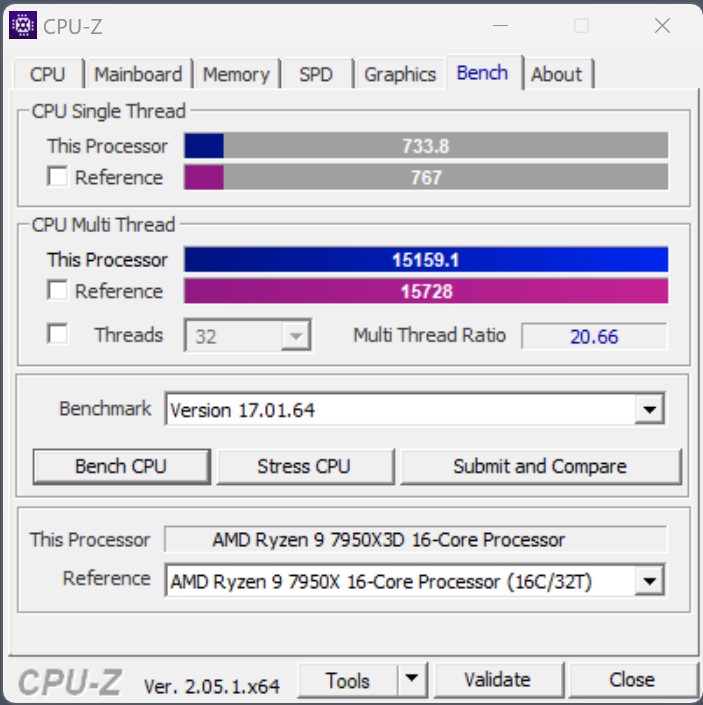
En este análisis, echamos un vistazo al AMD Ryzen 9 7950X3D, que es el nuevo buque insignia de la plataforma AM5. Para un funcionamiento sin problemas, definitivamente tiene que instalar el controlador de chipset más actual para asegurarse de que la asignación de procesos en segundo plano siempre funciona correctamente y sin problemas. Básicamente, el interior del AMD Ryzen 9 7950X3D está construido de forma similar a la versión no X3D, lo que significa que los dos CCD están conectados al troquel de E/S a través del Infinity Fabric.
En cuanto al consumo de energía, no vemos mucha desventaja en comparación con los modelos Ryzen 9 hasta ahora, ya que el TDP de los procesadores X3D es de solo 120 vatios. Sin embargo, el PPT (Package Power Tracking) máximo es ahora de sólo 162 vatios (mientras que antes era de 230 vatios). Podrá averiguar más adelante en nuestra prueba, si la reducción del consumo de energía tiene algún efecto y si es así, cuáles son.
Visión general de la familia AMD Ryzen 7000
| Modelo | Cores/Threads | Basic Clock Speed | Turbo Speed | L2-Cache | L3-Cache | TDP | PPT | Precio de lanzamiento |
|---|---|---|---|---|---|---|---|---|
| Ryzen9 7950X3D | 16/32 | 4,2 GHz | 5,7 GHz | 16x 1 MB | 128 MB | 120 vatios | 162 vatios | 699USD |
| Ryzen 9 7950X | 16/32 | 4,5 GHz | 5,7 GHz | 16x 1 MB | 64 MB | 170 vatios | 230 W | 699 USD |
| Ryzen 97900X3D | 12/24 | 4,4 GHz | 5,6 GHz | 12x 1 MB | 128 MB | 120 vatios | 162 vatios | 599 USD |
| Ryzen 9 7900X | 12/24 | 4,7 GHz | 5,6 GHz | 12x 1 MB | 64 MB | 170 vatios | 230 vatios | 549 USD |
| Ryzen 77800X3D | 8/16 | 4,2 GHz | 5,0 GHz | 8x 1 MB | 96 MB | 120 vatios | 162 vatios | 549 USD |
| Ryzen 7 7700X | 8/16 | 4,5 GHz | 5,4 GHz | 8x 1 MB | 32 MB | 105 vatios | 142 vatios | 399 USD |
| Ryzen 5 7600X | 6/12 | 4,7 GHz | 5,3 GHz | 6x 1 MB | 32 MB | 105 vatios | 142W | 299 USD |
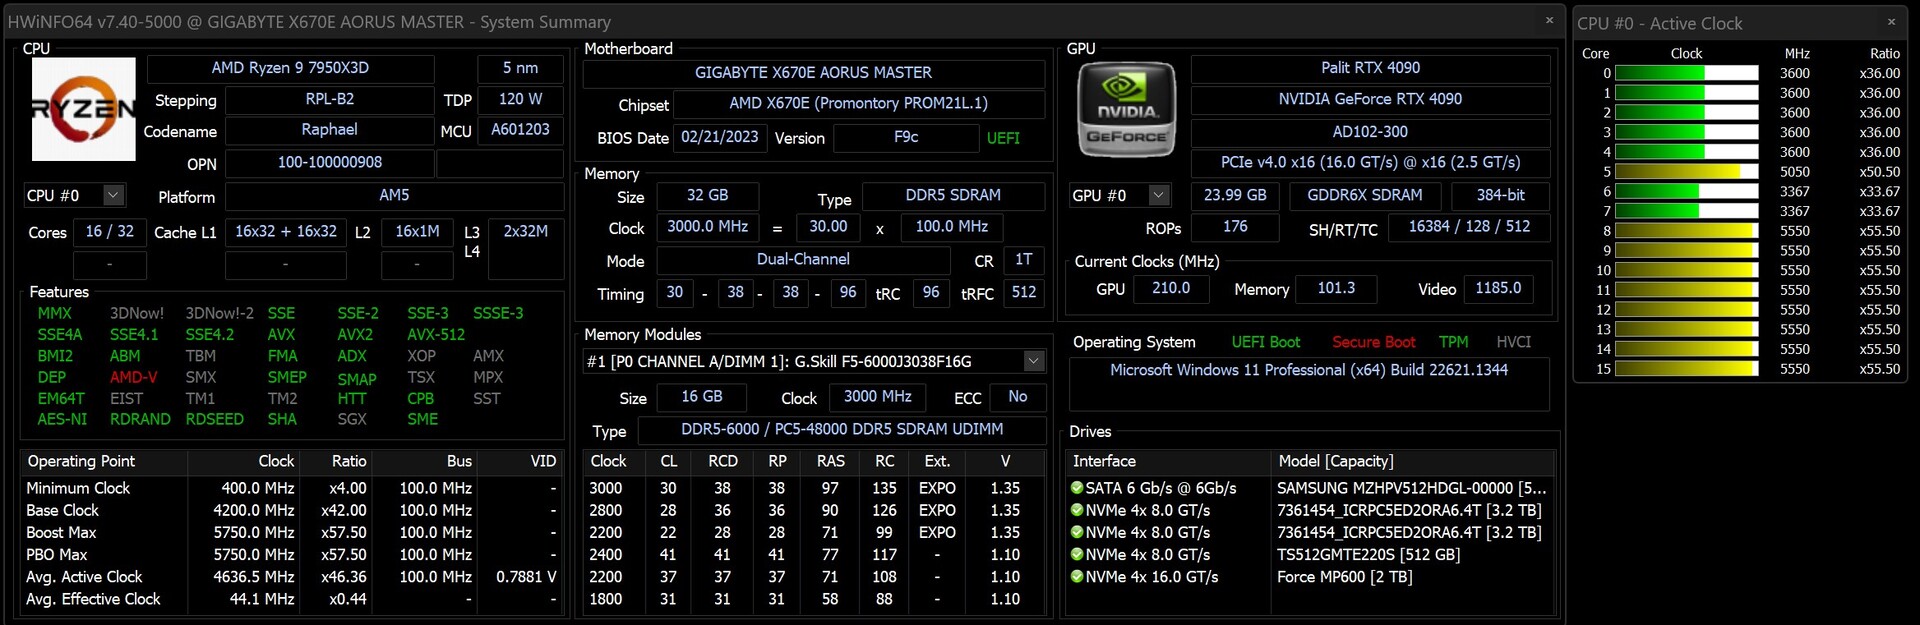
El sistema de pruebas en detalle
Utilizamos el siguiente sistema para los puntos de referencia y las pruebas que se indican a continuación:
- Streacom BC1 V2 Open Benchtable
- AMD Ryzen 9 7950X3D
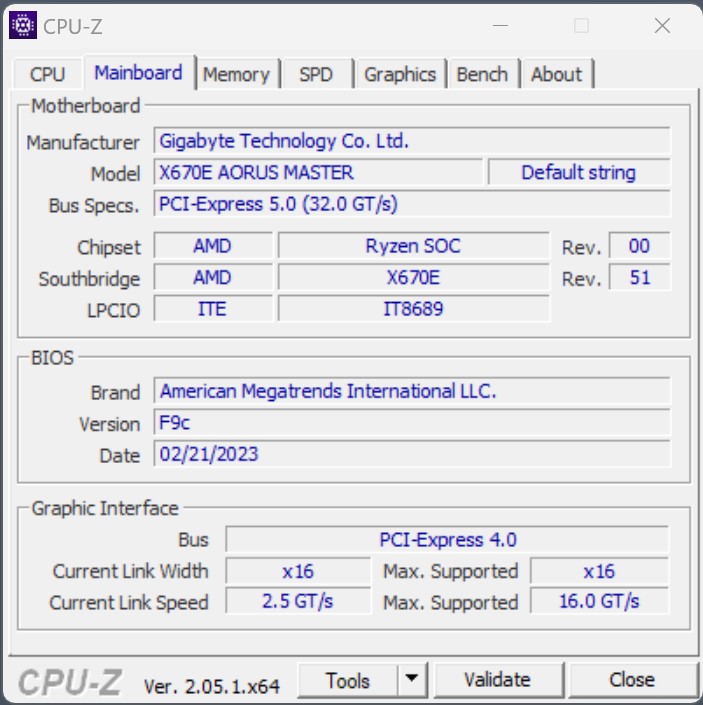
- Gigabyte X670E Aorus Master, BIOS: F9c
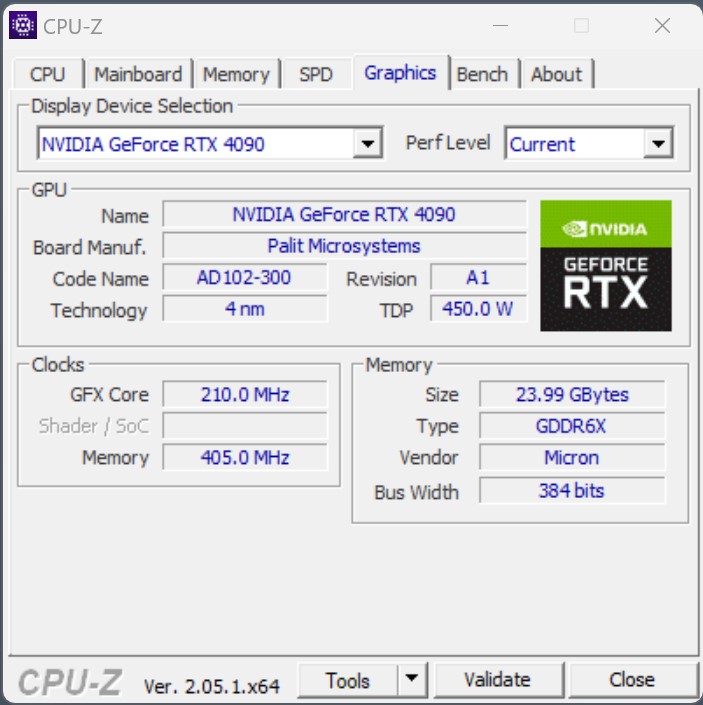
- Palit GeForce RTX 4090 GameRock OC
- Refrigeración por agua de bucle personalizado (bomba: Alphacool Aquastream XT Ultra, radiador: Watercool MO-RA3 420 LT BLACK)
- EVGA SuperNOVA P+ 1.600W
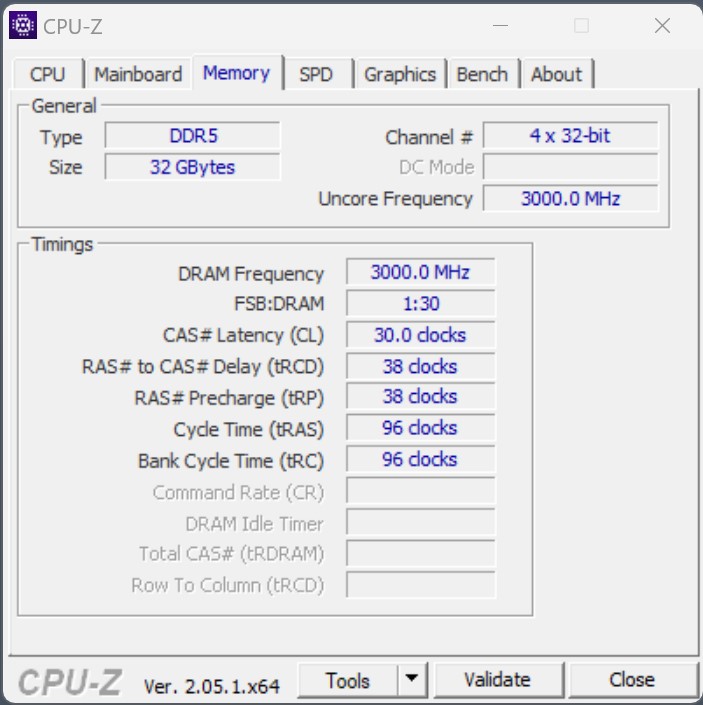
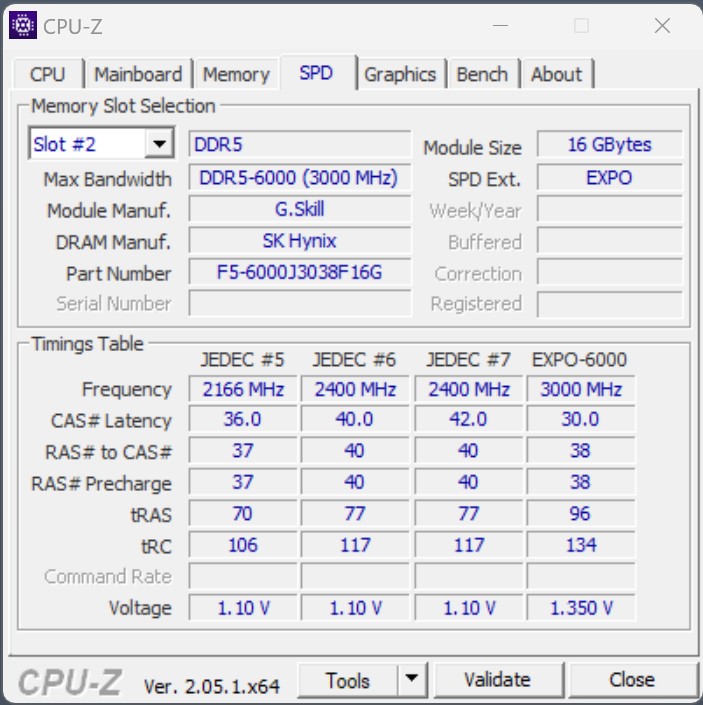
- G.Skill Trident Z5 Neo DDR5-6000 2x 16 GB, EXPO (DDR5-6000 CL30-38-38-96)
- SSD Intel Optane 905P 480 GB PCIe
- Intel SSD DC P4618 PCIe 3.1 x8 6,4 TB (para juegos)
- Microsoft Windows 11 Professional 64-Bit (versión 22H2)


Puntos de referencia de procesadores
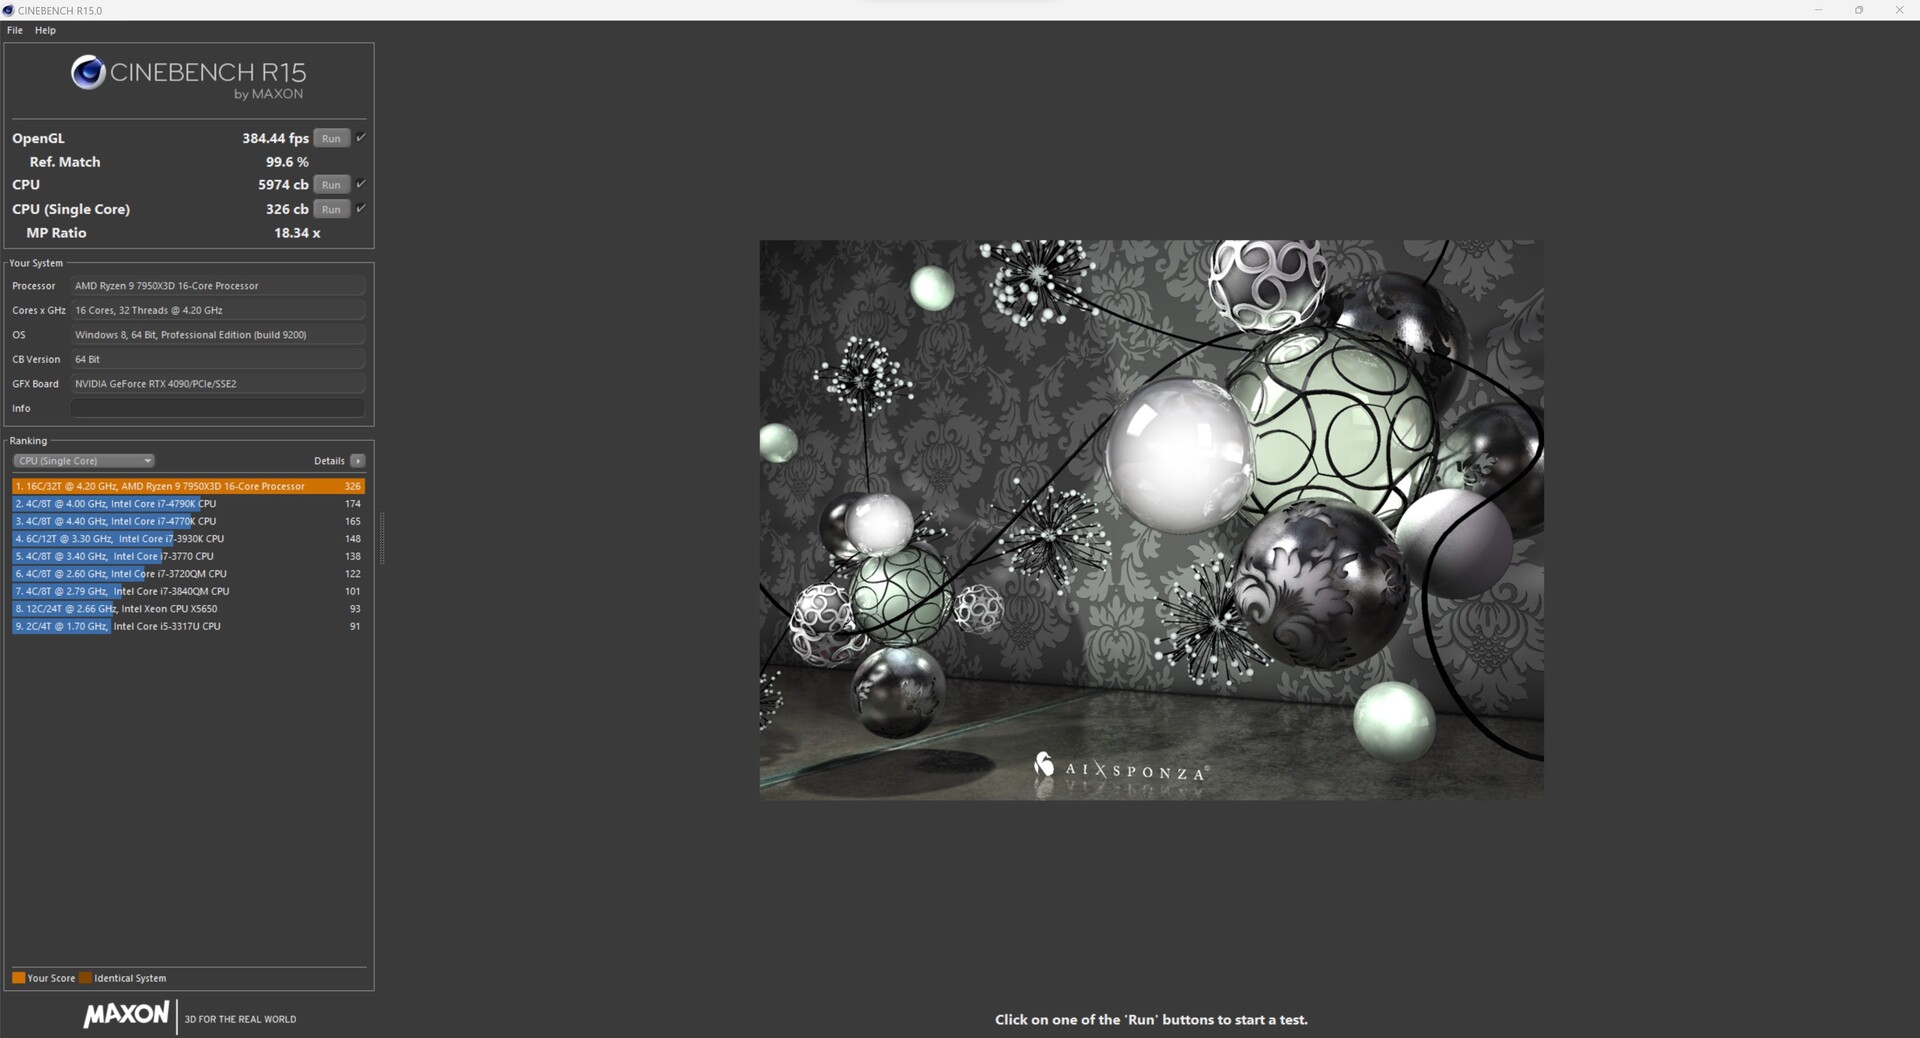
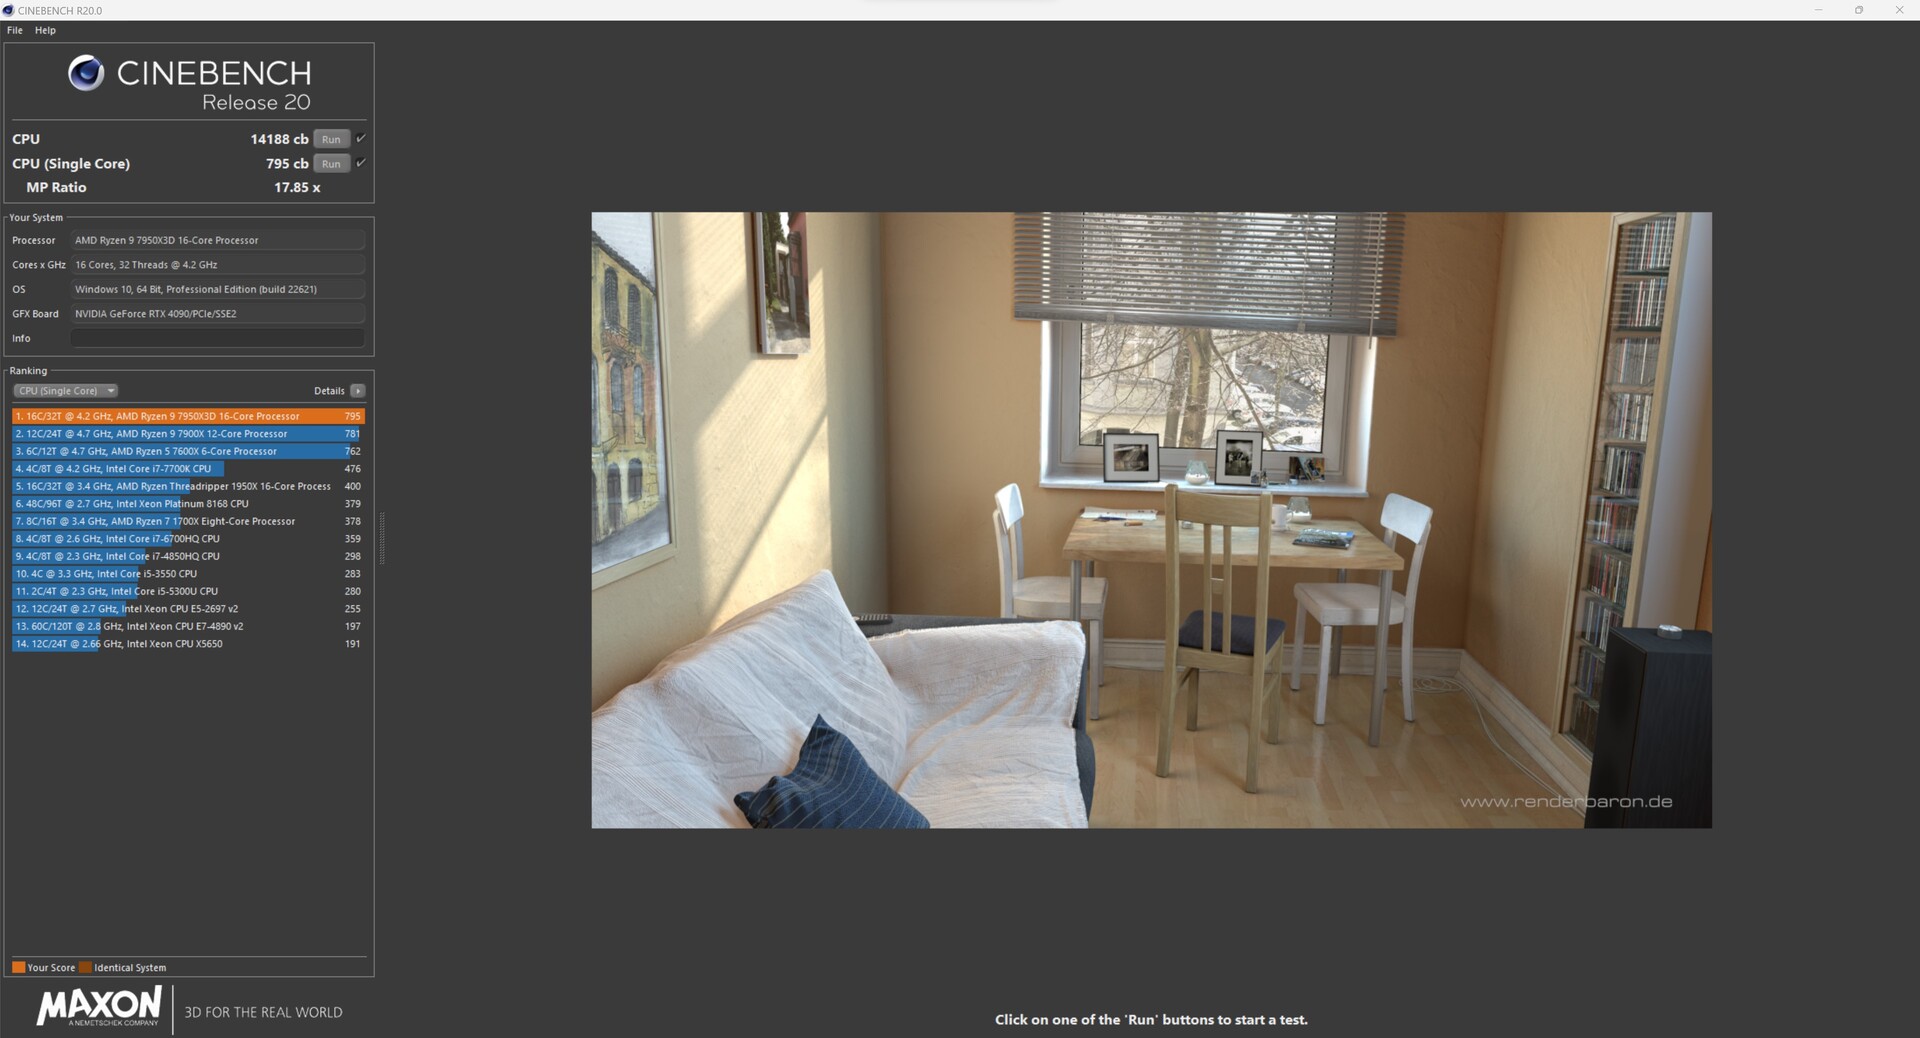
Ya pudimos hacernos una idea de las enormes capacidades de rendimiento del AMD Ryzen 9 7950X. Al mismo tiempo, el Intel Core i9-13900K seguía siendo ligeramente más rápido en términos de rendimiento puro de CPU. Con el AMD Ryzen 9 7950X3D todavía éramos un poco escépticos al principio, ya que el bajo consumo máximo de energía de la CPU todavía nos planteaba algunas preguntas. Pero después de nuestras pruebas iniciales de CPU, quedamos muy sorprendidos por el muy buen desarrollo de rendimiento del AMD Ryzen 9 7950X3D a pesar de esto. En general, es suficiente para quedar segundo en esta comparación. El anterior mejor modelo de AMD, el AMD Ryzen 9 7950X, ahora tiene que conformarse con el tercer puesto. Al mismo tiempo, seguimos viendo un Intel Core i9-13900K en lo más alto de nuestras clasificaciones de rendimiento. Sin embargo, el primer y segundo puesto sólo están separados por un único punto porcentual, que subjetivamente no tiene relevancia en el funcionamiento diario.
Si te fijas en las pruebas individuales, puedes ver algunos puntos fuertes a veces, pero también puntos débiles, lo que resulta en una buena media comparado con el Core i9-13900K de Intel. Al usar el 3D V-Cache, AMD pudo mejorar ligeramente el IPC del procesador de 16 núcleos. Al mismo tiempo, también vemos una ligera desventaja en las pruebas multinúcleo, que puede atribuirse a una menor velocidad de reloj bajo carga. Sin embargo, la eficiencia que AMD fue capaz de producir con su nuevo Ryzen 9 7950X3D sigue siendo considerable. A modo de comparación, sin límites de potencia el Intel Core i9-13900Ksolo se ve limitado por las temperaturas, que casi siempre alcanzan los 100 °C bajo carga. Pero no fueron pocas las veces que vimos más de 300 vatios en nuestras pruebas en el test Cinebench R15 Multi. ElAMD Ryzen 9 7950X fue un poco más eficiente, aunque casi siempre alcanzó los 230 vatios. Y ahora vemos un AMD Ryzen 9 7950X3D que ofrece un rendimiento igual de bueno con solo 162 vatios. Este es sin duda un camino que apunta en la dirección correcta.
Puedes encontrar más pruebas comparativas de los procesadores aquí.
| Performance rating - Percent | |
| Intel Core i9-13900K | |
| AMD Ryzen 9 7950X | |
| AMD Ryzen 9 7950X3D | |
| Intel Core i7-13700K | |
| AMD Ryzen 9 7900X | |
| AMD Ryzen 9 5950X | |
| Cinebench R15 | |
| CPU Single 64Bit | |
| Intel Core i9-13900K | |
| AMD Ryzen 9 7950X3D | |
| AMD Ryzen 9 7900X | |
| AMD Ryzen 9 7950X | |
| Intel Core i7-13700K | |
| AMD Ryzen 9 5950X | |
| CPU Multi 64Bit | |
| AMD Ryzen 9 7950X | |
| Intel Core i9-13900K | |
| AMD Ryzen 9 7950X3D | |
| AMD Ryzen 9 7900X | |
| Intel Core i7-13700K | |
| AMD Ryzen 9 5950X | |
| Cinebench R20 | |
| CPU (Single Core) | |
| Intel Core i9-13900K | |
| Intel Core i7-13700K | |
| AMD Ryzen 9 7950X3D | |
| AMD Ryzen 9 7900X | |
| AMD Ryzen 9 7950X | |
| AMD Ryzen 9 5950X | |
| CPU (Multi Core) | |
| Intel Core i9-13900K | |
| AMD Ryzen 9 7950X | |
| AMD Ryzen 9 7950X3D | |
| Intel Core i7-13700K | |
| AMD Ryzen 9 7900X | |
| AMD Ryzen 9 5950X | |
| Cinebench R23 | |
| Single Core | |
| Intel Core i9-13900K | |
| Intel Core i7-13700K | |
| AMD Ryzen 9 7950X3D | |
| AMD Ryzen 9 7900X | |
| AMD Ryzen 9 7950X | |
| AMD Ryzen 9 5950X | |
| Multi Core | |
| Intel Core i9-13900K | |
| AMD Ryzen 9 7950X | |
| AMD Ryzen 9 7950X3D | |
| Intel Core i7-13700K | |
| AMD Ryzen 9 7900X | |
| AMD Ryzen 9 5950X | |
| Cinebench R11.5 | |
| CPU Single 64Bit | |
| Intel Core i9-13900K | |
| AMD Ryzen 9 7950X3D | |
| AMD Ryzen 9 7900X | |
| AMD Ryzen 9 7950X | |
| Intel Core i7-13700K | |
| AMD Ryzen 9 5950X | |
| CPU Multi 64Bit | |
| Intel Core i9-13900K | |
| AMD Ryzen 9 7950X | |
| AMD Ryzen 9 7950X3D | |
| AMD Ryzen 9 7900X | |
| Intel Core i7-13700K | |
| AMD Ryzen 9 5950X | |
| Blender - v2.79 BMW27 CPU | |
| AMD Ryzen 9 5950X | |
| AMD Ryzen 9 7900X | |
| Intel Core i7-13700K | |
| AMD Ryzen 9 7950X3D | |
| AMD Ryzen 9 7950X | |
| Intel Core i9-13900K | |
| wPrime 2.10 | |
| 32m | |
| AMD Ryzen 9 5950X | |
| Intel Core i7-13700K | |
| AMD Ryzen 9 7950X3D | |
| Intel Core i9-13900K | |
| AMD Ryzen 9 7900X | |
| AMD Ryzen 9 7950X | |
| 1024m | |
| Intel Core i7-13700K | |
| Intel Core i9-13900K | |
| AMD Ryzen 9 5950X | |
| AMD Ryzen 9 7900X | |
| AMD Ryzen 9 7950X3D | |
| AMD Ryzen 9 7950X | |
| X264 HD Benchmark 4.0 | |
| Pass 1 | |
| Intel Core i9-13900K | |
| Intel Core i7-13700K | |
| AMD Ryzen 9 7950X3D | |
| AMD Ryzen 9 7950X | |
| AMD Ryzen 9 7900X | |
| AMD Ryzen 9 5950X | |
| Pass 2 | |
| AMD Ryzen 9 7950X | |
| Intel Core i9-13900K | |
| AMD Ryzen 9 7950X3D | |
| AMD Ryzen 9 7900X | |
| Intel Core i7-13700K | |
| AMD Ryzen 9 5950X | |
| WinRAR - Result | |
| AMD Ryzen 9 7900X | |
| AMD Ryzen 9 7950X3D | |
| AMD Ryzen 9 7950X | |
| Intel Core i9-13900K | |
| Intel Core i7-13700K | |
| AMD Ryzen 9 5950X | |
| TrueCrypt | |
| AES Mean 100MB | |
| AMD Ryzen 9 7950X | |
| Intel Core i9-13900K | |
| AMD Ryzen 9 5950X | |
| AMD Ryzen 9 7950X3D | |
| Intel Core i7-13700K | |
| AMD Ryzen 9 7900X | |
| Twofish Mean 100MB | |
| Intel Core i9-13900K | |
| AMD Ryzen 9 7950X | |
| AMD Ryzen 9 7950X3D | |
| Intel Core i7-13700K | |
| AMD Ryzen 9 5950X | |
| AMD Ryzen 9 7900X | |
| Serpent Mean 100MB | |
| Intel Core i9-13900K | |
| AMD Ryzen 9 7950X | |
| AMD Ryzen 9 7950X3D | |
| AMD Ryzen 9 5950X | |
| Intel Core i7-13700K | |
| AMD Ryzen 9 7900X | |
| Geekbench 5.5 | |
| Multi-Core | |
| AMD Ryzen 9 7950X3D | |
| Intel Core i9-13900K | |
| AMD Ryzen 9 7950X | |
| AMD Ryzen 9 7900X | |
| Intel Core i7-13700K | |
| AMD Ryzen 9 5950X | |
| Single-Core | |
| AMD Ryzen 9 7950X3D | |
| Intel Core i9-13900K | |
| AMD Ryzen 9 7900X | |
| AMD Ryzen 9 7950X | |
| Intel Core i7-13700K | |
| AMD Ryzen 9 5950X | |
| Geekbench 5.0 | |
| 5.0 Multi-Core | |
| Intel Core i9-13900K | |
| AMD Ryzen 9 7950X3D | |
| AMD Ryzen 9 7950X | |
| AMD Ryzen 9 7900X | |
| Intel Core i7-13700K | |
| AMD Ryzen 9 5950X | |
| 5.0 Single-Core | |
| Intel Core i9-13900K | |
| AMD Ryzen 9 7900X | |
| AMD Ryzen 9 7950X3D | |
| AMD Ryzen 9 7950X | |
| Intel Core i7-13700K | |
| AMD Ryzen 9 5950X | |
| Geekbench 4.4 | |
| 64 Bit Single-Core Score | |
| Intel Core i9-13900K | |
| AMD Ryzen 9 7950X3D | |
| AMD Ryzen 9 7900X | |
| AMD Ryzen 9 7950X | |
| Intel Core i7-13700K | |
| AMD Ryzen 9 5950X | |
| 64 Bit Multi-Core Score | |
| AMD Ryzen 9 7950X3D | |
| Intel Core i9-13900K | |
| AMD Ryzen 9 7950X | |
| AMD Ryzen 9 7900X | |
| Intel Core i7-13700K | |
| AMD Ryzen 9 5950X | |
| 3DMark 11 - 1280x720 Performance Physics | |
| AMD Ryzen 9 7950X3D | |
| AMD Ryzen 9 7950X | |
| Intel Core i9-13900K | |
| Intel Core i7-13700K | |
| AMD Ryzen 9 7900X | |
| AMD Ryzen 9 5950X | |
| 7-Zip 18.03 | |
| 7z b 4 | |
| AMD Ryzen 9 7950X3D | |
| AMD Ryzen 9 7950X | |
| Intel Core i9-13900K | |
| AMD Ryzen 9 5950X | |
| AMD Ryzen 9 7900X | |
| Intel Core i7-13700K | |
| 7z b 4 -mmt1 | |
| AMD Ryzen 9 7950X3D | |
| AMD Ryzen 9 7900X | |
| AMD Ryzen 9 7950X | |
| Intel Core i9-13900K | |
| Intel Core i7-13700K | |
| AMD Ryzen 9 5950X | |
| HWBOT x265 Benchmark v2.2 - 4k Preset | |
| AMD Ryzen 9 7950X | |
| Intel Core i9-13900K | |
| AMD Ryzen 9 7950X3D | |
| AMD Ryzen 9 7900X | |
| Intel Core i7-13700K | |
| AMD Ryzen 9 5950X | |
| R Benchmark 2.5 - Overall mean | |
| AMD Ryzen 9 5950X | |
| Intel Core i7-13700K | |
| AMD Ryzen 9 7950X | |
| AMD Ryzen 9 7900X | |
| AMD Ryzen 9 7950X3D | |
| Intel Core i9-13900K | |
| LibreOffice - 20 Documents To PDF | |
| AMD Ryzen 9 5950X | |
| AMD Ryzen 9 7950X3D | |
| Intel Core i9-13900K | |
| AMD Ryzen 9 7950X | |
| AMD Ryzen 9 7900X | |
| Intel Core i7-13700K | |
| WebXPRT 3 - Overall | |
| AMD Ryzen 9 7950X3D | |
| AMD Ryzen 9 7900X | |
| Intel Core i9-13900K | |
| AMD Ryzen 9 7950X | |
| Intel Core i7-13700K | |
| AMD Ryzen 9 5950X | |
| Mozilla Kraken 1.1 - Total | |
| AMD Ryzen 9 5950X | |
| Intel Core i7-13700K | |
| AMD Ryzen 9 7950X | |
| AMD Ryzen 9 7950X3D | |
| Intel Core i9-13900K | |
| AMD Ryzen 9 7900X | |
| 3DMark | |
| 1920x1080 Fire Strike Physics | |
| Intel Core i9-13900K | |
| AMD Ryzen 9 7950X | |
| Intel Core i7-13700K | |
| AMD Ryzen 9 7950X3D | |
| AMD Ryzen 9 7900X | |
| AMD Ryzen 9 5950X | |
| 2560x1440 Time Spy CPU | |
| Intel Core i9-13900K | |
| Intel Core i7-13700K | |
| AMD Ryzen 9 7950X3D | |
| AMD Ryzen 9 7900X | |
| AMD Ryzen 9 7950X | |
| AMD Ryzen 9 5950X | |
* ... más pequeño es mejor
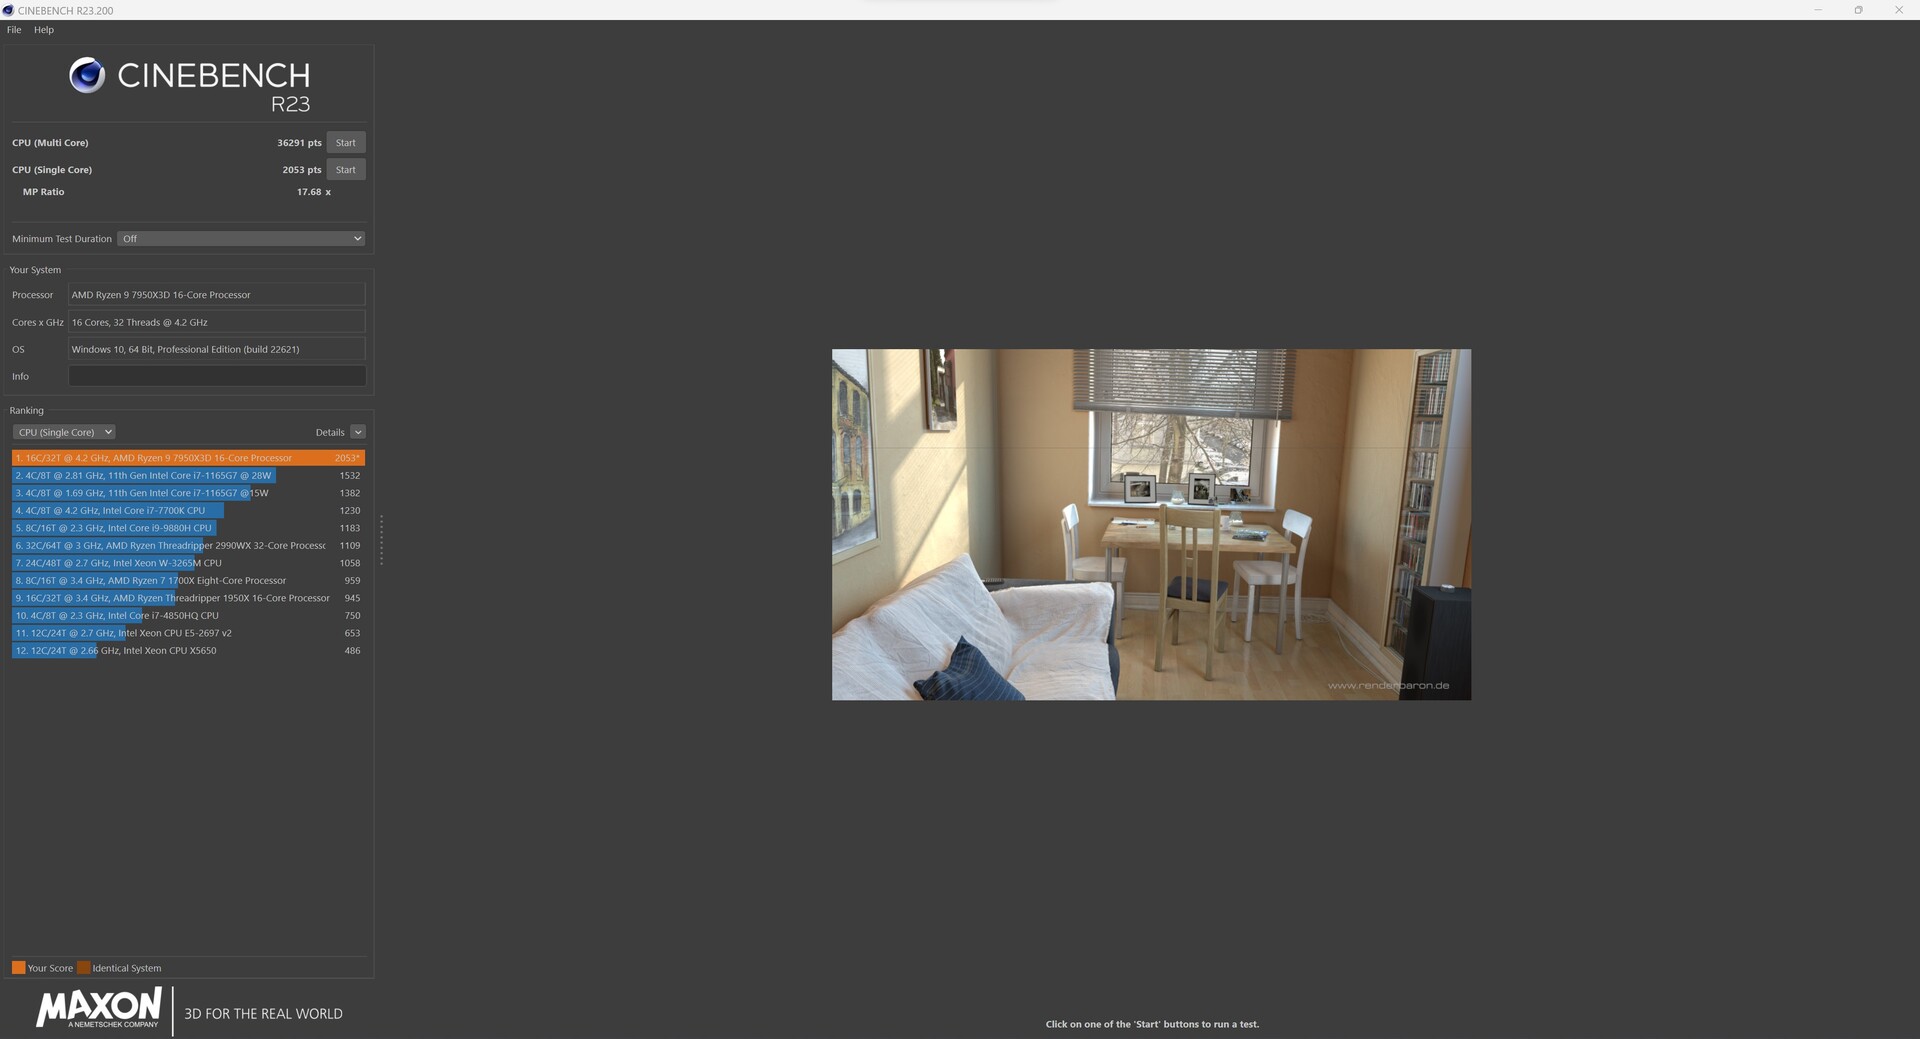
AMD Ryzen 9 7950X3D vs. Cinebench R15 Multi loop
El alto rendimiento multihilo que vemos durante una sola ejecución en la prueba Cinebench R15 Multi también puede mantenerse constantemente en nuestra configuración de pruebas. Todos los resultados del bucle Cinebench R15 Multi varían muy poco. Con una media de 5.942 puntos, nuestro AMD Ryzen 9 7950X3D queda tercero en esta comparación, mientras que el AMD Ryzen 9 7950Xy Intel Core i9-13900Ksiguen siendo capaces de ofrecer un rendimiento constante ligeramente superior.
Puntos de referencia sintéticos y rendimiento de las aplicaciones
En los benchmarks de aplicaciones sintéticas, vemos una carrera de cabeza a cabeza similar entre todos los modelos superiores. El AMD Ryzen 9 7950X3D y el AMD Ryzen 9 7950Xmuestran la misma velocidad en los índices de rendimiento medidos, y con el Core i9-13900Kintel vuelve a estar un pequeño paso por delante. Sin embargo, no notarás ninguna diferencia en el funcionamiento diario. En las pruebas de RAM, todas las CPU Ryzen 7000 actuales se benefician de DDR5, lo que les permite generar un rendimiento de datos significativamente mayor. Los sistemas Intel que enumeramos aquí en nuestra comparativa también funcionaron con RAM DDR5 en las pruebas realizadas en su momento.
| Performance rating - Percent | |
| Intel Core i9-13900K | |
| AMD Ryzen 9 7950X | |
| AMD Ryzen 9 7950X3D | |
| Intel Core i7-13700K | |
| AMD Ryzen 9 7900X | |
| AMD Ryzen 9 5950X | |
| PCMark 10 | |
| Productivity | |
| AMD Ryzen 9 7950X3D | |
| AMD Ryzen 9 7950X | |
| Intel Core i7-13700K | |
| AMD Ryzen 9 7900X | |
| Intel Core i9-13900K | |
| AMD Ryzen 9 5950X | |
| Essentials | |
| Intel Core i9-13900K | |
| AMD Ryzen 9 7900X | |
| AMD Ryzen 9 7950X | |
| AMD Ryzen 9 7950X3D | |
| Intel Core i7-13700K | |
| AMD Ryzen 9 5950X | |
| 3DMark | |
| 1920x1080 Fire Strike Physics | |
| Intel Core i9-13900K | |
| AMD Ryzen 9 7950X | |
| Intel Core i7-13700K | |
| AMD Ryzen 9 7950X3D | |
| AMD Ryzen 9 7900X | |
| AMD Ryzen 9 5950X | |
| 2560x1440 Time Spy CPU | |
| Intel Core i9-13900K | |
| Intel Core i7-13700K | |
| AMD Ryzen 9 7950X3D | |
| AMD Ryzen 9 7900X | |
| AMD Ryzen 9 7950X | |
| AMD Ryzen 9 5950X | |
| 3DMark 11 - 1280x720 Performance Physics | |
| AMD Ryzen 9 7950X3D | |
| AMD Ryzen 9 7950X | |
| Intel Core i9-13900K | |
| Intel Core i7-13700K | |
| AMD Ryzen 9 7900X | |
| AMD Ryzen 9 5950X | |
| CrossMark - Overall | |
| Intel Core i9-13900K | |
| AMD Ryzen 9 7950X | |
| AMD Ryzen 9 7900X | |
| Intel Core i7-13700K | |
| AMD Ryzen 9 7950X3D | |
| AMD Ryzen 9 5950X | |
| AIDA64 / Memory Copy | |
| Intel Core i9-13900K | |
| AMD Ryzen 9 7950X3D | |
| Intel Core i7-13700K | |
| AMD Ryzen 9 7900X | |
| AMD Ryzen 9 7950X | |
| AMD Ryzen 9 5950X | |
| Media de la clase (4514 - 234662, n=2225) | |
| AIDA64 / Memory Read | |
| Intel Core i9-13900K | |
| Intel Core i7-13700K | |
| AMD Ryzen 9 7950X3D | |
| AMD Ryzen 9 7950X | |
| AMD Ryzen 9 7900X | |
| AMD Ryzen 9 5950X | |
| Media de la clase (4031 - 271066, n=2187) | |
| AIDA64 / Memory Write | |
| AMD Ryzen 9 7950X3D | |
| AMD Ryzen 9 7900X | |
| AMD Ryzen 9 7950X | |
| Intel Core i9-13900K | |
| Intel Core i7-13700K | |
| Media de la clase (3506 - 242868, n=2192) | |
| AMD Ryzen 9 5950X | |
| AIDA64 / Memory Latency | |
| Media de la clase (6.1 - 536, n=2253) | |
| Intel Core i9-13900K | |
| Intel Core i7-13700K | |
| AMD Ryzen 9 5950X | |
| AMD Ryzen 9 7950X3D | |
| AMD Ryzen 9 7950X | |
| AMD Ryzen 9 7900X | |
* ... más pequeño es mejor
Puntos de referencia para juegos
En las pruebas de juegos, echamos un vistazo a probablemente la parte más interesante, ya que el AMD Ryzen 9 7950X3D apunta claramente al área de juegos de gama alta. En esta categoría de precios, el procesador se dirige exclusivamente a los entusiastas, como hace Intel con sus modelos Core i9. En la comparación directa, el AMD Ryzen 9 7950X3D supera al Intel Core i9-13900Ky es capaz de obtener una ventaja del 9% en los juegos que comparamos aquí. En comparación con el AMD Ryzen 9 7950Xvemos un aumento de rendimiento de alrededor del 6%, pero esto representa una media. Cuando nos acercamos al límite absoluto de CPU a 720p, el nuevo AMD Ryzen 9 7950X3D es capaz de aumentar el rendimiento en un 20% a veces. Medido con el preset 4K Ultra, la ventaja desaparece debido al límite GPU.
Sin embargo, de vez en cuando también encontramos algunos juegos que no son capaces de lidiar tan óptimamente con el 3D V-Cache. A veces, esto también puede estar relacionado con una asignación incorrecta del núcleo de la CPU, por ejemplo cuando los juegos sólo soportan 4 núcleos. La combinación de un AMD Ryzen 9 7950X3D y la Nvidia GeForce RTX 4090 es lo mejor que se puede configurar actualmente en el área de consumo. Así que no es de extrañar que todos los juegos que probamos aquí siempre se pudieran reproducir con fluidez incluso en 2.160p con los ajustes de detalle máximos.
Gaming Performance in Direct Comparison with Intel
| Performance rating - Percent | |
| AMD Ryzen 9 7950X3D | |
| AMD Ryzen 9 7950X | |
| Intel Core i9-13900K | |
| Intel Core i7-13700K | |
| F1 22 | |
| 1920x1080 Low Preset AA:T AF:16x | |
| AMD Ryzen 9 7950X3D | |
| AMD Ryzen 9 7950X | |
| Intel Core i9-13900K | |
| Intel Core i7-13700K | |
| 3840x2160 Ultra High Preset AA:T AF:16x | |
| AMD Ryzen 9 7950X | |
| Intel Core i7-13700K | |
| AMD Ryzen 9 7950X3D | |
| Intel Core i9-13900K | |
| Far Cry 5 | |
| 1280x720 Low Preset AA:T | |
| AMD Ryzen 9 7950X3D | |
| AMD Ryzen 9 7950X | |
| Intel Core i7-13700K | |
| Intel Core i9-13900K | |
| 3840x2160 Ultra Preset AA:T | |
| AMD Ryzen 9 7950X3D | |
| AMD Ryzen 9 7950X | |
| Intel Core i9-13900K | |
| Intel Core i7-13700K | |
| X-Plane 11.11 | |
| 1280x720 low (fps_test=1) | |
| Intel Core i9-13900K | |
| AMD Ryzen 9 7950X3D | |
| Intel Core i7-13700K | |
| AMD Ryzen 9 7950X | |
| 3840x2160 high (fps_test=3) | |
| AMD Ryzen 9 7950X3D | |
| Intel Core i9-13900K | |
| AMD Ryzen 9 7950X | |
| Intel Core i7-13700K | |
| Final Fantasy XV Benchmark | |
| 1280x720 Lite Quality | |
| Intel Core i7-13700K | |
| AMD Ryzen 9 7950X | |
| Intel Core i9-13900K | |
| AMD Ryzen 9 7950X3D | |
| 3840x2160 High Quality | |
| AMD Ryzen 9 7950X3D | |
| AMD Ryzen 9 7950X | |
| Intel Core i7-13700K | |
| Intel Core i9-13900K | |
| Dota 2 Reborn | |
| 1280x720 min (0/3) fastest | |
| AMD Ryzen 9 7950X3D | |
| AMD Ryzen 9 7950X | |
| Intel Core i9-13900K | |
| Intel Core i7-13700K | |
| 3840x2160 ultra (3/3) best looking | |
| AMD Ryzen 9 7950X3D | |
| AMD Ryzen 9 7950X | |
| Intel Core i9-13900K | |
| Intel Core i7-13700K | |
| The Witcher 3 | |
| 1024x768 Low Graphics & Postprocessing | |
| AMD Ryzen 9 7950X3D | |
| AMD Ryzen 9 7950X | |
| Intel Core i9-13900K | |
| Intel Core i7-13700K | |
| 3840x2160 High Graphics & Postprocessing (Nvidia HairWorks Off) | |
| AMD Ryzen 9 7950X | |
| Intel Core i9-13900K | |
| Intel Core i7-13700K | |
| AMD Ryzen 9 7950X3D | |
| F1 2021 | |
| 3840x2160 Ultra High Preset + Raytracing AA:T AF:16x | |
| AMD Ryzen 9 7950X3D | |
| Intel Core i7-13700K | |
| Intel Core i9-13900K | |
| AMD Ryzen 9 7950X | |
| 1280x720 Ultra Low Preset | |
| AMD Ryzen 9 7950X3D | |
| AMD Ryzen 9 7950X | |
| Intel Core i9-13900K | |
| Intel Core i7-13700K | |
| Shadow of the Tomb Raider | |
| 1280x720 Lowest Preset | |
| AMD Ryzen 9 7950X3D | |
| AMD Ryzen 9 7950X | |
| Intel Core i9-13900K | |
| Intel Core i7-13700K | |
| 3840x2160 Highest Preset AA:T | |
| Intel Core i7-13700K | |
| AMD Ryzen 9 7950X3D | |
| AMD Ryzen 9 7950X | |
| Intel Core i9-13900K | |
| GRID Legends | |
| 1280x720 Low Preset | |
| AMD Ryzen 9 7950X | |
| Intel Core i9-13900K | |
| Intel Core i7-13700K | |
| AMD Ryzen 9 7950X3D | |
| 3840x2160 Ultra Preset | |
| AMD Ryzen 9 7950X | |
| AMD Ryzen 9 7950X3D | |
| Intel Core i7-13700K | |
| Intel Core i9-13900K | |
| Borderlands 3 | |
| 1280x720 Very Low Overall Quality (DX11) | |
| AMD Ryzen 9 7950X3D | |
| Intel Core i9-13900K | |
| AMD Ryzen 9 7950X | |
| Intel Core i7-13700K | |
| 3840x2160 Badass Overall Quality (DX11) | |
| Intel Core i7-13700K | |
| AMD Ryzen 9 7950X3D | |
| AMD Ryzen 9 7950X | |
| Intel Core i9-13900K | |
| Tiny Tina's Wonderlands | |
| 1280x720 Lowest Preset (DX12) | |
| AMD Ryzen 9 7950X3D | |
| AMD Ryzen 9 7950X | |
| Intel Core i9-13900K | |
| Intel Core i7-13700K | |
| 3840x2160 Badass Preset (DX12) | |
| AMD Ryzen 9 7950X3D | |
| Intel Core i7-13700K | |
| AMD Ryzen 9 7950X | |
| Intel Core i9-13900K | |
| God of War | |
| 1280x720 Low Preset | |
| AMD Ryzen 9 7950X3D | |
| AMD Ryzen 9 7950X | |
| Intel Core i9-13900K | |
| Intel Core i7-13700K | |
| 3840x2160 Ultra Preset | |
| AMD Ryzen 9 7950X3D | |
| Intel Core i7-13700K | |
| Intel Core i9-13900K | |
| AMD Ryzen 9 7950X | |
| Far Cry New Dawn | |
| 1280x720 Low Preset | |
| AMD Ryzen 9 7950X3D | |
| Intel Core i9-13900K | |
| Intel Core i7-13700K | |
| AMD Ryzen 9 7950X | |
| 3840x2160 Ultra Preset | |
| AMD Ryzen 9 7950X3D | |
| Intel Core i9-13900K | |
| AMD Ryzen 9 7950X | |
| Intel Core i7-13700K | |
| Far Cry 6 | |
| 1280x720 Low Graphics Quality | |
| AMD Ryzen 9 7950X3D | |
| AMD Ryzen 9 7950X | |
| Intel Core i9-13900K | |
| Intel Core i7-13700K | |
| 3840x2160 Ultra Graphics Quality + HD Textures AA:T | |
| AMD Ryzen 9 7950X3D | |
| AMD Ryzen 9 7950X | |
| Intel Core i7-13700K | |
| Intel Core i9-13900K | |
AMD Ryzen 9 7950X3D with Nvidia GeForce RTX 4090
| bajo | medio | alto | ultra | QHD | 4K DLSS | 4K | |
|---|---|---|---|---|---|---|---|
| GTA V (2015) | 188 | 187.6 | 187.5 | 160.2 | 160.9 | 186.5 | |
| The Witcher 3 (2015) | 864.7 | 825.1 | 657.2 | 305 | 275.2 | ||
| Dota 2 Reborn (2015) | 314.1 | 287.6 | 285 | 252.7 | 245.4 | ||
| Final Fantasy XV Benchmark (2018) | 234 | 233 | 232 | 225 | 157.6 | ||
| X-Plane 11.11 (2018) | 225 | 215 | 187.1 | 158.4 | |||
| Far Cry 5 (2018) | 299 | 269 | 262 | 248 | 246 | 182 | |
| Strange Brigade (2018) | 672 | 543 | 532 | 524 | 501 | 285 | |
| Shadow of the Tomb Raider (2018) | 383 | 371 | 372 | 361 | 315 | 187.6 | |
| Far Cry New Dawn (2019) | 255 | 225 | 218 | 199 | 200 | 171 | |
| Metro Exodus (2019) | 293 | 260 | 224 | 193.5 | 178.9 | 139.4 | |
| Control (2019) | 240 | 240 | 240 | 218 | 137.1 | 112.5 | |
| Borderlands 3 (2019) | 308 | 273 | 255 | 242 | 223 | 136.4 | |
| F1 2020 (2020) | 594 | 503 | 496 | 453 | 425 | 288 | |
| F1 2021 (2021) | 682 | 642 | 526 | 271 | 271 | 203 | |
| Far Cry 6 (2021) | 255 | 233 | 215 | 208 | 202 | 140.9 | |
| Guardians of the Galaxy (2021) | 266 | 266 | 266 | 266 | 265 | 193 | |
| Forza Horizon 5 (2021) | 357 | 283 | 275 | 214 | 201 | 166 | |
| God of War (2022) | 356 | 330 | 279 | 208 | 180.1 | 130.1 | |
| GRID Legends (2022) | 289 | 269 | 245 | 234 | 233 | 196.8 | |
| Cyberpunk 2077 1.6 (2022) | 252 | 248.4 | 238.5 | 238.2 | 167.3 | 82.6 | |
| Tiny Tina's Wonderlands (2022) | 477 | 395 | 328 | 299 | 234 | 131.3 | |
| F1 22 (2022) | 475 | 444 | 417 | 204 | 158.9 | 82.3 | |
| The Quarry (2022) | 444 | 345 | 302 | 263 | 195.2 | 81.6 | |
| A Plague Tale Requiem (2022) | 203 | 197.9 | 184.4 | 162.3 | 124.9 | 150.2 | 77 |
| Uncharted Legacy of Thieves Collection (2022) | 150.2 | 149.2 | 145.3 | 145.6 | 144 | 103.9 | |
| Call of Duty Modern Warfare 2 2022 (2022) | 334 | 301 | 249 | 241 | 191 | 185 | 129 |
| Spider-Man Miles Morales (2022) | 214 | 206 | 187.3 | 187.2 | 179.9 | 130 | |
| The Callisto Protocol (2022) | 282.1 | 269 | 264.9 | 230.6 | 195.1 | 126.4 | |
| High On Life (2023) | 437 | 390 | 331 | 300 | 224 | 107 | |
| The Witcher 3 v4 (2023) | 351 | 305 | 245 | 226 | 223 | 149.6 | |
| Dead Space Remake (2023) | 286 | 281 | 261 | 258 | 199.3 | 106.5 | |
| Hogwarts Legacy (2023) | 181.8 | 166 | 143.1 | 132.1 | 130.2 | 77.5 | |
| Returnal (2023) | 283 | 281 | 258 | 235 | 187 | 119 | |
| Atomic Heart (2023) | 331 | 279 | 262 | 230 | 184 | 111.8 | |
| Company of Heroes 3 (2023) | 414 | 393.9 | 362.7 | 356.3 | 315.9 | 213.9 | |
| Sons of the Forest (2023) | 156 | 151.5 | 145.5 | 145.3 | 140.8 | 128 |
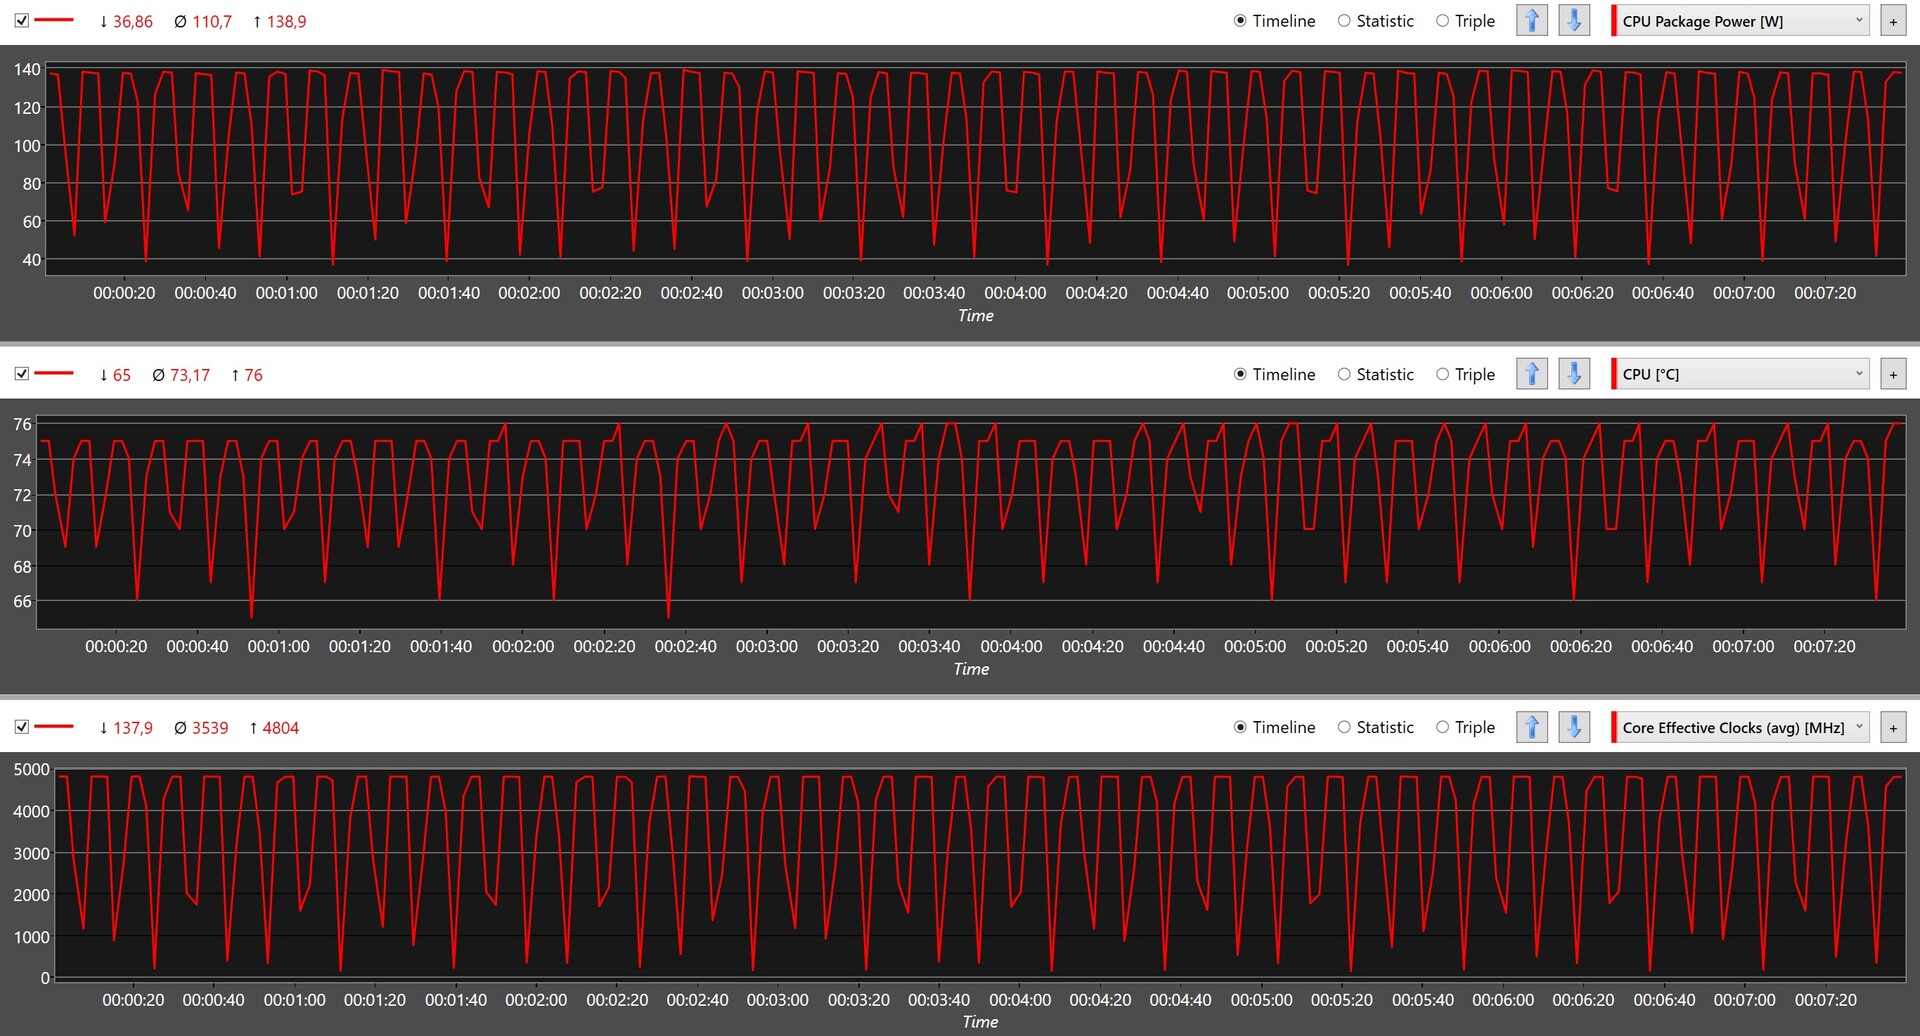
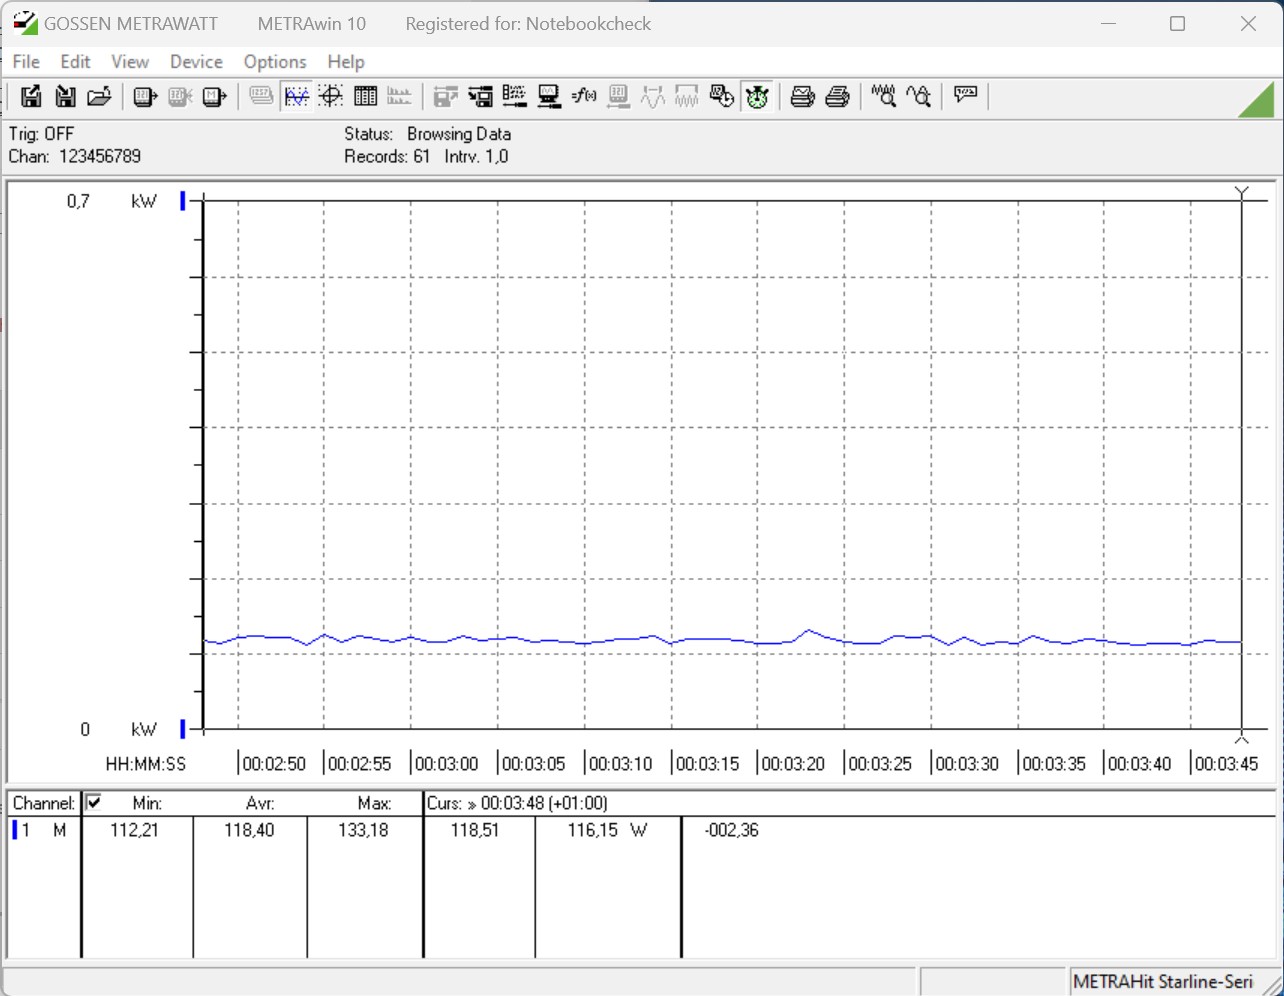
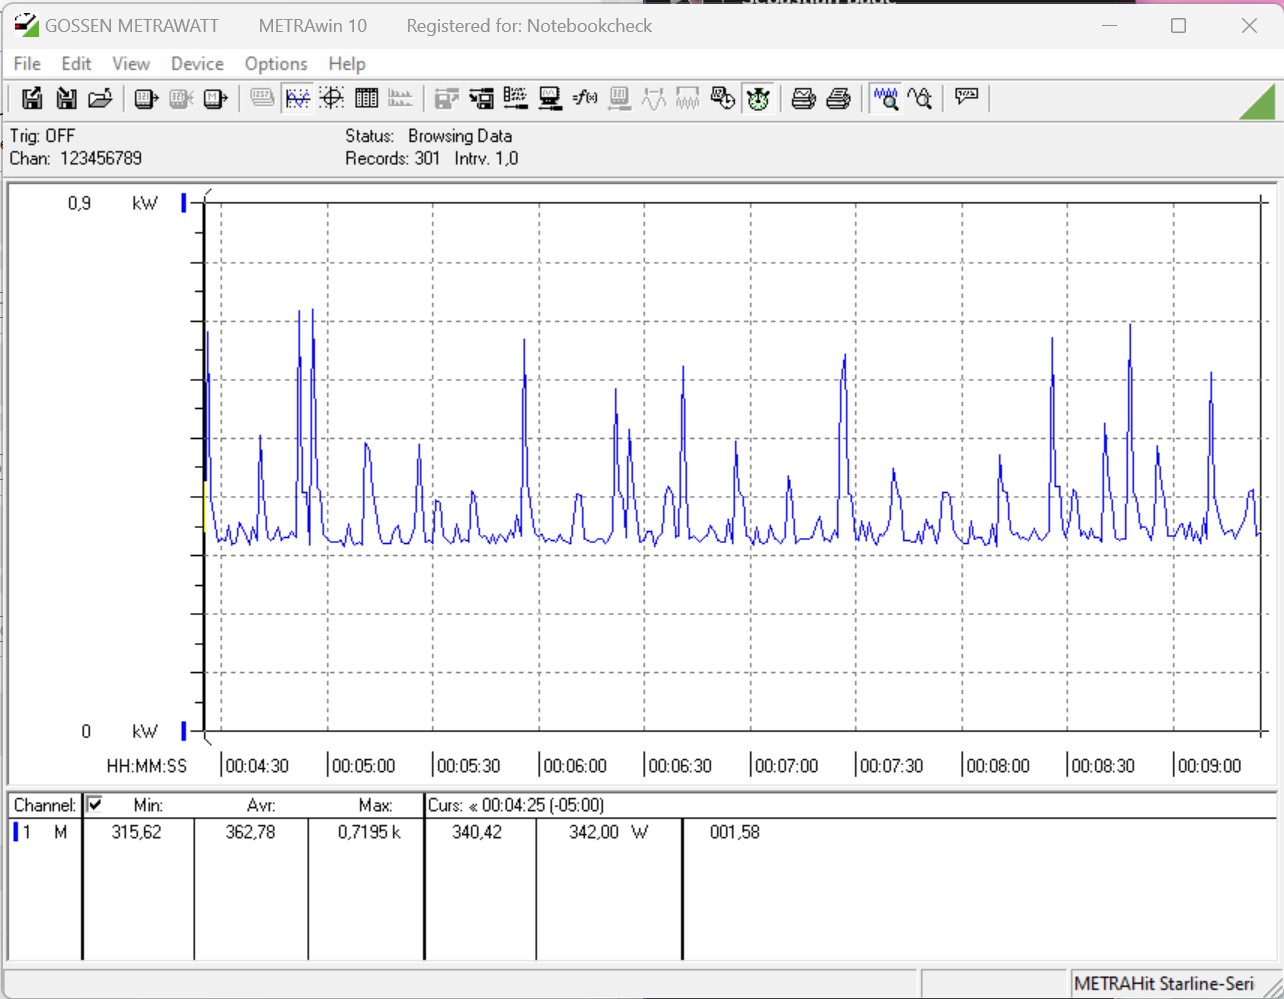
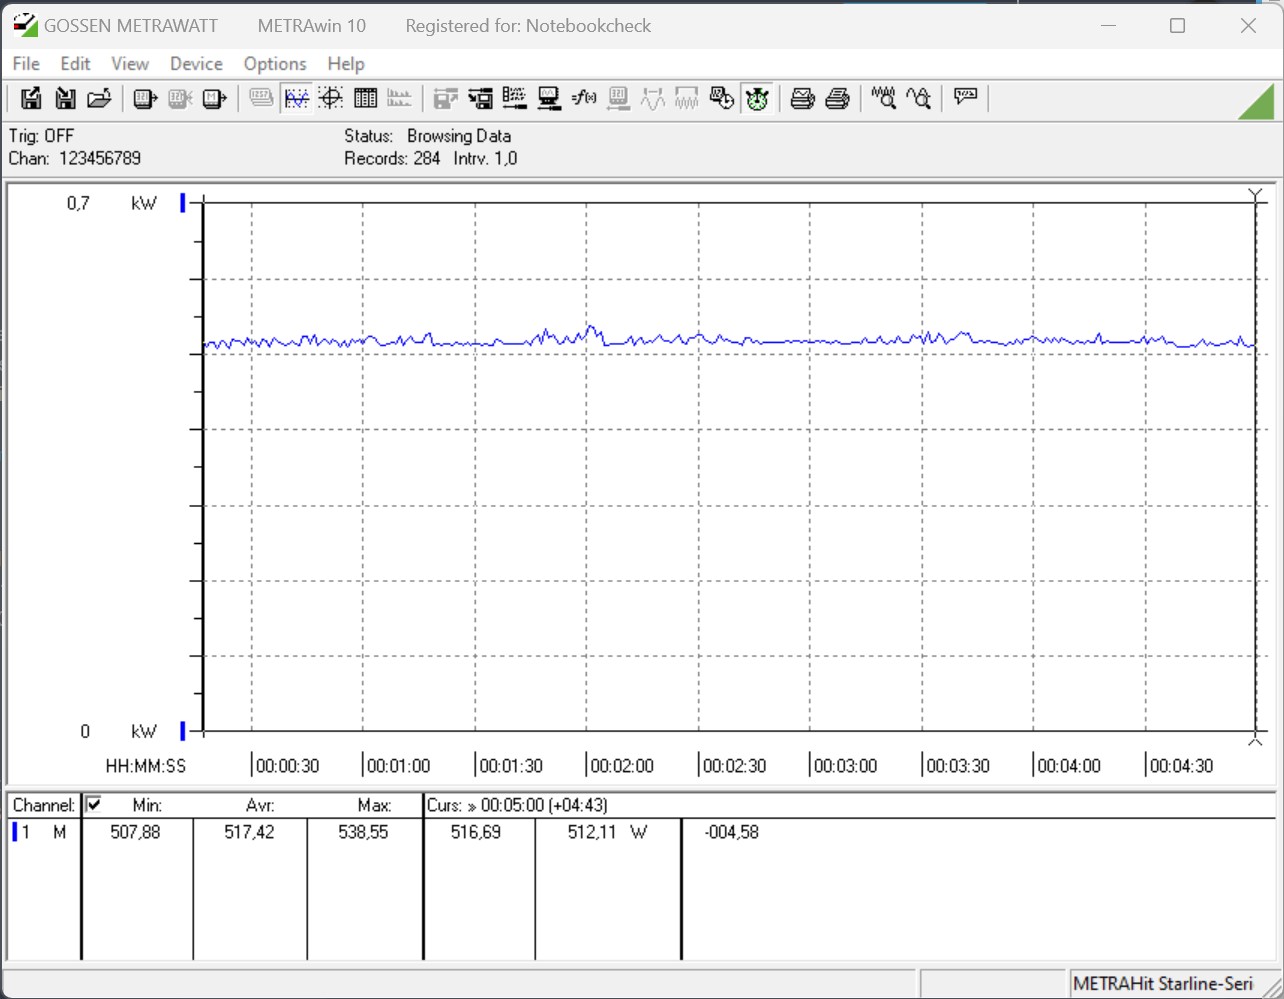
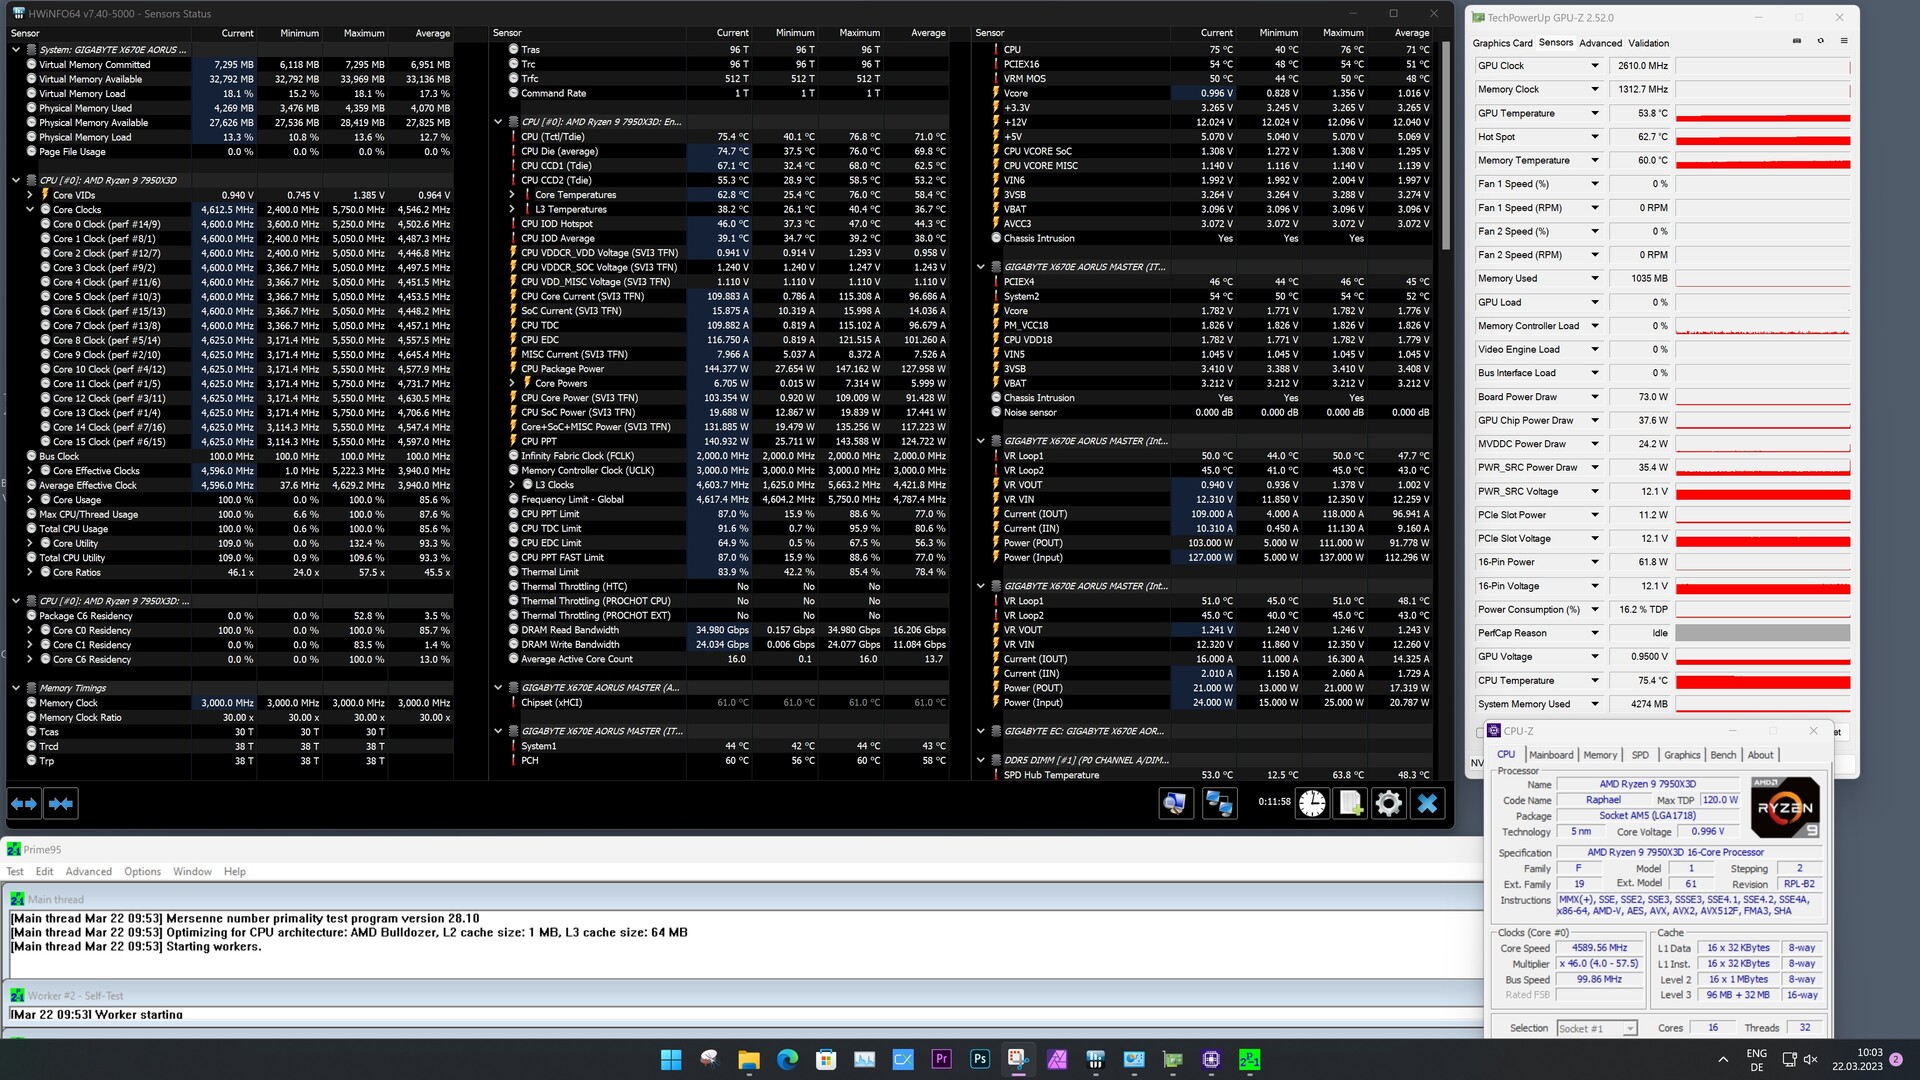
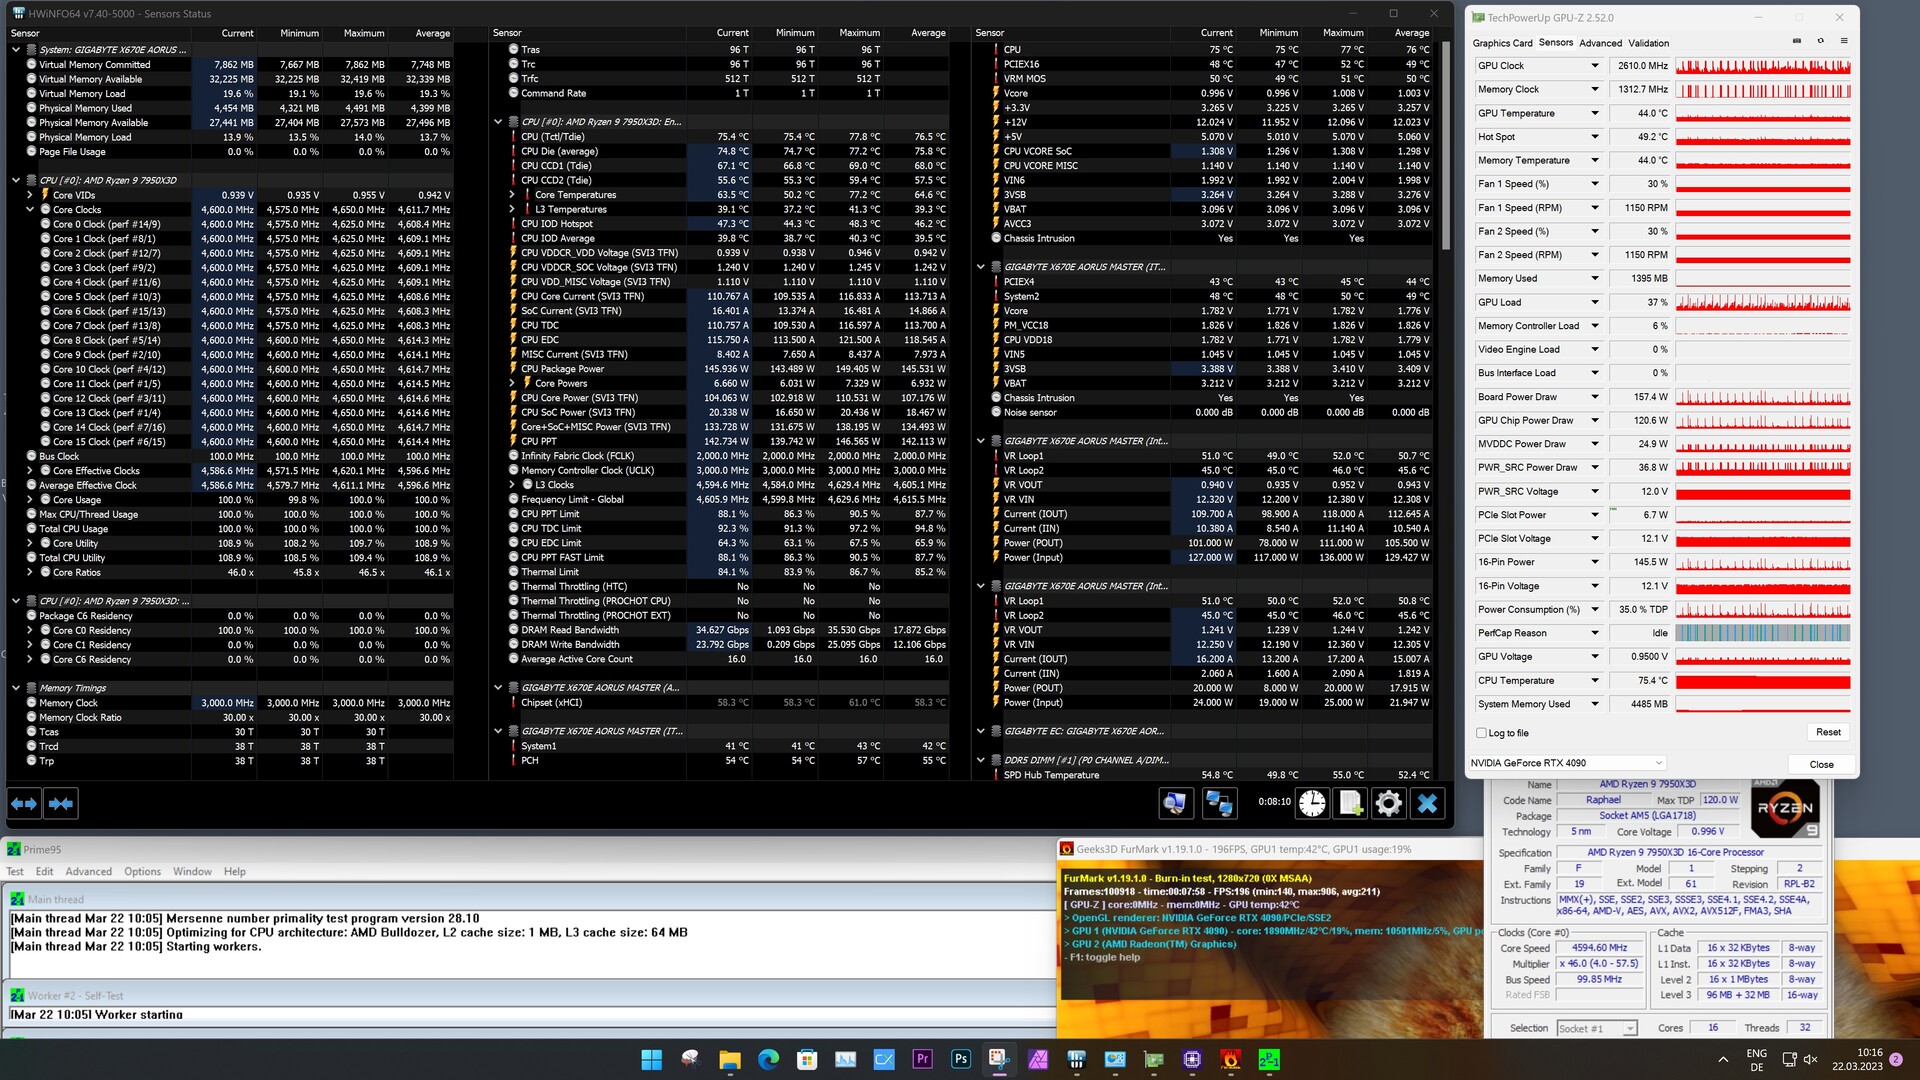
Consumo de energía - Sorprendentemente eficiente
Ya nos sorprendió muy positivamente el rendimiento del AMD Ryzen 9 7950X3D. Además, no debemos olvidar que AMD especifica un TDP de sólo 120 vatios para todos los modelos X3D actuales. Los modelos X más hambrientos de energía son capaces de consumir hasta 50 vatios más, con hasta 170 vatios, cuando los límites de potencia están activos.
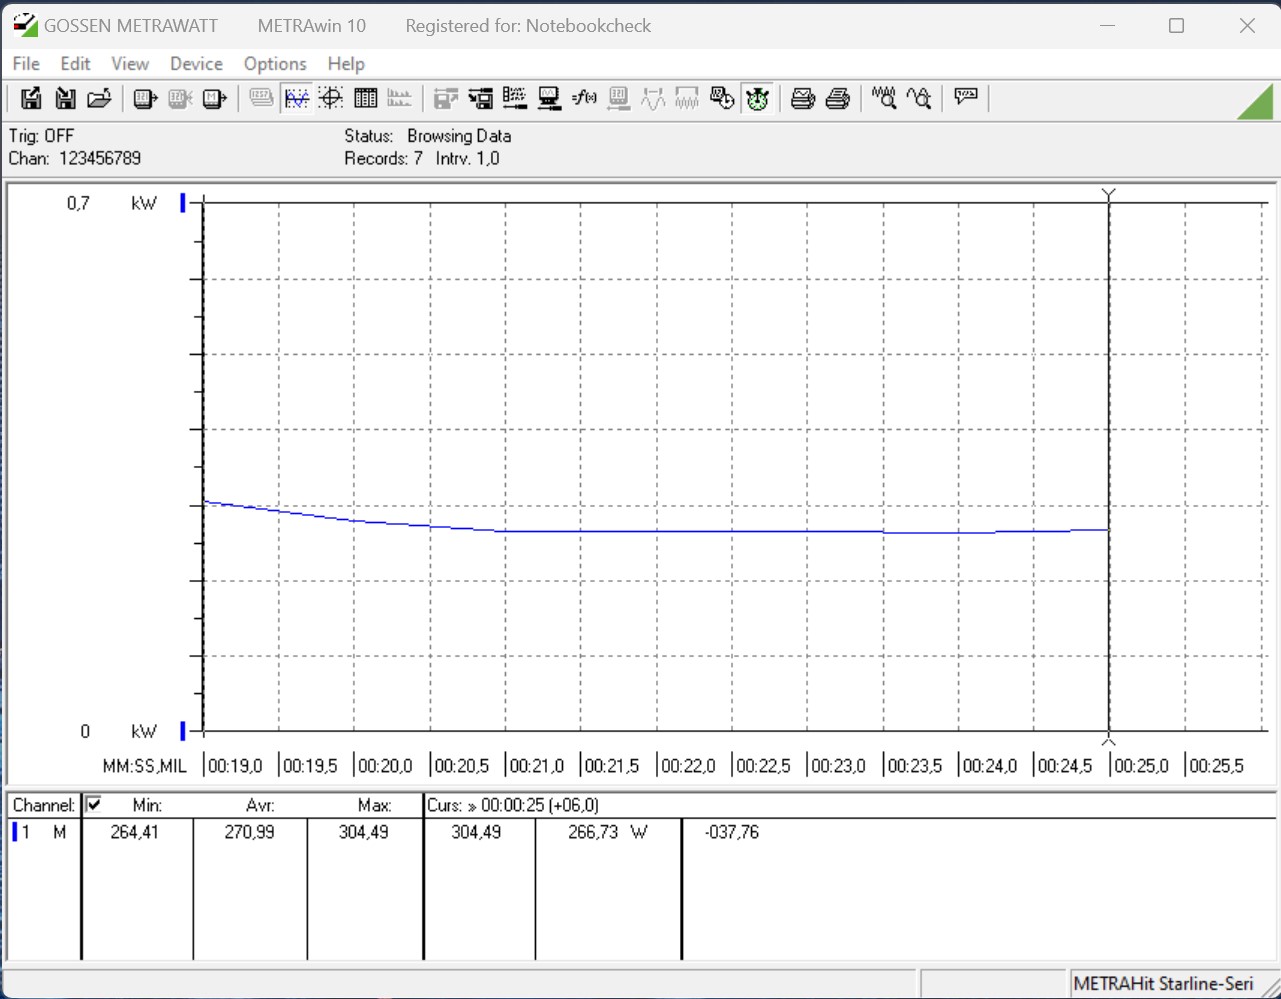
Sin embargo, durante el funcionamiento en reposo vemos un consumo relativamente alto de más de 100 vatios junto con nuestra placa base de pruebas (Gigabyte X670E Aorus Master). Pero a nuestro desencanto inicial sólo le siguen resultados positivos, y con sólo 273 vatios en el test Cinebench R15 Multi, medimos un consumo significativamente inferior al que vemos con los competidores de esta clase de precio. Esto también se muestra en el test de estrés Prime95 así como durante los juegos. Sin embargo, este último no es muy pesado para la CPU, por lo que la ventaja para el Intel Core i9-13900Kes significativamente menor. La Nvidia GeForce RTX 4090 asegura la mayor parte de la ventaja durante los juegos.
En comparación con el Intel Core i9-13900Kvemos una eficiencia significativamente mayor en el AMD Ryzen 9 7950X3D. Teniendo en cuenta el resultado de la prueba Cinebench R15 Multi, el buque insignia de AMD es superado, pero con 21,9 puntos por vatio, el más reciente procesador de 16 núcleos está significativamente por delante del competidor de Intel. En comparación, el Intel Core i9-13900K sólo alcanza los 12,9 puntos por vatio.
Debido al bajo consumo máximo de energía, el sistema de refrigeración también puede resultar un poco más pequeño. Sin embargo, también hay que tener en cuenta que AMD ha fijado 89 °C como temperatura máxima para el AMD Ryzen 9 7950X3D, antes de que la CPU tenga que ser estrangulada. En elAMD Ryzen 9 7950Xel límite de temperatura sigue siendo 95 °C. ElIntel Core i9-13900Ksólo se ralentiza a partir de los 100 °C cuando se desactivan los límites de potencia. Durante nuestro test de estrés, en ningún momento superamos el límite de 80 °C en nuestra configuración de pruebas, pero el responsable es la buena ventilación. En la misma configuración de prueba, elAMD Ryzen 9 7900Xse calentó bastante más, alcanzando más de 90 °C. Nuestra recomendación para una refrigeración adecuada es, por tanto, una solución AiO 240 o un potente disipador de aire. El Noctua NH-D15 se recomienda aquí, si quieres evitar usar una solución AiO.
| Power Consumption / Cinebench R15 Multi (external Monitor) | |
| Intel Core i9-13900K | |
| AMD Ryzen 9 7950X (Idle: 95.2 W) | |
| Intel Core i7-13700K | |
| AMD Ryzen 9 7900X | |
| AMD Ryzen 9 7950X3D | |
| AMD Ryzen 9 5950X (Idle: 78 W) | |
| Power Consumption / Cinebench R15 Multi Efficiency (external Monitor) | |
| AMD Ryzen 9 7950X3D | |
| AMD Ryzen 9 5950X | |
| AMD Ryzen 9 7950X | |
| AMD Ryzen 9 7900X | |
| Intel Core i9-13900K | |
| Power Consumption / Prime95 V2810 Stress (external Monitor) | |
| Intel Core i9-13900K | |
| Intel Core i7-13700K | |
| AMD Ryzen 9 7950X (Idle: 95.2 W) | |
| AMD Ryzen 9 7900X | |
| AMD Ryzen 9 7950X3D | |
| AMD Ryzen 9 5950X (Idle: 78 W) | |
| Power Consumption / The Witcher 3 ultra (external Monitor) | |
| AMD Ryzen 9 7900X | |
| AMD Ryzen 9 7950X (Idle: 95.2 W) | |
| Intel Core i7-13700K | |
| Intel Core i9-13900K | |
| AMD Ryzen 9 7950X3D | |
| AMD Ryzen 9 5950X (Idle: 78 W) | |
* ... más pequeño es mejor
Power Consumption With External Monitor
Pro
Contra
Veredicto - Extremadamente rápido y muy eficaz
El nuevo zócalo AM5 no lleva mucho tiempo disponible en el mercado, y AMD ya ofrece nuevas CPU más rápidas. Tras su presentación inicial en CES en enero de 2023, las expectativas sobre el rendimiento de los nuevos procesadores X3D eran altas. En nuestra prueba actual del AMD Ryzen 9 7950X3D, determinamos que AMD hizo muchas cosas bien, incluso si los costos de la plataforma son relativamente altos, siempre y cuando deba ser una base X670. Debido al requerimiento de DDR5, tienes que pagar más por la memoria de trabajo de lo que costaría DDR4.
El rendimiento del AMD Ryzen 9 7950X3D es convincente en todo momento, incluso si el rendimiento multi-core puro resulta ligeramente peor en comparación con los competidores. En juegos, el AMD Ryzen 9 7950X3D vuelve a compensarlo, quedando primero con una clara ventaja. La mayor diferencia puede verse en términos de consumo de energía. En nuestras pruebas, el AMD Ryzen 9 7950X3D resulta ser una CPU extremadamente eficiente. El rendimiento no es en absoluto peor que el de los mejores modelos actuales, y bajo carga el AMD Ryzen 9 7950X3D es siempre significativamente más eficiente en términos de consumo de energía. Debido a esto, tampoco necesitarás tener un sistema de refrigeración muy potente, ya que es mucho más fácil controlar el AMD Ryzen 9 7950X3D bajo carga que un Intel Core i9-13900k o AMD Ryzen 9 7950X.
El Ryzen 9 7950X3D de AMD ofrece un rendimiento excelente en todas las áreas, y además es casi siempre muy eficiente, lo que es una tendencia que hemos echado de menos a menudo últimamente.
En resumen, observamos que con el AMD Ryzen 9 7950X3D, AMD ofrece la CPU para juegos actualmente más rápida del mercado. Sin embargo, a menudo depende del juego específico, si es capaz de ofrecer todo el rendimiento conectado con la correcta asignación de hilos. Debido a la estructura híbrida proveniente de los dos CCDs diferentes, no siempre es un hecho que se prefiera el CCD con el 3D V-Cache.
Precio y disponibilidad
El AMD Ryzen 9 7950X3D está listado por $699 pero actualmente aparece como agotado en la tienda web de AMD https://shop-us-en.amd.com/processors/y de forma similar en otros lugares como Newegg. Así que aquellos que actualmente quieren por un AMD Ryzen 9 7950X3D tienen que traer un poco de paciencia y tal vez también un poco de suerte o dinero extra. Amazon actualmente lista por $ 1019 con sólo unas pocas unidades disponibles. La situación parece ser mejor con el AMD Ryzen 9 7900X3D ligeramente más pequeño, y AMD lo tiene a 599 dólares.
Transparencia
Nuestro equipo editorial se encarga de seleccionar los dispositivos que se someten a revisión. La muestra de prueba fue entregada al autor por el fabricante de forma gratuita para los fines de la revisión. No hubo influencia de terceros en esta revisión, ni el fabricante recibió una copia de esta revisión antes de su publicación. No había ninguna obligación de publicar esta reseña. Como empresa de medios independiente, Notebookcheck no está sujeta a la autoridad de fabricantes, minoristas o editores.
Así es como prueba Notebookcheck
Cada año, Notebookcheck revisa de forma independiente cientos de portátiles y smartphones utilizando procedimientos estandarizados para asegurar que todos los resultados son comparables. Hemos desarrollado continuamente nuestros métodos de prueba durante unos 20 años y hemos establecido los estándares de la industria en el proceso. En nuestros laboratorios de pruebas, técnicos y editores experimentados utilizan equipos de medición de alta calidad. Estas pruebas implican un proceso de validación en varias fases. Nuestro complejo sistema de clasificación se basa en cientos de mediciones y puntos de referencia bien fundamentados, lo que mantiene la objetividad.
