Análisis del PC de sobremesa de gama alta XMG SECTOR con Intel Core i9-13900K y Nvidia GeForce RTX 4090

Mucha gente asocia Schenker con portátiles potentes. La marca "XMG" añadida indica dispositivos de juego de gama alta, que entretanto también incluyen PC de sobremesa. En este análisis, nos centraremos en el XMG SECTOR basado en Intel. La configuración básica tiene un precio de 1.239 euros (1.306 dólares) y viene con un Intel Core i5-12400F, 16 GB de RAM y un procesador Nvidia GeForce RTX 3060. Nuestra unidad de pruebas es un modelo de gama alta con un Core i9-13900K y una GeForce RTX 4090pero también tiene un precio muy elevado de unos 4.700 euros. Sin embargo, gracias a las muchas opciones que ofrece la tienda XMGpuedes equipar el PC con varios componentes de hardware y montar un sistema adaptado específicamente a tus necesidades.
Una mirada detallada al XMG SECTOR Intel
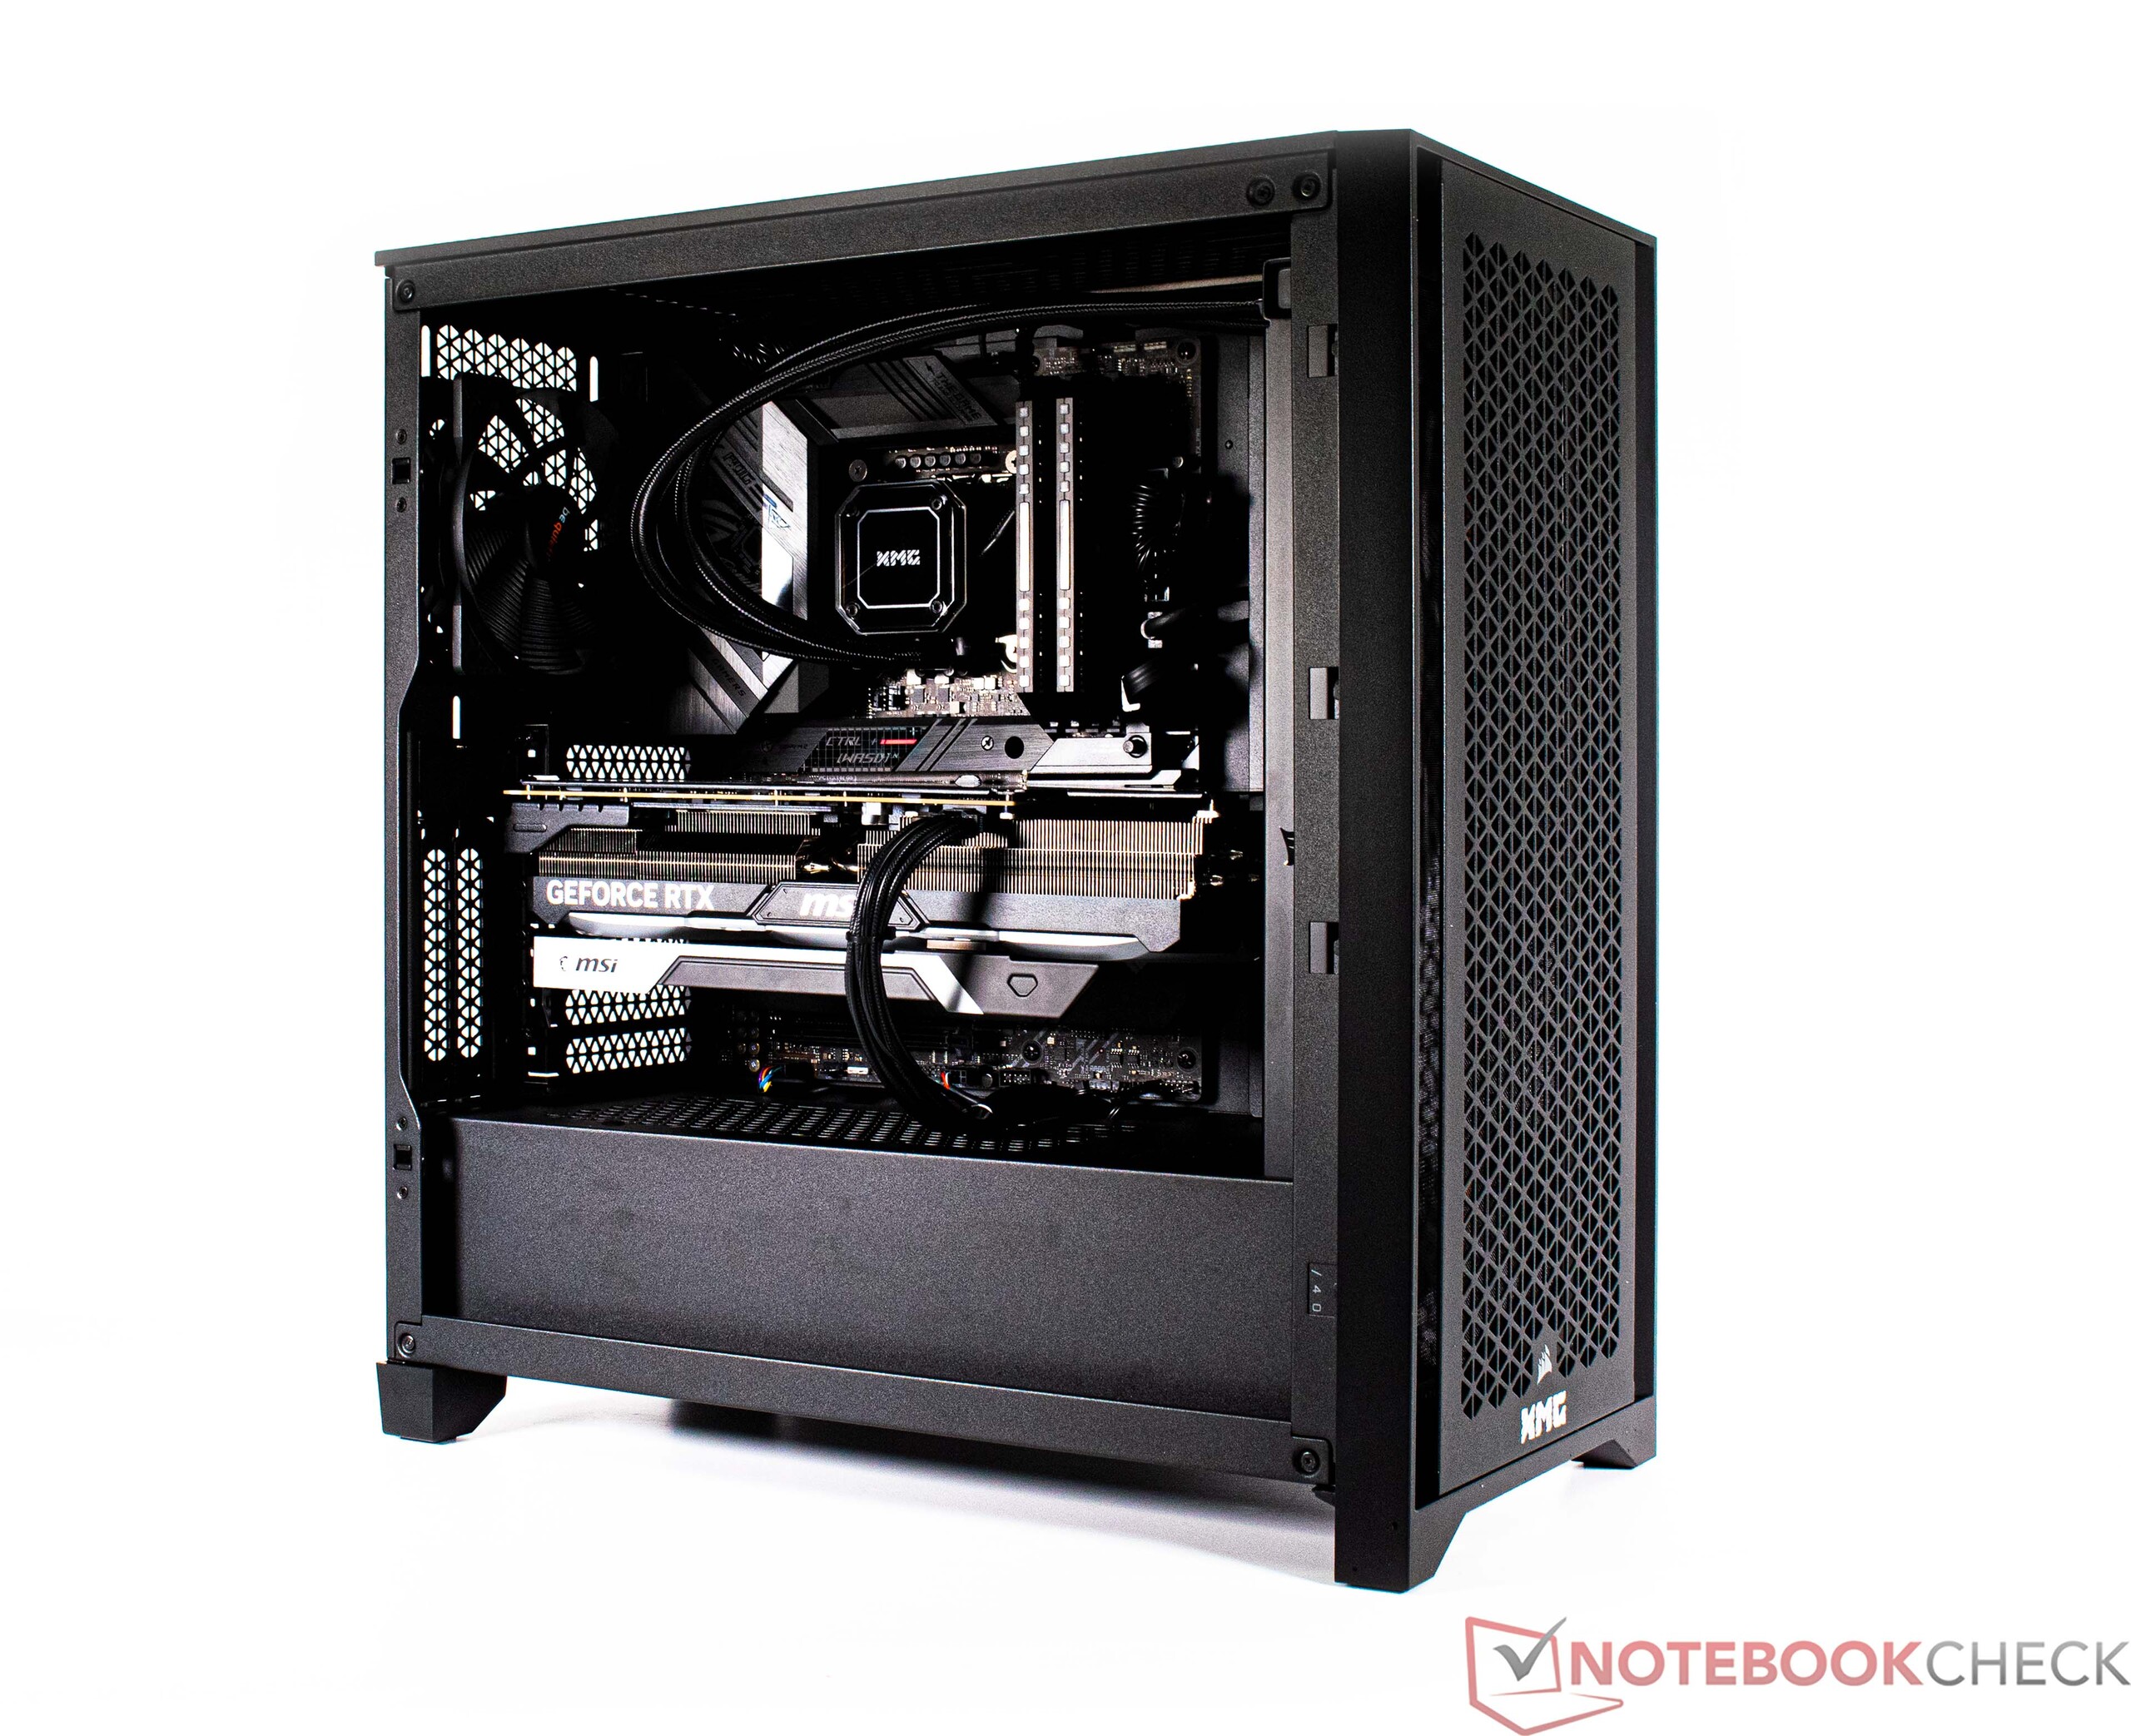
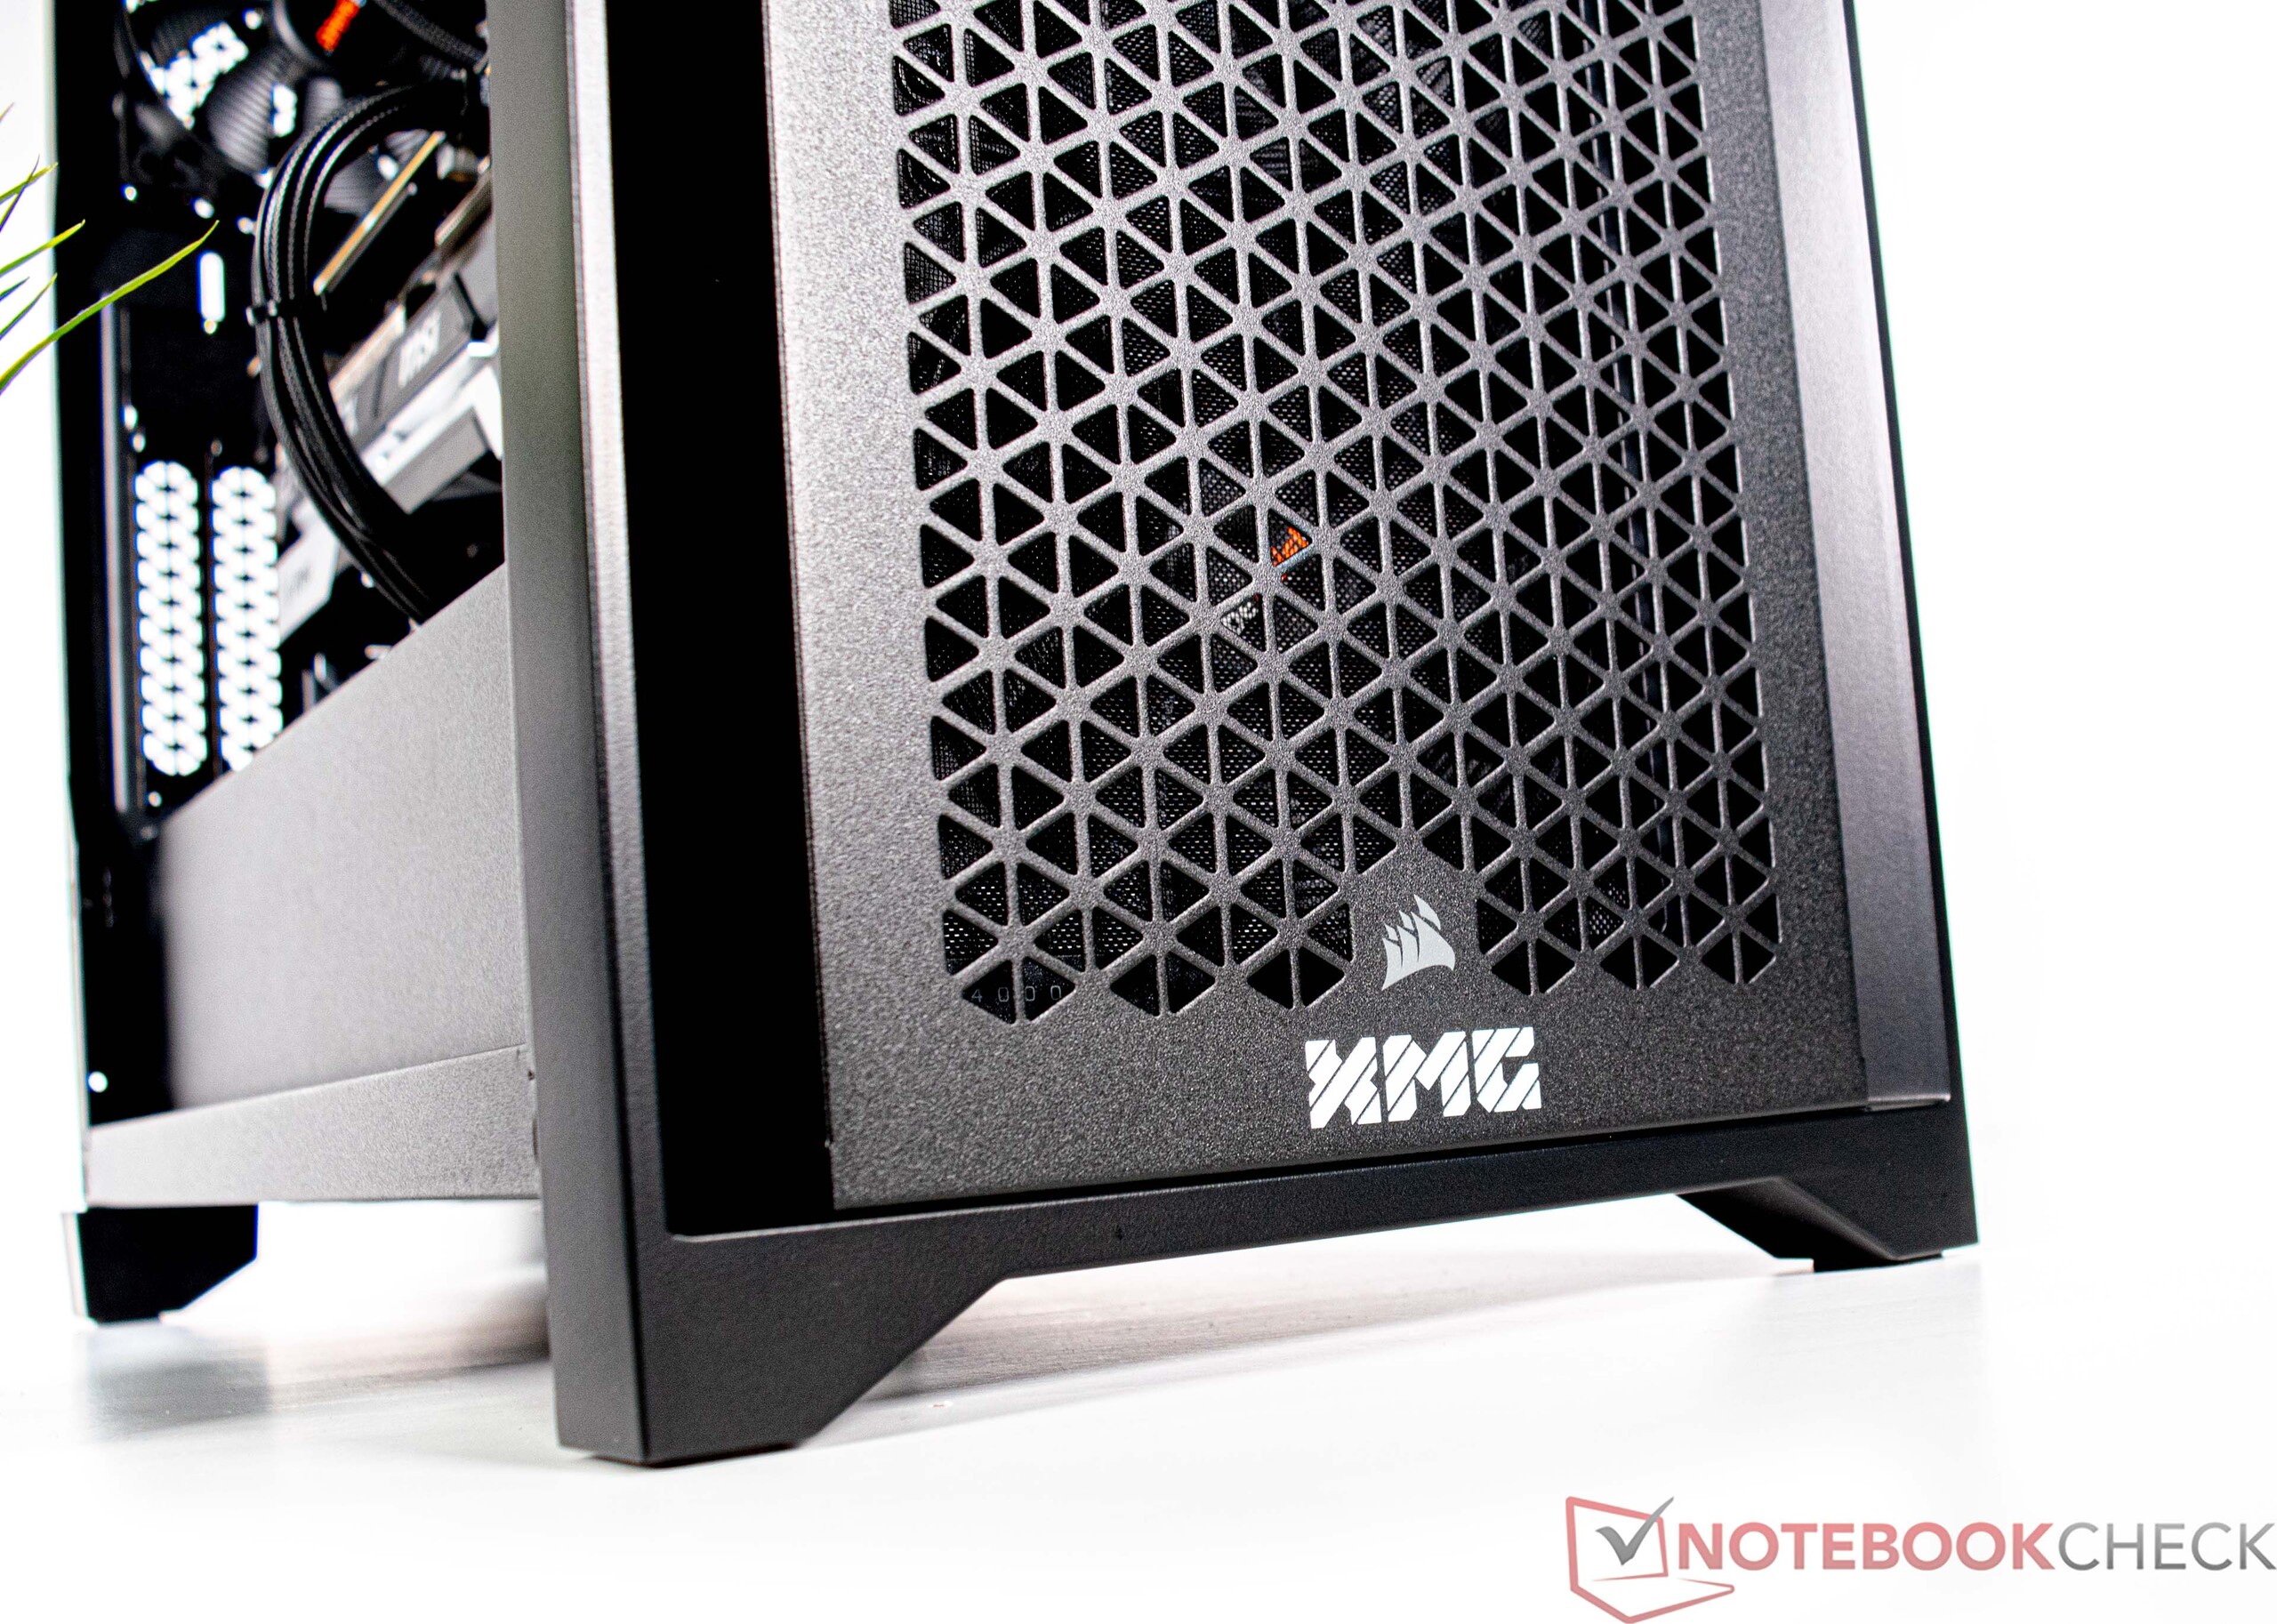
Caja - Corsair 4000D Airflow
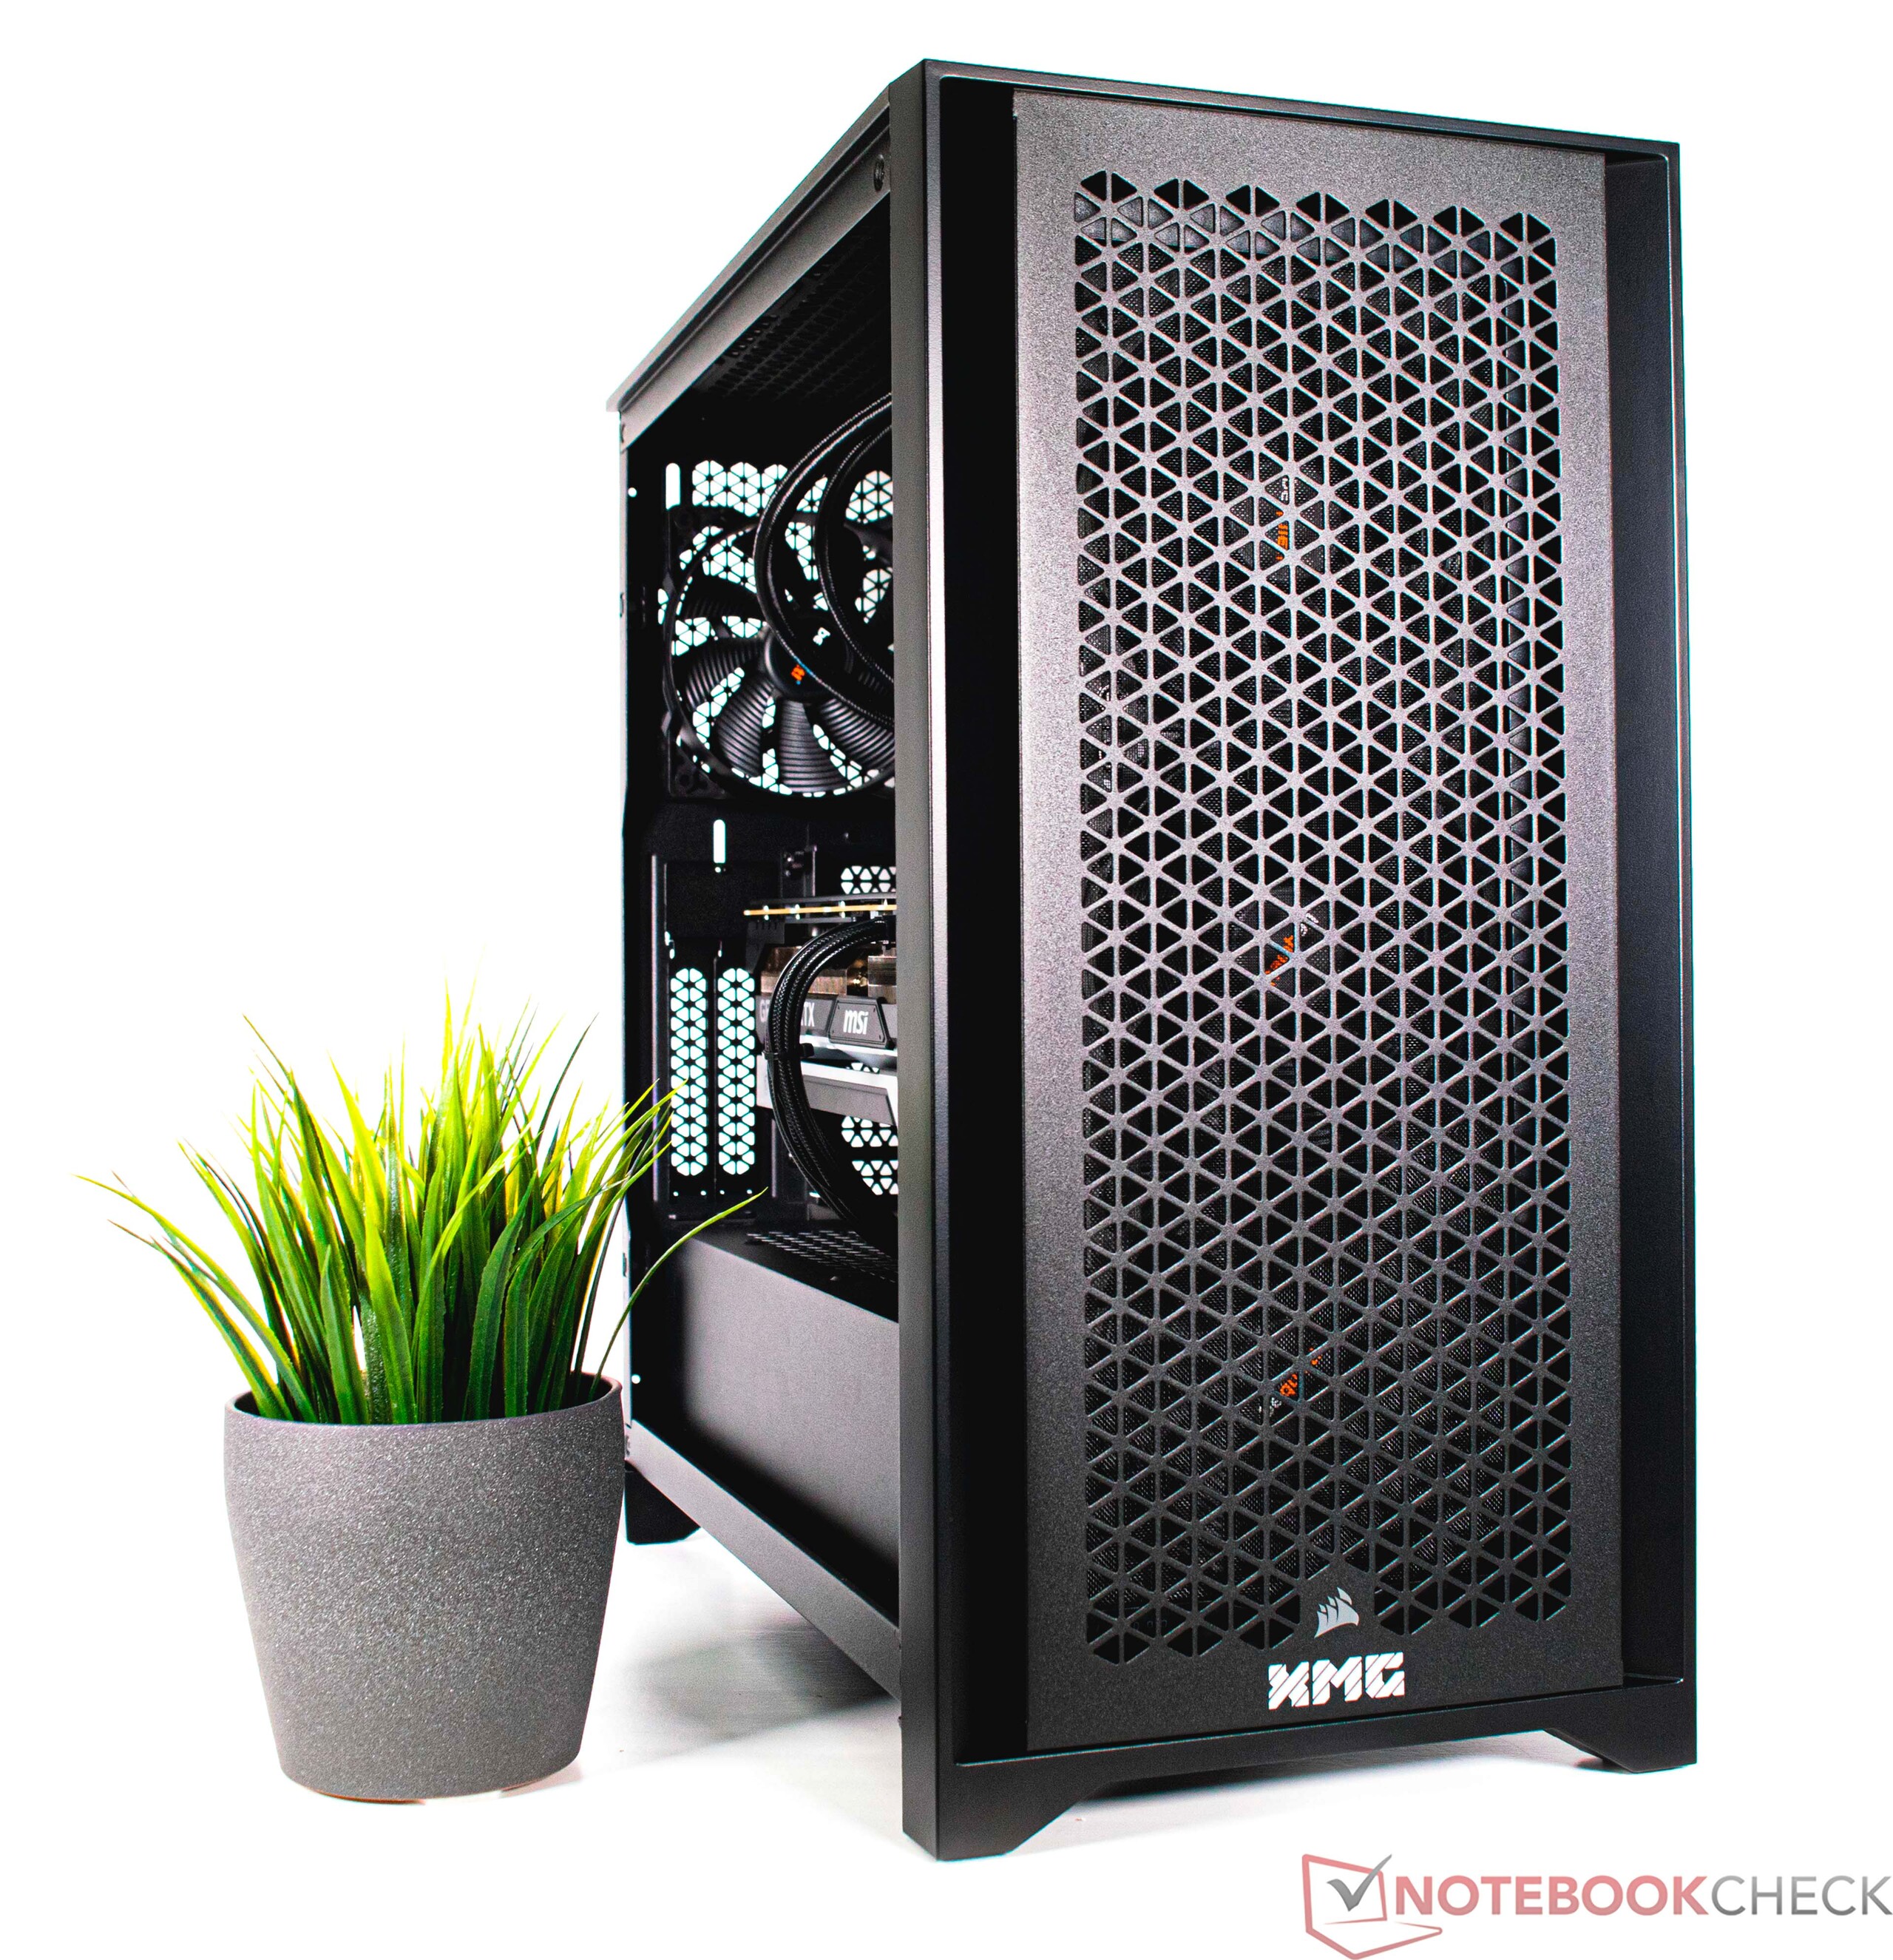
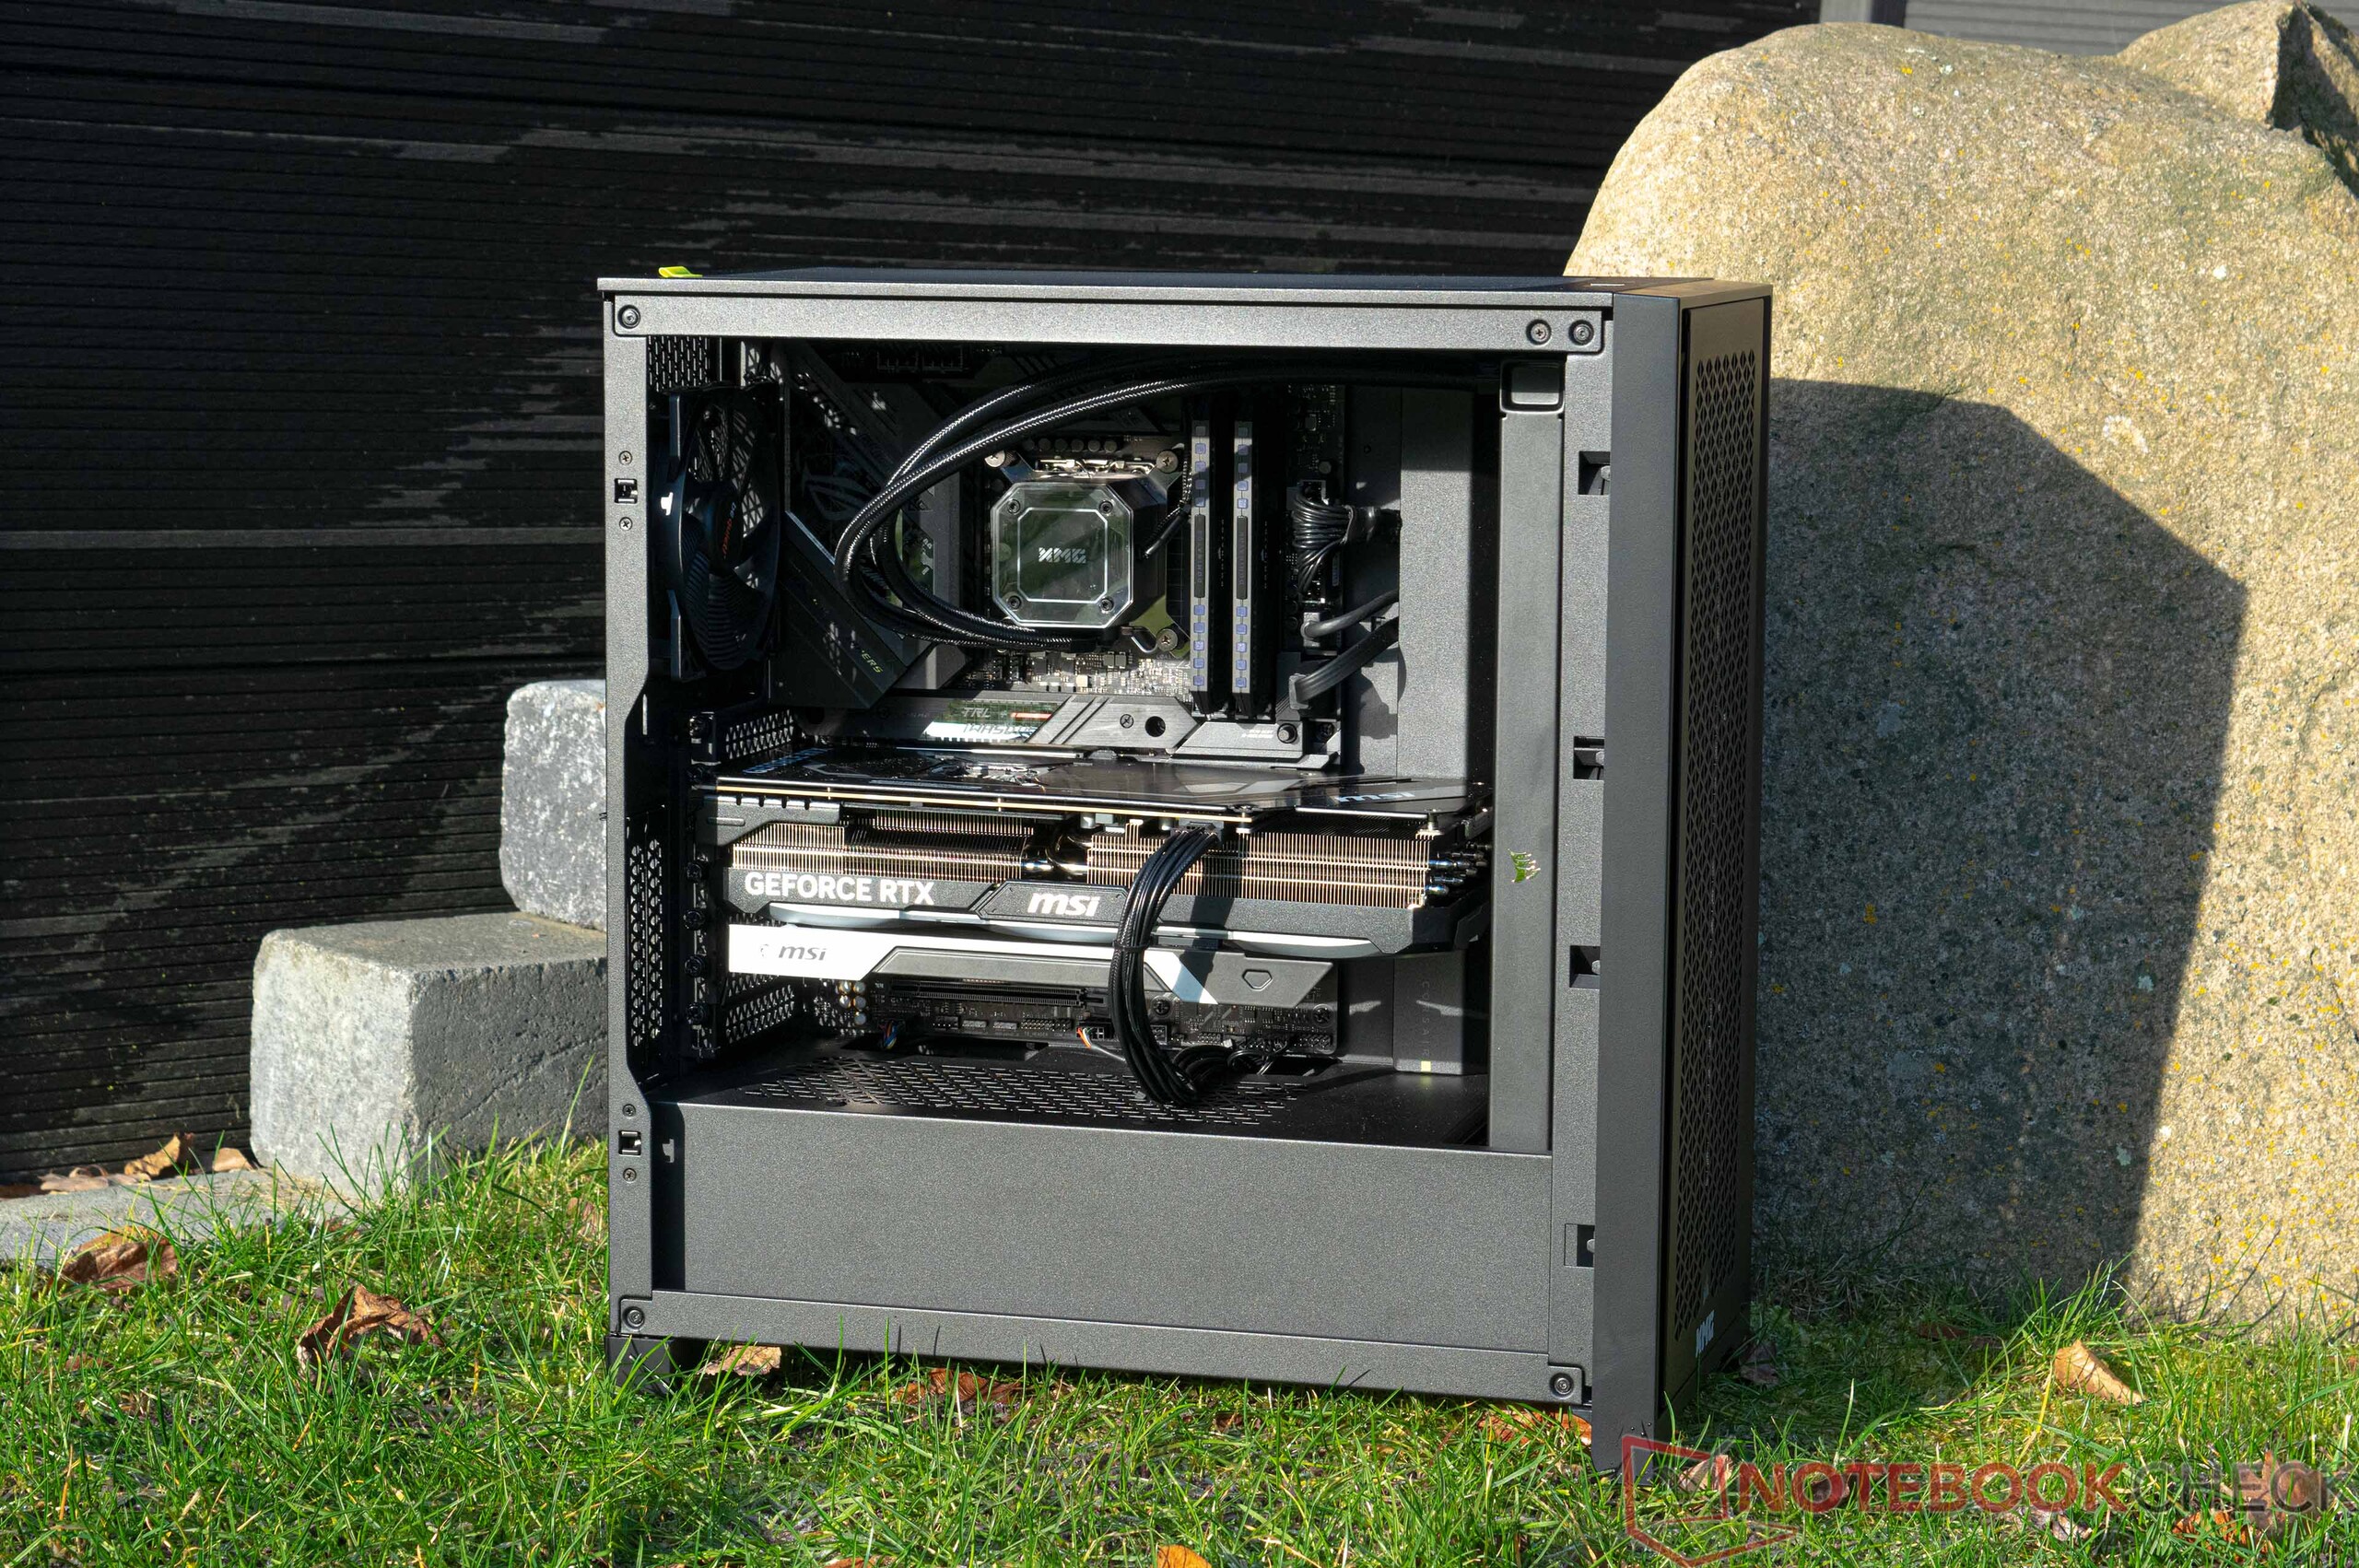
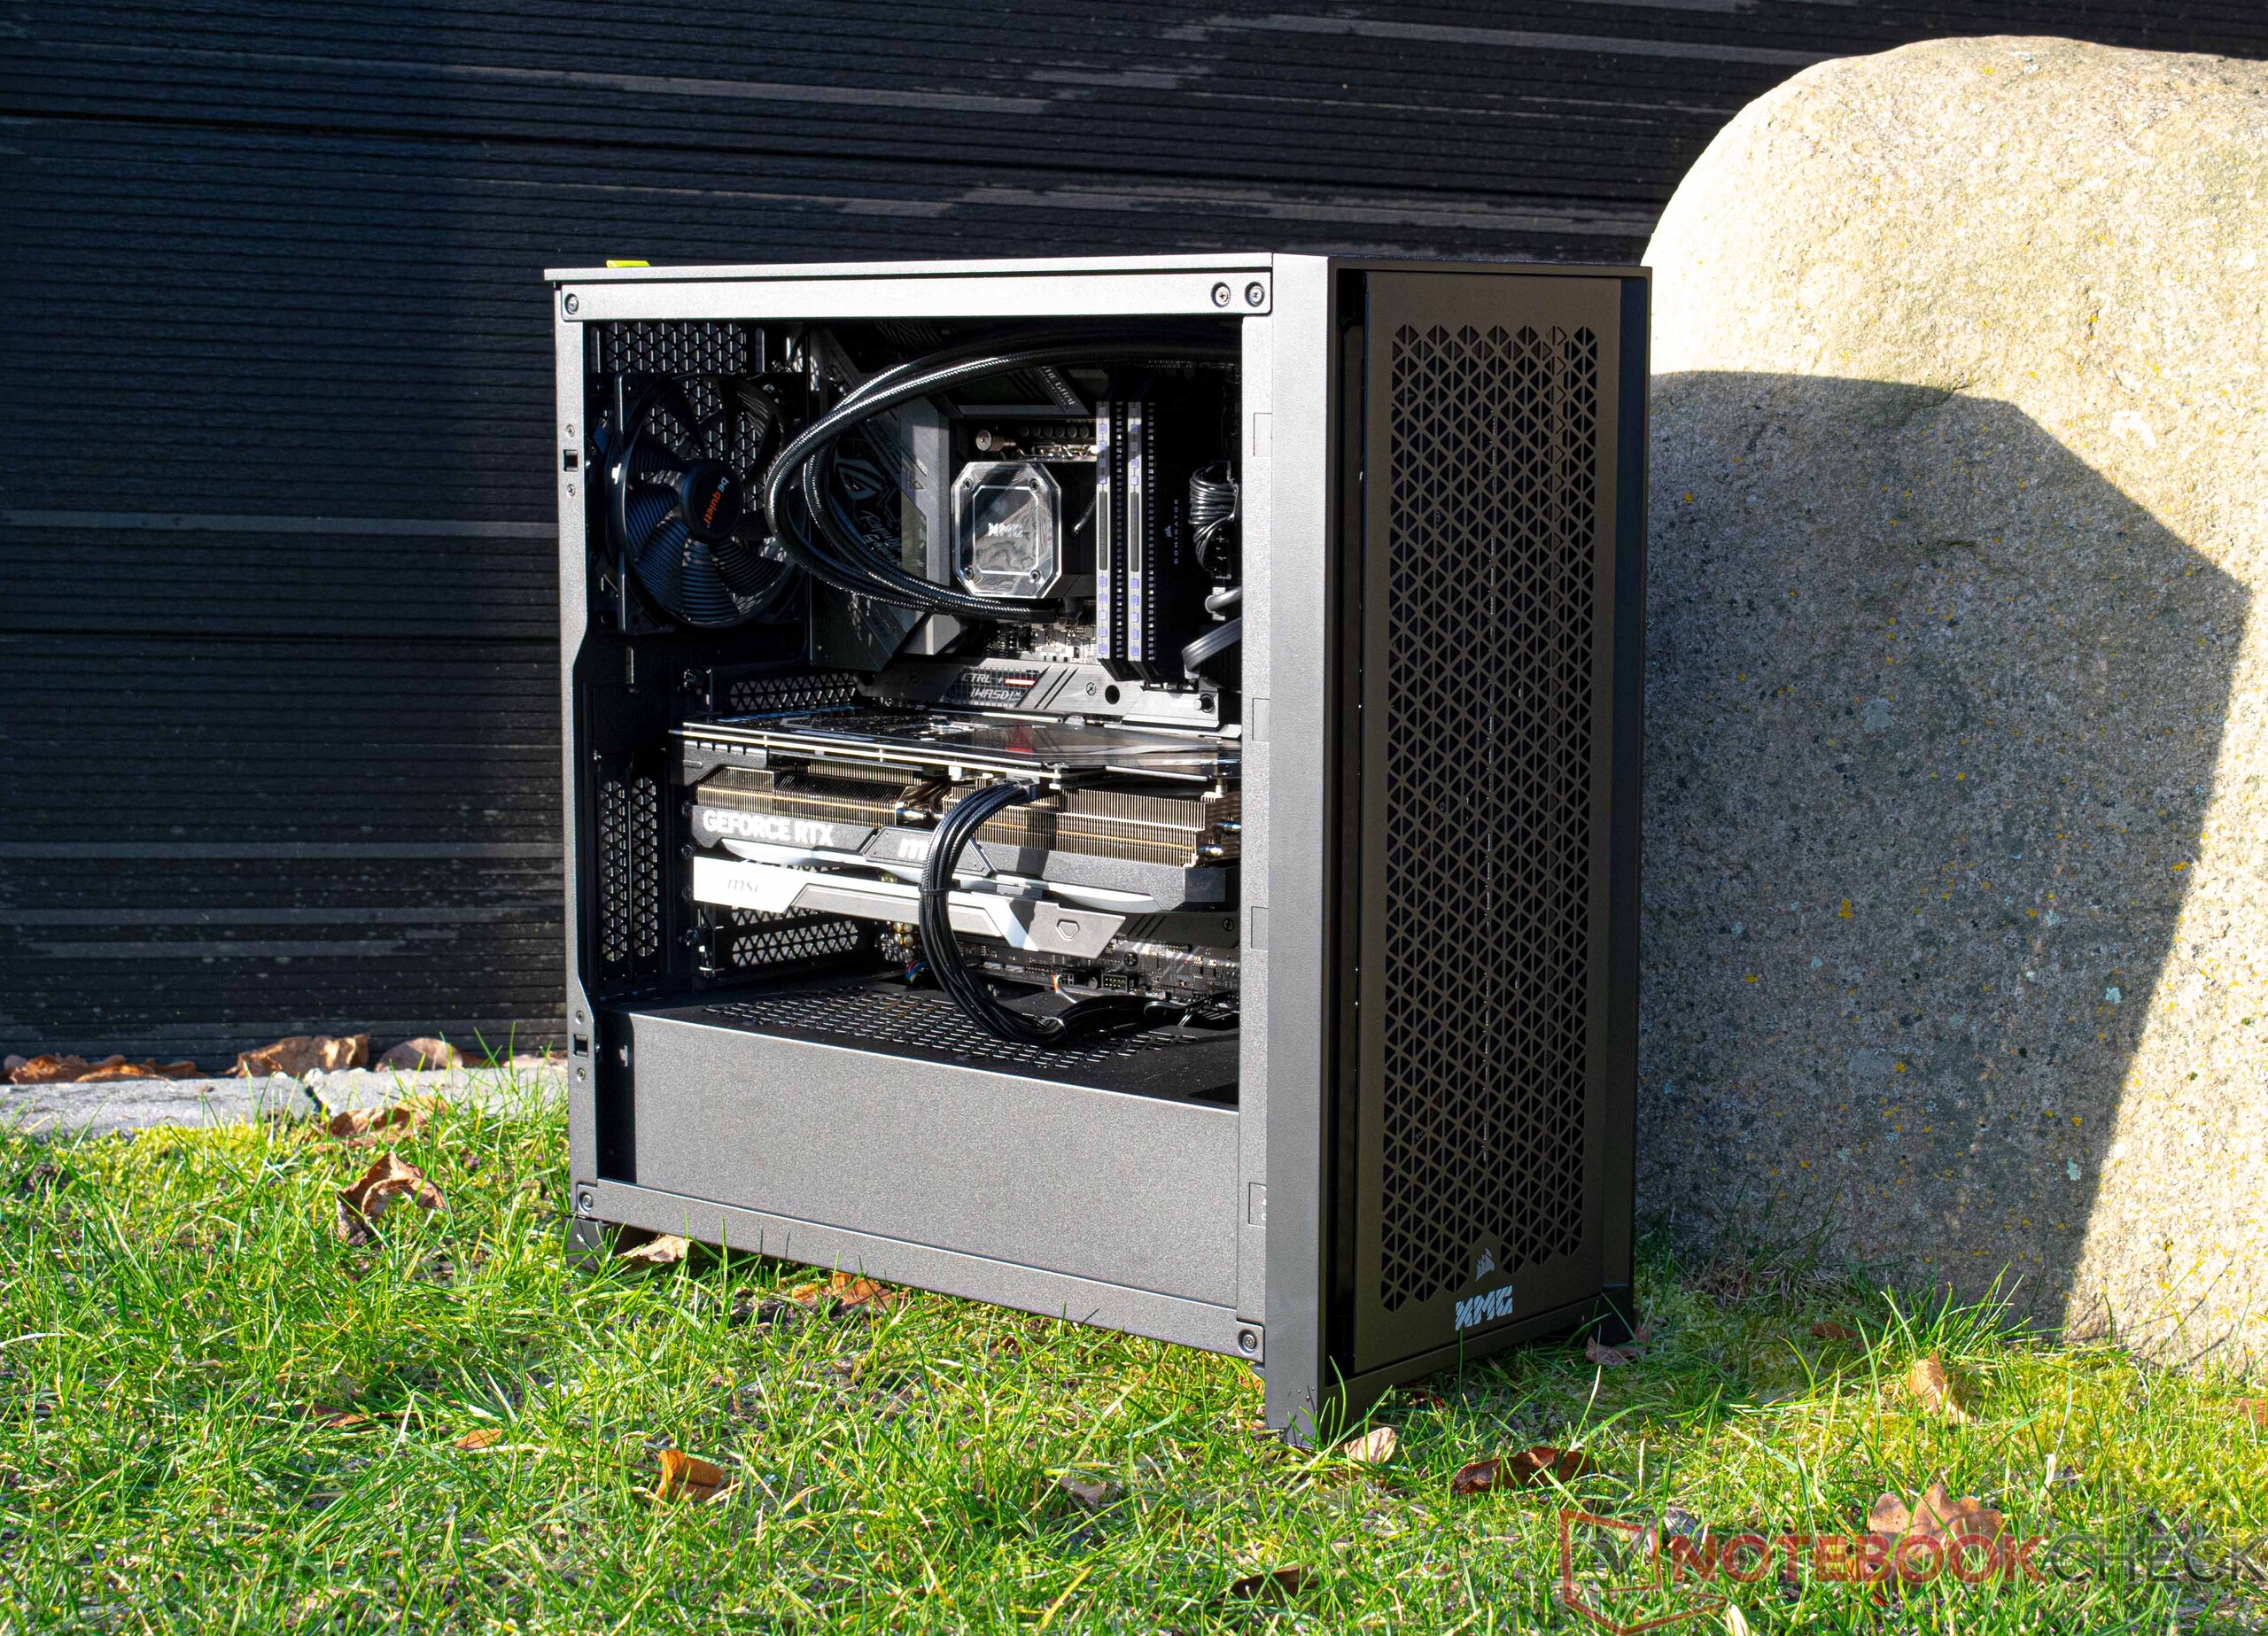
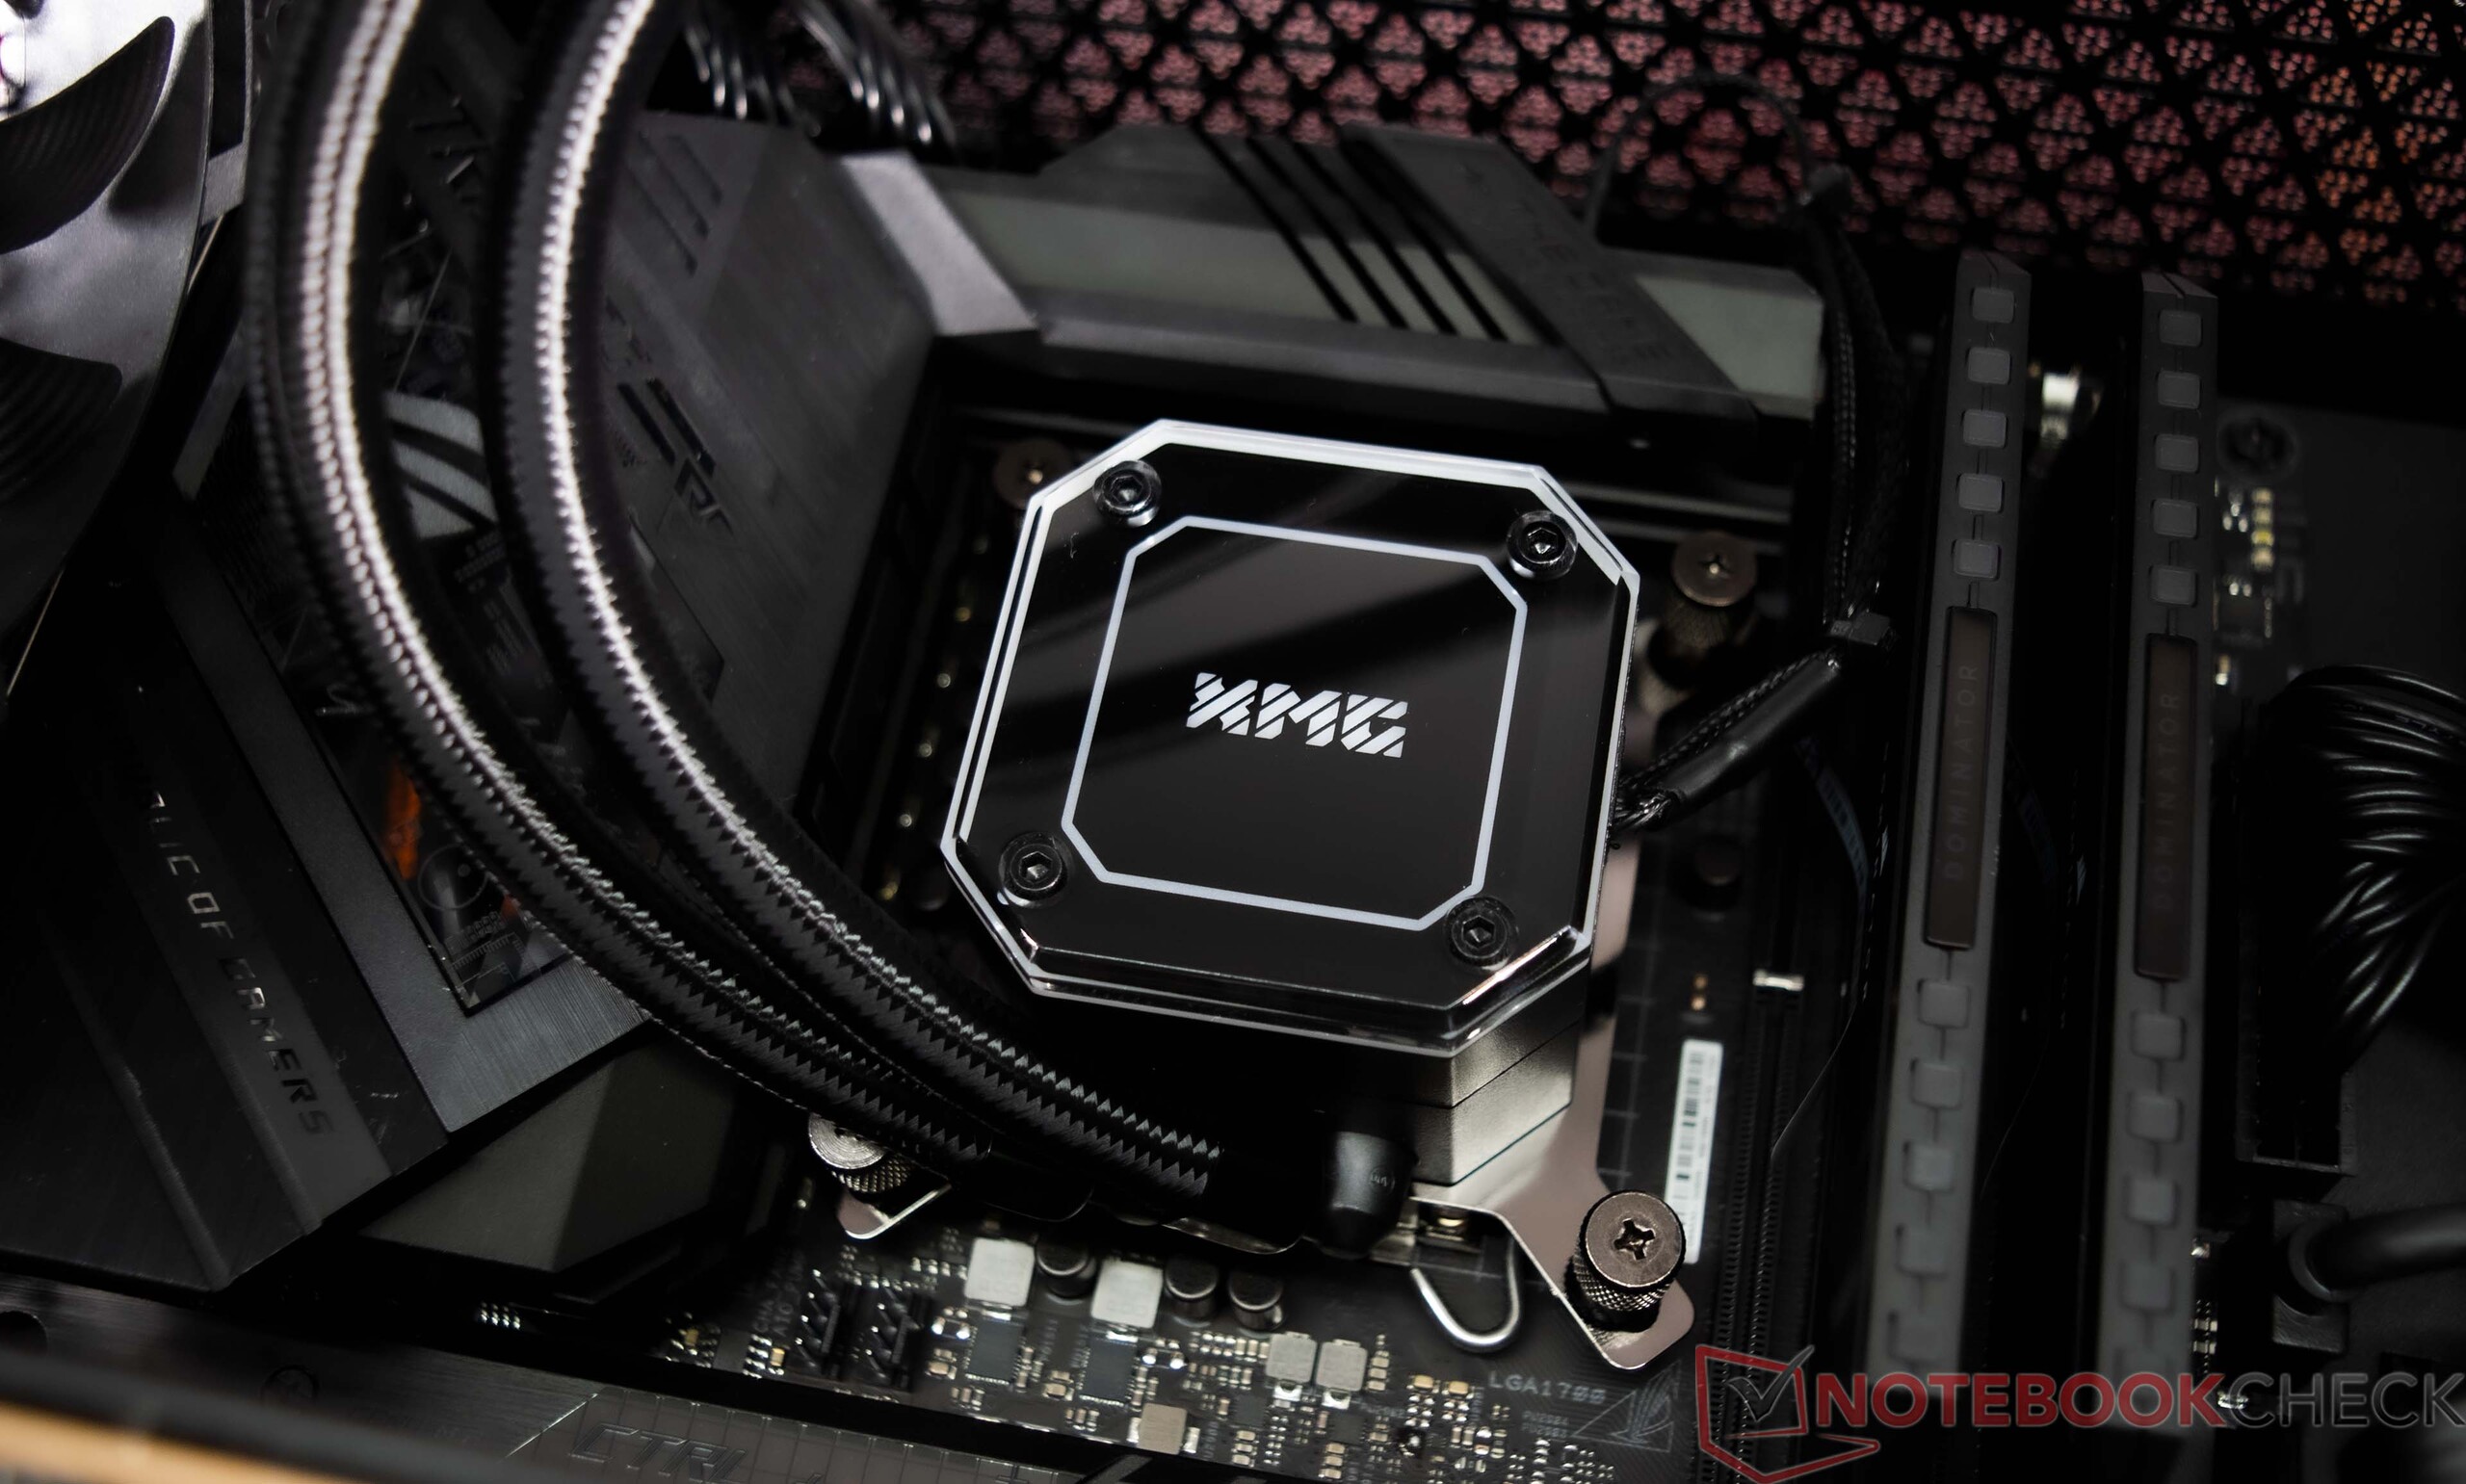
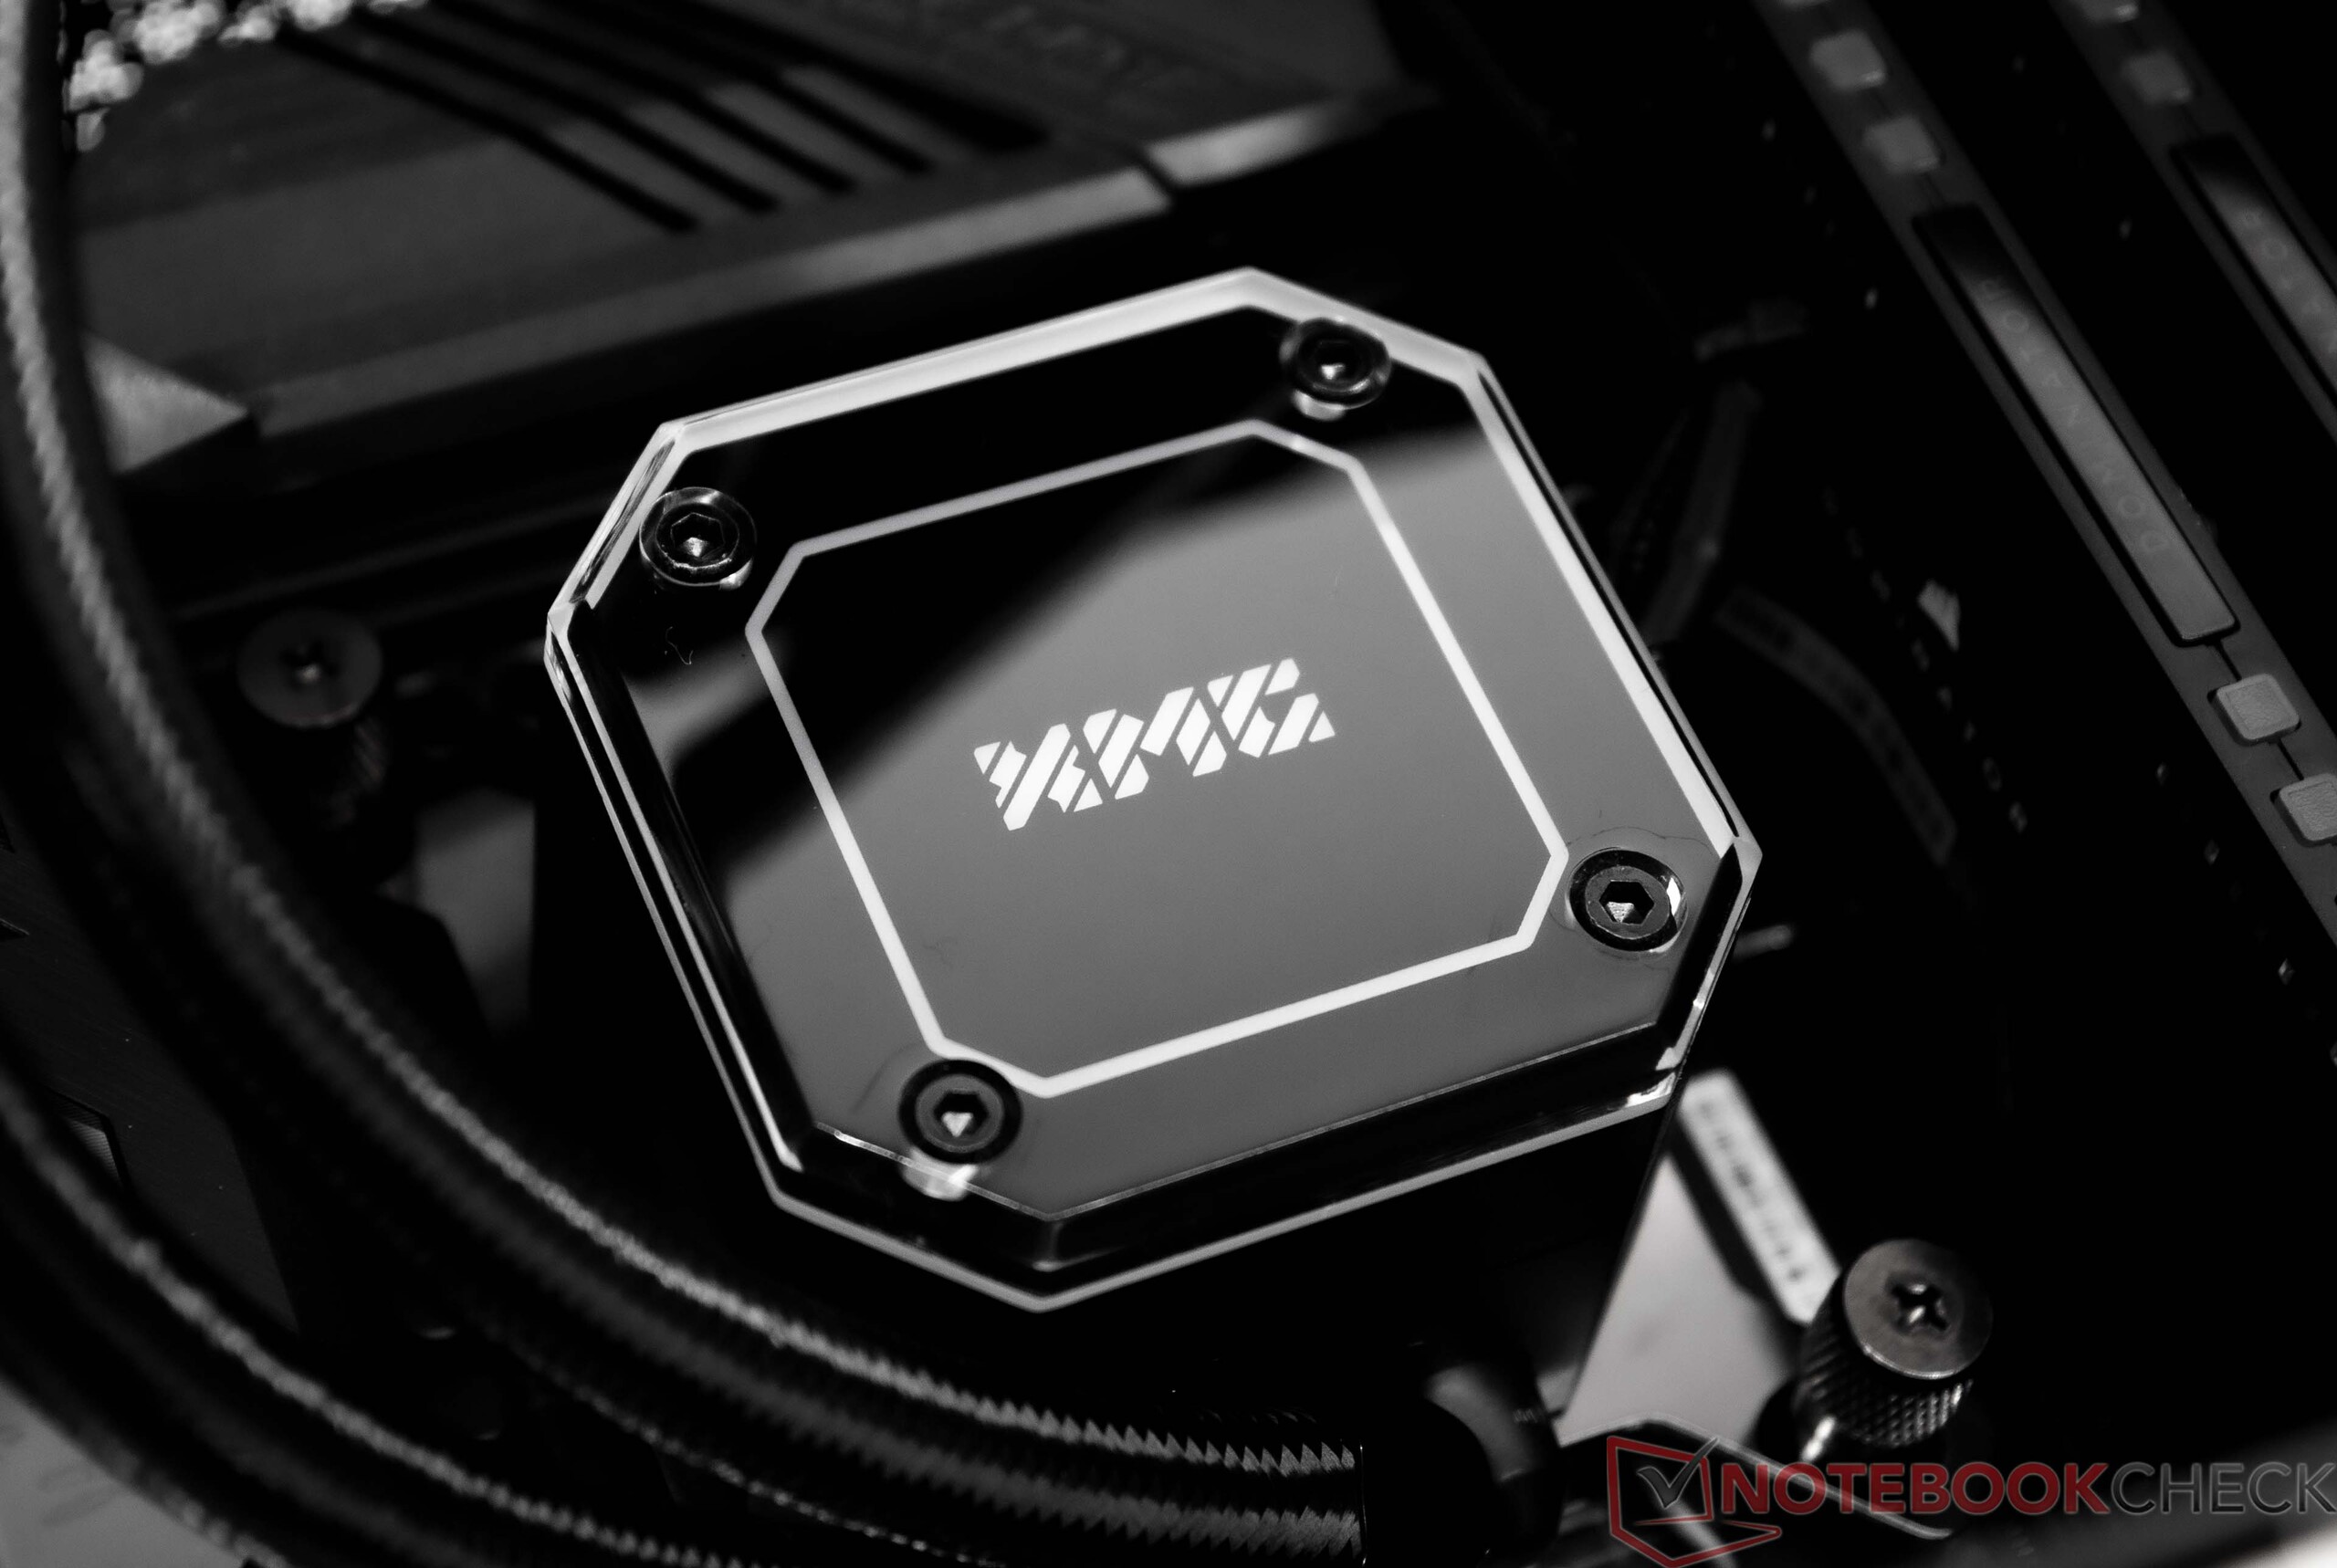
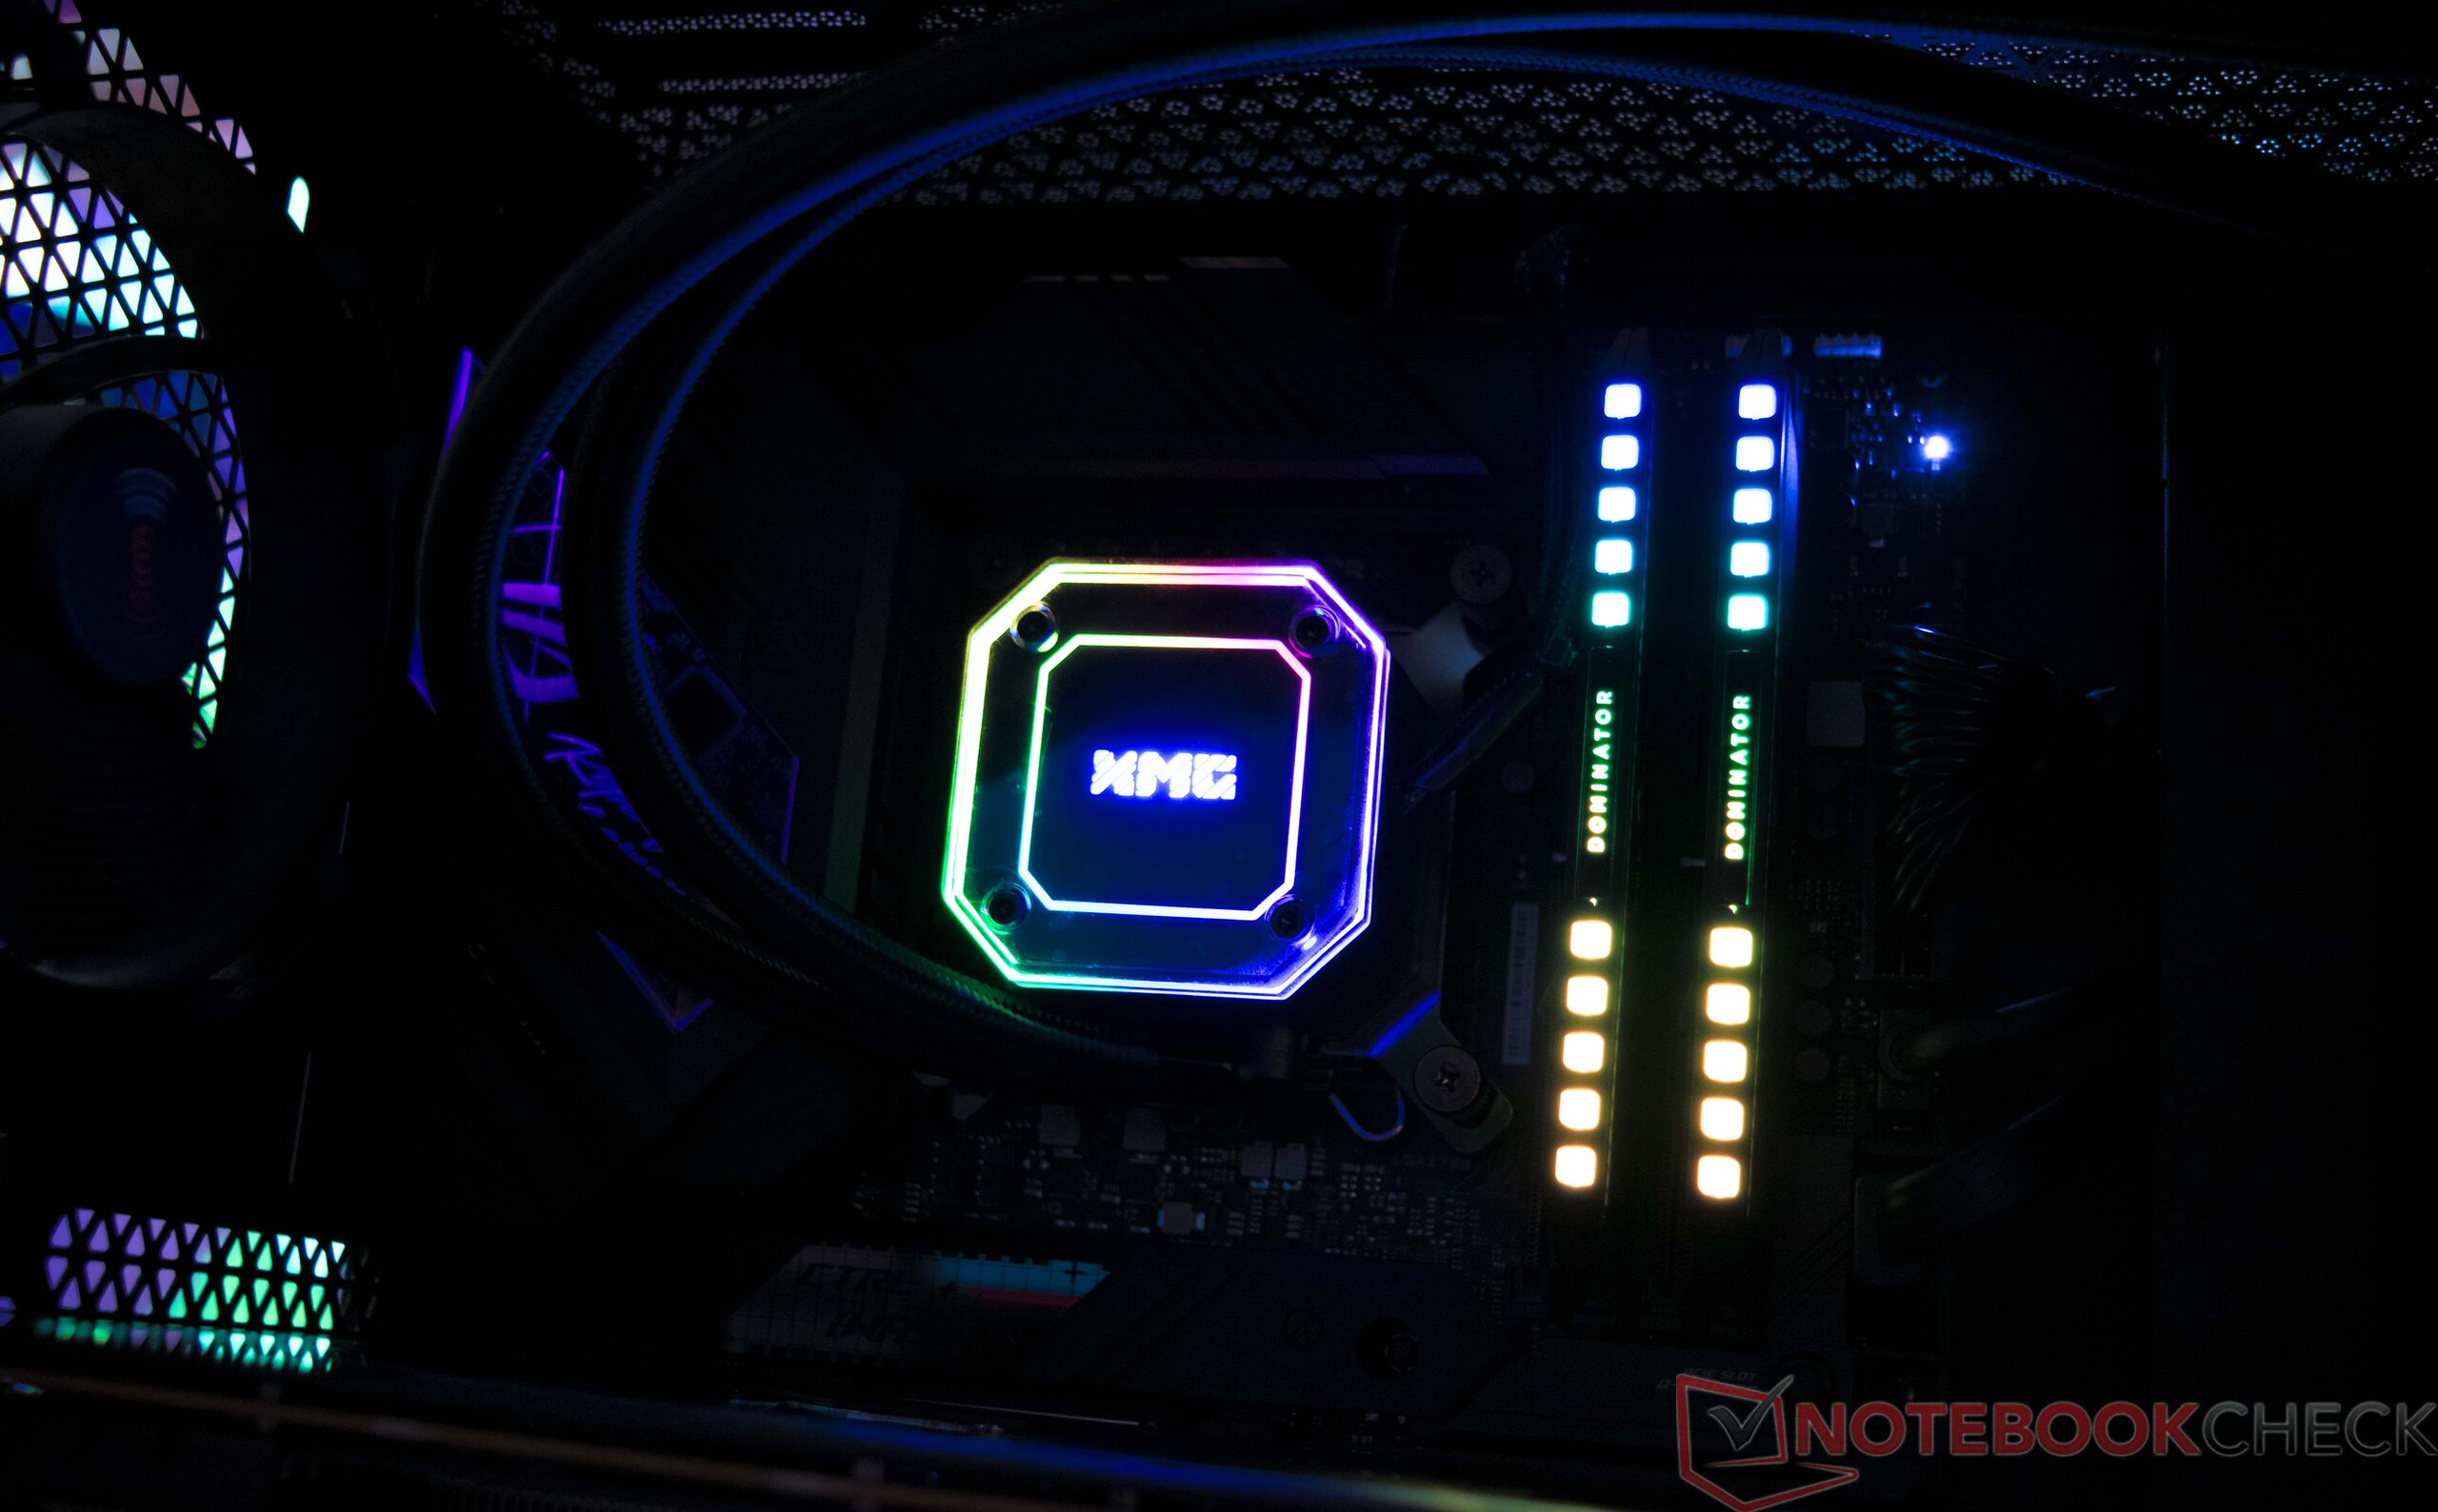
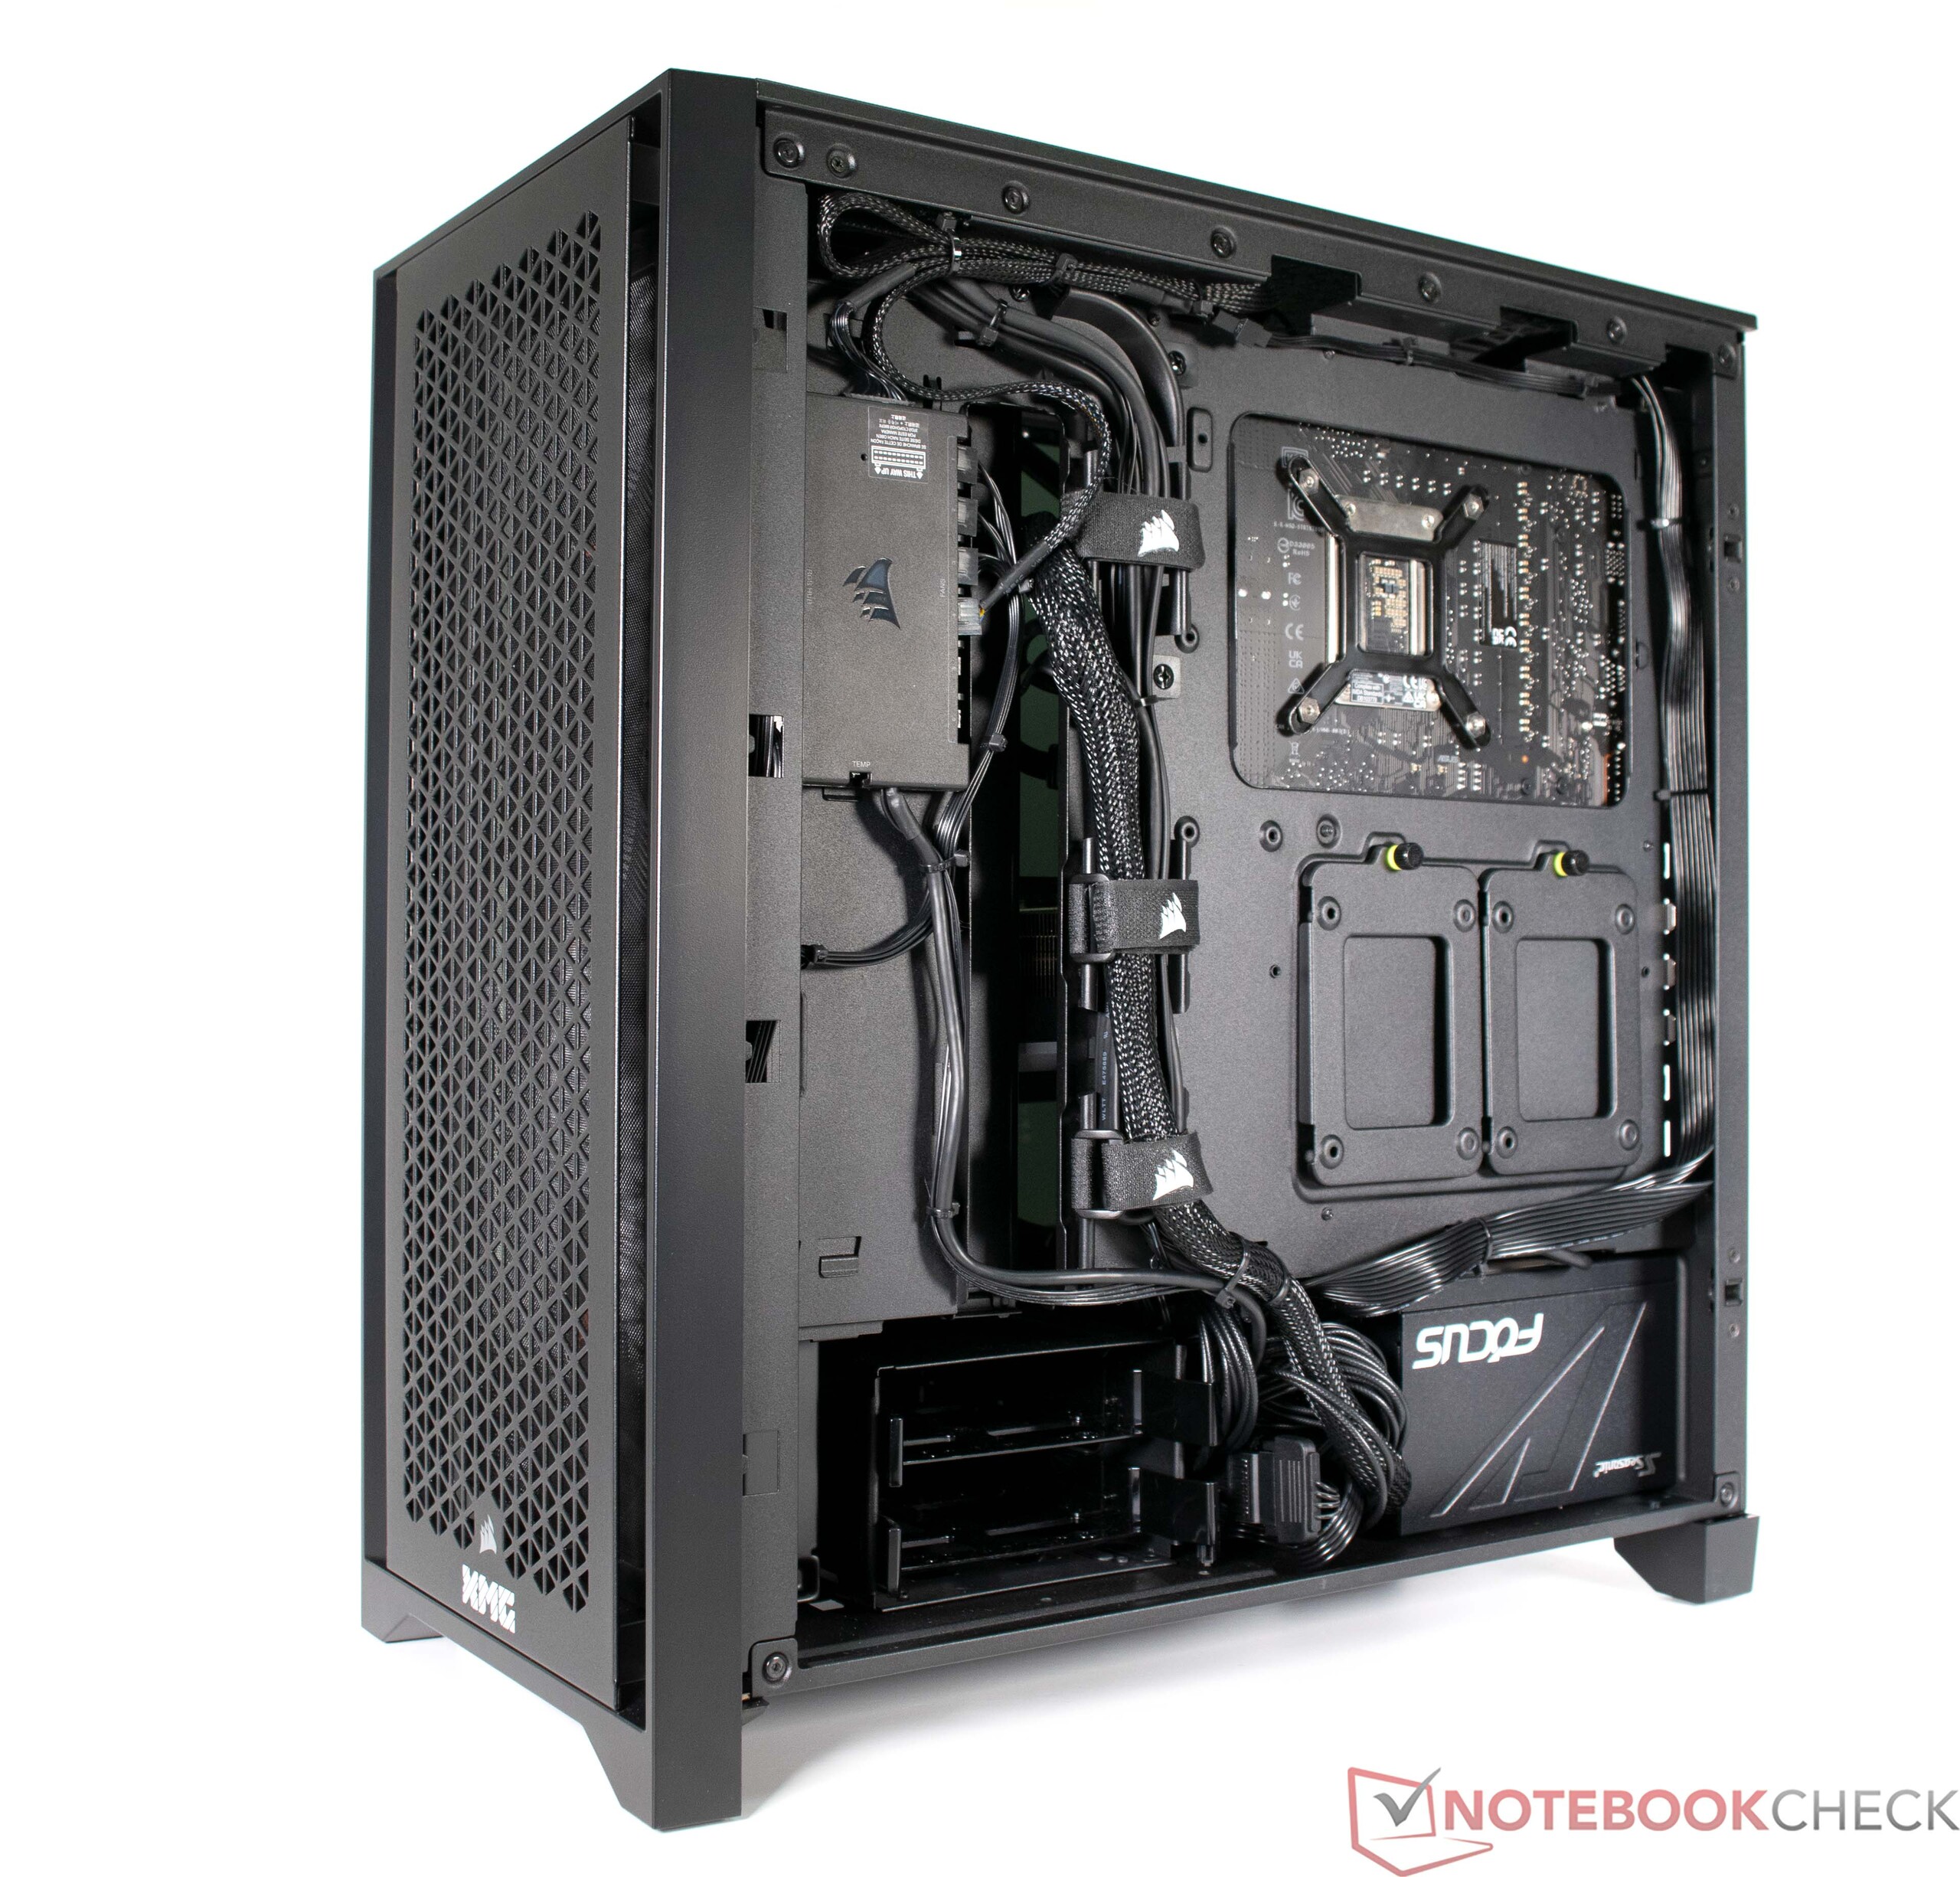
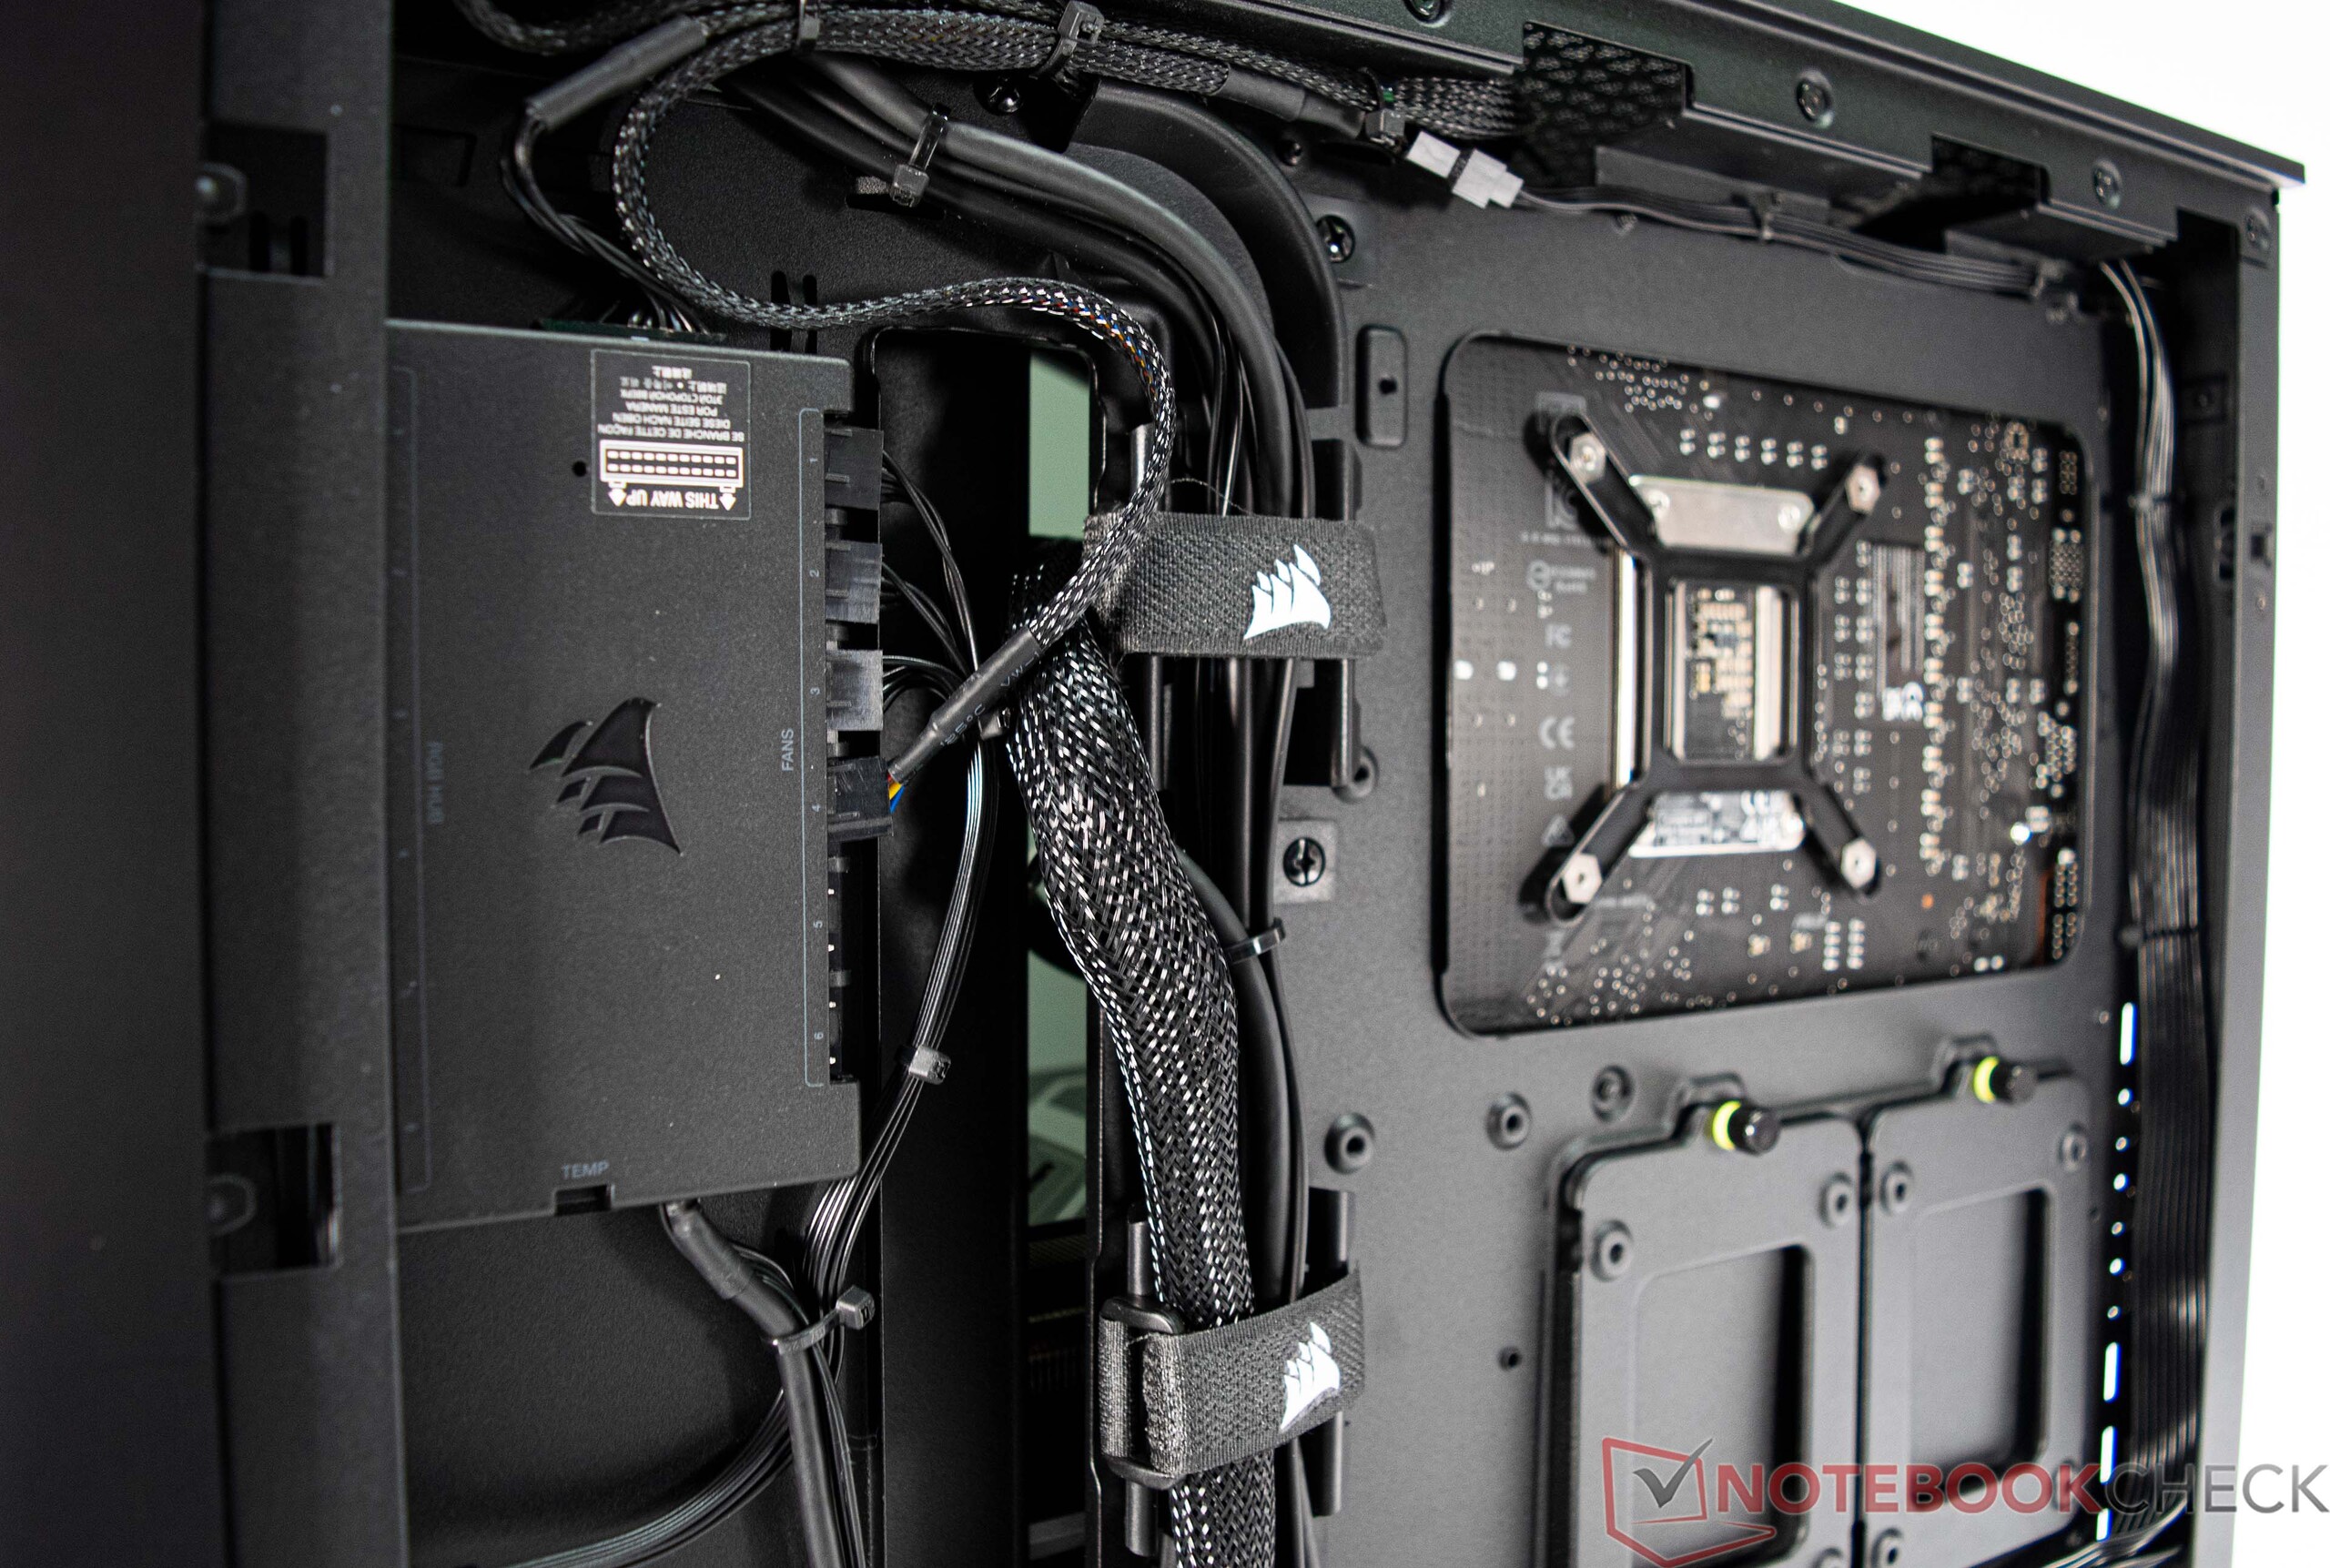
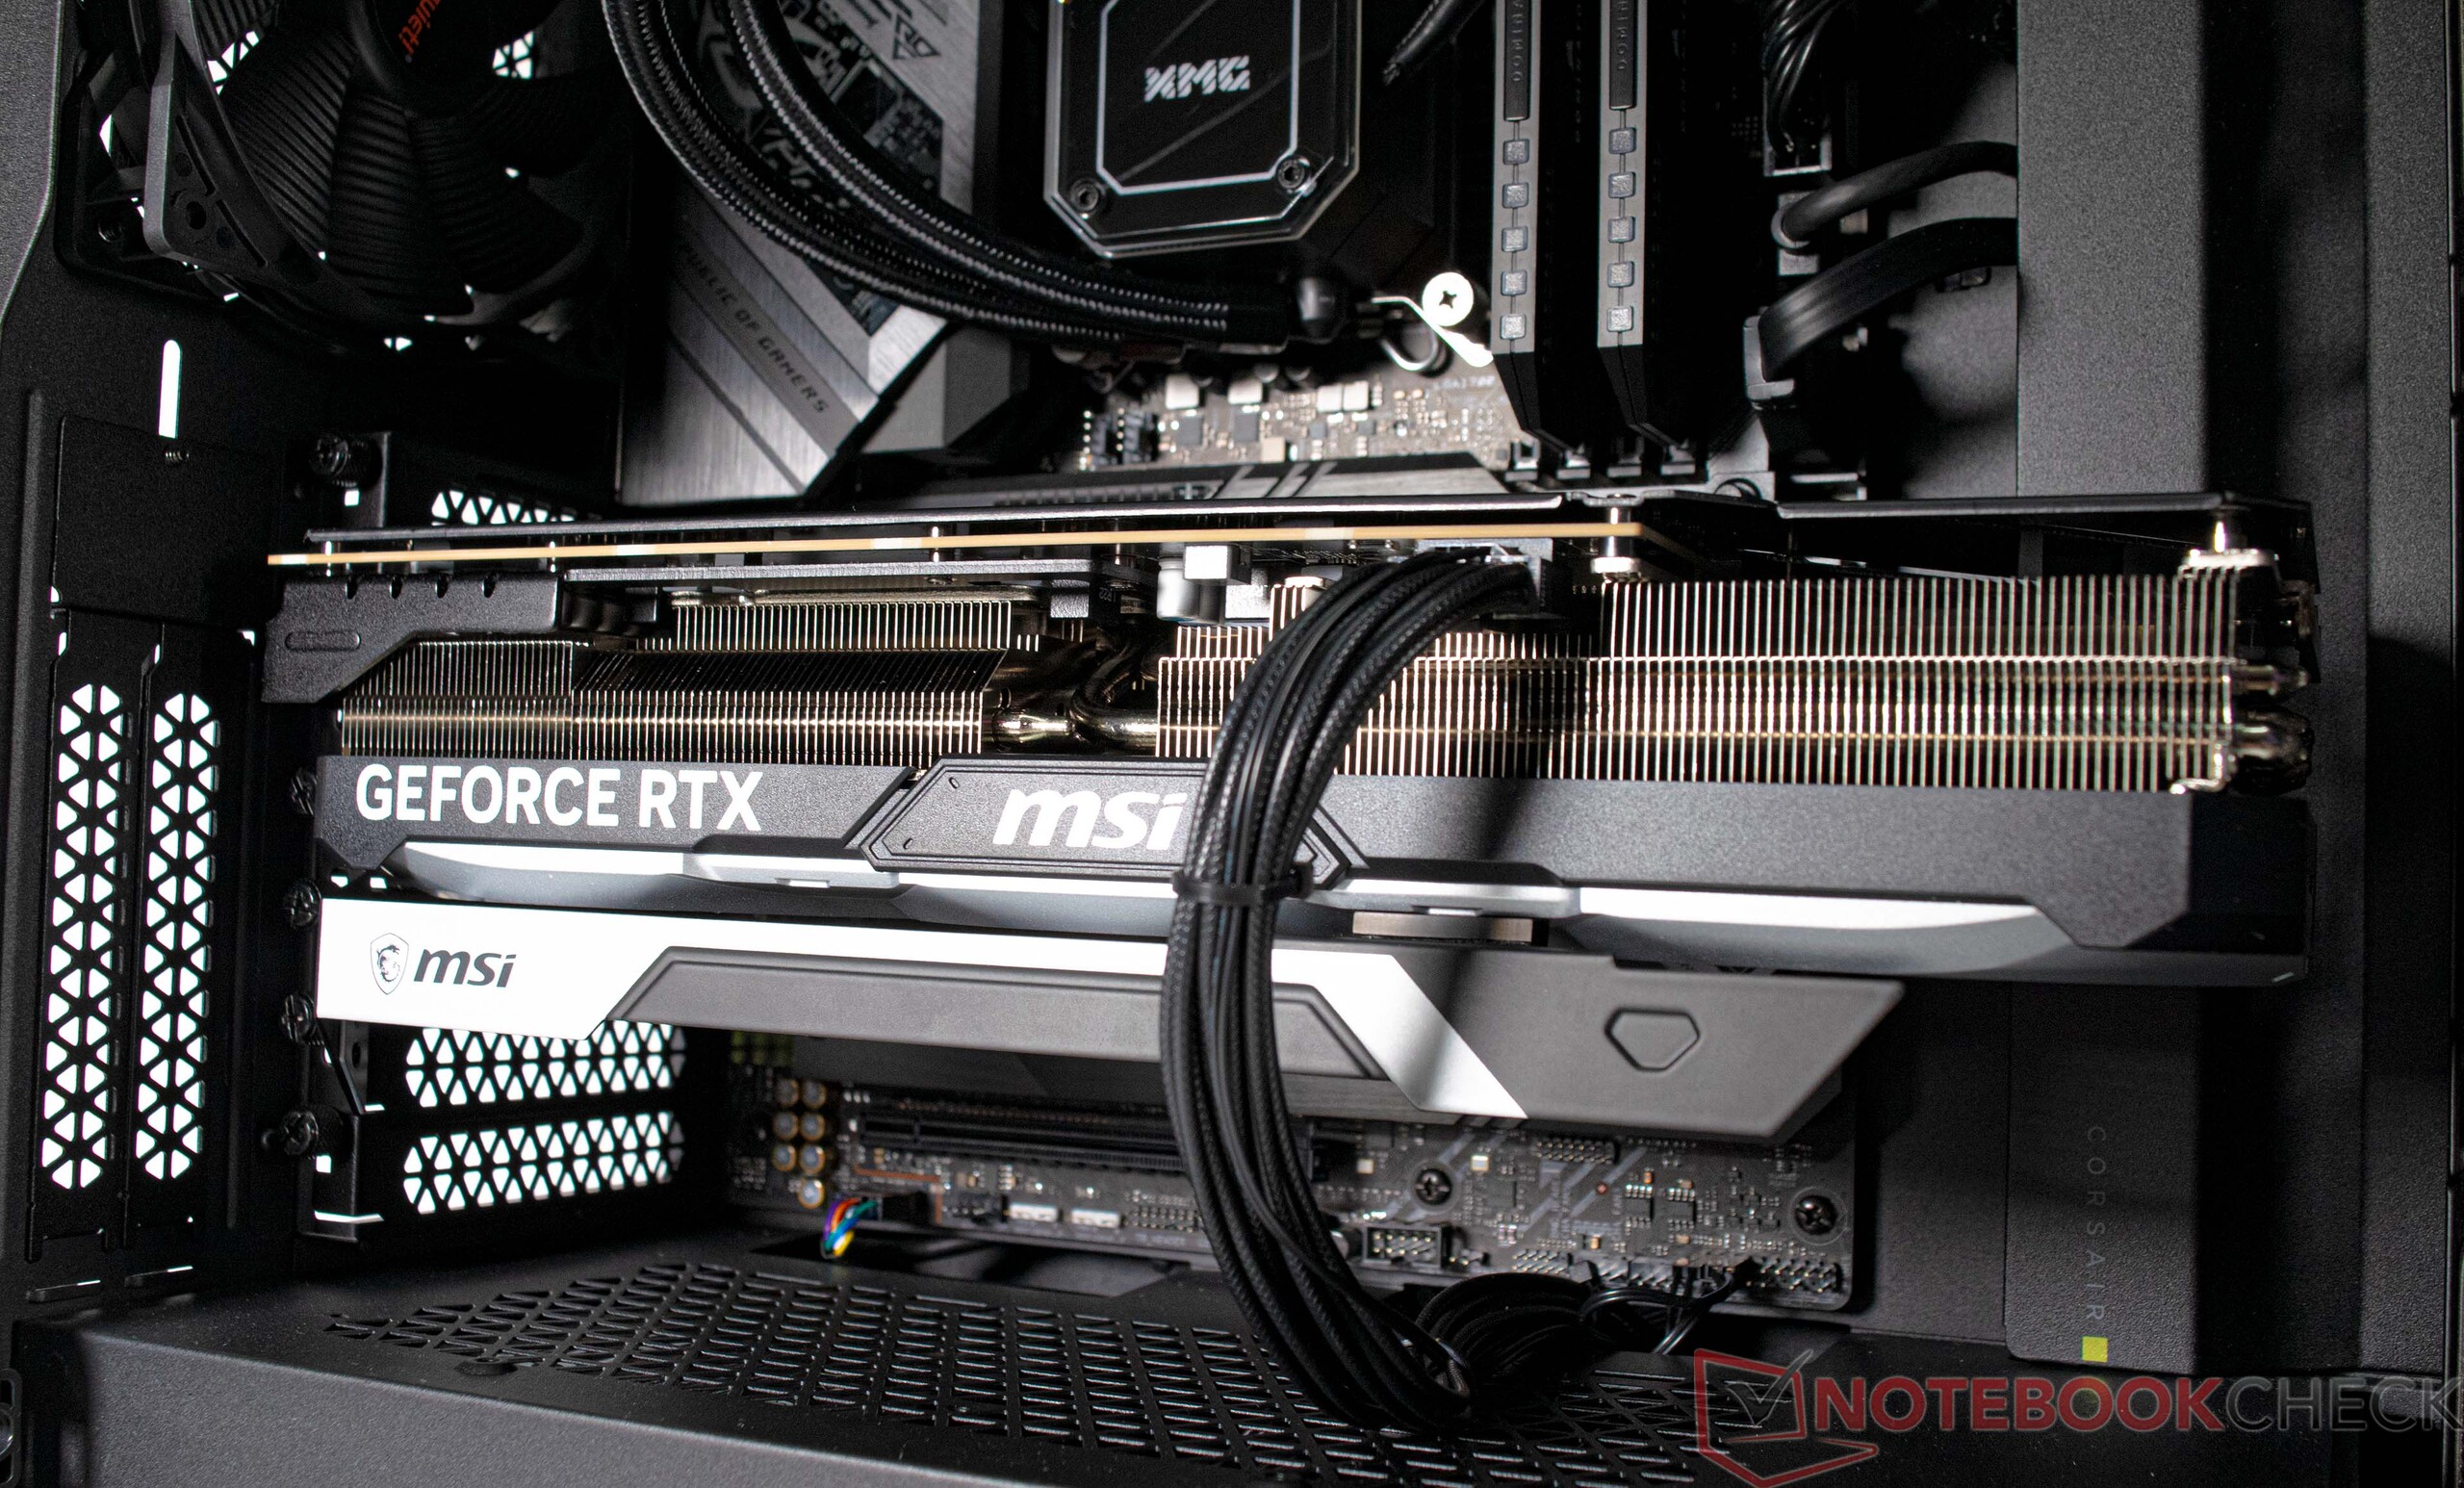
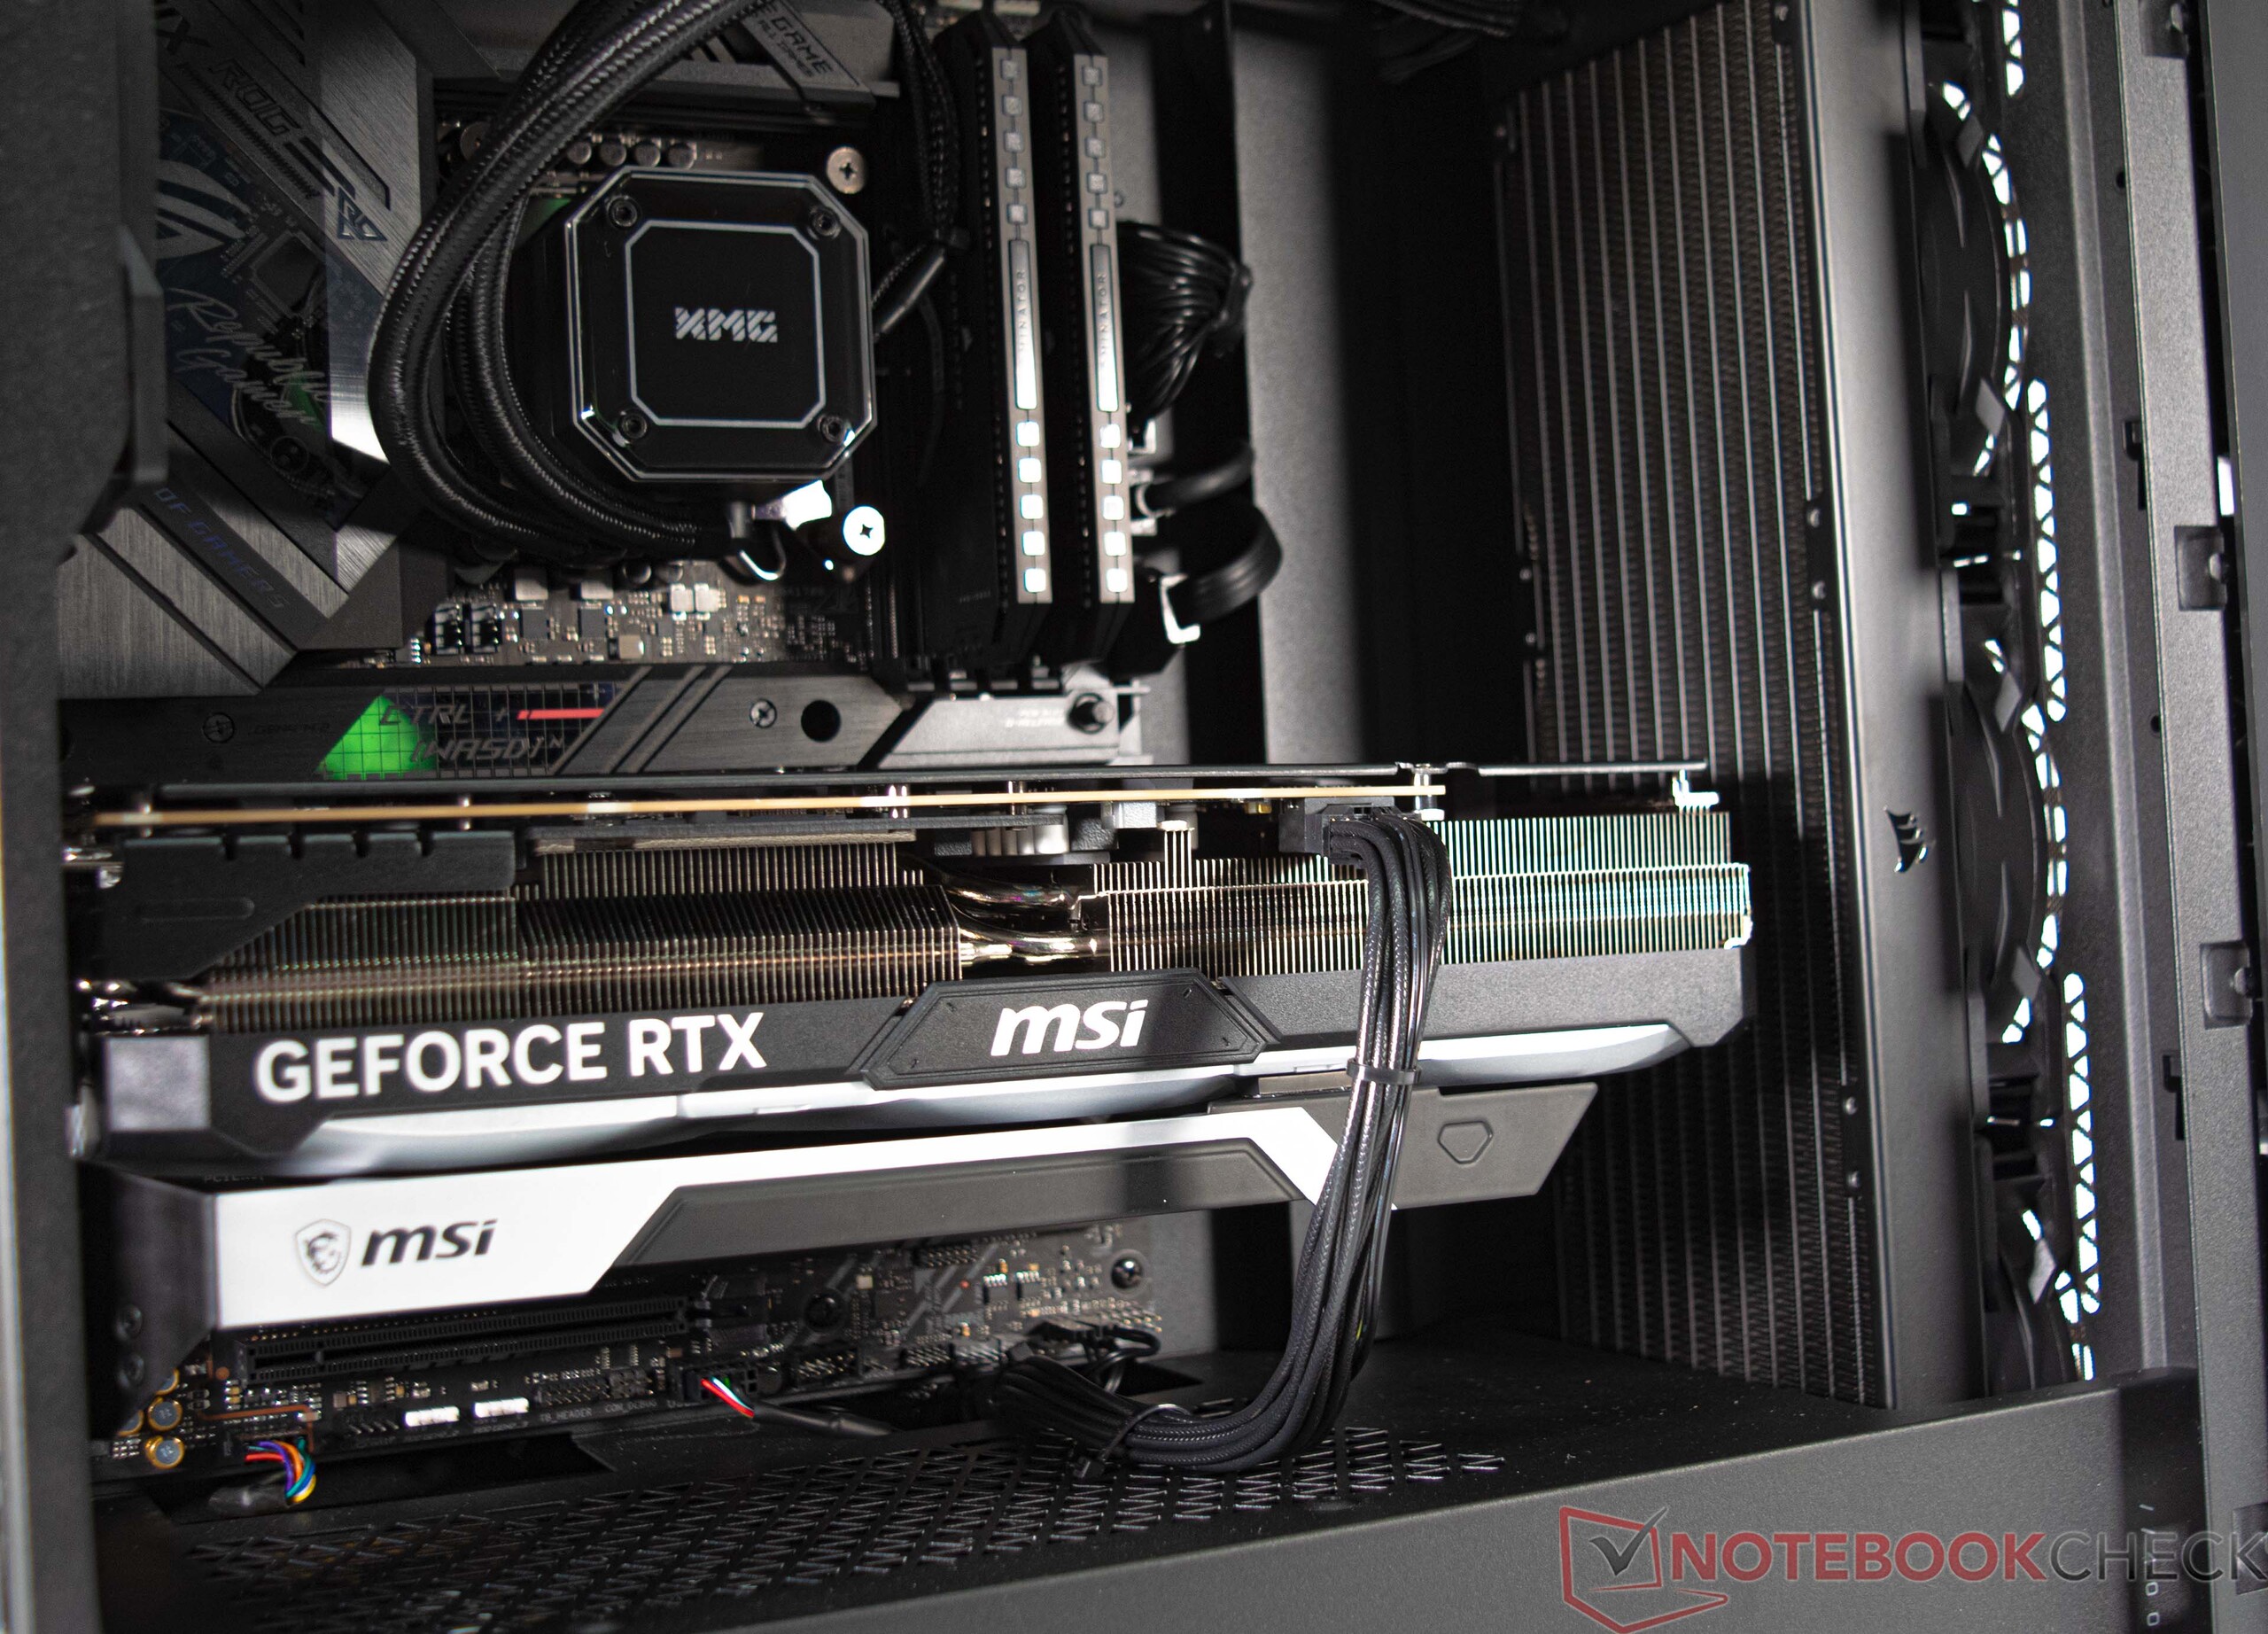
Schenker ha instalado el hardware de la XMG SECTOR Intel en una Corsair 4000D Airflow negra. La caja tiene una ventana de cristal oscuro para mostrar los componentes del interior con efectos de iluminación. Sin embargo, el disipador AIO incluido y los módulos de memoria Corsair Dominator RGB son las únicas fuentes de iluminación en nuestra configuración de prueba.
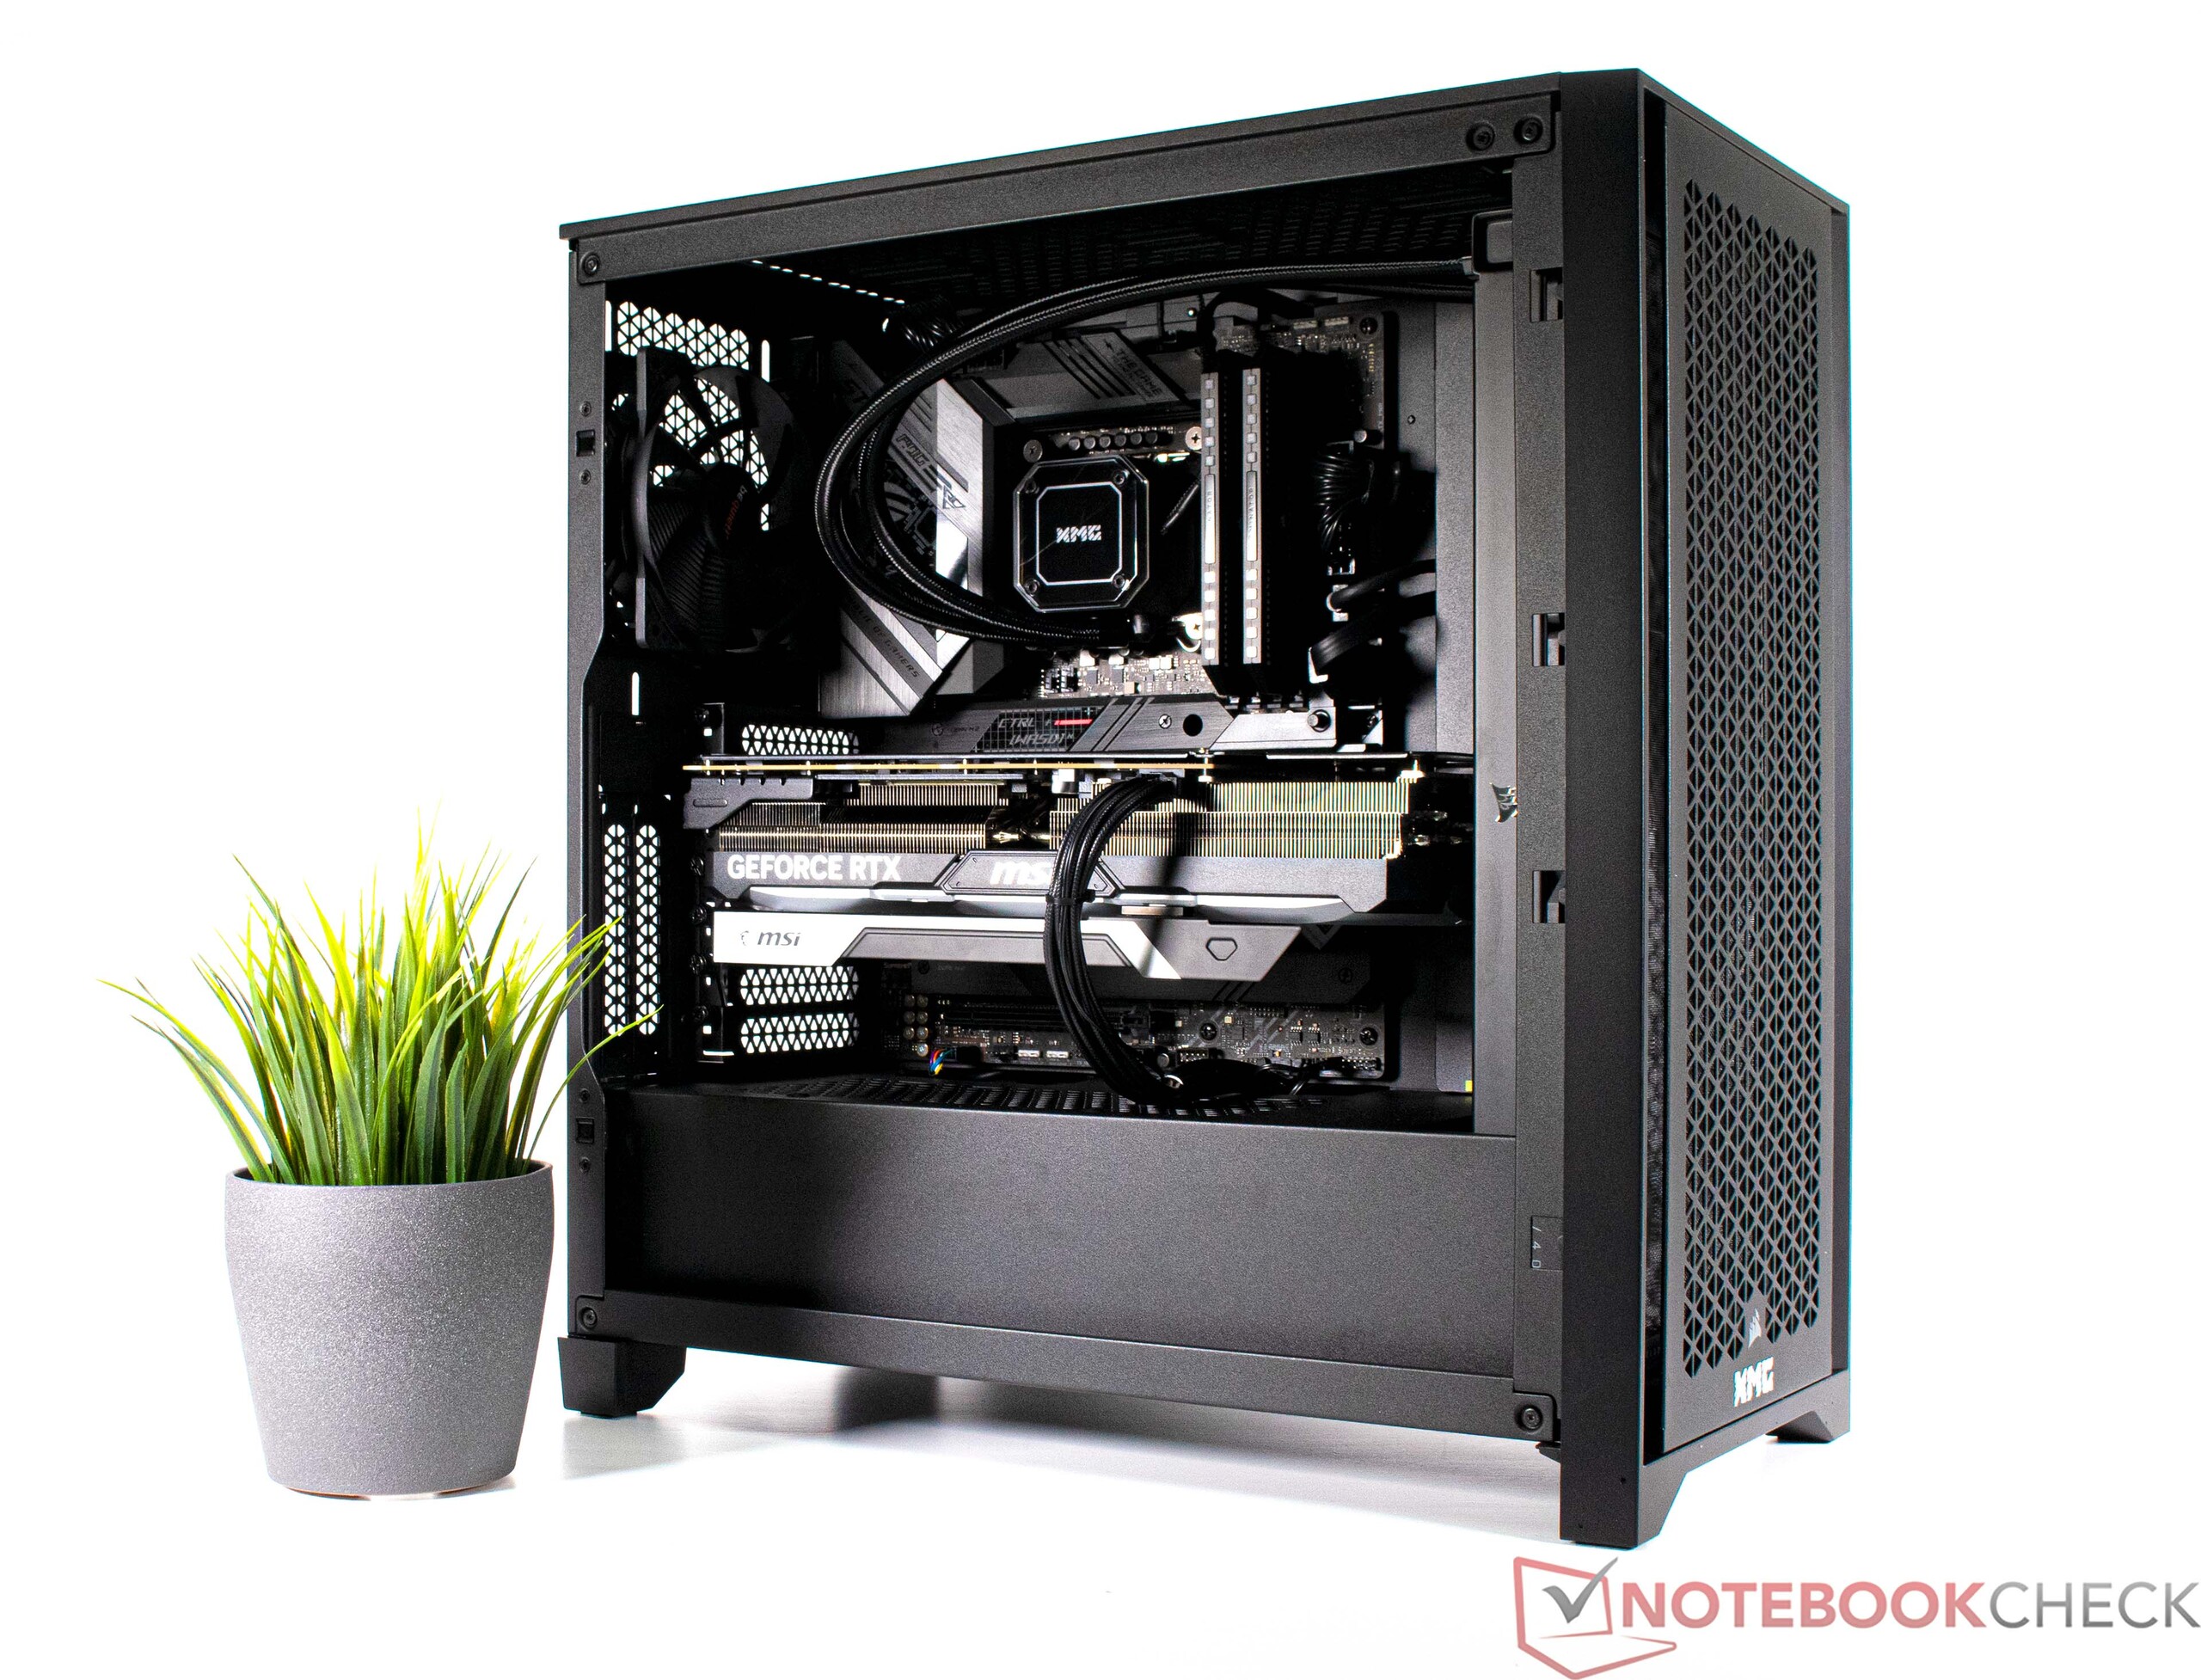
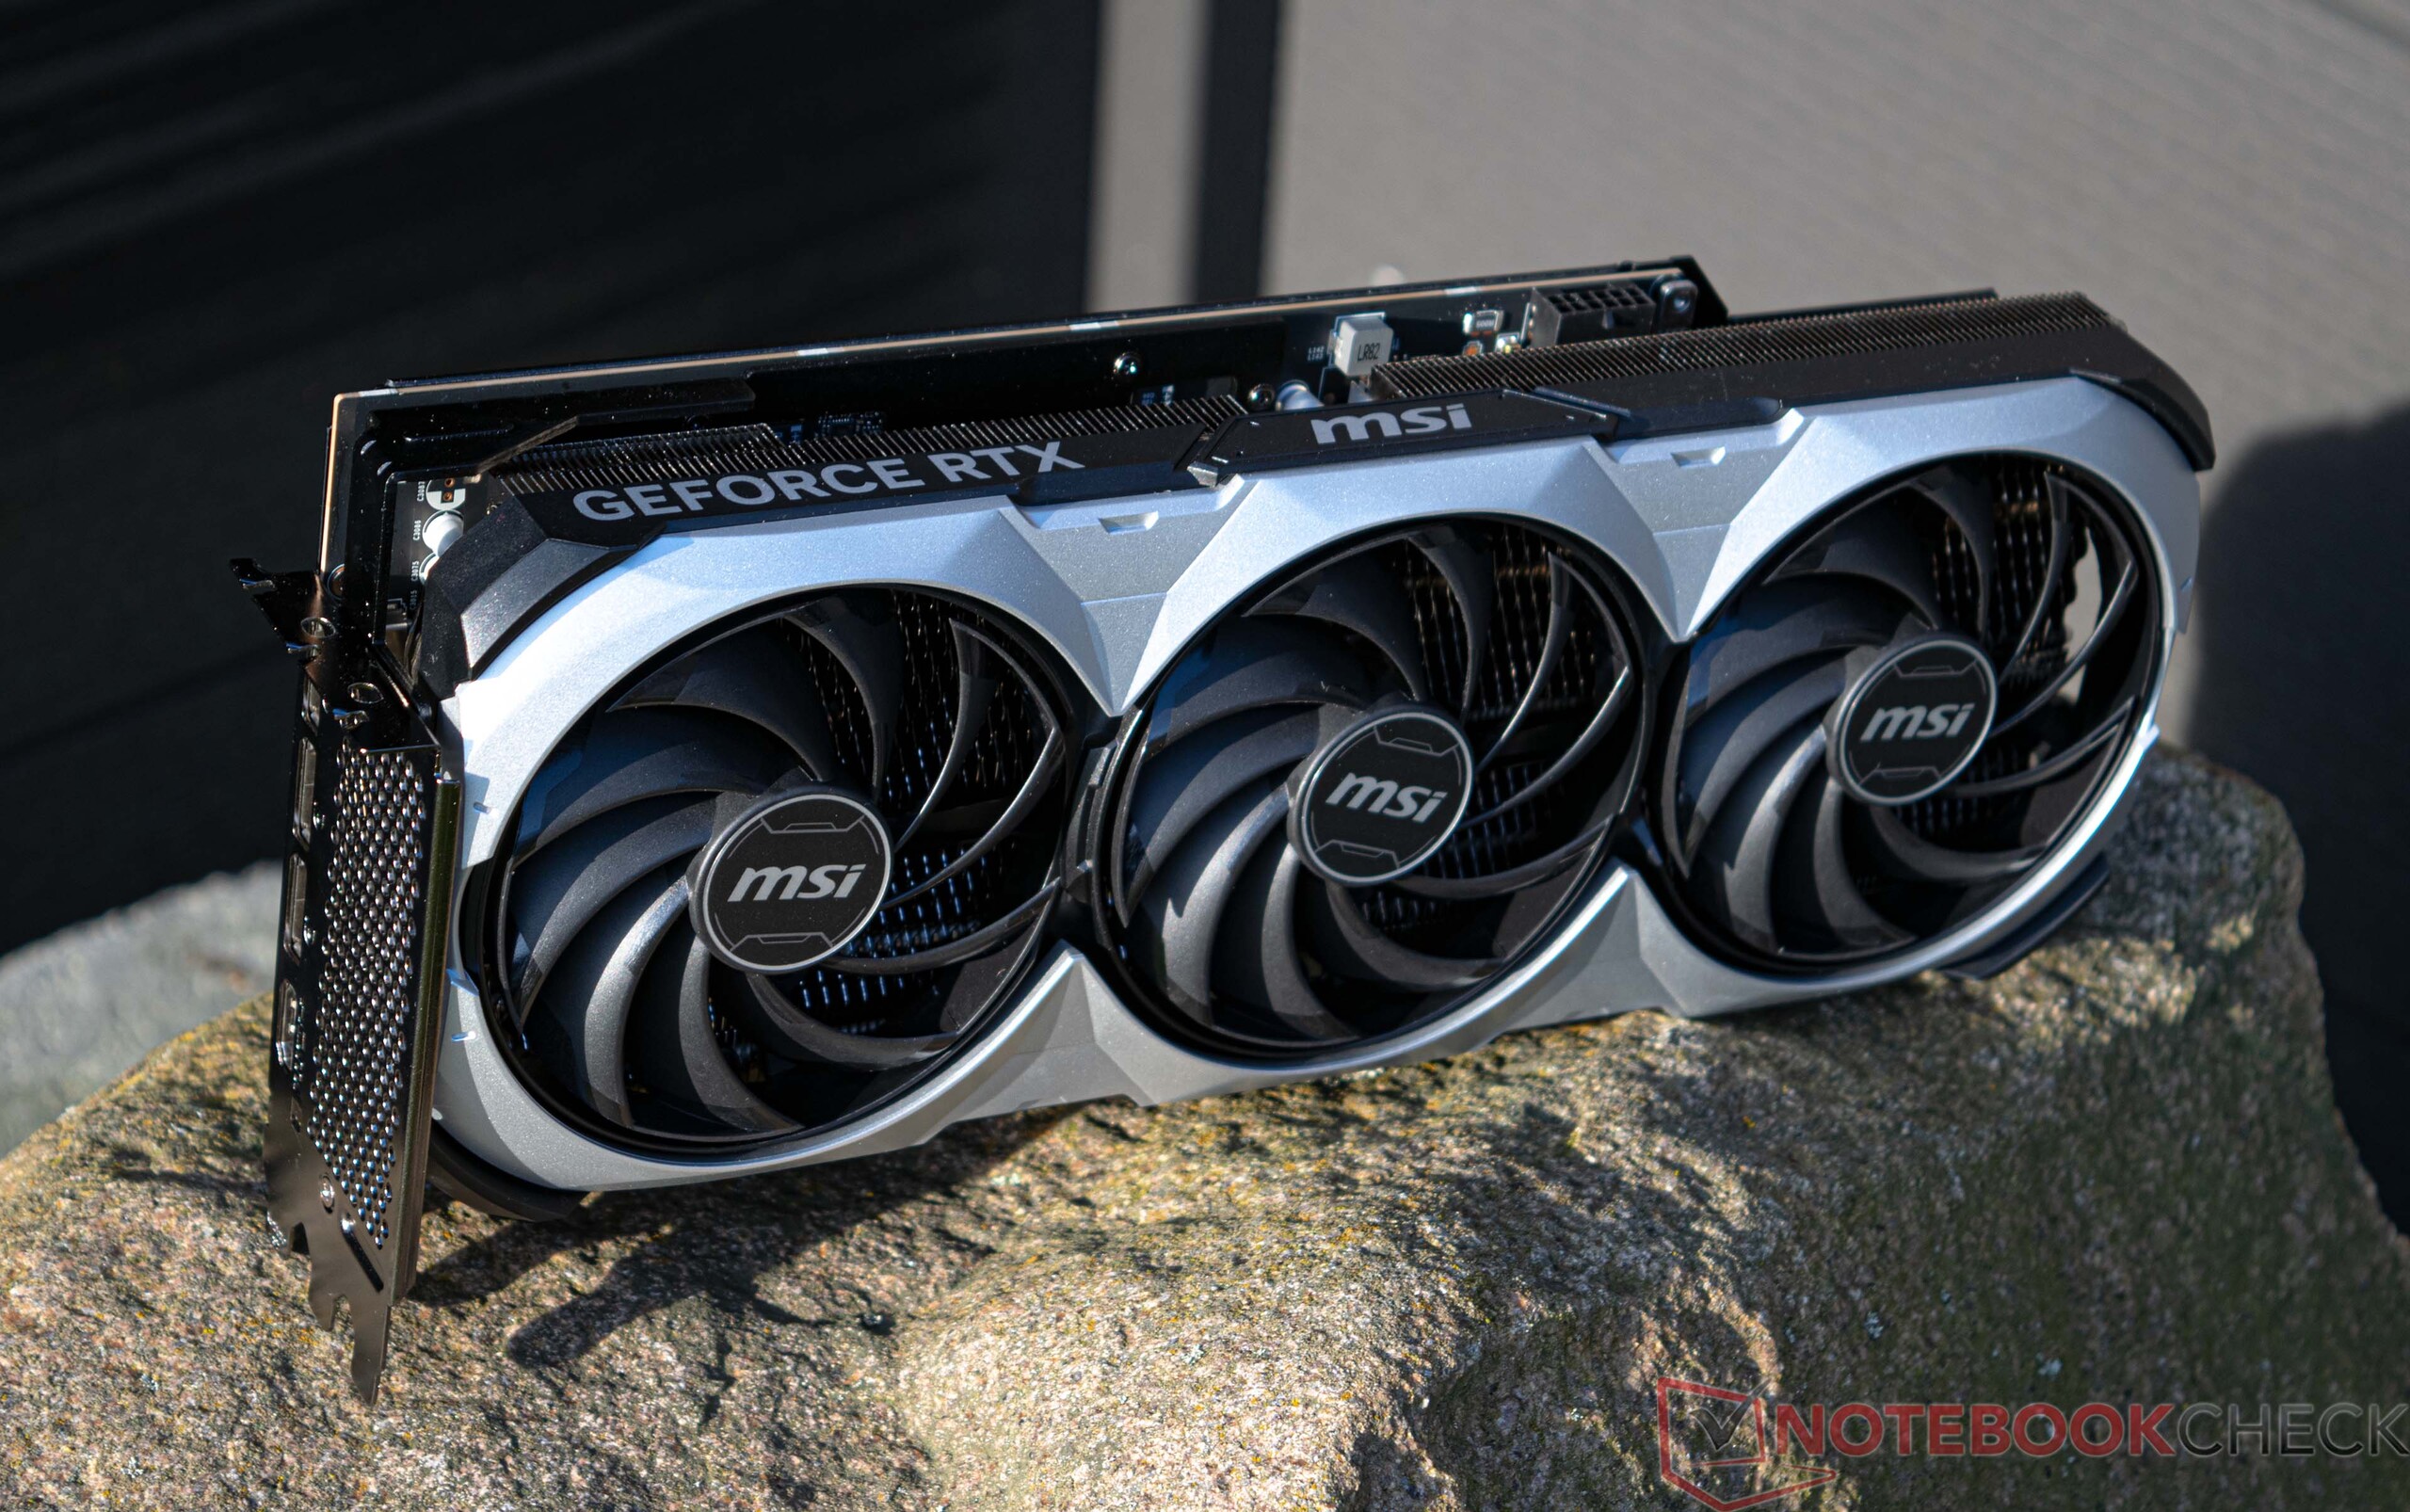
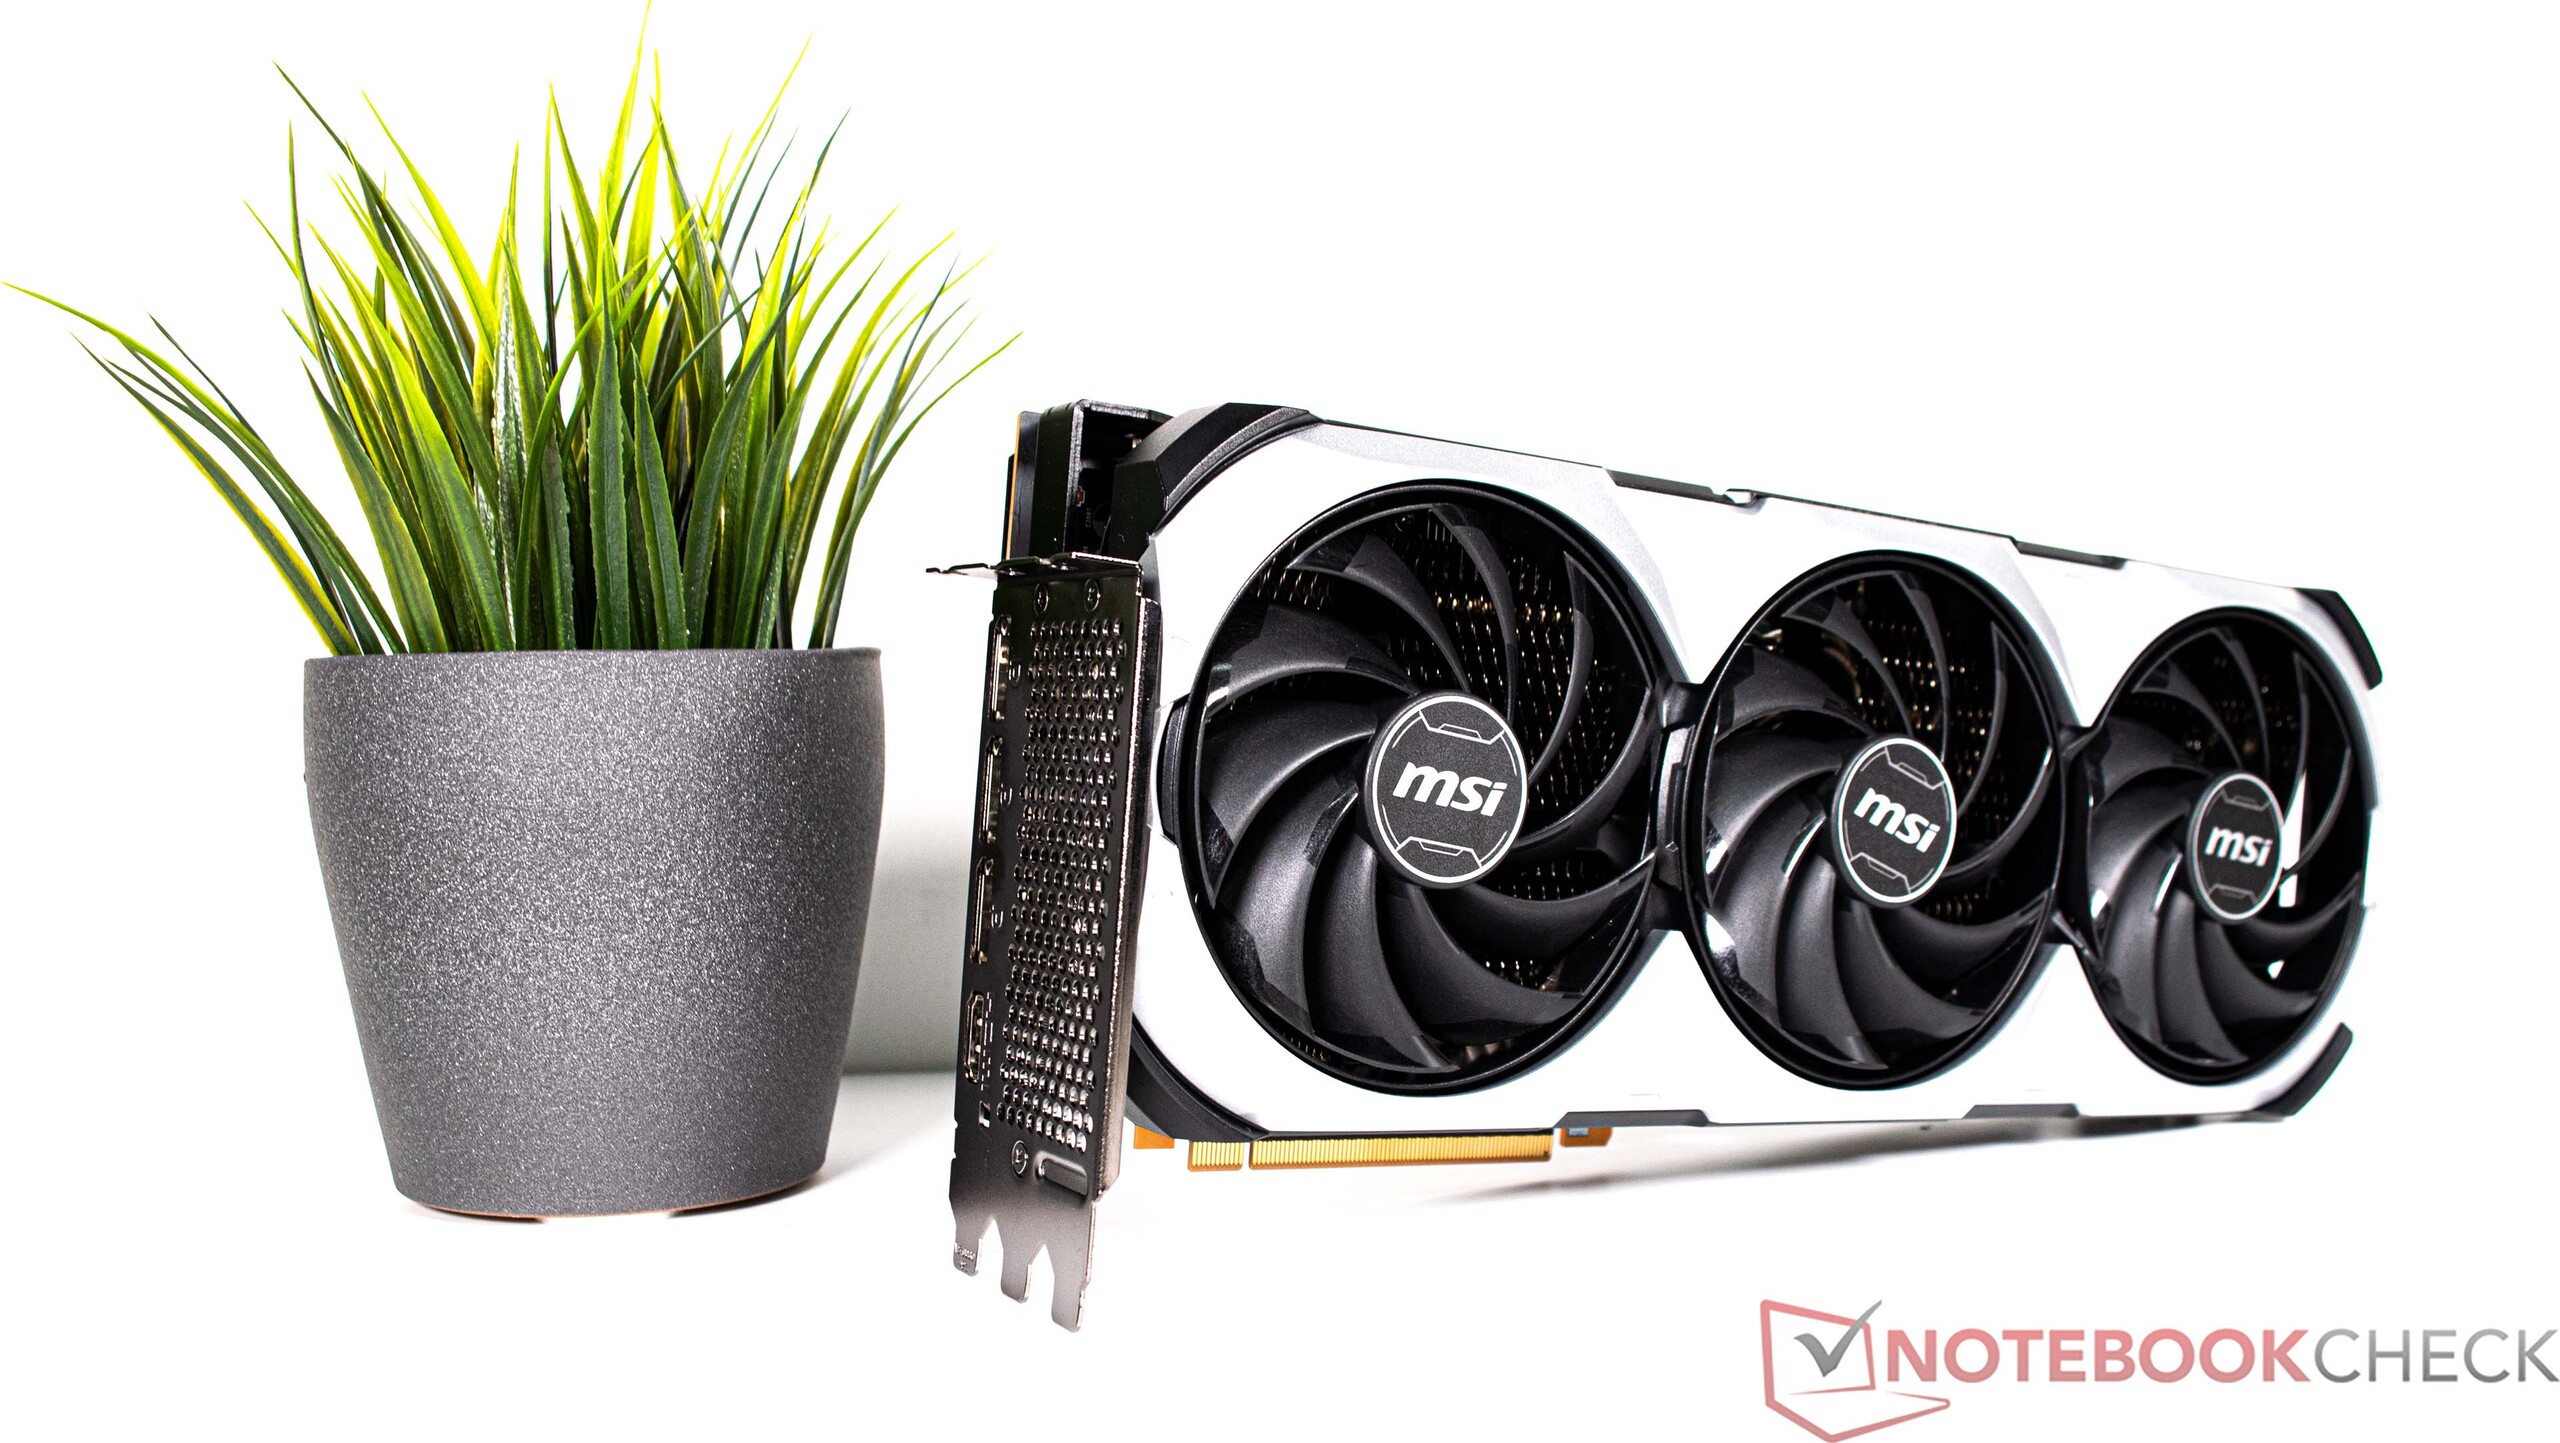
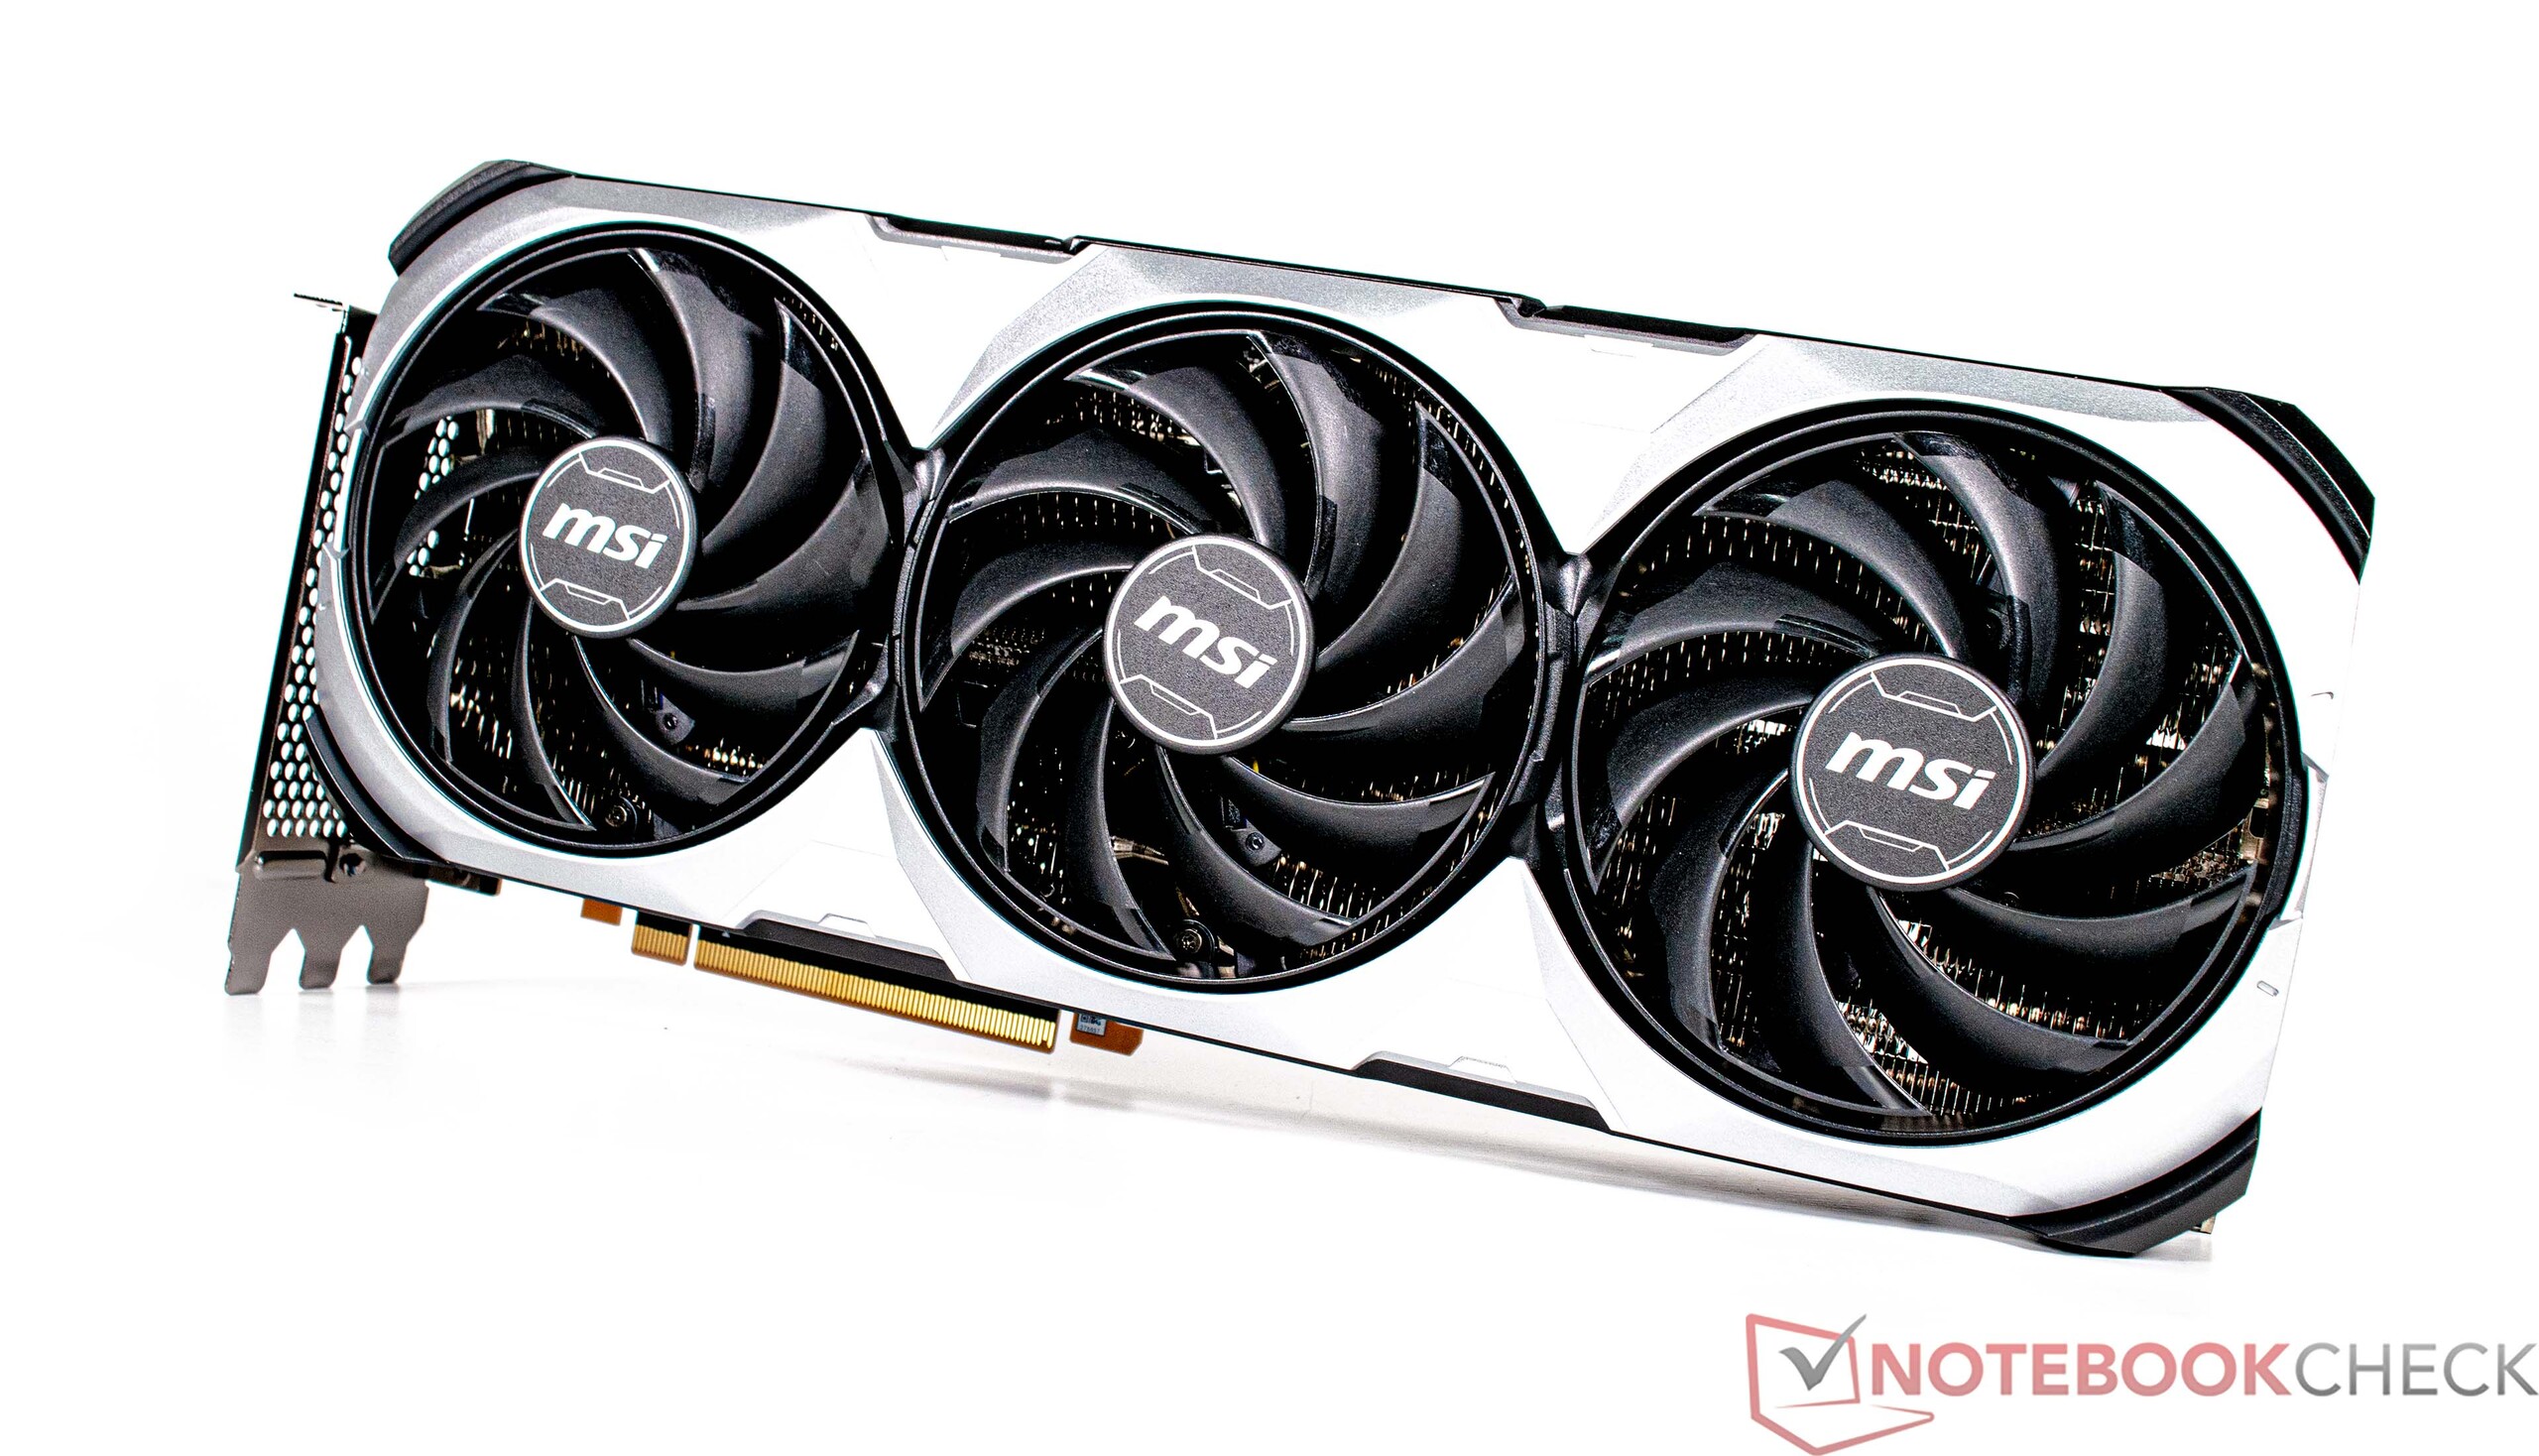
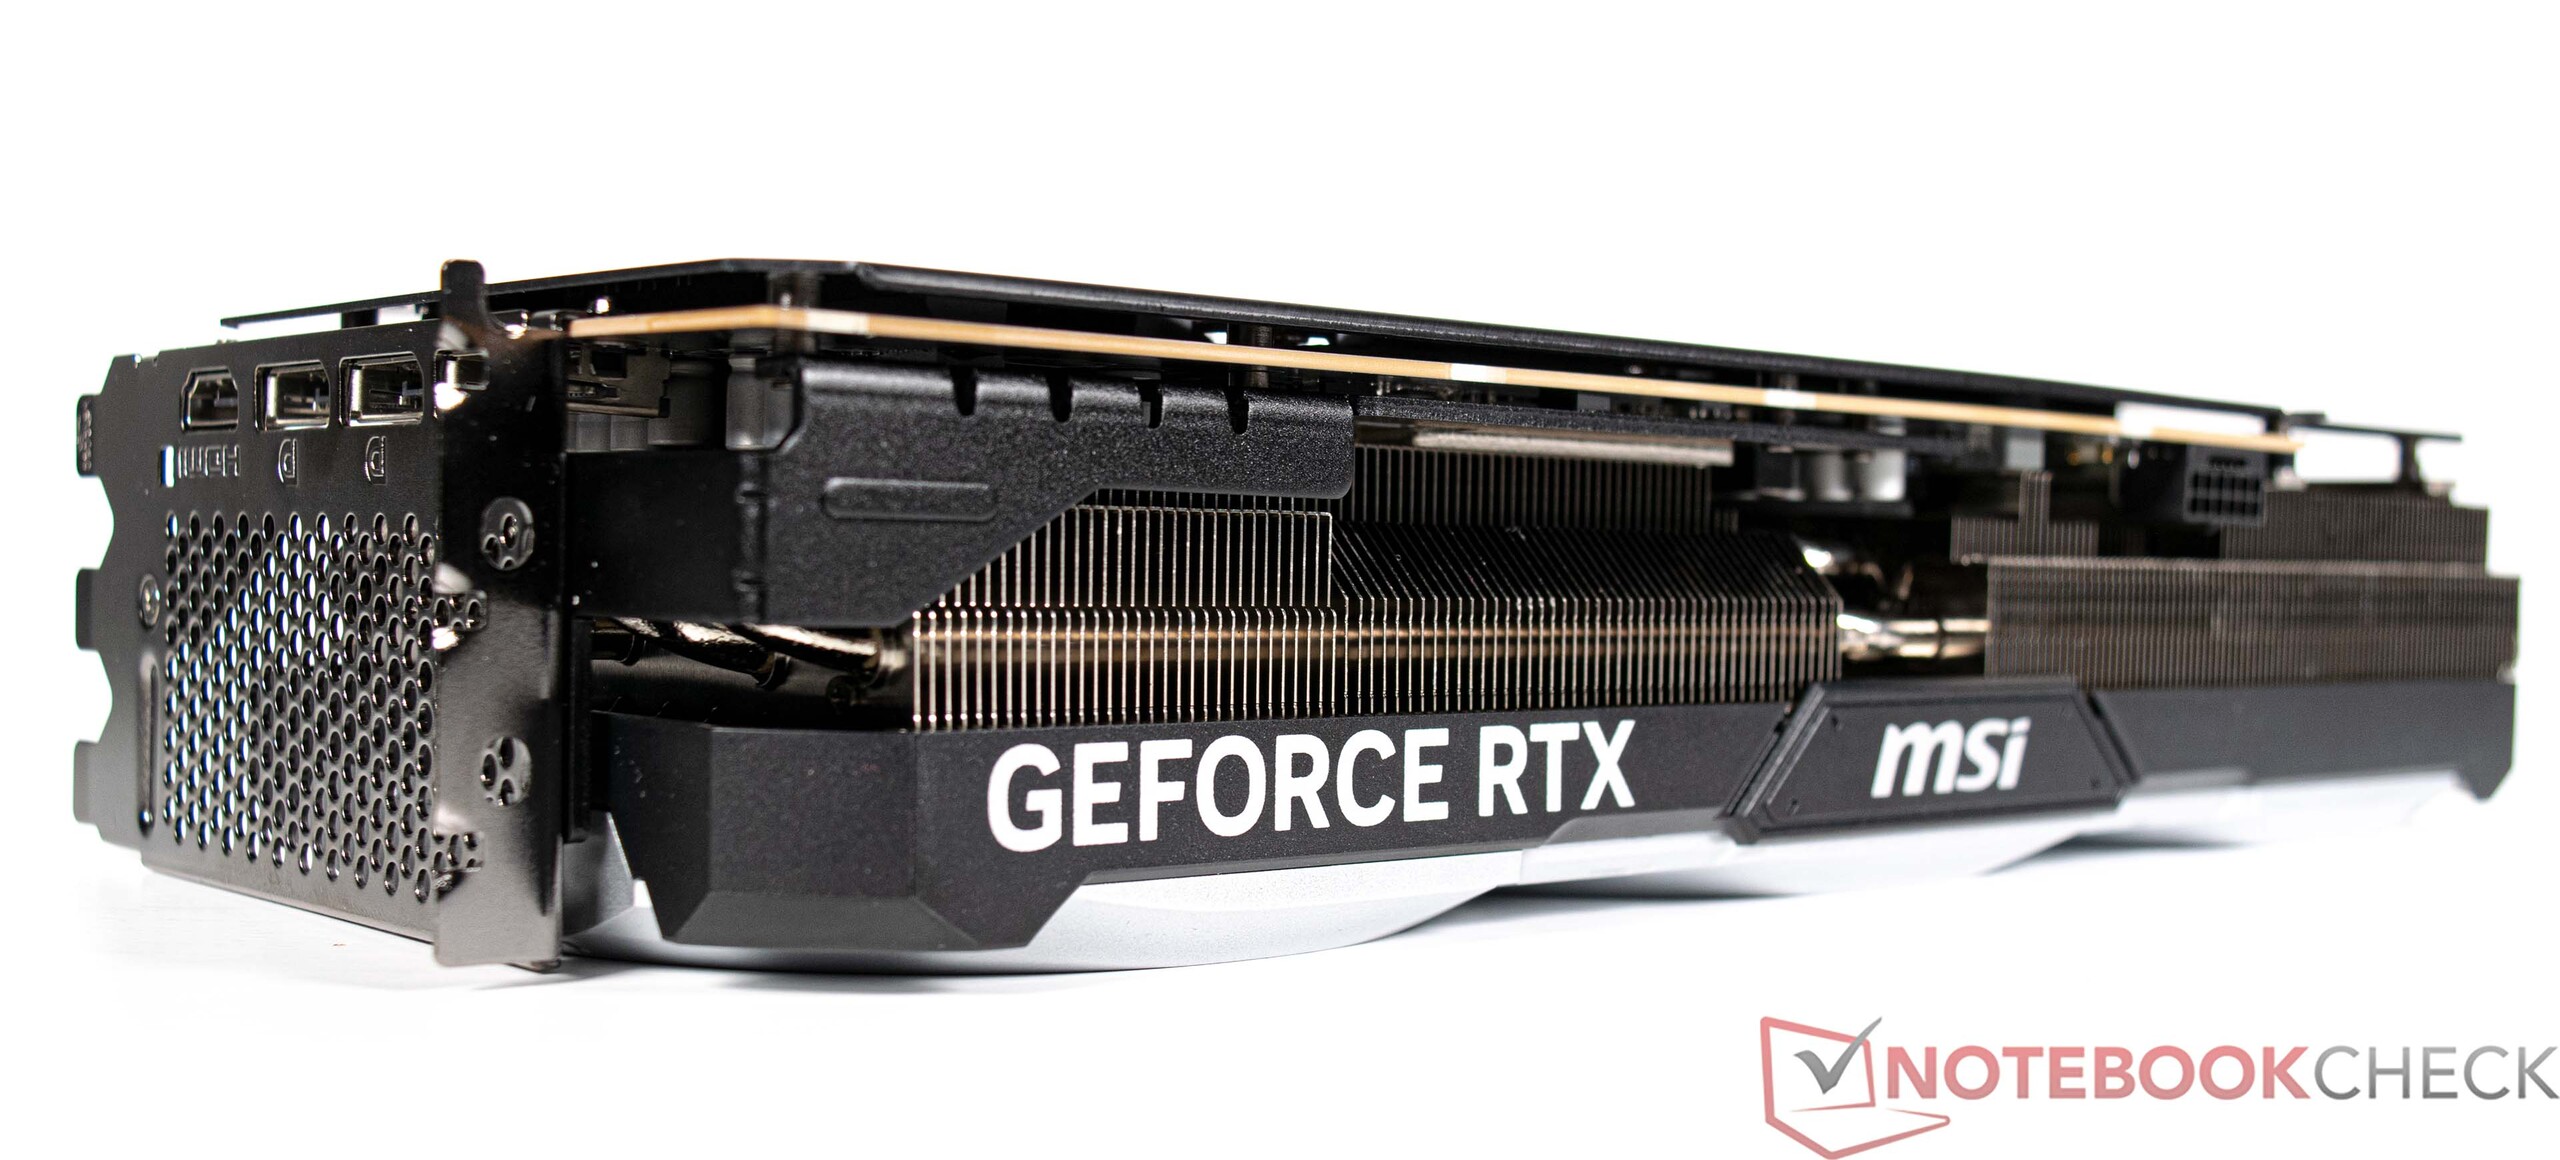
La Corsair 4000D Airflow es fundamentalmente una caja muy premium con espacio suficiente para albergar numerosos componentes. Incluso la enorme MSI GeForce RTX 4090 VENTUS 3X cabe fácilmente en la carcasa.
Especificaciones
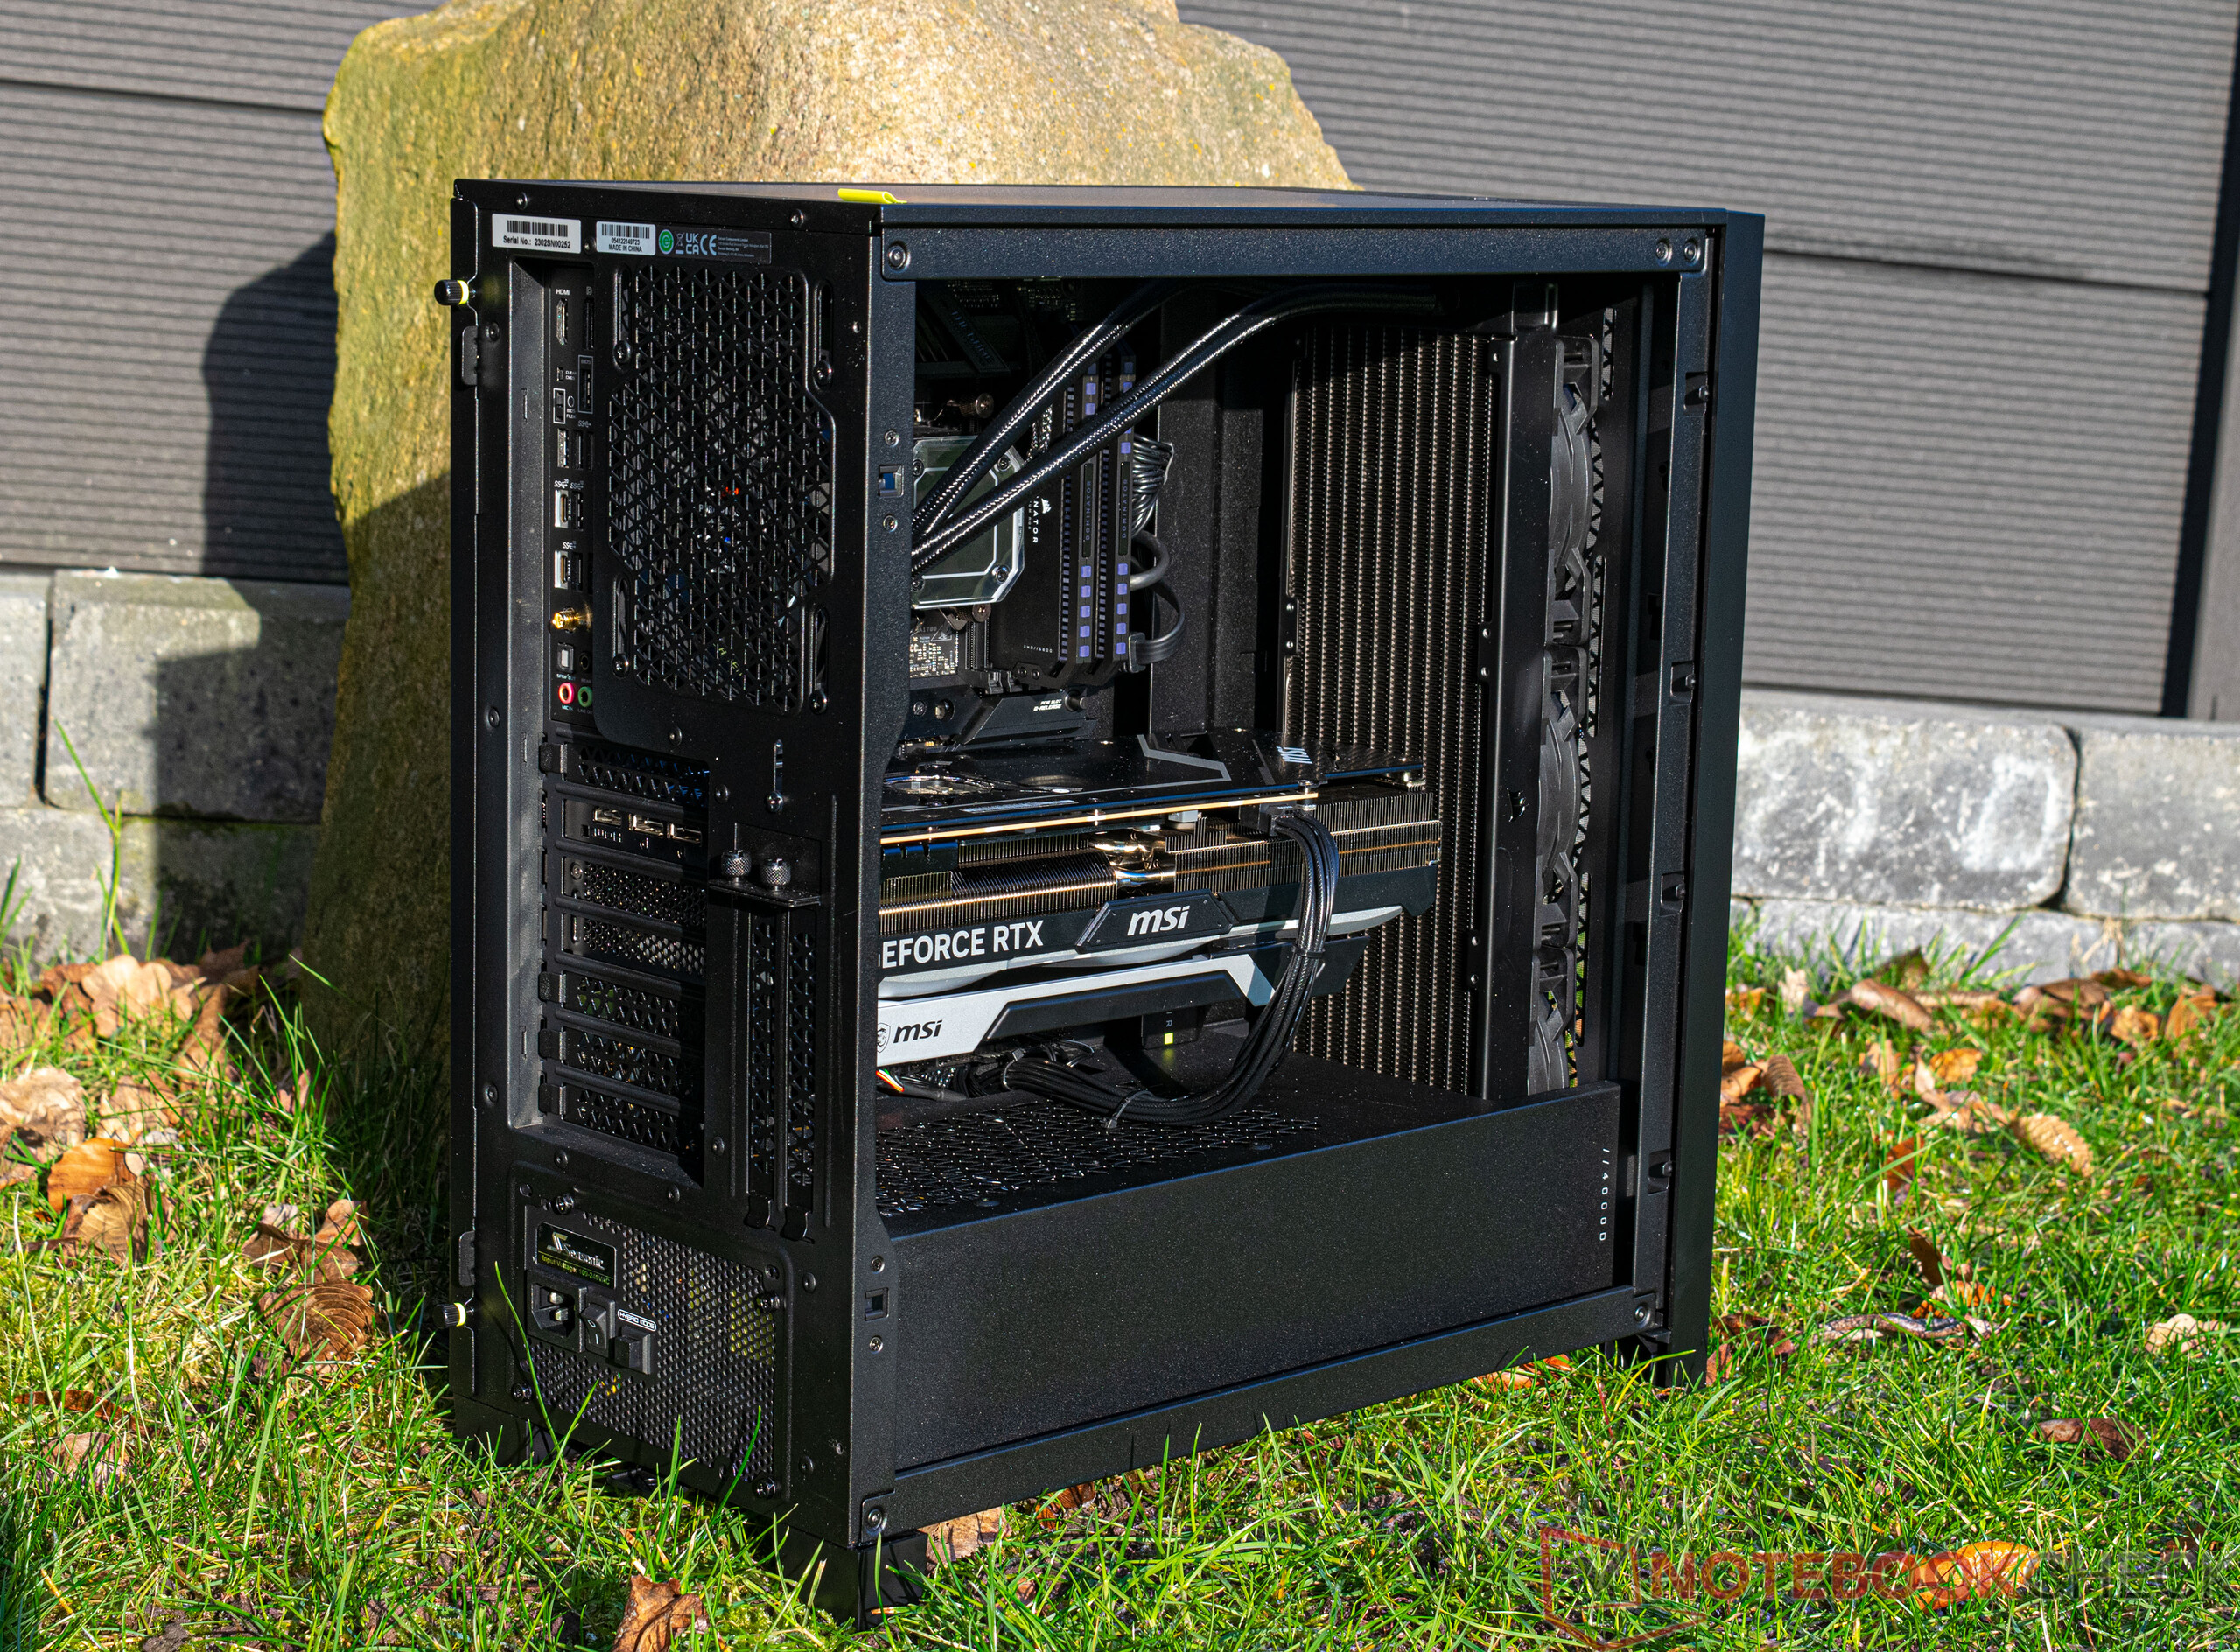
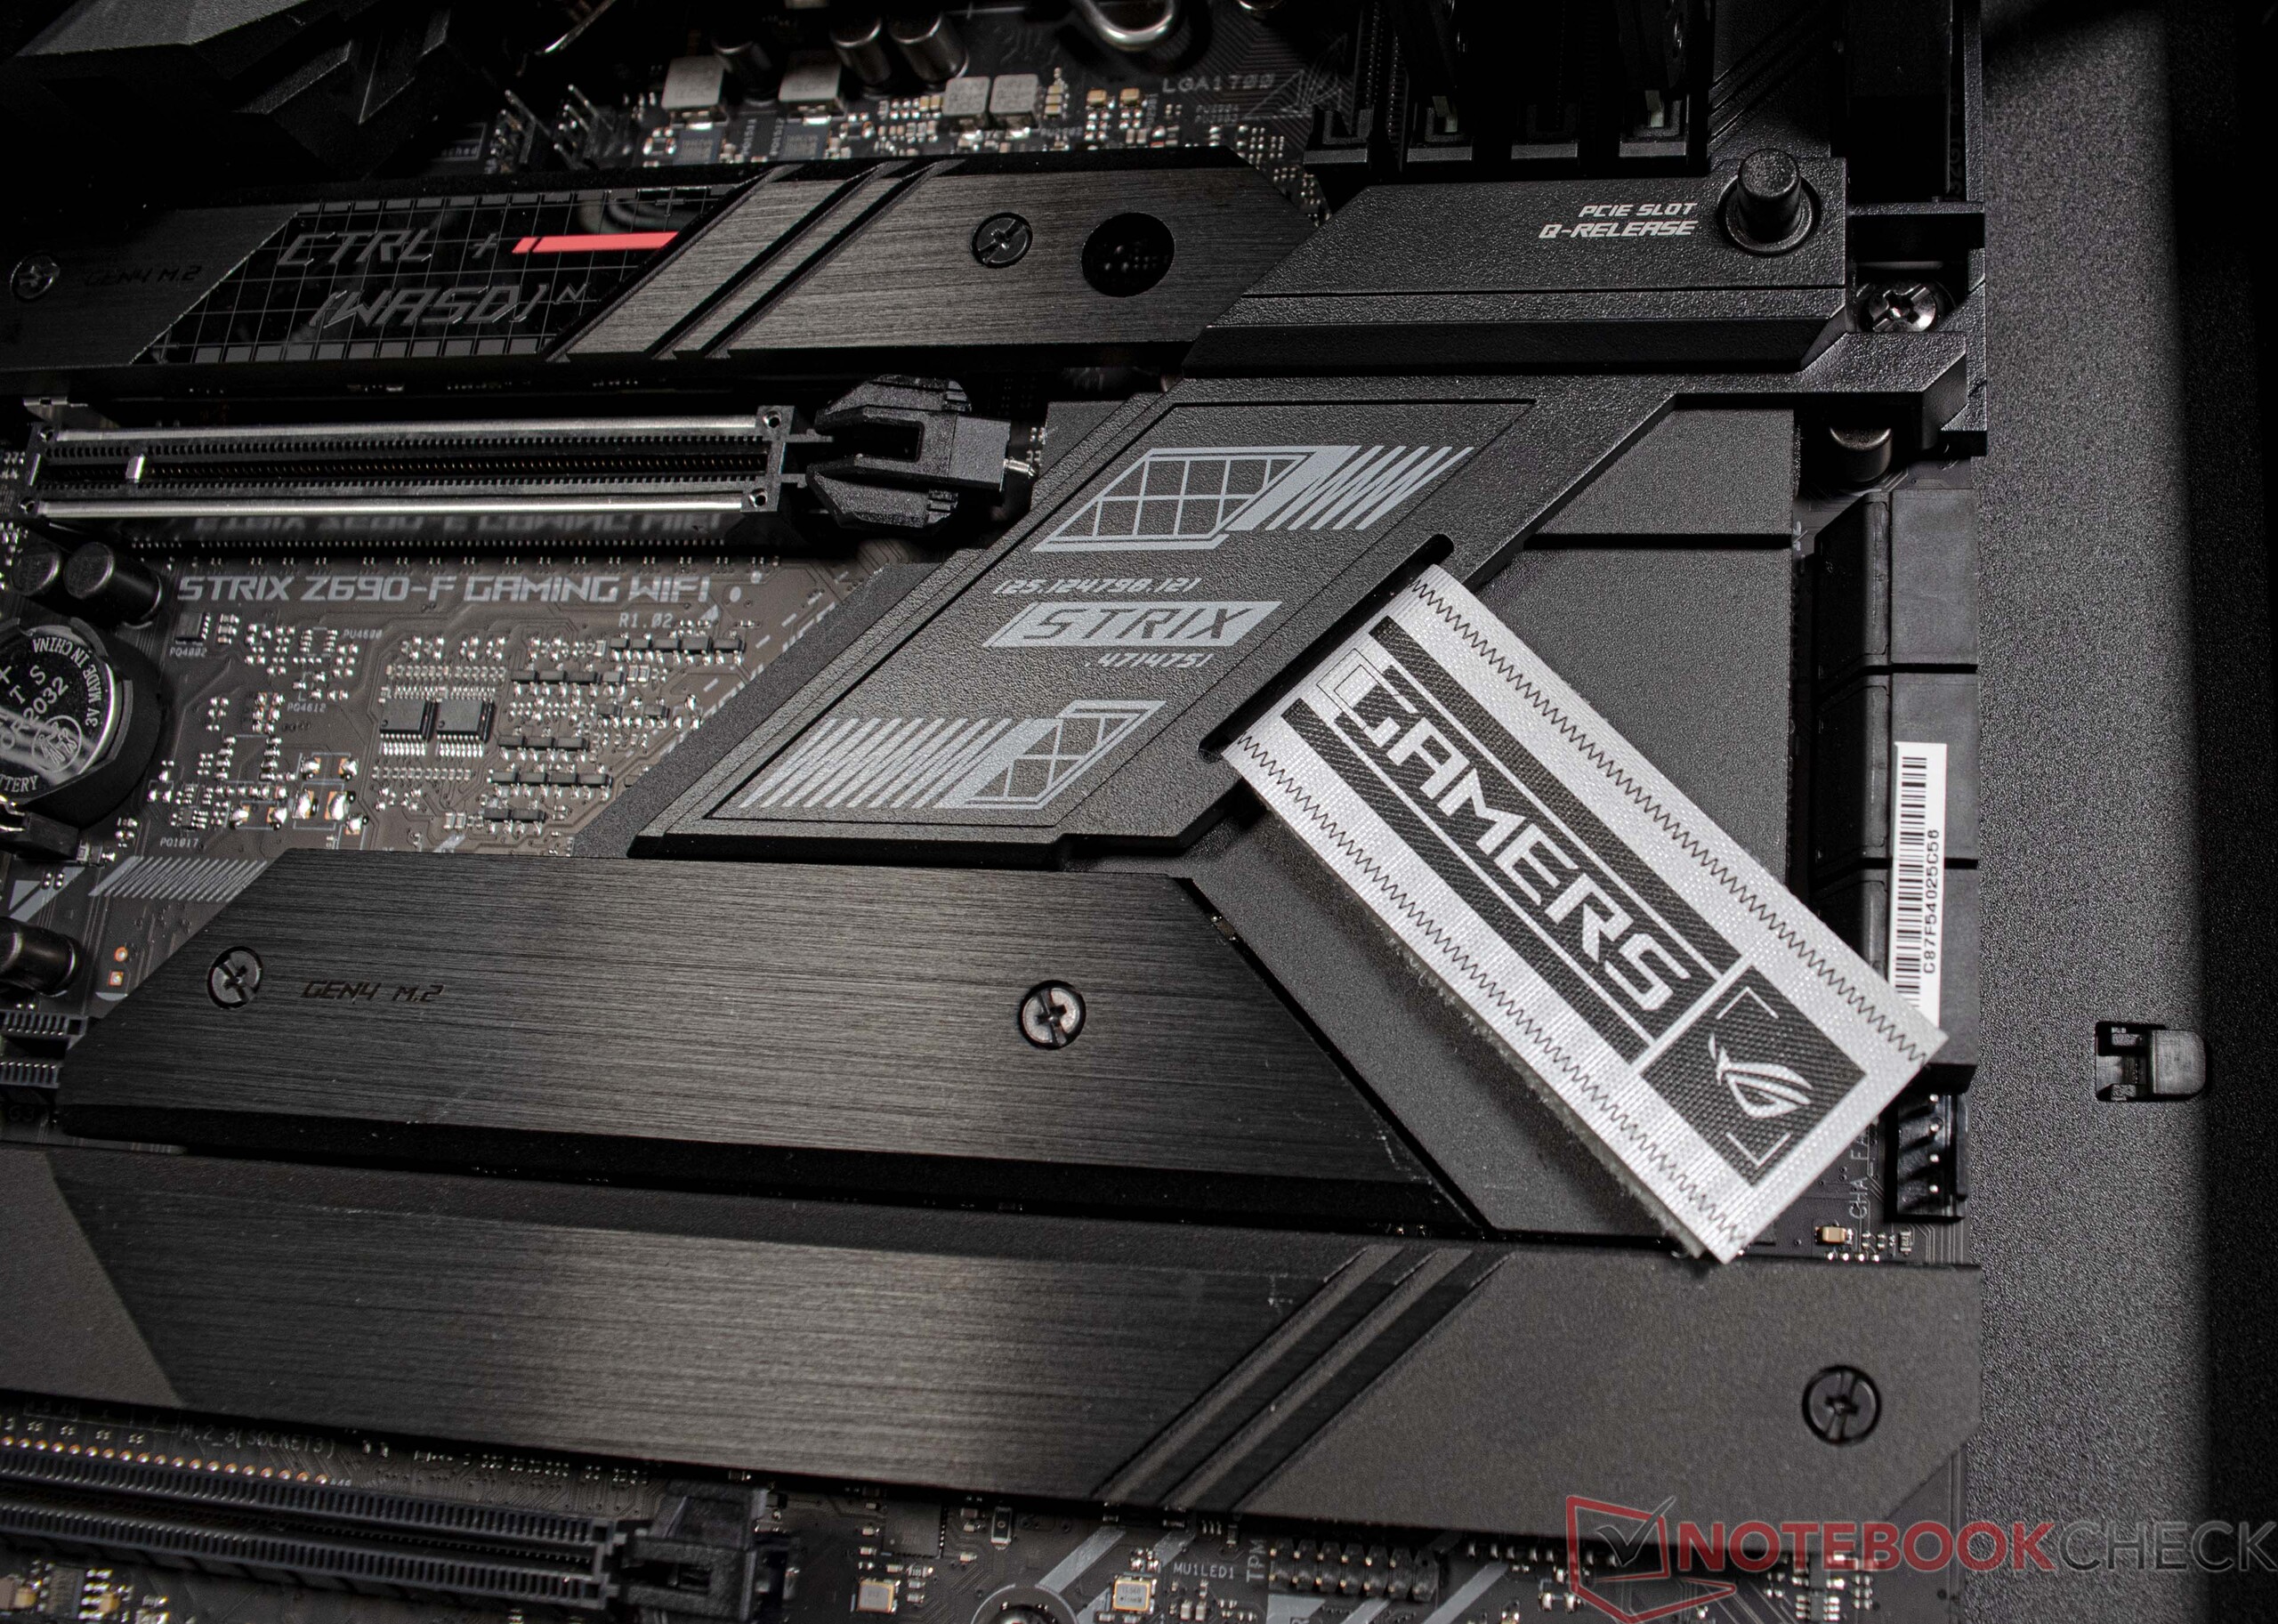
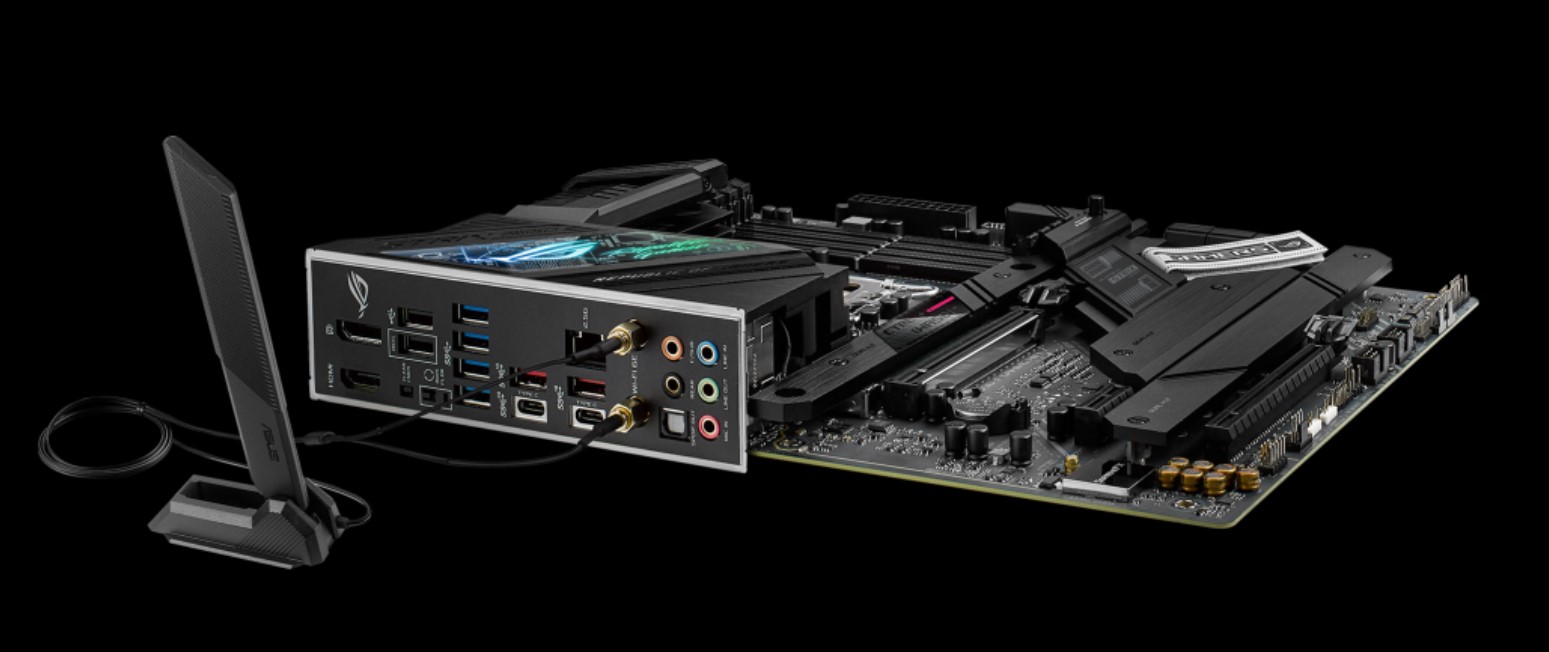
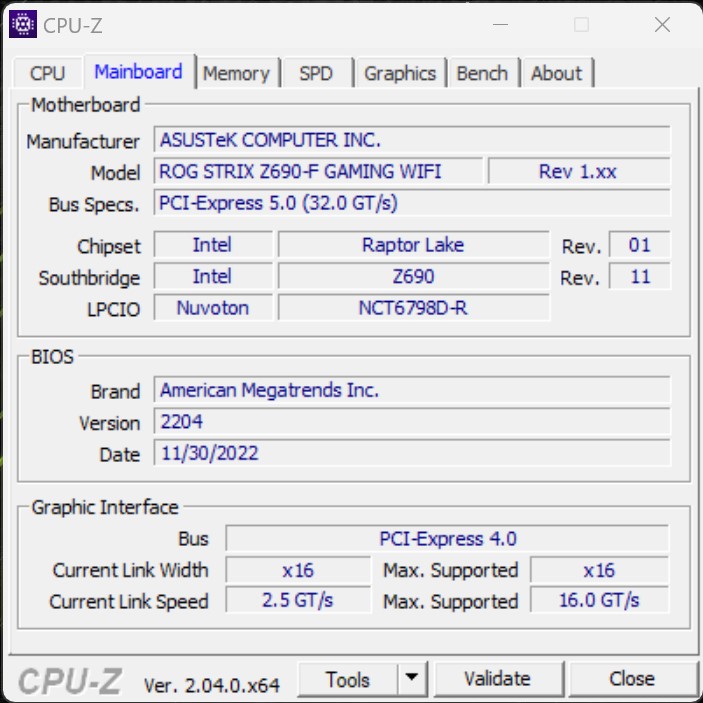
Prácticamente no se han hecho concesiones en cuanto a puertos de E/S. Por ejemplo, la placa base incluida (Asus ROG Strix Z690-F Gaming) ofrece un sinfín de interfaces USB y modernos puertos para redes. Además, puede alojar hasta cuatro SSD M.2 y 128 GB de RAM DDR5 y viene con 6 conectores SATA 6Gb/s. Los usuarios tienen acceso directo a un puerto USB-A y otro USB-C en el panel frontal del Corsair 4000D Airflow. Las salidas de pantalla disponibles dependen de la tarjeta gráfica del sistema. Nuestro modelo de pruebas tiene tres DisplayPorts y una salida HDMI. Si su sistema no está equipado con una CPU no F, puede utilizar la GPU integrada del procesador para la salida de vídeo como alternativa a la tarjeta gráfica dedicada. También hay varias formas de controlar las pantallas desde la placa base.
Conectividad
El Asus ROG Strix Z690-F Gaming lleva instalado un módulo inalámbrico Intel Wi-Fi 6E AX211. No nos impresionó del todo el rendimiento del módulo al probarlo con nuestro router de referencia, el Asus ROG Rapture GT-AXE11000. Las tasas de transferencia registradas estuvieron por debajo de nuestras expectativas cuando el sistema estaba conectado a la red 5G. Tras cambiar a una conexión 6G, las tasas de transferencia mejoraron sustancialmente. Como alternativa, la placa base de nuestro modelo de pruebas también tiene una interfaz RJ45 que soporta velocidades de hasta 2.5 Gbit/s.
Accesorios
En la caja, además del propio ordenador, encontrarás varios accesorios para la placa base, como cables y antenas Wi-Fi, así como cables sin usar pertenecientes a la fuente de alimentación, que es totalmente modular.
Mantenimiento
El mantenimiento del XMG SECTOR Intel es pan comido. Los paneles laterales del Corsair 4000D Airflow se pueden quitar fácilmente, lo que le permite limpiar el polvo de los ventiladores de forma rápida y cómoda. El Corsair iCUE H150i Elite Capellix incluido es una solución de refrigeración AIO de alto rendimiento que no requiere un gran mantenimiento.
Garantía
Schenker ofrece una garantía básica de 36 meses con servicio de recogida y devolución en cada XMG SECTOR Intel. Sin embargo, no existe la opción de ampliar el periodo de garantía durante el proceso de pedido.
Rendimiento: la segunda CPU Intel más rápida se une a la GPU más rápida
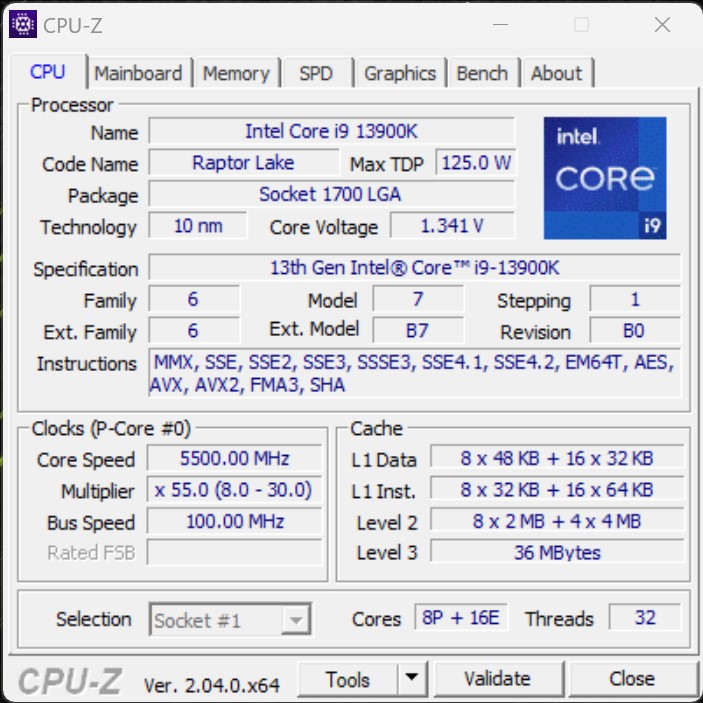
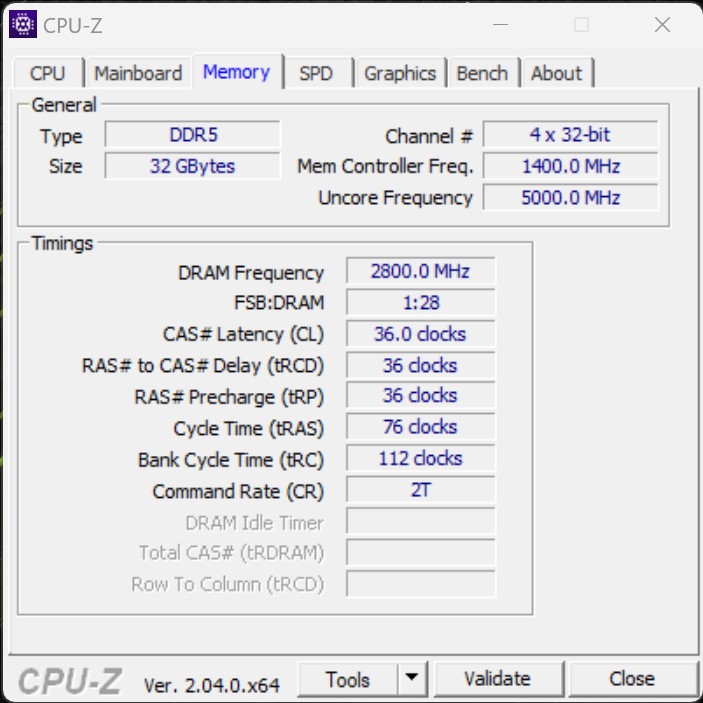
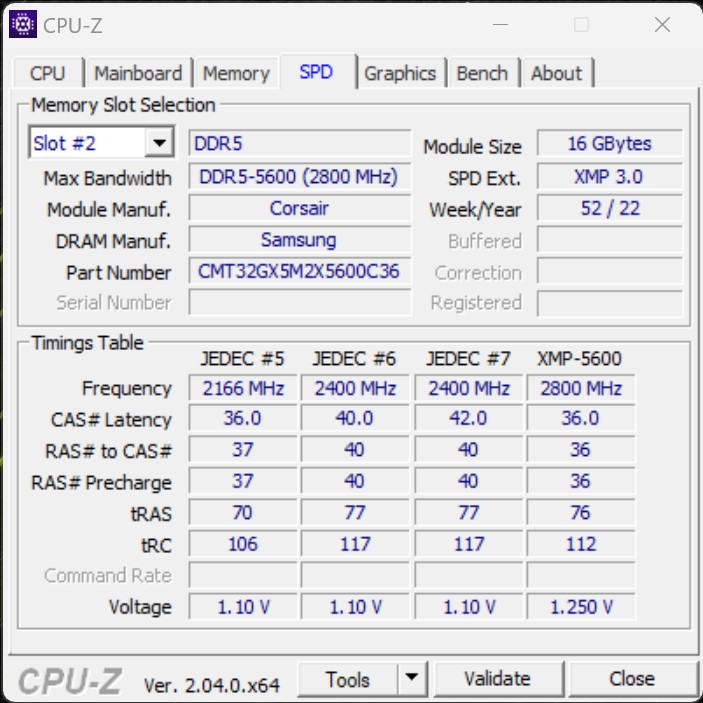
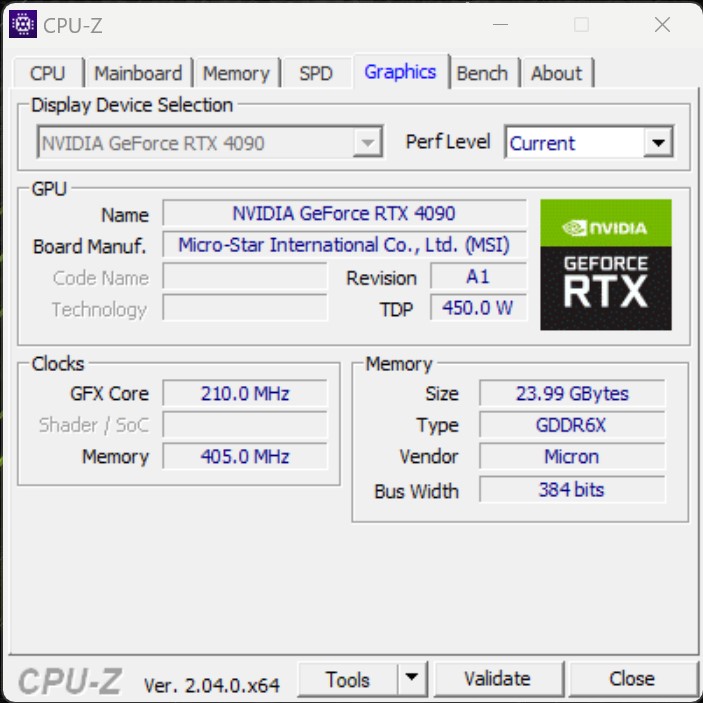
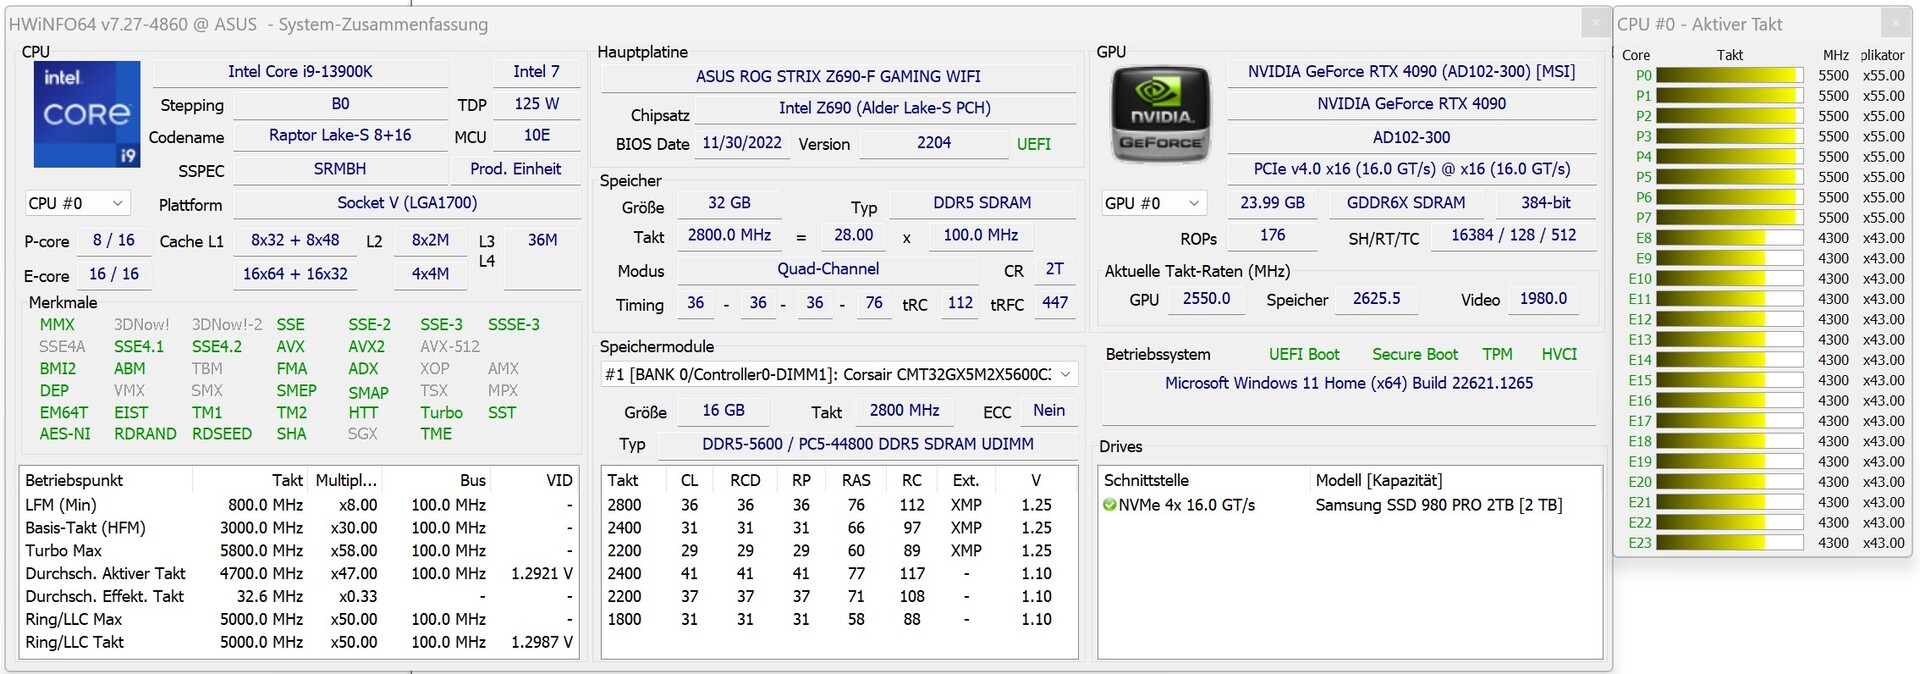
El XMG SECTOR Intel de este análisis está equipado con la segunda CPU Intel más rápida para juegos: el Core i9-13900K. El procesador está flanqueado por 32 GB de memoria y un SSD con la friolera de 2 TB de capacidad, lo que significa que el sistema tiene almacenamiento suficiente para acomodar juegos de PC con gran tamaño de instalación. La tarjeta gráfica incluida es una MSI GeForce RTX 4090 VENTUS 3X, que es la GPU más rápida para el mercado de consumo en estos momentos.
Condiciones de la prueba
Todas las pruebas relacionadas con el rendimiento se realizaron con el perfil de potencia configurado en "Alto rendimiento" para que podamos obtener los mejores resultados posibles. Además, el fabricante ya desactivó todas las restricciones de uso de energía de la CPU en la BIOS. Como resultado, el Core i9-13900K no estaba limitado a un consumo máximo de 253 vatios (el PL2 de la CPU). Sólo cambiamos a un plan de energía diferente cuando medimos el consumo de energía y los niveles de ruido. Visita en esta página para saber más sobre nuestros criterios de prueba.
Procesador
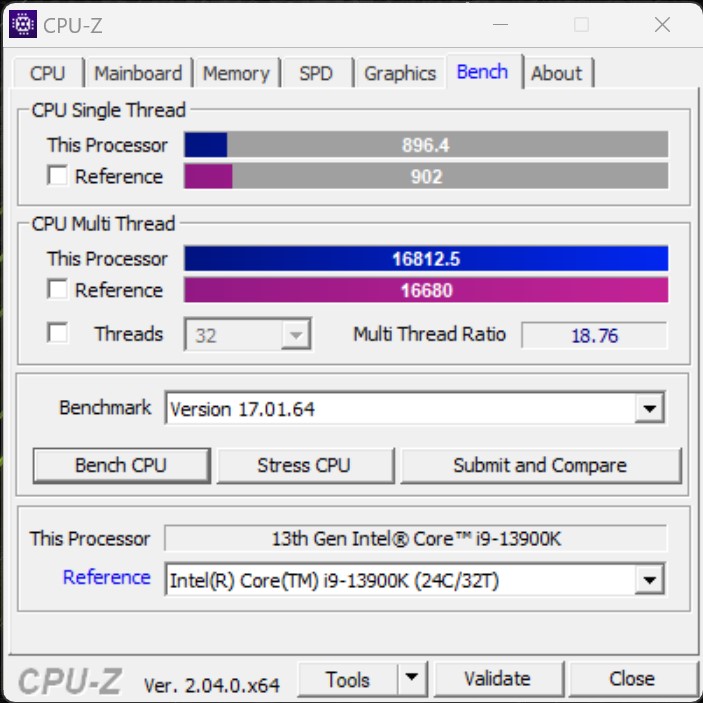
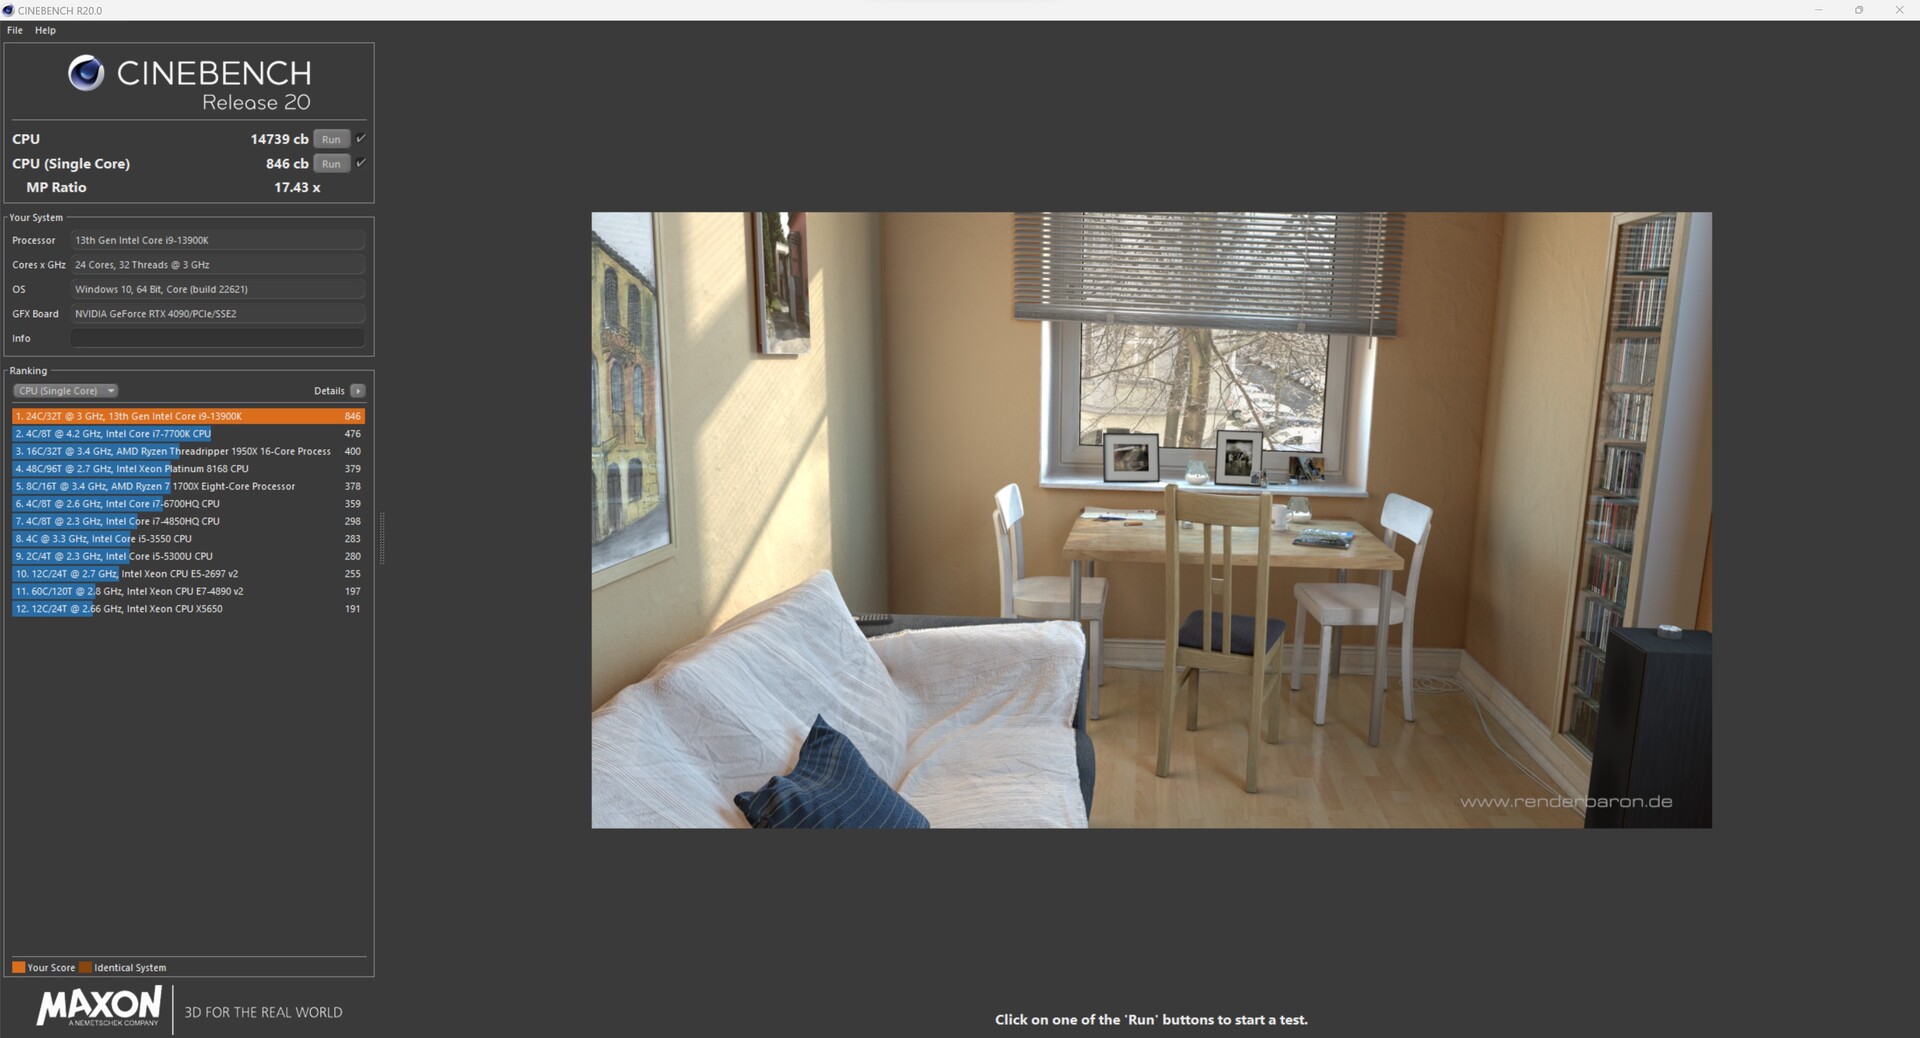
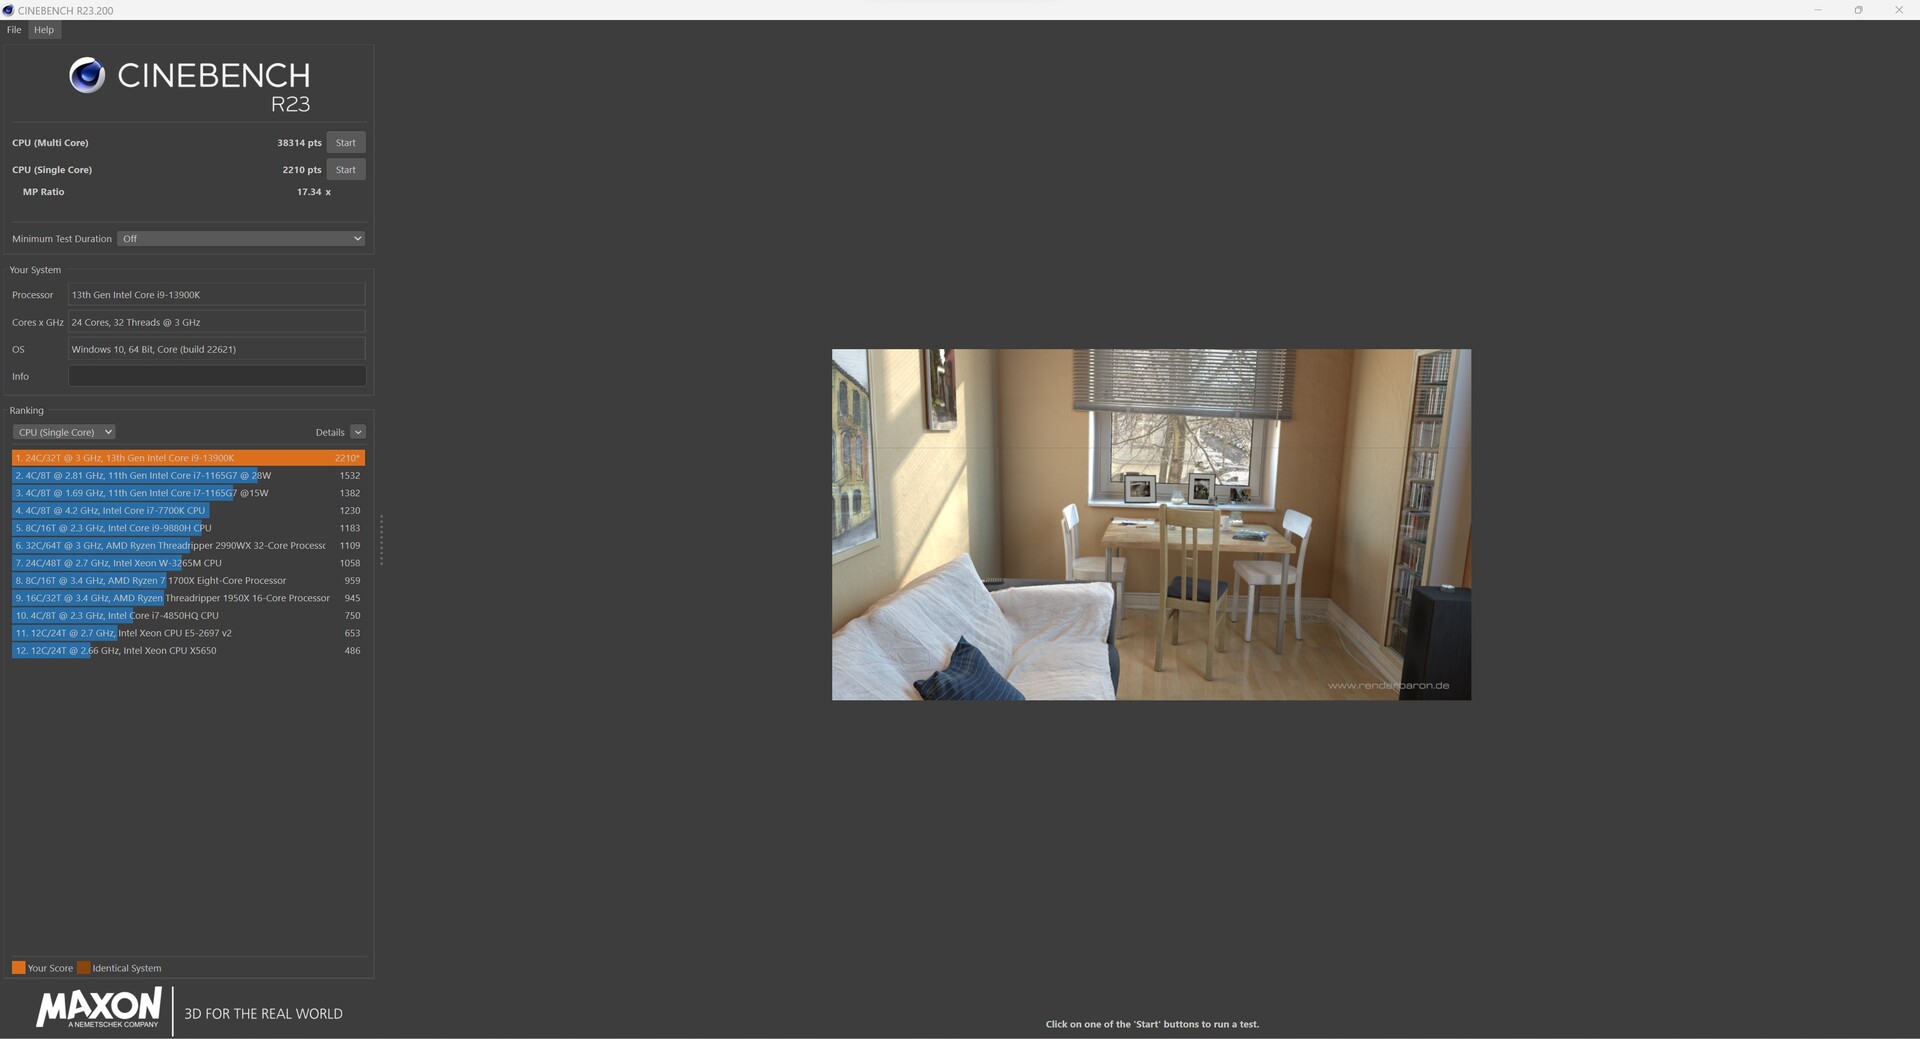
Nuestro XMG SECTOR Intel está equipado con un Core i9-13900Kque es la segunda CPU para juegos más rápida de Intel en este momento. Los resultados de la unidad de pruebas son tan buenos como cabría esperar. Está a la altura de los demás dispositivos de nuestra comparación. En lo que respecta al rendimiento, la diferencia entre el XMG SECTOR y el sistema de pruebas de especificaciones similares es extremadamente pequeña, de apenas un 2%, y casi puede atribuirse a las tolerancias de medición.
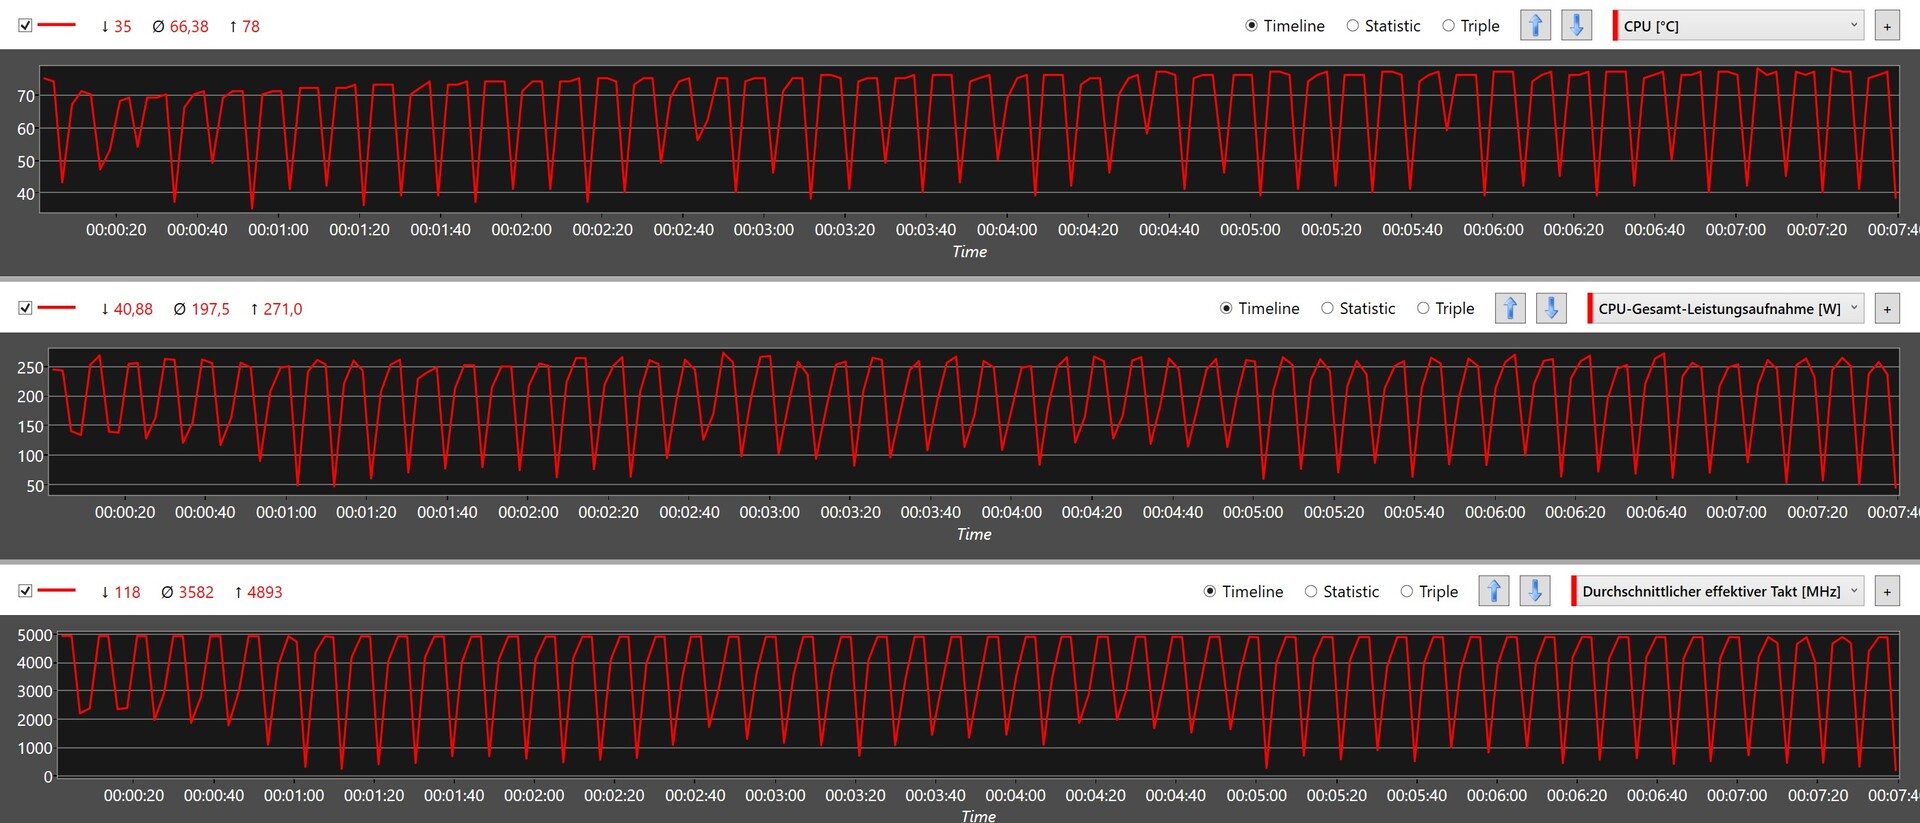
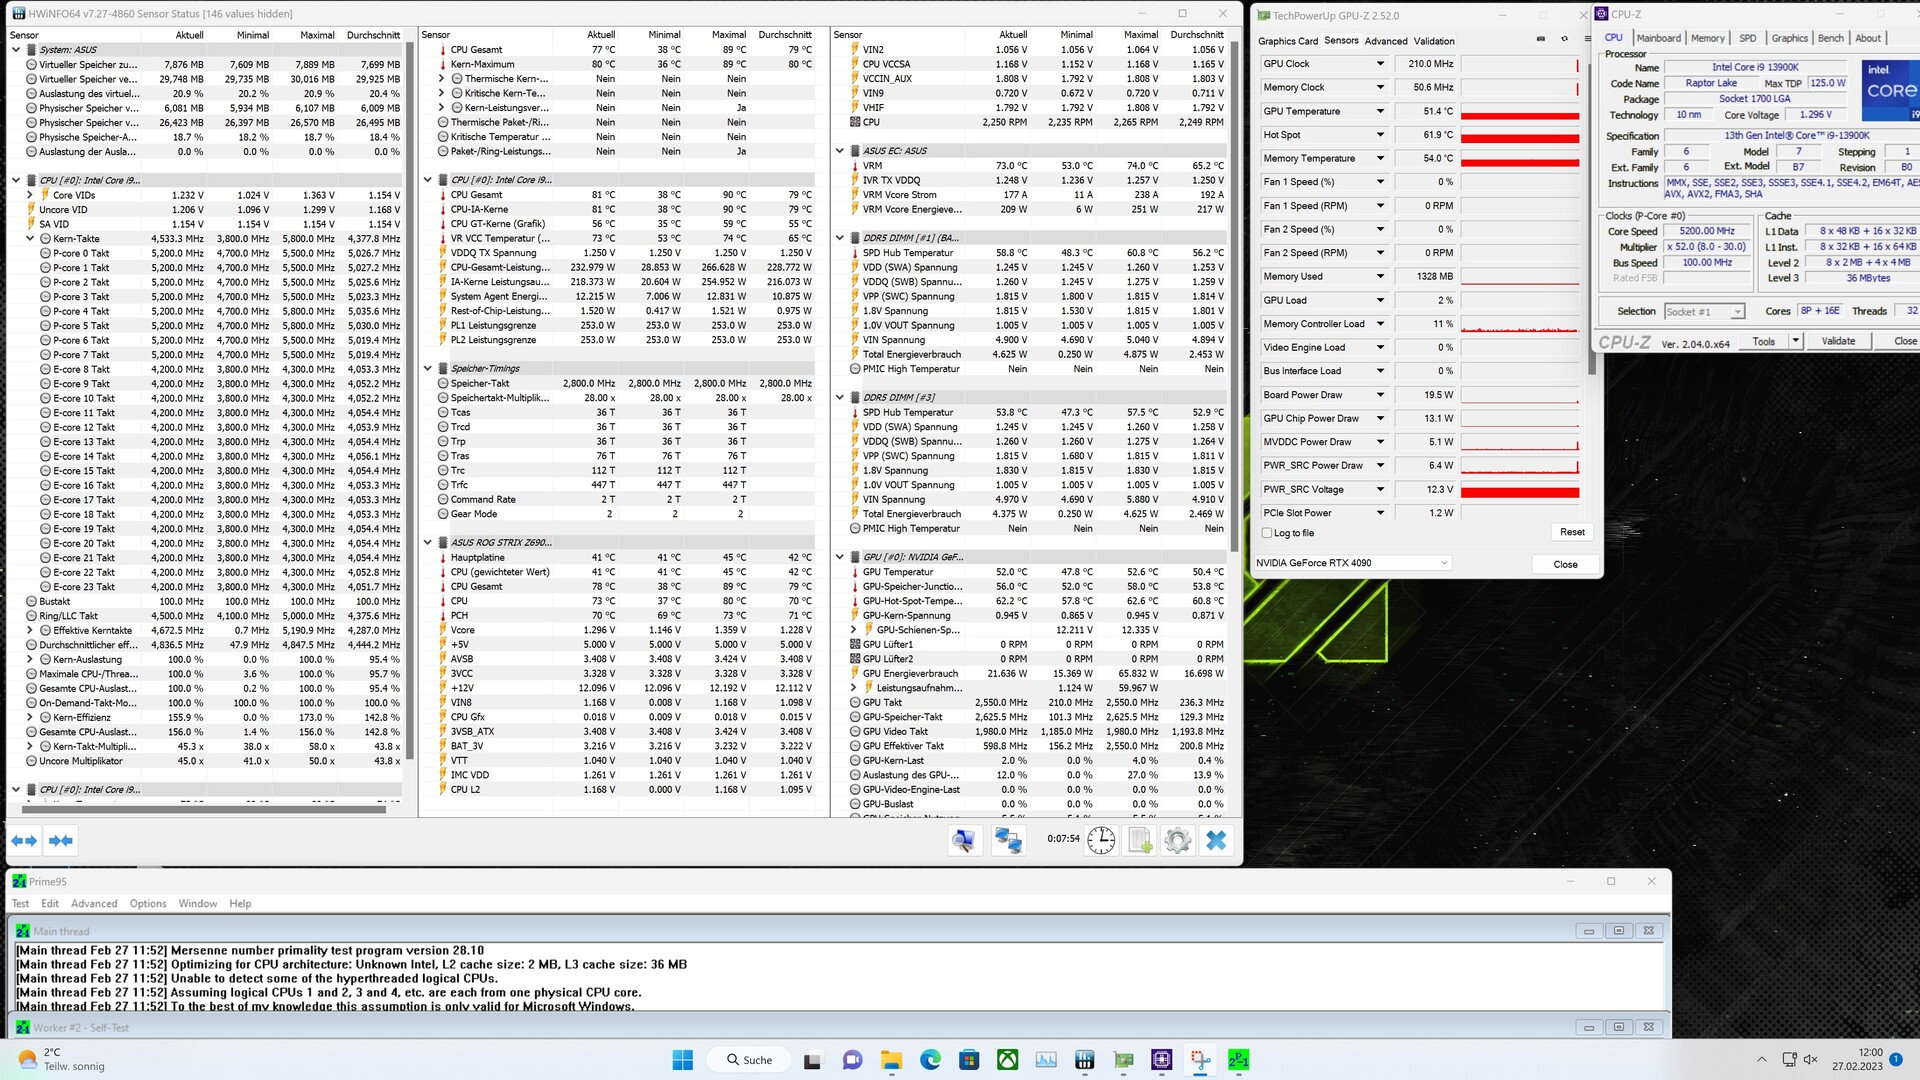
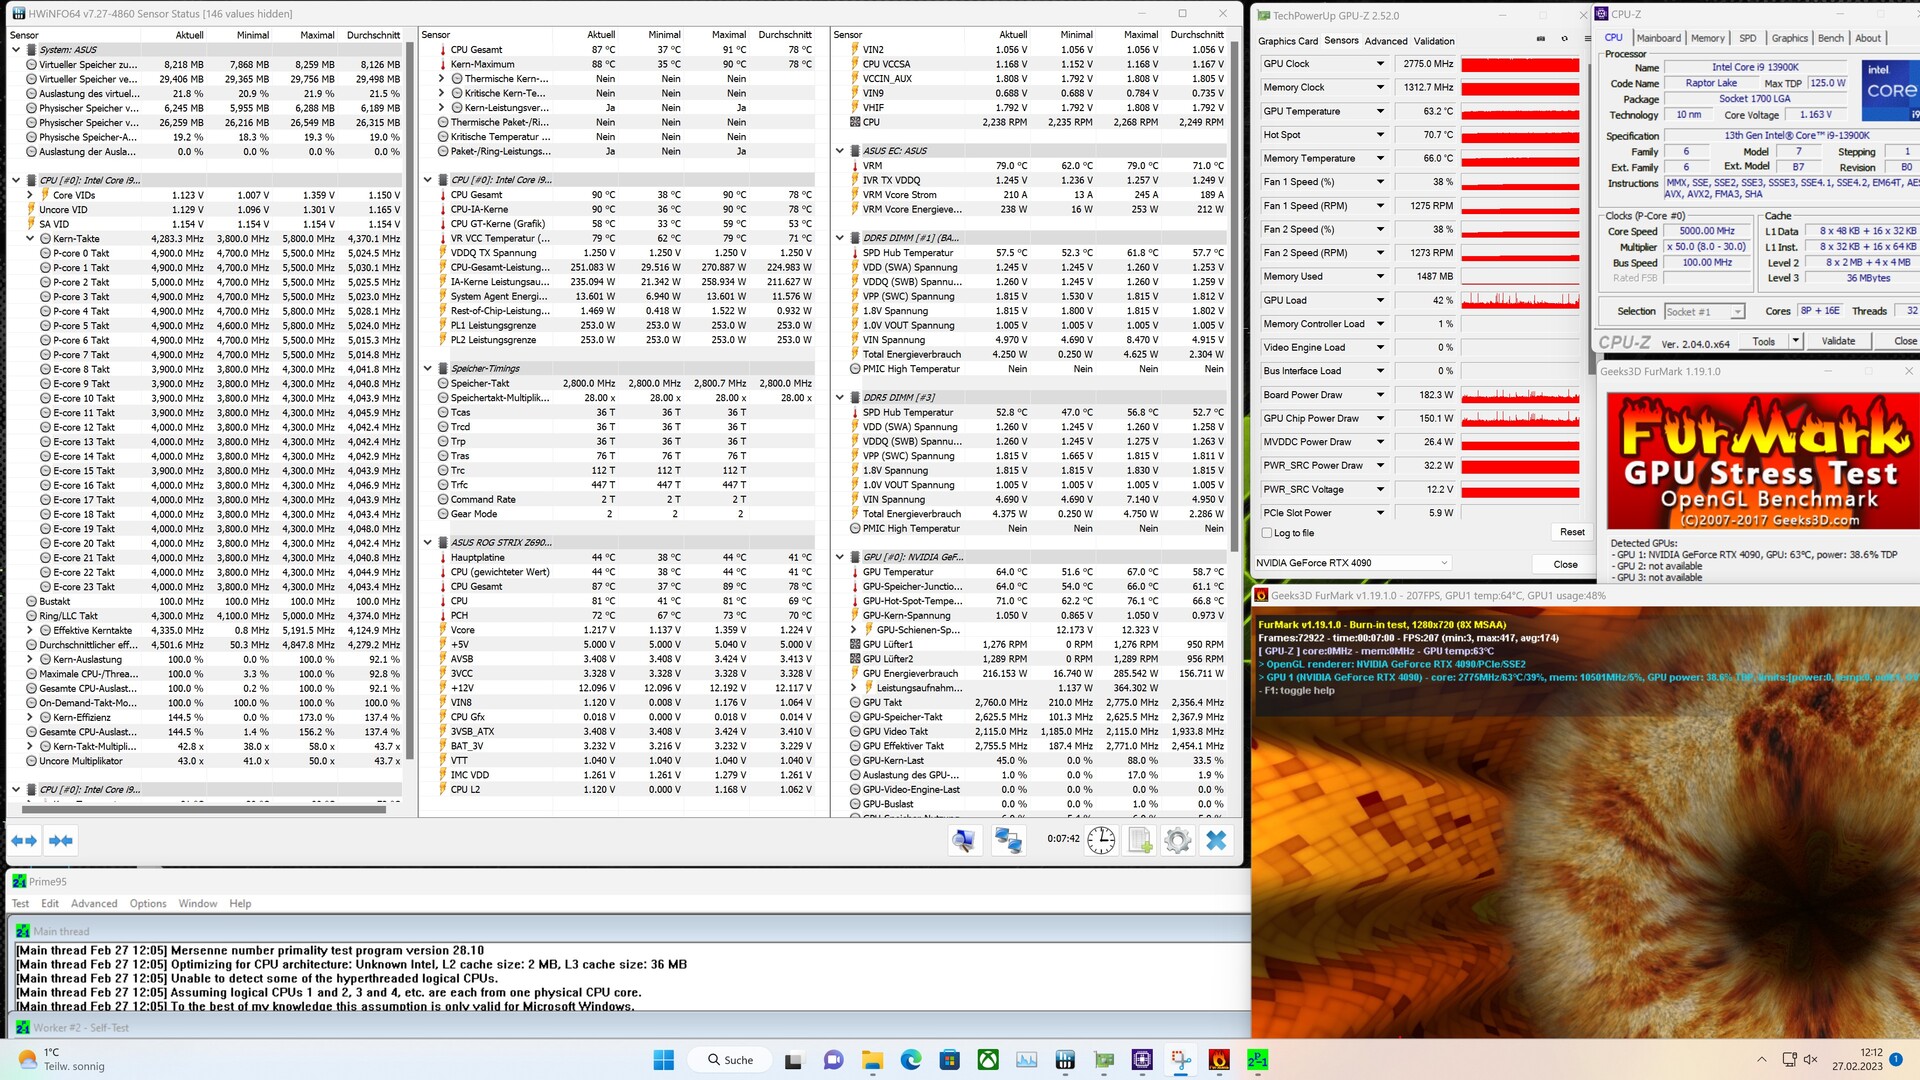
El procesador no está sujeto a ningún límite de potencia porque se han eliminado todas las restricciones. En consecuencia, el rendimiento de la CPU está limitado por la temperatura, que va de la mano con el refrigerador AIO instalado.
Puedes encontrar más pruebas de rendimiento del procesador en esta página.
* ... más pequeño es mejor
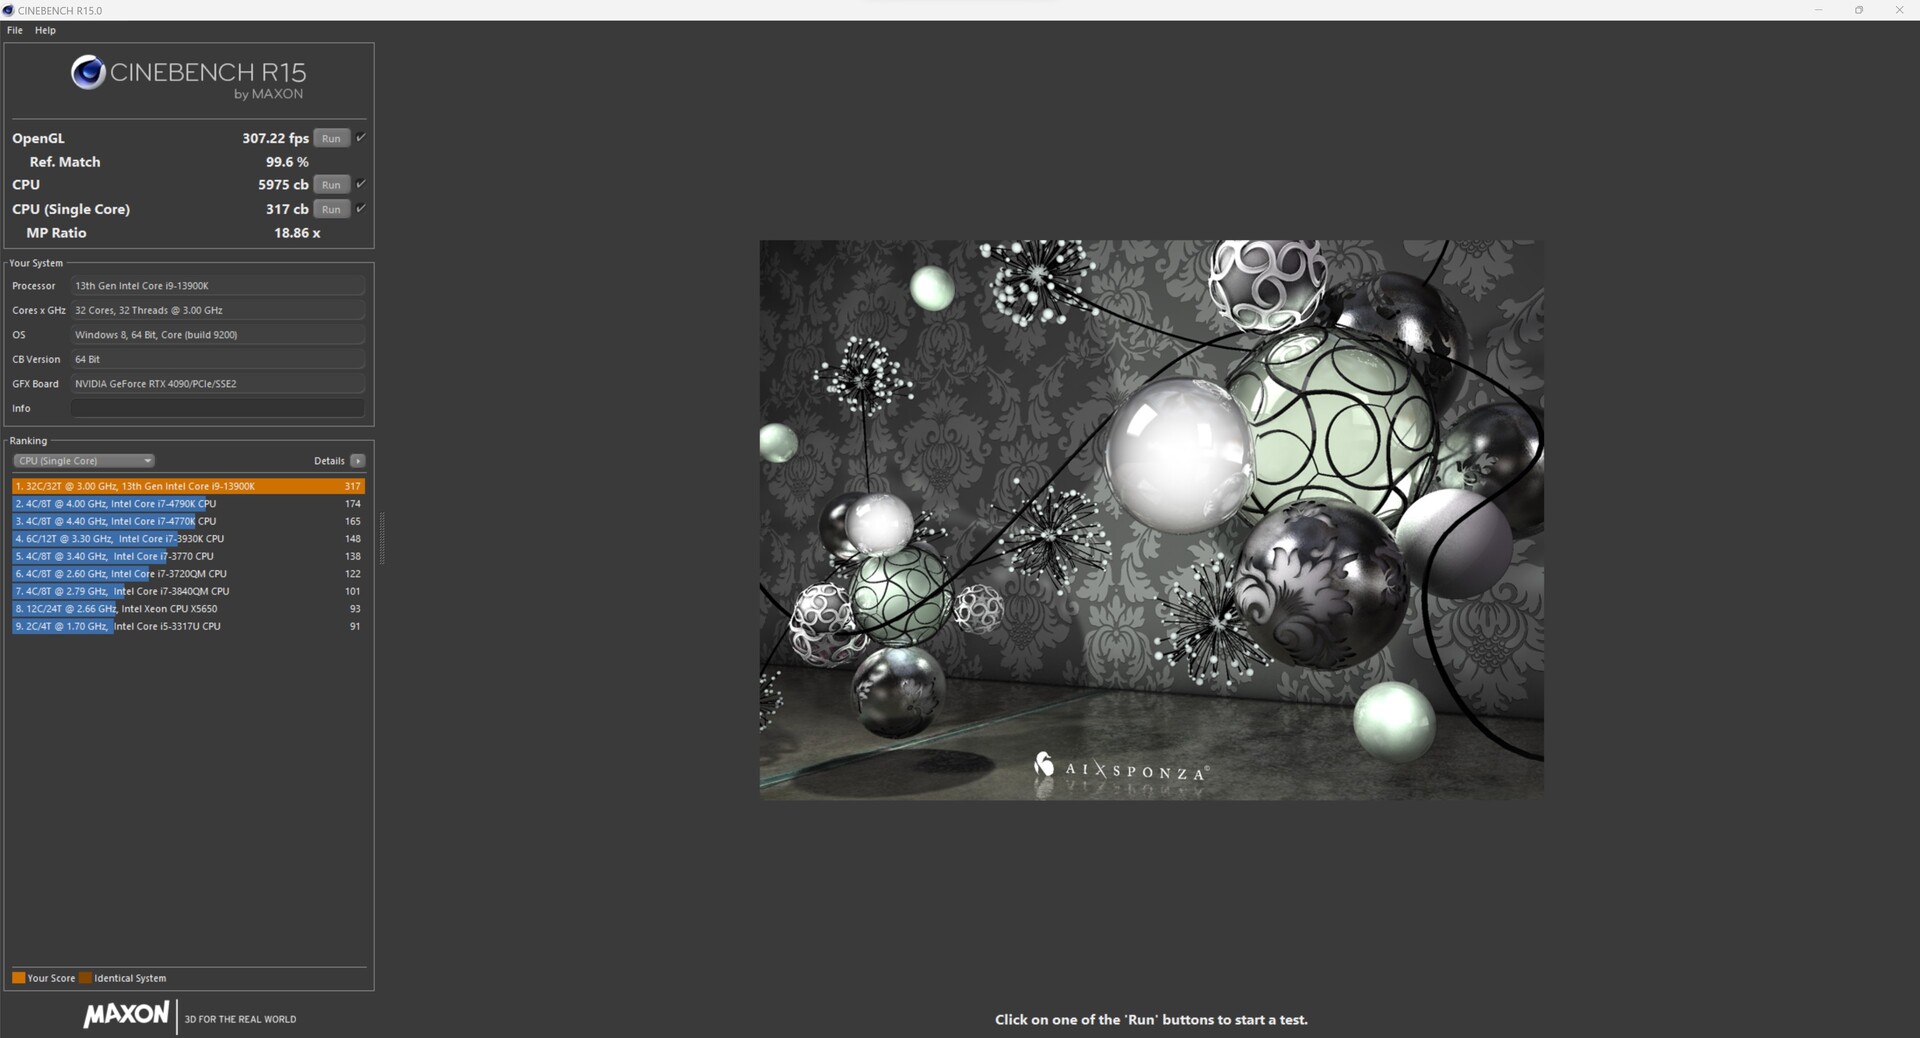
XMG SECTOR Intel en Cinebench R15 Multi loop
Ejecutar Cinebench R15 en bucle nos dio un primer vistazo a lo eficiente que es la solución de refrigeración en el PC. No hubo ninguna caída notable en el rendimiento después de las primeras ejecuciones. El XMG SECTOR Intel rindió muy bien, con una puntuación media de 5.917.
Rendimiento del sistema
El XMG SECTOR Intel fue extremadamente ágil en las pruebas sintéticas, situándose así a la altura de sus competidores. Además, nuestra unidad de pruebas ofreció un rendimiento sobresaliente en las pruebas de memoria AIDA64 y consiguió hacerse con el primer puesto gracias a su rápida memoria (DDR5-5600) y sus bajas latencias. Durante nuestro tiempo con el XMG SECTOR Intel, funcionó constantemente muy rápido sin ninguna latencia significativa.
| Performance rating - Percent | |
| AMD Ryzen 9 7900X | |
| NVIDIA GeForce RTX 3090 Founders Edition | |
| Intel Core i9-13900K | |
| Schenker XMG SECTOR, i9 13900K, RTX 4090 | |
| Intel Core i5-13600K | |
| Intel NUC13 Raptor Canyon | |
| Corsair One i300 | |
| Intel Core i9-12900K | |
| Intel Dragon Canyon NUC - RTX 3060 | |
| Minisforum Neptune Series NAD9 | |
| AIDA64 / Memory Copy | |
| Schenker XMG SECTOR, i9 13900K, RTX 4090 | |
| Intel Core i9-13900K | |
| Medio Intel Core i9-13900K (68722 - 80203, n=4) | |
| Corsair One i300 | |
| Intel Core i9-12900K | |
| NVIDIA GeForce RTX 3090 Founders Edition | |
| Intel Core i5-13600K | |
| Media de la clase Desktop (54743 - 98416, n=21, últimos 2 años) | |
| AMD Ryzen 9 7900X | |
| Intel NUC13 Raptor Canyon | |
| Minisforum Neptune Series NAD9 | |
| Intel Dragon Canyon NUC - RTX 3060 | |
| AIDA64 / Memory Read | |
| Schenker XMG SECTOR, i9 13900K, RTX 4090 | |
| Intel Core i9-13900K | |
| Medio Intel Core i9-13900K (73392 - 88780, n=4) | |
| Intel Core i9-12900K | |
| NVIDIA GeForce RTX 3090 Founders Edition | |
| Intel Core i5-13600K | |
| Media de la clase Desktop (58375 - 110448, n=21, últimos 2 años) | |
| AMD Ryzen 9 7900X | |
| Corsair One i300 | |
| Intel NUC13 Raptor Canyon | |
| Intel Dragon Canyon NUC - RTX 3060 | |
| Minisforum Neptune Series NAD9 | |
| AIDA64 / Memory Write | |
| NVIDIA GeForce RTX 3090 Founders Edition | |
| Media de la clase Desktop (60635 - 93889, n=21, últimos 2 años) | |
| Schenker XMG SECTOR, i9 13900K, RTX 4090 | |
| AMD Ryzen 9 7900X | |
| Intel Core i9-13900K | |
| Medio Intel Core i9-13900K (68948 - 78678, n=4) | |
| Intel Core i9-12900K | |
| Intel Core i5-13600K | |
| Corsair One i300 | |
| Intel NUC13 Raptor Canyon | |
| Minisforum Neptune Series NAD9 | |
| Intel Dragon Canyon NUC - RTX 3060 | |
| AIDA64 / Memory Latency | |
| Minisforum Neptune Series NAD9 | |
| Intel NUC13 Raptor Canyon | |
| Media de la clase Desktop (68.5 - 168, n=21, últimos 2 años) | |
| Intel Dragon Canyon NUC - RTX 3060 | |
| Corsair One i300 | |
| Intel Core i5-13600K | |
| Medio Intel Core i9-13900K (72.6 - 93.4, n=4) | |
| Intel Core i9-13900K | |
| Schenker XMG SECTOR, i9 13900K, RTX 4090 | |
| AMD Ryzen 9 7900X | |
| NVIDIA GeForce RTX 3090 Founders Edition | |
* ... más pequeño es mejor
Almacenamiento masivo
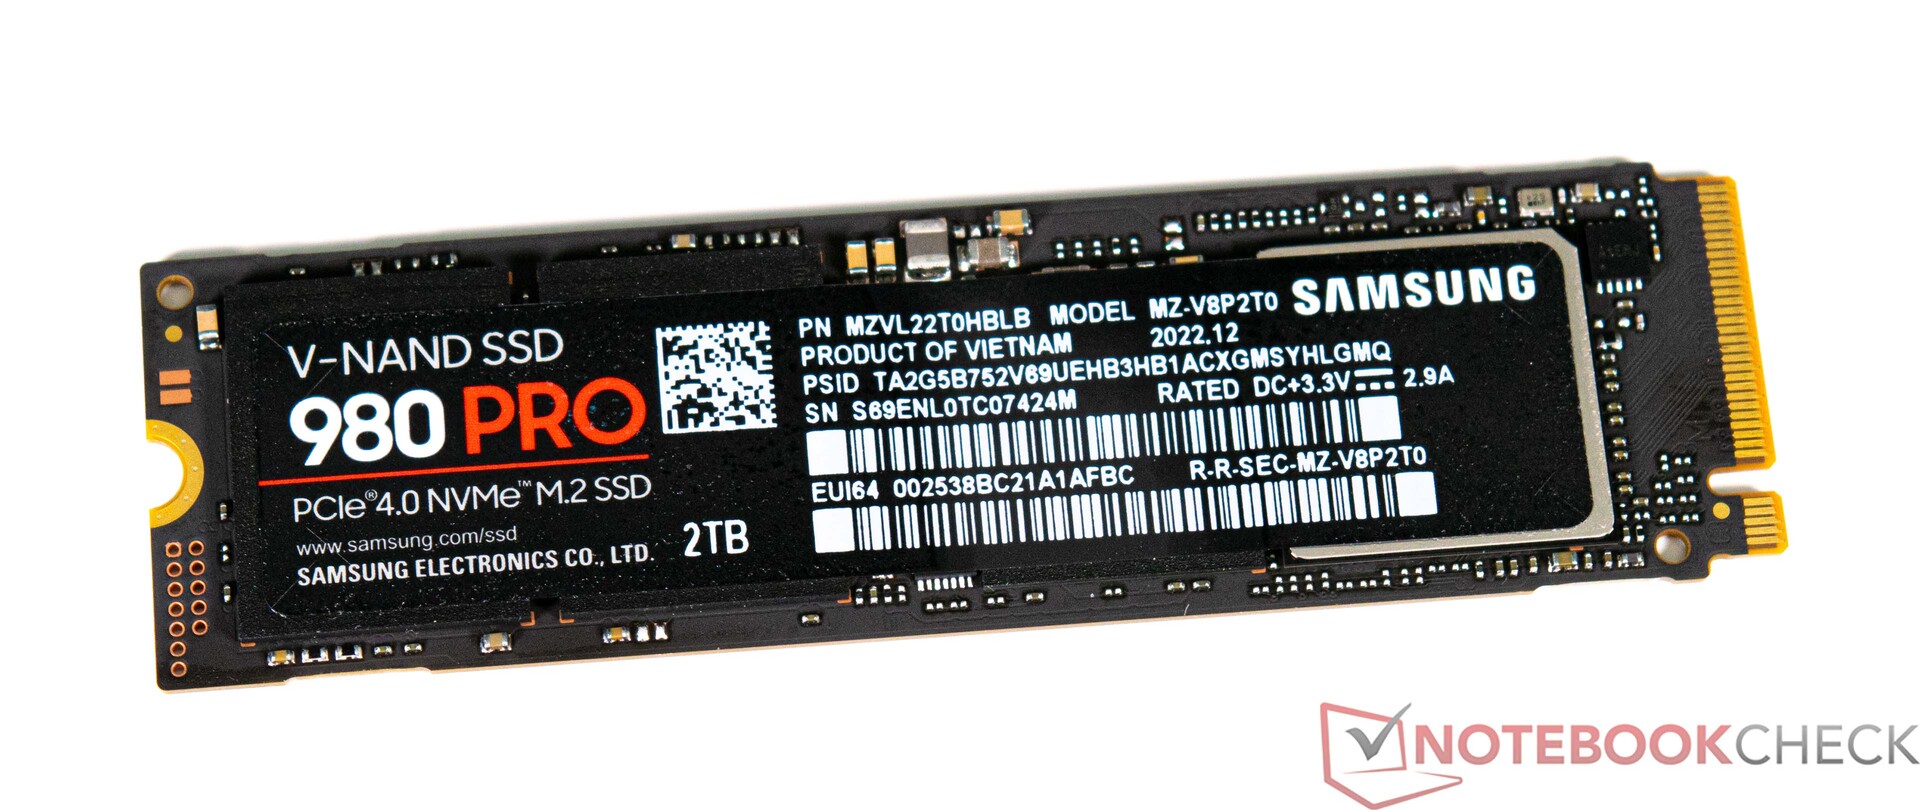
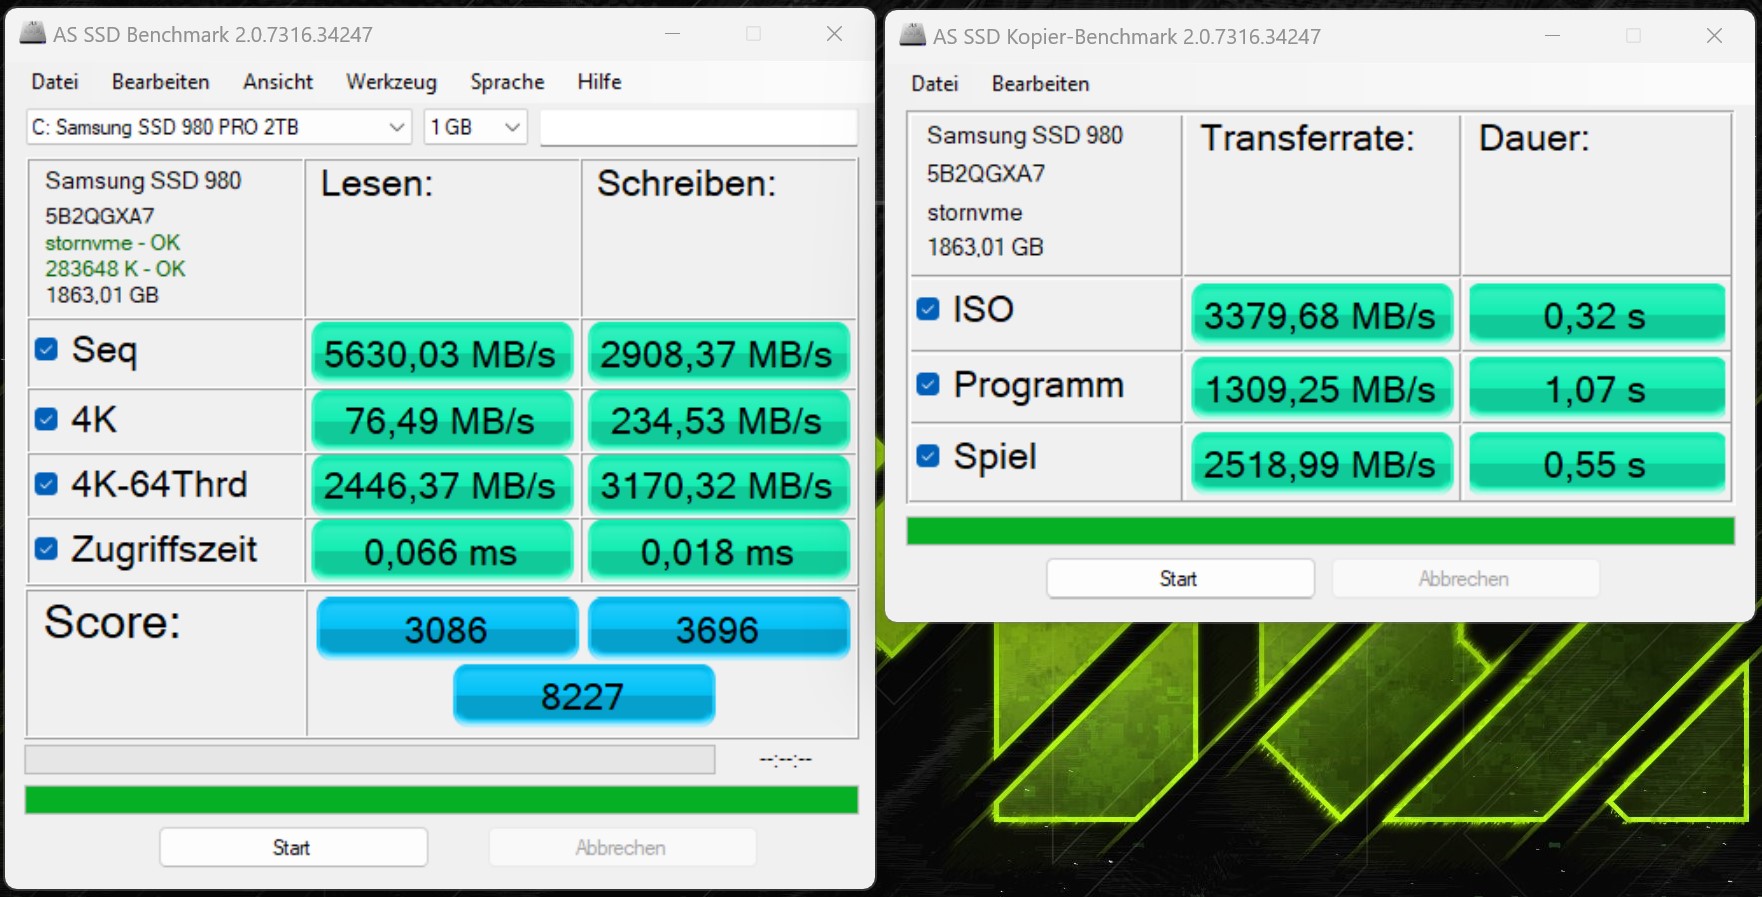
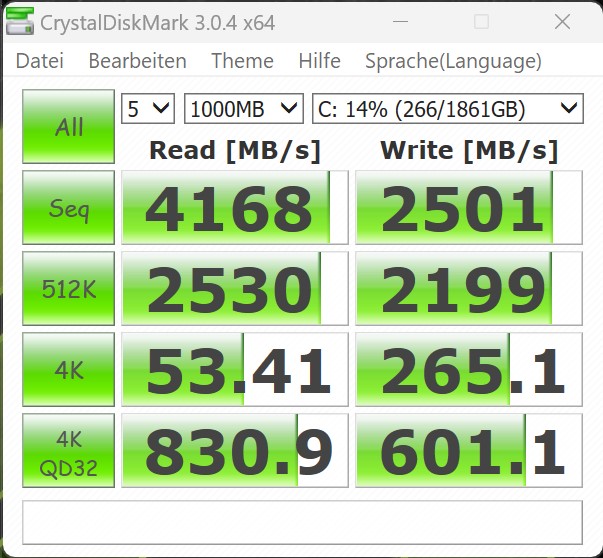
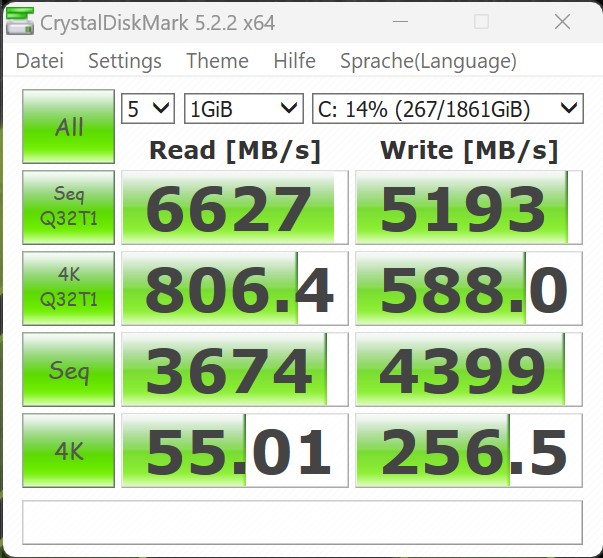
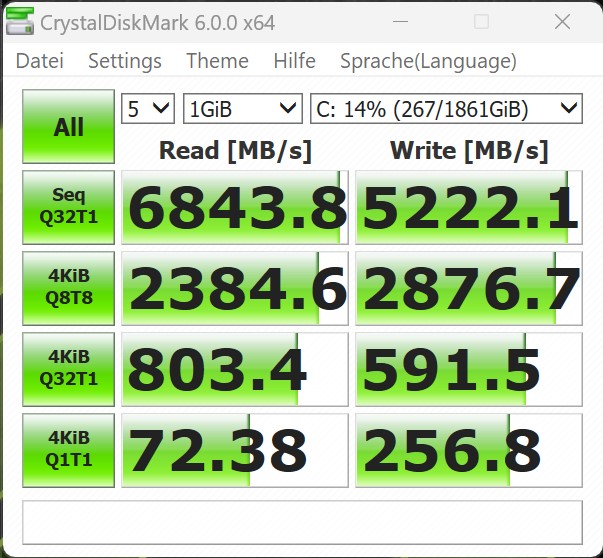
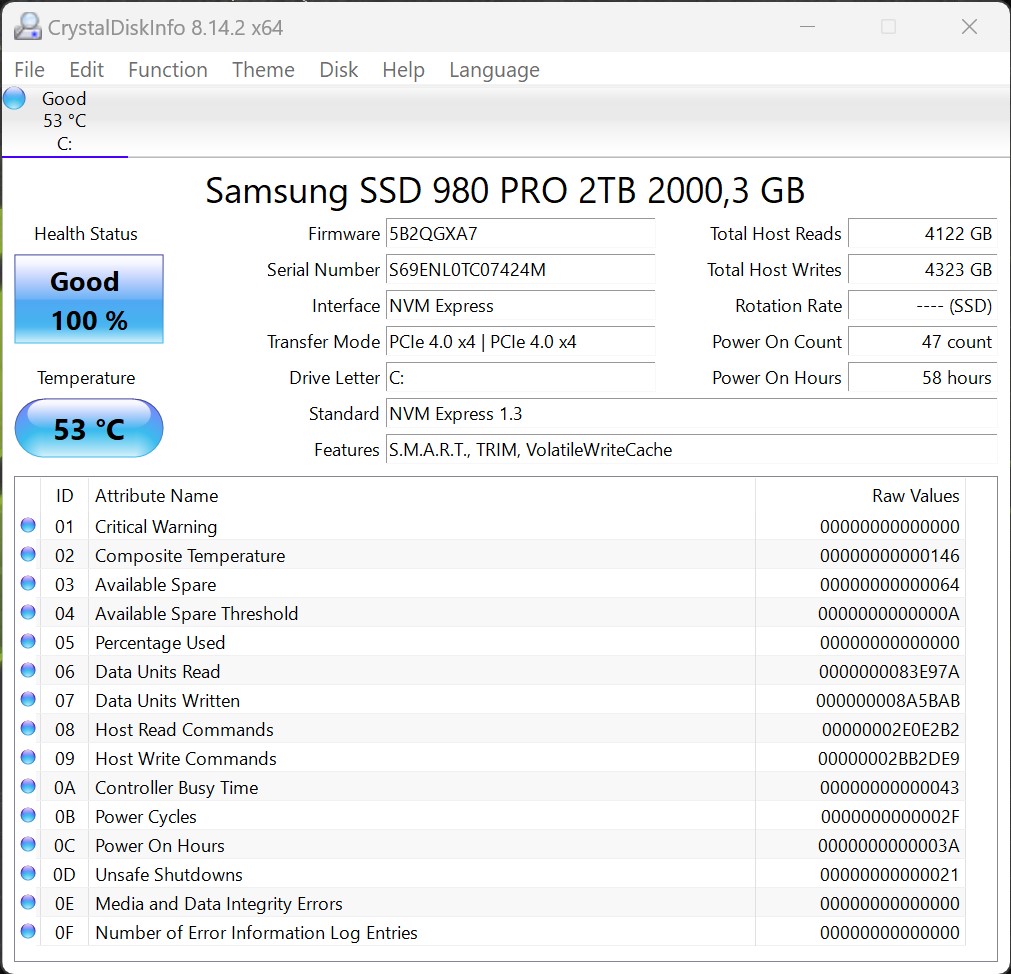
Nuestra unidad de pruebas está equipada con un SSD Samsung NVMe superveloz. El Samsung 980 Pro es uno de los SSDs de consumo más rápidos. Esto es algo que también podemos ver en las pruebas: la unidad superó casi consistentemente a las soluciones de almacenamiento de los dispositivos de la competencia. Sólo el Kingston Fury Renegade en el Intel NUC13 Raptor Canyon fue capaz de superar el rendimiento del Samsung 980 Pro en AS-SSD Benchmark. Dicho esto, es suficiente para que la SSD de Samsung quede primera en la clasificación general. Incluso durante la prueba de estrés, la unidad consiguió mantener una alta velocidad de lectura durante un periodo prolongado, lo que indica que la refrigeración de la SSD es muy eficaz.
Puedes instalar hasta tres SSD M.2 más en el Asus ROG Strix Z690-F Gaming. También existe la opción de conectar aún más unidades de almacenamiento a través de SATA.
Consulta nuestra tabla comparativa de dispositivos de almacenamiento en https://www.notebookcheck.net/Laptop-harddisks-HDD-SSD-benchmarks.22089.0.html para más información y pruebas.

| Drive Performance rating - Percent | |
| Media de la clase Desktop | |
| Schenker XMG SECTOR, i9 13900K, RTX 4090 | |
| Corsair One i300 | |
| NVIDIA GeForce RTX 3090 Founders Edition | |
| Intel NUC13 Raptor Canyon | |
| Intel Core i5-13600K | |
| Intel Core i9-13900K | |
| Minisforum Neptune Series NAD9 | |
| Intel Core i9-12900K -11! | |
| Intel Dragon Canyon NUC - RTX 3060 -11! | |
* ... más pequeño es mejor
Sustained Read: DiskSpd Read Loop, Queue Depth 8
Tarjeta gráfica - Sin concesiones con la GeForce RTX 4090
Puntos de referencia sintéticos
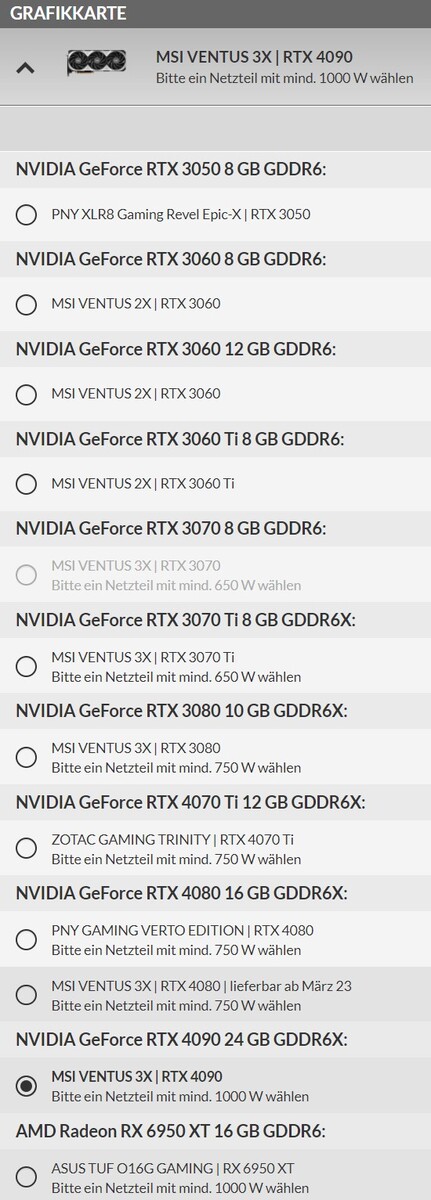
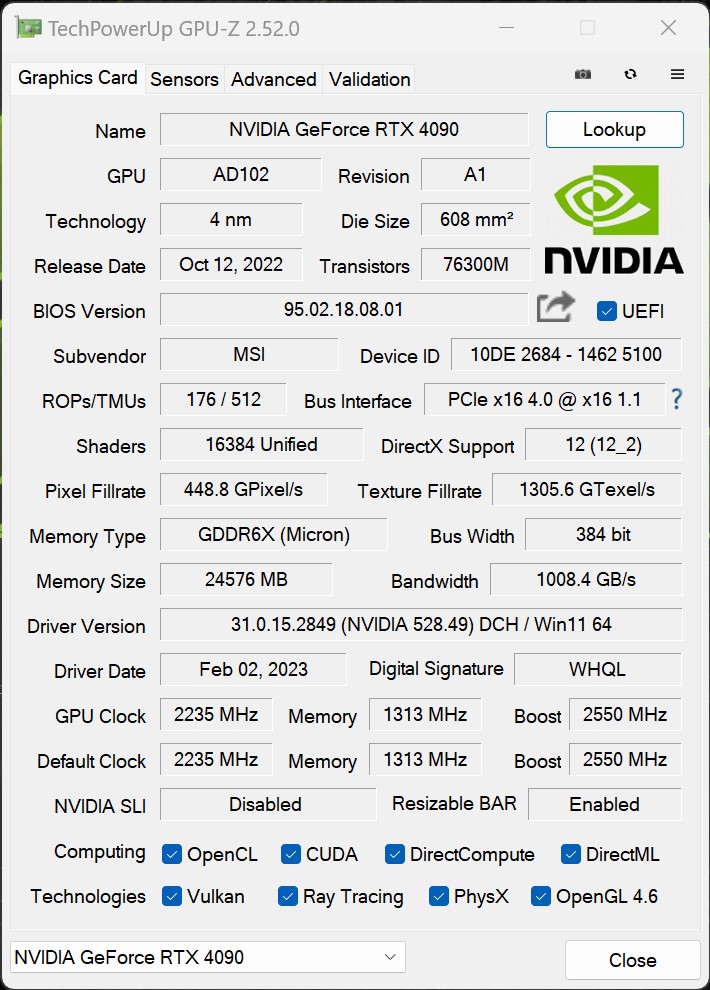
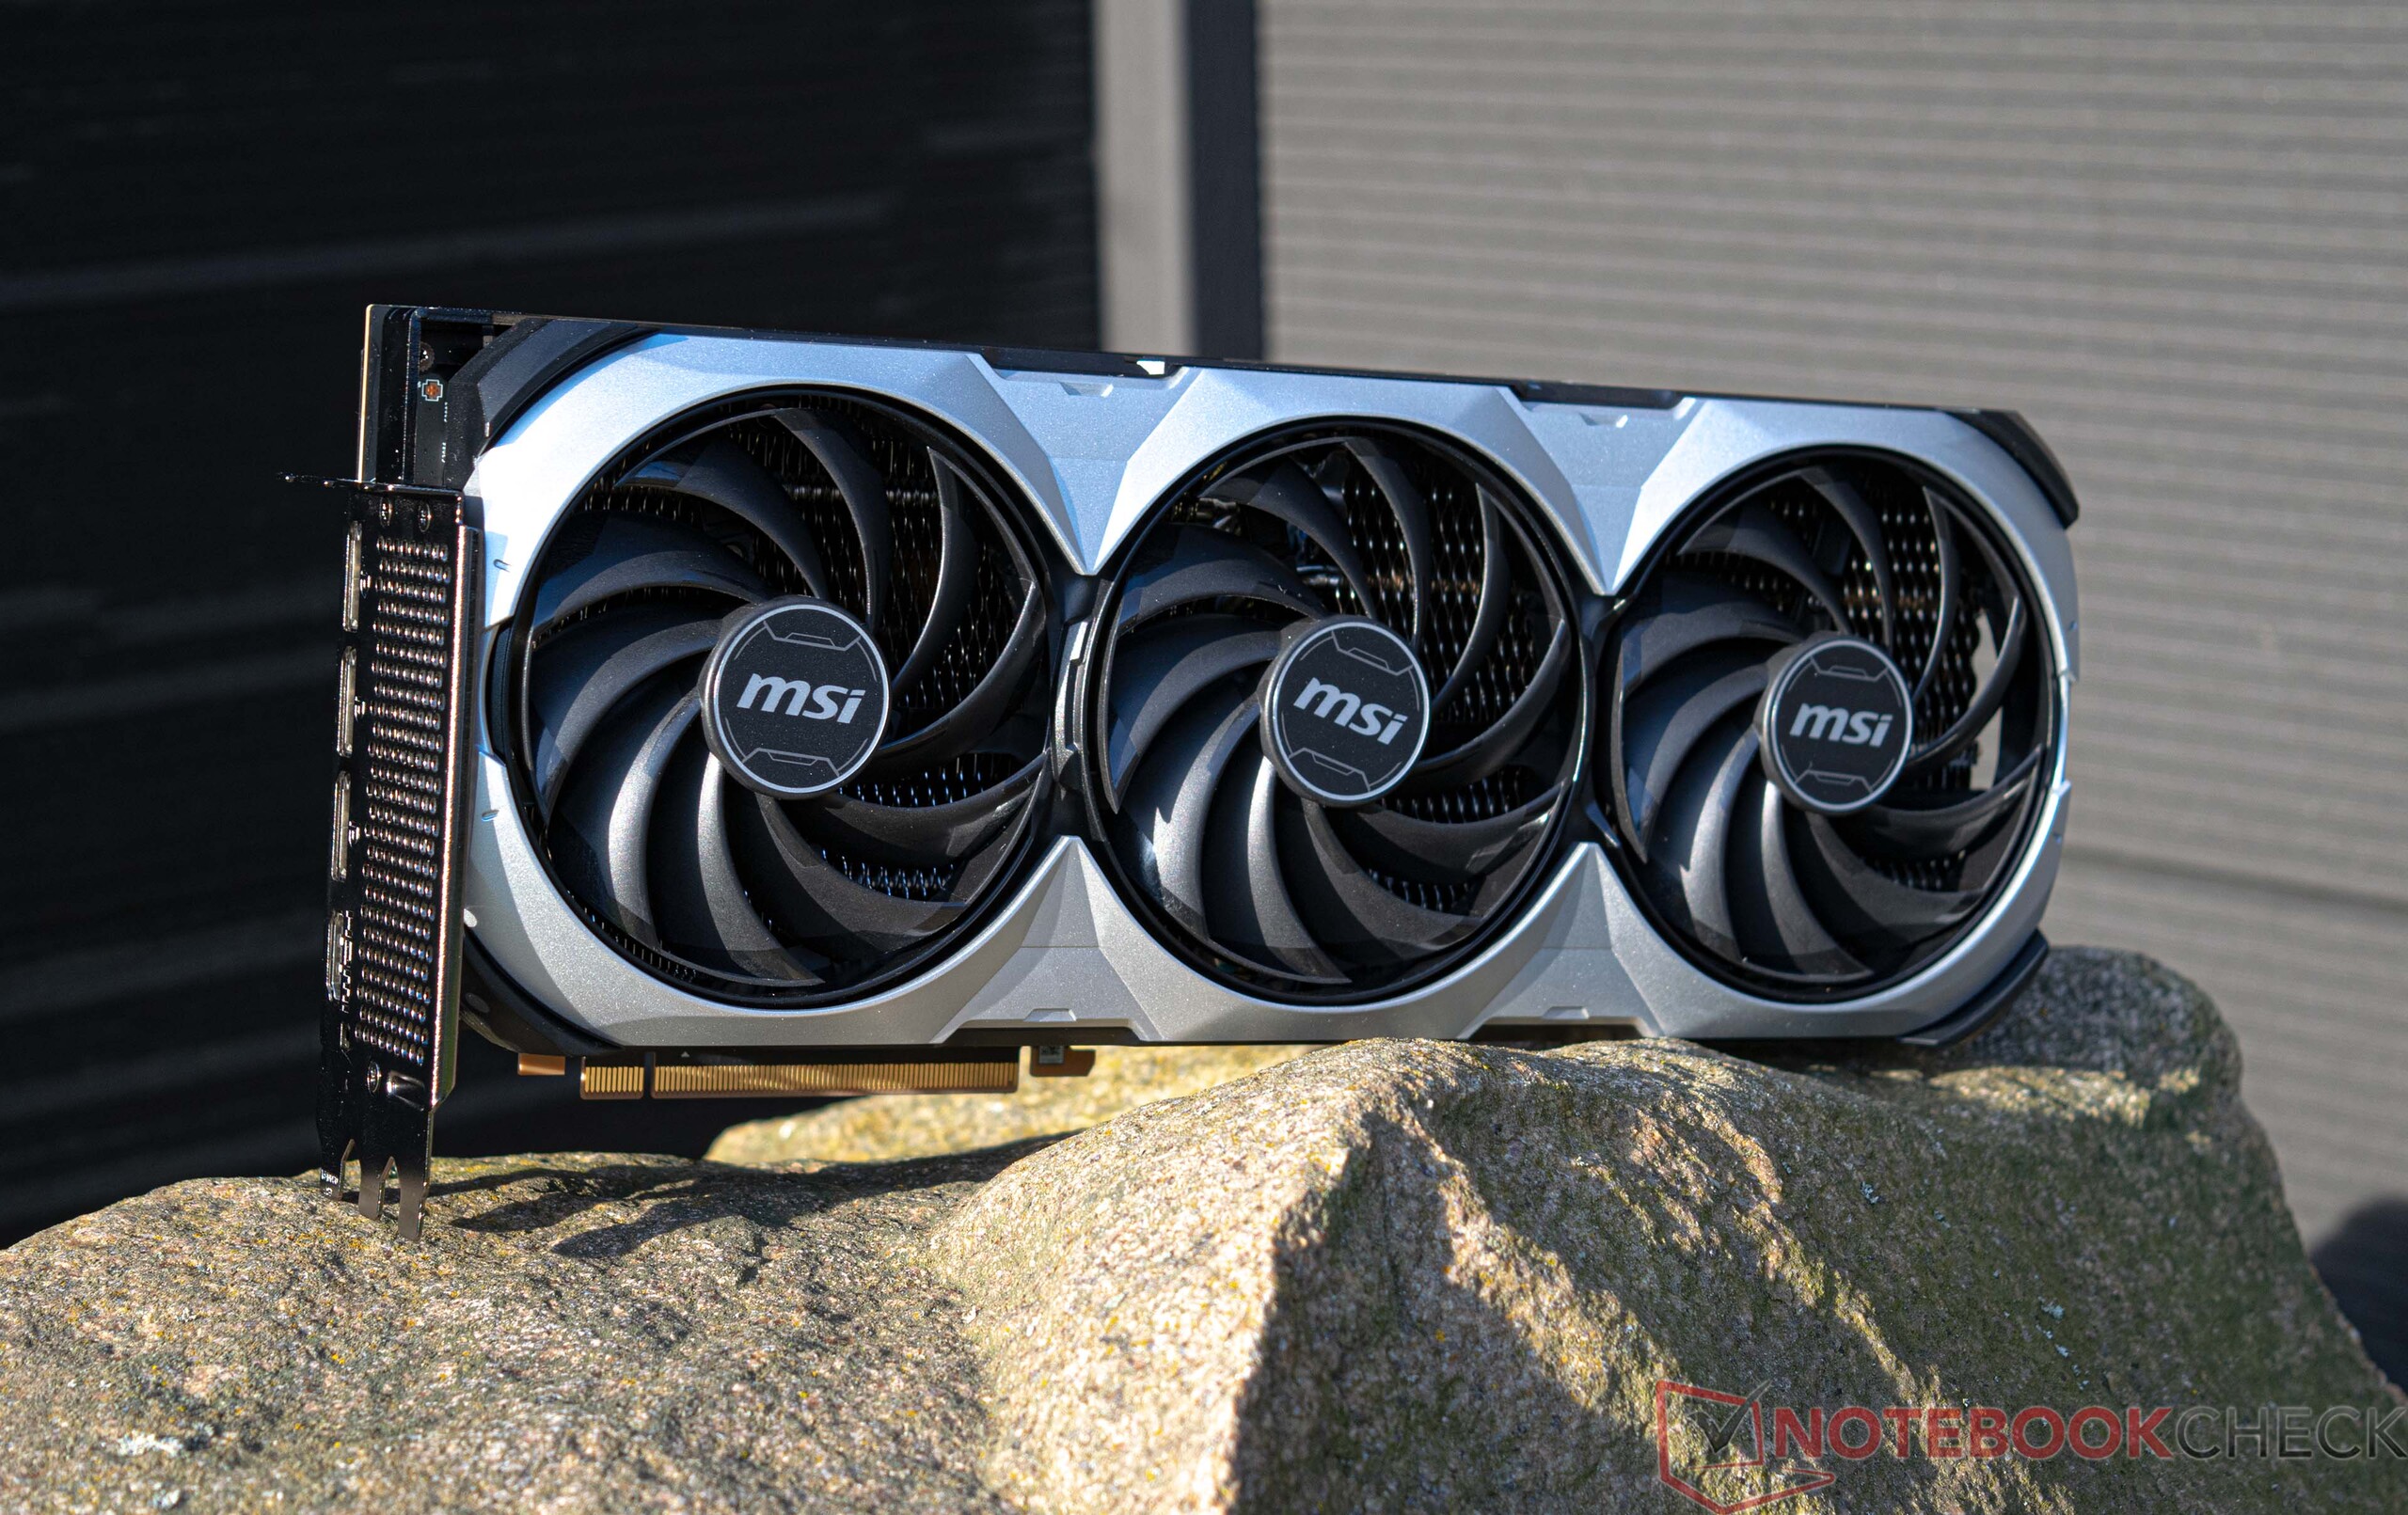
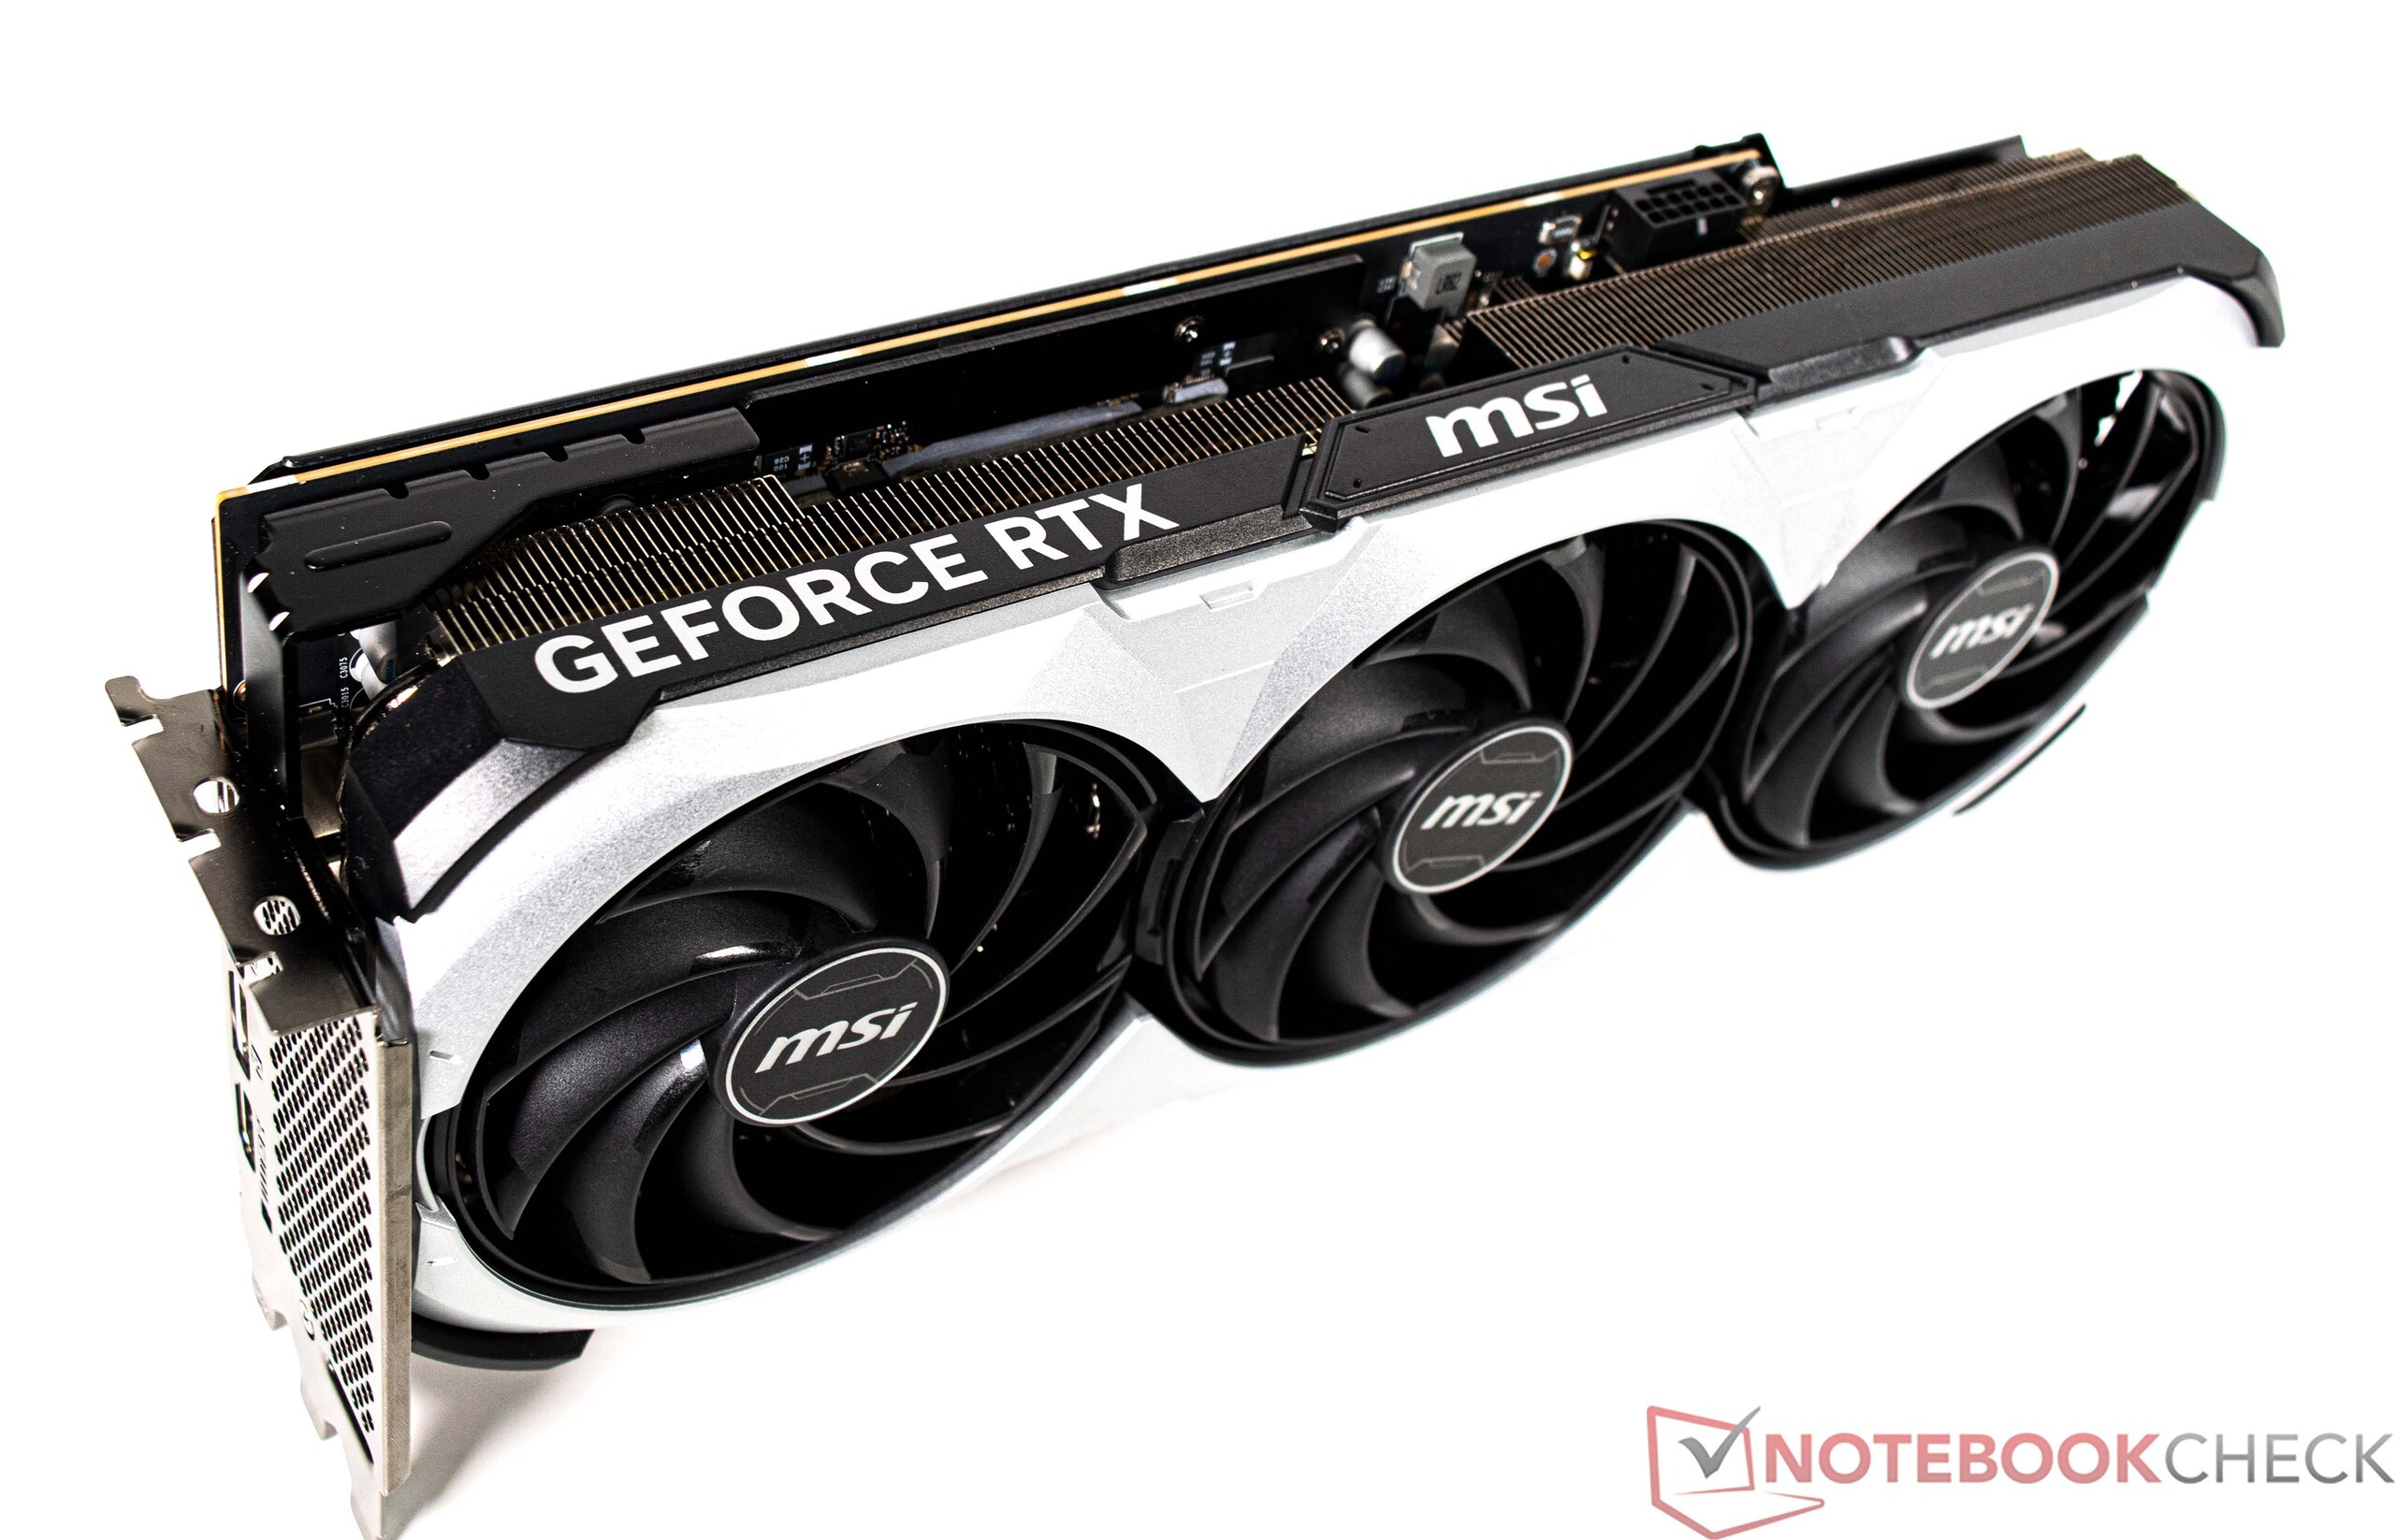
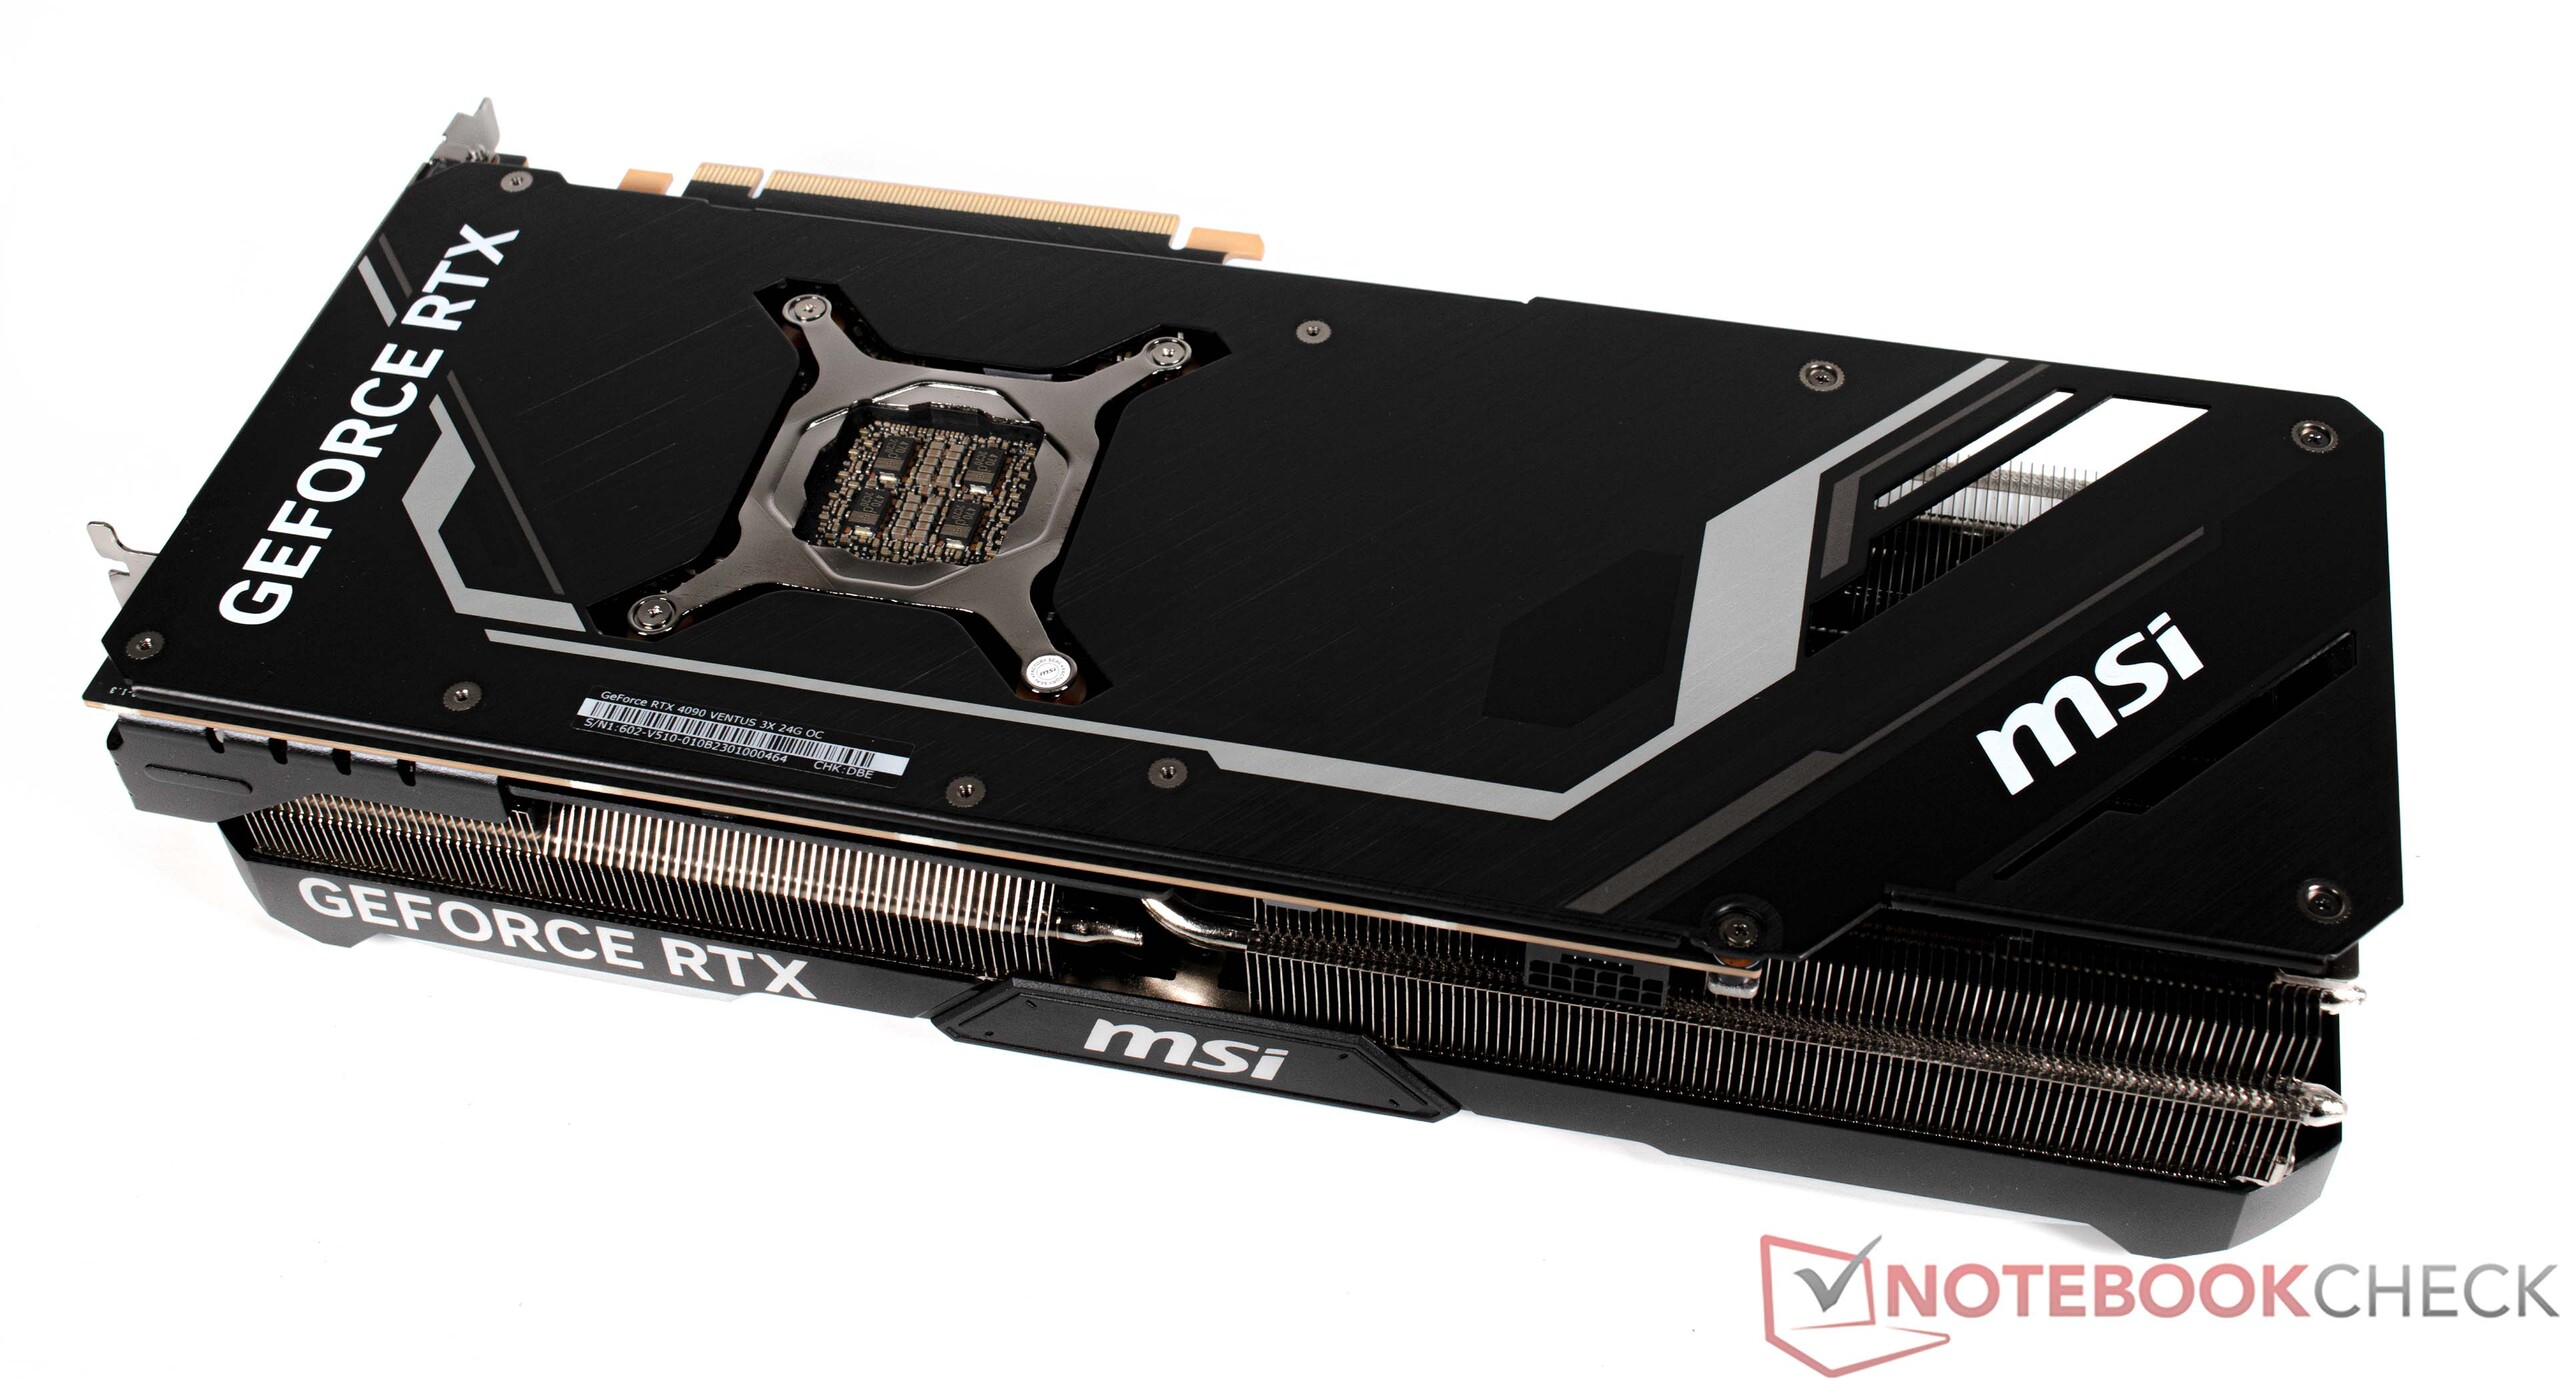
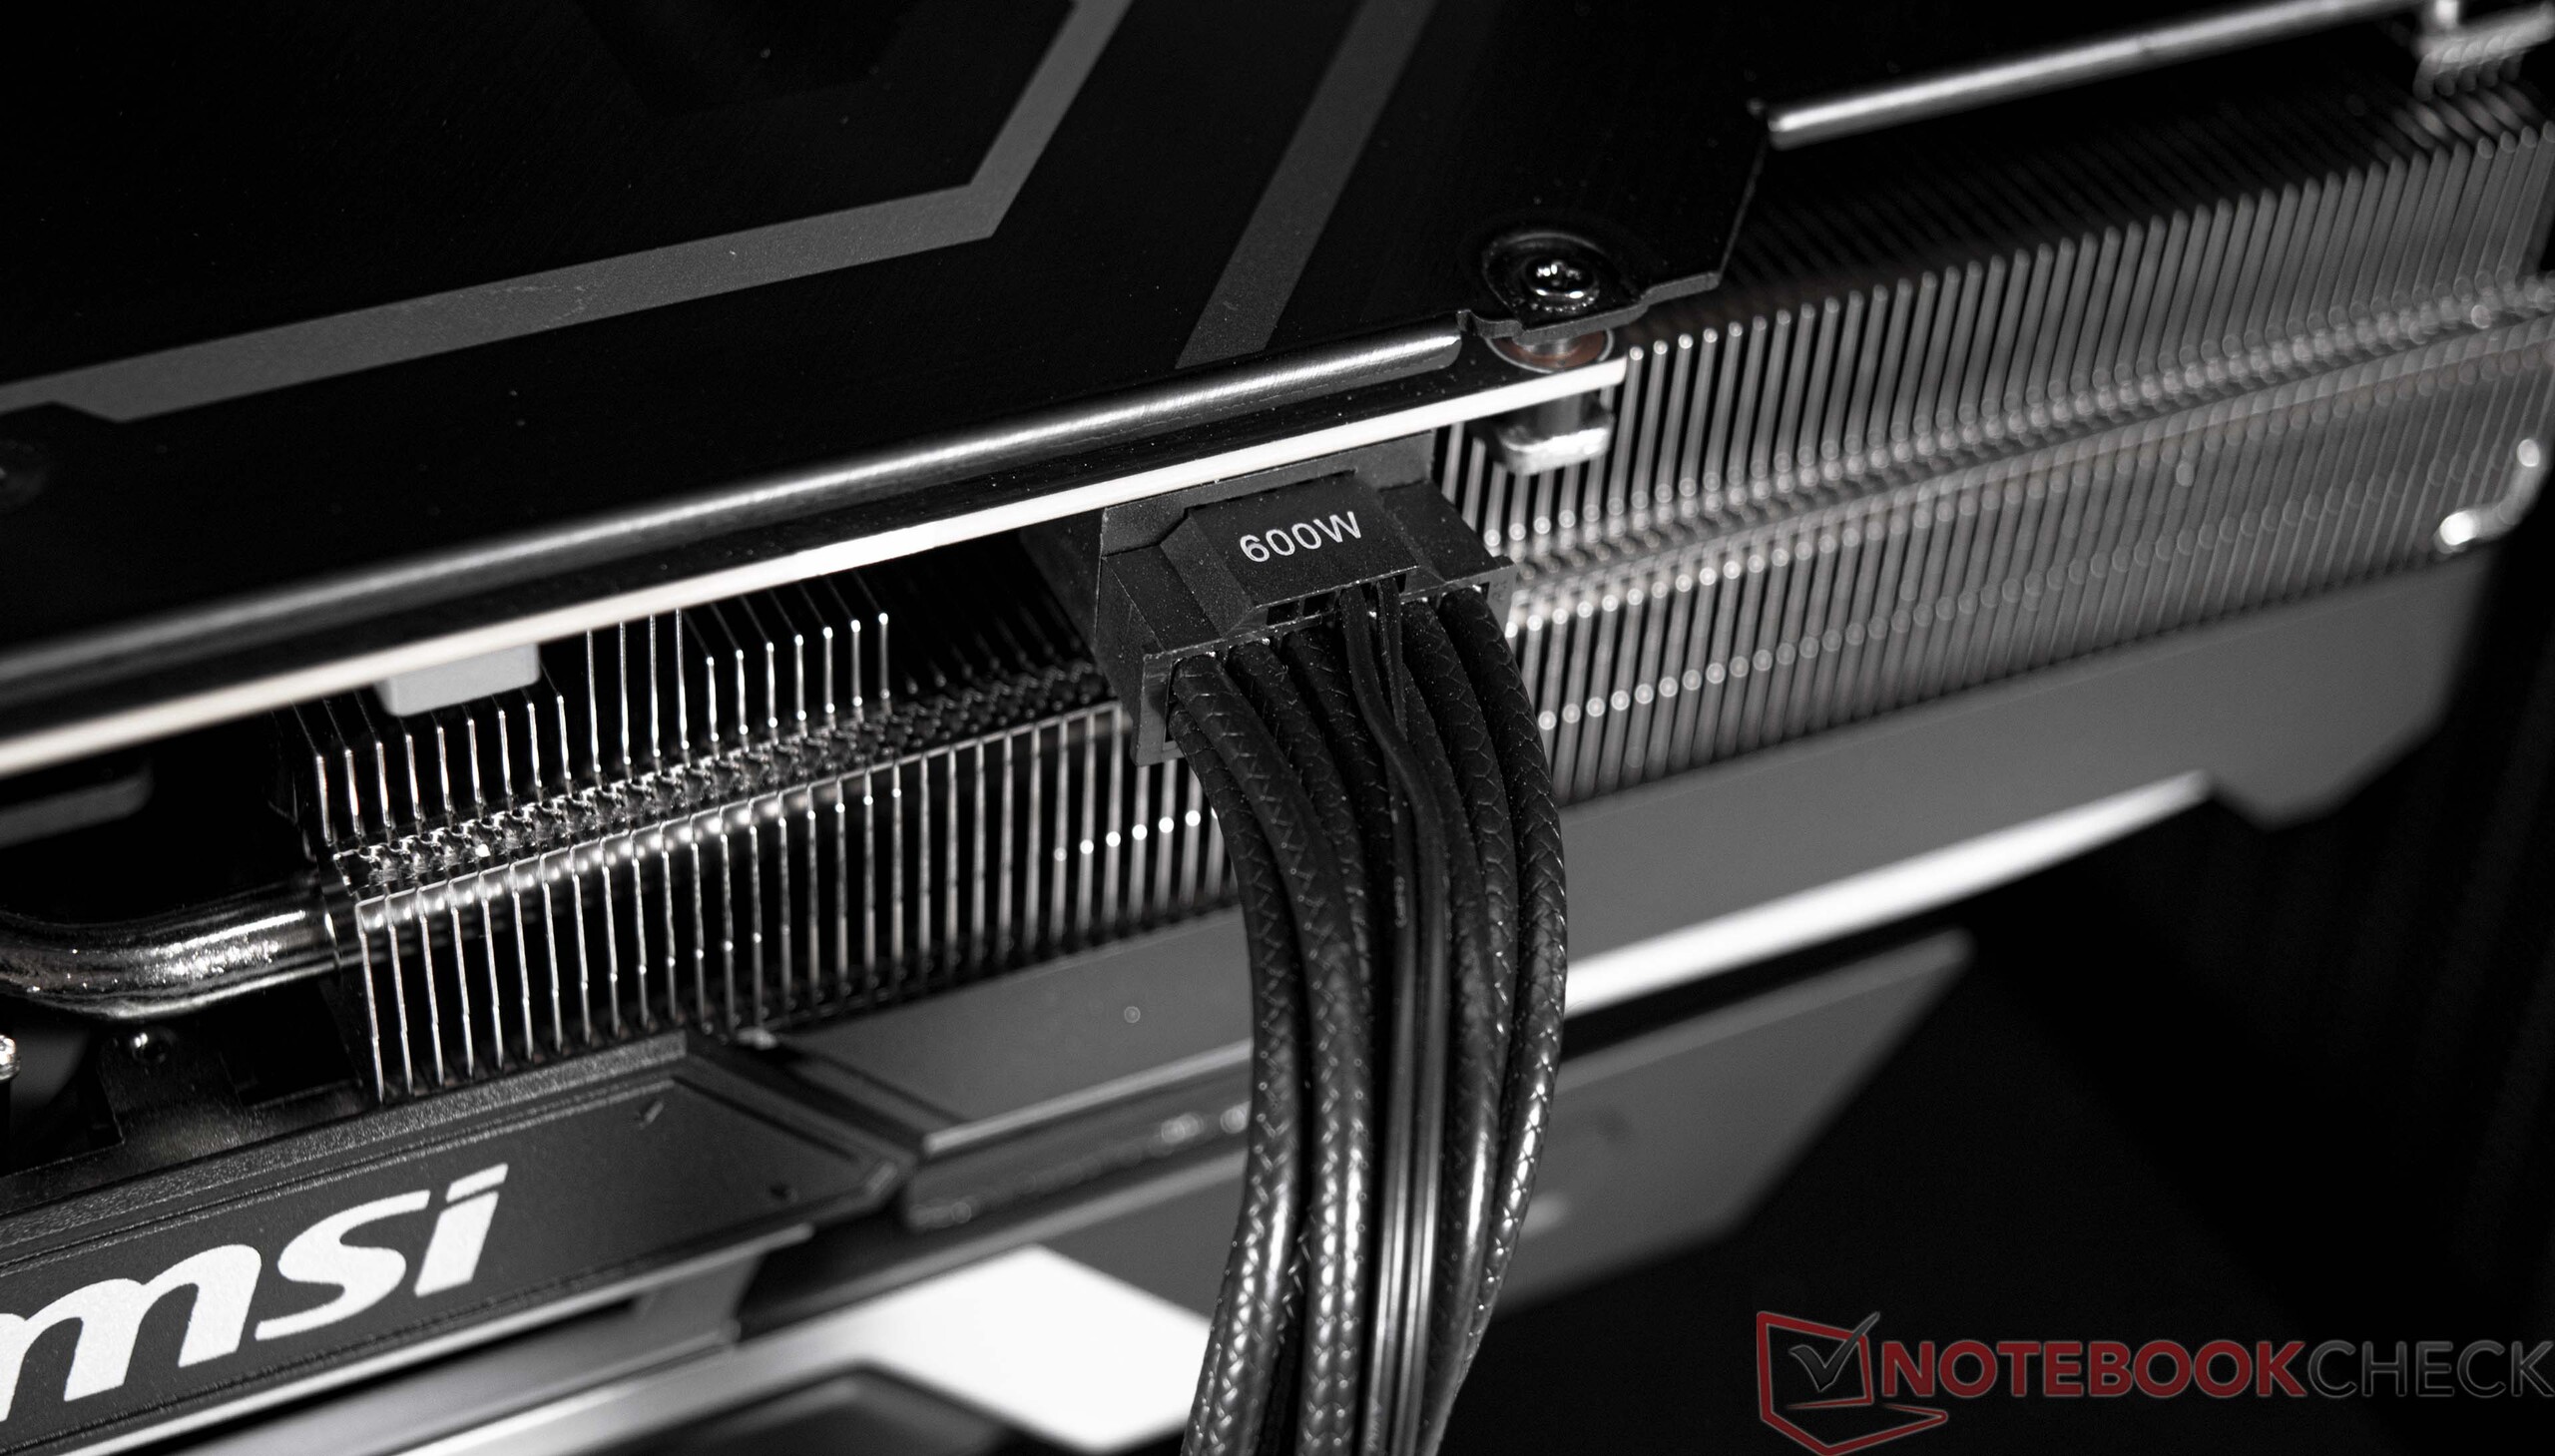
Nuestro modelo de prueba está equipado con la tarjeta gráfica de consumo más rápida del momento: la Nvidia GeForce RTX 4090. La GPU ofreció un rendimiento inmensamente alto en todas nuestras pruebas sintéticas, lo que está muy en línea con nuestras expectativas. Junto con el Core i9-13900Kla unidad de pruebas quedó segunda en la clasificación 3DMark. El primer puesto se lo llevó otraGeForce RTX 4090, esta vez un modelo de KFA2. Sin embargo, la MSI GeForce RTX 4090 VENTUS 3X puede competir muy bien con la tarjeta KFA2. El modelo de MSI ocupa mucho espacio en el XMG SECTOR Intel. Sin embargo, MSI ha decidido no dotar a la tarjeta de efectos de iluminación extravagantes. La GPU insignia de Nvidia aventaja considerablemente a las tarjetas gráficas de gama alta de AMD. El configurador te permite elegir entre una amplia gama de tarjetas gráficas Nvidia de las series 30 y 40. Si quieres una tarjeta AMD en tu sistema, la única opción es una Radeon RX 6950 XT. Las tarjetas AMD de la serie 7000 no están disponibles actualmente.
Visita esta página para obtener más información técnica sobre la Nvidia GeForce RTX 4090.
Visita nuestra tabla comparativa de GPUs https://www.notebookcheck.net/Mobile-Graphics-Cards-Benchmark-List.844.0.html para obtener más información y resultados de pruebas comparativas.
Compute benchmarks and professional applications
| 3DMark 05 Standard | 68661 puntos | |
| 3DMark 06 Standard Score | 70557 puntos | |
| 3DMark Vantage P Result | 133759 puntos | |
| 3DMark 11 Performance | 62922 puntos | |
| 3DMark Ice Storm Standard Score | 257615 puntos | |
| 3DMark Cloud Gate Standard Score | 85474 puntos | |
| 3DMark Fire Strike Score | 45450 puntos | |
| 3DMark Fire Strike Extreme Score | 37831 puntos | |
| 3DMark Time Spy Score | 32024 puntos | |
ayuda | ||
Rendimiento en juegos
Los magníficos resultados observados en los benchmarks sintéticos se ven reforzados por el excelente rendimiento en juegos del XMG SECTOR Intel. Ni que decir tiene que la GeForce RTX 4090 desempeña un papel crucial en ello. Pero también necesitarás una CPU extremadamente rápida para poder aprovechar eficazmente la potencia de la GPU Nvidia más rápida. Del mismo modo, recomendamos jugar a juegos principalmente a 2160p y ajustes máximos para poder aprovechar el rendimiento de la tarjeta gráfica en primer lugar. Aquellos que solo jueguen a 1080p pueden optar por una RTX 4070 Ti y ahorrarse bastante dinero.
Las funciones especiales de RTX, como DLSS 3.0 y la generación de fotogramas (FG), son por el momento exclusivas de las tarjetas de la serie RTX 40. Esto significa que si quieres disfrutar de ellas, tienes que comprar una RTX 4070 Ti. Esto significa que si quieres disfrutar de estas nuevas funciones, no tienes más remedio que hacerte con una GPU RTX Serie 40. La XMG SECTOR Intel es capaz de ejecutar sin problemas todos los juegos probados a 2160p y ajustes máximos. Además, aquellos que quieran activar el trazado de rayos pueden utilizar la característica en su mayoría sin limitaciones. Pero algunos juegos, como Cyberpunk 2077, pueden poner de rodillas incluso a un equipo de gama alta como el XMG SECTOR. Activar DLSS ayudará a que el PC vuelva a ejecutar estos juegos sin problemas a 2160p. Por su parte, AMD ofrece una función similar en forma de FSR. En última instancia, depende de los desarrolladores de juegos implementar estas funciones. Puedes visitar en esta página para ver una lista de juegos compatibles con DLSS 3.0 o que lo serán en el futuro.
| Metro Exodus - 1920x1080 Ultra Quality DXR AF:16x | |
| NVIDIA GeForce RTX 4090 | |
| AMD Radeon RX 7900 XTX | |
| NVIDIA GeForce RTX 4080 | |
| NVIDIA GeForce RTX 4090 | |
| AMD Radeon RX 7900 XT | |
| NVIDIA GeForce RTX 3080 Ti | |
| NVIDIA GeForce RTX 3090 | |
| Far Cry 6 - 1920x1080 Ultra Graphics Quality + HD Textures + DXR AA:T | |
| NVIDIA GeForce RTX 4080 | |
| AMD Radeon RX 7900 XTX | |
| AMD Radeon RX 7900 XT | |
| NVIDIA GeForce RTX 4090 | |
| NVIDIA GeForce RTX 4090 | |
| NVIDIA GeForce RTX 3080 Ti | |
| NVIDIA GeForce RTX 3090 | |
| AMD Radeon RX 6800 | |
| AMD Radeon RX 6950 XT | |
| Cyberpunk 2077 1.6 | |
| 3840x2160 Ray Tracing Ultra Preset (DLSS off) | |
| NVIDIA GeForce RTX 4090 | |
| NVIDIA GeForce RTX 4090 (1.6) | |
| NVIDIA GeForce RTX 4080 (1.6) | |
| NVIDIA GeForce RTX 3090 (1.6) | |
| AMD Radeon RX 7900 XTX (1.61) | |
| NVIDIA GeForce RTX 3080 Ti (1.61) | |
| AMD Radeon RX 7900 XT (1.61) | |
| AMD Radeon RX 6800 (1.61) | |
| 1920x1080 Ray Tracing Ultra Preset (DLSS off) | |
| NVIDIA GeForce RTX 4090 | |
| NVIDIA GeForce RTX 4090 (1.6) | |
| NVIDIA GeForce RTX 4080 (1.6) | |
| NVIDIA GeForce RTX 3080 Ti (1.61) | |
| NVIDIA GeForce RTX 3090 (1.6) | |
| AMD Radeon RX 7900 XTX (1.61) | |
| AMD Radeon RX 7900 XT (1.61) | |
| AMD Radeon RX 6800 (1.61) | |
| Control - 1920x1080 High Quality Preset & High Ray Tracing Preset (DX12) | |
| NVIDIA GeForce RTX 4090 | |
| NVIDIA GeForce RTX 4080 | |
| NVIDIA GeForce RTX 4090 | |
| AMD Radeon RX 7900 XTX | |
| NVIDIA GeForce RTX 3080 Ti | |
| AMD Radeon RX 7900 XT | |
| AMD Radeon RX 6950 XT | |
| Ghostwire Tokyo - 1920x1080 Highest Settings + Maximum Ray Tracing | |
| NVIDIA GeForce RTX 4090 | |
| NVIDIA GeForce RTX 4090 | |
| NVIDIA GeForce RTX 4080 | |
| AMD Radeon RX 7900 XTX | |
| NVIDIA GeForce RTX 3080 Ti | |
| AMD Radeon RX 7900 XT | |
| Guardians of the Galaxy - 1920x1080 Ultra Preset + Ultra Ray-Tracing | |
| NVIDIA GeForce RTX 4090 | |
| AMD Radeon RX 7900 XTX | |
| AMD Radeon RX 7900 XT | |
| The Callisto Protocol - 1920x1080 Ultra Preset (without FSR Upscaling) + Full Ray-Tracing | |
| AMD Radeon RX 7900 XTX | |
| NVIDIA GeForce RTX 4090 | |
| NVIDIA GeForce RTX 4090 | |
| AMD Radeon RX 7900 XT | |
| NVIDIA GeForce RTX 3080 Ti | |
| AMD Radeon RX 6800 | |
| bajo | medio | alto | ultra | QHD | 4K DLSS | 4K | |
|---|---|---|---|---|---|---|---|
| GTA V (2015) | 187.6 | 187.6 | 187 | 165.9 | 166.3 | 187.5 | |
| The Witcher 3 (2015) | 731.4 | 664.6 | 613.4 | 314.1 | 282 | ||
| Dota 2 Reborn (2015) | 287.9 | 258.5 | 256.3 | 219.7 | 226.8 | ||
| Final Fantasy XV Benchmark (2018) | 234 | 232 | 227 | 224 | 155.7 | ||
| X-Plane 11.11 (2018) | 237 | 209 | 160.6 | 139.3 | |||
| Far Cry 5 (2018) | 240 | 208 | 201 | 187 | 187 | 173 | |
| Strange Brigade (2018) | 627 | 506 | 506 | 506 | 488 | 281 | |
| Shadow of the Tomb Raider (2018) | 300 | 288 | 285 | 282 | 269 | 186 | |
| Far Cry New Dawn (2019) | 206 | 188 | 180 | 161 | 164 | 152 | |
| Metro Exodus (2019) | 260 | 235 | 191.9 | 177.3 | 165 | 136.3 | |
| Control (2019) | 233 | 233 | 233 | 232 | 114.4 | ||
| Borderlands 3 (2019) | 243 | 213 | 197.3 | 182.9 | 182.5 | 132.9 | |
| F1 2020 (2020) | 521 | 445 | 431 | 395 | 386 | 282 | |
| F1 2021 (2021) | 632 | 585 | 501 | 277 | 267 | 196.6 | |
| Far Cry 6 (2021) | 213 | 187.4 | 168.7 | 166.8 | 163.8 | 133.4 | |
| Guardians of the Galaxy (2021) | 220 | 220 | 219 | 216 | 215 | 214 | |
| Forza Horizon 5 (2021) | 285 | 245 | 244 | 187 | 178 | 148 | |
| God of War (2022) | 263 | 263 | 255 | 203 | 173.4 | 125.1 | |
| GRID Legends (2022) | 311 | 286 | 258 | 248 | 242 | 191.4 | |
| Cyberpunk 2077 1.6 (2022) | 195 | 185 | 182 | 181 | 167 | 80 | |
| Ghostwire Tokyo (2022) | 278 | 275 | 273 | 272 | 266 | 174.7 | |
| Tiny Tina's Wonderlands (2022) | 413 | 355 | 309 | 280 | 224 | 128.4 | |
| F1 22 (2022) | 415 | 377 | 364 | 195.4 | 149.7 | 81.1 | |
| A Plague Tale Requiem (2022) | 188.6 | 175.4 | 158.5 | 147.8 | 104.6 | 193.6 | 74.7 |
| Uncharted Legacy of Thieves Collection (2022) | 139.5 | 138.1 | 137.1 | 136.6 | 134.9 | 99.1 | |
| Call of Duty Modern Warfare 2 2022 (2022) | 248 | 247 | 232 | 230 | 187 | 215 | 128 |
| Spider-Man Miles Morales (2022) | 169.9 | 163.3 | 150.9 | 149.3 | 127.4 | 126.8 | |
| The Callisto Protocol (2022) | 234.8 | 224 | 204.9 | 203.8 | 184.8 | 124.9 | |
| The Witcher 3 v4 (2023) | 304 | 271 | 218 | 198.8 | 154.1 | 199.7 |
Emisiones
Emisiones sonoras
Según nuestras mediciones, el sistema es relativamente silencioso en reposo y produce sólo 32 dB(A) de ruido. Bajo una carga media, el ordenador es audible pero sigue siendo silencioso porque la tarjeta gráfica puede seguir refrigerándose pasivamente. Los ventiladores de la carcasa y los tres ventiladores de la GPU sólo giran cuando el sistema está sometido a una carga pesada. Nuestro sonómetro midió un pico de ruido de 40,6 dB(A) durante la prueba de estrés.
Ruido
| Ocioso |
| 32 / 32.1 / 32.3 dB(A) |
| Carga |
| 32.4 / 40.6 dB(A) |
 | ||
30 dB silencioso 40 dB(A) audible 50 dB(A) ruidosamente alto |
||
min: | ||
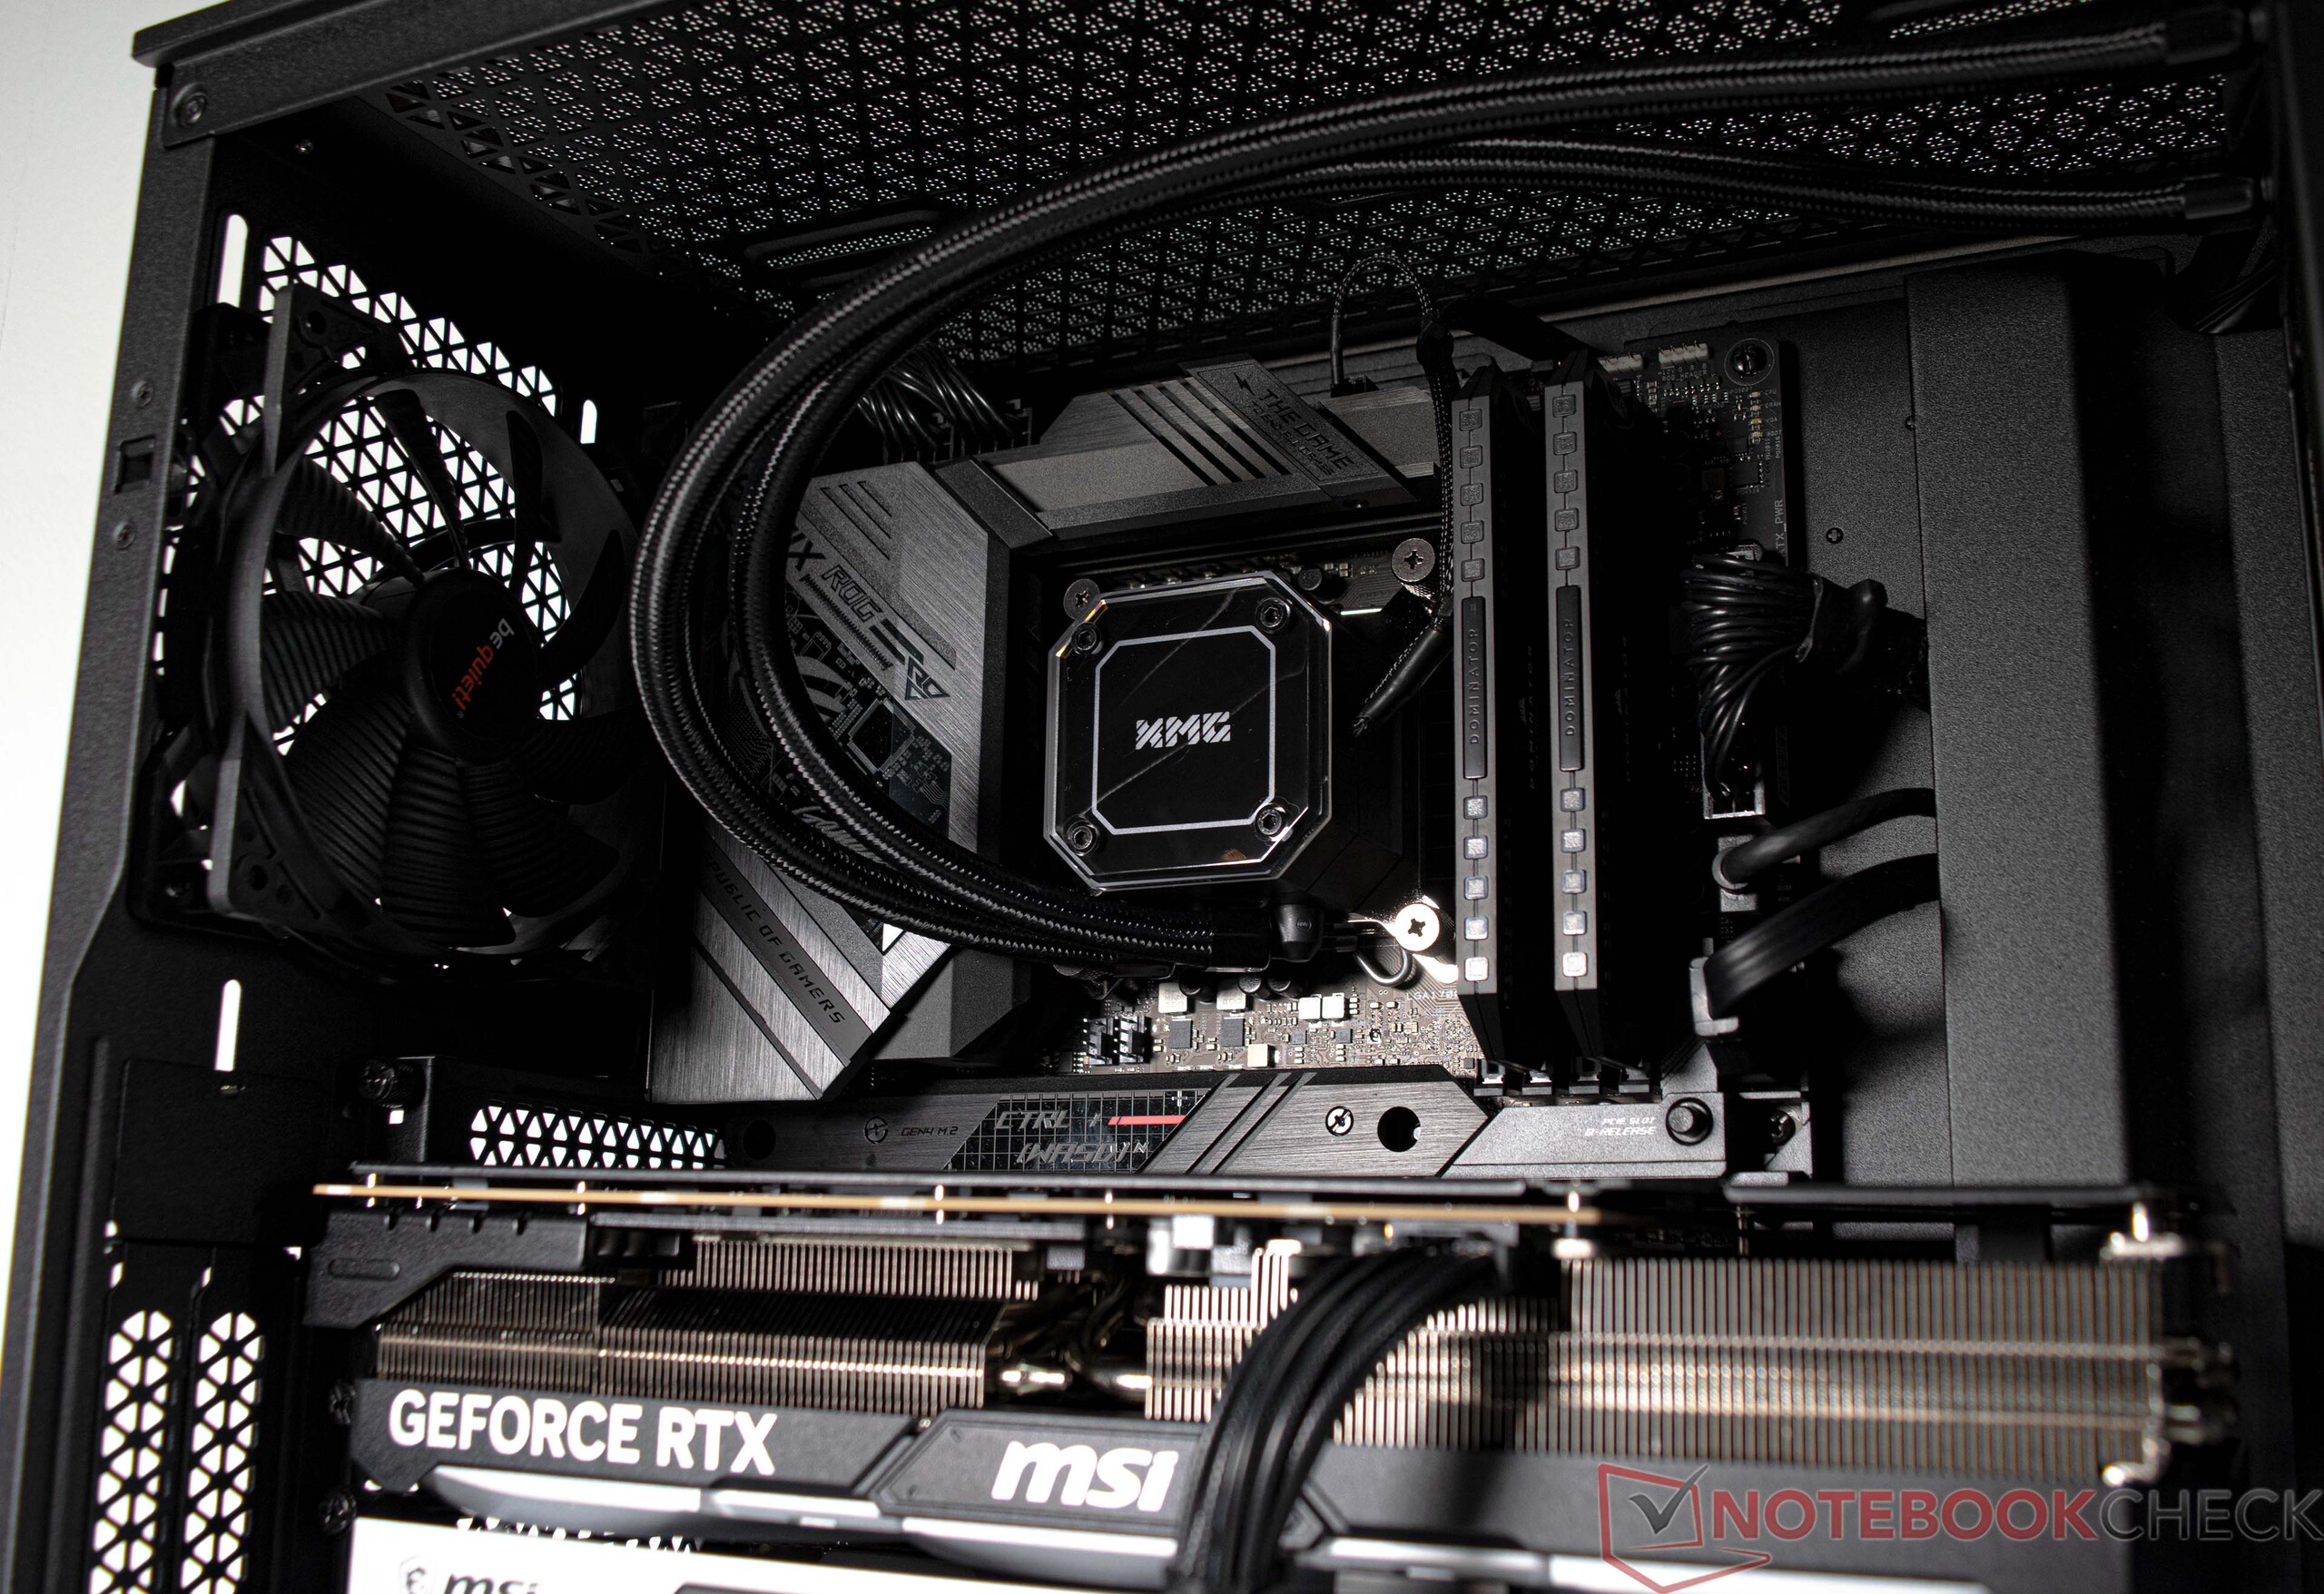
Temperatura
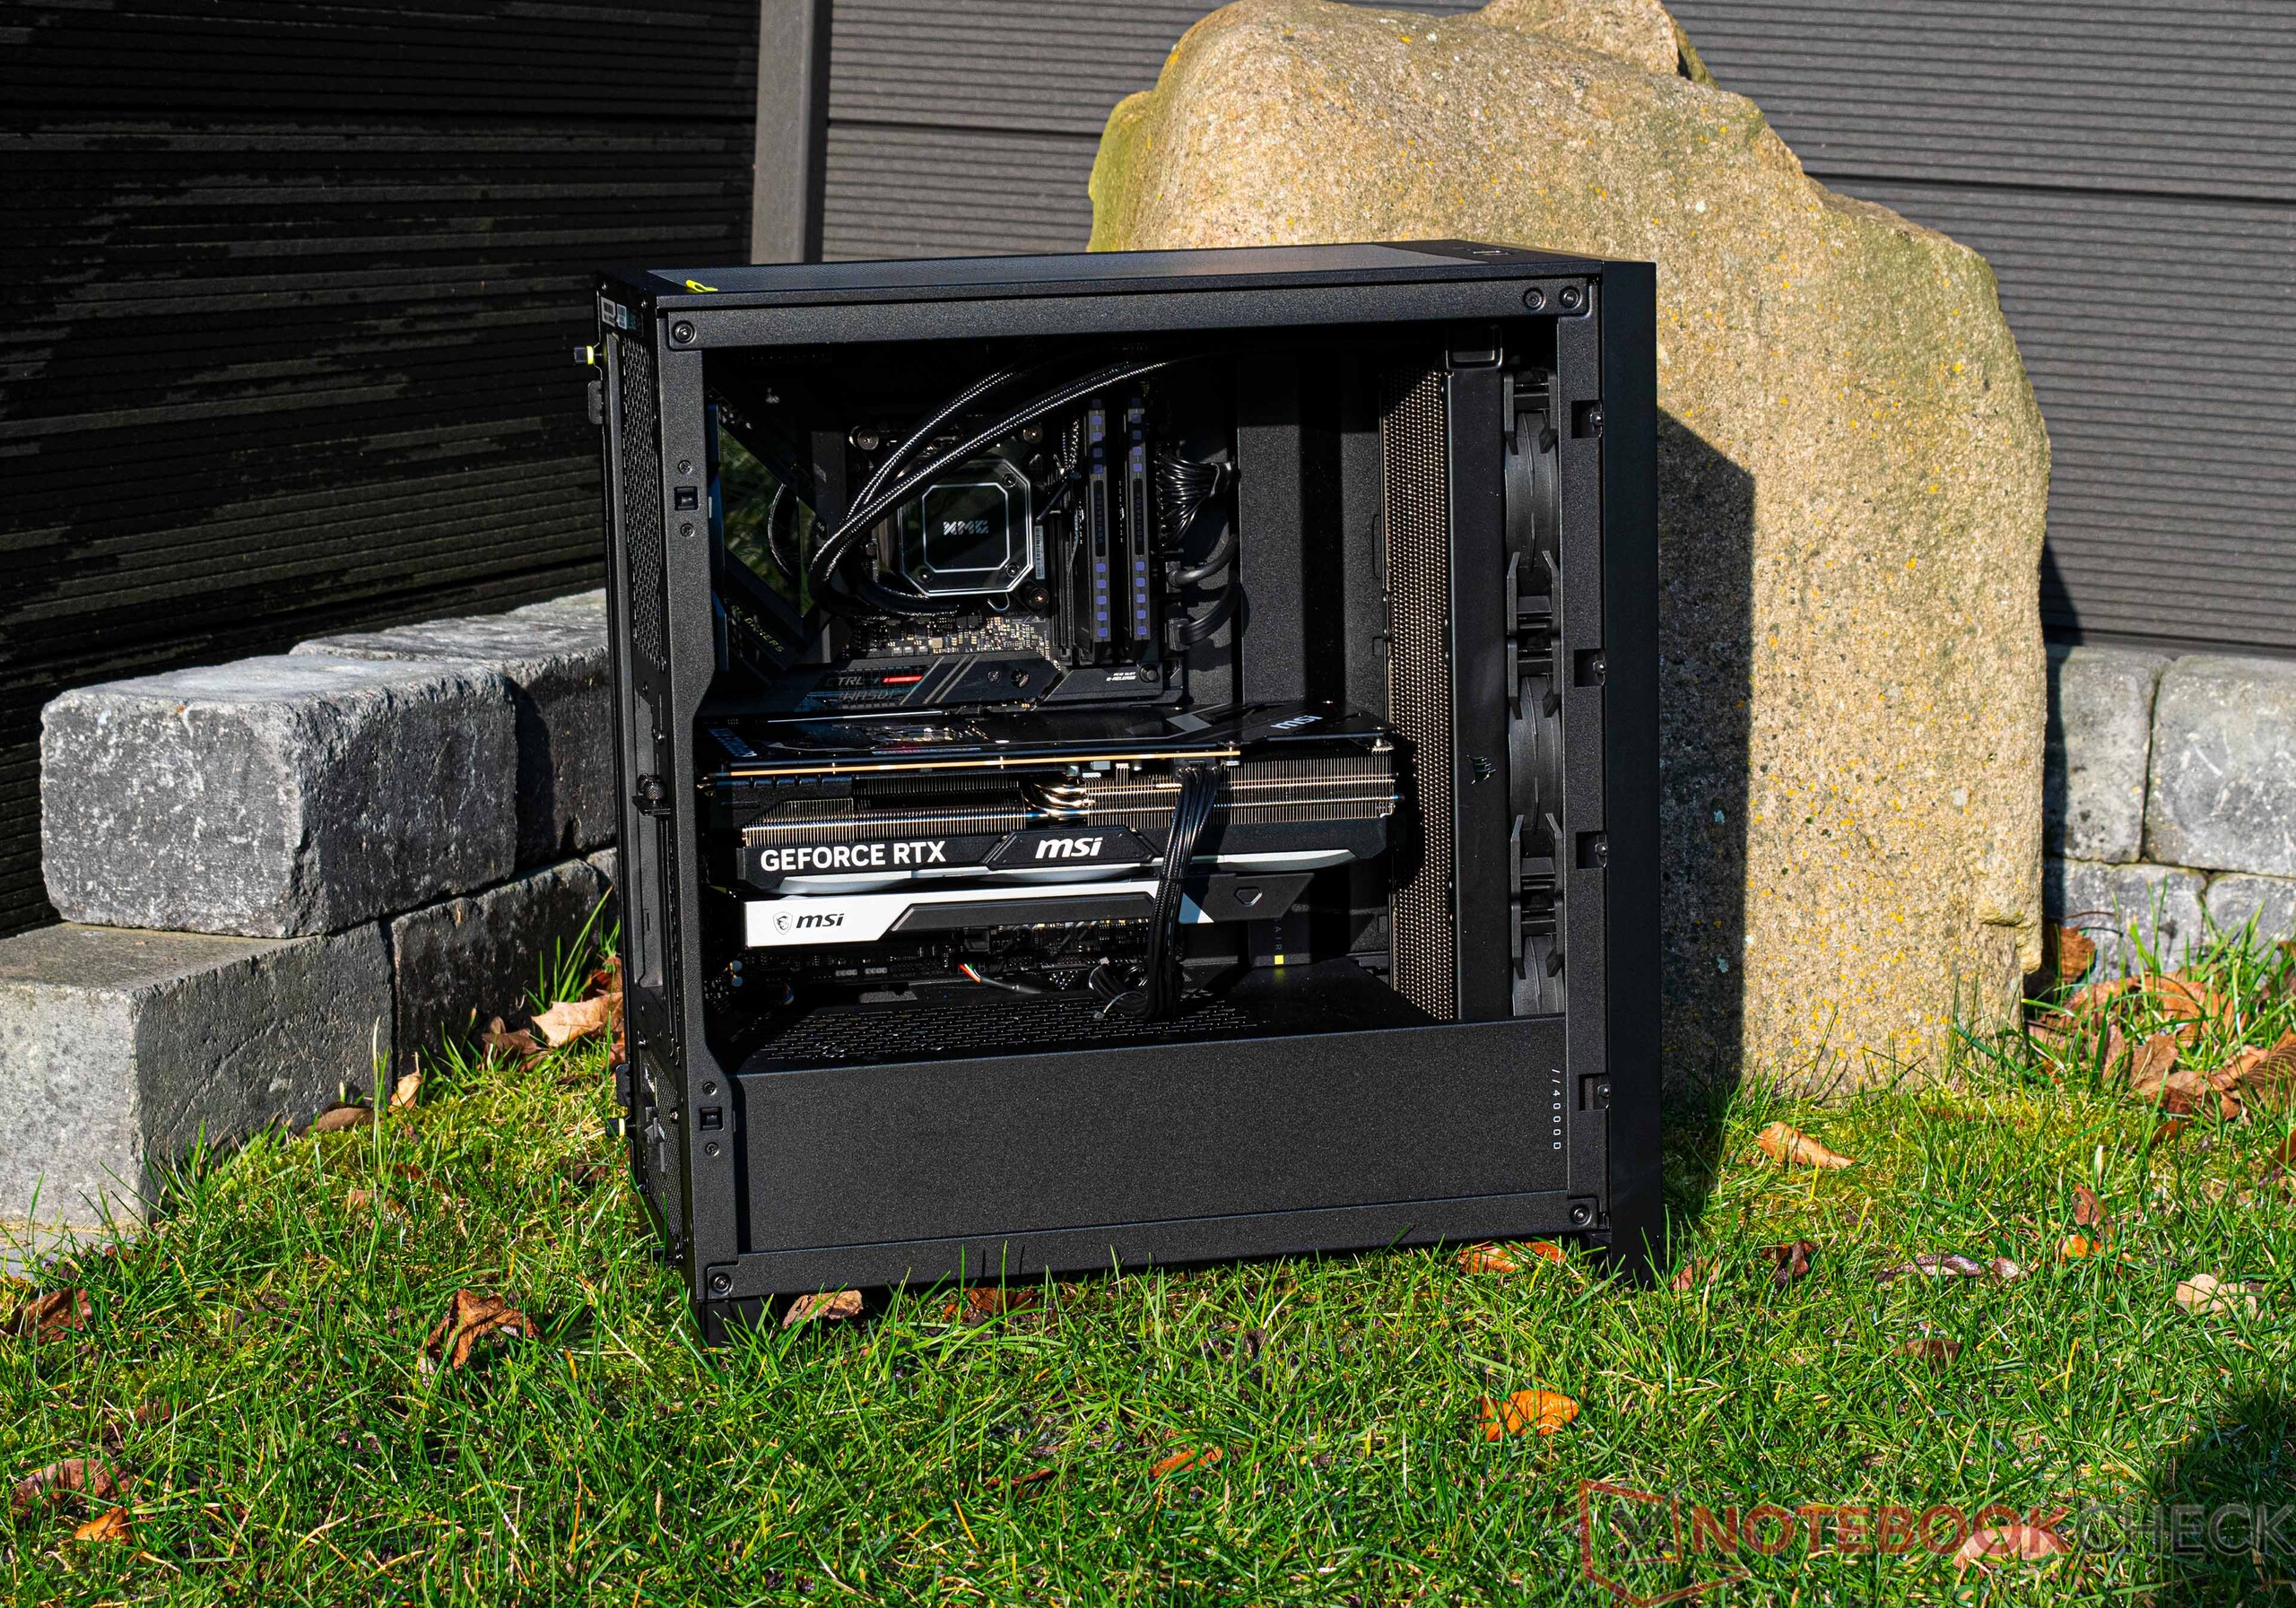
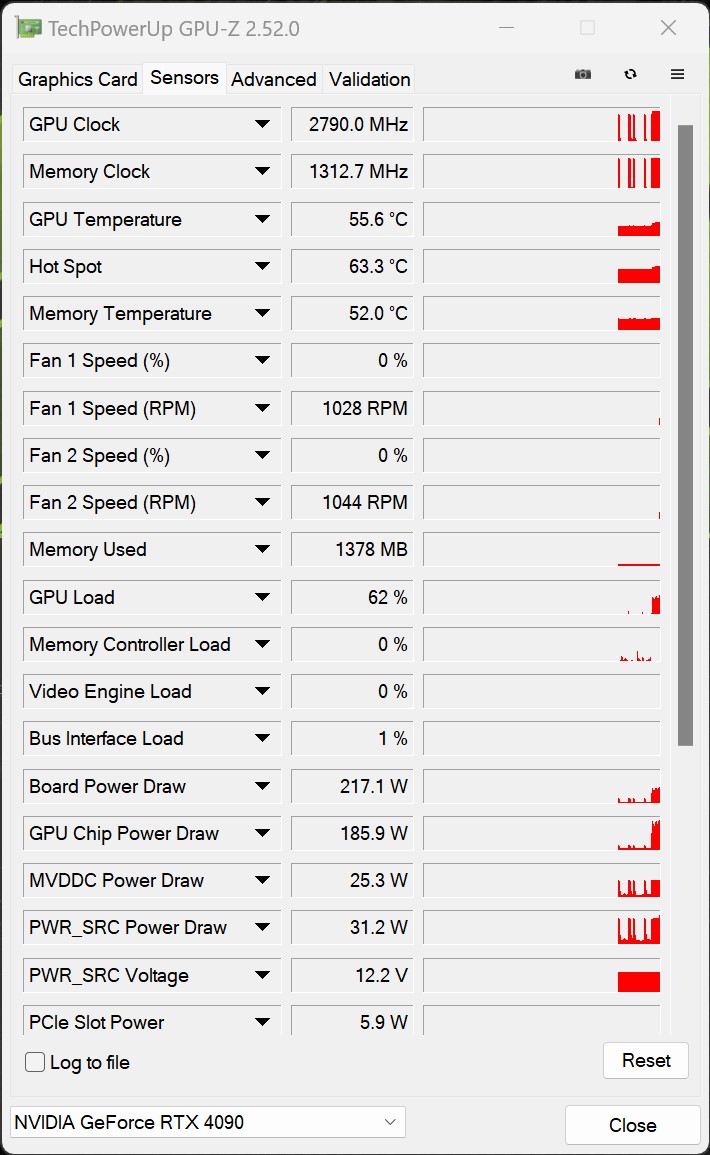
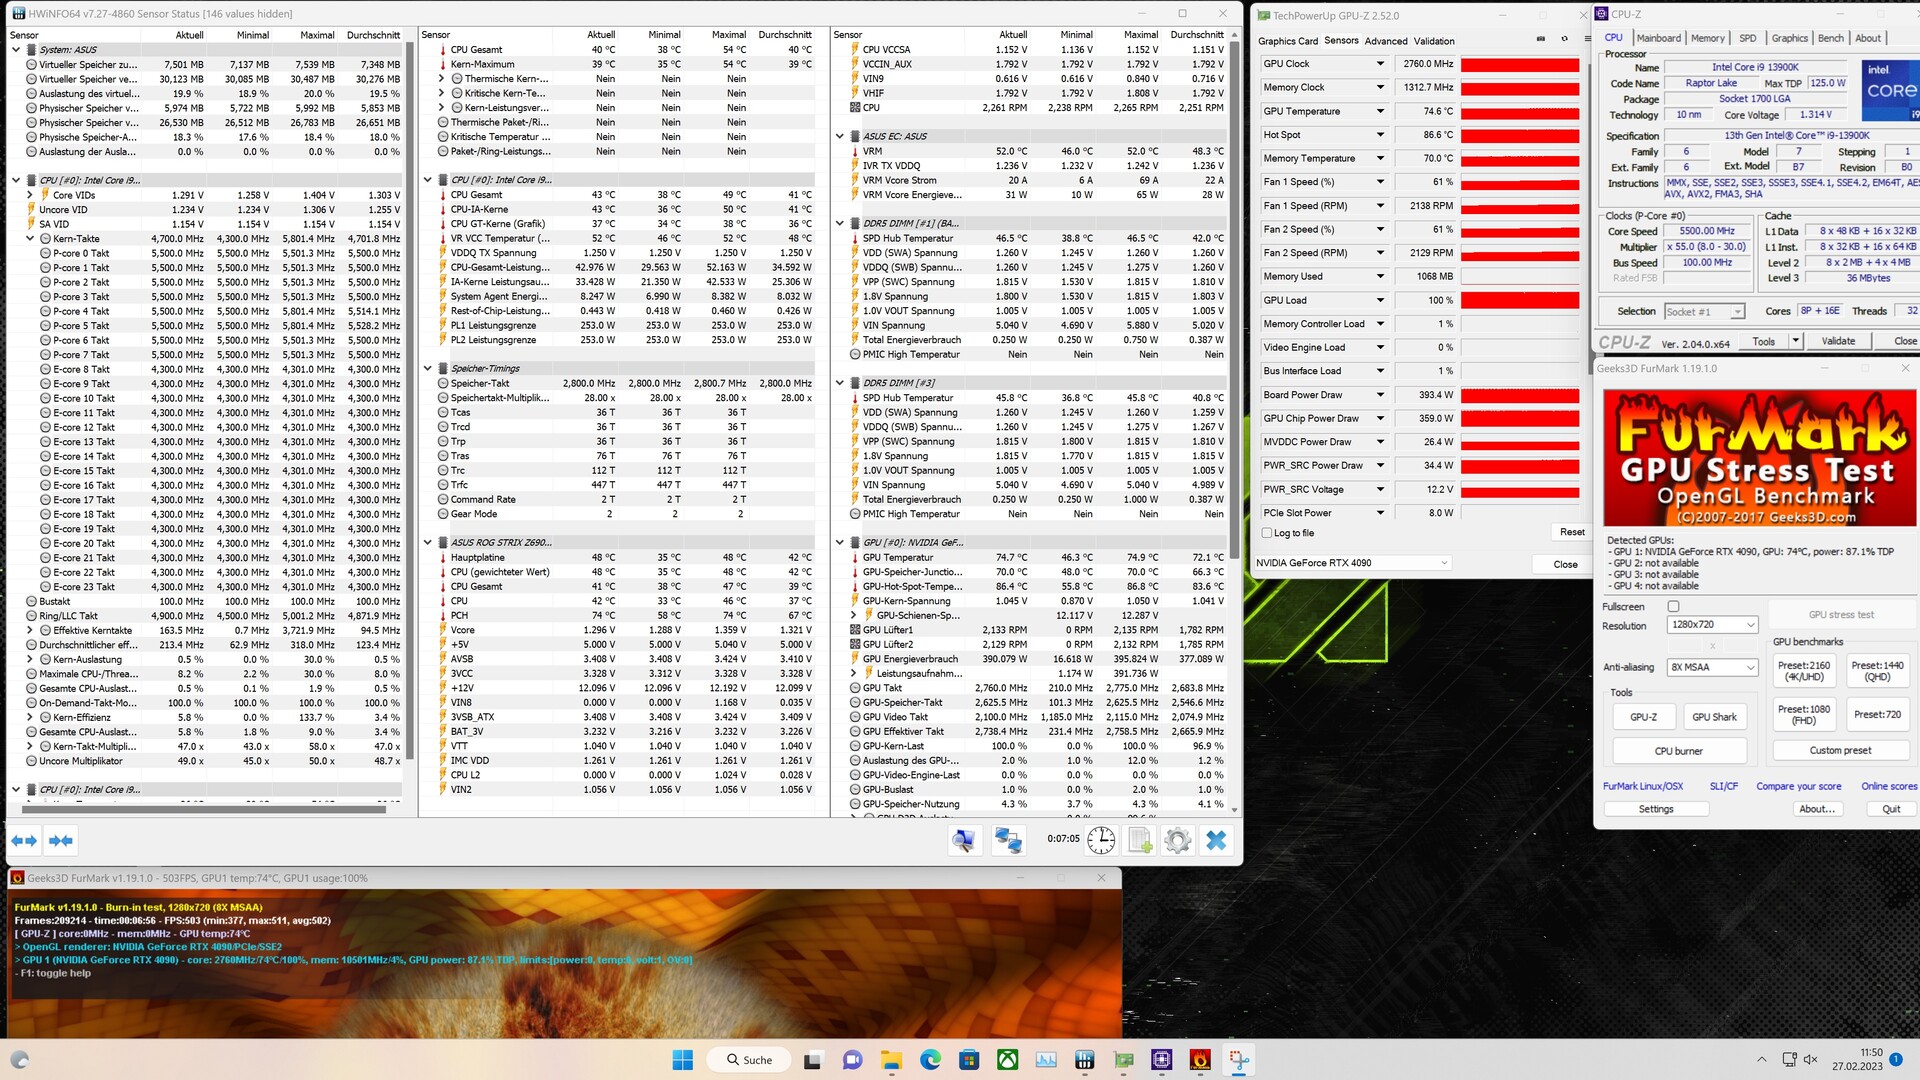
El XMG SECTOR Intel está diseñado para aspirar aire frío por la parte delantera y dirigir el aire caliente fuera de la carcasa por la parte superior y trasera. Pero el sistema sólo utiliza un ventilador para extraer el aire caliente de la carcasa. No hay ventiladores instalados en la parte superior. Sin embargo, el Corsair 4000D Airflow hace uso de tres ventiladores de entrada para crear una presión positiva para que el aire caliente pueda ser empujado fuera de la caja. El radiador de 360 mm del disipador AIO está montado justo detrás del panel frontal para garantizar una refrigeración óptima del procesador. En la prueba de estrés, vimos que la CPU alcanzaba los 90°C con un consumo medio de 228 vatios, mientras que las temperaturas de la GPU se acercaban a los 75°C, lo que es completamente seguro.
Consumo de energía
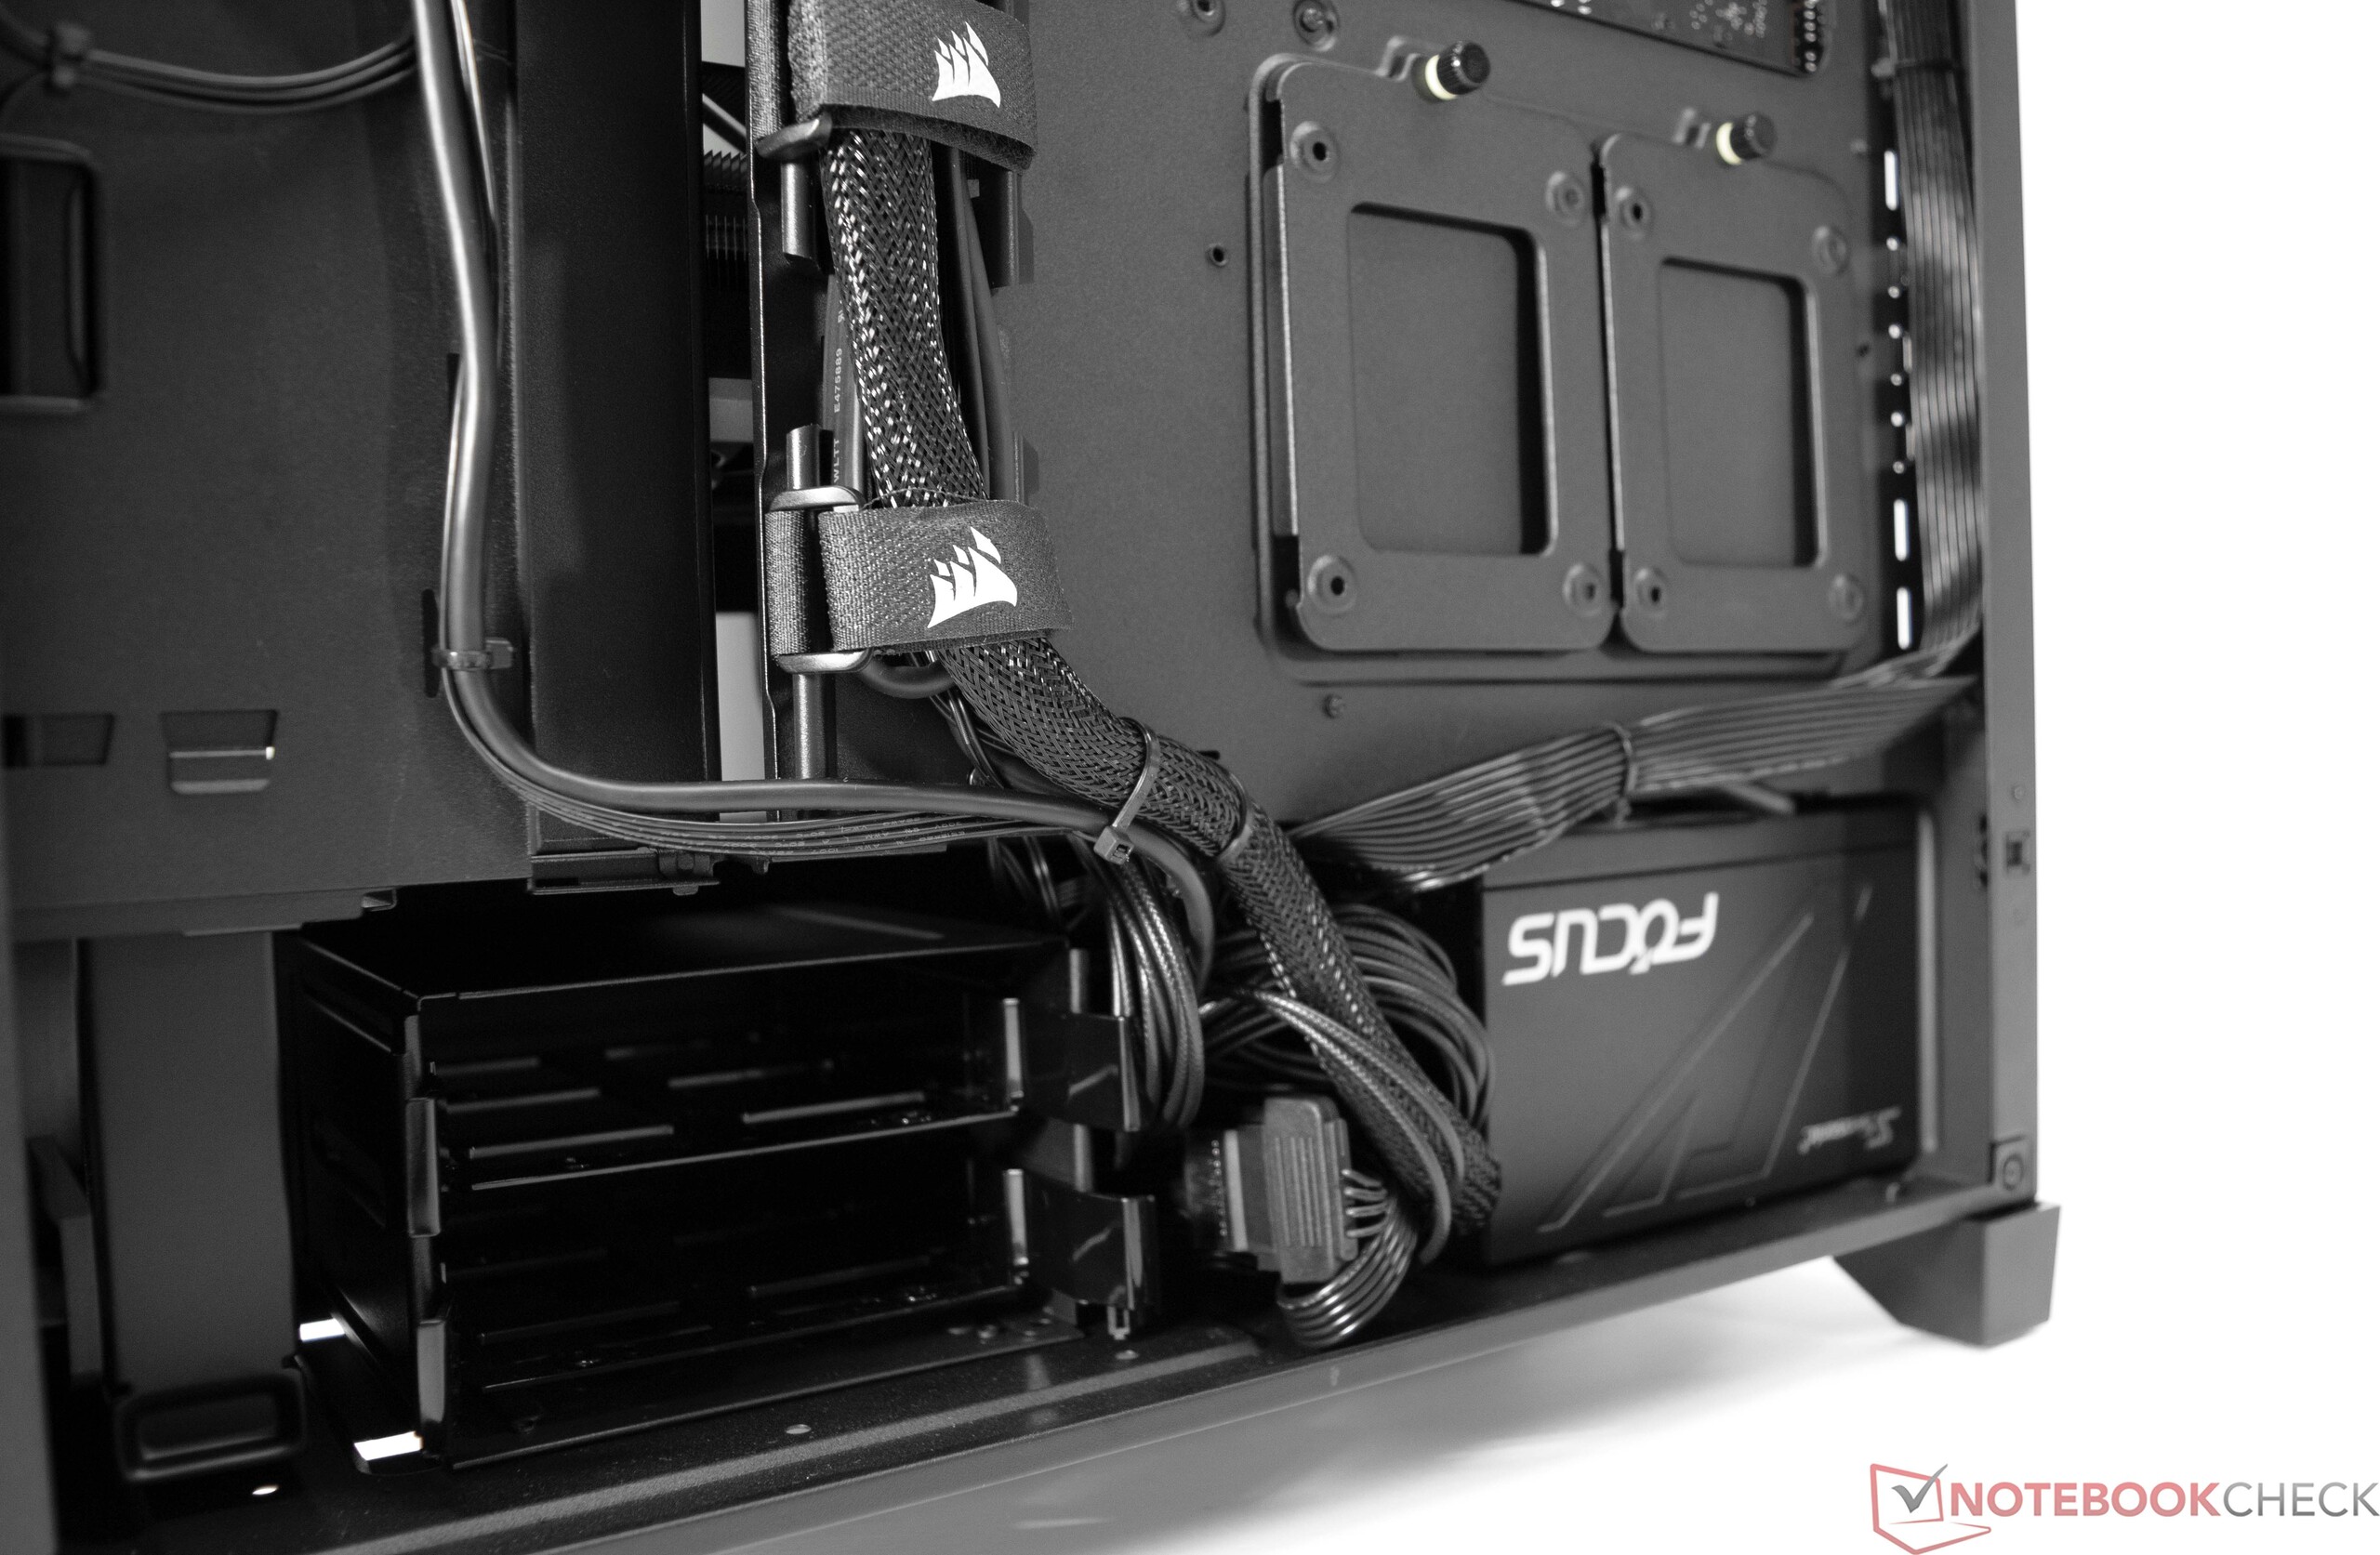
Todo el sistema está alimentado por una fuente de alimentación Seasonic de 1000 vatios. Durante nuestras pruebas, la fuente de alimentación no tuvo ningún problema en proporcionar a los componentes energía suficiente incluso a plena carga. Teniendo en cuenta todos los componentes de gama alta que contiene, es obvio que el sistema no va a consumir poca energía. El consumo de energía fue de alrededor de 78 a 96 vatios en reposo, que sigue siendo aceptable. Por el contrario, la fuente de alimentación de 1000 vatios tuvo que suministrar una media de 511 vatios durante los juegos. Notamos algunos picos ocasionales de consumo, pero ni siquiera los picos de hasta 778 vatios llevaron a la fuente de alimentación a sus límites. En la comparación, la unidad de pruebas queda ligeramente por detrás de nuestro sistema de pruebas GPU con una tarjeta gráfica similar.
| Power Consumption / The Witcher 3 ultra (external Monitor) | |
| AMD Radeon RX 6950 XT | |
| NVIDIA GeForce RTX 3090 Ti (Idle: 102 W) | |
| NVIDIA GeForce RTX 3090 | |
| NVIDIA GeForce RTX 4090 | |
| NVIDIA GeForce RTX 3080 12 GB | |
| NVIDIA GeForce RTX 4090 | |
| AMD Radeon RX 6900 XT (Idle: 99.15 W) | |
| Power Consumption / FurMark 1.19 GPU Stress Test (external Monitor) | |
| NVIDIA GeForce RTX 4090 | |
| AMD Radeon RX 6950 XT | |
| NVIDIA GeForce RTX 3090 | |
| NVIDIA GeForce RTX 3080 12 GB | |
| AMD Radeon RX 6900 XT (Idle: 99.15 W) | |
| NVIDIA GeForce RTX 4090 | |
* ... más pequeño es mejor
| Off / Standby | |
| Ocioso | |
| Carga |
|
Clave:
min: | |
Power consumption with external monitor
Pro
Contra
Veredicto: un PC para juegos rapidísimo

Con un Intel Core i9-13900K y una Nvidia GeForce RTX 4090nuestra configuración de prueba del XMG SECTOR Intel es uno de los PC para juegos más rápidos que se pueden montar ahora mismo. El sistema también se asienta sobre una base bastante moderna, a pesar de que su placa base "solo" cuenta con el chipset Z690. A pesar de ello, el sistema utiliza memoria DDR5. Además, su unidad de almacenamiento ofrece un rendimiento sólido y, con una capacidad de 2 TB, incluso ofrece espacio suficiente para guardar muchos juegos.
Basado en un Intel Core i9-13900K, el XMG SECTOR Intel ofrece un rendimiento excelente para toda una serie de casos de uso. Junto con la GeForce RTX 4090, el sistema es actualmente uno de los PC para juegos más rápidos disponibles en el mercado.
Nuestra unidad de análisis dispone de un rendimiento tan inmensamente alto que puede ejecutar sin problemas todos los juegos modernos a 2160p. Desde luego, el sistema no es una ganga, ya que cuesta unos 4.600 euros (4.851 dólares). Sin embargo, la configuración tiene sentido si quieres jugar a los últimos juegos sin ningún compromiso. Un sistema AMD de especificaciones similares con un Ryzen 9 7950X (también disponible en la tienda como XMG SECTOR AMD) cuesta unos 300 euros más
.Precio y disponibilidad
El XMG SECTOR Intel está disponible en la tienda en línea de Schenker bestware.com y cuesta aproximadamente 4.600 euros (4.851 dólares). También puede seleccionar componentes en función de sus necesidades específicas mediante el completo configurador.
Schenker XMG SECTOR, i9 13900K, RTX 4090
- 03/04/2023 v7 (old)
Sebastian Bade
Transparencia
La selección de los dispositivos que se van a reseñar corre a cargo de nuestro equipo editorial. La muestra de prueba fue proporcionada al autor en calidad de préstamo por el fabricante o el minorista a los efectos de esta reseña. El prestamista no tuvo ninguna influencia en esta reseña, ni el fabricante recibió una copia de la misma antes de su publicación. No había ninguna obligación de publicar esta reseña. Como empresa de medios independiente, Notebookcheck no está sujeta a la autoridad de fabricantes, minoristas o editores.
Así es como prueba Notebookcheck
Cada año, Notebookcheck revisa de forma independiente cientos de portátiles y smartphones utilizando procedimientos estandarizados para asegurar que todos los resultados son comparables. Hemos desarrollado continuamente nuestros métodos de prueba durante unos 20 años y hemos establecido los estándares de la industria en el proceso. En nuestros laboratorios de pruebas, técnicos y editores experimentados utilizan equipos de medición de alta calidad. Estas pruebas implican un proceso de validación en varias fases. Nuestro complejo sistema de clasificación se basa en cientos de mediciones y puntos de referencia bien fundamentados, lo que mantiene la objetividad.
