Análisis del Acer Predator Helios 300 PH315-53: La actualización proporciona (ligeramente) más potencia a la RTX 3070

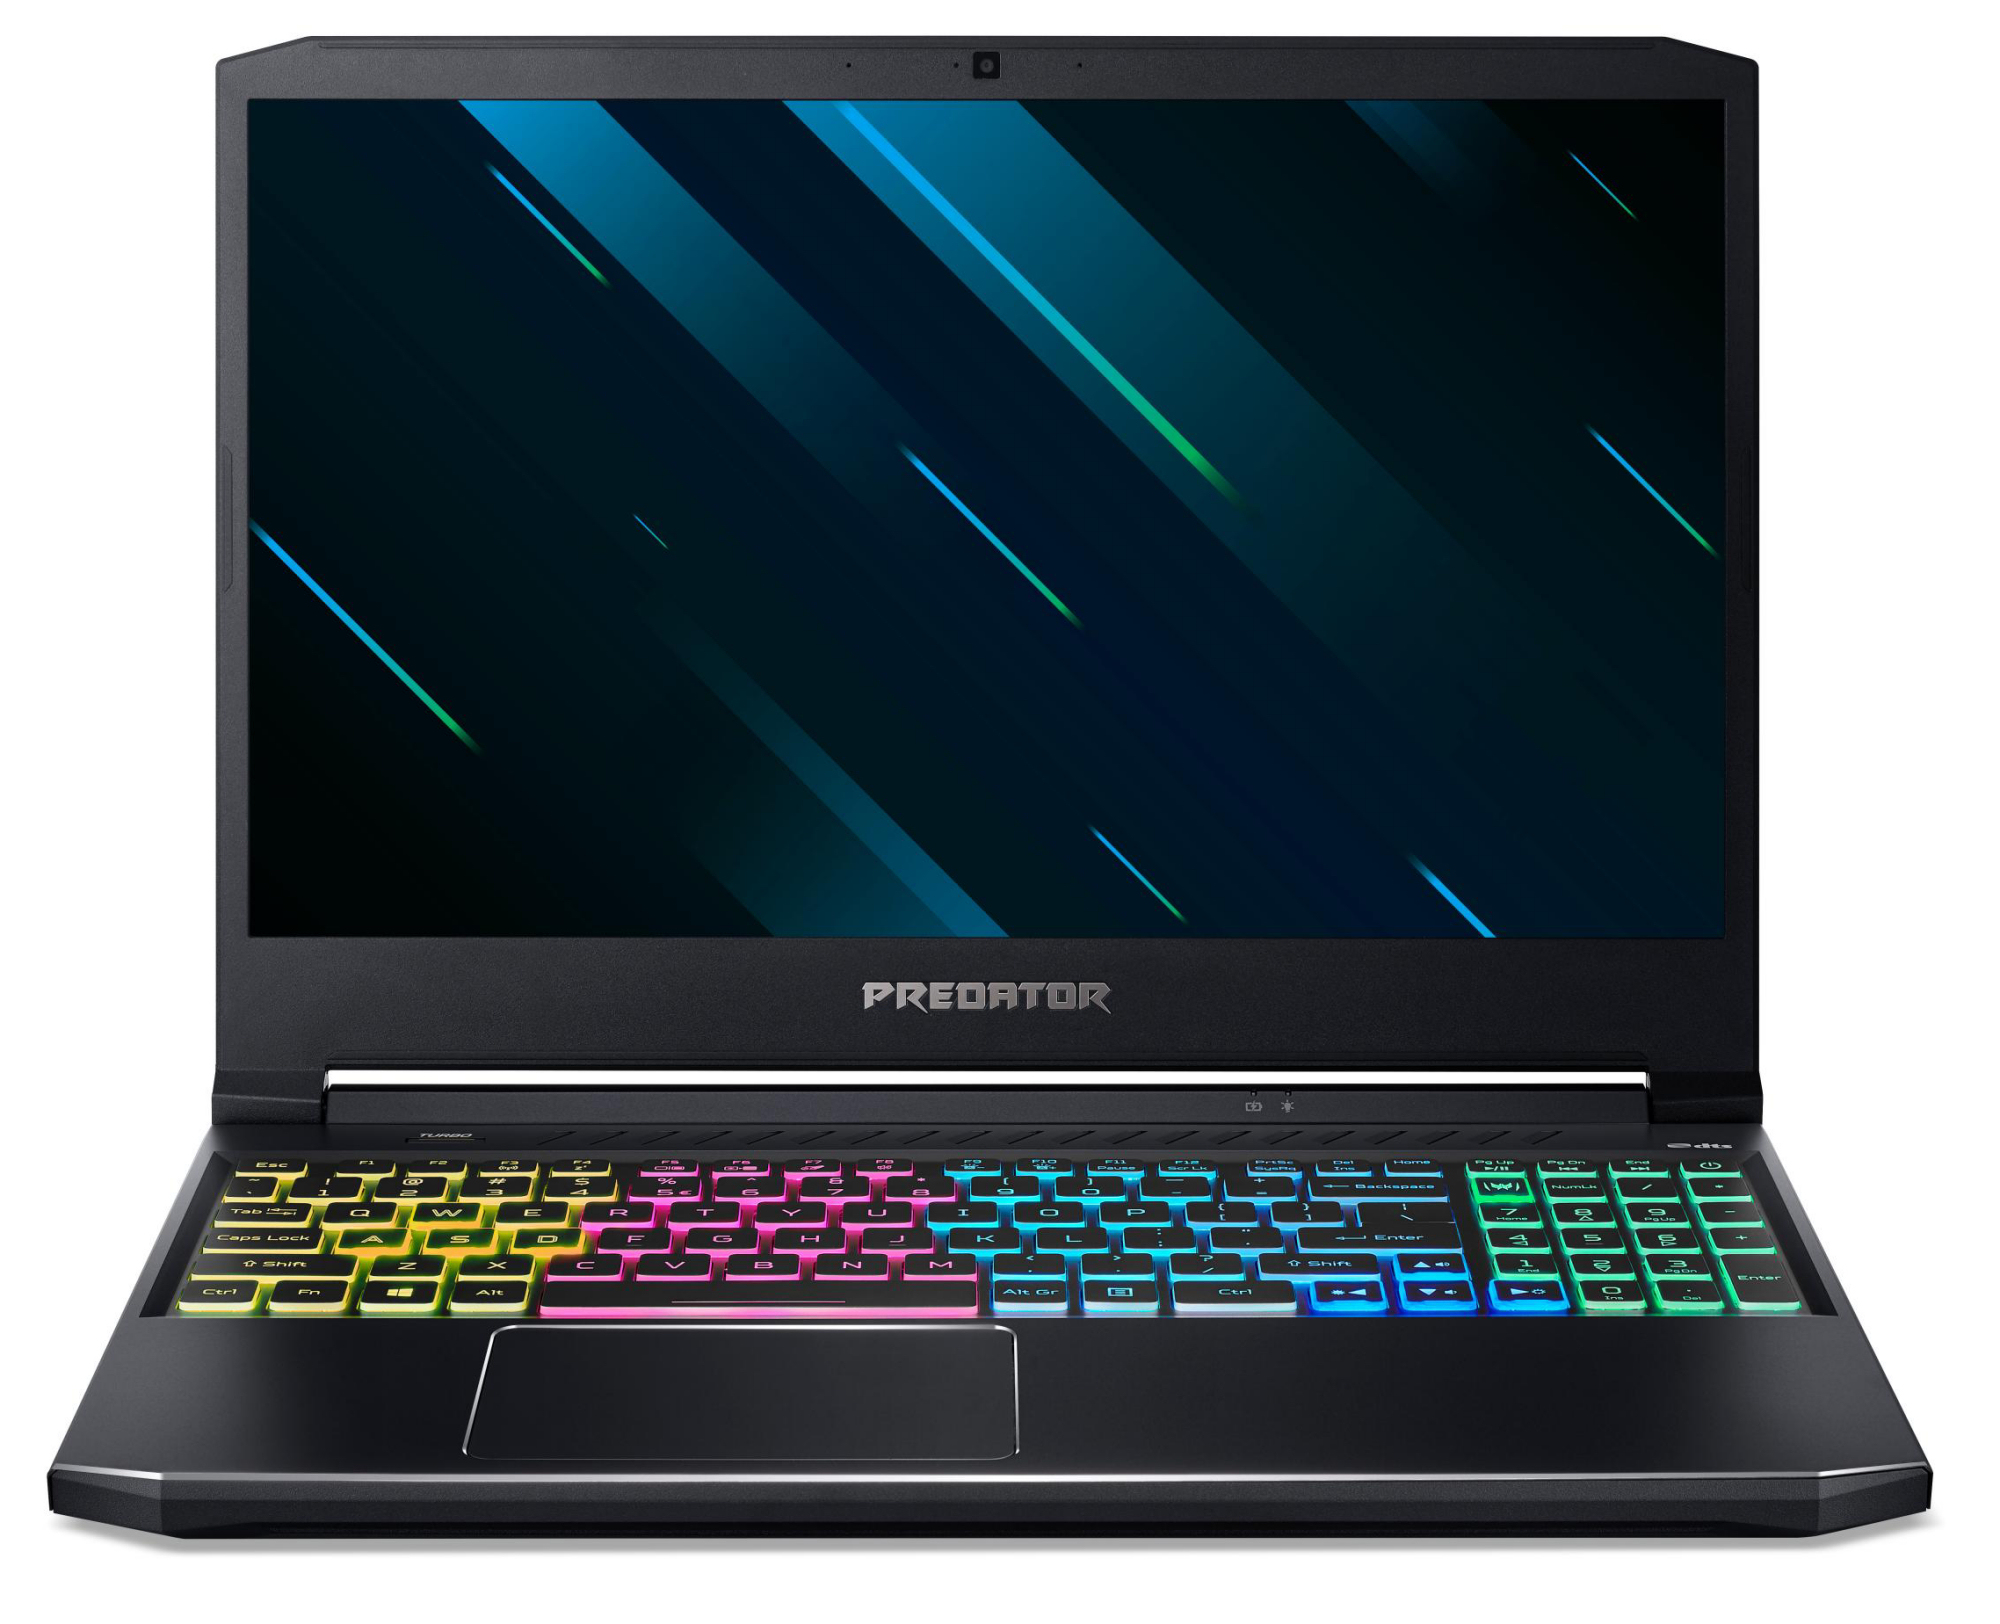
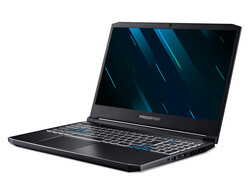
El Predator Helios 300 es un portátil para juegos en formato de 15,6 pulgadas. El dispositivo cuenta con unprocesadorCore i7-10750H y unaGPUGeForce RTX 3070 para portátiles. Entre sus competidores se encuentran dispositivos como el Aorus 15G XC, elMSI GS66 Stealth 10UG, y el Asus ROG Strix G15 G513QR.
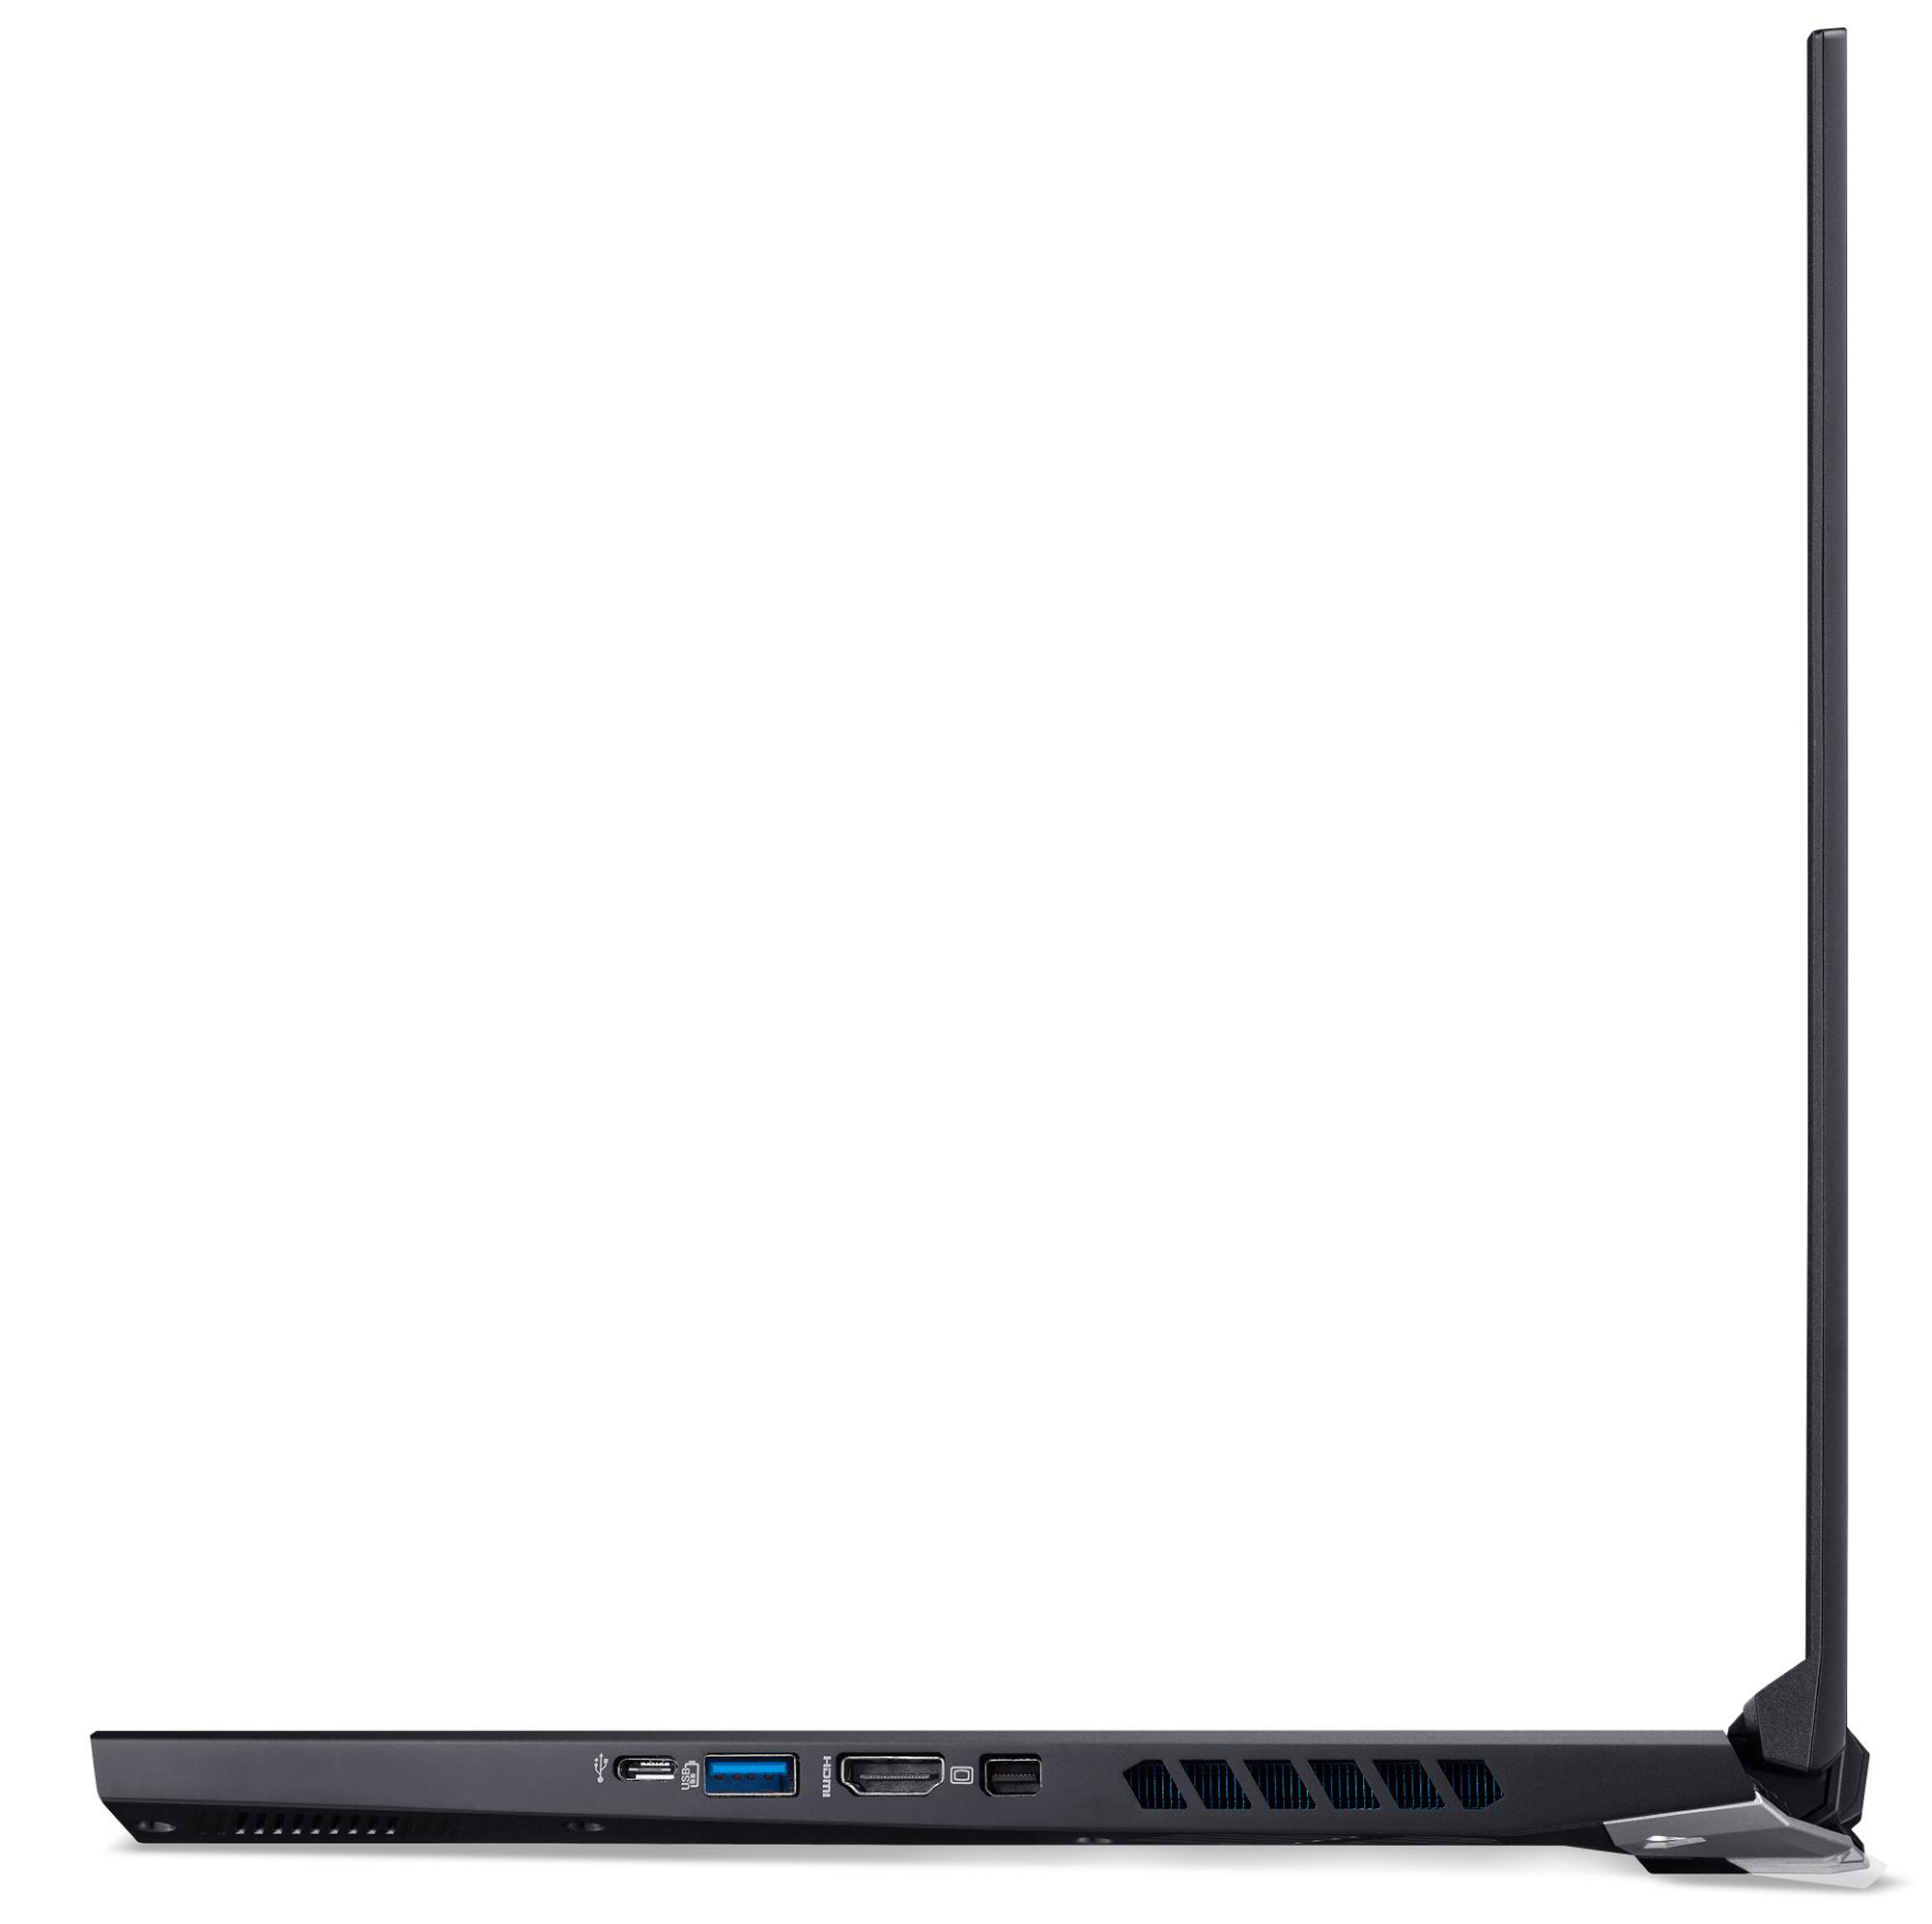
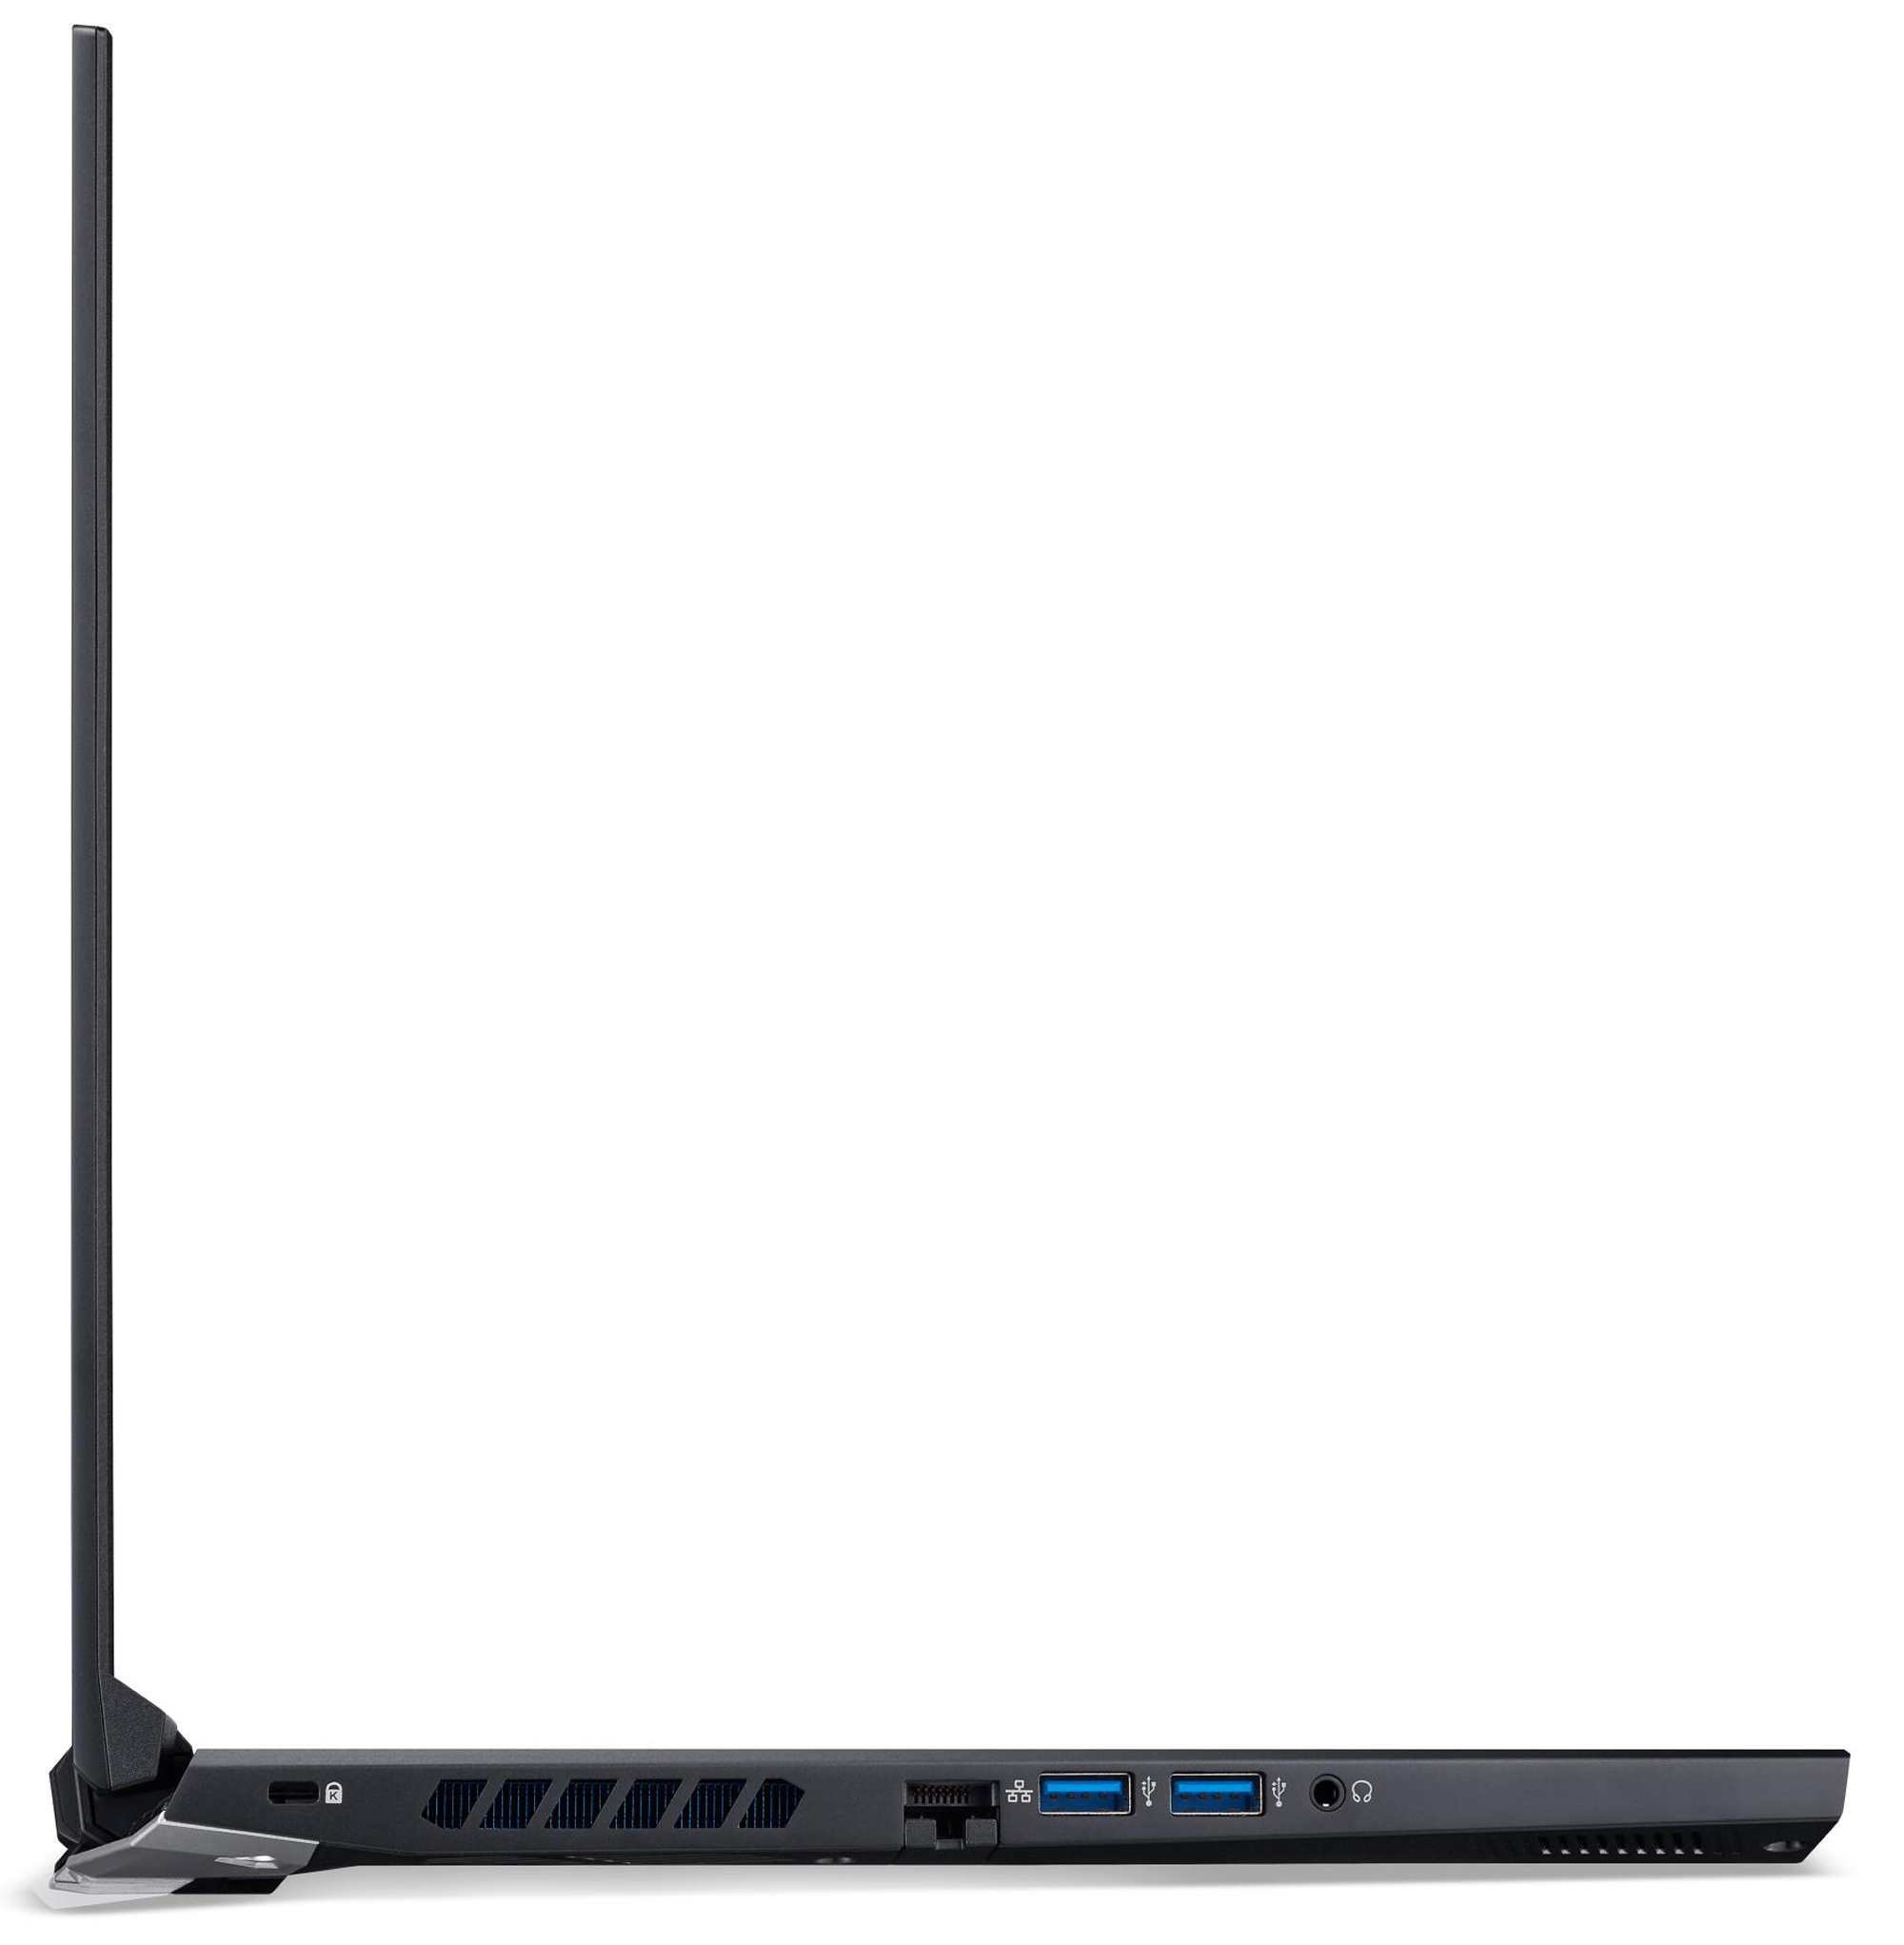
Como ya hemos analizado uno de los modelos hermanos del Predator, no entraremos en la carcasa, la conectividad, los dispositivos de entrada y los altavoces. La información correspondiente puede encontrarse en el análisis del Acer Predator Helios 300 PH315-53-77N5. También merece la pena echar un vistazo al análisis dedel predecesor similar.
Possible contenders in comparison
Valoración | Fecha | Modelo | Peso | Altura | Tamaño | Resolución | Precio |
|---|---|---|---|---|---|---|---|
| 83.8 % v7 (old) | 07/2021 | Acer Predator Helios 300 PH315-53-786B i7-10750H, GeForce RTX 3070 Laptop GPU | 2.2 kg | 22.9 mm | 15.60" | 1920x1080 | |
| 86.4 % v7 (old) | 02/2021 | Aorus 15G XC i7-10870H, GeForce RTX 3070 Laptop GPU | 2.1 kg | 23 mm | 15.60" | 1920x1080 | |
| 84 % v7 (old) | 02/2021 | MSI GS66 Stealth 10UG i7-10870H, GeForce RTX 3070 Laptop GPU | 2.1 kg | 19.8 mm | 15.60" | 1920x1080 | |
| 85 % v7 (old) | 02/2021 | Asus ROG Strix G15 G513QR R9 5900HX, GeForce RTX 3070 Laptop GPU | 2.3 kg | 27.2 mm | 15.60" | 1920x1080 |


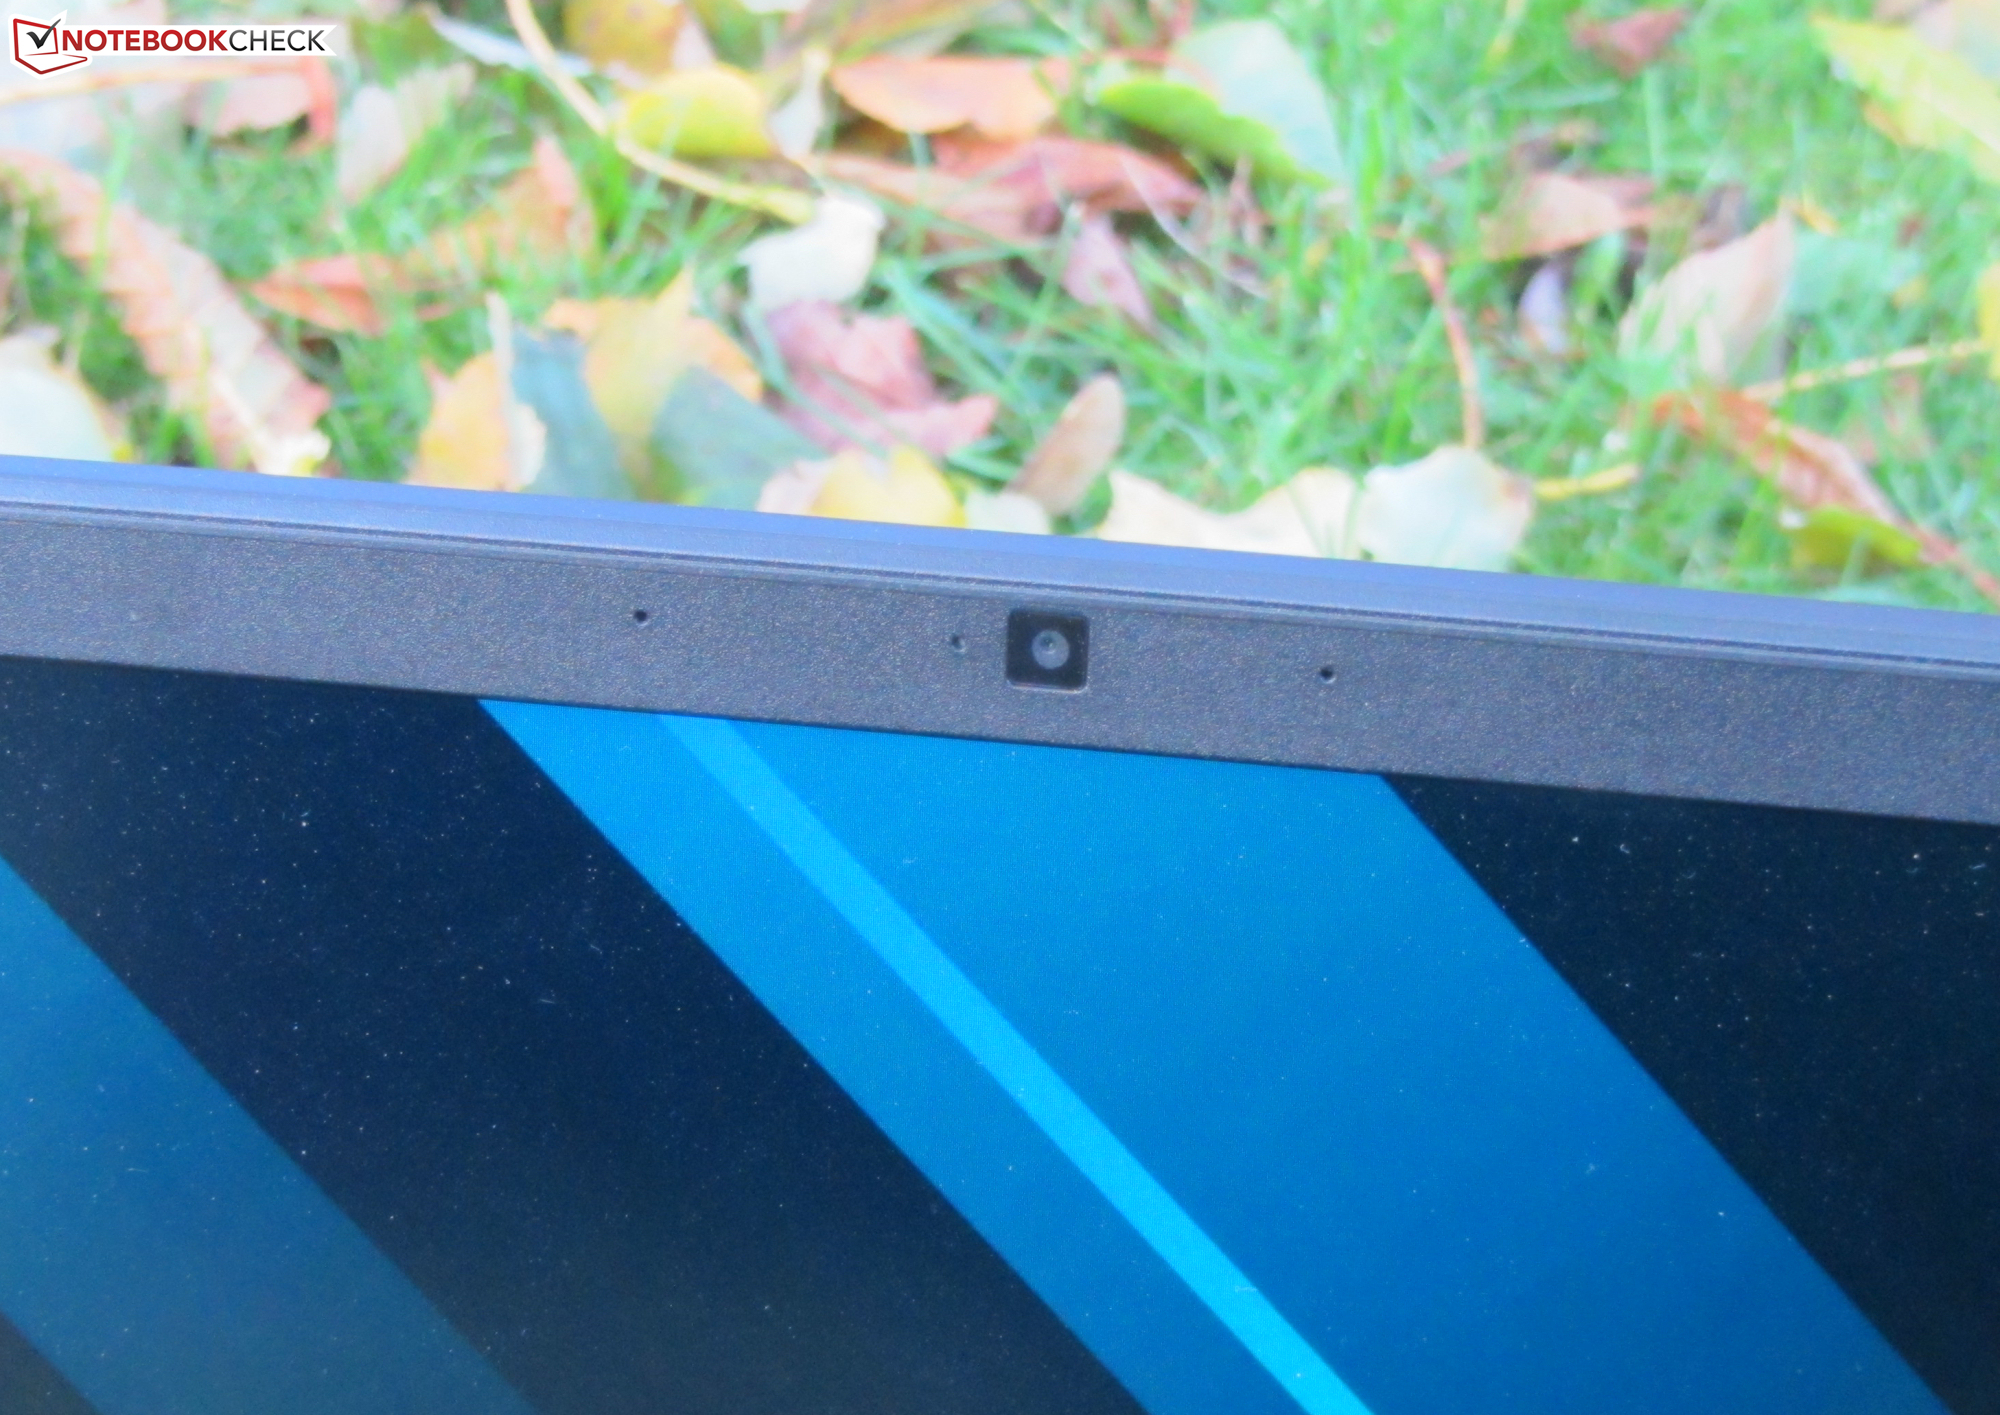


Pantalla - 240 Hz IPS
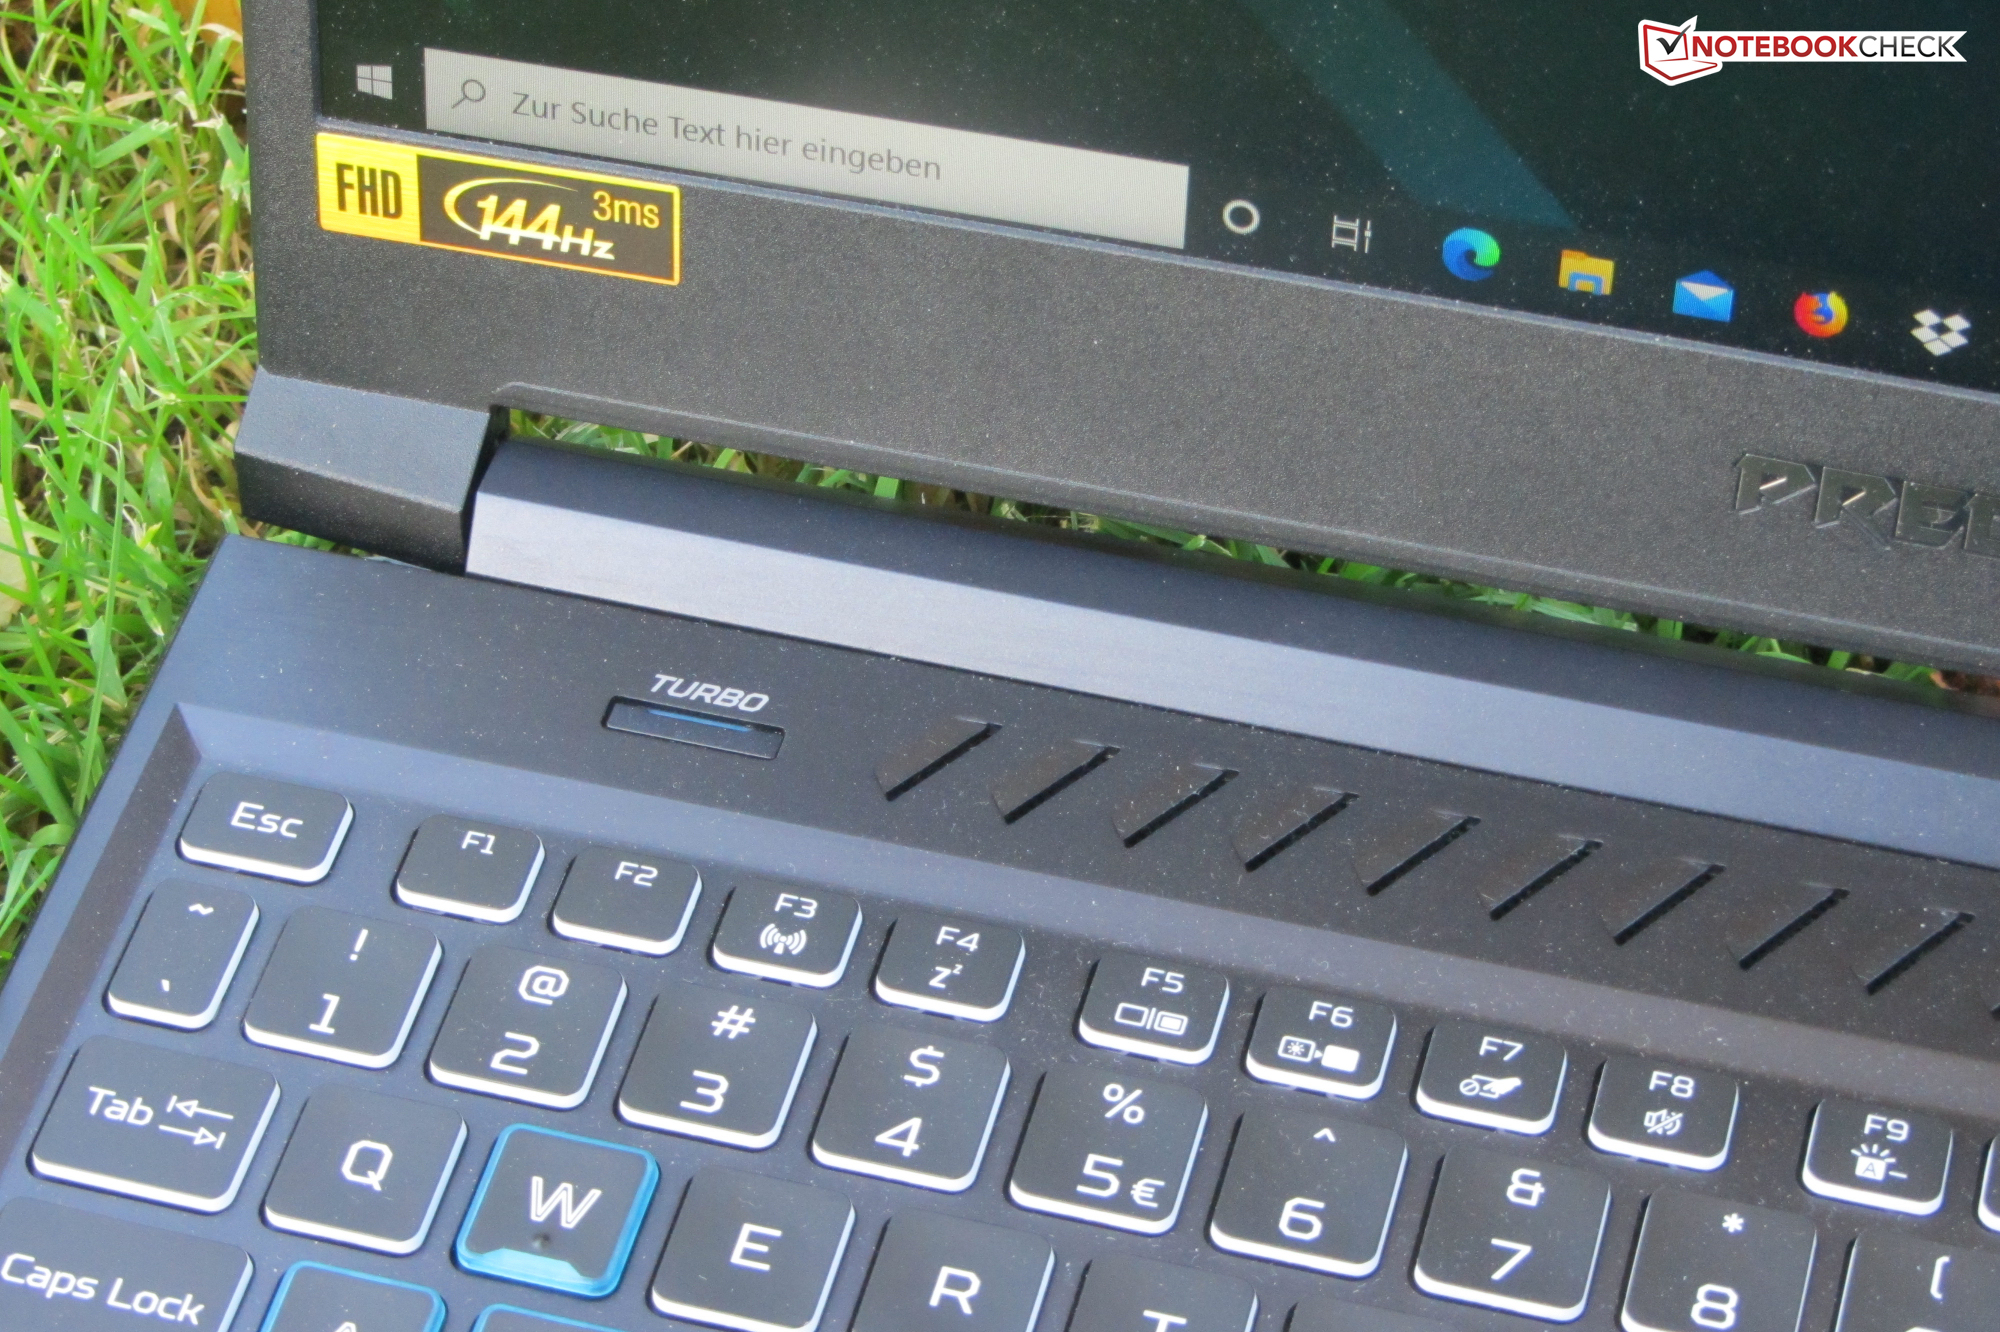
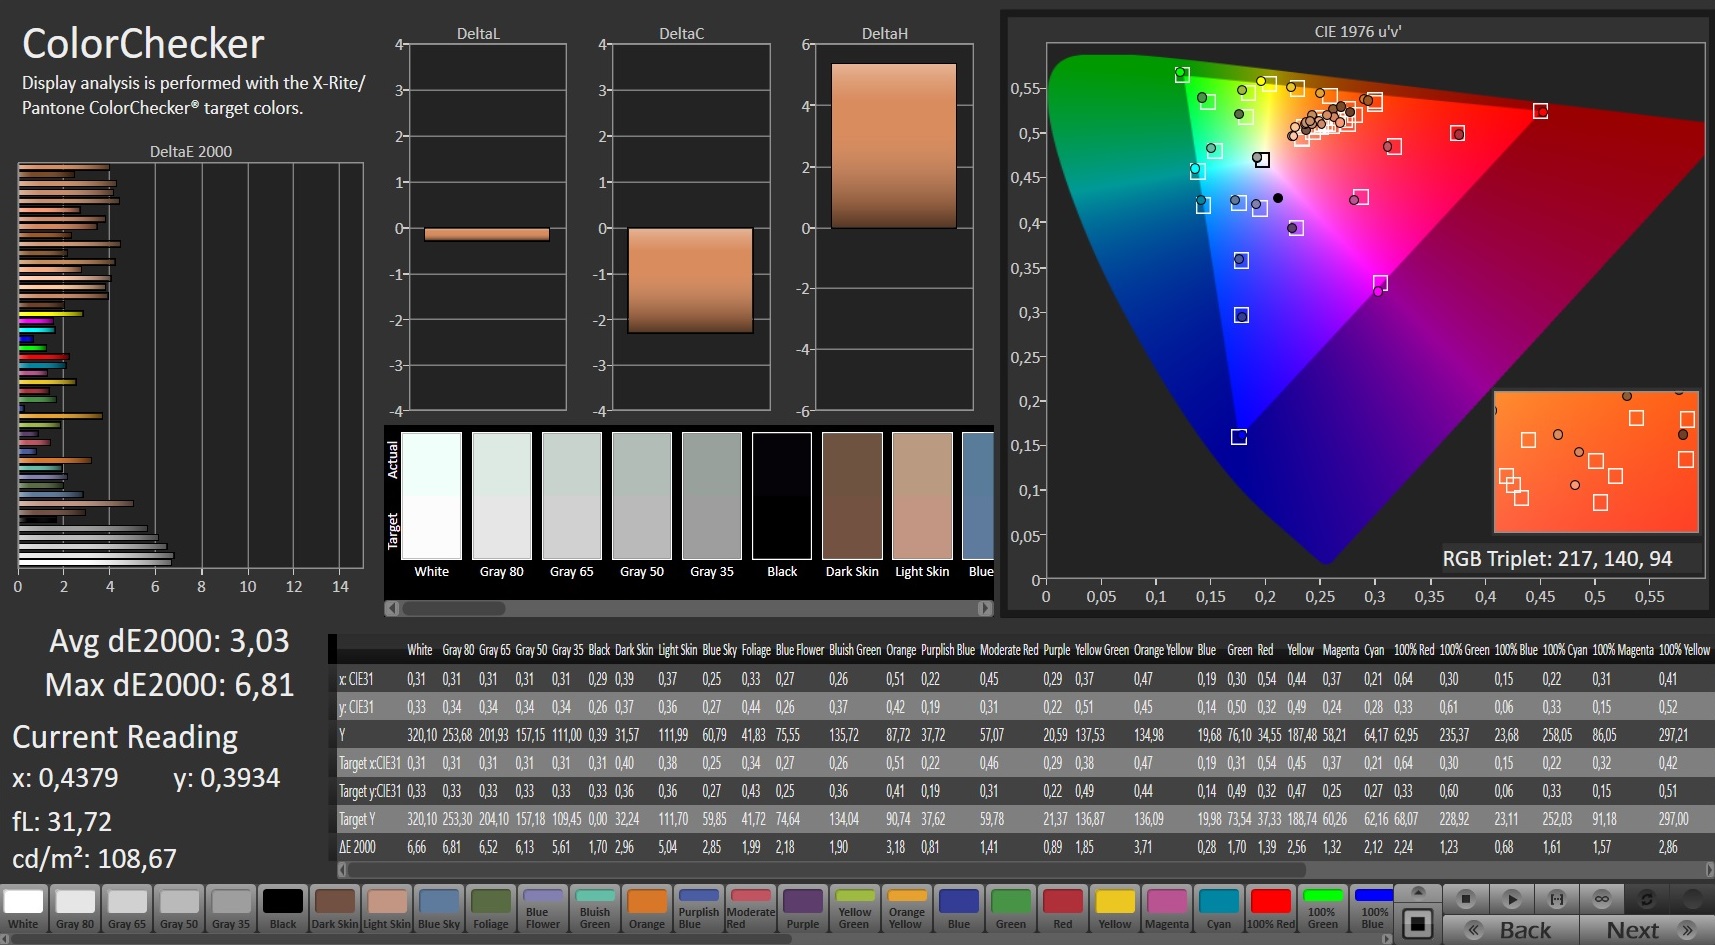
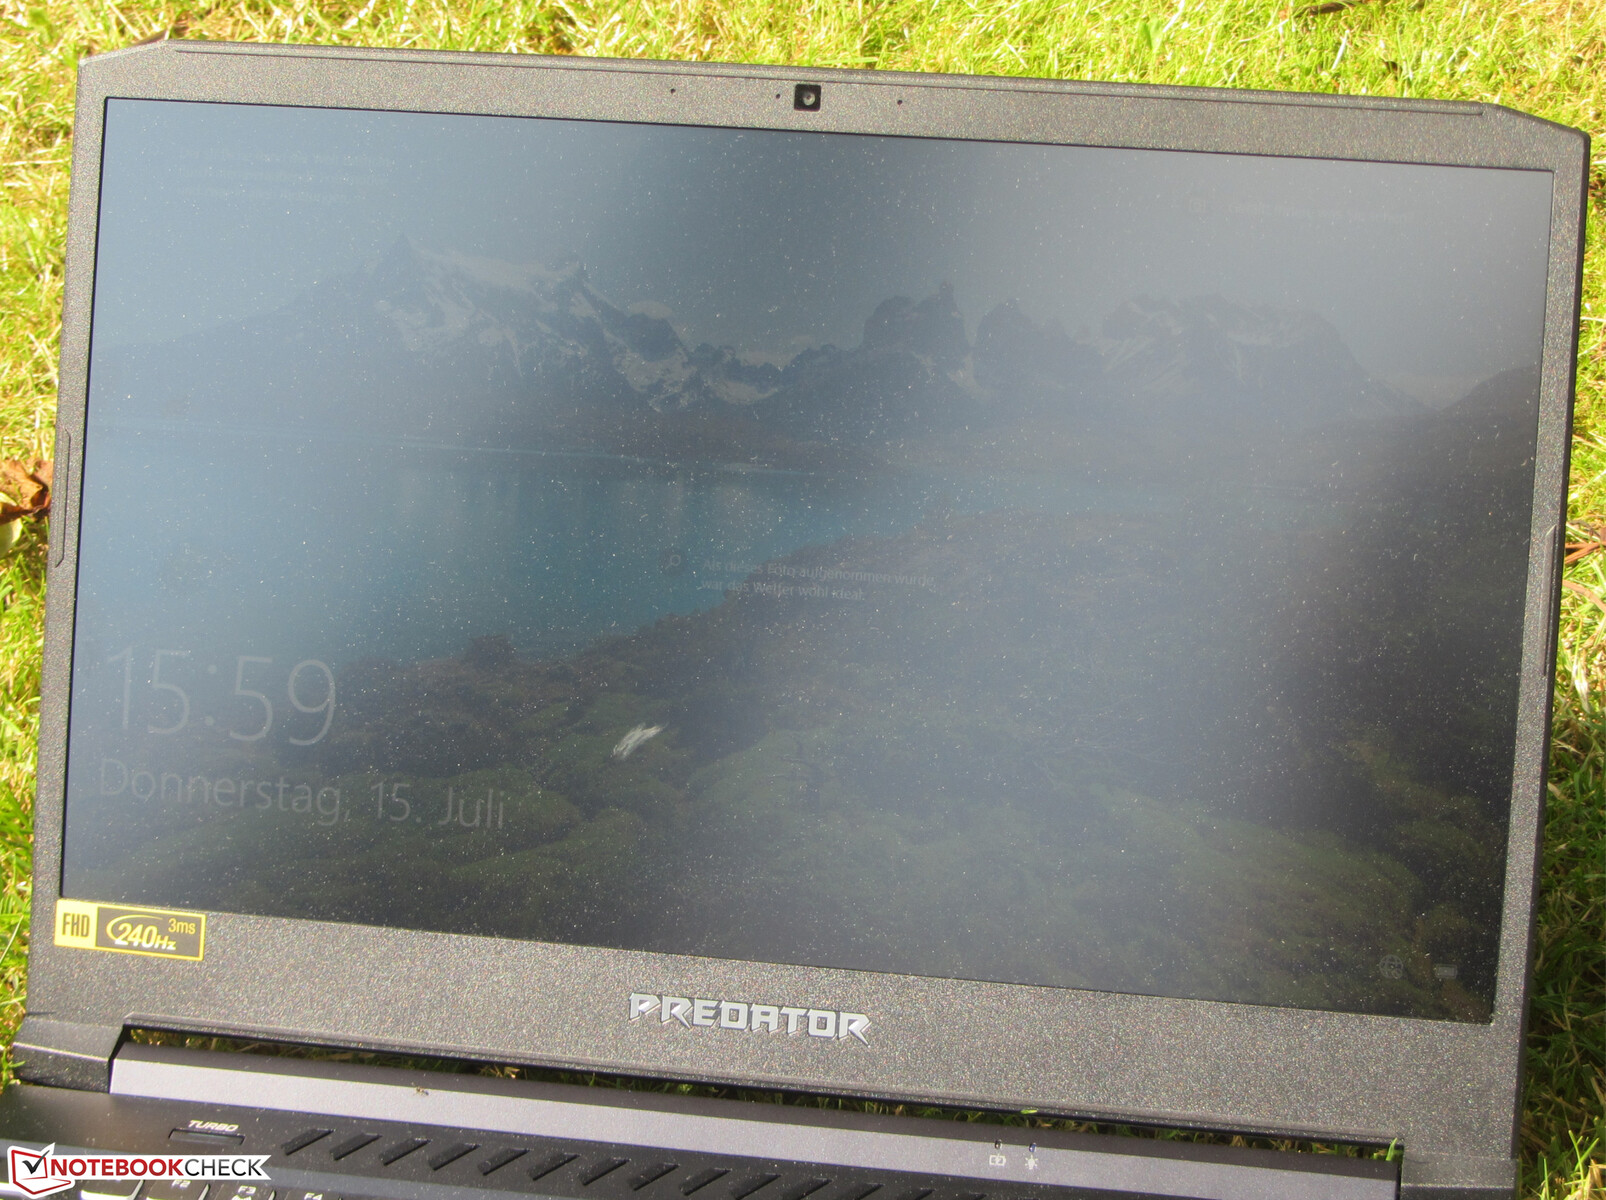
El brillo (290,4 cd/m²) y el contraste (975:1) de la pantalla mate de 15,6 pulgadas (1920x1080 píxeles) no alcanzan los objetivos respectivos (300 cd/m² y 1.000:1). El panel de 240 Hz tiene tiempos de respuesta rápidos.
A niveles de brillo del 13% o inferiores, el parpadeo se produce a una frecuencia de 23.580 Hz. Debido a la alta frecuencia, incluso los usuarios sensibles no deberían sufrir dolores de cabeza ni problemas oculares.
| |||||||||||||||||||||||||
iluminación: 87 %
Brillo con batería: 312 cd/m²
Contraste: 975:1 (Negro: 0.32 cd/m²)
ΔE ColorChecker Calman: 3.03 | ∀{0.5-29.43 Ø4.73}
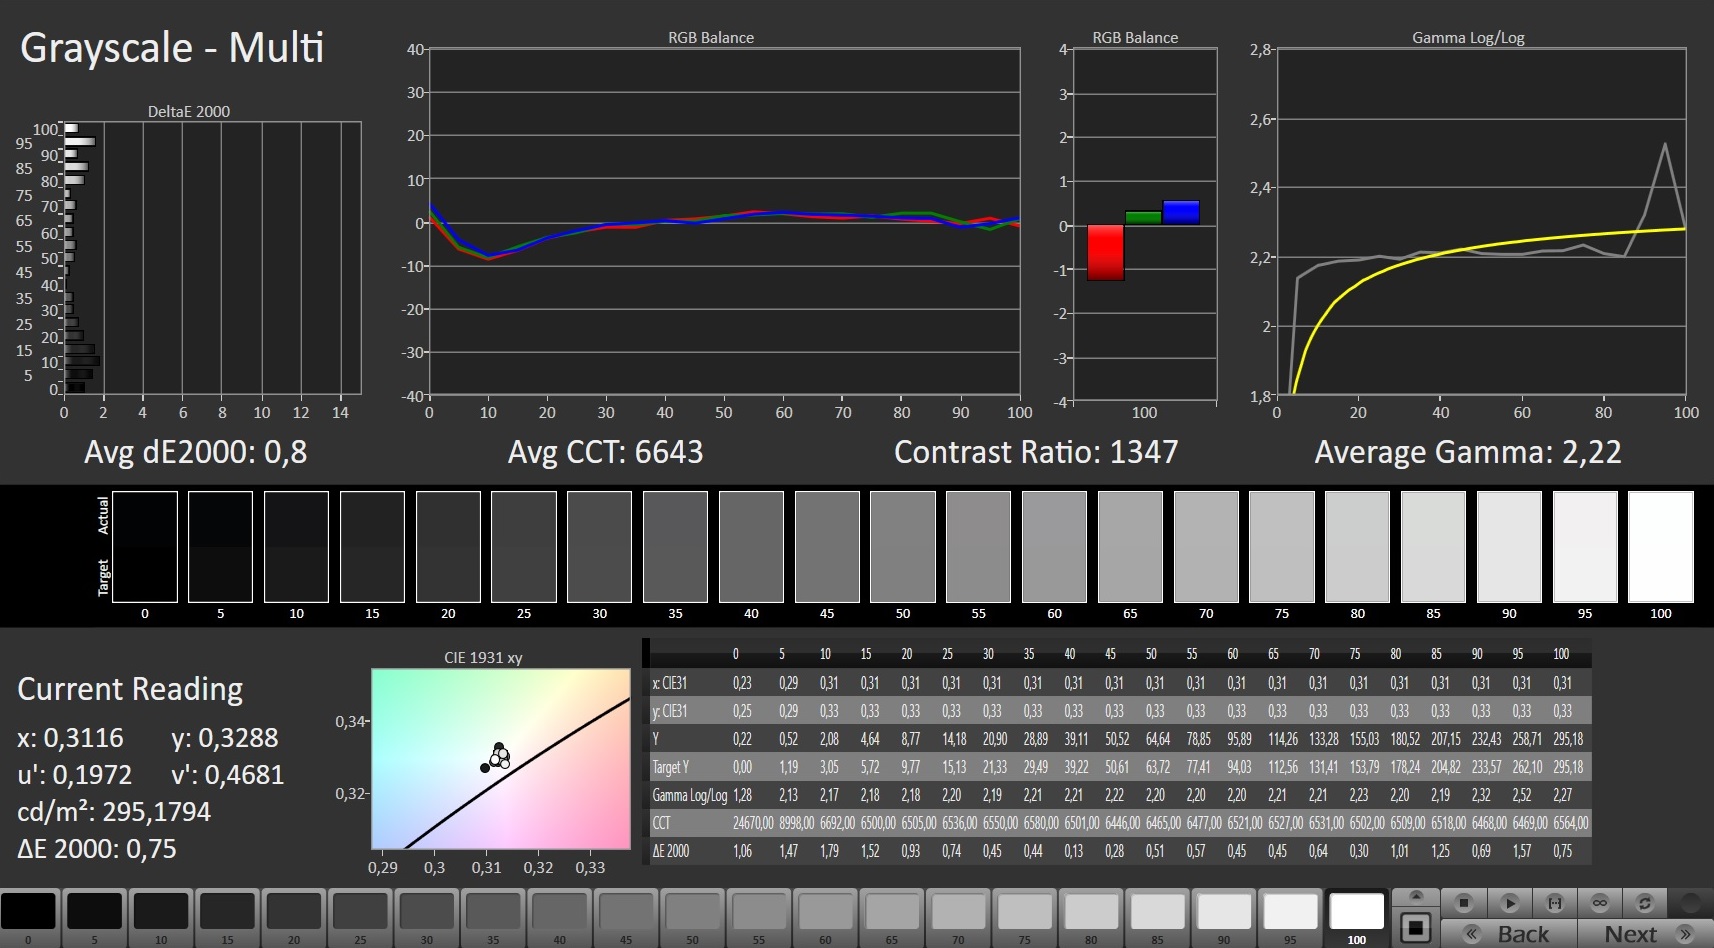
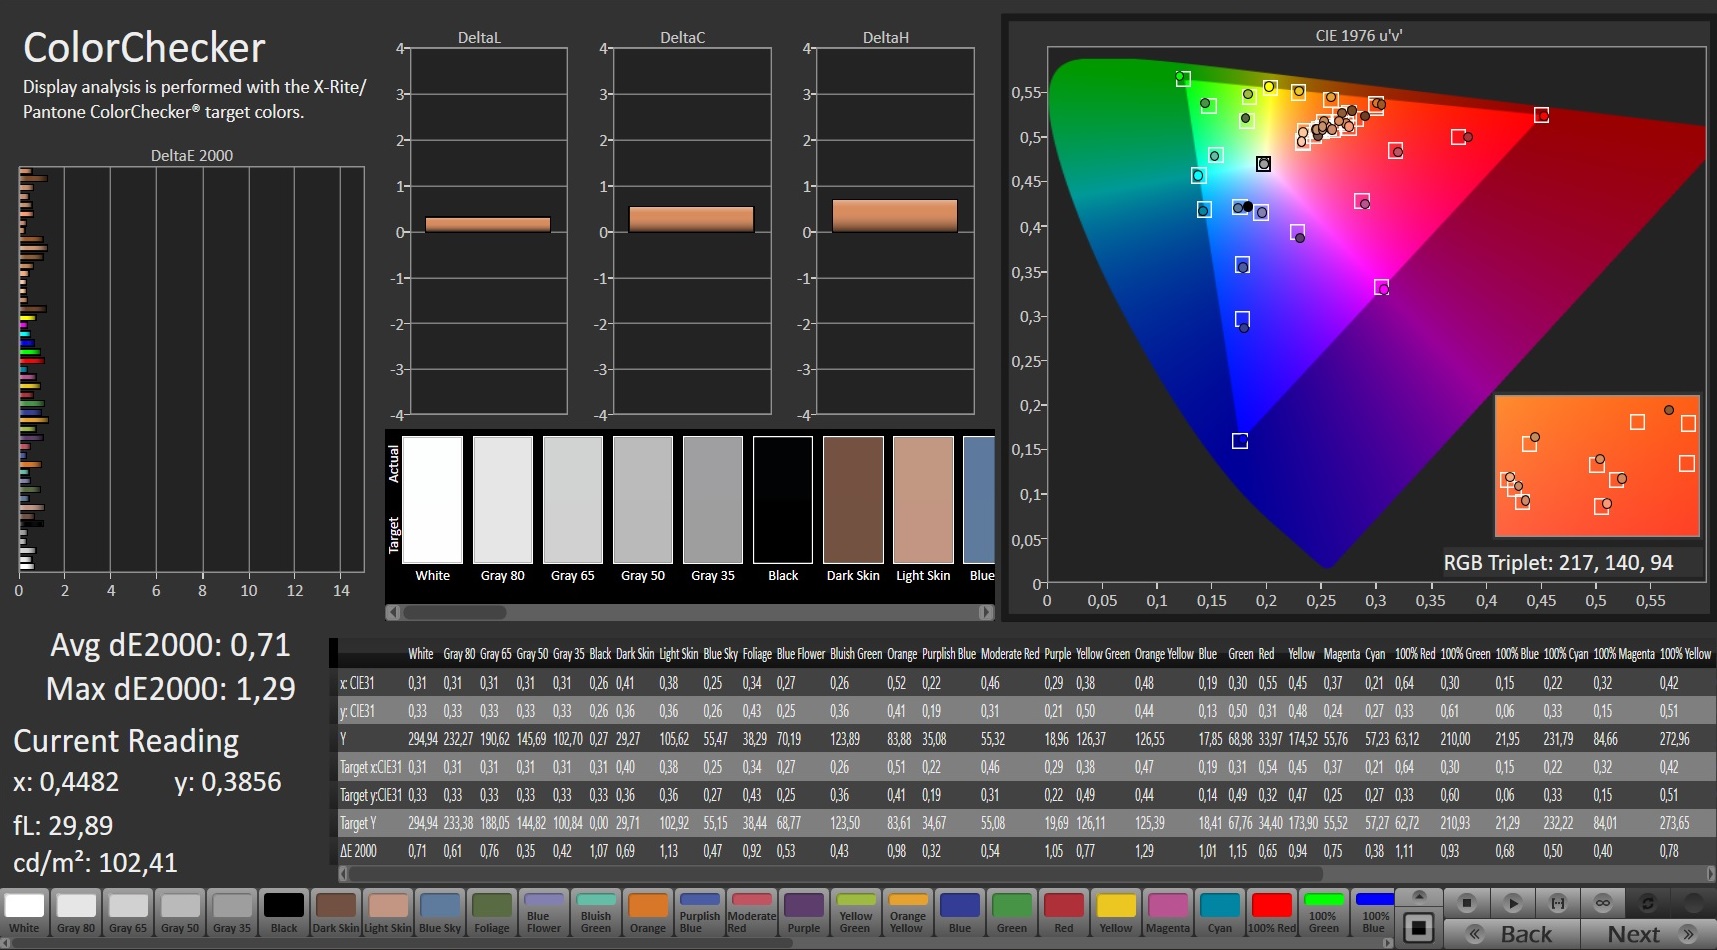
calibrated: 0.71
ΔE Greyscale Calman: 4.7 | ∀{0.09-98 Ø4.97}
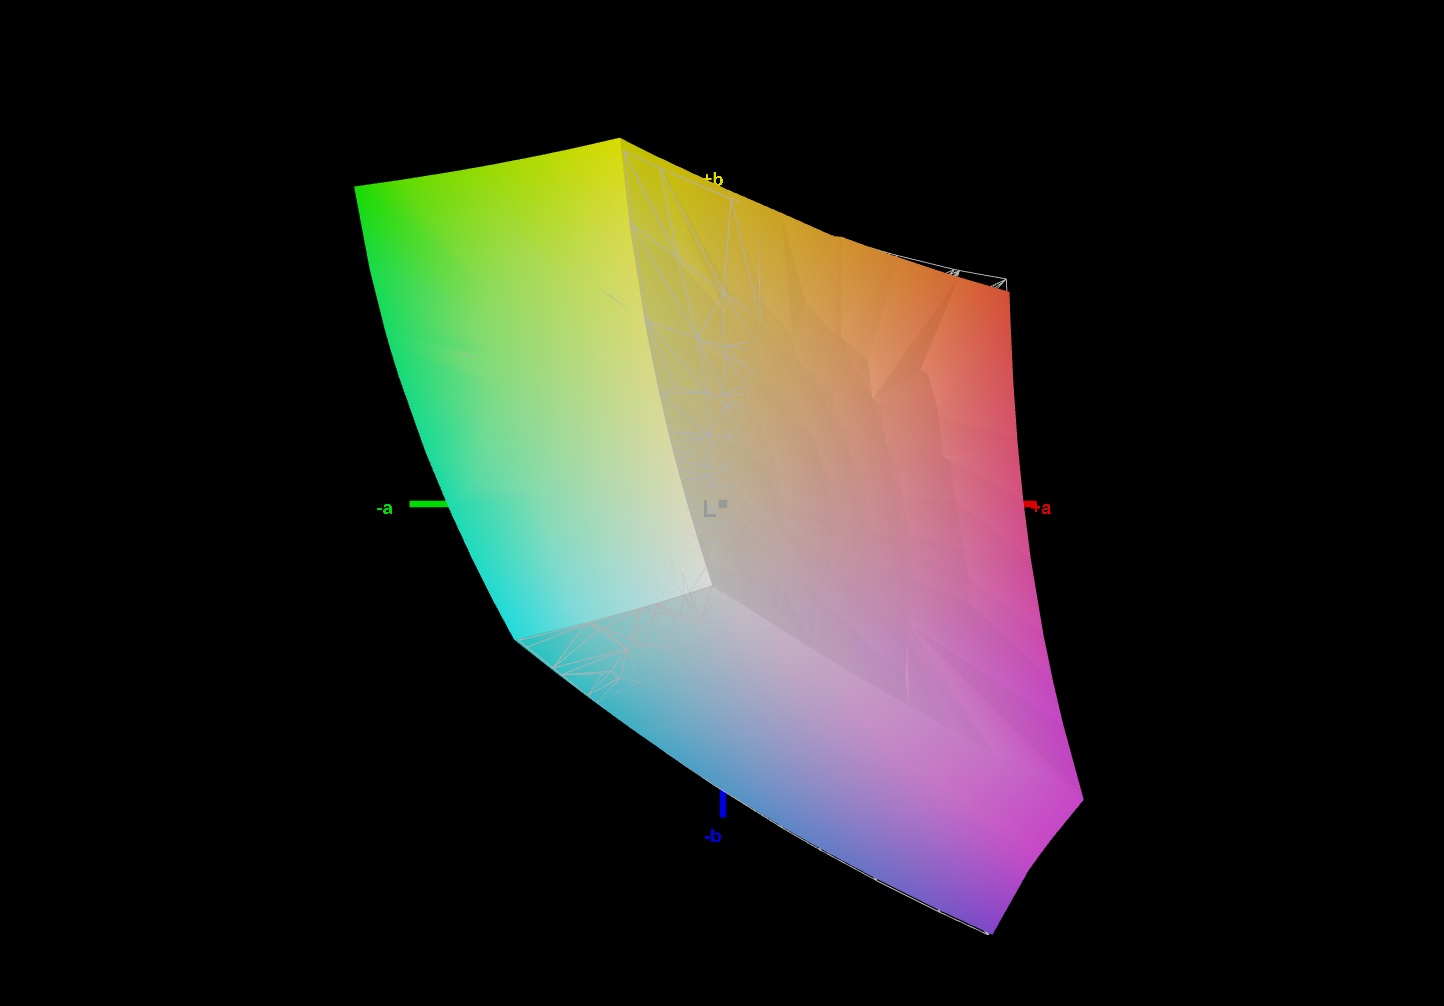
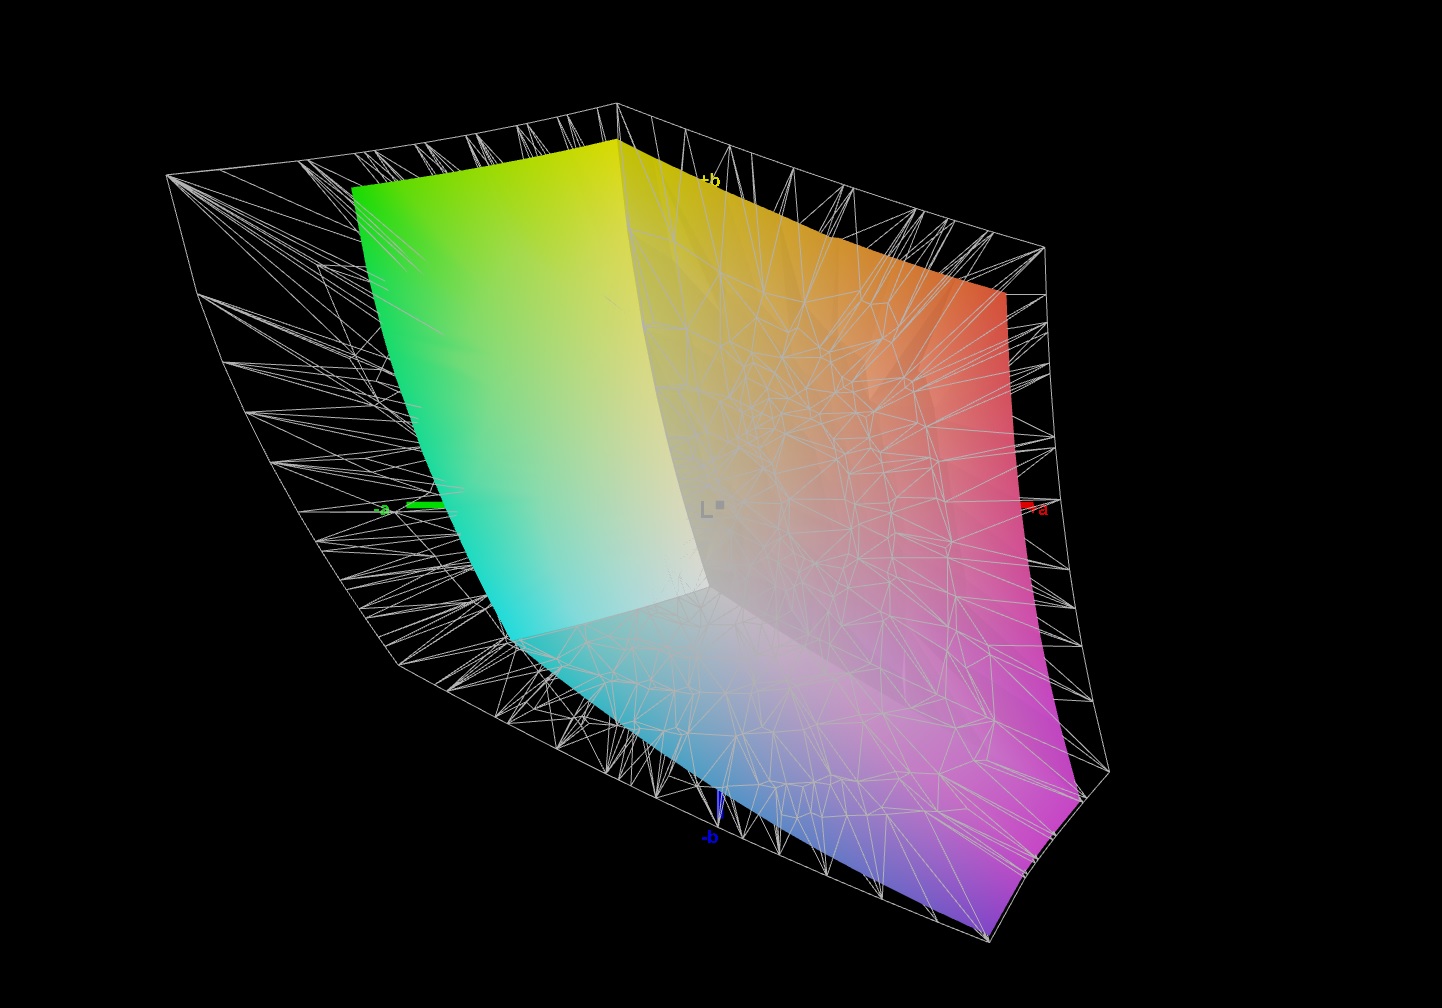
70.4% AdobeRGB 1998 (Argyll 3D)
99.4% sRGB (Argyll 3D)
68.4% Display P3 (Argyll 3D)
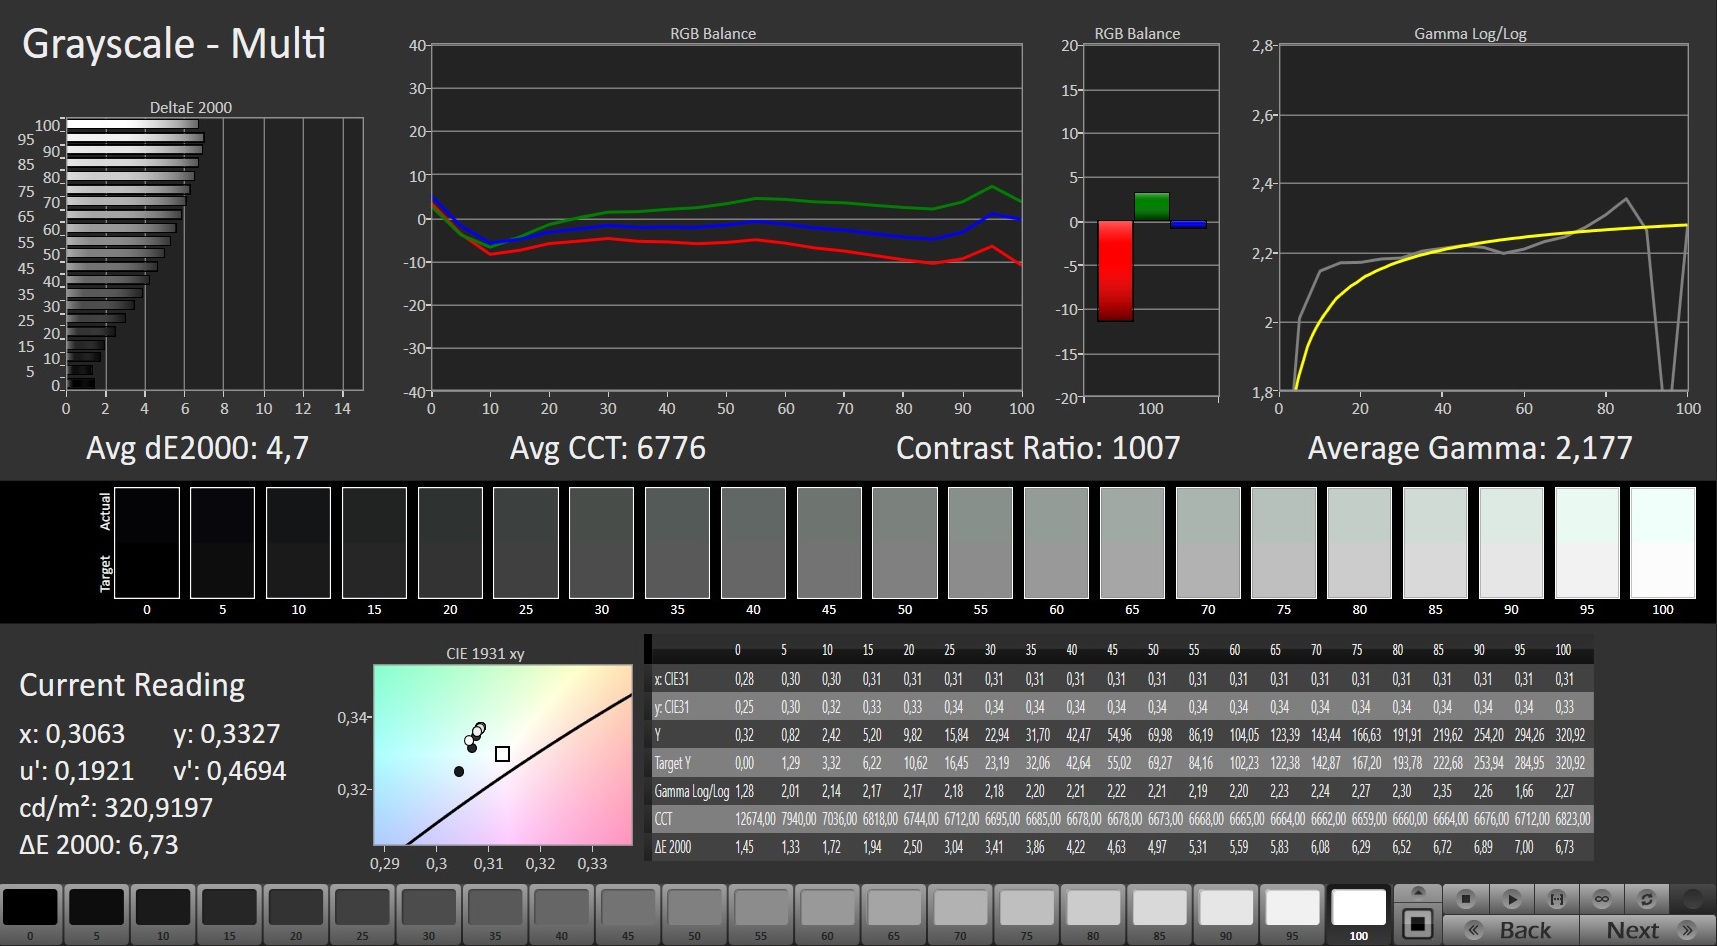
Gamma: 2.177
CCT: 6676 K
| Acer Predator Helios 300 PH315-53-786B Sharp LQ156M1JW09, IPS, 1920x1080, 15.6" | Aorus 15G XC Sharp LQ156M1JW03, IPS, 1920x1080, 15.6" | MSI GS66 Stealth 10UG AU Optronics B156HAN12.0, IPS, 1920x1080, 15.6" | Asus ROG Strix G15 G513QR LQ156M1JW25, IPS, 1920x1080, 15.6" | Acer Predator Helios 300 PH315-53-77N5 AU Optronics B156HAN08.2, IPS, 1920x1080, 15.6" | |
|---|---|---|---|---|---|
| Display | -4% | -1% | -3% | -6% | |
| Display P3 Coverage (%) | 68.4 | 65.6 -4% | 67.7 -1% | 67.7 -1% | 65.2 -5% |
| sRGB Coverage (%) | 99.4 | 97.5 -2% | 98.4 -1% | 94.3 -5% | 92.3 -7% |
| AdobeRGB 1998 Coverage (%) | 70.4 | 67.1 -5% | 69.1 -2% | 68.2 -3% | 66.3 -6% |
| Response Times | 17% | -11% | 23% | -16% | |
| Response Time Grey 50% / Grey 80% * (ms) | 15.2 ? | 9.6 ? 37% | 14.4 ? 5% | 8.2 ? 46% | 17 ? -12% |
| Response Time Black / White * (ms) | 9.2 ? | 9.6 ? -4% | 11.6 ? -26% | 9.2 ? -0% | 11 ? -20% |
| PWM Frequency (Hz) | 23580 ? | 24040 ? | |||
| Screen | 22% | -7% | 1% | 1% | |
| Brightness middle (cd/m²) | 312 | 288 -8% | 259.5 -17% | 308 -1% | 319 2% |
| Brightness (cd/m²) | 290 | 270 -7% | 264 -9% | 288 -1% | 294 1% |
| Brightness Distribution (%) | 87 | 89 2% | 90 3% | 86 -1% | 83 -5% |
| Black Level * (cd/m²) | 0.32 | 0.25 22% | 0.25 22% | 0.23 28% | 0.22 31% |
| Contrast (:1) | 975 | 1152 18% | 1038 6% | 1339 37% | 1450 49% |
| Colorchecker dE 2000 * | 3.03 | 1.19 61% | 2.52 17% | 3.28 -8% | 4.42 -46% |
| Colorchecker dE 2000 max. * | 6.81 | 3.79 44% | 5.55 19% | 8.51 -25% | 8.54 -25% |
| Colorchecker dE 2000 calibrated * | 0.71 | 0.71 -0% | 1.93 -172% | 0.83 -17% | |
| Greyscale dE 2000 * | 4.7 | 1.6 66% | 1.7 64% | 5 -6% | 4.84 -3% |
| Gamma | 2.177 101% | 2.229 99% | 2.04 108% | 2.057 107% | 2.39 92% |
| CCT | 6676 97% | 6539 99% | 6414 101% | 7393 88% | 6850 95% |
| Color Space (Percent of AdobeRGB 1998) (%) | 67 | 63.3 | 68 | 60 | |
| Color Space (Percent of sRGB) (%) | 90 | 98.8 | 90 | 92 | |
| Media total (Programa/Opciones) | 12% /
16% | -6% /
-7% | 7% /
3% | -7% /
-4% |
* ... más pequeño es mejor
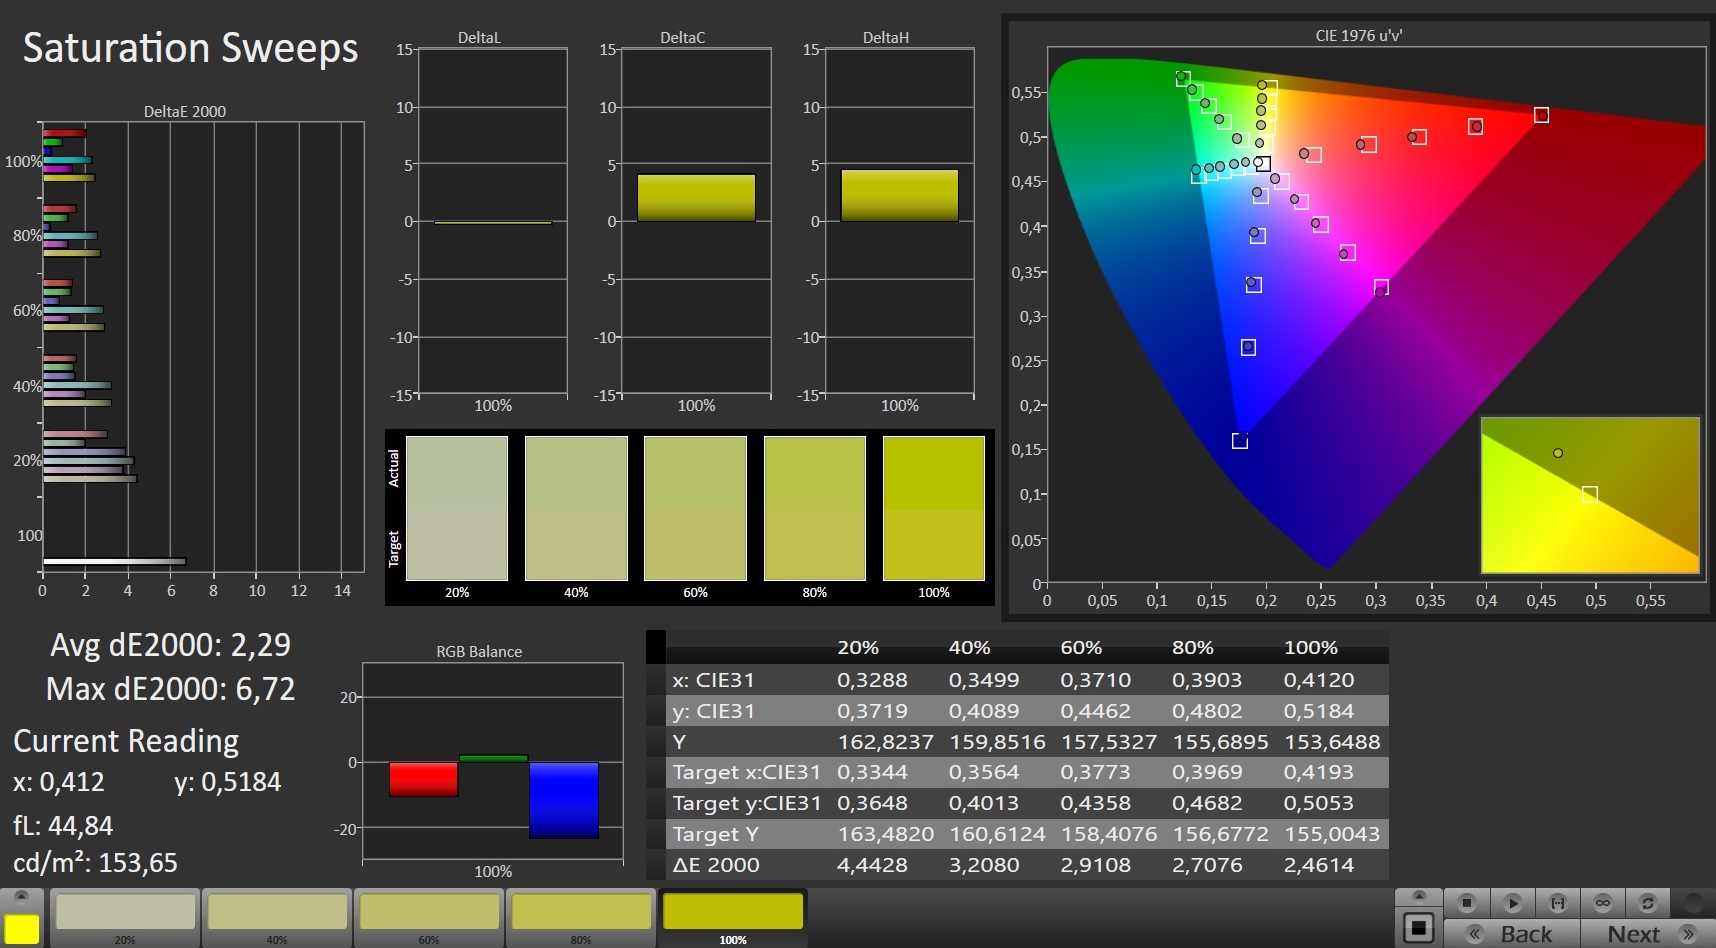
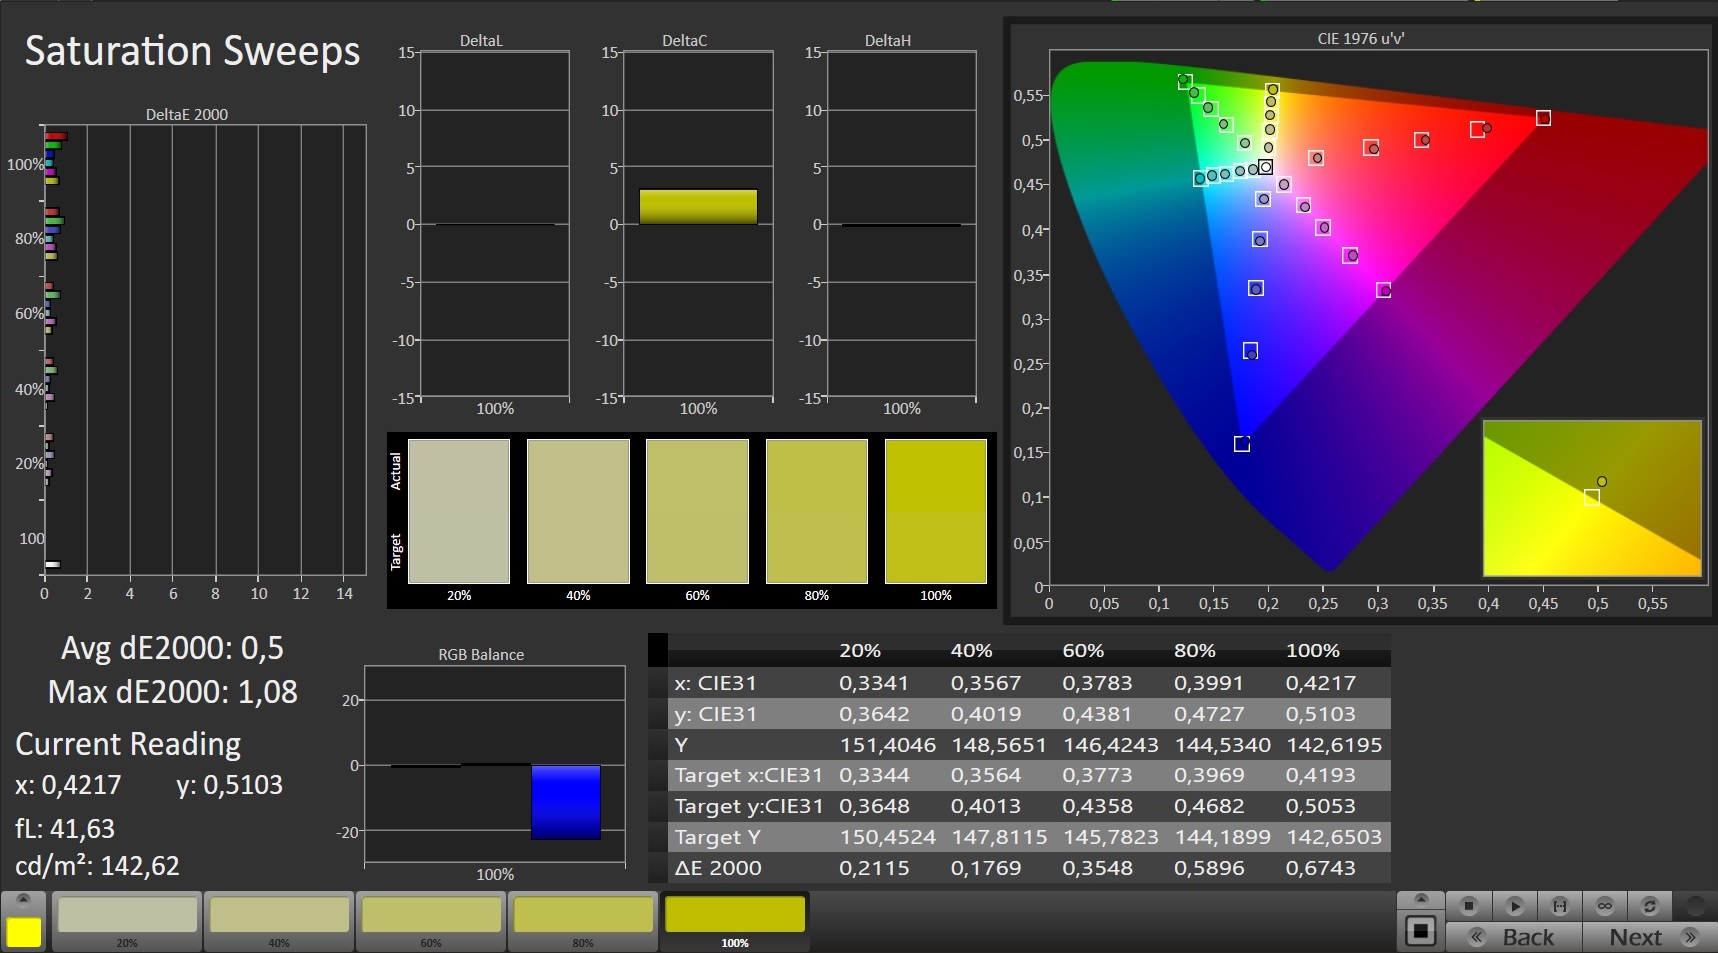
La pantalla muestra una buena reproducción del color nada más sacarla de la caja, y no alcanza el objetivo (DeltaE inferior a 3) por los pelos, con una desviación del color de 3,03. No sufre de un tinte azul, y se pueden lograr mejoras mediante la calibración: La desviación baja a 0,71 y las escalas de grises se muestran de forma más equilibrada. El espacio de color sRGB está mapeado al 99%. Los espacios de color AdobeRGB (70%) y DCI-P3 (68%) no se reproducen completamente
Tiempos de respuesta del display
| ↔ Tiempo de respuesta de Negro a Blanco | ||
|---|---|---|
| 9.2 ms ... subida ↗ y bajada ↘ combinada | ↗ 4.8 ms subida | 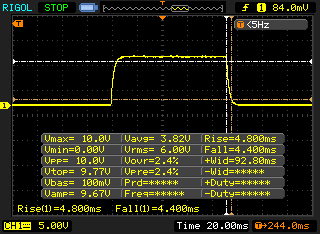 |
| ↘ 4.4 ms bajada | ||
| La pantalla mostró tiempos de respuesta rápidos en nuestros tests y debería ser adecuada para juegos. En comparación, todos los dispositivos de prueba van de ##min### (mínimo) a 240 (máximo) ms. » 25 % de todos los dispositivos son mejores. Esto quiere decir que el tiempo de respuesta medido es mejor que la media (19.9 ms) de todos los dispositivos testados. | ||
| ↔ Tiempo de respuesta 50% Gris a 80% Gris | ||
| 15.2 ms ... subida ↗ y bajada ↘ combinada | ↗ 7.6 ms subida | 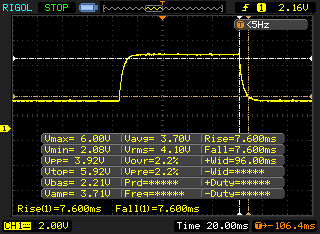 |
| ↘ 7.6 ms bajada | ||
| La pantalla mostró buenos tiempos de respuesta en nuestros tests pero podría ser demasiado lenta para los jugones competitivos. En comparación, todos los dispositivos de prueba van de ##min### (mínimo) a 636 (máximo) ms. » 29 % de todos los dispositivos son mejores. Esto quiere decir que el tiempo de respuesta medido es mejor que la media (31.1 ms) de todos los dispositivos testados. | ||
Parpadeo de Pantalla / PWM (Pulse-Width Modulation)
| Parpadeo de Pantalla / PWM detectado | 23580 Hz | ≤ 13 % de brillo | 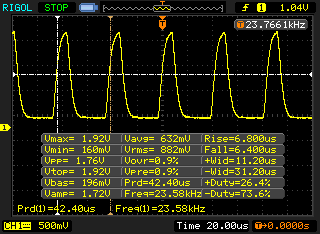 |
La retroiluminación del display parpadea a 23580 Hz (seguramente usa PWM - Pulse-Width Modulation) a un brillo del 13 % e inferior. Sobre este nivel de brillo no debería darse parpadeo / PWM. La frecuencia de 23580 Hz es bastante alta, por lo que la mayoría de gente sensible al parpadeo no debería ver parpadeo o tener fatiga visual. Comparación: 52 % de todos los dispositivos testados no usaron PWM para atenuar el display. Si se usó, medimos una media de 7784 (mínimo: 5 - máxmo: 343500) Hz. | |||
El panel IPS de ángulo de visión estable se puede leer desde cualquier posición. La lectura de la pantalla en exteriores es posible si el sol no es demasiado brillante y/o se buscan lugares a la sombra

Rendimiento - Suficiente para los próximos años
Con el Predator Helios 300, Acer tiene un portátil para juegos de 15,6 pulgadas en su línea que lleva todos los juegos modernos con fluidez a la pantalla
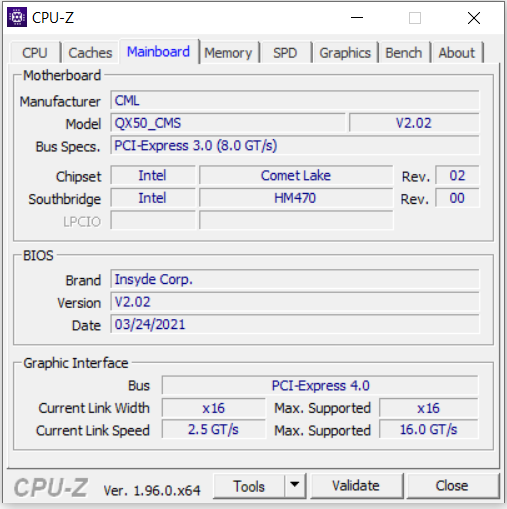
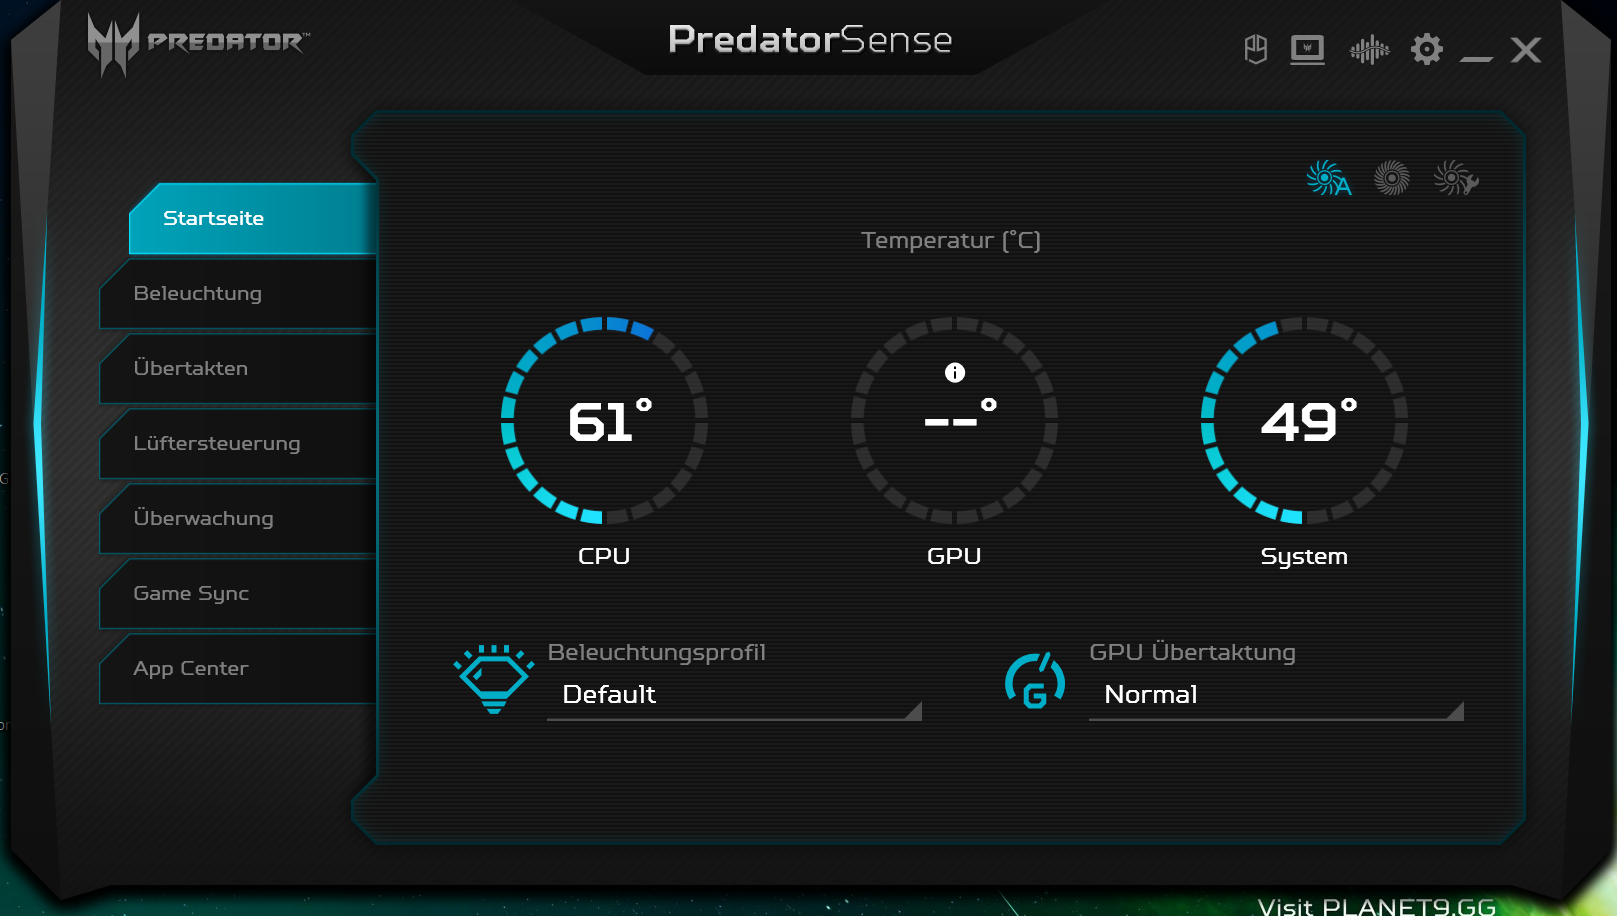
Condiciones de la prueba
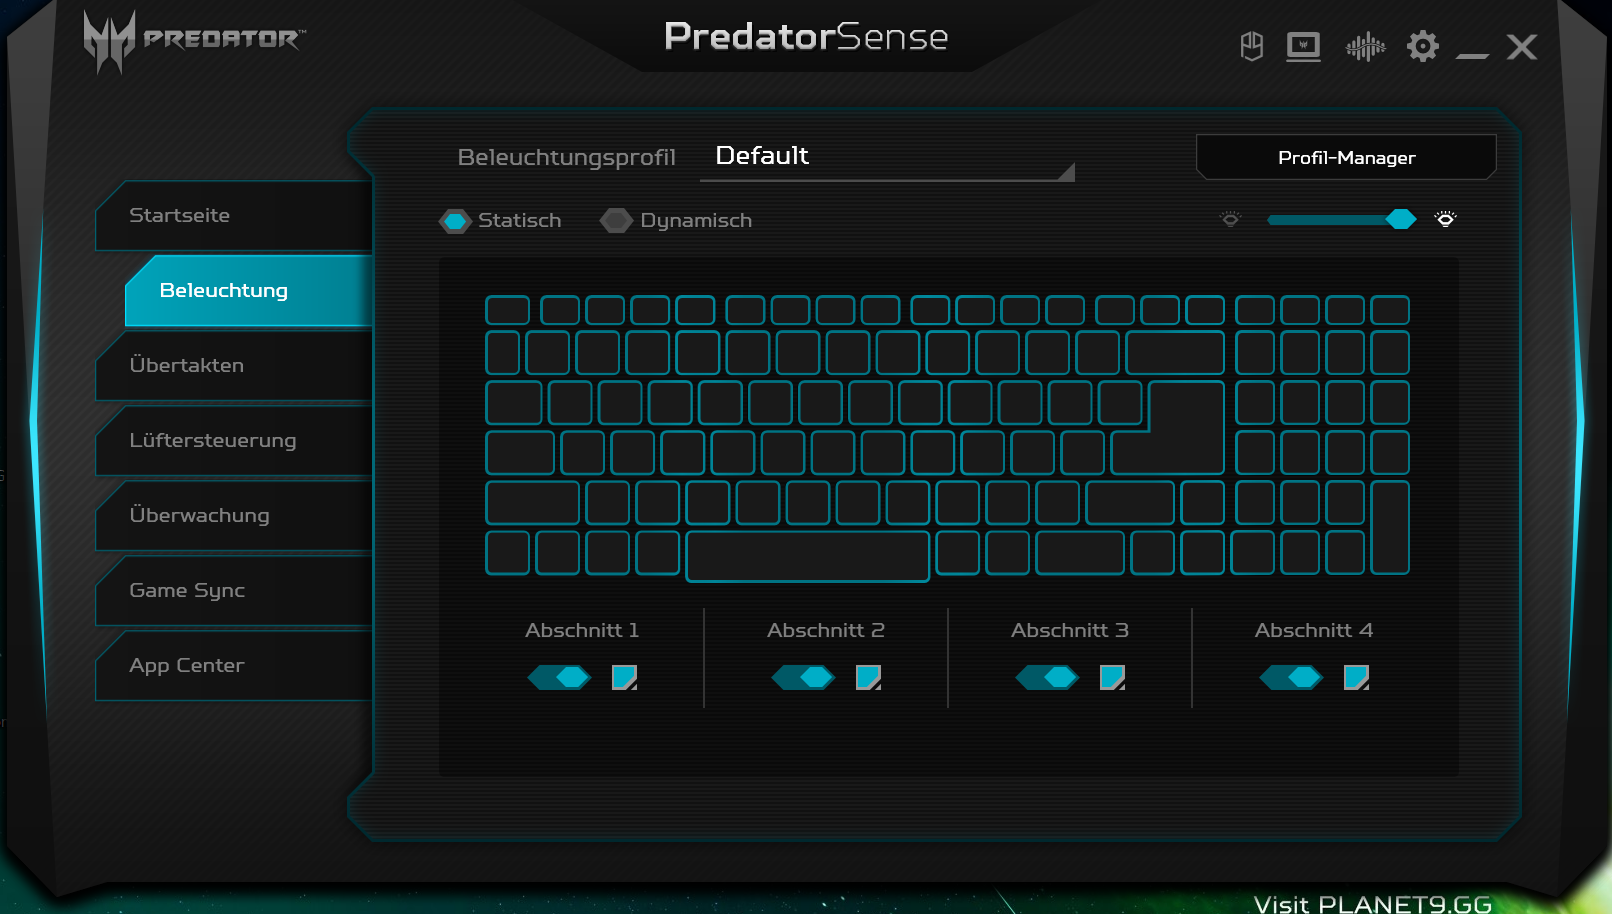
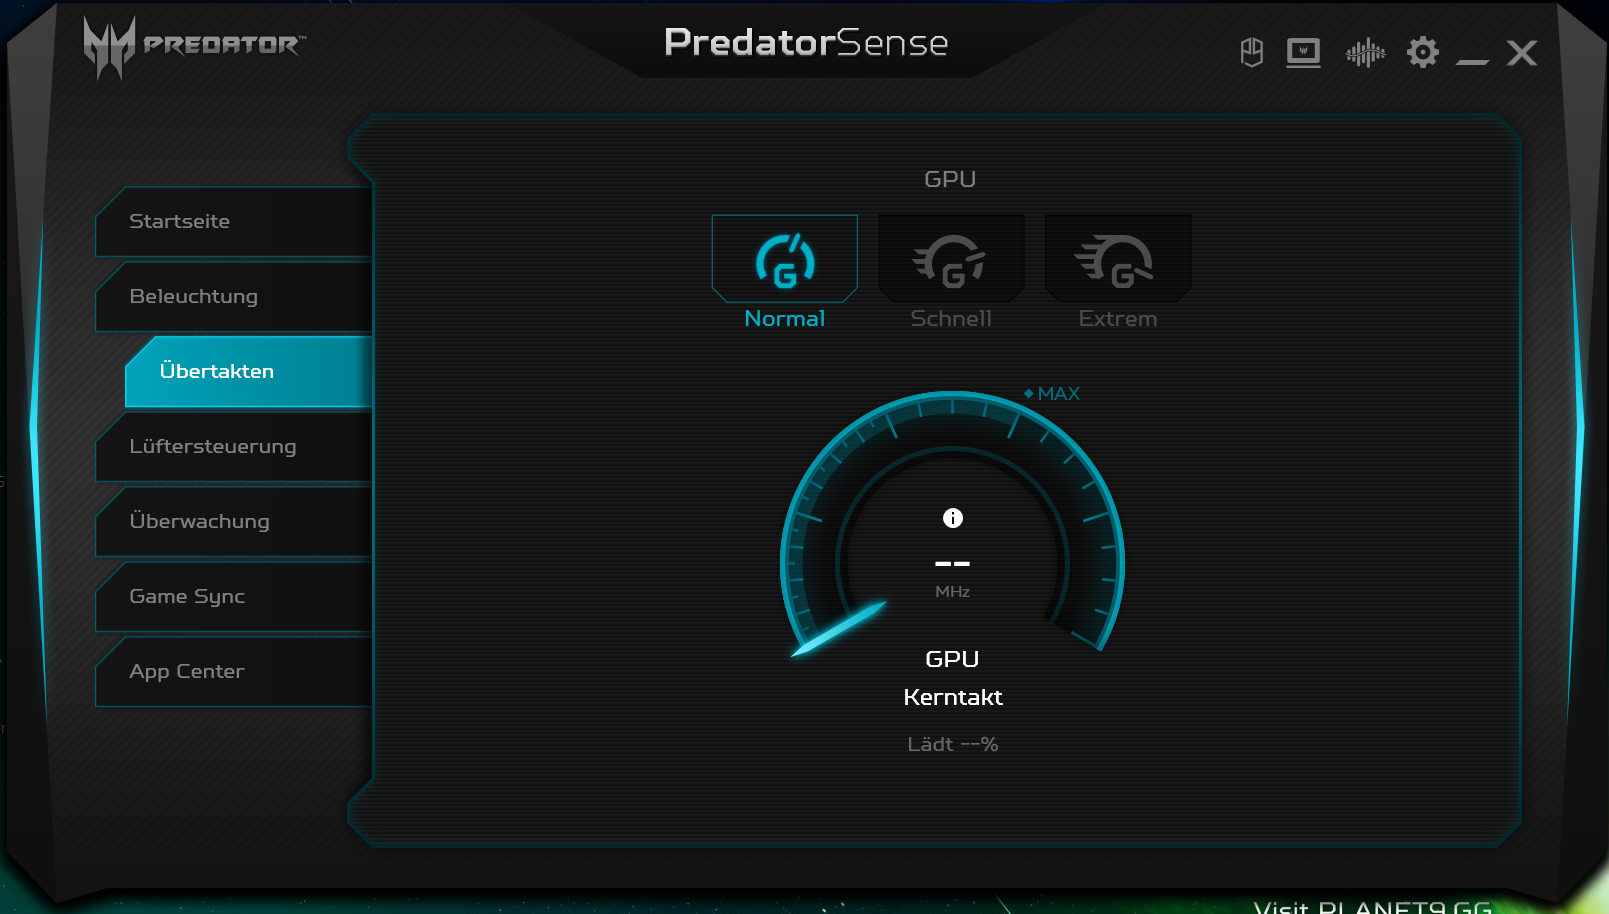
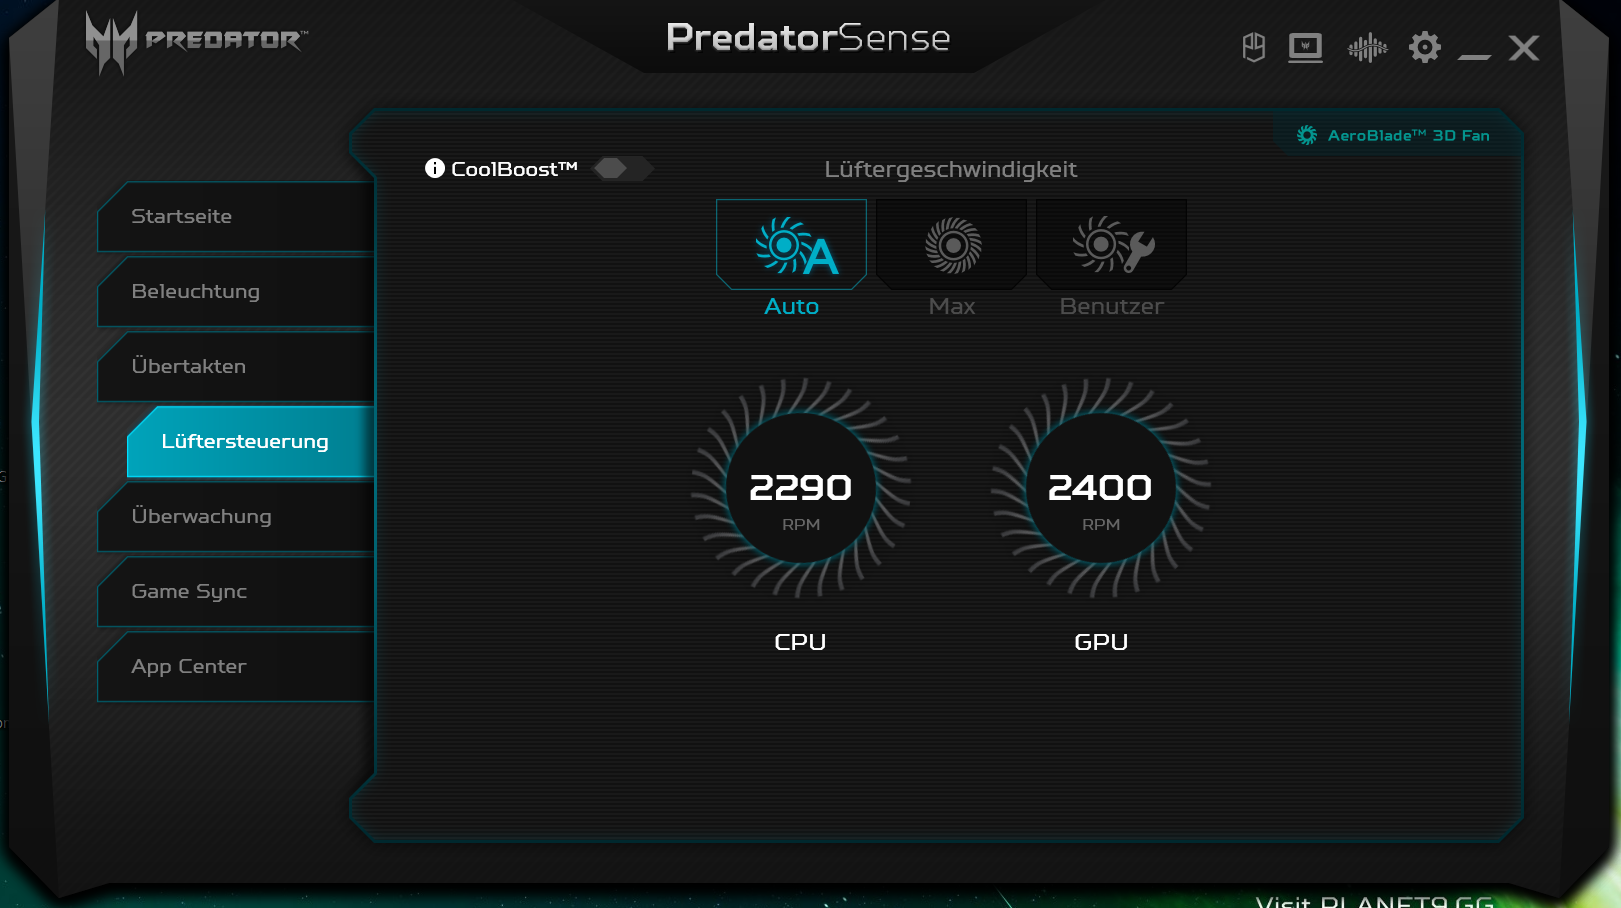
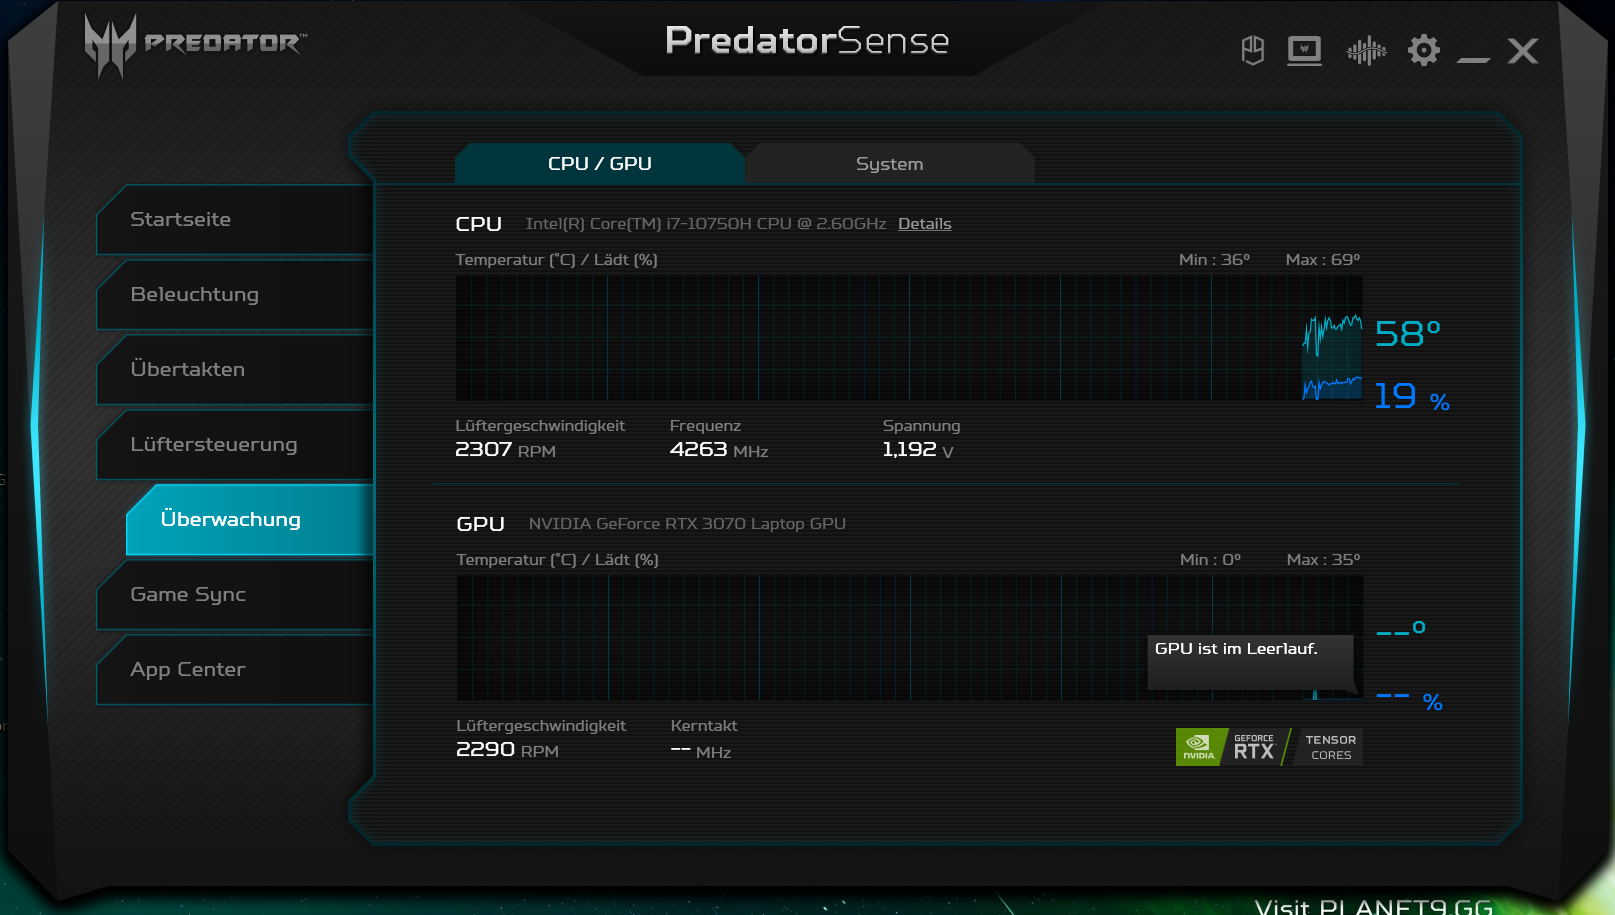
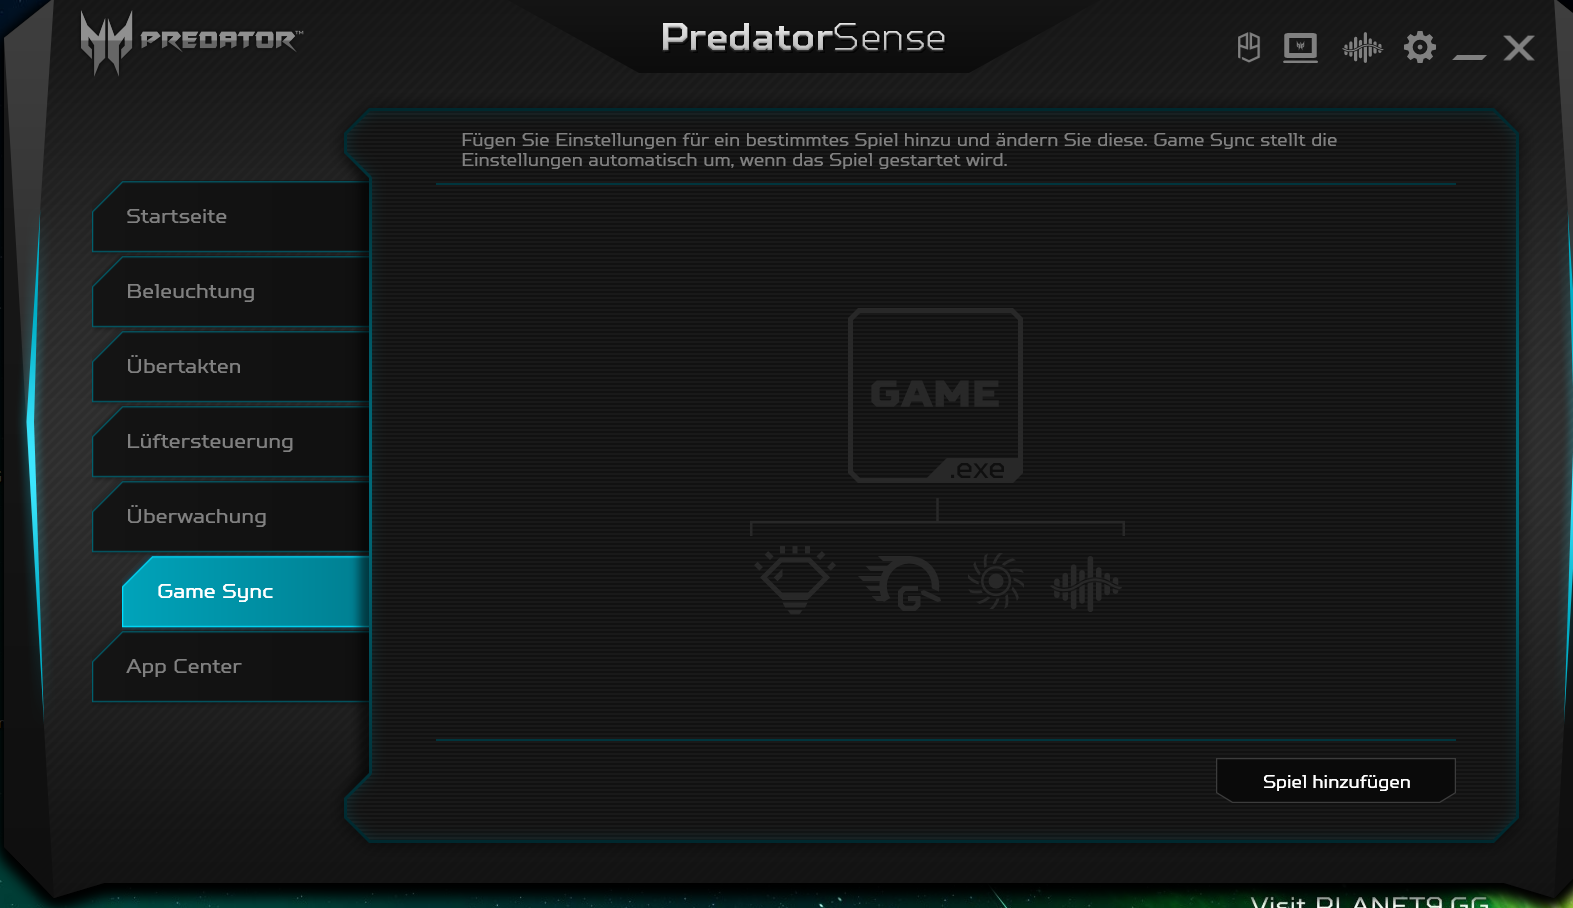
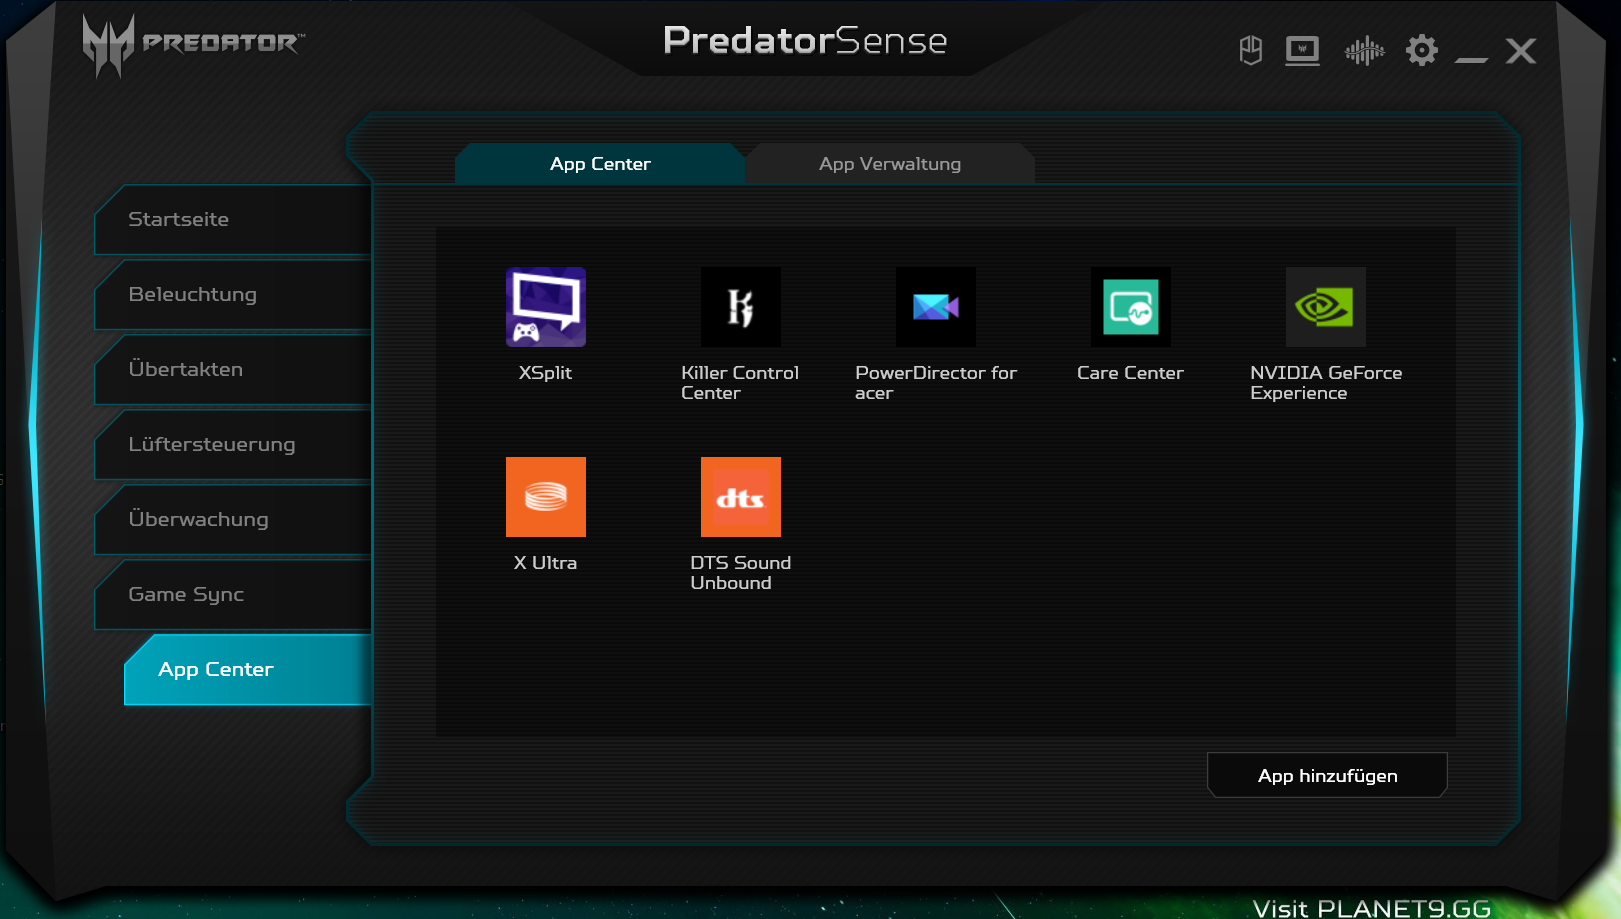
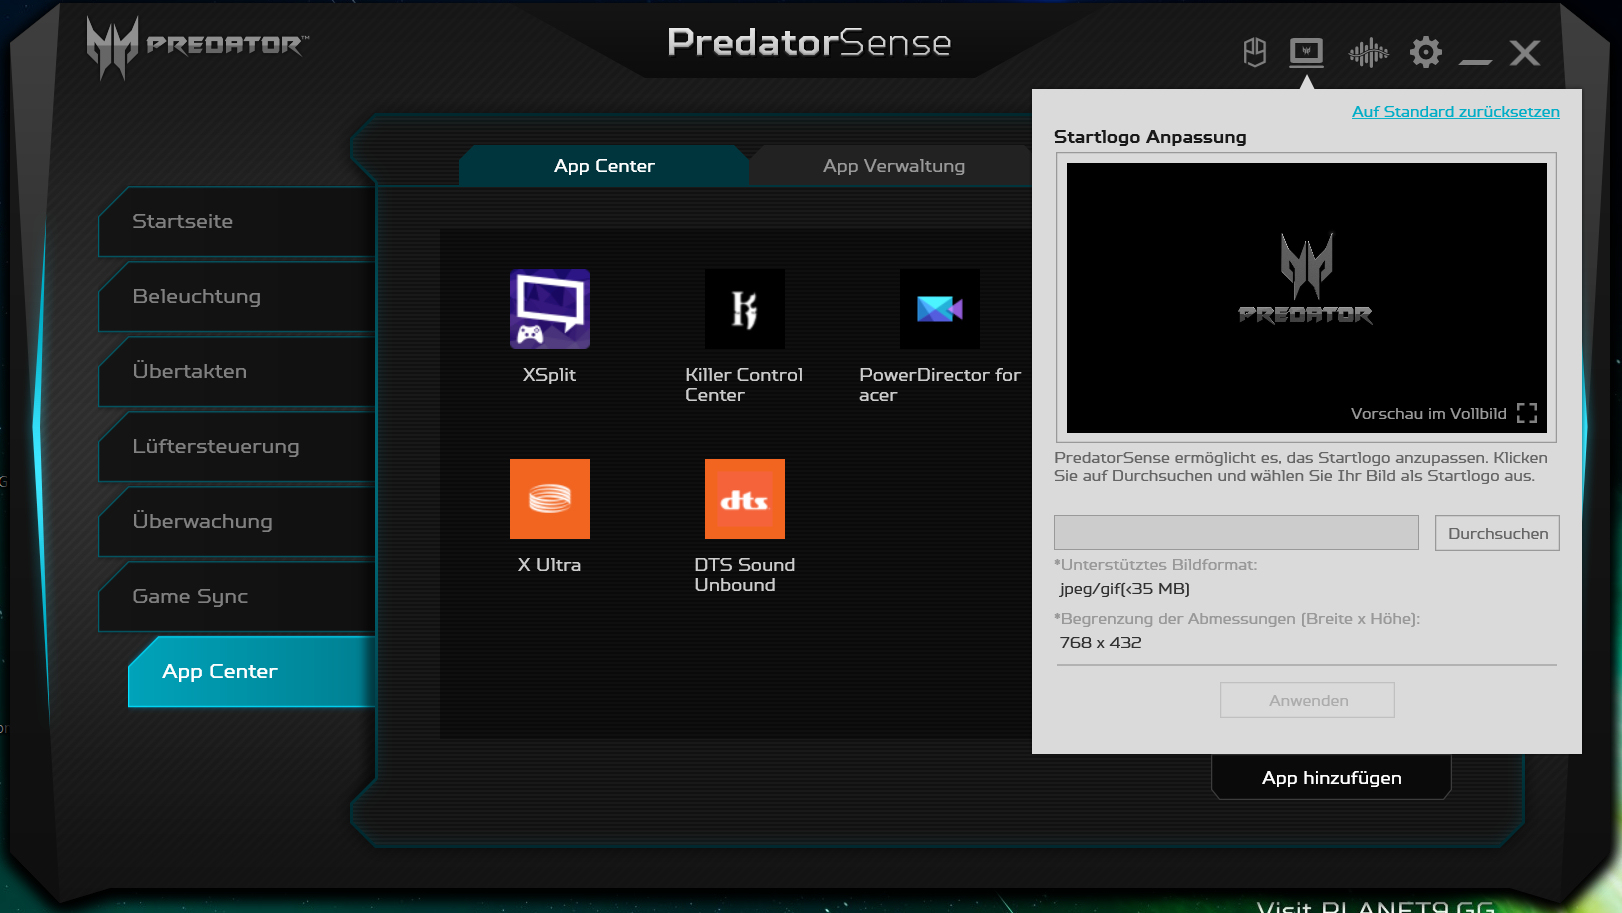
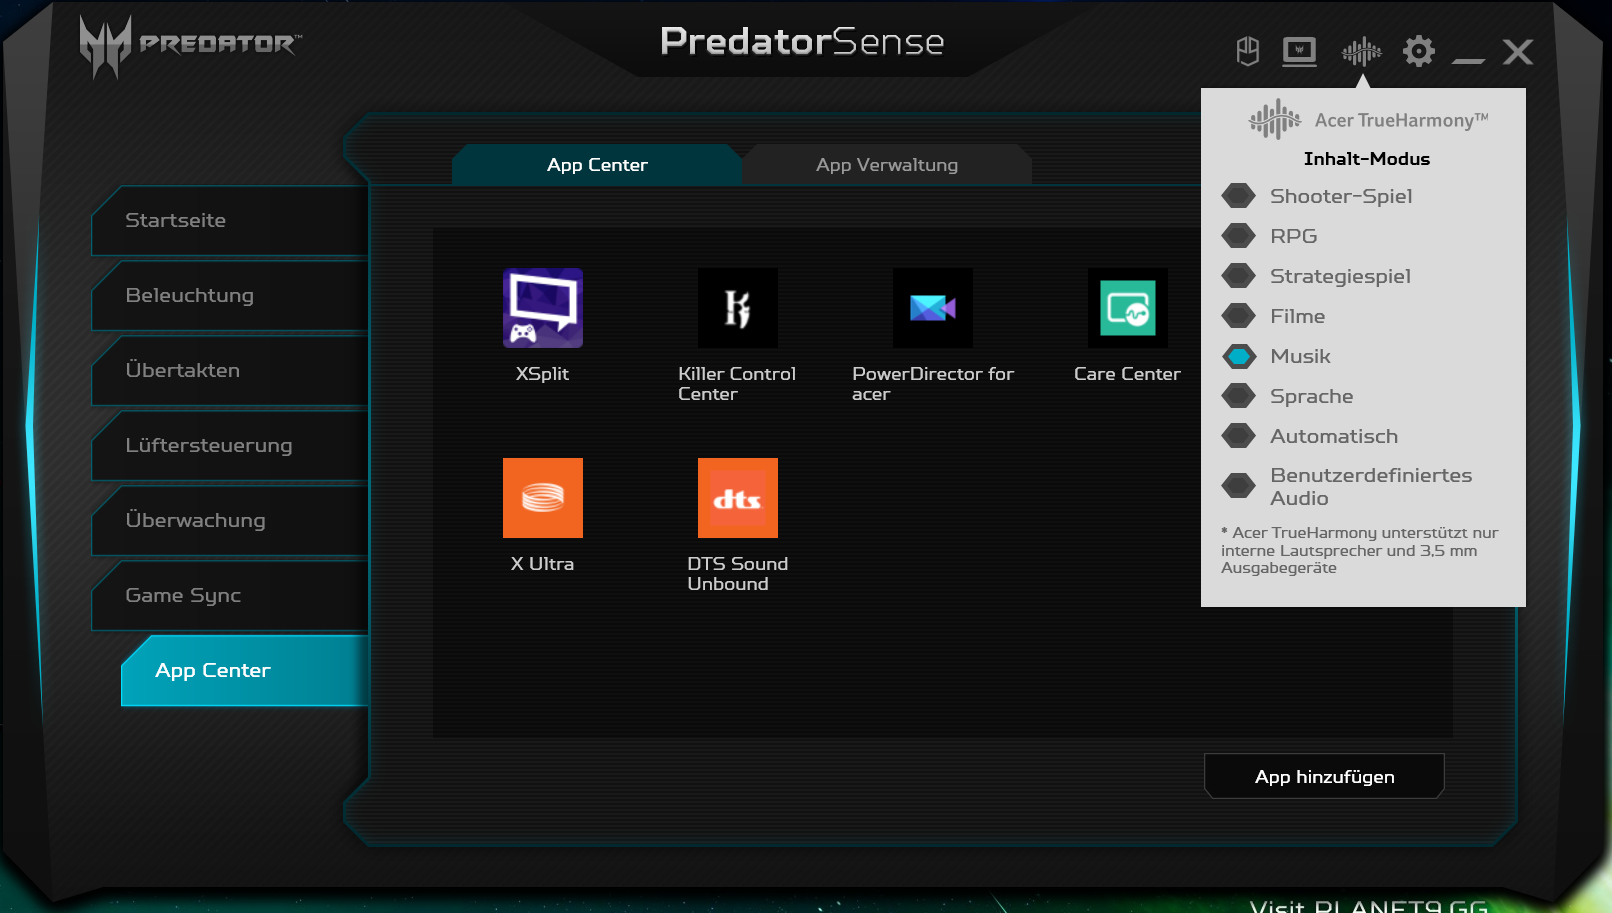
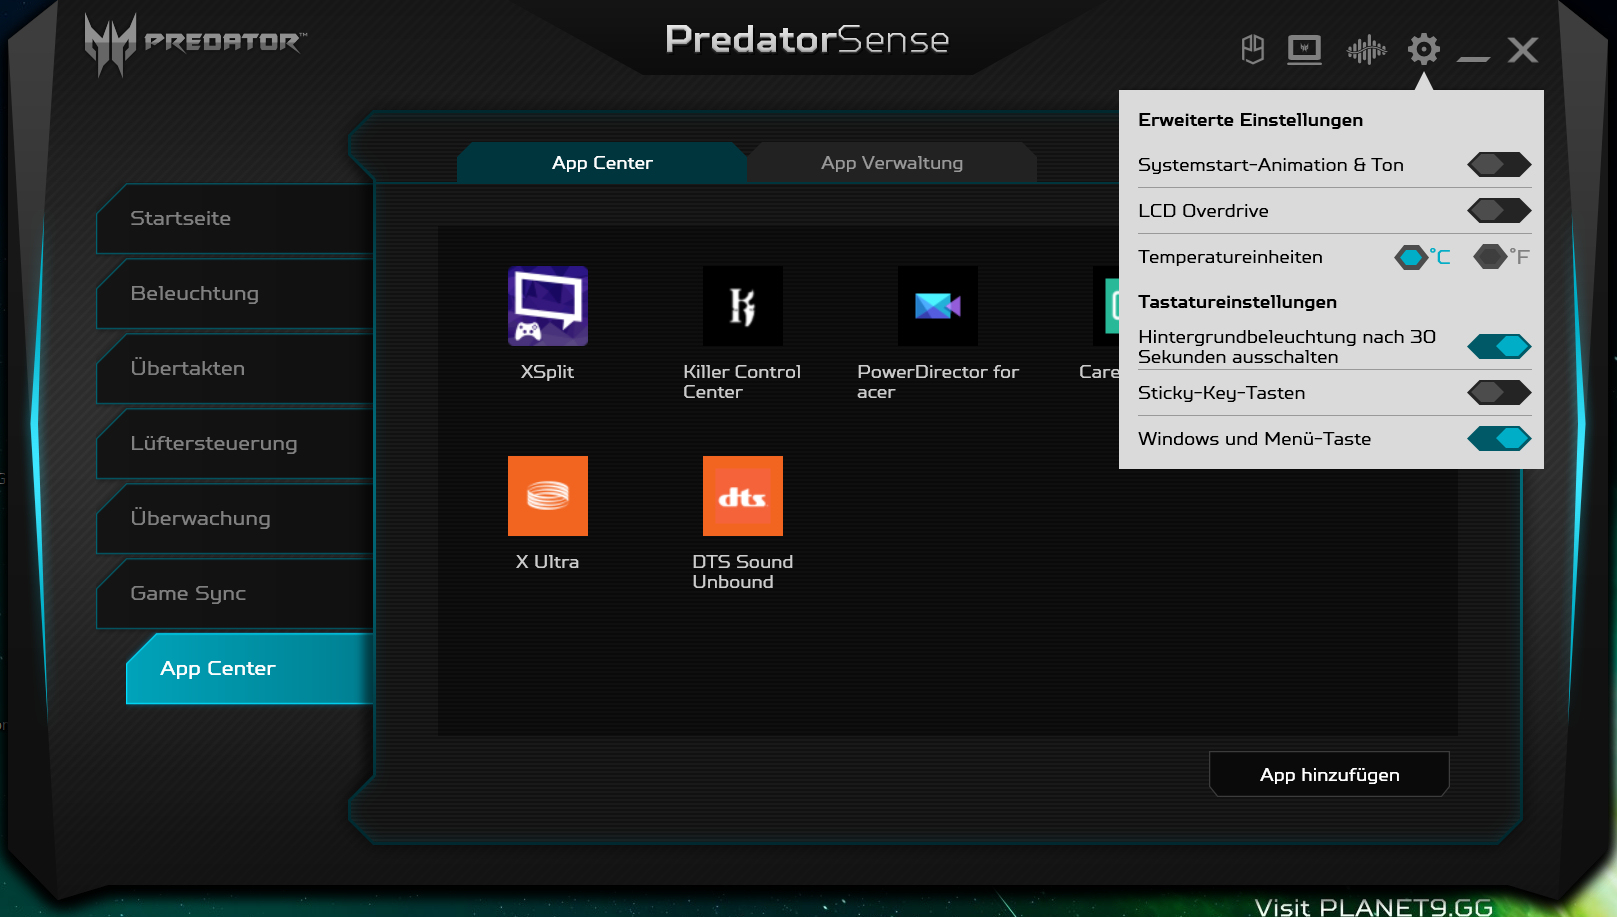
El software Predator Sense preinstalado permite a los usuarios ajustar el control de los ventiladores y realizar un overclocking automático de la GPU. Están disponibles los perfiles de GPU "Normal", "Rápido" y "Extremo". Nosotros utilizamos el control automático del ventilador y el perfil "Normal". Al pulsar el botón "Turbo" (situado encima del teclado) se activa el perfil "Extremo" de la GPU y permite que los ventiladores funcionen continuamente a plena potencia
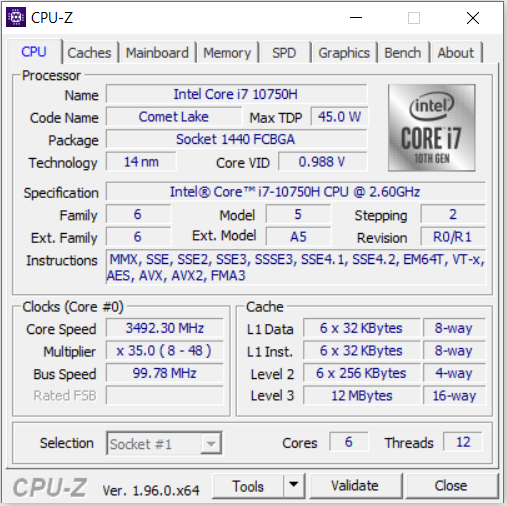
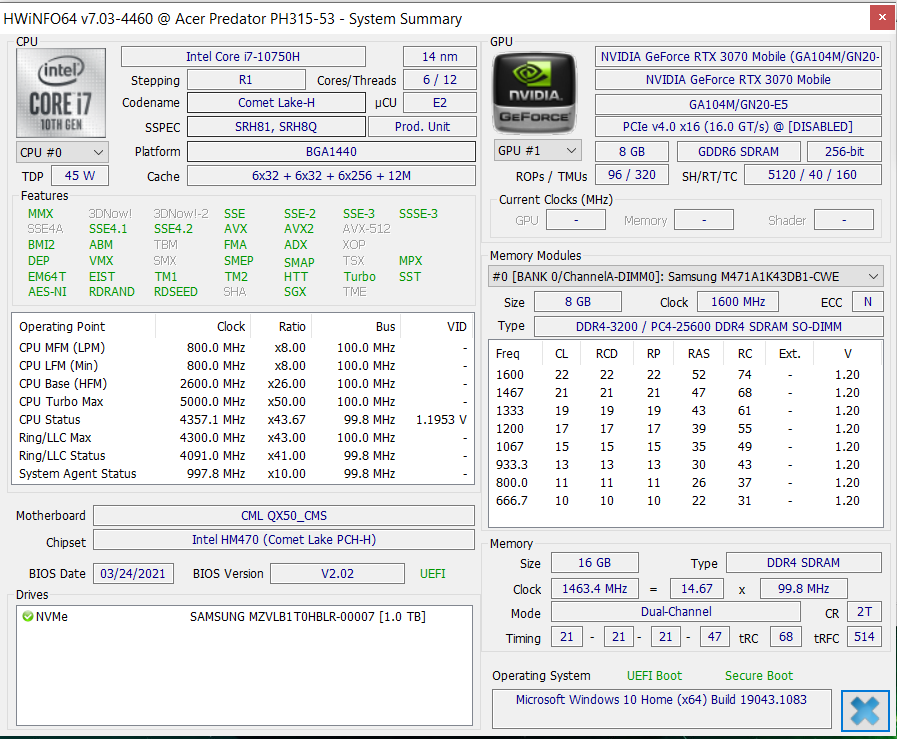
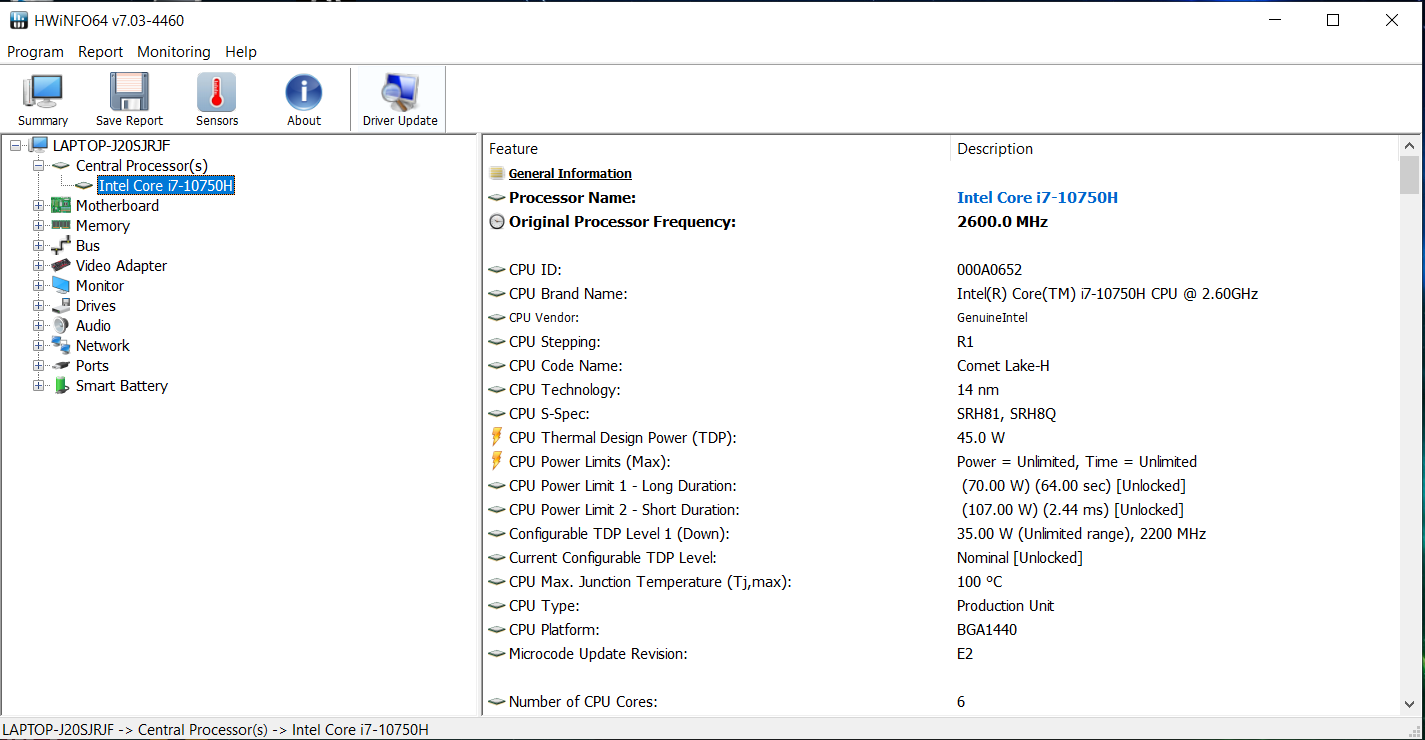
Procesador
El procesadorCore-i7-10750Hhexa-core
(Comet Lake) funciona a una velocidad de reloj base de 2,6 GHz. Se puede aumentar a 4,3 GHz (seis núcleos) o a 5 GHz (un núcleo) mediante Turbo. Soporta Hyper-Threading (dos hilos por núcleo).La prueba multihilo del benchmark Cinebench R15 se procesa entre 2,8 y 4,2 GHz. La prueba monohilo se ejecuta entre 4,2 y 4,4 GHz. En batería, las velocidades de reloj son de 1,9 a 2,7 GHz (multihilo) y de 2,5 a 3,2 GHz (monohilo), respectivamente.
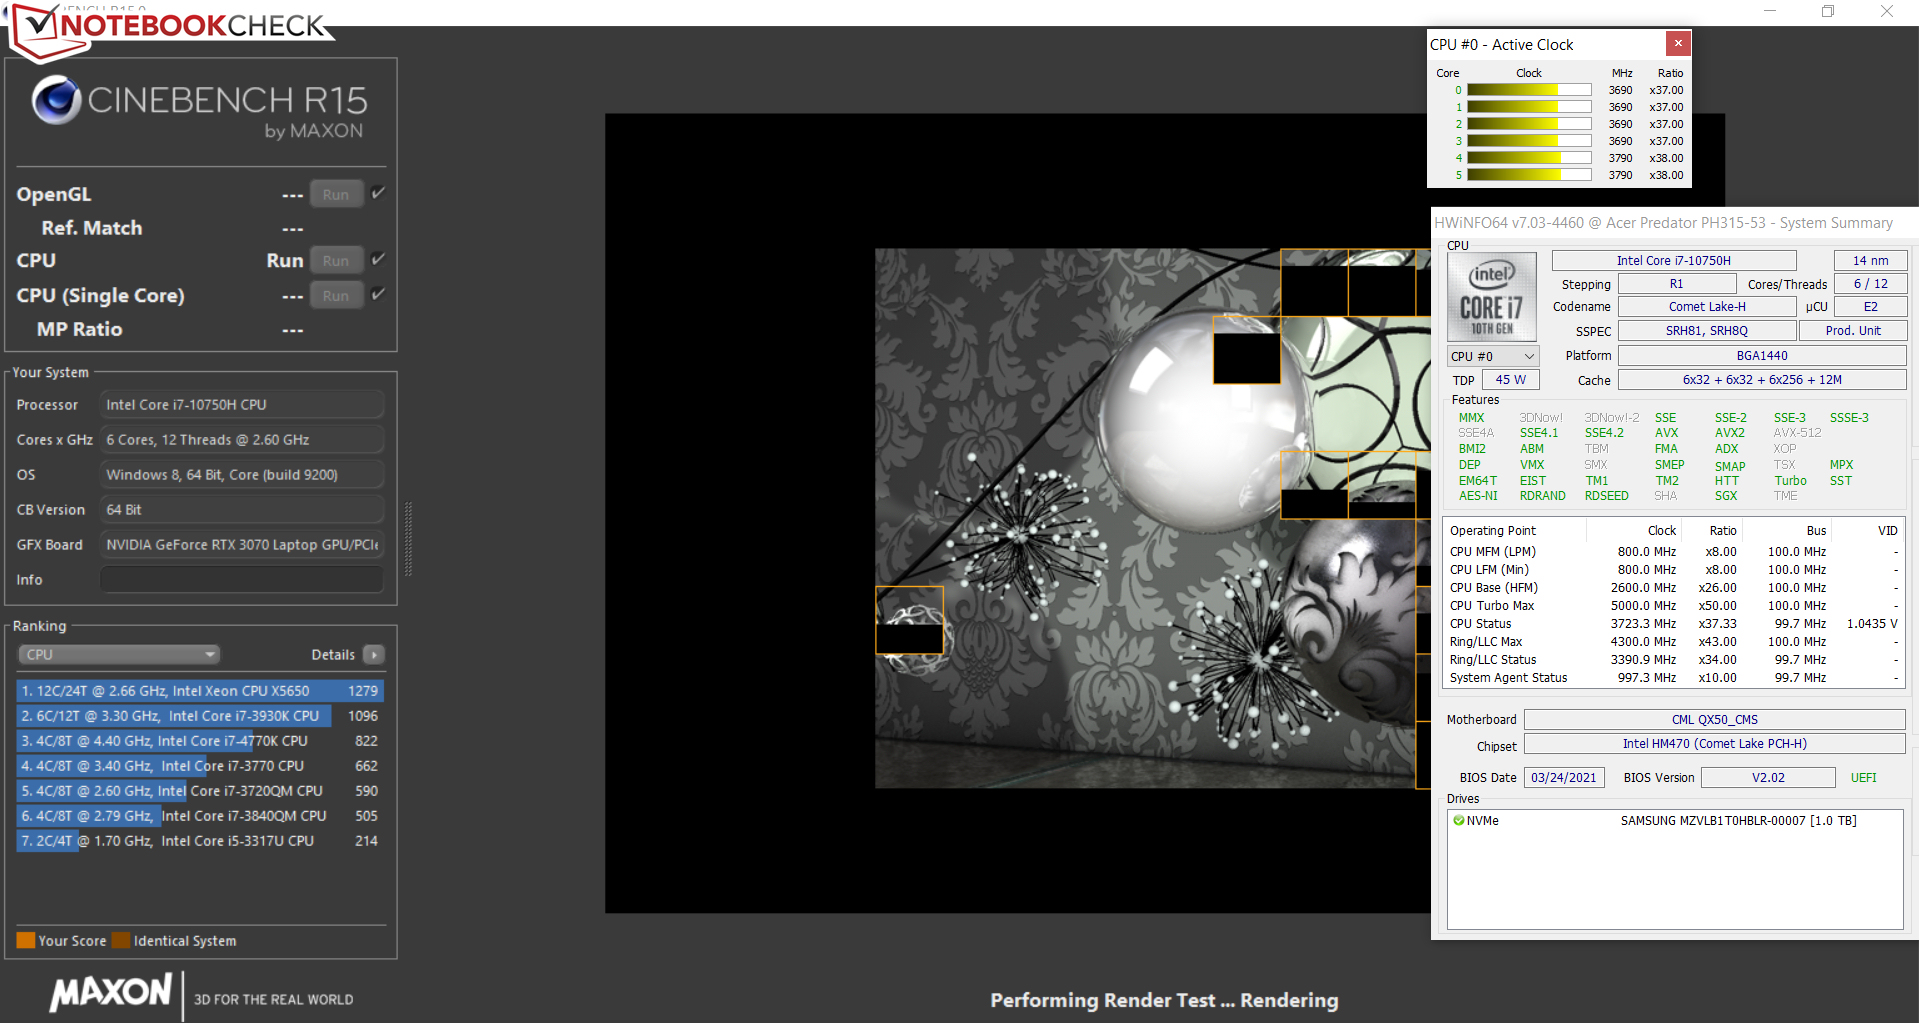
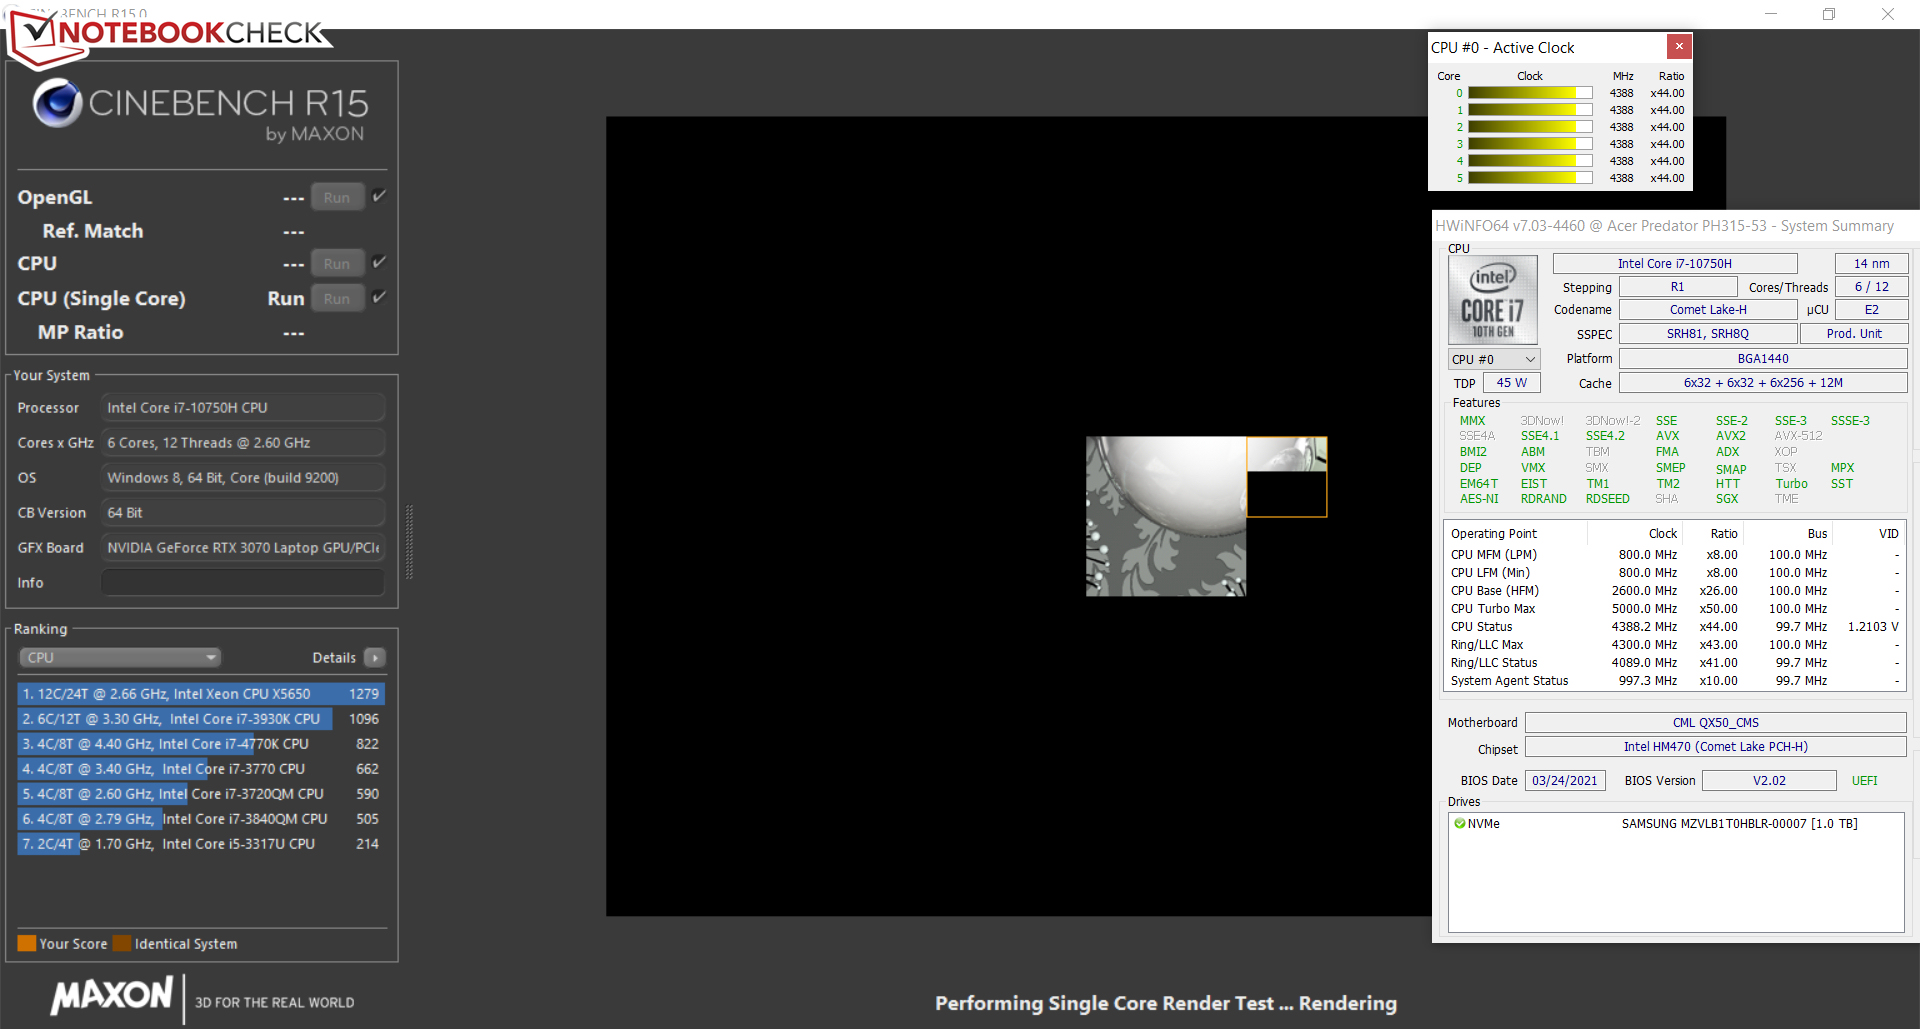
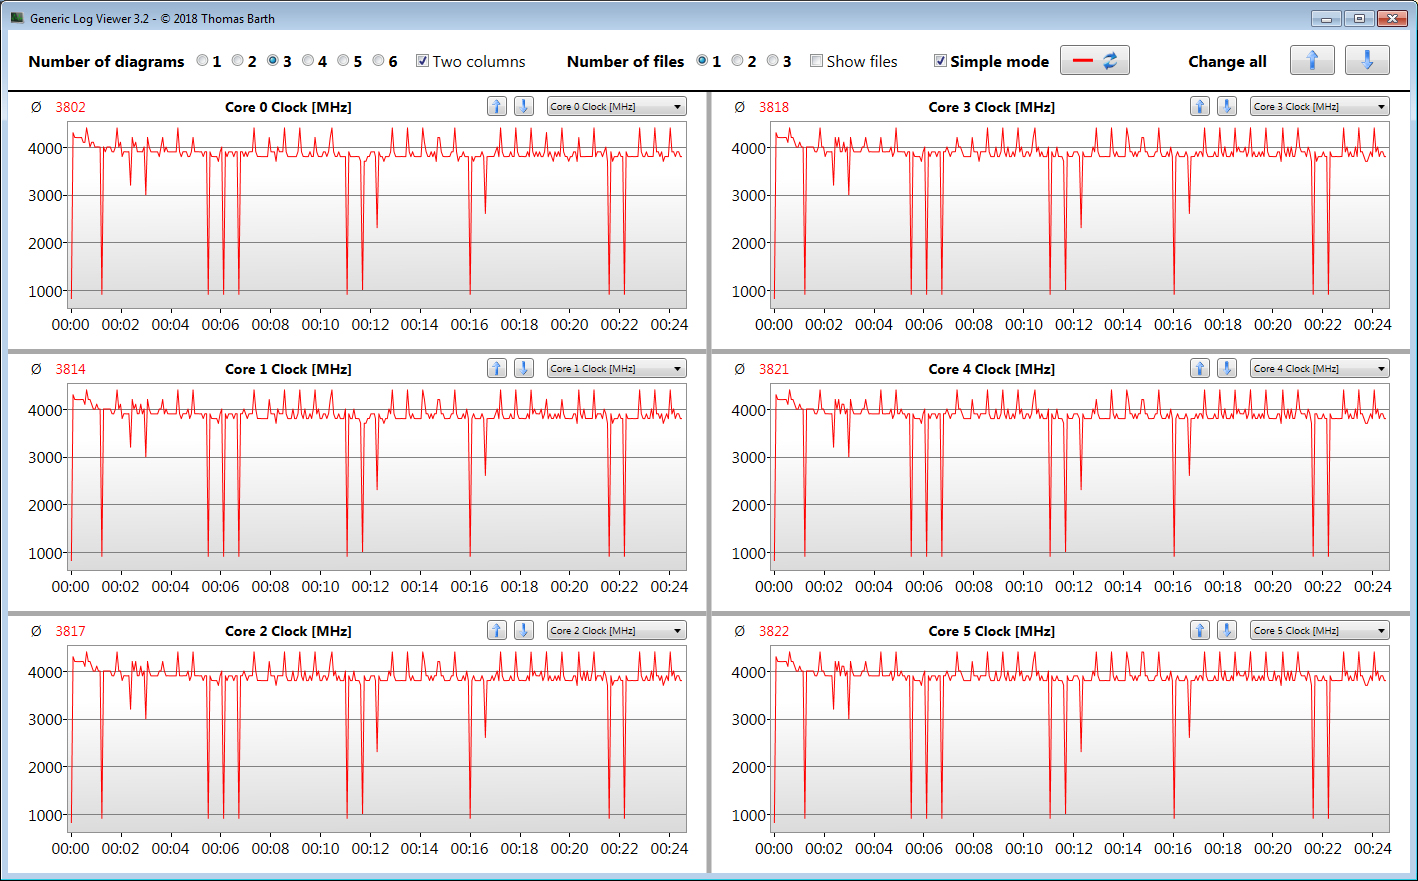
Verificamos si el Turbo de la CPU se utiliza de forma consistente cuando se conecta ejecutando la prueba multihilo del benchmark Cinebench R15 en un bucle continuo durante al menos 30 minutos. El Turbo se activa a un nivel bastante alto.
* ... más pequeño es mejor
Rendimiento del sistema
El sistema, rápido y fluido, ofrece suficiente potencia de cálculo para aplicaciones exigentes como los juegos y la edición de imágenes para los próximos años. Esto va acompañado de buenos resultados en PCMark

| PCMark 8 Home Score Accelerated v2 | 4275 puntos | |
| PCMark 8 Creative Score Accelerated v2 | 6202 puntos | |
| PCMark 8 Work Score Accelerated v2 | 5604 puntos | |
| PCMark 10 Score | 6034 puntos | |
ayuda | ||
| PCMark 10 / Score | |
| Media de la clase Gaming (5828 - 11574, n=94, últimos 2 años) | |
| Asus ROG Strix G15 G513QR | |
| Aorus 15G XC | |
| MSI GS66 Stealth 10UG | |
| Acer Predator Helios 300 PH315-53-786B | |
| Medio Intel Core i7-10750H, NVIDIA GeForce RTX 3070 Laptop GPU (6017 - 6034, n=2) | |
| Acer Predator Helios 300 PH315-53-77N5 | |
| PCMark 10 / Essentials | |
| Media de la clase Gaming (8810 - 12600, n=98, últimos 2 años) | |
| MSI GS66 Stealth 10UG | |
| Acer Predator Helios 300 PH315-53-77N5 | |
| Aorus 15G XC | |
| Acer Predator Helios 300 PH315-53-786B | |
| Medio Intel Core i7-10750H, NVIDIA GeForce RTX 3070 Laptop GPU (8652 - 8953, n=2) | |
| PCMark 10 / Productivity | |
| Media de la clase Gaming (6845 - 18766, n=96, últimos 2 años) | |
| Aorus 15G XC | |
| Medio Intel Core i7-10750H, NVIDIA GeForce RTX 3070 Laptop GPU (8022 - 8657, n=2) | |
| Acer Predator Helios 300 PH315-53-77N5 | |
| Acer Predator Helios 300 PH315-53-786B | |
| MSI GS66 Stealth 10UG | |
| PCMark 10 / Digital Content Creation | |
| Media de la clase Gaming (7602 - 19657, n=96, últimos 2 años) | |
| Aorus 15G XC | |
| MSI GS66 Stealth 10UG | |
| Acer Predator Helios 300 PH315-53-786B | |
| Medio Intel Core i7-10750H, NVIDIA GeForce RTX 3070 Laptop GPU (7893 - 8300, n=2) | |
| Acer Predator Helios 300 PH315-53-77N5 | |
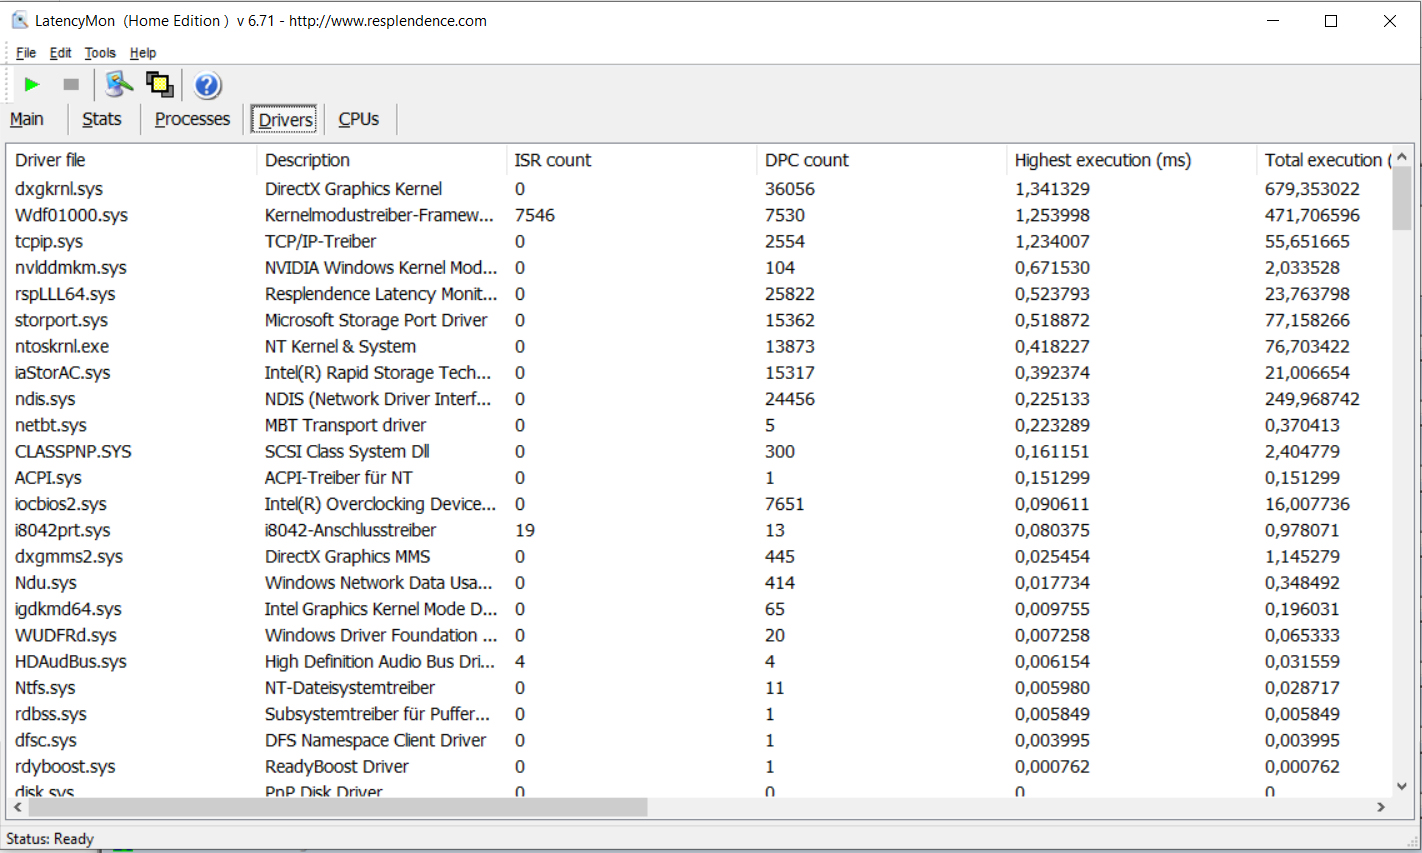
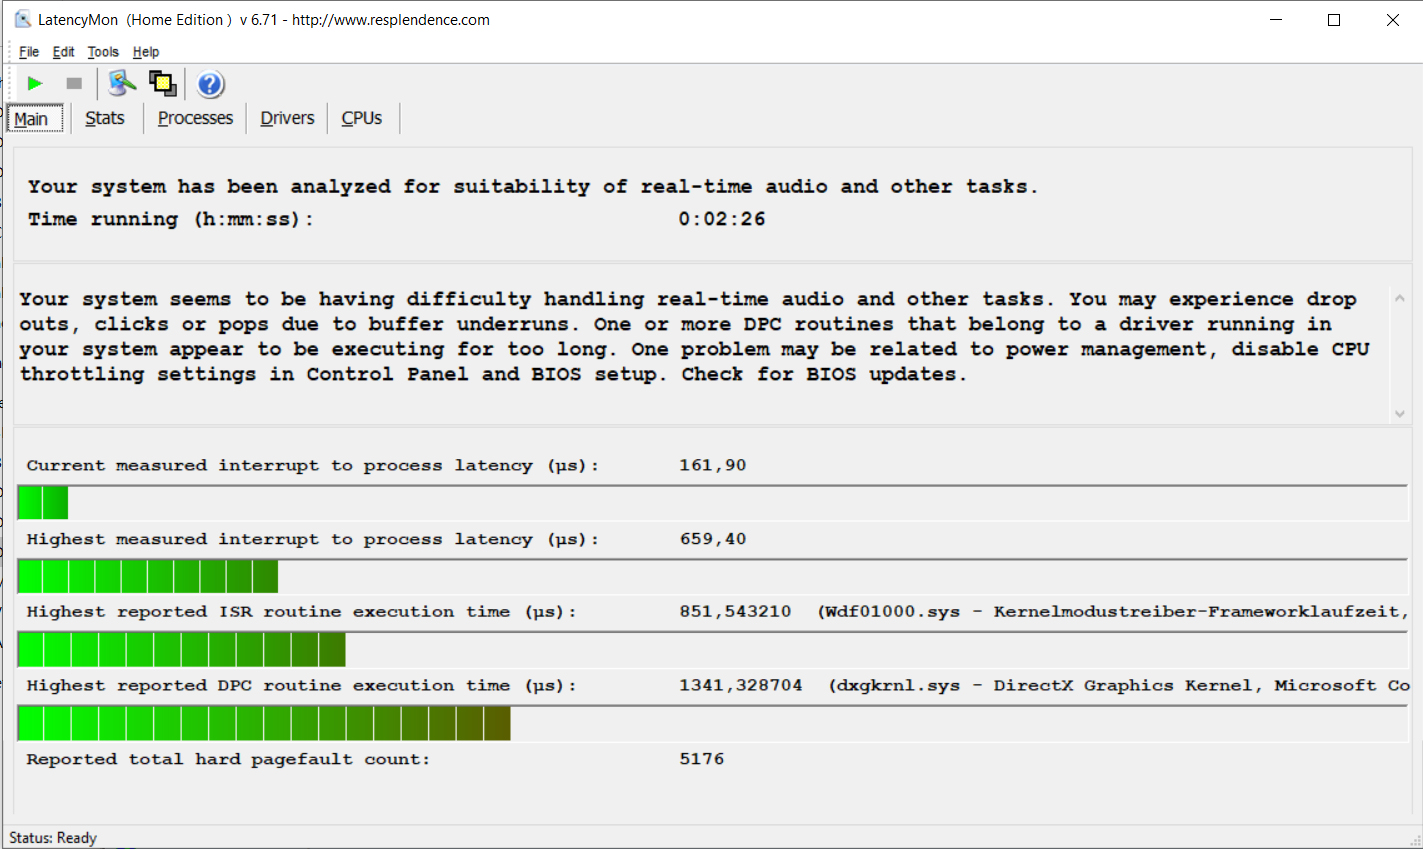
Latencias del CPD
Nuestra prueba de monitorización de latencia estandarizada (navegación web, reproducción de vídeo 4K, Prime95 de alta carga) reveló irregularidades en términos de latencias DPC. El sistema no parece adecuado para la edición de vídeo y audio en tiempo real
| DPC Latencies / LatencyMon - interrupt to process latency (max), Web, Youtube, Prime95 | |
| Aorus 15G XC | |
| Acer Predator Helios 300 PH315-53-77N5 | |
| MSI GS66 Stealth 10UG | |
| Acer Predator Helios 300 PH315-53-786B | |
| Asus ROG Strix G15 G513QR | |
* ... más pequeño es mejor
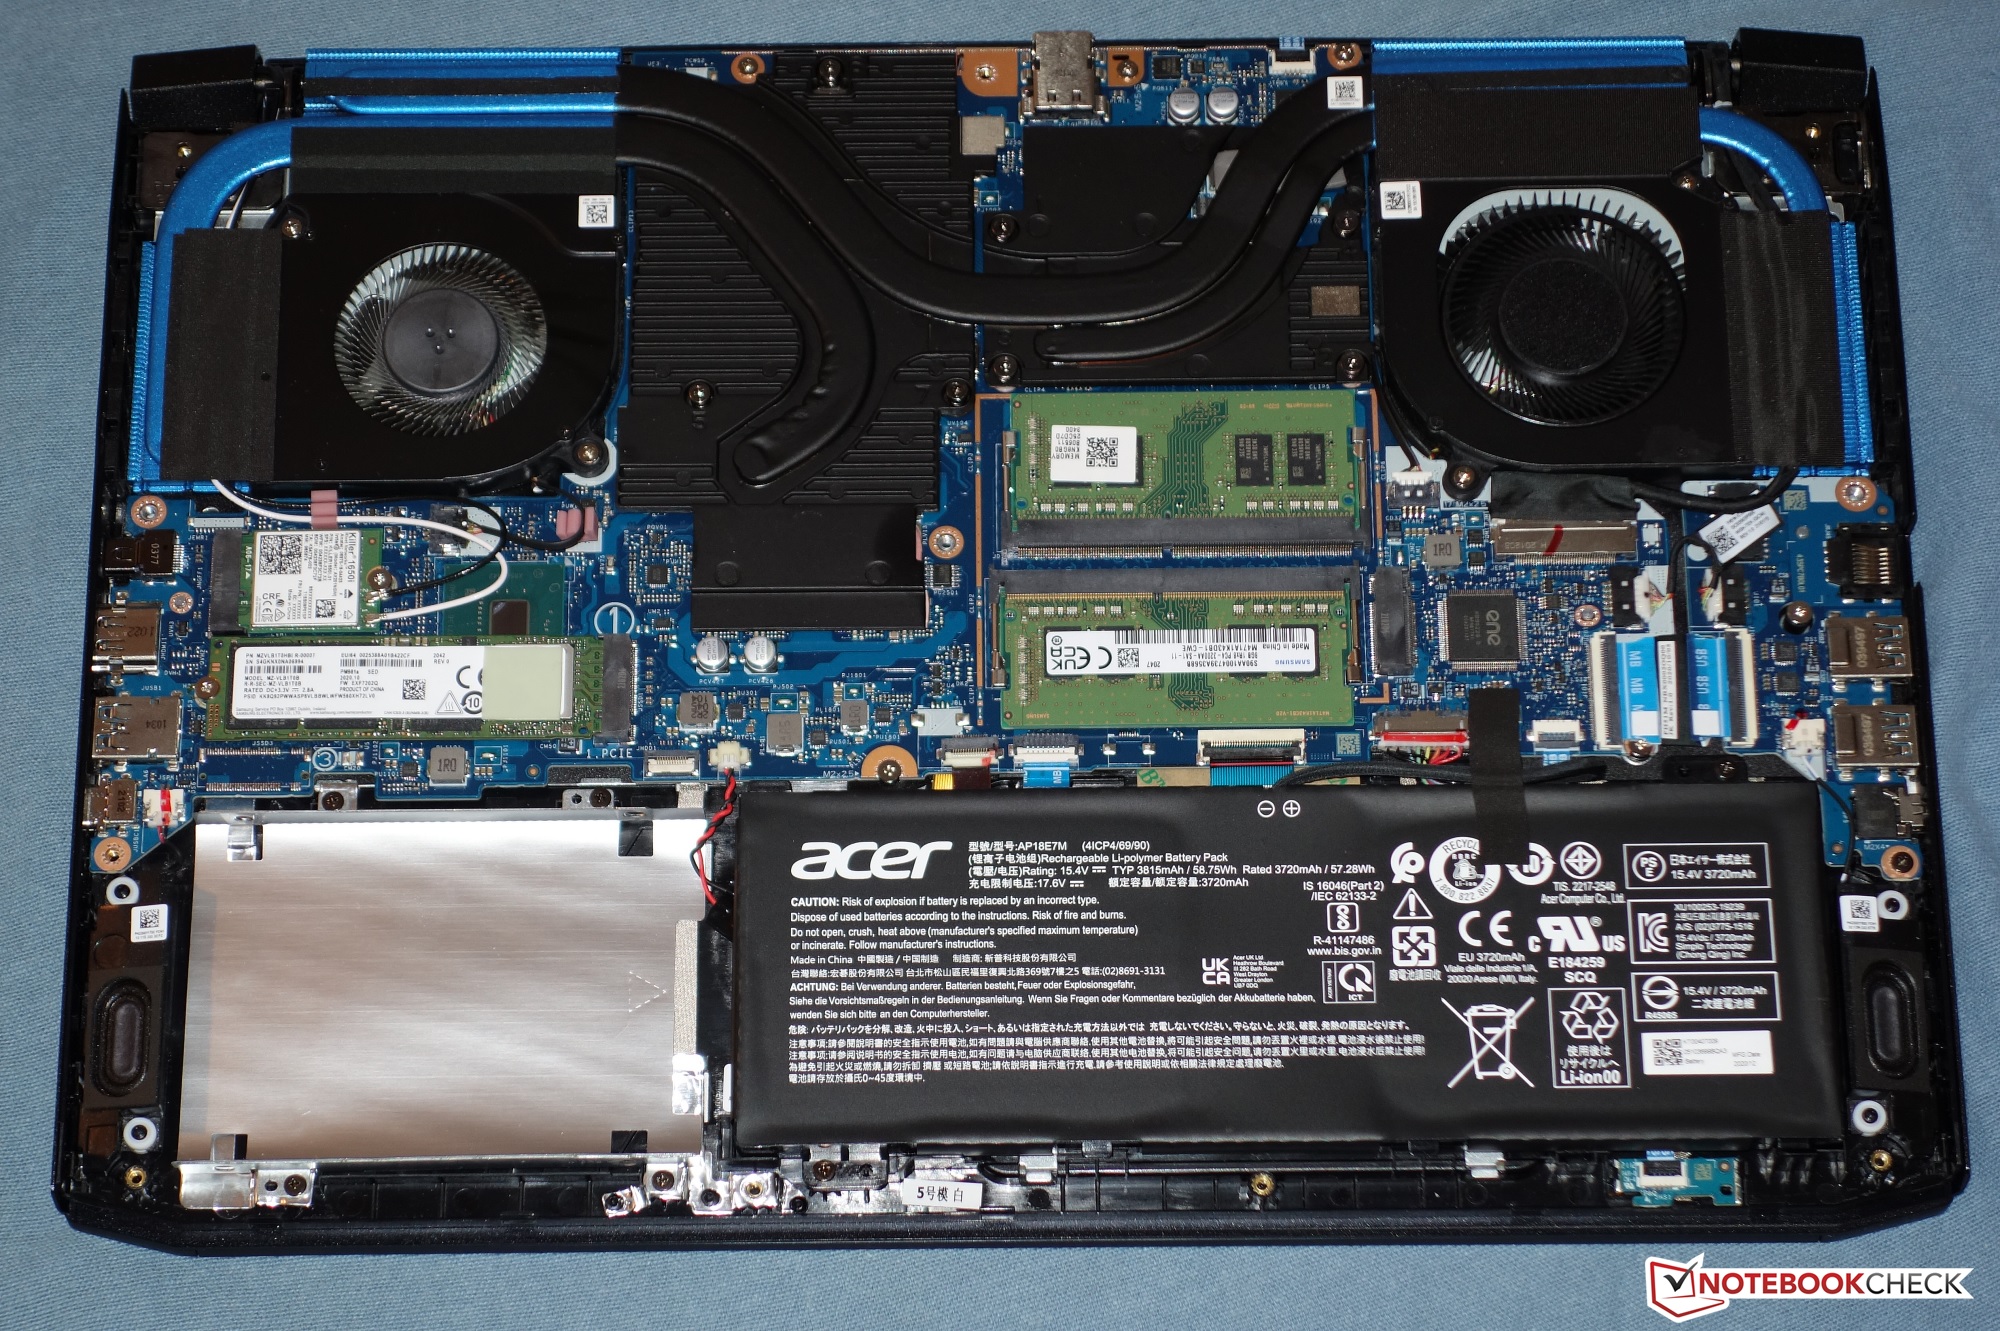
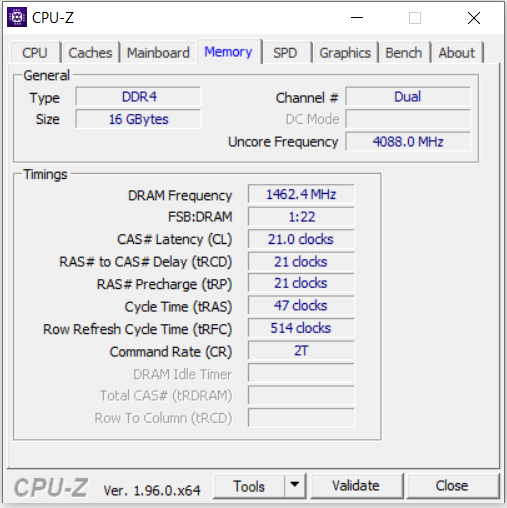
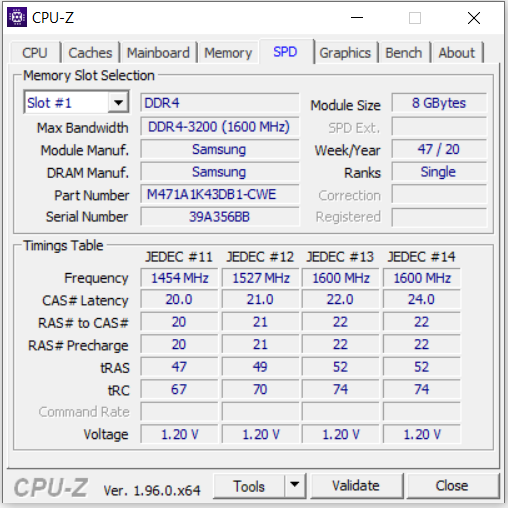
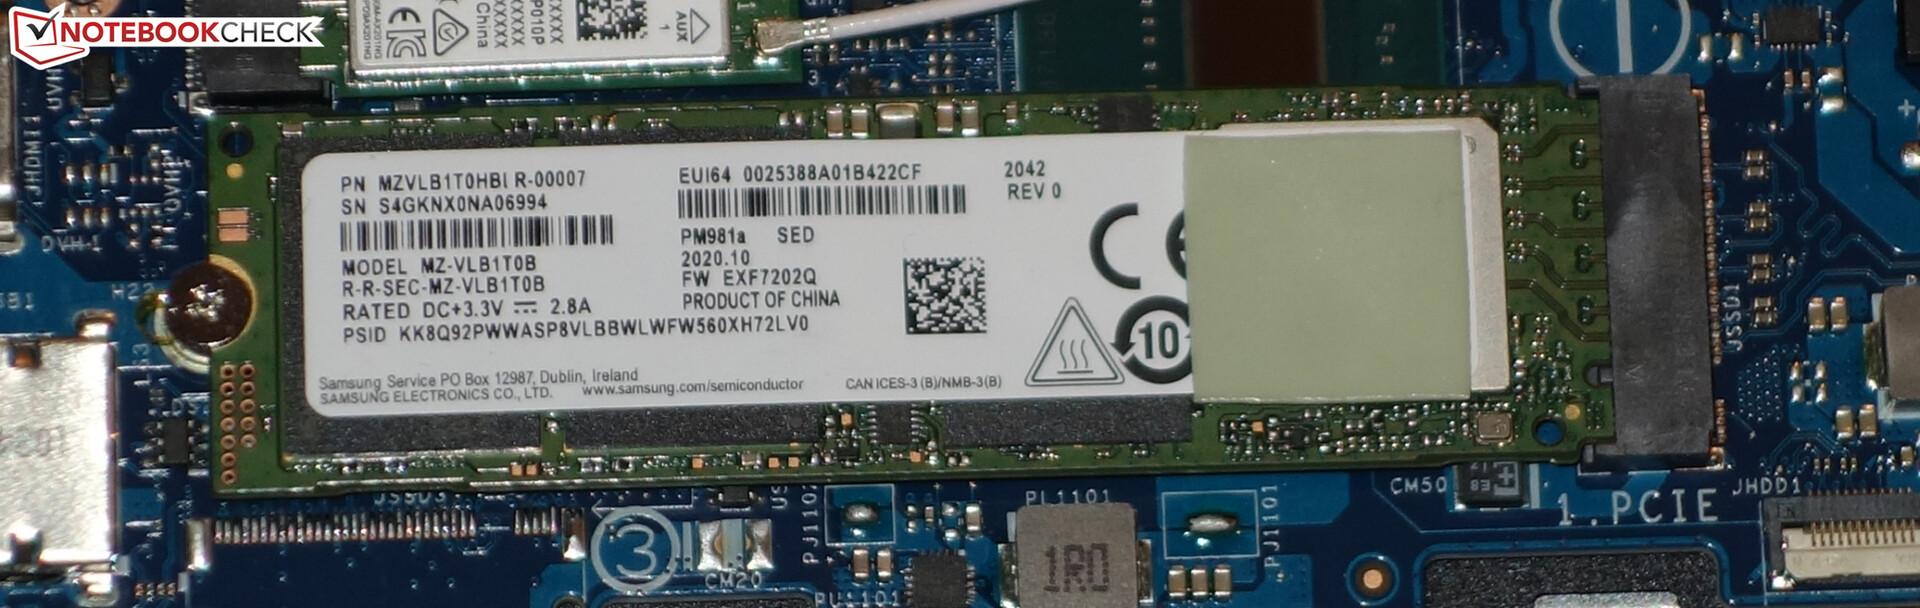
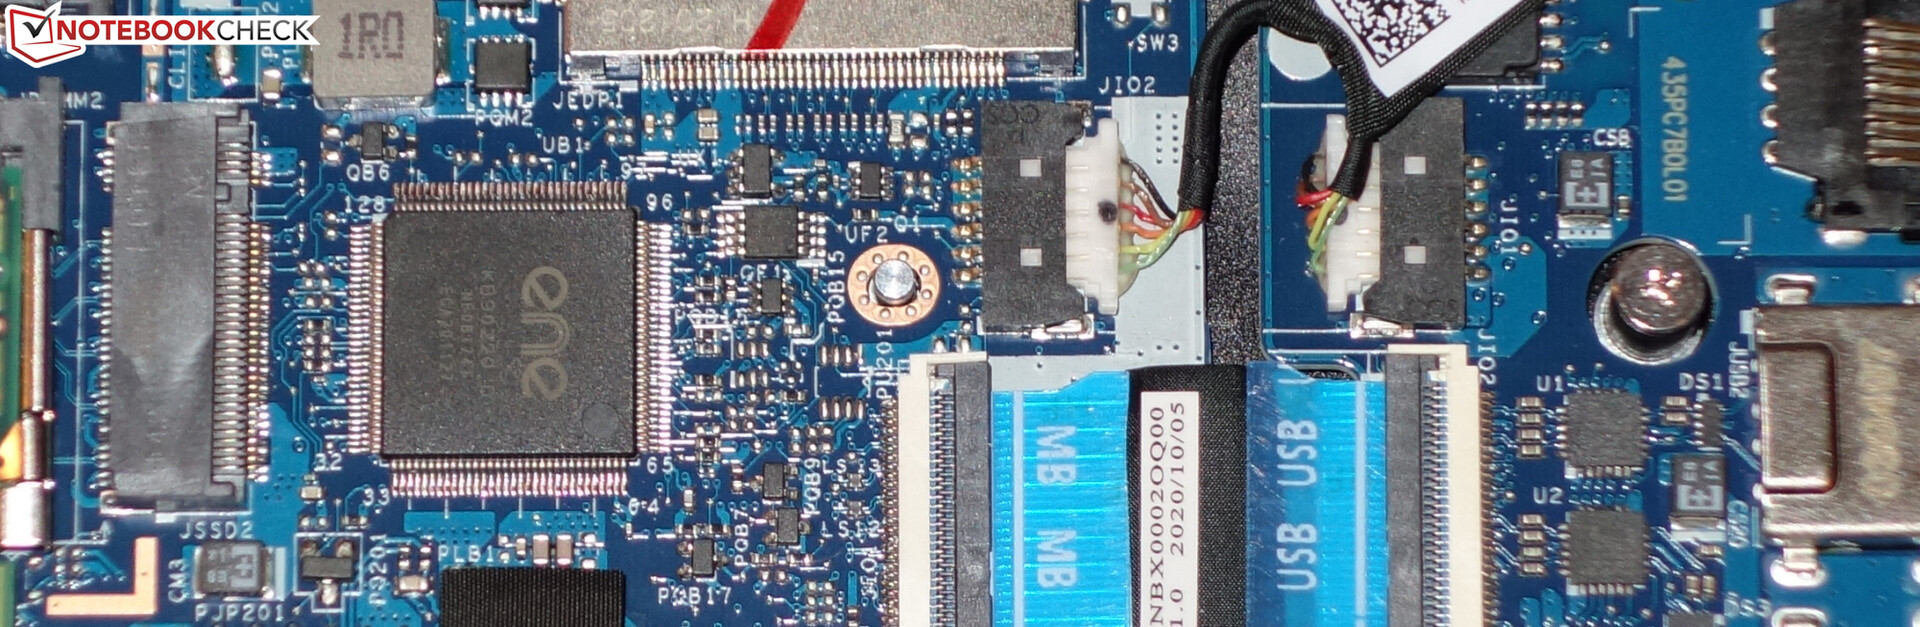
Almacenamiento
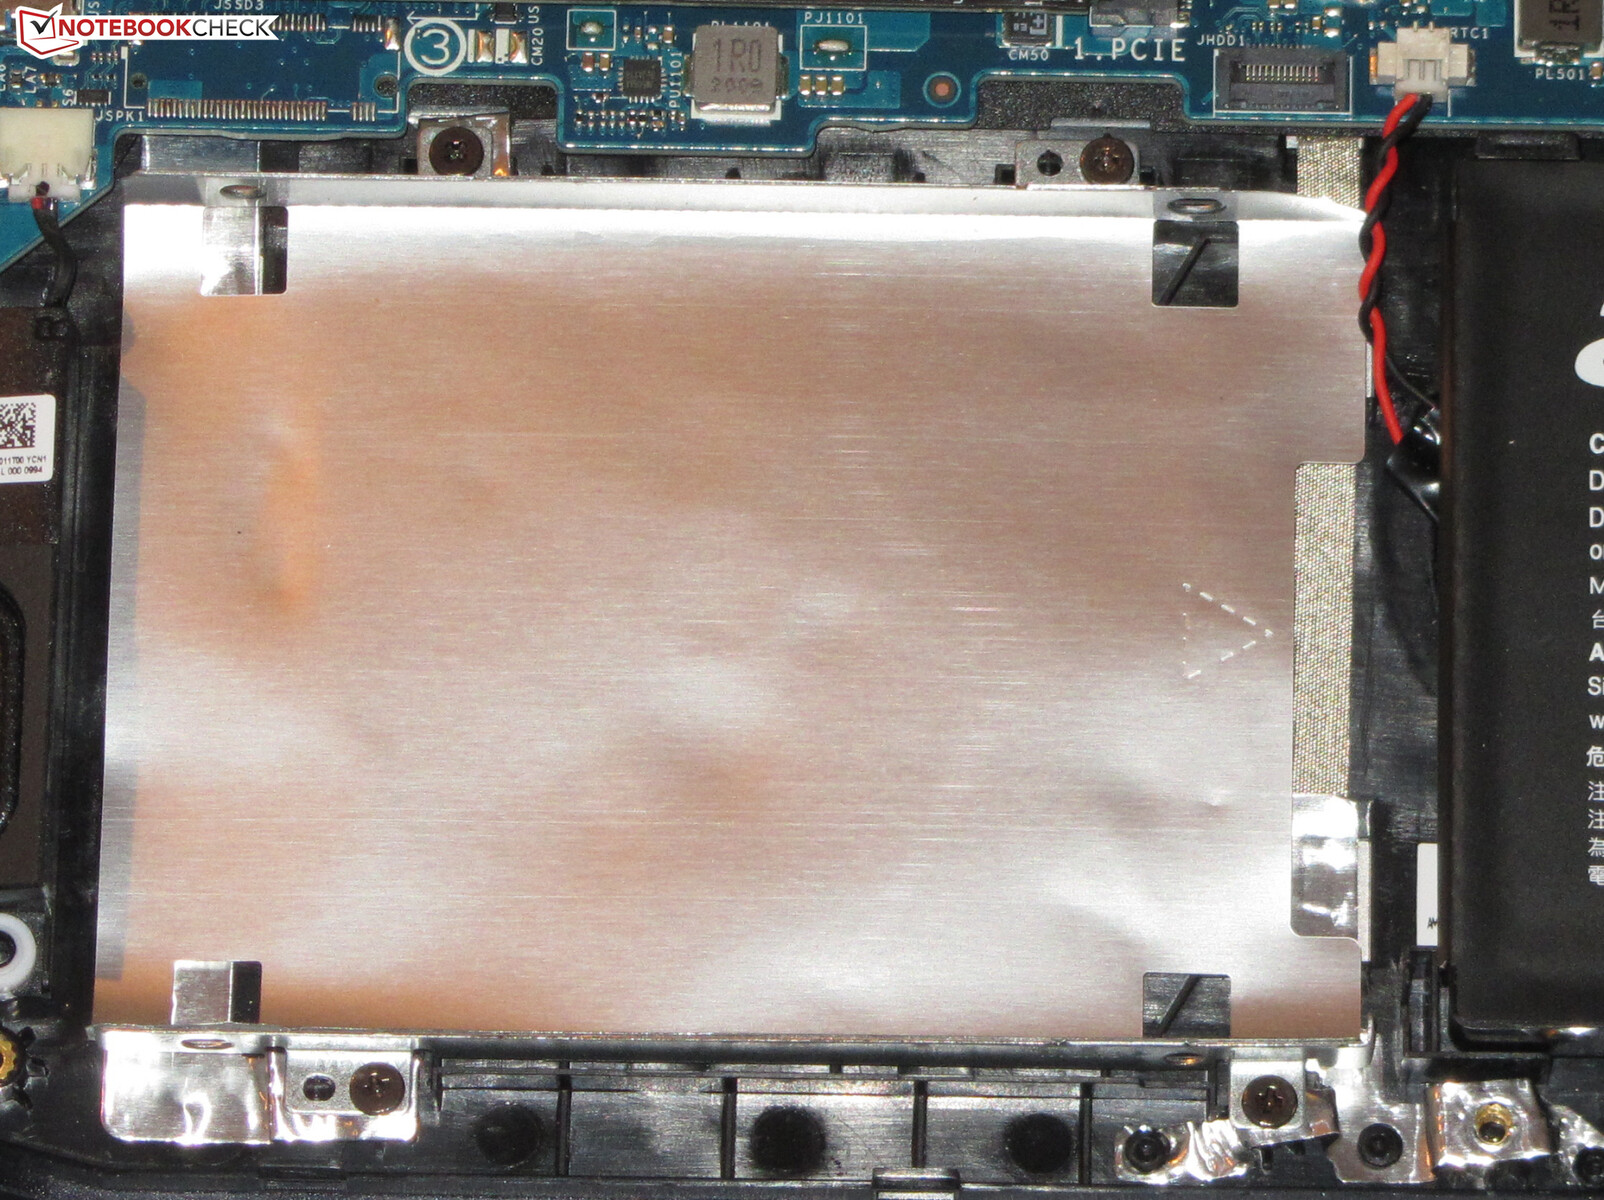
Un SSD NVMe (M.2-2280) de Samsung sirve como unidad del sistema. Ofrece 1 TB de espacio de almacenamiento y ofrece buenas tasas de transferencia. El portátil puede albergar un total de dos SSDs NVMe. También soporta RAID 0. El Predator también tiene espacio para un dispositivo de almacenamiento de 2.5 pulgadas. Se incluye la ranura SATA necesaria (en la caja) y el marco de montaje (dentro del portátil)

| Acer Predator Helios 300 PH315-53-786B Samsung PM981a MZVLB1T0HBLR | Aorus 15G XC ESR512GTLCG-EAC-4 | MSI GS66 Stealth 10UG WDC PC SN730 SDBPNTY-1T00 | Asus ROG Strix G15 G513QR SK Hynix HFM001TD3JX013N | Acer Predator Helios 300 PH315-53-77N5 WDC PC SN730 SDBQNTY-512GB | |
|---|---|---|---|---|---|
| AS SSD | -11% | -4% | -1% | -15% | |
| Seq Read (MB/s) | 2792 | 2048 -27% | 2198 -21% | 2881 3% | 2753 -1% |
| Seq Write (MB/s) | 2311 | 2403 4% | 2596 12% | 1570 -32% | 2495 8% |
| 4K Read (MB/s) | 48.34 | 48.27 0% | 43.81 -9% | 52.4 8% | 38.64 -20% |
| 4K Write (MB/s) | 93.9 | 101.6 8% | 115.5 23% | 124 32% | 88.8 -5% |
| 4K-64 Read (MB/s) | 1516 | 1606 6% | 1692 12% | 1334 -12% | 952 -37% |
| 4K-64 Write (MB/s) | 1940 | 1473 -24% | 2162 11% | 2189 13% | 1568 -19% |
| Access Time Read * (ms) | 0.131 | 0.056 | 0.055 | ||
| Access Time Write * (ms) | 0.04 | 0.038 5% | 0.098 -145% | 0.03 25% | 0.044 -10% |
| Score Read (Points) | 1843 | 1859 1% | 1956 6% | 1675 -9% | 1266 -31% |
| Score Write (Points) | 2265 | 1815 -20% | 2537 12% | 2470 9% | 1906 -16% |
| Score Total (Points) | 5030 | 4645 -8% | 5513 10% | 4943 -2% | 3811 -24% |
| Copy ISO MB/s (MB/s) | 1921 | 1188 -38% | 2236 16% | 1277 -34% | 2037 6% |
| Copy Program MB/s (MB/s) | 581 | 488.1 -16% | 690 19% | 575 -1% | 475.6 -18% |
| Copy Game MB/s (MB/s) | 1454 | 878 -40% | 1546 6% | 1272 -13% | 1018 -30% |
* ... más pequeño es mejor
Continuous load read: DiskSpd Read Loop, Queue Depth 8
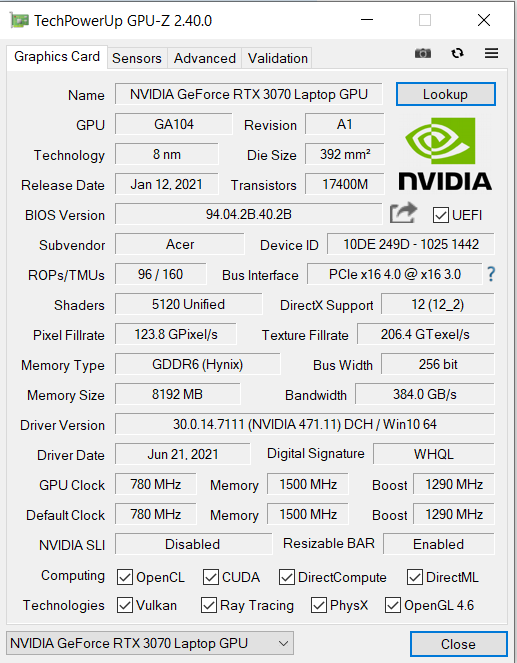
Tarjeta gráfica
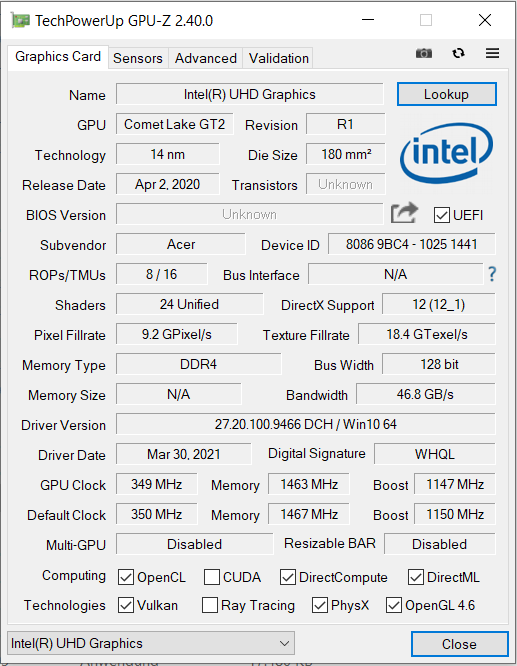
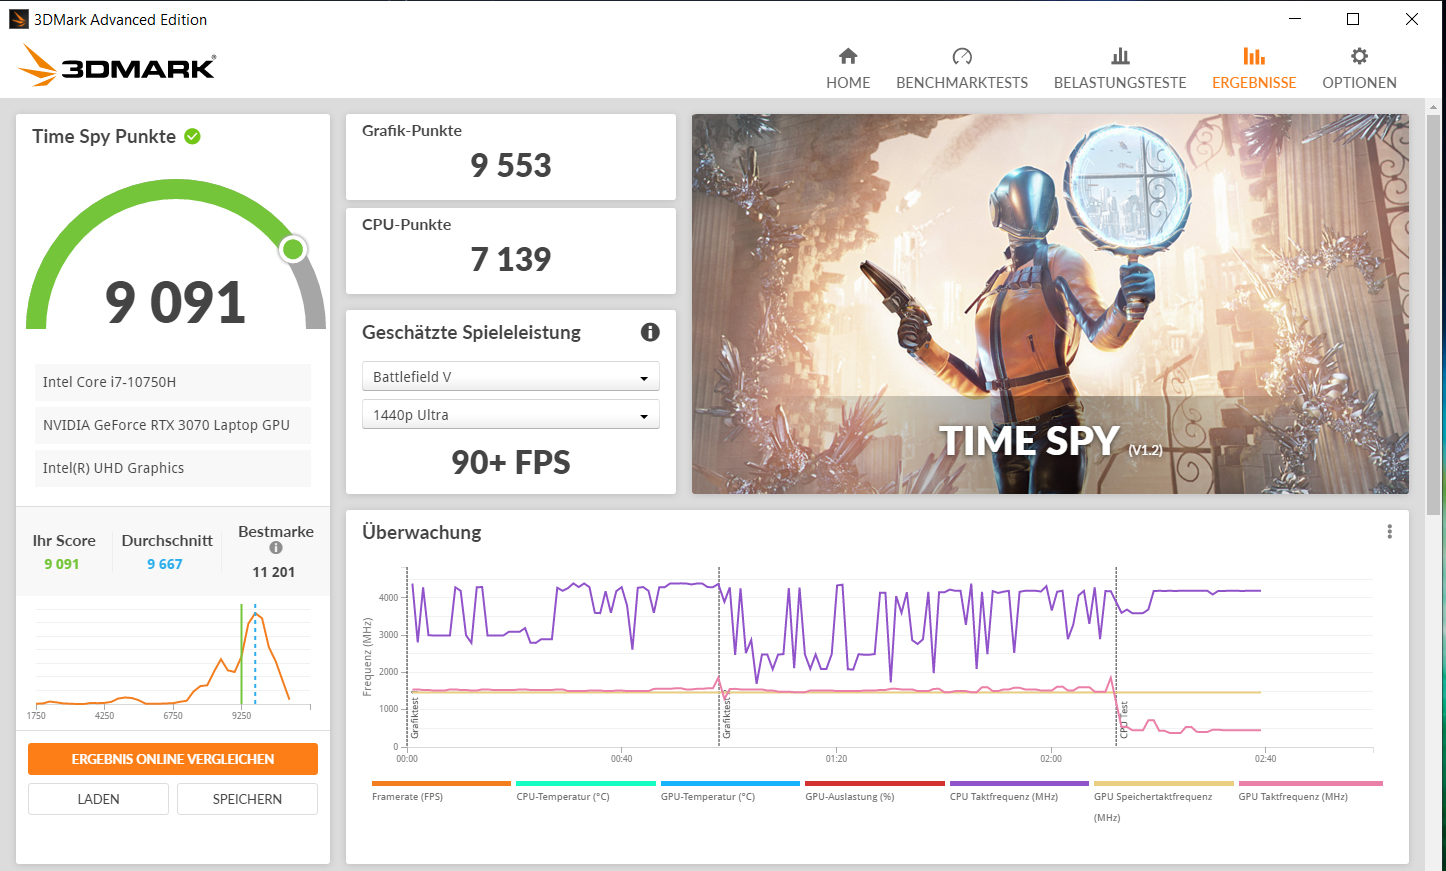
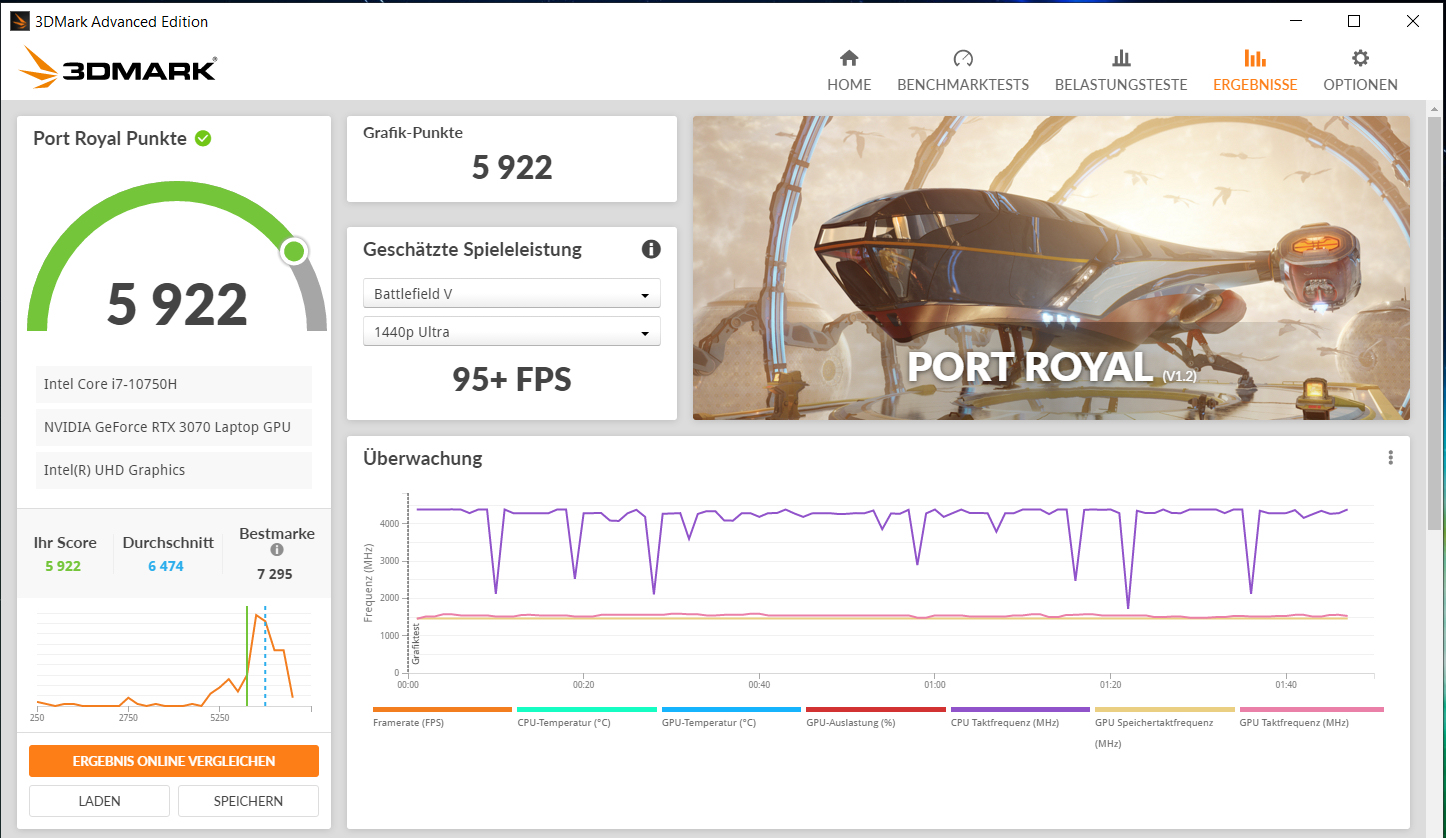
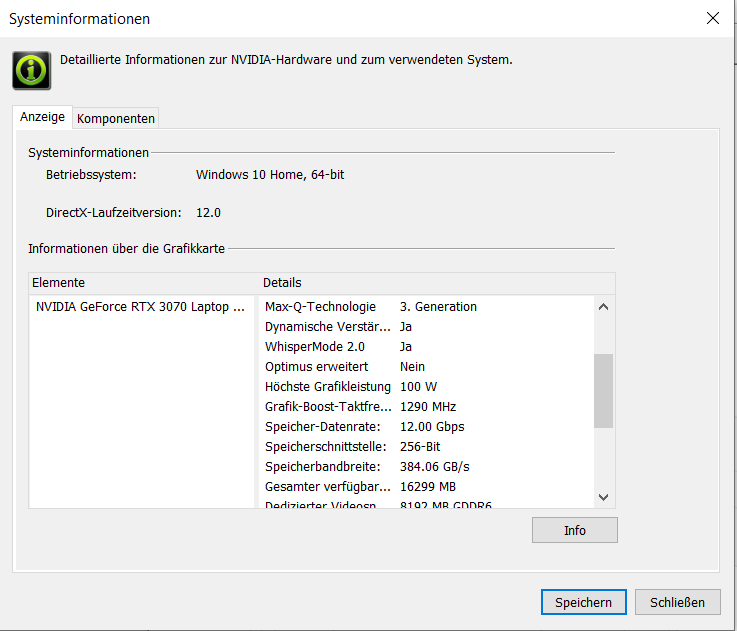
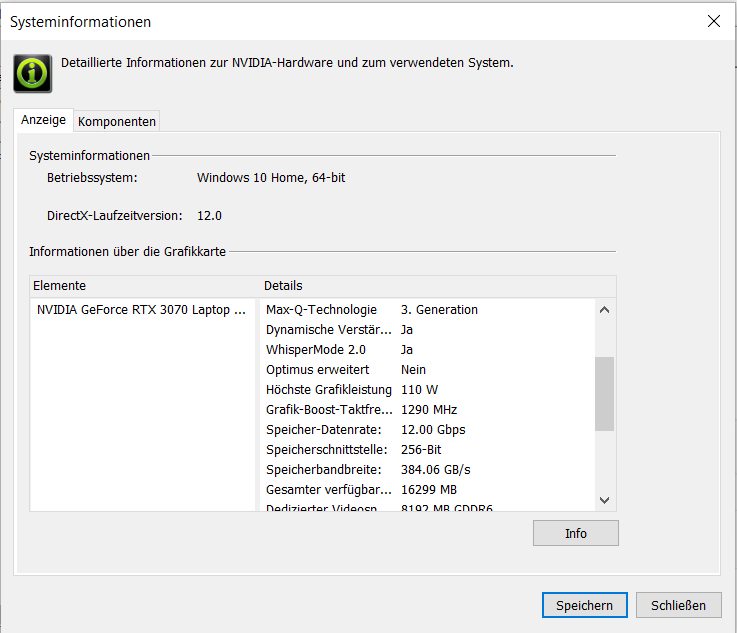
El rendimiento real de un núcleo gráfico RTX 3000 depende del TGP máximo que seleccione el fabricante del portátil dentro de los límites definidos por Nvidia. Acer proporcionó originalmente laGPU del portátilGeForce RTX 3070 (resumen de todos los portátiles RTX 3070 incluyendo sus TGPs) con un TGP máximo de 100 vatios. Una actualización de firmware (que se encuentra en la sección de descargasdel sitio web de Acer) aumenta el TGP a 110 vatios - también informamos sobre esto anteriormente.
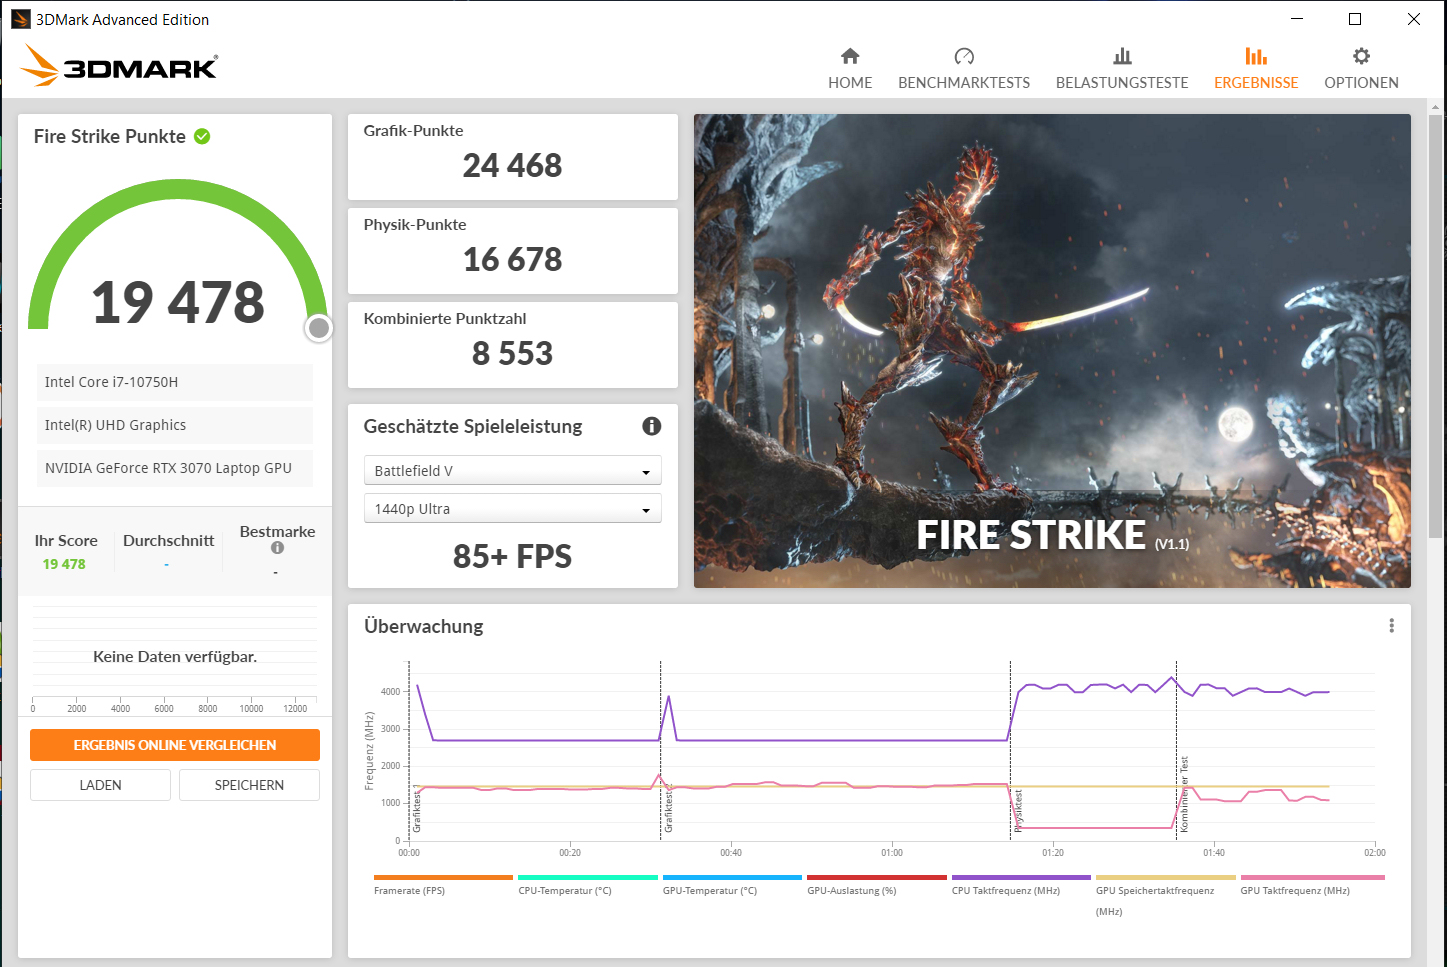
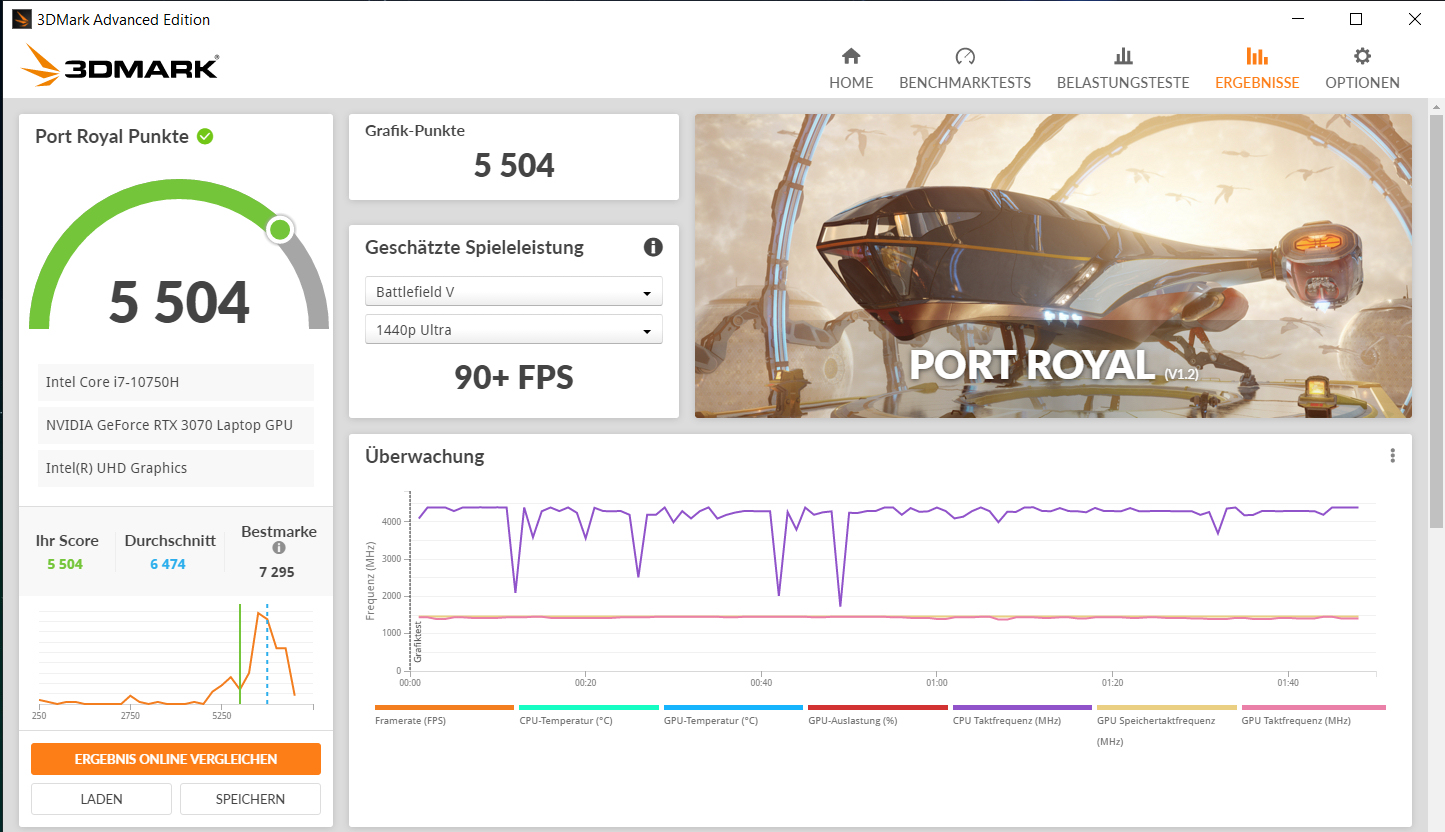
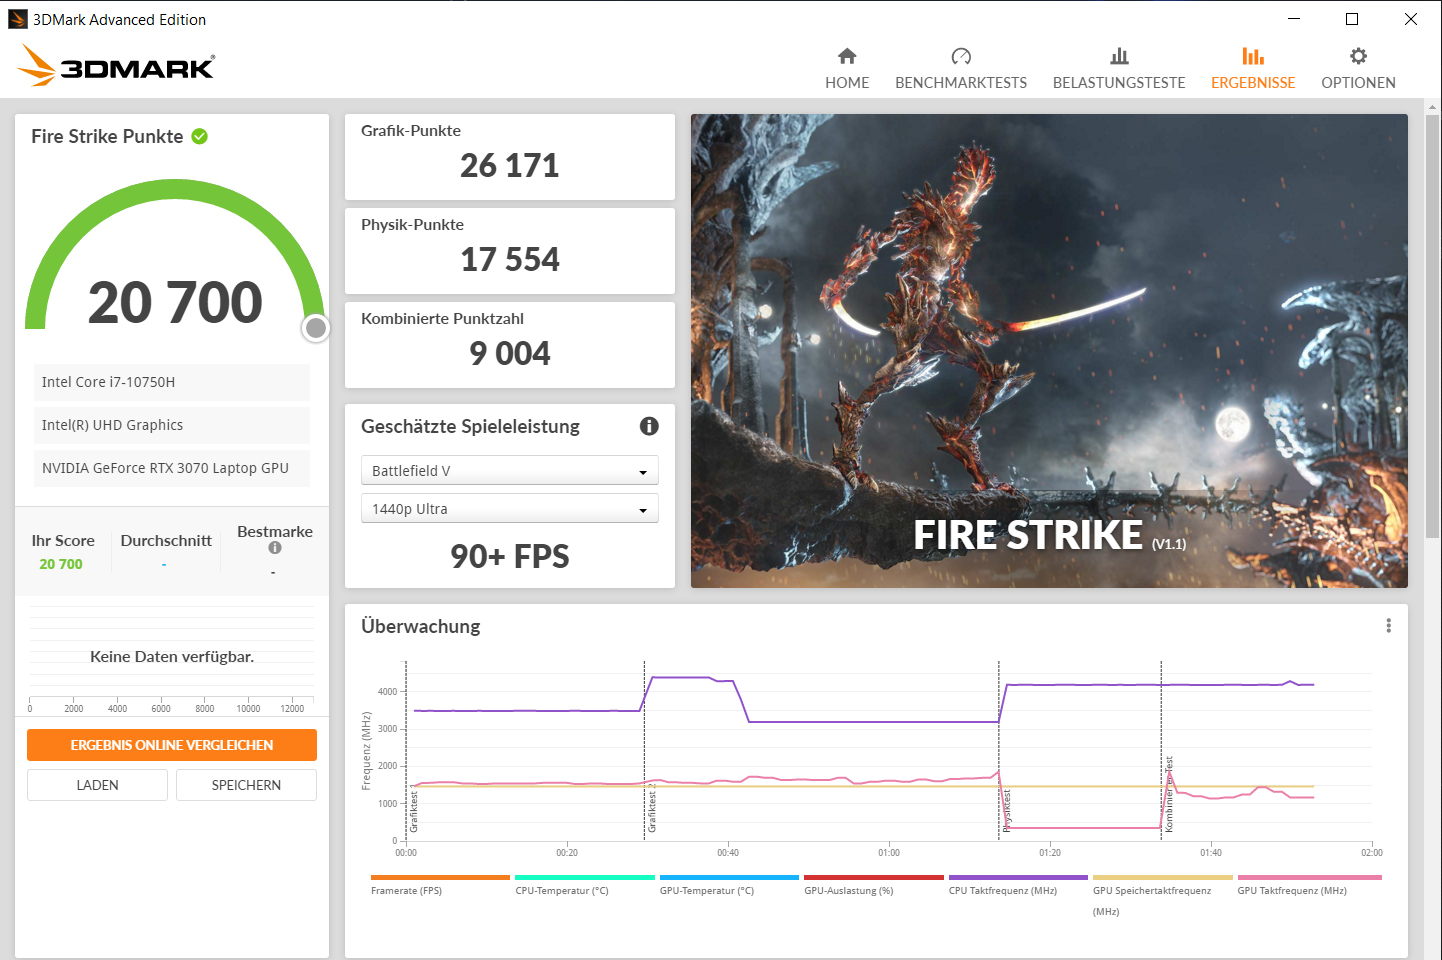
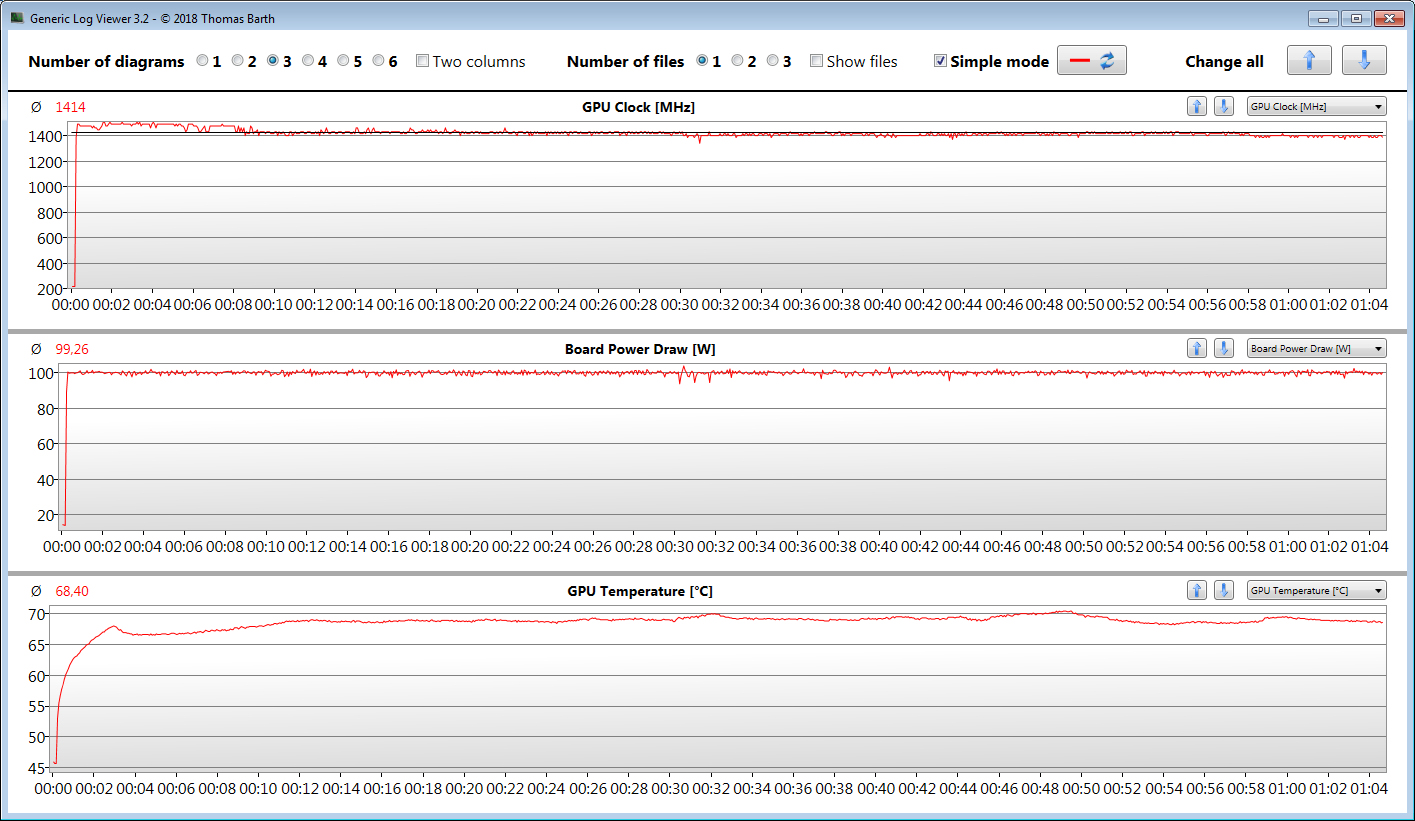
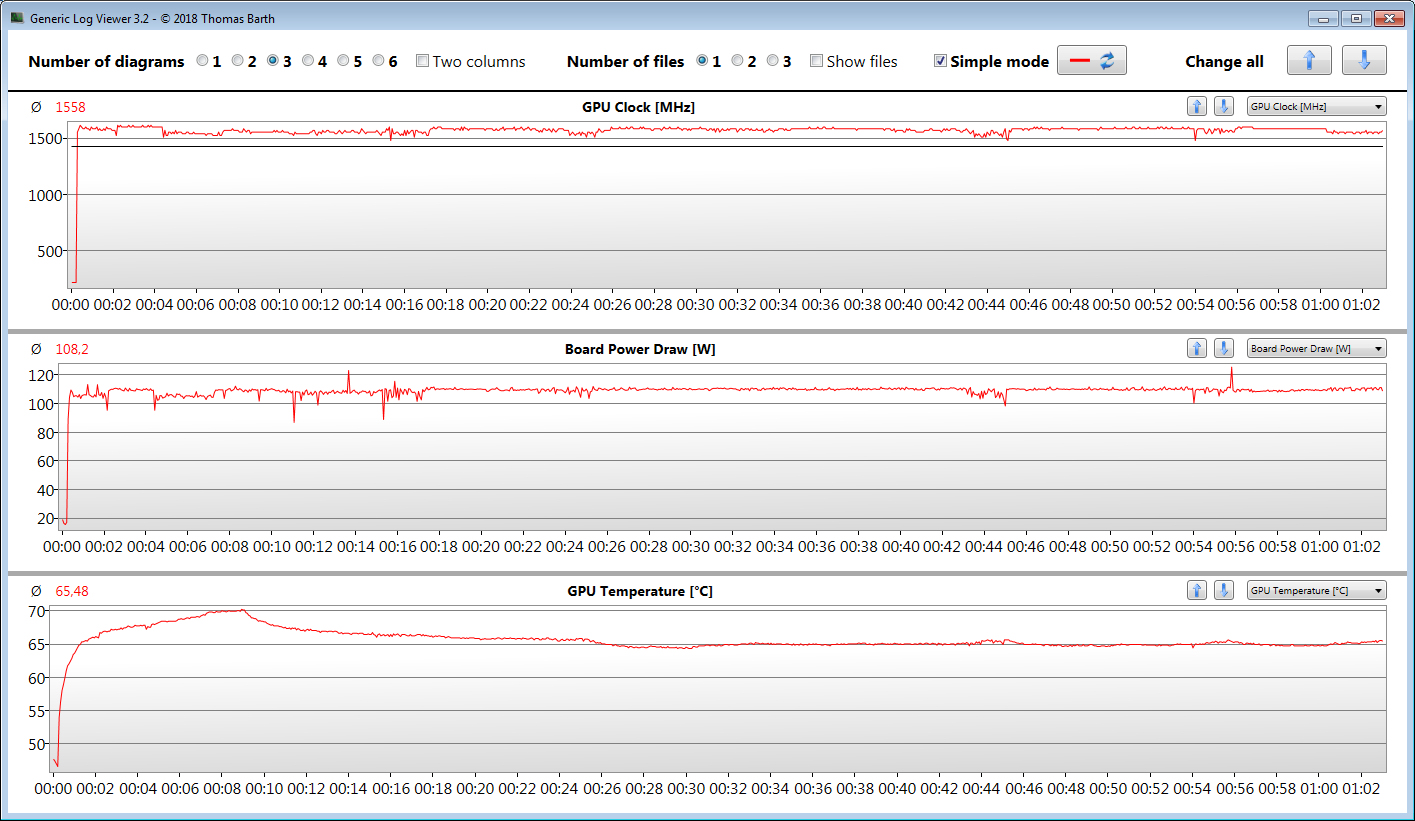
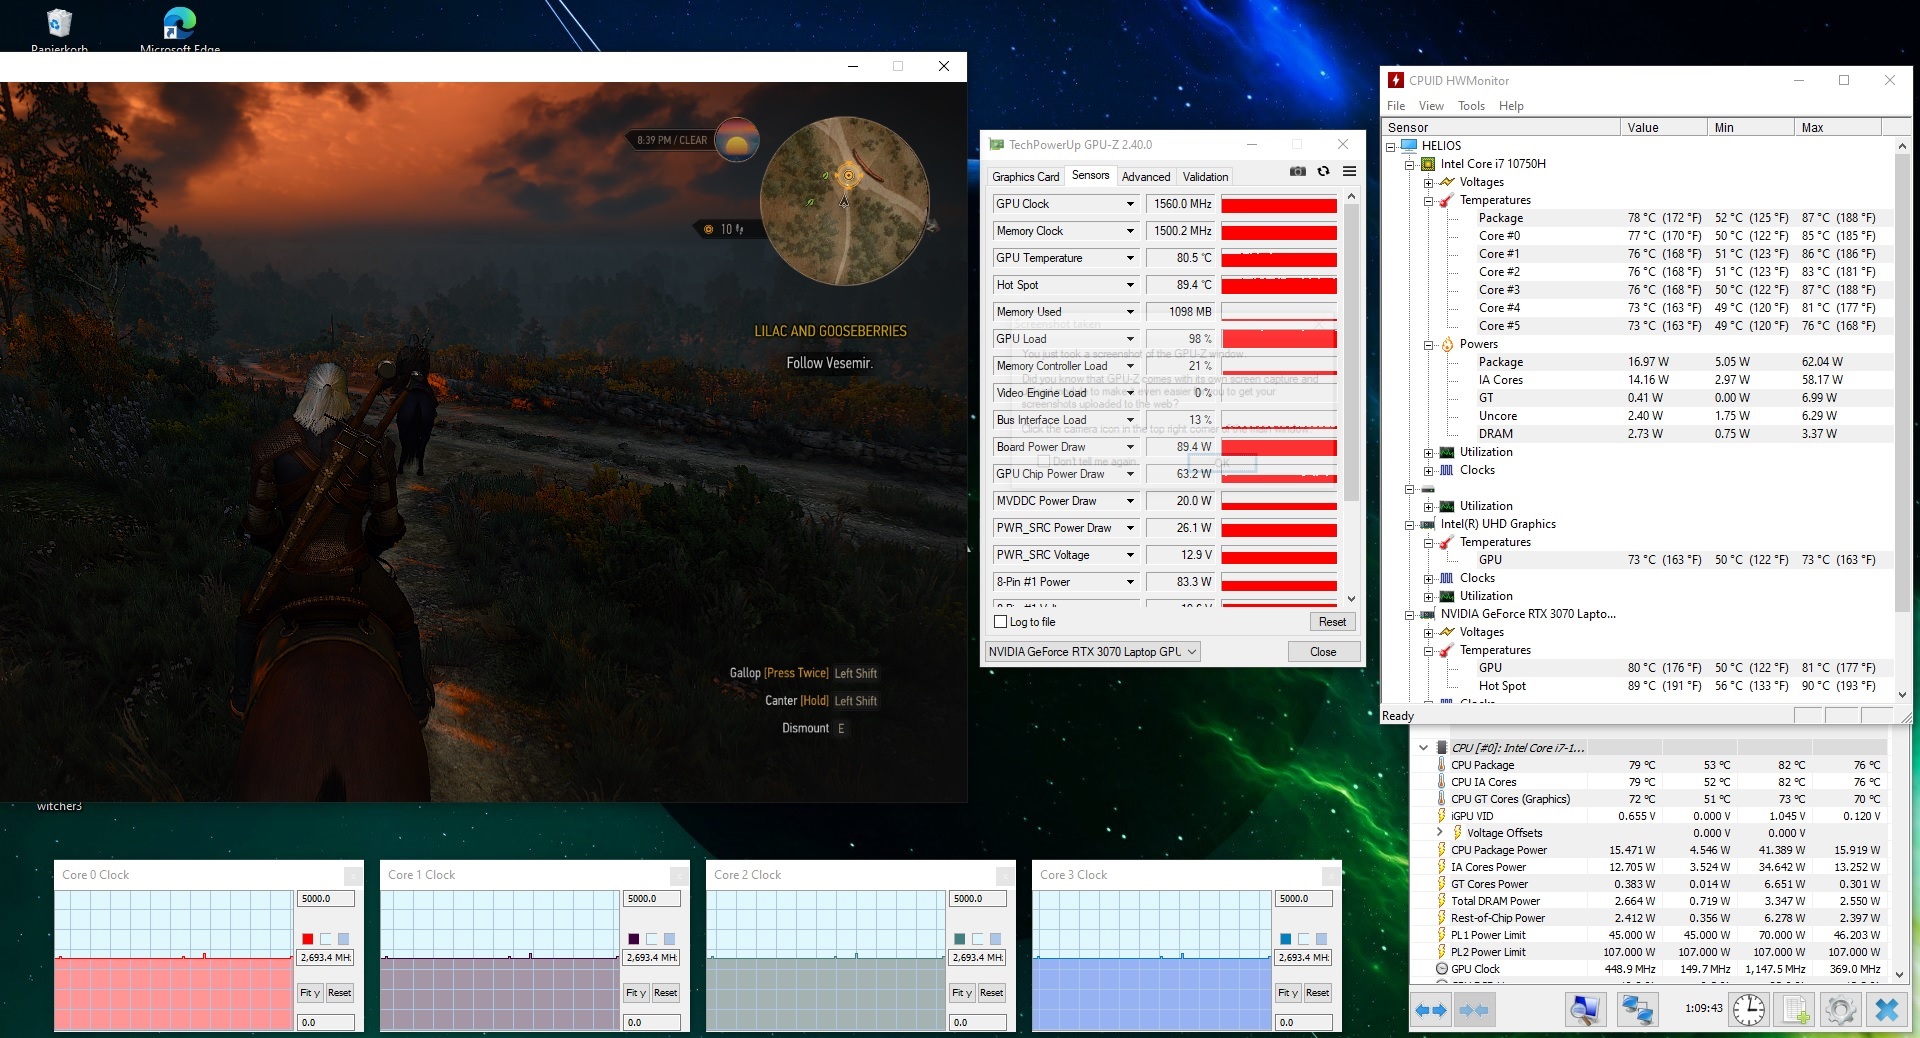
La GPU rinde decentemente y ofrece unos resultados de referencia de la RTX 3070 medios (TGP de 100 vatios) o ligeramente superiores a la media (TGP de 110 vatios). El nuevo máximo TGP de 110 vatios se utiliza cuando se activa el perfil de GPU "Extreme", y también puede mantenerse durante un periodo de tiempo prolongado (ver nuestraprueba Witcher 3 The )
LaGPUUHD Graphics 630 integrada en el procesador está activa, y el portátil funciona con la solución de conmutación de gráficos Optimus de Nvidia.


| 3DMark 11 Performance | 23408 puntos | |
| 3DMark Cloud Gate Standard Score | 38982 puntos | |
| 3DMark Fire Strike Score | 19478 puntos | |
| 3DMark Time Spy Score | 8487 puntos | |
ayuda | ||
| 3DMark 11 - 1280x720 Performance GPU | |
| Media de la clase Gaming (21841 - 80022, n=106, últimos 2 años) | |
| Acer Predator Helios 300 PH315-53-786B (Extrem, TGP 110W) | |
| Asus ROG Strix G15 G513QR | |
| Aorus 15G XC | |
| Medio NVIDIA GeForce RTX 3070 Laptop GPU (12535 - 38275, n=54) | |
| Acer Predator Helios 300 PH315-53-786B | |
| MSI GS66 Stealth 10UG | |
| Acer Predator Helios 300 PH315-53-77N5 | |
| 3DMark | |
| 1920x1080 Fire Strike Graphics | |
| Media de la clase Gaming (12242 - 62849, n=118, últimos 2 años) | |
| Acer Predator Helios 300 PH315-53-786B (Extrem, TGP 110W) | |
| Asus ROG Strix G15 G513QR | |
| Aorus 15G XC | |
| Acer Predator Helios 300 PH315-53-786B | |
| Medio NVIDIA GeForce RTX 3070 Laptop GPU (7178 - 29128, n=52) | |
| MSI GS66 Stealth 10UG | |
| Acer Predator Helios 300 PH315-53-77N5 | |
| 2560x1440 Time Spy Graphics | |
| Media de la clase Gaming (5012 - 26212, n=117, últimos 2 años) | |
| Asus ROG Strix G15 G513QR | |
| Acer Predator Helios 300 PH315-53-786B (Extrem, TGP 110W) | |
| Aorus 15G XC | |
| Medio NVIDIA GeForce RTX 3070 Laptop GPU (2644 - 11019, n=53) | |
| MSI GS66 Stealth 10UG | |
| Acer Predator Helios 300 PH315-53-786B | |
| Acer Predator Helios 300 PH315-53-77N5 | |
| 2560x1440 Port Royal Graphics | |
| Media de la clase Gaming (4395 - 17286, n=70, últimos 2 años) | |
| Acer Predator Helios 300 PH315-53-786B (Extrem, TGP 110W) | |
| Medio NVIDIA GeForce RTX 3070 Laptop GPU (1640 - 6542, n=39) | |
| Acer Predator Helios 300 PH315-53-786B | |
| MSI GS66 Stealth 10UG | |
| Acer Predator Helios 300 PH315-53-77N5 | |
Rendimiento de los juegos
El portátil lleva todos los juegos más recientes sin problemas a la pantalla. Normalmente se puede seleccionar la resolución Full HD (1920x1080 píxeles) y los ajustes de máxima calidad. El Predator ofrece tasas de frames que rondan la media de los portátiles que hemos probado hasta ahora con la RTX 3070. El aumento del TGP a 110 vatios lleva a una mejora de las tasas de frames en algunos títulos. No se puede identificar una mejora general
| The Witcher 3 - 1920x1080 Ultra Graphics & Postprocessing (HBAO+) | |
| Media de la clase Gaming (95 - 240, n=8, últimos 2 años) | |
| Acer Predator Helios 300 PH315-53-786B (Extrem, TGP 110W) | |
| Asus ROG Strix G15 G513QR | |
| Aorus 15G XC | |
| Medio NVIDIA GeForce RTX 3070 Laptop GPU (34.9 - 109, n=52) | |
| Acer Predator Helios 300 PH315-53-786B | |
| MSI GS66 Stealth 10UG | |
| Acer Predator Helios 300 PH315-53-77N5 | |
| Dota 2 Reborn - 1920x1080 ultra (3/3) best looking | |
| Media de la clase Gaming (84.8 - 248, n=110, últimos 2 años) | |
| Medio NVIDIA GeForce RTX 3070 Laptop GPU (26.9 - 163.9, n=58) | |
| Aorus 15G XC | |
| Acer Predator Helios 300 PH315-53-786B | |
| Acer Predator Helios 300 PH315-53-786B (Extrem, TGP 110W) | |
| MSI GS66 Stealth 10UG | |
| Asus ROG Strix G15 G513QR | |
| X-Plane 11.11 - 1920x1080 high (fps_test=3) | |
| Media de la clase Gaming (52.1 - 143.5, n=113, últimos 2 años) | |
| Medio NVIDIA GeForce RTX 3070 Laptop GPU (12.4 - 118.8, n=61) | |
| Aorus 15G XC | |
| MSI GS66 Stealth 10UG | |
| Acer Predator Helios 300 PH315-53-786B | |
| Acer Predator Helios 300 PH315-53-786B | |
| Asus ROG Strix G15 G513QR | |
| Final Fantasy XV Benchmark - 1920x1080 High Quality | |
| Media de la clase Gaming (41 - 215, n=101, últimos 2 años) | |
| Asus ROG Strix G15 G513QR (1.3) | |
| MSI GS66 Stealth 10UG (1.3) | |
| Acer Predator Helios 300 PH315-53-786B (1.3, Extrem, TGP 110W) | |
| Medio NVIDIA GeForce RTX 3070 Laptop GPU (27.9 - 107, n=49) | |
| Acer Predator Helios 300 PH315-53-786B (1.3) | |
| GTA V - 1920x1080 Highest AA:4xMSAA + FX AF:16x | |
| Media de la clase Gaming (48.3 - 186.9, n=100, últimos 2 años) | |
| Medio NVIDIA GeForce RTX 3070 Laptop GPU (21.7 - 125.8, n=50) | |
| MSI GS66 Stealth 10UG | |
| Acer Predator Helios 300 PH315-53-786B | |
| Acer Predator Helios 300 PH315-53-786B (Extrem, TGP 110W) | |
| Asus ROG Strix G15 G513QR | |
| Strange Brigade - 1920x1080 ultra AA:ultra AF:16 | |
| Media de la clase Gaming (76.3 - 456, n=91, últimos 2 años) | |
| Acer Predator Helios 300 PH315-53-786B (1.47.22.14 D3D12, Extrem, TGP 110W) | |
| Acer Predator Helios 300 PH315-53-786B (1.47.22.14 D3D12) | |
| Medio NVIDIA GeForce RTX 3070 Laptop GPU (36.2 - 194, n=46) | |
| Asus ROG Strix G15 G513QR (1.47.22.14 D3D12) | |
| MSI GS66 Stealth 10UG (1.47.22.14 D3D12) | |
| Far Cry 5 - 1920x1080 Ultra Preset AA:T | |
| Media de la clase Gaming (70 - 151, n=10, últimos 2 años) | |
| Medio NVIDIA GeForce RTX 3070 Laptop GPU (89 - 140, n=36) | |
| Acer Predator Helios 300 PH315-53-786B (Extrem, TGP 110W) | |
| Acer Predator Helios 300 PH315-53-786B | |
| Asus ROG Strix G15 G513QR | |
| Dirt 5 - 1920x1080 Ultra High Preset | |
| Medio NVIDIA GeForce RTX 3070 Laptop GPU (50 - 96, n=11) | |
| Acer Predator Helios 300 PH315-53-786B | |
| Acer Predator Helios 300 PH315-53-786B (Extrem, TGP 110W) | |
| Serious Sam 4 - 1920x1080 Ultra (DX12) AA:2xMS | |
| Medio NVIDIA GeForce RTX 3070 Laptop GPU (66.4 - 82.1, n=5) | |
| Acer Predator Helios 300 PH315-53-786B (Extrem, TGP 110W) | |
| Acer Predator Helios 300 PH315-53-786B | |
| Acer Predator Helios 300 PH315-53-77N5 | |
| Watch Dogs Legion | |
| 1920x1080 Ultra Preset (DX12) | |
| Medio NVIDIA GeForce RTX 3070 Laptop GPU (55 - 73, n=7) | |
| Acer Predator Helios 300 PH315-53-786B (Extrem, TGP 110W) | |
| Acer Predator Helios 300 PH315-53-786B | |
| 1920x1080 Ultra Preset + Ultra Ray Tracing (DX12) | |
| Medio NVIDIA GeForce RTX 3070 Laptop GPU (34 - 45.4, n=7) | |
| Acer Predator Helios 300 PH315-53-786B | |
| Acer Predator Helios 300 PH315-53-786B | |
Para comprobar si la velocidad de fotogramas se mantiene prácticamente constante durante un periodo de tiempo prolongado, dejamos que el juego The Witcher 3 funcionara durante unos 60 minutos a resolución Full HD y con los ajustes de máxima calidad. El personaje no se mueve. Salvo una pequeña caída de rendimiento, no se aprecia una disminución de la velocidad de fotogramas.
The Witcher 3 FPS diagram
| bajo | medio | alto | ultra | |
|---|---|---|---|---|
| GTA V (2015) | 176 | 169 | 142 | 85 |
| The Witcher 3 (2015) | 259 | 216 | 154 | 91.3 |
| Dota 2 Reborn (2015) | 144 | 131 | 120 | 114 |
| Final Fantasy XV Benchmark (2018) | 137 | 110 | 85.1 | |
| X-Plane 11.11 (2018) | 101 | 86.6 | 74.4 | |
| Far Cry 5 (2018) | 134 | 108 | 103 | 99 |
| Strange Brigade (2018) | 311 | 208 | 179 | 159 |
| Death Stranding (2020) | 137 | 121 | 118 | 115 |
| Serious Sam 4 (2020) | 117 | 82.6 | 78.9 | 69 |
| Watch Dogs Legion (2020) | 79.1 | 74 | 67.8 | 59.5 |
| Dirt 5 (2020) | 176 | 113 | 93.6 | 77.3 |
| Yakuza Like a Dragon (2020) | 113 | 100 | 99.5 | 90.7 |
| Outriders (2021) | 104 | 94 | 93.6 | 89.4 |
| Mass Effect Legendary Edition (2021) | 105 | 94.3 | ||
| Days Gone (2021) | 147 | 121 | 112 | 88.6 |
| F1 2021 (2021) | 205 | 169 | 149 | 96 |
Emisiones - El portátil Acer se calienta notablemente
Emisiones acústicas
El PH315 puede funcionar de forma silenciosa en reposo. Sin embargo, los ventiladores se aceleran ocasionalmente. Pero bajo carga, el silencio es historia. Los niveles máximos de presión sonora son de 51 dB(A) (prueba de estrés) y 49 dB(A) (prueba Witcher 3 ), respectivamente. Jugar sin auriculares no es agradable aquí. Uno de los ventiladores tiende a pulsar bajo carga
Ruido
| Ocioso |
| 25 / 27 / 35 dB(A) |
| Carga |
| 46 / 51 dB(A) |
 | ||
30 dB silencioso 40 dB(A) audible 50 dB(A) ruidosamente alto |
||
min: | ||
| Acer Predator Helios 300 PH315-53-786B i7-10750H, GeForce RTX 3070 Laptop GPU | Aorus 15G XC i7-10870H, GeForce RTX 3070 Laptop GPU | MSI GS66 Stealth 10UG i7-10870H, GeForce RTX 3070 Laptop GPU | Asus ROG Strix G15 G513QR R9 5900HX, GeForce RTX 3070 Laptop GPU | Acer Predator Helios 300 PH315-53-77N5 i7-10750H, GeForce RTX 2060 Mobile | Media de la clase Gaming | |
|---|---|---|---|---|---|---|
| Noise | -0% | -11% | 0% | 3% | 3% | |
| apagado / medio ambiente * (dB) | 25 | 25 -0% | 26.2 -5% | 24 4% | 25.2 -1% | 24.1 ? 4% |
| Idle Minimum * (dB) | 25 | 29 -16% | 34 -36% | 25 -0% | 25.2 -1% | 25.8 ? -3% |
| Idle Average * (dB) | 27 | 30 -11% | 34 -26% | 31 -15% | 25.2 7% | 27.4 ? -1% |
| Idle Maximum * (dB) | 35 | 31 11% | 34 3% | 33 6% | 25.2 28% | 29.9 ? 15% |
| Load Average * (dB) | 46 | 41 11% | 47.2 -3% | 45 2% | 43.5 5% | 43 ? 7% |
| Witcher 3 ultra * (dB) | 49 | 47 4% | 46.3 6% | 48 2% | 53.1 -8% | |
| Load Maximum * (dB) | 51 | 51 -0% | 58.2 -14% | 50 2% | 56 -10% | 54 ? -6% |
* ... más pequeño es mejor
Temperatura
La prueba de estrés (Prime95 y FurMark se ejecutan durante al menos una hora) es ejecutada por la CPU y la GPU a 2,7 GHz y 1.365 MHz, respectivamente. La prueba de estrés representa un escenario extremo. Utilizamos esta prueba para comprobar si el sistema se mantiene estable incluso a plena carga
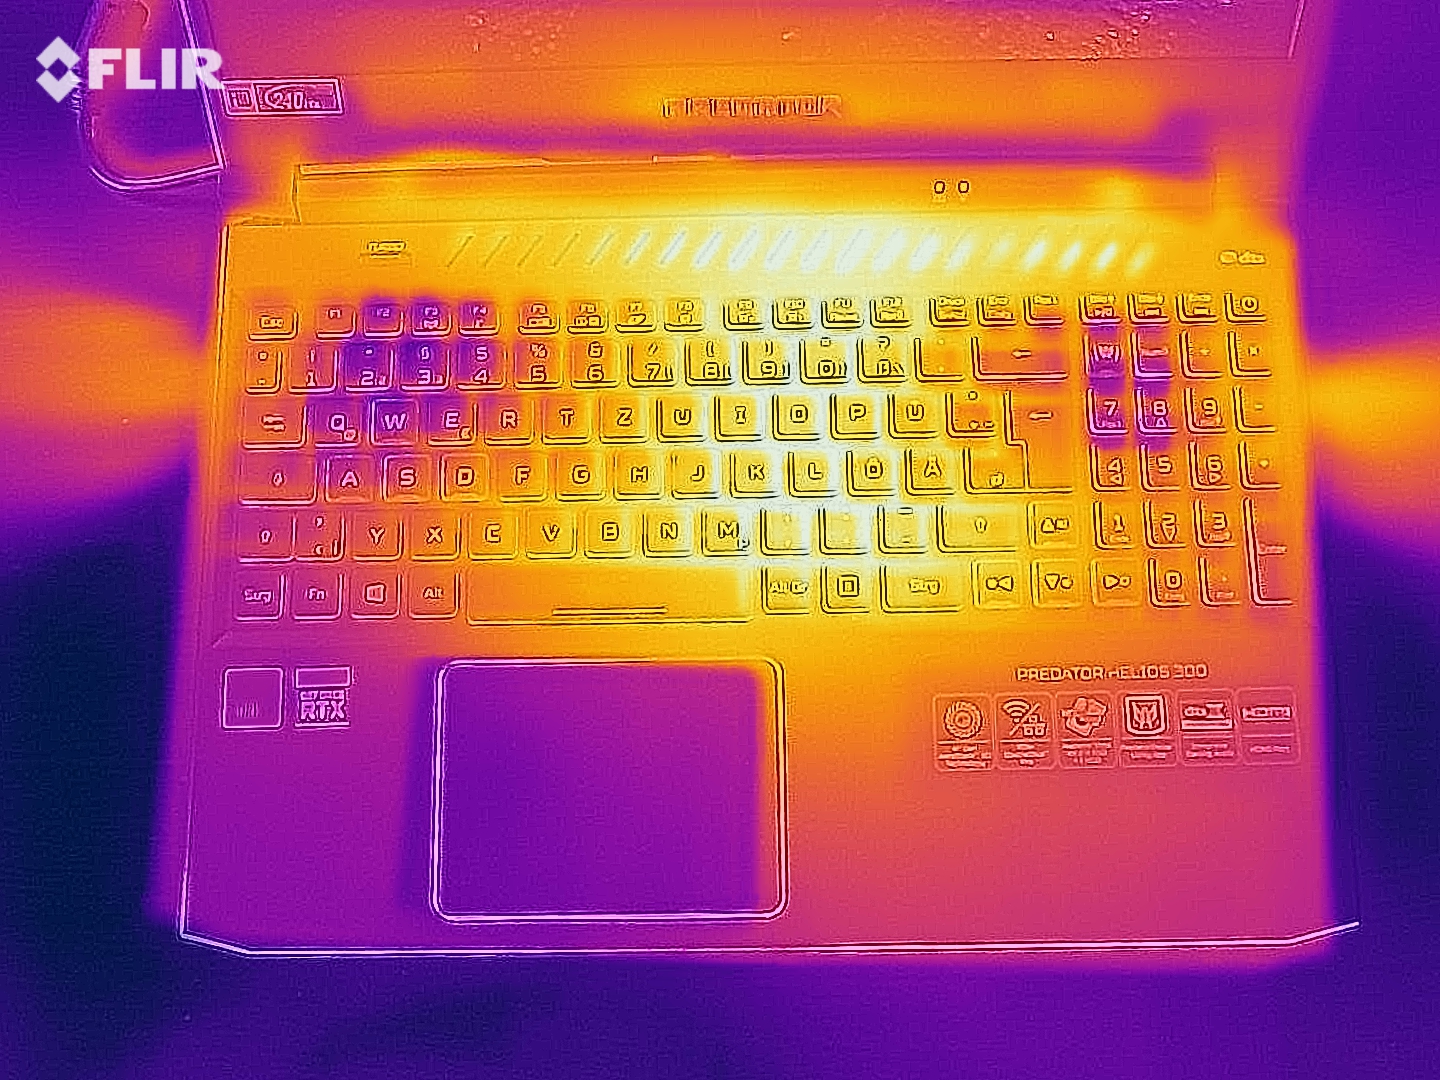
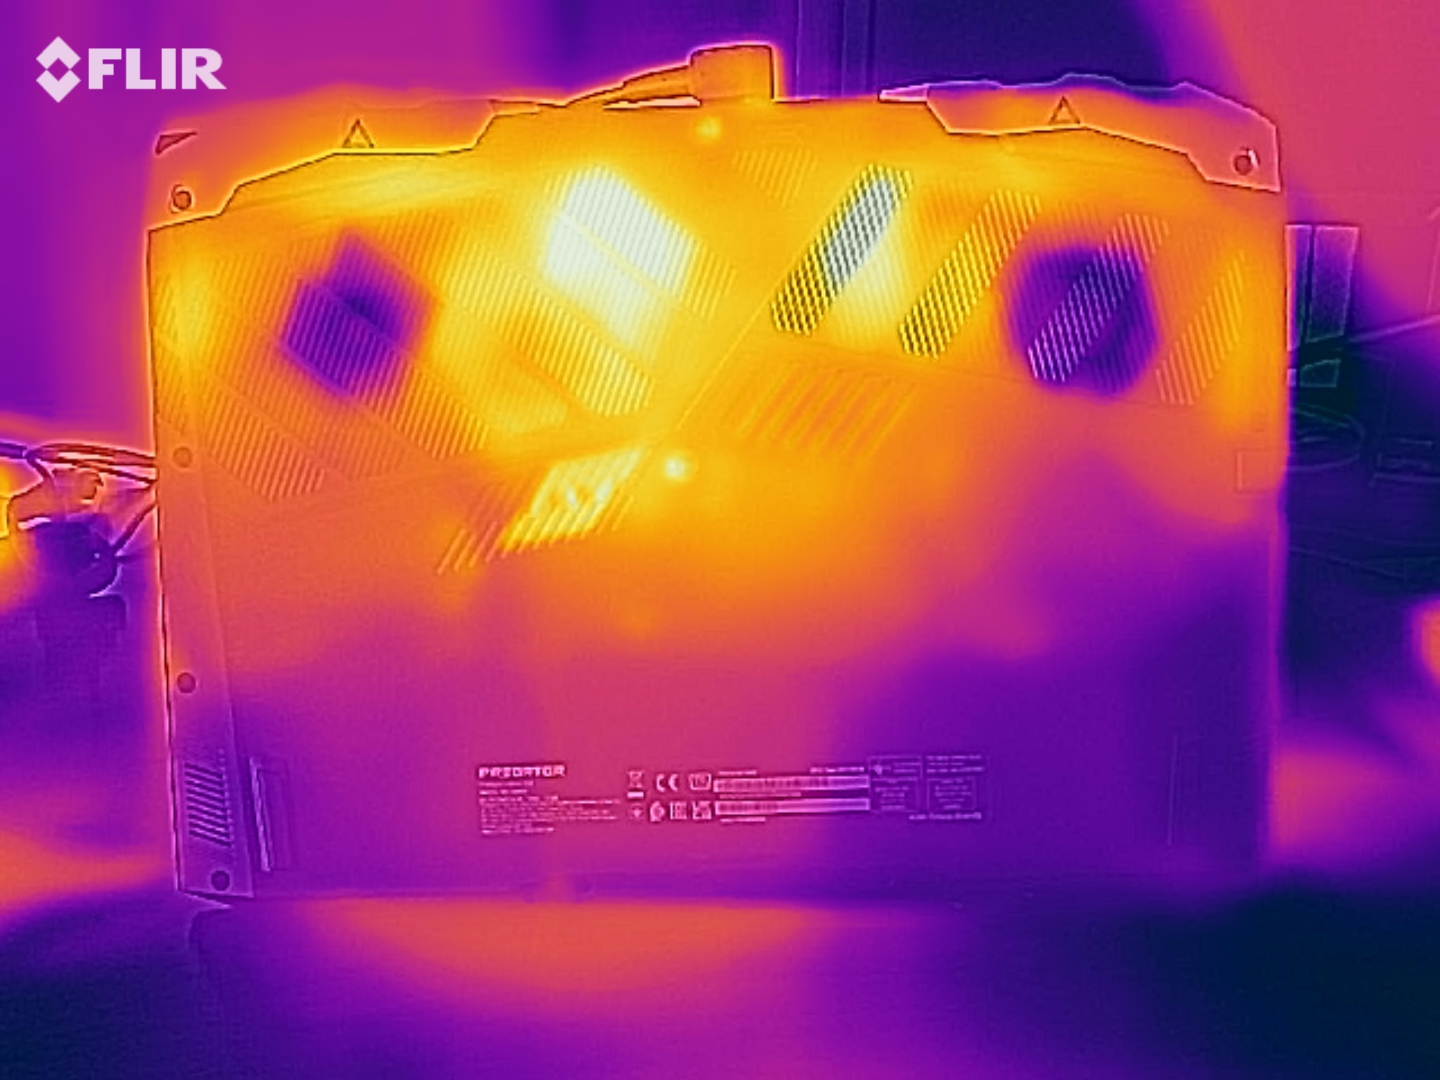
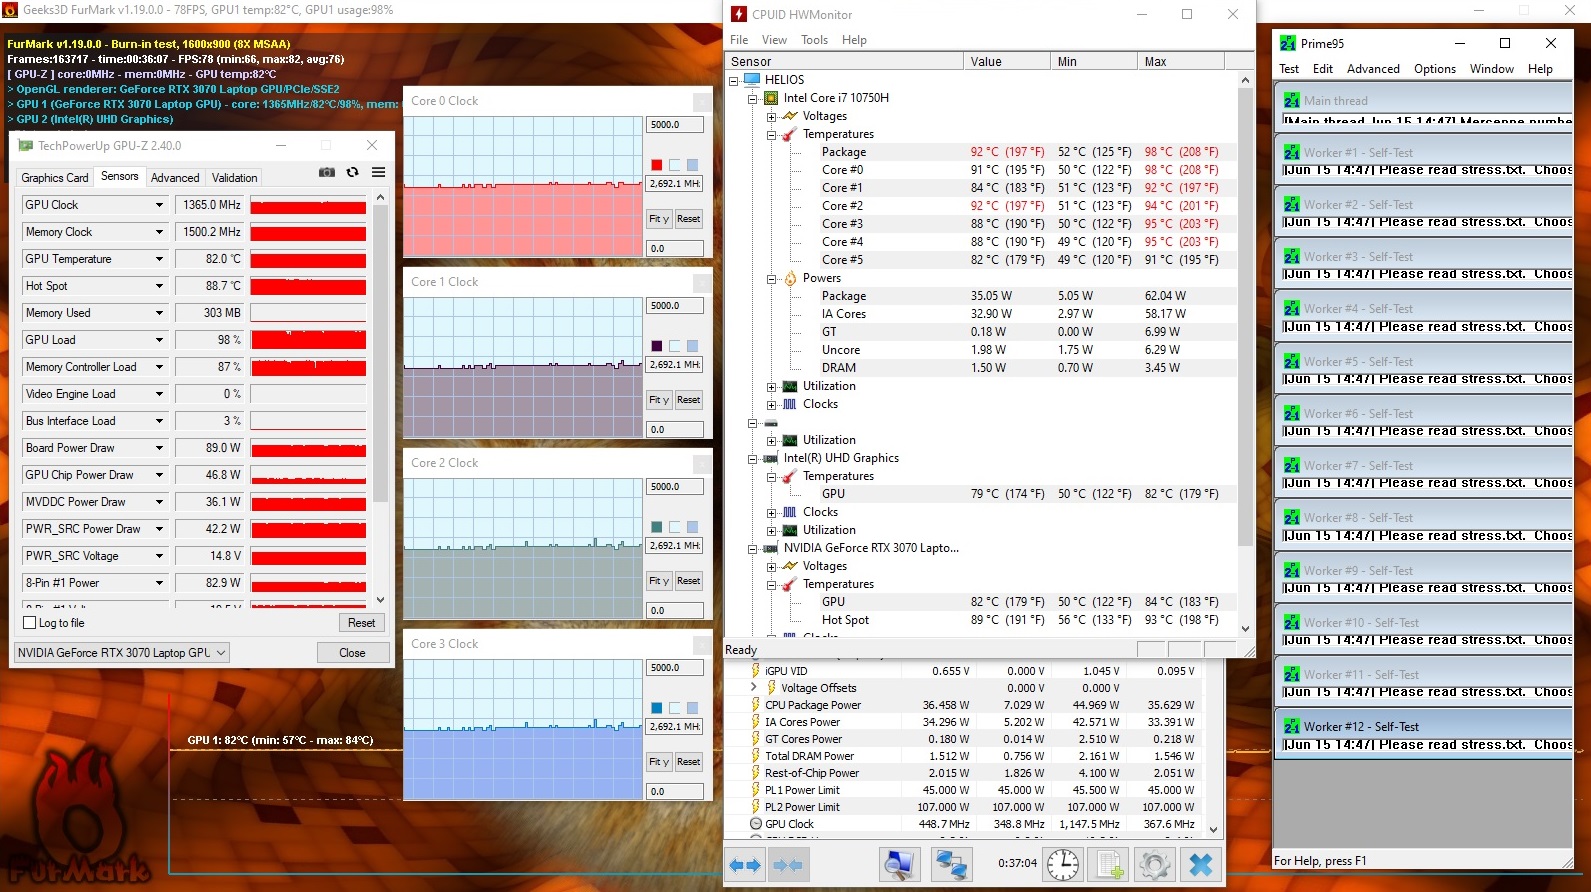
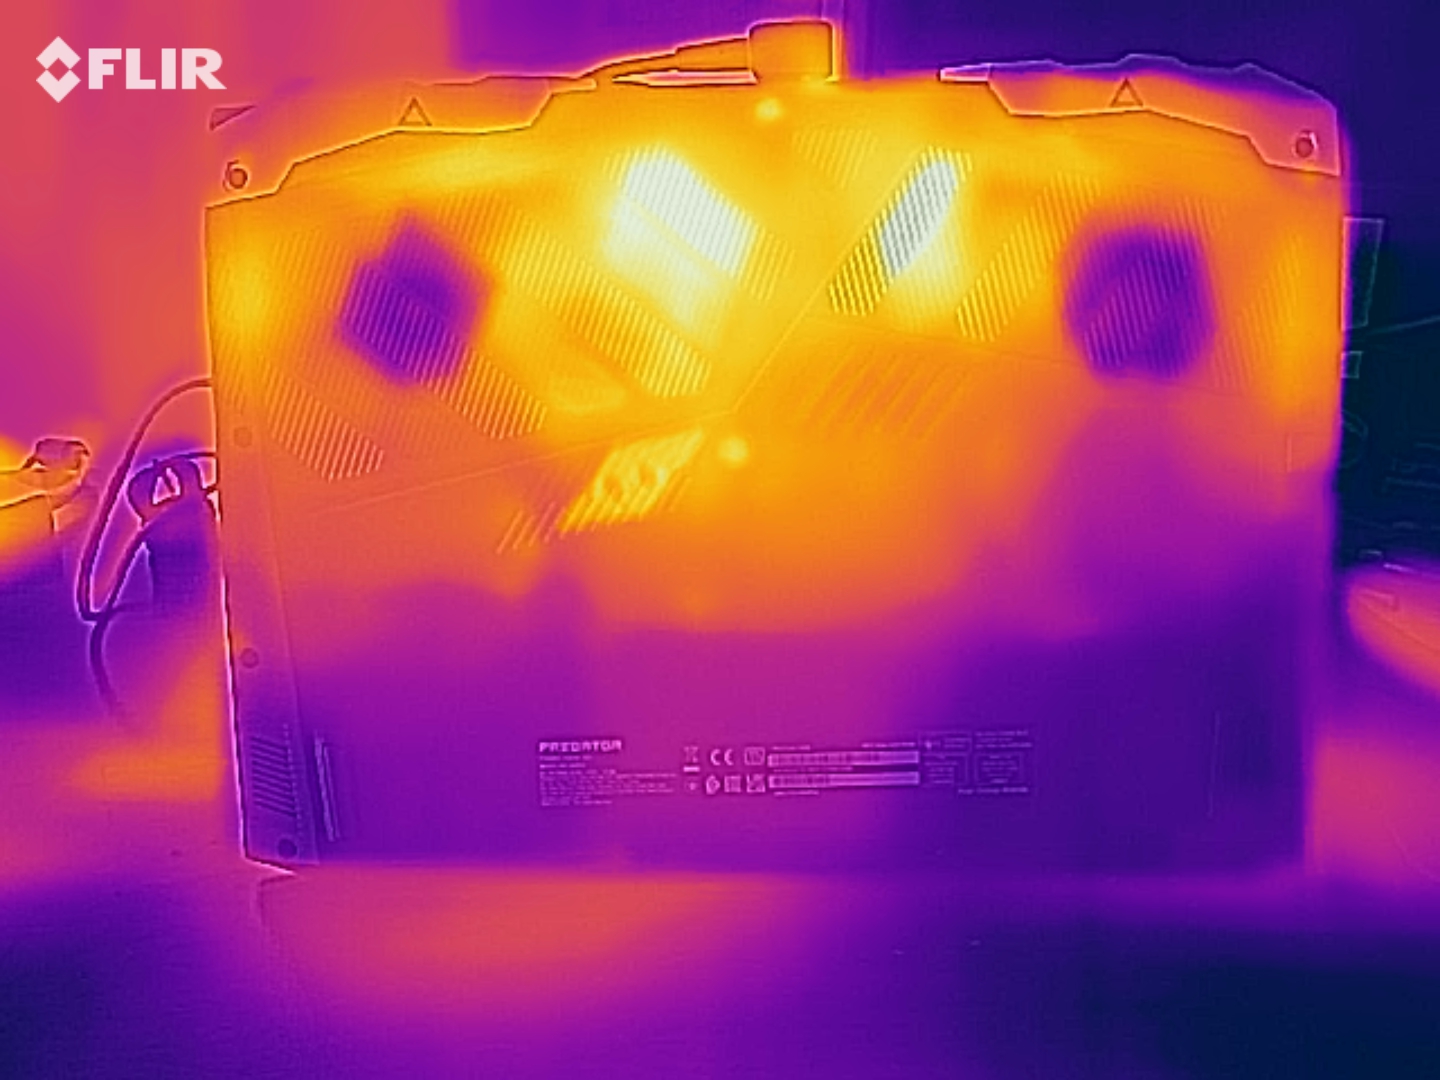
El portátil se calienta mucho. Se registraron temperaturas por encima de los 50 °C en varios puntos de medición durante el test de estrés, y la marca de 60 °C se superó en un punto de medición. El desarrollo del calor es algo menor cuando se ejecuta nuestra prueba The Witcher 3. El aparato no debe colocarse sobre el regazo bajo carga
(-) La temperatura máxima en la parte superior es de 50 °C / 122 F, frente a la media de 40.4 °C / 105 F, que oscila entre 21.2 y 68.8 °C para la clase Gaming.
(-) El fondo se calienta hasta un máximo de 63 °C / 145 F, frente a la media de 43.2 °C / 110 F
(+) En reposo, la temperatura media de la parte superior es de 30.1 °C / 86# F, frente a la media del dispositivo de 33.9 °C / 93 F.
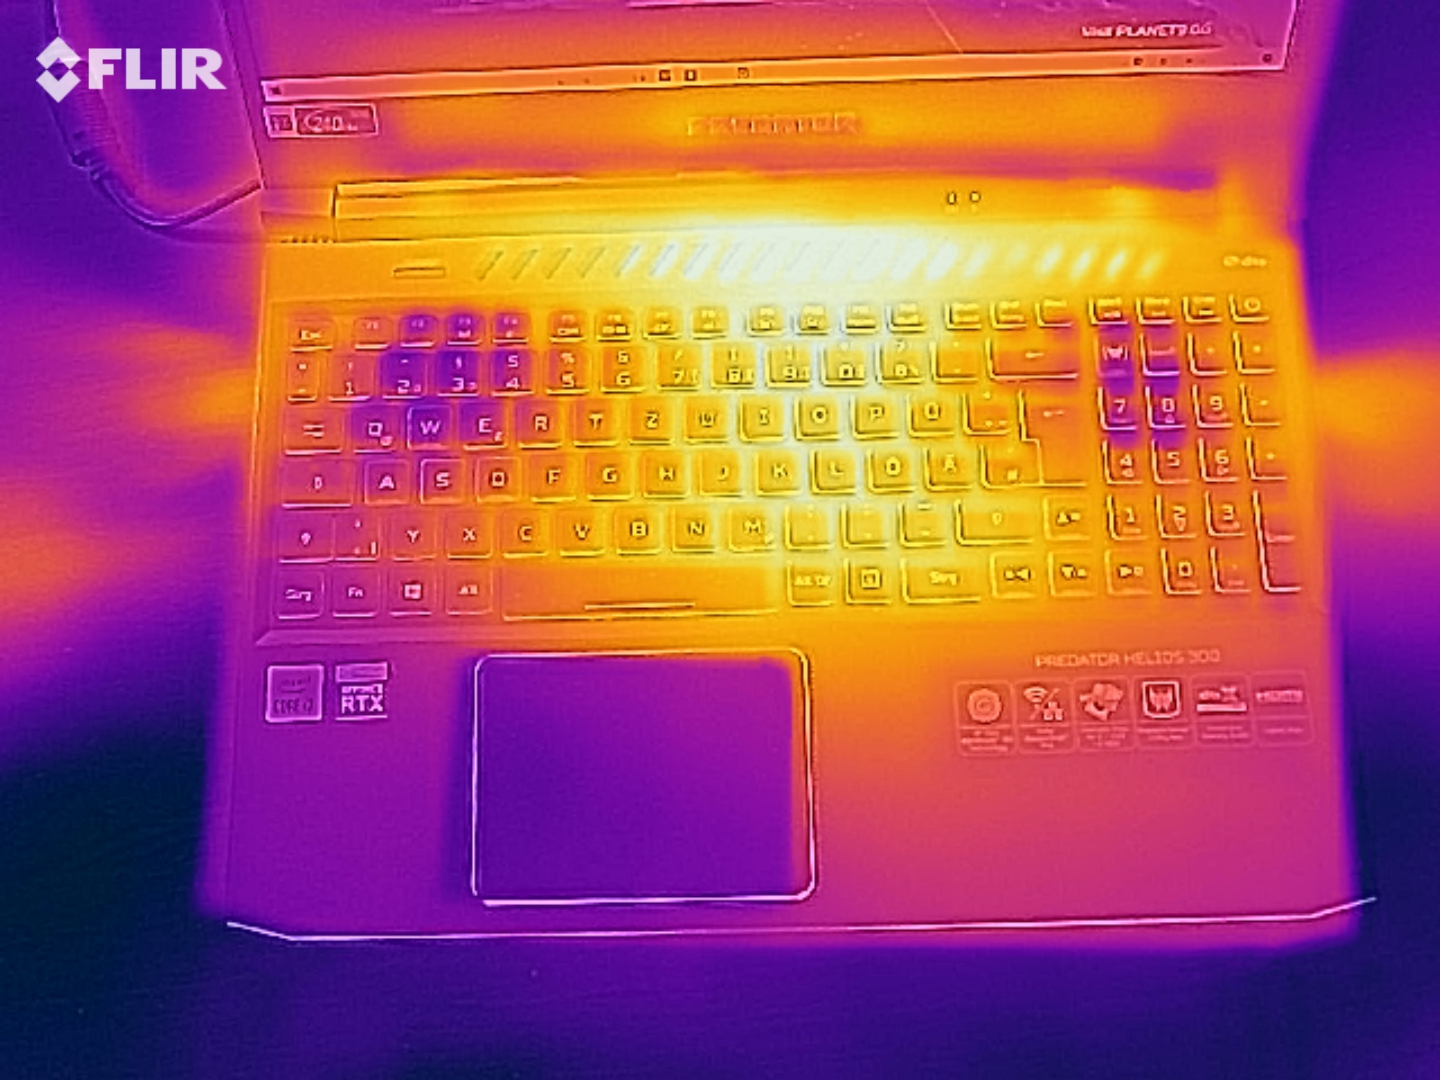
(-) Jugando a The Witcher 3, la temperatura media de la parte superior es de 43.9 °C / 111 F, frente a la media del dispositivo de 33.9 °C / 93 F.
(-) El reposamanos y el touchpad pueden calentarse mucho al tacto con un máximo de 40 °C / 104 F.
(-) La temperatura media de la zona del reposamanos de dispositivos similares fue de 28.8 °C / 83.8 F (-11.2 °C / -20.2 F).
| Acer Predator Helios 300 PH315-53-786B i7-10750H, GeForce RTX 3070 Laptop GPU | Aorus 15G XC i7-10870H, GeForce RTX 3070 Laptop GPU | MSI GS66 Stealth 10UG i7-10870H, GeForce RTX 3070 Laptop GPU | Asus ROG Strix G15 G513QR R9 5900HX, GeForce RTX 3070 Laptop GPU | Acer Predator Helios 300 PH315-53-77N5 i7-10750H, GeForce RTX 2060 Mobile | Media de la clase Gaming | |
|---|---|---|---|---|---|---|
| Heat | 12% | 13% | 9% | 21% | 10% | |
| Maximum Upper Side * (°C) | 50 | 45 10% | 40.2 20% | 49 2% | 44.1 12% | 45.2 ? 10% |
| Maximum Bottom * (°C) | 63 | 61 3% | 45.6 28% | 48 24% | 48 24% | 47.9 ? 24% |
| Idle Upper Side * (°C) | 32 | 27 16% | 28.8 10% | 31 3% | 25.2 21% | 31.1 ? 3% |
| Idle Bottom * (°C) | 35 | 28 20% | 37.4 -7% | 33 6% | 25.7 27% | 34.2 ? 2% |
* ... más pequeño es mejor
Altavoces
Acer Predator Helios 300 PH315-53-786B análisis de audio
(±) | la sonoridad del altavoz es media pero buena (81 dB)
Graves 100 - 315 Hz
(-) | casi sin bajos - de media 19% inferior a la mediana
(±) | la linealidad de los graves es media (10% delta a frecuencia anterior)
Medios 400 - 2000 Hz
(±) | medias más altas - de media 6.4% más altas que la mediana
(±) | la linealidad de los medios es media (9.1% delta respecto a la frecuencia anterior)
Altos 2 - 16 kHz
(+) | máximos equilibrados - a sólo 0.7% de la mediana
(+) | los máximos son lineales (1.9% delta a la frecuencia anterior)
Total 100 - 16.000 Hz
(±) | la linealidad del sonido global es media (17% de diferencia con la mediana)
En comparación con la misma clase
» 45% de todos los dispositivos probados de esta clase eran mejores, 12% similares, 43% peores
» El mejor tuvo un delta de 6%, la media fue 18%, el peor fue ###max##%
En comparación con todos los dispositivos probados
» 30% de todos los dispositivos probados eran mejores, 8% similares, 62% peores
» El mejor tuvo un delta de 4%, la media fue 24%, el peor fue ###max##%
Aorus 15G XC análisis de audio
(+) | los altavoces pueden reproducir a un volumen relativamente alto (#83 dB)
Graves 100 - 315 Hz
(-) | casi sin bajos - de media 22% inferior a la mediana
(±) | la linealidad de los graves es media (10.7% delta a frecuencia anterior)
Medios 400 - 2000 Hz
(±) | medias más altas - de media 5.7% más altas que la mediana
(+) | los medios son lineales (5.5% delta a la frecuencia anterior)
Altos 2 - 16 kHz
(+) | máximos equilibrados - a sólo 1.9% de la mediana
(+) | los máximos son lineales (5.6% delta a la frecuencia anterior)
Total 100 - 16.000 Hz
(±) | la linealidad del sonido global es media (17.4% de diferencia con la mediana)
En comparación con la misma clase
» 48% de todos los dispositivos probados de esta clase eran mejores, 12% similares, 40% peores
» El mejor tuvo un delta de 6%, la media fue 18%, el peor fue ###max##%
En comparación con todos los dispositivos probados
» 33% de todos los dispositivos probados eran mejores, 8% similares, 59% peores
» El mejor tuvo un delta de 4%, la media fue 24%, el peor fue ###max##%
Gestión de la energía: portátil Acer con buena duración de la batería
Consumo de energía
El Predator no nos depara ninguna sorpresa en términos de consumo de energía. El test de estrés y nuestro test The Witcher 3 elevan el consumo de energía a 220 vatios y una media de 164 vatios, respectivamente. La potencia nominal del adaptador de corriente es de 230 vatios. El siguiente gráfico ilustra el consumo de energía bastante constante del portátil durante nuestra prueba The Witcher 3
| Off / Standby | |
| Ocioso | |
| Carga |
|
Clave:
min: | |
Energy consumption during The Witcher 3
| Acer Predator Helios 300 PH315-53-786B i7-10750H, GeForce RTX 3070 Laptop GPU | Aorus 15G XC i7-10870H, GeForce RTX 3070 Laptop GPU | MSI GS66 Stealth 10UG i7-10870H, GeForce RTX 3070 Laptop GPU | Asus ROG Strix G15 G513QR R9 5900HX, GeForce RTX 3070 Laptop GPU | Acer Predator Helios 300 PH315-53-77N5 i7-10750H, GeForce RTX 2060 Mobile | Media de la clase Gaming | |
|---|---|---|---|---|---|---|
| Power Consumption | -49% | -49% | -14% | 9% | -67% | |
| Idle Minimum * (Watt) | 4 | 13 -225% | 12.9 -223% | 4 -0% | 2.9 27% | 13.2 ? -230% |
| Idle Average * (Watt) | 11 | 16 -45% | 15.4 -40% | 9 18% | 13.2 -20% | 18.9 ? -72% |
| Idle Maximum * (Watt) | 24 | 30 -25% | 27.1 -13% | 36 -50% | 19.8 17% | 24.3 ? -1% |
| Load Average * (Watt) | 91 | 92 -1% | 98.2 -8% | 130 -43% | 105 -15% | 108.3 ? -19% |
| Witcher 3 ultra * (Watt) | 164 | 154 6% | 164.9 -1% | 174 -6% | 127 23% | |
| Load Maximum * (Watt) | 220 | 223 -1% | 232.9 -6% | 227 -3% | 177 20% | 254 ? -15% |
* ... más pequeño es mejor
Duración de la batería
En la prueba Wi-Fi (acceso a sitios web usando un script) y la prueba de vídeo (el cortometraje Big Buck Bunny (codificación H.264, Full HD) ejecutado en bucle), el portátil de 15.6 pulgadas logra duraciones de 6:26 horas y 6:46 horas, respectivamente. Las funciones de ahorro de energía del portátil están desactivadas durante ambas pruebas, y el brillo de la pantalla está ajustado a unos 150 cd/m². Además, los módulos inalámbricos están desactivados para la prueba de vídeo
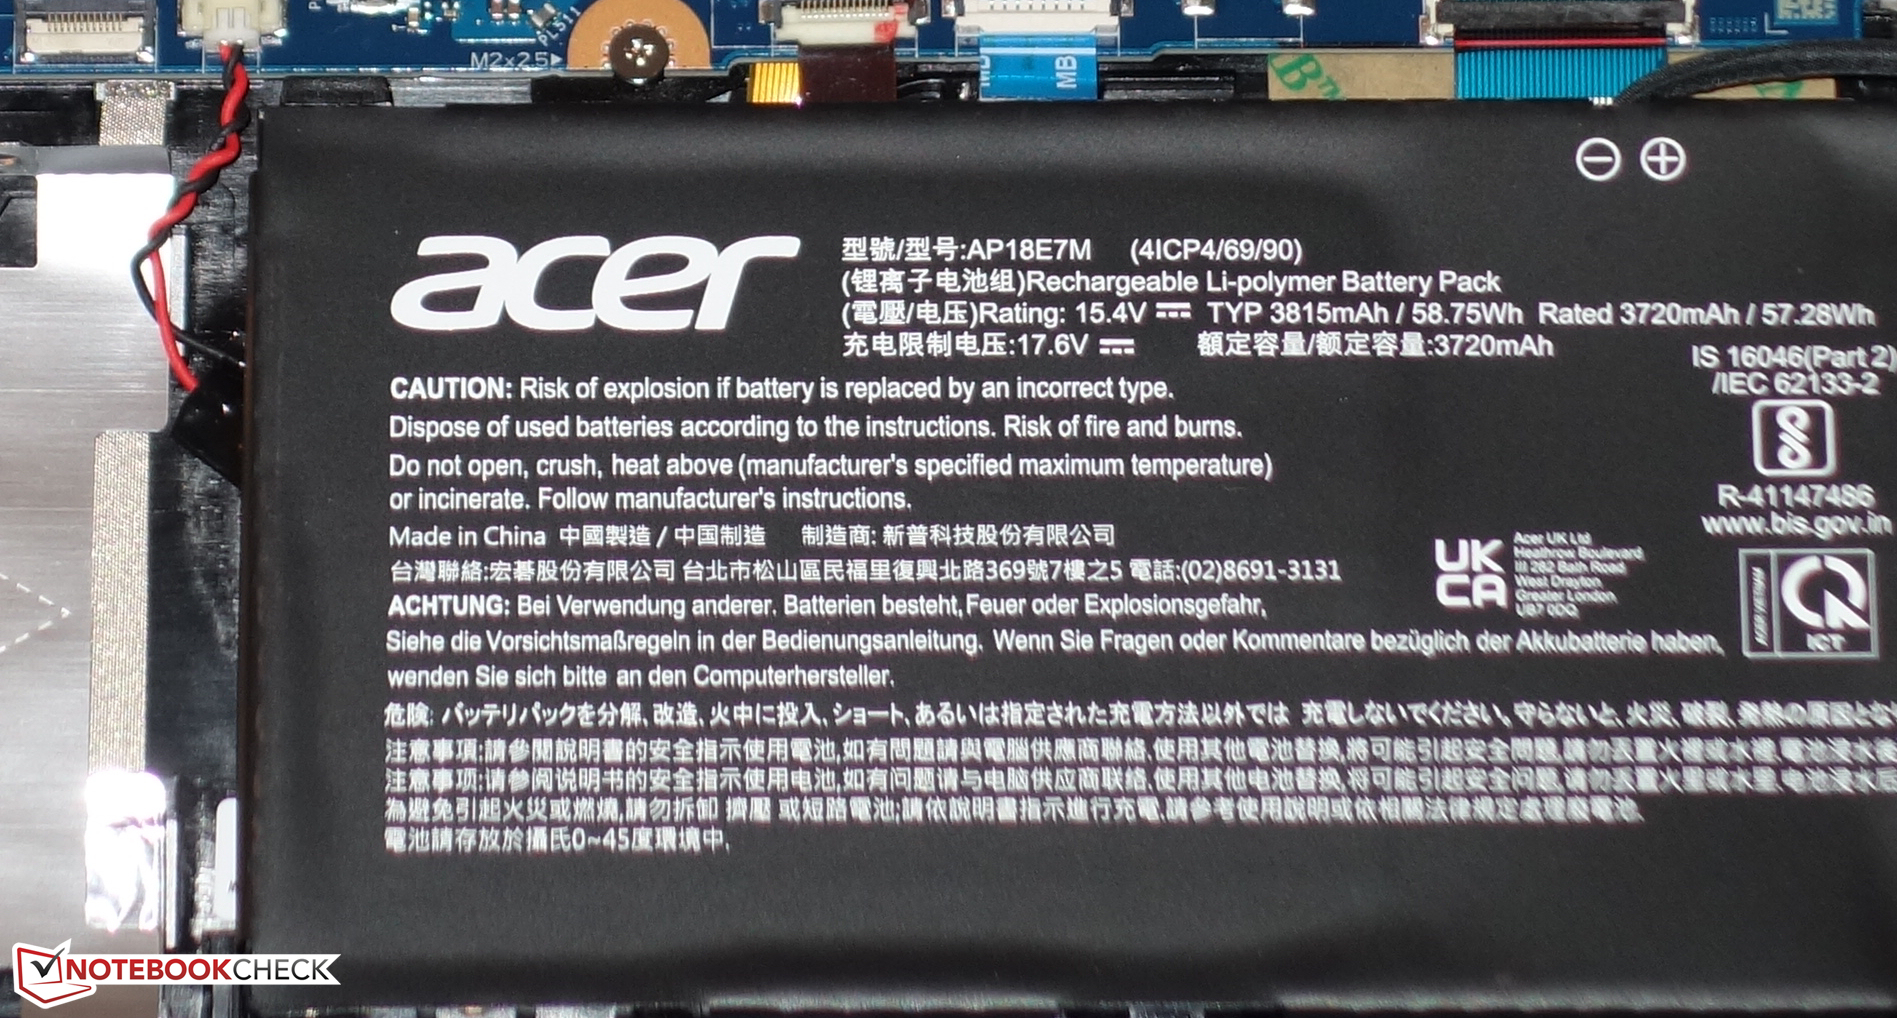
| Acer Predator Helios 300 PH315-53-786B i7-10750H, GeForce RTX 3070 Laptop GPU, 58.75 Wh | Aorus 15G XC i7-10870H, GeForce RTX 3070 Laptop GPU, 99 Wh | MSI GS66 Stealth 10UG i7-10870H, GeForce RTX 3070 Laptop GPU, 99.9 Wh | Asus ROG Strix G15 G513QR R9 5900HX, GeForce RTX 3070 Laptop GPU, 90 Wh | Acer Predator Helios 300 PH315-53-77N5 i7-10750H, GeForce RTX 2060 Mobile, 58.7 Wh | Media de la clase Gaming | |
|---|---|---|---|---|---|---|
| Duración de Batería | 10% | 20% | 43% | -7% | 3% | |
| Reader / Idle (h) | 10.6 | 9.6 -9% | 10.8 2% | 10.4 -2% | 8.71 ? -18% | |
| H.264 (h) | 6.8 | 6.5 -4% | 13.5 99% | 5.6 -18% | 8.26 ? 21% | |
| WiFi v1.3 (h) | 6.4 | 6.3 -2% | 7.1 11% | 7.4 16% | 4.7 -27% | 7.04 ? 10% |
| Load (h) | 1.5 | 2.3 53% | 2.2 47% | 1.7 13% | 1.8 20% | 1.47 ? -2% |
Pro
Contra
Veredicto - Sólido portátil para juegos a 240 Hz

El portátil gaming de Acer lo hace muy bien en general y ofrece tasas de frames medias en comparación con los portátiles RTX 3070 que hemos probado hasta ahora. El rendimiento aún tiene cierto margen de mejora: Una actualización de firmware aumenta el TGP máximo del GeForce RTX 3070 portátil GPU de 100 a 110 vatios - también informamos sobre esto anteriormente
Acer tiene un portátil gaming muy completo en su gama de productos con el Predator Helios 300 PH315-53.
La ralentización no es motivo de preocupación. La CPU y la GPU pueden desarrollar su rendimiento constantemente. El portátil se calienta mucho bajo carga - más que muchos competidores. El desarrollo de ruido está al nivel habitual de la clase
La duración de la batería es completamente adecuada. Sorprendentemente, el Predator deja a su modelo hermano muy por detrás en nuestras pruebas de duración en el mundo real - a pesar de las idénticas capacidades de batería. La pantalla (Full HD, IPS, 240 Hz) ofrece ángulos de visión estables, una superficie mate, tiempos de respuesta rápidos, una reproducción del color muy decente y una buena cobertura del espacio de color. Sin embargo, el brillo y el contraste deberían ser mayores. Los objetivos respectivos se incumplen por poco
El Aorus 15G XCpor ejemplo, podría ser una alternativa al Predator. En términos de precio, está a la par con el portátil Acer, pero ofrece más rendimiento de CPU en general gracias al procesador octa-core incorporado.
Precio y disponibilidad
En el momento de escribir esto, el AcerPredator Helios 300 es un poco difícil de conseguir en la configuración que revisamos. Sin embargo, todavía está listado en newegg(Core i7-10750H, GeForce RTX 3070, 16 GB RAM, 512 GB SSD, Windows 10 Home) por 1.699,99 dólares, aunque como "fuera de stock" con la opción de ser notificado cuando esté disponible de nuevo. Como alternativa, también puedes estar pendiente de otras tiendas comoAmazon, por ejemplo
Acer Predator Helios 300 PH315-53-786B
- 07/20/2021 v7 (old)
Sascha Mölck
Price comparison

