Acer Predator Helios 300 PH315-53 en review: Una máquina de juego rápida con un rendimiento extra

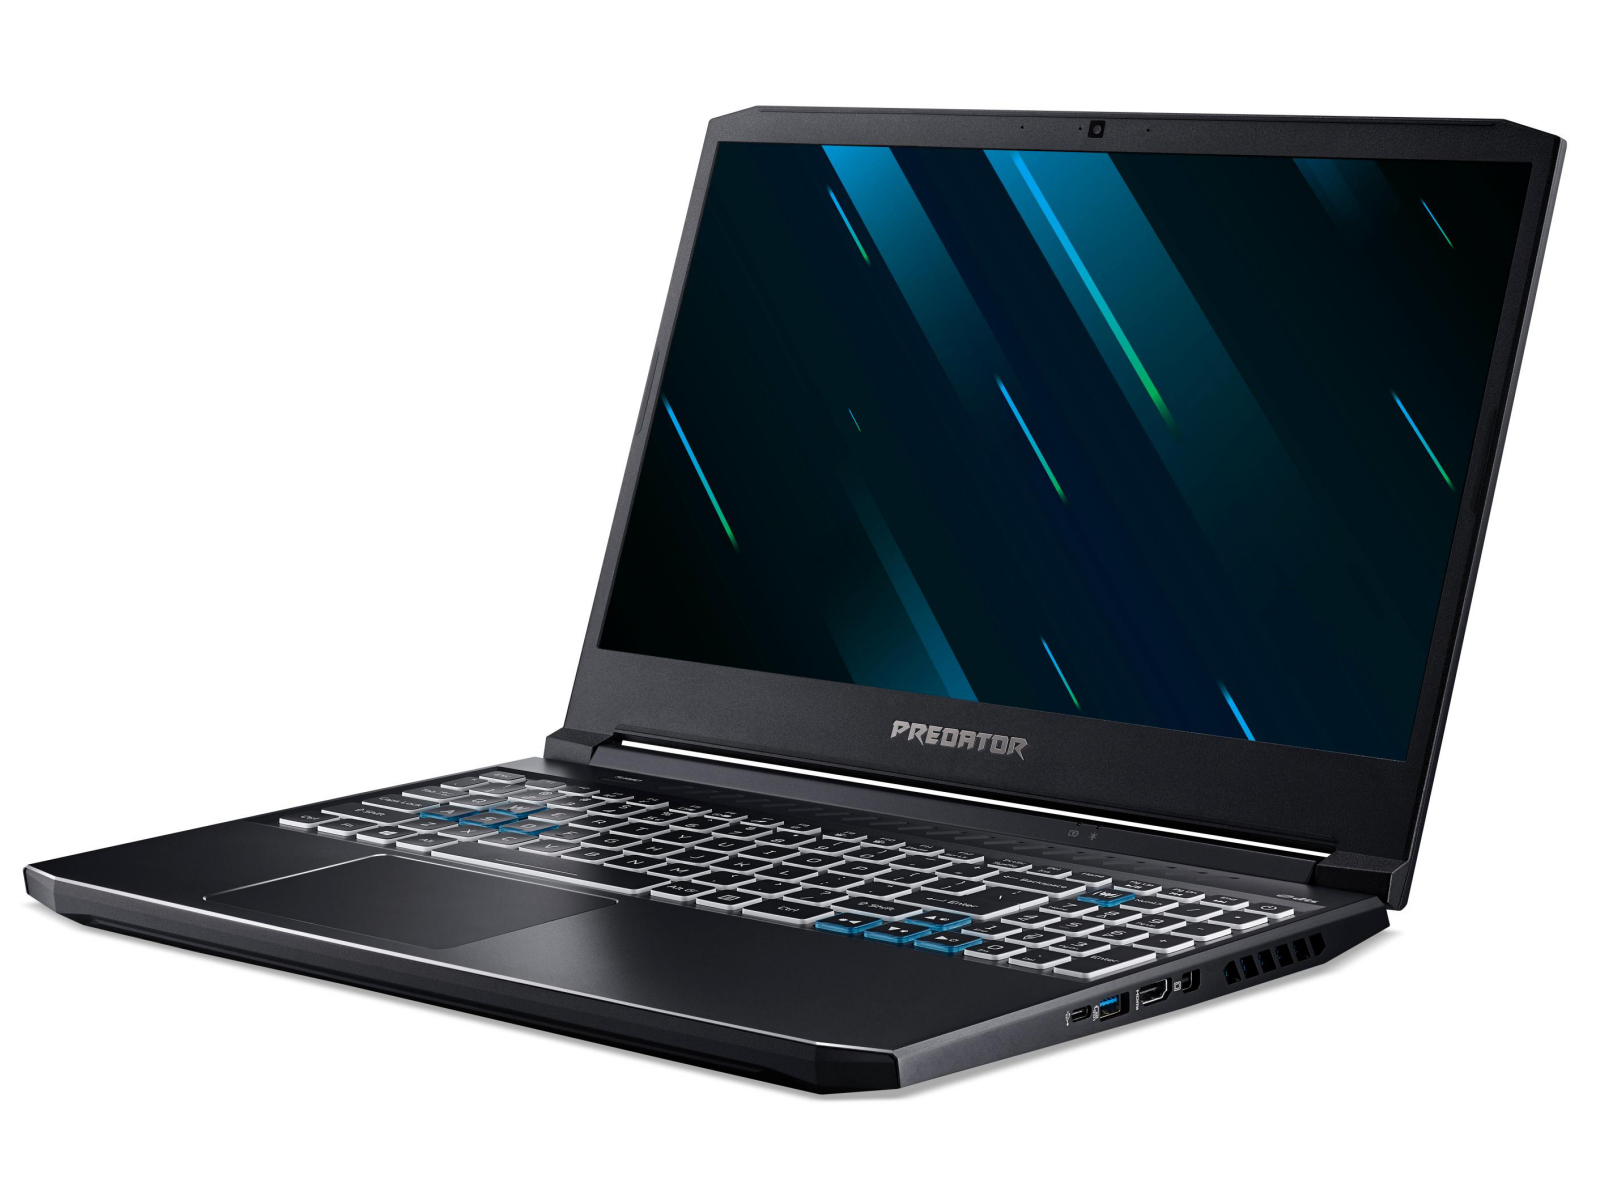
El Predator Helios es un portátil para juegos de 15,6 pulgadas. El dispositivo está alimentado por un procesador Core i7-10750H y una GPU GeForce RTX 2060. Los competidores incluyen dispositivos como el Dell G5 15 SE, el Aorus 5 KB, el Schenker XMG Core 15, y el Asus TUF A15 FA506IV.
Dado que el Predator es en gran medida idéntico en su construcción a su predecesor, no vamos a profundizar en la carcasa, la conectividad, los dispositivos de entrada, la pantalla y los altavoces - a menos que haya diferencias. La información correspondiente se puede encontrar en la review del Acer Predator Helios 300 PH315-52.
Valoración | Fecha | Modelo | Peso | Altura | Tamaño | Resolución | Precio |
|---|---|---|---|---|---|---|---|
| 82.9 % v7 (old) | 11/2020 | Acer Predator Helios 300 PH315-53-77N5 i7-10750H, GeForce RTX 2060 Mobile | 2.5 kg | 22.9 mm | 15.60" | 1920x1080 | |
| 83.7 % v7 (old) | 06/2020 | Dell G5 15 SE 5505 P89F R7 4800H, Radeon RX 5600M | 2.4 kg | 21.6 mm | 15.60" | 1920x1080 | |
| 83.7 % v7 (old) | 10/2020 | Aorus 5 KB i7-10750H, GeForce RTX 2060 Mobile | 2.1 kg | 28 mm | 15.60" | 1920x1080 | |
| 82.1 % v7 (old) | 09/2020 | Schenker XMG Core 15 GK5NR0O R7 4800H, GeForce RTX 2060 Mobile | 2 kg | 19.9 mm | 15.60" | 1920x1080 | |
| 82.7 % v7 (old) | 06/2020 | Asus TUF Gaming A15 FA506IV-HN172 R7 4800H, GeForce RTX 2060 Mobile | 2.2 kg | 24.9 mm | 15.60" | 1920x1080 |
Carcasa y conectividad - Ligeros cambios en comparación con el predecesor
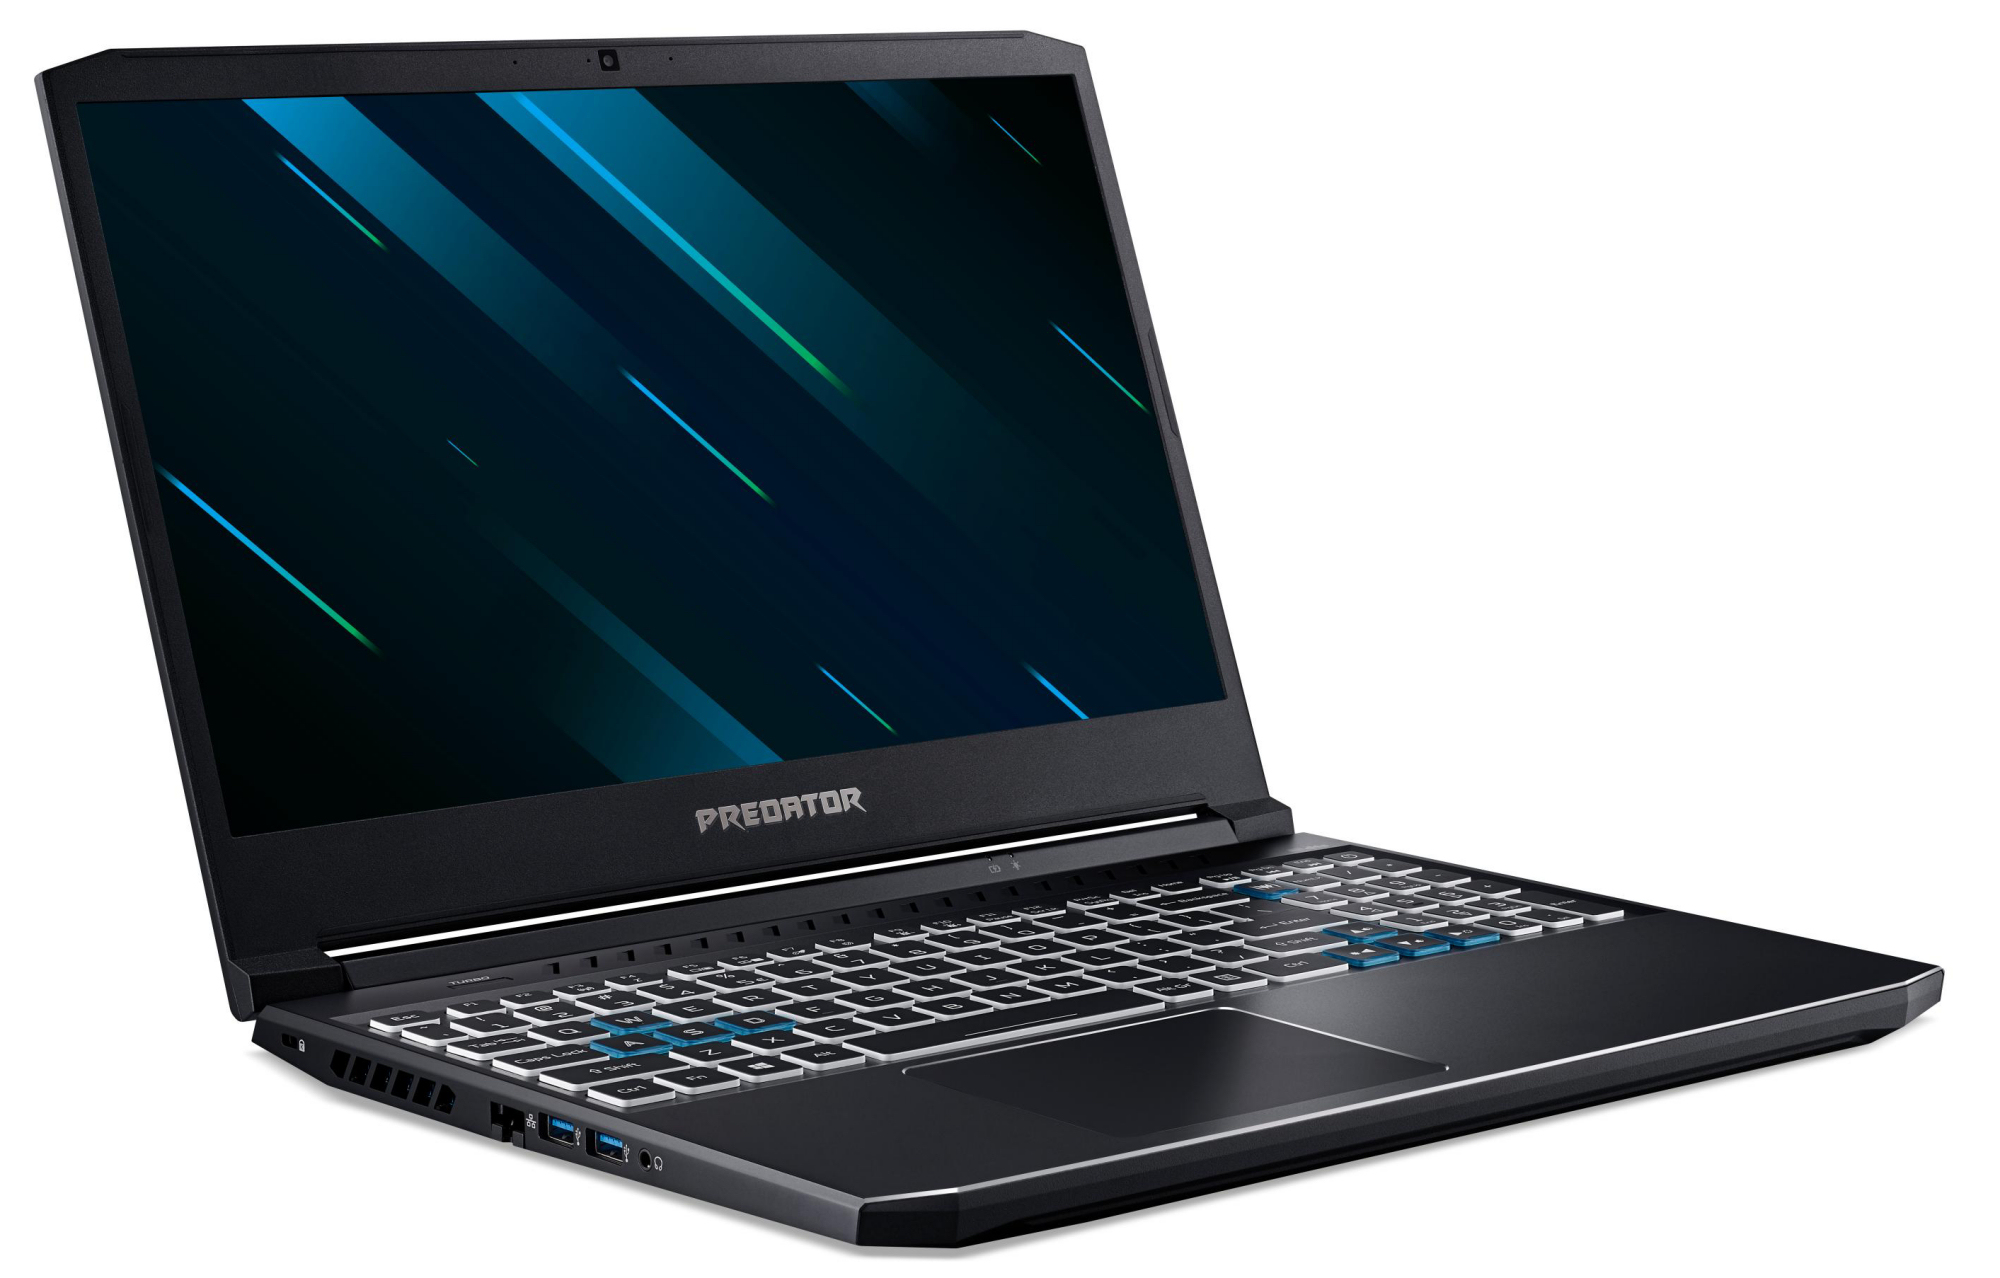
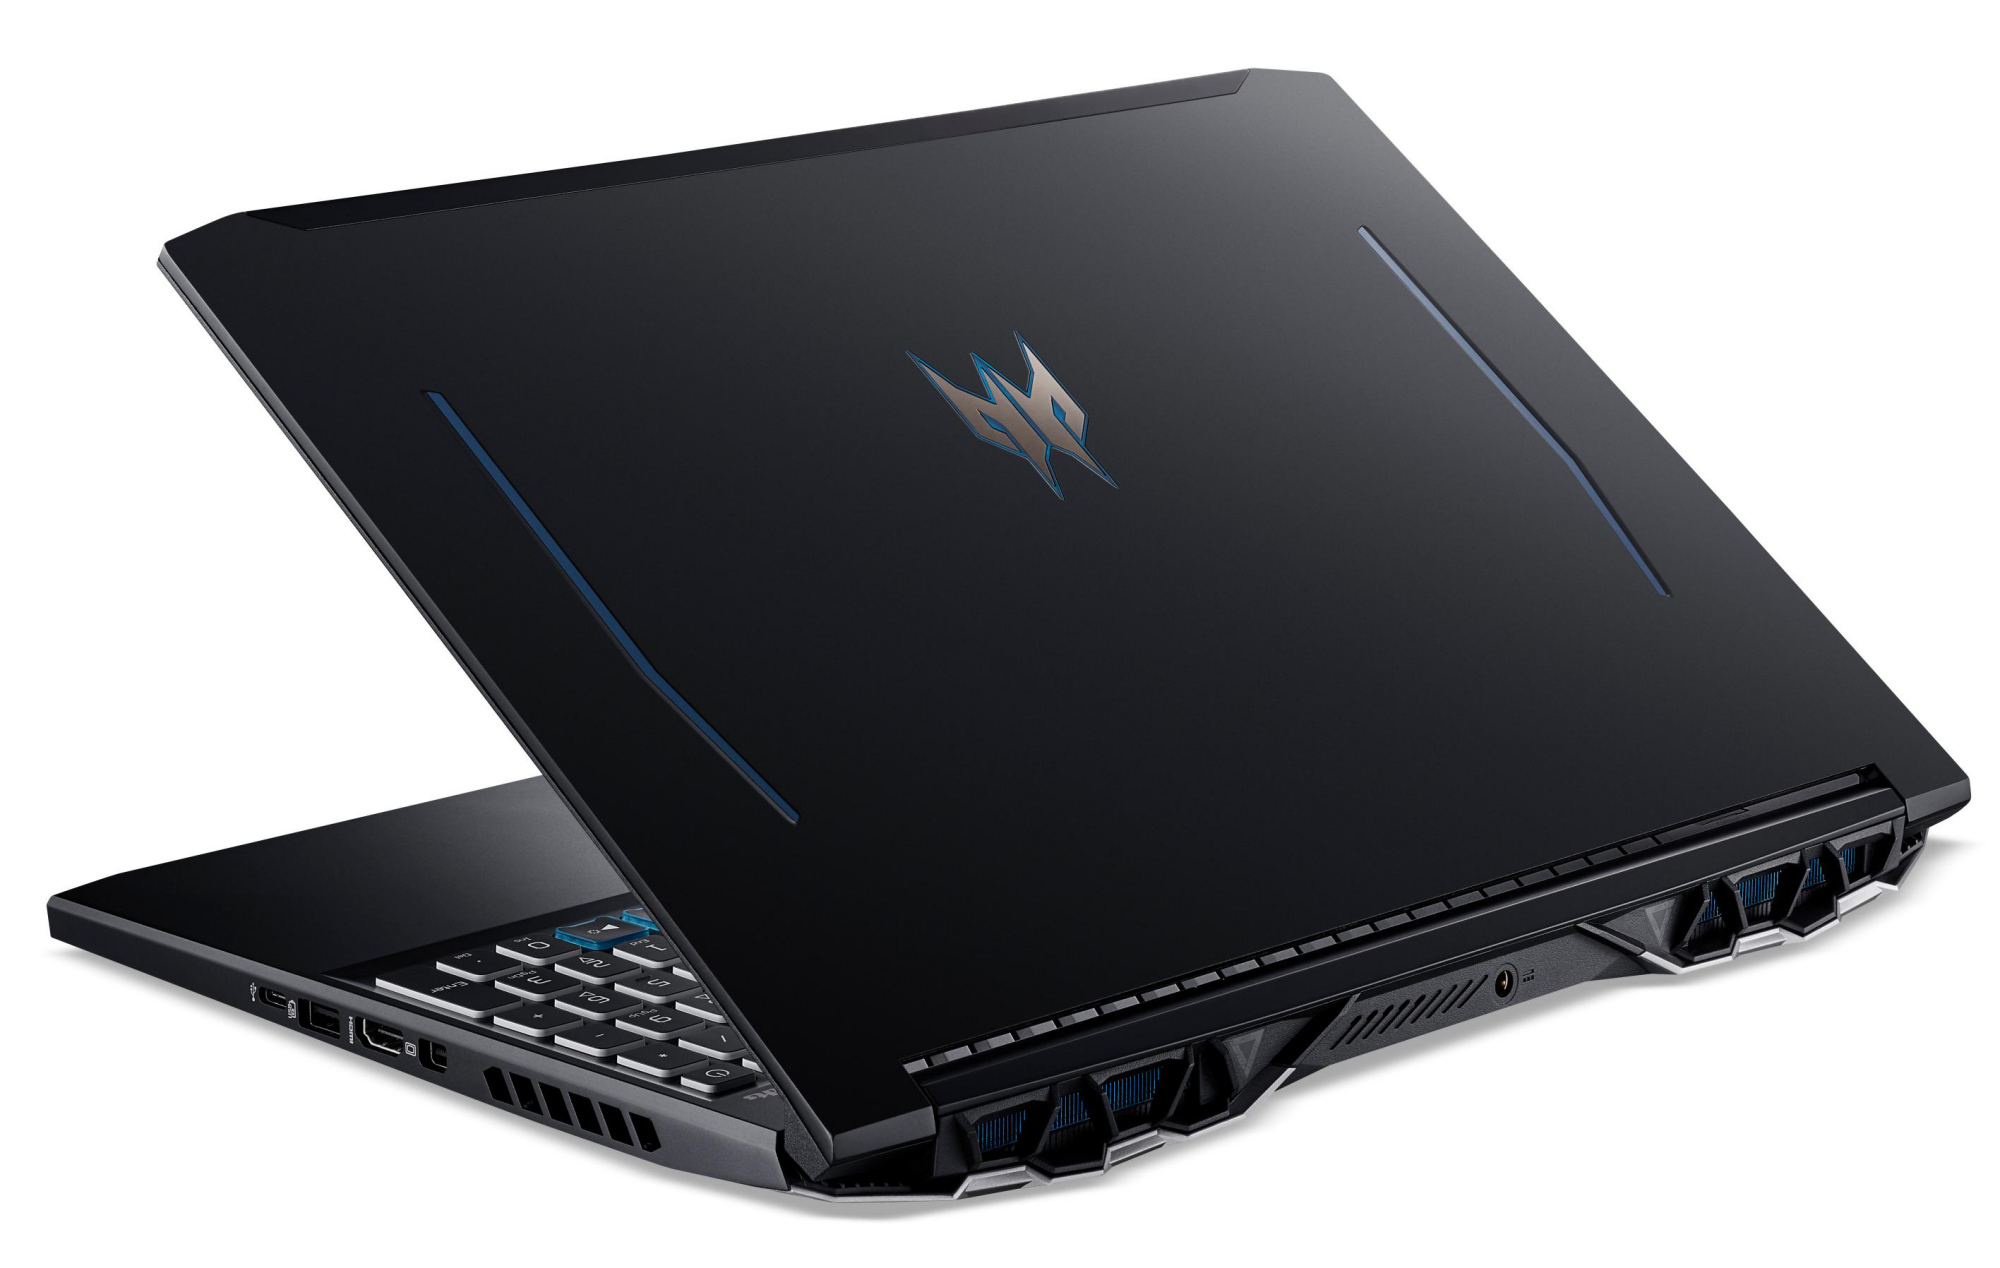
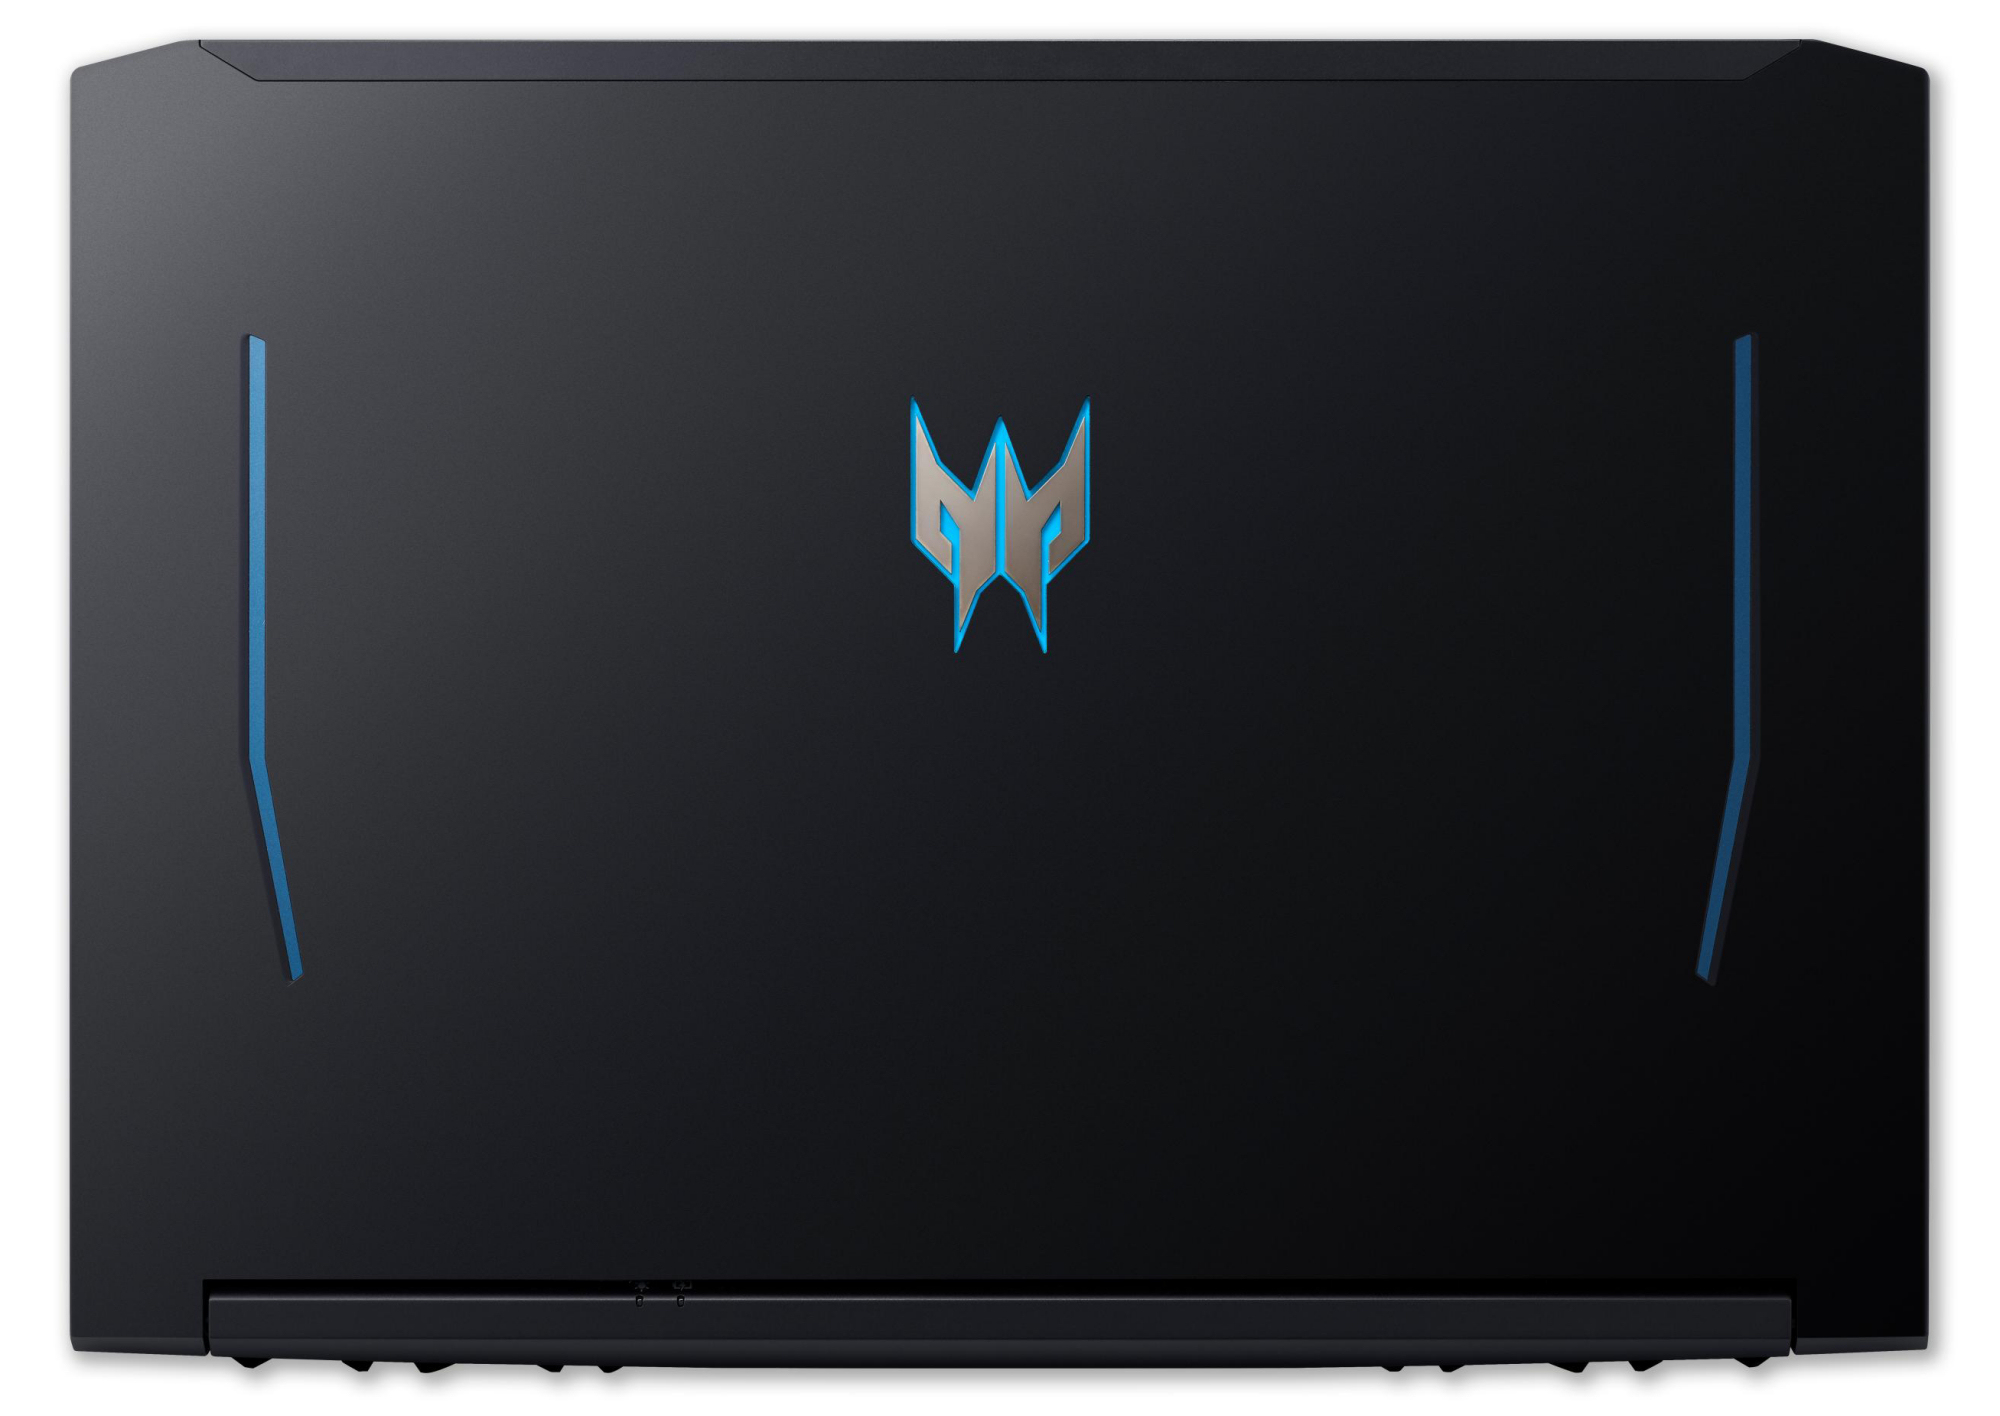
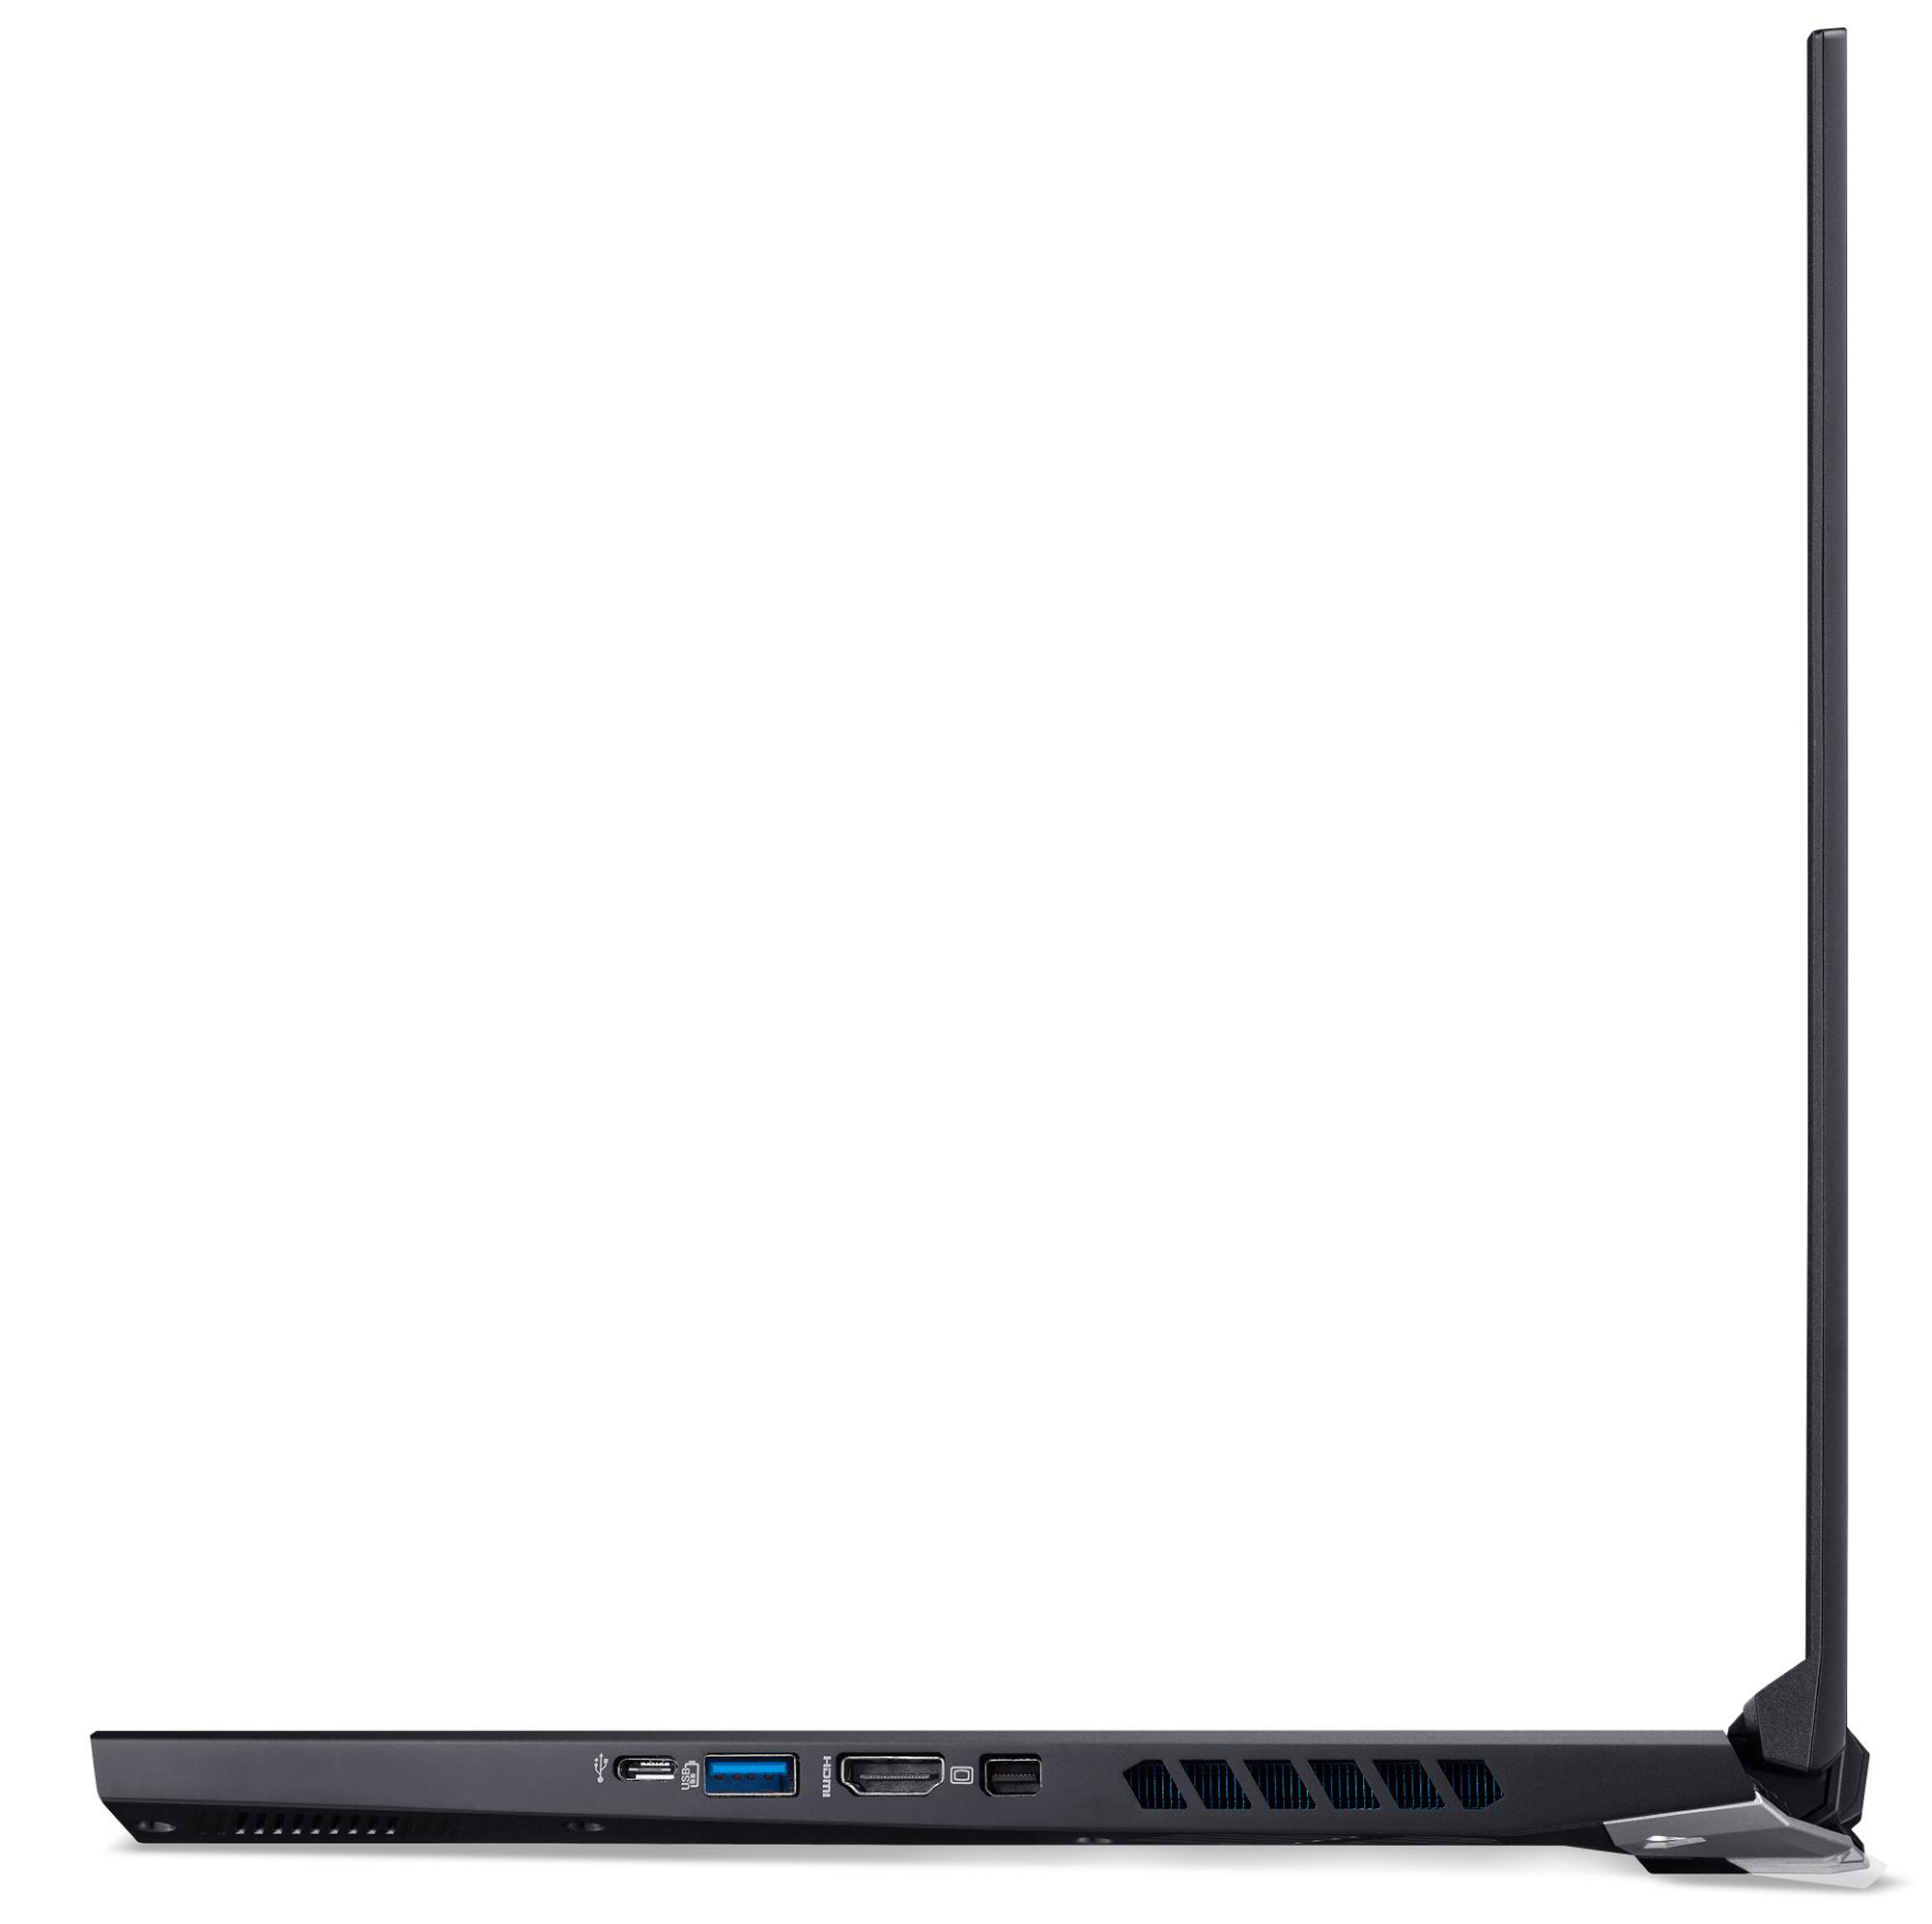
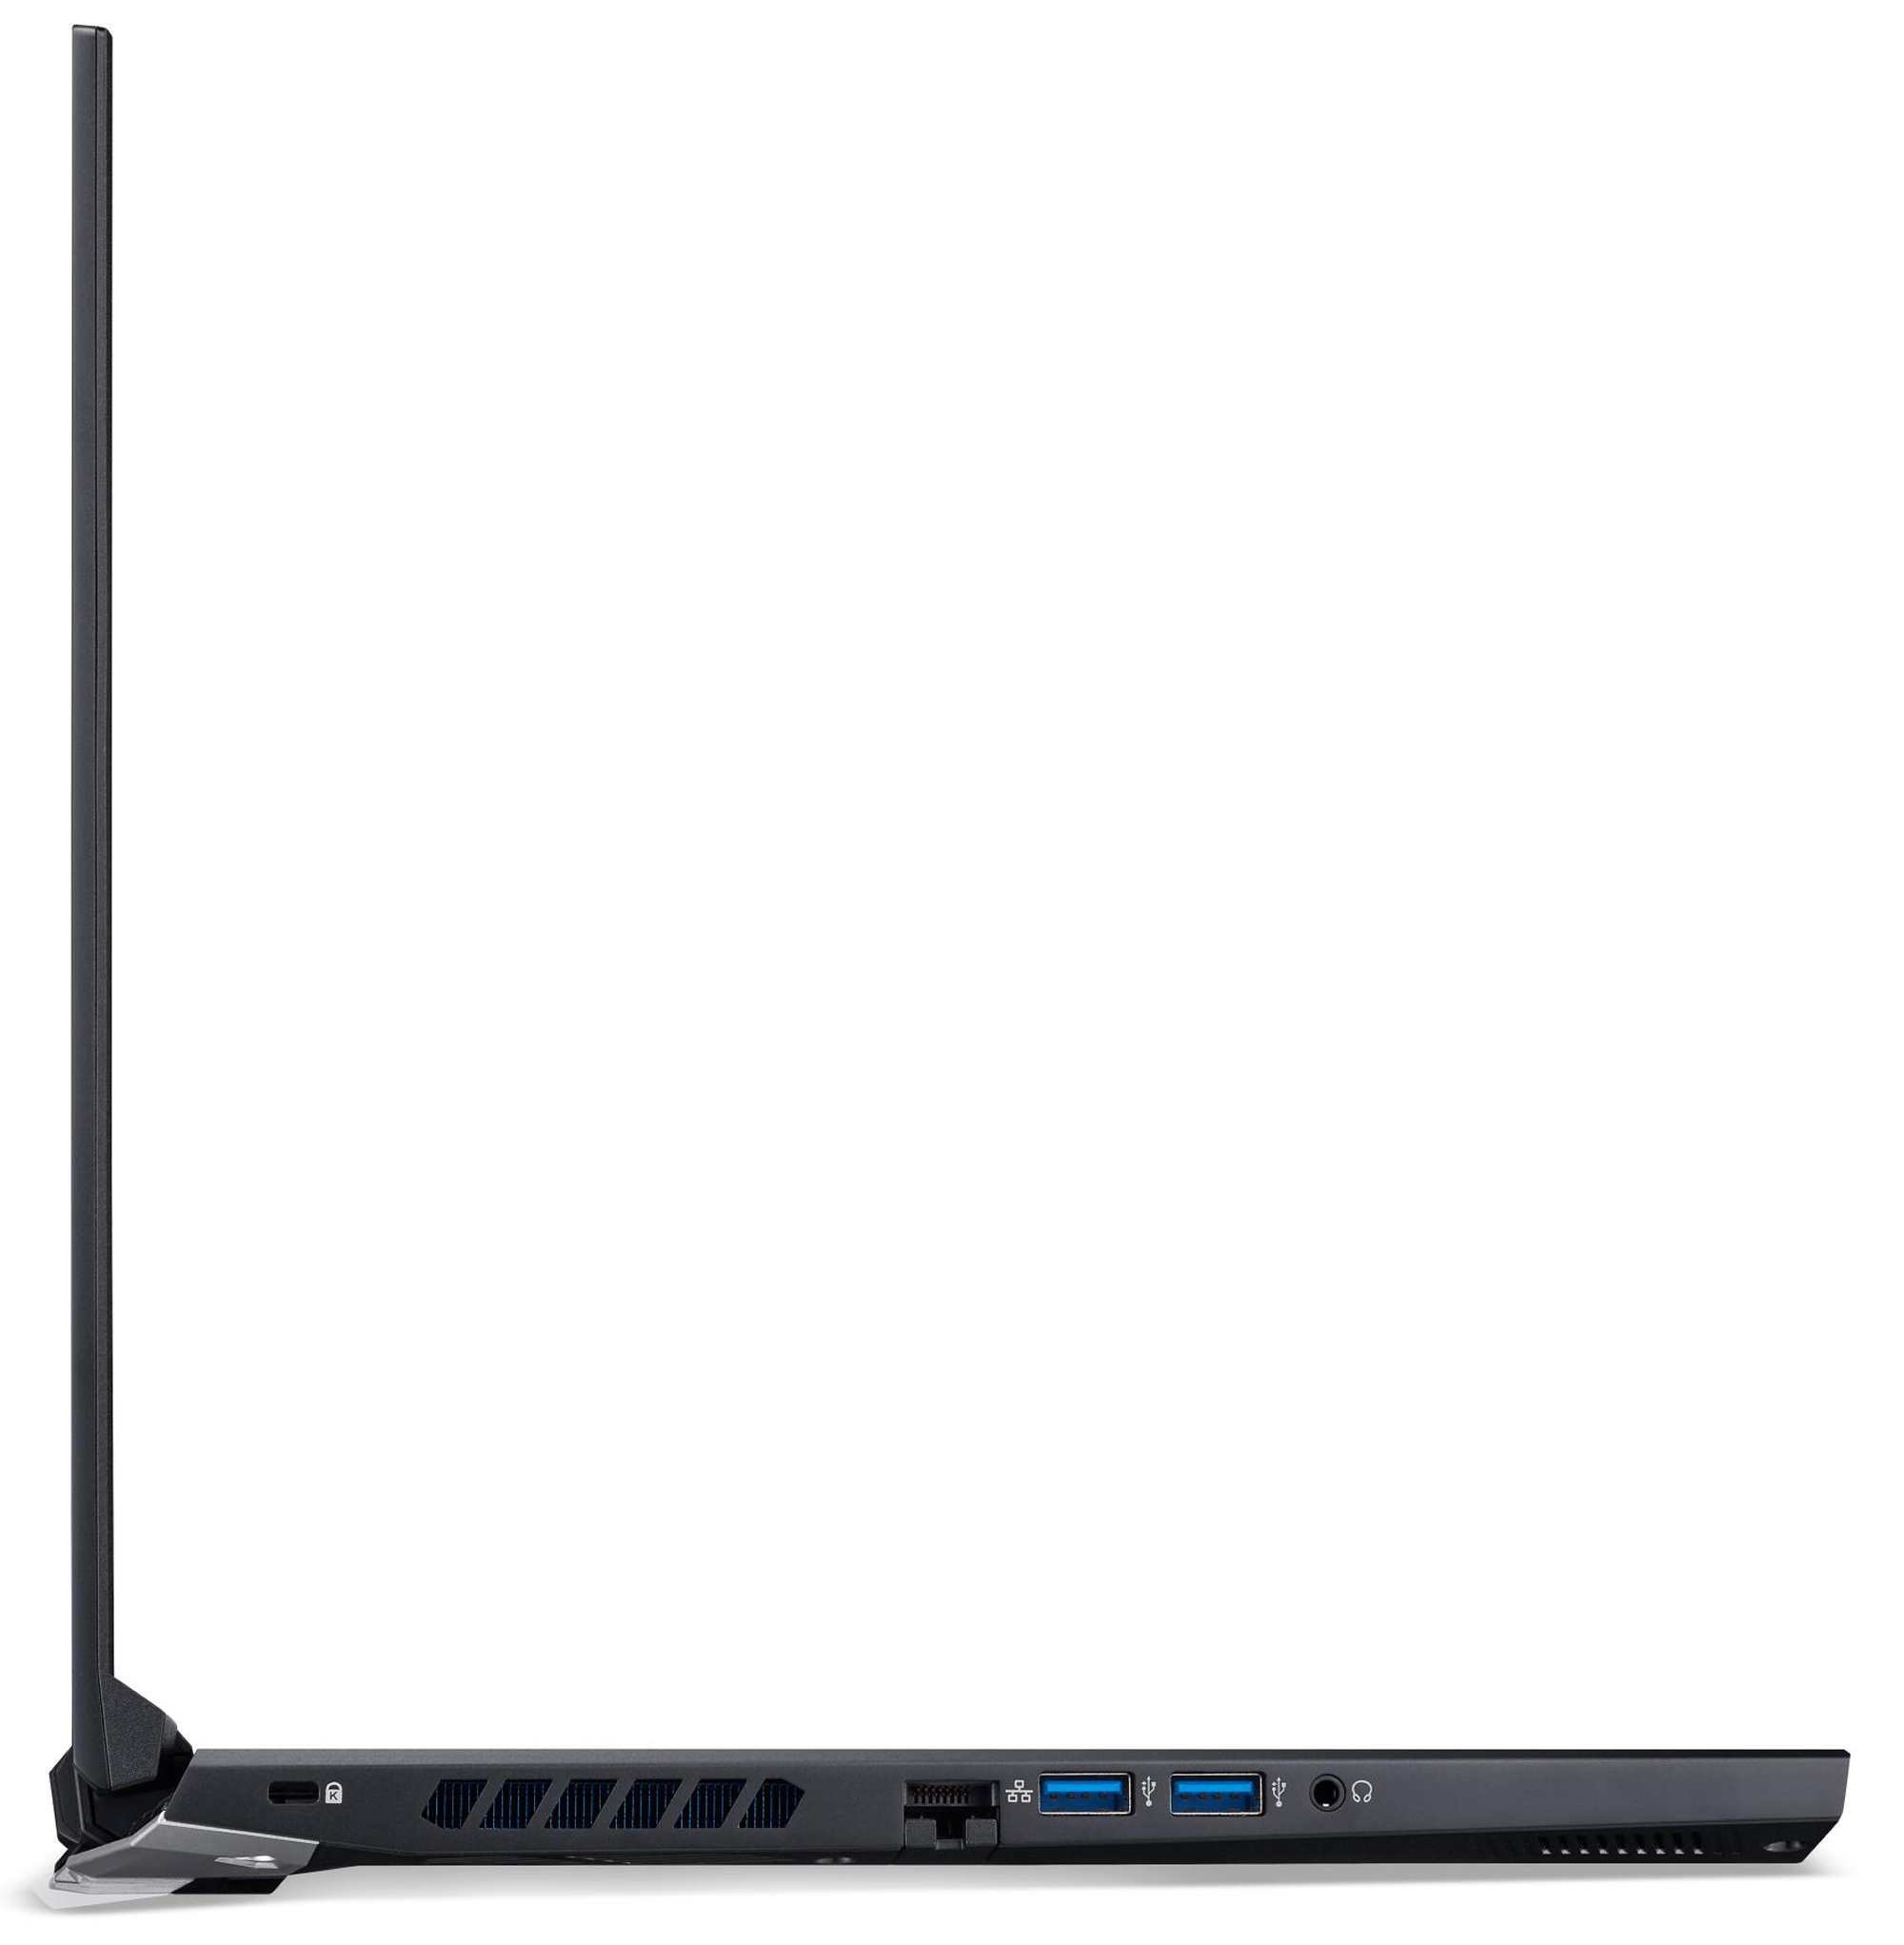
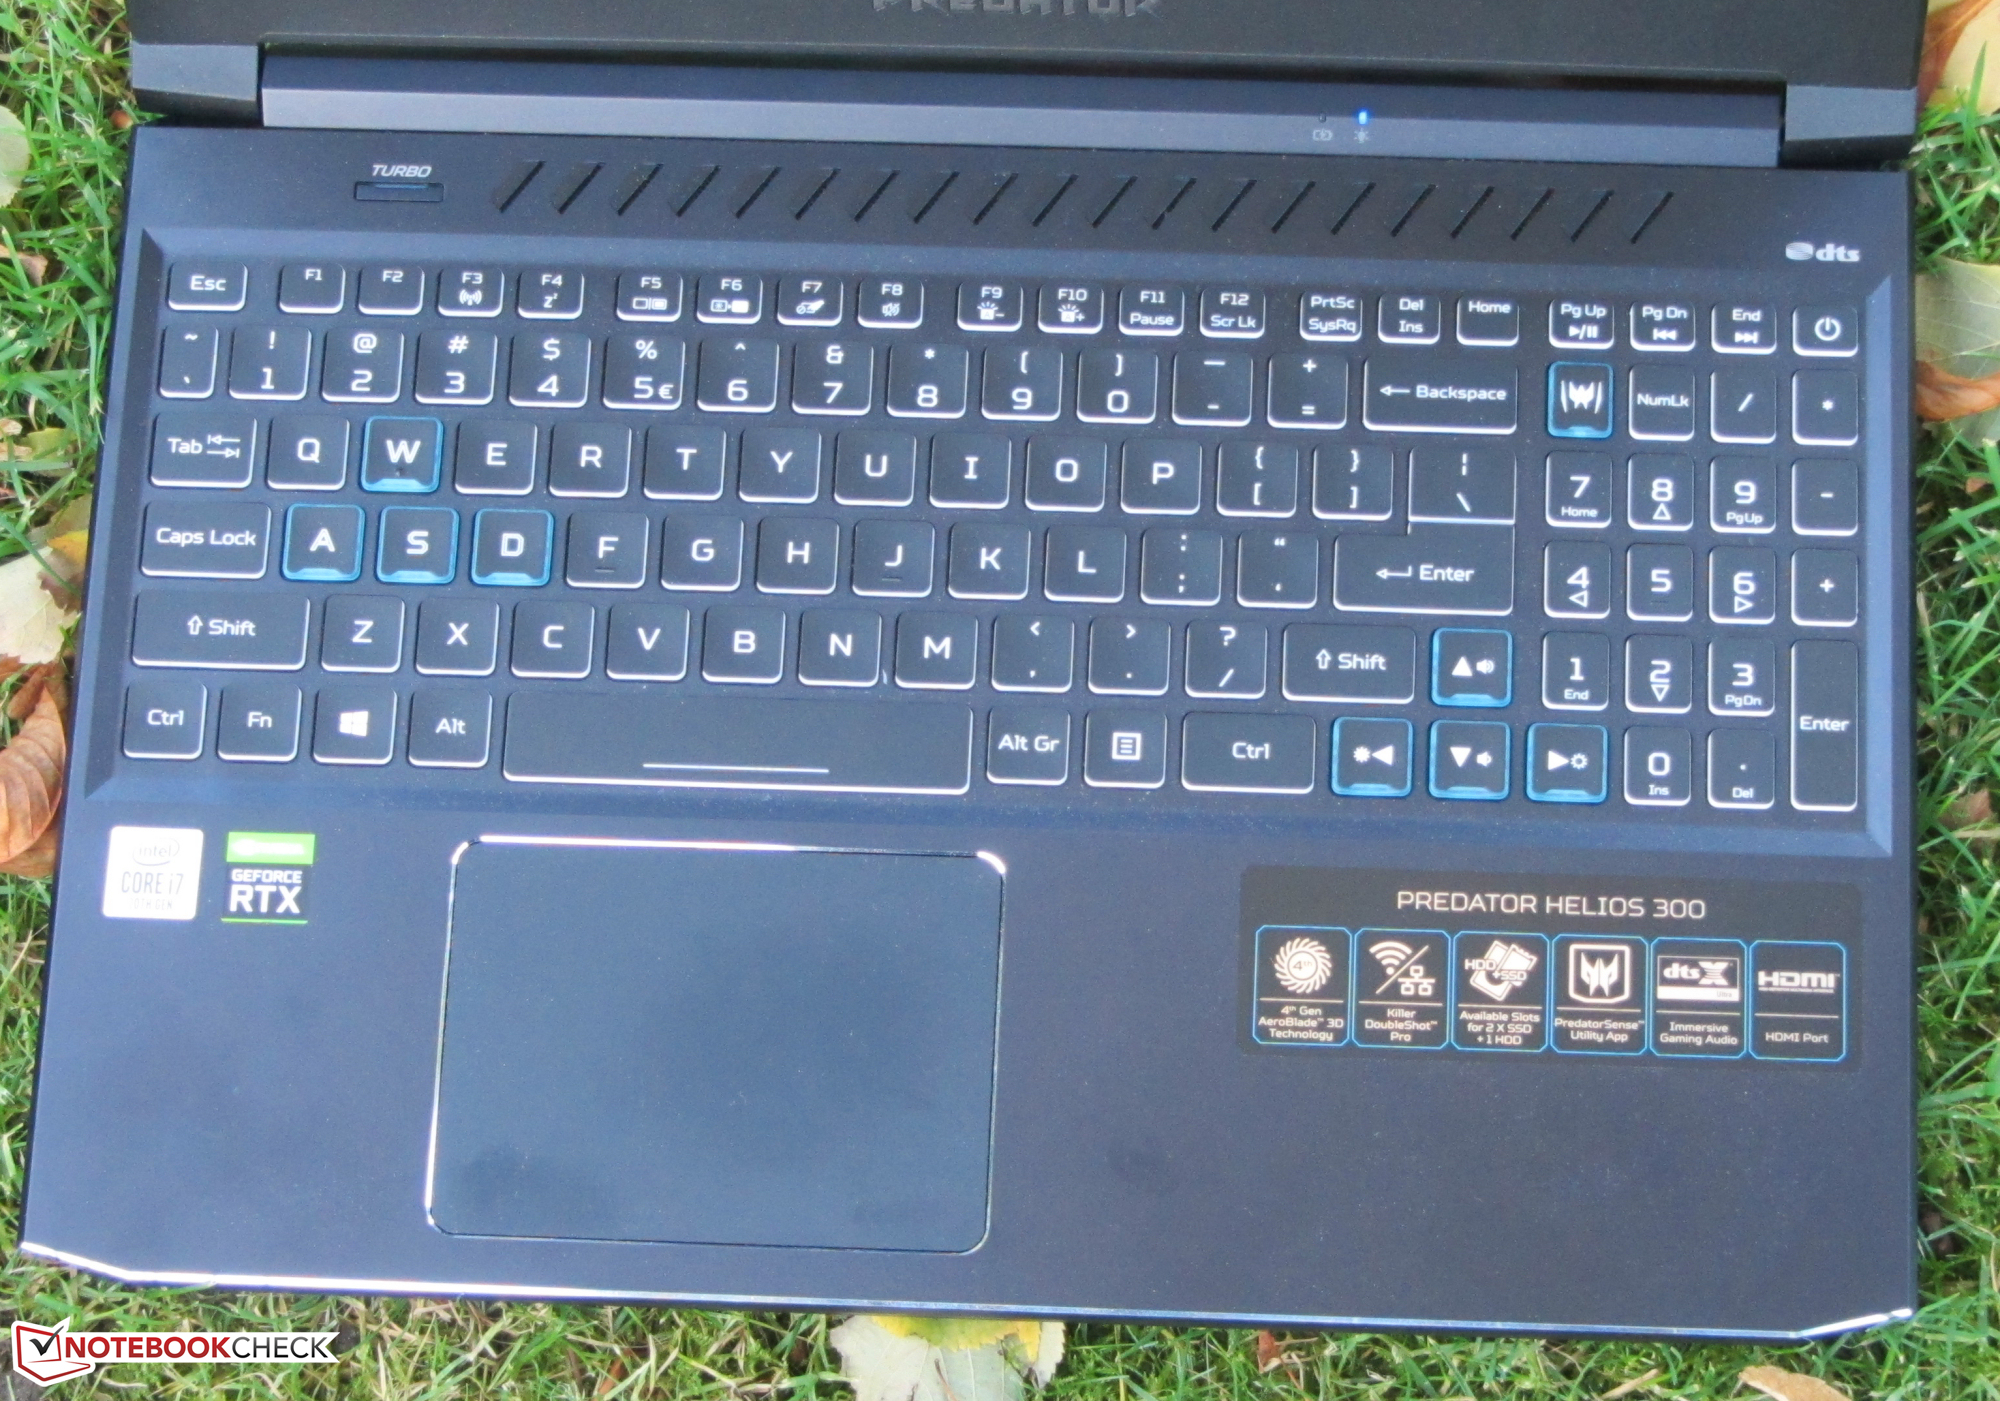
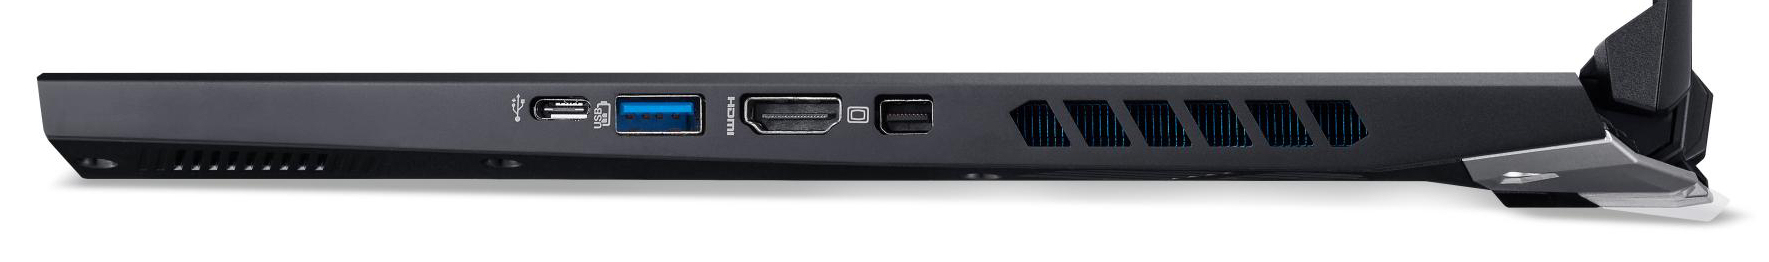
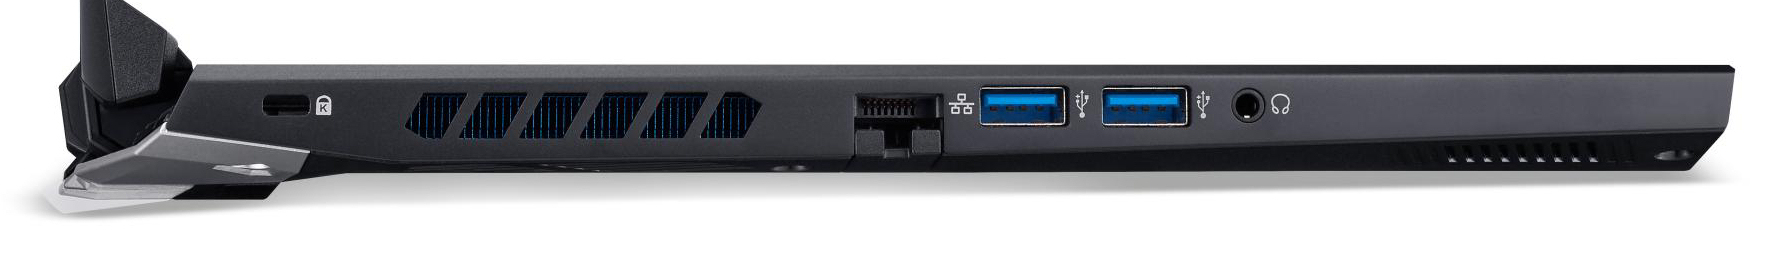
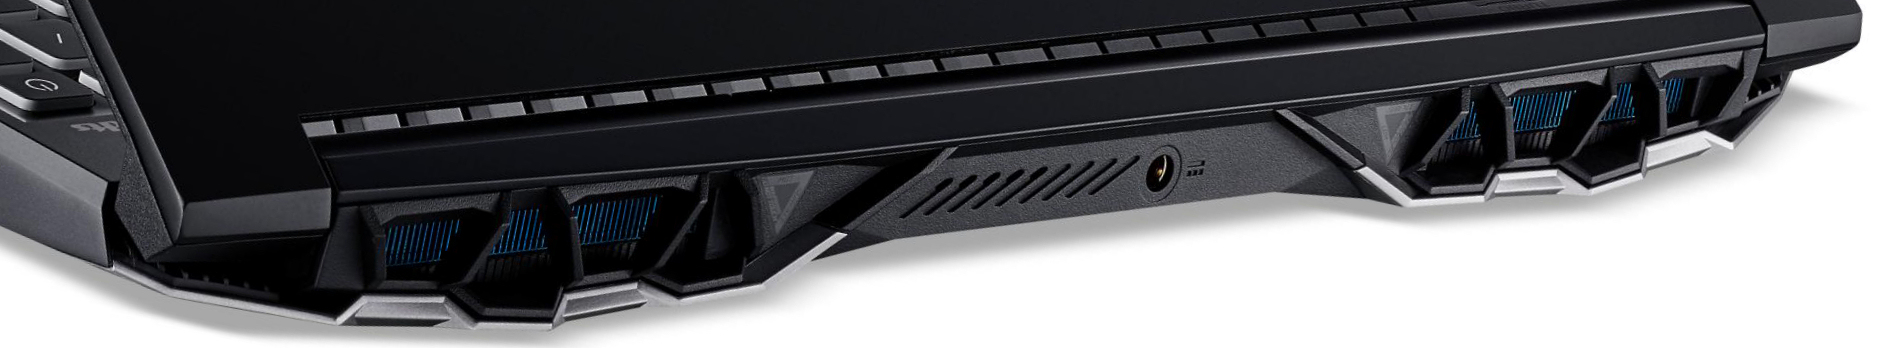
A primera vista, el chasis se parece al de su predecesor. Pero hay diferencias. Por ejemplo, el conector de la fuente de alimentación se ha movido del centro de la izquierda al centro de la parte trasera. La salida HDMI y el Mini DisplayPort han cambiado de lugar. Además, se han creado aberturas de ventilación adicionales sobre el teclado. Además, el modelo actual ha ganado algo de peso. También hay una nueva adición en términos de puertos: En lugar de un puerto USB tipo C 3.2 Gen 1, el modelo actual de Predator tiene un puerto USB tipo C 3.2 Gen 2 a bordo.


")
")


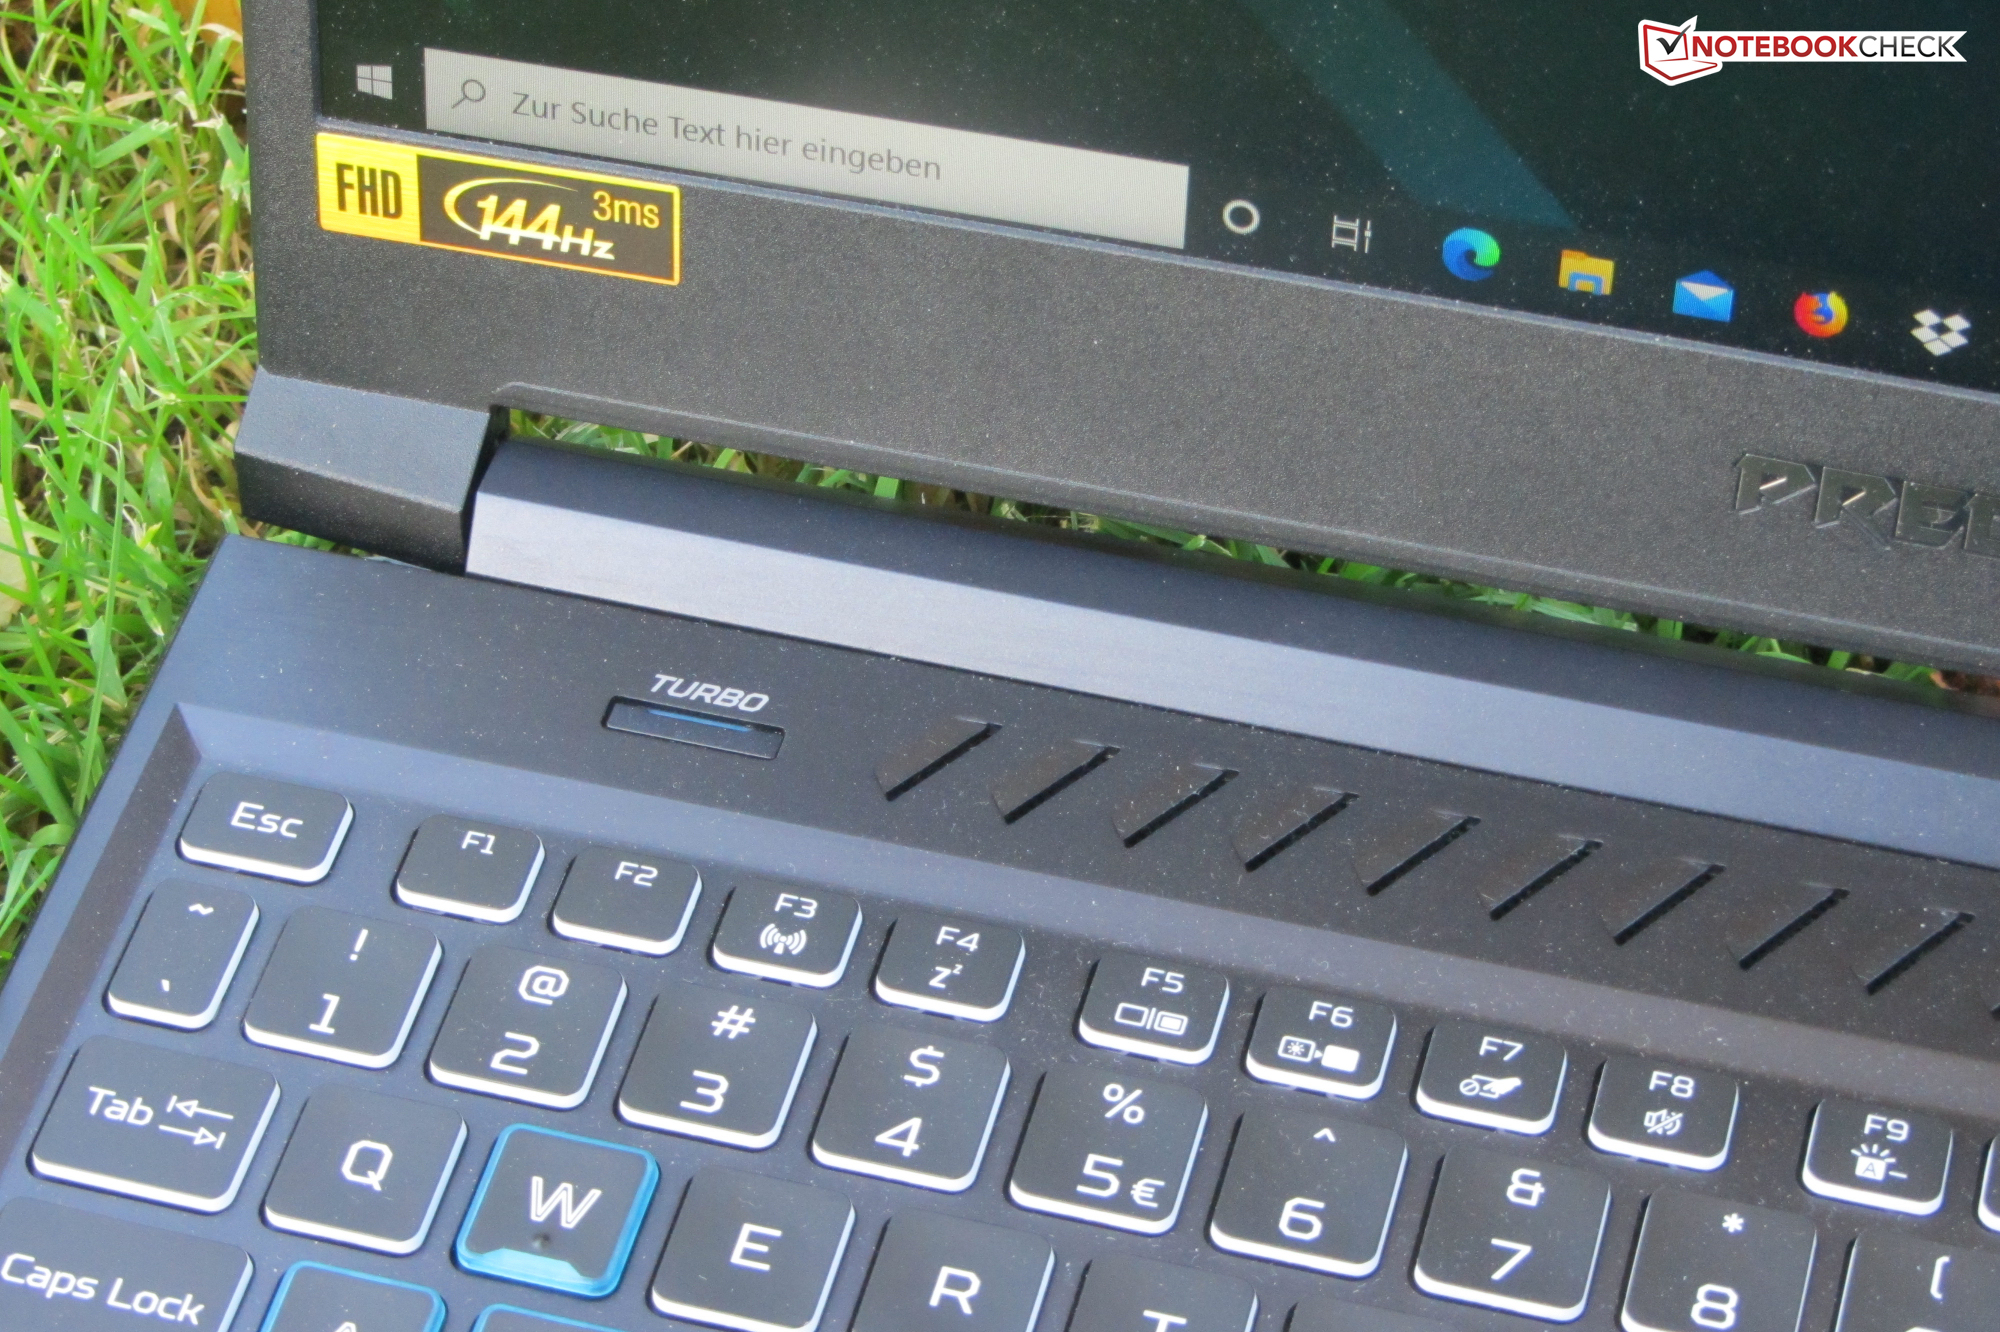
Display - 144 Hz IPS

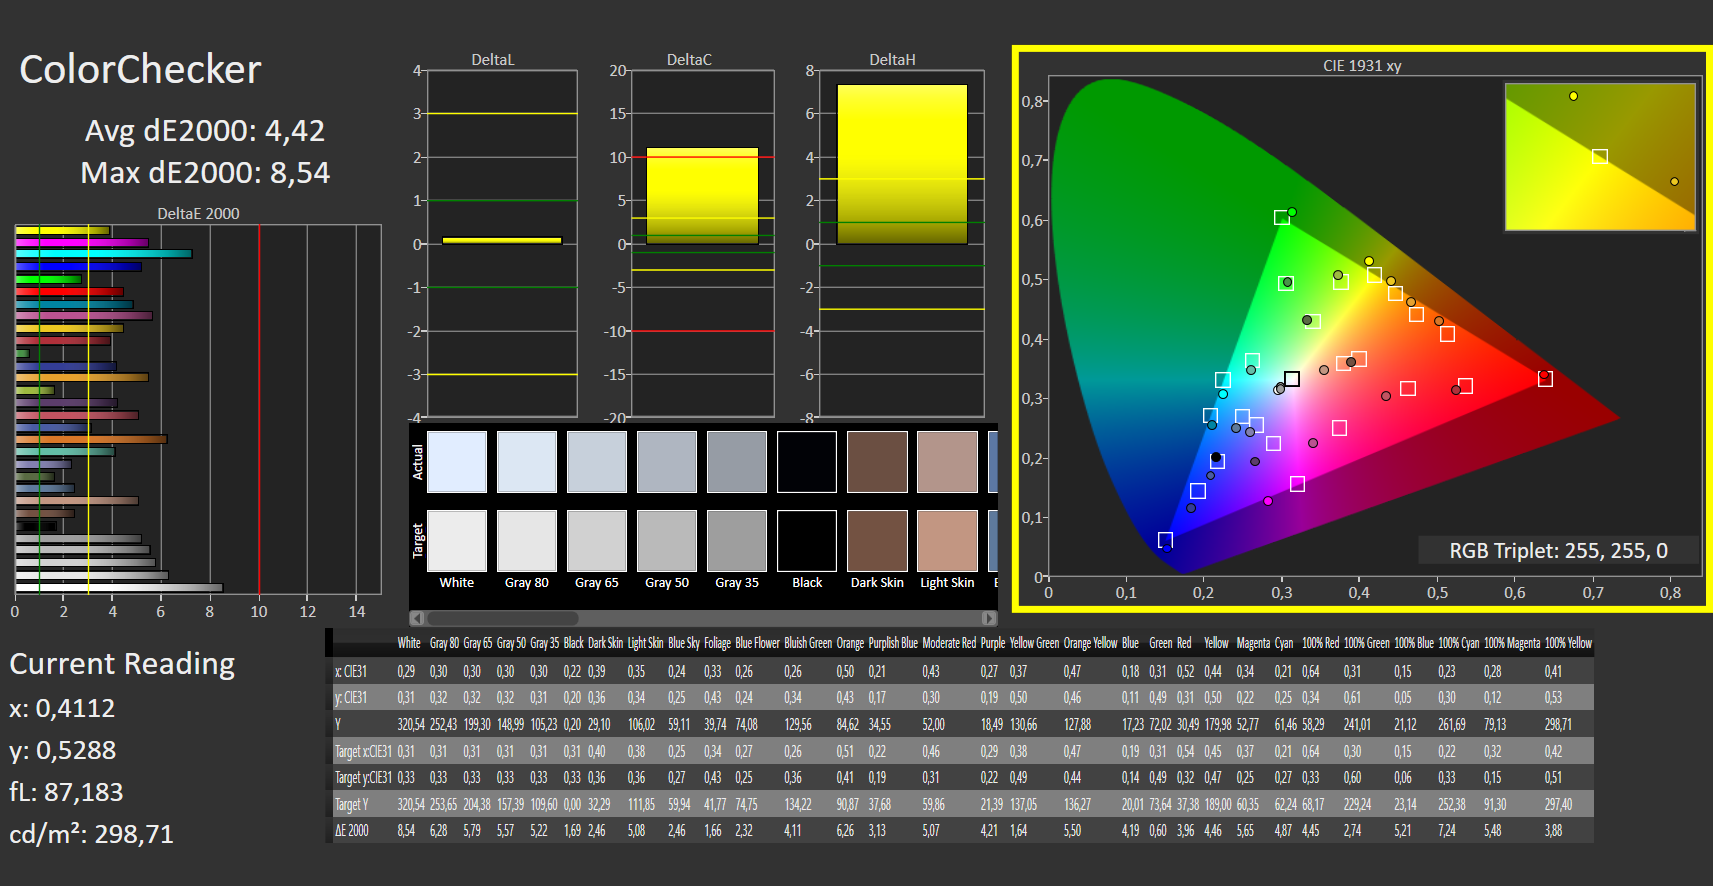
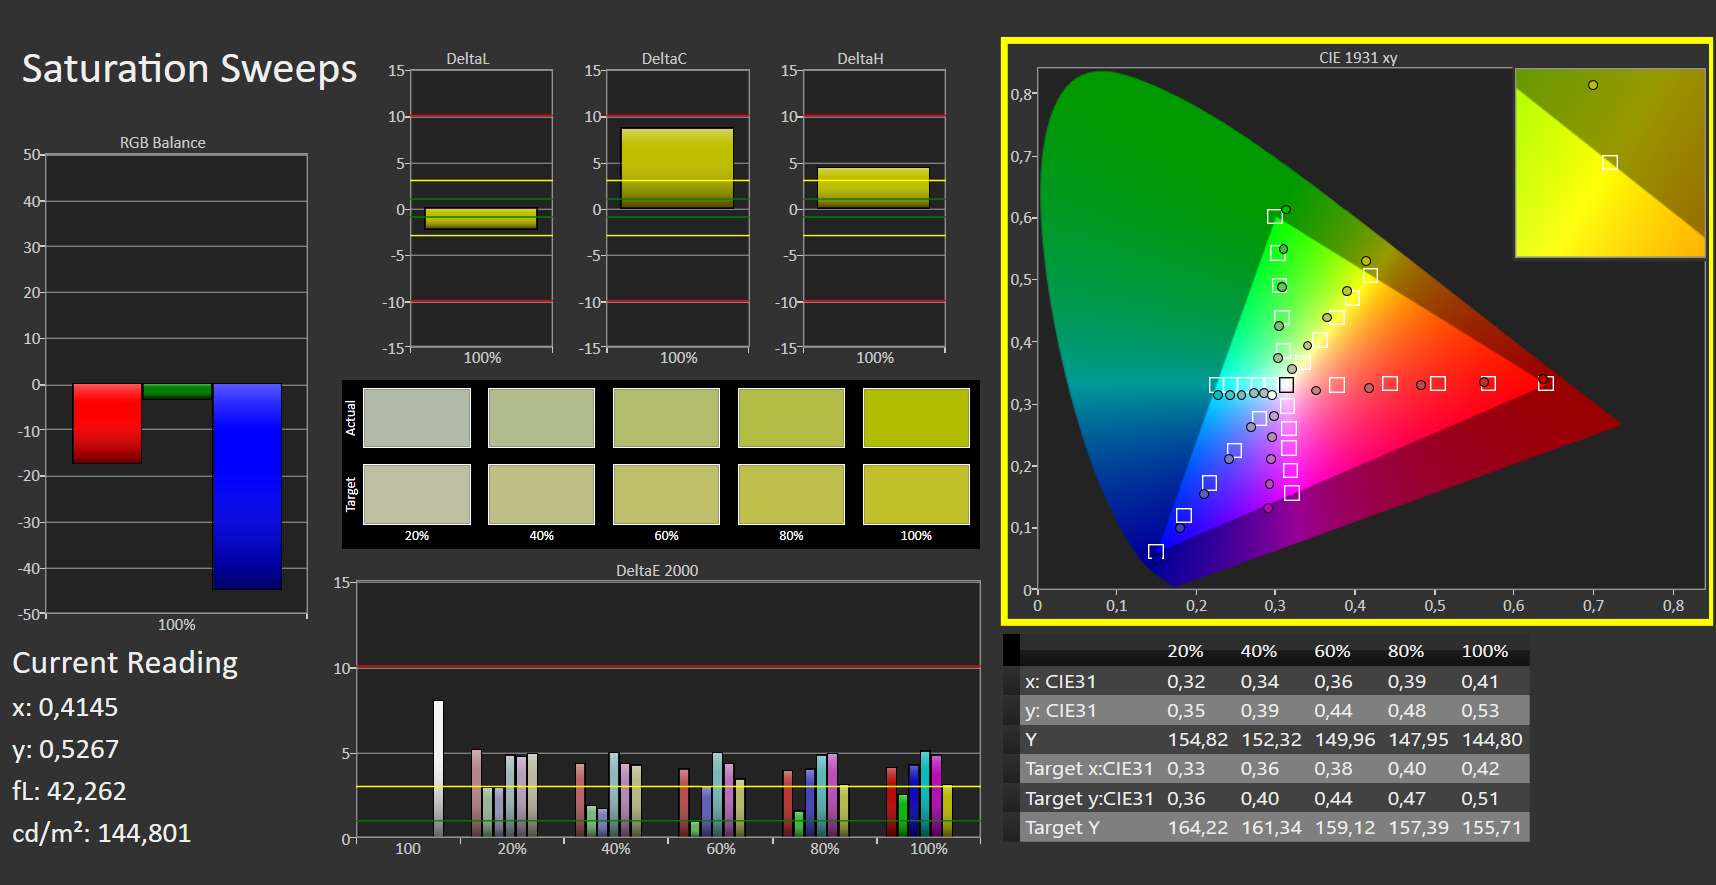
Mientras que el contraste (1.450:1) de la pantalla mate y de ángulo de visión estable de 15,6 pulgadas (Full HD, IPS) es bueno, el brillo (294,3 cd/m²) es casi aceptable. Consideramos que los valores superiores a 300 cd/m² son buenos. El panel de 144 Hz utilizado ofrece tiempos de respuesta rápidos y una reproducción de color decente. Es positivo: No pudimos detectar ningún parpadeo PWM.
Este es el mismo panel que se utilizó en el modelo anterior. Sin embargo, los valores medidos difieren ligeramente. Esta es una condición normal. Dos pantallas idénticas nunca serán 100% consistentes.
| |||||||||||||||||||||||||
iluminación: 83 %
Brillo con batería: 254 cd/m²
Contraste: 1450:1 (Negro: 0.22 cd/m²)
ΔE ColorChecker Calman: 4.42 | ∀{0.5-29.43 Ø4.71}
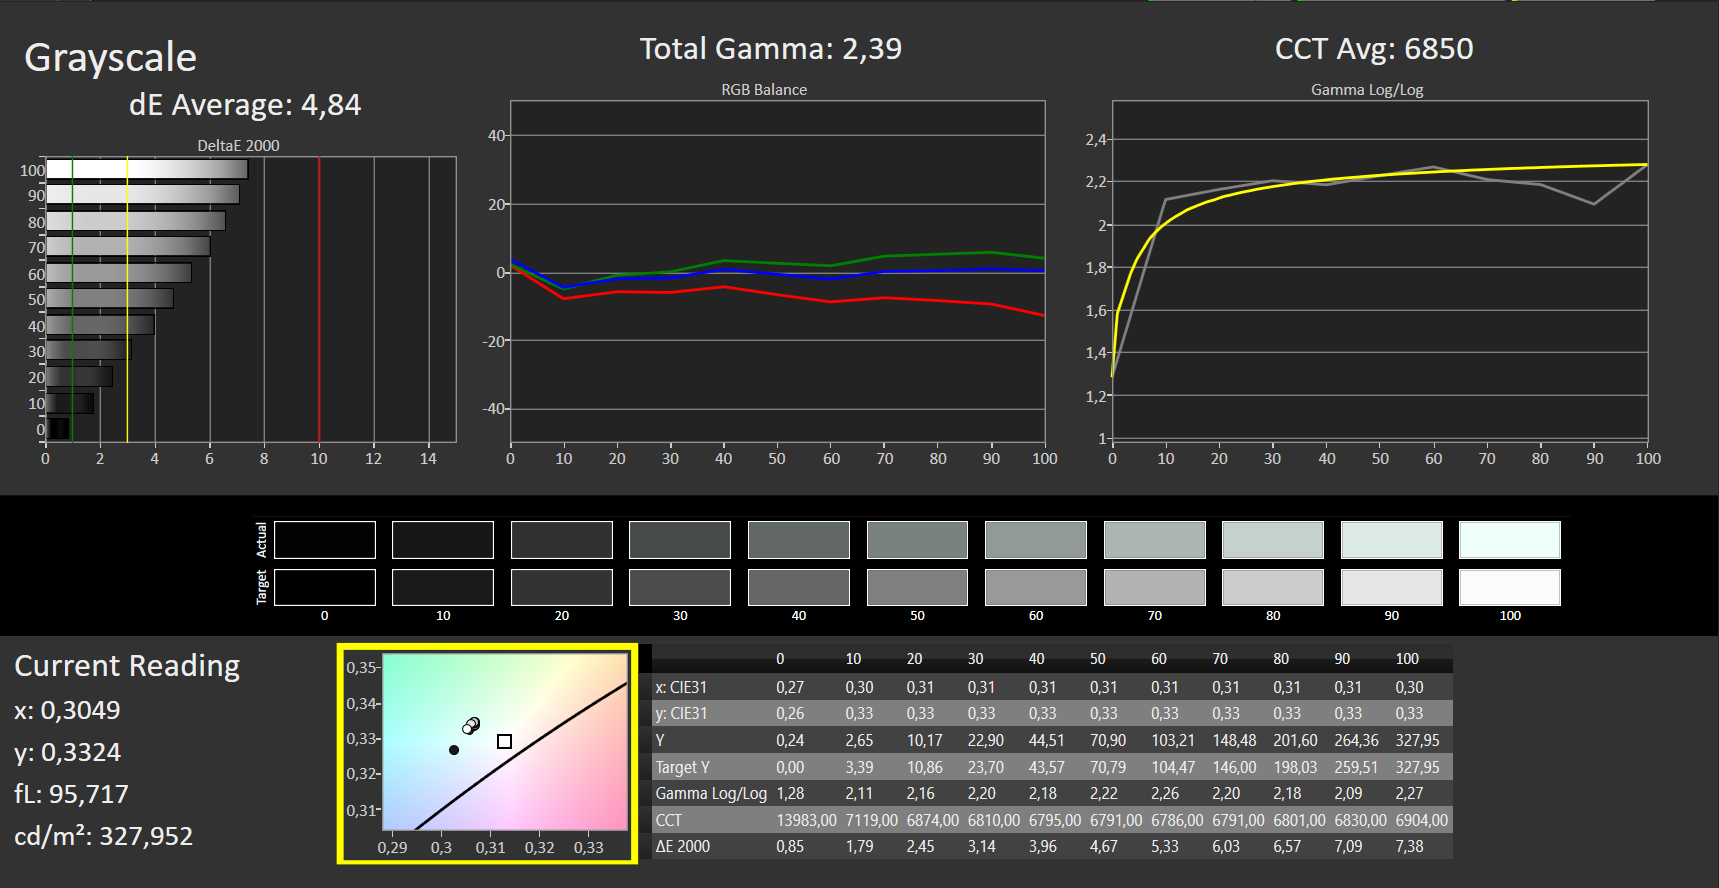
ΔE Greyscale Calman: 4.84 | ∀{0.09-98 Ø4.96}
92% sRGB (Argyll 1.6.3 3D)
60% AdobeRGB 1998 (Argyll 1.6.3 3D)
66.3% AdobeRGB 1998 (Argyll 3D)
92.3% sRGB (Argyll 3D)
65.2% Display P3 (Argyll 3D)
Gamma: 2.39
CCT: 6850 K
| Acer Predator Helios 300 PH315-53-77N5 AU Optronics B156HAN08.2, IPS, 1920x1080, 15.6" | Acer Predator Helios 300 PH315-52-79TY AUO, B156HAN08.2, IPS, 1920x1080, 15.6" | Dell G5 15 SE 5505 P89F BOE NV156FH, WVA, 1920x1080, 15.6" | Aorus 5 KB LG Philips LP156WFG-SPB2 (LGD05E8), IPS, 1920x1080, 15.6" | Schenker XMG Core 15 GK5NR0O LM156LF-1F02, IPS, 1920x1080, 15.6" | Asus TUF Gaming A15 FA506IV-HN172 LM156LF-2F01, IPS, 1920x1080, 15.6" | |
|---|---|---|---|---|---|---|
| Display | -1% | -3% | -1% | 3% | -39% | |
| Display P3 Coverage (%) | 65.2 | 64.1 -2% | 63 -3% | 63.4 -3% | 67.2 3% | 38.92 -40% |
| sRGB Coverage (%) | 92.3 | 93 1% | 90.1 -2% | 92.8 1% | 95.9 4% | 58.5 -37% |
| AdobeRGB 1998 Coverage (%) | 66.3 | 65.7 -1% | 64.1 -3% | 64.8 -2% | 68.5 3% | 40.22 -39% |
| Response Times | 15% | -9% | 7% | 29% | -109% | |
| Response Time Grey 50% / Grey 80% * (ms) | 17 ? | 15 ? 12% | 20.4 ? -20% | 14.4 ? 15% | 9.6 ? 44% | 34 ? -100% |
| Response Time Black / White * (ms) | 11 ? | 9 ? 18% | 10.8 ? 2% | 11.2 ? -2% | 9.6 ? 13% | 24 ? -118% |
| PWM Frequency (Hz) | 198.4 ? | |||||
| Screen | -2% | 0% | 10% | -13% | -17% | |
| Brightness middle (cd/m²) | 319 | 325 2% | 292 -8% | 318 0% | 312 -2% | 280 -12% |
| Brightness (cd/m²) | 294 | 310 5% | 290 -1% | 298 1% | 290 -1% | 254 -14% |
| Brightness Distribution (%) | 83 | 82 -1% | 77 -7% | 87 5% | 87 5% | 88 6% |
| Black Level * (cd/m²) | 0.22 | 0.255 -16% | 0.27 -23% | 0.3 -36% | 0.2 9% | 0.15 32% |
| Contrast (:1) | 1450 | 1275 -12% | 1081 -25% | 1060 -27% | 1560 8% | 1867 29% |
| Colorchecker dE 2000 * | 4.42 | 4.28 3% | 3.99 10% | 2.49 44% | 4.84 -10% | 5.89 -33% |
| Colorchecker dE 2000 max. * | 8.54 | 8.42 1% | 6.11 28% | 5.06 41% | 13.85 -62% | 19 -122% |
| Greyscale dE 2000 * | 4.84 | 5.01 -4% | 3.3 32% | 1.6 67% | 9 -86% | 4.08 16% |
| Gamma | 2.39 92% | 2.6 85% | 2.25 98% | 2.211 100% | 2.105 105% | 2.33 94% |
| CCT | 6850 95% | 7678 85% | 7047 92% | 6714 97% | 8099 80% | 7303 89% |
| Color Space (Percent of AdobeRGB 1998) (%) | 60 | 60 0% | 58.1 -3% | 65 8% | 68 13% | 37 -38% |
| Color Space (Percent of sRGB) (%) | 92 | 93 1% | 89.7 -2% | 89 -3% | 92 0% | 58 -37% |
| Colorchecker dE 2000 calibrated * | 1.45 | 3.02 | 1.53 | 1.77 | 4.79 | |
| Media total (Programa/Opciones) | 4% /
0% | -4% /
-2% | 5% /
7% | 6% /
-4% | -55% /
-34% |
* ... más pequeño es mejor
Tiempos de respuesta del display
| ↔ Tiempo de respuesta de Negro a Blanco | ||
|---|---|---|
| 11 ms ... subida ↗ y bajada ↘ combinada | ↗ 6 ms subida | 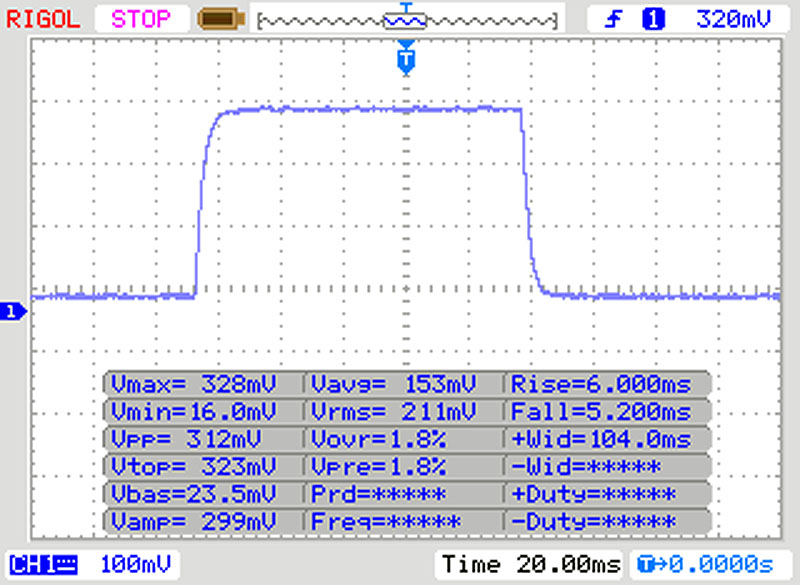 |
| ↘ 5 ms bajada | ||
| La pantalla mostró buenos tiempos de respuesta en nuestros tests pero podría ser demasiado lenta para los jugones competitivos. En comparación, todos los dispositivos de prueba van de ##min### (mínimo) a 240 (máximo) ms. » 30 % de todos los dispositivos son mejores. Esto quiere decir que el tiempo de respuesta medido es mejor que la media (19.8 ms) de todos los dispositivos testados. | ||
| ↔ Tiempo de respuesta 50% Gris a 80% Gris | ||
| 17 ms ... subida ↗ y bajada ↘ combinada | ↗ 9 ms subida | 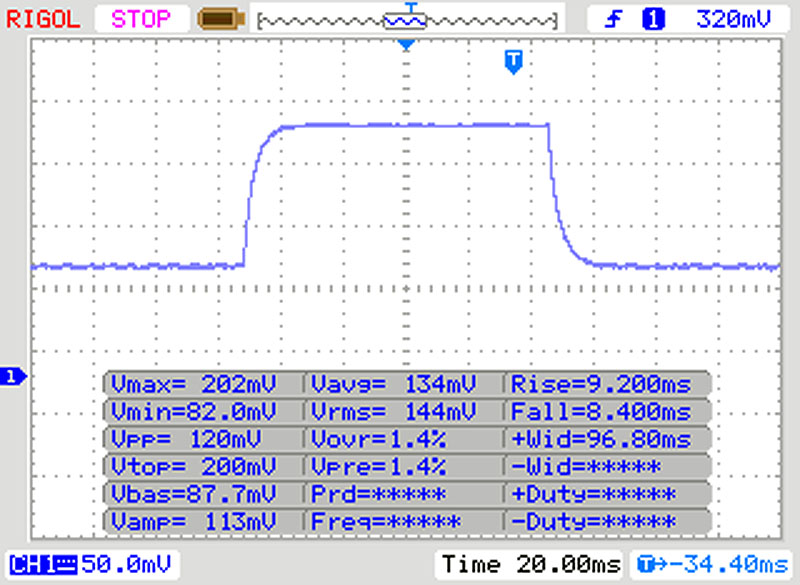 |
| ↘ 8 ms bajada | ||
| La pantalla mostró buenos tiempos de respuesta en nuestros tests pero podría ser demasiado lenta para los jugones competitivos. En comparación, todos los dispositivos de prueba van de ##min### (mínimo) a 636 (máximo) ms. » 31 % de todos los dispositivos son mejores. Esto quiere decir que el tiempo de respuesta medido es mejor que la media (30.9 ms) de todos los dispositivos testados. | ||
Parpadeo de Pantalla / PWM (Pulse-Width Modulation)
| Parpadeo de Pantalla / PWM no detectado | 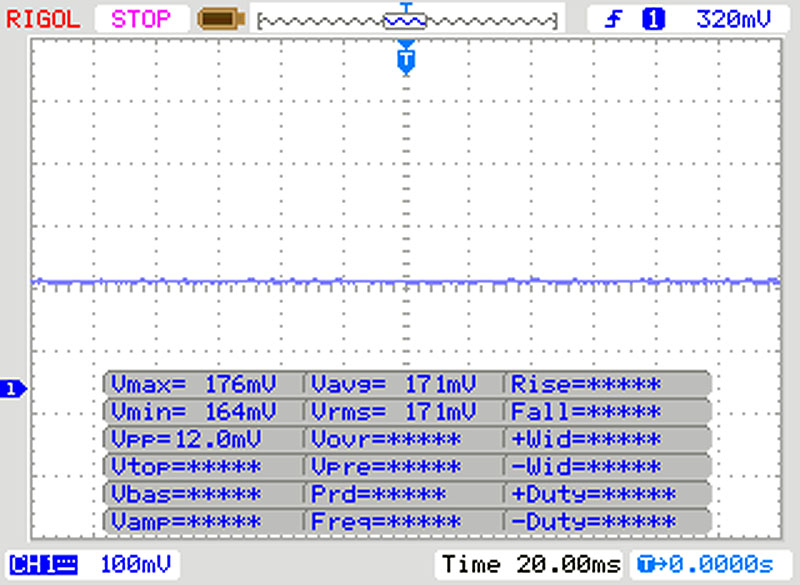 | ||
Comparación: 52 % de todos los dispositivos testados no usaron PWM para atenuar el display. Si se usó, medimos una media de 7744 (mínimo: 5 - máxmo: 343500) Hz. | |||
Rendimiento - Predator con overclocking automático de la GPU
Con el Predator Helios 300, Acer tiene un portátil para juegos de 15,6 pulgadas en su gama que lleva todos los juegos modernos a la pantalla sin problemas. El precio de nuestro dispositivo de prueba debería ser aproximadamente entre 1.500 y 1.600 euros (~$1.744 y ~$1.860). Existen otras variantes de configuración. Los precios comienzan en alrededor de 1.020 Euros (~$1.186).
Condiciones de la prueba
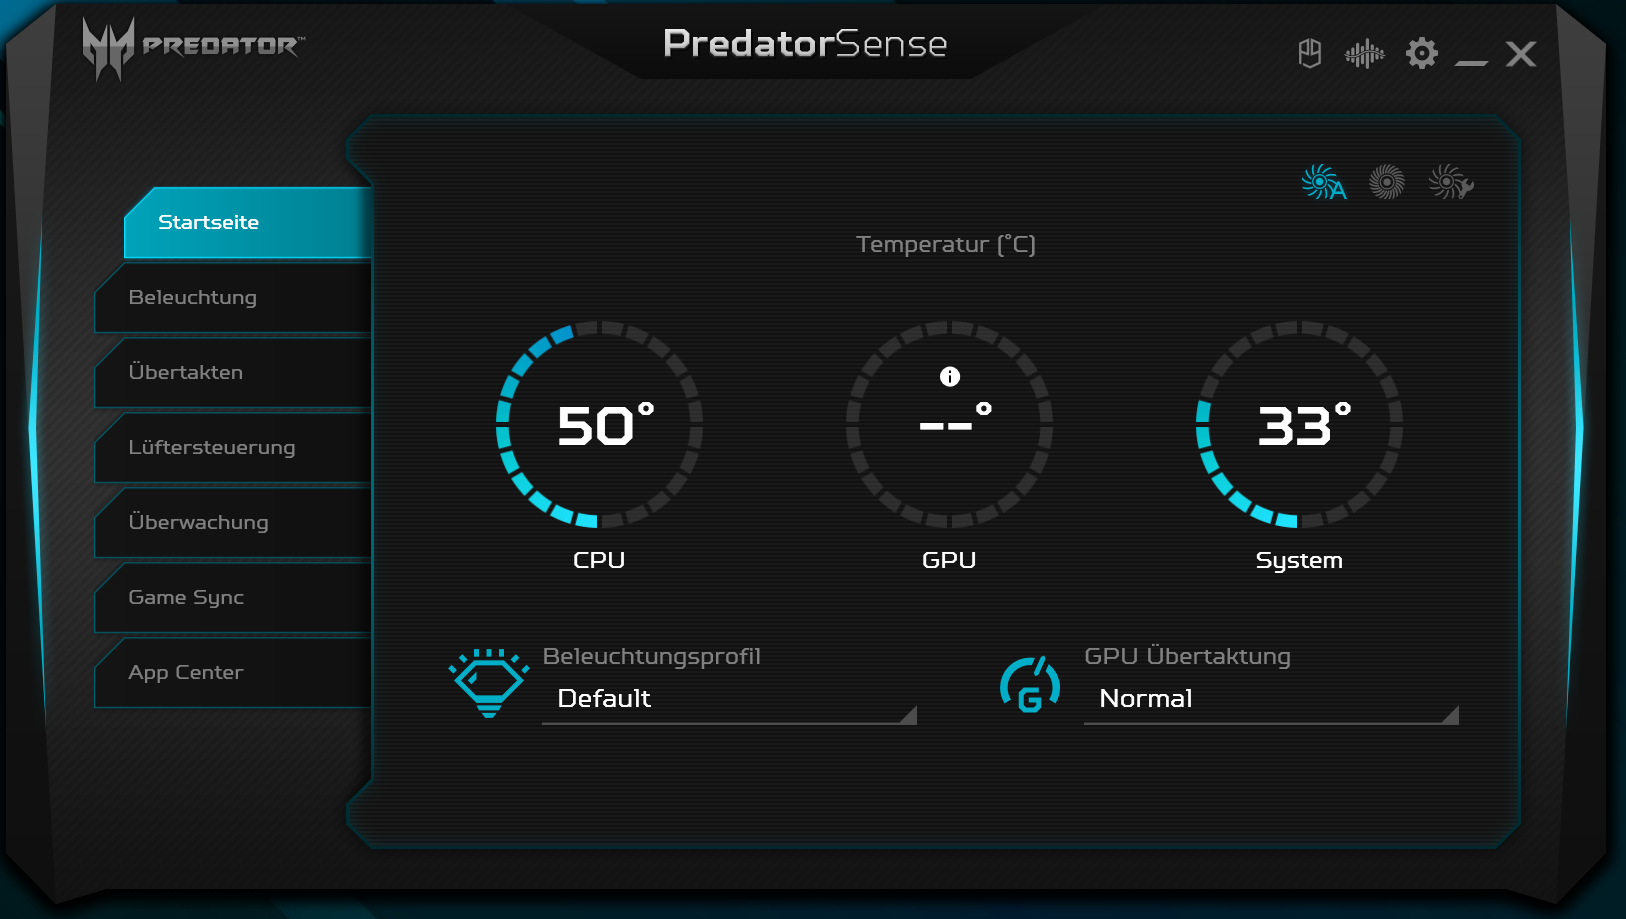
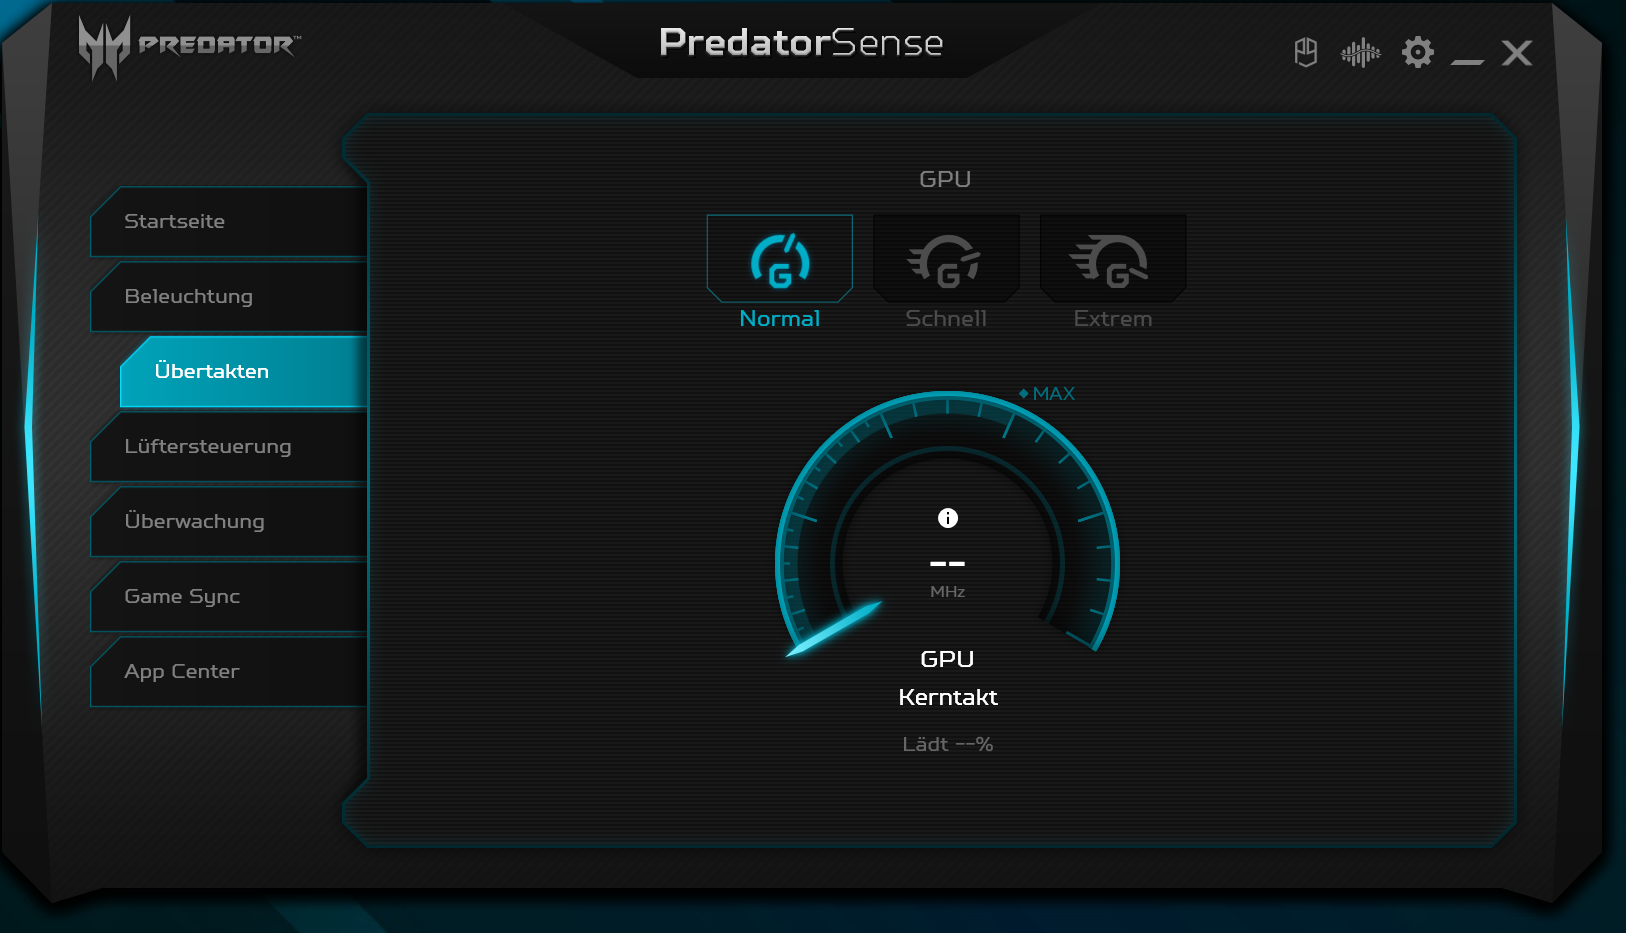
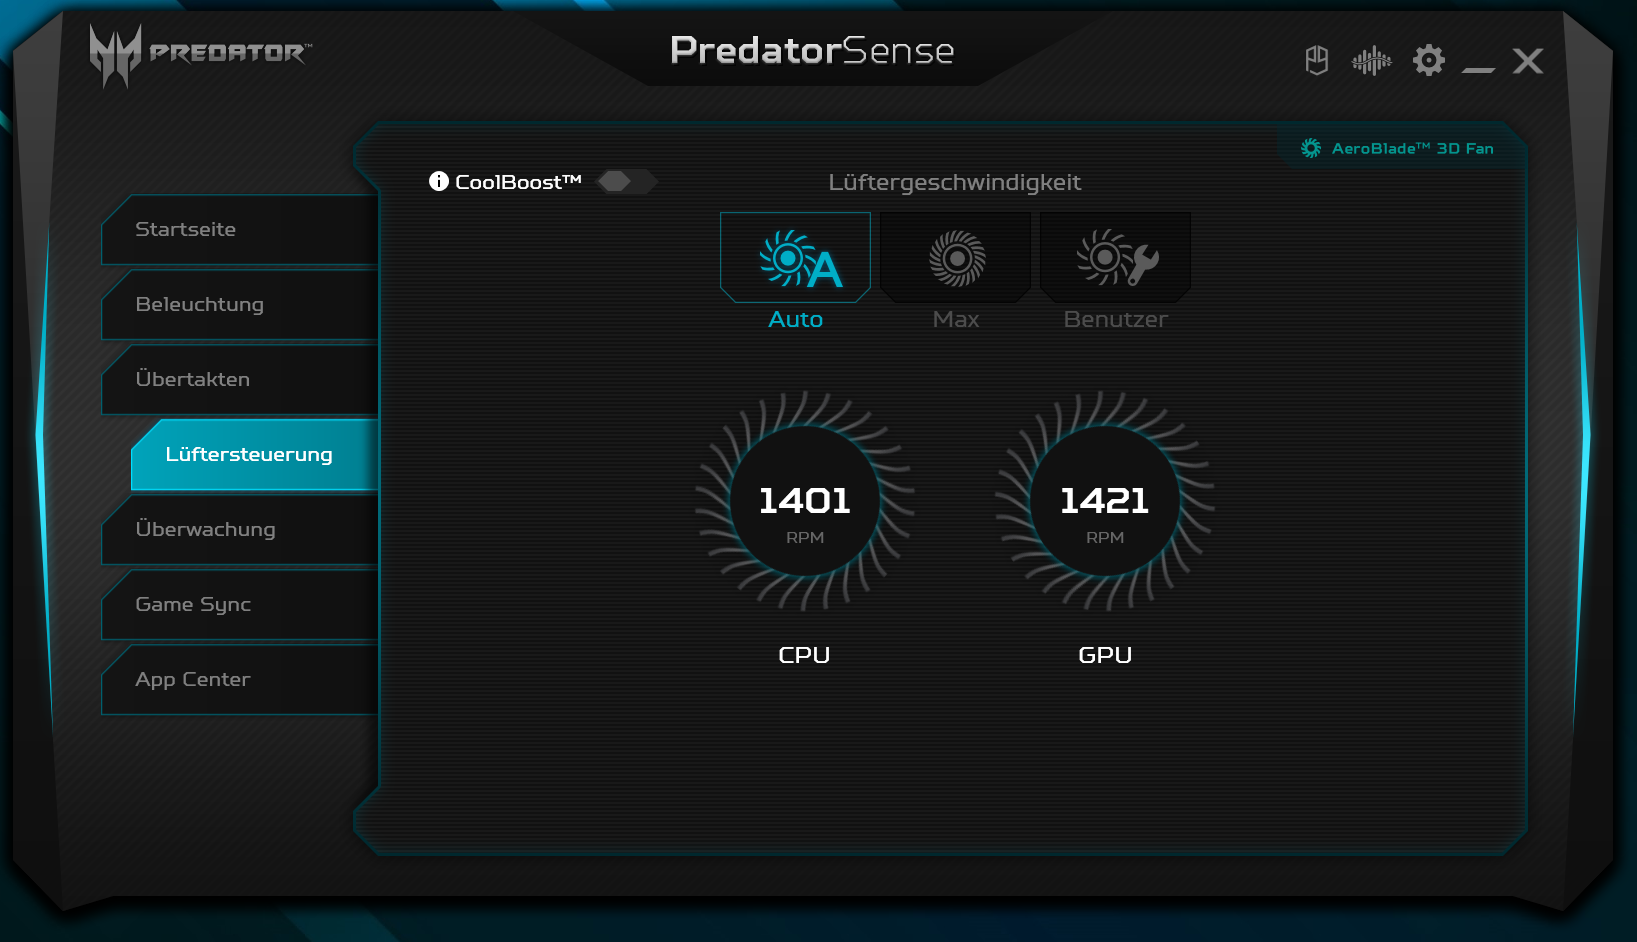
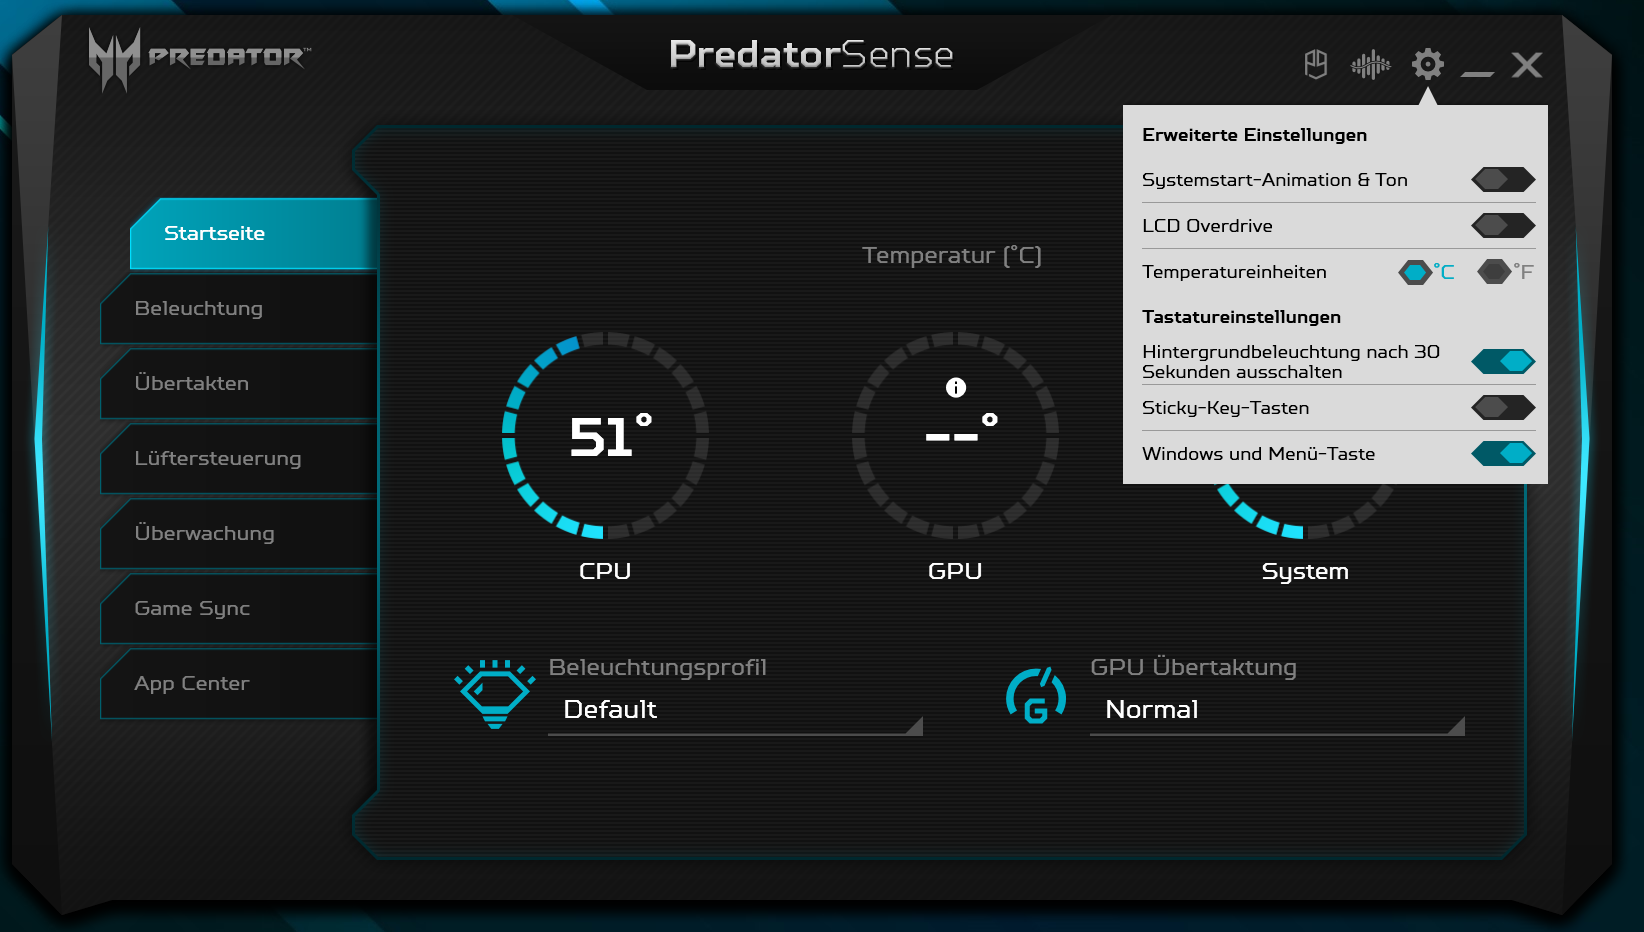
El software Predator Sense preinstalado permite el ajuste del control del ventilador y el overclocking automático de la GPU. Los perfiles de la GPU "Normal", "Rápido" y "Extremo" están disponibles. Realizamos nuestra prueba con el control automático del ventilador y bajo el perfil de GPU "Normal". Algunos benchmarks fueron adicionalmente ejecutados bajo el perfil "Extremo".
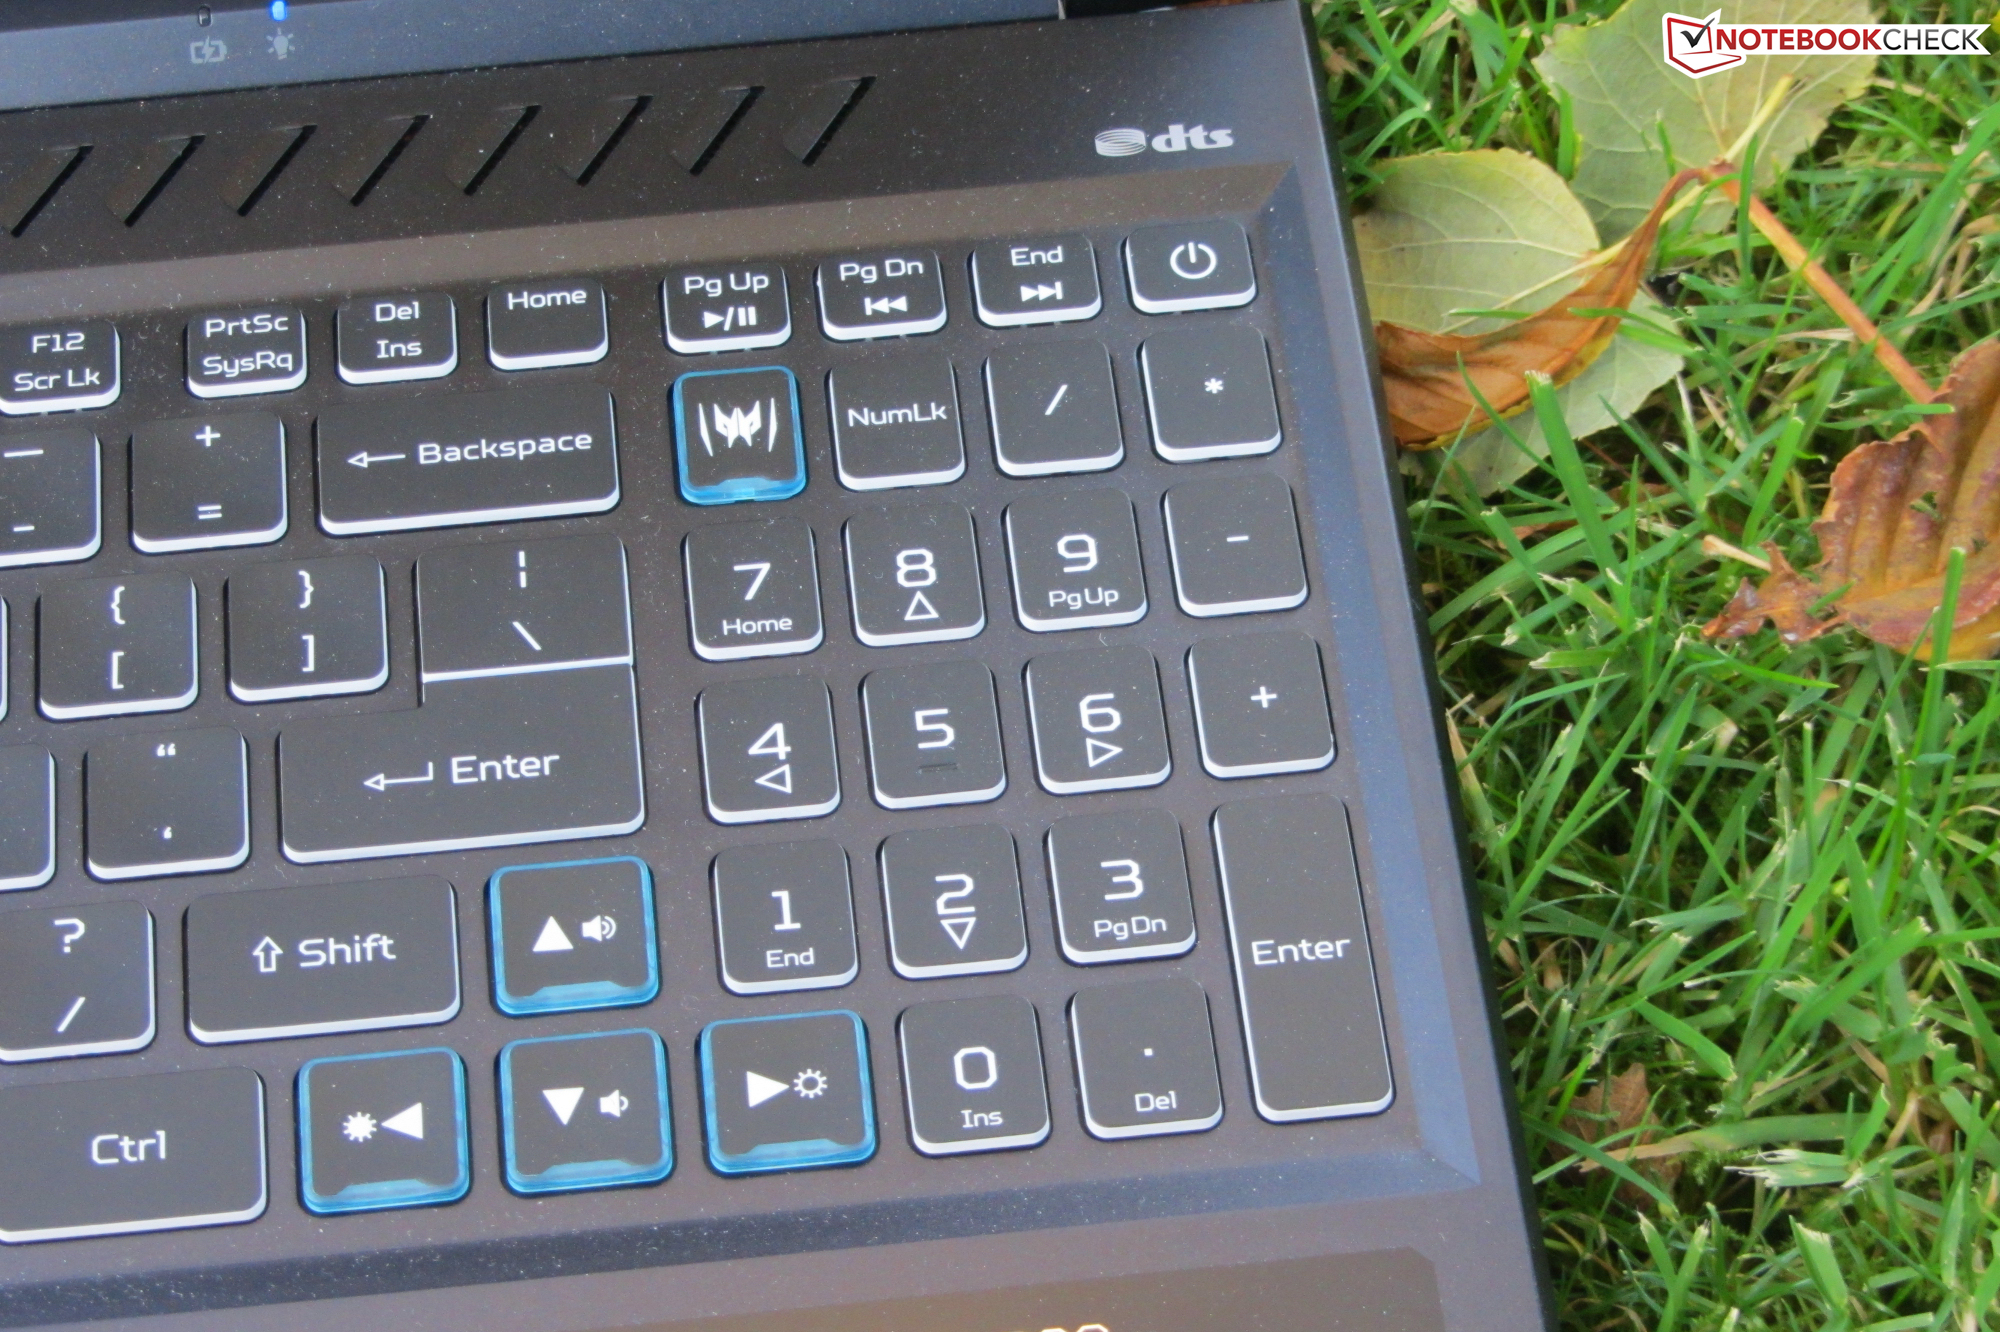
Acer ha colocado una tecla "Turbo" sobre el teclado. Si se pulsa esta tecla, los ventiladores funcionan permanentemente a plena potencia y se activa el perfil de GPU "Extremo".
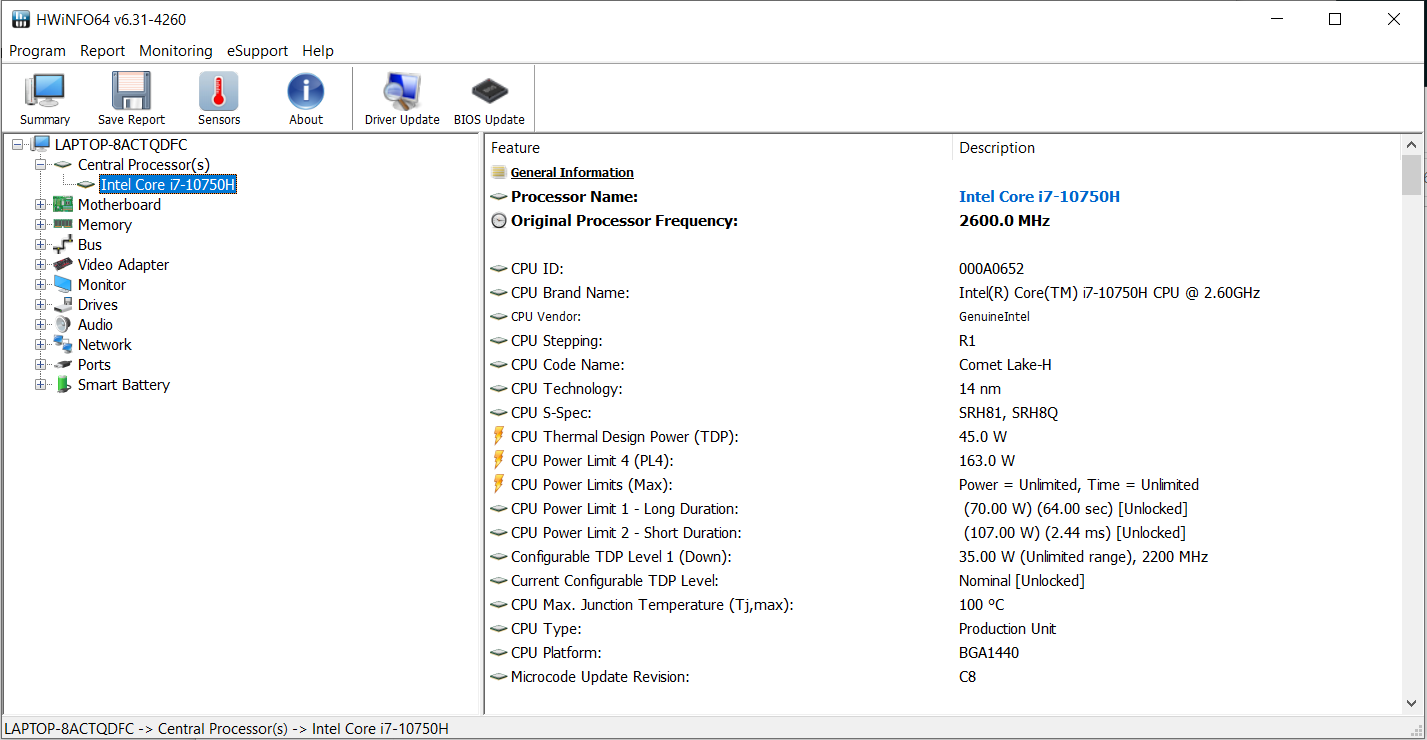
Procesador
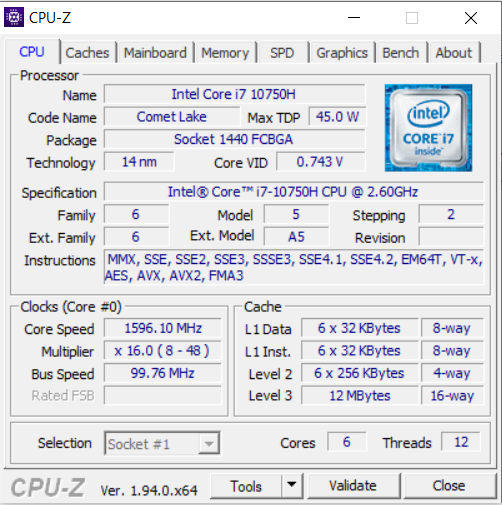
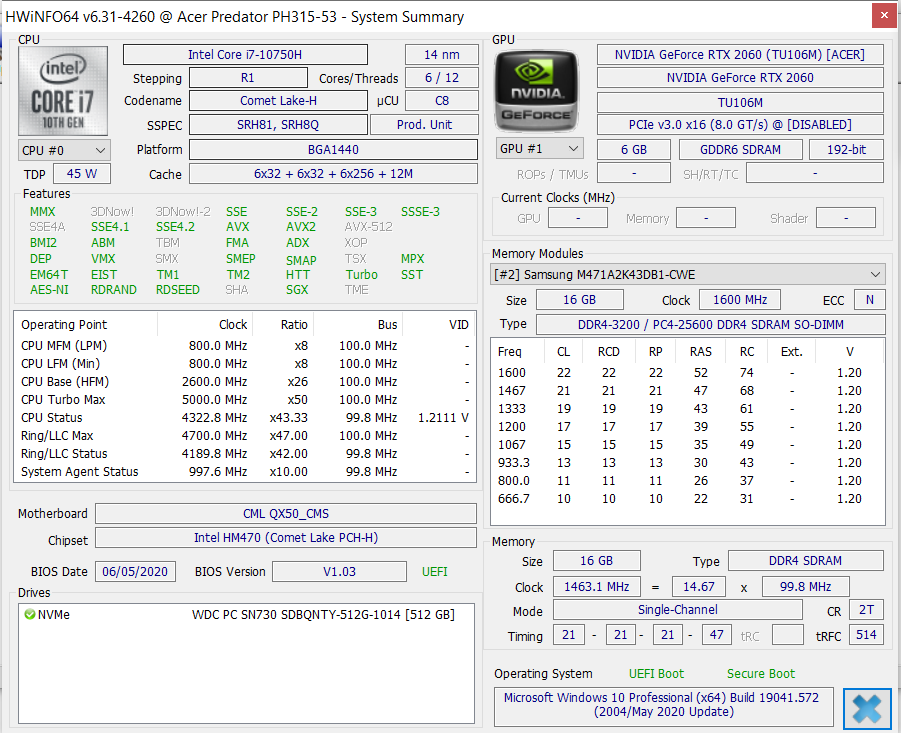
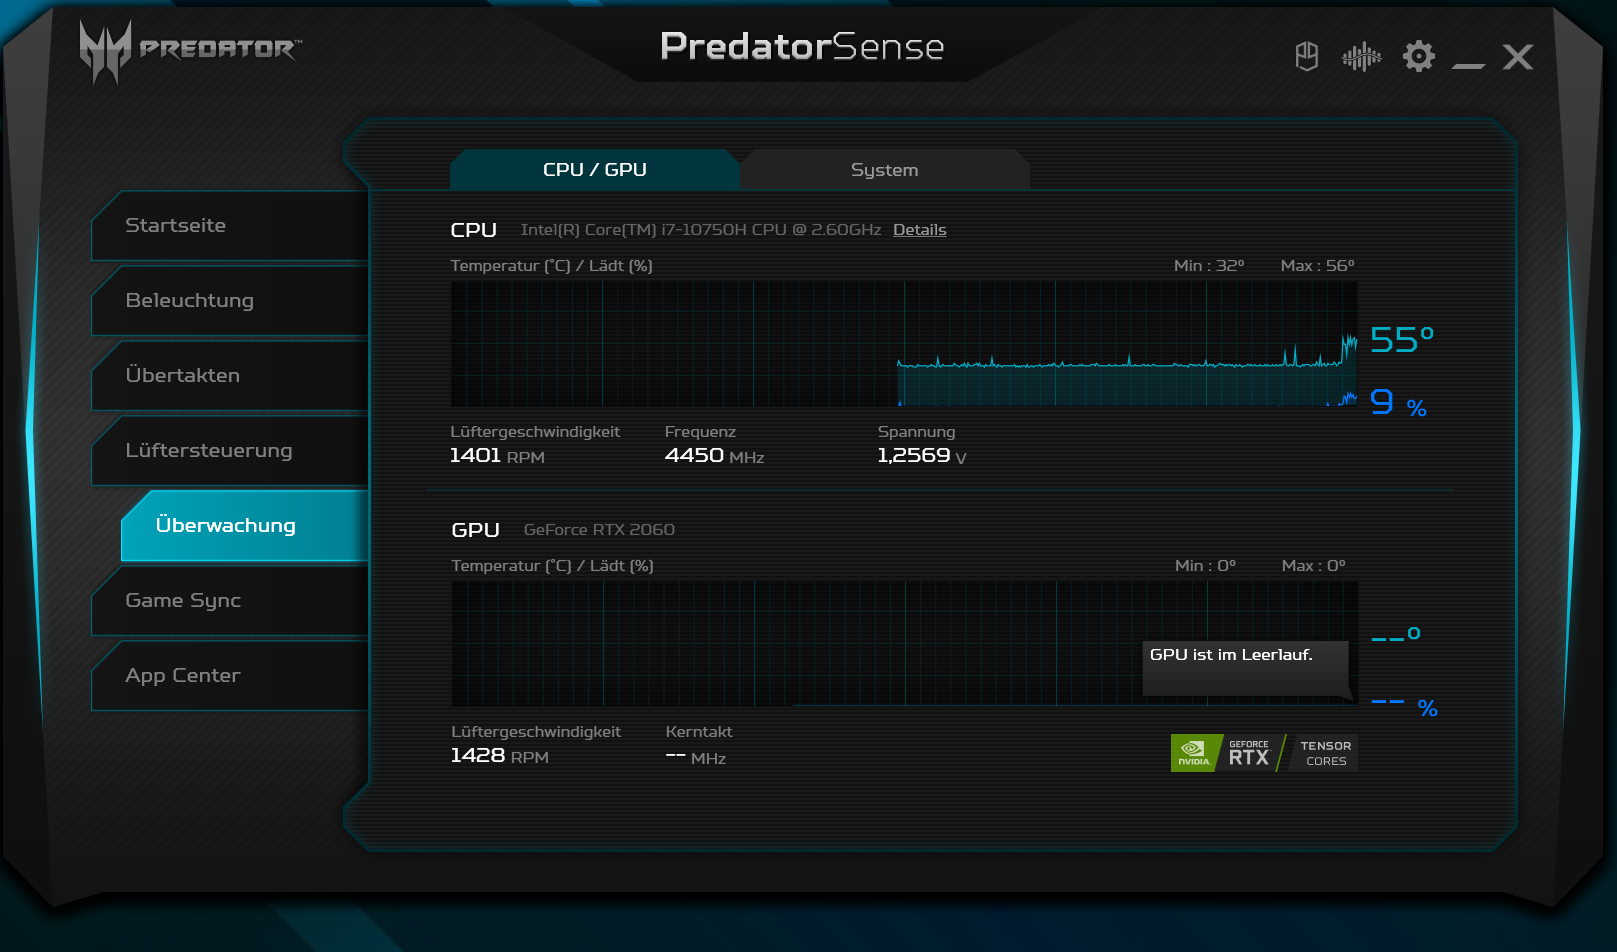
El procesador hexa-core Core i7-10750H (Comet Lake) funciona a una velocidad base de 2,6 GHz. La velocidad puede aumentarse a 4,3 GHz (seis núcleos) o 5 GHz (un núcleo) mediante Turbo. Se admite Hyper-Threading (dos hilos por núcleo).
El procesador funciona a través de las pruebas de CPU del benchmark Cinebench R15 a 4,2 GHz (multihilo) y 4,2 a 5 GHz (un solo hilo), respectivamente. Con la energía de las baterías, las velocidades son de 2,4 a 2,6 GHz (multihilo) y de 2,4 a 3,2 GHz (un solo hilo), respectivamente.
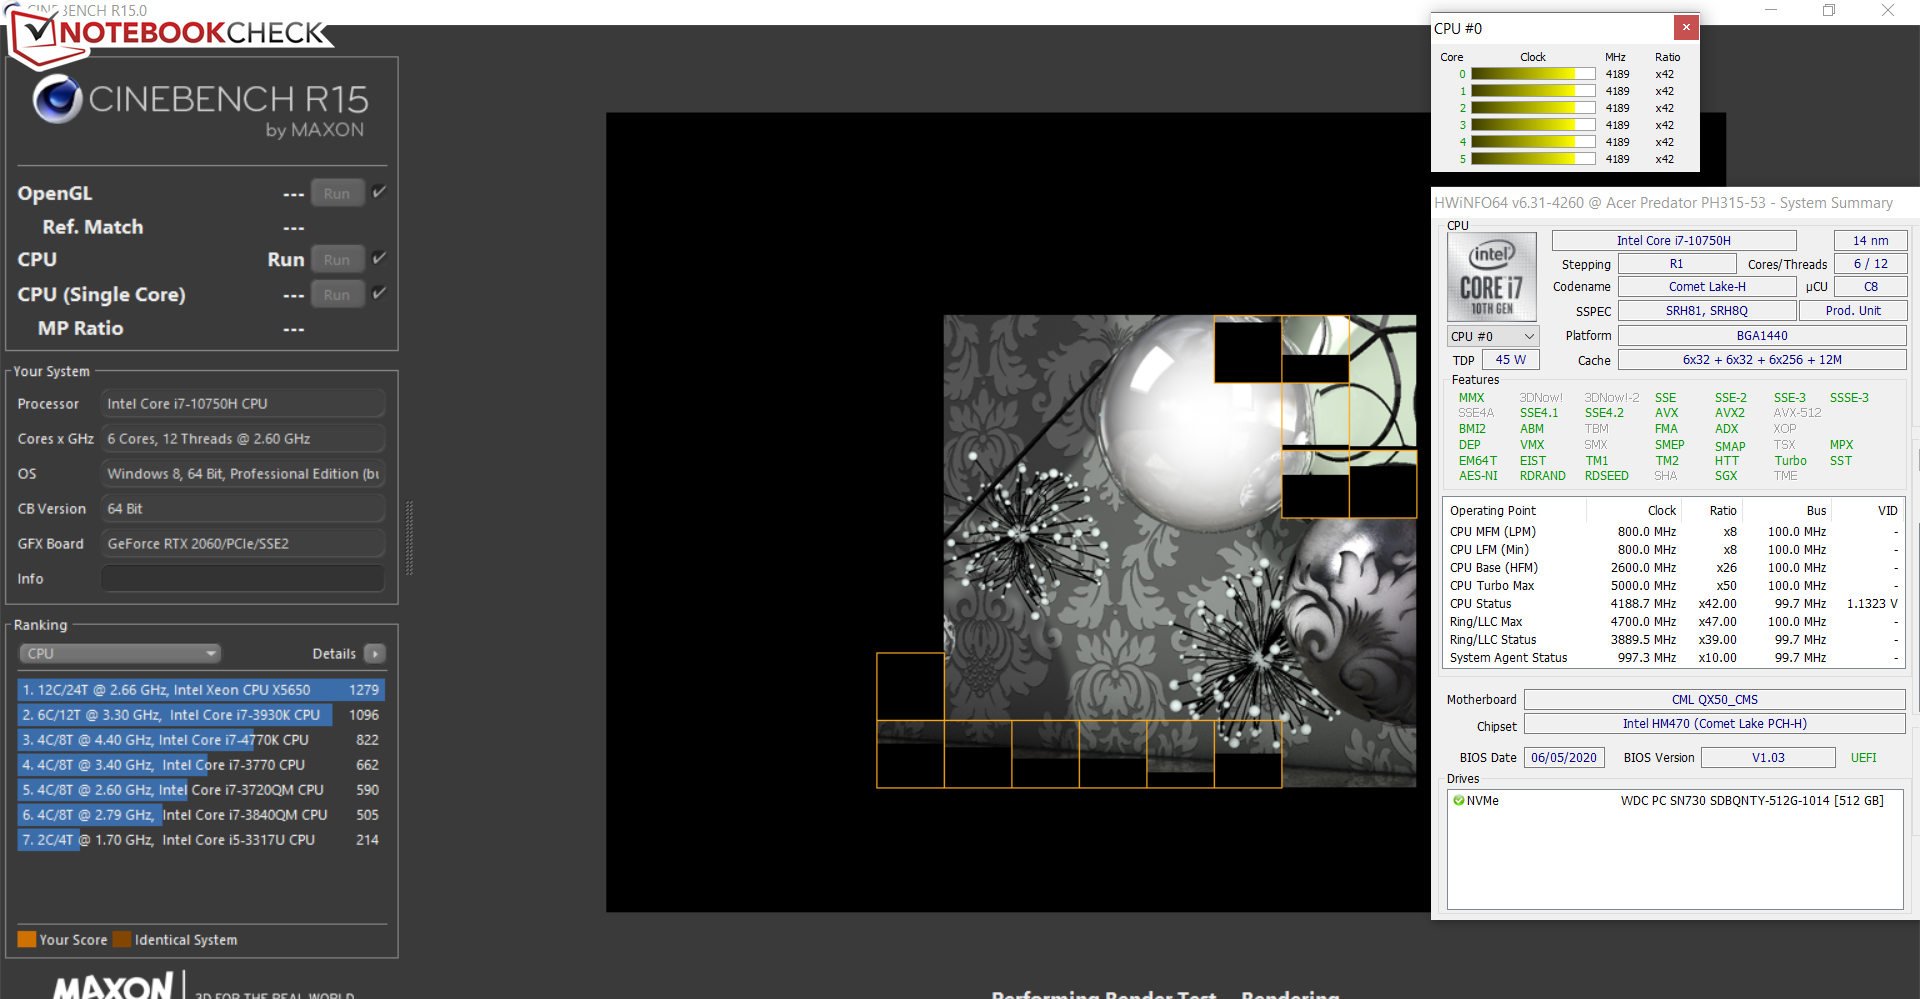
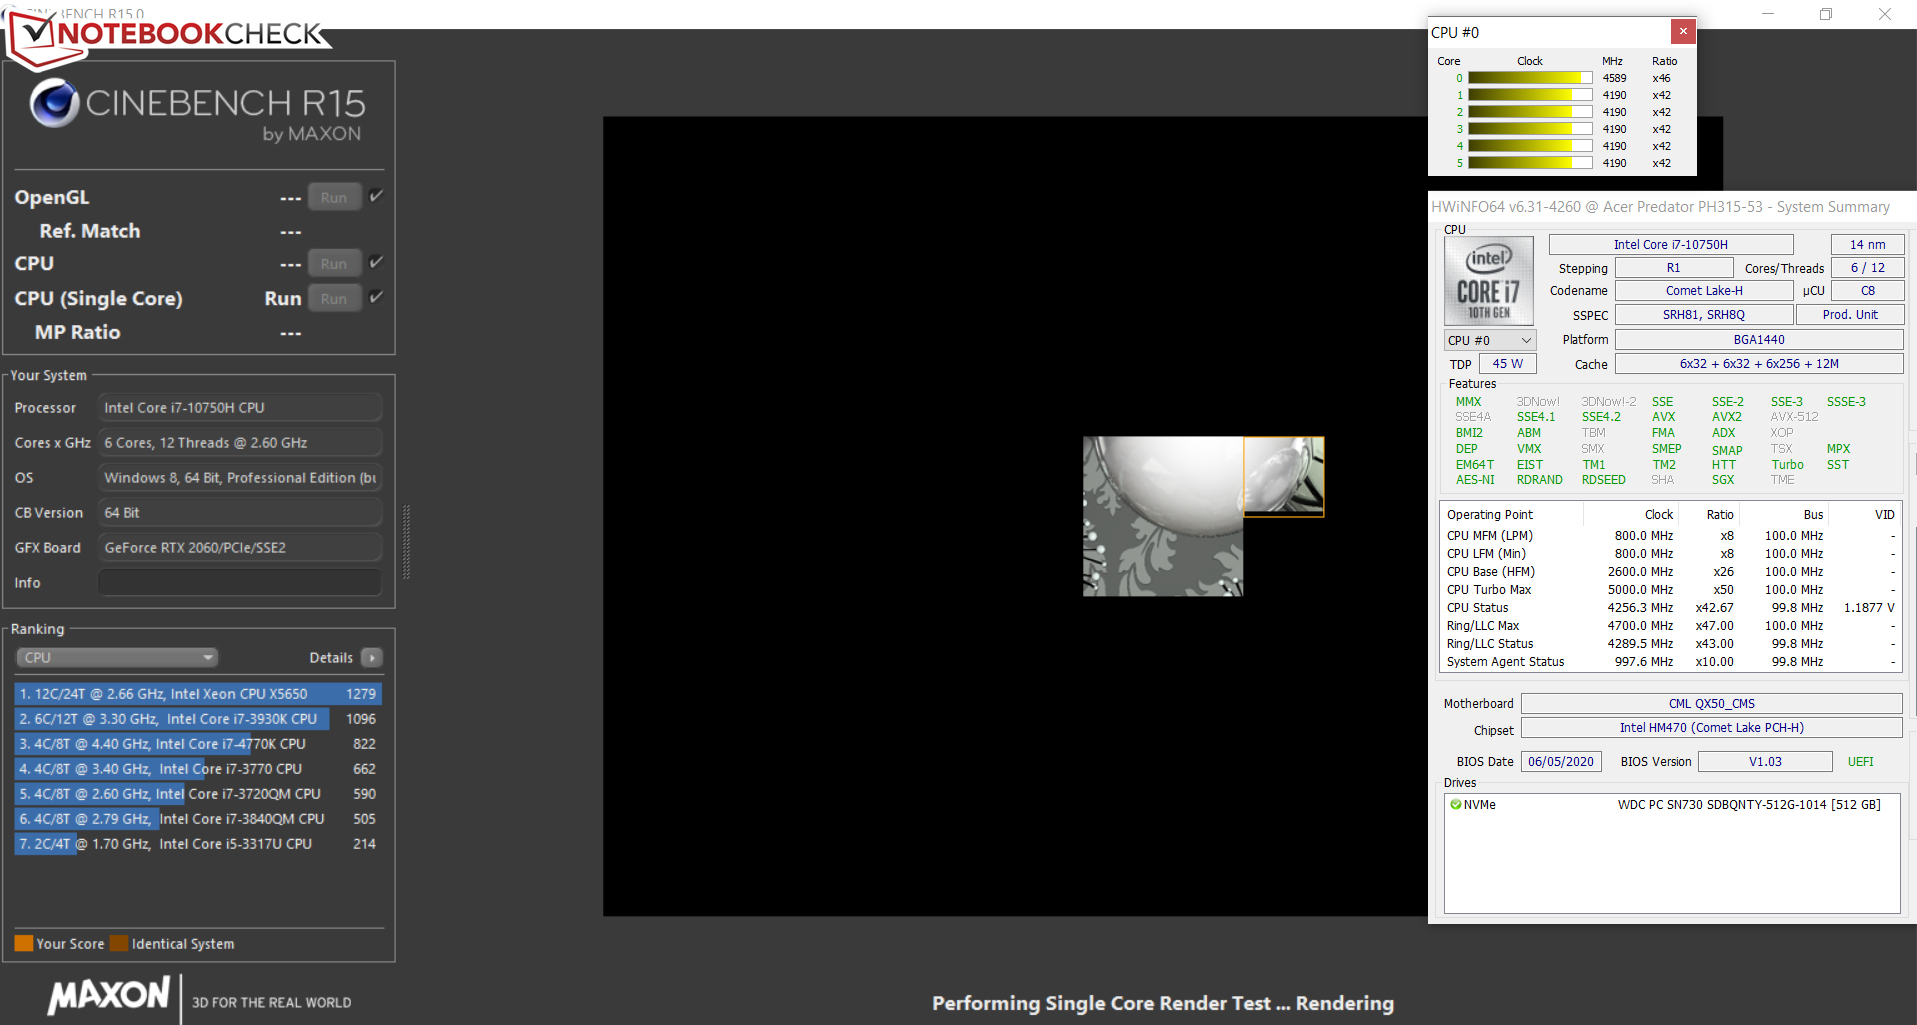
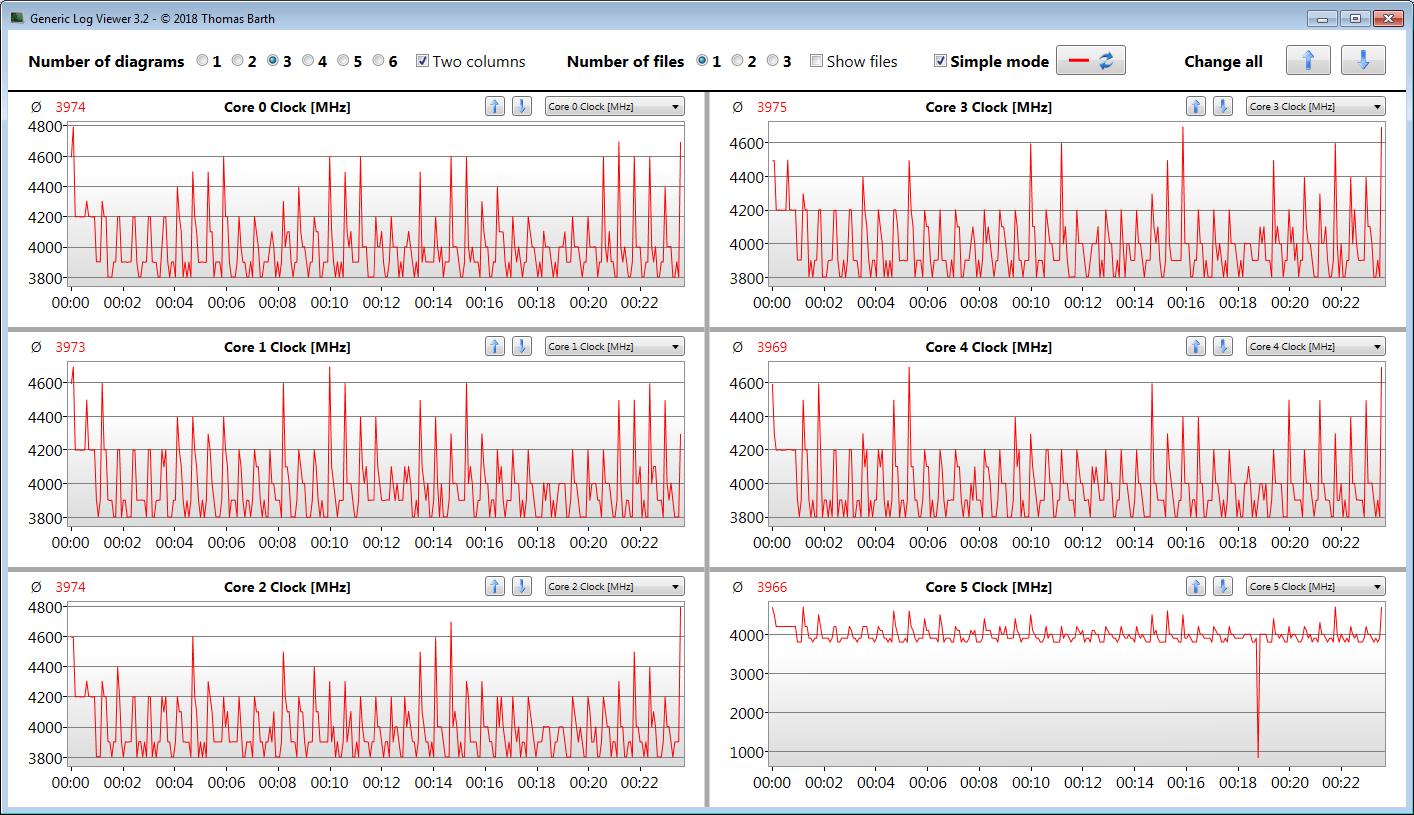
Verificamos si el Turbo de la CPU se usa consistentemente cuando se conecta ejecutando la prueba multihilo del Cinebench R15 en un bucle continuo durante al menos 30 minutos. El Turbo se utiliza en gran medida.
* ... más pequeño es mejor
Rendimiento del sistema
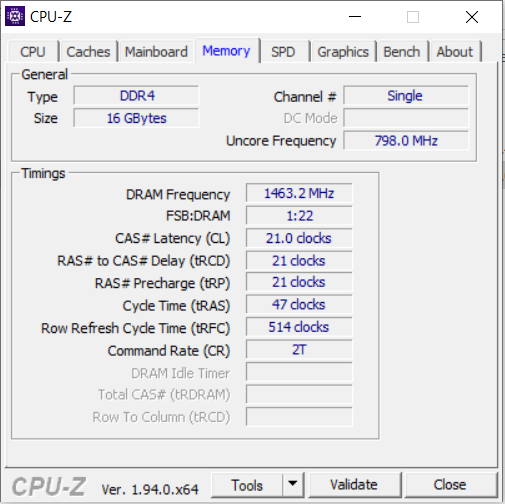
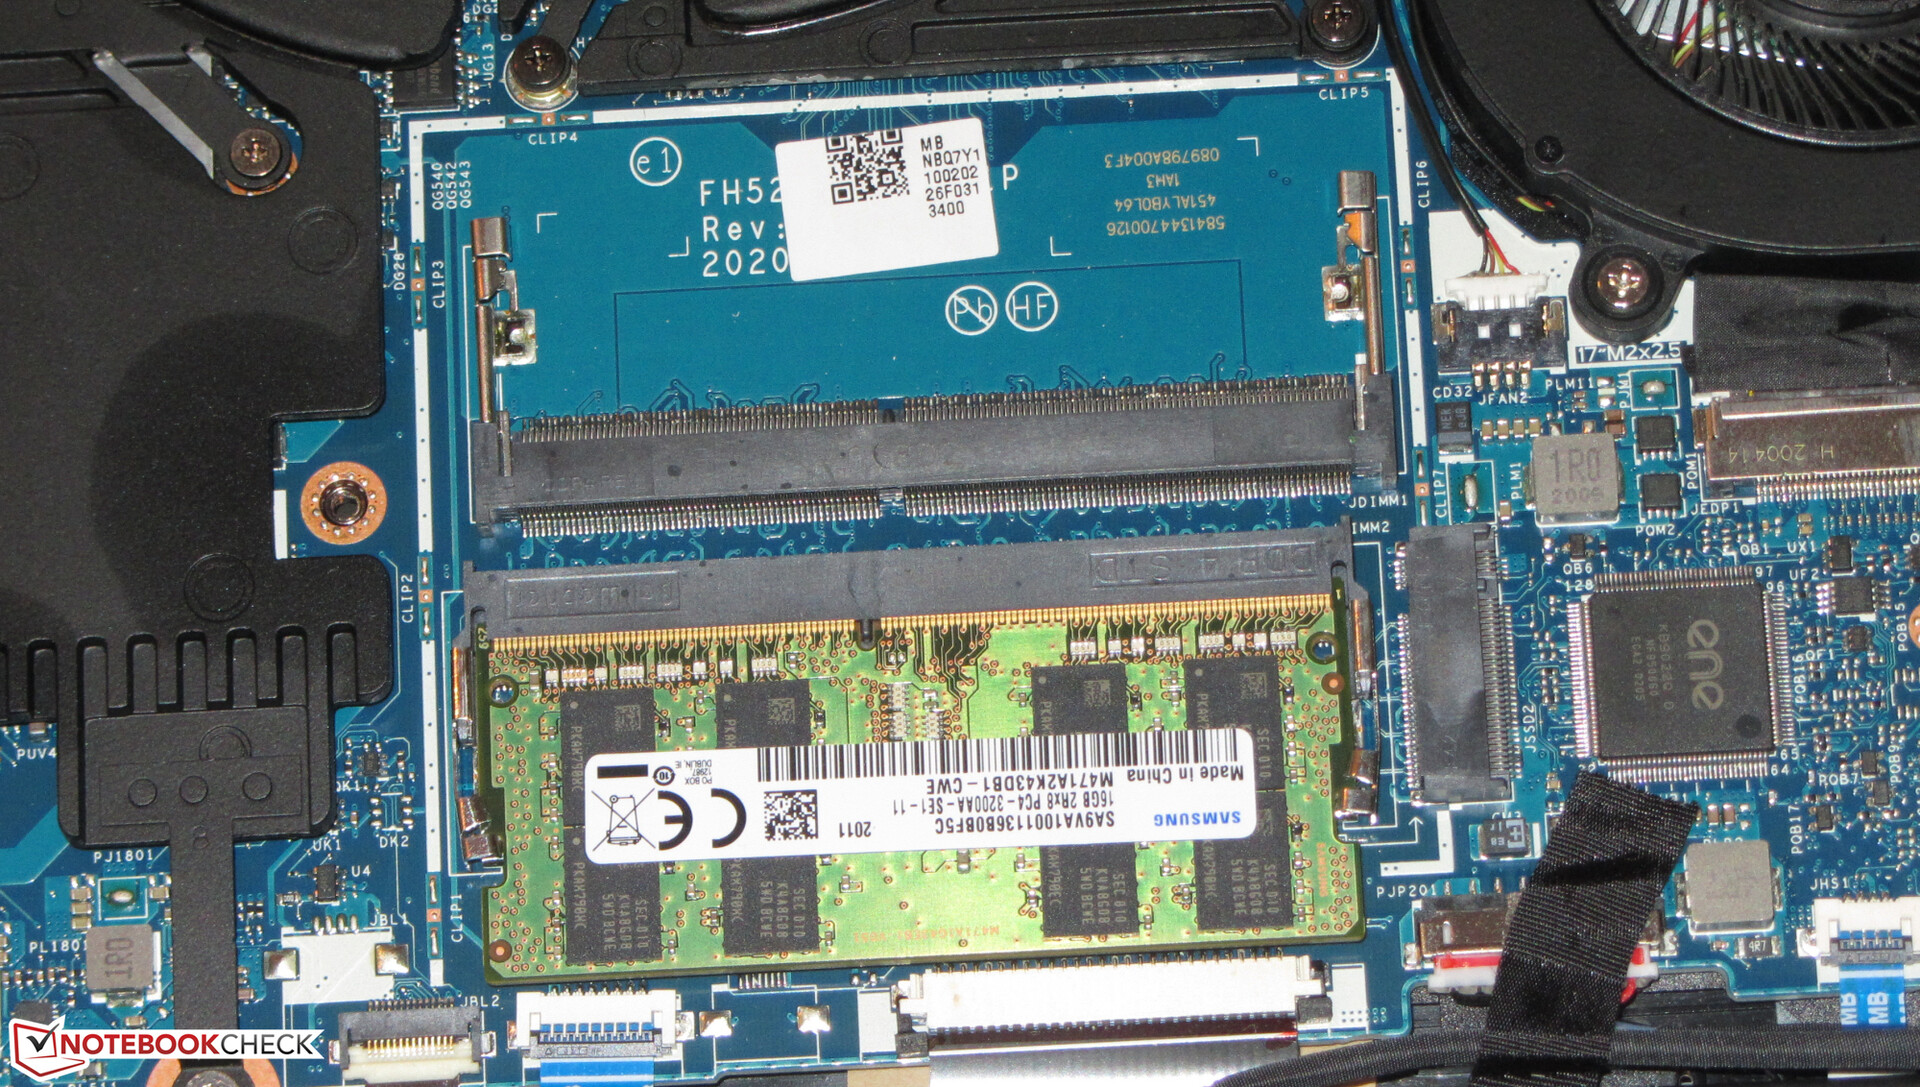
El sistema es rápido y suave. Los resultados del PCMark son buenos. El portátil ofrece suficiente potencia de computación para aplicaciones que exigen un alto rendimiento, como juegos, edición de vídeo y procesamiento de imágenes para los próximos años. Se podría lograr un ligero aumento del rendimiento activando el modo de doble canal. Para ello, el portátil tendría que estar equipado con un segundo módulo de memoria.
| PCMark 8 Home Score Accelerated v2 | 4160 puntos | |
| PCMark 8 Creative Score Accelerated v2 | 5899 puntos | |
| PCMark 8 Work Score Accelerated v2 | 5405 puntos | |
| PCMark 10 Score | 5921 puntos | |
ayuda | ||
Latencias DPC
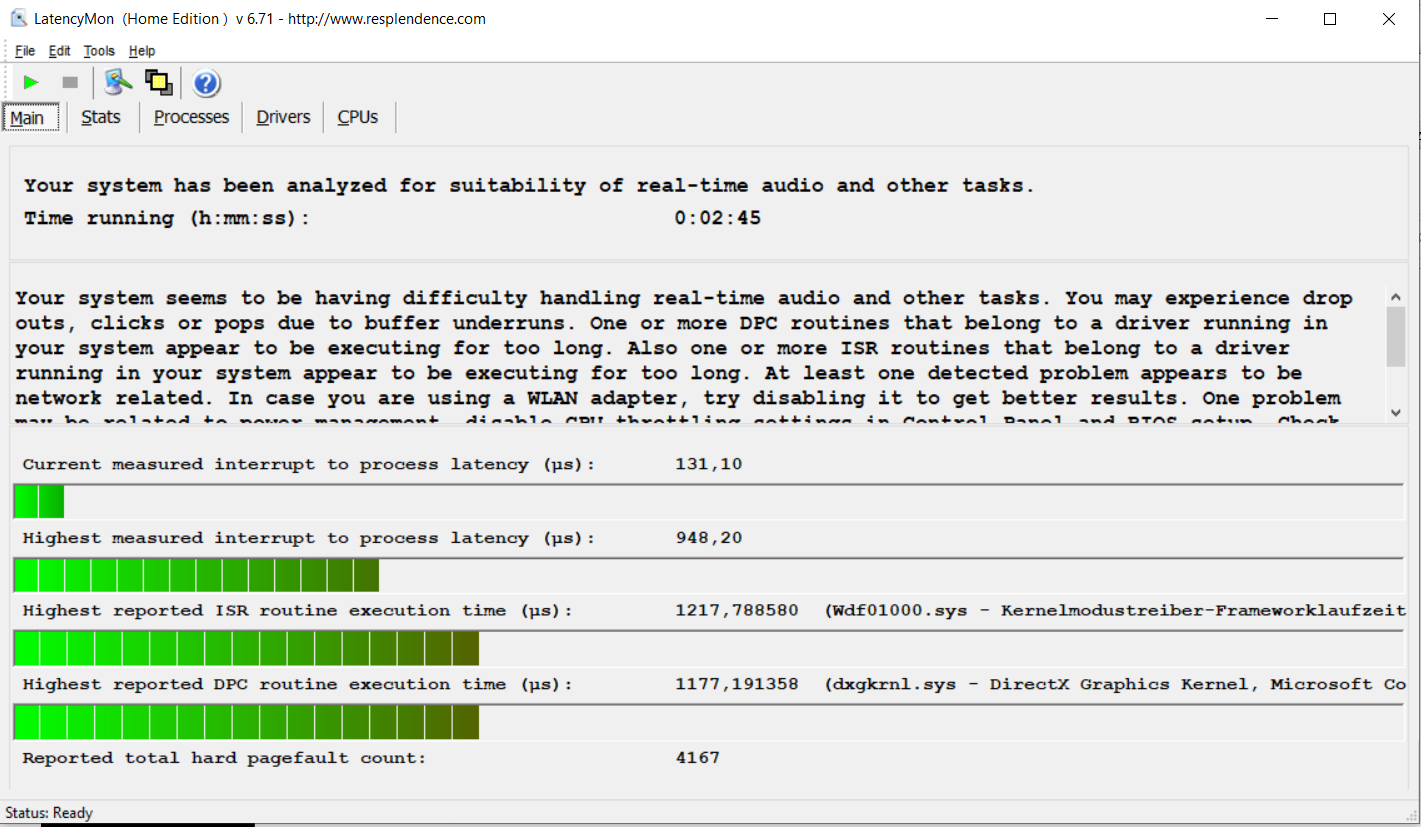
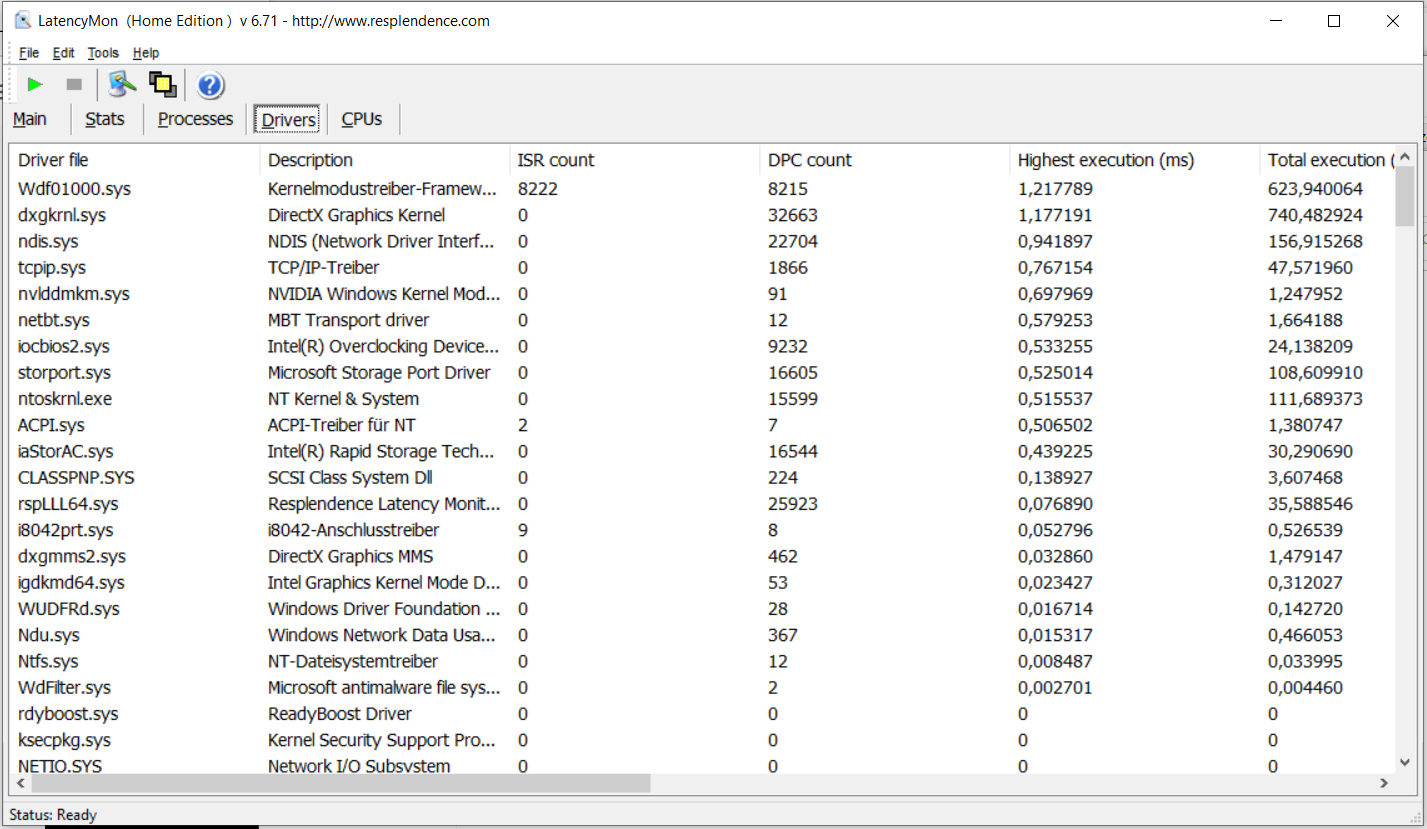
En nuestra prueba de monitor de latencia estandarizada (navegación por la web, reproducción de vídeo 4K, Prime95 de alta carga), pudimos observar problemas con las latencias DPC. El sistema no parece ser adecuado para la edición de vídeo y audio en tiempo real.
| DPC Latencies / LatencyMon - interrupt to process latency (max), Web, Youtube, Prime95 | |
| Dell G5 15 SE 5505 P89F | |
| Schenker XMG Core 15 GK5NR0O | |
| MSI Bravo 15 A4DCR | |
| Aorus 5 KB | |
| Acer Predator Helios 300 PH315-53-77N5 | |
| Asus TUF Gaming A15 FA506IV-HN172 | |
| HP Pavilion Gaming 15-ec1177ng | |
* ... más pequeño es mejor
Almacenamiento
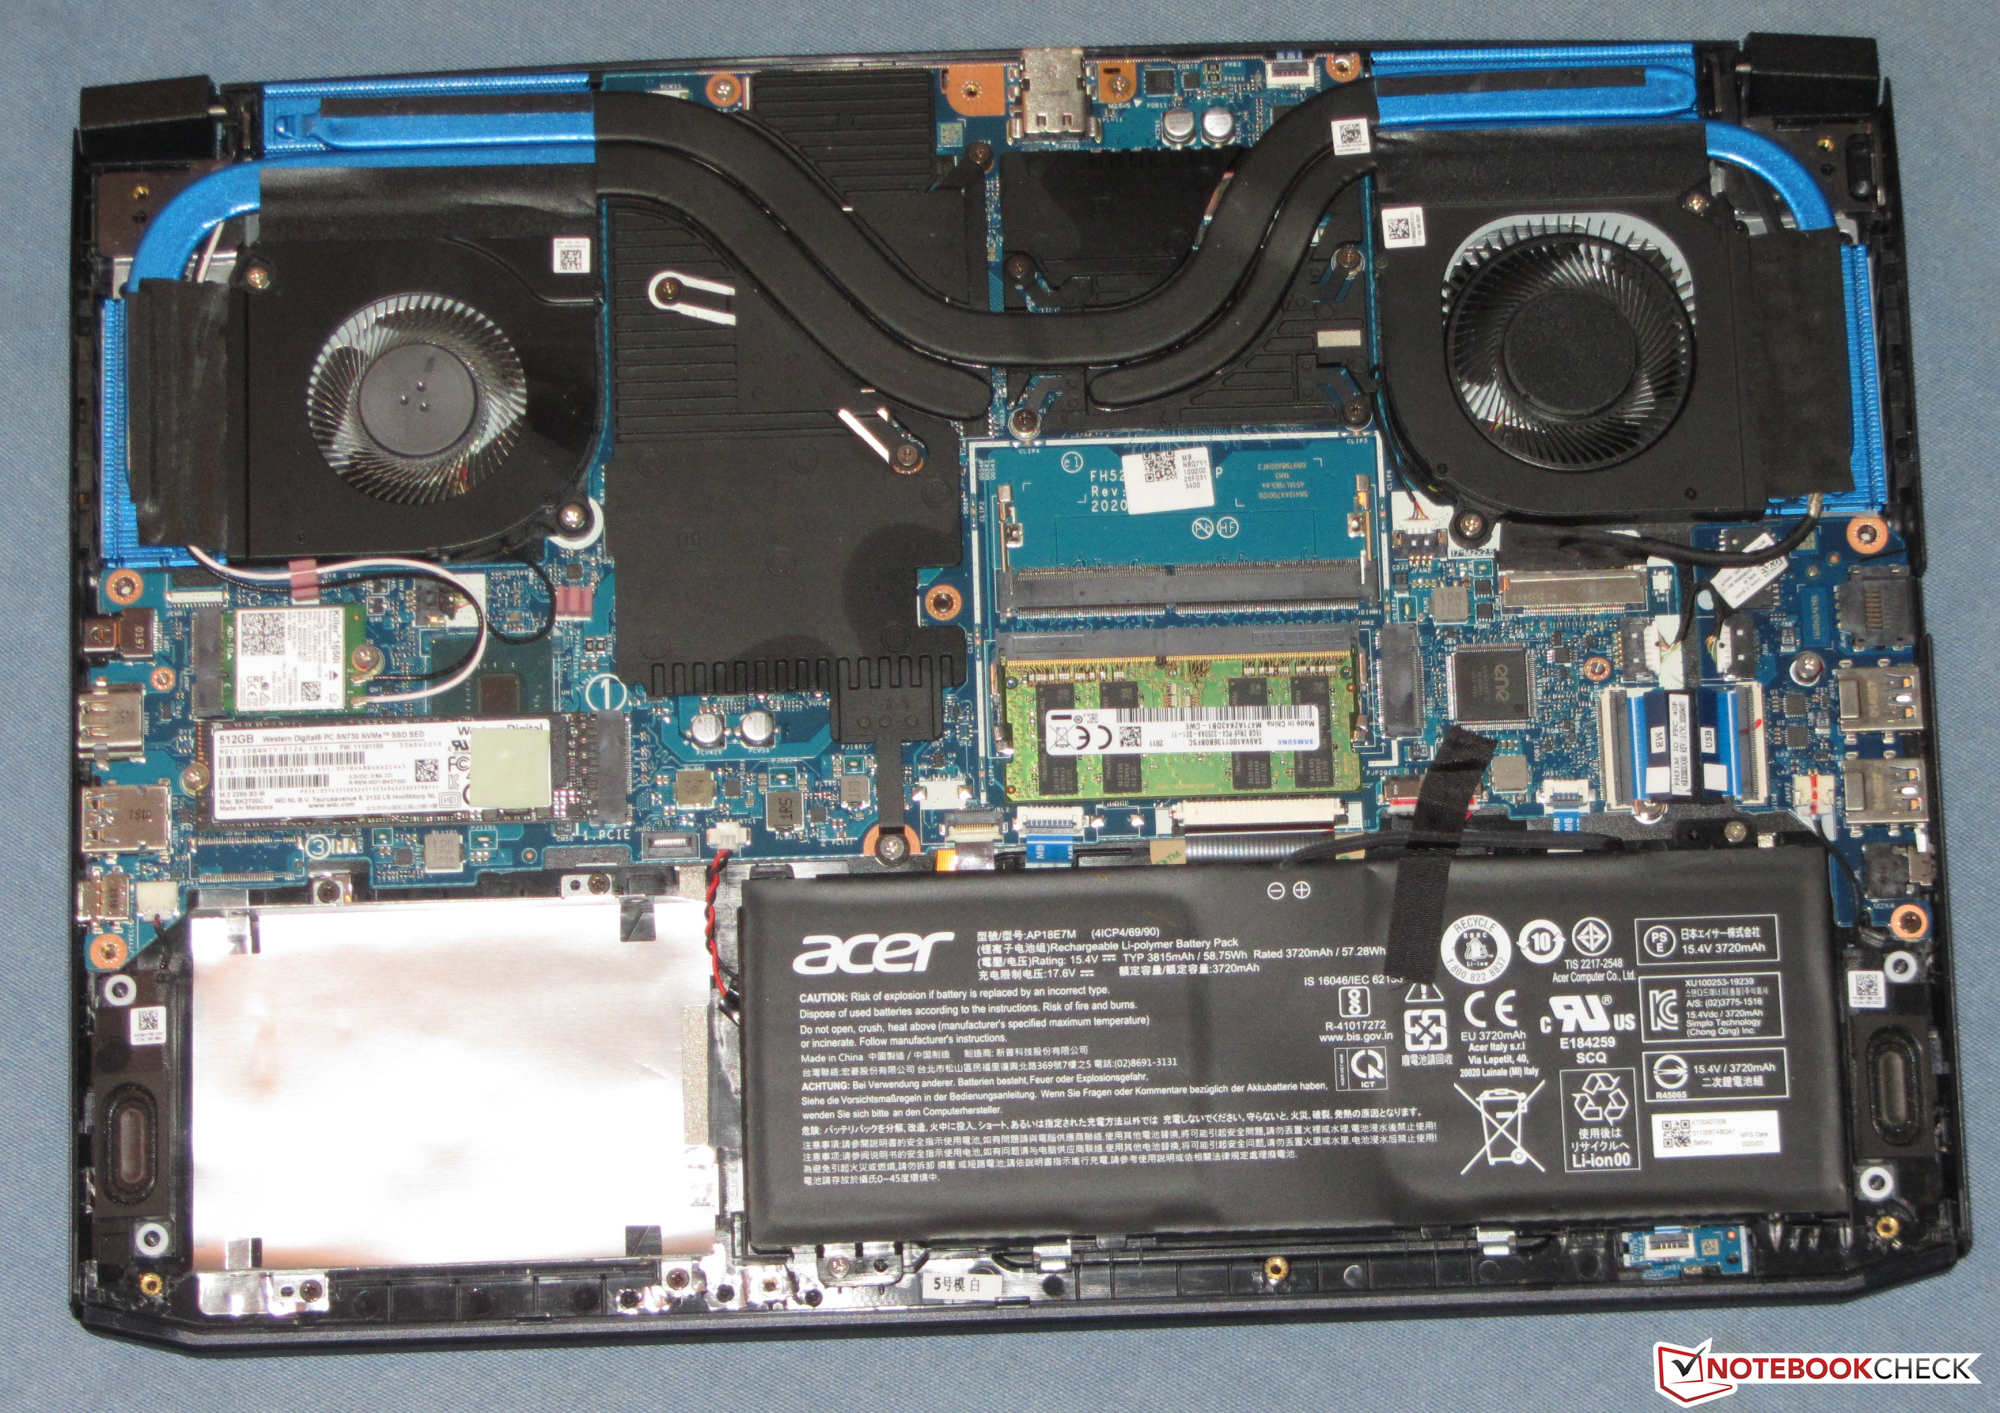
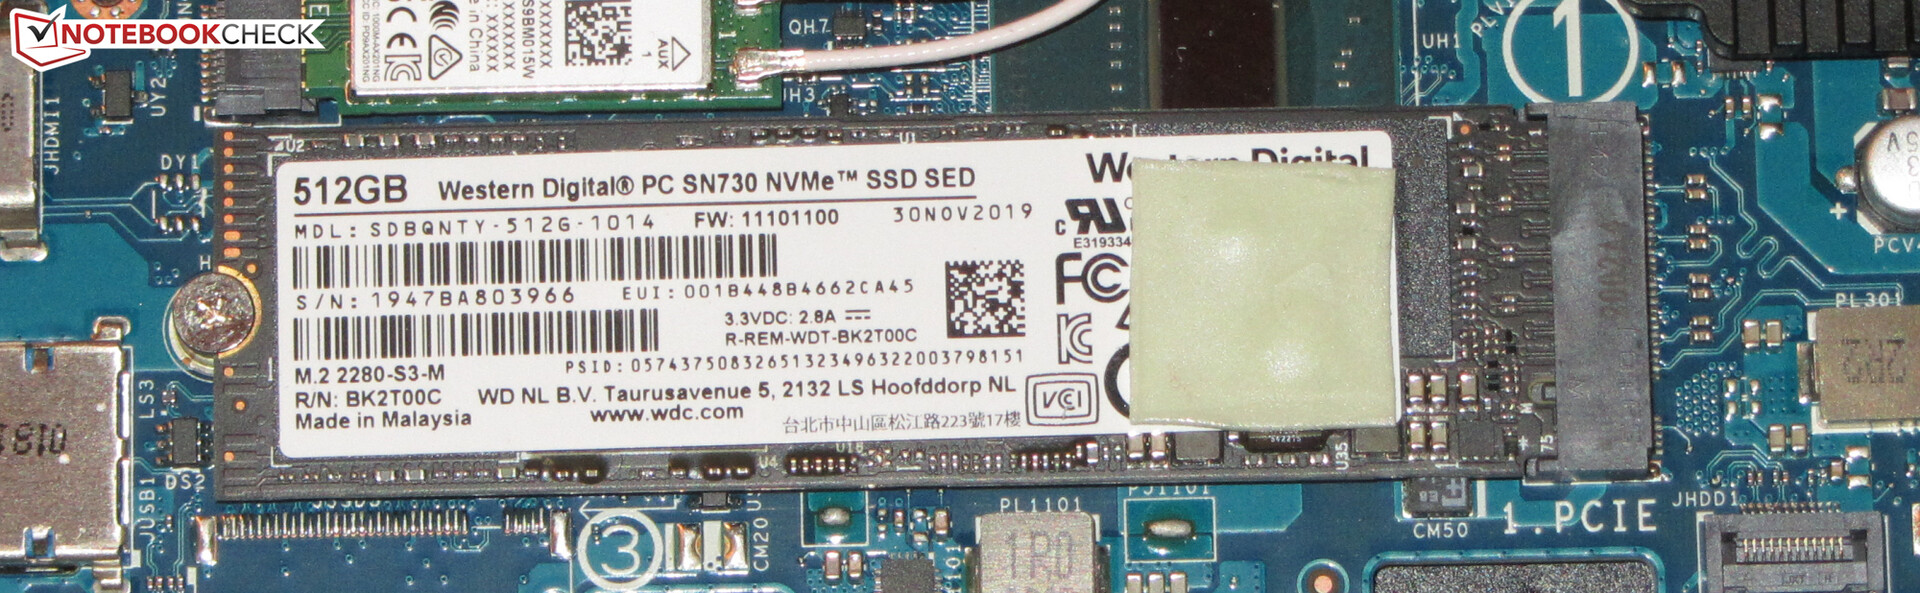
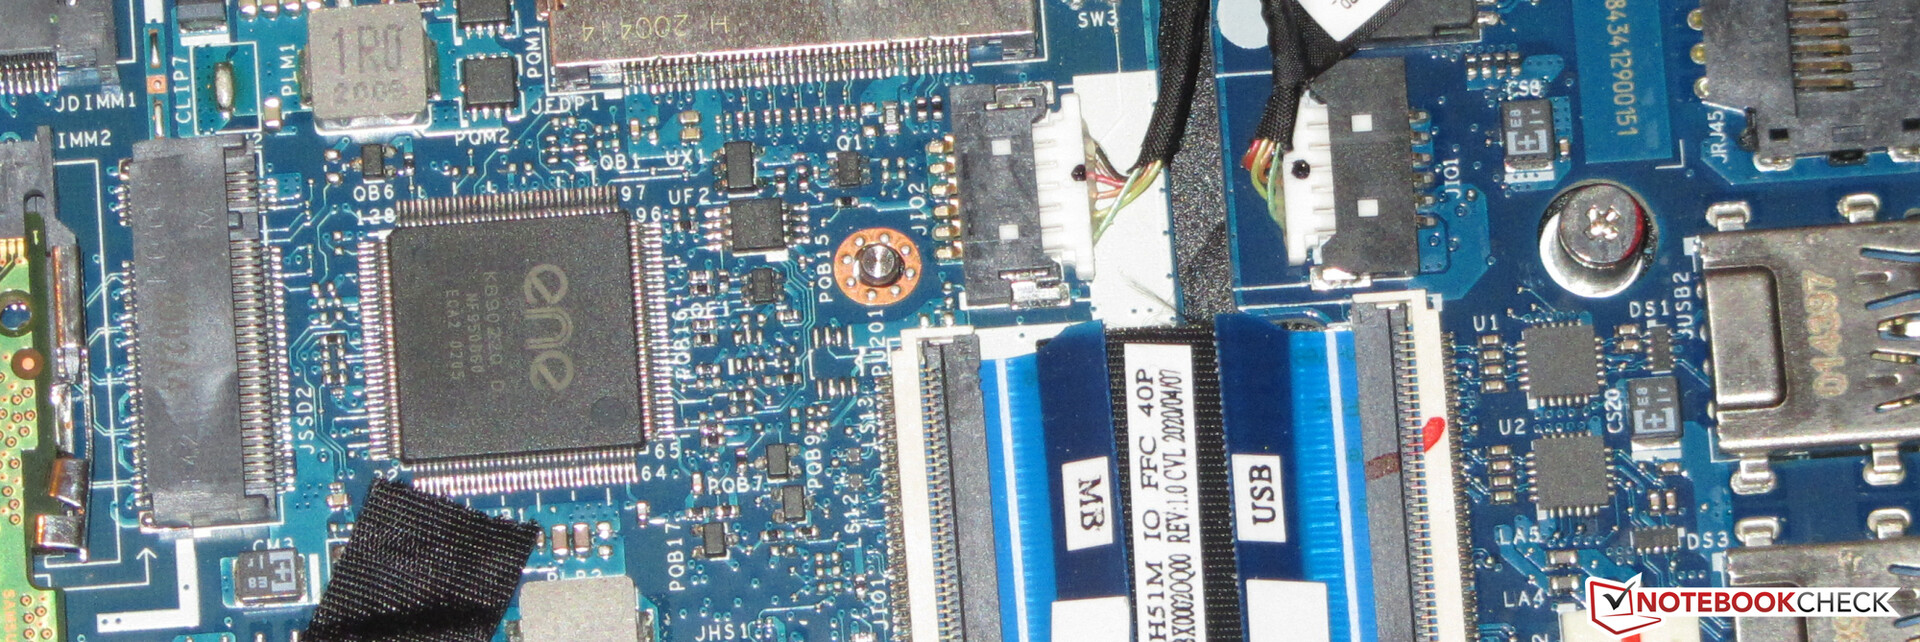
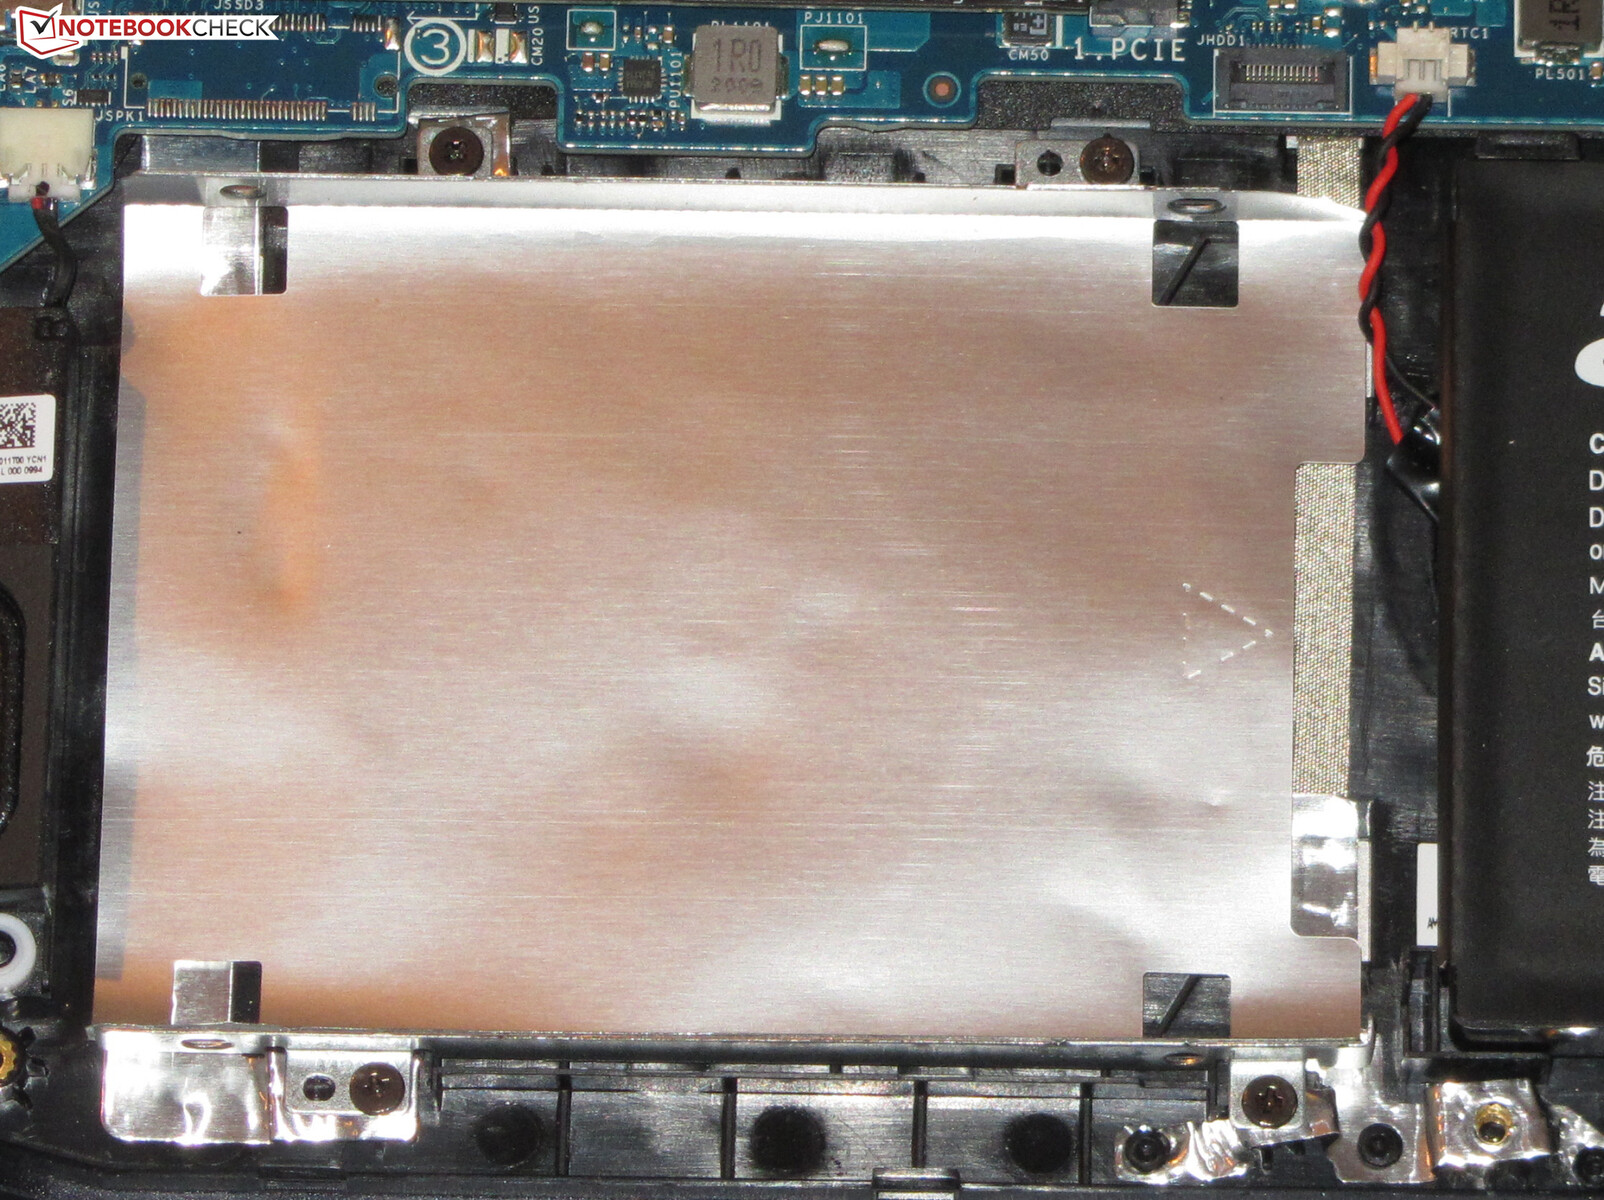
El portátil puede alojar dos SSD NVMe en el formato M.2 2280, que podrían formar una matriz RAID 0 si fuera necesario. Nuestro dispositivo de prueba sólo está equipado con un SSD NVMe que proporciona 512 GB de espacio de almacenamiento. Las tasas de transferencia son buenas. Además, el Predator todavía tiene espacio para un medio de almacenamiento de 2,5 pulgadas. Nuestro dispositivo de prueba no puede ser actualizado con ese tipo de unidad, porque la ranura SATA necesaria no está incluida.

| Acer Predator Helios 300 PH315-53-77N5 WDC PC SN730 SDBQNTY-512GB | Acer Predator Helios 300 PH315-52-79TY WDC PC SN720 SDAPNTW-512G | Dell G5 15 SE 5505 P89F Samsung PM991 MZ9LQ512HALU | Aorus 5 KB ADATA XPG SX8200 Pro (ASX8200PNP-512GT) | Schenker XMG Core 15 GK5NR0O Samsung SSD 970 EVO Plus 500GB | Asus TUF Gaming A15 FA506IV-HN172 Kingston OM8PCP3512F-AB | Medio WDC PC SN730 SDBQNTY-512GB | |
|---|---|---|---|---|---|---|---|
| CrystalDiskMark 5.2 / 6 | -7% | -17% | 11% | 29% | -13% | -2% | |
| Write 4K (MB/s) | 137.5 | 108.7 -21% | 142.1 3% | 162.1 18% | 233 69% | 219.8 60% | 140.9 ? 2% |
| Read 4K (MB/s) | 48.24 | 44.91 -7% | 46.43 -4% | 60.7 26% | 54.5 13% | 50.2 4% | 45.6 ? -5% |
| Write Seq (MB/s) | 2644 | 2424 -8% | 1108 -58% | 2366 -11% | 3050 15% | 979 -63% | 2066 ? -22% |
| Read Seq (MB/s) | 1718 | 1617 -6% | 1622 -6% | 2633 53% | 3042 77% | 1990 16% | 2014 ? 17% |
| Write 4K Q32T1 (MB/s) | 416.6 | 356.9 -14% | 467 12% | 428.2 3% | 520 25% | 516 24% | 472 ? 13% |
| Read 4K Q32T1 (MB/s) | 525 | 557 6% | 525 0% | 582 11% | 546 4% | 298.3 -43% | 453 ? -14% |
| Write Seq Q32T1 (MB/s) | 2705 | 2542 -6% | 1203 -56% | 2480 -8% | 3241 20% | 982 -64% | 2433 ? -10% |
| Read Seq Q32T1 (MB/s) | 3213 | 3218 0% | 2288 -29% | 3121 -3% | 3538 10% | 1907 -41% | 3237 ? 1% |
| Write 4K Q8T8 (MB/s) | 1138 | 981 | |||||
| Read 4K Q8T8 (MB/s) | 1346 | 300.9 | |||||
| AS SSD | 4% | -29% | 0% | 32% | -23% | 3% | |
| Seq Read (MB/s) | 2753 | 2841 3% | 1386 -50% | 2795 2% | 2836 3% | 1682 -39% | 2506 ? -9% |
| Seq Write (MB/s) | 2495 | 2009 -19% | 1234 -51% | 2172 -13% | 2452 -2% | 904 -64% | 1655 ? -34% |
| 4K Read (MB/s) | 38.64 | 39.34 2% | 41.32 7% | 53.3 38% | 60.4 56% | 60.2 56% | 42.2 ? 9% |
| 4K Write (MB/s) | 88.8 | 102.8 16% | 128 44% | 121.3 37% | 190.5 115% | 164.8 86% | 127.5 ? 44% |
| 4K-64 Read (MB/s) | 952 | 1257 32% | 854 -10% | 714 -25% | 1283 35% | 472.5 -50% | 1061 ? 11% |
| 4K-64 Write (MB/s) | 1568 | 1522 -3% | 721 -54% | 1376 -12% | 2298 47% | 845 -46% | 1480 ? -6% |
| Access Time Read * (ms) | 0.086 | 0.098 | 0.049 | 0.034 | 0.087 | 0.1012 ? | |
| Access Time Write * (ms) | 0.044 | 0.036 18% | 0.095 -116% | 0.036 18% | 0.02 55% | 0.02 55% | 0.03833 ? 13% |
| Score Read (Points) | 1266 | 1581 25% | 1034 -18% | 1046 -17% | 1627 29% | 701 -45% | 1354 ? 7% |
| Score Write (Points) | 1906 | 1825 -4% | 973 -49% | 1714 -10% | 2734 43% | 1101 -42% | 1772 ? -7% |
| Score Total (Points) | 3811 | 4175 10% | 2536 -33% | 3279 -14% | 5184 36% | 2143 -44% | 3781 ? -1% |
| Copy ISO MB/s (MB/s) | 2037 | 1446 -29% | 1284 -37% | 2039 0% | 675 -67% | 1903 ? -7% | |
| Copy Program MB/s (MB/s) | 475.6 | 473.4 0% | 401.9 -15% | 438 -8% | 248.4 -48% | 533 ? 12% | |
| Copy Game MB/s (MB/s) | 1018 | 971 -5% | 1013 0% | 1137 12% | 535 -47% | 1074 ? 6% | |
| Media total (Programa/Opciones) | -2% /
-0% | -23% /
-25% | 6% /
5% | 31% /
31% | -18% /
-19% | 1% /
1% |
* ... más pequeño es mejor
Continuous load read: DiskSpd Read Loop, Queue Depth 8
Tarjeta gráfica
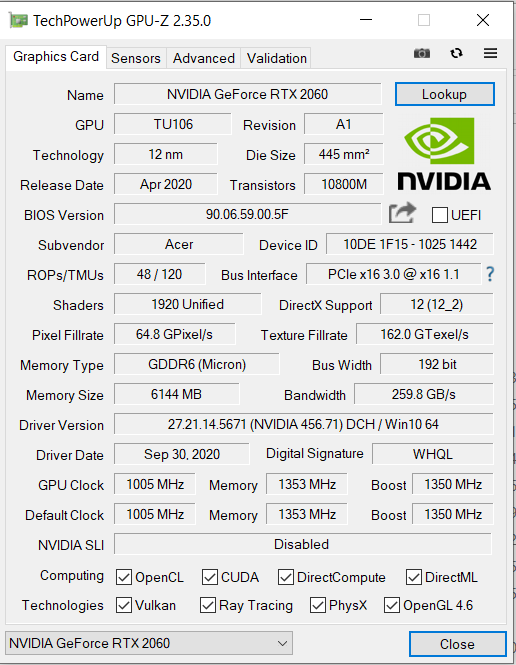
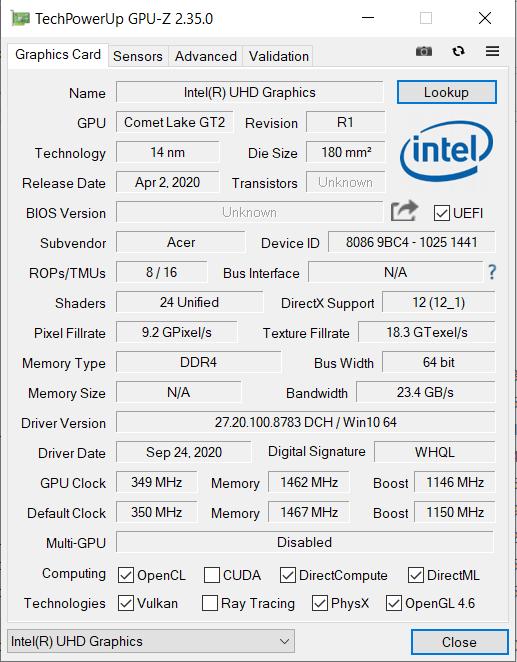
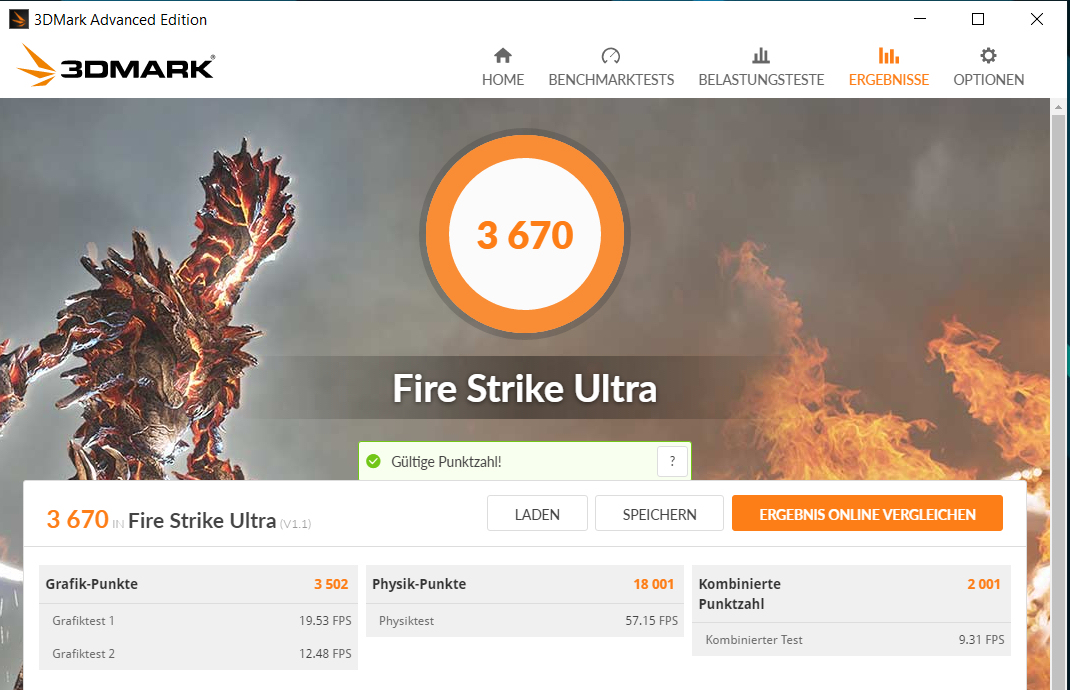
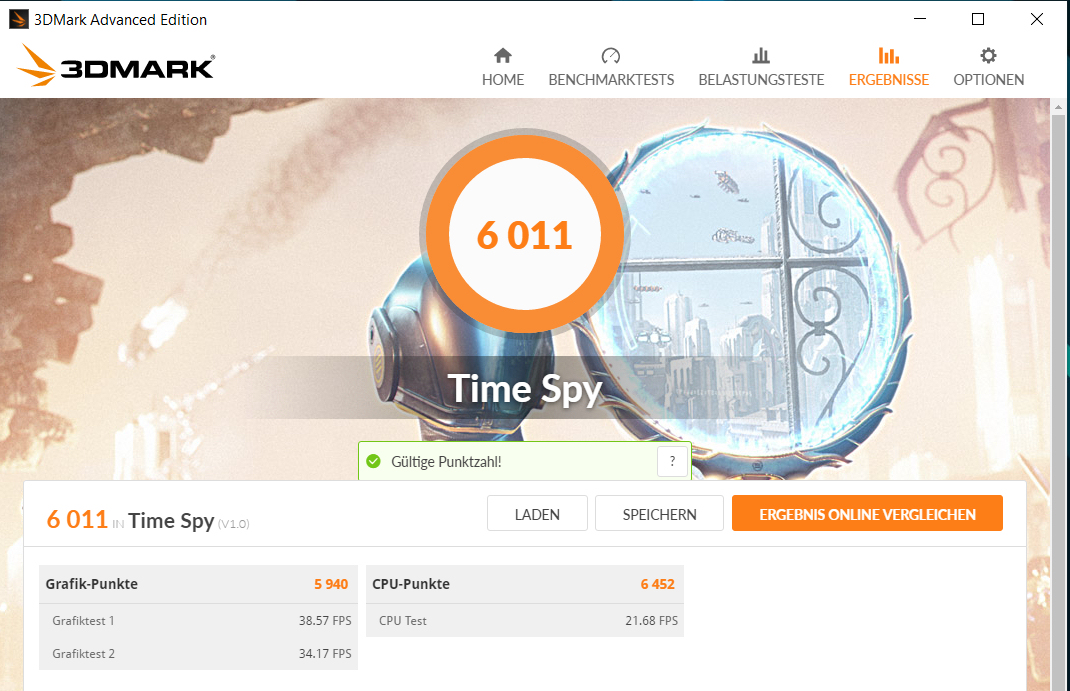
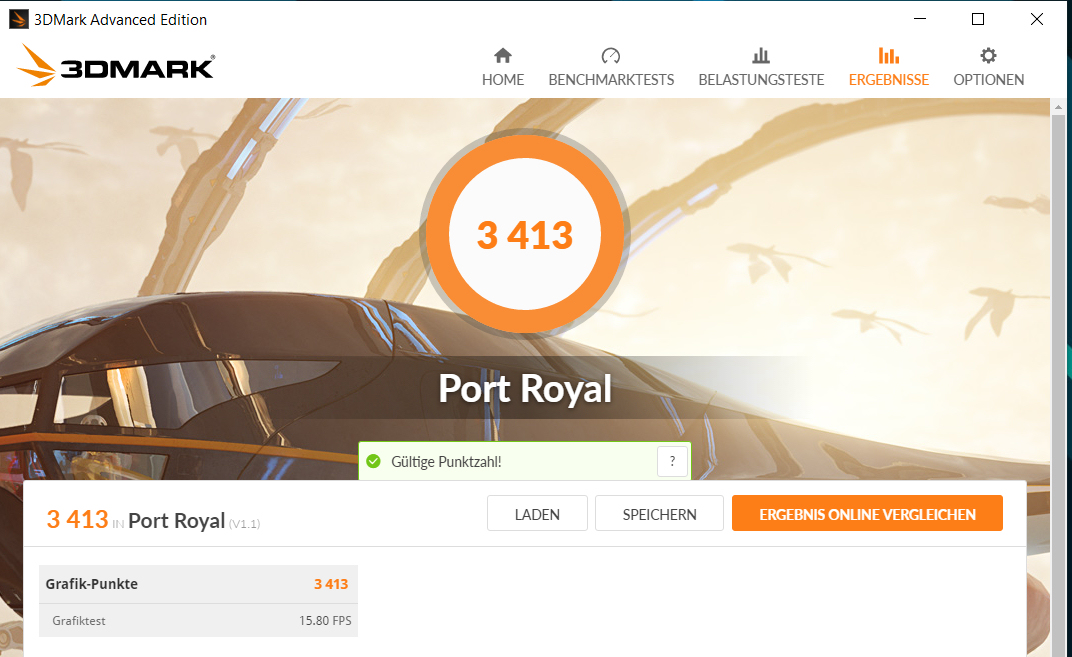
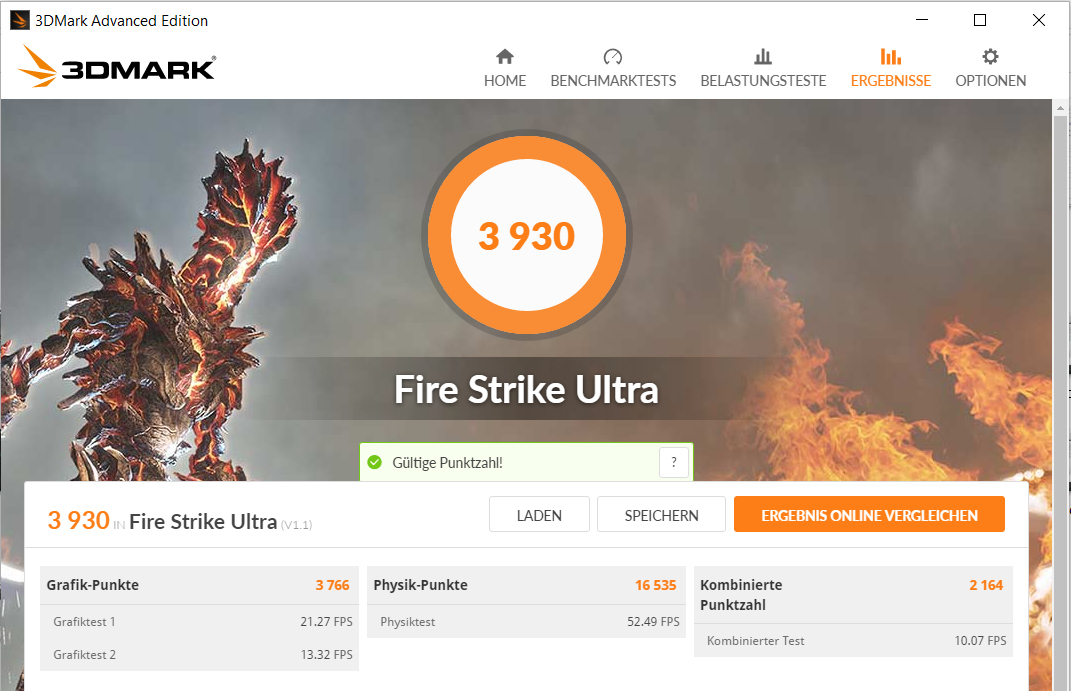
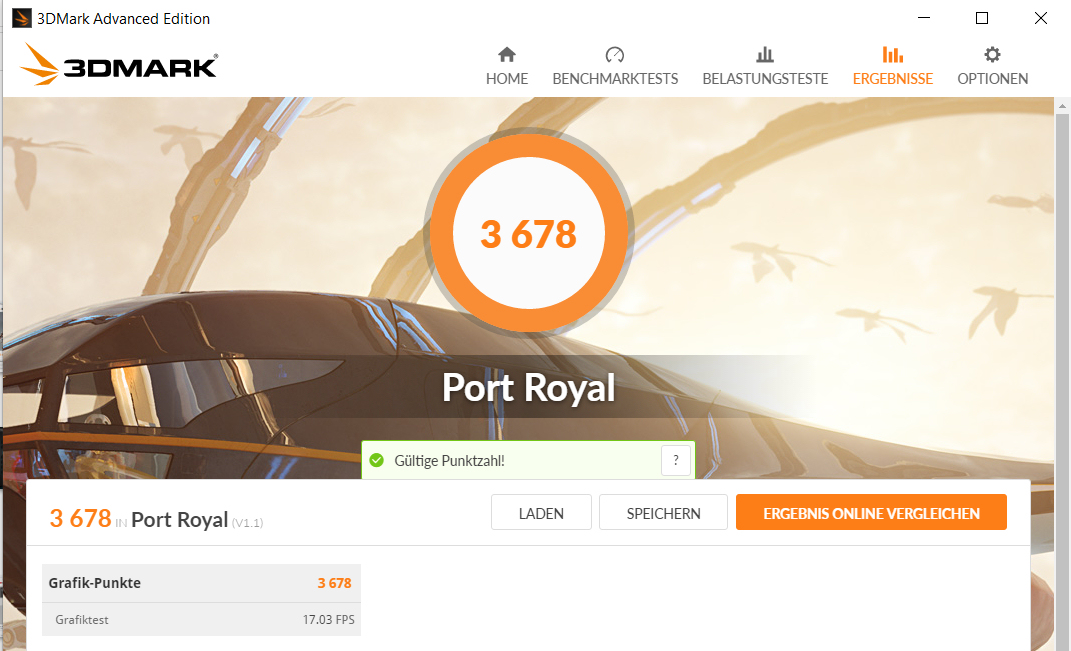
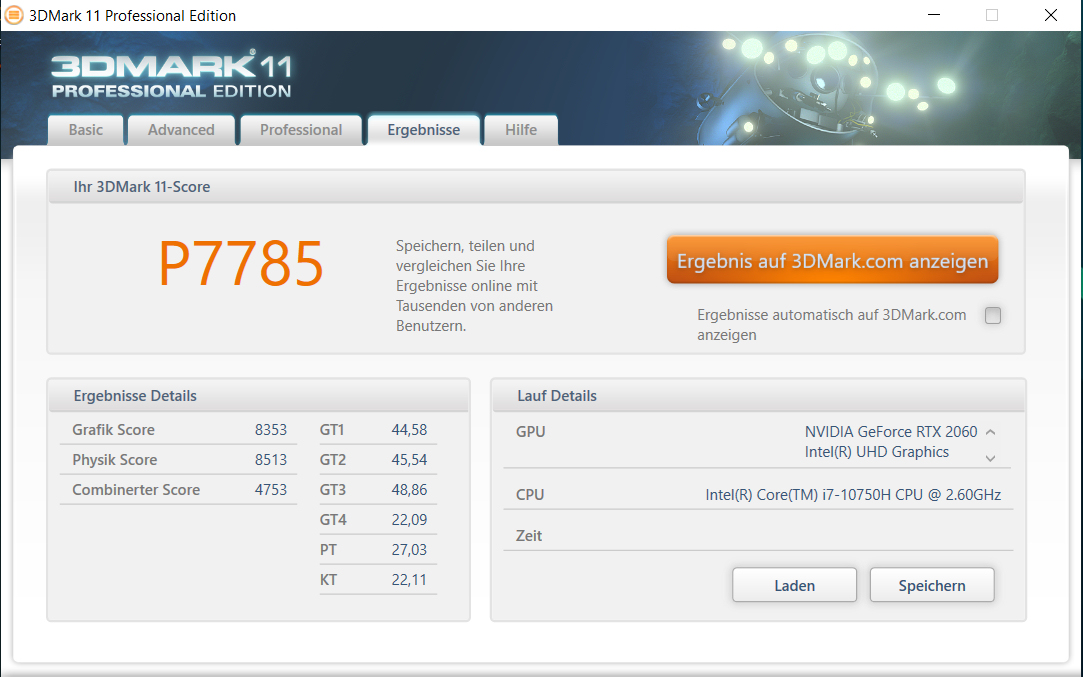
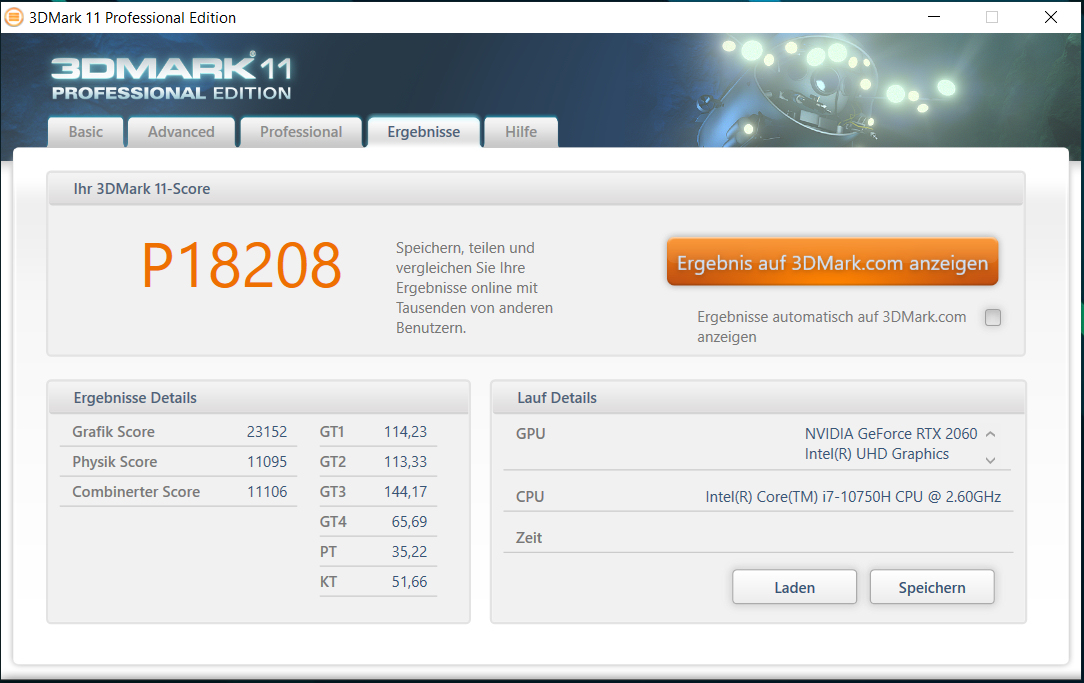
El núcleo de gráficos de la GeForce RTX 2060 es un modelo básico en la clase superior de la GPU. Puede acceder a la rápida memoria de gráficos GDDR6 (6.144 MB). Los resultados en las pruebas de referencia de 3DMark están en un nivel normal para la GPU RTX 2060. Además, el perfil de la GPU Predator Sense "Extreme" sólo proporciona un ligero aumento del rendimiento. El chip UHD Graphics 630 integrado en el procesador está activo, y el portátil funciona con la solución de conmutación de gráficos Optimus de Nvidia.
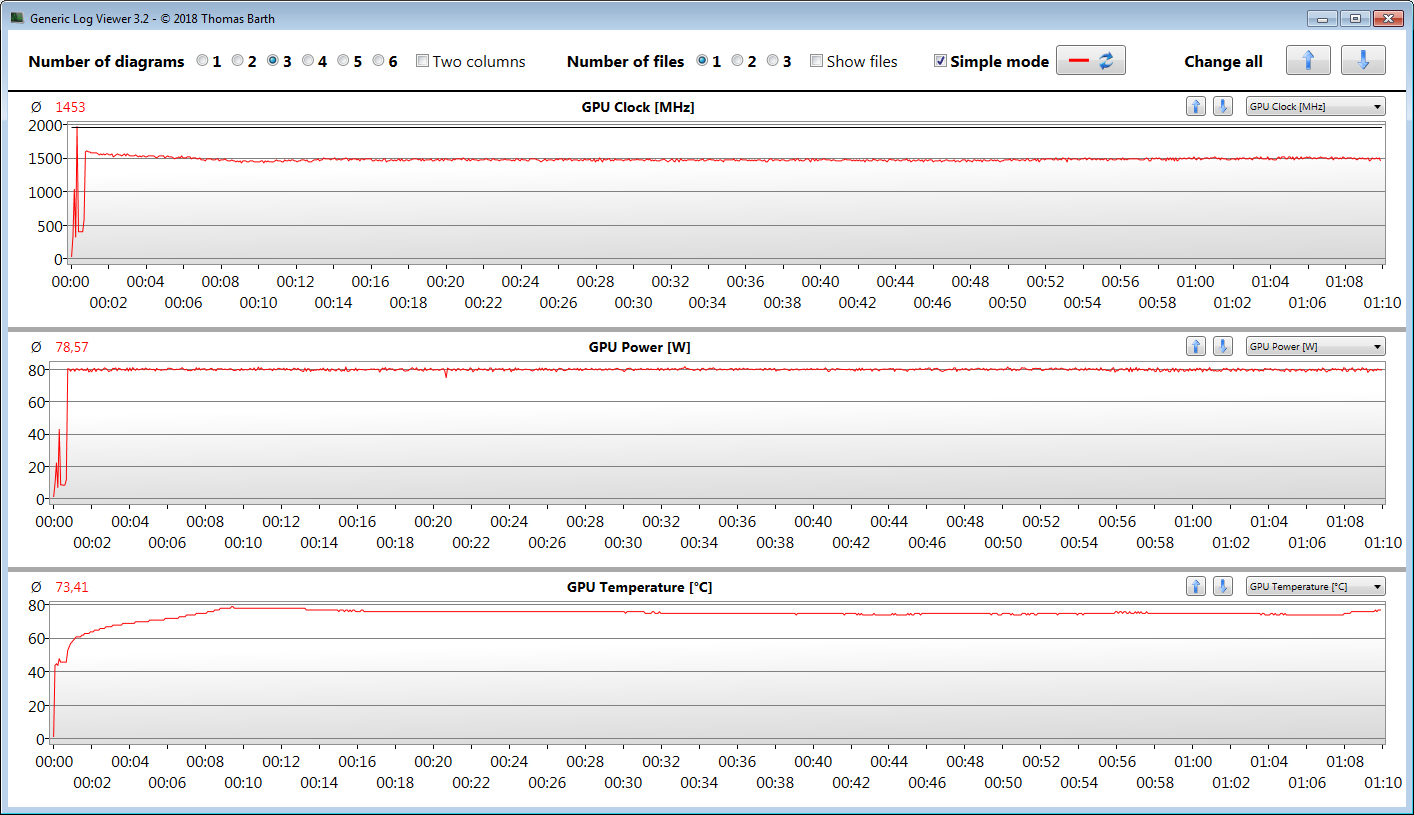
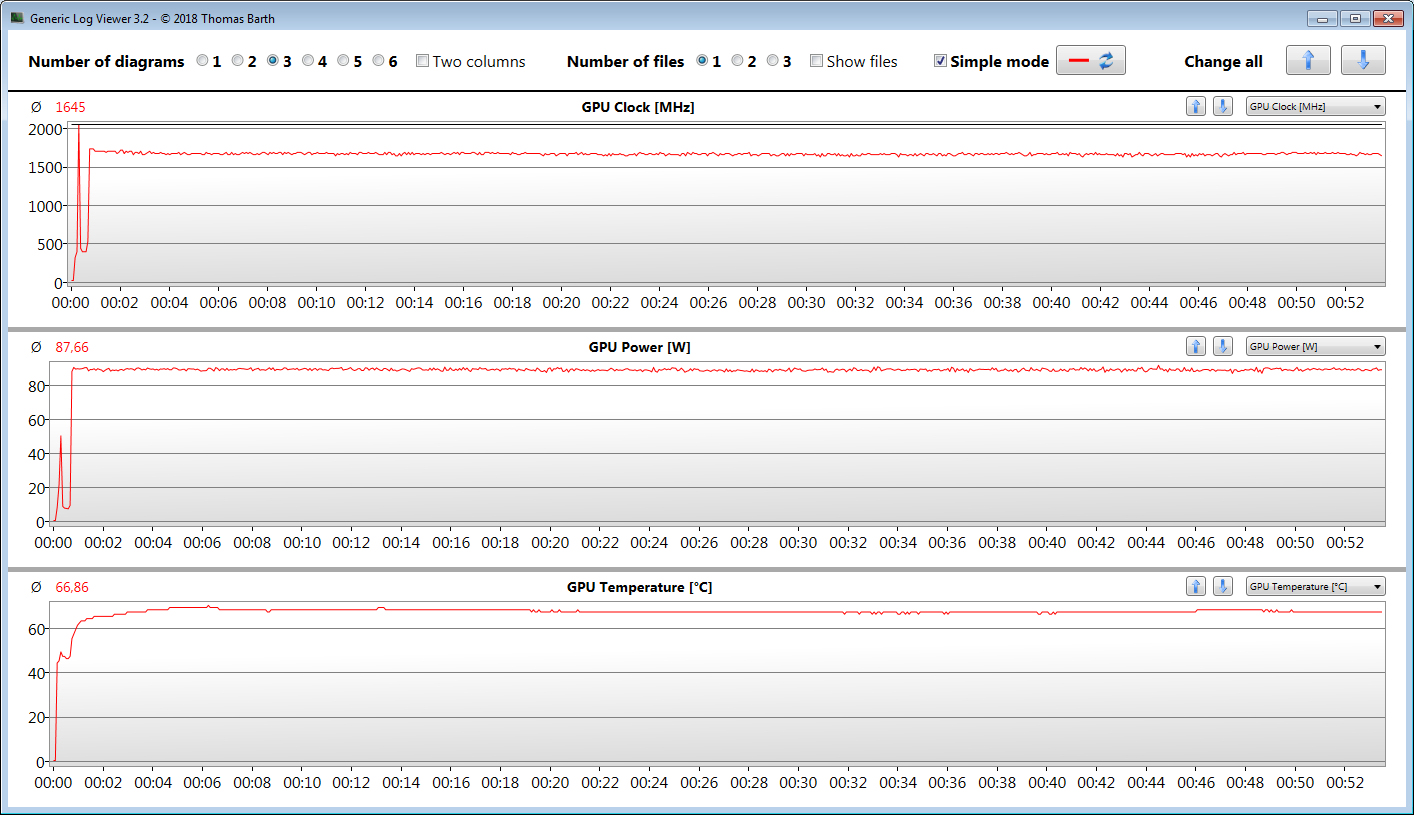
Nvidia especifica un rango de entre 1.005 MHz (base) y 1.350 MHz (boost) para esta GPU DirectX 12. Se pueden alcanzar velocidades más altas si la GPU no alcanza un umbral de temperatura y/o energía especificado. El máximo es de 2.032 MHz. Nuestra prueba de The Witcher 3 se realiza a una velocidad media de 1.453 MHz y 1.645 MHz (perfil de la GPU: Extremo), respectivamente.

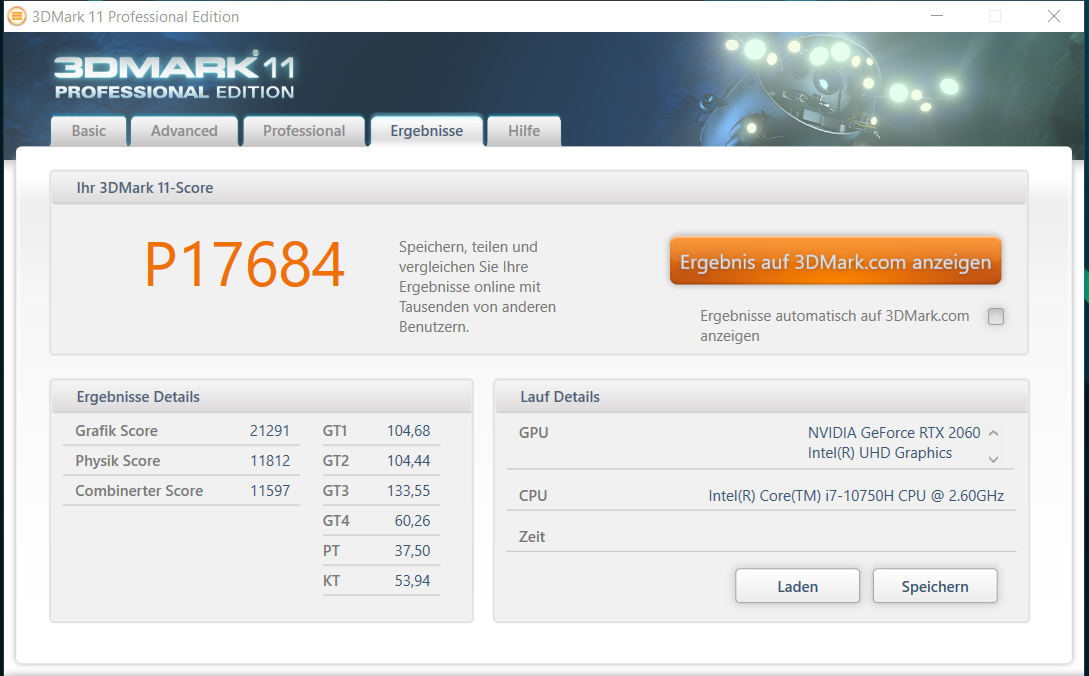
| 3DMark 11 Performance | 17684 puntos | |
| 3DMark Cloud Gate Standard Score | 36435 puntos | |
| 3DMark Fire Strike Score | 14732 puntos | |
| 3DMark Time Spy Score | 6011 puntos | |
ayuda | ||
| 3DMark 11 - 1280x720 Performance GPU | |
| Media de la clase Gaming (21841 - 80022, n=103, últimos 2 años) | |
| Dell G5 15 SE 5505 P89F | |
| Acer Predator Helios 300 PH315-53-77N5 (Extrem) | |
| Aorus 5 KB | |
| Schenker XMG Core 15 GK5NR0O | |
| Asus TUF Gaming A15 FA506IV-HN172 | |
| Medio NVIDIA GeForce RTX 2060 Mobile (19143 - 24662, n=40) | |
| Acer Predator Helios 300 PH315-53-77N5 | |
| Acer Predator Helios 300 PH315-52-79TY | |
| HP Pavilion Gaming 15-ec1177ng | |
| MSI Bravo 15 A4DCR | |
El rendimiento de los juegos
La combinación CPU-GPU incorporada puede llevar todos los últimos juegos a la pantalla sin problemas. Normalmente se puede seleccionar una resolución Full HD y ajustes de alta a máxima calidad. Las resoluciones más altas (para ello habría que conectar un monitor apropiado) requieren una reducción del nivel de calidad. El perfil de la GPU "Extreme" sólo produce un ligero aumento de la velocidad de cuadro (véase el diagrama comparativo).
La memoria monocanal es responsable de que algunos juegos logren velocidades de cuadro significativamente más bajas en configuraciones bajas que en portátiles con equipamiento similar. Un segundo módulo de memoria (= modo de doble canal activo) aportaría mejoras.
| Shadow of the Tomb Raider | |
| 1920x1080 Highest Preset AA:T | |
| Media de la clase Gaming (96 - 116, n=2, últimos 2 años) | |
| Acer Predator Helios 300 PH317-54-75G8 | |
| Aorus 7 KB | |
| Acer Predator Helios 300 PH315-53-77N5 (Extrem) | |
| Medio NVIDIA GeForce RTX 2060 Mobile (54 - 86, n=22) | |
| Acer Predator Helios 300 PH315-53-77N5 | |
| Dell G5 15 SE 5505 P89F | |
| MSI Bravo 15 A4DCR | |
| 1280x720 Lowest Preset | |
| Dell G5 15 SE 5505 P89F | |
| Aorus 7 KB | |
| Medio NVIDIA GeForce RTX 2060 Mobile (88 - 133, n=19) | |
| Acer Predator Helios 300 PH317-54-75G8 | |
| MSI Bravo 15 A4DCR | |
| Acer Predator Helios 300 PH315-53-77N5 | |
| Serious Sam 4 - 1920x1080 Ultra (DX12) AA:2xMS | |
| Acer Predator Helios 300 PH315-53-77N5 (Extrem) | |
| Acer Predator Helios 300 PH317-54-75G8 | |
| Aorus 7 KB | |
| Medio NVIDIA GeForce RTX 2060 Mobile (50.3 - 63.3, n=6) | |
| Acer Predator Helios 300 PH315-53-77N5 | |
| Horizon Zero Dawn - 1920x1080 Ultimate Quality | |
| Acer Predator Helios 300 PH317-54-75G8 | |
| Acer Predator Helios 300 PH315-53-77N5 (Extrem) | |
| Medio NVIDIA GeForce RTX 2060 Mobile (54 - 67, n=6) | |
| Acer Predator Helios 300 PH315-53-77N5 | |
| Aorus 7 KB | |
| HP Pavilion Gaming 15-ec1177ng | |
| Mafia Definitive Edition - 1920x1080 High Preset | |
| Aorus 7 KB | |
| Medio NVIDIA GeForce RTX 2060 Mobile (60.2 - 76.1, n=4) | |
| Acer Predator Helios 300 PH317-54-75G8 | |
| Acer Predator Helios 300 PH315-53-77N5 | |
| Star Wars Squadrons - 1920x1080 Ultra Preset | |
| Medio NVIDIA GeForce RTX 2060 Mobile (156.2 - 181, n=3) | |
| Acer Predator Helios 300 PH317-54-75G8 | |
| Acer Predator Helios 300 PH315-53-77N5 | |
Para verificar si las frecuencias de cuadro se mantienen en gran medida constantes durante un período de tiempo prolongado, dejamos que el juego The Witcher 3 se ejecute durante unos 60 minutos con una resolución Full HD y una configuración de máxima calidad. El personaje no se mueve. No se encontró una caída en la frecuencia de fotogramas.
| bajo | medio | alto | ultra | |
|---|---|---|---|---|
| BioShock Infinite (2013) | 307.3 | 270.5 | 249.6 | 130.9 |
| The Witcher 3 (2015) | 226.4 | 172.4 | 110.7 | 64.8 |
| Shadow of the Tomb Raider (2018) | 88 | 80 | 76 | 71 |
| Doom Eternal (2020) | 171 | 126.9 | 117.9 | 114 |
| Gears Tactics (2020) | 201.6 | 128.5 | 93.4 | 66.5 |
| Horizon Zero Dawn (2020) | 106 | 72 | 67 | 57 |
| Serious Sam 4 (2020) | 113 | 75.7 | 69.9 | 56.6 |
| Mafia Definitive Edition (2020) | 94.3 | 62.5 | 60.2 | |
| Star Wars Squadrons (2020) | 262.1 | 184.5 | 172.8 | 156.2 |
Emisiones - El Helios 300 se vuelve ruidoso bajo carga
Emisiones de ruido
Los ventiladores no hacen mucho ruido cuando están en reposo. Se quedan parados o funcionan a muy baja velocidad. Eso es todo bajo carga. De esta manera, registramos niveles máximos de presión sonora de 56 dB(A) (prueba de esfuerzo) y 53,1 dB(A) (nuestra prueba de The Witcher 3), respectivamente.
Ruido
| Ocioso |
| 25.2 / 25.2 / 25.2 dB(A) |
| Carga |
| 43.5 / 56 dB(A) |
 | ||
30 dB silencioso 40 dB(A) audible 50 dB(A) ruidosamente alto |
||
min: | ||
| Acer Predator Helios 300 PH315-53-77N5 i7-10750H, GeForce RTX 2060 Mobile | Acer Predator Helios 300 PH315-52-79TY i7-9750H, GeForce GTX 1660 Ti Mobile | Dell G5 15 SE 5505 P89F R7 4800H, Radeon RX 5600M | Aorus 5 KB i7-10750H, GeForce RTX 2060 Mobile | Schenker XMG Core 15 GK5NR0O R7 4800H, GeForce RTX 2060 Mobile | Asus TUF Gaming A15 FA506IV-HN172 R7 4800H, GeForce RTX 2060 Mobile | Medio NVIDIA GeForce RTX 2060 Mobile | Media de la clase Gaming | |
|---|---|---|---|---|---|---|---|---|
| Noise | -8% | 1% | -11% | -4% | -7% | -12% | -4% | |
| apagado / medio ambiente * (dB) | 25.2 | 30.2 -20% | 28 -11% | 25 1% | 25 1% | 30.2 -20% | 27.9 ? -11% | 24.1 ? 4% |
| Idle Minimum * (dB) | 25.2 | 31 -23% | 28 -11% | 26 -3% | 26 -3% | 30.2 -20% | 29 ? -15% | 25.9 ? -3% |
| Idle Average * (dB) | 25.2 | 31 -23% | 28 -11% | 30 -19% | 30 -19% | 30.2 -20% | 30 ? -19% | 27.4 ? -9% |
| Idle Maximum * (dB) | 25.2 | 31 -23% | 28 -11% | 34 -35% | 32 -27% | 30.2 -20% | 33 ? -31% | 30.1 ? -19% |
| Load Average * (dB) | 43.5 | 41.5 5% | 28 36% | 53 -22% | 46 -6% | 40 8% | 44 ? -1% | 43.7 ? -0% |
| Witcher 3 ultra * (dB) | 53.1 | 46.7 12% | 50.6 5% | 51 4% | 48 10% | 49 8% | ||
| Load Maximum * (dB) | 56 | 46.9 16% | 50.6 10% | 56 -0% | 48 14% | 49 12% | 51.6 ? 8% | 54.3 ? 3% |
* ... más pequeño es mejor
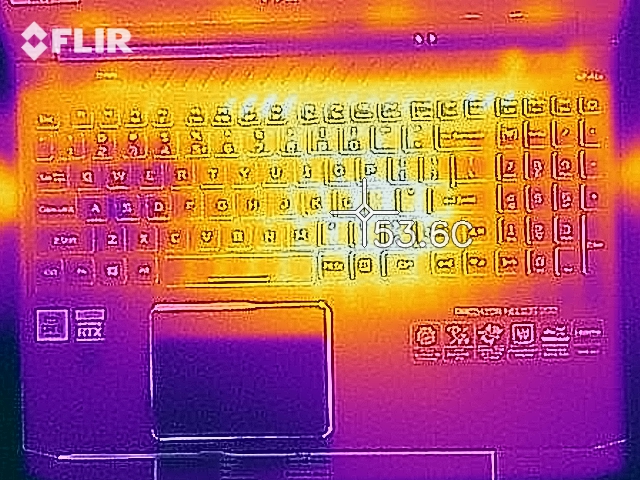
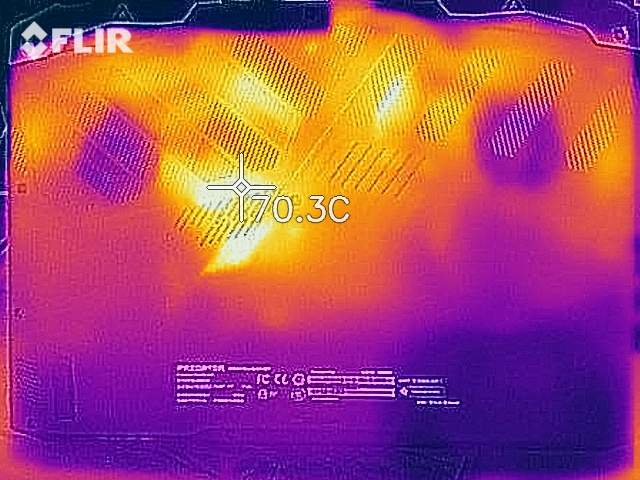
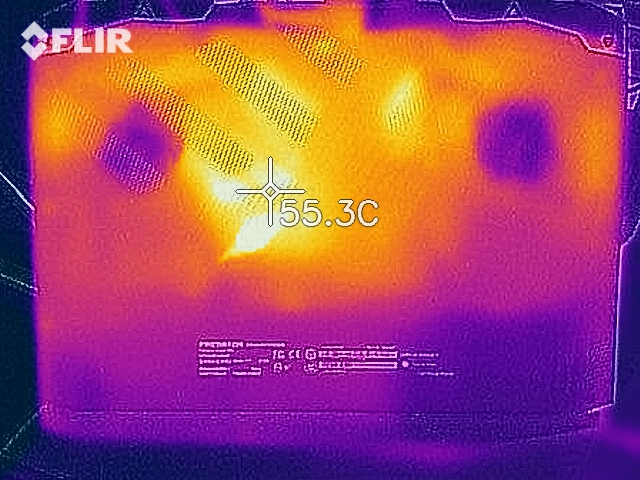
Temperatura
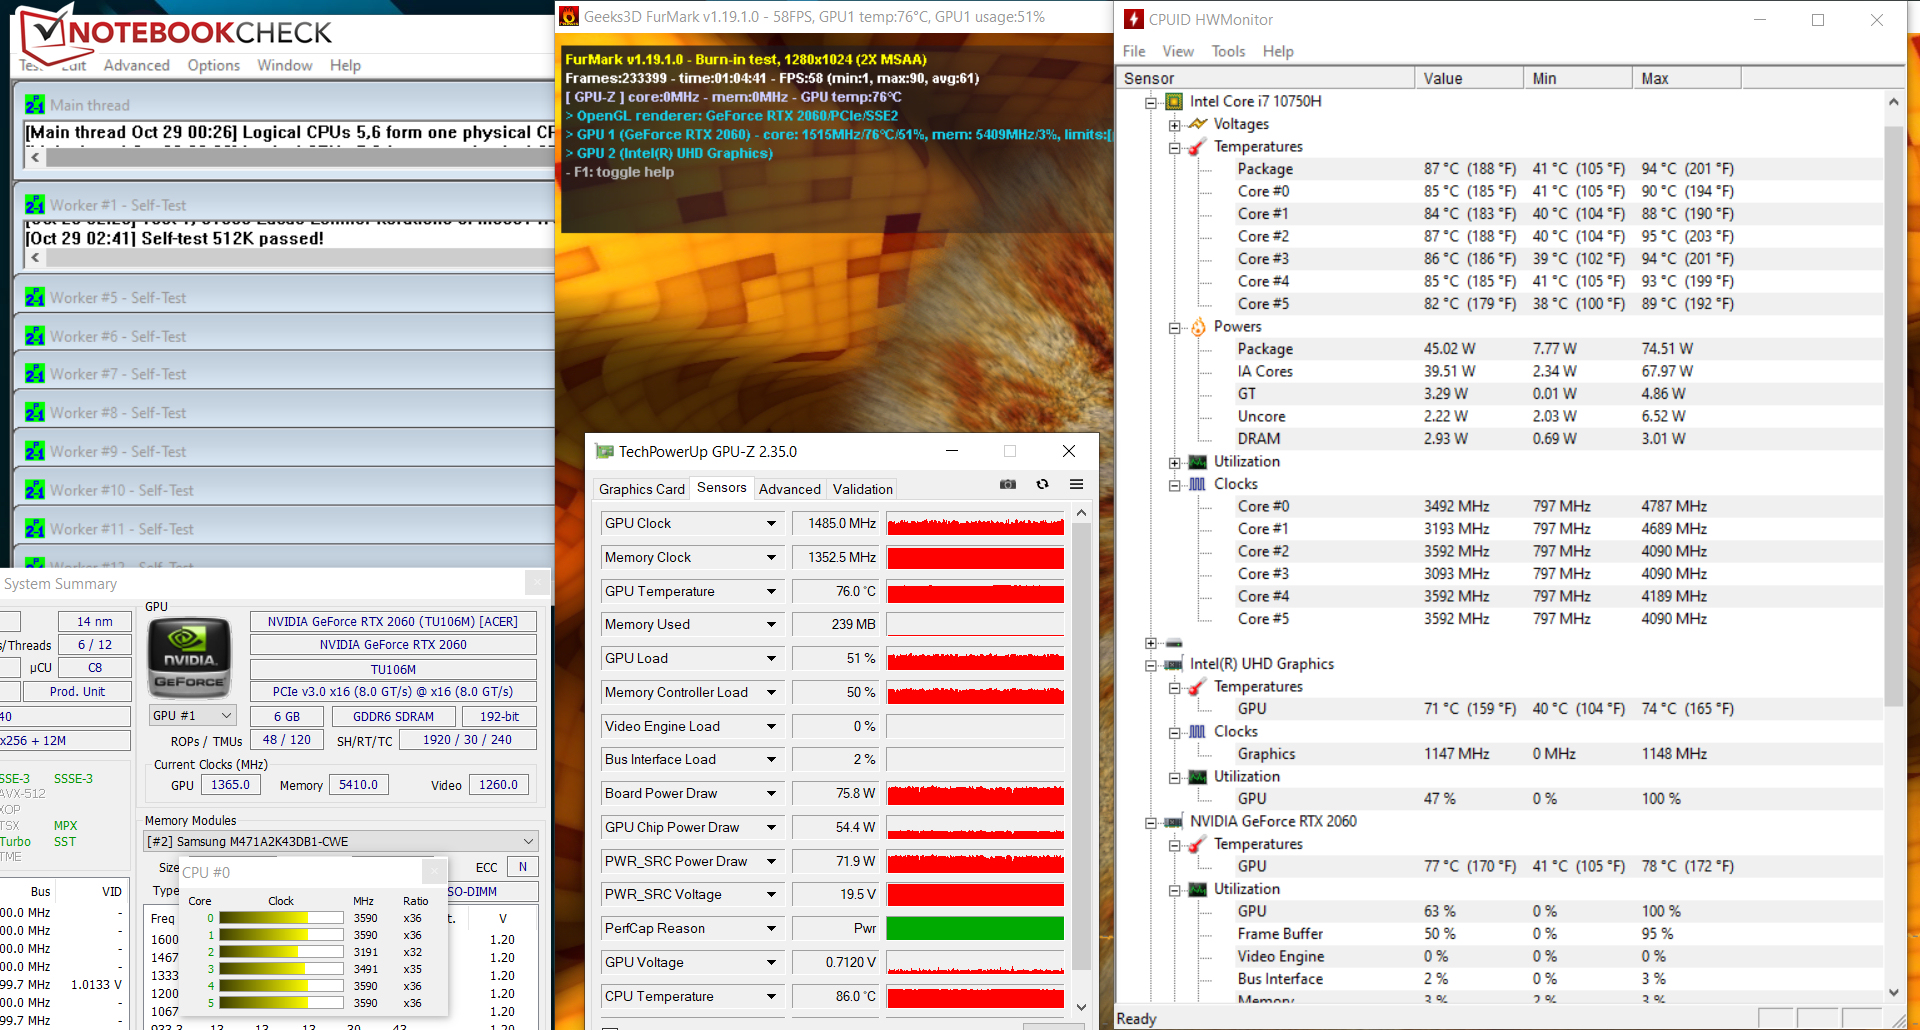
La prueba de estrés (Prime95 y FurMark se ejecutan durante al menos una hora) se realiza con la CPU y la GPU a 3 a 3,5 GHz y 1,2 a 1,4 GHz, respectivamente. Con la energía de la batería, las velocidades son de 800 MHz (CPU) y 1.380 MHz (GPU). La prueba de esfuerzo representa un escenario extremo. Con esta prueba, comprobamos si el sistema se mantiene estable incluso a plena carga.
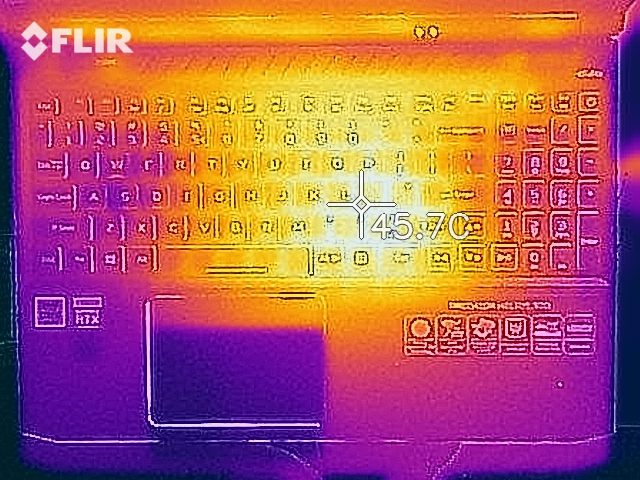
Durante la prueba de esfuerzo, registramos temperaturas en el rango de 40°C (~104 °F) en algunos puntos de medición. El desarrollo de calor es significativamente menor cuando realizamos nuestra prueba de The Witcher 3. En el uso diario, los valores están en el rango verde.
(±) La temperatura máxima en la parte superior es de 44.1 °C / 111 F, frente a la media de 40.4 °C / 105 F, que oscila entre 21.2 y 68.8 °C para la clase Gaming.
(-) El fondo se calienta hasta un máximo de 48 °C / 118 F, frente a la media de 43.2 °C / 110 F
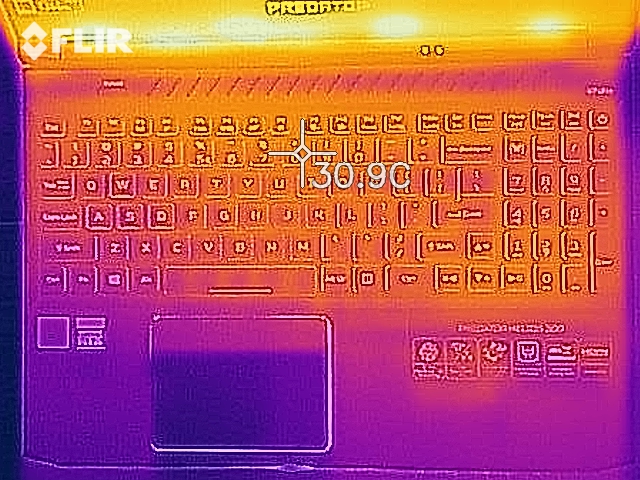
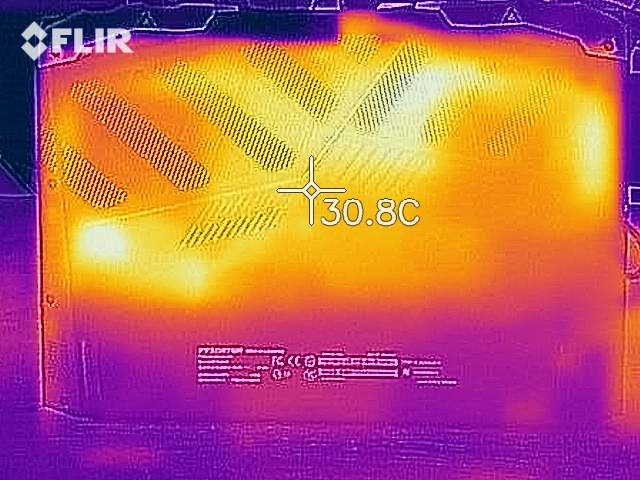
(+) En reposo, la temperatura media de la parte superior es de 24.1 °C / 75# F, frente a la media del dispositivo de 33.9 °C / 93 F.
(±) Jugando a The Witcher 3, la temperatura media de la parte superior es de 33.9 °C / 93 F, frente a la media del dispositivo de 33.9 °C / 93 F.
(+) El reposamanos y el panel táctil están a una temperatura inferior a la de la piel, con un máximo de 31.9 °C / 89.4 F y, por tanto, son fríos al tacto.
(-) La temperatura media de la zona del reposamanos de dispositivos similares fue de 28.8 °C / 83.8 F (-3.1 °C / -5.6 F).
| Acer Predator Helios 300 PH315-53-77N5 i7-10750H, GeForce RTX 2060 Mobile | Acer Predator Helios 300 PH315-52-79TY i7-9750H, GeForce GTX 1660 Ti Mobile | Dell G5 15 SE 5505 P89F R7 4800H, Radeon RX 5600M | Aorus 5 KB i7-10750H, GeForce RTX 2060 Mobile | Schenker XMG Core 15 GK5NR0O R7 4800H, GeForce RTX 2060 Mobile | Asus TUF Gaming A15 FA506IV-HN172 R7 4800H, GeForce RTX 2060 Mobile | Medio NVIDIA GeForce RTX 2060 Mobile | Media de la clase Gaming | |
|---|---|---|---|---|---|---|---|---|
| Heat | -3% | -18% | -19% | -22% | -4% | -17% | -15% | |
| Maximum Upper Side * (°C) | 44.1 | 52 -18% | 53 -20% | 50 -13% | 51 -16% | 42.9 3% | 47.2 ? -7% | 45.1 ? -2% |
| Maximum Bottom * (°C) | 48 | 46.3 4% | 57.6 -20% | 49 -2% | 64 -33% | 49.9 -4% | 52.7 ? -10% | 48.1 ? -0% |
| Idle Upper Side * (°C) | 25.2 | 24.8 2% | 27.4 -9% | 35 -39% | 29 -15% | 27.8 -10% | 31 ? -23% | 31 ? -23% |
| Idle Bottom * (°C) | 25.7 | 25.4 1% | 31 -21% | 31 -21% | 32 -25% | 27 -5% | 32.9 ? -28% | 34.2 ? -33% |
* ... más pequeño es mejor
Altavoces
Los altavoces estéreo están situados en la zona frontal de la parte inferior del dispositivo. Producen un sonido decente que carece de bajos. Para una mejor experiencia de sonido, se deben utilizar auriculares o altavoces externos.
Acer Predator Helios 300 PH315-53-77N5 análisis de audio
(±) | la sonoridad del altavoz es media pero buena (74.4 dB)
Graves 100 - 315 Hz
(-) | casi sin bajos - de media 20.9% inferior a la mediana
(±) | la linealidad de los graves es media (10.1% delta a frecuencia anterior)
Medios 400 - 2000 Hz
(±) | medias más altas - de media 5.7% más altas que la mediana
(±) | la linealidad de los medios es media (10.3% delta respecto a la frecuencia anterior)
Altos 2 - 16 kHz
(+) | máximos equilibrados - a sólo 1.3% de la mediana
(+) | los máximos son lineales (4.7% delta a la frecuencia anterior)
Total 100 - 16.000 Hz
(±) | la linealidad del sonido global es media (18.2% de diferencia con la mediana)
En comparación con la misma clase
» 58% de todos los dispositivos probados de esta clase eran mejores, 8% similares, 35% peores
» El mejor tuvo un delta de 6%, la media fue 18%, el peor fue ###max##%
En comparación con todos los dispositivos probados
» 39% de todos los dispositivos probados eran mejores, 8% similares, 53% peores
» El mejor tuvo un delta de 4%, la media fue 23%, el peor fue ###max##%
Gestión de la energía: la duración de la batería del PH315 es aceptable
El consumo de energía
En el uso inactivo, registramos un consumo máximo de 19,8 vatios. La prueba de estrés y nuestra prueba de The Witcher 3 permiten que la demanda aumente a 177 y 127 vatios, respectivamente. La salida del adaptador de corriente es de 230 vatios.
| Off / Standby | |
| Ocioso | |
| Carga |
|
Clave:
min: | |
| Acer Predator Helios 300 PH315-53-77N5 i7-10750H, GeForce RTX 2060 Mobile | Acer Predator Helios 300 PH315-52-79TY i7-9750H, GeForce GTX 1660 Ti Mobile | Dell G5 15 SE 5505 P89F R7 4800H, Radeon RX 5600M | Aorus 5 KB i7-10750H, GeForce RTX 2060 Mobile | Schenker XMG Core 15 GK5NR0O R7 4800H, GeForce RTX 2060 Mobile | Asus TUF Gaming A15 FA506IV-HN172 R7 4800H, GeForce RTX 2060 Mobile | Medio NVIDIA GeForce RTX 2060 Mobile | Media de la clase Gaming | |
|---|---|---|---|---|---|---|---|---|
| Power Consumption | -115% | -10% | -38% | -54% | -7% | -71% | -95% | |
| Idle Minimum * (Watt) | 2.9 | 17.2 -493% | 6.5 -124% | 8 -176% | 12 -314% | 5.4 -86% | 11.5 ? -297% | 13.1 ? -352% |
| Idle Average * (Watt) | 13.2 | 22.6 -71% | 10.6 20% | 12 9% | 14 -6% | 10 24% | 16.5 ? -25% | 19 ? -44% |
| Idle Maximum * (Watt) | 19.8 | 25.5 -29% | 11 44% | 21 -6% | 20 -1% | 10.5 47% | 23.7 ? -20% | 24.6 ? -24% |
| Load Average * (Watt) | 105 | 88 16% | 84.1 20% | 128 -22% | 103 2% | 135 -29% | 107.5 ? -2% | 111.3 ? -6% |
| Witcher 3 ultra * (Watt) | 127 | 152.9 -20% | 138 -9% | 125 2% | 144 -13% | |||
| Load Maximum * (Watt) | 177 | 177 -0% | 180.4 -2% | 217 -23% | 193 -9% | 147 17% | 199.7 ? -13% | 260 ? -47% |
* ... más pequeño es mejor
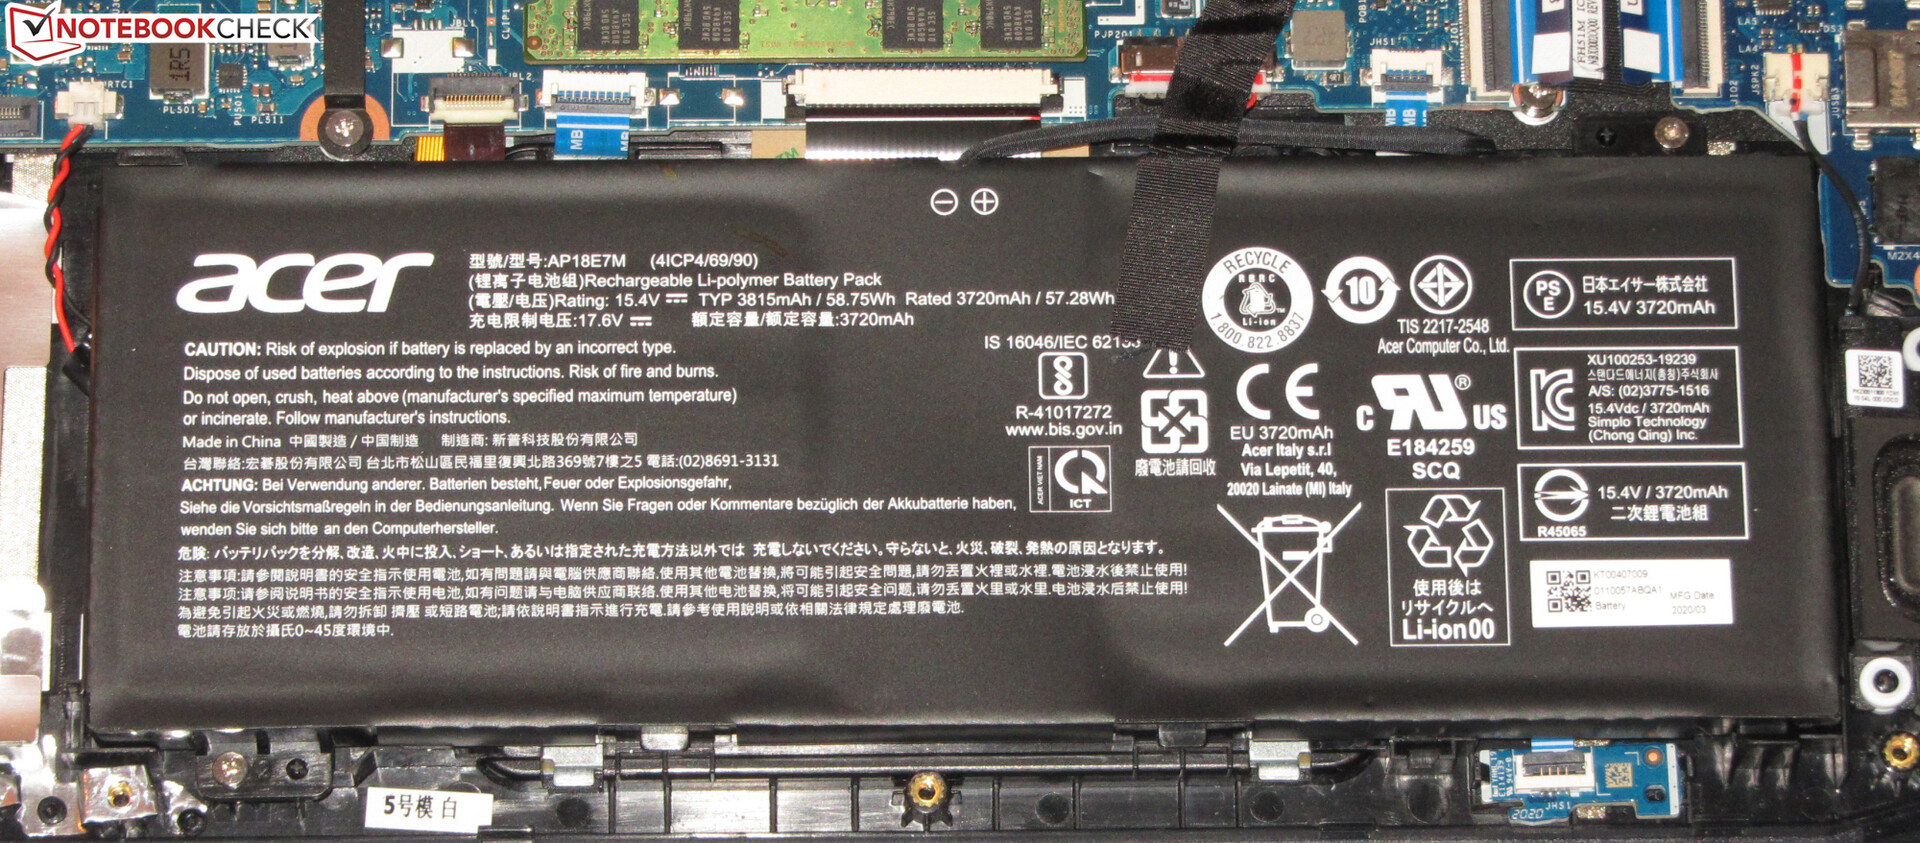
Duración de la batería
El portátil de Acer alcanza tiempos de ejecución de 4:40 horas y 5:38 horas, respectivamente, en nuestra prueba de WLAN (acceso a sitios web usando un guión) y prueba de vídeo (el cortometraje Big Buck Bunny (codificación H.264, Full HD) corriendo en un bucle). Durante ambas pruebas, las funciones de ahorro de energía están desactivadas, y el brillo de la pantalla se ajusta a unos 150 cd/m². Para realizar la prueba de vídeo, los módulos inalámbricos también se desactivan.
| Acer Predator Helios 300 PH315-53-77N5 i7-10750H, GeForce RTX 2060 Mobile, 58.7 Wh | Acer Predator Helios 300 PH315-52-79TY i7-9750H, GeForce GTX 1660 Ti Mobile, 58.75 Wh | Dell G5 15 SE 5505 P89F R7 4800H, Radeon RX 5600M, 51 Wh | Aorus 5 KB i7-10750H, GeForce RTX 2060 Mobile, 48.96 Wh | Schenker XMG Core 15 GK5NR0O R7 4800H, GeForce RTX 2060 Mobile, 62 Wh | Asus TUF Gaming A15 FA506IV-HN172 R7 4800H, GeForce RTX 2060 Mobile, 48 Wh | Media de la clase Gaming | |
|---|---|---|---|---|---|---|---|
| Duración de Batería | -38% | 8% | -18% | -1% | 7% | 14% | |
| Reader / Idle (h) | 10.4 | 5 -52% | 11.2 8% | 9 -13% | 7.8 -25% | 9.8 -6% | 7.84 ? -25% |
| H.264 (h) | 5.6 | 3.4 -39% | 6.2 11% | 5.4 -4% | 8.27 ? 48% | ||
| WiFi v1.3 (h) | 4.7 | 3.5 -26% | 6.2 32% | 4.8 2% | 5.9 26% | 6.2 32% | 7.08 ? 51% |
| Load (h) | 1.8 | 1.2 -33% | 1.5 -17% | 1 -44% | 1.5 -17% | 1.9 6% | 1.496 ? -17% |
Pro
Contra
Veredicto
El portátil para juegos de Acer lleva todos los últimos juegos a la pantalla sin problemas gracias al procesador Core i7-10750H y al núcleo gráfico GeForce RTX 2060. Aquí se puede utilizar una resolución Full HD y ajustes de alta a máxima calidad. El rendimiento de la GPU se puede aumentar si es necesario.
El Acer Predator Helios 300 PH315-53 es un portátil para juegos muy completo que también ofrece cierta libertad de acción.
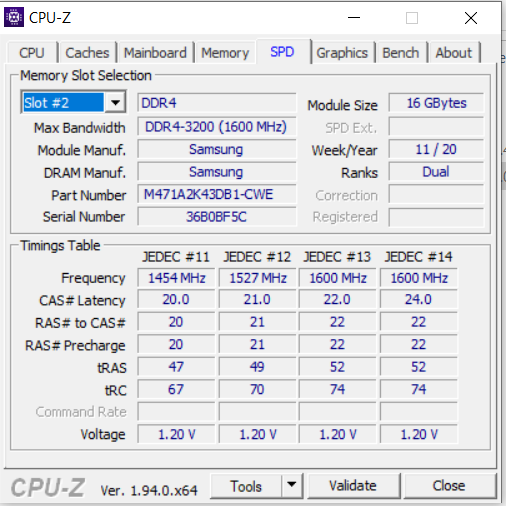
El hardware está soportado por 16 GB de RAM (1x 16 GB, modo de un solo canal). El ordenador portátil puede y debe ser actualizado con un segundo módulo de memoria para activar el modo de doble canal. Esto provoca un ligero aumento del rendimiento. La capacidad de espacio de almacenamiento (512 GB, NVMe SSD) no es muy grande para un portátil para juegos. Se podría instalar una segunda NVMe SSD. El Predator también soporta RAID 0.
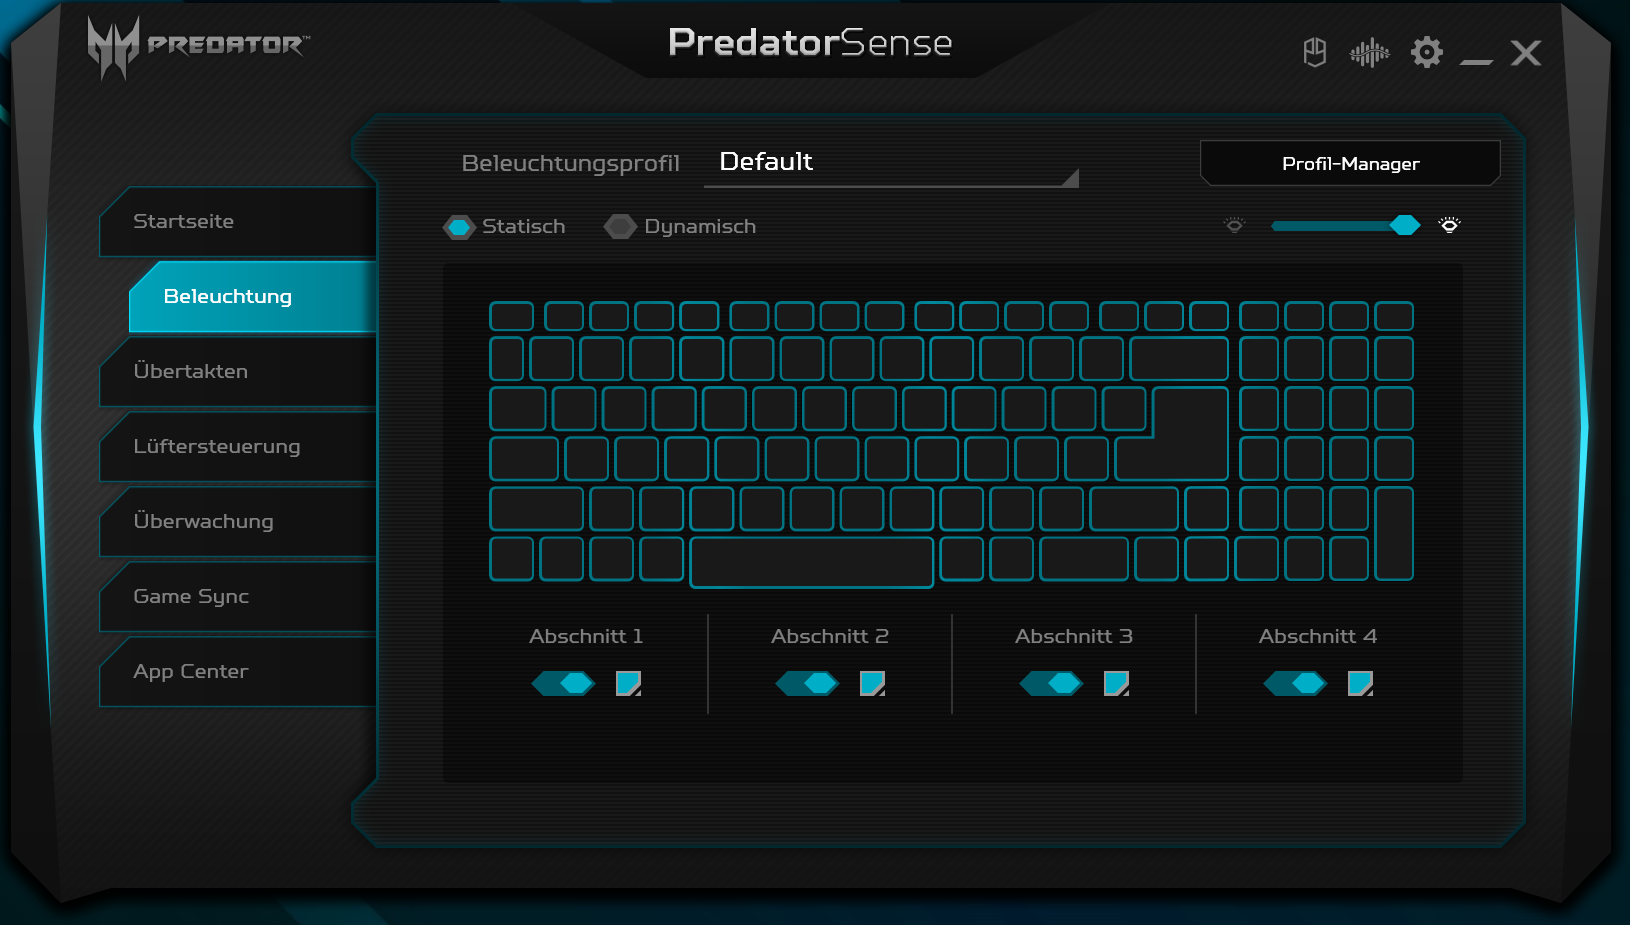
La pantalla (Full HD, IPS, 144 Hz) ofrece ángulos de visión estables, una superficie mate, buen contraste, tiempos de respuesta rápidos y una reproducción del color decente. Sin embargo, el brillo máximo debería ser más alto. El teclado (retroiluminado) ha demostrado ser adecuado para el uso diario. La duración de la batería es aceptable. Además, el Helios no tiene un puerto Thunderbolt 3. Sólo hay un puerto USB tipo C 3.2 Gen 2, y no soporta ni DisplayPort ni Power Delivery.
El Predator ha causado una buena impresión en principio. Sin embargo, cuando se trata de memoria y almacenamiento, nuestra variante de configuración no está óptimamente equipada. Puede que haya costos de seguimiento para un segundo módulo de memoria o un segundo SSD NVMe . Si usted está fundamentalmente interesado en el Predator, le recomendamos que compre una versión mejor equipada.
Acer Predator Helios 300 PH315-53-77N5
- 10/30/2020 v7 (old)
Sascha Mölck
Price comparison
