Análisis del portátil MSI GS66 Stealth 10UG: ¿Cómo de rápido es un GeForce RTX 3070 de 95 W?
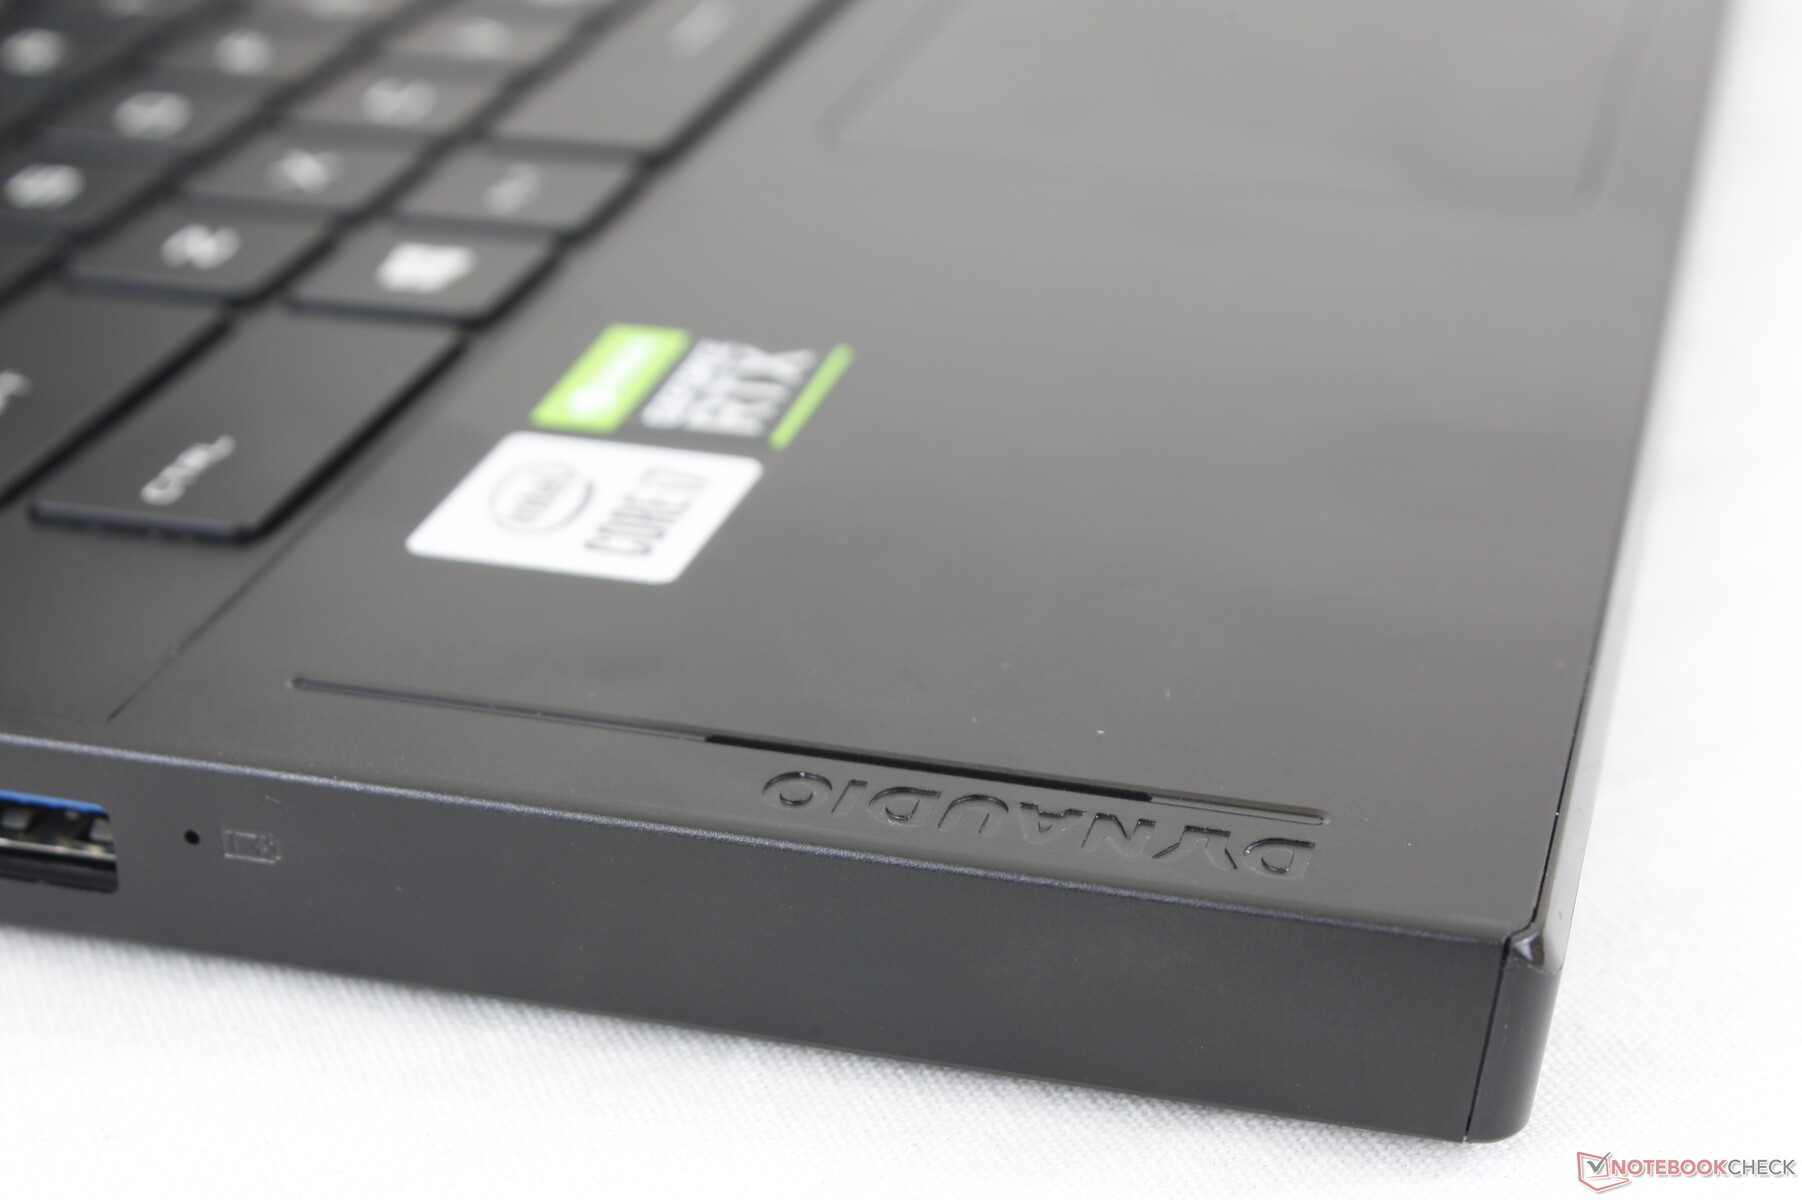
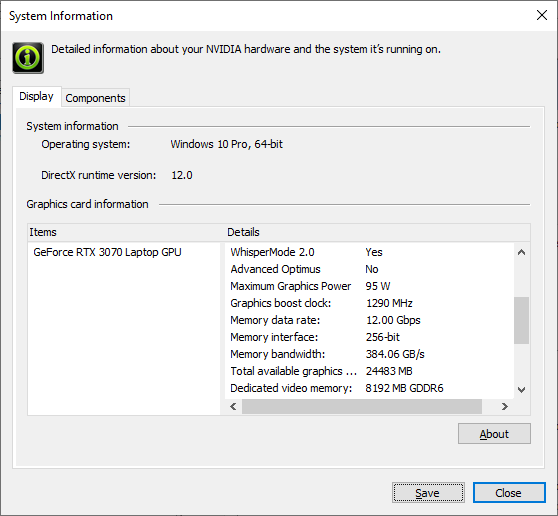
MSI se ha subido rápidamente al carro de los portátiles GeForce RTX 30 con un montón de modelos actualizados entre los que elegir. El GS66, el GE76 y el GE66 están ahora disponibles con las últimas GPUs Nvidia Ampere para reemplazar las opciones Turing del año pasado. Nuestra configuración GS66 10UG viene con una GeForce RTX 3070 que MSI nos ha confirmado que tiene un TGP de 95 W. También hay una nueva CPU Core i7-10870H para complementar la Core i7-10875H existente.
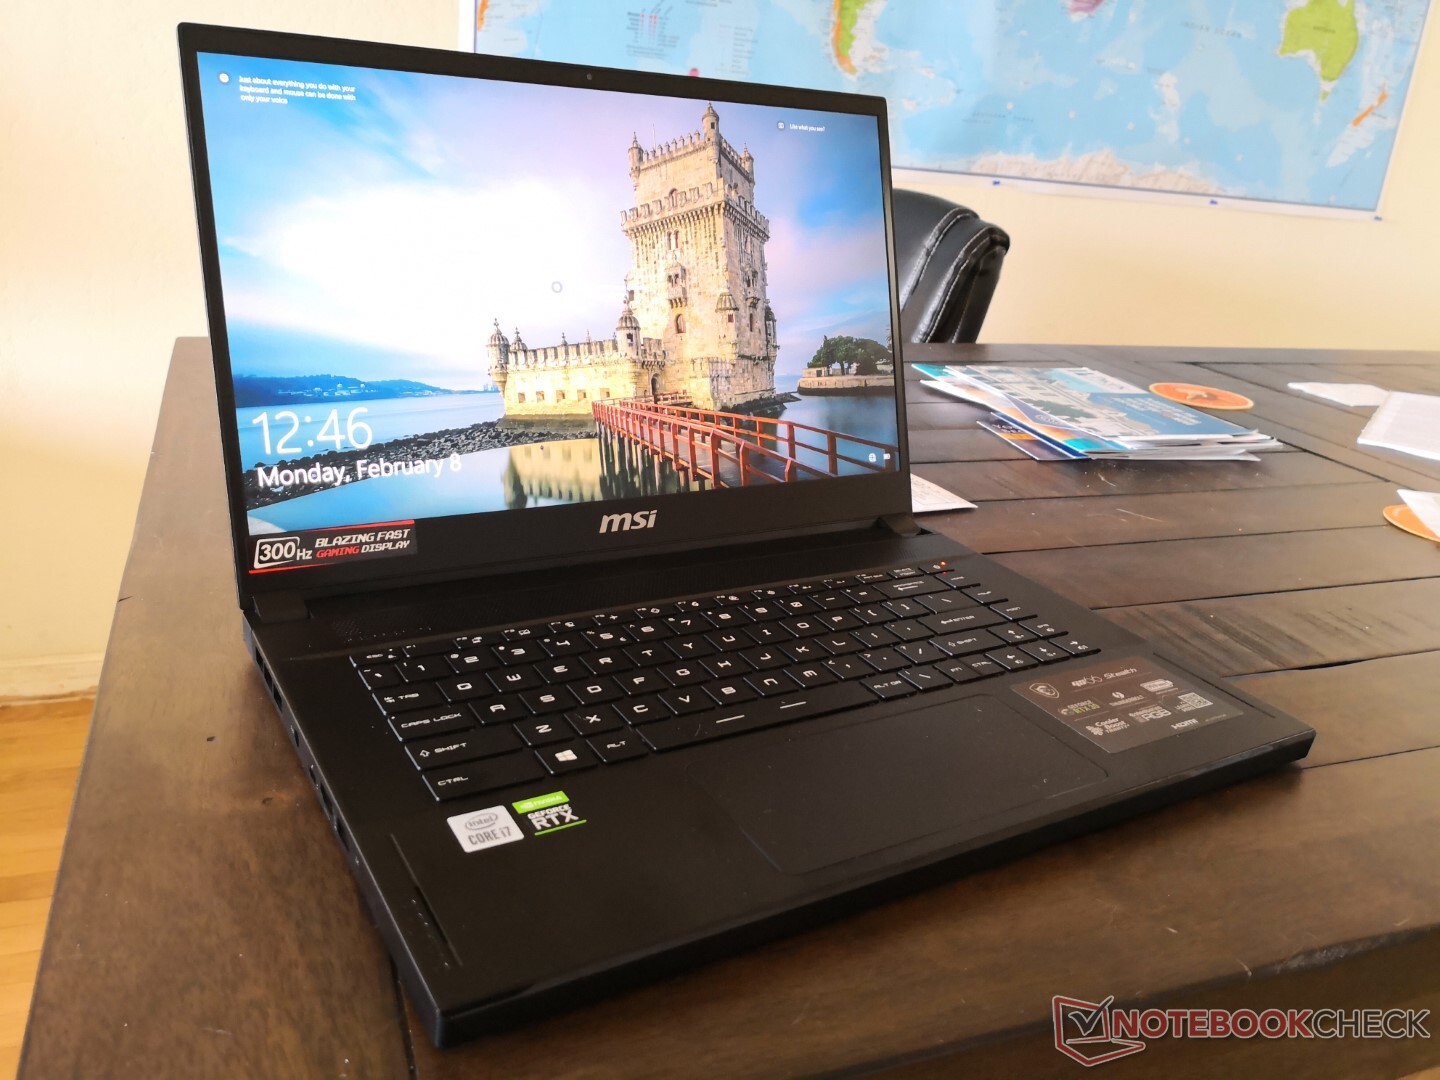
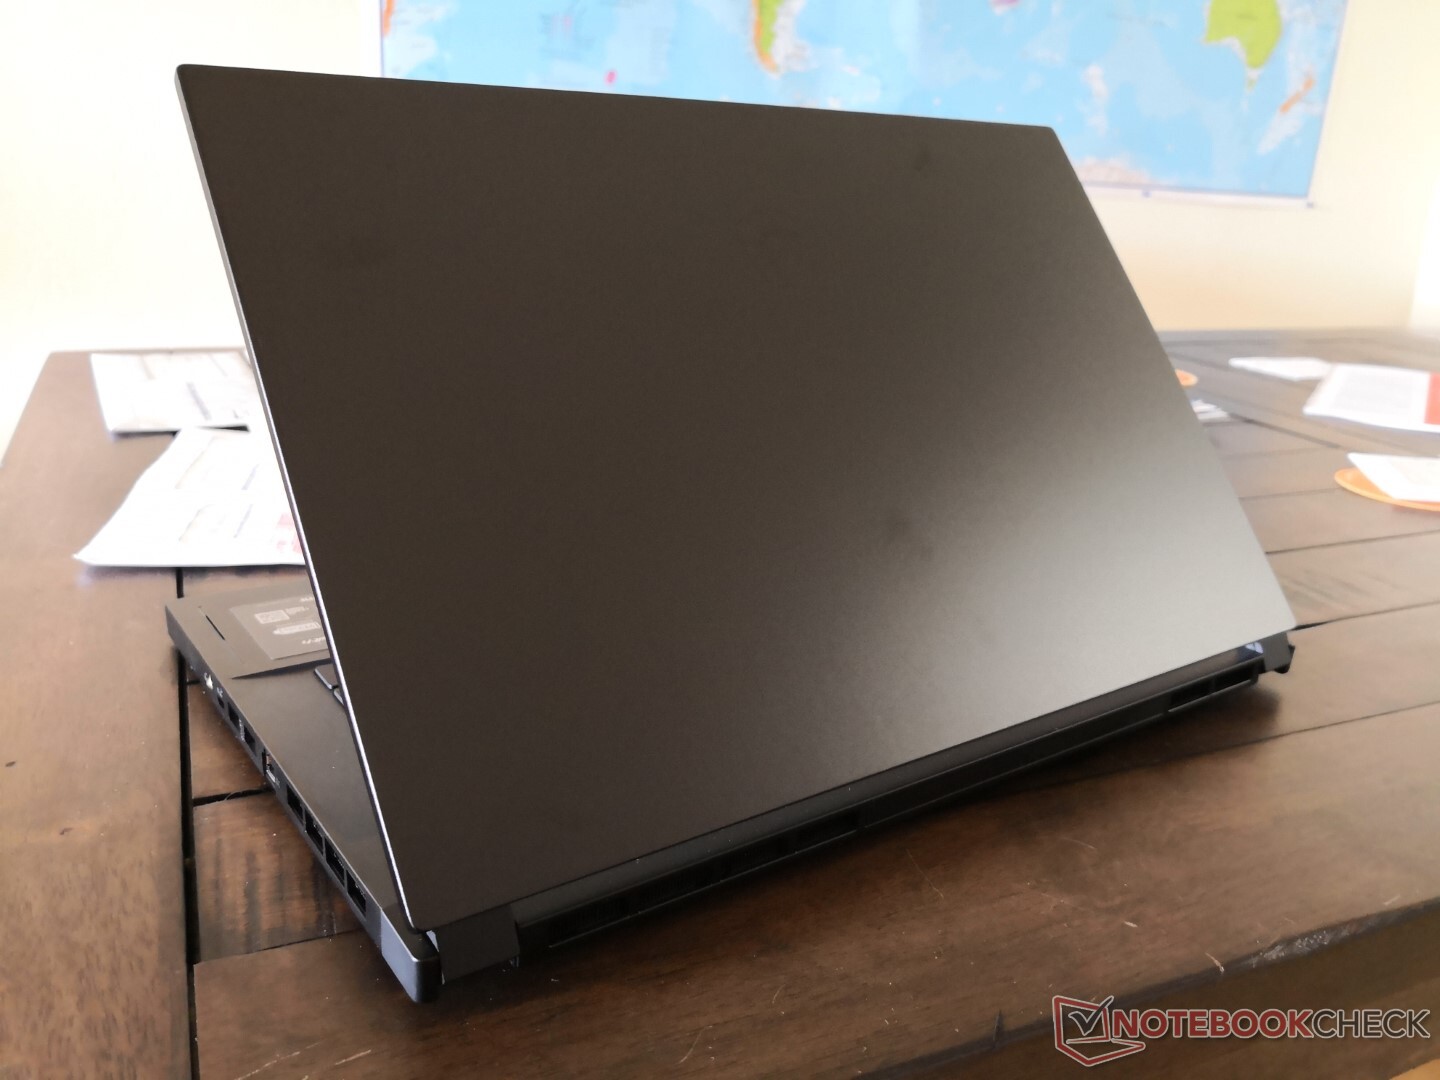
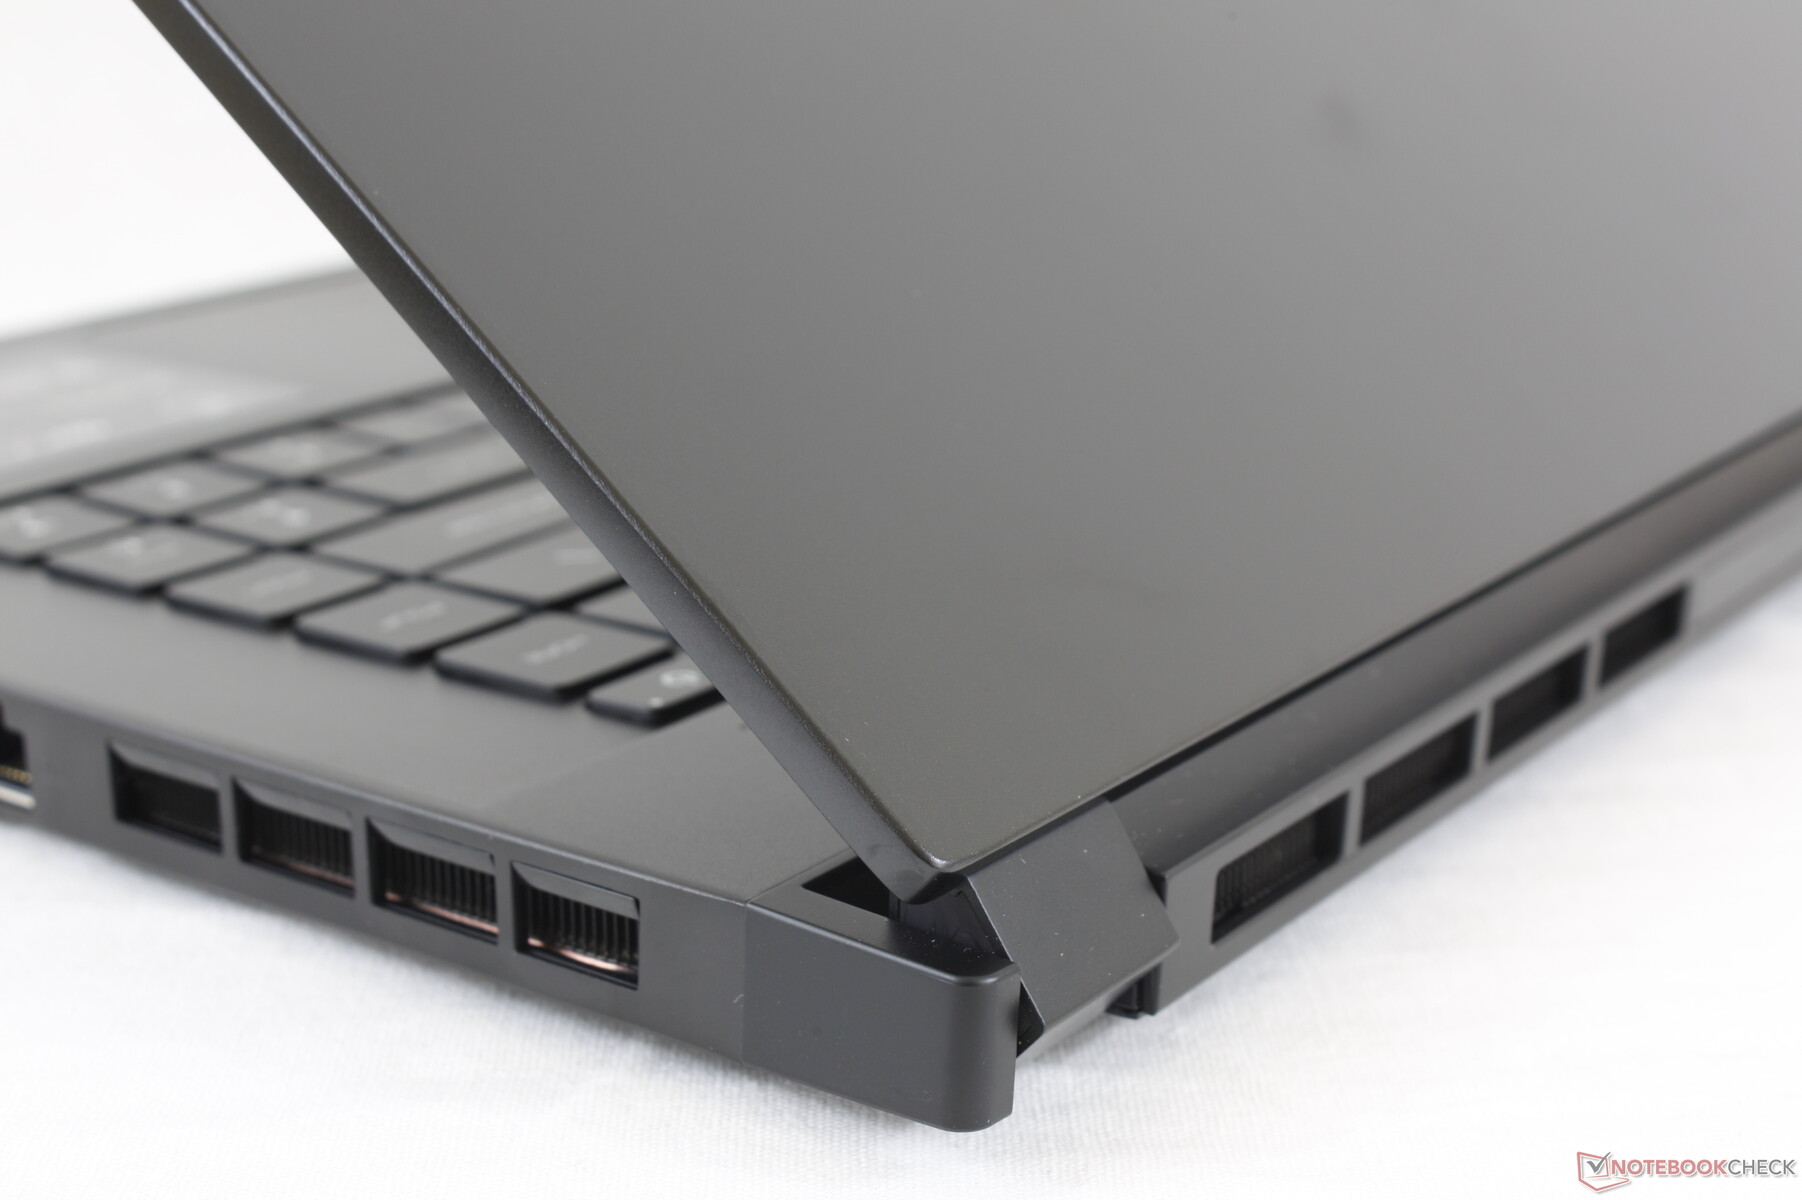
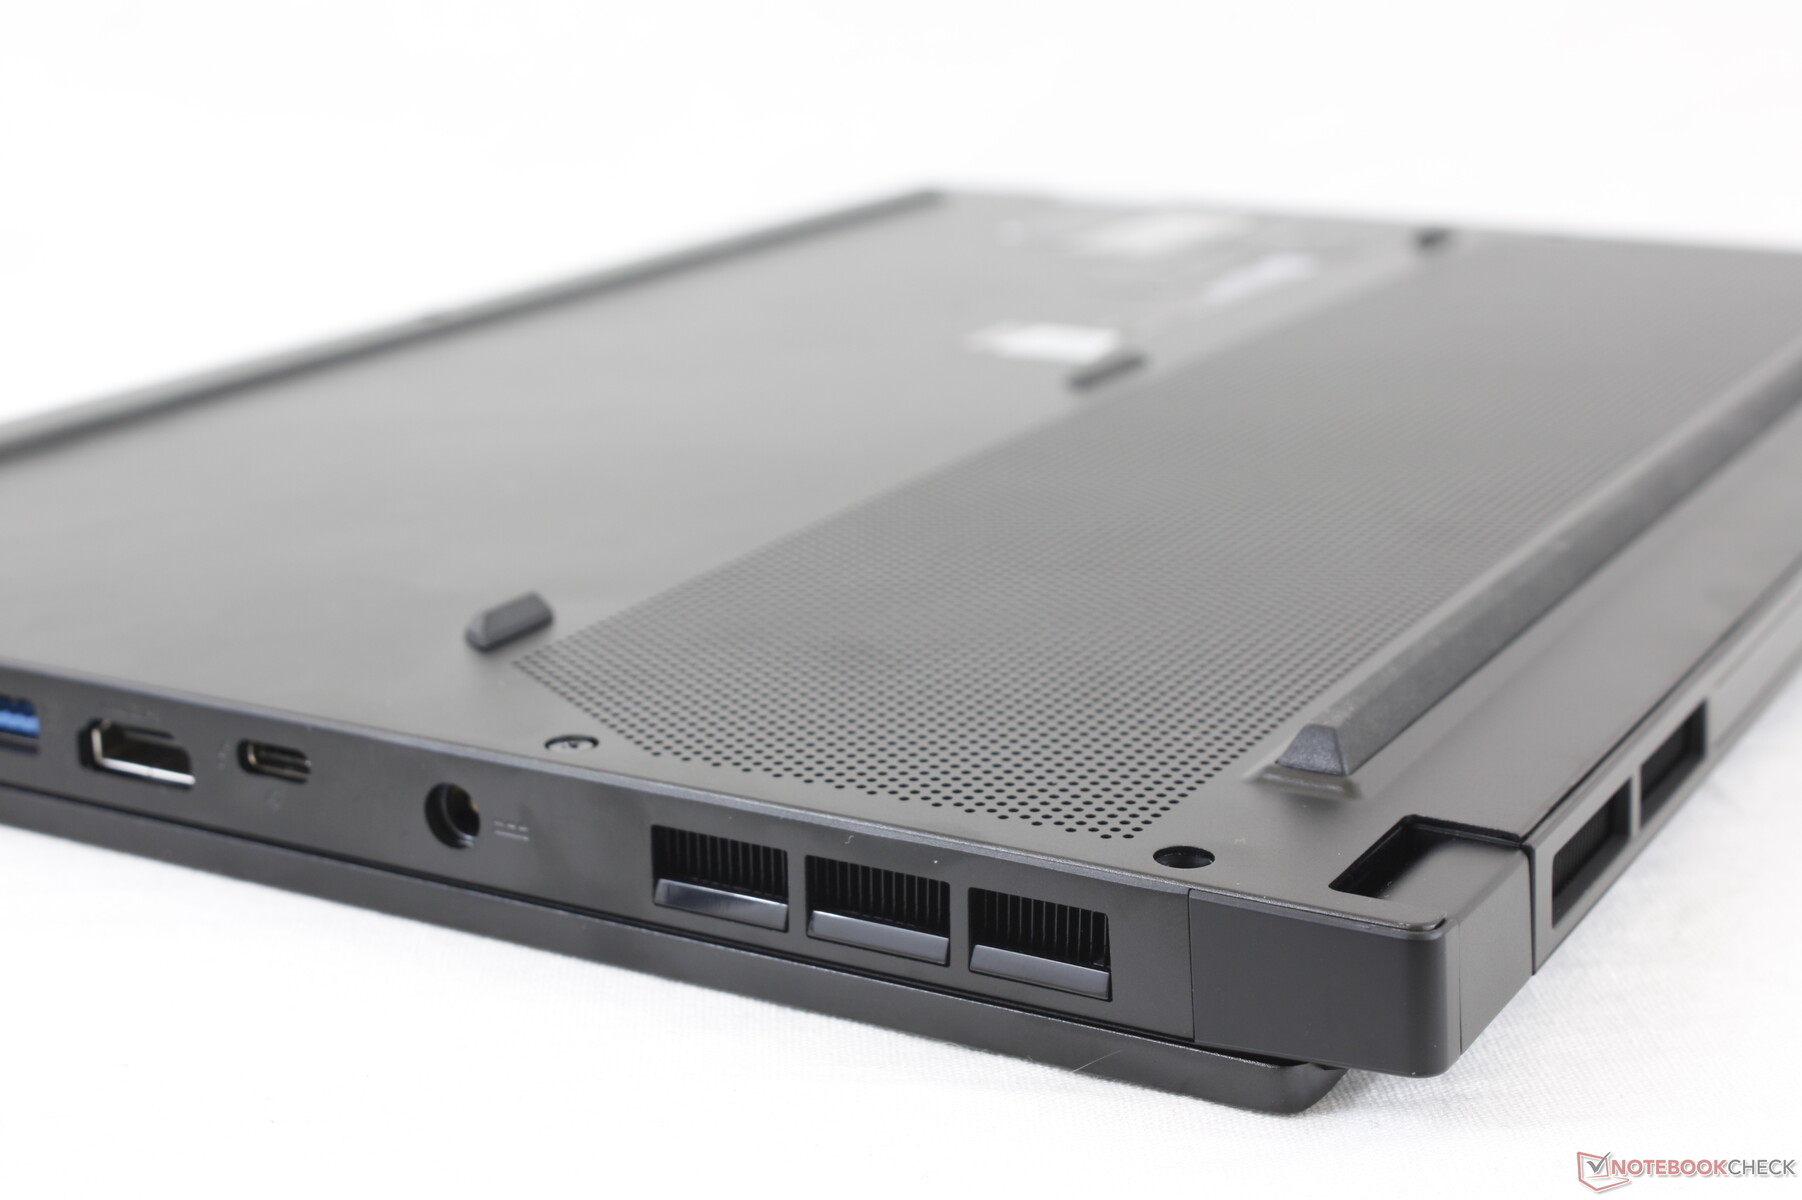
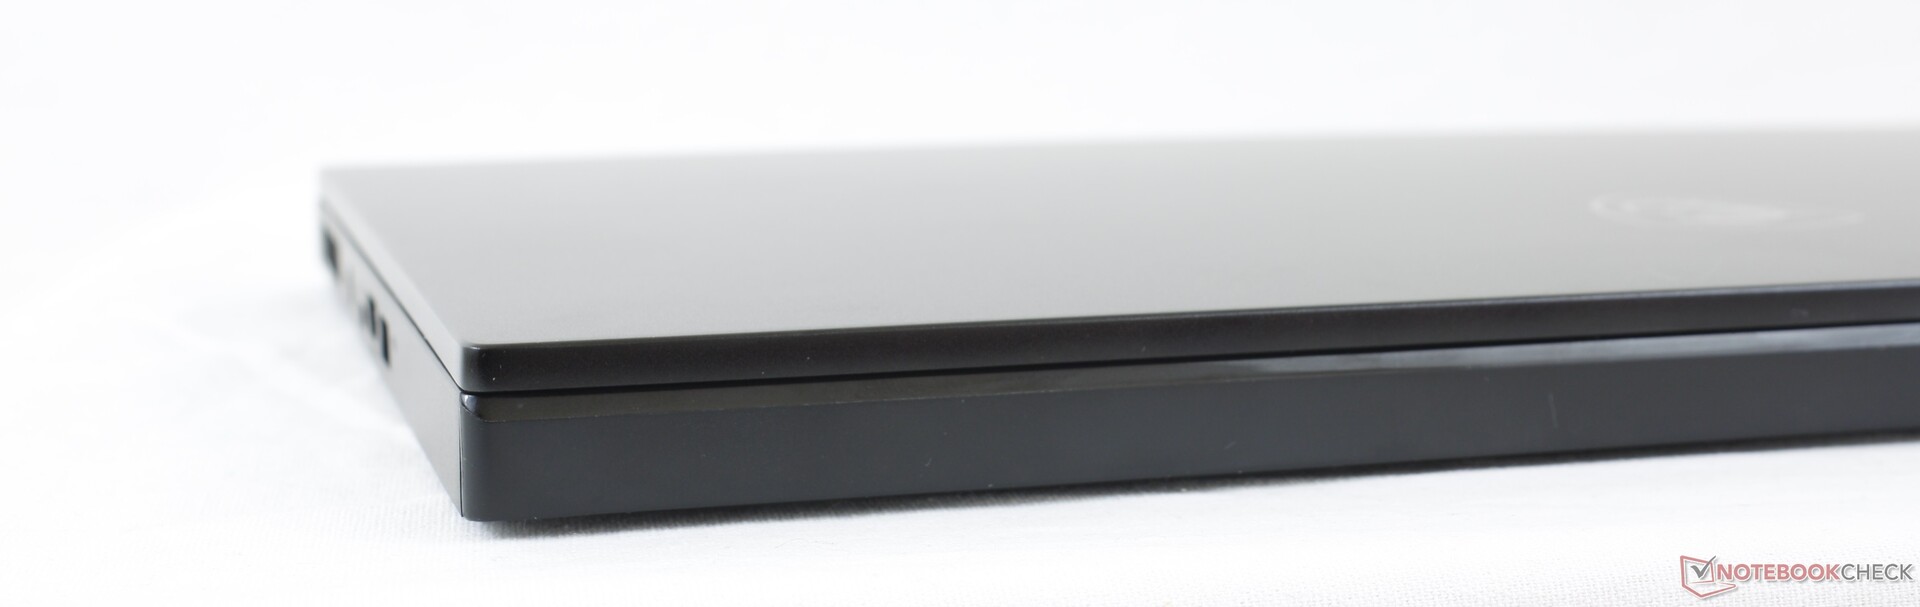
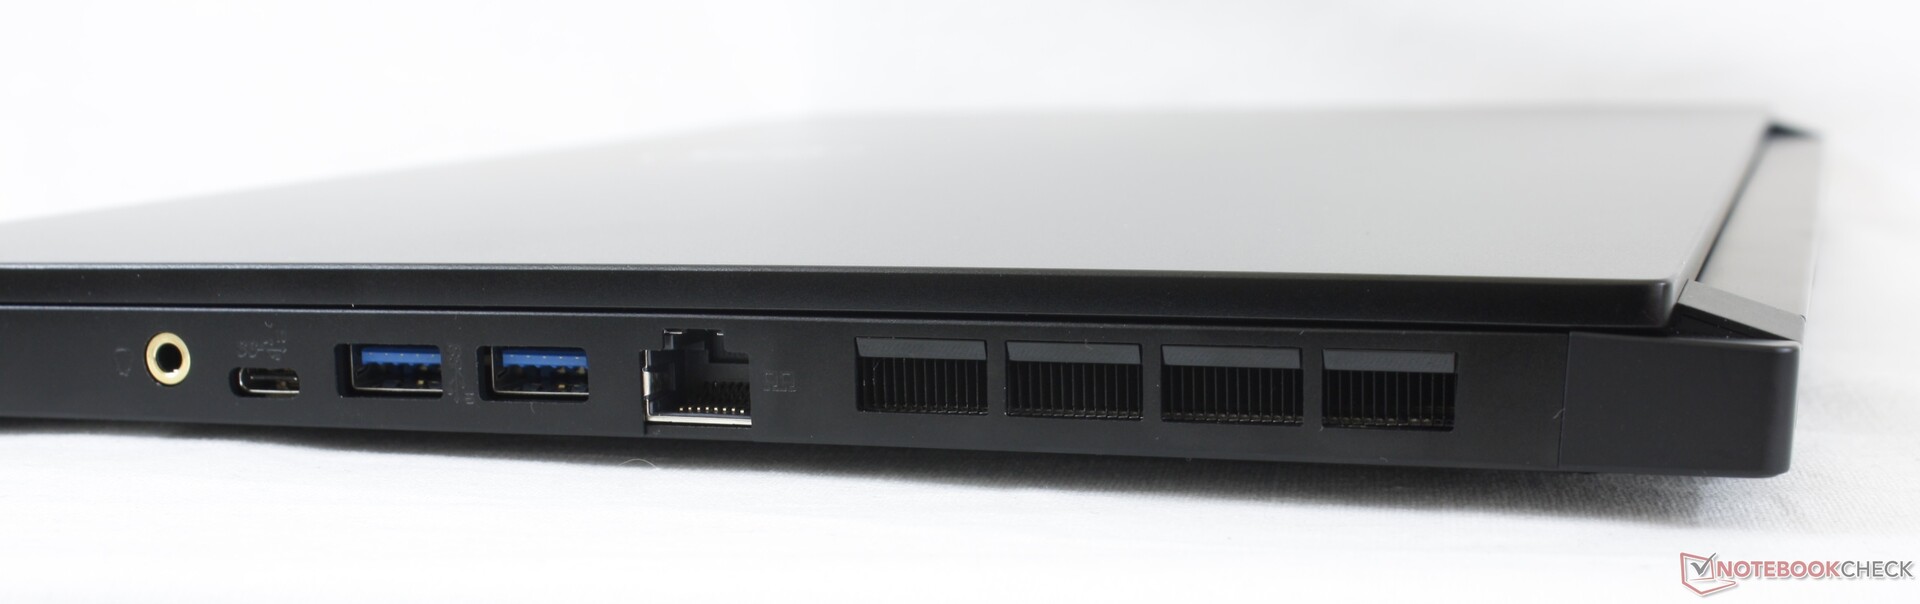
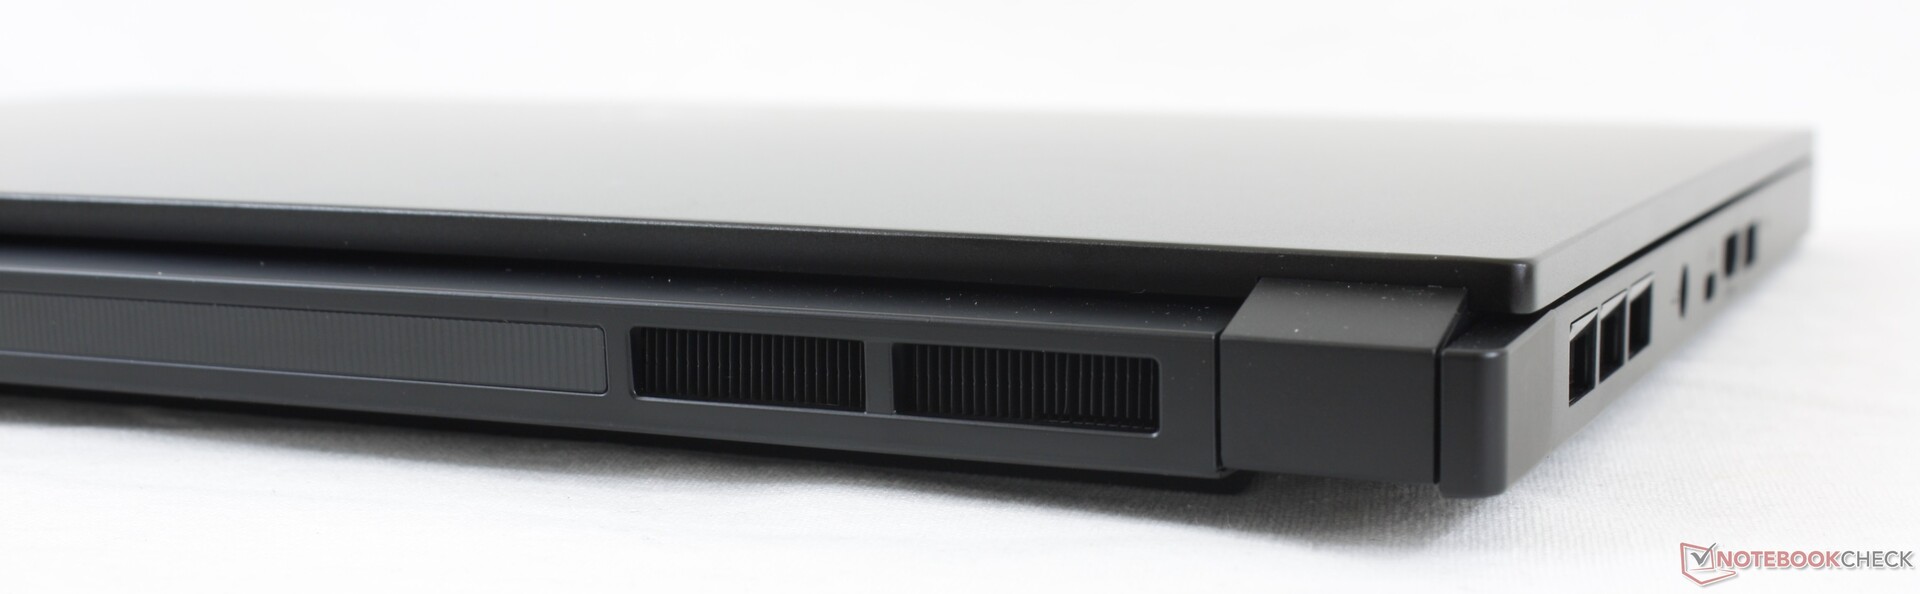
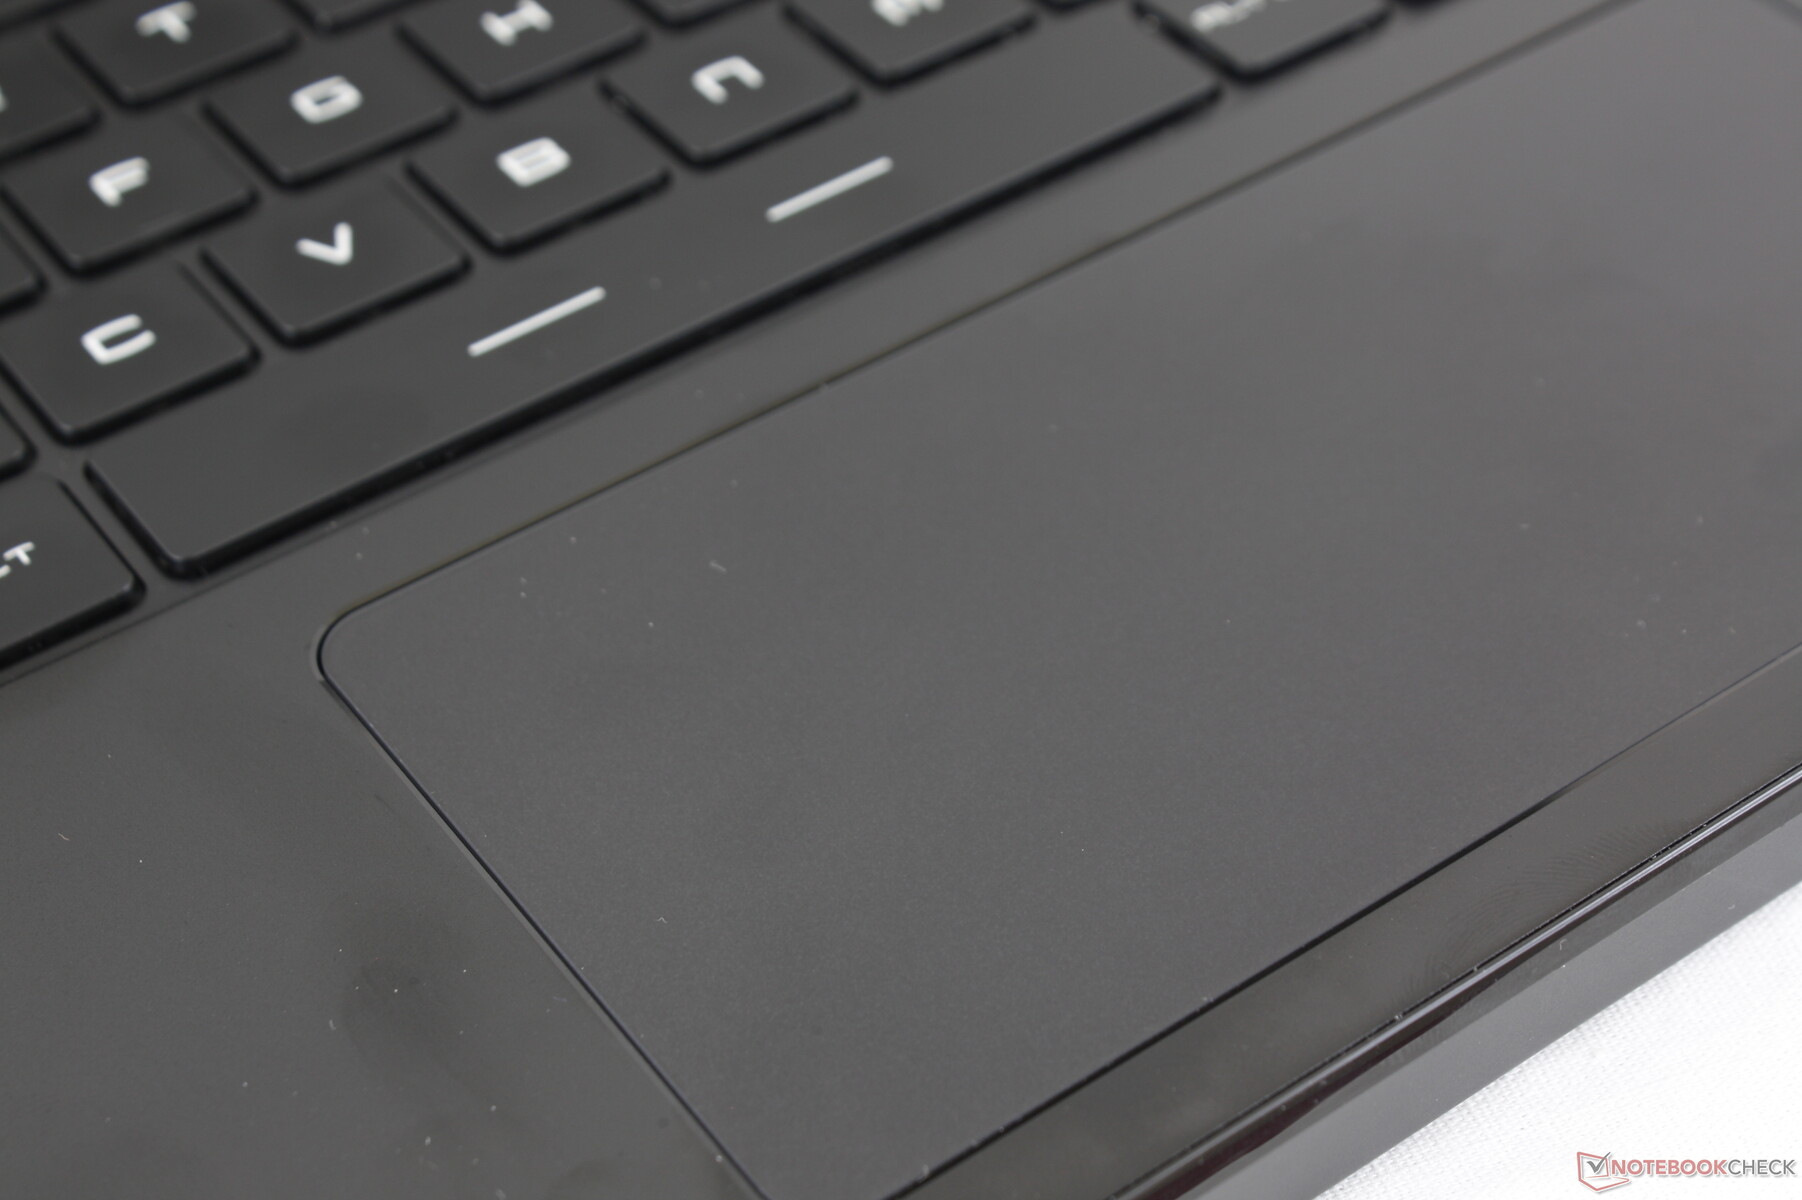
Aparte de la nueva CPU y GPU, el chasis sigue siendo visualmente idéntico a los anteriores modelos GS66. Recomendamos consultar nuestros análisis existentes sobre el GS66 para saber más sobre las características físicas del portátil, ya que todas se aplican aquí también. El GS66 compite directamente con otros portátiles ultradelgados de alto rendimiento de 15,6 pulgadas como el Razer Blade 15, el Lenovo Legion 7, el Gigabyte Aero 15 y la serie Asus Zephyrus.
Más opiniones de MSI:
potential competitors in comparison
Valoración | Fecha | Modelo | Peso | Altura | Tamaño | Resolución | Precio |
|---|---|---|---|---|---|---|---|
| 84 % v7 (old) | 02/2021 | MSI GS66 Stealth 10UG i7-10870H, GeForce RTX 3070 Laptop GPU | 2.1 kg | 19.8 mm | 15.60" | 1920x1080 | |
| 84 % v7 (old) | 05/2020 | MSI GS66 10SGS i7-10750H, GeForce RTX 2080 Super Max-Q | 2.2 kg | 20 mm | 15.60" | 1920x1080 | |
| 82.4 % v7 (old) | 02/2021 | Asus TUF Dash F15 FX516PR i7-11370H, GeForce RTX 3070 Laptop GPU | 2 kg | 20 mm | 15.60" | 1920x1080 | |
| 86.9 % v7 (old) | 08/2020 | Razer Blade 15 RTX 2070 Super Max-Q i7-10875H, GeForce RTX 2070 Super Max-Q | 2.1 kg | 17.8 mm | 15.60" | 1920x1080 | |
| 84.5 % v7 (old) | 01/2021 | Aorus 15P WB i7-10750H, GeForce RTX 2070 Max-Q | 2.1 kg | 23 mm | 15.60" | 1920x1080 | |
| 84.8 % v7 (old) | 08/2020 | Alienware m15 R3 P87F i7-10750H, GeForce RTX 2070 Mobile | 2.3 kg | 19.9 mm | 15.60" | 1920x1080 |
Caso
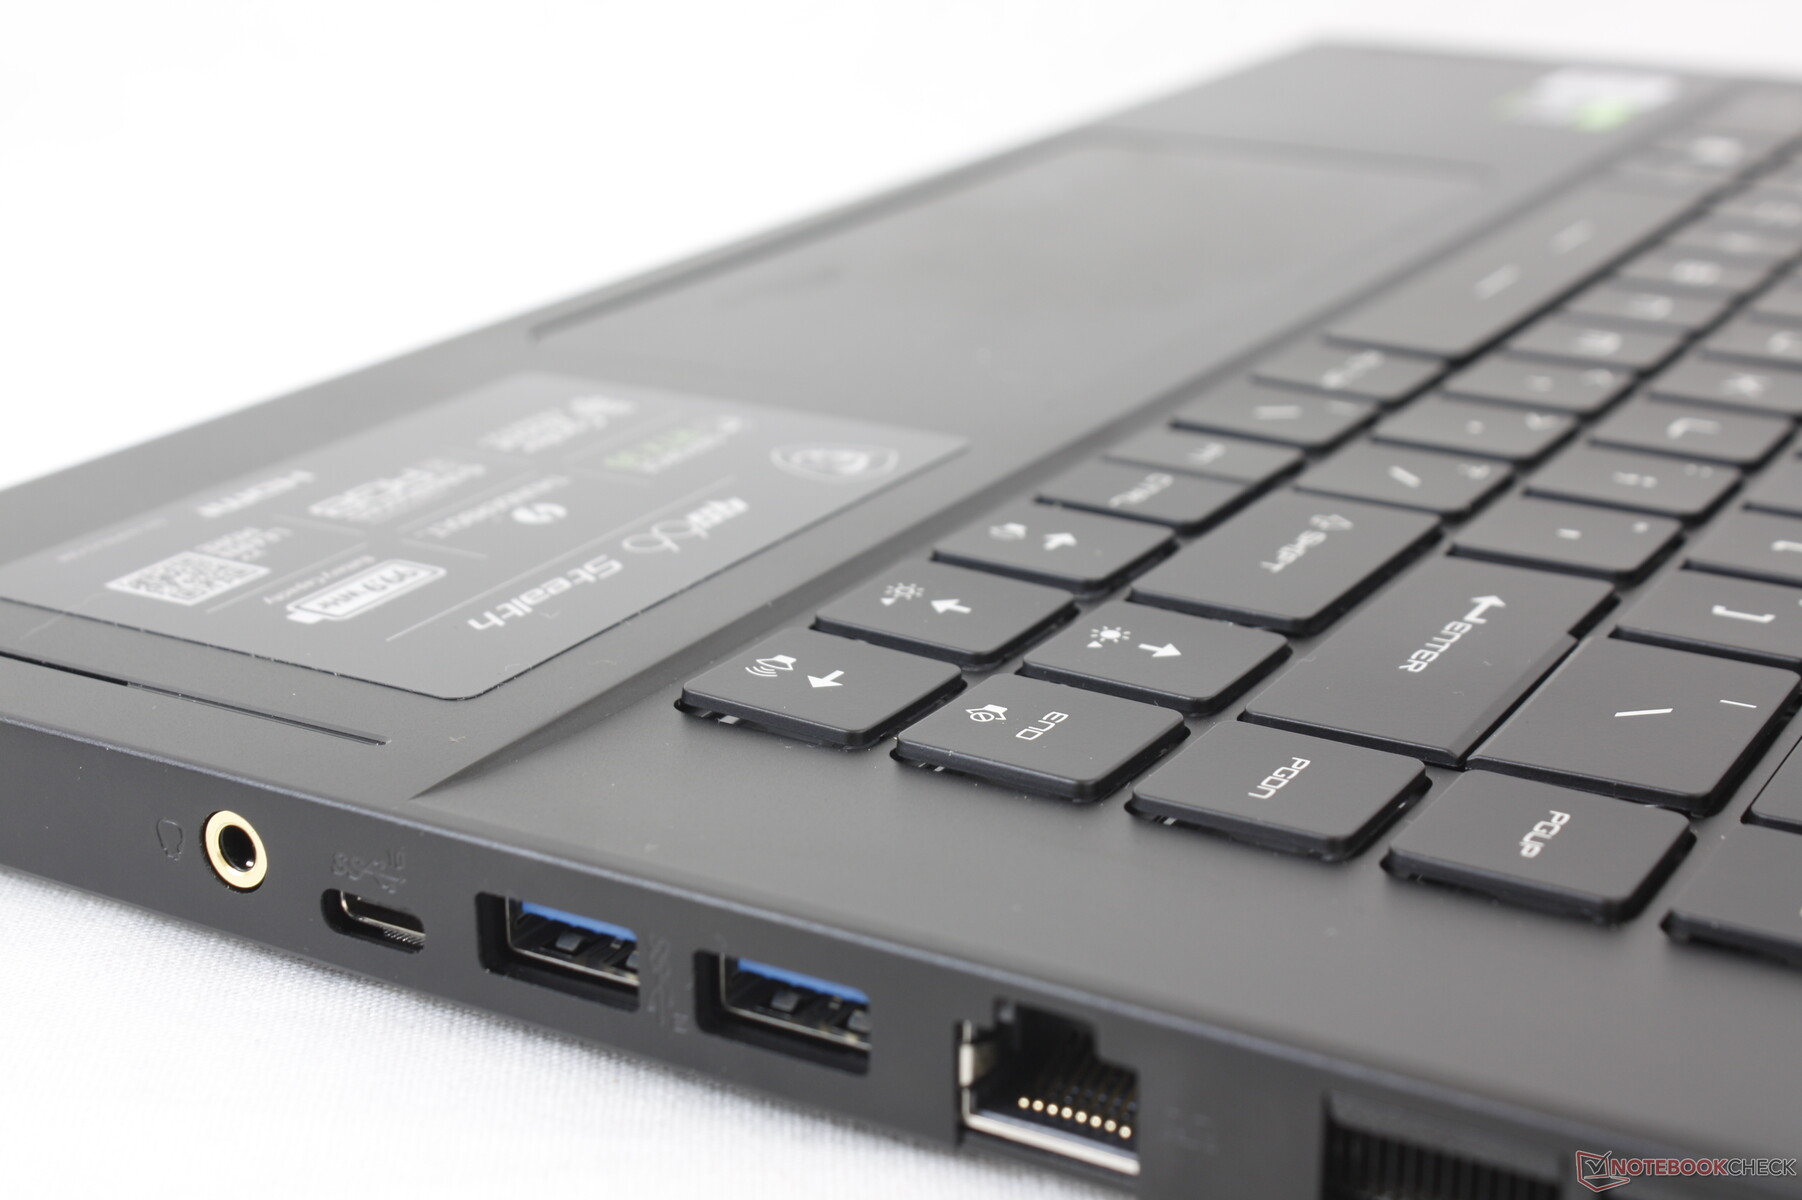
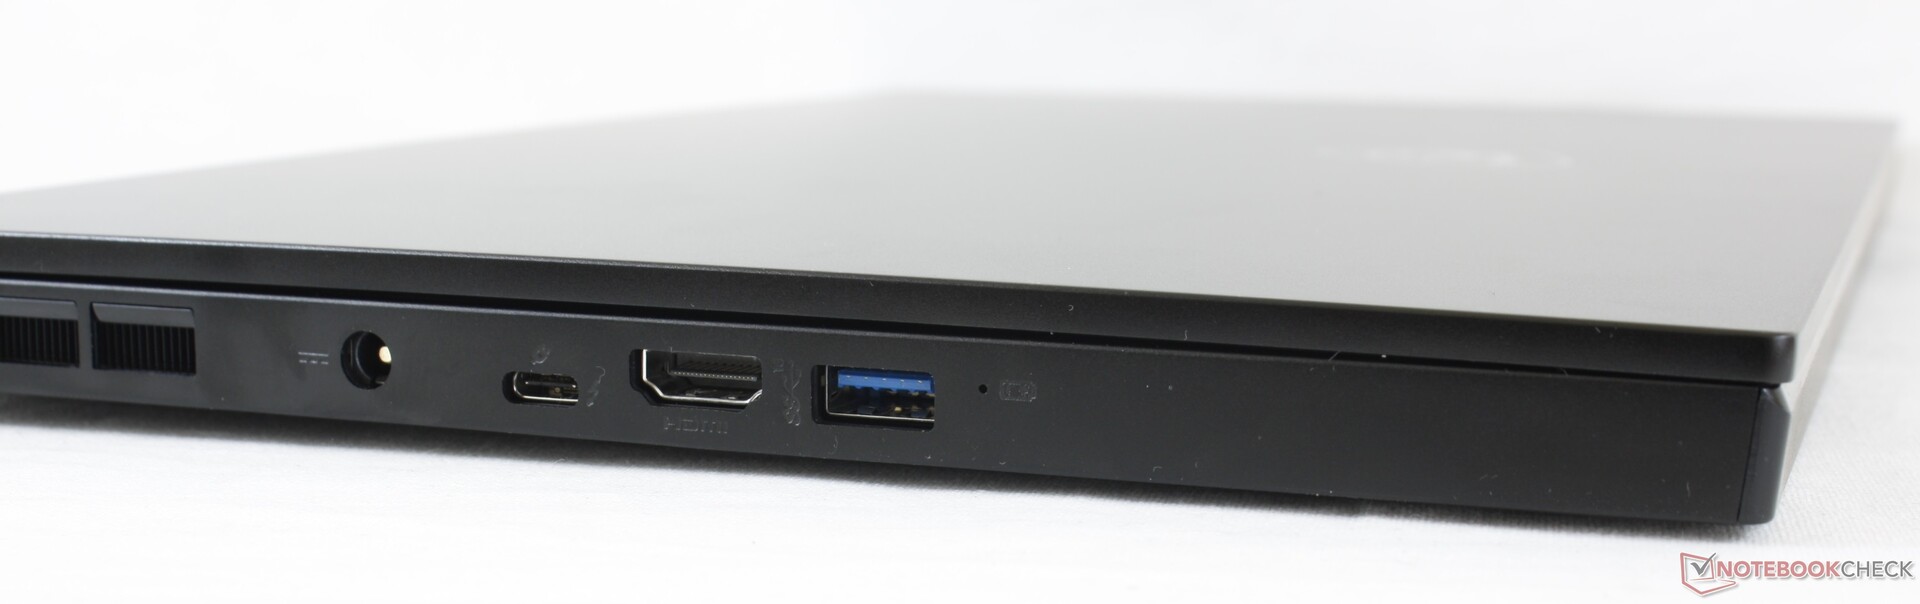
Conectividad
Comunicación
Cámara web


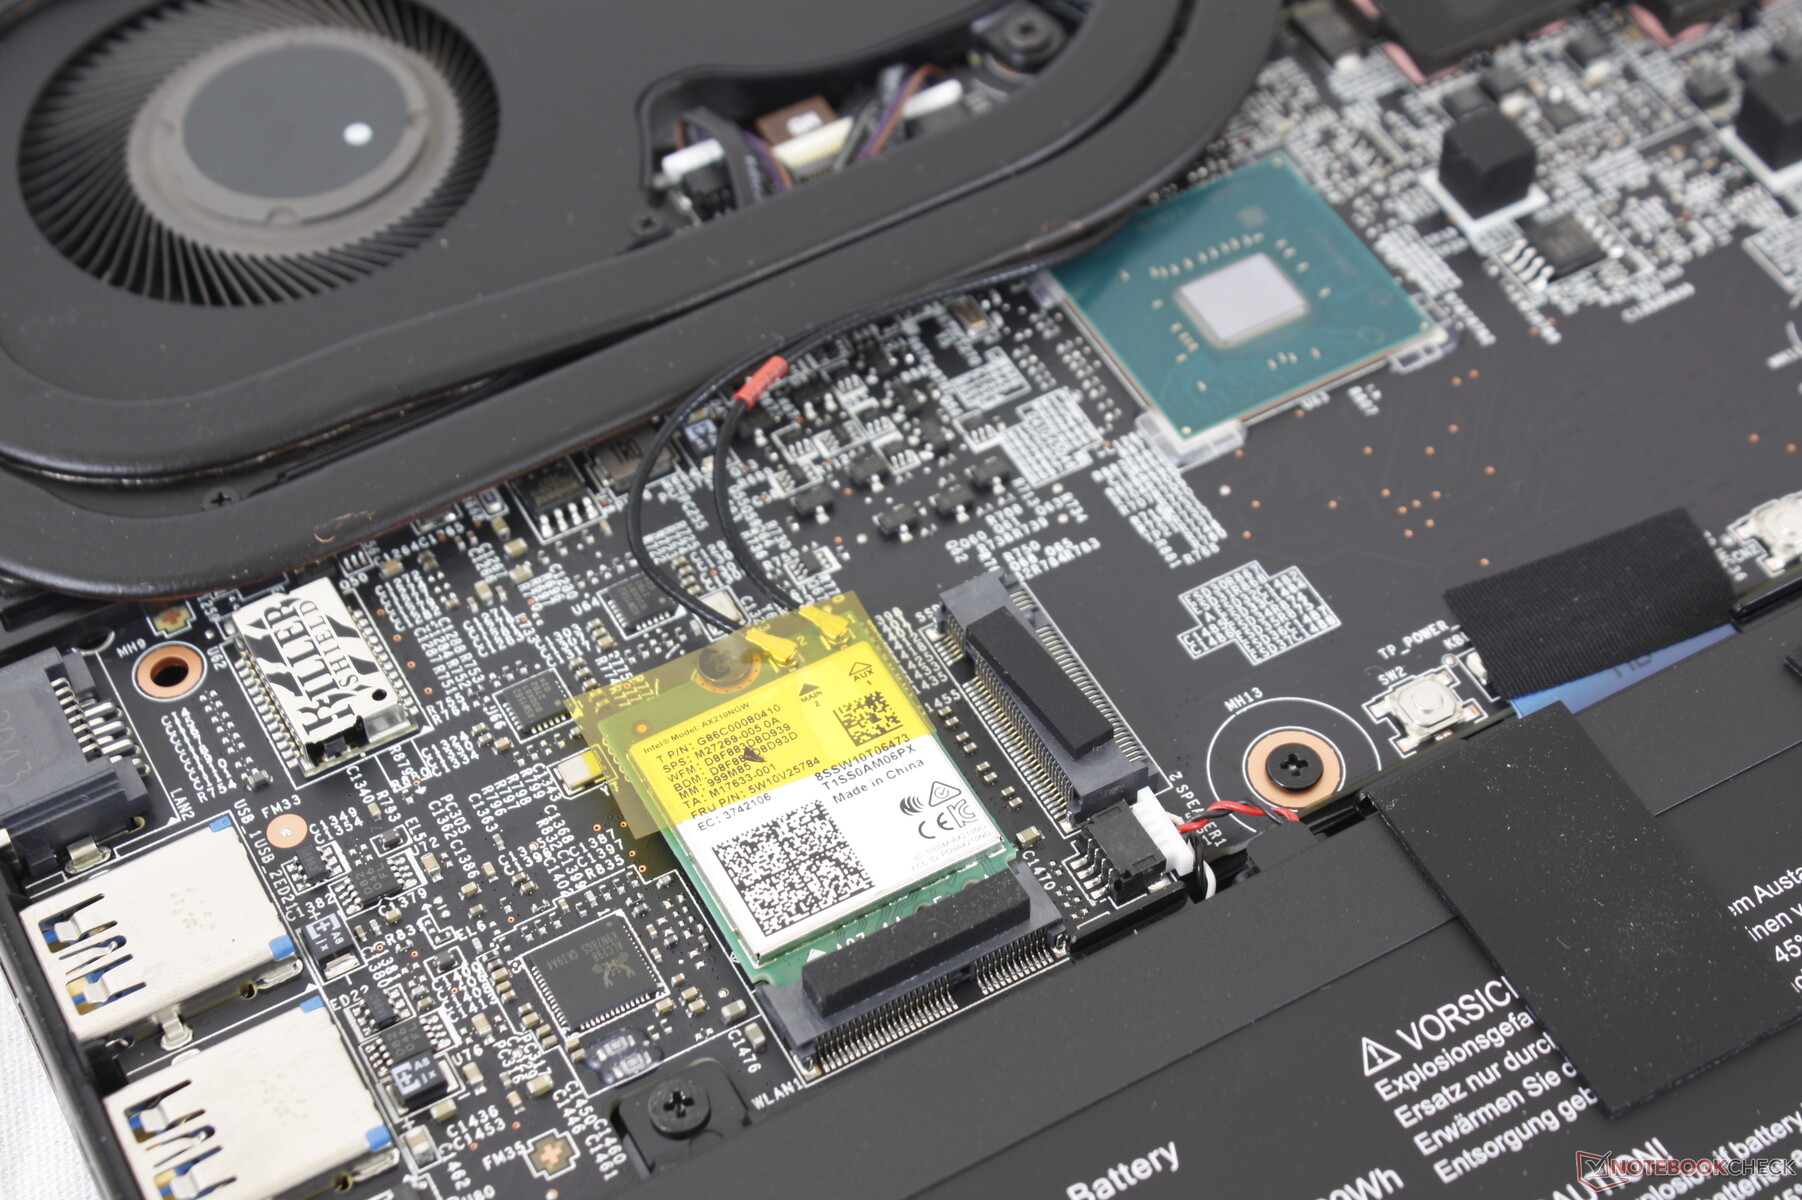
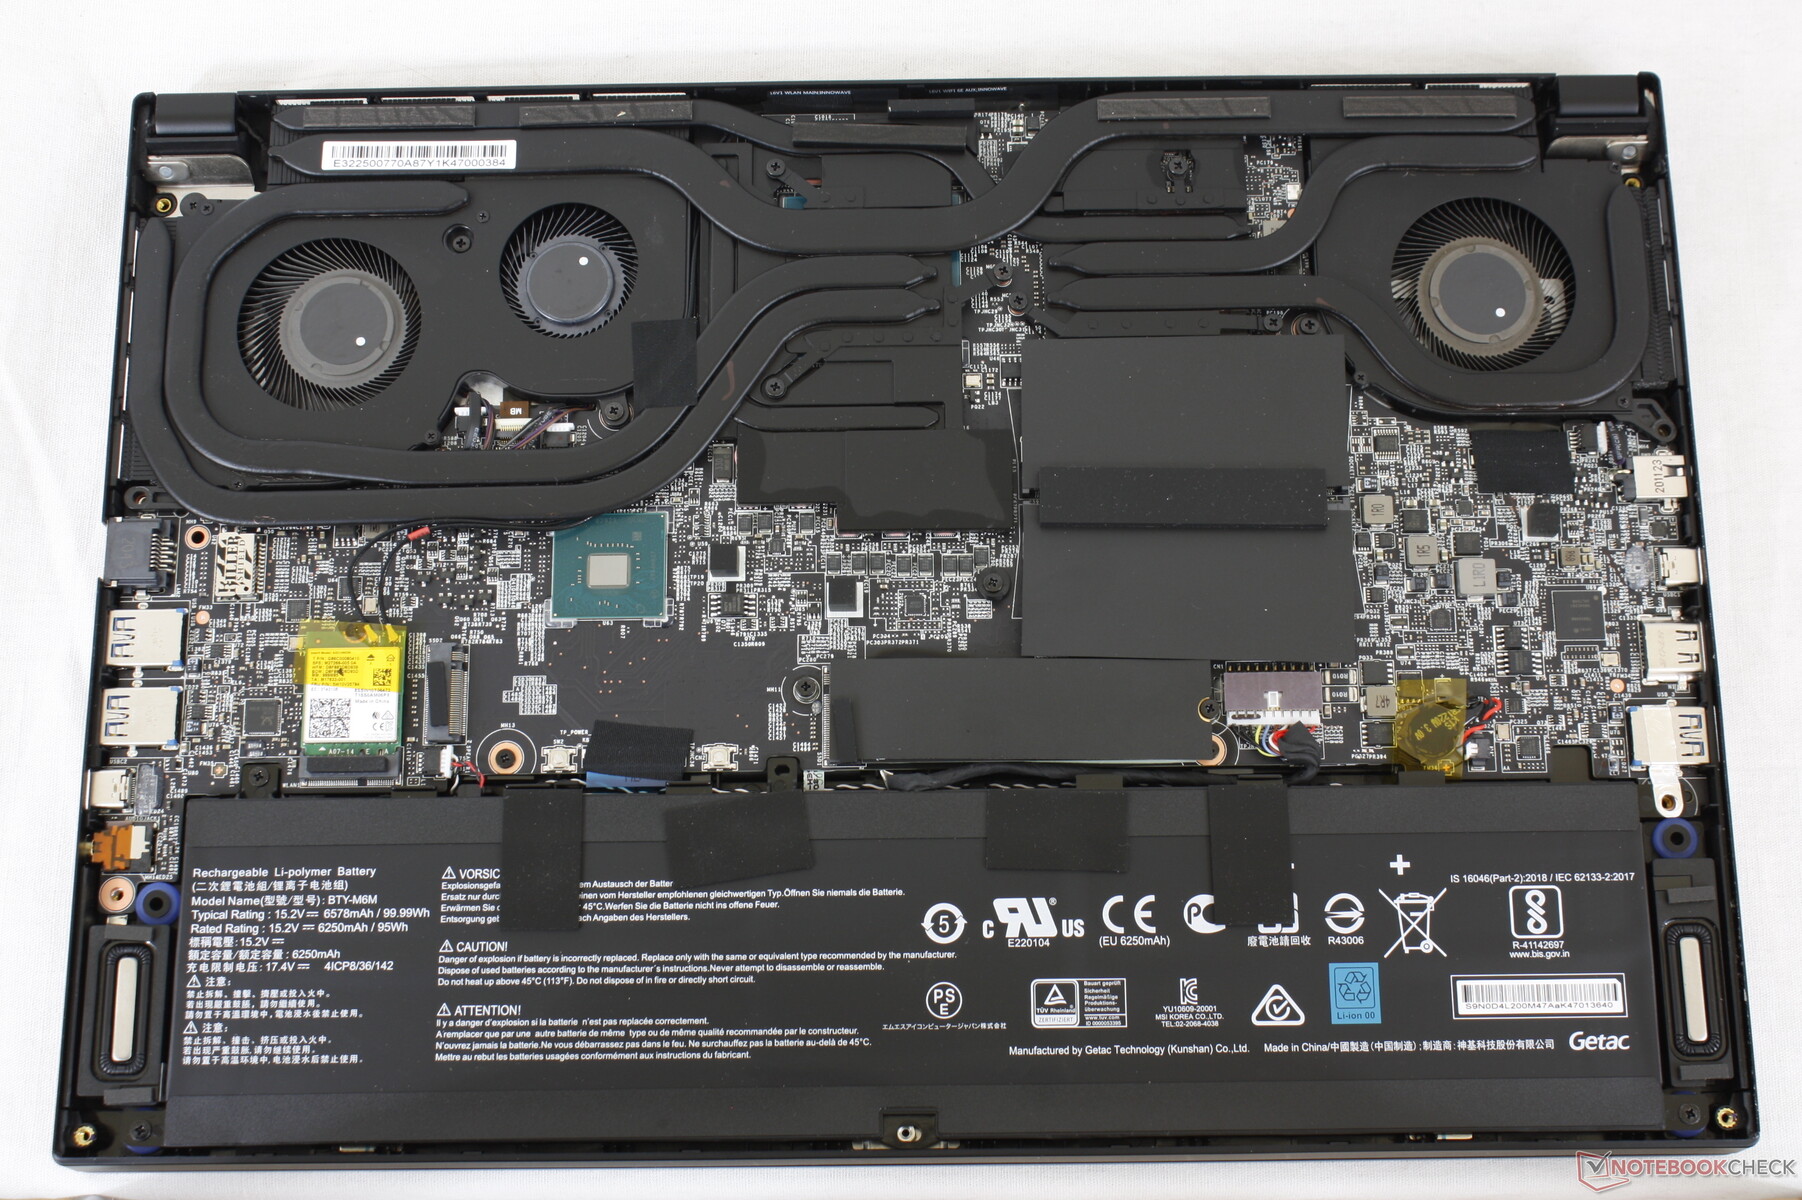
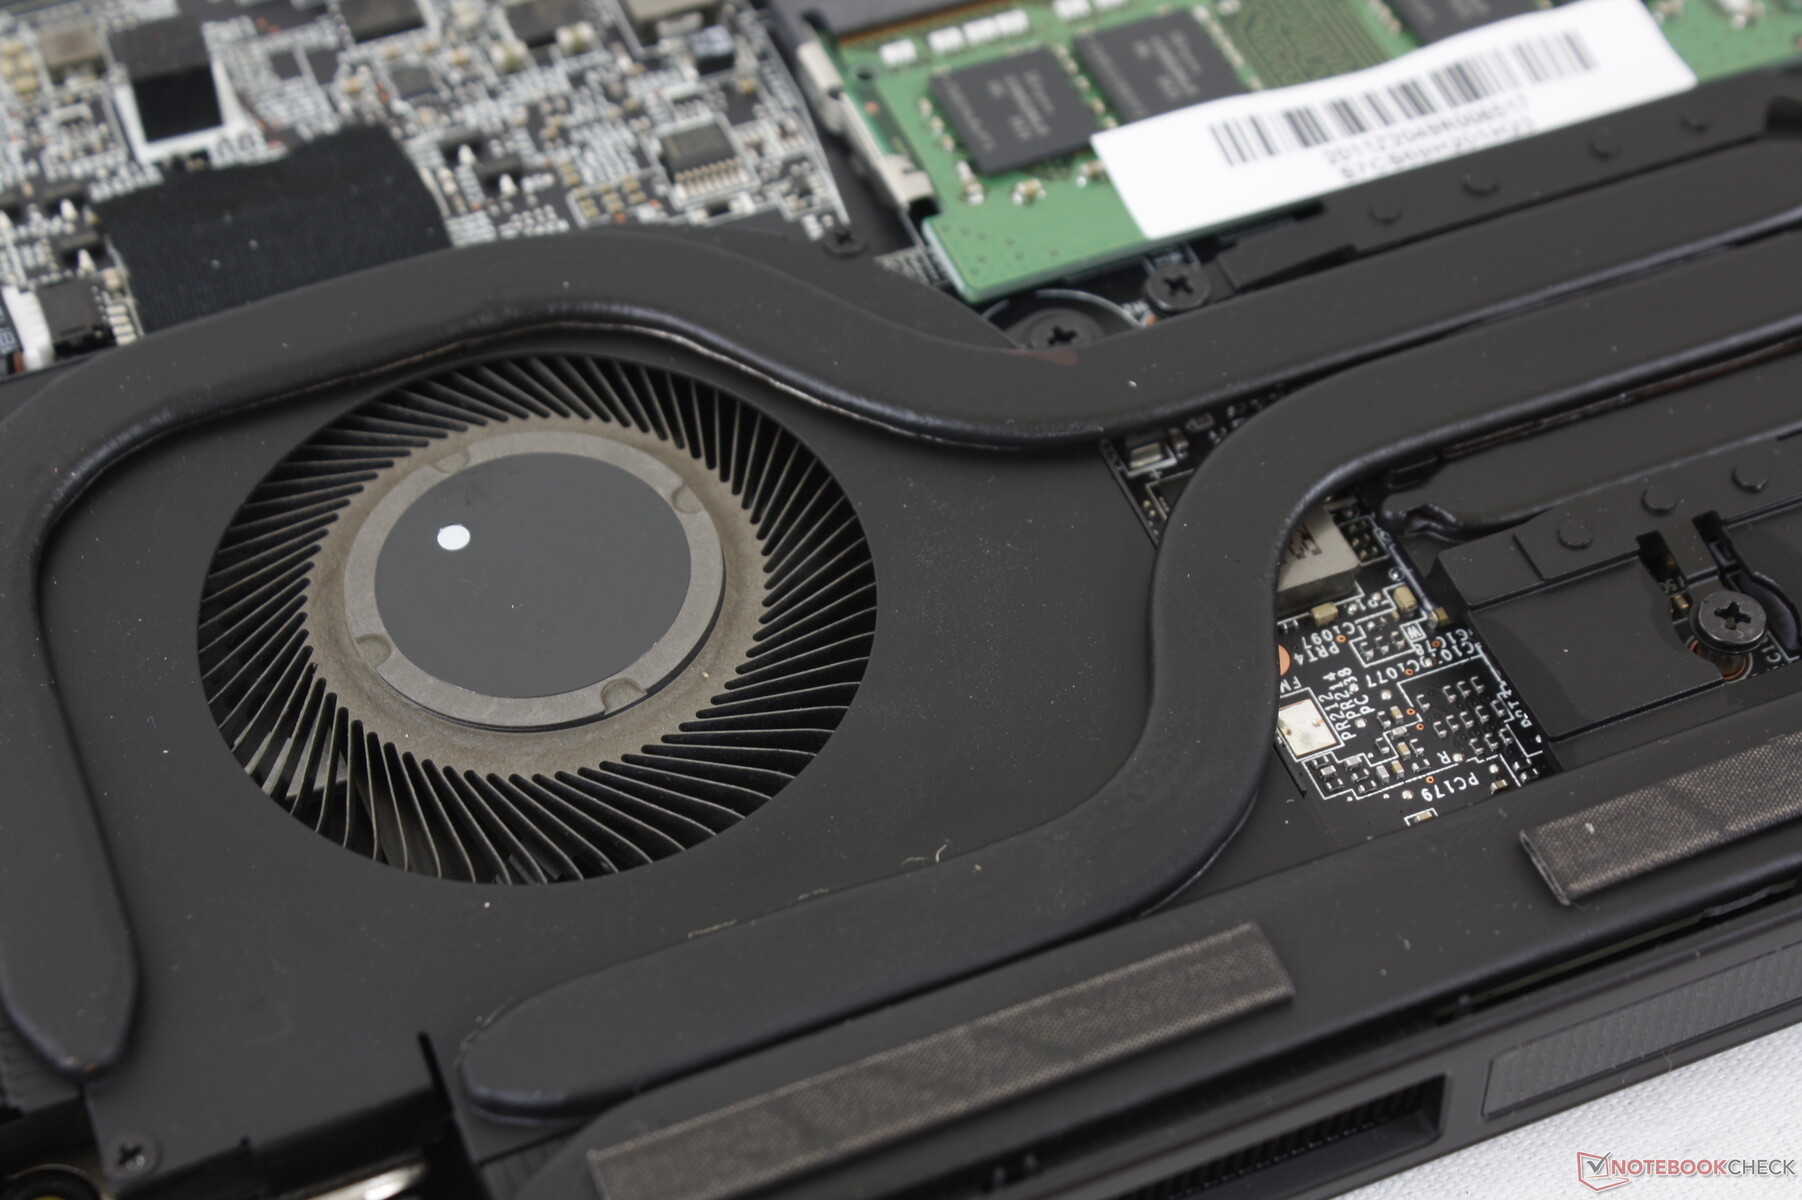
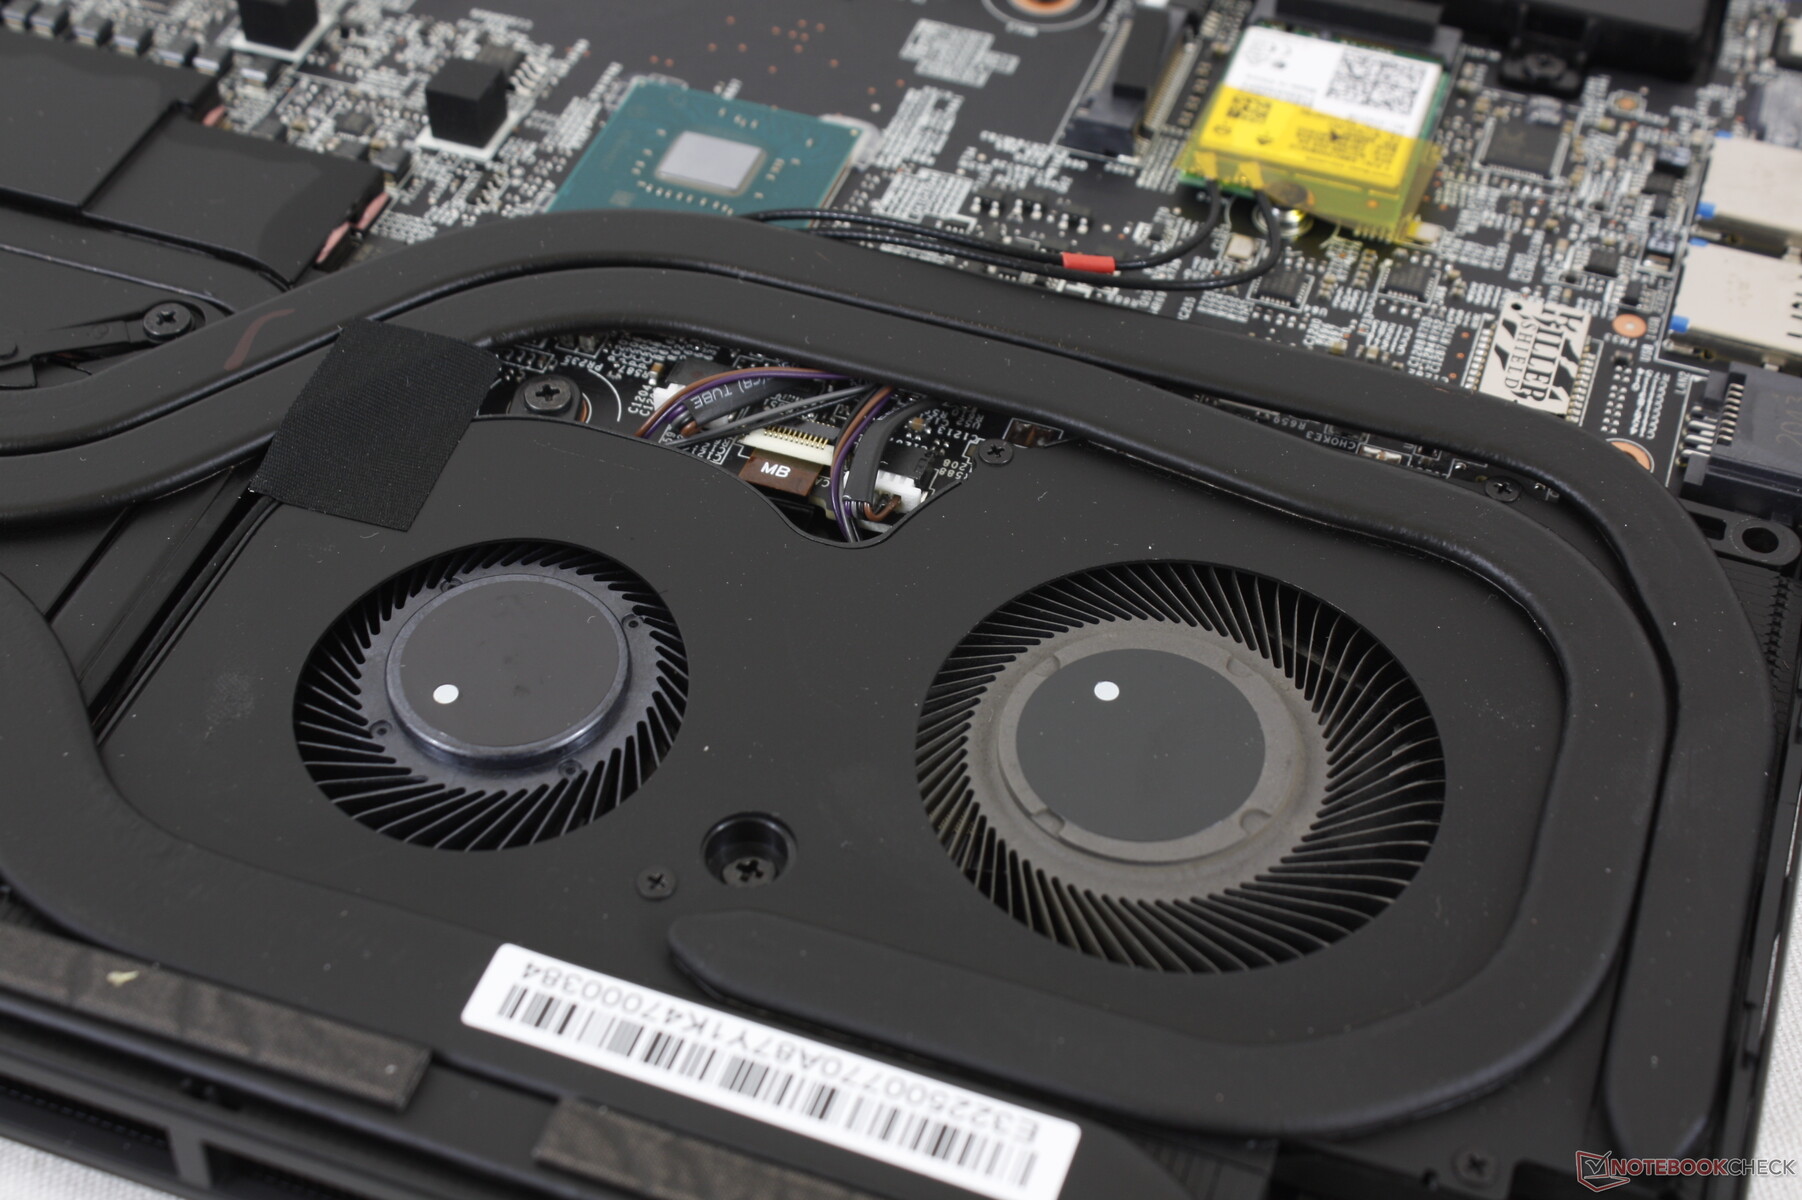
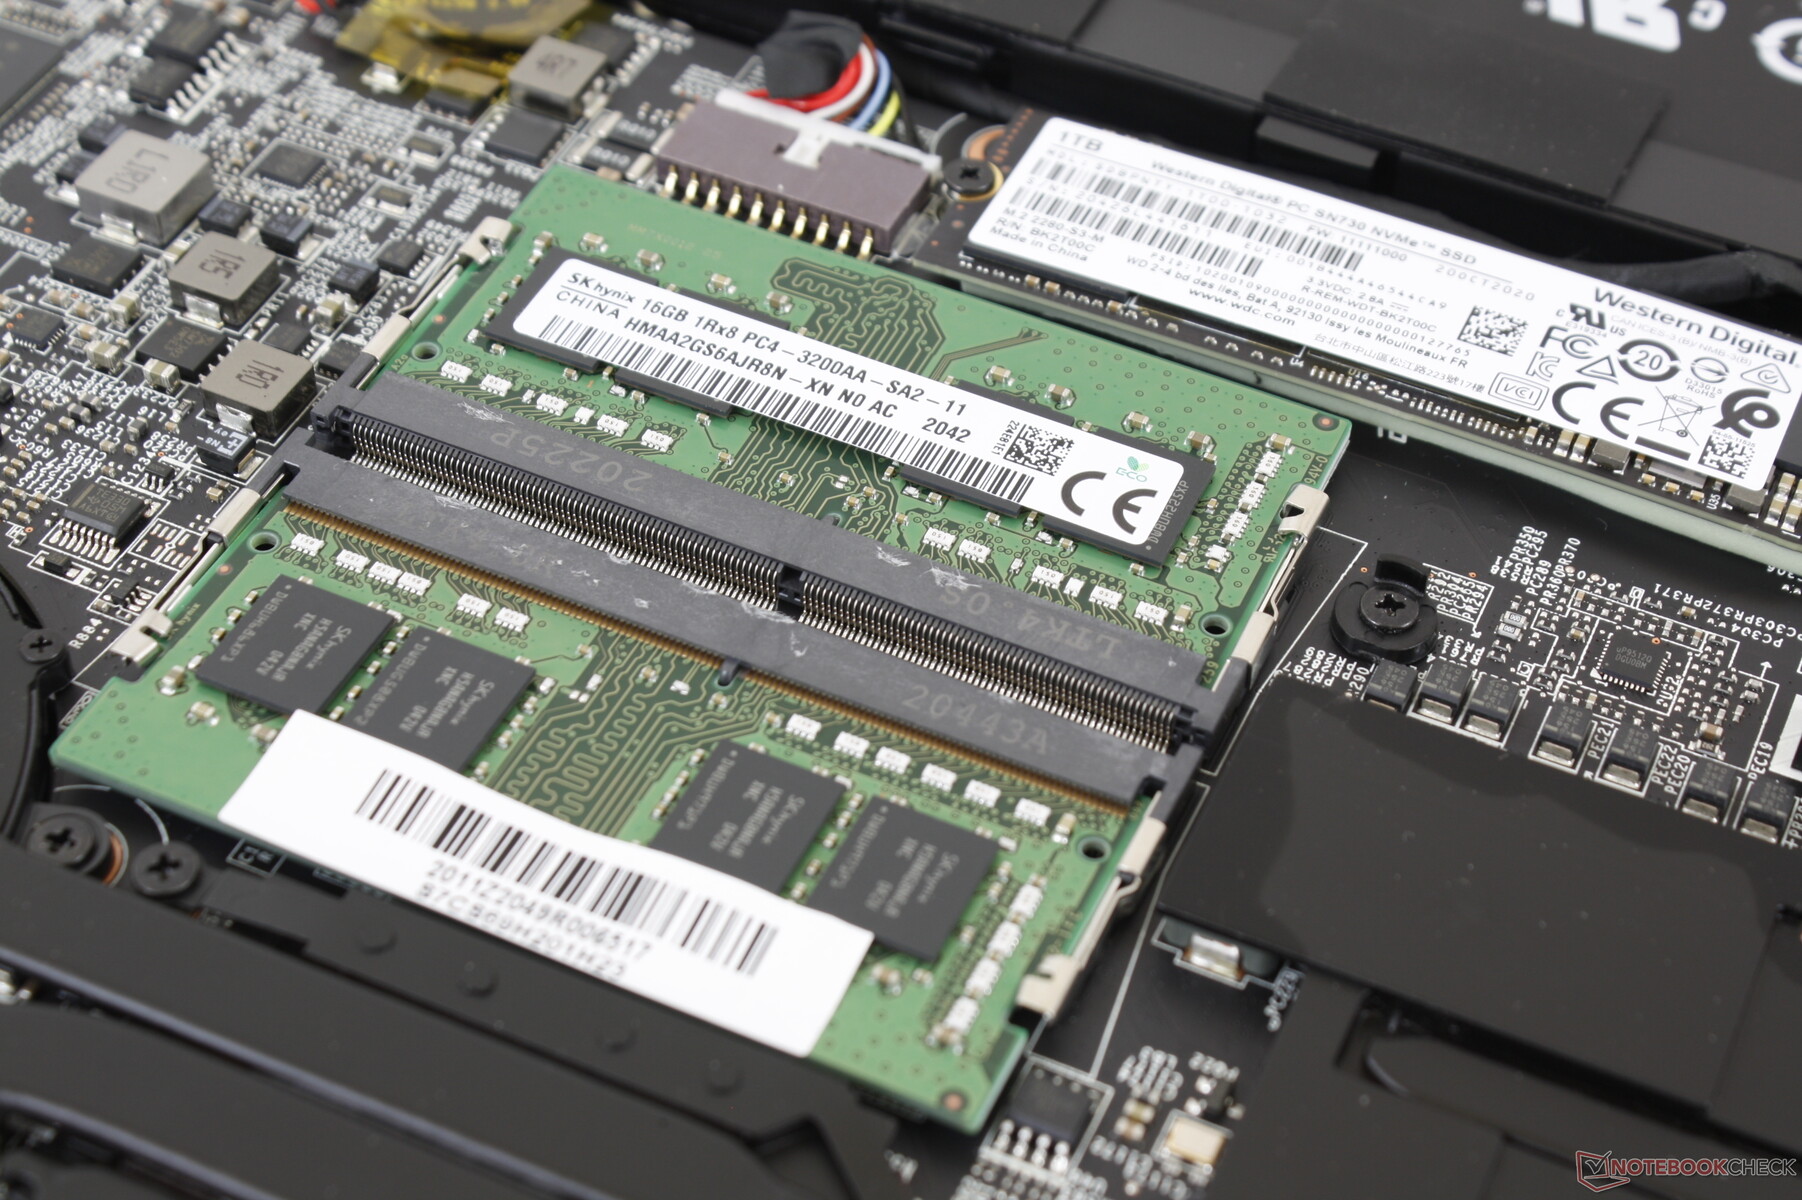
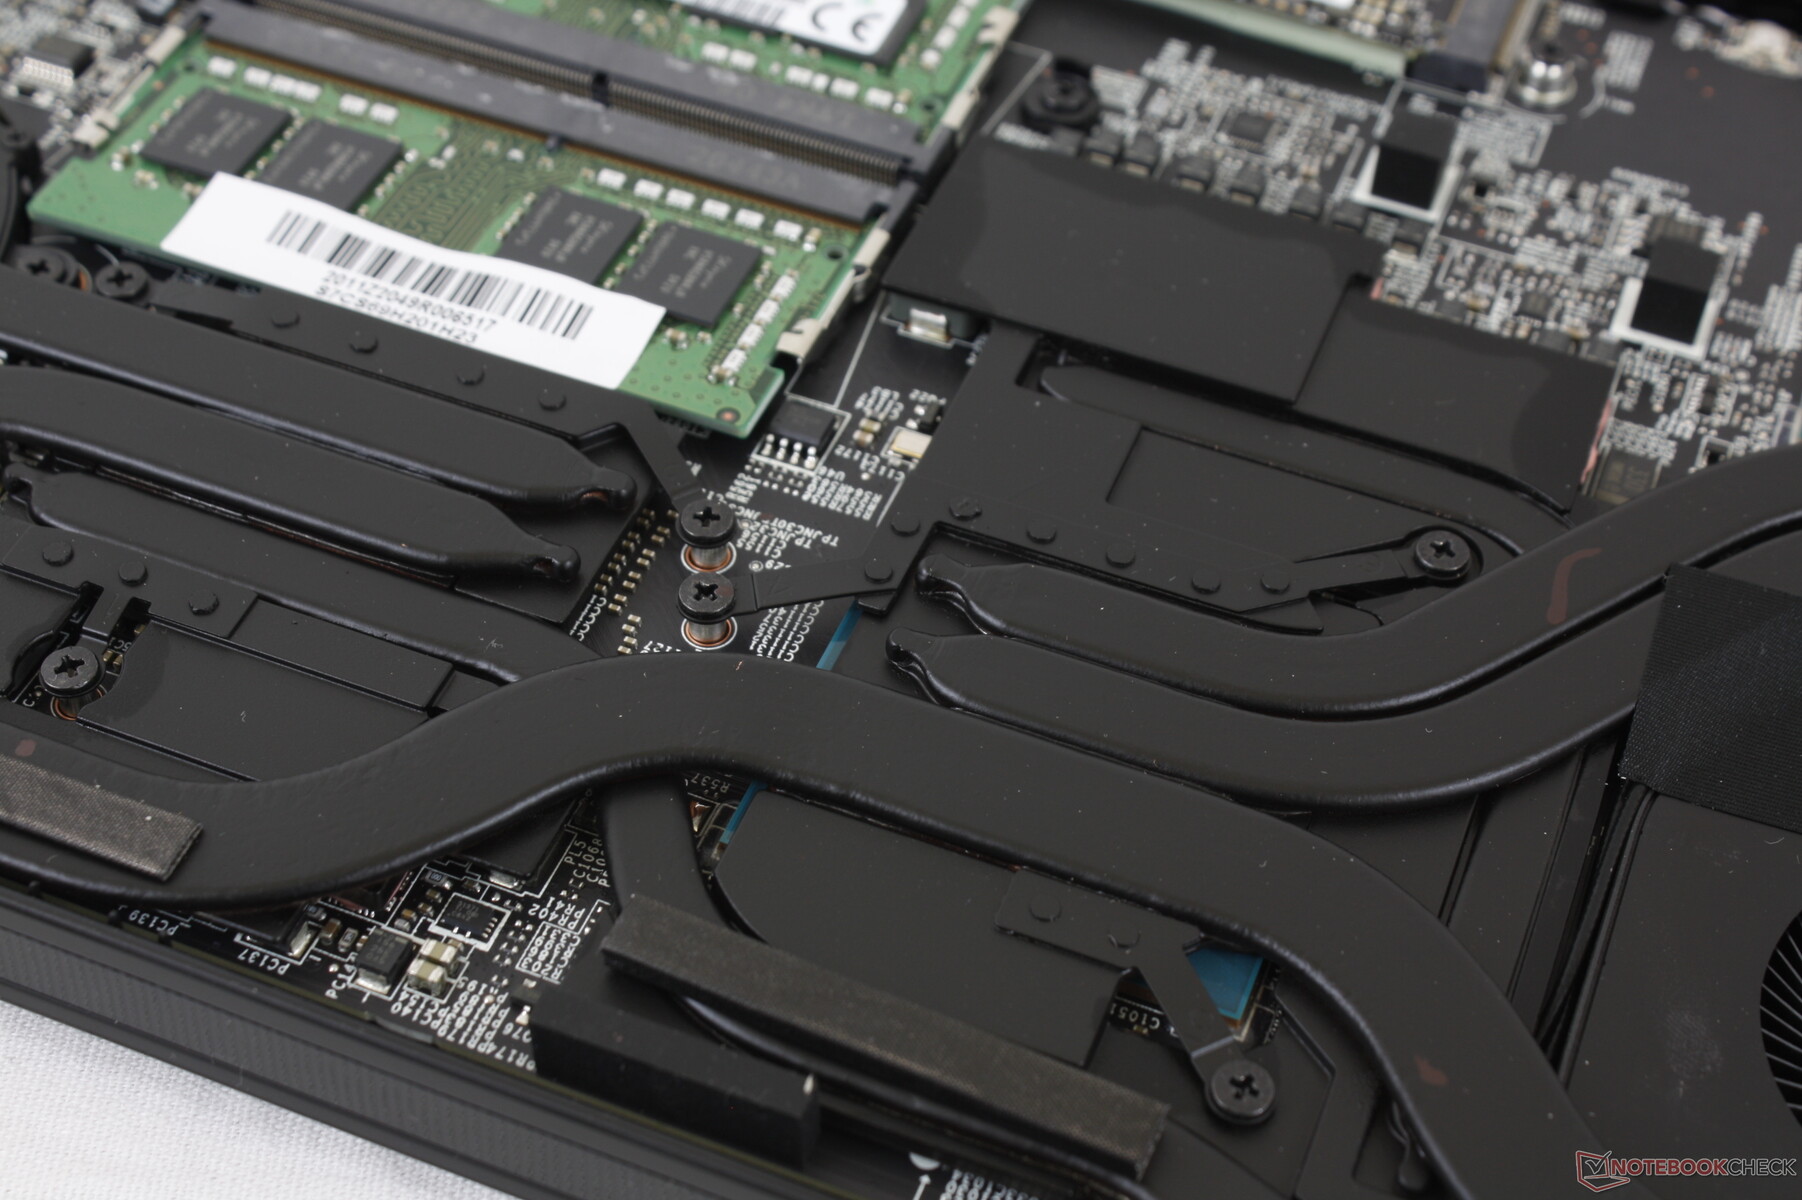
Mantenimiento
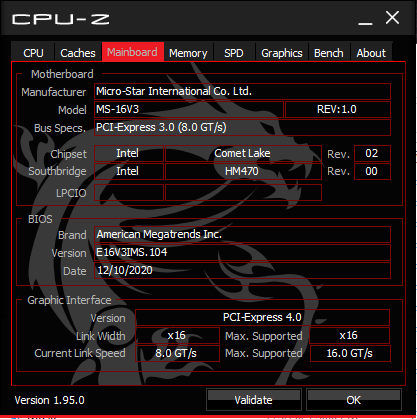
MSI no ha hecho cambios internos importantes fuera del cambio de CPU y GPU. La solución de refrigeración y los componentes parecen idénticos a los que observamos en el GS66 con motor Turing del año pasado.
Accesorios y garantía
La caja incluye un gran paño de terciopelo, además del habitual adaptador de CA y los manuales. Se aplica la garantía limitada estándar de un año con opciones adicionales si se adquiere en Xotic PC.
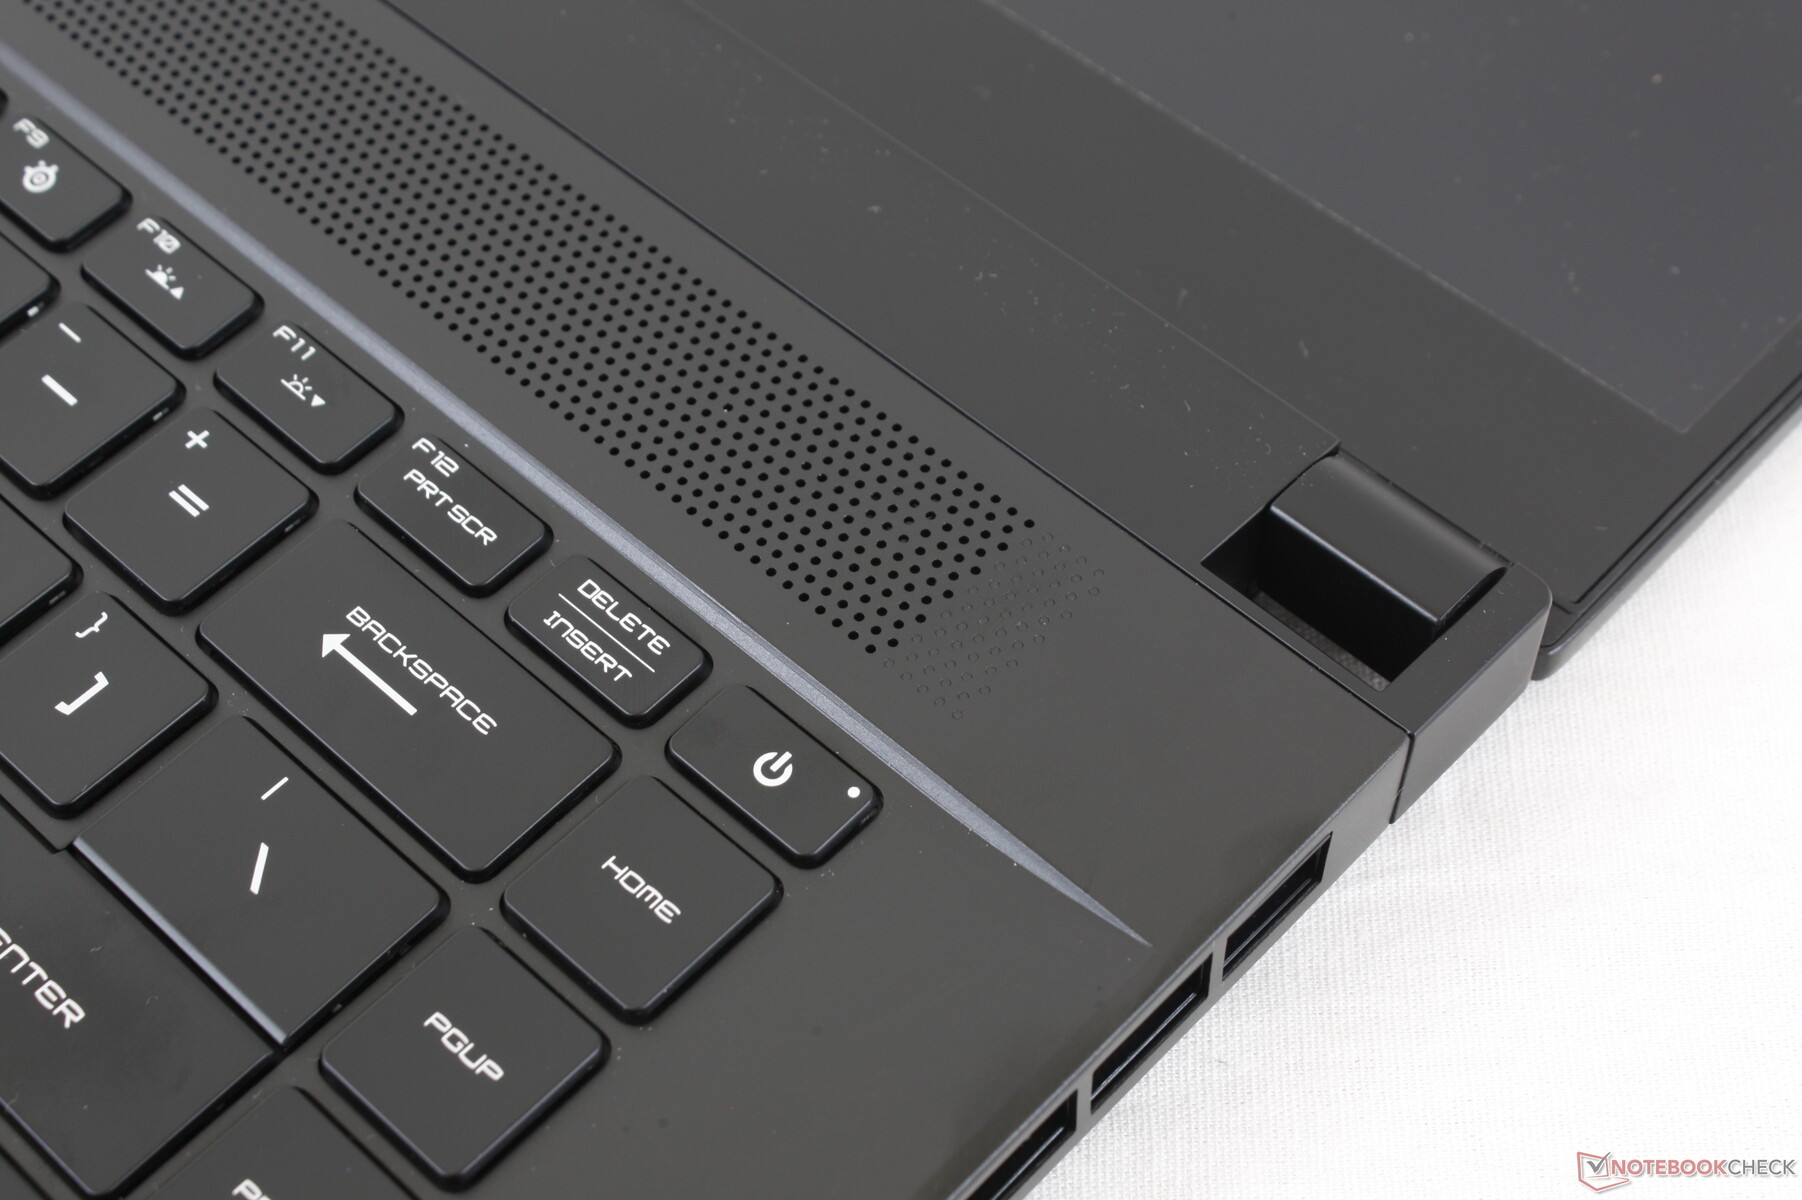
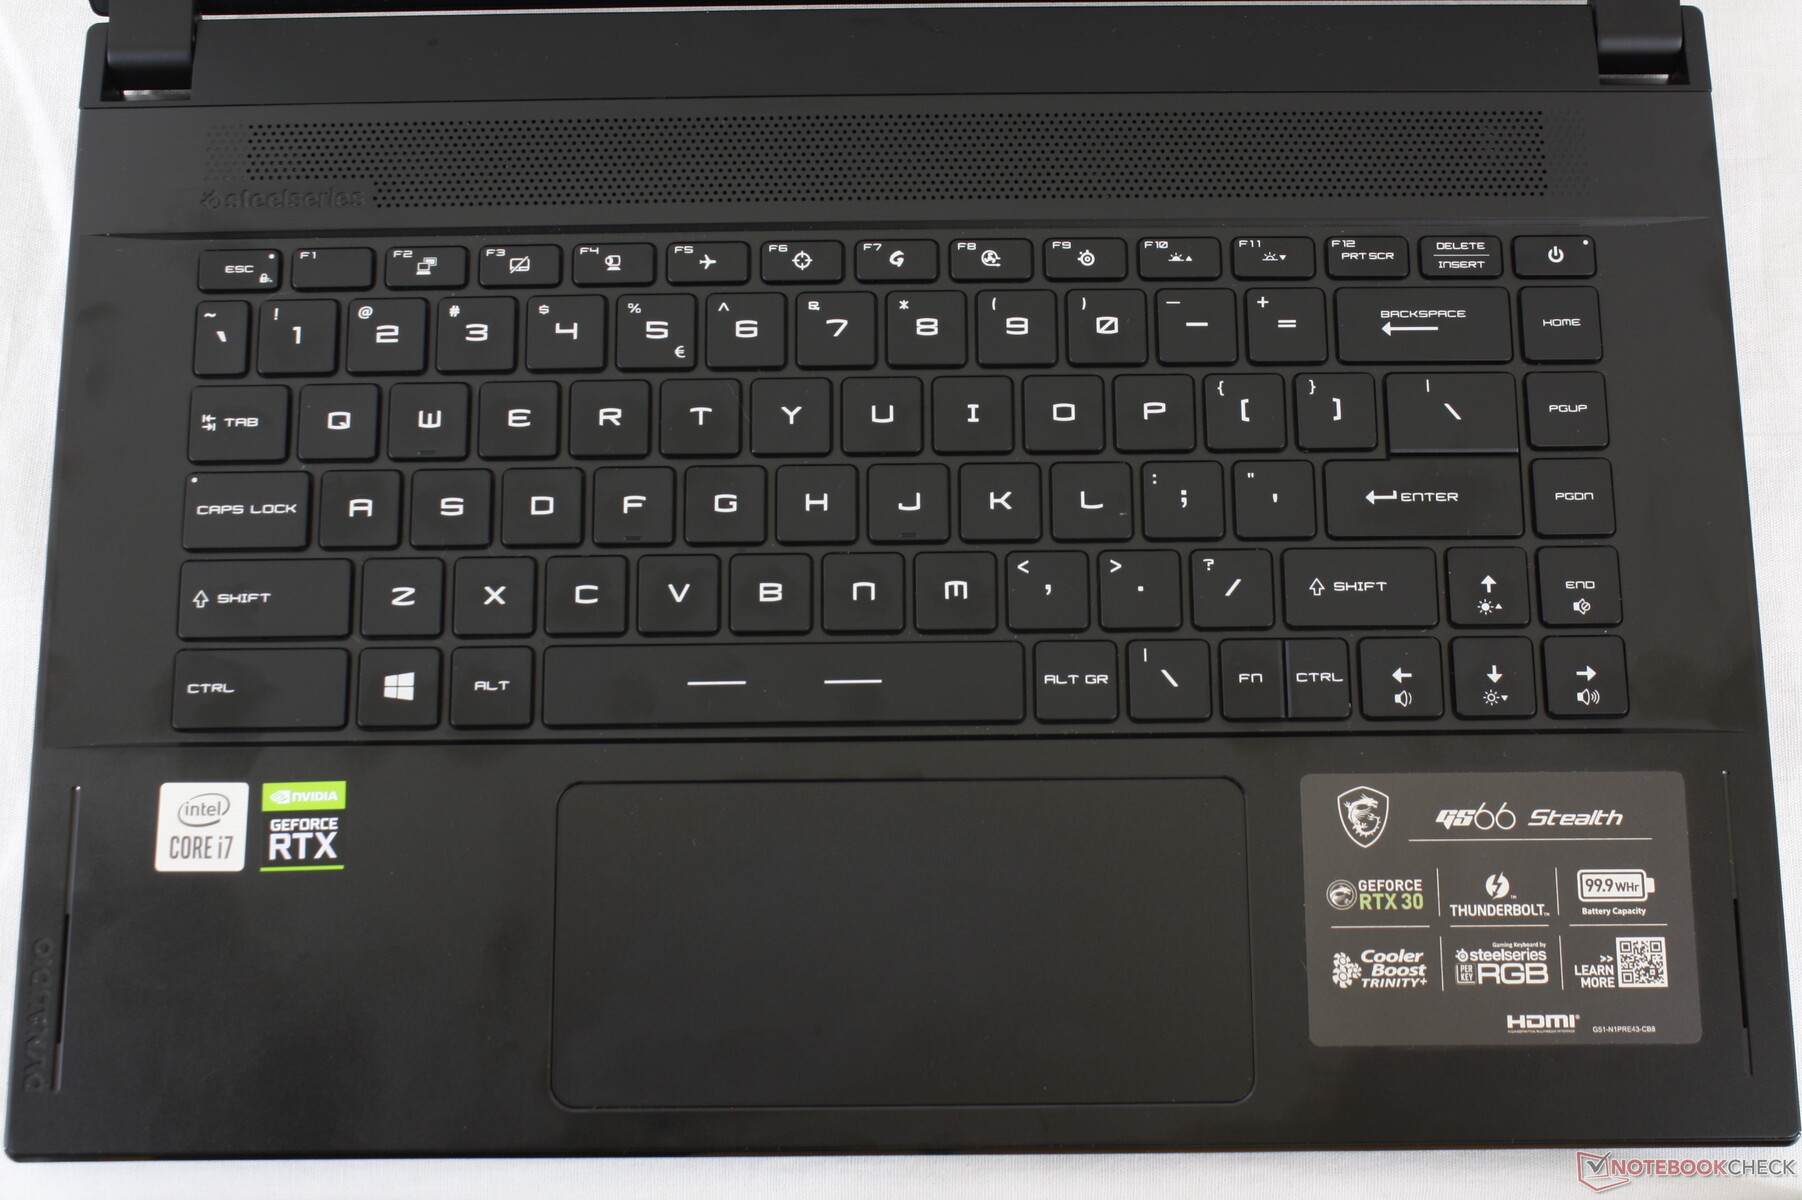
Dispositivos de entrada


Mostrar
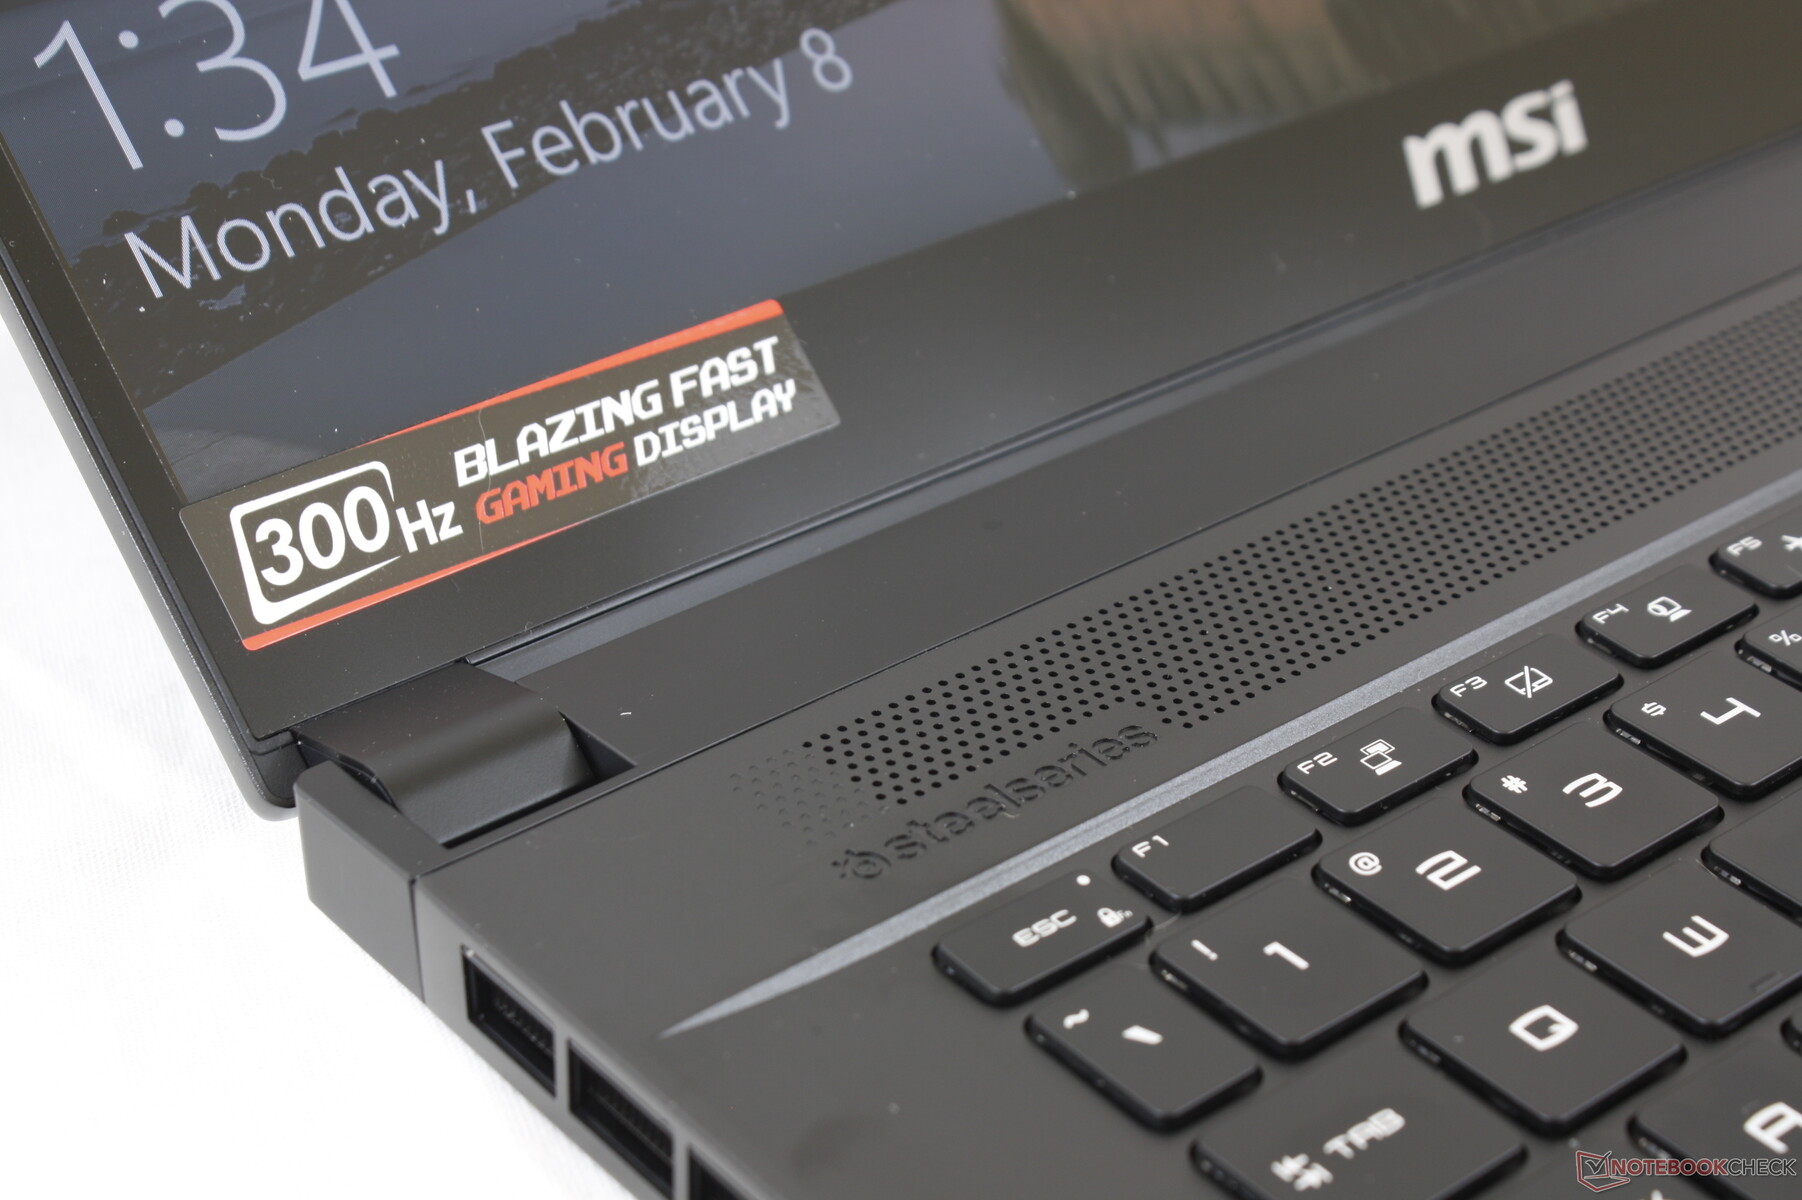
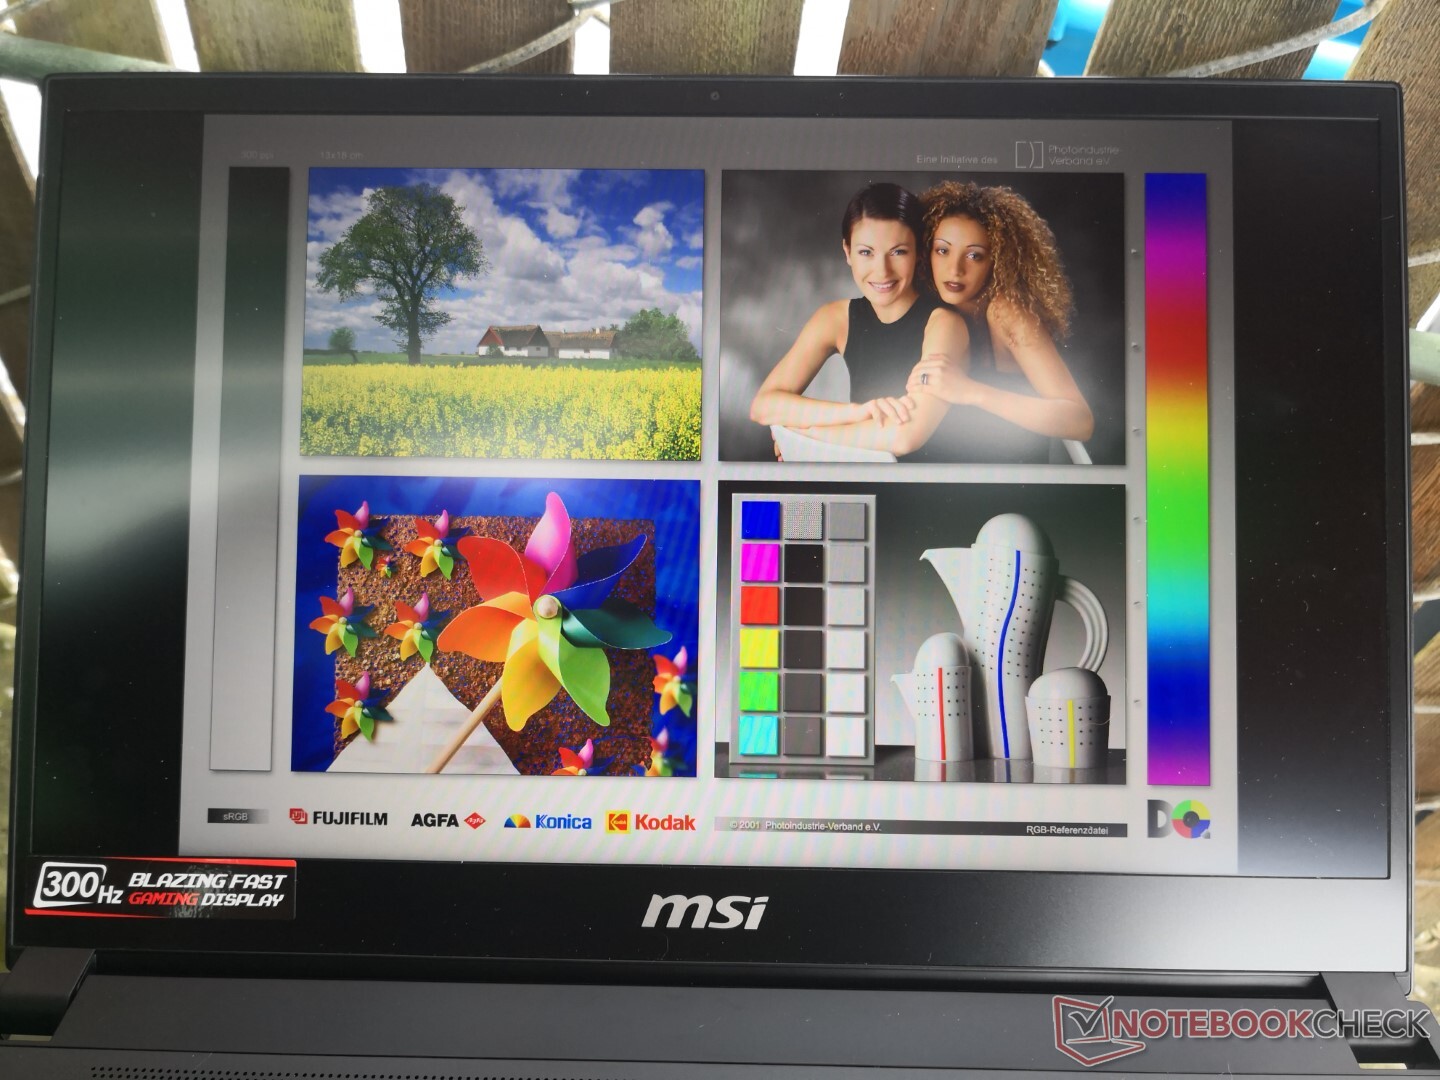
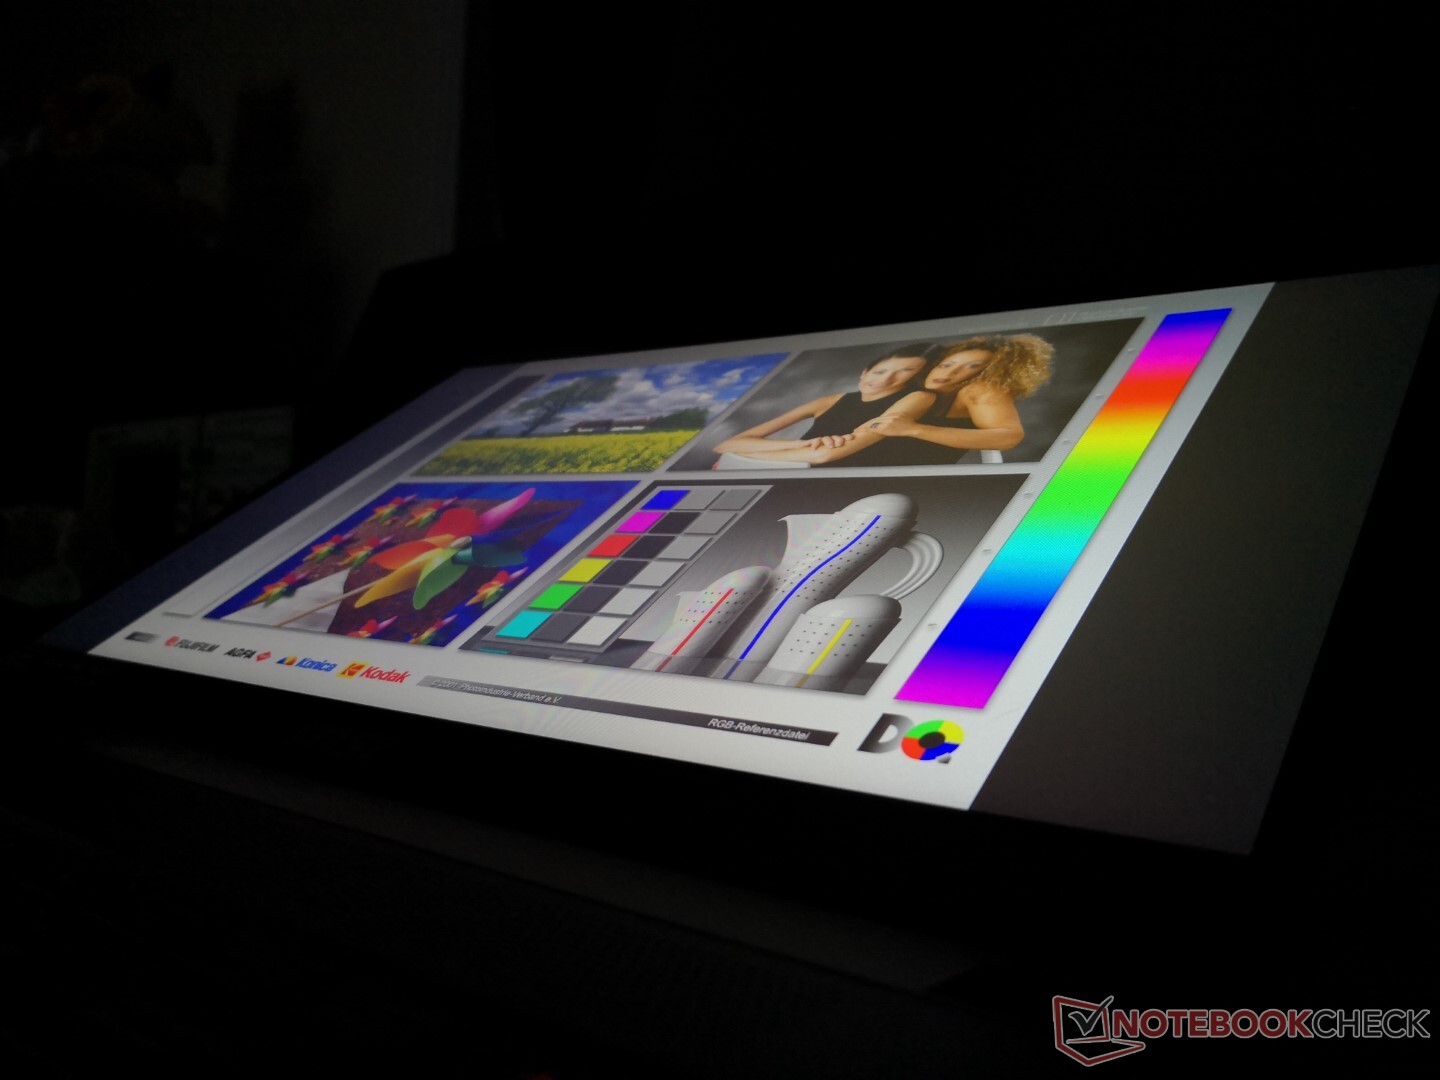
El panel IPS AU Optronics B156HAN12.0 de 300 Hz de nuestro GS66 10UG es el mismo que el del GS66 10SGS del año pasado. Sin embargo, extrañamente, el brillo máximo es notablemente menor esta vez, con sólo 264 nits en comparación con los 331 nits del modelo anterior, incluso después de comprobarlo dos veces. No estamos seguros de por qué ocurre esto, ya que tampoco podemos identificar controles o limitadores de brillo automáticos.
Aparte de la discrepancia de brillo, otras características del panel permanecen intactas, incluyendo los tiempos de respuesta muy rápidos, la relación de contraste >1000:1 y el amplio espacio de color. Los usuarios deben tener en cuenta que la tasa de refresco de 300 Hz es útil incluso si es poco probable que se alcancen velocidades de fotogramas tan altas cuando se juega.


| |||||||||||||||||||||||||
iluminación: 90 %
Brillo con batería: 259.5 cd/m²
Contraste: 1038:1 (Negro: 0.25 cd/m²)
ΔE ColorChecker Calman: 2.52 | ∀{0.5-29.43 Ø4.73}
calibrated: 1.93
ΔE Greyscale Calman: 1.7 | ∀{0.09-98 Ø4.97}
98.8% sRGB (Argyll 1.6.3 3D)
63.3% AdobeRGB 1998 (Argyll 1.6.3 3D)
69.1% AdobeRGB 1998 (Argyll 3D)
98.4% sRGB (Argyll 3D)
67.7% Display P3 (Argyll 3D)
Gamma: 2.04
CCT: 6414 K
| MSI GS66 Stealth 10UG AU Optronics B156HAN12.0, IPS, 15.6", 1920x1080 | MSI GS66 10SGS AU Optronics B156HAN12.0, IPS, 15.6", 1920x1080 | Asus TUF Dash F15 FX516PR LQ156M1JW26 (SHP1532), IPS, 15.6", 1920x1080 | Razer Blade 15 RTX 2070 Super Max-Q AU Optronics B156HAN12.0, IPS, 15.6", 1920x1080 | Aorus 15P WB BOE HF NV156FHM-N4G, IPS, 15.6", 1920x1080 | Alienware m15 R3 P87F AU Optronics B156HAN, IPS, 15.6", 1920x1080 | |
|---|---|---|---|---|---|---|
| Display | 2% | -1% | 2% | -7% | 1% | |
| Display P3 Coverage (%) | 67.7 | 69.9 3% | 66.9 -1% | 69.4 3% | 63 -7% | 68.6 1% |
| sRGB Coverage (%) | 98.4 | 99.1 1% | 98.1 0% | 98.8 0% | 91.3 -7% | 98.9 1% |
| AdobeRGB 1998 Coverage (%) | 69.1 | 71.1 3% | 67.9 -2% | 70.5 2% | 64.6 -7% | 69.8 1% |
| Response Times | 18% | 16% | 55% | 30% | 40% | |
| Response Time Grey 50% / Grey 80% * (ms) | 14.4 ? | 11.2 ? 22% | 12 ? 17% | 3.2 ? 78% | 8.8 ? 39% | 4 ? 72% |
| Response Time Black / White * (ms) | 11.6 ? | 10 ? 14% | 10 ? 14% | 8 ? 31% | 9.2 ? 21% | 10.8 ? 7% |
| PWM Frequency (Hz) | 23580 ? | |||||
| Screen | 14% | -3% | -12% | -7% | -6% | |
| Brightness middle (cd/m²) | 259.5 | 339.4 31% | 286 10% | 345.4 33% | 275 6% | 326.7 26% |
| Brightness (cd/m²) | 264 | 331 25% | 275 4% | 342 30% | 268 2% | 316 20% |
| Brightness Distribution (%) | 90 | 92 2% | 91 1% | 90 0% | 91 1% | 87 -3% |
| Black Level * (cd/m²) | 0.25 | 0.24 4% | 0.25 -0% | 0.34 -36% | 0.33 -32% | 0.33 -32% |
| Contrast (:1) | 1038 | 1414 36% | 1144 10% | 1016 -2% | 833 -20% | 990 -5% |
| Colorchecker dE 2000 * | 2.52 | 1.58 37% | 2.43 4% | 3.18 -26% | 2.72 -8% | 2.4 5% |
| Colorchecker dE 2000 max. * | 5.55 | 3.8 32% | 6.33 -14% | 6.57 -18% | 4.45 20% | 6.06 -9% |
| Colorchecker dE 2000 calibrated * | 1.93 | 1.47 24% | 0.83 57% | 1.77 8% | 2.09 -8% | 1.51 22% |
| Greyscale dE 2000 * | 1.7 | 2.3 -35% | 3.5 -106% | 3.8 -124% | 2.3 -35% | 3.2 -88% |
| Gamma | 2.04 108% | 2.24 98% | 2.32 95% | 2.15 102% | 2.266 97% | 2.13 103% |
| CCT | 6414 101% | 6952 93% | 7145 91% | 7109 91% | 6933 94% | 7129 91% |
| Color Space (Percent of AdobeRGB 1998) (%) | 63.3 | 64.8 2% | 68 7% | 64.3 2% | 65 3% | 63.7 1% |
| Color Space (Percent of sRGB) (%) | 98.8 | 99.4 1% | 91 -8% | 99 0% | 90 -9% | 99.2 0% |
| Media total (Programa/Opciones) | 11% /
13% | 4% /
-0% | 15% /
-1% | 5% /
-3% | 12% /
1% |
* ... más pequeño es mejor
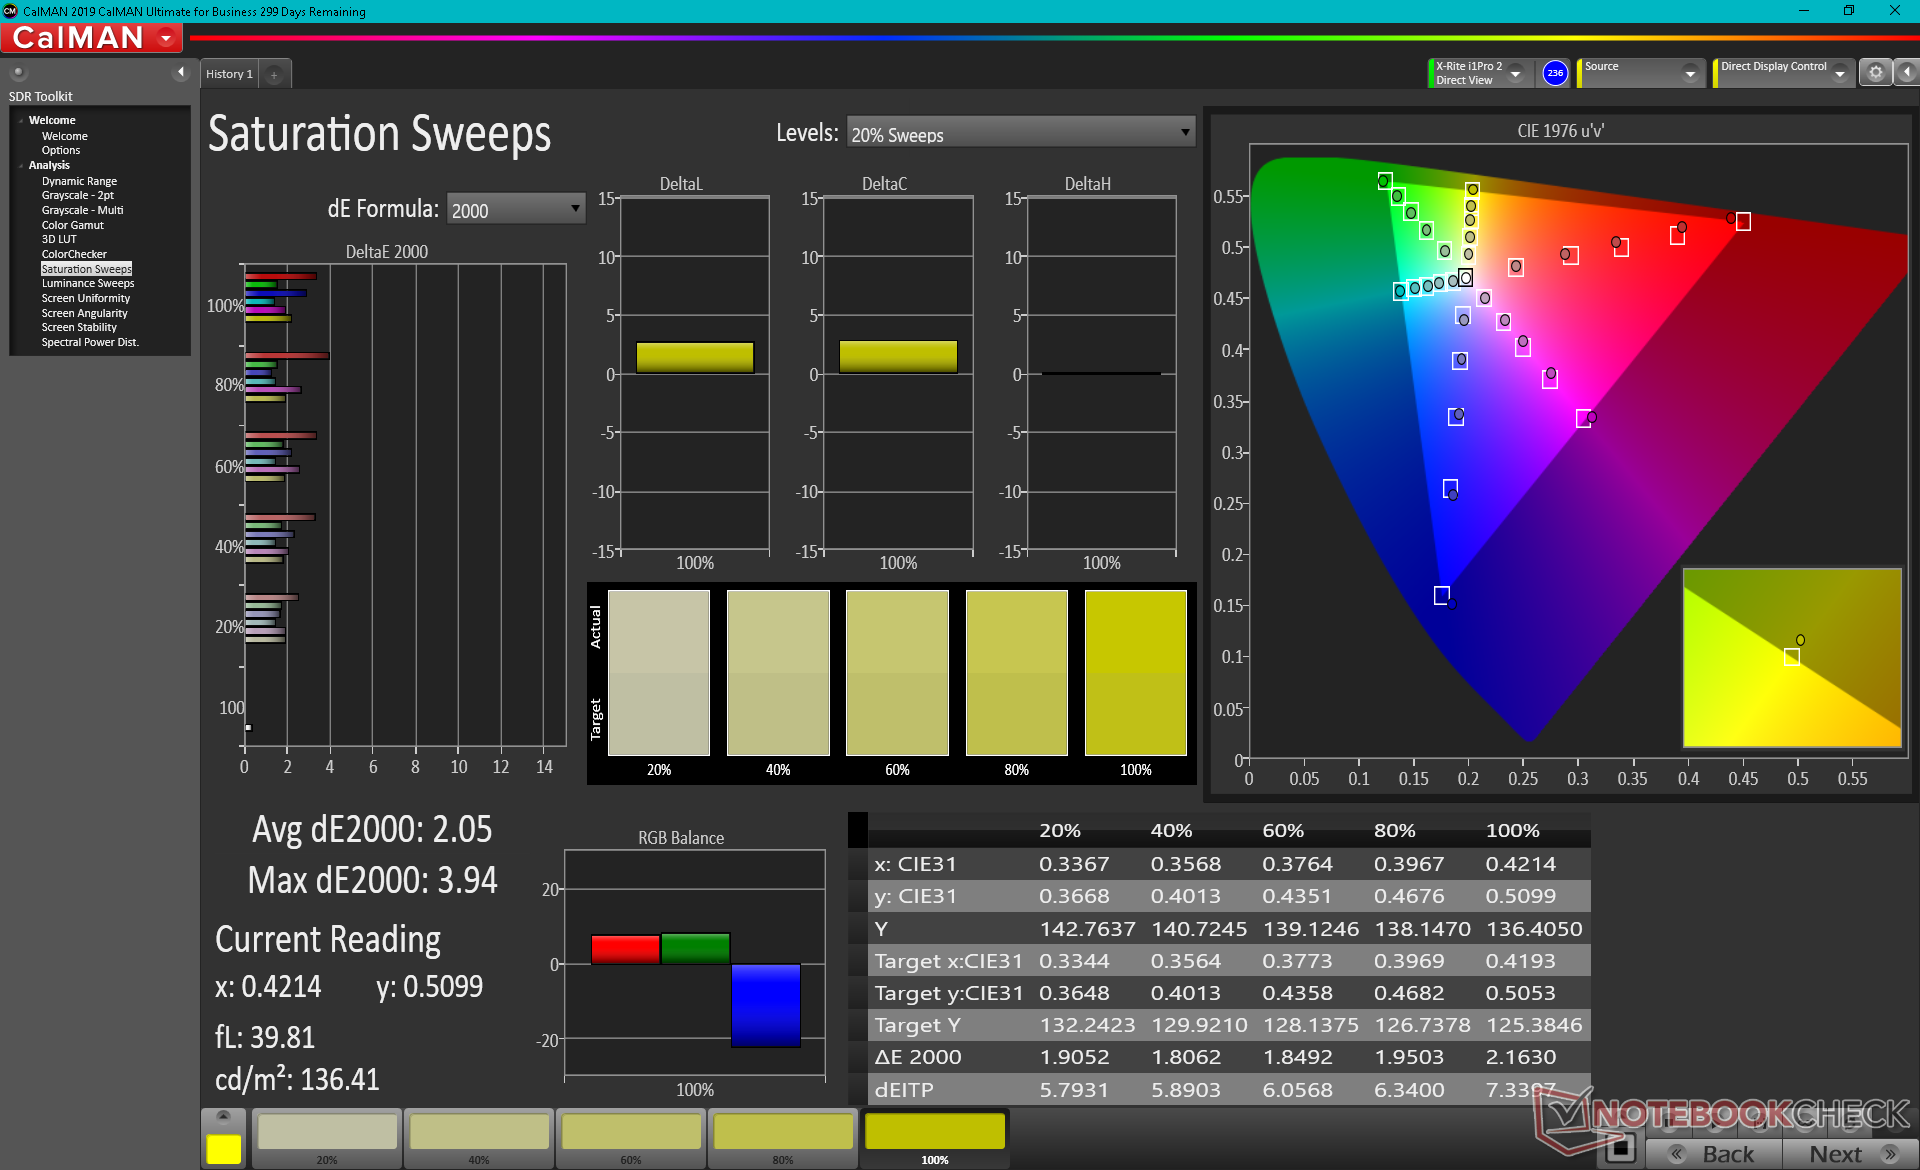
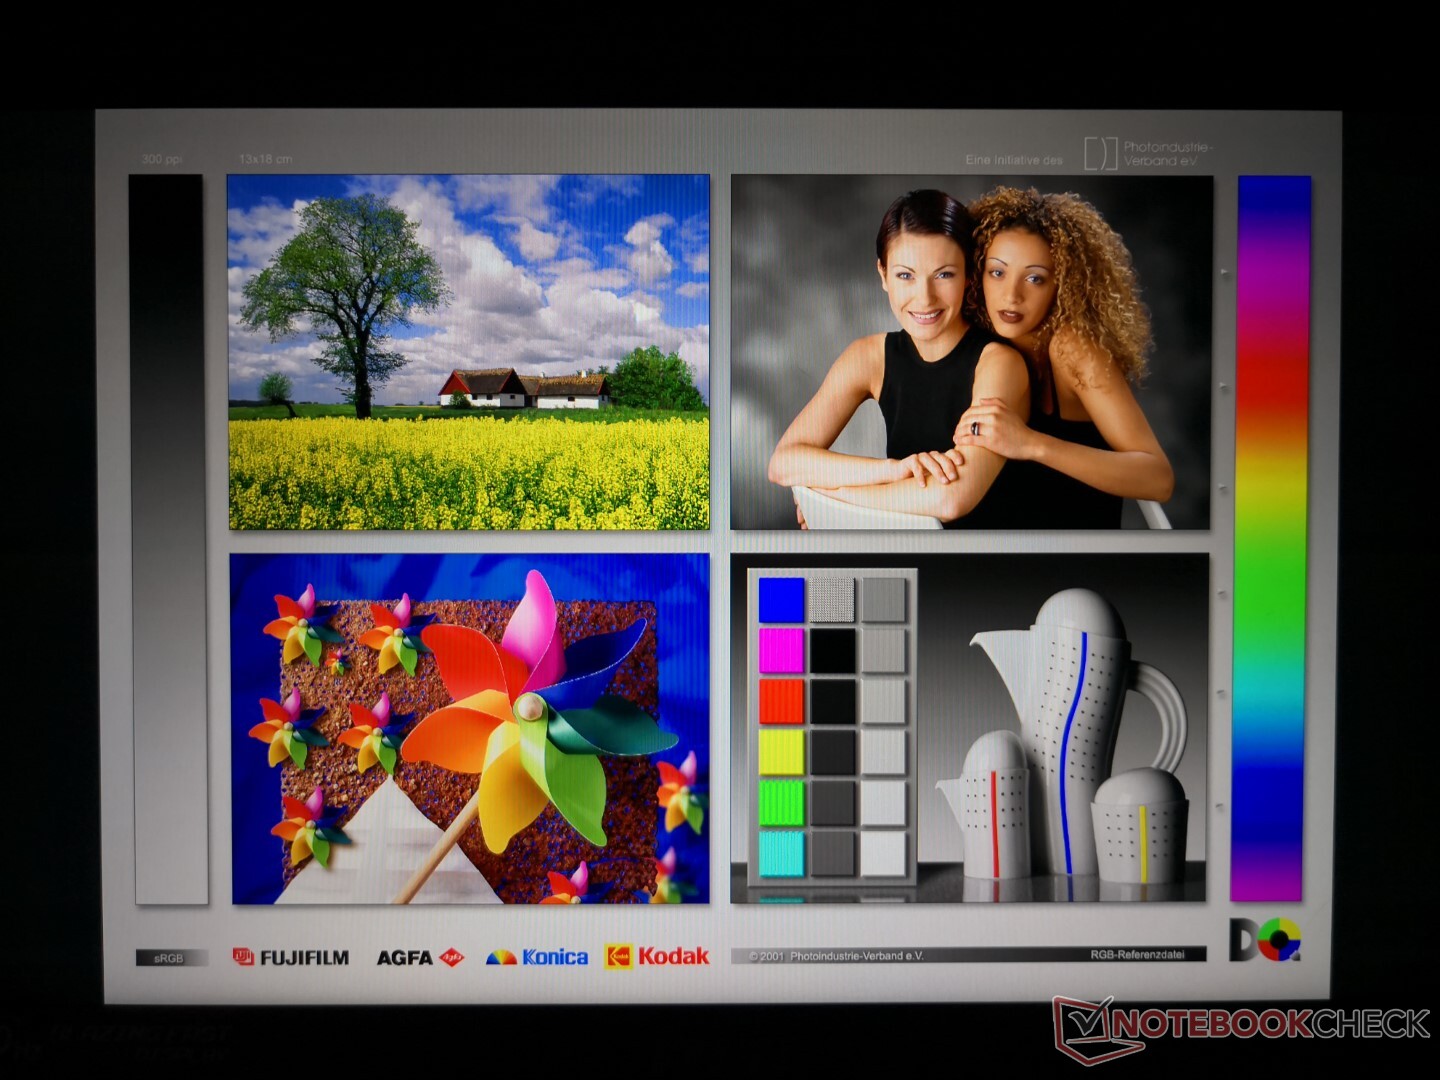
El espacio de color es idéntico al de los paneles 1080p de alta frecuencia de refresco del año pasado, con aproximadamente un 63% de AdobeRGB y un 99% de sRGB. MSI no ofrece por el momento opciones 4K para su GeForce RTX 30 GS66 refresh.
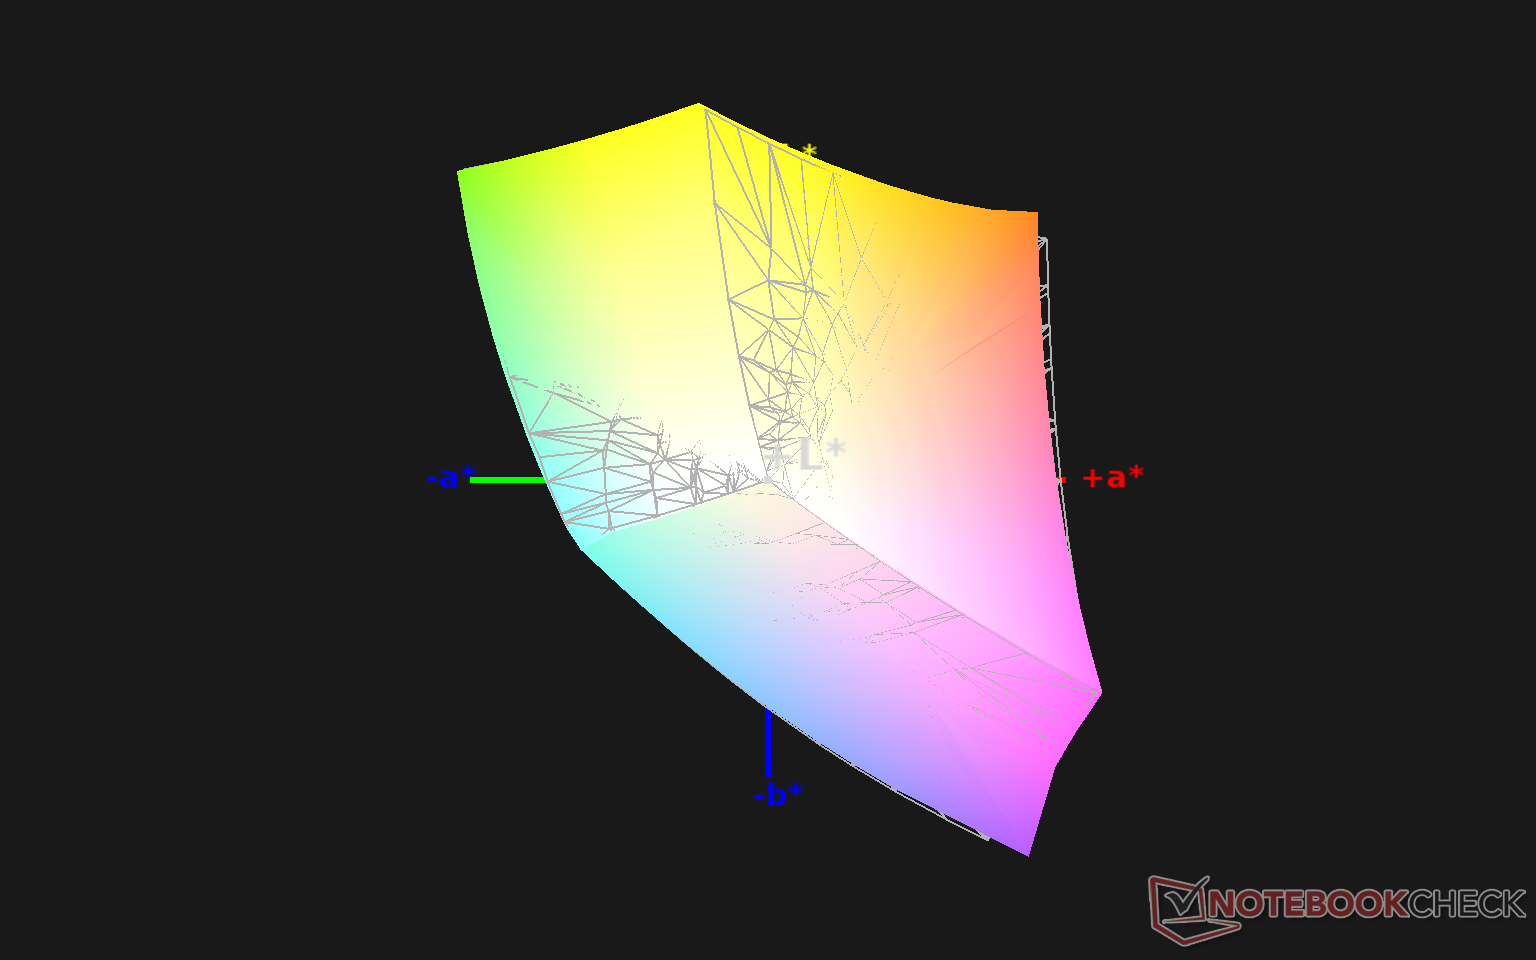
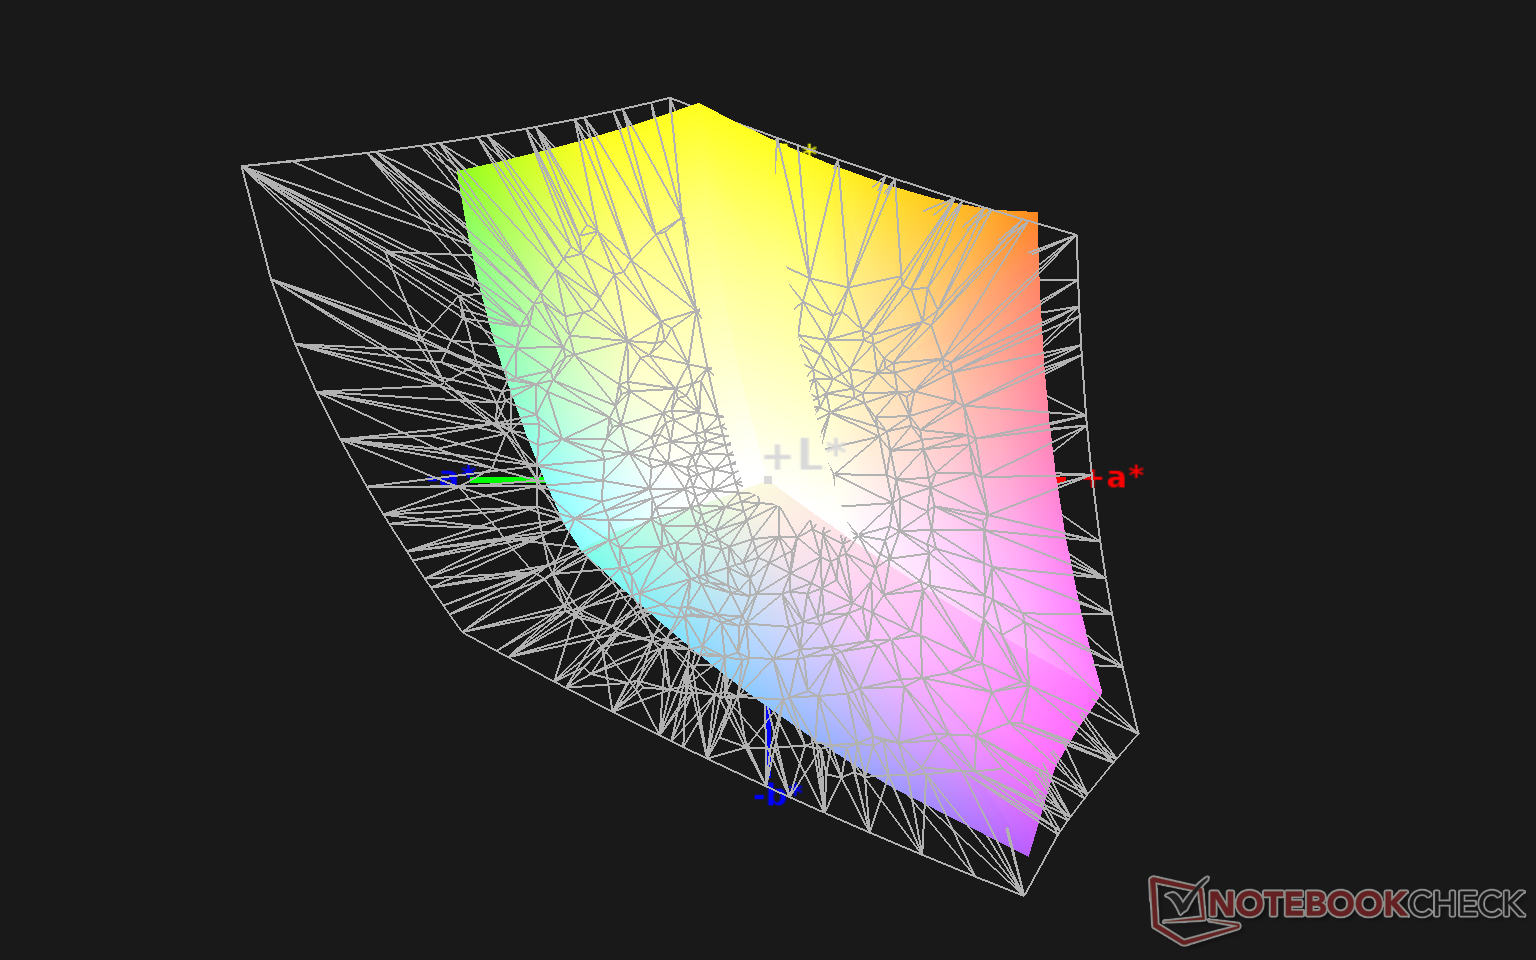
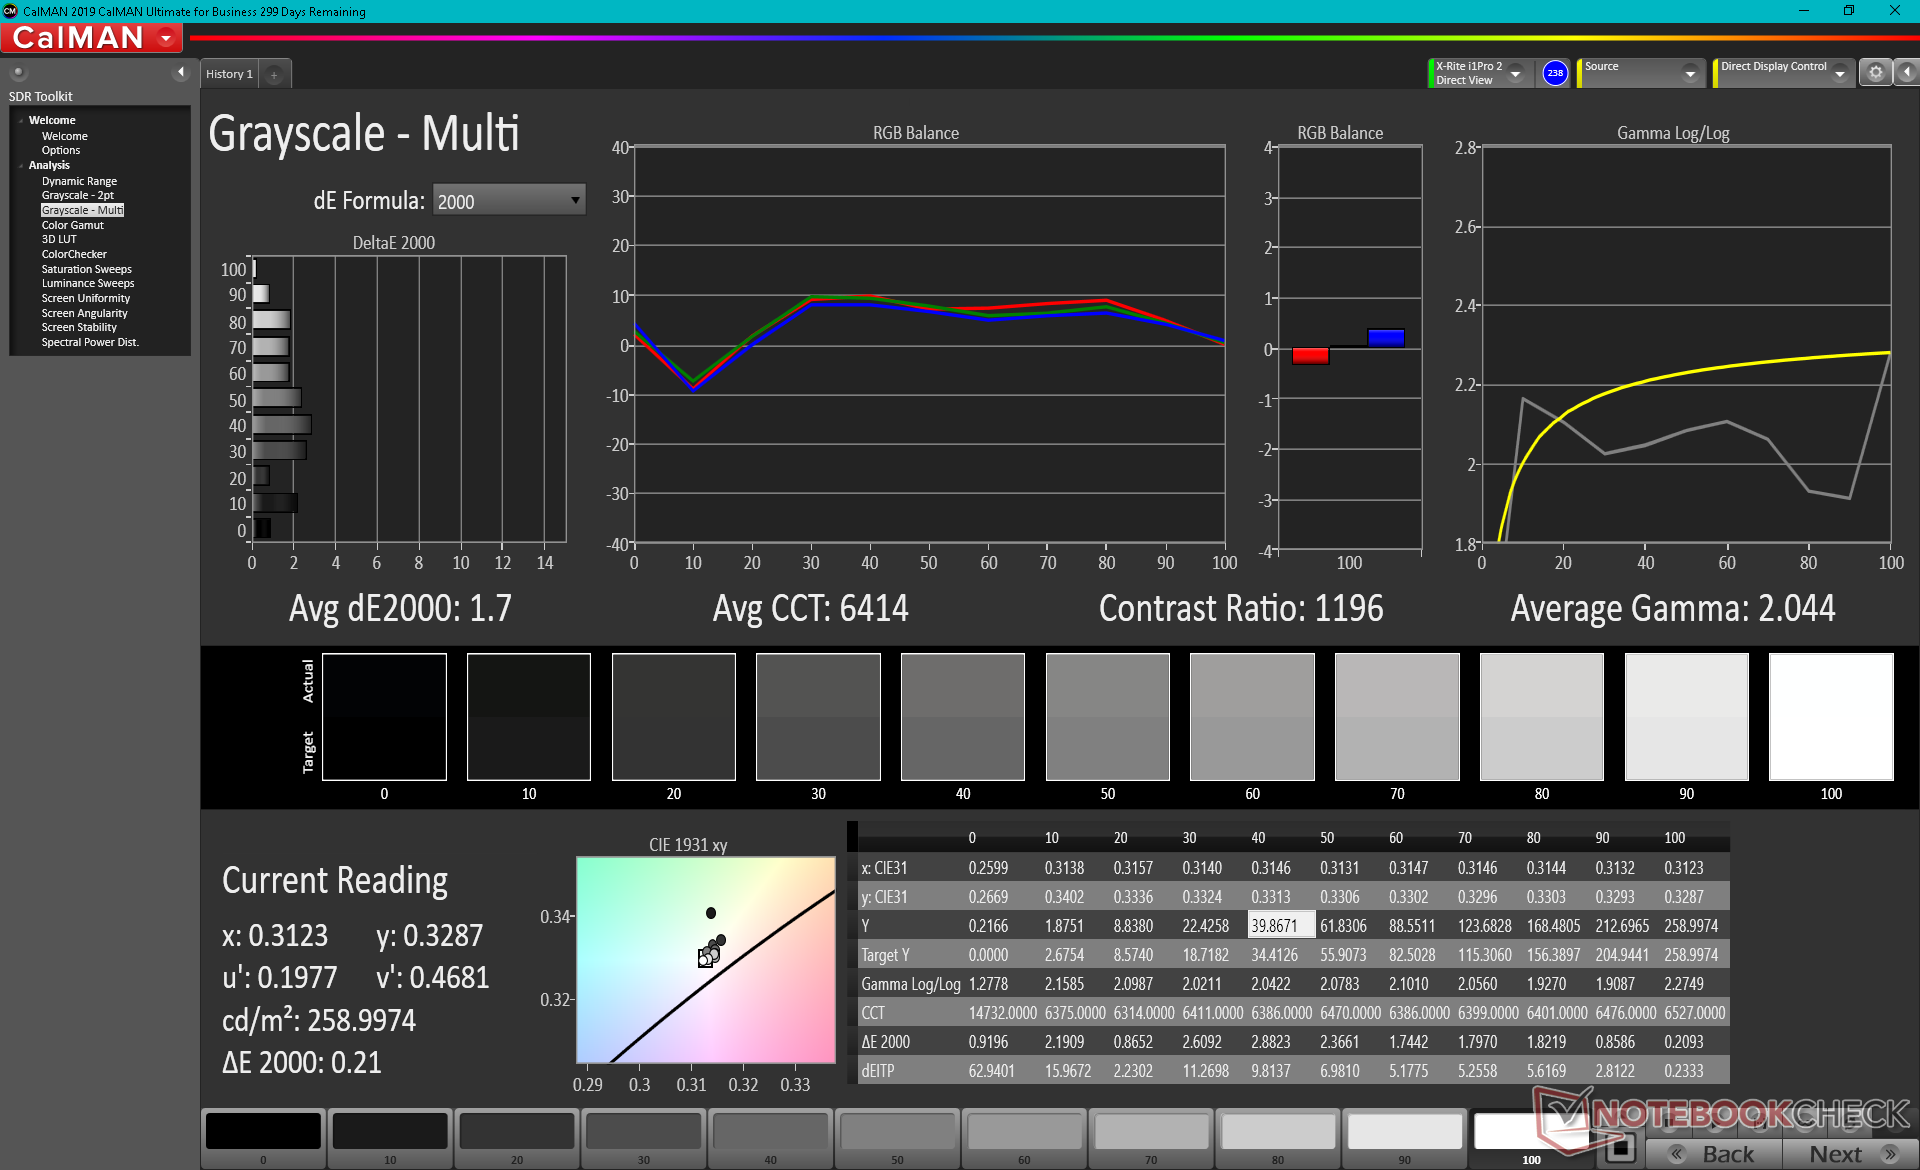
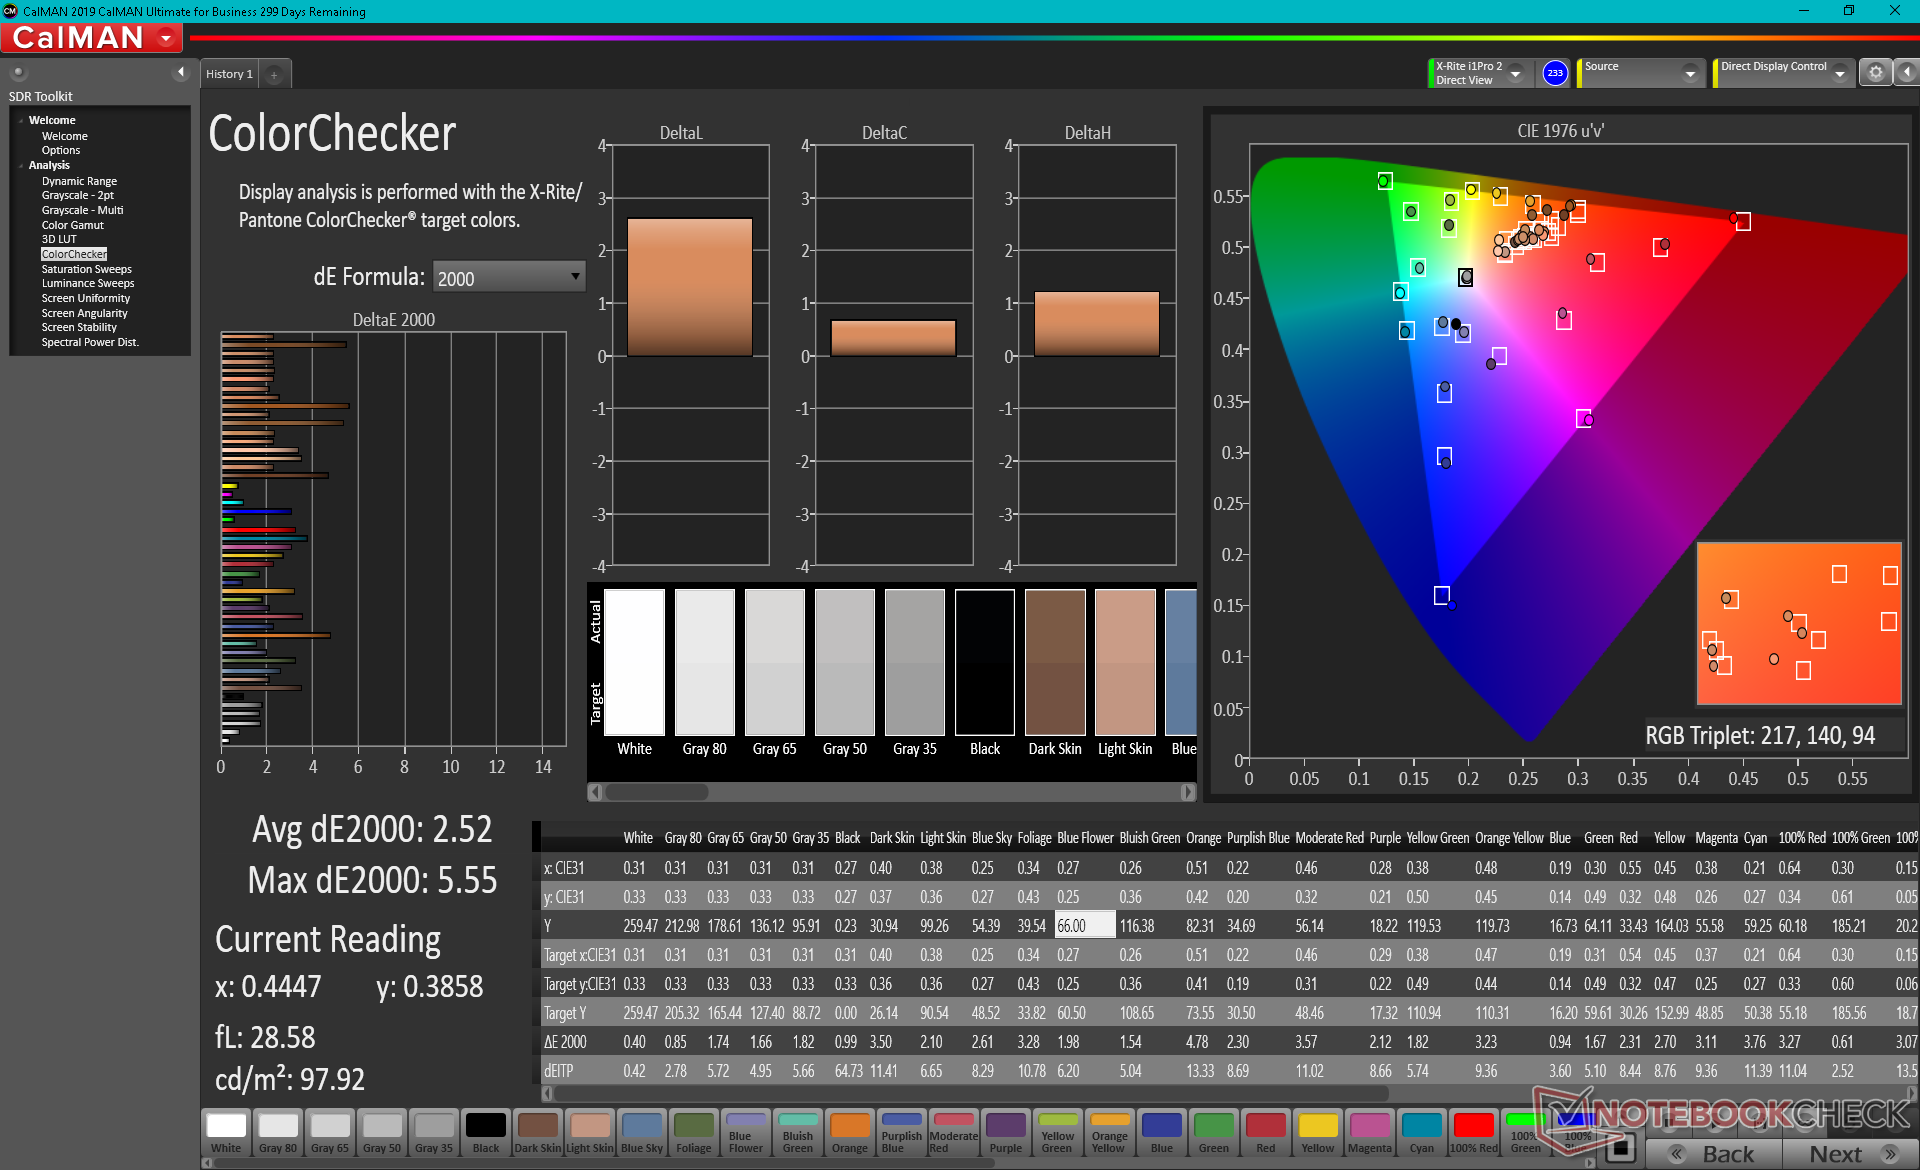
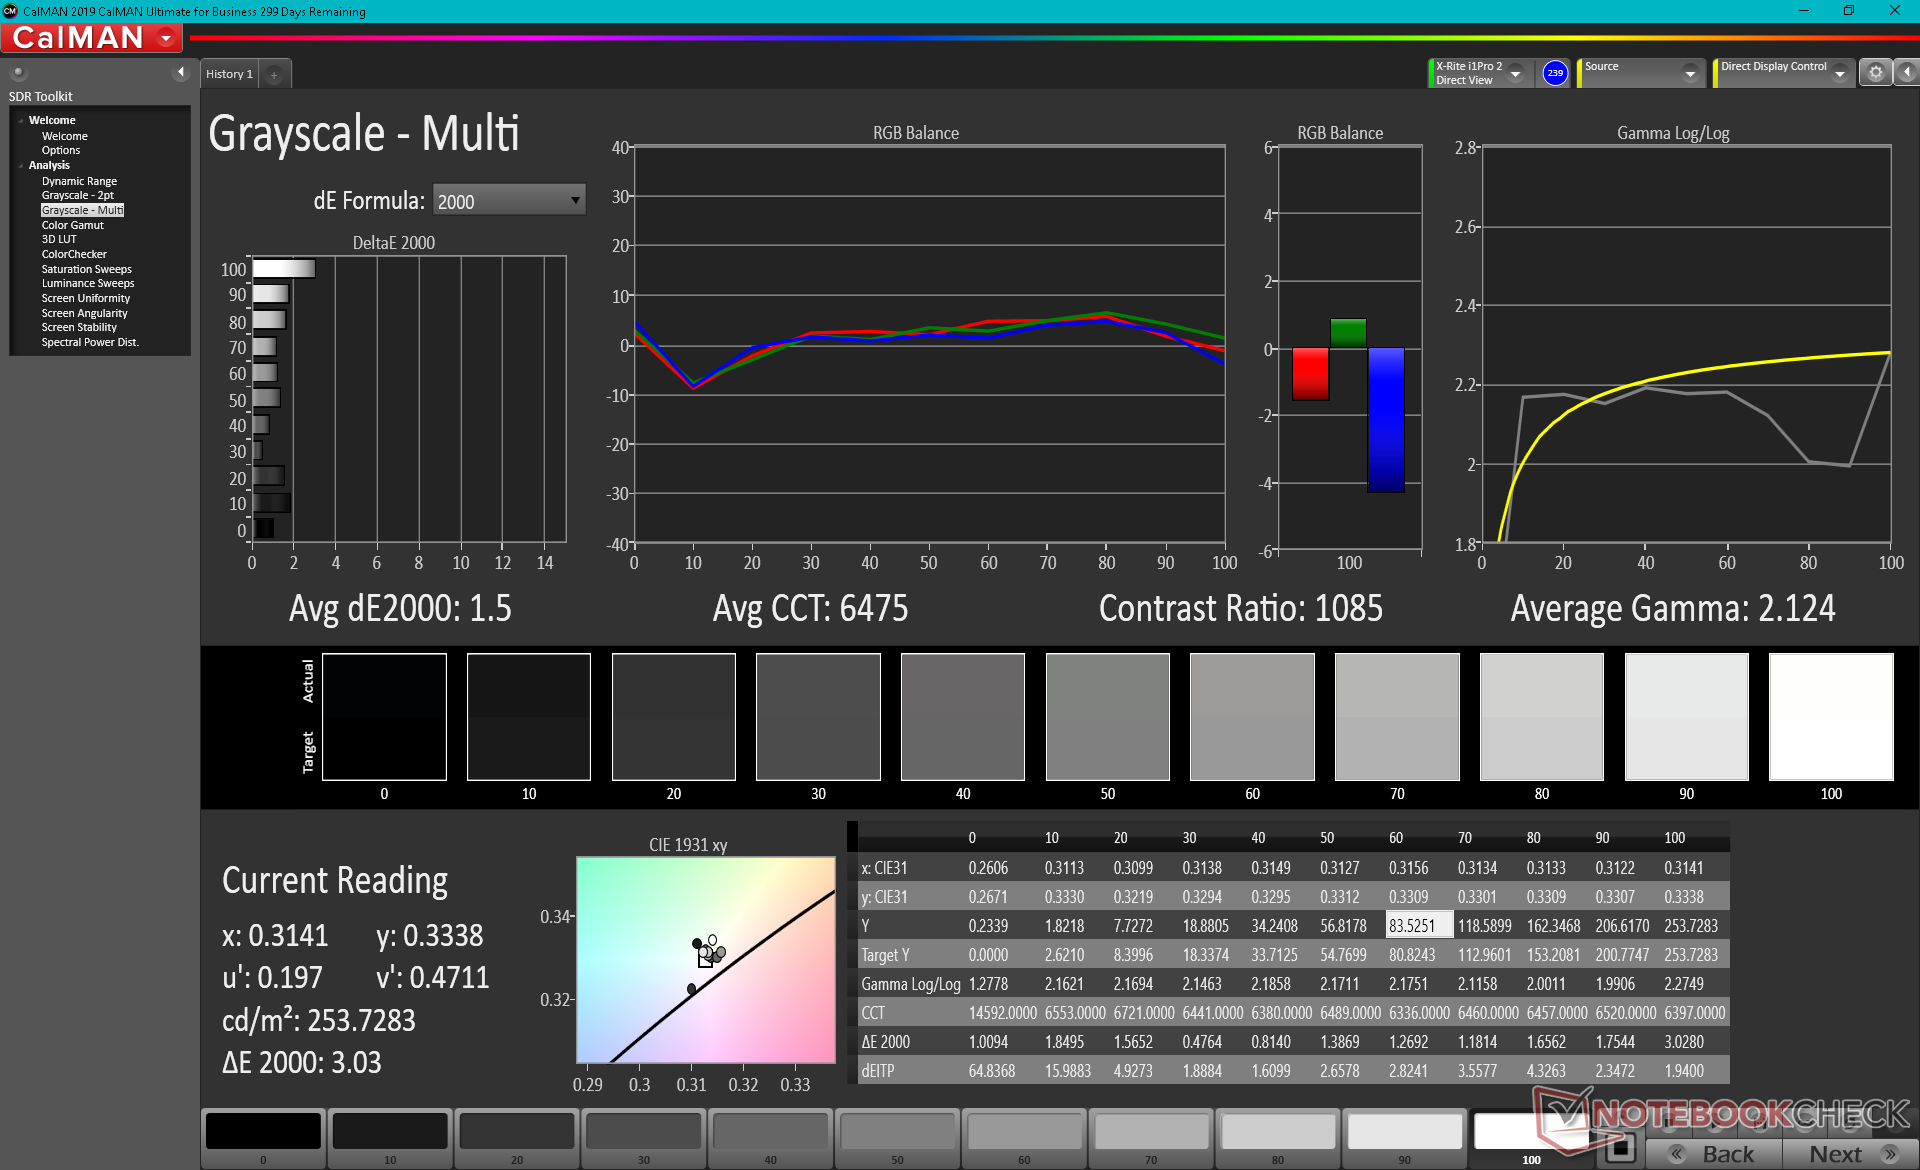
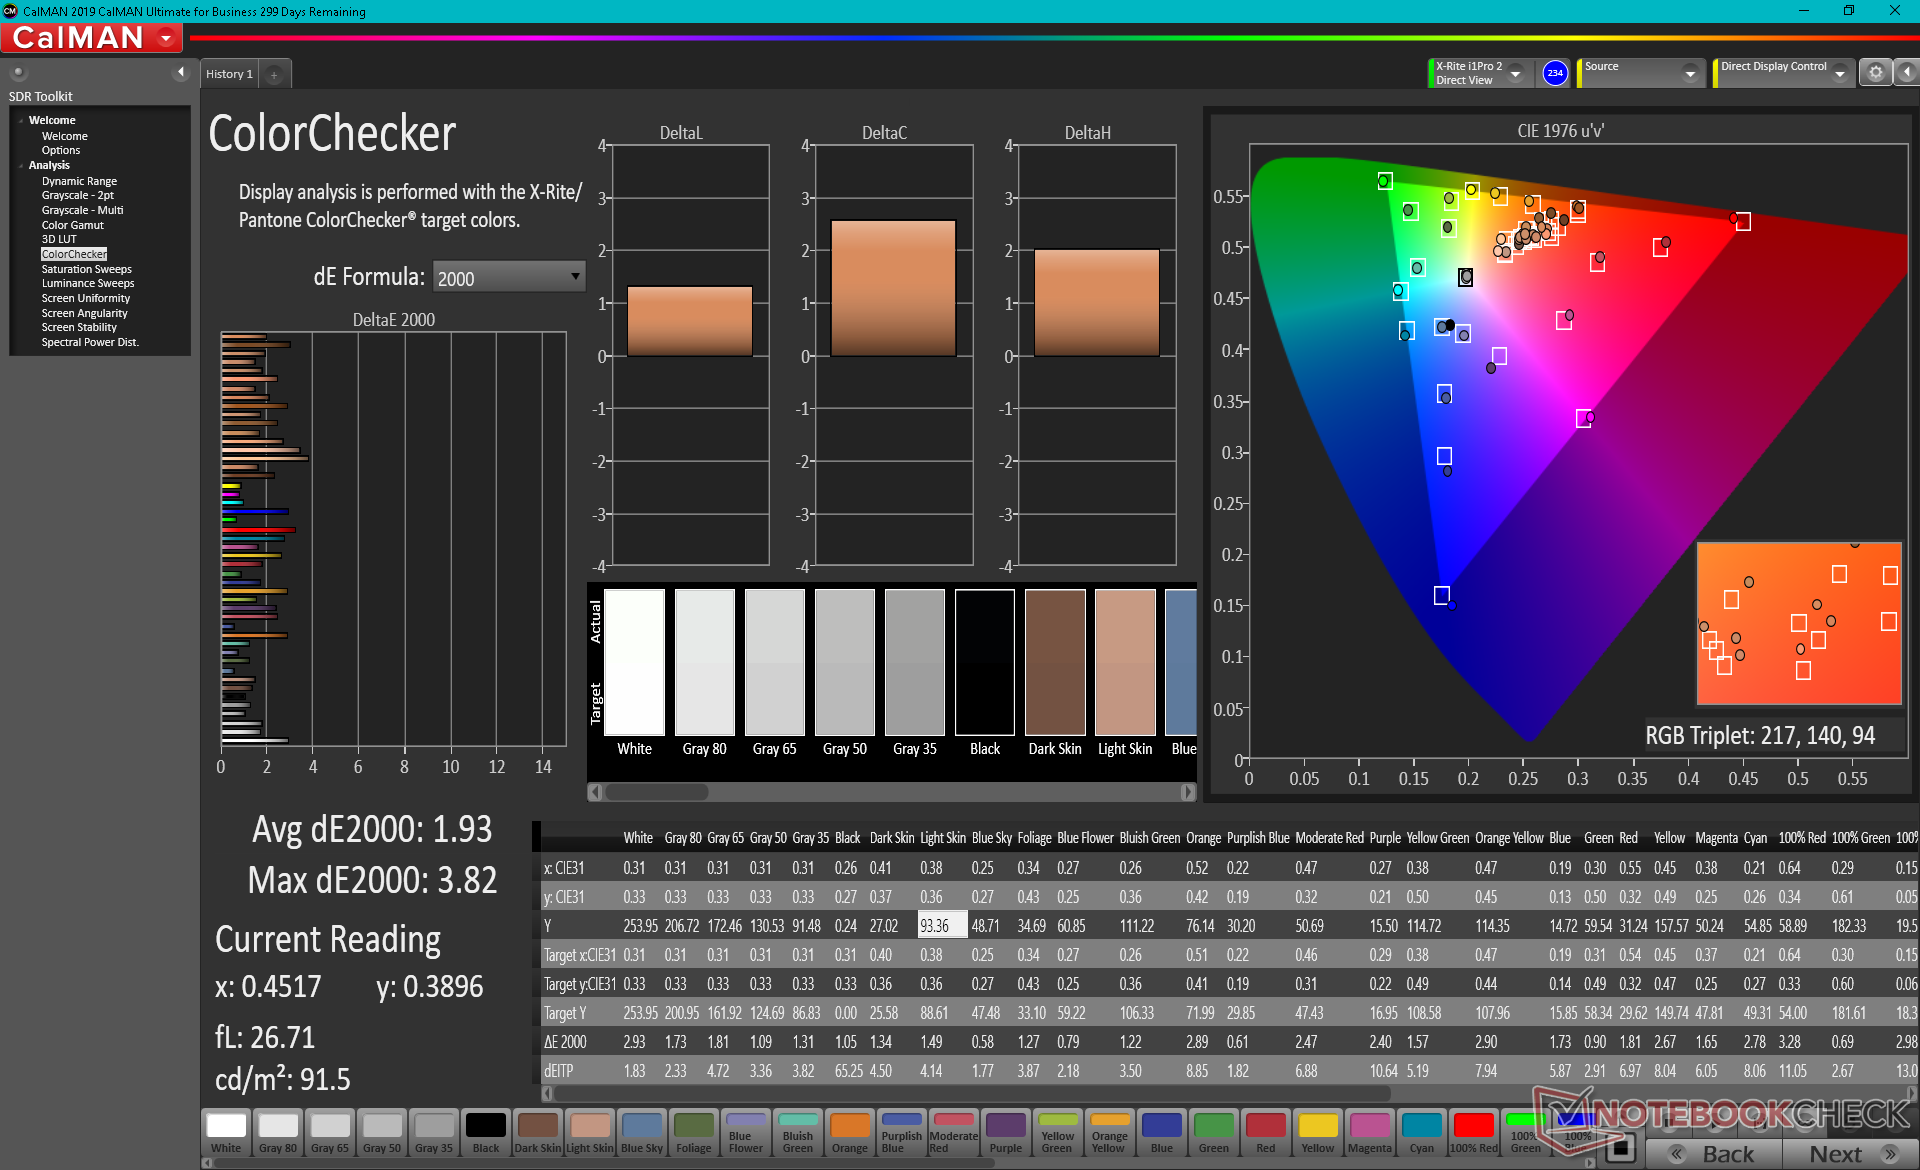
La pantalla está bien calibrada con respecto al estándar sRGB desde el principio, con valores medios de escala de grises y deltaE de ColorChcker de sólo 1,7 y 2,52, respectivamente. Estos valores mejorarían sólo marginalmente después de calibrar el panel nosotros mismos.

Tiempos de respuesta del display
| ↔ Tiempo de respuesta de Negro a Blanco | ||
|---|---|---|
| 11.6 ms ... subida ↗ y bajada ↘ combinada | ↗ 7.6 ms subida | 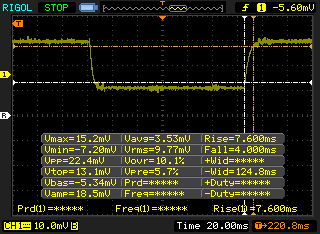 |
| ↘ 4 ms bajada | ||
| La pantalla mostró buenos tiempos de respuesta en nuestros tests pero podría ser demasiado lenta para los jugones competitivos. En comparación, todos los dispositivos de prueba van de ##min### (mínimo) a 240 (máximo) ms. » 31 % de todos los dispositivos son mejores. Esto quiere decir que el tiempo de respuesta medido es mejor que la media (19.9 ms) de todos los dispositivos testados. | ||
| ↔ Tiempo de respuesta 50% Gris a 80% Gris | ||
| 14.4 ms ... subida ↗ y bajada ↘ combinada | ↗ 6.8 ms subida | 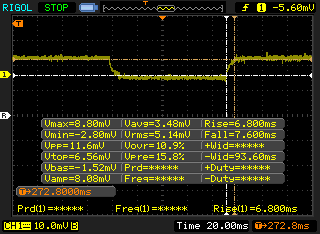 |
| ↘ 7.6 ms bajada | ||
| La pantalla mostró buenos tiempos de respuesta en nuestros tests pero podría ser demasiado lenta para los jugones competitivos. En comparación, todos los dispositivos de prueba van de ##min### (mínimo) a 636 (máximo) ms. » 28 % de todos los dispositivos son mejores. Esto quiere decir que el tiempo de respuesta medido es mejor que la media (31.1 ms) de todos los dispositivos testados. | ||
Parpadeo de Pantalla / PWM (Pulse-Width Modulation)
| Parpadeo de Pantalla / PWM no detectado | 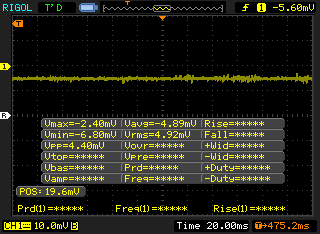 | ||
Comparación: 52 % de todos los dispositivos testados no usaron PWM para atenuar el display. Si se usó, medimos una media de 7794 (mínimo: 5 - máxmo: 343500) Hz. | |||
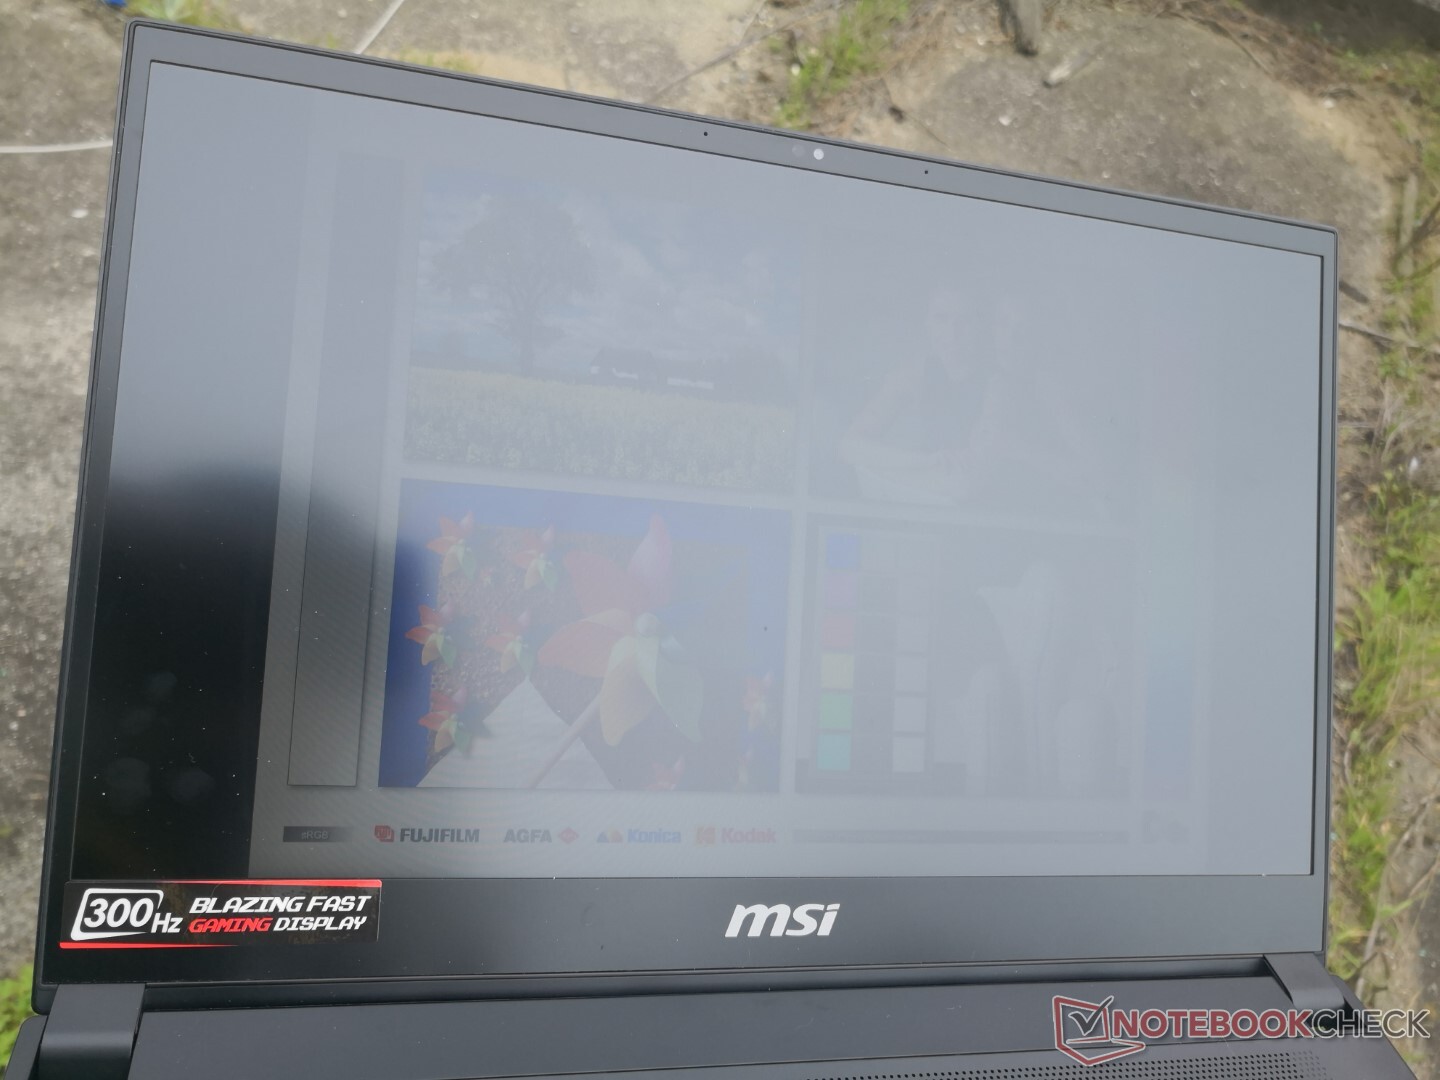
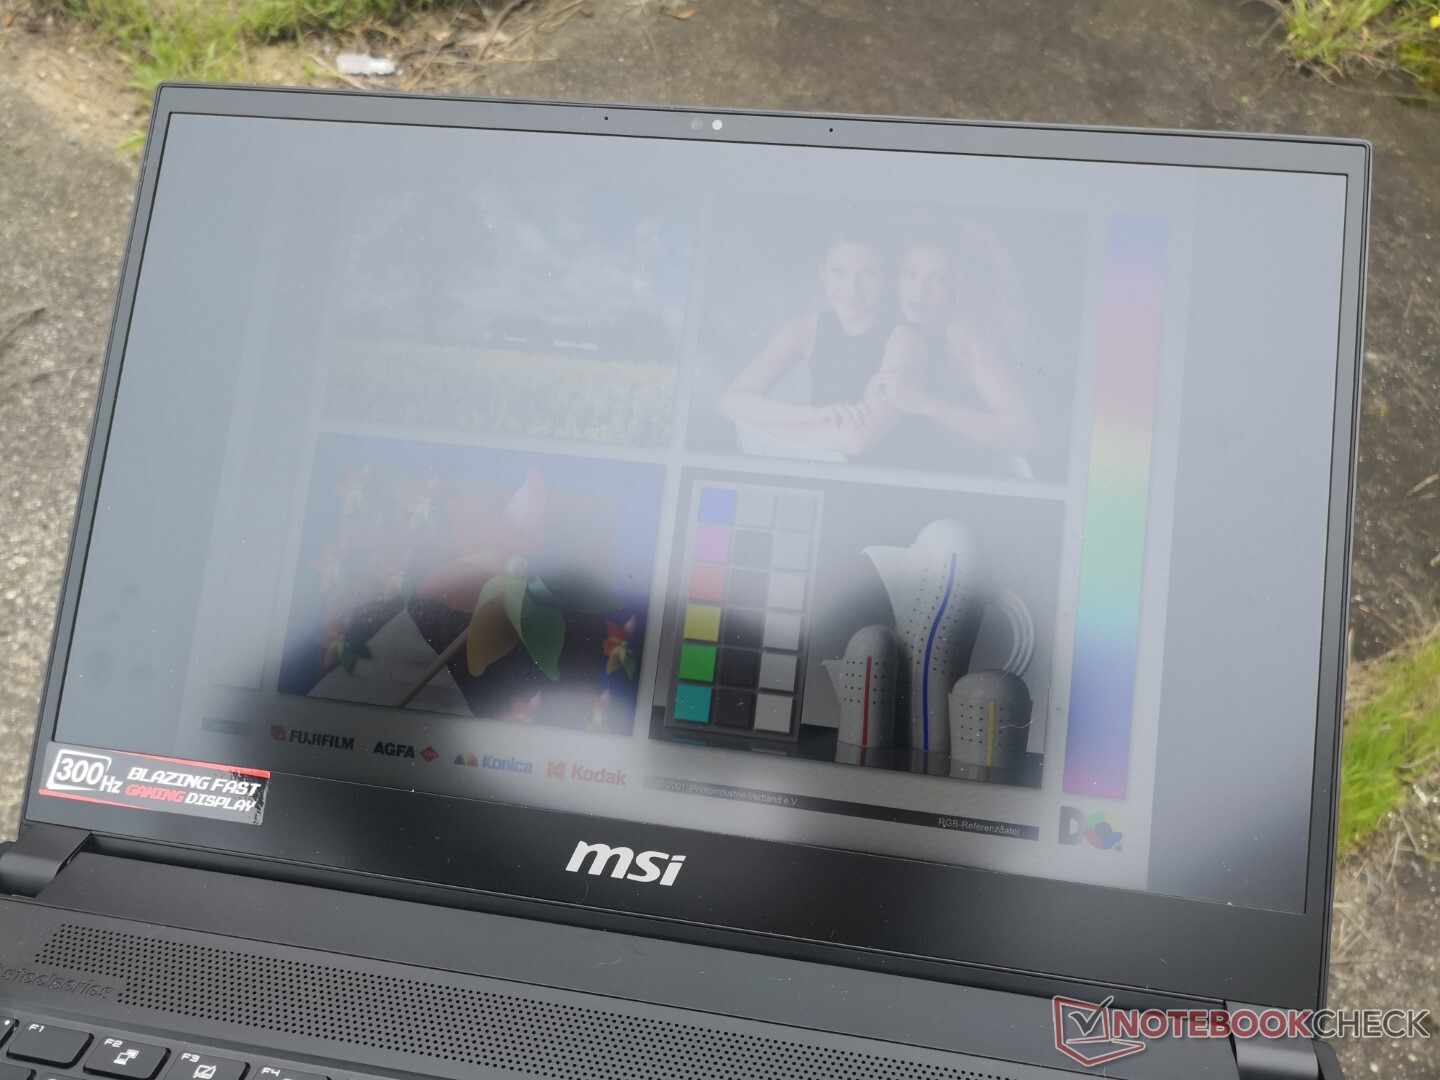
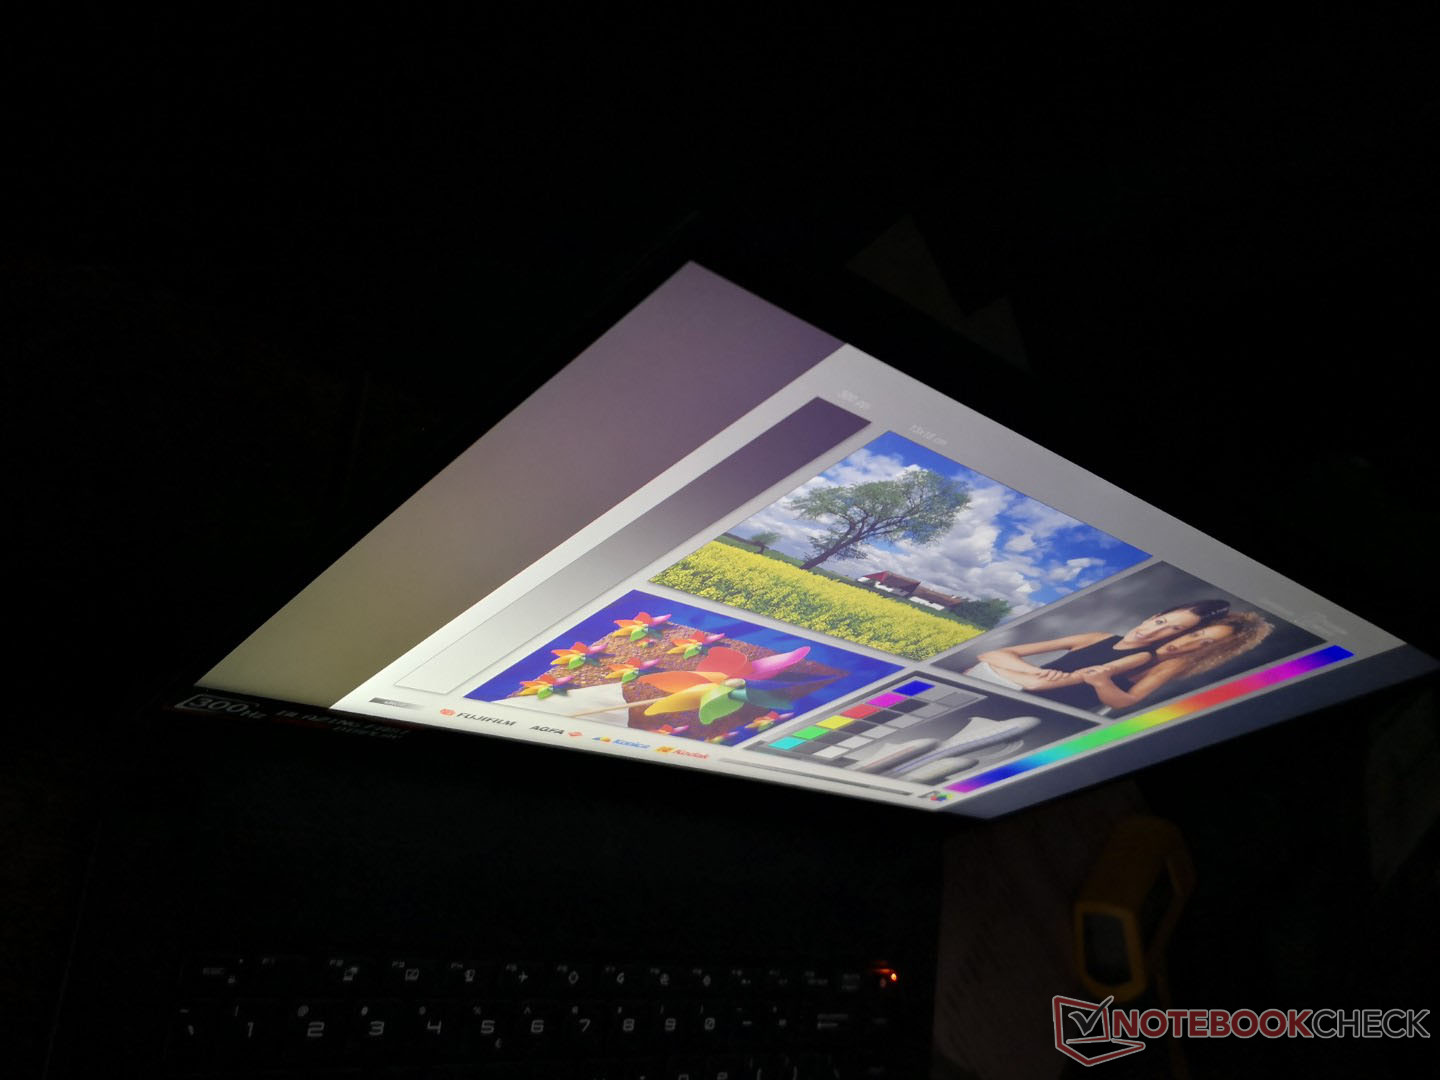
La visibilidad en exteriores es peor que la de la mayoría de Ultrabooks, ya que la pantalla simplemente no es tan brillante. El último Dell XPS 15, por ejemplo, es más de dos veces más brillante que nuestro MSI. Para un portátil de juego tan delgado y ligero, esperábamos un display más vibrante cuando viajamos y trabajamos fuera de la oficina.
Rendimiento
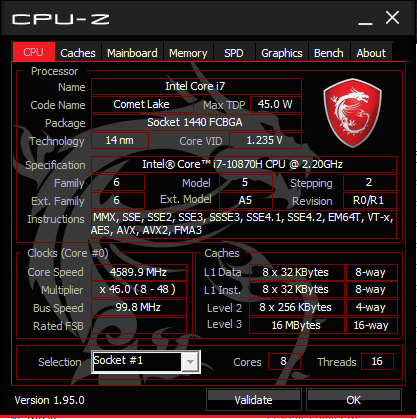
El Core i7-10870H es exactamente igual que el Core i7-10875H con sólo un par de pequeñas diferencias. En primer lugar, las velocidades de reloj base y máxima son cada una 100 MHz más lentas que el Core i7-10875H, a 2,2 GHz frente a 2,3 GHz y 5 GHz frente a 5,1 GHz, respectivamente. En segundo lugar, la CPU no es compatible con ciertas características de seguridad de Intel, como vPro y Trusted Execution, que los portátiles dedicados a los juegos probablemente nunca utilizarían, de todos modos. Se rumorea que Intel introdujo el Core i7-10870H para aliviar los problemas de suministro que algunos fabricantes de portátiles estaban experimentando con el Core i7-10875H a finales del año pasado.
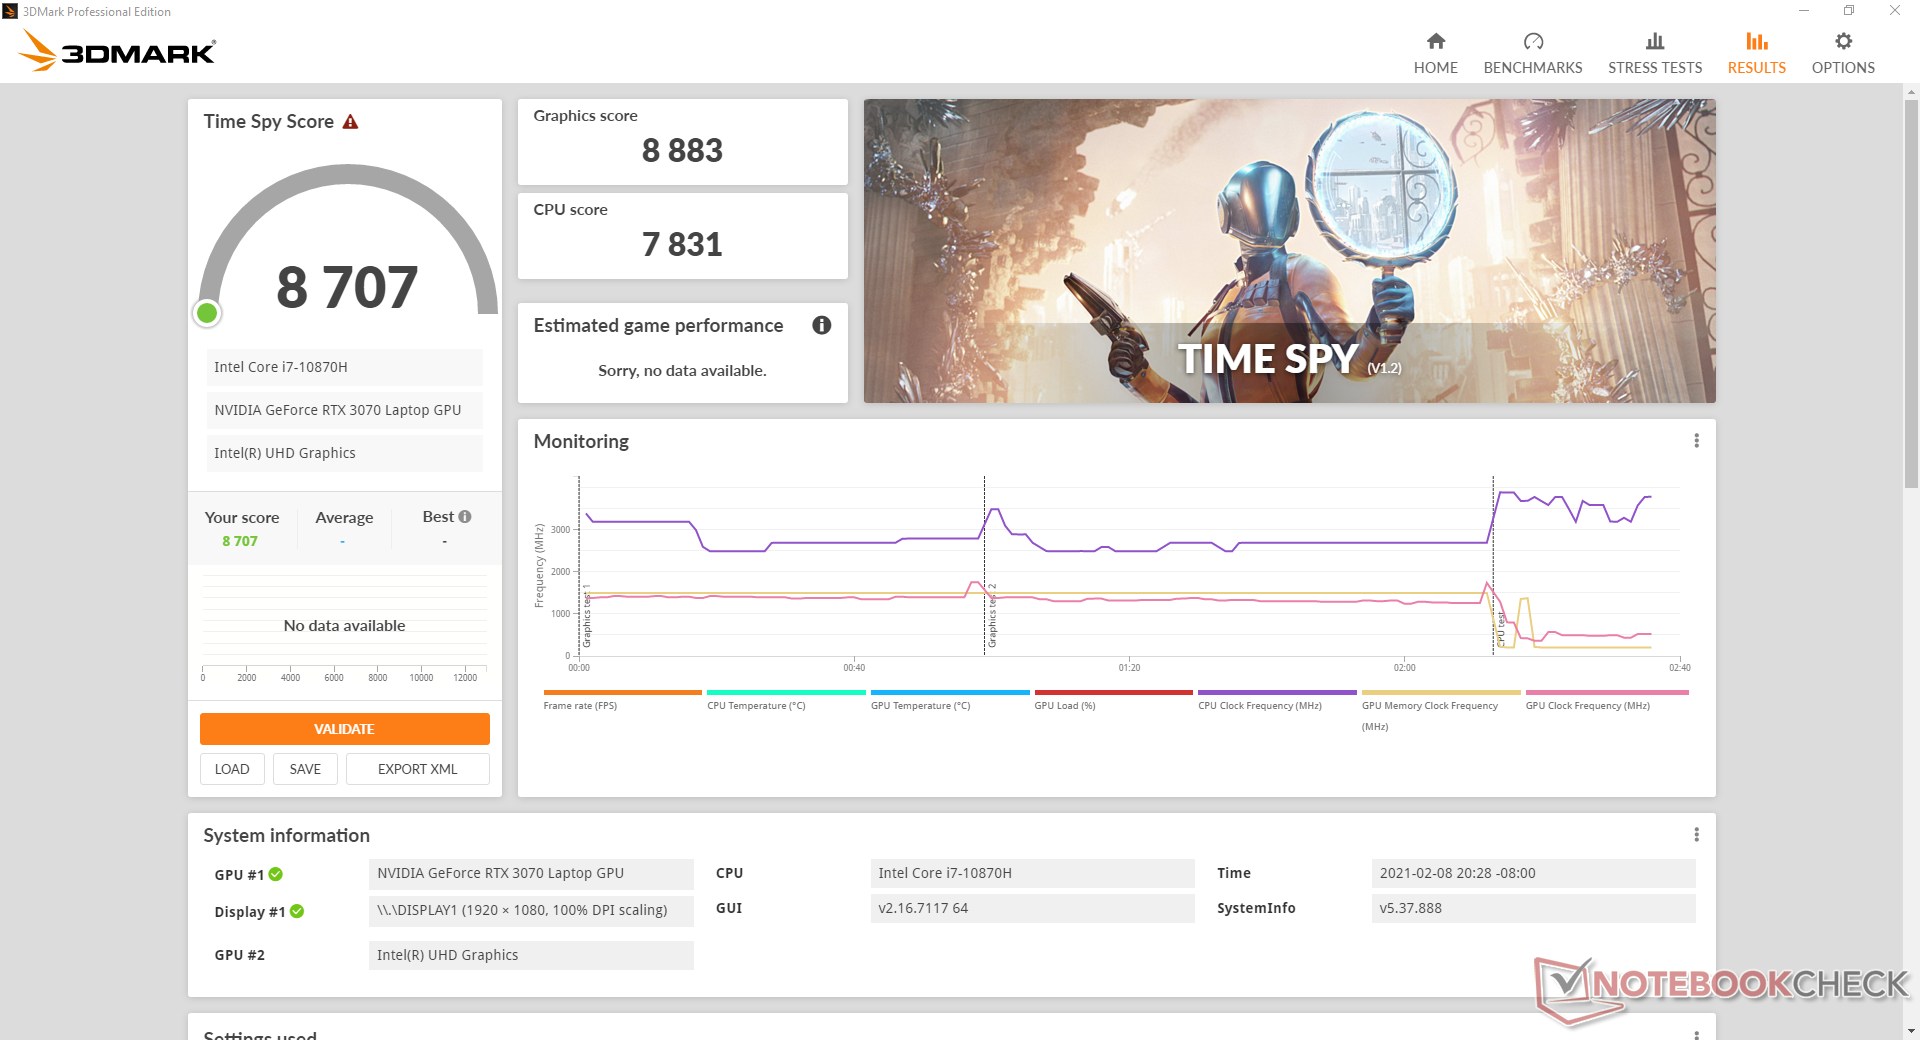
A menos que se indique lo contrario, nuestras pruebas de rendimiento se realizaron en el modo de rendimiento extremo. Recomendamos a los usuarios que se familiaricen con el software MSI Dragon Center, ya que aquí se pueden encontrar importantes controles de rendimiento y de ventiladores. Hay que tener en cuenta que la herramienta de monitorización en tiempo real Dragon Center es propensa a congelarse cuando la CPU está al 100% de utilización, por lo que no siempre es fiable.
Procesador
El rendimiento bruto de la CPU está donde esperamos que esté según las pruebas CineBench con puntuaciones que están apenas unos puntos porcentuales por detrás del Core i7-10875H. Sin embargo, el Turbo Boost máximo no es sostenible durante largos periodos como ejemplifica nuestra prueba de bucle CineBench R15 xT. El rendimiento empieza con fuerza con casi 1650 puntos antes de caer a 1480 puntos y menos con el tiempo. Los resultados no cambian ni siquiera después de una nueva prueba. Hay que tener en cuenta que habíamos puesto el sistema en modo Cooler Boost Turbo antes de empezar la prueba en bucle, por lo que el GS66 debería rendir al máximo en estas condiciones.
A pesar de la caída en la velocidad de reloj, el Core i7-10870H aún puede ofrecer un rendimiento multihilo entre un 30 y un 35 por ciento más rápido que el Core i7-10750H del GS66 del año pasado para situarse aproximadamente entre los competidores AMD Ryzen 5 4600H y Ryzen 7 4800H.
Cinebench R15: CPU Multi 64Bit | CPU Single 64Bit
Blender: v2.79 BMW27 CPU
7-Zip 18.03: 7z b 4 -mmt1 | 7z b 4
Geekbench 5.5: Single-Core | Multi-Core
HWBOT x265 Benchmark v2.2: 4k Preset
LibreOffice : 20 Documents To PDF
R Benchmark 2.5: Overall mean
Cinebench R15: CPU Multi 64Bit | CPU Single 64Bit
Blender: v2.79 BMW27 CPU
7-Zip 18.03: 7z b 4 -mmt1 | 7z b 4
Geekbench 5.5: Single-Core | Multi-Core
HWBOT x265 Benchmark v2.2: 4k Preset
LibreOffice : 20 Documents To PDF
R Benchmark 2.5: Overall mean
* ... más pequeño es mejor
Rendimiento del sistema
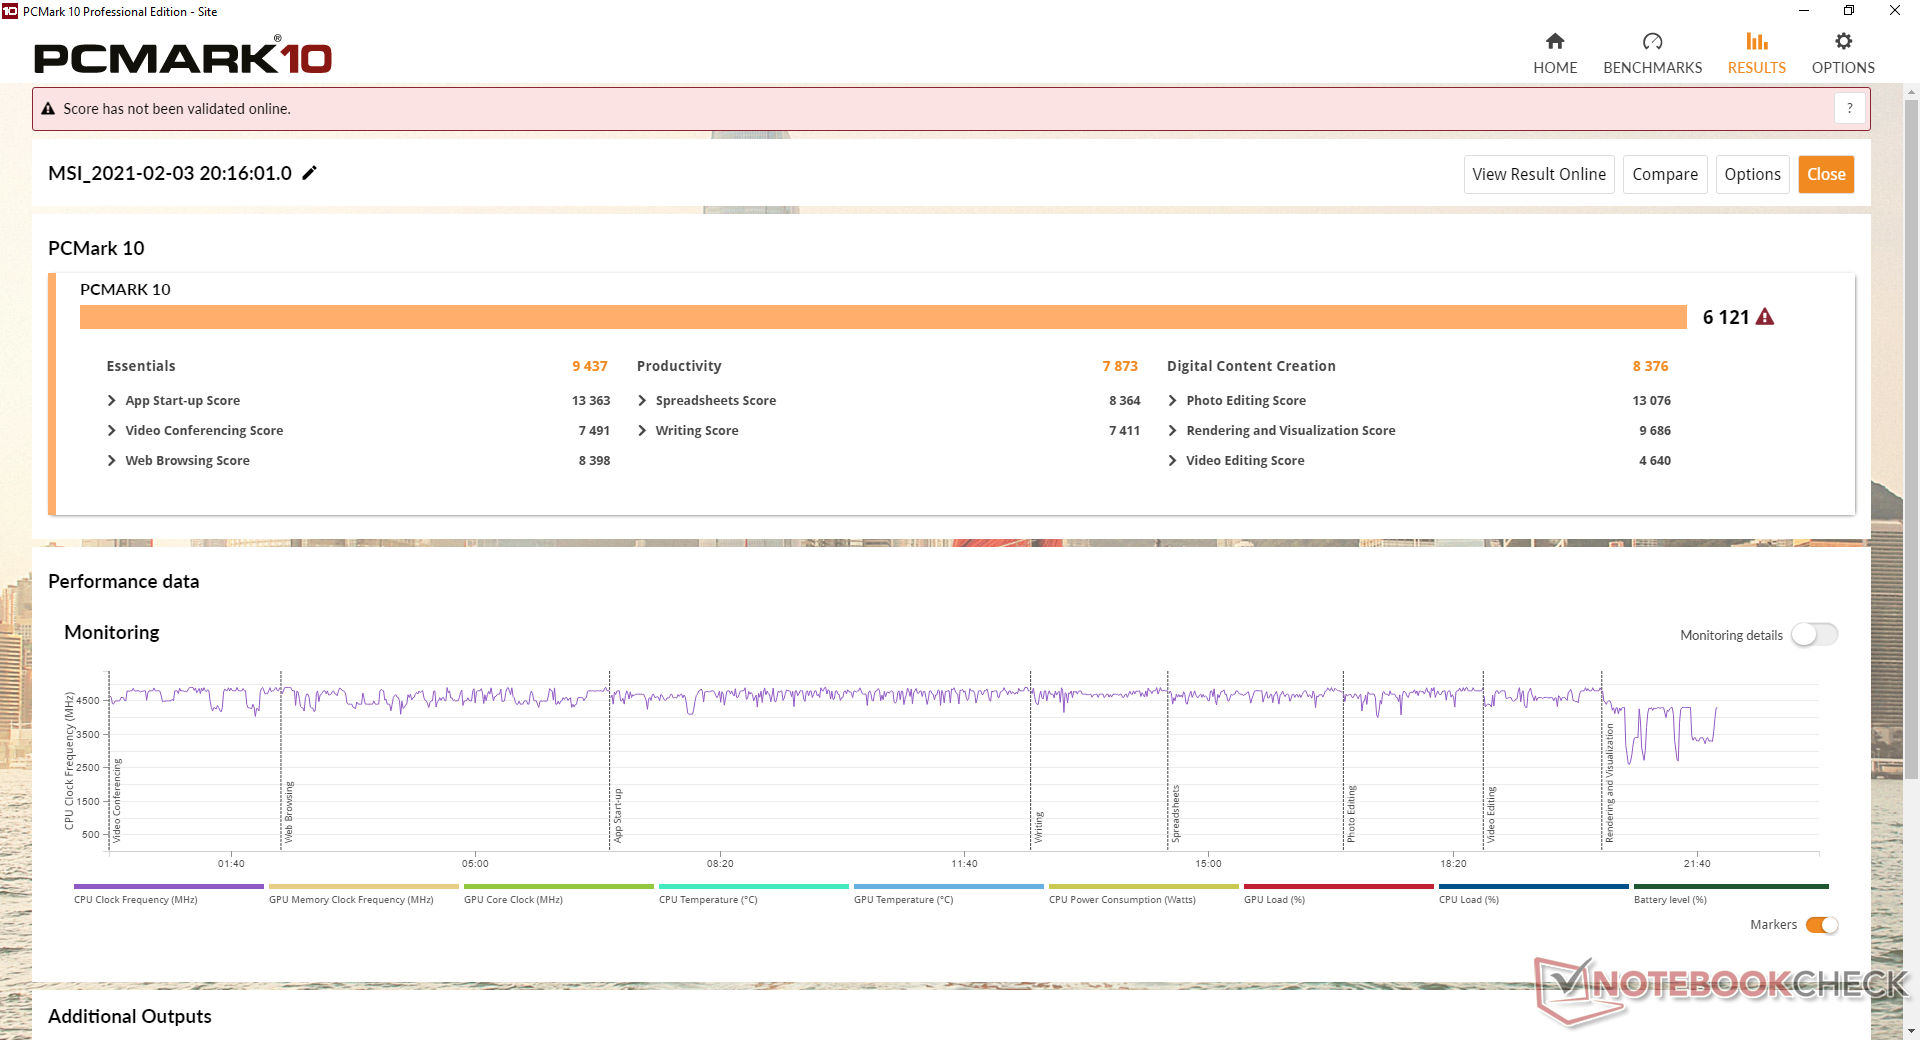
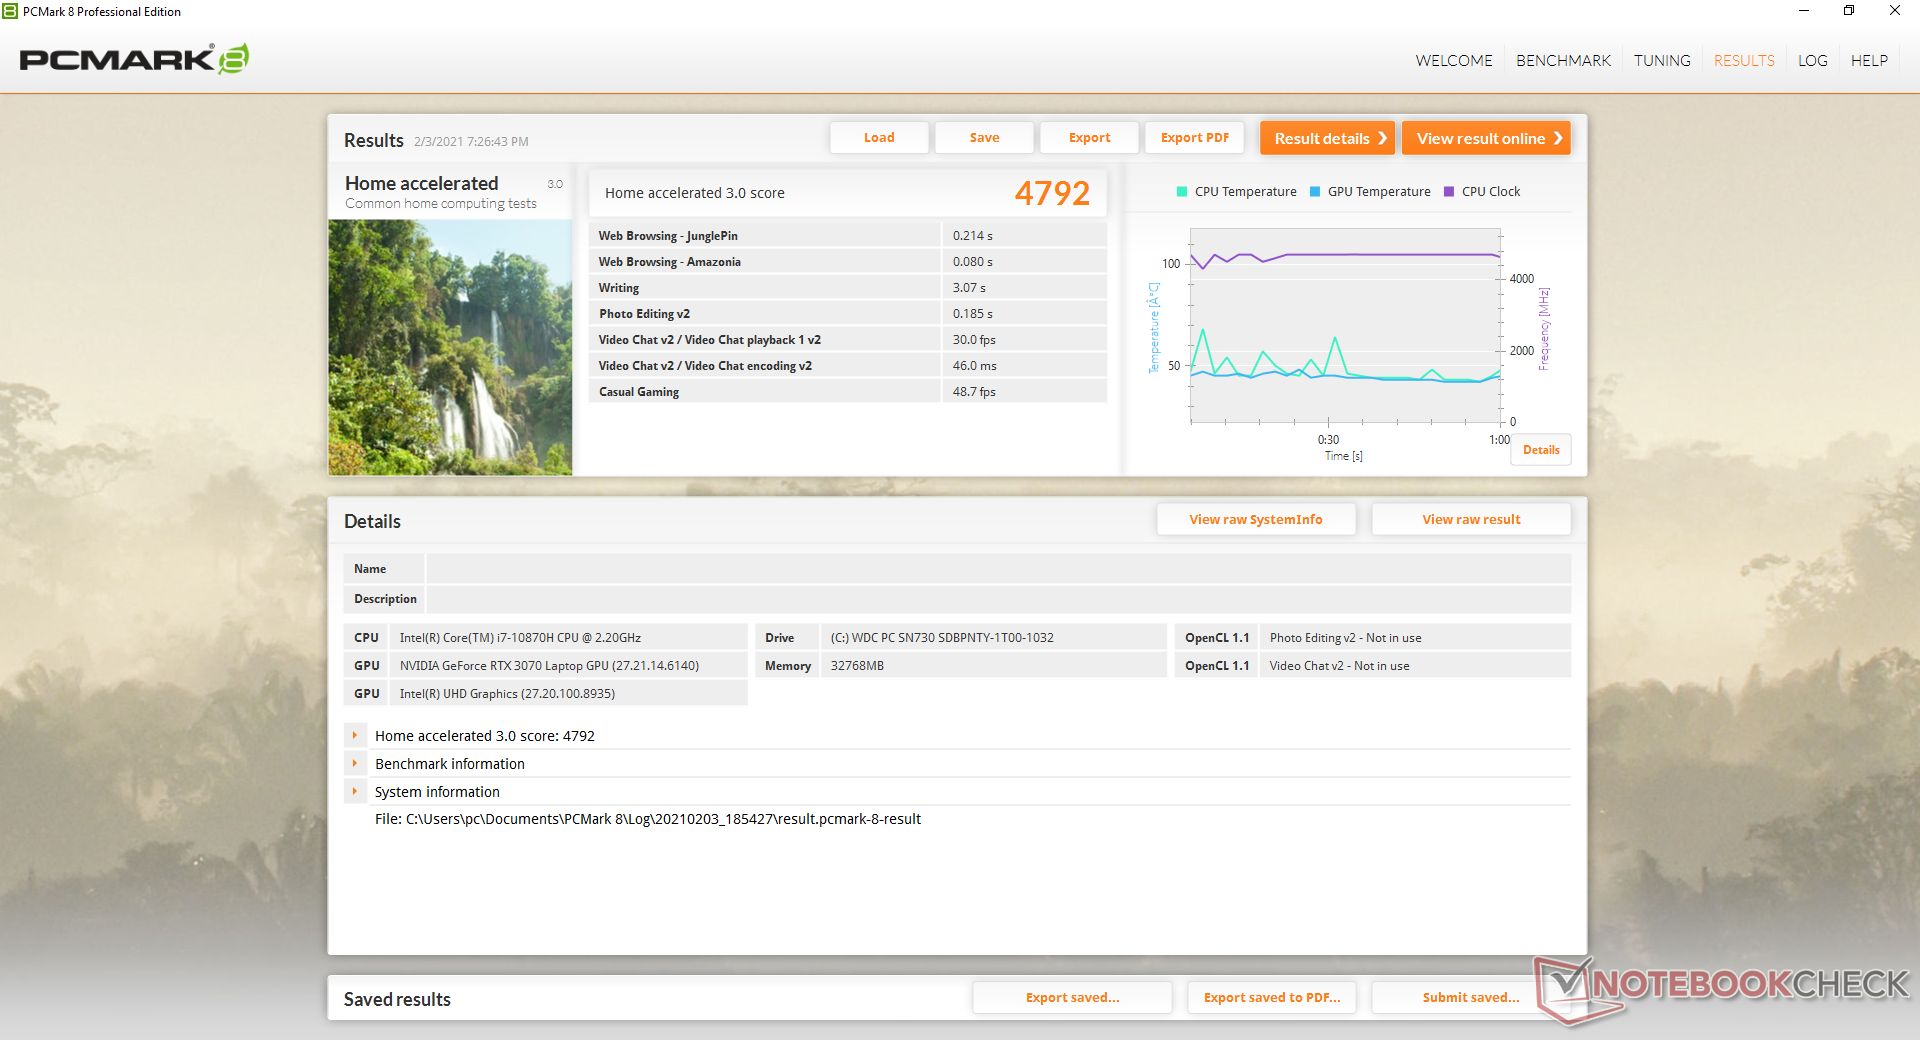
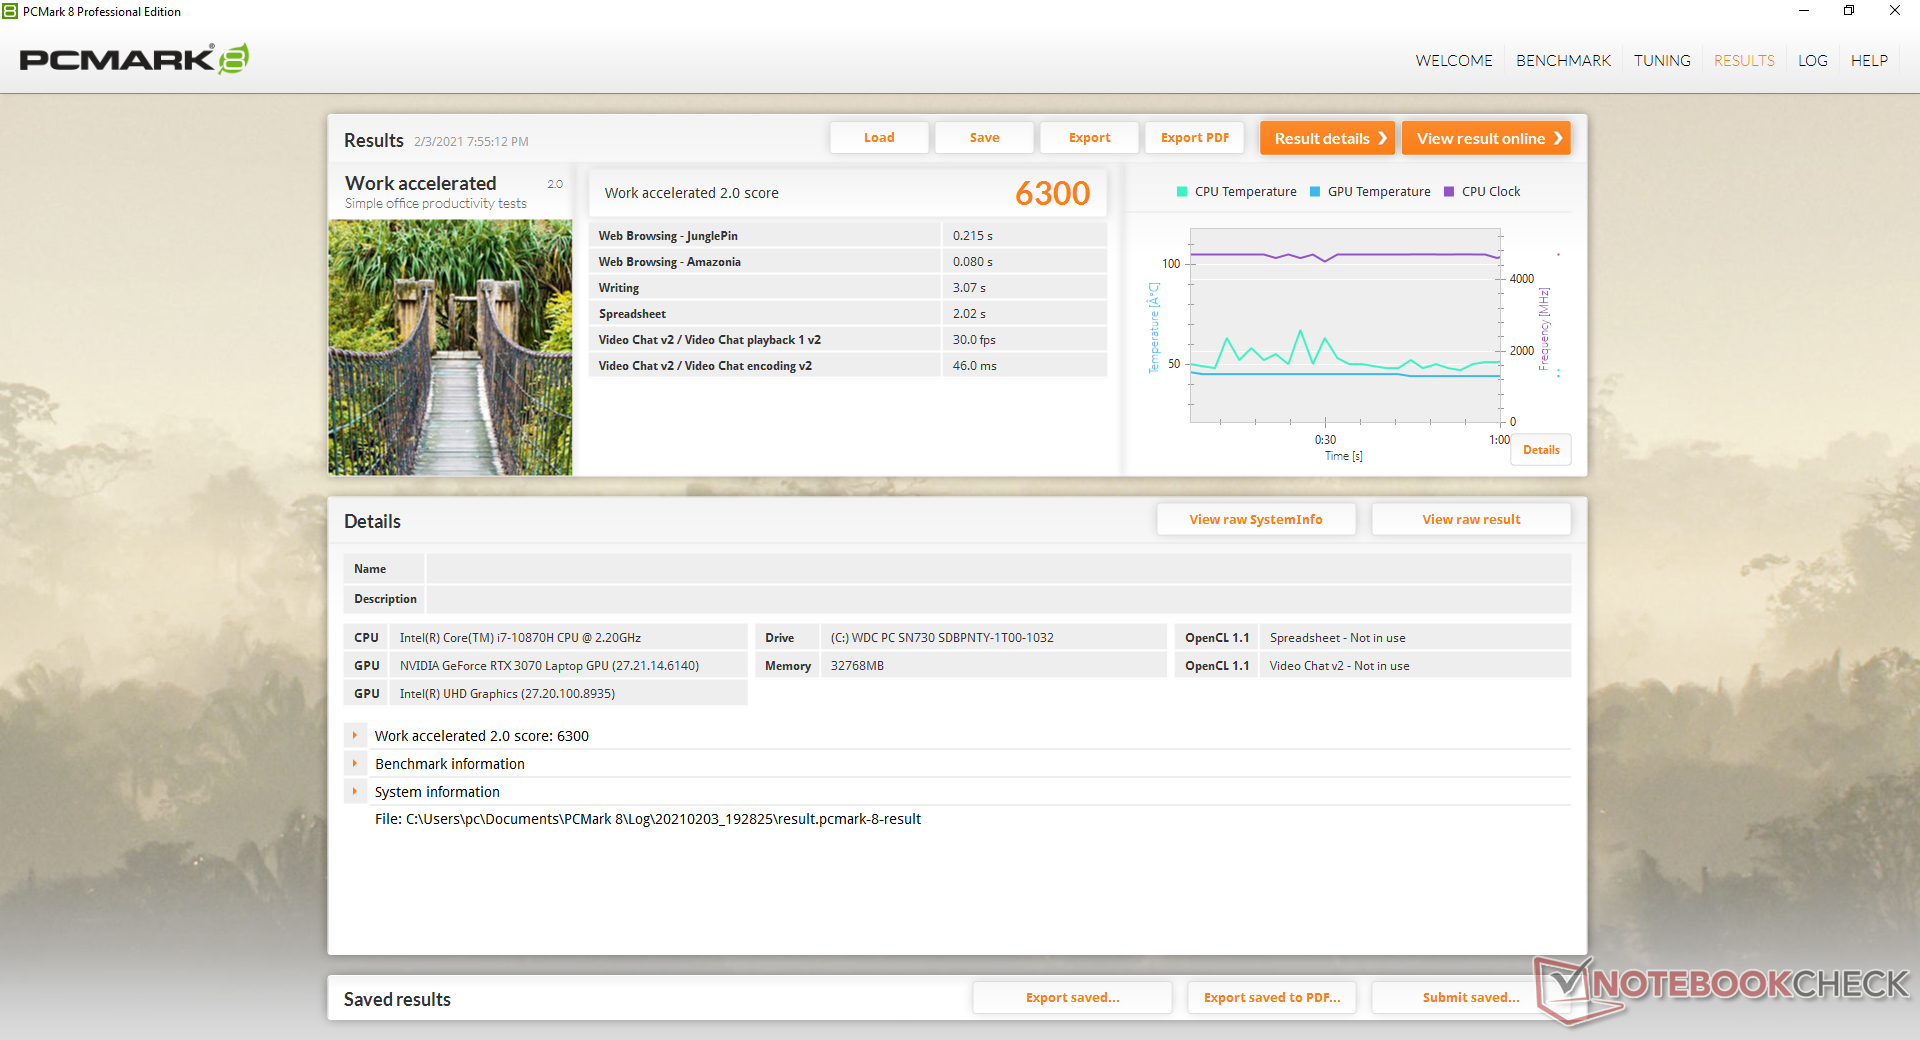
Los resultados de PCMark están dentro de los puntos porcentuales de un solo dígito de otros portátiles con GeForce RTX, incluidos los de la antigua serie Turing. En otras palabras, no parece que la ventaja de rendimiento de la GPU de generación a generación de Ampere móvil sea lo suficientemente amplia como para impactar realmente en las puntuaciones de PCMark.
| PCMark 8 | |
| Home Score Accelerated v2 | |
| Razer Blade 15 RTX 2070 Super Max-Q | |
| Alienware m15 R3 P87F | |
| MSI GS66 Stealth 10UG | |
| MSI GS66 10SGS | |
| Aorus 15P WB | |
| Work Score Accelerated v2 | |
| Razer Blade 15 RTX 2070 Super Max-Q | |
| MSI GS66 Stealth 10UG | |
| Alienware m15 R3 P87F | |
| MSI GS66 10SGS | |
| Aorus 15P WB | |
| PCMark 8 Home Score Accelerated v2 | 4792 puntos | |
| PCMark 8 Work Score Accelerated v2 | 6300 puntos | |
| PCMark 10 Score | 6121 puntos | |
ayuda | ||
Latencia del CPD
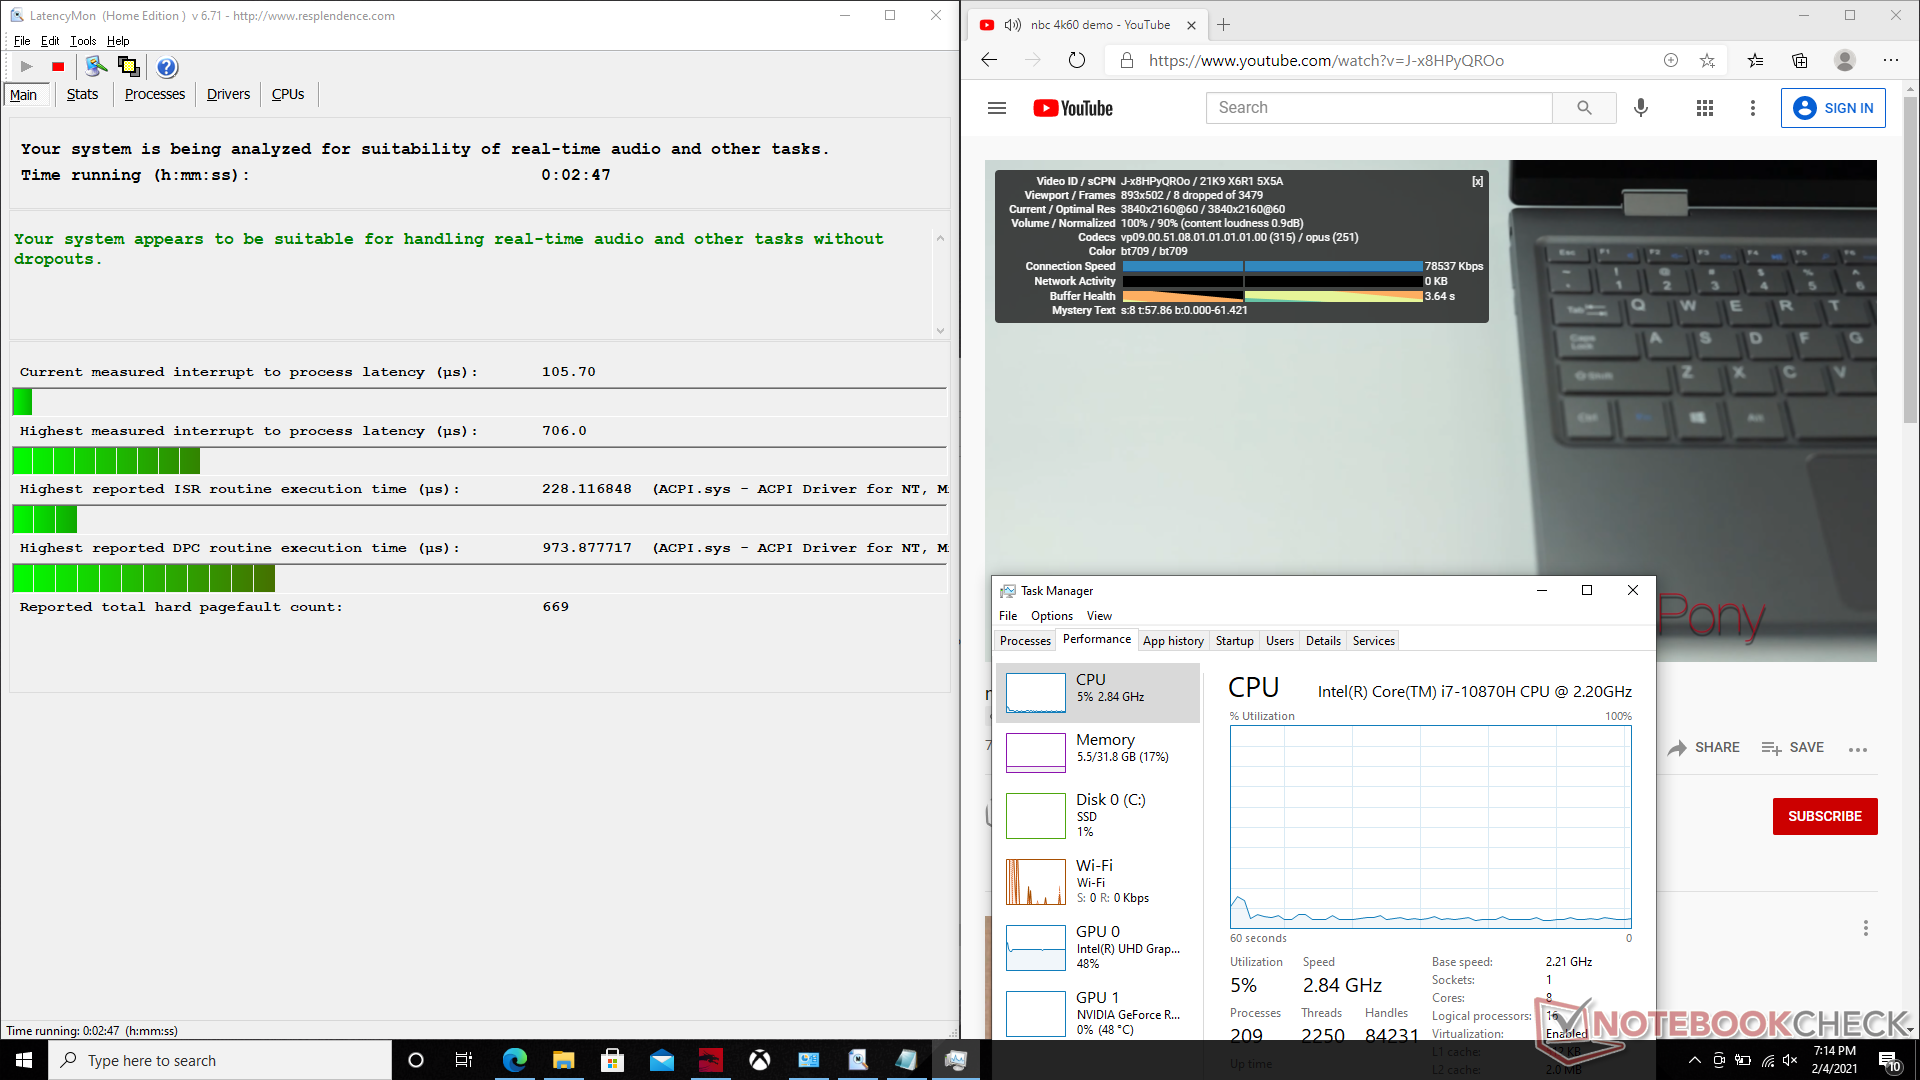
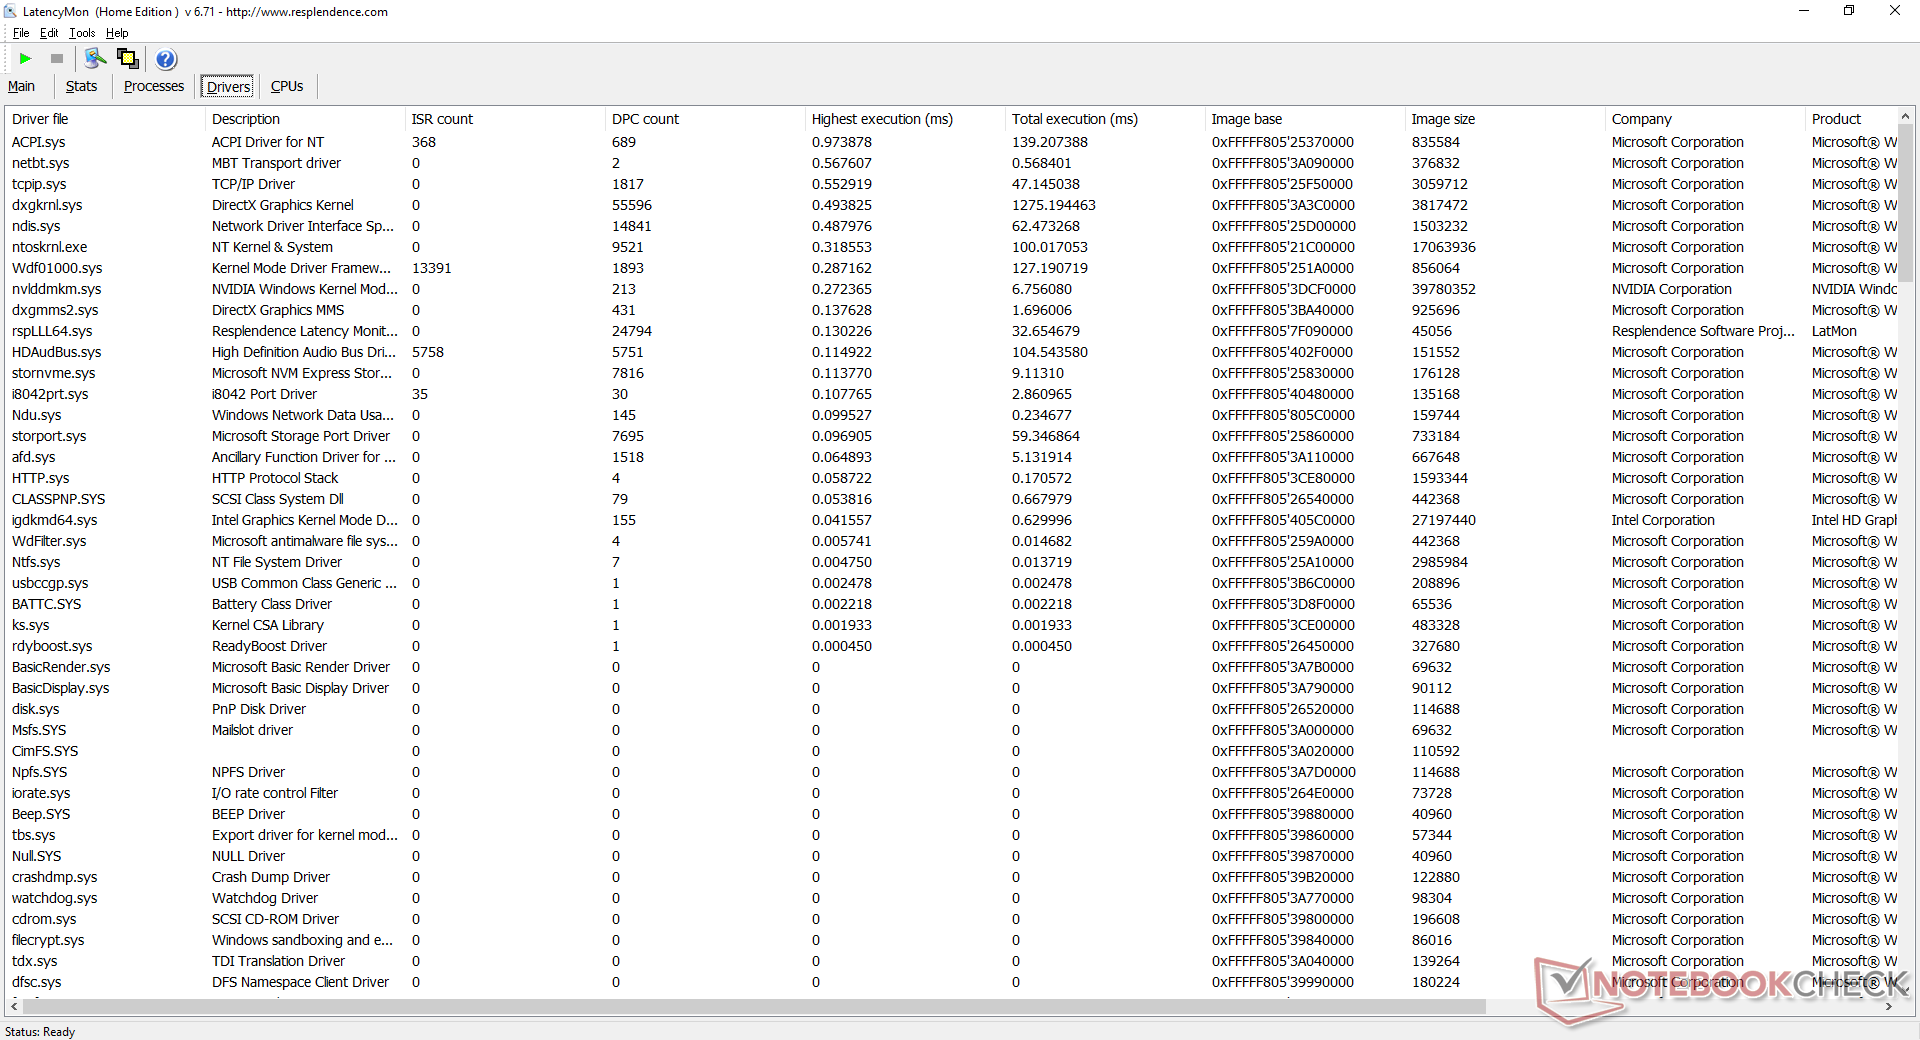
LatencyMon no muestra problemas de latencia importantes al abrir varias pestañas de nuestra página web. La reproducción de vídeo 4K a 60 FPS es fluida pero no perfecta, con 8 fotogramas perdidos durante nuestra prueba de vídeo de un minuto.
| DPC Latencies / LatencyMon - interrupt to process latency (max), Web, Youtube, Prime95 | |
| Razer Blade 15 RTX 2070 Super Max-Q | |
| MSI GS66 10SGS | |
| Alienware m15 R3 P87F | |
| Asus TUF Dash F15 FX516PR | |
| Aorus 15P WB | |
| MSI GS66 Stealth 10UG | |
* ... más pequeño es mejor
Dispositivos de almacenamiento
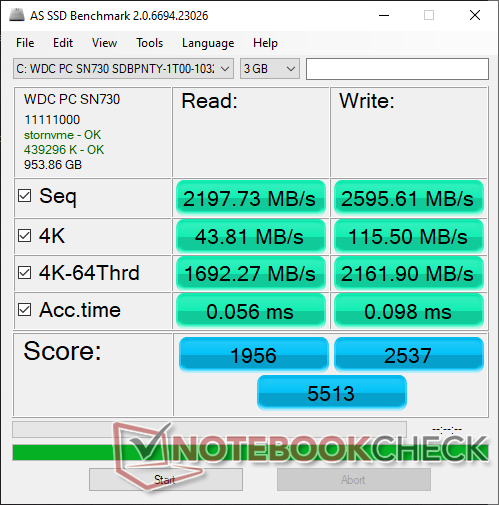
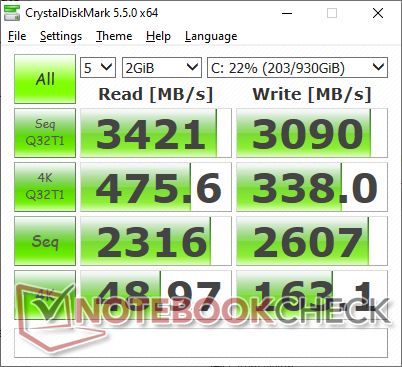
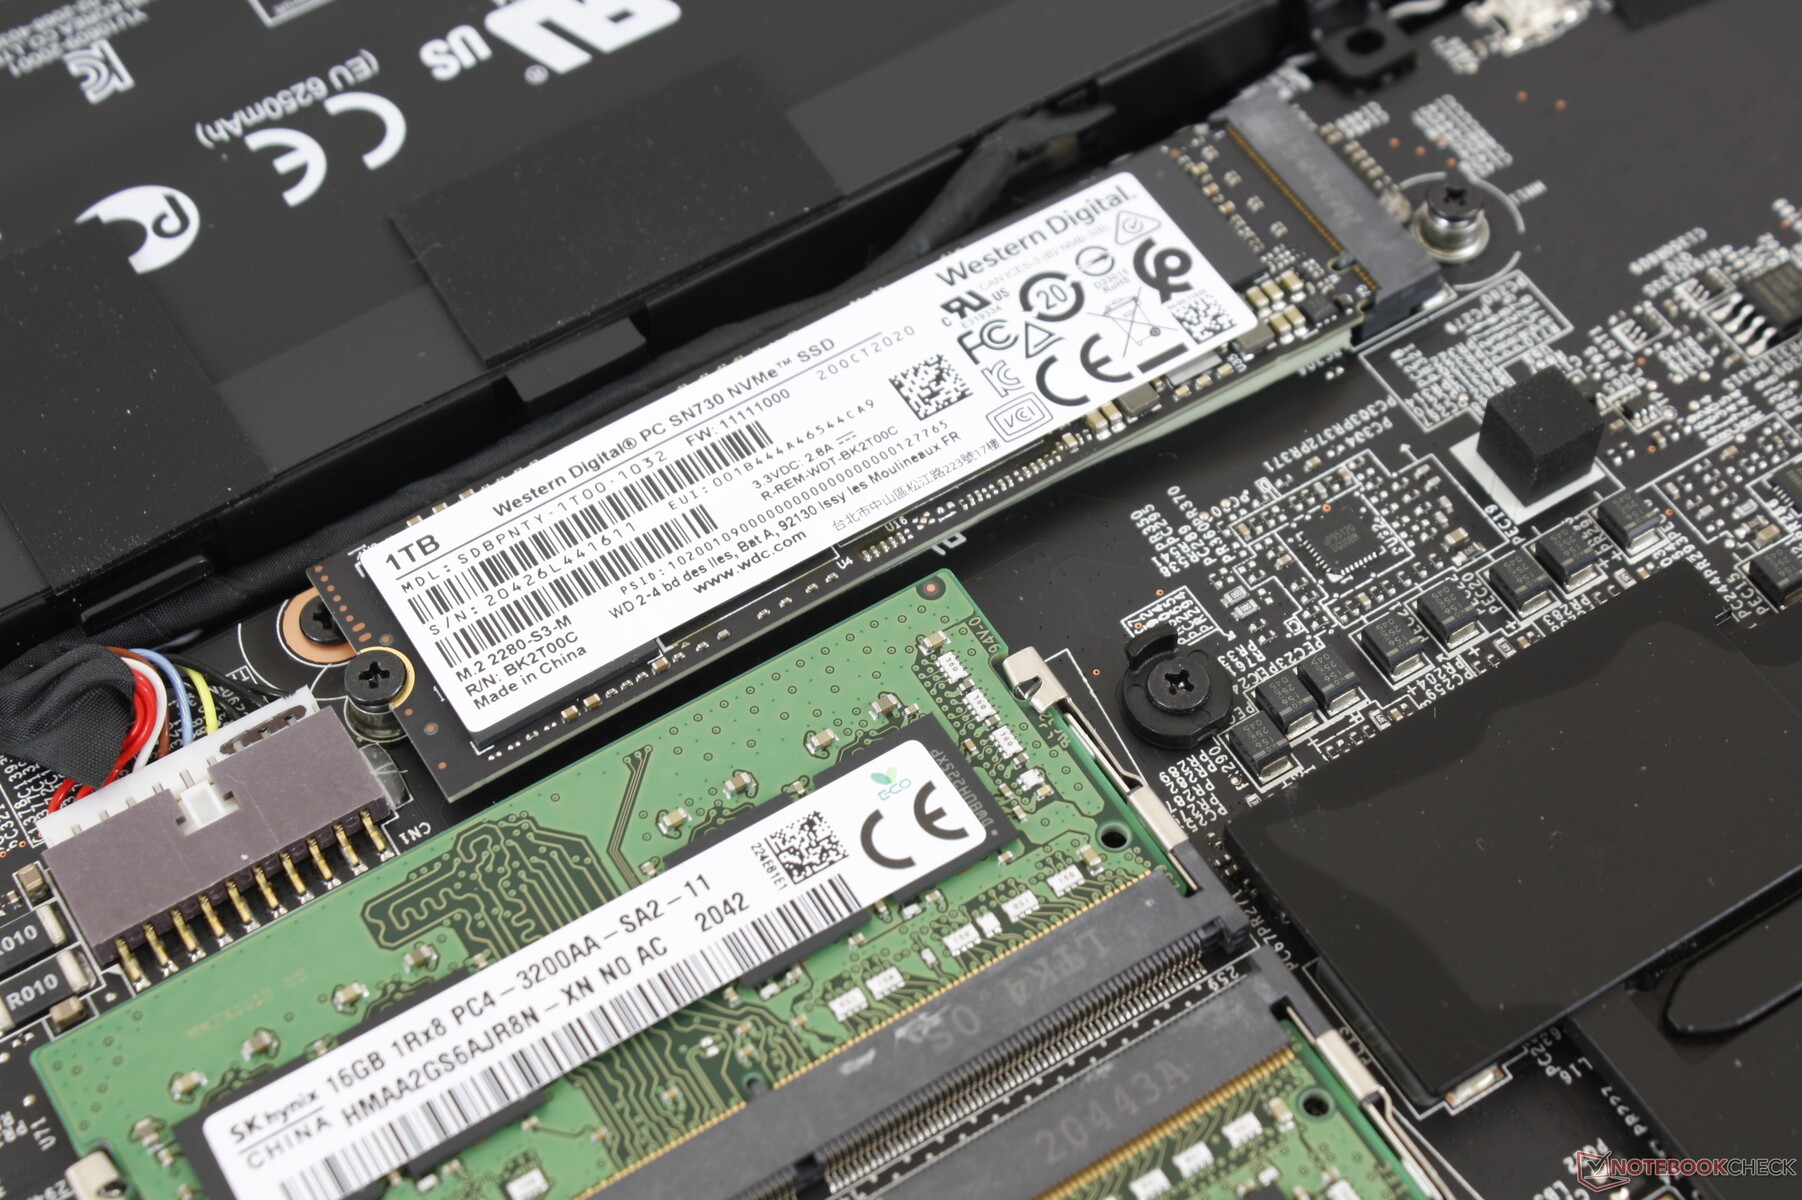
| MSI GS66 Stealth 10UG WDC PC SN730 SDBPNTY-1T00 | MSI GS66 10SGS Samsung SSD PM981 MZVLB512HAJQ | Asus TUF Dash F15 FX516PR SK Hynix HFM001TD3JX013N | Razer Blade 15 RTX 2070 Super Max-Q Samsung SSD PM981a MZVLB512HBJQ | Aorus 15P WB ADATA XPG SX8200 Pro (ASX8200PNP-512GT) | Alienware m15 R3 P87F 2x Micron 2200S 512 GB (RAID 0) | |
|---|---|---|---|---|---|---|
| AS SSD | -11% | -20% | -9% | -18% | -40% | |
| Seq Read (MB/s) | 2198 | 1086 -51% | 2671 22% | 1957 -11% | 2241 2% | 2058 -6% |
| Seq Write (MB/s) | 2596 | 1901 -27% | 1501 -42% | 2092 -19% | 2121 -18% | 2316 -11% |
| 4K Read (MB/s) | 43.81 | 51 16% | 39.65 -9% | 50.2 15% | 52.3 19% | 39.72 -9% |
| 4K Write (MB/s) | 115.5 | 117.3 2% | 69 -40% | 96.5 -16% | 116.2 1% | 62.9 -46% |
| 4K-64 Read (MB/s) | 1692 | 1503 -11% | 1209 -29% | 1594 -6% | 713 -58% | 1334 -21% |
| 4K-64 Write (MB/s) | 2162 | 1721 -20% | 1650 -24% | 2005 -7% | 827 -62% | 1271 -41% |
| Access Time Read * (ms) | 0.056 | 0.059 -5% | 0.093 -66% | 0.057 -2% | 0.054 4% | 0.062 -11% |
| Access Time Write * (ms) | 0.098 | 0.1 -2% | 0.055 44% | 0.112 -14% | 0.031 68% | 0.388 -296% |
| Score Read (Points) | 1956 | 1662 -15% | 1516 -22% | 1840 -6% | 989 -49% | 1580 -19% |
| Score Write (Points) | 2537 | 2029 -20% | 1869 -26% | 2310 -9% | 1155 -54% | 1565 -38% |
| Score Total (Points) | 5513 | 4588 -17% | 4105 -26% | 5103 -7% | 2659 -52% | 3968 -28% |
| Copy ISO MB/s (MB/s) | 2236 | 2155 -4% | 1793 -20% | 2192 -2% | 1685 -25% | |
| Copy Program MB/s (MB/s) | 690 | 715 4% | 573 -17% | 576 -17% | 669 -3% | |
| Copy Game MB/s (MB/s) | 1546 | 1506 -3% | 1418 -8% | 1062 -31% | 1493 -3% | |
| CrystalDiskMark 5.2 / 6 | -10% | -13% | 3% | 3% | -7% | |
| Write 4K (MB/s) | 163.1 | 132.5 -19% | 129.6 -21% | 139.8 -14% | 131.7 -19% | 67.3 -59% |
| Read 4K (MB/s) | 48.97 | 45.03 -8% | 44.71 -9% | 48.62 -1% | 55.7 14% | 41.47 -15% |
| Write Seq (MB/s) | 2607 | 1987 -24% | 1929 -26% | 2260 -13% | 2273 -13% | 2239 -14% |
| Read Seq (MB/s) | 2316 | 1434 -38% | 2035 -12% | 2135 -8% | 2533 9% | 2112 -9% |
| Write 4K Q32T1 (MB/s) | 338 | 467.5 38% | 425.9 26% | 499.3 48% | 475.1 41% | 488.9 45% |
| Read 4K Q32T1 (MB/s) | 475.6 | 536 13% | 433.4 -9% | 552 16% | 590 24% | 557 17% |
| Write Seq Q32T1 (MB/s) | 3090 | 2003 -35% | 1390 -55% | 2960 -4% | 2373 -23% | 2654 -14% |
| Read Seq Q32T1 (MB/s) | 3421 | 3306 -3% | 3505 2% | 3269 -4% | 3068 -10% | 3137 -8% |
| Media total (Programa/Opciones) | -11% /
-10% | -17% /
-17% | -3% /
-5% | -8% /
-10% | -24% /
-28% |
* ... más pequeño es mejor

Disk Throttling: DiskSpd Read Loop, Queue Depth 8
Rendimiento de la GPU
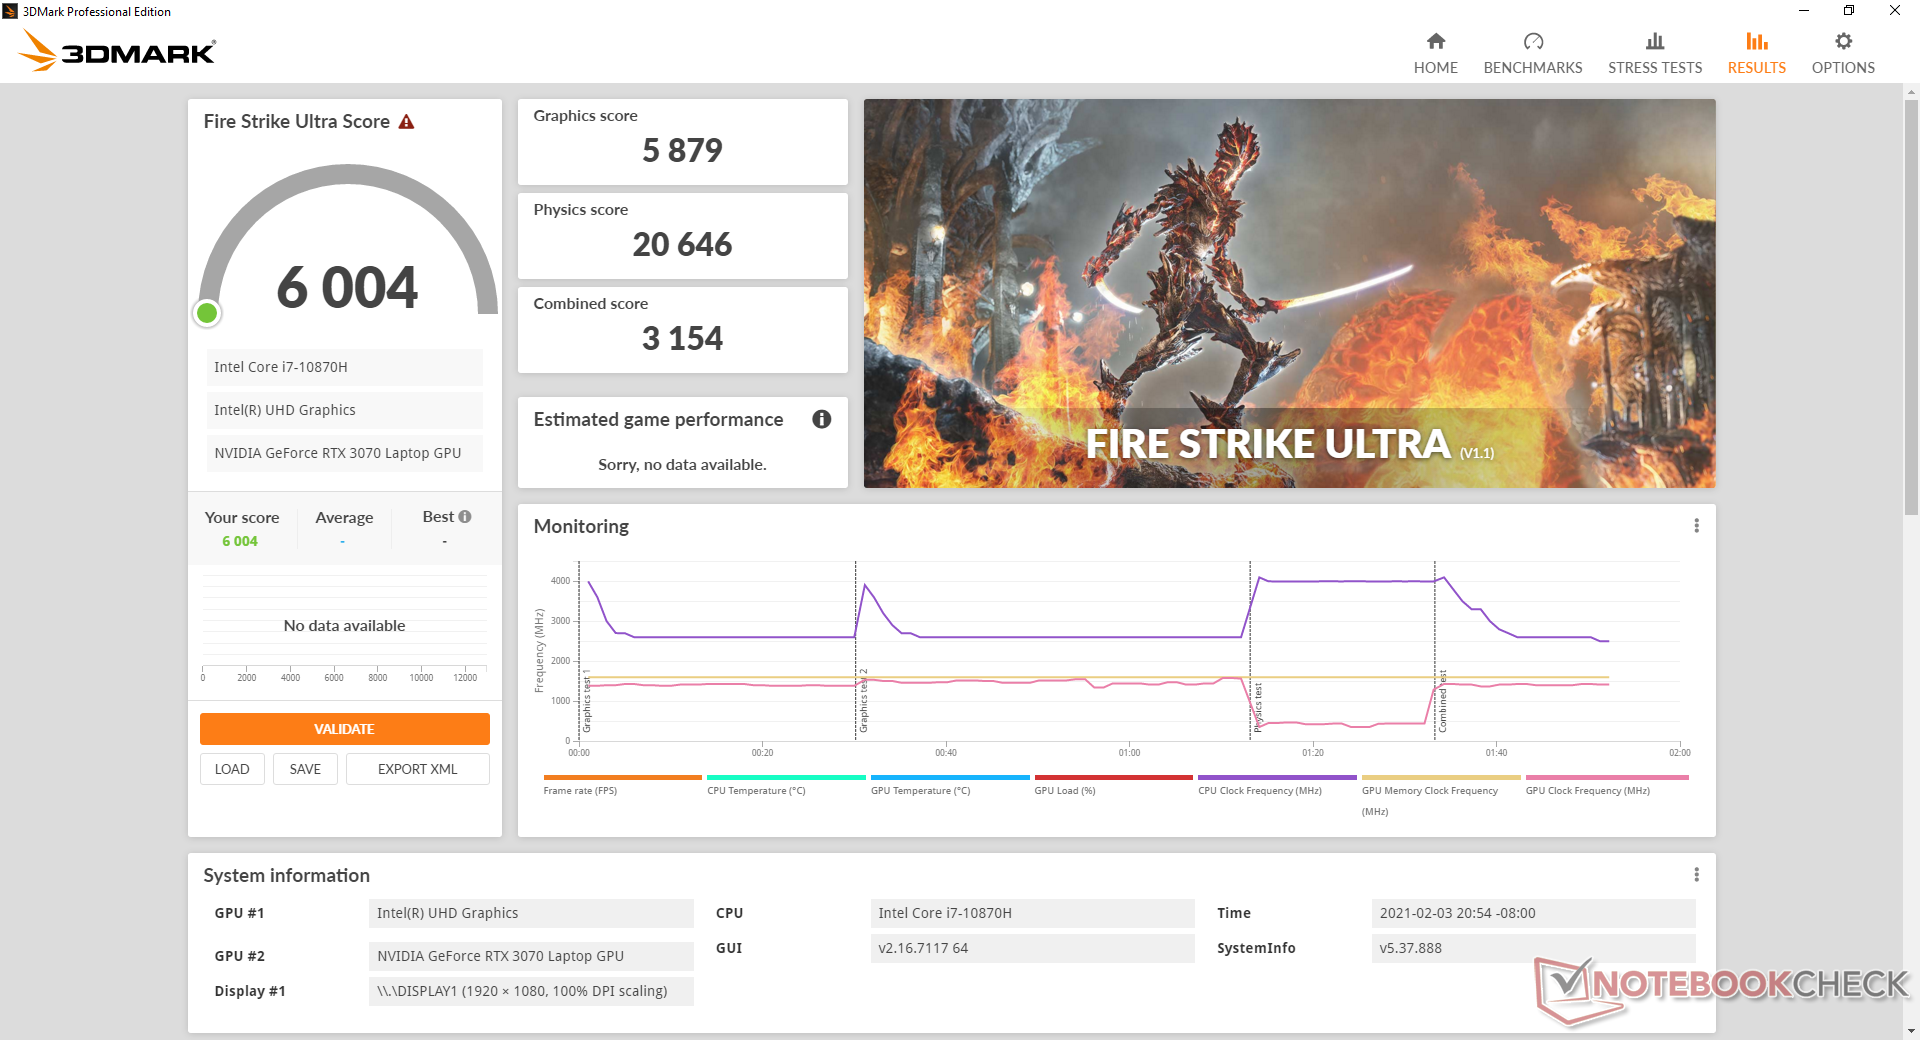
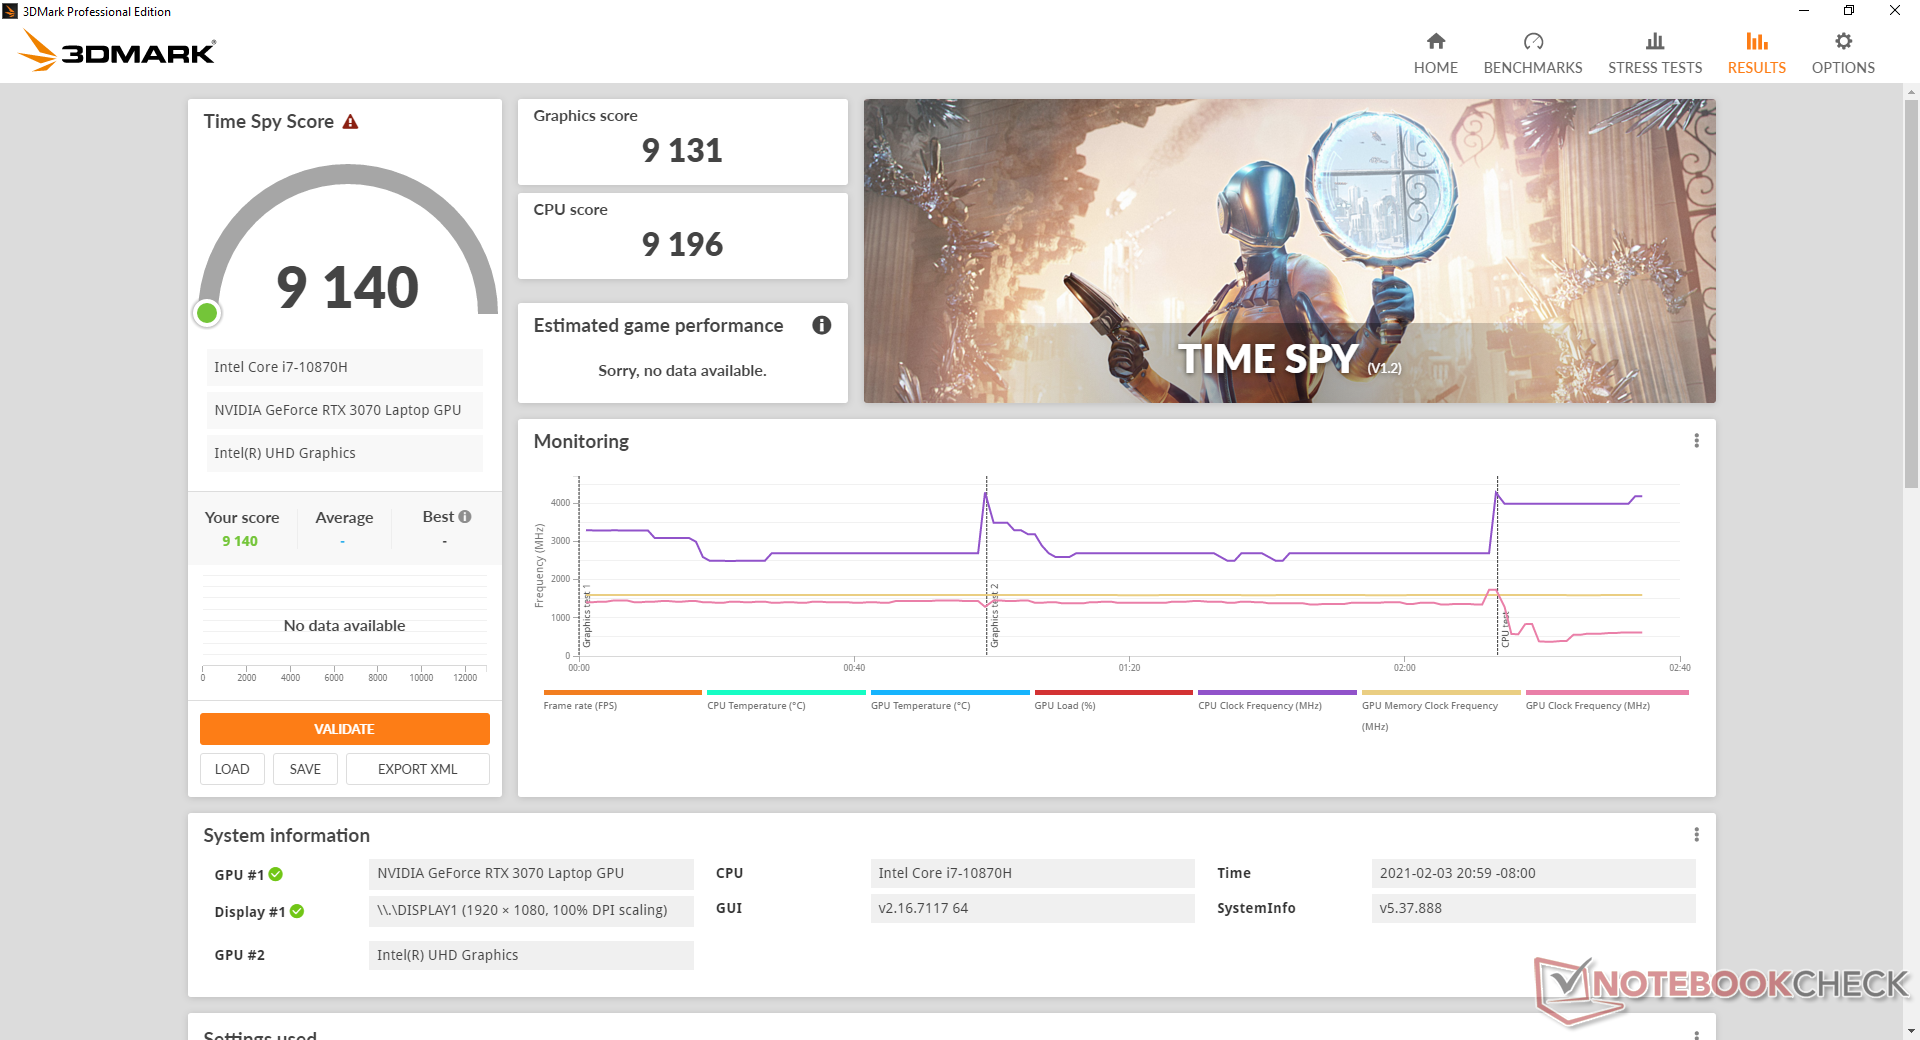
La GeForce RTX 3070 para móviles es un 20% más rápida que la GeForce RTX 2080 Max-Q del GS66 10SGS del año pasado o un 30% más rápida que la 2070 Super Max-Q del GS66 10SFS. Las ganancias entre generaciones no se acercan a las de la RTX 3070 de sobremesa, ya que la versión de sobremesa ofrece un 50 por ciento más de potencia gráfica que nuestra versión móvil. El rendimiento general en juegos está a la altura de la RTX 2070 de sobremesa.
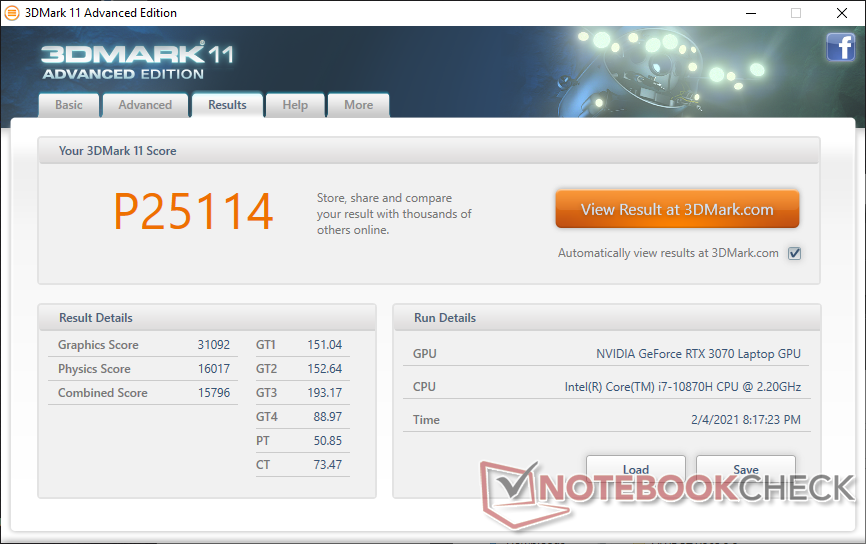
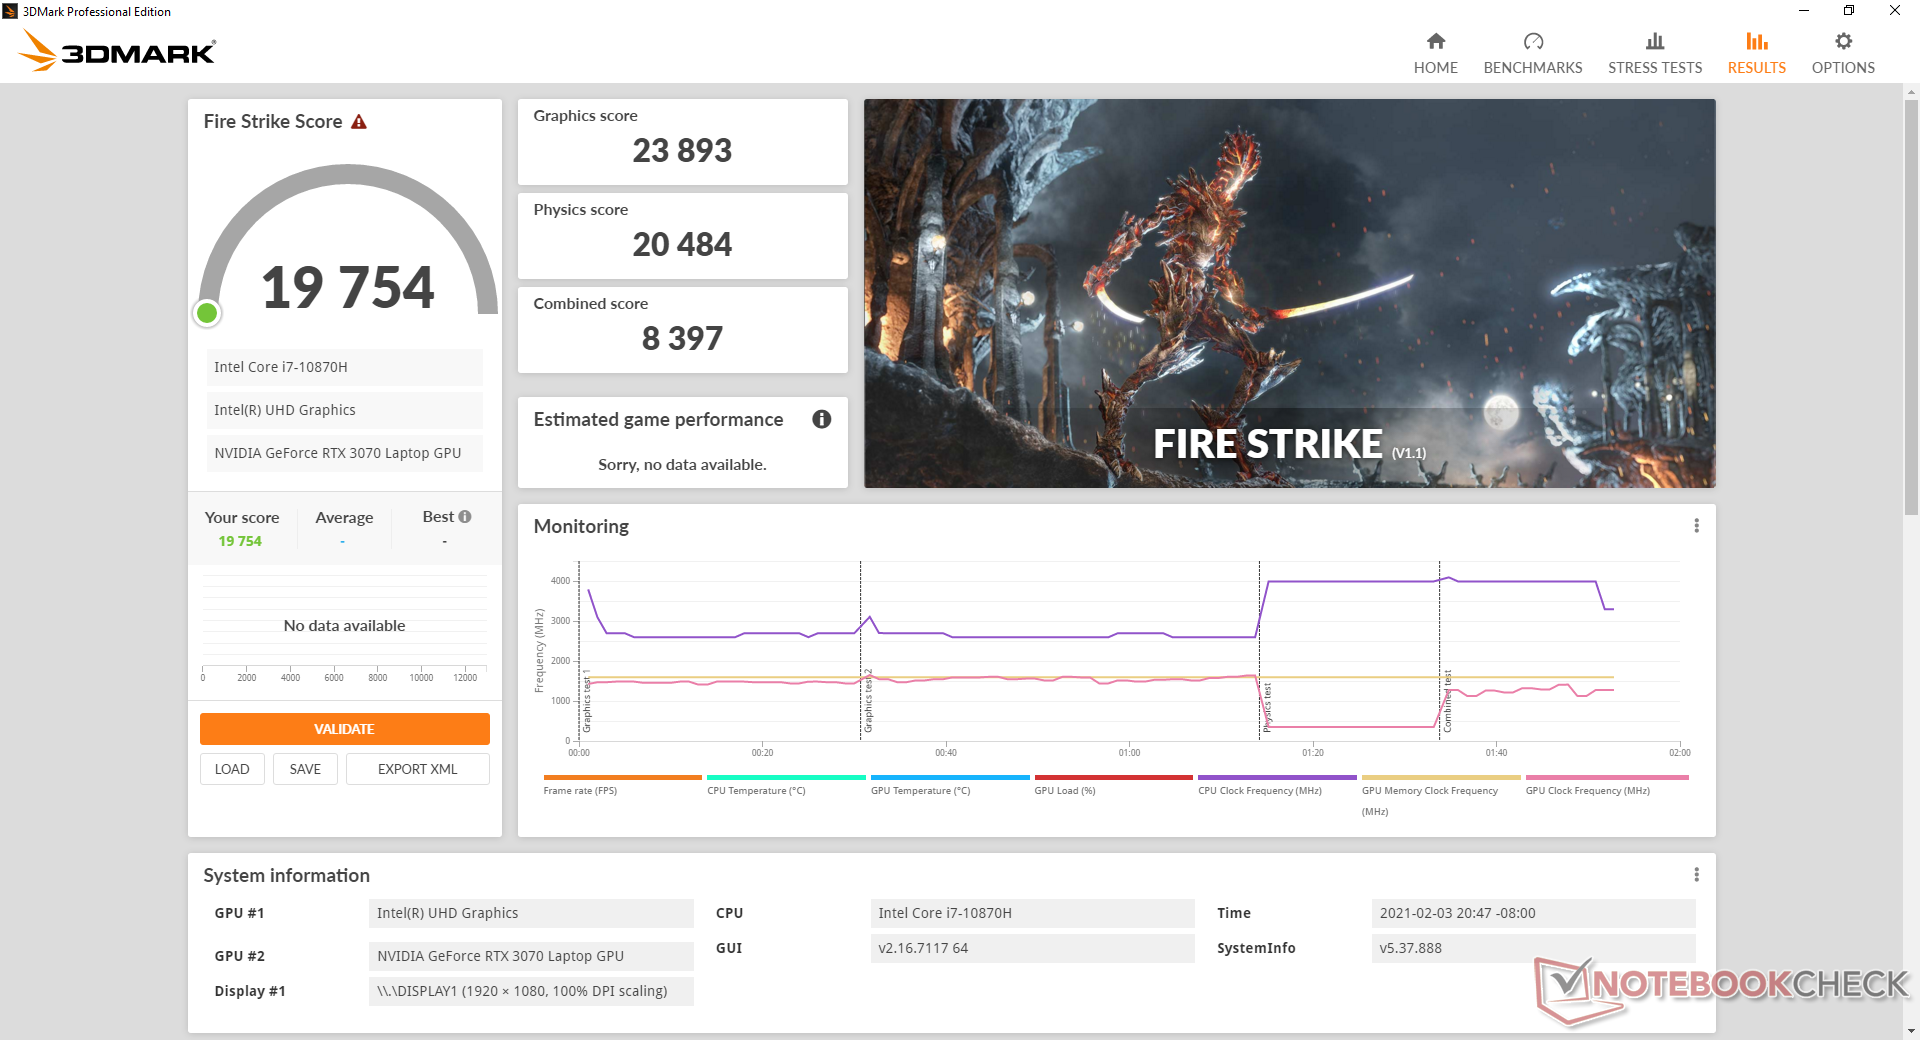
| 3DMark 11 Performance | 25114 puntos | |
| 3DMark Cloud Gate Standard Score | 49338 puntos | |
| 3DMark Fire Strike Score | 19754 puntos | |
| 3DMark Time Spy Score | 9140 puntos | |
ayuda | ||
| bajo | medio | alto | ultra | |
|---|---|---|---|---|
| GTA V (2015) | 178 | 169 | 152 | 90.4 |
| The Witcher 3 (2015) | 335.9 | 246.7 | 152.6 | 89.7 |
| Dota 2 Reborn (2015) | 137 | 120 | 120 | 107 |
| Final Fantasy XV Benchmark (2018) | 151 | 111 | 87.5 | |
| X-Plane 11.11 (2018) | 107 | 90.5 | 76.4 | |
| Strange Brigade (2018) | 347 | 213 | 175 | 155 |
Emissions
Ruido del sistema
El ruido del ventilador es casi el mismo que el del modelo del año pasado a pesar de la actualización de la GPU, lo que no es sorprendente porque la solución de refrigeración y los objetivos de TGP no han cambiado. Aunque esto significa que los propietarios están obteniendo más rendimiento con el mismo nivel de ruido del ventilador, también significa que MSI no ha mejorado el comportamiento del ruido del ventilador sin recurrir al Nvidia Whisper Mode 2.0 que limita las tasas de fotogramas. Nos quejamos del ruido constante de los ventiladores en el GS66 del año pasado incluso cuando simplemente estaba en modo "Silencioso" y esto sigue siendo así en el modelo 2021. Los ventiladores también tienden a pulsar entre 40,8 dB(A) y 46,3 dB(A) durante nuestro Witcher 3 funcionamiento.
Activando el modo Cooler Boost, que es la versión de MSI del modo "Turbo", el ruido del ventilador sube a 58 dB(A) sin importar la carga en pantalla. Hay que tener en cuenta que este aumento es muy significativo en relación con los pequeños beneficios de rendimiento obtenidos como se muestra en nuestra sección de pruebas de estrés. Los jugadores pueden pensar dos veces antes de usar esta función, ya que sus beneficios pueden no valer la pena.
| MSI GS66 Stealth 10UG GeForce RTX 3070 Laptop GPU, i7-10870H, WDC PC SN730 SDBPNTY-1T00 | MSI GS66 10SGS GeForce RTX 2080 Super Max-Q, i7-10750H, Samsung SSD PM981 MZVLB512HAJQ | Asus TUF Dash F15 FX516PR GeForce RTX 3070 Laptop GPU, i7-11370H, SK Hynix HFM001TD3JX013N | Razer Blade 15 RTX 2070 Super Max-Q GeForce RTX 2070 Super Max-Q, i7-10875H, Samsung SSD PM981a MZVLB512HBJQ | Alienware m15 R3 P87F GeForce RTX 2070 Mobile, i7-10750H, 2x Micron 2200S 512 GB (RAID 0) | |
|---|---|---|---|---|---|
| Noise | 5% | 5% | 9% | 8% | |
| apagado / medio ambiente * (dB) | 26.2 | 28.5 -9% | 24 8% | 27 -3% | 26.3 -0% |
| Idle Minimum * (dB) | 34 | 30 12% | 25 26% | 27 21% | 26.7 21% |
| Idle Average * (dB) | 34 | 30 12% | 30 12% | 27 21% | 26.7 21% |
| Idle Maximum * (dB) | 34 | 30.9 9% | 35 -3% | 27 21% | 30.7 10% |
| Load Average * (dB) | 47.2 | 39.5 16% | 53 -12% | 44.7 5% | 40.2 15% |
| Witcher 3 ultra * (dB) | 46.3 | 48 -4% | 48 -4% | 51.2 -11% | 51 -10% |
| Load Maximum * (dB) | 58.2 | 59.4 -2% | 54 7% | 54 7% | 59.7 -3% |
* ... más pequeño es mejor
Ruido
| Ocioso |
| 34 / 34 / 34 dB(A) |
| Carga |
| 47.2 / 58.2 dB(A) |
 | ||
30 dB silencioso 40 dB(A) audible 50 dB(A) ruidosamente alto |
||
min: | ||
Temperatura
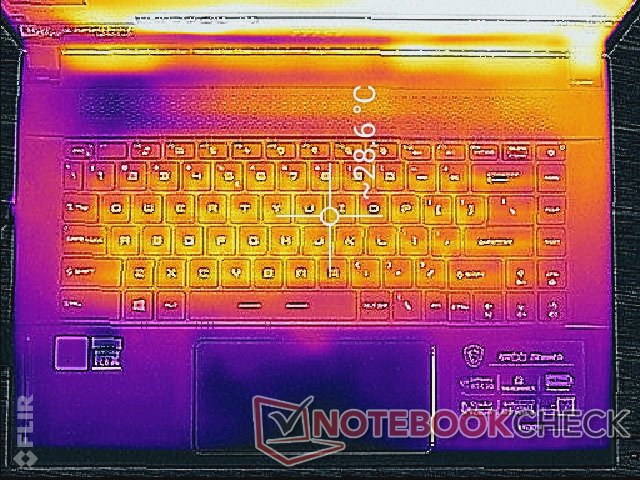
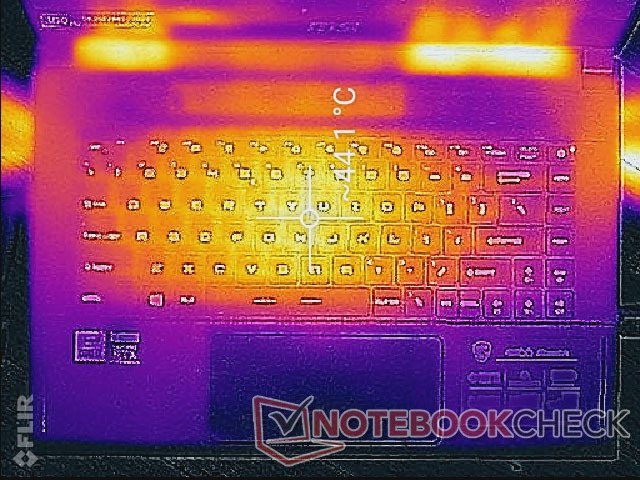
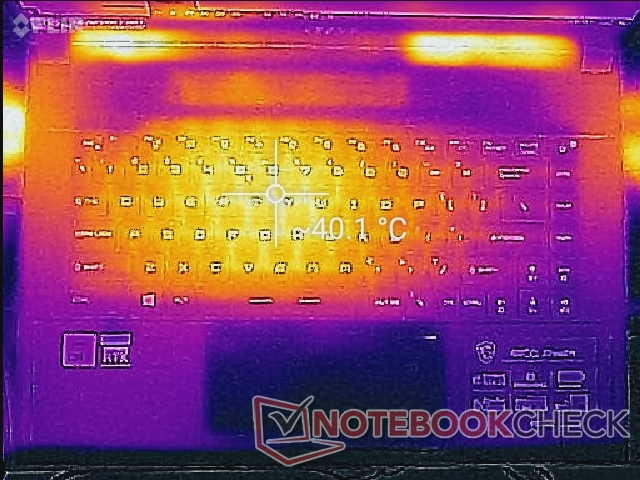
Las temperaturas de la superficie no difieren demasiado de las de los modelos Turing GS66, ya que MSI busca temperaturas similares de una generación a otra. El centro del teclado puede calentarse hasta 44 C cuando se juega, mientras que los reposamanos, las teclas WASD y las teclas de dirección permanecen mucho más frías para un juego más cómodo. El Razer Blade 15 de la competencia se calienta más, especialmente en los reposamanos, debido a su diseño unibody más resistente y al menor número de rejillas de ventilación.
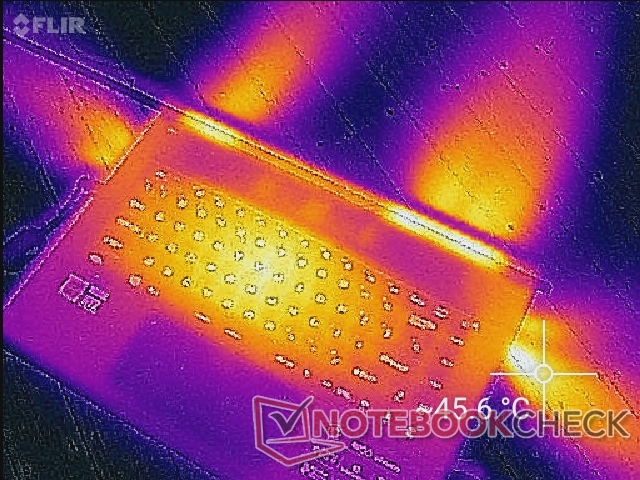
(±) La temperatura máxima en la parte superior es de 40.2 °C / 104 F, frente a la media de 40.4 °C / 105 F, que oscila entre 21.2 y 68.8 °C para la clase Gaming.
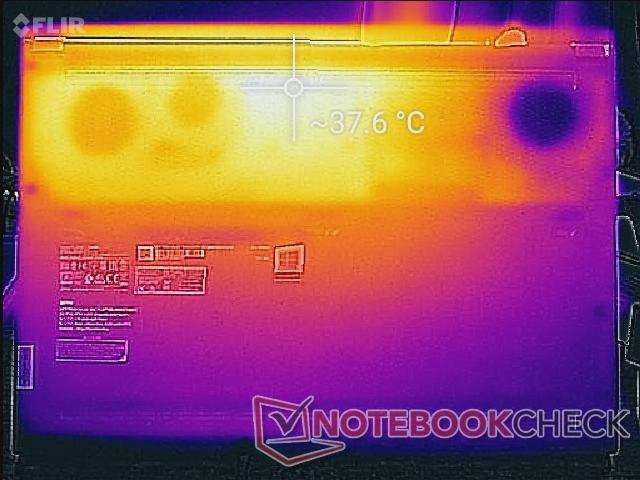
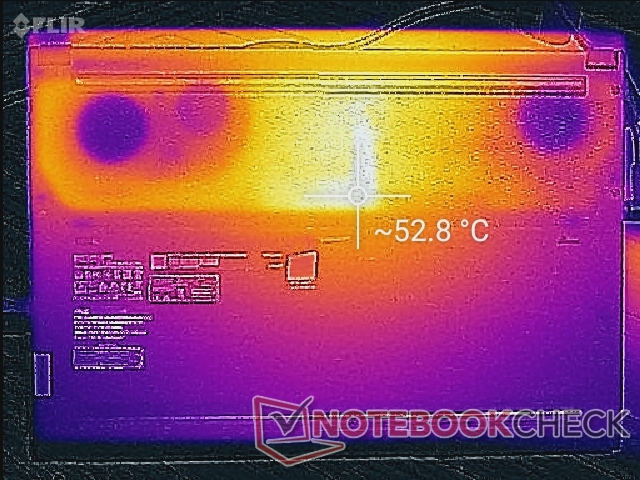
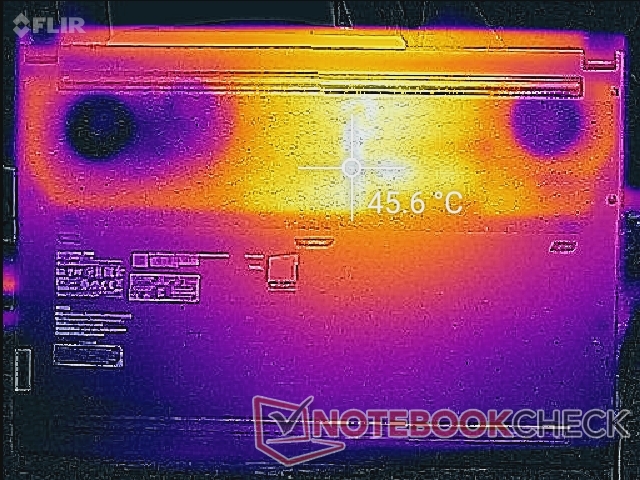
(-) El fondo se calienta hasta un máximo de 45.6 °C / 114 F, frente a la media de 43.2 °C / 110 F
(+) En reposo, la temperatura media de la parte superior es de 27 °C / 81# F, frente a la media del dispositivo de 33.9 °C / 93 F.
(+) Jugando a The Witcher 3, la temperatura media de la parte superior es de 31.3 °C / 88 F, frente a la media del dispositivo de 33.9 °C / 93 F.
(+) El reposamanos y el panel táctil están a una temperatura inferior a la de la piel, con un máximo de 26.2 °C / 79.2 F y, por tanto, son fríos al tacto.
(+) La temperatura media de la zona del reposamanos de dispositivos similares fue de 28.8 °C / 83.8 F (+2.6 °C / 4.6 F).
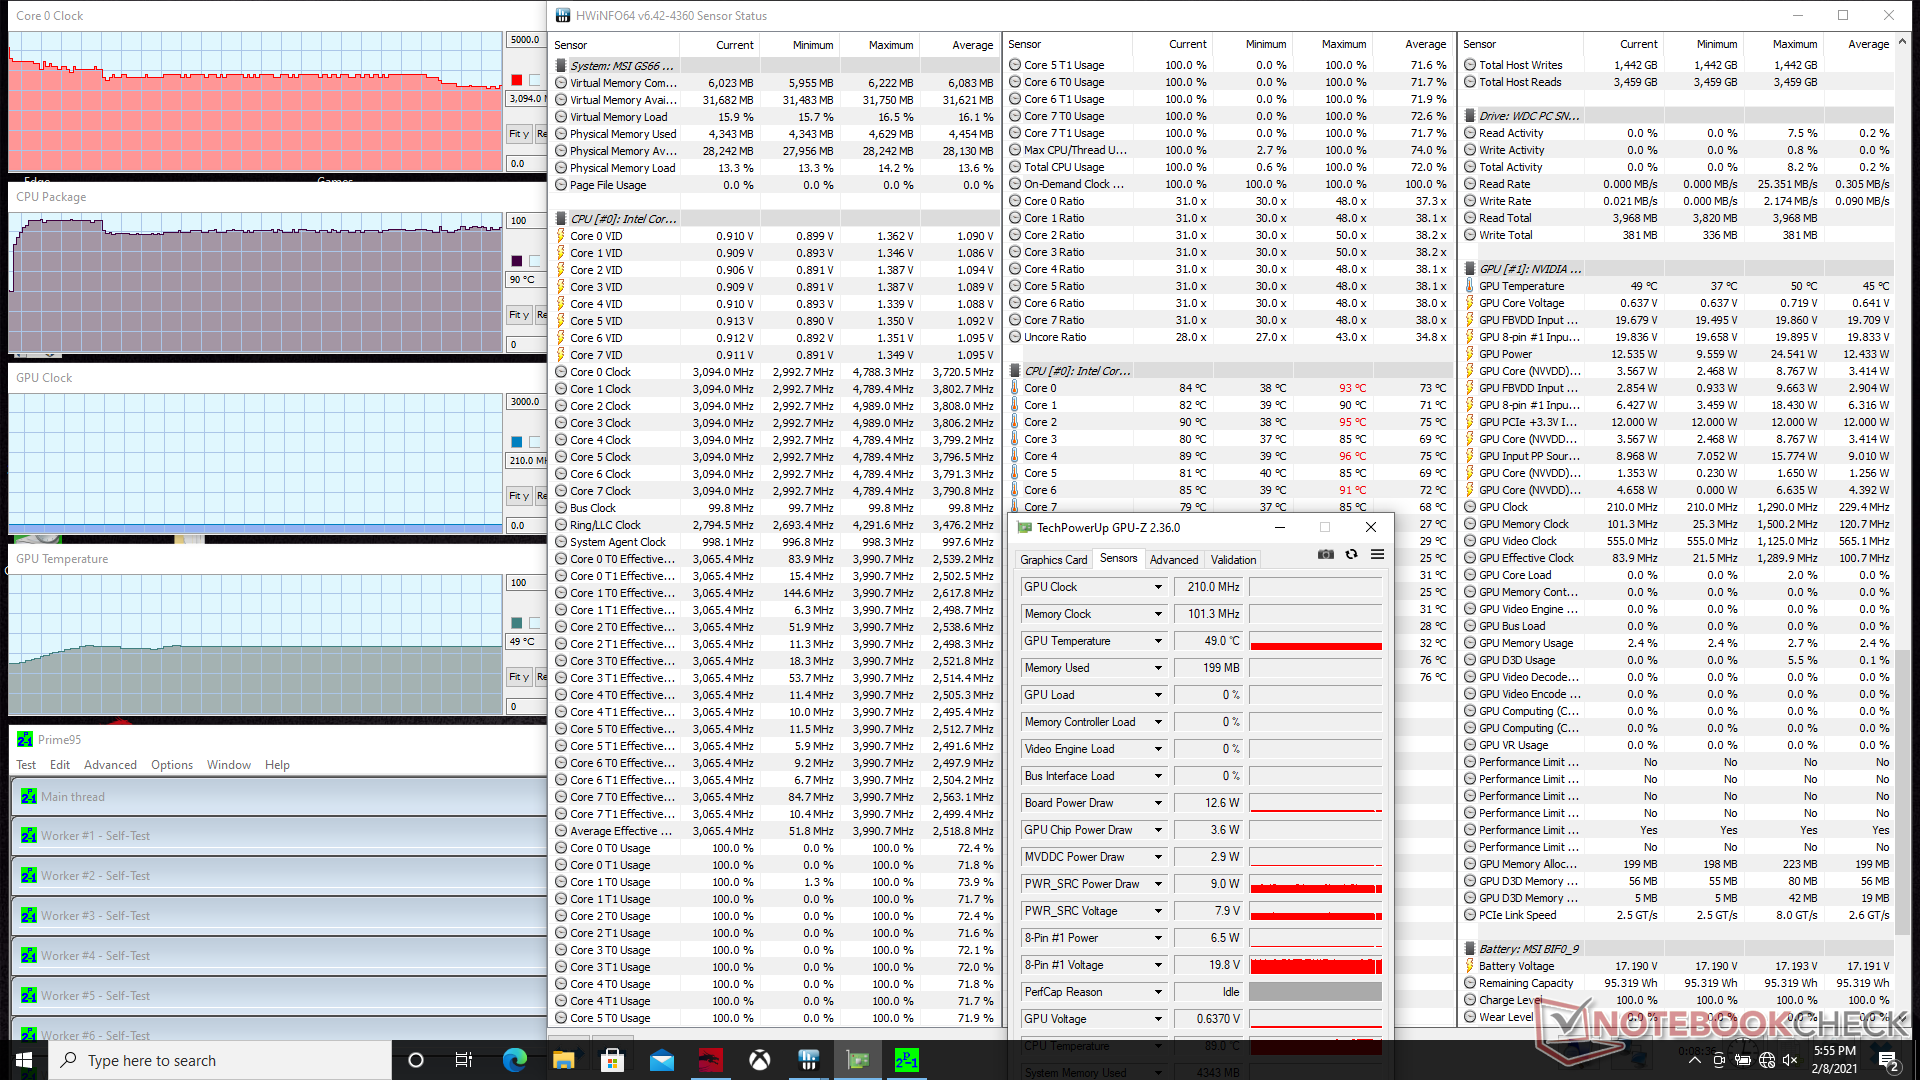
Prueba de esfuerzo
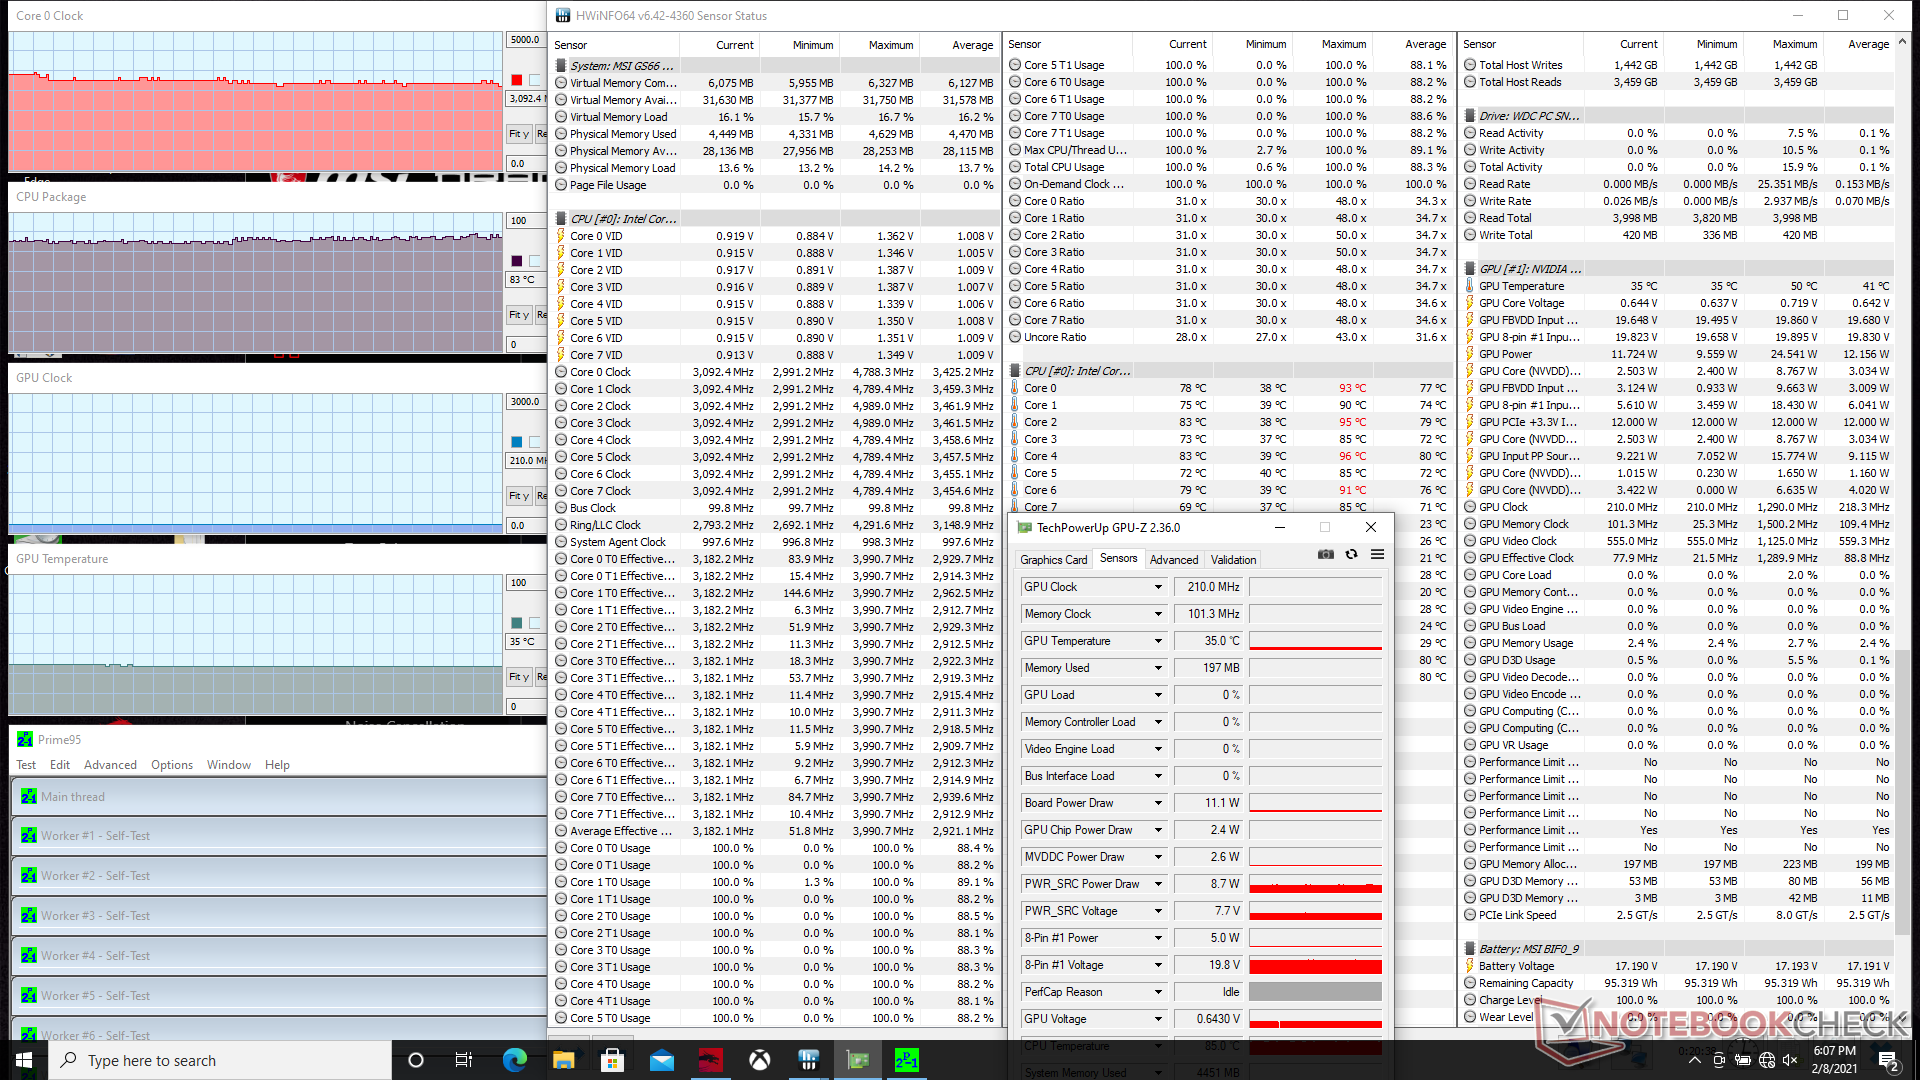
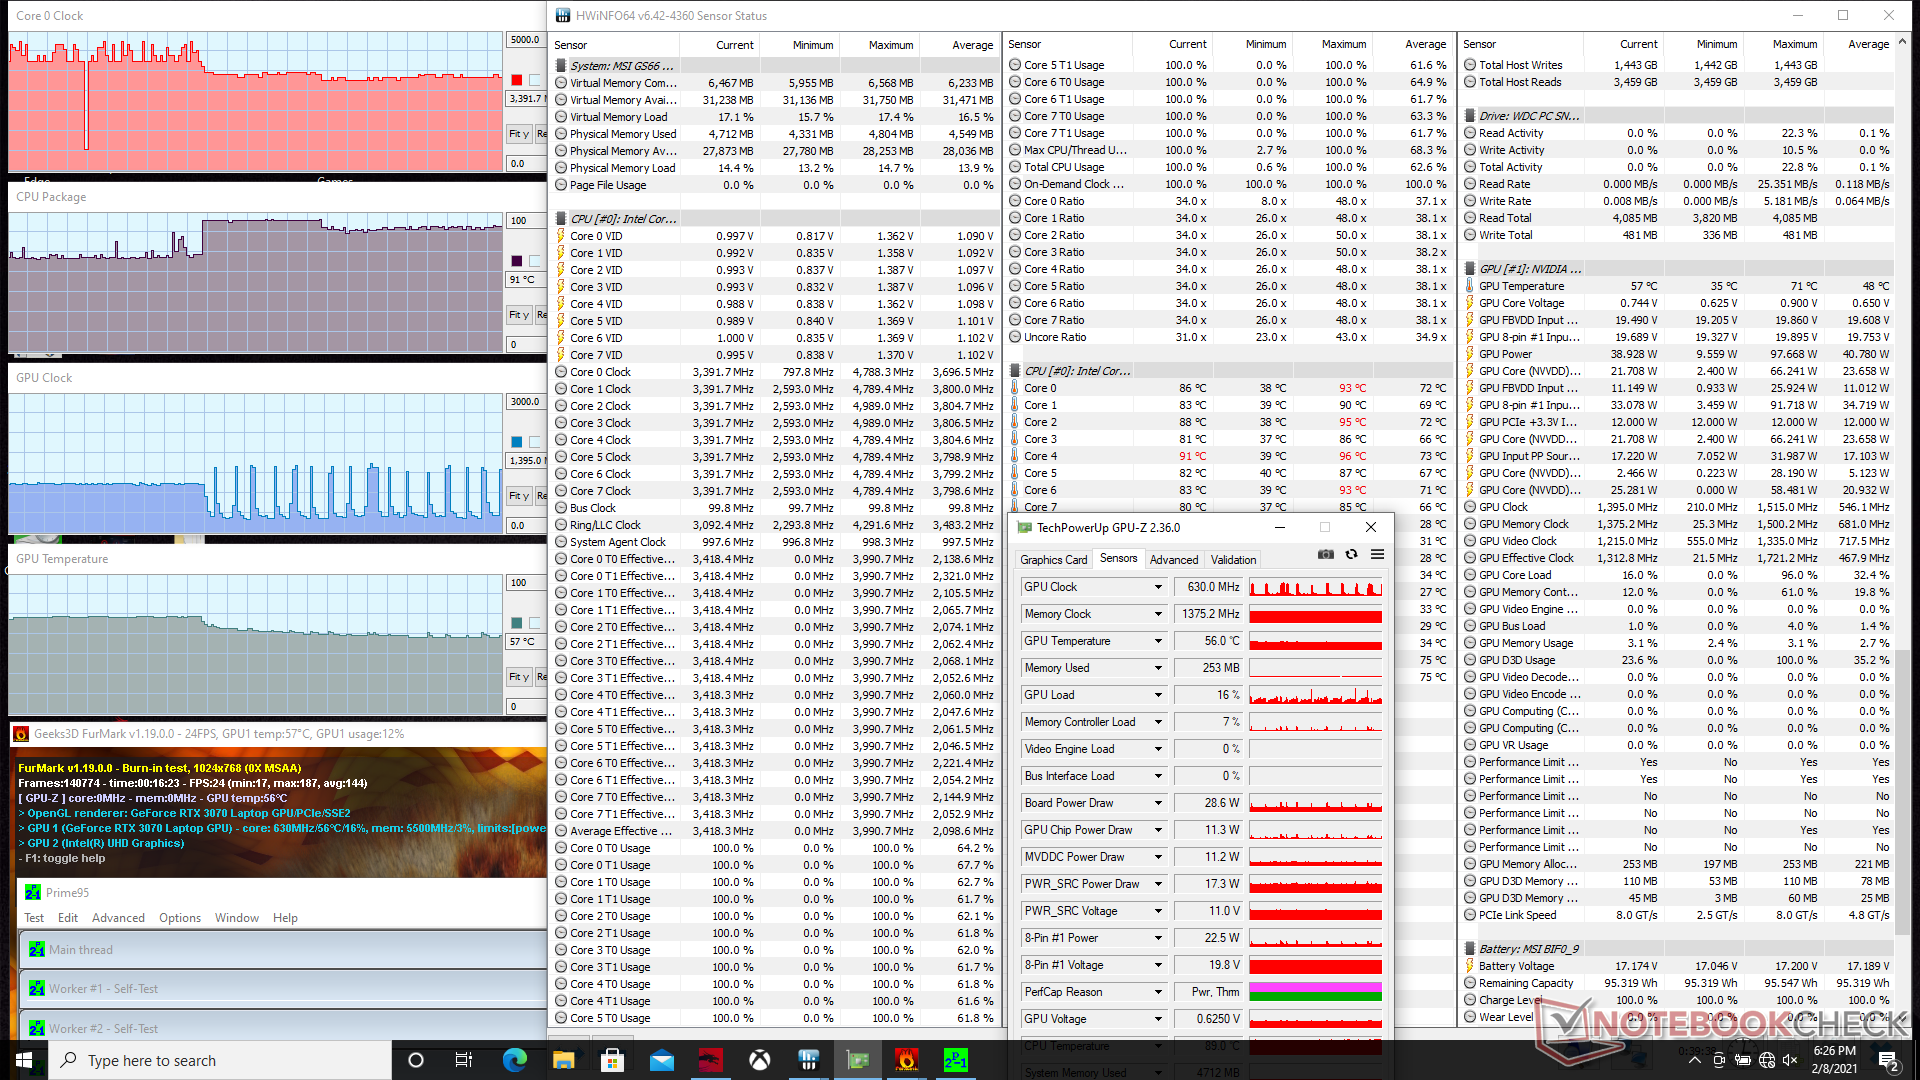
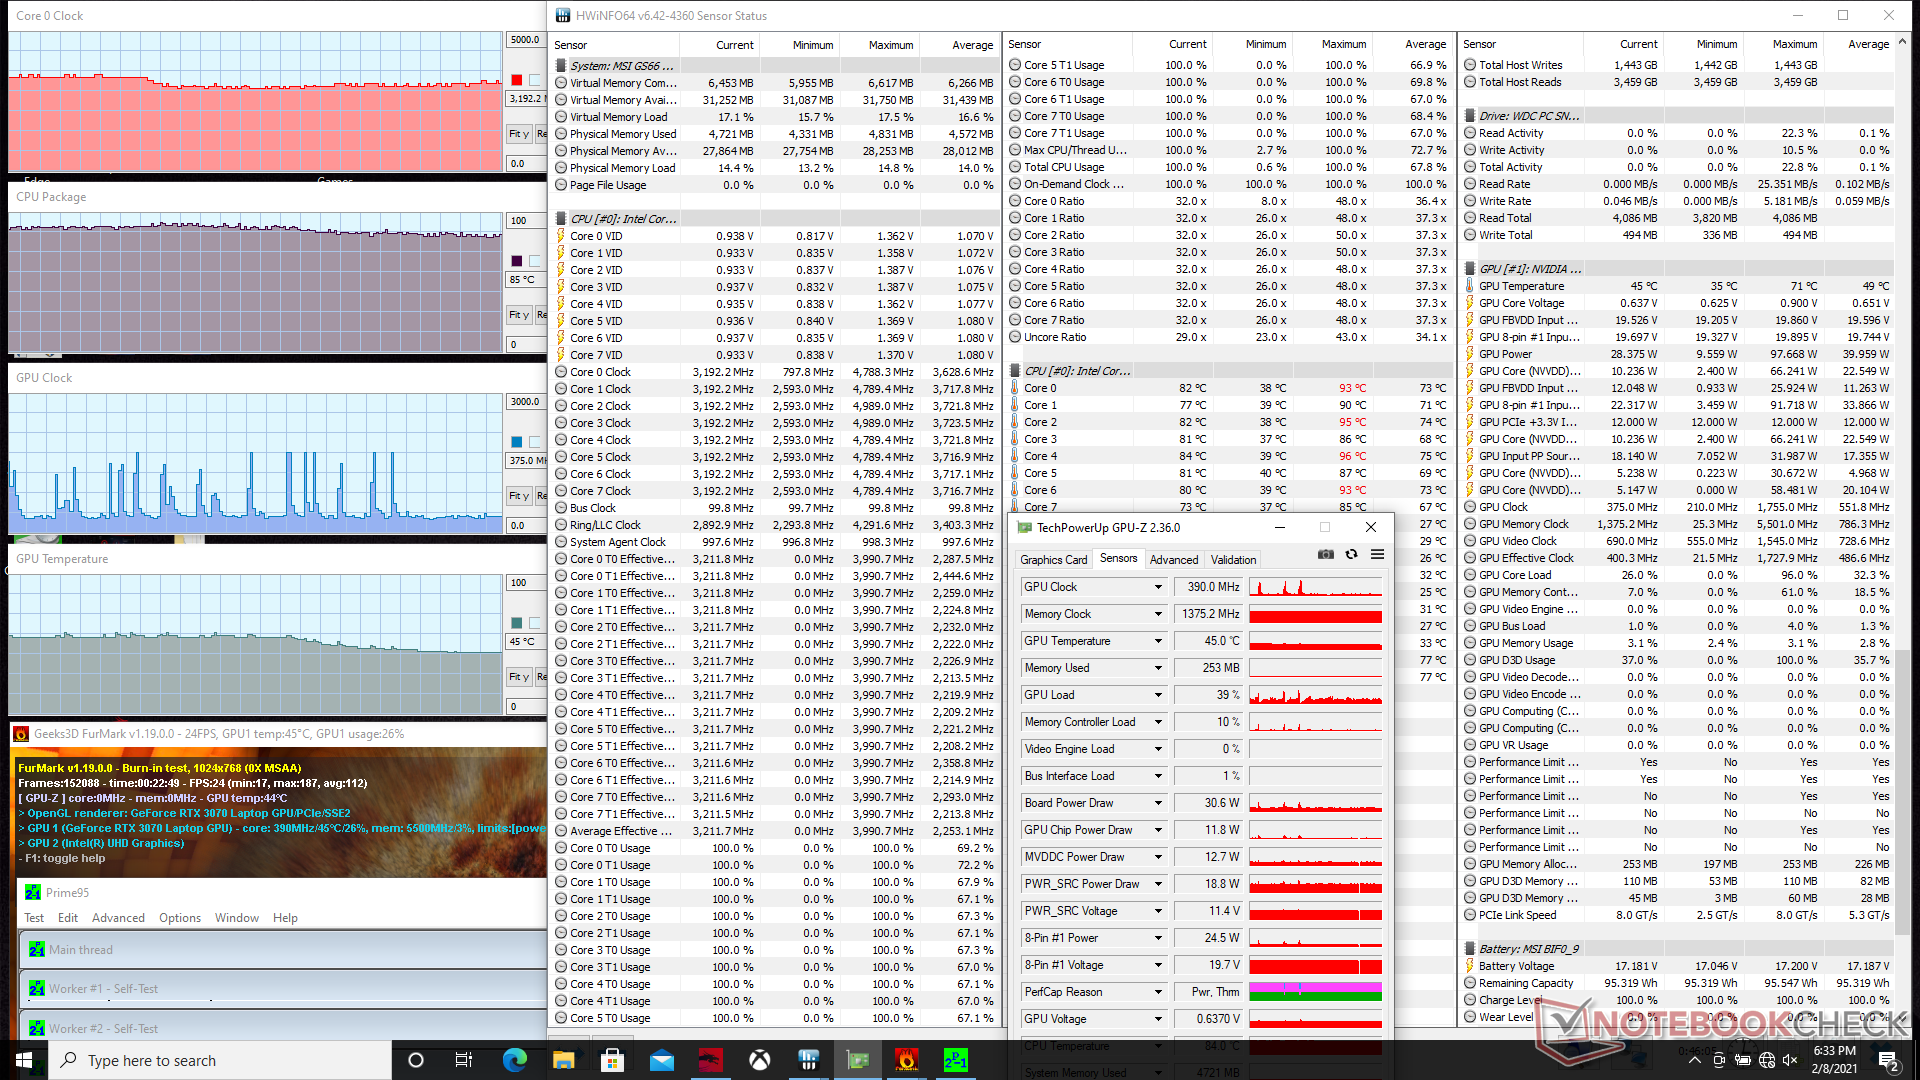
Estresamos el portátil con cargas sintéticas para identificar posibles problemas de ralentización o estabilidad tanto en modo Cooler Boost como en modo no Cooler Boost. Cuando se ejecuta Prime95 con Cooler Boost desactivado, la CPU sube a 4 GHz y 95 C durante los primeros segundos antes de caer y estabilizarse en 3,0 GHz y 90 C. Si Cooler Boost está activado, la temperatura del núcleo cae a 83 C mientras que la velocidad de reloj sigue siendo la misma.
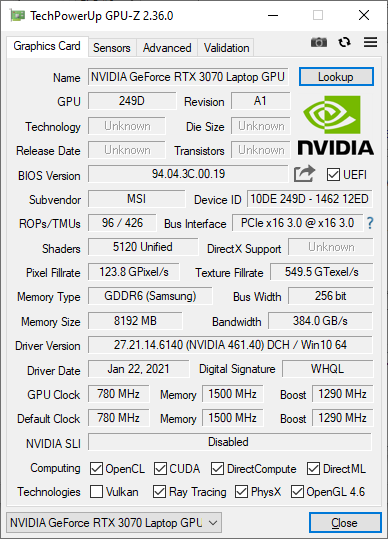
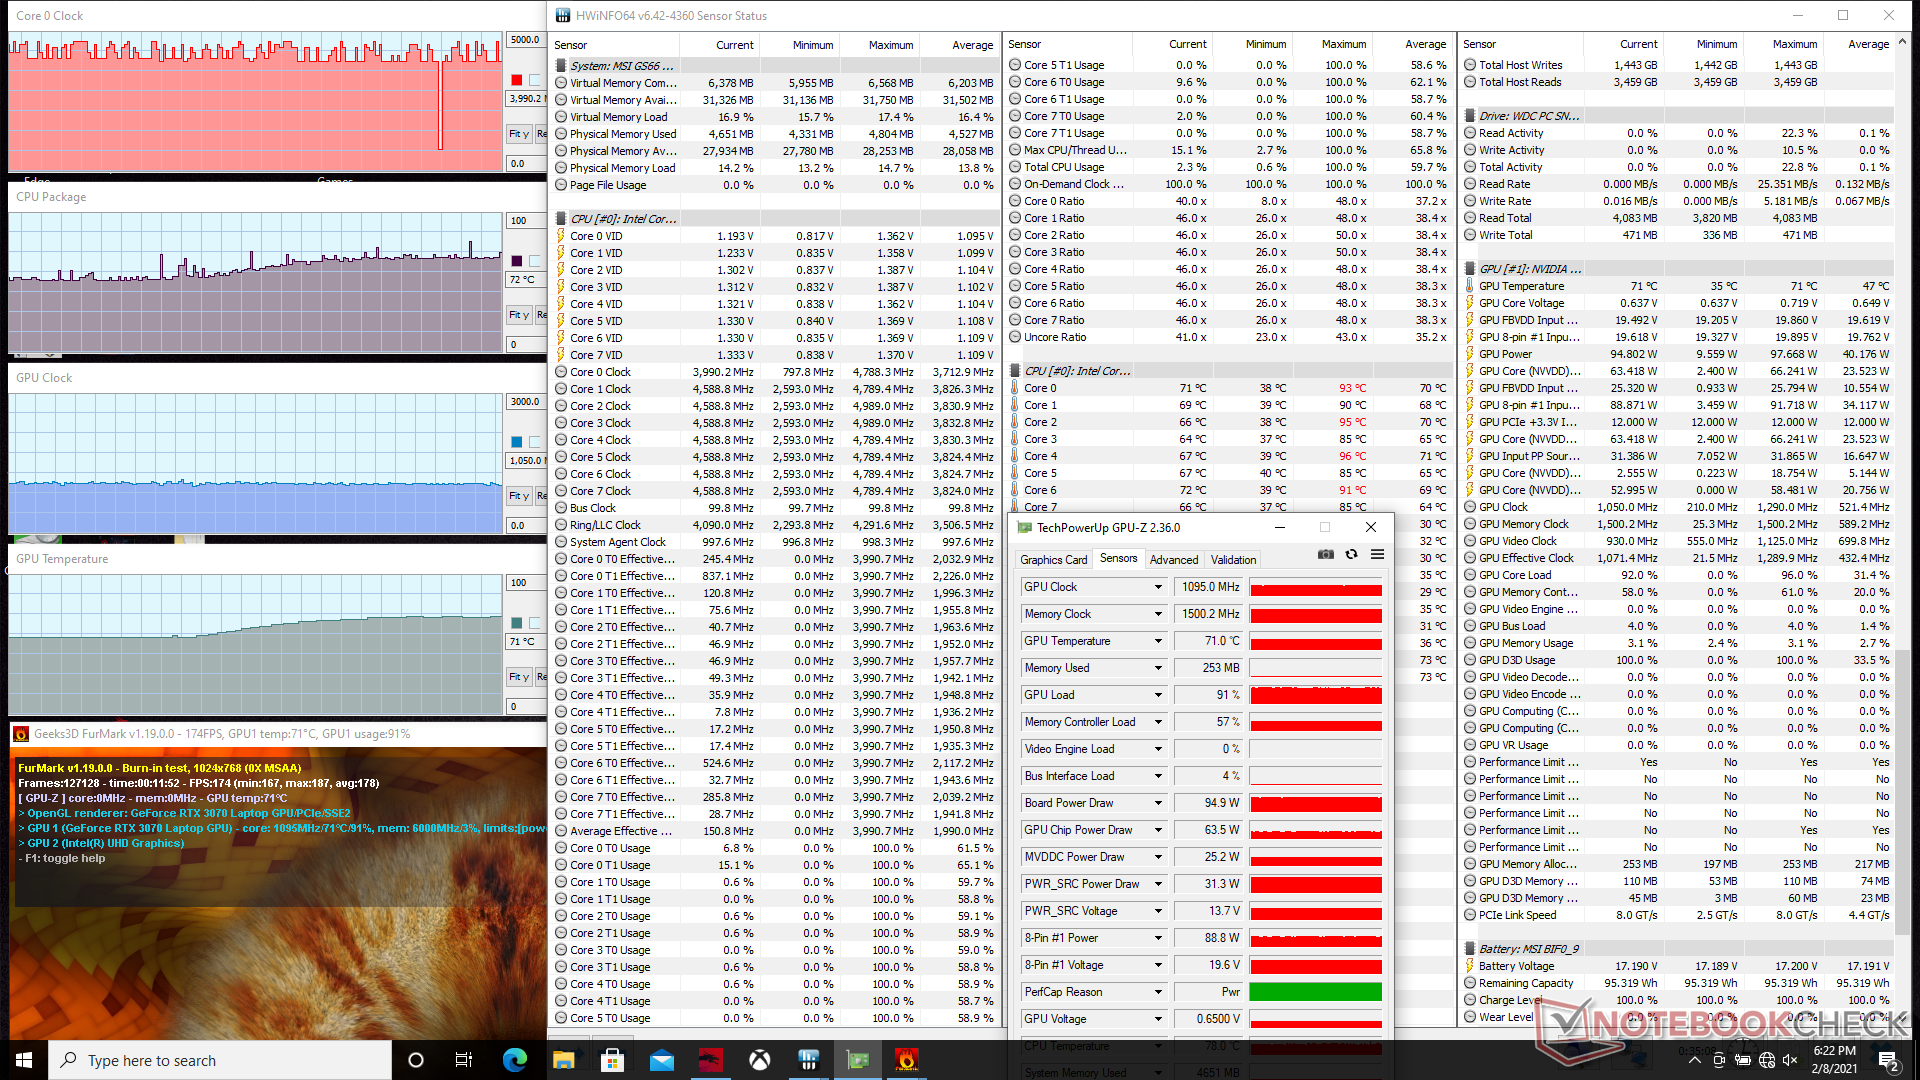
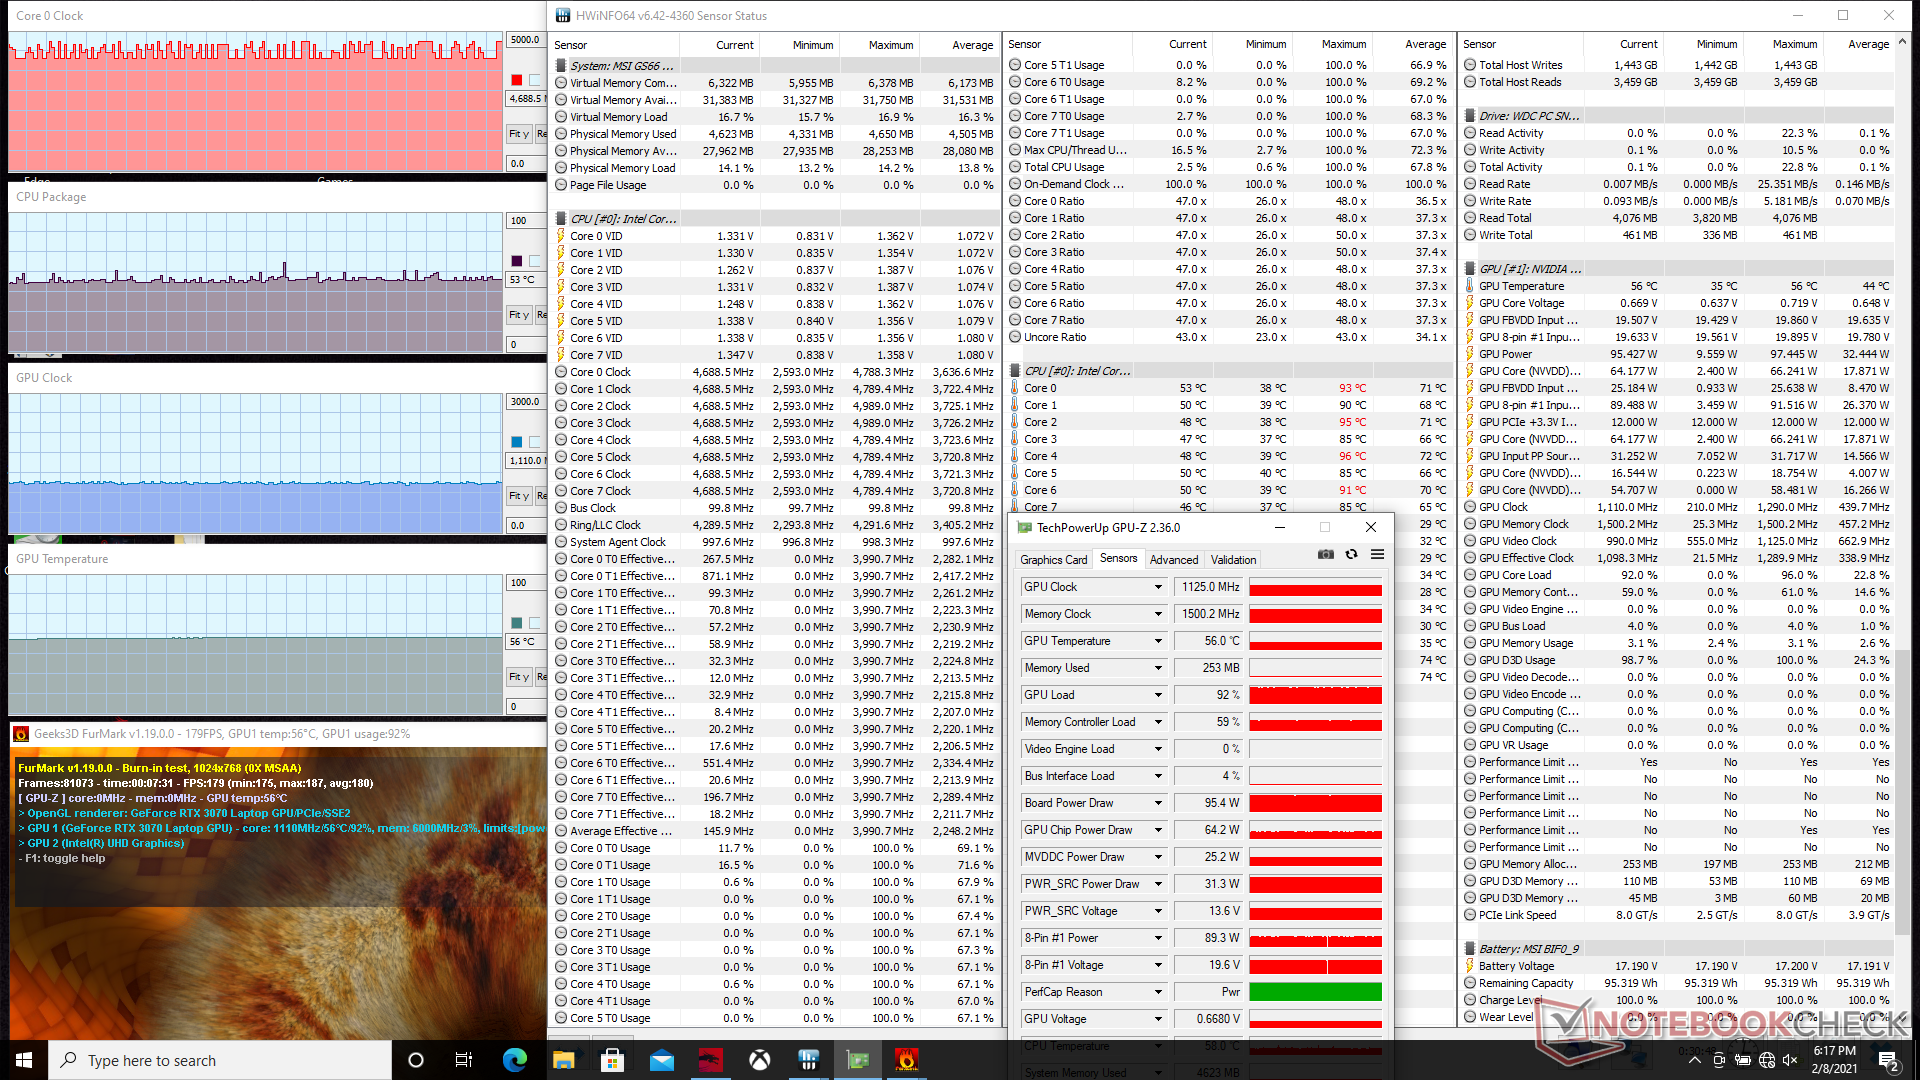
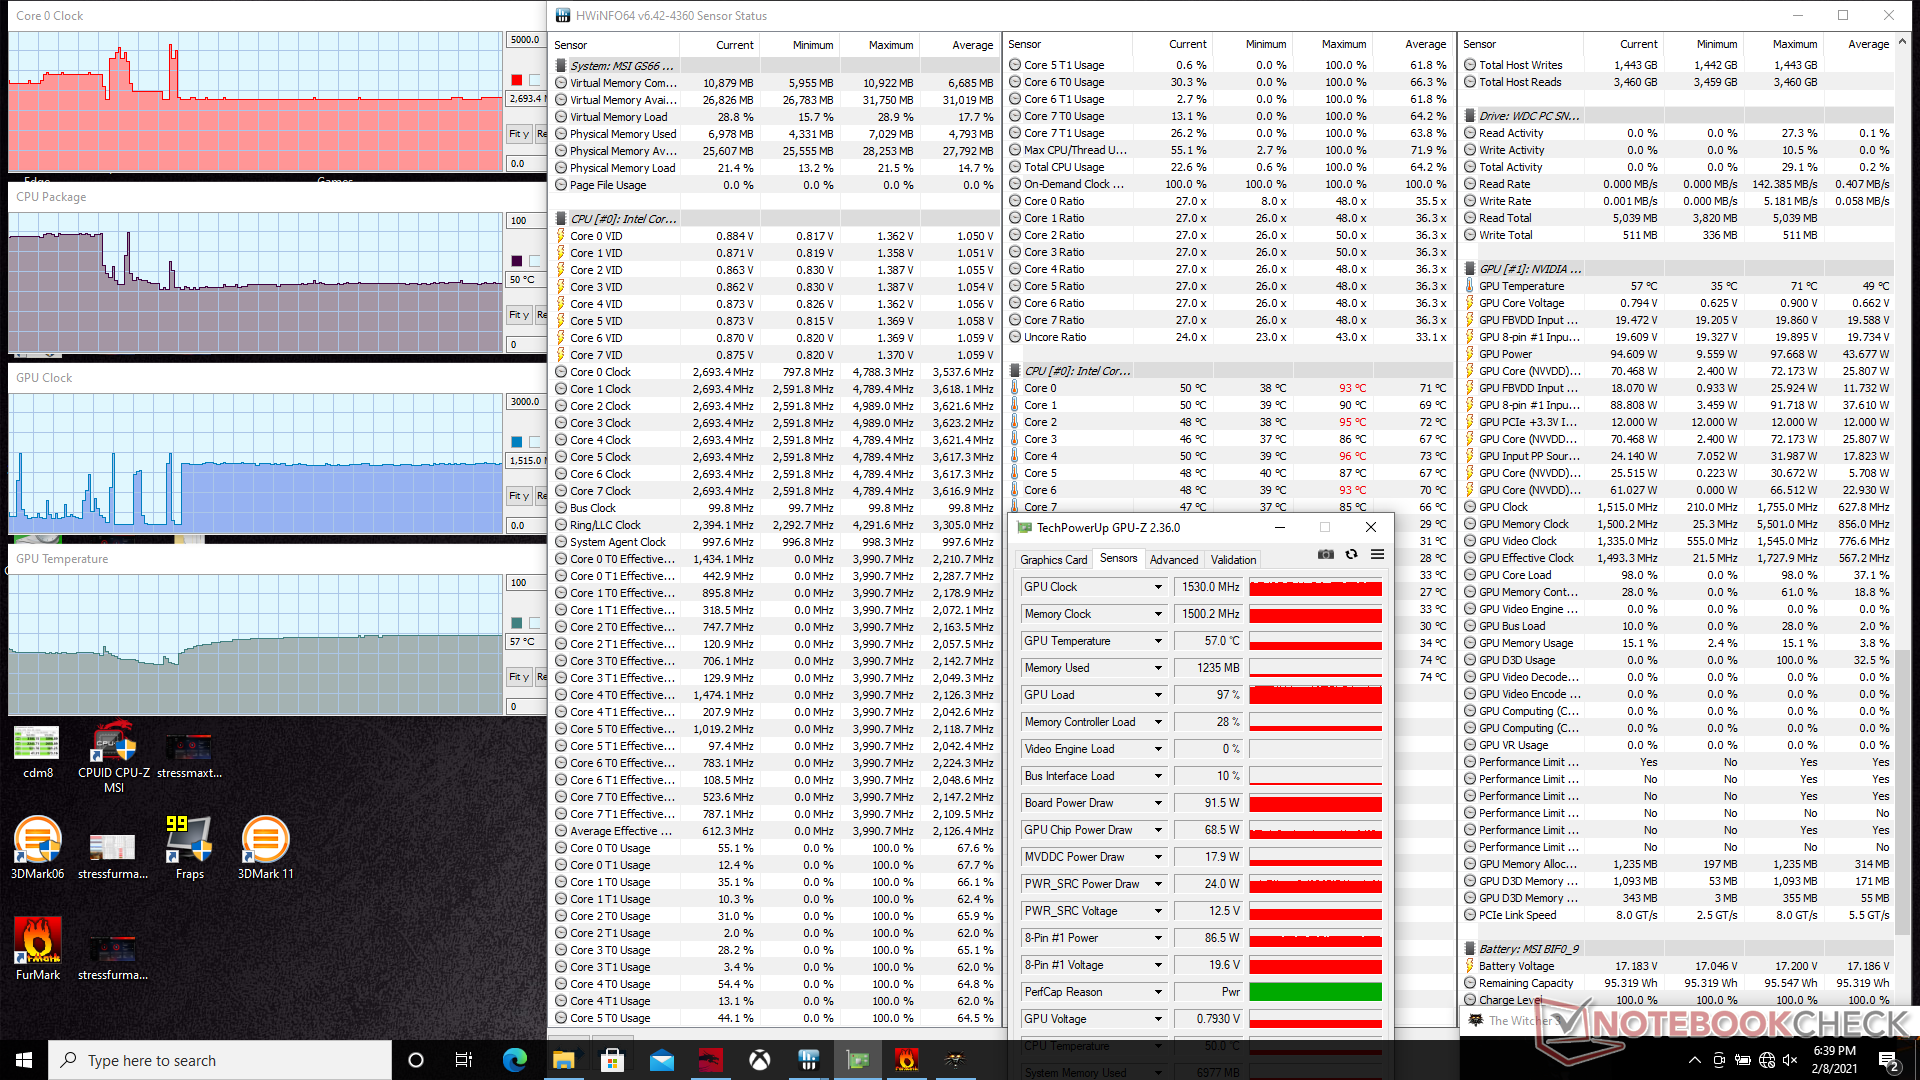
Si se ejecuta FurMark con Cooler Boost activado, la temperatura de la GPU se reduce significativamente a 56 C, en comparación con los 71 C que se registran si la función está desactivada. La velocidad de reloj de la GPU también sería ligeramente superior, entre 50 y 60 MHz. GPU-Z muestra un consumo de energía sostenido de la placa de 95,4 W que coincide con la afirmación de MSI de un TGP de 95 W.


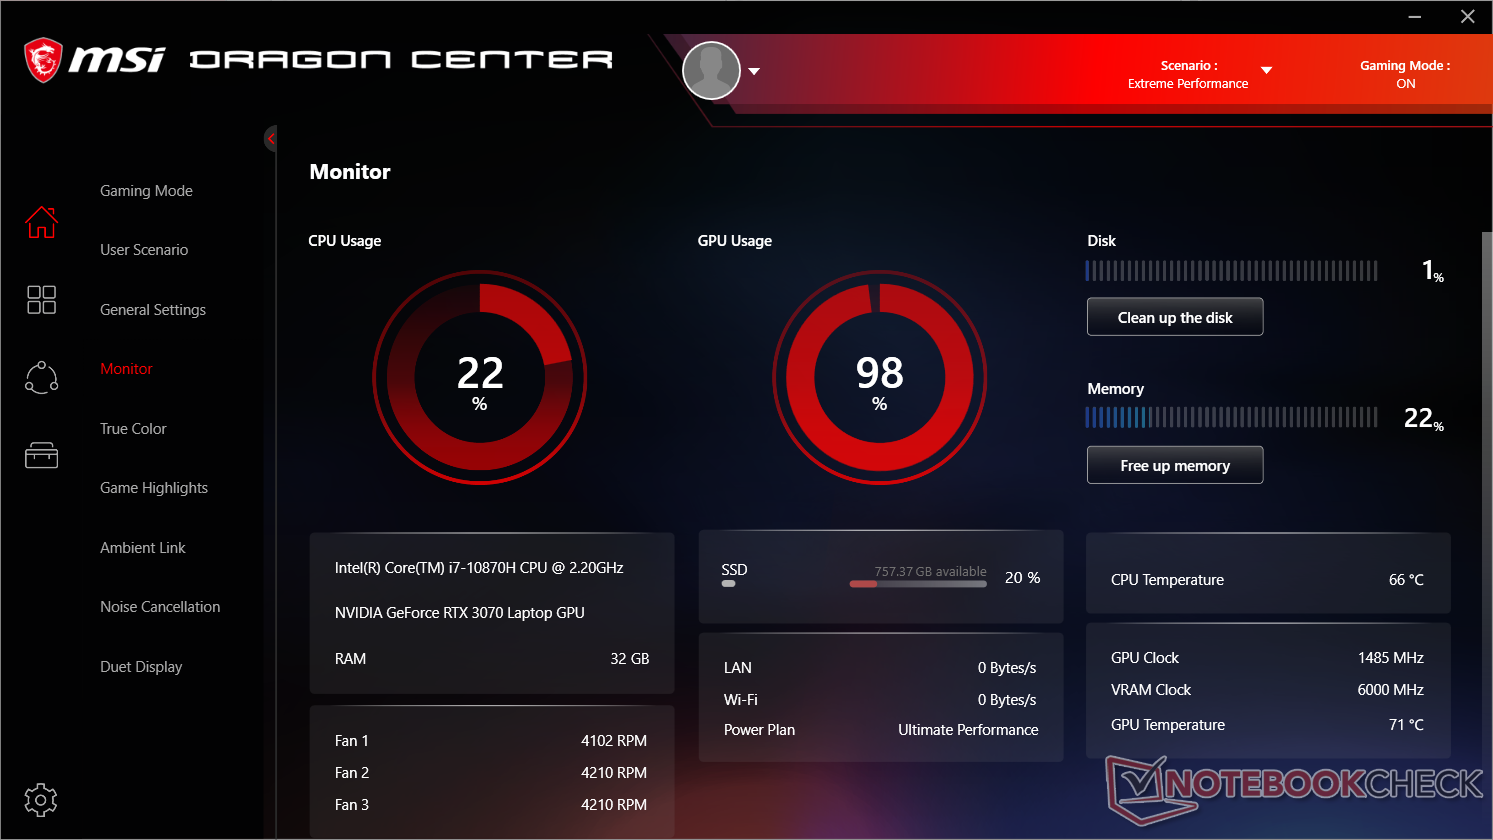
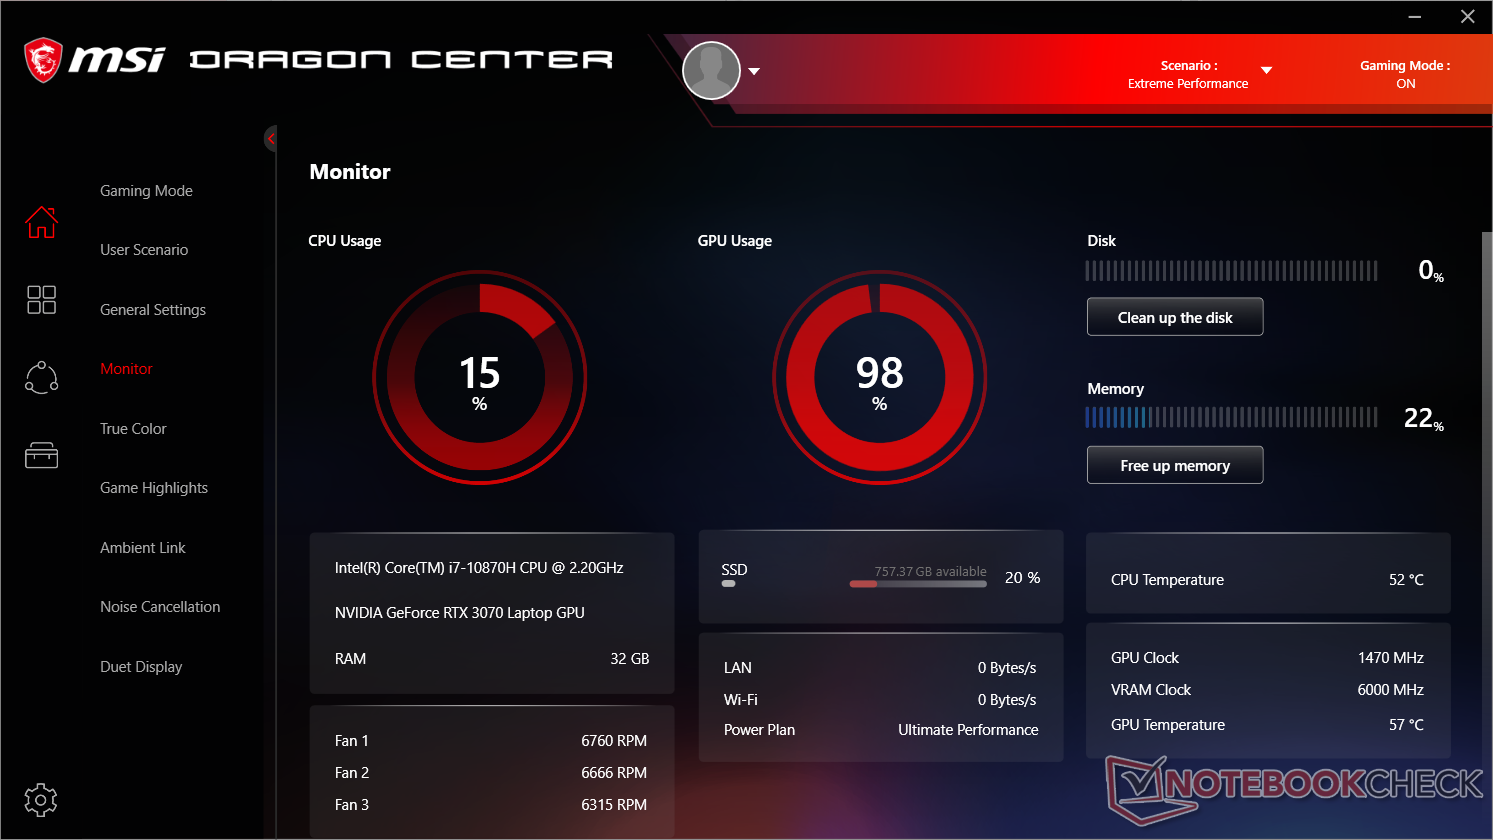
La ejecución de Witcher 3 es más representativo de las cargas de juego del mundo real que Prime95 o FurMark. La CPU y la GPU se estabilizan a temperaturas relativamente bajas de 66 C y 71 C, respectivamente, incluso sin activar Cooler Boost. Al activar la función, las temperaturas de la CPU y la GPU caen a sólo 50 C y 57 C, respectivamente. Las frecuencias de reloj ni siquiera son mucho más altas con Cooler Boost a pesar del aumento extremo del ruido del ventilador. Por tanto, el modo Cooler Boost tiene más que ver con la mejora de las temperaturas que con la maximización de la velocidad de fotogramas en los juegos.

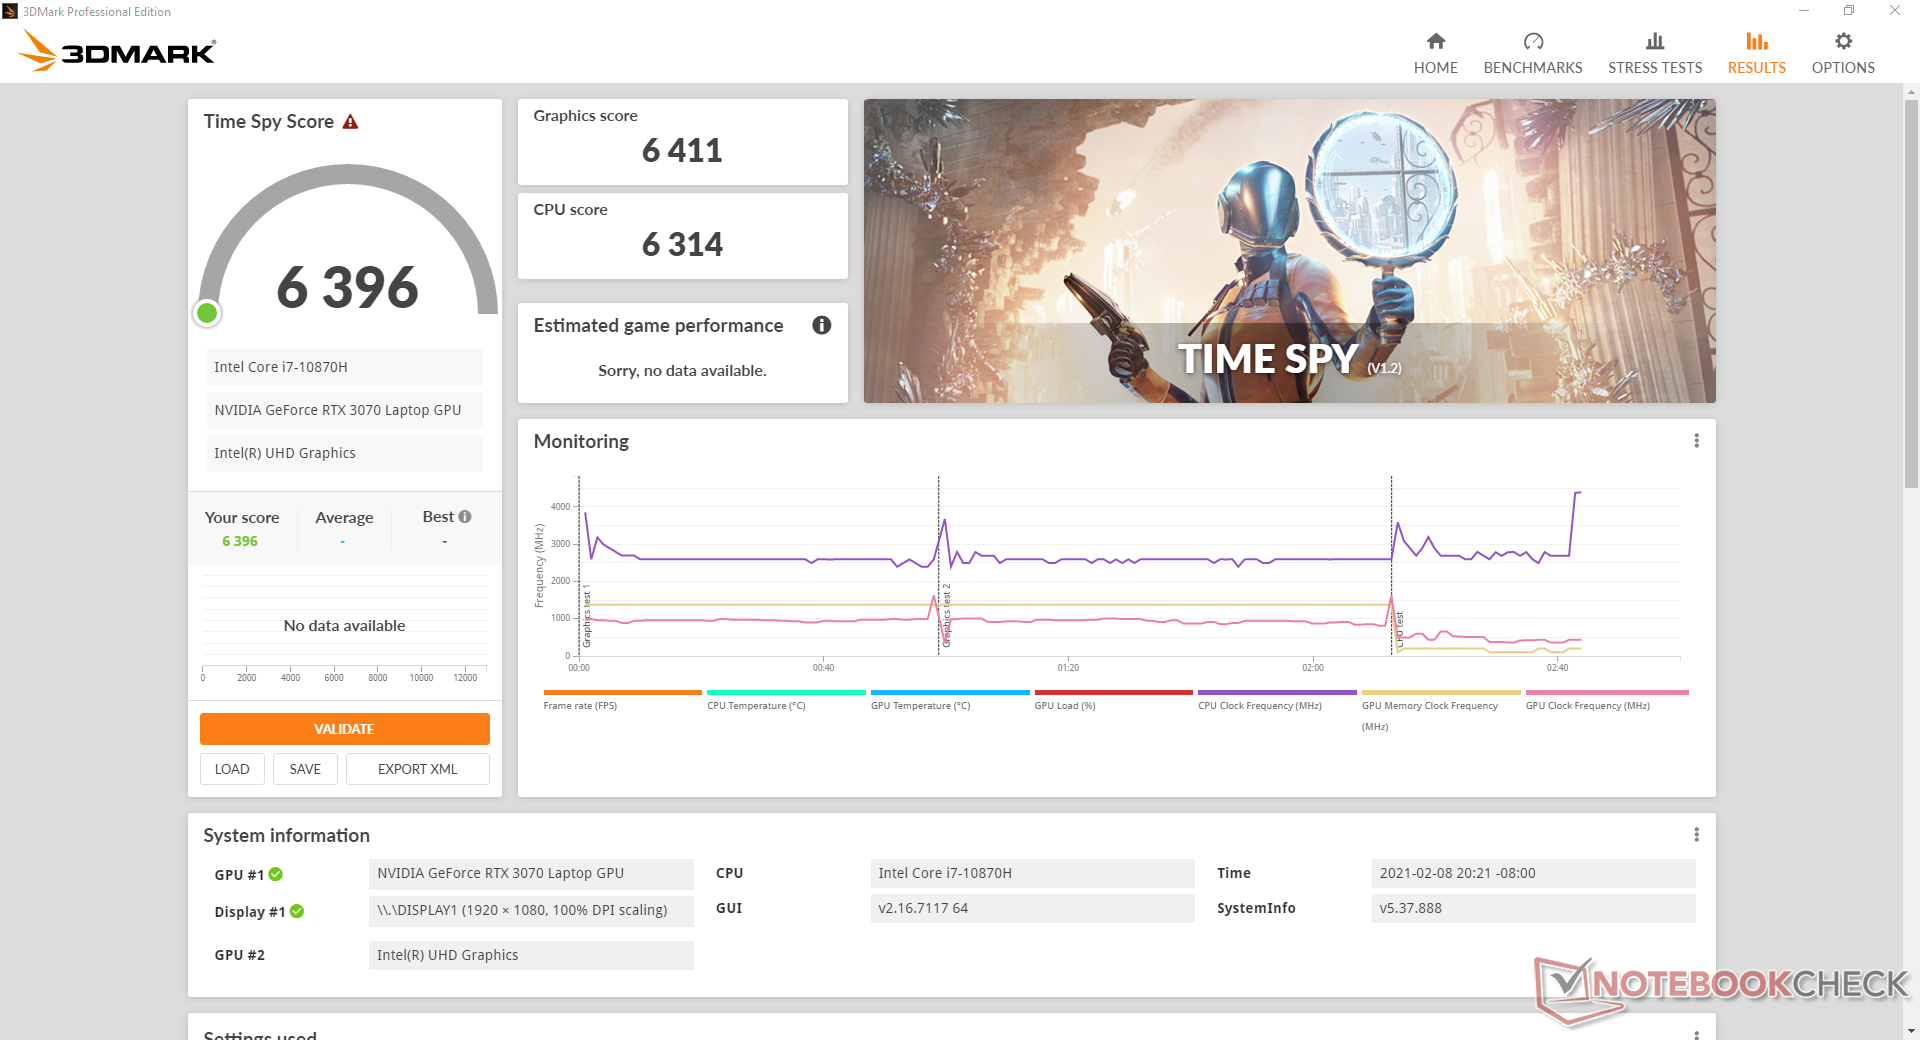
La ejecución simultánea de Prime95 y FurMark reduce la GPU a unos 375 MHz y 31 W de consumo, independientemente de la configuración del Cooler Boost. La CPU, sin embargo, casi no se ve afectada, ya que sigue funcionando a más de 3 GHz.
| Relojde la CPU(GHz) | Reloj dela GPU(MHz) | Temperatura media de la CPU (°C) | Temperaturamediade la GPU (°C) | |
| Sistema en reposo (Cooler Boost desactivado) | -- | --41 | 37 | |
| Estrés Prime95 (Cooler Boost desactivado) | 3,0 - 3,1 | -- | 90 | 49 |
| Estrés Prime95 (Cooler Boostactivado) | 3,0 - 3,1 | -- | 83 | 35 |
| FurMark Stress (Cooler Boost off) | -- | 1050 | 72 | 71 |
| FurMark Stress (Cooler Boost activado) | -- | 1110 | 53 | 56 |
| Witcher 3 Estrés (Cooler Boost off) | 2.7 | 1440 | 66 | 71 |
| Witcher 3 Estrés (Cooler Boost activado) | 2.7 | 1515 | 50 | 57 |
| Prime95 + FurMark Stress (Cooler Boost off) | 3.3 - 3.4 | 375 - 1440 | 91 | 57 |
| Prime95 + FurMark Stress (Cooler Boost on) | 3.1 - 3.2 | 375 | 85 | 45 |
Altavoces


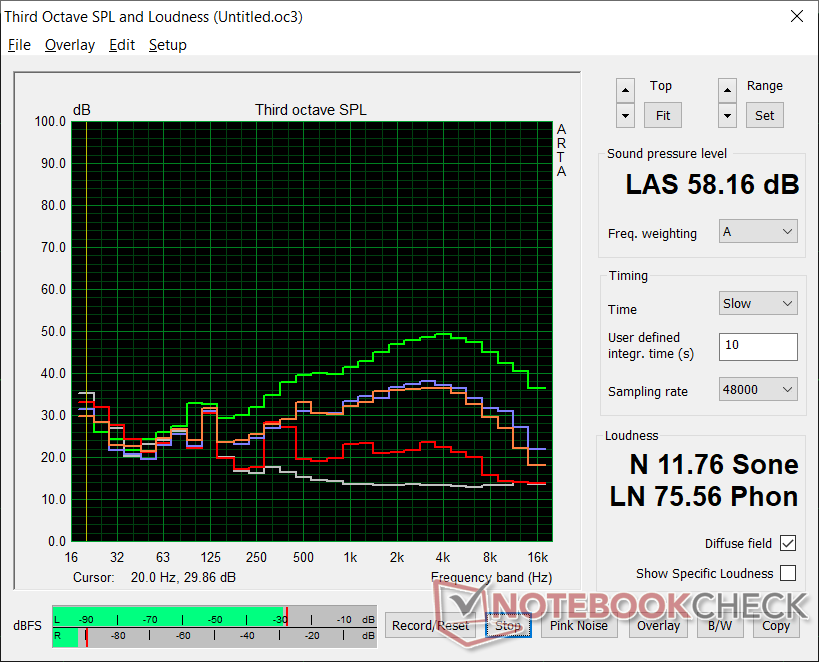
MSI GS66 Stealth 10UG análisis de audio
(±) | la sonoridad del altavoz es media pero buena (81 dB)
Graves 100 - 315 Hz
(-) | casi sin bajos - de media 18.9% inferior a la mediana
(±) | la linealidad de los graves es media (13.6% delta a frecuencia anterior)
Medios 400 - 2000 Hz
(±) | medias más altas - de media 6.1% más altas que la mediana
(+) | los medios son lineales (5.7% delta a la frecuencia anterior)
Altos 2 - 16 kHz
(+) | máximos equilibrados - a sólo 2.4% de la mediana
(±) | la linealidad de los máximos es media (8% delta a frecuencia anterior)
Total 100 - 16.000 Hz
(±) | la linealidad del sonido global es media (20.3% de diferencia con la mediana)
En comparación con la misma clase
» 72% de todos los dispositivos probados de esta clase eran mejores, 6% similares, 23% peores
» El mejor tuvo un delta de 6%, la media fue 18%, el peor fue ###max##%
En comparación con todos los dispositivos probados
» 53% de todos los dispositivos probados eran mejores, 8% similares, 39% peores
» El mejor tuvo un delta de 4%, la media fue 24%, el peor fue ###max##%
Apple MacBook 12 (Early 2016) 1.1 GHz análisis de audio
(+) | los altavoces pueden reproducir a un volumen relativamente alto (#83.6 dB)
Graves 100 - 315 Hz
(±) | lubina reducida - en promedio 11.3% inferior a la mediana
(±) | la linealidad de los graves es media (14.2% delta a frecuencia anterior)
Medios 400 - 2000 Hz
(+) | medios equilibrados - a sólo 2.4% de la mediana
(+) | los medios son lineales (5.5% delta a la frecuencia anterior)
Altos 2 - 16 kHz
(+) | máximos equilibrados - a sólo 2% de la mediana
(+) | los máximos son lineales (4.5% delta a la frecuencia anterior)
Total 100 - 16.000 Hz
(+) | el sonido global es lineal (10.2% de diferencia con la mediana)
En comparación con la misma clase
» 7% de todos los dispositivos probados de esta clase eran mejores, 2% similares, 91% peores
» El mejor tuvo un delta de 5%, la media fue 18%, el peor fue ###max##%
En comparación con todos los dispositivos probados
» 5% de todos los dispositivos probados eran mejores, 1% similares, 94% peores
» El mejor tuvo un delta de 4%, la media fue 24%, el peor fue ###max##%
Energy Management
Consumo de energía
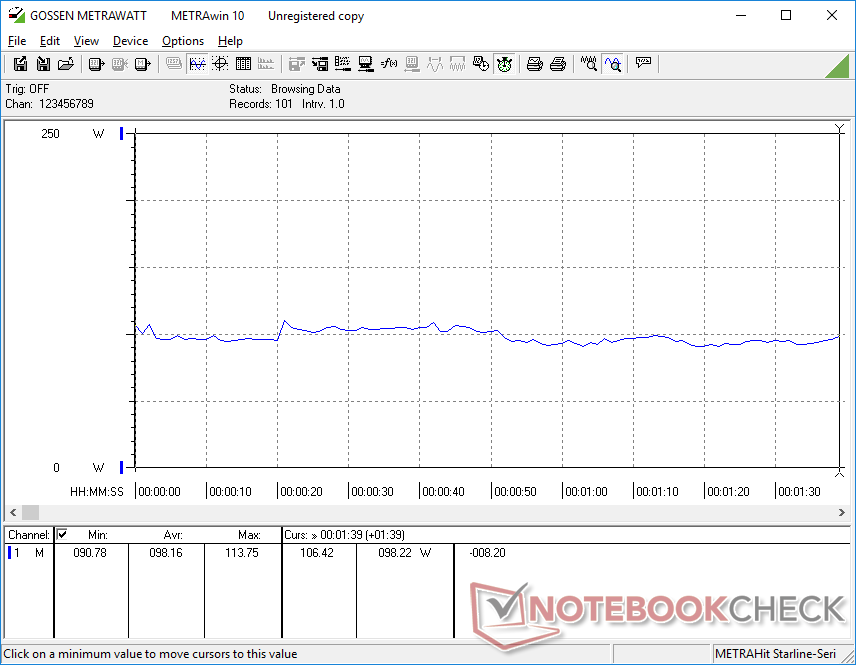
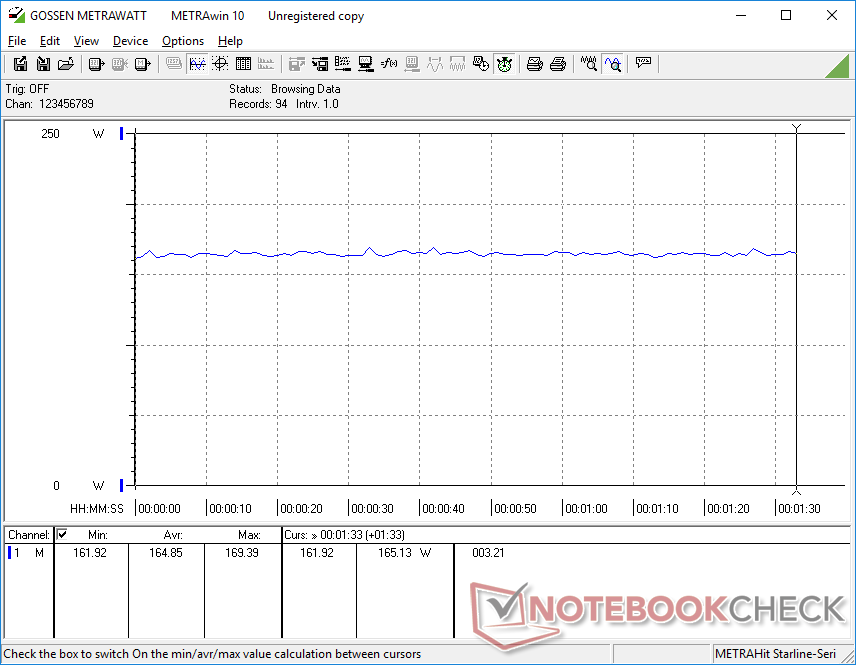
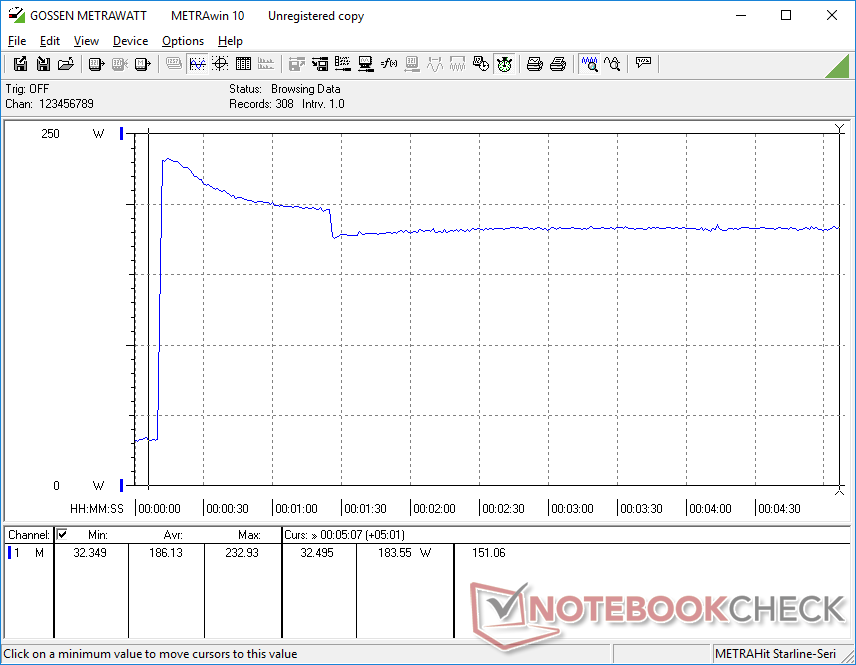
El consumo general de energía es similar al que registramos en el GS66 10SFS con la antigua GeForce RTX 2070 Super Max-Q. Lo más notable es que el consumo de energía en nuestro GS66 10UG es solo un 6 por ciento más alto cuando se juega, aunque el sistema ofrece un rendimiento gráfico aproximadamente un 30 por ciento más rápido para mostrar un rendimiento por vatio superior al de la GPU Turing del año pasado.
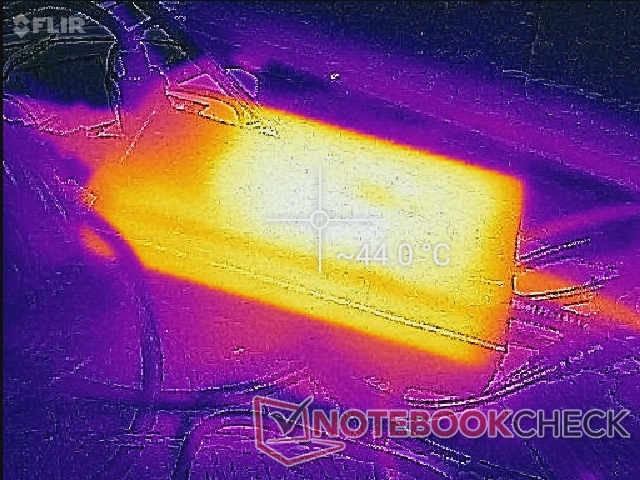
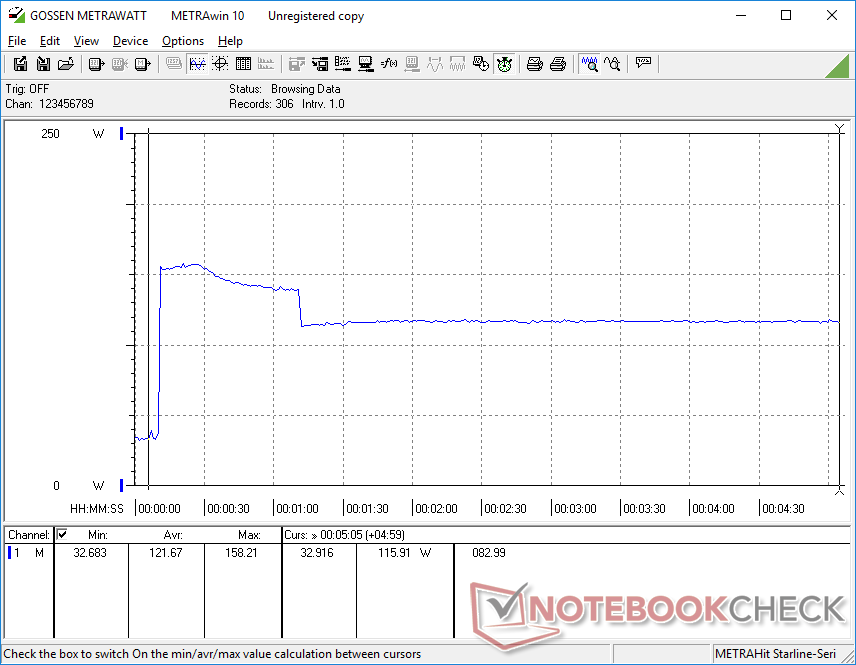
Registramos un consumo máximo temporal de 233 W con el adaptador de CA de 230 W de tamaño medio (~15,3 x 7,3 x 3 cm) cuando ejecutamos Prime95 y FurMark simultáneamente. La tasa sostenida está más cerca de los 184 W debido a las limitaciones térmicas
| Off / Standby | |
| Ocioso | |
| Carga |
|
Clave:
min: | |
| MSI GS66 Stealth 10UG i7-10870H, GeForce RTX 3070 Laptop GPU, WDC PC SN730 SDBPNTY-1T00, IPS, 1920x1080, 15.6" | MSI GS66 10SGS i7-10750H, GeForce RTX 2080 Super Max-Q, Samsung SSD PM981 MZVLB512HAJQ, IPS, 1920x1080, 15.6" | Asus TUF Dash F15 FX516PR i7-11370H, GeForce RTX 3070 Laptop GPU, SK Hynix HFM001TD3JX013N, IPS, 1920x1080, 15.6" | Alienware m15 R3 P87F i7-10750H, GeForce RTX 2070 Mobile, 2x Micron 2200S 512 GB (RAID 0), IPS, 1920x1080, 15.6" | MSI GS66 Stealth 10SFS i9-10980HK, GeForce RTX 2070 Super Max-Q, Samsung SSD PM981 MZVLB1T0HALR, IPS, 1920x1080, 15.6" | |
|---|---|---|---|---|---|
| Power Consumption | -3% | 25% | -95% | -2% | |
| Idle Minimum * (Watt) | 12.9 | 14.9 -16% | 9 30% | 34 -164% | 13 -1% |
| Idle Average * (Watt) | 15.4 | 17.5 -14% | 11 29% | 48.6 -216% | 16 -4% |
| Idle Maximum * (Watt) | 27.1 | 29.5 -9% | 16 41% | 58.2 -115% | 27 -0% |
| Load Average * (Watt) | 98.2 | 94.8 3% | 107 -9% | 129.4 -32% | 109 -11% |
| Witcher 3 ultra * (Watt) | 164.9 | 146.1 11% | 121 27% | 214.5 -30% | 155 6% |
| Load Maximum * (Watt) | 232.9 | 210.9 9% | 162 30% | 257.3 -10% | 236 -1% |
* ... más pequeño es mejor
Duración de la batería
La duración es casi idéntica a la que registramos en el antiguo GS66 10SGS alimentado por Turing, con unas 7 horas de uso WLAN en el mundo real con el perfil de energía equilibrado. El sistema también puede recargarse por USB-C, aunque a un ritmo más lento.
Experimentamos un comportamiento de carga extraño con el adaptador de CA incluido en nuestra unidad de pruebas. Al cargar desde el vacío, la velocidad de carga era extremadamente lenta hasta el punto de que una hora completa sólo cargaba el 10 por ciento. Luego, la tasa de carga inexplicablemente se recuperaba a su tasa "normal" para recargar completamente el portátil de 1,5 a 2 horas más tarde. Este mismo fenómeno se producía incluso después de volver a probarlo. Recomendamos a los nuevos propietarios que comprueben dos veces sus tasas de carga para asegurarse de que no está tardando más de lo normal en recargar la batería.
| MSI GS66 Stealth 10UG i7-10870H, GeForce RTX 3070 Laptop GPU, 99.9 Wh | MSI GS66 10SGS i7-10750H, GeForce RTX 2080 Super Max-Q, 99.99 Wh | Asus TUF Dash F15 FX516PR i7-11370H, GeForce RTX 3070 Laptop GPU, 76 Wh | Razer Blade 15 RTX 2070 Super Max-Q i7-10875H, GeForce RTX 2070 Super Max-Q, 80 Wh | Aorus 15P WB i7-10750H, GeForce RTX 2070 Max-Q, 94.24 Wh | Alienware m15 R3 P87F i7-10750H, GeForce RTX 2070 Mobile, 86 Wh | |
|---|---|---|---|---|---|---|
| Duración de Batería | -12% | 38% | -11% | 3% | -61% | |
| Reader / Idle (h) | 10.8 | 10.2 -6% | 16 48% | 11.3 5% | 5 -54% | |
| WiFi v1.3 (h) | 7.1 | 6.9 -3% | 9.1 28% | 6.3 -11% | 7.1 0% | 2.8 -61% |
| Load (h) | 2.2 | 1.6 -27% | 2.3 5% | 0.7 -68% |
Pro
Contra
Veredicto

La actualización de la GeForce RTX 2070 de sobremesa a la RTX 3070 de sobremesa supondrá una ganancia de entre el 40 y el 45% en el rendimiento gráfico bruto. Por su parte, la actualización de la GeForce RTX 2070 para móviles a la RTX 3070 para móviles supondrá un aumento del 25 al 30 por ciento. La GS66 de 2021 puede venir equipada con una nueva GPU de lujo, pero las limitaciones de potencia siguen siendo similares, por lo que las ganancias generales entre generaciones son menores. Es más rápida, sin duda, pero no tanto. Los jugadores que busquen una nueva GS66 pueden considerar las SKU RTX 20 un poco más antiguas sin sentir que se están perdiendo algo grande.
La GS66 con gráficos GeForce RTX 30 ofrece un rendimiento gráfico más rápido que las opciones del año pasado sin necesidad de funcionar con más calor, más ruido o menos tiempo. Sin embargo, las ganancias son de leves a moderadas en el mejor de los casos.
Se recomienda evitar la opción Core i9-10980HK, ya que no ofrece beneficios significativos sobre el Core i7-10875H o el i7-10870H. Gastar esos dólares extra en más RAM, almacenamiento o una opción de GPU más rápida sería un enfoque más equilibrado.
Precio y disponibilidad
MSI GS66 Stealth 10UG
- 02/11/2021 v7 (old)
Allen Ngo
Price comparison

