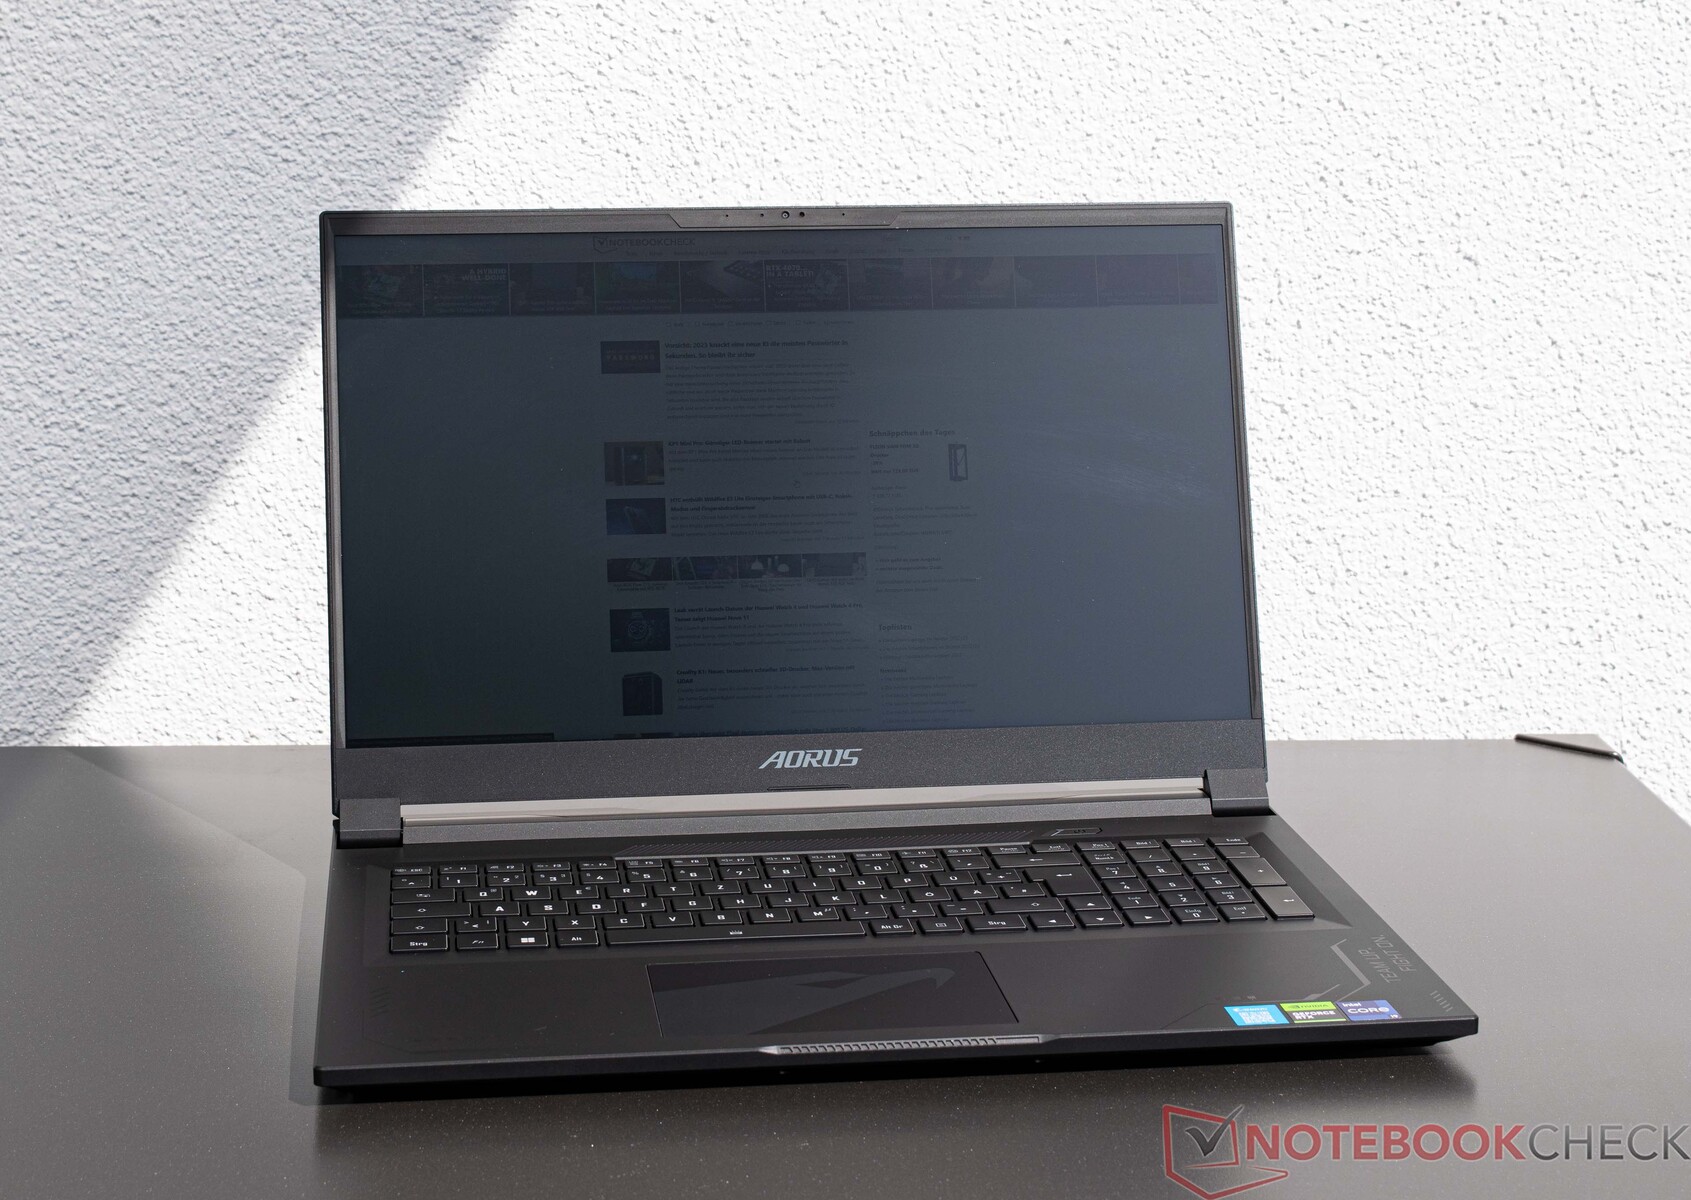
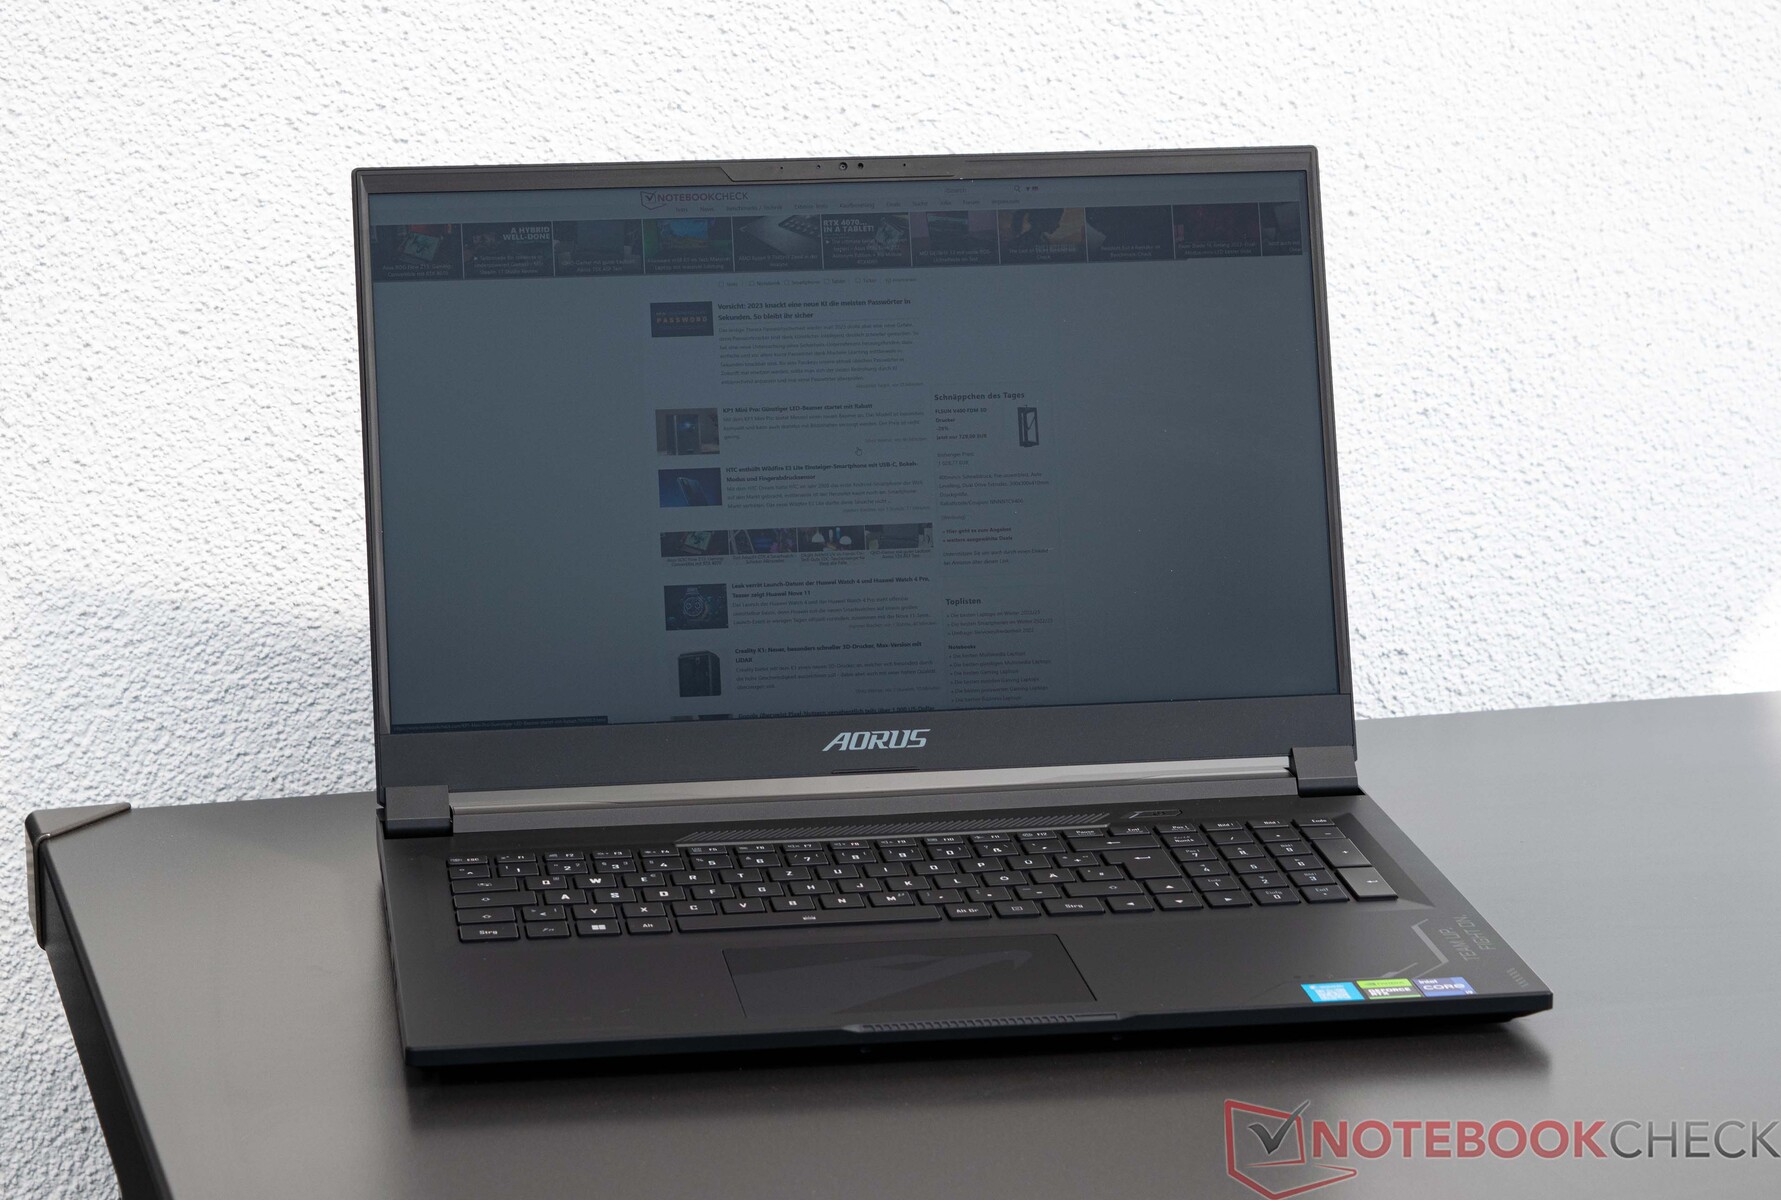
Análisis del Aorus 17X AZF: Portátil gaming de gama alta con i9-13900HX y RTX 4090 en una carcasa delgada
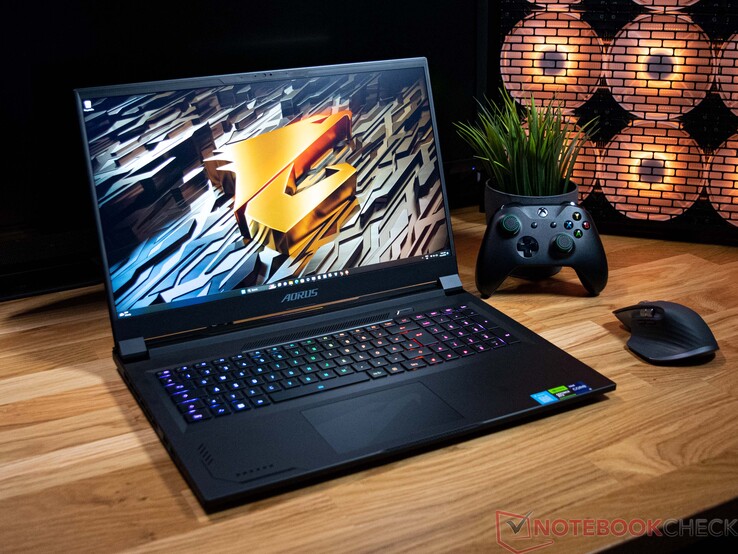
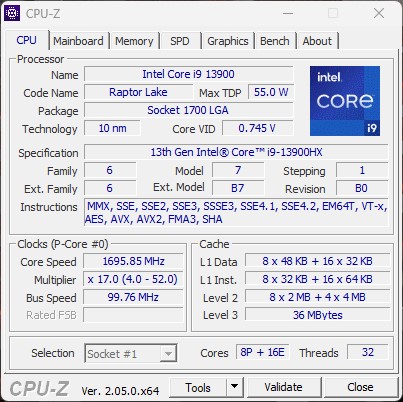
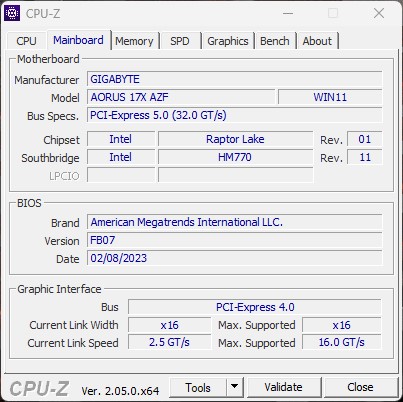
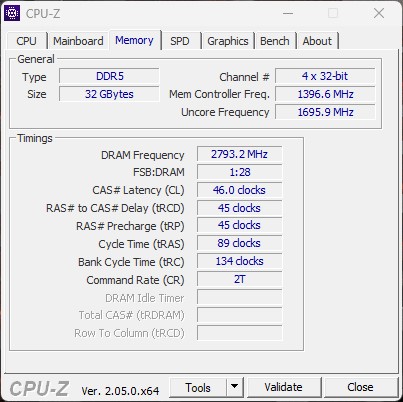
El nuevo Aorus 17X AZF se basa en un procesador Intel Raptor Lake H y la última GPU móvil insignia de Nvidia. Un Intel Core i9 13900HX trabaja junto con una GPU Nvidia GeForce RTX 4090 para portátiles bajo el capó. Estos dos componentes por sí solos dan una idea de la finalidad prevista del portátil. Pero, ¿qué rendimiento ofrece el hardware en una carcasa tan delgada? Echamos un vistazo a esto y entraremos en más detalles más adelante. Pero la CPU y la GPU por sí solas no hacen un buen portátil para juegos: en el Aorus 17X AZF van acompañadas de una pantalla de 17 pulgadas a 240 Hz, así como de un total de 2 TB de almacenamiento SSD que puede almacenar fácilmente un gran número de juegos y otros programas. Esta configuración cuesta 3.499,00 dólares.
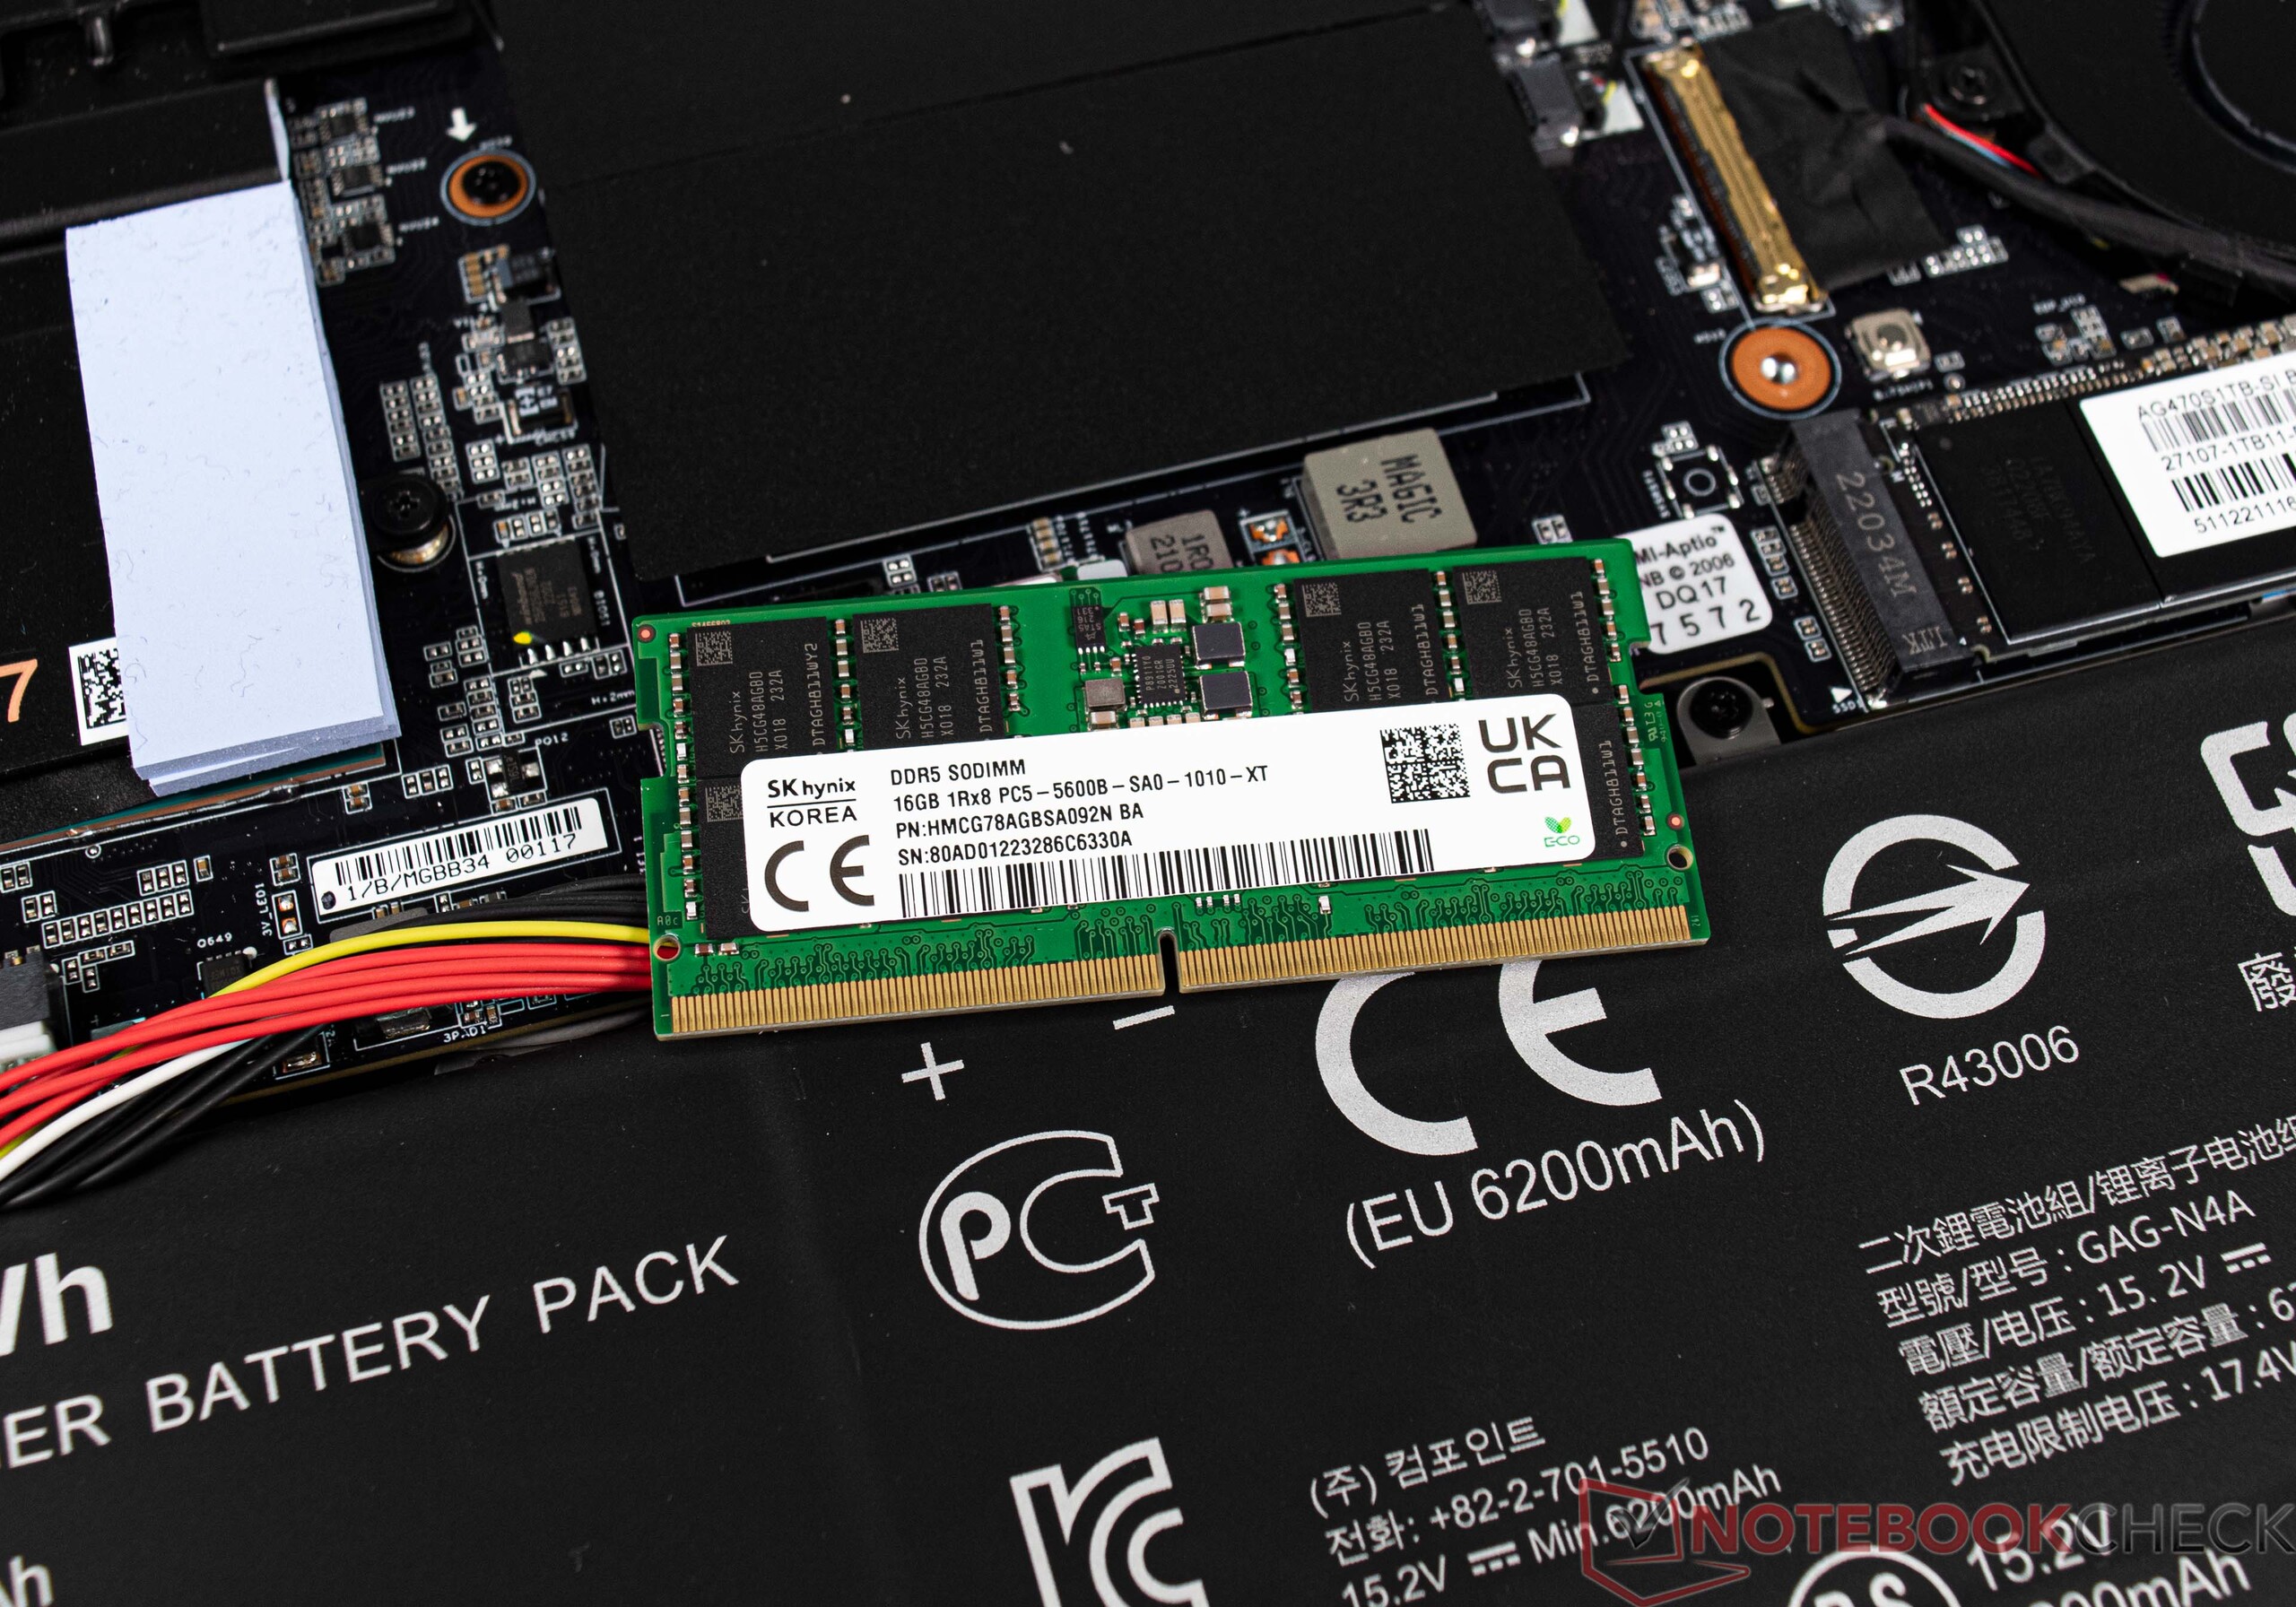
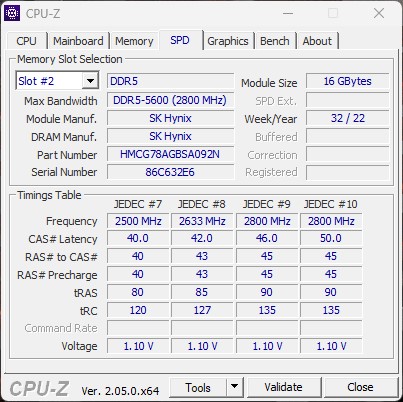
Como alternativa, el Aorus 17X está disponible con un procesador Intel Core i7 13700HX. Aunque no hay más opciones en cuanto a la tarjeta gráfica, la velocidad de la memoria RAM DDR5 puede variar. El Core i7 está técnicamente limitado a un máximo de 4800 MT/s, mientras que el modelo Core i9 tiene a su disposición un máximo de 5600 MT/s.
Los portátiles de la competencia de esta clase también ofrecen niveles similares de rendimiento si nos fijamos en las especificaciones técnicas, ya que también están equipados con procesadores Intel Raptor-Lake H y GPU móviles Ada-Lovelace. En la siguiente tabla se puede encontrar un resumen detallado de los dispositivos de la comparación.
Posibles contendientes en la comparación
Valoración | Fecha | Modelo | Peso | Altura | Tamaño | Resolución | Precio |
|---|---|---|---|---|---|---|---|
| 86 % v7 (old) | 04/2023 | Aorus 17X AZF i9-13900HX, GeForce RTX 4090 Laptop GPU | 2.9 kg | 21.8 mm | 17.30" | 2560x1440 | |
| 88.4 % v7 (old) | 03/2023 | Medion Erazer Beast X40 i9-13900HX, GeForce RTX 4090 Laptop GPU | 2.9 kg | 33 mm | 17.00" | 2560x1600 | |
| 88.3 % v7 (old) | 03/2023 | MSI GE78HX 13VH-070US i9-13950HX, GeForce RTX 4080 Laptop GPU | 3 kg | 23 mm | 17.00" | 2560x1600 | |
| 85.4 % v7 (old) | 03/2023 | HP Omen 17-ck2097ng i9-13900HX, GeForce RTX 4080 Laptop GPU | 2.8 kg | 27 mm | 17.30" | 2560x1440 | |
| 90.7 % v7 (old) | 04/2023 | Alienware m18 R1 i9-13980HX, GeForce RTX 4090 Laptop GPU | 3.9 kg | 26.7 mm | 18.00" | 1920x1200 | |
| 89 % v7 (old) | 02/2023 | MSI Titan GT77 HX 13VI i9-13950HX, GeForce RTX 4090 Laptop GPU | 3.5 kg | 23 mm | 17.30" | 3840x2160 |
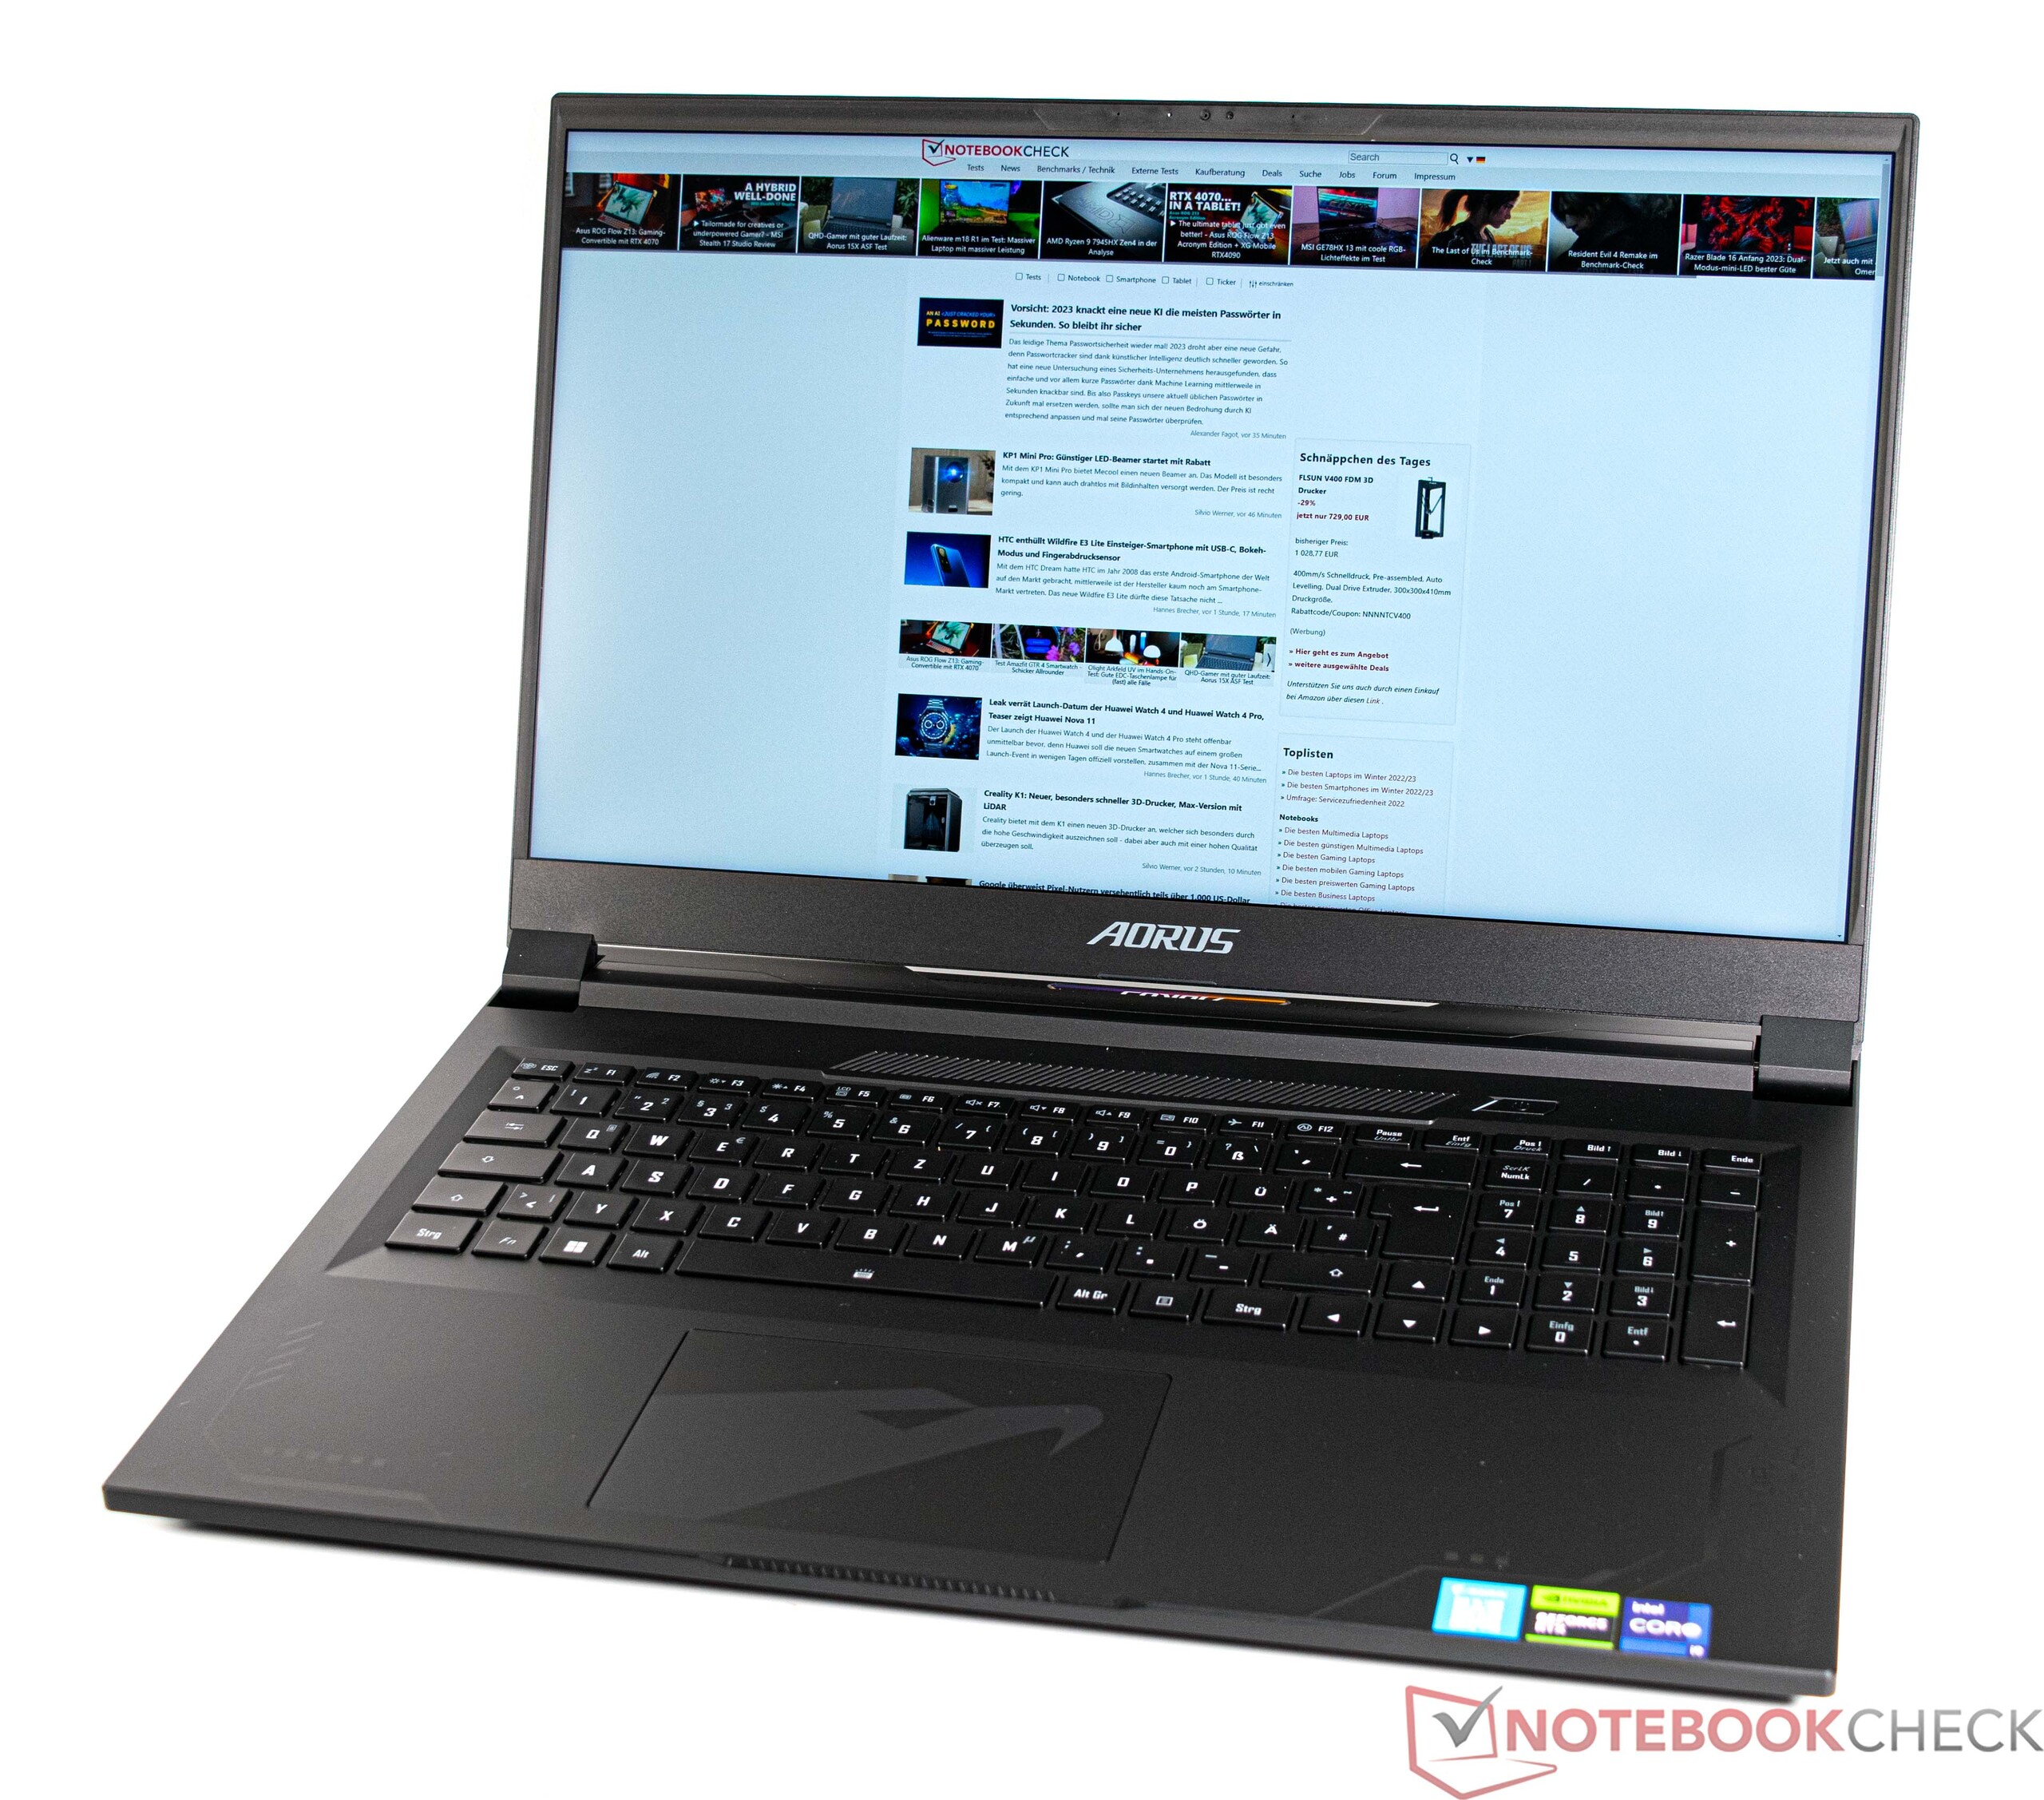
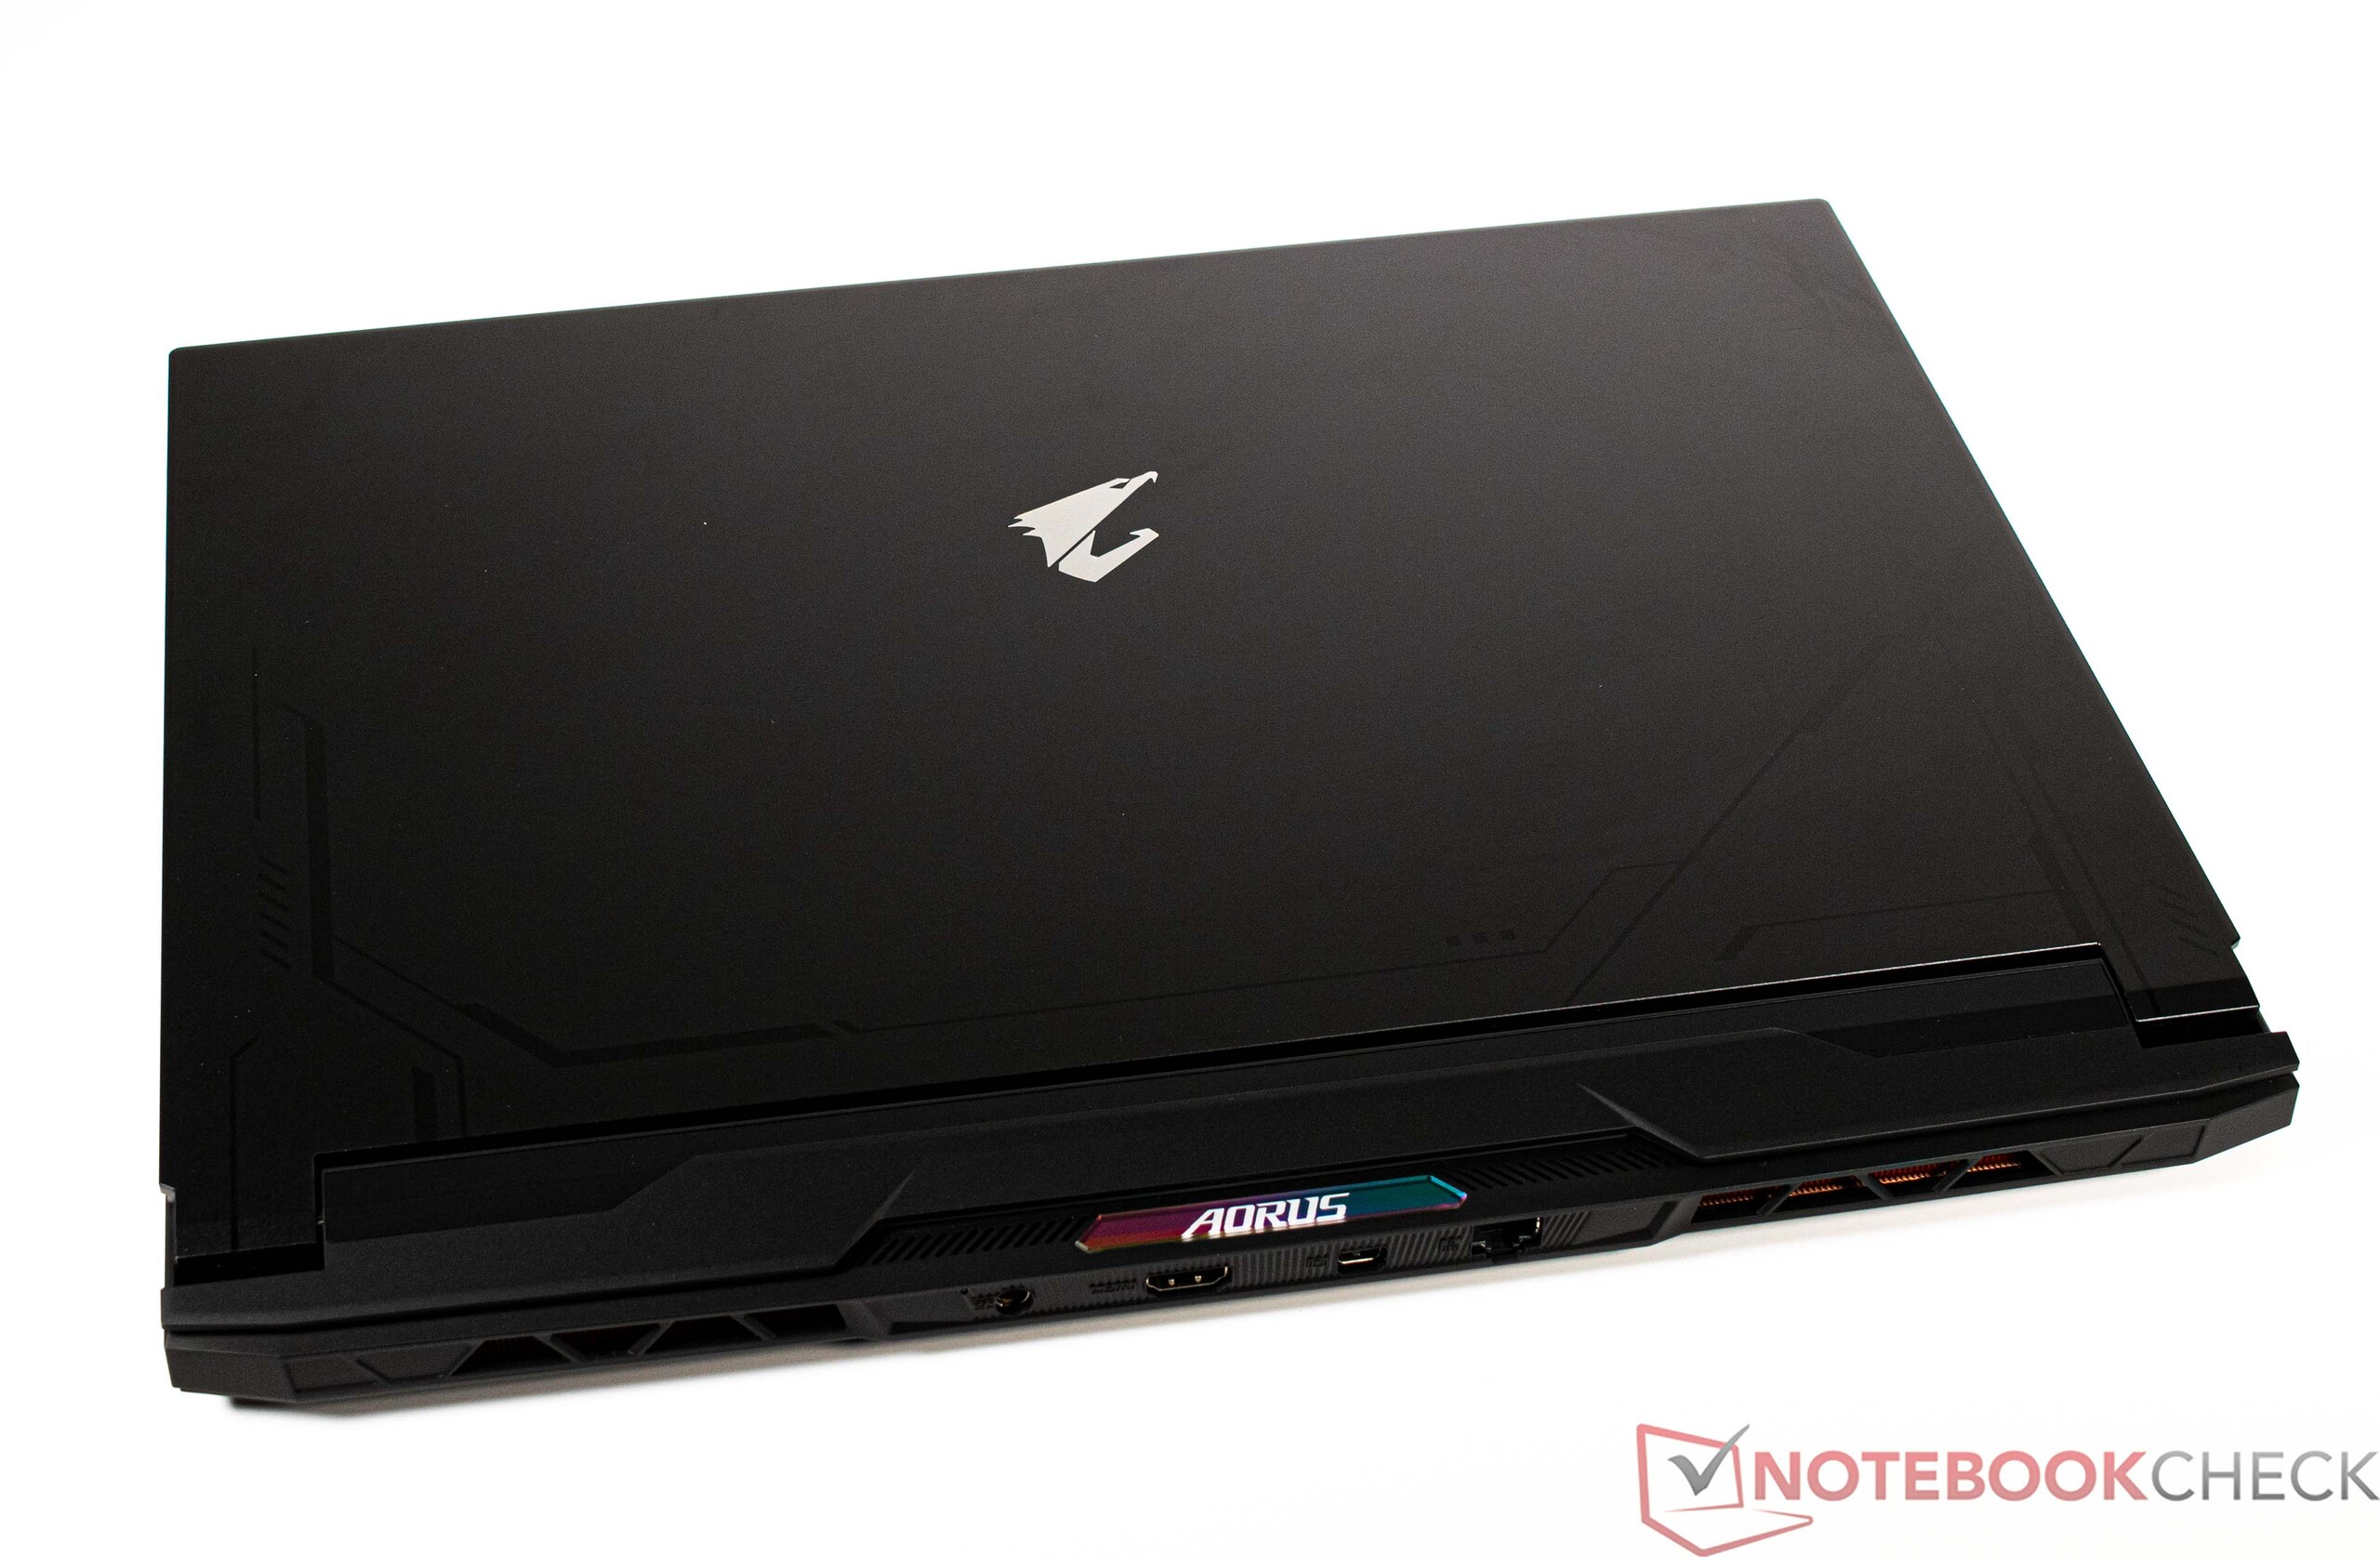
Carcasa - Aluminio y plástico en el Aorus 17X
El Aorus 17X está hecho principalmente de aluminio y plástico. Esto tiene la ventaja de su bajo peso, ya que con menos de 3 kilos, el dispositivo es uno de los representantes más ligeros aquí en comparación. Sólo el HP Omen 17 es ligeramente más ligero.
En términos de estabilidad, la elección de los materiales resulta ser algo desventajosa, pero aún así demostró ser sólido en nuestra prueba de presión. Los fabricantes siempre tienen que lograr un equilibrio entre estabilidad y movilidad en los grandes portátiles de 17 pulgadas, lo que creemos que se ha logrado en el Aorus 17X AZF. La tapa del display, hecha de aluminio en la parte superior, es relativamente estable, aunque aún puede retorcerse con un poco de esfuerzo. Las bisagras también son estables, se sienten sólidas y reducen el tambaleo al mínimo. Además, es posible abrir la pantalla con una sola mano.
Los únicos elementos de color están en la parte trasera en forma de letras Aorus iluminadas. También hay un logo Aorus plateado en la tapa de la pantalla, que rompe la monotonía del dispositivo, que por lo demás es completamente negro.
Equipamiento
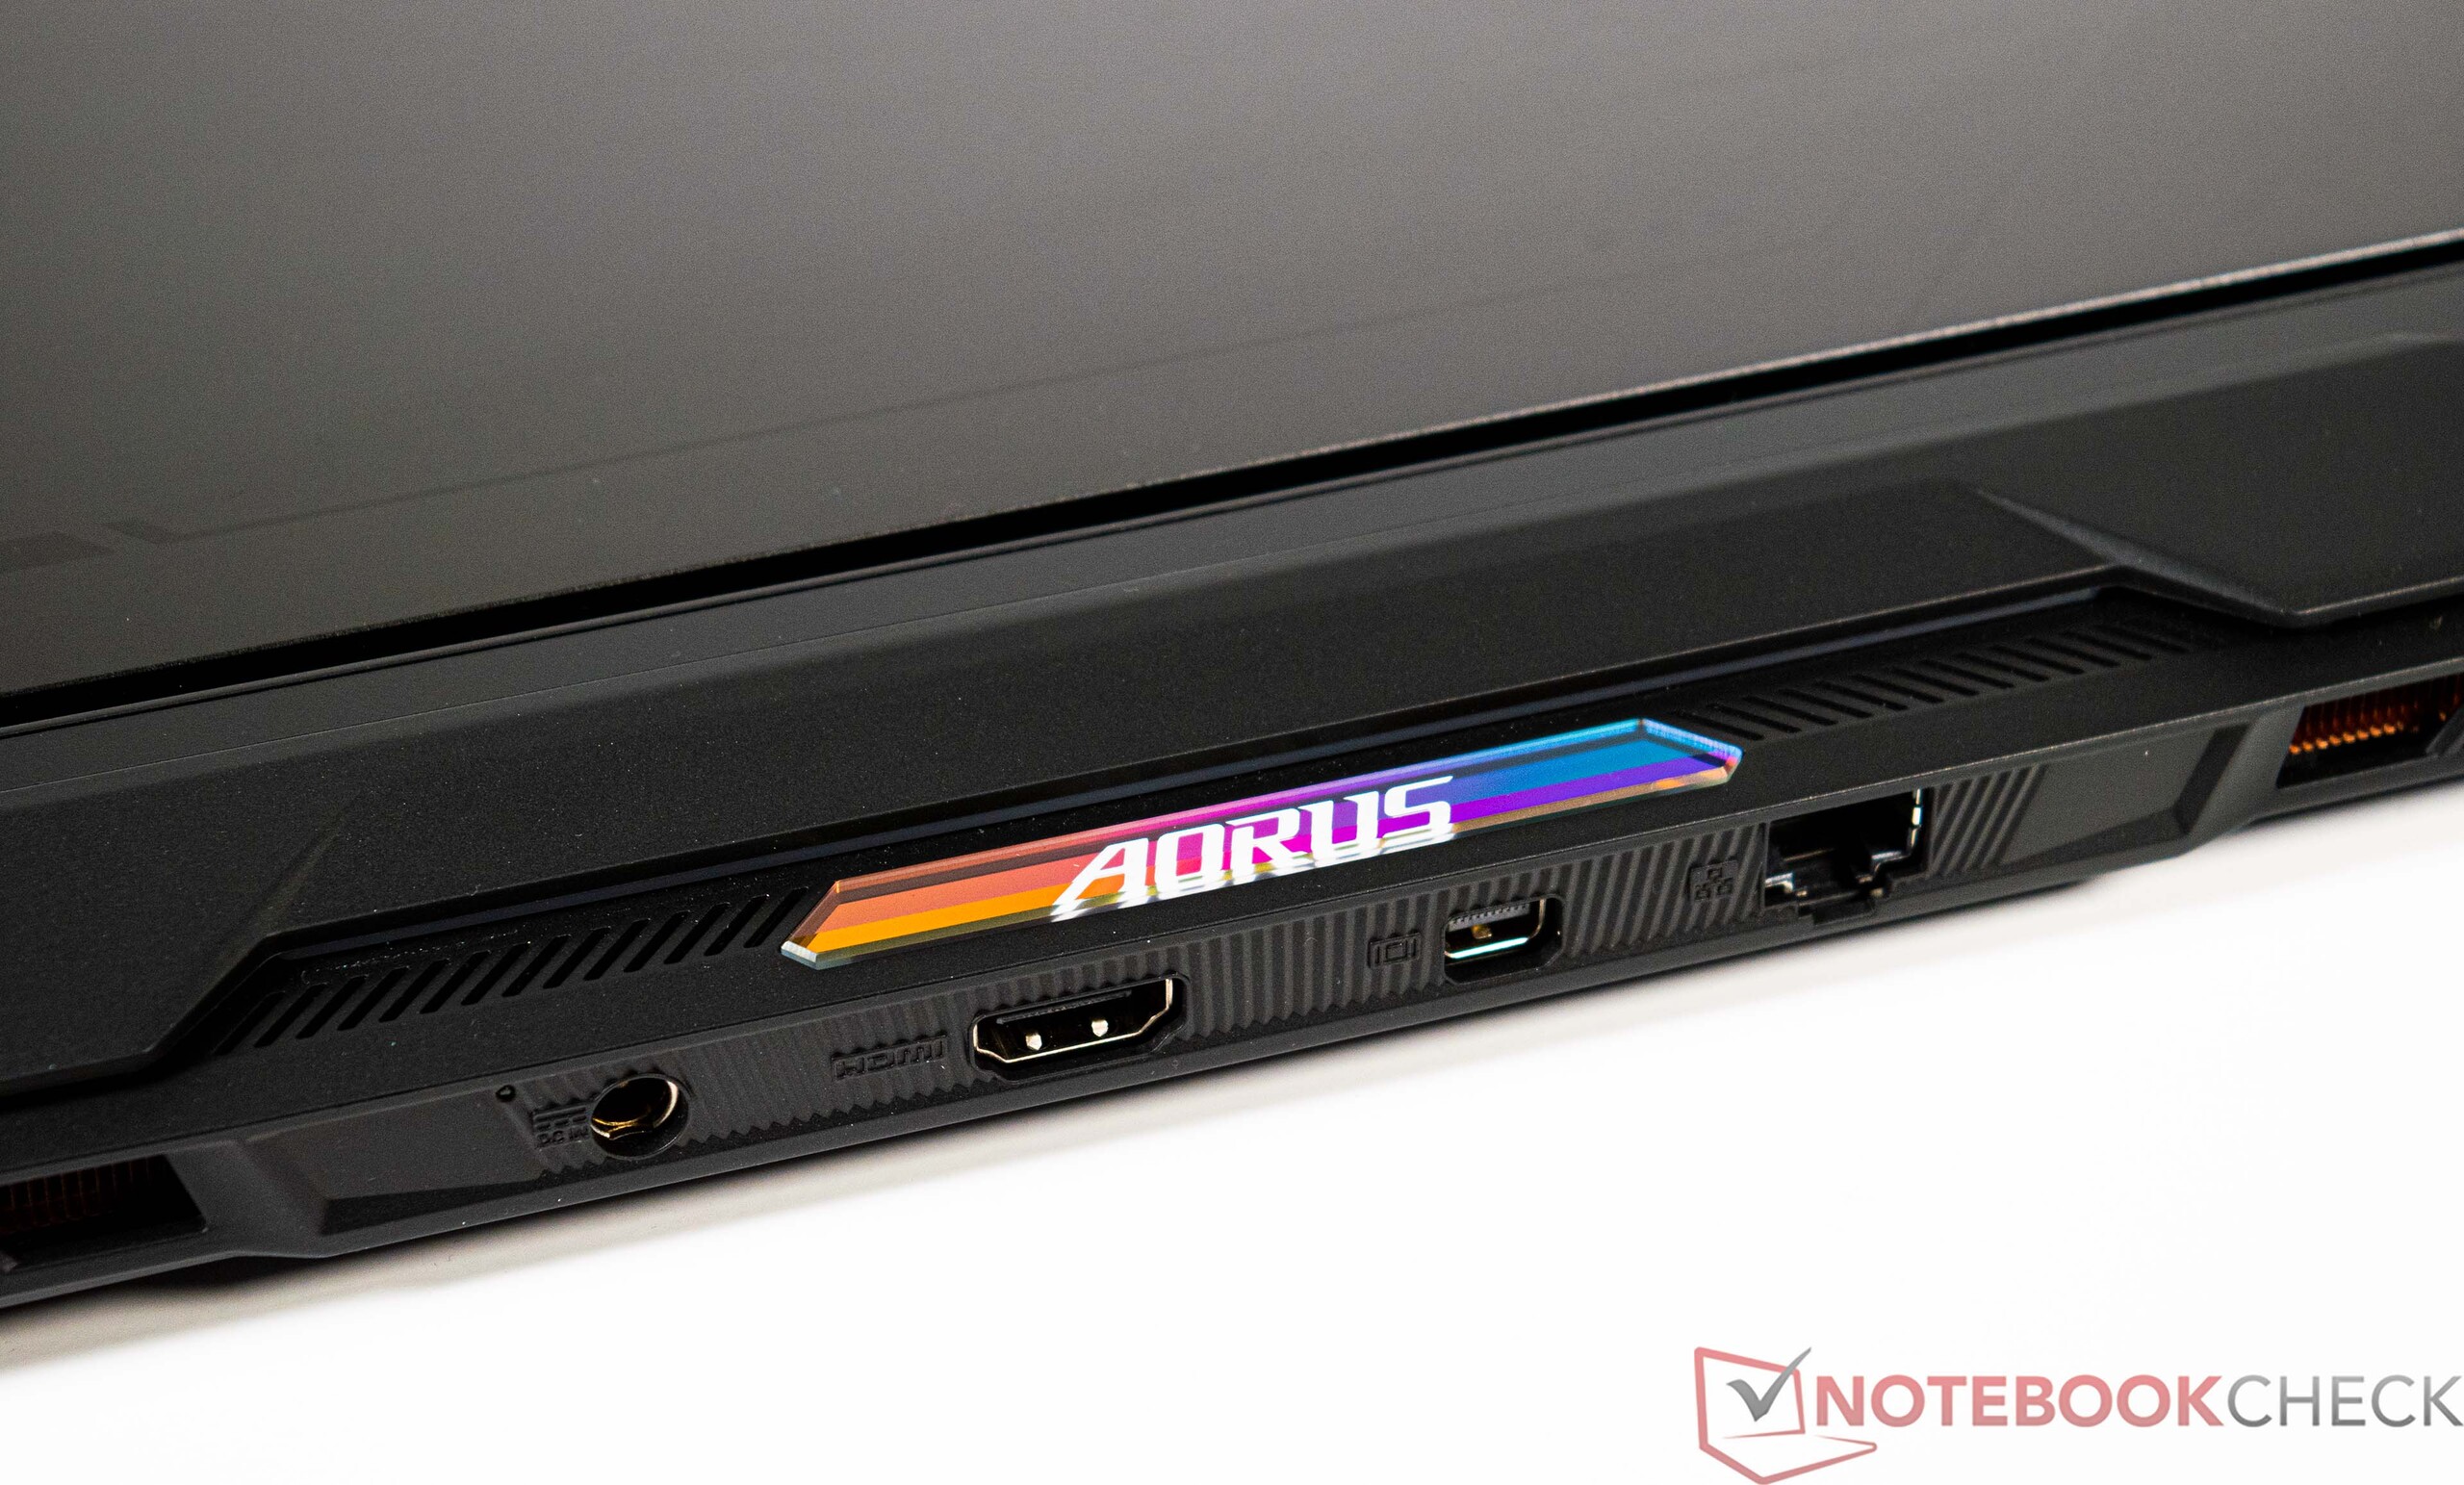
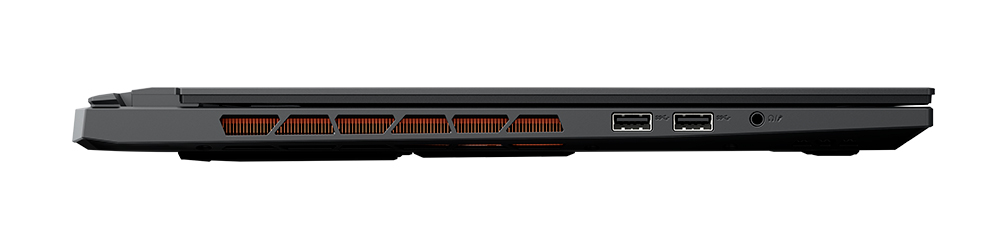
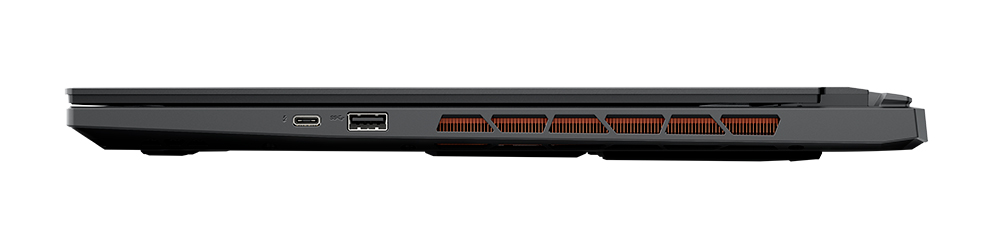
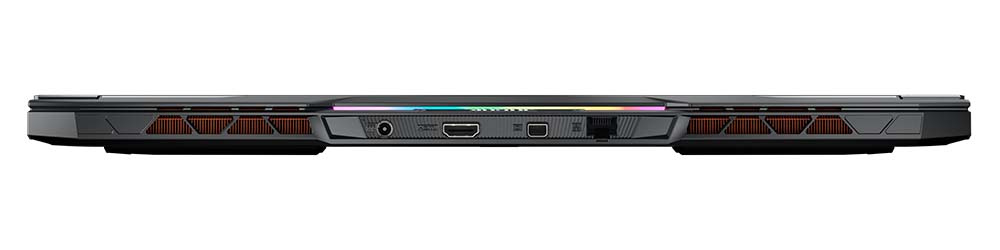
El Aorus 17X AZF por desgracia no ofrece una selección tan amplia de puertos, pero las interfaces disponibles deberían, empero, satisfacer a la mayoría de usuarios. Después de todo, hay un moderno puerto Thunderbolt 4 con Power Delivery (PD) y tres puertos USB convencionales. Mientras tanto, se pueden conectar pantallas externas por HDMI o DisplayPort. La localización de las interfaces es decente, aunque el fabricante no tenía muchas opciones debido a la expansiva construcción de tubos de calor del interior.
Comunicación
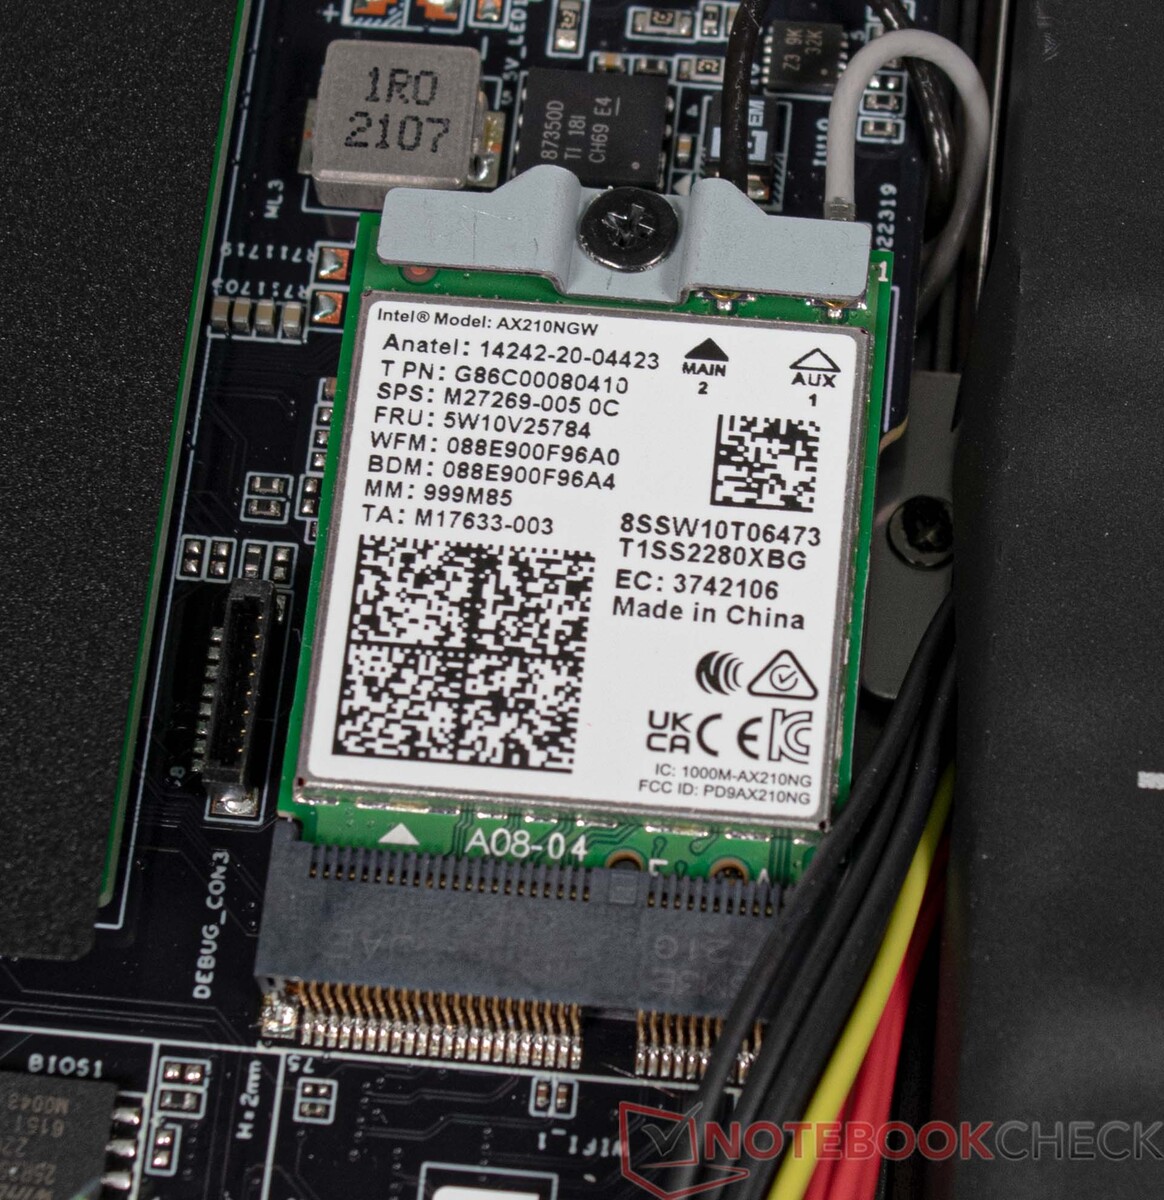
El módulo WLAN instalado ofrece un buen rendimiento, por lo que el Aorus 17X AZF no tiene nada que envidiar a la competencia aquí. Nuestro Asus ROG Rapture GT-AXE11000 se usó como router de pruebas. Alternativamente, el Aorus 17X AZF también ofrece un puerto Ethernet, que ofrece tasas de hasta 2.5 GBit/s.
Cámara web
La webcam del Aorus 17X AZF tiene capacidad FHD, lo que la hace adecuada para videotelefonía sencilla. Se le restaron algunos puntos debido a la falta de fidelidad de color. El micrófono dual-array, por otro lado, hace una buena labor, ya que las grabaciones desde diferentes direcciones se reproducen a un volumen similar.


Mantenimiento
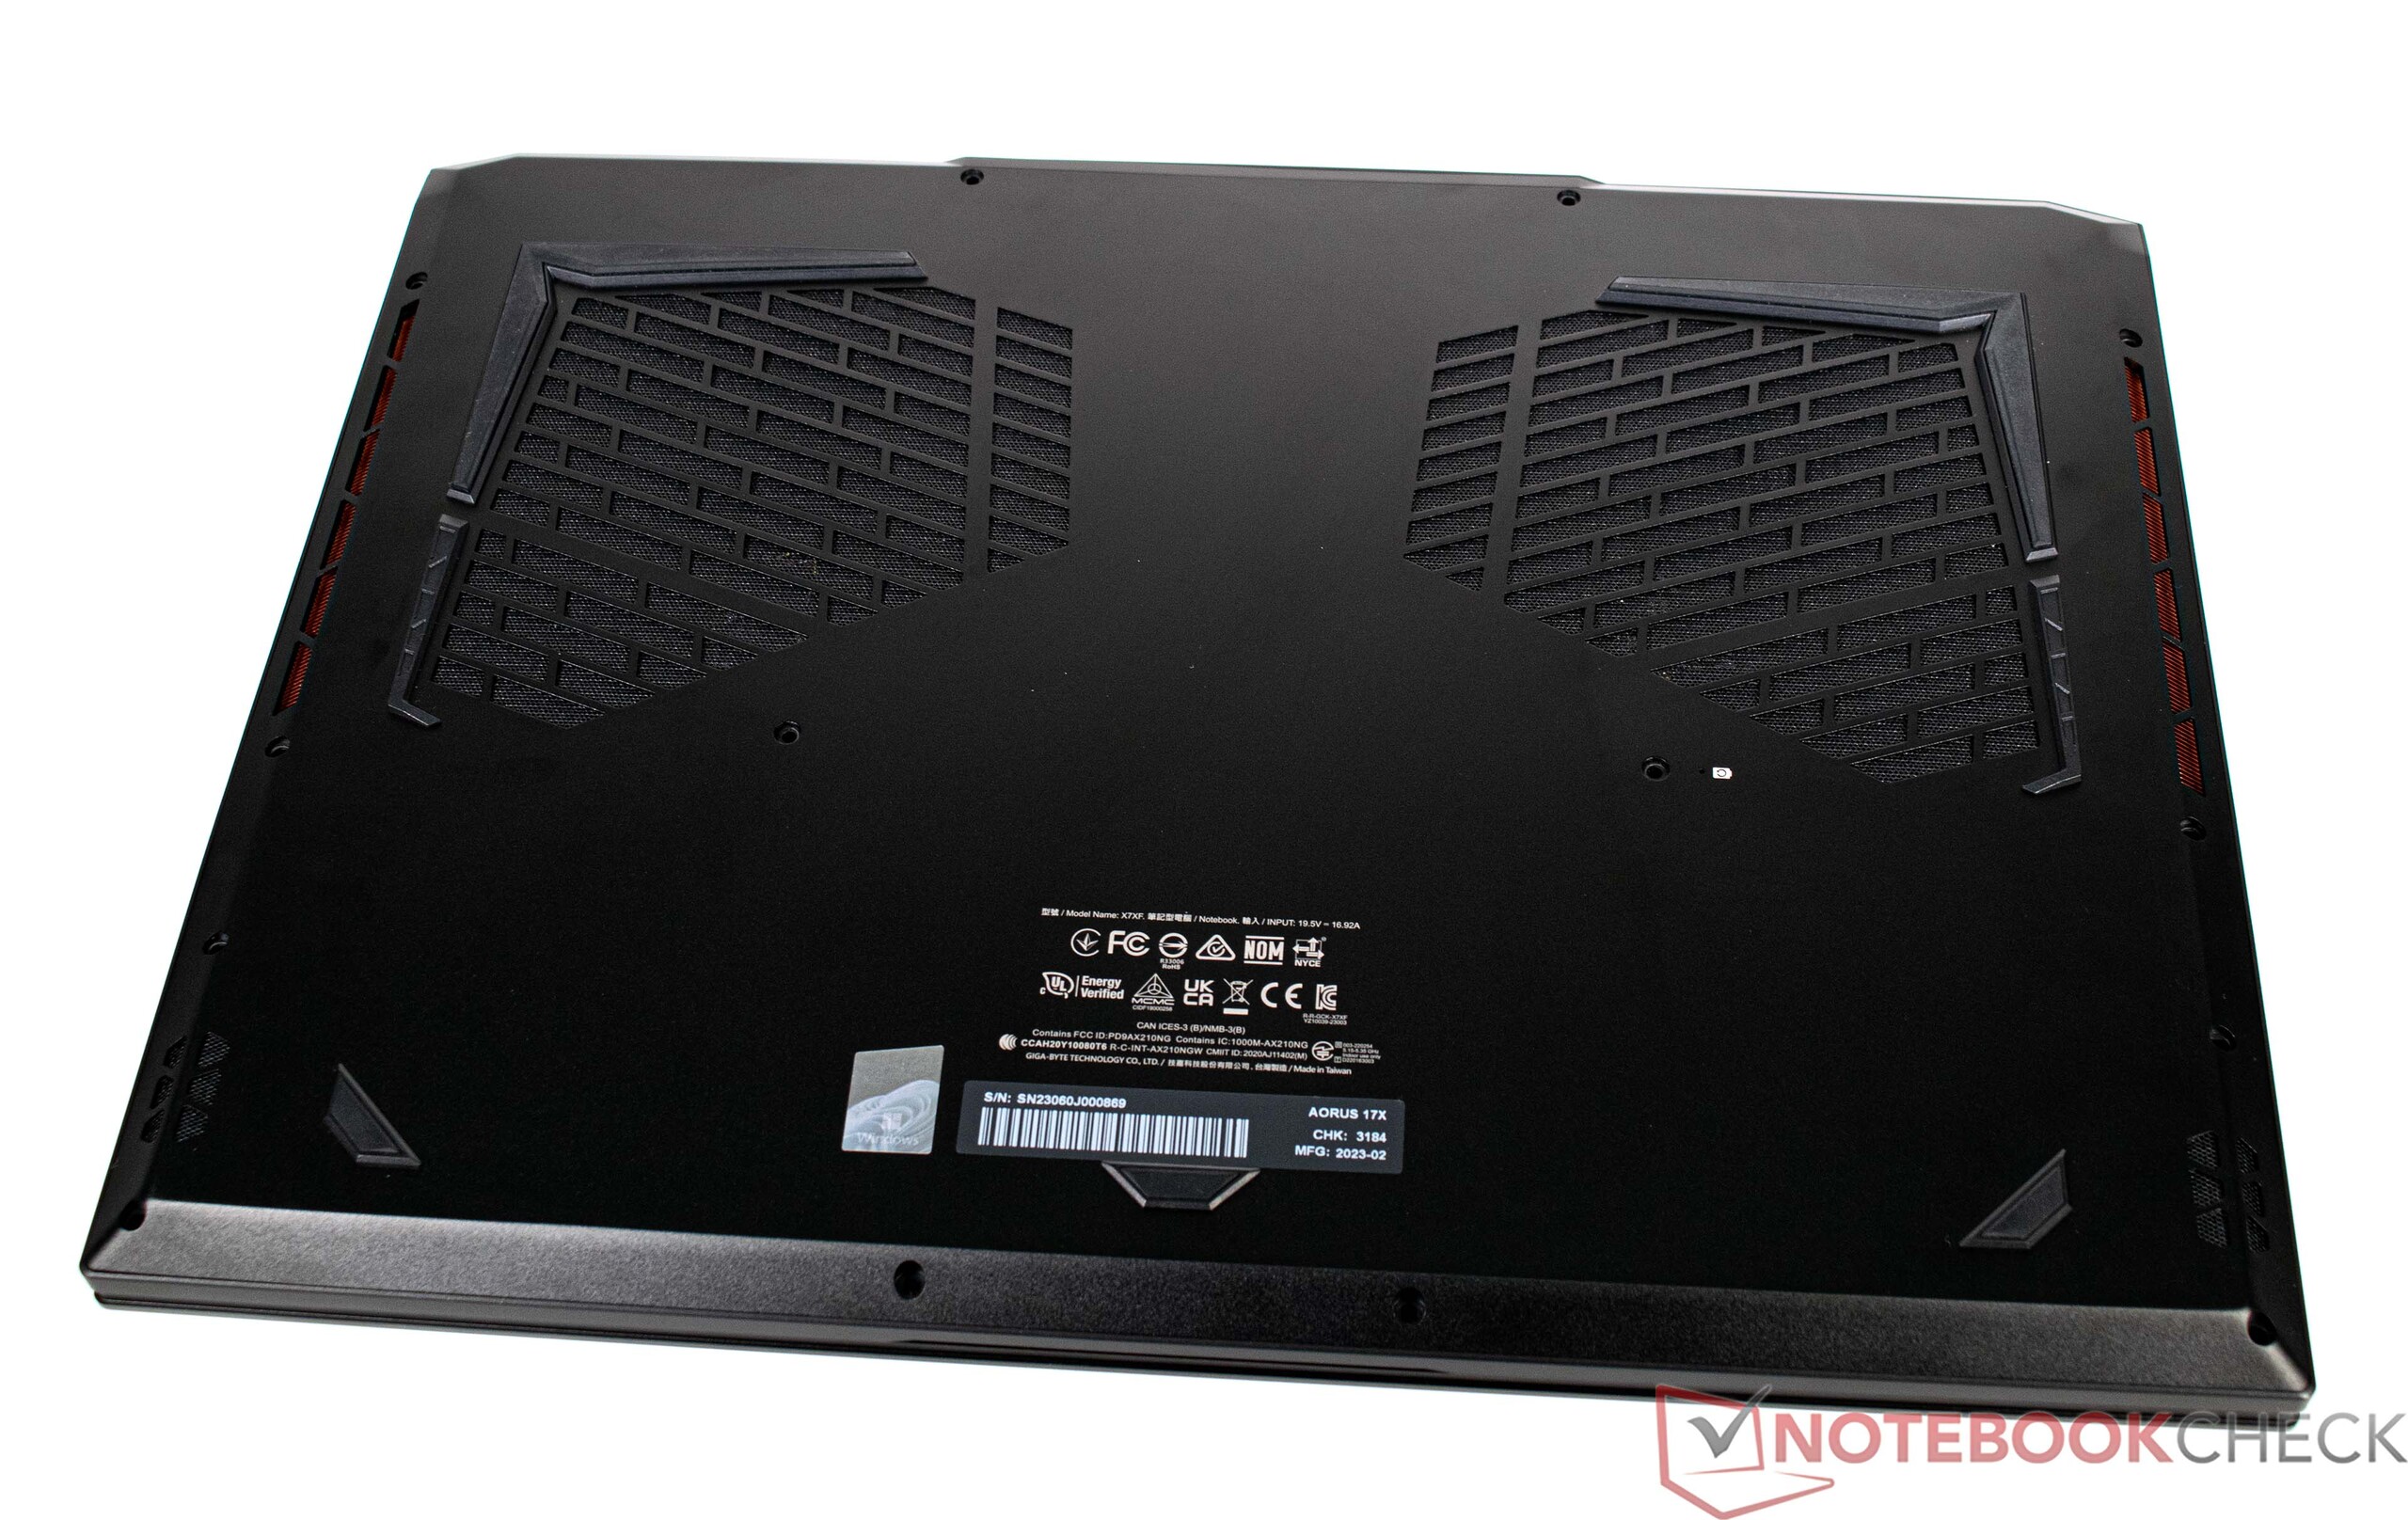
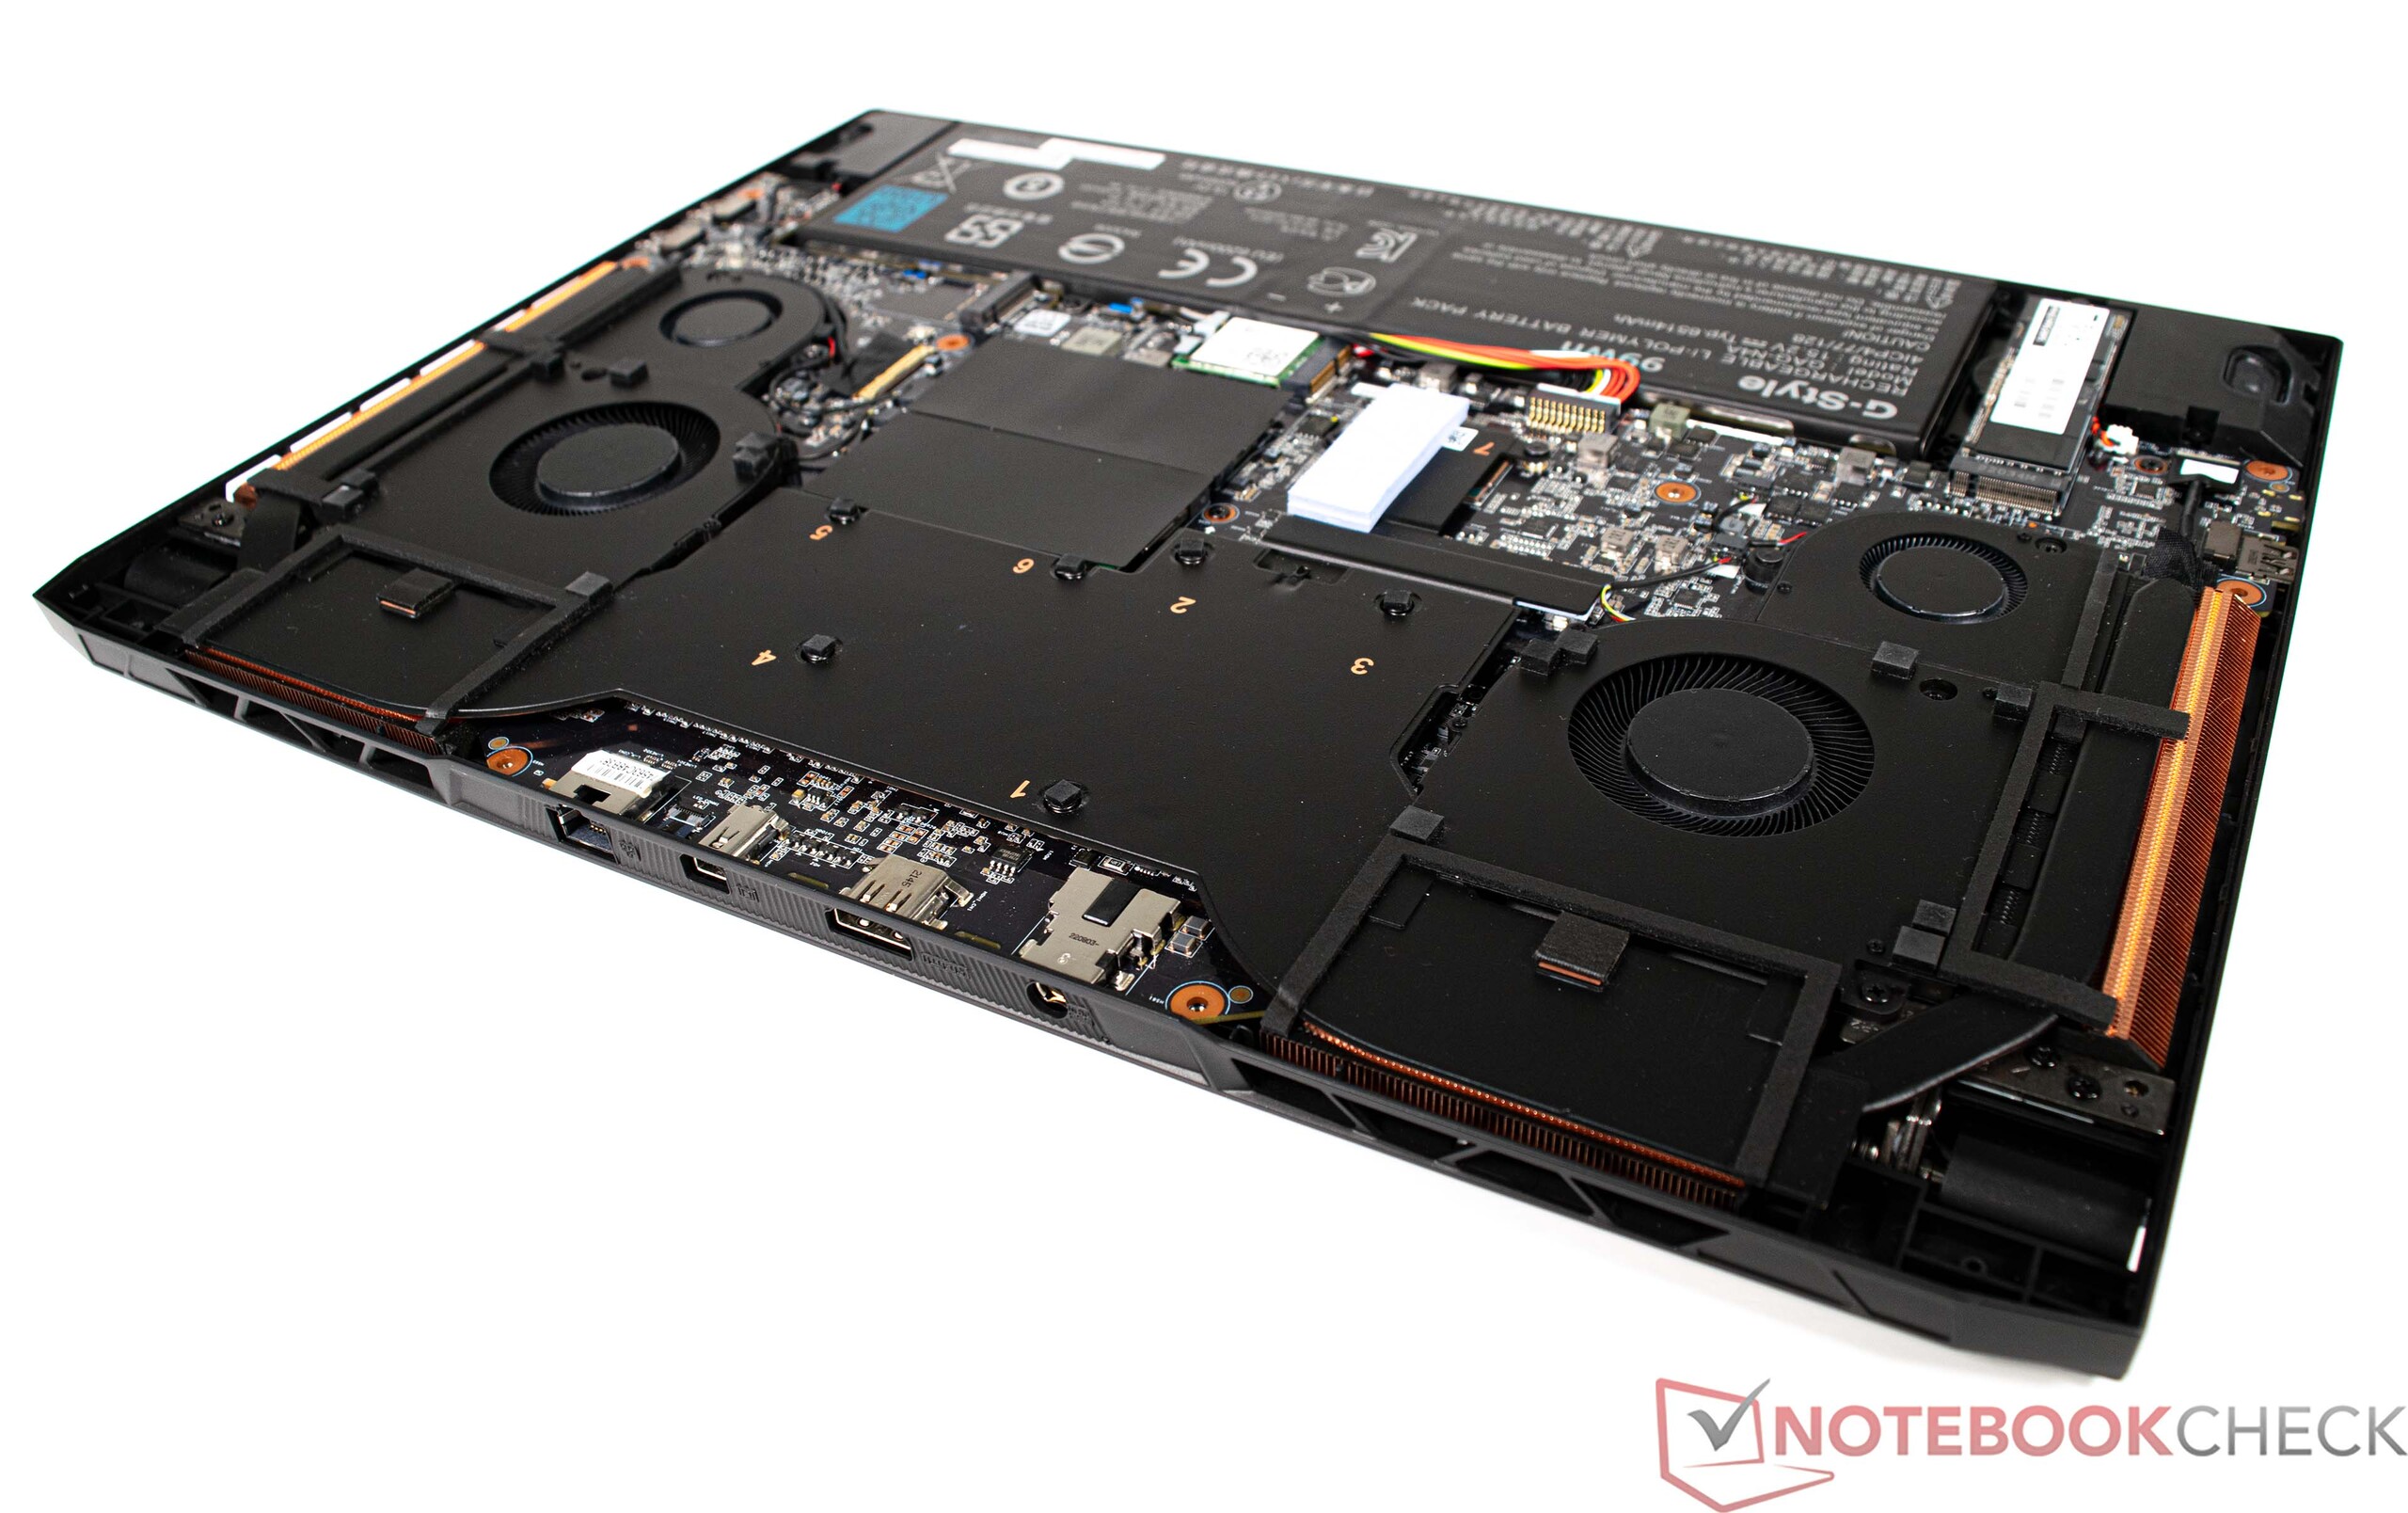
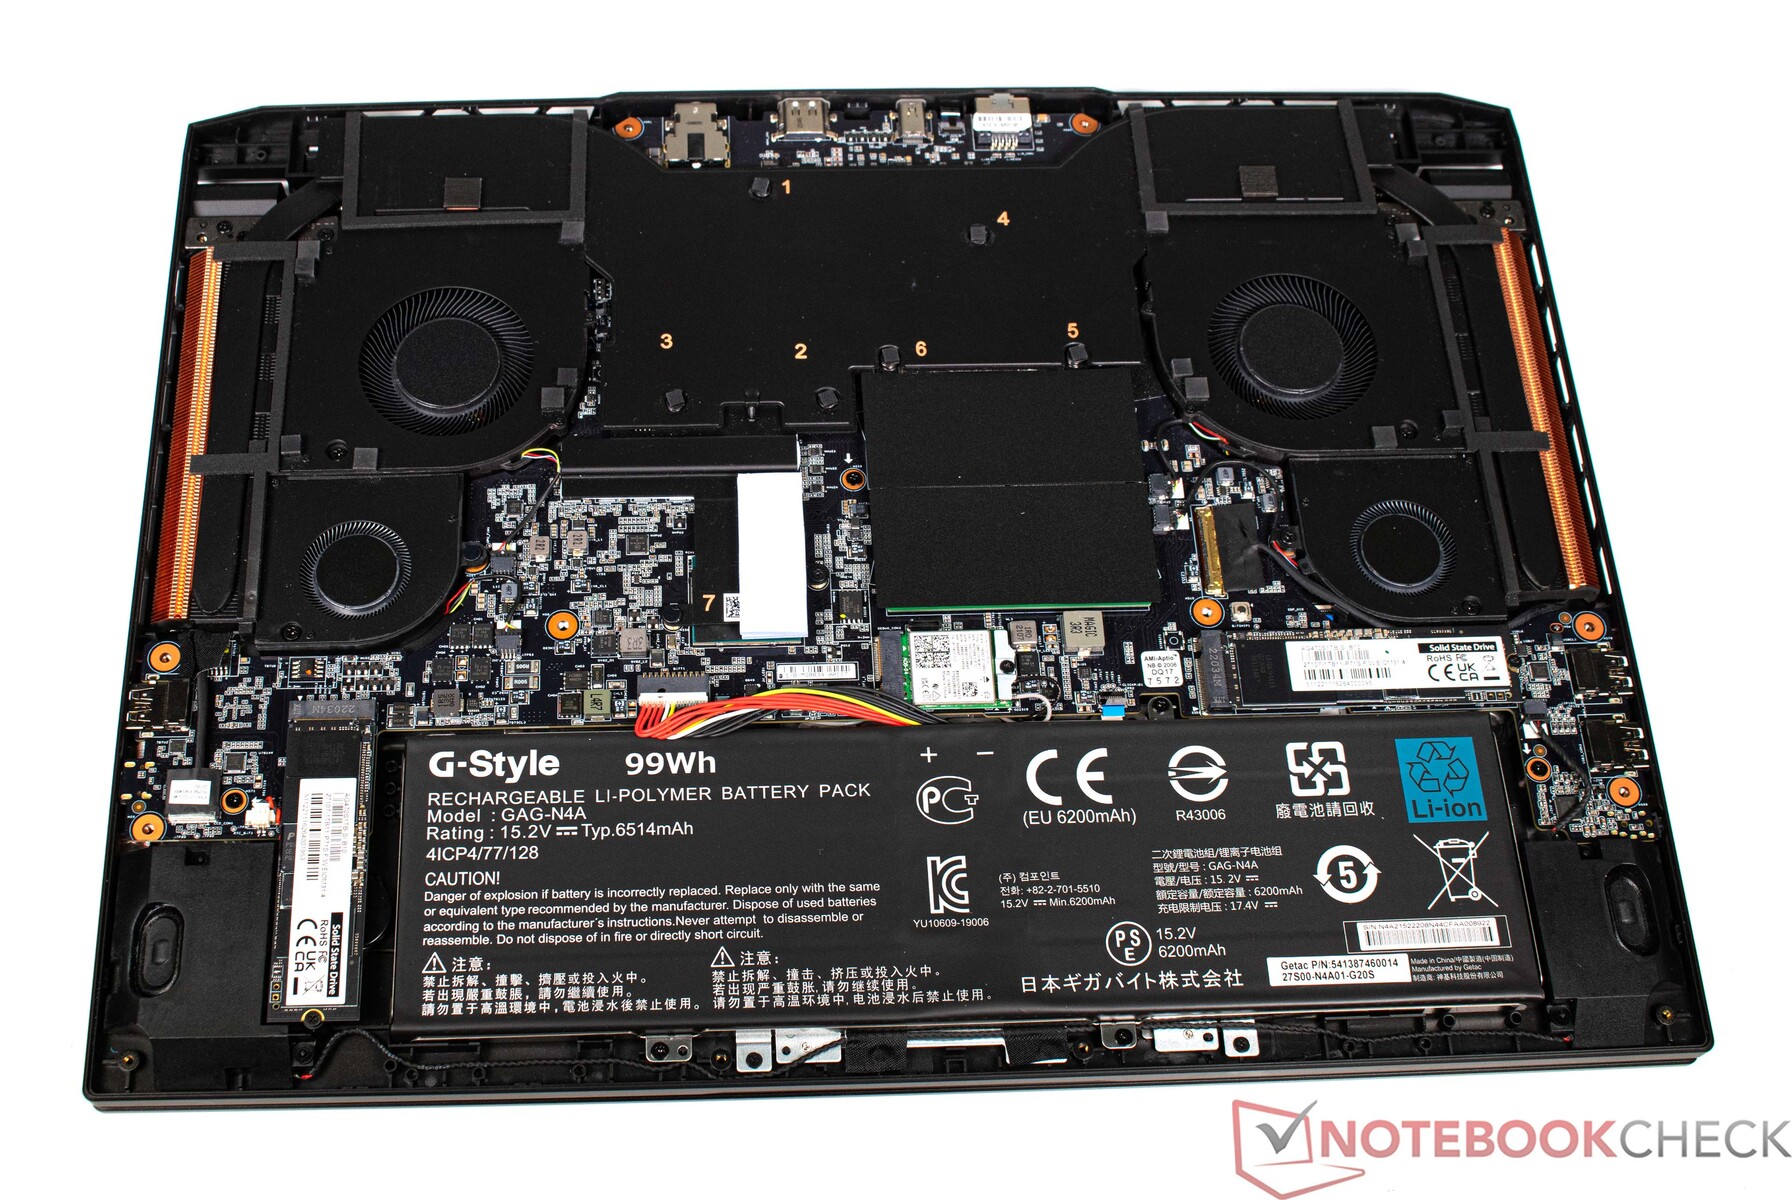
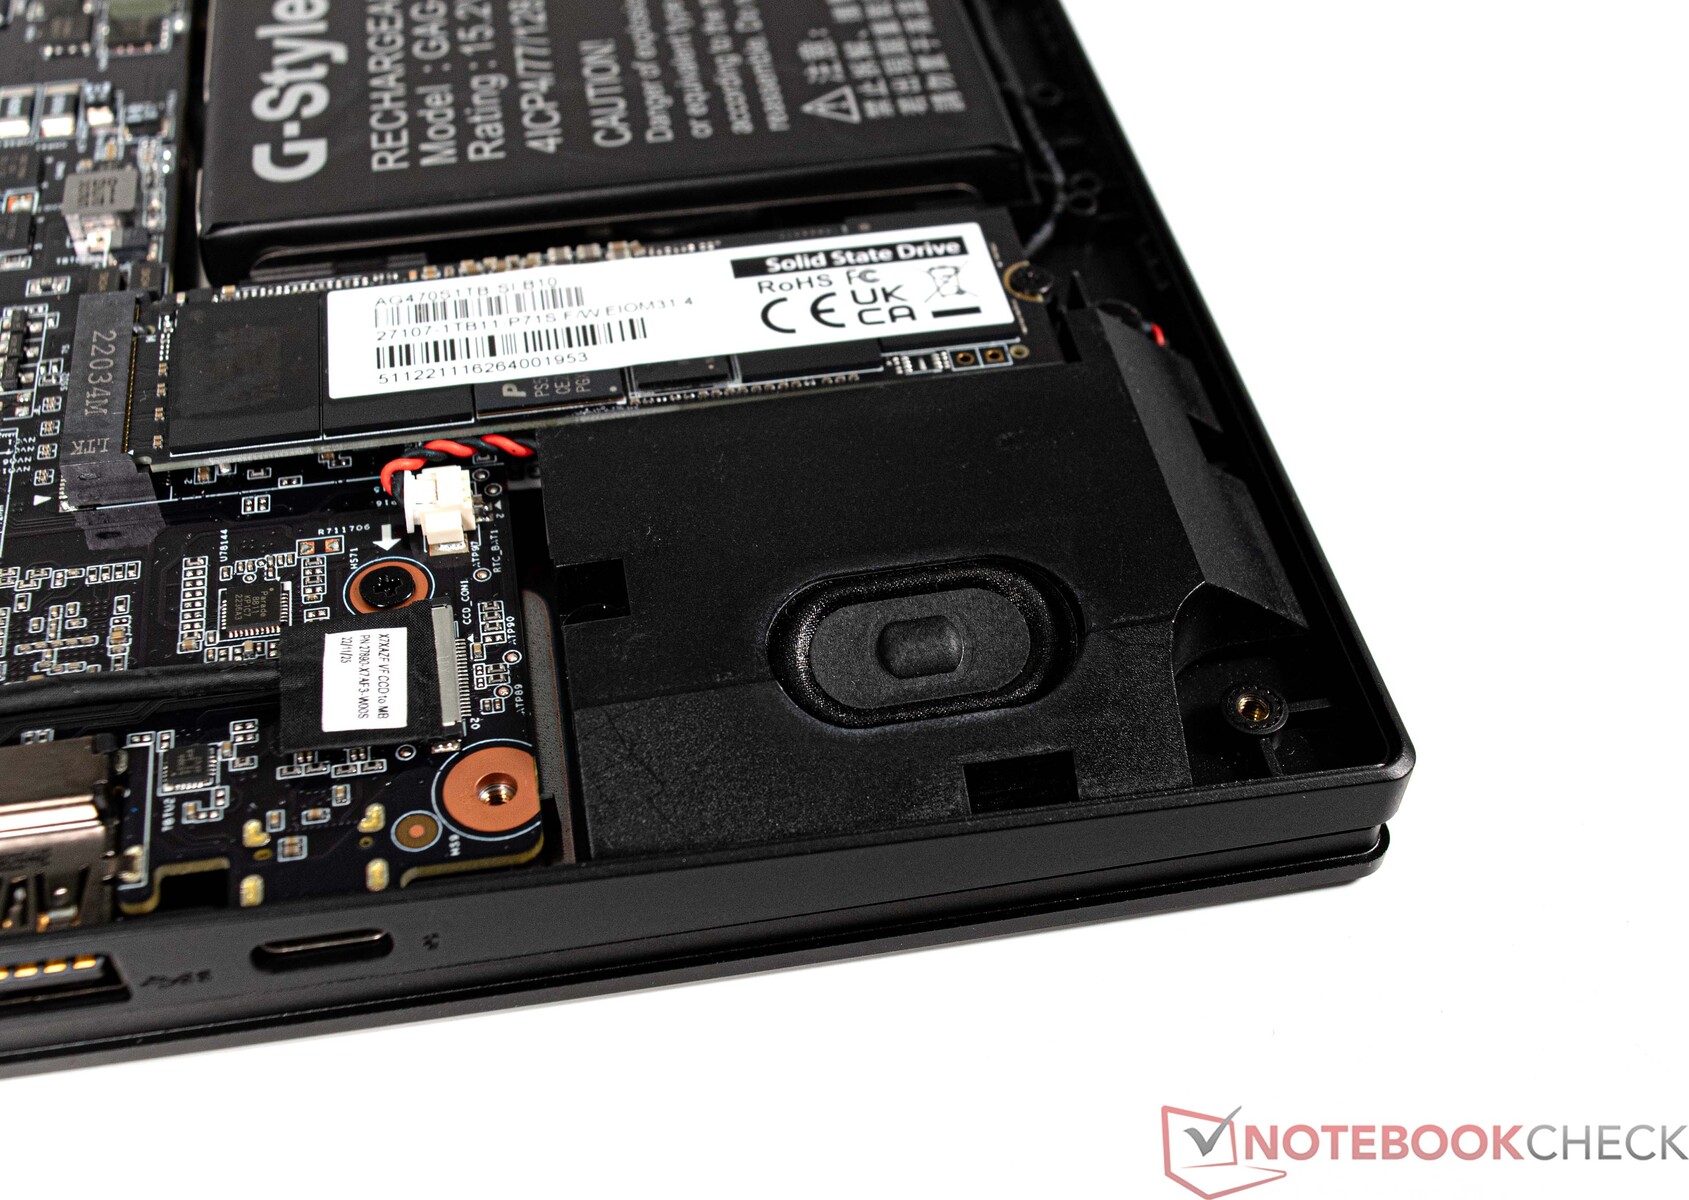
Los trabajos de mantenimiento son fundamentalmente posibles en el Aorus 17X AZF. Sin embargo, la placa base, que está sujeta con numerosos tornillos, tiene que retirarse para ello. Todo lo importante está bajo la placa base, como los cuatro ventiladores, el almacenamiento masivo y la RAM. En nuestro caso, el portátil está completamente equipado y no hay ranuras libres para RAM o SSD.
Garantía
En Alemania, el Aorus 17X AZF tiene una garantía de 24 meses con servicio de recogida y devolución incluido. Esto, por supuesto, puede variar de un país a otro, por lo que los compradores deben volver a comprobarlo antes de la compra.
Software
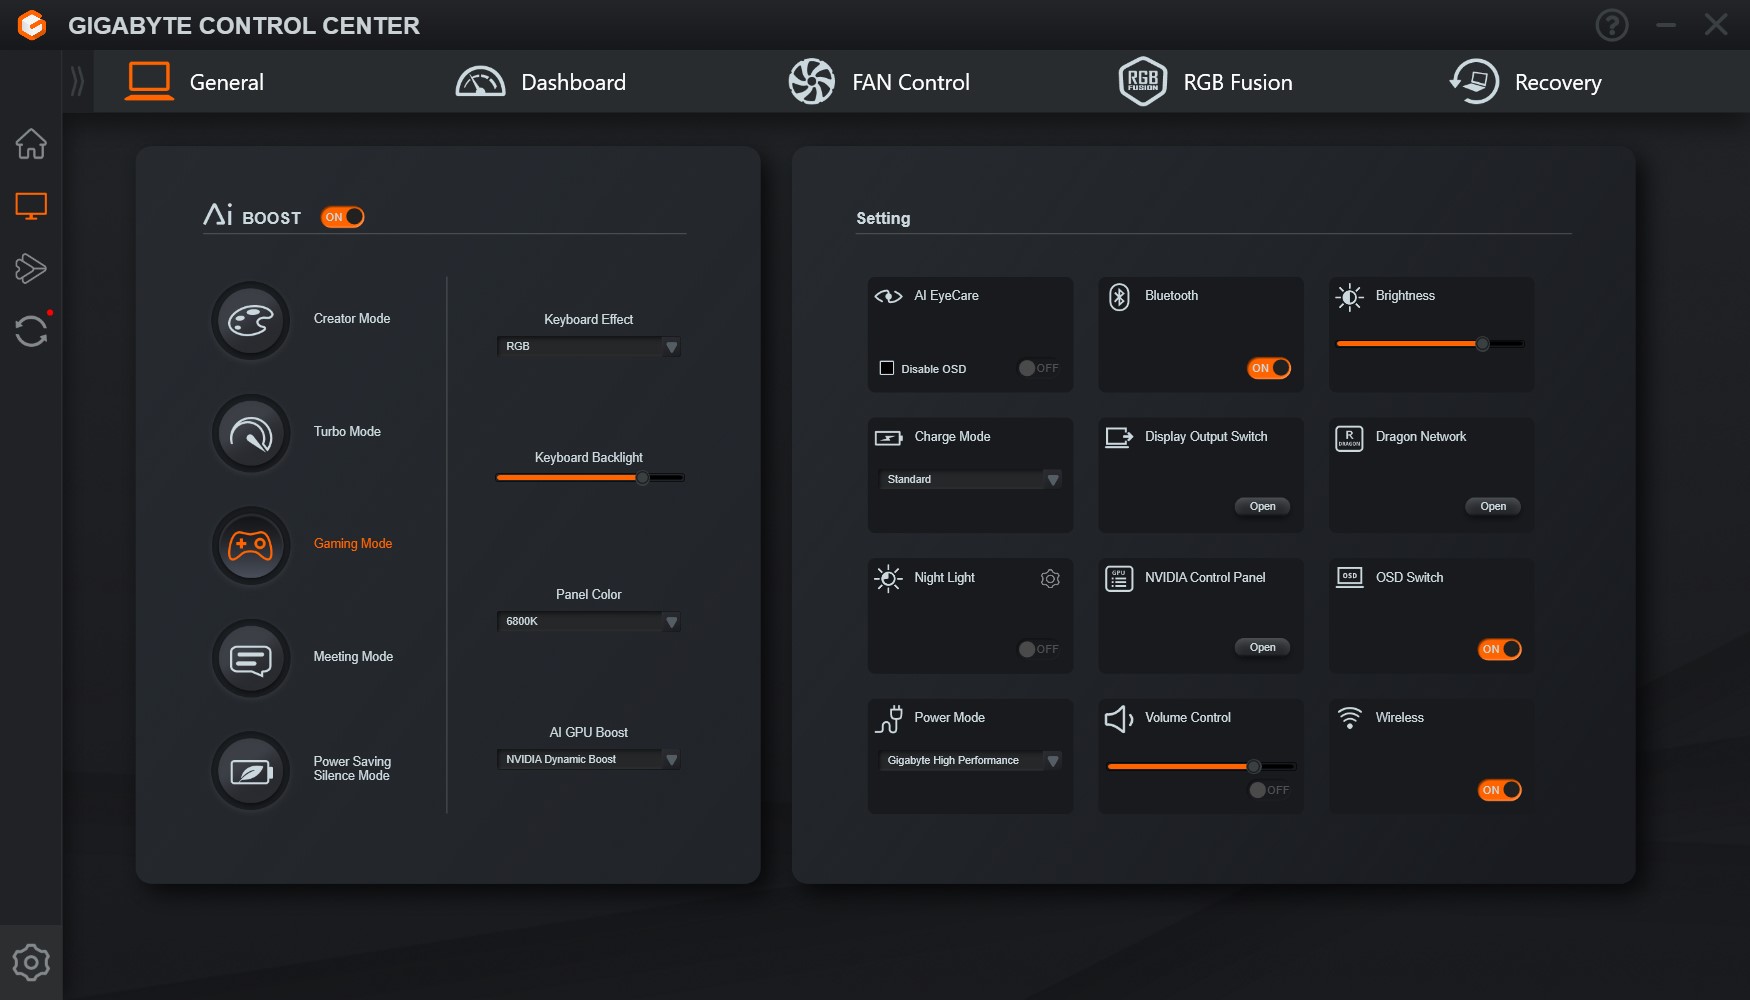
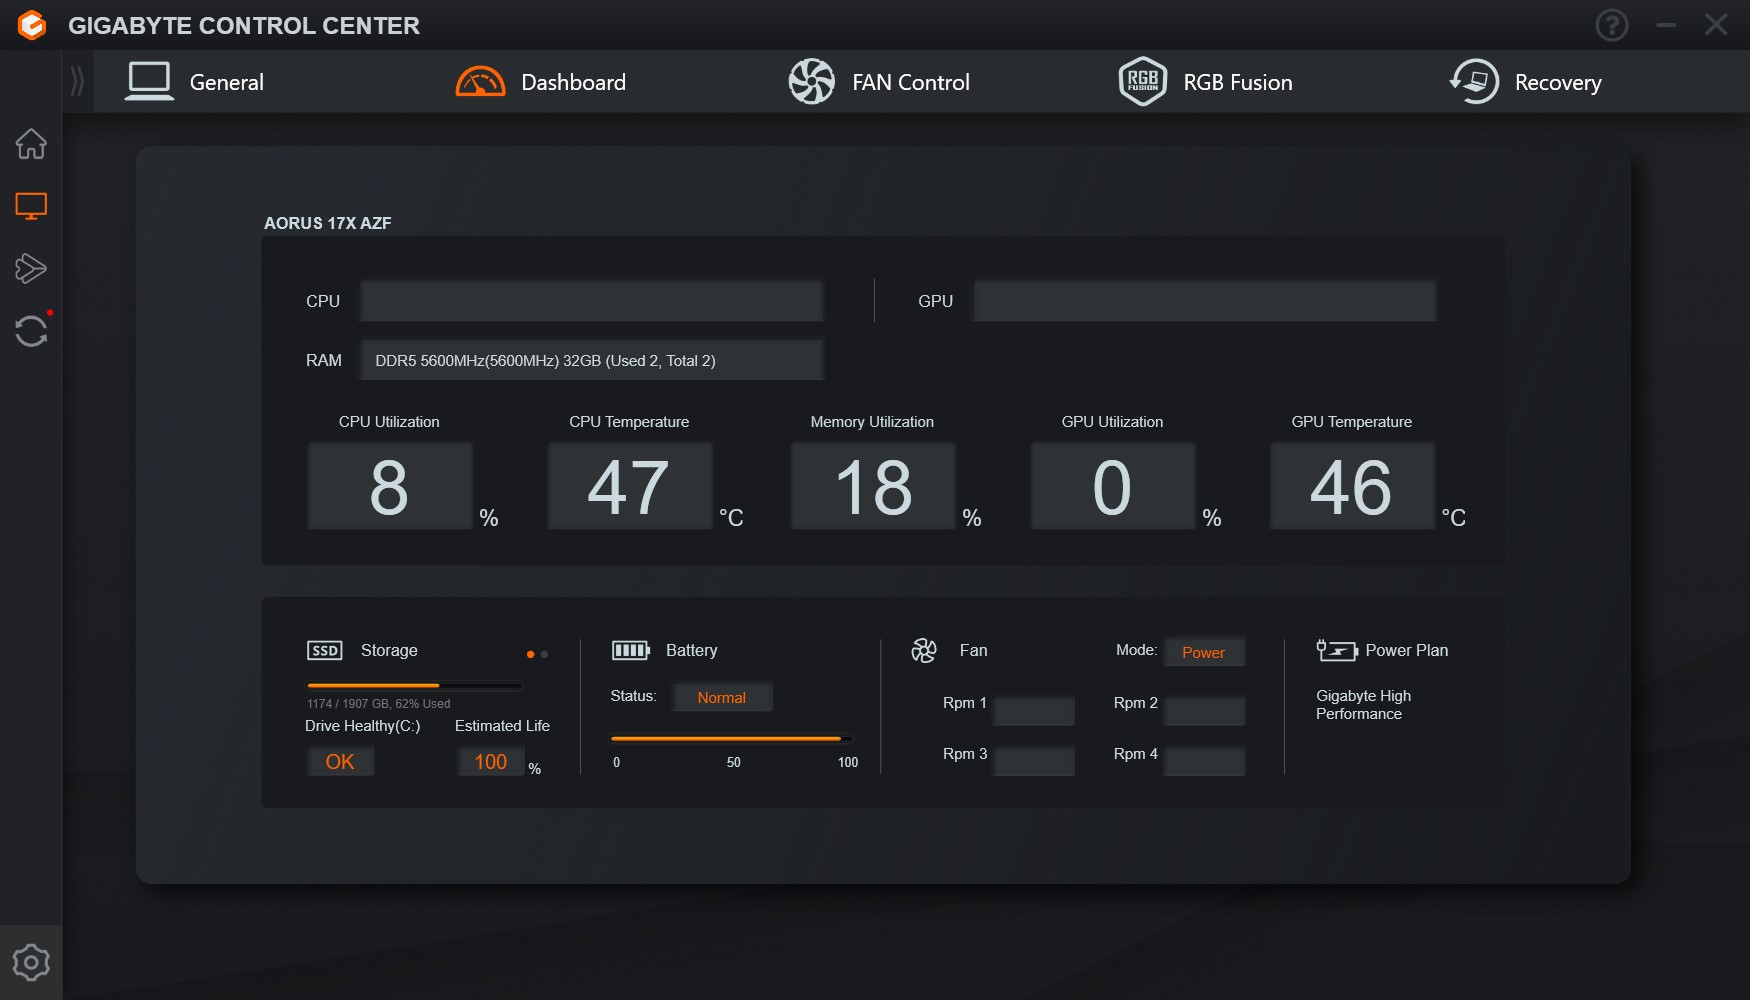
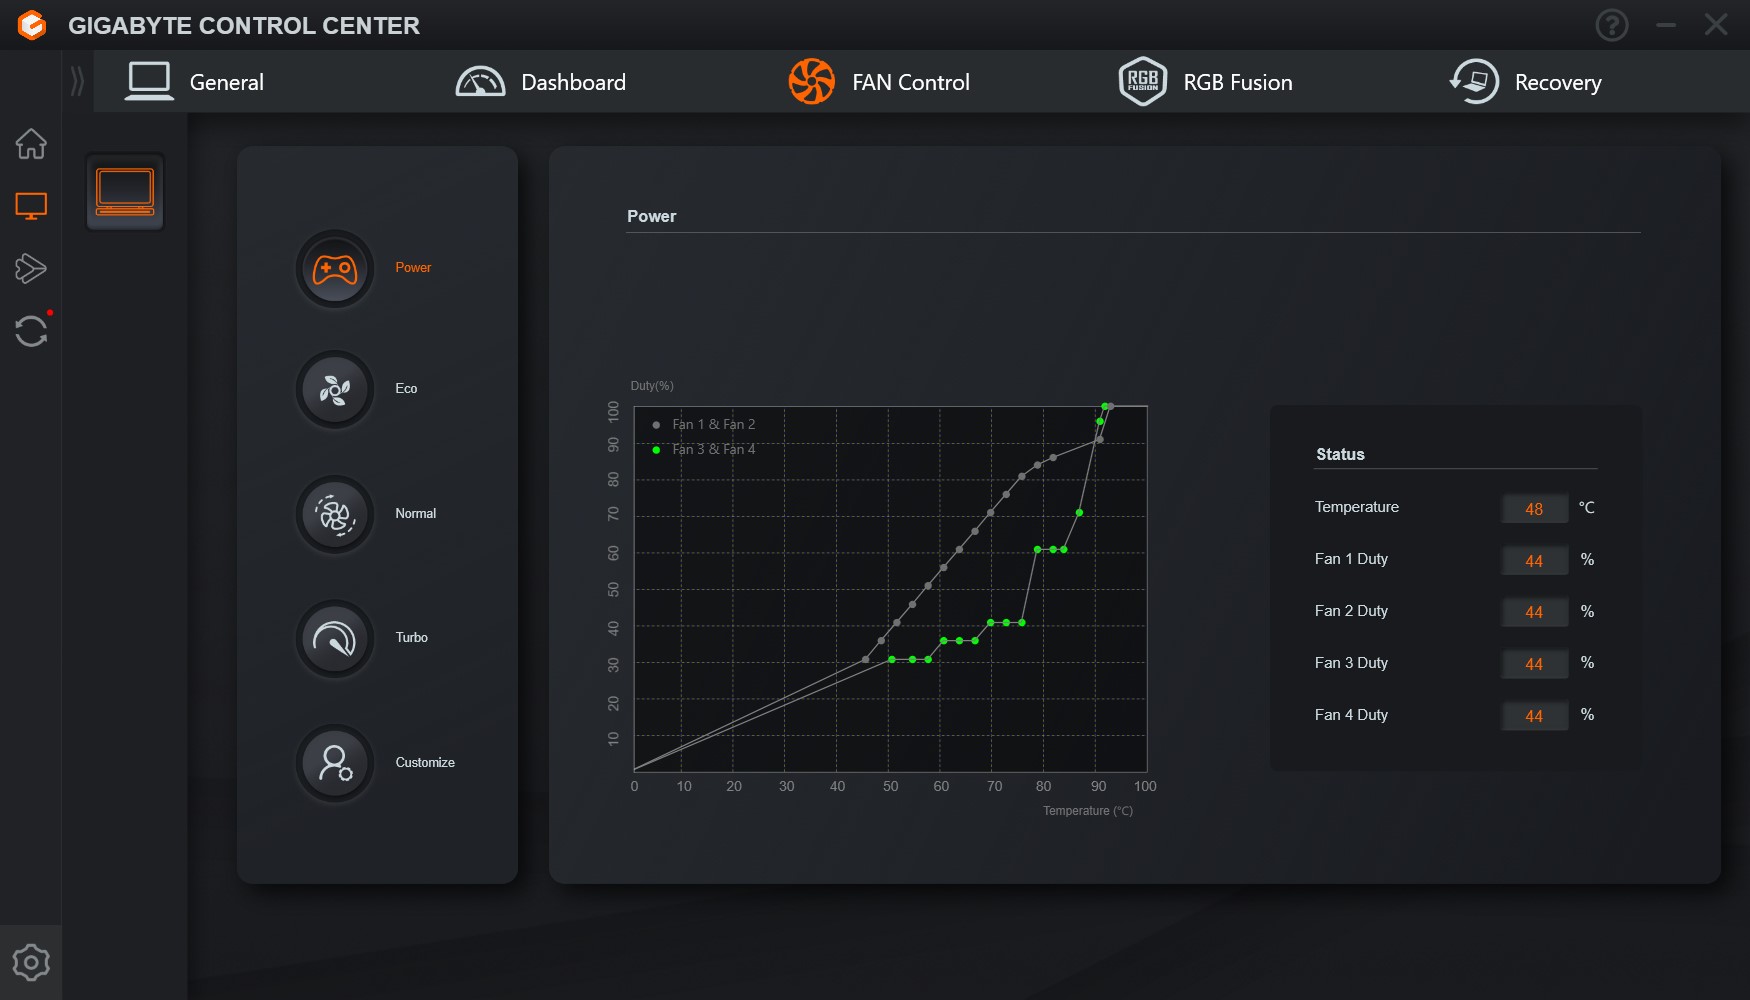
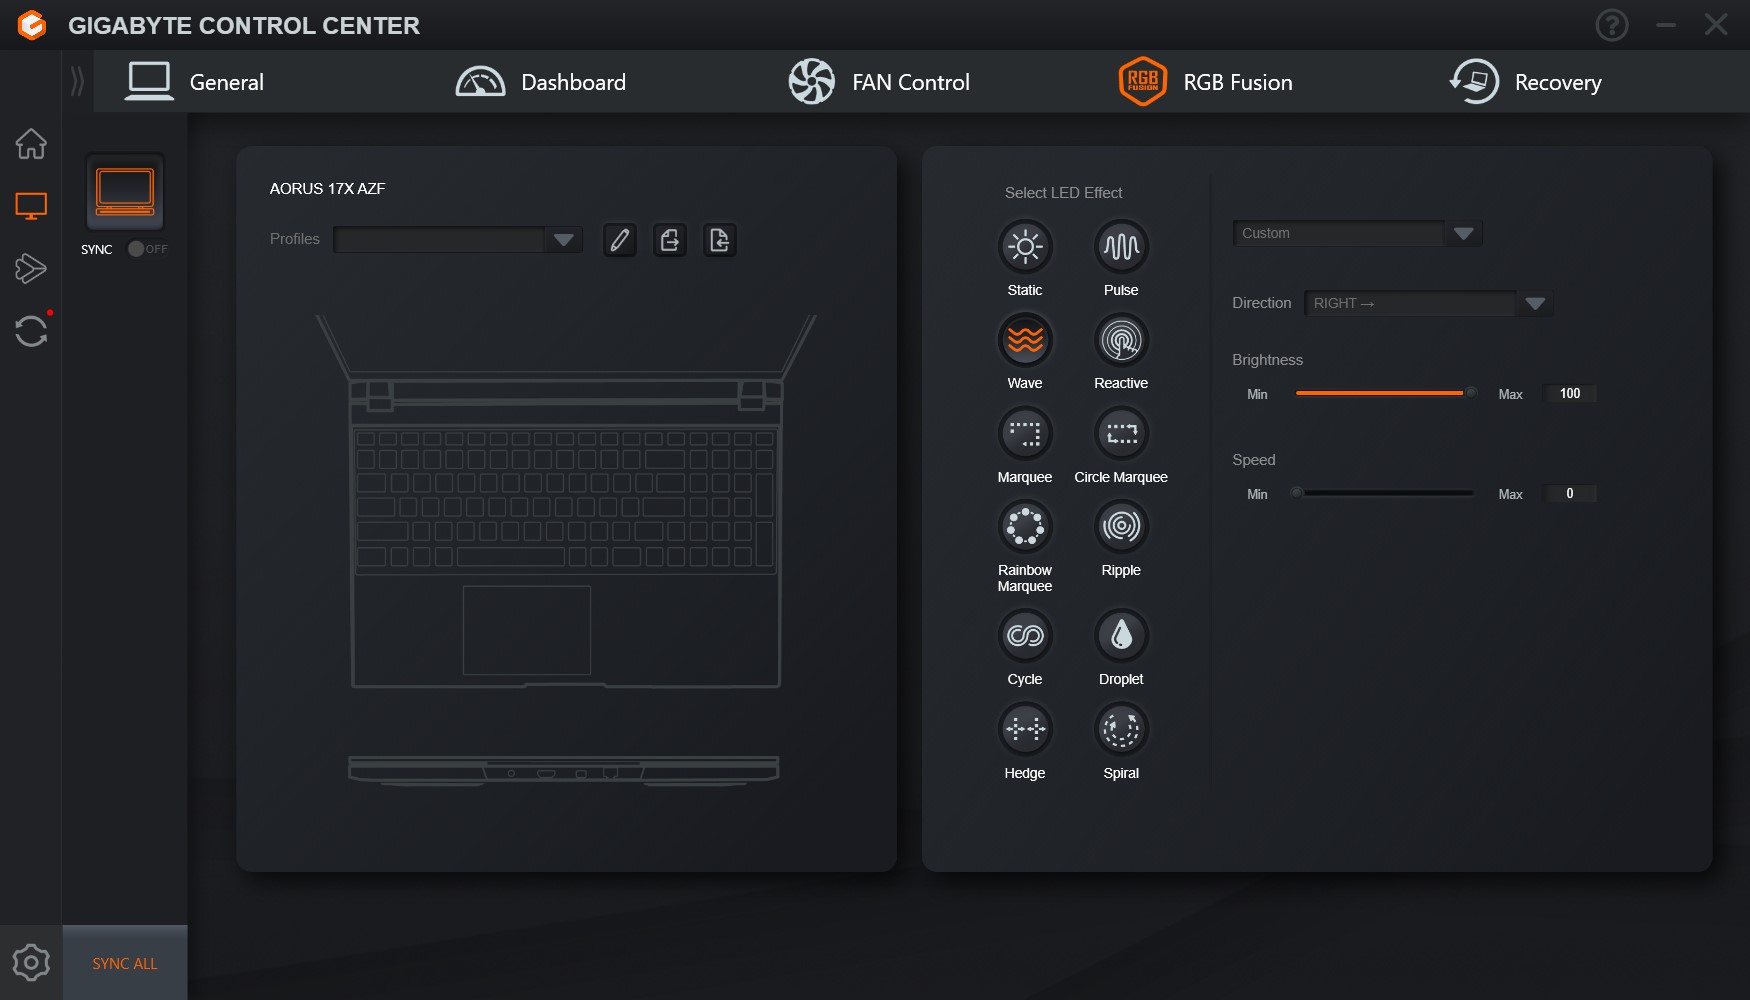
El Gigabyte Control Center (GCC) se usa para controlar y monitorizar los componentes del Aorus 17X AZF. En nuestras pruebas no encontramos problemas con GCC, que puede usarse para regular el rendimiento del portátil y así influir en el ruido de fondo. La curva del ventilador puede ajustarse un poco a través de la pestaña FAN Control. Además, se puede seleccionar un gran número de efectos de retroiluminación para el teclado.
Dispositivos de entrada
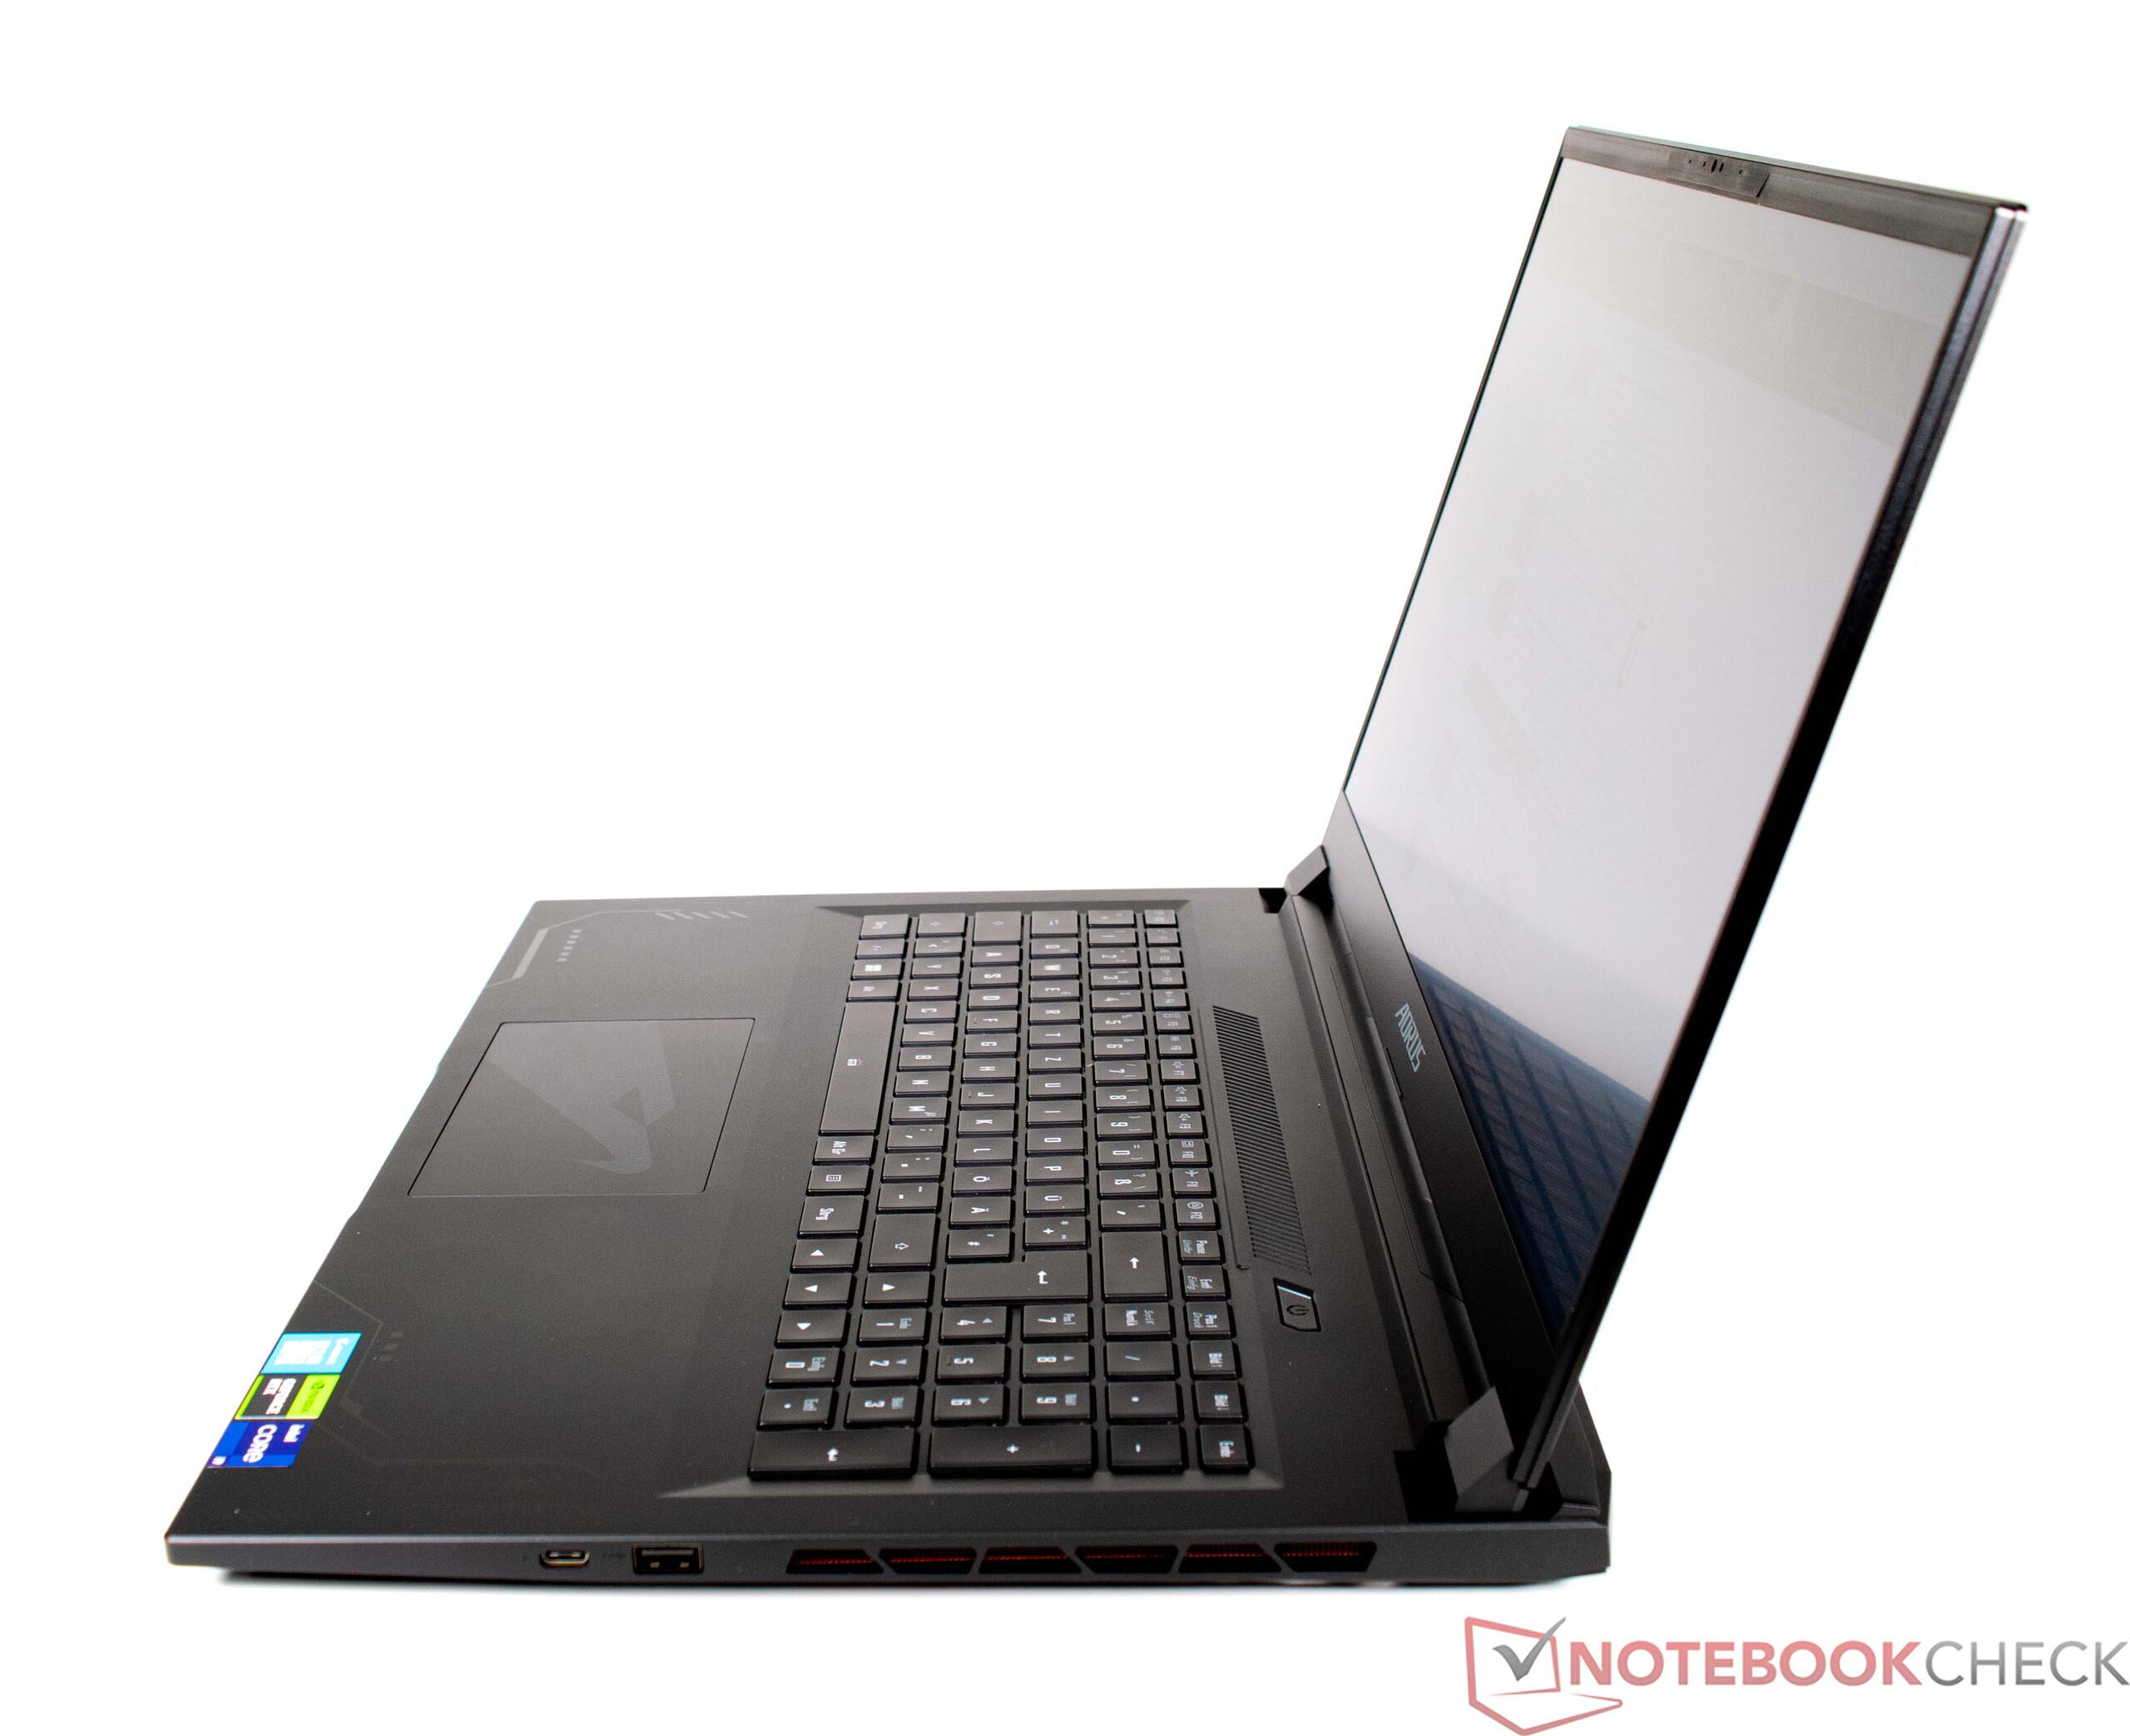
Teclado
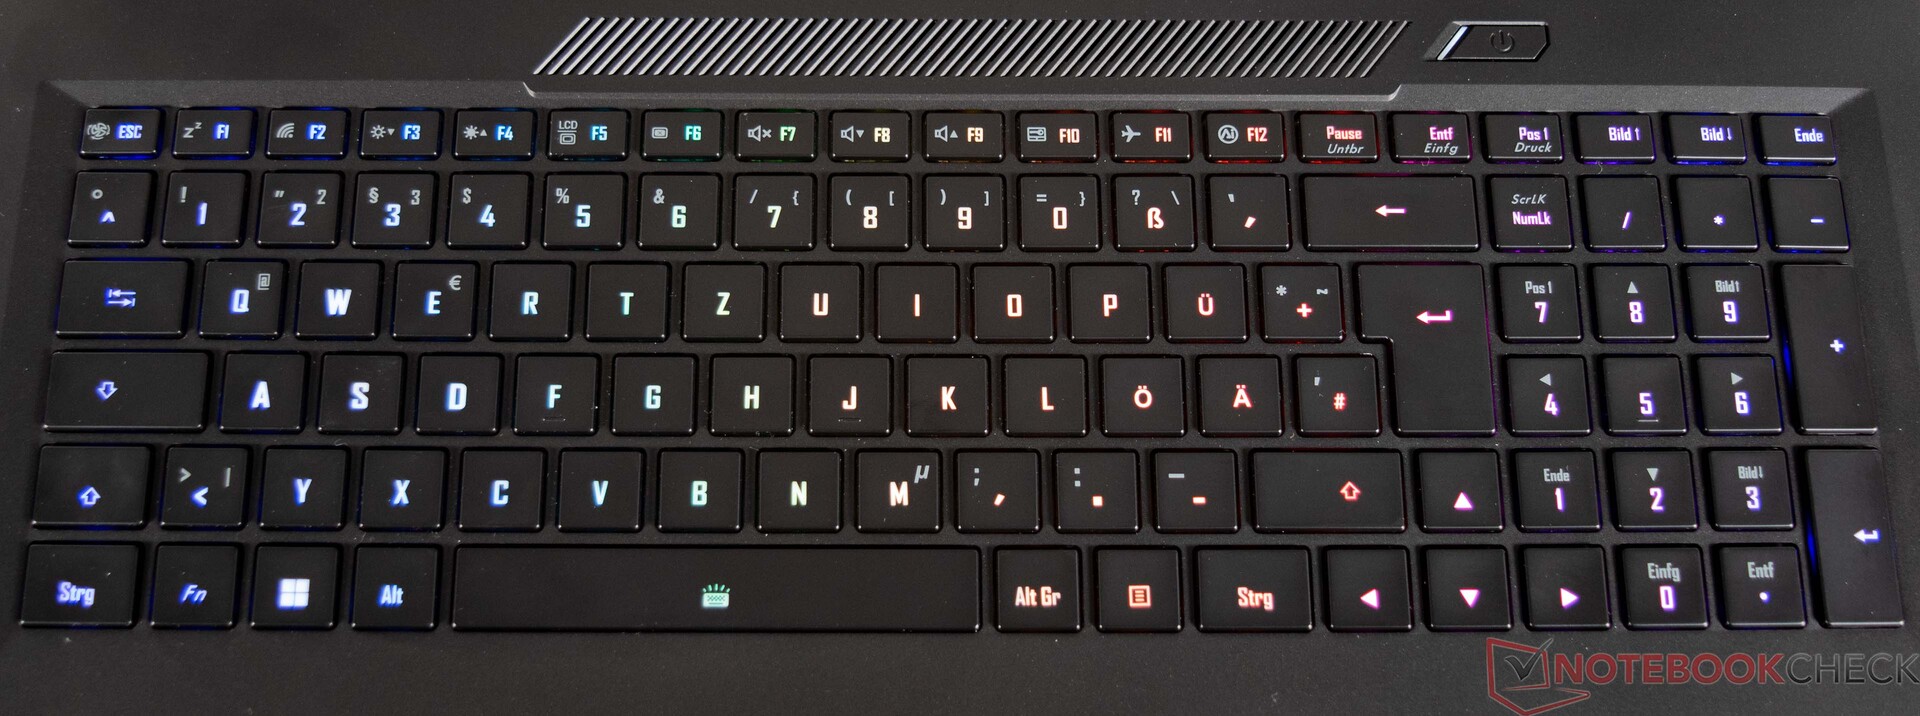
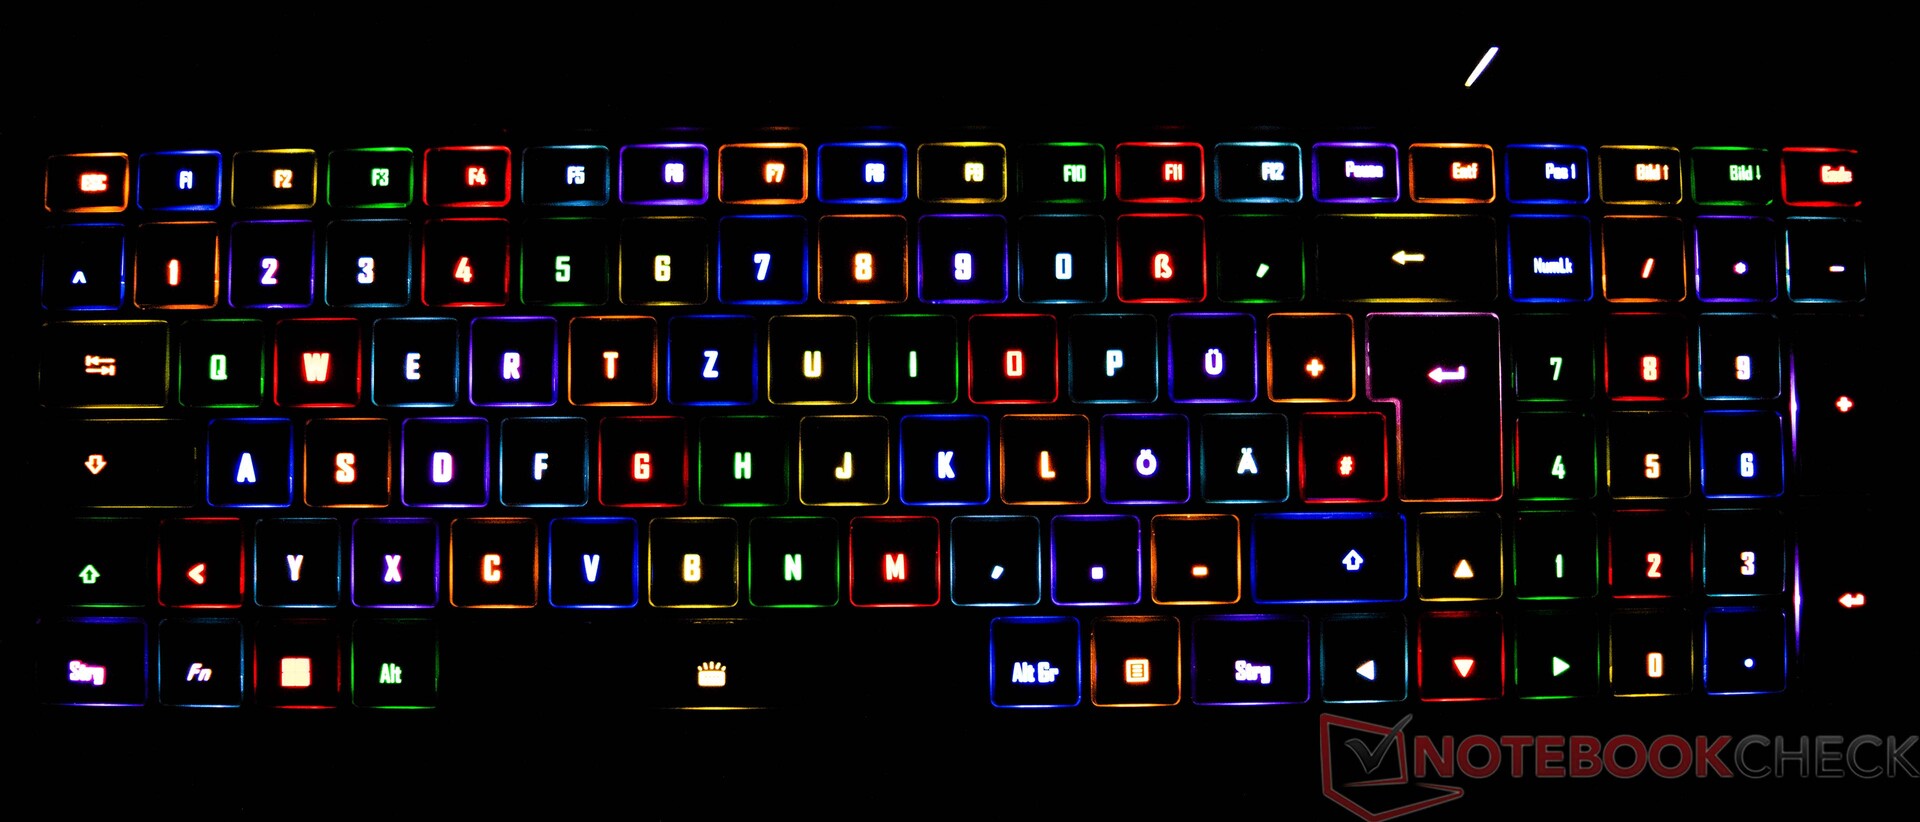
El Aorus 17X AZF viene con un teclado chiclet retroiluminado de 6 filas, que incluye un teclado numérico. Las suaves teclas tienen un desplazamiento medio y un claro punto de presión. El teclado cede ligeramente al escribir, pero no es demasiado pronunciado. La retroiluminación puede ajustarse a tres niveles de brillo usando una combinación de teclas, y hay muchas más opciones de efectos de iluminación a través del GCC (Gigabyte Control Center).
Panel táctil
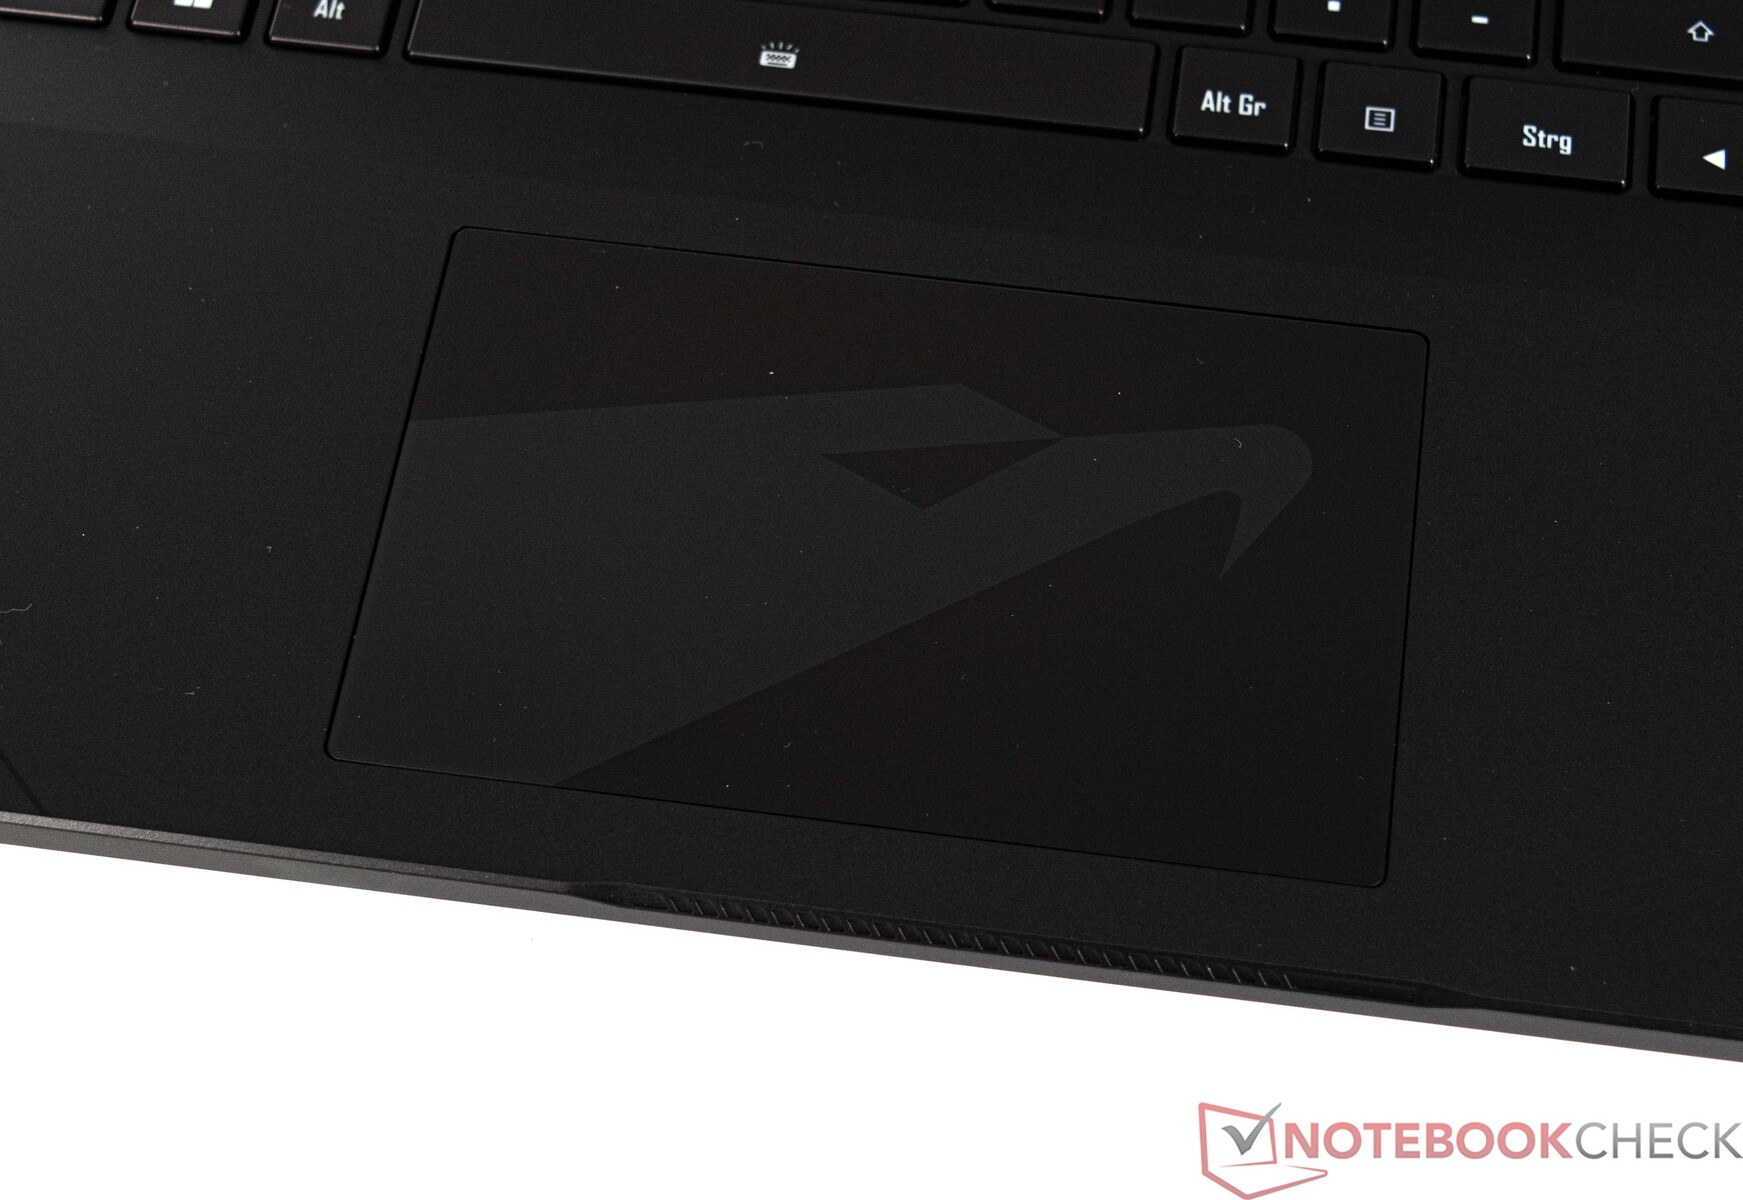
El sustituto del ratón en forma de ClickPad multitáctil (aprox. 12,1 x 7,6 cm) ofrece un tamaño agradable. Aorus también ha superpuesto su propio logo en el toucpad, lo que resulta agradable a la vista. El ClickPad ofrece una superficie lisa, que permite un deslizamiento suave del dedo. La superficie de entrada puede usarse en su totalidad y también reacciona bien en las esquinas. El pad ofrece un recorrido corto para las entradas y proporciona una respuesta clara gracias a su claro punto de presión.
Mostrar
El Aorus 17X AZF viene con un buen panel QHD, que debería satisfacer las necesidades de la mayoría de jugones con una tasa de refresco de 240 Hz. Sin embargo, el brillo medio de nuestro modelo de pruebas es claramente inferior al de la competencia. Una media de sólo 276 cd/m² es demasiado baja y sólo basta para el último puesto. El Aorus 17X AZF también pierde puntos importantes en la puntuación de display con ligeros halos. No se detectó PWM
Las opciones de display alternativas, como un panel 4K, no están pensadas para el Aorus 17X AZF.
| |||||||||||||||||||||||||
iluminación: 90 %
Brillo con batería: 294 cd/m²
Contraste: 1050:1 (Negro: 0.28 cd/m²)
ΔE ColorChecker Calman: 2.81 | ∀{0.5-29.43 Ø4.71}
calibrated: 0.86
ΔE Greyscale Calman: 3.4 | ∀{0.09-98 Ø4.96}
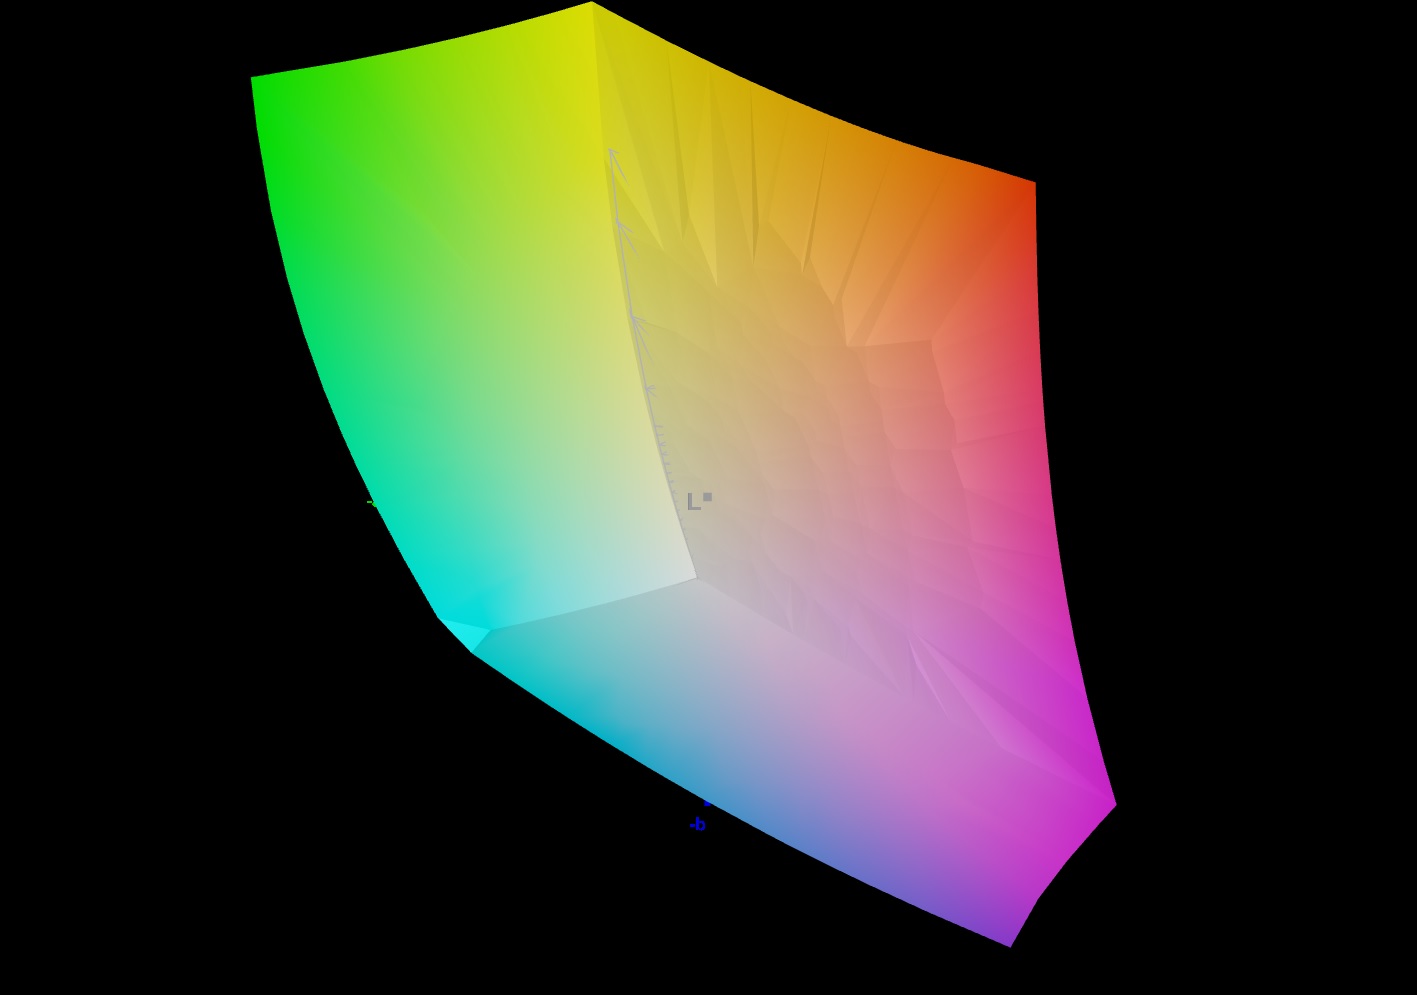
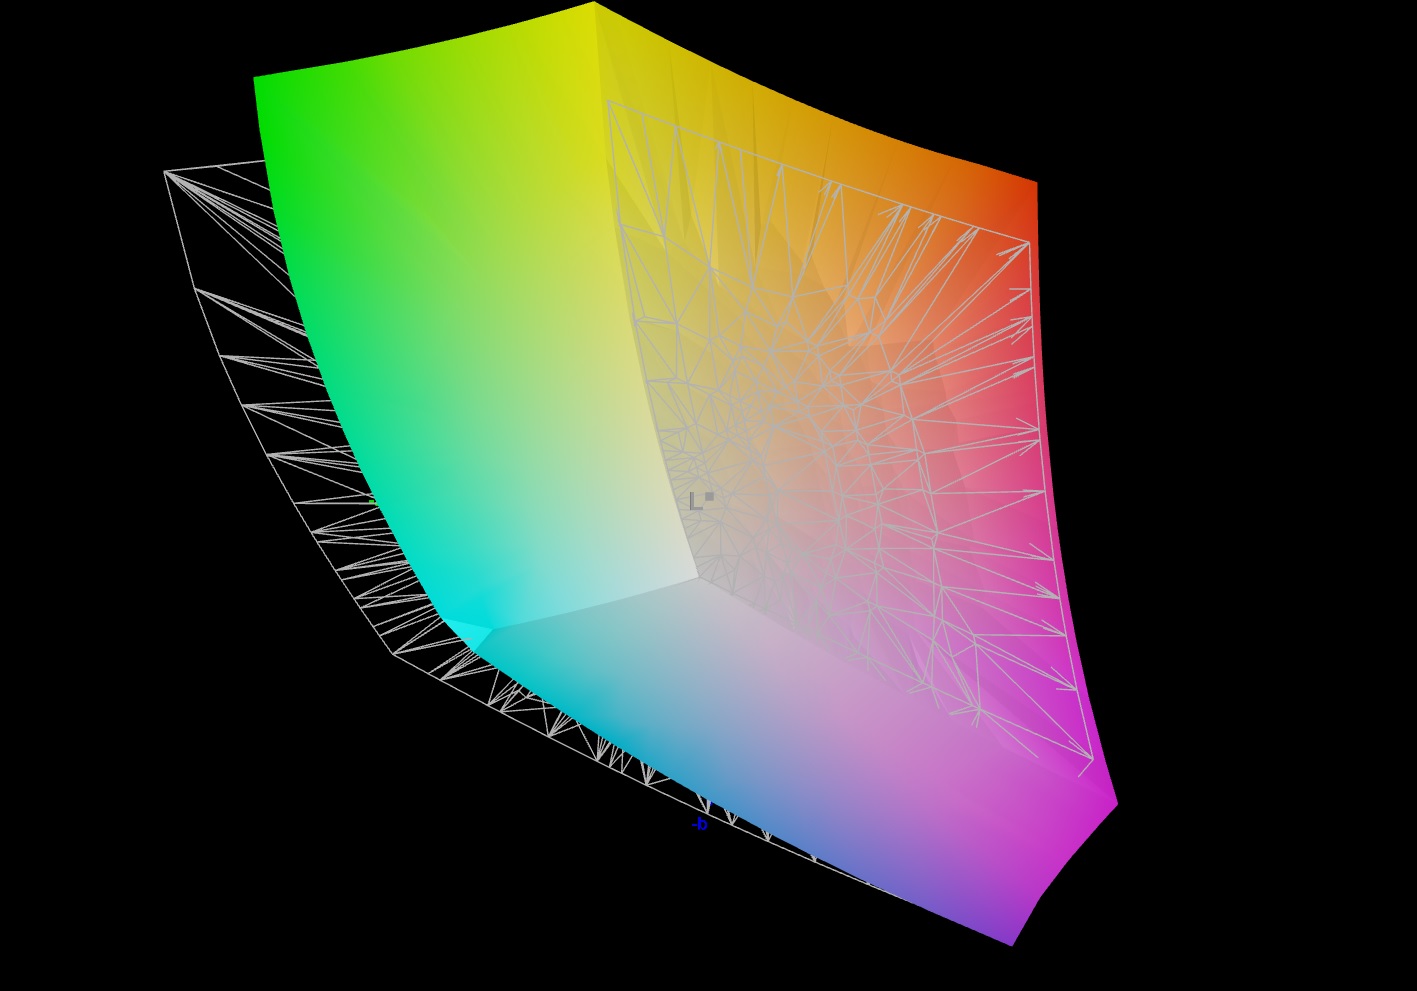
84.5% AdobeRGB 1998 (Argyll 3D)
99.9% sRGB (Argyll 3D)
96.7% Display P3 (Argyll 3D)
Gamma: 2.301
CCT: 7389 K
| Aorus 17X AZF BOE09F9, IPS, 2560x1440, 17.3" | Medion Erazer Beast X40 BOE NE170QDM-NZ1, IPS, 2560x1600, 17" | MSI GE78HX 13VH-070US AU Optronics B170QAN01.2, IPS, 2560x1600, 17" | HP Omen 17-ck2097ng BOE BOE09BF, IPS, 2560x1440, 17.3" | MSI Titan GT77 HX 13VI B173ZAN06.C, Mini-LED, 3840x2160, 17.3" | Alienware m18 R1 Chi Mei 180JME, IPS, 1920x1200, 18" | |
|---|---|---|---|---|---|---|
| Display | -16% | 1% | -17% | 2% | 2% | |
| Display P3 Coverage (%) | 96.7 | 68.6 -29% | 97.6 1% | 67.4 -30% | 94.9 -2% | 97.7 1% |
| sRGB Coverage (%) | 99.9 | 99.8 0% | 99.9 0% | 97.6 -2% | 99.9 0% | 100 0% |
| AdobeRGB 1998 Coverage (%) | 84.5 | 69.4 -18% | 86.5 2% | 69.6 -18% | 92.4 9% | 89.8 6% |
| Response Times | 23% | 54% | 1% | -169% | 41% | |
| Response Time Grey 50% / Grey 80% * (ms) | 14 ? | 11.3 ? 19% | 4.2 ? 70% | 15.6 ? -11% | 38.4 ? -174% | 3 ? 79% |
| Response Time Black / White * (ms) | 10.1 ? | 7.5 ? 26% | 6.4 ? 37% | 8.9 ? 12% | 26.6 ? -163% | 9.9 ? 2% |
| PWM Frequency (Hz) | 2380 ? | |||||
| Screen | 11% | -24% | 14% | 64117% | 26% | |
| Brightness middle (cd/m²) | 294 | 384 31% | 398.6 36% | 371 26% | 606 106% | 372.8 27% |
| Brightness (cd/m²) | 276 | 377 37% | 384 39% | 350 27% | 602 118% | 367 33% |
| Brightness Distribution (%) | 90 | 90 0% | 89 -1% | 90 0% | 93 3% | 97 8% |
| Black Level * (cd/m²) | 0.28 | 0.45 -61% | 0.46 -64% | 0.32 -14% | 0.0001 100% | 0.32 -14% |
| Contrast (:1) | 1050 | 853 -19% | 867 -17% | 1159 10% | 6060000 577043% | 1165 11% |
| Colorchecker dE 2000 * | 2.81 | 2.05 27% | 4.05 -44% | 1.74 38% | 4.8 -71% | 1.92 32% |
| Colorchecker dE 2000 max. * | 5.7 | 3.64 36% | 8.68 -52% | 3.59 37% | 8.2 -44% | 3.65 36% |
| Colorchecker dE 2000 calibrated * | 0.86 | 0.74 14% | 1.02 -19% | 1.01 -17% | 1.8 -109% | 0.51 41% |
| Greyscale dE 2000 * | 3.4 | 2.3 32% | 6.5 -91% | 2.8 18% | 6.5 -91% | 1.5 56% |
| Gamma | 2.301 96% | 2.017 109% | 2.11 104% | 2.19 100% | 2.63 84% | 2.34 94% |
| CCT | 7389 88% | 6546 99% | 7518 86% | 6474 100% | 6596 99% | 6607 98% |
| Media total (Programa/Opciones) | 6% /
7% | 10% /
-7% | -1% /
5% | 21317% /
41195% | 23% /
23% |
* ... más pequeño es mejor
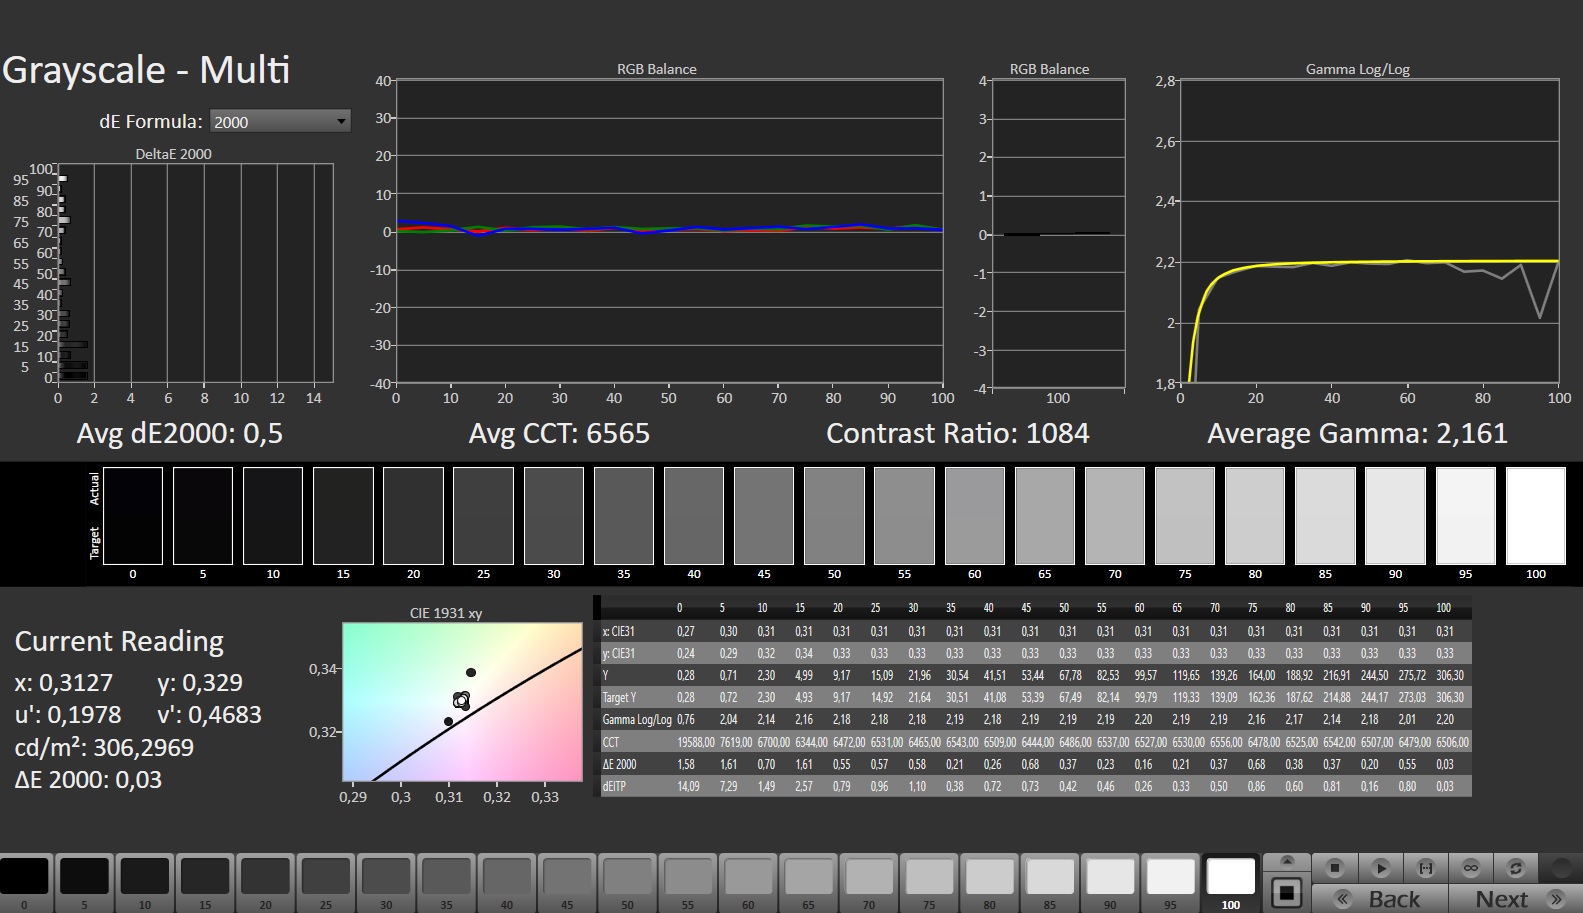
Subjetivamente, la calidad de visualización de la pantalla es impecable y no hay grano visible a pesar de la superficie mate. En resumen, los valores DeltaE-2000 medidos están relativamente cerca del valor objetivo de 3 en el estado de entrega. Sin embargo, otros portátiles de la clase demuestran que se puede hacer mejor. Pudimos mejorar considerablemente los valores mediante calibración manual. Además, también pudimos reducir un poco el tinte azul. Por tanto, recomendamos usar el perfil ICC enlazado más arriba si quieres usar el dispositivo para editar imágenes.
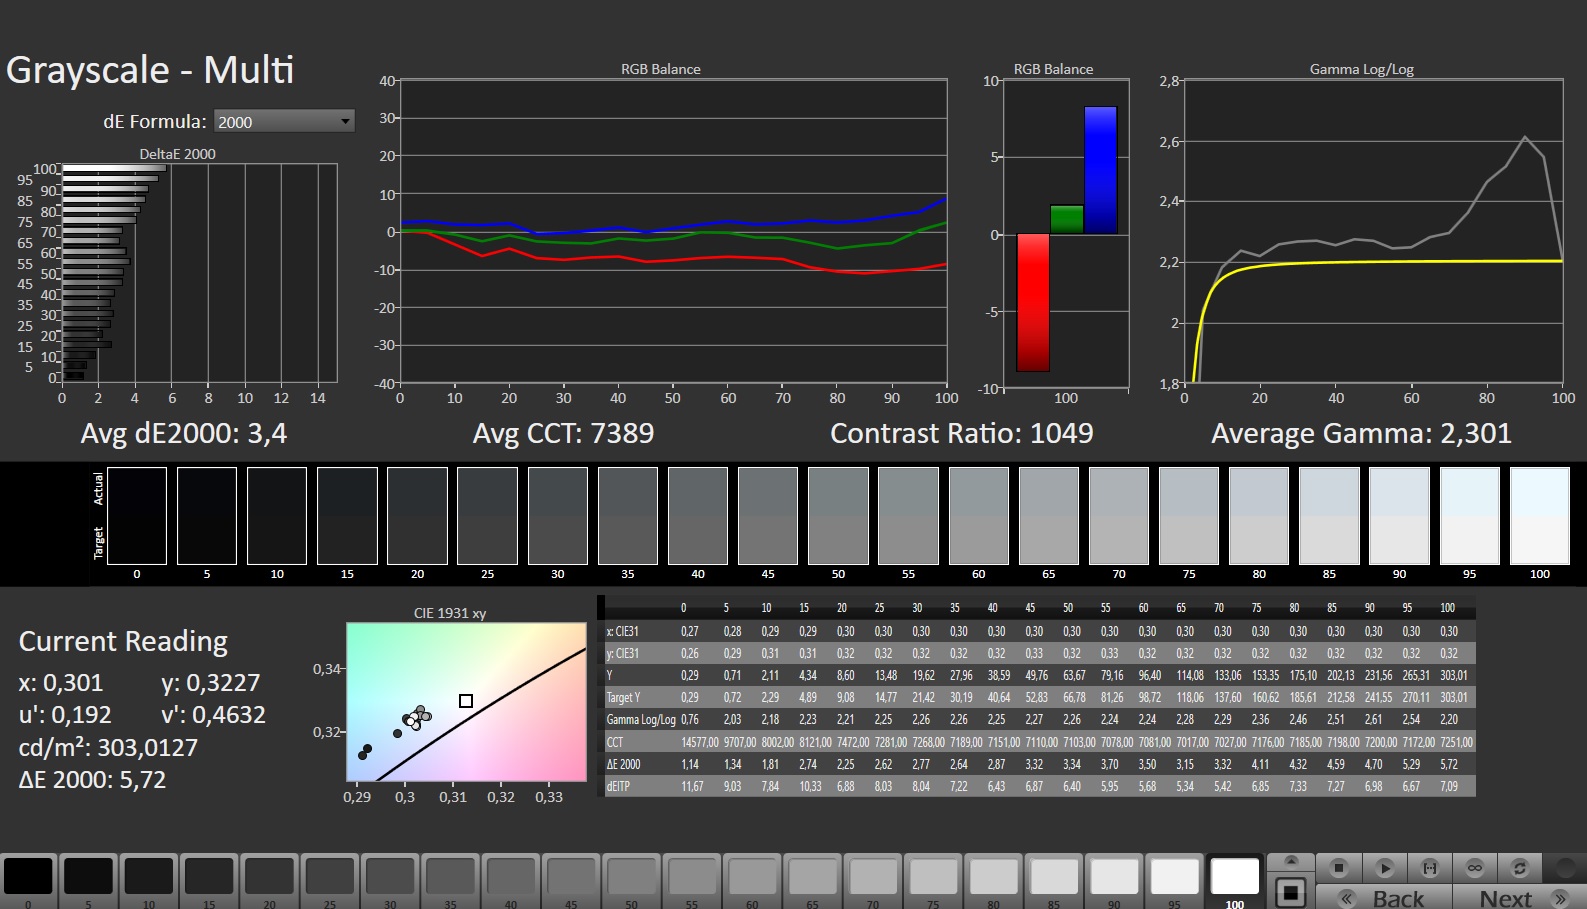
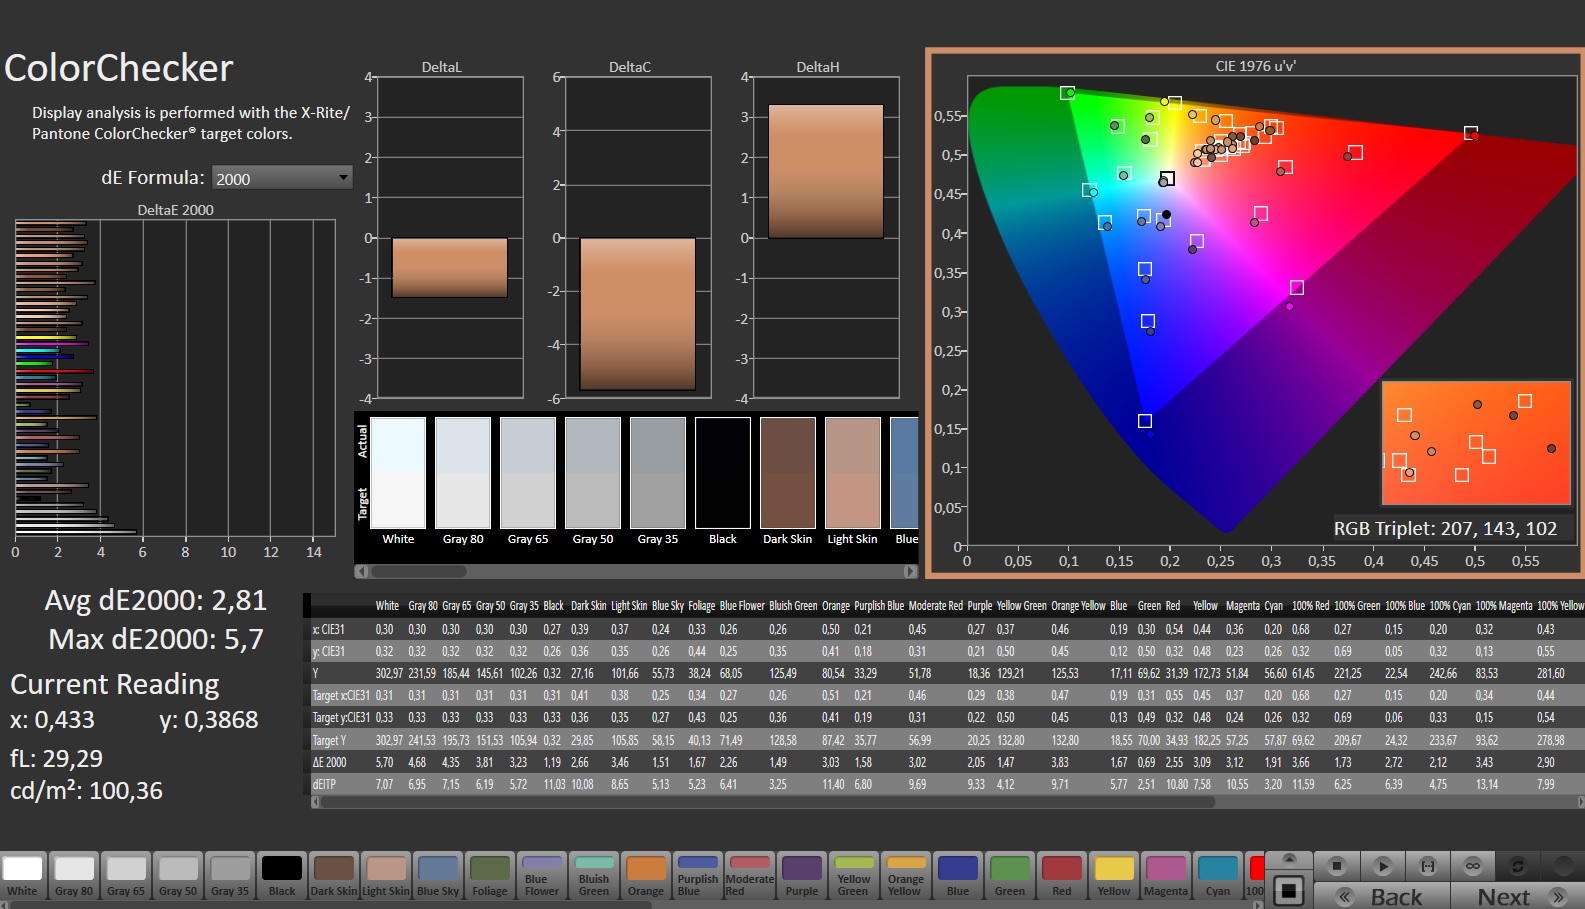
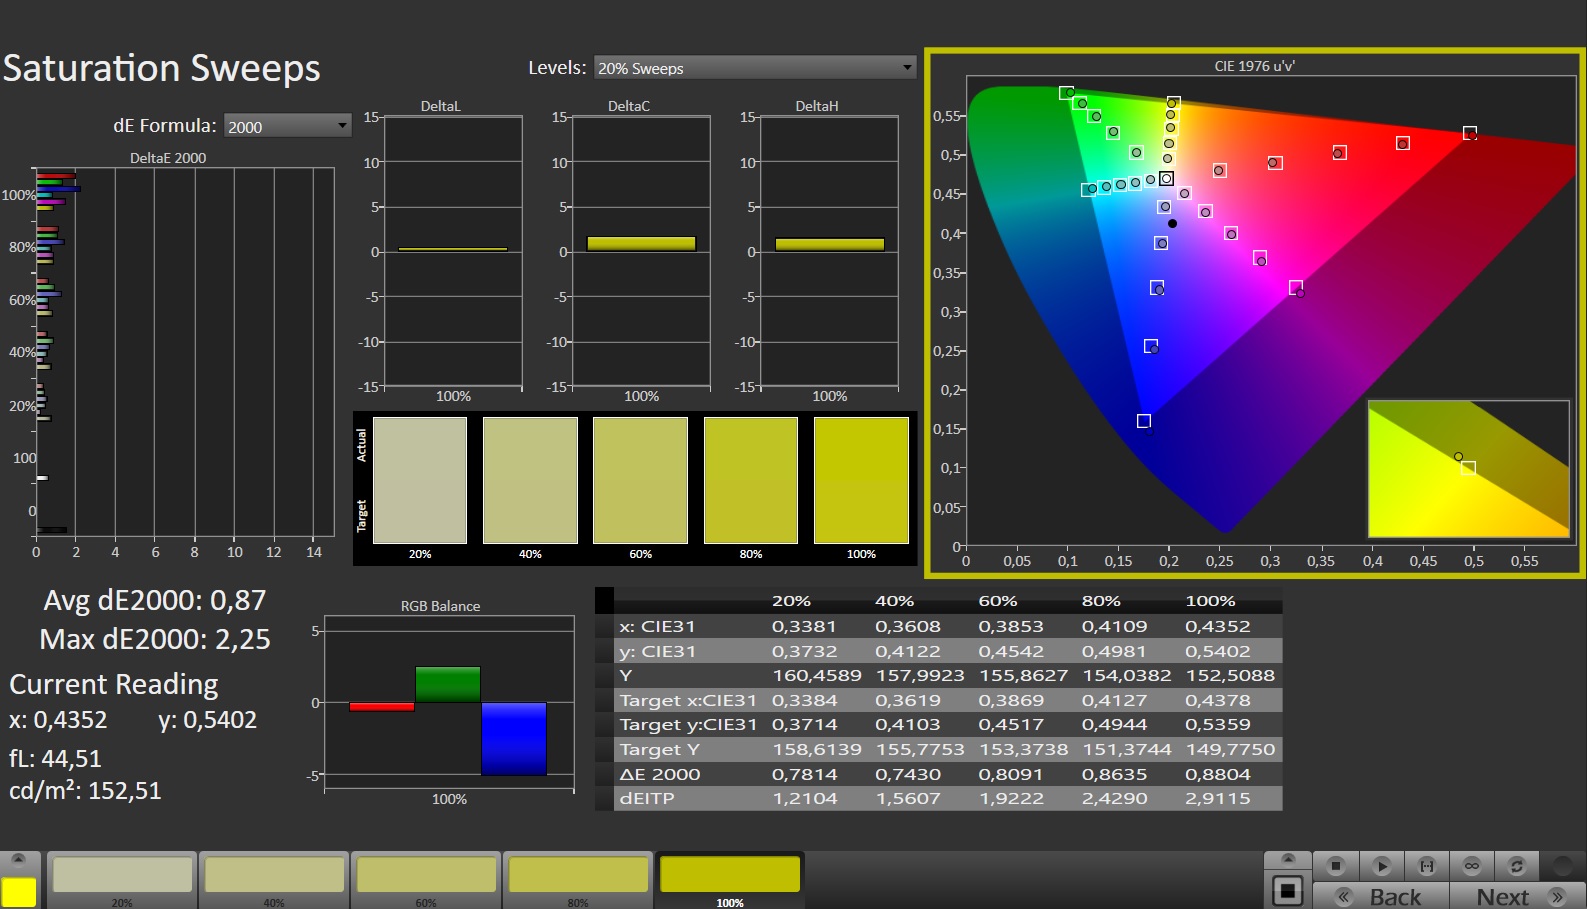
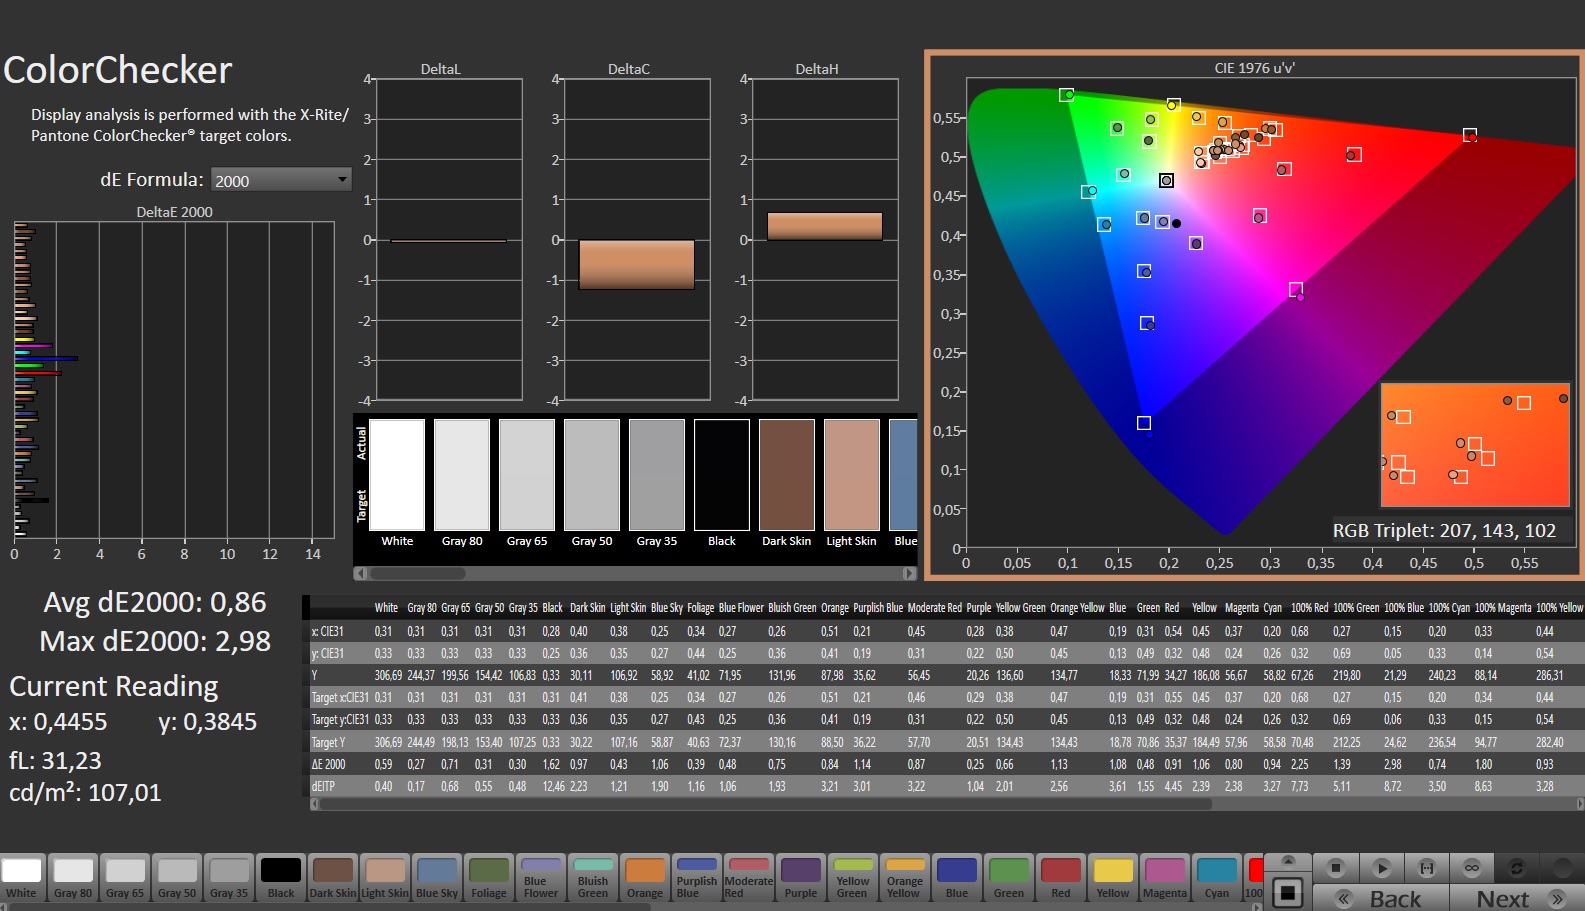
La cobertura del espacio de color medido es buena y el espacio de color sRGB está totalmente cubierto al 100%. El espacio de color AdobeRGB ampliado está suficientemente cubierto con un 84,5% y el espacio de color P3 con un 96,7%.

Tiempos de respuesta del display
| ↔ Tiempo de respuesta de Negro a Blanco | ||
|---|---|---|
| 10.1 ms ... subida ↗ y bajada ↘ combinada | ↗ 5.3 ms subida | 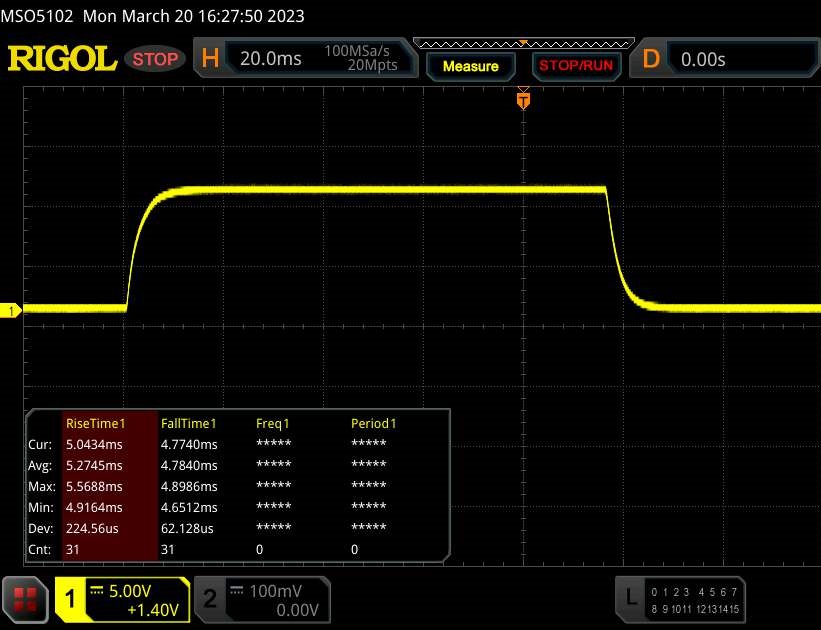 |
| ↘ 4.8 ms bajada | ||
| La pantalla mostró buenos tiempos de respuesta en nuestros tests pero podría ser demasiado lenta para los jugones competitivos. En comparación, todos los dispositivos de prueba van de ##min### (mínimo) a 240 (máximo) ms. » 28 % de todos los dispositivos son mejores. Esto quiere decir que el tiempo de respuesta medido es mejor que la media (19.8 ms) de todos los dispositivos testados. | ||
| ↔ Tiempo de respuesta 50% Gris a 80% Gris | ||
| 14 ms ... subida ↗ y bajada ↘ combinada | ↗ 6.9 ms subida | 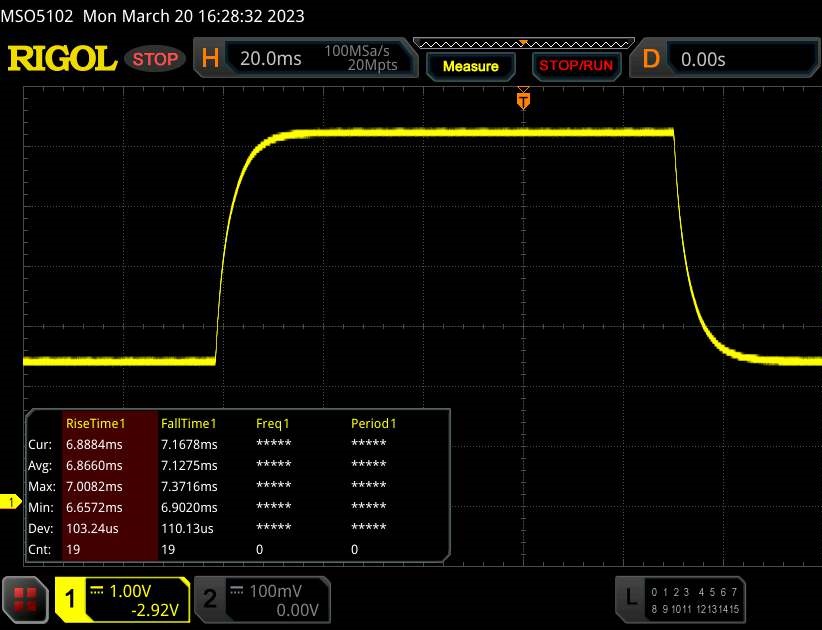 |
| ↘ 7.1 ms bajada | ||
| La pantalla mostró buenos tiempos de respuesta en nuestros tests pero podría ser demasiado lenta para los jugones competitivos. En comparación, todos los dispositivos de prueba van de ##min### (mínimo) a 636 (máximo) ms. » 28 % de todos los dispositivos son mejores. Esto quiere decir que el tiempo de respuesta medido es mejor que la media (30.9 ms) de todos los dispositivos testados. | ||
Parpadeo de Pantalla / PWM (Pulse-Width Modulation)
| Parpadeo de Pantalla / PWM no detectado | 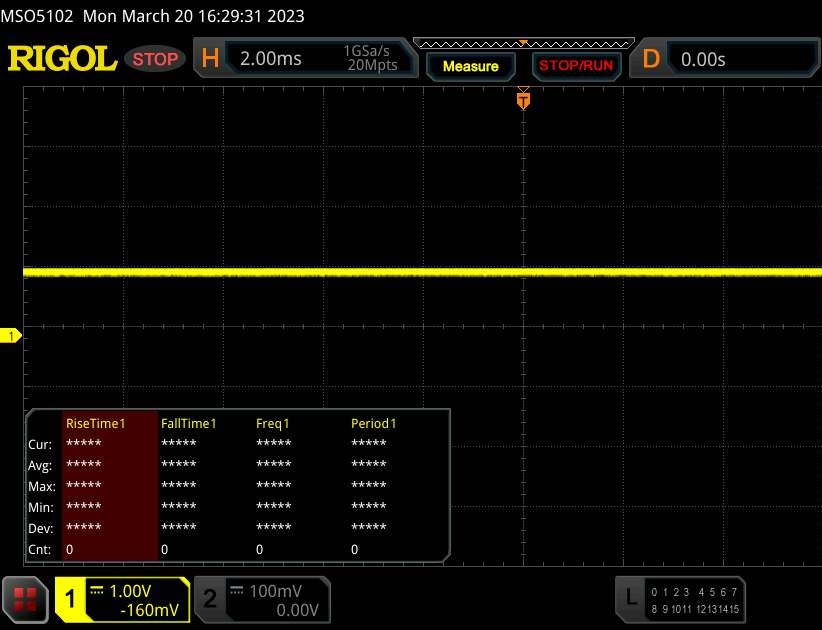 | ||
Comparación: 52 % de todos los dispositivos testados no usaron PWM para atenuar el display. Si se usó, medimos una media de 7748 (mínimo: 5 - máxmo: 343500) Hz. | |||
El brillo comparativamente bajo de la pantalla no favorece el uso en exteriores. No obstante, es posible trabajar en exteriores a pleno brillo, aunque con algunas limitaciones. Debe evitarse la luz solar directa.
El panel IPS instalado ofrece una calidad de imagen excelente en condiciones normales de uso. Las dificultades en forma de ligero empañamiento solo se producen en las imágenes de las cuatro esquinas.

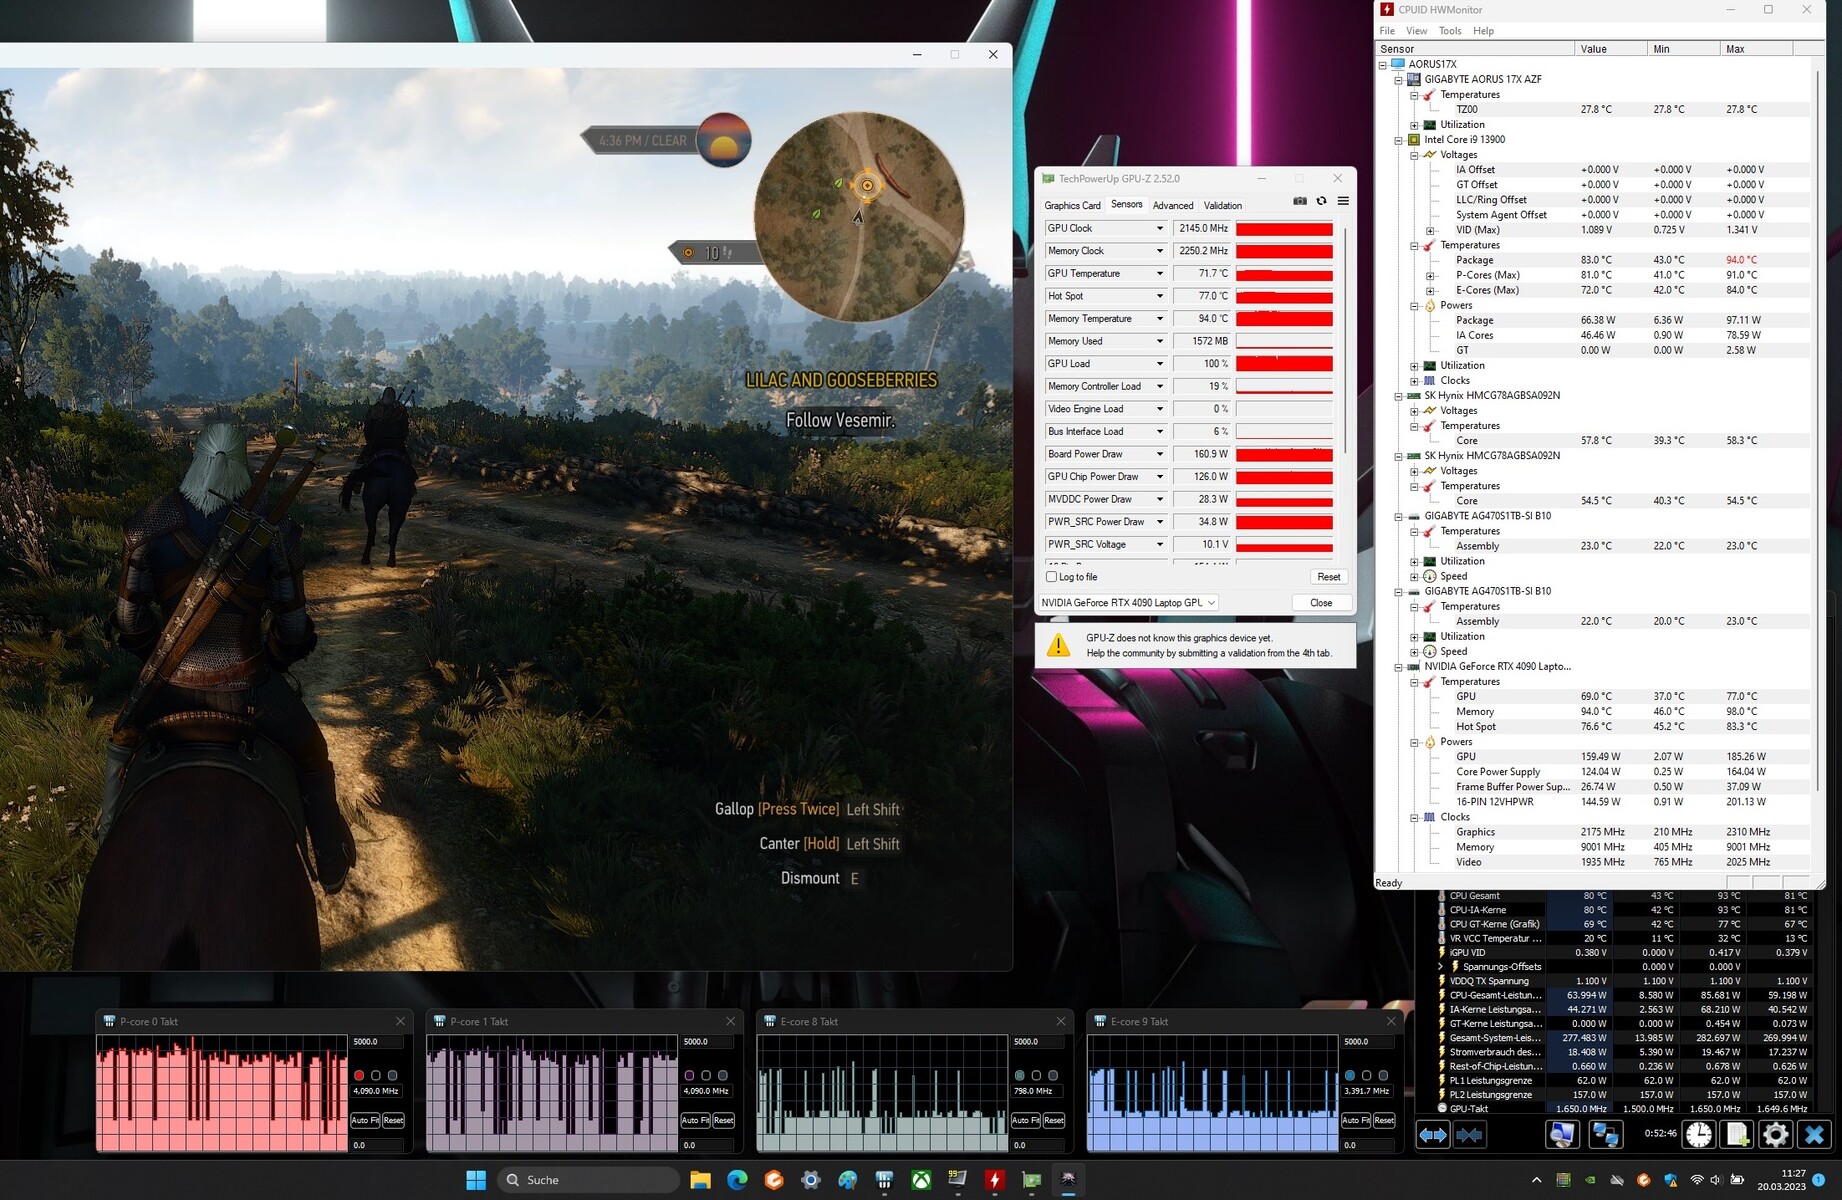
Actuación - Raptor Lake combinado con Ada Lovelace
El Aorus 17X AZF es actualmente uno de los portátiles para juegos más potentes y ofrece un rendimiento excelente, impulsado por Raptor Lake y Ada Lovelace. La configuración de esta unidad de pruebas está disponible por US$3499.99.
Condiciones de ensayo
Además de los modos de rendimiento típicos (ver tabla), el centro de control del Aorus 17X AZF (Gigabyte Control Center) ofrece una función AI Boost de nivel superior que usamos. El Centro de Control seleccionó el perfil apropiado - Modo Juego y Modo Creador para las pruebas, Modo Ahorro de Energía para los tests de batería
Elmodo Turbo se activa en casos individuales para un pequeño aumento del rendimiento, pero esto tiene un precio: Los ventiladores trabajan constantemente a plena potencia. En el modo Reunión, el dispositivo funciona muy silenciosamente, casi hasta el punto del silencio. Como resultado, el rendimiento disminuye notablemente, aunque el rendimiento multihilo se ve más afectado que el rendimiento monohilo.
| Creator Modus | Turbo Modus | Gaming Modus | Meeting Modus | Energiespar Ruhemodus | |
|---|---|---|---|---|---|
| Límite de potencia 1 | 86 vatios | 86 vatios | 86 vatios | 15 vatios | 15 vatios |
| Límite de potencia 2 | 157 vatios | 157 vatios | 157 vatios | 30 vatios | 30 vatios |
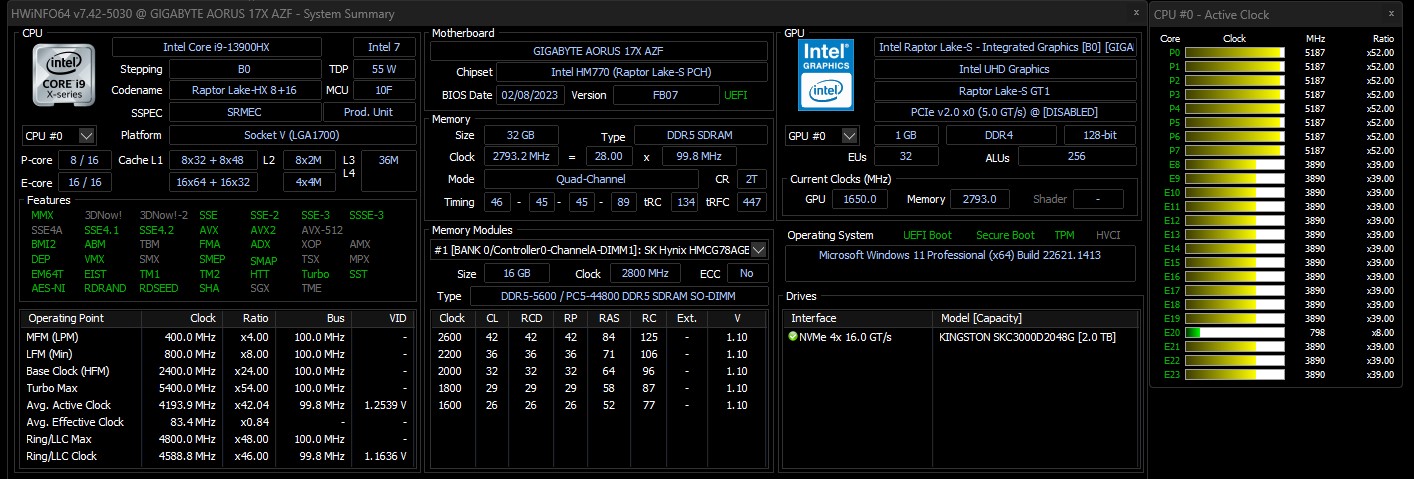
Procesador
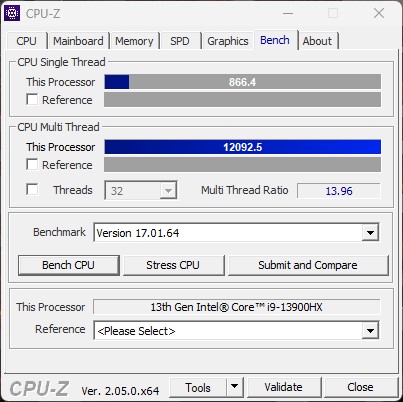
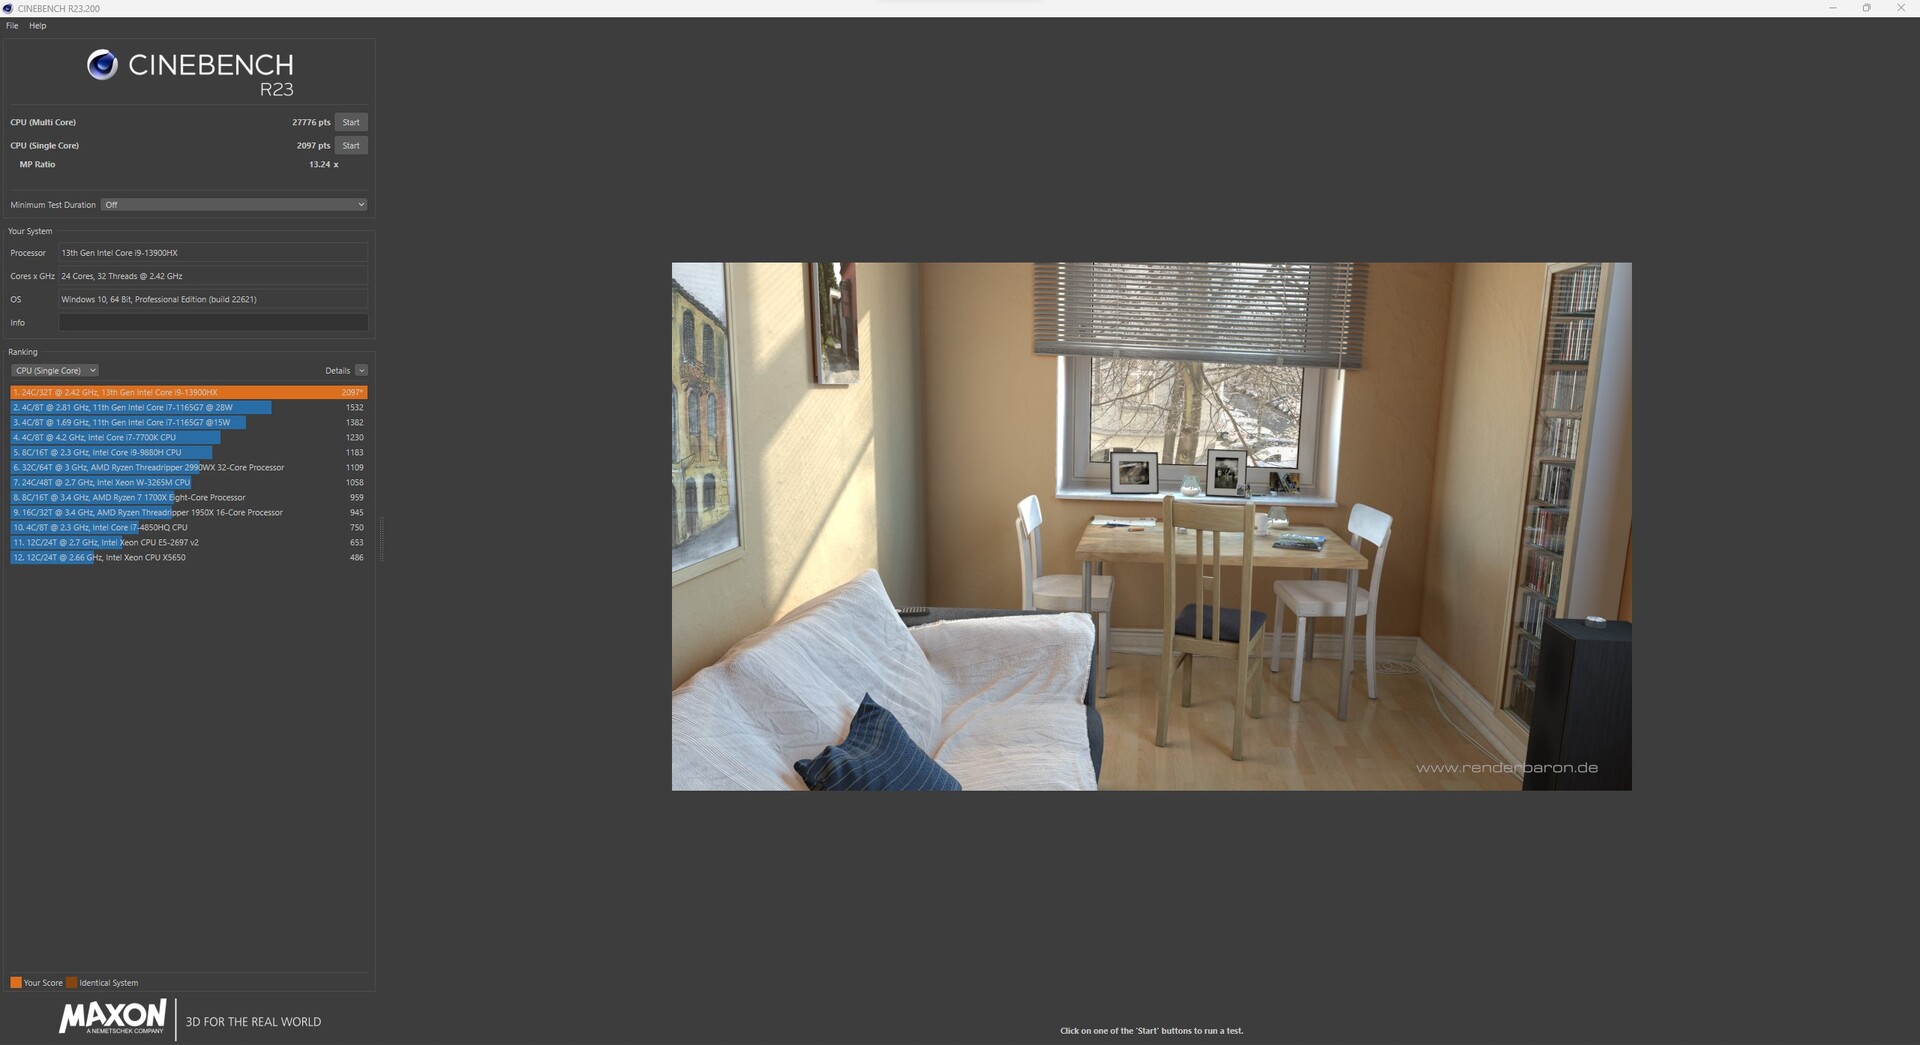
En Intel Core-i7-13900HX-Prozessor (Raptor Lake) consta de 16 núcleos eficientes (sin hyperthreading, de 1,6 a 3,9 GHz) y 8 núcleos de rendimiento (hyperthreading, de 2,2 a 5,4 GHz). Hay 32 núcleos lógicos de CPU en total, lo que se acompañó de un enorme rendimiento multihilo en nuestras pruebas. En las pruebas comparativas, todos los contendientes están en una apretada carrera cabeza a cabeza. Sin embargo, en la clasificación de rendimiento de la CPU, que representa el valor medio de los puntos de referencia presentados, nuestra unidad de pruebas quedó en penúltimo lugar. Sólo el HP Omen 17, que usa el mismo SoC, puede ser superado aquí, mientras que el Medion Erazer Beastofrece un rendimiento algo mejor. Los demás competidores lo hacen mejor gracias a sus SoC ligeramente más rápidos. No obstante, la diferencia con el MSI GE78HX es manejable con sólo un 12%.
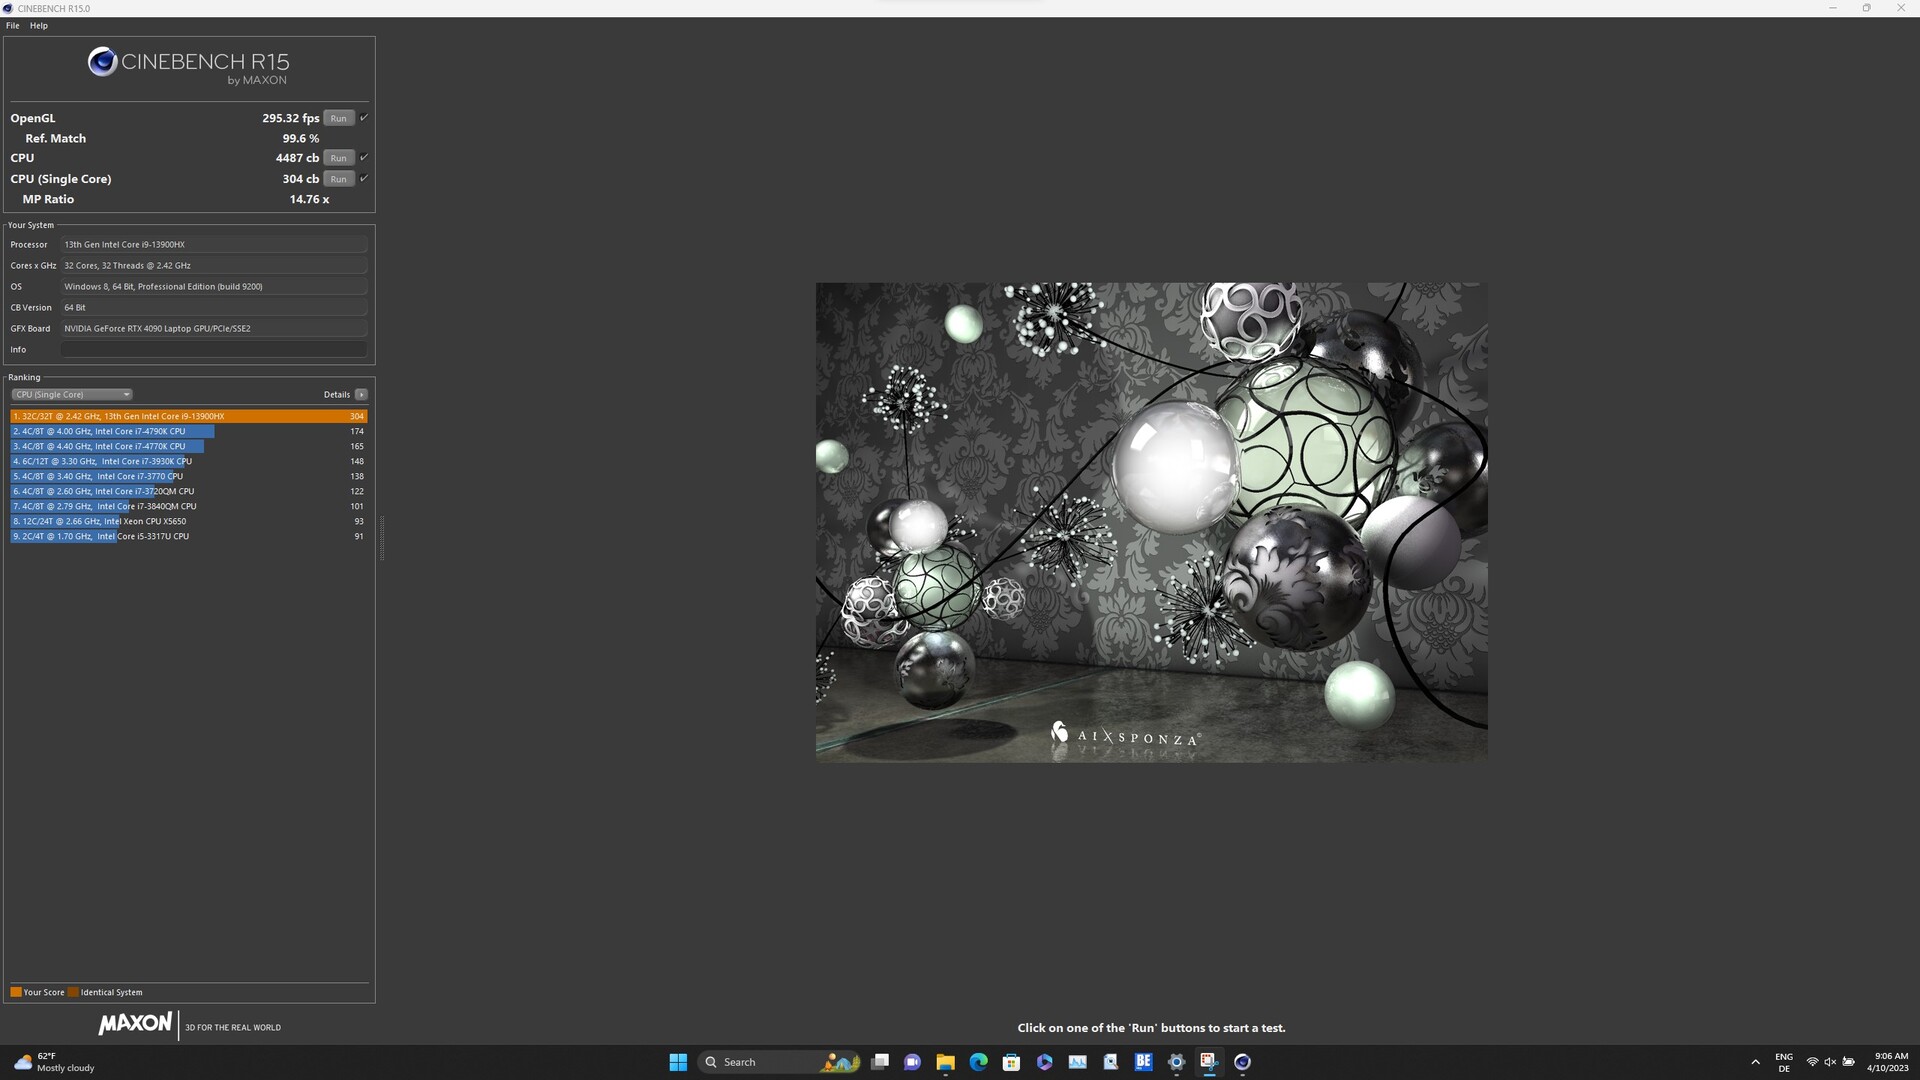
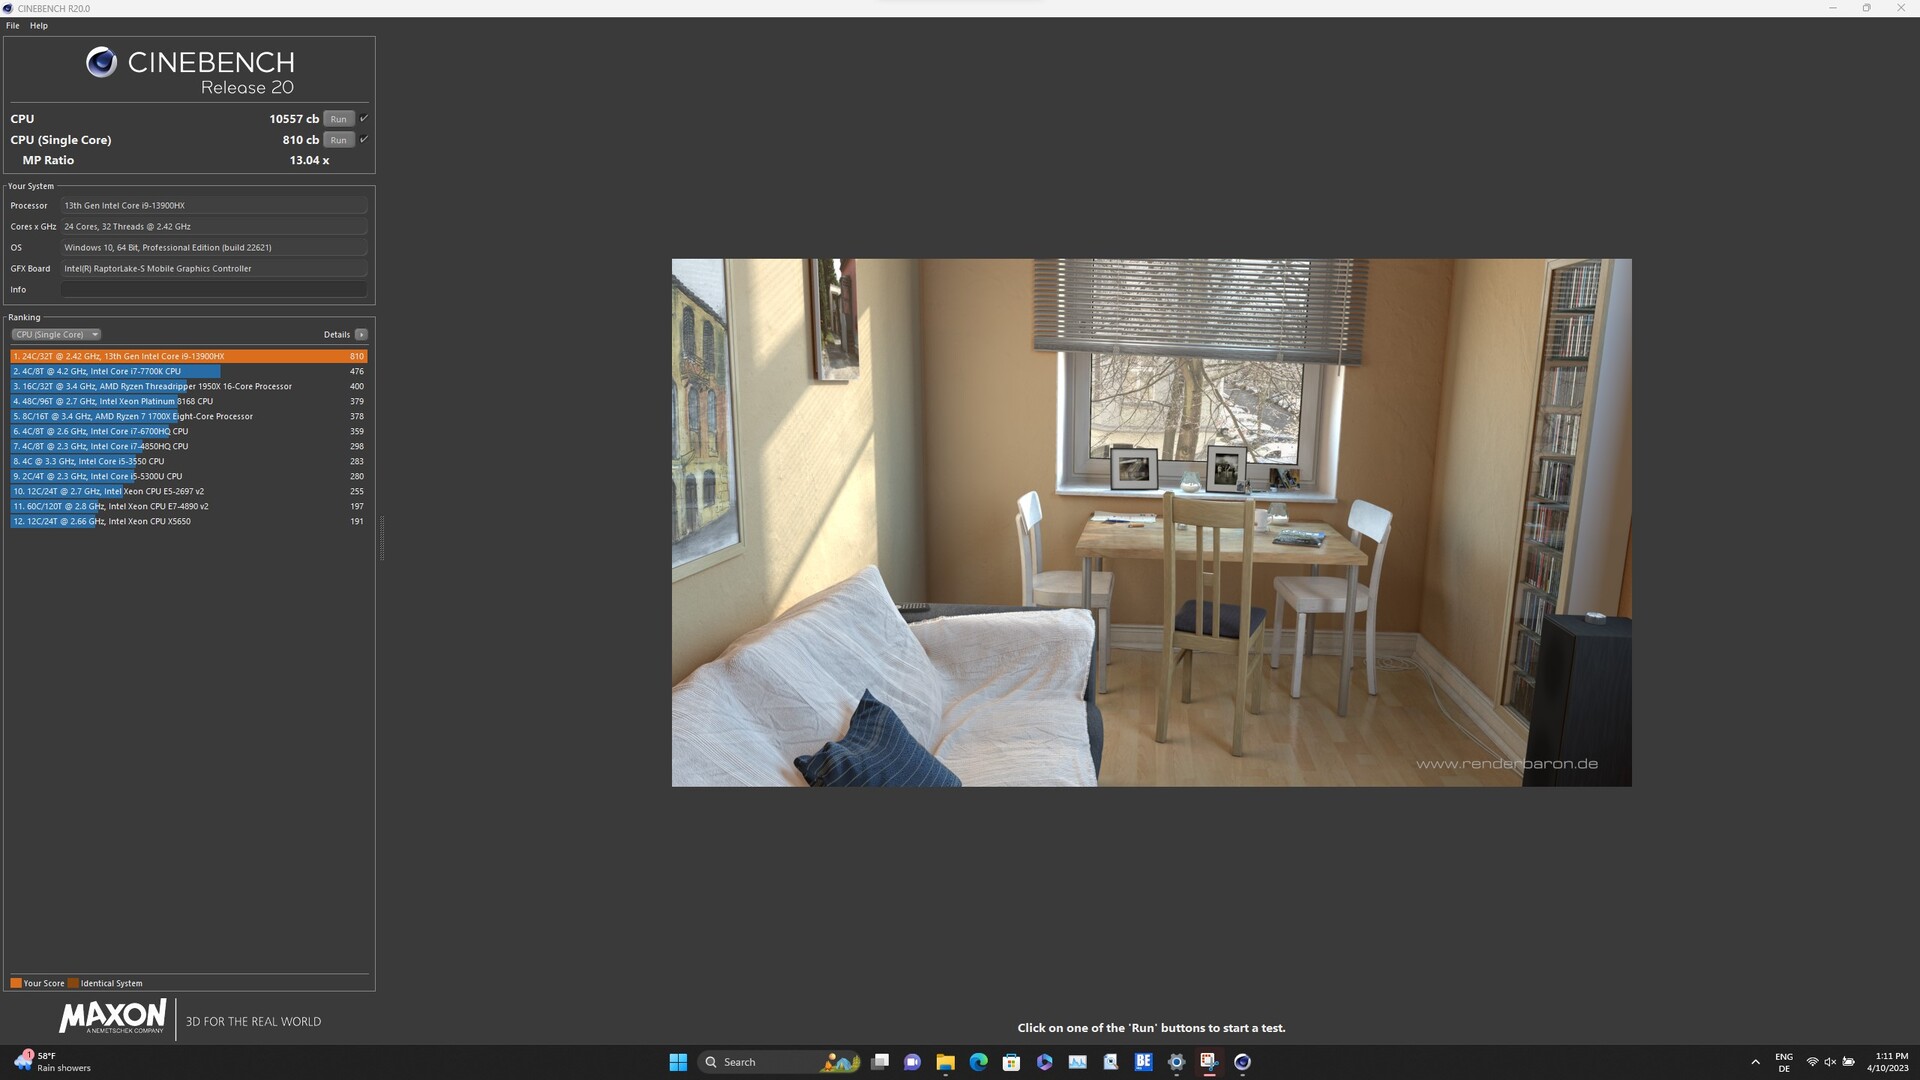
El test de bucle CB15 muestra que el CPU boost se usa sólo al principio. La carga multihilo permanente simulada hace que el reloj caiga ligeramente tras la primera ejecución, aunque el rendimiento se mantiene estable a partir de la tercera.
Cinebench R15 Multi Sustained Load
Cinebench R23: Multi Core | Single Core
Cinebench R20: CPU (Multi Core) | CPU (Single Core)
Cinebench R15: CPU Multi 64Bit | CPU Single 64Bit
Blender: v2.79 BMW27 CPU
7-Zip 18.03: 7z b 4 | 7z b 4 -mmt1
Geekbench 5.5: Multi-Core | Single-Core
HWBOT x265 Benchmark v2.2: 4k Preset
LibreOffice : 20 Documents To PDF
R Benchmark 2.5: Overall mean
| CPU Performance rating | |
| MSI GE78HX 13VH-070US | |
| Alienware m18 R1 | |
| MSI Titan GT77 HX 13VI | |
| Medion Erazer Beast X40 | |
| Medio Intel Core i9-13900HX | |
| Aorus 17X AZF | |
| HP Omen 17-ck2097ng | |
| Media de la clase Gaming | |
| Cinebench R23 / Multi Core | |
| MSI Titan GT77 HX 13VI | |
| MSI GE78HX 13VH-070US | |
| Alienware m18 R1 | |
| Medion Erazer Beast X40 | |
| Medio Intel Core i9-13900HX (24270 - 32623, n=23) | |
| Aorus 17X AZF | |
| Media de la clase Gaming (10488 - 42661, n=108, últimos 2 años) | |
| HP Omen 17-ck2097ng | |
| Cinebench R23 / Single Core | |
| MSI GE78HX 13VH-070US | |
| Alienware m18 R1 | |
| MSI Titan GT77 HX 13VI | |
| Aorus 17X AZF | |
| HP Omen 17-ck2097ng | |
| Medio Intel Core i9-13900HX (1867 - 2105, n=20) | |
| Medion Erazer Beast X40 | |
| Media de la clase Gaming (1166 - 2415, n=108, últimos 2 años) | |
| Cinebench R20 / CPU (Multi Core) | |
| MSI Titan GT77 HX 13VI | |
| MSI GE78HX 13VH-070US | |
| Alienware m18 R1 | |
| Medion Erazer Beast X40 | |
| Medio Intel Core i9-13900HX (9152 - 12541, n=21) | |
| Aorus 17X AZF | |
| Media de la clase Gaming (4029 - 16433, n=107, últimos 2 años) | |
| HP Omen 17-ck2097ng | |
| Cinebench R20 / CPU (Single Core) | |
| Aorus 17X AZF | |
| Alienware m18 R1 | |
| HP Omen 17-ck2097ng | |
| MSI Titan GT77 HX 13VI | |
| MSI GE78HX 13VH-070US | |
| Medio Intel Core i9-13900HX (722 - 810, n=21) | |
| Medion Erazer Beast X40 | |
| Media de la clase Gaming (442 - 913, n=107, últimos 2 años) | |
| Cinebench R15 / CPU Multi 64Bit | |
| MSI Titan GT77 HX 13VI | |
| MSI GE78HX 13VH-070US | |
| Alienware m18 R1 | |
| Medion Erazer Beast X40 | |
| Medio Intel Core i9-13900HX (3913 - 4970, n=22) | |
| Aorus 17X AZF | |
| HP Omen 17-ck2097ng | |
| Media de la clase Gaming (1578 - 6330, n=106, últimos 2 años) | |
| Cinebench R15 / CPU Single 64Bit | |
| Aorus 17X AZF | |
| MSI GE78HX 13VH-070US | |
| Alienware m18 R1 | |
| HP Omen 17-ck2097ng | |
| MSI Titan GT77 HX 13VI | |
| Medion Erazer Beast X40 | |
| Media de la clase Gaming (188.8 - 350, n=107, últimos 2 años) | |
| Medio Intel Core i9-13900HX (247 - 304, n=22) | |
| Blender / v2.79 BMW27 CPU | |
| HP Omen 17-ck2097ng | |
| Media de la clase Gaming (79 - 330, n=105, últimos 2 años) | |
| Aorus 17X AZF | |
| Medio Intel Core i9-13900HX (101 - 153, n=22) | |
| Medion Erazer Beast X40 | |
| MSI GE78HX 13VH-070US | |
| MSI Titan GT77 HX 13VI | |
| Alienware m18 R1 | |
| 7-Zip 18.03 / 7z b 4 | |
| Alienware m18 R1 | |
| MSI Titan GT77 HX 13VI | |
| MSI GE78HX 13VH-070US | |
| Medion Erazer Beast X40 | |
| Medio Intel Core i9-13900HX (90675 - 127283, n=21) | |
| HP Omen 17-ck2097ng | |
| Aorus 17X AZF | |
| Media de la clase Gaming (33491 - 148086, n=106, últimos 2 años) | |
| 7-Zip 18.03 / 7z b 4 -mmt1 | |
| Aorus 17X AZF | |
| MSI GE78HX 13VH-070US | |
| HP Omen 17-ck2097ng | |
| MSI Titan GT77 HX 13VI | |
| Medion Erazer Beast X40 | |
| Alienware m18 R1 | |
| Medio Intel Core i9-13900HX (6340 - 7177, n=21) | |
| Media de la clase Gaming (4199 - 7436, n=106, últimos 2 años) | |
| Geekbench 5.5 / Multi-Core | |
| Alienware m18 R1 | |
| MSI GE78HX 13VH-070US | |
| MSI Titan GT77 HX 13VI | |
| HP Omen 17-ck2097ng | |
| Medion Erazer Beast X40 | |
| Medio Intel Core i9-13900HX (17614 - 21075, n=22) | |
| Aorus 17X AZF | |
| Media de la clase Gaming (6460 - 28263, n=106, últimos 2 años) | |
| Geekbench 5.5 / Single-Core | |
| MSI GE78HX 13VH-070US | |
| HP Omen 17-ck2097ng | |
| Media de la clase Gaming (986 - 2474, n=106, últimos 2 años) | |
| Aorus 17X AZF | |
| Alienware m18 R1 | |
| MSI Titan GT77 HX 13VI | |
| Medion Erazer Beast X40 | |
| Medio Intel Core i9-13900HX (1345 - 2093, n=22) | |
| HWBOT x265 Benchmark v2.2 / 4k Preset | |
| MSI GE78HX 13VH-070US | |
| Alienware m18 R1 | |
| MSI Titan GT77 HX 13VI | |
| Medion Erazer Beast X40 | |
| Medio Intel Core i9-13900HX (23.5 - 34.4, n=22) | |
| Media de la clase Gaming (11.5 - 44.4, n=106, últimos 2 años) | |
| HP Omen 17-ck2097ng | |
| Aorus 17X AZF | |
| LibreOffice / 20 Documents To PDF | |
| Media de la clase Gaming (33.2 - 88.8, n=106, últimos 2 años) | |
| MSI GE78HX 13VH-070US | |
| Alienware m18 R1 | |
| MSI Titan GT77 HX 13VI | |
| Aorus 17X AZF | |
| HP Omen 17-ck2097ng | |
| Medion Erazer Beast X40 | |
| Medio Intel Core i9-13900HX (32.8 - 51.1, n=21) | |
| R Benchmark 2.5 / Overall mean | |
| Media de la clase Gaming (0.3439 - 0.759, n=107, últimos 2 años) | |
| MSI Titan GT77 HX 13VI | |
| Medio Intel Core i9-13900HX (0.375 - 0.4564, n=22) | |
| Medion Erazer Beast X40 | |
| Aorus 17X AZF | |
| Alienware m18 R1 | |
| HP Omen 17-ck2097ng | |
| MSI GE78HX 13VH-070US | |
* ... más pequeño es mejor
AIDA64: FP32 Ray-Trace | FPU Julia | CPU SHA3 | CPU Queen | FPU SinJulia | FPU Mandel | CPU AES | CPU ZLib | FP64 Ray-Trace | CPU PhotoWorxx
| Performance rating | |
| Alienware m18 R1 | |
| MSI GE78HX 13VH-070US | |
| MSI Titan GT77 HX 13VI | |
| Medion Erazer Beast X40 | |
| Media de la clase Gaming | |
| Medio Intel Core i9-13900HX | |
| Aorus 17X AZF | |
| HP Omen 17-ck2097ng | |
| AIDA64 / FP32 Ray-Trace | |
| Media de la clase Gaming (10227 - 85542, n=106, últimos 2 años) | |
| Alienware m18 R1 | |
| MSI Titan GT77 HX 13VI | |
| MSI GE78HX 13VH-070US | |
| Medion Erazer Beast X40 | |
| Medio Intel Core i9-13900HX (17589 - 27615, n=22) | |
| Aorus 17X AZF | |
| HP Omen 17-ck2097ng | |
| AIDA64 / FPU Julia | |
| Alienware m18 R1 | |
| MSI Titan GT77 HX 13VI | |
| Media de la clase Gaming (51376 - 372155, n=106, últimos 2 años) | |
| MSI GE78HX 13VH-070US | |
| Medion Erazer Beast X40 | |
| Medio Intel Core i9-13900HX (88686 - 137015, n=22) | |
| Aorus 17X AZF | |
| HP Omen 17-ck2097ng | |
| AIDA64 / CPU SHA3 | |
| Alienware m18 R1 | |
| MSI Titan GT77 HX 13VI | |
| MSI GE78HX 13VH-070US | |
| Medion Erazer Beast X40 | |
| Media de la clase Gaming (2180 - 10115, n=106, últimos 2 años) | |
| Medio Intel Core i9-13900HX (4362 - 7029, n=22) | |
| Aorus 17X AZF | |
| HP Omen 17-ck2097ng | |
| AIDA64 / CPU Queen | |
| Alienware m18 R1 | |
| MSI GE78HX 13VH-070US | |
| MSI Titan GT77 HX 13VI | |
| HP Omen 17-ck2097ng | |
| Medio Intel Core i9-13900HX (125644 - 141385, n=22) | |
| Medion Erazer Beast X40 | |
| Aorus 17X AZF | |
| Media de la clase Gaming (49785 - 173351, n=90, últimos 2 años) | |
| AIDA64 / FPU SinJulia | |
| MSI Titan GT77 HX 13VI | |
| MSI GE78HX 13VH-070US | |
| Alienware m18 R1 | |
| Medion Erazer Beast X40 | |
| Medio Intel Core i9-13900HX (12334 - 17179, n=22) | |
| Media de la clase Gaming (4424 - 33636, n=106, últimos 2 años) | |
| Aorus 17X AZF | |
| HP Omen 17-ck2097ng | |
| AIDA64 / FPU Mandel | |
| Media de la clase Gaming (25115 - 196829, n=106, últimos 2 años) | |
| Alienware m18 R1 | |
| MSI Titan GT77 HX 13VI | |
| MSI GE78HX 13VH-070US | |
| Medion Erazer Beast X40 | |
| Medio Intel Core i9-13900HX (43850 - 69202, n=22) | |
| Aorus 17X AZF | |
| HP Omen 17-ck2097ng | |
| AIDA64 / CPU AES | |
| Aorus 17X AZF | |
| Medio Intel Core i9-13900HX (89413 - 237881, n=22) | |
| MSI Titan GT77 HX 13VI | |
| Alienware m18 R1 | |
| MSI GE78HX 13VH-070US | |
| Medion Erazer Beast X40 | |
| Media de la clase Gaming (39258 - 247074, n=106, últimos 2 años) | |
| HP Omen 17-ck2097ng | |
| AIDA64 / CPU ZLib | |
| MSI GE78HX 13VH-070US | |
| MSI Titan GT77 HX 13VI | |
| Alienware m18 R1 | |
| Medion Erazer Beast X40 | |
| Medio Intel Core i9-13900HX (1284 - 1958, n=22) | |
| Media de la clase Gaming (574 - 2531, n=106, últimos 2 años) | |
| Aorus 17X AZF | |
| HP Omen 17-ck2097ng | |
| AIDA64 / FP64 Ray-Trace | |
| Media de la clase Gaming (5509 - 45446, n=106, últimos 2 años) | |
| Alienware m18 R1 | |
| MSI Titan GT77 HX 13VI | |
| MSI GE78HX 13VH-070US | |
| Medion Erazer Beast X40 | |
| Medio Intel Core i9-13900HX (9481 - 15279, n=22) | |
| Aorus 17X AZF | |
| HP Omen 17-ck2097ng | |
| AIDA64 / CPU PhotoWorxx | |
| Alienware m18 R1 | |
| HP Omen 17-ck2097ng | |
| Aorus 17X AZF | |
| MSI GE78HX 13VH-070US | |
| Medio Intel Core i9-13900HX (42994 - 51994, n=22) | |
| Media de la clase Gaming (12271 - 89891, n=106, últimos 2 años) | |
| Medion Erazer Beast X40 | |
| MSI Titan GT77 HX 13VI | |
Rendimiento del sistema
En las pruebas de rendimiento del sistema, el Aorus 17X AZF ocupa un lugar similar al de las pruebas de CPU. No obstante, el rendimiento de sistema es excelente y muy superior a la media de la clase de portátiles de juego de los últimos dos años. En las pruebas AIDA64, el Aorus 17X AZF ofrece unos resultados impecables gracias a la rápida RAM DDR5, lo que sitúa a nuestro modelo de pruebas en segundo lugar por detrás delAlienware m18 R1.
CrossMark: Overall | Productivity | Creativity | Responsiveness
| PCMark 10 / Score | |
| MSI Titan GT77 HX 13VI | |
| MSI GE78HX 13VH-070US | |
| Alienware m18 R1 | |
| Media de la clase Gaming (5828 - 12414, n=94, últimos 2 años) | |
| Medio Intel Core i9-13900HX, NVIDIA GeForce RTX 4090 Laptop GPU (7690 - 9331, n=8) | |
| Medion Erazer Beast X40 | |
| Aorus 17X AZF | |
| HP Omen 17-ck2097ng | |
| PCMark 10 / Essentials | |
| HP Omen 17-ck2097ng | |
| MSI Titan GT77 HX 13VI | |
| MSI GE78HX 13VH-070US | |
| Medio Intel Core i9-13900HX, NVIDIA GeForce RTX 4090 Laptop GPU (10972 - 11983, n=8) | |
| Medion Erazer Beast X40 | |
| Alienware m18 R1 | |
| Aorus 17X AZF | |
| Media de la clase Gaming (8810 - 11935, n=98, últimos 2 años) | |
| PCMark 10 / Productivity | |
| Medion Erazer Beast X40 | |
| Media de la clase Gaming (6845 - 25323, n=96, últimos 2 años) | |
| MSI GE78HX 13VH-070US | |
| Medio Intel Core i9-13900HX, NVIDIA GeForce RTX 4090 Laptop GPU (9038 - 11680, n=8) | |
| Aorus 17X AZF | |
| Alienware m18 R1 | |
| HP Omen 17-ck2097ng | |
| MSI Titan GT77 HX 13VI | |
| PCMark 10 / Digital Content Creation | |
| MSI Titan GT77 HX 13VI | |
| Alienware m18 R1 | |
| MSI GE78HX 13VH-070US | |
| Media de la clase Gaming (7602 - 19954, n=96, últimos 2 años) | |
| Medio Intel Core i9-13900HX, NVIDIA GeForce RTX 4090 Laptop GPU (10605 - 16395, n=8) | |
| Medion Erazer Beast X40 | |
| Aorus 17X AZF | |
| HP Omen 17-ck2097ng | |
| CrossMark / Overall | |
| Alienware m18 R1 | |
| Aorus 17X AZF | |
| MSI Titan GT77 HX 13VI | |
| Medion Erazer Beast X40 | |
| Medio Intel Core i9-13900HX, NVIDIA GeForce RTX 4090 Laptop GPU (1825 - 2295, n=8) | |
| HP Omen 17-ck2097ng | |
| Media de la clase Gaming (1366 - 2409, n=95, últimos 2 años) | |
| MSI GE78HX 13VH-070US | |
| CrossMark / Productivity | |
| Aorus 17X AZF | |
| Alienware m18 R1 | |
| Medion Erazer Beast X40 | |
| MSI Titan GT77 HX 13VI | |
| Medio Intel Core i9-13900HX, NVIDIA GeForce RTX 4090 Laptop GPU (1666 - 2166, n=8) | |
| Media de la clase Gaming (1386 - 2254, n=95, últimos 2 años) | |
| MSI GE78HX 13VH-070US | |
| HP Omen 17-ck2097ng | |
| CrossMark / Creativity | |
| Alienware m18 R1 | |
| MSI Titan GT77 HX 13VI | |
| Medion Erazer Beast X40 | |
| Medio Intel Core i9-13900HX, NVIDIA GeForce RTX 4090 Laptop GPU (2162 - 2514, n=8) | |
| Aorus 17X AZF | |
| Media de la clase Gaming (1343 - 2786, n=95, últimos 2 años) | |
| HP Omen 17-ck2097ng | |
| MSI GE78HX 13VH-070US | |
| CrossMark / Responsiveness | |
| Aorus 17X AZF | |
| Alienware m18 R1 | |
| MSI Titan GT77 HX 13VI | |
| Medion Erazer Beast X40 | |
| Medio Intel Core i9-13900HX, NVIDIA GeForce RTX 4090 Laptop GPU (1441 - 2275, n=8) | |
| HP Omen 17-ck2097ng | |
| Media de la clase Gaming (1226 - 2334, n=95, últimos 2 años) | |
| MSI GE78HX 13VH-070US | |
| PCMark 10 Score | 7690 puntos | |
ayuda | ||
| AIDA64 / Memory Copy | |
| Alienware m18 R1 | |
| Aorus 17X AZF | |
| HP Omen 17-ck2097ng | |
| MSI GE78HX 13VH-070US | |
| Medio Intel Core i9-13900HX (67716 - 79193, n=22) | |
| Media de la clase Gaming (21750 - 129946, n=106, últimos 2 años) | |
| Medion Erazer Beast X40 | |
| MSI Titan GT77 HX 13VI | |
| AIDA64 / Memory Read | |
| Alienware m18 R1 | |
| Aorus 17X AZF | |
| HP Omen 17-ck2097ng | |
| MSI GE78HX 13VH-070US | |
| Medio Intel Core i9-13900HX (73998 - 88462, n=22) | |
| Medion Erazer Beast X40 | |
| Media de la clase Gaming (22956 - 118858, n=106, últimos 2 años) | |
| MSI Titan GT77 HX 13VI | |
| AIDA64 / Memory Write | |
| Alienware m18 R1 | |
| HP Omen 17-ck2097ng | |
| Aorus 17X AZF | |
| MSI GE78HX 13VH-070US | |
| Media de la clase Gaming (22297 - 135096, n=106, últimos 2 años) | |
| Medio Intel Core i9-13900HX (65472 - 77045, n=22) | |
| Medion Erazer Beast X40 | |
| MSI Titan GT77 HX 13VI | |
| AIDA64 / Memory Latency | |
| Media de la clase Gaming (75.3 - 259, n=106, últimos 2 años) | |
| MSI Titan GT77 HX 13VI | |
| Medion Erazer Beast X40 | |
| Medio Intel Core i9-13900HX (75.3 - 91.1, n=22) | |
| HP Omen 17-ck2097ng | |
| MSI GE78HX 13VH-070US | |
| Aorus 17X AZF | |
| Alienware m18 R1 | |
* ... más pequeño es mejor
Latencias del CPD
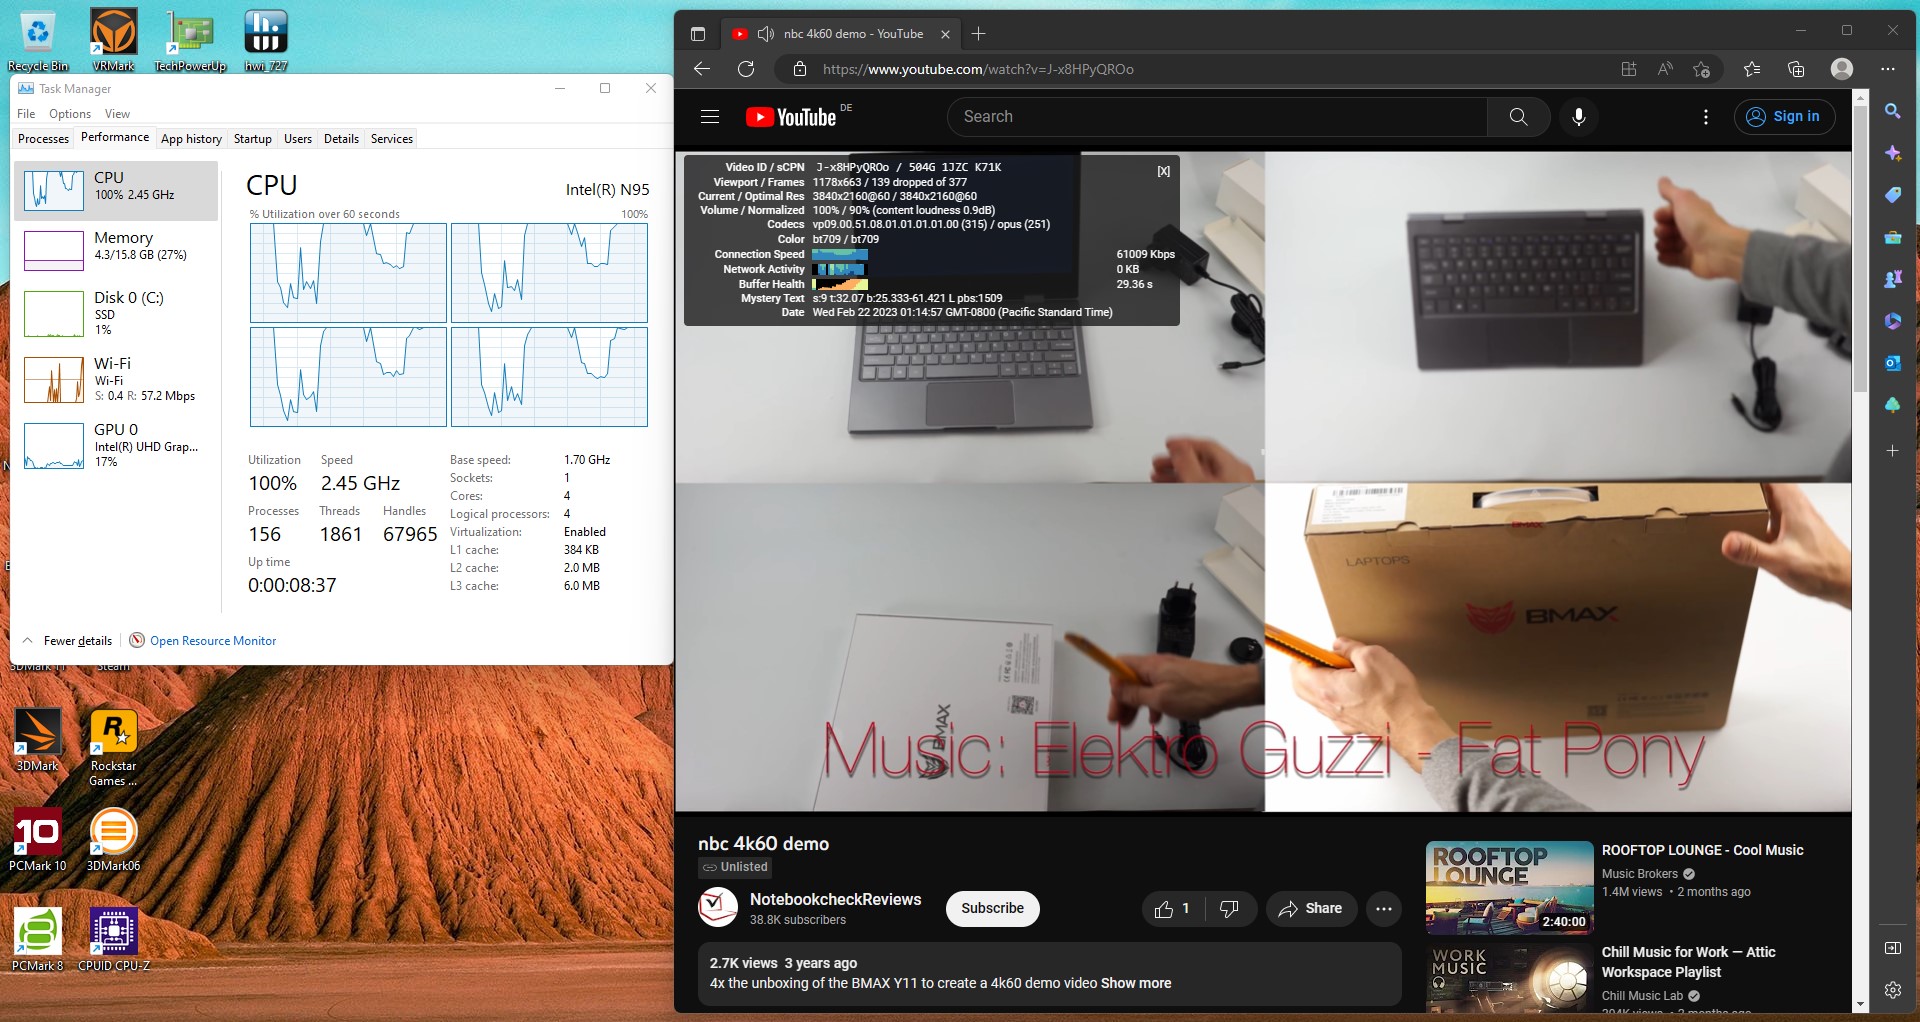
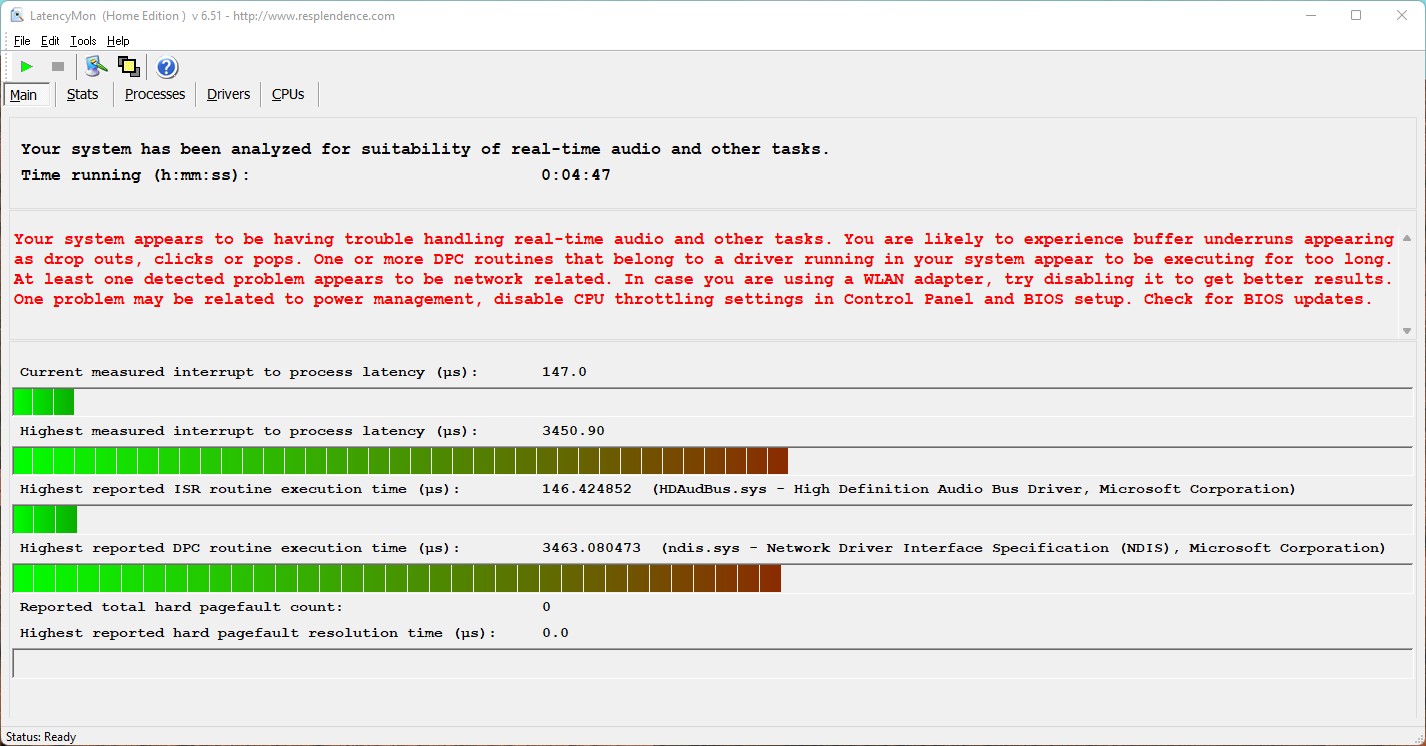
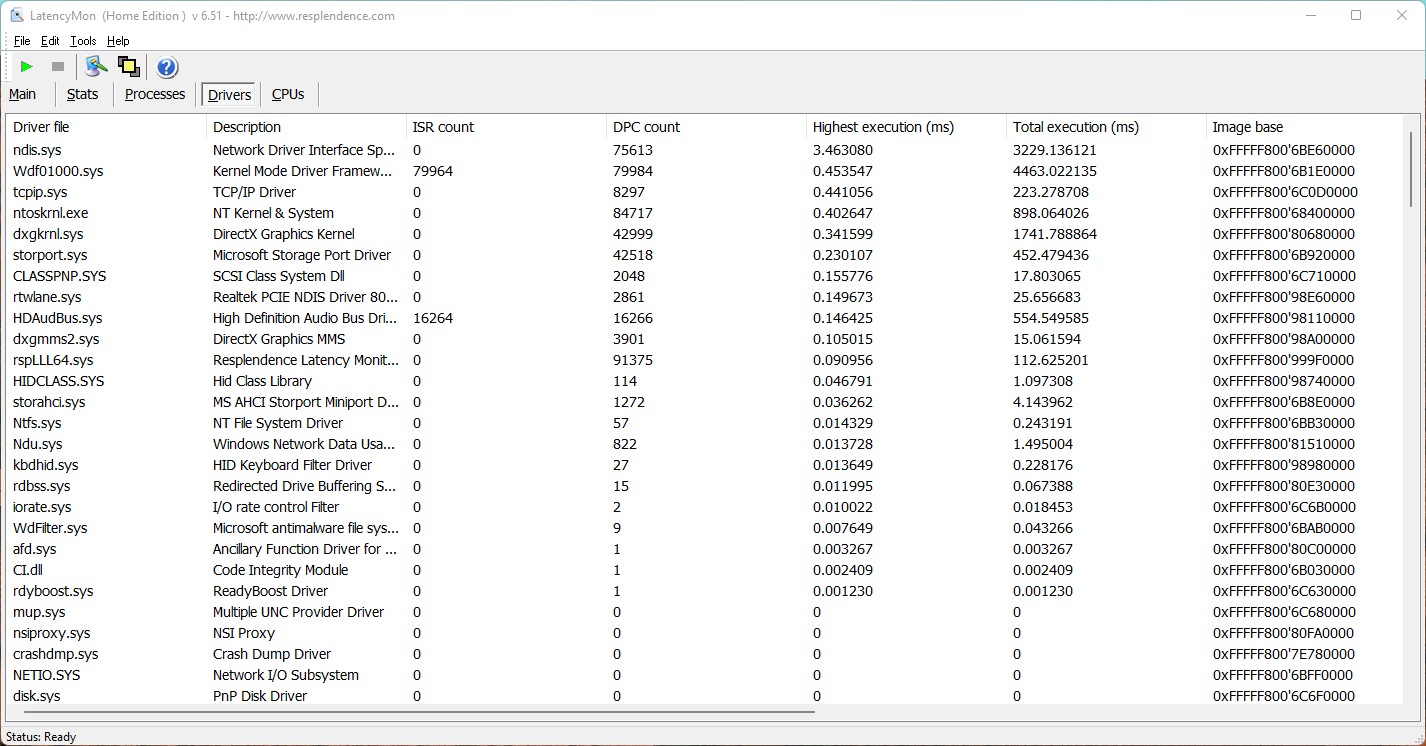
Nuestro test estandarizado de monitorización de latencia (navegación web, reproducción de vídeo 4k, Prime95 a alta carga) revela valores extremos en el Aorus 17X AZF. Las futuras actualizaciones software deberían mejorar esto para que el sistema sea adecuado para la edición de vídeo y audio en tiempo real sin limitaciones.
| DPC Latencies / LatencyMon - interrupt to process latency (max), Web, Youtube, Prime95 | |
| Aorus 17X AZF | |
| MSI Titan GT77 HX 13VI | |
| MSI GE78HX 13VH-070US | |
| Alienware m18 R1 | |
| Medion Erazer Beast X40 | |
| HP Omen 17-ck2097ng | |
* ... más pequeño es mejor
Dispositivos de almacenamiento
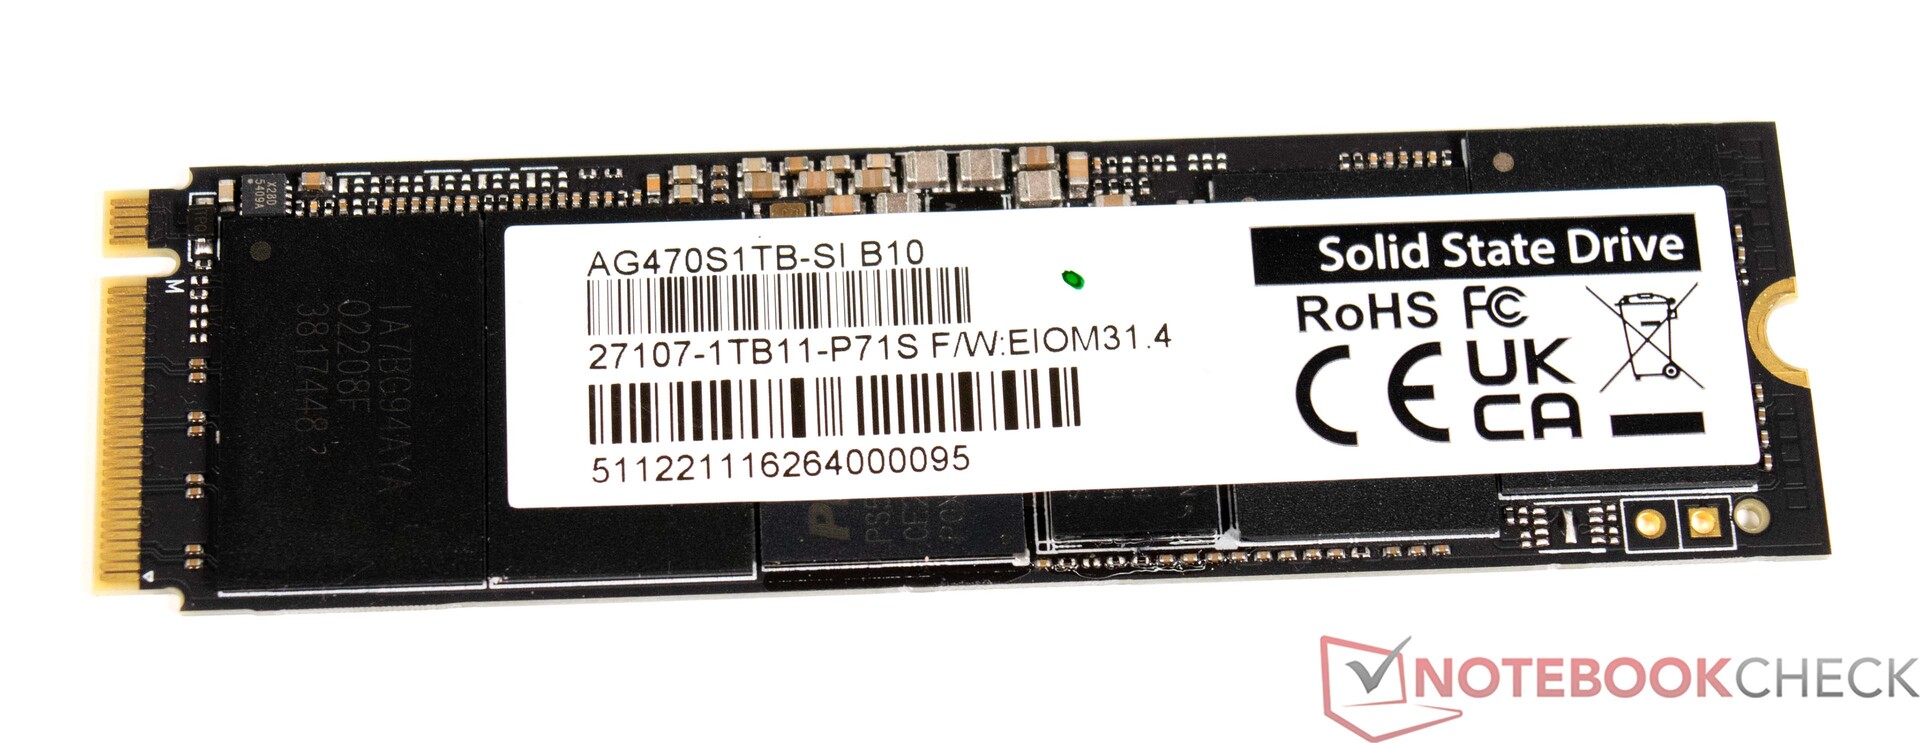
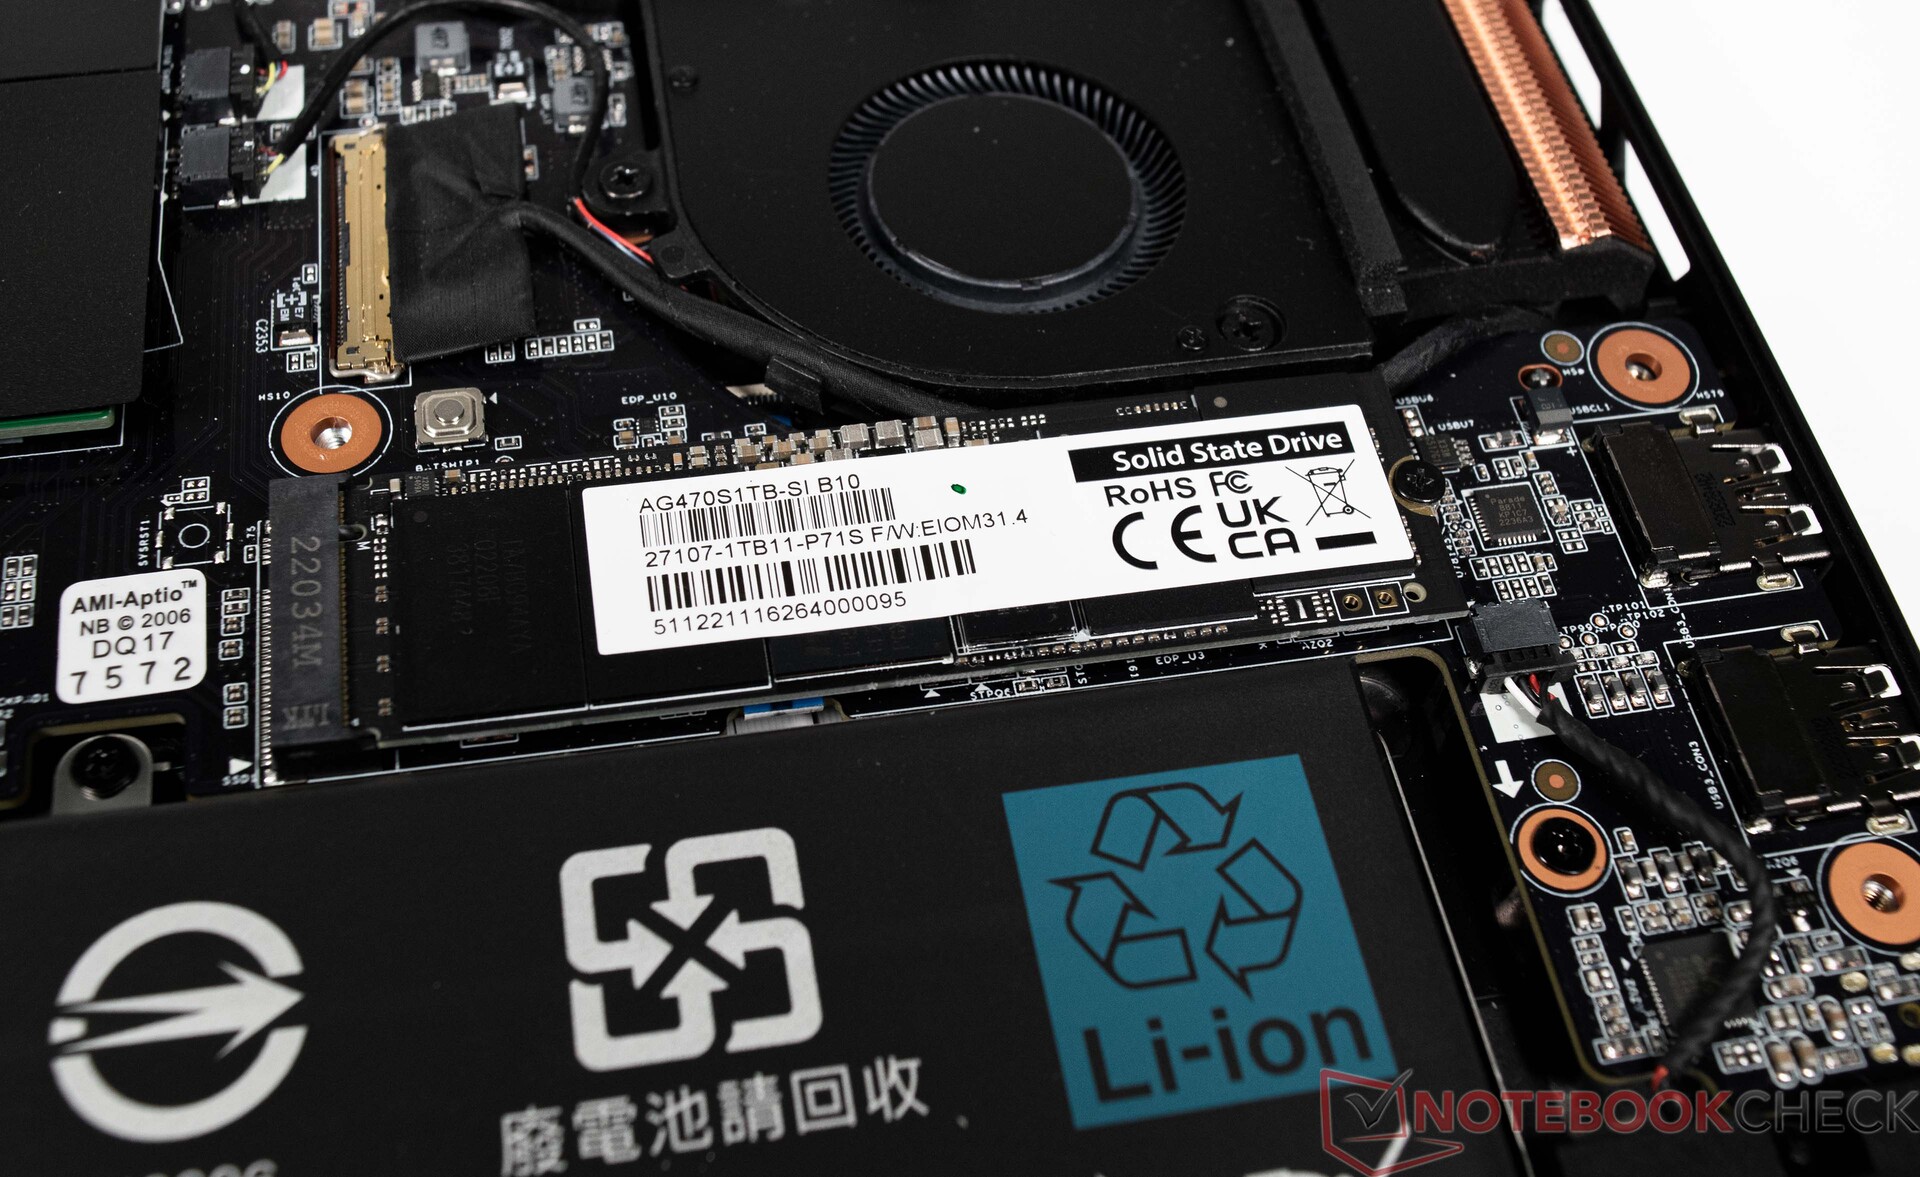
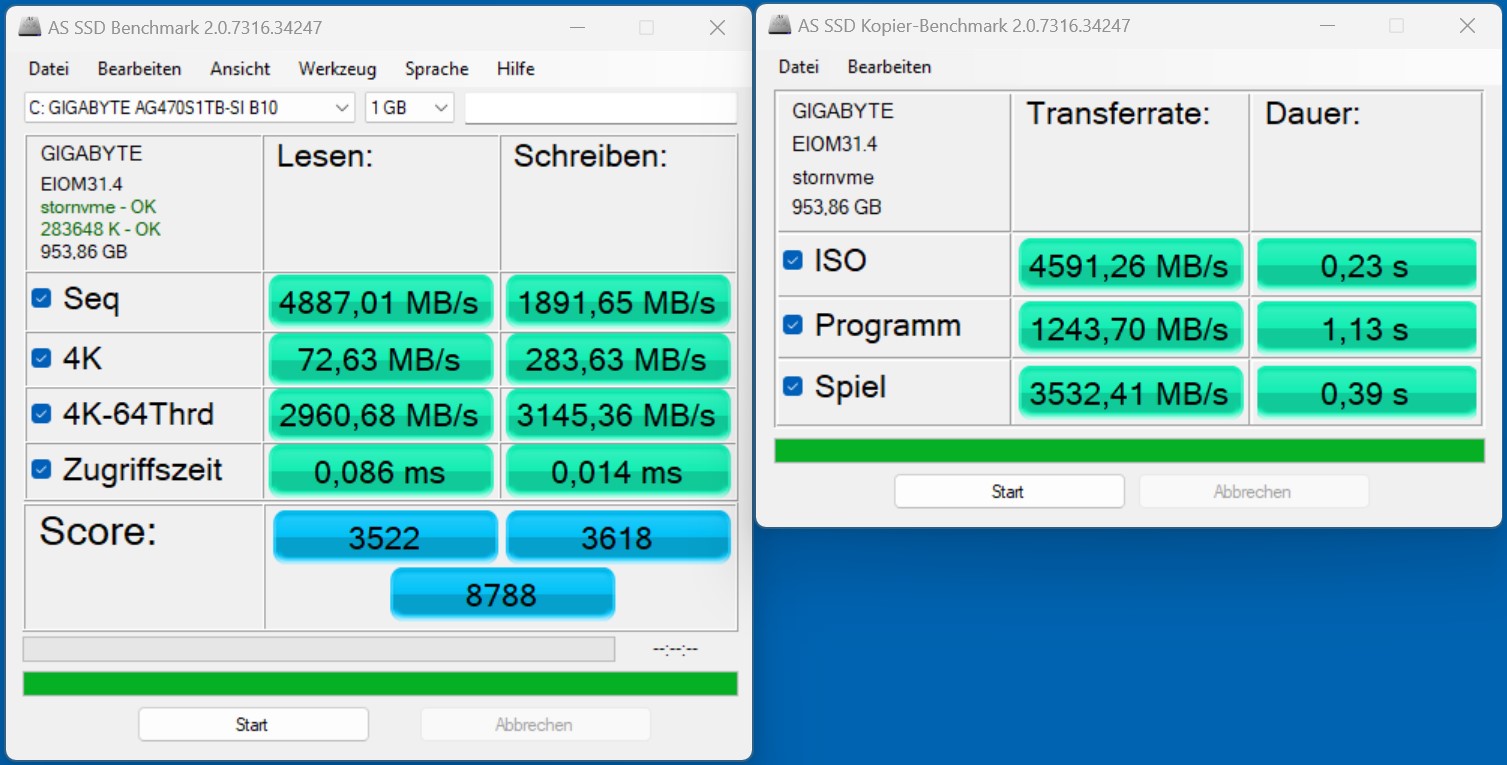
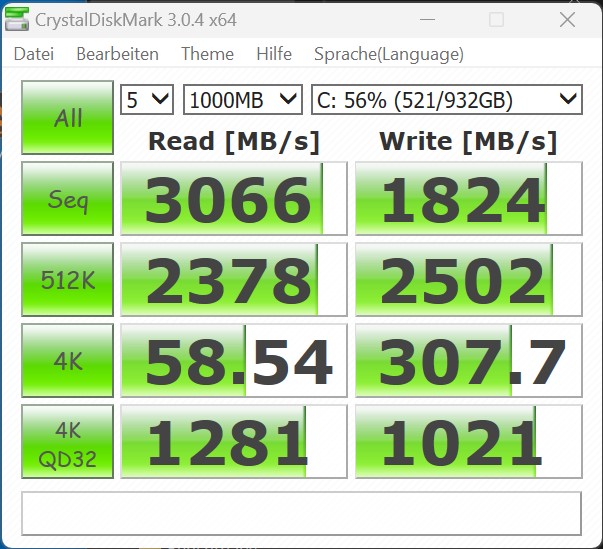
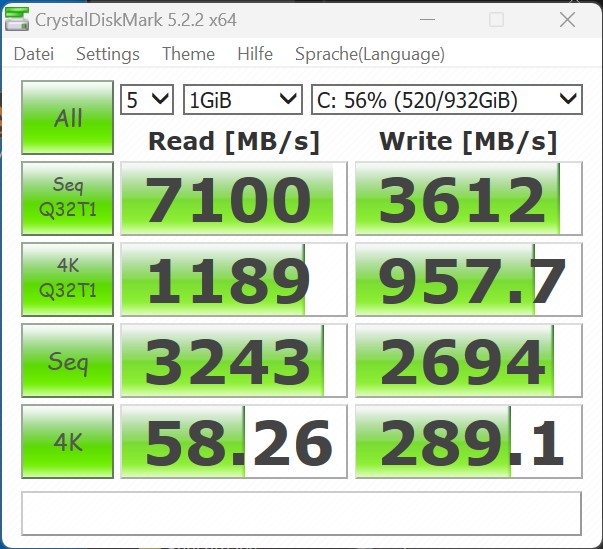
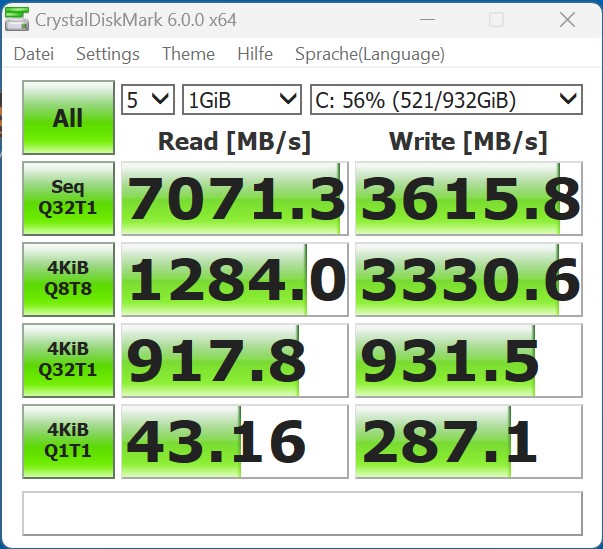
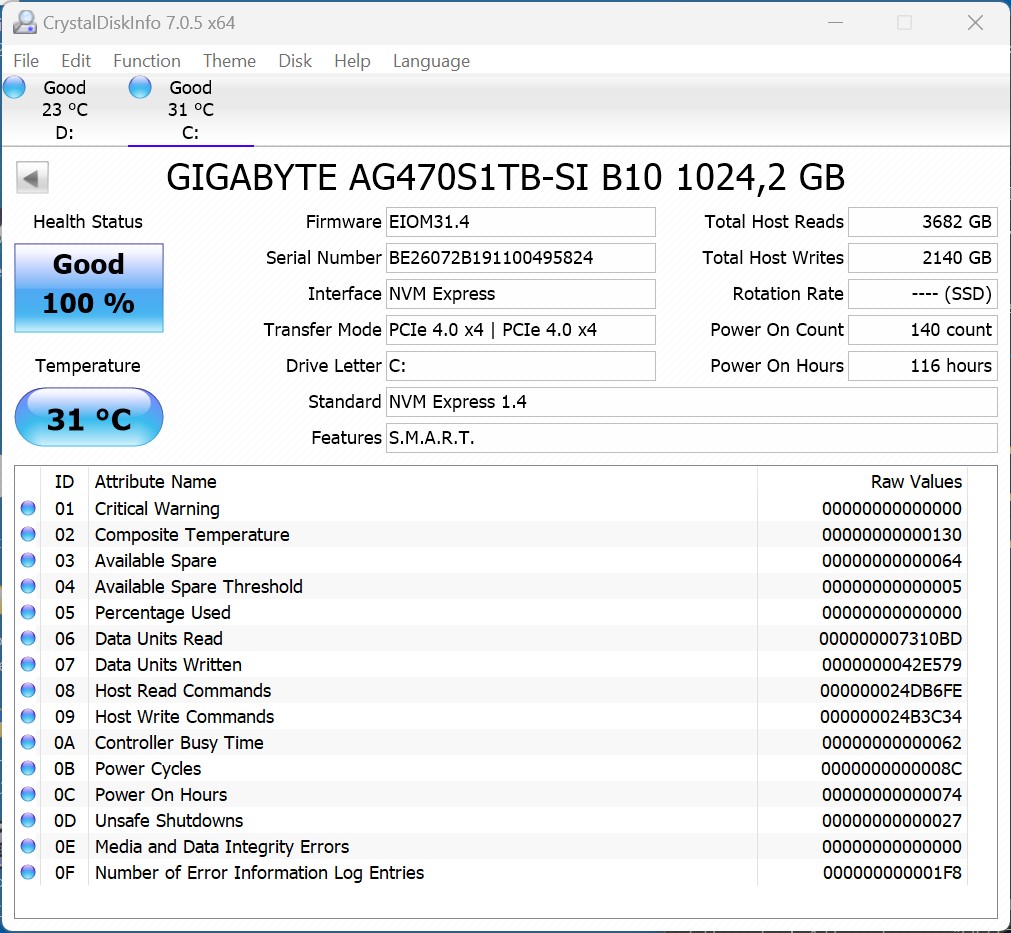
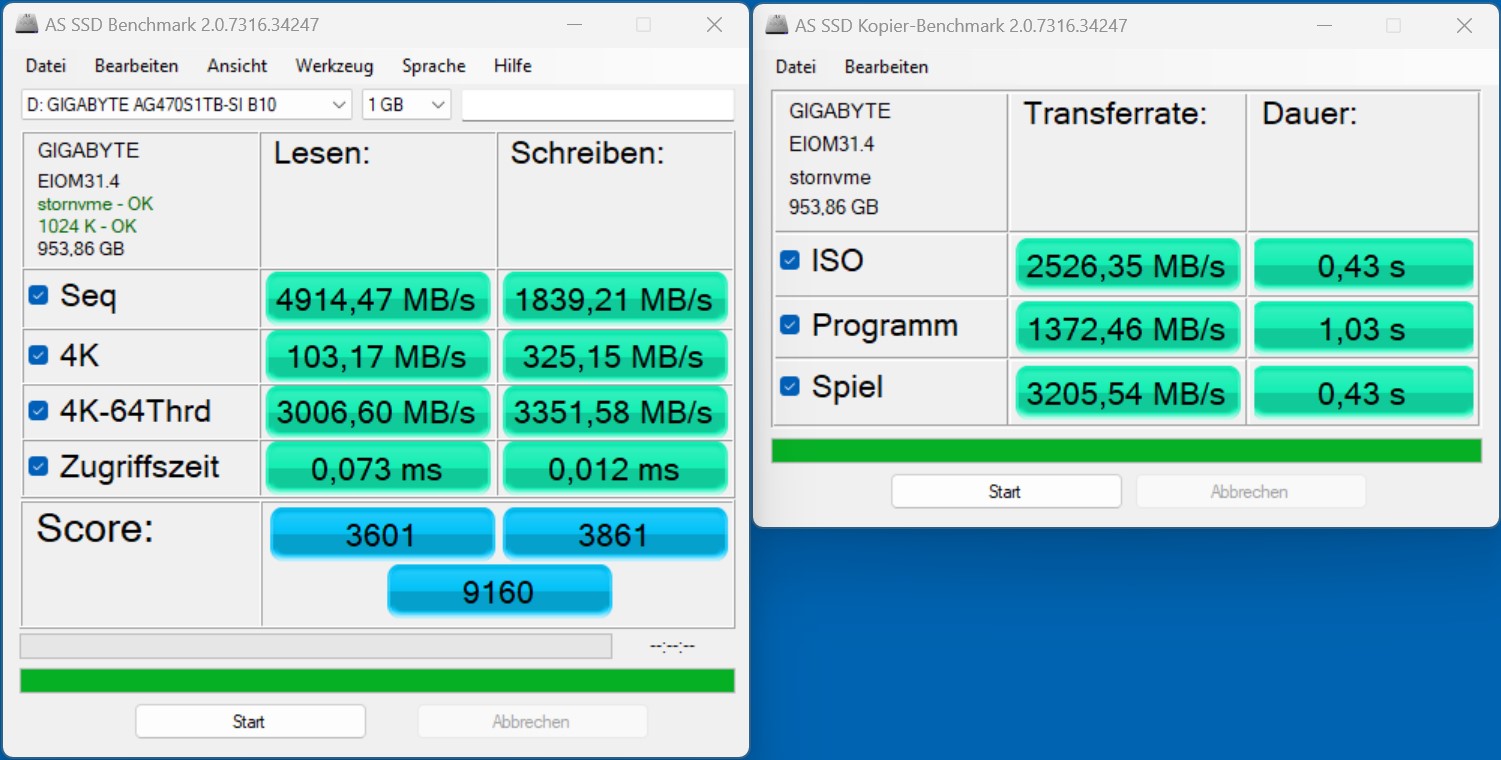
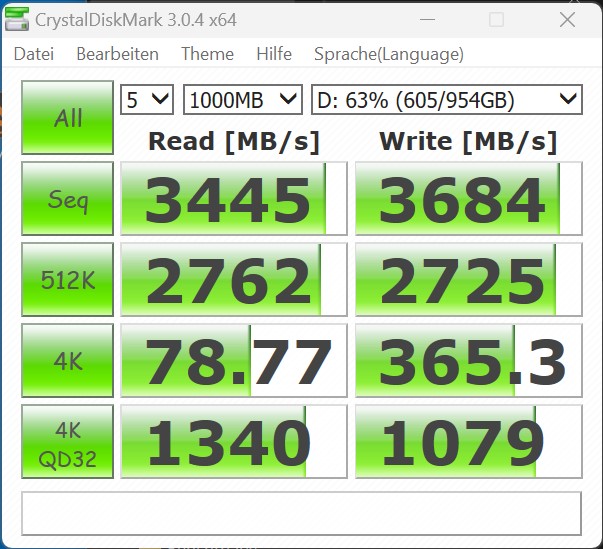
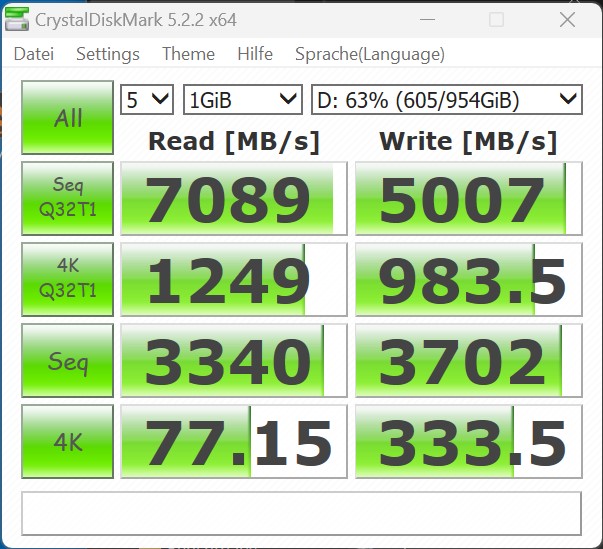
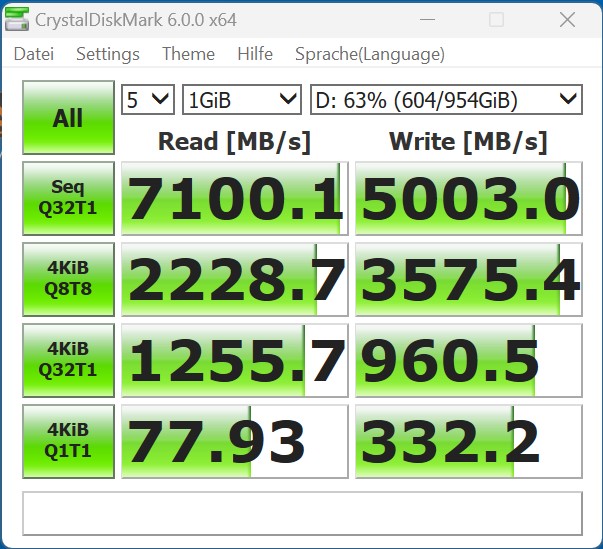
El Aorus 17X AZF usa un SSD interno. Para ser más precisos, nuestro modelo de pruebas ofrece dos SSDs NVMe, cada uno con 1 TB de espacio de almacenamiento, lo que es adecuado para su propósito. Por tanto, se pueden almacenar montones de datos en los dos dispositivos de almacenamiento masivo. Las dos unidades soportan PCIe 4.0 y también están conectadas a todo el ancho de banda con cuatro carriles. El rendimiento es sólido, incluso aunque varios dispositivos de la comparación muestren mejor rendimiento en algunos casos. Sin embargo, el Aorus 17X AZF ya está completamente equipado con dos SSDs. Por supuesto, también se pueden instalar modelos de 2 TB en el dispositivo. Mientras tanto, la parte inferior de la carcasa se usa para una refrigeración efectiva, por lo que el dispositivo pasó nuestro test de estrés con nota.
Para más comparaciones y puntos de referencia, consulte nuestratabla comparativa aquí.
SSD 1
SSD 2


* ... más pequeño es mejor
Sustained Read Performance: DiskSpd Read Loop, Queue Depth 8
Tarjeta gráfica
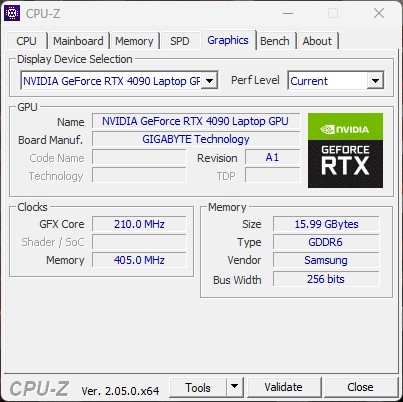
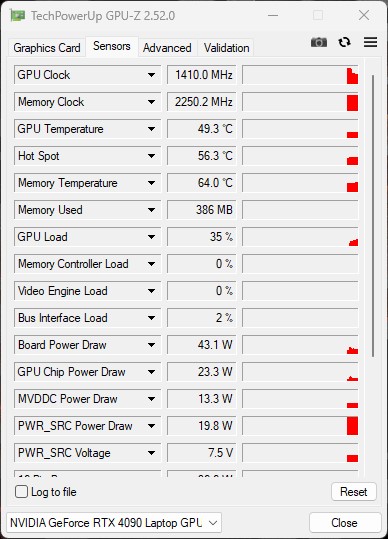
El Aorus 17X AZF utiliza unaGPU Nvidia GeForce RTX 4090 para portátilesque tiene un TGP máximo posible de hasta 175 vatios (150 vatios + 25 vatios Dynamic Boost). El rendimiento 3D es correspondientemente bueno, aunque los portátiles de la competencia con la misma tarjeta gráfica son capaces de sacar un poco más de rendimiento. La diferencia con la GPU de portátil Nvidia GeForce RTX 4080 es considerablemente mayor, con un 9 y un 18 por ciento, respectivamente. En comparación con el Medion Erazer Beastprácticamente vemos el mismo rendimiento en nuestro Aorus 17X AZF.
Se pueden encontrar más pruebas comparativas de la GPU para portátiles Nvidia GeForce RTX 4090 aquí.
| 3DMark 05 Standard | 61850 puntos | |
| 3DMark 06 Standard Score | 61681 puntos | |
| 3DMark 11 Performance | 43896 puntos | |
| 3DMark Ice Storm Standard Score | 247981 puntos | |
| 3DMark Cloud Gate Standard Score | 58934 puntos | |
| 3DMark Fire Strike Score | 35428 puntos | |
| 3DMark Fire Strike Extreme Score | 24235 puntos | |
| 3DMark Time Spy Score | 20085 puntos | |
ayuda | ||
* ... más pequeño es mejor
Rendimiento en juegos
El portátil está equipado con una pantalla QHD, lo que significa que todos los títulos actuales se pueden reproducir al máximo detalle sin problemas. A veces el rendimiento de laGPU Nvidia GeForce RTX 4090 para portátilespuede alimentar fácilmente pantallas externas 4K en resolución nativa. La VRAM de 16 GB es buena, está preparada para el futuro y no es un cuello de botella, ni siquiera en QHD. En nuestras pruebas de juegos, el Aorus 17X AZF queda en un sólido tercer puesto. Todos los representantes que usan GPU Nvidia GeForce RTX 4090 para portátilesofrecen niveles de rendimiento similares.
| Performance rating - Percent | |
| Alienware m18 R1 | |
| MSI Titan GT77 HX 13VI | |
| Aorus 17X AZF | |
| Medion Erazer Beast X40 | |
| MSI GE78HX 13VH-070US | |
| HP Omen 17-ck2097ng | |
| Media de la clase Gaming | |
| The Witcher 3 - 1920x1080 Ultra Graphics & Postprocessing (HBAO+) | |
| Alienware m18 R1 | |
| Aorus 17X AZF | |
| MSI Titan GT77 HX 13VI | |
| Media de la clase Gaming (104.7 - 240, n=7, últimos 2 años) | |
| Medion Erazer Beast X40 | |
| MSI GE78HX 13VH-070US | |
| HP Omen 17-ck2097ng | |
| GTA V - 1920x1080 Highest AA:4xMSAA + FX AF:16x | |
| Medion Erazer Beast X40 | |
| Alienware m18 R1 | |
| MSI Titan GT77 HX 13VI | |
| Aorus 17X AZF | |
| Media de la clase Gaming (48.3 - 186.9, n=94, últimos 2 años) | |
| HP Omen 17-ck2097ng | |
| MSI GE78HX 13VH-070US | |
| Final Fantasy XV Benchmark - 1920x1080 High Quality | |
| Alienware m18 R1 | |
| MSI Titan GT77 HX 13VI | |
| Aorus 17X AZF | |
| Medion Erazer Beast X40 | |
| Media de la clase Gaming (41 - 215, n=95, últimos 2 años) | |
| MSI GE78HX 13VH-070US | |
| HP Omen 17-ck2097ng | |
| Strange Brigade - 1920x1080 ultra AA:ultra AF:16 | |
| Aorus 17X AZF | |
| MSI Titan GT77 HX 13VI | |
| Alienware m18 R1 | |
| Medion Erazer Beast X40 | |
| Media de la clase Gaming (76.3 - 458, n=87, últimos 2 años) | |
| HP Omen 17-ck2097ng | |
| MSI GE78HX 13VH-070US | |
| Dota 2 Reborn - 1920x1080 ultra (3/3) best looking | |
| Alienware m18 R1 | |
| MSI Titan GT77 HX 13VI | |
| Aorus 17X AZF | |
| Medion Erazer Beast X40 | |
| HP Omen 17-ck2097ng | |
| Media de la clase Gaming (84.8 - 252, n=108, últimos 2 años) | |
| MSI GE78HX 13VH-070US | |
| F1 22 - 1920x1080 Ultra High Preset AA:T AF:16x | |
| Alienware m18 R1 | |
| MSI Titan GT77 HX 13VI | |
| Aorus 17X AZF | |
| Medion Erazer Beast X40 | |
| MSI GE78HX 13VH-070US | |
| HP Omen 17-ck2097ng | |
| Media de la clase Gaming (40.1 - 121.2, n=4, últimos 2 años) | |
| The Callisto Protocol - 1920x1080 Ultra Preset (without FSR Upscaling) | |
| MSI Titan GT77 HX 13VI | |
| Aorus 17X AZF | |
| Medio NVIDIA GeForce RTX 4090 Laptop GPU (102.6 - 150.7, n=6) | |
| Medio NVIDIA GeForce RTX 4080 Laptop GPU (111.5 - 120.4, n=2) | |
| HP Omen 17-ck2097ng | |
| Atomic Heart - 1920x1080 Atomic Preset | |
| Medio NVIDIA GeForce RTX 4090 Laptop GPU (128.6 - 166, n=3) | |
| Aorus 17X AZF | |
| Medion Erazer Beast X40 | |
| HP Omen 17-ck2097ng | |
| Medio NVIDIA GeForce RTX 4080 Laptop GPU (n=1) | |
| Company of Heroes 3 - 1920x1080 Maximum Settings | |
| Aorus 17X AZF | |
| Medio NVIDIA GeForce RTX 4090 Laptop GPU (215 - 235, n=2) | |
| Medion Erazer Beast X40 | |
| HP Omen 17-ck2097ng | |
| Medio NVIDIA GeForce RTX 4080 Laptop GPU (n=1) | |
| Dead Space Remake - 1920x1080 Ultra Preset AA:T | |
| Aorus 17X AZF | |
| Medio NVIDIA GeForce RTX 4090 Laptop GPU (129 - 140.8, n=2) | |
| MSI Titan GT77 HX 13VI | |
| Medio NVIDIA GeForce RTX 4080 Laptop GPU (n=1) | |
| Media de la clase Gaming (n=1últimos 2 años) | |
| Tiny Tina's Wonderlands - 1920x1080 Badass Preset (DX12) | |
| Alienware m18 R1 | |
| MSI Titan GT77 HX 13VI | |
| Medio NVIDIA GeForce RTX 4090 Laptop GPU (141.1 - 189.4, n=14) | |
| Aorus 17X AZF | |
| Medio NVIDIA GeForce RTX 4080 Laptop GPU (112.9 - 167.1, n=9) | |
| Media de la clase Gaming (55 - 159.4, n=4, últimos 2 años) | |
| High On Life - 1920x1080 Very High Preset | |
| Aorus 17X AZF | |
| Medio NVIDIA GeForce RTX 4090 Laptop GPU (180.3 - 185.2, n=2) | |
| Medio NVIDIA GeForce RTX 4080 Laptop GPU (n=1) | |
| The Witcher 3 / High Graphics & Postprocessing (Nvidia HairWorks Off) | |
| Alienware m18 R1 | |
| MSI Titan GT77 HX 13VI | |
| Aorus 17X AZF | |
| MSI GE78HX 13VH-070US | |
| Medio NVIDIA GeForce RTX 4090 Laptop GPU (290 - 449, n=23) | |
| Media de la clase Gaming (341 - 404, n=2, últimos 2 años) | |
| Medion Erazer Beast X40 | |
| HP Omen 17-ck2097ng | |
| The Witcher 3 / Ultra Graphics & Postprocessing (HBAO+) | |
| Alienware m18 R1 | |
| Aorus 17X AZF | |
| MSI Titan GT77 HX 13VI | |
| Medio NVIDIA GeForce RTX 4090 Laptop GPU (139.2 - 216, n=35) | |
| Media de la clase Gaming (104.7 - 240, n=7, últimos 2 años) | |
| Medion Erazer Beast X40 | |
| MSI GE78HX 13VH-070US | |
| HP Omen 17-ck2097ng | |
Para comprobar si las frecuencias de cuadro se mantienen estables y constantes durante un periodo de tiempo más largo, ejecutamos "The Witcher 3" durante 60 minutos a resolución Full HD y con los detalles al máximo. El personaje del juego no se movió. La frecuencia de refresco es constante, como revela el gráfico.
Witcher 3 FPS chart
| bajo | medio | alto | ultra | QHD | 4K | |
|---|---|---|---|---|---|---|
| GTA V (2015) | 187 | 186.1 | 182.2 | 135.3 | 132.9 | 174.3 |
| The Witcher 3 (2015) | 554.3 | 506.7 | 395.8 | 200 | 145.9 | |
| Dota 2 Reborn (2015) | 235.6 | 199.8 | 191.6 | 176.1 | 175.75 | |
| Final Fantasy XV Benchmark (2018) | 222 | 205 | 177.6 | 152.4 | 89.9 | |
| X-Plane 11.11 (2018) | 195.9 | 173.5 | 138.5 | 118.5 | ||
| Far Cry 5 (2018) | 186 | 170 | 161 | 162 | 152 | 98 |
| Strange Brigade (2018) | 527 | 441 | 414 | 386 | 300 | 154.6 |
| Shadow of the Tomb Raider (2018) | 247 | 219 | 210 | 198.6 | 162.5 | 95.2 |
| Far Cry New Dawn (2019) | 170 | 148 | 145 | 131 | 128 | 102 |
| Metro Exodus (2019) | 187.7 | 160.6 | 134.5 | 112.9 | 98 | 68.6 |
| Borderlands 3 (2019) | 208 | 182.1 | 163.6 | 146.5 | 115.8 | 67.9 |
| F1 2020 (2020) | 413 | 354 | 344 | 305 | 253 | 148.7 |
| F1 2021 (2021) | 466 | 421 | 356 | 204 | 182.7 | 107.8 |
| Far Cry 6 (2021) | 175.7 | 154.3 | 136.3 | 128.9 | 115.1 | 73.1 |
| God of War (2022) | 176.8 | 176.7 | 166.8 | 123.6 | 101.5 | 72.7 |
| GRID Legends (2022) | 227 | 209 | 190.1 | 183.2 | 178.9 | 128.6 |
| Tiny Tina's Wonderlands (2022) | 320 | 263 | 194 | 158.3 | 112.5 | 65.7 |
| F1 22 (2022) | 315 | 299 | 283 | 128.9 | 83.5 | 43 |
| The Callisto Protocol (2022) | 193.3 | 168.2 | 166.4 | 131.1 | 101.3 | 61.6 |
| High On Life (2023) | 277 | 246 | 211 | 185.2 | 126.1 | 56.9 |
| Dead Space Remake (2023) | 153.4 | 150.7 | 142.3 | 140.8 | 105.6 | 56.2 |
| Hogwarts Legacy (2023) | 116 | 100.7 | 93.7 | 89.7 | 80.9 | 50.5 |
| Returnal (2023) | 195 | 191 | 176 | 155 | 119 | 70 |
| Atomic Heart (2023) | 217 | 187.1 | 166.6 | 138.5 | 107.8 | 62.7 |
| Company of Heroes 3 (2023) | 308.5 | 280.4 | 239.6 | 235.2 | 194.8 | 117.4 |
| Resident Evil 4 Remake (2023) | 232 | 189.7 | 187.3 | 136.3 | 109.2 | 63.4 |
| The Last of Us (2023) | 113.7 | 110.8 | 109 | 105 | 81.8 | 43.8 |
Emisiones - El Aorus 17X AZF también puede ser silencioso
Ruido
En inactivo y durante el uso diario (oficina e internet), los cuatro ventiladores suelen girar a baja velocidad. Con hasta 34 dB(A), el Aorus 17X AZF es muy tolerable. Bajo carga, ocasionalmente puede volverse muy ruidoso con valores máximos de 54 dB(A) registrados en nuestro test de estrés. Además, los ventiladores producen un sonido de alta frecuencia, que subjetivamente hace que el volumen sea aún más alto.
En principio, el Aorus 17X AZF también permite un funcionamiento casi silencioso. Para ello hay que usar los perfiles Modo Reunión o Modo de reposo de ahorro de energía, que se pueden seleccionar a través del GCC (Gigabyte Control Center). La reducción resultante en el consumo de energía de la CPU sigue siendo suficiente para el uso diario.
El GCC también permite controlar manualmente el ventilador. Además de los perfiles predefinidos, puedes usar tus propias curvas de ventilador.
Ruido
| Ocioso |
| 28 / 29 / 34 dB(A) |
| Carga |
| 51 / 54 dB(A) |
 | ||
30 dB silencioso 40 dB(A) audible 50 dB(A) ruidosamente alto |
||
min: | ||
| Aorus 17X AZF i9-13900HX, GeForce RTX 4090 Laptop GPU | Medion Erazer Beast X40 i9-13900HX, GeForce RTX 4090 Laptop GPU | MSI GE78HX 13VH-070US i9-13950HX, GeForce RTX 4080 Laptop GPU | HP Omen 17-ck2097ng i9-13900HX, GeForce RTX 4080 Laptop GPU | MSI Titan GT77 HX 13VI i9-13950HX, GeForce RTX 4090 Laptop GPU | Alienware m18 R1 i9-13980HX, GeForce RTX 4090 Laptop GPU | |
|---|---|---|---|---|---|---|
| Noise | 4% | 7% | 4% | 1% | 16% | |
| apagado / medio ambiente * (dB) | 25 | 24 4% | 23.4 6% | 24 4% | 24.6 2% | 22.8 9% |
| Idle Minimum * (dB) | 28 | 25 11% | 24.2 14% | 31 -11% | 29.2 -4% | 23 18% |
| Idle Average * (dB) | 29 | 29 -0% | 25.6 12% | 32 -10% | 29.2 -1% | 23 21% |
| Idle Maximum * (dB) | 34 | 35 -3% | 31 9% | 33 3% | 29.2 14% | 23 32% |
| Load Average * (dB) | 51 | 51 -0% | 43.3 15% | 45 12% | 50.7 1% | 35.6 30% |
| Witcher 3 ultra * (dB) | 57 | 51 11% | 56.3 1% | 45 21% | 53.3 6% | 51.3 10% |
| Load Maximum * (dB) | 54 | 53 2% | 59.1 -9% | 50 7% | 61 -13% | 56.7 -5% |
* ... más pequeño es mejor
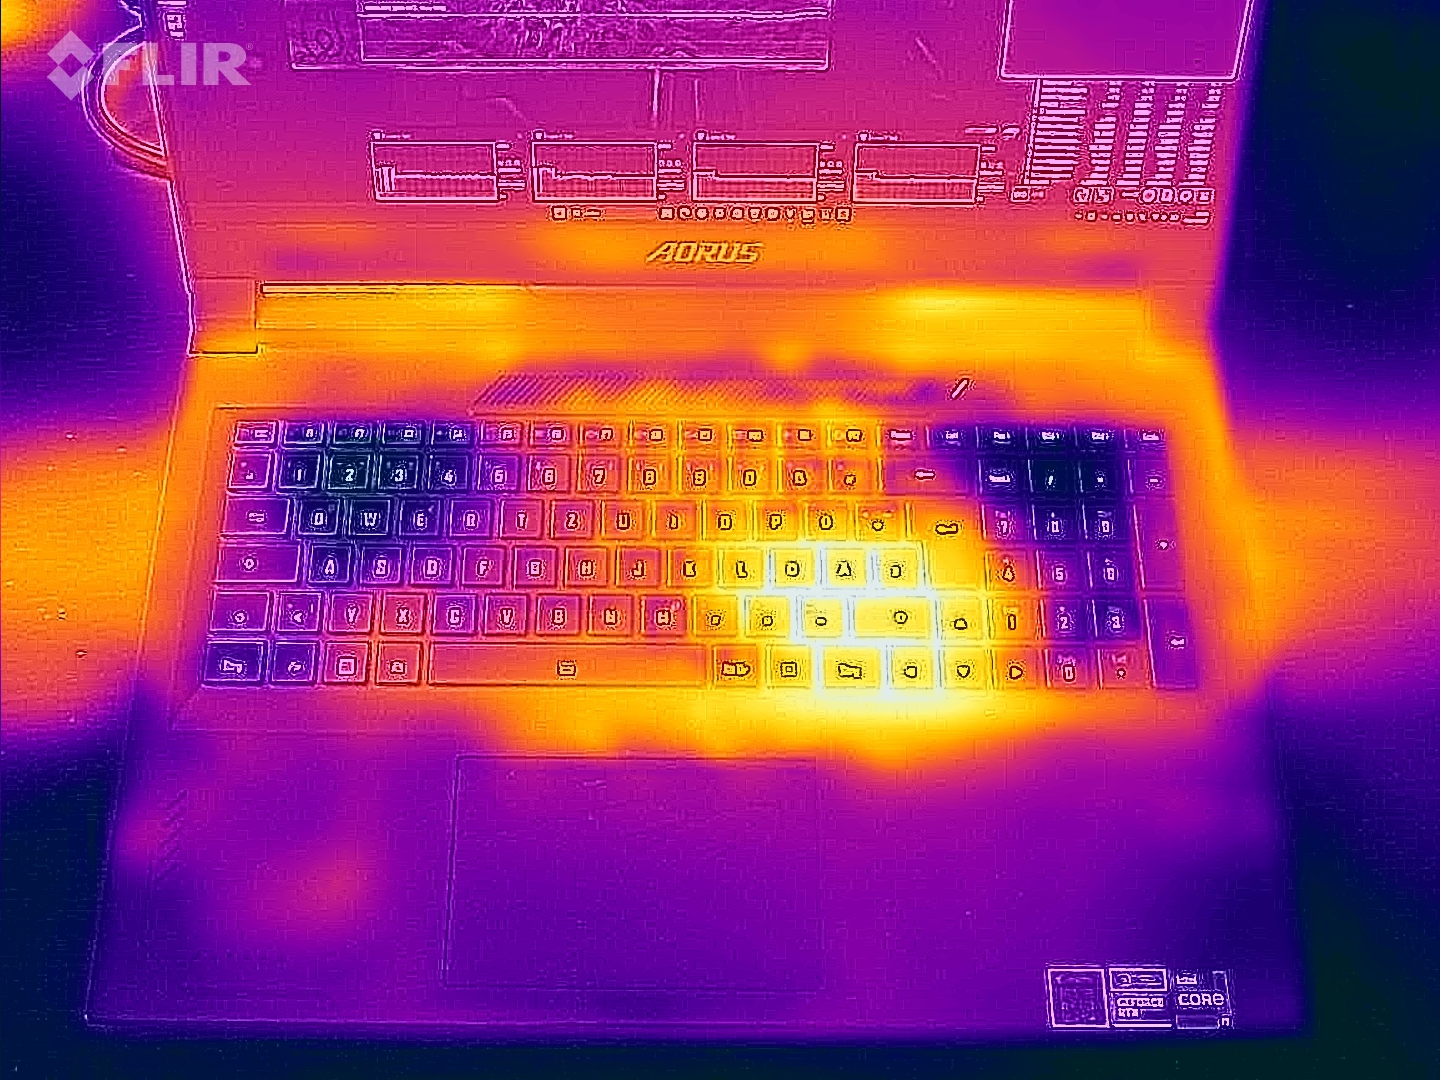
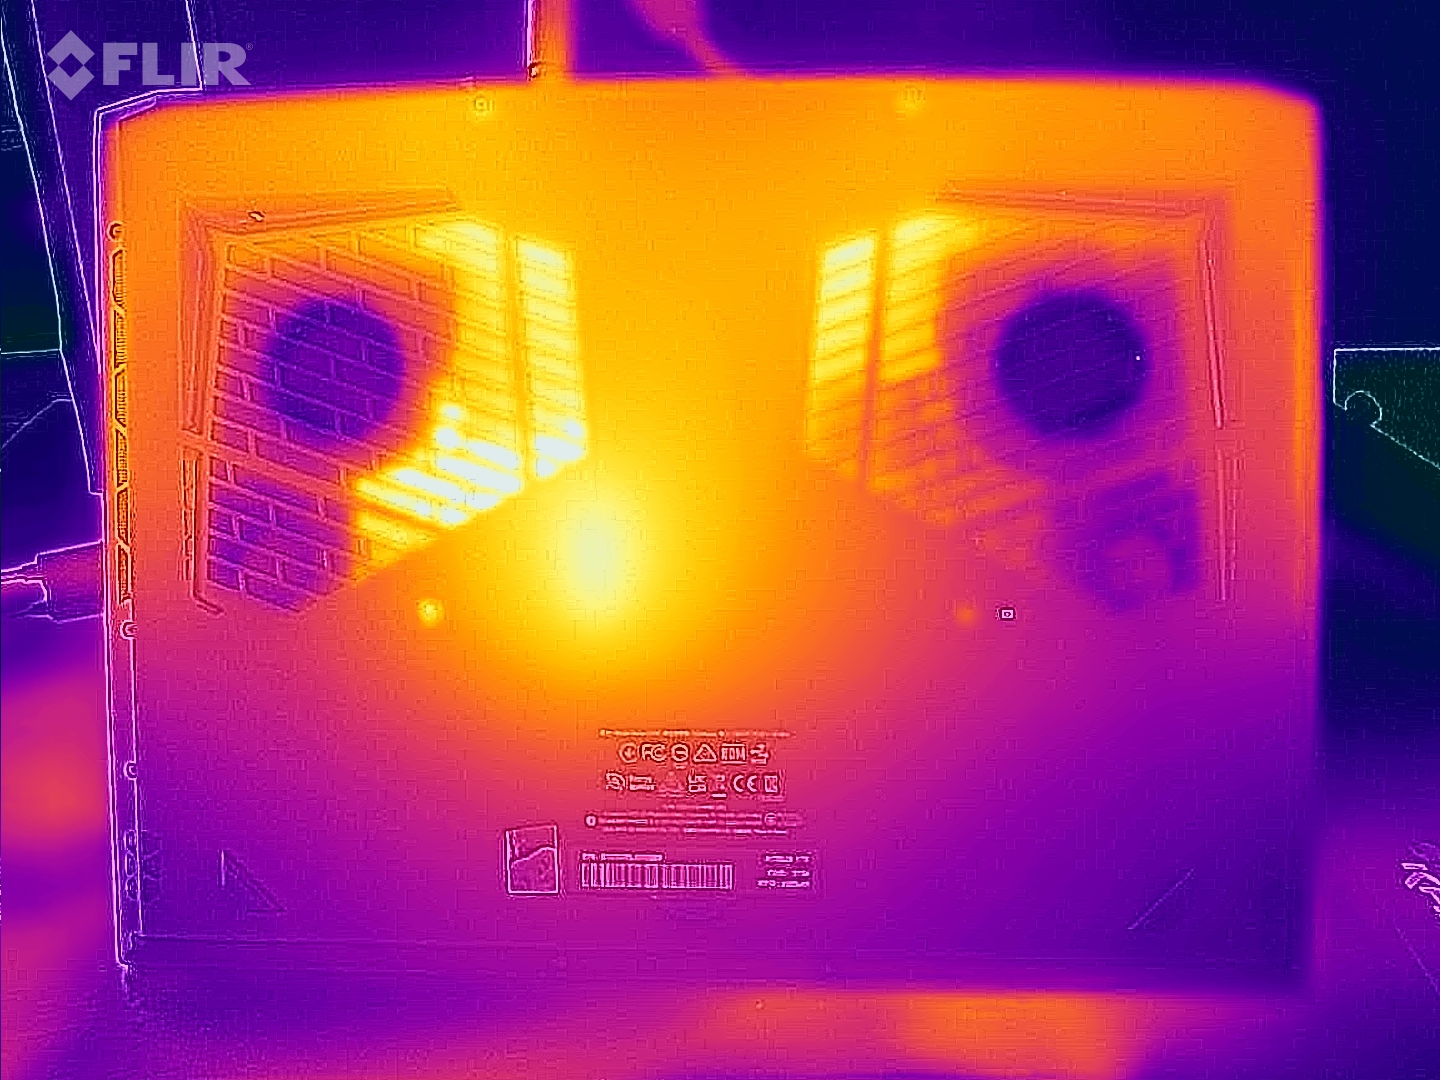
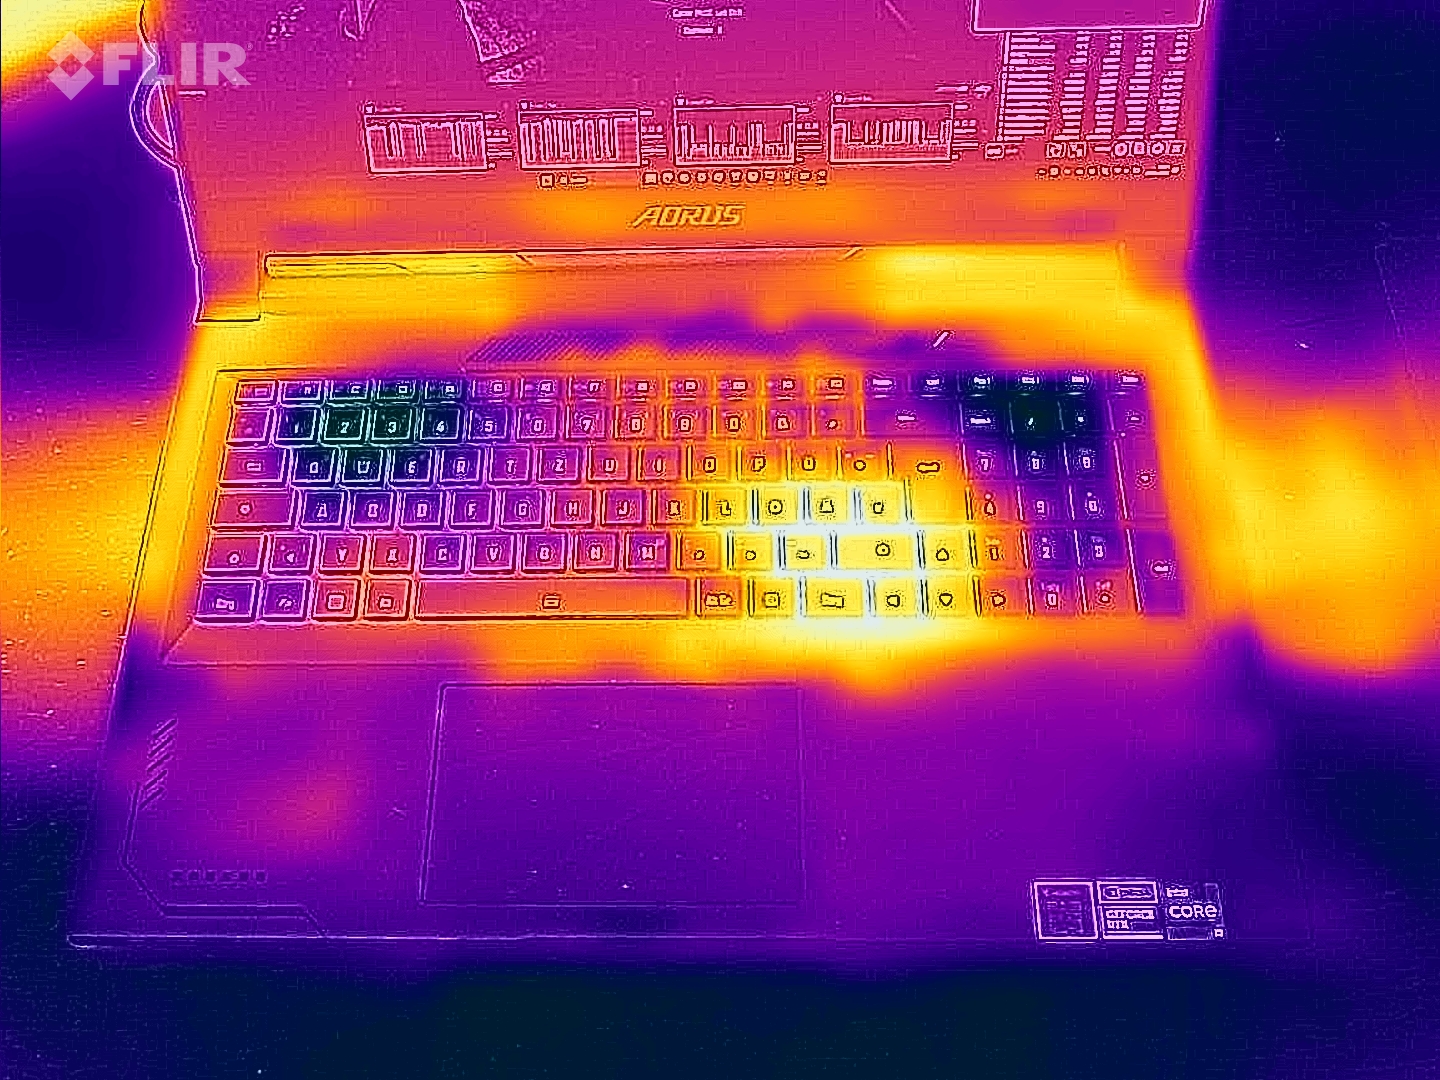
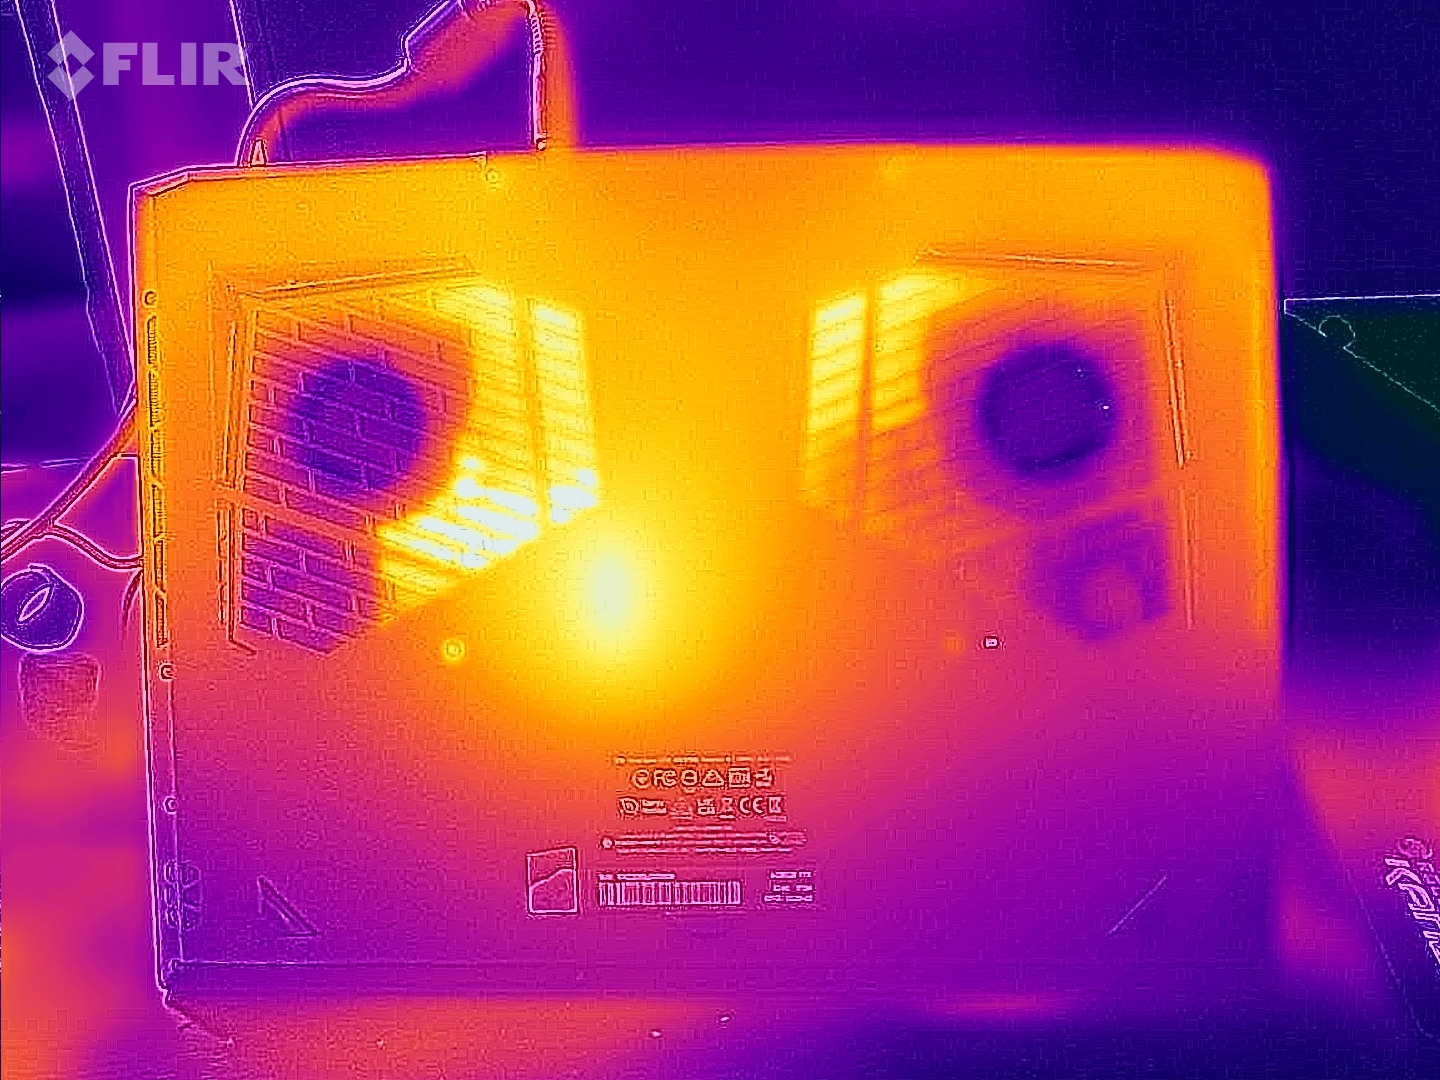
Temperatura
No se observaron altas temperaturas de la carcasa en el simple uso diario en oficina e internet. Sólo bajo carga, como durante pruebas de estrés o juegos, el portátil se calienta significativamente. Registramos los mayores índices en la parte inferior y en la zona de las salidas del ventilador.
(-) La temperatura máxima en la parte superior es de 47 °C / 117 F, frente a la media de 40.4 °C / 105 F, que oscila entre 21.2 y 68.8 °C para la clase Gaming.
(-) El fondo se calienta hasta un máximo de 51 °C / 124 F, frente a la media de 43.2 °C / 110 F
(+) En reposo, la temperatura media de la parte superior es de 28.1 °C / 83# F, frente a la media del dispositivo de 33.9 °C / 93 F.
(±) Jugando a The Witcher 3, la temperatura media de la parte superior es de 38 °C / 100 F, frente a la media del dispositivo de 33.9 °C / 93 F.
(+) Los reposamanos y el panel táctil alcanzan como máximo la temperatura de la piel (34 °C / 93.2 F) y, por tanto, no están calientes.
(-) La temperatura media de la zona del reposamanos de dispositivos similares fue de 28.8 °C / 83.8 F (-5.2 °C / -9.4 F).
| Aorus 17X AZF Intel Core i9-13900HX, NVIDIA GeForce RTX 4090 Laptop GPU | Medion Erazer Beast X40 Intel Core i9-13900HX, NVIDIA GeForce RTX 4090 Laptop GPU | MSI GE78HX 13VH-070US Intel Core i9-13950HX, NVIDIA GeForce RTX 4080 Laptop GPU | HP Omen 17-ck2097ng Intel Core i9-13900HX, NVIDIA GeForce RTX 4080 Laptop GPU | MSI Titan GT77 HX 13VI Intel Core i9-13950HX, NVIDIA GeForce RTX 4090 Laptop GPU | Alienware m18 R1 Intel Core i9-13980HX, NVIDIA GeForce RTX 4090 Laptop GPU | |
|---|---|---|---|---|---|---|
| Heat | -1% | 7% | 13% | 12% | 15% | |
| Maximum Upper Side * (°C) | 47 | 48 -2% | 37.4 20% | 41 13% | 40.6 14% | 39 17% |
| Maximum Bottom * (°C) | 51 | 52 -2% | 45 12% | 51 -0% | 41.1 19% | 36.4 29% |
| Idle Upper Side * (°C) | 30 | 30 -0% | 29.8 1% | 24 20% | 26.2 13% | 29.2 3% |
| Idle Bottom * (°C) | 31 | 31 -0% | 32.4 -5% | 25 19% | 30.3 2% | 27.8 10% |
* ... más pequeño es mejor
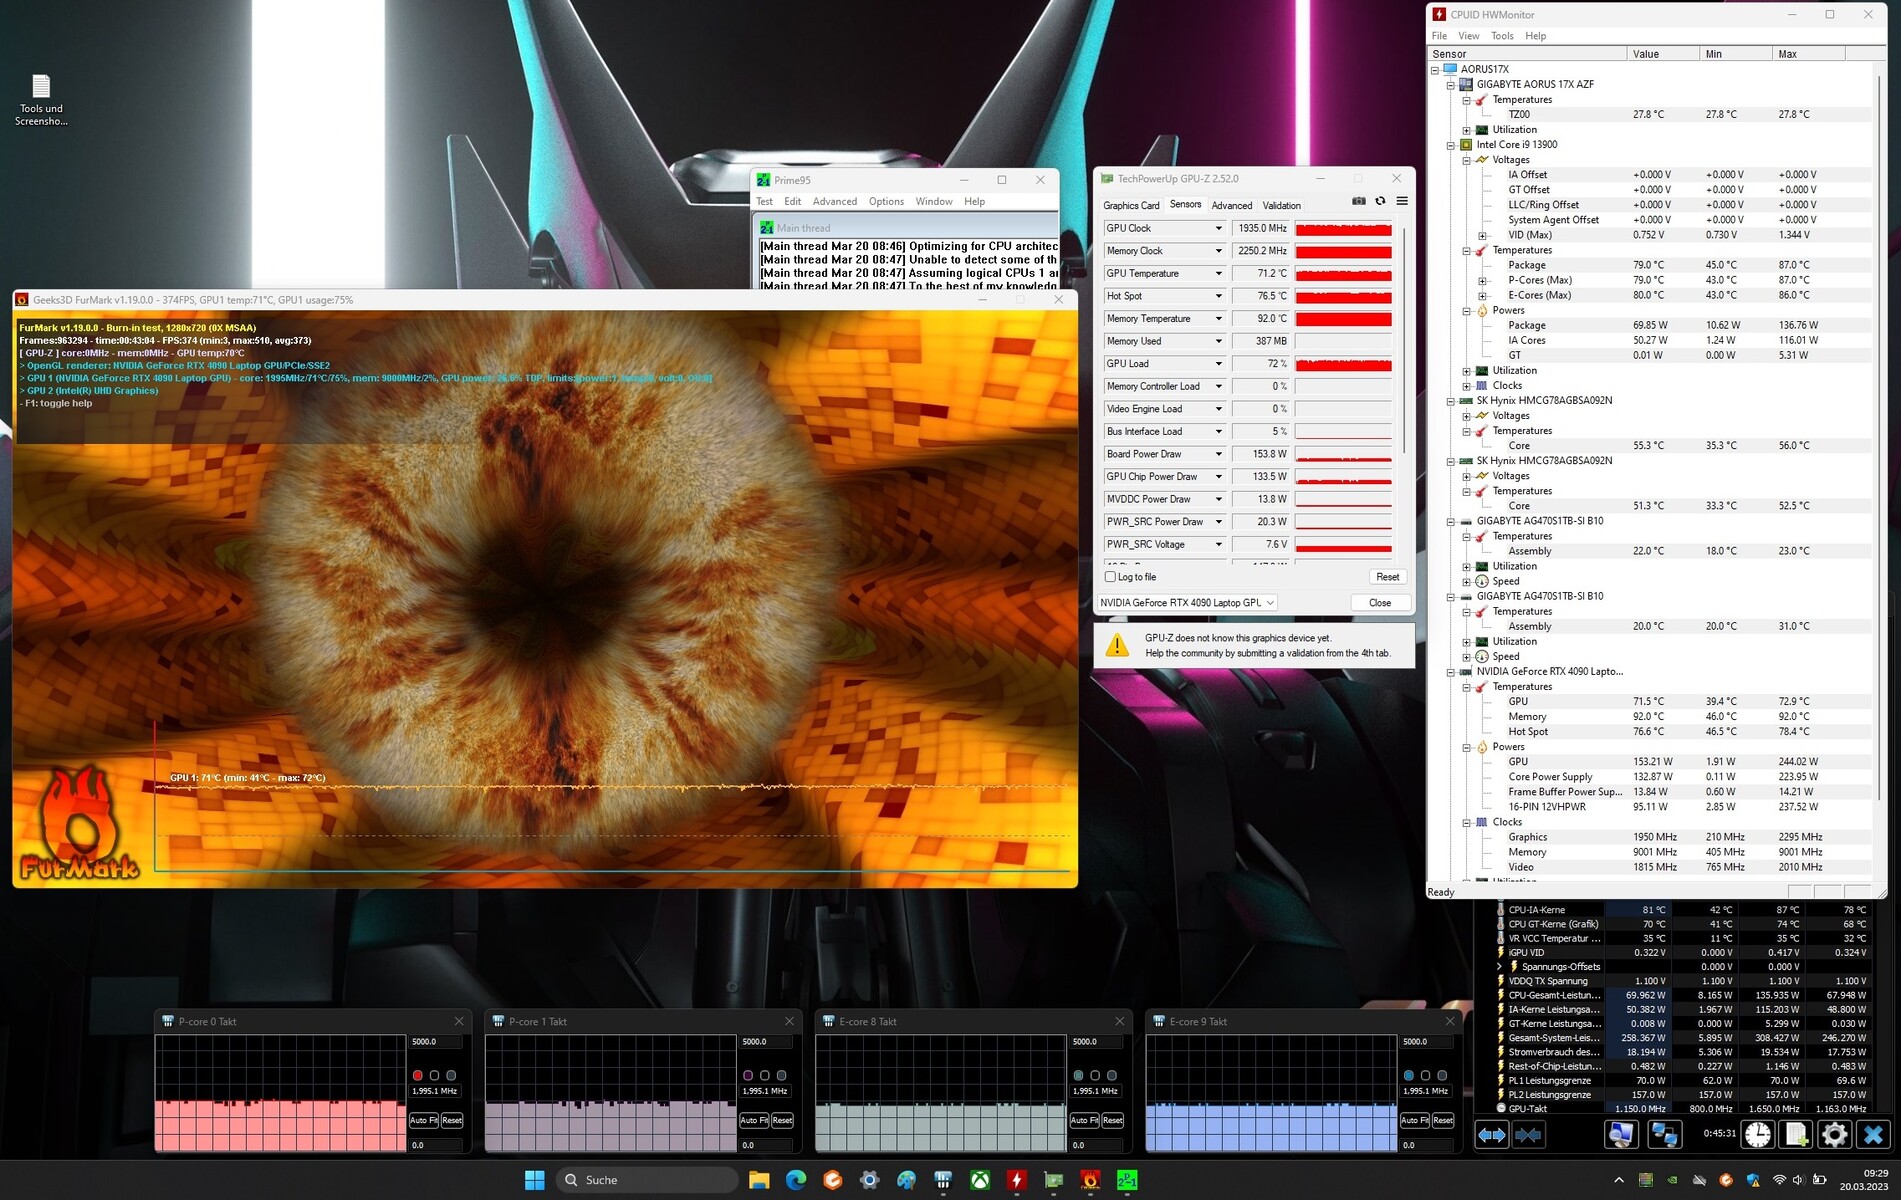
Prueba de resistencia
La prueba de estrés, que simulamos con Prime95 y Furmark en funcionamiento continuo, representa un escenario extremo para comprobar la estabilidad del sistema a plena carga. La CPU arranca con velocidades de reloj elevadas, que se reducen al poco tiempo porque PL2 no puede mantenerse permanentemente. Los núcleos P y E del Intel Core i7 13900HX funcionan constantemente a algo menos de 2 GHz durante largos periodos de tiempo.
Altavoces
Los altavoces estéreo producen un sonido sólido, pero los graves son menos impresionantes debido a la falta de volumen. Se recomiendan auriculares o un sistema de altavoces externo para una mejor experiencia de sonido.
Aorus 17X AZF análisis de audio
(+) | los altavoces pueden reproducir a un volumen relativamente alto (#83 dB)
Graves 100 - 315 Hz
(-) | casi sin bajos - de media 27.1% inferior a la mediana
(±) | la linealidad de los graves es media (13% delta a frecuencia anterior)
Medios 400 - 2000 Hz
(+) | medios equilibrados - a sólo 4.5% de la mediana
(+) | los medios son lineales (5% delta a la frecuencia anterior)
Altos 2 - 16 kHz
(+) | máximos equilibrados - a sólo 1.4% de la mediana
(+) | los máximos son lineales (4.3% delta a la frecuencia anterior)
Total 100 - 16.000 Hz
(±) | la linealidad del sonido global es media (17.9% de diferencia con la mediana)
En comparación con la misma clase
» 55% de todos los dispositivos probados de esta clase eran mejores, 9% similares, 36% peores
» El mejor tuvo un delta de 6%, la media fue 18%, el peor fue ###max##%
En comparación con todos los dispositivos probados
» 37% de todos los dispositivos probados eran mejores, 8% similares, 55% peores
» El mejor tuvo un delta de 4%, la media fue 23%, el peor fue ###max##%
Medion Erazer Beast X40 análisis de audio
(+) | los altavoces pueden reproducir a un volumen relativamente alto (#88 dB)
Graves 100 - 315 Hz
(-) | casi sin bajos - de media 20.2% inferior a la mediana
(±) | la linealidad de los graves es media (8.4% delta a frecuencia anterior)
Medios 400 - 2000 Hz
(±) | medias más altas - de media 5.5% más altas que la mediana
(+) | los medios son lineales (6.5% delta a la frecuencia anterior)
Altos 2 - 16 kHz
(+) | máximos equilibrados - a sólo 3.1% de la mediana
(+) | los máximos son lineales (5.8% delta a la frecuencia anterior)
Total 100 - 16.000 Hz
(±) | la linealidad del sonido global es media (16.1% de diferencia con la mediana)
En comparación con la misma clase
» 39% de todos los dispositivos probados de esta clase eran mejores, 7% similares, 54% peores
» El mejor tuvo un delta de 6%, la media fue 18%, el peor fue ###max##%
En comparación con todos los dispositivos probados
» 26% de todos los dispositivos probados eran mejores, 5% similares, 69% peores
» El mejor tuvo un delta de 4%, la media fue 23%, el peor fue ###max##%
Gestión de la energía
Consumo de energía
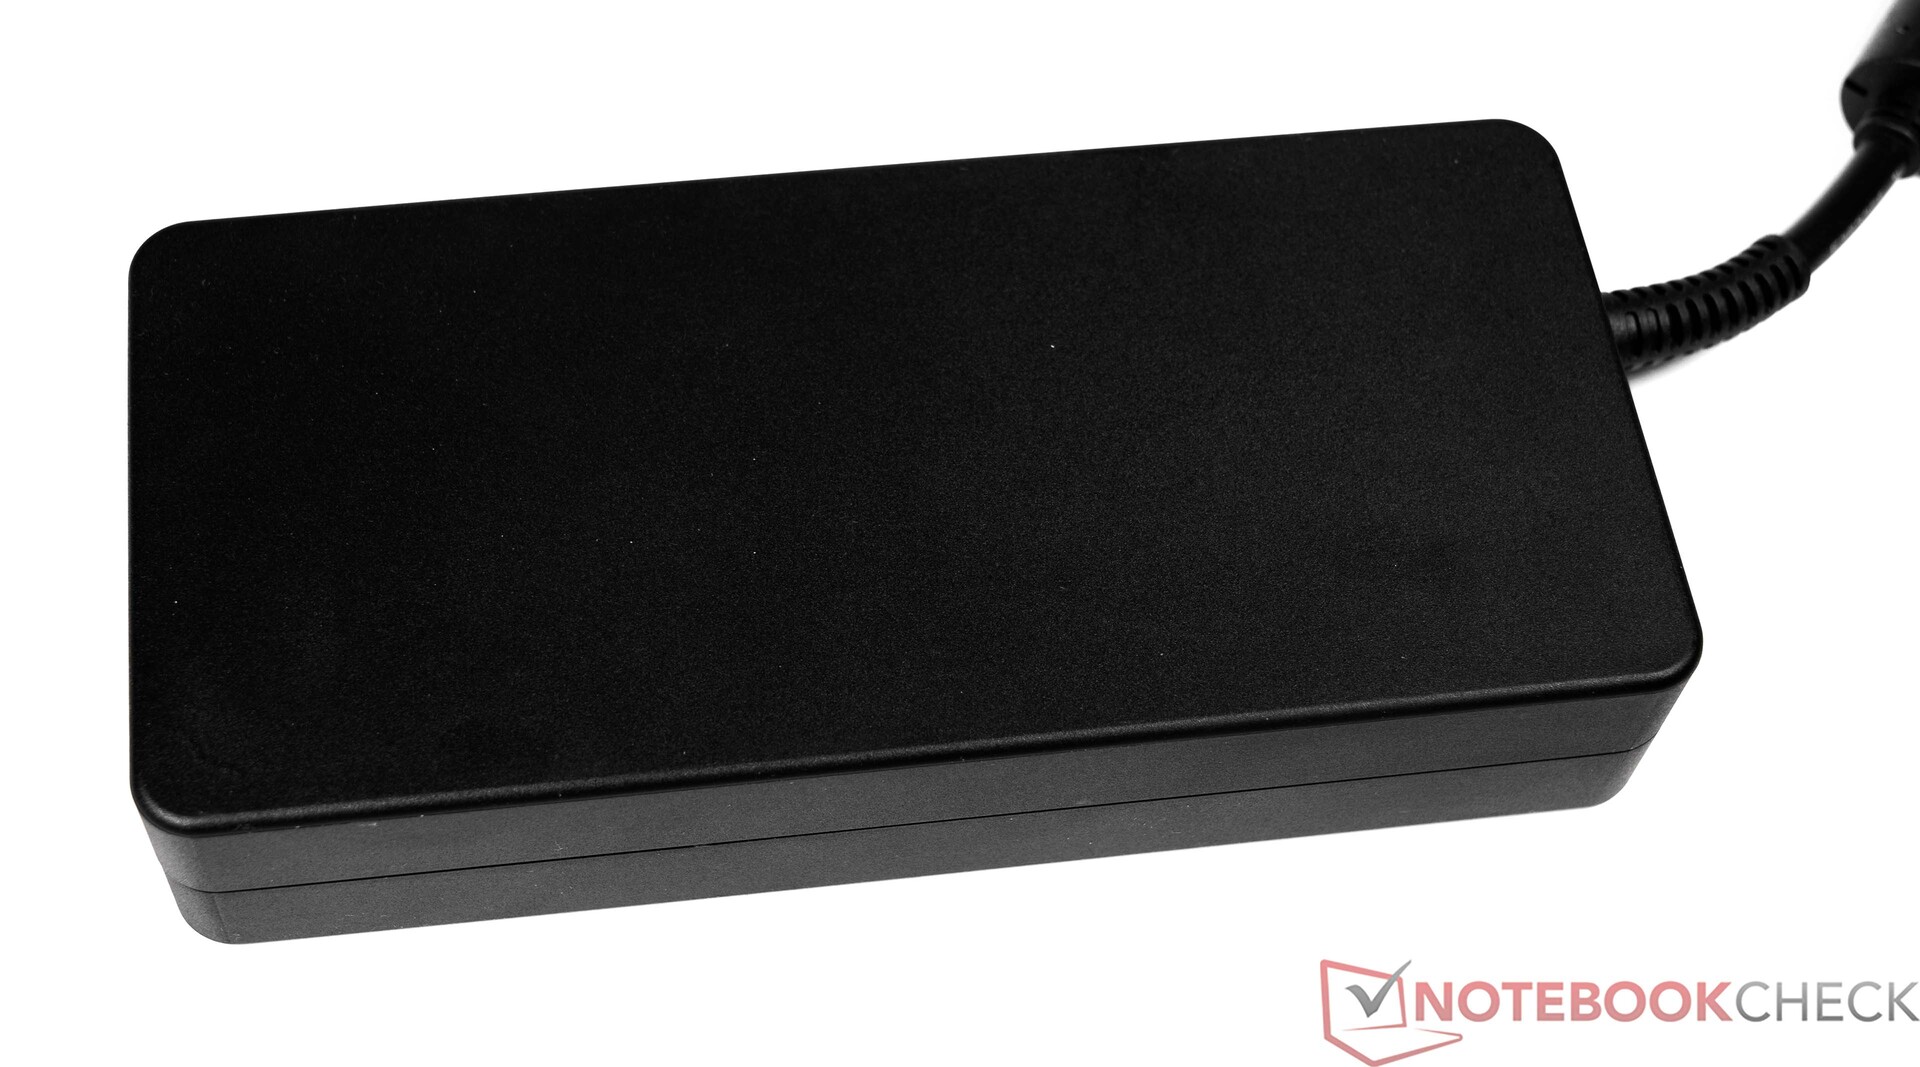
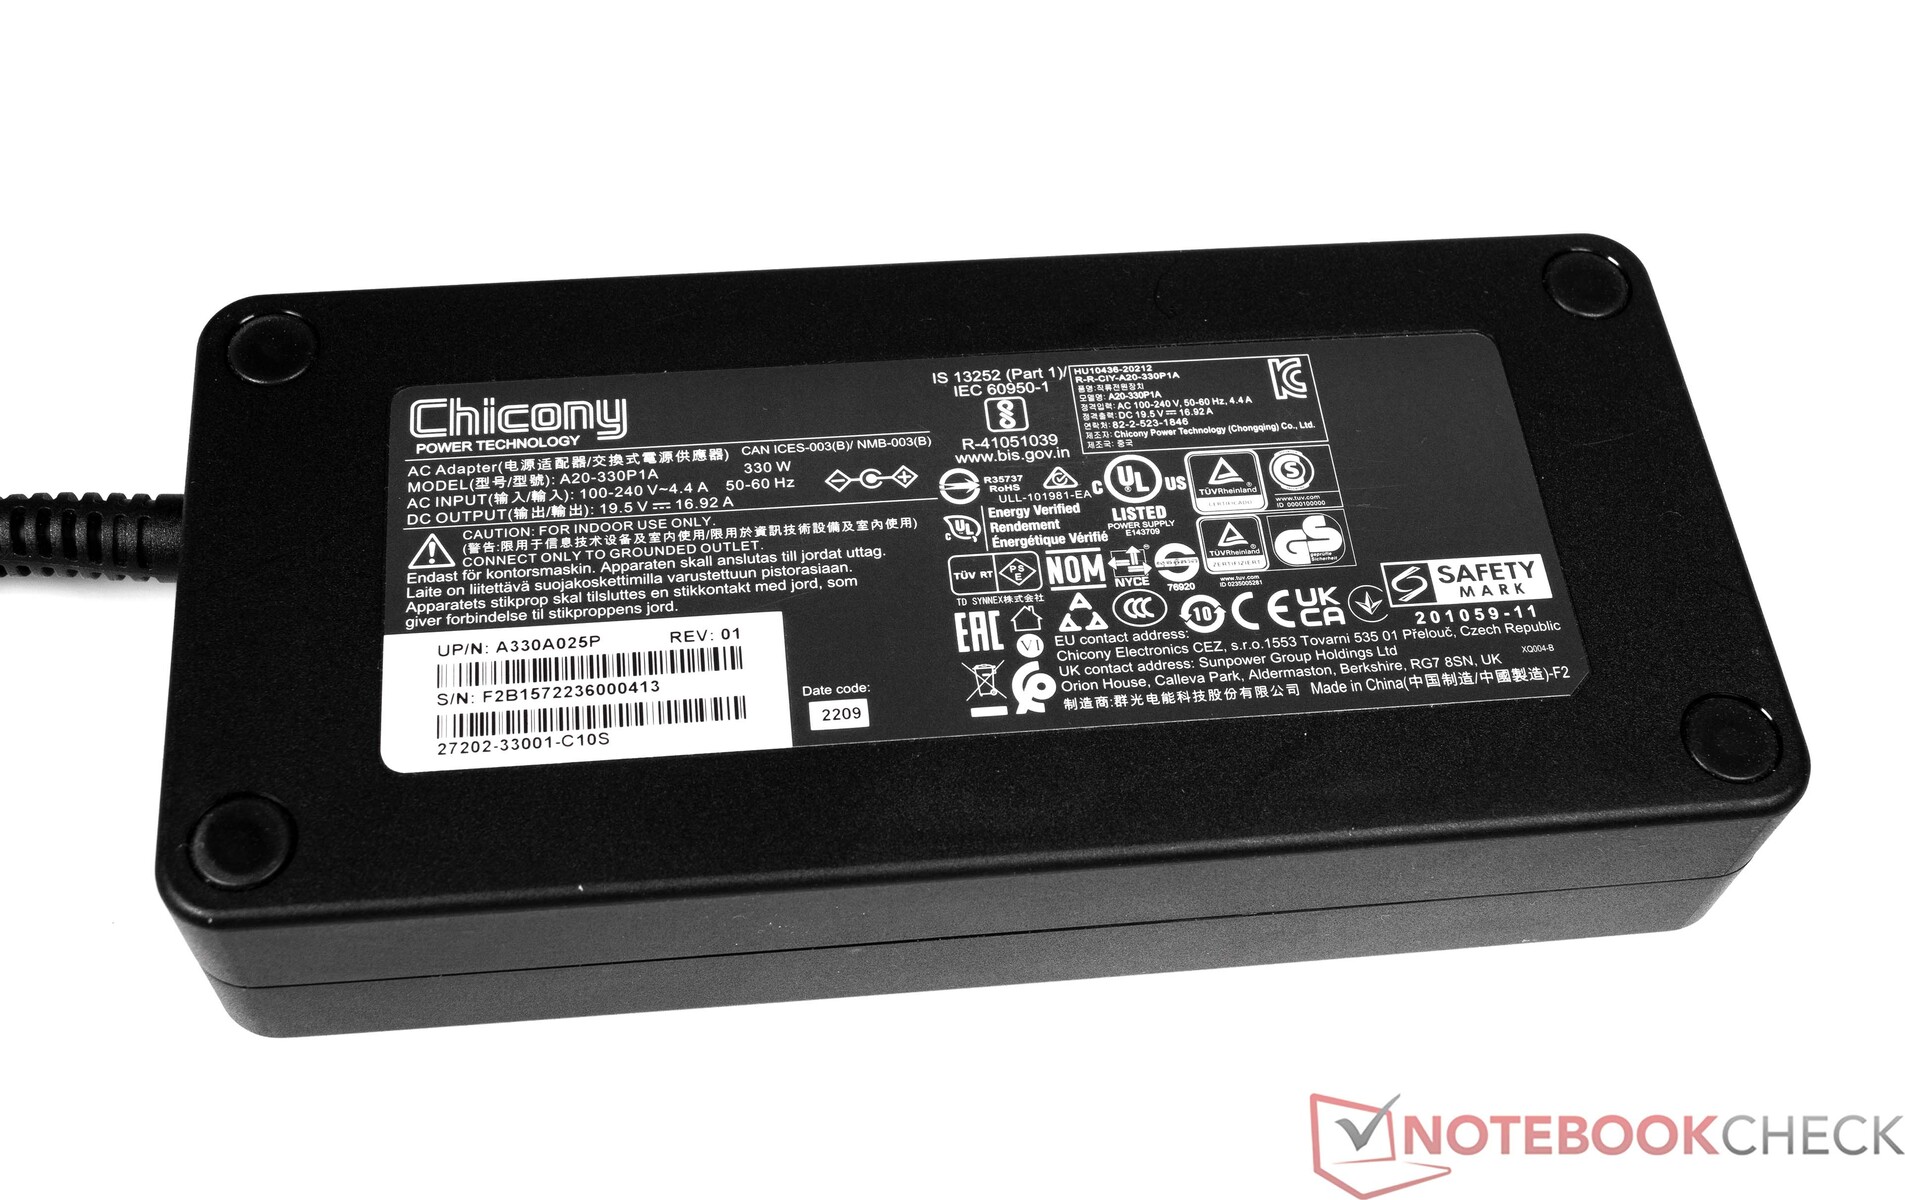
El Aorus 17X AZF no muestra anomalías en términos de consumo de energía. Los valores comprobados en inactivo parecen bastante buenos y en algunos casos son bastante mejores que los de la competencia. Vemos valores normales bajo carga. El adaptador de corriente está suficientemente dimensionado con 330 vatios, incluso si se necesitan 334 vatios para ráfagas cortas.
| Off / Standby | |
| Ocioso | |
| Carga |
|
Clave:
min: | |
| Aorus 17X AZF i9-13900HX, GeForce RTX 4090 Laptop GPU | Medion Erazer Beast X40 i9-13900HX, GeForce RTX 4090 Laptop GPU | MSI GE78HX 13VH-070US i9-13950HX, GeForce RTX 4080 Laptop GPU | HP Omen 17-ck2097ng i9-13900HX, GeForce RTX 4080 Laptop GPU | MSI Titan GT77 HX 13VI i9-13950HX, GeForce RTX 4090 Laptop GPU | Alienware m18 R1 i9-13980HX, GeForce RTX 4090 Laptop GPU | Medio NVIDIA GeForce RTX 4090 Laptop GPU | Media de la clase Gaming | |
|---|---|---|---|---|---|---|---|---|
| Power Consumption | -3% | -14% | -4% | -9% | -46% | -19% | 5% | |
| Idle Minimum * (Watt) | 11 | 11 -0% | 16.1 -46% | 16 -45% | 14 -27% | 21.6 -96% | 16.2 ? -47% | 13 ? -18% |
| Idle Average * (Watt) | 17 | 18 -6% | 24 -41% | 20 -18% | 21.6 -27% | 25.2 -48% | 23.1 ? -36% | 19 ? -12% |
| Idle Maximum * (Watt) | 29 | 30 -3% | 34 -17% | 26 10% | 24.8 14% | 56.7 -96% | 34.2 ? -18% | 24.5 ? 16% |
| Load Average * (Watt) | 134 | 136 -1% | 123.6 8% | 135 -1% | 122.5 9% | 164.1 -22% | 130.5 ? 3% | 111.1 ? 17% |
| Witcher 3 ultra * (Watt) | 278 | 280 -1% | 286 -3% | 215 23% | 265 5% | 311 -12% | ||
| Load Maximum * (Watt) | 334 | 363 -9% | 285.7 14% | 299 10% | 418 -25% | 338.9 -1% | 324 ? 3% | 260 ? 22% |
* ... más pequeño es mejor
Power consumption Witcher 3 / Stress test
Power consumption with an external monitor
Duración de la batería
El Aorus 17X AZF logró tiempos de ejecución de 6:29 h y 6:43 h en nuestro test WLAN (llamando a webs a través de un script) y test de vídeo (cortometraje Big Buck Bunny, codificación H.264, FHD, en bucle), respectivamente. Son tasas aceptables y reflejan la media de la clase de portátiles de juego. Durante ambas pruebas, se desactivaron las funciones de ahorro de energía del portátil y se ajustó el brillo de la pantalla a unos 150 cd/m². En nuestro caso, esto supuso una reducción del brillo del 50%.
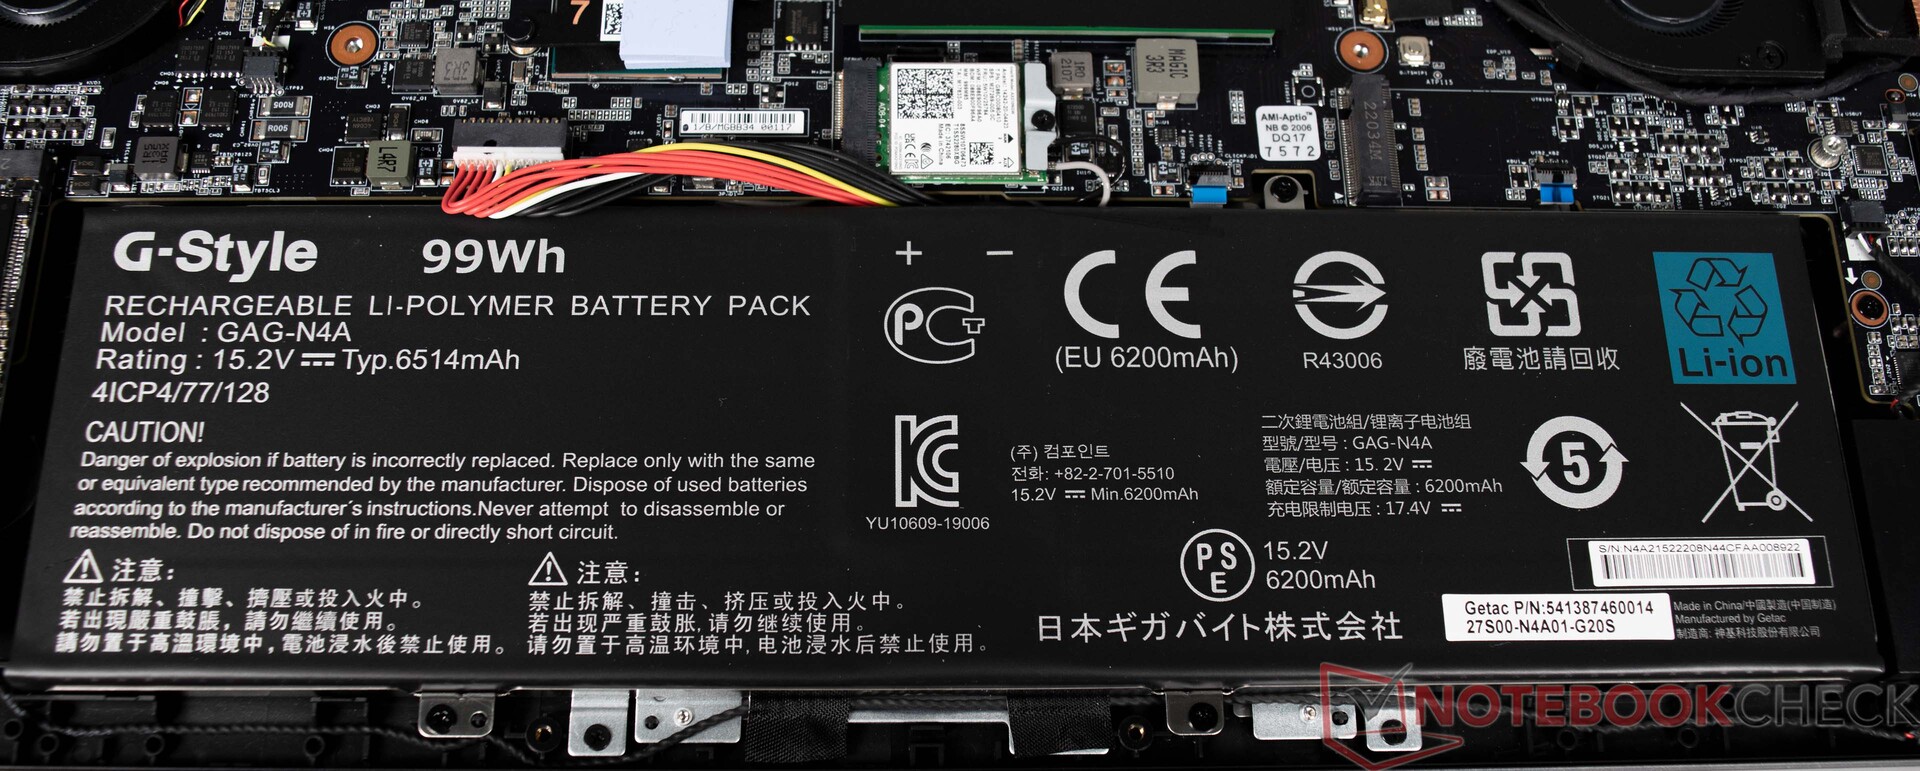
El Aorus 17X AZF está equipado con una gran batería de 99 Wh, que también es el máximo en un portátil. Casi todos los dispositivos de la comparación ofrecen una batería con la misma capacidad. Sólo el HP Omen 17 tiene que conformarse con una batería más pequeña de 83 Wh, por lo que queda notablemente por detrás.
| Aorus 17X AZF i9-13900HX, GeForce RTX 4090 Laptop GPU, 99 Wh | Medion Erazer Beast X40 i9-13900HX, GeForce RTX 4090 Laptop GPU, 99.8 Wh | MSI GE78HX 13VH-070US i9-13950HX, GeForce RTX 4080 Laptop GPU, 99 Wh | HP Omen 17-ck2097ng i9-13900HX, GeForce RTX 4080 Laptop GPU, 83 Wh | MSI Titan GT77 HX 13VI i9-13950HX, GeForce RTX 4090 Laptop GPU, 99.9 Wh | Alienware m18 R1 i9-13980HX, GeForce RTX 4090 Laptop GPU, 97 Wh | Media de la clase Gaming | |
|---|---|---|---|---|---|---|---|
| Duración de Batería | -1% | -18% | -44% | -20% | -46% | -1% | |
| Reader / Idle (h) | 9 | 9.4 4% | 7.3 -19% | 4.2 -53% | 5.6 -38% | 8.27 ? -8% | |
| H.264 (h) | 6.7 | 6.9 3% | 3.7 -45% | 6 -10% | 8.32 ? 24% | ||
| WiFi v1.3 (h) | 6.5 | 6.4 -2% | 6.1 -6% | 3.6 -45% | 5.3 -18% | 4.3 -34% | 7.11 ? 9% |
| Load (h) | 2.1 | 1.9 -10% | 1.5 -29% | 1.4 -33% | 1.4 -33% | 0.7 -67% | 1.502 ? -28% |
Pro
Contra
Veredicto: potencia móvil para jugar sin concesiones
El Aorus 17X AZF es un portátil para juegos diseñado para requisitos extremos. El portátil de 17 pulgadas pudo ejecutar todos los juegos probados sin problemas en la resolución nativa del display y sin pérdidas de calidad. Sin embargo, está limitado a juegos a 1440p, lo que está bien. Las reservas de rendimiento están disponibles y se puede acceder a ellas a través de pantallas 4K externas. ElGPU de portátil Nvidia GeForce RTX 4090 ofrece una enorme cantidad de rendimiento y es capaz de mantenerlo permanentemente. Esto está flanqueado por un potente Intel Core-i7-13900HX. Sin embargo, en una comparación directa con dispositivos comparables, la CPU del Aorus 17X AZF no siempre es capaz de imponerse. No obstante, la diferencia no es tan grande y es poco probable que se note en el día a día.
Nos gusta mucho el hardware restante: 32 GB de RAM DDR5 y un total de 2 TB de almacenamiento SSD hacen un sistema excelente en general para que no tengas que actualizarlo en un tiempo. La pantalla con capacidad QHD también encaja bien con el portátil y también es adecuada para la edición de fotos y vídeo
Por otro lado, hay limitaciones en el volumen, que no se pueden ignorar durante la carga. De nuevo, el problema también es común a otros portátiles gaming y no es exclusivo del Aorus 17X AZF. La conectividad también necesita mejoras y podría ser más amplia para un dispositivo de 17 pulgadas. Al menos el portátil tiene una moderna conexión Thunderbolt
En términos de movilidad, el Aorus 17X AZF queda bien posicionado porque la duración de batería registrada refleja una buena media de la clase. El dispositivo incluso puede manejarse casi en silencio a través del Gigabyte Control Center, que ofrece numerosas opciones de ajuste
Los que busquen una alternativa más barata deberían echar un vistazo al HP Omen 17, que también ofrece un rendimiento excelente en 1.440p con la tecnologíaGPU para portátiles Nvidia GeForce RTX 4080.
Precio y disponibilidad
Se recomienda a los compradores interesados que consulten directamente la página del producto correspondiente en la tienda web de Gigabyte, donde encontrarán una lista de distribuidores oficiales. En EE.UU., por ejemplo, el Aorus 17X AZF aparece en Amazon y Newegg por 3.499,00 dólares (pero actualmente agotado en ambas plataformas).
Los precios son a fecha de 17.04.2023 y están sujetos a cambios.
Aorus 17X AZF
- 04/14/2023 v7 (old)
Sebastian Bade
Transparencia
La selección de los dispositivos que se van a reseñar corre a cargo de nuestro equipo editorial. La muestra de prueba fue proporcionada al autor en calidad de préstamo por el fabricante o el minorista a los efectos de esta reseña. El prestamista no tuvo ninguna influencia en esta reseña, ni el fabricante recibió una copia de la misma antes de su publicación. No había ninguna obligación de publicar esta reseña. Como empresa de medios independiente, Notebookcheck no está sujeta a la autoridad de fabricantes, minoristas o editores.
Así es como prueba Notebookcheck
Cada año, Notebookcheck revisa de forma independiente cientos de portátiles y smartphones utilizando procedimientos estandarizados para asegurar que todos los resultados son comparables. Hemos desarrollado continuamente nuestros métodos de prueba durante unos 20 años y hemos establecido los estándares de la industria en el proceso. En nuestros laboratorios de pruebas, técnicos y editores experimentados utilizan equipos de medición de alta calidad. Estas pruebas implican un proceso de validación en varias fases. Nuestro complejo sistema de clasificación se basa en cientos de mediciones y puntos de referencia bien fundamentados, lo que mantiene la objetividad.Price comparison

