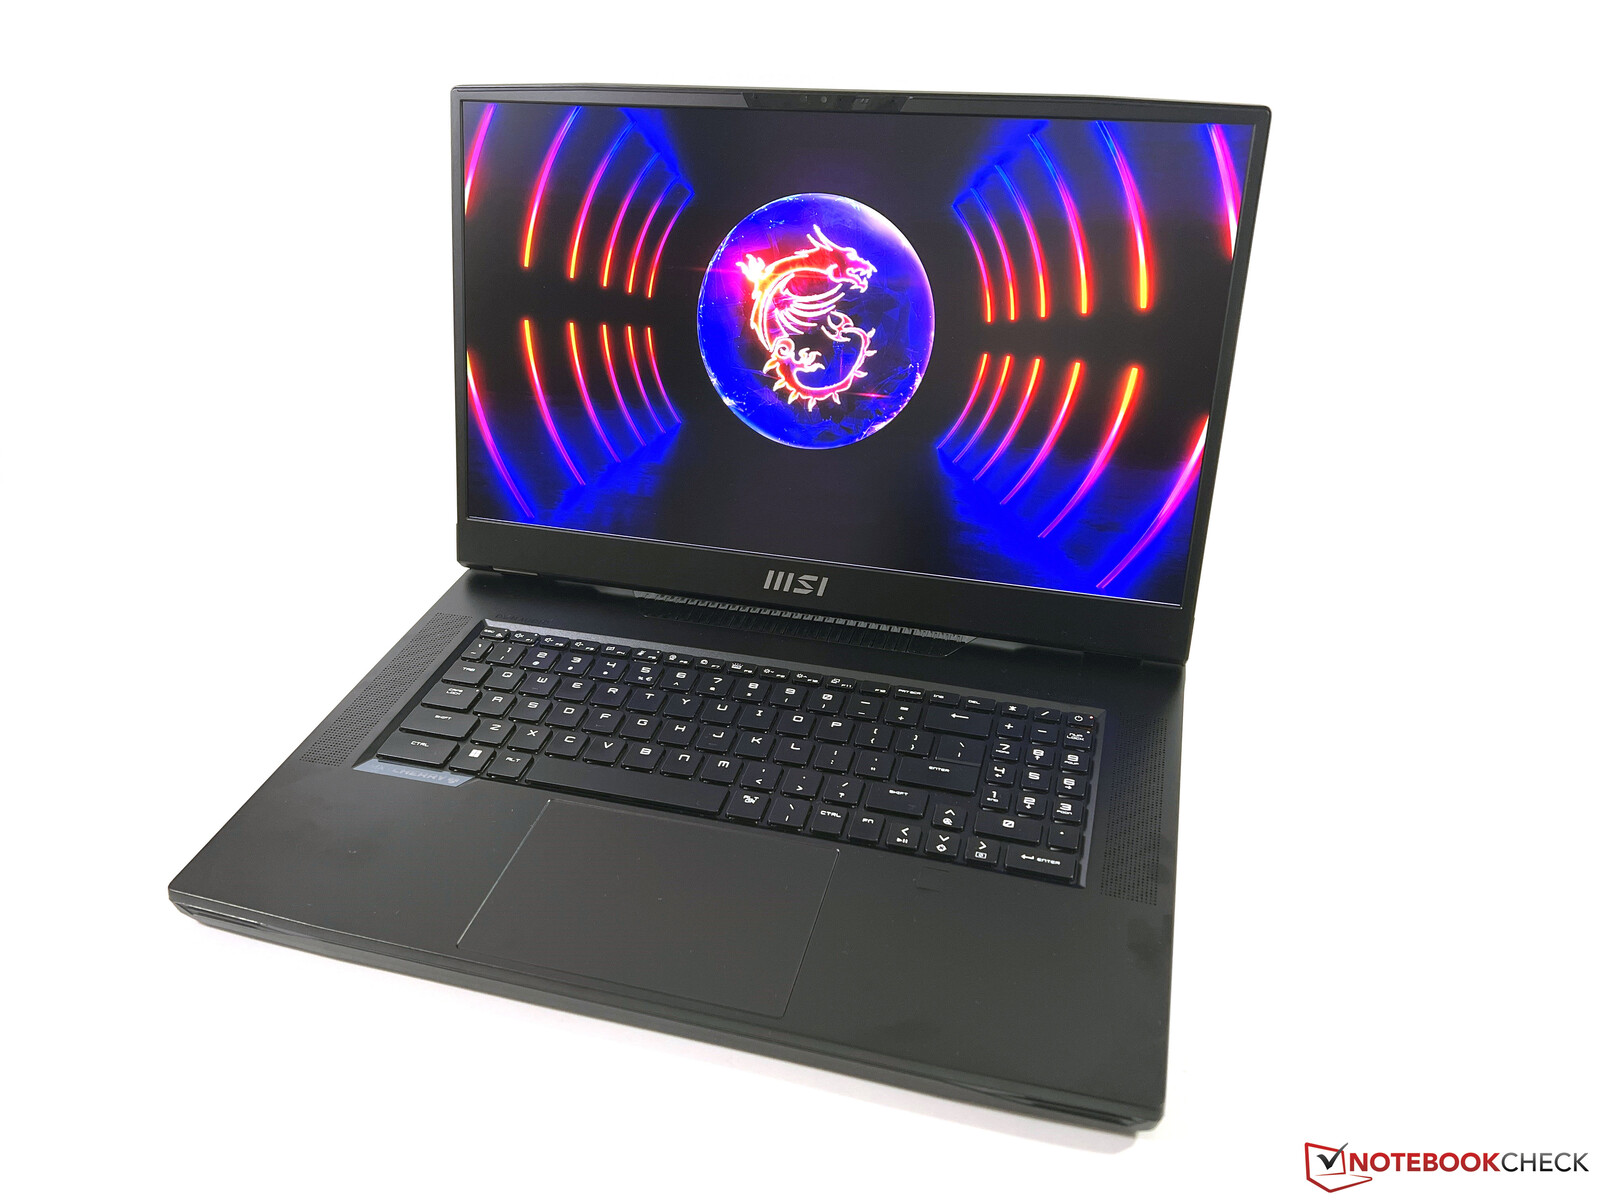
MSI Titan GT77 HX 13V - El portátil de juego definitivo con RTX 4090 y Core i9-13950HX
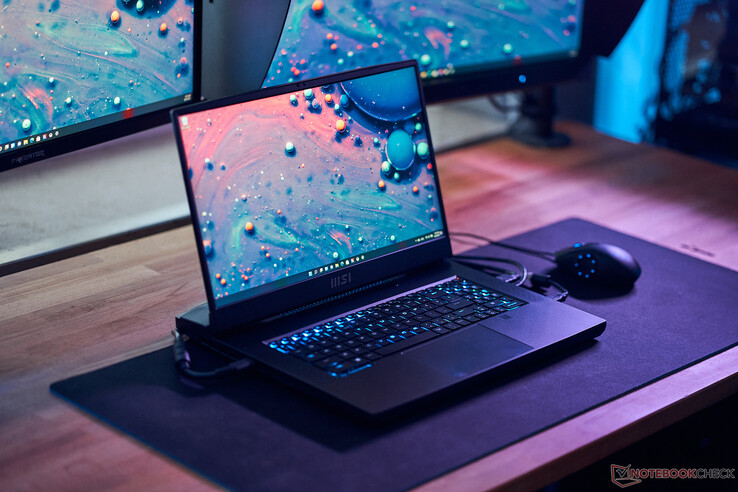
La serie Titan GT77 de MSI ofrece portátiles de juego emblemáticos diseñados para ofrecer el máximo rendimiento. El nuevo modelo 2023 GT77 HX 13VI continúa este concepto y utiliza algunos de los mejores componentes móviles que existen. Además de las últimas CPU Raptor Lake-HX de Intel, también podrás disfrutar de las flamantes GPU para portátiles de Nvidia: GeForce RTX 4080o GeForce RTX 4090. MSI también equipa el nuevo GT77 con una pantalla 4K Mini-LED con una frecuencia de actualización de 144 Hz.
Nuestra unidad de análisis es una unidad de preproducción con elCore i9-13950HXGeForce RTX 4090, 64 GB de RAM, 4 TB de almacenamiento SSD y la pantalla 4K Mini-LED. Las configuraciones de venta al público (GT77 HX 13VI) con las mismas especificaciones se enviarán con elCore i9-13980HX(ligeramente superior, pero sin soporte vPro a cambio) por un PVPR de 6599 euros en Alemania (5299 $); la SKU con RTX 4080 y 2 TB de almacenamiento SSD se vende por 5499 euros (GT77 HX 13VH, 4299 $).
Posibles contendientes en la comparación
Valoración | Fecha | Modelo | Peso | Altura | Tamaño | Resolución | Precio |
|---|---|---|---|---|---|---|---|
| 89 % v7 (old) | 02/2023 | MSI Titan GT77 HX 13VI i9-13950HX, GeForce RTX 4090 Laptop GPU | 3.5 kg | 23 mm | 17.30" | 3840x2160 | |
| 91.2 % v7 (old) | 02/2023 | Razer Blade 16 Early 2023 i9-13950HX, GeForce RTX 4080 Laptop GPU | 2.4 kg | 21.99 mm | 16.00" | 2560x1600 | |
| 86.9 % v7 (old) | 11/2022 | Asus ROG Strix Scar 17 SE G733CX-LL014W i9-12950HX, GeForce RTX 3080 Ti Laptop GPU | 2.9 kg | 28.3 mm | 17.30" | 2560x1440 | |
| 88.3 % v7 (old) | 08/2022 | MSI Titan GT77 12UHS i9-12900HX, GeForce RTX 3080 Ti Laptop GPU | 3.3 kg | 23 mm | 17.30" | 1920x1080 | |
| 89.2 % v7 (old) | 05/2022 | Alienware x17 R2 P48E i9-12900HK, GeForce RTX 3080 Ti Laptop GPU | 3.1 kg | 20.9 mm | 17.30" | 1920x1080 | |
| 87.6 % v7 (old) | 09/2022 | Schenker XMG Neo 17 M22 R9 6900HX, GeForce RTX 3080 Ti Laptop GPU | 2.8 kg | 27 mm | 17.00" | 2560x1600 |
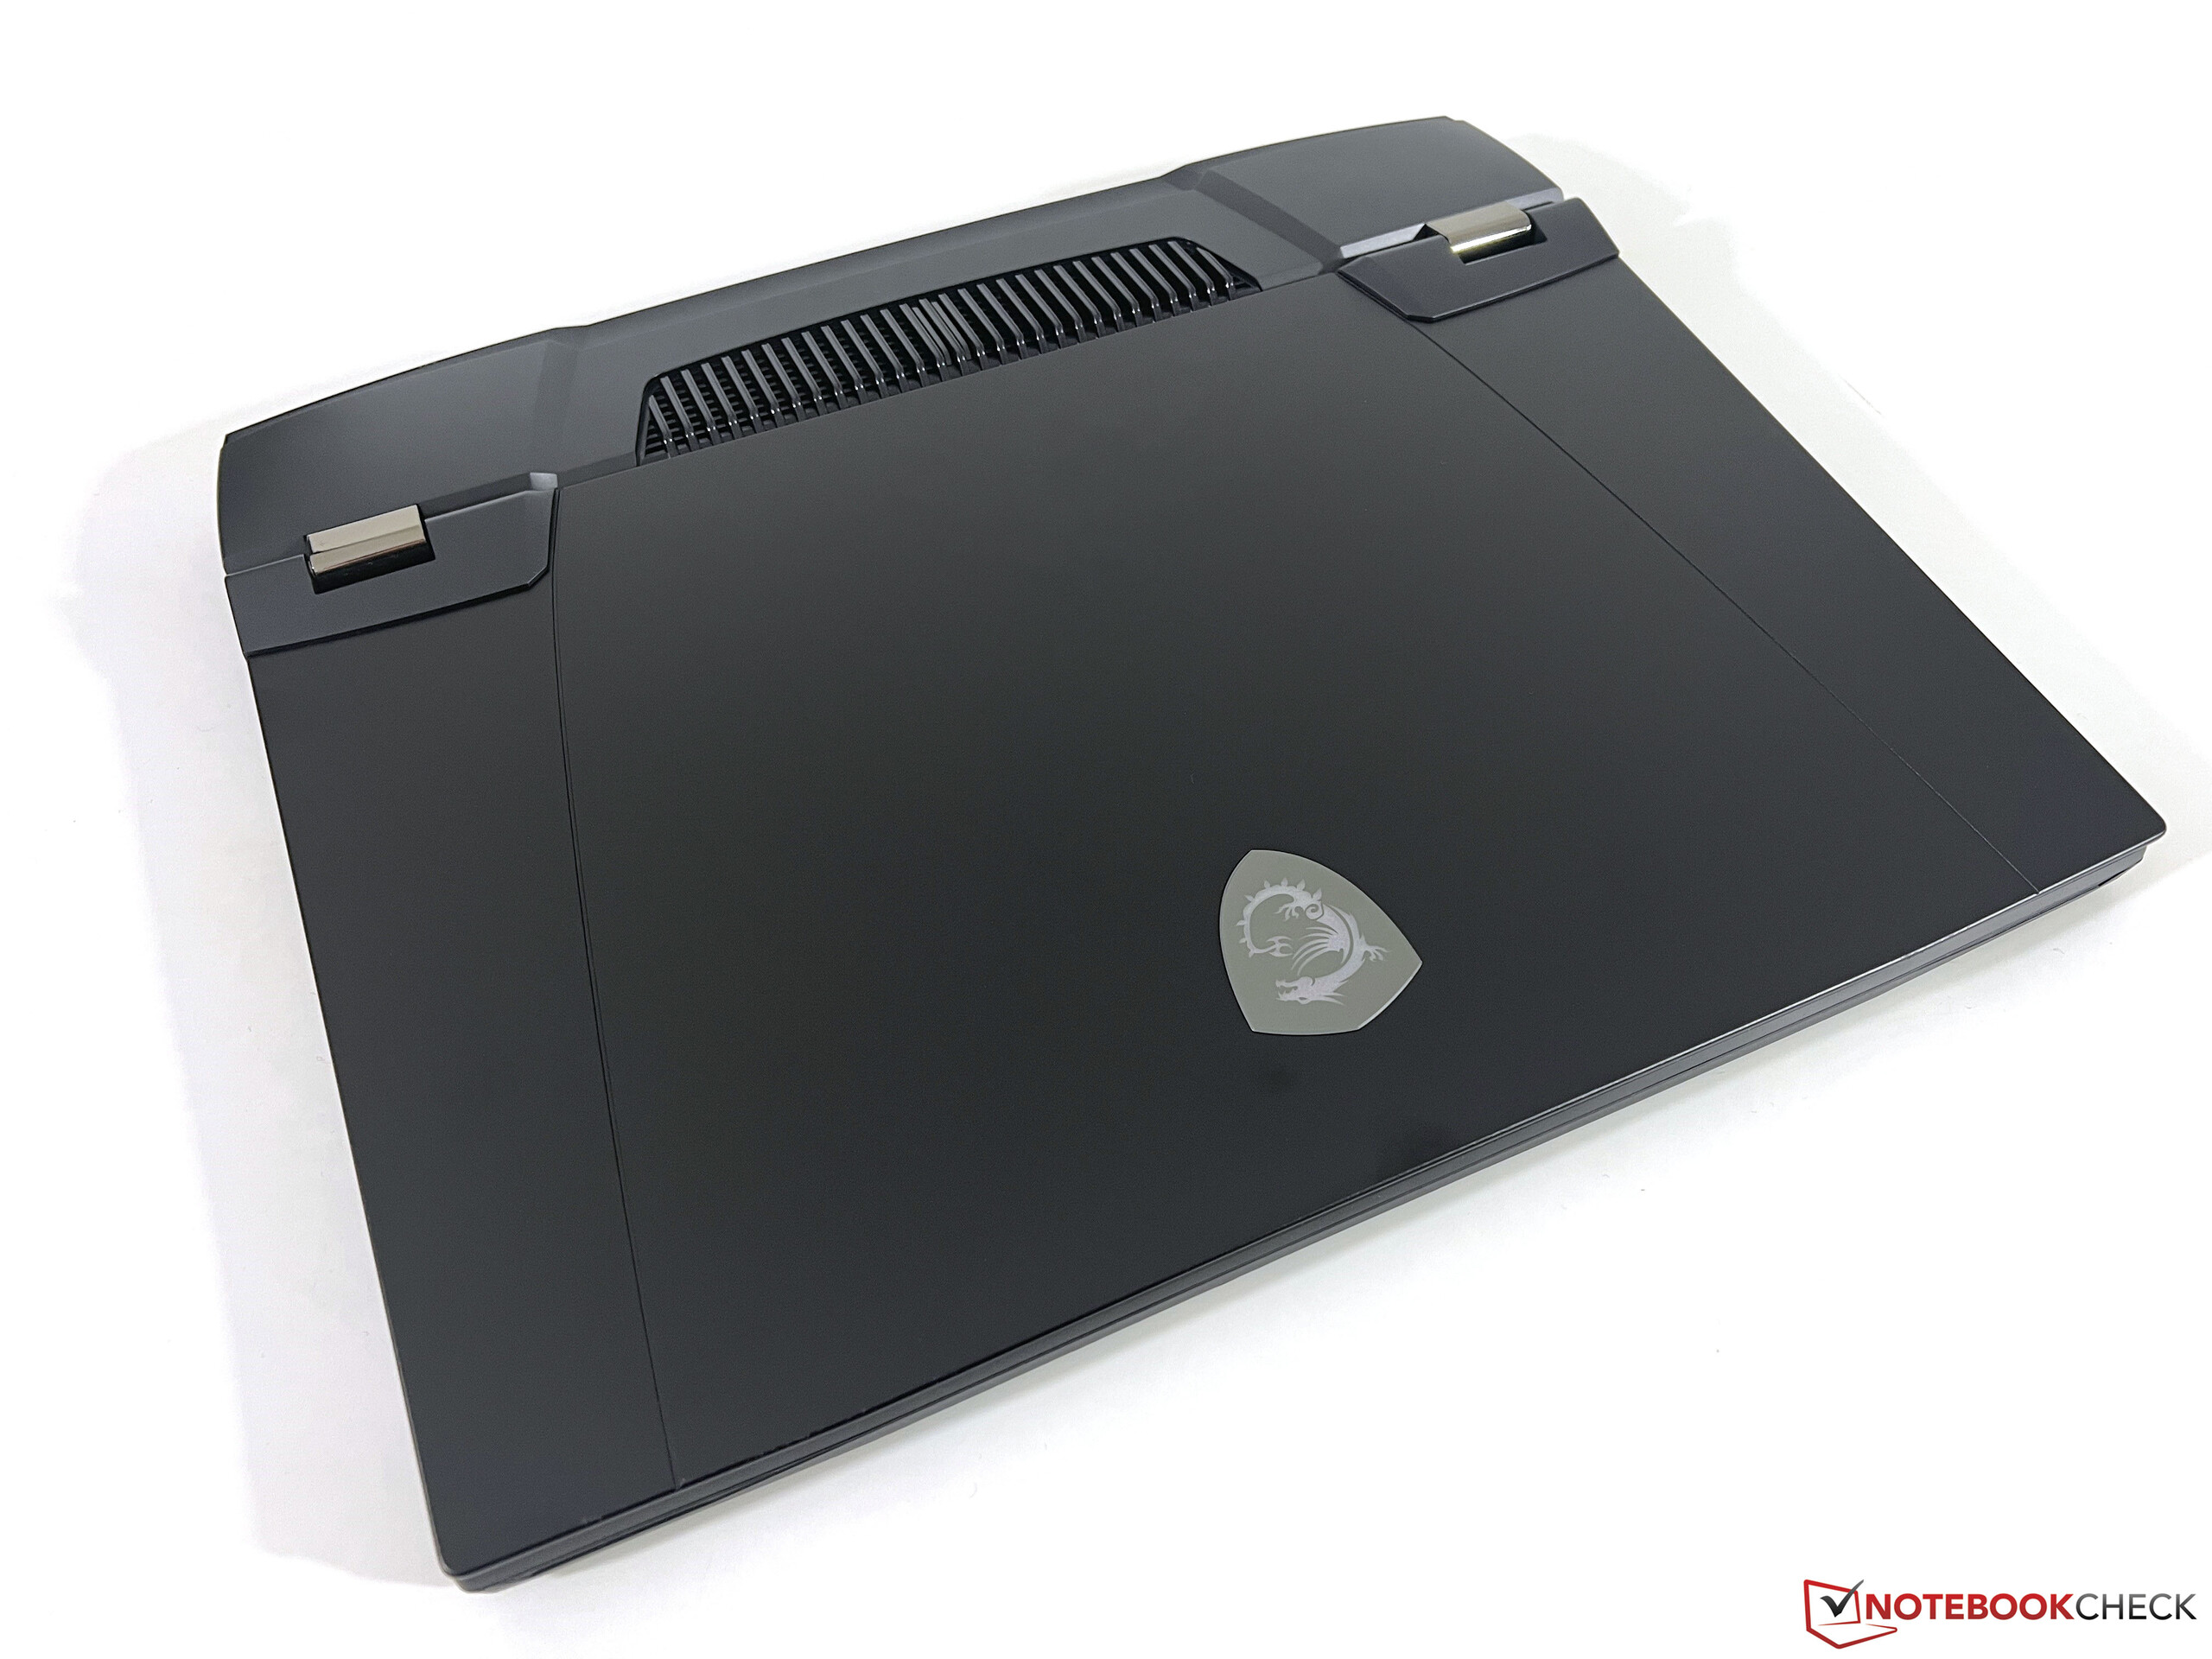
Caso - Titán con iluminación limitada
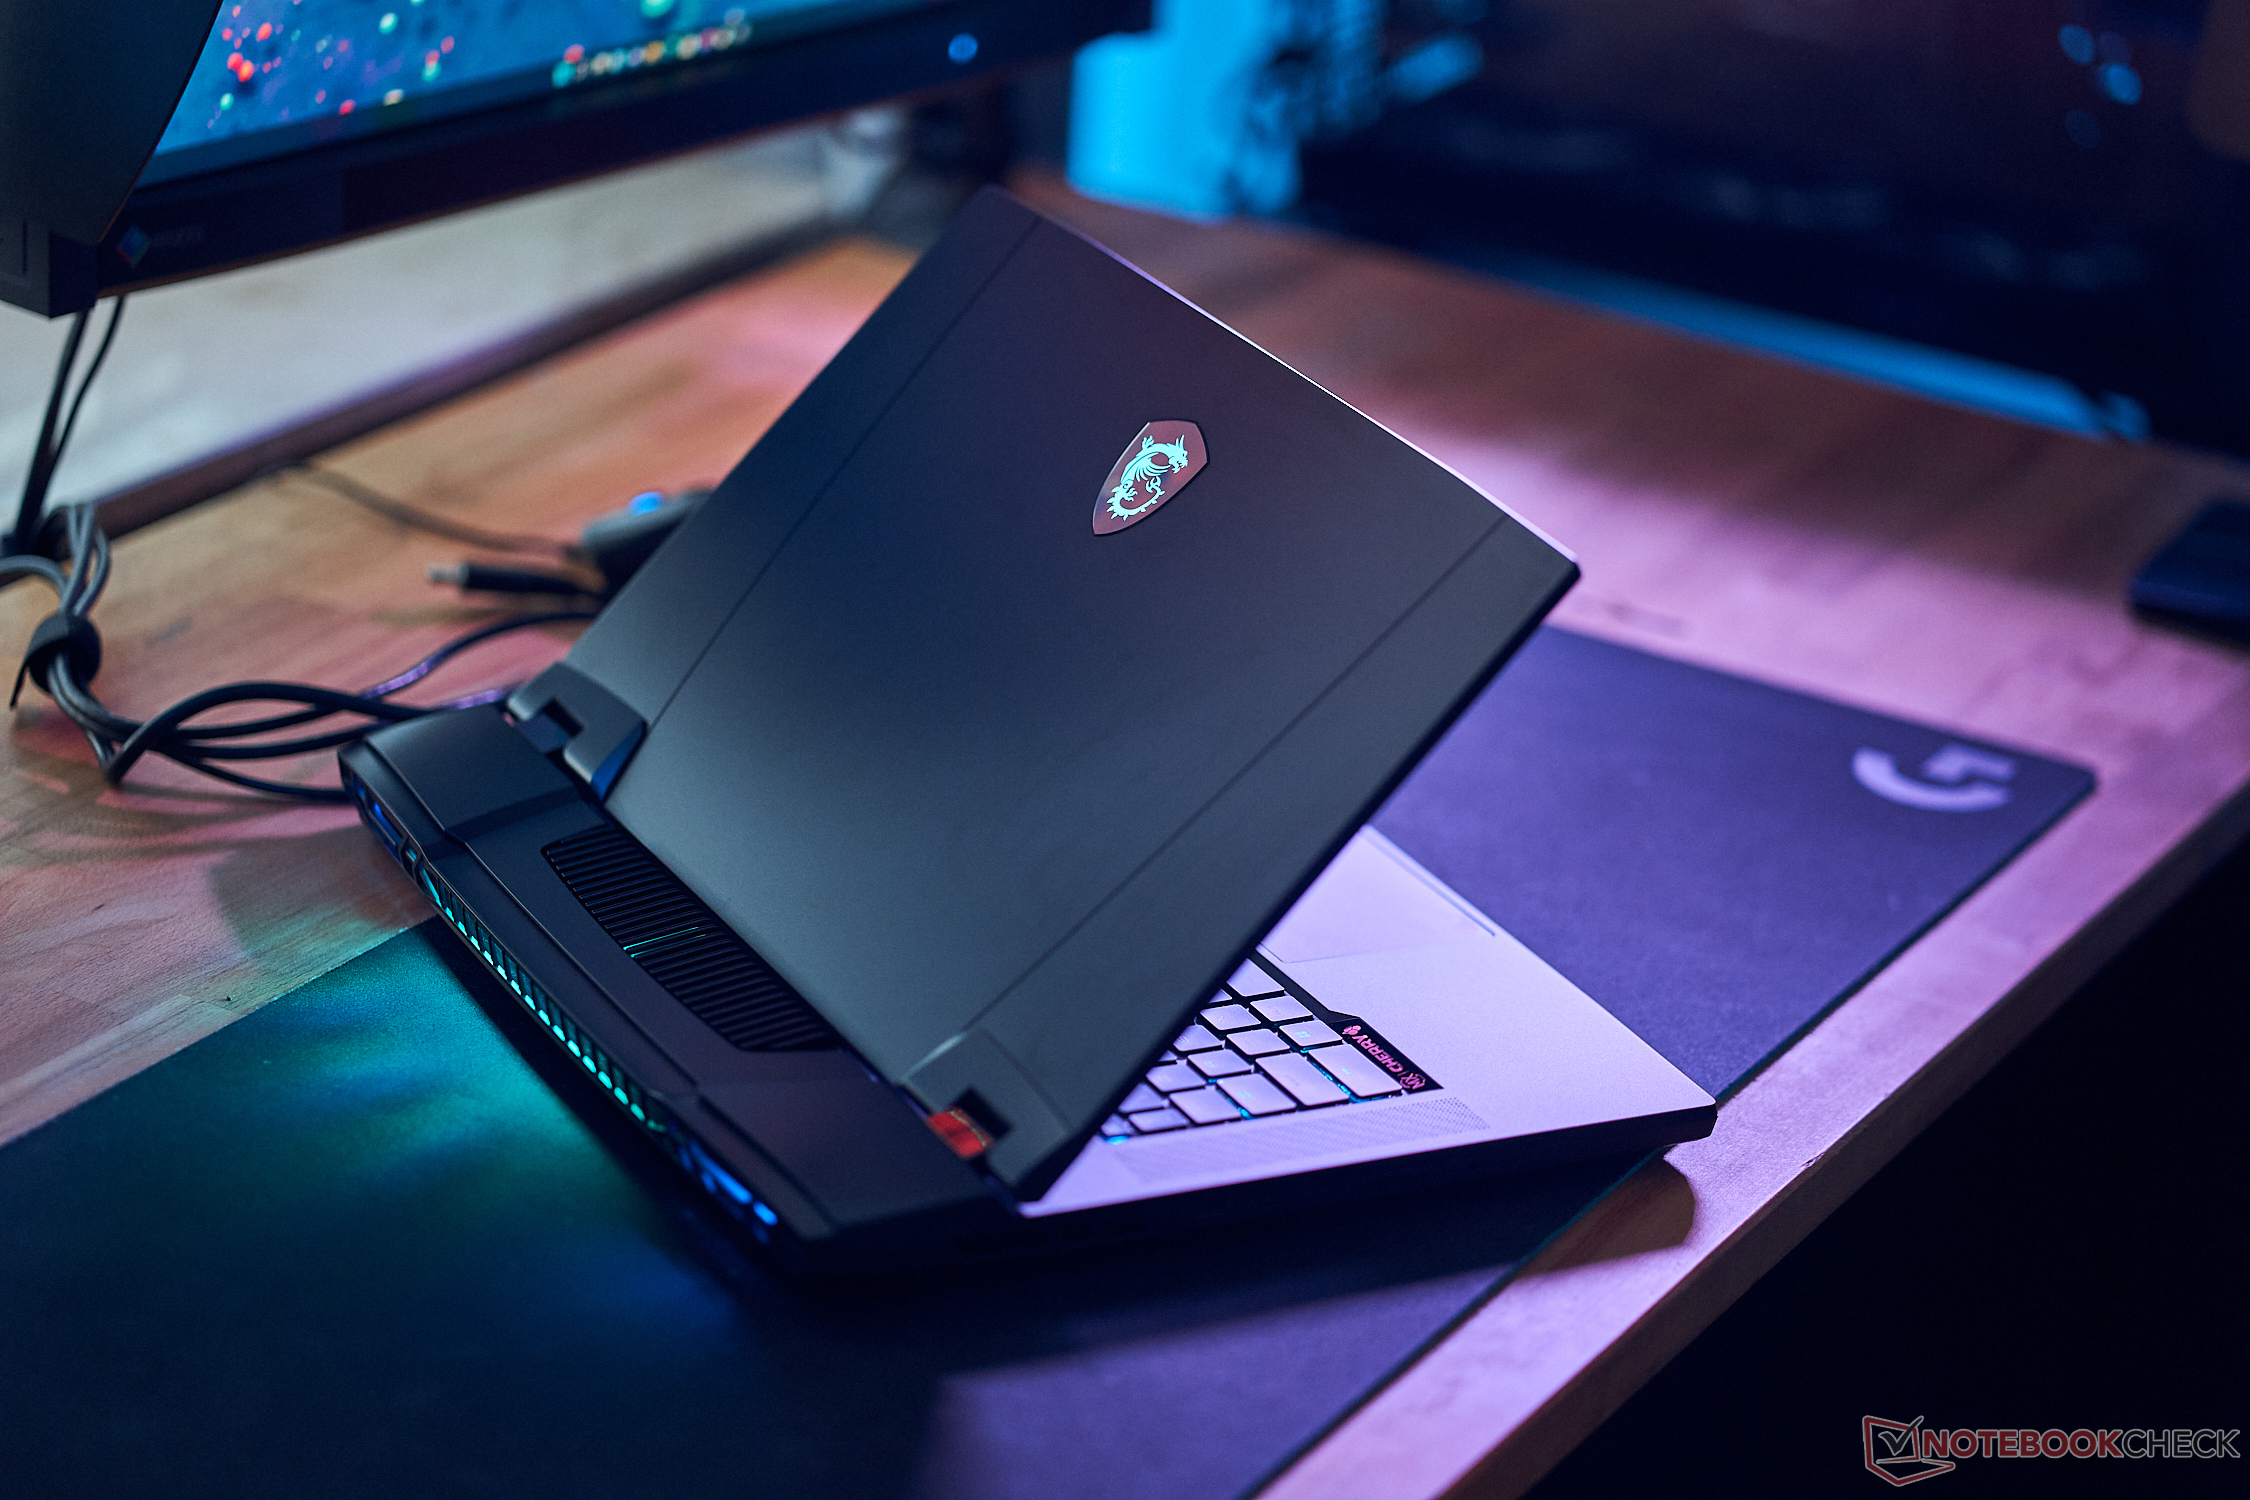
MSI introdujo un nuevo diseño de chasis para laTitan GT77por lo que no hay cambios visuales para el nuevo modelo. El chasis negro es muy sobrio para un gamer de gama alta y la iluminación RGB también se limita al logo de la tapa y a las salidas de ventilación de la trasera. Depende de las preferencias personales, pero al menos puedes usar el portátil en entornos profesionales si apagas la iluminación. Rápidamente verás huellas dactilares en las superficies lisas, que requieren una limpieza regular. MSI sigue usando una pantalla de aspecto 16:9 para el modelo 2023.
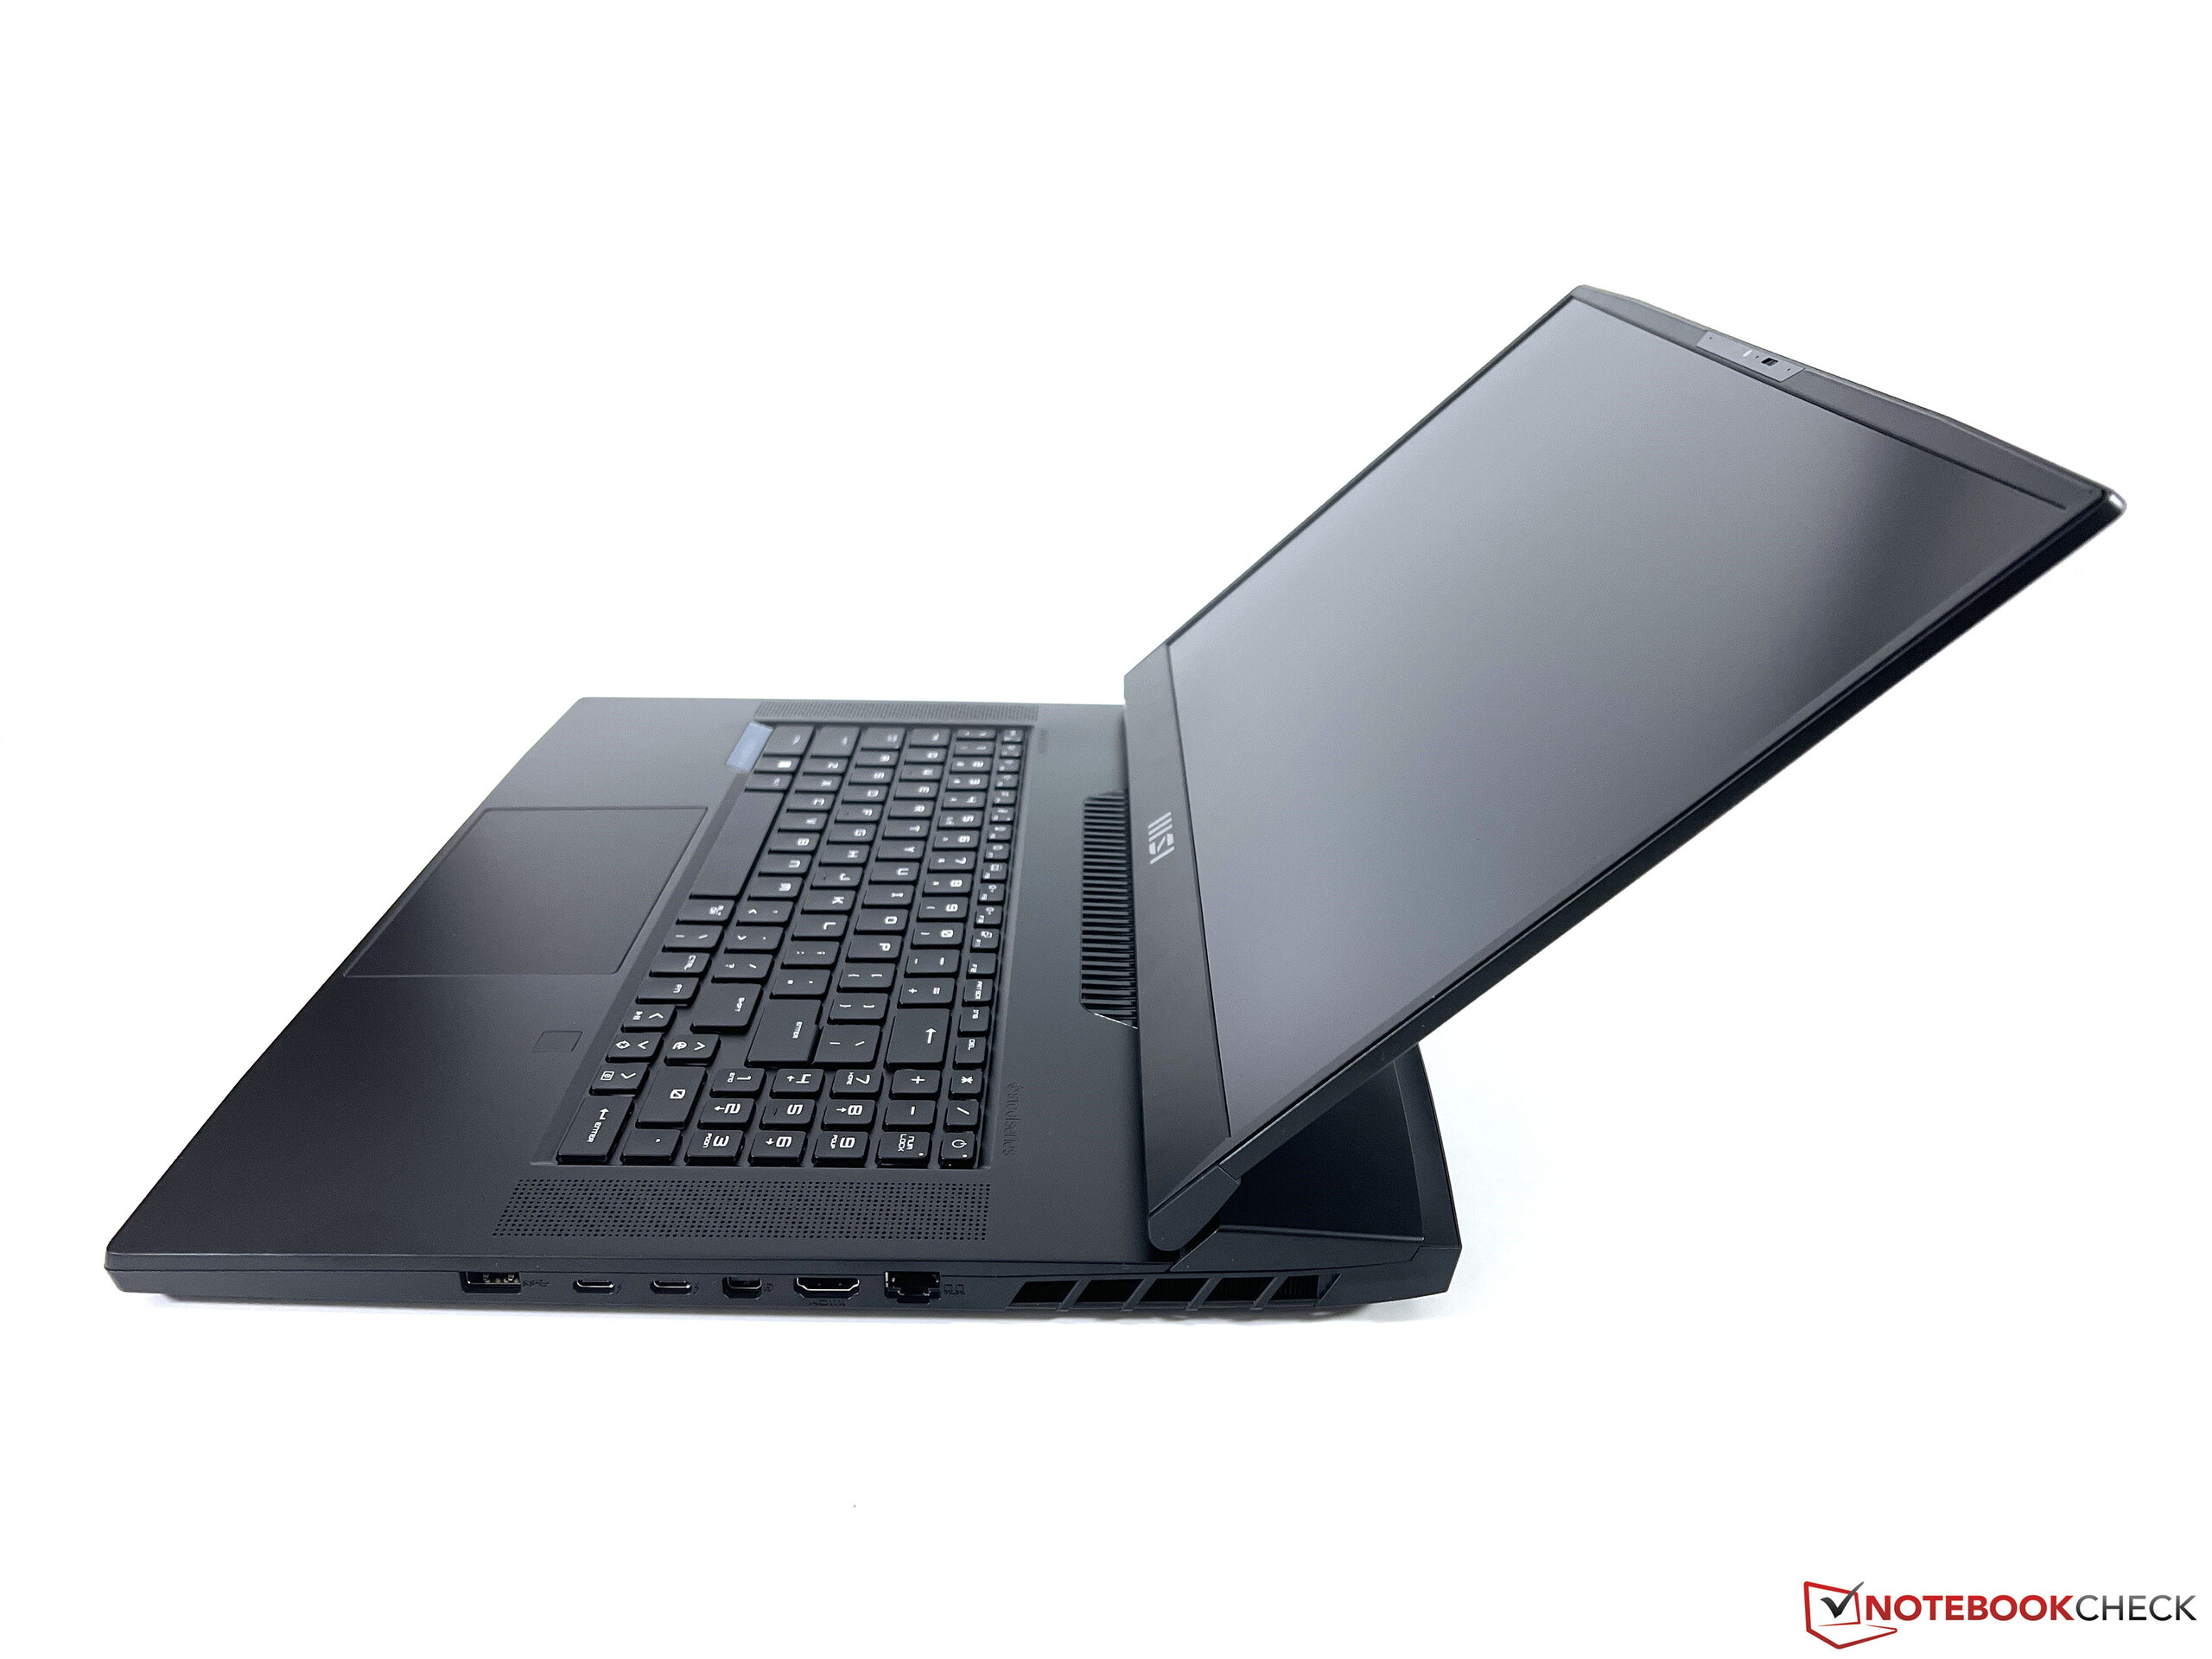
La calidad del chasis es decente, aunque esté casi enteramente hecho de plástico. Especialmente el material rugoso de la parte inferior no cumple las expectativas del elevado precio y también podría usarse en un portátil de 500 Euros. Sin embargo, la calidad general de construcción es decente; la unidad base es muy robusta y sólo se oyen pequeños crujidos. La tapa por otro lado es más flexible, pero no pudimos provocar distorsiones de imagen. Habríamos preferido bisagras de display algo más rígidas y la tapa se tambalea un poco cuando ajustas el ángulo de apertura (hasta ~135º).
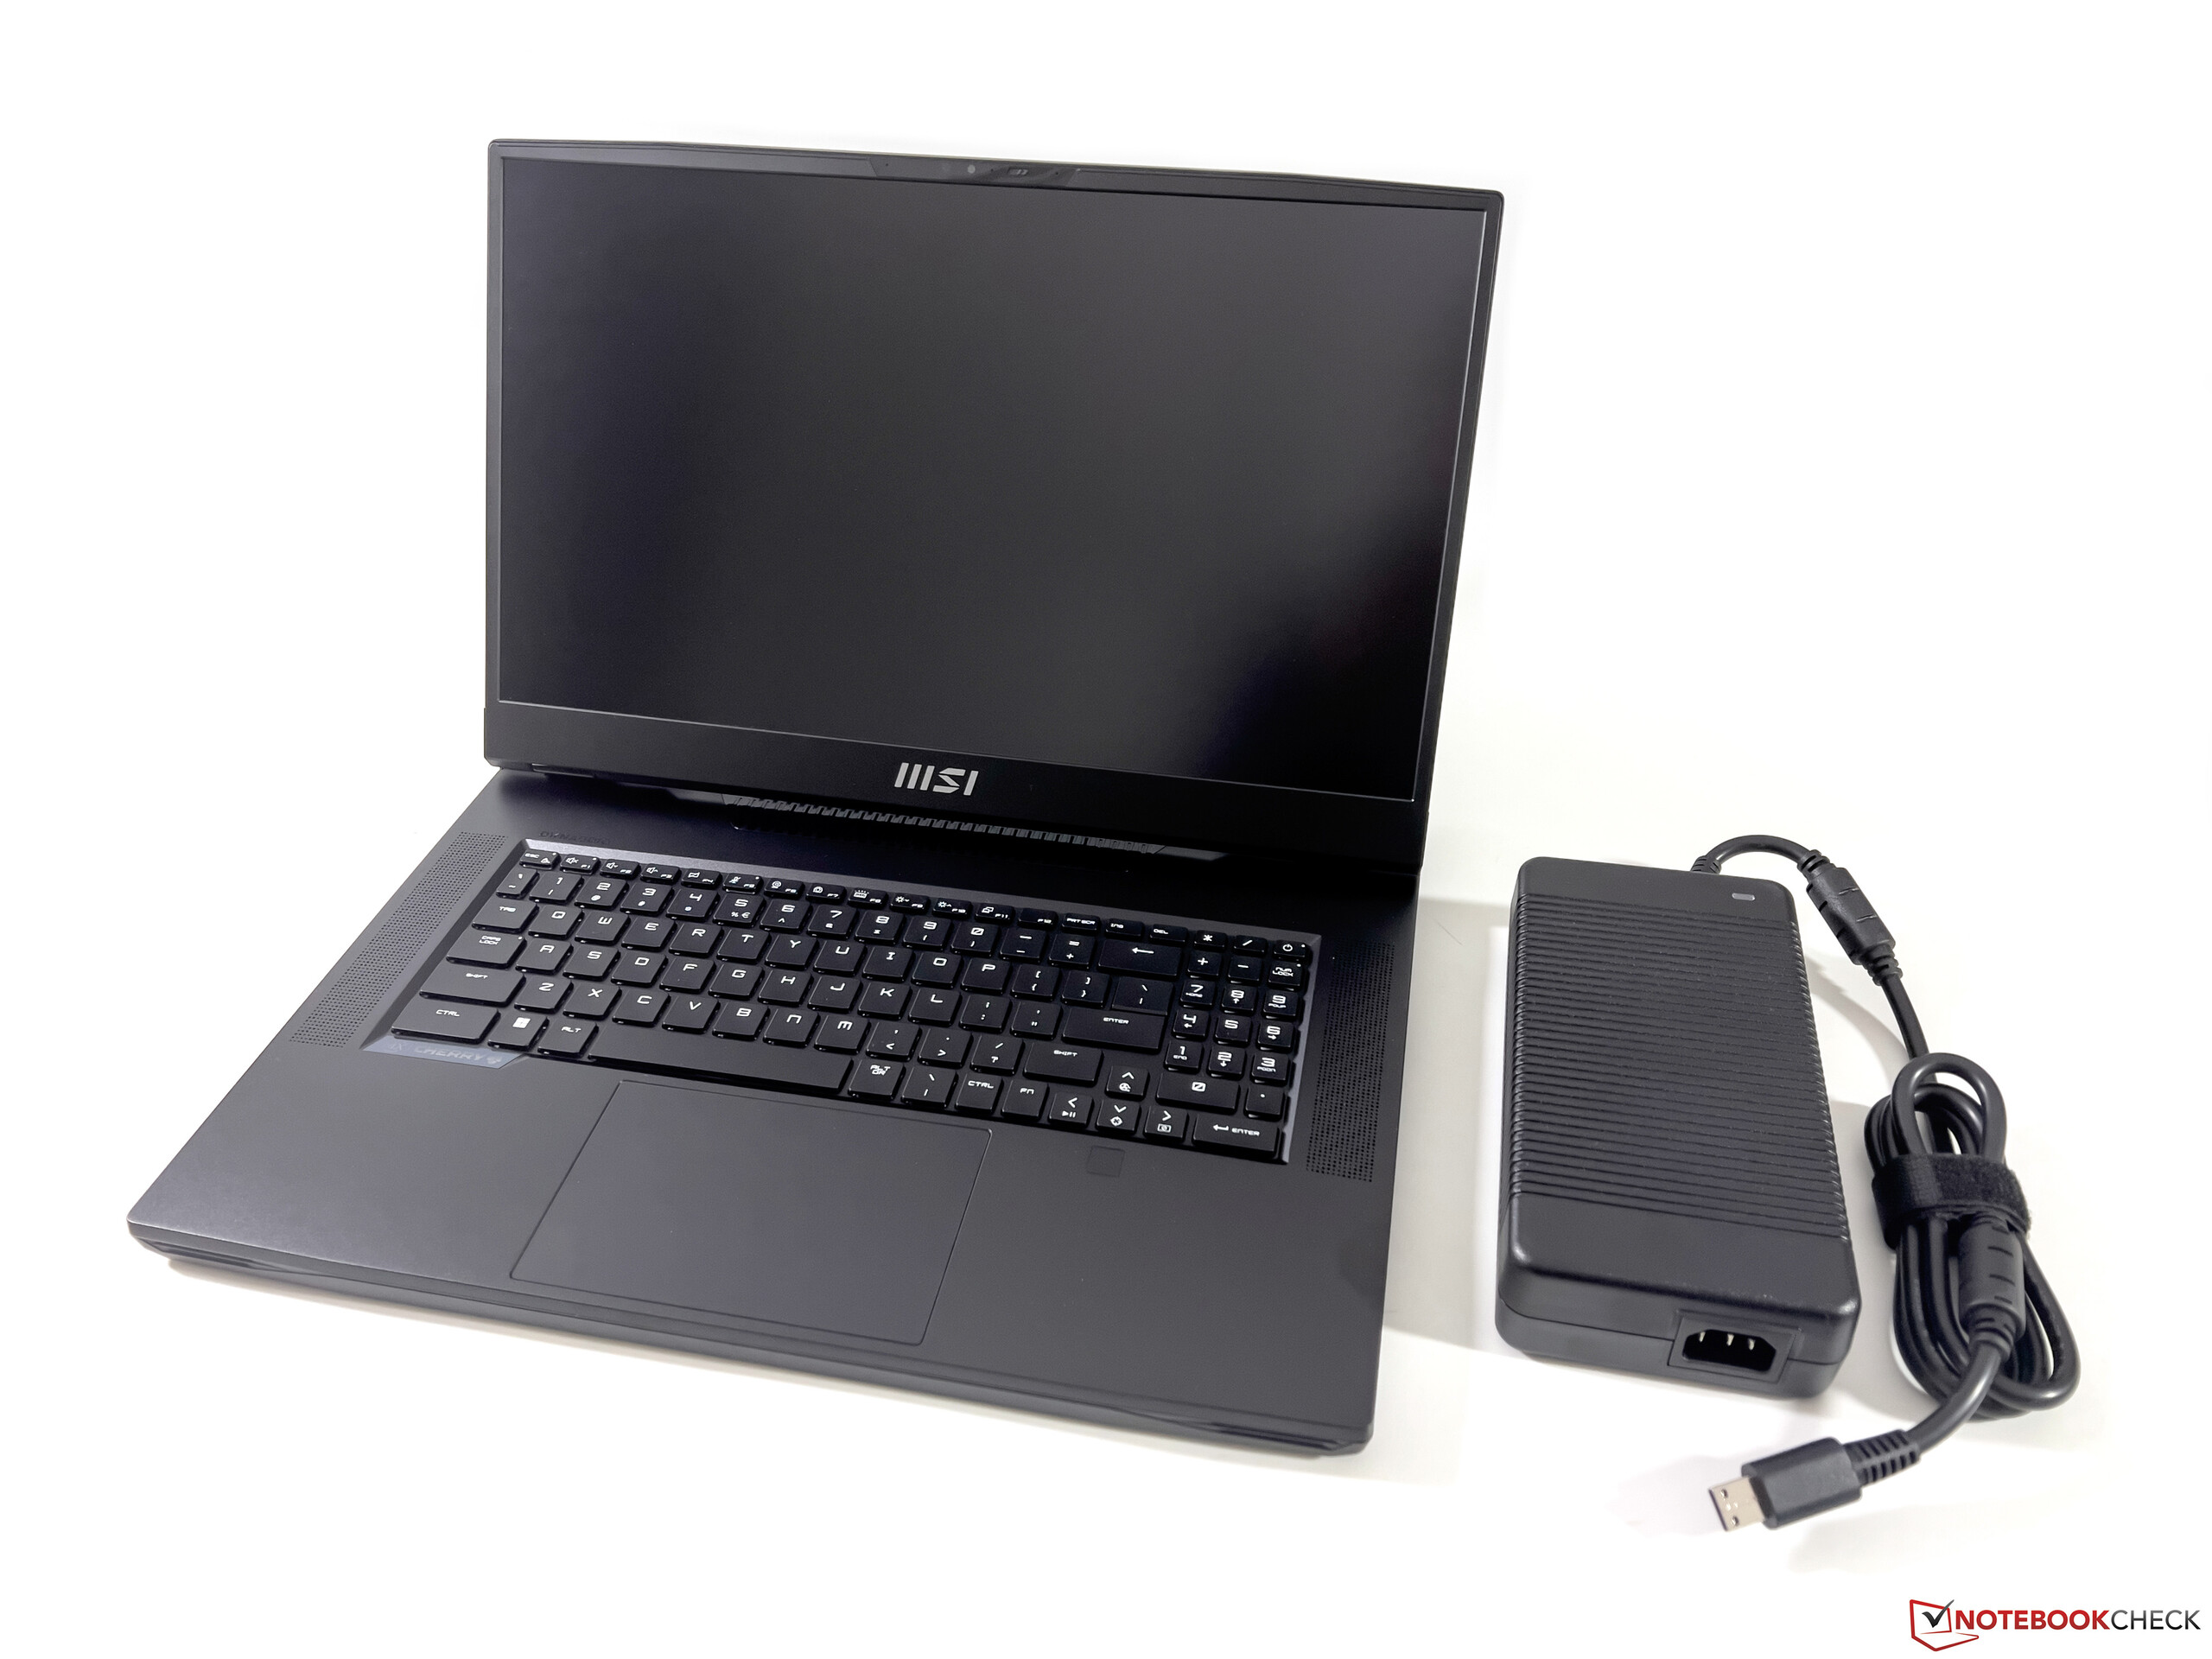
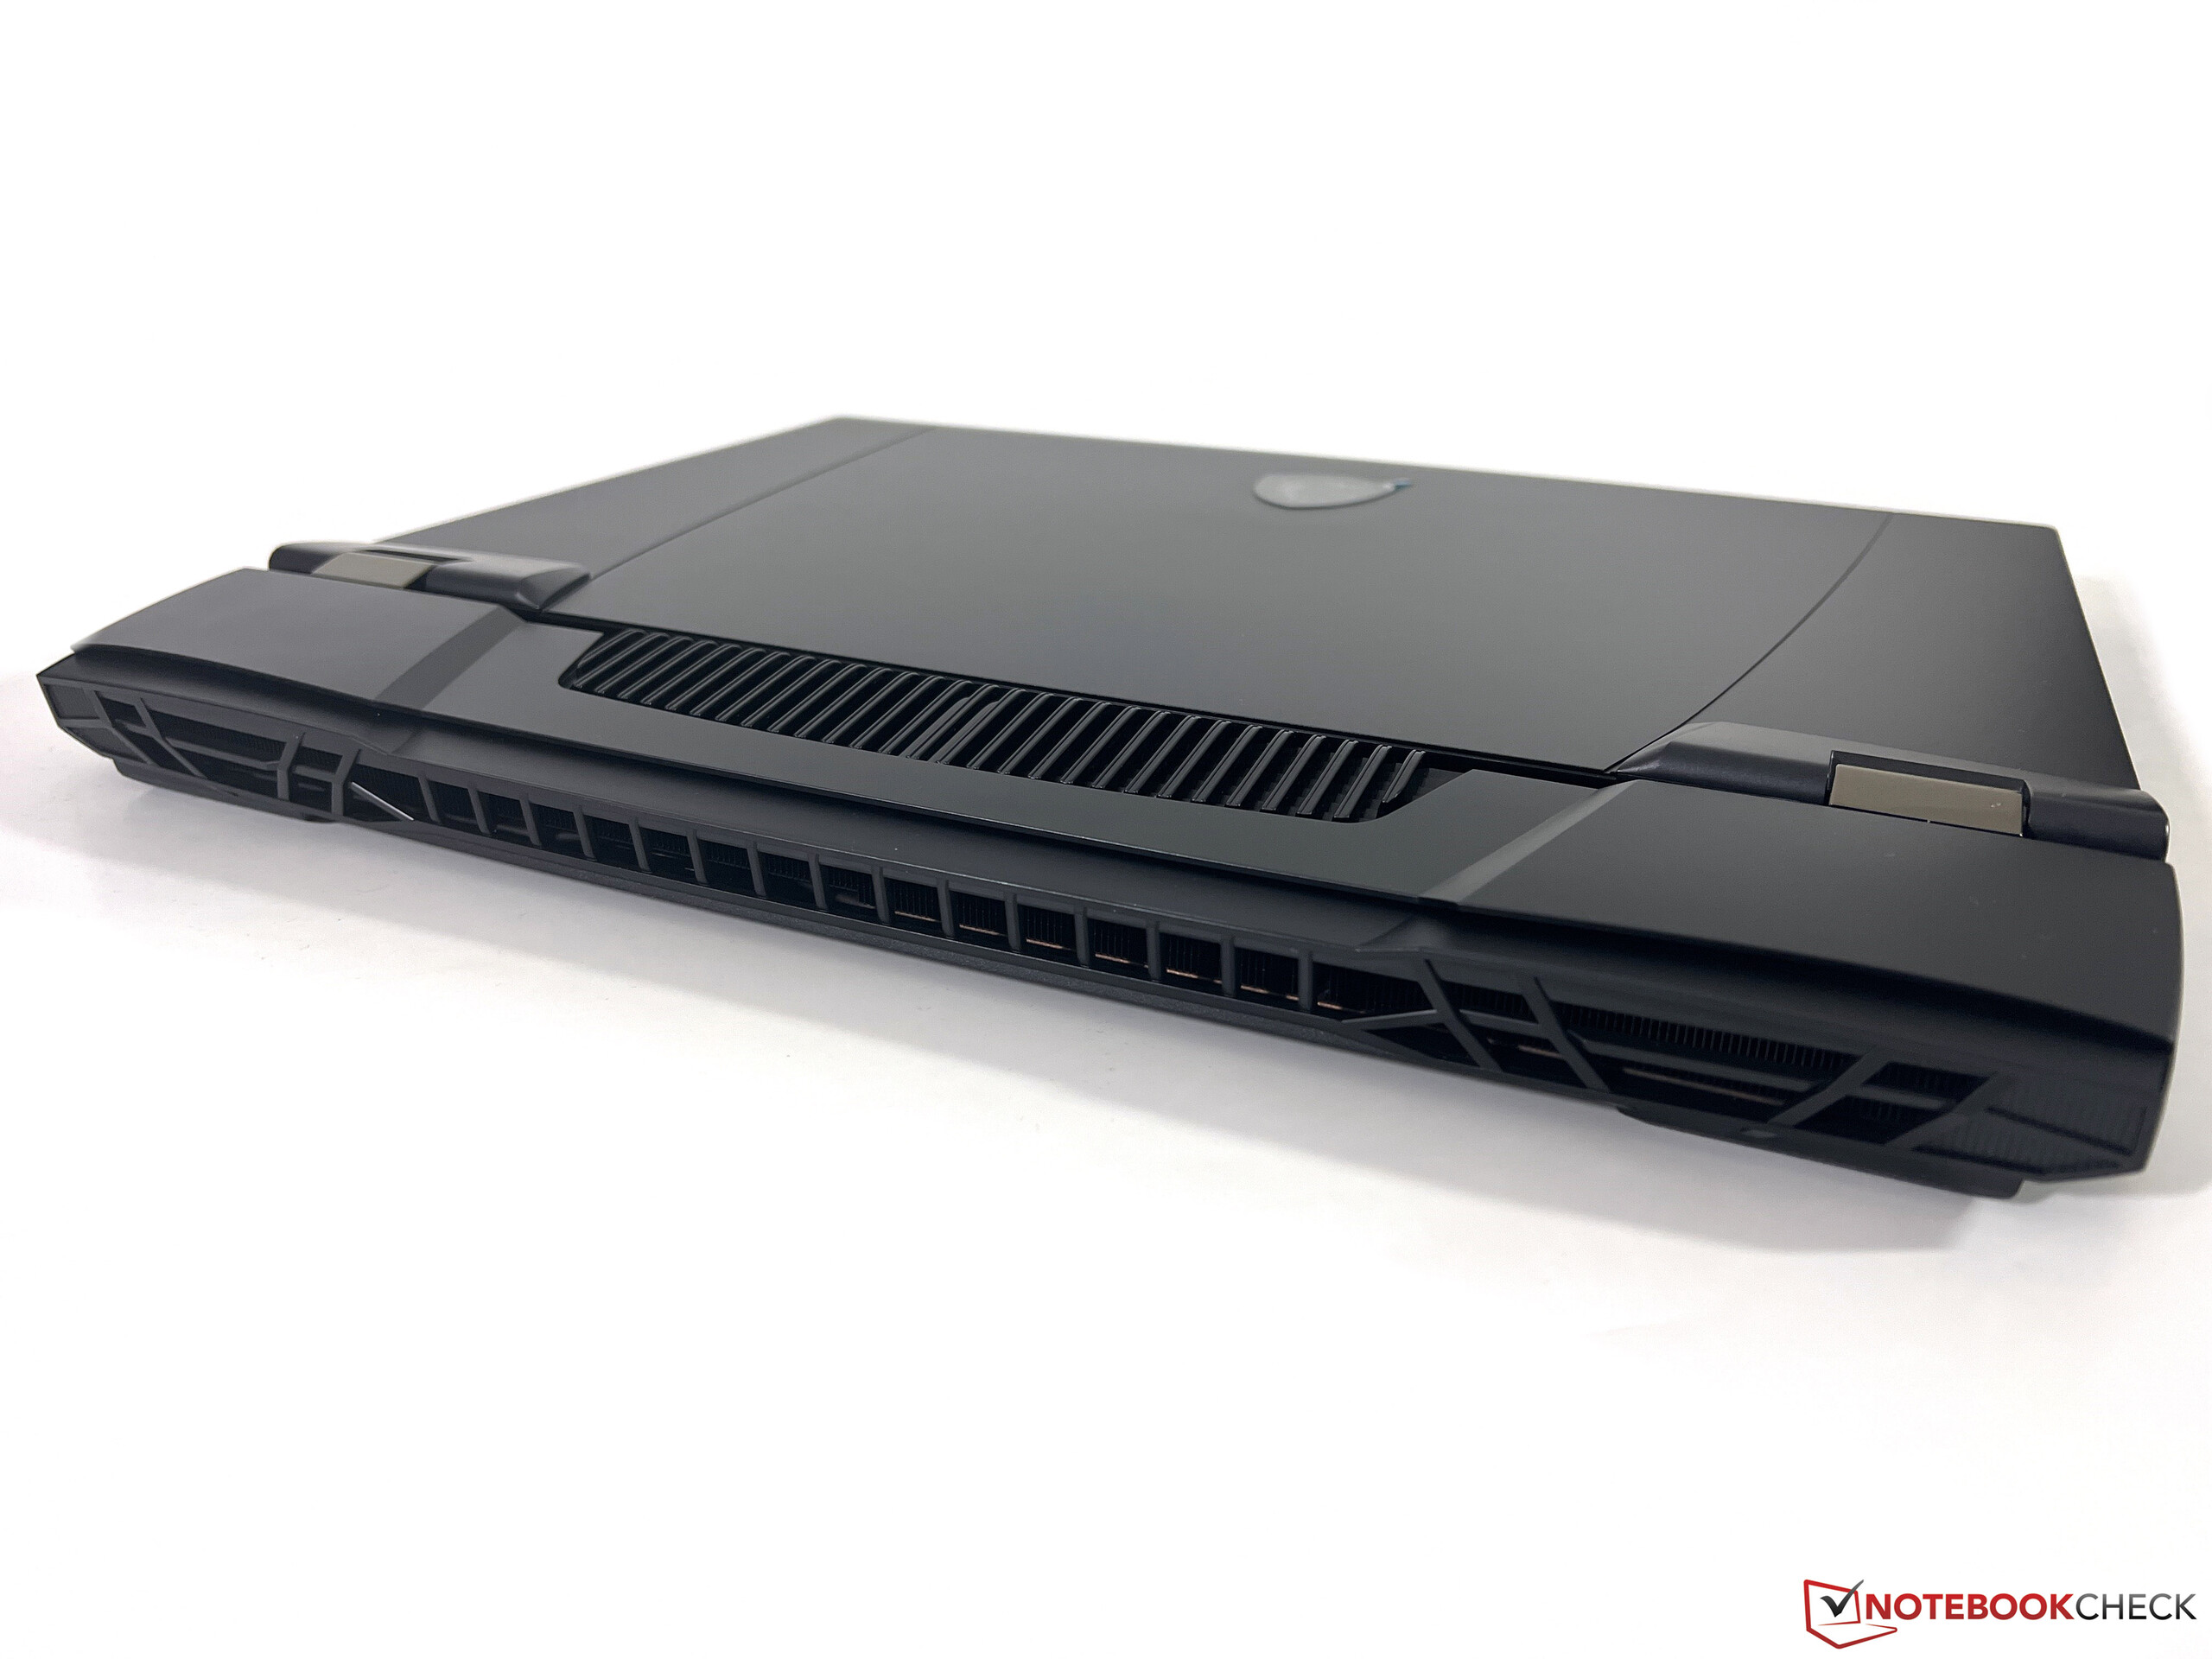
El GT77 sigue siendo una máquina comparativamente delgada, con 2,3 cm, sobre todo teniendo en cuenta su potente hardware. Sin embargo, debido a la gran unidad de refrigeración de la parte trasera, el portátil es muy profundo y ocupa mucho más espacio que sus rivales. También es muy pesado, con casi 3,5 kg, a los que hay que añadir otros 1,4 kg por el voluminoso adaptador de corriente de 330 W.
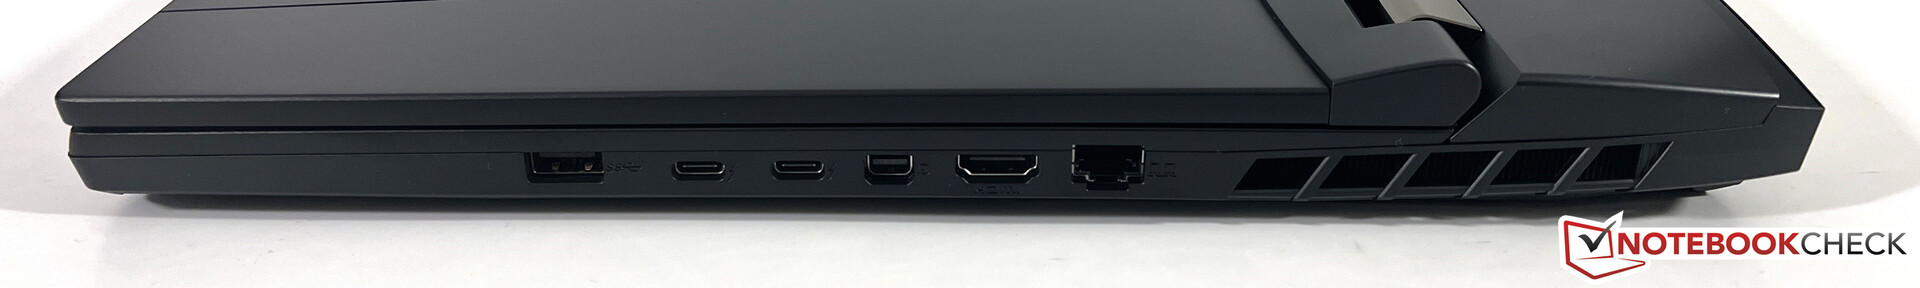
Conectividad - Thunderbolt y lector de tarjetas
No ha cambiado nada en cuanto a puertos y sigue teniendo todos los estándares importantes. Todos los puertos están en los dos laterales, ya que la trasera se usa exclusivamente para la refrigeración. También puedes cargar la batería en el puerto USB-C trasero, pero requiere un adaptador de corriente de 100W (los módulos de 65W no funcionaron).
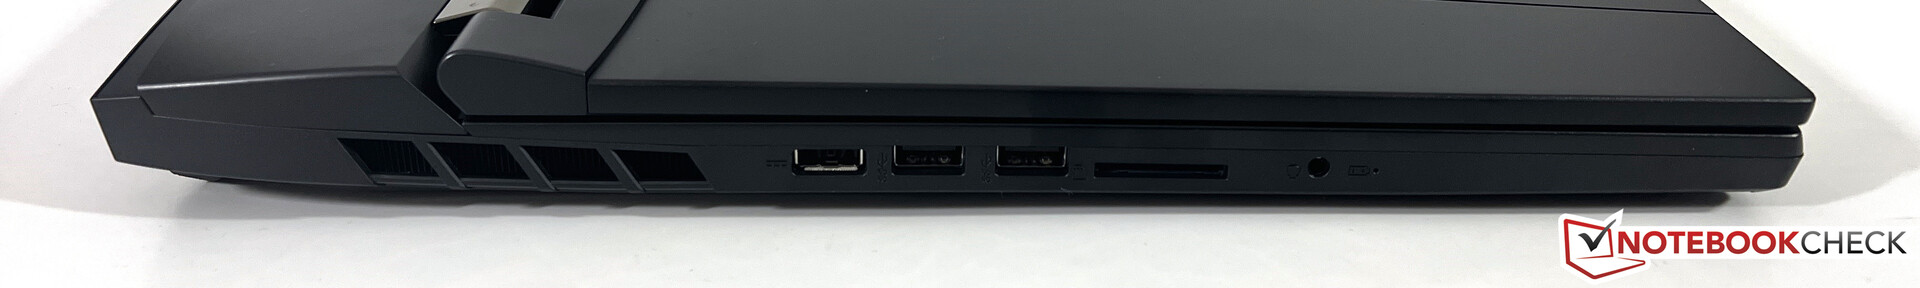
Lector de tarjetas SD
El lector de tarjetas SD admite tarjetas de memoria de tamaño normal y alcanza velocidades de transferencia medias de más de 80 MB/s con nuestra tarjeta de referencia (AV Pro V60).
| SD Card Reader | |
| average JPG Copy Test (av. of 3 runs) | |
| Alienware x17 R2 P48E (AV Pro V60) | |
| Media de la clase Gaming (20.9 - 210, n=54, últimos 2 años) | |
| Razer Blade 16 Early 2023 (AV PRO microSD 128 GB V60) | |
| MSI Titan GT77 HX 13VI (Angelibird AV Pro V60) | |
| MSI Titan GT77 12UHS (AV PRO microSD 128 GB V60) | |
| Schenker XMG Neo 17 M22 (AV PRO microSD 128 GB V60) | |
| maximum AS SSD Seq Read Test (1GB) | |
| Alienware x17 R2 P48E (AV Pro V60) | |
| Razer Blade 16 Early 2023 (AV PRO microSD 128 GB V60) | |
| Media de la clase Gaming (25.5 - 261, n=51, últimos 2 años) | |
| MSI Titan GT77 12UHS (AV PRO microSD 128 GB V60) | |
| MSI Titan GT77 HX 13VI (Angelibird AV Pro V60) | |
Comunicación
MSI equipa el nuevo Titan GT77 con el módulo Wi-Fi Killer AX1690i, que soporta el actual estándar Wi-Fi 6E así como Bluetooth 5.3. Nuestro ejemplar de EE.UU. no se conectó a los 6 GHz de nuestro router de referencia de Asus, pero la calidad de la señal también fue muy buena cuando usamos la red de 5 GHz (Wi-Fi 6). También puede usar el puerto Ethernet de 2,5 Gbps.
Cámara web
La webcam está equipada con un obturador mecánico, pero eso es prácticamente todo lo positivo. MSI sigue usando la mala webcam 720p, que no saca buenas fotos ni siquiera en buenas condiciones de luz. Puedes esperar más en 2023, especialmente teniendo en cuenta el precio.


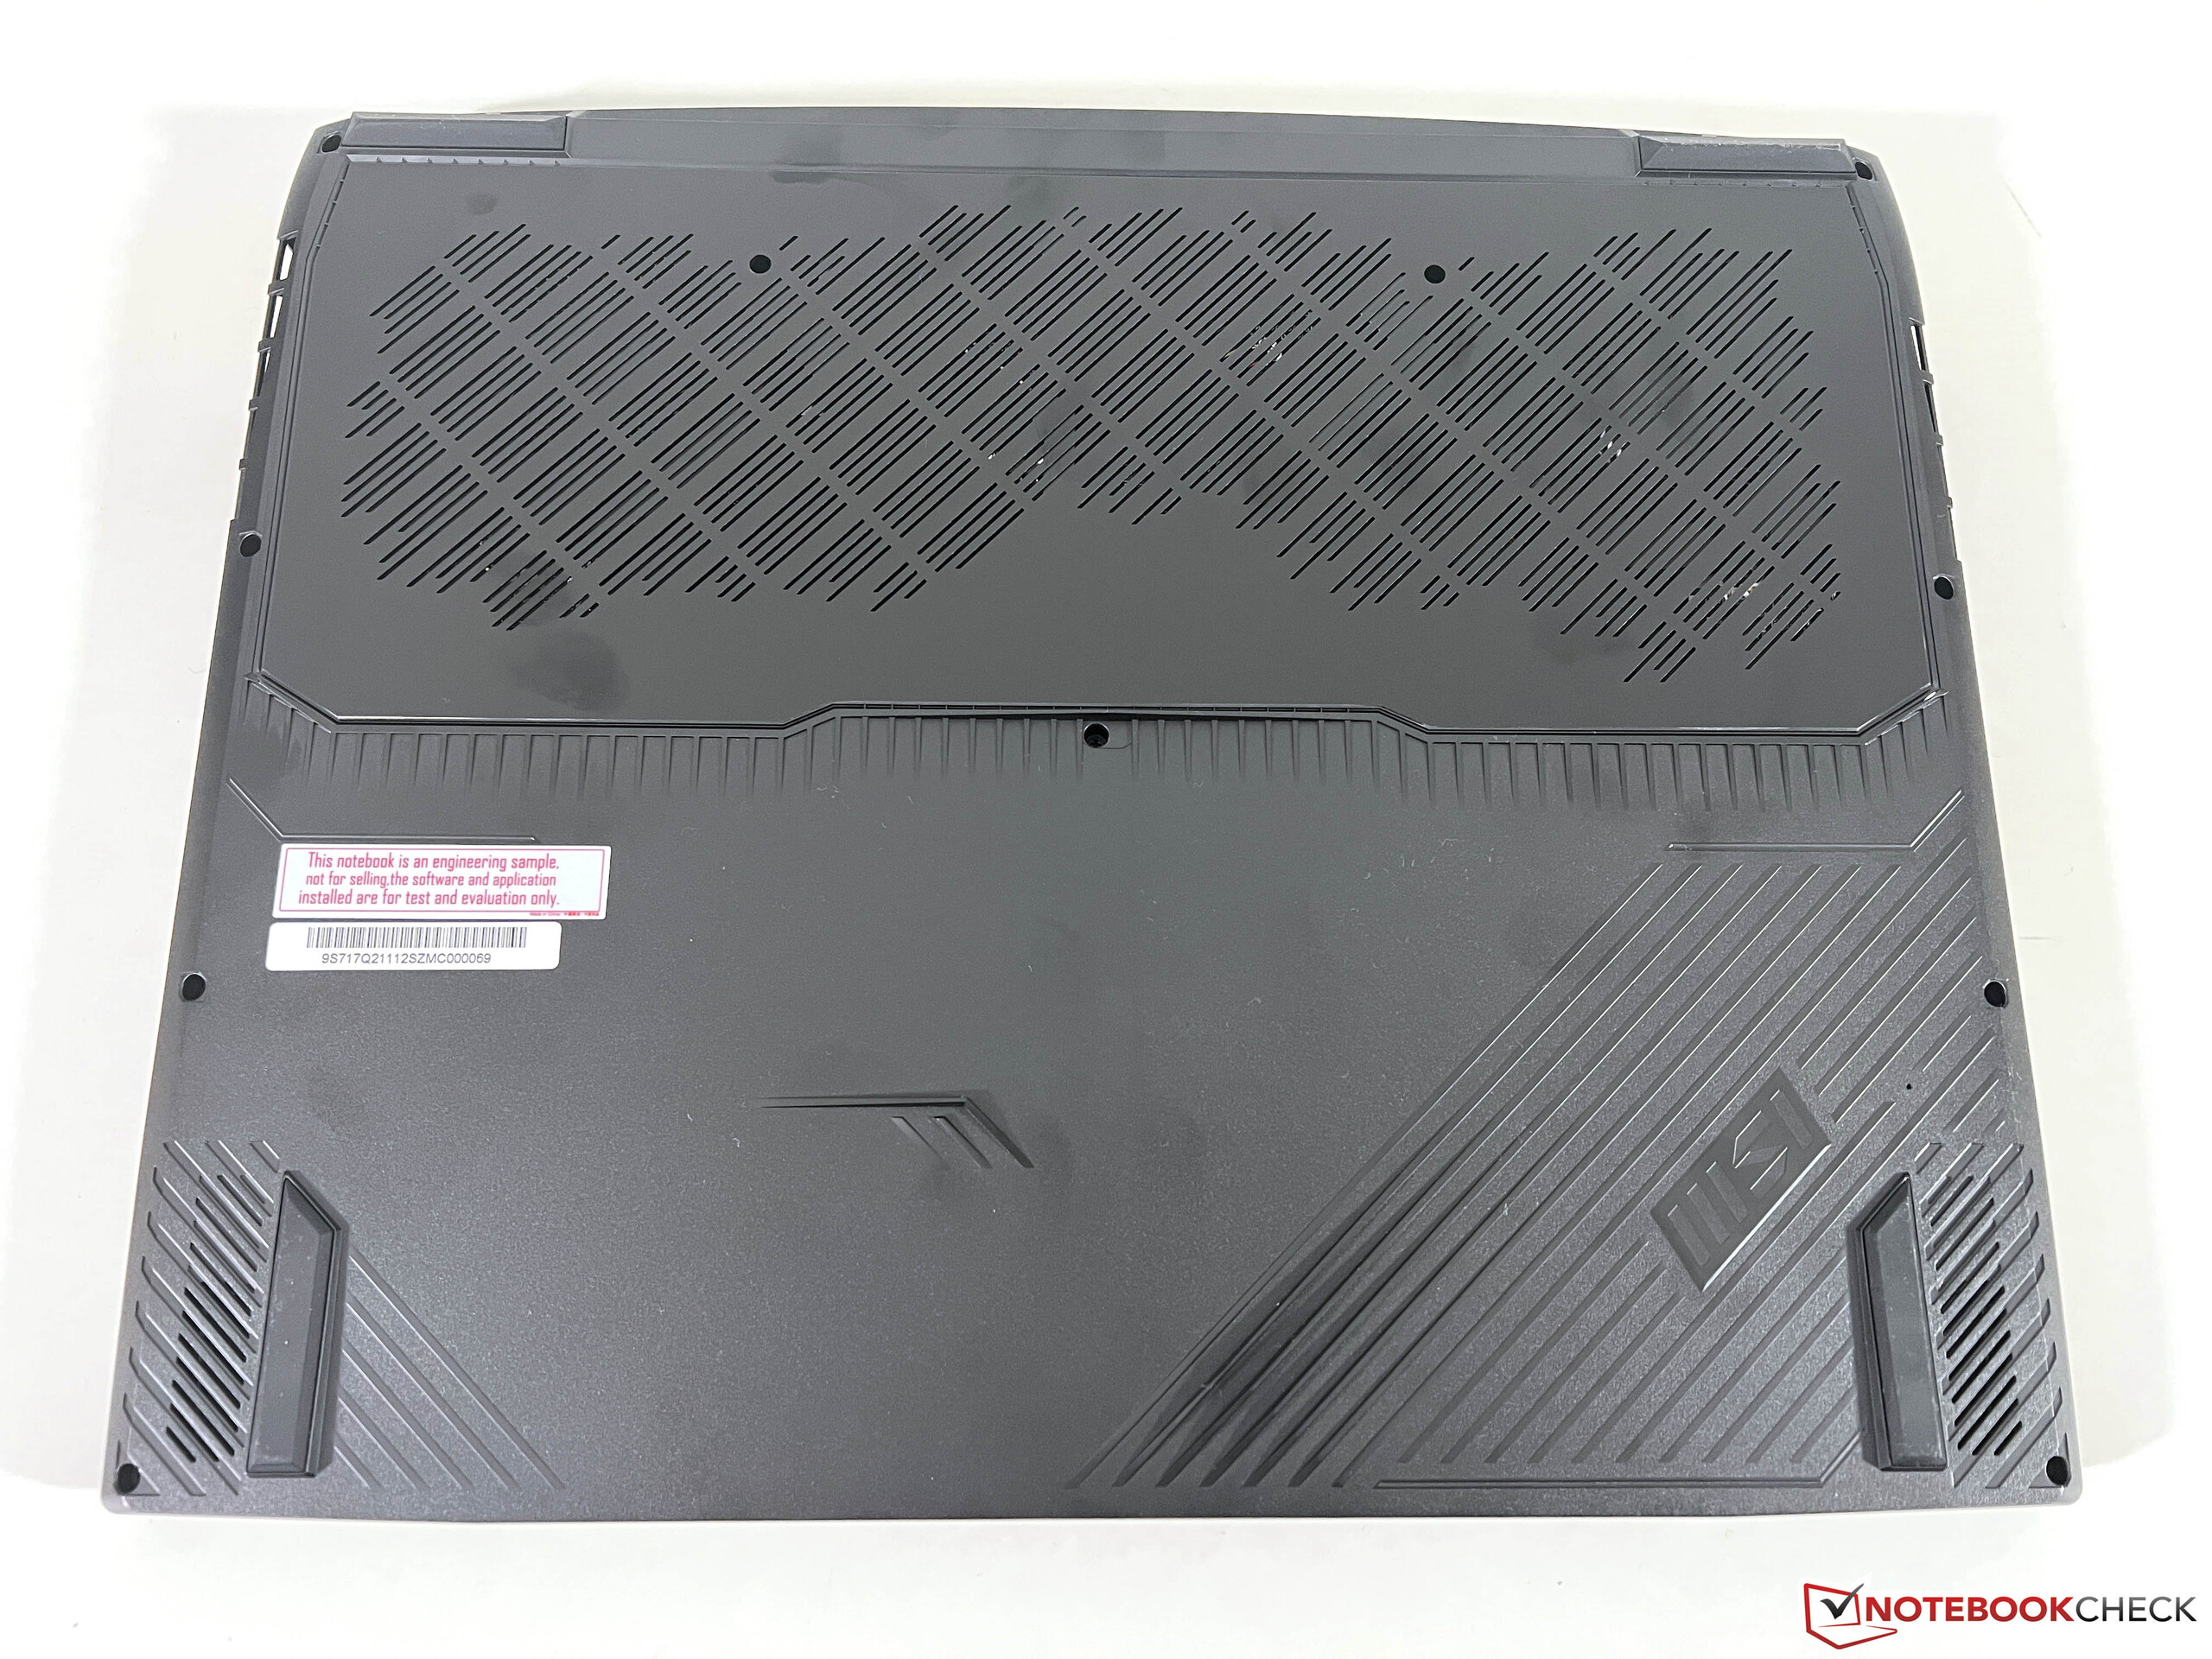
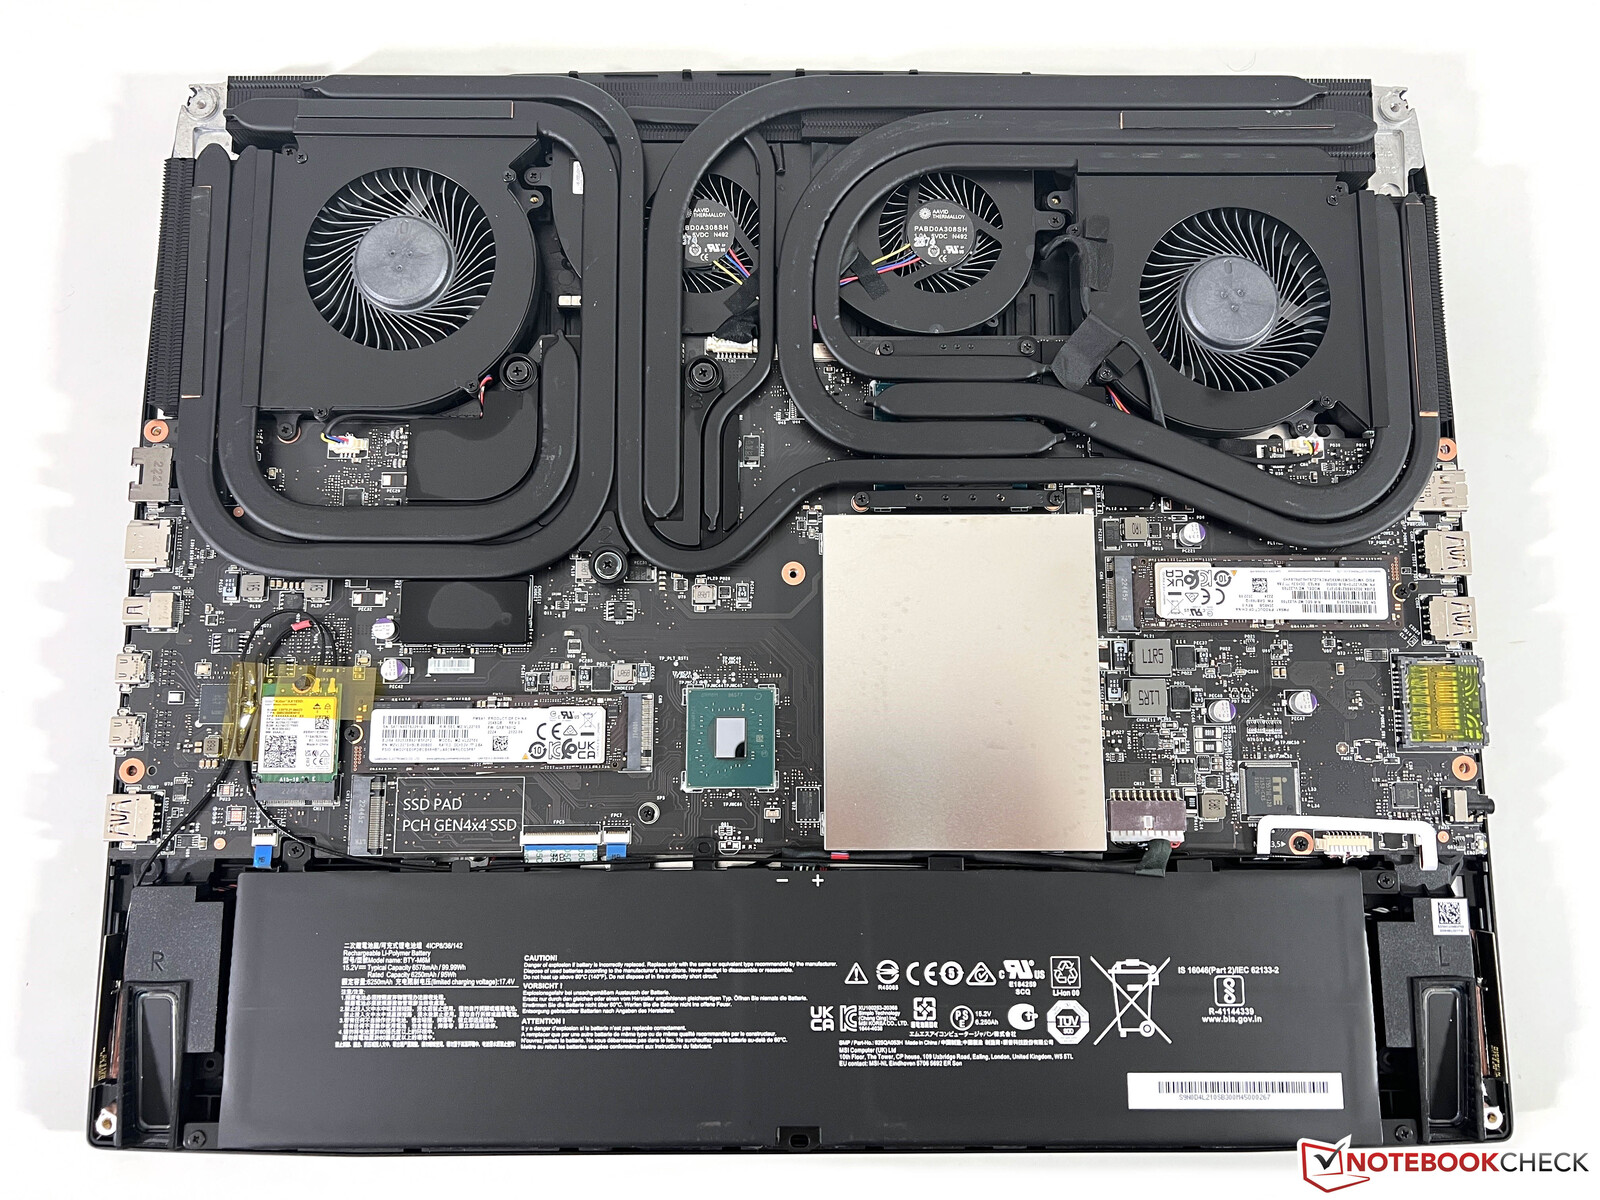
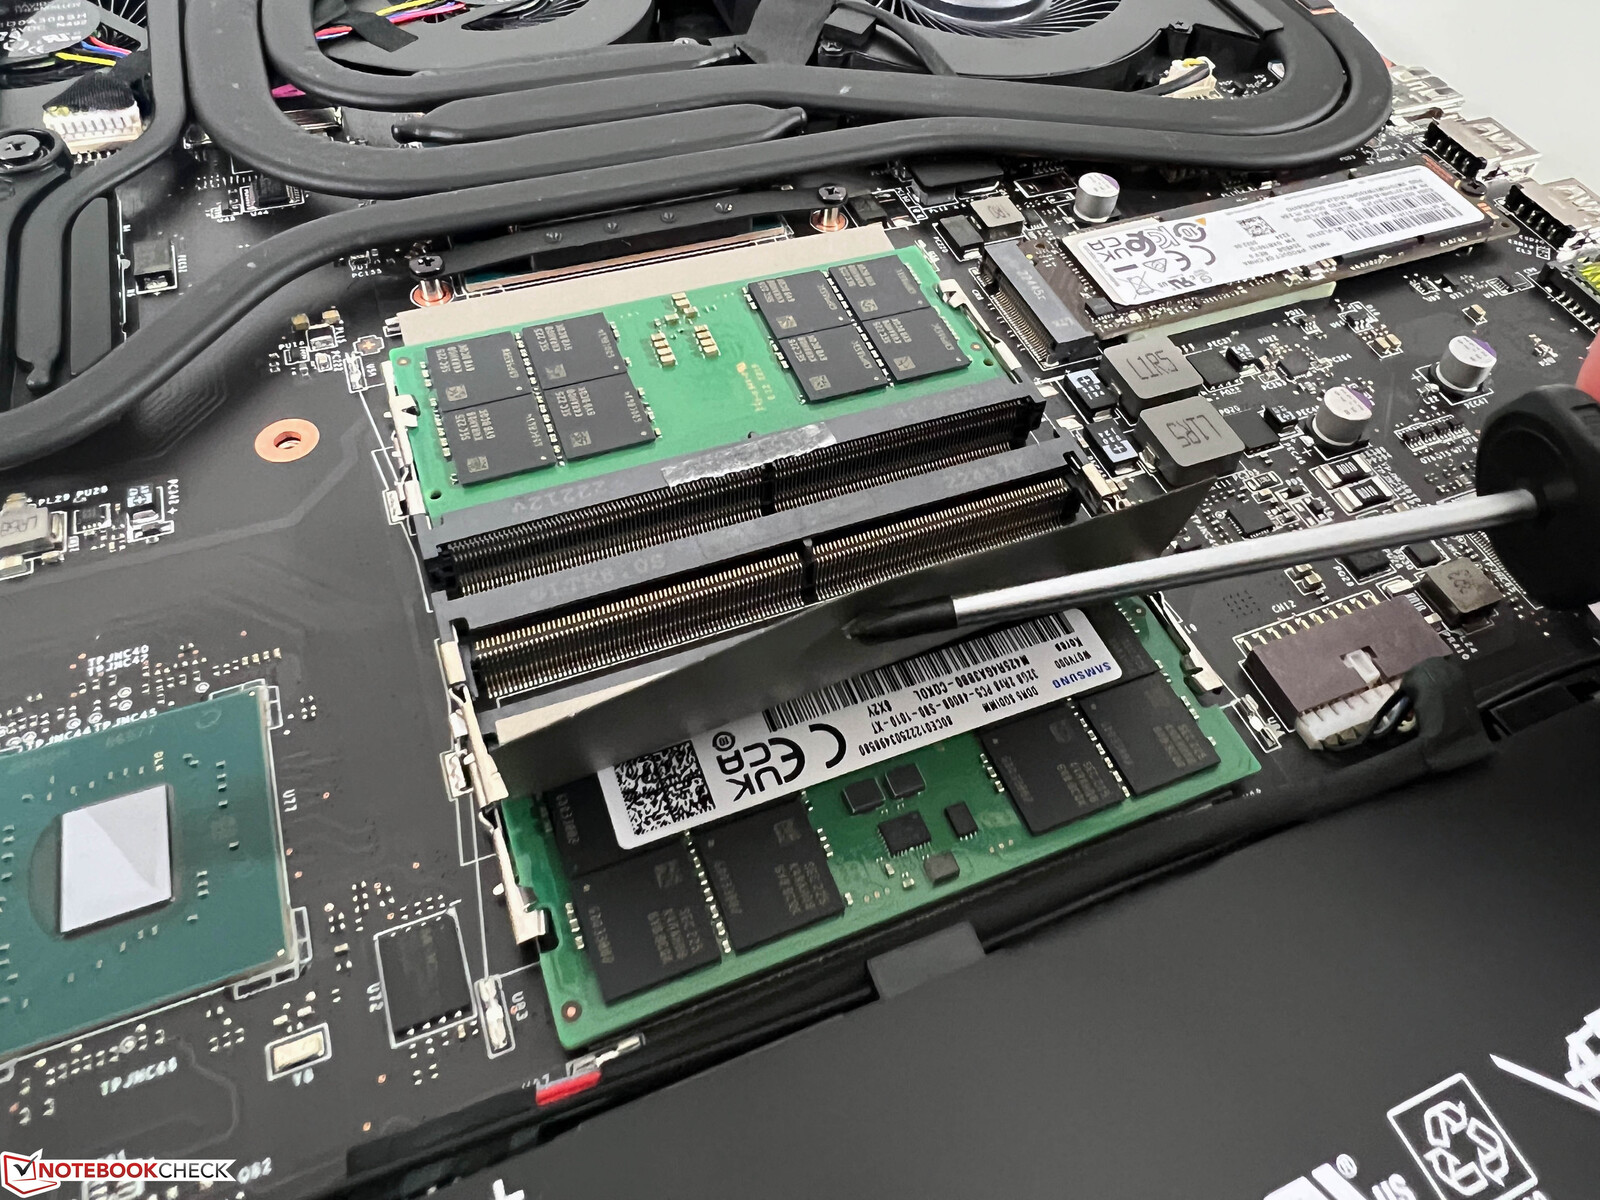
Mantenimiento
Toda la cubierta inferior está asegurada por tornillos Philips estándar y se puede quitar, pero la cubierta está muy bien sujeta y el proceso no es fácil. Además de cuatro ranuras SO-DIMM también puedes usar tres ranuras M.2 para actualizaciones. También es posible cambiar el módulo Wi-Fi y limpiar los ventiladores. MSI cambió la distribución de la refrigeración y usa más tubos de calor comparado con el modelo anteriorlo que significa que la cuarta ranura M.2 tuvo que ser eliminada.
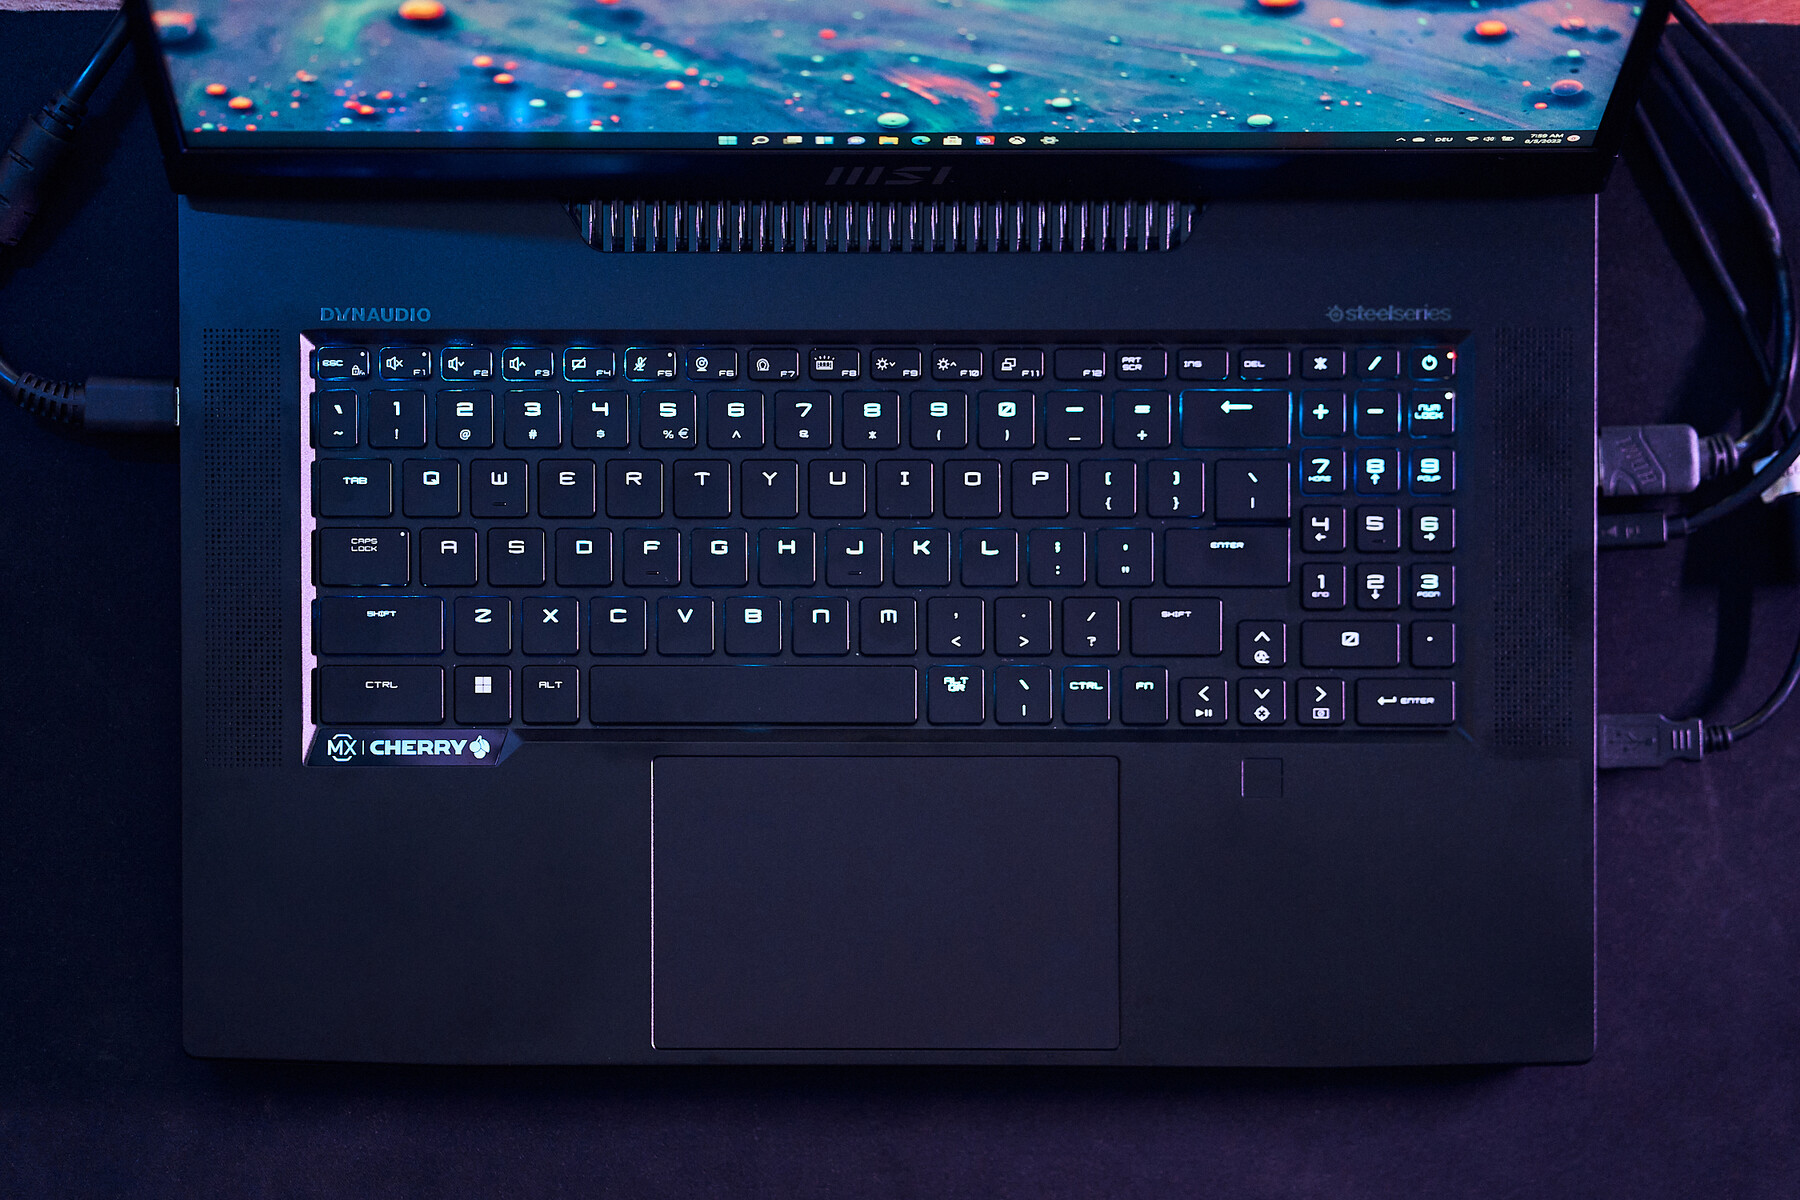
Dispositivos de entrada - MSI con un gran teclado mecánico
Ya nos gustó el teclado mecánico del modelo anterior y eso no ha cambiado. El ruido de tecleo es un poco más alto en comparación con los teclados de cúpula de goma convencionales, pero la unidad Cherry es notablemente más silenciosa que el teclado mecánico que se puede conseguir para elXMG Neo 17por ejemplo. Las teclas de flecha y el teclado numérico dedicado (que es un poco más estrecho) utilizan interruptores convencionales. Es posible ajustar la iluminación para cada tecla individualmente, pero también puedes elegir un color discreto para todas las teclas. El escáner de huellas dactilares está implementado en el reposamuñecas, justo debajo de las teclas de dirección.
El gran clickpad funcionó bien durante nuestro análisis y las operaciones de cursor estándar no son un problema, pero el ruido de clic es un poco alto. Sin embargo, la mayoría de los jugadores usarán un ratón o gamepad externo.
Pantalla - 4K Mini-LED con 144 Hz
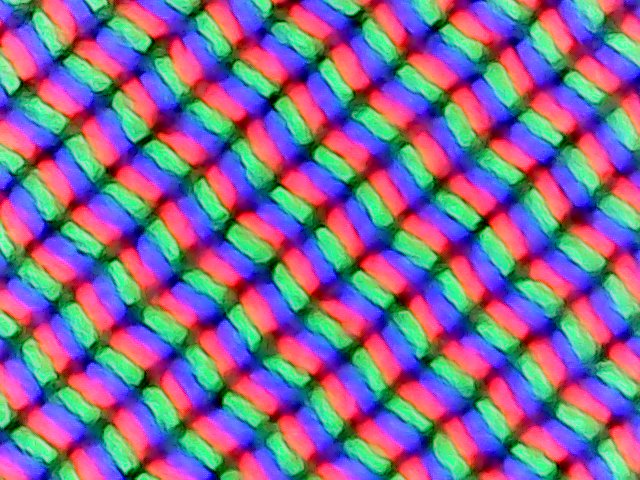
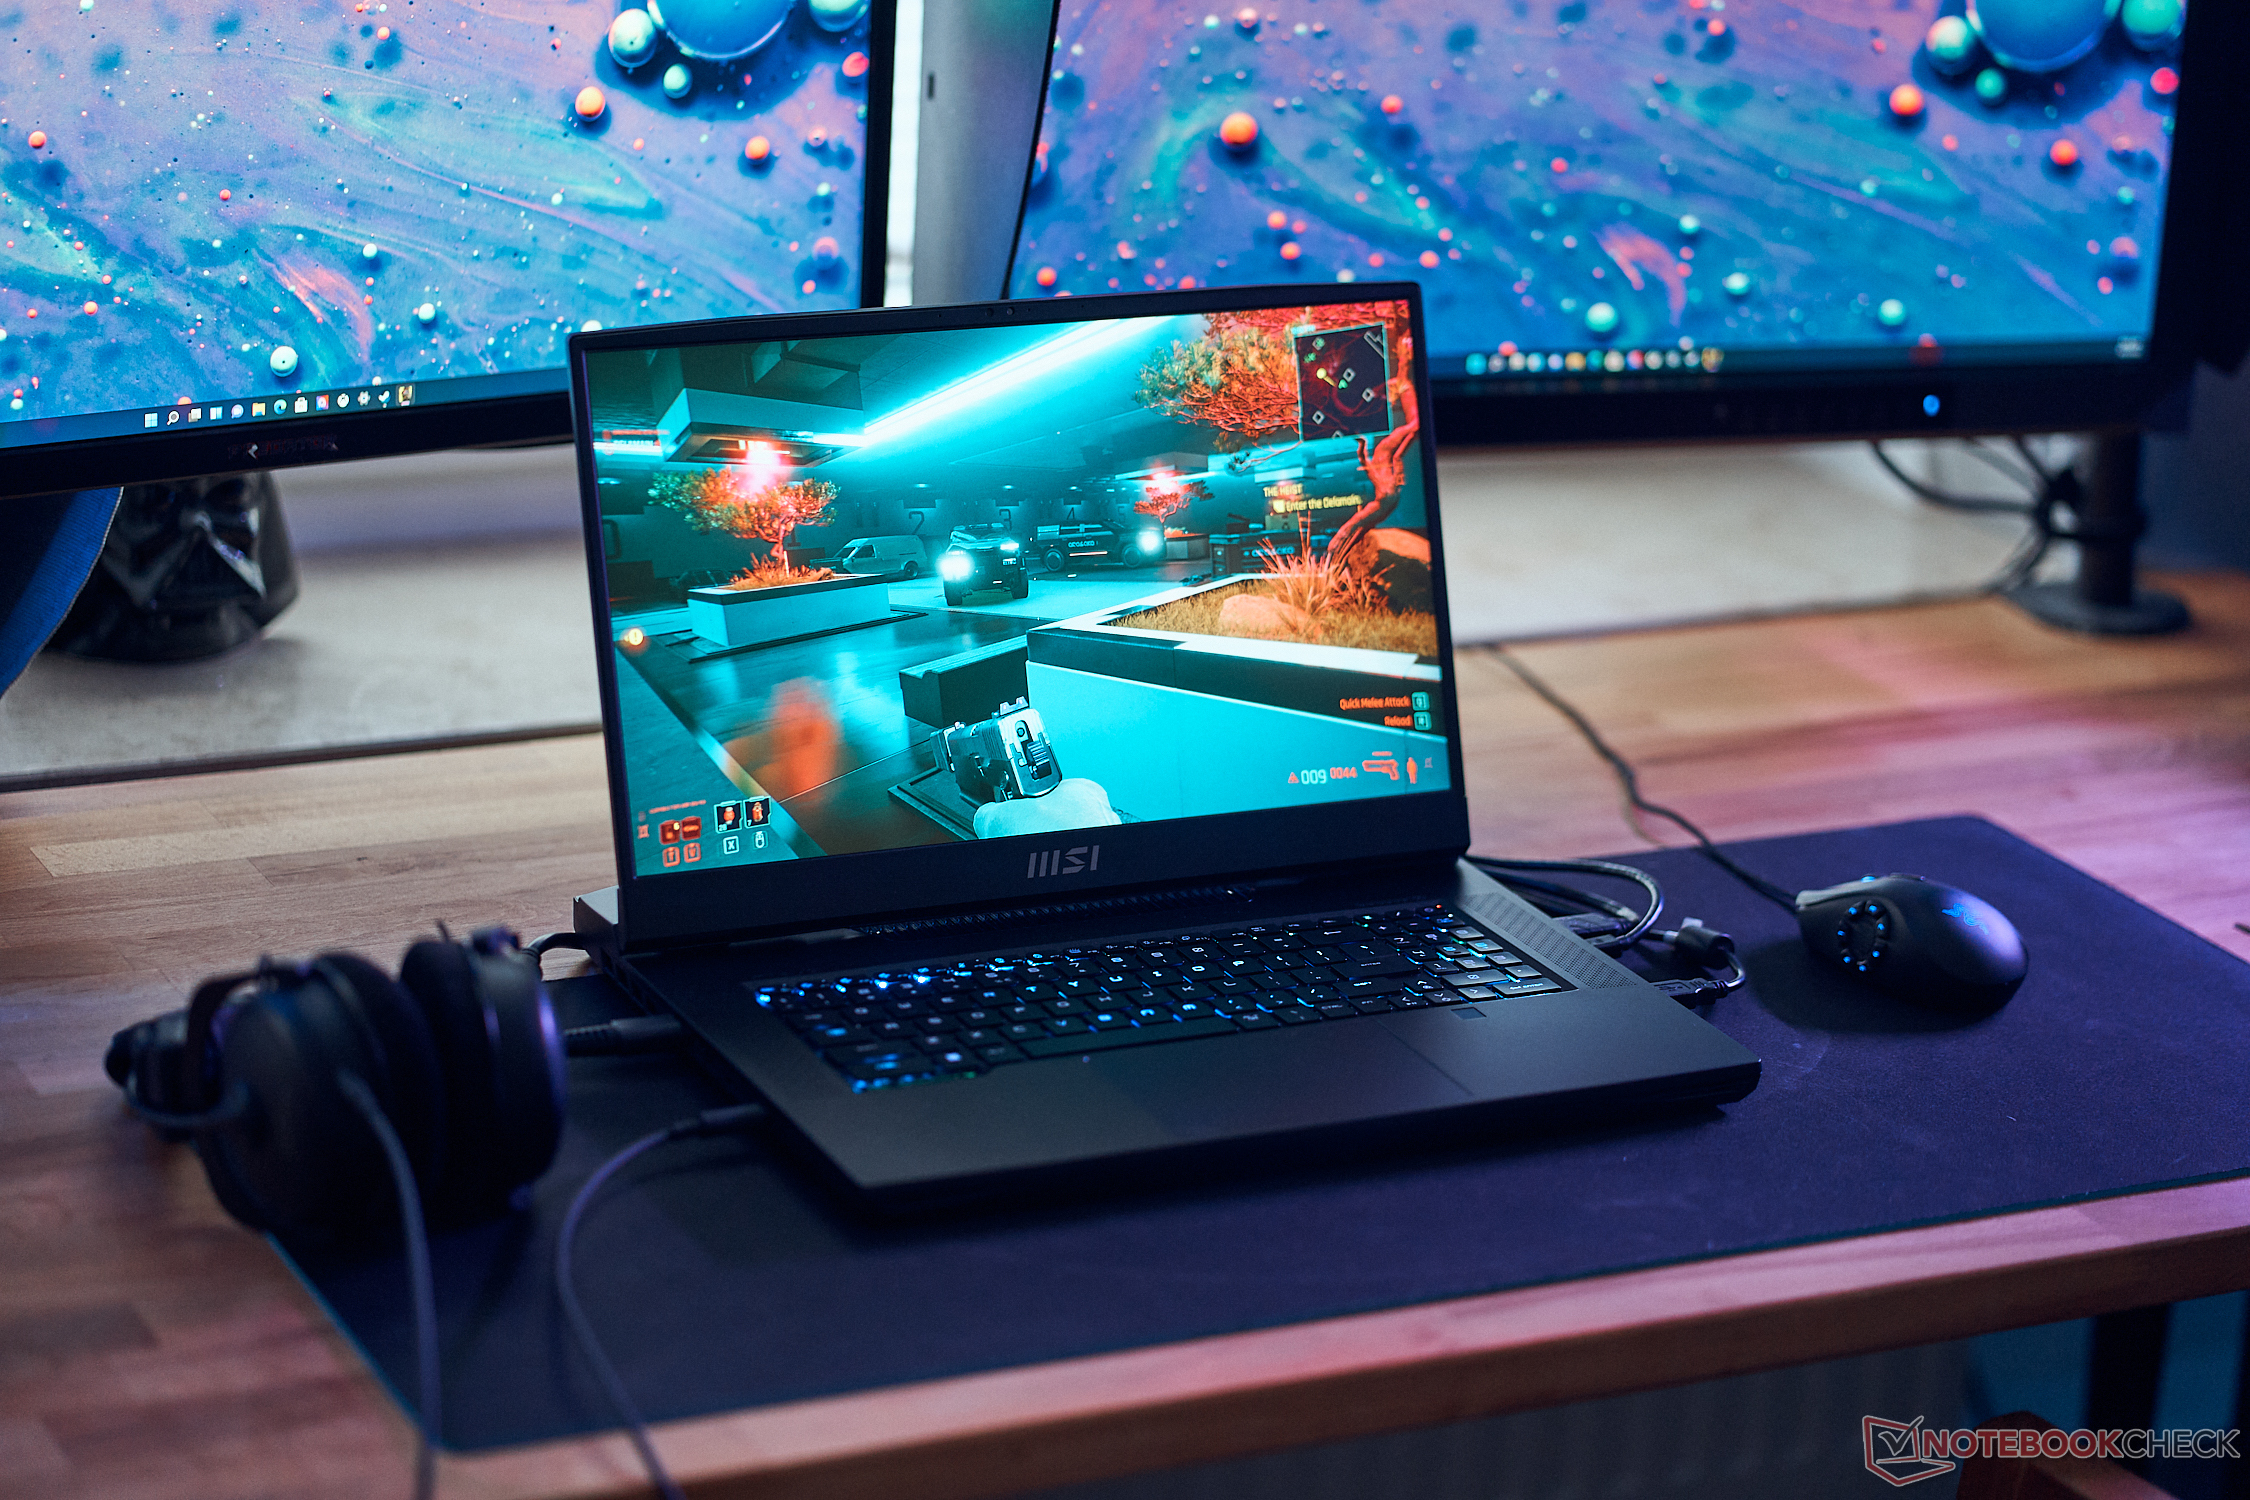
MSI no sólo usa los últimos modelos de CPU y GPU, sino que también ofrece un flamante panel Mini-LED con resolución 4K (16:9, 3840 x 2160 pixels) y una tasa de refresco de 144 Hz. También se puede conseguir una pantalla IPS QHD con 240 Hz. La calidad de imagen subjetiva del panel Mini-LED mate de AU Optronics (B173ZAN06.C) es impresionante, con contenidos nítidos y colores ricos. Las imágenes negras son realmente negras y no hay sangrado de retroiluminación en las pantallas Mini-LED. MSI anuncia más de 1000 zonas de atenuación, pero aún se nota blooming. Los objetos brillantes sobre fondos oscuros crean nubes brillantes, ya que toda la zona de atenuación está iluminada. Sin embargo, sólo lo notarás realmente cuando aparezcan logos, pero no lo notamos durante juegos o cosas cotidianas. Medimos un brillo medio de 600 nits y un ratio de contraste muy alto gracias al bajo valor de negro.
El panel soporta HDR 1000 y podemos confirmar un brillo máximo de más de 1000 nits en una imagen completamente blanca, pero el panel no alcanza valores superiores mientras que el panel Mini-LED delApple MacBook Pro 16puede alcanzar hasta 1600 nits en pequeñas partes de la pantalla. La implementación de HDR en Windows sigue siendo una catástrofe comparada con macOS. El HDR tiene que activarse manualmente, ya no puedes usar perfiles de color y no puedes usar HDR en batería. No nos sorprendería que muchos usuarios no usaran HDR en absoluto teniendo en cuenta estos problemas, lo que es una pena. La calidad de los vídeos HDR es comparable a la del MacBook Pro 16 a pesar de la superficie mate, y lo probamos codo con codo.
| |||||||||||||||||||||||||
iluminación: 93 %
Brillo con batería: 402 cd/m²
Contraste: 6060000:1 (Negro: 0.0001 cd/m²)
ΔE ColorChecker Calman: 4.8 | ∀{0.5-29.43 Ø4.71}
calibrated: 1.8
ΔE Greyscale Calman: 6.5 | ∀{0.09-98 Ø4.96}
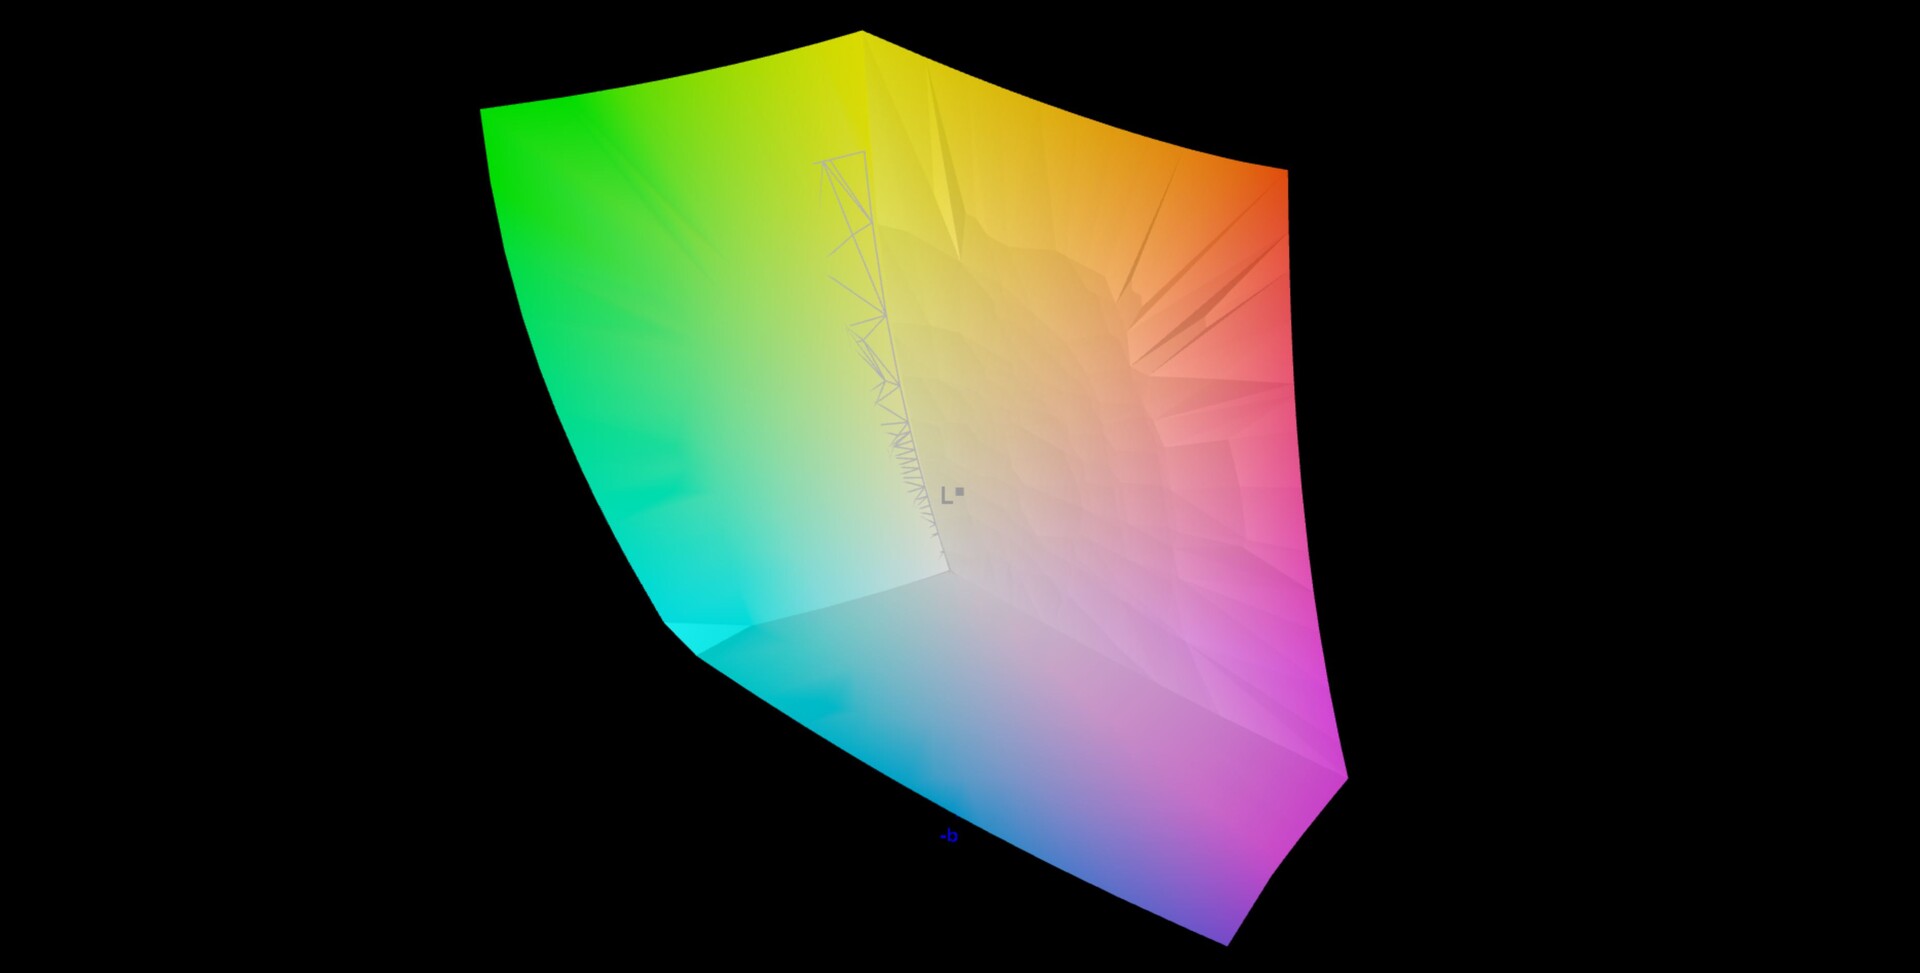
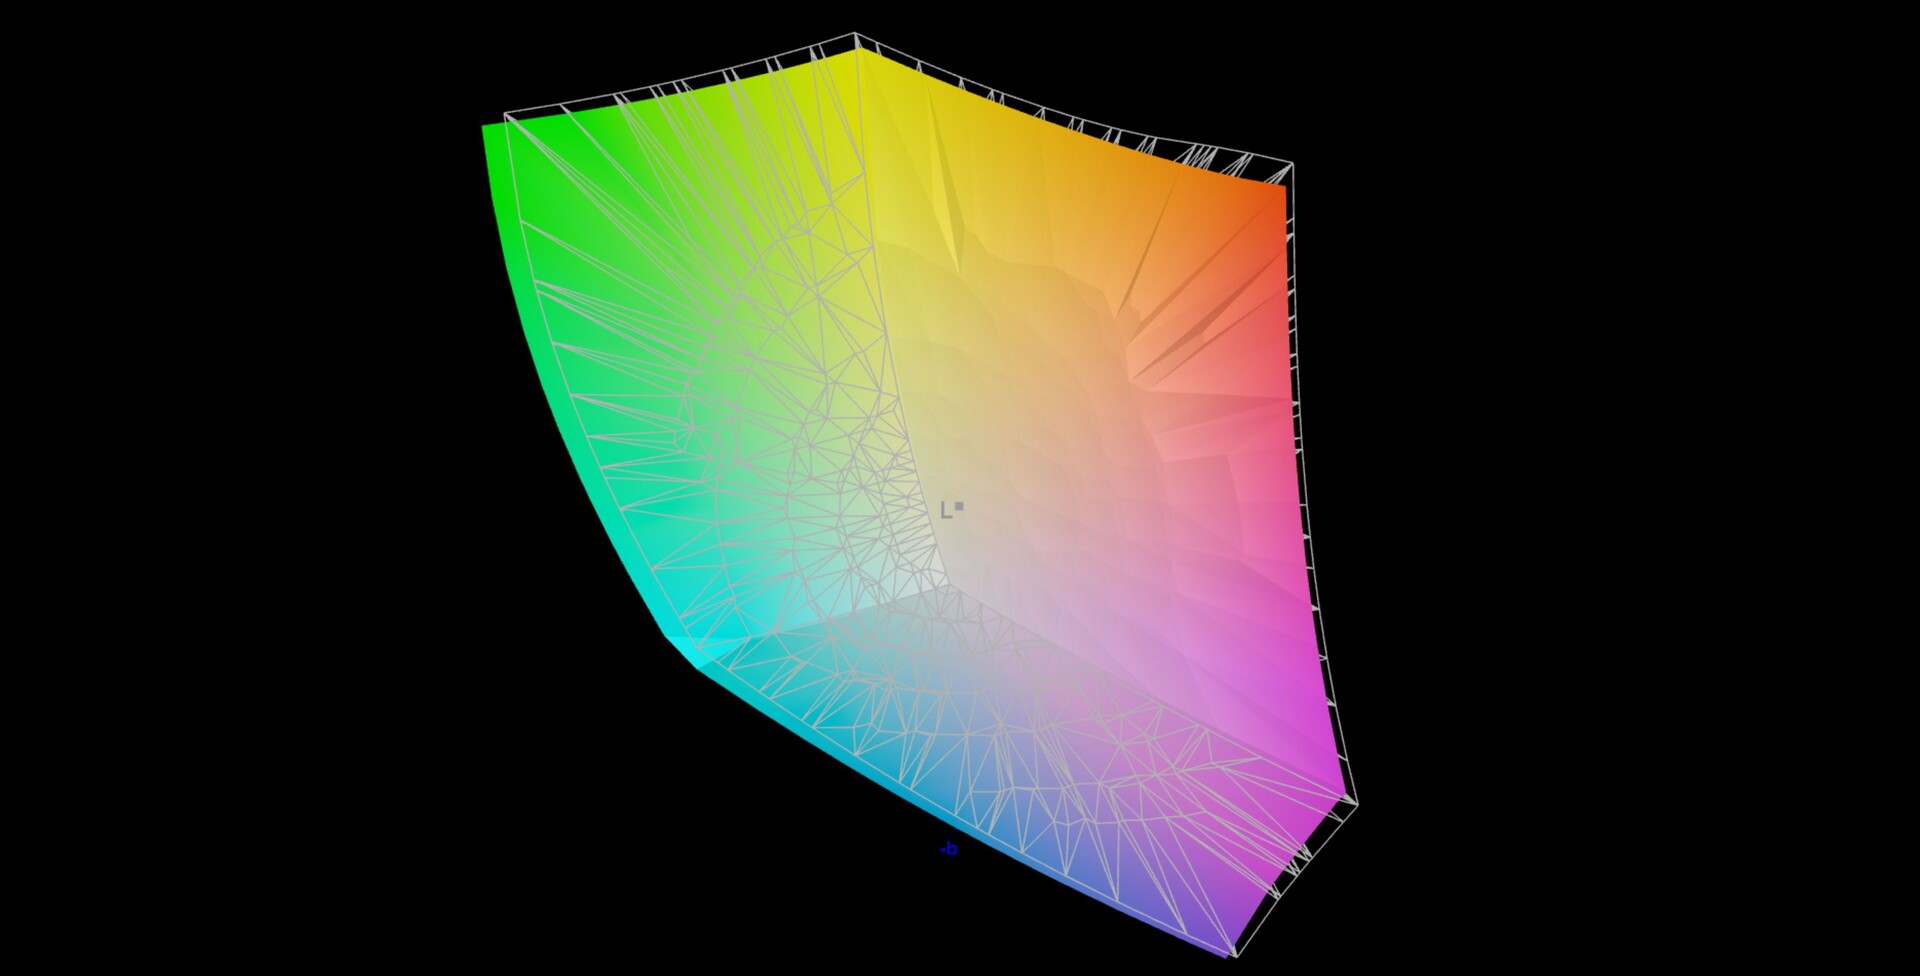
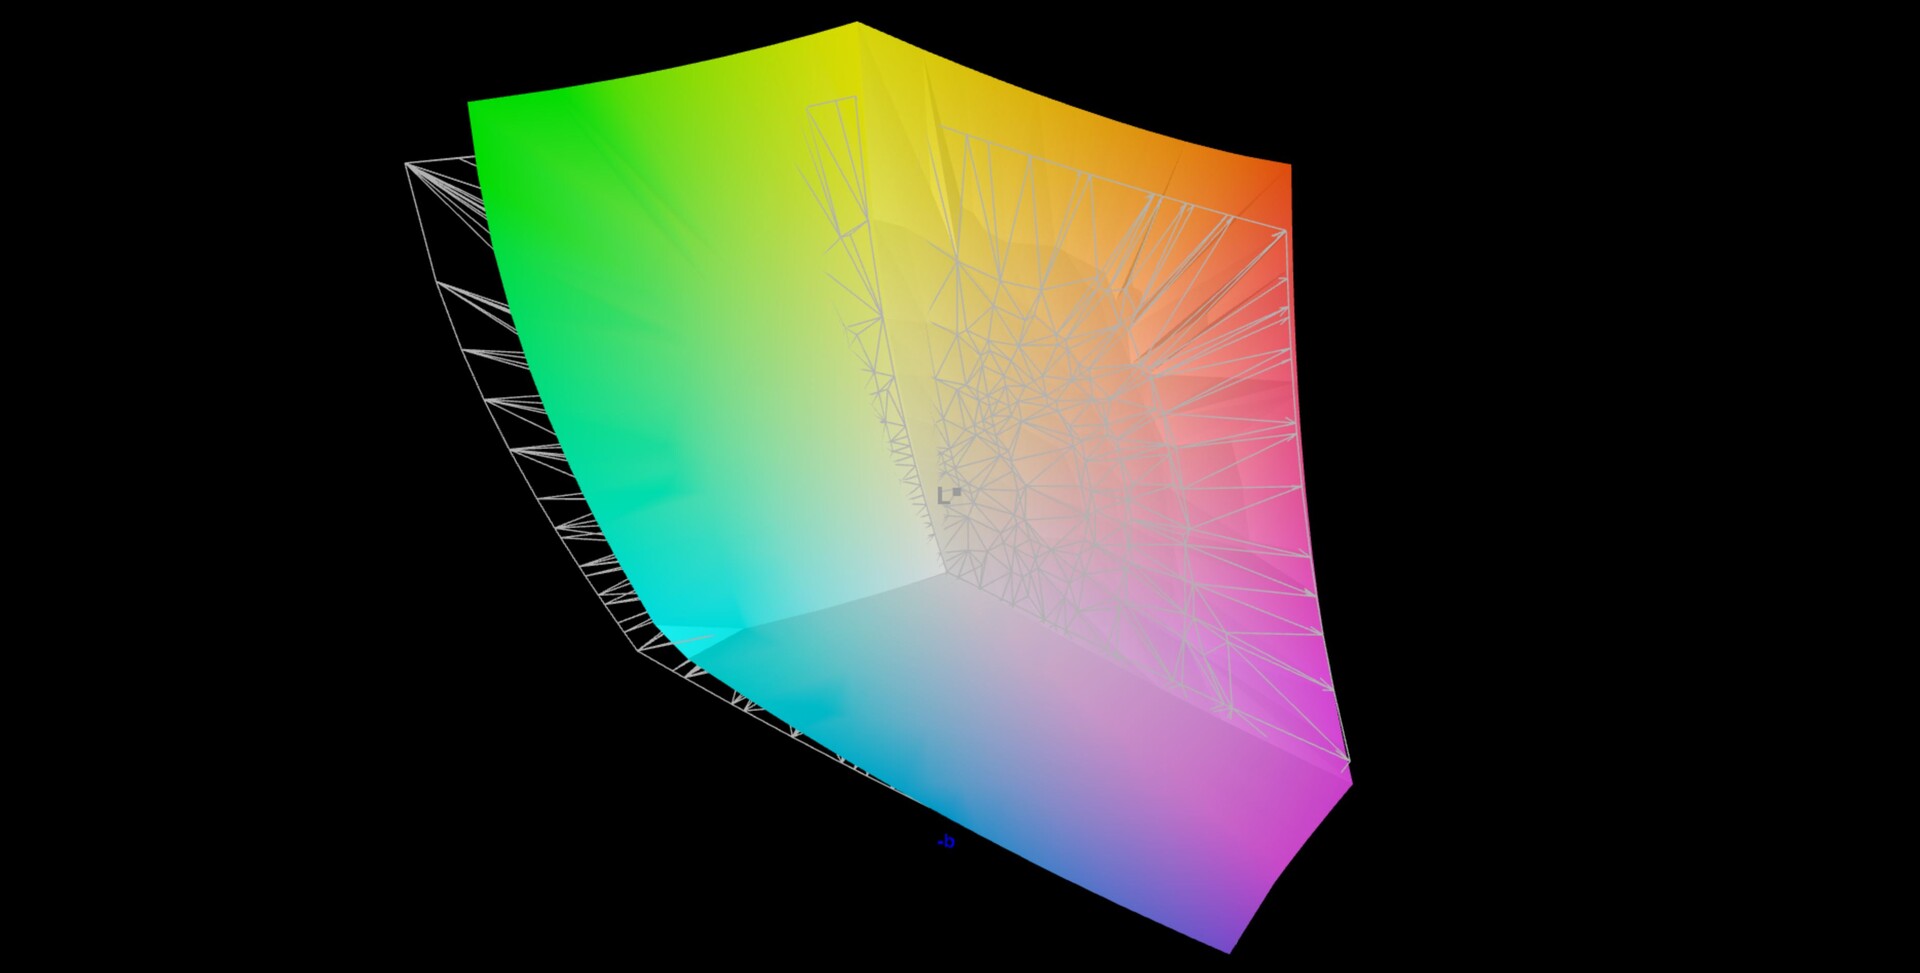
92.4% AdobeRGB 1998 (Argyll 3D)
99.9% sRGB (Argyll 3D)
94.9% Display P3 (Argyll 3D)
Gamma: 2.63
CCT: 6596 K
| MSI Titan GT77 HX 13VI B173ZAN06.C, Mini-LED, 3840x2160, 17.3" | Razer Blade 16 Early 2023 CSOT T3 MNG007DA4-1, IPS, 2560x1600, 16" | Asus ROG Strix Scar 17 SE G733CX-LL014W NE173QHM-NZ2, IPS, 2560x1440, 17.3" | MSI Titan GT77 12UHS Sharp SHP1544 LQ173M1JW08, IPS-Level, 1920x1080, 17.3" | Alienware x17 R2 P48E AU Optronics B173HAN, IPS, 1920x1080, 17.3" | Schenker XMG Neo 17 M22 BOE0A99, IPS, 2560x1600, 17" | |
|---|---|---|---|---|---|---|
| Display | 0% | -2% | -16% | -10% | -17% | |
| Display P3 Coverage (%) | 94.9 | 98.5 4% | 97.1 2% | 70.8 -25% | 79.2 -17% | 69 -27% |
| sRGB Coverage (%) | 99.9 | 100 0% | 99.9 0% | 98.9 -1% | 99.8 0% | 99.8 0% |
| AdobeRGB 1998 Coverage (%) | 92.4 | 89.7 -3% | 84.8 -8% | 73 -21% | 79.6 -14% | 69.6 -25% |
| Response Times | 69% | 74% | 86% | 67% | 75% | |
| Response Time Grey 50% / Grey 80% * (ms) | 38.4 ? | 6.6 ? 83% | 5.7 ? 85% | 3.03 ? 92% | 12.4 ? 68% | 10.8 ? 72% |
| Response Time Black / White * (ms) | 26.6 ? | 12 ? 55% | 10.1 ? 62% | 5.28 ? 80% | 9.2 ? 65% | 6.1 ? 77% |
| PWM Frequency (Hz) | 2380 ? | |||||
| Screen | -38877% | -37485% | -44442% | -32218% | -47756% | |
| Brightness middle (cd/m²) | 606 | 456.8 -25% | 320 -47% | 280 -54% | 365.4 -40% | 415 -32% |
| Brightness (cd/m²) | 602 | 437 -27% | 303 -50% | 275 -54% | 344 -43% | 399 -34% |
| Brightness Distribution (%) | 93 | 83 -11% | 87 -6% | 79 -15% | 85 -9% | 90 -3% |
| Black Level * (cd/m²) | 0.0001 | 0.35 -349900% | 0.3 -299900% | 0.4 -399900% | 0.29 -289900% | 0.43 -429900% |
| Contrast (:1) | 6060000 | 1305 -100% | 1067 -100% | 700 -100% | 1260 -100% | 965 -100% |
| Colorchecker dE 2000 * | 4.8 | 3.7 23% | 1.1 77% | 2.1 56% | 3.17 34% | 1.44 70% |
| Colorchecker dE 2000 max. * | 8.2 | 6.42 22% | 2.7 67% | 5.83 29% | 7.69 6% | 2.33 72% |
| Colorchecker dE 2000 calibrated * | 1.8 | 0.66 63% | 1.58 12% | 0.51 72% | 0.89 51% | |
| Greyscale dE 2000 * | 6.5 | 2.6 60% | 1.1 83% | 3.3 49% | 5.3 18% | 1.8 72% |
| Gamma | 2.63 84% | 2.3 96% | 2.13 103% | 2.13 103% | 2.18 101% | 2.132 103% |
| CCT | 6596 99% | 6108 106% | 6599 98% | 7060 92% | 5879 111% | 6327 103% |
| Media total (Programa/Opciones) | -12936% /
-24983% | -12471% /
-23057% | -14791% /
-28561% | -10720% /
-20704% | -15899% /
-30693% |
* ... más pequeño es mejor
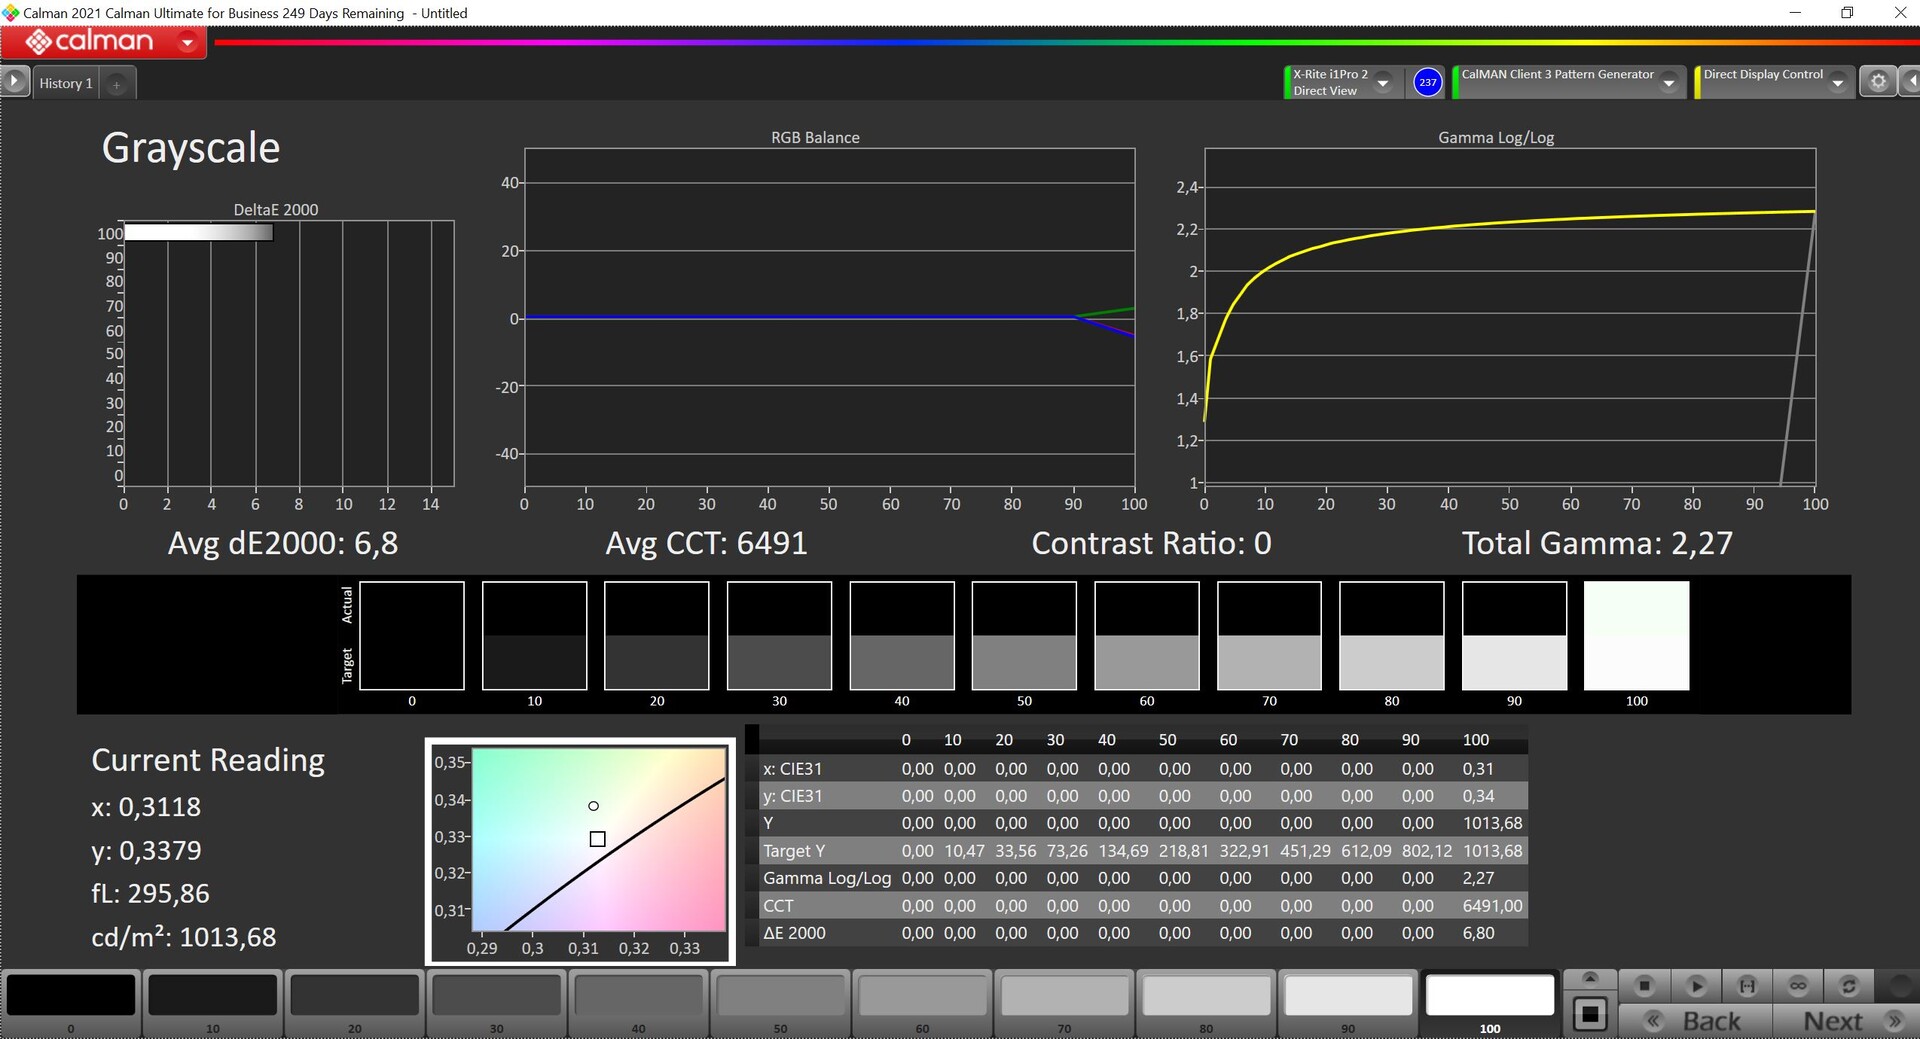
MSI envía la Titan GT77 con el software True Color, que ofrece diferentes preselecciones para espacios de color y escenarios (como Gamer, Office, Movie) y puedes incluso usar el software para calibrar la pantalla. Usamos el software profesional CalMAN en combinación con el espectrofotómetro X-Rite i1 Pro 2 y el perfil Display P3, ya que se supone que el panel cubre toda la gama P3.
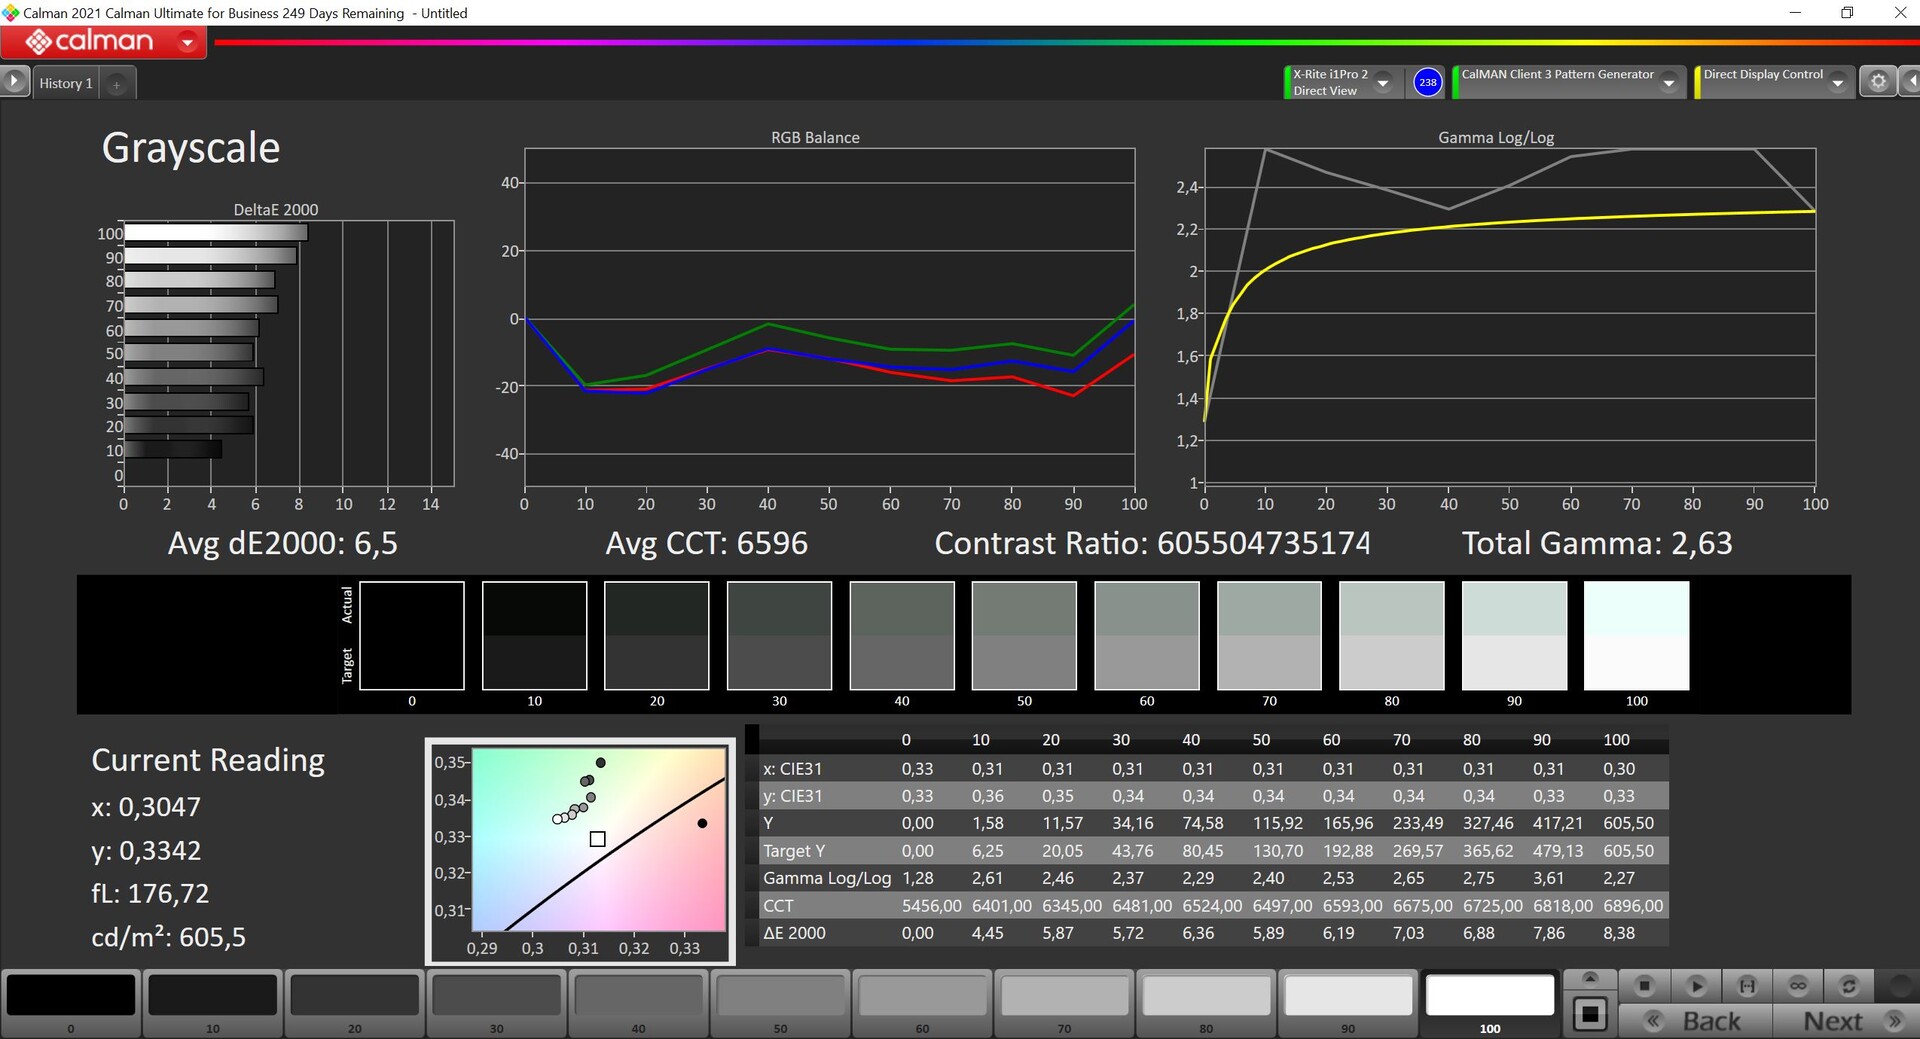
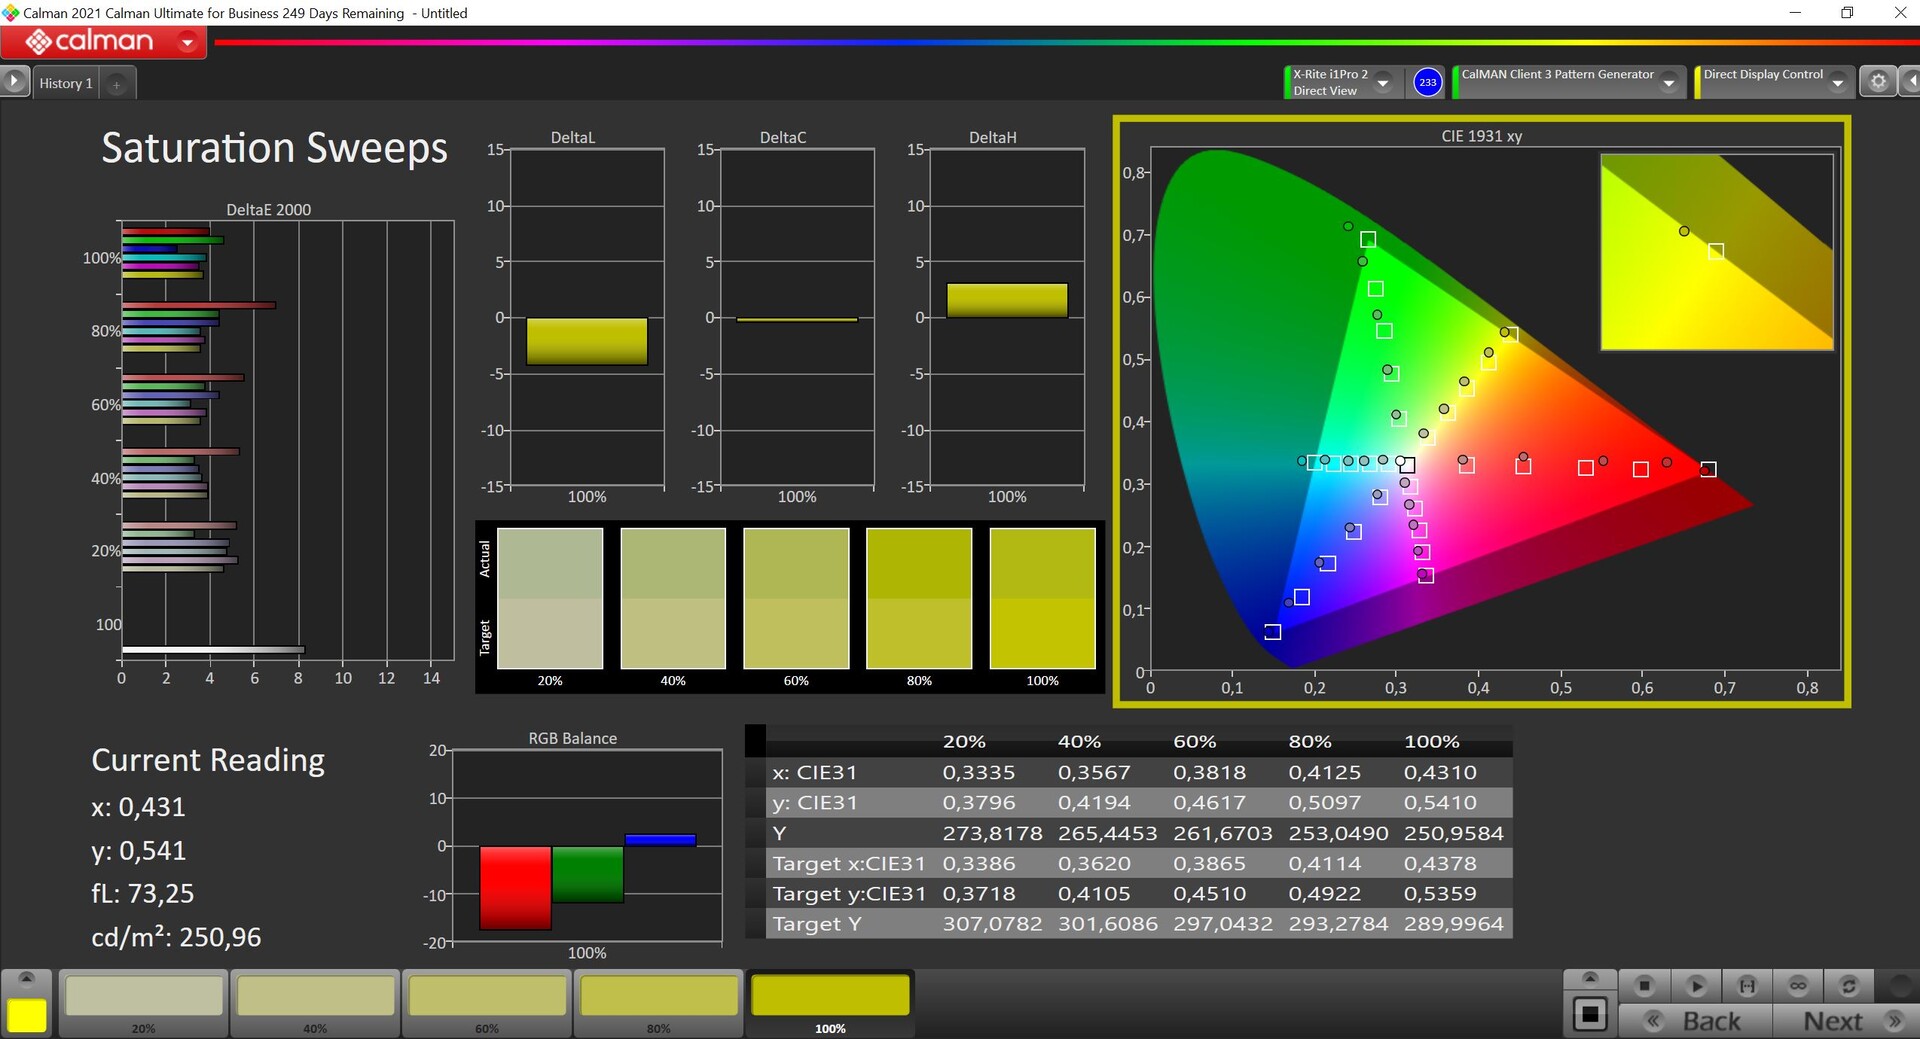
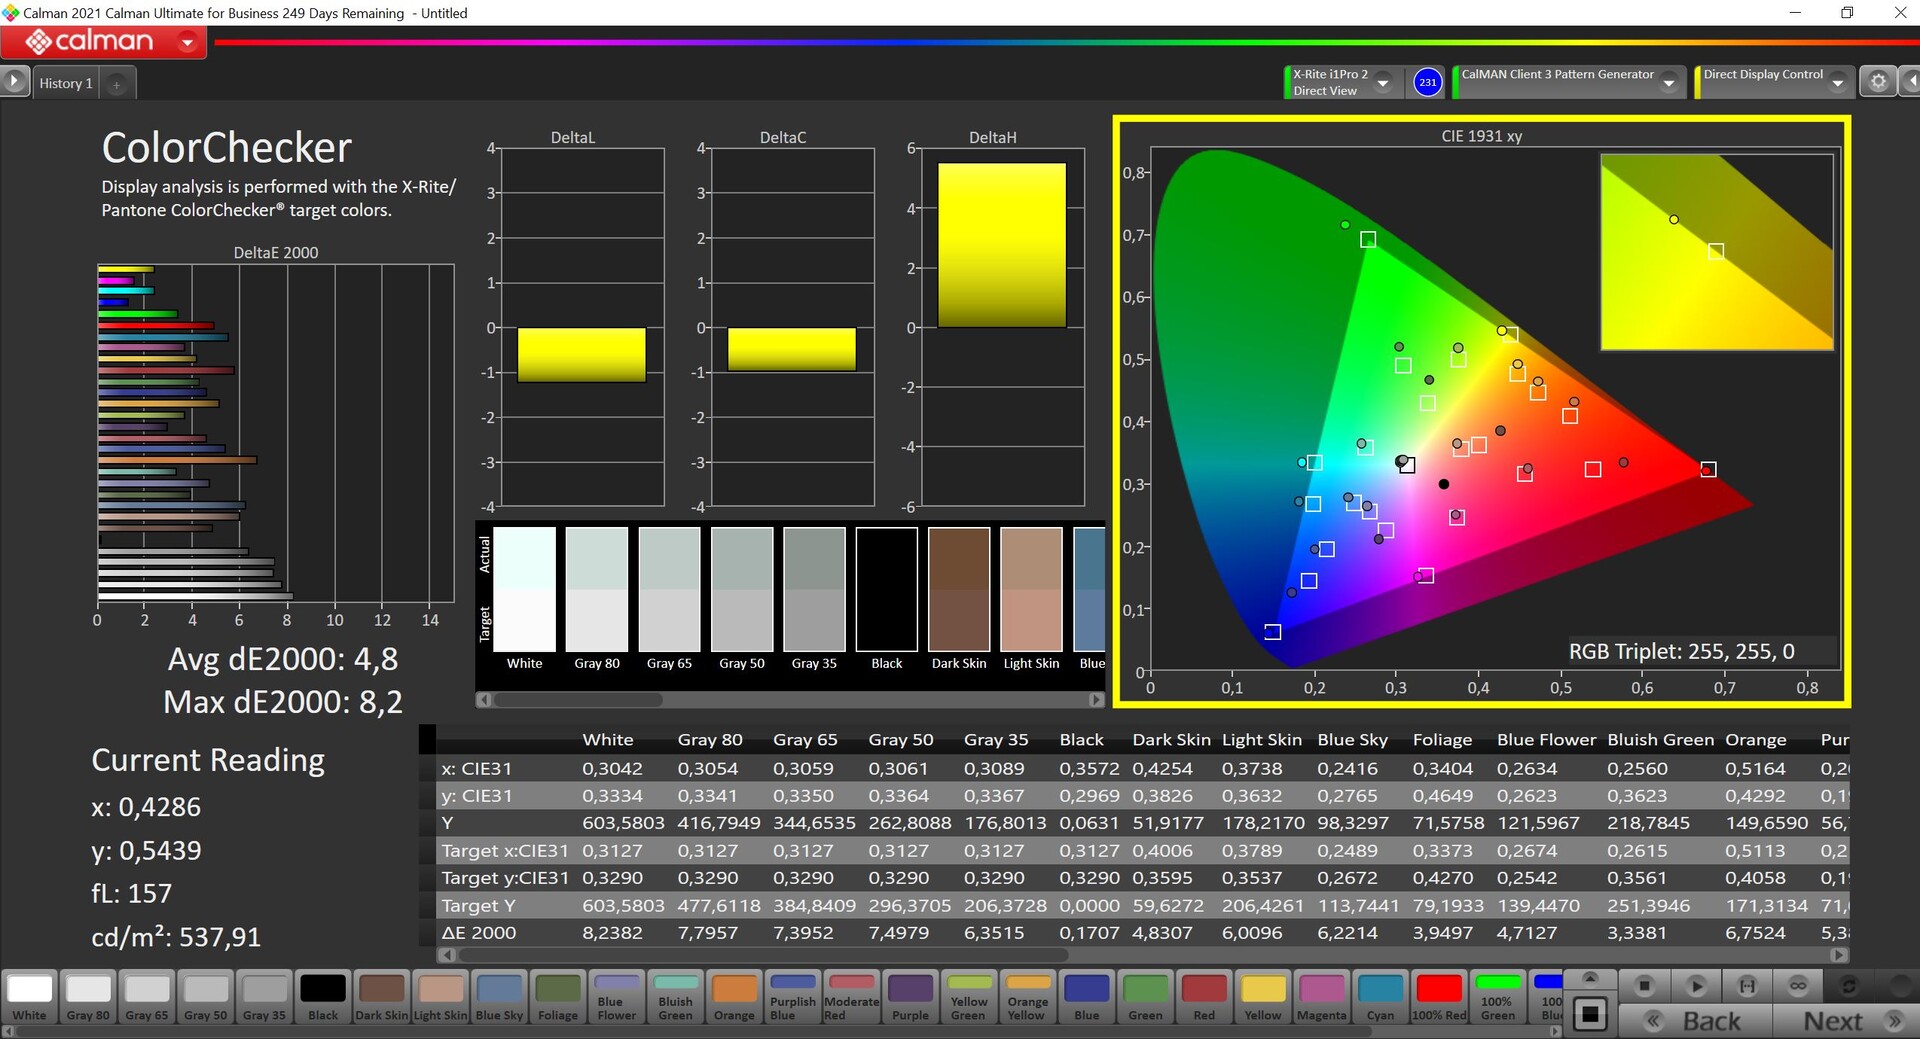
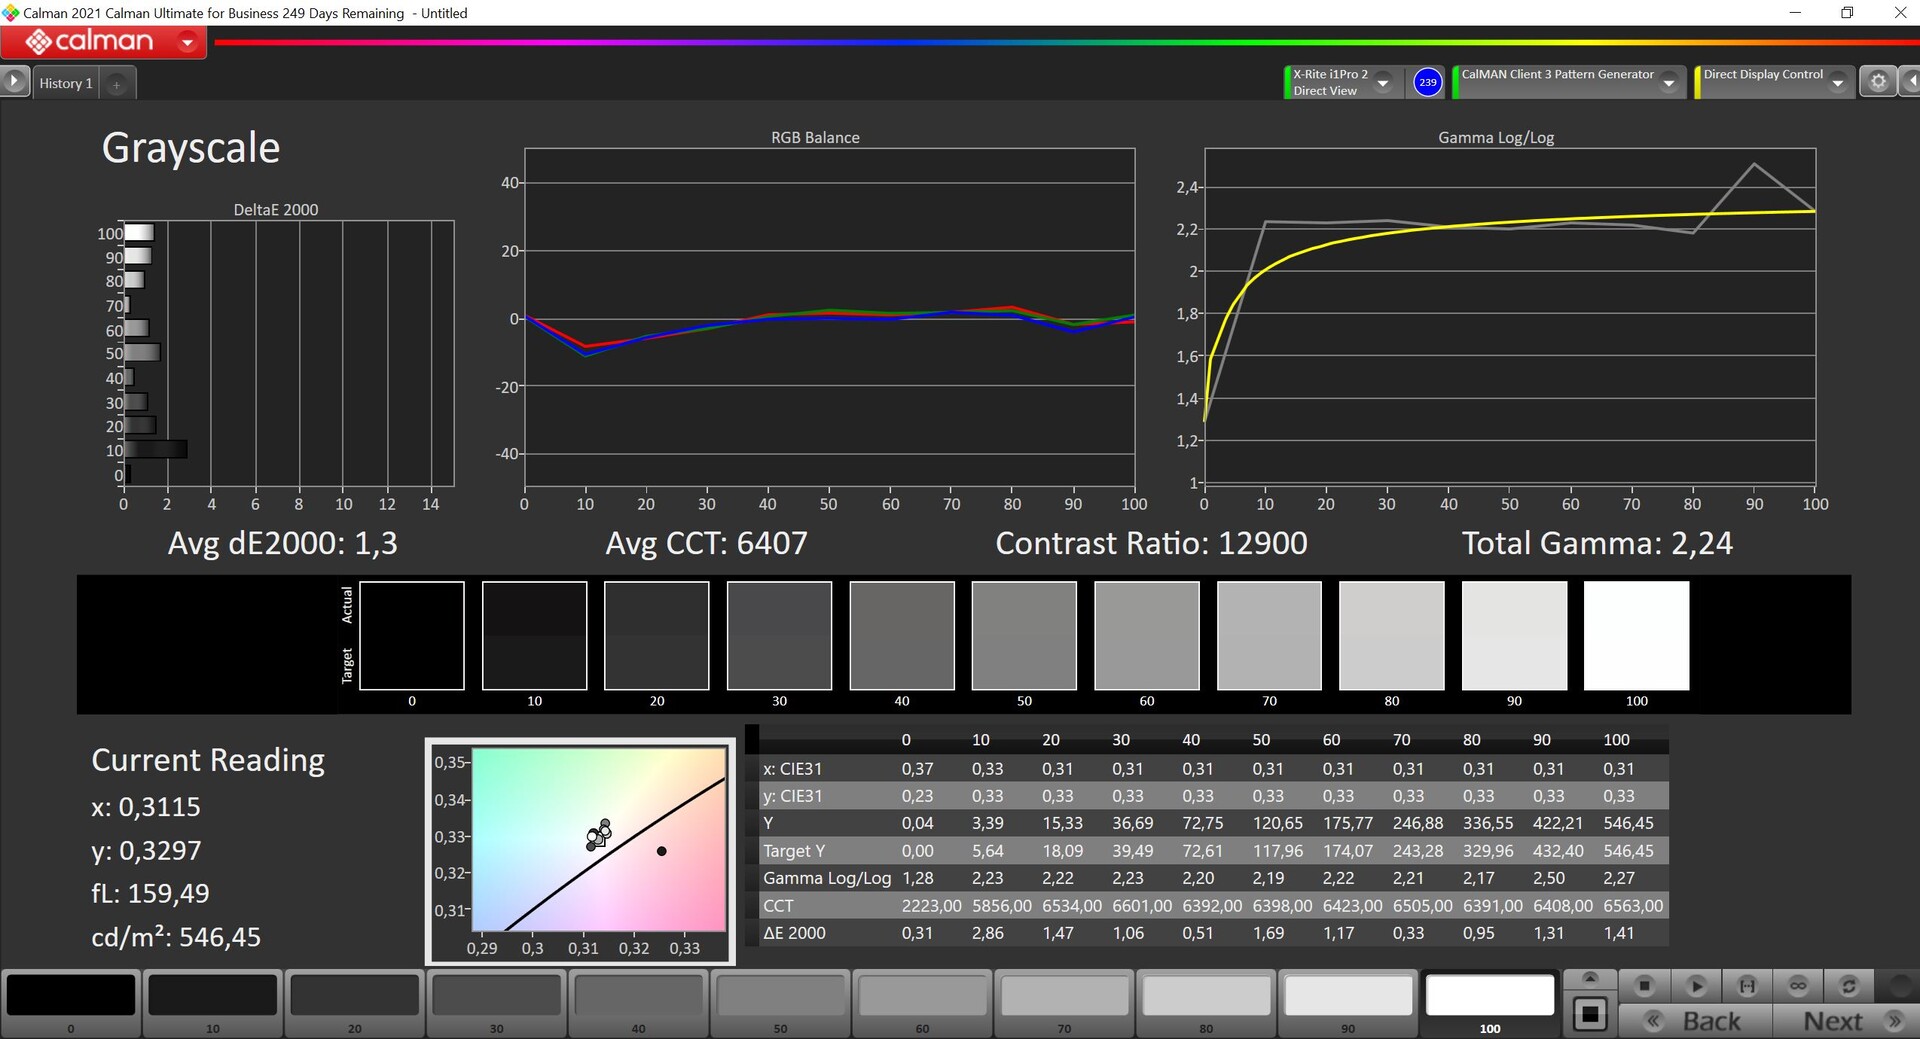
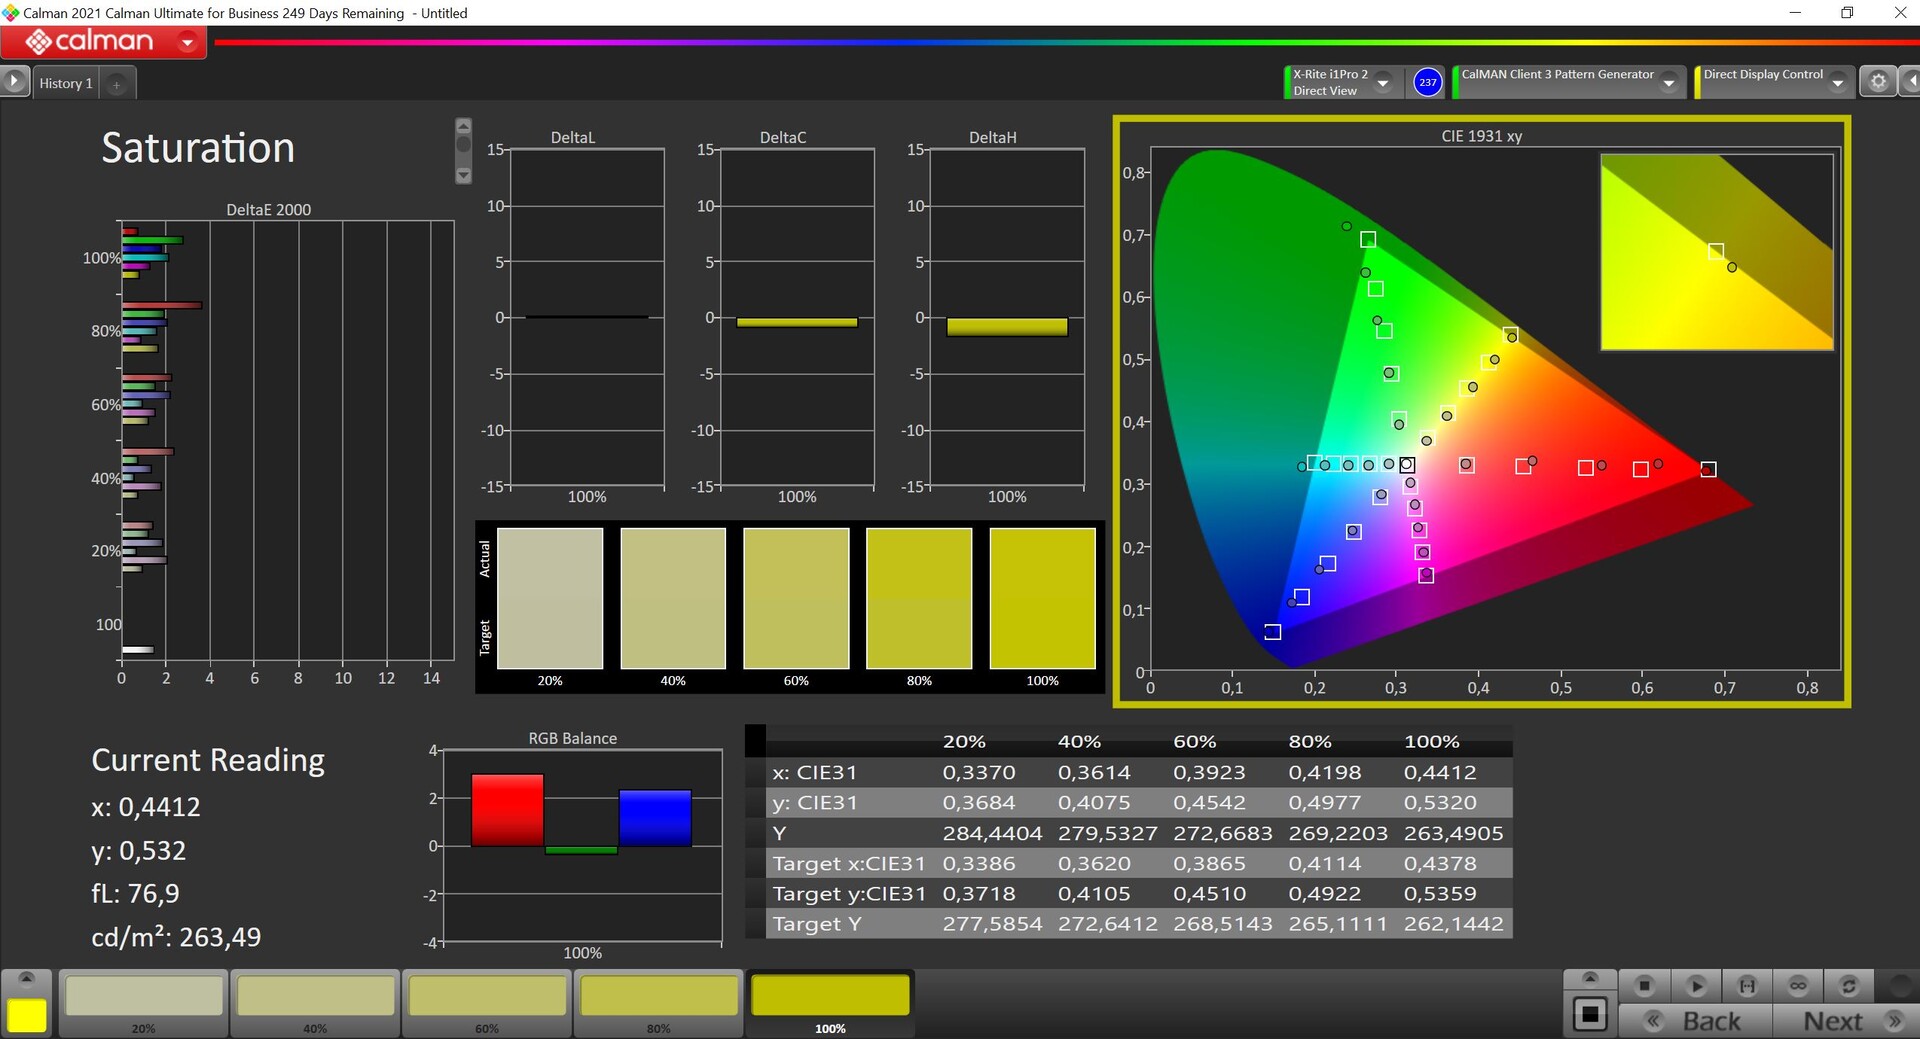
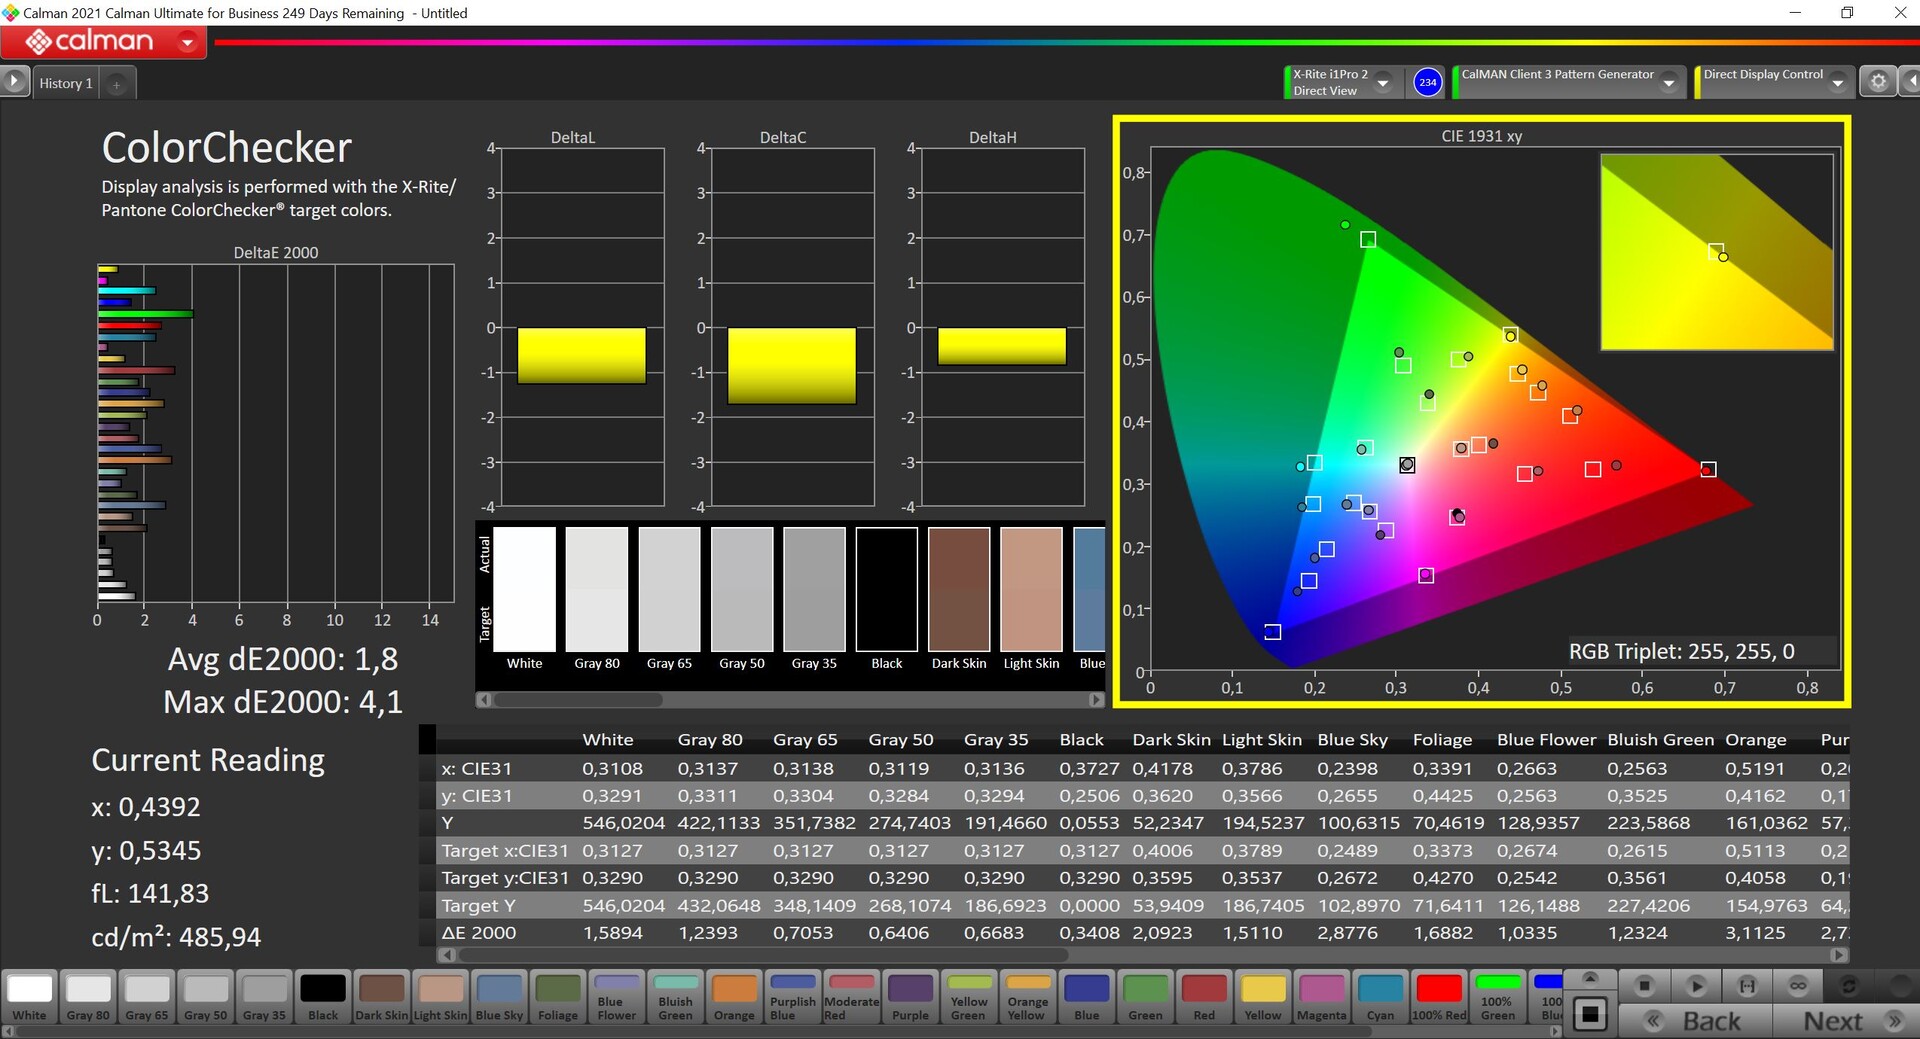
Las desviaciones respecto a la gama de referencia P3 son muy elevadas desde el primer momento, tanto para la escala de grises como para los colores. Nuestro propio calibrado (el perfil correspondiente está disponible gratuitamente en la caja del display de arriba) mejora notablemente el rendimiento del color, pero también reduce el brillo máximo en unos 50 nits. Seguimos recomendando el perfil calibrado y es posible editar fotos/vídeos, aunque nuestras mediciones muestran que el espacio de color P3 sólo está cubierto en un 95 %.
Tiempos de respuesta del display
| ↔ Tiempo de respuesta de Negro a Blanco | ||
|---|---|---|
| 26.6 ms ... subida ↗ y bajada ↘ combinada | ↗ 9.2 ms subida | 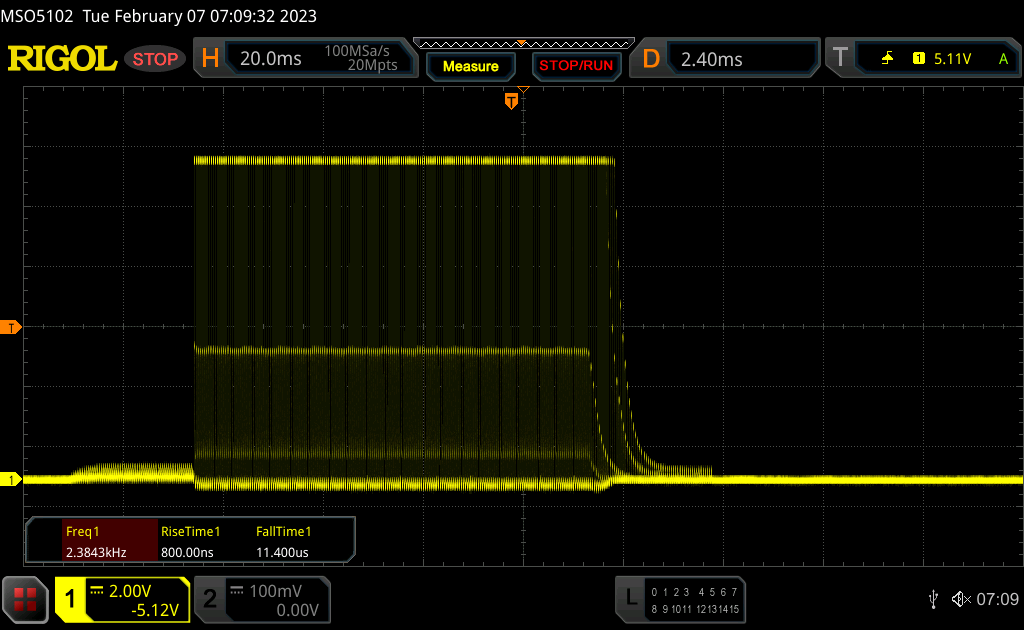 |
| ↘ 17.4 ms bajada | ||
| La pantalla mostró tiempos de respuesta relativamente lentos en nuestros tests pero podría ser demasiado lenta para los jugones. En comparación, todos los dispositivos de prueba van de ##min### (mínimo) a 240 (máximo) ms. » 67 % de todos los dispositivos son mejores. Eso quiere decir que el tiempo de respuesta es peor que la media (19.8 ms) de todos los dispositivos testados. | ||
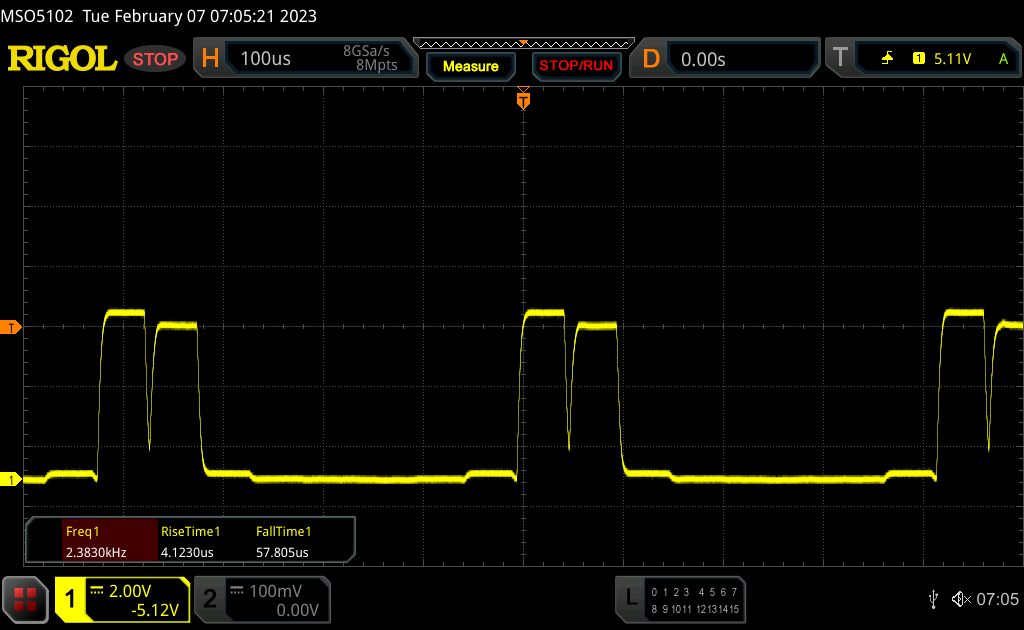
| ↔ Tiempo de respuesta 50% Gris a 80% Gris | ||
| 38.4 ms ... subida ↗ y bajada ↘ combinada | ↗ 13.6 ms subida | 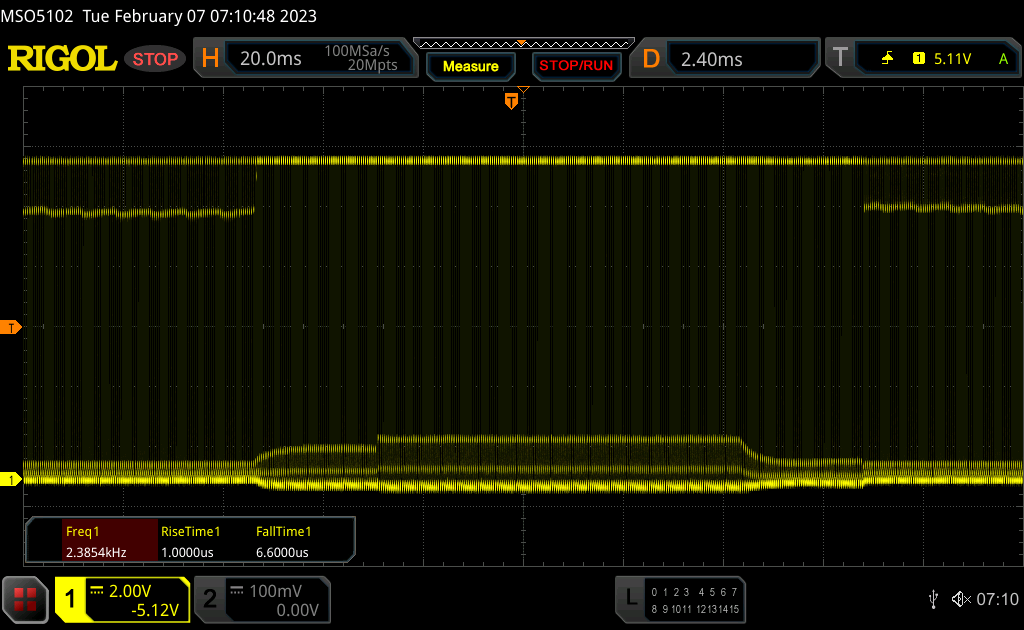 |
| ↘ 24.8 ms bajada | ||
| La pantalla mostró tiempos de respuesta lentos en nuestros tests y podría ser demasiado lenta para los jugones. En comparación, todos los dispositivos de prueba van de ##min### (mínimo) a 636 (máximo) ms. » 58 % de todos los dispositivos son mejores. Eso quiere decir que el tiempo de respuesta es peor que la media (30.9 ms) de todos los dispositivos testados. | ||
Parpadeo de Pantalla / PWM (Pulse-Width Modulation)
| Parpadeo de Pantalla / PWM detectado | 2380 Hz | ≤ 100 % de brillo | 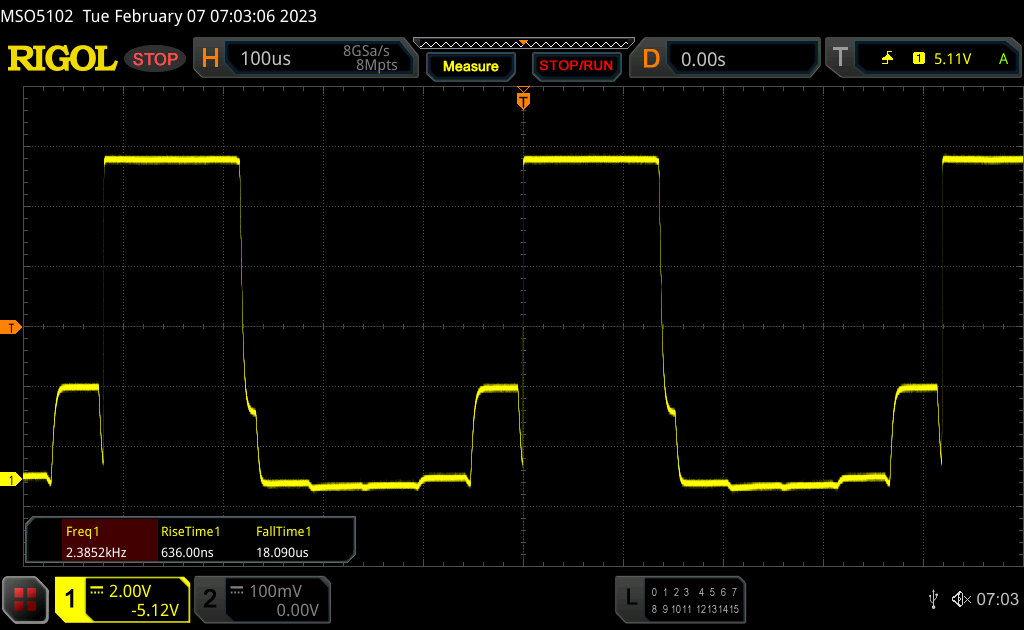 |
La retroiluminación del display parpadea a 2380 Hz (seguramente usa PWM - Pulse-Width Modulation) a un brillo del 100 % e inferior. Sobre este nivel de brillo no debería darse parpadeo / PWM. La frecuencia de 2380 Hz es bastante alta, por lo que la mayoría de gente sensible al parpadeo no debería ver parpadeo o tener fatiga visual. Comparación: 52 % de todos los dispositivos testados no usaron PWM para atenuar el display. Si se usó, medimos una media de 7744 (mínimo: 5 - máxmo: 343500) Hz. | |||


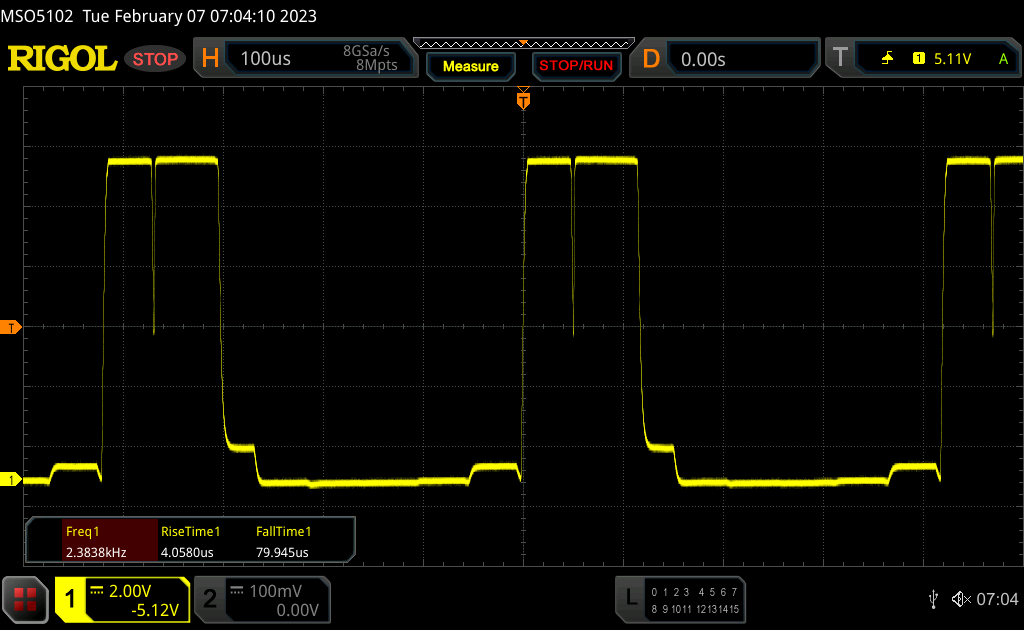
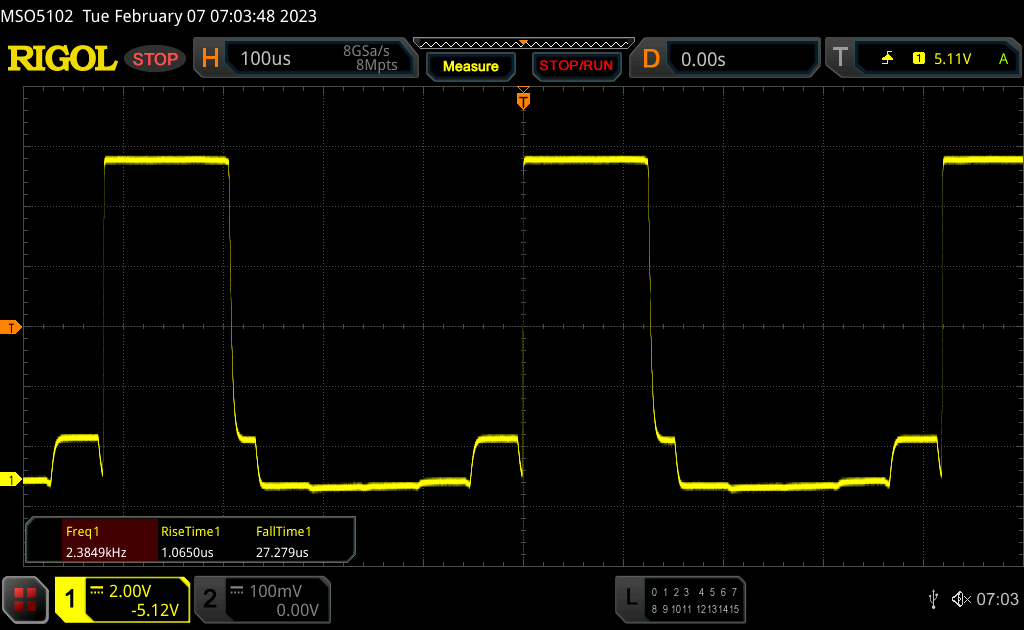
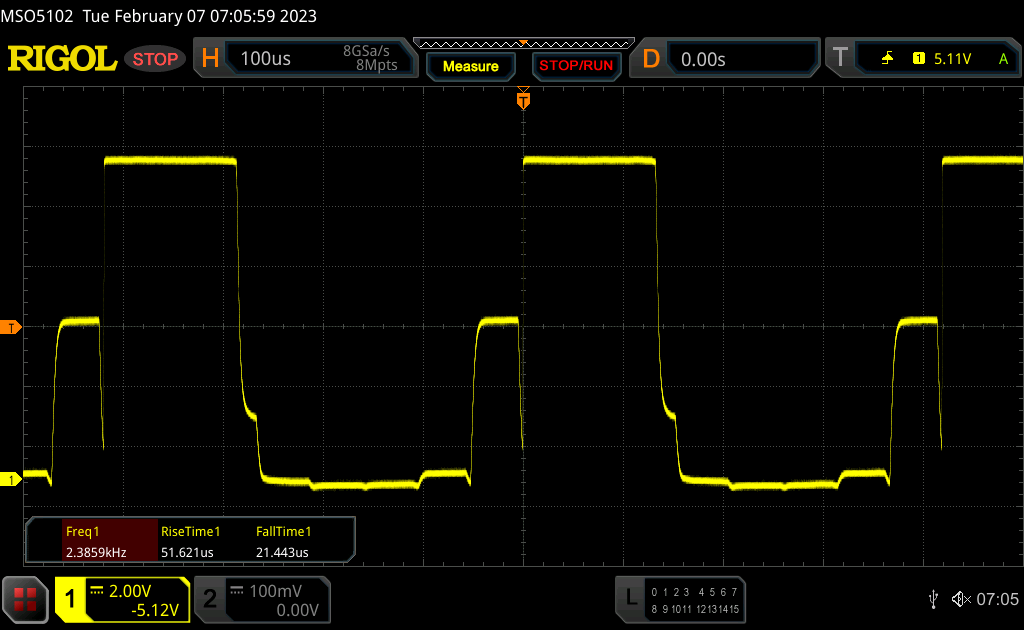
Detectamos PWM en todos los niveles de brillo (incluso el máximo brillo HDR) con una frecuencia de 2,38 kHz, lo que hace realmente difícil determinar los tiempos de respuesta. Añadiremos los resultados correspondientes más adelante.
El panel mate y el elevado brillo deberían ser geniales en exteriores, pero MSI limita las capacidades en exteriores del GT77. No se puede usar HDR con batería y el brillo SDR máximo también baja de ~600 a ~400 nits en cuanto desconectas el adaptador de corriente. No hay limitaciones en términos de estabilidad de ángulos de visión.

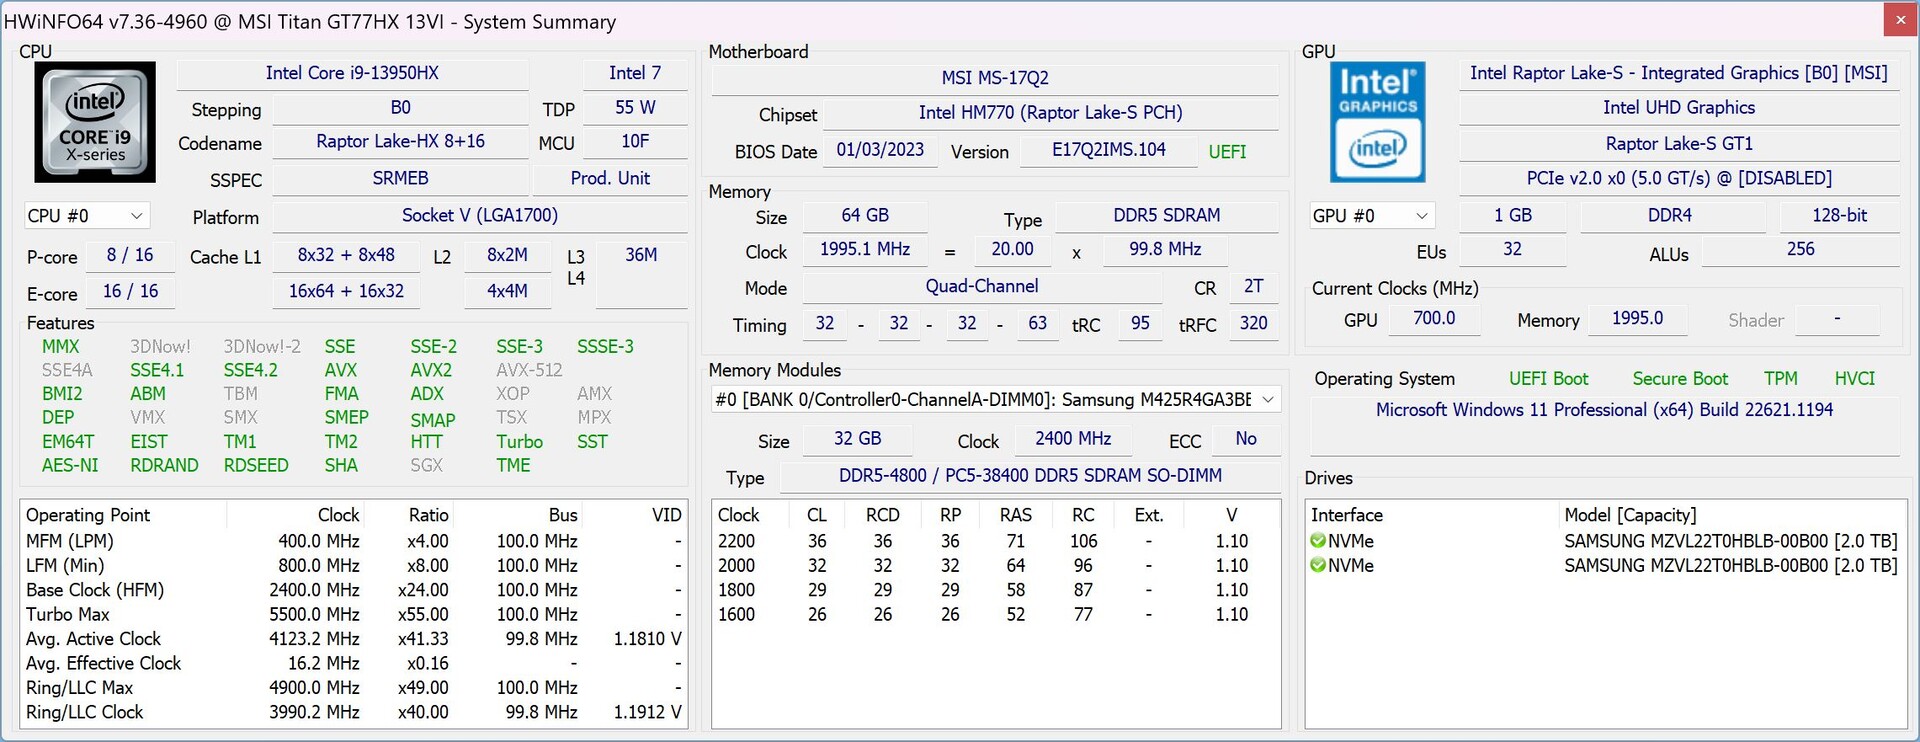
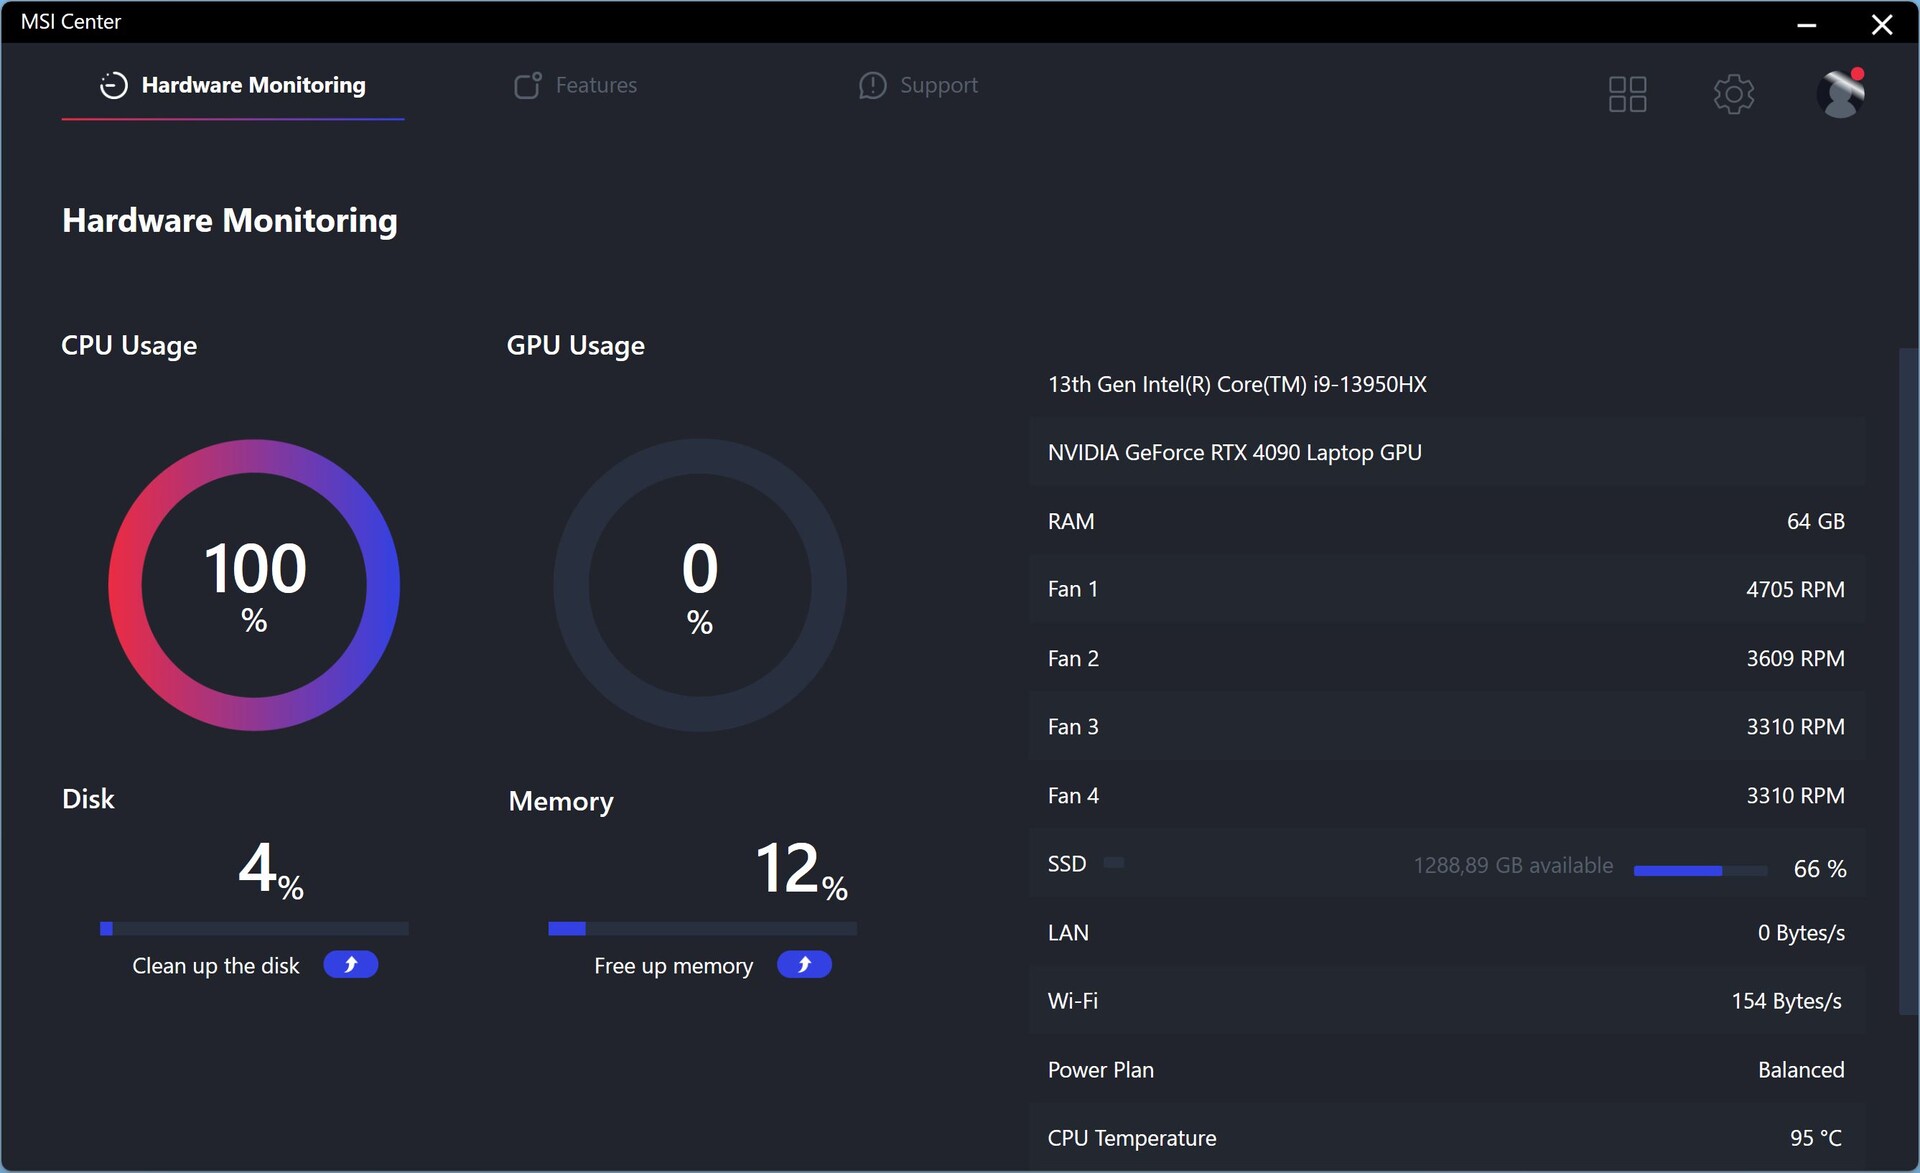
Rendimiento - Core i9 HX y RTX 4090
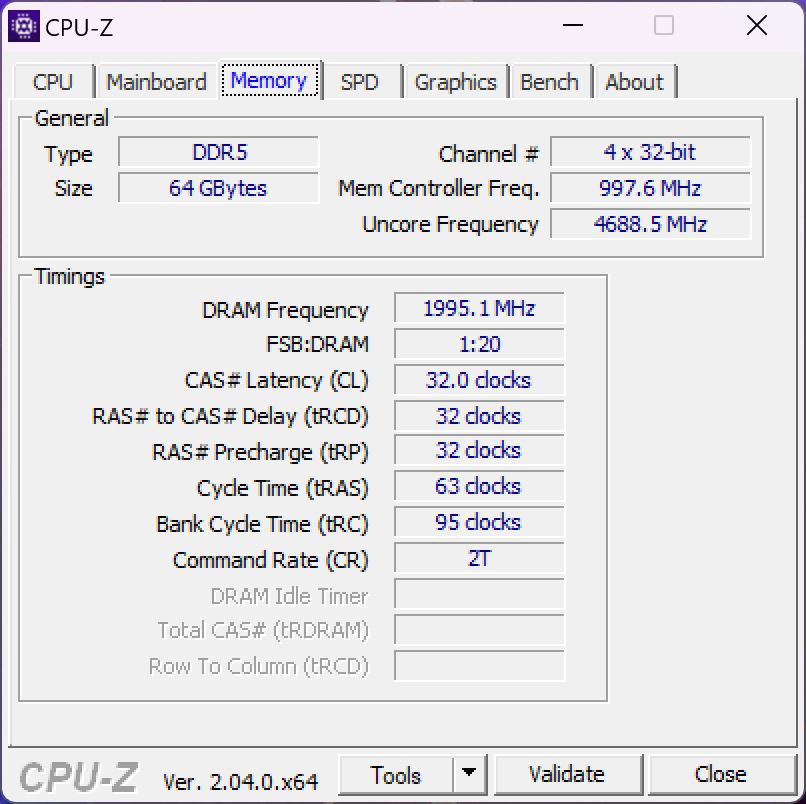
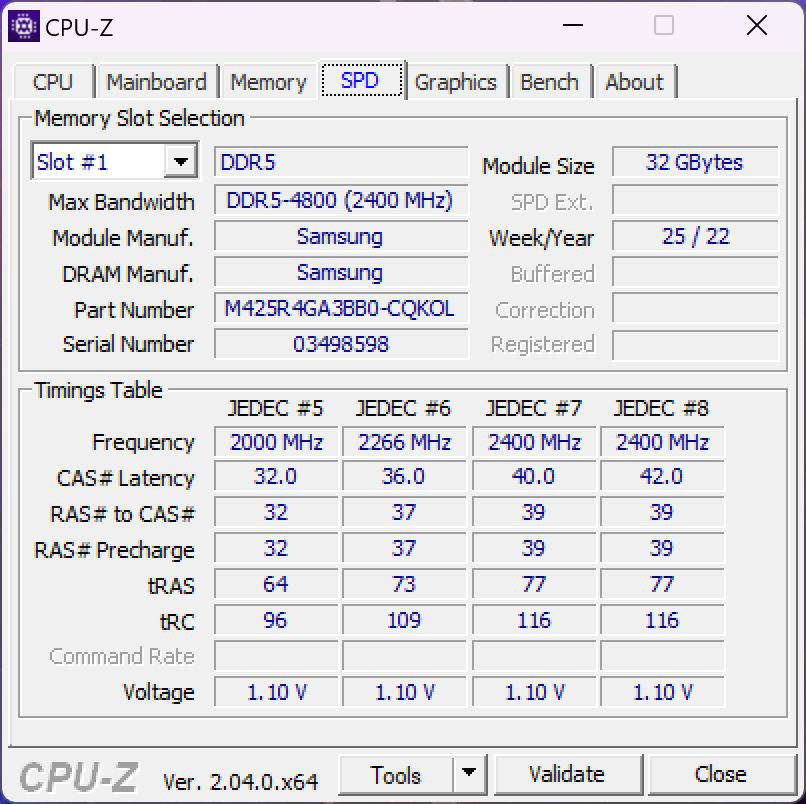
Nuestra unidad de análisis está equipada con elCore i9-13950HXuna de las CPUs móviles más rápidas de Intel. La versión comercial estará equipada con elCore i9-13980HXpero sólo ofrece una frecuencia máxima 100 MHz superior para los núcleos P en favor del soporte vPro. Esto último no es importante cuando juegas, pero puede ser interesante cuando planeas usar la Titan como estación de trabajo móvil. MSI sigue usando DDR5-4800 en lugar de la más rápida DDR5-5600 y puedes elegir la nuevaGeForce RTX 4080o laRTX 4090para portátiles.
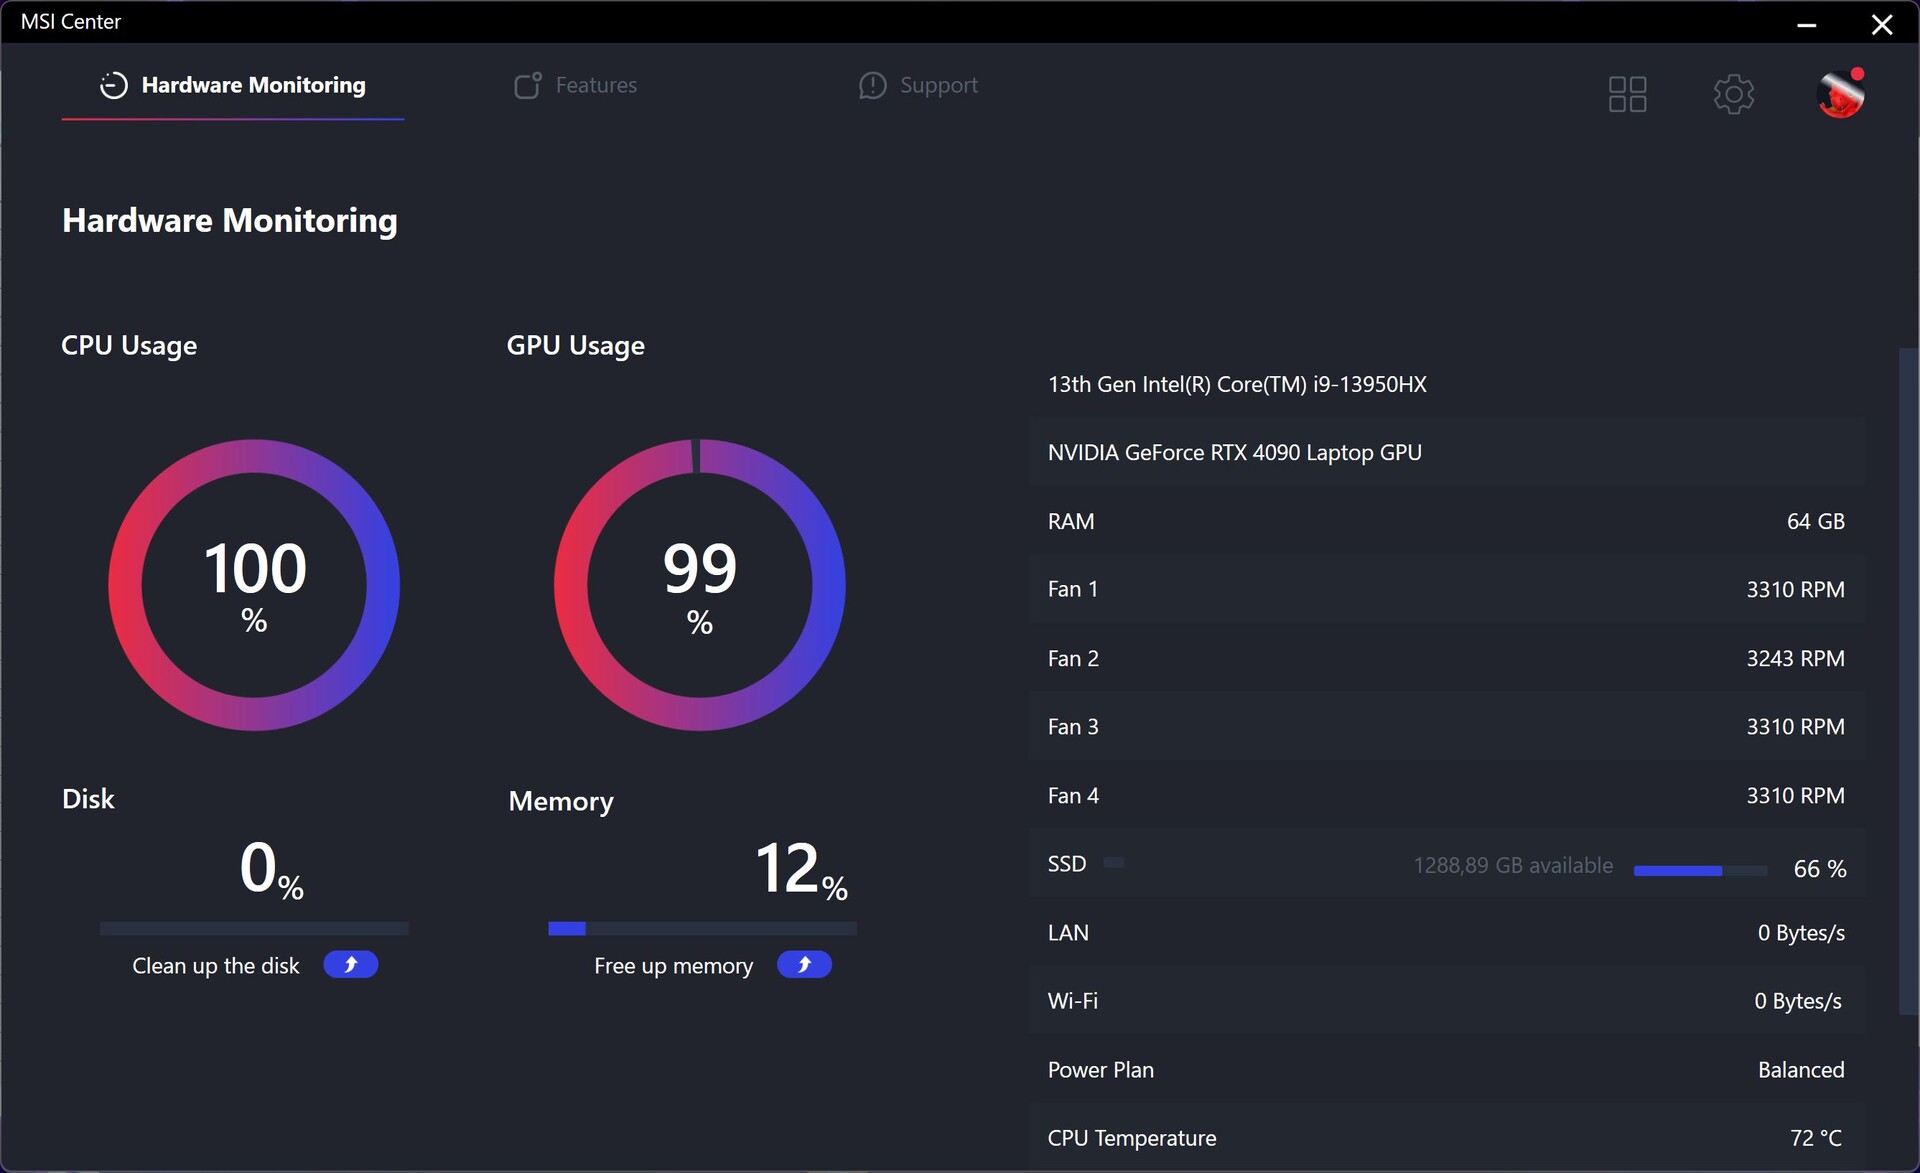
Ajustes de revisión
El software preinstalado MSI Center ofrece diferentes ajustes de rendimiento con un Modo AI y cuatro preajustes adicionales (Rendimiento Extremo, Equilibrado, Silencioso, Super Batería). También puedes elegir el modo gráfico (híbrido, sólo dGPU, sólo iGPU) gracias a un MUX, pero no hay soporte para Advanced Optimus, lo que implica que los cambios requieren un reinicio.
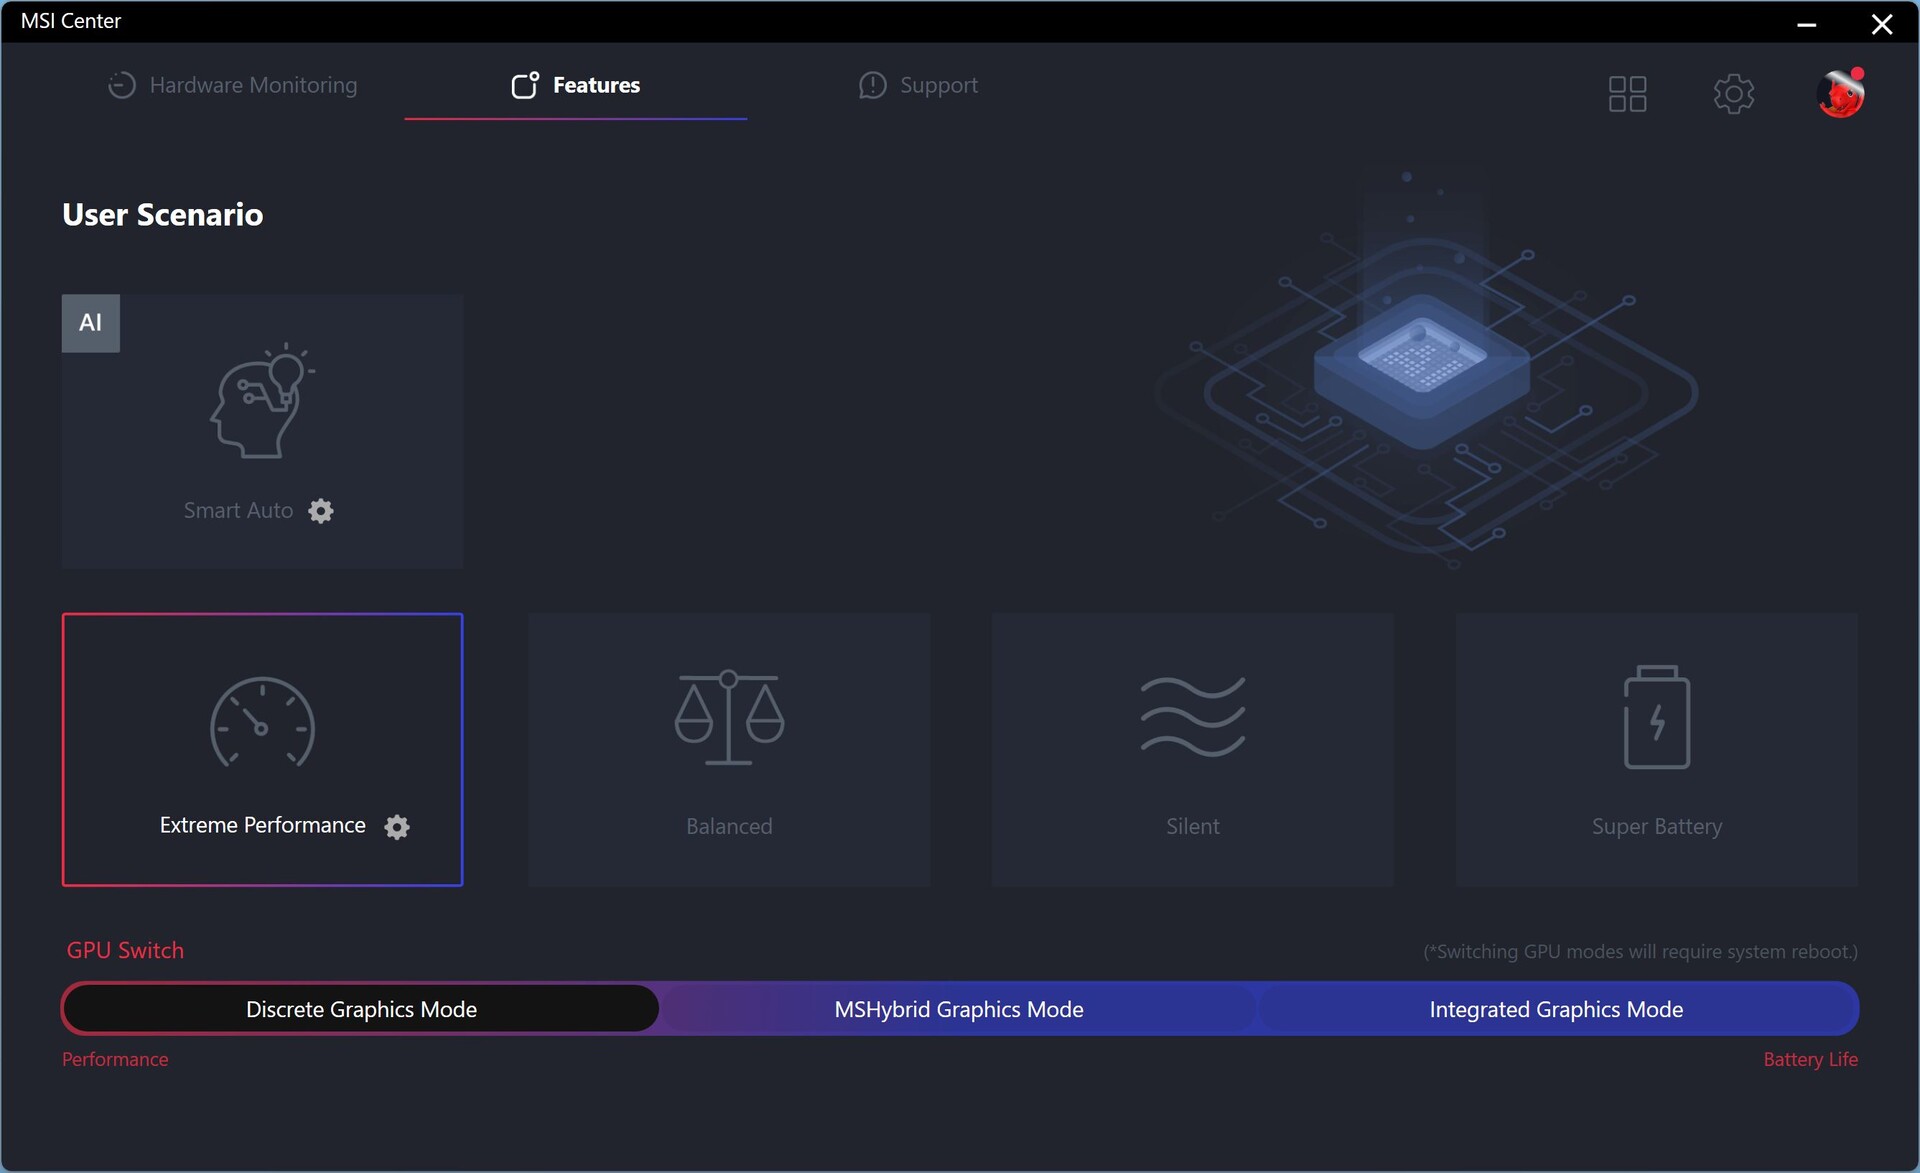
Usamos la configuración de Rendimiento Extremo con el modo de GPU discreta (iGPU desactivada) para nuestras pruebas, pero usamos la iGPU para los tests de batería. No experimentamos ningún problema serio con el software MSI, pero hubo un bug con el modo de gráfica discreta por el que no pudimos bajar el brillo del display. Esperamos que este problema se solucione en las unidades de venta al público.
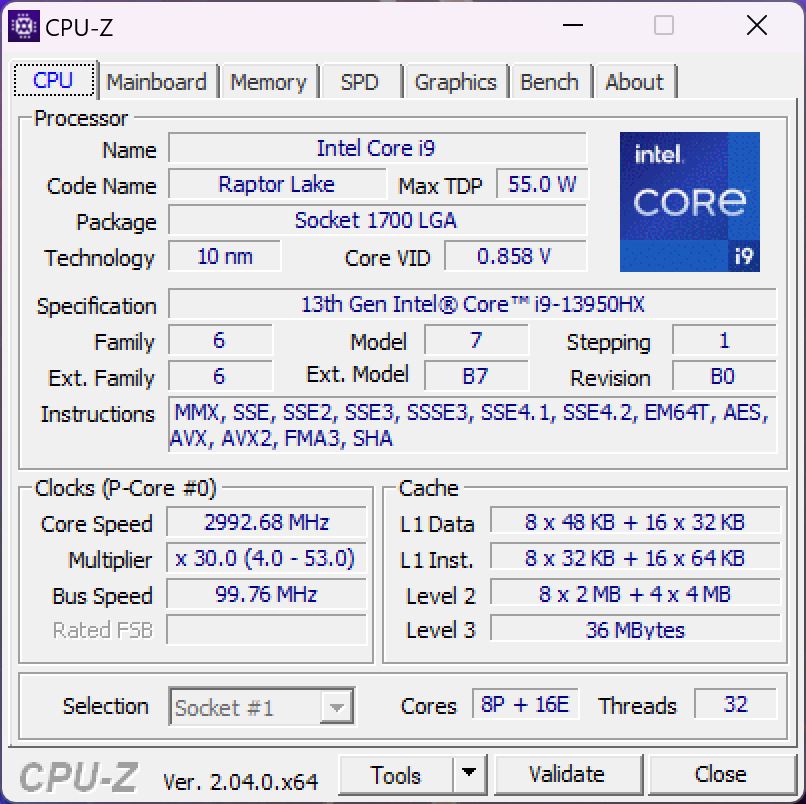
Procesador - Core i9-13950HX
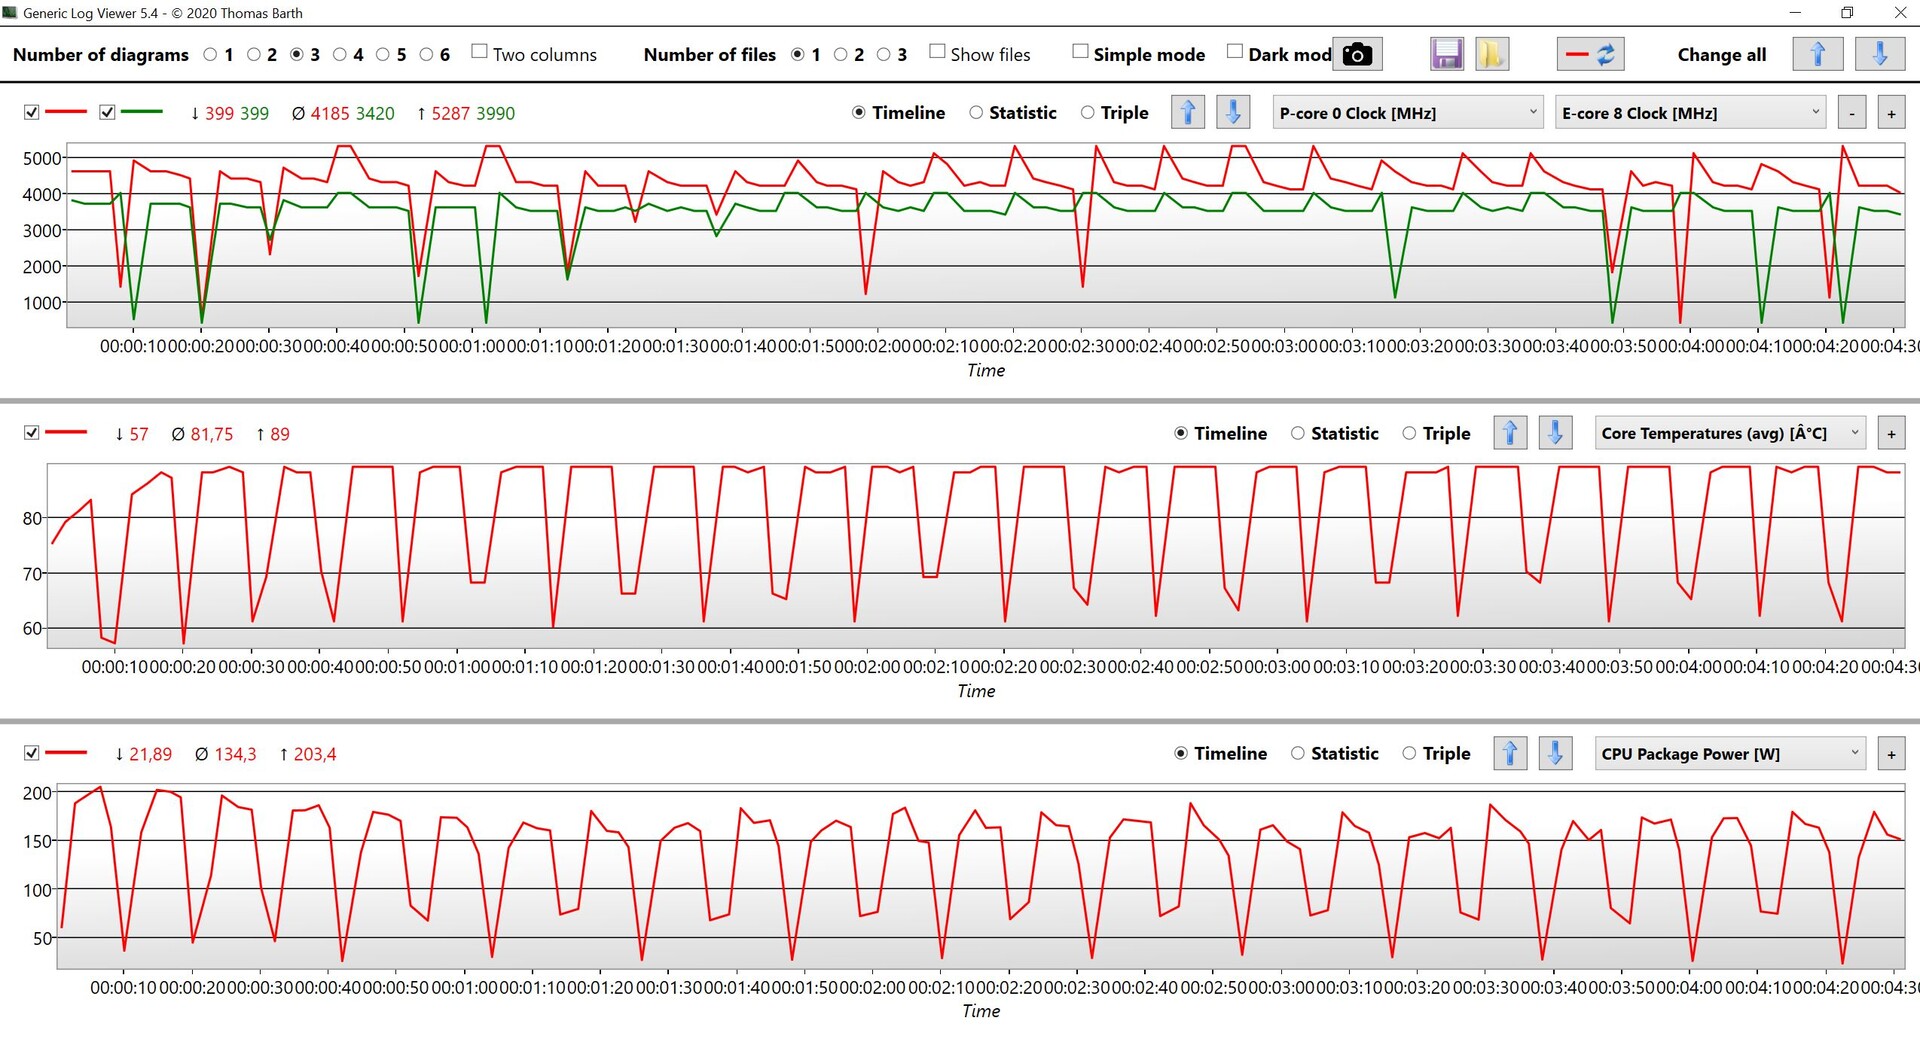
Al contrario que los procesadores móviles Raptor Lake más lentosintel ha cambiado la configuración de los núcleos de los chips de gama alta de la serie HX en comparación con las antiguas CPU Alder Lake. Los relojes son más altos, pero ahora también hay el doble de núcleos de eficiencia (de 8 a 16), lo que significa que la CPU puede ejecutar hasta 32 hilos simultáneamente (16 núcleos E + 8 núcleos P con hyper threading).
El rendimiento del nuevoCore i9-13950HXen el MSI Titan GT77 es excelente gracias a los generosos límites de potencia. El rendimiento fluctúa un poco, pero podemos observar un consumo de más de 200W al principio de los benchmarks antes de que el chip se asiente en torno a los 150W. El salto de rendimiento con respecto al antiguoTitan GT77con elCore i9-12900HXes del 22 % en todas las pruebas de CPU y el Core i9-13950HX en el nuevoRazer Blade 16también es superado en un 14 %.
Como era de esperar, vemos las mayores mejoras en las pruebas multinúcleo, donde sólo se nota el mayor número de núcleos. Por ejemplo: El nuevo GT77 es un 45 % más rápido que el antiguo GT77 con el Core i9-12900HX en Cinebench R23 Multi. La ventaja sobre otros procesadores Raptor Lake HX también demuestra que se trata de una implementación muy rápida. El nuevo modelo también es más rápido en las pruebas mononúcleo, pero la ventaja es mucho menor, del 6-10 %.
El rendimiento de la CPU está bloqueado a 25 W en batería, incluso en el modo de rendimiento más rápido, lo que resulta en un déficit de rendimiento de más del 70 % en escenarios multinúcleo. En nuestra sección técnica.
Cinebench R15 Multi Dauertest
Cinebench R23: Multi Core | Single Core
Cinebench R20: CPU (Multi Core) | CPU (Single Core)
Cinebench R15: CPU Multi 64Bit | CPU Single 64Bit
Blender: v2.79 BMW27 CPU
7-Zip 18.03: 7z b 4 | 7z b 4 -mmt1
Geekbench 5.5: Multi-Core | Single-Core
HWBOT x265 Benchmark v2.2: 4k Preset
LibreOffice : 20 Documents To PDF
R Benchmark 2.5: Overall mean
| CPU Performance rating | |
| MSI Titan GT77 HX 13VI | |
| Schenker XMG Neo 16 Raptor Lake | |
| Medio Intel Core i9-13950HX | |
| Razer Blade 16 Early 2023 | |
| Media de la clase Gaming | |
| MSI Titan GT77 12UHS | |
| Asus ROG Strix Scar 17 SE G733CX-LL014W | |
| Alienware x17 R2 P48E | |
| Schenker XMG Neo 17 M22 | |
| Cinebench R23 / Multi Core | |
| MSI Titan GT77 HX 13VI | |
| Medio Intel Core i9-13950HX (24560 - 33277, n=7) | |
| Schenker XMG Neo 16 Raptor Lake | |
| Schenker XMG Neo 16 Raptor Lake | |
| Schenker XMG Neo 16 Raptor Lake | |
| Media de la clase Gaming (10488 - 42661, n=104, últimos 2 años) | |
| Razer Blade 16 Early 2023 | |
| MSI Titan GT77 12UHS | |
| Asus ROG Strix Scar 17 SE G733CX-LL014W | |
| Alienware x17 R2 P48E | |
| Schenker XMG Neo 17 M22 | |
| Cinebench R23 / Single Core | |
| MSI Titan GT77 HX 13VI | |
| Medio Intel Core i9-13950HX (1952 - 2113, n=7) | |
| Schenker XMG Neo 16 Raptor Lake | |
| Razer Blade 16 Early 2023 | |
| Media de la clase Gaming (1601 - 2415, n=104, últimos 2 años) | |
| MSI Titan GT77 12UHS | |
| Alienware x17 R2 P48E | |
| Asus ROG Strix Scar 17 SE G733CX-LL014W | |
| Schenker XMG Neo 17 M22 | |
| Cinebench R20 / CPU (Multi Core) | |
| MSI Titan GT77 HX 13VI | |
| Schenker XMG Neo 16 Raptor Lake | |
| Medio Intel Core i9-13950HX (8697 - 12648, n=7) | |
| Media de la clase Gaming (4029 - 16433, n=103, últimos 2 años) | |
| Razer Blade 16 Early 2023 | |
| MSI Titan GT77 12UHS | |
| Asus ROG Strix Scar 17 SE G733CX-LL014W | |
| Alienware x17 R2 P48E | |
| Schenker XMG Neo 17 M22 | |
| Cinebench R20 / CPU (Single Core) | |
| MSI Titan GT77 HX 13VI | |
| Medio Intel Core i9-13950HX (742 - 816, n=7) | |
| Media de la clase Gaming (622 - 913, n=103, últimos 2 años) | |
| Schenker XMG Neo 16 Raptor Lake | |
| Razer Blade 16 Early 2023 | |
| Asus ROG Strix Scar 17 SE G733CX-LL014W | |
| MSI Titan GT77 12UHS | |
| Alienware x17 R2 P48E | |
| Schenker XMG Neo 17 M22 | |
| Cinebench R15 / CPU Multi 64Bit | |
| MSI Titan GT77 HX 13VI | |
| Schenker XMG Neo 16 Raptor Lake | |
| Schenker XMG Neo 16 Raptor Lake | |
| Medio Intel Core i9-13950HX (3625 - 5227, n=7) | |
| Razer Blade 16 Early 2023 | |
| Media de la clase Gaming (1578 - 6330, n=102, últimos 2 años) | |
| MSI Titan GT77 12UHS | |
| Asus ROG Strix Scar 17 SE G733CX-LL014W | |
| Alienware x17 R2 P48E | |
| Schenker XMG Neo 17 M22 | |
| Cinebench R15 / CPU Single 64Bit | |
| MSI Titan GT77 HX 13VI | |
| Media de la clase Gaming (188.8 - 350, n=103, últimos 2 años) | |
| Schenker XMG Neo 16 Raptor Lake | |
| Schenker XMG Neo 16 Raptor Lake | |
| Medio Intel Core i9-13950HX (274 - 303, n=7) | |
| MSI Titan GT77 12UHS | |
| Asus ROG Strix Scar 17 SE G733CX-LL014W | |
| Razer Blade 16 Early 2023 | |
| Alienware x17 R2 P48E | |
| Schenker XMG Neo 17 M22 | |
| Blender / v2.79 BMW27 CPU | |
| Schenker XMG Neo 17 M22 | |
| Asus ROG Strix Scar 17 SE G733CX-LL014W | |
| Alienware x17 R2 P48E | |
| Media de la clase Gaming (79 - 330, n=101, últimos 2 años) | |
| MSI Titan GT77 12UHS | |
| Razer Blade 16 Early 2023 | |
| Medio Intel Core i9-13950HX (100 - 137, n=7) | |
| Schenker XMG Neo 16 Raptor Lake | |
| MSI Titan GT77 HX 13VI | |
| 7-Zip 18.03 / 7z b 4 | |
| MSI Titan GT77 HX 13VI | |
| Schenker XMG Neo 16 Raptor Lake | |
| Medio Intel Core i9-13950HX (99351 - 127295, n=7) | |
| Razer Blade 16 Early 2023 | |
| Media de la clase Gaming (33491 - 148086, n=102, últimos 2 años) | |
| MSI Titan GT77 12UHS | |
| Asus ROG Strix Scar 17 SE G733CX-LL014W | |
| Alienware x17 R2 P48E | |
| Schenker XMG Neo 17 M22 | |
| 7-Zip 18.03 / 7z b 4 -mmt1 | |
| MSI Titan GT77 HX 13VI | |
| Schenker XMG Neo 16 Raptor Lake | |
| Medio Intel Core i9-13950HX (6445 - 7064, n=7) | |
| Media de la clase Gaming (4824 - 7436, n=102, últimos 2 años) | |
| Razer Blade 16 Early 2023 | |
| MSI Titan GT77 12UHS | |
| Asus ROG Strix Scar 17 SE G733CX-LL014W | |
| Schenker XMG Neo 17 M22 | |
| Alienware x17 R2 P48E | |
| Geekbench 5.5 / Multi-Core | |
| Schenker XMG Neo 16 Raptor Lake | |
| MSI Titan GT77 HX 13VI | |
| Medio Intel Core i9-13950HX (16776 - 21853, n=7) | |
| Razer Blade 16 Early 2023 | |
| Media de la clase Gaming (6460 - 28263, n=102, últimos 2 años) | |
| MSI Titan GT77 12UHS | |
| Asus ROG Strix Scar 17 SE G733CX-LL014W | |
| Alienware x17 R2 P48E | |
| Schenker XMG Neo 17 M22 | |
| Geekbench 5.5 / Single-Core | |
| Media de la clase Gaming (1403 - 2474, n=102, últimos 2 años) | |
| MSI Titan GT77 HX 13VI | |
| Schenker XMG Neo 16 Raptor Lake | |
| Medio Intel Core i9-13950HX (1805 - 2097, n=7) | |
| MSI Titan GT77 12UHS | |
| Alienware x17 R2 P48E | |
| Asus ROG Strix Scar 17 SE G733CX-LL014W | |
| Razer Blade 16 Early 2023 | |
| Schenker XMG Neo 17 M22 | |
| HWBOT x265 Benchmark v2.2 / 4k Preset | |
| MSI Titan GT77 HX 13VI | |
| Schenker XMG Neo 16 Raptor Lake | |
| Medio Intel Core i9-13950HX (26 - 34.5, n=7) | |
| Media de la clase Gaming (11.5 - 44.4, n=102, últimos 2 años) | |
| Razer Blade 16 Early 2023 | |
| MSI Titan GT77 12UHS | |
| Asus ROG Strix Scar 17 SE G733CX-LL014W | |
| Alienware x17 R2 P48E | |
| Schenker XMG Neo 17 M22 | |
| LibreOffice / 20 Documents To PDF | |
| Schenker XMG Neo 17 M22 | |
| Media de la clase Gaming (33.2 - 88.8, n=102, últimos 2 años) | |
| Razer Blade 16 Early 2023 | |
| MSI Titan GT77 HX 13VI | |
| Schenker XMG Neo 16 Raptor Lake | |
| Medio Intel Core i9-13950HX (32.8 - 52.1, n=7) | |
| Alienware x17 R2 P48E | |
| MSI Titan GT77 12UHS | |
| Asus ROG Strix Scar 17 SE G733CX-LL014W | |
| R Benchmark 2.5 / Overall mean | |
| Schenker XMG Neo 17 M22 | |
| Alienware x17 R2 P48E | |
| Asus ROG Strix Scar 17 SE G733CX-LL014W | |
| Media de la clase Gaming (0.3439 - 0.59, n=102, últimos 2 años) | |
| MSI Titan GT77 12UHS | |
| Razer Blade 16 Early 2023 | |
| MSI Titan GT77 HX 13VI | |
| Medio Intel Core i9-13950HX (0.3823 - 0.4121, n=7) | |
| Schenker XMG Neo 16 Raptor Lake | |
* ... más pequeño es mejor
AIDA64: FP32 Ray-Trace | FPU Julia | CPU SHA3 | CPU Queen | FPU SinJulia | FPU Mandel | CPU AES | CPU ZLib | FP64 Ray-Trace | CPU PhotoWorxx
| Performance rating | |
| MSI Titan GT77 HX 13VI | |
| Media de la clase Gaming | |
| Schenker XMG Neo 16 Raptor Lake | |
| Medio Intel Core i9-13950HX | |
| Razer Blade 16 Early 2023 | |
| MSI Titan GT77 12UHS | |
| Asus ROG Strix Scar 17 SE G733CX-LL014W | |
| Schenker XMG Neo 17 M22 | |
| Alienware x17 R2 P48E | |
| AIDA64 / FP32 Ray-Trace | |
| Media de la clase Gaming (10227 - 85542, n=102, últimos 2 años) | |
| MSI Titan GT77 HX 13VI | |
| Schenker XMG Neo 16 Raptor Lake | |
| Razer Blade 16 Early 2023 | |
| Razer Blade 16 Early 2023 | |
| Razer Blade 16 Early 2023 | |
| Medio Intel Core i9-13950HX (17993 - 28957, n=9) | |
| MSI Titan GT77 12UHS | |
| Asus ROG Strix Scar 17 SE G733CX-LL014W | |
| Schenker XMG Neo 17 M22 | |
| Alienware x17 R2 P48E | |
| AIDA64 / FPU Julia | |
| Media de la clase Gaming (51376 - 372155, n=102, últimos 2 años) | |
| MSI Titan GT77 HX 13VI | |
| Schenker XMG Neo 16 Raptor Lake | |
| Razer Blade 16 Early 2023 | |
| Razer Blade 16 Early 2023 | |
| Razer Blade 16 Early 2023 | |
| Medio Intel Core i9-13950HX (89362 - 144303, n=9) | |
| MSI Titan GT77 12UHS | |
| Schenker XMG Neo 17 M22 | |
| Asus ROG Strix Scar 17 SE G733CX-LL014W | |
| Alienware x17 R2 P48E | |
| AIDA64 / CPU SHA3 | |
| MSI Titan GT77 HX 13VI | |
| Schenker XMG Neo 16 Raptor Lake | |
| Media de la clase Gaming (2180 - 10115, n=102, últimos 2 años) | |
| Razer Blade 16 Early 2023 | |
| Razer Blade 16 Early 2023 | |
| Razer Blade 16 Early 2023 | |
| Medio Intel Core i9-13950HX (4518 - 7093, n=9) | |
| MSI Titan GT77 12UHS | |
| Asus ROG Strix Scar 17 SE G733CX-LL014W | |
| Alienware x17 R2 P48E | |
| Schenker XMG Neo 17 M22 | |
| AIDA64 / CPU Queen | |
| MSI Titan GT77 HX 13VI | |
| Schenker XMG Neo 16 Raptor Lake | |
| Medio Intel Core i9-13950HX (131931 - 140103, n=8) | |
| Razer Blade 16 Early 2023 | |
| Razer Blade 16 Early 2023 | |
| Media de la clase Gaming (49785 - 173351, n=86, últimos 2 años) | |
| Alienware x17 R2 P48E | |
| Asus ROG Strix Scar 17 SE G733CX-LL014W | |
| MSI Titan GT77 12UHS | |
| Schenker XMG Neo 17 M22 | |
| AIDA64 / FPU SinJulia | |
| MSI Titan GT77 HX 13VI | |
| Schenker XMG Neo 16 Raptor Lake | |
| Razer Blade 16 Early 2023 | |
| Razer Blade 16 Early 2023 | |
| Razer Blade 16 Early 2023 | |
| Media de la clase Gaming (4424 - 33636, n=102, últimos 2 años) | |
| Medio Intel Core i9-13950HX (12318 - 17057, n=9) | |
| MSI Titan GT77 12UHS | |
| Schenker XMG Neo 17 M22 | |
| Asus ROG Strix Scar 17 SE G733CX-LL014W | |
| Alienware x17 R2 P48E | |
| AIDA64 / FPU Mandel | |
| Media de la clase Gaming (25115 - 196829, n=102, últimos 2 años) | |
| MSI Titan GT77 HX 13VI | |
| Schenker XMG Neo 16 Raptor Lake | |
| Razer Blade 16 Early 2023 | |
| Razer Blade 16 Early 2023 | |
| Razer Blade 16 Early 2023 | |
| Medio Intel Core i9-13950HX (44372 - 71038, n=9) | |
| Schenker XMG Neo 17 M22 | |
| MSI Titan GT77 12UHS | |
| Asus ROG Strix Scar 17 SE G733CX-LL014W | |
| Alienware x17 R2 P48E | |
| AIDA64 / CPU AES | |
| MSI Titan GT77 12UHS | |
| Asus ROG Strix Scar 17 SE G733CX-LL014W | |
| Razer Blade 16 Early 2023 | |
| Razer Blade 16 Early 2023 | |
| Razer Blade 16 Early 2023 | |
| Medio Intel Core i9-13950HX (99981 - 204491, n=9) | |
| MSI Titan GT77 HX 13VI | |
| Schenker XMG Neo 17 M22 | |
| Schenker XMG Neo 16 Raptor Lake | |
| Media de la clase Gaming (39258 - 247074, n=102, últimos 2 años) | |
| Alienware x17 R2 P48E | |
| AIDA64 / CPU ZLib | |
| MSI Titan GT77 HX 13VI | |
| Schenker XMG Neo 16 Raptor Lake | |
| Razer Blade 16 Early 2023 | |
| Razer Blade 16 Early 2023 | |
| Razer Blade 16 Early 2023 | |
| Medio Intel Core i9-13950HX (1263 - 2069, n=9) | |
| Media de la clase Gaming (574 - 2531, n=102, últimos 2 años) | |
| MSI Titan GT77 12UHS | |
| Asus ROG Strix Scar 17 SE G733CX-LL014W | |
| Alienware x17 R2 P48E | |
| Schenker XMG Neo 17 M22 | |
| AIDA64 / FP64 Ray-Trace | |
| Media de la clase Gaming (5509 - 45446, n=102, últimos 2 años) | |
| MSI Titan GT77 HX 13VI | |
| Schenker XMG Neo 16 Raptor Lake | |
| Razer Blade 16 Early 2023 | |
| Razer Blade 16 Early 2023 | |
| Razer Blade 16 Early 2023 | |
| Medio Intel Core i9-13950HX (9649 - 15573, n=9) | |
| MSI Titan GT77 12UHS | |
| Asus ROG Strix Scar 17 SE G733CX-LL014W | |
| Schenker XMG Neo 17 M22 | |
| Alienware x17 R2 P48E | |
| AIDA64 / CPU PhotoWorxx | |
| Razer Blade 16 Early 2023 | |
| Razer Blade 16 Early 2023 | |
| Razer Blade 16 Early 2023 | |
| Medio Intel Core i9-13950HX (40233 - 50864, n=9) | |
| Media de la clase Gaming (12271 - 89891, n=102, últimos 2 años) | |
| Schenker XMG Neo 16 Raptor Lake | |
| Asus ROG Strix Scar 17 SE G733CX-LL014W | |
| MSI Titan GT77 12UHS | |
| MSI Titan GT77 HX 13VI | |
| Alienware x17 R2 P48E | |
| Schenker XMG Neo 17 M22 | |
Rendimiento del sistema
El rendimiento subjetivo del GT77 es excelente y los resultados de los benchmarks sintéticos también son muy buenos, pero esto no es de extrañar teniendo en cuenta la potencia del hardware. Los rivales también son muy rápidos y notarás una gran diferencia entre los sistemas.
CrossMark: Overall | Productivity | Creativity | Responsiveness
| PCMark 10 / Score | |
| MSI Titan GT77 HX 13VI | |
| Media de la clase Gaming (5828 - 12414, n=93, últimos 2 años) | |
| Medio Intel Core i9-13950HX, NVIDIA GeForce RTX 4090 Laptop GPU (7597 - 8884, n=2) | |
| MSI Titan GT77 12UHS | |
| Alienware x17 R2 P48E | |
| Razer Blade 16 Early 2023 | |
| Asus ROG Strix Scar 17 SE G733CX-LL014W | |
| Schenker XMG Neo 17 M22 | |
| PCMark 10 / Essentials | |
| MSI Titan GT77 HX 13VI | |
| Medio Intel Core i9-13950HX, NVIDIA GeForce RTX 4090 Laptop GPU (10903 - 11761, n=2) | |
| Alienware x17 R2 P48E | |
| MSI Titan GT77 12UHS | |
| Razer Blade 16 Early 2023 | |
| Media de la clase Gaming (8810 - 11935, n=97, últimos 2 años) | |
| Asus ROG Strix Scar 17 SE G733CX-LL014W | |
| Schenker XMG Neo 17 M22 | |
| PCMark 10 / Productivity | |
| Media de la clase Gaming (6845 - 25323, n=95, últimos 2 años) | |
| MSI Titan GT77 12UHS | |
| Alienware x17 R2 P48E | |
| Asus ROG Strix Scar 17 SE G733CX-LL014W | |
| MSI Titan GT77 HX 13VI | |
| Schenker XMG Neo 17 M22 | |
| Medio Intel Core i9-13950HX, NVIDIA GeForce RTX 4090 Laptop GPU (8330 - 9851, n=2) | |
| Razer Blade 16 Early 2023 | |
| PCMark 10 / Digital Content Creation | |
| MSI Titan GT77 HX 13VI | |
| Medio Intel Core i9-13950HX, NVIDIA GeForce RTX 4090 Laptop GPU (13099 - 16424, n=2) | |
| Razer Blade 16 Early 2023 | |
| Media de la clase Gaming (7602 - 19954, n=95, últimos 2 años) | |
| MSI Titan GT77 12UHS | |
| Alienware x17 R2 P48E | |
| Asus ROG Strix Scar 17 SE G733CX-LL014W | |
| Schenker XMG Neo 17 M22 | |
| CrossMark / Overall | |
| MSI Titan GT77 HX 13VI | |
| Asus ROG Strix Scar 17 SE G733CX-LL014W | |
| MSI Titan GT77 12UHS | |
| Medio Intel Core i9-13950HX, NVIDIA GeForce RTX 4090 Laptop GPU (2019 - 2139, n=2) | |
| Schenker XMG Neo 16 Raptor Lake | |
| Media de la clase Gaming (1366 - 2409, n=94, últimos 2 años) | |
| Alienware x17 R2 P48E | |
| Schenker XMG Neo 17 M22 | |
| Razer Blade 16 Early 2023 | |
| CrossMark / Productivity | |
| MSI Titan GT77 12UHS | |
| MSI Titan GT77 HX 13VI | |
| Asus ROG Strix Scar 17 SE G733CX-LL014W | |
| Medio Intel Core i9-13950HX, NVIDIA GeForce RTX 4090 Laptop GPU (1909 - 1977, n=2) | |
| Media de la clase Gaming (1386 - 2254, n=94, últimos 2 años) | |
| Schenker XMG Neo 16 Raptor Lake | |
| Alienware x17 R2 P48E | |
| Schenker XMG Neo 17 M22 | |
| Razer Blade 16 Early 2023 | |
| CrossMark / Creativity | |
| MSI Titan GT77 HX 13VI | |
| Schenker XMG Neo 16 Raptor Lake | |
| Asus ROG Strix Scar 17 SE G733CX-LL014W | |
| Medio Intel Core i9-13950HX, NVIDIA GeForce RTX 4090 Laptop GPU (2222 - 2423, n=2) | |
| MSI Titan GT77 12UHS | |
| Media de la clase Gaming (1343 - 2786, n=94, últimos 2 años) | |
| Alienware x17 R2 P48E | |
| Schenker XMG Neo 17 M22 | |
| Razer Blade 16 Early 2023 | |
| CrossMark / Responsiveness | |
| MSI Titan GT77 12UHS | |
| Asus ROG Strix Scar 17 SE G733CX-LL014W | |
| MSI Titan GT77 HX 13VI | |
| Medio Intel Core i9-13950HX, NVIDIA GeForce RTX 4090 Laptop GPU (1792 - 1861, n=2) | |
| Media de la clase Gaming (1226 - 2334, n=94, últimos 2 años) | |
| Alienware x17 R2 P48E | |
| Schenker XMG Neo 16 Raptor Lake | |
| Schenker XMG Neo 17 M22 | |
| Razer Blade 16 Early 2023 | |
| PCMark 10 Score | 8884 puntos | |
ayuda | ||
| AIDA64 / Memory Copy | |
| Razer Blade 16 Early 2023 | |
| Razer Blade 16 Early 2023 | |
| Razer Blade 16 Early 2023 | |
| Medio Intel Core i9-13950HX (61938 - 78813, n=9) | |
| Media de la clase Gaming (21750 - 129946, n=102, últimos 2 años) | |
| Schenker XMG Neo 16 Raptor Lake | |
| MSI Titan GT77 12UHS | |
| MSI Titan GT77 HX 13VI | |
| Asus ROG Strix Scar 17 SE G733CX-LL014W | |
| Alienware x17 R2 P48E | |
| Schenker XMG Neo 17 M22 | |
| AIDA64 / Memory Read | |
| Razer Blade 16 Early 2023 | |
| Razer Blade 16 Early 2023 | |
| Razer Blade 16 Early 2023 | |
| Medio Intel Core i9-13950HX (62368 - 86831, n=9) | |
| Schenker XMG Neo 16 Raptor Lake | |
| Media de la clase Gaming (22956 - 118858, n=102, últimos 2 años) | |
| Asus ROG Strix Scar 17 SE G733CX-LL014W | |
| MSI Titan GT77 HX 13VI | |
| MSI Titan GT77 12UHS | |
| Alienware x17 R2 P48E | |
| Schenker XMG Neo 17 M22 | |
| AIDA64 / Memory Write | |
| Razer Blade 16 Early 2023 | |
| Razer Blade 16 Early 2023 | |
| Razer Blade 16 Early 2023 | |
| Media de la clase Gaming (22297 - 135096, n=102, últimos 2 años) | |
| Medio Intel Core i9-13950HX (59501 - 80441, n=9) | |
| Schenker XMG Neo 16 Raptor Lake | |
| Asus ROG Strix Scar 17 SE G733CX-LL014W | |
| MSI Titan GT77 HX 13VI | |
| MSI Titan GT77 12UHS | |
| Schenker XMG Neo 17 M22 | |
| Alienware x17 R2 P48E | |
| AIDA64 / Memory Latency | |
| Media de la clase Gaming (75.3 - 165.4, n=102, últimos 2 años) | |
| Razer Blade 16 Early 2023 | |
| Razer Blade 16 Early 2023 | |
| Razer Blade 16 Early 2023 | |
| Alienware x17 R2 P48E | |
| MSI Titan GT77 HX 13VI | |
| Schenker XMG Neo 17 M22 | |
| Schenker XMG Neo 16 Raptor Lake | |
| Medio Intel Core i9-13950HX (84.4 - 99.5, n=9) | |
| MSI Titan GT77 12UHS | |
| Asus ROG Strix Scar 17 SE G733CX-LL014W | |
* ... más pequeño es mejor
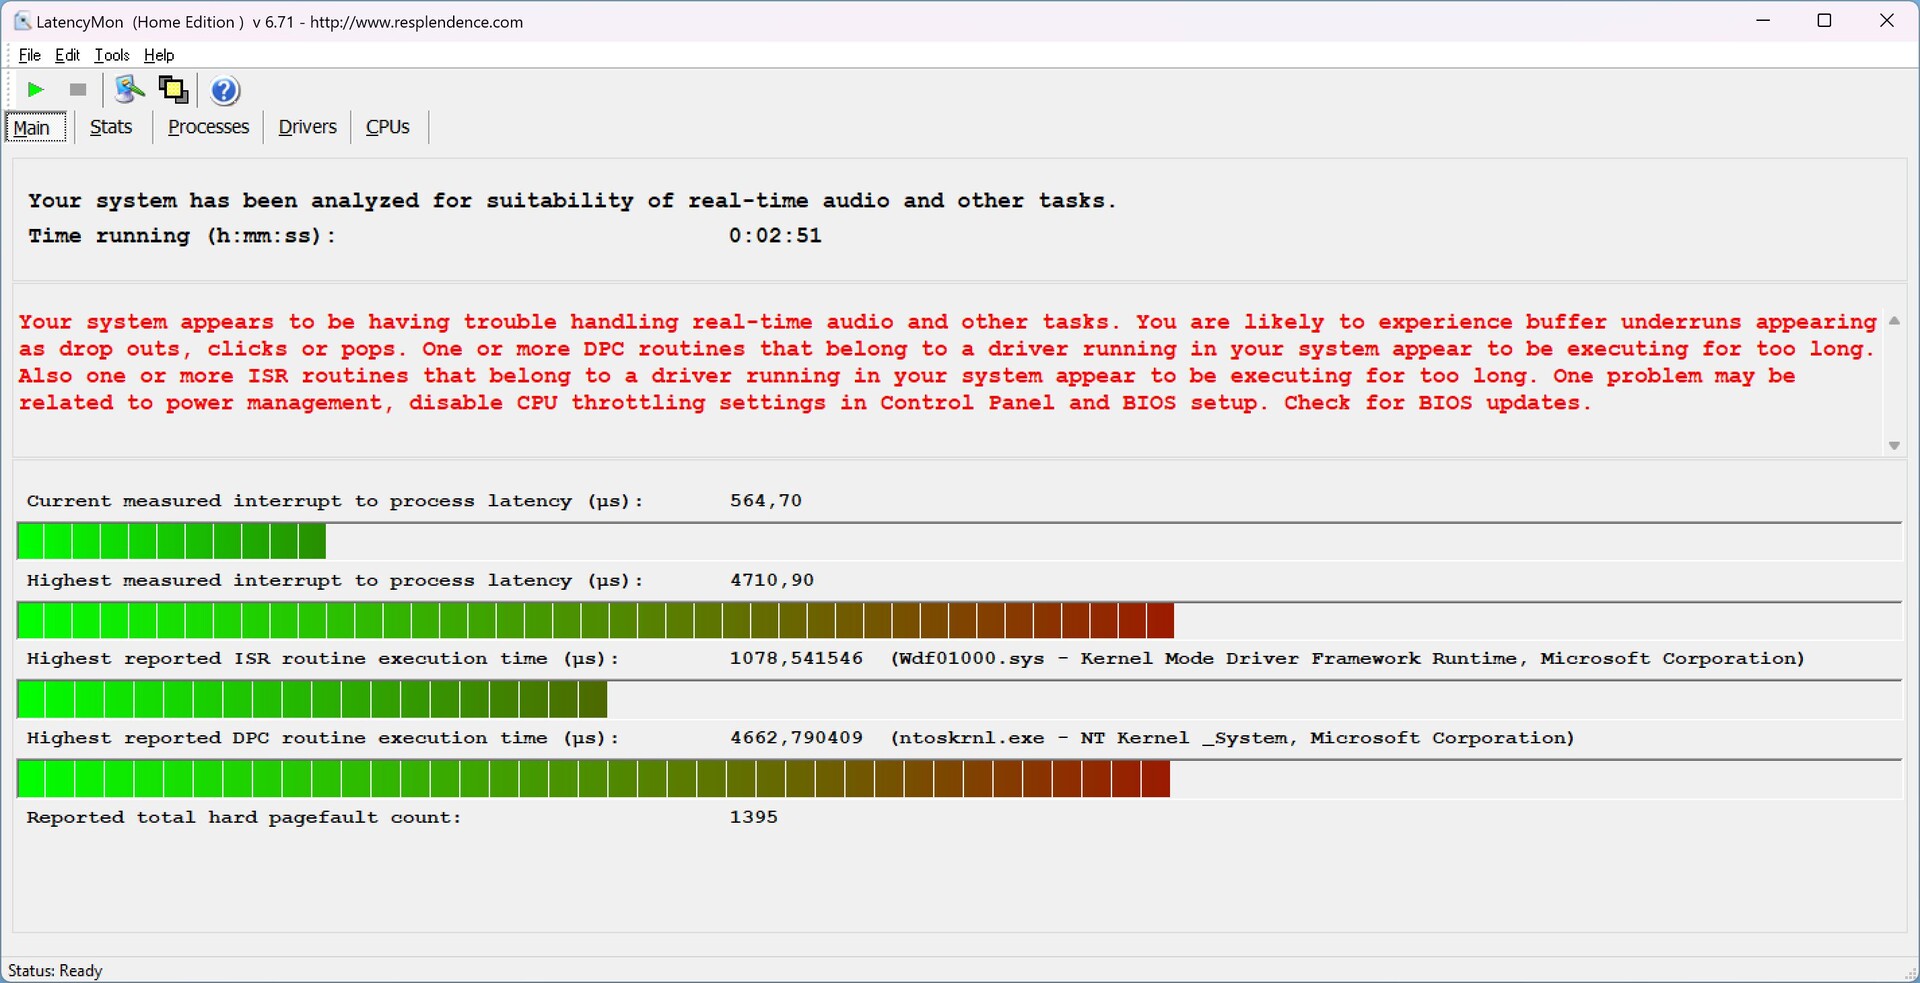
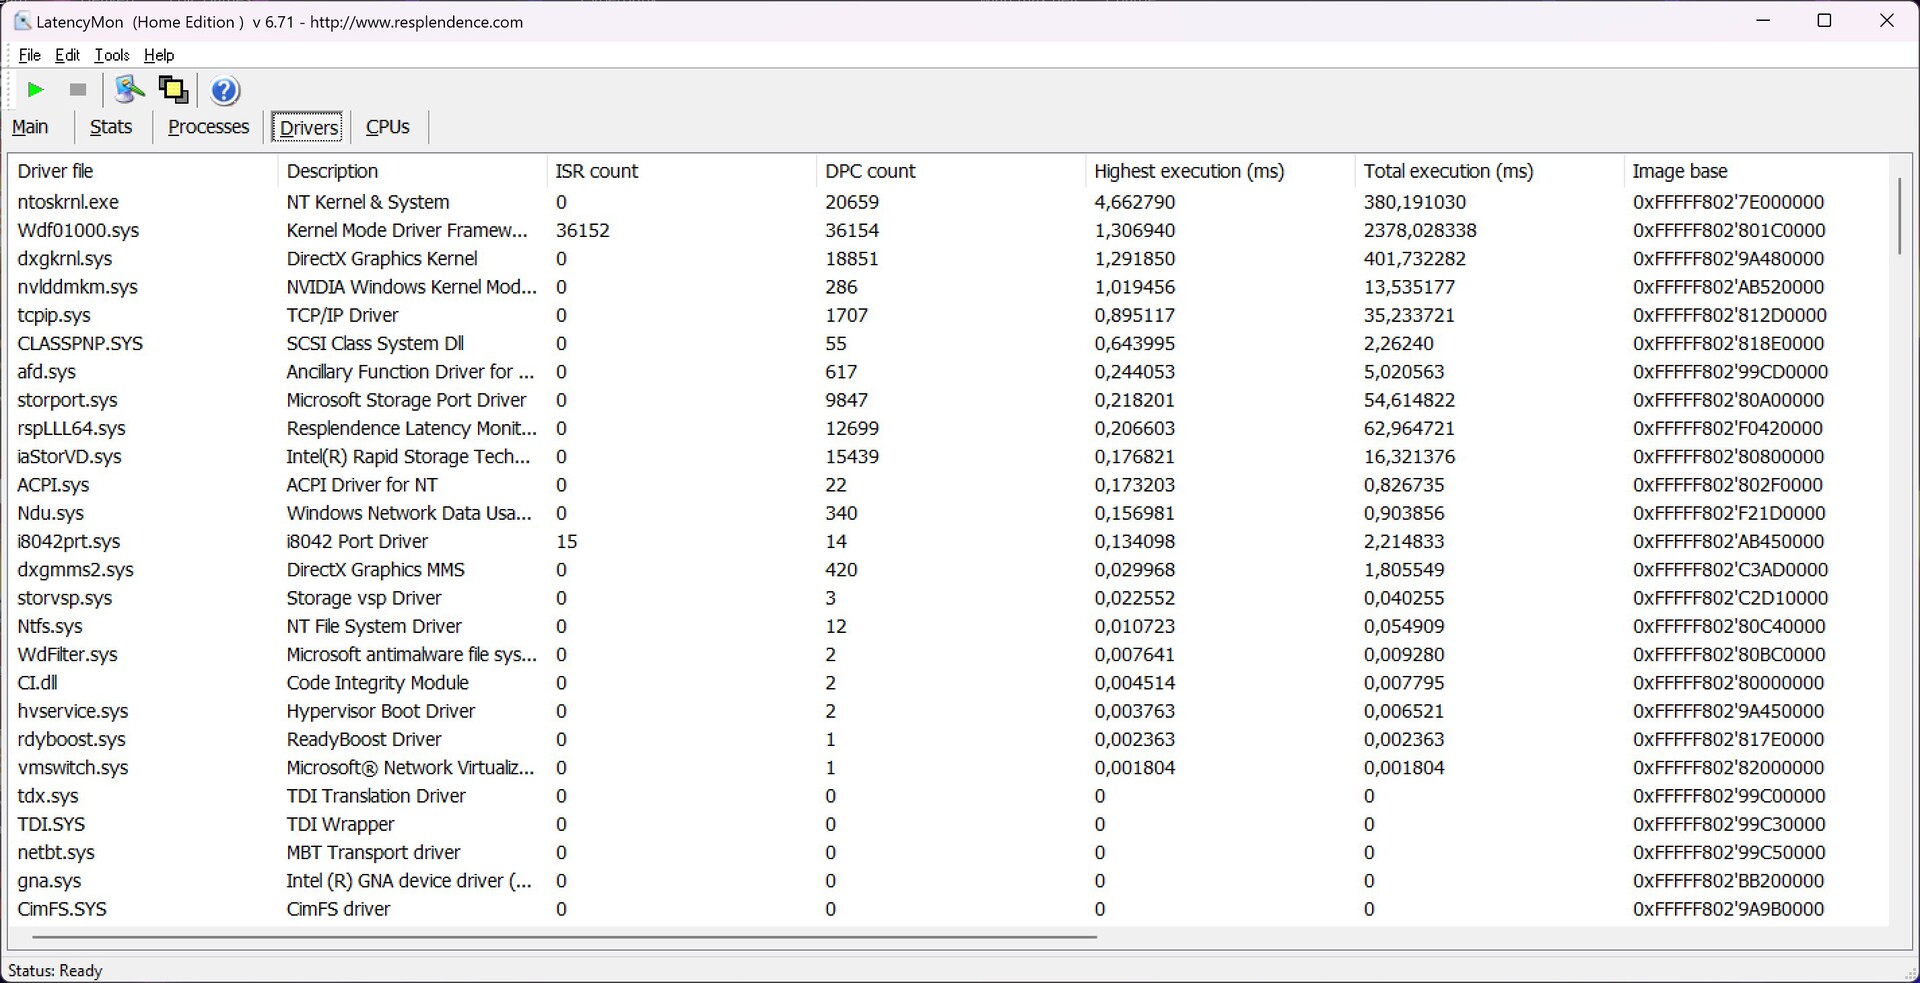
Latencia del CPD
Nuestra prueba de latencia estandarizada (navegación web, reproducción 4K de YouTube, carga de la CPU) muestra importantes limitaciones para las aplicaciones de audio en tiempo real con la versión actual de la BIOS (1.04).
| DPC Latencies / LatencyMon - interrupt to process latency (max), Web, Youtube, Prime95 | |
| MSI Titan GT77 HX 13VI | |
| Schenker XMG Neo 17 M22 | |
| Asus ROG Strix Scar 17 SE G733CX-LL014W | |
| Razer Blade 16 Early 2023 | |
| MSI Titan GT77 12UHS | |
| MSI Titan GT77 12UHS | |
| Alienware x17 R2 P48E | |
* ... más pequeño es mejor
Dispositivos de almacenamiento
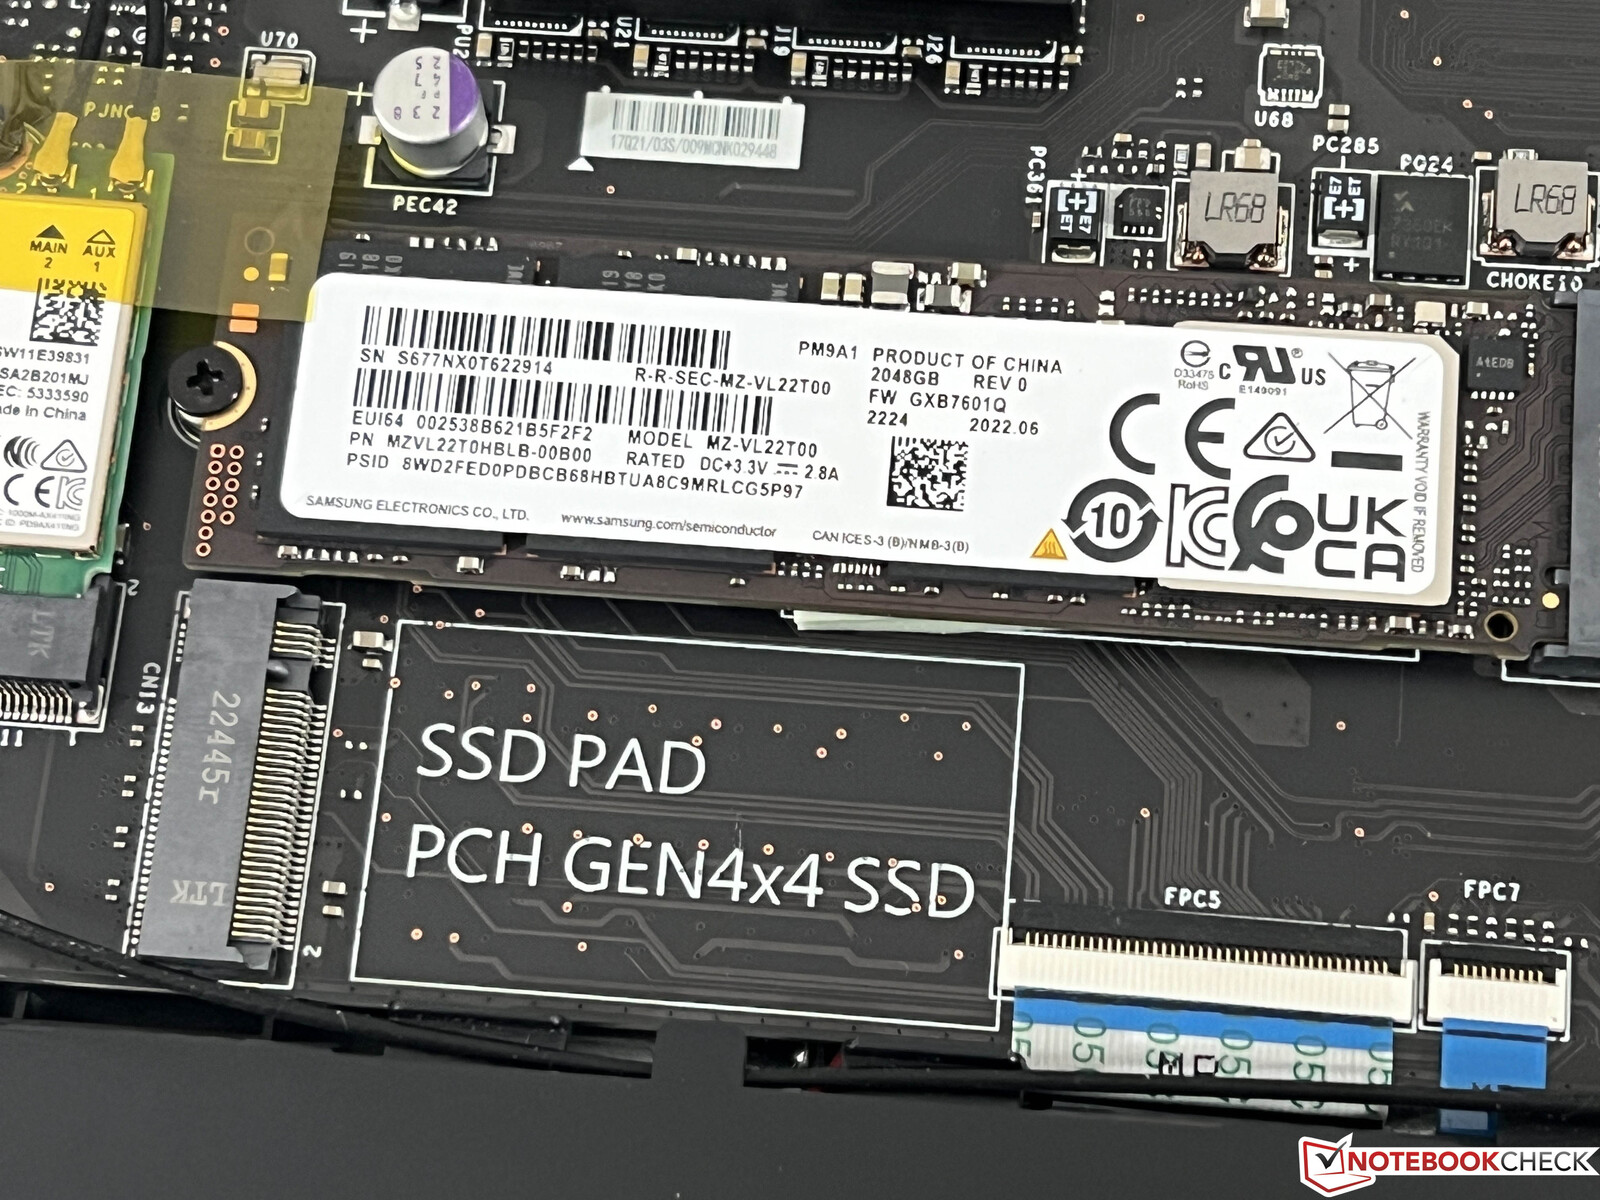
El 2023 Titan es uno de los primeros portátiles con una rápida interfaz PCIe 5.0, pero apenas hay SSDs adecuados en el mercado todavía. Las otras dos ranuras soportan PCIe 4.0 y nuestra unidad de pruebas está equipada con dos SSDs de 2 TB de Samsung (PM9A1, versión OEM del 980 Pro) en una configuración RAID 0. Además de la enorme capacidad de 4 TB (3.97 libres para el usuario) también podemos registrar tasas de transferencia superiores a los 11 GB/s. Sin embargo, este rendimiento no puede mantenerse mucho tiempo y caerá considerablemente tras unos minutos, por lo que un refrigerador SSD podría haber sido una buena idea. Hay más pruebas comparativas de SSD disponibles aquí.

* ... más pequeño es mejor
Disk Throttling: DiskSpd Read Loop, Queue Depth 8
Rendimiento de la GPU - Portátil RTX 4090
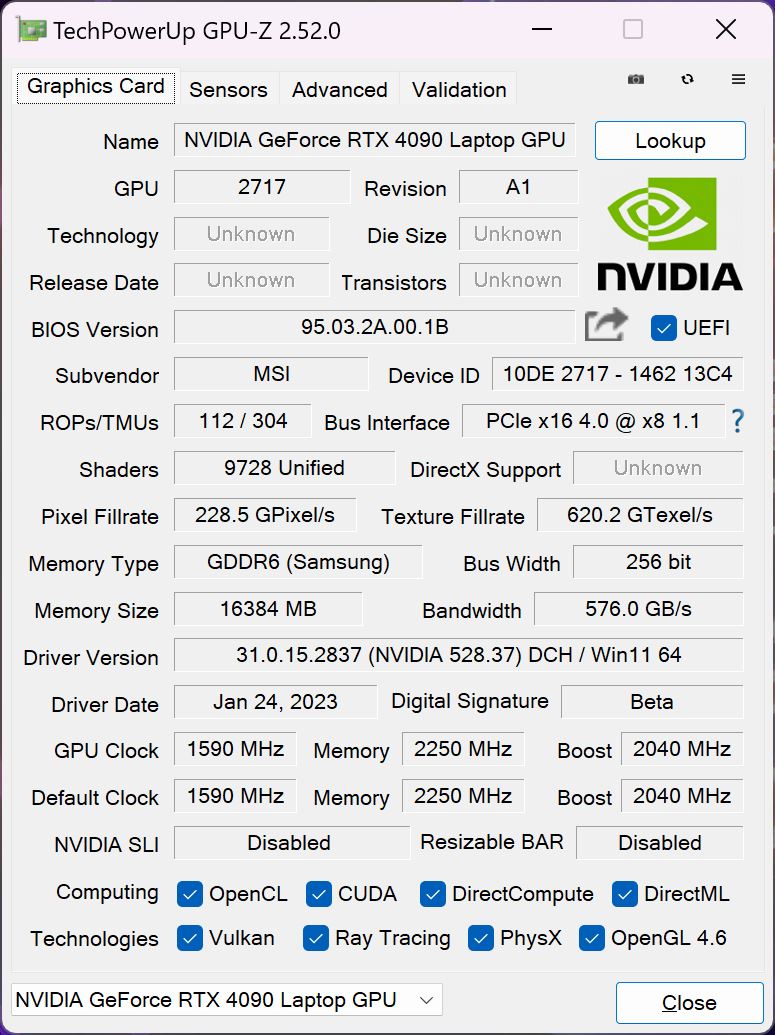
LaGeForce RTX 4090es la nueva GPU móvil de gama alta de Nvidia y la GT77 utiliza la versión más rápida con un consumo máximo de 175 W (150 W de TGP + 25 W de Dynamic Boost de la CPU), 16 GB de VRAM y un reloj central máximo de 2340 MHz.
El rendimiento gráfico es excelente y la nueva RTX 4090 se sitúa entre los modelos de sobremesaRTX 3090/RTX 3090 Tiy los modelos de sobremesaRTX 4070 TiyRTX 4080en pruebas sintéticas. La ventaja sobre la antigua móvilRTX 3080 Tien la anteriorGT77es del 40-60 % (dependiendo del benchmark) a pesar del mismo TGP. LarTX 4080 móvildelRazer Blade 16es entre un 17 y un 19 % más lenta dependiendo de la prueba.
La nueva Titan puede mantener el rendimiento gráfico y el test de estrés 3dMark Time Spy se pasa fácilmente al 99 %. El consumo de energía está limitado a 27W en batería, lo que resulta en un déficit de rendimiento de casi el 80 %.
Geekbench 5.5: OpenCL Score
GFXBench: 3840x2160 4K Aztec Ruins High Tier Offscreen | 2560x1440 Aztec Ruins High Tier Offscreen
| 3DMark / Wild Life Extreme Unlimited | |
| NVIDIA GeForce RTX 3090 Ti | |
| NVIDIA GeForce RTX 4090 Laptop GPU | |
| Medio NVIDIA GeForce RTX 4090 Laptop GPU (34246 - 44948, n=7) | |
| Media de la clase Gaming (22281 - 47946, n=17, últimos 2 años) | |
| NVIDIA GeForce RTX 3080 Ti Laptop GPU | |
| NVIDIA GeForce RTX 3080 Ti Laptop GPU | |
| NVIDIA GeForce RTX 3080 Ti Laptop GPU | |
| Apple M2 Max 38-Core GPU | |
| NVIDIA GeForce RTX 3080 Ti Laptop GPU | |
| 3DMark / Speed Way Score | |
| NVIDIA GeForce RTX 4080 | |
| NVIDIA GeForce RTX 4090 Laptop GPU | |
| NVIDIA GeForce RTX 4090 Laptop GPU | |
| Medio NVIDIA GeForce RTX 4090 Laptop GPU (4401 - 5940, n=27) | |
| NVIDIA GeForce RTX 4070 Ti | |
| NVIDIA GeForce RTX 3080 Ti | |
| NVIDIA GeForce RTX 3090 | |
| Media de la clase Gaming (1577 - 6643, n=43, últimos 2 años) | |
| NVIDIA GeForce RTX 4080 Laptop GPU | |
| NVIDIA GeForce RTX 3080 Ti Laptop GPU | |
| GFXBench / 4K Aztec Ruins High Tier Offscreen | |
| Medio NVIDIA GeForce RTX 4090 Laptop GPU (239 - 246, n=3) | |
| NVIDIA GeForce RTX 4090 Laptop GPU | |
| NVIDIA GeForce RTX 4080 Laptop GPU | |
| Apple M2 Max 38-Core GPU | |
| Media de la clase Gaming (100.4 - 243, n=6, últimos 2 años) | |
| GFXBench / Aztec Ruins High Tier Offscreen | |
| Medio NVIDIA GeForce RTX 4090 Laptop GPU (518 - 550, n=3) | |
| NVIDIA GeForce RTX 4090 Laptop GPU | |
| NVIDIA GeForce RTX 4080 Laptop GPU | |
| Apple M2 Max 38-Core GPU | |
| Media de la clase Gaming (232 - 507, n=6, últimos 2 años) | |
| 3DMark 06 Standard Score | 67927 puntos | |
| 3DMark Vantage P Result | 113387 puntos | |
| 3DMark 11 Performance | 49253 puntos | |
| 3DMark Fire Strike Score | 37594 puntos | |
| 3DMark Fire Strike Extreme Score | 25475 puntos | |
| 3DMark Time Spy Score | 20862 puntos | |
ayuda | ||
Photoshop PugetBench: Filter Score | General Score | GPU Score | Overall Score
Premiere Pro PugetBench: GPU 0.9 | Live Playback 0.9 | Export 0.9 | Overall Score 0.9
| Blender / v3.3 Classroom OPTIX/RTX | |
| Alienware x15 R2 P111F | |
| Asus ROG Strix Scar 17 SE G733CX-LL014W | |
| MSI Titan GT77 12UHS | |
| Media de la clase Gaming (9 - 32, n=103, últimos 2 años) | |
| Razer Blade 16 Early 2023 | |
| ASUS TUF Gaming GeForce RTX 3080 Ti OC | |
| Intel Core i5-13400F | |
| Medio NVIDIA GeForce RTX 4090 Laptop GPU (9 - 19, n=39) | |
| KFA2 GeForce RTX 4070 Ti SG | |
| MSI Titan GT77 HX 13VI | |
| Schenker XMG Neo 16 Raptor Lake | |
| KFA2 GeForce RTX 4080 SG | |
| Blender / v3.3 Classroom CUDA | |
| Alienware x15 R2 P111F | |
| Asus ROG Strix Scar 17 SE G733CX-LL014W | |
| Media de la clase Gaming (15 - 228, n=103, últimos 2 años) | |
| MSI Titan GT77 12UHS | |
| Razer Blade 16 Early 2023 | |
| ASUS TUF Gaming GeForce RTX 3080 Ti OC | |
| Intel Core i5-13400F | |
| Medio NVIDIA GeForce RTX 4090 Laptop GPU (16 - 24, n=39) | |
| Schenker XMG Neo 16 Raptor Lake | |
| MSI Titan GT77 HX 13VI | |
| Blender / v3.3 Classroom CPU | |
| Alienware x15 R2 P111F | |
| Intel Core i5-13400F | |
| Apple MacBook Pro 16 2023 M2 Max | |
| Asus ROG Strix Scar 17 SE G733CX-LL014W | |
| MSI Titan GT77 12UHS | |
| Media de la clase Gaming (122 - 565, n=99, últimos 2 años) | |
| Razer Blade 16 Early 2023 | |
| Schenker XMG Neo 16 Raptor Lake | |
| Medio NVIDIA GeForce RTX 4090 Laptop GPU (144 - 305, n=39) | |
| MSI Titan GT77 HX 13VI | |
| ASUS TUF Gaming GeForce RTX 3080 Ti OC | |
| Blender / v3.3 Classroom METAL | |
| Apple MacBook Pro 16 2023 M2 Max | |
| Photoshop PugetBench / Filter Score | |
| KFA2 GeForce RTX 4080 SG | |
| ASUS TUF Gaming GeForce RTX 3080 Ti OC | |
| KFA2 GeForce RTX 4070 Ti SG | |
| Intel Core i5-13400F | |
| Apple MacBook Pro 16 2023 M2 Max | |
| MSI Titan GT77 HX 13VI | |
| Medio NVIDIA GeForce RTX 4090 Laptop GPU (91.9 - 104.6, n=5) | |
| Photoshop PugetBench / General Score | |
| MSI Titan GT77 HX 13VI | |
| Medio NVIDIA GeForce RTX 4090 Laptop GPU (151.8 - 168.2, n=5) | |
| Apple MacBook Pro 16 2023 M2 Max | |
| KFA2 GeForce RTX 4080 SG | |
| ASUS TUF Gaming GeForce RTX 3080 Ti OC | |
| KFA2 GeForce RTX 4070 Ti SG | |
| Intel Core i5-13400F | |
| Photoshop PugetBench / GPU Score | |
| KFA2 GeForce RTX 4080 SG | |
| ASUS TUF Gaming GeForce RTX 3080 Ti OC | |
| KFA2 GeForce RTX 4070 Ti SG | |
| Apple MacBook Pro 16 2023 M2 Max | |
| Medio NVIDIA GeForce RTX 4090 Laptop GPU (109.1 - 119.4, n=5) | |
| MSI Titan GT77 HX 13VI | |
| Intel Core i5-13400F | |
| Photoshop PugetBench / Overall Score | |
| KFA2 GeForce RTX 4080 SG | |
| ASUS TUF Gaming GeForce RTX 3080 Ti OC | |
| KFA2 GeForce RTX 4070 Ti SG | |
| MSI Titan GT77 HX 13VI | |
| Medio NVIDIA GeForce RTX 4090 Laptop GPU (1225 - 1356, n=5) | |
| Apple MacBook Pro 16 2023 M2 Max | |
| Intel Core i5-13400F | |
| Premiere Pro PugetBench / GPU 0.9 | |
| MSI Titan GT77 HX 13VI | |
| Medio NVIDIA GeForce RTX 4090 Laptop GPU (75.8 - 109.2, n=3) | |
| KFA2 GeForce RTX 4080 SG | |
| Intel Core i5-13400F | |
| ASUS TUF Gaming GeForce RTX 3080 Ti OC | |
| KFA2 GeForce RTX 4070 Ti SG | |
| Apple MacBook Pro 16 2023 M2 Max | |
| Premiere Pro PugetBench / Live Playback 0.9 | |
| MSI Titan GT77 HX 13VI | |
| Medio NVIDIA GeForce RTX 4090 Laptop GPU (91.7 - 118, n=3) | |
| KFA2 GeForce RTX 4080 SG | |
| KFA2 GeForce RTX 4070 Ti SG | |
| ASUS TUF Gaming GeForce RTX 3080 Ti OC | |
| Intel Core i5-13400F | |
| Apple MacBook Pro 16 2023 M2 Max | |
| Premiere Pro PugetBench / Export 0.9 | |
| MSI Titan GT77 HX 13VI | |
| KFA2 GeForce RTX 4070 Ti SG | |
| KFA2 GeForce RTX 4080 SG | |
| ASUS TUF Gaming GeForce RTX 3080 Ti OC | |
| Medio NVIDIA GeForce RTX 4090 Laptop GPU (78.4 - 113.4, n=3) | |
| Apple MacBook Pro 16 2023 M2 Max | |
| Intel Core i5-13400F | |
| Premiere Pro PugetBench / Overall Score 0.9 | |
| Apple MacBook Pro 16 2023 M2 Max | |
| MSI Titan GT77 HX 13VI | |
| Medio NVIDIA GeForce RTX 4090 Laptop GPU (821 - 1105, n=3) | |
| KFA2 GeForce RTX 4070 Ti SG | |
| KFA2 GeForce RTX 4080 SG | |
| ASUS TUF Gaming GeForce RTX 3080 Ti OC | |
| Intel Core i5-13400F | |
Photoshop PugetBench: Filter Score | General Score | GPU Score | Overall Score
Premiere Pro PugetBench: GPU 0.9 | Live Playback 0.9 | Export 0.9 | Overall Score 0.9
* ... más pequeño es mejor
La RTX 4090 no tiene controladores especiales como las GPU para estaciones de trabajo, pero el rendimiento sigue siendo impresionante y la nueva GPU GeForce puede incluso superar a la profesionalRTX A5500en algunas de las pruebas SPECviewperf (como Maya, SiemensNX). Sin embargo, la GPU de consumo a veces también queda por debajo, así que depende de tu carga de trabajo, pero las GPU profesionales no siempre son necesarias.
Rendimiento en juegos
El rendimiento de juego es increíble y la combinación del Core i9-13950HX y la RTX 4090 maneja todos los juegos probados con fluidez incluso en 4K con los ajustes al máximo. La única excepción son los casos extremos como Cyberpunk 2077 con el preajuste RT Ultra en 4K, dónde puede ayudar con el reescalado (más sobre esto más adelante). Nuestros juegos predeterminados que probamos con cada portátil muestran una ventaja media del 26 % sobre la antiguaRTX 3080 Tipero la ventaja es mayor en títulos más nuevos y resoluciones más altas.
| The Witcher 3 - 1920x1080 Ultra Graphics & Postprocessing (HBAO+) | |
| Schenker XMG Neo 16 Raptor Lake | |
| MSI Titan GT77 HX 13VI | |
| Media de la clase Gaming (104.7 - 240, n=7, últimos 2 años) | |
| Razer Blade 16 Early 2023 | |
| MSI Titan GT77 12UHS | |
| Alienware x17 R2 P48E | |
| Schenker XMG Neo 17 M22 | |
| Asus ROG Strix Scar 17 SE G733CX-LL014W | |
El rendimiento de Raytracing también es muy bueno y la nueva RTX 4090 está más o menos a la par con larTX 4070 Ti de sobremesa.
| The Witcher 3 v4 - 1920x1080 RT Ultra Preset / On AA:FX | |
| KFA2 GeForce RTX 4070 Ti SG | |
| MSI Titan GT77 HX 13VI | |
| Schenker XMG Neo 16 Raptor Lake | |
| Medio NVIDIA GeForce RTX 4090 Laptop GPU (53.1 - 68, n=5) | |
| The Callisto Protocol - 1920x1080 Ultra Preset (without FSR Upscaling) + Full Ray-Tracing | |
| KFA2 GeForce RTX 4080 SG | |
| KFA2 GeForce RTX 4070 Ti SG | |
| ASUS TUF Gaming GeForce RTX 3080 Ti OC | |
| MSI Titan GT77 HX 13VI | |
| Medio NVIDIA GeForce RTX 4090 Laptop GPU (32 - 79.6, n=5) | |
| Schenker XMG Neo 16 Raptor Lake | |
| Spider-Man Miles Morales - 1920x0180 Very High Preset + Ray-Tracing AA:T | |
| KFA2 GeForce RTX 4080 SG | |
| KFA2 GeForce RTX 4070 Ti SG | |
| Schenker XMG Neo 16 Raptor Lake | |
| ASUS TUF Gaming GeForce RTX 3080 Ti OC | |
| MSI Titan GT77 HX 13VI | |
| Medio NVIDIA GeForce RTX 4090 Laptop GPU (79.6 - 96.2, n=4) | |
| Watch Dogs Legion - 1920x1080 Ultra Preset + Ultra Ray Tracing (DX12) | |
| Schenker XMG Neo 16 Raptor Lake | |
| Zotac Gaming GeForce RTX 3090 Ti AMP Extreme Holo | |
| Medio NVIDIA GeForce RTX 4090 Laptop GPU (84 - 90, n=2) | |
| MSI Titan GT77 HX 13VI | |
| Razer Blade 16 Early 2023 | |
| MSI Titan GT77 12UHS | |
| Alienware x15 R2 P111F | |
| Juego | Ajuste | DLSS desactivado | DLSS activado (Equilibrado) | Diferencia |
|---|---|---|---|---|
| Spider-Man Miles Morales | 4K Ultra | 83 FPS | 132 FPS | +59 % |
| Witcher 3 4.00 | 4K RT Ultra | 27 FPS | 50 FPS | +85 % |
| Cyberpunk 2077 1.5 | RT 4K | 22 FPS | 95 FPS | +331 % |
| God of War | 4K Ultra | 80 FPS | 111 FPS | +38 % |
Normalmente realizamos nuestras pruebas de juegos sin tecnologías de escalado como Nvidia DLSS o AMD FSR. Sin embargo, el rendimiento puede beneficiarse mucho cuando el título lo admite y notamos algunas mejoras importantes con DLSS 3.0 activado sin ningún déficit visual. Teniendo en cuenta estos resultados, las próximas variantes más pequeñasRTX 4060yRTX 4070deberían ser capaces de manejar juegos 4K cuando DLSS está activo.
El rendimiento de juego es completamente estable, lo que también muestra nuestro bucle Witcher 3. Sin embargo, el rendimiento vuelve a reducirse masivamente en batería.
Witcher 3 FPS-Diagramm
También comprobamos la eficiencia de la nueva GPU con nuestra prueba Witcher 3. La influencia de la CPU no es muy grande y usamos los valores conectados a una pantalla externa, por lo que podemos eliminar los diferentes tipos de pantallas y también comparar los resultados con GPUs de sobremesa. El resultado de la nueva RTX 4090 es impresionante, porque la GPU es en torno a un 40 % más eficiente que la RTX 3080 Ti Mobile (140 W) en elAlienware x15y larTX 4080 de sobremesa. La nueva GT77 también es un 53 % más eficiente que el modelo anterior con laRTX 3080 Ticon el mismo TGP.
| bajo | medio | alto | ultra | QHD | 4K DLSS | 4K | |
|---|---|---|---|---|---|---|---|
| GTA V (2015) | 184.1 | 182.6 | 140.9 | 138.5 | 175.7 | ||
| The Witcher 3 (2015) | 619 | 546 | 422 | 198.9 | 160 | ||
| Dota 2 Reborn (2015) | 225 | 206 | 194.1 | 185.9 | 178.9 | ||
| Final Fantasy XV Benchmark (2018) | 230 | 221 | 187.4 | 162.9 | 94.7 | ||
| X-Plane 11.11 (2018) | 203 | 177.5 | 134.1 | 114.3 | |||
| Far Cry 5 (2018) | 186 | 173 | 160 | 159 | 113 | ||
| Strange Brigade (2018) | 490 | 396 | 391 | 373 | 309 | 159.3 | |
| Shadow of the Tomb Raider (2018) | 245 | 227 | 219 | 214 | 187 | 103 | |
| Metro Exodus (2019) | 204 | 183 | 153 | 132 | 116 | 81 | |
| Control (2019) | 240 | 232 | 187 | 122 | 63 | ||
| Borderlands 3 (2019) | 201 | 176 | 162 | 151 | 130 | 76 | |
| Horizon Zero Dawn (2020) | 209 | 189 | 174 | 163 | 154 | 131 | 95 |
| Mafia Definitive Edition (2020) | 219 | 189 | 179 | 161 | 93 | ||
| Watch Dogs Legion (2020) | 152 | 144 | 131 | 120 | 109 | 69 | |
| F1 2021 (2021) | 501 | 449 | 417 | 209 | 192.4 | 114.4 | |
| Far Cry 6 (2021) | 167 | 147 | 144 | 135 | 89 | ||
| Forza Horizon 5 (2021) | 220 | 181 | 174 | 124 | 113 | 95 | |
| God of War (2022) | 201 | 200 | 180 | 133 | 115 | 80 | |
| Rainbow Six Extraction (2022) | 378 | 347 | 346 | 314 | 219 | 112 | |
| Dying Light 2 (2022) | 240 | 206 | 174 | 121 | 62 | ||
| GRID Legends (2022) | 254 | 230 | 210 | 199 | 190 | 132 | |
| Cyberpunk 2077 1.6 (2022) | 156 | 144 | 138 | 135 | 98 | 56 | |
| Ghostwire Tokyo (2022) | 237 | 236 | 234 | 231 | 206 | 100 | |
| Tiny Tina's Wonderlands (2022) | 339 | 289 | 224 | 182 | 131 | 70 | |
| F1 22 (2022) | 316 | 294 | 283 | 138.2 | 90.1 | 44.9 | |
| Call of Duty Modern Warfare 2 2022 (2022) | 230 | 215 | 183 | 176 | 135 | 126 | 85 |
| Spider-Man Miles Morales (2022) | 134 | 131 | 118 | 116 | 113 | 83 | |
| The Callisto Protocol (2022) | 195 | 181 | 145 | 144 | 114 | 68 | |
| The Witcher 3 v4 (2023) | 240 | 189 | 173 | 150 | 104 | 50 | |
| Dead Space Remake (2023) | 147 | 141 | 130 | 129 | 100 | 53 |
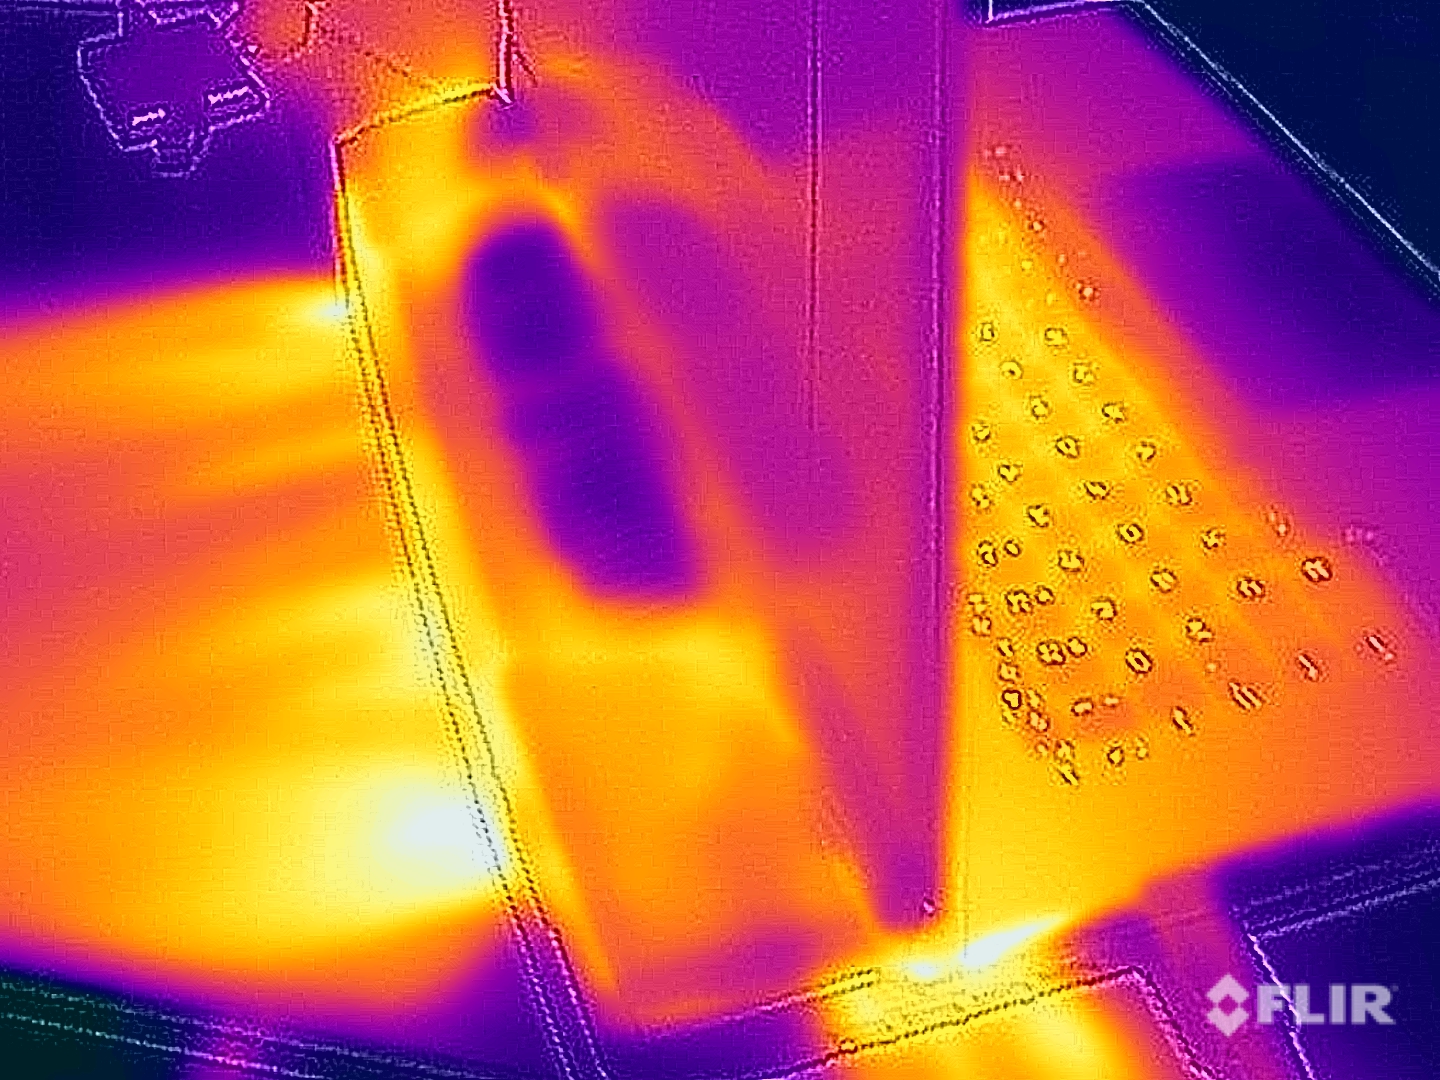
Emisiones - GT77 con más tubos de calor
Ruido del sistema
La Titan GT77 usa cuatro ventiladores y muchos tubos de calor para disipar todo el calor. Uno de los ventiladores (Ventilador 1 según MSI Control) siempre está girando a ~1500 rpm independientemente de los ajustes de potencia, lo que resulta en un murmullo de 29.2 dB(A). Por tanto, nunca es un sistema silencioso y a veces también puedes oír ruidos electrónicos a 29 dB(A). La constante actividad del ventilador significa que los ventiladores no girarán durante cargas de trabajo ligeras como la navegación web. Si empiezas a estresar la CPU o la GPU, sin embargo, se volverá muy ruidoso rápidamente. Es bastante interesante que obtuvimos los ventiladores más ruidosos durante la carga de CPU con 61 dB(A), mientras que el test de estrés "sólo" resultó en 53.3 dB(A). La razón es el comportamiento del ventilador, que también puede verse en las imágenes de abajo.
Medimos entre 53 y 56 dB(A) dependiendo del título, lo que obviamente es muy ruidoso. Hay dos enfoques diferentes aquí, puedes usar auriculares (favorablemente con cancelación de ruido) o usar el modo Silencioso, que limitará el ruido del ventilador a 39.6 dB(A). El rendimiento también se verá afectado, pero la mayoría de los juegos seguirán funcionando sin problemas gracias a las enormes reservas de rendimiento. Puedes activar la función Cooler Boost manualmente, lo que se traducirá en 62,8 dB(A), pero nunca alcanzamos este nivel durante las pruebas.
| Rendimiento extremo | Equilibrada | Silenciosa | |
|---|---|---|---|
| Witcher 3 4.00 Ultra 4K | 55,7 dB(A) | 55,7 dB(A) | 39,6 dB(A) |
| Witcher 3 Ultra | 53,3 dB(A) | 53,3 dB(A) | 39,6 dB(A) |
| Dead Space Remake Ultra 4K | 55,7 dB(A) | 53,3 dB(A) | 39,6 dB(A) |
| CB R23 Multi | 61 dB(A) | 55,7 dB(A) | 36,8 dB(A) |
| Furmark | 56,1 dB(A) | 53,3 dB(A) | 39,6 dB(A) |
Ruido
| Ocioso |
| 29.2 / 29.2 / 29.2 dB(A) |
| Carga |
| 50.7 / 61 dB(A) |
 | ||
30 dB silencioso 40 dB(A) audible 50 dB(A) ruidosamente alto |
||
min: | ||
| MSI Titan GT77 HX 13VI GeForce RTX 4090 Laptop GPU, i9-13950HX, Samsung PM9A1 MZVL22T0HBLB | Razer Blade 16 Early 2023 GeForce RTX 4080 Laptop GPU, i9-13950HX, SSSTC CA6-8D1024 | Asus ROG Strix Scar 17 SE G733CX-LL014W GeForce RTX 3080 Ti Laptop GPU, i9-12950HX, Samsung PM9A1 MZVL22T0HBLB | MSI Titan GT77 12UHS GeForce RTX 3080 Ti Laptop GPU, i9-12900HX, Samsung PM9A1 MZVL21T0HCLR | Alienware x17 R2 P48E GeForce RTX 3080 Ti Laptop GPU, i9-12900HK, 2x Samsung PM9A1 1TB (RAID 0) | Schenker XMG Neo 17 M22 GeForce RTX 3080 Ti Laptop GPU, R9 6900HX, Samsung SSD 980 Pro 1TB MZ-V8P1T0BW | |
|---|---|---|---|---|---|---|
| Noise | 16% | 19% | 10% | 18% | -2% | |
| apagado / medio ambiente * (dB) | 24.6 | 23 7% | 23.9 3% | 21.9 11% | 22.7 8% | 26 -6% |
| Idle Minimum * (dB) | 29.2 | 23 21% | 23.9 18% | 24.53 16% | 23.1 21% | 26 11% |
| Idle Average * (dB) | 29.2 | 23 21% | 23.9 18% | 24.53 16% | 23.1 21% | 29 1% |
| Idle Maximum * (dB) | 29.2 | 23.6 19% | 23.9 18% | 24.53 16% | 23.1 21% | 40 -37% |
| Load Average * (dB) | 50.7 | 39 23% | 34.3 32% | 46.25 9% | 31.9 37% | 47 7% |
| Witcher 3 ultra * (dB) | 53.3 | 51.6 3% | 56.86 -7% | 52.5 2% | 52 2% | |
| Load Maximum * (dB) | 61 | 51.3 16% | 45.9 25% | 54.25 11% | 52.5 14% | 54 11% |
* ... más pequeño es mejor
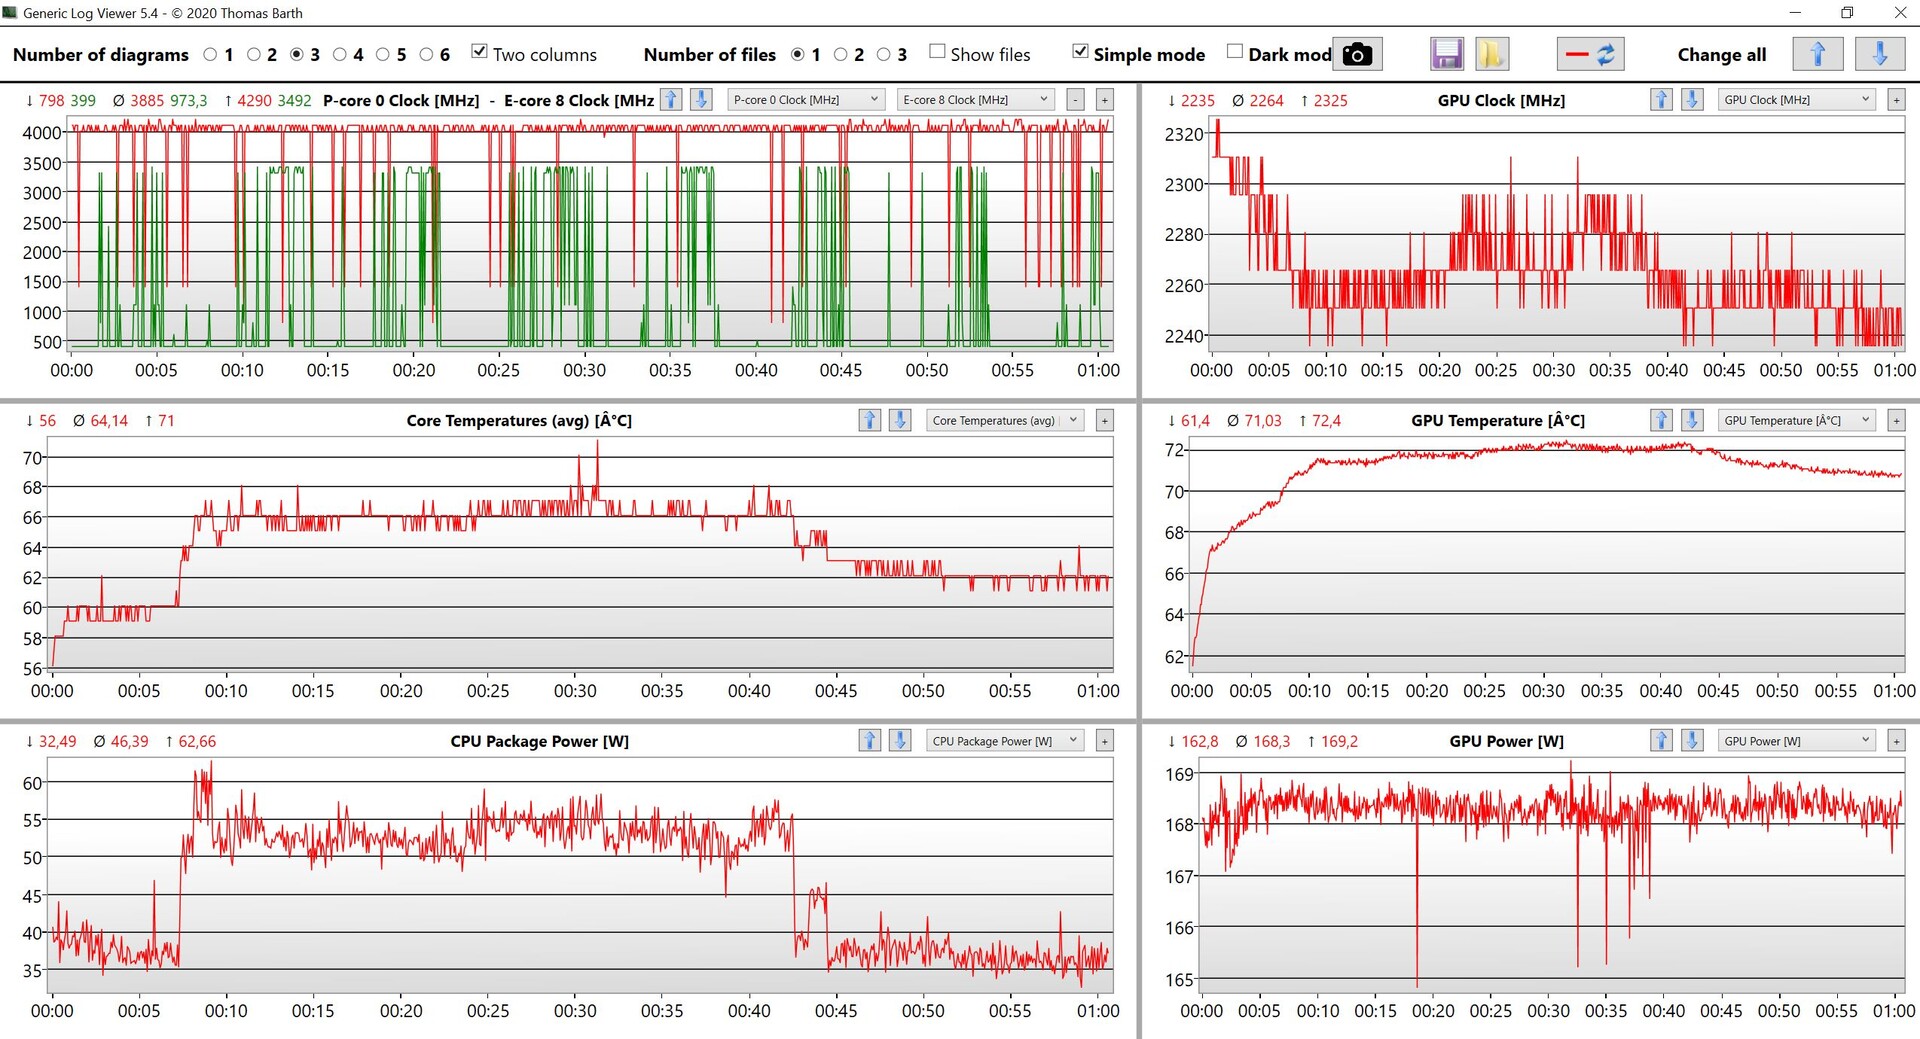
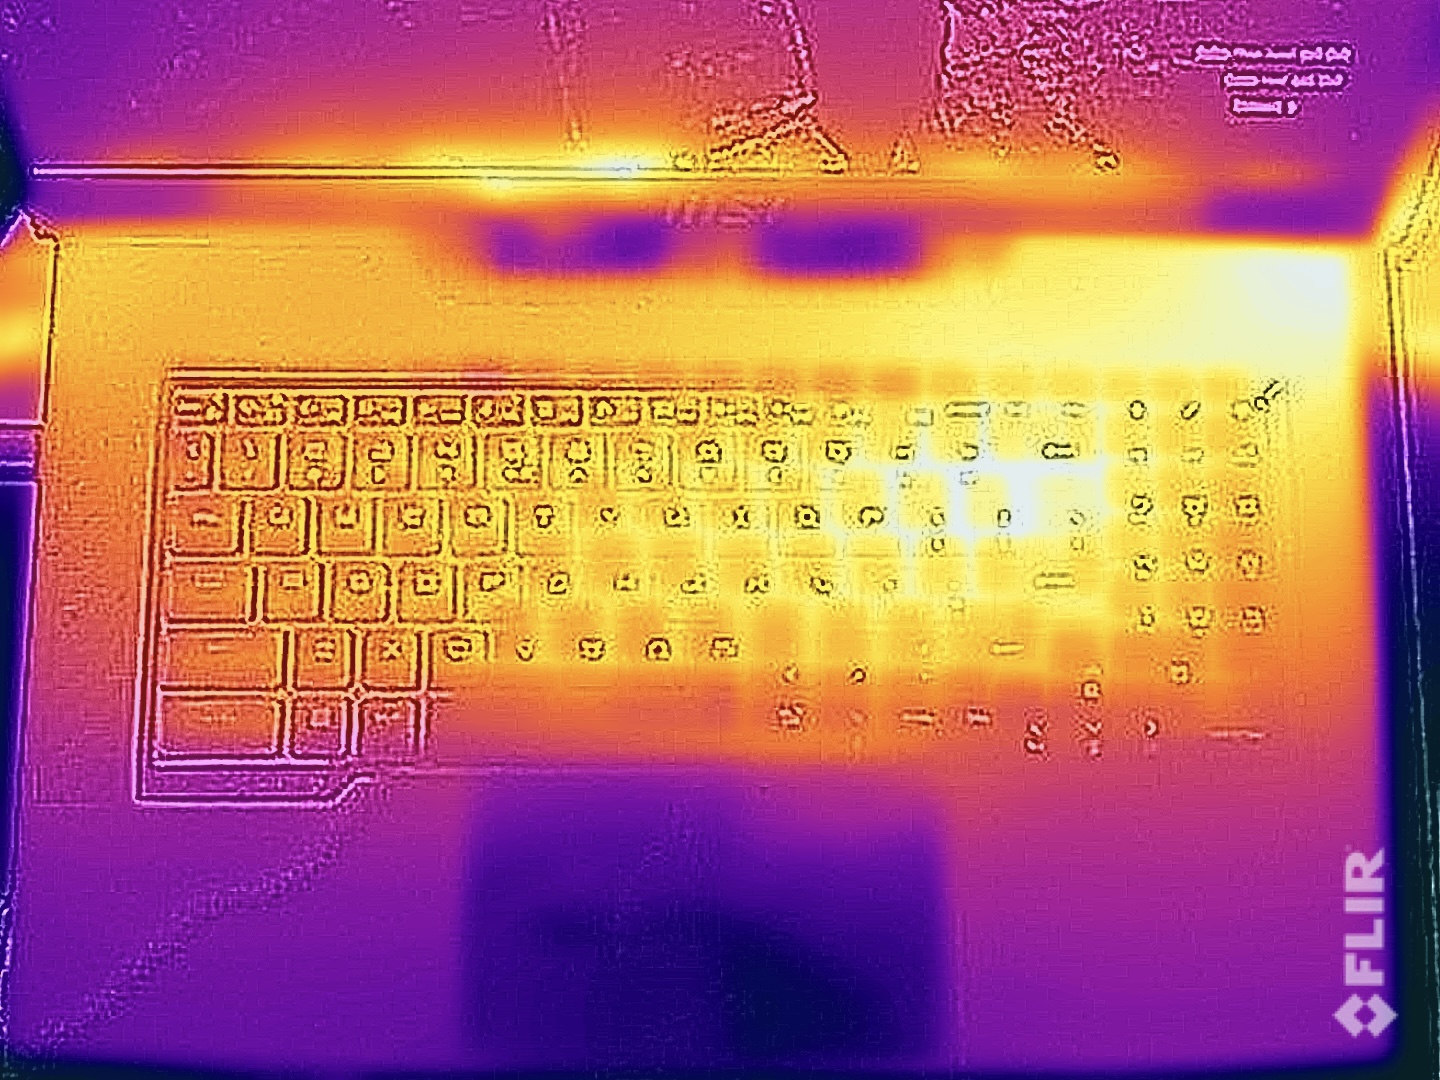
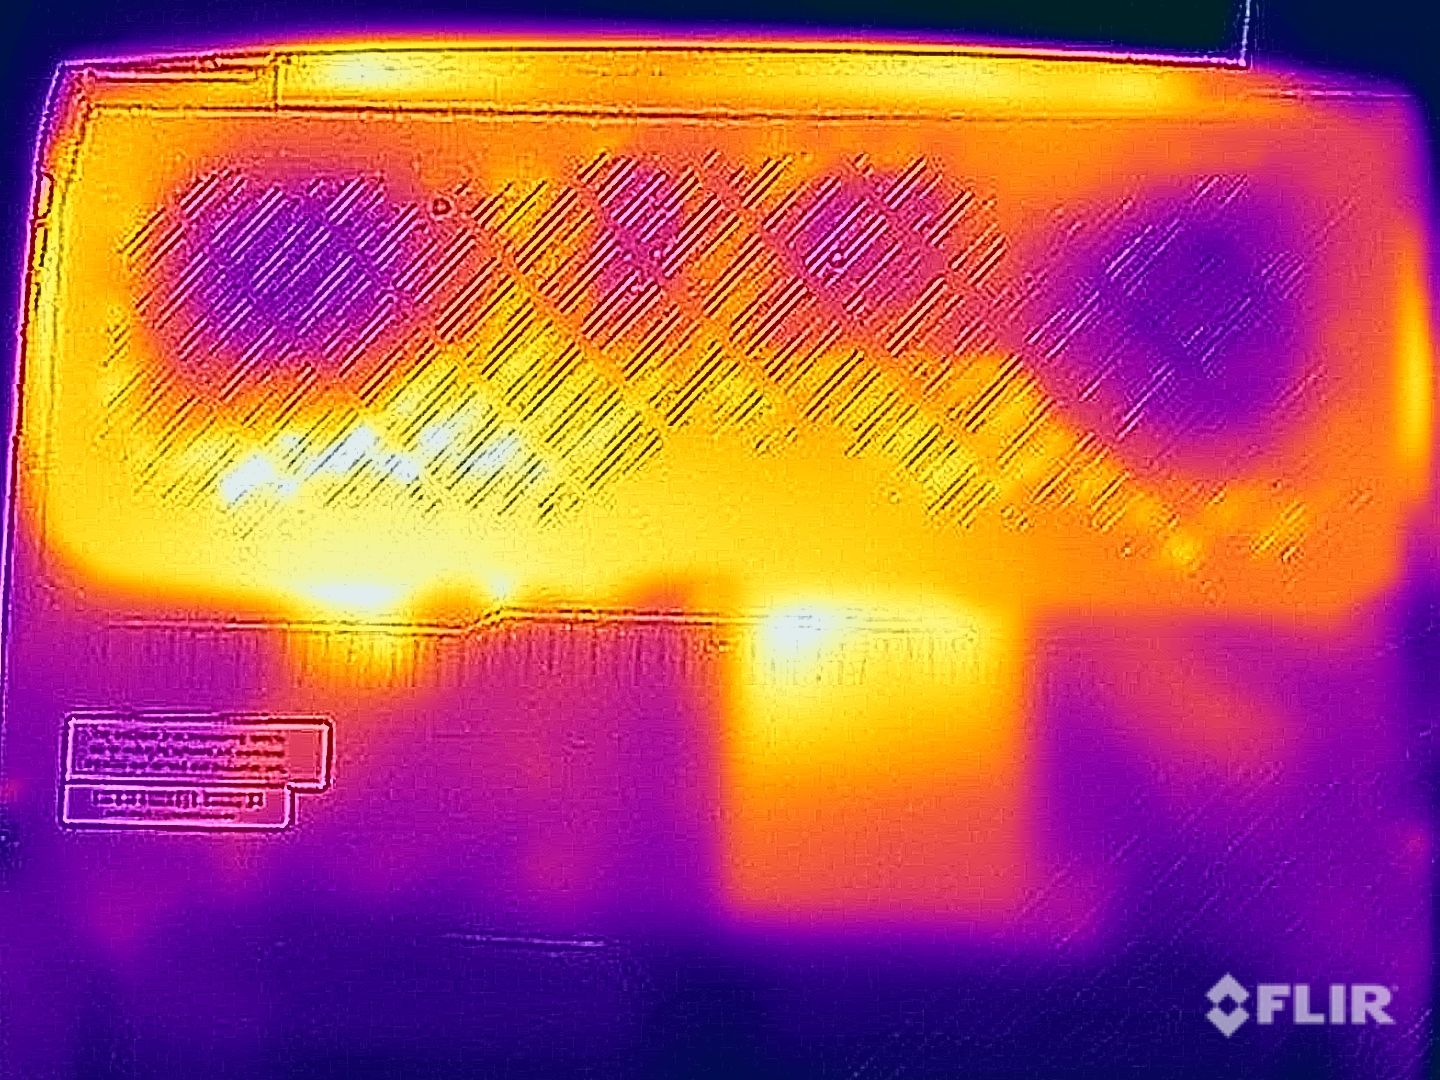
Temperatura
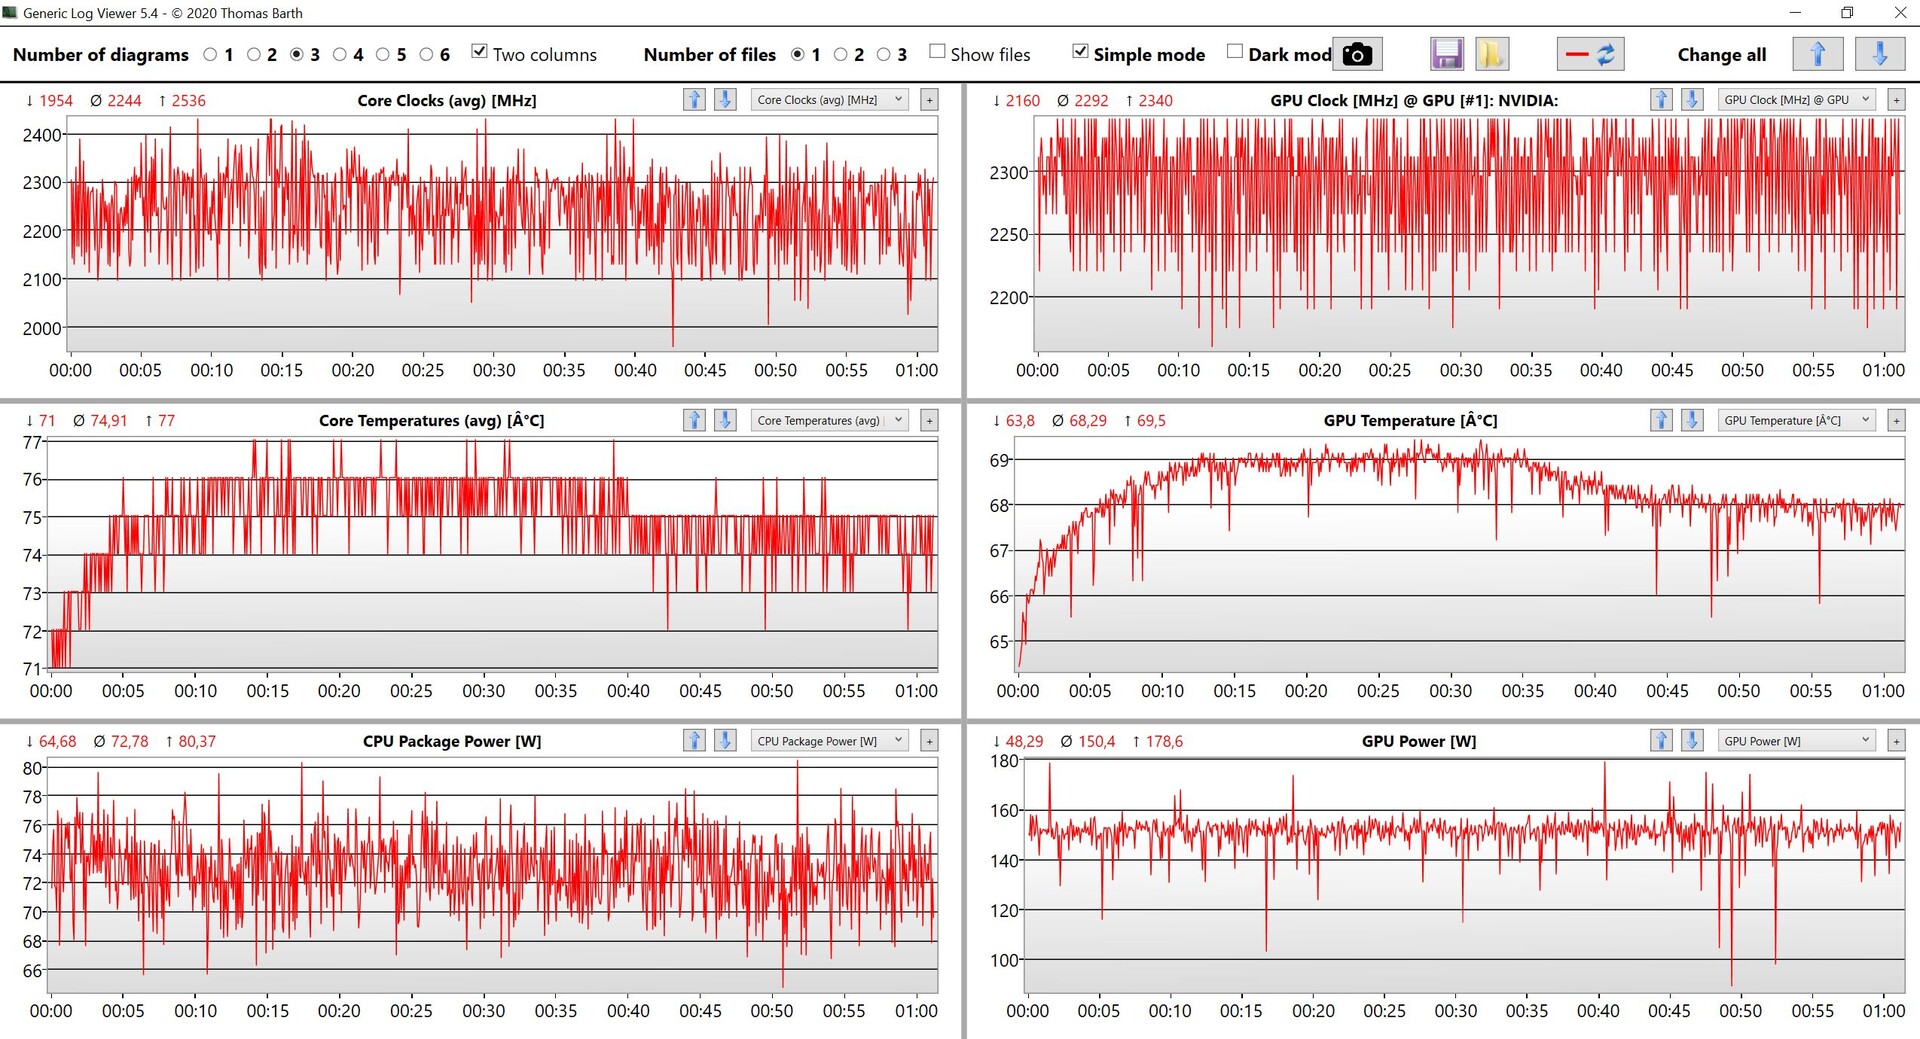
Los ventiladores ruidosos tienen una gran ventaja, porque las temperaturas superficiales son sorprendentemente bajas y puedes seguir usando el teclado sin limitaciones durante las sesiones de juego más largas. Comprobamos los resultados varias veces, pero las cifras eran las mismas. Apenas podemos medir más de 40 °C bajo carga, lo que es un gran resultado teniendo en cuenta el rendimiento.
La CPU y la GPU se nivelan rápidamente a 75W y 150W, respectivamente, durante la prueba de estrés y el rendimiento se mantiene estable. El sistema refrigera un total de 225W, pero MSI incluso anuncia hasta 250W para sistemas con elCore i9-13980HXpor lo que las temperaturas podrían ser algo superiores (no esperamos ventiladores aún más ruidosos).
(±) La temperatura máxima en la parte superior es de 40.6 °C / 105 F, frente a la media de 40.4 °C / 105 F, que oscila entre 21.2 y 68.8 °C para la clase Gaming.
(±) El fondo se calienta hasta un máximo de 41.1 °C / 106 F, frente a la media de 43.2 °C / 110 F
(+) En reposo, la temperatura media de la parte superior es de 25.2 °C / 77# F, frente a la media del dispositivo de 33.9 °C / 93 F.
(±) Jugando a The Witcher 3, la temperatura media de la parte superior es de 36.2 °C / 97 F, frente a la media del dispositivo de 33.9 °C / 93 F.
(+) El reposamanos y el panel táctil están a una temperatura inferior a la de la piel, con un máximo de 29.6 °C / 85.3 F y, por tanto, son fríos al tacto.
(±) La temperatura media de la zona del reposamanos de dispositivos similares fue de 28.8 °C / 83.8 F (-0.8 °C / -1.5 F).
| MSI Titan GT77 HX 13VI Intel Core i9-13950HX, NVIDIA GeForce RTX 4090 Laptop GPU | Razer Blade 16 Early 2023 Intel Core i9-13950HX, NVIDIA GeForce RTX 4080 Laptop GPU | Asus ROG Strix Scar 17 SE G733CX-LL014W Intel Core i9-12950HX, NVIDIA GeForce RTX 3080 Ti Laptop GPU | MSI Titan GT77 12UHS Intel Core i9-12900HX, NVIDIA GeForce RTX 3080 Ti Laptop GPU | Alienware x17 R2 P48E Intel Core i9-12900HK, NVIDIA GeForce RTX 3080 Ti Laptop GPU | Schenker XMG Neo 17 M22 AMD Ryzen 9 6900HX, NVIDIA GeForce RTX 3080 Ti Laptop GPU | |
|---|---|---|---|---|---|---|
| Heat | -5% | -19% | -22% | -11% | -18% | |
| Maximum Upper Side * (°C) | 40.6 | 40 1% | 48.8 -20% | 40.8 -0% | 49.6 -22% | 49 -21% |
| Maximum Bottom * (°C) | 41.1 | 37.6 9% | 52.4 -27% | 52.4 -27% | 42.4 -3% | 52 -27% |
| Idle Upper Side * (°C) | 26.2 | 32.4 -24% | 30.4 -16% | 34.6 -32% | 29.2 -11% | 30 -15% |
| Idle Bottom * (°C) | 30.3 | 31.4 -4% | 34.1 -13% | 38.4 -27% | 32 -6% | 33 -9% |
* ... más pequeño es mejor
Altavoces
El GT77 sigue ofreciendo dos buenos altavoces estéreo en combinación con dos woofers, que producen un sonido decente. Sin embargo, no se puede disfrutar realmente durante los juegos ya que los ventiladores son demasiado ruidosos, pero el sistema de sonido es definitivamente suficiente para la reproducción ocasional de música y vídeo.
MSI Titan GT77 HX 13VI análisis de audio
(+) | los altavoces pueden reproducir a un volumen relativamente alto (#90.1 dB)
Graves 100 - 315 Hz
(±) | lubina reducida - en promedio 14.3% inferior a la mediana
(±) | la linealidad de los graves es media (7.5% delta a frecuencia anterior)
Medios 400 - 2000 Hz
(+) | medios equilibrados - a sólo 3.5% de la mediana
(+) | los medios son lineales (3.2% delta a la frecuencia anterior)
Altos 2 - 16 kHz
(+) | máximos equilibrados - a sólo 1.9% de la mediana
(+) | los máximos son lineales (3.8% delta a la frecuencia anterior)
Total 100 - 16.000 Hz
(+) | el sonido global es lineal (11.1% de diferencia con la mediana)
En comparación con la misma clase
» 8% de todos los dispositivos probados de esta clase eran mejores, 3% similares, 89% peores
» El mejor tuvo un delta de 6%, la media fue 18%, el peor fue ###max##%
En comparación con todos los dispositivos probados
» 7% de todos los dispositivos probados eran mejores, 2% similares, 91% peores
» El mejor tuvo un delta de 4%, la media fue 23%, el peor fue ###max##%
Alienware x17 R2 P48E análisis de audio
(+) | los altavoces pueden reproducir a un volumen relativamente alto (#84.3 dB)
Graves 100 - 315 Hz
(±) | lubina reducida - en promedio 9.7% inferior a la mediana
(+) | el bajo es lineal (5.5% delta a la frecuencia anterior)
Medios 400 - 2000 Hz
(+) | medios equilibrados - a sólo 1.6% de la mediana
(+) | los medios son lineales (3% delta a la frecuencia anterior)
Altos 2 - 16 kHz
(±) | máximos más altos - de media 5% más altos que la mediana
(±) | la linealidad de los máximos es media (7.6% delta a frecuencia anterior)
Total 100 - 16.000 Hz
(+) | el sonido global es lineal (9.3% de diferencia con la mediana)
En comparación con la misma clase
» 3% de todos los dispositivos probados de esta clase eran mejores, 2% similares, 95% peores
» El mejor tuvo un delta de 6%, la media fue 18%, el peor fue ###max##%
En comparación con todos los dispositivos probados
» 3% de todos los dispositivos probados eran mejores, 1% similares, 96% peores
» El mejor tuvo un delta de 4%, la media fue 23%, el peor fue ###max##%
Gestión de la energía - Titán con batería de 99,9 Wh
Consumo de energía
El consumo de energía de la nueva GT77 en ralentí con la iGPU no es demasiado malo y tampoco hay grandes diferencias con modelos anteriores bajo carga, lo que es impresionante teniendo en cuenta el aumento de rendimiento. Podemos observar un consumo máximo de hasta 420W cuando iniciamos la prueba de estrés, pero bajará rápidamente a ~290W una vez que los componentes se hayan asentado. Esto significa que el adaptador de corriente de 330W es suficiente.
| Off / Standby | |
| Ocioso | |
| Carga |
|
Clave:
min: | |
| MSI Titan GT77 HX 13VI i9-13950HX, GeForce RTX 4090 Laptop GPU, Samsung PM9A1 MZVL22T0HBLB, Mini-LED, 3840x2160, 17.3" | Razer Blade 16 Early 2023 i9-13950HX, GeForce RTX 4080 Laptop GPU, SSSTC CA6-8D1024, IPS, 2560x1600, 16" | Asus ROG Strix Scar 17 SE G733CX-LL014W i9-12950HX, GeForce RTX 3080 Ti Laptop GPU, Samsung PM9A1 MZVL22T0HBLB, IPS, 2560x1440, 17.3" | MSI Titan GT77 12UHS i9-12900HX, GeForce RTX 3080 Ti Laptop GPU, Samsung PM9A1 MZVL21T0HCLR, IPS-Level, 1920x1080, 17.3" | Alienware x17 R2 P48E i9-12900HK, GeForce RTX 3080 Ti Laptop GPU, 2x Samsung PM9A1 1TB (RAID 0), IPS, 1920x1080, 17.3" | Schenker XMG Neo 17 M22 R9 6900HX, GeForce RTX 3080 Ti Laptop GPU, Samsung SSD 980 Pro 1TB MZ-V8P1T0BW, IPS, 2560x1600, 17" | Medio NVIDIA GeForce RTX 4090 Laptop GPU | Media de la clase Gaming | |
|---|---|---|---|---|---|---|---|---|
| Power Consumption | -12% | -7% | -30% | -37% | 33% | -9% | 13% | |
| Idle Minimum * (Watt) | 14 | 15.2 -9% | 19.3 -38% | 30.21 -116% | 24.1 -72% | 7 50% | 16.2 ? -16% | 13.1 ? 6% |
| Idle Average * (Watt) | 21.6 | 22.8 -6% | 26.5 -23% | 32.42 -50% | 28.5 -32% | 11 49% | 23.1 ? -7% | 19 ? 12% |
| Idle Maximum * (Watt) | 24.8 | 49.8 -101% | 27.1 -9% | 33.7 -36% | 60 -142% | 17 31% | 34.2 ? -38% | 24.6 ? 1% |
| Load Average * (Watt) | 122.5 | 121.2 1% | 141 -15% | 125.09 -2% | 128.7 -5% | 92 25% | 130.5 ? -7% | 111.3 ? 9% |
| Witcher 3 ultra * (Watt) | 265 | 242 9% | 225 15% | 256 3% | 254 4% | 221 17% | ||
| Load Maximum * (Watt) | 418 | 273.7 35% | 307.9 26% | 321.88 23% | 323 23% | 306 27% | 324 ? 22% | 260 ? 38% |
* ... más pequeño es mejor
Power consumption Witcher 3 / Stress test
Power consumption external screen
Duración de la batería
MSI ya implementa la mayor batería posible con 99.9 Wh, pero la duración de la batería sigue siendo limitada debido a las elevadas cifras de consumo. Ya mencionamos que el brillo del display se reduce en batería y que tampoco puedes usar HDR, pero puedes esperar unas 5-6 horas con un brillo de 150 nits (69 % del brillo máximo de nuestro modelo de pruebas) en escenarios prácticos. La duración mínima es de 1.5 horas, pero ya hemos mencionado que el rendimiento se reduce mucho. Una carga completa tarda 158 minutos cuando se enciende el dispositivo; el 80 % de la capacidad está disponible tras poco más de 1.5 horas.
| MSI Titan GT77 HX 13VI i9-13950HX, GeForce RTX 4090 Laptop GPU, 99.9 Wh | Razer Blade 16 Early 2023 i9-13950HX, GeForce RTX 4080 Laptop GPU, 95.2 Wh | Asus ROG Strix Scar 17 SE G733CX-LL014W i9-12950HX, GeForce RTX 3080 Ti Laptop GPU, 90 Wh | MSI Titan GT77 12UHS i9-12900HX, GeForce RTX 3080 Ti Laptop GPU, 99.9 Wh | Alienware x17 R2 P48E i9-12900HK, GeForce RTX 3080 Ti Laptop GPU, 87 Wh | Schenker XMG Neo 17 M22 R9 6900HX, GeForce RTX 3080 Ti Laptop GPU, 99 Wh | Media de la clase Gaming | |
|---|---|---|---|---|---|---|---|
| Duración de Batería | 8% | -21% | 17% | -53% | 36% | 26% | |
| H.264 (h) | 6 | 7.2 20% | 6.6 10% | 8.27 ? 38% | |||
| WiFi v1.3 (h) | 5.3 | 6.1 15% | 4.2 -21% | 6.9 30% | 2 -62% | 9 70% | 7.08 ? 34% |
| Load (h) | 1.4 | 1.4 0% | 1.4 0% | 0.8 -43% | 1.8 29% | 1.496 ? 7% | |
| Witcher 3 ultra (h) | 1.5 |
Pro
Contra
Veredicto - GT77 con un rendimiento de juego extremo y una gran pantalla
Lo más probable es que la nueva MSI Titan GT77 sólo llegue a un grupo muy reducido de usuarios debido a su elevado precio, pero sigue siendo un impresionante escaparate de lo que es posible. El jugador de gama alta combina los mejores componentes que se pueden conseguir actualmente en casi todos los aspectos y es un paquete global muy bueno, que no tiene por qué esconderse detrás de sistemas de sobremesa completos.
Ya conocemos el chasis del predecesor y deja una impresión decente, pero las opciones de iluminación son bastante limitadas (lo que puede ser bueno o malo según tus preferencias) y las superficies lisas son muy propensas a las huellas. El teclado mecánico sigue siendo excelente y hay suficientes puertos. El nuevo Procesador HX de la actual generación Raptor Lake de Intel es en torno a un 22 % más rápido que su predecesor de media, pero las nuevasGeForce RTX 4090es aún más impresionante. A pesar del TGP similar de 175 W, es entre un 40 % y un 60 % más rápida que la antiguaRTX 3080 Tiy puede competir con las versiones de sobremesa de las RTX 3090/RTX 3090 Ti. Comparada con las actuales GPU RTX-40xx de sobremesa, la nueva RTX 4090 Laptop se sitúa justo entre la RTX 4070 Ti y la RTX 4080.
Ningún portátil para juegos ofrece más rendimiento ahora mismo: El MSI GT77 con el Core i9-13950HX y la GeForce RTX 4090 utiliza el hardware más rápido que se puede conseguir para un portátil. Los juegos también se ven increíbles en el nuevo panel 4K Mini-LED.
La combinación de hardware no tiene problemas con la resolución 4K nativa de la nueva pantalla Mini-LED (144 Hz). La calidad de imagen subjetiva es excelente y los juegos se ven realmente bien. También puedes usar el panel para editar imágenes tras un calibrado, lo que es posible con el software True Color preinstalado. El display también soporta HDR con un brillo de más de 1000 nits, pero la implementación HDR en Windows sigue siendo terrible comparada con macOS, donde funciona a la perfección.
Teniendo en cuenta el potente hardware, el discreto diseño del chasis, la buena pantalla y el excelente teclado, la Titan GT77 también funciona realmente bien como estación de trabajo móvil e incluso la RTX A5500 se queda atrás en algunas aplicaciones profesionales.
La refrigeración funciona realmente bien con cuatro ventiladores y un montón de tubos de calor, y apenas podemos medir temperaturas superficiales de más de 40 °C incluso bajo carga, pero a cambio los ventiladores son extremadamente ruidosos. Deberías esperar entre 54-57 dB(A) durante el juego e incluso más de 60 dB(A) cuando sólo estresas la CPU. El ruido del ventilador es muy constante, pero aún así recomendaríamos auriculares (preferiblemente con cancelación de ruido activa). También es posible usar el modo Silencioso y reducir el ruido del ventilador a 40 dB(A). El rendimiento se verá afectado, pero seguirá siendo más que suficiente en la mayoría de títulos.
El MSI Titan GT77 también tiene algunos inconvenientes, especialmente teniendo en cuenta su elevado precio. Esto incluye el uso de plástico barato (especialmente la cubierta inferior), la lenta Ram DDR5-4800 y la mala webcam 720p. El rendimiento de los dos SSD de 2 TB en configuración RAID 0 es muy alto, pero no estable. El GT77 es el primer portátil de juego de 17 pulgadas con el nuevo hardware de nuestro análisis y ya estamos impacientes por probar la competencia en las próximas semanas.
Precio y disponibilidad
La nueva MSI Titan GT77 HX 13 VI está disponible en la tienda de MSI por 5299 dólares.
MSI Titan GT77 HX 13VI
- 02/07/2023 v7 (old)
Andreas Osthoff
Transparencia
La selección de los dispositivos que se van a reseñar corre a cargo de nuestro equipo editorial. La muestra de prueba fue proporcionada al autor en calidad de préstamo por el fabricante o el minorista a los efectos de esta reseña. El prestamista no tuvo ninguna influencia en esta reseña, ni el fabricante recibió una copia de la misma antes de su publicación. No había ninguna obligación de publicar esta reseña. Como empresa de medios independiente, Notebookcheck no está sujeta a la autoridad de fabricantes, minoristas o editores.
Así es como prueba Notebookcheck
Cada año, Notebookcheck revisa de forma independiente cientos de portátiles y smartphones utilizando procedimientos estandarizados para asegurar que todos los resultados son comparables. Hemos desarrollado continuamente nuestros métodos de prueba durante unos 20 años y hemos establecido los estándares de la industria en el proceso. En nuestros laboratorios de pruebas, técnicos y editores experimentados utilizan equipos de medición de alta calidad. Estas pruebas implican un proceso de validación en varias fases. Nuestro complejo sistema de clasificación se basa en cientos de mediciones y puntos de referencia bien fundamentados, lo que mantiene la objetividad.Price comparison

