Análisis del Medion Erazer Beast X40: Portátil para juegos con RTX 4090
Aunque entra en la categoría de portátiles para juegos, el Erazer Beast X40 también está concebido para otros escenarios de uso muy exigentes. El rendimiento informático necesario lo proporcionan una CPU Raptor Lake y una GPU Ada Lovelace. En comparación con sus predecesores Análisis del Medion Erazer Beast X30: Un portátil de juegos QHD delgado y potente , el portátil ha recibido una importante renovación: Medion le ha dado una nueva relación de aspecto de pantalla (16:10 en lugar de 16:9), un sistema de refrigeración con refrigeración por agua opcional y un teclado mecánico.
El X40 se basa en un barebone Tongfang (GM7PX9N) que es prácticamente idéntico al utilizado para el XMG Neo 17. Compite con modelos de la talla del MSI Titan GT77 HX 13VI, Alienware x17 R2 P48E, Razer Blade 16 (principios de 2023)y Asus ROG Strix Scar 18 2023 G834JY.
Posibles contendientes en la comparación
Valoración | Fecha | Modelo | Peso | Altura | Tamaño | Resolución | Precio |
|---|---|---|---|---|---|---|---|
| 88.4 % v7 (old) | 03/2023 | Medion Erazer Beast X40 i9-13900HX, GeForce RTX 4090 Laptop GPU | 2.9 kg | 33 mm | 17.00" | 2560x1600 | |
| 89 % v7 (old) | 02/2023 | MSI Titan GT77 HX 13VI i9-13950HX, GeForce RTX 4090 Laptop GPU | 3.5 kg | 23 mm | 17.30" | 3840x2160 | |
| 91.2 % v7 (old) | 02/2023 | Razer Blade 16 Early 2023 i9-13950HX, GeForce RTX 4080 Laptop GPU | 2.4 kg | 21.99 mm | 16.00" | 2560x1600 | |
| 87.6 % v7 (old) | 09/2022 | Schenker XMG Neo 17 M22 R9 6900HX, GeForce RTX 3080 Ti Laptop GPU | 2.8 kg | 27 mm | 17.00" | 2560x1600 | |
| 89.2 % v7 (old) | 05/2022 | Alienware x17 R2 P48E i9-12900HK, GeForce RTX 3080 Ti Laptop GPU | 3.1 kg | 20.9 mm | 17.30" | 1920x1080 | |
| 86.6 % v7 (old) | 02/2023 | Asus ROG Strix Scar 18 2023 G834JY-N6005W i9-13980HX, GeForce RTX 4090 Laptop GPU | 3.1 kg | 30.8 mm | 18.00" | 2560x1600 |
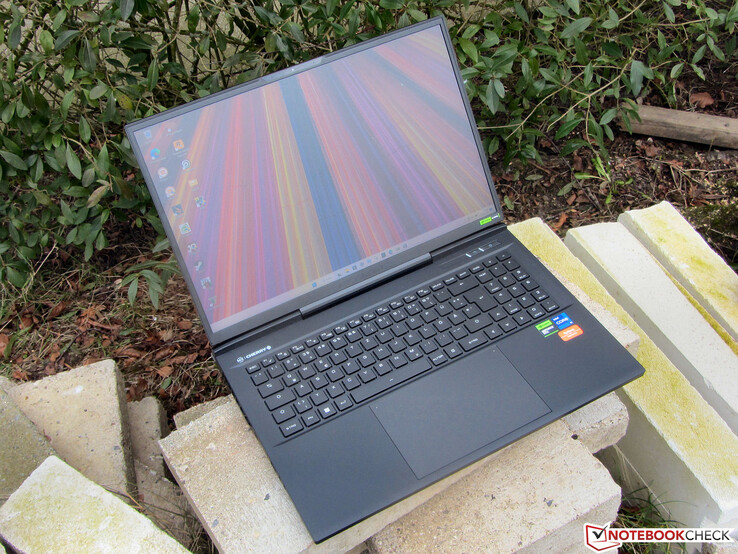
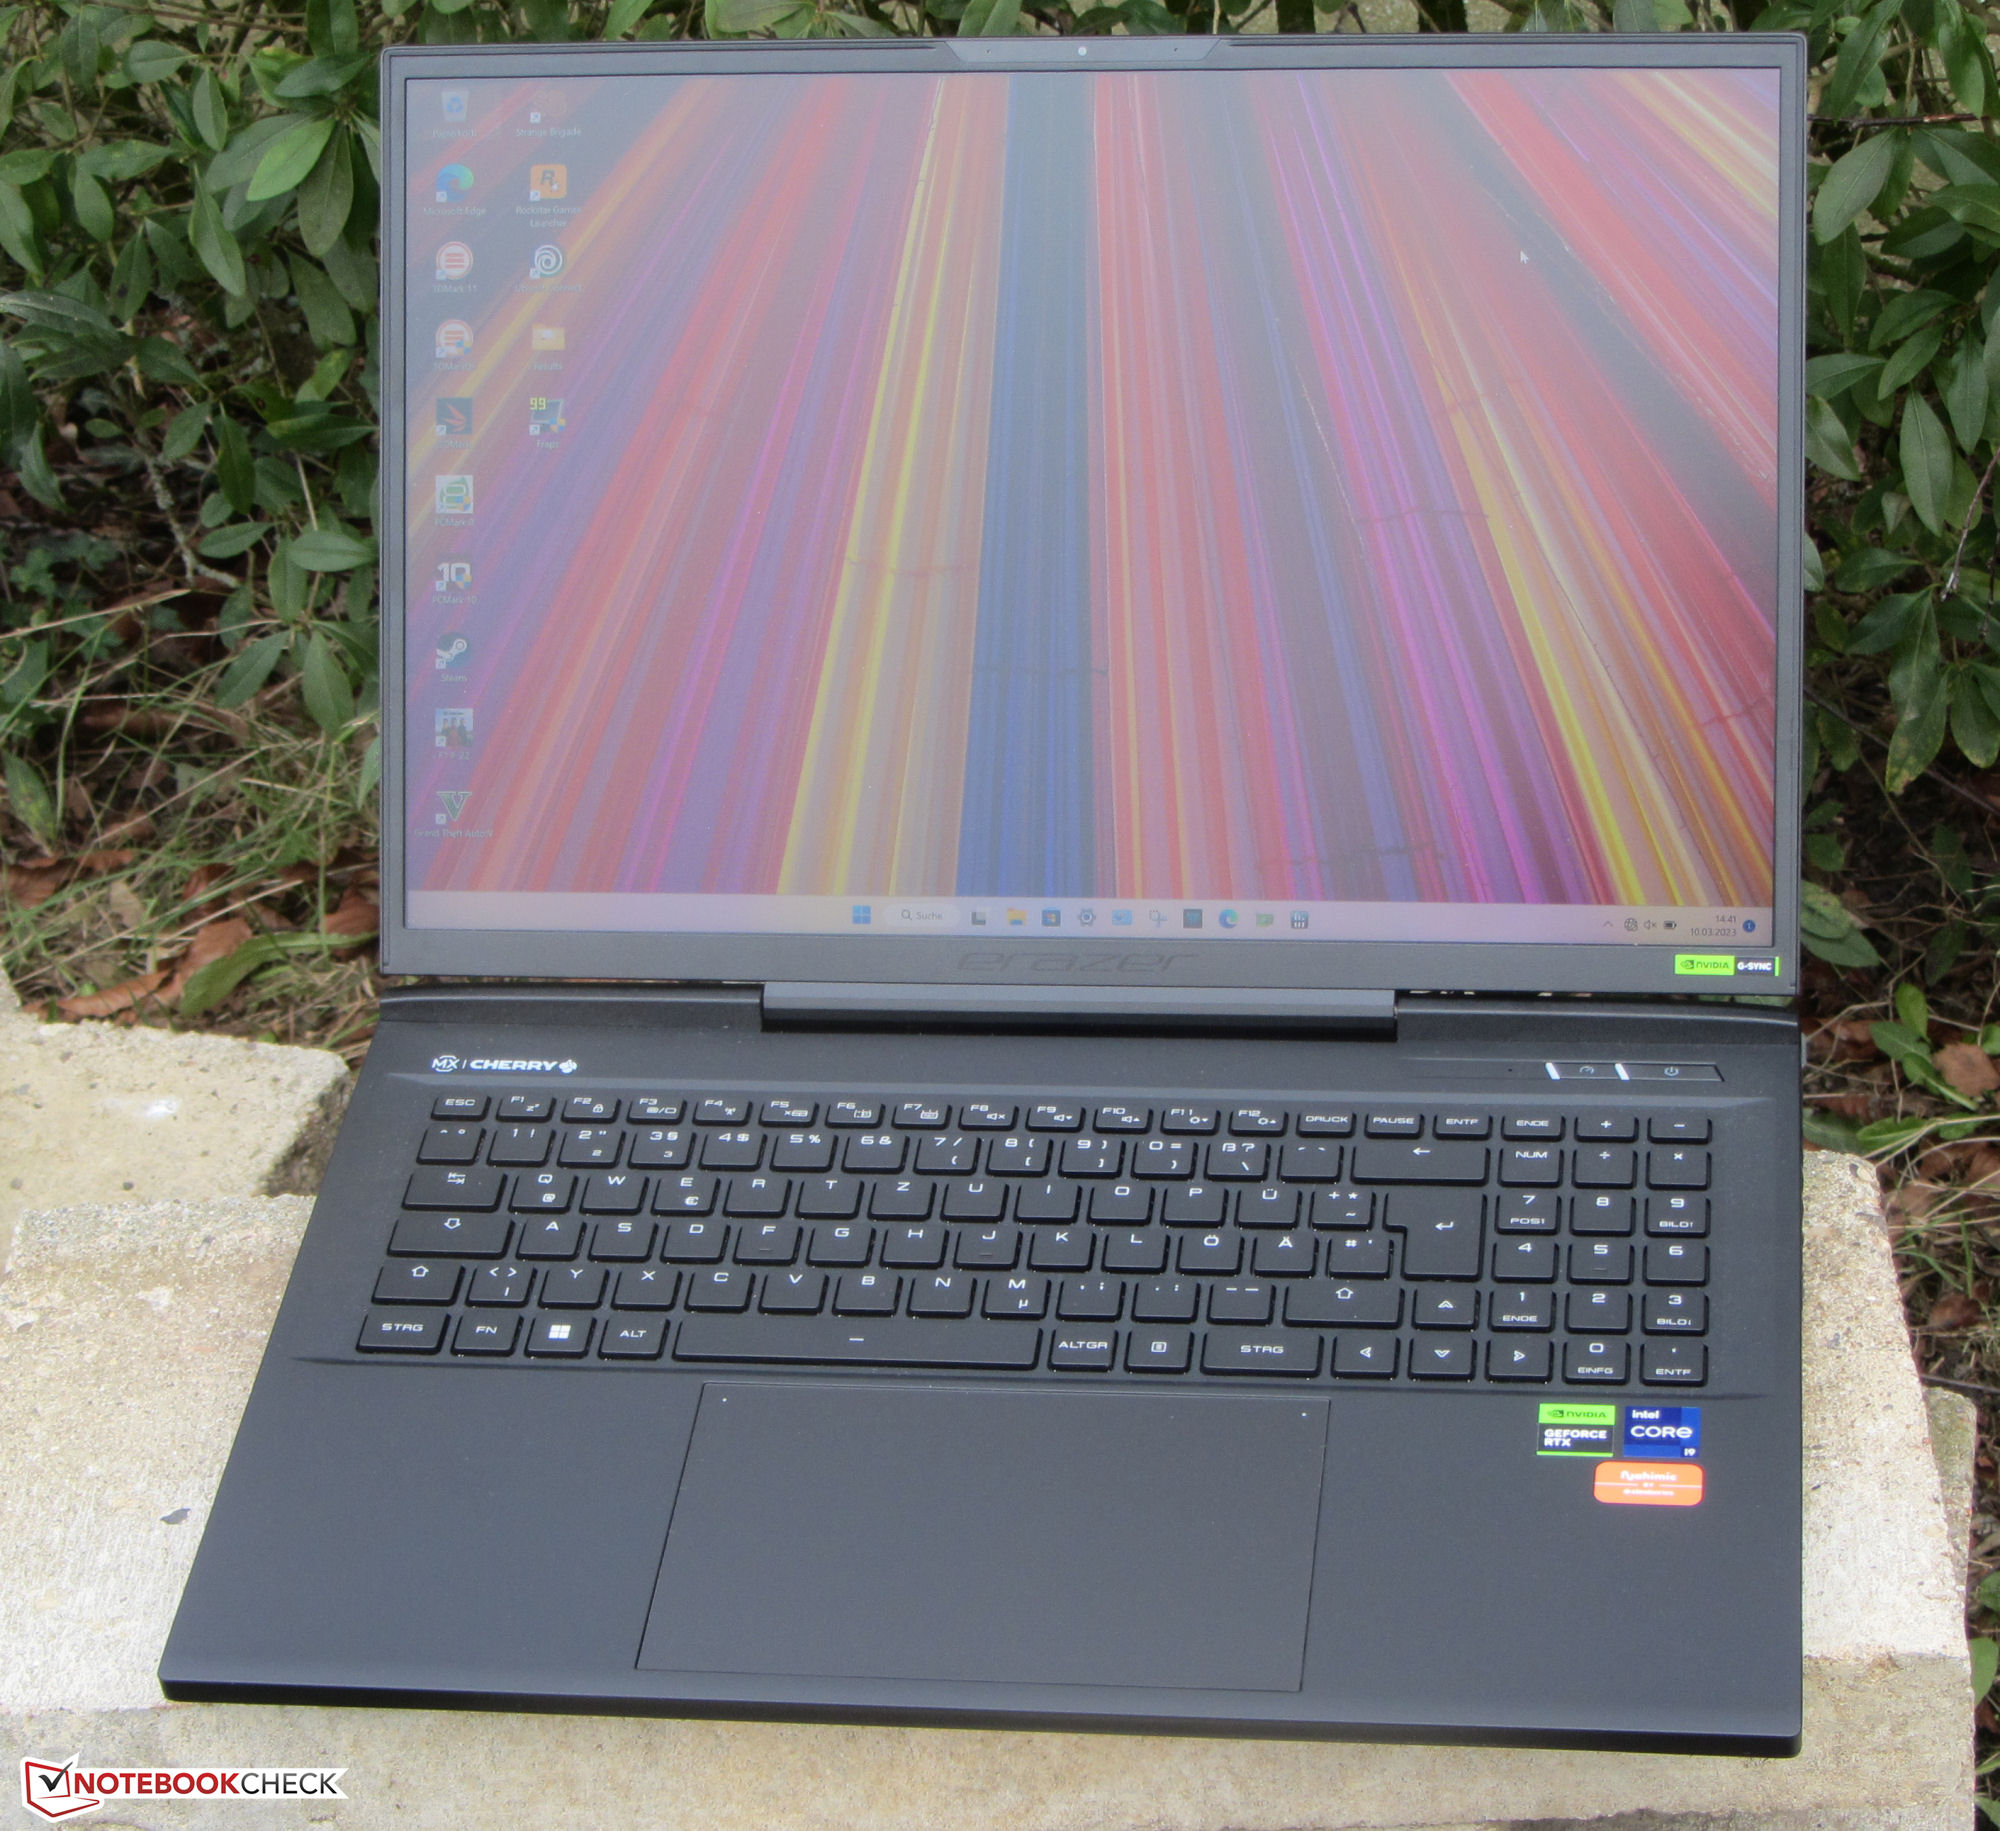
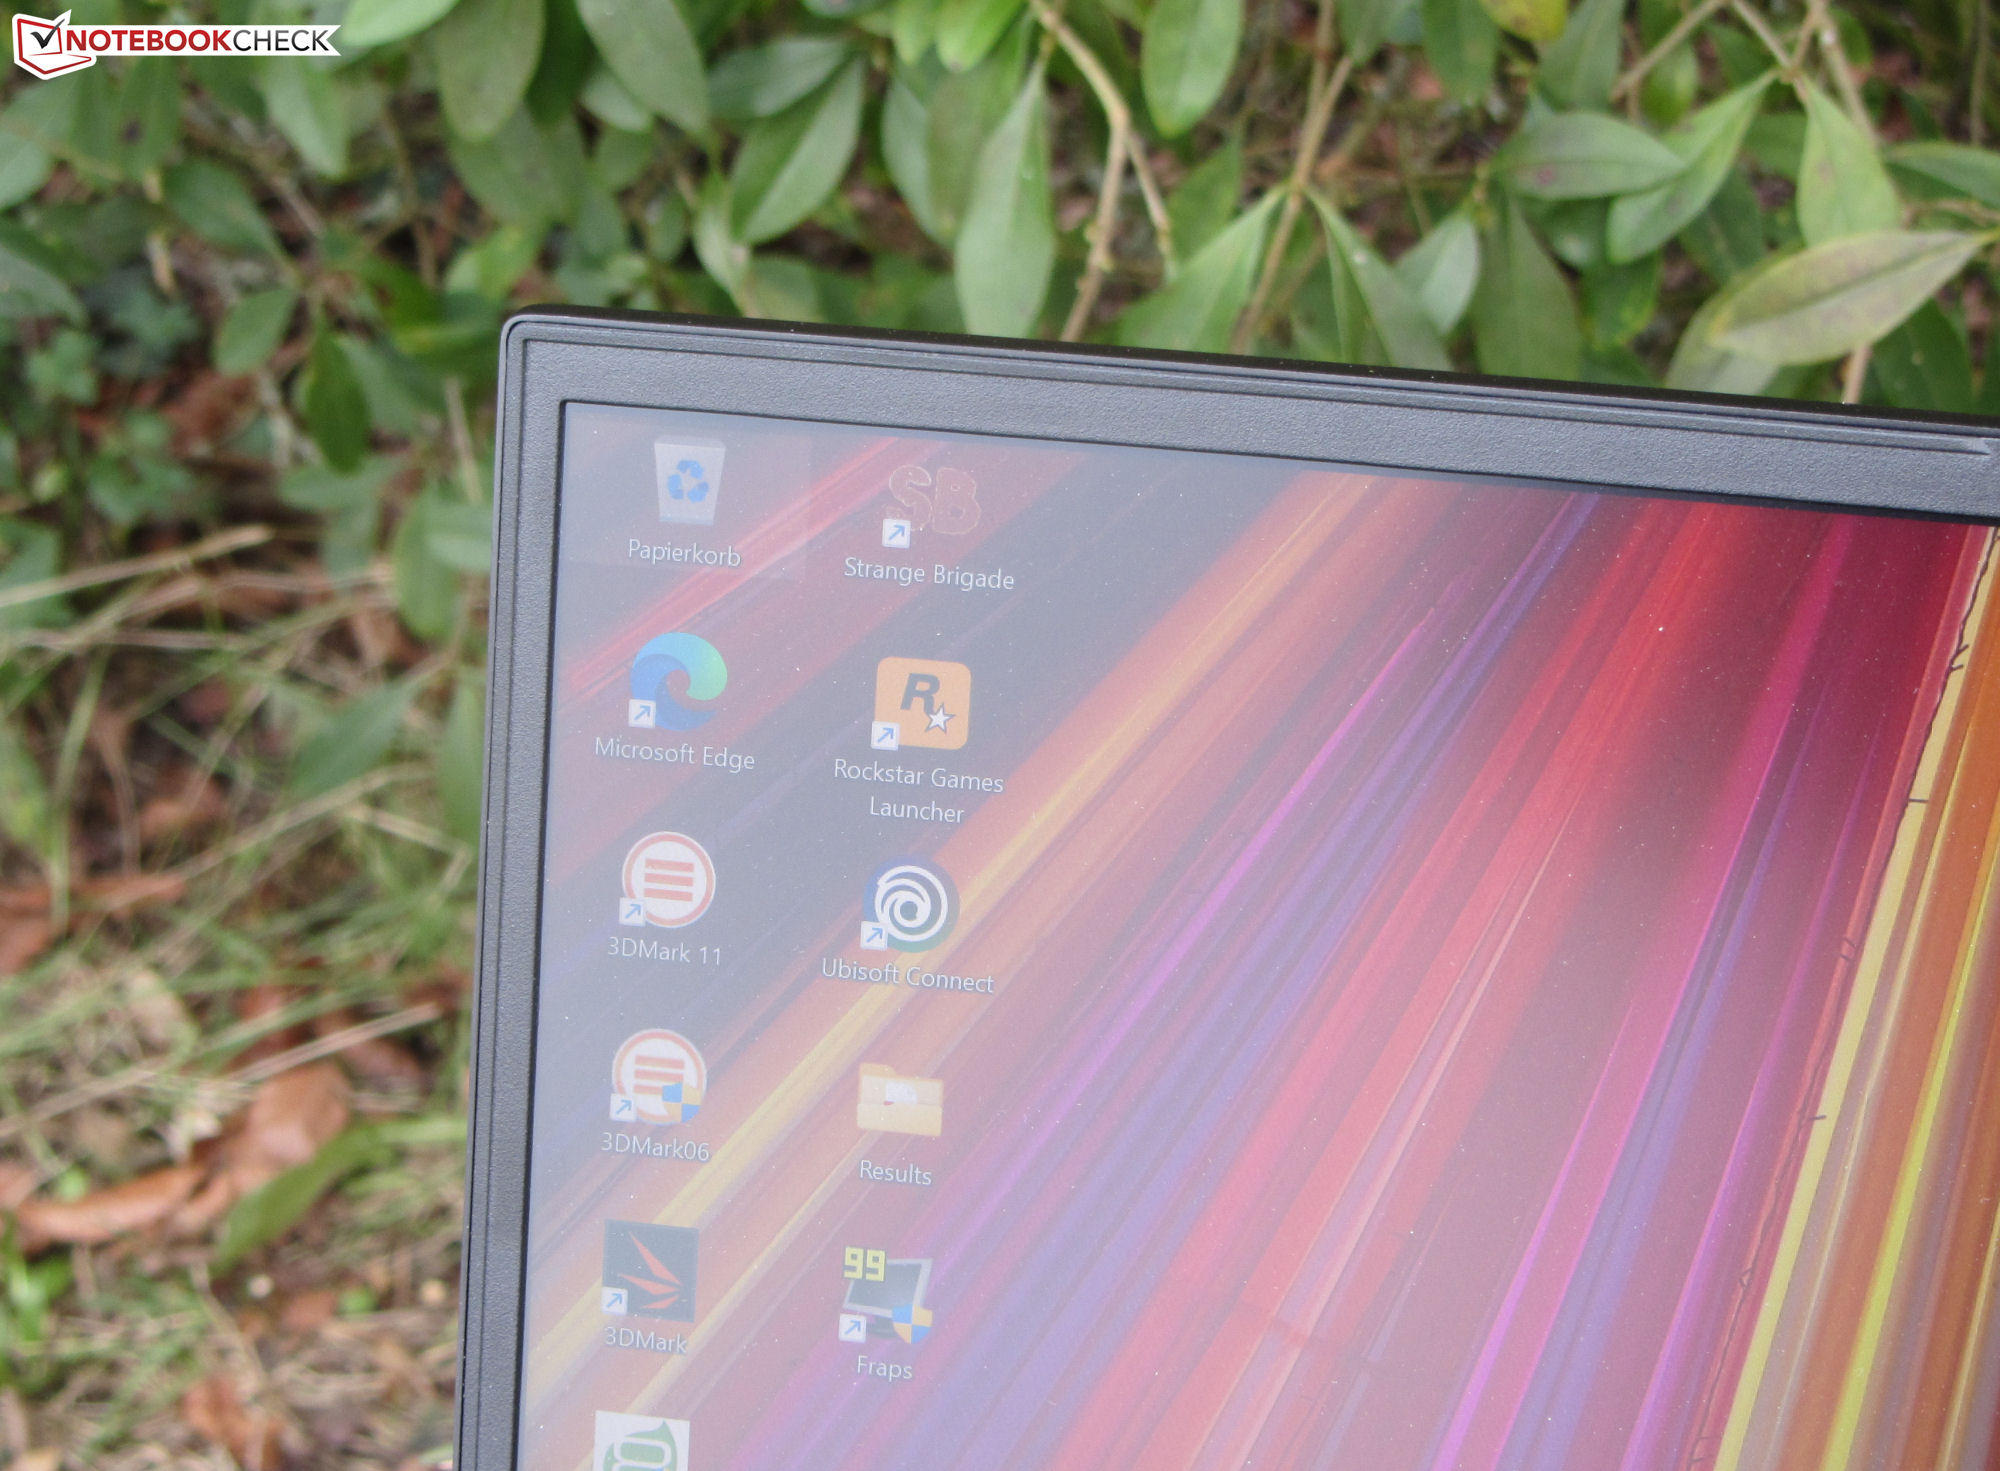
Carcasa - El Erazer tiene un chasis metálico
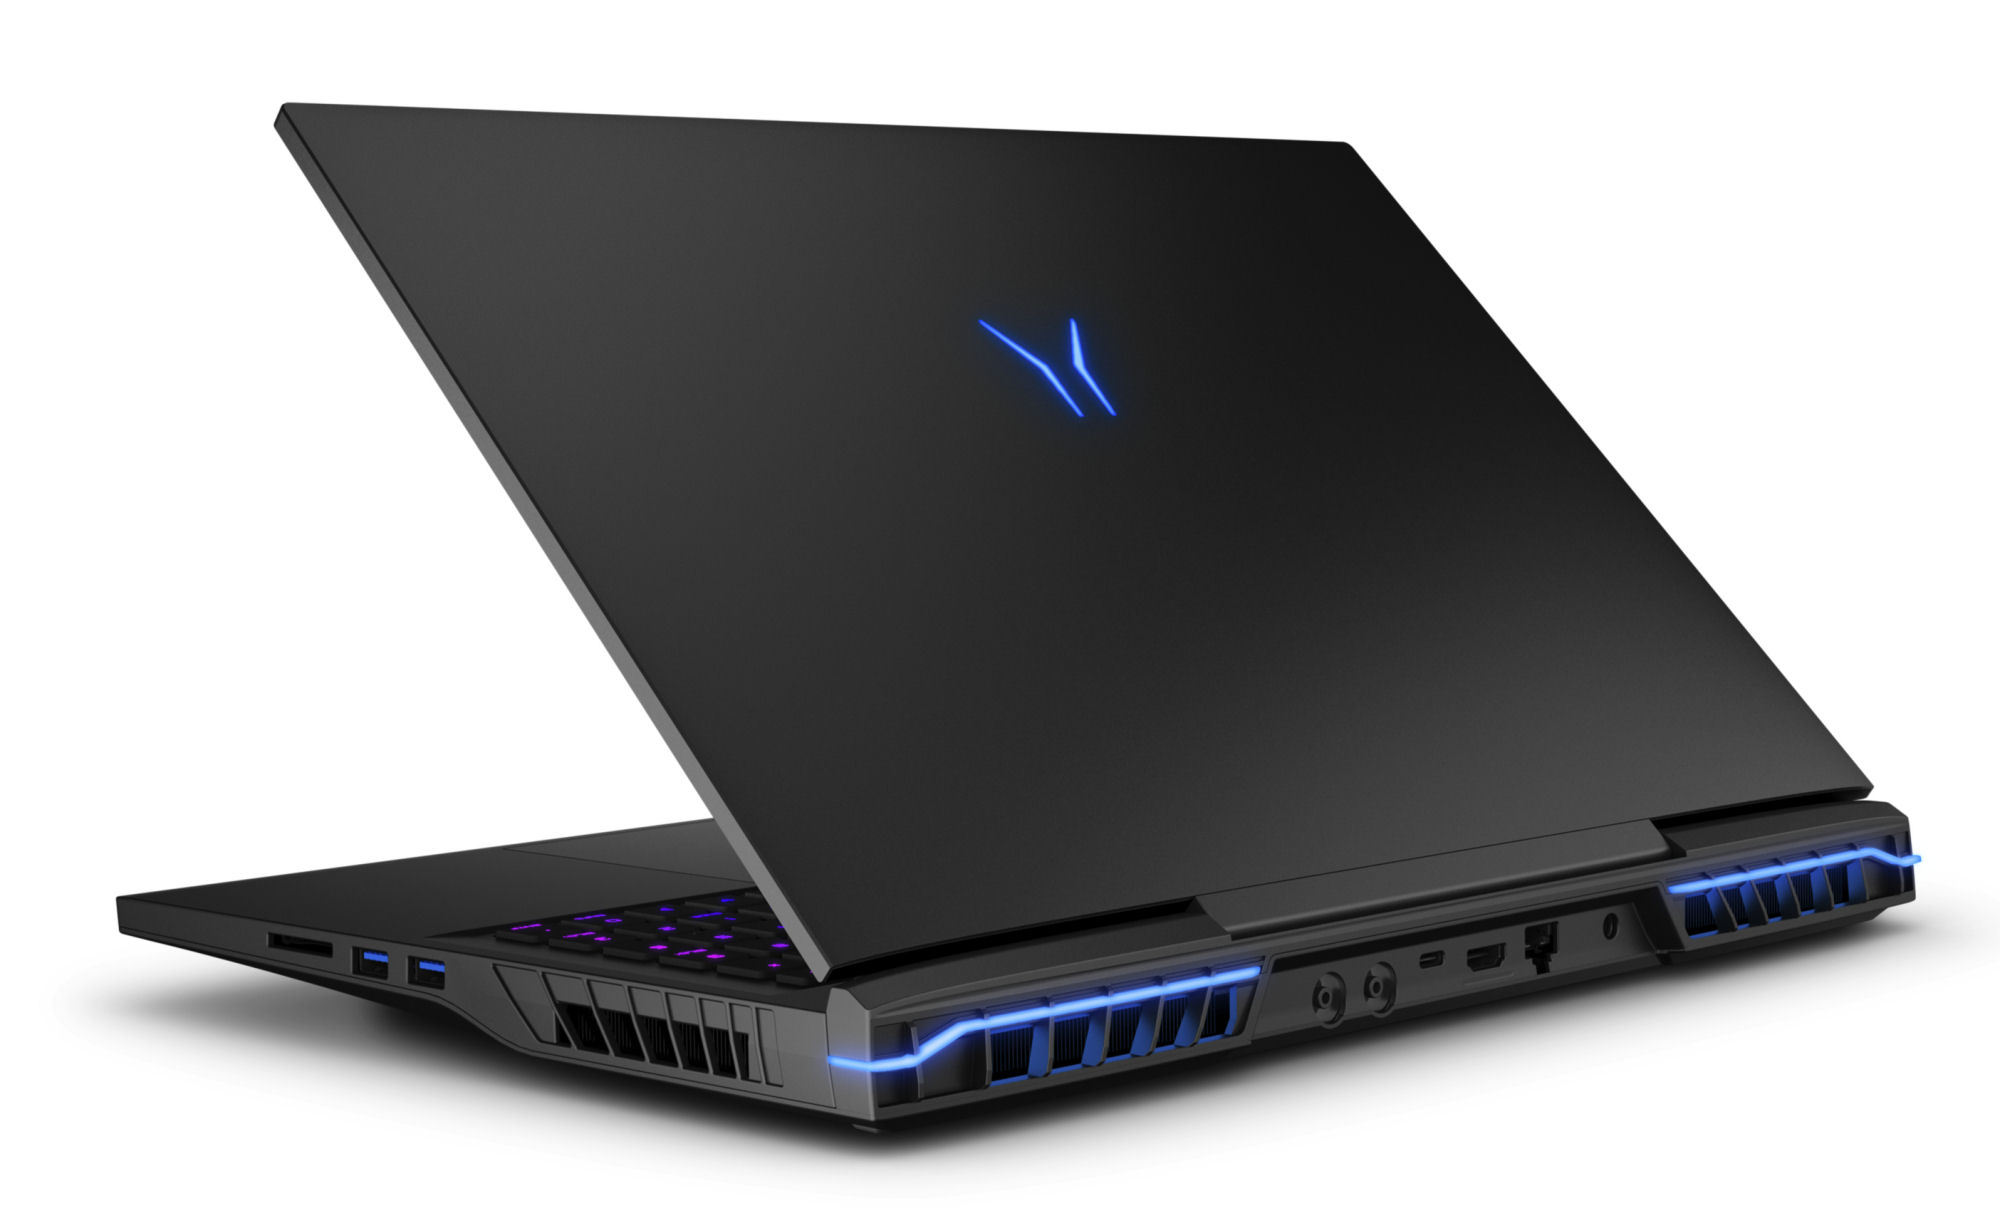
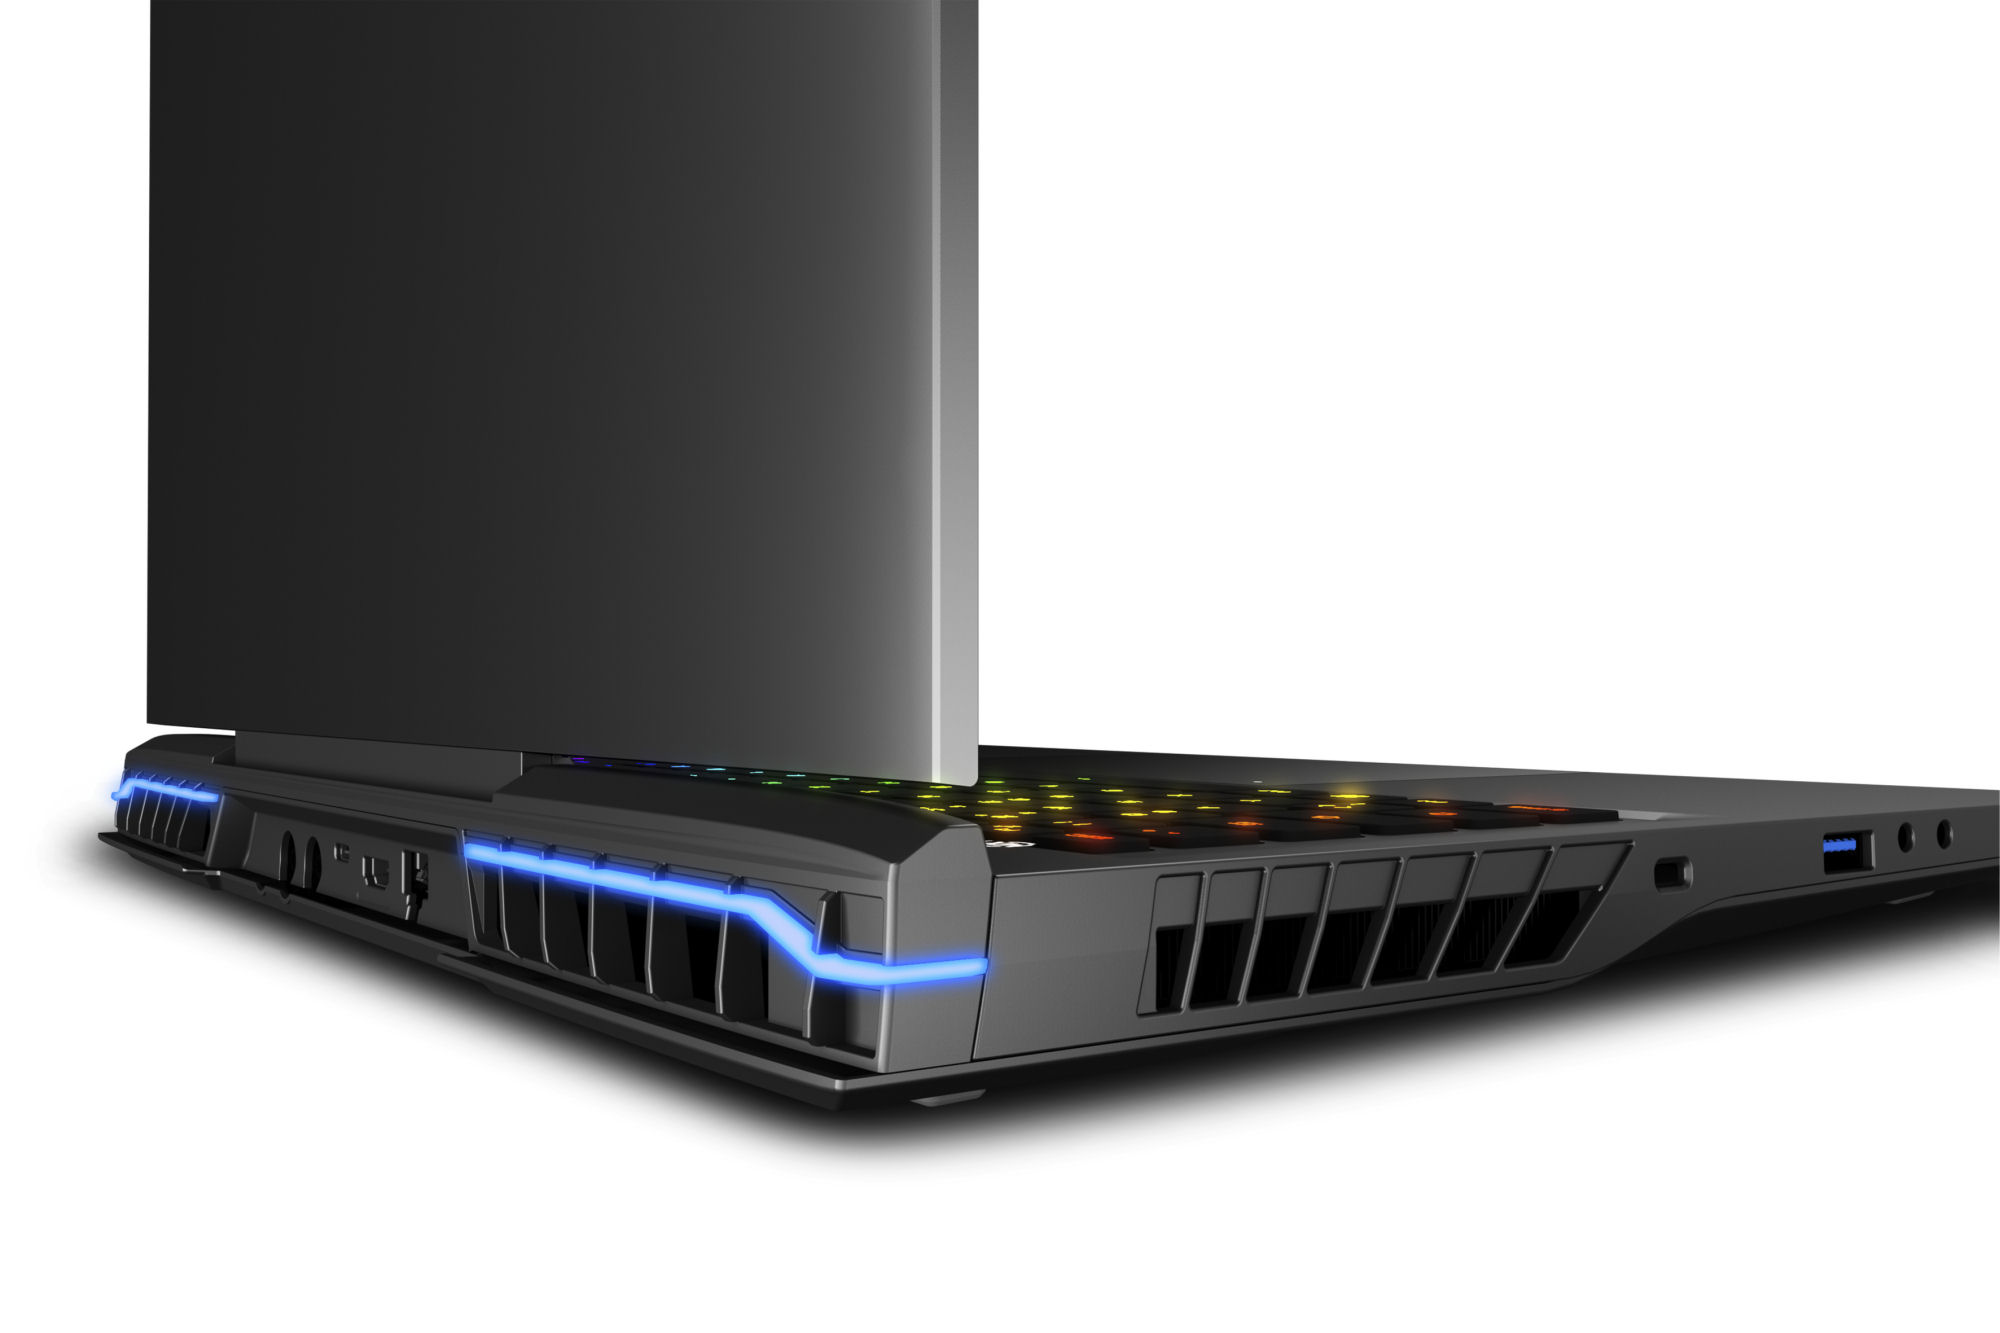
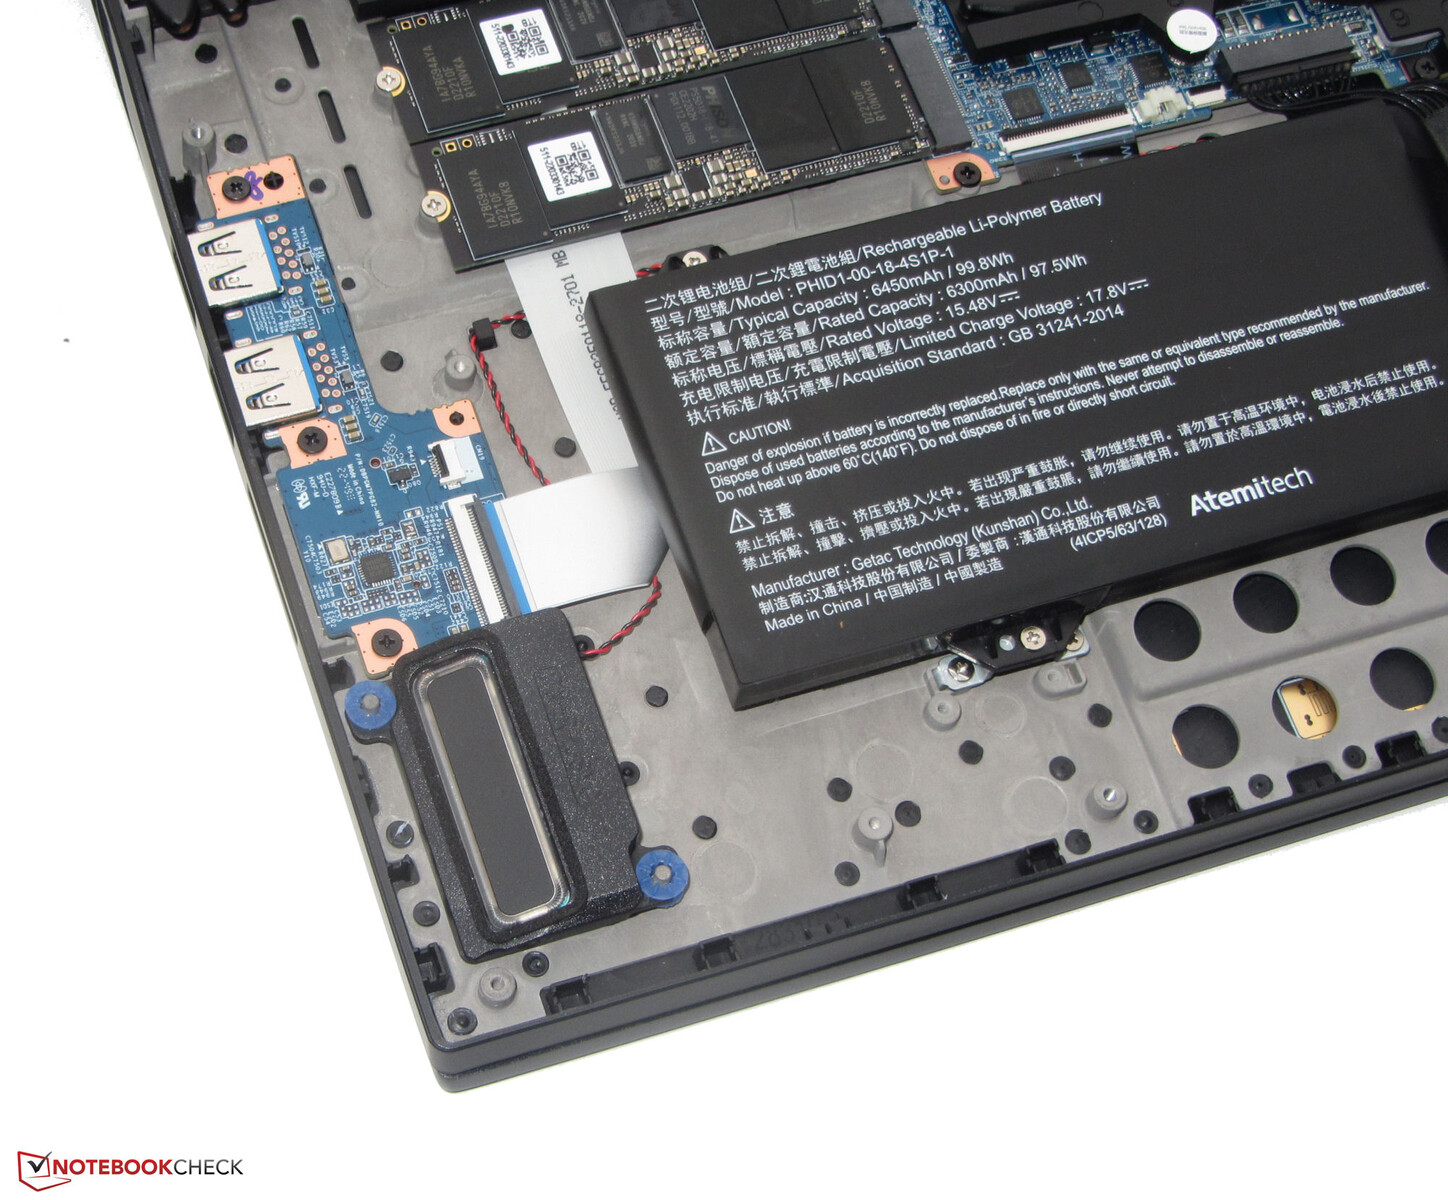
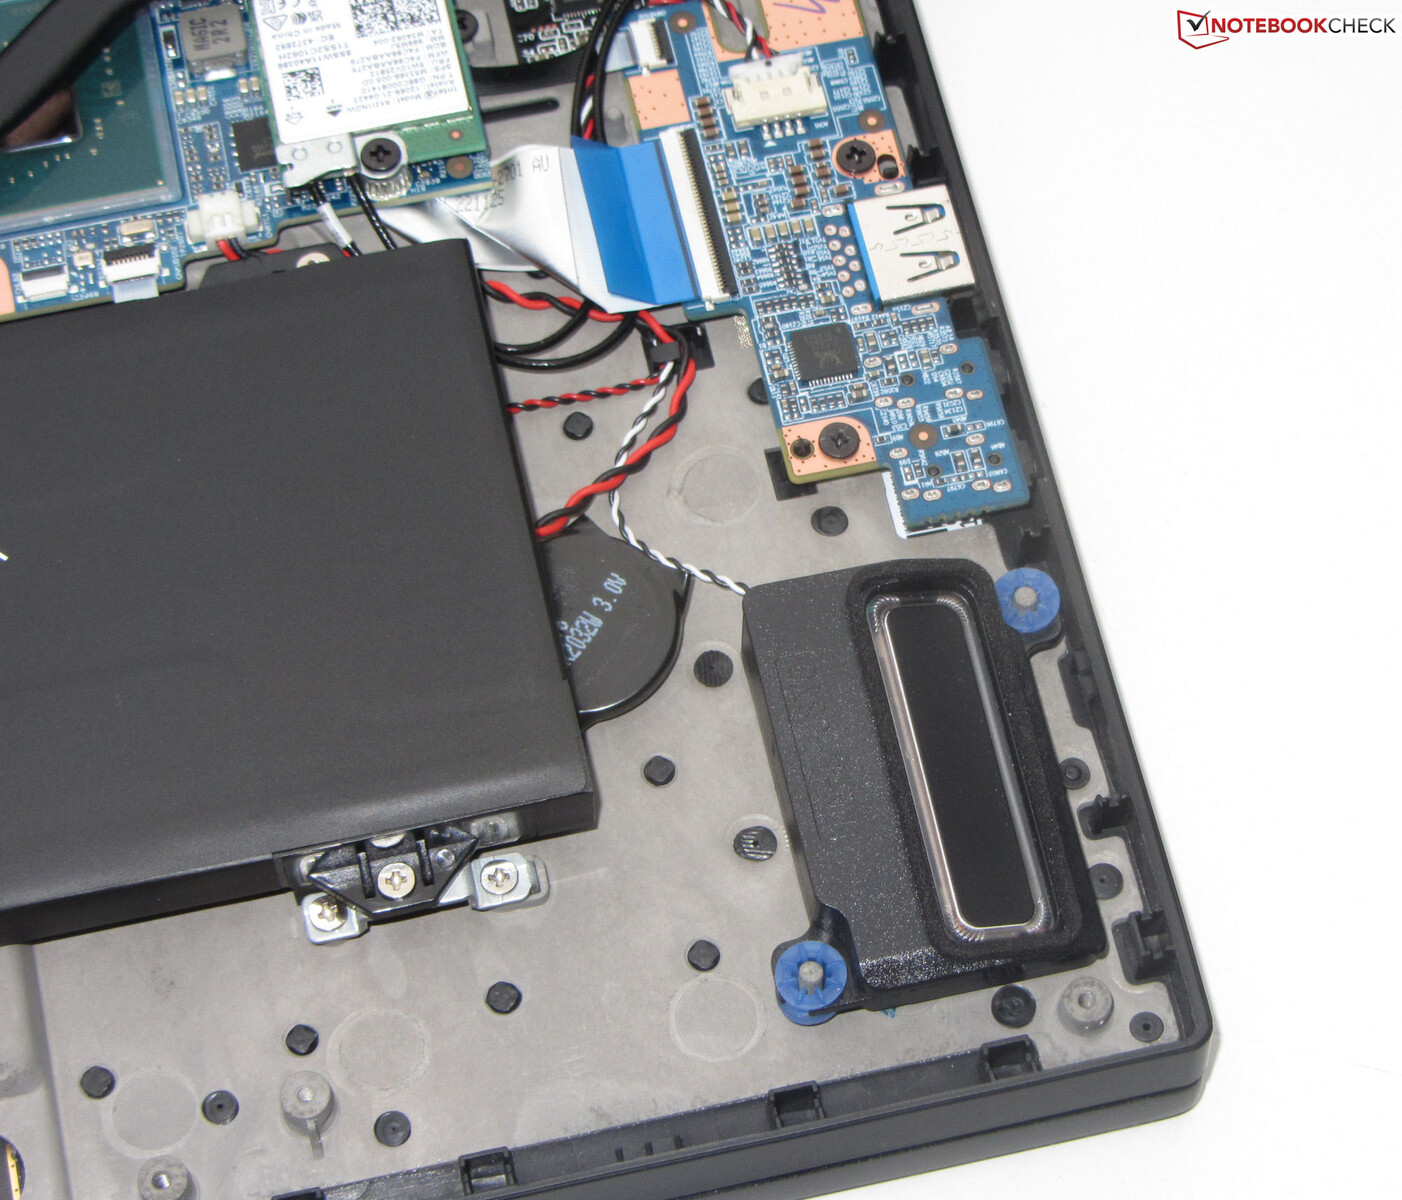
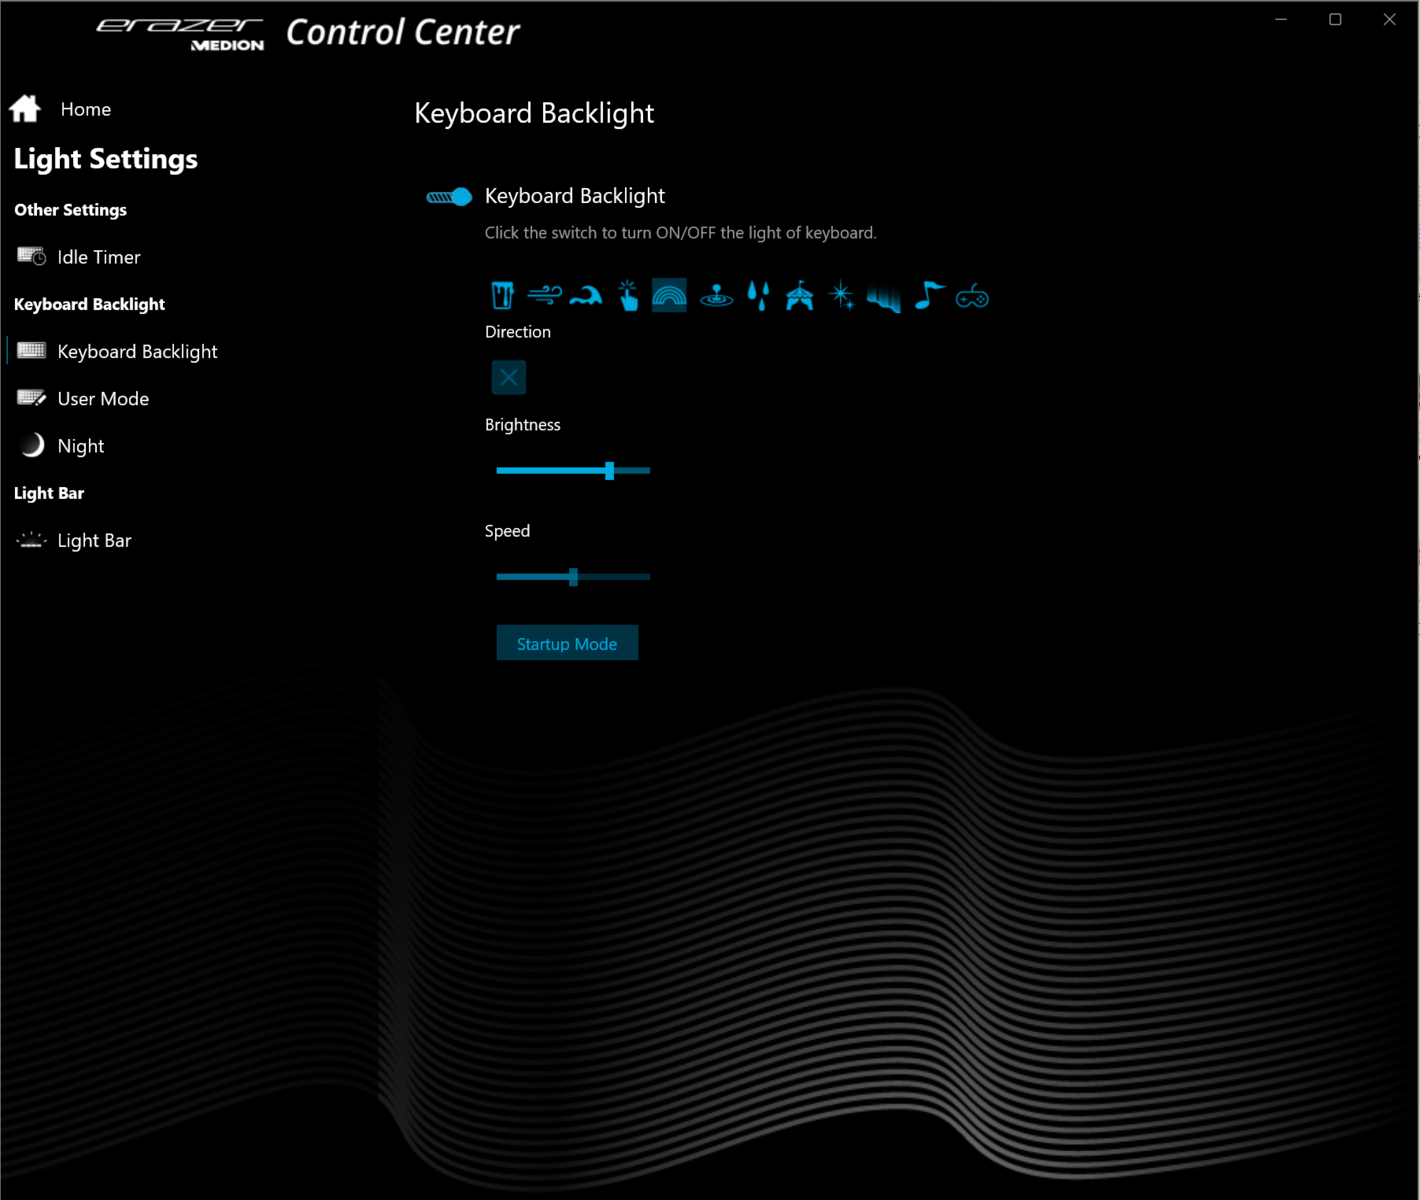
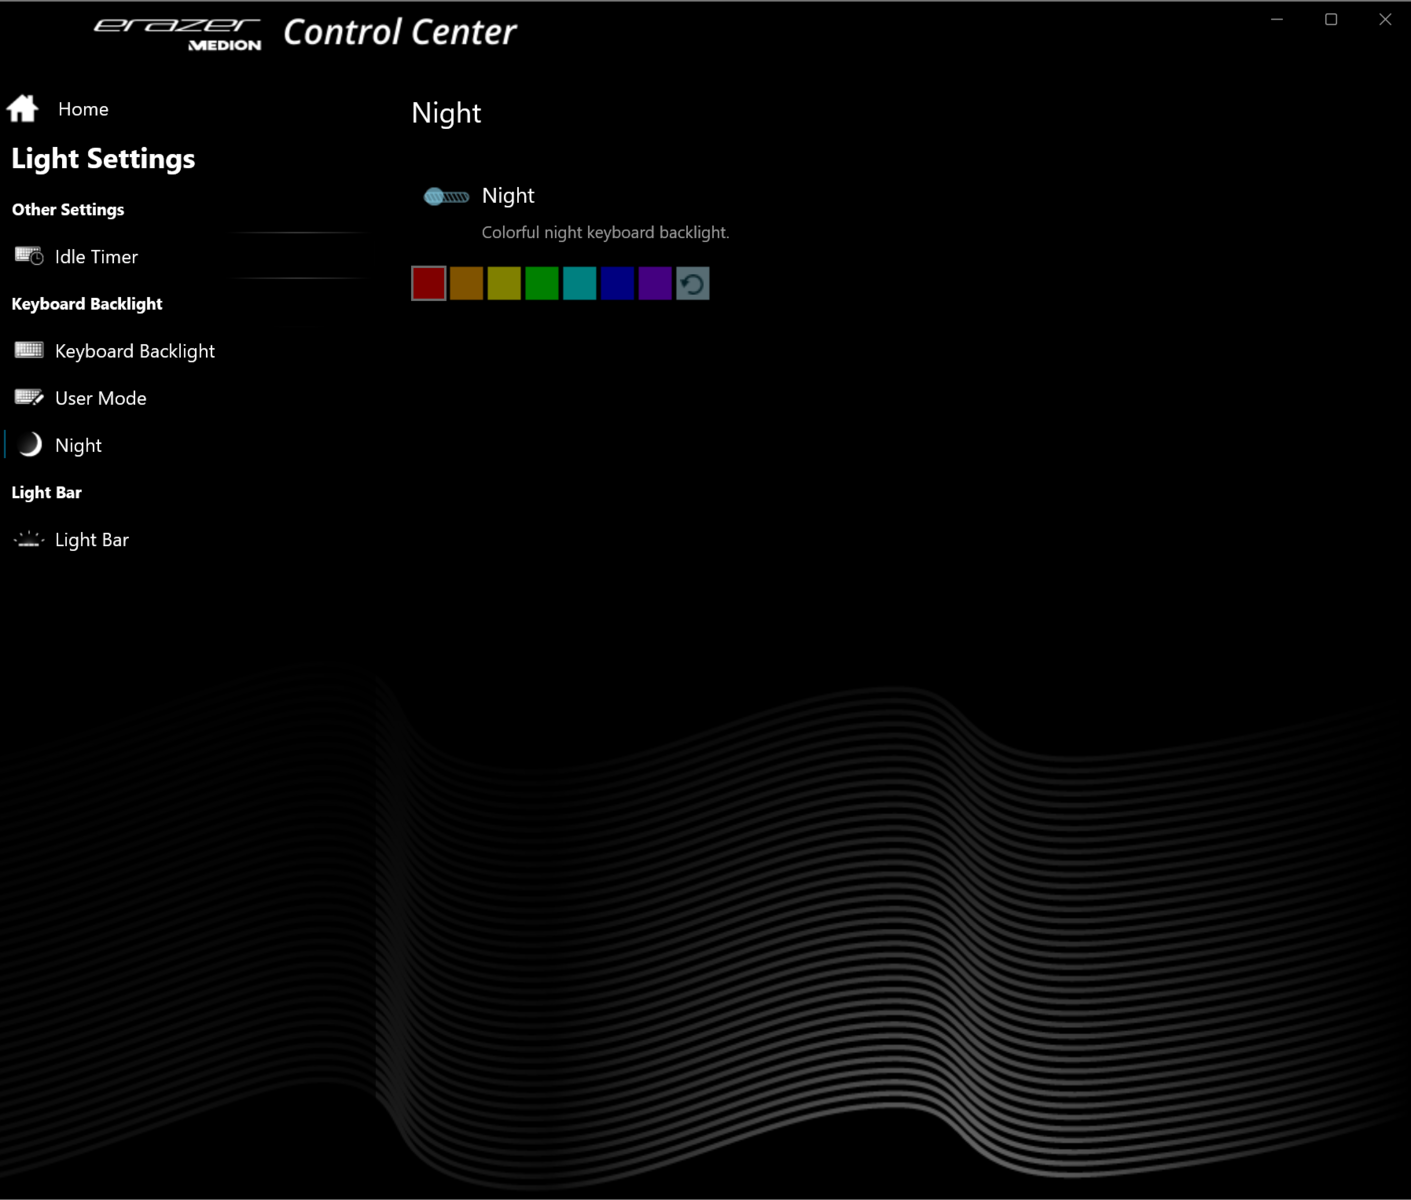
La Erazer Beast X40 renuncia a un aspecto ruidoso y llamativo en favor de un diseño discreto que no destacaría en un entorno profesional. Al igual que sus predecesores, el X40 utiliza un chasis de metal negro con acabados mate. La parte inferior está recubierta de goma adherente. La retroiluminación del teclado (RGB), así como dos tiras de LED (RGB) totalmente configurables situadas sobre las rejillas de ventilación traseras, aportan un toque de color al portátil. La batería, que está atornillada en lugar de pegada, y el resto de las partes internas son accesibles una vez que se retira la cubierta inferior.
No notamos ningún problema de fabricación en nuestra unidad de prueba. Los huecos en el chasis son agradables y apretados, y no hay exceso de materiales sobrantes del proceso de fabricación. Es prácticamente imposible torcer la sección de la base. La tapa se puede flexionar ligeramente, pero la cantidad de cesión es totalmente aceptable. Las bisagras mantienen la pantalla firmemente en su sitio y permiten plegarla hasta unos 140 grados. La tapa del portátil no se puede abrir con una mano.
El Medion Erazer Beast X40 es uno de los dispositivos más compactos de nuestra comparativa y se sitúa en algún punto intermedio en lo que a peso se refiere.
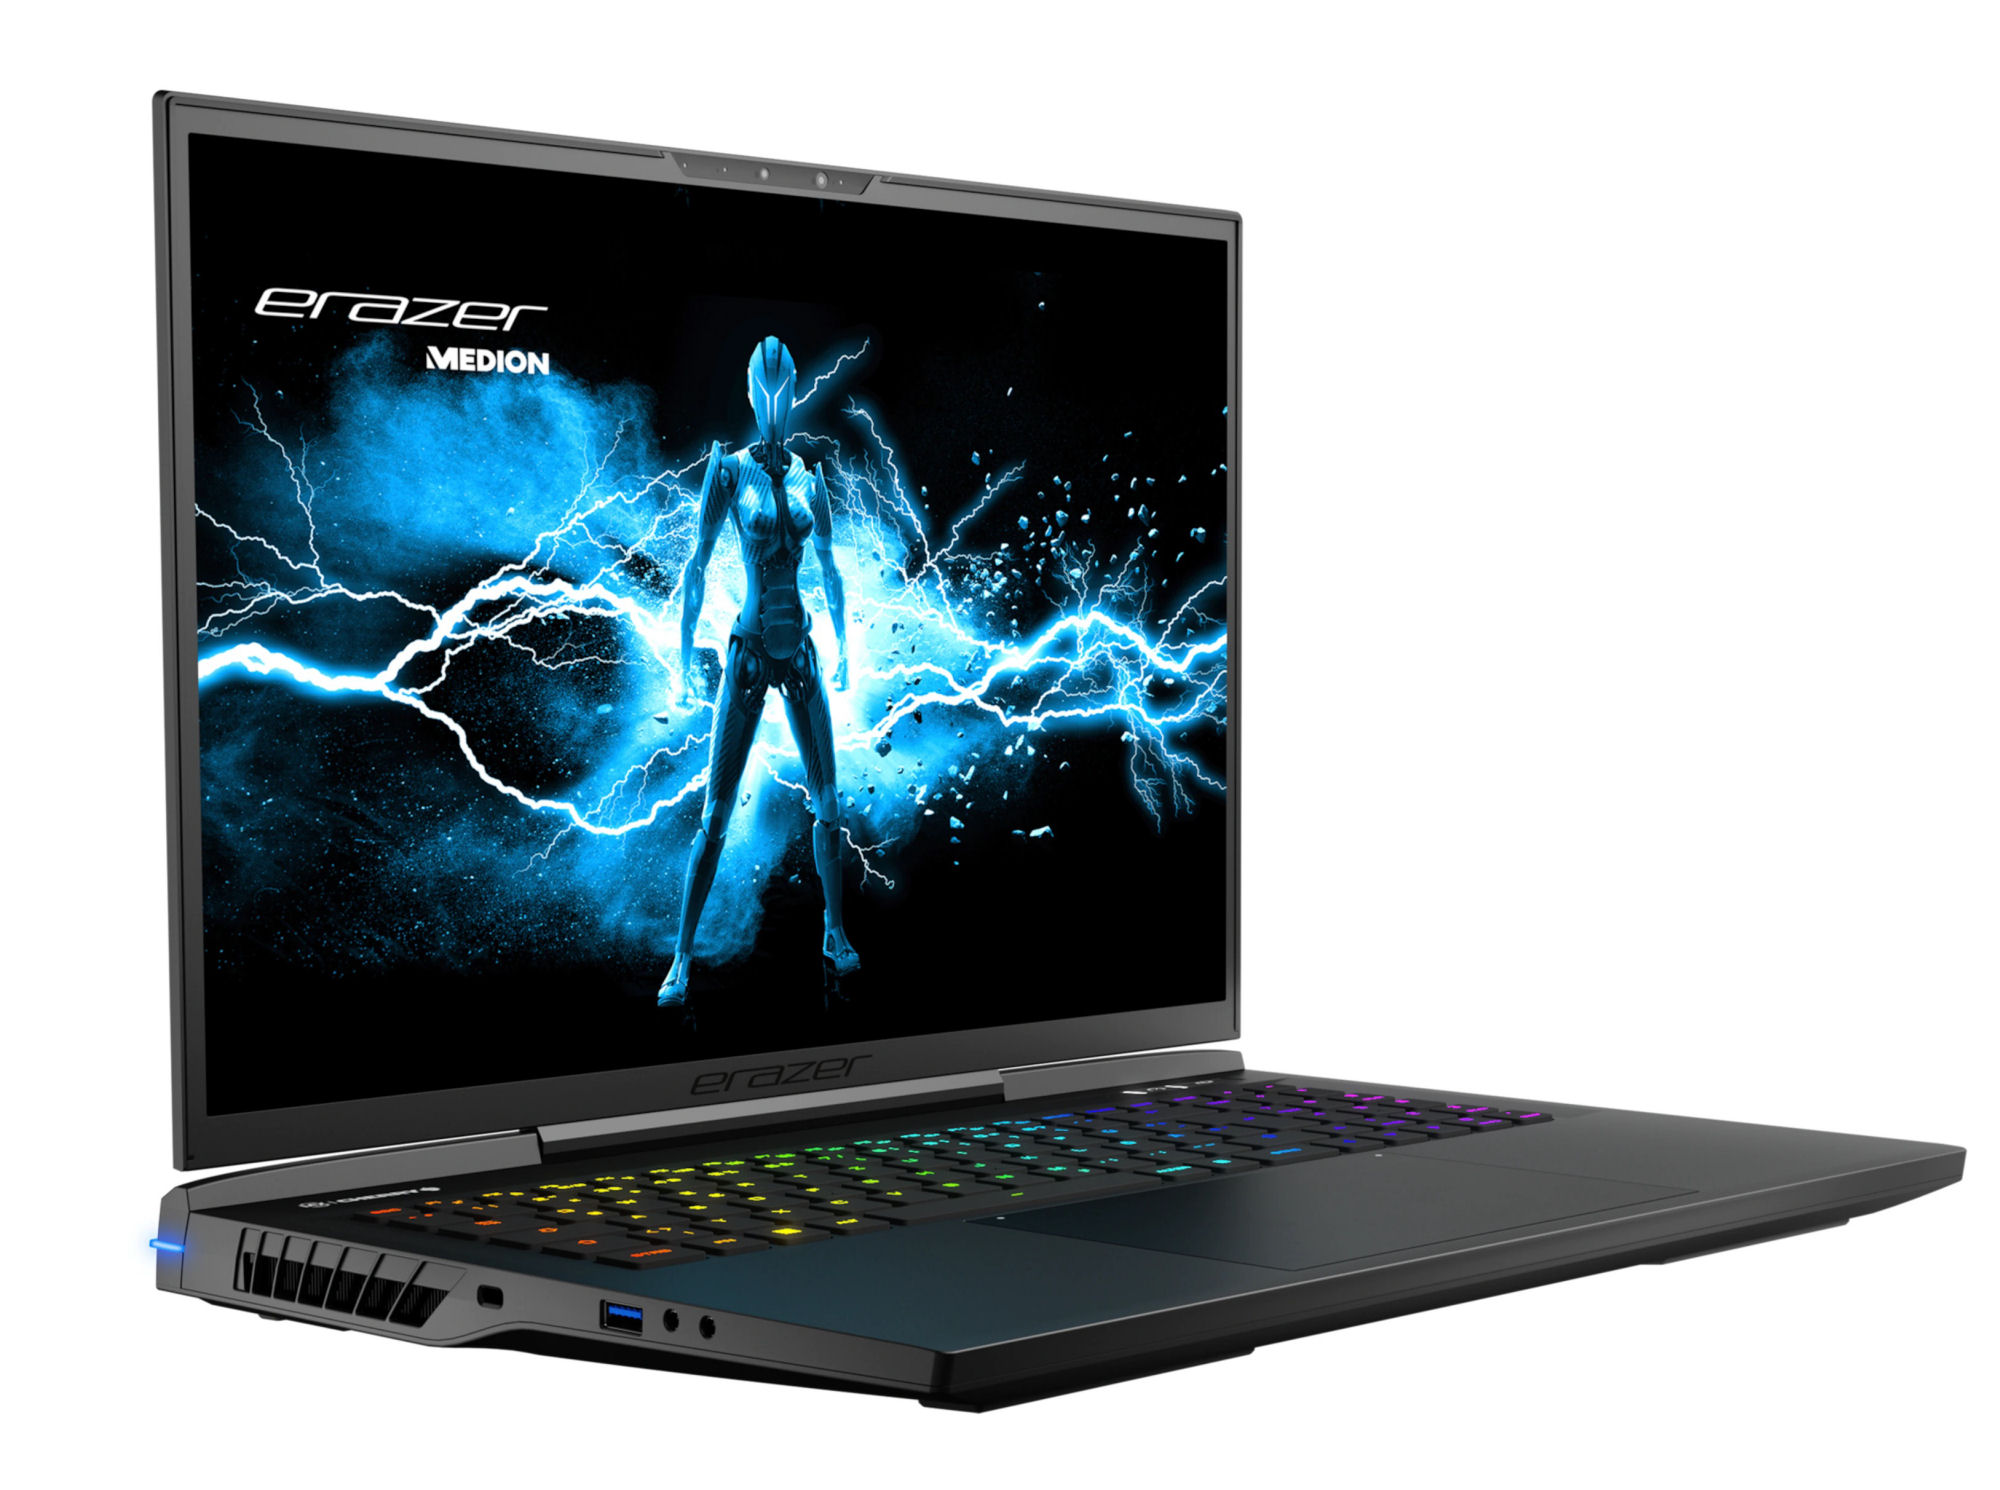
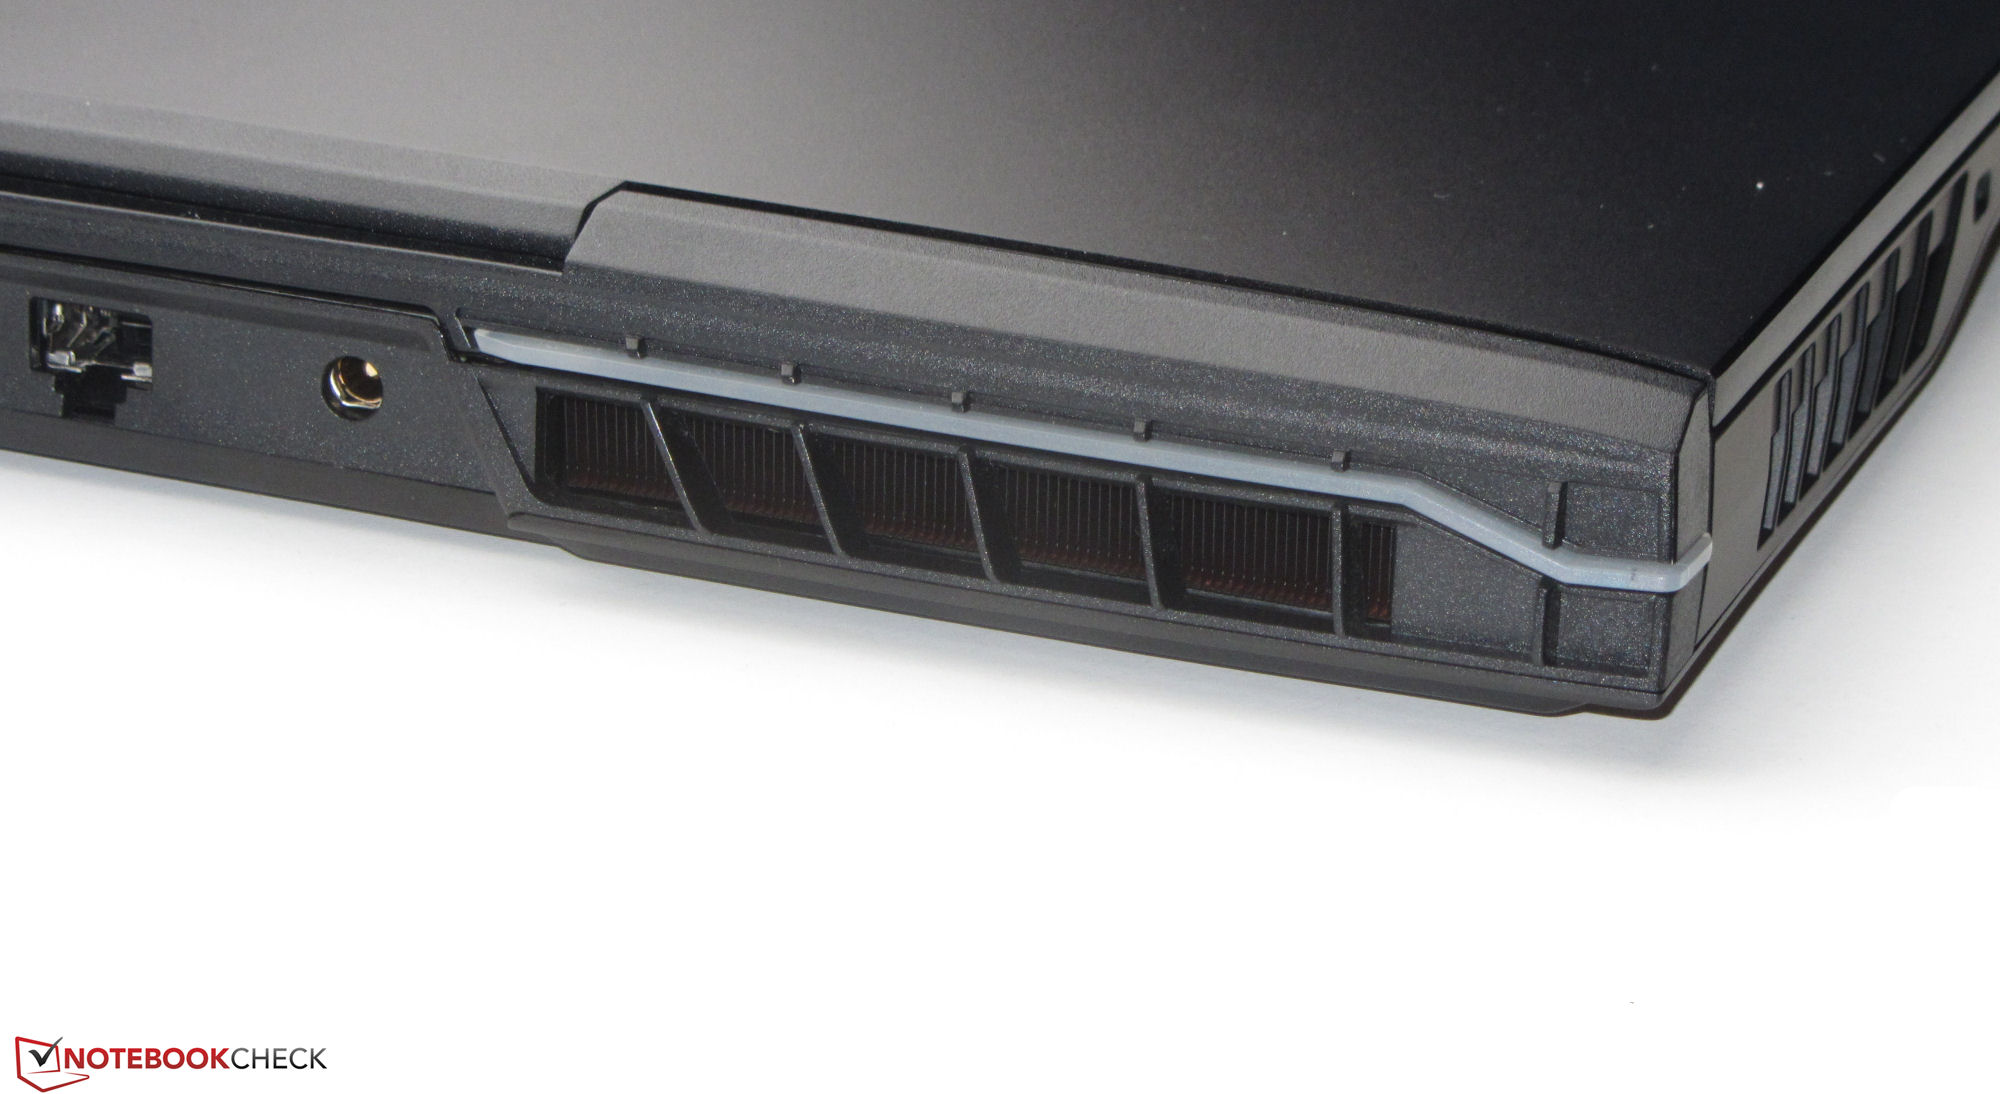
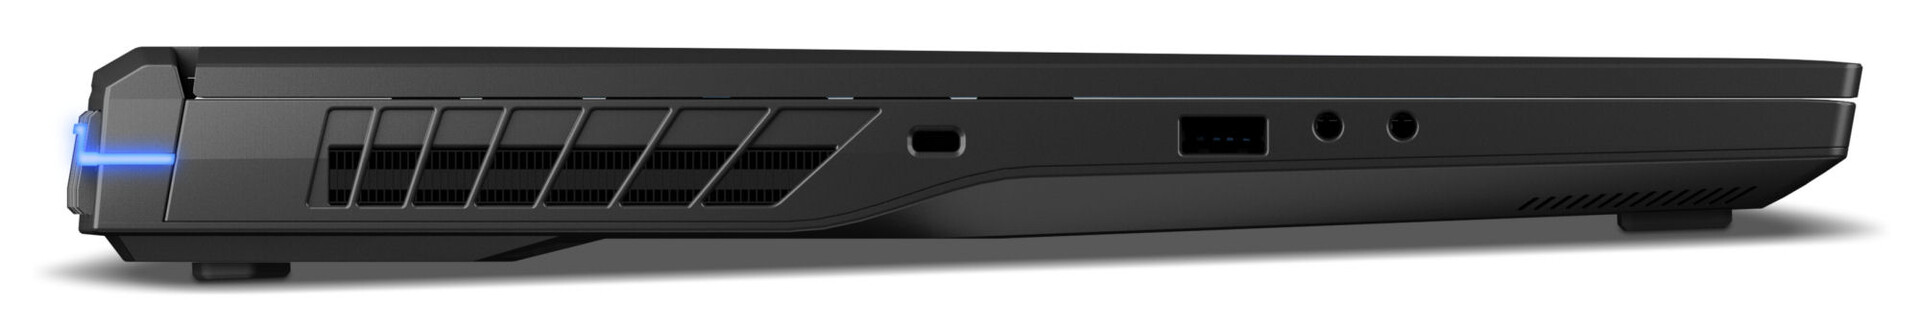
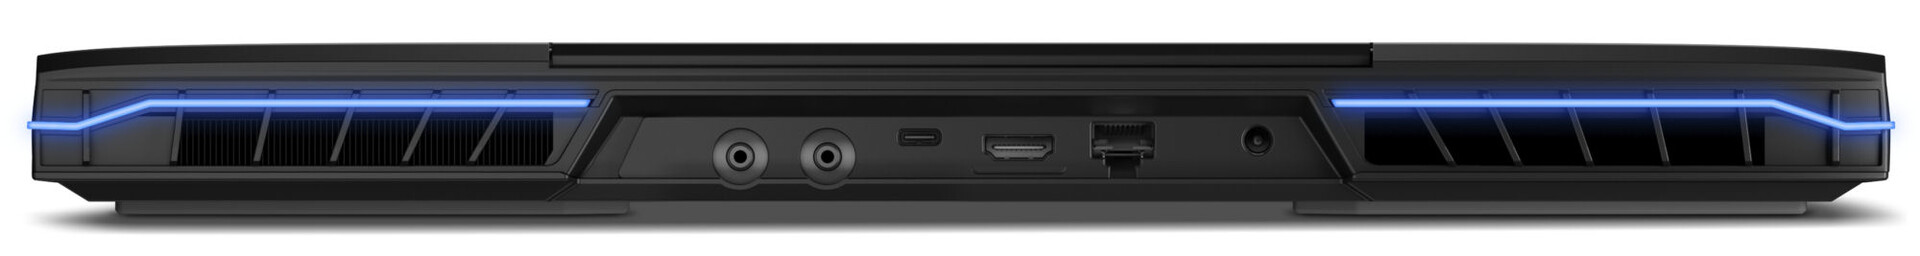
Especificaciones - Thunderbolt 4 para la Bestia
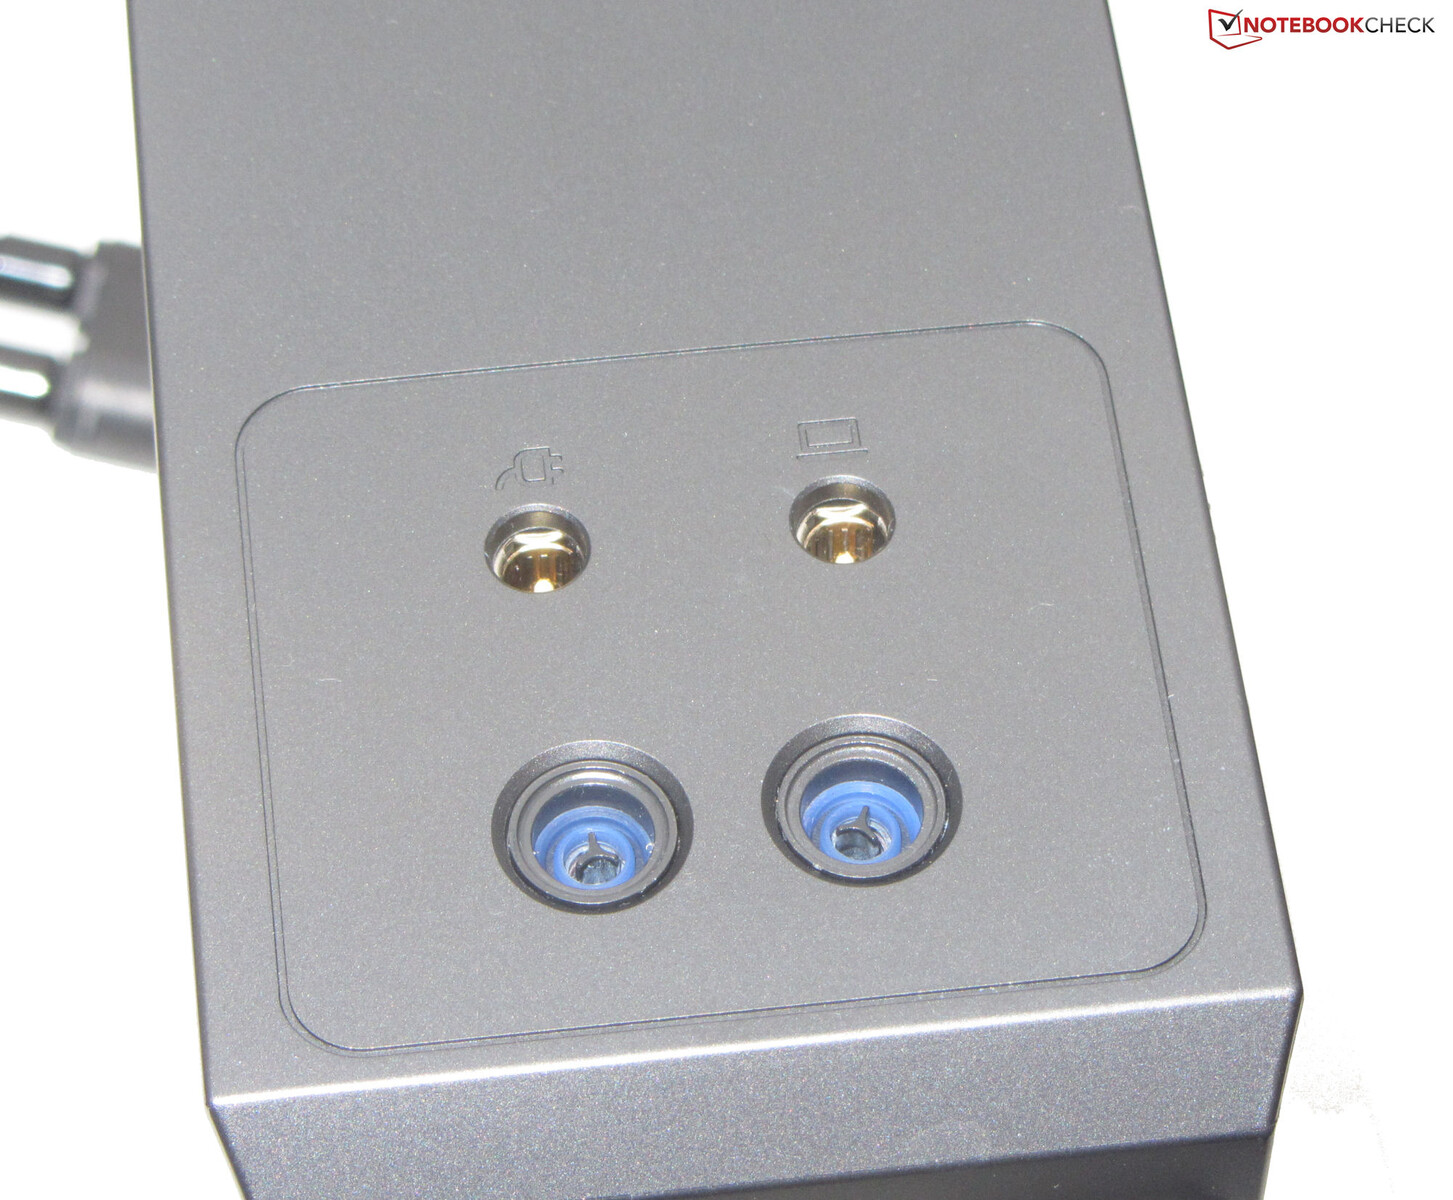
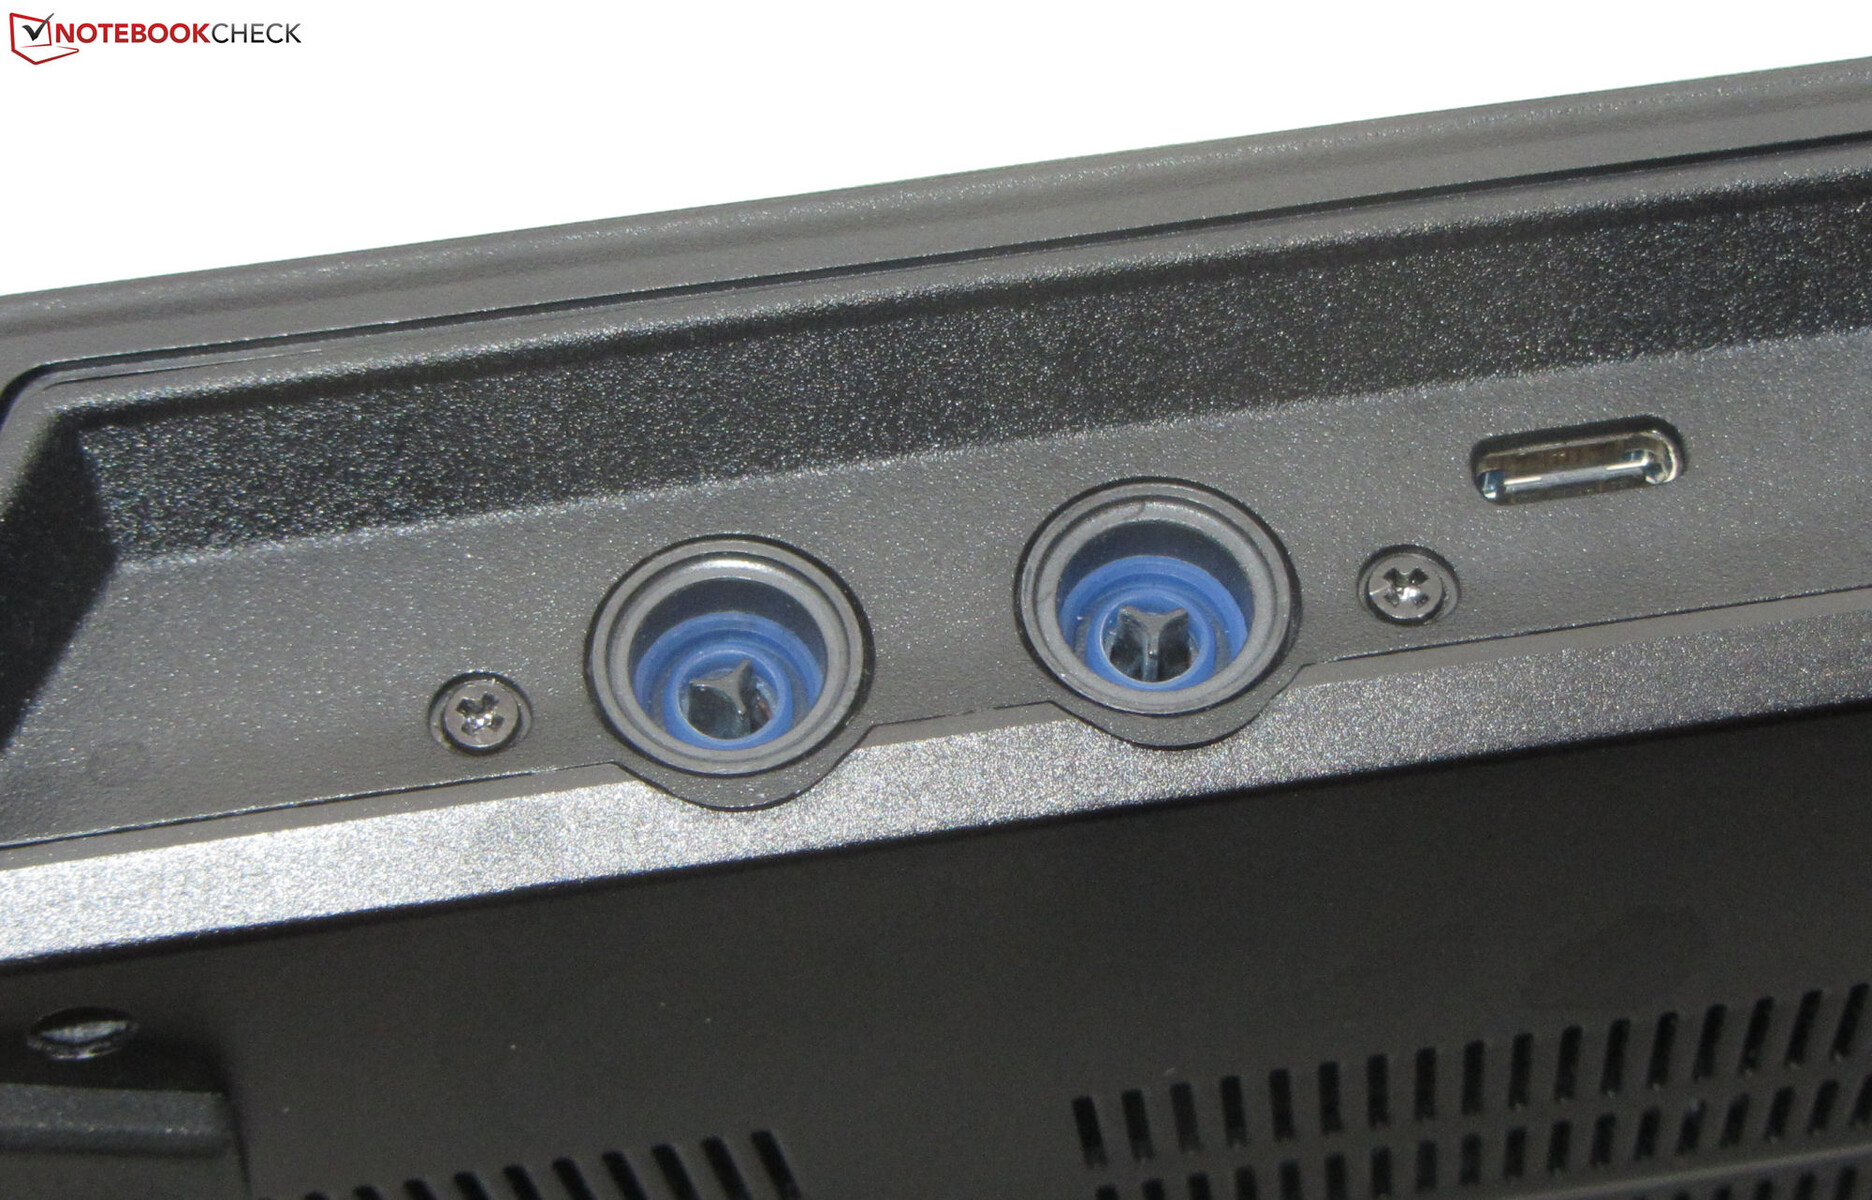
El Erazer tiene tres puertos USB-A (2x USB 3.2 Gen 1, 1x USB 3.2 Gen 2) y un puerto USB-C (Thunderbolt 4) a bordo. Este último no soporta Power Delivery pero puede emitir señales DisplayPort. El portátil tiene un total de dos salidas de vídeo (HDMI 2.1, DP), dos tomas de audio (auriculares y entrada de micrófono), un puerto Gigabit Ethernet y una ranura Kensington. En la parte trasera, también encontrará conectores para la solución opcional de refrigeración por agua.
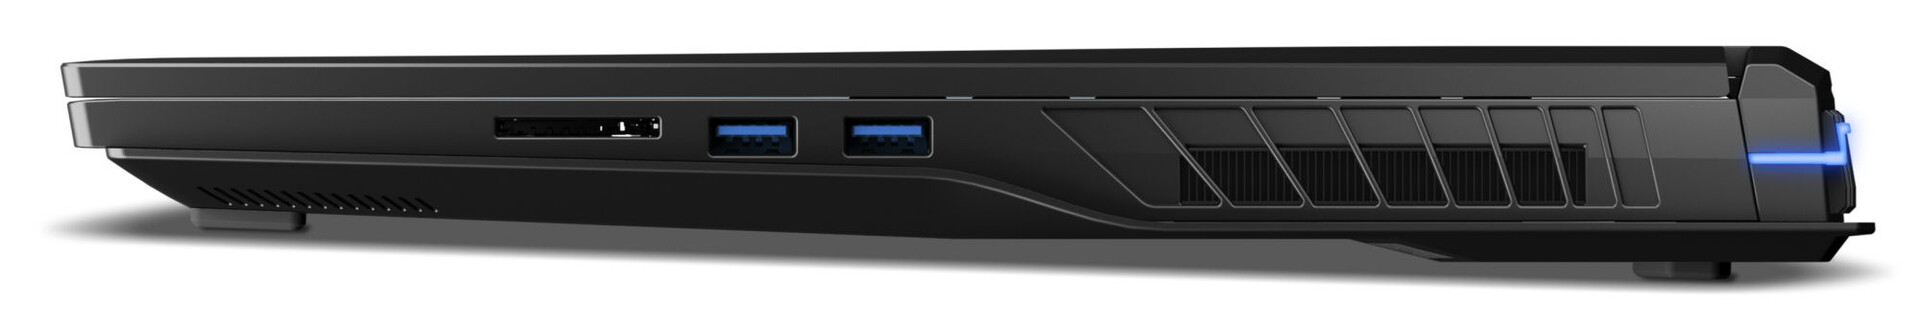
Lector de tarjetas SD
El lector de tarjetas SD es un modelo de velocidad media que, junto con nuestra tarjeta de referencia AV Pro microSD 128 GB V60, consiguió alcanzar velocidades de hasta 77 MB/s al transferir 250 imágenes JPEG de unos 5 MB cada una y 86 MB/s al copiar grandes cantidades de datos.
| SD Card Reader | |
| average JPG Copy Test (av. of 3 runs) | |
| Alienware x17 R2 P48E (AV Pro V60) | |
| Media de la clase Gaming (20.9 - 210, n=54, últimos 2 años) | |
| Razer Blade 16 Early 2023 (AV PRO microSD 128 GB V60) | |
| MSI Titan GT77 HX 13VI (Angelibird AV Pro V60) | |
| Medion Erazer Beast X40 (AV PRO microSD 128 GB V60) | |
| Schenker XMG Neo 17 M22 (AV PRO microSD 128 GB V60) | |
| maximum AS SSD Seq Read Test (1GB) | |
| Alienware x17 R2 P48E (AV Pro V60) | |
| Razer Blade 16 Early 2023 (AV PRO microSD 128 GB V60) | |
| Media de la clase Gaming (25.5 - 261, n=51, últimos 2 años) | |
| MSI Titan GT77 HX 13VI (Angelibird AV Pro V60) | |
| Medion Erazer Beast X40 (AV PRO microSD 128 GB V60) | |
Conectividad
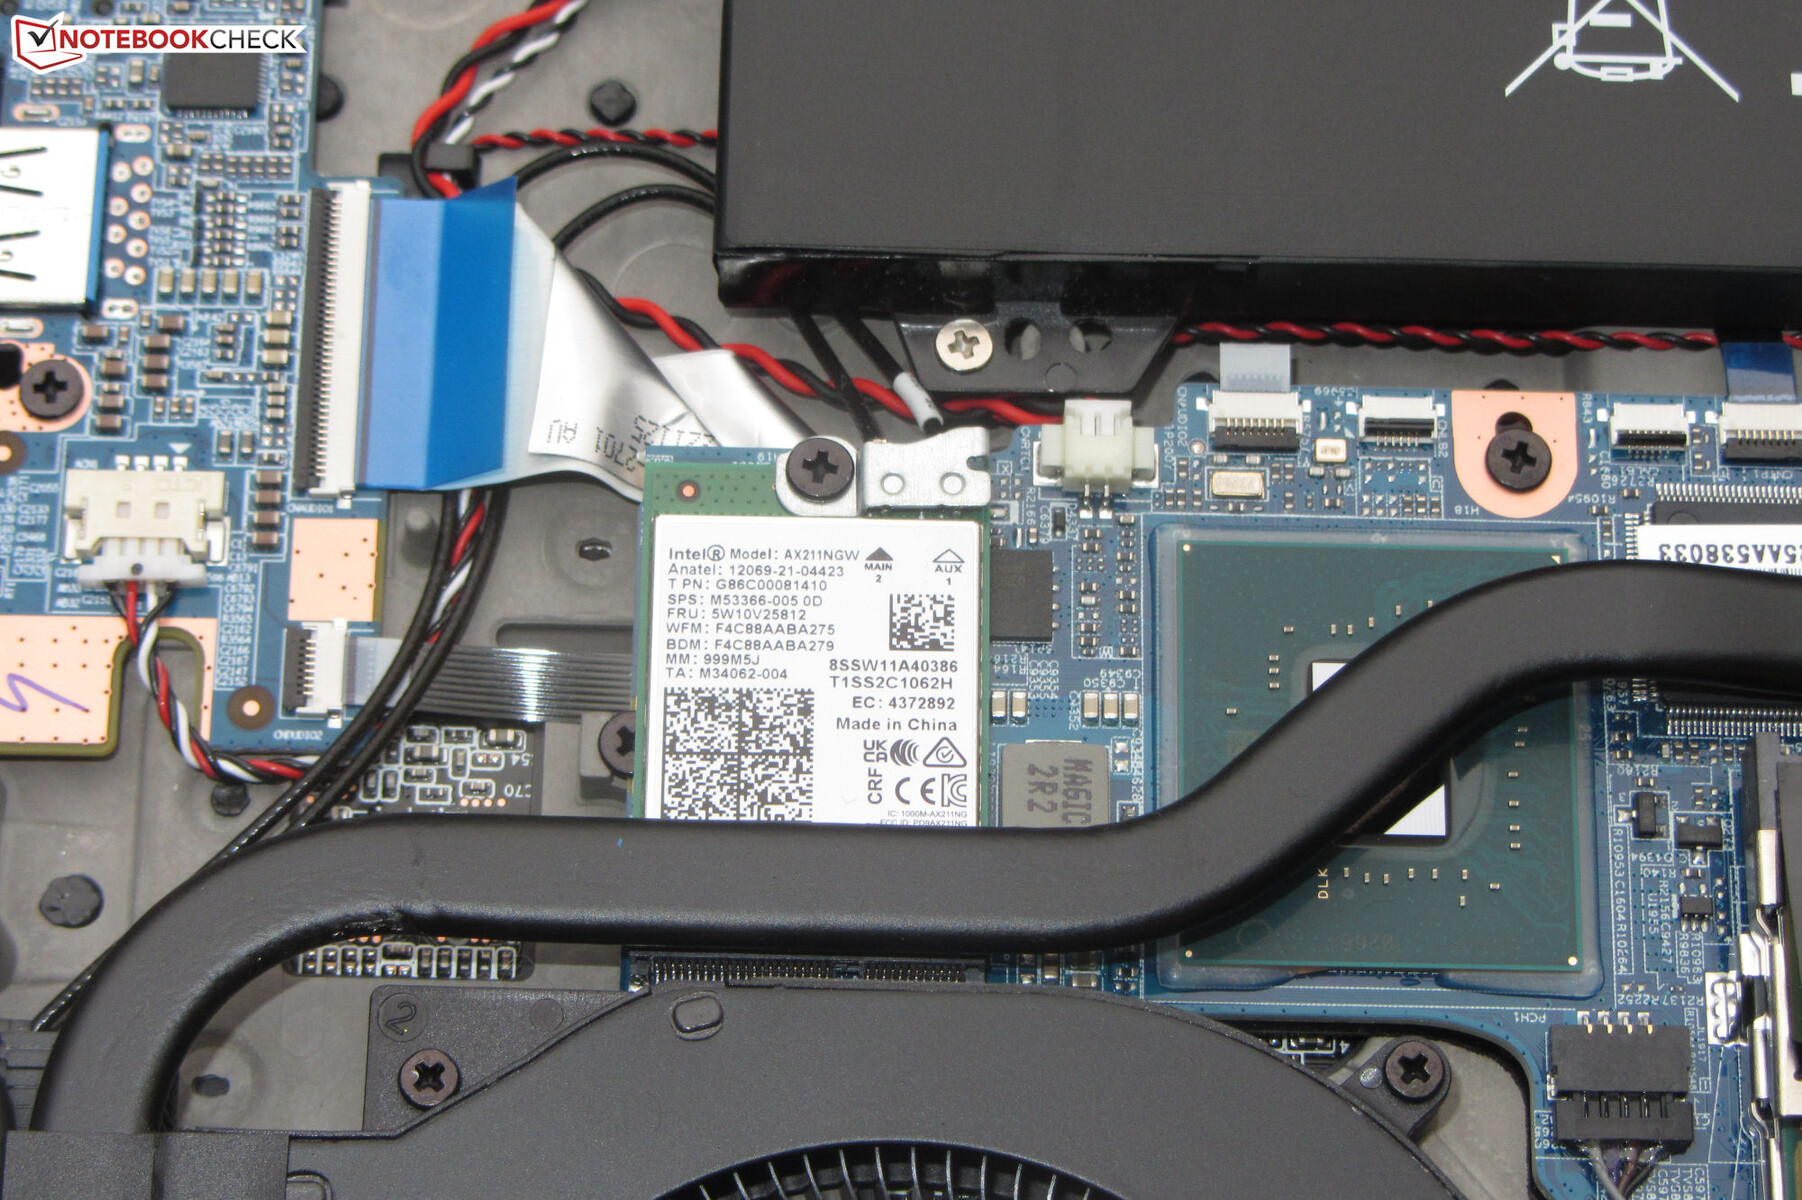
En condiciones óptimas (sin otros dispositivos Wi-Fi en las inmediaciones, corta distancia entre el portátil y el PC servidor), el Erazer ofreció excelentes velocidades de transferencia por Wi-Fi porque Medion ha optado por un módulo Intel AX211 Wi-Fi 6E. De las conexiones de red por cable se encarga el chip Realtek RTL8125 Gigabit Ethernet, capaz de alcanzar velocidades de hasta 2,5 Gbit/s.
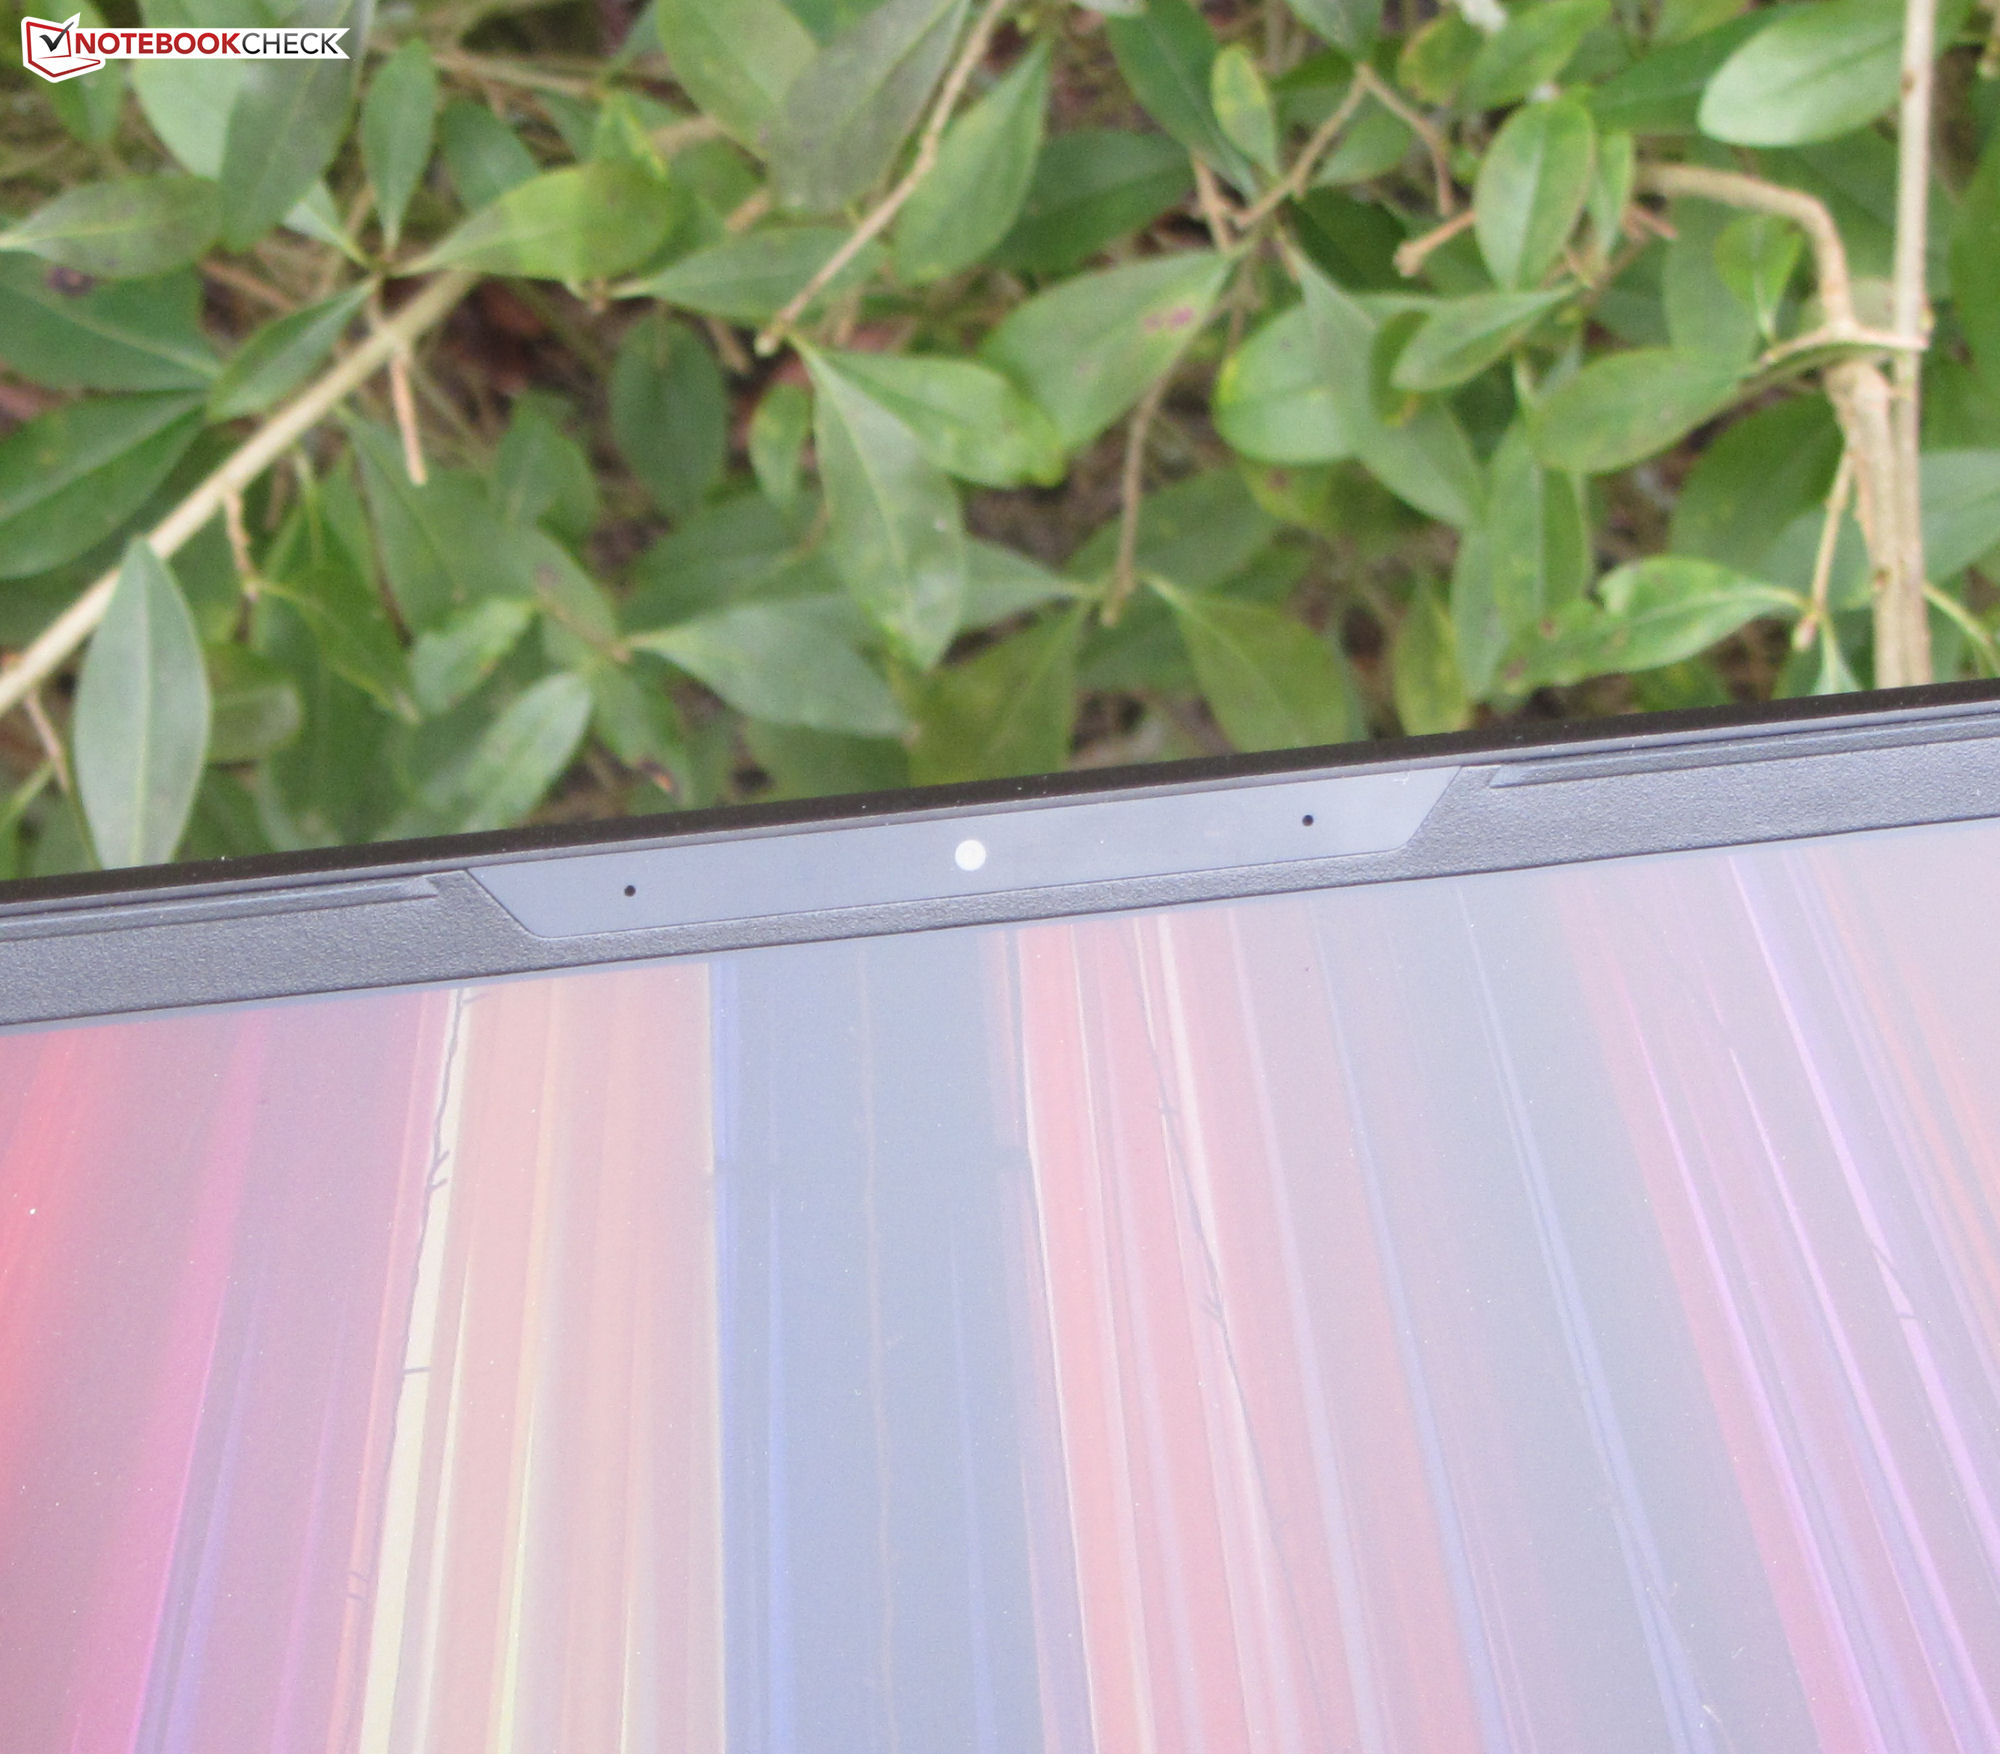
Cámara web
La webcam de 2,1 MP captura imágenes a una resolución máxima de 1.920 x 1.080. Carece de precisión cromática: los colores producidos por la cámara se desvían significativamente de los colores de referencia. No hay obturador mecánico de privacidad en la webcam.


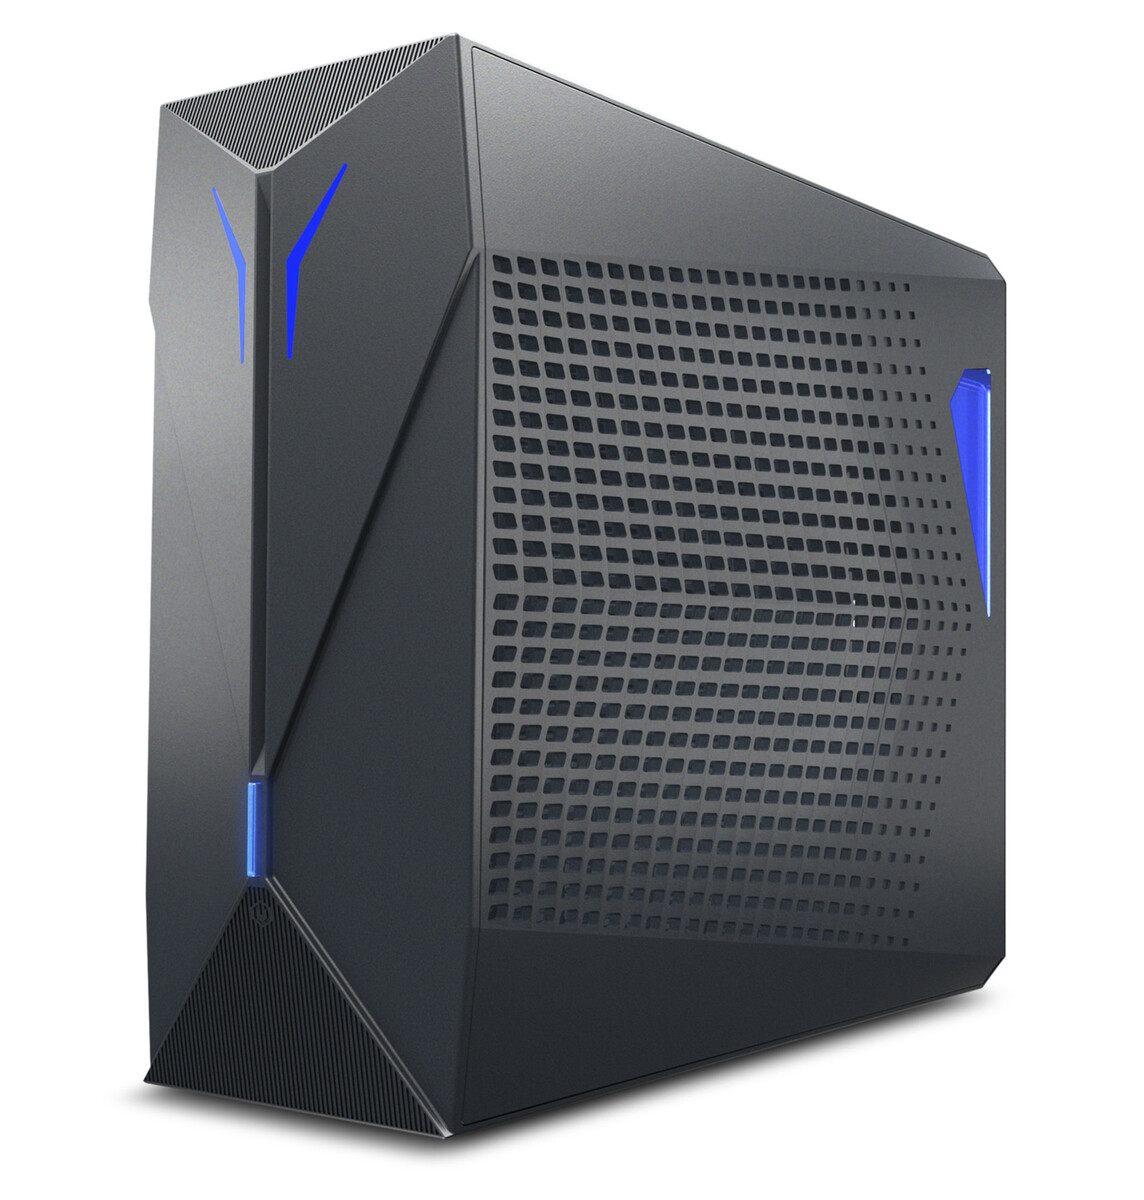
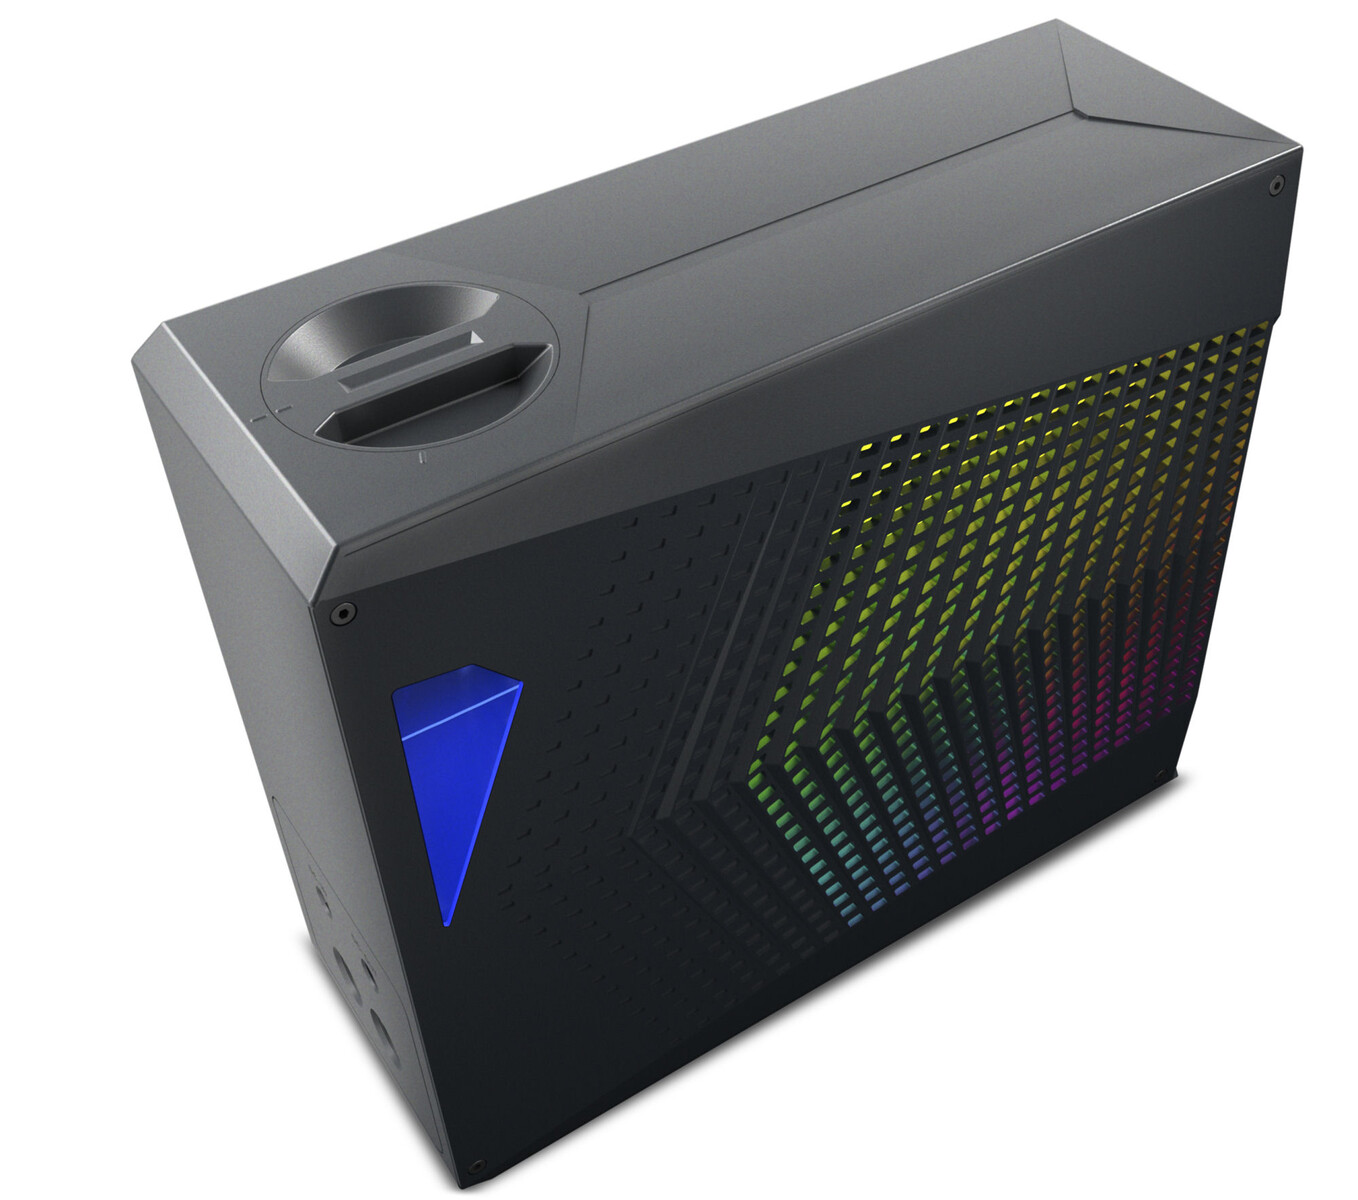
Accesorios
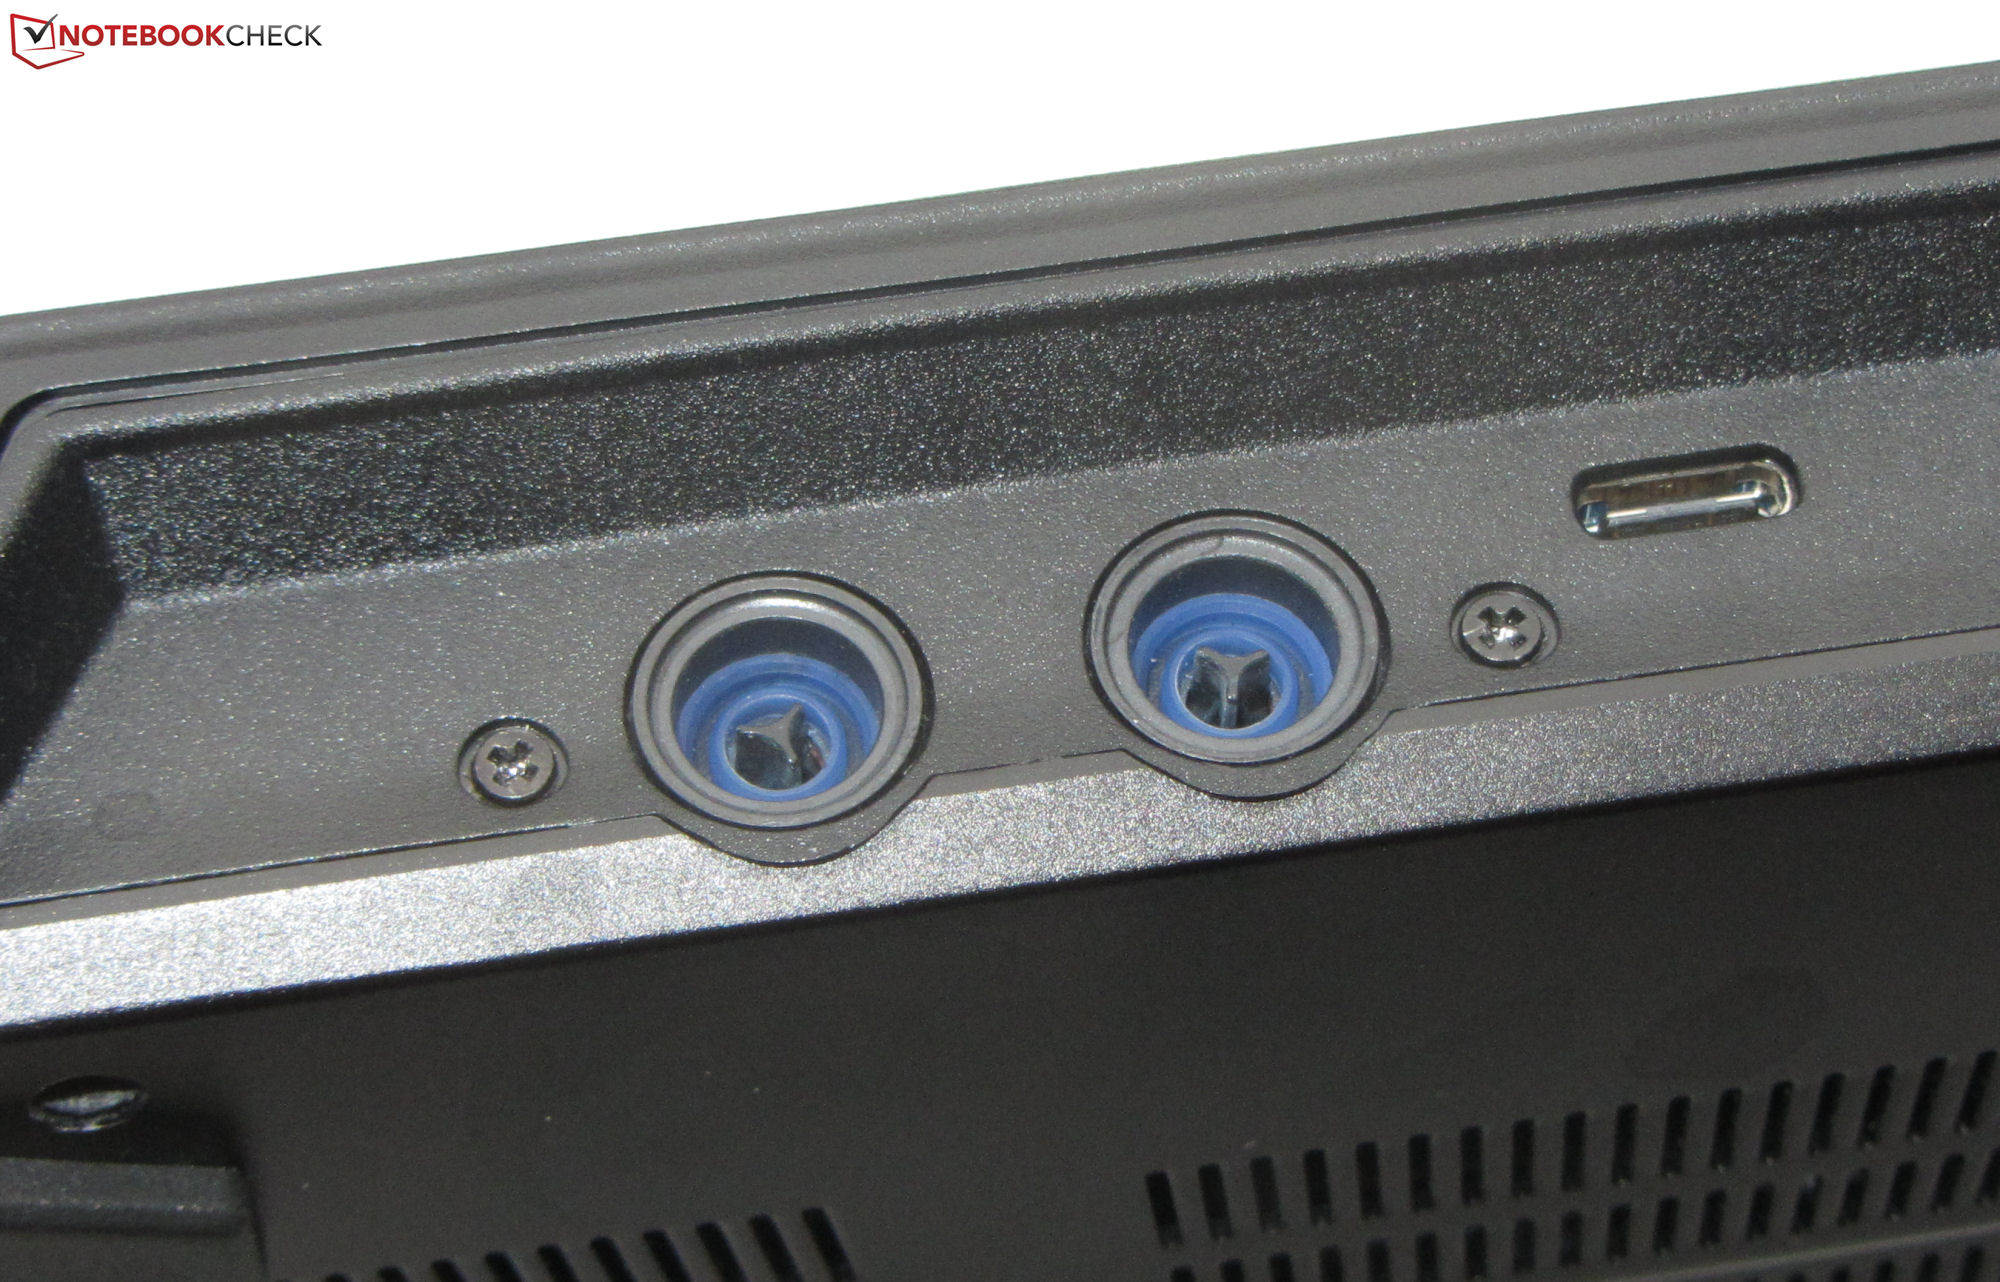
El portátil se entrega sin más accesorios que la documentación habitual y un adaptador de corriente. Medion ofrece una solución de refrigeración por agua externa opcional por unos 250 euros (270 dólares), que la empresa también nos proporcionó para las pruebas.
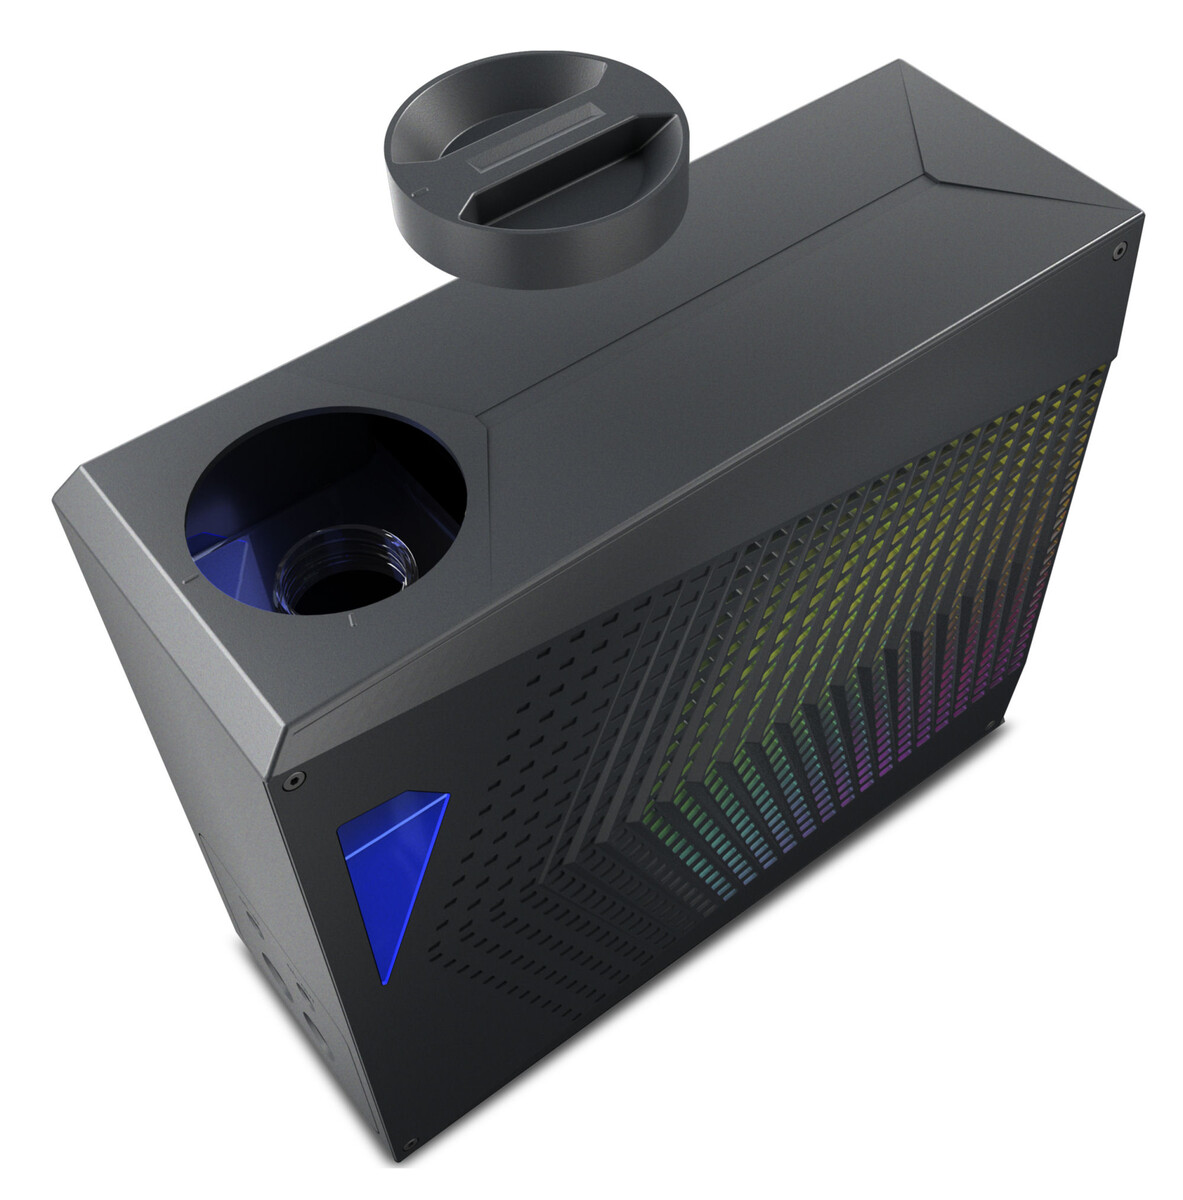
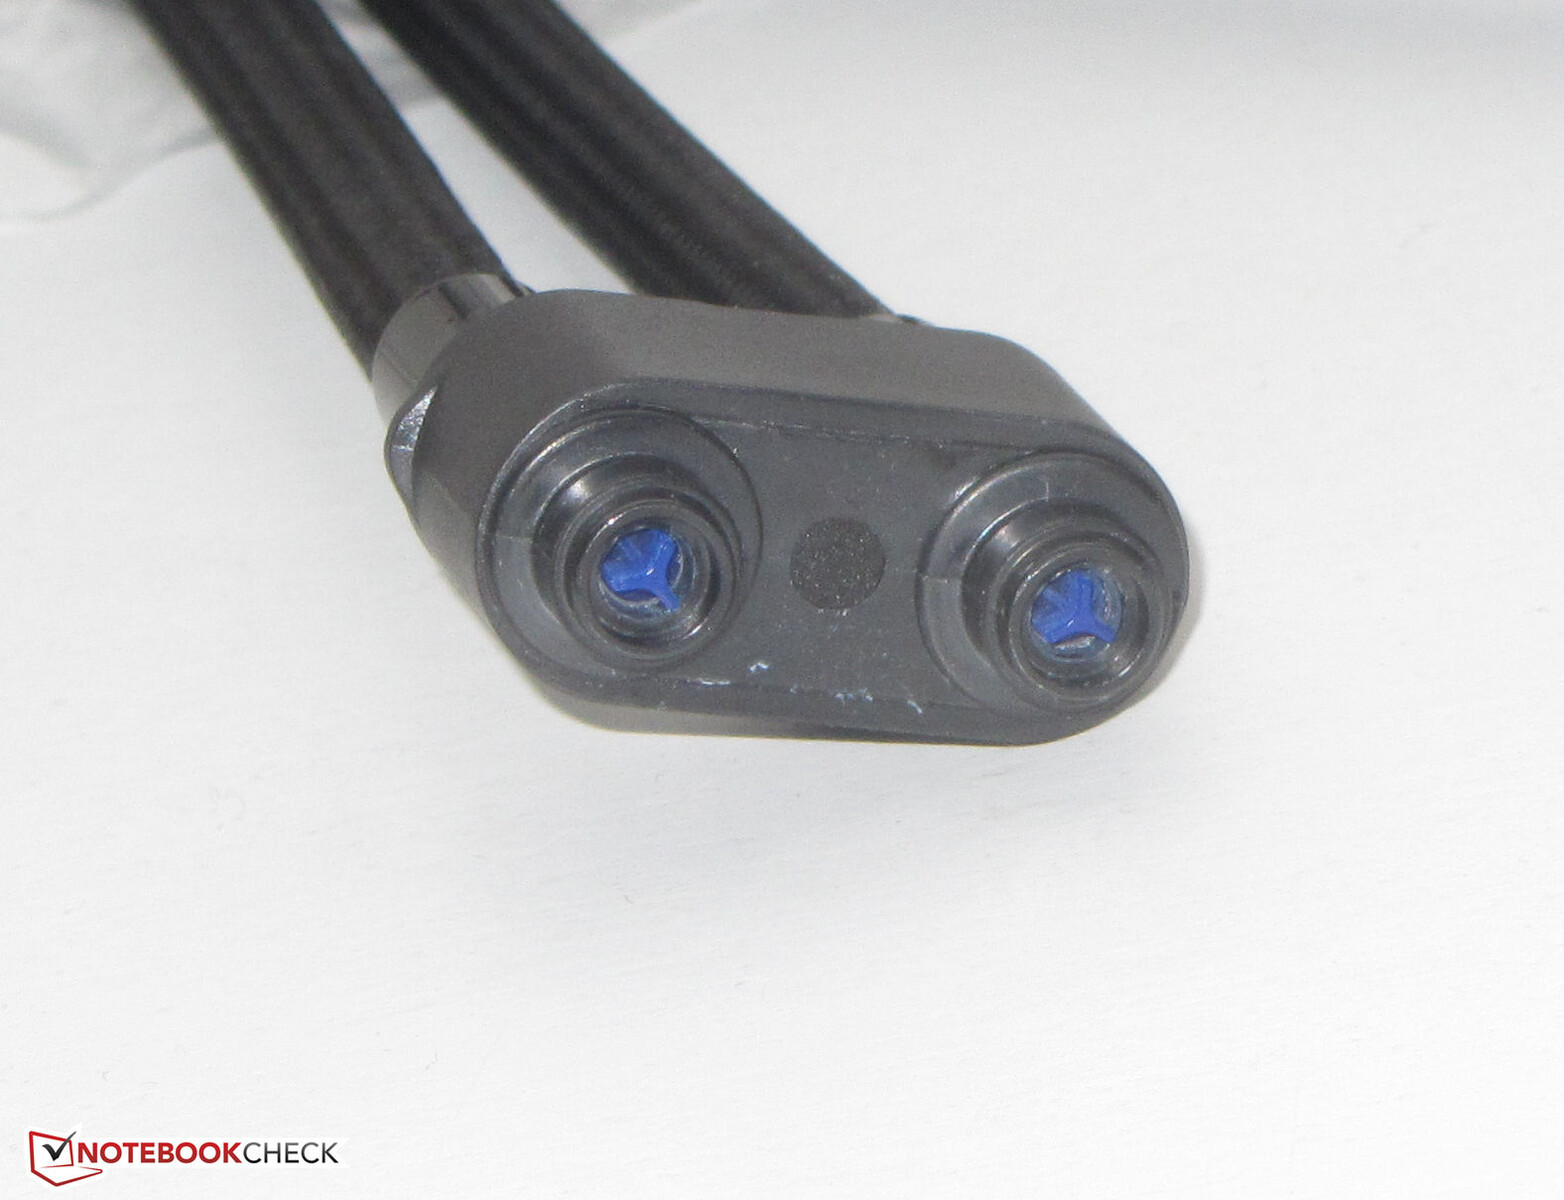
La pequeña unidad de refrigeración es bastante fácil de usar: basta con llenarla de agua destilada, conectar los cables y tubos, y encenderla. El portátil y la unidad de refrigeración externa se comunican entre sí por Bluetooth, y la conexión se establece automáticamente. El cargador del portátil suministra energía tanto al X40 como a la unidad de refrigeración. Los tubos de agua se sujetan magnéticamente, sin necesidad de apretar tornillos. Sin embargo, es posible que se escapen algunas gotas de agua al desconectar los tubos.
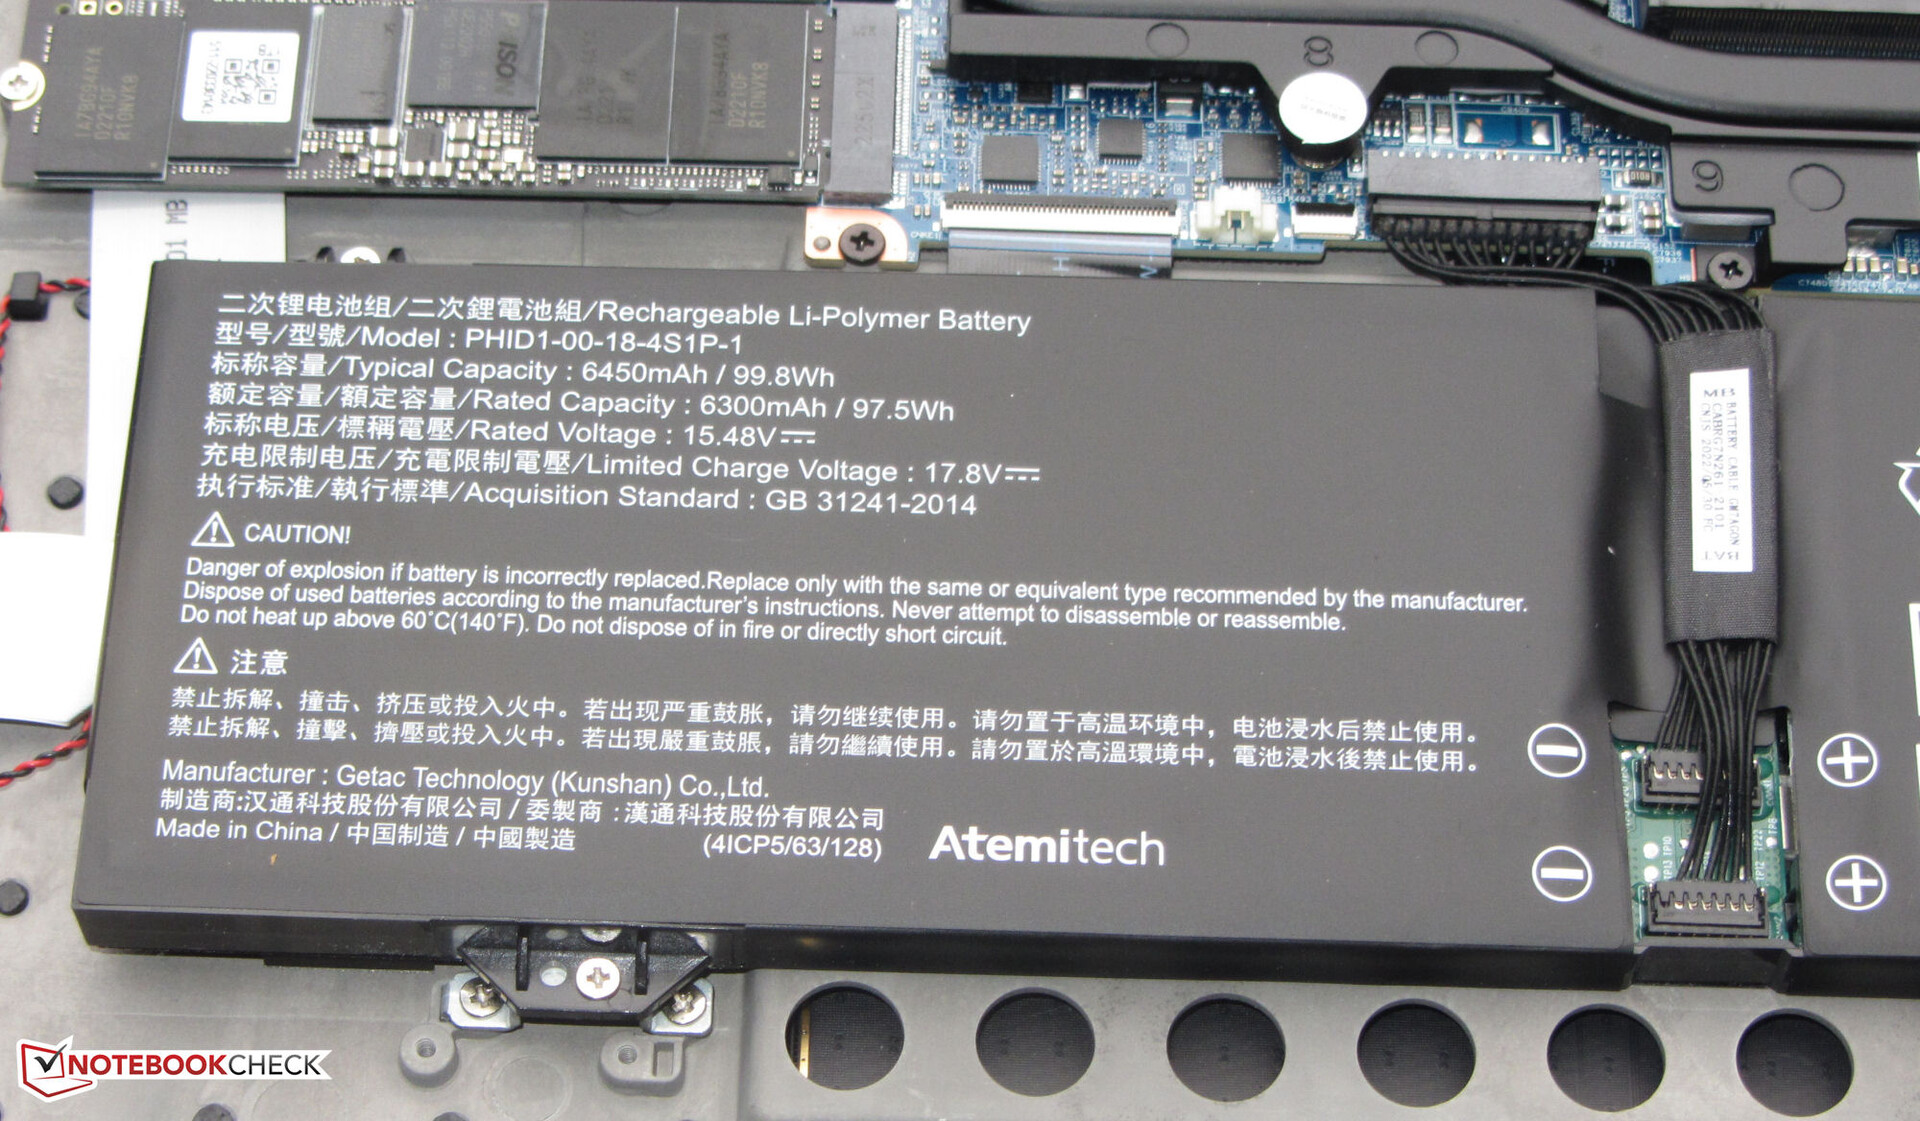
Mantenimiento
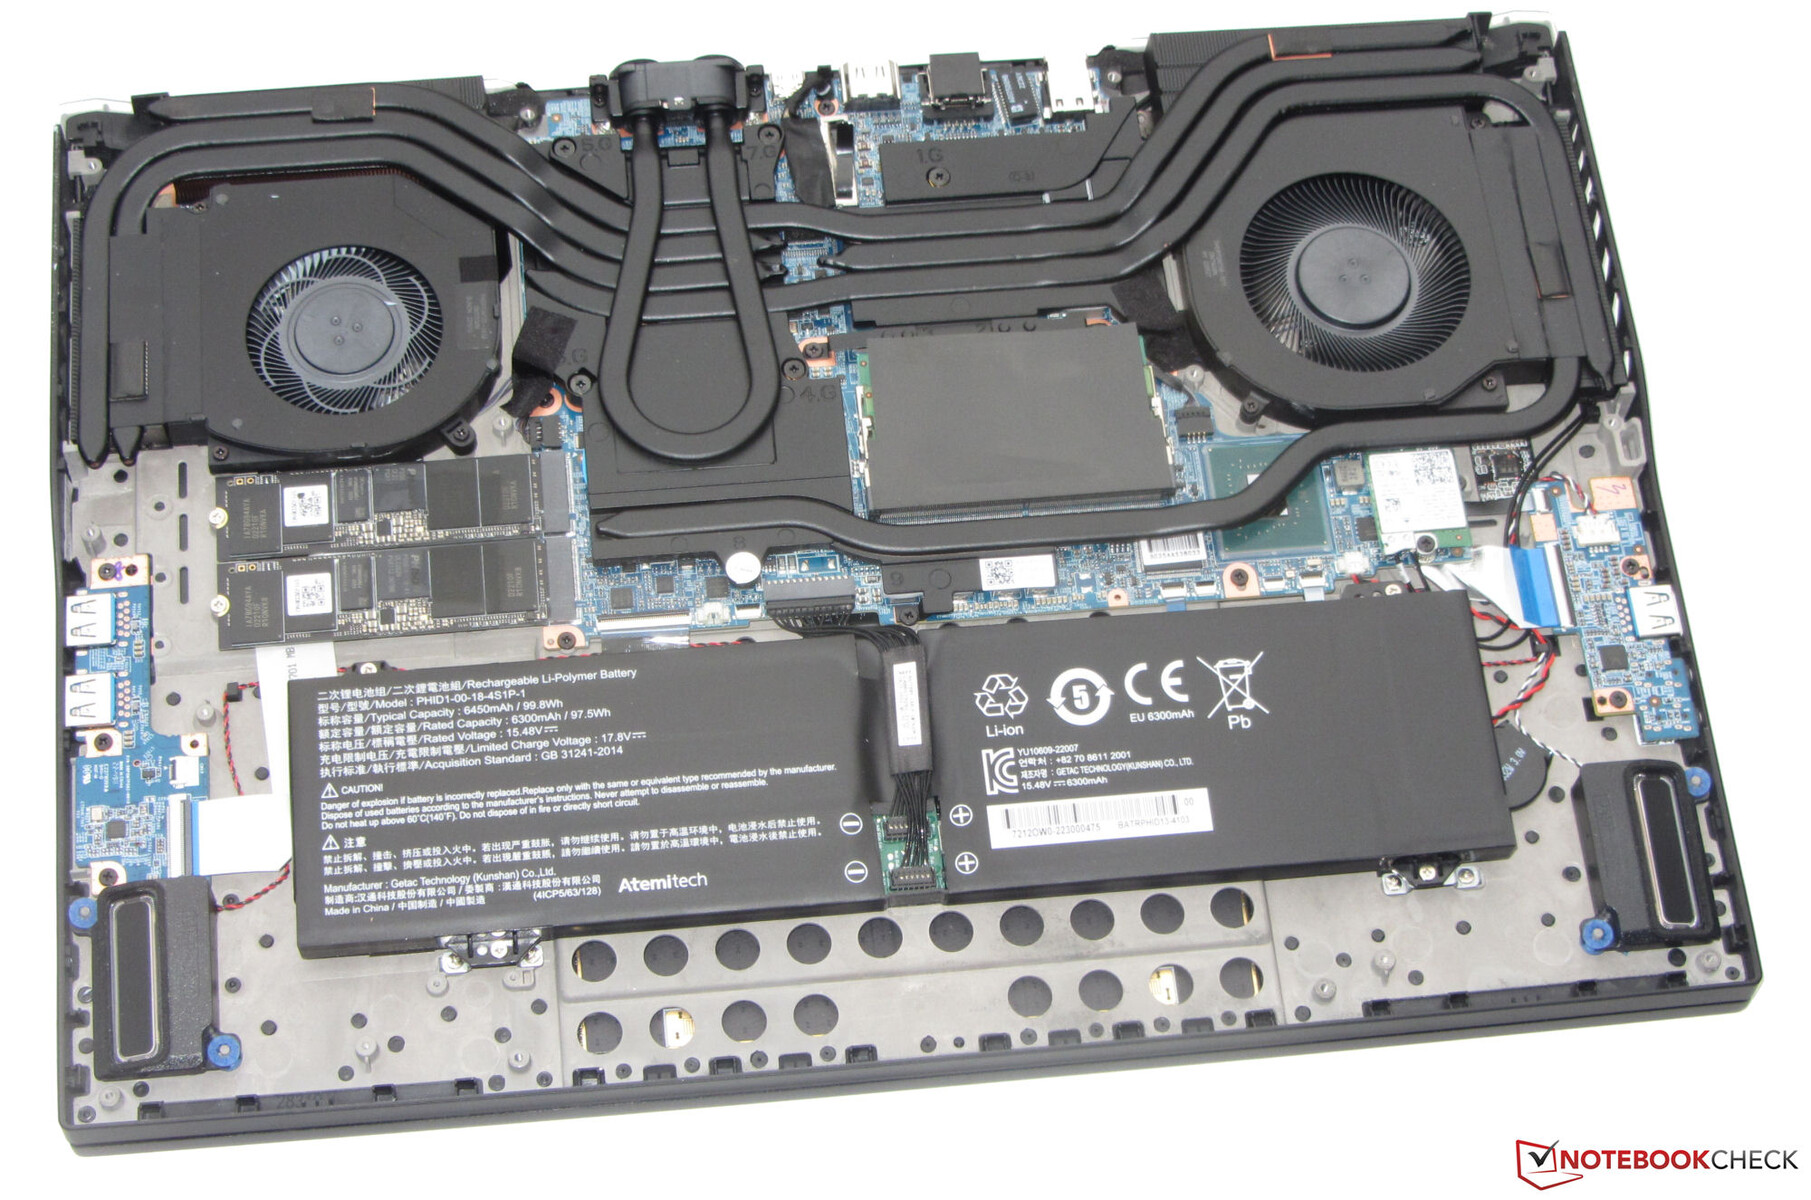
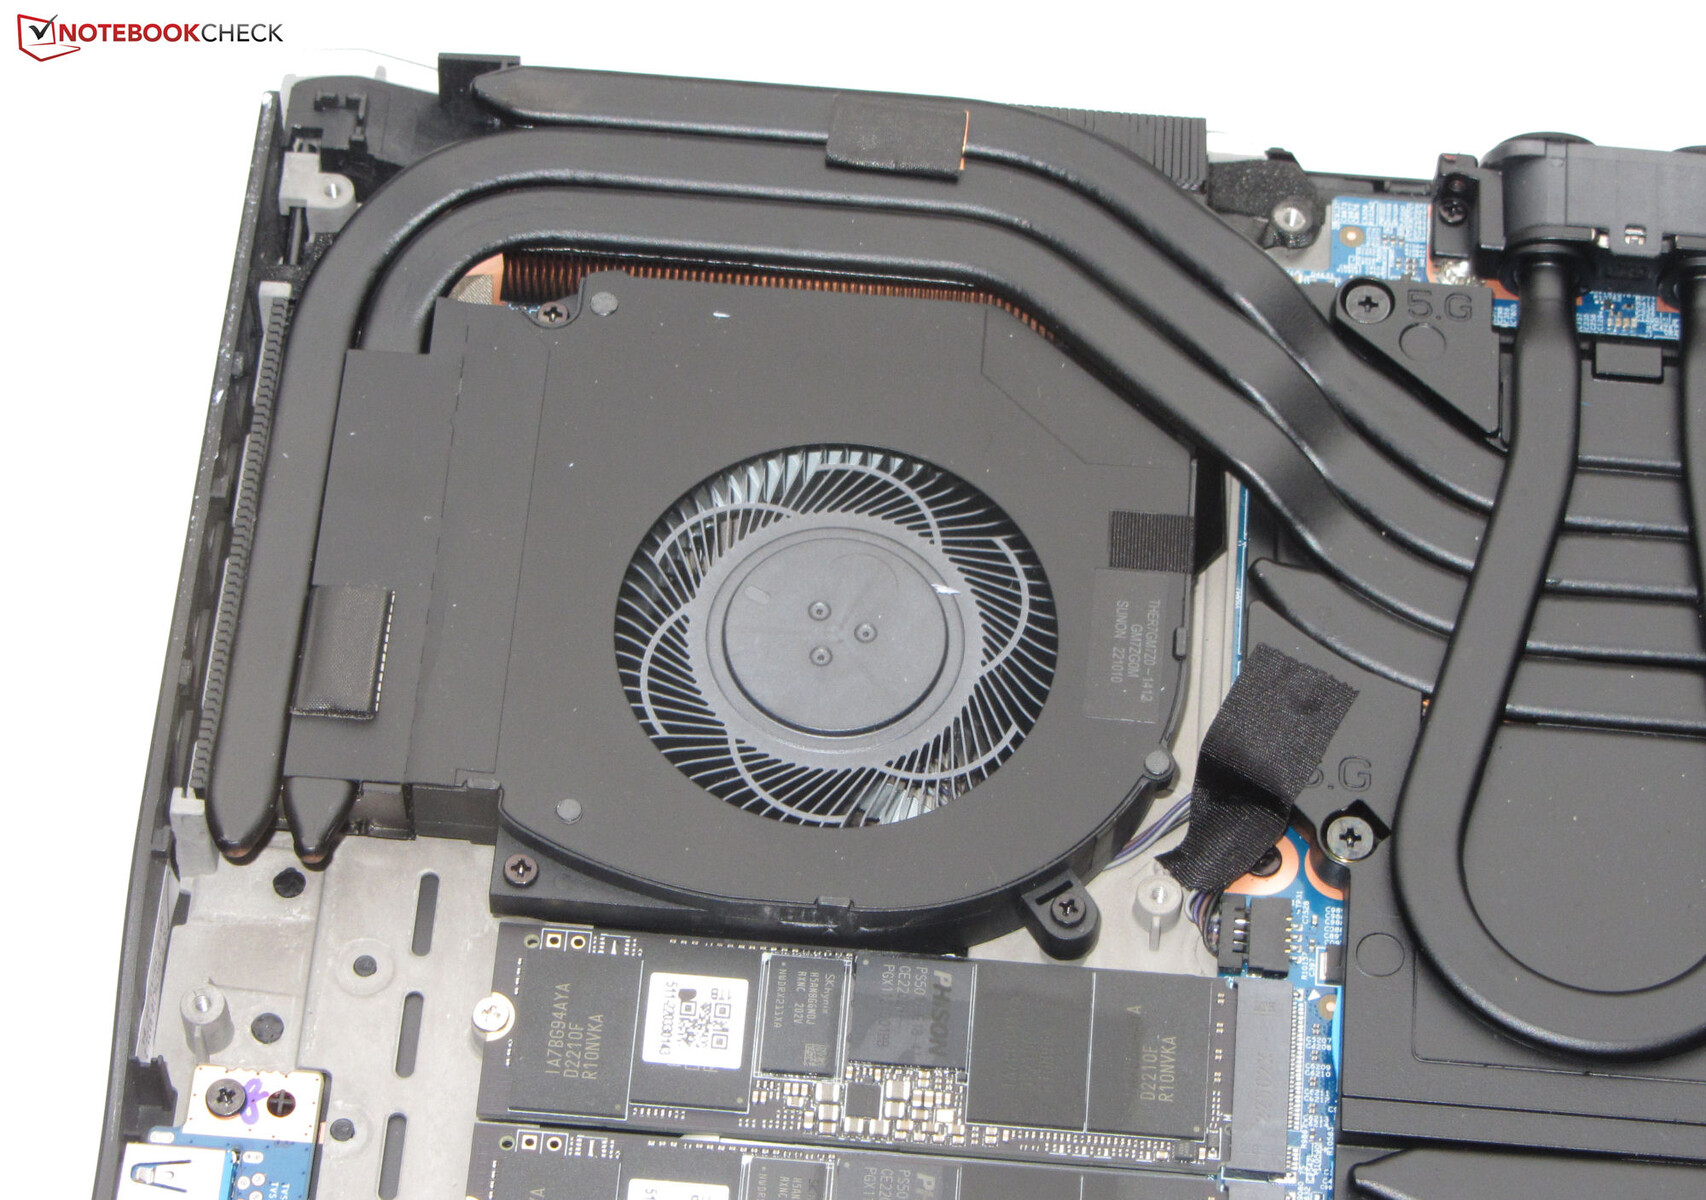
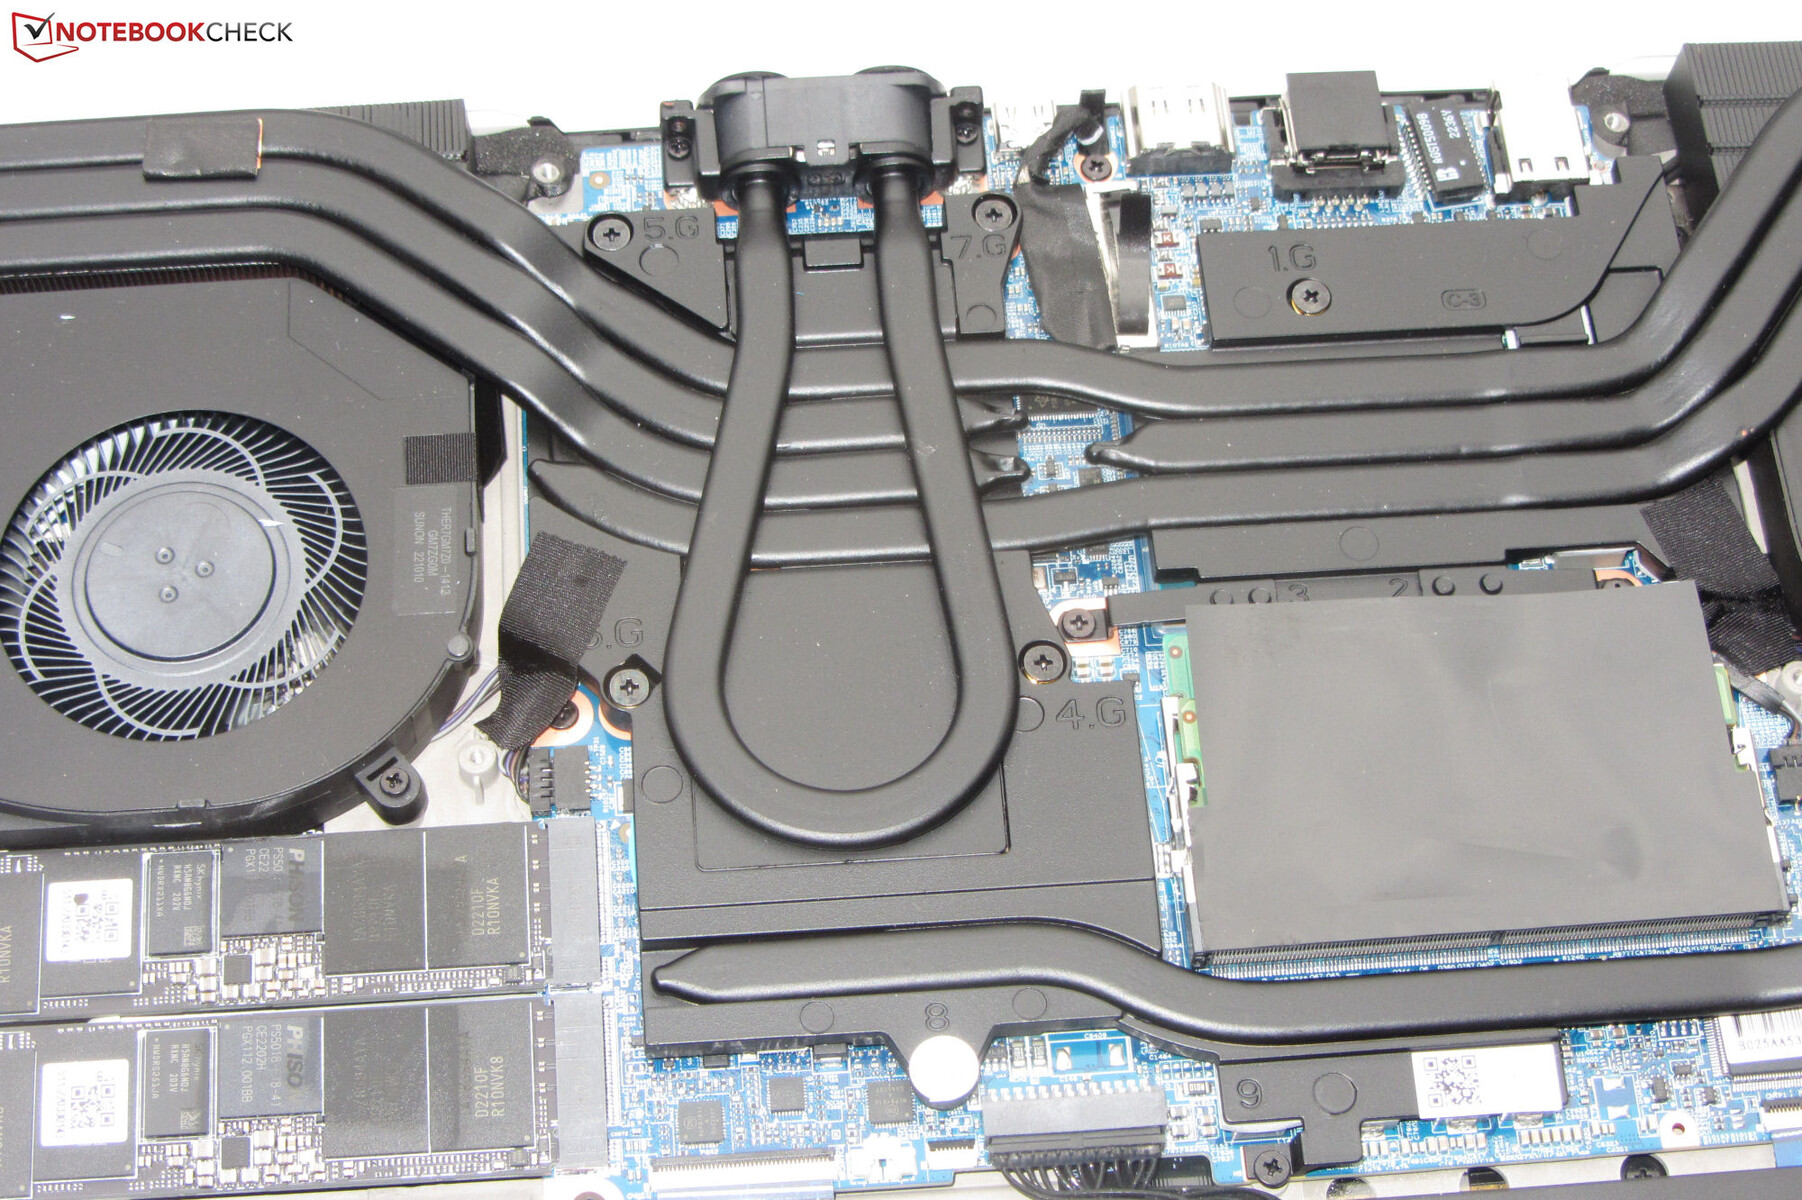
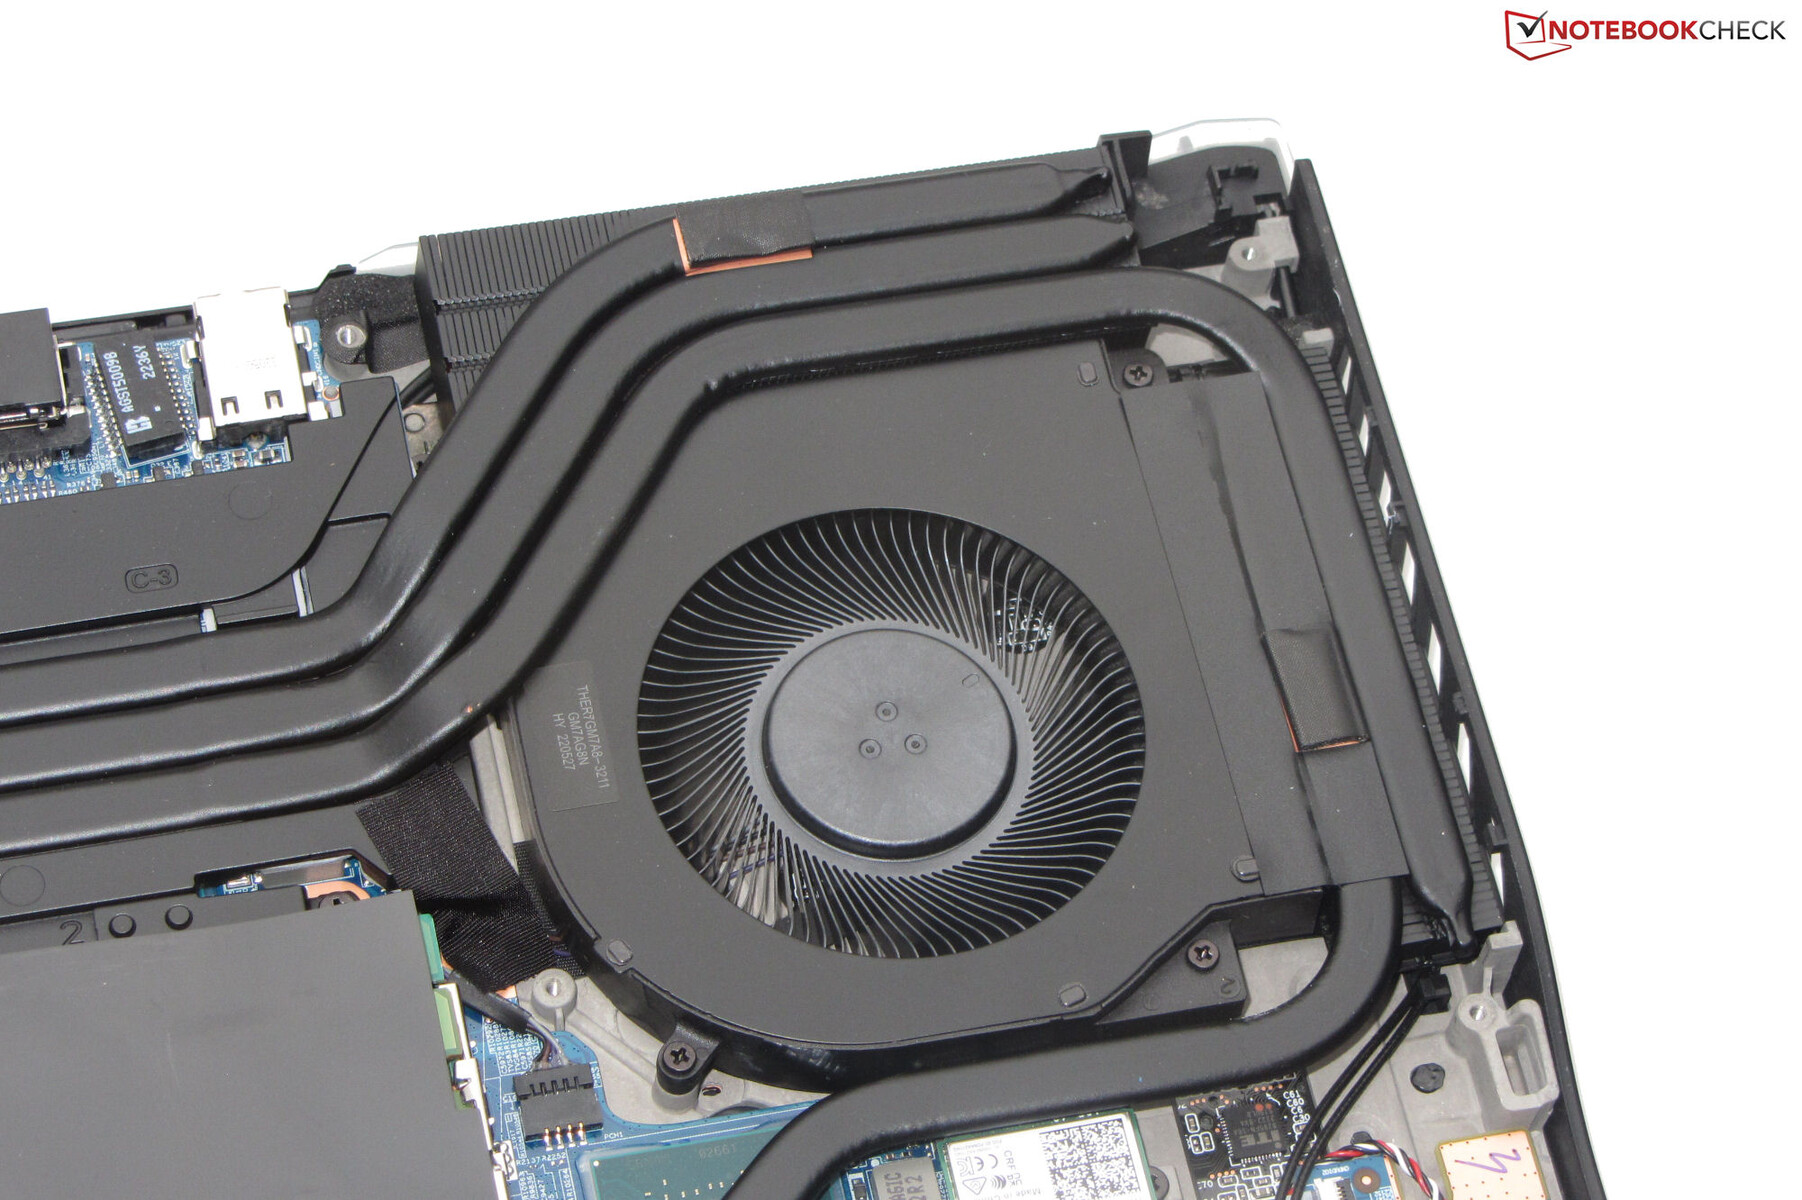
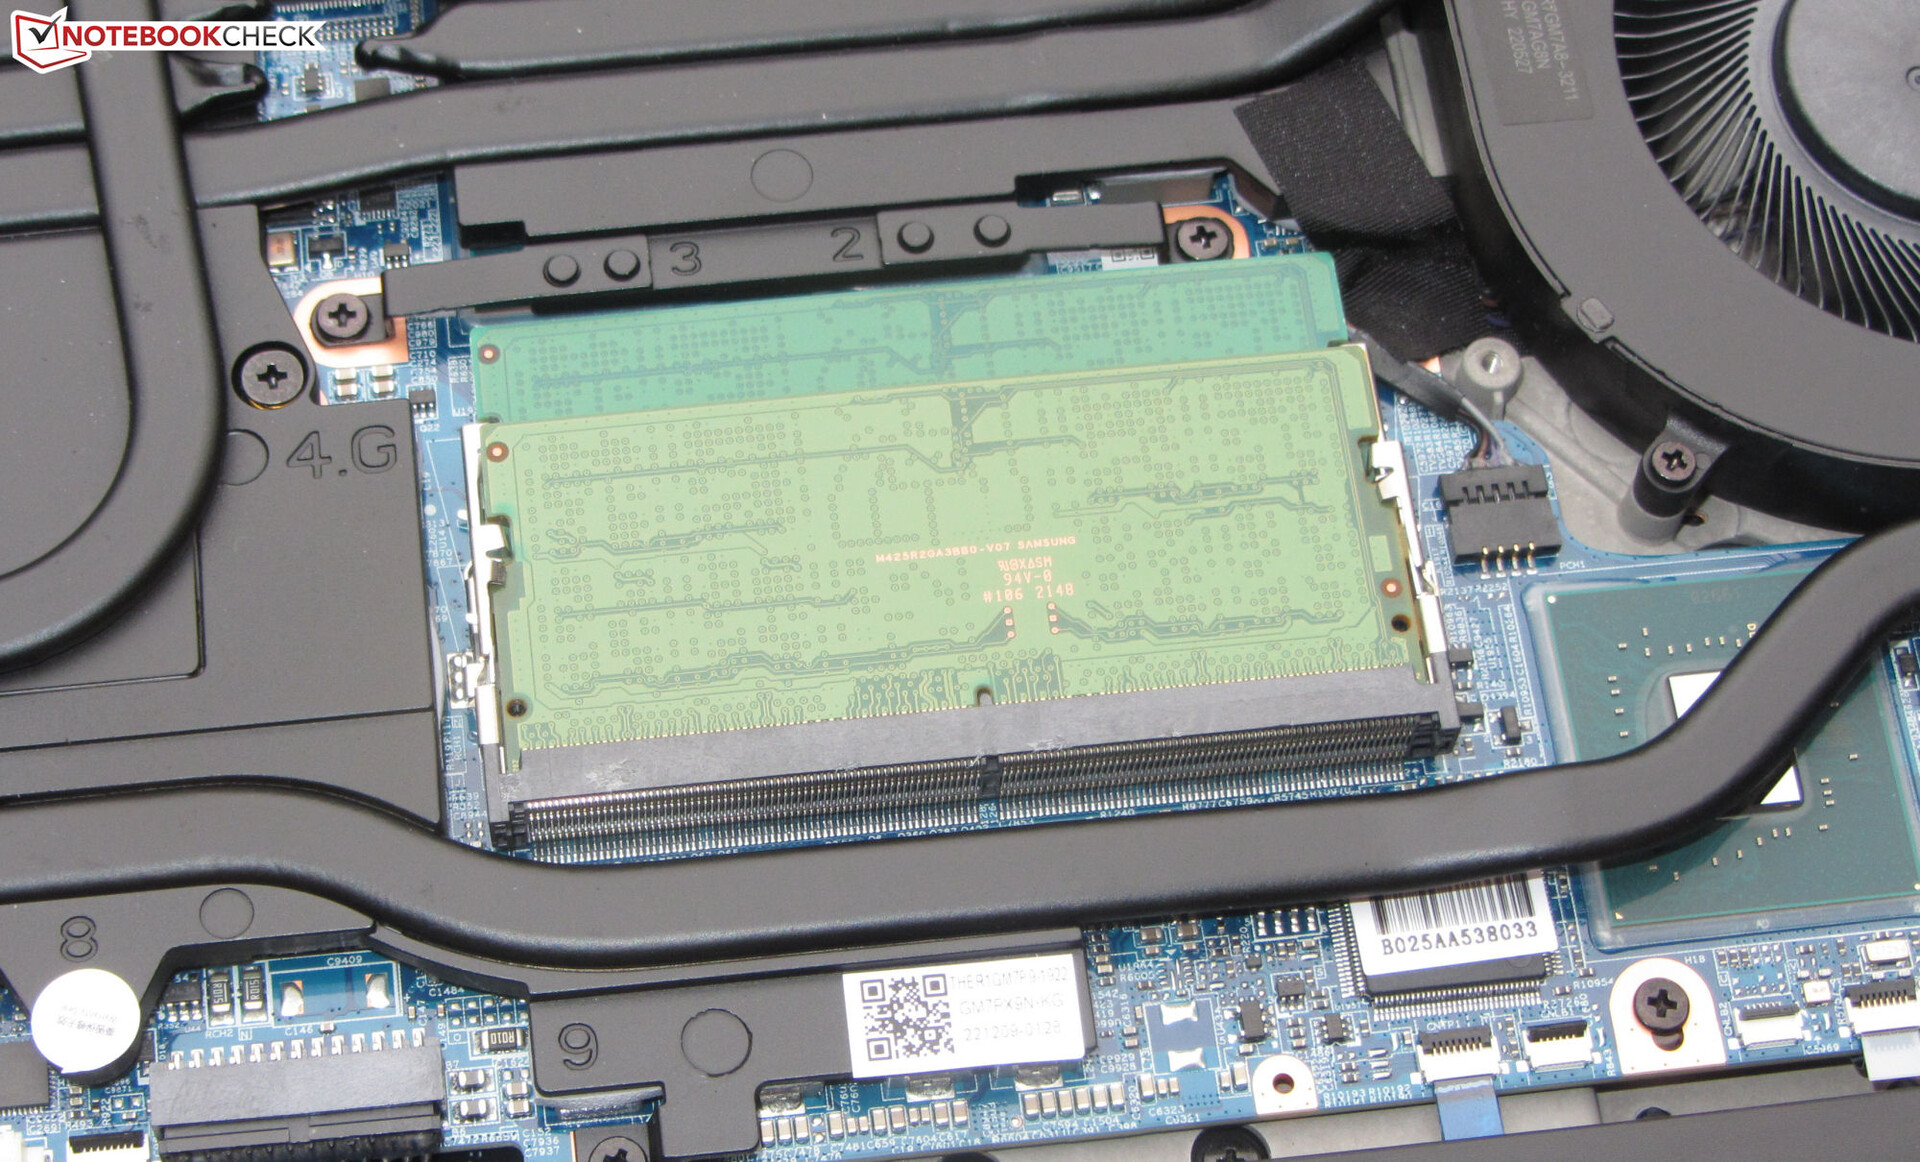
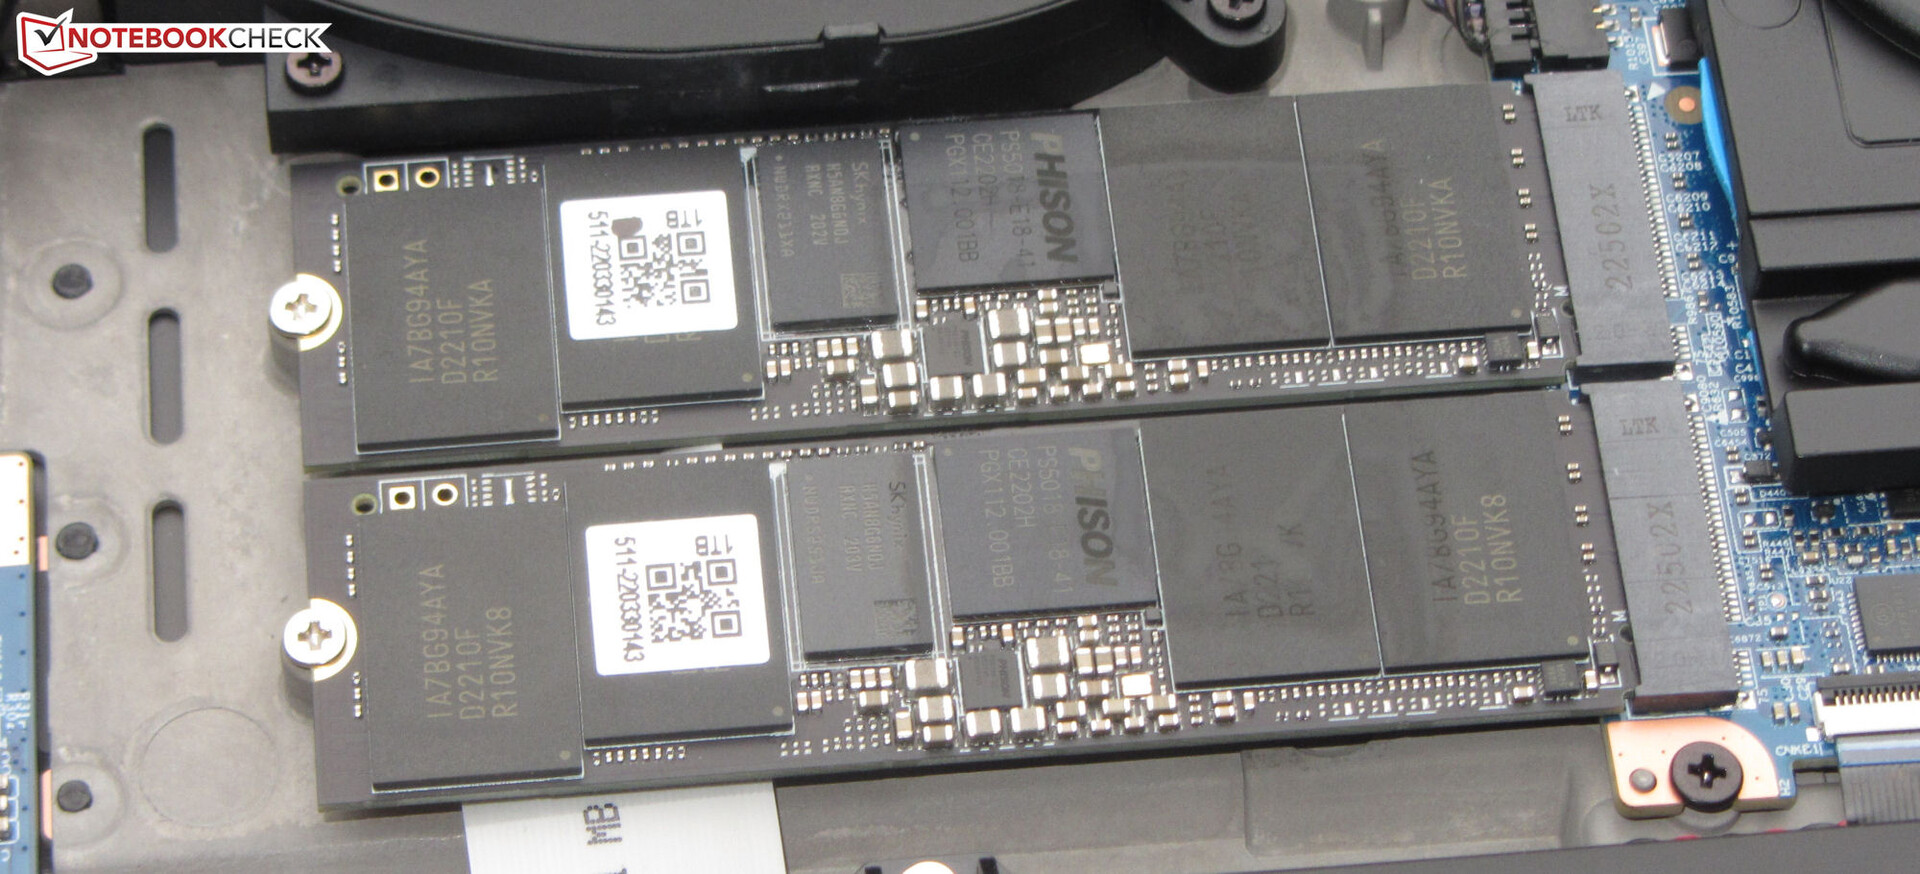
Para retirar la cubierta inferior, es necesario aflojar todos los tornillos de la parte inferior, así como dos tornillos más en la parte posterior junto a los conectores de refrigeración por agua. Después de eso, la cubierta inferior se puede sacar con un movimiento brusco por las rejillas de ventilación de escape. Al retirar la cubierta se puede acceder a las ranuras de memoria (ambas en uso), dos SSD PCIe 4.0, el módulo Wi-Fi, los ventiladores, la batería de la BIOS y la batería recargable.
Garantía
Medion ofrece una garantía de dos años para el Erazer. Existen opciones de actualización, pero deben adquirirse junto con el portátil en la tienda en línea de Medion. No es posible actualizar o ampliar la garantía después de comprar el portátil. Ampliar un año la garantía cuesta casi 200 euros (216 dólares).
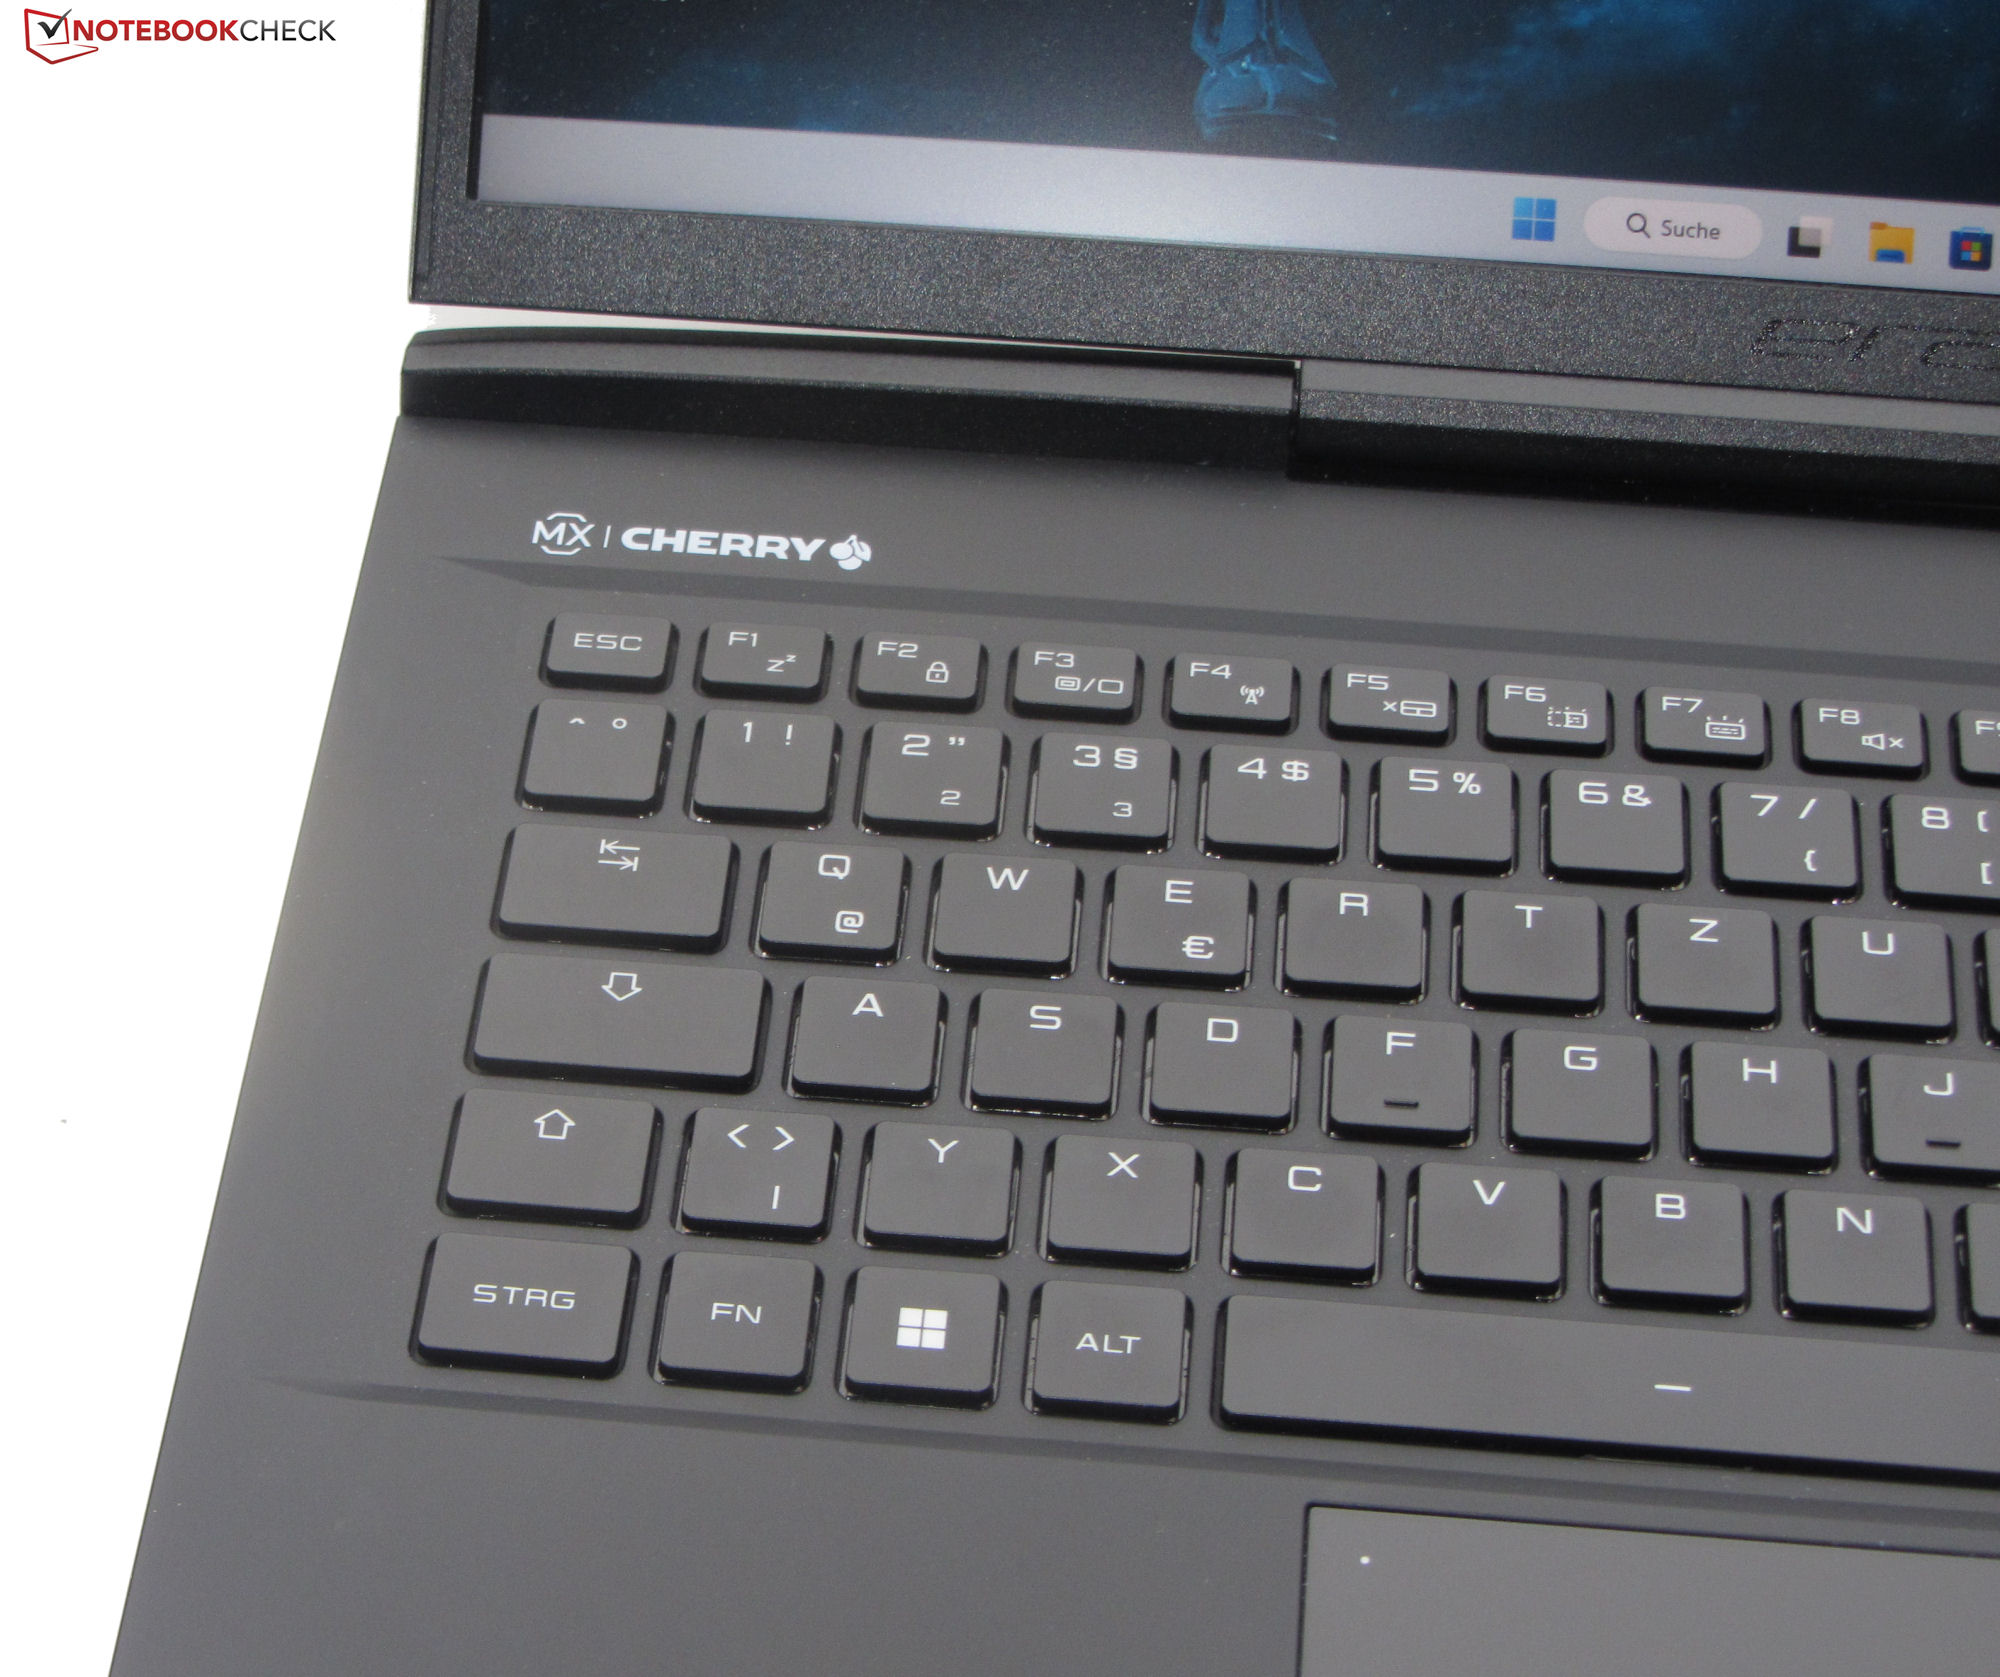
Dispositivos de entrada - Teclado mecánico con interruptores Cherry MX
Teclado
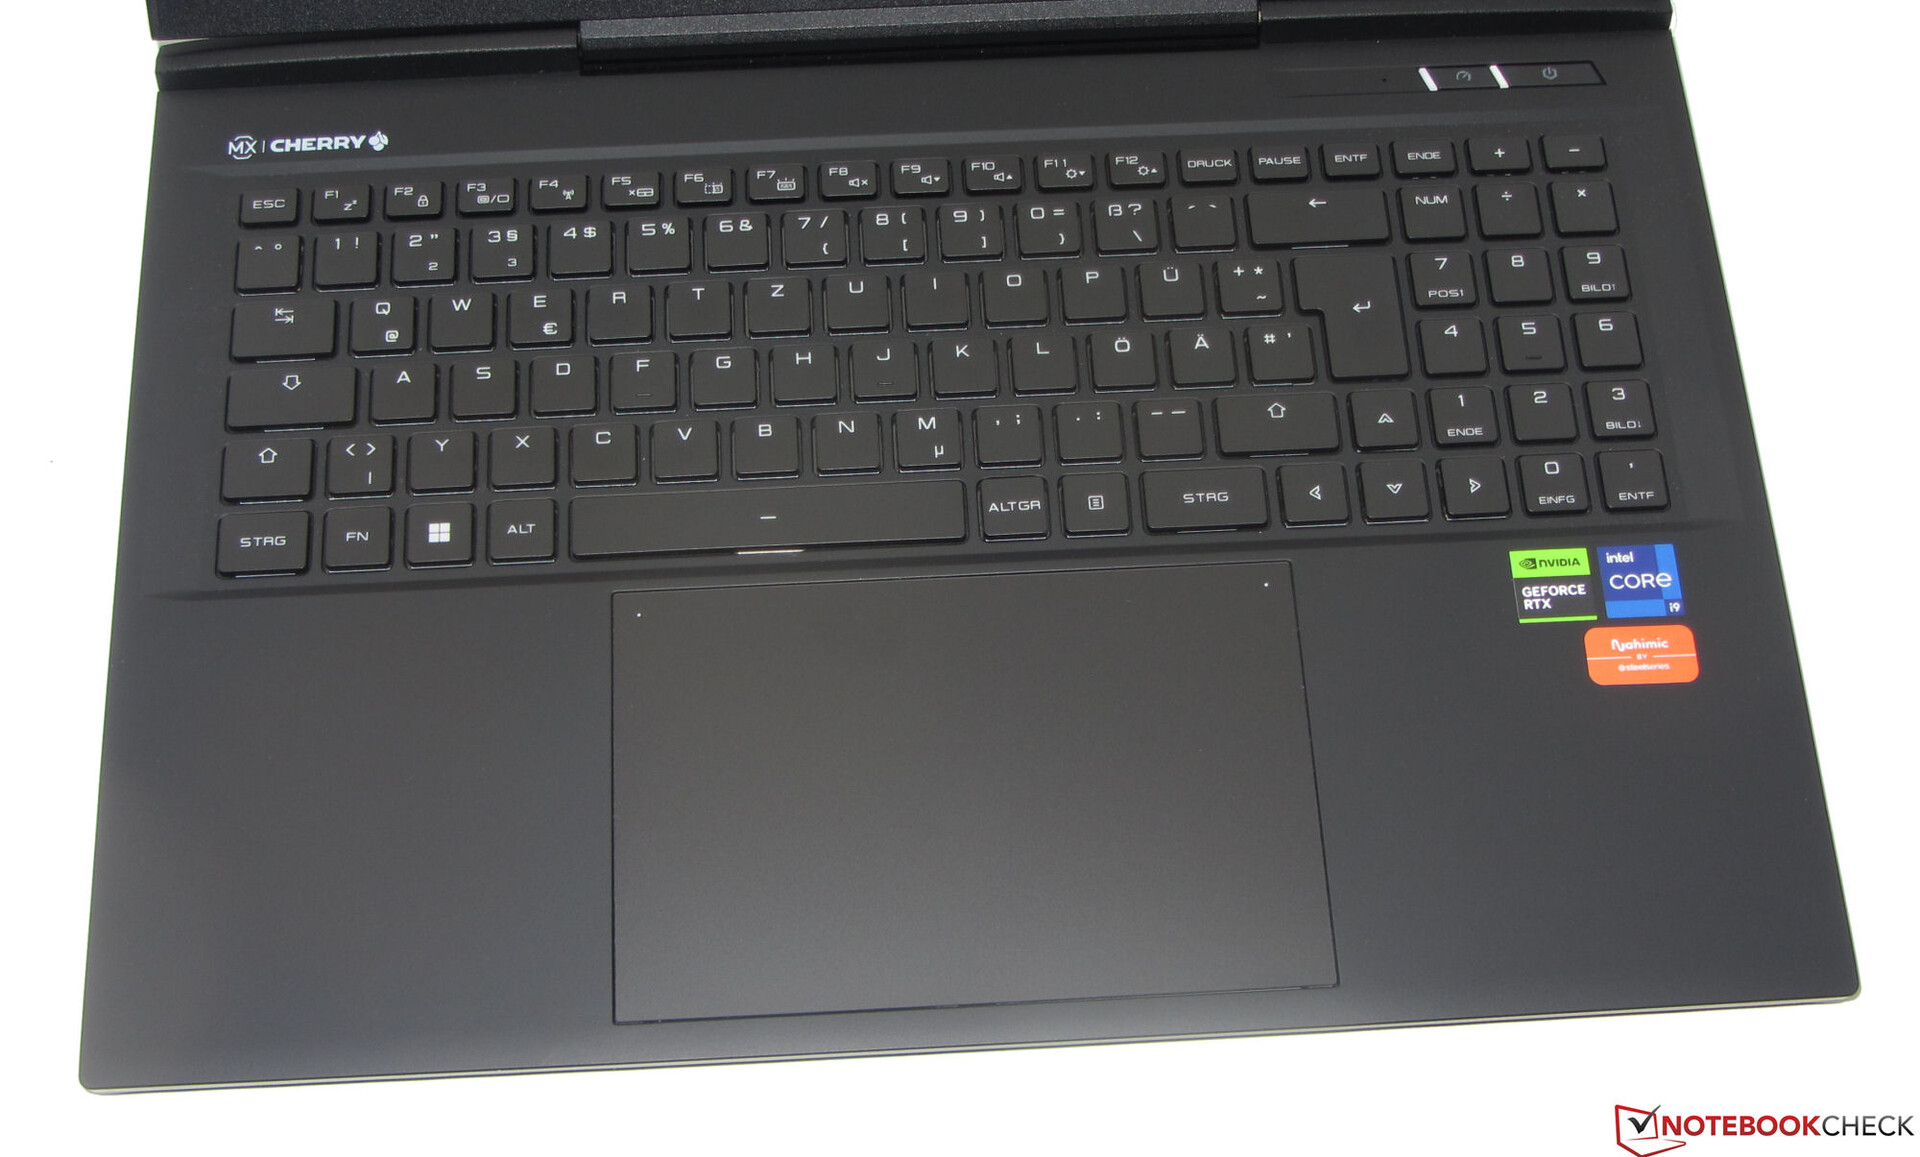
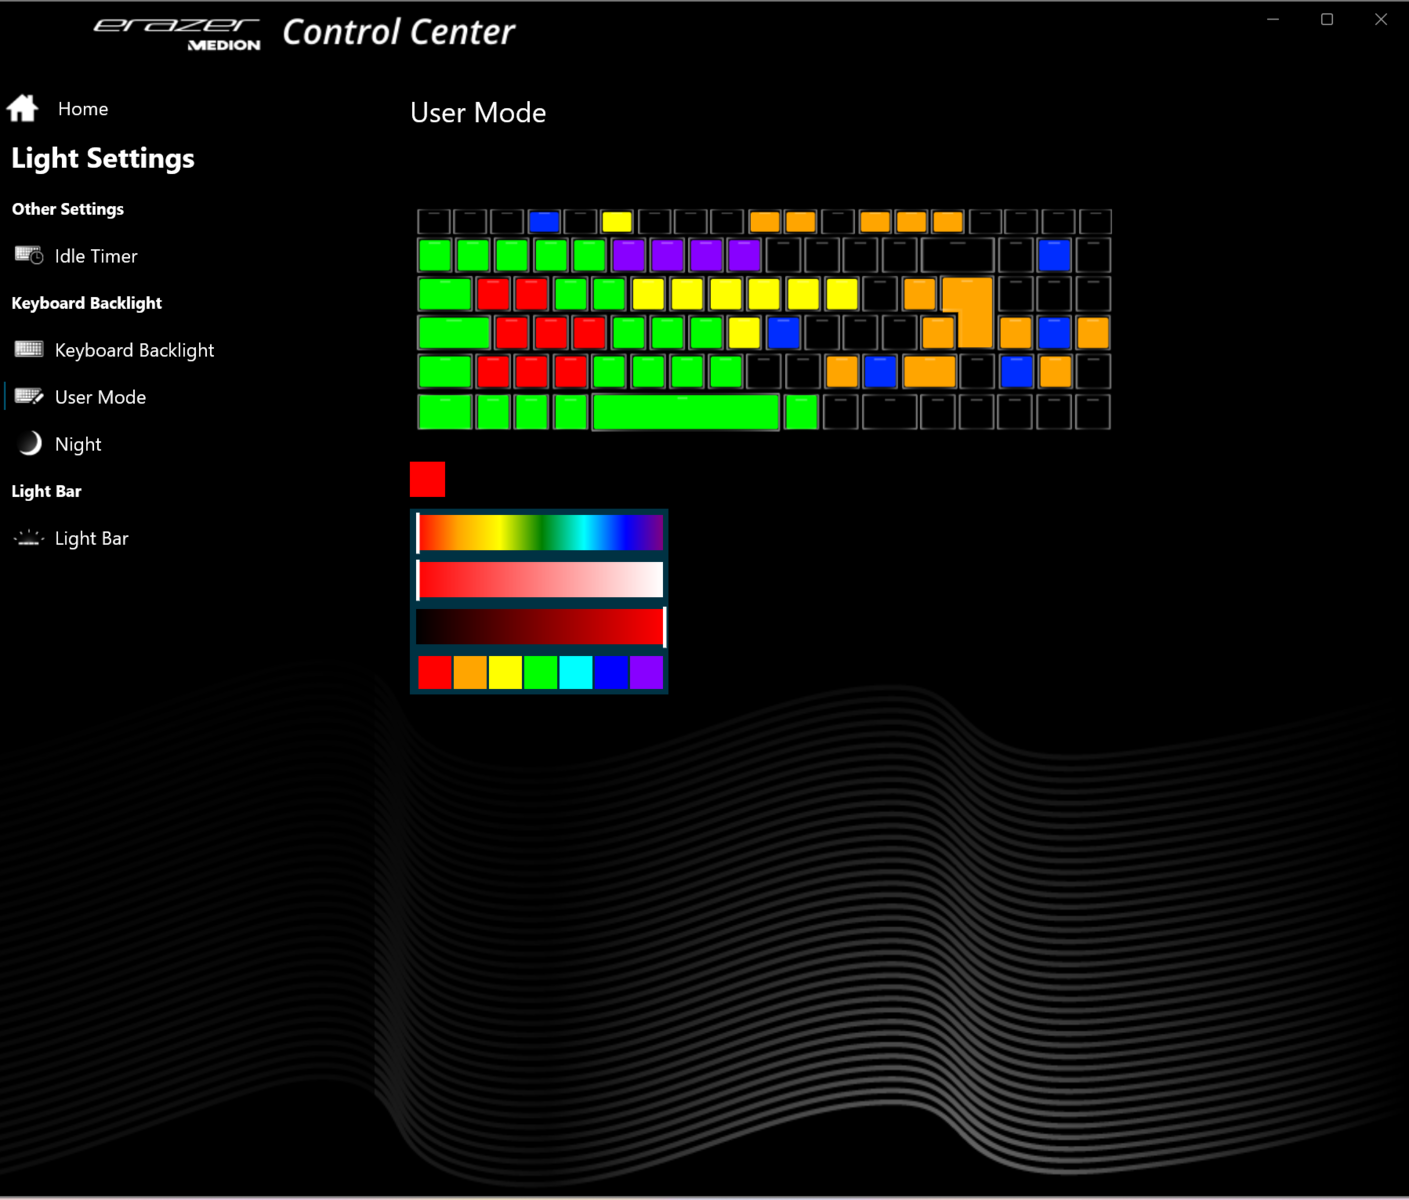
Los teclados mecánicos suelen ser conocidos por su precisión de entrada y respuesta, así como por su sensación de tecleo de primera calidad; esto no es diferente en el caso del teclado X40. Sus interruptores Cherry MX ofrecen un recorrido moderado y un punto de accionamiento audible y táctil. El teclado no se flexiona al escribir. Hay dos teclas de función que permiten ajustar la iluminación RGB por tecla a uno de los cuatro niveles de brillo. En general, el Erazer Beast X40 es un teclado fantástico.
Panel táctil
Con unas medidas aproximadas de 15,5 x 10 cm, el clickpad multitáctil tiene una superficie lisa que permite deslizar los dedos con facilidad. Ofrece un recorrido corto y un punto de clic bien definido. Hay LEDs de estado en las esquinas superiores del pad. Tocando el LED izquierdo se activa o desactiva todo el panel táctil, mientras que el LED derecho se utiliza para activar o desactivar sólo la mitad derecha del panel.
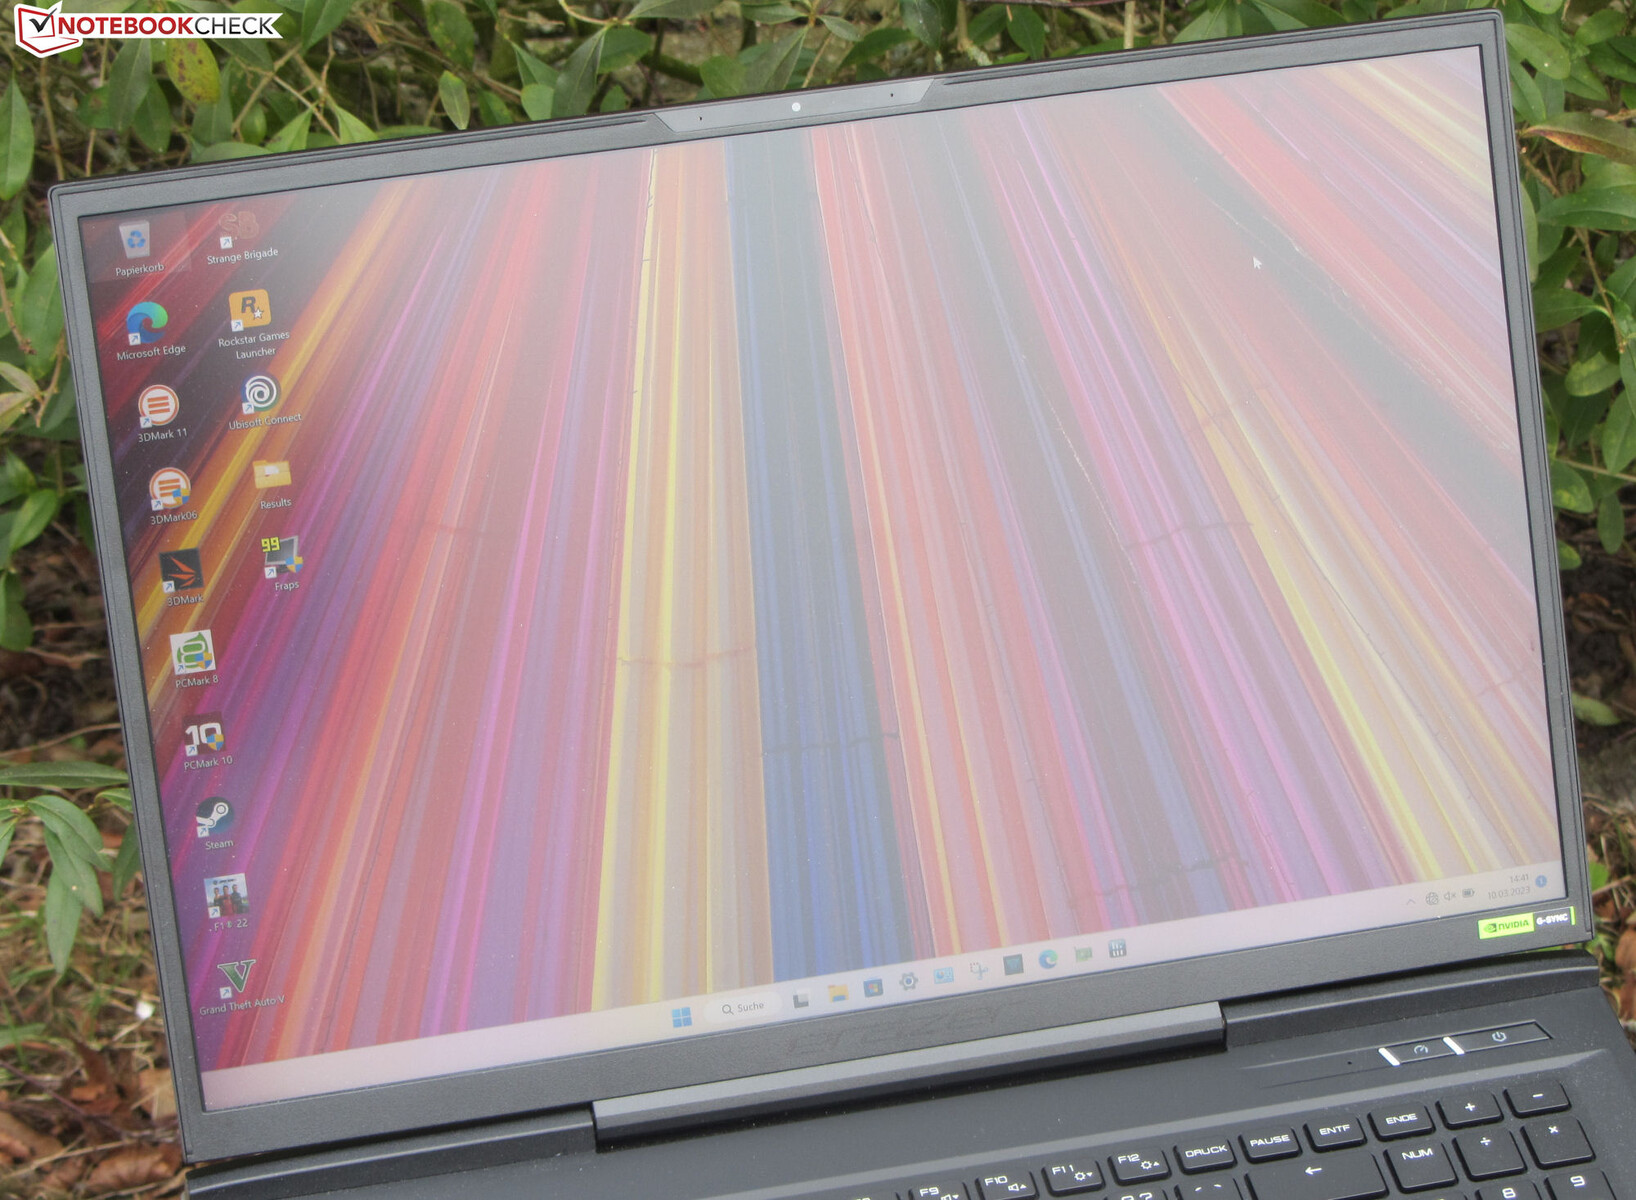
Pantalla - QHD+ con relación de aspecto 16:10
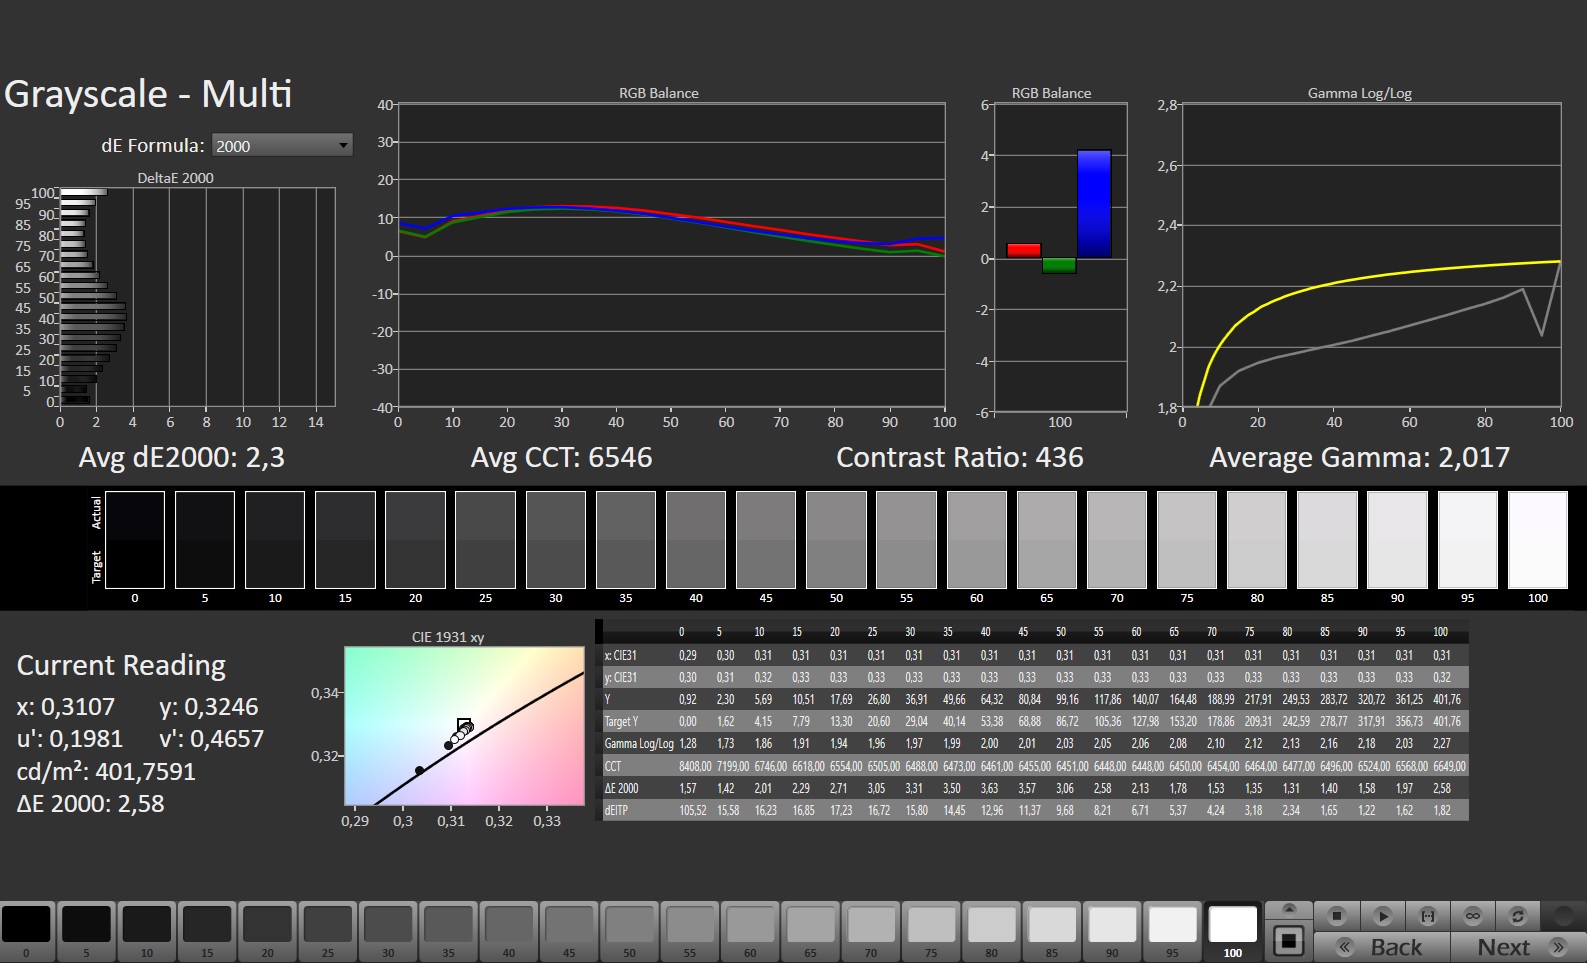
La pantalla IPS mate de 17 pulgadas (2.560 x 1.440) tiene una relación de aspecto 16:10 y destaca por un brillo adecuado, rápidos tiempos de respuesta, alta frecuencia de refresco (240 Hz) y ausencia de parpadeo PWM. Pero su relación de contraste no llega a lo que se considera bueno (>1.000:1).
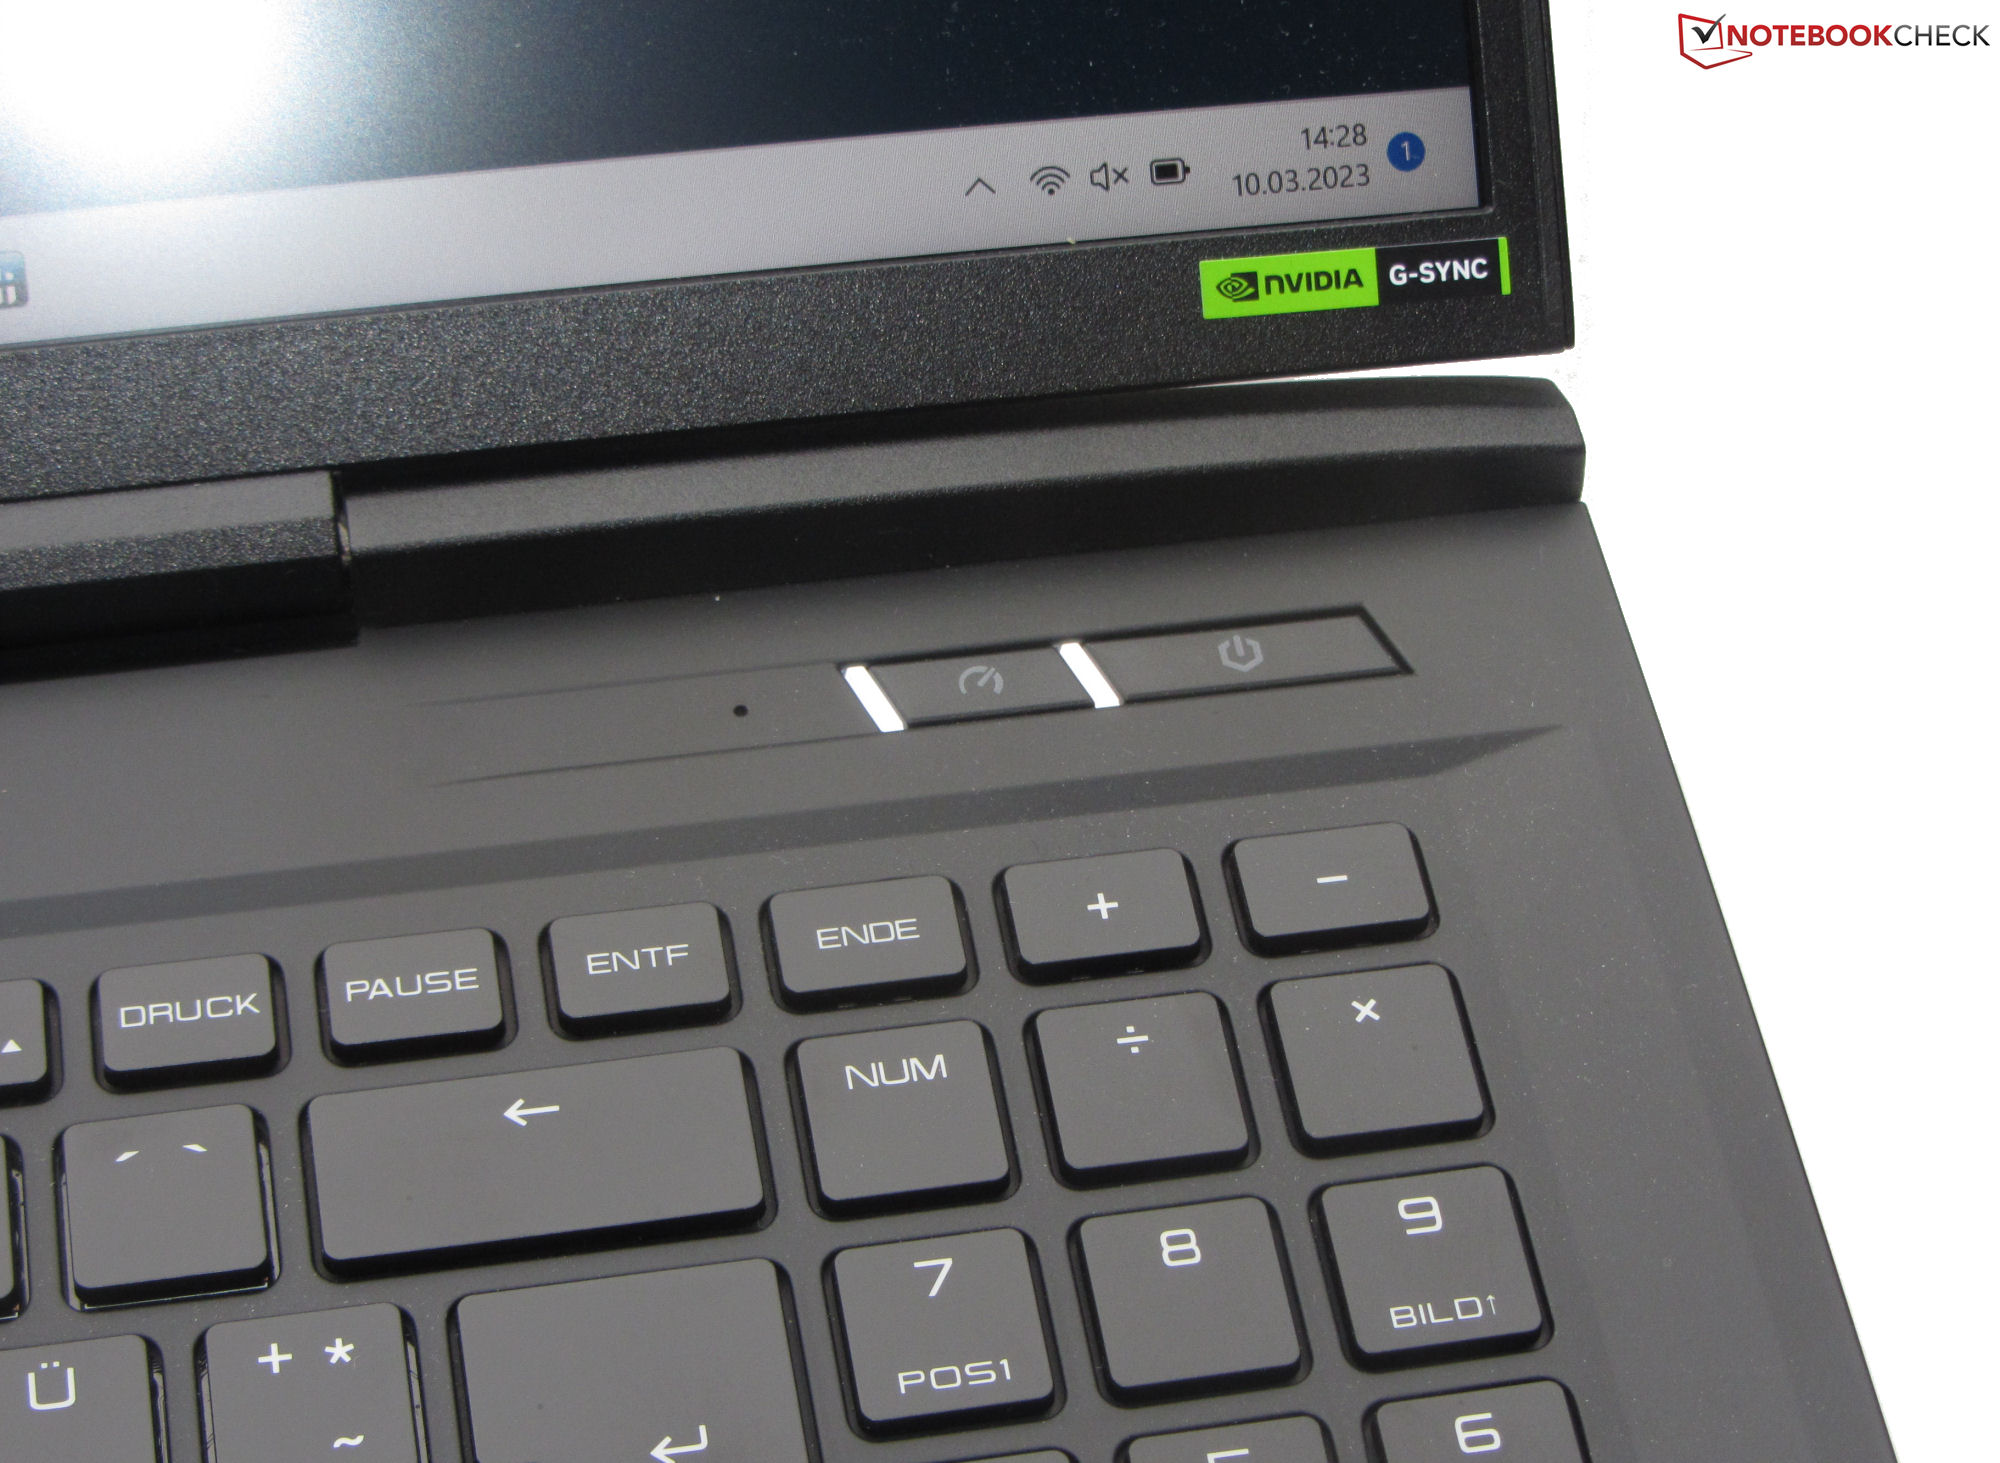
El panel es compatible con G-Sync, una tecnología que ayuda a que la frecuencia de refresco de la pantalla se adapte dinámicamente a la frecuencia de imagen que emite la GPU. De este modo, la experiencia visual es más fluida, sobre todo en los juegos.
| |||||||||||||||||||||||||
iluminación: 90 %
Brillo con batería: 384 cd/m²
Contraste: 853:1 (Negro: 0.45 cd/m²)
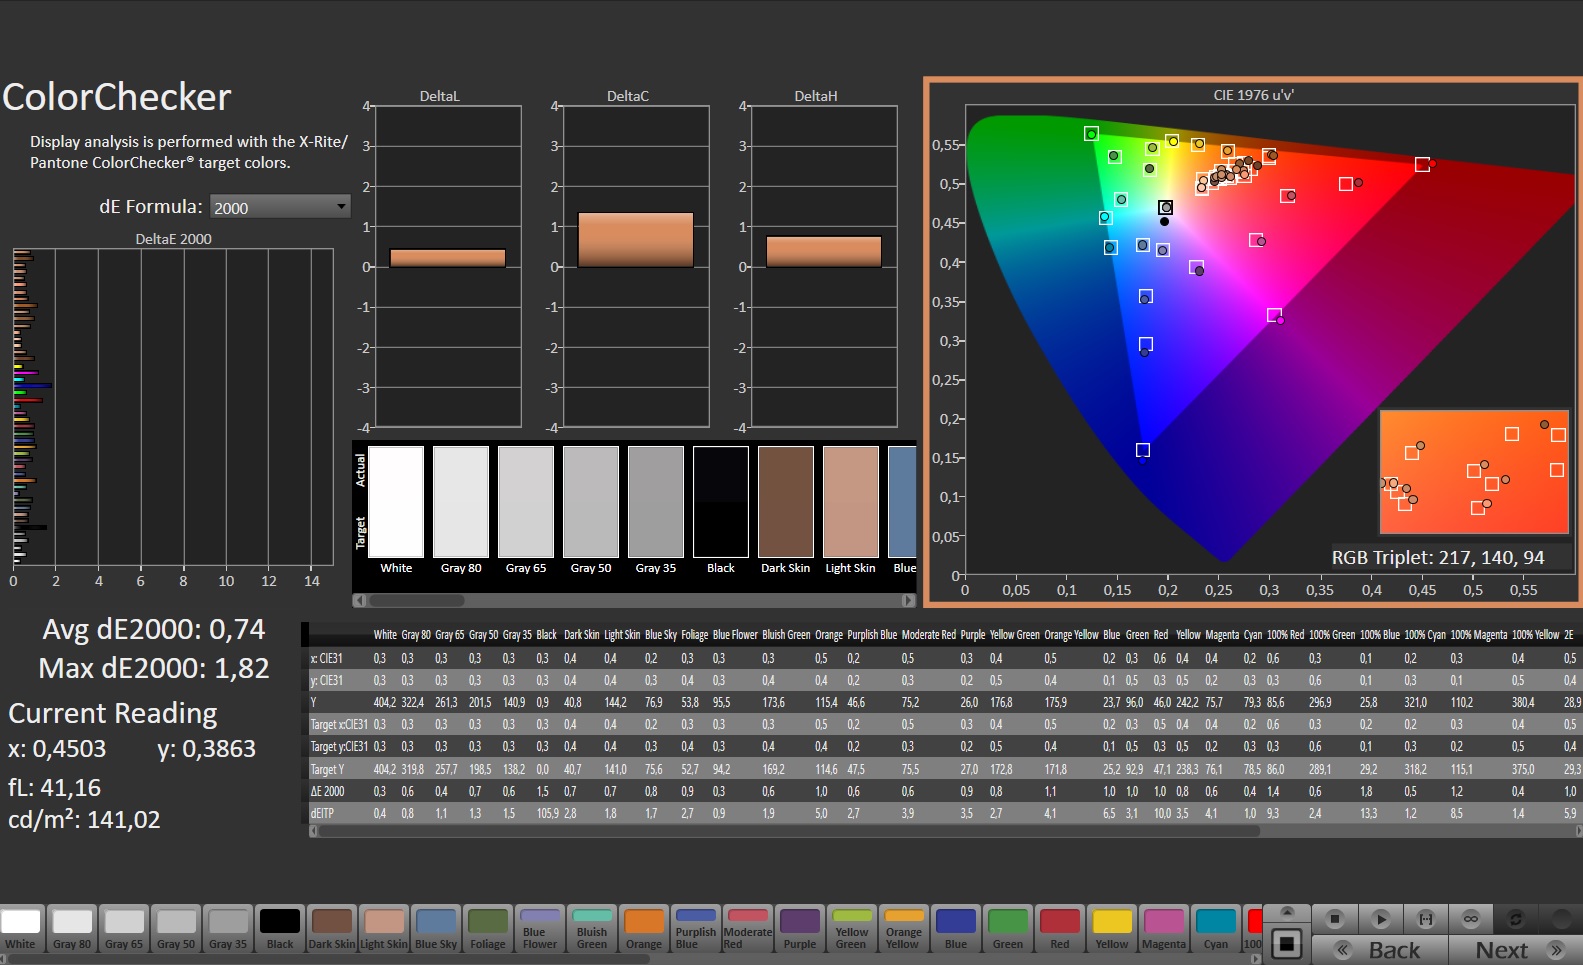
ΔE ColorChecker Calman: 2.05 | ∀{0.5-29.43 Ø4.71}
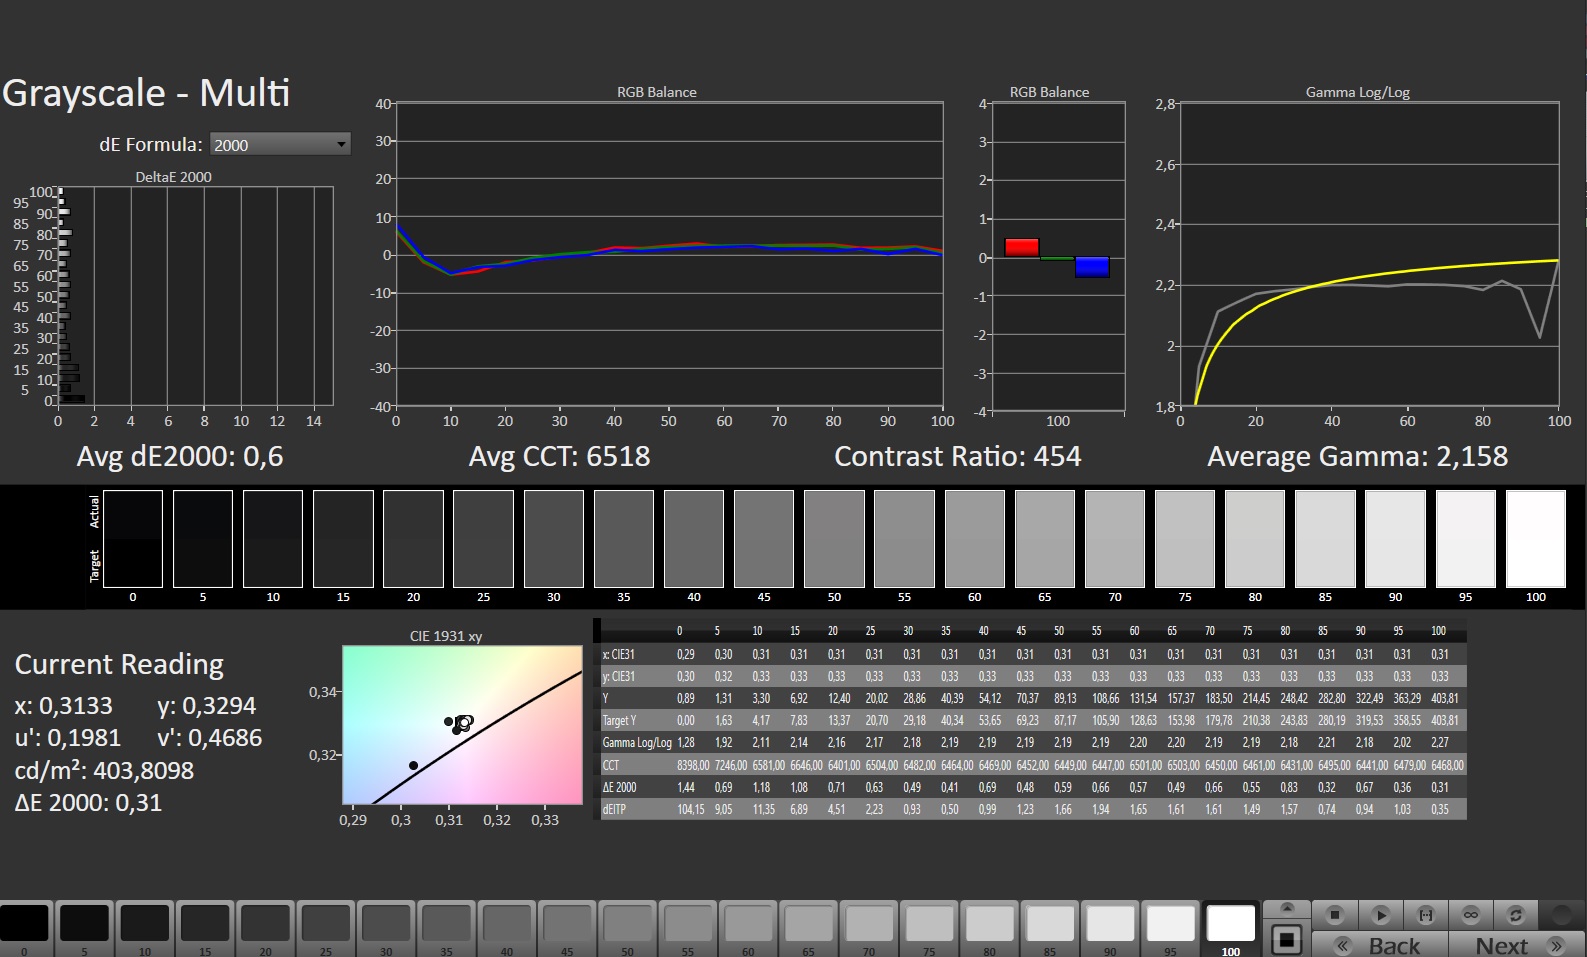
calibrated: 0.74
ΔE Greyscale Calman: 2.3 | ∀{0.09-98 Ø4.96}
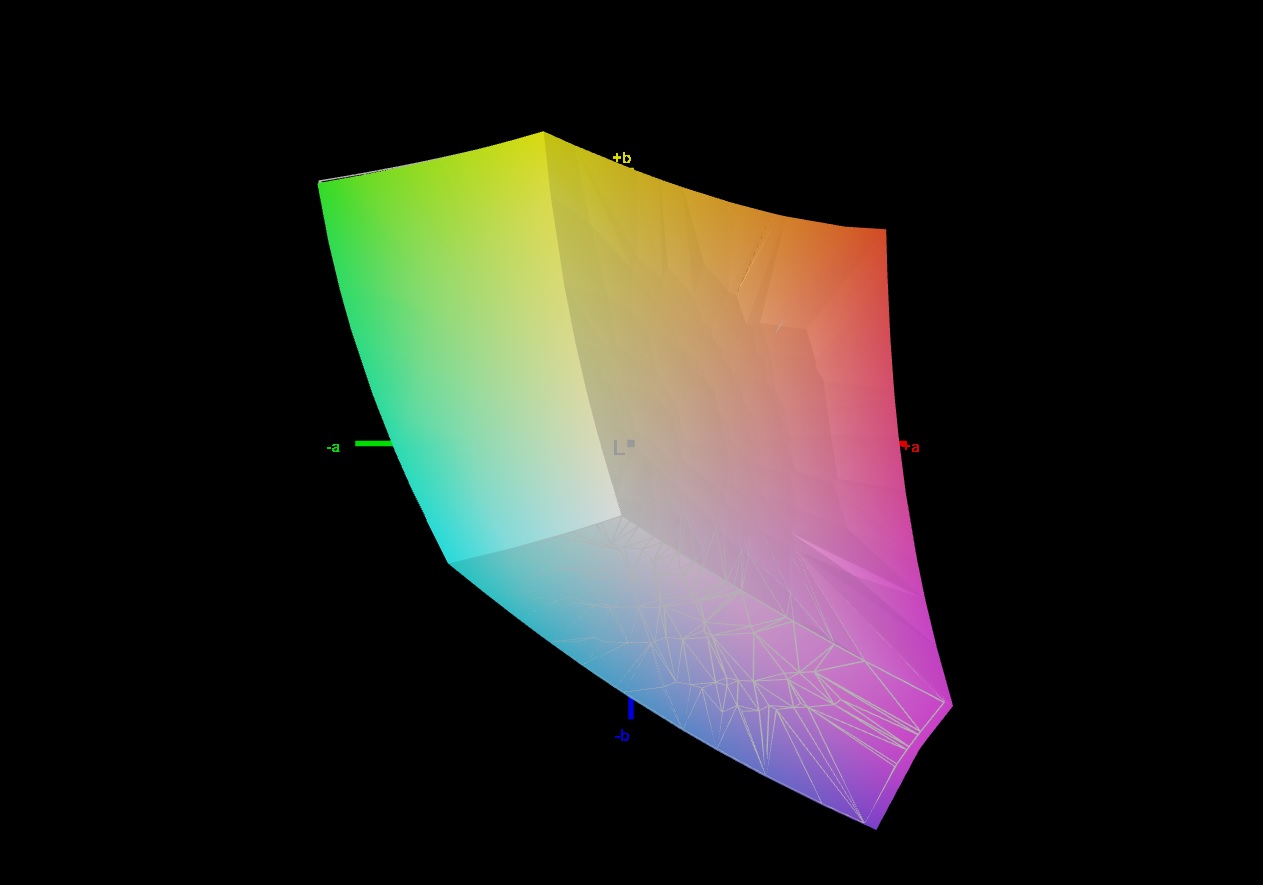
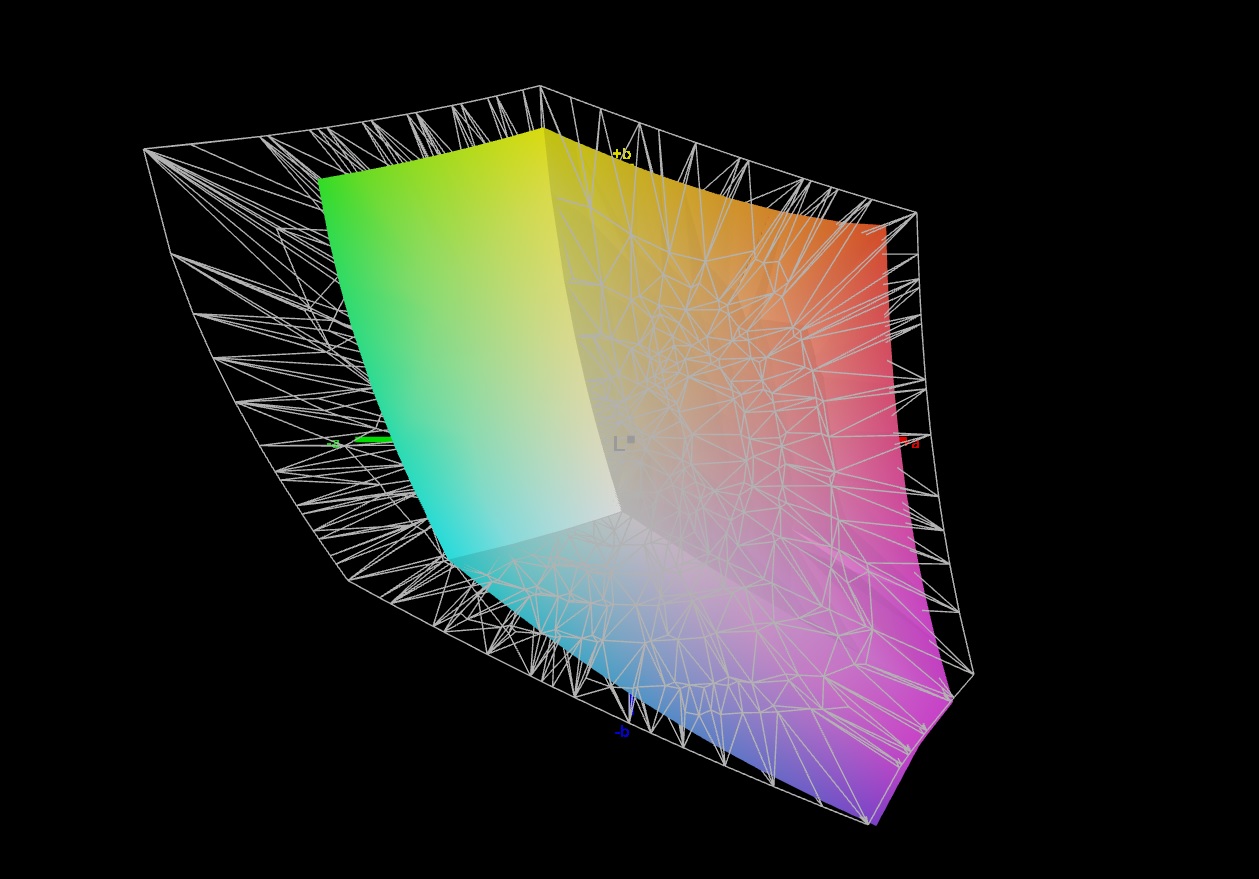
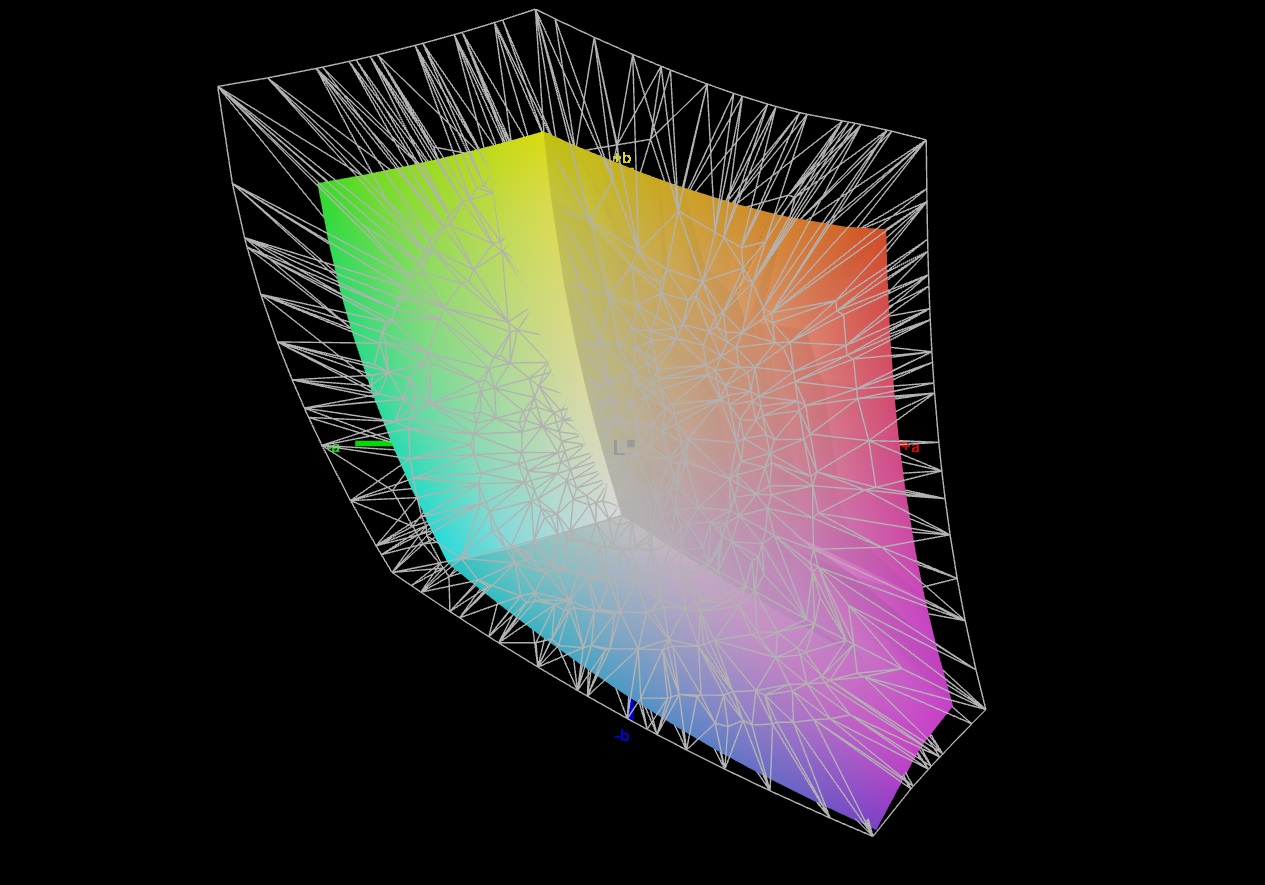
69.4% AdobeRGB 1998 (Argyll 3D)
99.8% sRGB (Argyll 3D)
68.6% Display P3 (Argyll 3D)
Gamma: 2.017
CCT: 6546 K
| Medion Erazer Beast X40 BOE NE170QDM-NZ1, IPS, 2560x1600, 17" | MSI Titan GT77 HX 13VI B173ZAN06.C, Mini-LED, 3840x2160, 17.3" | Razer Blade 16 Early 2023 CSOT T3 MNG007DA4-1, IPS, 2560x1600, 16" | Schenker XMG Neo 17 M22 BOE0A99, IPS, 2560x1600, 17" | Alienware x17 R2 P48E AU Optronics B173HAN, IPS, 1920x1080, 17.3" | Asus ROG Strix Scar 18 2023 G834JY-N6005W NE180QDM-NZ2, IPS, 2560x1600, 18" | |
|---|---|---|---|---|---|---|
| Display | 24% | 24% | 0% | 10% | 21% | |
| Display P3 Coverage (%) | 68.6 | 94.9 38% | 98.5 44% | 69 1% | 79.2 15% | 97.2 42% |
| sRGB Coverage (%) | 99.8 | 99.9 0% | 100 0% | 99.8 0% | 99.8 0% | 99.9 0% |
| AdobeRGB 1998 Coverage (%) | 69.4 | 92.4 33% | 89.7 29% | 69.6 0% | 79.6 15% | 84.9 22% |
| Response Times | -248% | -9% | 12% | -17% | 19% | |
| Response Time Grey 50% / Grey 80% * (ms) | 11.3 ? | 38.4 ? -240% | 6.6 ? 42% | 10.8 ? 4% | 12.4 ? -10% | 5.41 ? 52% |
| Response Time Black / White * (ms) | 7.5 ? | 26.6 ? -255% | 12 ? -60% | 6.1 ? 19% | 9.2 ? -23% | 8.62 ? -15% |
| PWM Frequency (Hz) | 2380 ? | |||||
| Screen | 78886% | -6% | 11% | -22% | -92% | |
| Brightness middle (cd/m²) | 384 | 606 58% | 456.8 19% | 415 8% | 365.4 -5% | 490 28% |
| Brightness (cd/m²) | 377 | 602 60% | 437 16% | 399 6% | 344 -9% | 468 24% |
| Brightness Distribution (%) | 90 | 93 3% | 83 -8% | 90 0% | 85 -6% | 86 -4% |
| Black Level * (cd/m²) | 0.45 | 0.0001 100% | 0.35 22% | 0.43 4% | 0.29 36% | 0.54 -20% |
| Contrast (:1) | 853 | 6060000 710334% | 1305 53% | 965 13% | 1260 48% | 907 6% |
| Colorchecker dE 2000 * | 2.05 | 4.8 -134% | 3.7 -80% | 1.44 30% | 3.17 -55% | 4.97 -142% |
| Colorchecker dE 2000 max. * | 3.64 | 8.2 -125% | 6.42 -76% | 2.33 36% | 7.69 -111% | 11.02 -203% |
| Colorchecker dE 2000 calibrated * | 0.74 | 1.8 -143% | 0.66 11% | 0.89 -20% | 0.51 31% | 2.97 -301% |
| Greyscale dE 2000 * | 2.3 | 6.5 -183% | 2.6 -13% | 1.8 22% | 5.3 -130% | 7.2 -213% |
| Gamma | 2.017 109% | 2.63 84% | 2.3 96% | 2.132 103% | 2.18 101% | 2.161 102% |
| CCT | 6546 99% | 6596 99% | 6108 106% | 6327 103% | 5879 111% | 6515 100% |
| Media total (Programa/Opciones) | 26221% /
50682% | 3% /
-0% | 8% /
9% | -10% /
-15% | -17% /
-52% |
* ... más pequeño es mejor
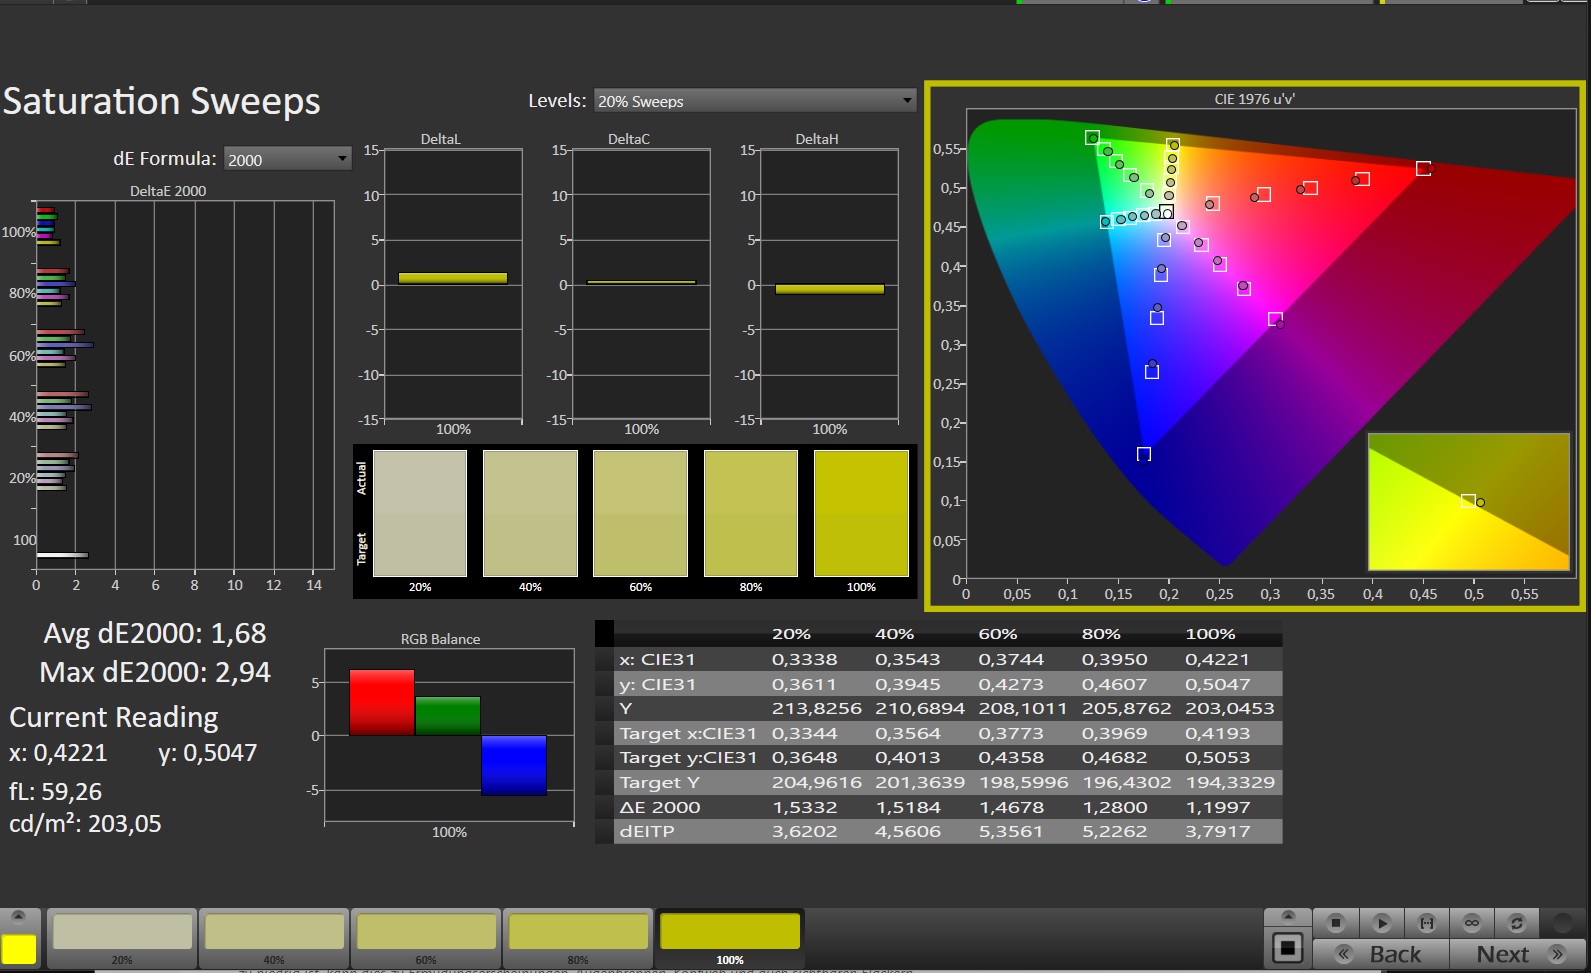
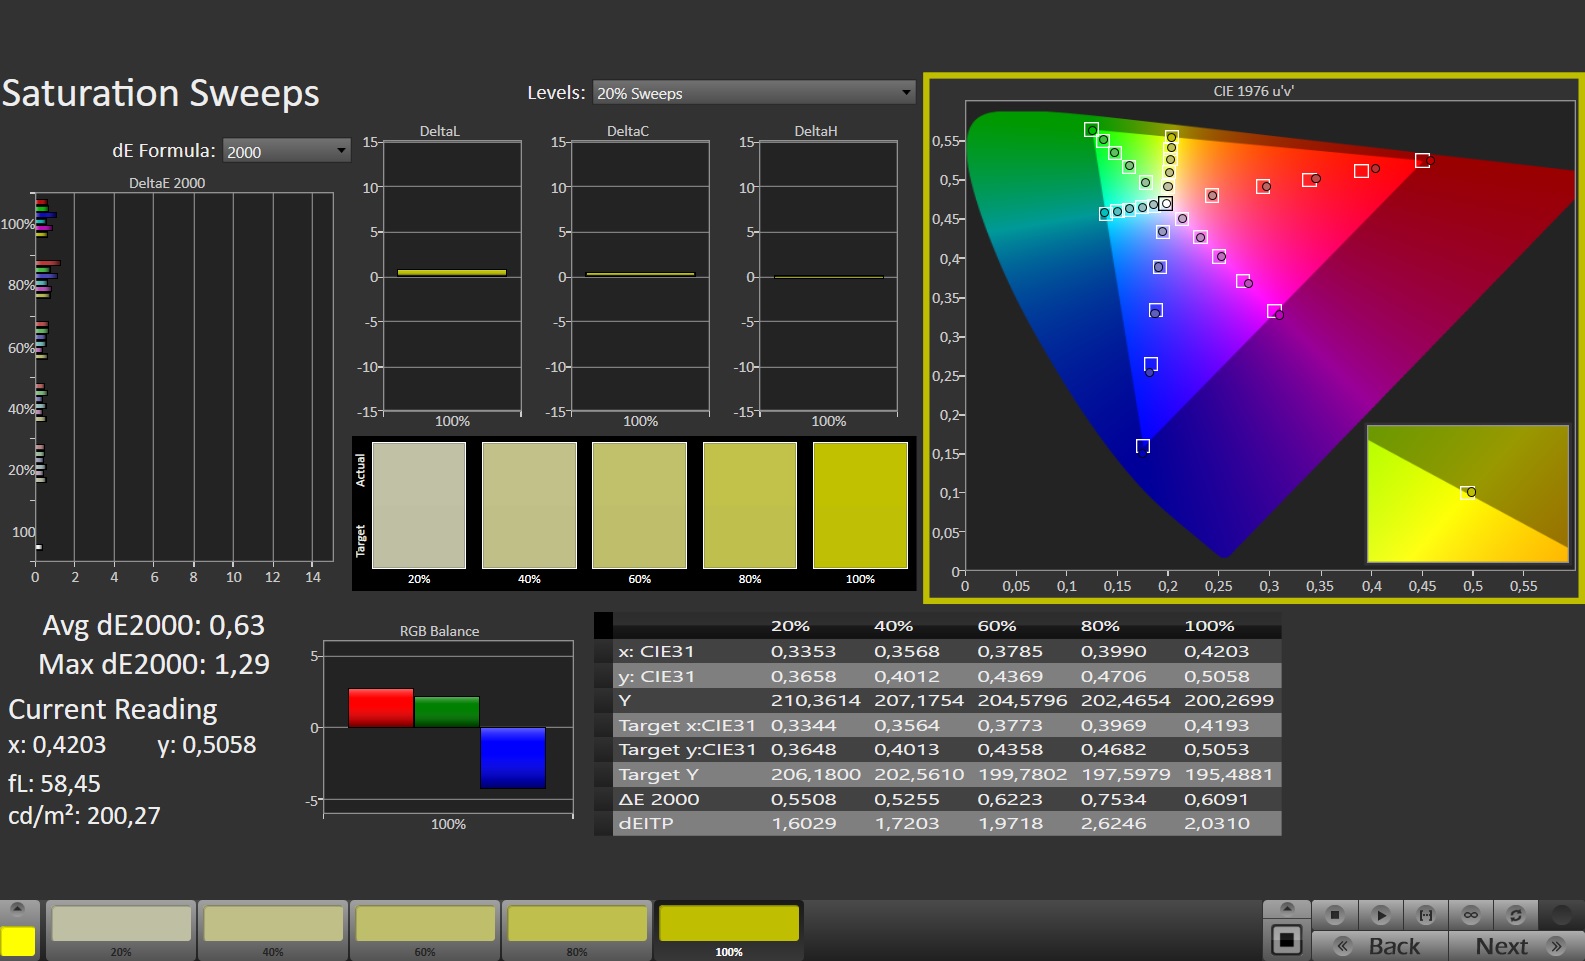
La pantalla ya ofrece una excelente reproducción del color nada más sacarla de la caja. Su diferencia de color media de aproximadamente 2 es significativamente inferior al umbral de lo que se considera bueno (Delta E < 3). Calibrar la pantalla redujo la diferencia media de color a 0,74 e hizo que la escala de grises fuera más equilibrada. El panel es capaz de cubrir todo el espacio de color sRGB, pero no AdobeRGB y DCI-P3. Las pantallas de algunos portátiles de la competencia ofrecen mejores resultados en cuanto a cobertura cromática.

Tiempos de respuesta del display
| ↔ Tiempo de respuesta de Negro a Blanco | ||
|---|---|---|
| 7.5 ms ... subida ↗ y bajada ↘ combinada | ↗ 3.3 ms subida | 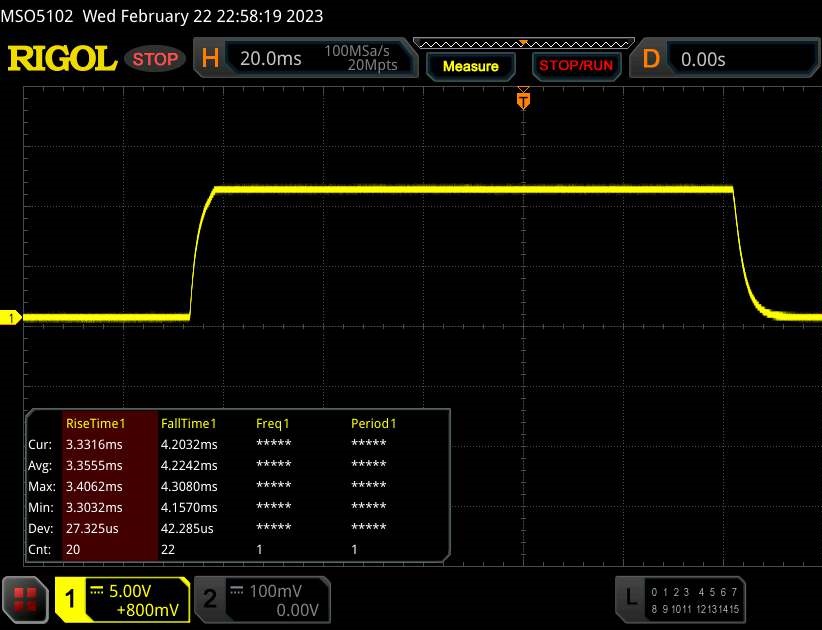 |
| ↘ 4.2 ms bajada | ||
| La pantalla mostró tiempos de respuesta muy rápidos en nuestros tests y debería ser adecuada para juegos frenéticos. En comparación, todos los dispositivos de prueba van de ##min### (mínimo) a 240 (máximo) ms. » 22 % de todos los dispositivos son mejores. Esto quiere decir que el tiempo de respuesta medido es mejor que la media (19.8 ms) de todos los dispositivos testados. | ||
| ↔ Tiempo de respuesta 50% Gris a 80% Gris | ||
| 11.3 ms ... subida ↗ y bajada ↘ combinada | ↗ 5.4 ms subida | 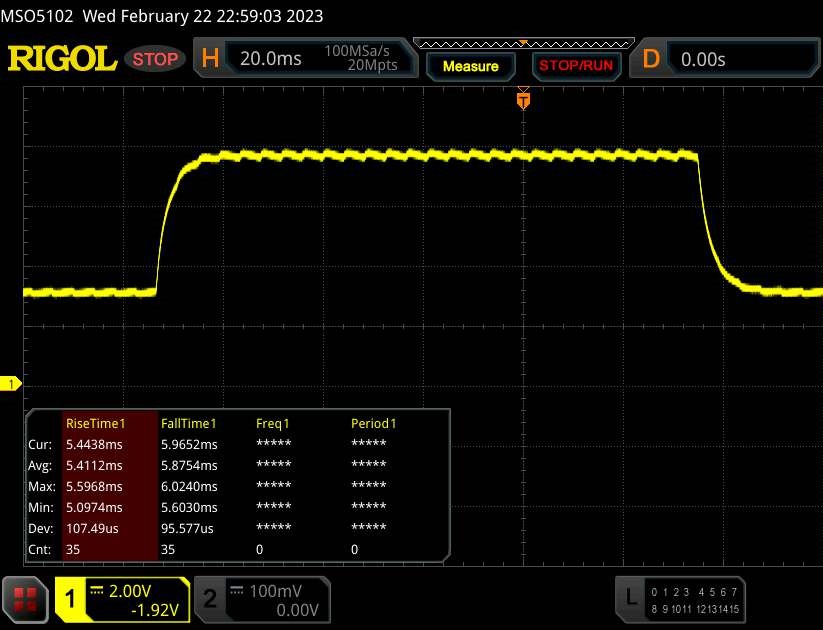 |
| ↘ 5.9 ms bajada | ||
| La pantalla mostró buenos tiempos de respuesta en nuestros tests pero podría ser demasiado lenta para los jugones competitivos. En comparación, todos los dispositivos de prueba van de ##min### (mínimo) a 636 (máximo) ms. » 25 % de todos los dispositivos son mejores. Esto quiere decir que el tiempo de respuesta medido es mejor que la media (31 ms) de todos los dispositivos testados. | ||
Parpadeo de Pantalla / PWM (Pulse-Width Modulation)
| Parpadeo de Pantalla / PWM no detectado | 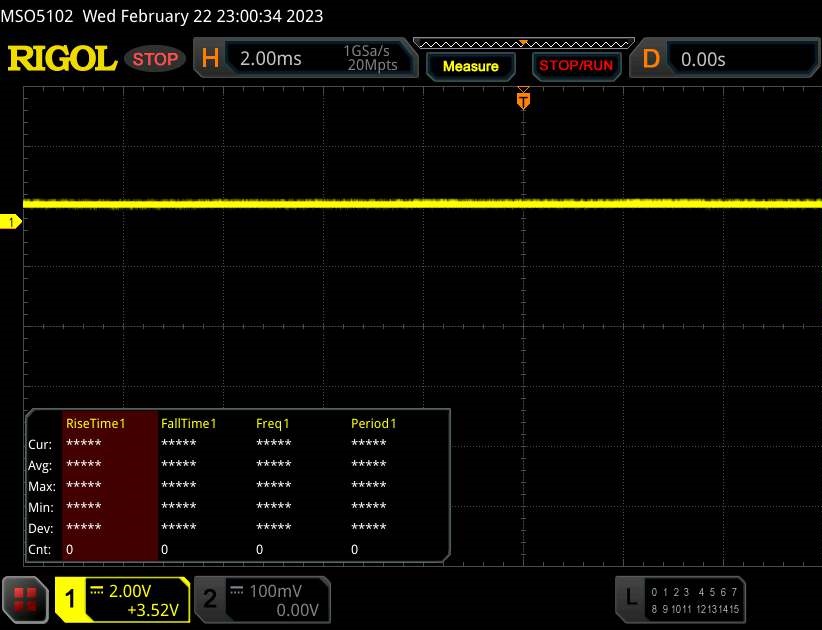 | ||
Comparación: 52 % de todos los dispositivos testados no usaron PWM para atenuar el display. Si se usó, medimos una media de 7757 (mínimo: 5 - máxmo: 343500) Hz. | |||
El panel IPS tiene un amplio ángulo de visión y es fácilmente legible desde cualquier posición. La pantalla es definitivamente utilizable en exteriores, siempre que el sol no sea demasiado brillante.

Actuación - Raptor Lake conoce a Ada Lovelace
Aunque está diseñado principalmente para juegos QHD+, el Erazer Beast X40 también rinde bien en aplicaciones de edición y renderizado de vídeo. El músculo informático necesario lo proporcionan Raptor Lake y Ada Lovelace. El modelo X40 de este análisis puede adquirirse por unos 4.500 euros (4.856 dólares). Pero Medion también ofrece una configuración ligeramente inferior (RTX 4080 y 1 TB SSD; por lo demás idéntica) a 3.500 € (3.777 US$).
Condiciones de la prueba
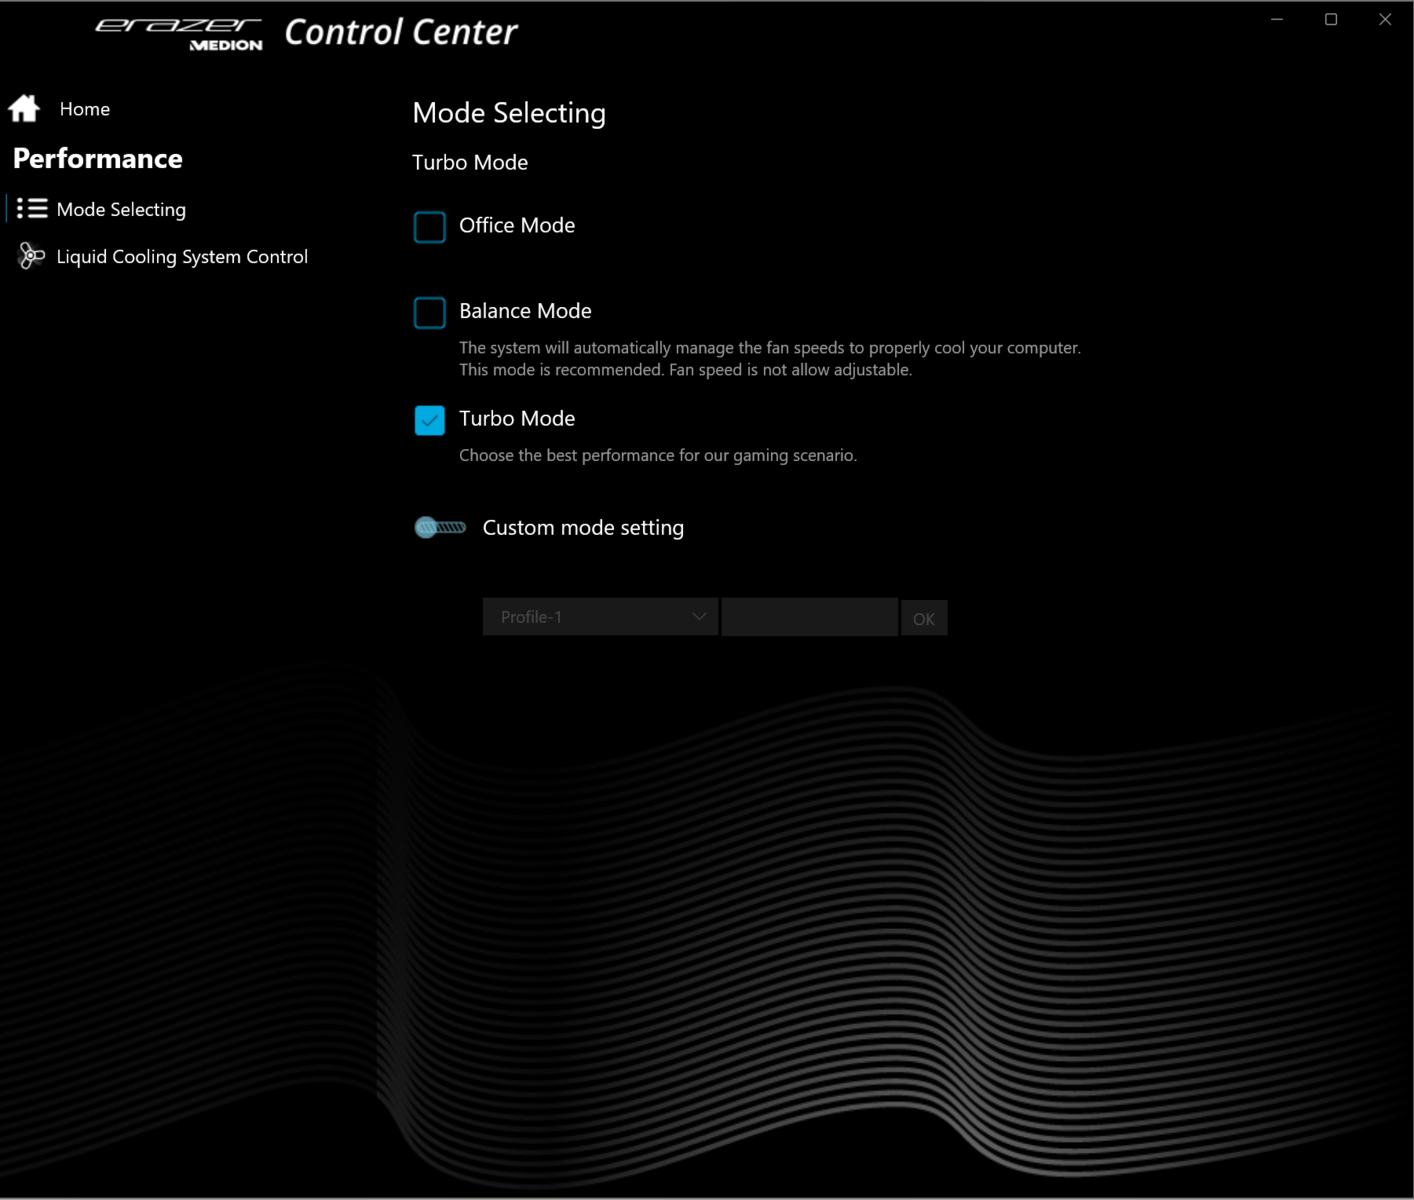
Hay tres modos de rendimiento especificados por el fabricante: Office, Balance y Turbo. Usamos el modo Turbo para las pruebas de rendimiento y el modo Office para nuestras pruebas de duración de la batería, y activamos Nvidia Optimus en ambos casos. Tras completar estas pruebas, ejecutamos más pruebas con el modo dGPU activado y la unidad de refrigeración por agua externa conectada. Puedes encontrar los resultados de estas pruebas adicionales en la tabla comparativa, pero no se tienen en cuenta para la valoración.
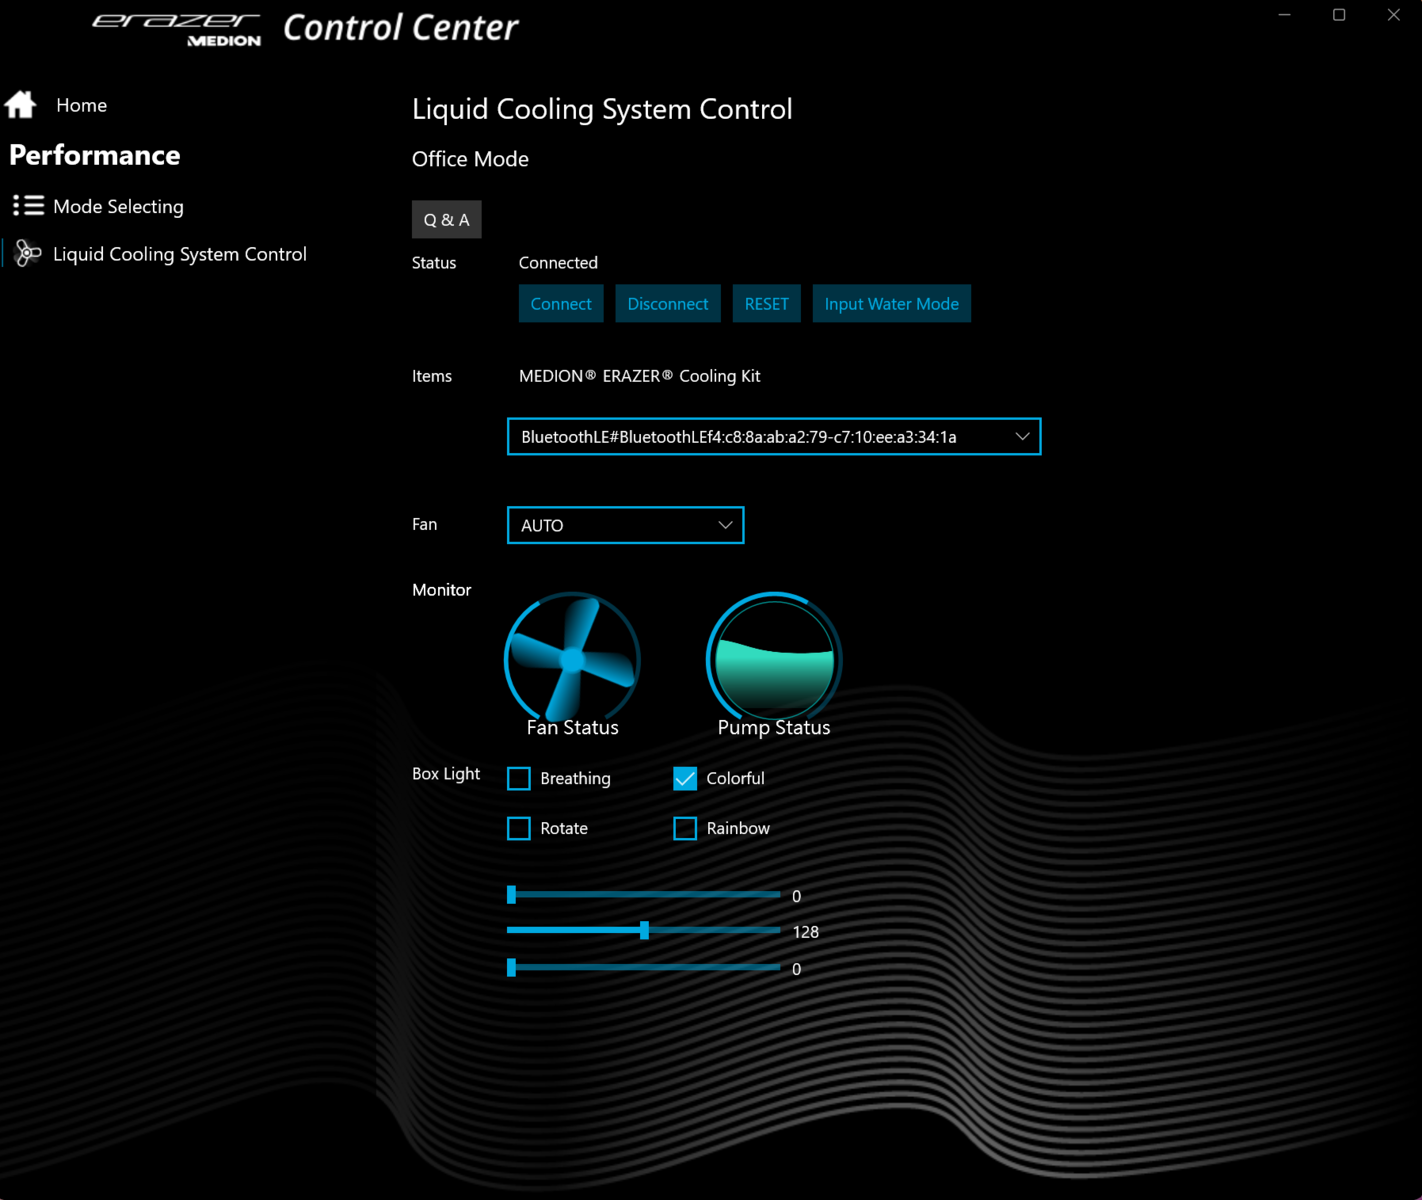
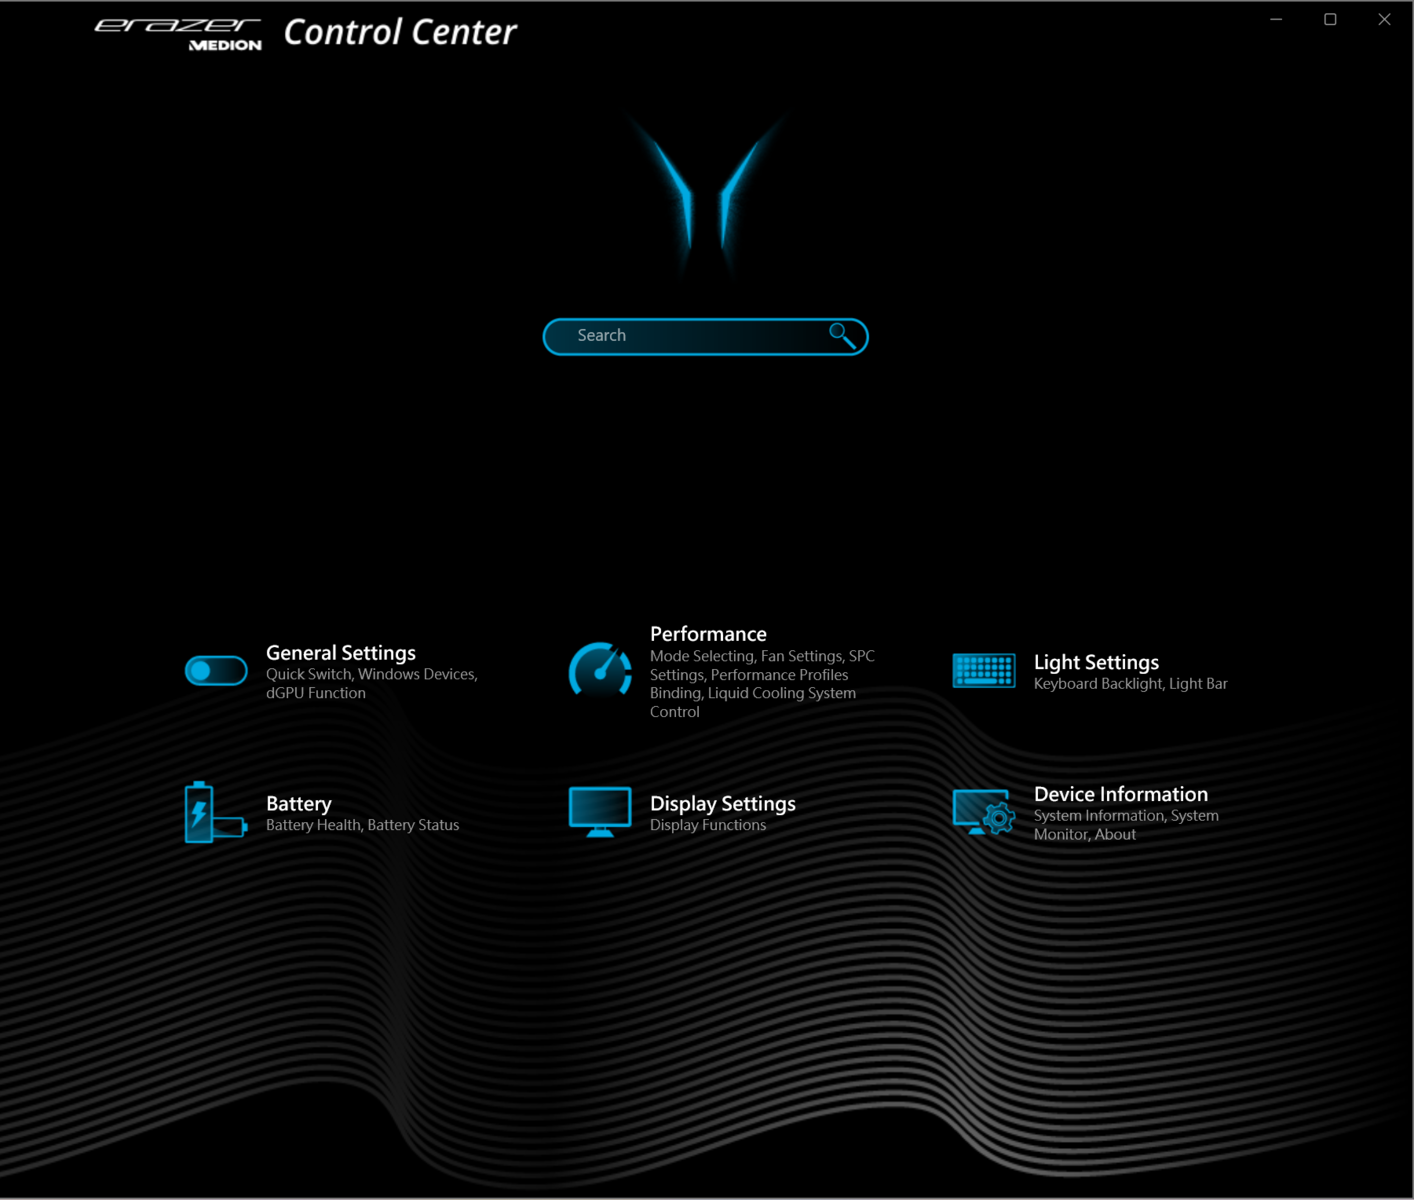
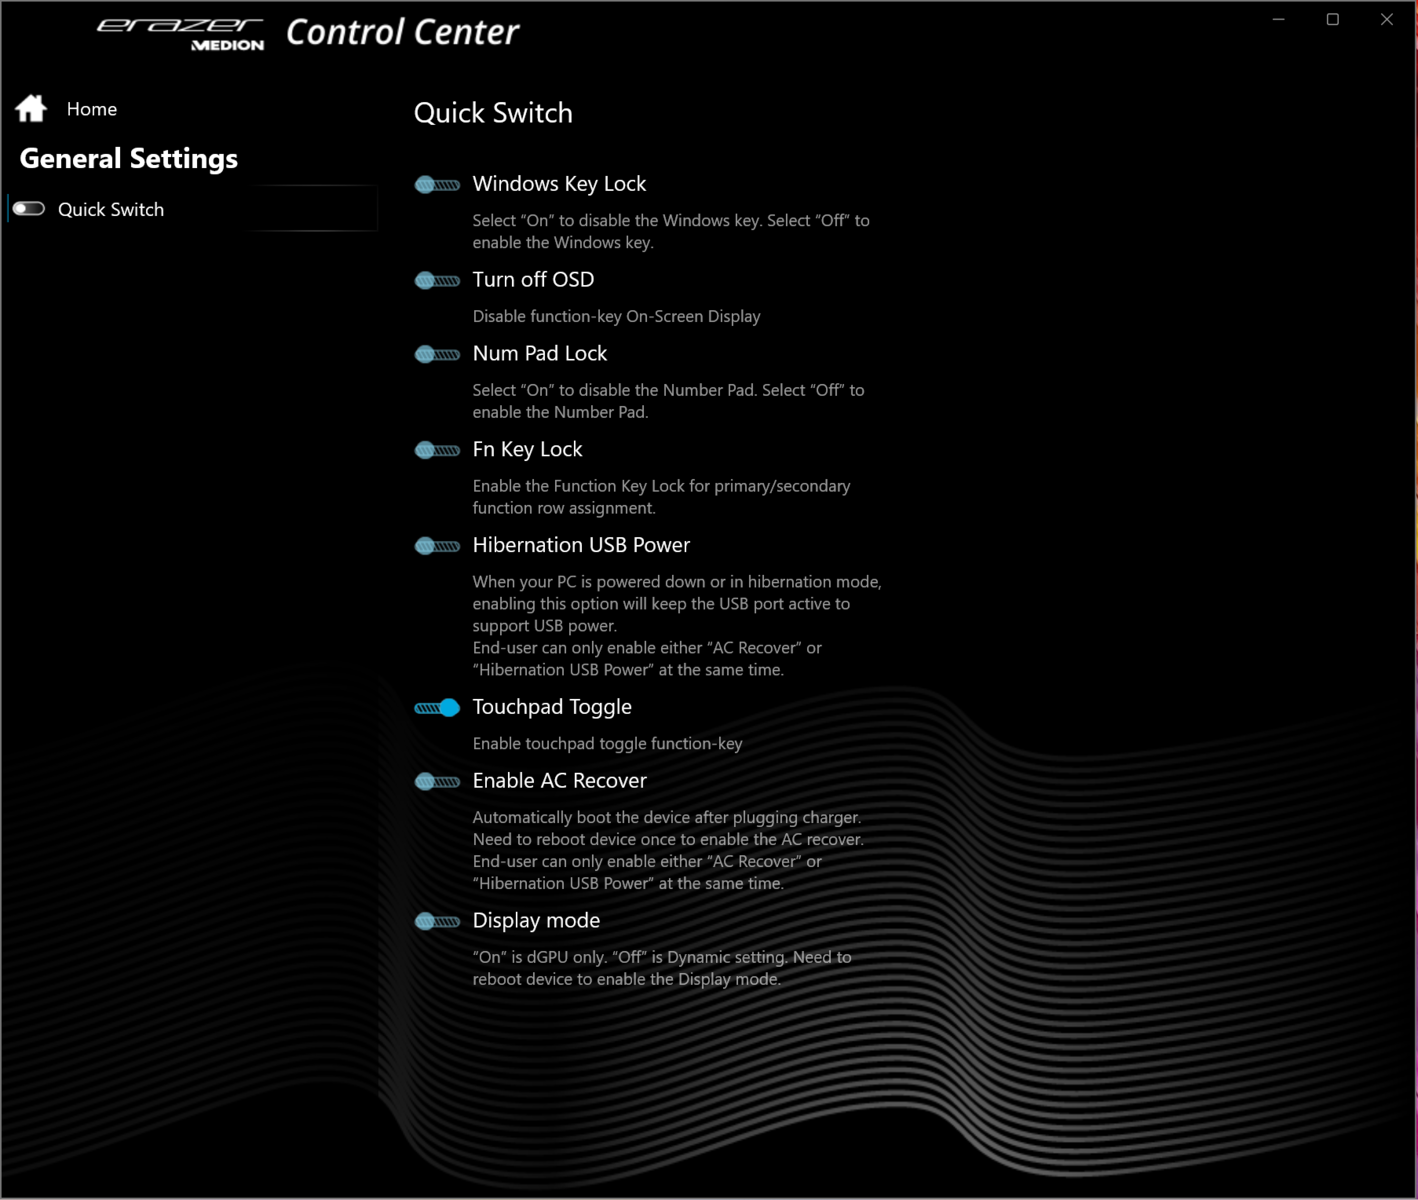
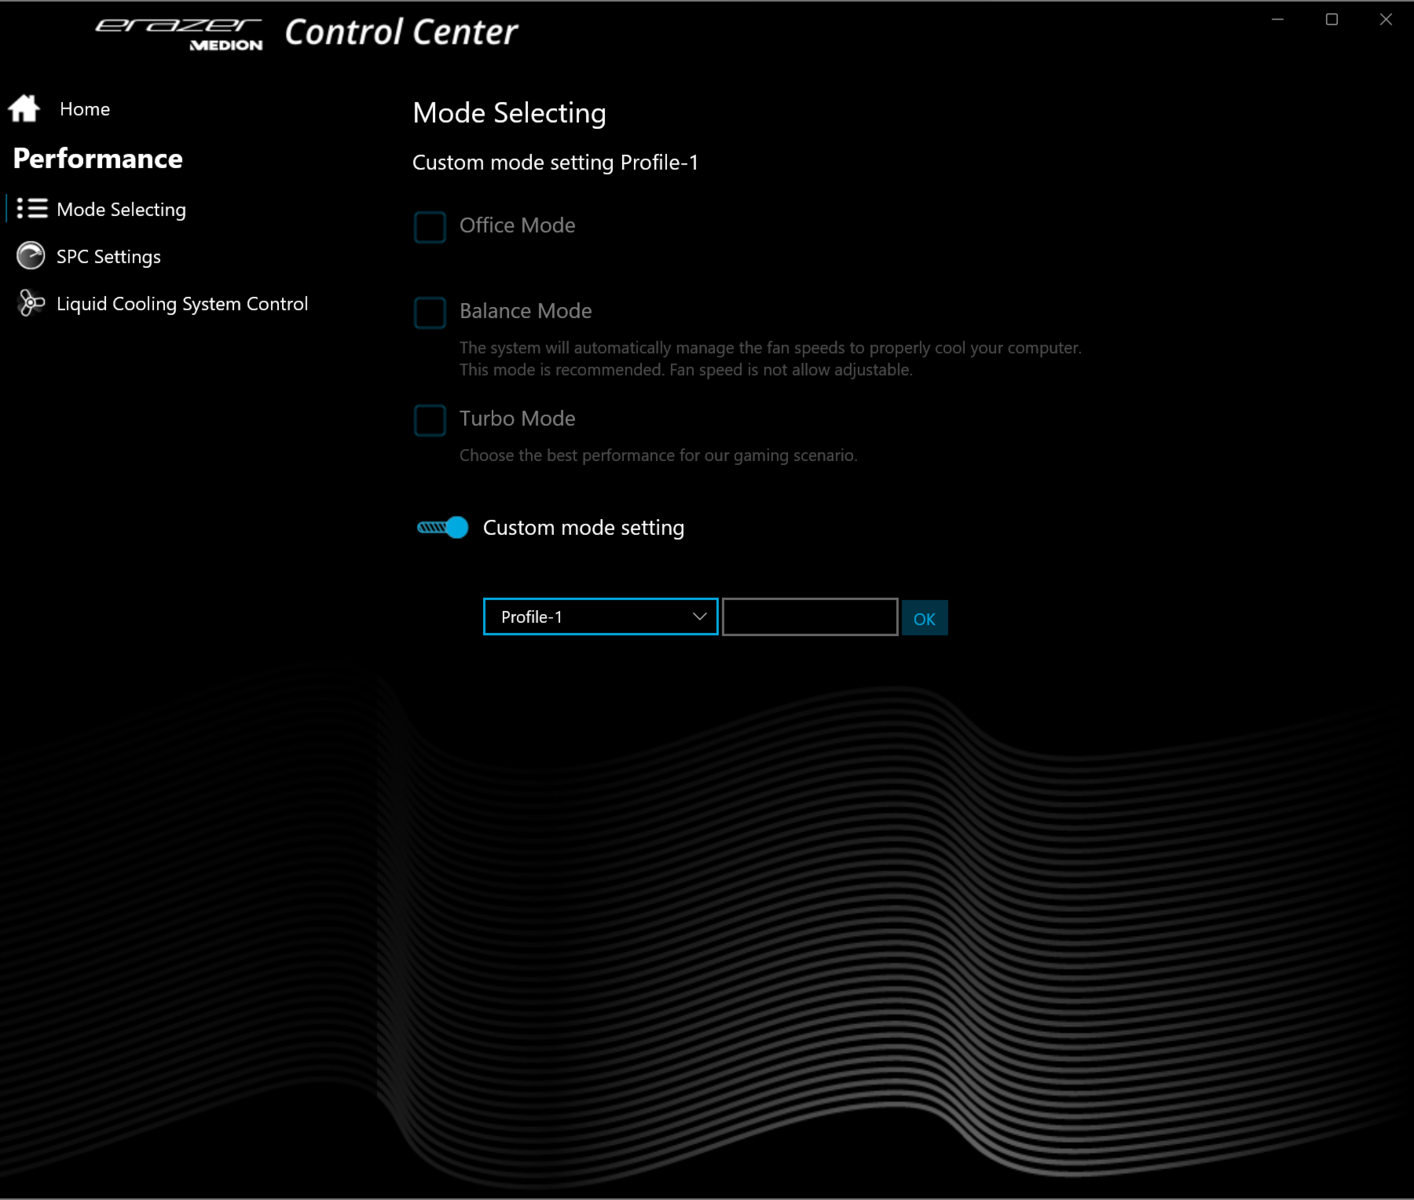
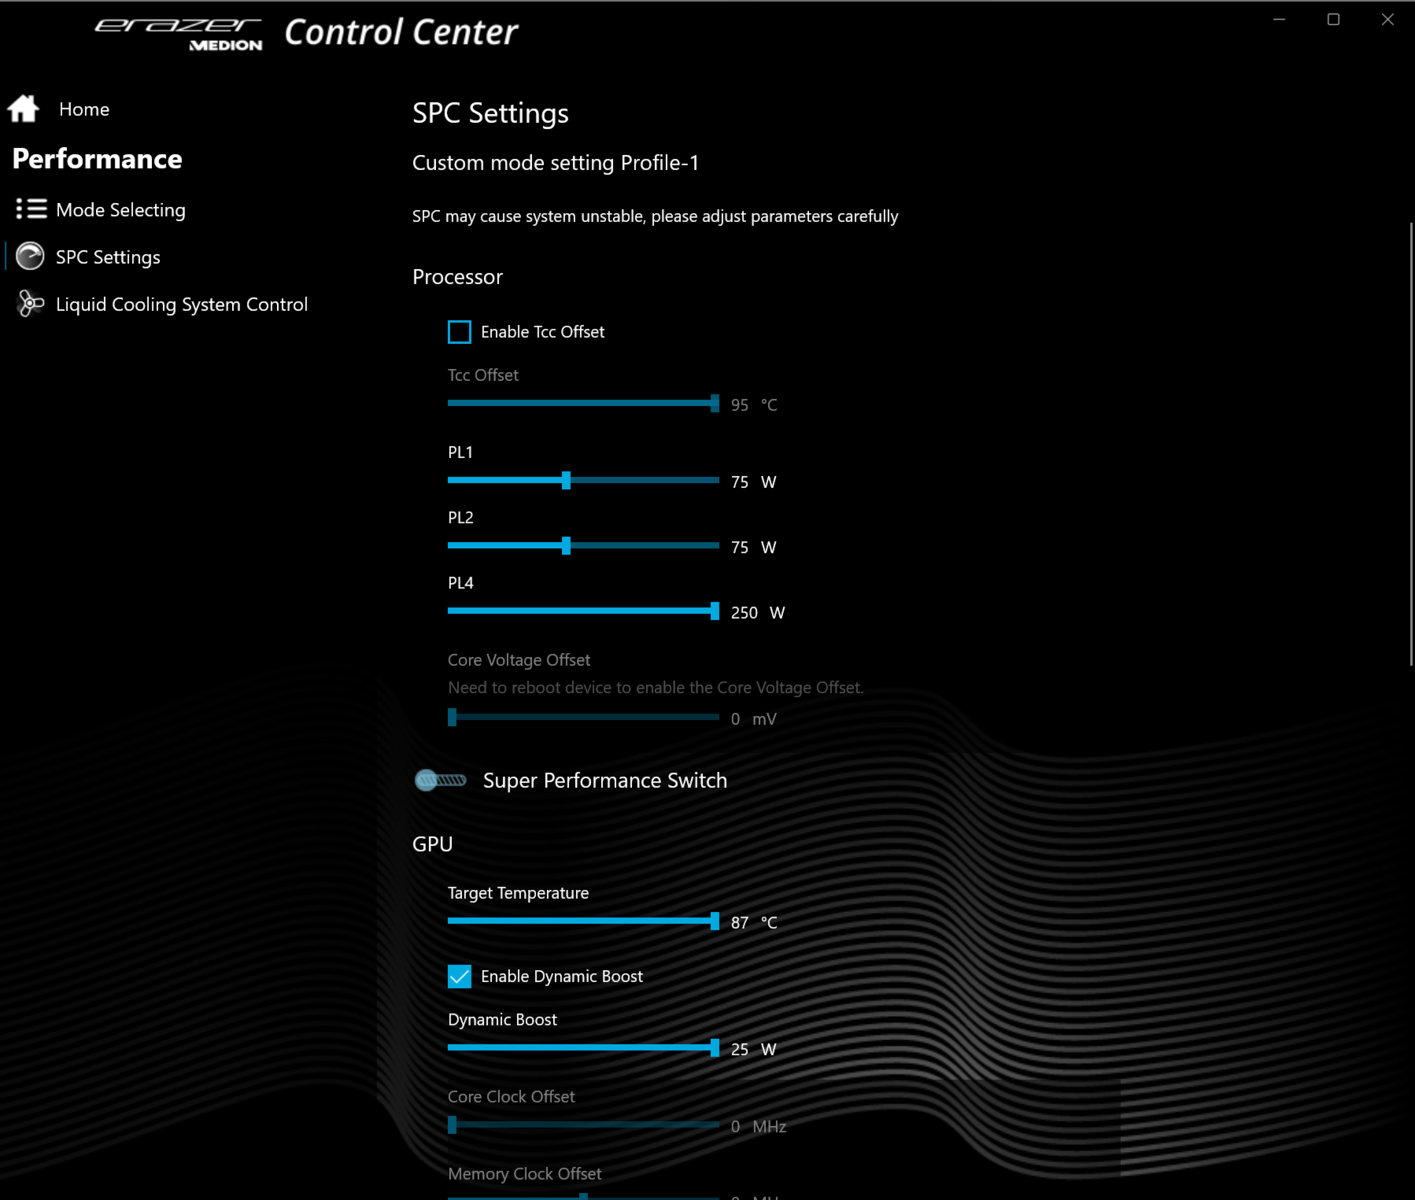
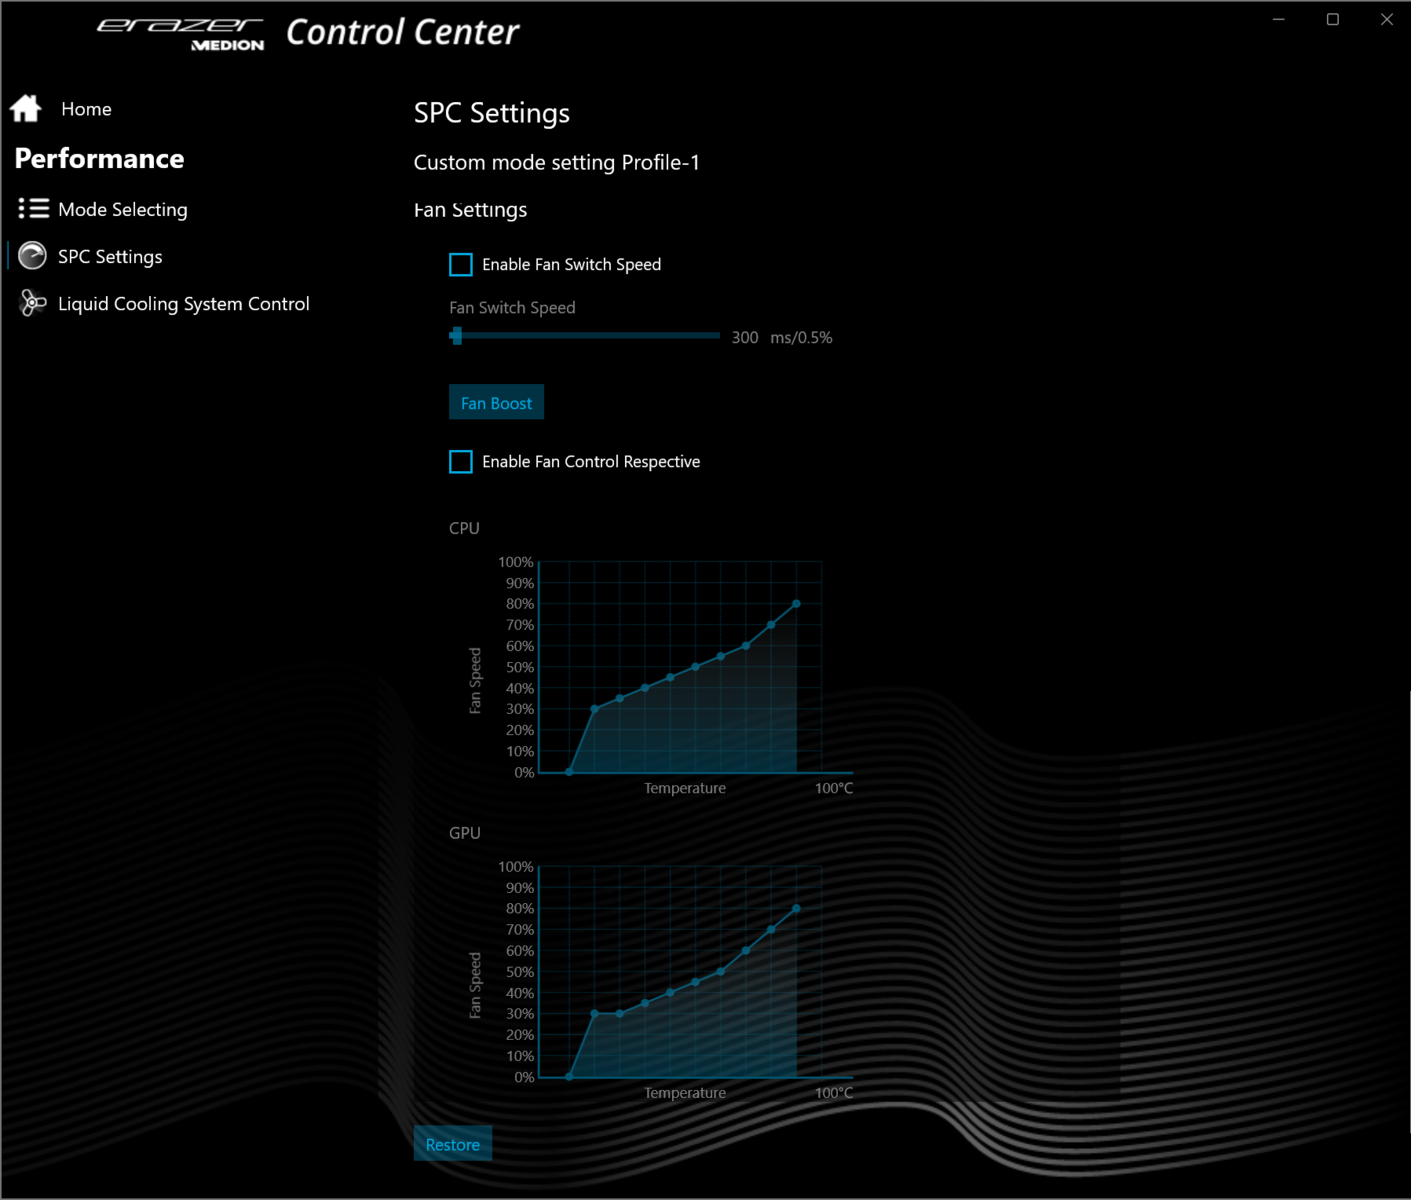
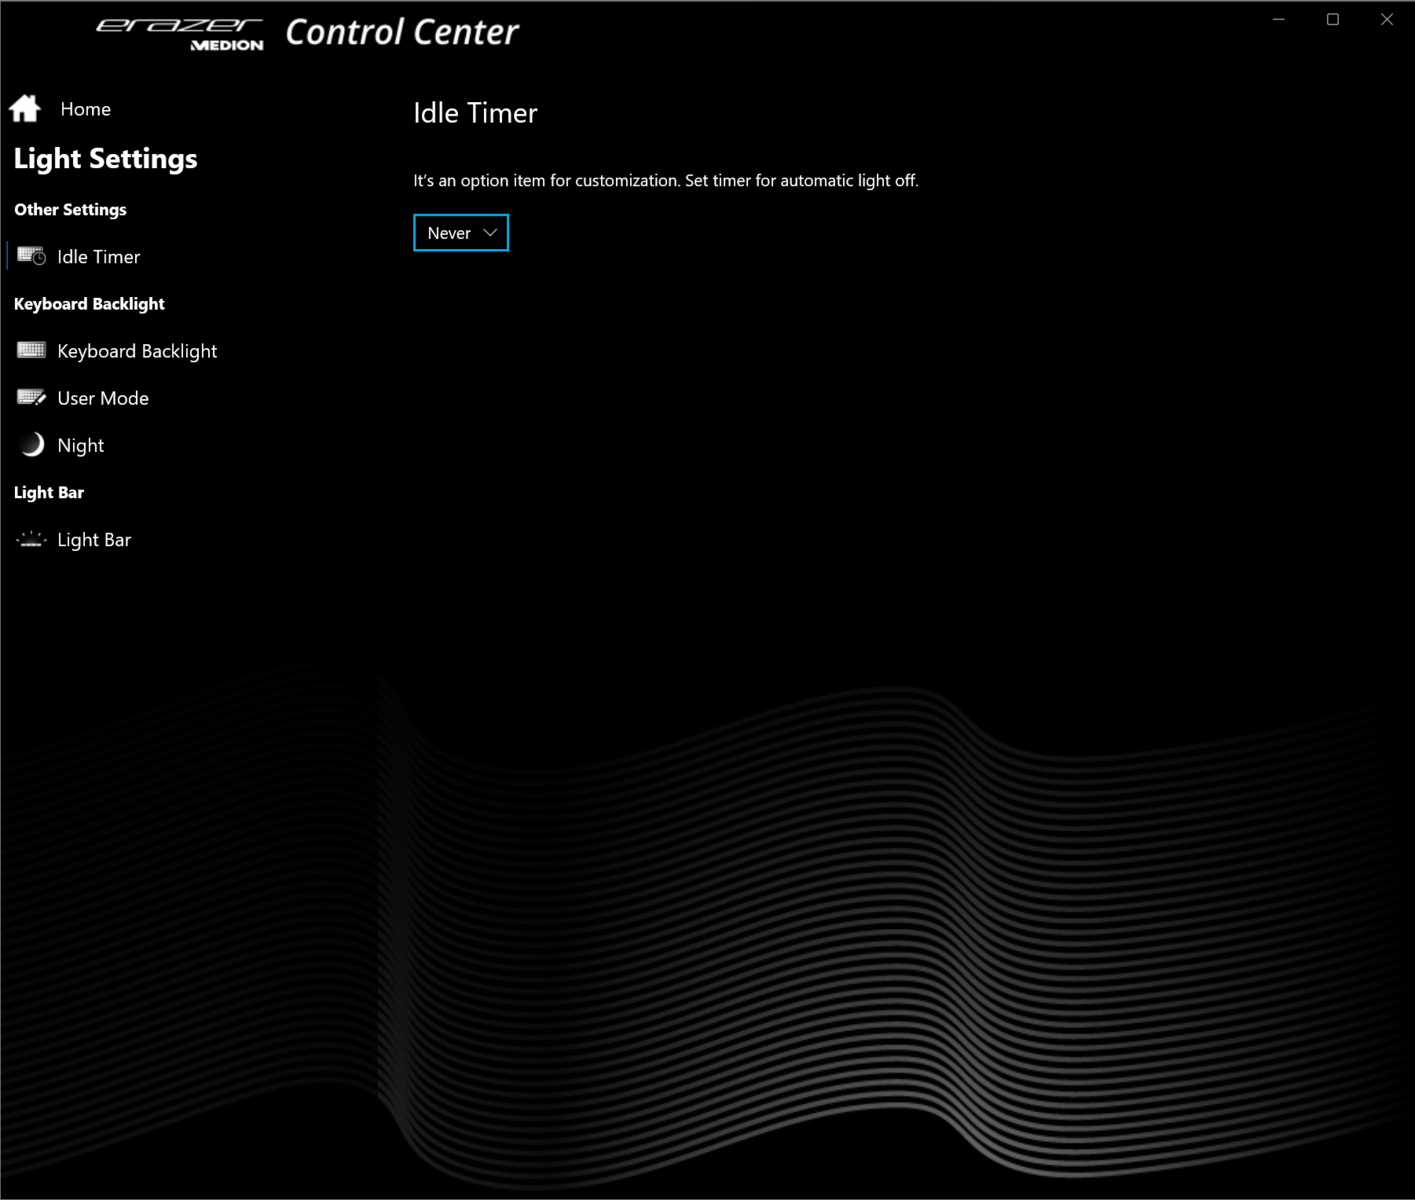
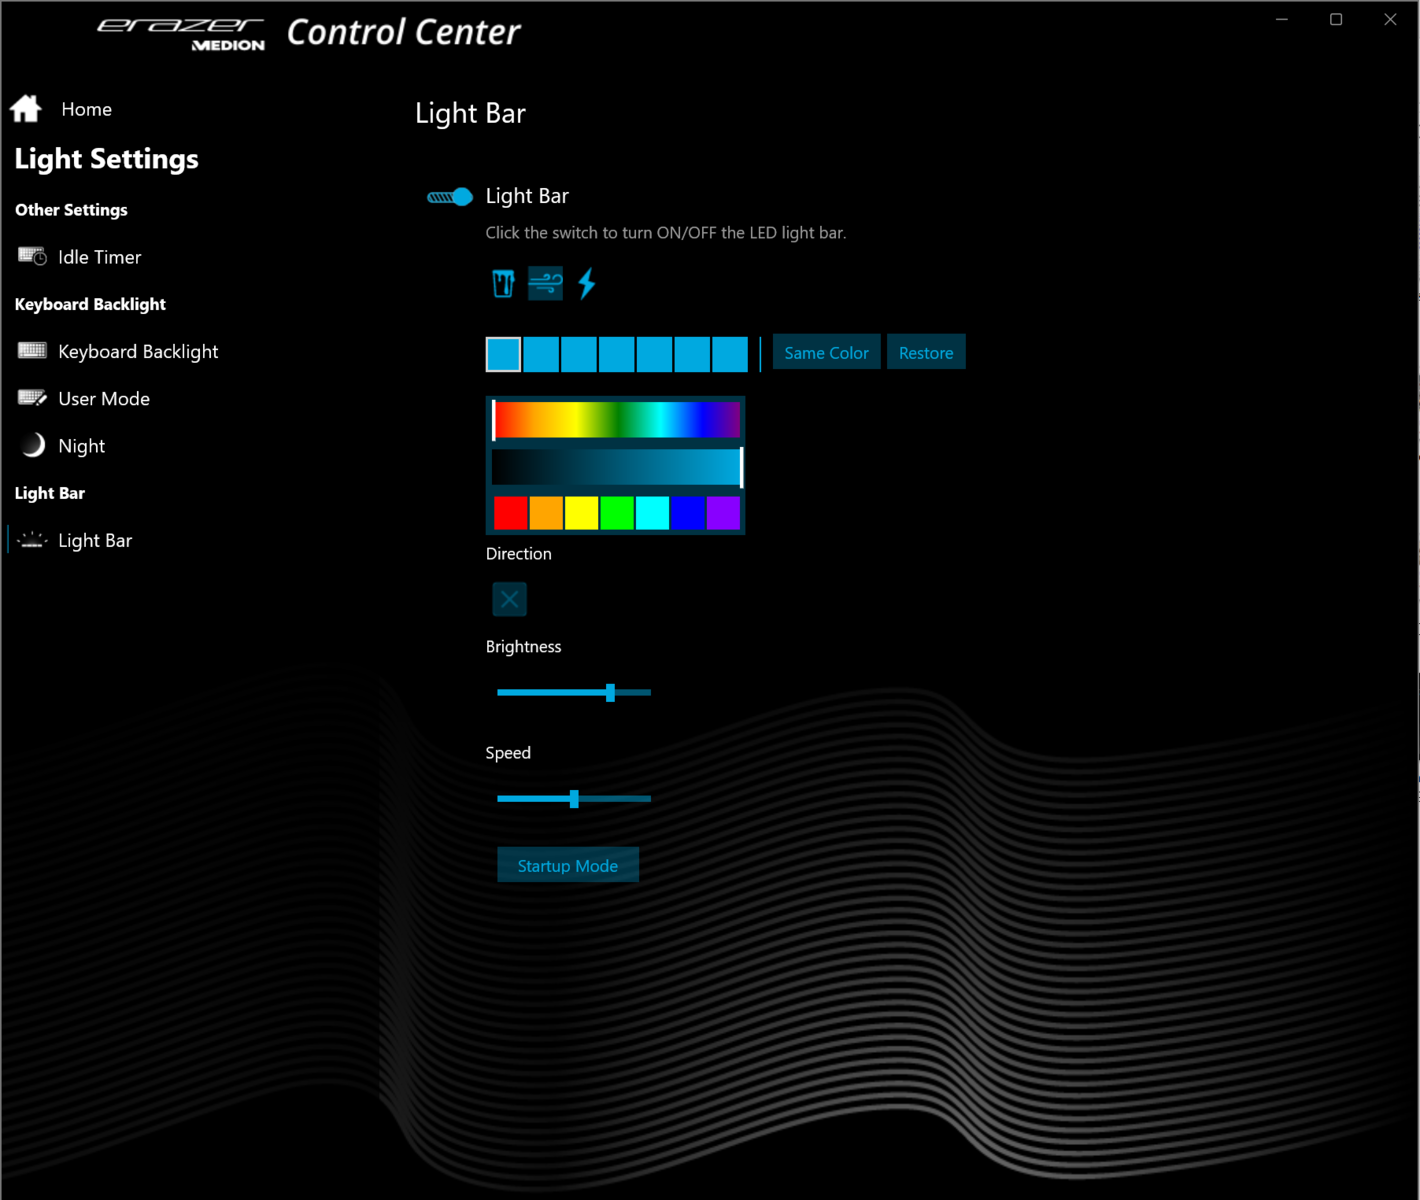
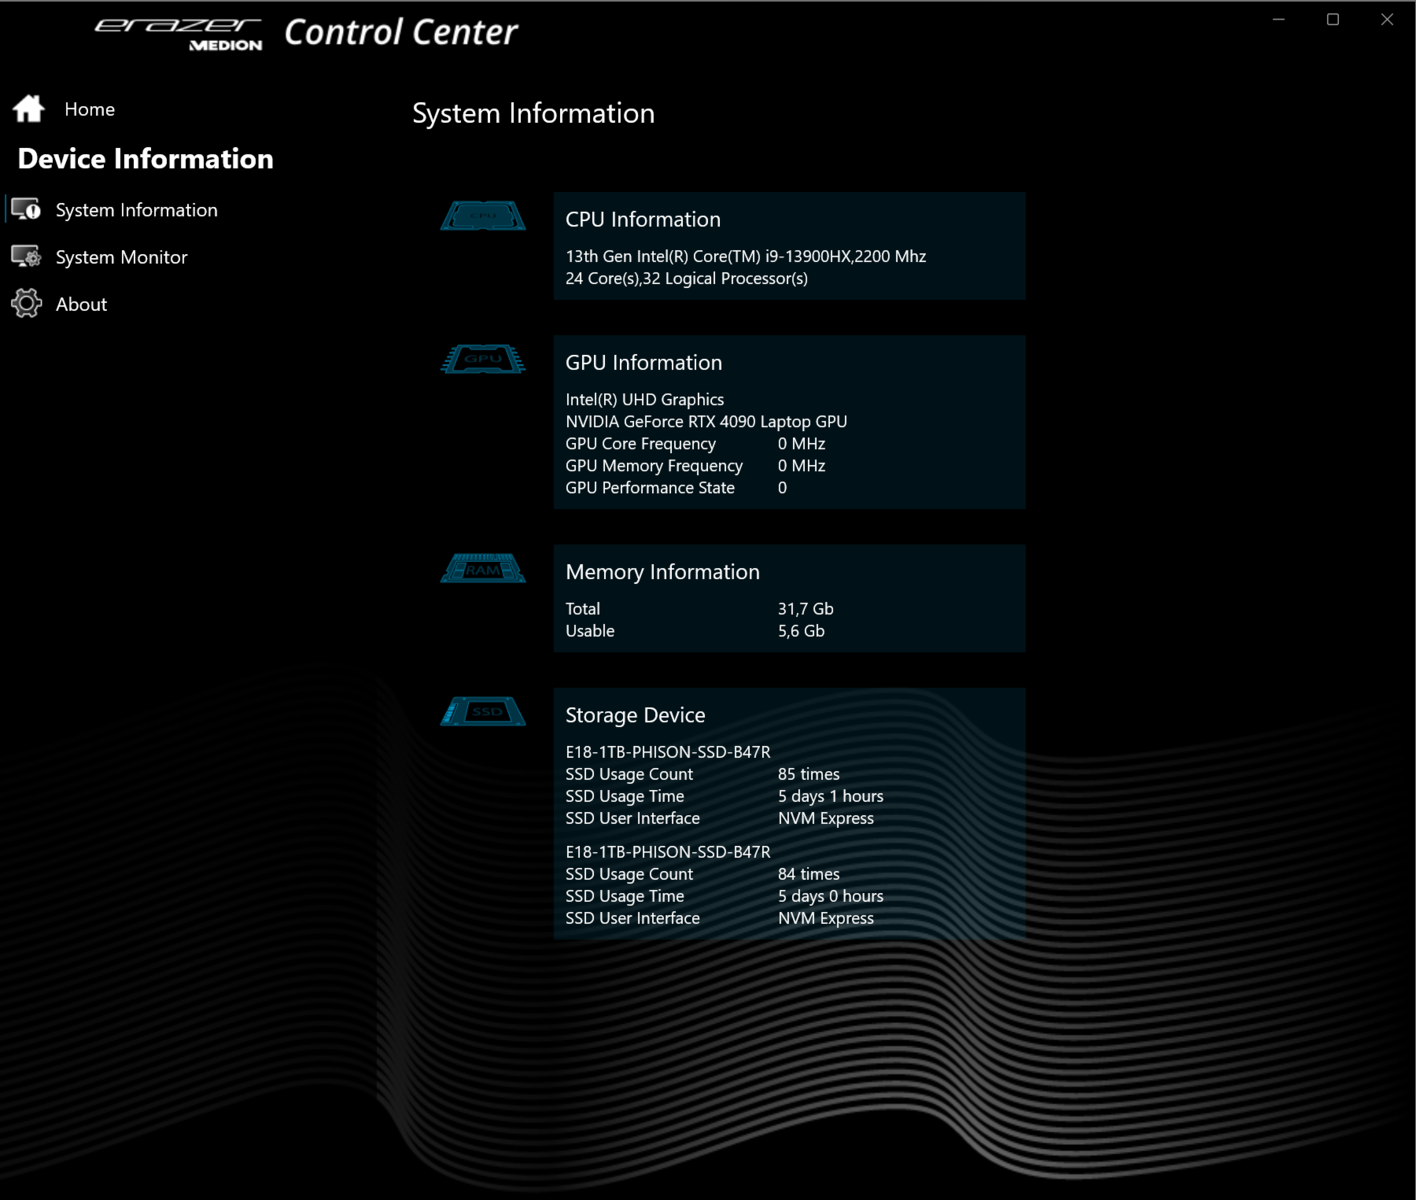
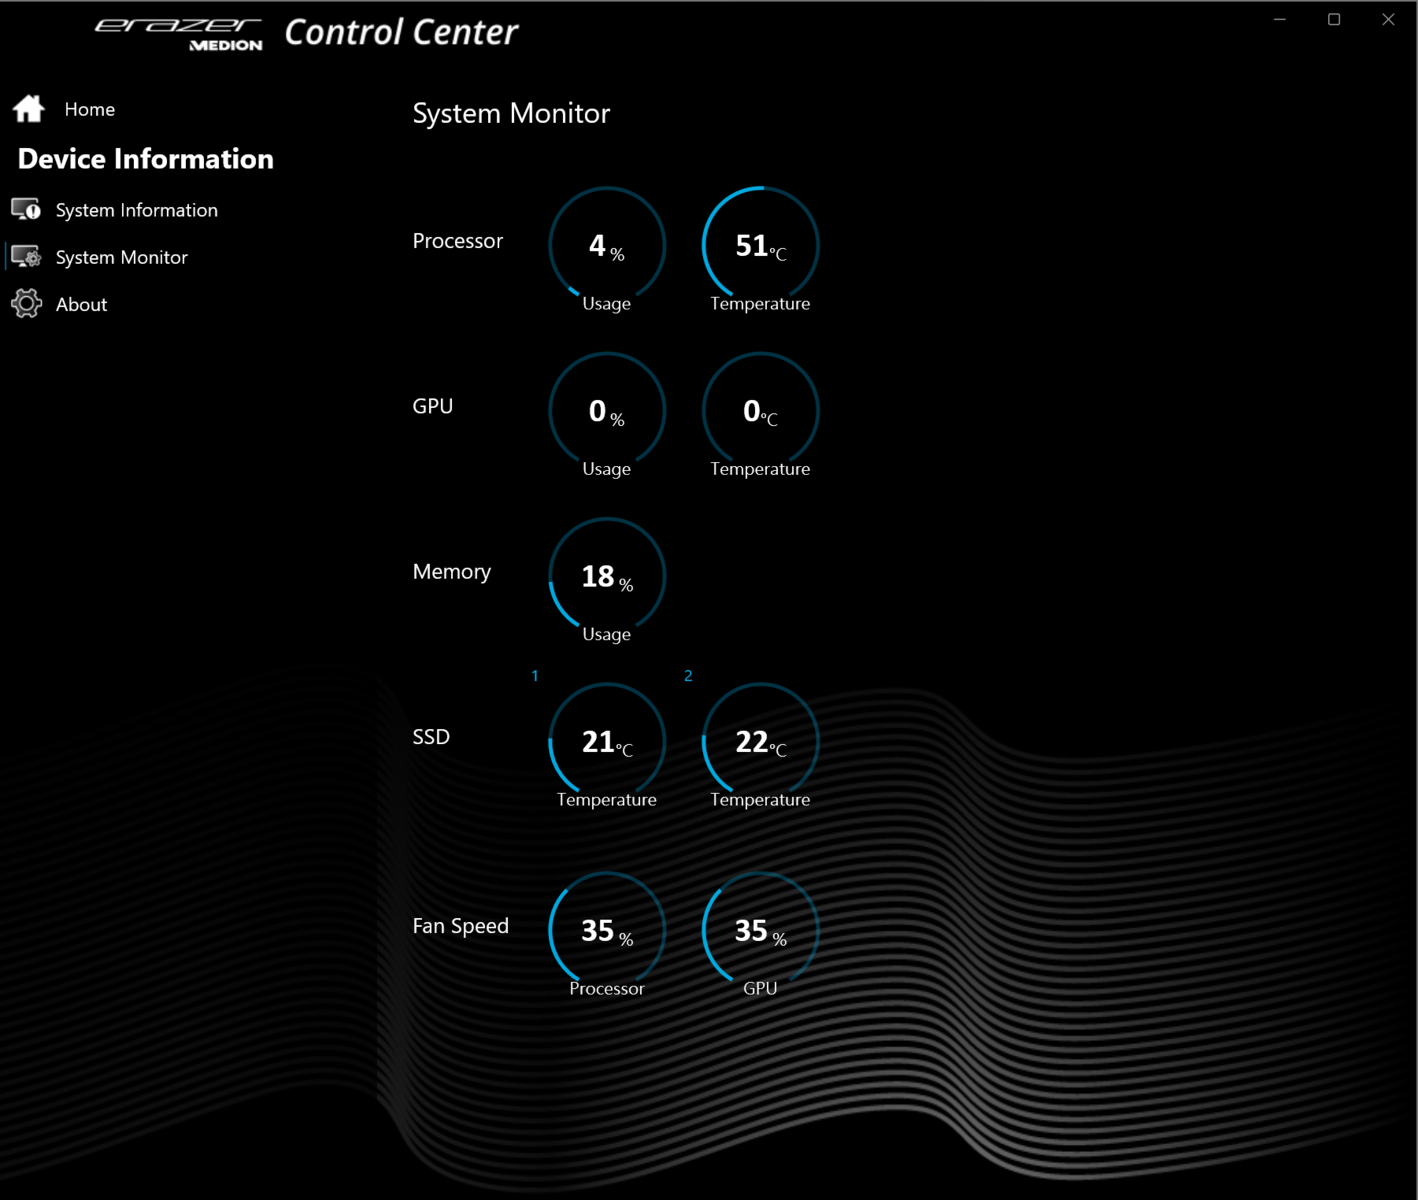
Los usuarios pueden alternar entre los tres modos usando un botón dedicado justo al lado del botón de encendido. Un LED de estado indica qué modo está activado en ese momento. También se pueden crear perfiles personalizados con el software Control Center preinstalado. Por ejemplo, se pueden especificar los límites de potencia de la CPU, el TGP de la GPU, los límites de temperatura, etc.
Nota: Hemos utilizado la interfaz de usuario en inglés del software Control Center porque hay algunos problemas con la traducción al alemán. El software te permite cambiar entre los dos idiomas.
| Modo Turbo | Modo Equilibrado | Modo Oficina | |
|---|---|---|---|
| Límite de potencia 1 | 160 vatios | 160 vatios | 160 vatios |
| Límite de potencia 2 | 160 vatios | 160 vatios | 160 vatios |
Procesador
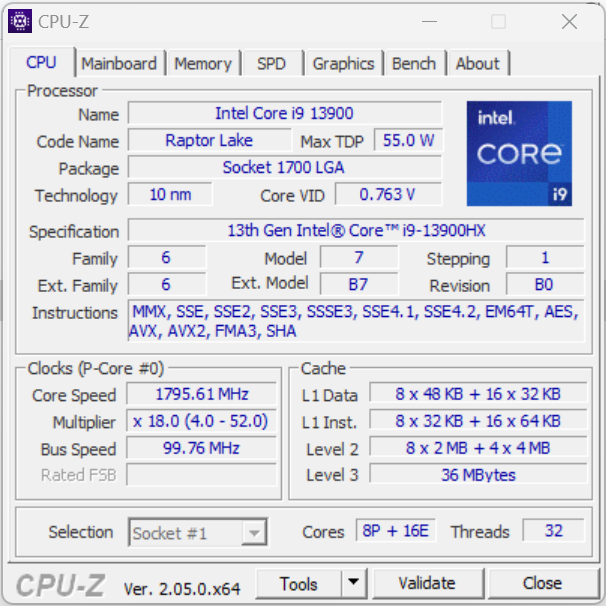
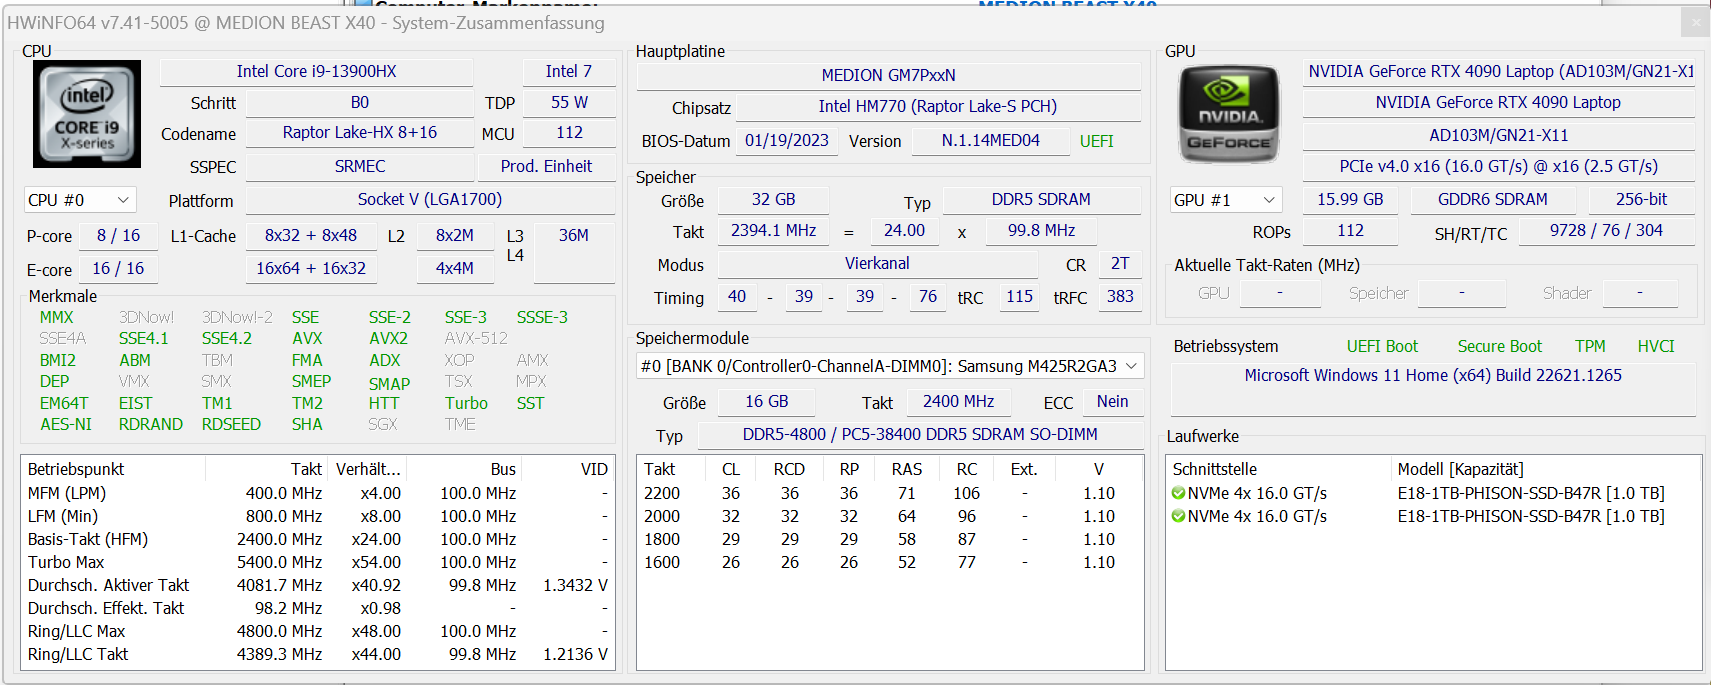
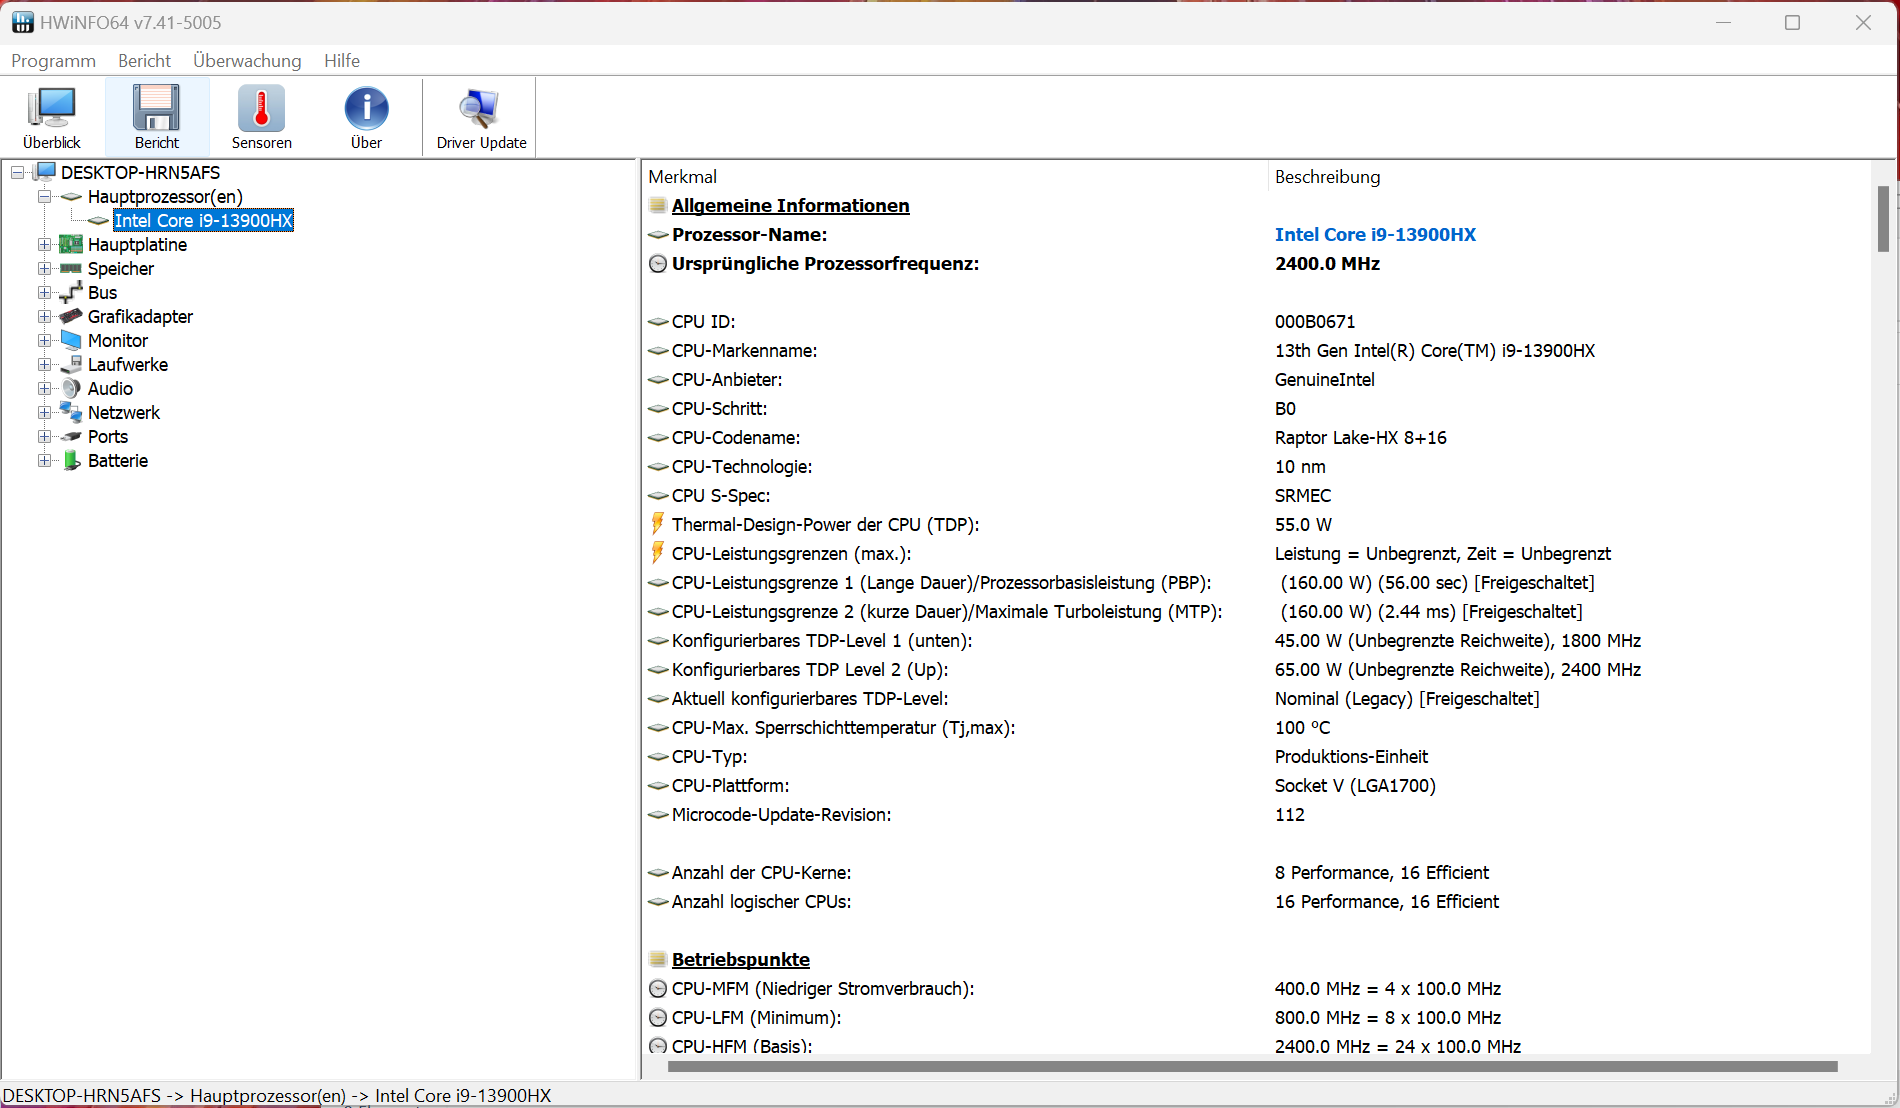
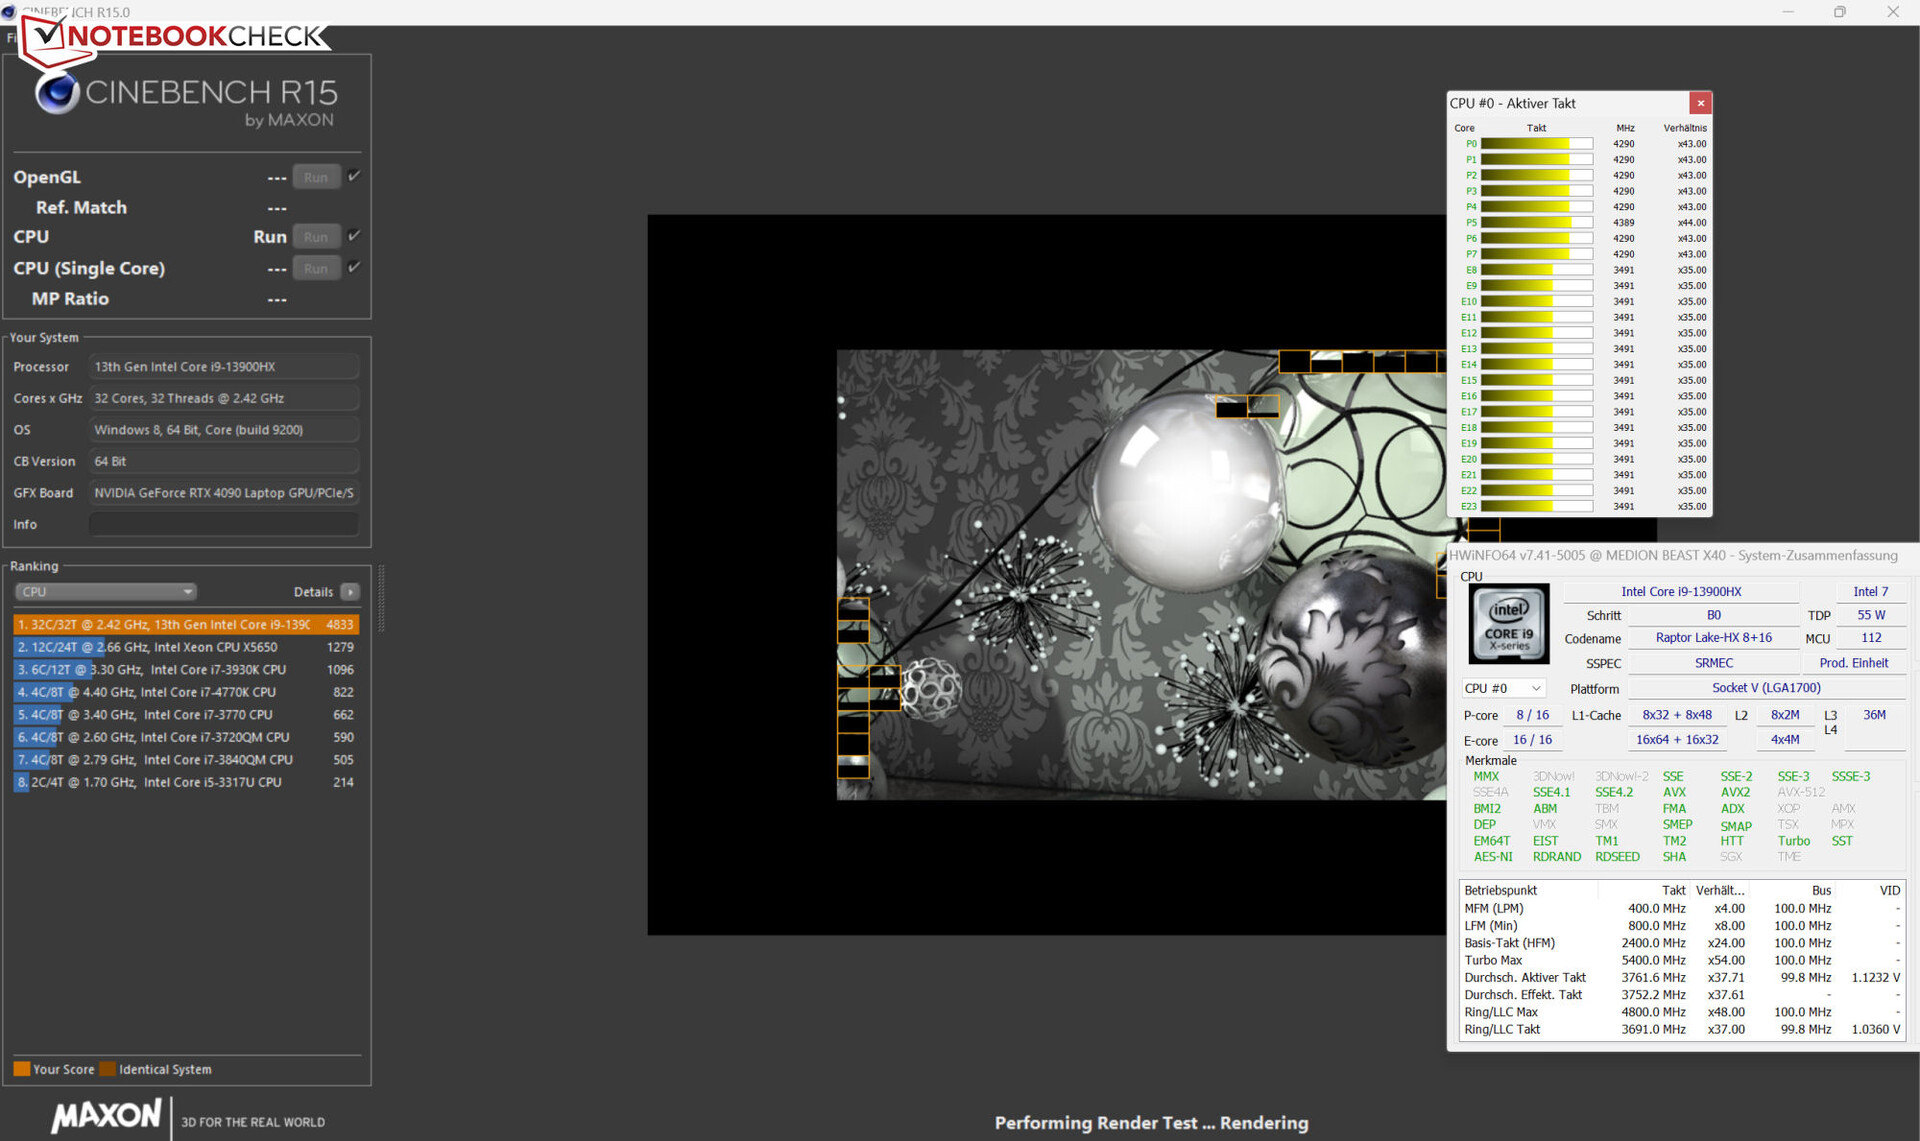
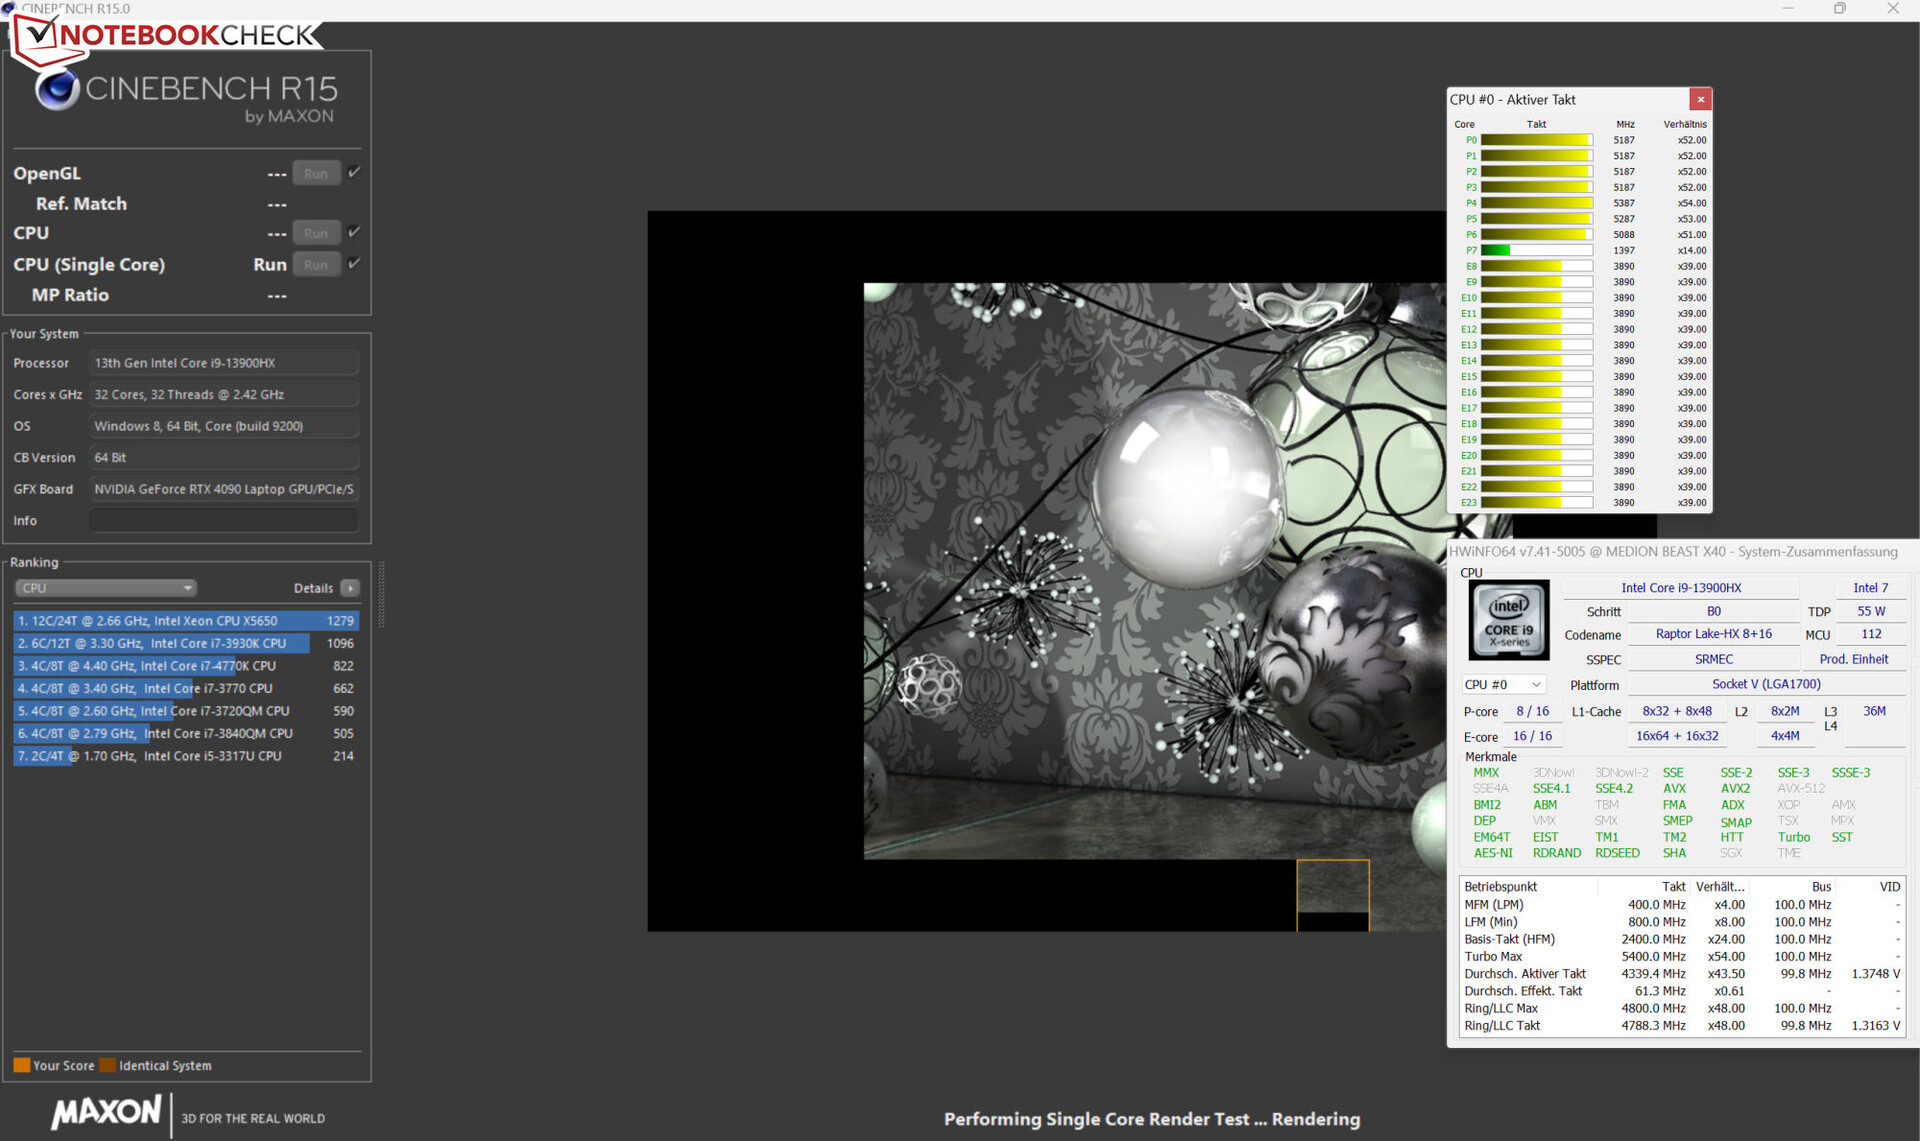
El Core i9-13900HX (Raptor Lake) consta de ocho núcleos de rendimiento (Hyper-Threading, 2,2 a 5,4 GHz) y dieciséis núcleos de eficiencia (sin Hyper-Threading, 1,6 a 3,9 GHz), lo que resulta en un total de 40 núcleos lógicos. Los resultados obtenidos en los benchmarks están ligeramente por encima de lo que la CPU puede producir de media.
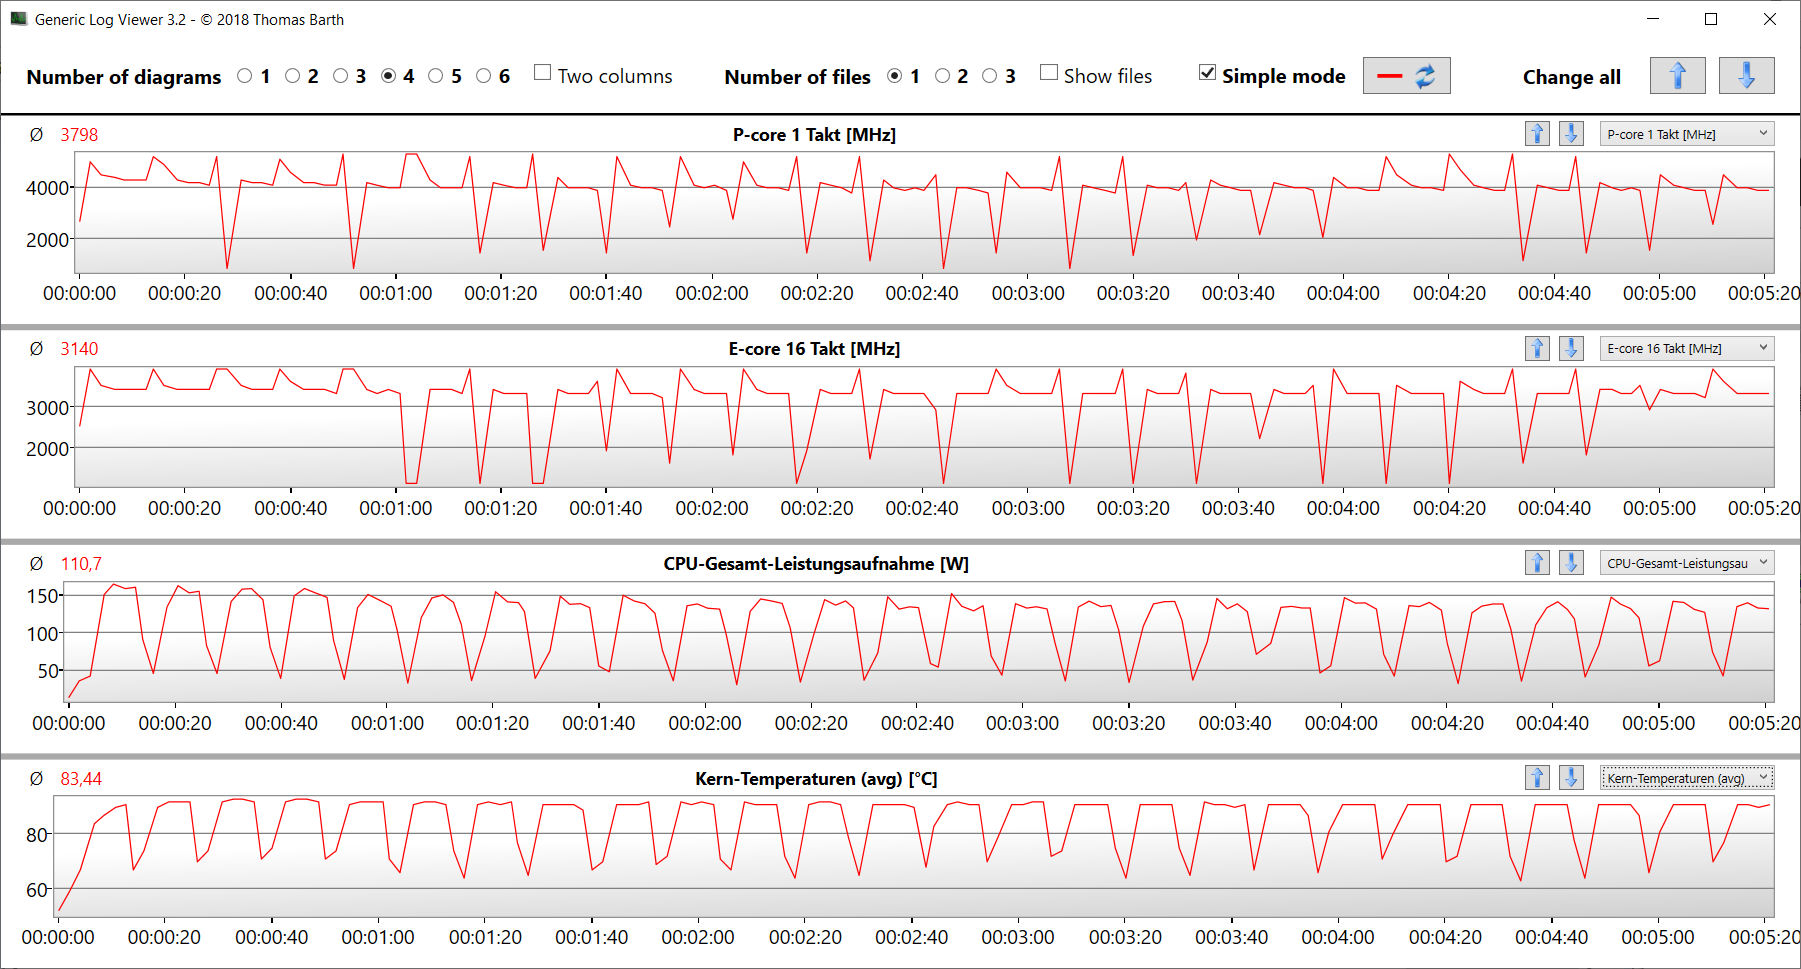
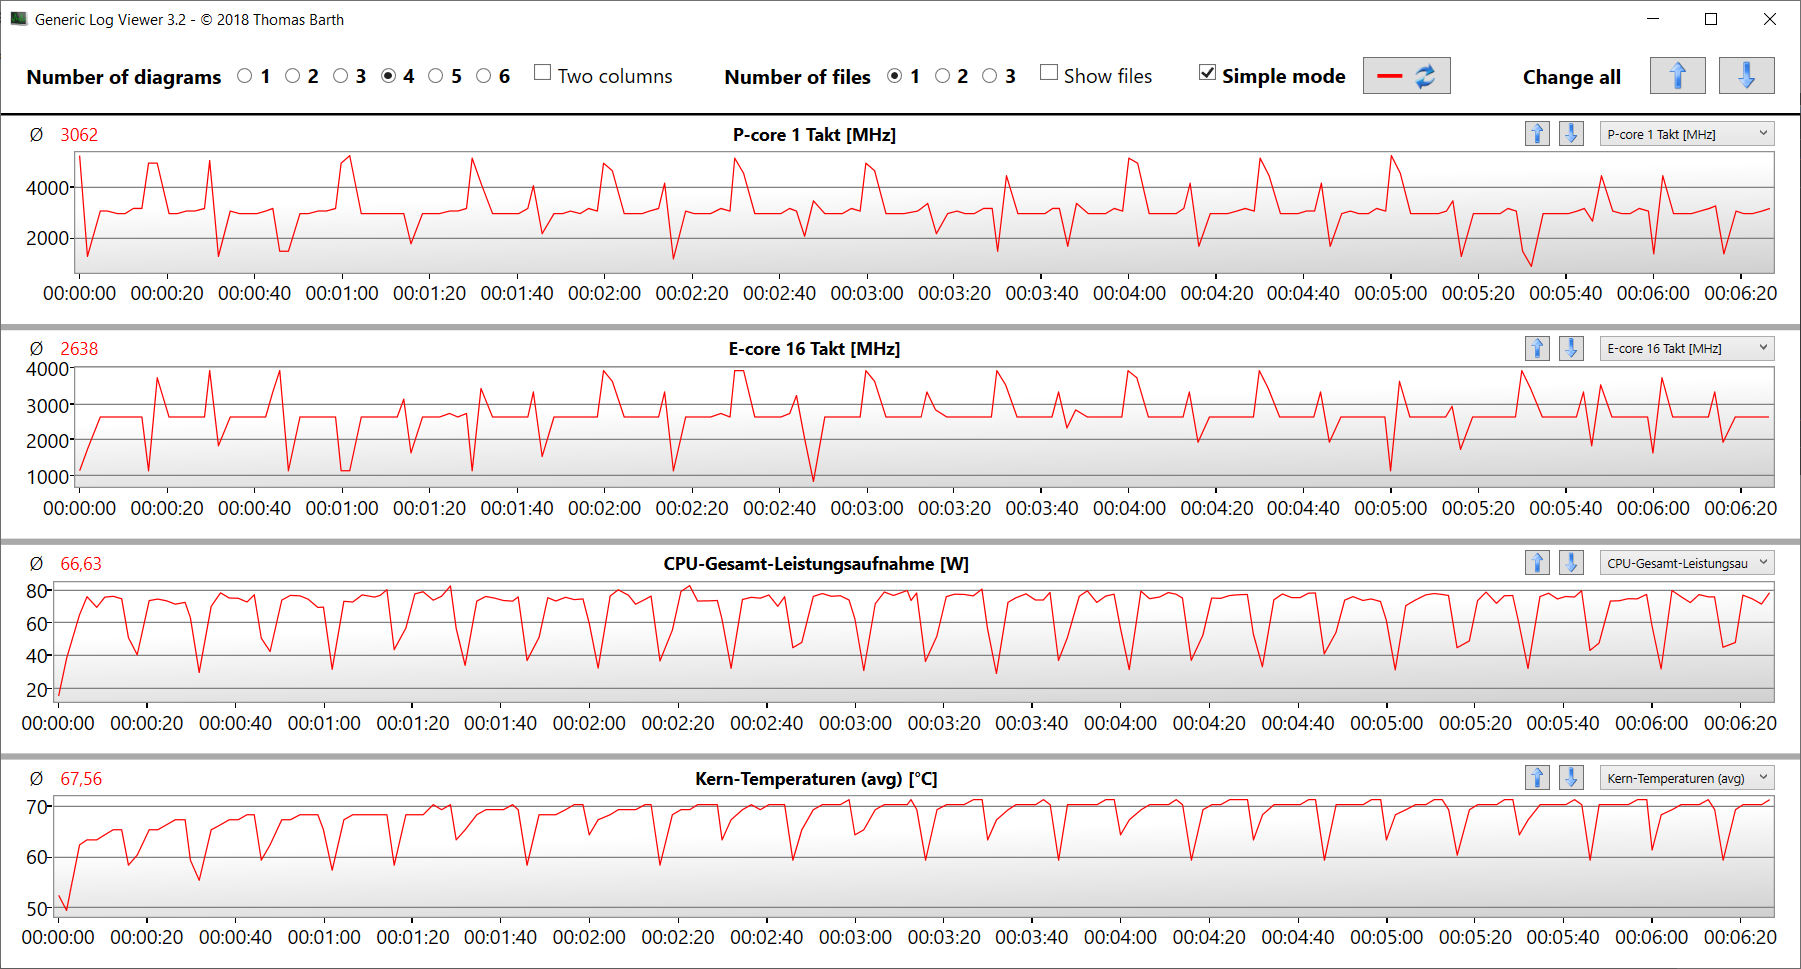
Con el Erazer Beast X40 enchufado, su CPU ejecutó Cinebench R15 a velocidades de reloj de altas a máximas. Con batería, el rendimiento monohilo fue sólo ligeramente inferior (puntuación: 228), mientras que el rendimiento multihilo sufrió un golpe considerable (puntuación: 1.154). La ejecución de Cinebench 15 en bucle demostró que la CPU es capaz de funcionar constantemente a altas velocidades cuando está conectada a la red eléctrica.
El uso de la unidad de refrigeración por agua no supuso un aumento drástico del rendimiento. No obstante, el rendimiento de la CPU fue más estable bajo carga multihilo sostenida (bucle CB15), y la temperatura media de la CPU bajó unos 5°C.
Cinebench R15 Multi Sustained Load
| CPU Performance rating - Percent | |
| Asus ROG Strix Scar 18 2023 G834JY-N6005W | |
| MSI Titan GT77 HX 13VI | |
| Medion Erazer Beast X40 | |
| Medion Erazer Beast X40 | |
| Medio Intel Core i9-13900HX | |
| Razer Blade 16 Early 2023 | |
| Media de la clase Gaming | |
| Alienware x17 R2 P48E | |
| Schenker XMG Neo 17 M22 | |
| Cinebench R20 | |
| CPU (Multi Core) | |
| MSI Titan GT77 HX 13VI | |
| Asus ROG Strix Scar 18 2023 G834JY-N6005W | |
| Medion Erazer Beast X40 (dGPU, Cooling) | |
| Medion Erazer Beast X40 | |
| Medio Intel Core i9-13900HX (9152 - 12541, n=21) | |
| Media de la clase Gaming (4029 - 16433, n=106, últimos 2 años) | |
| Razer Blade 16 Early 2023 | |
| Alienware x17 R2 P48E | |
| Schenker XMG Neo 17 M22 | |
| CPU (Single Core) | |
| Asus ROG Strix Scar 18 2023 G834JY-N6005W | |
| MSI Titan GT77 HX 13VI | |
| Medion Erazer Beast X40 (dGPU, Cooling) | |
| Medio Intel Core i9-13900HX (722 - 810, n=21) | |
| Medion Erazer Beast X40 | |
| Media de la clase Gaming (442 - 913, n=106, últimos 2 años) | |
| Razer Blade 16 Early 2023 | |
| Alienware x17 R2 P48E | |
| Schenker XMG Neo 17 M22 | |
| Cinebench R15 | |
| CPU Multi 64Bit | |
| MSI Titan GT77 HX 13VI | |
| Medion Erazer Beast X40 | |
| Medion Erazer Beast X40 (dGPU, Cooling) | |
| Medion Erazer Beast X40 (dGPU, Cooling) | |
| Asus ROG Strix Scar 18 2023 G834JY-N6005W | |
| Razer Blade 16 Early 2023 | |
| Medio Intel Core i9-13900HX (3913 - 4970, n=22) | |
| Media de la clase Gaming (1578 - 6330, n=105, últimos 2 años) | |
| Alienware x17 R2 P48E | |
| Schenker XMG Neo 17 M22 | |
| CPU Single 64Bit | |
| Asus ROG Strix Scar 18 2023 G834JY-N6005W | |
| MSI Titan GT77 HX 13VI | |
| Medion Erazer Beast X40 | |
| Media de la clase Gaming (188.8 - 350, n=106, últimos 2 años) | |
| Medion Erazer Beast X40 (dGPU, Cooling) | |
| Medion Erazer Beast X40 (dGPU, Cooling) | |
| Medio Intel Core i9-13900HX (247 - 304, n=22) | |
| Razer Blade 16 Early 2023 | |
| Alienware x17 R2 P48E | |
| Schenker XMG Neo 17 M22 | |
| Blender - v2.79 BMW27 CPU | |
| Schenker XMG Neo 17 M22 | |
| Alienware x17 R2 P48E | |
| Media de la clase Gaming (79 - 330, n=104, últimos 2 años) | |
| Medio Intel Core i9-13900HX (101 - 153, n=22) | |
| Razer Blade 16 Early 2023 | |
| Medion Erazer Beast X40 | |
| Asus ROG Strix Scar 18 2023 G834JY-N6005W | |
| Medion Erazer Beast X40 (dGPU, Cooling) | |
| MSI Titan GT77 HX 13VI | |
| HWBOT x265 Benchmark v2.2 - 4k Preset | |
| Asus ROG Strix Scar 18 2023 G834JY-N6005W | |
| MSI Titan GT77 HX 13VI | |
| Medion Erazer Beast X40 (dGPU, Cooling) | |
| Medion Erazer Beast X40 | |
| Medio Intel Core i9-13900HX (23.5 - 34.4, n=22) | |
| Media de la clase Gaming (11.5 - 44.4, n=105, últimos 2 años) | |
| Razer Blade 16 Early 2023 | |
| Alienware x17 R2 P48E | |
| Schenker XMG Neo 17 M22 | |
| LibreOffice - 20 Documents To PDF | |
| Schenker XMG Neo 17 M22 | |
| Media de la clase Gaming (33.2 - 88.8, n=105, últimos 2 años) | |
| Razer Blade 16 Early 2023 | |
| MSI Titan GT77 HX 13VI | |
| Medion Erazer Beast X40 | |
| Medio Intel Core i9-13900HX (32.8 - 51.1, n=21) | |
| Alienware x17 R2 P48E | |
| Medion Erazer Beast X40 (dGPU, Cooling) | |
| Asus ROG Strix Scar 18 2023 G834JY-N6005W | |
| R Benchmark 2.5 - Overall mean | |
| Schenker XMG Neo 17 M22 | |
| Alienware x17 R2 P48E | |
| Media de la clase Gaming (0.3439 - 0.759, n=106, últimos 2 años) | |
| Razer Blade 16 Early 2023 | |
| MSI Titan GT77 HX 13VI | |
| Medio Intel Core i9-13900HX (0.375 - 0.4564, n=22) | |
| Medion Erazer Beast X40 | |
| Medion Erazer Beast X40 (dGPU, Cooling) | |
| Asus ROG Strix Scar 18 2023 G834JY-N6005W | |
* ... más pequeño es mejor
AIDA64: FP32 Ray-Trace | FPU Julia | CPU SHA3 | CPU Queen | FPU SinJulia | FPU Mandel | CPU AES | CPU ZLib | FP64 Ray-Trace | CPU PhotoWorxx
| Performance rating | |
| MSI Titan GT77 HX 13VI | |
| Asus ROG Strix Scar 18 2023 G834JY-N6005W | |
| Medion Erazer Beast X40 | |
| Medion Erazer Beast X40 | |
| Media de la clase Gaming | |
| Medio Intel Core i9-13900HX | |
| Razer Blade 16 Early 2023 | |
| Schenker XMG Neo 17 M22 | |
| Alienware x17 R2 P48E | |
| AIDA64 / FP32 Ray-Trace | |
| Media de la clase Gaming (10227 - 85542, n=105, últimos 2 años) | |
| MSI Titan GT77 HX 13VI (v6.85.6300) | |
| Asus ROG Strix Scar 18 2023 G834JY-N6005W (v6.85.6300) | |
| Medion Erazer Beast X40 (v6.75.6100, dGPU, Cooling) | |
| Medion Erazer Beast X40 (v6.75.6100) | |
| Razer Blade 16 Early 2023 (v6.85.6300) | |
| Razer Blade 16 Early 2023 (v8.20.8100) | |
| Razer Blade 16 Early 2023 (v6.92.6600) | |
| Medio Intel Core i9-13900HX (17589 - 27615, n=22) | |
| Schenker XMG Neo 17 M22 (v6.70.6000) | |
| Alienware x17 R2 P48E (v6.50.5800) | |
| AIDA64 / FPU Julia | |
| MSI Titan GT77 HX 13VI (v6.85.6300) | |
| Media de la clase Gaming (51376 - 238426, n=105, últimos 2 años) | |
| Asus ROG Strix Scar 18 2023 G834JY-N6005W (v6.85.6300) | |
| Medion Erazer Beast X40 (v6.75.6100, dGPU, Cooling) | |
| Medion Erazer Beast X40 (v6.75.6100) | |
| Razer Blade 16 Early 2023 (v6.85.6300) | |
| Razer Blade 16 Early 2023 (v8.20.8100) | |
| Razer Blade 16 Early 2023 (v6.92.6600) | |
| Medio Intel Core i9-13900HX (88686 - 137015, n=22) | |
| Schenker XMG Neo 17 M22 (v6.70.6000) | |
| Alienware x17 R2 P48E (v6.50.5800) | |
| AIDA64 / CPU SHA3 | |
| MSI Titan GT77 HX 13VI (v6.85.6300) | |
| Asus ROG Strix Scar 18 2023 G834JY-N6005W (v6.85.6300) | |
| Medion Erazer Beast X40 (v6.75.6100, dGPU, Cooling) | |
| Medion Erazer Beast X40 (v6.75.6100) | |
| Media de la clase Gaming (2180 - 10115, n=105, últimos 2 años) | |
| Razer Blade 16 Early 2023 (v6.85.6300) | |
| Razer Blade 16 Early 2023 (v6.92.6600) | |
| Razer Blade 16 Early 2023 (v8.20.8100) | |
| Medio Intel Core i9-13900HX (4362 - 7029, n=22) | |
| Alienware x17 R2 P48E (v6.50.5800) | |
| Schenker XMG Neo 17 M22 (v6.70.6000) | |
| AIDA64 / CPU Queen | |
| Asus ROG Strix Scar 18 2023 G834JY-N6005W (v6.85.6300) | |
| MSI Titan GT77 HX 13VI (v6.85.6300) | |
| Razer Blade 16 Early 2023 (v6.92.6600) | |
| Razer Blade 16 Early 2023 (v6.85.6300) | |
| Medion Erazer Beast X40 (v6.75.6100, dGPU, Cooling) | |
| Medio Intel Core i9-13900HX (125644 - 141385, n=22) | |
| Medion Erazer Beast X40 (v6.75.6100) | |
| Media de la clase Gaming (49785 - 173351, n=90, últimos 2 años) | |
| Alienware x17 R2 P48E (v6.50.5800) | |
| Schenker XMG Neo 17 M22 (v6.70.6000) | |
| AIDA64 / FPU SinJulia | |
| Asus ROG Strix Scar 18 2023 G834JY-N6005W (v6.85.6300) | |
| MSI Titan GT77 HX 13VI (v6.85.6300) | |
| Medion Erazer Beast X40 (v6.75.6100, dGPU, Cooling) | |
| Medion Erazer Beast X40 (v6.75.6100) | |
| Razer Blade 16 Early 2023 (v6.85.6300) | |
| Razer Blade 16 Early 2023 (v8.20.8100) | |
| Razer Blade 16 Early 2023 (v6.92.6600) | |
| Medio Intel Core i9-13900HX (12334 - 17179, n=22) | |
| Media de la clase Gaming (4424 - 33636, n=105, últimos 2 años) | |
| Schenker XMG Neo 17 M22 (v6.70.6000) | |
| Alienware x17 R2 P48E (v6.50.5800) | |
| AIDA64 / FPU Mandel | |
| Media de la clase Gaming (25115 - 128721, n=105, últimos 2 años) | |
| MSI Titan GT77 HX 13VI (v6.85.6300) | |
| Asus ROG Strix Scar 18 2023 G834JY-N6005W (v6.85.6300) | |
| Medion Erazer Beast X40 (v6.75.6100, dGPU, Cooling) | |
| Medion Erazer Beast X40 (v6.75.6100) | |
| Razer Blade 16 Early 2023 (v6.85.6300) | |
| Razer Blade 16 Early 2023 (v8.20.8100) | |
| Razer Blade 16 Early 2023 (v6.92.6600) | |
| Medio Intel Core i9-13900HX (43850 - 69202, n=22) | |
| Schenker XMG Neo 17 M22 (v6.70.6000) | |
| Alienware x17 R2 P48E (v6.50.5800) | |
| AIDA64 / CPU AES | |
| Razer Blade 16 Early 2023 (v6.92.6600) | |
| Razer Blade 16 Early 2023 (v8.20.8100) | |
| Razer Blade 16 Early 2023 (v6.85.6300) | |
| Medio Intel Core i9-13900HX (89413 - 237881, n=22) | |
| MSI Titan GT77 HX 13VI (v6.85.6300) | |
| Schenker XMG Neo 17 M22 (v6.70.6000) | |
| Asus ROG Strix Scar 18 2023 G834JY-N6005W (v6.85.6300) | |
| Medion Erazer Beast X40 (v6.75.6100, dGPU, Cooling) | |
| Medion Erazer Beast X40 (v6.75.6100) | |
| Media de la clase Gaming (39258 - 247074, n=105, últimos 2 años) | |
| Alienware x17 R2 P48E (v6.50.5800) | |
| AIDA64 / CPU ZLib | |
| MSI Titan GT77 HX 13VI (v6.85.6300) | |
| Asus ROG Strix Scar 18 2023 G834JY-N6005W (v6.85.6300) | |
| Medion Erazer Beast X40 (v6.75.6100, dGPU, Cooling) | |
| Medion Erazer Beast X40 (v6.75.6100) | |
| Razer Blade 16 Early 2023 (v6.85.6300) | |
| Razer Blade 16 Early 2023 (v6.92.6600) | |
| Razer Blade 16 Early 2023 (v8.20.8100) | |
| Medio Intel Core i9-13900HX (1284 - 1958, n=22) | |
| Media de la clase Gaming (574 - 2531, n=105, últimos 2 años) | |
| Alienware x17 R2 P48E (v6.50.5800) | |
| Schenker XMG Neo 17 M22 (v6.70.6000) | |
| AIDA64 / FP64 Ray-Trace | |
| Media de la clase Gaming (5509 - 45446, n=105, últimos 2 años) | |
| MSI Titan GT77 HX 13VI (v6.85.6300) | |
| Asus ROG Strix Scar 18 2023 G834JY-N6005W (v6.85.6300) | |
| Medion Erazer Beast X40 (v6.75.6100, dGPU, Cooling) | |
| Medion Erazer Beast X40 (v6.75.6100) | |
| Razer Blade 16 Early 2023 (v6.85.6300) | |
| Razer Blade 16 Early 2023 (v6.92.6600) | |
| Razer Blade 16 Early 2023 (v8.20.8100) | |
| Medio Intel Core i9-13900HX (9481 - 15279, n=22) | |
| Schenker XMG Neo 17 M22 (v6.70.6000) | |
| Alienware x17 R2 P48E (v6.50.5800) | |
| AIDA64 / CPU PhotoWorxx | |
| Razer Blade 16 Early 2023 (v6.85.6300) | |
| Razer Blade 16 Early 2023 (v6.92.6600) | |
| Razer Blade 16 Early 2023 (v8.20.8100) | |
| Medio Intel Core i9-13900HX (42994 - 51994, n=22) | |
| Media de la clase Gaming (12271 - 89891, n=105, últimos 2 años) | |
| Medion Erazer Beast X40 (v6.75.6100, dGPU, Cooling) | |
| Asus ROG Strix Scar 18 2023 G834JY-N6005W (v6.85.6300) | |
| Medion Erazer Beast X40 (v6.75.6100) | |
| MSI Titan GT77 HX 13VI (v6.85.6300) | |
| Alienware x17 R2 P48E (v6.50.5800) | |
| Schenker XMG Neo 17 M22 (v6.70.6000) | |
Rendimiento del sistema
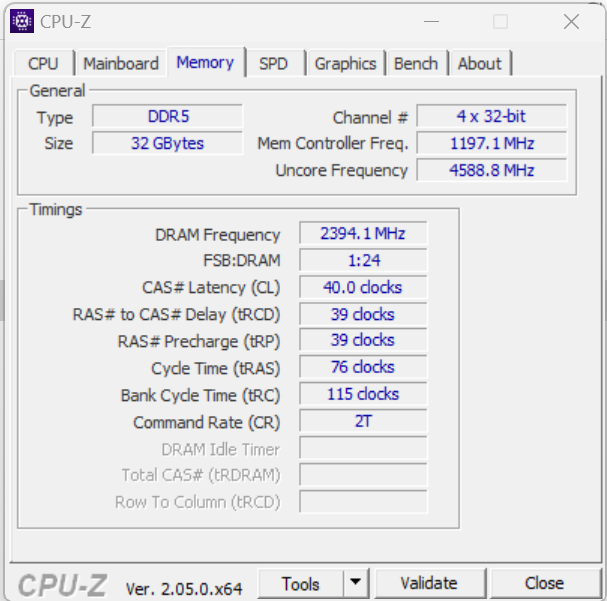
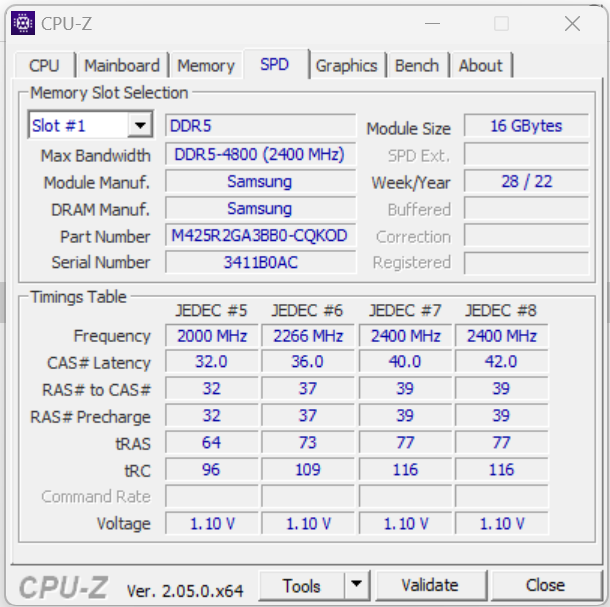
El hardware de este ágil sistema ofrece un rendimiento más que suficiente para tareas como juegos y renderizado. El portátil viene con 32 GB de memoria en modo de doble canal. Y las velocidades de transferencia de la memoria son las típicas de una RAM DDR5-4800. Y lo que es más, el sistema también ofreció unos resultados PCMark excelentes en nuestras pruebas.
CrossMark: Overall | Productivity | Creativity | Responsiveness
| PCMark 10 / Score | |
| Medion Erazer Beast X40 (dGPU, Cooling) | |
| MSI Titan GT77 HX 13VI | |
| Asus ROG Strix Scar 18 2023 G834JY-N6005W | |
| Medio Intel Core i9-13900HX, NVIDIA GeForce RTX 4090 Laptop GPU (7690 - 9331, n=8) | |
| Media de la clase Gaming (5828 - 12414, n=93, últimos 2 años) | |
| Alienware x17 R2 P48E | |
| Medion Erazer Beast X40 | |
| Razer Blade 16 Early 2023 | |
| Schenker XMG Neo 17 M22 | |
| PCMark 10 / Essentials | |
| MSI Titan GT77 HX 13VI | |
| Medion Erazer Beast X40 (dGPU, Cooling) | |
| Medio Intel Core i9-13900HX, NVIDIA GeForce RTX 4090 Laptop GPU (10972 - 11983, n=8) | |
| Medion Erazer Beast X40 | |
| Alienware x17 R2 P48E | |
| Razer Blade 16 Early 2023 | |
| Media de la clase Gaming (8810 - 11935, n=97, últimos 2 años) | |
| Schenker XMG Neo 17 M22 | |
| PCMark 10 / Productivity | |
| Medion Erazer Beast X40 (dGPU, Cooling) | |
| Medion Erazer Beast X40 | |
| Media de la clase Gaming (6845 - 25323, n=95, últimos 2 años) | |
| Medio Intel Core i9-13900HX, NVIDIA GeForce RTX 4090 Laptop GPU (9038 - 11680, n=8) | |
| Alienware x17 R2 P48E | |
| MSI Titan GT77 HX 13VI | |
| Schenker XMG Neo 17 M22 | |
| Razer Blade 16 Early 2023 | |
| PCMark 10 / Digital Content Creation | |
| MSI Titan GT77 HX 13VI | |
| Medion Erazer Beast X40 (dGPU, Cooling) | |
| Razer Blade 16 Early 2023 | |
| Media de la clase Gaming (7602 - 19954, n=95, últimos 2 años) | |
| Medio Intel Core i9-13900HX, NVIDIA GeForce RTX 4090 Laptop GPU (10605 - 16395, n=8) | |
| Alienware x17 R2 P48E | |
| Medion Erazer Beast X40 | |
| Schenker XMG Neo 17 M22 | |
| CrossMark / Overall | |
| Medion Erazer Beast X40 (dGPU, Cooling) | |
| MSI Titan GT77 HX 13VI | |
| Medion Erazer Beast X40 | |
| Medio Intel Core i9-13900HX, NVIDIA GeForce RTX 4090 Laptop GPU (1825 - 2295, n=8) | |
| Asus ROG Strix Scar 18 2023 G834JY-N6005W | |
| Media de la clase Gaming (1366 - 2409, n=94, últimos 2 años) | |
| Alienware x17 R2 P48E | |
| Schenker XMG Neo 17 M22 | |
| Razer Blade 16 Early 2023 | |
| CrossMark / Productivity | |
| Medion Erazer Beast X40 (dGPU, Cooling) | |
| Medion Erazer Beast X40 | |
| MSI Titan GT77 HX 13VI | |
| Medio Intel Core i9-13900HX, NVIDIA GeForce RTX 4090 Laptop GPU (1666 - 2166, n=8) | |
| Asus ROG Strix Scar 18 2023 G834JY-N6005W | |
| Media de la clase Gaming (1386 - 2254, n=94, últimos 2 años) | |
| Alienware x17 R2 P48E | |
| Schenker XMG Neo 17 M22 | |
| Razer Blade 16 Early 2023 | |
| CrossMark / Creativity | |
| Asus ROG Strix Scar 18 2023 G834JY-N6005W | |
| MSI Titan GT77 HX 13VI | |
| Medion Erazer Beast X40 (dGPU, Cooling) | |
| Medion Erazer Beast X40 | |
| Medio Intel Core i9-13900HX, NVIDIA GeForce RTX 4090 Laptop GPU (2162 - 2514, n=8) | |
| Media de la clase Gaming (1343 - 2786, n=94, últimos 2 años) | |
| Alienware x17 R2 P48E | |
| Schenker XMG Neo 17 M22 | |
| Razer Blade 16 Early 2023 | |
| CrossMark / Responsiveness | |
| Medion Erazer Beast X40 (dGPU, Cooling) | |
| MSI Titan GT77 HX 13VI | |
| Medion Erazer Beast X40 | |
| Medio Intel Core i9-13900HX, NVIDIA GeForce RTX 4090 Laptop GPU (1441 - 2275, n=8) | |
| Media de la clase Gaming (1226 - 2334, n=94, últimos 2 años) | |
| Alienware x17 R2 P48E | |
| Asus ROG Strix Scar 18 2023 G834JY-N6005W | |
| Schenker XMG Neo 17 M22 | |
| Razer Blade 16 Early 2023 | |
| PCMark 8 Home Score Accelerated v2 | 4936 puntos | |
| PCMark 8 Work Score Accelerated v2 | 6075 puntos | |
| PCMark 10 Score | 7932 puntos | |
ayuda | ||
| AIDA64 / Memory Copy | |
| Razer Blade 16 Early 2023 | |
| Razer Blade 16 Early 2023 | |
| Razer Blade 16 Early 2023 | |
| Medio Intel Core i9-13900HX (67716 - 79193, n=22) | |
| Media de la clase Gaming (21750 - 129946, n=105, últimos 2 años) | |
| Medion Erazer Beast X40 | |
| Asus ROG Strix Scar 18 2023 G834JY-N6005W | |
| MSI Titan GT77 HX 13VI | |
| Alienware x17 R2 P48E | |
| Schenker XMG Neo 17 M22 | |
| AIDA64 / Memory Read | |
| Razer Blade 16 Early 2023 | |
| Razer Blade 16 Early 2023 | |
| Razer Blade 16 Early 2023 | |
| Medio Intel Core i9-13900HX (73998 - 88462, n=22) | |
| Asus ROG Strix Scar 18 2023 G834JY-N6005W | |
| Medion Erazer Beast X40 | |
| Media de la clase Gaming (22956 - 118858, n=105, últimos 2 años) | |
| MSI Titan GT77 HX 13VI | |
| Alienware x17 R2 P48E | |
| Schenker XMG Neo 17 M22 | |
| AIDA64 / Memory Write | |
| Razer Blade 16 Early 2023 | |
| Razer Blade 16 Early 2023 | |
| Razer Blade 16 Early 2023 | |
| Media de la clase Gaming (22297 - 135096, n=105, últimos 2 años) | |
| Medio Intel Core i9-13900HX (65472 - 77045, n=22) | |
| Asus ROG Strix Scar 18 2023 G834JY-N6005W | |
| Medion Erazer Beast X40 | |
| MSI Titan GT77 HX 13VI | |
| Schenker XMG Neo 17 M22 | |
| Alienware x17 R2 P48E | |
| AIDA64 / Memory Latency | |
| Media de la clase Gaming (75.3 - 259, n=105, últimos 2 años) | |
| Razer Blade 16 Early 2023 | |
| Razer Blade 16 Early 2023 | |
| Razer Blade 16 Early 2023 | |
| Alienware x17 R2 P48E | |
| MSI Titan GT77 HX 13VI | |
| Schenker XMG Neo 17 M22 | |
| Asus ROG Strix Scar 18 2023 G834JY-N6005W | |
| Medion Erazer Beast X40 | |
| Medio Intel Core i9-13900HX (75.3 - 91.1, n=22) | |
* ... más pequeño es mejor
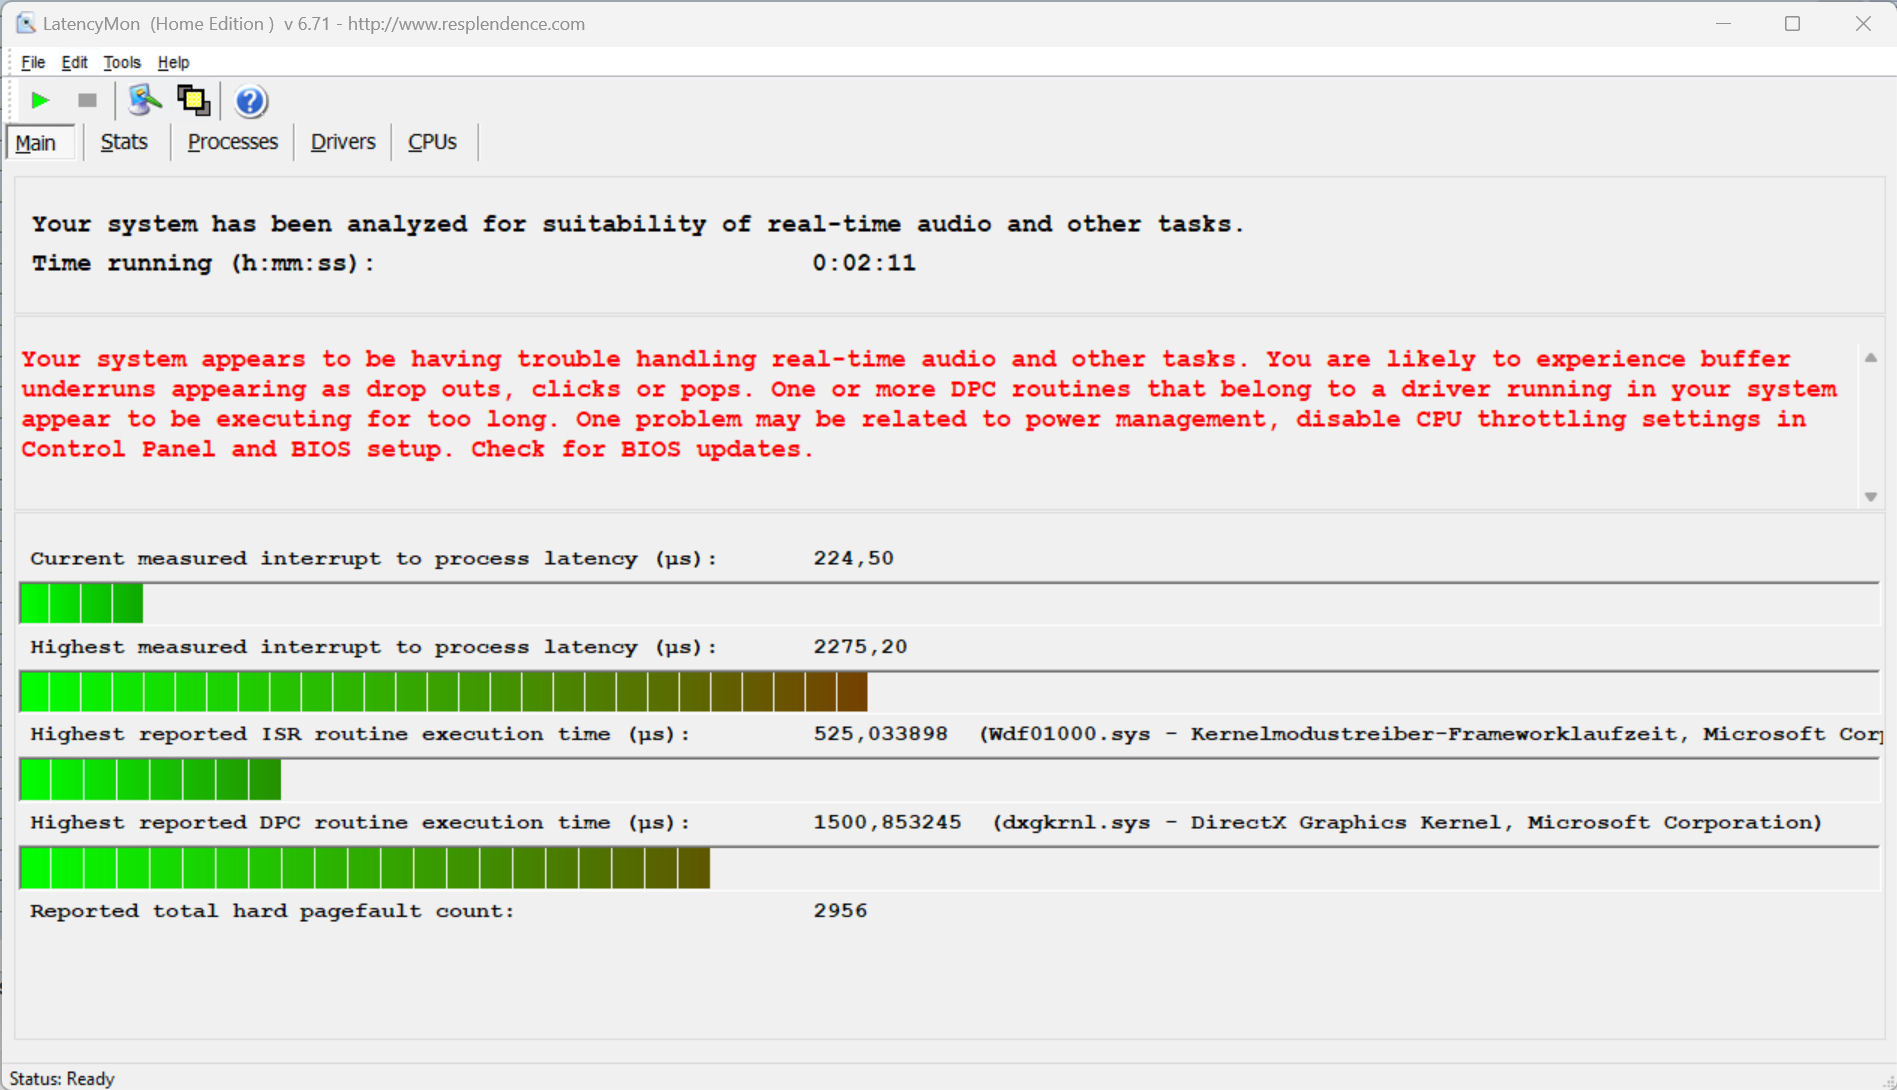
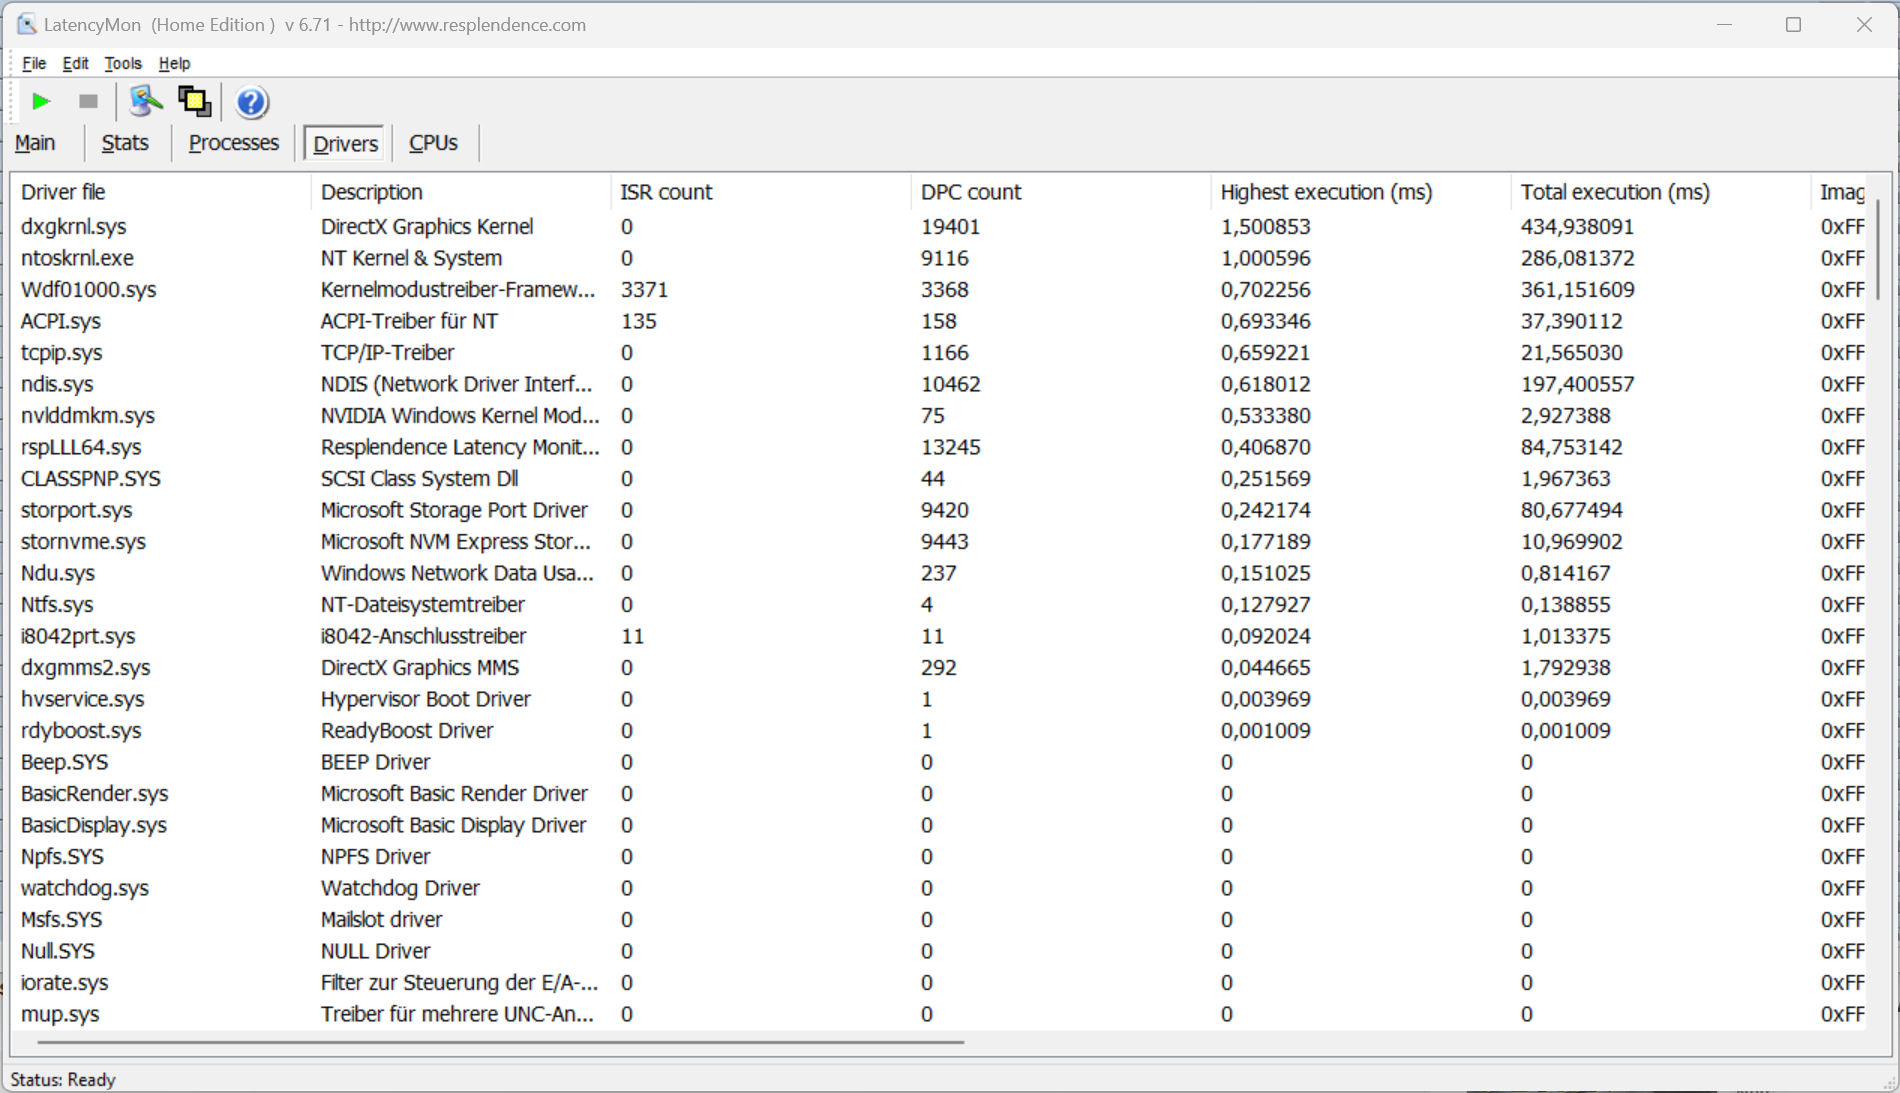
Latencia del CPD
Nuestra prueba de monitorización de latencia estandarizada, que incluye navegación web, reproducción de vídeo 4K y carga alta de Prime95, reveló algunos problemas. El sistema parece inadecuado para el procesamiento de vídeo y audio en tiempo real. Esperamos que futuras actualizaciones de software ayuden a rectificar estos problemas.
| DPC Latencies / LatencyMon - interrupt to process latency (max), Web, Youtube, Prime95 | |
| MSI Titan GT77 HX 13VI | |
| Schenker XMG Neo 17 M22 | |
| Razer Blade 16 Early 2023 | |
| Medion Erazer Beast X40 | |
| Alienware x17 R2 P48E | |
| Asus ROG Strix Scar 18 2023 G834JY-N6005W | |
* ... más pequeño es mejor
Almacenamiento masivo
Medion equipó nuestra unidad de pruebas X40 con dos SSDs de 1 TB (PCIe 4.0, M.2-2280) fabricados por Phison. Uno de ellos sirve como unidad de sistema, y el otro se usa para almacenamiento de datos. No sólo los SSD no forman una configuración RAID, sino que el propio portátil no soporta RAID. Las unidades incluidas no están entre las mejores SSD del mercado. Aun así, siguen ofreciendo un gran rendimiento. Otra cosa positiva a mencionar es que no notamos ninguna caída de rendimiento causada por la ralentización térmica.

* ... más pequeño es mejor
Sustained Load Read: DiskSpd Read Loop, Queue Depth 8
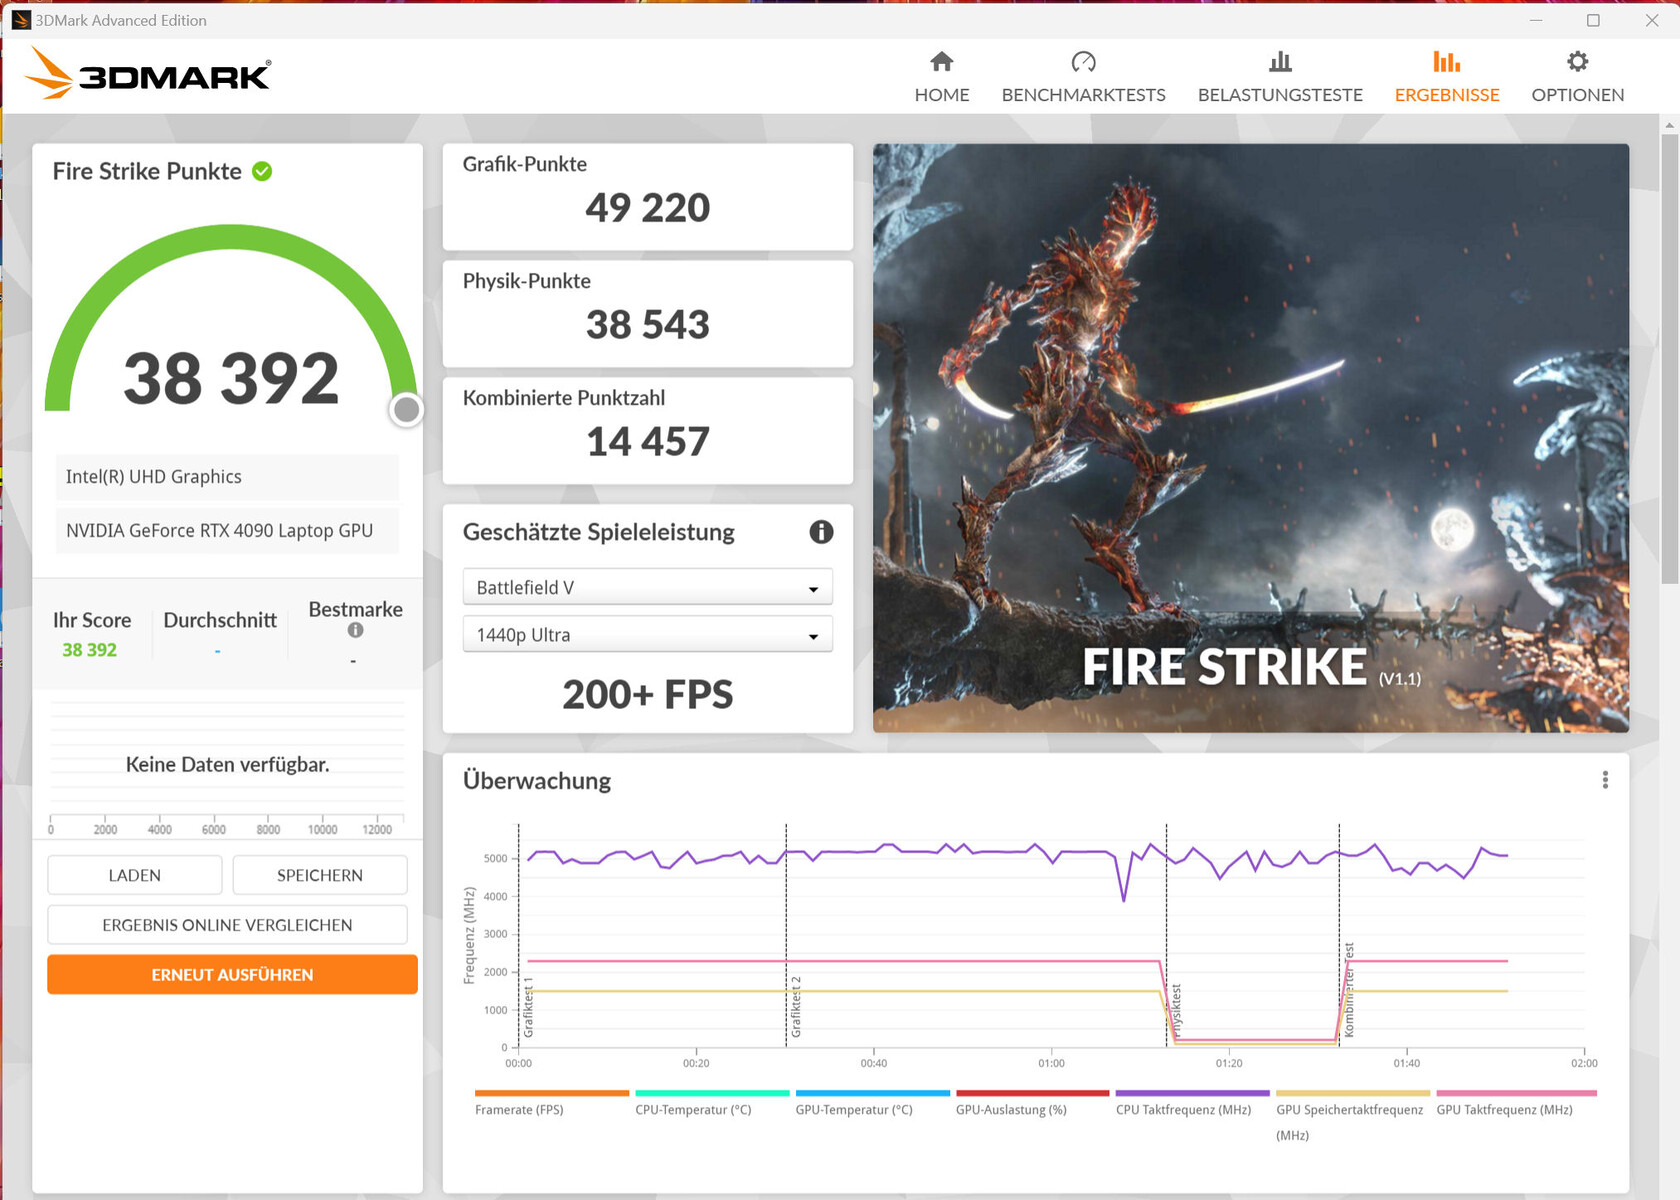
Tarjeta gráfica
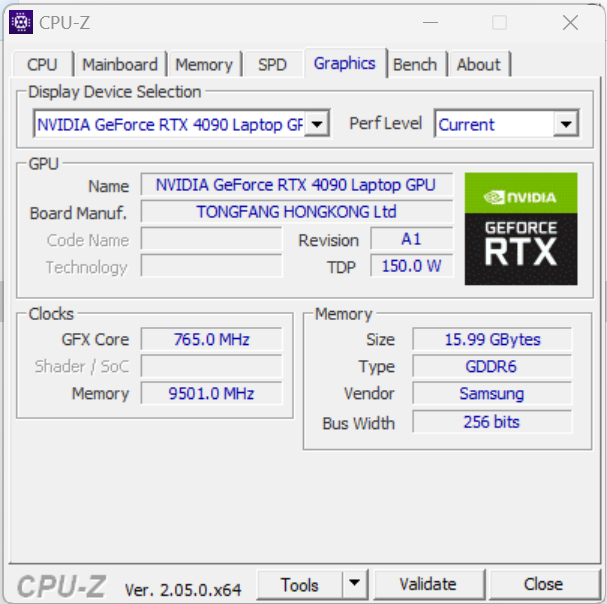
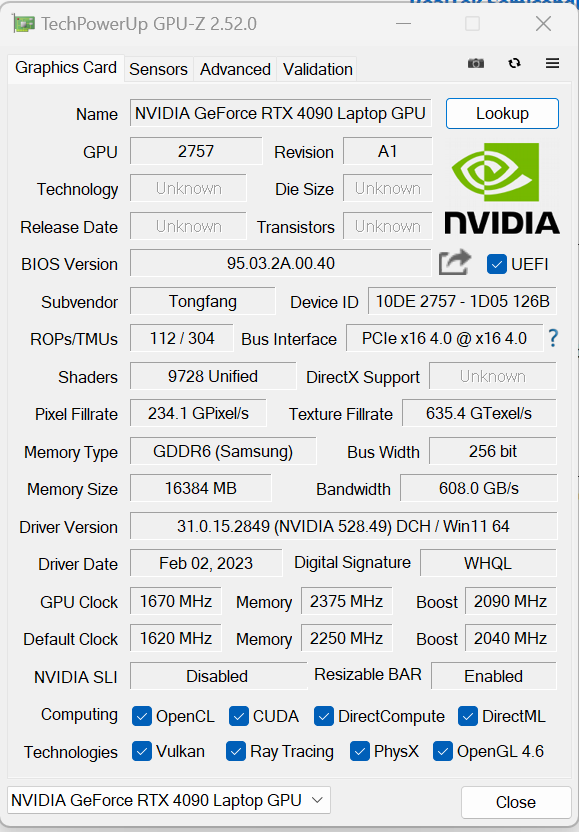
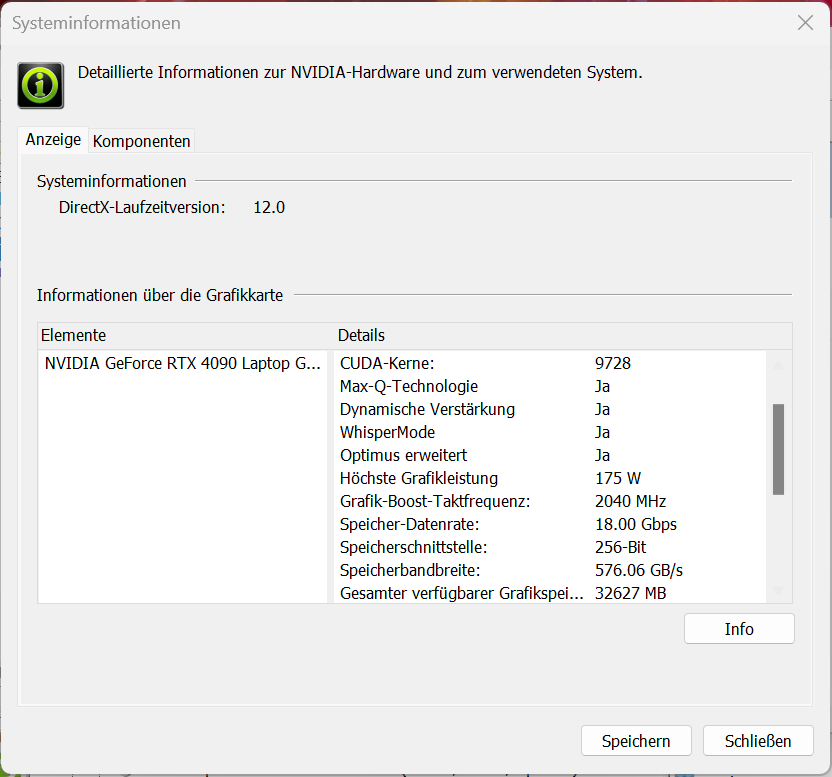
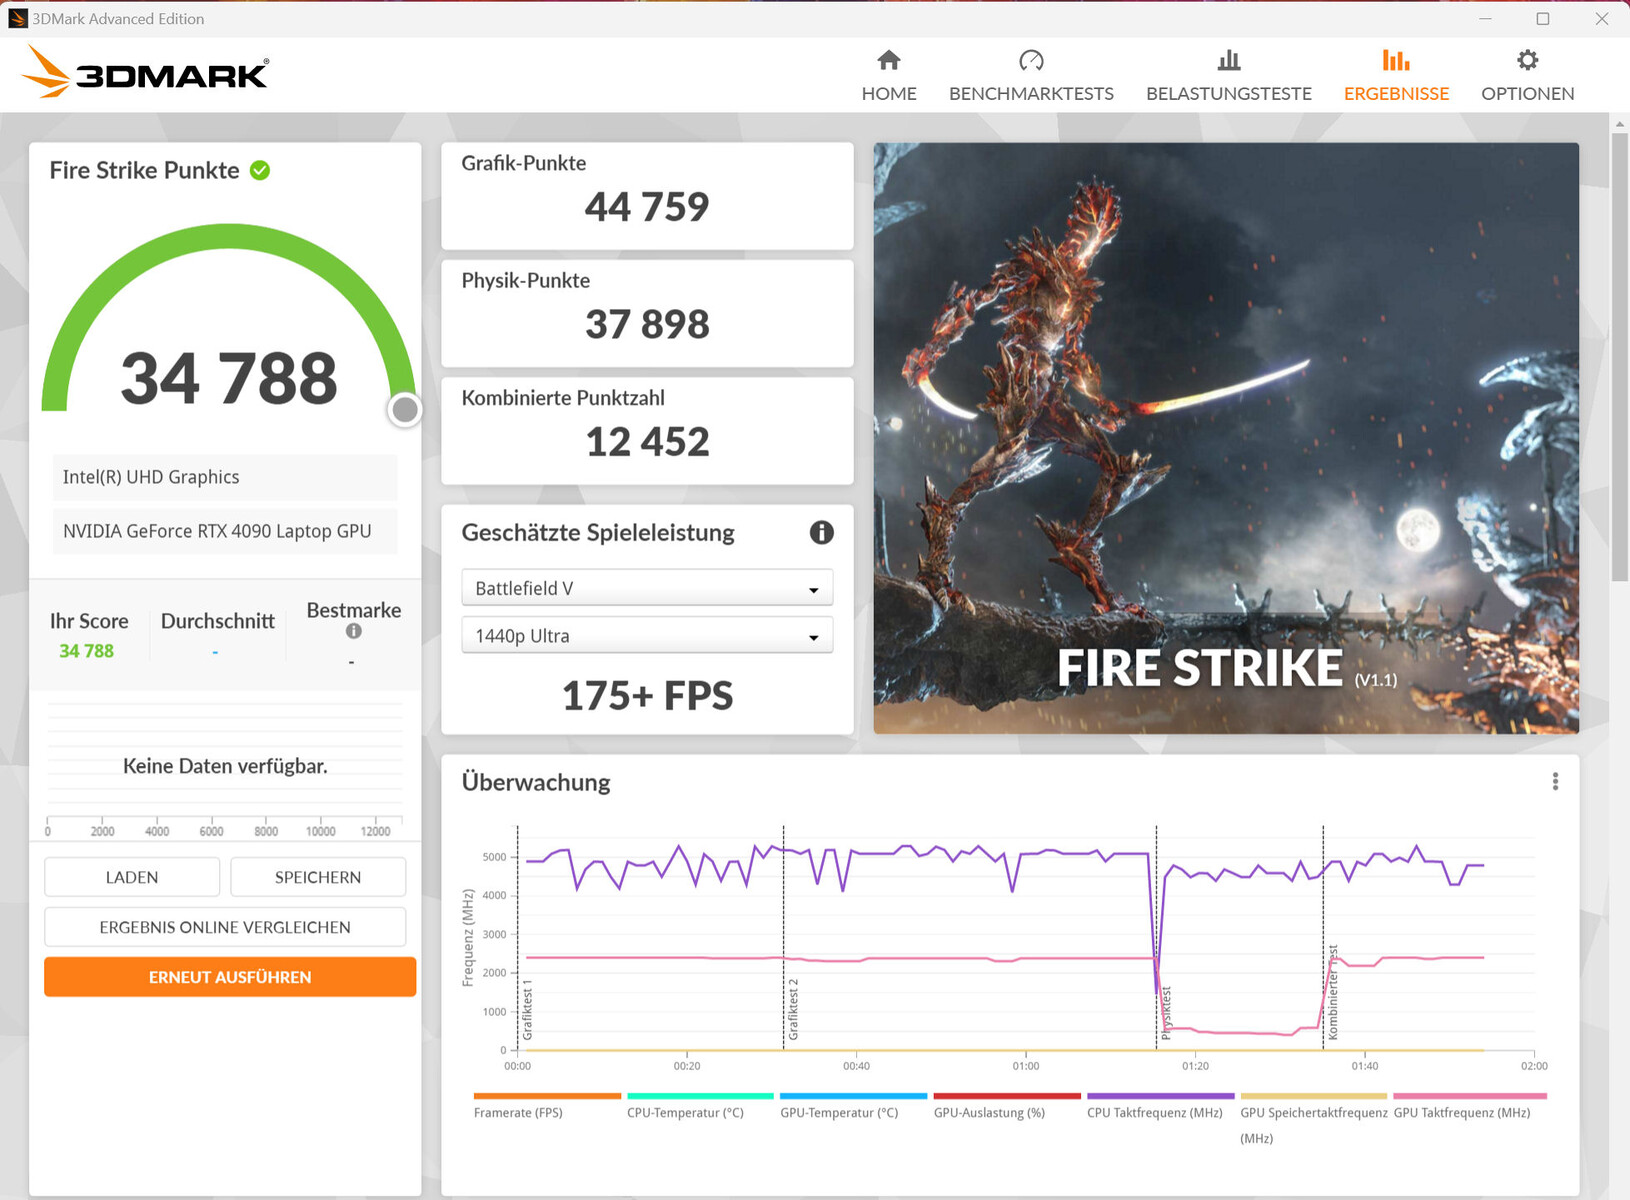
La GeForce RTX 4090 Laptop es la actual GPU móvil insignia de Nvidia. Cuenta con 9.728 unidades de sombreado, un bus de memoria de 256 bits y 16.384 MB de memoria GDDR6 de alta velocidad. La RTX 4090 dispone de hasta 175 vatios de TGP (150 vatios + 25 vatios de Dynamic Boost), el máximo posible. Pero el TGP no se utilizó a fondo durante nuestra prueba en Witcher 3.
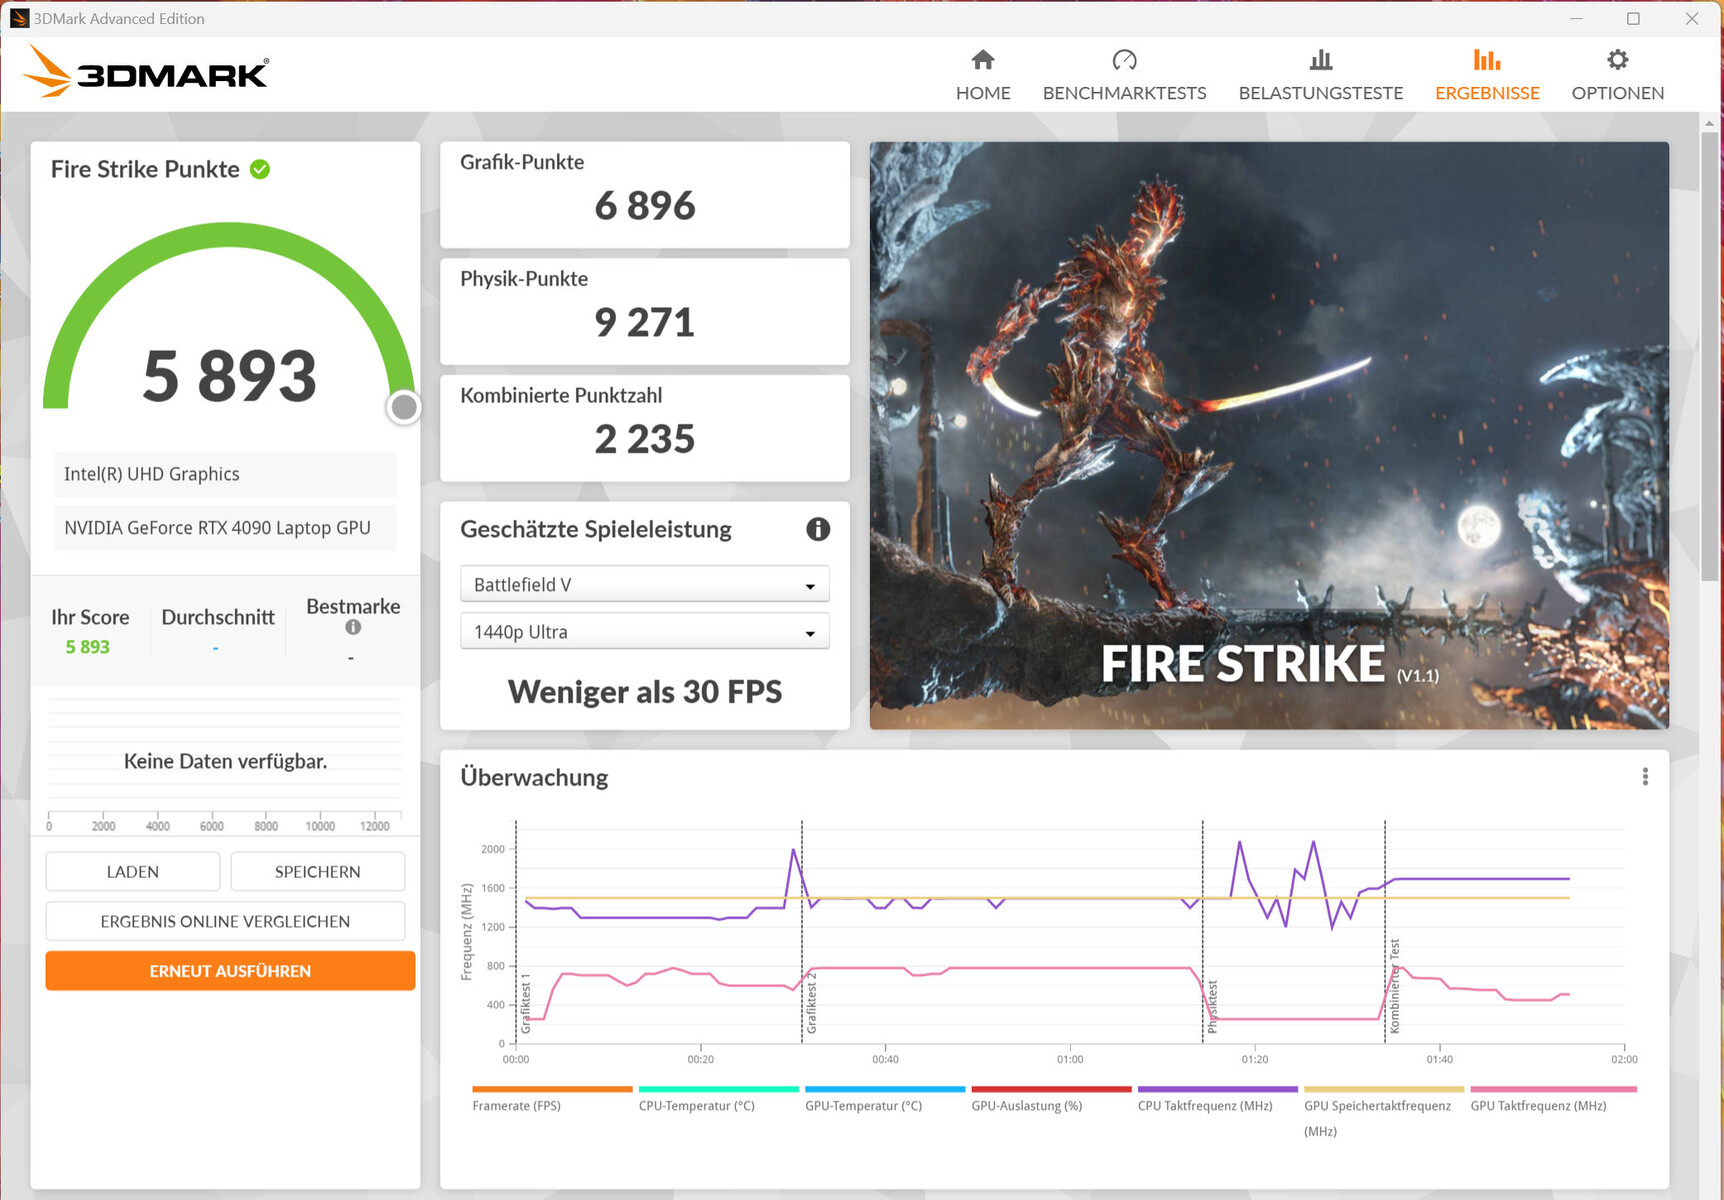
Los resultados del benchmark están a la par (modo Optimus) o ligeramente mejor que (modo dGPU) lo que hemos visto hasta ahora de la RTX 4090 Laptop en promedio. El portátil también soporta Optimus Avanzado. Cambiar entre modo dGPU y Optimus no requiere reiniciar el ordenador.
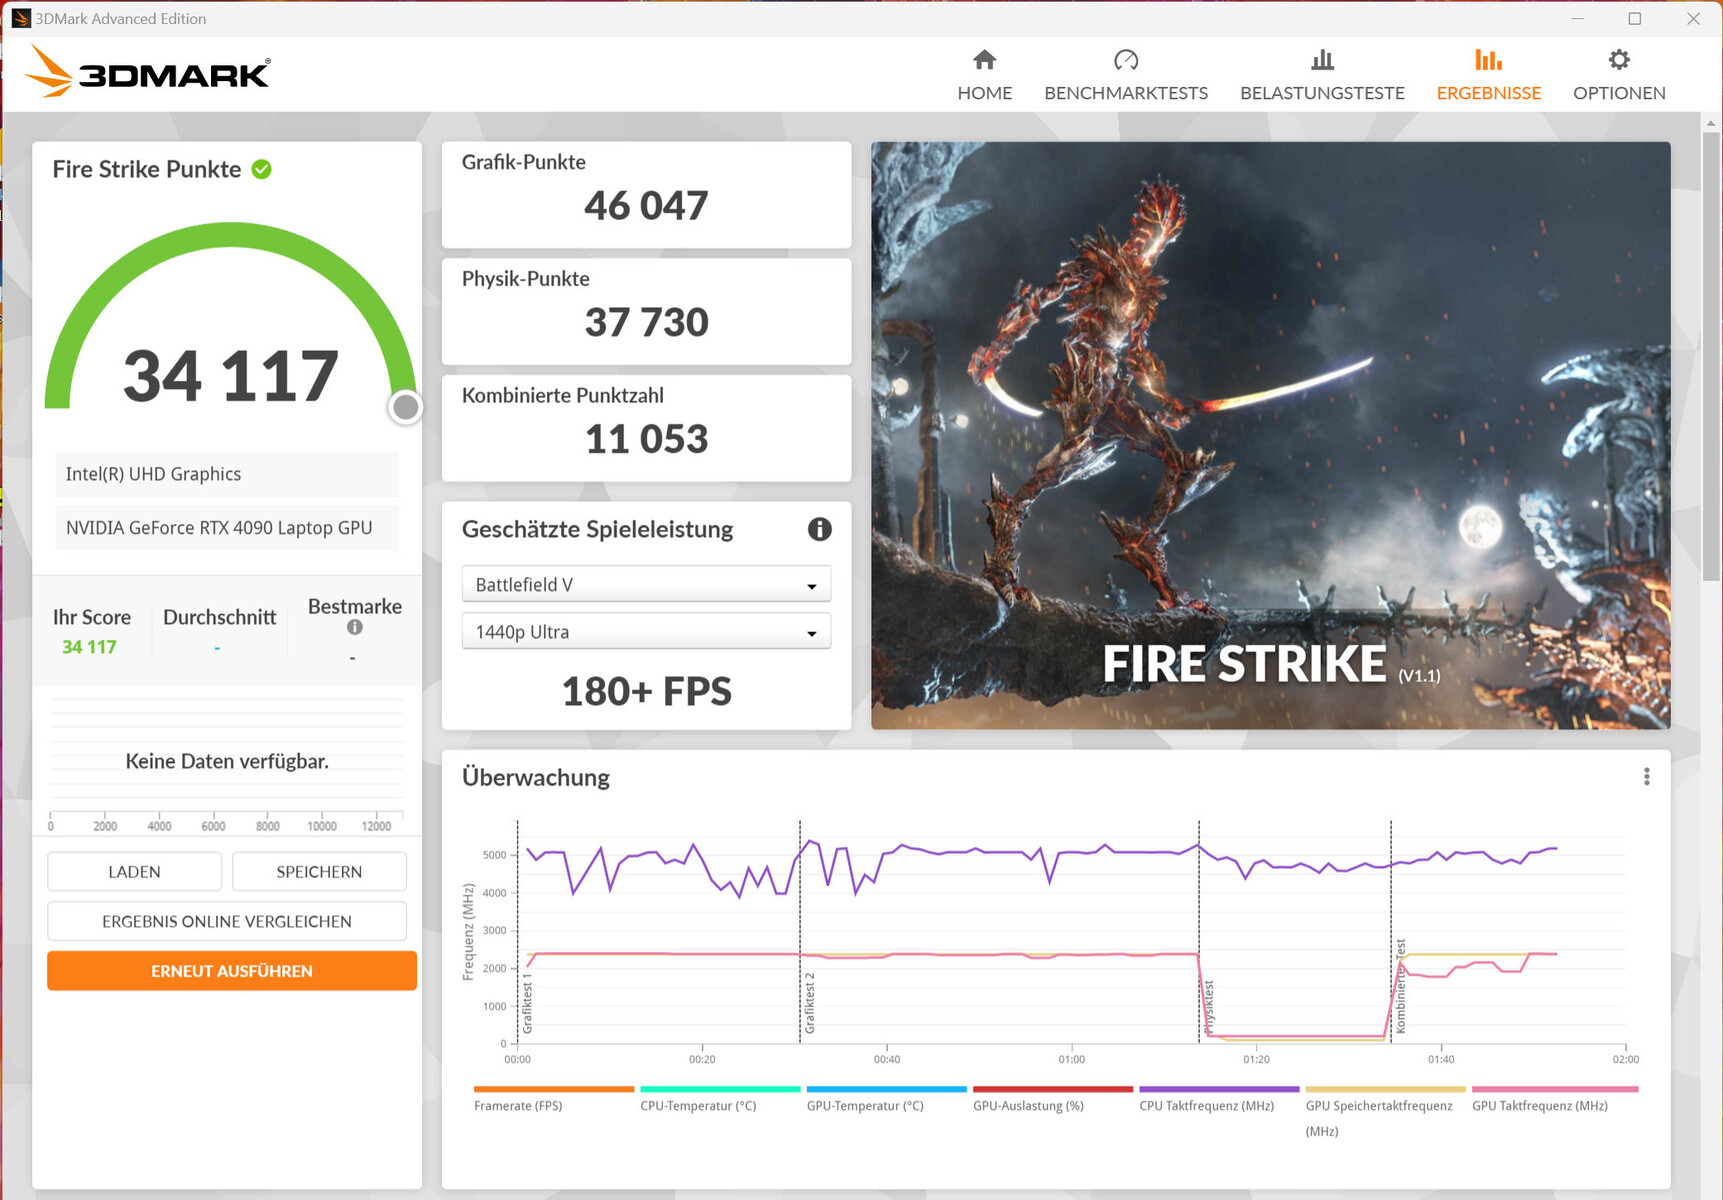
La refrigeración por agua opcional puede dar una ligera ganancia de rendimiento en algunos puntos de referencia y juegos. Witcher 3 así, por ejemplo, la velocidad de fotogramas fue superior durante nuestras pruebas. La temperatura media de la GPU también fue más baja que cuando se utiliza sólo refrigeración por aire.
| 3DMark Performance rating - Percent | |
| MSI Titan GT77 HX 13VI -1! | |
| Medion Erazer Beast X40 | |
| Medion Erazer Beast X40 | |
| Asus ROG Strix Scar 18 2023 G834JY-N6005W | |
| Medion Erazer Beast X40 | |
| Medio NVIDIA GeForce RTX 4090 Laptop GPU | |
| Razer Blade 16 Early 2023 -1! | |
| Media de la clase Gaming | |
| Alienware x17 R2 P48E | |
| Schenker XMG Neo 17 M22 -1! | |
| 3DMark 11 - 1280x720 Performance GPU | |
| Medion Erazer Beast X40 (dGPU, Cooling) | |
| MSI Titan GT77 HX 13VI | |
| Medion Erazer Beast X40 | |
| Medion Erazer Beast X40 (dGPU) | |
| Medio NVIDIA GeForce RTX 4090 Laptop GPU (54073 - 73027, n=42) | |
| Asus ROG Strix Scar 18 2023 G834JY-N6005W | |
| Razer Blade 16 Early 2023 | |
| Media de la clase Gaming (21841 - 80022, n=104, últimos 2 años) | |
| Alienware x17 R2 P48E | |
| Schenker XMG Neo 17 M22 | |
| 3DMark 06 Standard Score | 60717 puntos | |
| 3DMark 11 Performance | 47487 puntos | |
| 3DMark Cloud Gate Standard Score | 66757 puntos | |
| 3DMark Fire Strike Score | 34788 puntos | |
| 3DMark Time Spy Score | 19708 puntos | |
ayuda | ||
| Blender | |
| v3.3 Classroom OPTIX/RTX | |
| Media de la clase Gaming (9 - 32, n=106, últimos 2 años) | |
| Razer Blade 16 Early 2023 (3.3.3) | |
| Medion Erazer Beast X40 (3.3.3) | |
| Medio NVIDIA GeForce RTX 4090 Laptop GPU (9 - 19, n=39) | |
| Medion Erazer Beast X40 (3.3.3, dGPU, Cooling) | |
| MSI Titan GT77 HX 13VI (3.3.3) | |
| Asus ROG Strix Scar 18 2023 G834JY-N6005W (3.3.3) | |
| Medion Erazer Beast X40 (3.3.3, dGPU) | |
| v3.3 Classroom CUDA | |
| Media de la clase Gaming (15 - 228, n=106, últimos 2 años) | |
| Razer Blade 16 Early 2023 (3.3.3) | |
| Medion Erazer Beast X40 (3.3.3) | |
| Medion Erazer Beast X40 (3.3.3, dGPU, Cooling) | |
| Medio NVIDIA GeForce RTX 4090 Laptop GPU (16 - 24, n=39) | |
| Asus ROG Strix Scar 18 2023 G834JY-N6005W (3.3.3) | |
| Asus ROG Strix Scar 18 2023 G834JY-N6005W (3.3.3) | |
| Medion Erazer Beast X40 (3.3.3, dGPU) | |
| MSI Titan GT77 HX 13VI (3.3.3) | |
| Geekbench 5.5 | |
| OpenCL Score | |
| Medion Erazer Beast X40 (dGPU) | |
| MSI Titan GT77 HX 13VI | |
| Asus ROG Strix Scar 18 2023 G834JY-N6005W | |
| Medio NVIDIA GeForce RTX 4090 Laptop GPU (6841 - 237138, n=39) | |
| Medion Erazer Beast X40 | |
| Medion Erazer Beast X40 (dGPU, Cooling) | |
| Razer Blade 16 Early 2023 | |
| Media de la clase Gaming (80702 - 277970, n=101, últimos 2 años) | |
| Alienware x17 R2 P48E | |
| Schenker XMG Neo 17 M22 | |
| Vulkan Score 5.5 | |
| Medion Erazer Beast X40 (dGPU, Cooling) | |
| Media de la clase Gaming (18857 - 246759, n=76, últimos 2 años) | |
| Medio NVIDIA GeForce RTX 4090 Laptop GPU (49663 - 163089, n=28) | |
| MSI Titan GT77 HX 13VI | |
| Alienware x17 R2 P48E | |
| Medion Erazer Beast X40 (dGPU) | |
| Razer Blade 16 Early 2023 | |
| Asus ROG Strix Scar 18 2023 G834JY-N6005W | |
| V-Ray Benchmark Next 4.10 | |
| GPU | |
| Asus ROG Strix Scar 18 2023 G834JY-N6005W (v4.10.07 ) | |
| MSI Titan GT77 HX 13VI (v4.10.07 ) | |
| Medion Erazer Beast X40 (v4.10.07 ) | |
| Medion Erazer Beast X40 (v4.10.07, dGPU) | |
| Medio NVIDIA GeForce RTX 4090 Laptop GPU (873 - 1334, n=30) | |
| Medion Erazer Beast X40 (v4.10.07, dGPU, Cooling ) | |
| Media de la clase Gaming (427 - 1627, n=99, últimos 2 años) | |
| Schenker XMG Neo 17 M22 (v4.10.07 ) | |
| CPU | |
| MSI Titan GT77 HX 13VI (v4.10.07 ) | |
| Medion Erazer Beast X40 (v4.10.07, dGPU, Cooling) | |
| Asus ROG Strix Scar 18 2023 G834JY-N6005W (v4.10.07 ) | |
| Medion Erazer Beast X40 (v4.10.07 ) | |
| Medion Erazer Beast X40 (v4.10.07, dGPU) | |
| Medio NVIDIA GeForce RTX 4090 Laptop GPU (18206 - 37629, n=30) | |
| Media de la clase Gaming (10048 - 45327, n=97, últimos 2 años) | |
| Schenker XMG Neo 17 M22 (v4.10.07 ) | |
* ... más pequeño es mejor
Rendimiento de juego
El X40 permite a los usuarios jugar a juegos en QHD+ y ajustes máximos. Es posible usar una resolución mayor si se conecta el portátil a un monitor adecuado. Los juegos que probamos en general se ejecutaron a velocidades de fotogramas similares a las que hemos visto de la RTX 4090 hasta ahora. Dependiendo del juego, puede ser capaz de obtener mayores velocidades de fotogramas mediante la conducción de la pantalla directamente desde el GeForce GPU.
| Performance rating - Percent | |
| Medion Erazer Beast X40 | |
| Medion Erazer Beast X40 | |
| Asus ROG Strix Scar 18 2023 G834JY-N6005W -1! | |
| MSI Titan GT77 HX 13VI | |
| Medion Erazer Beast X40 | |
| Medio NVIDIA GeForce RTX 4090 Laptop GPU | |
| Razer Blade 16 Early 2023 | |
| Media de la clase Gaming | |
| Alienware x17 R2 P48E | |
| Schenker XMG Neo 17 M22 | |
| The Witcher 3 - 1920x1080 Ultra Graphics & Postprocessing (HBAO+) | |
| Medion Erazer Beast X40 (dGPU) | |
| Medion Erazer Beast X40 (dGPU, Cooling) | |
| MSI Titan GT77 HX 13VI | |
| Medio NVIDIA GeForce RTX 4090 Laptop GPU (139.2 - 216, n=35) | |
| Media de la clase Gaming (104.7 - 240, n=7, últimos 2 años) | |
| Medion Erazer Beast X40 | |
| Razer Blade 16 Early 2023 | |
| Alienware x17 R2 P48E | |
| Schenker XMG Neo 17 M22 | |
| GTA V - 1920x1080 Highest AA:4xMSAA + FX AF:16x | |
| Medion Erazer Beast X40 (dGPU) | |
| Medion Erazer Beast X40 | |
| Medion Erazer Beast X40 (dGPU, Cooling) | |
| Asus ROG Strix Scar 18 2023 G834JY-N6005W | |
| MSI Titan GT77 HX 13VI | |
| Razer Blade 16 Early 2023 | |
| Medio NVIDIA GeForce RTX 4090 Laptop GPU (91.1 - 167.7, n=40) | |
| Media de la clase Gaming (48.3 - 186.9, n=94, últimos 2 años) | |
| Alienware x17 R2 P48E | |
| Schenker XMG Neo 17 M22 | |
| Final Fantasy XV Benchmark - 1920x1080 High Quality | |
| MSI Titan GT77 HX 13VI (1.3) | |
| Medion Erazer Beast X40 (1.3, dGPU) | |
| Medion Erazer Beast X40 (1.3, dGPU, Cooling) | |
| Asus ROG Strix Scar 18 2023 G834JY-N6005W (1.3) | |
| Medion Erazer Beast X40 (1.3) | |
| Medio NVIDIA GeForce RTX 4090 Laptop GPU (122.2 - 201, n=40) | |
| Razer Blade 16 Early 2023 (1.3) | |
| Media de la clase Gaming (41 - 215, n=95, últimos 2 años) | |
| Alienware x17 R2 P48E (1.3) | |
| Schenker XMG Neo 17 M22 (1.3) | |
| Strange Brigade - 1920x1080 ultra AA:ultra AF:16 | |
| Medion Erazer Beast X40 (1.47.22.14 D3D12, dGPU, Cooling) | |
| Medion Erazer Beast X40 (1.47.22.14 D3D12, dGPU) | |
| MSI Titan GT77 HX 13VI (1.47.22.14 D3D12) | |
| Asus ROG Strix Scar 18 2023 G834JY-N6005W (1.47.22.14 D3D12) | |
| Medion Erazer Beast X40 (1.47.22.14 D3D12) | |
| Medio NVIDIA GeForce RTX 4090 Laptop GPU (233 - 421, n=39) | |
| Razer Blade 16 Early 2023 (1.47.22.14 D3D12) | |
| Media de la clase Gaming (76.3 - 458, n=87, últimos 2 años) | |
| Alienware x17 R2 P48E (1.47.22.14 D3D12) | |
| Schenker XMG Neo 17 M22 (1.47.22.14 D3D12) | |
| Dota 2 Reborn - 1920x1080 ultra (3/3) best looking | |
| Razer Blade 16 Early 2023 | |
| Asus ROG Strix Scar 18 2023 G834JY-N6005W | |
| MSI Titan GT77 HX 13VI | |
| Medion Erazer Beast X40 (dGPU, Cooling) | |
| Medion Erazer Beast X40 (dGPU) | |
| Medio NVIDIA GeForce RTX 4090 Laptop GPU (115.7 - 220, n=42) | |
| Medion Erazer Beast X40 | |
| Alienware x17 R2 P48E | |
| Media de la clase Gaming (84.8 - 248, n=107, últimos 2 años) | |
| Schenker XMG Neo 17 M22 | |
| X-Plane 11.11 - 1920x1080 high (fps_test=3) | |
| Asus ROG Strix Scar 18 2023 G834JY-N6005W | |
| Razer Blade 16 Early 2023 | |
| Medion Erazer Beast X40 (dGPU) | |
| Medion Erazer Beast X40 (dGPU, Cooling) | |
| MSI Titan GT77 HX 13VI | |
| MSI Titan GT77 HX 13VI | |
| Medio NVIDIA GeForce RTX 4090 Laptop GPU (77.8 - 166.2, n=46) | |
| Medion Erazer Beast X40 | |
| Alienware x17 R2 P48E | |
| Media de la clase Gaming (55.5 - 143.5, n=109, últimos 2 años) | |
| Schenker XMG Neo 17 M22 | |
| Returnal | |
| 1920x1080 Epic Preset | |
| Medio NVIDIA GeForce RTX 4090 Laptop GPU (141 - 155, n=3) | |
| Medion Erazer Beast X40 | |
| 2560x1440 Epic Preset | |
| Medio NVIDIA GeForce RTX 4090 Laptop GPU (113 - 119, n=3) | |
| Medion Erazer Beast X40 | |
| 1920x1080 Epic Preset + Epic Ray-Tracing | |
| Medio NVIDIA GeForce RTX 4090 Laptop GPU (126 - 128, n=2) | |
| Medion Erazer Beast X40 | |
| Atomic Heart | |
| 1920x1080 Atomic Preset | |
| Medio NVIDIA GeForce RTX 4090 Laptop GPU (128.6 - 166, n=3) | |
| Medion Erazer Beast X40 | |
| 2560x1440 Atomic Preset | |
| Medio NVIDIA GeForce RTX 4090 Laptop GPU (93.8 - 135, n=3) | |
| Medion Erazer Beast X40 | |
| Hogwarts Legacy | |
| 1920x1080 Ultra Preset AA:High T | |
| Medion Erazer Beast X40 | |
| Media de la clase Gaming (n=1últimos 2 años) | |
| Medio NVIDIA GeForce RTX 4090 Laptop GPU (41.2 - 166.1, n=4) | |
| 2560x1440 Ultra Preset AA:High T | |
| Medion Erazer Beast X40 | |
| Media de la clase Gaming (n=1últimos 2 años) | |
| Medio NVIDIA GeForce RTX 4090 Laptop GPU (40.6 - 125.9, n=4) | |
| 1920x1080 Ultra Preset + Full Ray Tracing AA:High T | |
| Medion Erazer Beast X40 | |
| Medio NVIDIA GeForce RTX 4090 Laptop GPU (52.2 - 67, n=3) | |
| Company of Heroes 3 | |
| 1920x1080 Maximum Settings | |
| Medio NVIDIA GeForce RTX 4090 Laptop GPU (215 - 235, n=2) | |
| Medion Erazer Beast X40 | |
| 2560x1440 Maximum Settings | |
| Medio NVIDIA GeForce RTX 4090 Laptop GPU (176.4 - 194.8, n=2) | |
| Medion Erazer Beast X40 | |
| Sons of the Forest | |
| 1920x1080 Ultra Preset AA:T | |
| Medio NVIDIA GeForce RTX 4090 Laptop GPU (85.7 - 93.9, n=2) | |
| Medion Erazer Beast X40 | |
| 2560x1440 Ultra Preset AA:T | |
| Medio NVIDIA GeForce RTX 4090 Laptop GPU (85.2 - 89.6, n=2) | |
| Medion Erazer Beast X40 | |
Para comprobar si el portátil puede ejecutar juegos con frecuencias de cuadro estables durante un periodo prolongado, ejecutamos The Witcher 3 durante unos 60 minutos en Full HD y con los ajustes de calidad al máximo sin mover el personaje del jugador. No observamos ninguna caída en la frecuencia de imagen.
Witcher 3 FPS graph
| bajo | medio | alto | ultra | QHD | |
|---|---|---|---|---|---|
| GTA V (2015) | 187.5 | 187.1 | 186 | 151.3 | 145.3 |
| The Witcher 3 (2015) | 586.4 | 511.4 | 363.8 | 195.1 | |
| Dota 2 Reborn (2015) | 215 | 193.5 | 182.6 | 171.5 | |
| Final Fantasy XV Benchmark (2018) | 232 | 207 | 176.2 | 146.7 | |
| X-Plane 11.11 (2018) | 187.1 | 162.9 | 128.3 | ||
| Far Cry 5 (2018) | 199 | 172 | 167 | 158 | 151 |
| Strange Brigade (2018) | 515 | 387 | 369 | 365 | 292 |
| Hunt Showdown (2020) | 367 | 285 | 262 | 168 | |
| Death Stranding (2020) | 179 | 171.4 | 166.6 | 163 | 162.1 |
| Yakuza Like a Dragon (2020) | 179.7 | 167.7 | 166.6 | 152.3 | 138.1 |
| Back 4 Blood (2021) | 403 | 309 | 309 | 327 | |
| Guardians of the Galaxy (2021) | 163 | 160 | 158 | 152 | 141 |
| Riders Republic (2021) | 209 | 200 | 185 | 179 | 146 |
| Elex 2 (2022) | 118.2 | 117.1 | 116.2 | 116.2 | 116.7 |
| F1 22 (2022) | 301 | 290 | 268 | 118.2 | 79.9 |
| The Quarry (2022) | 278 | 211 | 177.3 | 146.1 | 100.2 |
| Hogwarts Legacy (2023) | 242 | 204 | 186.5 | 166.1 | 125.9 |
| Returnal (2023) | 178 | 171 | 164 | 146 | 113 |
| Atomic Heart (2023) | 205 | 161.8 | 144.2 | 128.6 | 93.8 |
| Company of Heroes 3 (2023) | 285.3 | 262.9 | 235.2 | 215.2 | 176.4 |
| Sons of the Forest (2023) | 96.1 | 90 | 87.9 | 85.7 | 85.2 |
Emisiones - El portátil Erazer puede llegar a ser bastante ruidoso
Emisiones sonoras
El portátil es relativamente silencioso en el uso diario (por ejemplo, aplicaciones ofimáticas, navegación web). Los ventiladores pueden incluso dejar de girar de vez en cuando. Como era de esperar, el X40 puede llegar a ser bastante ruidoso bajo carga pesada, produciendo hasta 53 dB(A) de ruido durante el test de estrés y el test Witcher 3. A pesar de los niveles de ruido bastante altos, el sonido producido por los dos ventiladores es tolerable en su conjunto: un silbido va acompañado de un zumbido sonoro que gradualmente se convierte en un ligero silbido al aumentar la velocidad del ventilador.
Los ventiladores del portátil se calman cuando se conecta la unidad externa de refrigeración por agua. Sin embargo, la propia unidad también contribuye al ruido general: aunque la bomba es relativamente silenciosa en uso, el ventilador del interior del refrigerador hace más ruido. En conjunto, creemos que el ruido general es más agradable cuando se utiliza la unidad de refrigeración por agua.
Ruido
| Ocioso |
| 25 / 29 / 35 dB(A) |
| Carga |
| 51 / 53 dB(A) |
 | ||
30 dB silencioso 40 dB(A) audible 50 dB(A) ruidosamente alto |
||
min: | ||
| Medion Erazer Beast X40 GeForce RTX 4090 Laptop GPU, i9-13900HX | MSI Titan GT77 HX 13VI GeForce RTX 4090 Laptop GPU, i9-13950HX | Razer Blade 16 Early 2023 GeForce RTX 4080 Laptop GPU, i9-13950HX | Schenker XMG Neo 17 M22 GeForce RTX 3080 Ti Laptop GPU, R9 6900HX | Alienware x17 R2 P48E GeForce RTX 3080 Ti Laptop GPU, i9-12900HK | Asus ROG Strix Scar 18 2023 G834JY-N6005W GeForce RTX 4090 Laptop GPU, i9-13980HX | |
|---|---|---|---|---|---|---|
| Noise | -3% | 13% | -3% | 15% | 4% | |
| apagado / medio ambiente * (dB) | 24 | 24.6 -3% | 23 4% | 26 -8% | 22.7 5% | 23.9 -0% |
| Idle Minimum * (dB) | 25 | 29.2 -17% | 23 8% | 26 -4% | 23.1 8% | 23.9 4% |
| Idle Average * (dB) | 29 | 29.2 -1% | 23 21% | 29 -0% | 23.1 20% | 32.6 -12% |
| Idle Maximum * (dB) | 35 | 29.2 17% | 23.6 33% | 40 -14% | 23.1 34% | 32.6 7% |
| Load Average * (dB) | 51 | 50.7 1% | 39 24% | 47 8% | 31.9 37% | 35.9 30% |
| Witcher 3 ultra * (dB) | 51 | 53.3 -5% | 51.6 -1% | 52 -2% | 52.5 -3% | |
| Load Maximum * (dB) | 53 | 61 -15% | 51.3 3% | 54 -2% | 52.5 1% | 55.8 -5% |
* ... más pequeño es mejor
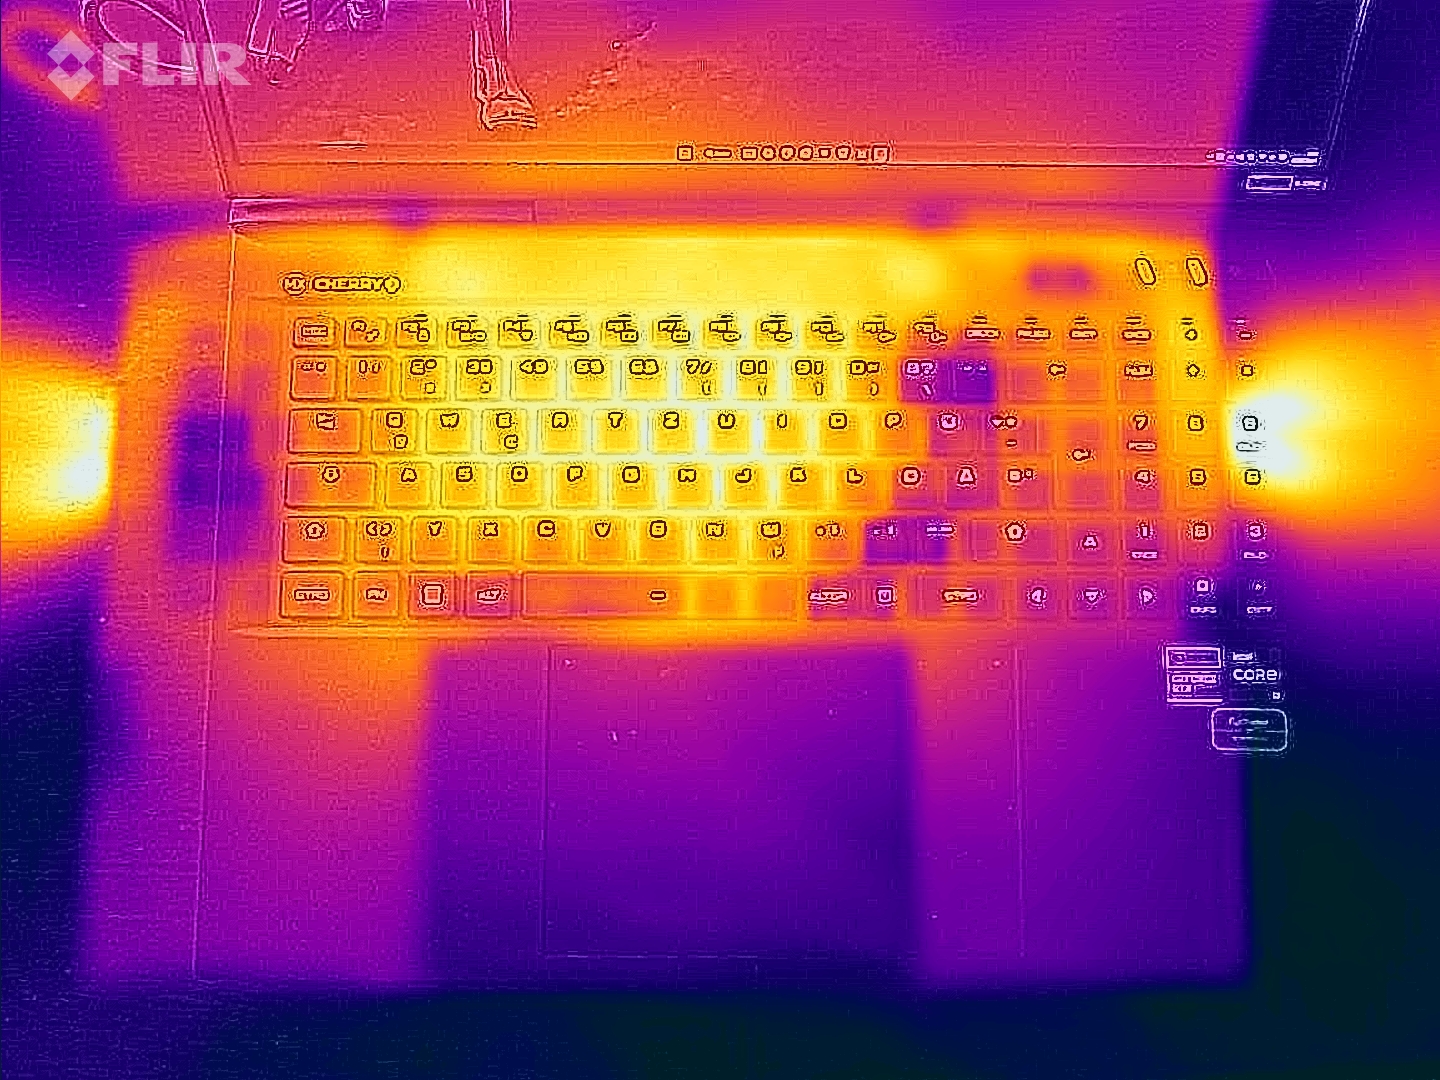
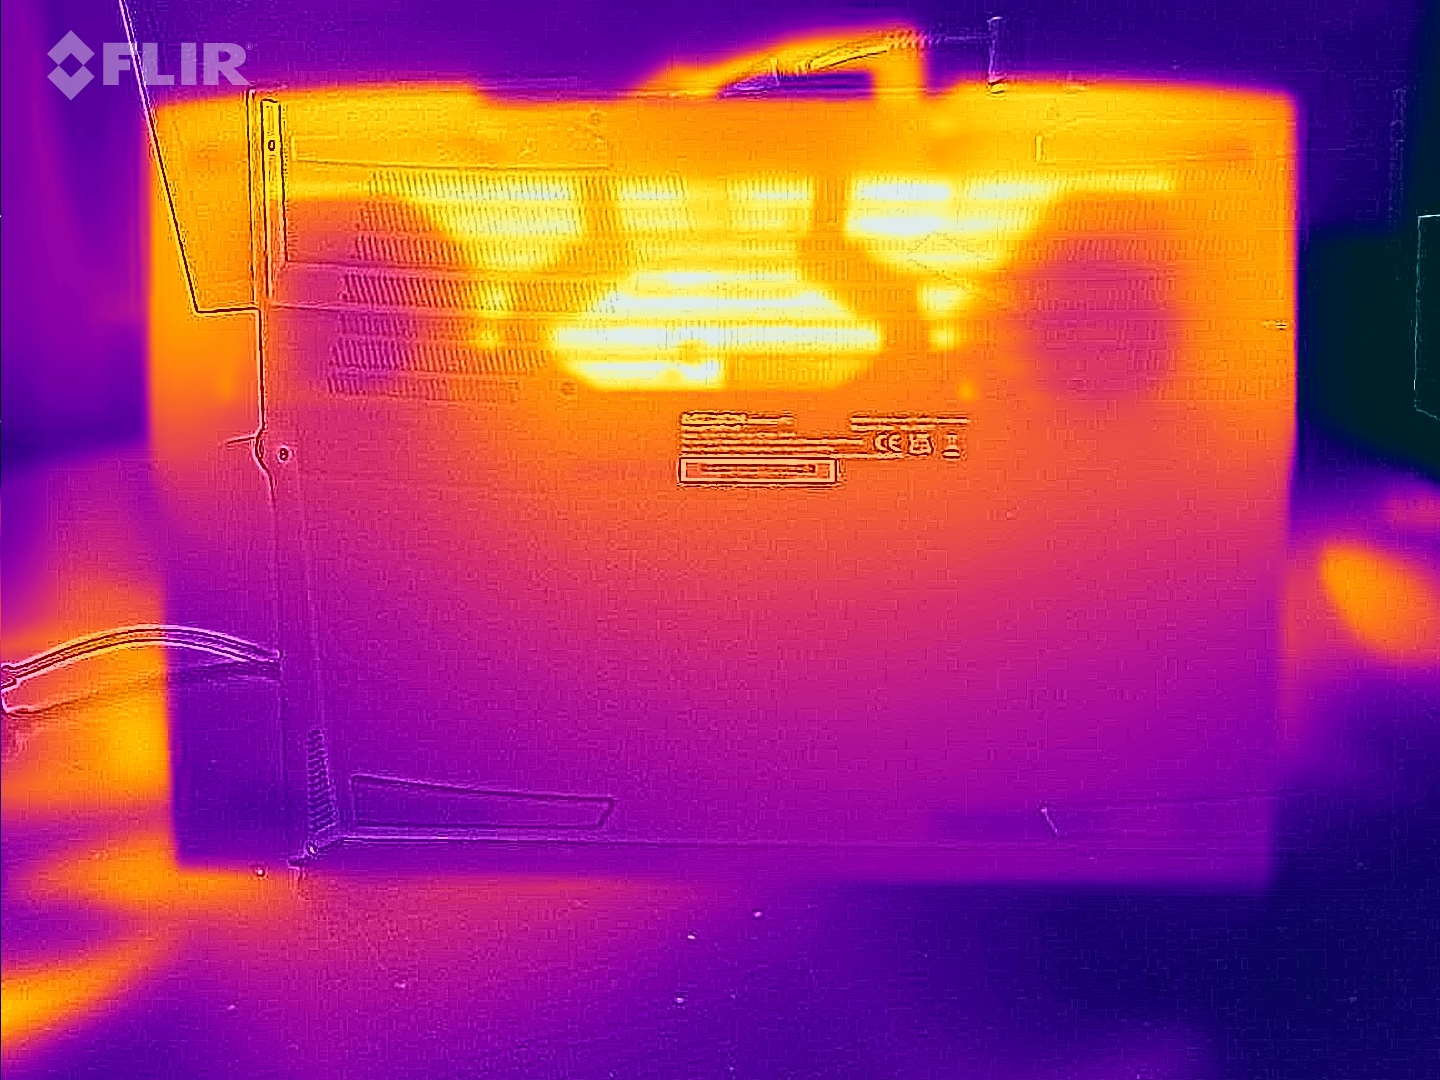
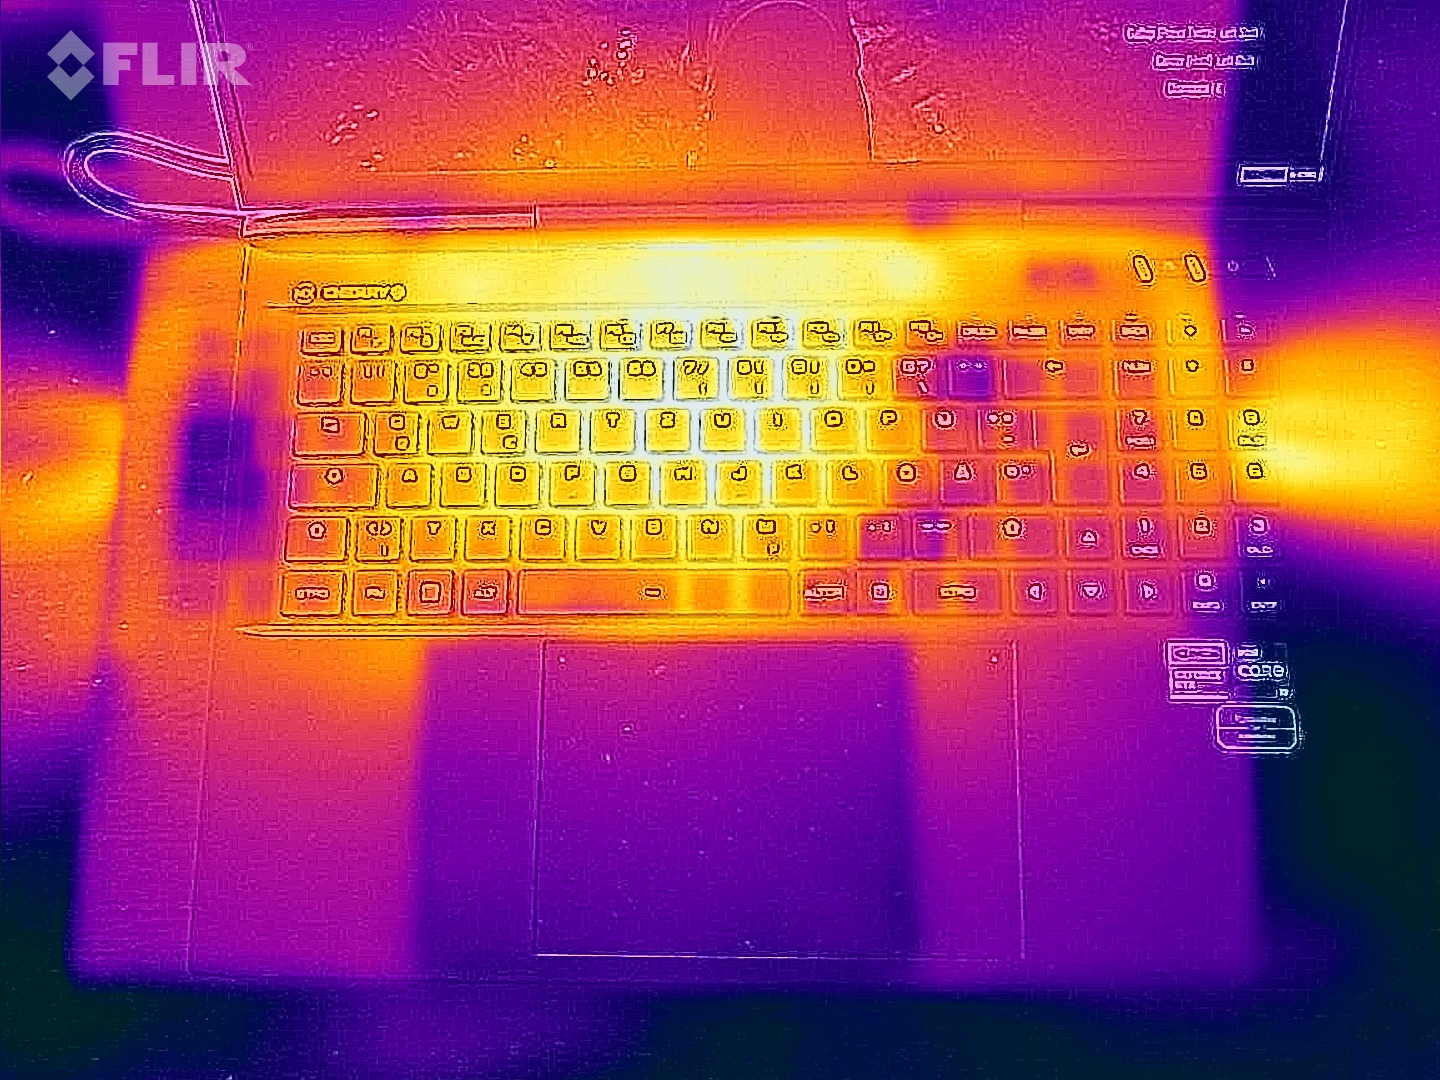
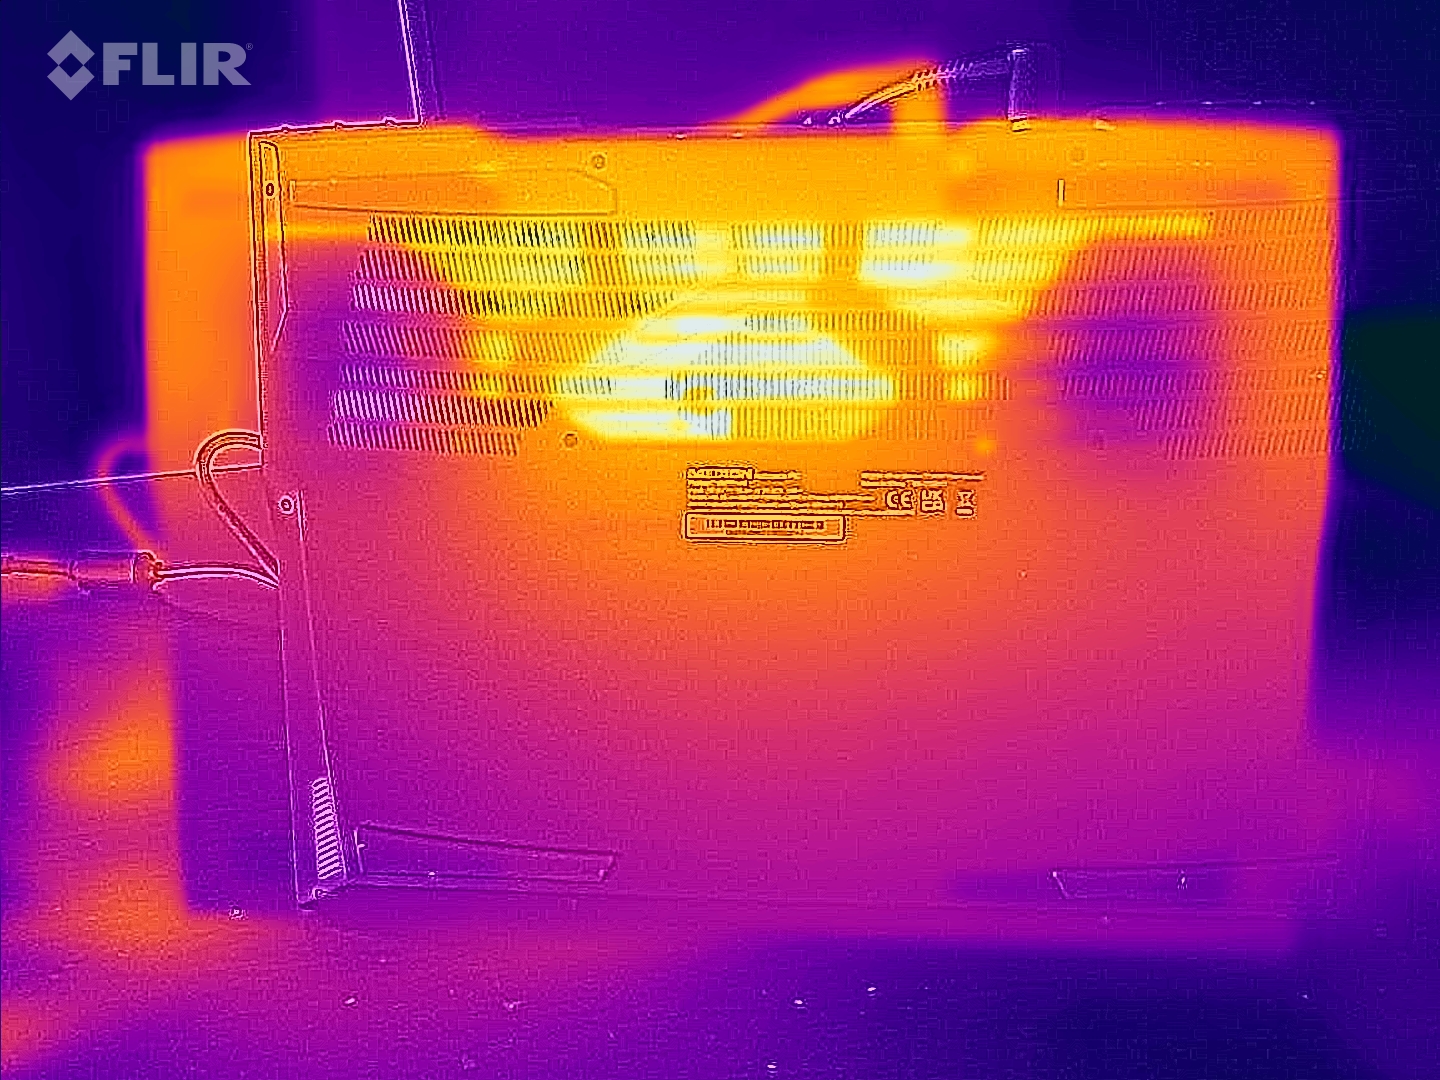
Temperatura
Las temperaturas del chasis se mantienen dentro de un rango aceptable en casos de uso cotidiano, como la ejecución de software ofimático y navegadores de Internet. El portátil se calienta notablemente pero no demasiado bajo carga, como observamos durante la prueba de estrés y la prueba Witcher 3. Las temperaturas de la CPU tampoco son motivo de preocupación.
(-) La temperatura máxima en la parte superior es de 48 °C / 118 F, frente a la media de 40.4 °C / 105 F, que oscila entre 21.2 y 68.8 °C para la clase Gaming.
(-) El fondo se calienta hasta un máximo de 52 °C / 126 F, frente a la media de 43.2 °C / 110 F
(+) En reposo, la temperatura media de la parte superior es de 28.2 °C / 83# F, frente a la media del dispositivo de 33.9 °C / 93 F.
(-) Jugando a The Witcher 3, la temperatura media de la parte superior es de 40.7 °C / 105 F, frente a la media del dispositivo de 33.9 °C / 93 F.
(+) Los reposamanos y el panel táctil alcanzan como máximo la temperatura de la piel (34 °C / 93.2 F) y, por tanto, no están calientes.
(-) La temperatura media de la zona del reposamanos de dispositivos similares fue de 28.8 °C / 83.8 F (-5.2 °C / -9.4 F).
| Medion Erazer Beast X40 Intel Core i9-13900HX, NVIDIA GeForce RTX 4090 Laptop GPU | MSI Titan GT77 HX 13VI Intel Core i9-13950HX, NVIDIA GeForce RTX 4090 Laptop GPU | Razer Blade 16 Early 2023 Intel Core i9-13950HX, NVIDIA GeForce RTX 4080 Laptop GPU | Schenker XMG Neo 17 M22 AMD Ryzen 9 6900HX, NVIDIA GeForce RTX 3080 Ti Laptop GPU | Alienware x17 R2 P48E Intel Core i9-12900HK, NVIDIA GeForce RTX 3080 Ti Laptop GPU | Asus ROG Strix Scar 18 2023 G834JY-N6005W Intel Core i9-13980HX, NVIDIA GeForce RTX 4090 Laptop GPU | |
|---|---|---|---|---|---|---|
| Heat | 13% | 9% | -2% | 4% | -0% | |
| Maximum Upper Side * (°C) | 48 | 40.6 15% | 40 17% | 49 -2% | 49.6 -3% | 54 -13% |
| Maximum Bottom * (°C) | 52 | 41.1 21% | 37.6 28% | 52 -0% | 42.4 18% | 46 12% |
| Idle Upper Side * (°C) | 30 | 26.2 13% | 32.4 -8% | 30 -0% | 29.2 3% | 30 -0% |
| Idle Bottom * (°C) | 31 | 30.3 2% | 31.4 -1% | 33 -6% | 32 -3% | 31 -0% |
* ... más pequeño es mejor
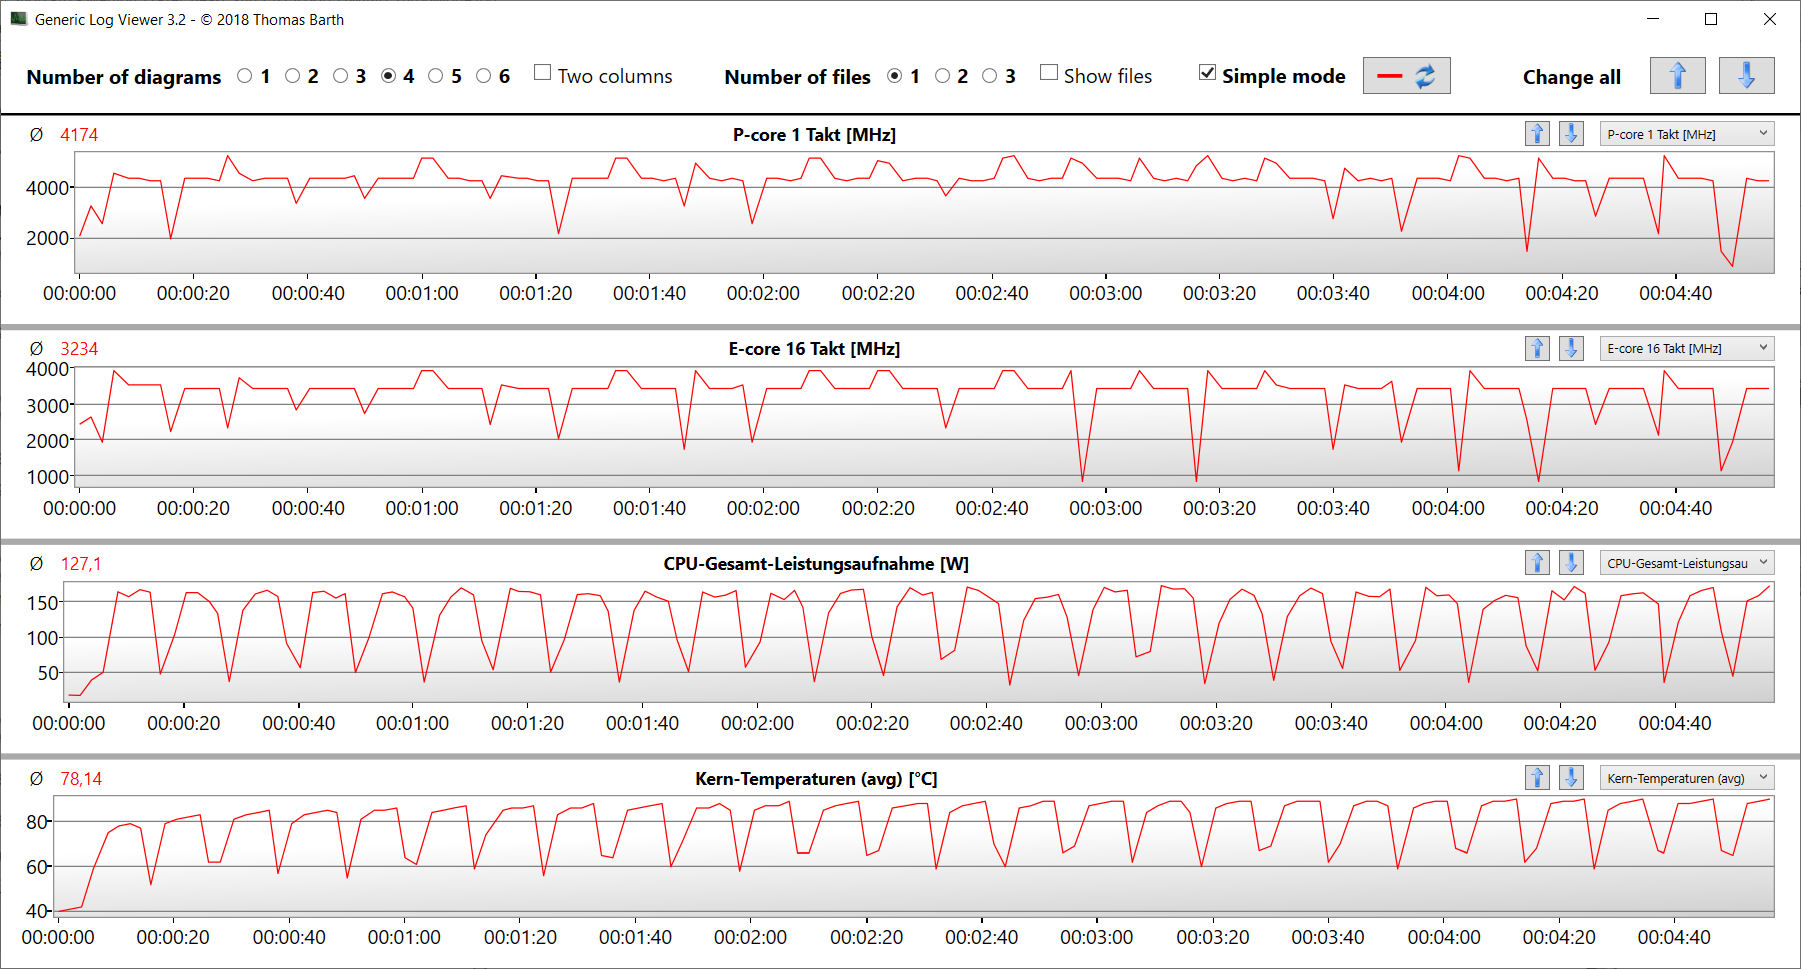
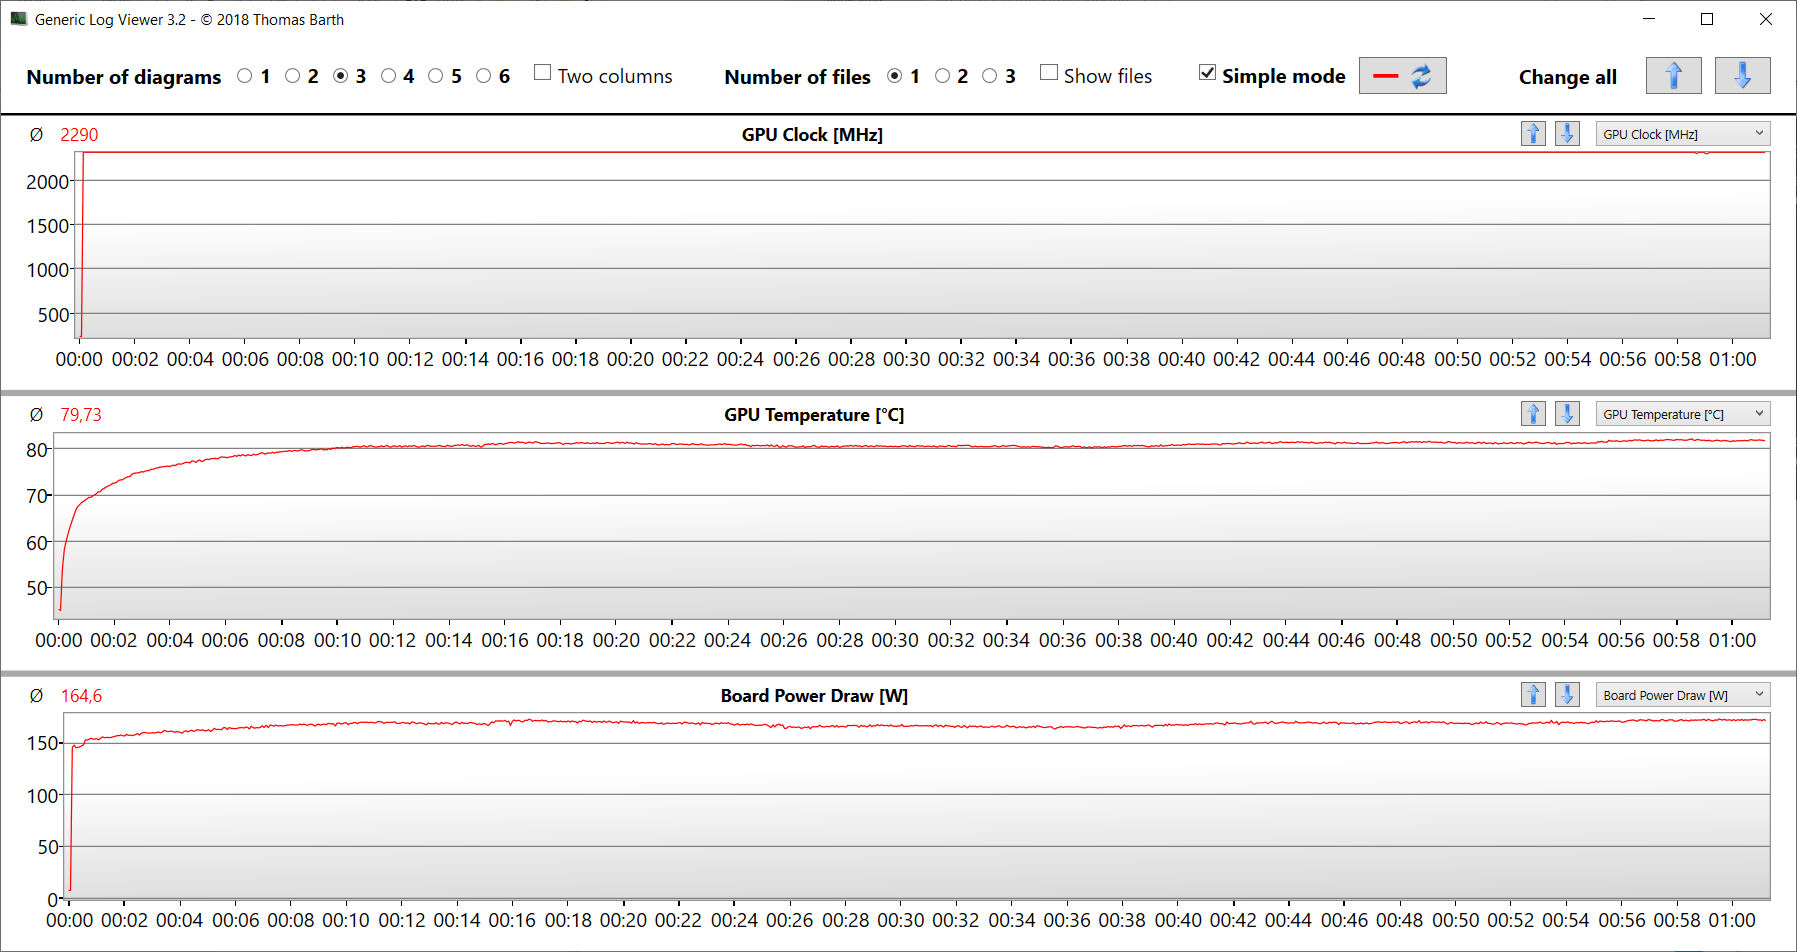
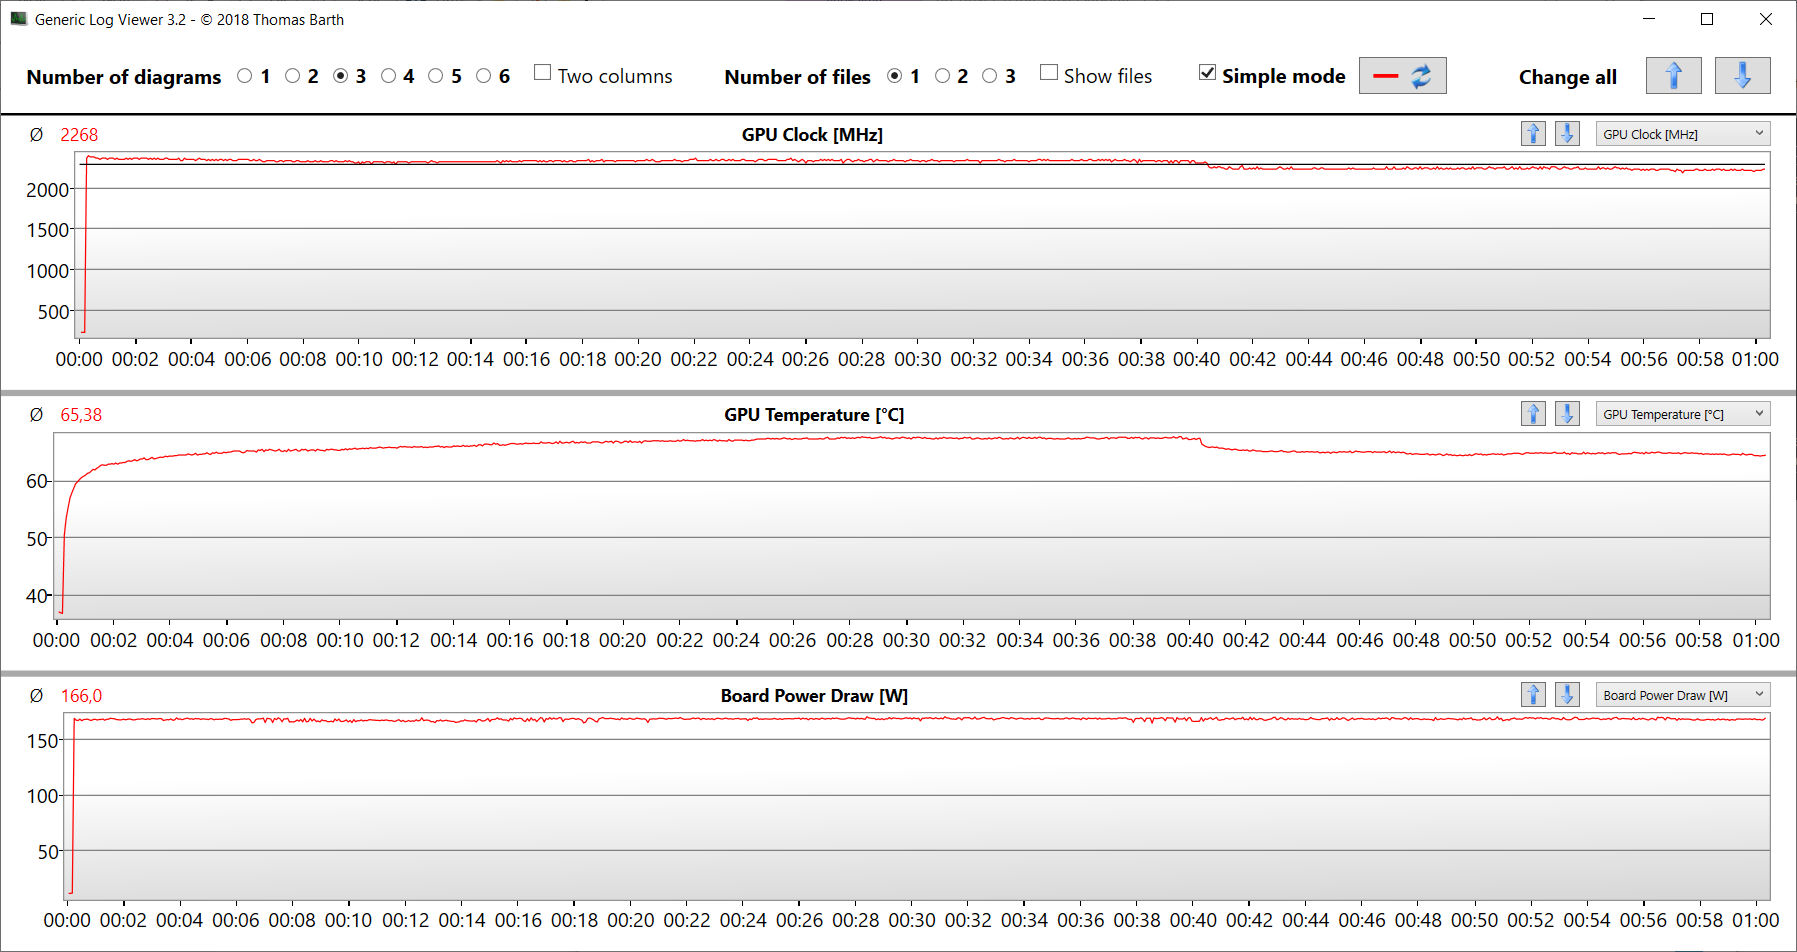
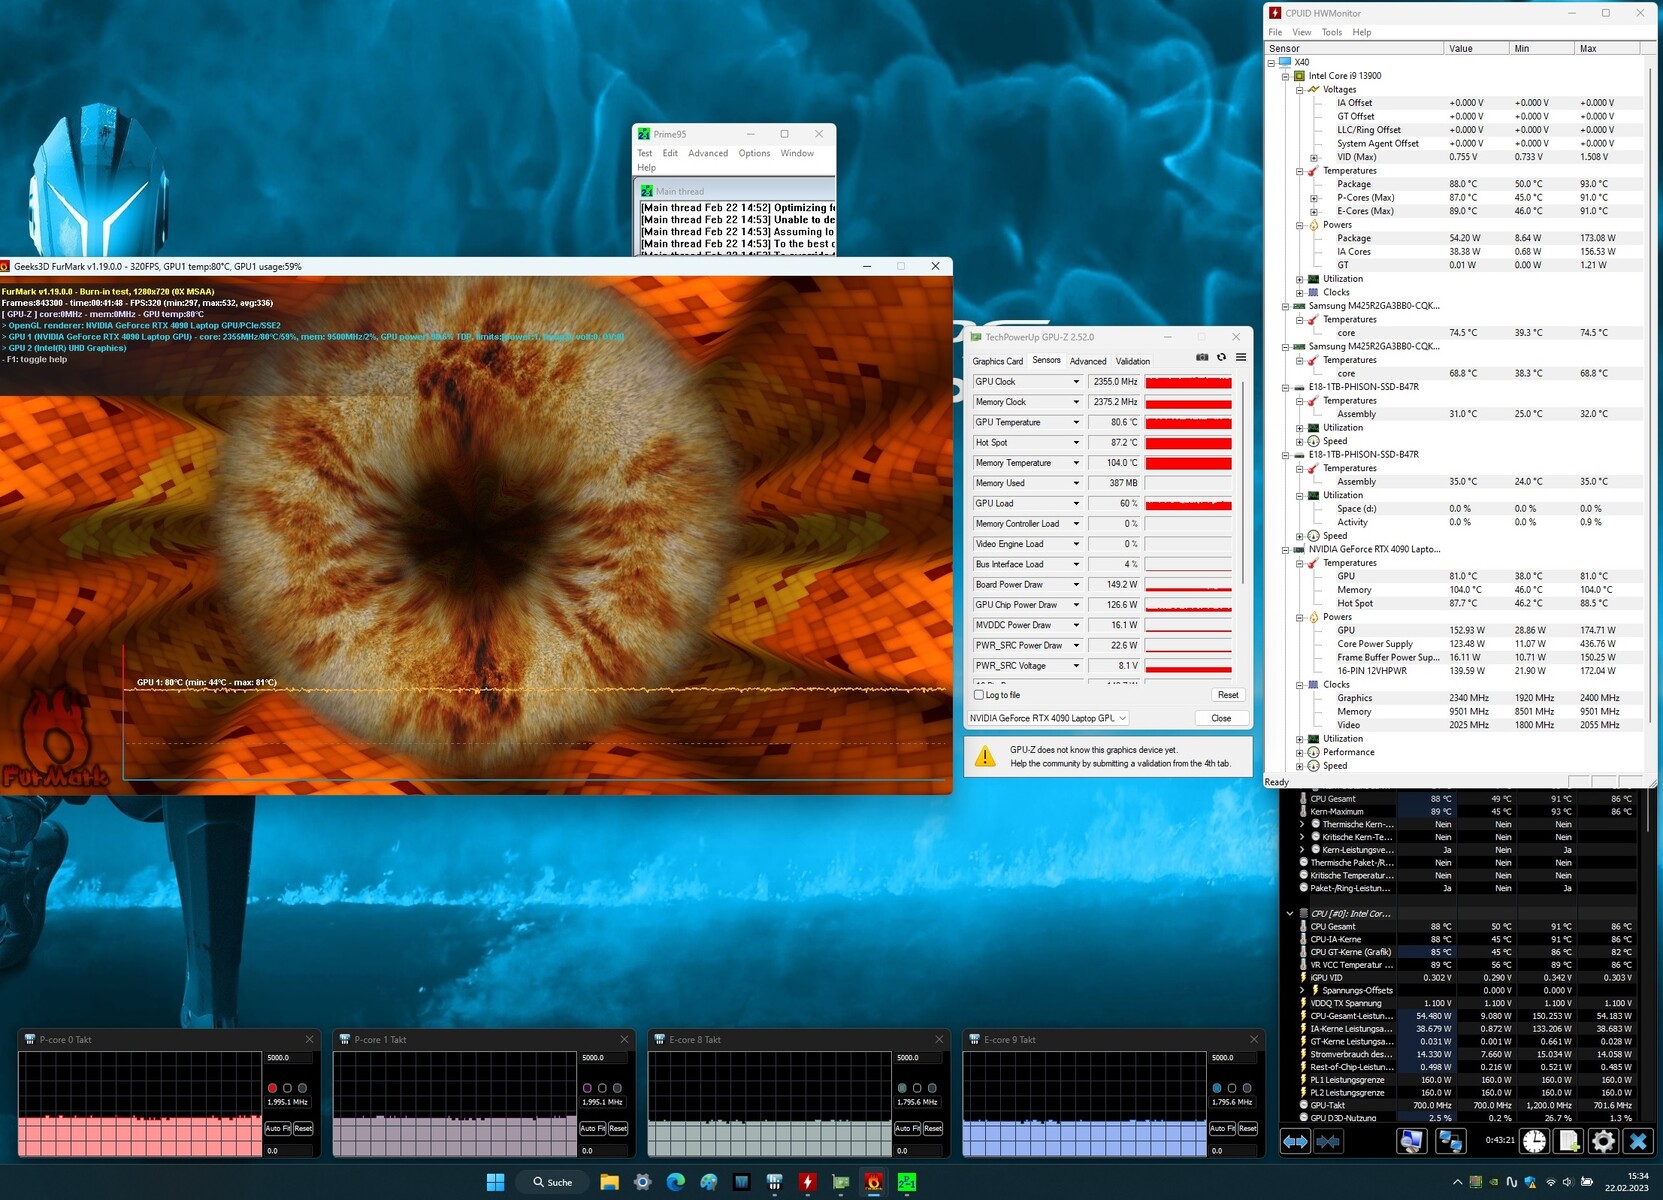
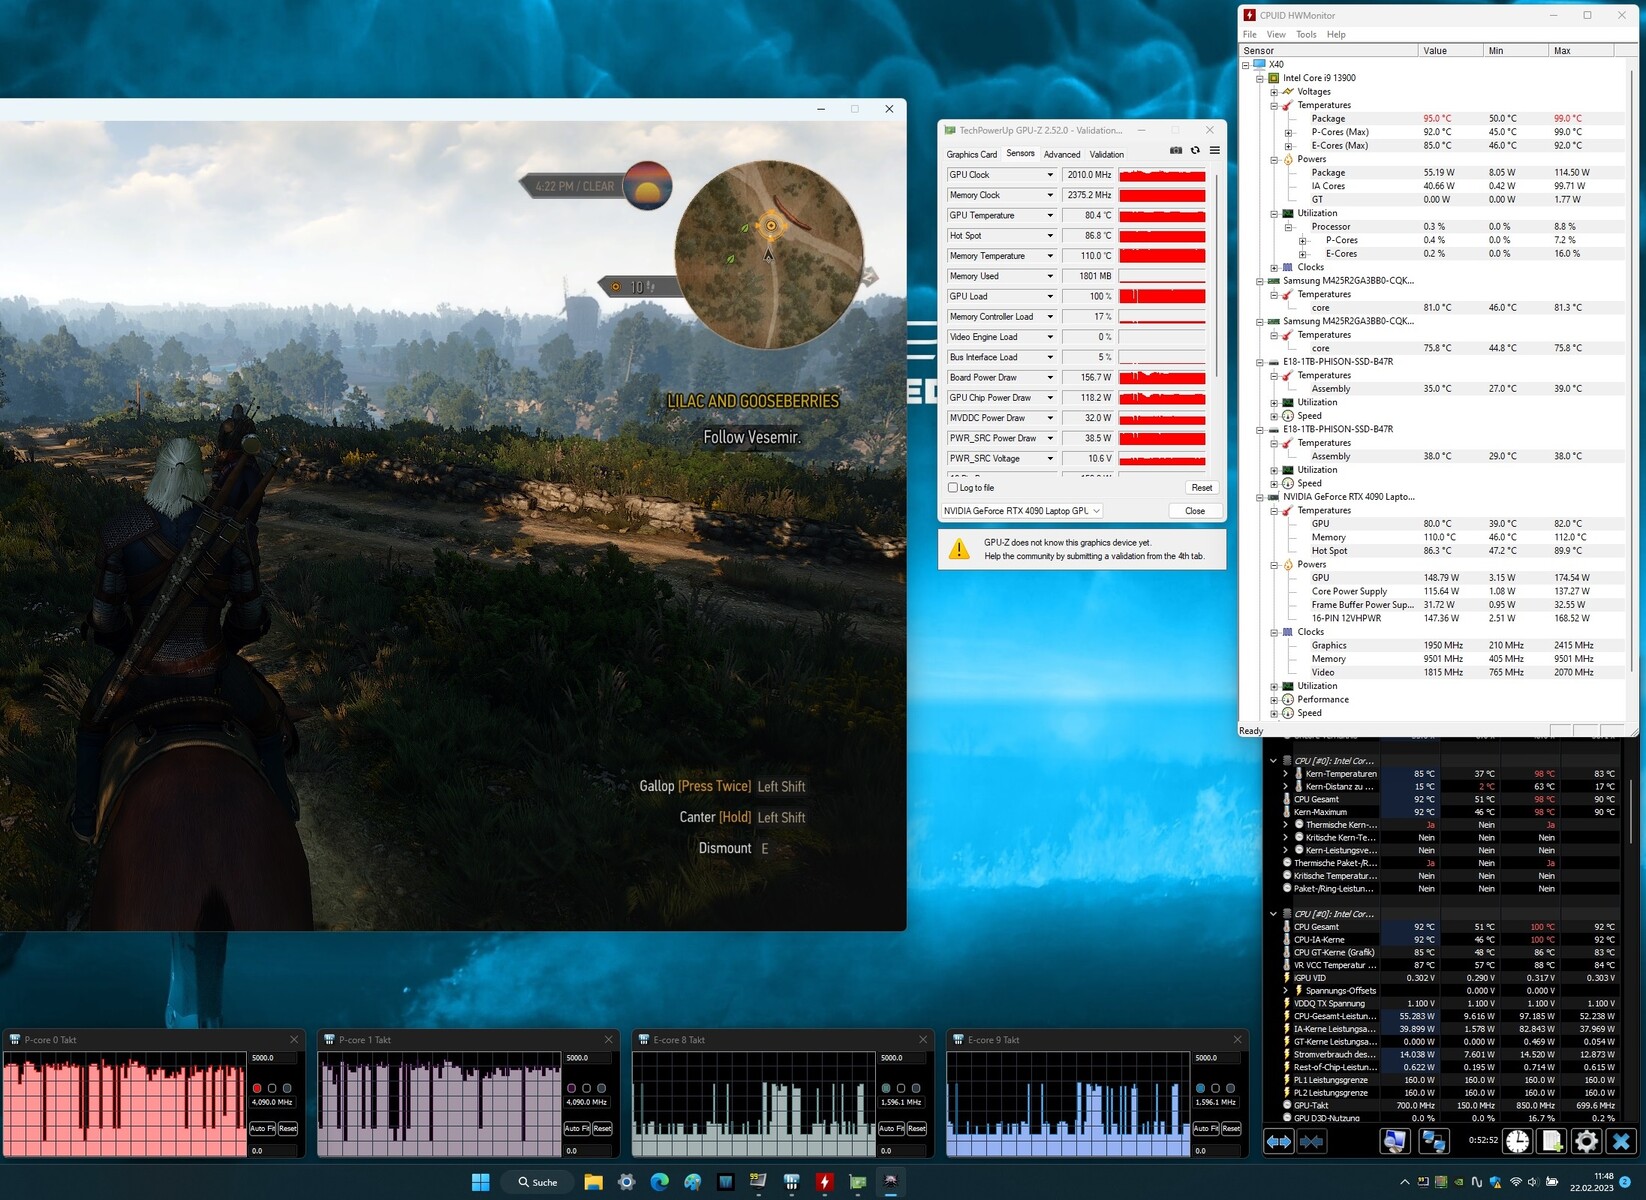
Prueba de esfuerzo
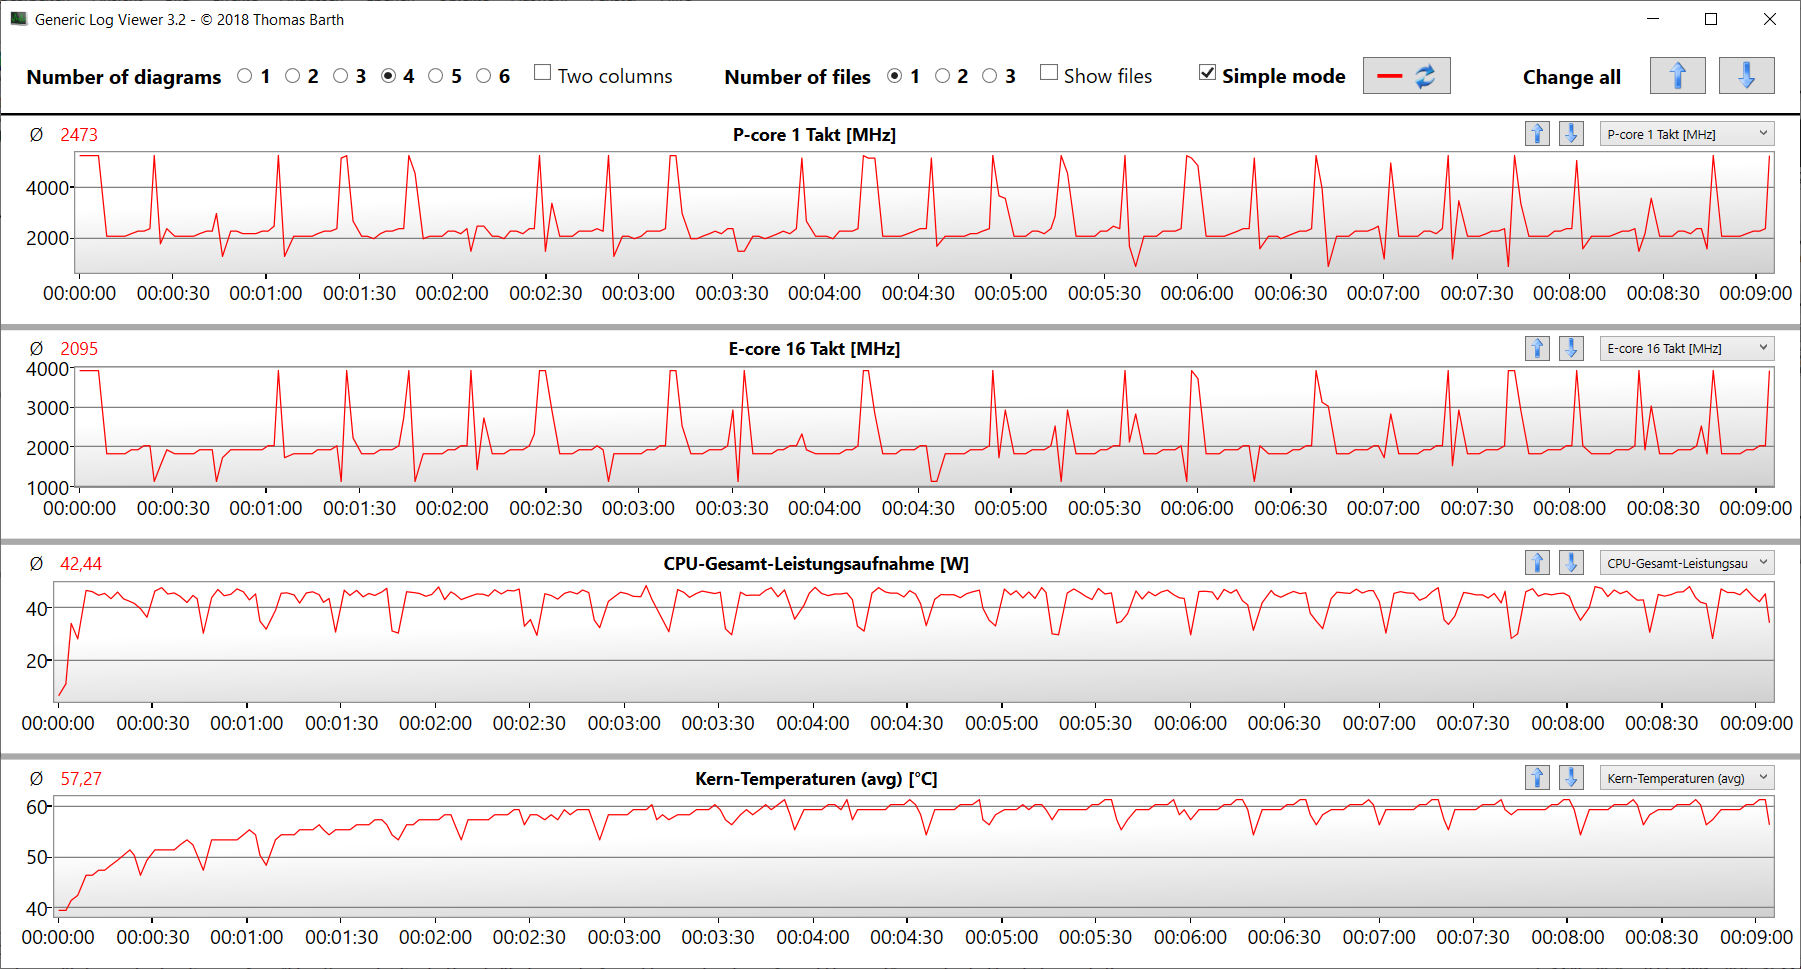
Para la prueba de estrés, dejamos que Prime95 y FurMark funcionaran durante un periodo prolongado. Representa un escenario extremo diseñado para evaluar la estabilidad del sistema a plena carga. La CPU comenzó a altas velocidades de reloj (núcleos P: 4 GHz, núcleos E: 3,3 GHz), mientras que la GPU fluctuaba entre 1 y 1,5 GHz. Al cabo de unos cinco minutos, los núcleos P y E de la CPU descendieron gradualmente hasta los 2 GHz y 1,8 GHz respectivamente, pero el reloj de la GPU subió hasta los 2,3 o 2,4 GHz
Altavoces
Los altavoces estéreo suenan decentemente, pero apenas producen graves. Recomendamos usar unos auriculares o unos altavoces externos para disfrutar de una mejor experiencia de audio.
Medion Erazer Beast X40 análisis de audio
(+) | los altavoces pueden reproducir a un volumen relativamente alto (#88 dB)
Graves 100 - 315 Hz
(-) | casi sin bajos - de media 20.2% inferior a la mediana
(±) | la linealidad de los graves es media (8.4% delta a frecuencia anterior)
Medios 400 - 2000 Hz
(±) | medias más altas - de media 5.5% más altas que la mediana
(+) | los medios son lineales (6.5% delta a la frecuencia anterior)
Altos 2 - 16 kHz
(+) | máximos equilibrados - a sólo 3.1% de la mediana
(+) | los máximos son lineales (5.8% delta a la frecuencia anterior)
Total 100 - 16.000 Hz
(±) | la linealidad del sonido global es media (16.1% de diferencia con la mediana)
En comparación con la misma clase
» 39% de todos los dispositivos probados de esta clase eran mejores, 7% similares, 54% peores
» El mejor tuvo un delta de 6%, la media fue 18%, el peor fue ###max##%
En comparación con todos los dispositivos probados
» 26% de todos los dispositivos probados eran mejores, 5% similares, 69% peores
» El mejor tuvo un delta de 4%, la media fue 23%, el peor fue ###max##%
MSI Titan GT77 HX 13VI análisis de audio
(+) | los altavoces pueden reproducir a un volumen relativamente alto (#90.1 dB)
Graves 100 - 315 Hz
(±) | lubina reducida - en promedio 14.3% inferior a la mediana
(±) | la linealidad de los graves es media (7.5% delta a frecuencia anterior)
Medios 400 - 2000 Hz
(+) | medios equilibrados - a sólo 3.5% de la mediana
(+) | los medios son lineales (3.2% delta a la frecuencia anterior)
Altos 2 - 16 kHz
(+) | máximos equilibrados - a sólo 1.9% de la mediana
(+) | los máximos son lineales (3.8% delta a la frecuencia anterior)
Total 100 - 16.000 Hz
(+) | el sonido global es lineal (11.1% de diferencia con la mediana)
En comparación con la misma clase
» 8% de todos los dispositivos probados de esta clase eran mejores, 3% similares, 89% peores
» El mejor tuvo un delta de 6%, la media fue 18%, el peor fue ###max##%
En comparación con todos los dispositivos probados
» 7% de todos los dispositivos probados eran mejores, 2% similares, 91% peores
» El mejor tuvo un delta de 4%, la media fue 23%, el peor fue ###max##%
Gestión de la energía - El X40 ofrece una resistencia bastante buena
Consumo de energía
El consumo de energía del X40 fue de 280 vatios de media en la prueba Witcher 3 y alcanzó brevemente un máximo de 363 vatios en la prueba de estrés. Mientras que el consumo se redujo ligeramente en el transcurso de la prueba Witcher 3, fluctuó a lo largo de la prueba de estrés. En reposo, el portátil consume una cantidad de energía bastante normal para el hardware que contiene. El cargador incluido tiene una potencia nominal de 330 vatios, por lo que puede suministrar suficiente energía al portátil.
| Off / Standby | |
| Ocioso | |
| Carga |
|
Clave:
min: | |
| Medion Erazer Beast X40 i9-13900HX, GeForce RTX 4090 Laptop GPU | MSI Titan GT77 HX 13VI i9-13950HX, GeForce RTX 4090 Laptop GPU | Razer Blade 16 Early 2023 i9-13950HX, GeForce RTX 4080 Laptop GPU | Schenker XMG Neo 17 M22 R9 6900HX, GeForce RTX 3080 Ti Laptop GPU | Alienware x17 R2 P48E i9-12900HK, GeForce RTX 3080 Ti Laptop GPU | Asus ROG Strix Scar 18 2023 G834JY-N6005W i9-13980HX, GeForce RTX 4090 Laptop GPU | Medio NVIDIA GeForce RTX 4090 Laptop GPU | Media de la clase Gaming | |
|---|---|---|---|---|---|---|---|---|
| Power Consumption | -5% | -14% | 31% | -42% | -30% | -15% | 8% | |
| Idle Minimum * (Watt) | 11 | 14 -27% | 15.2 -38% | 7 36% | 24.1 -119% | 17.3 -57% | 16.2 ? -47% | 13 ? -18% |
| Idle Average * (Watt) | 18 | 21.6 -20% | 22.8 -27% | 11 39% | 28.5 -58% | 27 -50% | 23.1 ? -28% | 19 ? -6% |
| Idle Maximum * (Watt) | 30 | 24.8 17% | 49.8 -66% | 17 43% | 60 -100% | 46 -53% | 34.2 ? -14% | 24.6 ? 18% |
| Load Average * (Watt) | 136 | 122.5 10% | 121.2 11% | 92 32% | 128.7 5% | 133 2% | 130.5 ? 4% | 110.7 ? 19% |
| Witcher 3 ultra * (Watt) | 280 | 265 5% | 242 14% | 221 21% | 254 9% | |||
| Load Maximum * (Watt) | 363 | 418 -15% | 273.7 25% | 306 16% | 323 11% | 329 9% | 324 ? 11% | 259 ? 29% |
* ... más pequeño es mejor
Power consumption Witcher 3 / Stress test
Power consumption with external monitor
Duración de la batería
El portátil de 17 pulgadas duró 6h 22m y 6h 56m respectivamente en la prueba Wi-Fi (acceso automático a sitios web mediante un guión) y la prueba de vídeo (reproducción en bucle del cortometraje Big Buck Bunny, codificado en H.264, en Full HD). Para ambas pruebas, se desactivaron todas las funciones de ahorro de energía del portátil y se ajustó el brillo de la pantalla a unos 150 cd/m². El adaptador inalámbrico también se desactivó cuando realizamos la prueba de vídeo.
En general, el Erazer ofrece una gran duración de la batería para un portátil de tan alto rendimiento. Puede durar más que la mayoría de los competidores, incluso con baterías de idéntica capacidad.
| Medion Erazer Beast X40 i9-13900HX, GeForce RTX 4090 Laptop GPU, 99.8 Wh | MSI Titan GT77 HX 13VI i9-13950HX, GeForce RTX 4090 Laptop GPU, 99.9 Wh | Razer Blade 16 Early 2023 i9-13950HX, GeForce RTX 4080 Laptop GPU, 95.2 Wh | Schenker XMG Neo 17 M22 R9 6900HX, GeForce RTX 3080 Ti Laptop GPU, 99 Wh | Alienware x17 R2 P48E i9-12900HK, GeForce RTX 3080 Ti Laptop GPU, 87 Wh | Asus ROG Strix Scar 18 2023 G834JY-N6005W i9-13980HX, GeForce RTX 4090 Laptop GPU, 90 Wh | Media de la clase Gaming | |
|---|---|---|---|---|---|---|---|
| Duración de Batería | -19% | -12% | 15% | -62% | -14% | -0% | |
| Reader / Idle (h) | 9.4 | 8.9 -5% | 12 28% | 3.9 -59% | 8.27 ? -12% | ||
| H.264 (h) | 6.9 | 6 -13% | 6.6 -4% | 7 1% | 8.32 ? 21% | ||
| WiFi v1.3 (h) | 6.4 | 5.3 -17% | 6.1 -5% | 9 41% | 2 -69% | 7.1 11% | 7.11 ? 11% |
| Load (h) | 1.9 | 1.4 -26% | 1.4 -26% | 1.8 -5% | 0.8 -58% | 0.9 -53% | 1.502 ? -21% |
| Witcher 3 ultra (h) | 0.9 |
Pro
Contra
Veredicto - Excepcional portátil para juegos de gama alta

El Medion Erazer Beast X40 es un portátil diseñado para escenarios de uso muy exigentes, como la edición de vídeo, el renderizado y los juegos. El músculo informático necesario para estas aplicaciones lo proporciona una de las combinaciones CPU-GPU más potentes del momento: un Core i9-13900HX emparejado con una GeForce RTX 4090.
El procesador y la tarjeta gráfica son capaces de funcionar constantemente a altas velocidades de reloj, y el X40 produce una cantidad de calor y ruido bastante normal para esta clase de dispositivo.
En definitiva, el Erazer Beast X40 es un portátil convincente para juegos y otras aplicaciones exigentes.
La pantalla mate 16:10 de 17 pulgadas (QHD, IPS, 240 Hz, G-Sync, sRGB) se ve muy bien en su mayor parte. El único inconveniente es que su contraste es ligeramente demasiado bajo. El magnífico teclado mecánico (con iluminación RGB) hace que el portátil resulte aún más atractivo. Los que nunca hayan usado un teclado mecánico tendrán una nueva experiencia de mecanografiado. El puerto Thunderbolt 4 del portátil abre opciones de expansión (p.ej. GPU externa, solución de anclaje) pero no soporta Power Delivery.
Una posible alternativa al Erazer Beast X40 es el Asus ROG Strix Scar 18 2023 G834JY. El Asus ROG destaca por su panel QHD+ 16:10 de 18 pulgadas, más RAM (64 GB) y soporte RAID. Con un precio de unos 4.800 euros (5.177 dólares), está en la misma horquilla de precios que el Beast. Si el dinero no es problema, puedes echar un vistazo alMSI Titan GT77 HX 13V como alternativa. Ofrece un rendimiento de CPU ligeramente superior, tres ranuras SSD, soporte RAID y cuatro zócalos RAM. La pantalla mini-LED, excepcionalmente brillante y con un contraste excelente, es uno de los puntos fuertes del dispositivo. Pero el paquete completo te costará unos 6.600 euros (7.120 dólares).
Veredicto sobre la refrigeración por agua
La unidad de refrigeración por agua opcional hace fundamentalmente lo que se supone que debe hacer: mejorar el rendimiento (Medion promete hasta un 10% de aumento) y reducir el calor y el ruido. En el uso real, sin embargo, el aumento de rendimiento es más bien modesto, y el portátil queda confinado en un lugar fijo. Las únicas ventajas que quedan son temperaturas y niveles de ruido más bajos. Depende de cada propietario de un X40 decidir si estas ventajas merecen los 250 euros (270 dólares) extra.
Precio y disponibilidad
En Alemania, la configuración de prueba del Medion Erazer Beast X40 está disponible en Saturn.de y tiene un precio de 4.499 euros (4.856 dólares).
Medion Erazer Beast X40
- 03/20/2023 v7 (old)
Sascha Mölck
Transparencia
La selección de los dispositivos que se van a reseñar corre a cargo de nuestro equipo editorial. La muestra de prueba fue proporcionada al autor en calidad de préstamo por el fabricante o el minorista a los efectos de esta reseña. El prestamista no tuvo ninguna influencia en esta reseña, ni el fabricante recibió una copia de la misma antes de su publicación. No había ninguna obligación de publicar esta reseña. Como empresa de medios independiente, Notebookcheck no está sujeta a la autoridad de fabricantes, minoristas o editores.
Así es como prueba Notebookcheck
Cada año, Notebookcheck revisa de forma independiente cientos de portátiles y smartphones utilizando procedimientos estandarizados para asegurar que todos los resultados son comparables. Hemos desarrollado continuamente nuestros métodos de prueba durante unos 20 años y hemos establecido los estándares de la industria en el proceso. En nuestros laboratorios de pruebas, técnicos y editores experimentados utilizan equipos de medición de alta calidad. Estas pruebas implican un proceso de validación en varias fases. Nuestro complejo sistema de clasificación se basa en cientos de mediciones y puntos de referencia bien fundamentados, lo que mantiene la objetividad.Price comparison

