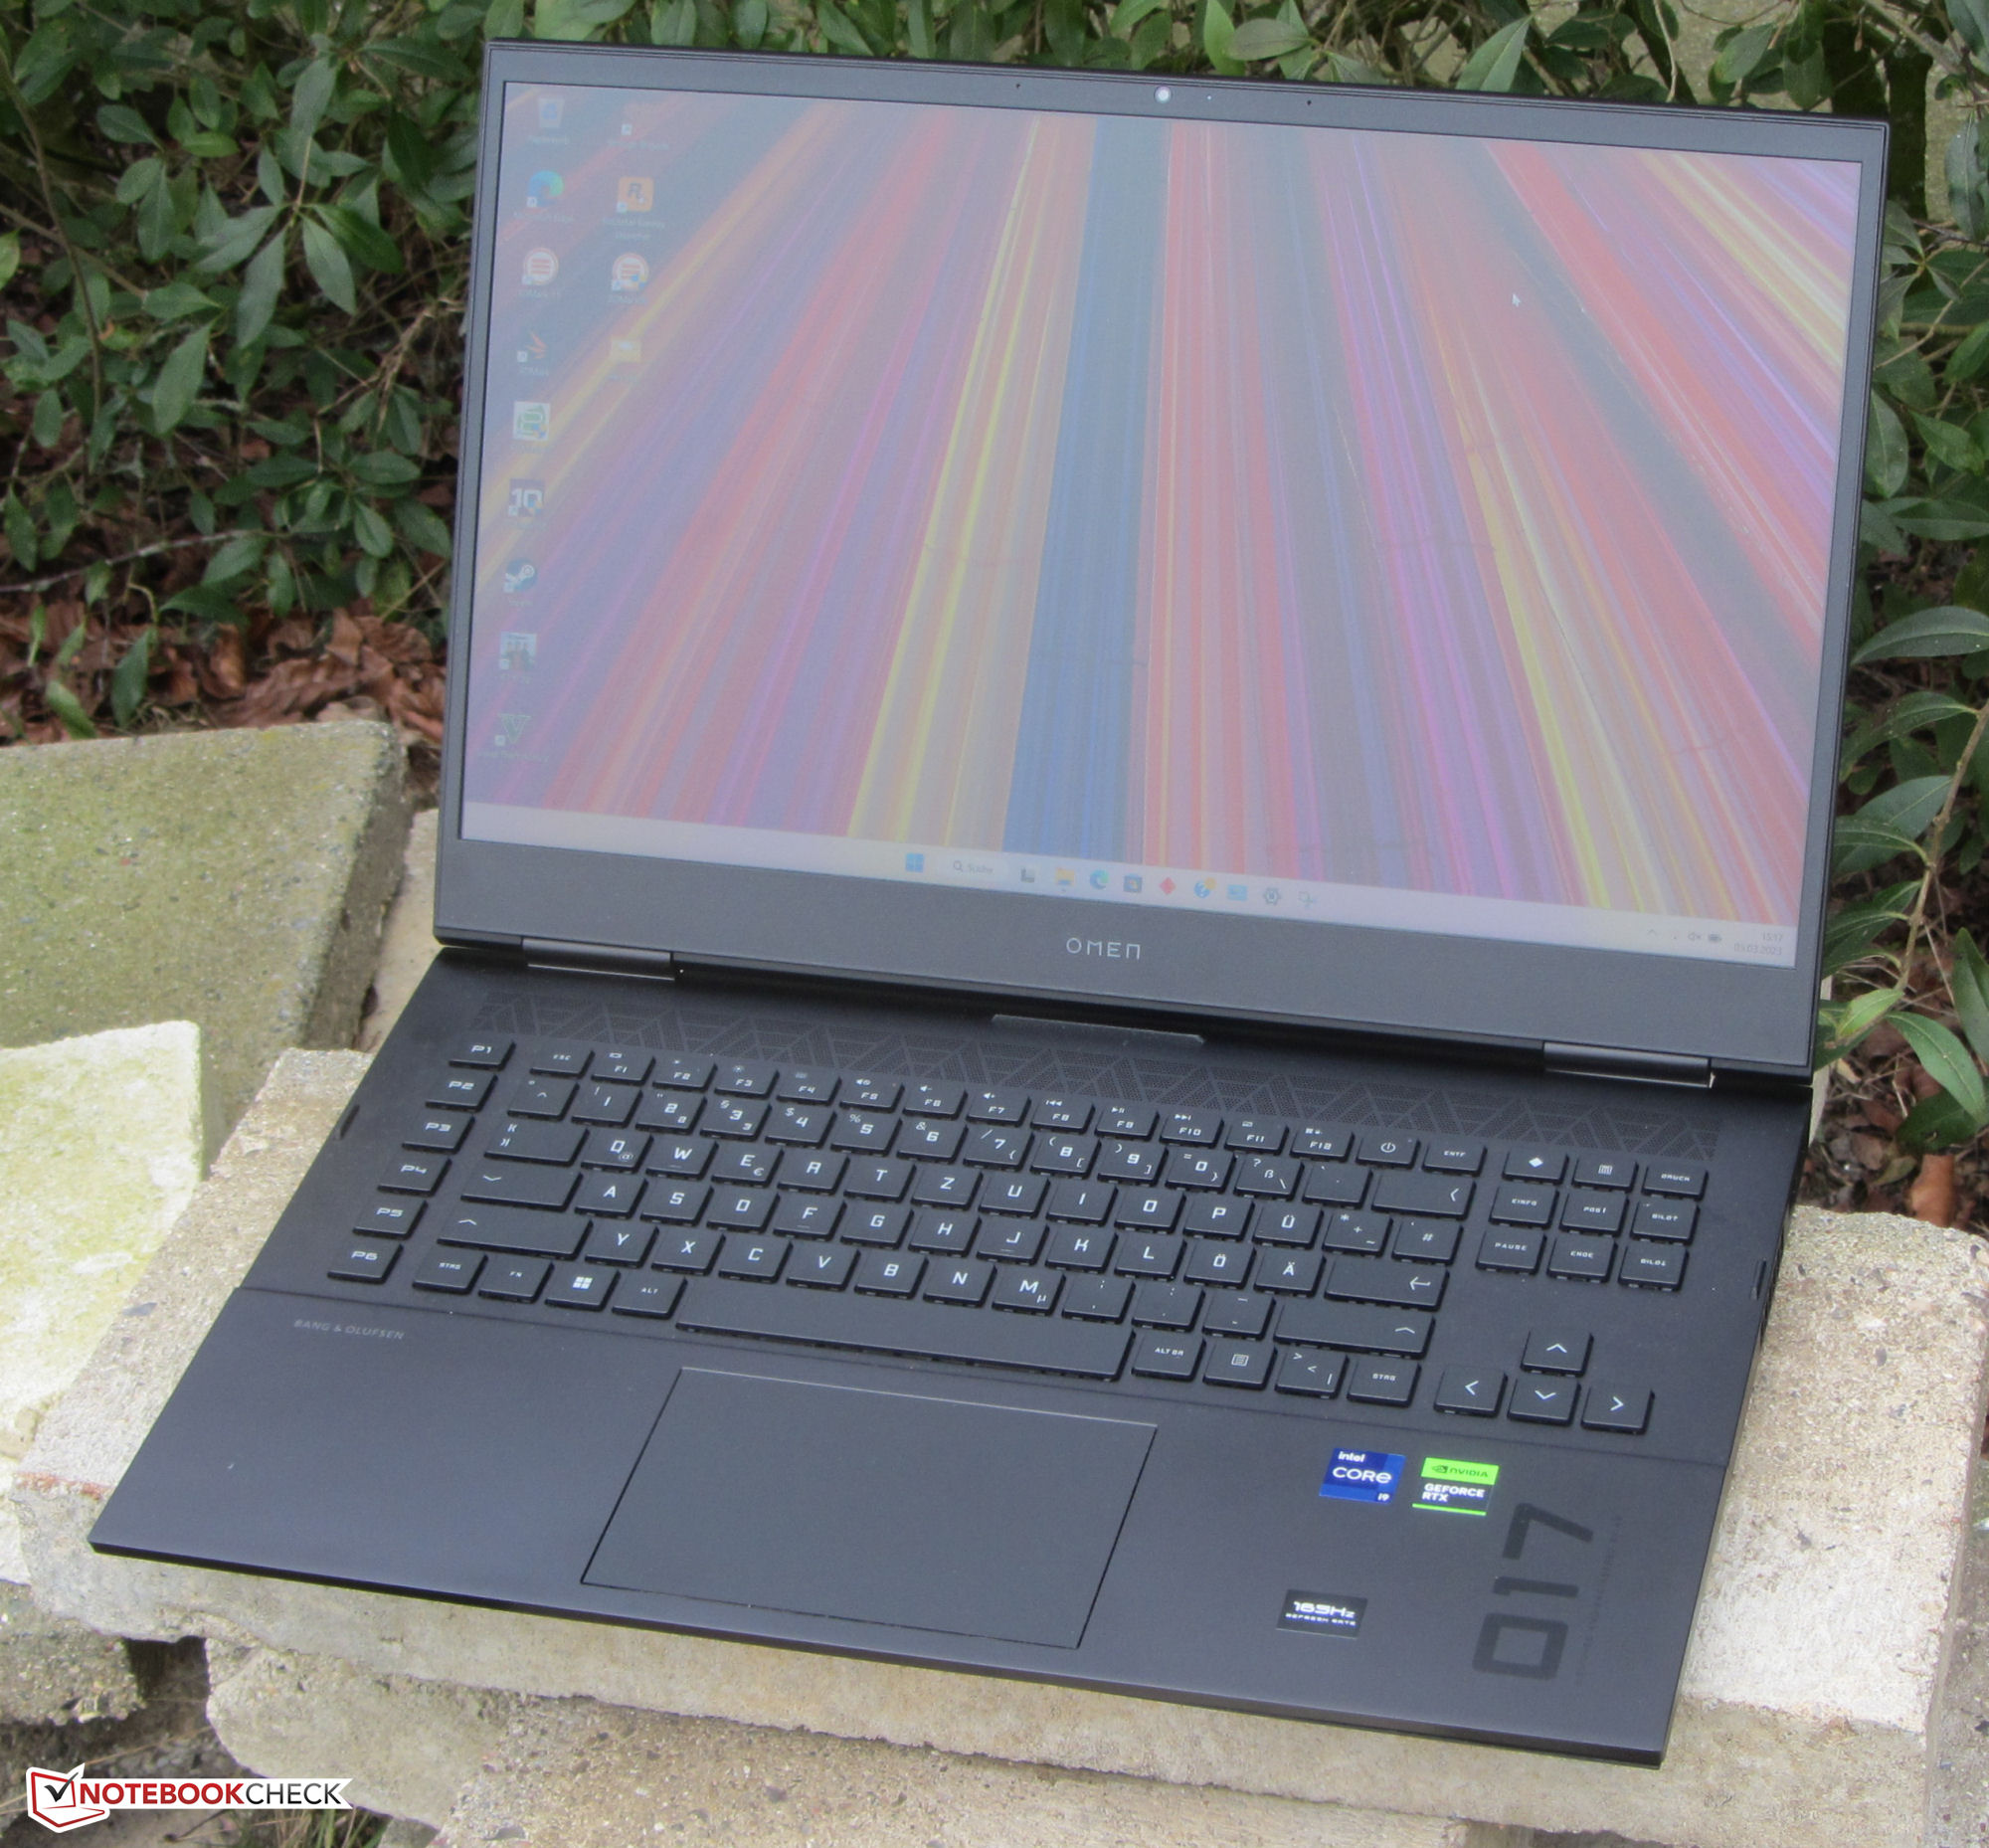
Análisis del HP Omen 17 (2023): Portátil para juegos con RTX 4080

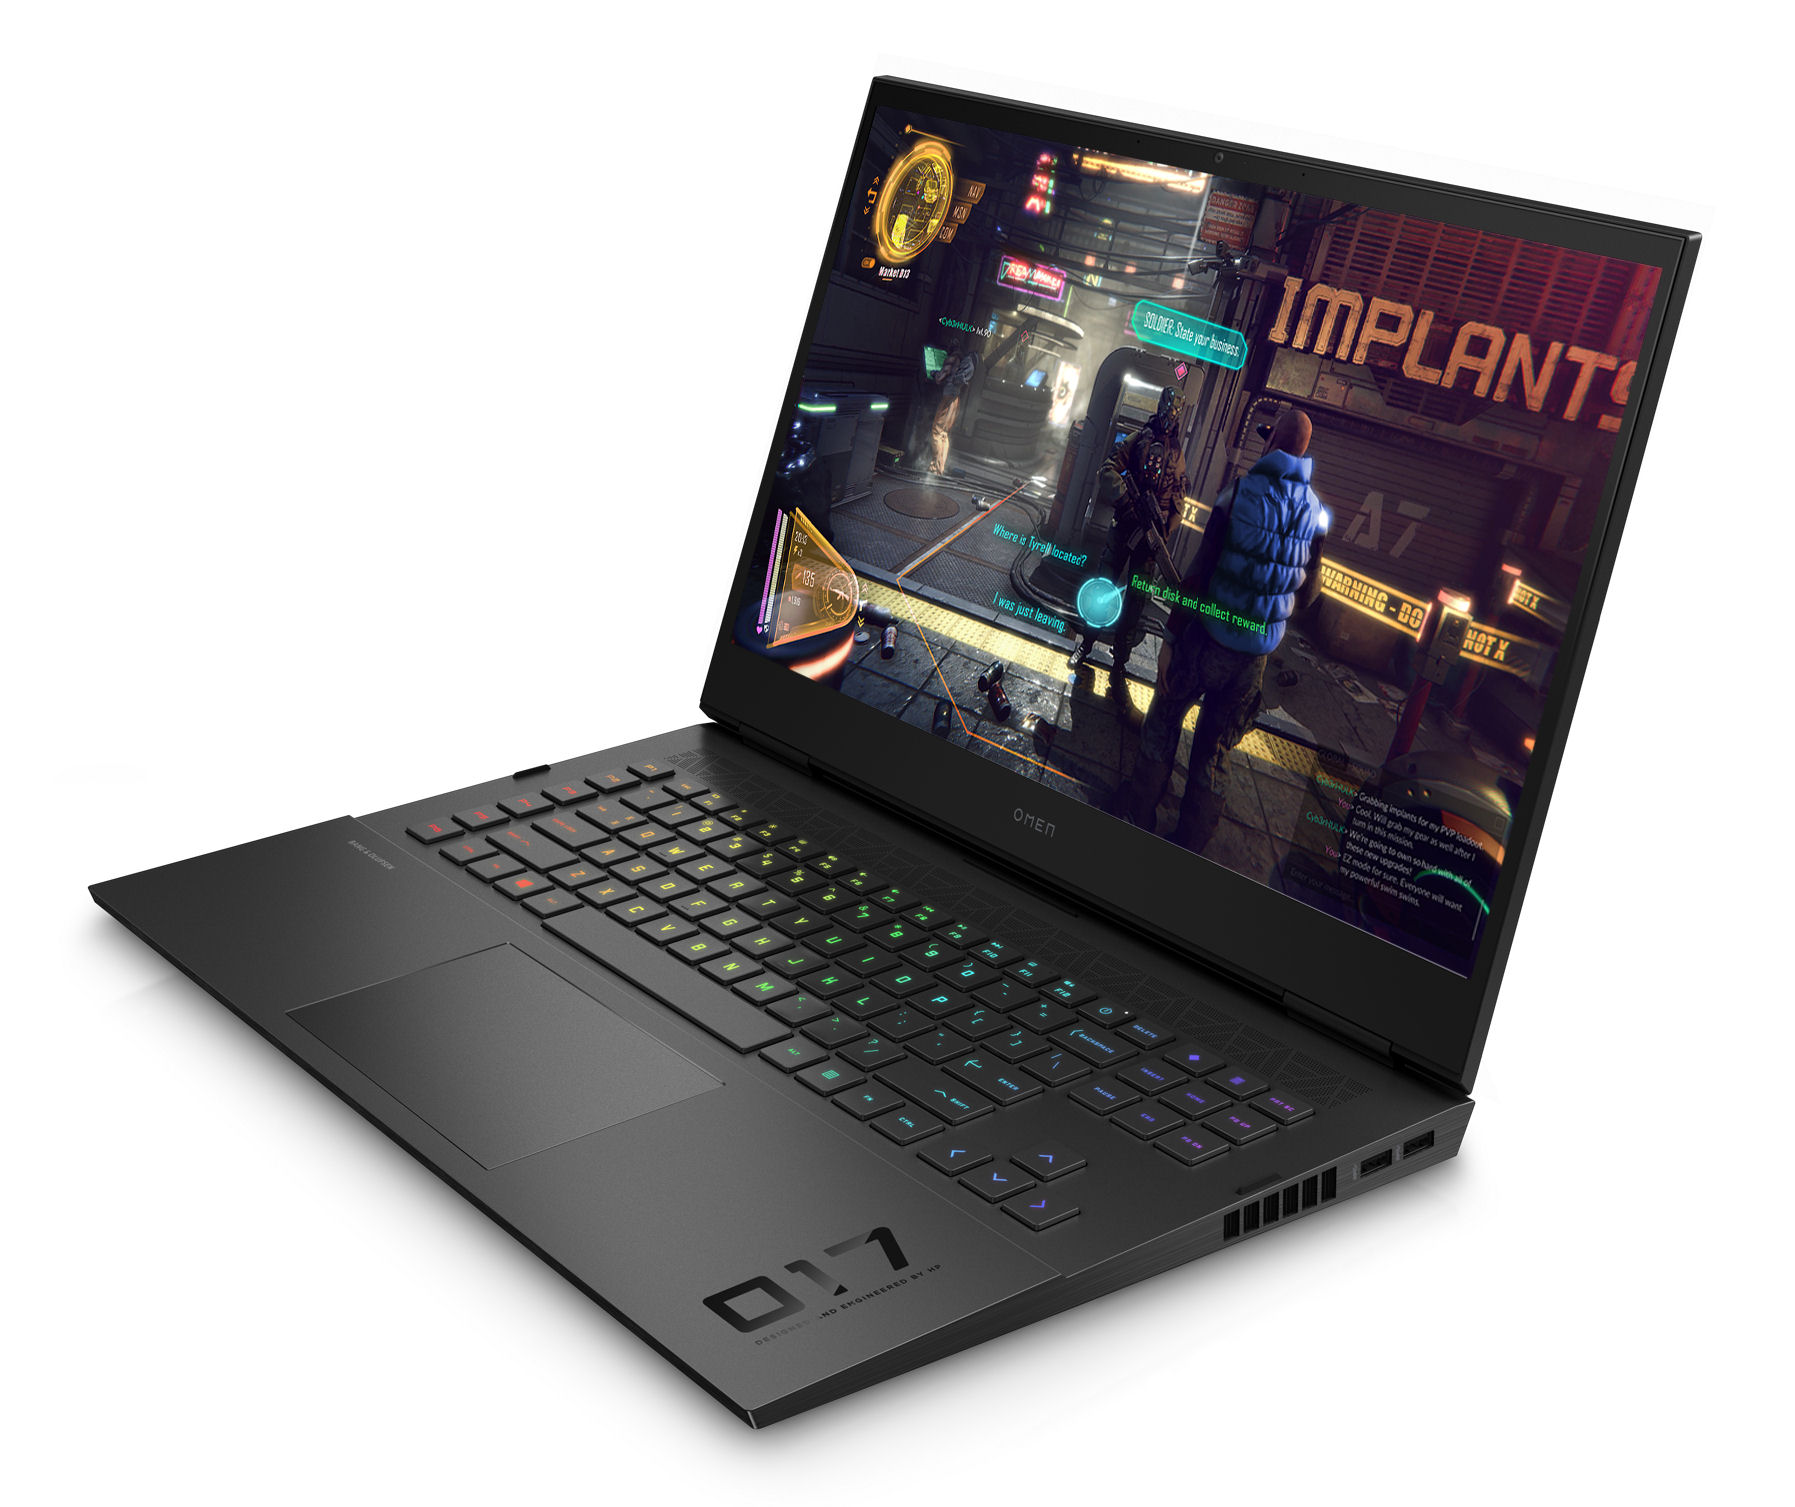
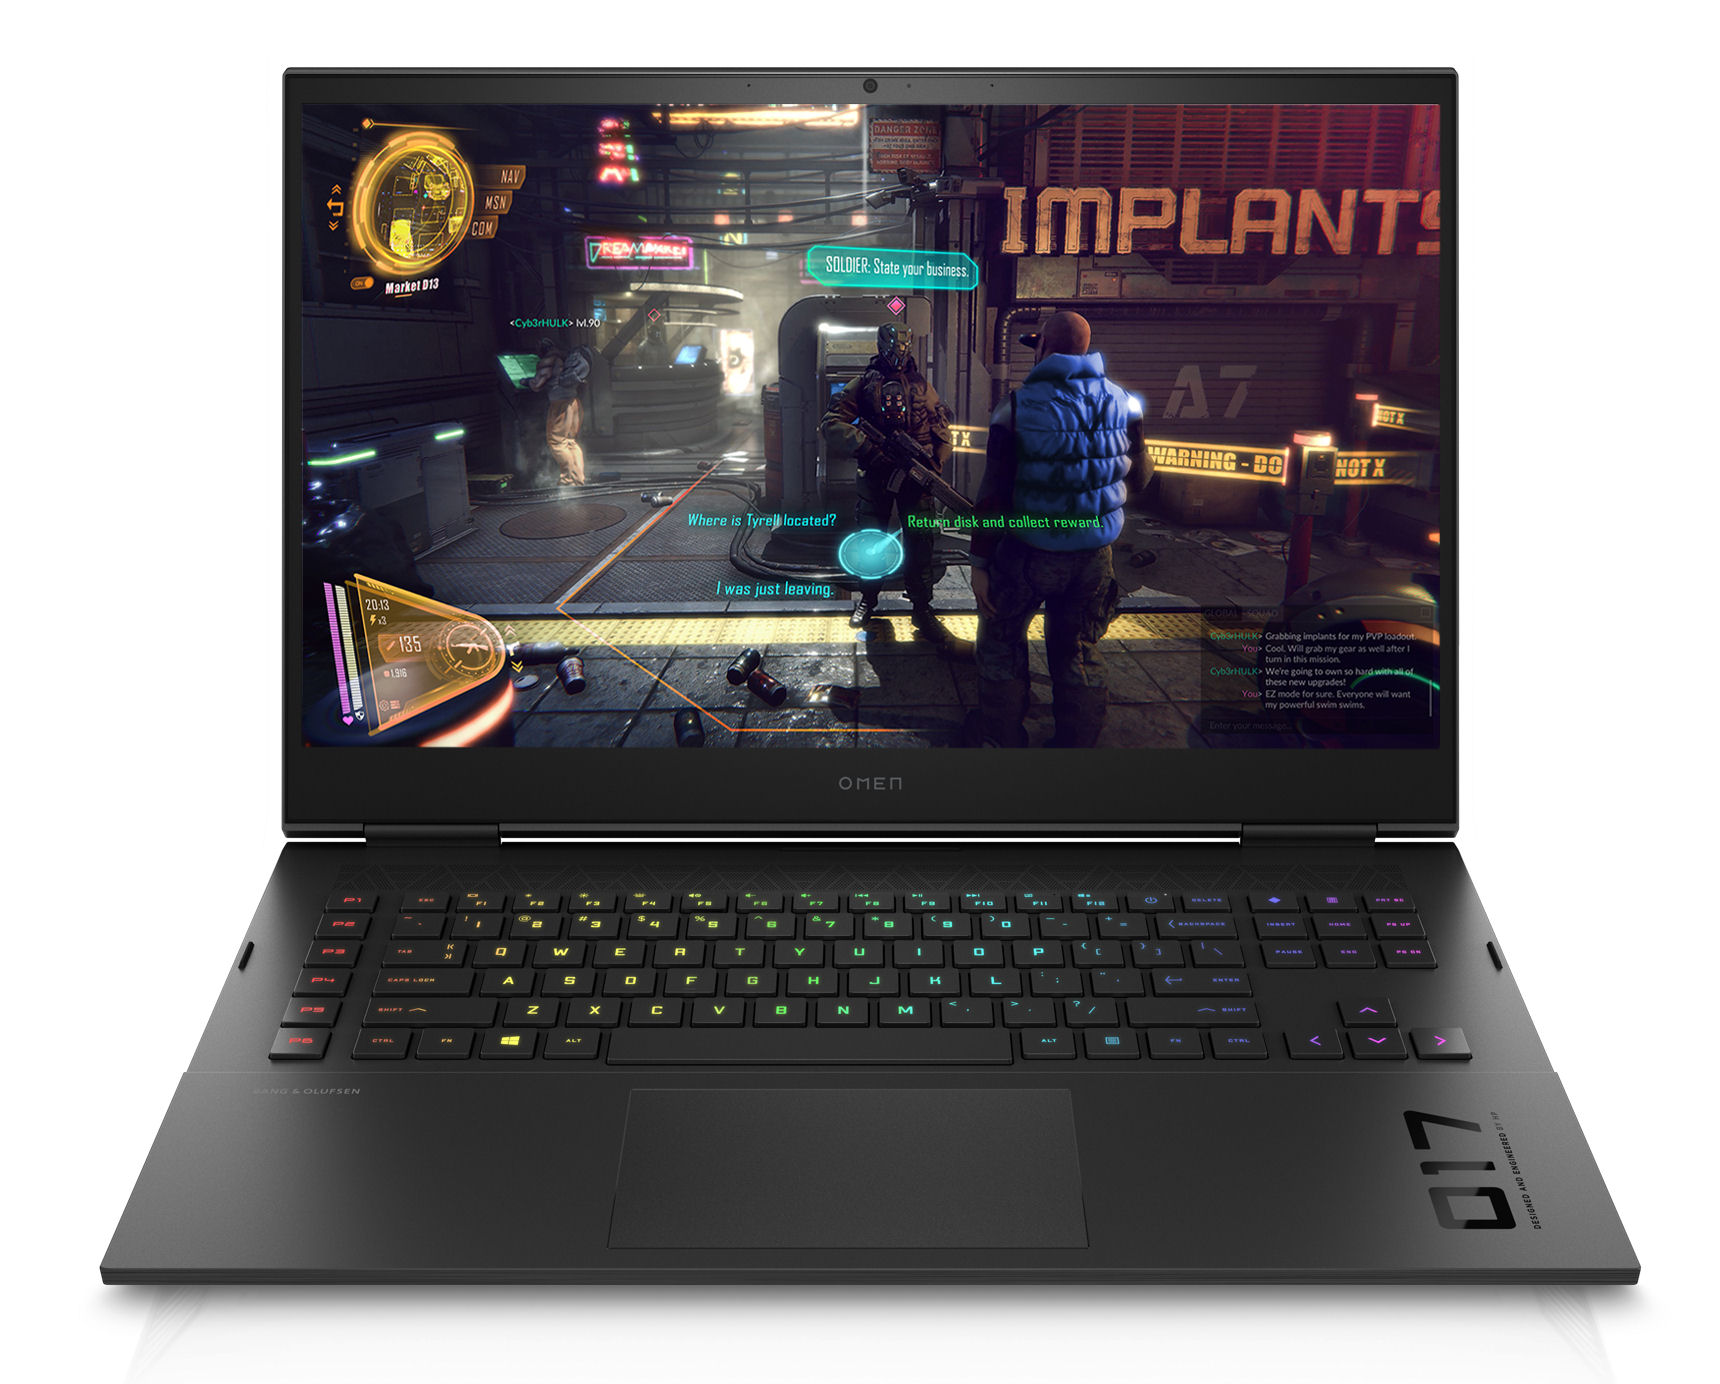
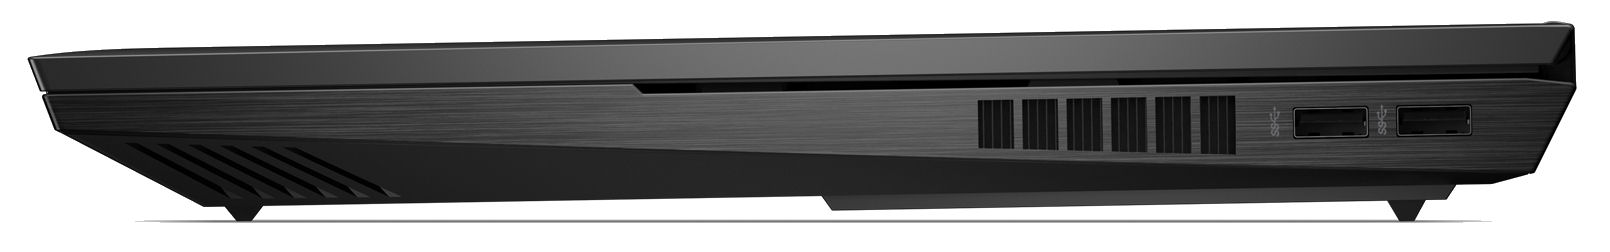
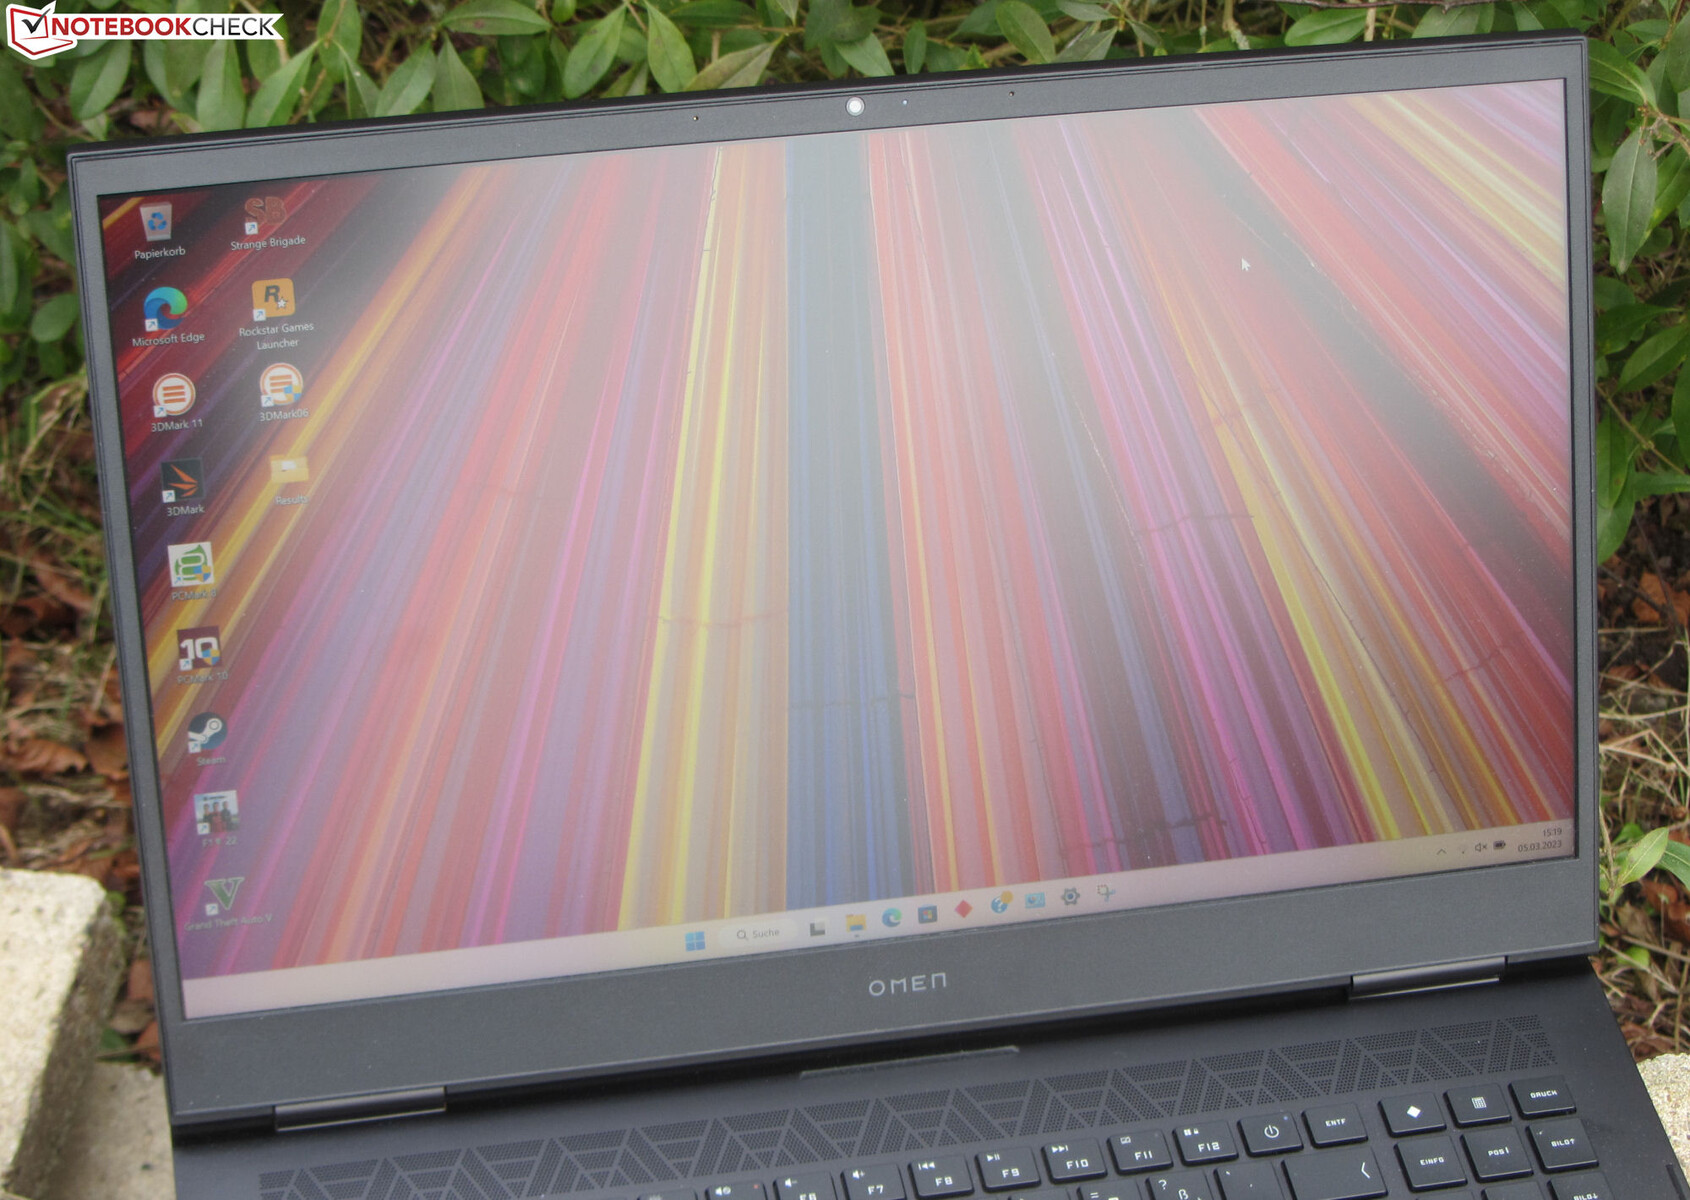
El modelo 2023 del Omen 17, que es un portátil para juegos de gama alta, utiliza la misma carcasa que ya conocemos de su predecesor, pero incluye hardware actual: El portátil funciona con chips Raptor Lake y Ada Lovelace. HP combina un Core i9 con una GPU RTX 4080, pidiendo casi 3.300 euros (3.582 dólares) por todo el paquete. Entre los competidores se encuentran portátiles como el Alienware m17 R5, elRazer Blade 16 (principios de 2023), elAsus ROG Strix G16 G614JZy el Lenovo Legion Pro 7 16IRX8H.
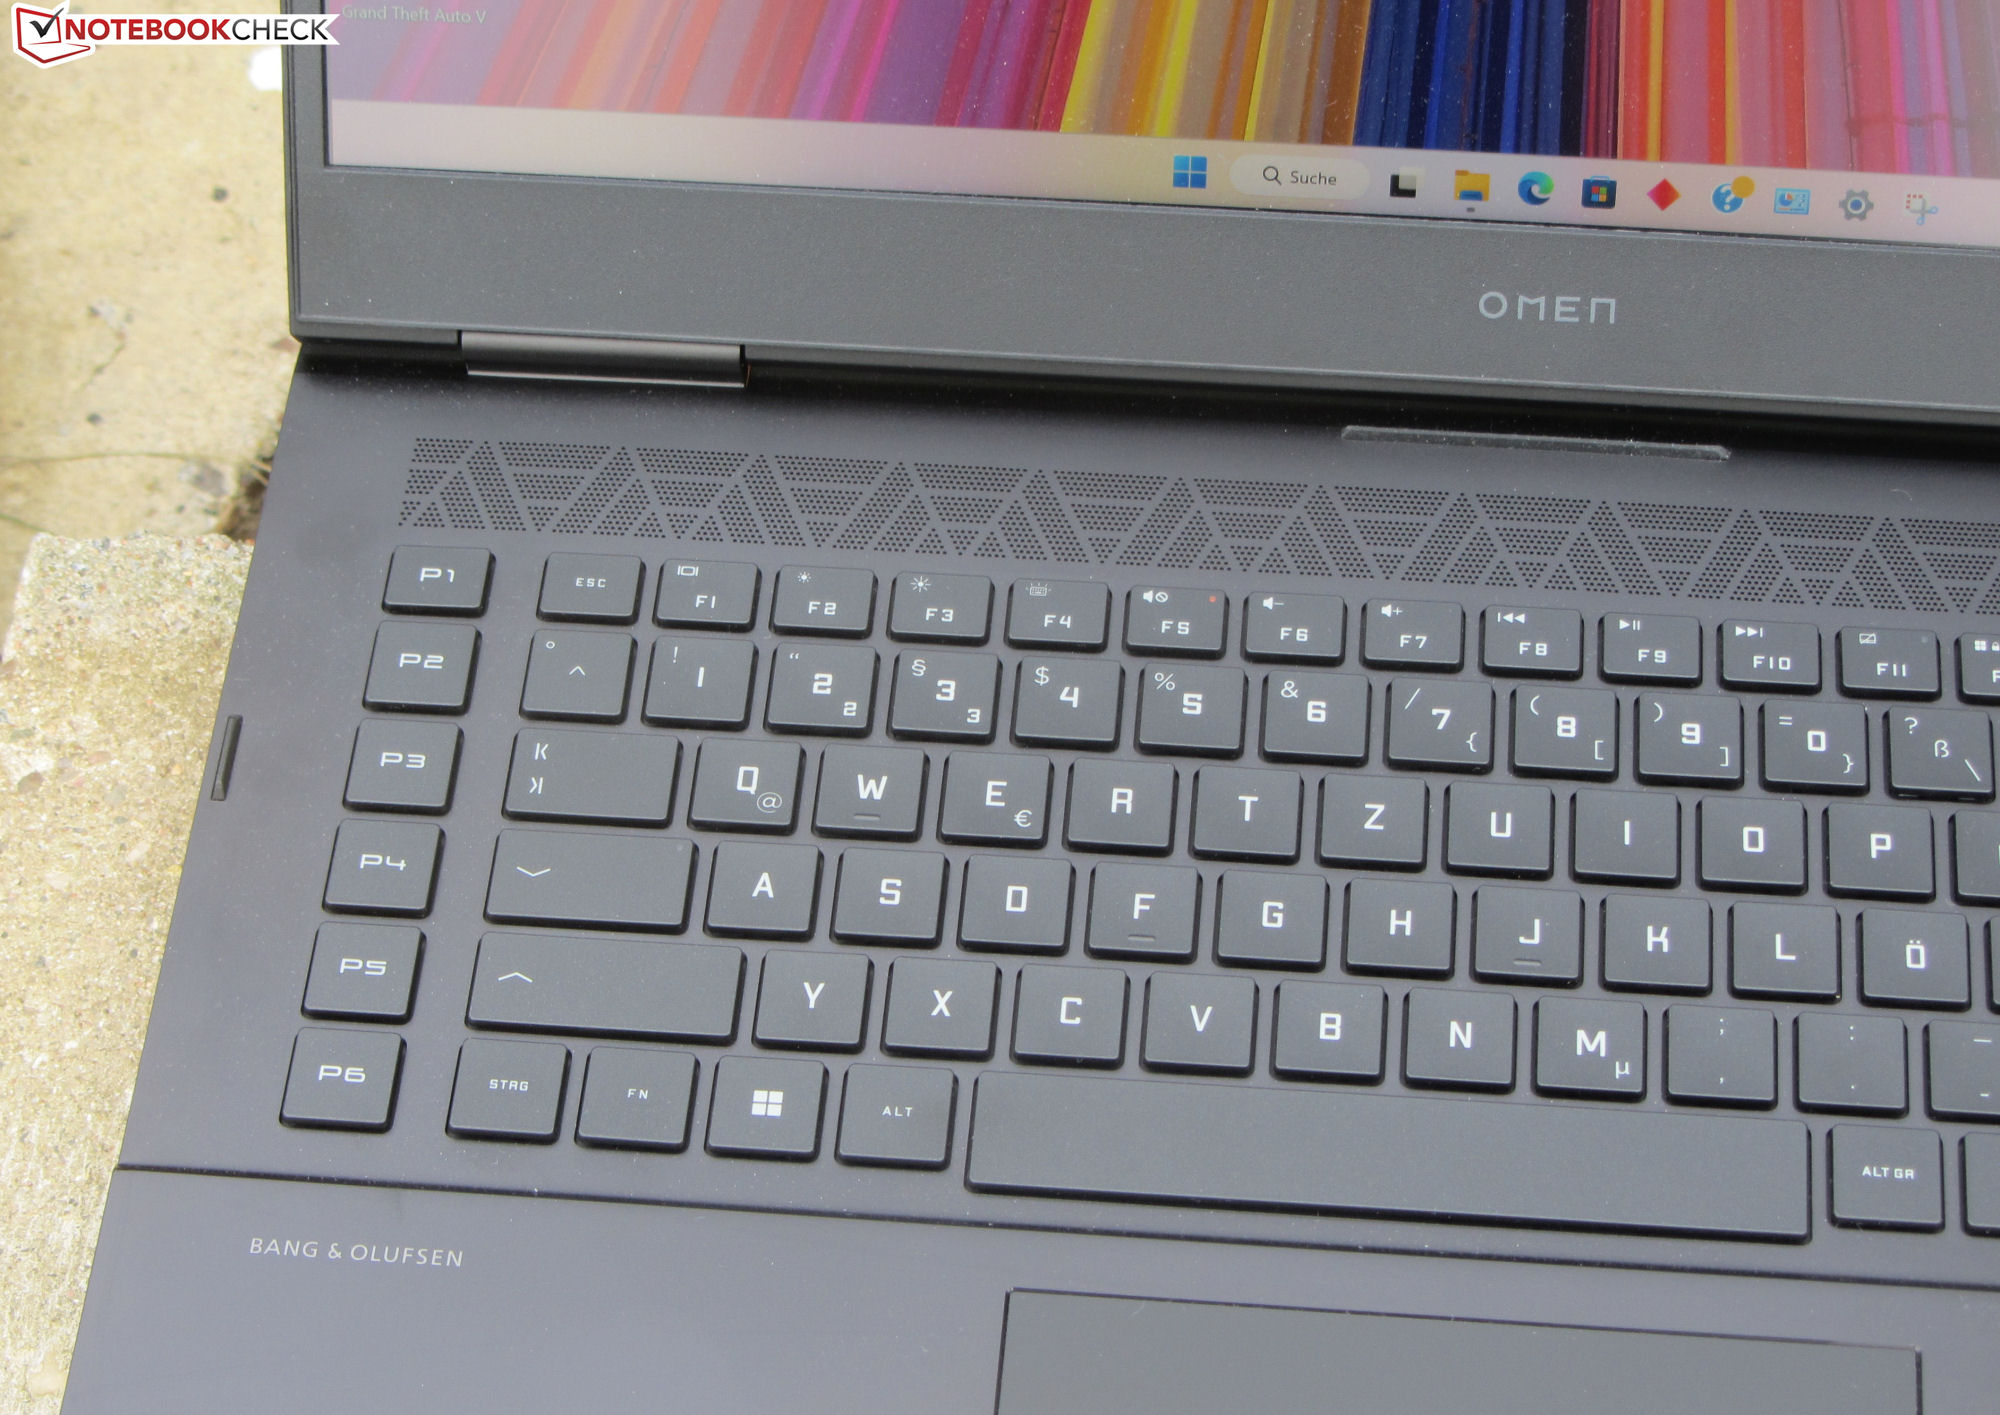
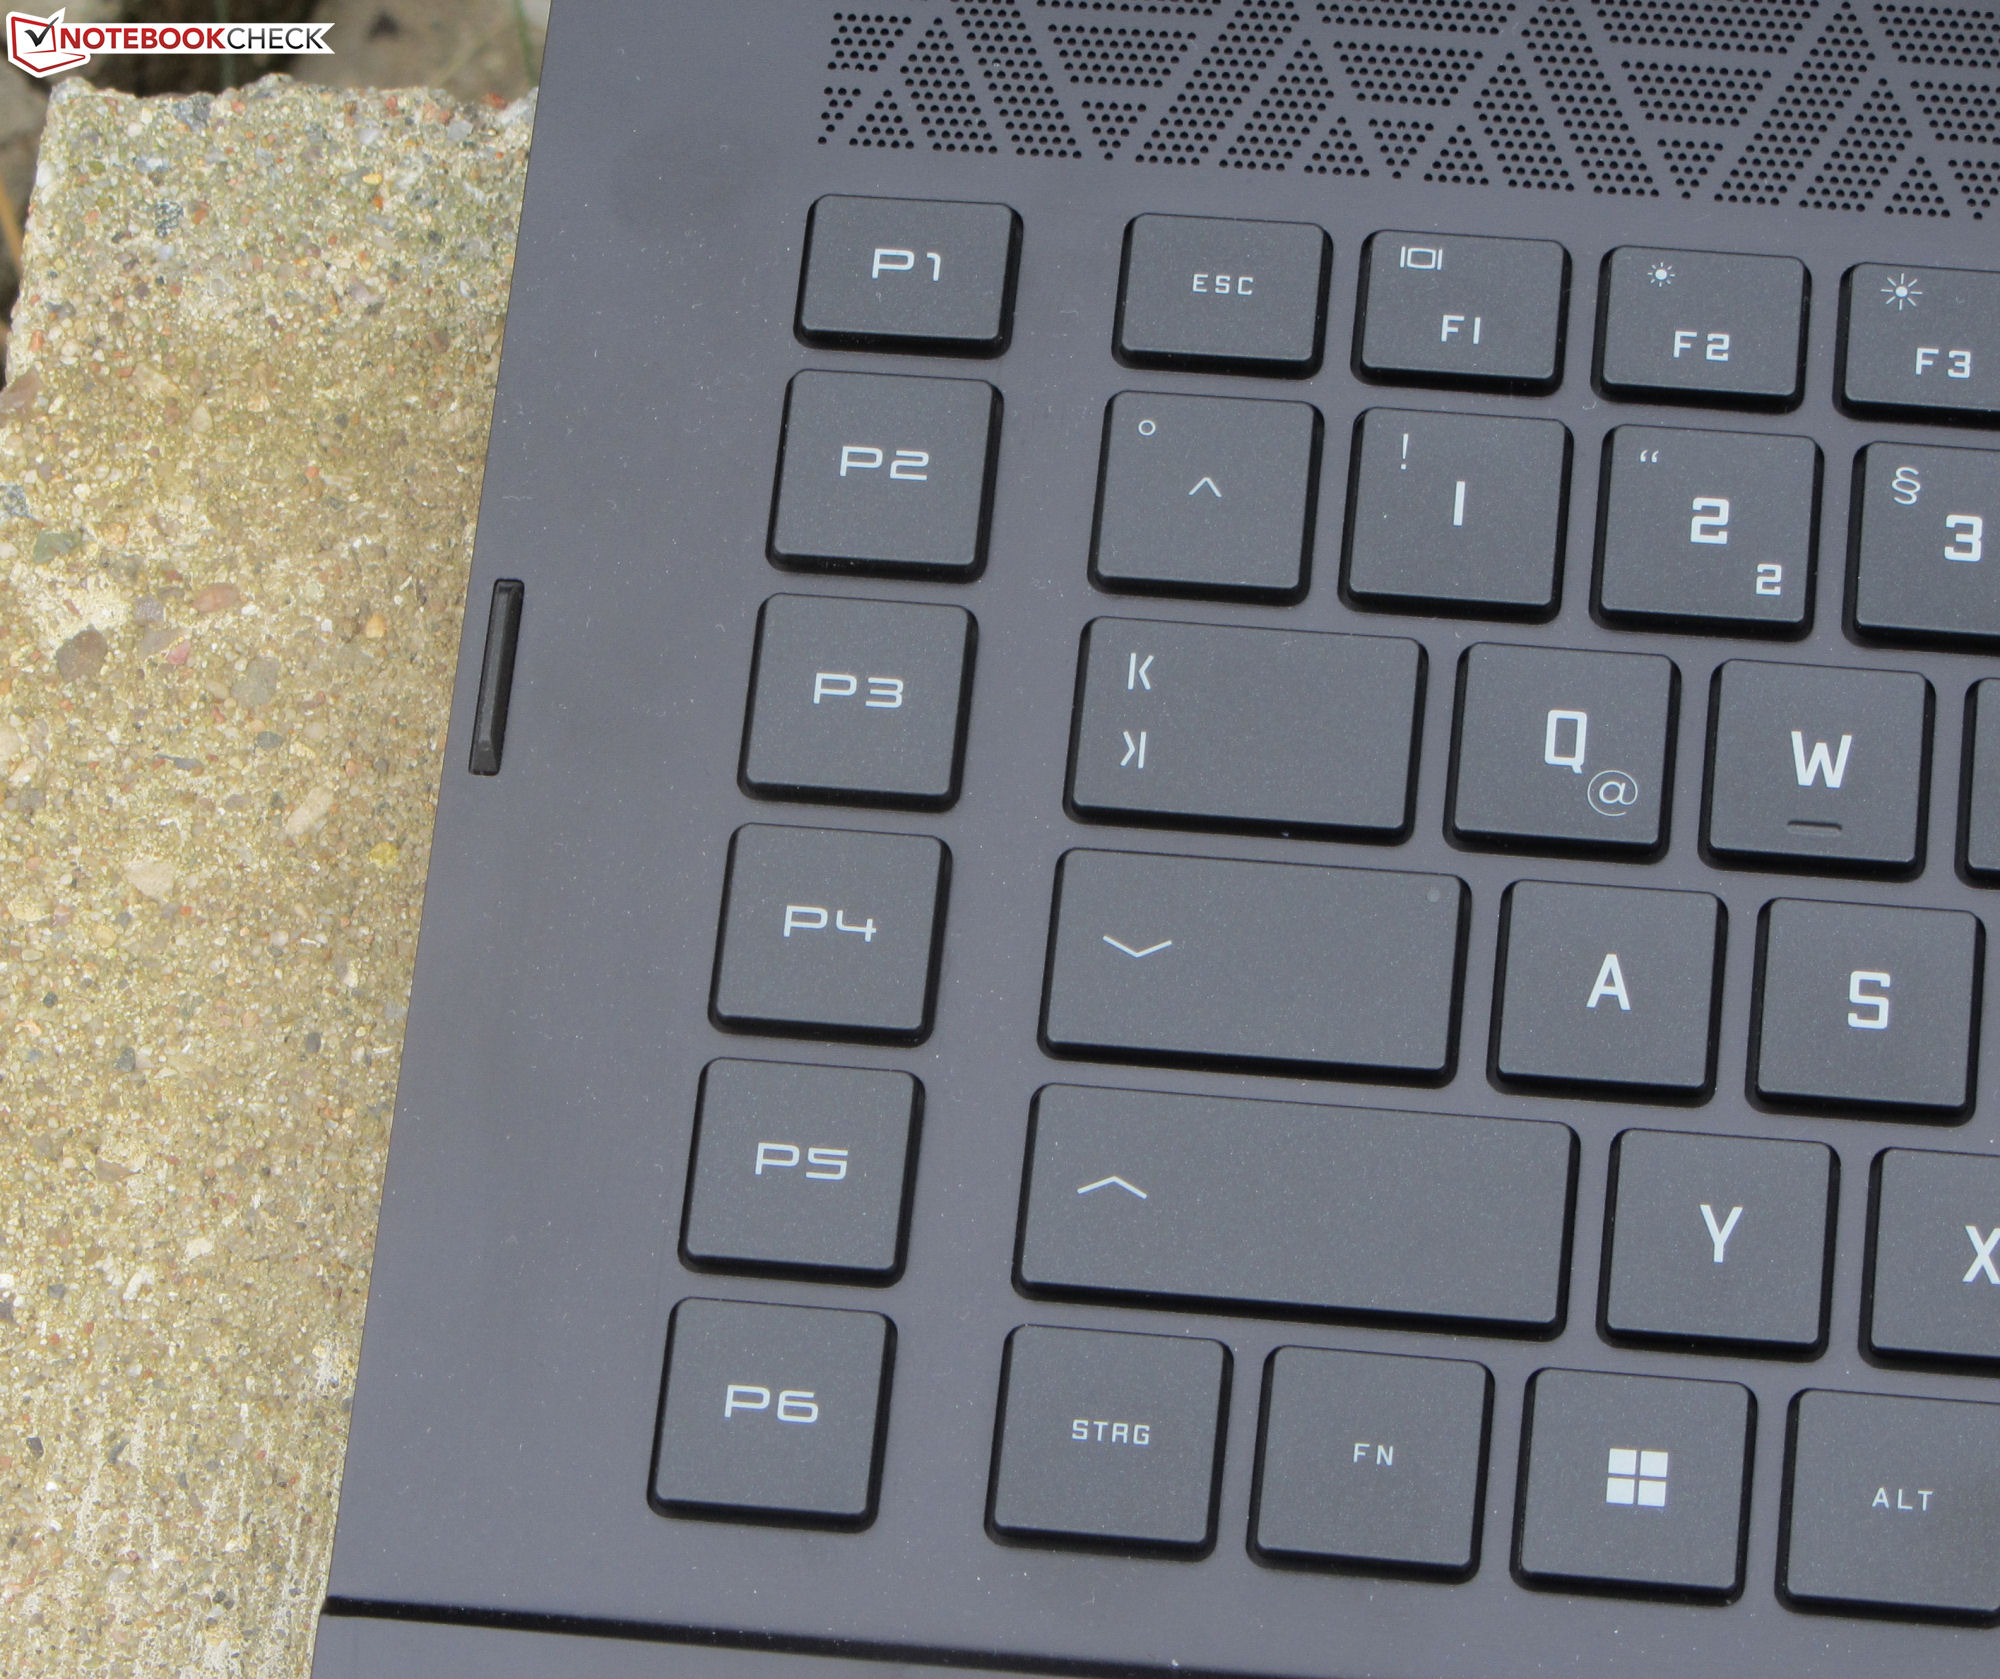
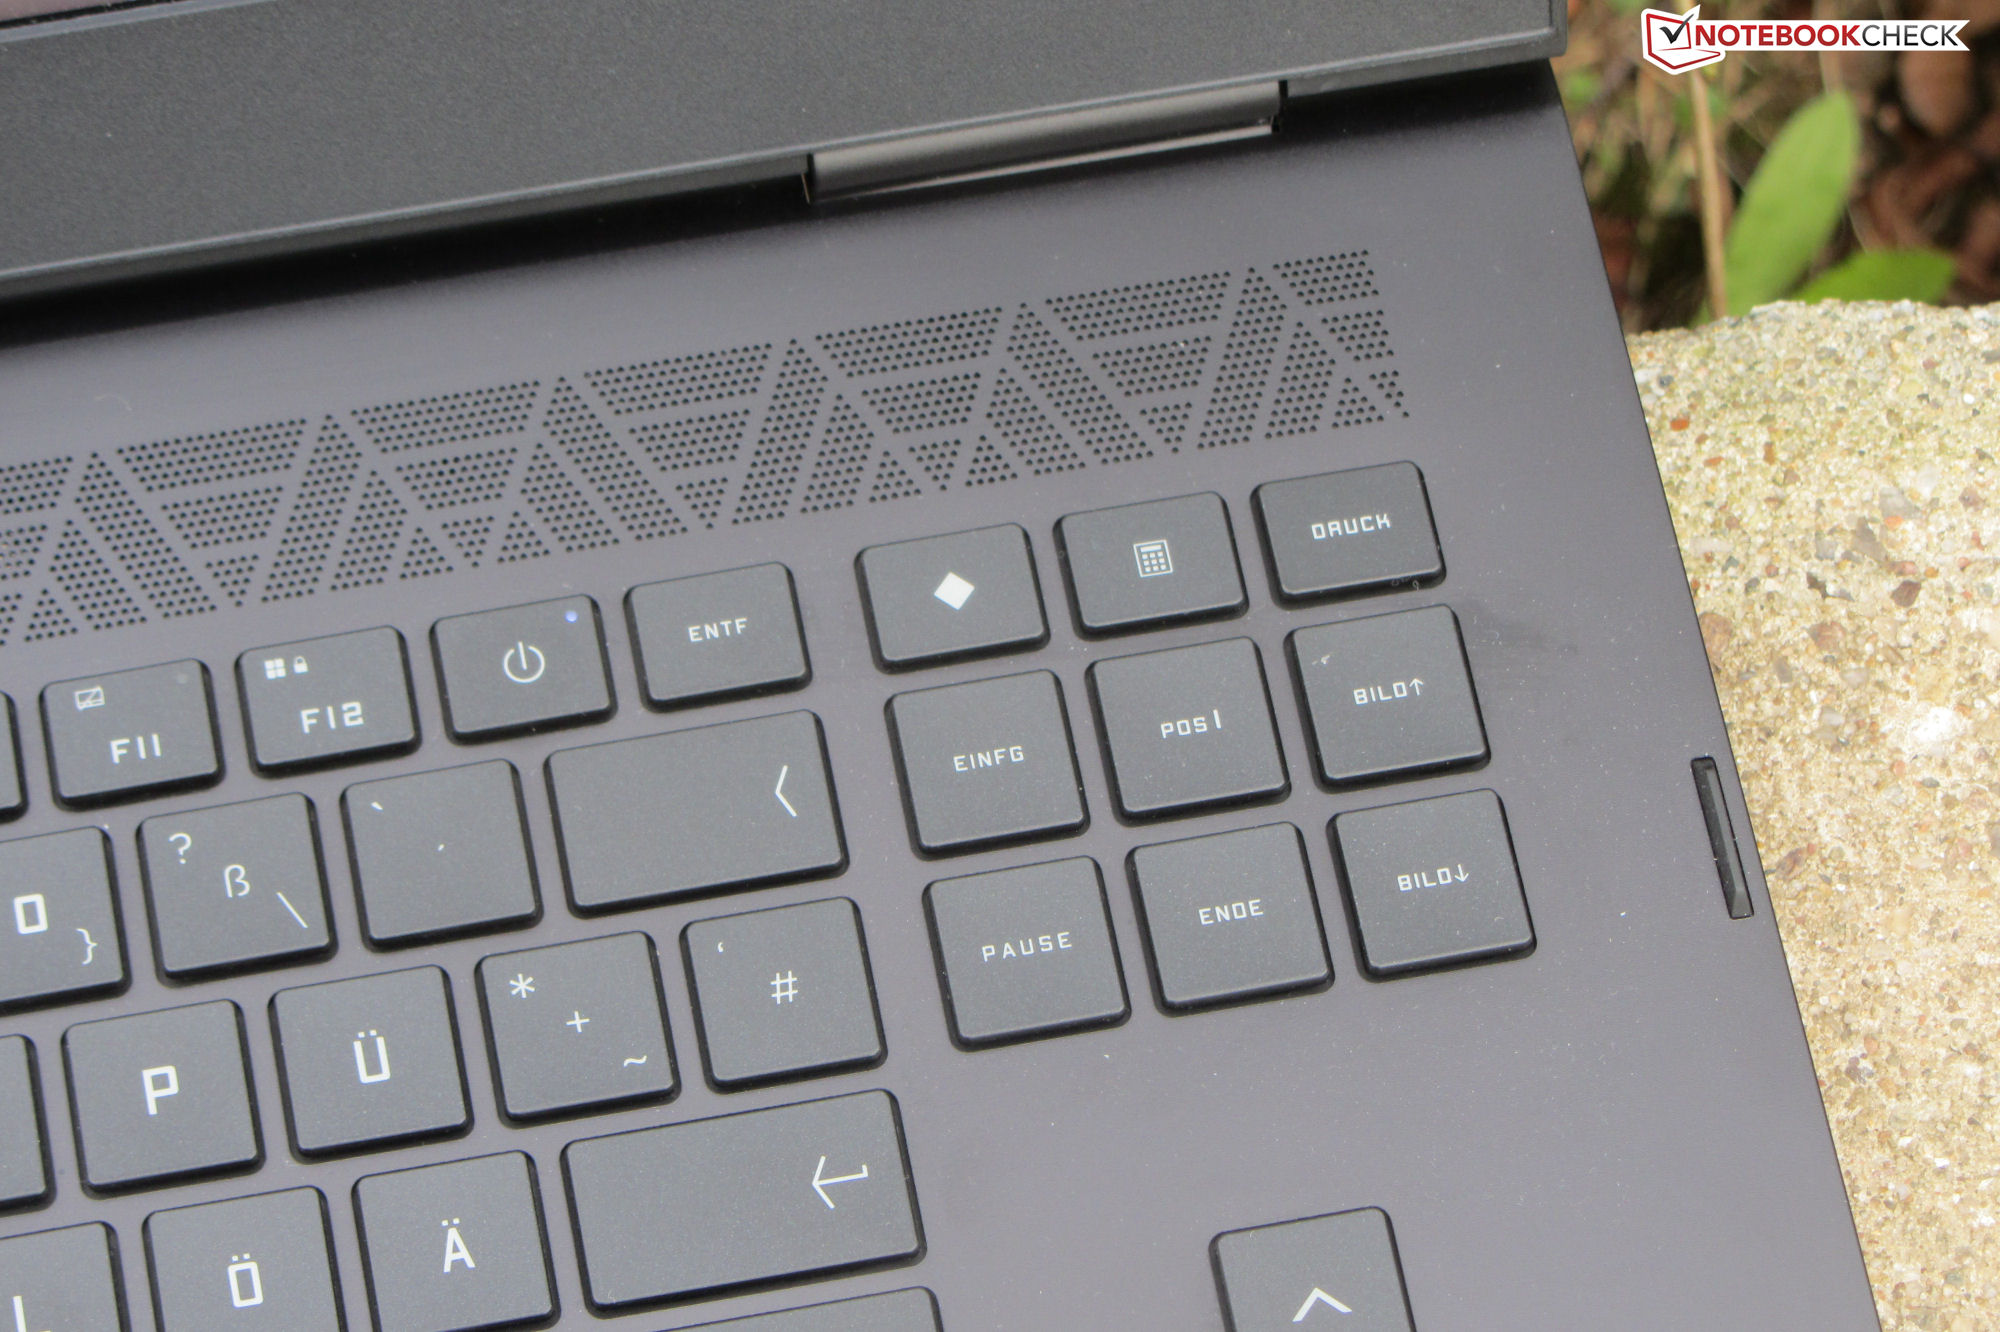
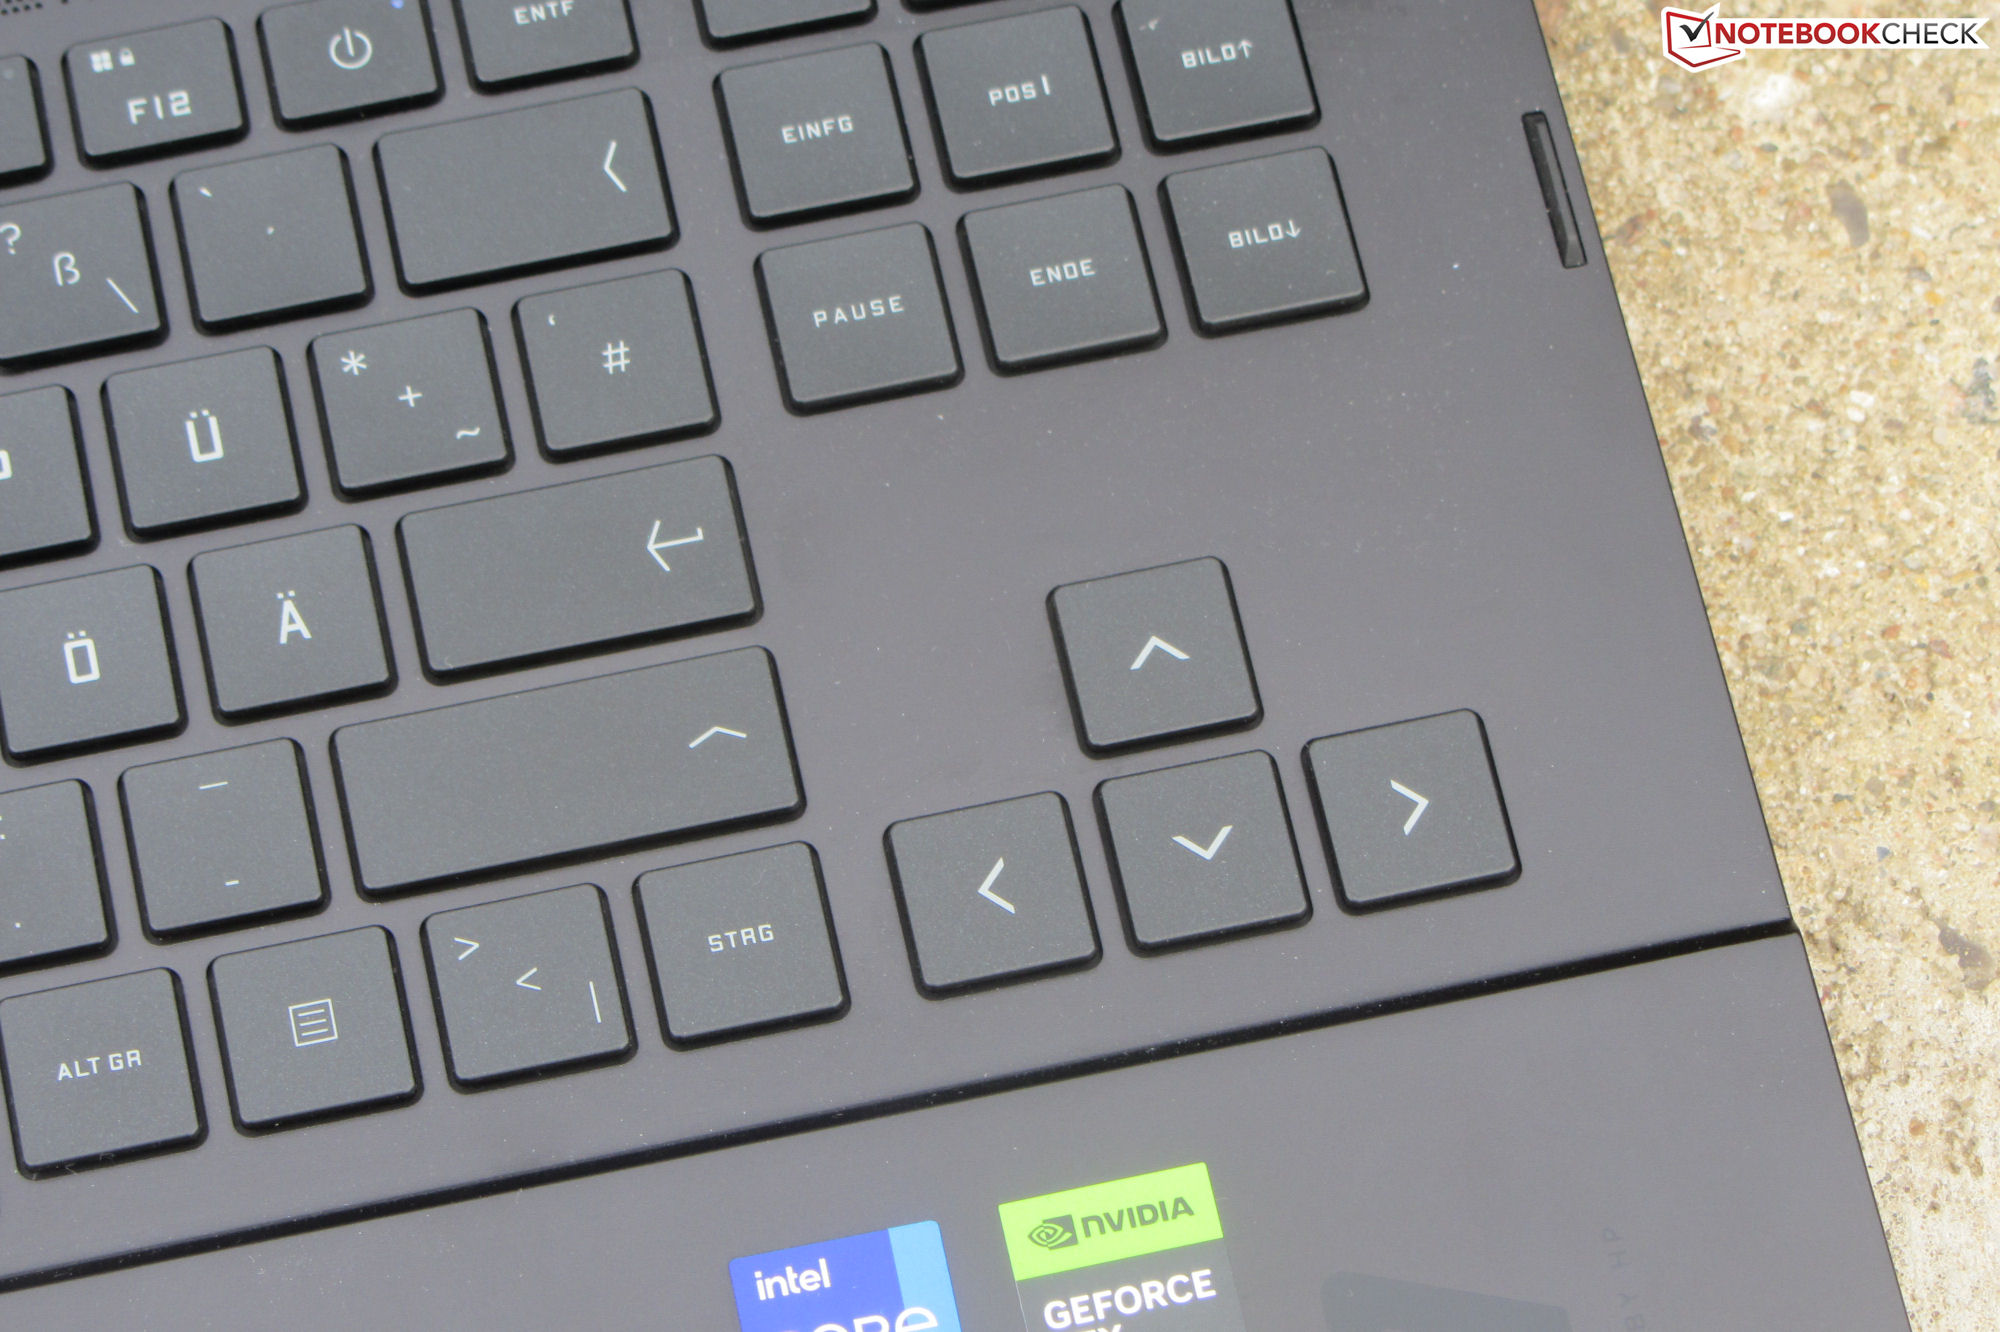
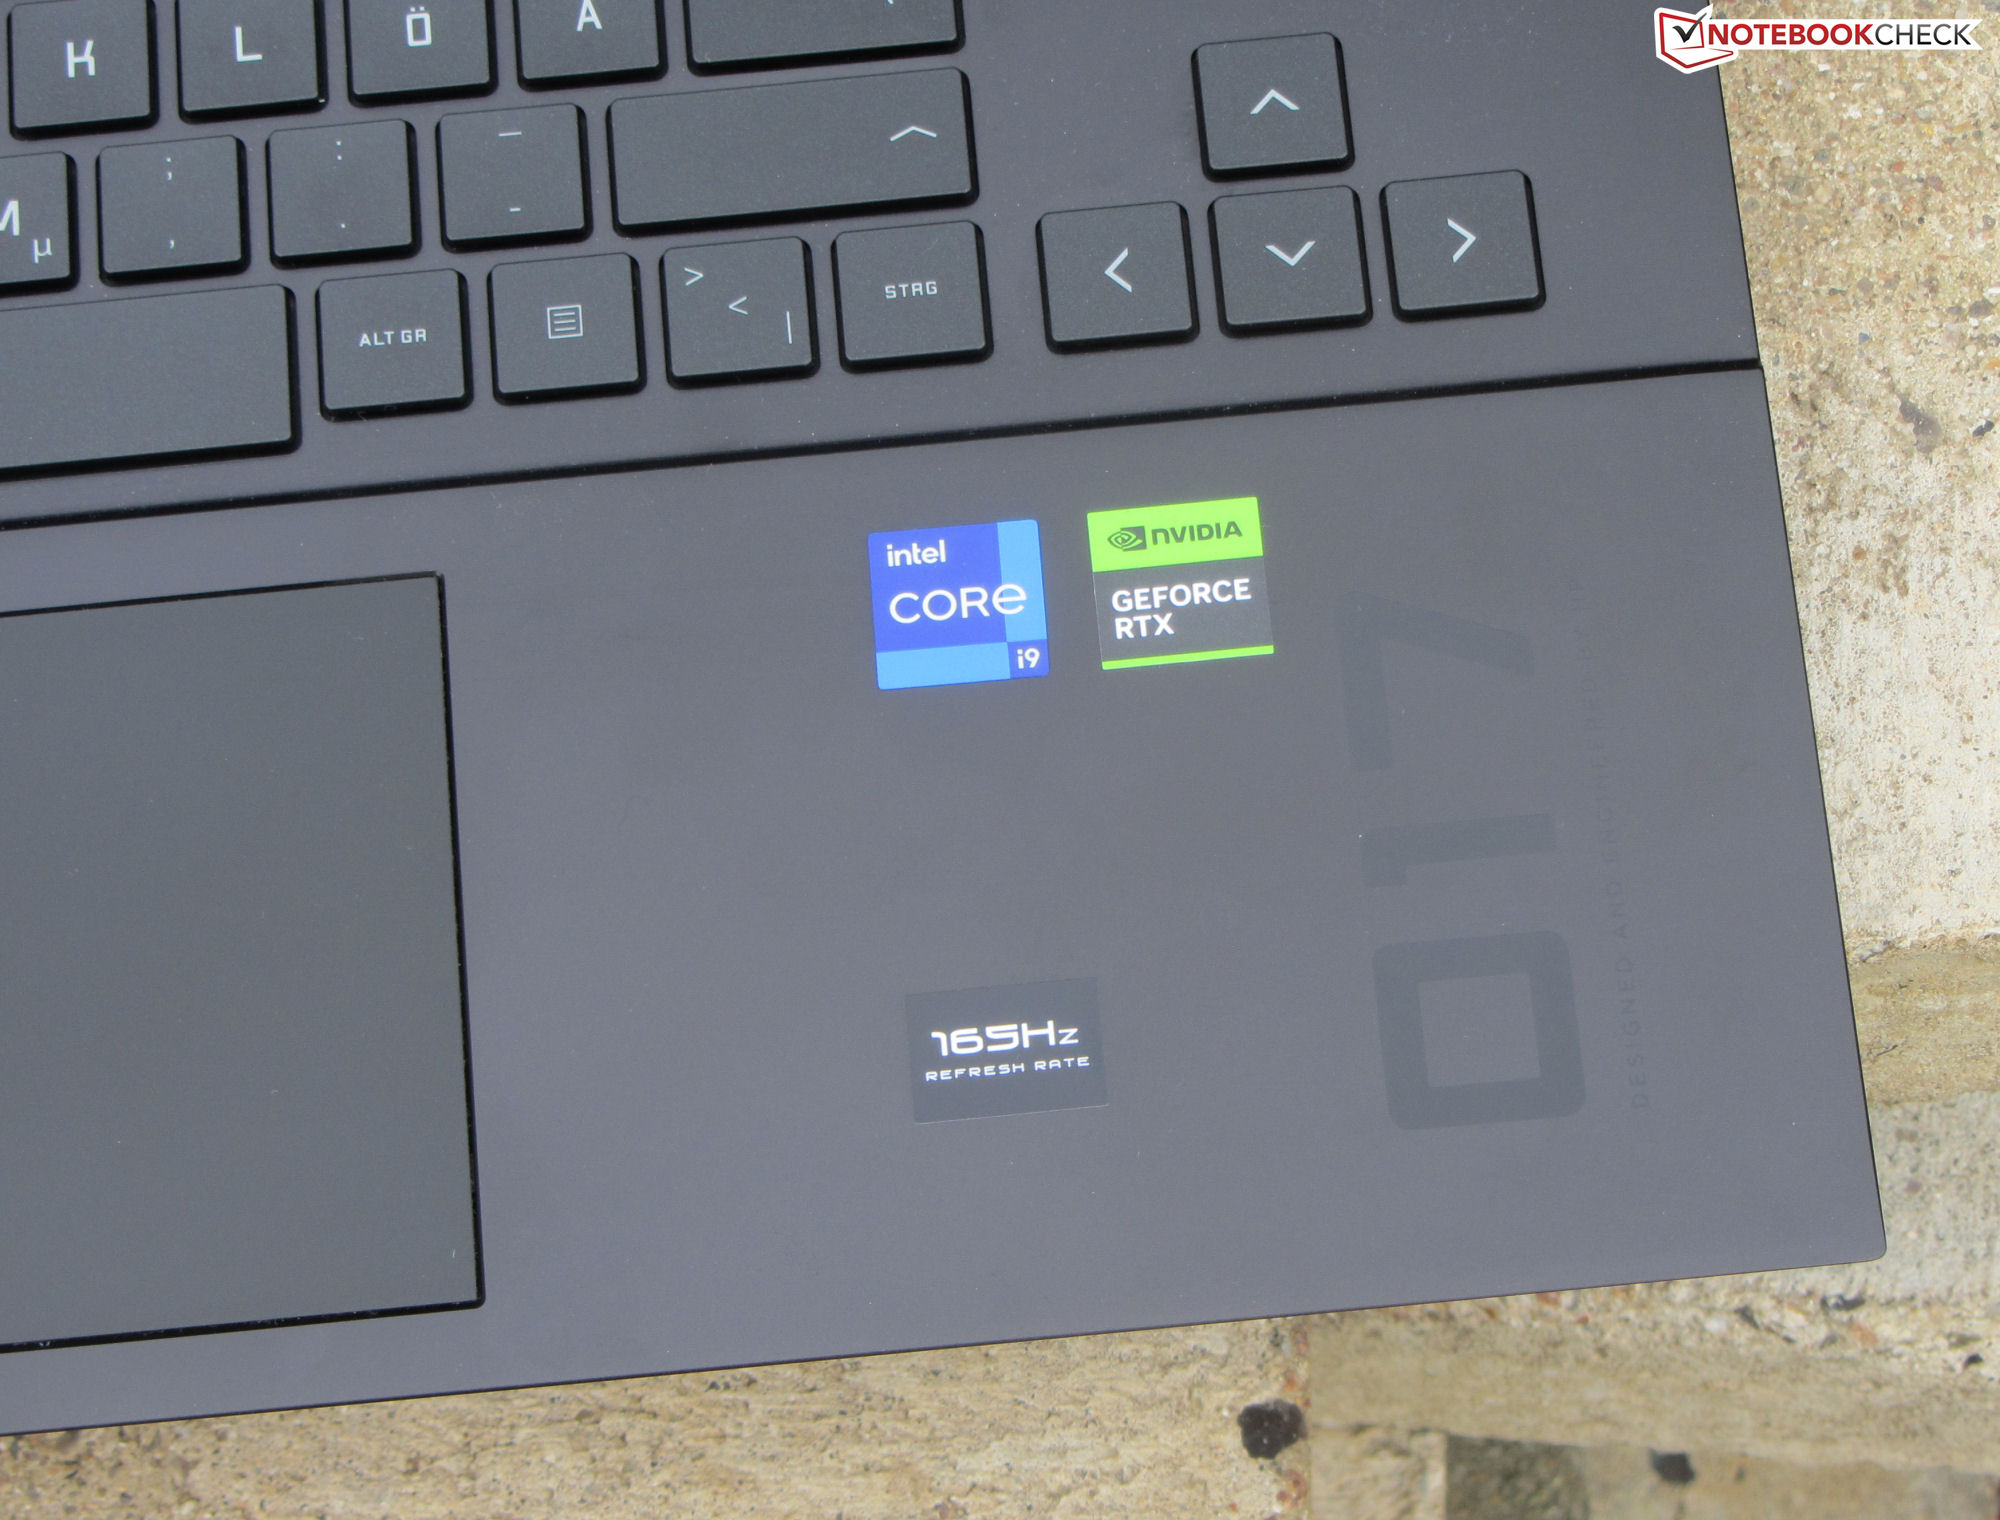
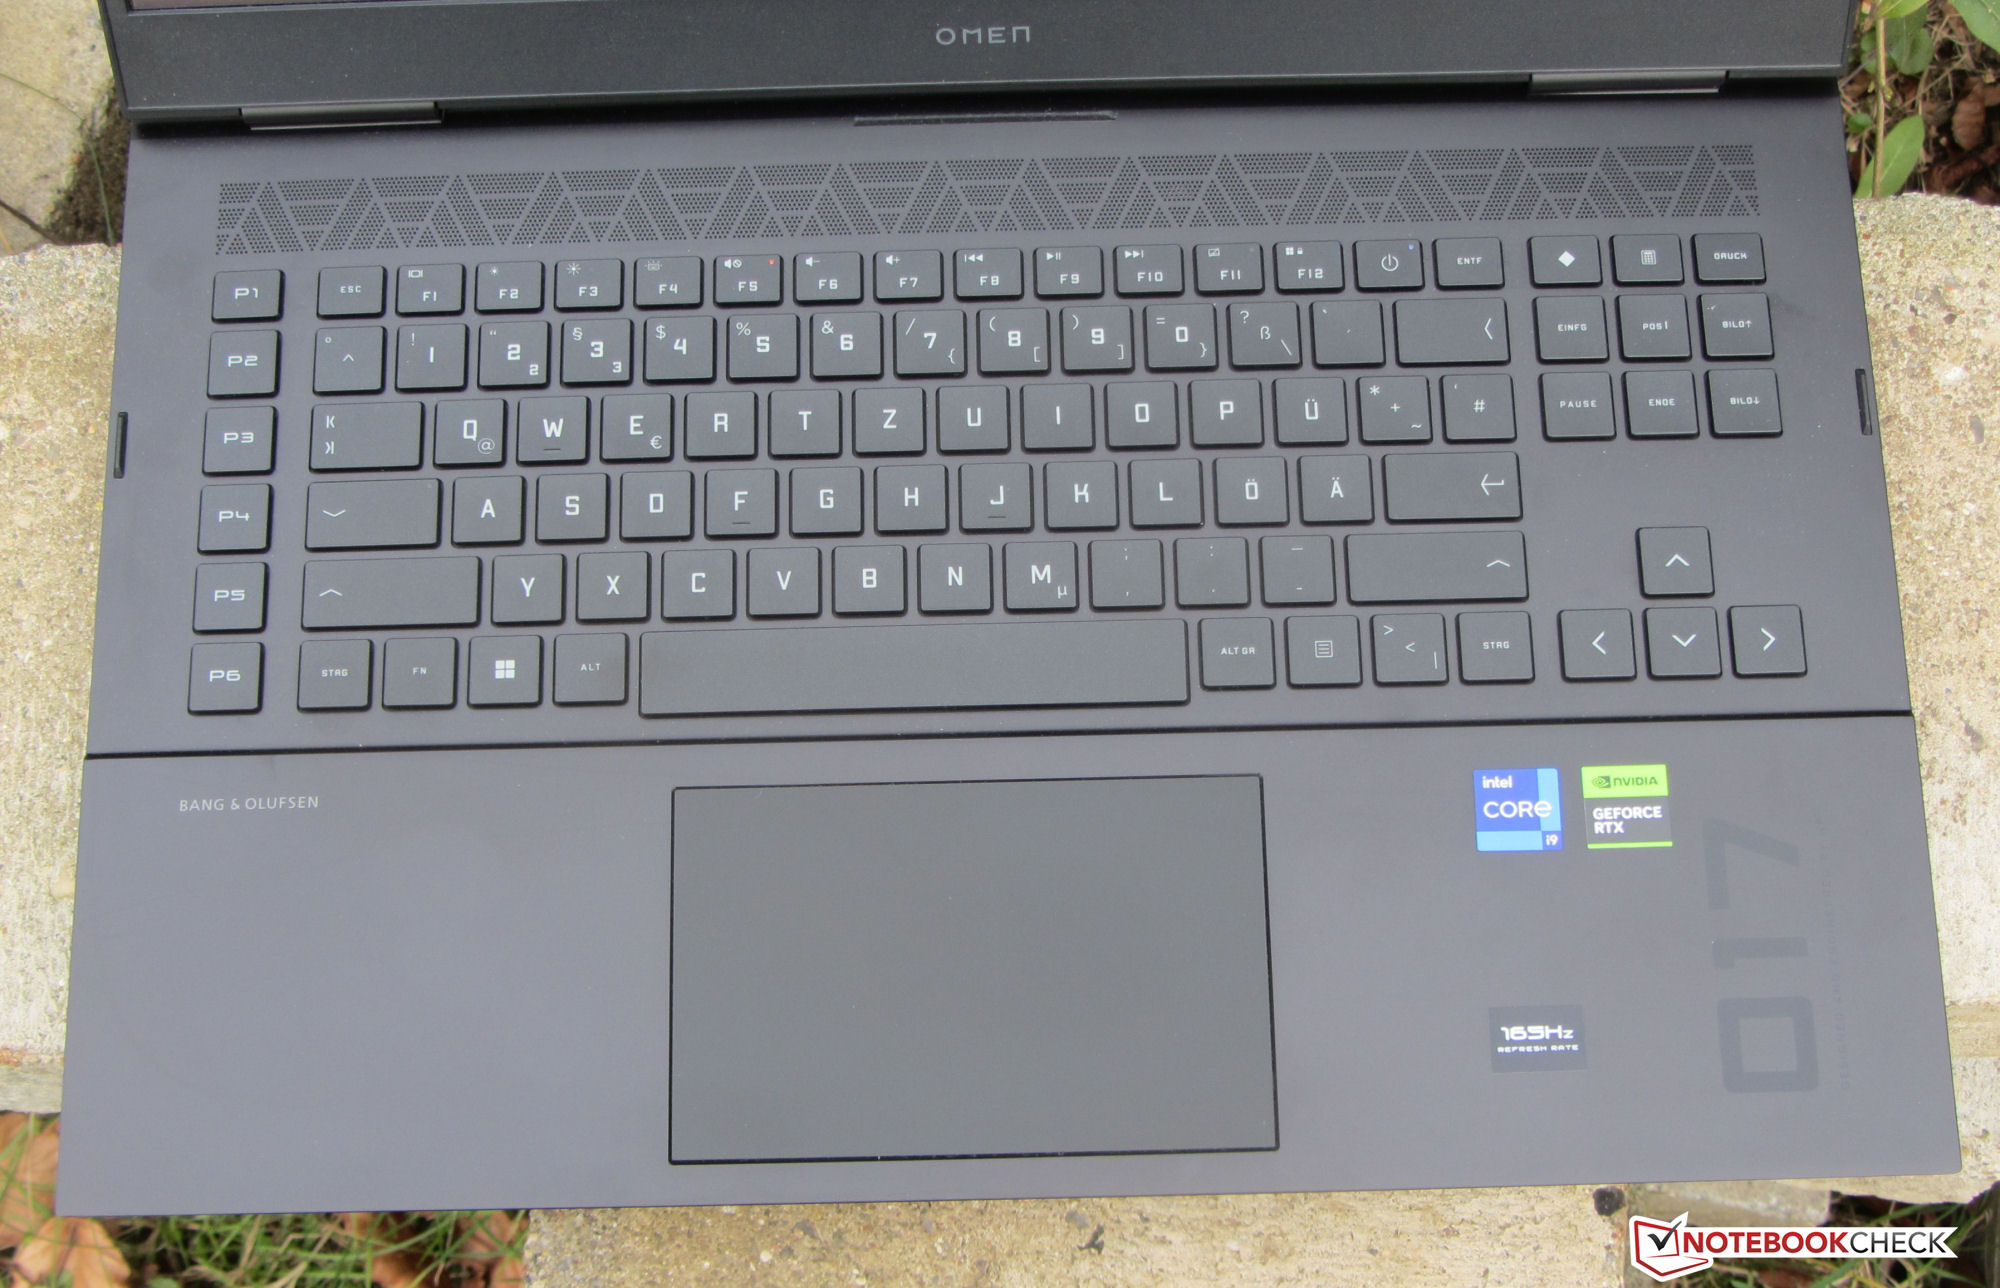
Puedes encontrar información sobre la carcasa, el equipo, los dispositivos de entrada y los altavoces en nuestro análisis del modelo predecesorque es idéntico en esos aspectos.
Posibles contendientes en la comparación
Valoración | Fecha | Modelo | Peso | Altura | Tamaño | Resolución | Precio |
|---|---|---|---|---|---|---|---|
| 85.4 % v7 (old) | 03/2023 | HP Omen 17-ck2097ng i9-13900HX, GeForce RTX 4080 Laptop GPU | 2.8 kg | 27 mm | 17.30" | 2560x1440 | |
| 86.1 % v7 (old) | 01/2023 | Alienware m17 R5 (R9 6900HX, RX 6850M XT) R9 6900HX, Radeon RX 6850M XT | 3.4 kg | 26.7 mm | 17.00" | 3840x2160 | |
| 91.2 % v7 (old) | 02/2023 | Razer Blade 16 Early 2023 i9-13950HX, GeForce RTX 4080 Laptop GPU | 2.4 kg | 21.99 mm | 16.00" | 2560x1600 | |
| 89.4 % v7 (old) | 02/2023 | Lenovo Legion Pro 7 16IRX8H i9-13900HX, GeForce RTX 4080 Laptop GPU | 2.7 kg | 26 mm | 16.00" | 2560x1600 | |
| 88.4 % v7 (old) | 03/2023 | Asus ROG Strix G16 G614JZ i9-13980HX, GeForce RTX 4080 Laptop GPU | 2.4 kg | 30.4 mm | 16.00" | 2560x1600 |
| SD Card Reader | |
| average JPG Copy Test (av. of 3 runs) | |
| Media de la clase Gaming (20.9 - 210, n=54, últimos 2 años) | |
| Razer Blade 16 Early 2023 (AV PRO microSD 128 GB V60) | |
| HP Omen 17-ck2097ng (AV PRO microSD 128 GB V60) | |
| maximum AS SSD Seq Read Test (1GB) | |
| Razer Blade 16 Early 2023 (AV PRO microSD 128 GB V60) | |
| Media de la clase Gaming (25.5 - 261, n=51, últimos 2 años) | |
| HP Omen 17-ck2097ng (AV PRO microSD 128 GB V60) | |


Pantalla - QHD con cobertura sRGB
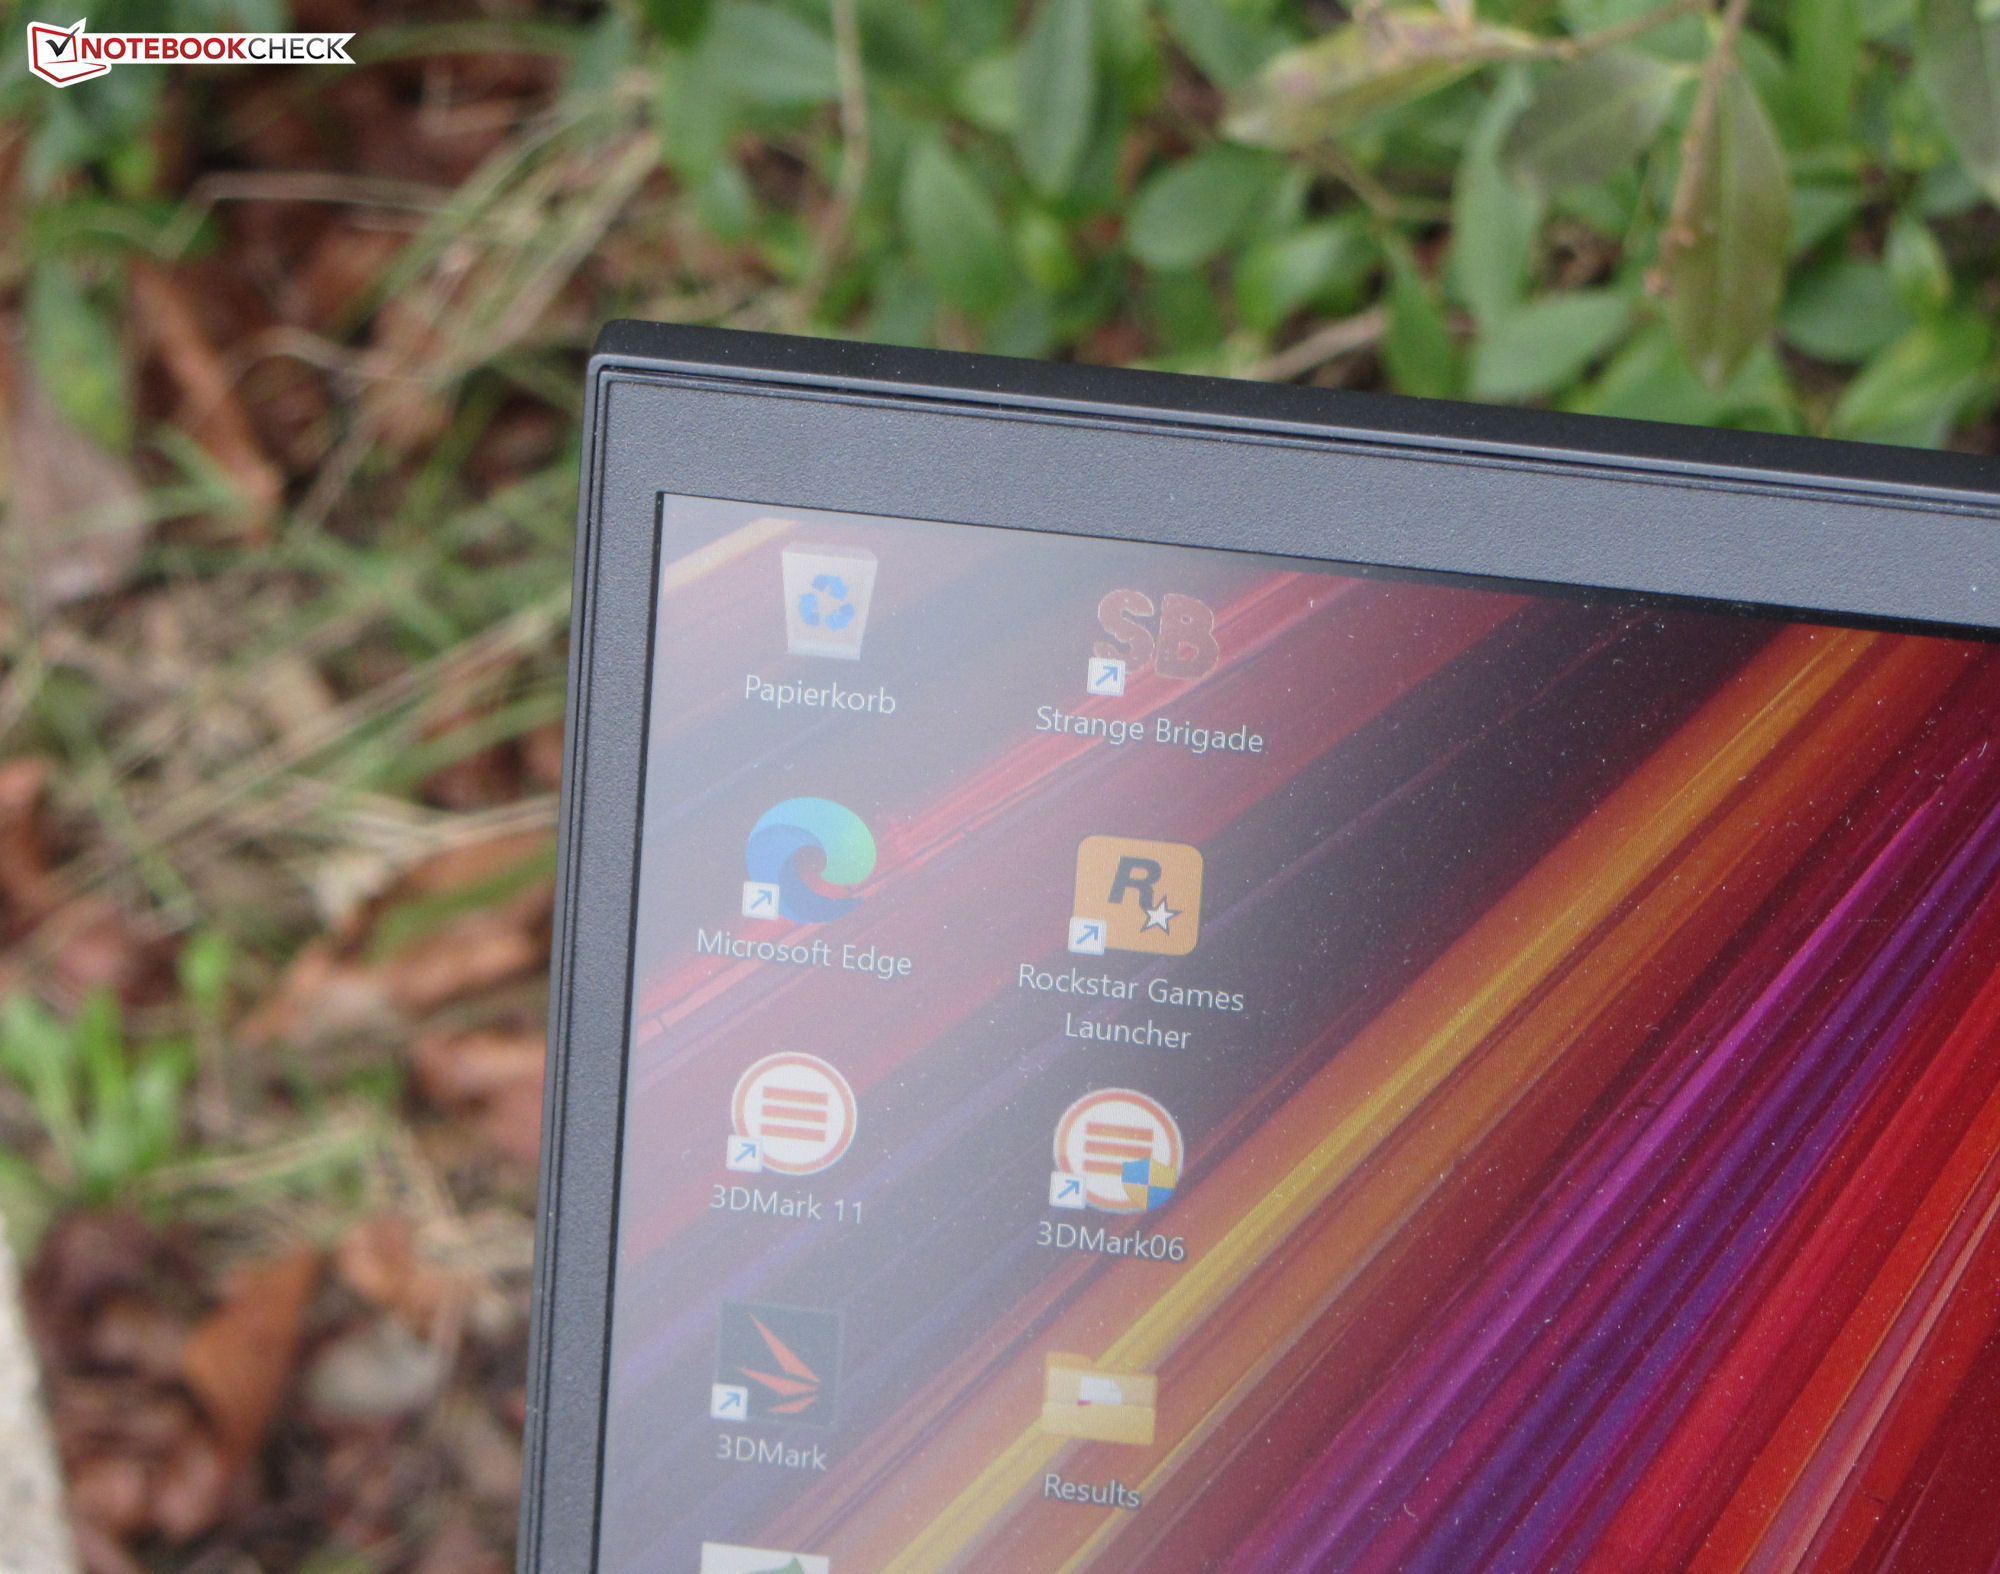
Mientras que a estas alturas muchos competidores prefieren usar pantallas 16:10, HP se mantiene fiel al formato 16:9 en el Omen. Un rasgo positivo es que el sensible panel de 165-Hz no muestra parpadeo PWM en ningún nivel de brillo.
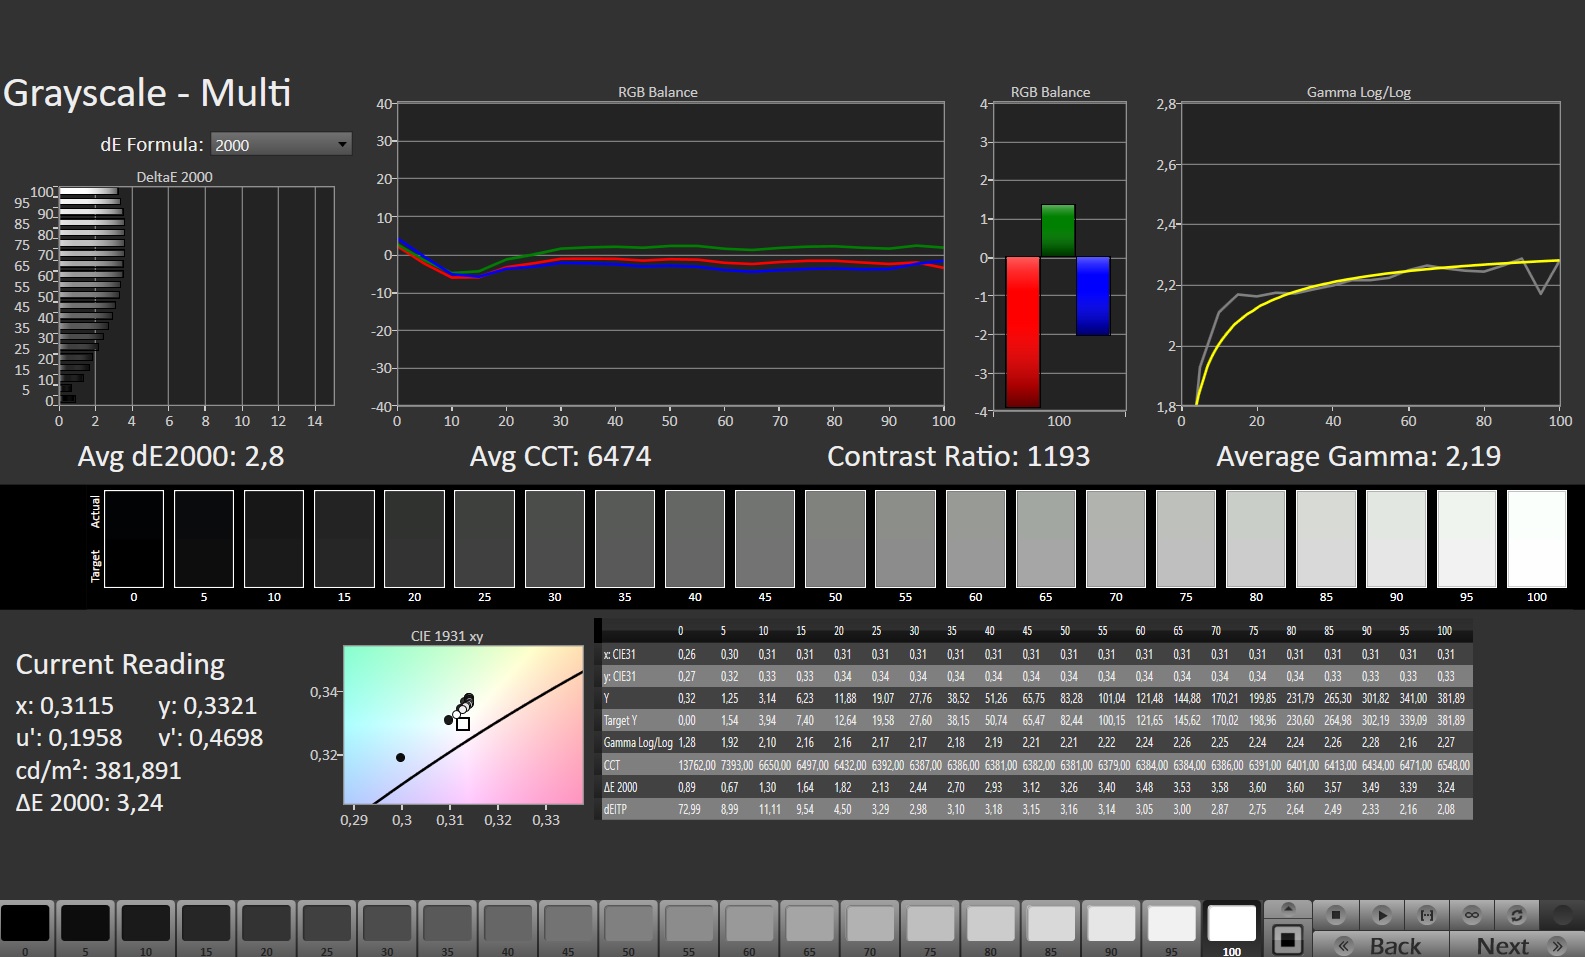
El brillo y el contraste de la pantalla mate de 17.3 pulgadas (2,560 x 1,440 pixels) cumplen los requisitos (> 300 cd/m² y 1,000:1). Sin embargo, la pantalla Omen ofrece el brillo más bajo entre las pantallas de nuestros competidores. El Legion 7 Pro tiene el panel más brillante.
| |||||||||||||||||||||||||
iluminación: 90 %
Brillo con batería: 371 cd/m²
Contraste: 1159:1 (Negro: 0.32 cd/m²)
ΔE ColorChecker Calman: 1.74 | ∀{0.5-29.43 Ø4.71}
calibrated: 1.01
ΔE Greyscale Calman: 2.8 | ∀{0.09-98 Ø4.96}
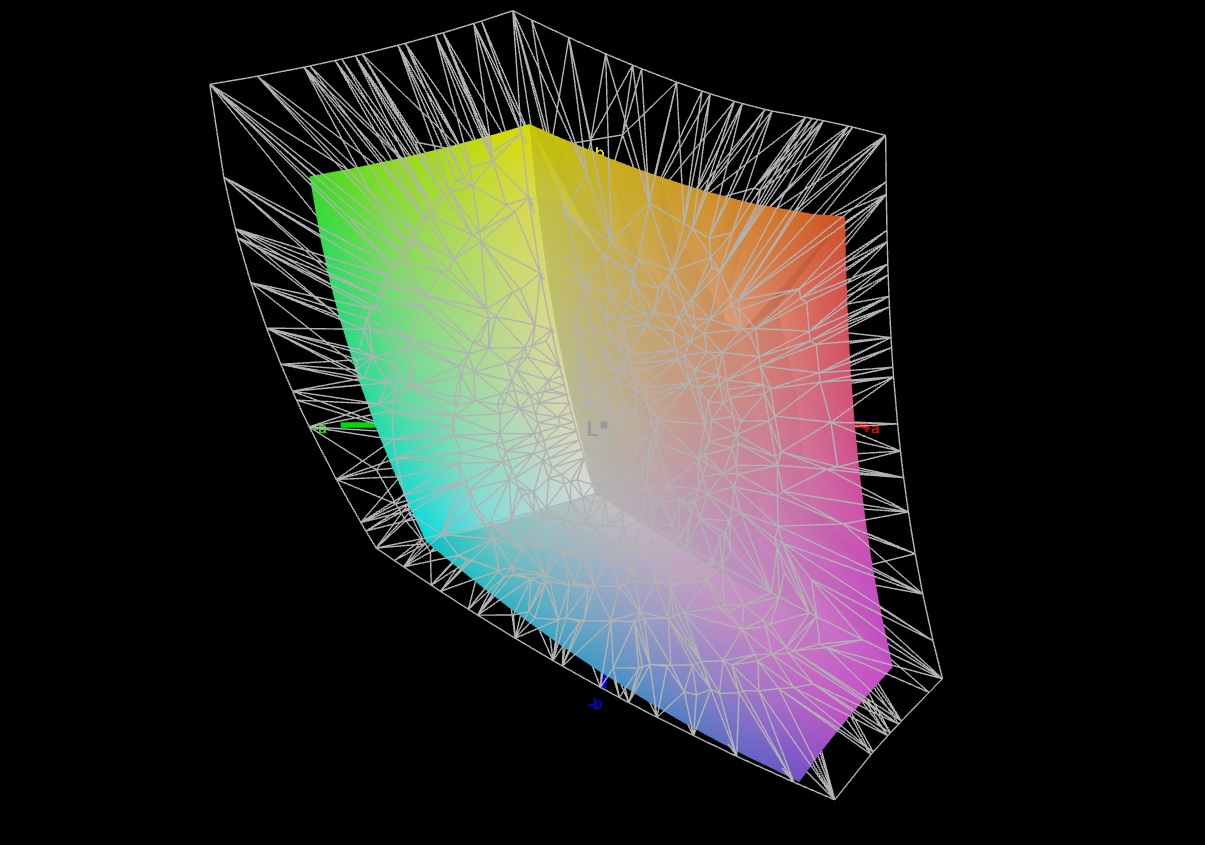
69.6% AdobeRGB 1998 (Argyll 3D)
97.6% sRGB (Argyll 3D)
67.4% Display P3 (Argyll 3D)
Gamma: 2.19
CCT: 6474 K
| HP Omen 17-ck2097ng BOE BOE09BF, IPS, 2560x1440, 17.3" | Alienware m17 R5 (R9 6900HX, RX 6850M XT) AU Optronics AUODBA3, IPS, 3840x2160, 17" | Razer Blade 16 Early 2023 CSOT T3 MNG007DA4-1, IPS, 2560x1600, 16" | Lenovo Legion Pro 7 16IRX8H MNG007DA2-3 (CSO1628), IPS, 2560x1600, 16" | Asus ROG Strix G16 G614JZ TL160ADMP03-0, IPS, 2560x1600, 16" | HP Omen 17-ck1075ng BOE09EE, IPS, 1920x1080, 17.3" | |
|---|---|---|---|---|---|---|
| Display | 24% | 26% | 2% | 23% | -11% | |
| Display P3 Coverage (%) | 67.4 | 97.2 44% | 98.5 46% | 69.1 3% | 97 44% | 59.03 -12% |
| sRGB Coverage (%) | 97.6 | 99.6 2% | 100 2% | 99.7 2% | 99.9 2% | 87.46 -10% |
| AdobeRGB 1998 Coverage (%) | 69.6 | 88.4 27% | 89.7 29% | 71.2 2% | 84.9 22% | 61.04 -12% |
| Response Times | -18% | 12% | 28% | 47% | -1% | |
| Response Time Grey 50% / Grey 80% * (ms) | 15.6 ? | 16.4 ? -5% | 6.6 ? 58% | 12.3 ? 21% | 5.1 ? 67% | 14 ? 10% |
| Response Time Black / White * (ms) | 8.9 ? | 11.6 ? -30% | 12 ? -35% | 5.9 ? 34% | 6.6 ? 26% | 10 ? -12% |
| PWM Frequency (Hz) | 100 ? | |||||
| Screen | -88% | -12% | 25% | 3% | -15% | |
| Brightness middle (cd/m²) | 371 | 484 30% | 456.8 23% | 511 38% | 470 27% | 321 -13% |
| Brightness (cd/m²) | 350 | 449 28% | 437 25% | 469 34% | 459 31% | 302 -14% |
| Brightness Distribution (%) | 90 | 87 -3% | 83 -8% | 86 -4% | 93 3% | 84 -7% |
| Black Level * (cd/m²) | 0.32 | 0.55 -72% | 0.35 -9% | 0.4 -25% | 0.42 -31% | 0.41 -28% |
| Contrast (:1) | 1159 | 880 -24% | 1305 13% | 1278 10% | 1119 -3% | 783 -32% |
| Colorchecker dE 2000 * | 1.74 | 4.8 -176% | 3.7 -113% | 0.95 45% | 1.86 -7% | 1.62 7% |
| Colorchecker dE 2000 max. * | 3.59 | 7.48 -108% | 6.42 -79% | 2.07 42% | 3.87 -8% | 4.08 -14% |
| Colorchecker dE 2000 calibrated * | 1.01 | 4.74 -369% | 0.66 35% | 0.91 10% | 0.93 8% | 1.93 -91% |
| Greyscale dE 2000 * | 2.8 | 5.5 -96% | 2.6 7% | 0.6 79% | 2.7 4% | 1.24 56% |
| Gamma | 2.19 100% | 2.42 91% | 2.3 96% | 2.176 101% | 2.246 98% | 2.41 91% |
| CCT | 6474 100% | 6148 106% | 6108 106% | 6545 99% | 6711 97% | 6261 104% |
| Media total (Programa/Opciones) | -27% /
-54% | 9% /
-0% | 18% /
21% | 24% /
13% | -9% /
-12% |
* ... más pequeño es mejor
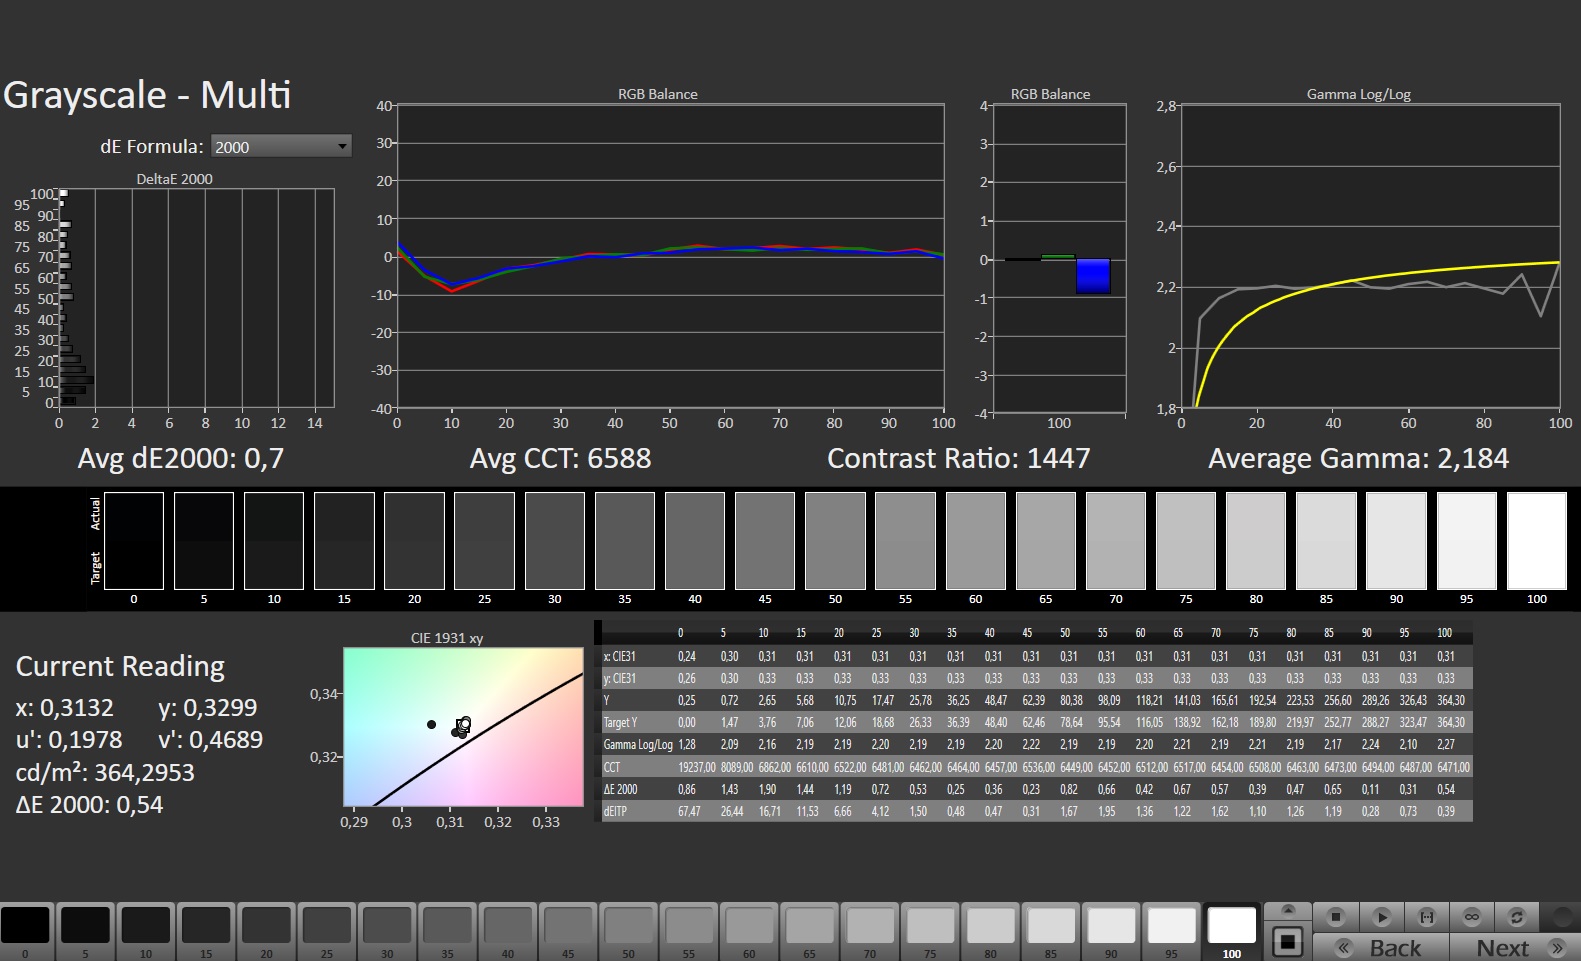
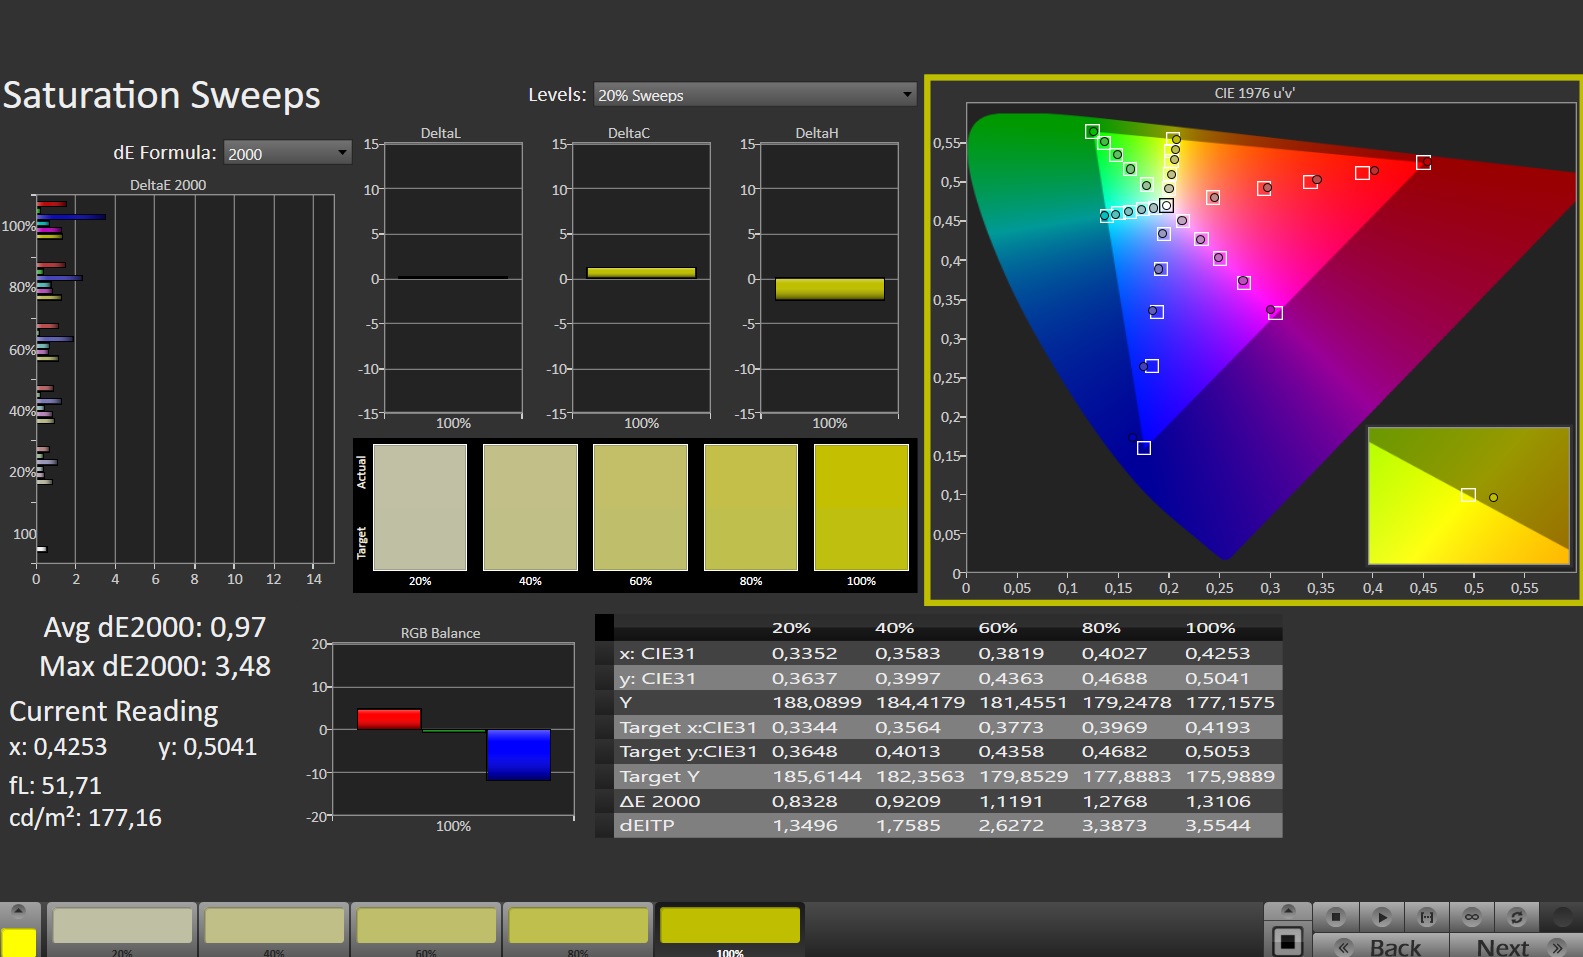
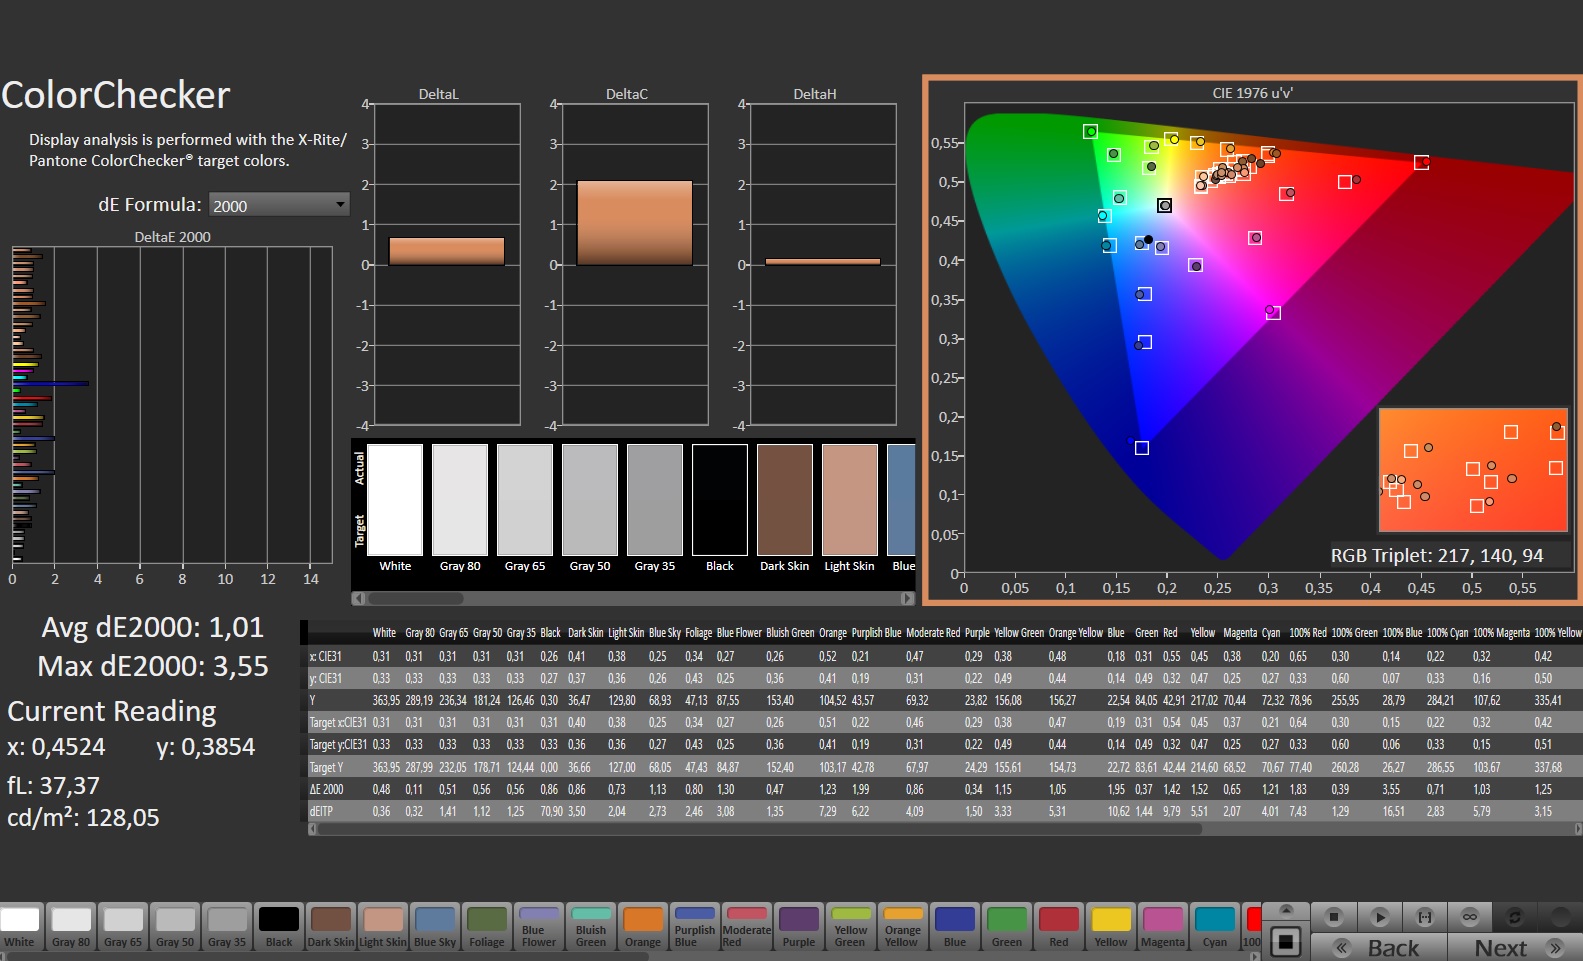
En el estado de entrega, la reproducción del color ya es muy buena, y se puede mejorar aún más con una calibración, que hace que la desviación del color baje de 1,74 a 1 (valor objetivo < 3). Además, la escala de grises también se reproduce de forma más uniforme.
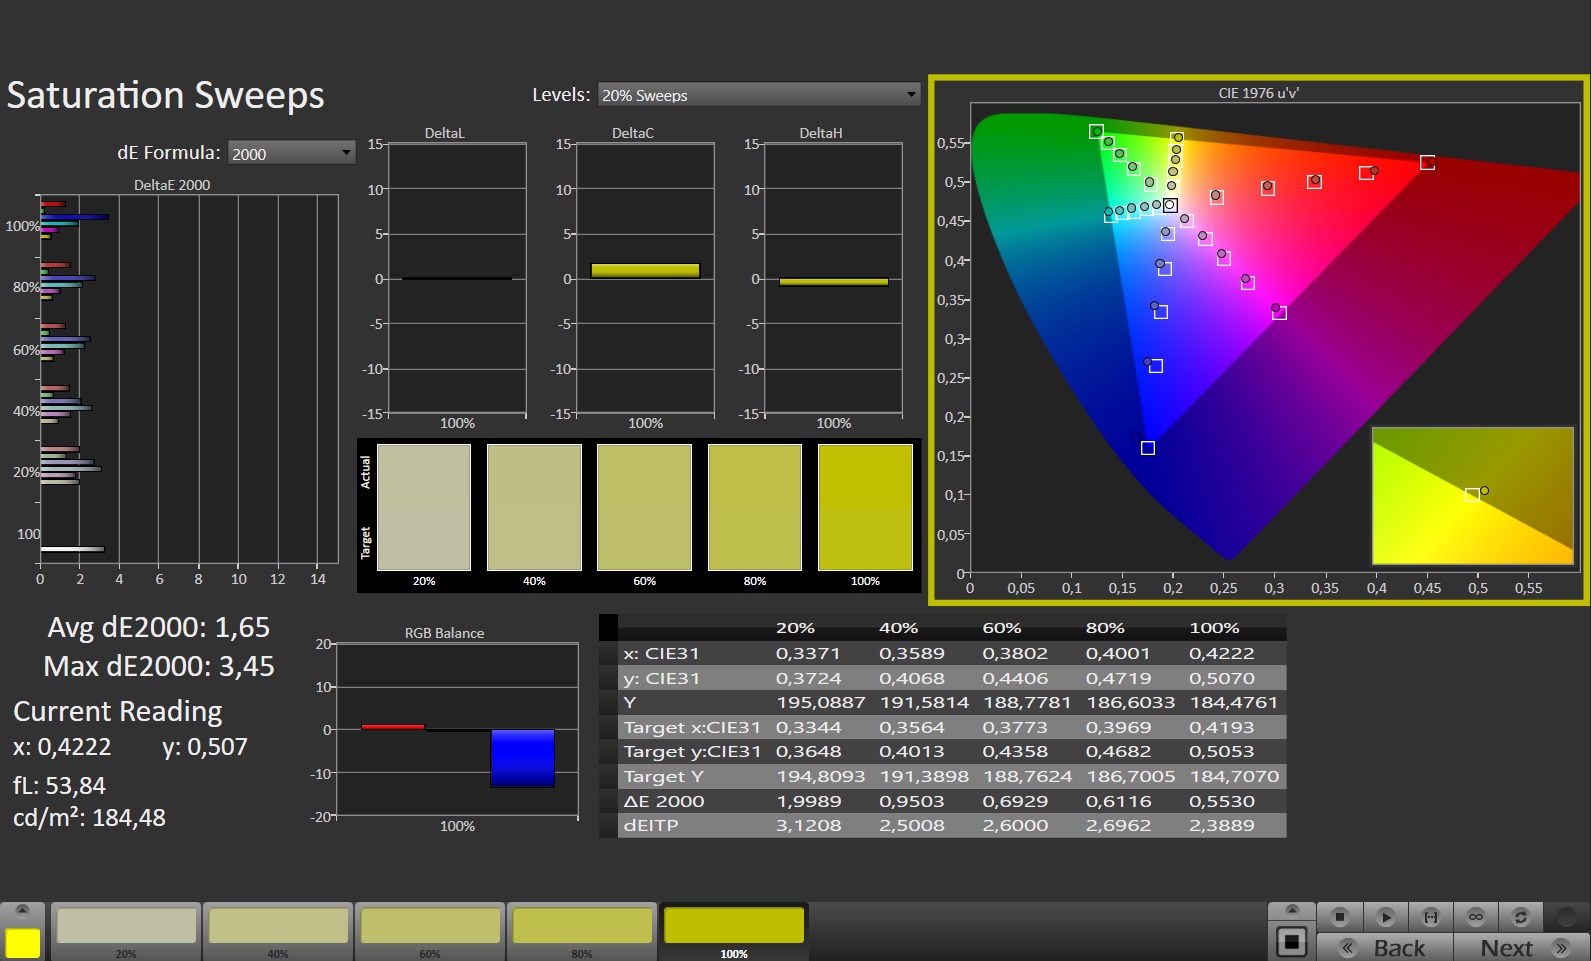
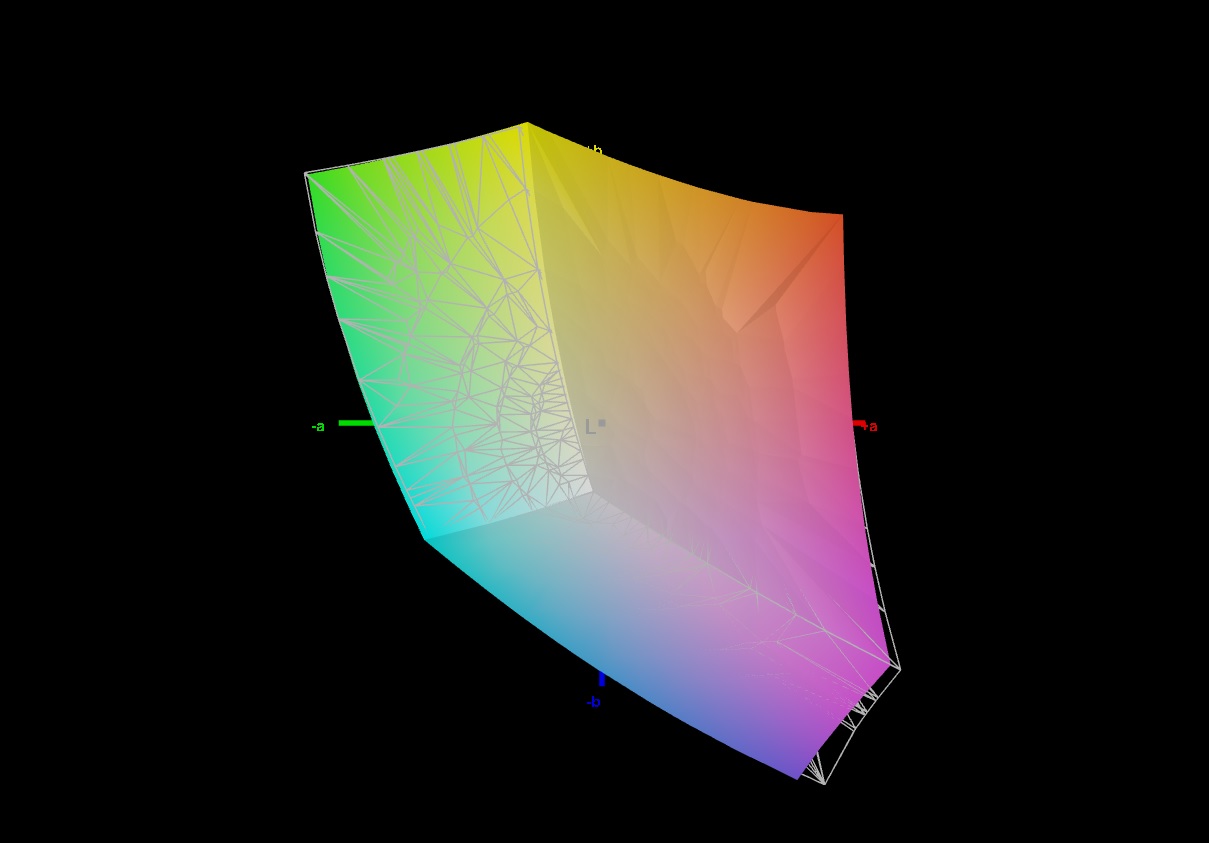
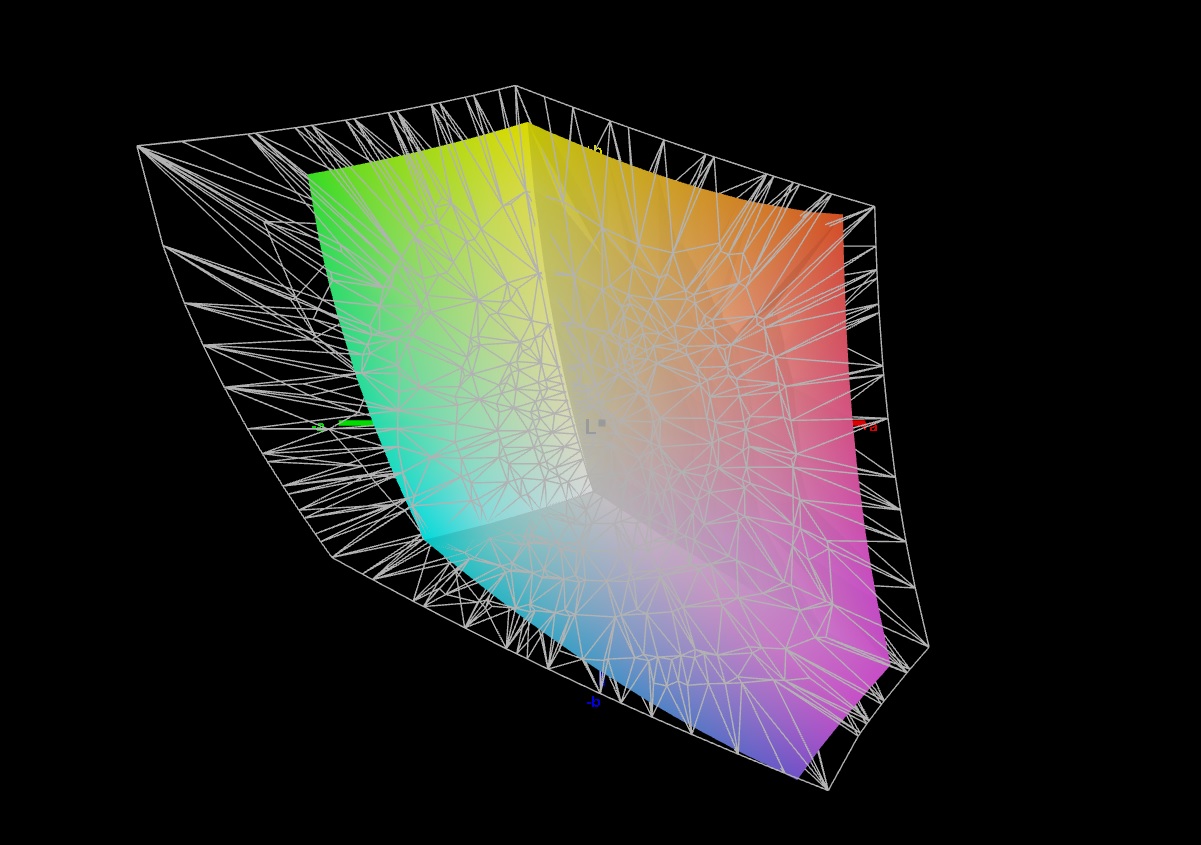
La pantalla es capaz de cubrir el espacio de color sRGB casi por completo, pero no los espacios de color AdobeRGB y DCI-P3. Las pantallas de la mayoría de los competidores obtienen mejores resultados aquí, y sólo el panel del Legionen el mismo nivel.

Tiempos de respuesta del display
| ↔ Tiempo de respuesta de Negro a Blanco | ||
|---|---|---|
| 8.9 ms ... subida ↗ y bajada ↘ combinada | ↗ 3.7 ms subida | 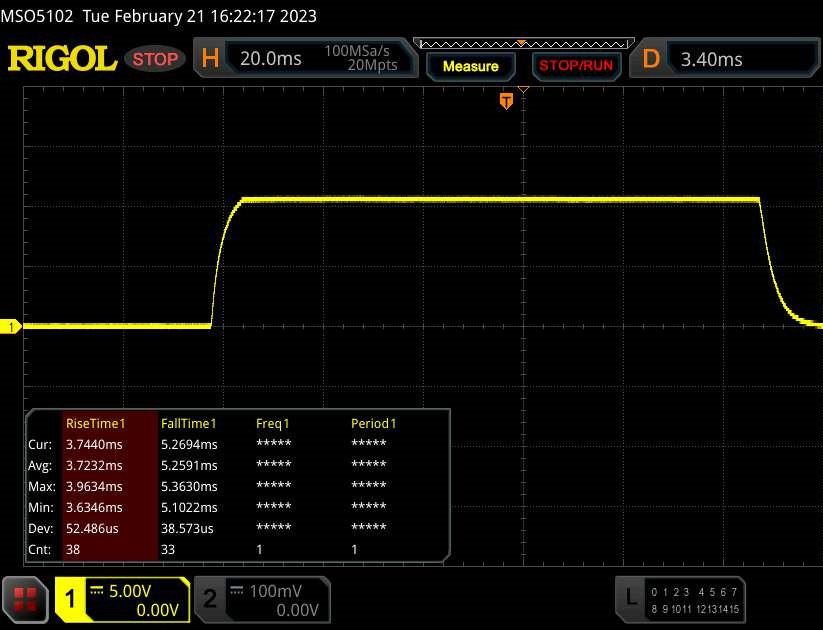 |
| ↘ 5.2 ms bajada | ||
| La pantalla mostró tiempos de respuesta rápidos en nuestros tests y debería ser adecuada para juegos. En comparación, todos los dispositivos de prueba van de ##min### (mínimo) a 240 (máximo) ms. » 25 % de todos los dispositivos son mejores. Esto quiere decir que el tiempo de respuesta medido es mejor que la media (19.8 ms) de todos los dispositivos testados. | ||
| ↔ Tiempo de respuesta 50% Gris a 80% Gris | ||
| 15.6 ms ... subida ↗ y bajada ↘ combinada | ↗ 7.3 ms subida | 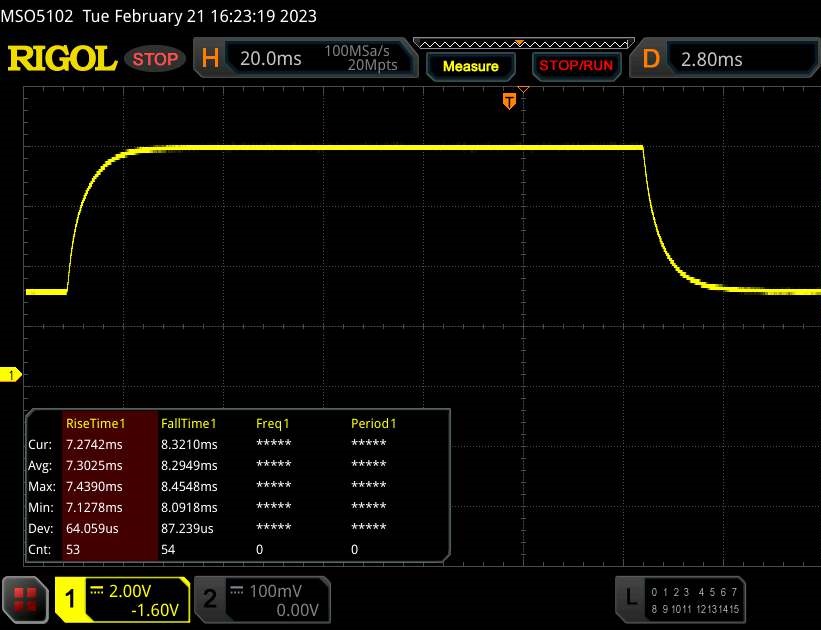 |
| ↘ 8.3 ms bajada | ||
| La pantalla mostró buenos tiempos de respuesta en nuestros tests pero podría ser demasiado lenta para los jugones competitivos. En comparación, todos los dispositivos de prueba van de ##min### (mínimo) a 636 (máximo) ms. » 30 % de todos los dispositivos son mejores. Esto quiere decir que el tiempo de respuesta medido es mejor que la media (31 ms) de todos los dispositivos testados. | ||
Parpadeo de Pantalla / PWM (Pulse-Width Modulation)
| Parpadeo de Pantalla / PWM no detectado | 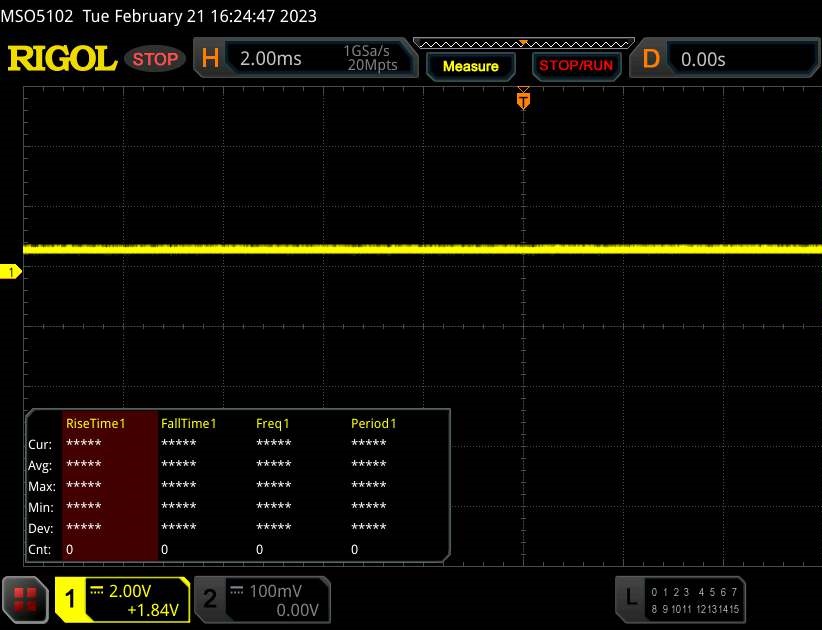 | ||
Comparación: 52 % de todos los dispositivos testados no usaron PWM para atenuar el display. Si se usó, medimos una media de 7754 (mínimo: 5 - máxmo: 343500) Hz. | |||
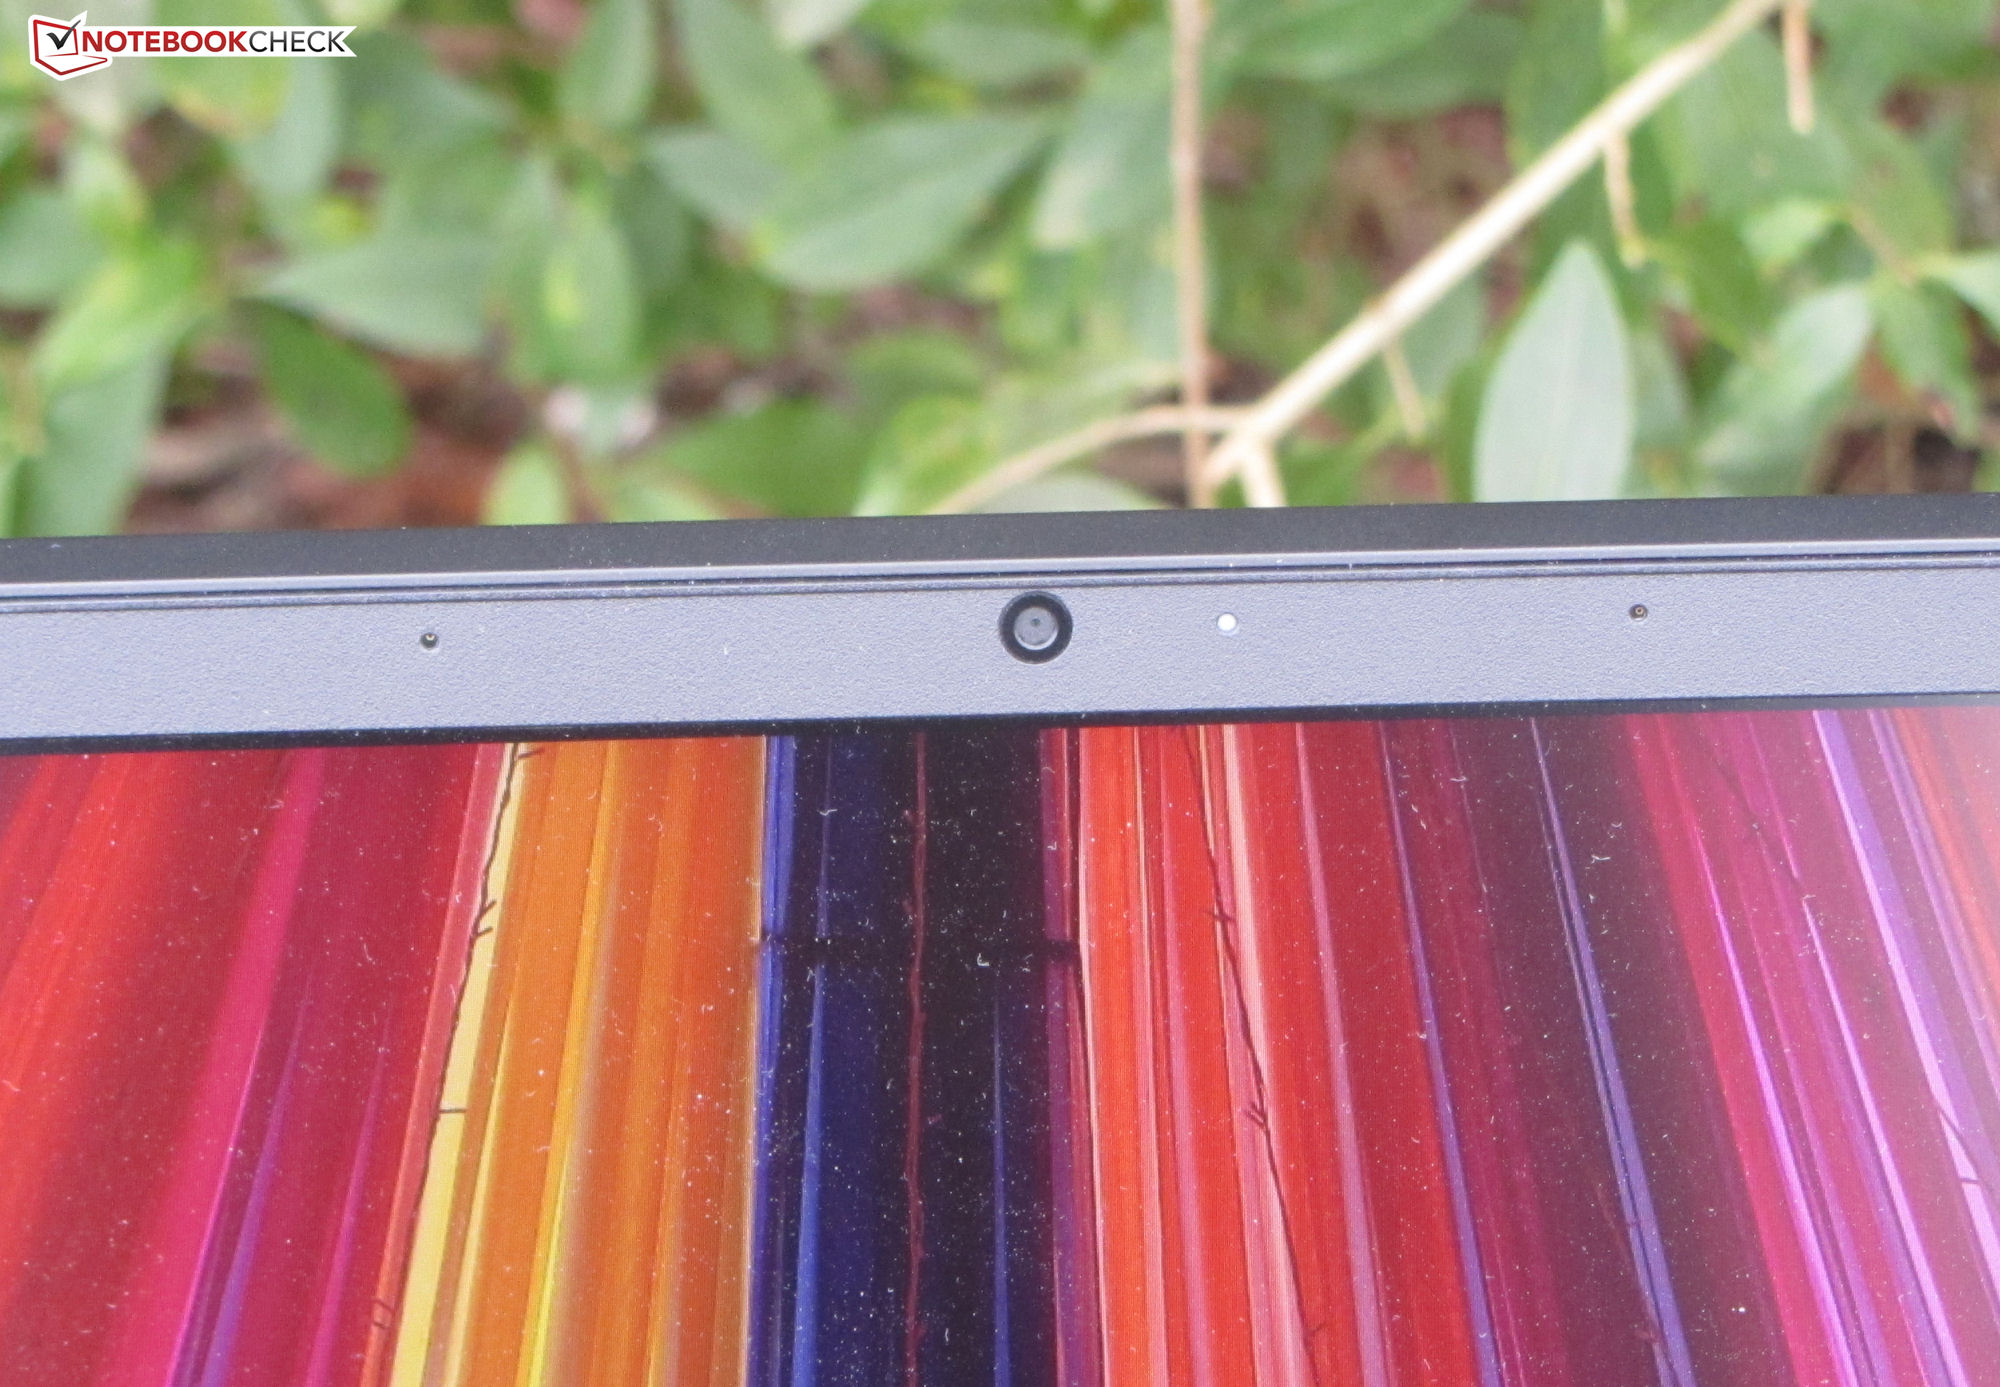
Los ángulos de visión del panel IPS son estables, por lo que se puede leer desde cualquier ángulo de visión. La pantalla se puede leer en exteriores, siempre que no haya luz solar directa.

Rendimiento - El portátil HP ofrece un hardware potente
Con el Omen 17, Hewlett Packard ofrece un portátil de 17,3 pulgadas orientado a los juegos QHD, pero que también da la talla en otras áreas de aplicación que requieren un alto rendimiento. El rendimiento informático necesario lo ofrecen los chips Raptor Lake y Ada Lovelace. Nuestra unidad de pruebas del Omen está disponible por unos 3,300 Euros.
Condiciones de la prueba
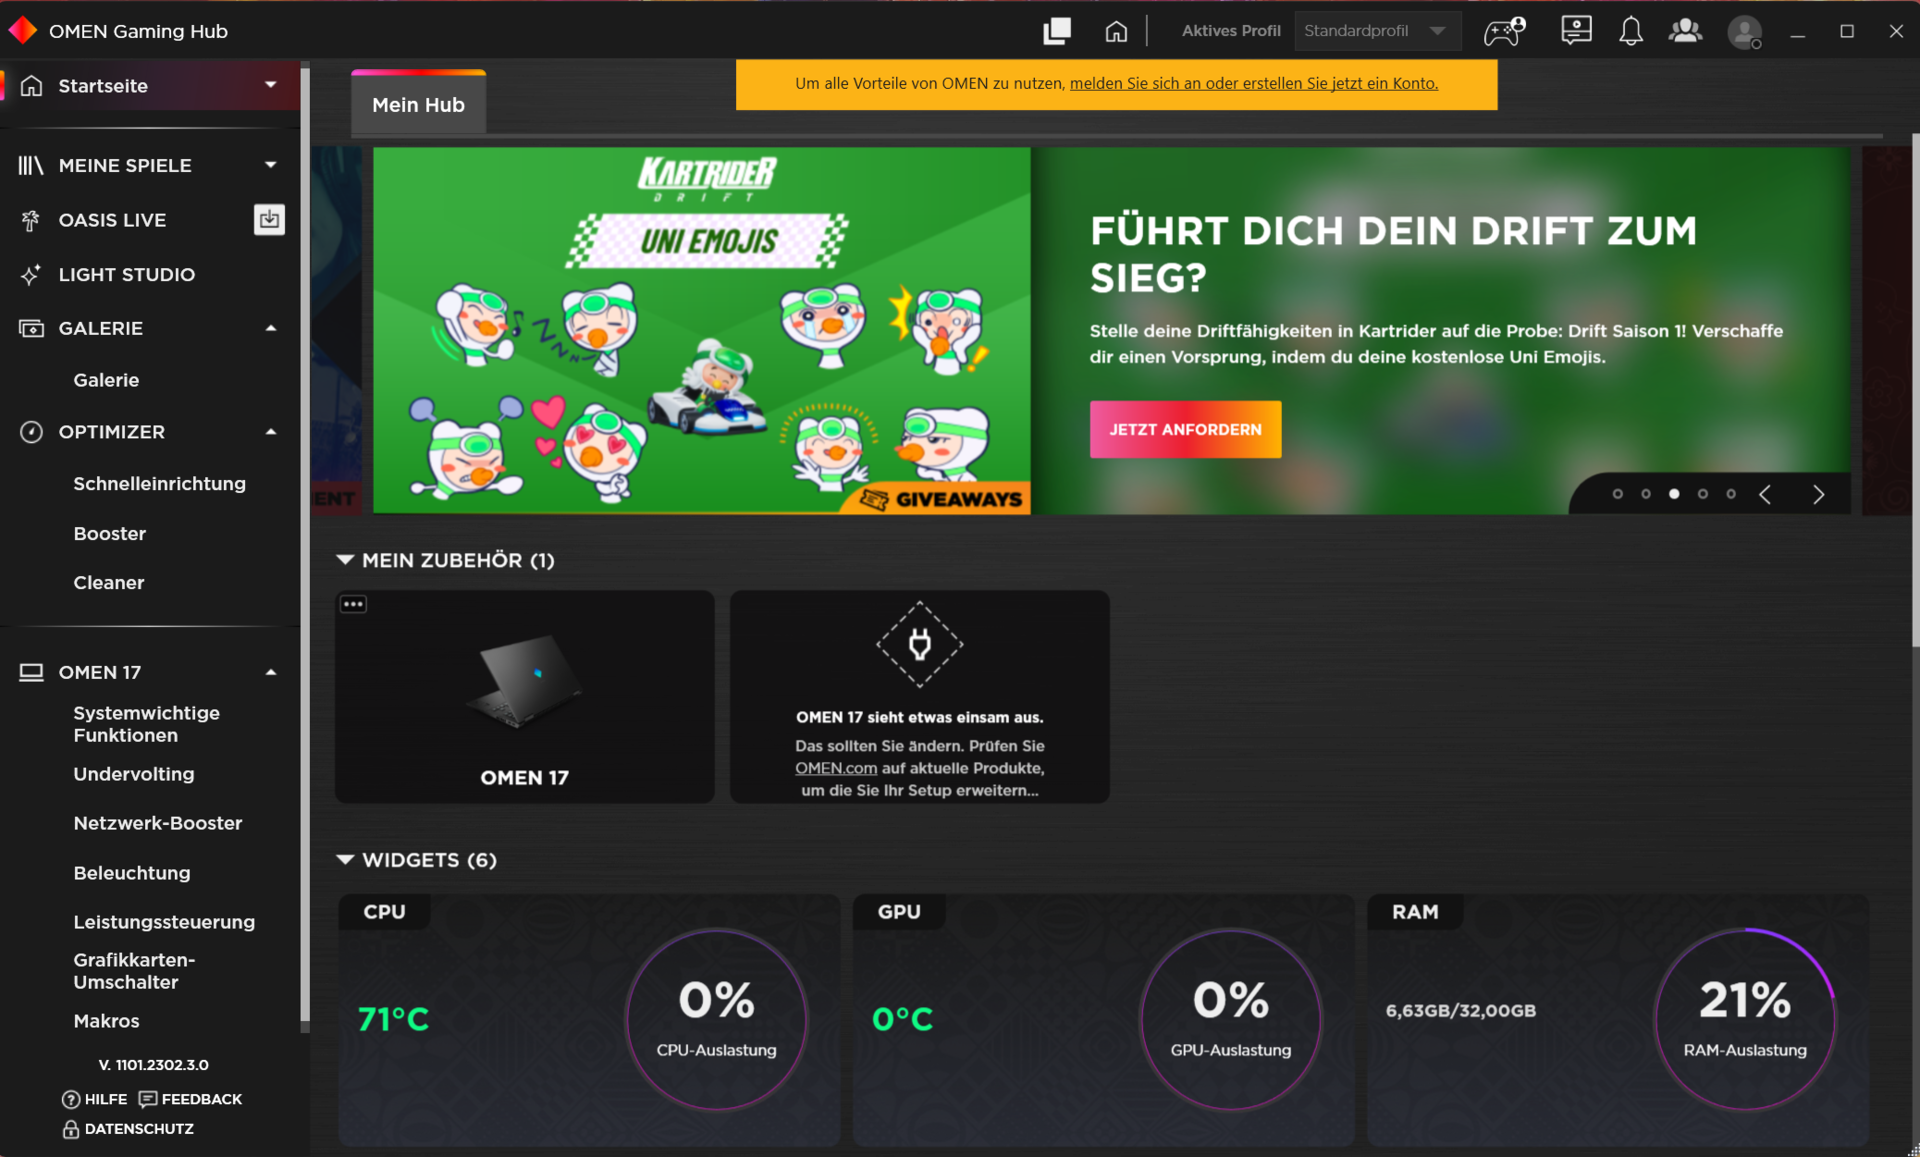
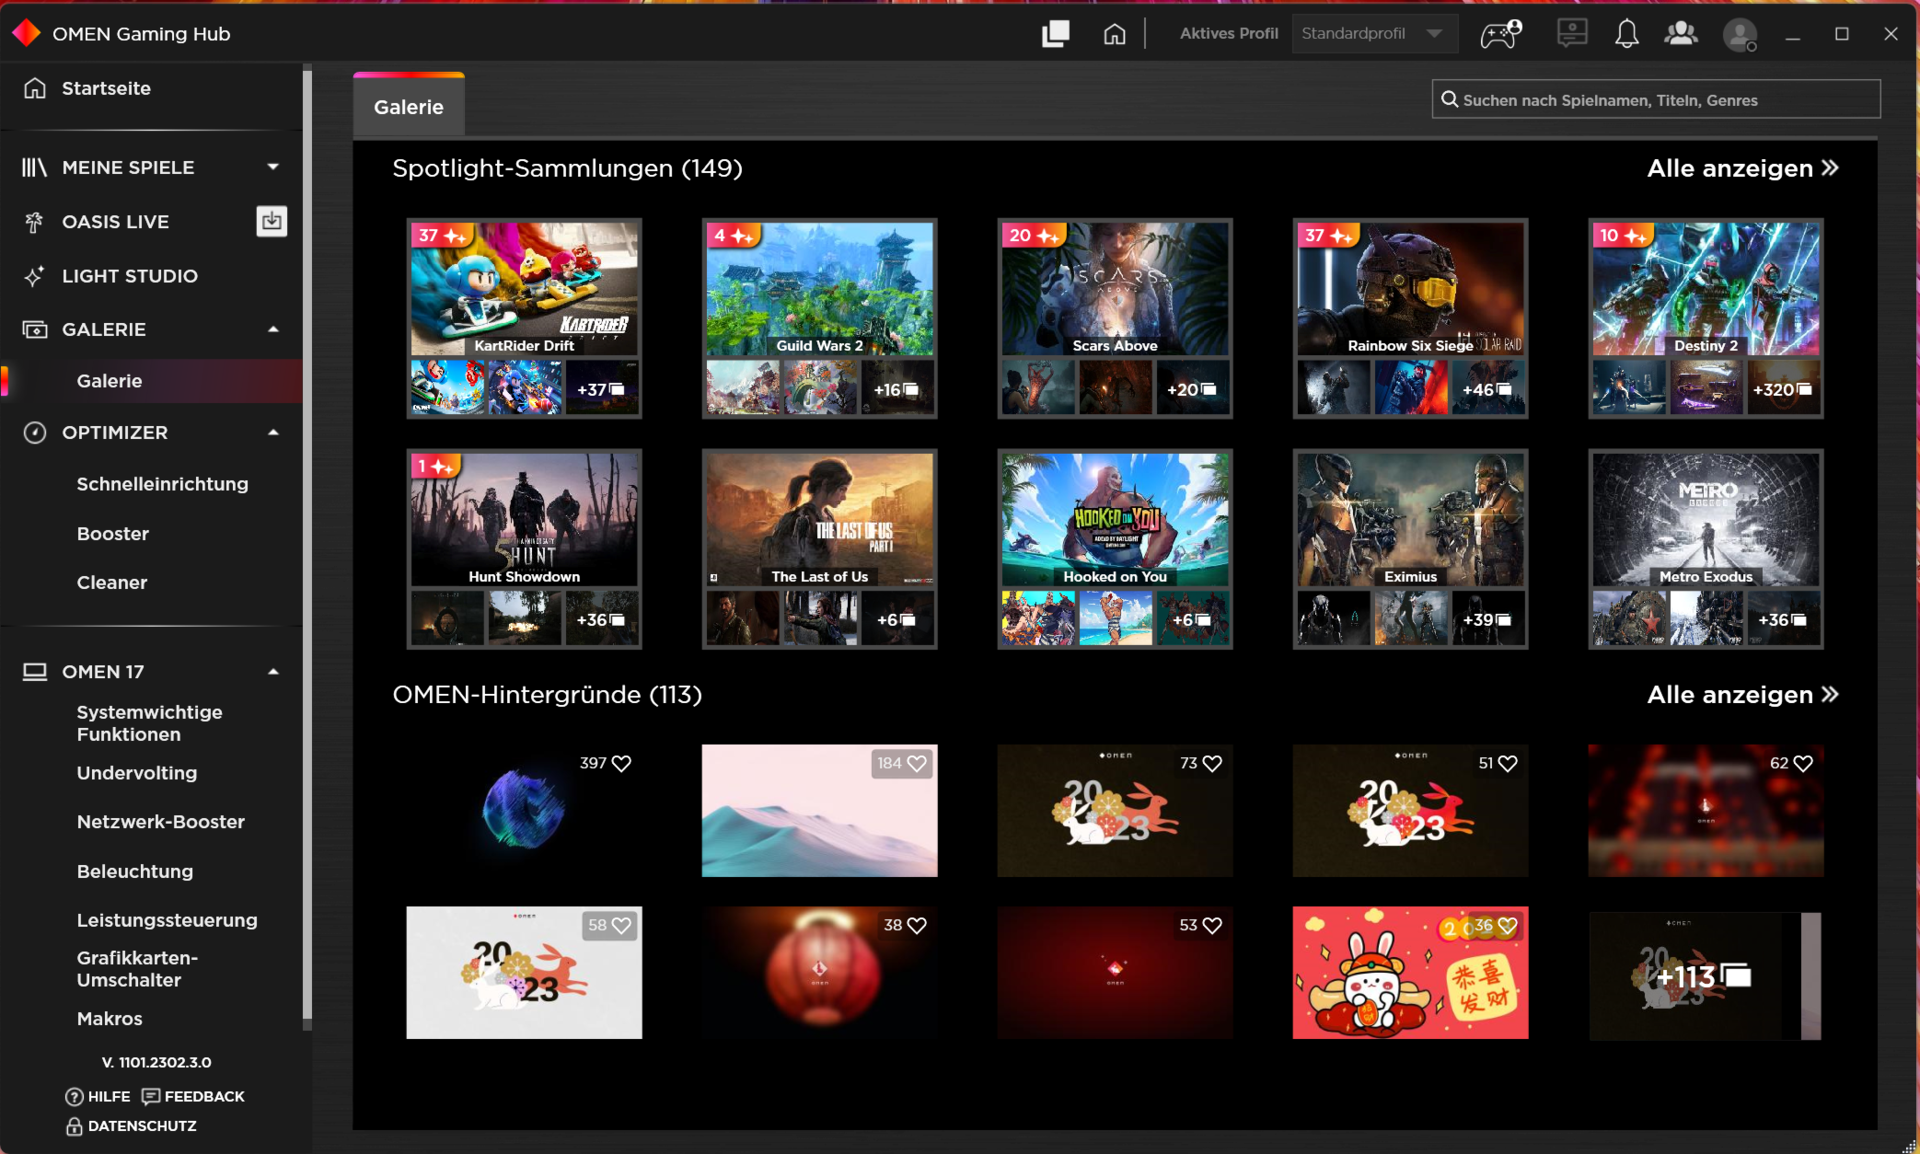
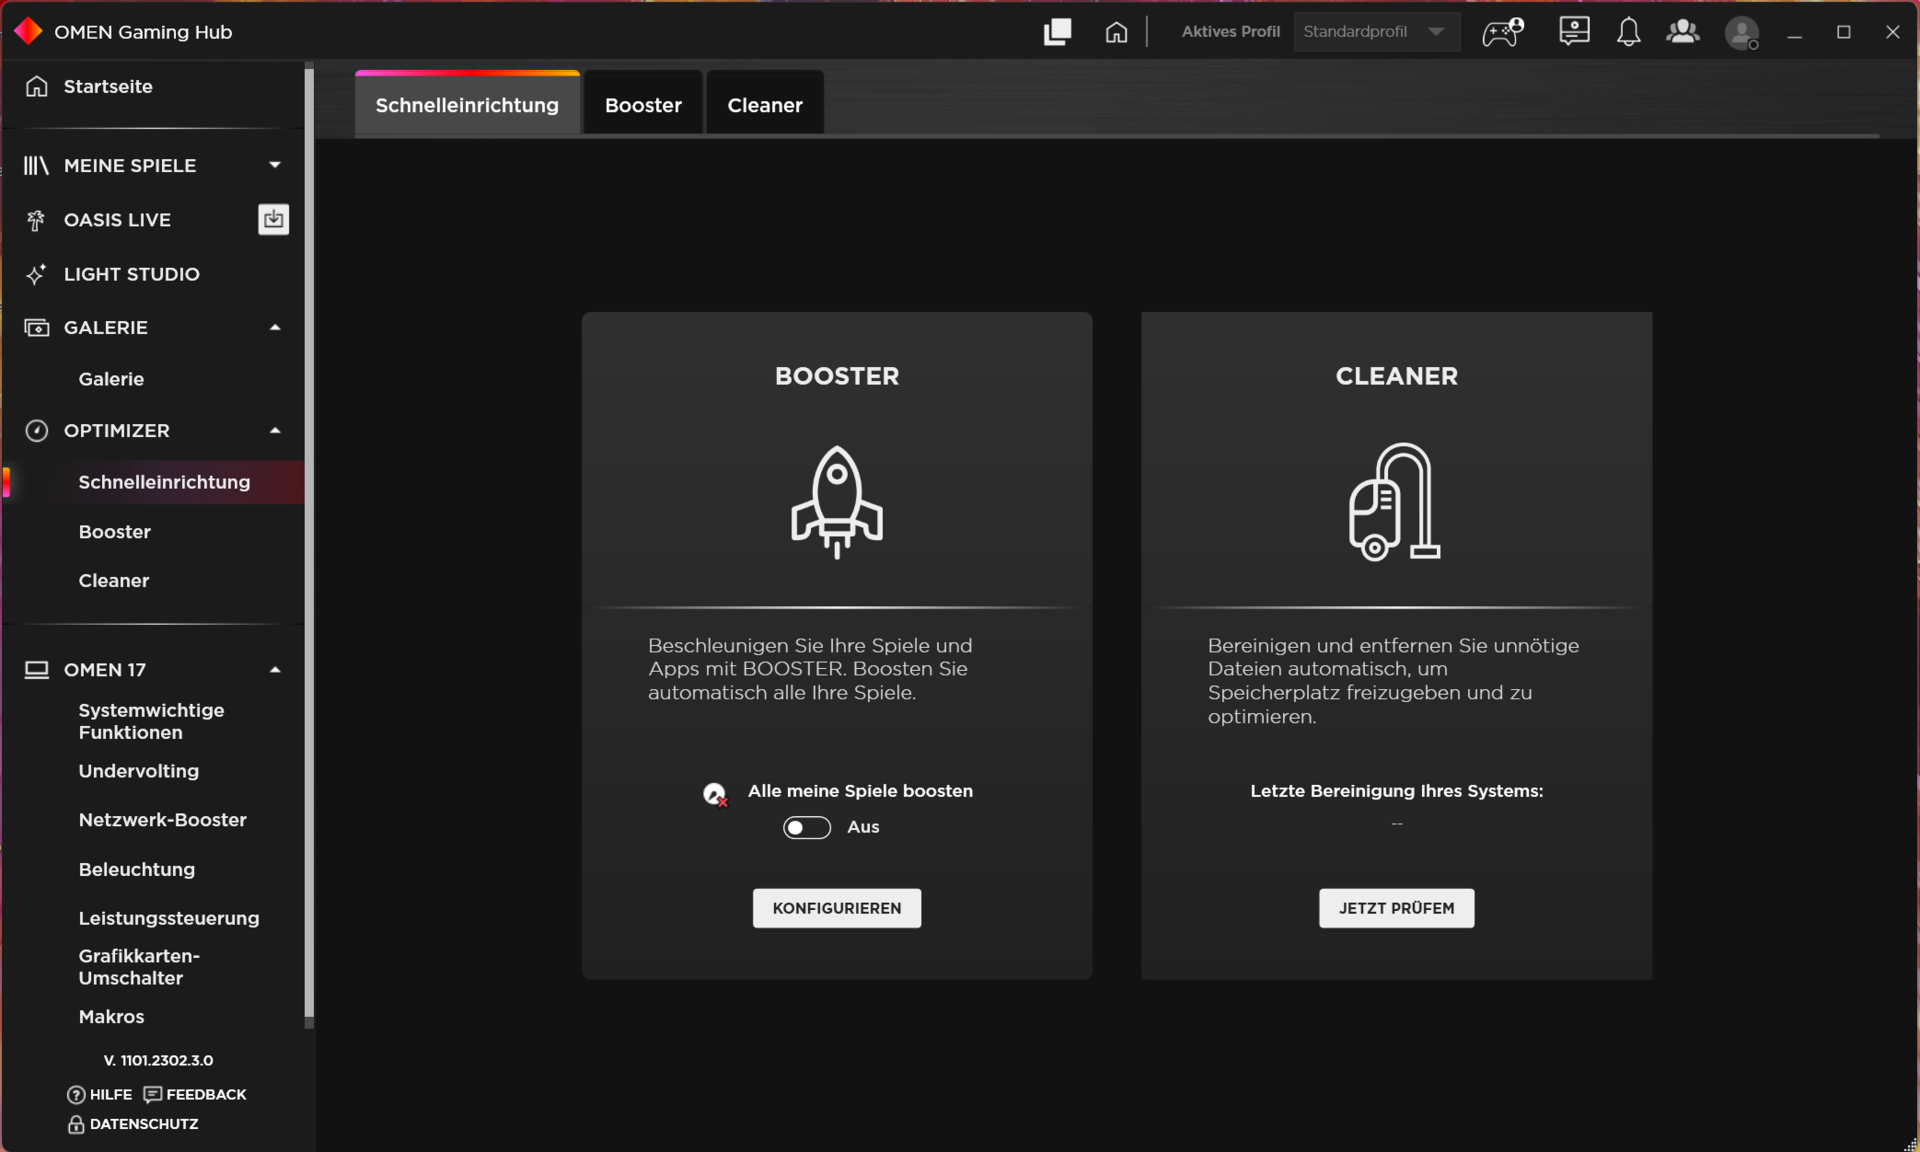
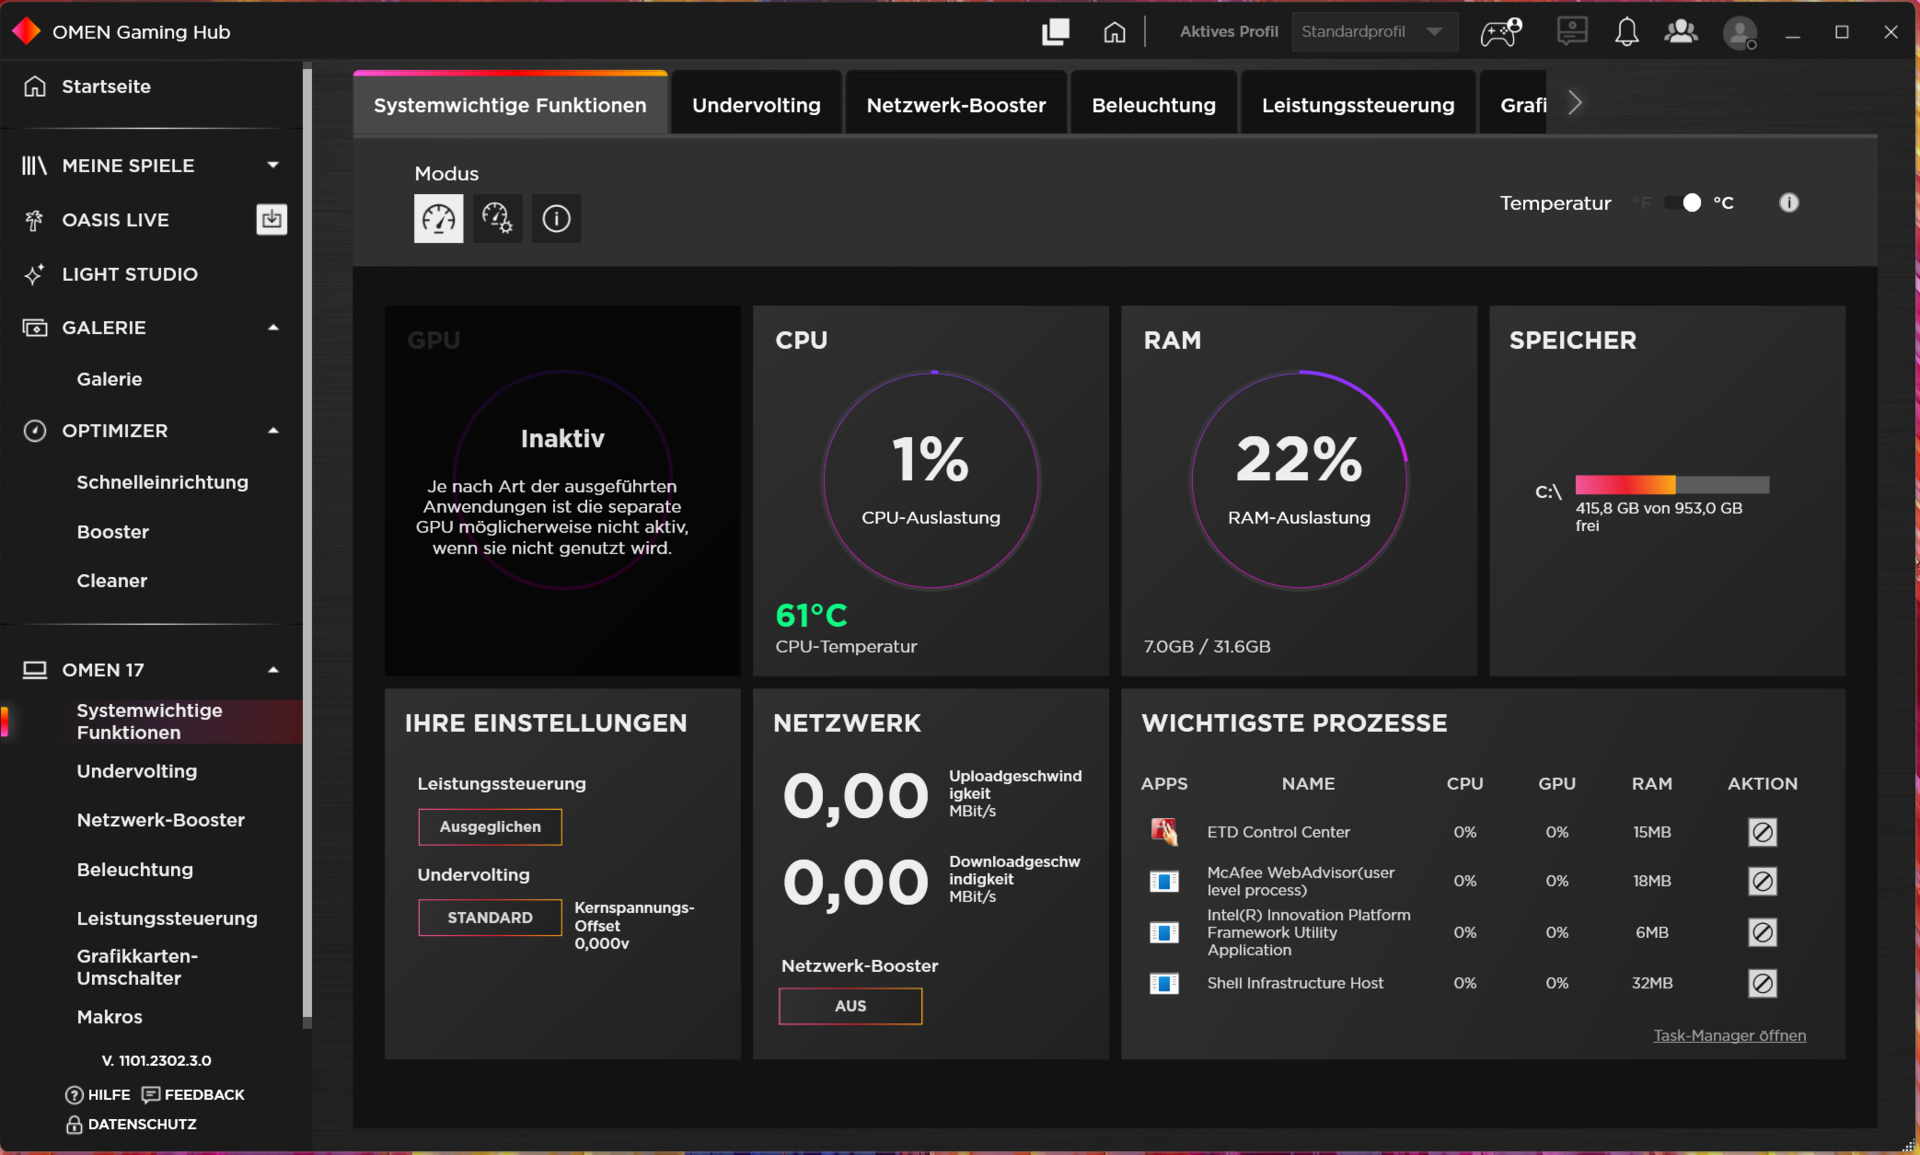
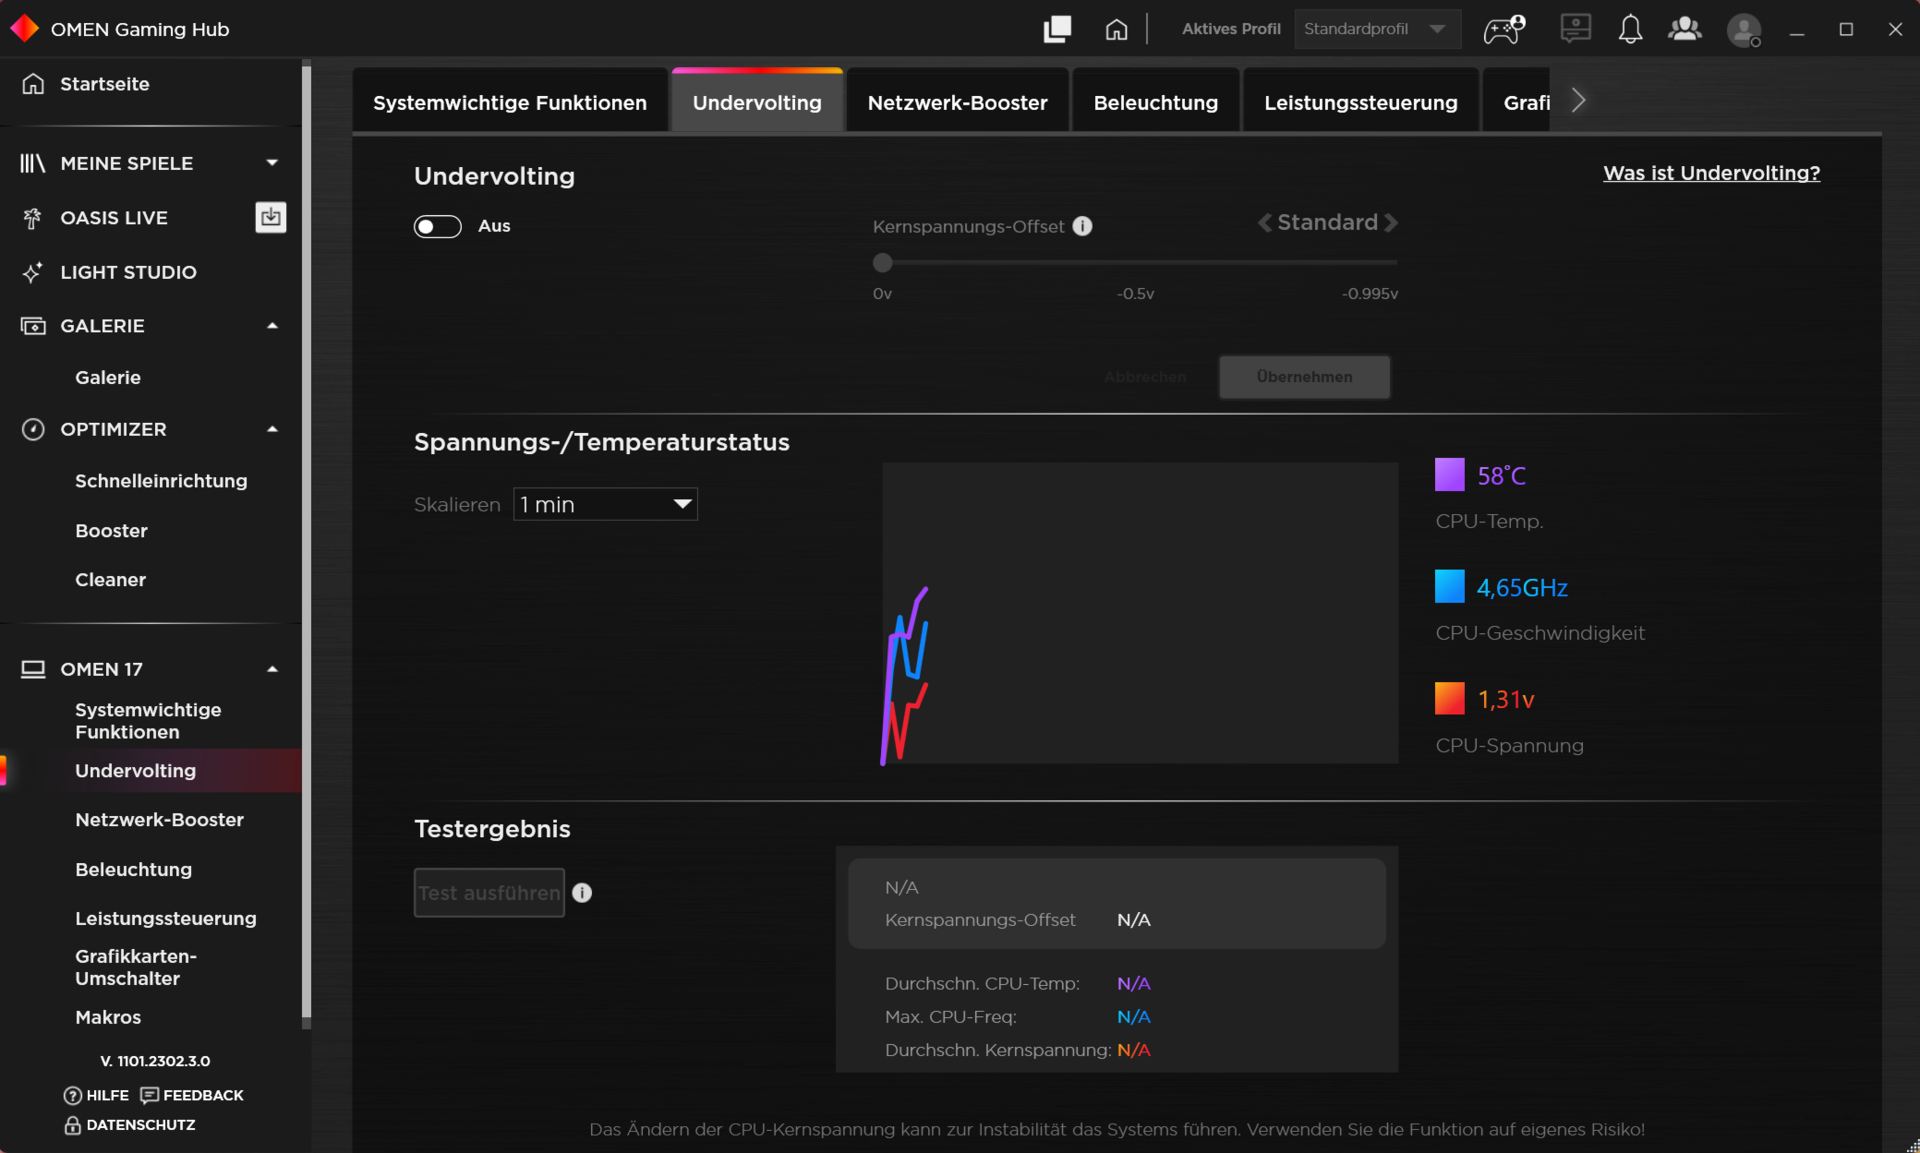
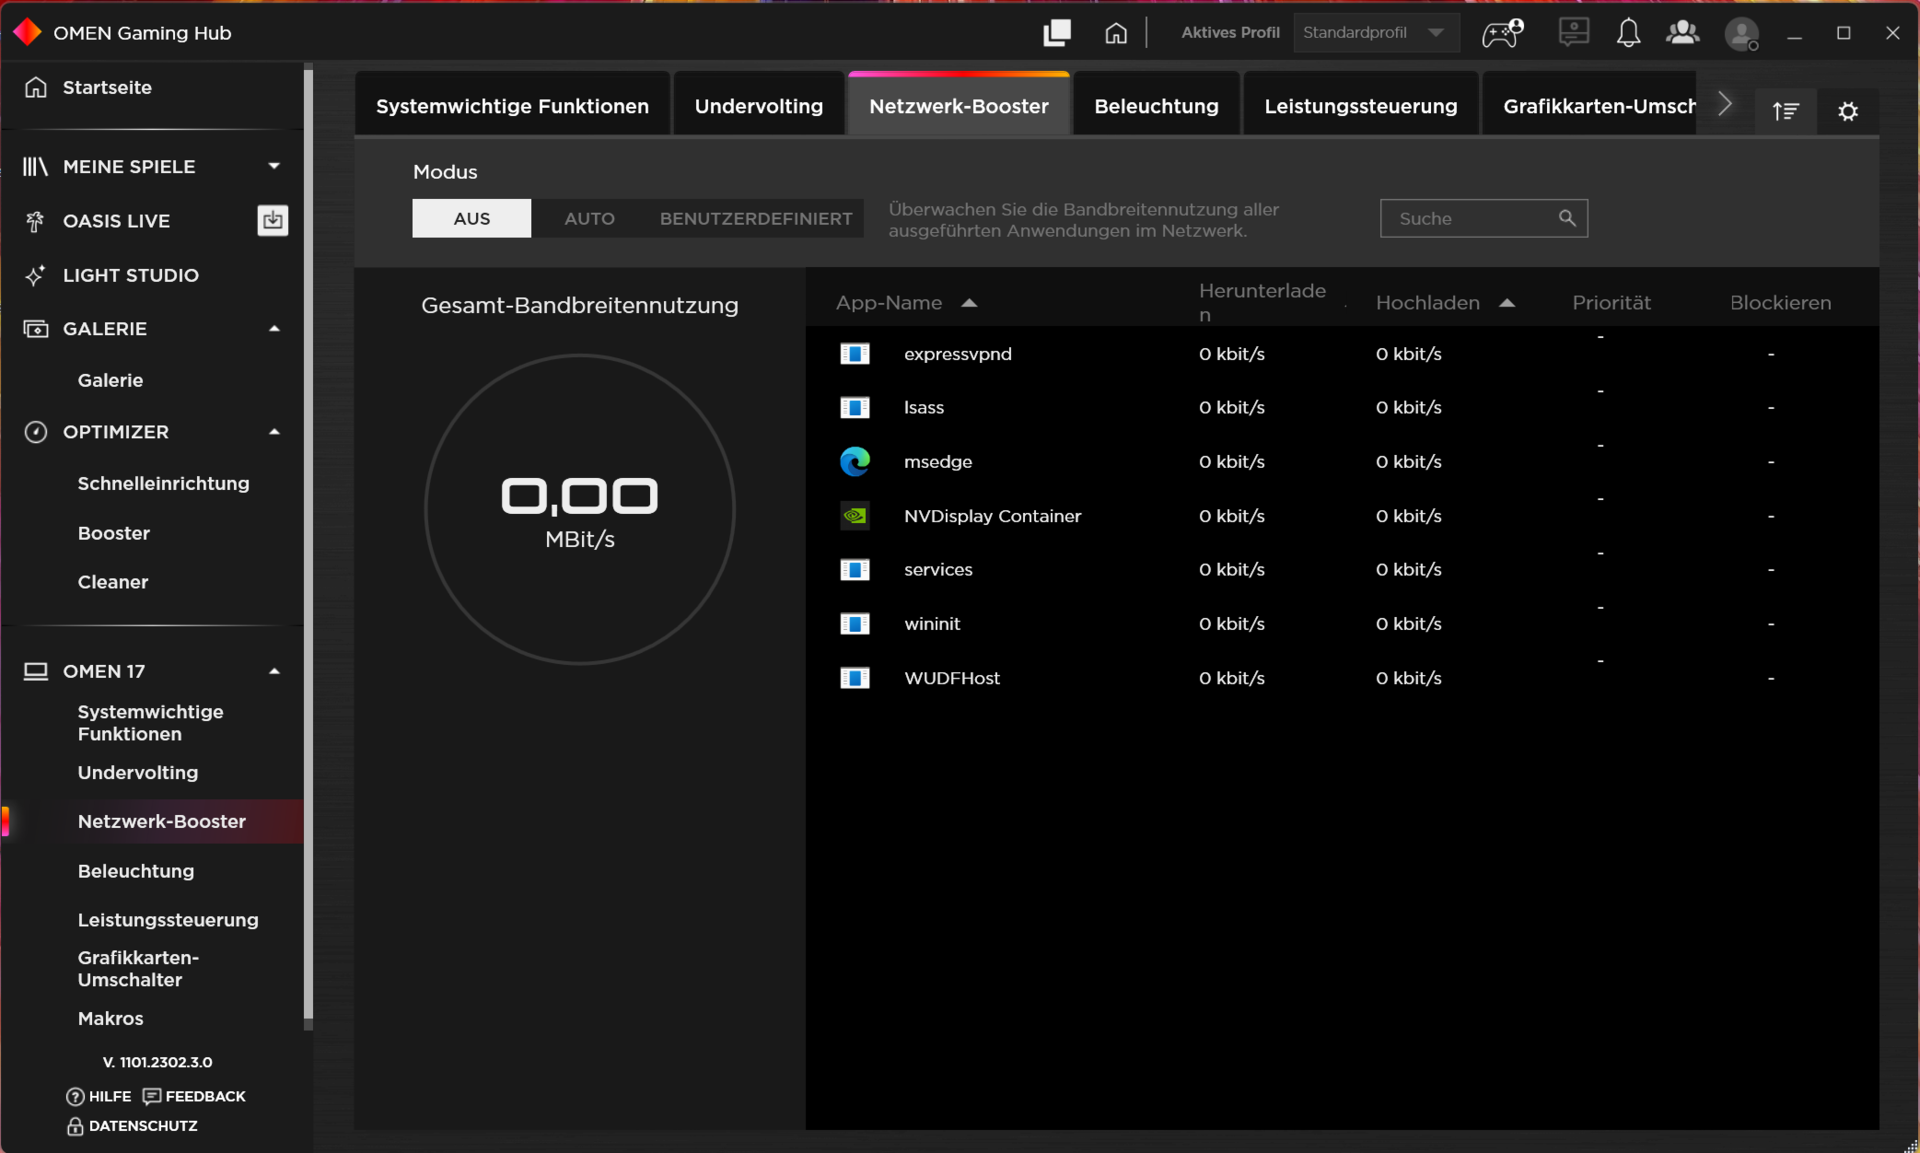
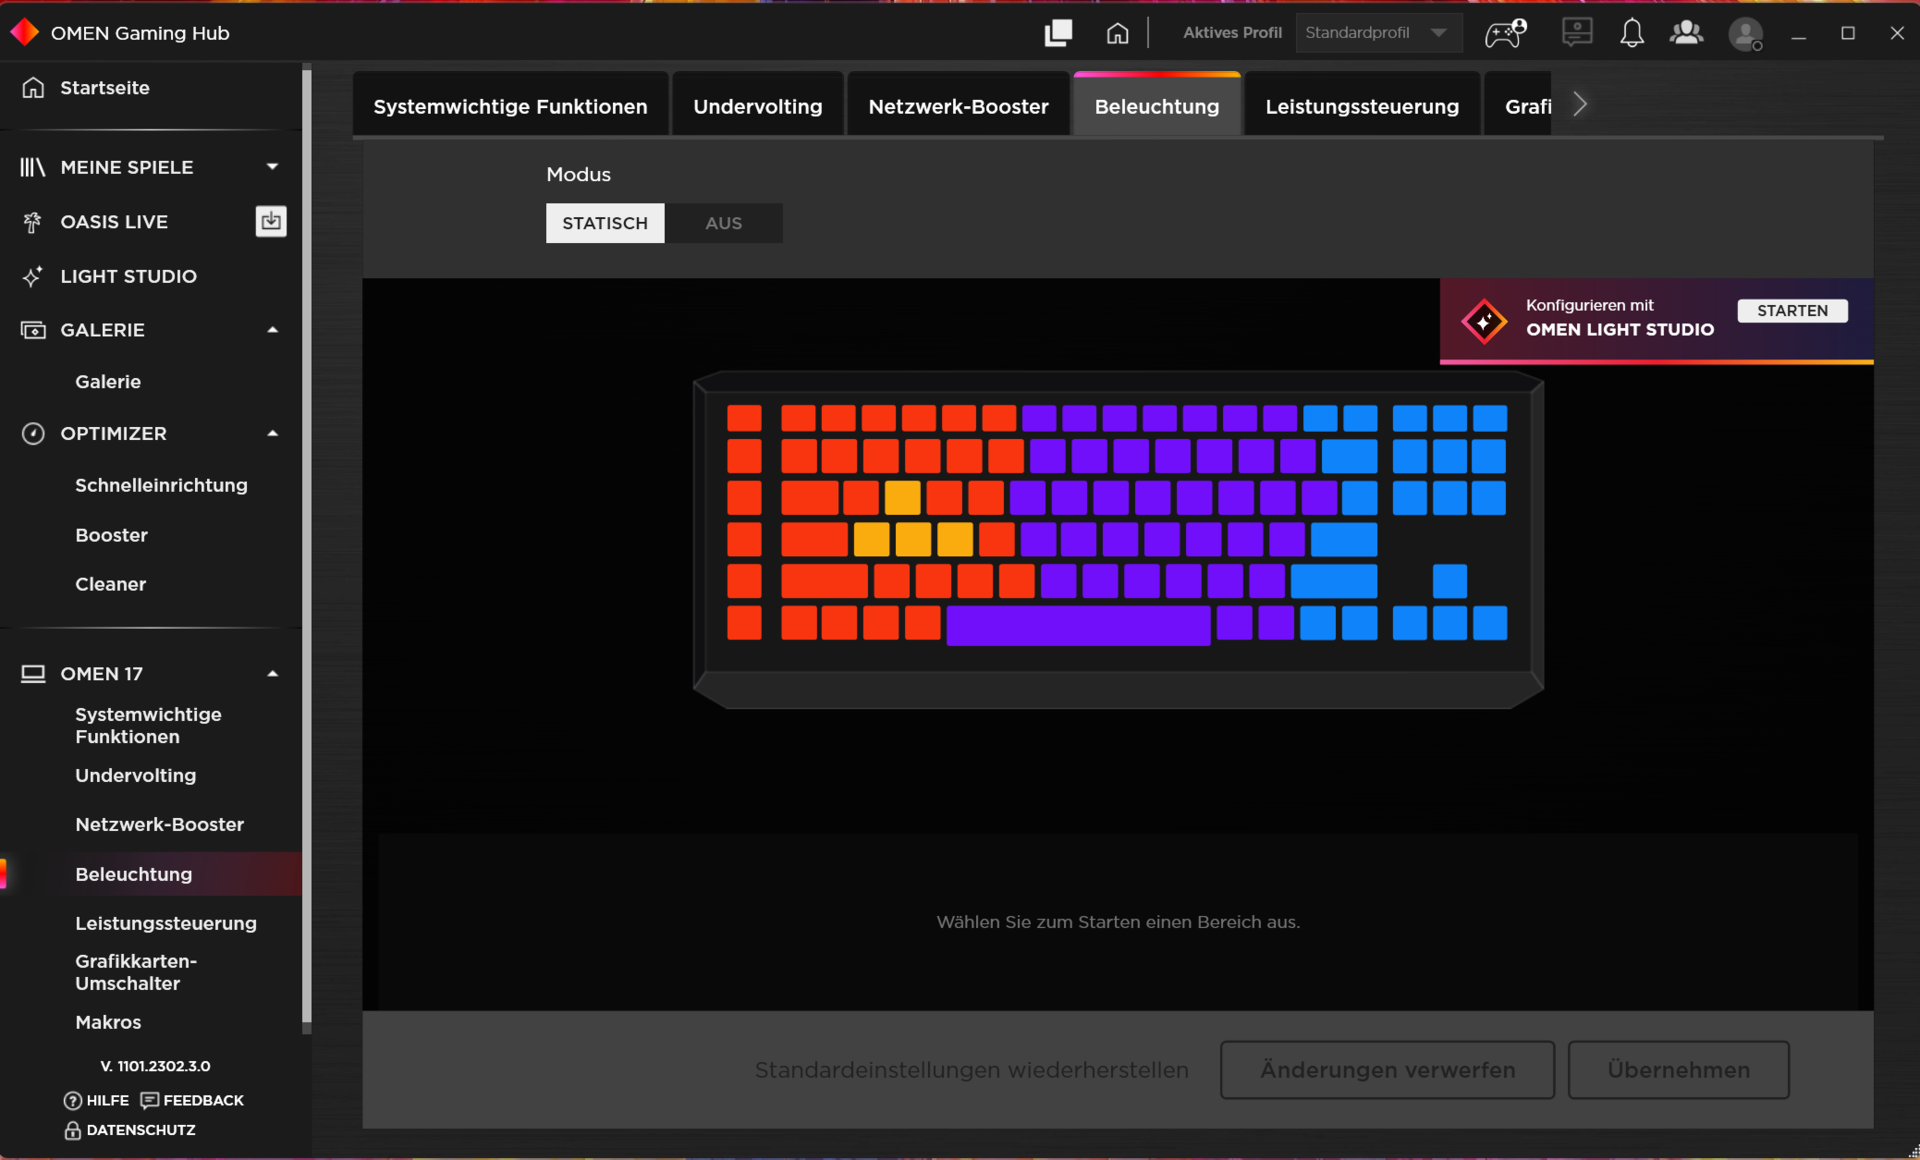
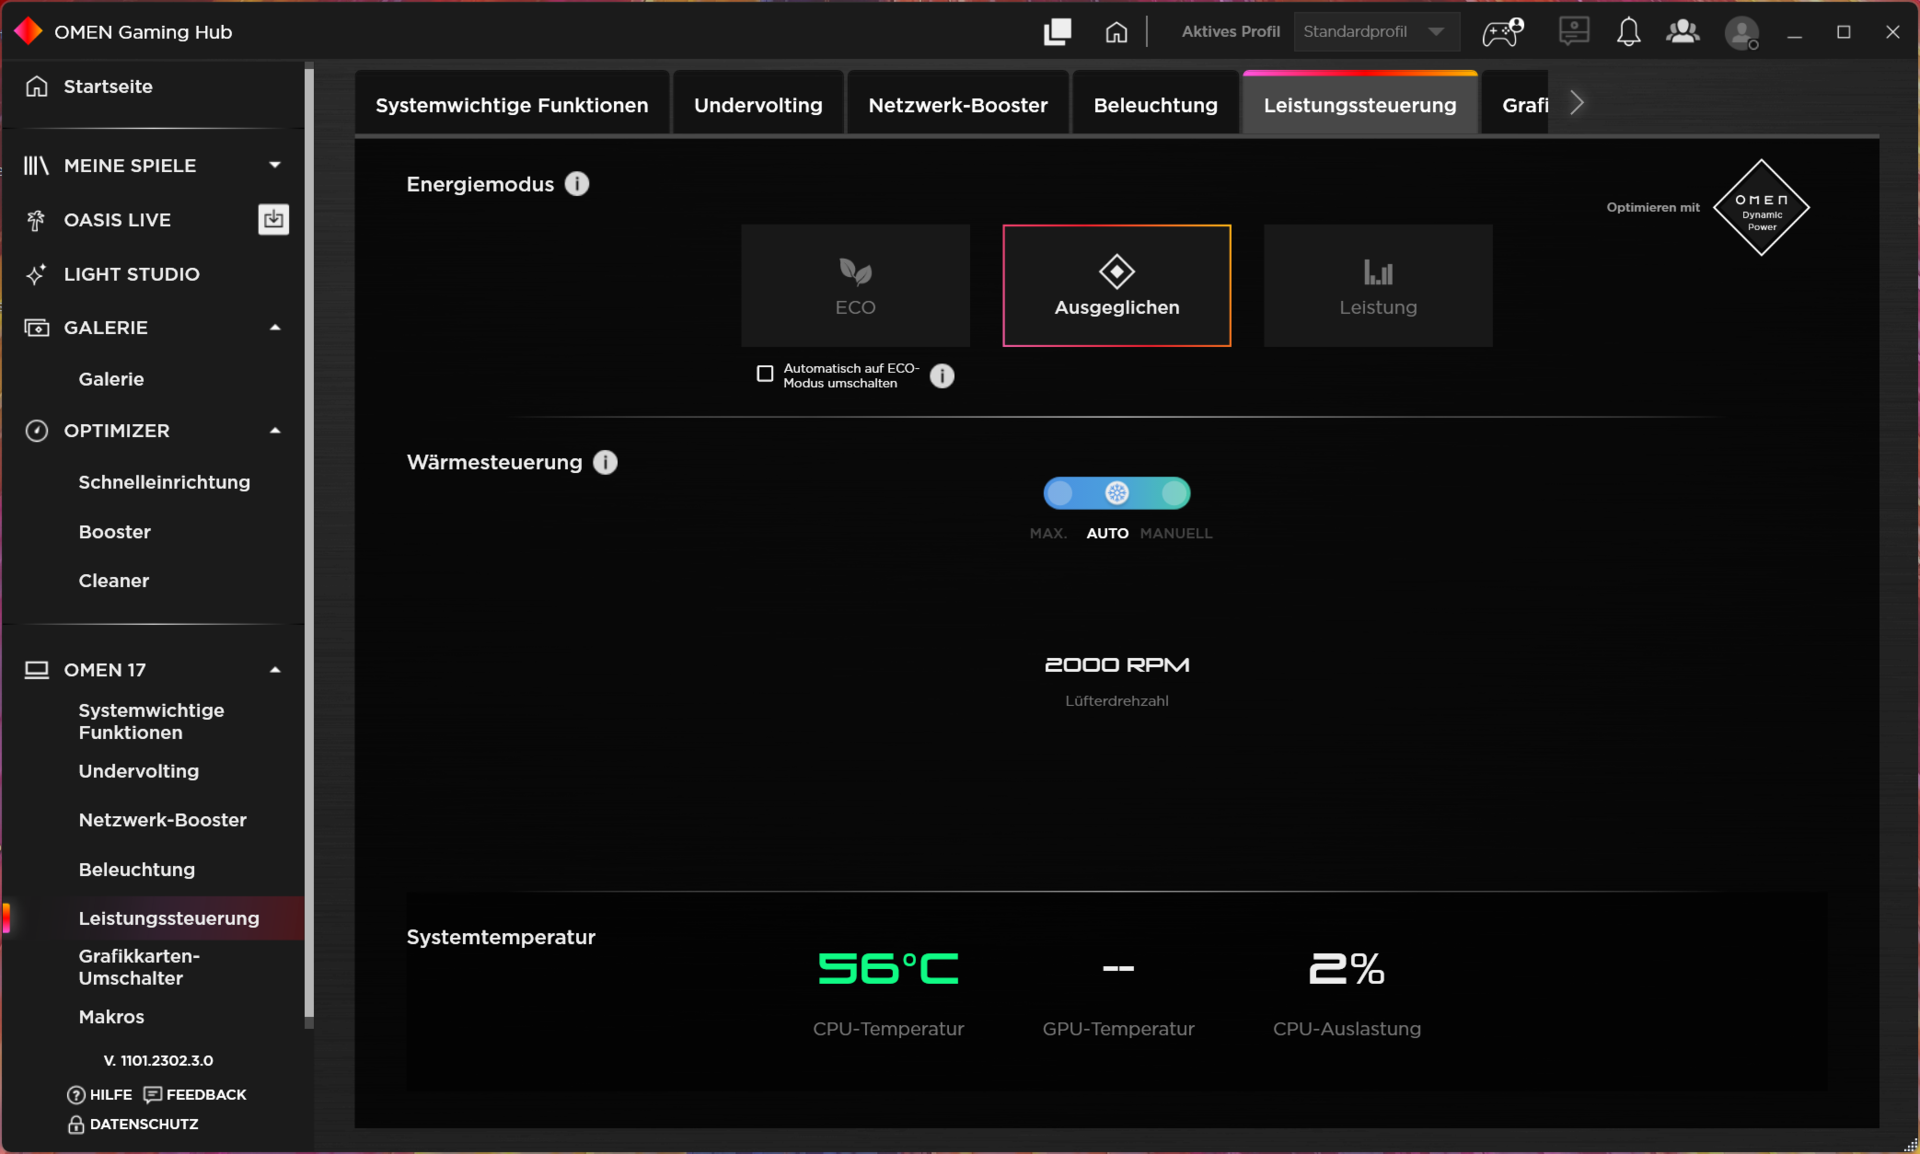
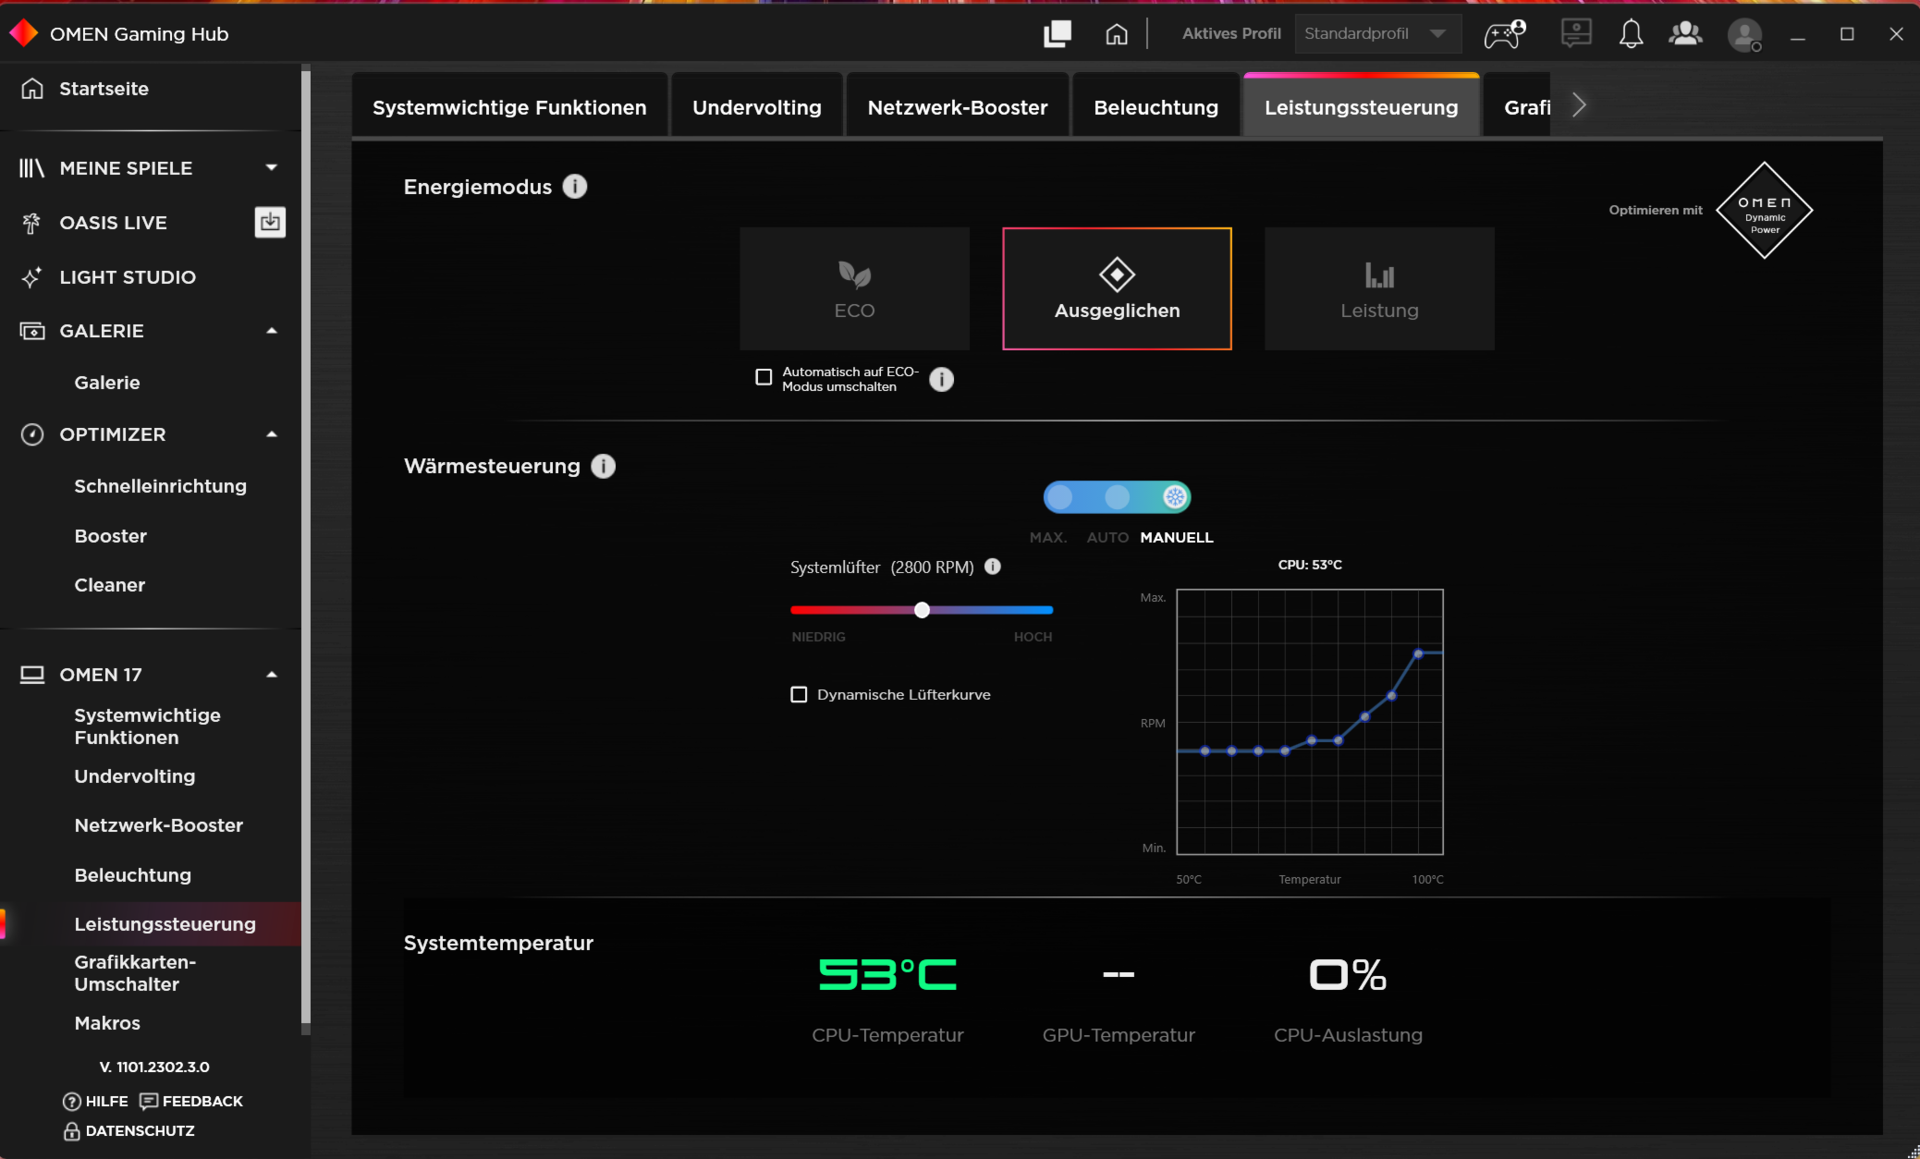
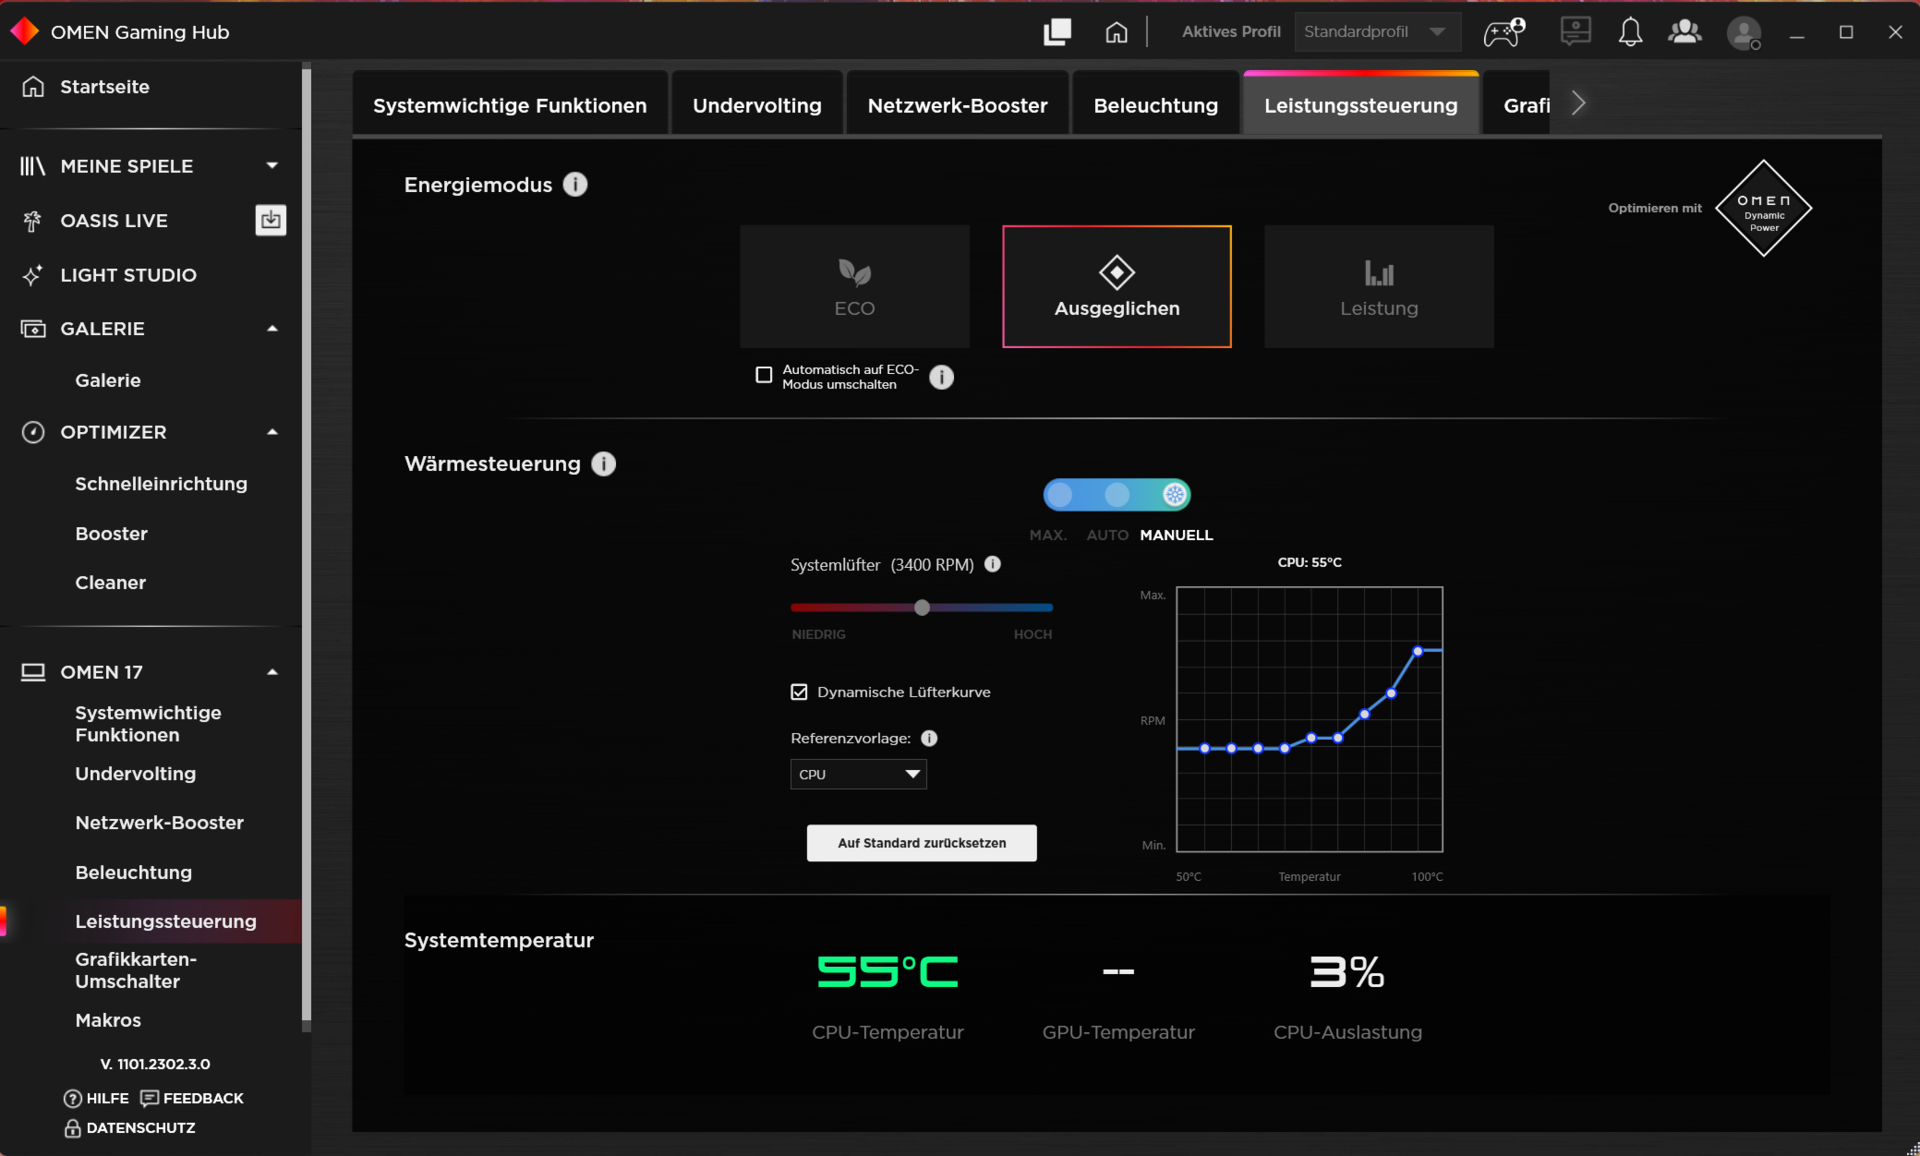
El software Omen Gaming Hub preinstalado representa el centro de control del portátil. Además de seleccionar un modo de energía (ver tabla), también permite bajar el voltaje de la CPU y configurar una curva de ventilador individual. Dado que el modo "Rendimiento" creó algunos problemas en nuestra unidad de pruebas (extraños tartamudeos y caídas de rendimiento), usamos principalmente el modo de energía "Equilibrado" junto con el control automático del ventilador. Optimus estaba activado.
| Rendimiento | Equilibrado | Eco | |
|---|---|---|---|
| Límite de potencia 1 | 100 vatios | 55 vatios | 55 vatios |
| Límite de potencia 2 | 130 vatios | 130 vatios | 130 vatios |
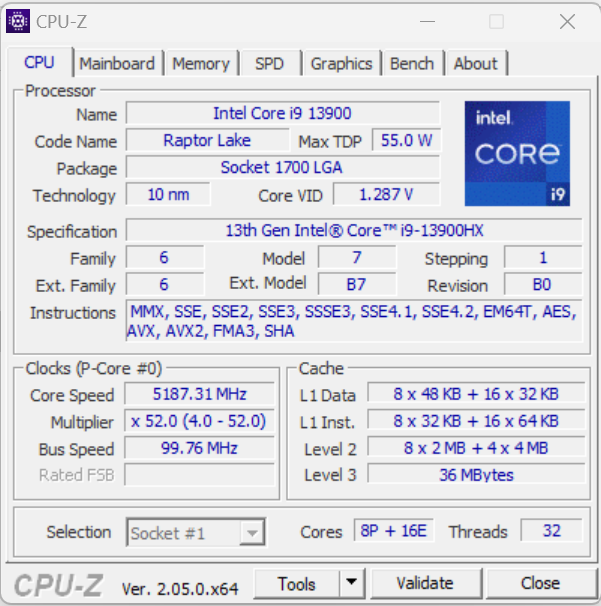
Procesador
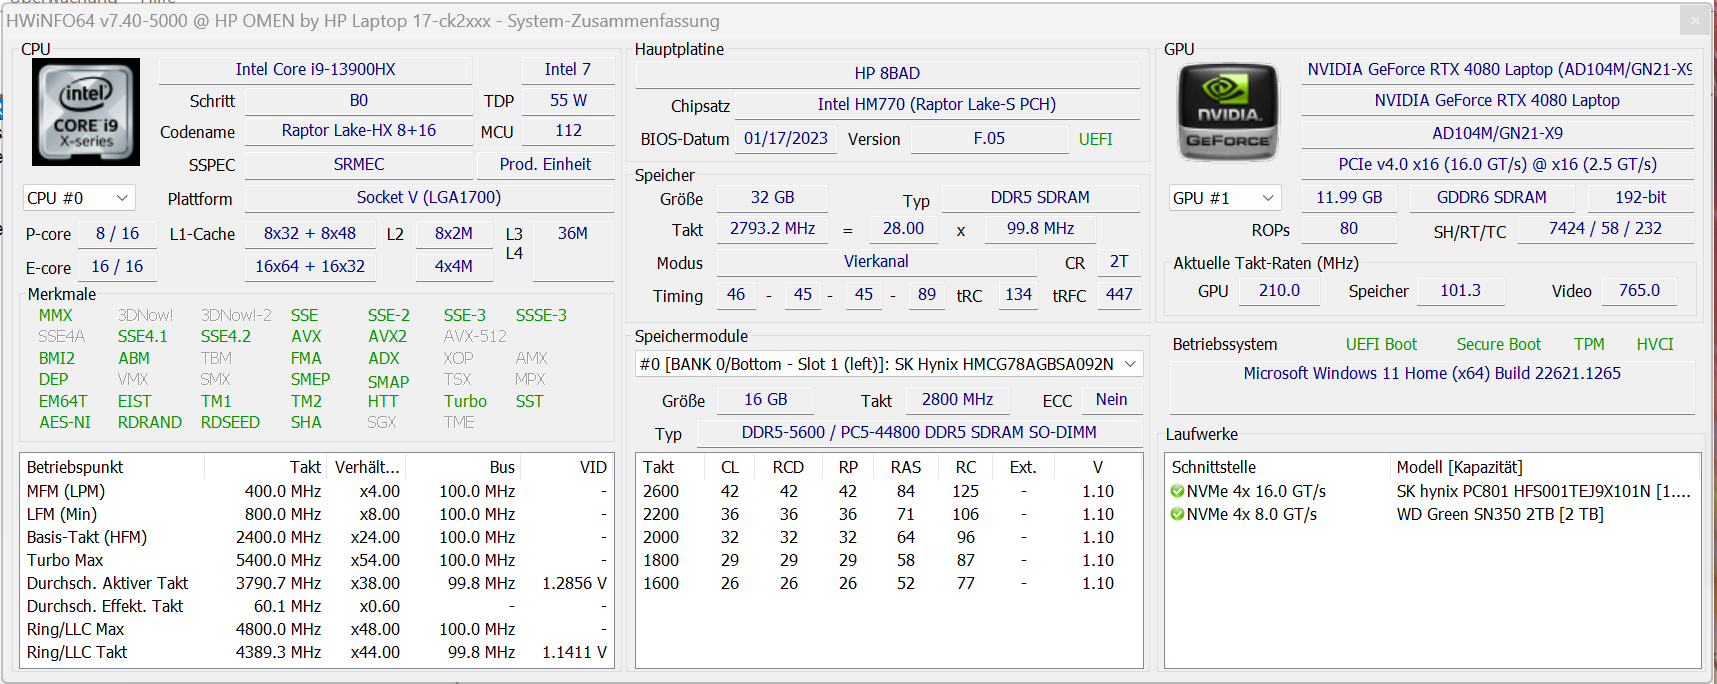
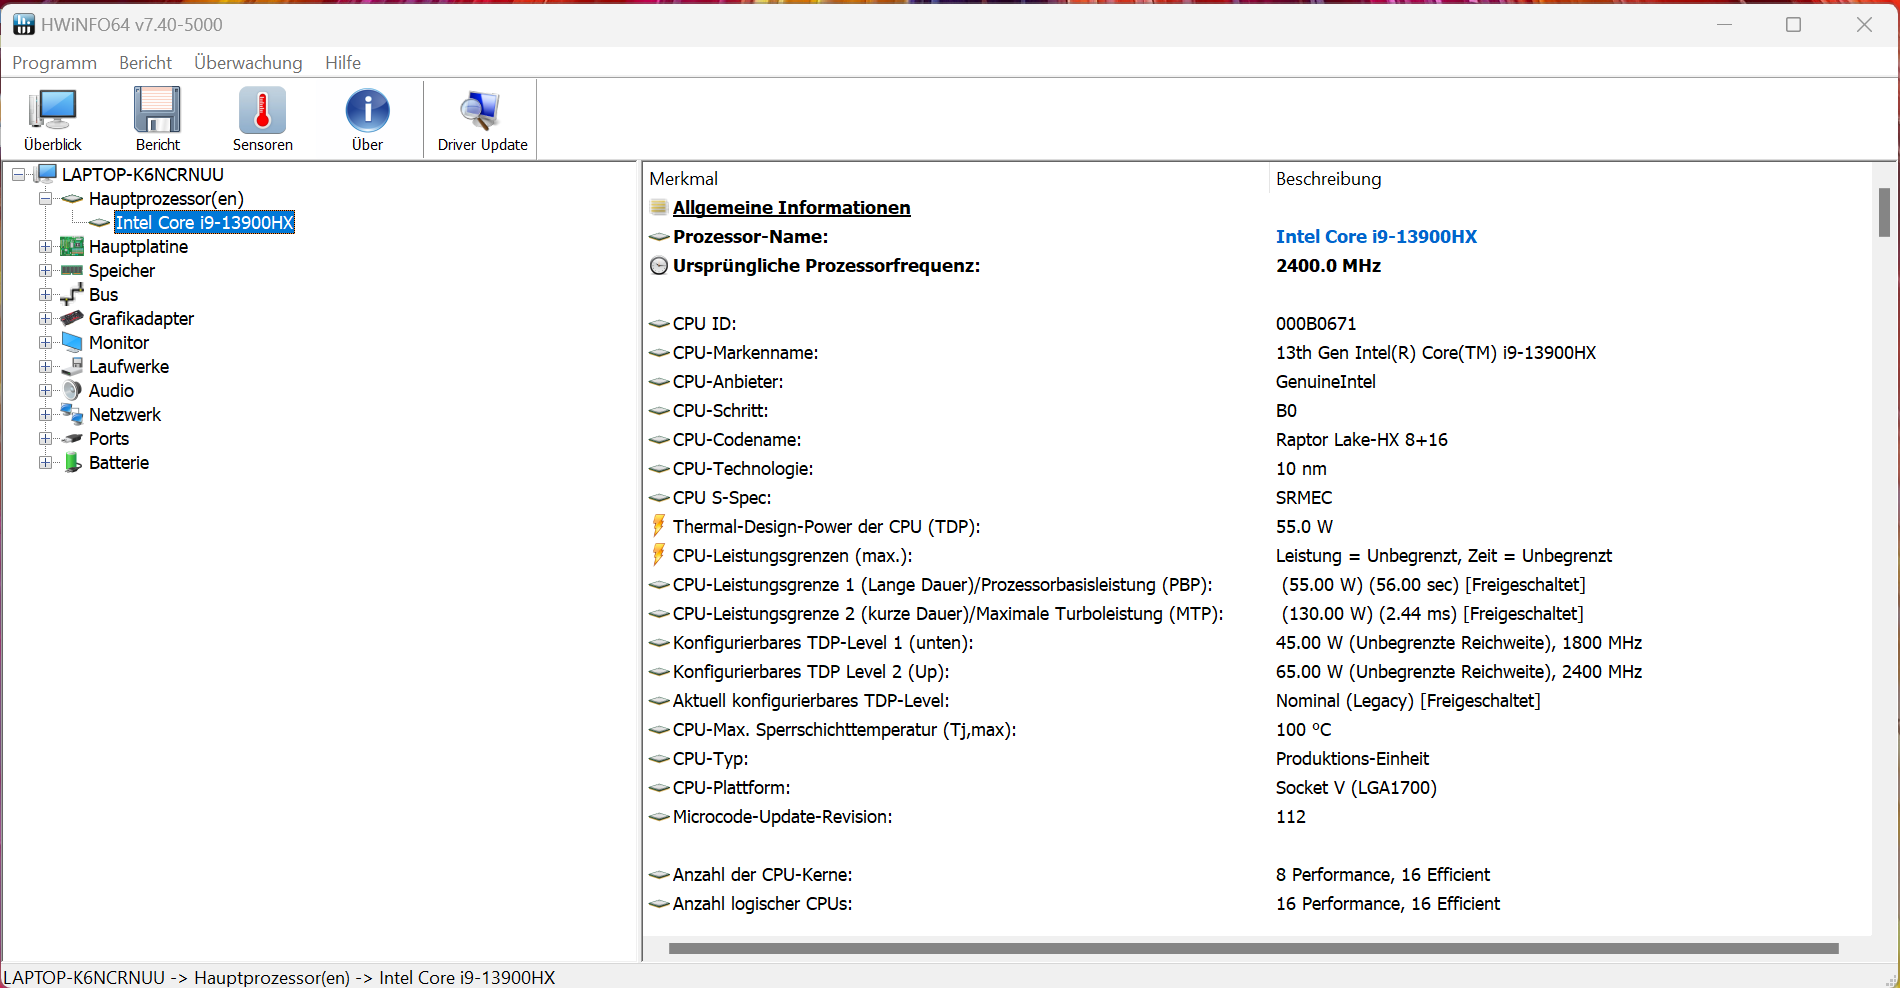
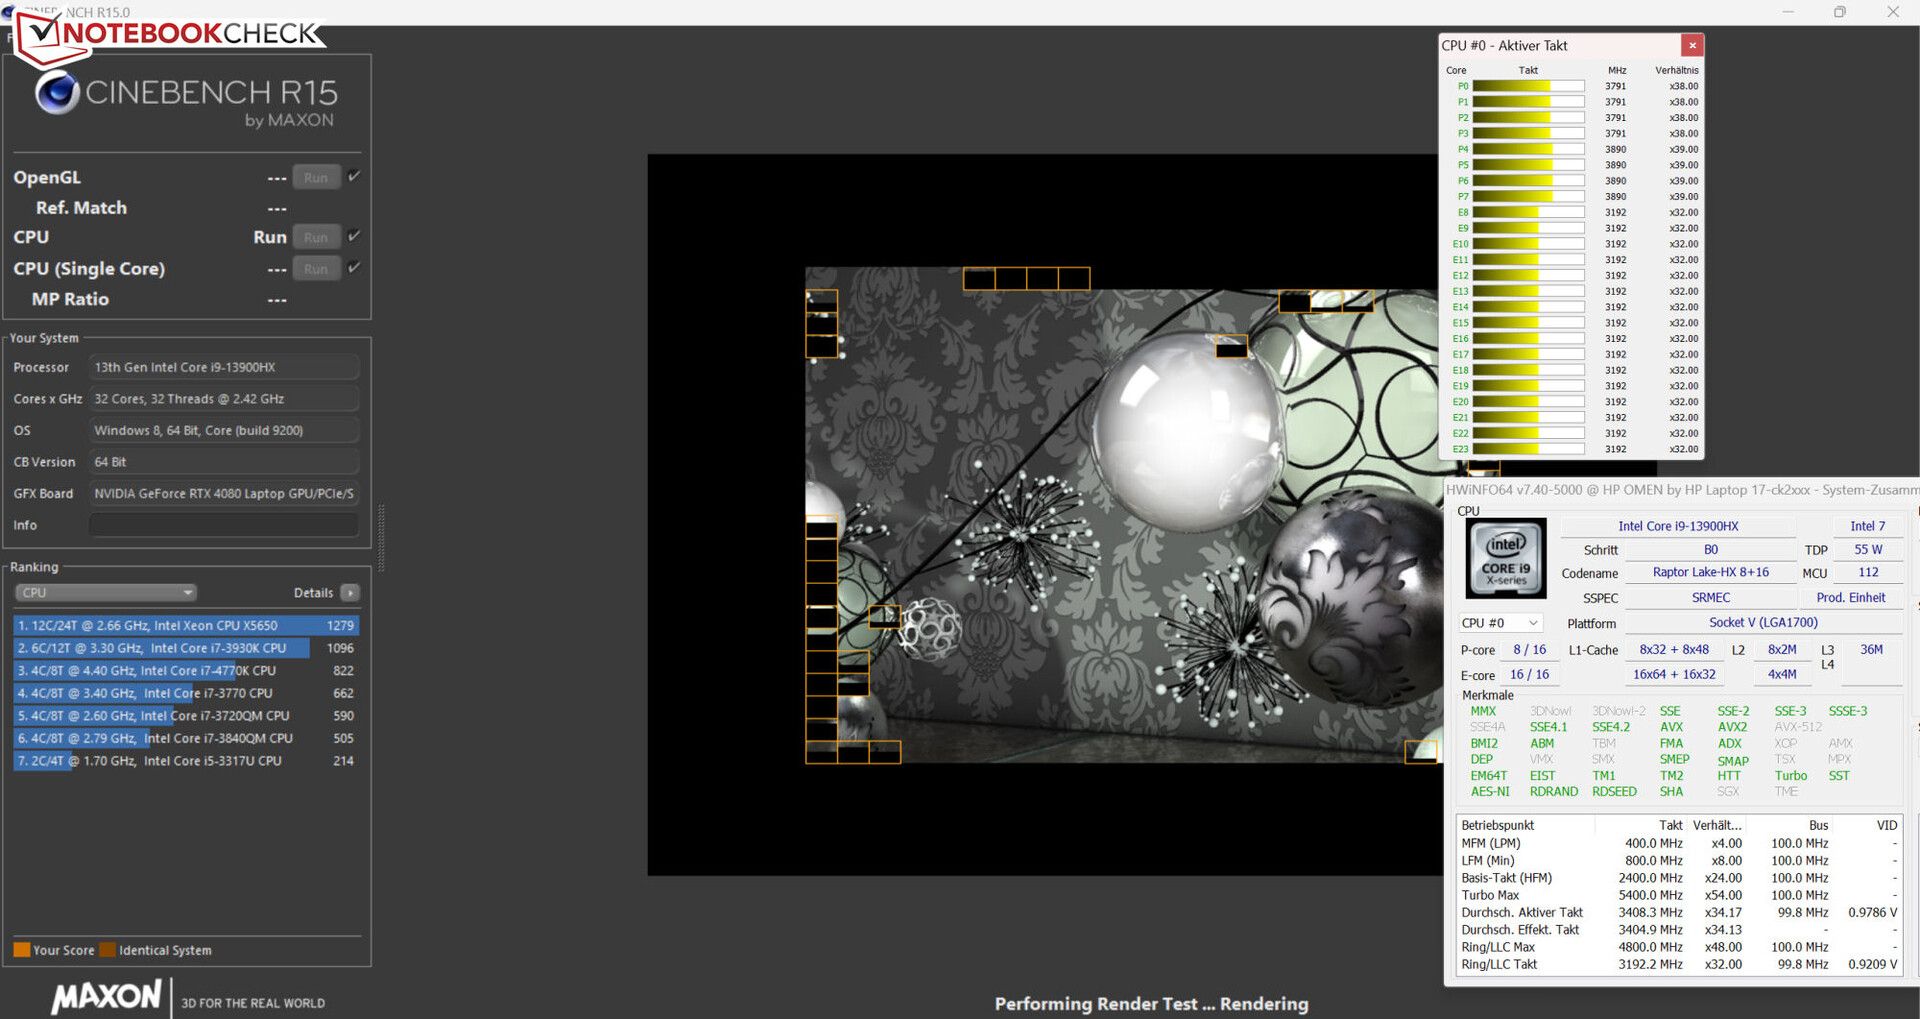
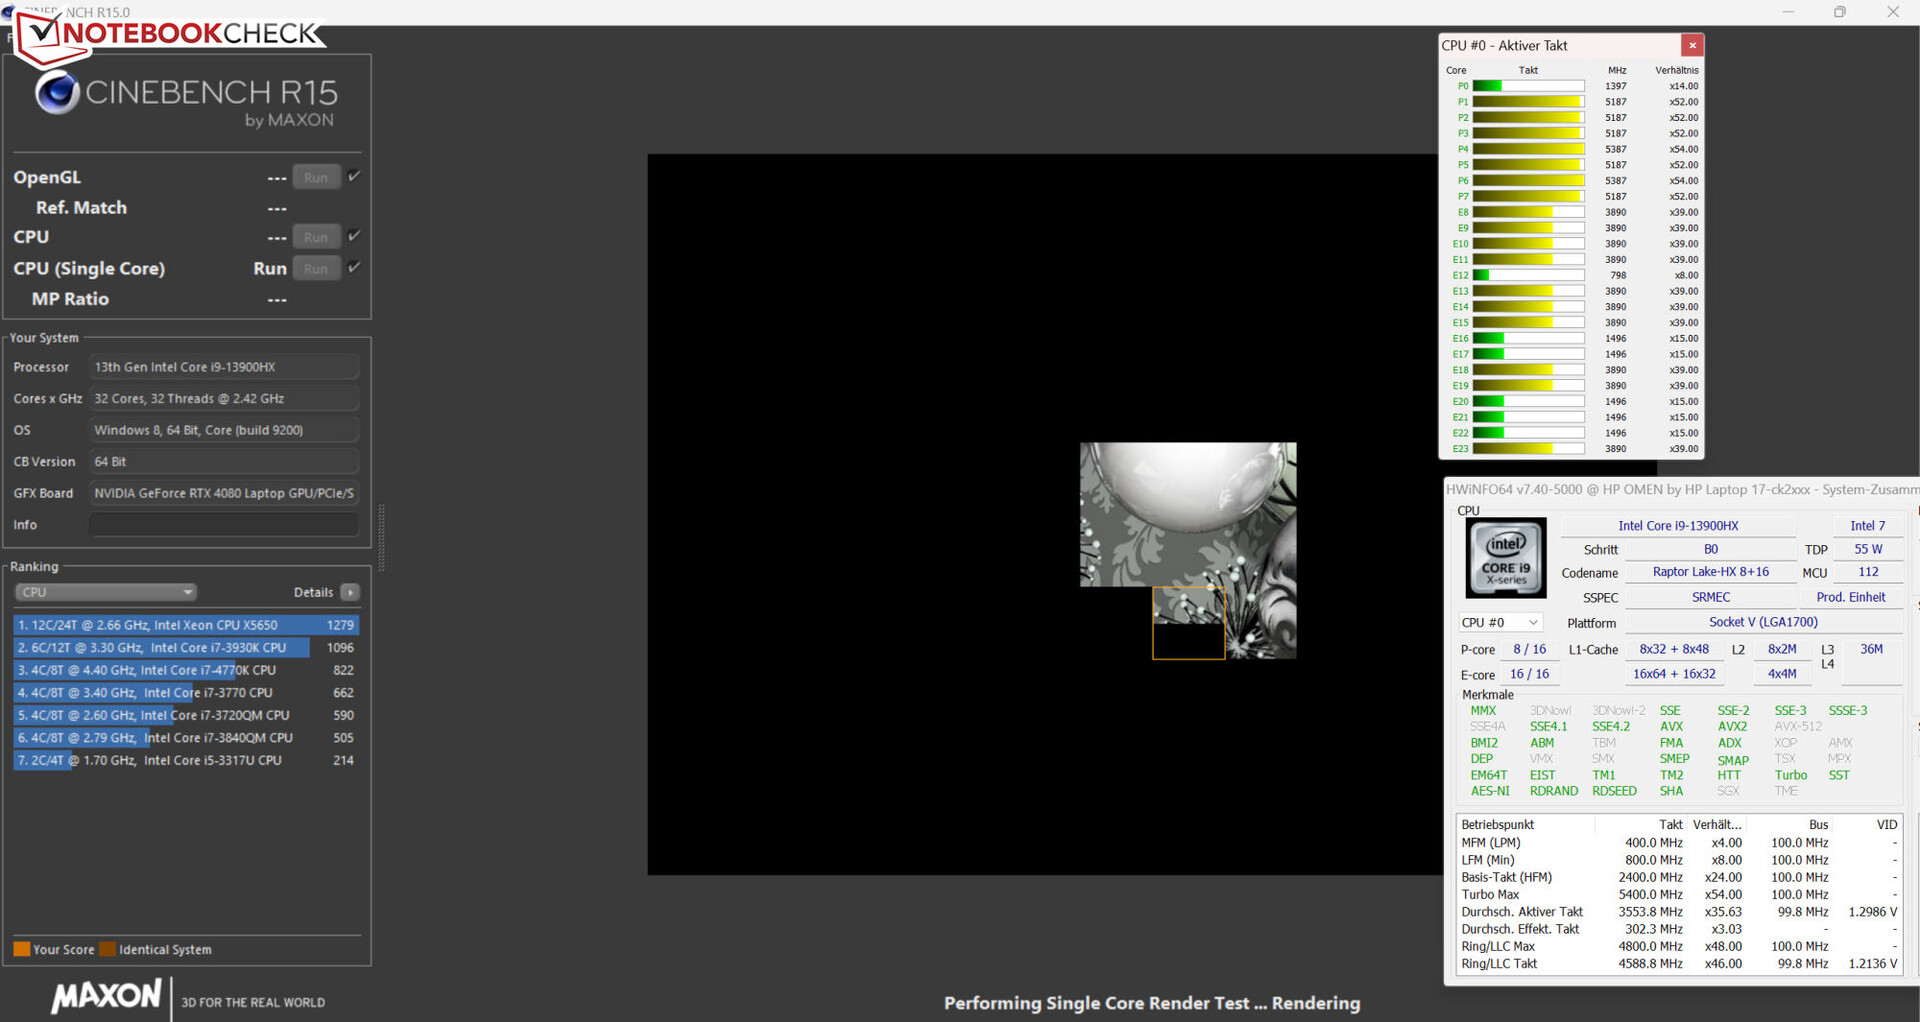
ElCore i9-13900HX(Raptor Lake) consta de dieciséis núcleos de Eficiencia (sin hyperthreading, de 1,6 a 3,9 GHz) y ocho núcleos de Rendimiento (hyperthreading, de 2,2 a 5,4 GHz), lo que resulta en un total de 32 núcleos lógicos de CPU.
En funcionamiento en red, el procesador supera las pruebas de CPU del benchmark Cinebench R15 con velocidades de reloj de media-alta a alta (multihilo) y de alta a máxima (un solo hilo). Mientras que el rendimiento de un solo hilo (254 puntos) desciende ligeramente en funcionamiento con batería, la caída del rendimiento multihilo es significativa (1.303 puntos).
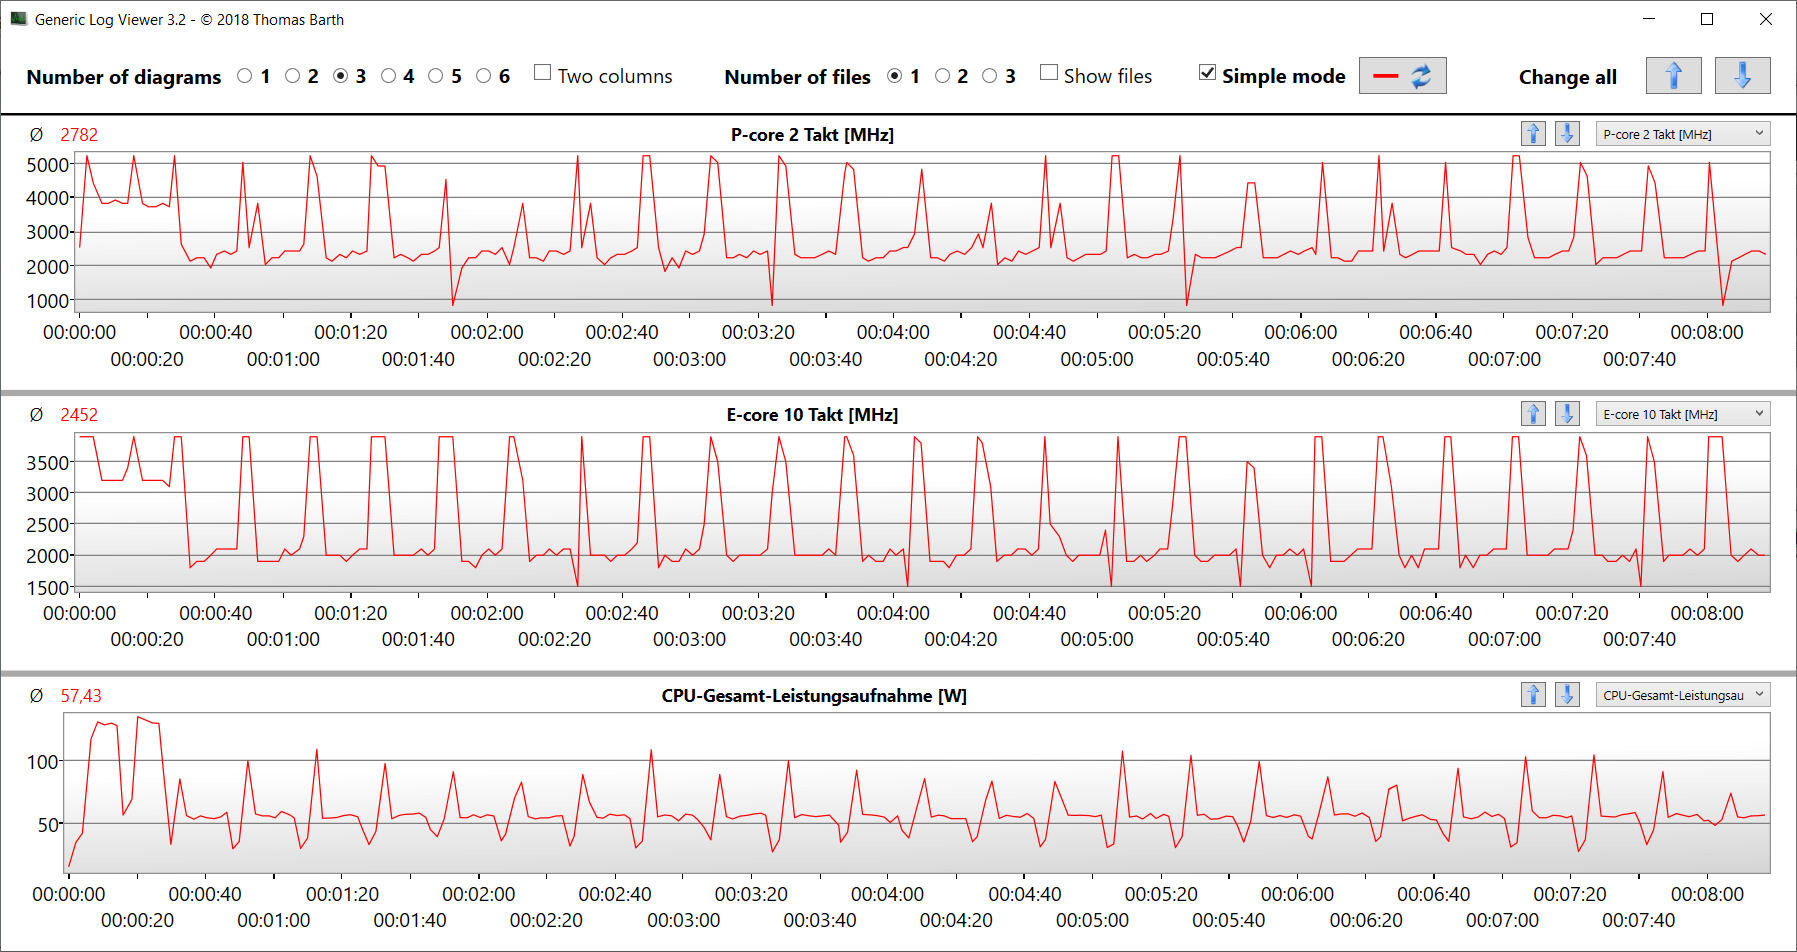
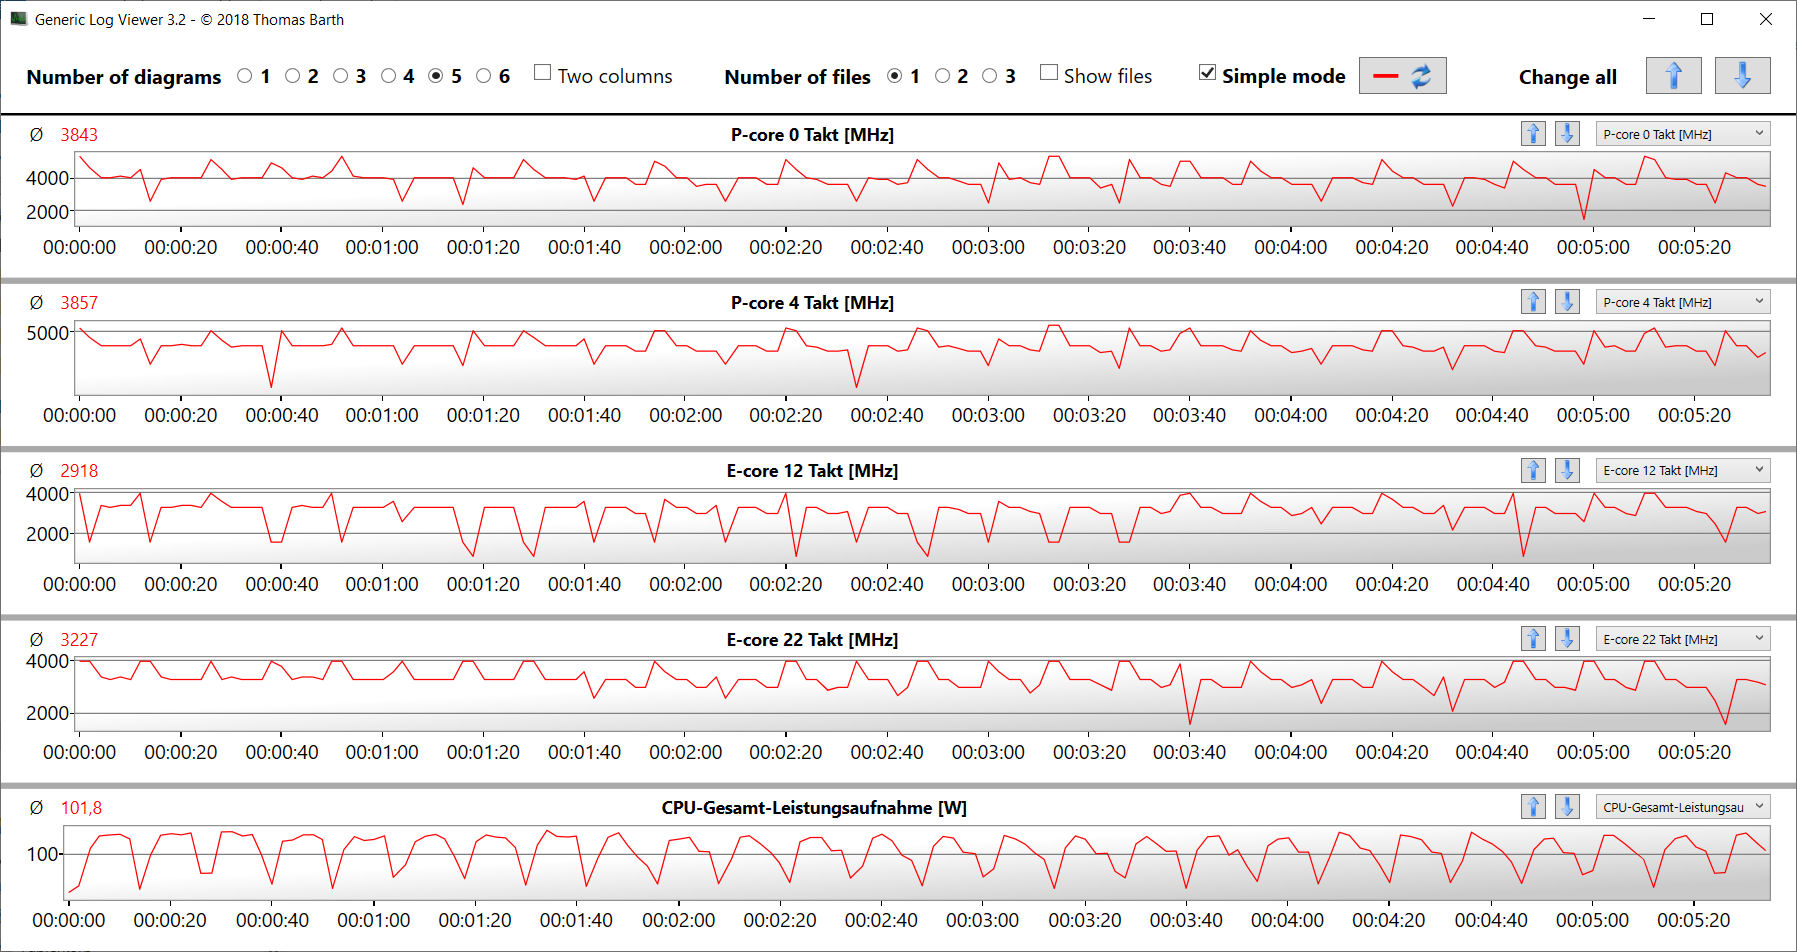
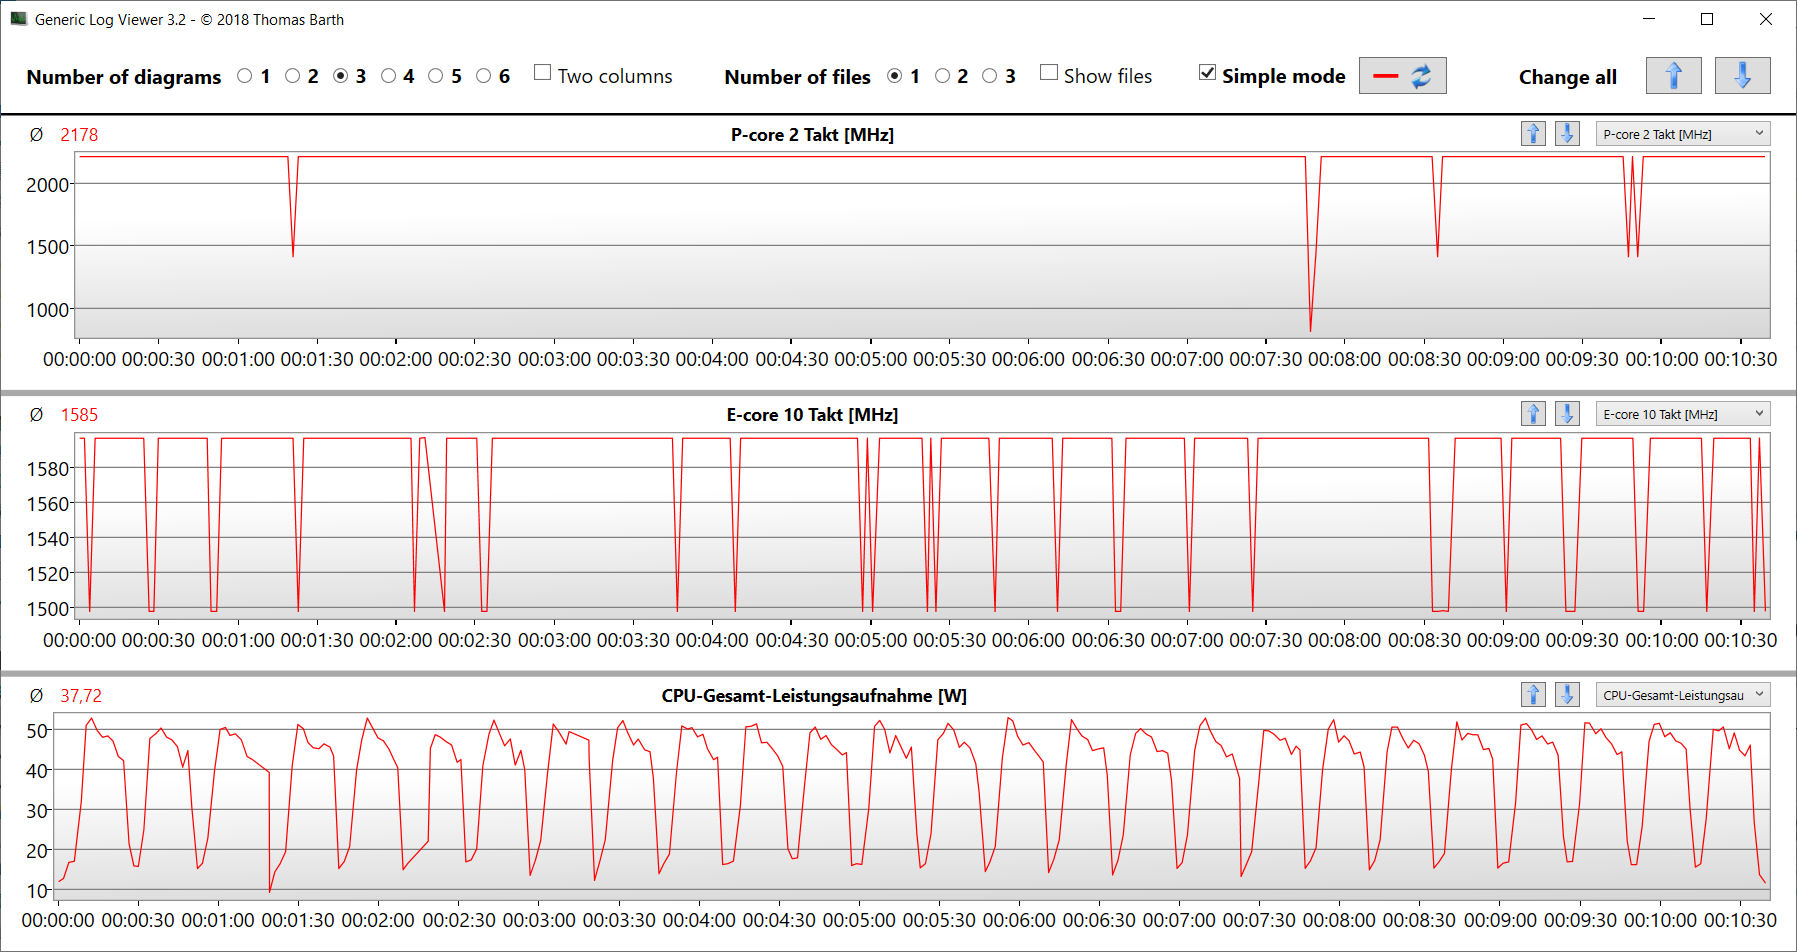
Los resultados del benchmark se sitúan al nivel (monohilo) de la media de la CPU o por debajo (multihilo). En general, el modo "Rendimiento" sólo supone una ligera ventaja de rendimiento, siendo las pruebas AIDA las que más se benefician. Por otro lado, también hará que la velocidad de la CPU se mantenga en un nivel alto bajo carga multihilo constante, como muestra la prueba de bucle CB15.
Cinebench R15 Multi Constant Load Test
| CPU Performance rating - Percent | |
| Lenovo Legion Pro 7 16IRX8H | |
| Asus ROG Strix G16 G614JZ | |
| HP Omen 17-ck2097ng | |
| Medio Intel Core i9-13900HX | |
| HP Omen 17-ck2097ng | |
| Razer Blade 16 Early 2023 | |
| Media de la clase Gaming | |
| Alienware m17 R5 (R9 6900HX, RX 6850M XT) | |
| Cinebench R20 | |
| CPU (Multi Core) | |
| Asus ROG Strix G16 G614JZ | |
| Lenovo Legion Pro 7 16IRX8H | |
| Medio Intel Core i9-13900HX (9152 - 12541, n=21) | |
| HP Omen 17-ck2097ng (Leistung) | |
| Media de la clase Gaming (4029 - 16433, n=106, últimos 2 años) | |
| HP Omen 17-ck2097ng | |
| Razer Blade 16 Early 2023 | |
| Alienware m17 R5 (R9 6900HX, RX 6850M XT) | |
| CPU (Single Core) | |
| Asus ROG Strix G16 G614JZ | |
| HP Omen 17-ck2097ng | |
| HP Omen 17-ck2097ng (Leistung) | |
| Lenovo Legion Pro 7 16IRX8H | |
| Medio Intel Core i9-13900HX (722 - 810, n=21) | |
| Media de la clase Gaming (442 - 913, n=106, últimos 2 años) | |
| Razer Blade 16 Early 2023 | |
| Alienware m17 R5 (R9 6900HX, RX 6850M XT) | |
| Cinebench R15 | |
| CPU Multi 64Bit | |
| Lenovo Legion Pro 7 16IRX8H | |
| Asus ROG Strix G16 G614JZ (turbo) | |
| Asus ROG Strix G16 G614JZ | |
| Razer Blade 16 Early 2023 | |
| Medio Intel Core i9-13900HX (3913 - 4970, n=22) | |
| HP Omen 17-ck2097ng (Leistung) | |
| HP Omen 17-ck2097ng | |
| Media de la clase Gaming (1578 - 6330, n=105, últimos 2 años) | |
| Alienware m17 R5 (R9 6900HX, RX 6850M XT) | |
| CPU Single 64Bit | |
| Asus ROG Strix G16 G614JZ | |
| Asus ROG Strix G16 G614JZ (turbo) | |
| Lenovo Legion Pro 7 16IRX8H | |
| HP Omen 17-ck2097ng | |
| HP Omen 17-ck2097ng (Leistung) | |
| Media de la clase Gaming (188.8 - 350, n=106, últimos 2 años) | |
| Medio Intel Core i9-13900HX (247 - 304, n=22) | |
| Razer Blade 16 Early 2023 | |
| Alienware m17 R5 (R9 6900HX, RX 6850M XT) | |
| Blender - v2.79 BMW27 CPU | |
| Alienware m17 R5 (R9 6900HX, RX 6850M XT) | |
| HP Omen 17-ck2097ng | |
| Media de la clase Gaming (79 - 330, n=104, últimos 2 años) | |
| Medio Intel Core i9-13900HX (101 - 153, n=22) | |
| Razer Blade 16 Early 2023 | |
| HP Omen 17-ck2097ng (Leistung) | |
| Asus ROG Strix G16 G614JZ | |
| Lenovo Legion Pro 7 16IRX8H | |
| HWBOT x265 Benchmark v2.2 - 4k Preset | |
| Lenovo Legion Pro 7 16IRX8H | |
| HP Omen 17-ck2097ng (Leistung) | |
| Asus ROG Strix G16 G614JZ | |
| Medio Intel Core i9-13900HX (23.5 - 34.4, n=22) | |
| Media de la clase Gaming (11.5 - 44.4, n=105, últimos 2 años) | |
| Razer Blade 16 Early 2023 | |
| HP Omen 17-ck2097ng | |
| Alienware m17 R5 (R9 6900HX, RX 6850M XT) | |
| LibreOffice - 20 Documents To PDF | |
| Alienware m17 R5 (R9 6900HX, RX 6850M XT) | |
| Media de la clase Gaming (33.2 - 88.8, n=105, últimos 2 años) | |
| Asus ROG Strix G16 G614JZ | |
| Razer Blade 16 Early 2023 | |
| HP Omen 17-ck2097ng | |
| Lenovo Legion Pro 7 16IRX8H | |
| Medio Intel Core i9-13900HX (32.8 - 51.1, n=21) | |
| HP Omen 17-ck2097ng (Leistung) | |
| R Benchmark 2.5 - Overall mean | |
| Alienware m17 R5 (R9 6900HX, RX 6850M XT) | |
| Media de la clase Gaming (0.3439 - 0.759, n=106, últimos 2 años) | |
| Razer Blade 16 Early 2023 | |
| Medio Intel Core i9-13900HX (0.375 - 0.4564, n=22) | |
| Lenovo Legion Pro 7 16IRX8H | |
| HP Omen 17-ck2097ng (Leistung) | |
| Asus ROG Strix G16 G614JZ | |
| HP Omen 17-ck2097ng | |
* ... más pequeño es mejor
AIDA64: FP32 Ray-Trace | FPU Julia | CPU SHA3 | CPU Queen | FPU SinJulia | FPU Mandel | CPU AES | CPU ZLib | FP64 Ray-Trace | CPU PhotoWorxx
| Performance rating | |
| Lenovo Legion Pro 7 16IRX8H | |
| Asus ROG Strix G16 G614JZ | |
| Media de la clase Gaming | |
| Medio Intel Core i9-13900HX | |
| HP Omen 17-ck2097ng | |
| Razer Blade 16 Early 2023 | |
| HP Omen 17-ck2097ng | |
| Alienware m17 R5 (R9 6900HX, RX 6850M XT) | |
| AIDA64 / FP32 Ray-Trace | |
| Media de la clase Gaming (10227 - 85542, n=105, últimos 2 años) | |
| Asus ROG Strix G16 G614JZ (v6.75.6100) | |
| Lenovo Legion Pro 7 16IRX8H (v6.85.6300) | |
| Razer Blade 16 Early 2023 (v6.85.6300) | |
| Razer Blade 16 Early 2023 (v8.20.8100) | |
| Razer Blade 16 Early 2023 (v6.92.6600) | |
| Medio Intel Core i9-13900HX (17589 - 27615, n=22) | |
| HP Omen 17-ck2097ng (v6.75.6100, Leistung) | |
| HP Omen 17-ck2097ng (v6.75.6100) | |
| Alienware m17 R5 (R9 6900HX, RX 6850M XT) (v6.75.6100) | |
| AIDA64 / FPU Julia | |
| Media de la clase Gaming (51376 - 238426, n=105, últimos 2 años) | |
| Lenovo Legion Pro 7 16IRX8H (v6.85.6300) | |
| Asus ROG Strix G16 G614JZ (v6.75.6100) | |
| Razer Blade 16 Early 2023 (v6.85.6300) | |
| Razer Blade 16 Early 2023 (v8.20.8100) | |
| Razer Blade 16 Early 2023 (v6.92.6600) | |
| Medio Intel Core i9-13900HX (88686 - 137015, n=22) | |
| HP Omen 17-ck2097ng (v6.75.6100, Leistung) | |
| Alienware m17 R5 (R9 6900HX, RX 6850M XT) (v6.75.6100) | |
| HP Omen 17-ck2097ng (v6.75.6100) | |
| AIDA64 / CPU SHA3 | |
| Lenovo Legion Pro 7 16IRX8H (v6.85.6300) | |
| Asus ROG Strix G16 G614JZ (v6.75.6100) | |
| Media de la clase Gaming (2180 - 10115, n=105, últimos 2 años) | |
| Razer Blade 16 Early 2023 (v6.85.6300) | |
| Razer Blade 16 Early 2023 (v6.92.6600) | |
| Razer Blade 16 Early 2023 (v8.20.8100) | |
| Medio Intel Core i9-13900HX (4362 - 7029, n=22) | |
| HP Omen 17-ck2097ng (v6.75.6100, Leistung) | |
| HP Omen 17-ck2097ng (v6.75.6100) | |
| Alienware m17 R5 (R9 6900HX, RX 6850M XT) (v6.75.6100) | |
| AIDA64 / CPU Queen | |
| Asus ROG Strix G16 G614JZ (v6.75.6100) | |
| Razer Blade 16 Early 2023 (v6.92.6600) | |
| Razer Blade 16 Early 2023 (v6.85.6300) | |
| HP Omen 17-ck2097ng | |
| Lenovo Legion Pro 7 16IRX8H (v6.85.6300) | |
| Medio Intel Core i9-13900HX (125644 - 141385, n=22) | |
| HP Omen 17-ck2097ng (v6.75.6100, Leistung) | |
| Media de la clase Gaming (49785 - 173351, n=90, últimos 2 años) | |
| Alienware m17 R5 (R9 6900HX, RX 6850M XT) (v6.75.6100) | |
| AIDA64 / FPU SinJulia | |
| Asus ROG Strix G16 G614JZ (v6.75.6100) | |
| Razer Blade 16 Early 2023 (v6.85.6300) | |
| Razer Blade 16 Early 2023 (v8.20.8100) | |
| Razer Blade 16 Early 2023 (v6.92.6600) | |
| Lenovo Legion Pro 7 16IRX8H (v6.85.6300) | |
| HP Omen 17-ck2097ng (v6.75.6100, Leistung) | |
| Medio Intel Core i9-13900HX (12334 - 17179, n=22) | |
| Media de la clase Gaming (4424 - 33636, n=105, últimos 2 años) | |
| Alienware m17 R5 (R9 6900HX, RX 6850M XT) (v6.75.6100) | |
| HP Omen 17-ck2097ng (v6.75.6100) | |
| AIDA64 / FPU Mandel | |
| Media de la clase Gaming (25115 - 128721, n=105, últimos 2 años) | |
| Lenovo Legion Pro 7 16IRX8H (v6.85.6300) | |
| Asus ROG Strix G16 G614JZ (v6.75.6100) | |
| Razer Blade 16 Early 2023 (v6.85.6300) | |
| Razer Blade 16 Early 2023 (v8.20.8100) | |
| Razer Blade 16 Early 2023 (v6.92.6600) | |
| Medio Intel Core i9-13900HX (43850 - 69202, n=22) | |
| HP Omen 17-ck2097ng (v6.75.6100, Leistung) | |
| Alienware m17 R5 (R9 6900HX, RX 6850M XT) (v6.75.6100) | |
| HP Omen 17-ck2097ng (v6.75.6100) | |
| AIDA64 / CPU AES | |
| Razer Blade 16 Early 2023 (v6.92.6600) | |
| Razer Blade 16 Early 2023 (v8.20.8100) | |
| Razer Blade 16 Early 2023 (v6.85.6300) | |
| Medio Intel Core i9-13900HX (89413 - 237881, n=22) | |
| Asus ROG Strix G16 G614JZ (v6.75.6100) | |
| Lenovo Legion Pro 7 16IRX8H (v6.85.6300) | |
| HP Omen 17-ck2097ng (v6.75.6100, Leistung) | |
| Media de la clase Gaming (39258 - 247074, n=105, últimos 2 años) | |
| HP Omen 17-ck2097ng (v6.75.6100) | |
| Alienware m17 R5 (R9 6900HX, RX 6850M XT) (v6.75.6100) | |
| AIDA64 / CPU ZLib | |
| Lenovo Legion Pro 7 16IRX8H (v6.85.6300) | |
| Asus ROG Strix G16 G614JZ (v6.75.6100) | |
| Razer Blade 16 Early 2023 (v6.85.6300) | |
| Razer Blade 16 Early 2023 (v6.92.6600) | |
| Razer Blade 16 Early 2023 (v8.20.8100) | |
| Medio Intel Core i9-13900HX (1284 - 1958, n=22) | |
| HP Omen 17-ck2097ng (v6.75.6100, Leistung) | |
| Media de la clase Gaming (574 - 2531, n=105, últimos 2 años) | |
| HP Omen 17-ck2097ng (v6.75.6100) | |
| Alienware m17 R5 (R9 6900HX, RX 6850M XT) (v6.75.6100) | |
| AIDA64 / FP64 Ray-Trace | |
| Media de la clase Gaming (5509 - 45446, n=105, últimos 2 años) | |
| Lenovo Legion Pro 7 16IRX8H (v6.85.6300) | |
| Asus ROG Strix G16 G614JZ (v6.75.6100) | |
| Razer Blade 16 Early 2023 (v6.85.6300) | |
| Razer Blade 16 Early 2023 (v6.92.6600) | |
| Razer Blade 16 Early 2023 (v8.20.8100) | |
| Medio Intel Core i9-13900HX (9481 - 15279, n=22) | |
| HP Omen 17-ck2097ng (v6.75.6100, Leistung) | |
| HP Omen 17-ck2097ng (v6.75.6100) | |
| Alienware m17 R5 (R9 6900HX, RX 6850M XT) (v6.75.6100) | |
| AIDA64 / CPU PhotoWorxx | |
| Razer Blade 16 Early 2023 (v6.85.6300) | |
| Razer Blade 16 Early 2023 (v6.92.6600) | |
| Razer Blade 16 Early 2023 (v8.20.8100) | |
| HP Omen 17-ck2097ng (v6.75.6100) | |
| HP Omen 17-ck2097ng (v6.75.6100, Leistung) | |
| Lenovo Legion Pro 7 16IRX8H (v6.85.6300) | |
| Medio Intel Core i9-13900HX (42994 - 51994, n=22) | |
| Media de la clase Gaming (12271 - 89891, n=105, últimos 2 años) | |
| Asus ROG Strix G16 G614JZ (v6.75.6100) | |
| Alienware m17 R5 (R9 6900HX, RX 6850M XT) (v6.75.6100) | |
Rendimiento del sistema
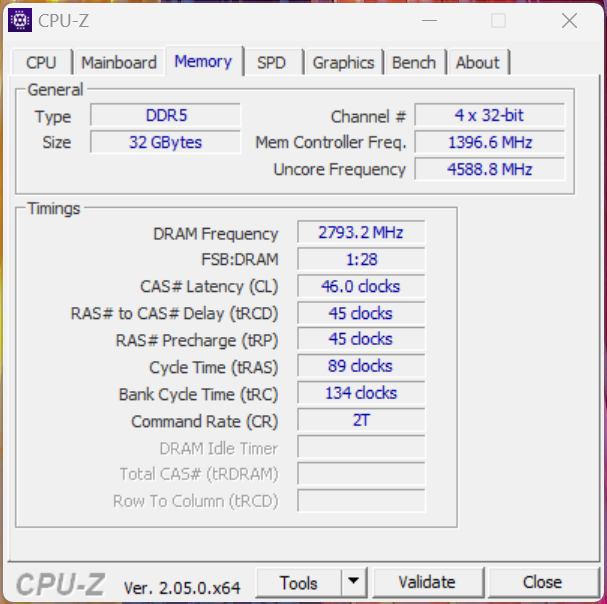
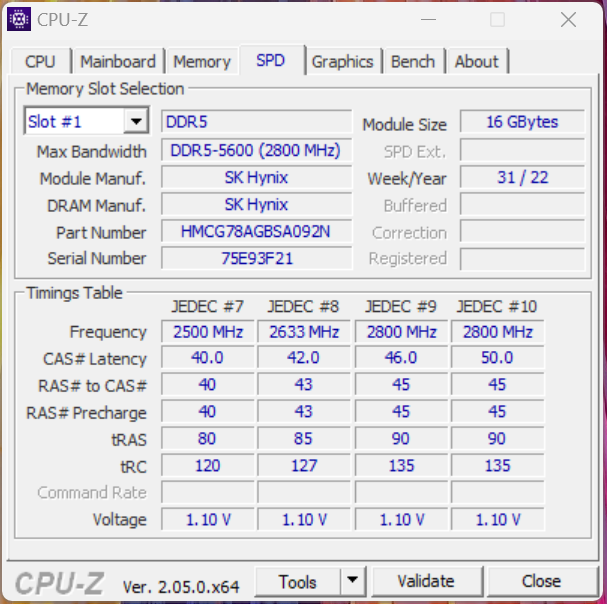
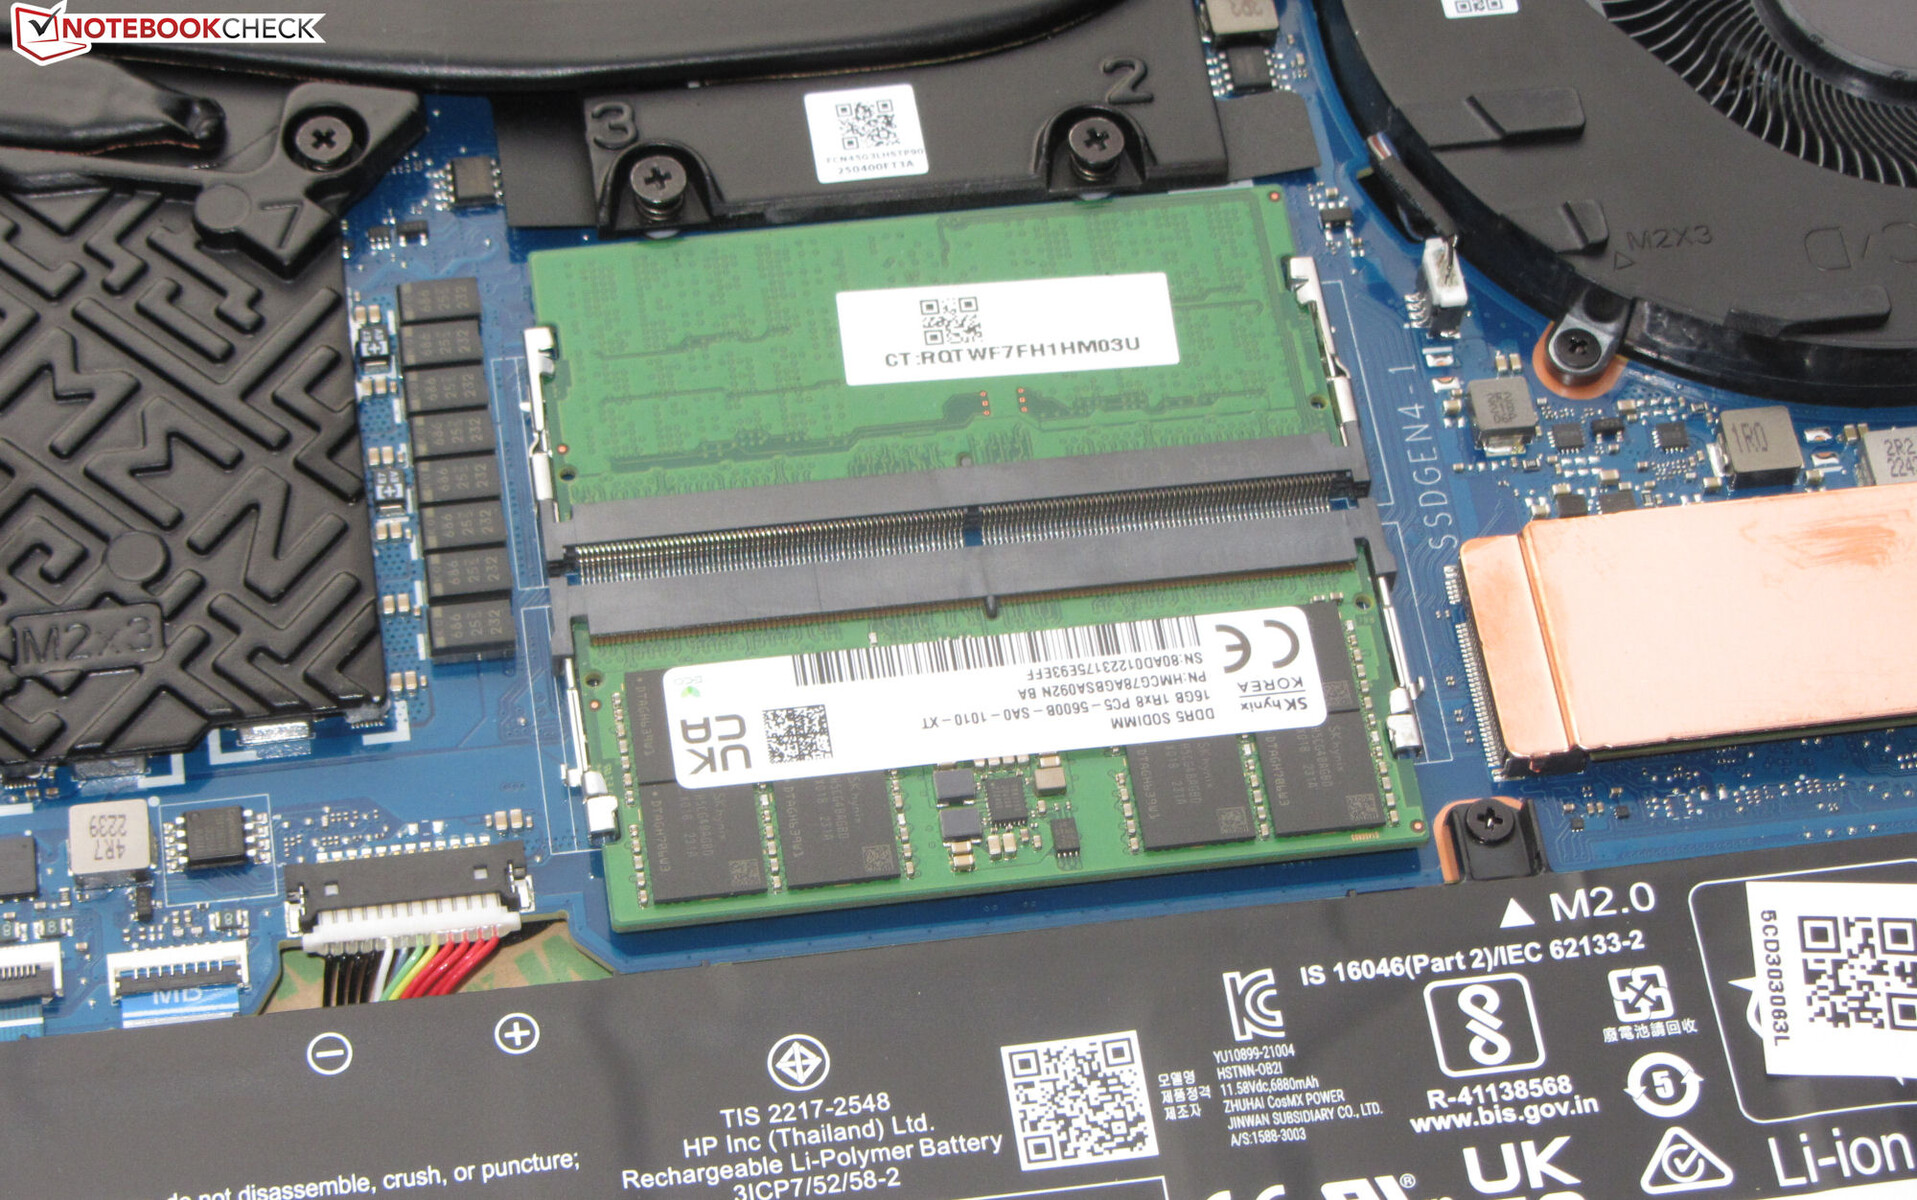
El sistema, que funciona sin problemas, ofrece un rendimiento informático suficiente para áreas de aplicación que requieren mucha potencia, como el renderizado y los juegos. Las tasas de transferencia de la memoria de trabajo se sitúan en niveles normales para un almacenamiento DDR5-5600. Van acompañadas de buenos resultados en PC-Mark.
CrossMark: Overall | Productivity | Creativity | Responsiveness
| PCMark 10 / Score | |
| Media de la clase Gaming (5828 - 12414, n=93, últimos 2 años) | |
| Medio Intel Core i9-13900HX, NVIDIA GeForce RTX 4080 Laptop GPU (7609 - 8549, n=3) | |
| Razer Blade 16 Early 2023 | |
| Lenovo Legion Pro 7 16IRX8H | |
| HP Omen 17-ck2097ng | |
| Alienware m17 R5 (R9 6900HX, RX 6850M XT) | |
| Asus ROG Strix G16 G614JZ | |
| PCMark 10 / Essentials | |
| Asus ROG Strix G16 G614JZ | |
| HP Omen 17-ck2097ng | |
| Lenovo Legion Pro 7 16IRX8H | |
| Medio Intel Core i9-13900HX, NVIDIA GeForce RTX 4080 Laptop GPU (10982 - 11824, n=3) | |
| Razer Blade 16 Early 2023 | |
| Media de la clase Gaming (8810 - 11935, n=97, últimos 2 años) | |
| Alienware m17 R5 (R9 6900HX, RX 6850M XT) | |
| PCMark 10 / Productivity | |
| Media de la clase Gaming (6845 - 25323, n=95, últimos 2 años) | |
| Lenovo Legion Pro 7 16IRX8H | |
| Medio Intel Core i9-13900HX, NVIDIA GeForce RTX 4080 Laptop GPU (9976 - 10788, n=3) | |
| HP Omen 17-ck2097ng | |
| Alienware m17 R5 (R9 6900HX, RX 6850M XT) | |
| Razer Blade 16 Early 2023 | |
| Asus ROG Strix G16 G614JZ | |
| PCMark 10 / Digital Content Creation | |
| Razer Blade 16 Early 2023 | |
| Media de la clase Gaming (7602 - 19954, n=95, últimos 2 años) | |
| Medio Intel Core i9-13900HX, NVIDIA GeForce RTX 4080 Laptop GPU (10135 - 14720, n=3) | |
| Alienware m17 R5 (R9 6900HX, RX 6850M XT) | |
| Asus ROG Strix G16 G614JZ | |
| Lenovo Legion Pro 7 16IRX8H | |
| HP Omen 17-ck2097ng | |
| CrossMark / Overall | |
| Asus ROG Strix G16 G614JZ | |
| Medio Intel Core i9-13900HX, NVIDIA GeForce RTX 4080 Laptop GPU (1991 - 2194, n=2) | |
| HP Omen 17-ck2097ng | |
| Media de la clase Gaming (1366 - 2409, n=94, últimos 2 años) | |
| Alienware m17 R5 (R9 6900HX, RX 6850M XT) | |
| Razer Blade 16 Early 2023 | |
| CrossMark / Productivity | |
| Asus ROG Strix G16 G614JZ | |
| Medio Intel Core i9-13900HX, NVIDIA GeForce RTX 4080 Laptop GPU (1828 - 2059, n=2) | |
| Media de la clase Gaming (1386 - 2254, n=94, últimos 2 años) | |
| HP Omen 17-ck2097ng | |
| Alienware m17 R5 (R9 6900HX, RX 6850M XT) | |
| Razer Blade 16 Early 2023 | |
| CrossMark / Creativity | |
| Asus ROG Strix G16 G614JZ | |
| Medio Intel Core i9-13900HX, NVIDIA GeForce RTX 4080 Laptop GPU (2239 - 2411, n=2) | |
| Media de la clase Gaming (1343 - 2786, n=94, últimos 2 años) | |
| HP Omen 17-ck2097ng | |
| Razer Blade 16 Early 2023 | |
| Alienware m17 R5 (R9 6900HX, RX 6850M XT) | |
| CrossMark / Responsiveness | |
| Asus ROG Strix G16 G614JZ | |
| Medio Intel Core i9-13900HX, NVIDIA GeForce RTX 4080 Laptop GPU (1808 - 1998, n=2) | |
| HP Omen 17-ck2097ng | |
| Media de la clase Gaming (1226 - 2334, n=94, últimos 2 años) | |
| Razer Blade 16 Early 2023 | |
| Alienware m17 R5 (R9 6900HX, RX 6850M XT) | |
| PCMark 8 Home Score Accelerated v2 | 5074 puntos | |
| PCMark 8 Work Score Accelerated v2 | 6244 puntos | |
| PCMark 10 Score | 7609 puntos | |
ayuda | ||
| AIDA64 / Memory Copy | |
| Razer Blade 16 Early 2023 | |
| Razer Blade 16 Early 2023 | |
| Razer Blade 16 Early 2023 | |
| HP Omen 17-ck2097ng | |
| Lenovo Legion Pro 7 16IRX8H | |
| Medio Intel Core i9-13900HX (67716 - 79193, n=22) | |
| Media de la clase Gaming (21750 - 129946, n=105, últimos 2 años) | |
| Asus ROG Strix G16 G614JZ | |
| HP Omen 17-ck1075ng | |
| Alienware m17 R5 (R9 6900HX, RX 6850M XT) | |
| AIDA64 / Memory Read | |
| Razer Blade 16 Early 2023 | |
| Razer Blade 16 Early 2023 | |
| Razer Blade 16 Early 2023 | |
| HP Omen 17-ck2097ng | |
| Lenovo Legion Pro 7 16IRX8H | |
| Medio Intel Core i9-13900HX (73998 - 88462, n=22) | |
| Media de la clase Gaming (22956 - 118858, n=105, últimos 2 años) | |
| Asus ROG Strix G16 G614JZ | |
| HP Omen 17-ck1075ng | |
| Alienware m17 R5 (R9 6900HX, RX 6850M XT) | |
| AIDA64 / Memory Write | |
| Razer Blade 16 Early 2023 | |
| Razer Blade 16 Early 2023 | |
| Razer Blade 16 Early 2023 | |
| HP Omen 17-ck2097ng | |
| Media de la clase Gaming (22297 - 135096, n=105, últimos 2 años) | |
| Medio Intel Core i9-13900HX (65472 - 77045, n=22) | |
| Lenovo Legion Pro 7 16IRX8H | |
| Asus ROG Strix G16 G614JZ | |
| HP Omen 17-ck1075ng | |
| Alienware m17 R5 (R9 6900HX, RX 6850M XT) | |
| AIDA64 / Memory Latency | |
| Media de la clase Gaming (75.3 - 259, n=105, últimos 2 años) | |
| HP Omen 17-ck1075ng | |
| Razer Blade 16 Early 2023 | |
| Razer Blade 16 Early 2023 | |
| Razer Blade 16 Early 2023 | |
| Alienware m17 R5 (R9 6900HX, RX 6850M XT) | |
| Asus ROG Strix G16 G614JZ | |
| Medio Intel Core i9-13900HX (75.3 - 91.1, n=22) | |
| HP Omen 17-ck2097ng | |
| Lenovo Legion Pro 7 16IRX8H | |
* ... más pequeño es mejor
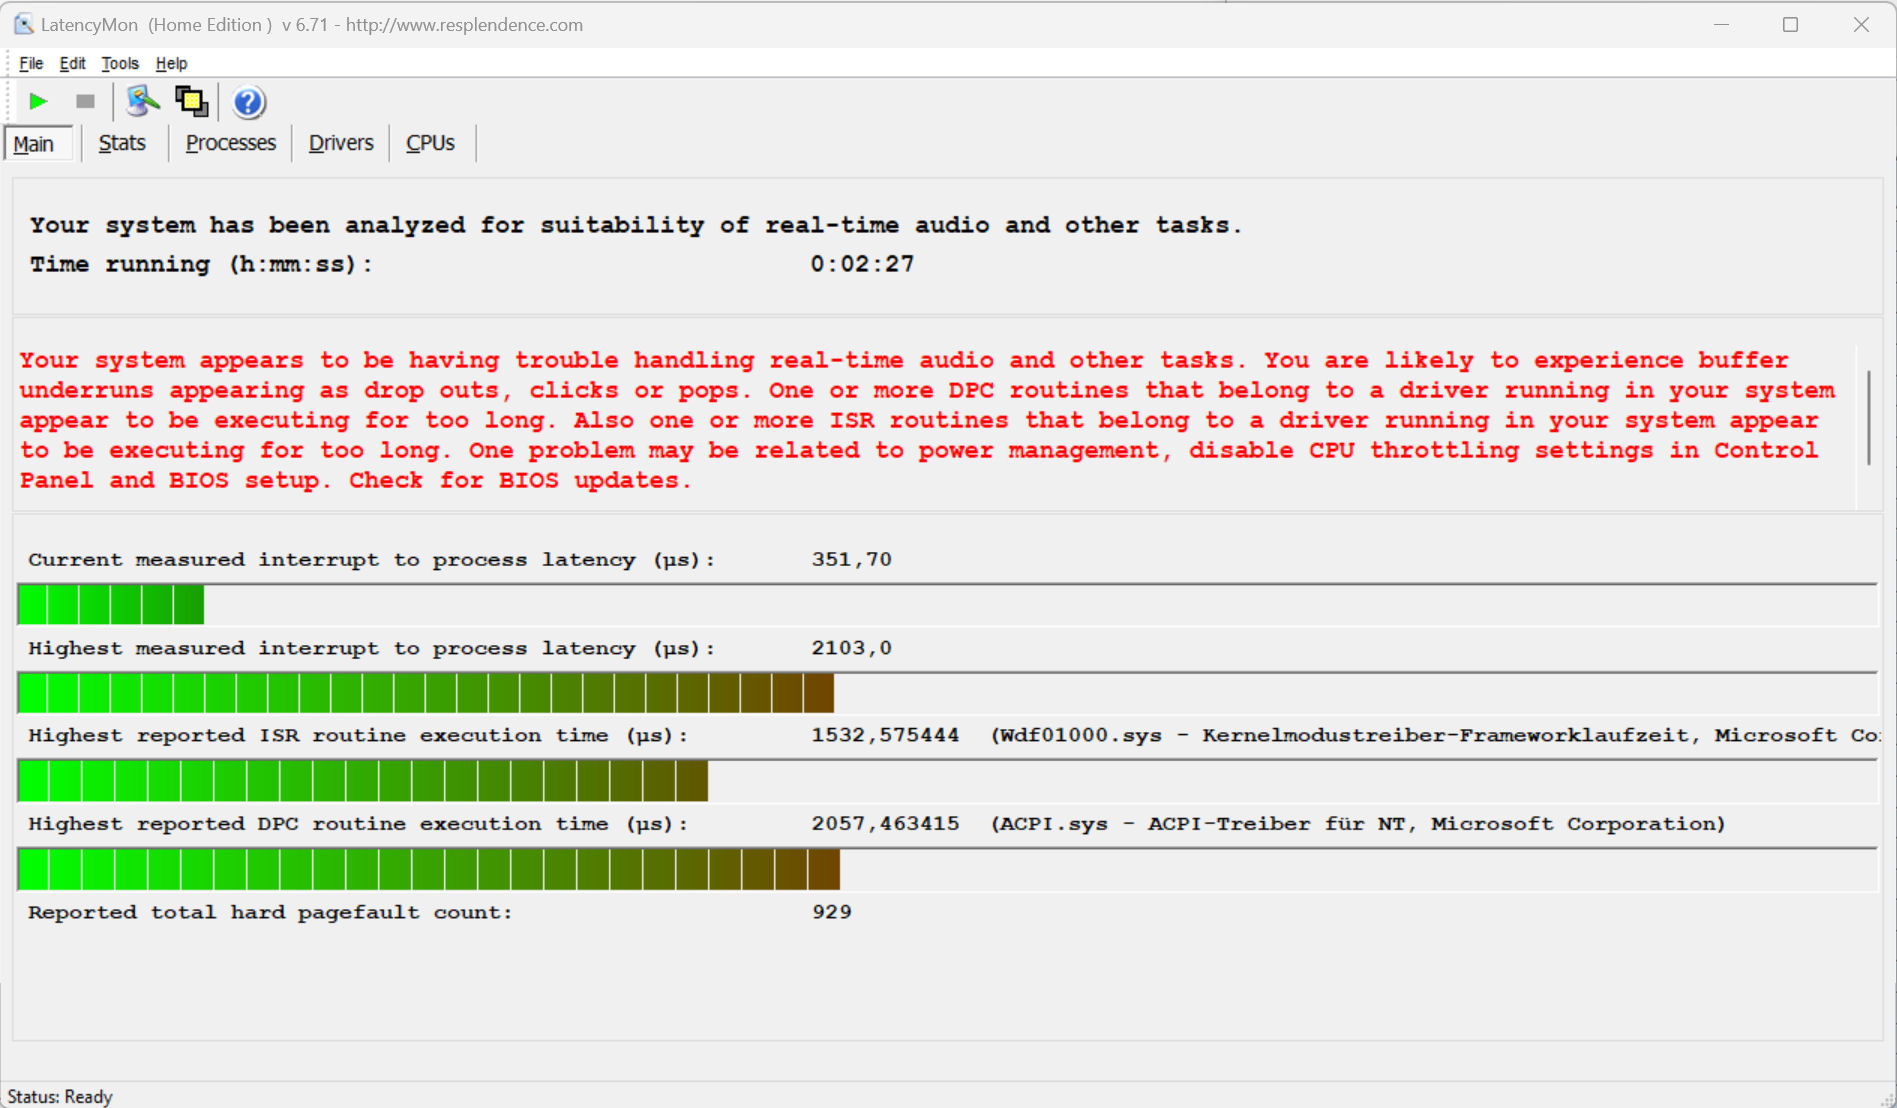
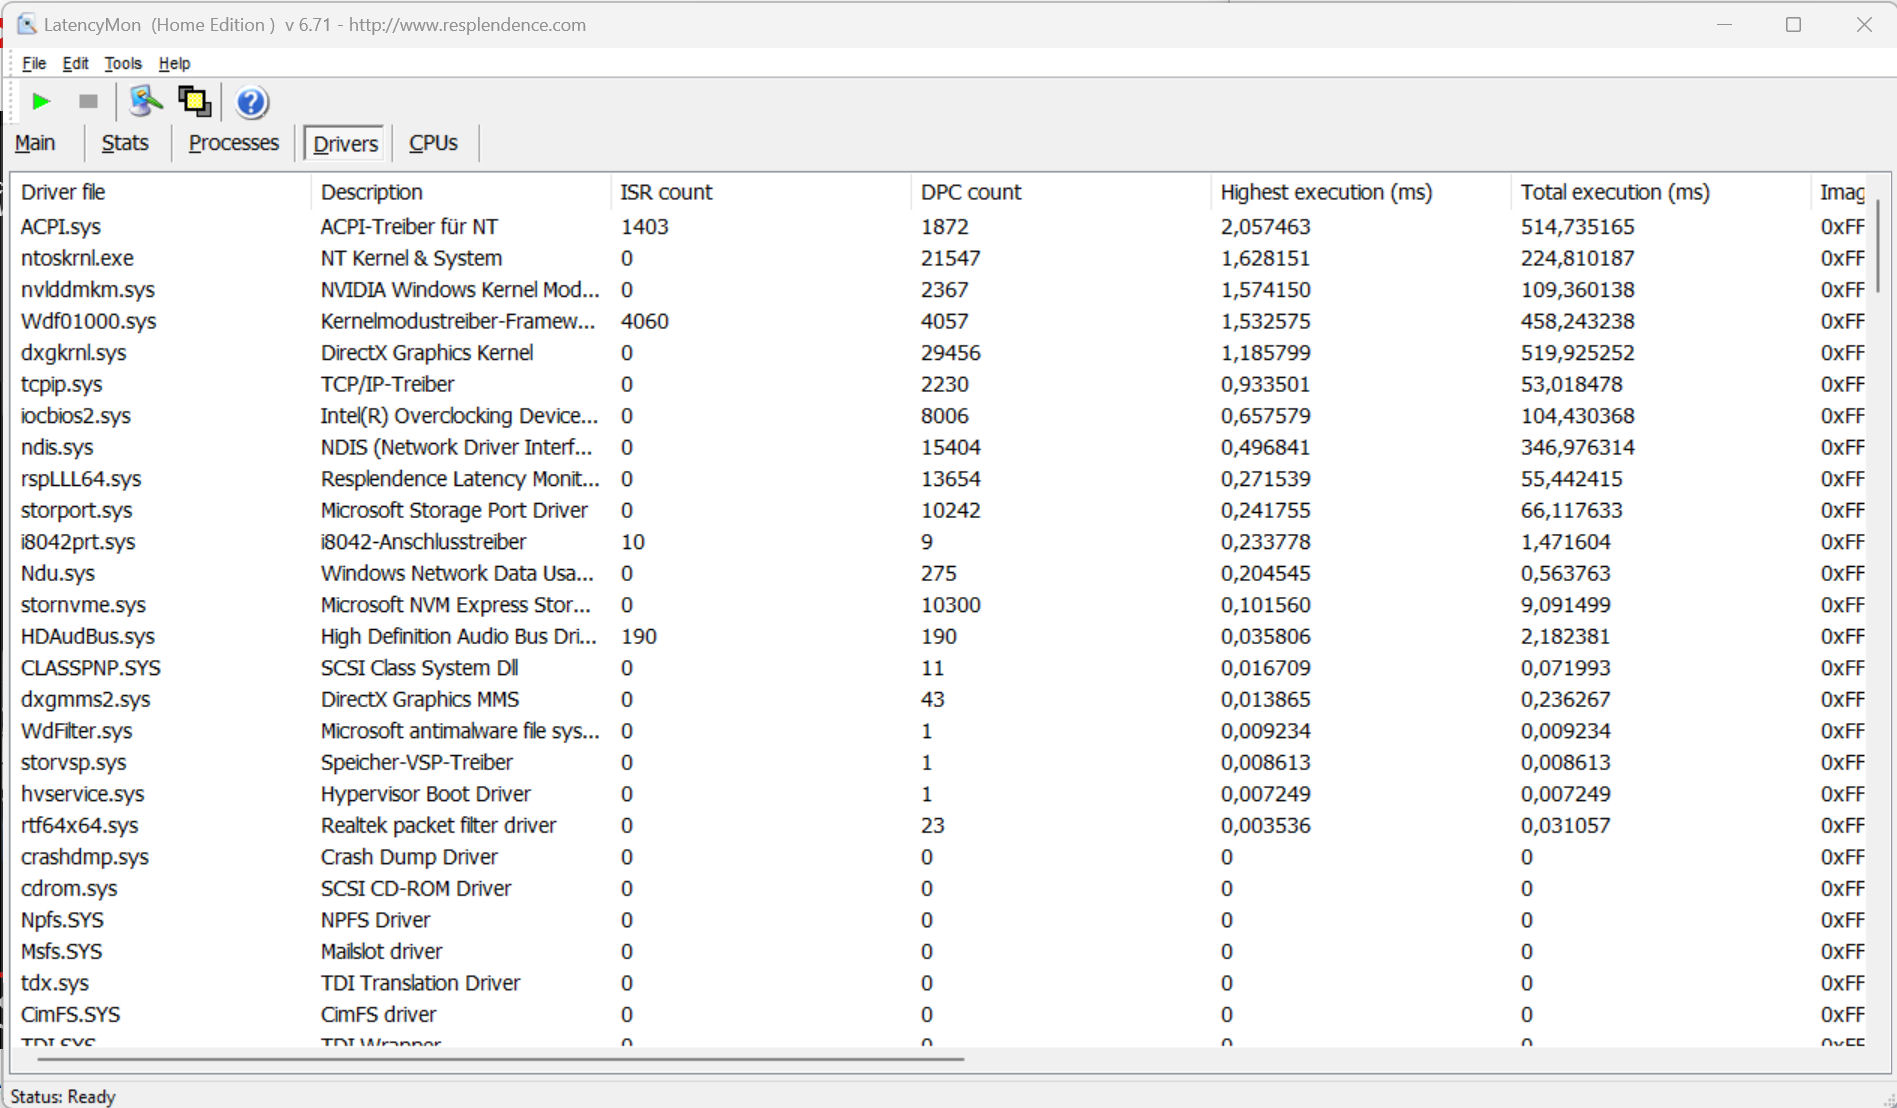
Latencias del CPD
La prueba estandarizada Latency Monitor (navegación web, reproducción de vídeo 4k, Prime95 alta carga) revela algunos comportamientos llamativos. El sistema no parece adecuado para el procesamiento de vídeo y audio en tiempo real. Futuras actualizaciones de software pueden llevar a algunas mejoras o empeorar aún más las cosas.
| DPC Latencies / LatencyMon - interrupt to process latency (max), Web, Youtube, Prime95 | |
| Asus ROG Strix G16 G614JZ | |
| Razer Blade 16 Early 2023 | |
| HP Omen 17-ck2097ng | |
| Alienware m17 R5 (R9 6900HX, RX 6850M XT) | |
| Lenovo Legion Pro 7 16IRX8H | |
* ... más pequeño es mejor
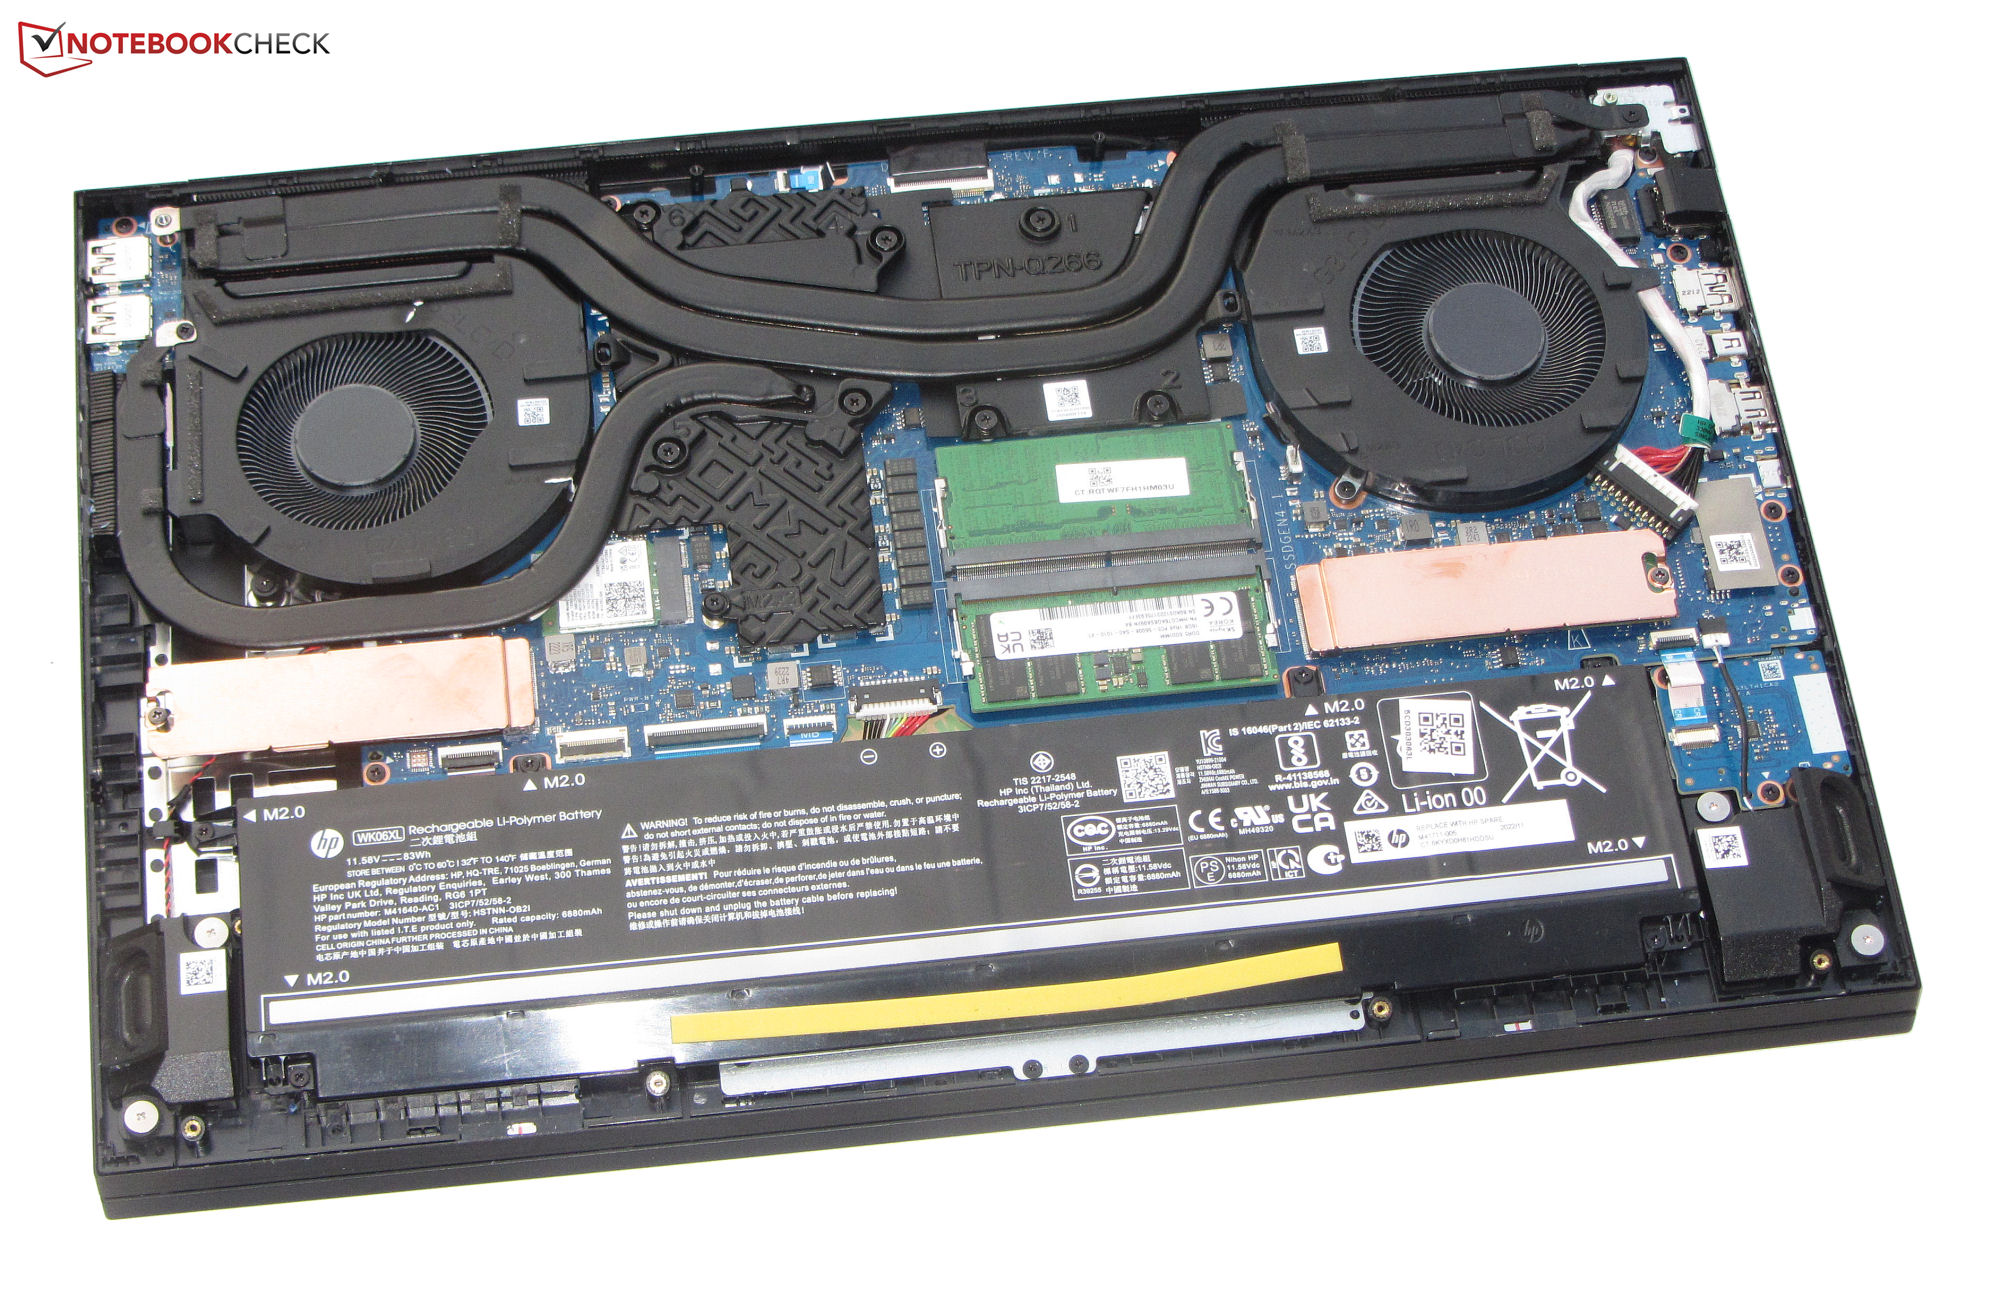
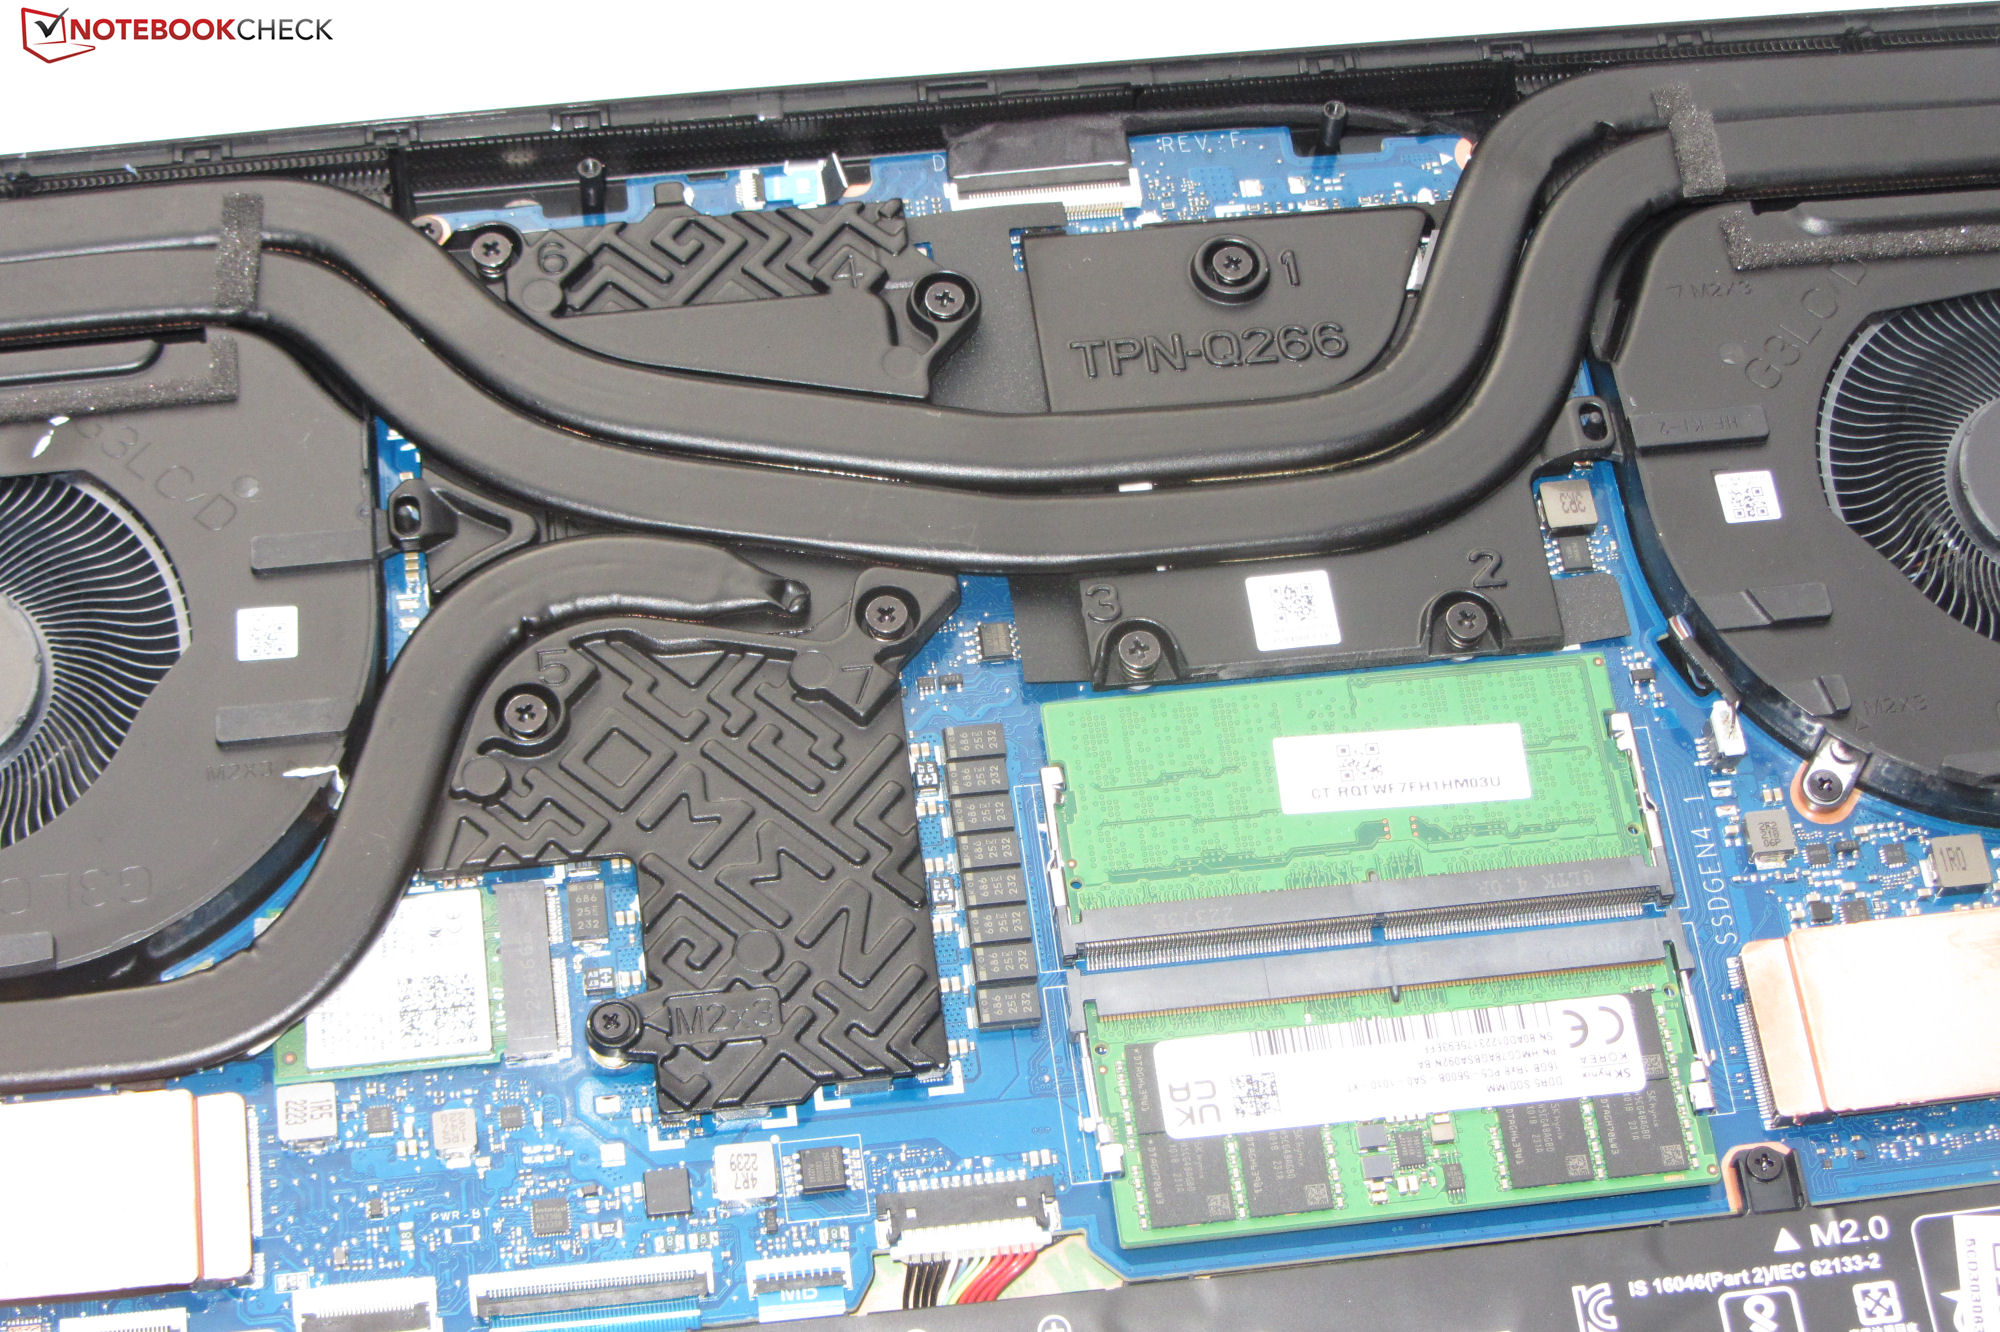
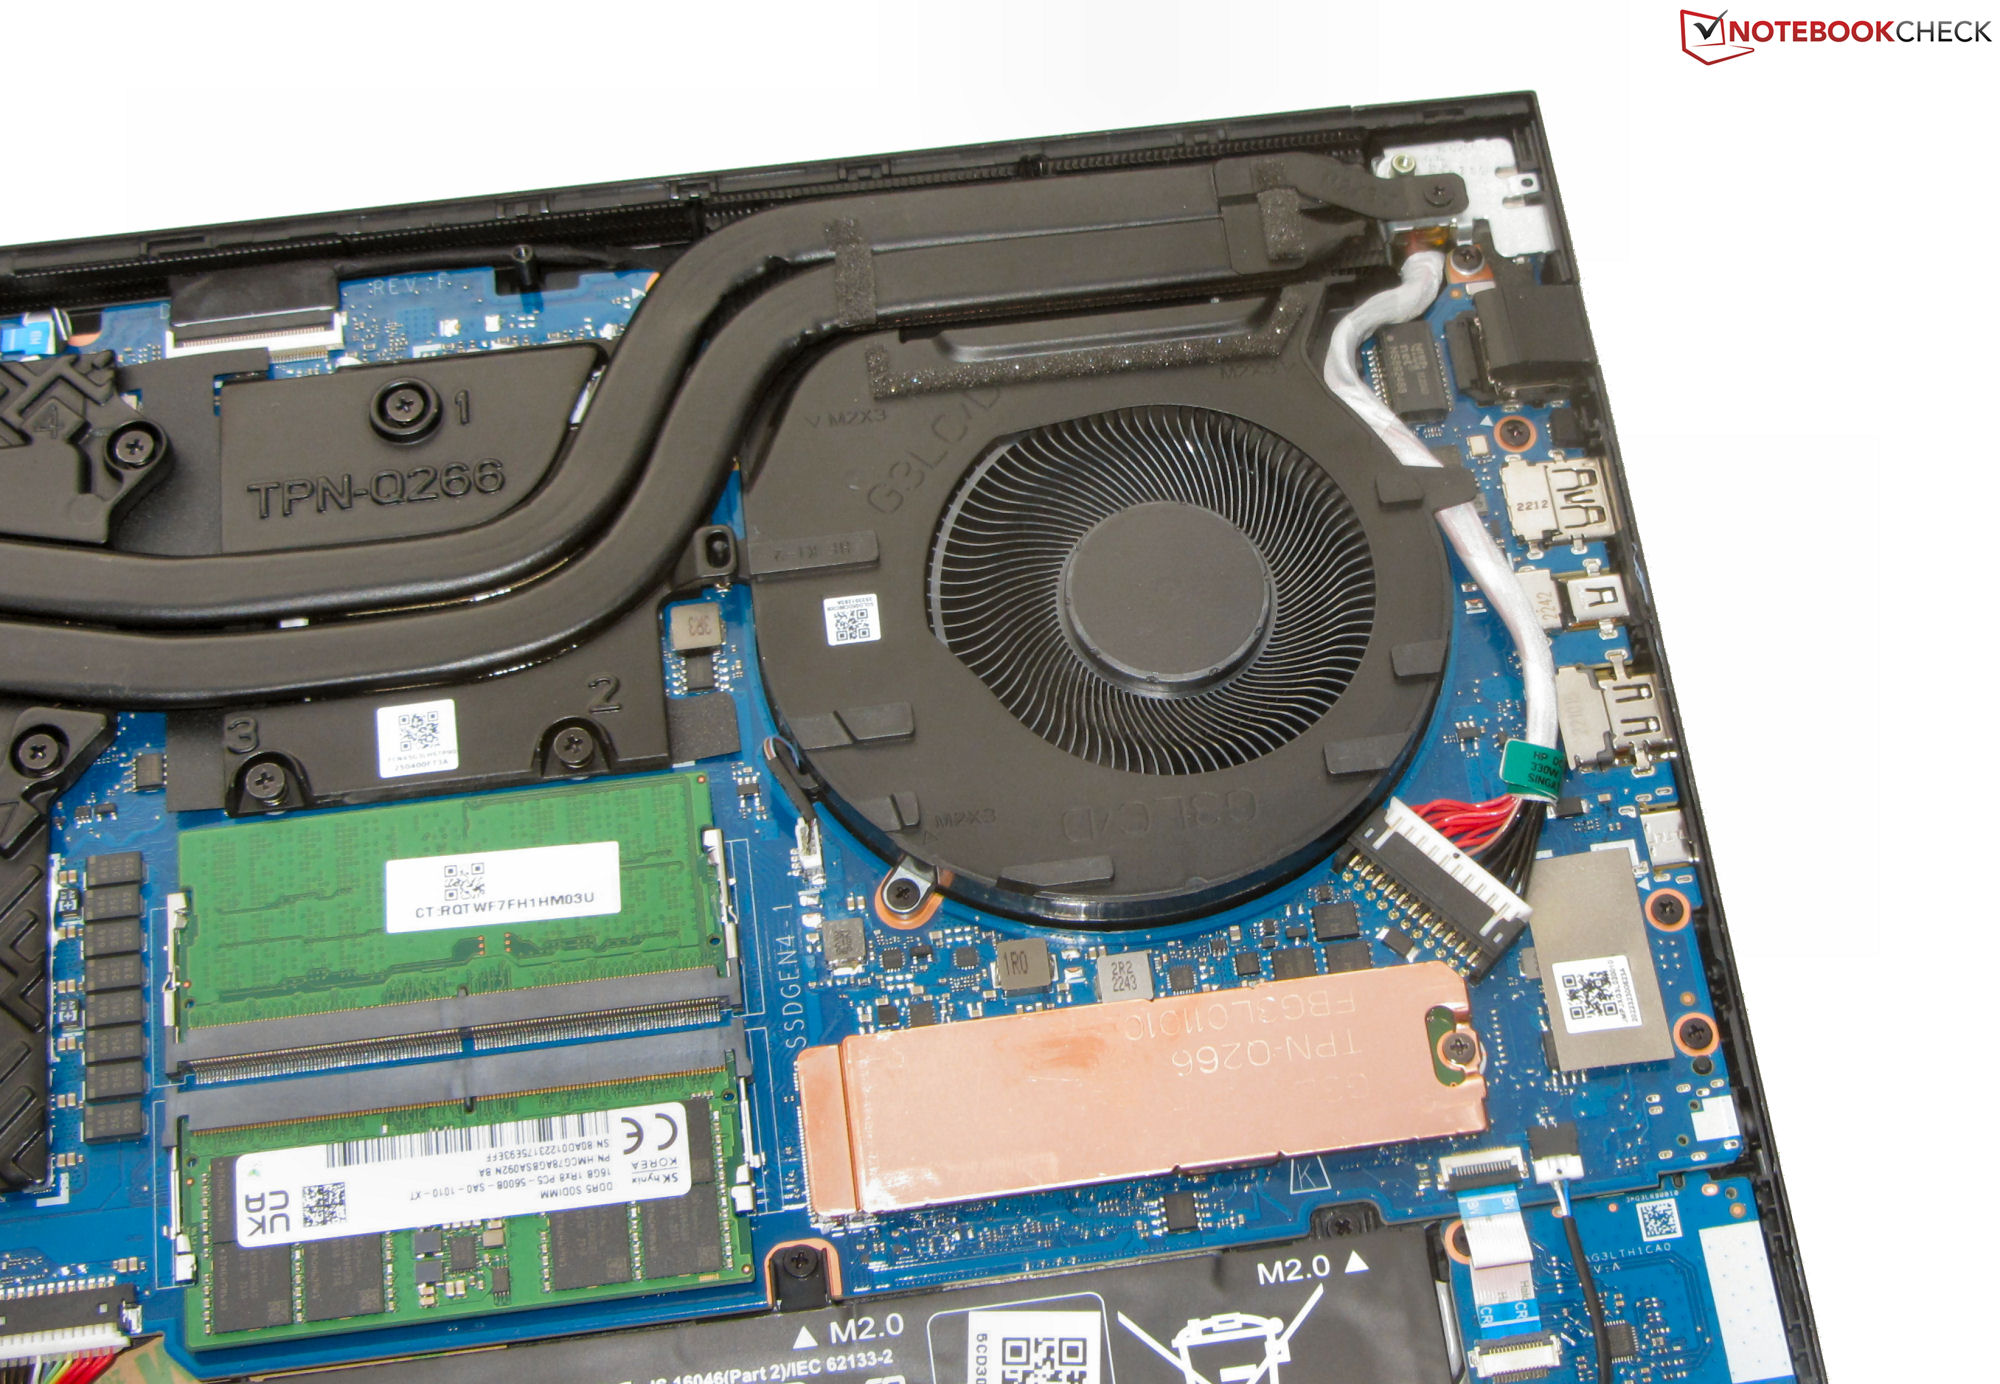
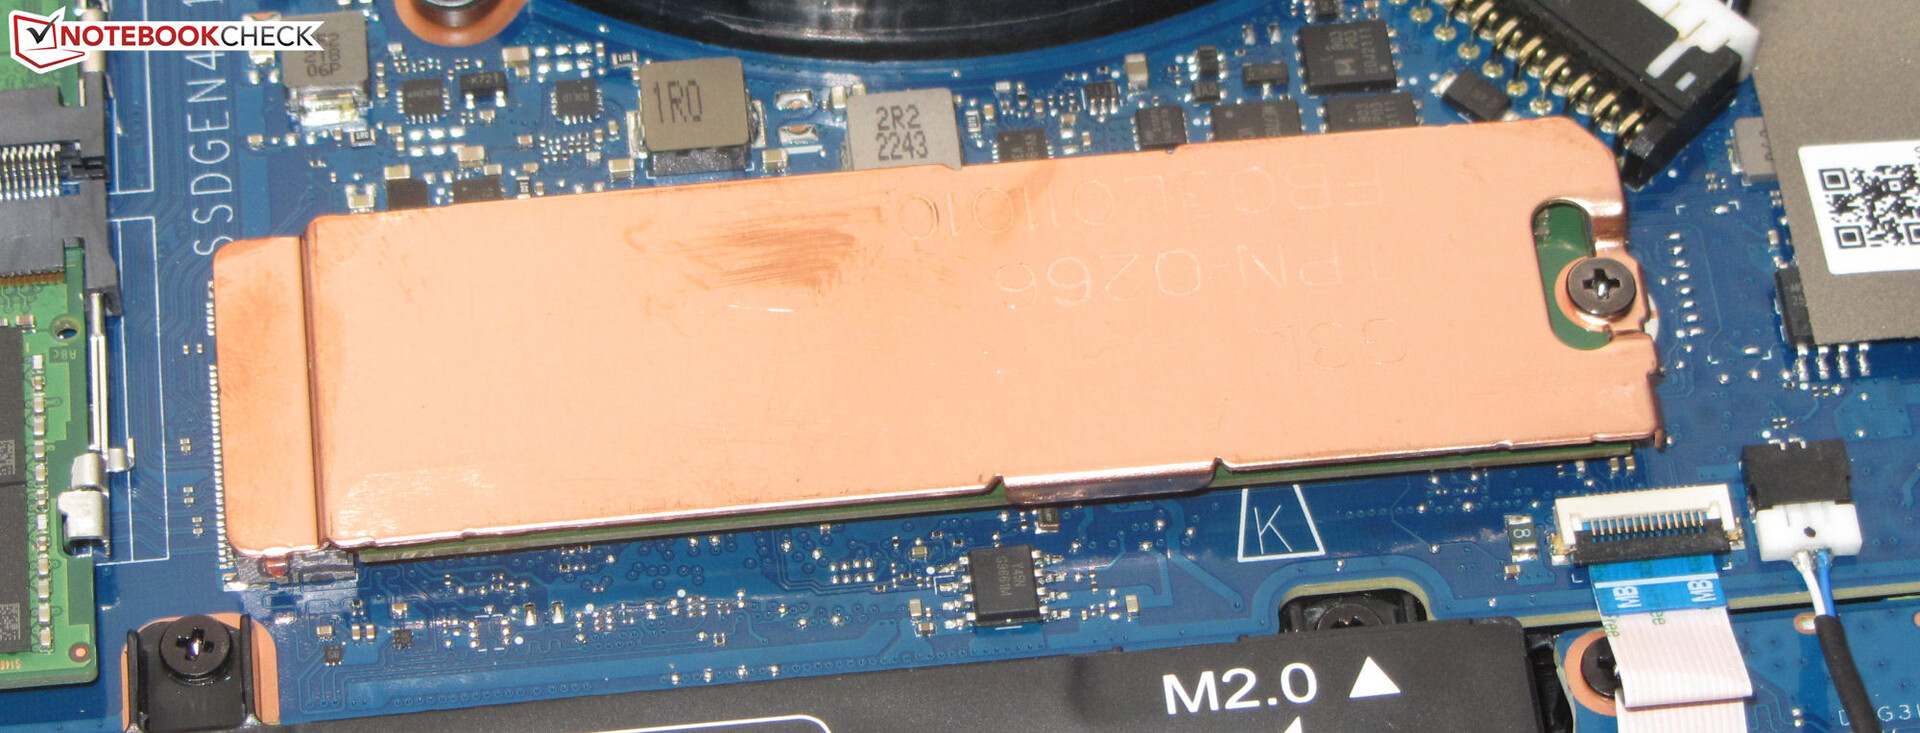
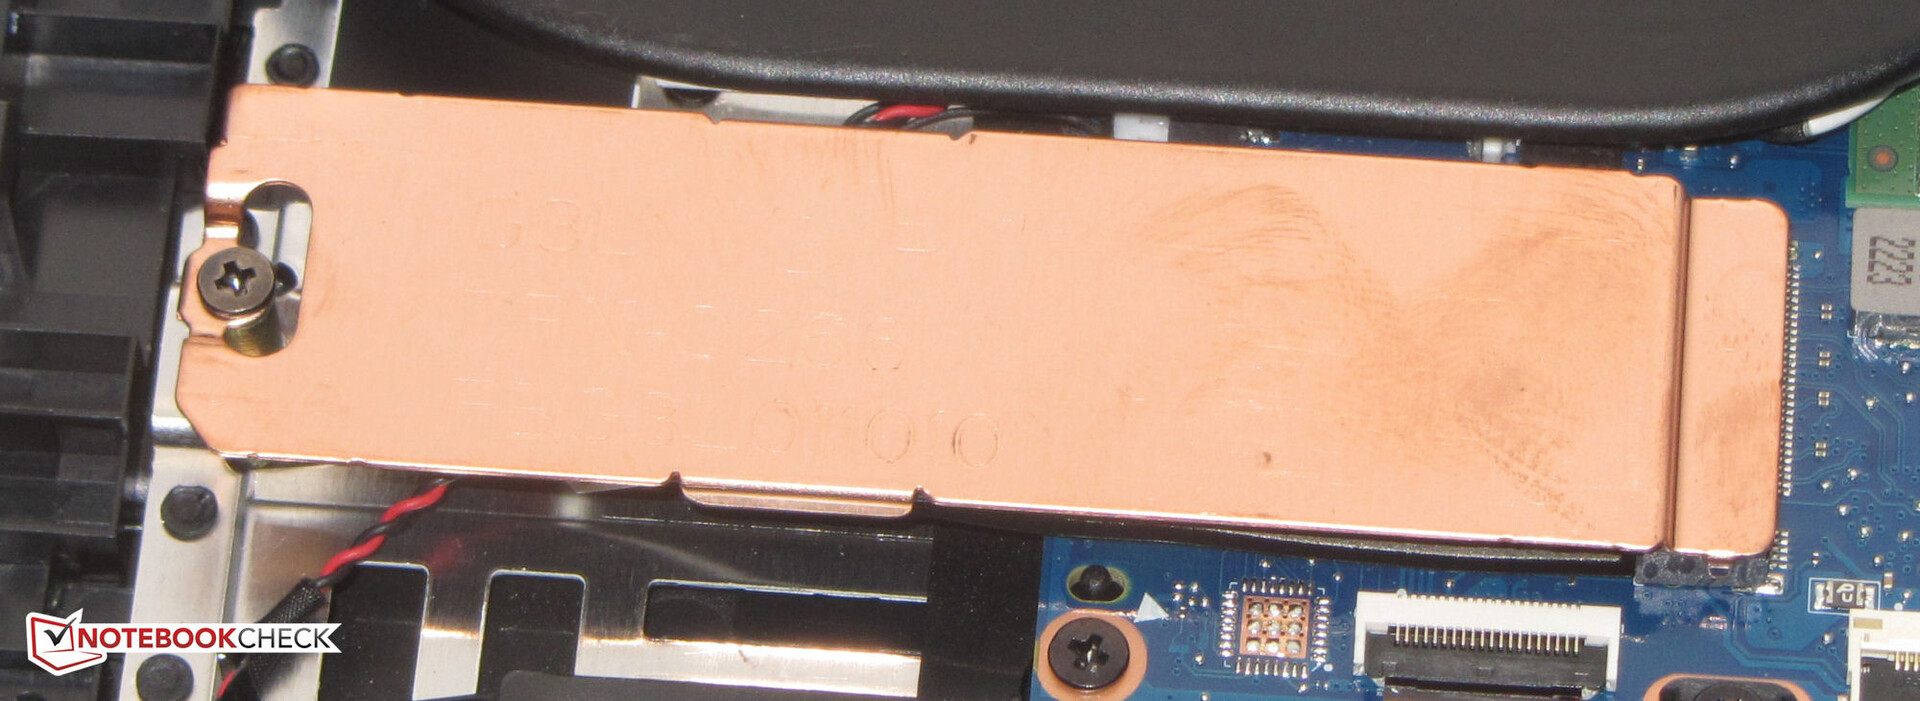
Solución de almacenamiento
El Omen ofrece espacio para dos SSD PCIe 4 en formato M.2-2280. El SSD PCIe 4 (1 TB) de SK Hynix que se usa aquí ofrece muy buenas tasas de transferencia. Sin embargo, en las últimas partes del bucle DiskSpd, observamos algunas caídas de rendimiento ocasionales, probablemente debidas al ahogo térmico.

* ... más pequeño es mejor
Disk Throttling: DiskSpd Read Loop, Queue Depth 8
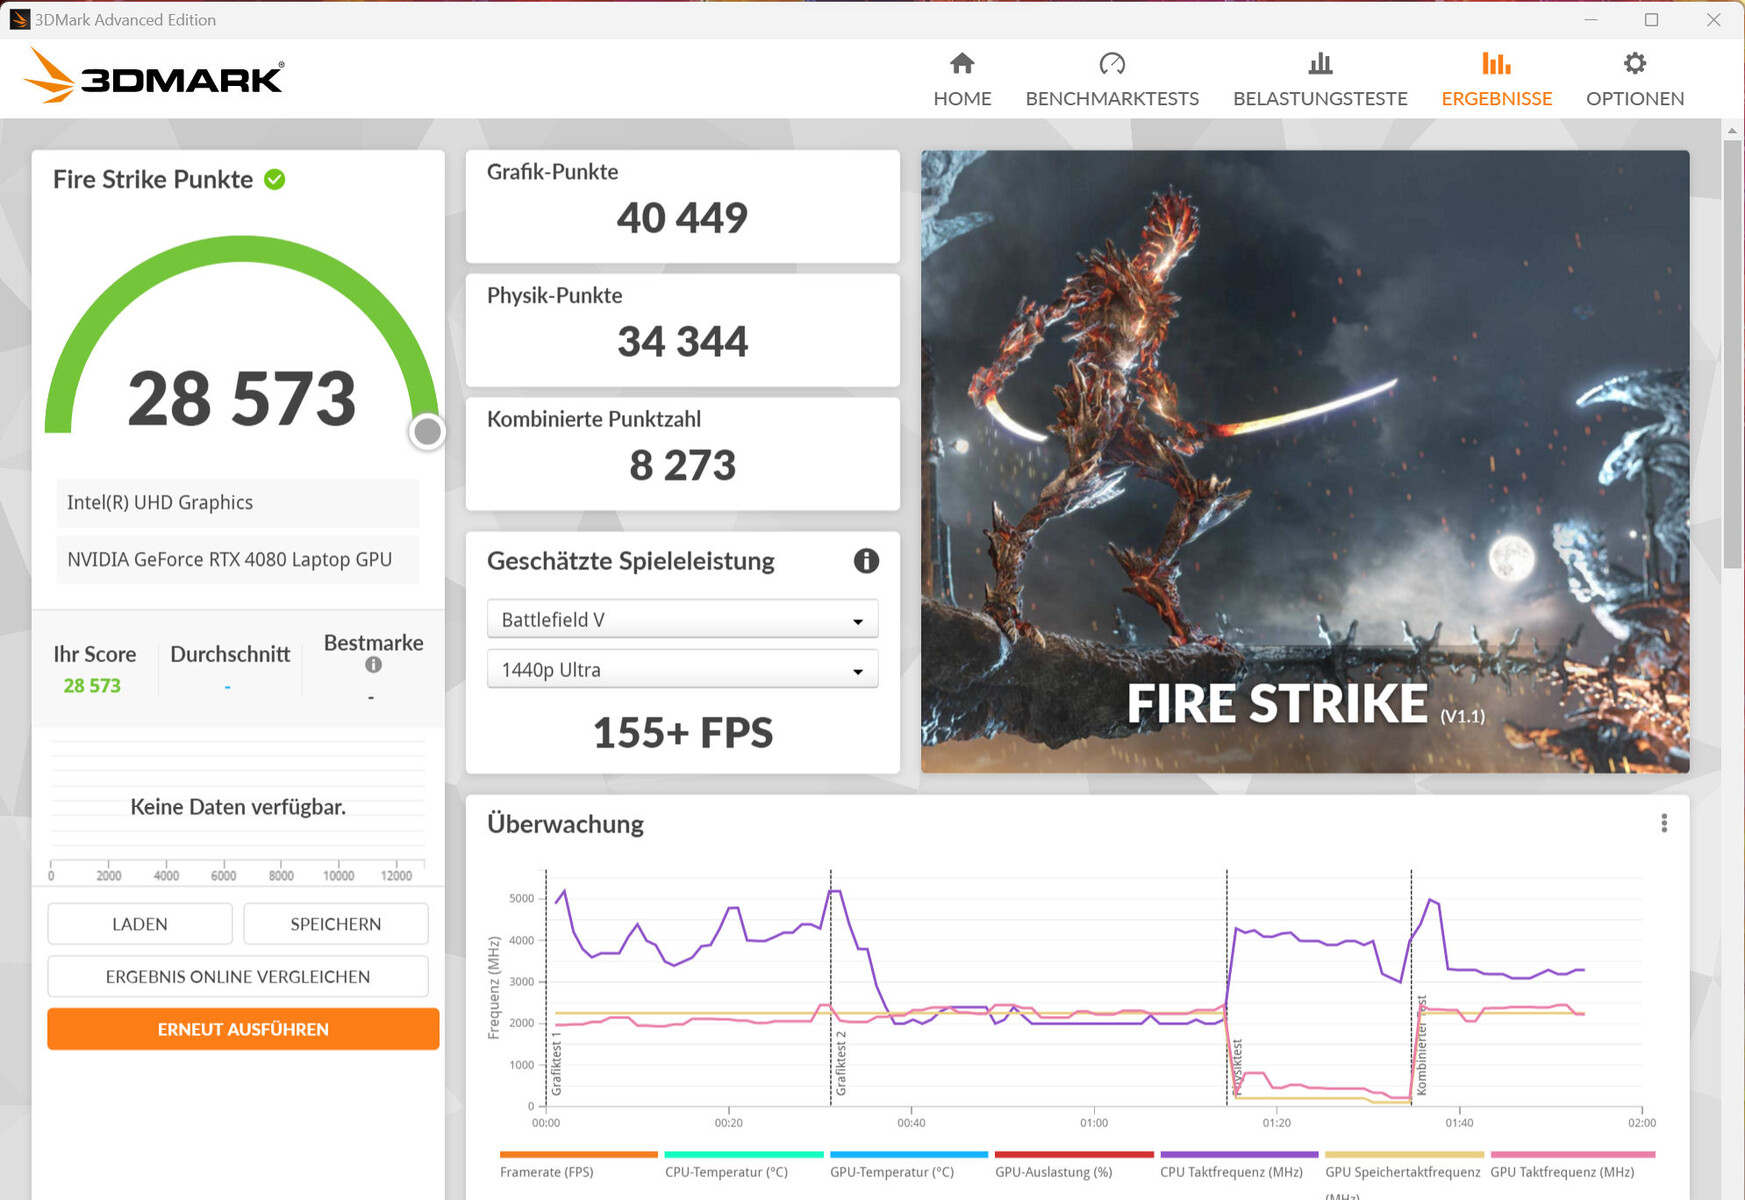
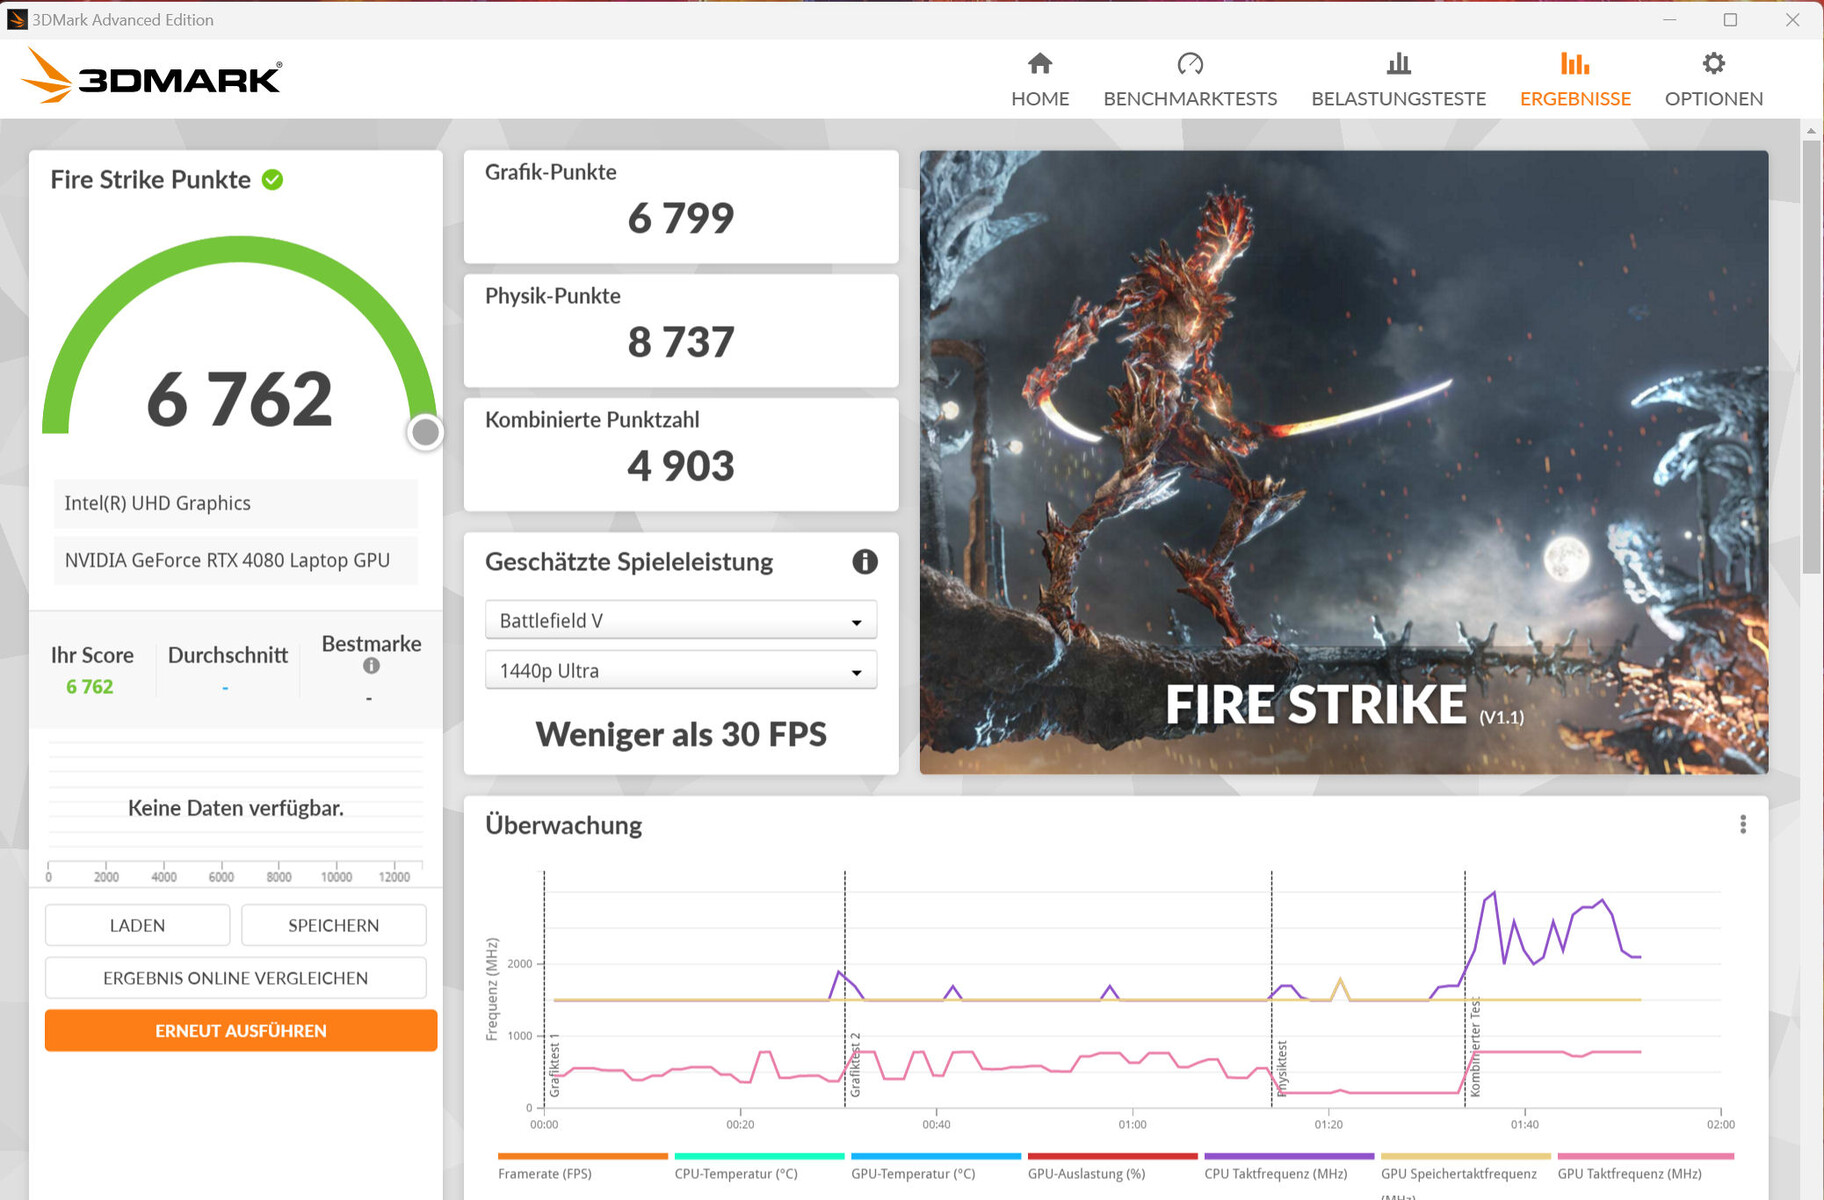
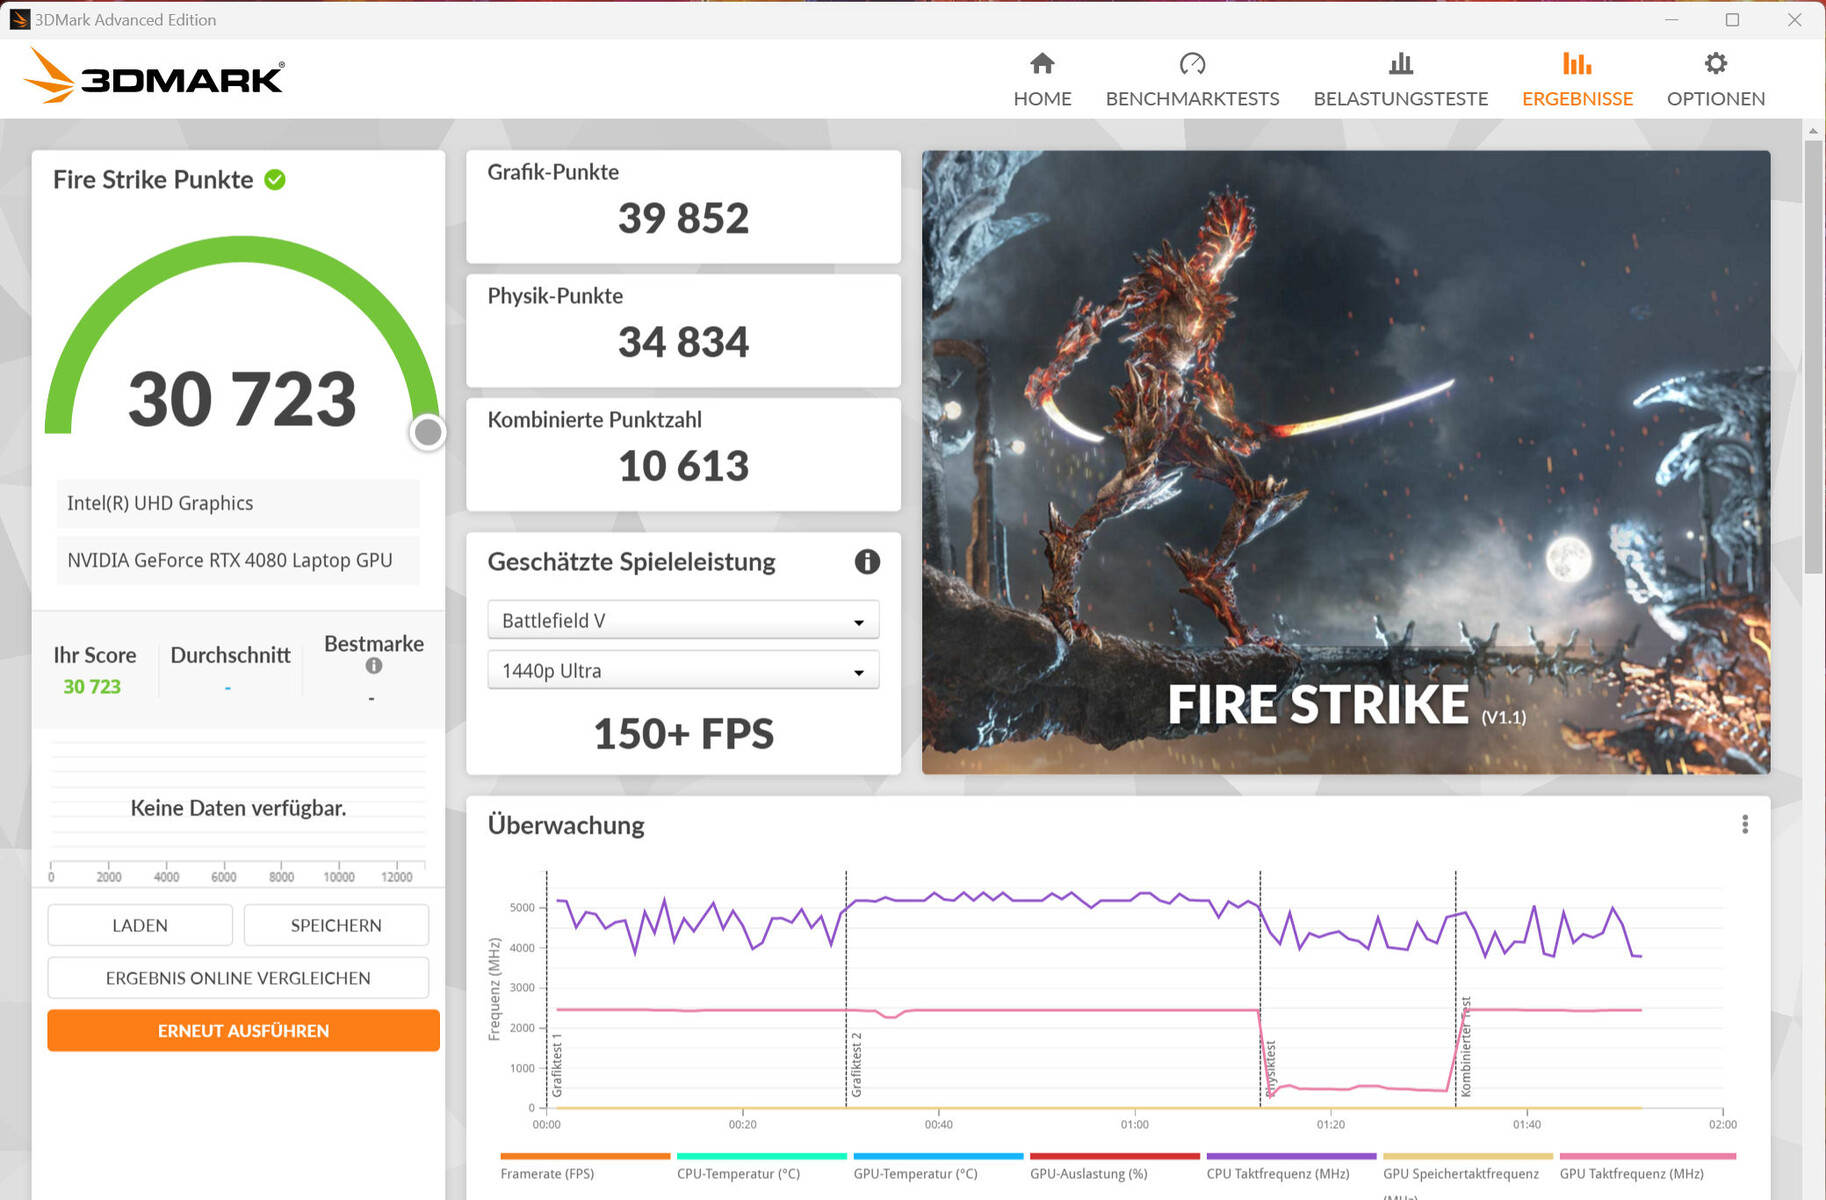
Tarjeta gráfica
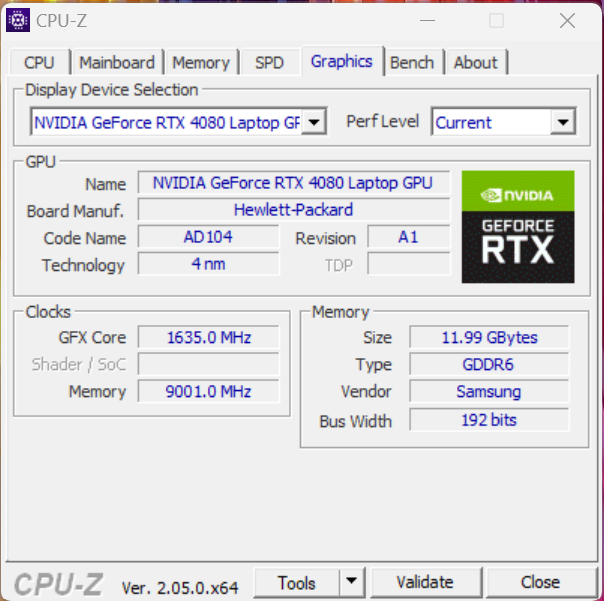
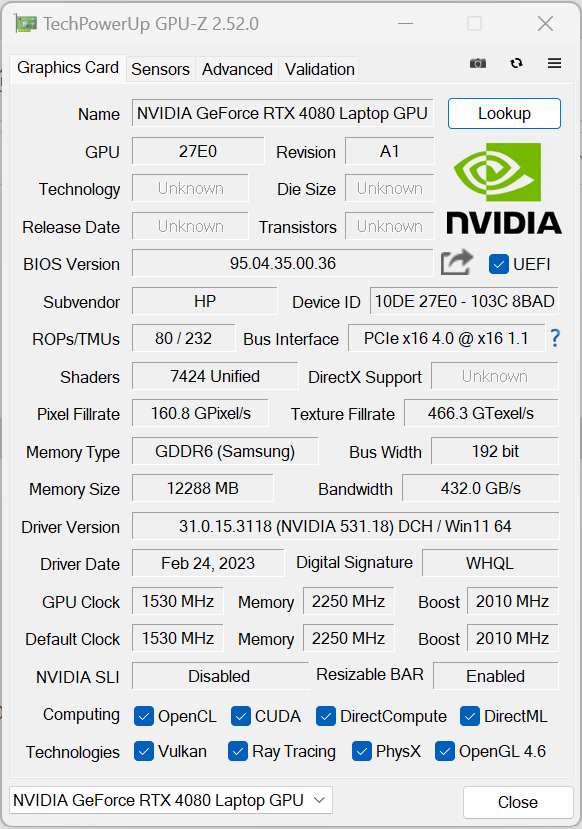
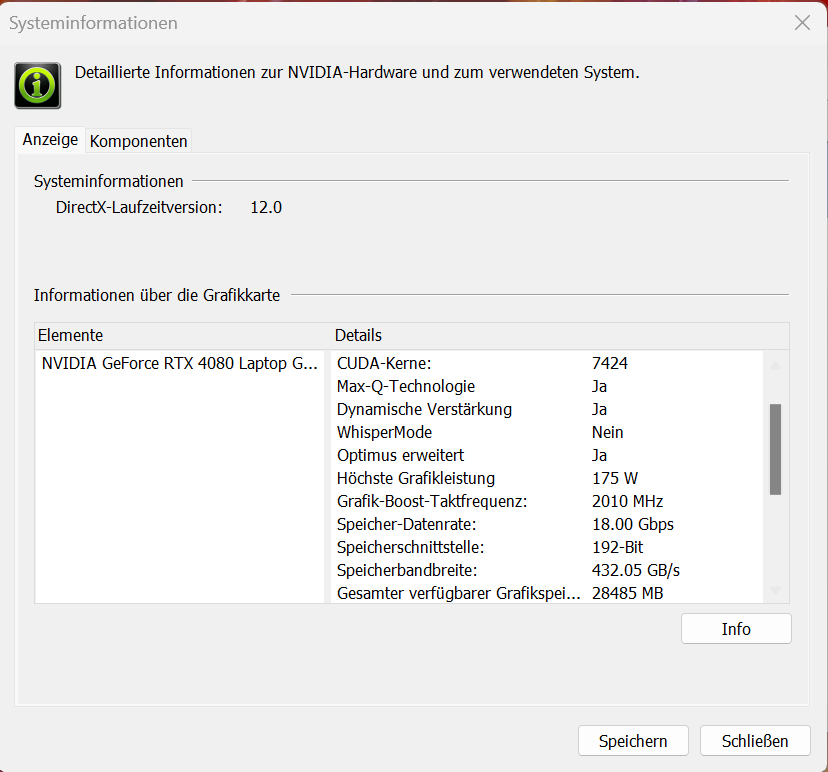
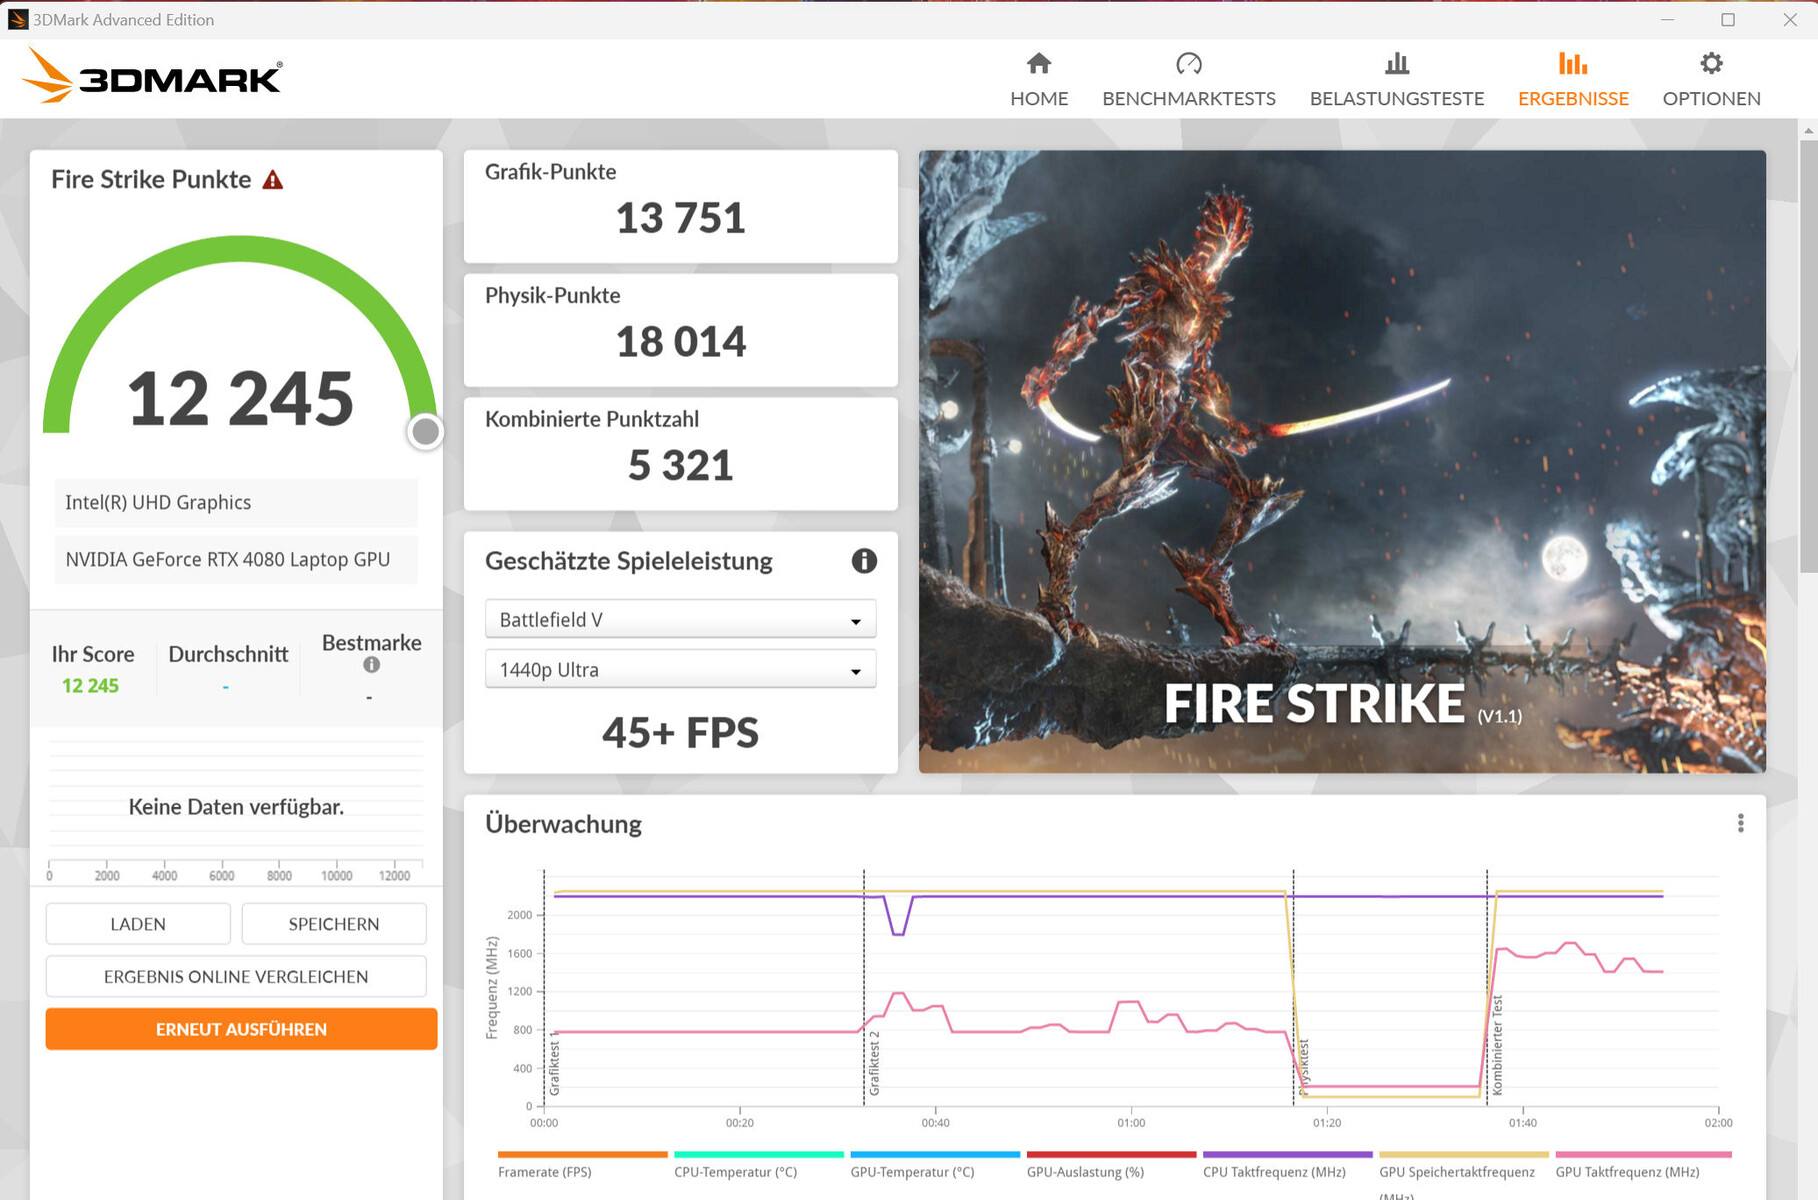
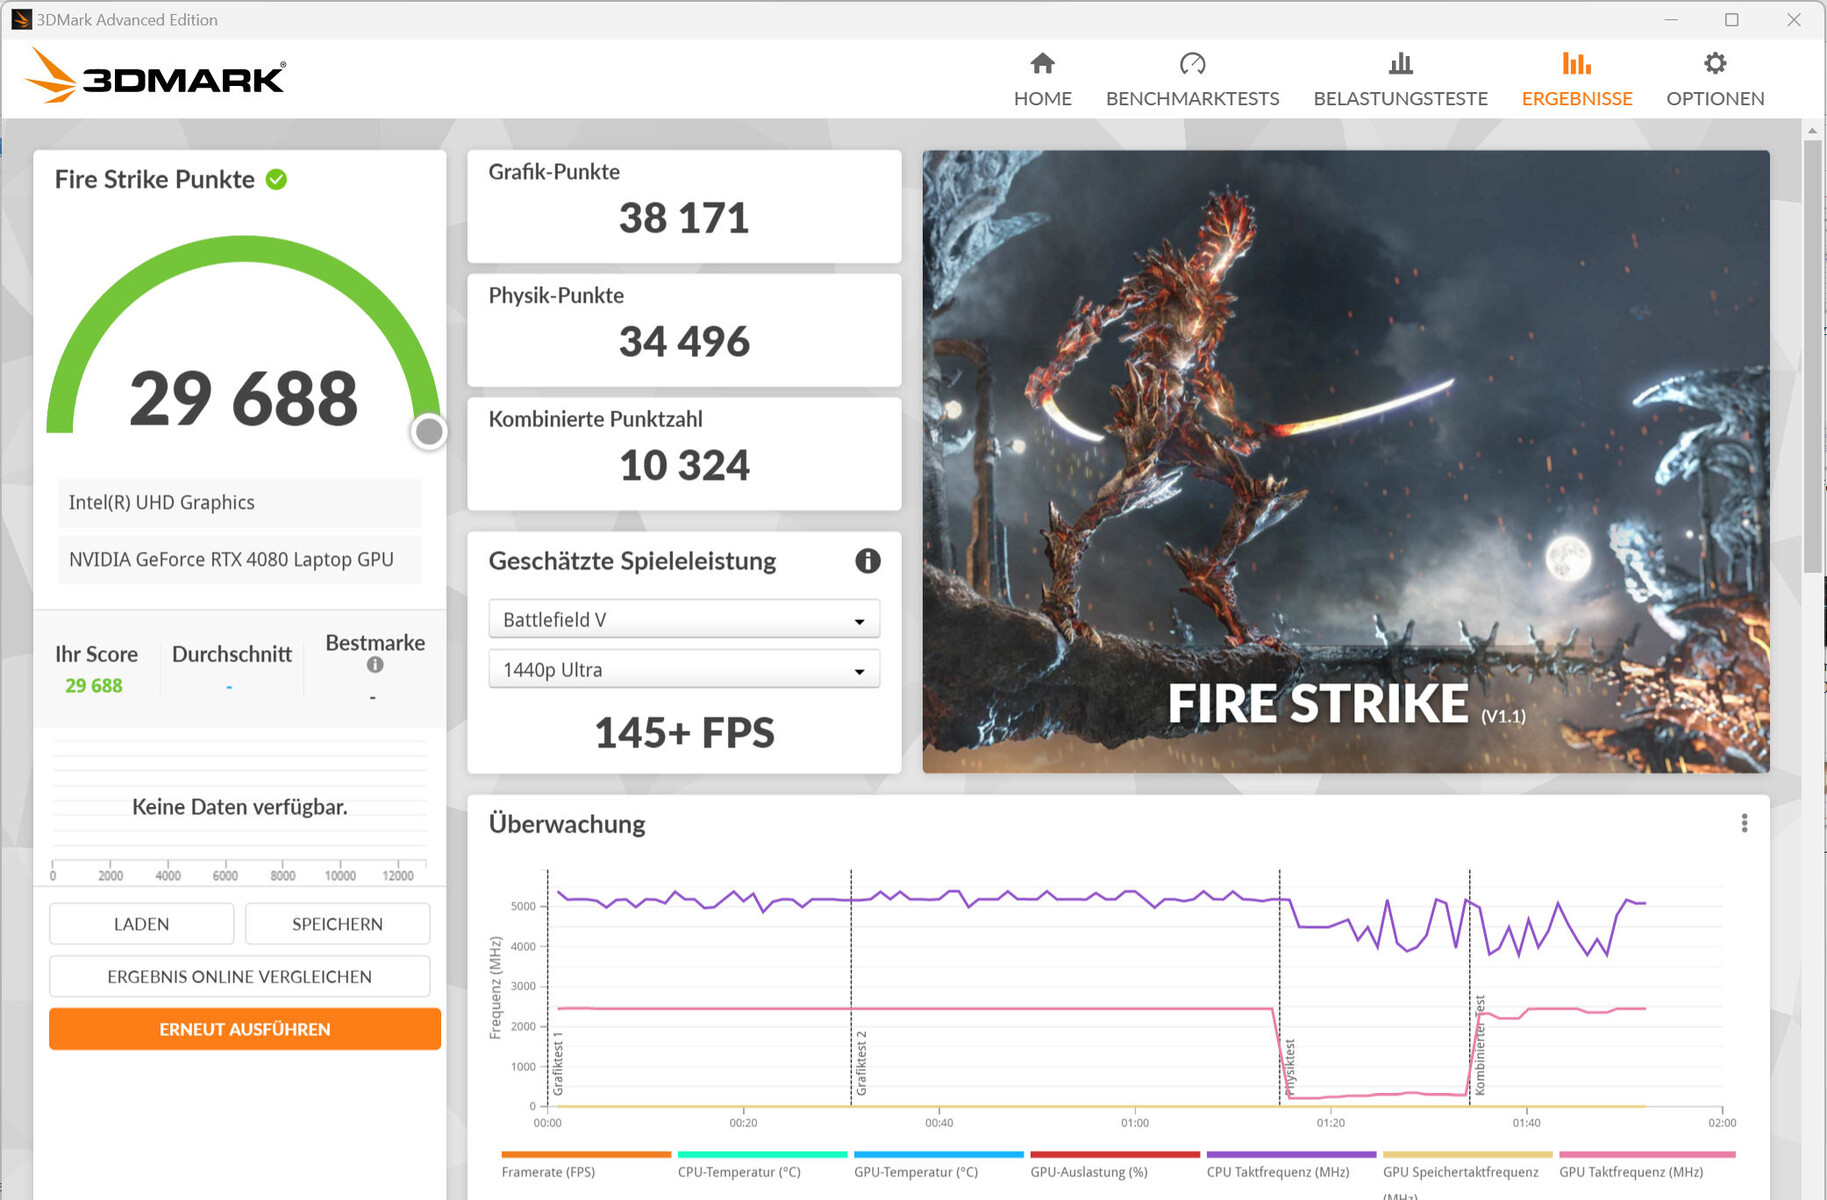
Con laGeForce RTX 4080para portátiles, HP utiliza la actual número dos de la cartera de GPU móviles de Nvidia. Tiene 7.424 sombreadores, un bus de 192 bits y es capaz de utilizar el rápido almacenamiento GDDR6 (12.288 MB). La RTX 4080 está configurada con un TGP de 175 vatios (150 W + 25 W Dynamic Boost), que es el máximo configurable según Nvidia. Según nuestra prueba The Witcher 3, el TGP no se usa del todo.
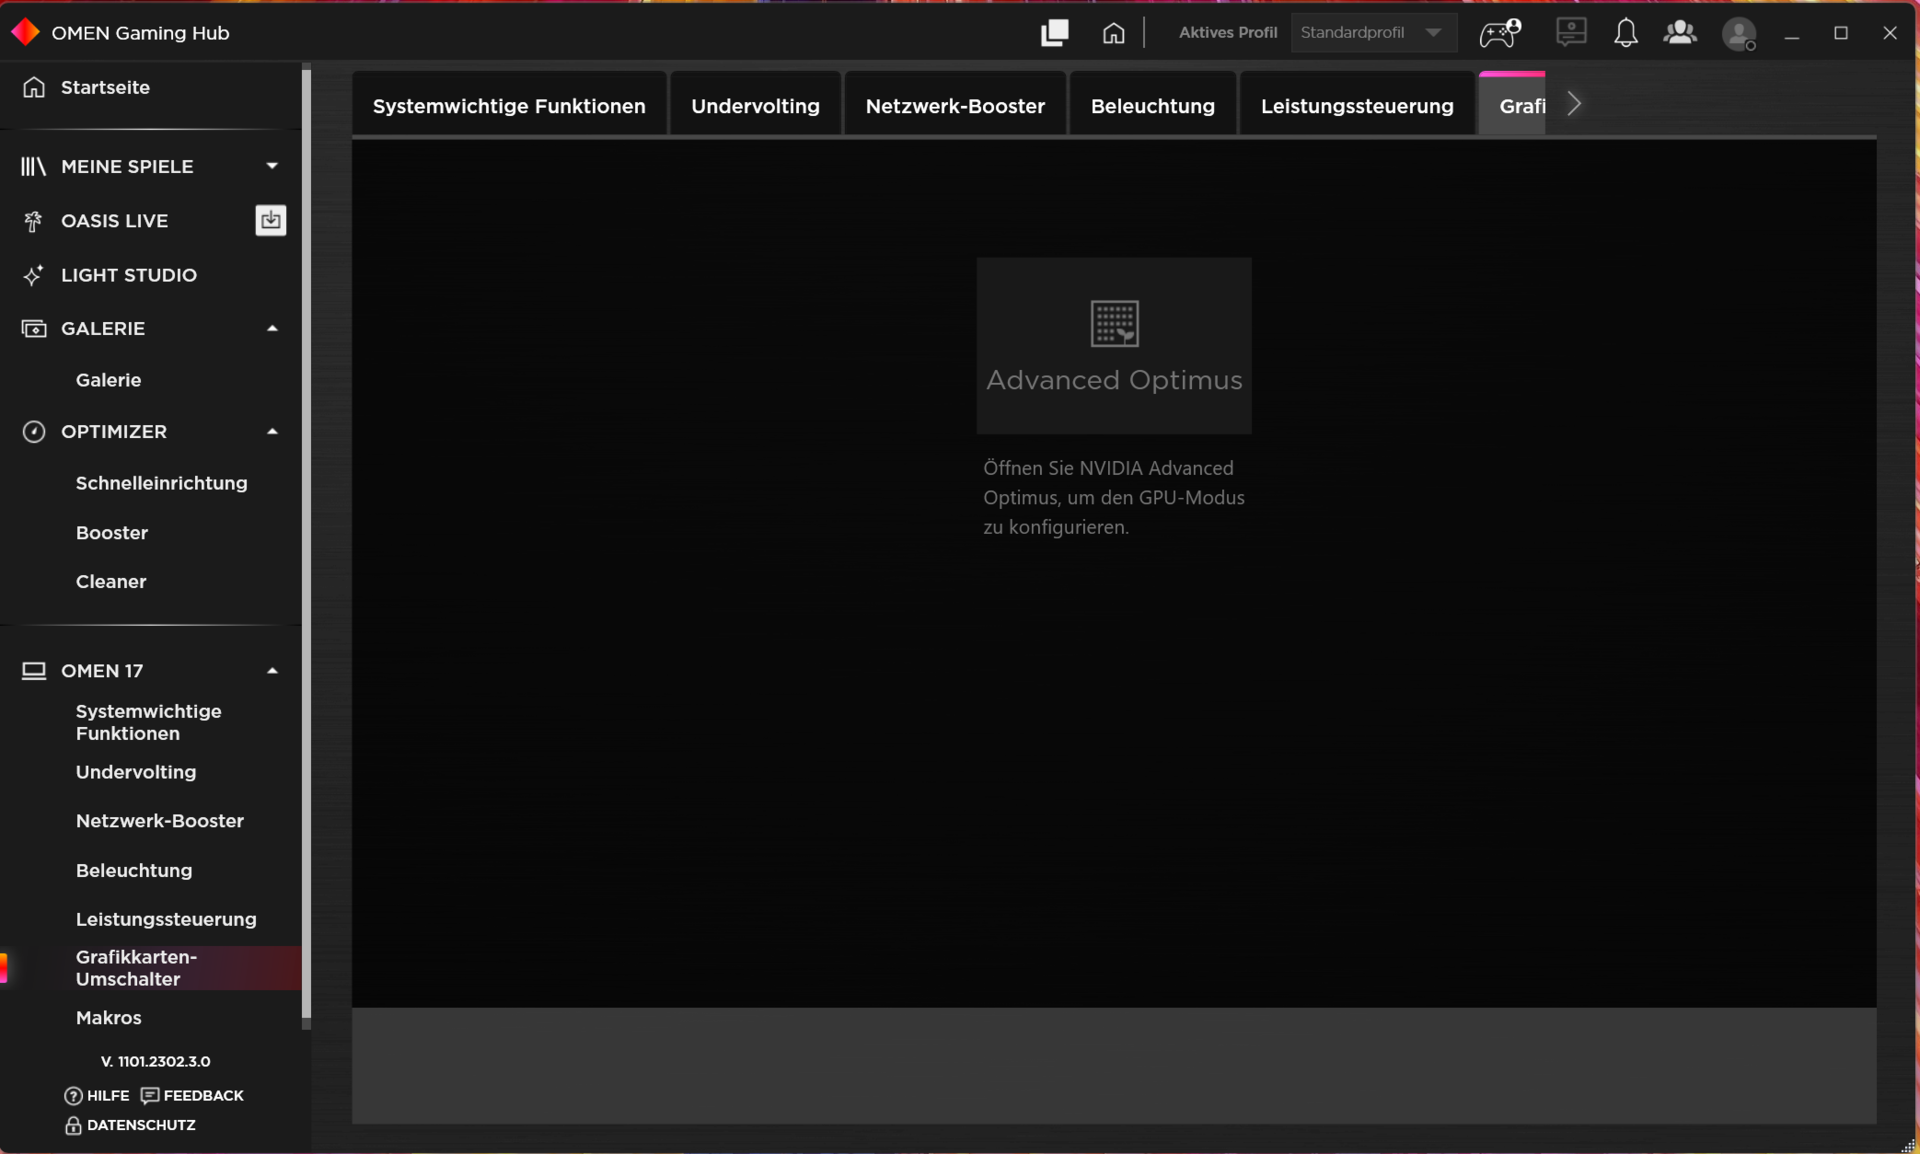
Los resultados del benchmark se sitúan por debajo de la media de las GPU RTX 4080 que hemos probado hasta ahora. El perfil "Rendimiento" dará lugar a algunos pequeños aumentos ocasionales en el rendimiento gráfico. El modo dGPU no dará lugar a más mejoras. Cambiar entre dGPU y Optimus no requiere reiniciar - Optimus Avanzado es compatible.
| 3DMark Performance rating - Percent | |
| Asus ROG Strix G16 G614JZ | |
| Lenovo Legion Pro 7 16IRX8H | |
| Razer Blade 16 Early 2023 -1! | |
| Medio NVIDIA GeForce RTX 4080 Laptop GPU | |
| HP Omen 17-ck2097ng | |
| HP Omen 17-ck2097ng | |
| HP Omen 17-ck2097ng | |
| Media de la clase Gaming | |
| Alienware m17 R5 (R9 6900HX, RX 6850M XT) | |
| 3DMark 11 - 1280x720 Performance GPU | |
| Lenovo Legion Pro 7 16IRX8H | |
| HP Omen 17-ck2097ng (Leistung) | |
| Asus ROG Strix G16 G614JZ | |
| Medio NVIDIA GeForce RTX 4080 Laptop GPU (45199 - 63128, n=24) | |
| Razer Blade 16 Early 2023 | |
| HP Omen 17-ck2097ng | |
| HP Omen 17-ck2097ng (Leistung, dGPU) | |
| Media de la clase Gaming (21841 - 80022, n=104, últimos 2 años) | |
| Alienware m17 R5 (R9 6900HX, RX 6850M XT) | |
| Blender | |
| v3.3 Classroom OPTIX/RTX | |
| Media de la clase Gaming (9 - 32, n=106, últimos 2 años) | |
| HP Omen 17-ck2097ng (3.3.3) | |
| Medio NVIDIA GeForce RTX 4080 Laptop GPU (13 - 20, n=22) | |
| Razer Blade 16 Early 2023 (3.3.3) | |
| Lenovo Legion Pro 7 16IRX8H (3.3.3) | |
| Asus ROG Strix G16 G614JZ (3.3.3) | |
| HP Omen 17-ck2097ng (3.3.3, Leistung) | |
| v3.3 Classroom CUDA | |
| Media de la clase Gaming (15 - 228, n=106, últimos 2 años) | |
| Lenovo Legion Pro 7 16IRX8H (3.3.3) | |
| HP Omen 17-ck2097ng (3.3.3, Leistung) | |
| Medio NVIDIA GeForce RTX 4080 Laptop GPU (21 - 28, n=23) | |
| Razer Blade 16 Early 2023 (3.3.3) | |
| HP Omen 17-ck2097ng (3.3.3) | |
| Asus ROG Strix G16 G614JZ (3.3.3) | |
| HP Omen 17-ck2097ng (3.3.3, dGPU, Leistung) | |
| V-Ray 5 Benchmark | |
| GPU RTX | |
| Media de la clase Gaming (1146 - 4363, n=33, últimos 2 años) | |
| HP Omen 17-ck2097ng (5.0.1) | |
| HP Omen 17-ck2097ng (5.0.1, dGPU, Leistung) | |
| Razer Blade 16 Early 2023 (5.0.1) | |
| HP Omen 17-ck2097ng (5.0.1, Leistung) | |
| Medio NVIDIA GeForce RTX 4080 Laptop GPU (2128 - 2843, n=17) | |
| GPU CUDA | |
| Media de la clase Gaming (887 - 3288, n=33, últimos 2 años) | |
| HP Omen 17-ck2097ng (5.0.1, dGPU, Leistung) | |
| HP Omen 17-ck2097ng (5.0.1, Leistung) | |
| HP Omen 17-ck2097ng (5.0.1) | |
| Medio NVIDIA GeForce RTX 4080 Laptop GPU (1647 - 2112, n=17) | |
| Razer Blade 16 Early 2023 (5.0.1) | |
| CPU | |
| Media de la clase Gaming (5864 - 30302, n=32, últimos 2 años) | |
| HP Omen 17-ck2097ng (5.0.1, Leistung) | |
| Razer Blade 16 Early 2023 (5.0.1) | |
| HP Omen 17-ck2097ng (5.0.1, dGPU, Leistung) | |
| Medio NVIDIA GeForce RTX 4080 Laptop GPU (11906 - 21823, n=17) | |
| HP Omen 17-ck2097ng (5.0.1) | |
| V-Ray Benchmark Next 4.10 | |
| GPU | |
| HP Omen 17-ck2097ng (v4.10.07, Leistung) | |
| Asus ROG Strix G16 G614JZ (v4.10.07 ) | |
| Lenovo Legion Pro 7 16IRX8H (v4.10.07 ) | |
| HP Omen 17-ck2097ng (v4.10.07 ) | |
| Medio NVIDIA GeForce RTX 4080 Laptop GPU (812 - 1036, n=16) | |
| HP Omen 17-ck2097ng (v4.10.07, dGPU, Leistung) | |
| Media de la clase Gaming (427 - 1627, n=99, últimos 2 años) | |
| Alienware m17 R5 (R9 6900HX, RX 6850M XT) (v4.10.07 ) | |
| CPU | |
| Lenovo Legion Pro 7 16IRX8H (v4.10.07 ) | |
| Asus ROG Strix G16 G614JZ (v4.10.07 ) | |
| HP Omen 17-ck2097ng (v4.10.07, Leistung) | |
| Medio NVIDIA GeForce RTX 4080 Laptop GPU (19636 - 31653, n=16) | |
| Media de la clase Gaming (10048 - 45327, n=97, últimos 2 años) | |
| HP Omen 17-ck2097ng (v4.10.07, dGPU, Leistung) | |
| HP Omen 17-ck2097ng (v4.10.07 ) | |
| Alienware m17 R5 (R9 6900HX, RX 6850M XT) (v4.10.07 ) | |
| Geekbench 5.5 - OpenCL Score | |
| Asus ROG Strix G16 G614JZ | |
| HP Omen 17-ck2097ng (Leistung) | |
| HP Omen 17-ck2097ng (dGPU, Leistung) | |
| Razer Blade 16 Early 2023 | |
| HP Omen 17-ck2097ng | |
| Medio NVIDIA GeForce RTX 4080 Laptop GPU (146413 - 189320, n=23) | |
| Media de la clase Gaming (80702 - 277970, n=101, últimos 2 años) | |
| Lenovo Legion Pro 7 16IRX8H | |
| Alienware m17 R5 (R9 6900HX, RX 6850M XT) | |
| Geekbench 6.0 - GPU OpenCL 6.0 | |
| Media de la clase Gaming (155885 - 241981, n=3, últimos 2 años) | |
| HP Omen 17-ck2097ng | |
| Medio NVIDIA GeForce RTX 4080 Laptop GPU (153564 - 175235, n=3) | |
* ... más pequeño es mejor
Rendimiento en juegos
La Omen, que está orientada a juegos QHD con ajustes de altos a máximos, también permite resoluciones más altas cuando se conecta el monitor correspondiente. Las frecuencias de cuadro de los juegos que probamos están por debajo de la media de todas las GPUs RTX 4080 que hemos probado hasta ahora. El perfil "Rendimiento" produce un aumento de las frecuencias de cuadro ligeramente superior a la media. En algunos juegos, el modo dGPU es capaz de proporcionar un aumento adicional.
| Performance rating - Percent | |
| Asus ROG Strix G16 G614JZ | |
| Razer Blade 16 Early 2023 | |
| Lenovo Legion Pro 7 16IRX8H | |
| HP Omen 17-ck2097ng | |
| HP Omen 17-ck2097ng | |
| Medio NVIDIA GeForce RTX 4080 Laptop GPU | |
| Media de la clase Gaming | |
| HP Omen 17-ck2097ng | |
| Alienware m17 R5 (R9 6900HX, RX 6850M XT) | |
| The Witcher 3 - 1920x1080 Ultra Graphics & Postprocessing (HBAO+) | |
| Media de la clase Gaming (104.7 - 240, n=7, últimos 2 años) | |
| Lenovo Legion Pro 7 16IRX8H | |
| Razer Blade 16 Early 2023 | |
| Asus ROG Strix G16 G614JZ | |
| HP Omen 17-ck2097ng (dGPU) | |
| HP Omen 17-ck2097ng (Leistung) | |
| Medio NVIDIA GeForce RTX 4080 Laptop GPU (130.4 - 186.1, n=20) | |
| HP Omen 17-ck2097ng | |
| Alienware m17 R5 (R9 6900HX, RX 6850M XT) | |
| GTA V - 1920x1080 Highest AA:4xMSAA + FX AF:16x | |
| Asus ROG Strix G16 G614JZ | |
| Lenovo Legion Pro 7 16IRX8H | |
| Razer Blade 16 Early 2023 | |
| Media de la clase Gaming (48.3 - 186.9, n=94, últimos 2 años) | |
| Medio NVIDIA GeForce RTX 4080 Laptop GPU (102.9 - 152.7, n=21) | |
| HP Omen 17-ck2097ng (Leistung) | |
| HP Omen 17-ck2097ng (dGPU, Leistung) | |
| HP Omen 17-ck2097ng | |
| Alienware m17 R5 (R9 6900HX, RX 6850M XT) | |
| Final Fantasy XV Benchmark - 1920x1080 High Quality | |
| Asus ROG Strix G16 G614JZ (1.3) | |
| HP Omen 17-ck2097ng (1.3, dGPU, Leistung) | |
| HP Omen 17-ck2097ng (1.3, Leistung) | |
| Lenovo Legion Pro 7 16IRX8H (1.3) | |
| Medio NVIDIA GeForce RTX 4080 Laptop GPU (129 - 182.1, n=23) | |
| Razer Blade 16 Early 2023 (1.3) | |
| Media de la clase Gaming (41 - 215, n=95, últimos 2 años) | |
| HP Omen 17-ck2097ng (1.3) | |
| Alienware m17 R5 (R9 6900HX, RX 6850M XT) (1.3) | |
| Strange Brigade - 1920x1080 ultra AA:ultra AF:16 | |
| Asus ROG Strix G16 G614JZ (1.47.22.14 D3D12) | |
| HP Omen 17-ck2097ng (1.47.22.14 D3D12, dGPU, Leistung) | |
| Razer Blade 16 Early 2023 (1.47.22.14 D3D12) | |
| Lenovo Legion Pro 7 16IRX8H (1.47.22.14 D3D12) | |
| Medio NVIDIA GeForce RTX 4080 Laptop GPU (239 - 357, n=22) | |
| HP Omen 17-ck2097ng (1.47.22.14 D3D12, Leistung) | |
| Media de la clase Gaming (76.3 - 458, n=87, últimos 2 años) | |
| HP Omen 17-ck2097ng (1.47.22.14 D3D12) | |
| Alienware m17 R5 (R9 6900HX, RX 6850M XT) (1.47.22.14 D3D12) | |
| Dota 2 Reborn - 1920x1080 ultra (3/3) best looking | |
| Razer Blade 16 Early 2023 | |
| Asus ROG Strix G16 G614JZ | |
| Lenovo Legion Pro 7 16IRX8H | |
| HP Omen 17-ck2097ng (Leistung) | |
| HP Omen 17-ck2097ng (dGPU, Leistung) | |
| Medio NVIDIA GeForce RTX 4080 Laptop GPU (133 - 194.7, n=23) | |
| HP Omen 17-ck2097ng | |
| Media de la clase Gaming (84.8 - 248, n=107, últimos 2 años) | |
| Alienware m17 R5 (R9 6900HX, RX 6850M XT) | |
| X-Plane 11.11 - 1920x1080 high (fps_test=3) | |
| Asus ROG Strix G16 G614JZ | |
| Razer Blade 16 Early 2023 | |
| Lenovo Legion Pro 7 16IRX8H | |
| HP Omen 17-ck2097ng (dGPU, Leistung) | |
| Medio NVIDIA GeForce RTX 4080 Laptop GPU (89.3 - 143.5, n=25) | |
| HP Omen 17-ck2097ng (Leistung) | |
| HP Omen 17-ck2097ng | |
| Media de la clase Gaming (55.5 - 143.5, n=109, últimos 2 años) | |
| Alienware m17 R5 (R9 6900HX, RX 6850M XT) | |
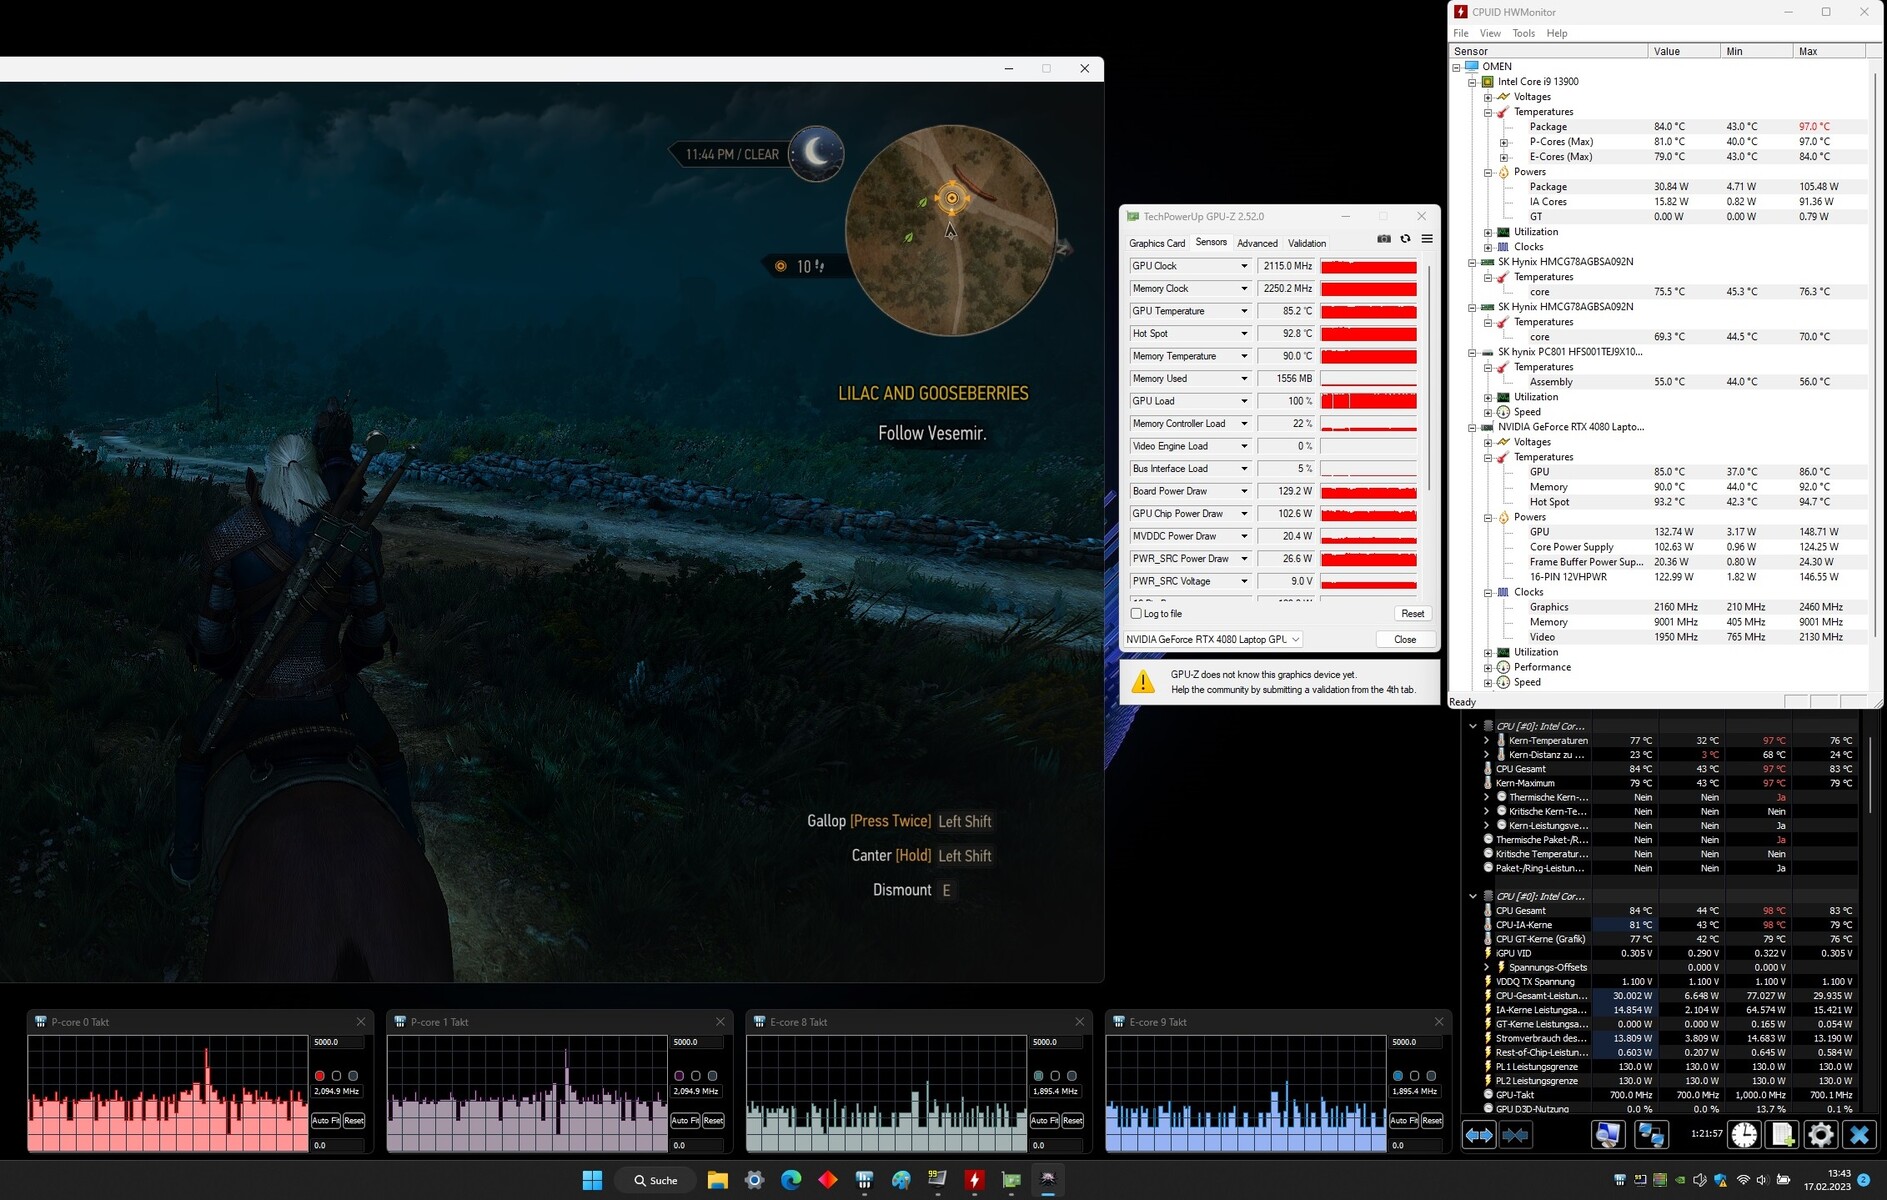
Para evaluar si las frecuencias de cuadro se mantienen constantes en gran medida durante un periodo de tiempo más largo, ejecutamos el juego "The Witcher 3" durante unos 60 minutos en resolución Full-HD y ajustes de máxima calidad. El personaje del juego no se mueve durante este tiempo. No notamos ninguna caída en las frecuencias de cuadro.
The Witcher 3 FPS Chart
| bajo | medio | alto | ultra | QHD | |
|---|---|---|---|---|---|
| GTA V (2015) | 183.8 | 183.1 | 175.5 | 121.1 | 116 |
| The Witcher 3 (2015) | 459.7 | 400.5 | 287.8 | 164 | |
| Dota 2 Reborn (2015) | 206 | 180.5 | 167.2 | 155.3 | |
| Final Fantasy XV Benchmark (2018) | 192.4 | 173 | 145.4 | 117.5 | |
| X-Plane 11.11 (2018) | 169 | 146.9 | 119.4 | ||
| Far Cry 5 (2018) | 160 | 132 | 129 | 126 | 124 |
| Strange Brigade (2018) | 388 | 300 | 290 | 276 | 208 |
| F1 22 (2022) | 255 | 248 | 231 | 97.5 | 67.6 |
| The Callisto Protocol (2022) | 167.6 | 153.7 | 148.3 | 111.5 | 83.7 |
| Returnal (2023) | 150 | 147 | 137 | 121 | 92 |
| Atomic Heart (2023) | 170.8 | 142.3 | 121.1 | 100.3 | 79.2 |
| Company of Heroes 3 (2023) | 275 | 244.6 | 206.5 | 205.31 | 153.8 |
| Sons of the Forest (2023) | 78.1 | 75 | 74.6 | 69.7 | 66.8 |
Emisiones - El portátil HP produce mucho ruido
Niveles de ruido
En el funcionamiento cotidiano (oficina, Internet) y durante el funcionamiento en vacío, los ventiladores en constante funcionamiento son claramente audibles. Bajo carga pesada (prueba de estrés, Witcher 3), el nivel de ruido aumenta aún más y es posible alcanzar volúmenes de hasta 50 dB (A). El modo "Rendimiento" provoca un aumento más rápido del nivel de ruido hasta el máximo, manteniéndose en ese nivel. El ruido consiste en algunos zumbidos acompañados de un silbido tenue.
La BIOS del Omen contiene la opción "Ventilador siempre encendido" propia de HP, que está activada por defecto. Desactivar esta opción no produce ningún cambio en nuestra unidad de pruebas.
Ruido
| Ocioso |
| 31 / 32 / 33 dB(A) |
| Carga |
| 45 / 50 dB(A) |
 | ||
30 dB silencioso 40 dB(A) audible 50 dB(A) ruidosamente alto |
||
min: | ||
| HP Omen 17-ck2097ng i9-13900HX, GeForce RTX 4080 Laptop GPU | Alienware m17 R5 (R9 6900HX, RX 6850M XT) R9 6900HX, Radeon RX 6850M XT | Razer Blade 16 Early 2023 i9-13950HX, GeForce RTX 4080 Laptop GPU | Lenovo Legion Pro 7 16IRX8H i9-13900HX, GeForce RTX 4080 Laptop GPU | Asus ROG Strix G16 G614JZ i9-13980HX, GeForce RTX 4080 Laptop GPU | HP Omen 17-ck1075ng i7-12700H, GeForce RTX 3070 Ti Laptop GPU | |
|---|---|---|---|---|---|---|
| Noise | 11% | 12% | -2% | 2% | -2% | |
| apagado / medio ambiente * (dB) | 24 | 23 4% | 23 4% | 24 -0% | 25 -4% | 25.4 -6% |
| Idle Minimum * (dB) | 31 | 23 26% | 23 26% | 26 16% | 26 16% | 28 10% |
| Idle Average * (dB) | 32 | 28.11 12% | 23 28% | 28 12% | 28 12% | 28 12% |
| Idle Maximum * (dB) | 33 | 28.11 15% | 23.6 28% | 34 -3% | 30 9% | 31.2 5% |
| Load Average * (dB) | 45 | 30.62 32% | 39 13% | 47 -4% | 48 -7% | 52.2 -16% |
| Witcher 3 ultra * (dB) | 45 | 49.75 -11% | 51.6 -15% | 55 -22% | 49 -9% | 52.2 -16% |
| Load Maximum * (dB) | 50 | 50.17 -0% | 51.3 -3% | 56 -12% | 52 -4% | 52.2 -4% |
* ... más pequeño es mejor
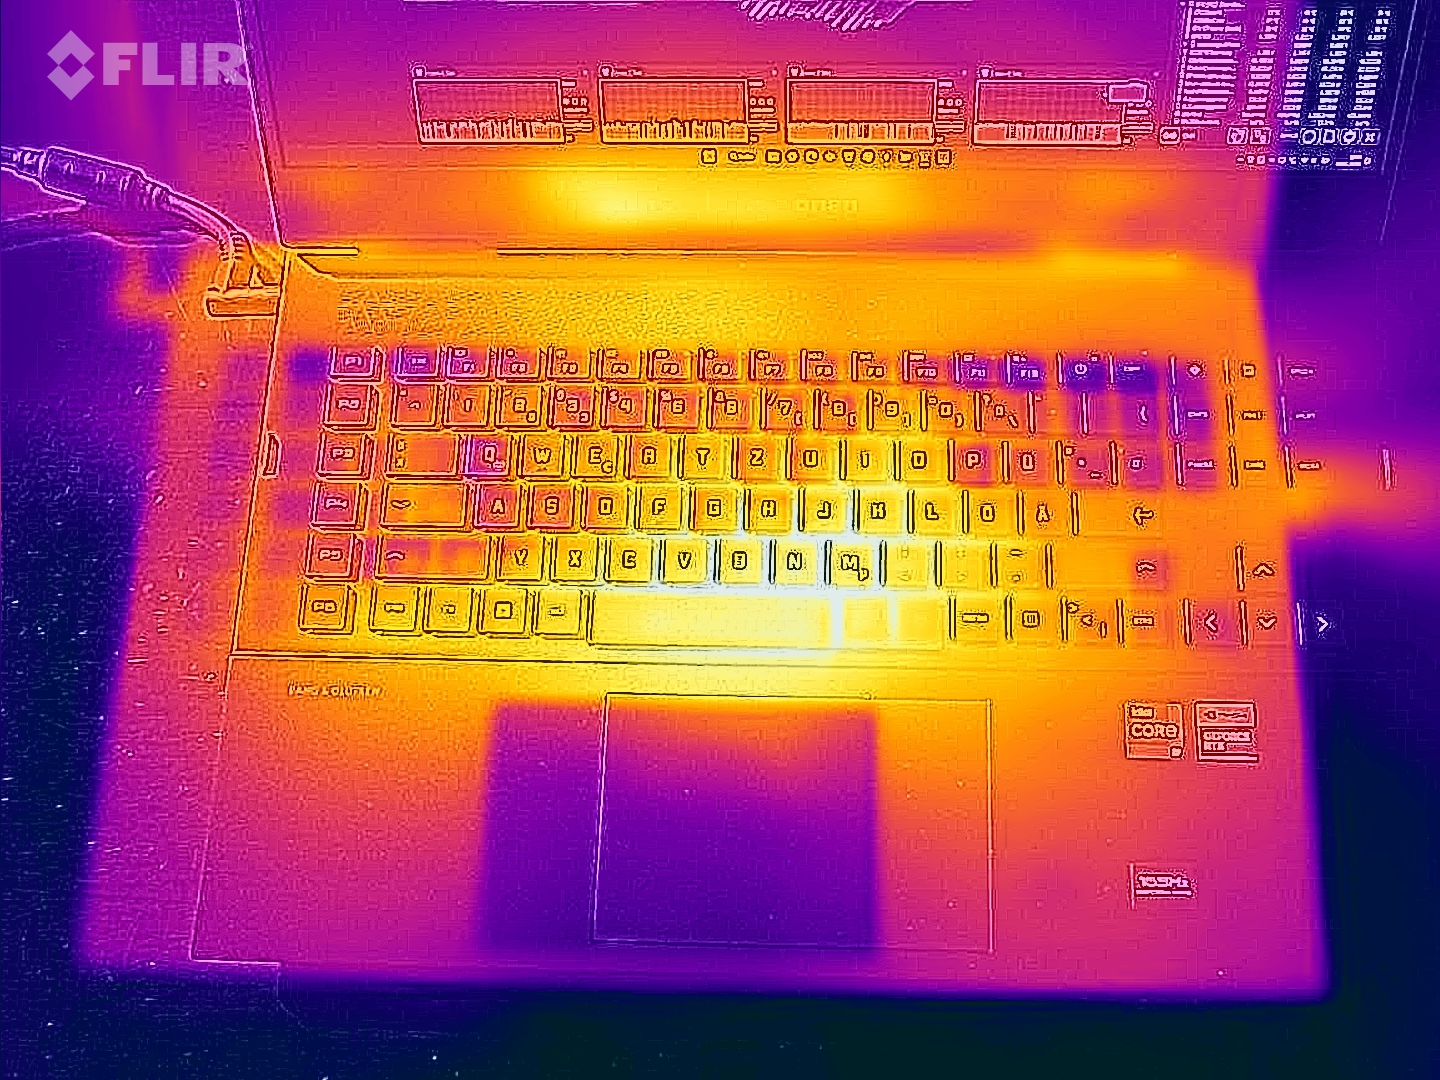
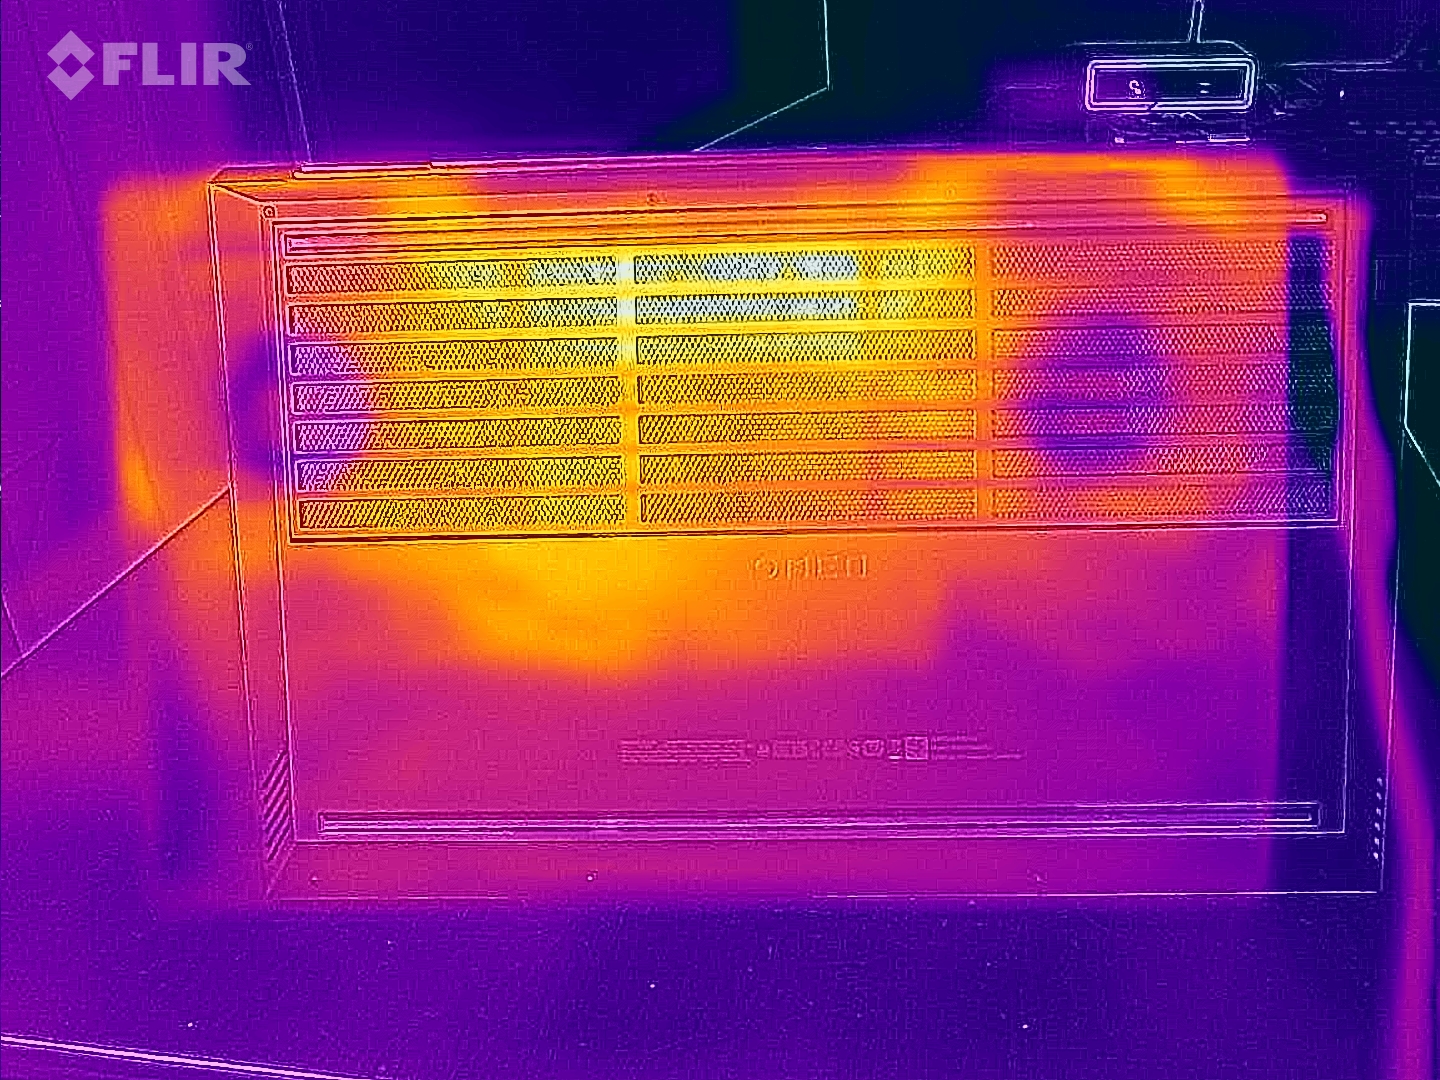
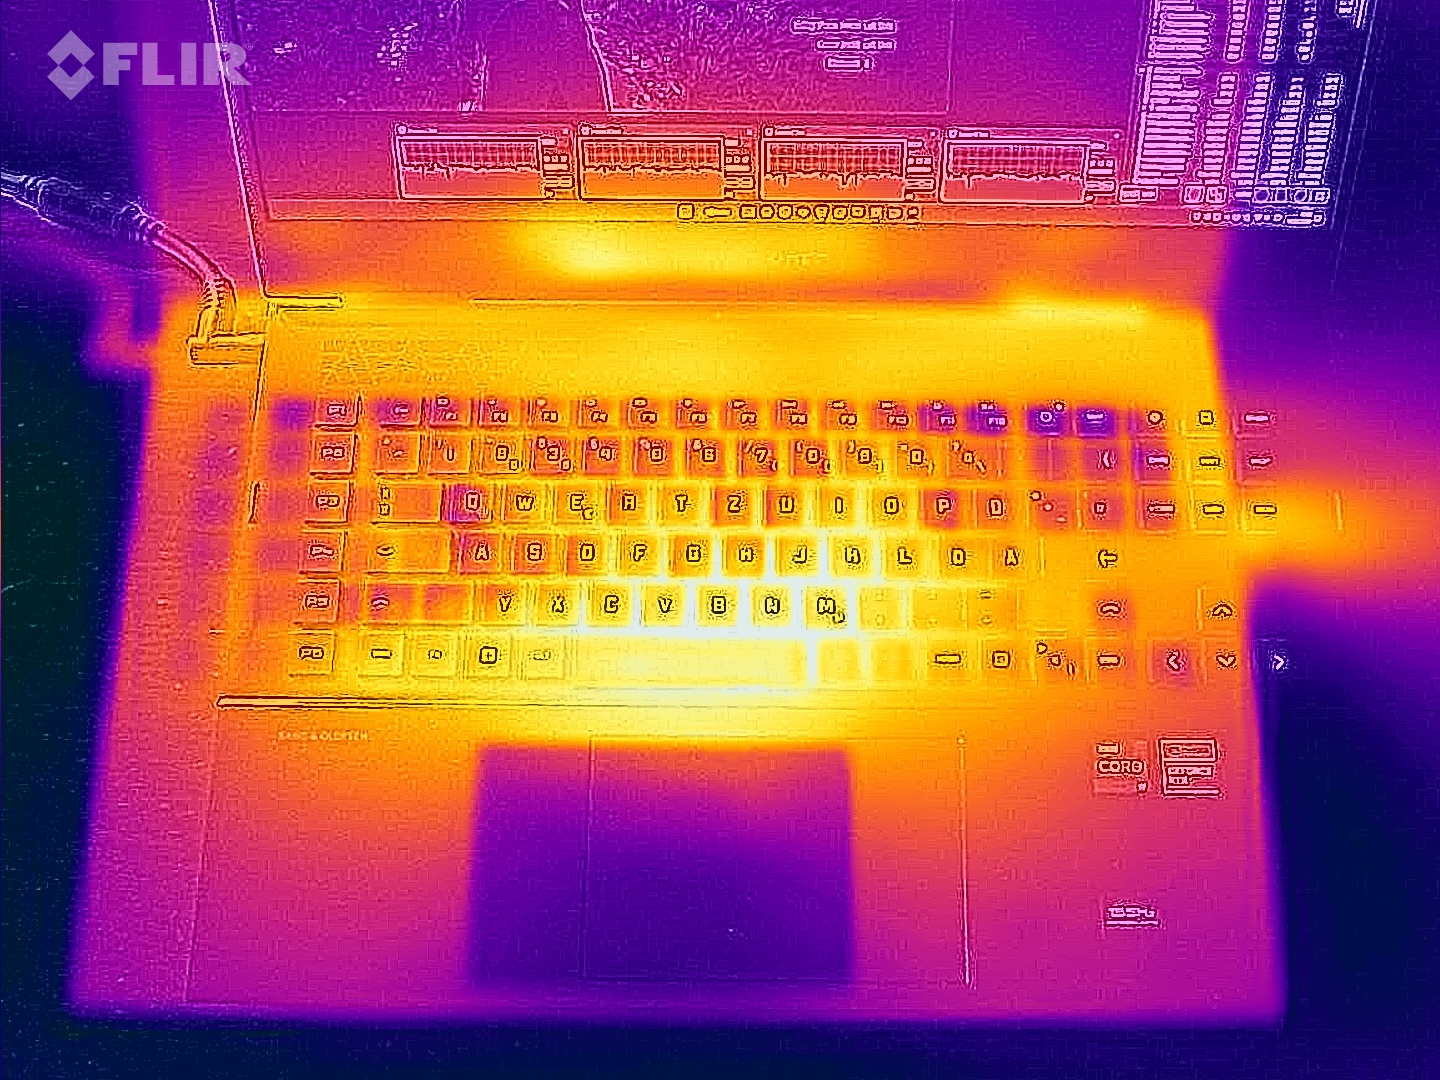
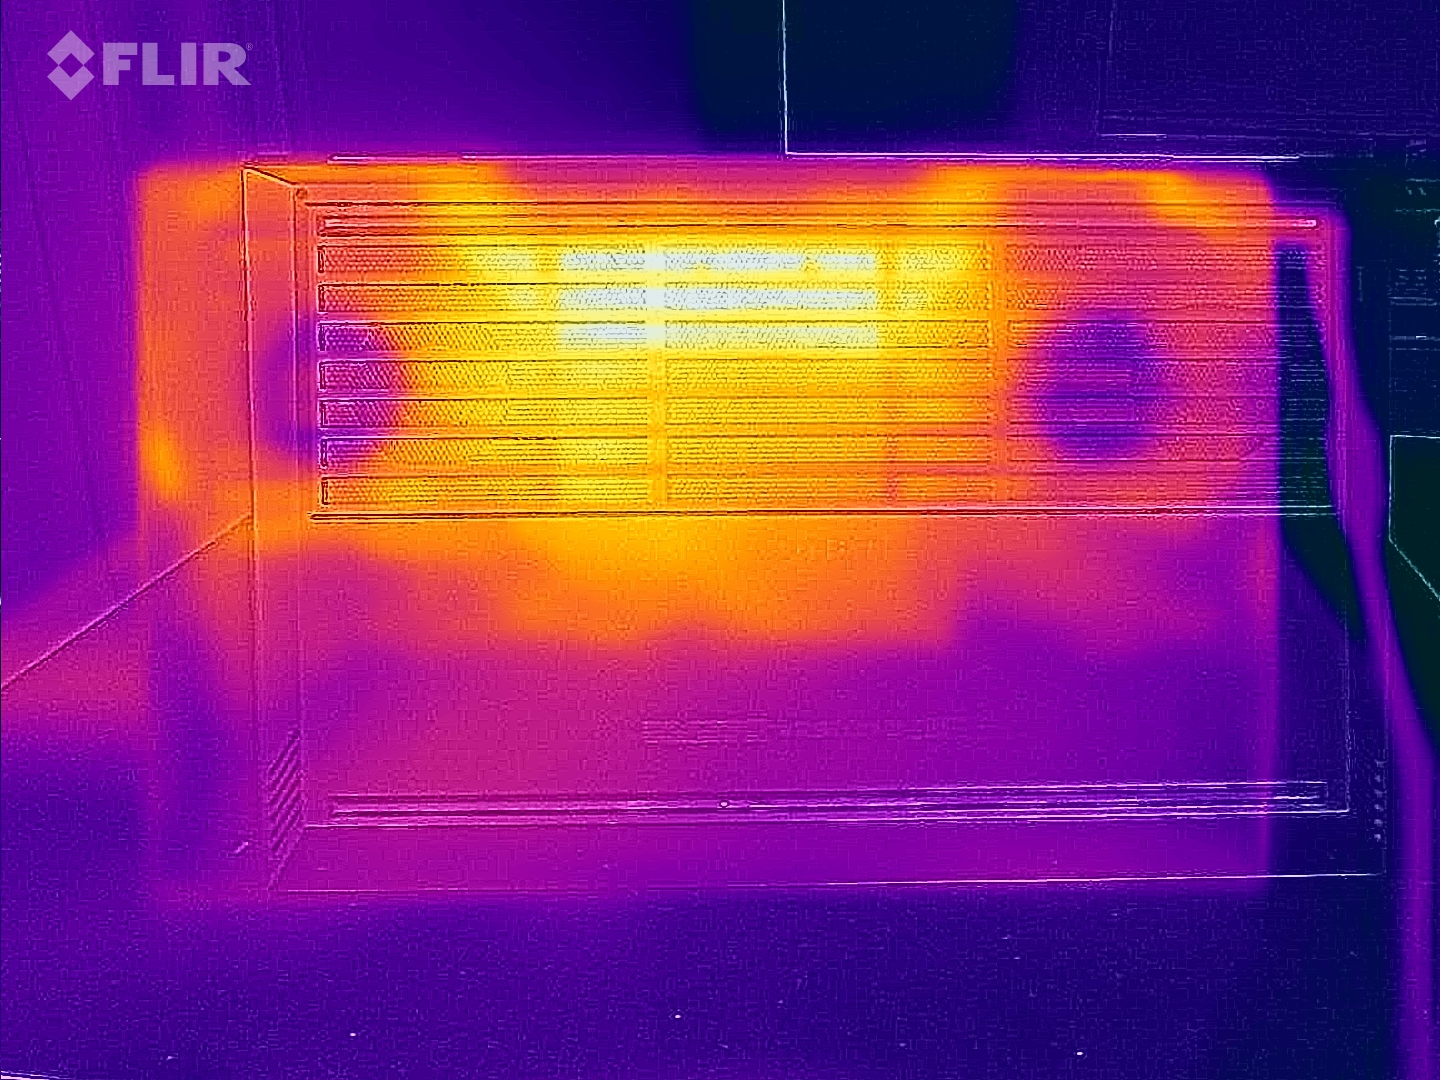
Temperaturas
En el funcionamiento diario (Office, Internet), las temperaturas de la carcasa se mantienen dentro del rango verde. Bajo carga (test de estrés, The Witcher 3), el portátil se calienta notablemente, pero se mantiene dentro de los límites - al menos en la parte superior. Las temperaturas de la CPU no dan motivos de preocupación.
(±) La temperatura máxima en la parte superior es de 41 °C / 106 F, frente a la media de 40.4 °C / 105 F, que oscila entre 21.2 y 68.8 °C para la clase Gaming.
(-) El fondo se calienta hasta un máximo de 51 °C / 124 F, frente a la media de 43.2 °C / 110 F
(+) En reposo, la temperatura media de la parte superior es de 23.7 °C / 75# F, frente a la media del dispositivo de 33.9 °C / 93 F.
(-) Jugando a The Witcher 3, la temperatura media de la parte superior es de 38.2 °C / 101 F, frente a la media del dispositivo de 33.9 °C / 93 F.
(+) Los reposamanos y el panel táctil alcanzan como máximo la temperatura de la piel (35 °C / 95 F) y, por tanto, no están calientes.
(-) La temperatura media de la zona del reposamanos de dispositivos similares fue de 28.8 °C / 83.8 F (-6.2 °C / -11.2 F).
| HP Omen 17-ck2097ng Intel Core i9-13900HX, NVIDIA GeForce RTX 4080 Laptop GPU | Alienware m17 R5 (R9 6900HX, RX 6850M XT) AMD Ryzen 9 6900HX, AMD Radeon RX 6850M XT | Razer Blade 16 Early 2023 Intel Core i9-13950HX, NVIDIA GeForce RTX 4080 Laptop GPU | Lenovo Legion Pro 7 16IRX8H Intel Core i9-13900HX, NVIDIA GeForce RTX 4080 Laptop GPU | Asus ROG Strix G16 G614JZ Intel Core i9-13980HX, NVIDIA GeForce RTX 4080 Laptop GPU | HP Omen 17-ck1075ng Intel Core i7-12700H, NVIDIA GeForce RTX 3070 Ti Laptop GPU | |
|---|---|---|---|---|---|---|
| Heat | -20% | -8% | -28% | -23% | -16% | |
| Maximum Upper Side * (°C) | 41 | 53 -29% | 40 2% | 48 -17% | 54 -32% | 31.3 24% |
| Maximum Bottom * (°C) | 51 | 56 -10% | 37.6 26% | 49 4% | 55 -8% | 43.3 15% |
| Idle Upper Side * (°C) | 24 | 30 -25% | 32.4 -35% | 40 -67% | 29 -21% | 31.3 -30% |
| Idle Bottom * (°C) | 25 | 29 -16% | 31.4 -26% | 33 -32% | 33 -32% | 43.3 -73% |
* ... más pequeño es mejor
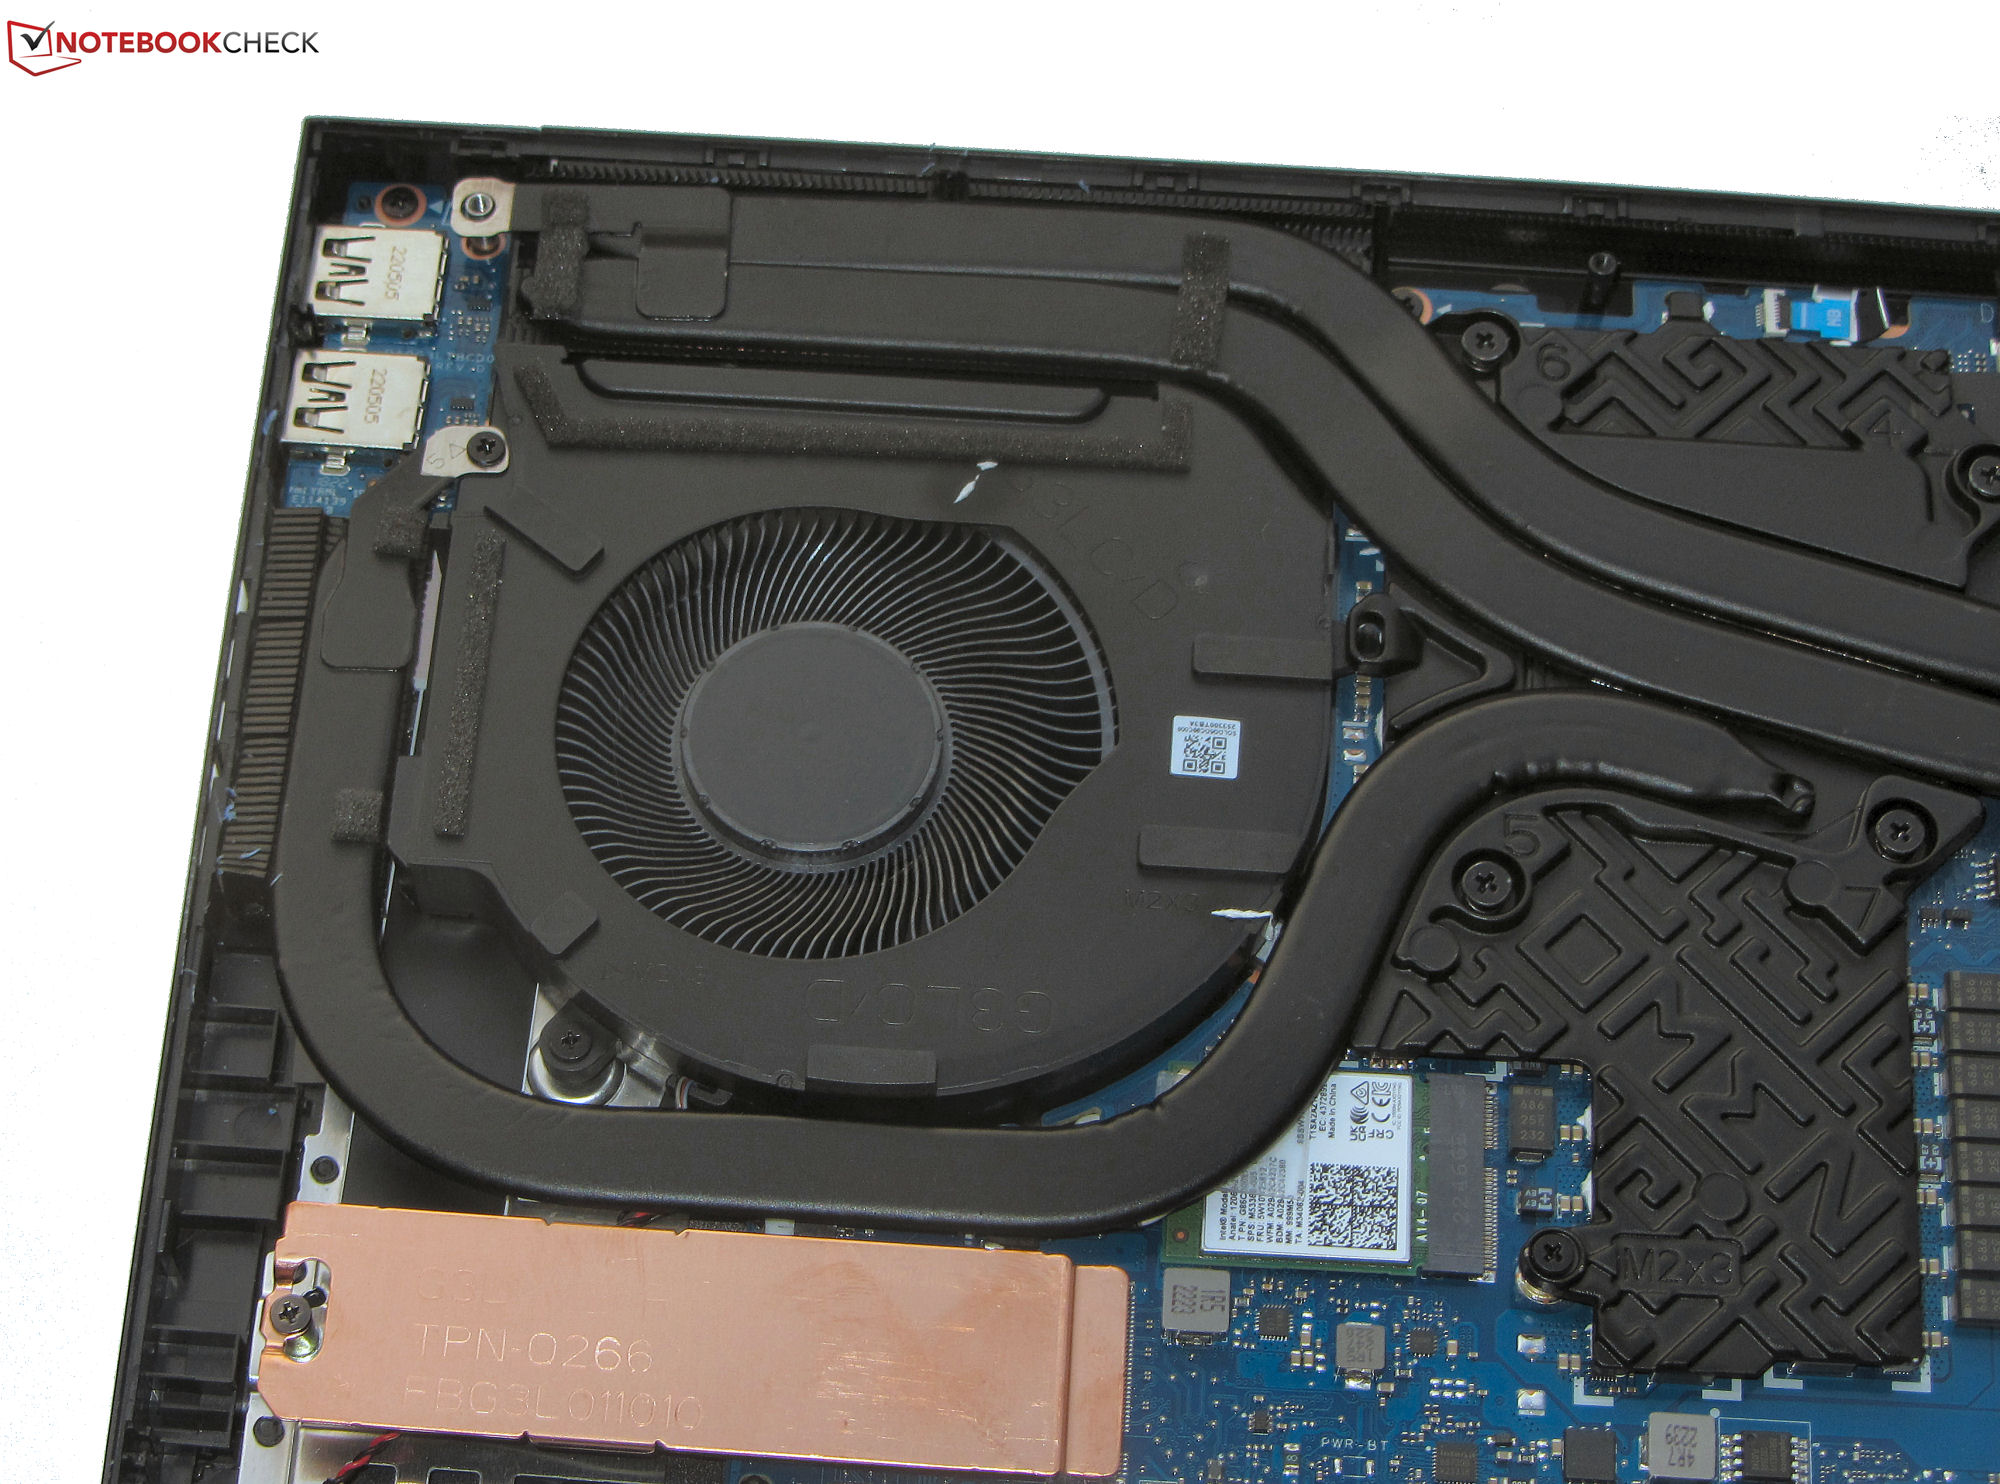
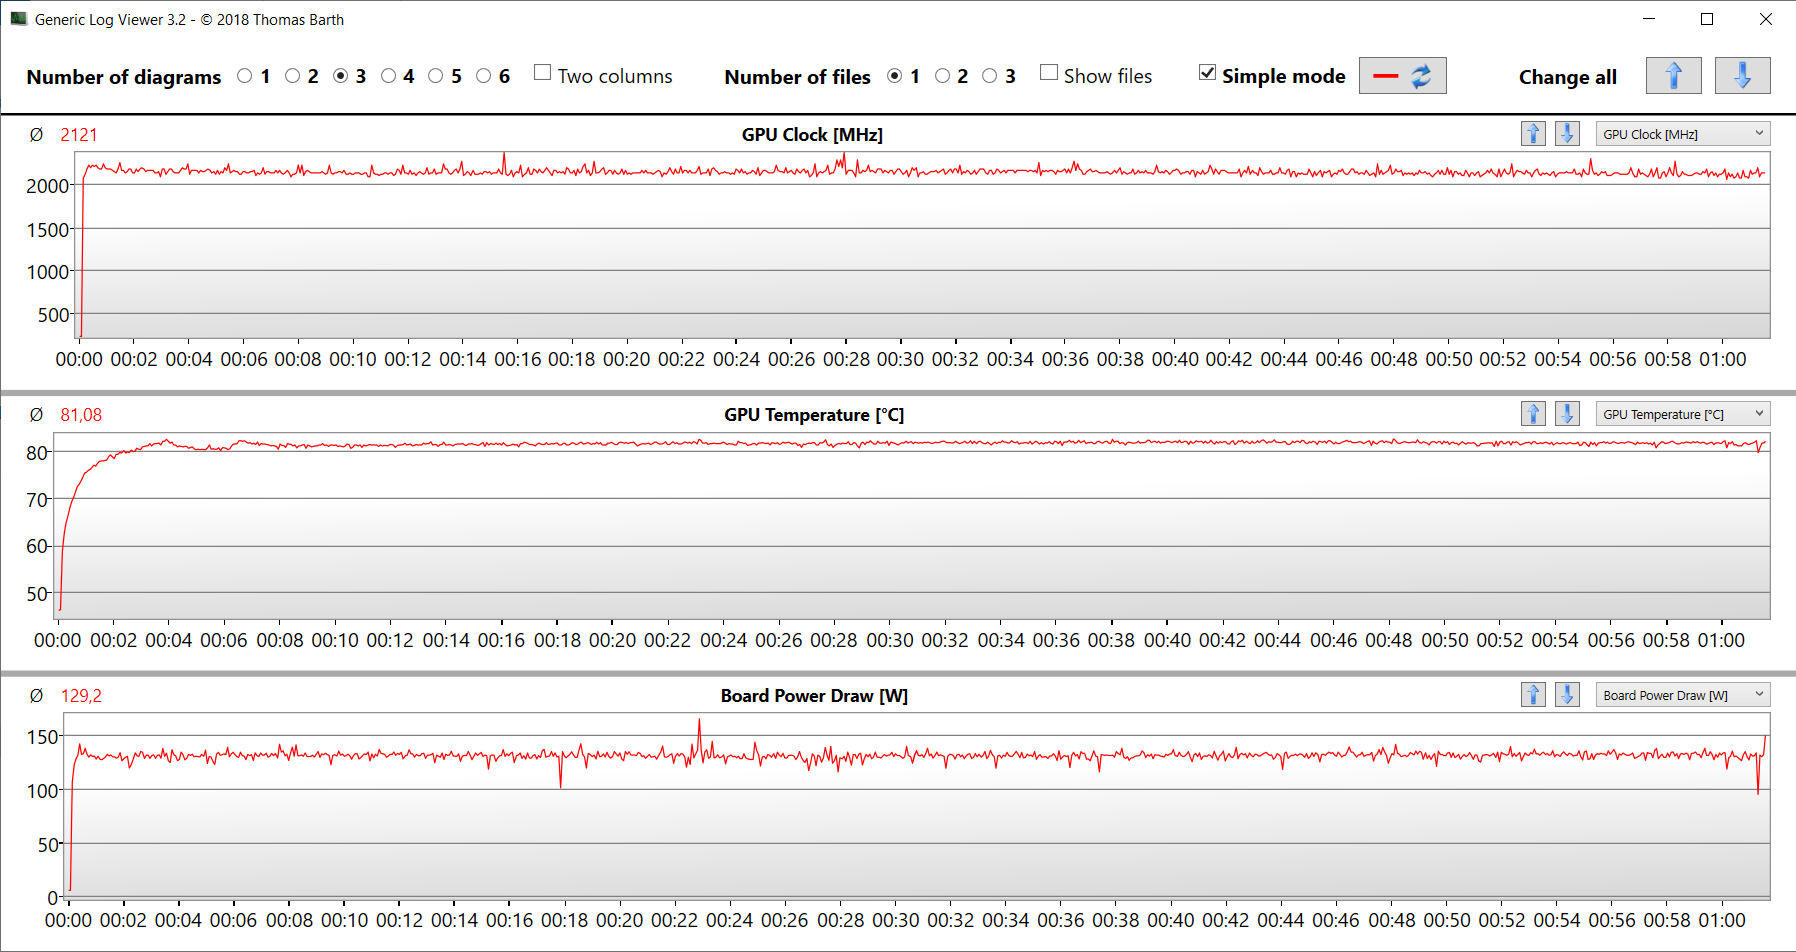
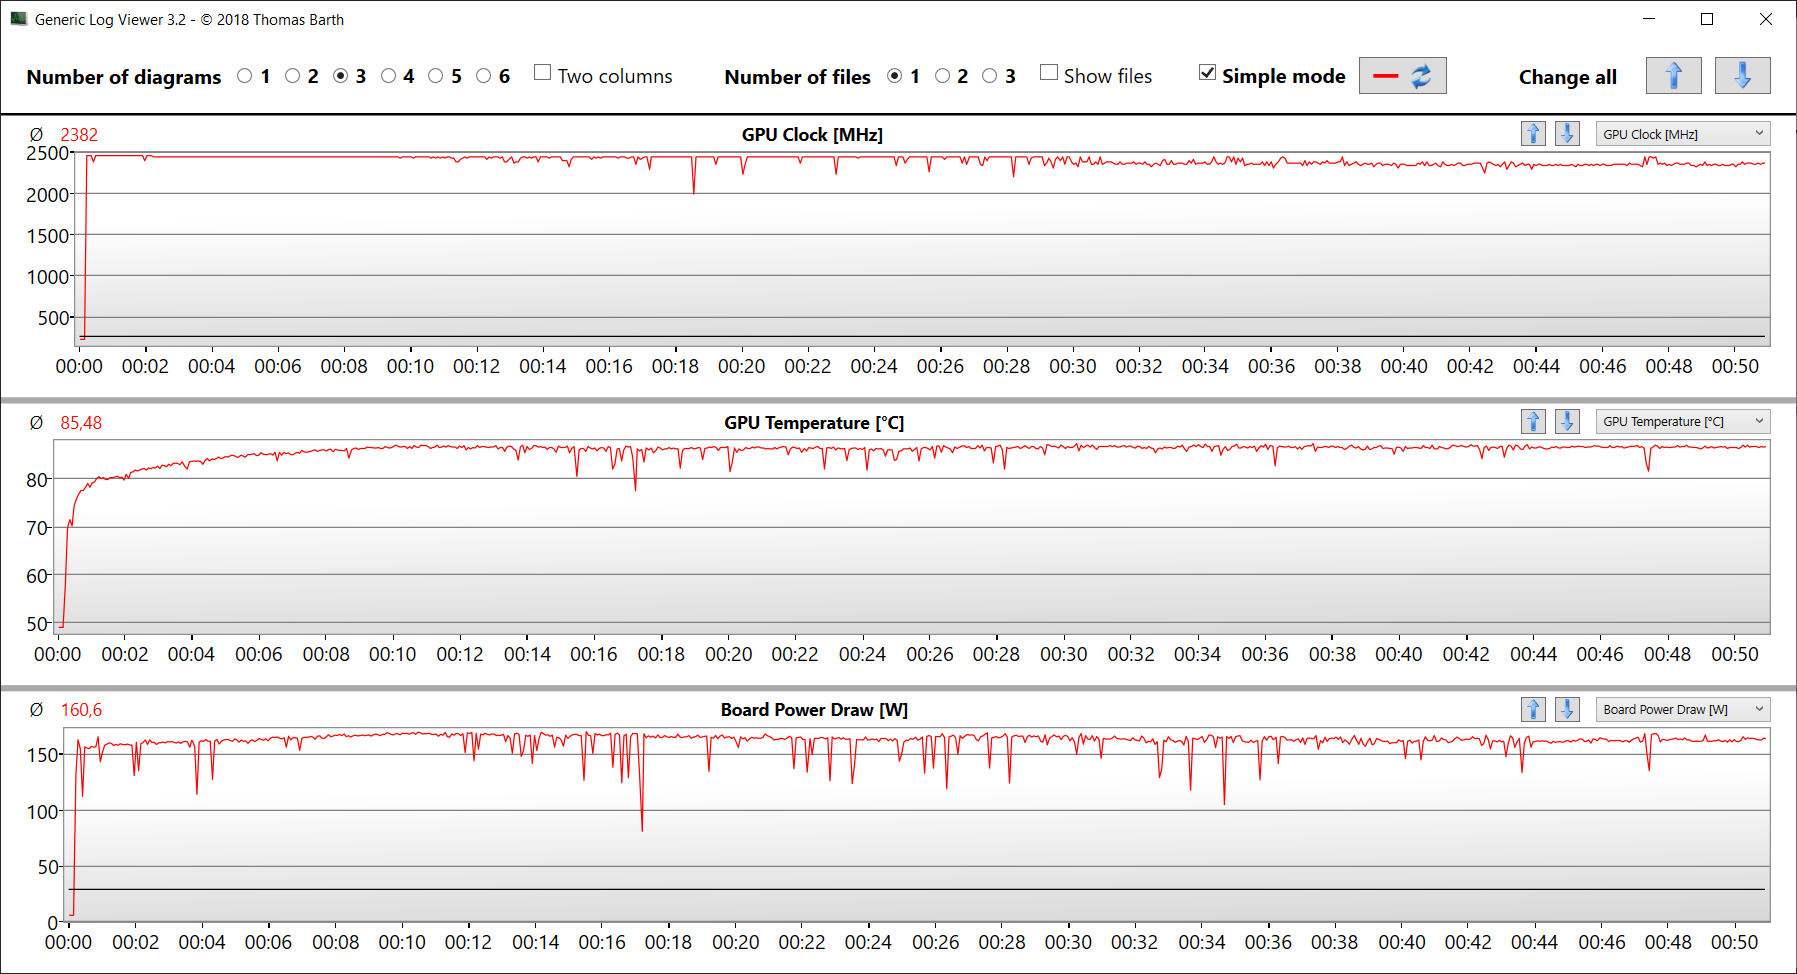
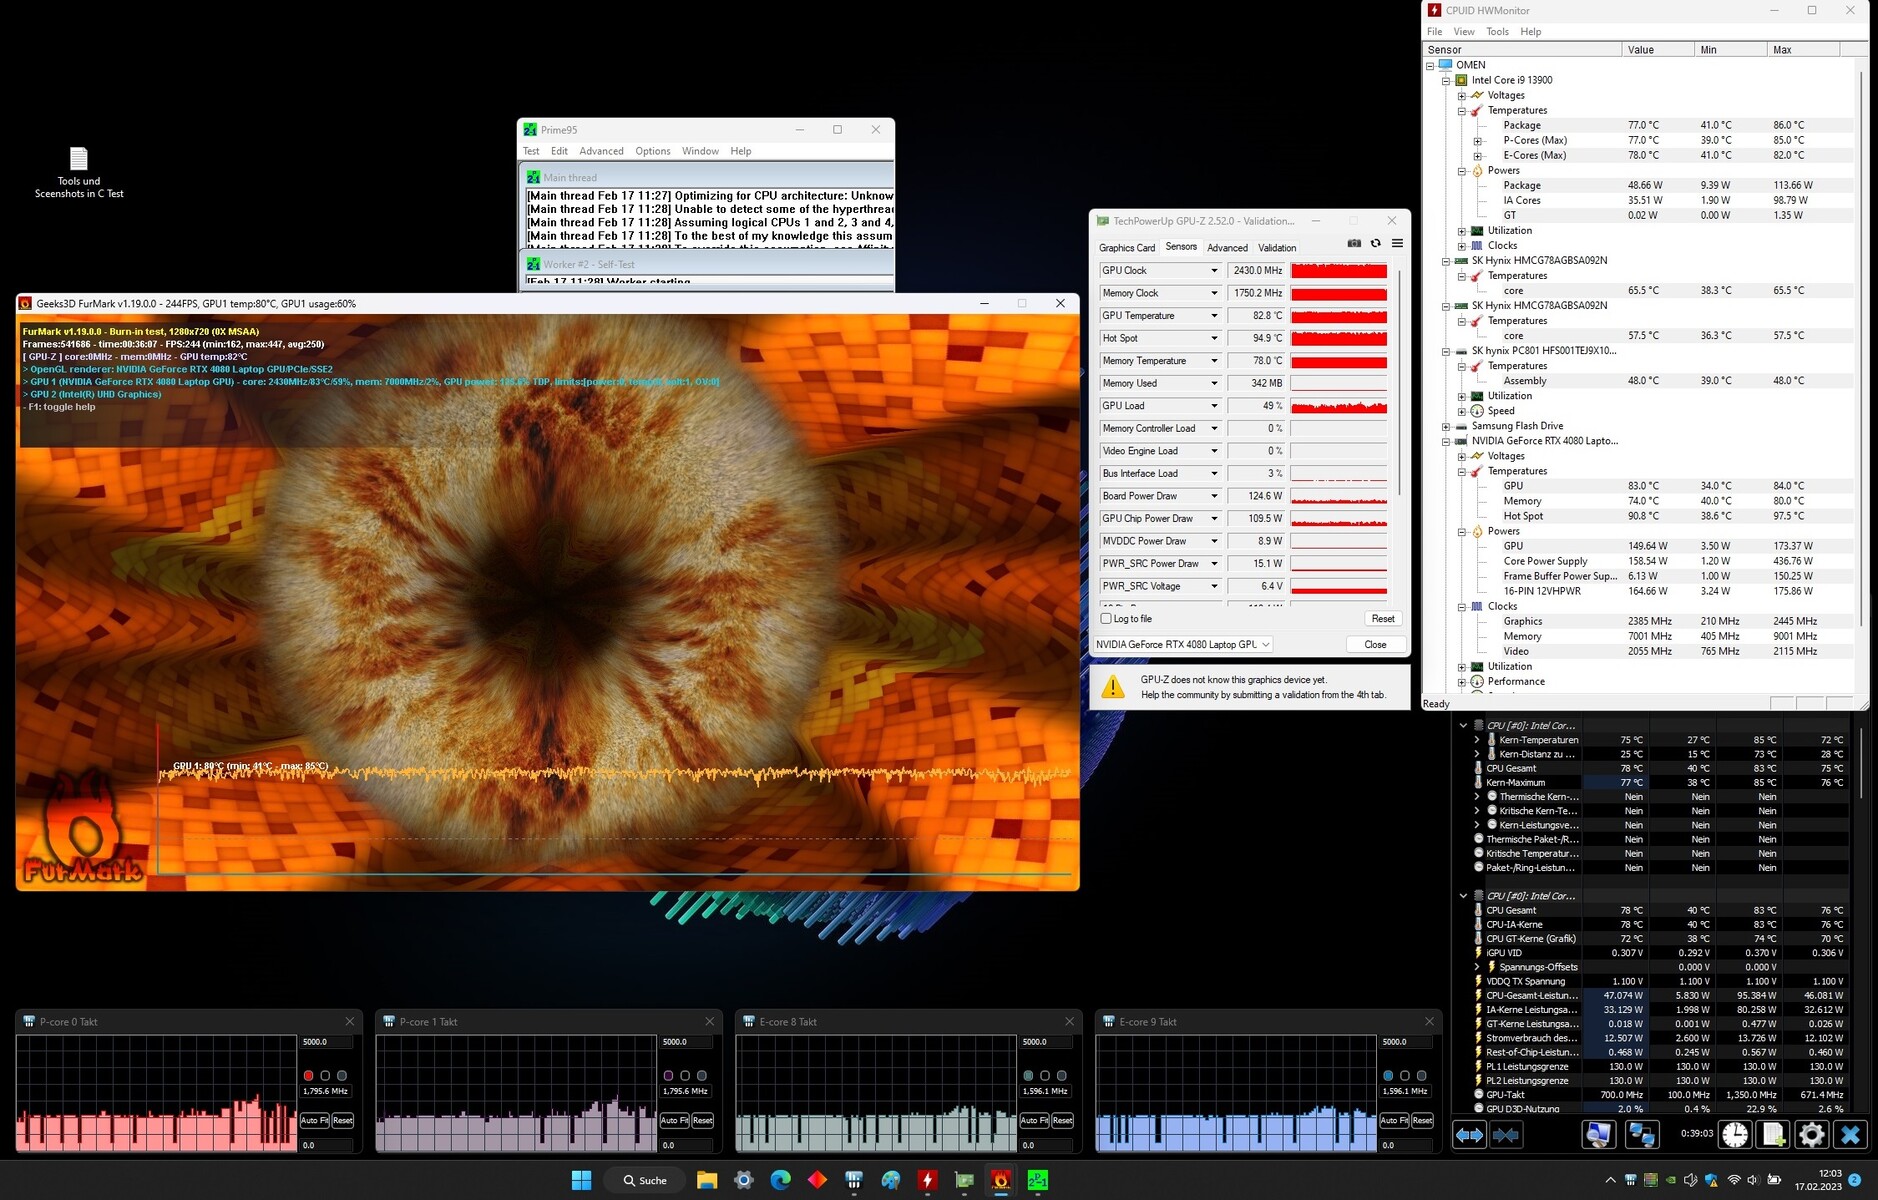
Prueba de resistencia
Nuestra prueba de estrés con Prime95 y Furmark ejecutándose constantemente representa un escenario extremo que utilizamos para evaluar la estabilidad del sistema a plena carga. La CPU (P: 3,8 GHz, E: 3,2 GHz) y la GPU (de 2 a 2,1 GHz) comienzan la prueba con altas velocidades de reloj. Al cabo de poco tiempo, la velocidad de la CPU desciende a aproximadamente 1,8 GHz (núcleos P) y 2 GHz (núcleos E), mientras que la velocidad de la GPU aumenta a 2,3 - 2,4 GHz al mismo tiempo.
Altavoces
Los altavoces estéreo producen un sonido decente, pero apenas tiene graves.
HP Omen 17-ck2097ng análisis de audio
(±) | la sonoridad del altavoz es media pero buena (81 dB)
Graves 100 - 315 Hz
(-) | casi sin bajos - de media 21% inferior a la mediana
(±) | la linealidad de los graves es media (14.6% delta a frecuencia anterior)
Medios 400 - 2000 Hz
(+) | medios equilibrados - a sólo 1.4% de la mediana
(+) | los medios son lineales (2.9% delta a la frecuencia anterior)
Altos 2 - 16 kHz
(+) | máximos equilibrados - a sólo 2.2% de la mediana
(+) | los máximos son lineales (3.8% delta a la frecuencia anterior)
Total 100 - 16.000 Hz
(+) | el sonido global es lineal (13.8% de diferencia con la mediana)
En comparación con la misma clase
» 21% de todos los dispositivos probados de esta clase eran mejores, 7% similares, 71% peores
» El mejor tuvo un delta de 6%, la media fue 18%, el peor fue ###max##%
En comparación con todos los dispositivos probados
» 15% de todos los dispositivos probados eran mejores, 4% similares, 81% peores
» El mejor tuvo un delta de 4%, la media fue 23%, el peor fue ###max##%
Asus ROG Strix Scar 17 SE G733CX-LL014W análisis de audio
(±) | la sonoridad del altavoz es media pero buena (73.3 dB)
Graves 100 - 315 Hz
(±) | lubina reducida - en promedio 6.2% inferior a la mediana
(±) | la linealidad de los graves es media (7.5% delta a frecuencia anterior)
Medios 400 - 2000 Hz
(+) | medios equilibrados - a sólo 2% de la mediana
(+) | los medios son lineales (3.9% delta a la frecuencia anterior)
Altos 2 - 16 kHz
(+) | máximos equilibrados - a sólo 3.5% de la mediana
(±) | la linealidad de los máximos es media (9.3% delta a frecuencia anterior)
Total 100 - 16.000 Hz
(+) | el sonido global es lineal (13.6% de diferencia con la mediana)
En comparación con la misma clase
» 20% de todos los dispositivos probados de esta clase eran mejores, 7% similares, 73% peores
» El mejor tuvo un delta de 6%, la media fue 18%, el peor fue ###max##%
En comparación con todos los dispositivos probados
» 15% de todos los dispositivos probados eran mejores, 4% similares, 82% peores
» El mejor tuvo un delta de 4%, la media fue 23%, el peor fue ###max##%
Gestión de la alimentación - Portátil para juegos con una fuente de alimentación de 330 vatios
Consumo de energía
El consumo de energía se sitúa en niveles normales para el hardware utilizado. Durante nuestro test Witcher 3 el consumo se mantiene constante, y durante el test de estrés el consumo cae tras unos minutos - la CPU se ralentiza. La fuente de alimentación incluida (330 vatios) es de tamaño suficiente.
| Off / Standby | |
| Ocioso | |
| Carga |
|
Clave:
min: | |
| HP Omen 17-ck2097ng i9-13900HX, GeForce RTX 4080 Laptop GPU | Alienware m17 R5 (R9 6900HX, RX 6850M XT) R9 6900HX, Radeon RX 6850M XT | Razer Blade 16 Early 2023 i9-13950HX, GeForce RTX 4080 Laptop GPU | Lenovo Legion Pro 7 16IRX8H i9-13900HX, GeForce RTX 4080 Laptop GPU | Asus ROG Strix G16 G614JZ i9-13980HX, GeForce RTX 4080 Laptop GPU | HP Omen 17-ck1075ng i7-12700H, GeForce RTX 3070 Ti Laptop GPU | Medio NVIDIA GeForce RTX 4080 Laptop GPU | Media de la clase Gaming | |
|---|---|---|---|---|---|---|---|---|
| Power Consumption | 18% | -16% | -13% | 5% | 13% | -7% | 12% | |
| Idle Minimum * (Watt) | 16 | 13 19% | 15.2 5% | 18 -13% | 10 37% | 12.2 24% | 16.9 ? -6% | 13 ? 19% |
| Idle Average * (Watt) | 20 | 16.5 17% | 22.8 -14% | 24 -20% | 16 20% | 18 10% | 22 ? -10% | 19 ? 5% |
| Idle Maximum * (Watt) | 26 | 17 35% | 49.8 -92% | 32 -23% | 27 -4% | 19.4 25% | 34.1 ? -31% | 24.6 ? 5% |
| Load Average * (Watt) | 135 | 93 31% | 121.2 10% | 130 4% | 129 4% | 128 5% | 117.9 ? 13% | 110.7 ? 18% |
| Witcher 3 ultra * (Watt) | 215 | 239 -11% | 242 -13% | 260 -21% | 247 -15% | 209 3% | ||
| Load Maximum * (Watt) | 299 | 251 16% | 273.7 8% | 320 -7% | 342 -14% | 266 11% | 297 ? 1% | 259 ? 13% |
* ... más pequeño es mejor
Power Consumption The Witcher 3 / Stress Test
Power Consumption with External Monitor
Duración de la batería
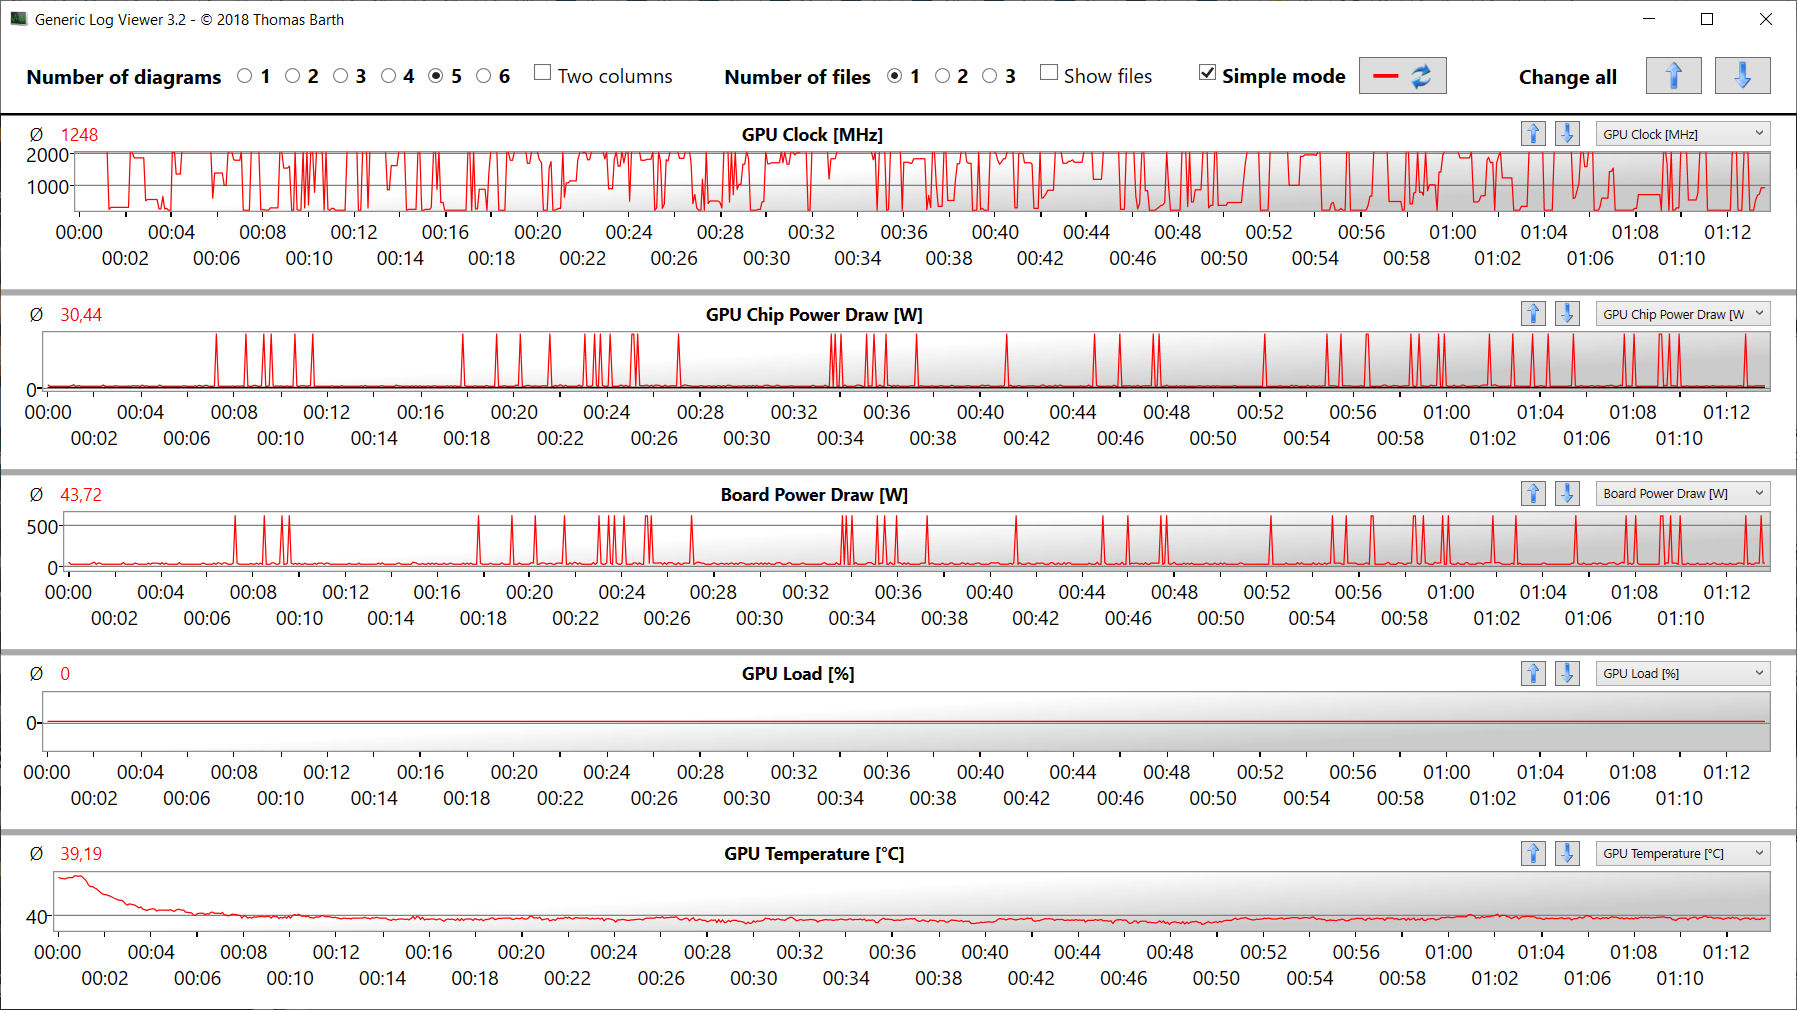
La duración de la batería del Omen no es satisfactoria. Incluso un portátil de juegos potente debería poder durar más en funcionamiento Optimus con una batería de 83-Wh. No pudimos determinar hasta ahora si esto se debe a un problema de hardware o de software.
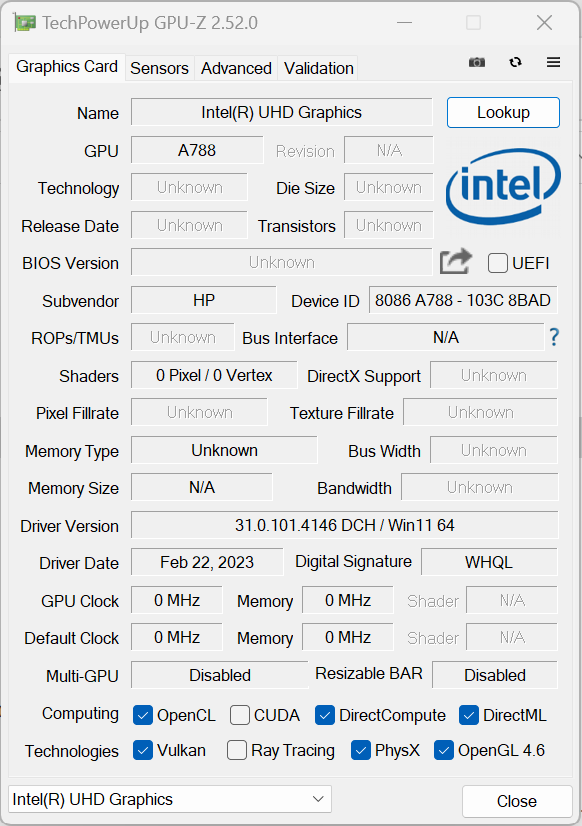
Los archivos de registro dan un indicio del problema: Durante las pruebas de baja carga (WiFi, inactivo, vídeo), la GPU GeForce debería estar inactiva y dejar todo el trabajo a la iGPU. Sin embargo, la GPU GeForce suele funcionar aquí a máxima velocidad, con una carga del 0%. Según GPU-Z, esto conlleva un consumo de energía de hasta 45 vatios.
Por esta razón, pedimos una nueva unidad de pruebas a HP para comprobarlo, pero aún no la hemos recibido. En cuanto la recibamos, volveremos a probarlo.
| HP Omen 17-ck2097ng i9-13900HX, GeForce RTX 4080 Laptop GPU, 83 Wh | Alienware m17 R5 (R9 6900HX, RX 6850M XT) R9 6900HX, Radeon RX 6850M XT, 97 Wh | Razer Blade 16 Early 2023 i9-13950HX, GeForce RTX 4080 Laptop GPU, 95.2 Wh | Lenovo Legion Pro 7 16IRX8H i9-13900HX, GeForce RTX 4080 Laptop GPU, 99.9 Wh | Asus ROG Strix G16 G614JZ i9-13980HX, GeForce RTX 4080 Laptop GPU, 90 Wh | HP Omen 17-ck1075ng i7-12700H, GeForce RTX 3070 Ti Laptop GPU, 78 Wh | Media de la clase Gaming | |
|---|---|---|---|---|---|---|---|
| Duración de Batería | 31% | 60% | 48% | 74% | 80% | 82% | |
| Reader / Idle (h) | 4.2 | 8.9 112% | 6.4 52% | 8.9 112% | 8.27 ? 97% | ||
| H.264 (h) | 3.7 | 4.9 32% | 8.32 ? 125% | ||||
| WiFi v1.3 (h) | 3.6 | 4.8 33% | 6.1 69% | 5.1 42% | 9.7 169% | 6.2 72% | 7.11 ? 98% |
| Load (h) | 1.4 | 1.8 29% | 1.4 0% | 2.1 50% | 1.1 -21% | 2.2 57% | 1.502 ? 7% |
| Gaming (h) | 1 |
Pro
Contra
Veredicto - Un sólido portátil de gama alta para juegos
Con el Omen 17, HP ofrece un potente portátil para juegos QHD del segmento de gama alta. Con su procesadorCore i9-13900HXy su procesador GeForce RTX 4080laptop GPU, el portátil también debería funcionar bien en otras áreas de aplicación como el procesamiento y renderizado de vídeo. Un veloz SSD PCIe 4 (1 TB) ofrece el espacio de almacenamiento necesario y asegura tiempos de carga cortos. También hay espacio para un segundo SSD.
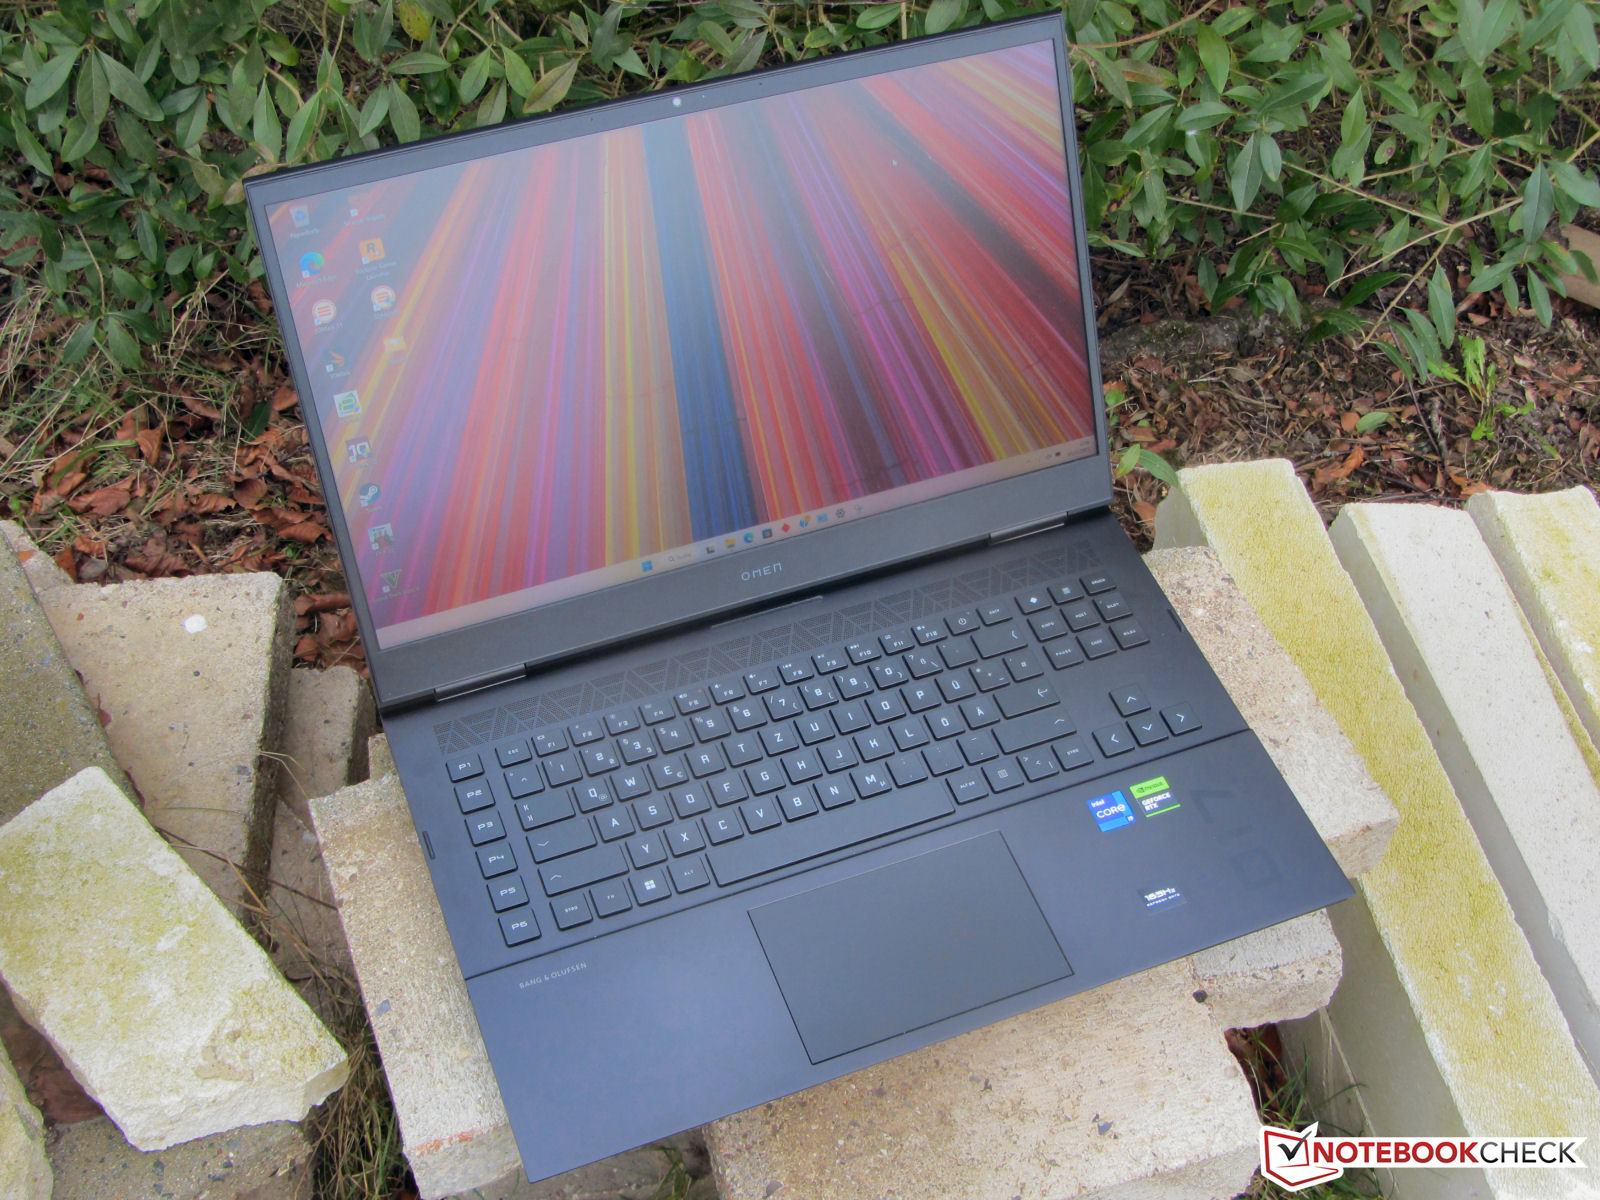
El HP Omen 17 (2023) representa un sólido portátil de juego, pero no aprovecha todo su potencial.
El procesador y el núcleo gráfico pueden funcionar a velocidades de reloj constantemente altas. El ruido y el desarrollo de calor están en los niveles altos que son normales para esta clase de portátil. Sin embargo, el portátil produce demasiado ruido en el funcionamiento diario.
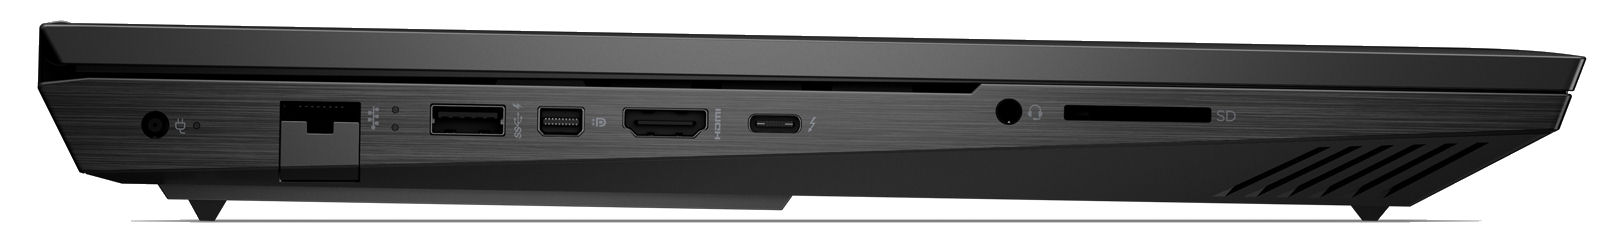
La pantalla mate de 17.3 pulgadas (QHD, IPS, 165 Hz, sRGB) deja una impresión sólida. En general rinde ligeramente mejor que el panel FHD del predecesor del Predecesor Omenpero peor que la mayoría de competidores. Una conexión Thunderbolt 4 ofrece algunas opciones de expansión (solución de acoplamiento, GPU externa). Además, también puede usarse para cargar la batería con un cargador USB-C (mín. 65 vatios, 20 V), y soporta Power Delivery.
Debido a un posible defecto, no podemos emitir un juicio definitivo sobre la duración de la batería en este momento. Volveremos a medir la duración de la batería en cuanto recibamos una unidad de reemplazo de HP. Dado que la duración de la batería apenas tiene impacto en la valoración final de un portátil de juego, la valoración sólo cambiará ligeramente como mucho.
Como alternativa, puedes echar un vistazo al Lenovo Legion Pro 7 16IRX8Hque es capaz de obtener un mayor rendimiento de la misma combinación CPU/GPU. Además, puntúa con una pantalla más brillante en formato 16:10.
Precio y disponibilidad
El Omen 17 (2023) está disponible en HP a partir de 1499,99 $. Un modelo similar a nuestra configuración probada salvo por tener un i7-13700 costaría $2,429.99 en USA.
HP Omen 17-ck2097ng
- 03/28/2023 v7 (old)
Sascha Mölck
Transparencia
La selección de los dispositivos que se van a reseñar corre a cargo de nuestro equipo editorial. La muestra de prueba fue proporcionada al autor en calidad de préstamo por el fabricante o el minorista a los efectos de esta reseña. El prestamista no tuvo ninguna influencia en esta reseña, ni el fabricante recibió una copia de la misma antes de su publicación. No había ninguna obligación de publicar esta reseña. Como empresa de medios independiente, Notebookcheck no está sujeta a la autoridad de fabricantes, minoristas o editores.
Así es como prueba Notebookcheck
Cada año, Notebookcheck revisa de forma independiente cientos de portátiles y smartphones utilizando procedimientos estandarizados para asegurar que todos los resultados son comparables. Hemos desarrollado continuamente nuestros métodos de prueba durante unos 20 años y hemos establecido los estándares de la industria en el proceso. En nuestros laboratorios de pruebas, técnicos y editores experimentados utilizan equipos de medición de alta calidad. Estas pruebas implican un proceso de validación en varias fases. Nuestro complejo sistema de clasificación se basa en cientos de mediciones y puntos de referencia bien fundamentados, lo que mantiene la objetividad.Price comparison

