Análisis del portátil MSI Raider GE78 HX 13VH: 13ª generación Core i9-13950HX y GeForce RTX 4080 actualizaciones
Presentado en CES 2023el Raider GE78 de 16:10 y 17,0 pulgadas sucede al Raider GE77 de 16:9 y 17,3 pulgadas de 2022 con componentes internos mejorados y un diseño de chasis totalmente nuevo. Incorpora algunas de las CPU Intel Raptor Lake-H y GPU móviles GeForce 40 más potentes disponibles actualmente en cualquier modelo de portátil. La serie GE de MSI se sitúa justo por debajo de la serie Titan GT77, aún más cara y de mayor tamaño, en términos de clasificación.
Las referencias van desde la CPU Core i9-13950HX de 13ª generación, la GPU GeForce RTX 4070 de 140 W y la pantalla IPS de 1920 x 1200 a 165 Hz hasta la Core i9-13980HX, la RTX 4090 de 175 W y la pantalla IPS de 2560 x 1600 a 240 Hz por unos 4200 dólares. Nuestra unidad de pruebas específica es una configuración de gama media-alta con Core i9-13950HX, 175 W RTX 4080, y pantalla 1600p por unos 3700 USD.
Entre los competidores del GE78 se incluyen otros portátiles para juegos de 17 pulgadas de gama alta como el Razer Blade 17, Asus ROG Strix Scar 17,Alienware m17 R5o elEluktronics Mech-17 GP2. También está disponible una versión de 16,0 pulgadas llamada Raider GE68.
Más opiniones sobre MSI:
Posibles contendientes en la comparación
Valoración | Fecha | Modelo | Peso | Altura | Tamaño | Resolución | Precio |
|---|---|---|---|---|---|---|---|
| 88.3 % v7 (old) | 03/2023 | MSI GE78HX 13VH-070US i9-13950HX, GeForce RTX 4080 Laptop GPU | 3 kg | 23 mm | 17.00" | 2560x1600 | |
| 89.9 % v7 (old) | 03/2023 | Eluktronics Mech-17 GP2 i9-13900HX, GeForce RTX 4090 Laptop GPU | 2.9 kg | 27 mm | 17.00" | 2560x1600 | |
| 88.4 % v7 (old) | 04/2023 | Asus ROG Strix G17 G713PI R9 7945HX, GeForce RTX 4070 Laptop GPU | 2.8 kg | 30.7 mm | 17.30" | 2560x1440 | |
| 89 % v7 (old) | 02/2023 | MSI Titan GT77 HX 13VI i9-13950HX, GeForce RTX 4090 Laptop GPU | 3.5 kg | 23 mm | 17.30" | 3840x2160 | |
| 86.8 % v7 (old) | 07/2022 | MSI Raider GE77 HX 12UHS i9-12900HX, GeForce RTX 3080 Ti Laptop GPU | 3.1 kg | 25.9 mm | 17.30" | 3840x2160 | |
| 89.9 % v7 (old) | 07/2022 | Razer Blade 17 Early 2022 i9-12900H, GeForce RTX 3080 Ti Laptop GPU | 2.8 kg | 19.9 mm | 17.30" | 3840x2160 |
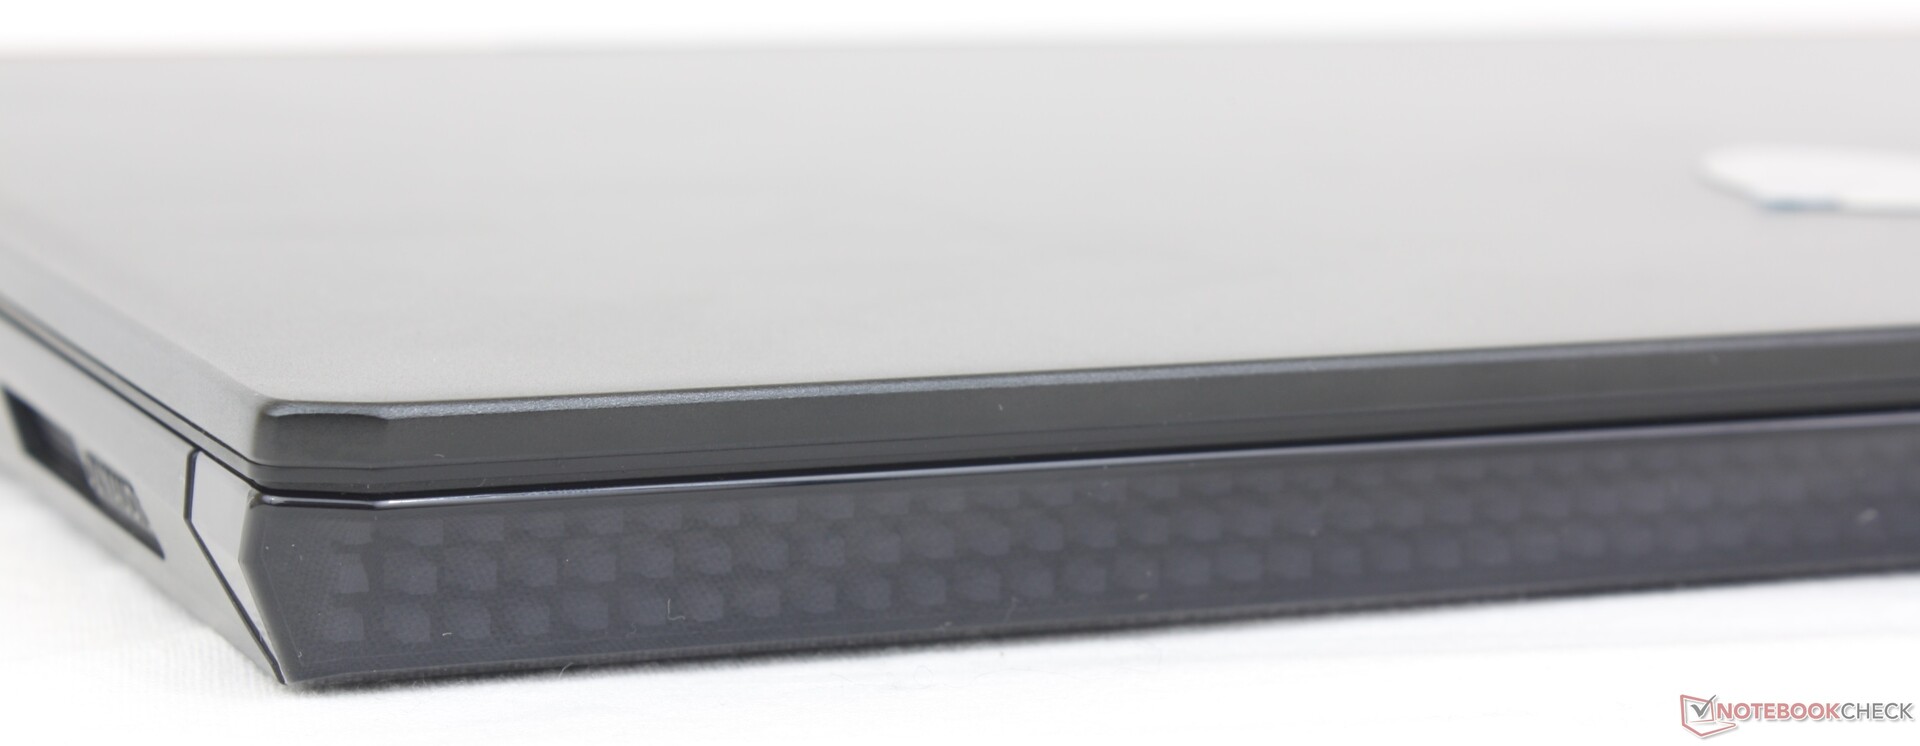
Maletín - Retro-Futurista
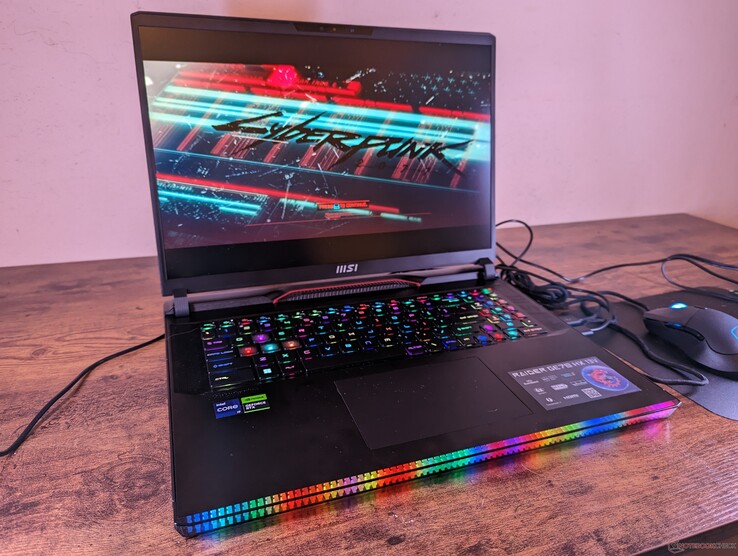
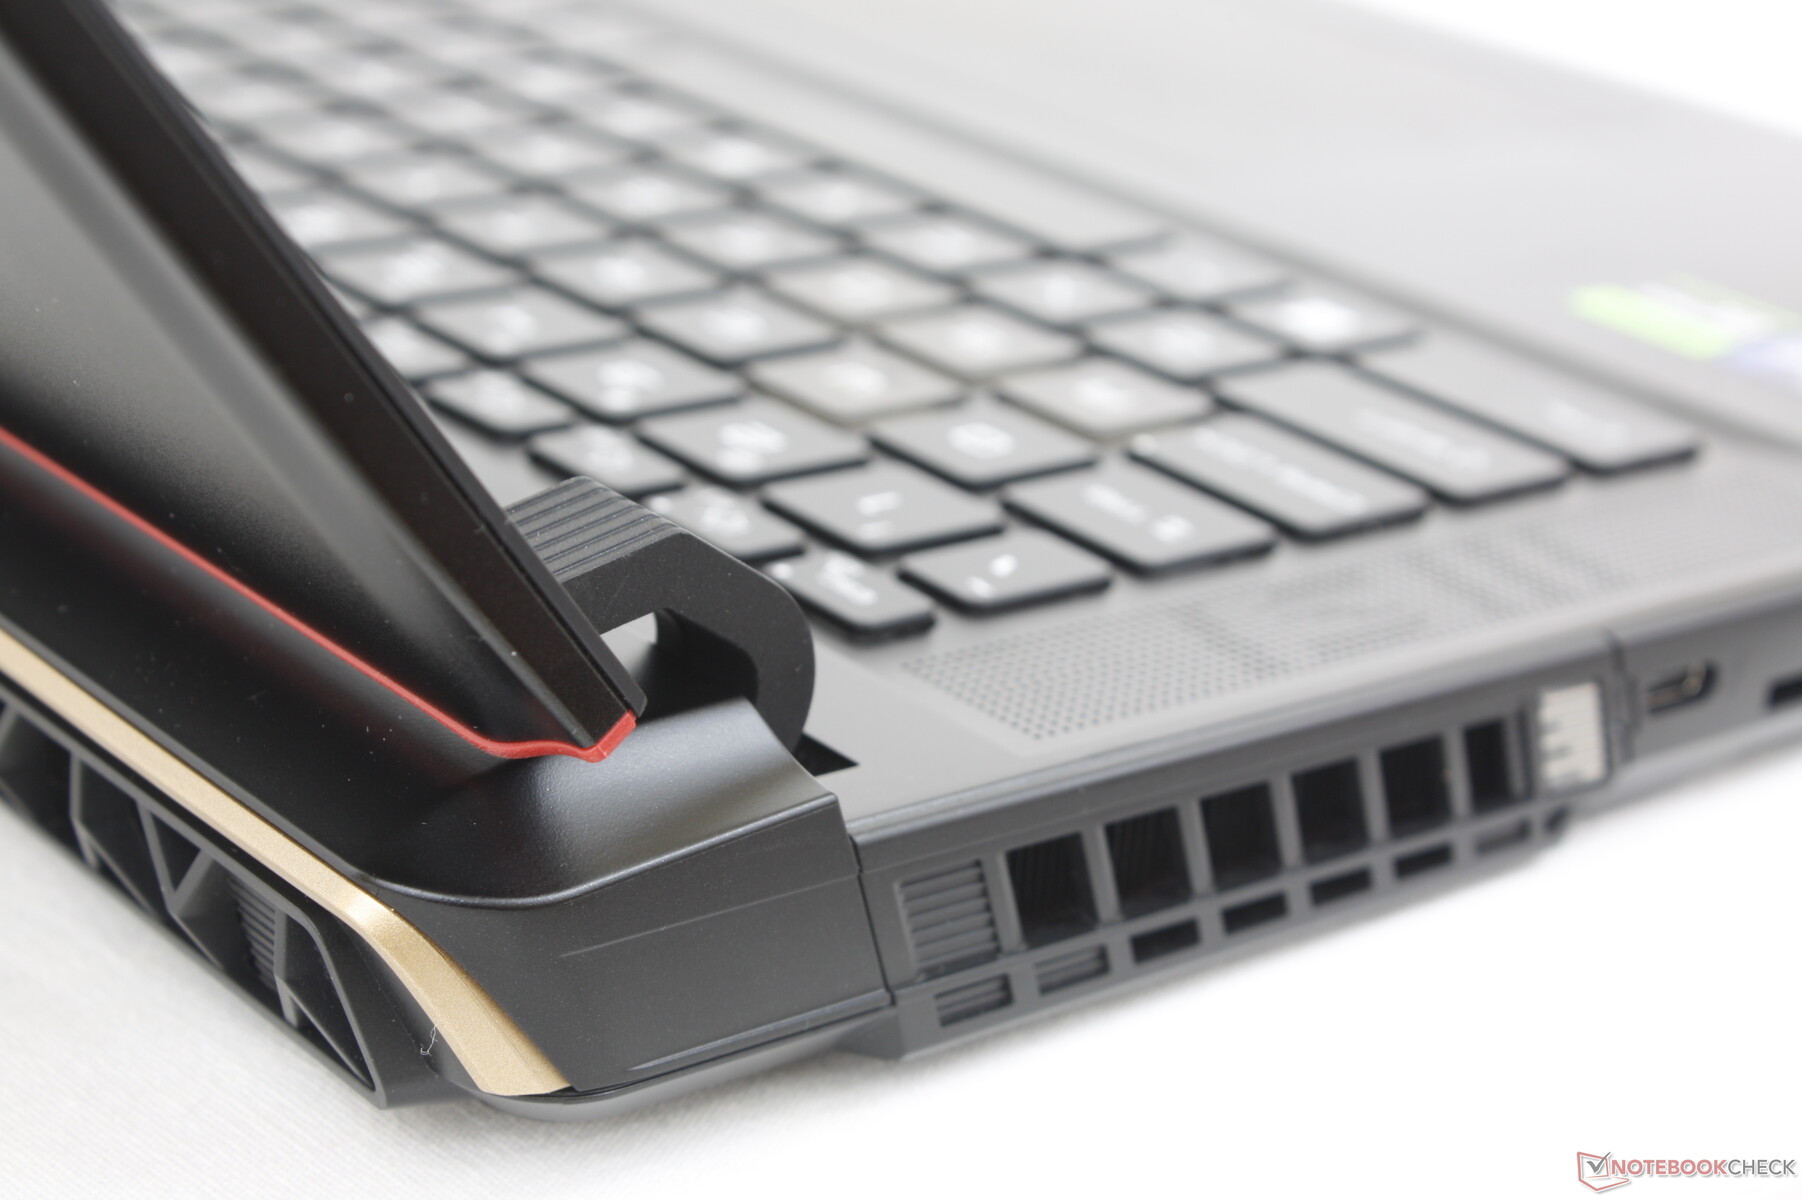
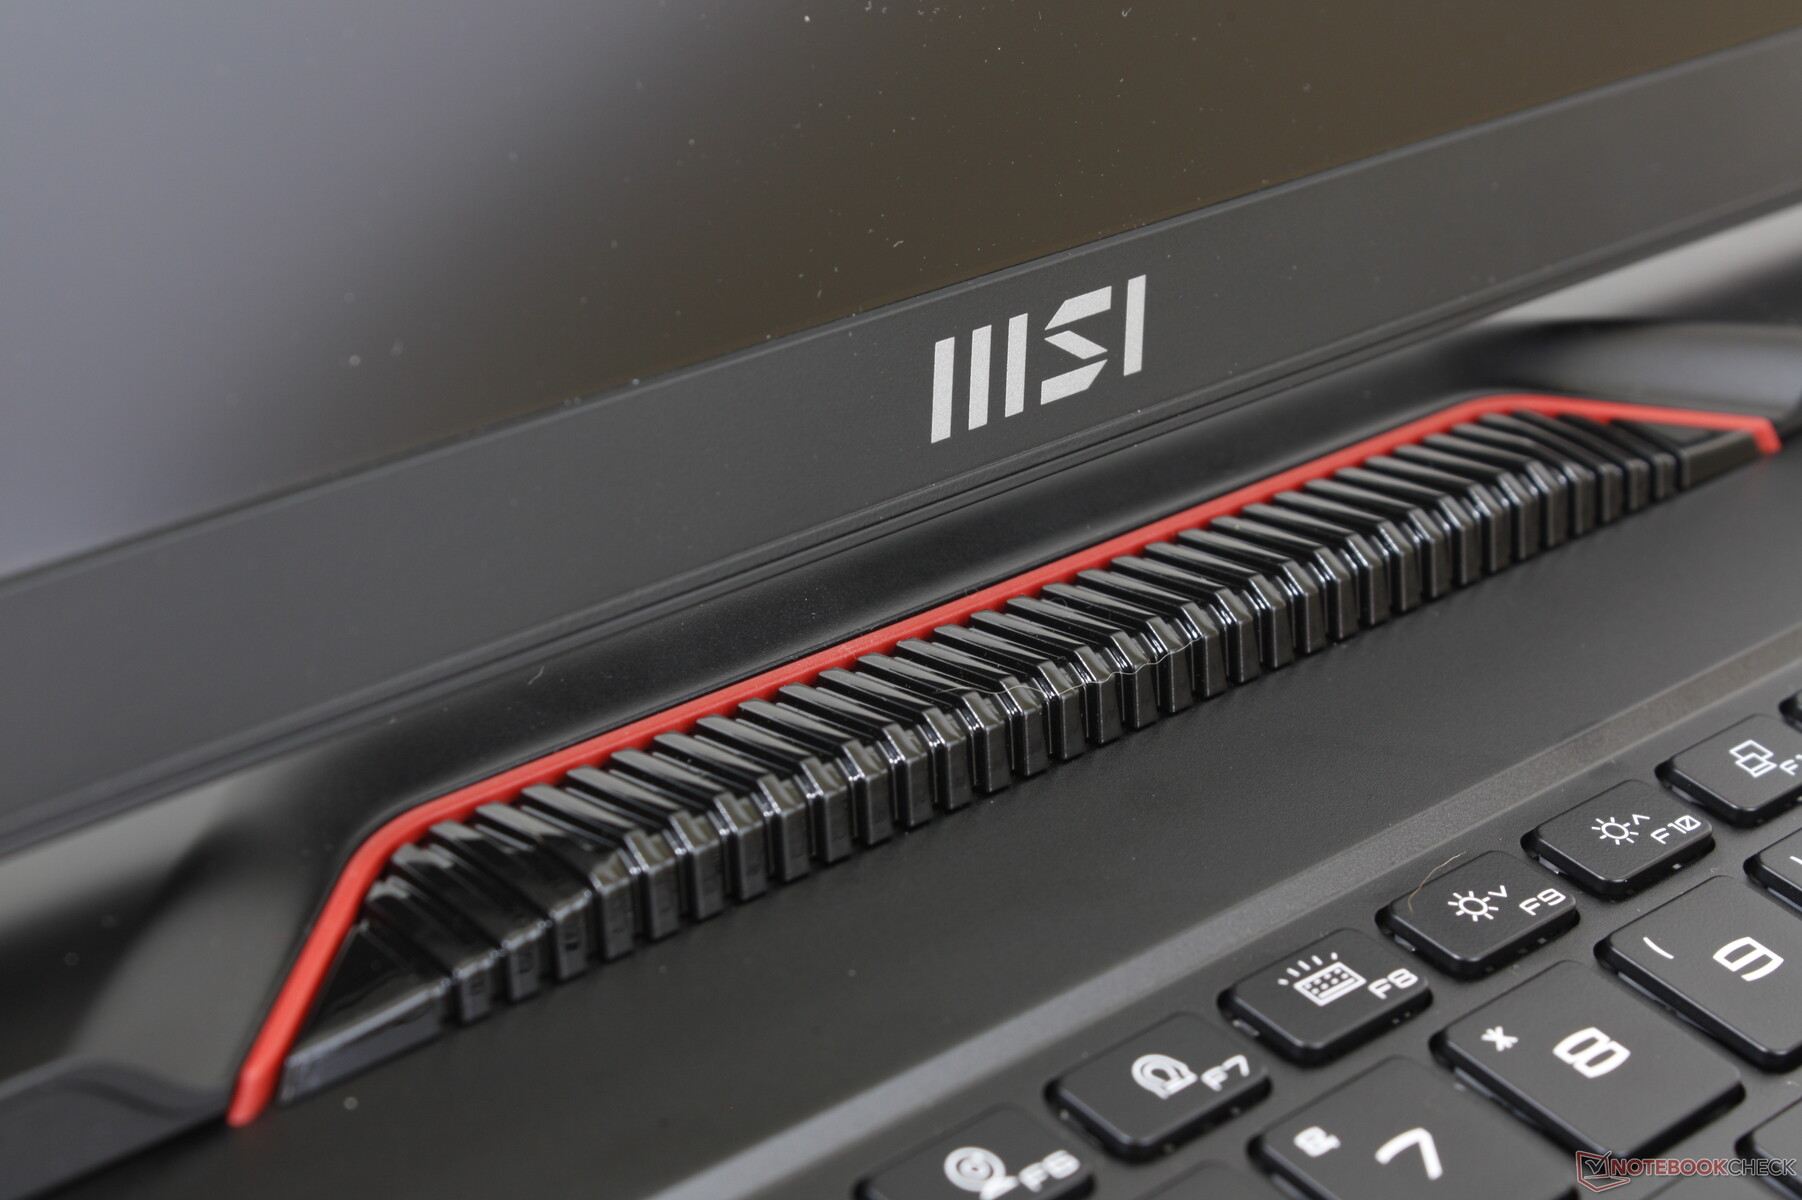
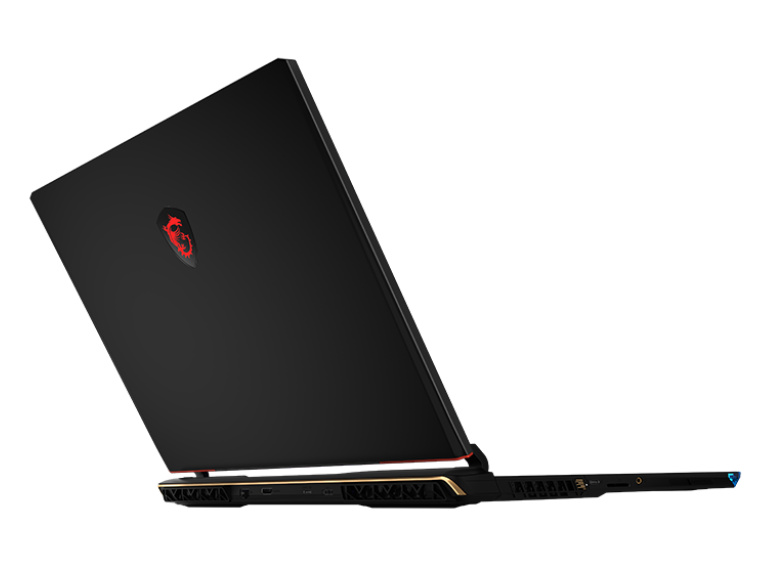
Según MSI, el diseño del último modelo GE priorizaba el minimalismo con superficies lisas y planas. En un intento por devolver algo de estilo a la serie, el diseño del GE78 se inspira en los juegos de 8 bits y la estética de los 80. Así, el último modelo incorpora más curvas a lo largo de su parte trasera y una barra de luces reimaginada a lo largo del borde frontal que consiste en "píxeles" LED RGB individuales. Las luces pixeladas tienen un estilo similar al del Hyundai Ioniq 6, que también se inspira en la estética retro. El resultado final es un aspecto único que ayuda a distinguir visualmente el GE78 del resto de portátiles para juegos del mercado. Sin embargo, que el nuevo GE78 tenga o no mejor aspecto que el antiguo GE77 es cuestión de gustos.
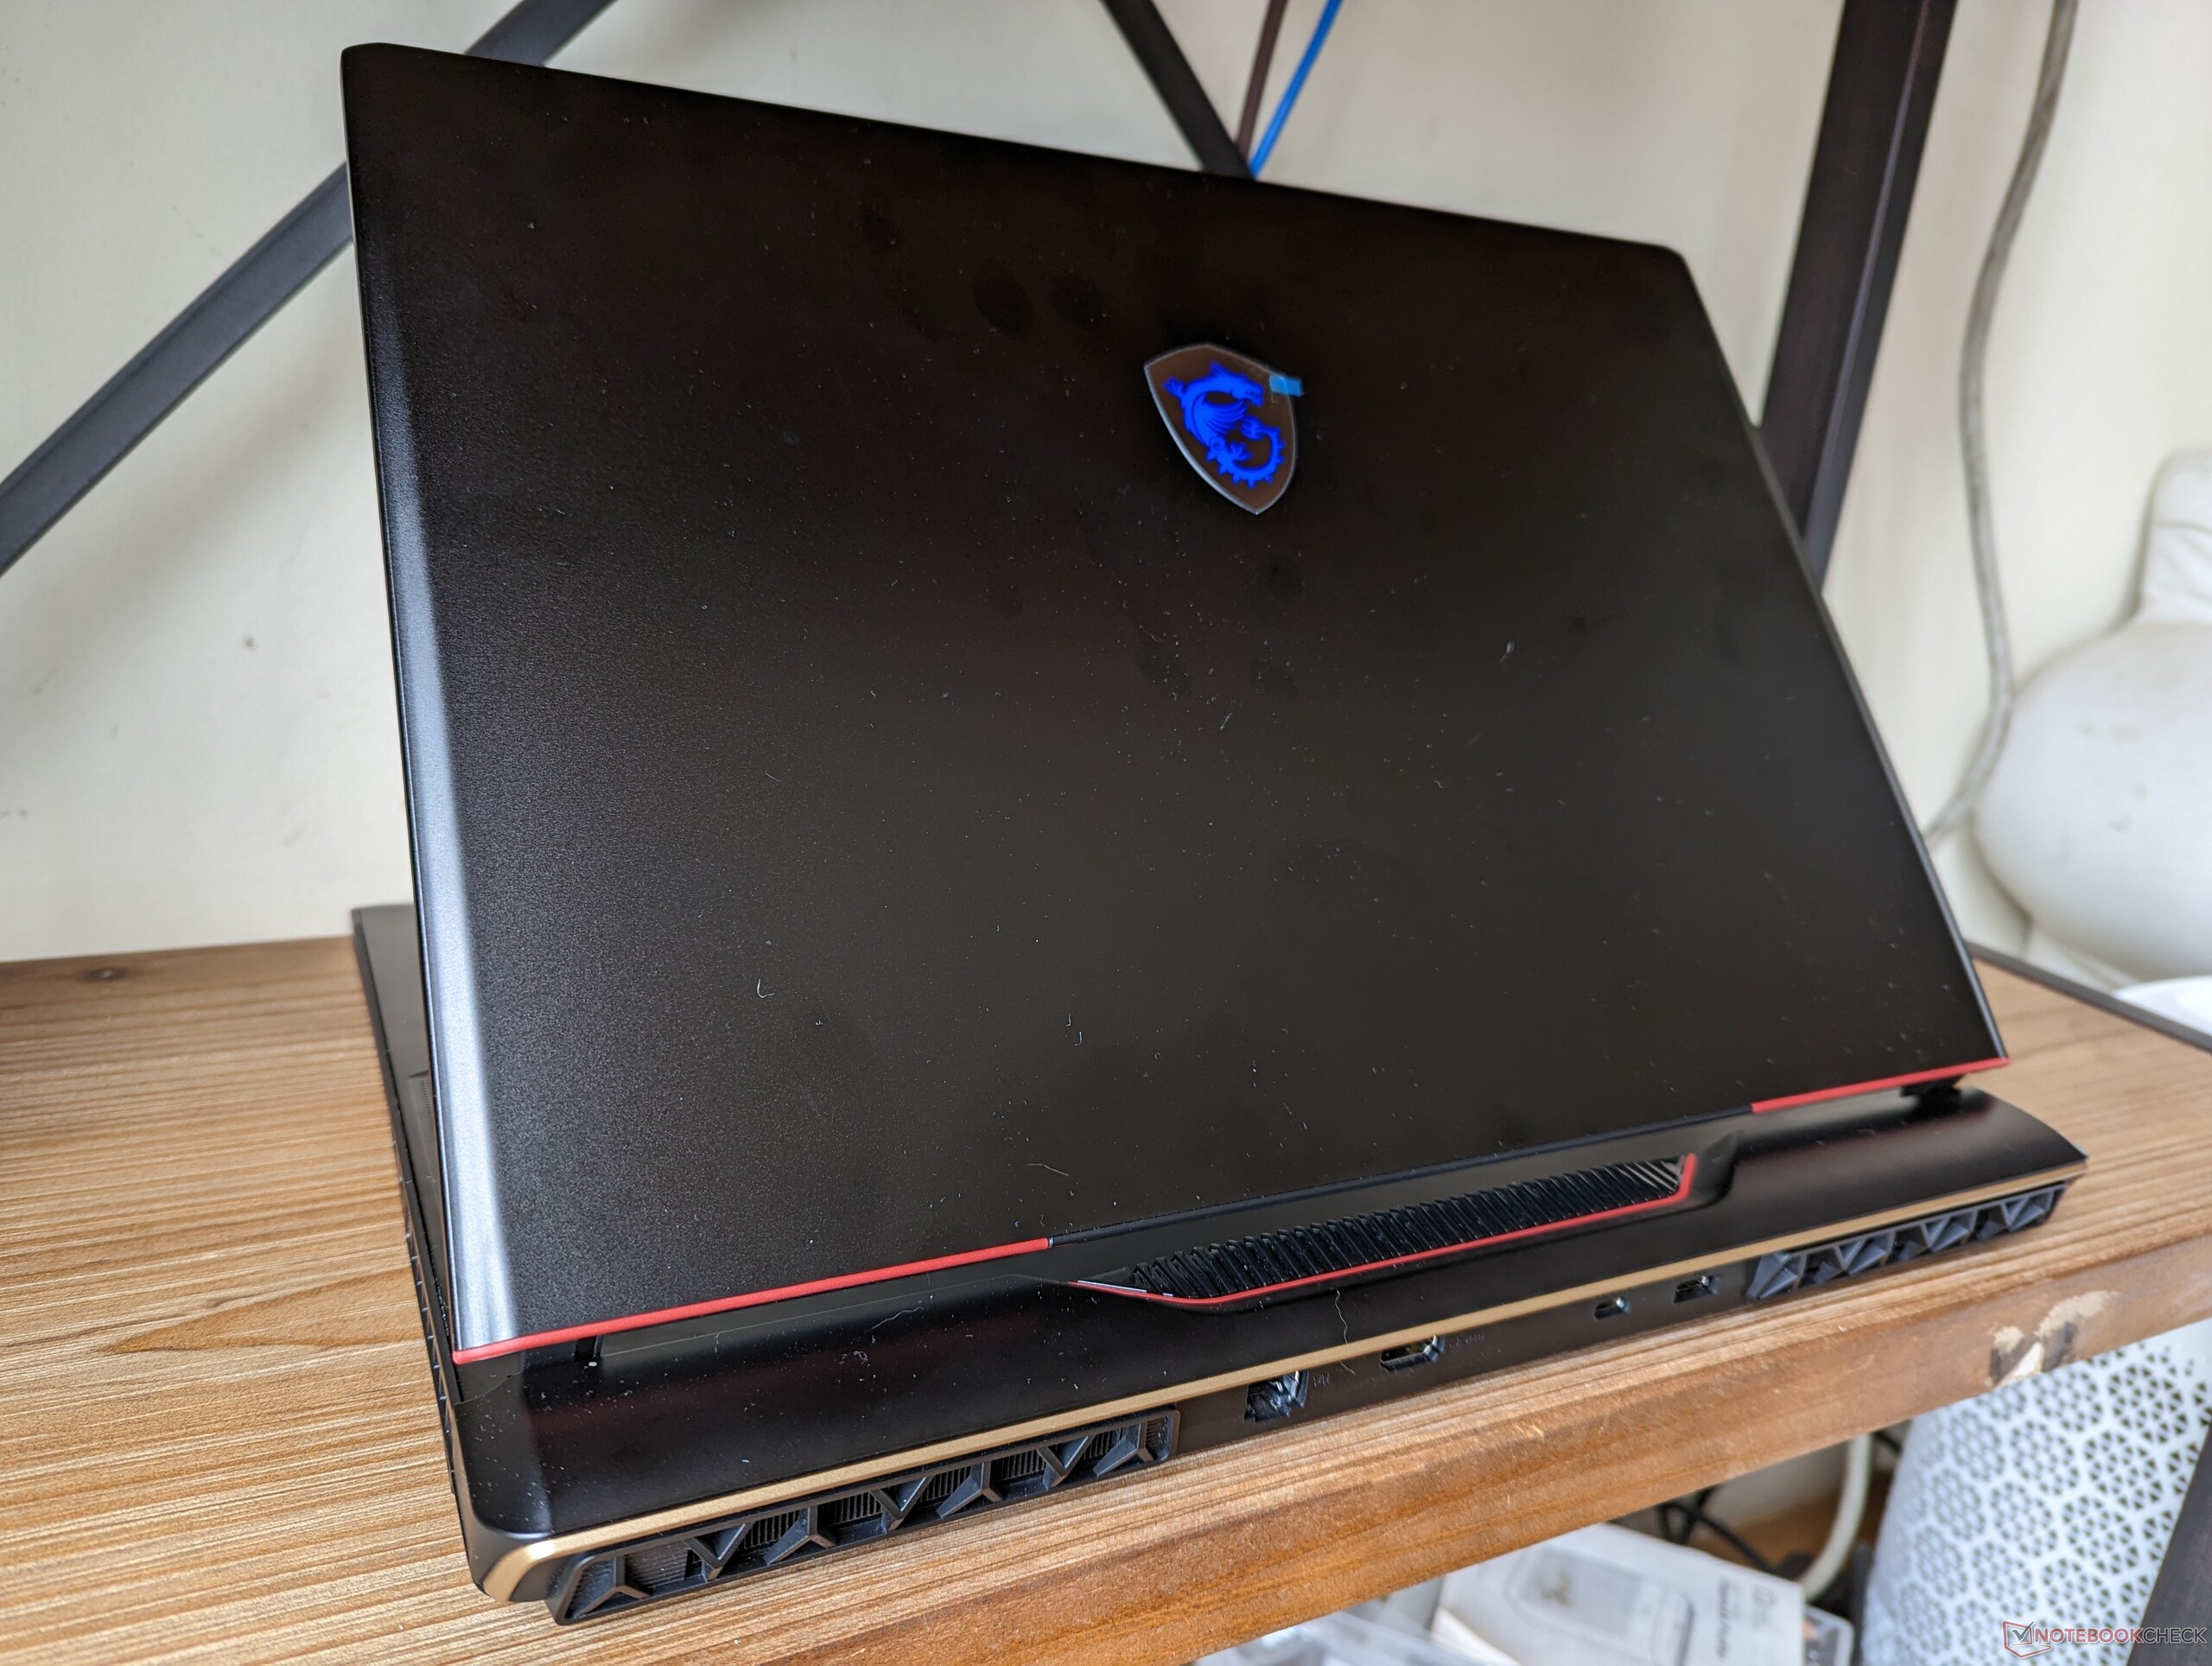
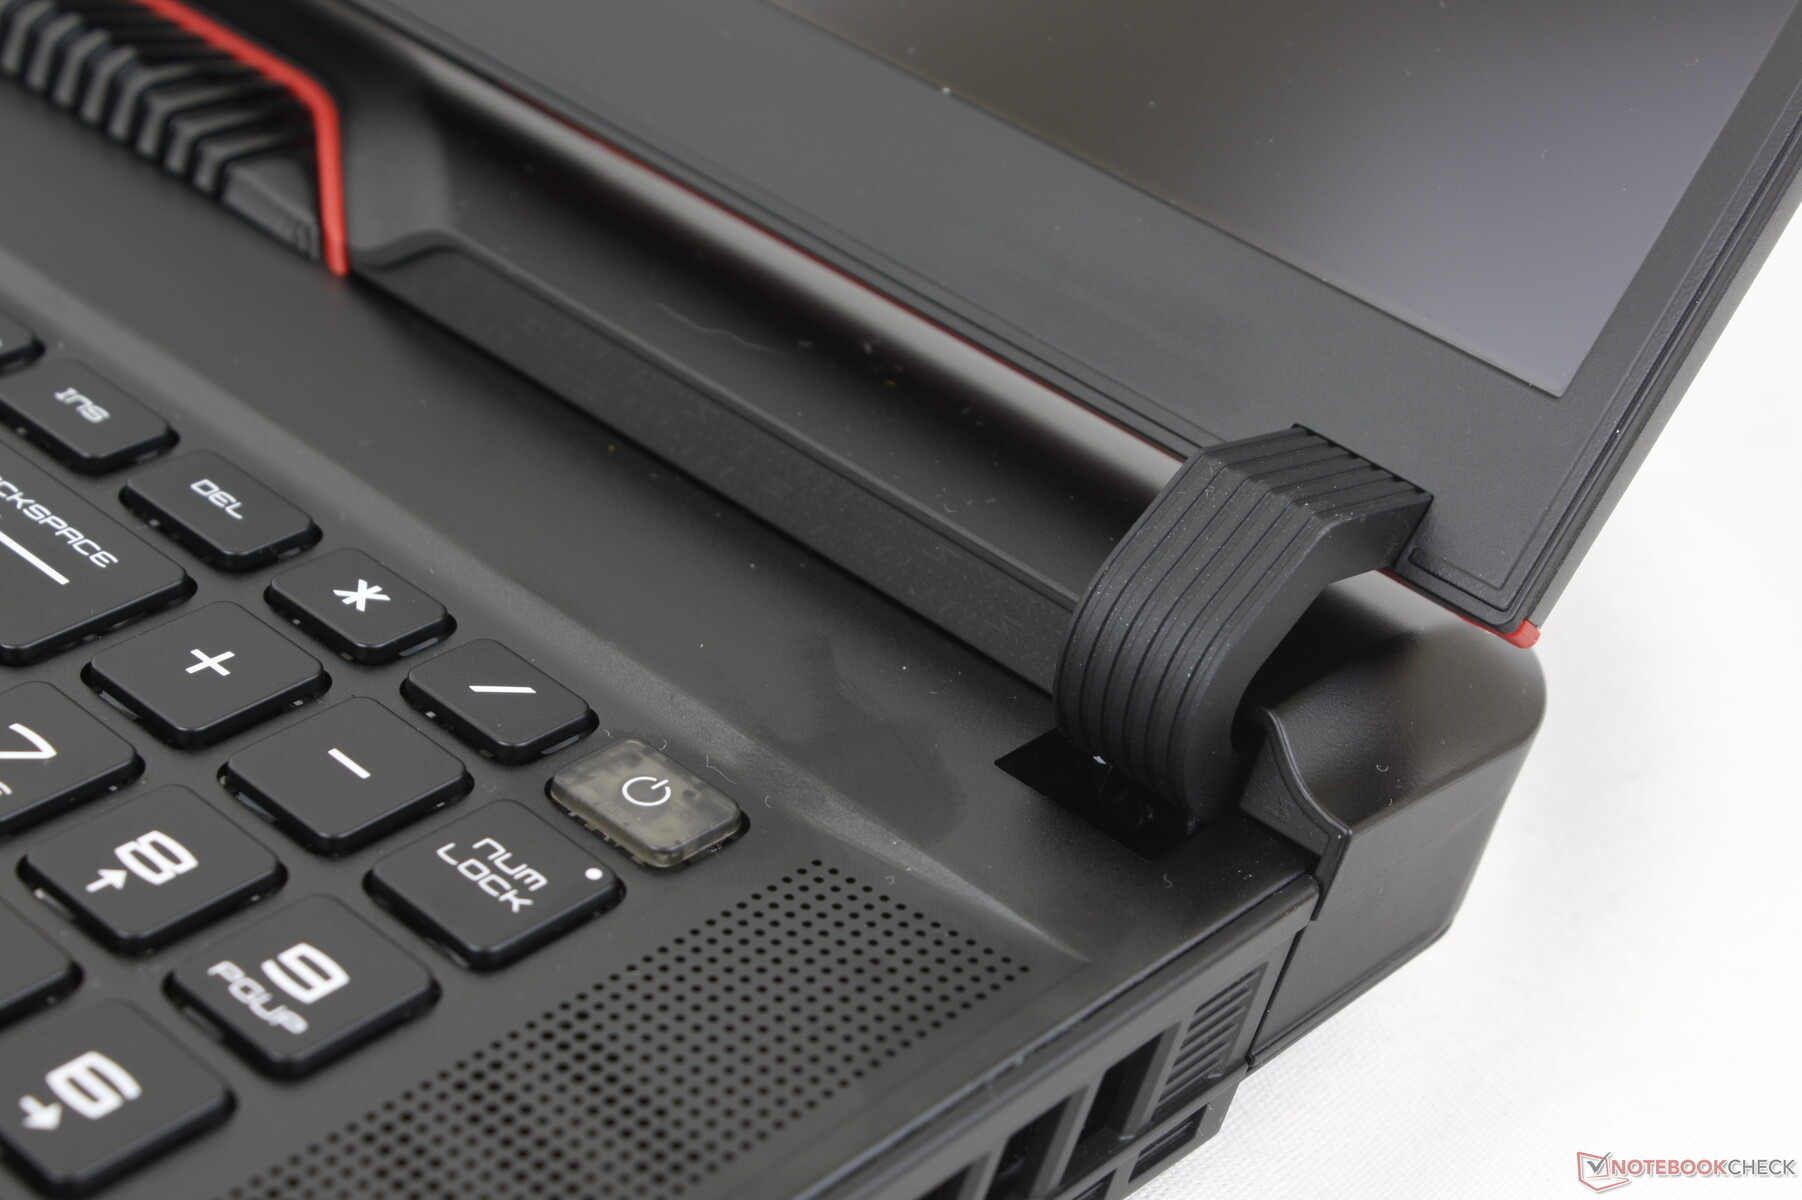
La calidad de construcción no queda relegada a un segundo plano por todos los cambios estéticos. Las nuevas bisagras, por ejemplo, son ahora más grandes y firmes que las del GE77, por lo que es probable que duren más. De hecho, se parecen mucho a las bisagras de la serie Serie Asus Strix Scar. Por lo demás, la rigidez del chasis es similar a la del GE77, con mínimos crujidos y apenas un poco de alabeo al aplicar presión sobre la tapa exterior.
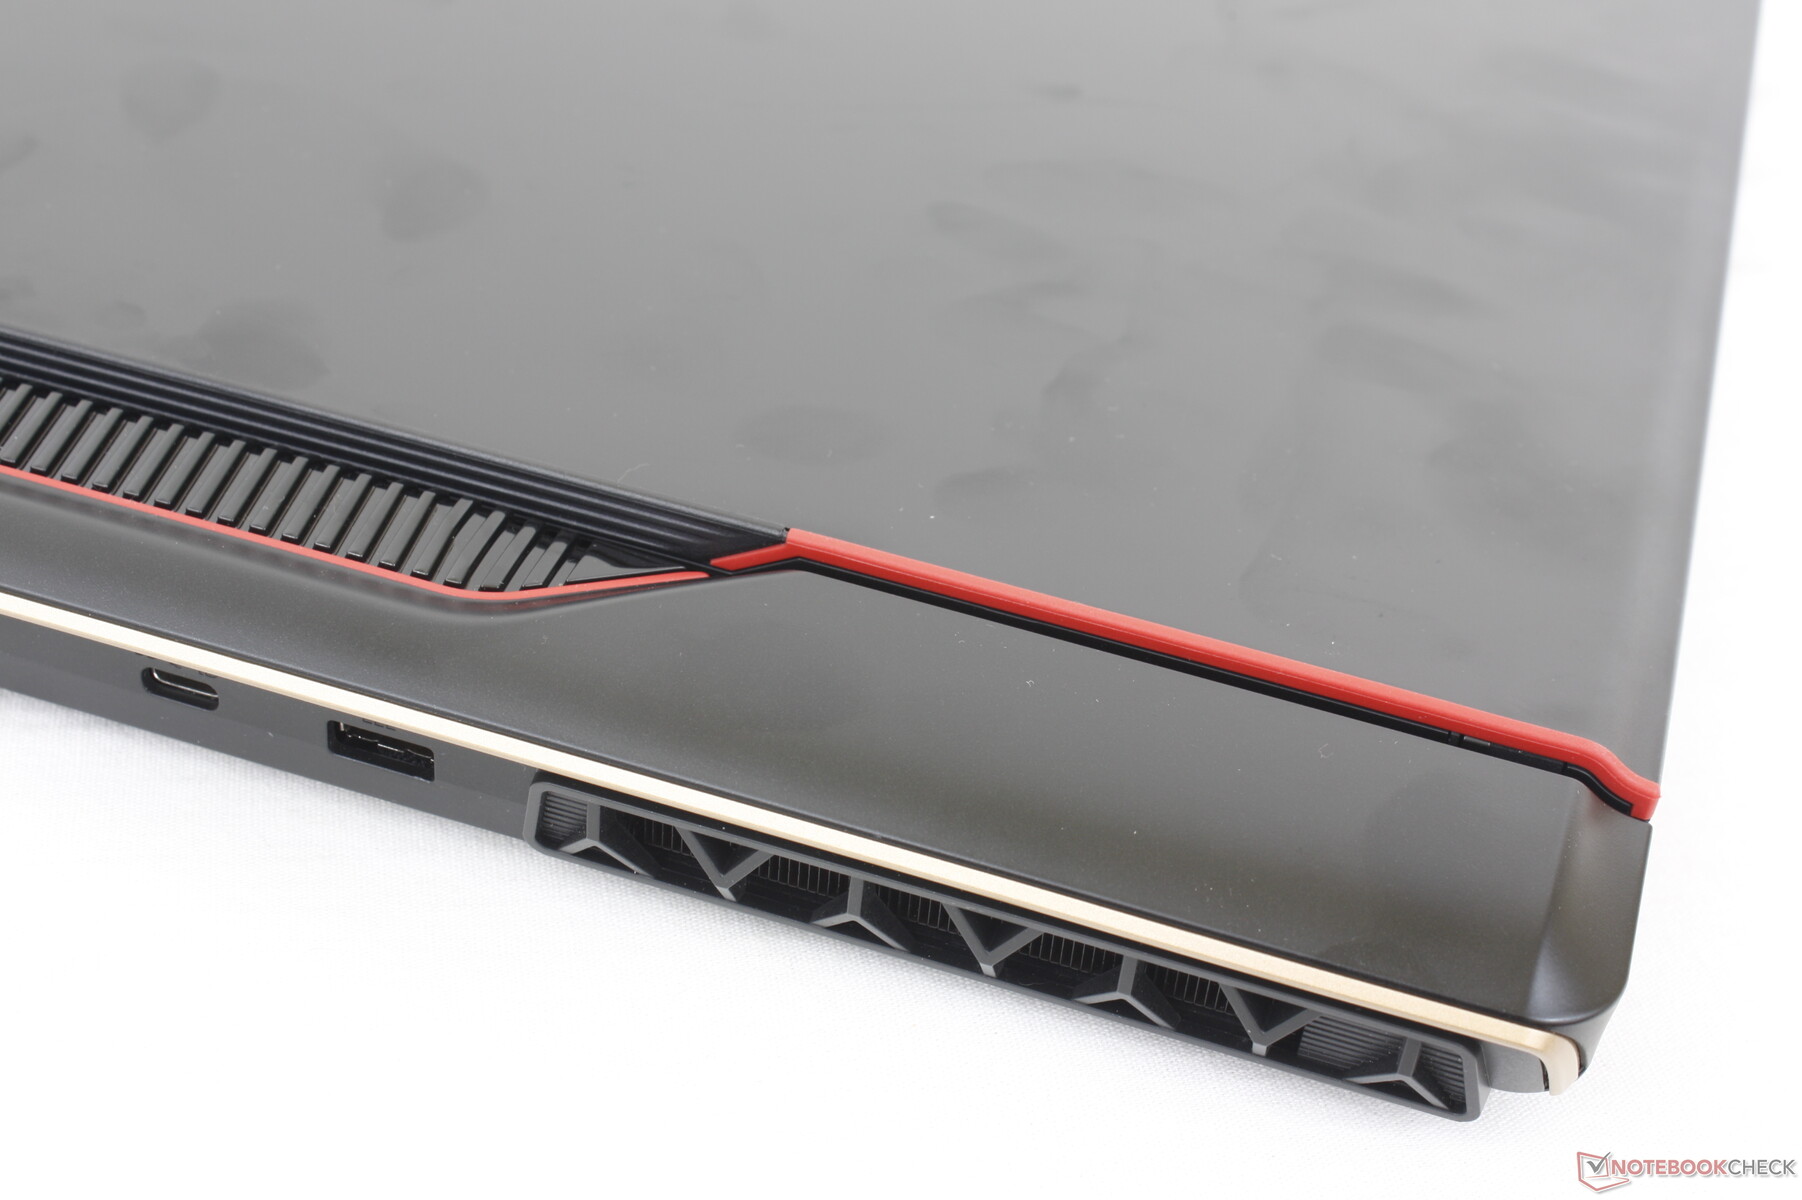
Hay más posibilidades de que se produzcan separaciones entre materiales, ya que el esqueleto del GE78 consta de más piezas individuales que un diseño unibody típico como el Razer Blade. Esto es especialmente cierto en la parte trasera y los bordes, donde podemos notar una brecha ligeramente más ancha en un lado que en el otro en nuestra unidad de prueba. No es preocupante, pero merece la pena comprobarlo.
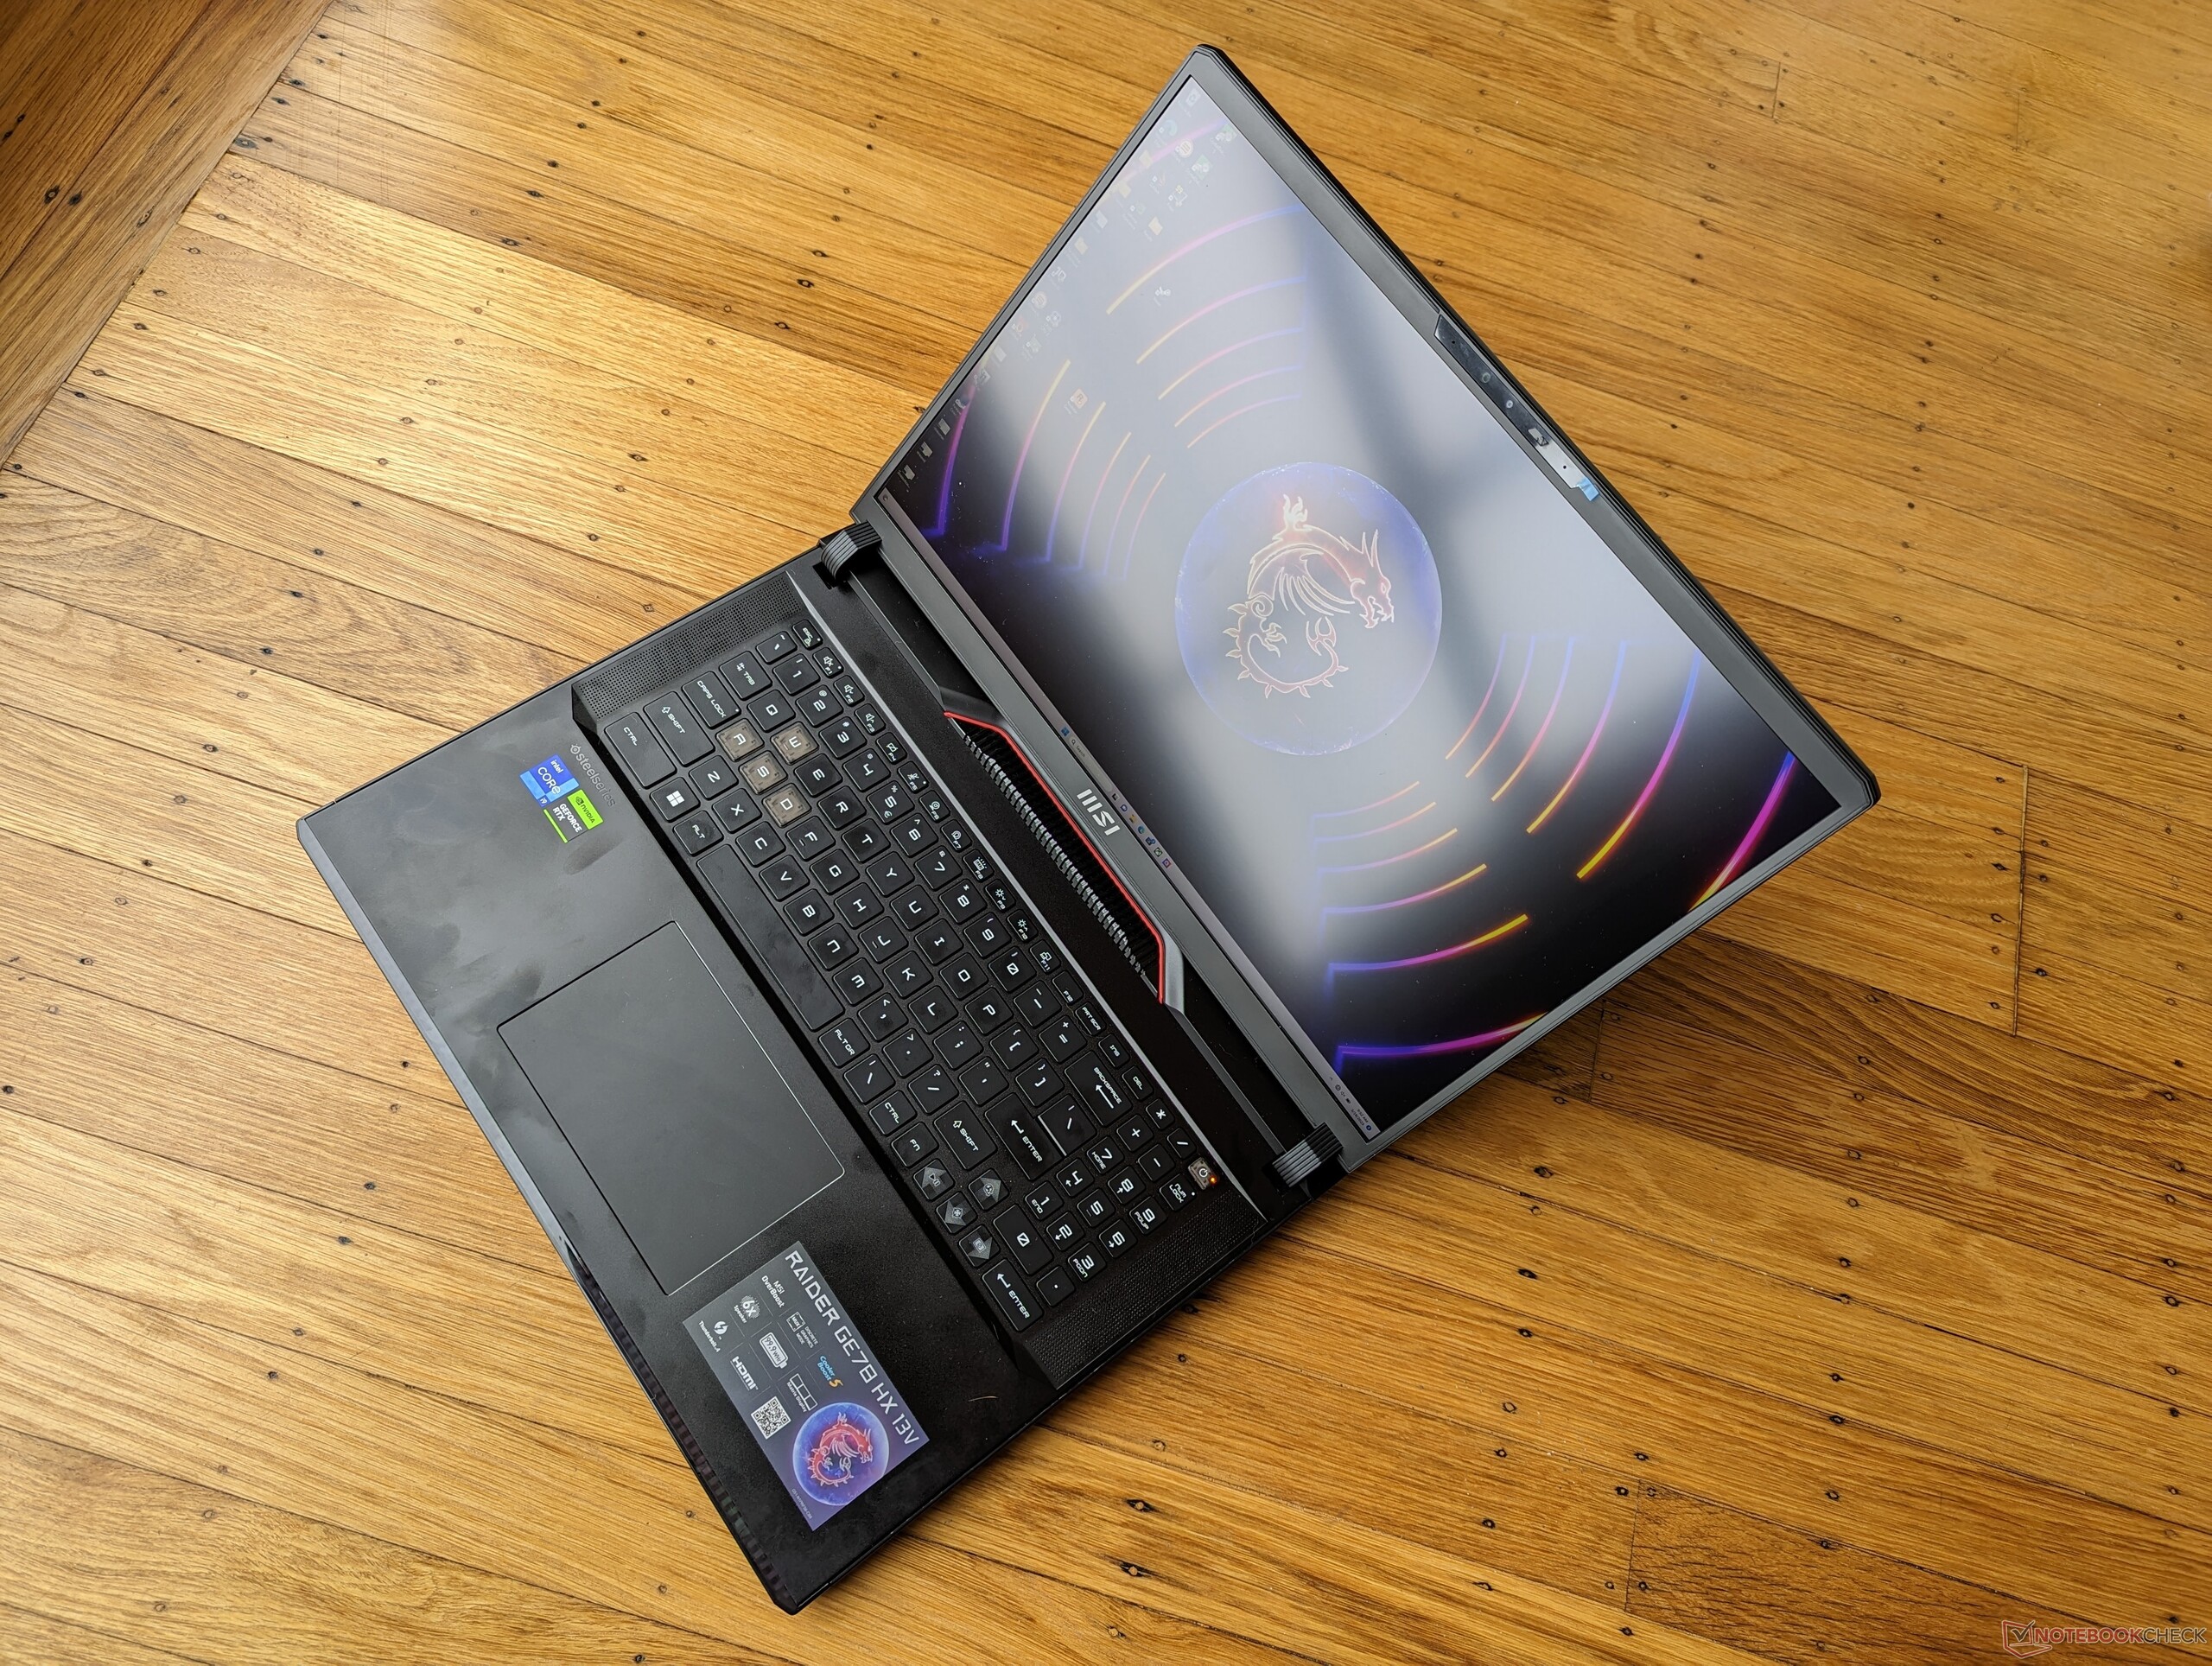
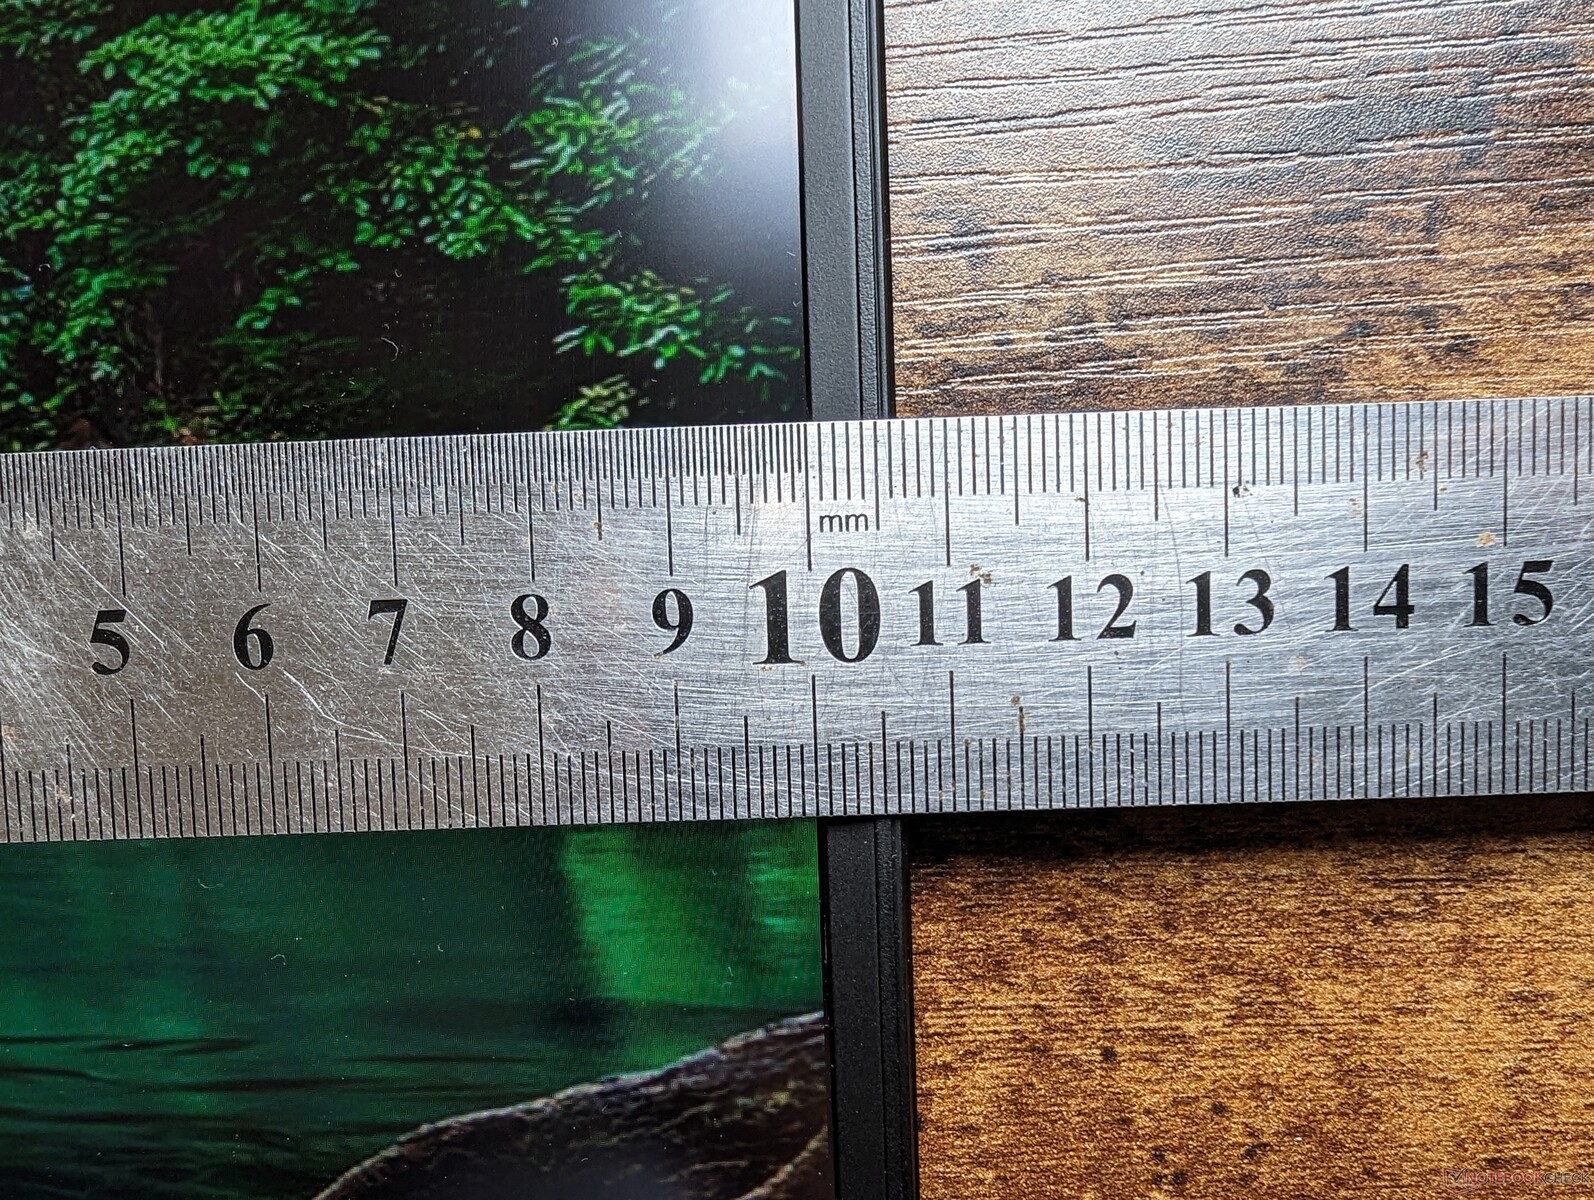
Debido al cambio en la relación de aspecto de 16:9 a 16:10, el GE78 es más corto en longitud pero más ancho en anchura para una huella más cuadrada que su predecesor. Sin embargo, sigue siendo un par de milímetros más delgado, así que no piense que el GE78 es más grueso sólo por su estética de inspiración retro. El peso total es unos 200 gramos superior al del Razer Blade 17.
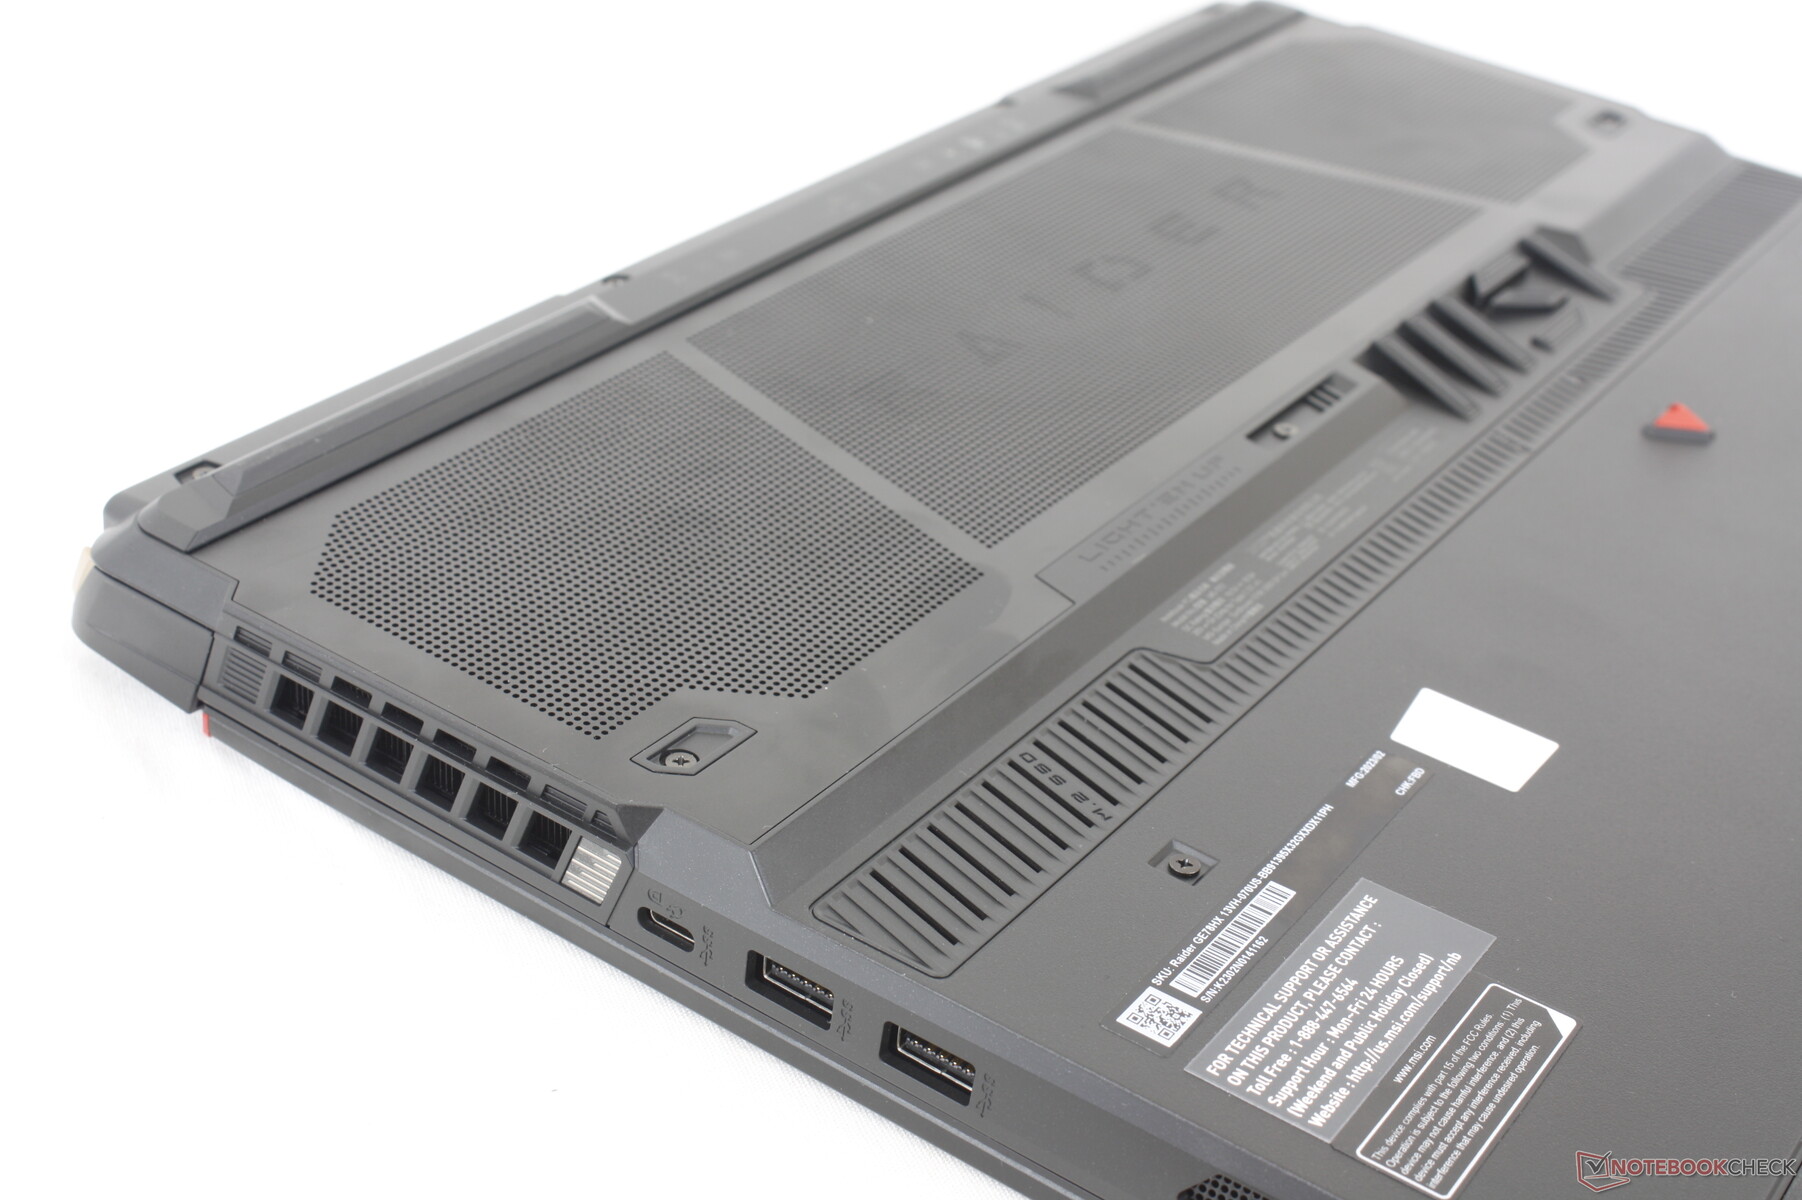
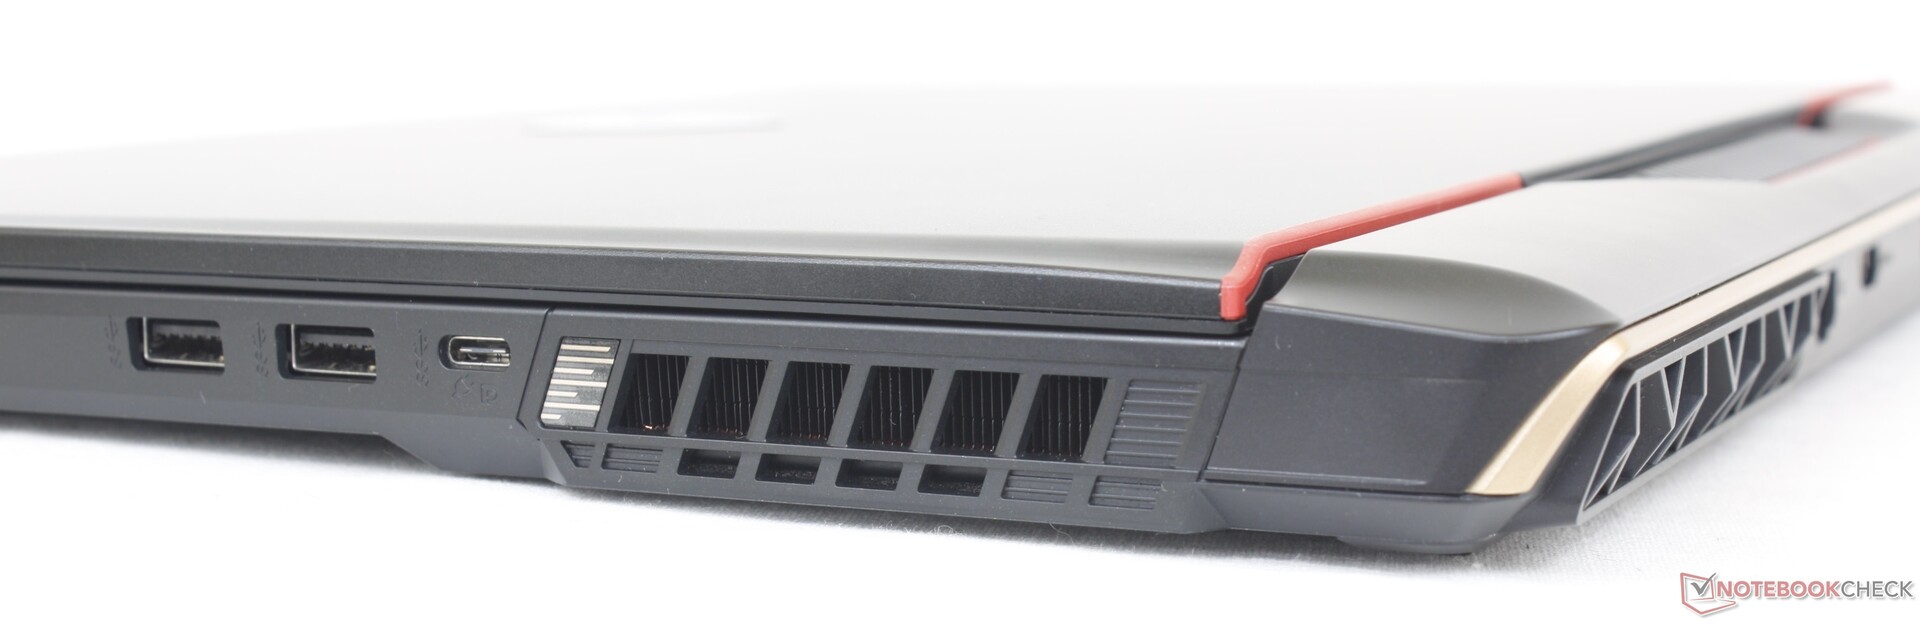
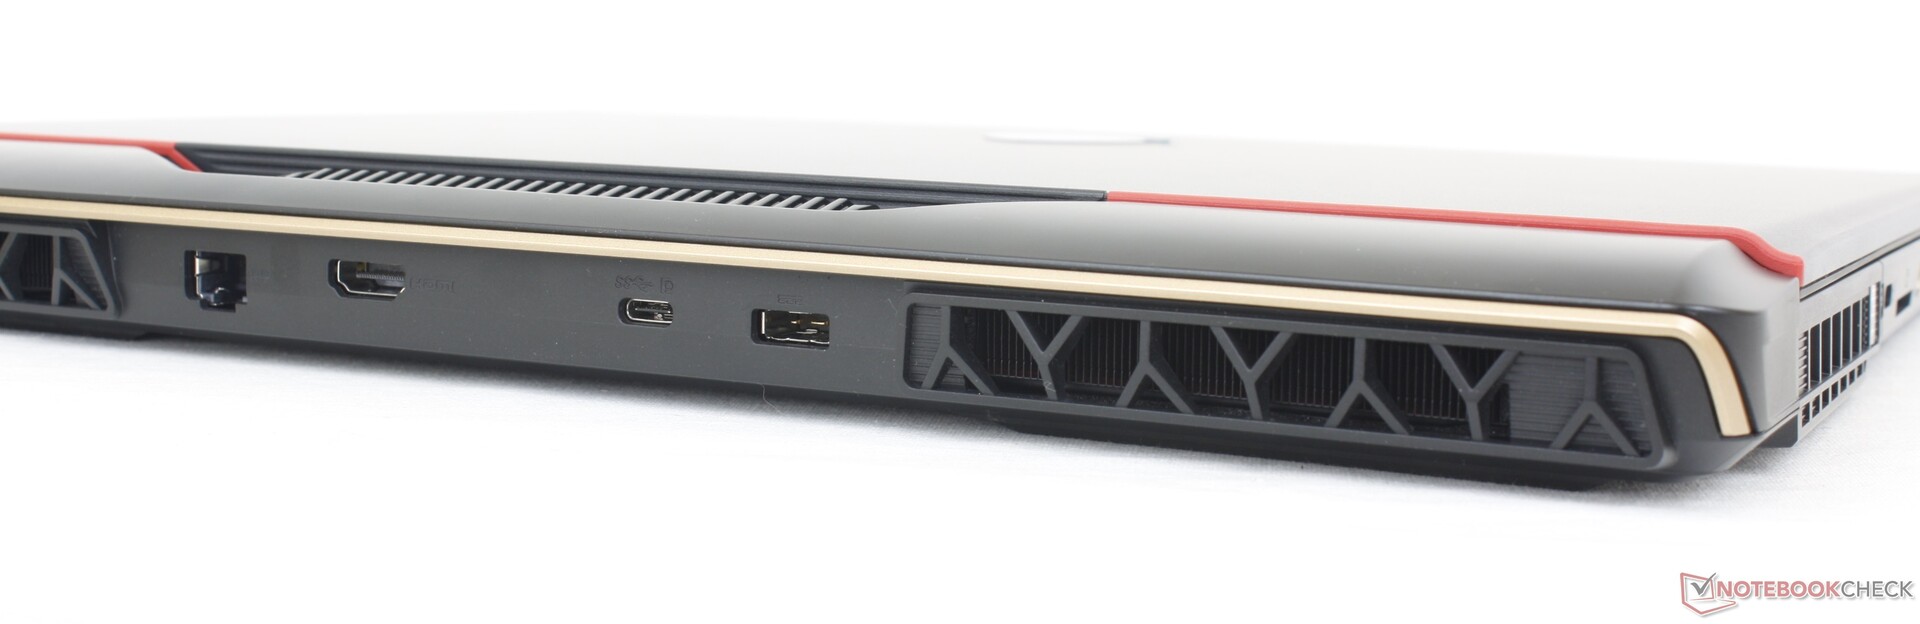
Conectividad: USB-C en todas direcciones
Las opciones y la posición de los puertos han cambiado con respecto al GE77. Lo más notable es que el GE78 cambia un puerto USB-A por un tercer puerto USB-C, por lo que ahora hay un puerto USB-C a cada lado del chasis.
Por desgracia, los tres puertos USB-C no son todos iguales. En primer lugar, los dispositivos Thunderbolt solo son compatibles con el puerto USB-C izquierdo. Y en segundo lugar, sus funcionalidades DisplayPort están vinculadas a la configuración MUX. Cuando la dGPU está activa, por ejemplo, nuestro monitor externo DP solo funcionaría en el puerto USB-C del borde derecho, mientras que no funcionaría en los puertos USB-C izquierdo o trasero. Si el modo iGPU o GPU híbrida está activo, nuestro monitor externo DP sólo funcionaría en el puerto USB-C del borde izquierdo mientras que no funcionaría en los puertos USB-C del borde trasero o derecho. No conseguimos que DP funcione en absoluto en el puerto USB-C trasero.
En tercer lugar, MSI anuncia Power Delivery pero tampoco pudimos hacerlo funcionar. Nuestra unidad no se recargó por USB-C sin importar qué puerto o cuántos adaptadores USB-C probamos.
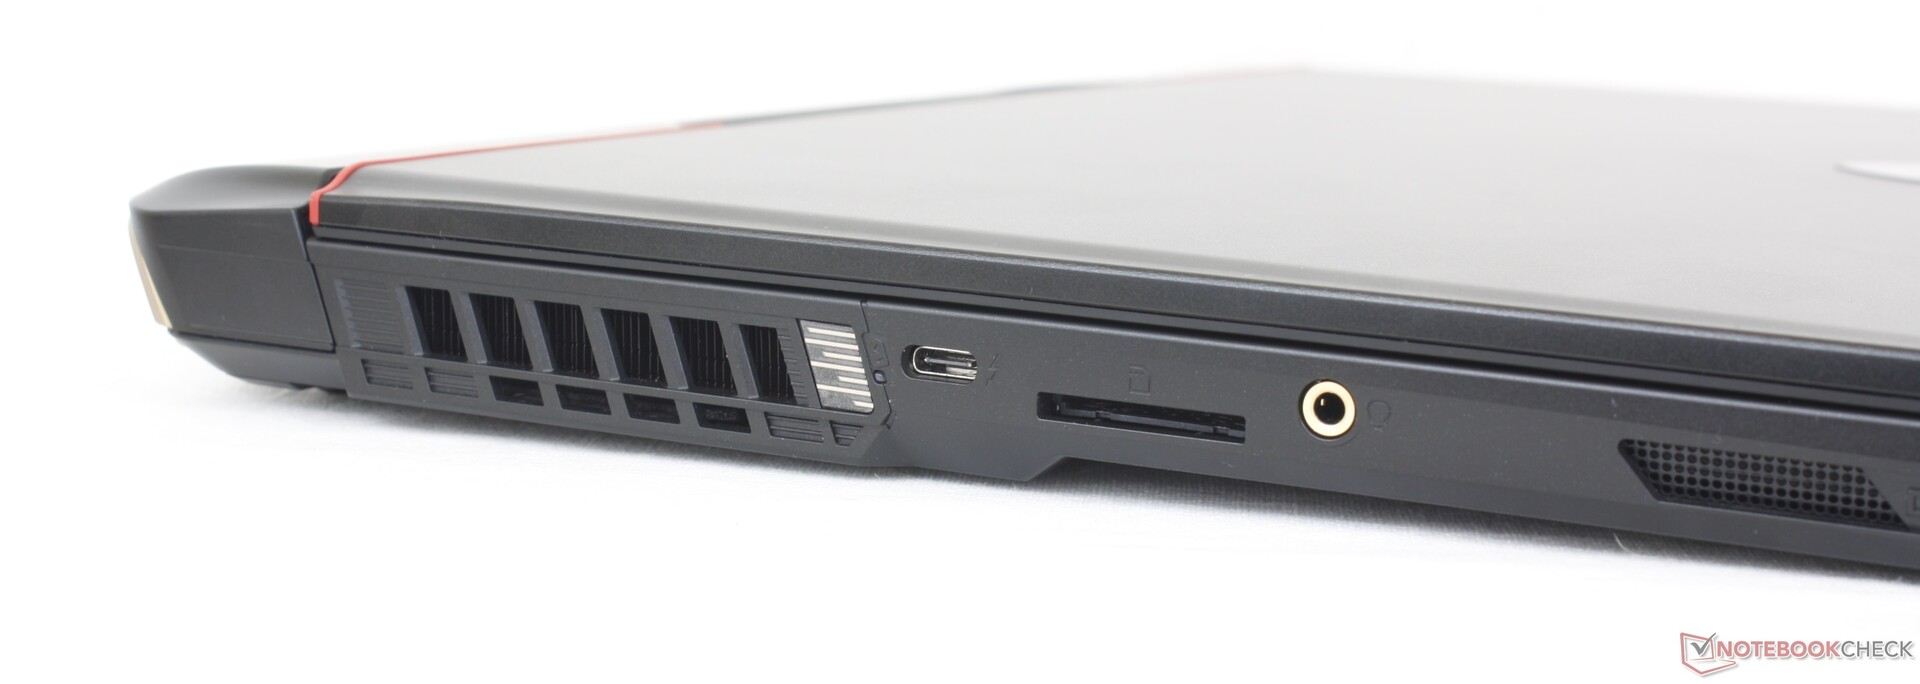
Lector de tarjetas SD
Las velocidades de transferencia desde el lector SD integrado son decepcionantes teniendo en cuenta el elevado precio del GE78. Pasar 1 GB de fotos de nuestra tarjeta UHS-II de prueba al escritorio lleva unos 16 segundos, frente a la mitad en el Razer Blade 17.
| SD Card Reader | |
| average JPG Copy Test (av. of 3 runs) | |
| Razer Blade 17 Early 2022 (AV PRO microSD 128 GB V60) | |
| MSI Titan GT77 HX 13VI (Angelibird AV Pro V60) | |
| Eluktronics Mech-17 GP2 (Angelibird AV Pro V60) | |
| MSI GE78HX 13VH-070US (Angelibird AV Pro V60) | |
| MSI Raider GE77 HX 12UHS (AV PRO microSD 128 GB V60) | |
| maximum AS SSD Seq Read Test (1GB) | |
| Eluktronics Mech-17 GP2 (Angelibird AV Pro V60) | |
| MSI GE78HX 13VH-070US (Angelibird AV Pro V60) | |
| MSI Titan GT77 HX 13VI (Angelibird AV Pro V60) | |
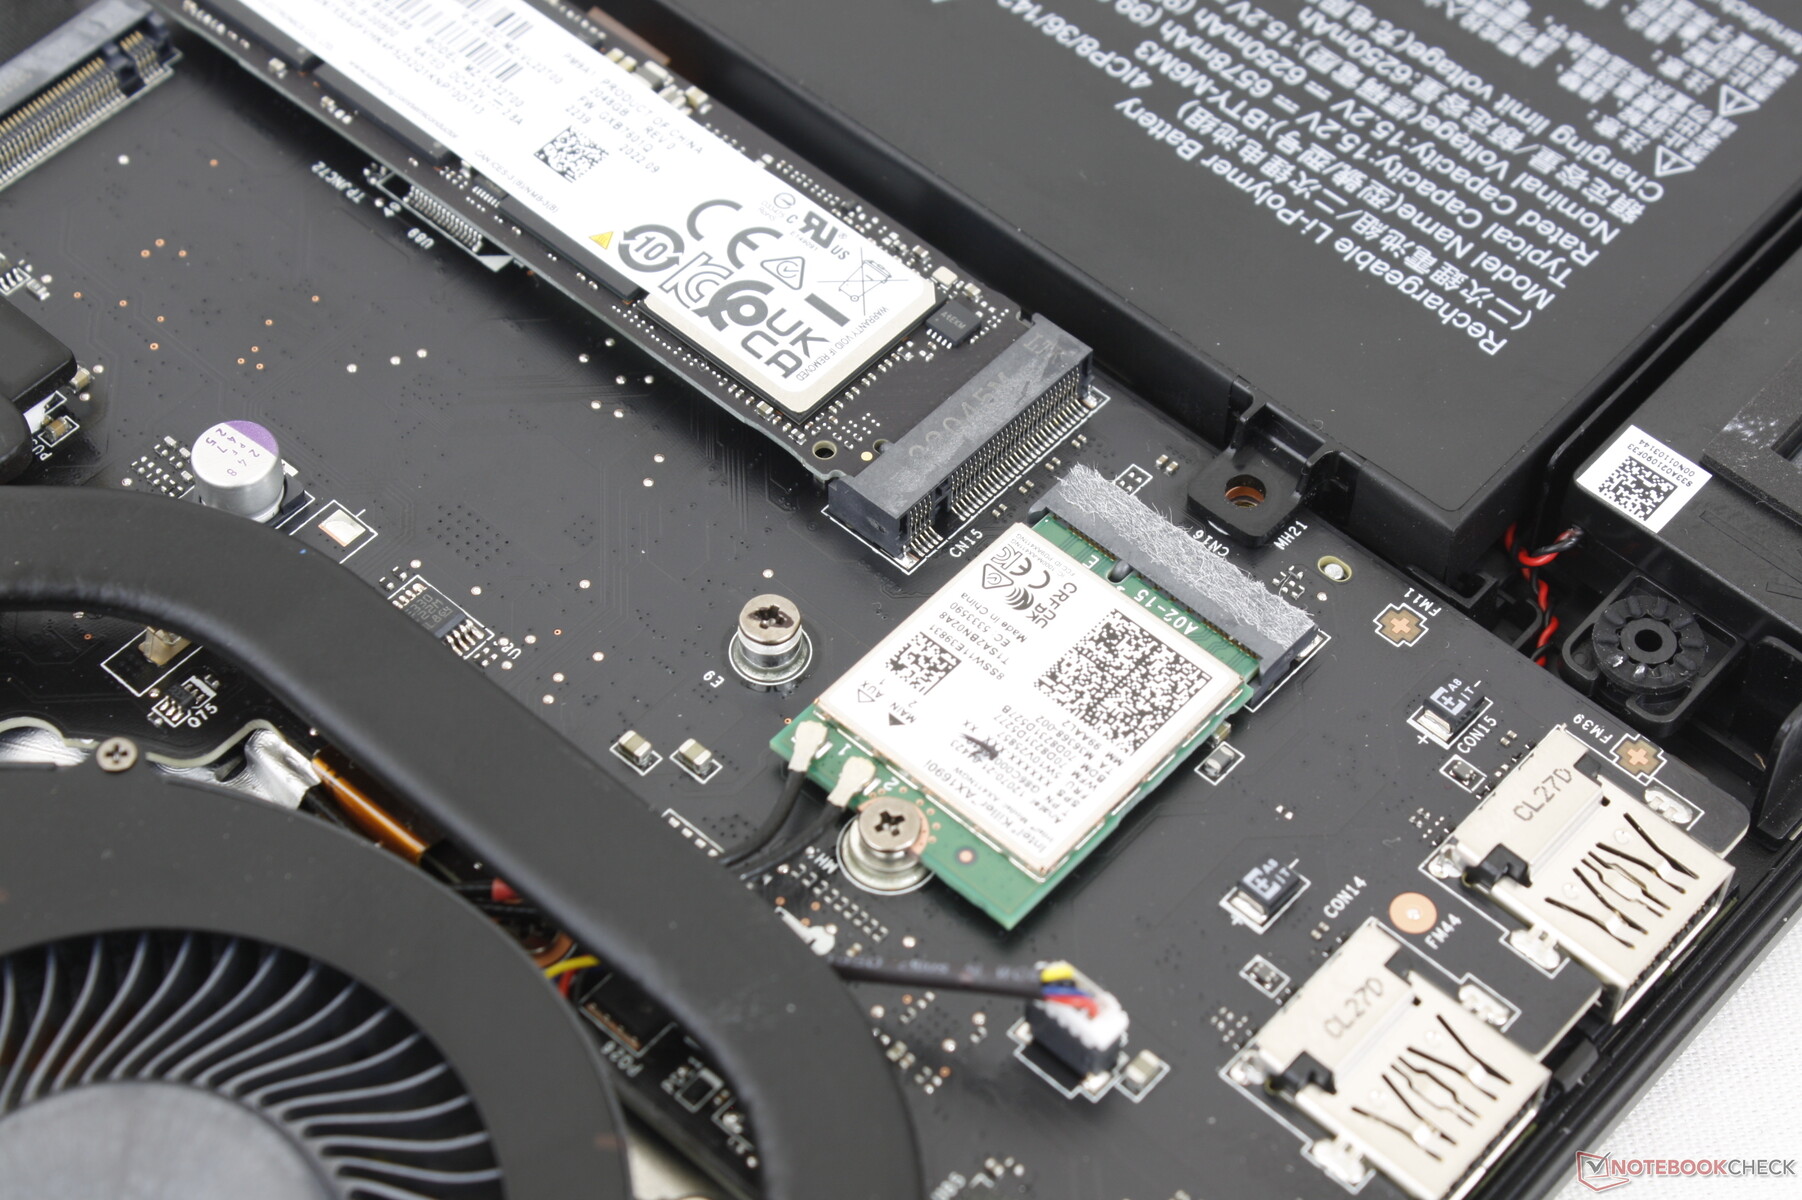
Comunicación
Un Killer AX1690i viene de serie para la conectividad Wi-Fi 6E y Bluetooth 5.3. El módulo Killer es básicamente un Intel AX210/211 rebautizado y optimizado para portátiles de juegos. No experimentamos ningún problema al emparejarlo con nuestro router de prueba Asus AXE11000 de 6 GHz.
| Networking | |
| iperf3 transmit AXE11000 | |
| Asus ROG Strix G17 G713PI | |
| MSI Titan GT77 HX 13VI | |
| Eluktronics Mech-17 GP2 | |
| MSI GE78HX 13VH-070US | |
| iperf3 receive AXE11000 | |
| Asus ROG Strix G17 G713PI | |
| Razer Blade 17 Early 2022 | |
| MSI Titan GT77 HX 13VI | |
| Eluktronics Mech-17 GP2 | |
| MSI GE78HX 13VH-070US | |
| iperf3 transmit AXE11000 6GHz | |
| MSI GE78HX 13VH-070US | |
| iperf3 receive AXE11000 6GHz | |
| MSI Raider GE77 HX 12UHS | |
| MSI GE78HX 13VH-070US | |
Cámara web
La webcam integrada de 2 MP del GE78 sigue siendo un estándar en la mayoría de portátiles para juegos. Otros fabricantes, como Razer, han subido la apuesta a 5 MP para obtener una imagen más nítida.
Los infrarrojos y el obturador físico de la webcam vienen de serie para permitir el uso de Hello y aumentar la privacidad, respectivamente.


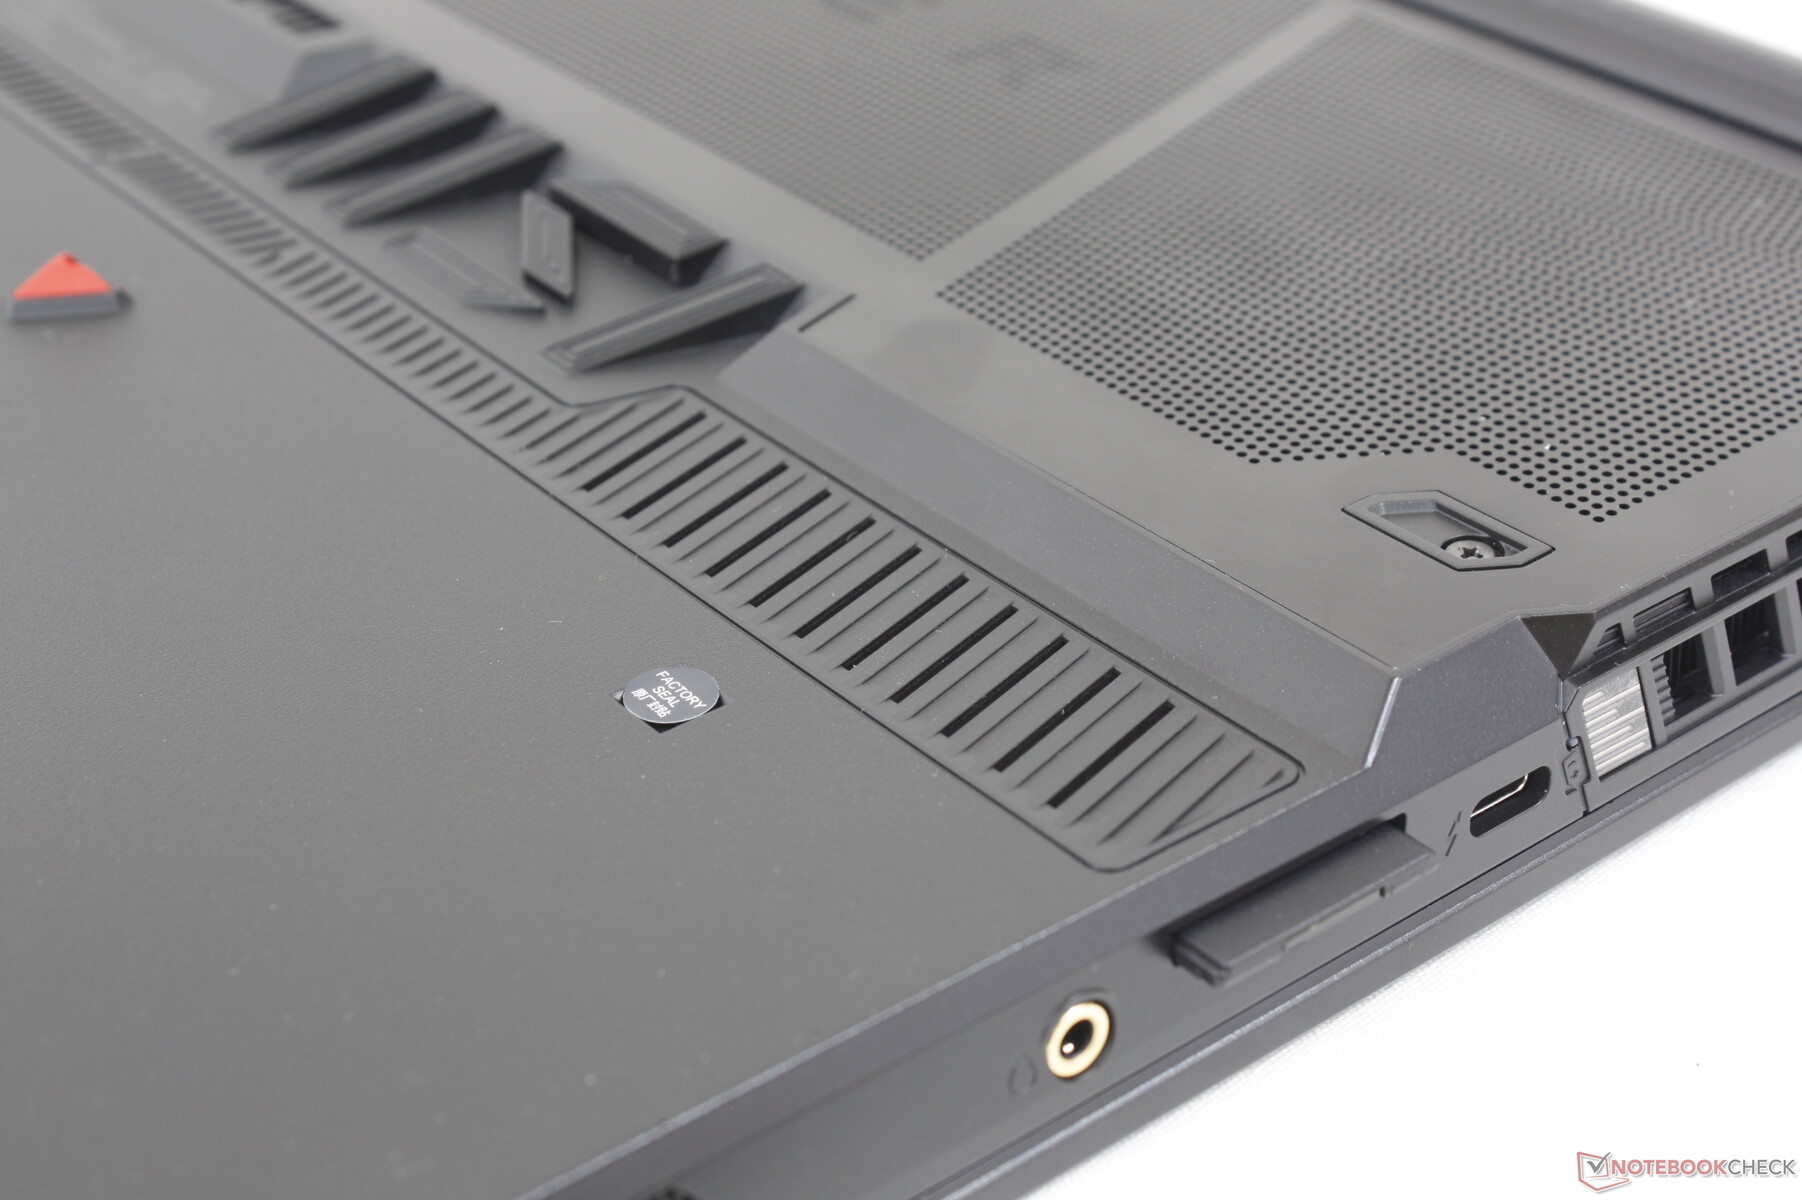
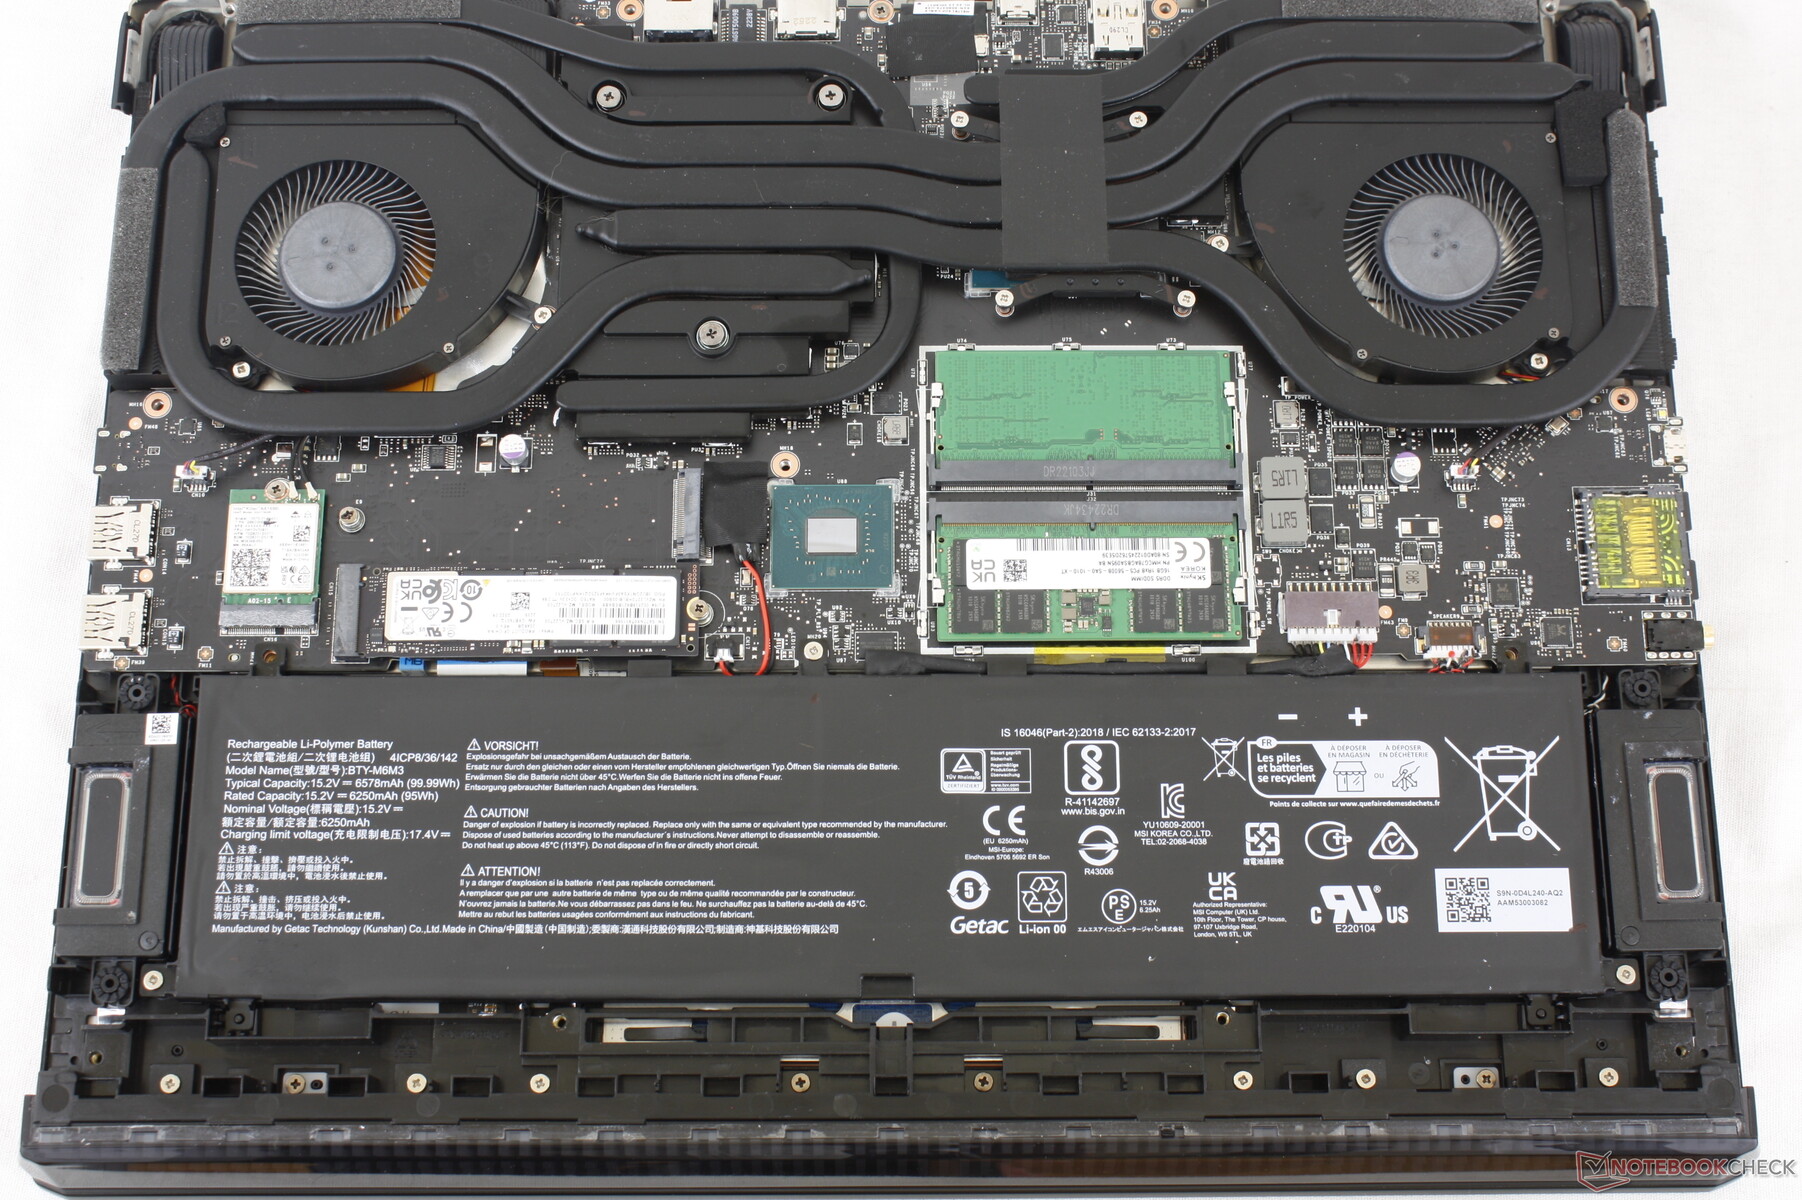
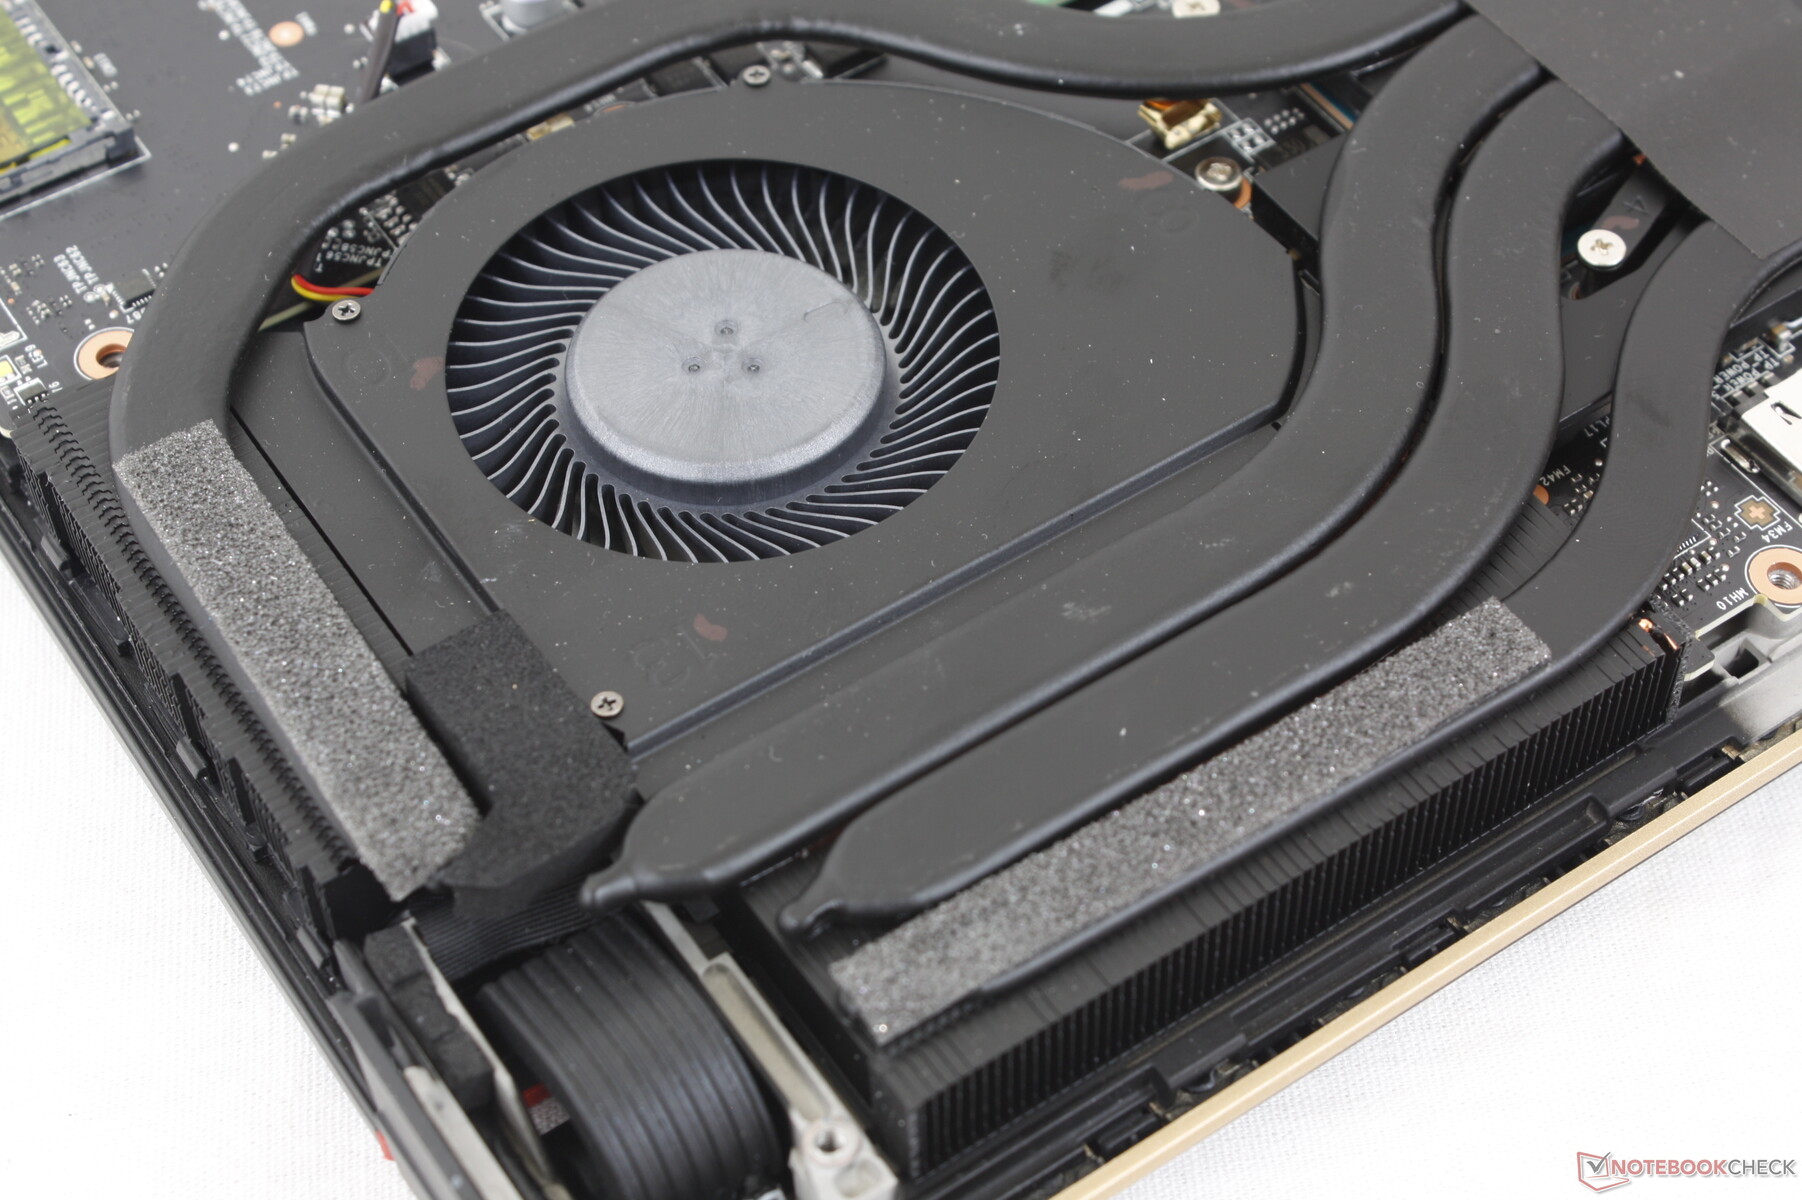
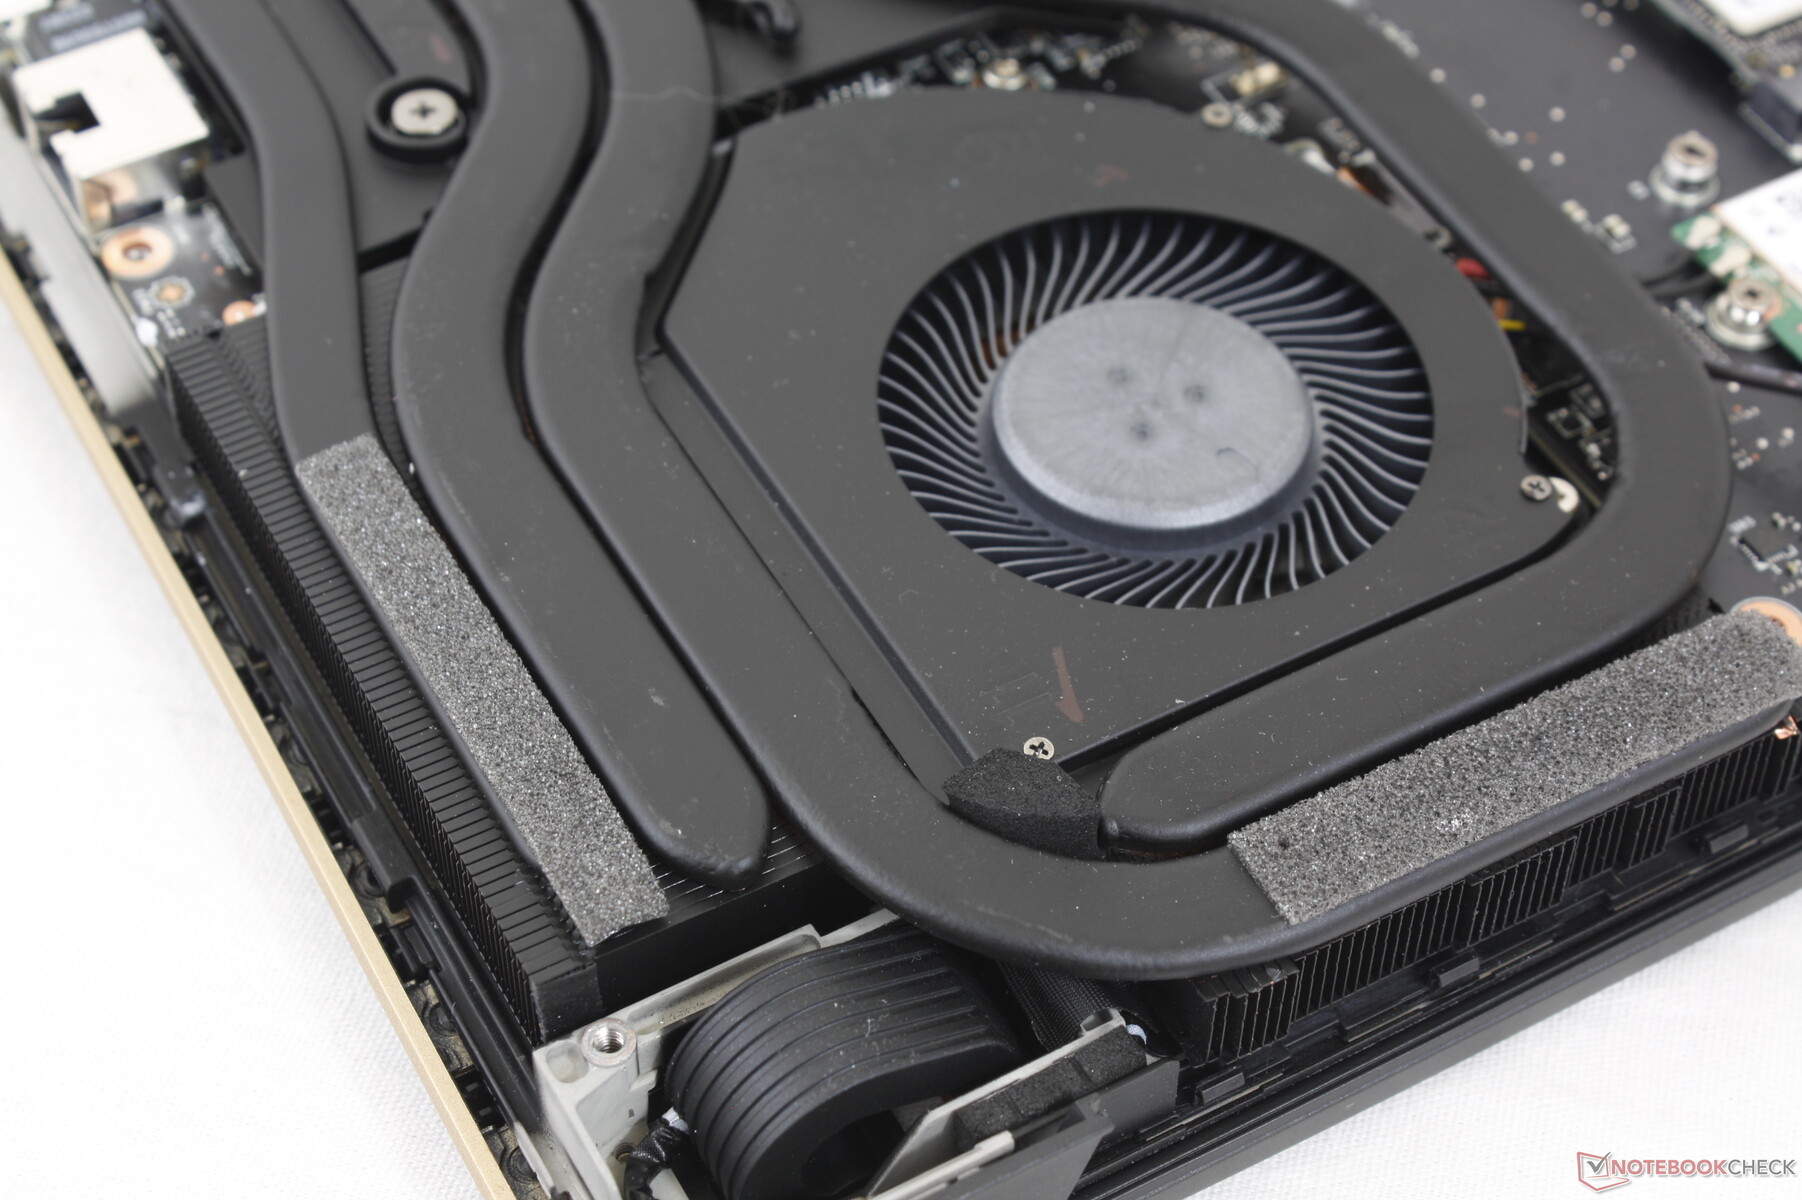
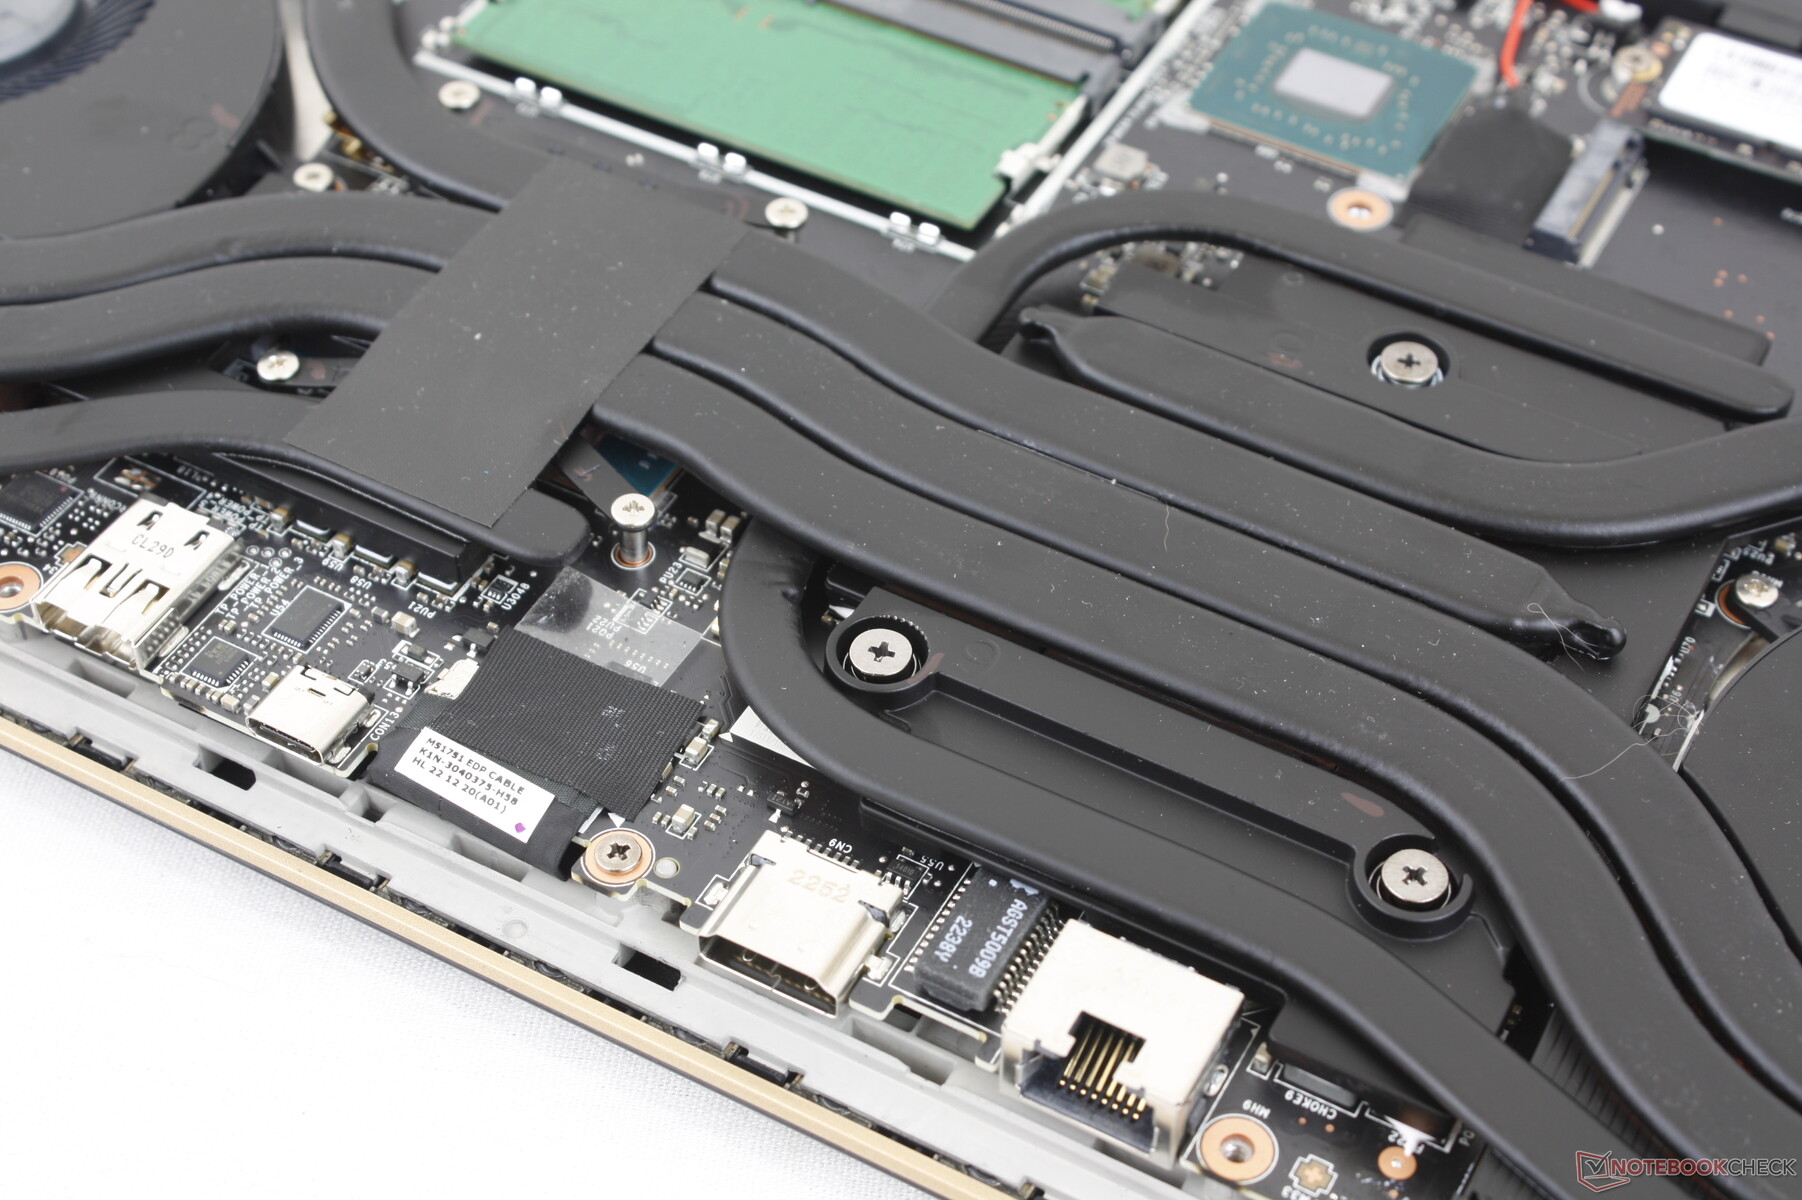
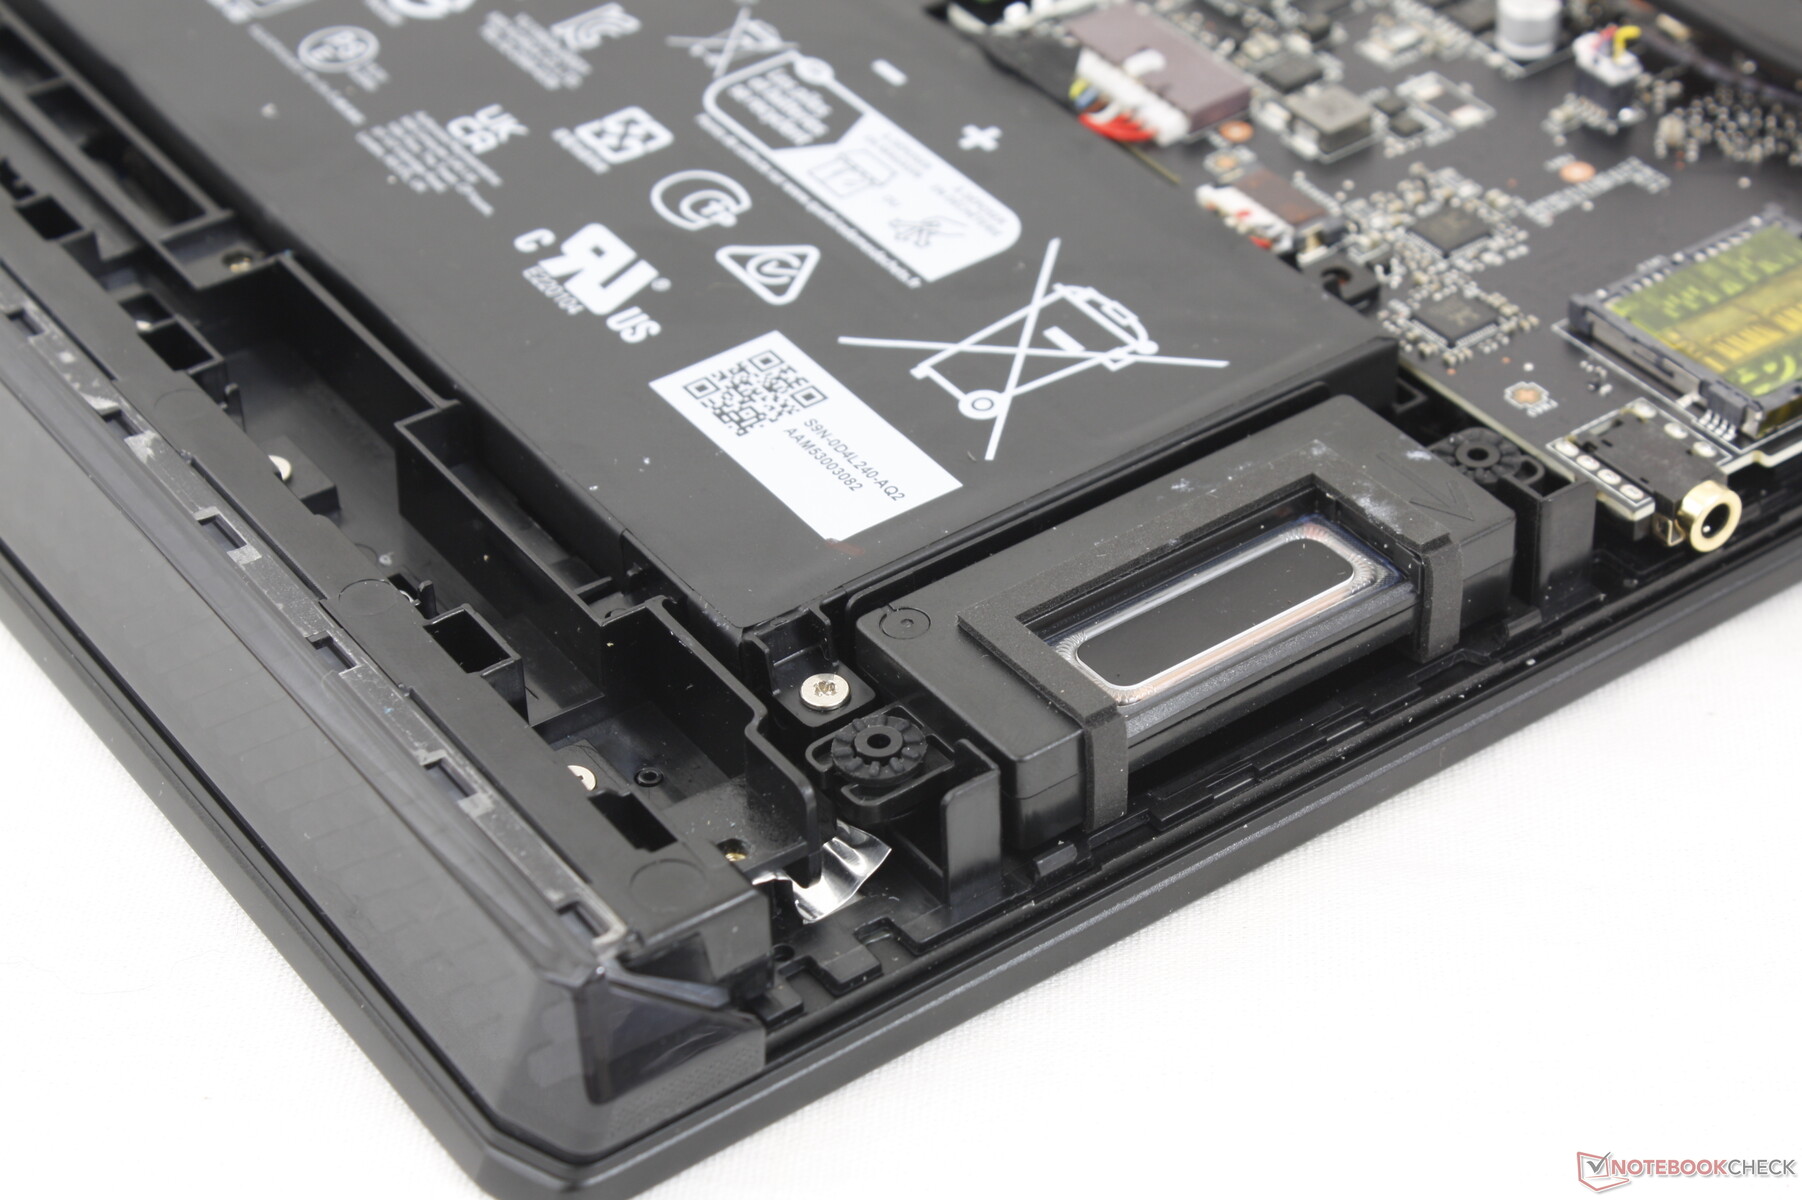
Mantenimiento: un poco más difícil que antes
El panel inferior está asegurado por 12 tornillos Philips. Como es habitual en MSI, hay que romper una pegatina de "precinto de fábrica" si se quiere sacar el panel inferior para repararlo.
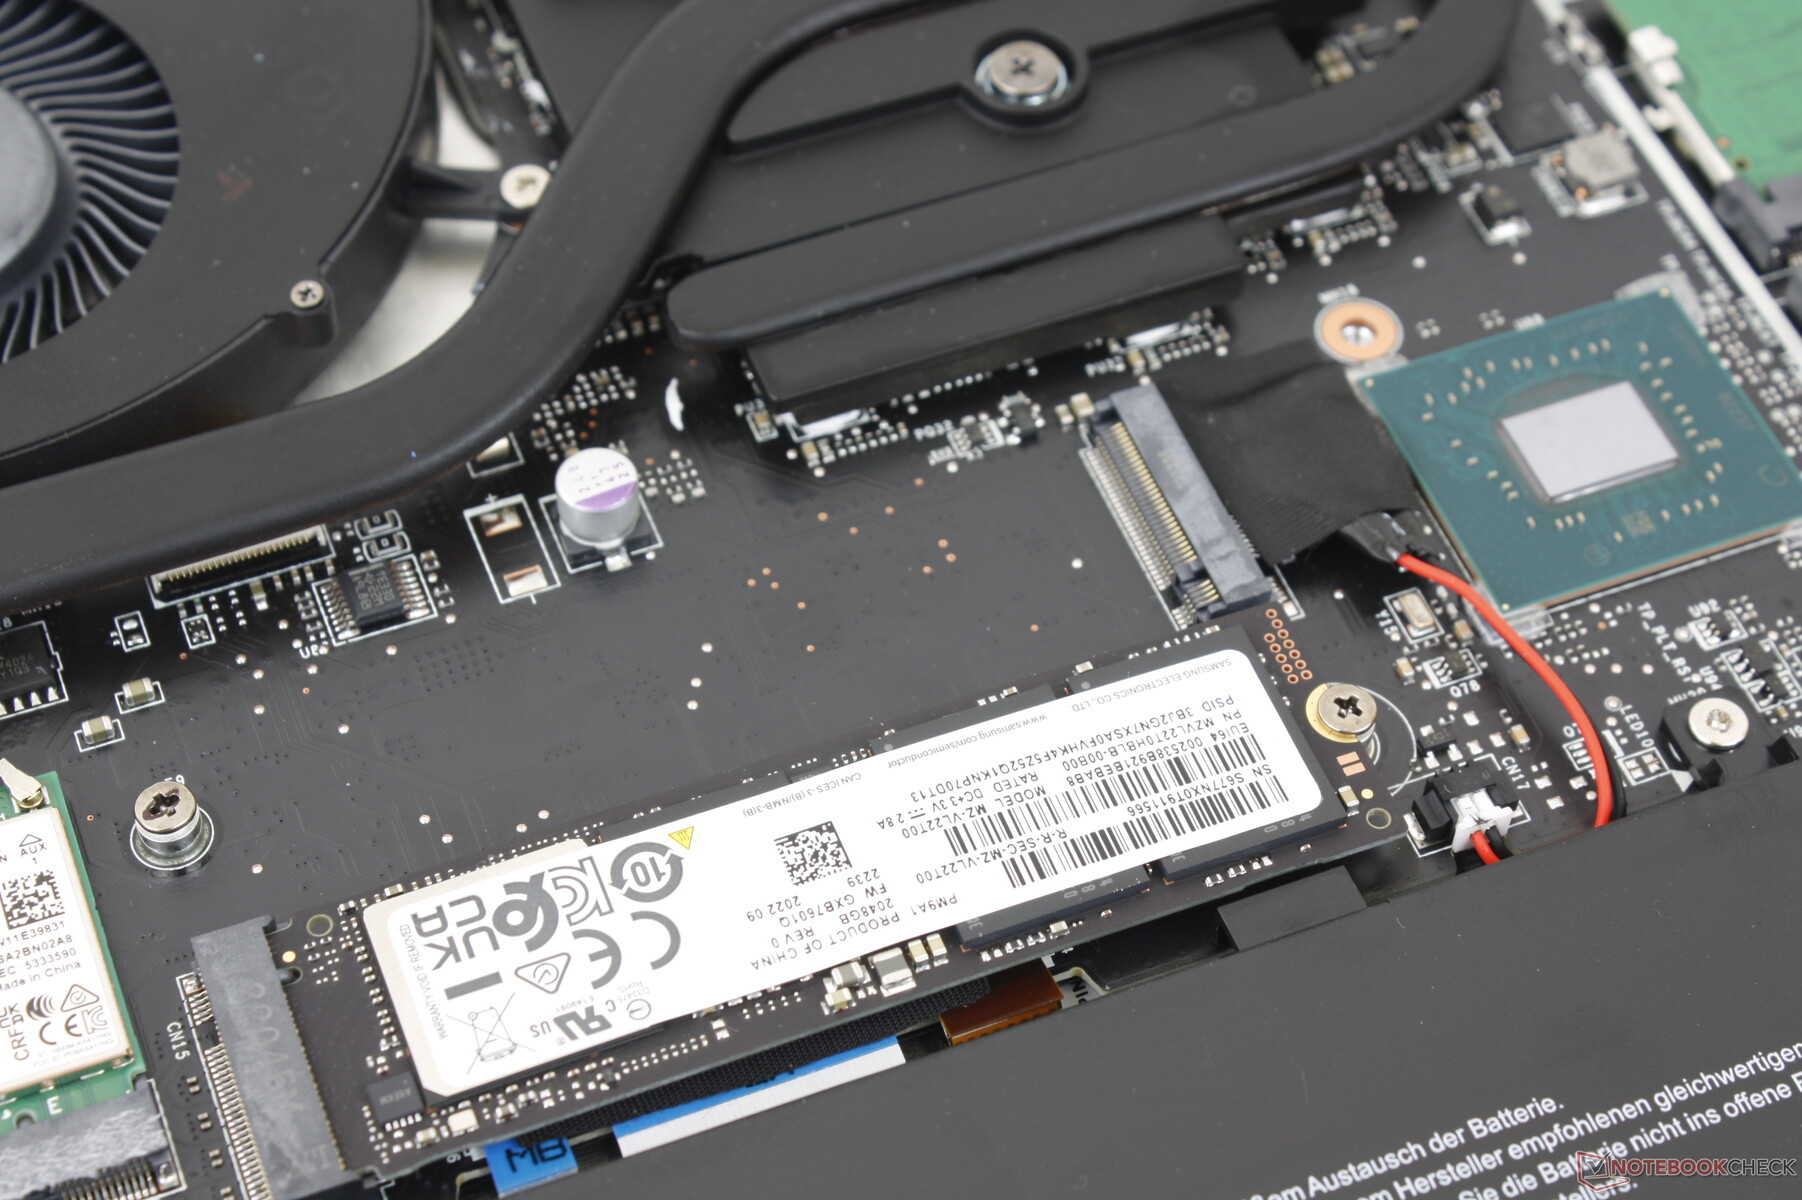
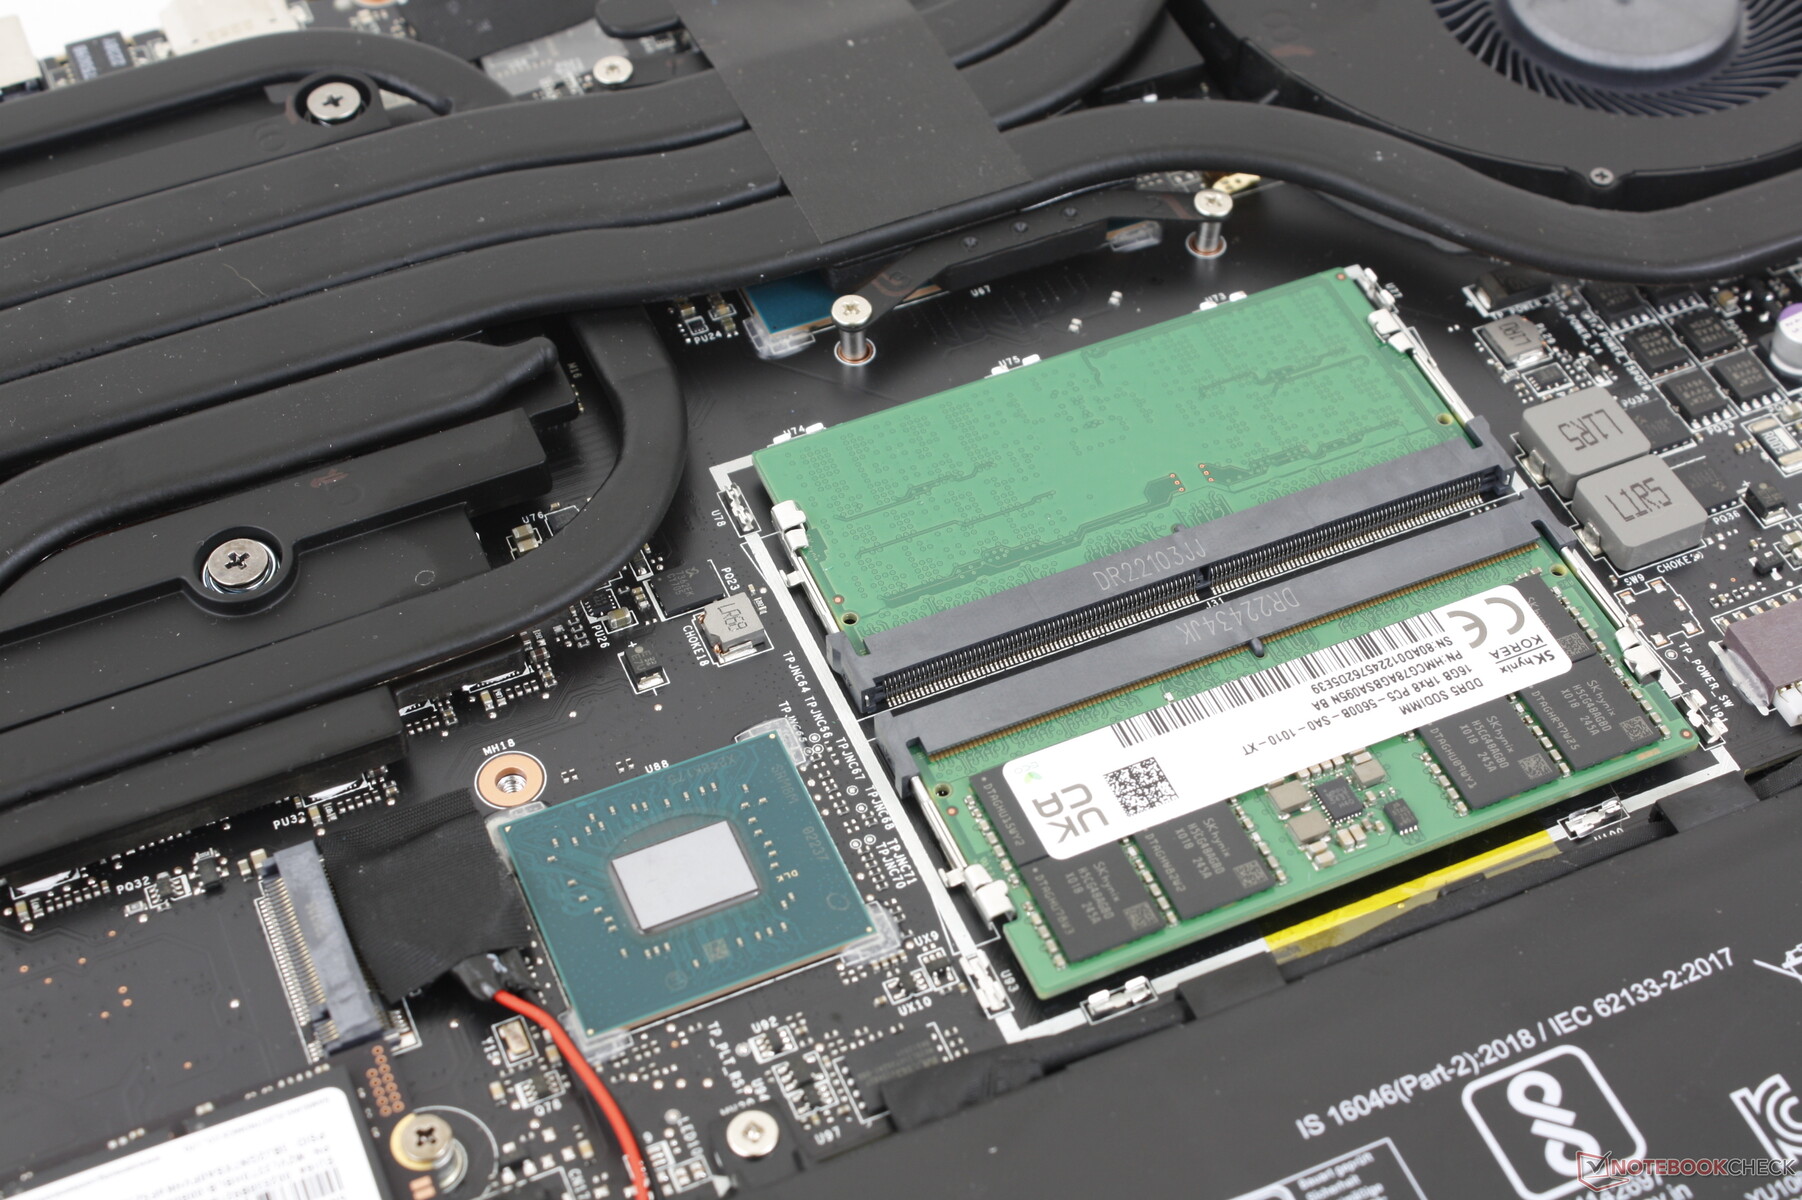
Se recomienda usar un borde de plástico afilado al retirar el panel inferior porque los cierres de los bordes pueden estar bastante apretados. Una vez fuera, los usuarios tendrán acceso directo a 2 ranuras SODIMM, 2 ranuras SSD M.2, el módulo WLAN y la batería.
Accesorios y garantía
No hay más extras en la caja que el adaptador de CA y la documentación. Se aplica la garantía limitada estándar de un año si se compra en EE.UU.
Dispositivos de entrada: más grandes y refinados
Teclado
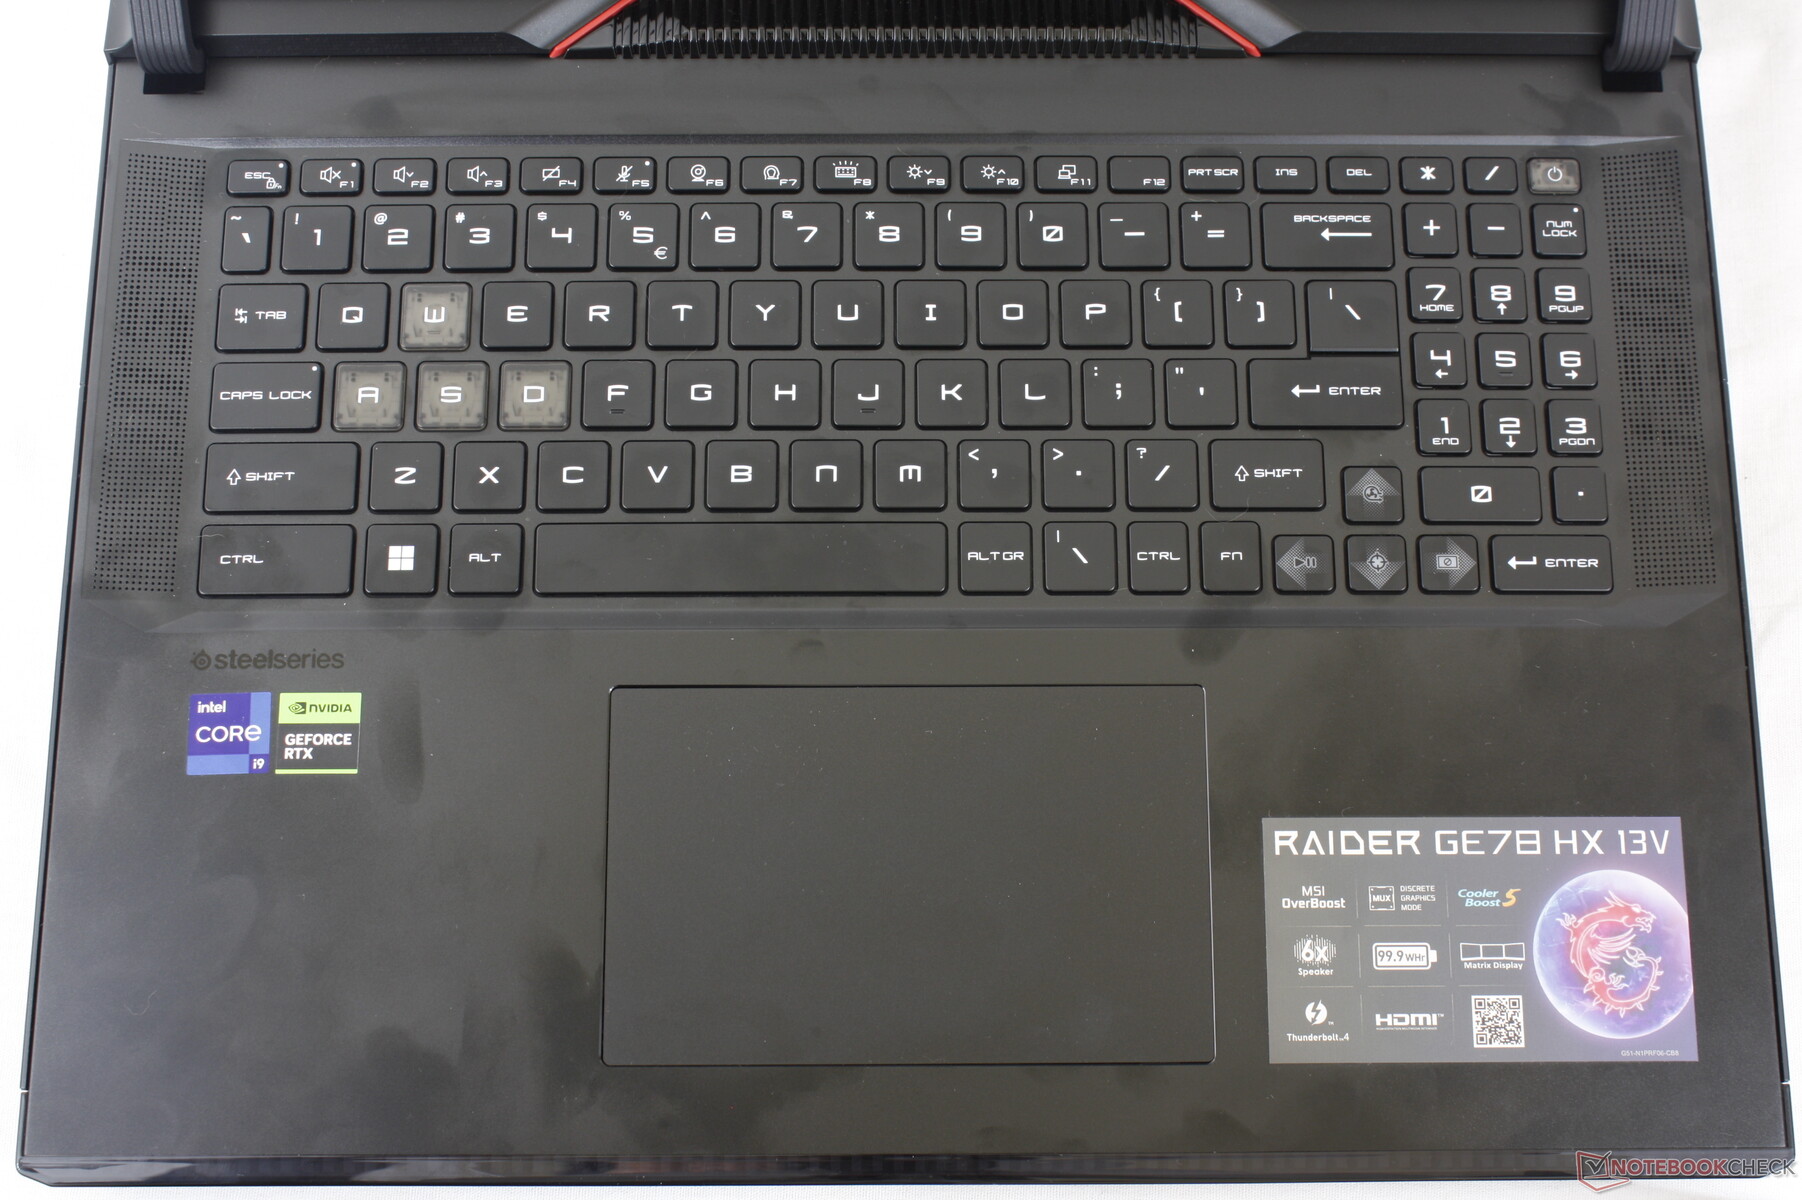
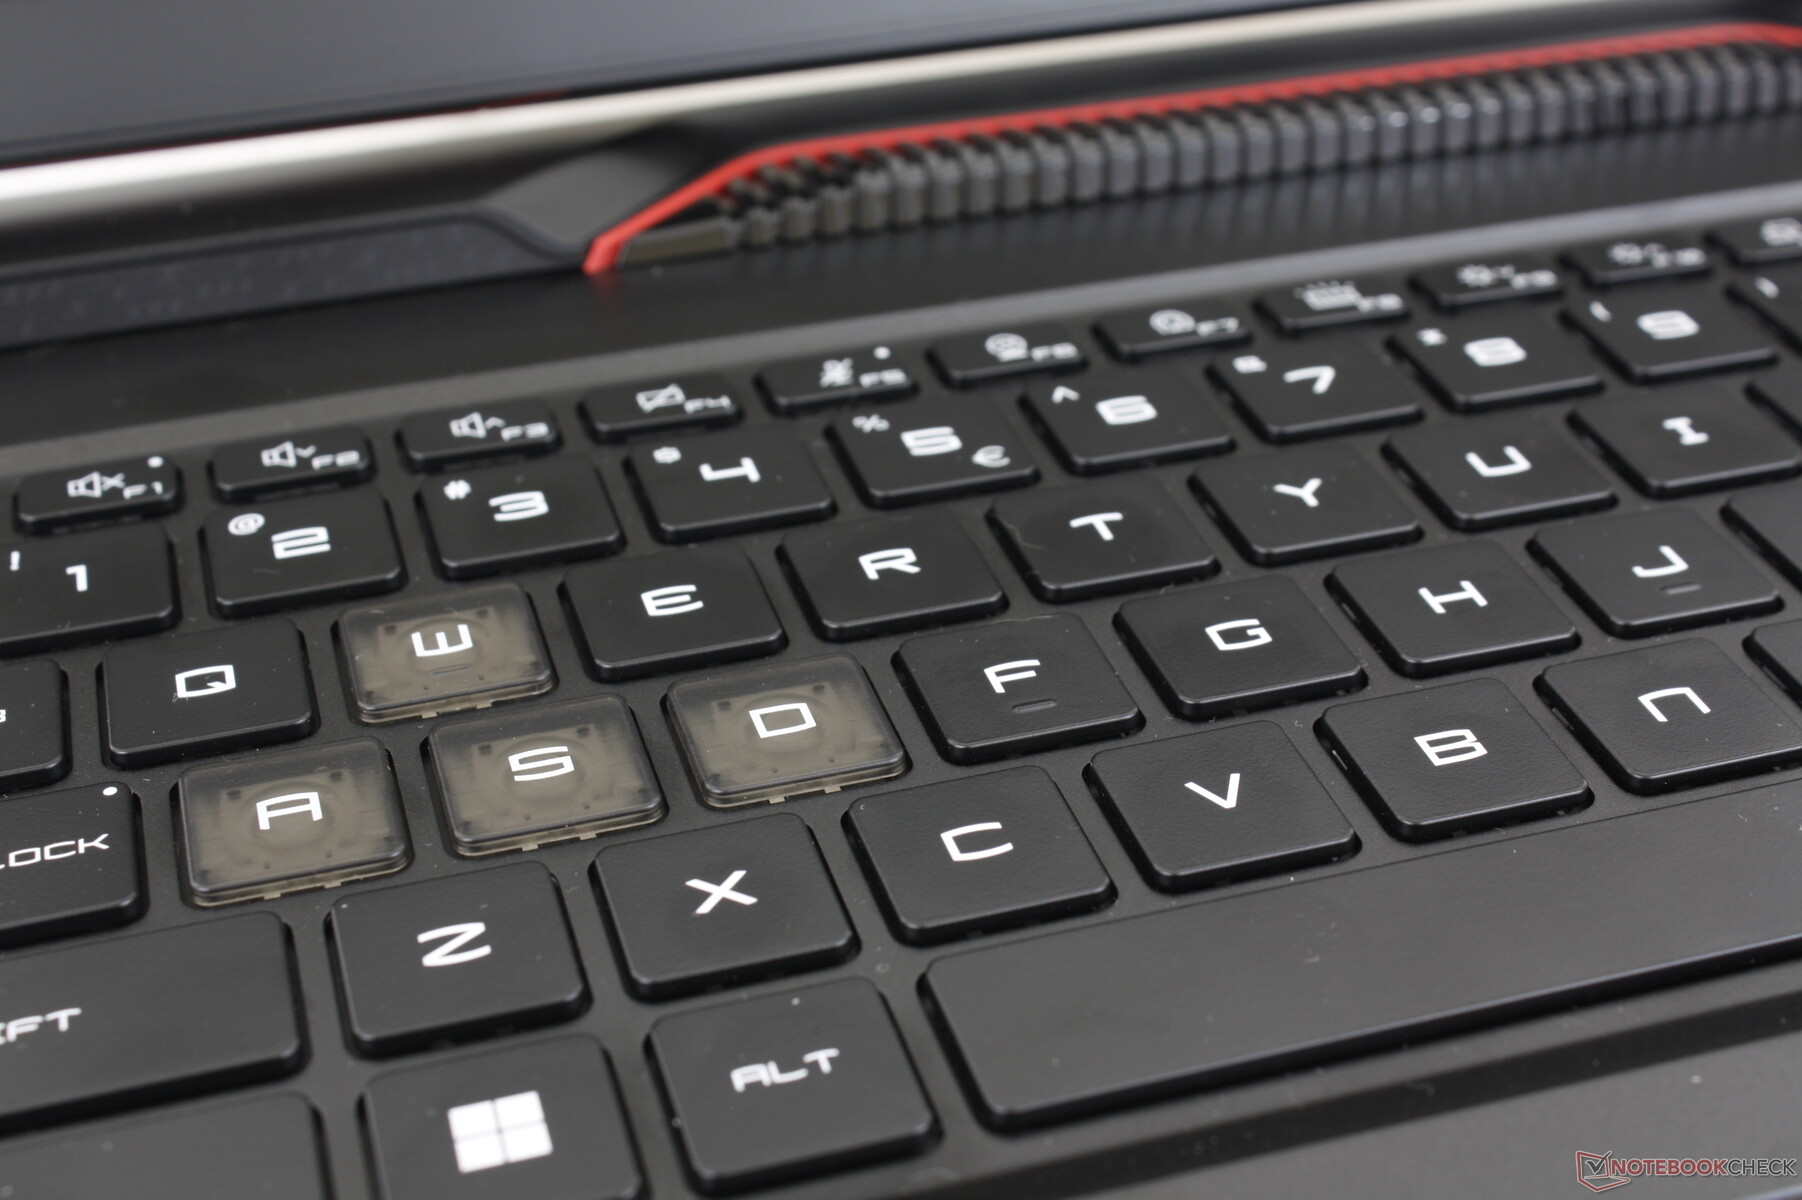
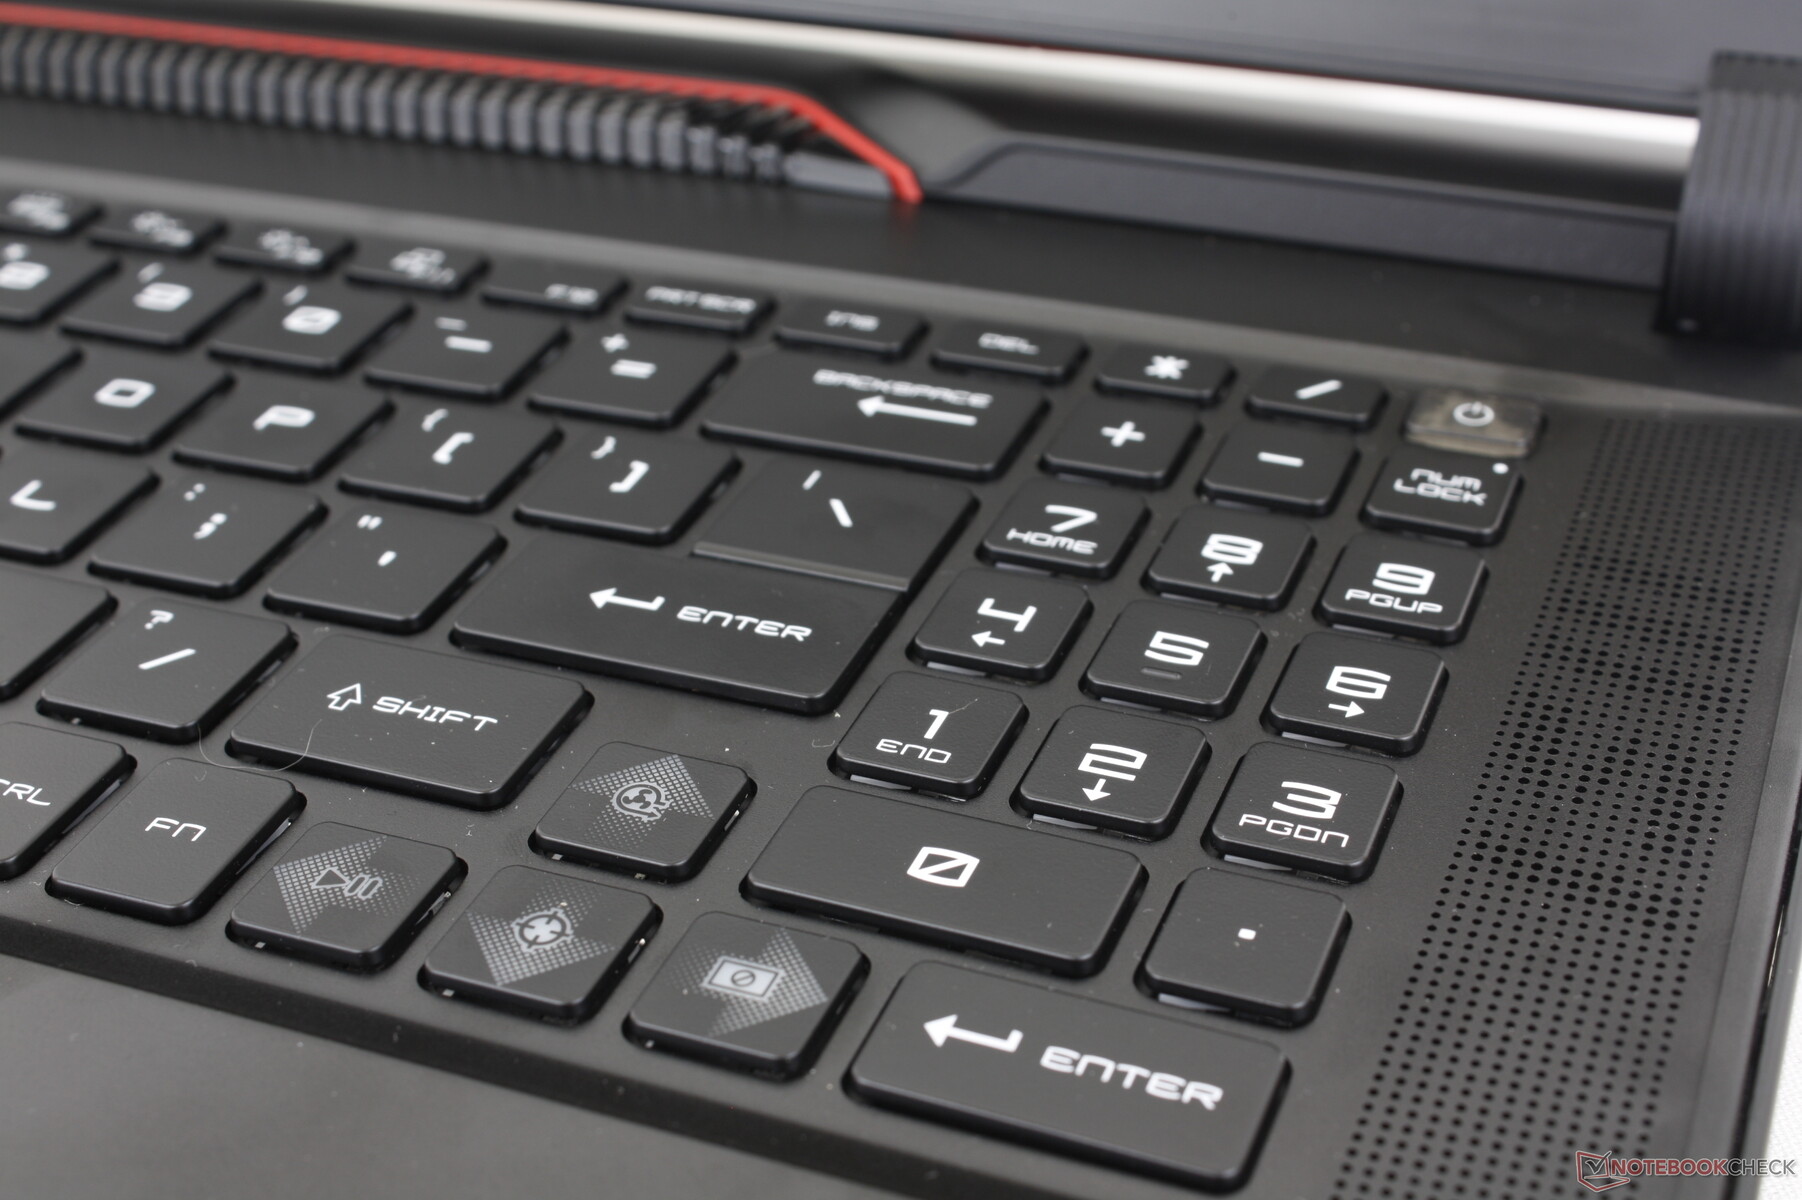
MSI ha renovado las tapas y el etiquetado de las teclas en comparación con el GE77. La respuesta de las teclas sigue siendo muy buena, si no mejor, que antes; las teclas Space y Enter en particular son más ruidosas y hacen más clic esta vez para una experiencia de mecanografiado más satisfactoria.
Las teclas de dirección y el teclado numérico podrían mejorar un poco. A pesar del gran formato de 17 pulgadas, estas teclas son pequeñas y estrechas. En comparación, las teclas de dirección y el teclado numérico de la serie Serie Legion de Lenovo son más grandes y espaciosos. Los juegos que a menudo utilizan las teclas de dirección, como los títulos de carreras, pueden ser más difíciles de jugar en el sistema MSI.
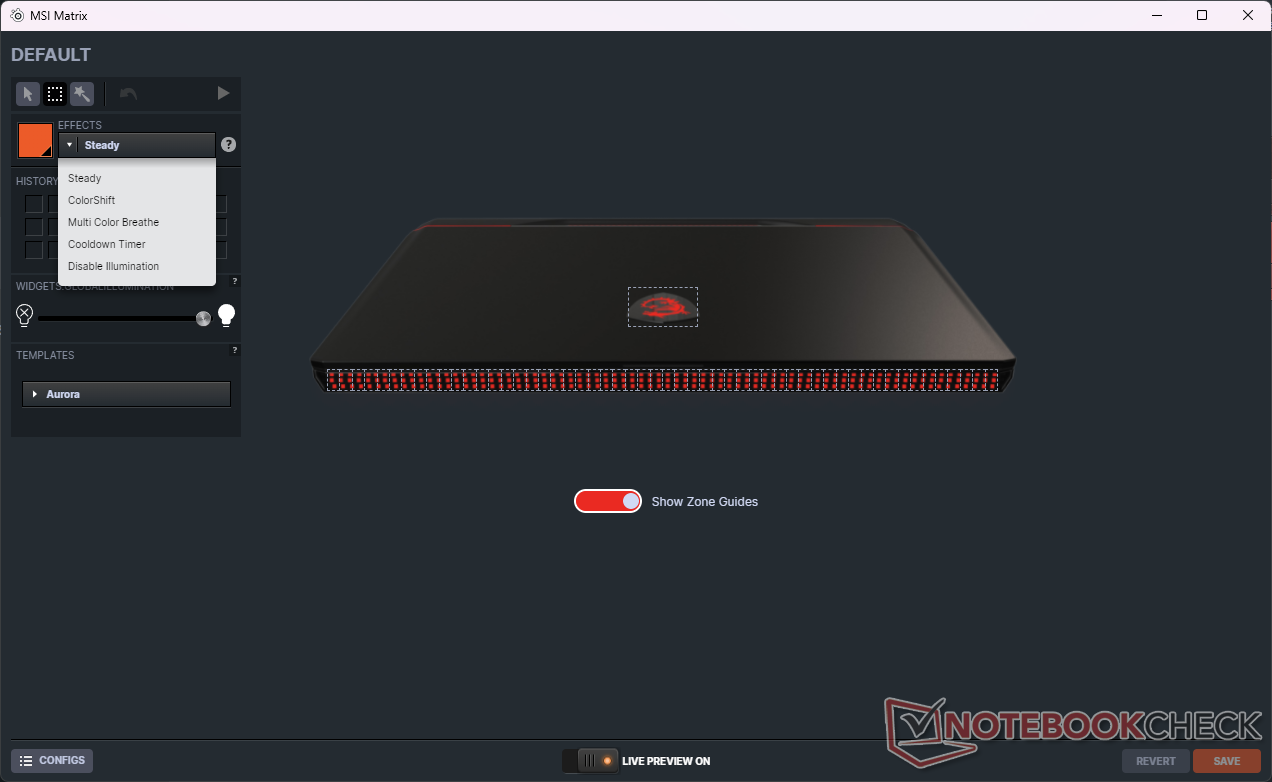
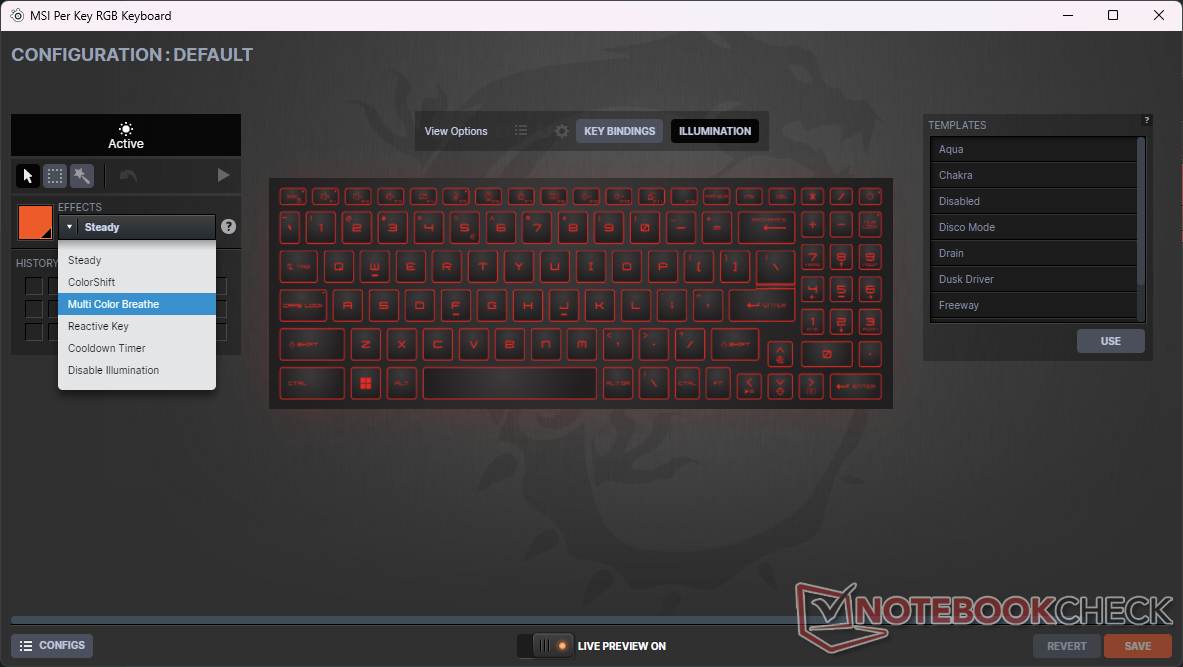
Los efectos de iluminación RGB por tecla se controlan mediante el software SteelSeries GG preinstalado, como se muestra en las capturas de pantalla siguientes. La aplicación también controla la barra de luz "matriz" de píxeles a lo largo del borde frontal del chasis.
Panel táctil
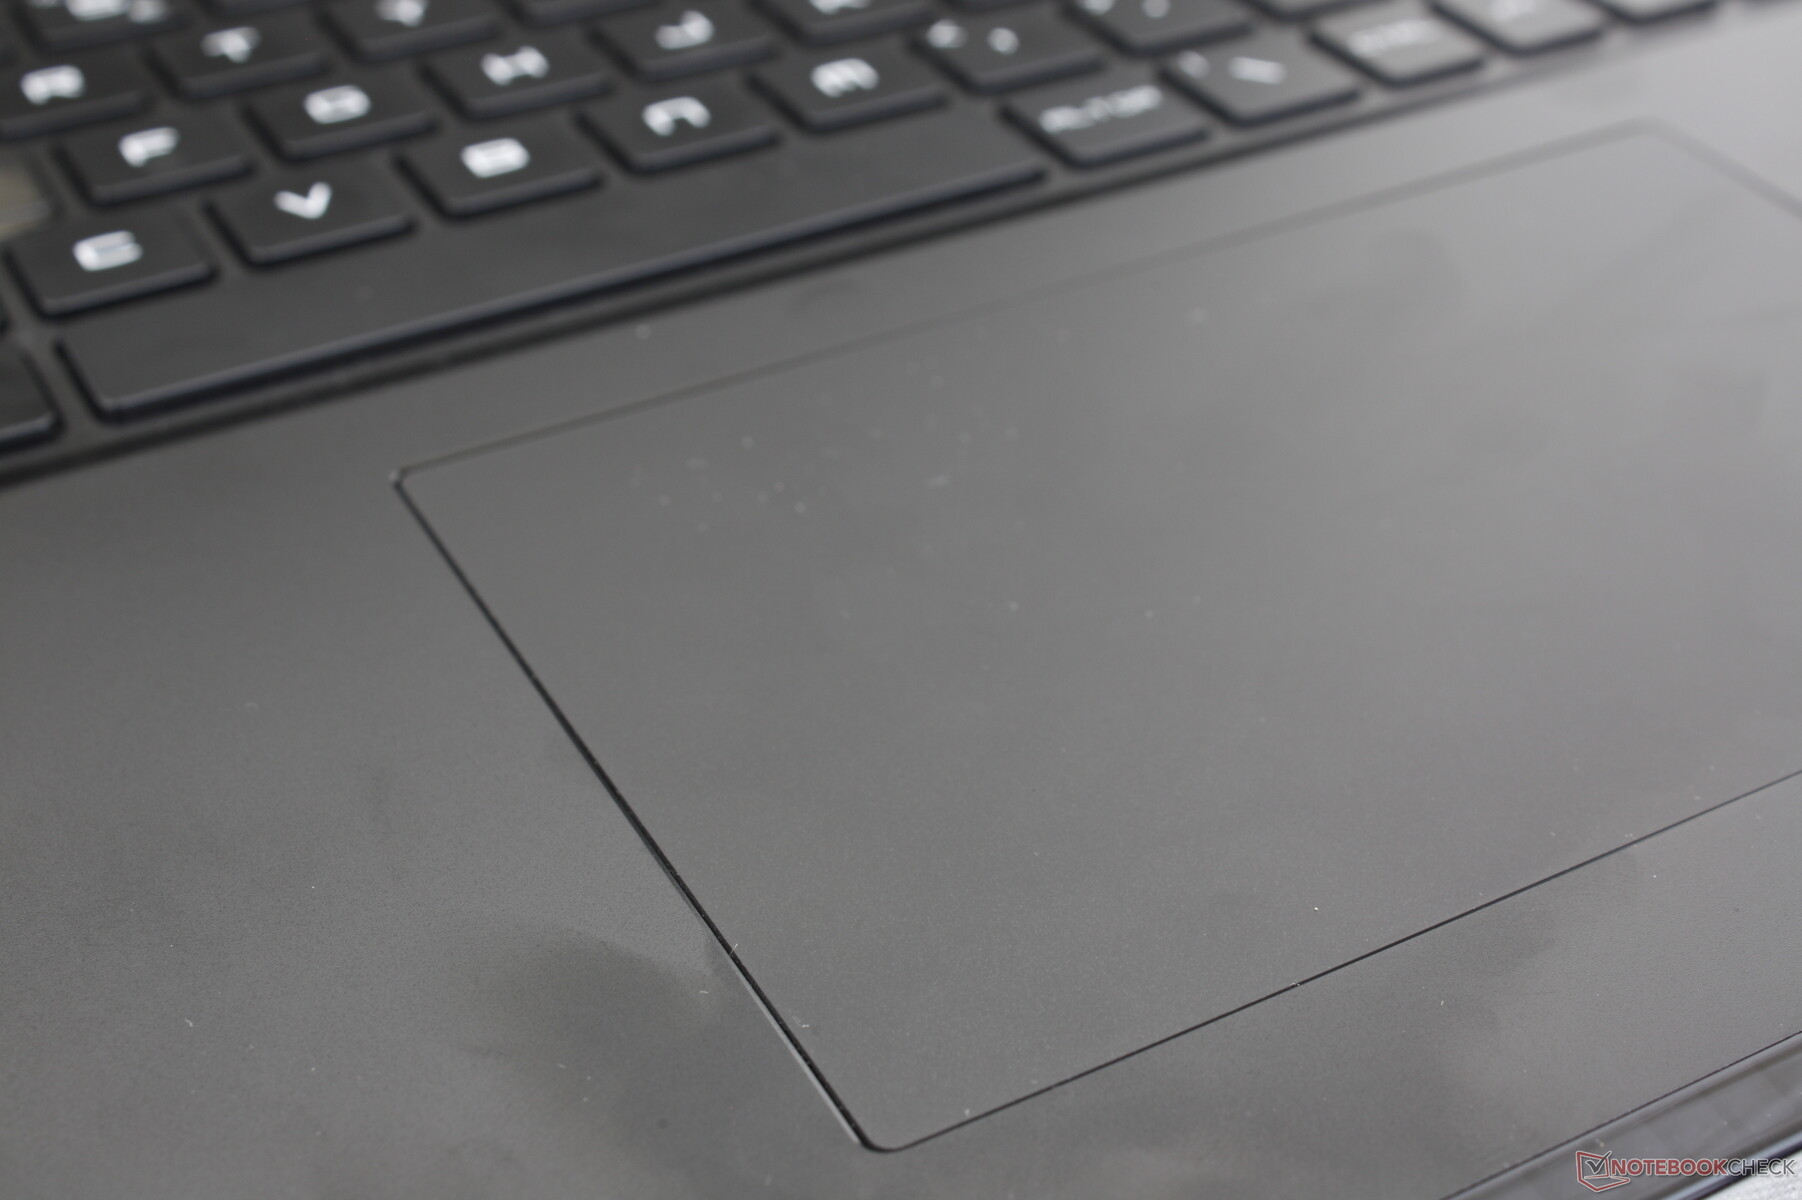
El tamaño del clickpad ha crecido desde los diminutos 10,5 x 6,5 cm del GE77 a los 13 x 8,2 cm del GE78. Sin embargo, el deslizamiento sobre la superficie de plástico es más pegajoso de lo esperado, por lo que hay un poco más de resistencia cuando se desliza a velocidades más rápidas. La respuesta al presionar es silenciosa, pero demasiado superficial y débil, por lo que la sensación general es insatisfactoria.
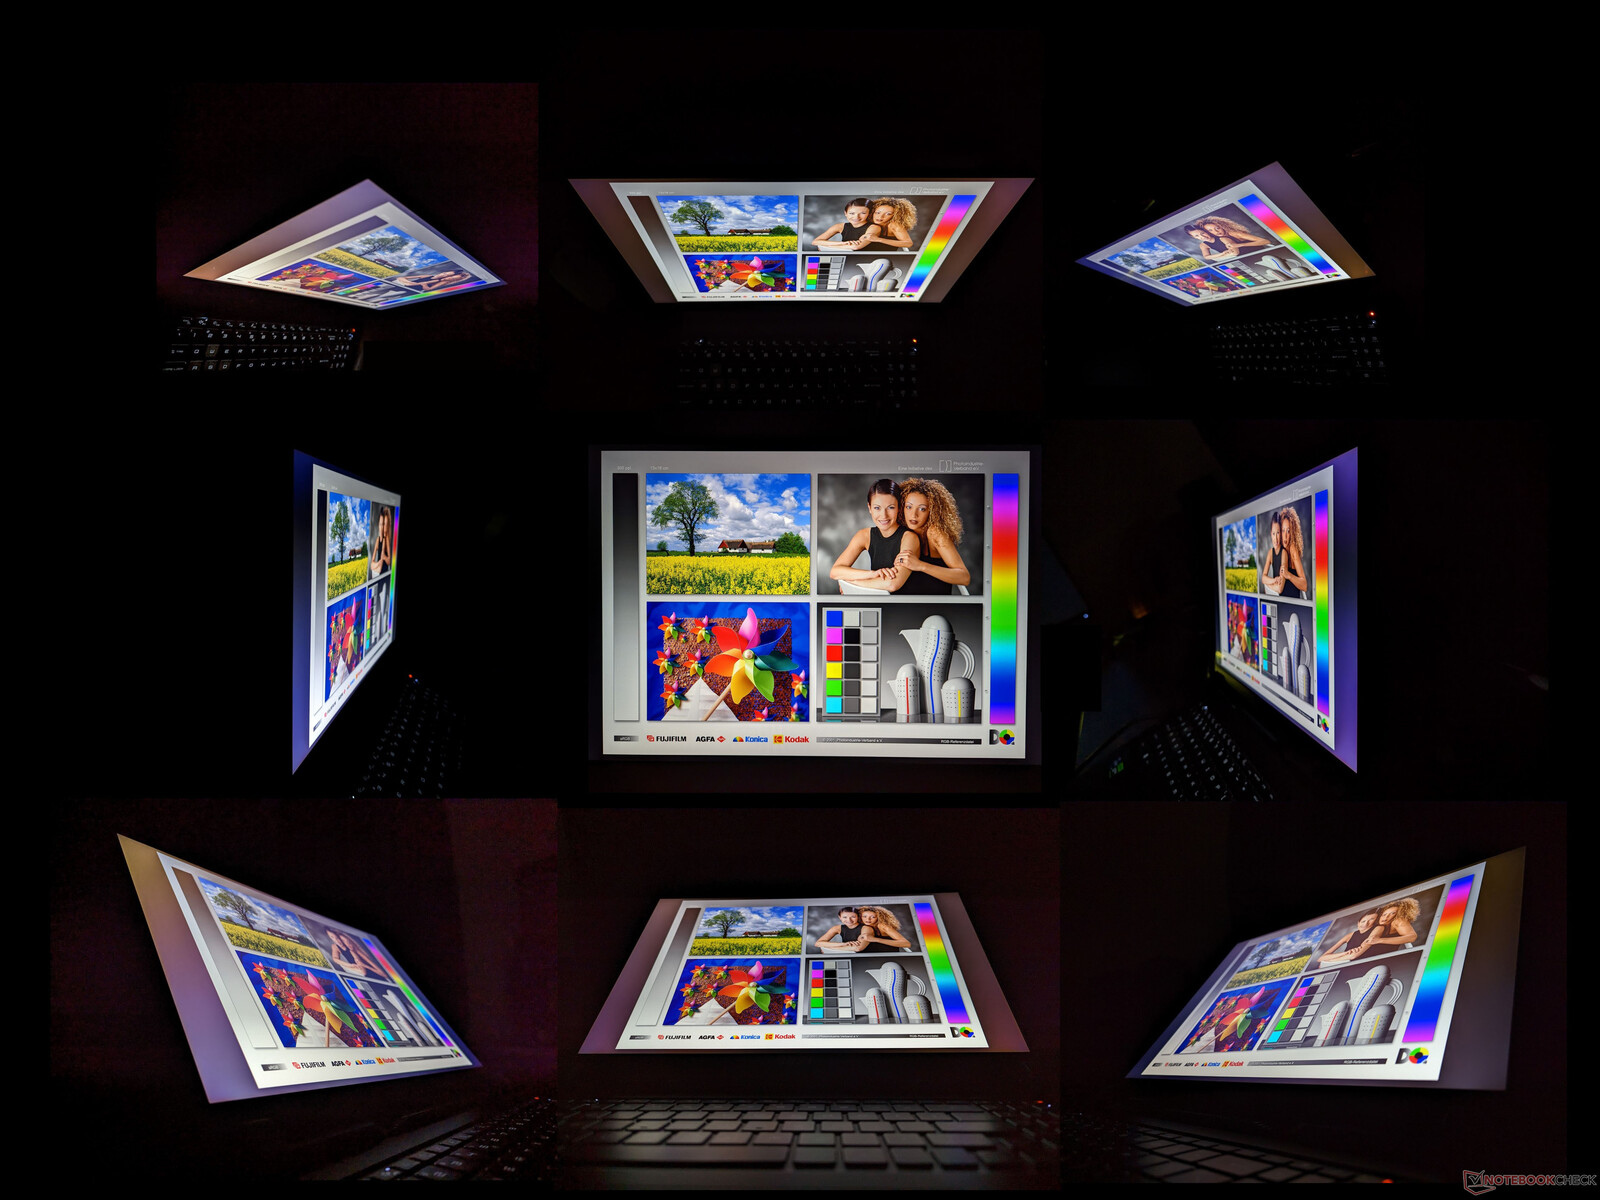
Pantalla - ¿Dónde está la compatibilidad con G-Sync?
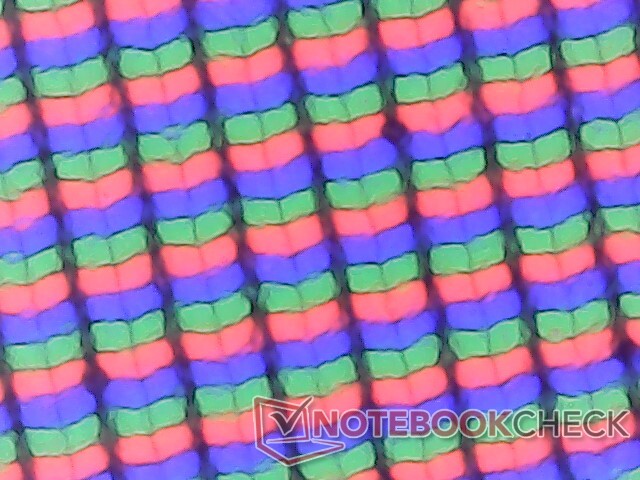
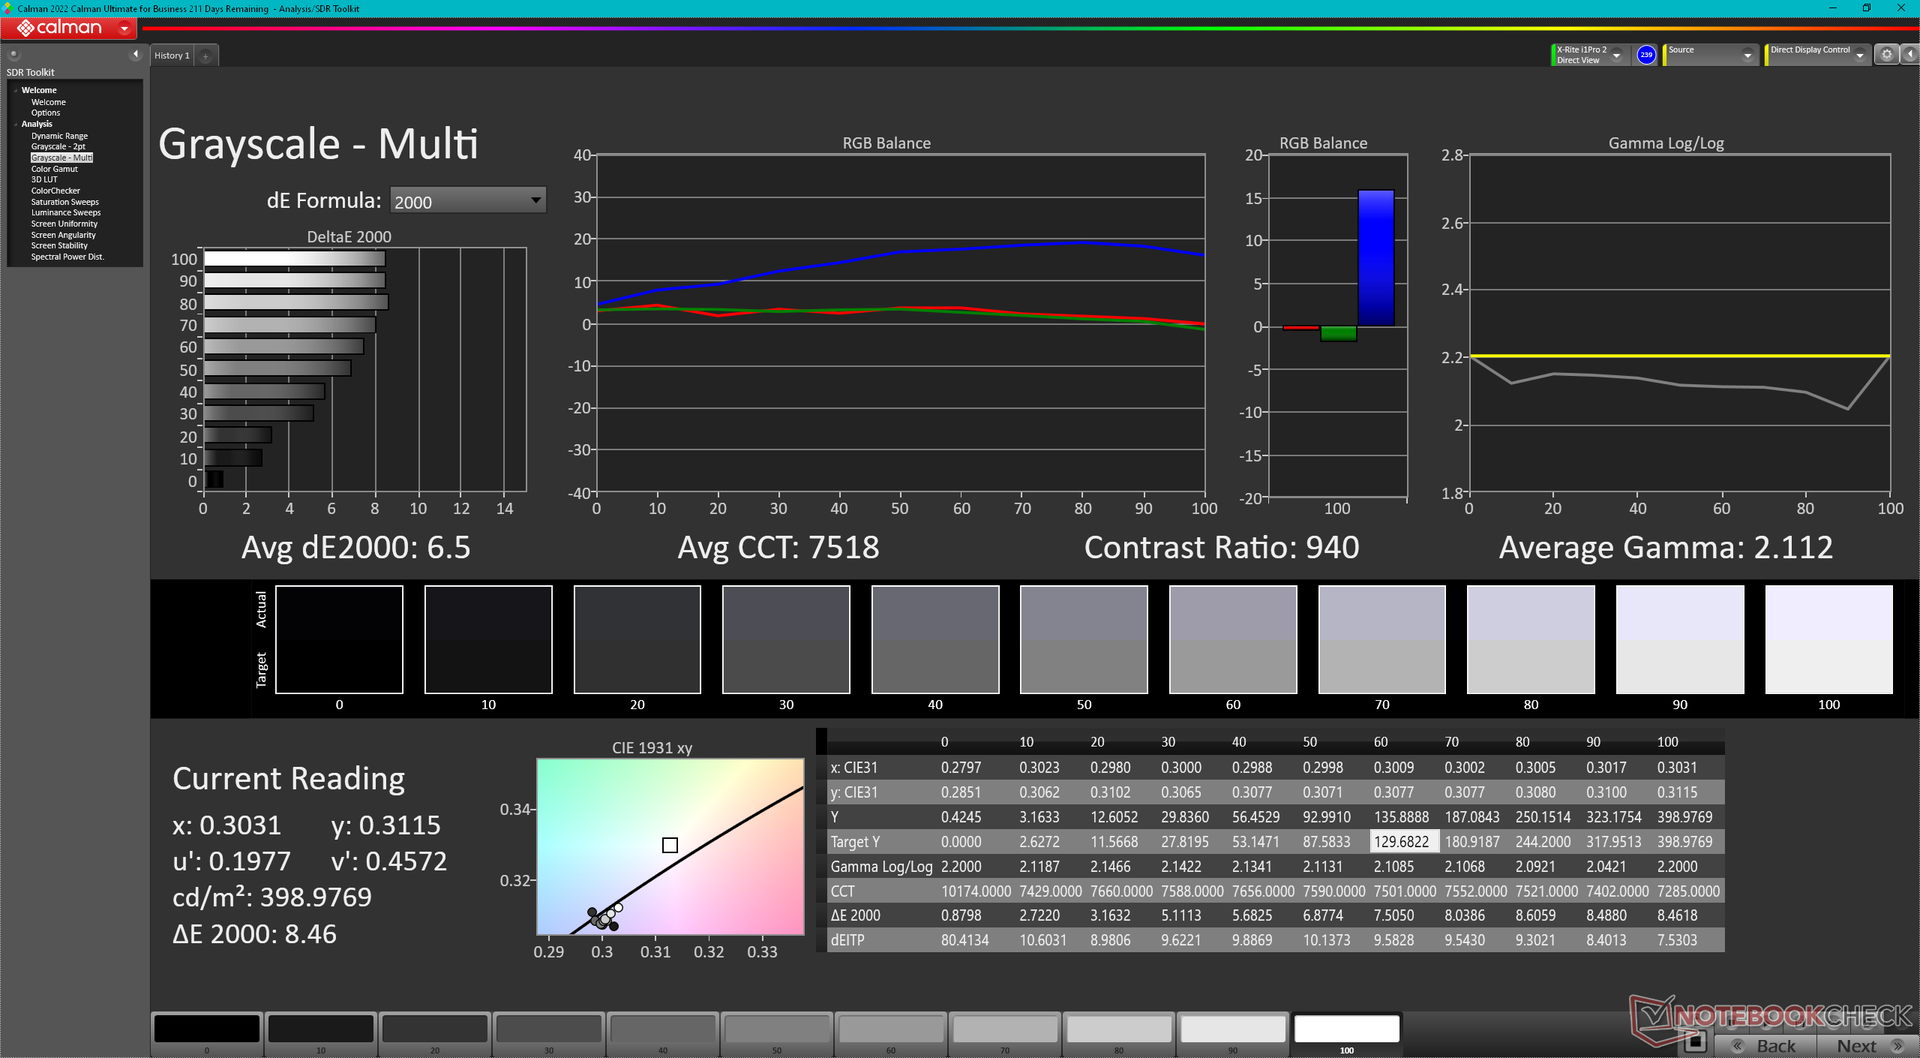
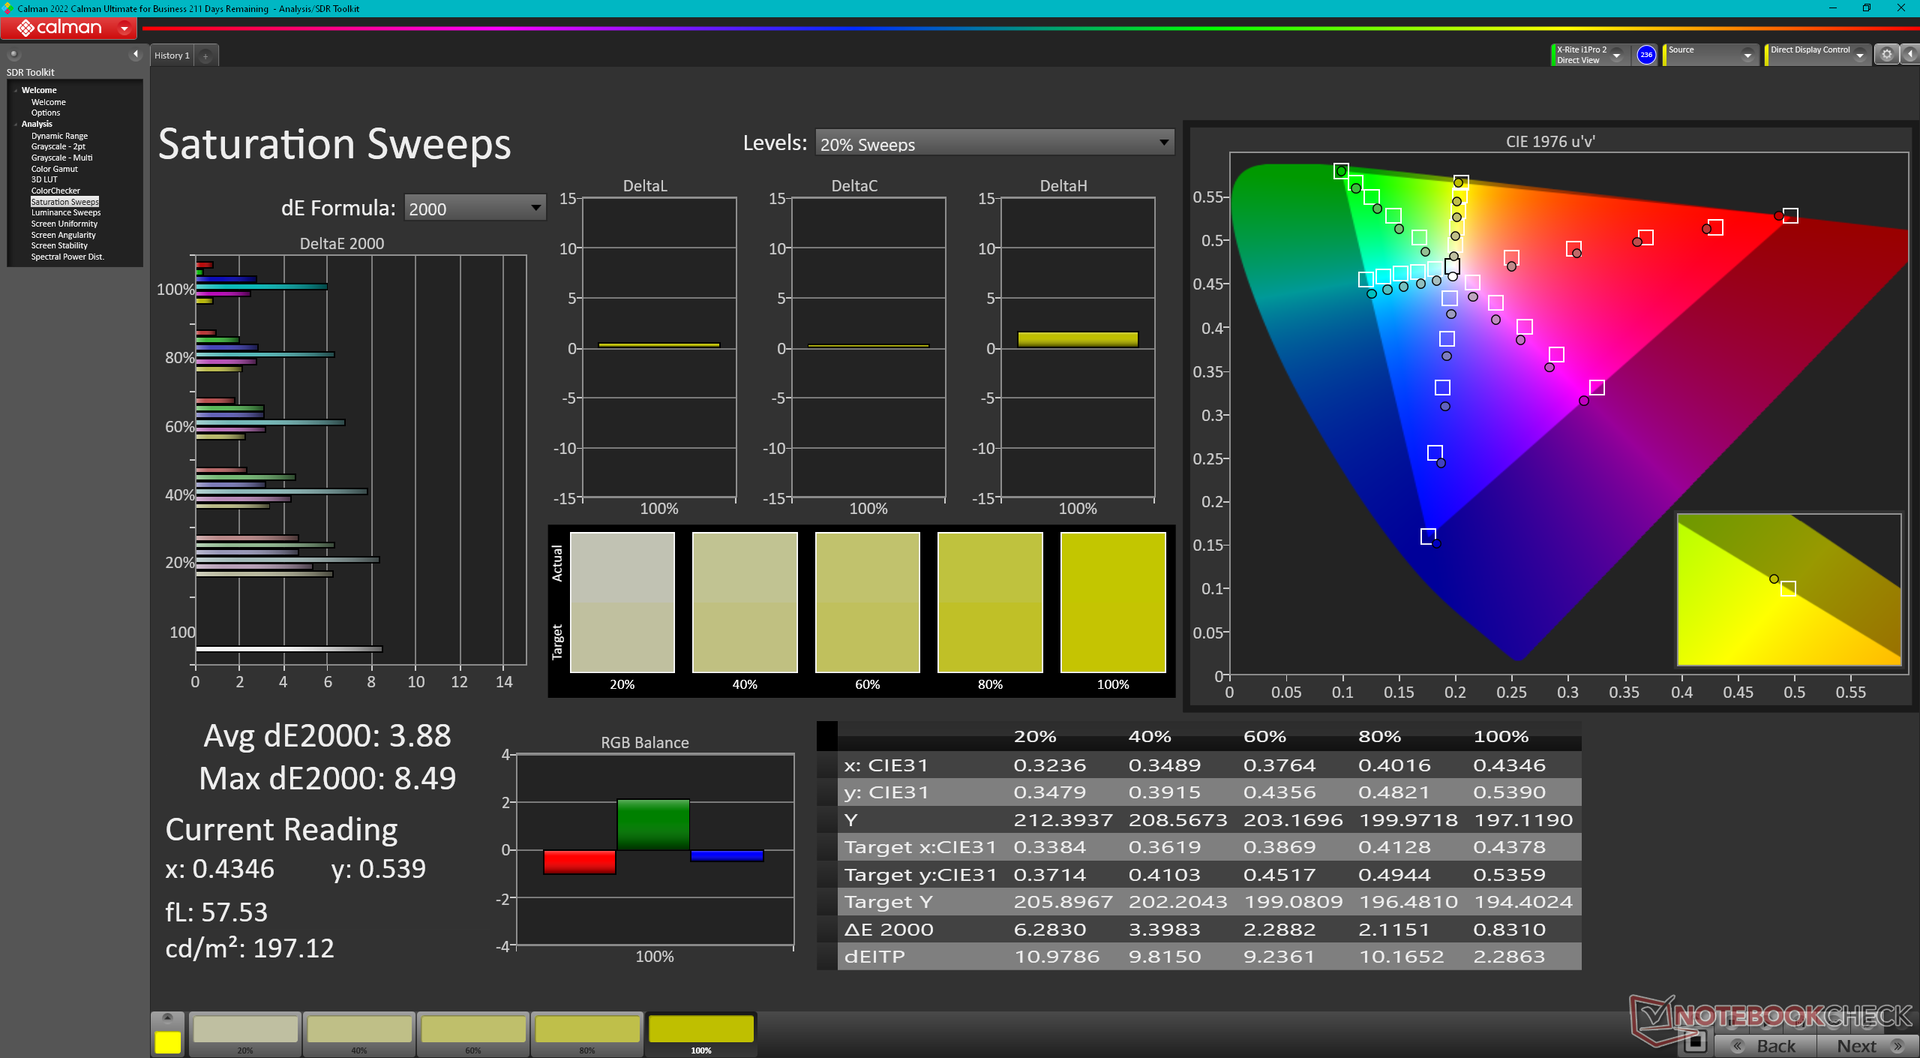
El GE78 es el primer portátil de nuestra base de datos que incorpora el panel IPS AU Optronics B170QAN01.2. Sin embargo, todas nuestras mediciones internas muestran que es esencialmente idéntico al panel AU Optronics B173ZAN06.1 del GE77 del año pasado salvo en tamaño (17.0" vs. 17.3"), relación de aspecto (16:10 vs. 16:9), y frecuencia de refresco (240 Hz vs. 120 Hz). Los atributos principales, como los amplios colores P3, los rápidos tiempos de respuesta, el brillo de 400 nits y la decente relación de contraste, siguen siendo prácticamente los mismos para una experiencia visual similar entre ambos.
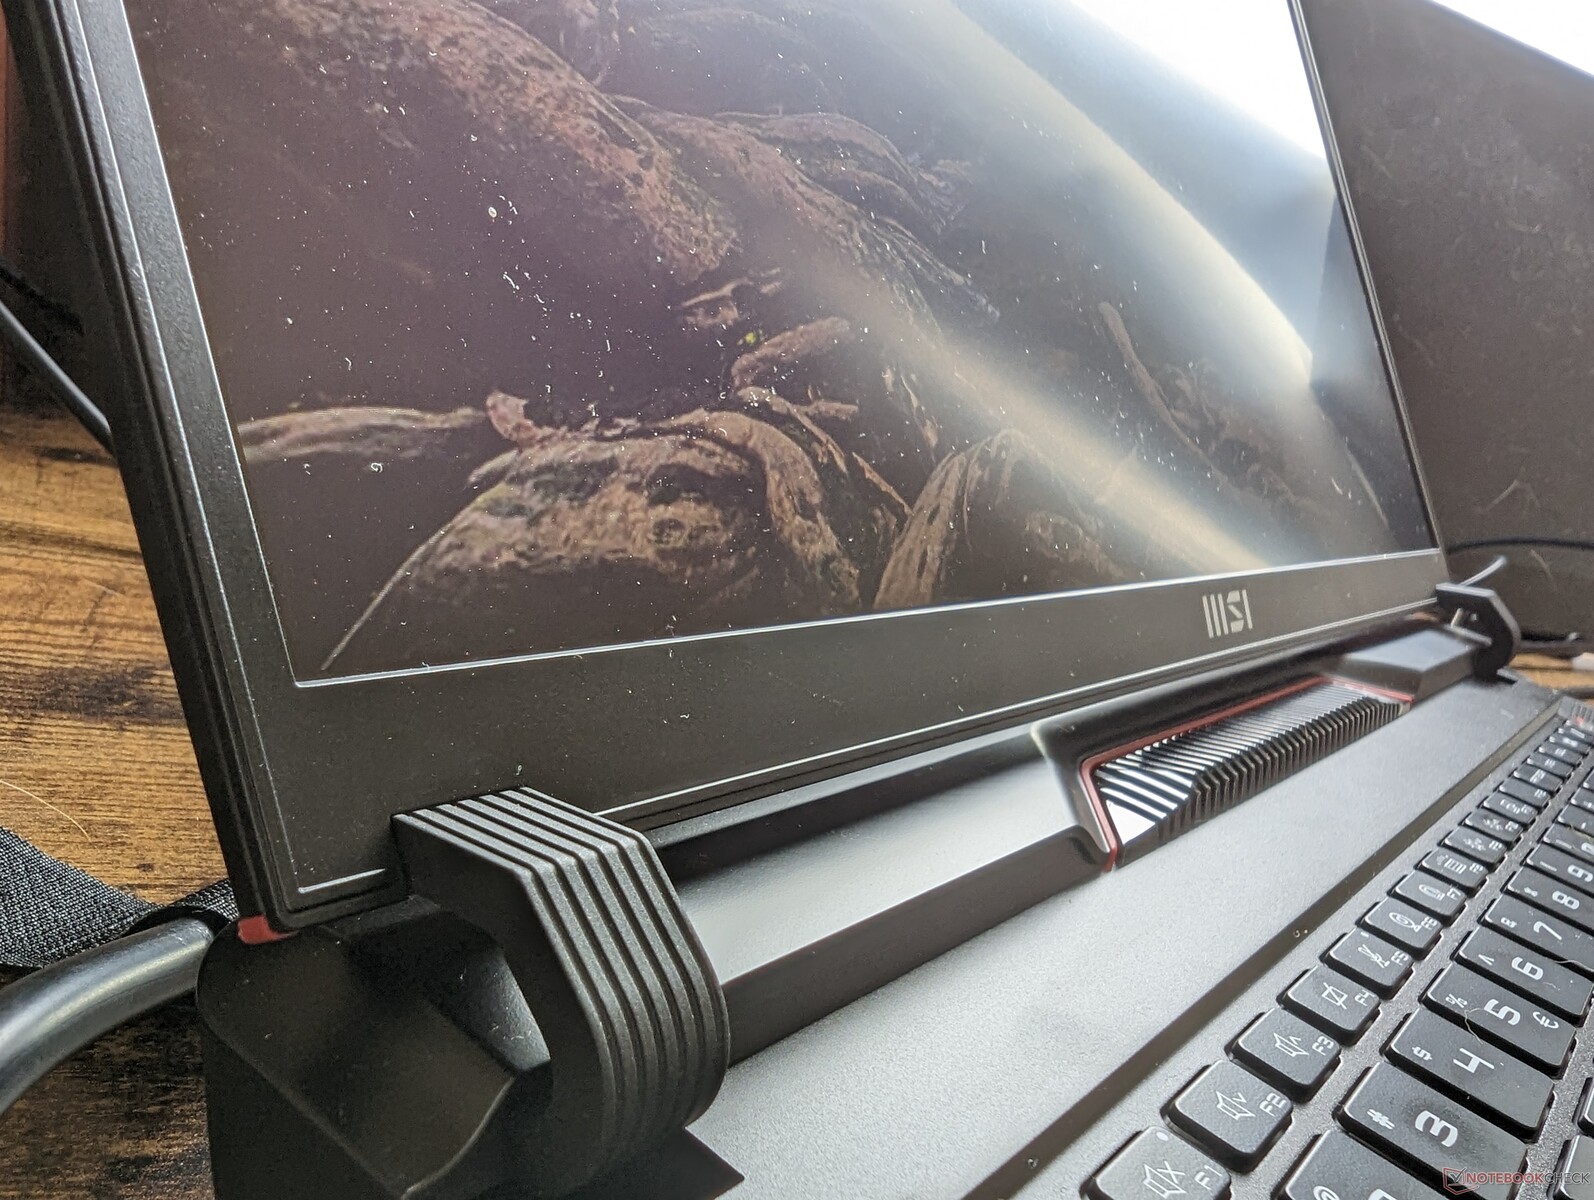
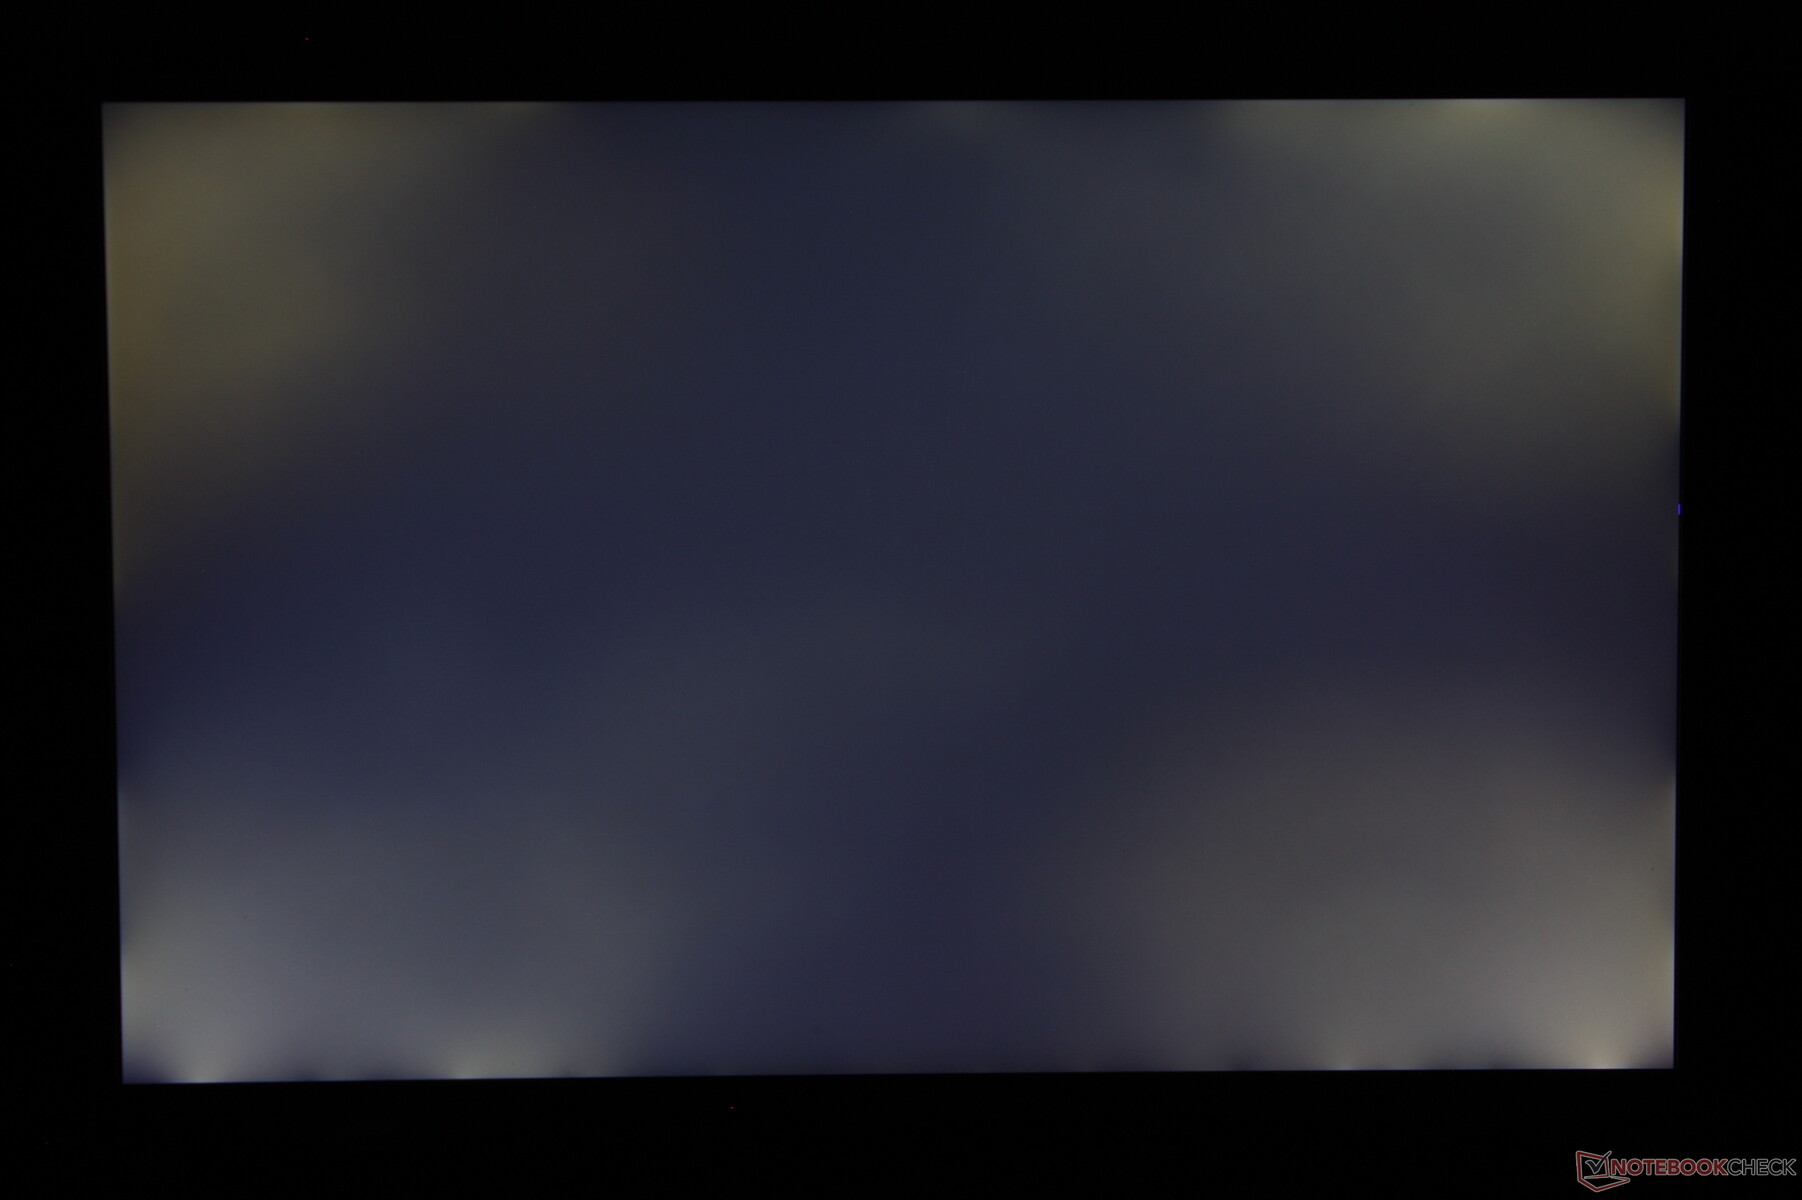
Quizá el aspecto más atroz del display sea su terrible control del sangrado de la retroiluminación en nuestra unidad de pruebas específica. Como se muestra en la siguiente captura de pantalla, el sangrado de luz es notable especialmente durante la reproducción de películas con bordes negros o al jugar a ciertos juegos. Es de esperar cierto nivel de sangrado de la retroiluminación en la mayoría de paneles IPS, pero es demasiado sustancial en un portátil de gama alta como nuestro GE78.
| |||||||||||||||||||||||||
iluminación: 89 %
Brillo con batería: 398.6 cd/m²
Contraste: 867:1 (Negro: 0.46 cd/m²)
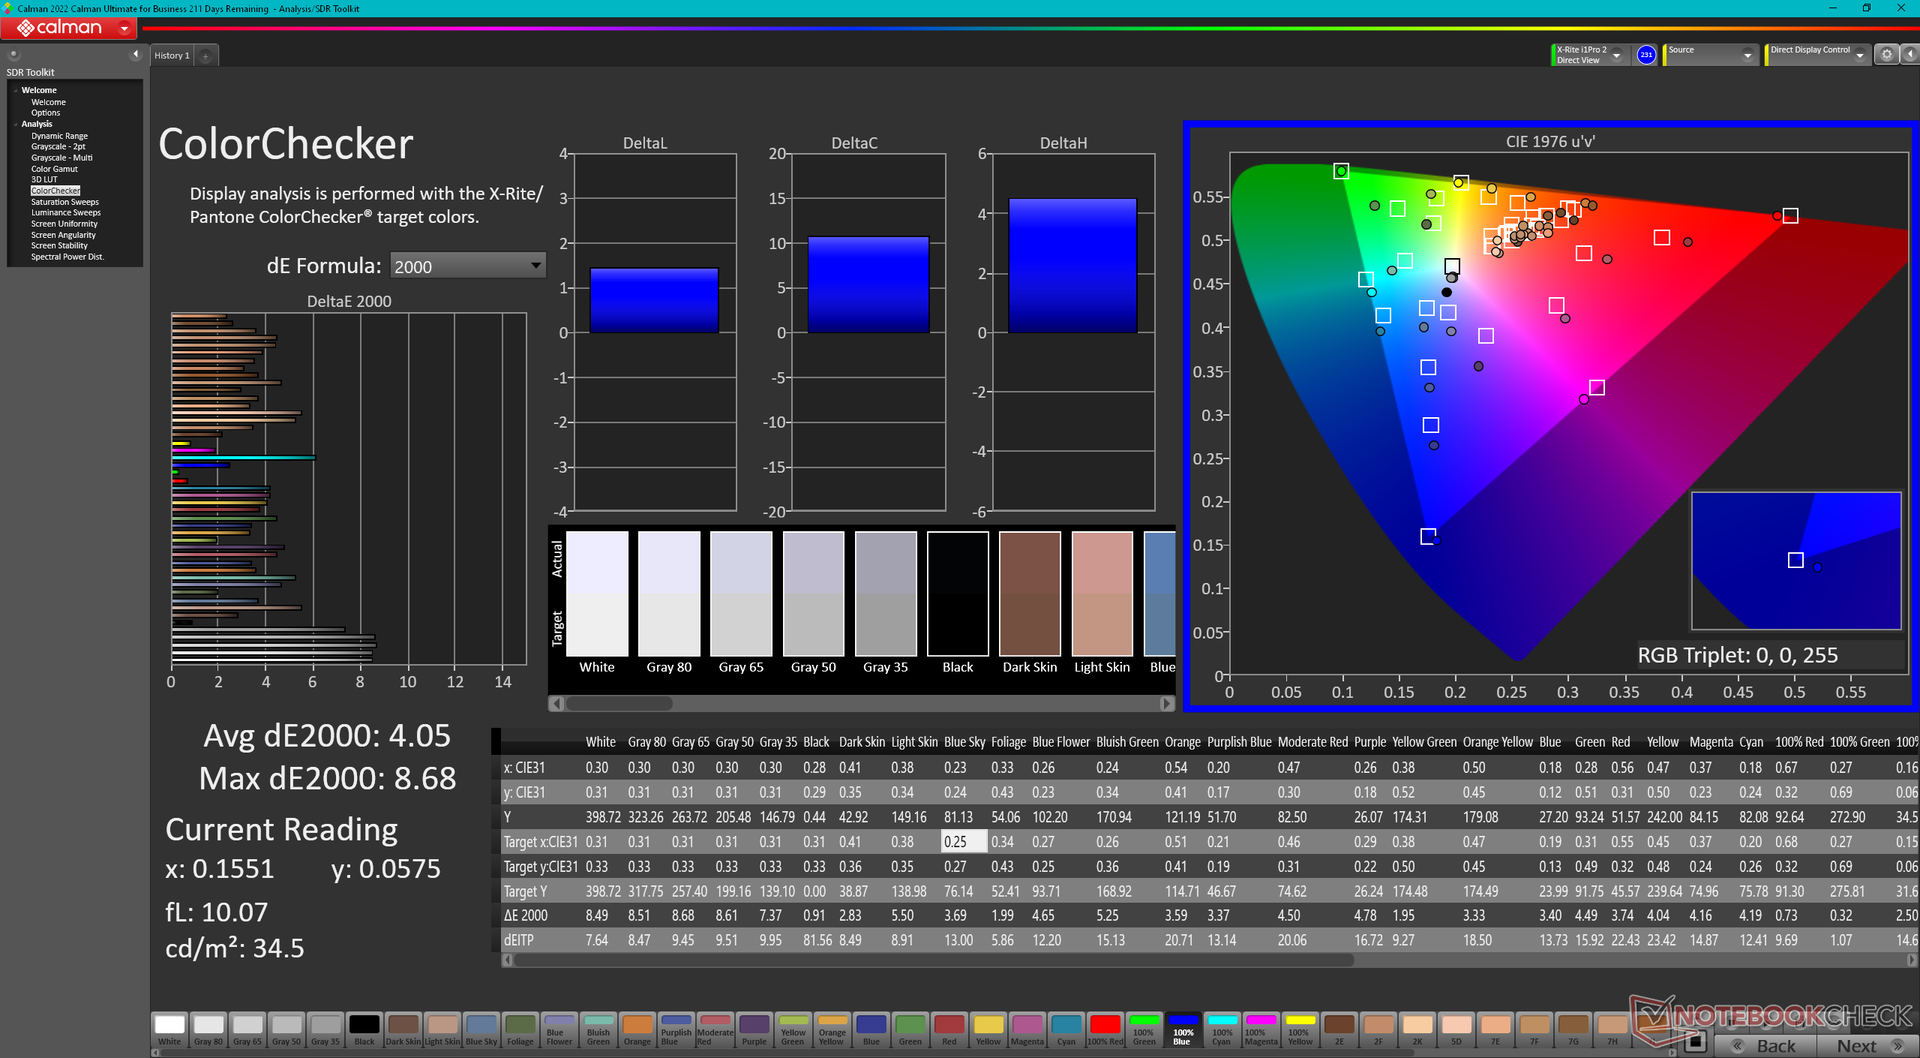
ΔE ColorChecker Calman: 4.05 | ∀{0.5-29.43 Ø4.71}
calibrated: 1.02
ΔE Greyscale Calman: 6.5 | ∀{0.09-98 Ø4.96}
86.5% AdobeRGB 1998 (Argyll 3D)
99.9% sRGB (Argyll 3D)
97.6% Display P3 (Argyll 3D)
Gamma: 2.11
CCT: 7518 K
| MSI GE78HX 13VH-070US AU Optronics B170QAN01.2, IPS, 2560x1600, 17" | Eluktronics Mech-17 GP2 BOE NE170QDM-NZ1, IPS, 2560x1600, 17" | Asus ROG Strix G17 G713PI BOE0B69, IPS, 2560x1440, 17.3" | MSI Titan GT77 HX 13VI B173ZAN06.C, Mini-LED, 3840x2160, 17.3" | MSI Raider GE77 HX 12UHS AU Optronics B173ZAN06.1, IPS, 3840x2160, 17.3" | Razer Blade 17 Early 2022 AU Optronics B173ZAN06.9, IPS, 3840x2160, 17.3" | |
|---|---|---|---|---|---|---|
| Display | -16% | 0% | 1% | -1% | 1% | |
| Display P3 Coverage (%) | 97.6 | 69.1 -29% | 98.3 1% | 94.9 -3% | 96.6 -1% | 99.4 2% |
| sRGB Coverage (%) | 99.9 | 99.7 0% | 100 0% | 99.9 0% | 99.8 0% | 100 0% |
| AdobeRGB 1998 Coverage (%) | 86.5 | 69.8 -19% | 85.9 -1% | 92.4 7% | 85.8 -1% | 87.3 1% |
| Response Times | -117% | -30% | -565% | -13% | -33% | |
| Response Time Grey 50% / Grey 80% * (ms) | 4.2 ? | 12 ? -186% | 5.3 ? -26% | 38.4 ? -814% | 5.8 ? -38% | 7.5 ? -79% |
| Response Time Black / White * (ms) | 6.4 ? | 9.4 ? -47% | 8.6 ? -34% | 26.6 ? -316% | 5.6 ? 13% | 5.6 ? 13% |
| PWM Frequency (Hz) | 2380 ? | |||||
| Screen | 27% | 27% | 77665% | -32% | 36% | |
| Brightness middle (cd/m²) | 398.6 | 417.3 5% | 327 -18% | 606 52% | 381 -4% | 503 26% |
| Brightness (cd/m²) | 384 | 387 1% | 320 -17% | 602 57% | 371 -3% | 486 27% |
| Brightness Distribution (%) | 89 | 87 -2% | 89 0% | 93 4% | 84 -6% | 84 -6% |
| Black Level * (cd/m²) | 0.46 | 0.42 9% | 0.38 17% | 0.0001 100% | 0.52 -13% | 0.44 4% |
| Contrast (:1) | 867 | 994 15% | 861 -1% | 6060000 698862% | 733 -15% | 1143 32% |
| Colorchecker dE 2000 * | 4.05 | 2.14 47% | 1.01 75% | 4.8 -19% | 1.08 73% | |
| Colorchecker dE 2000 max. * | 8.68 | 4.09 53% | 4.01 54% | 8.2 6% | 4.54 48% | |
| Colorchecker dE 2000 calibrated * | 1.02 | 0.42 59% | 0.41 60% | 1.8 -76% | 2.53 -148% | 0.6 41% |
| Greyscale dE 2000 * | 6.5 | 3.1 52% | 1.6 75% | 6.5 -0% | 1.3 80% | |
| Gamma | 2.11 104% | 2.19 100% | 2.168 101% | 2.63 84% | 2.151 102% | |
| CCT | 7518 86% | 6040 108% | 6659 98% | 6596 99% | 6541 99% | |
| Media total (Programa/Opciones) | -35% /
-3% | -1% /
13% | 25700% /
49847% | -15% /
-20% | 1% /
19% |
* ... más pequeño es mejor
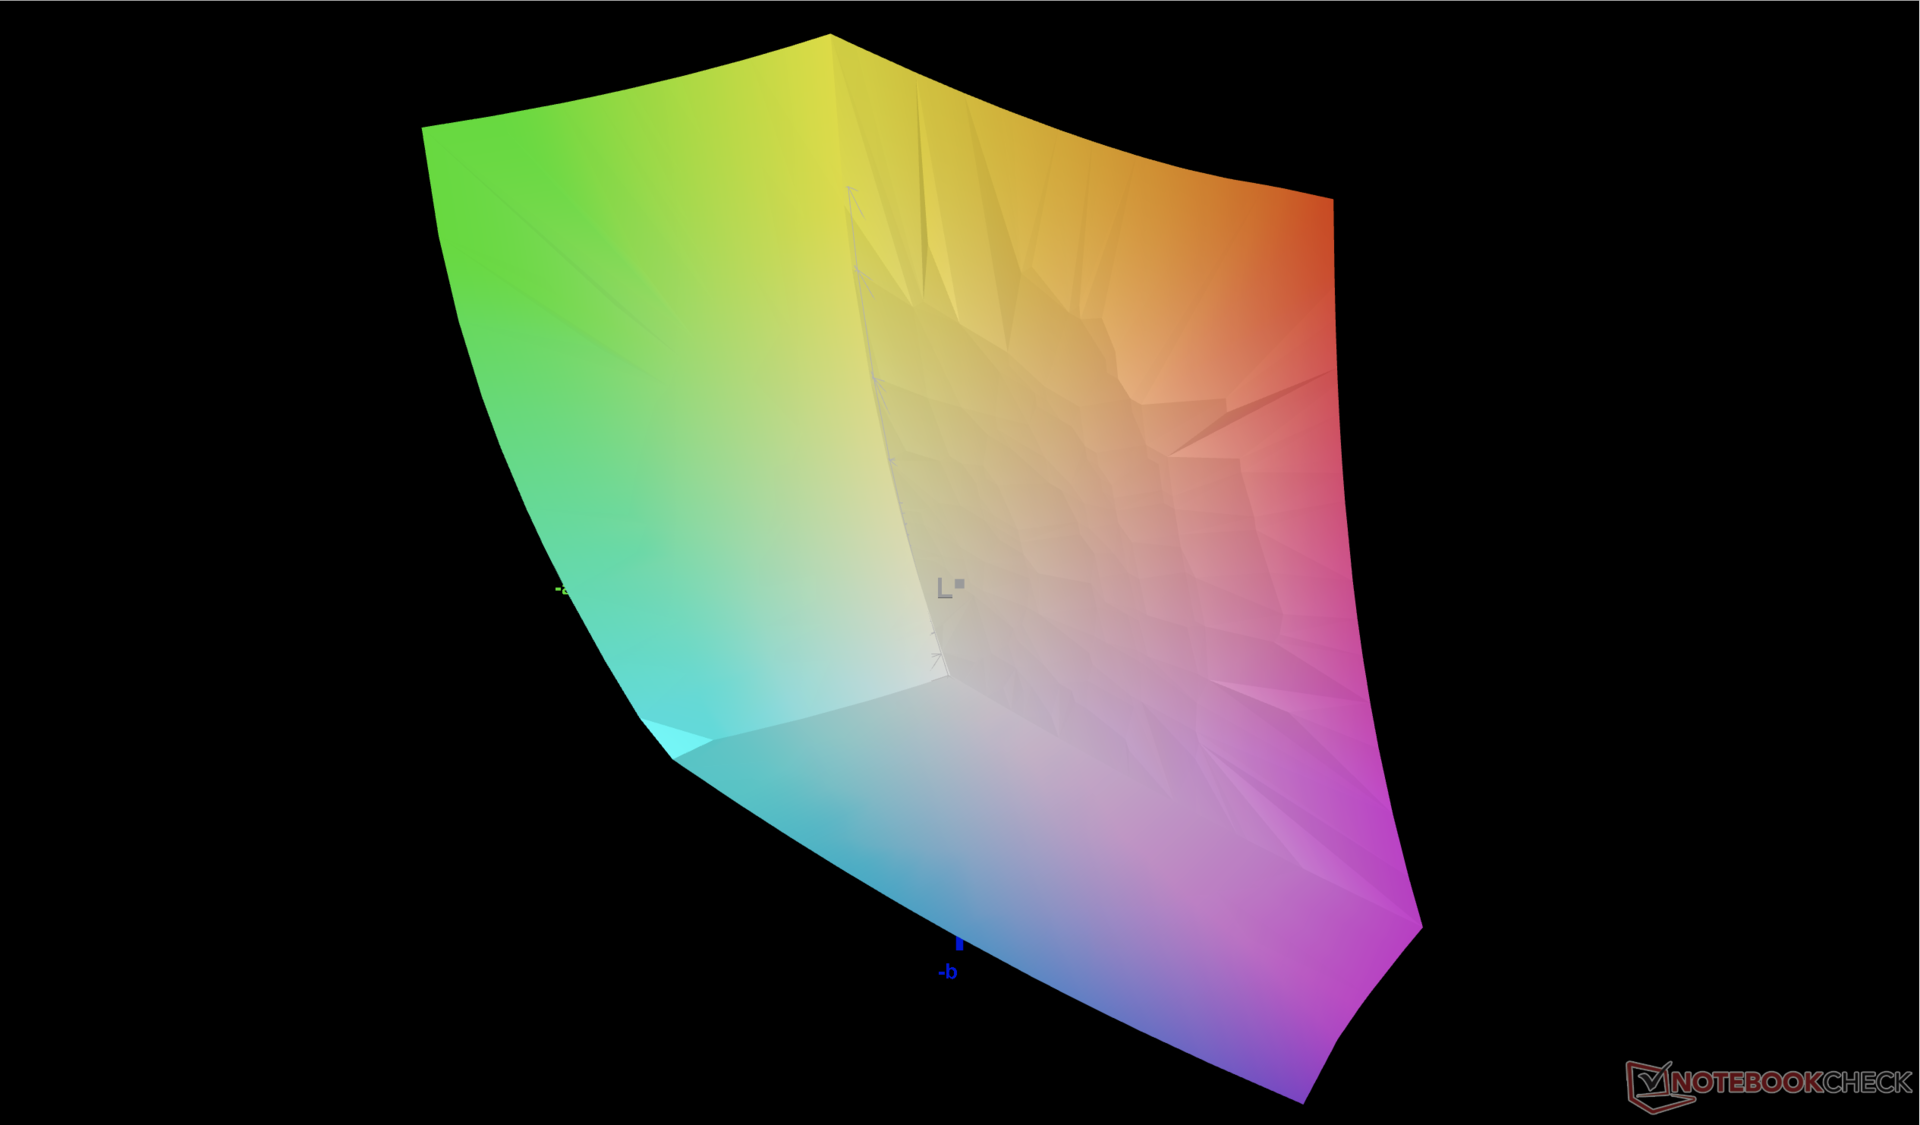
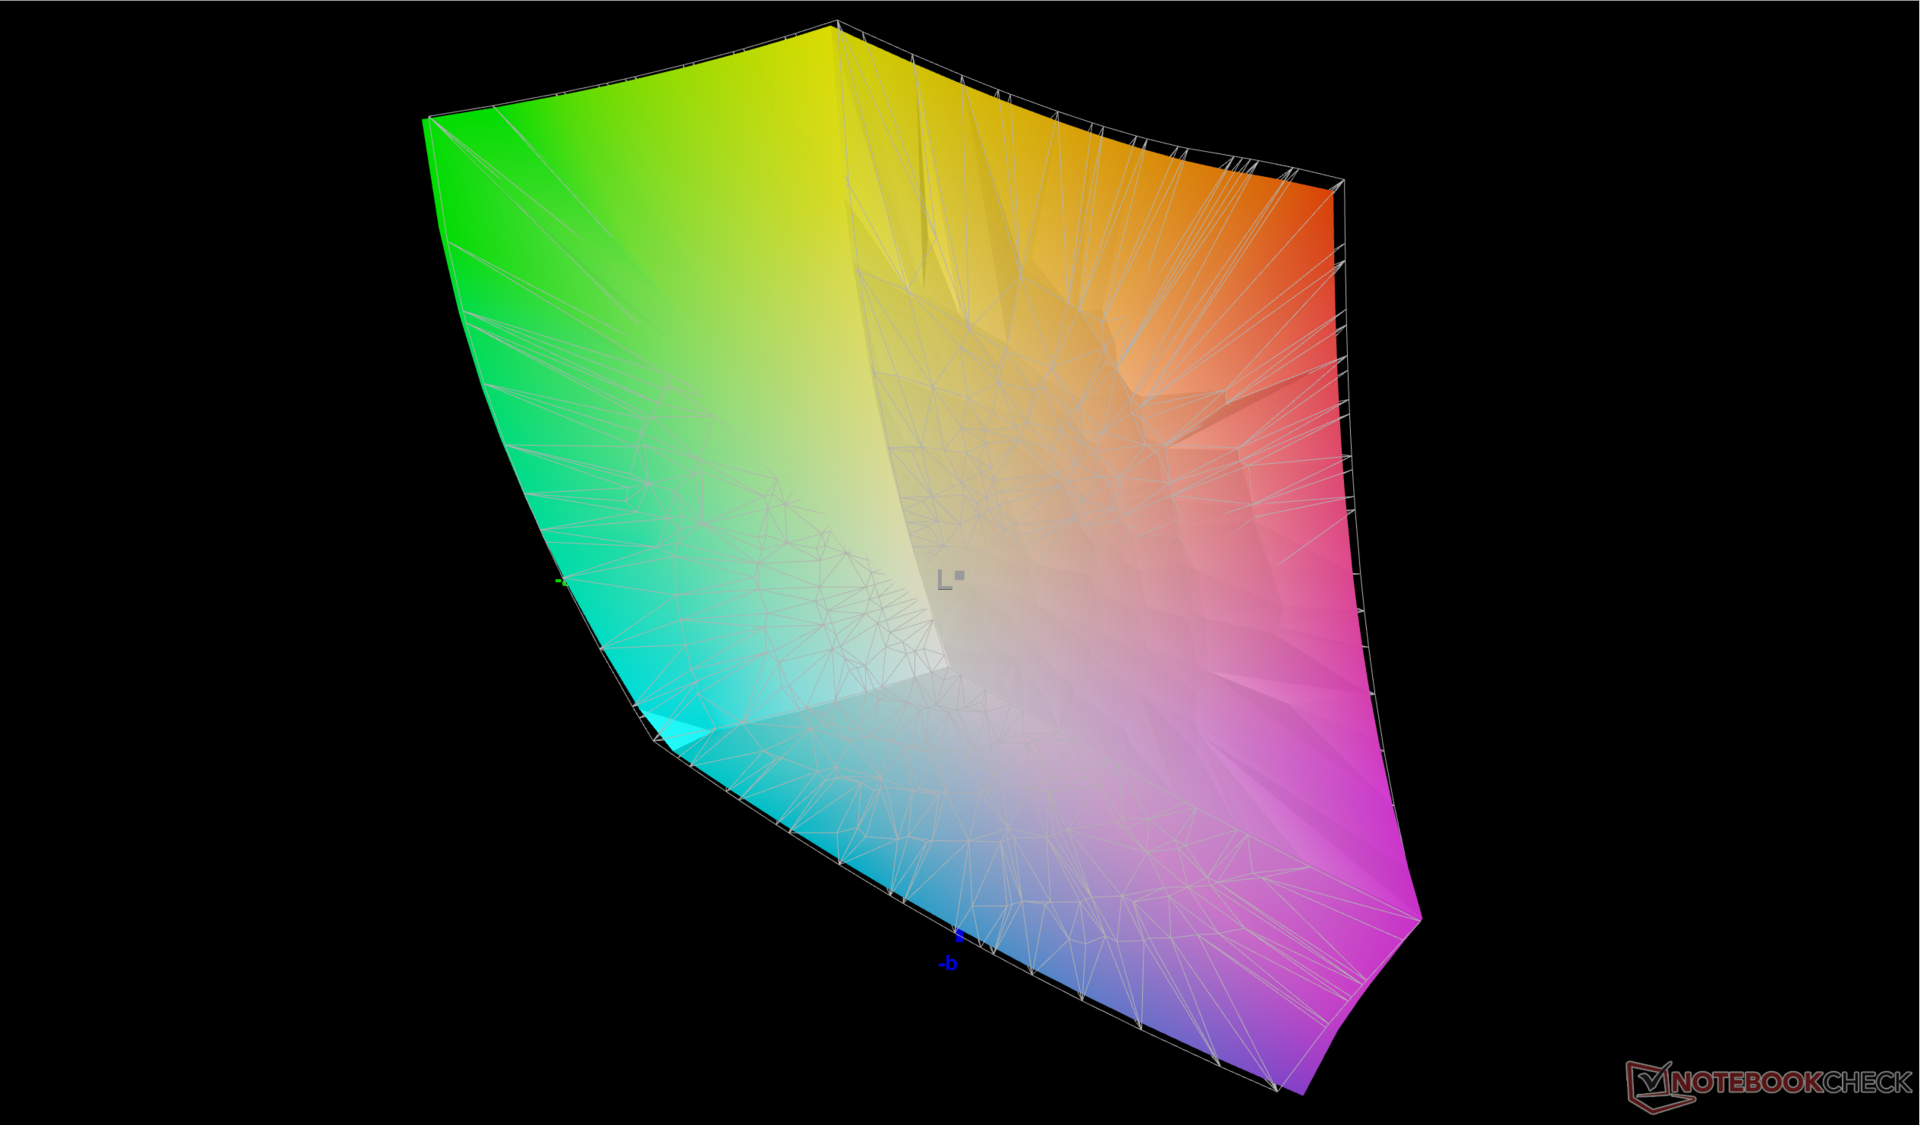
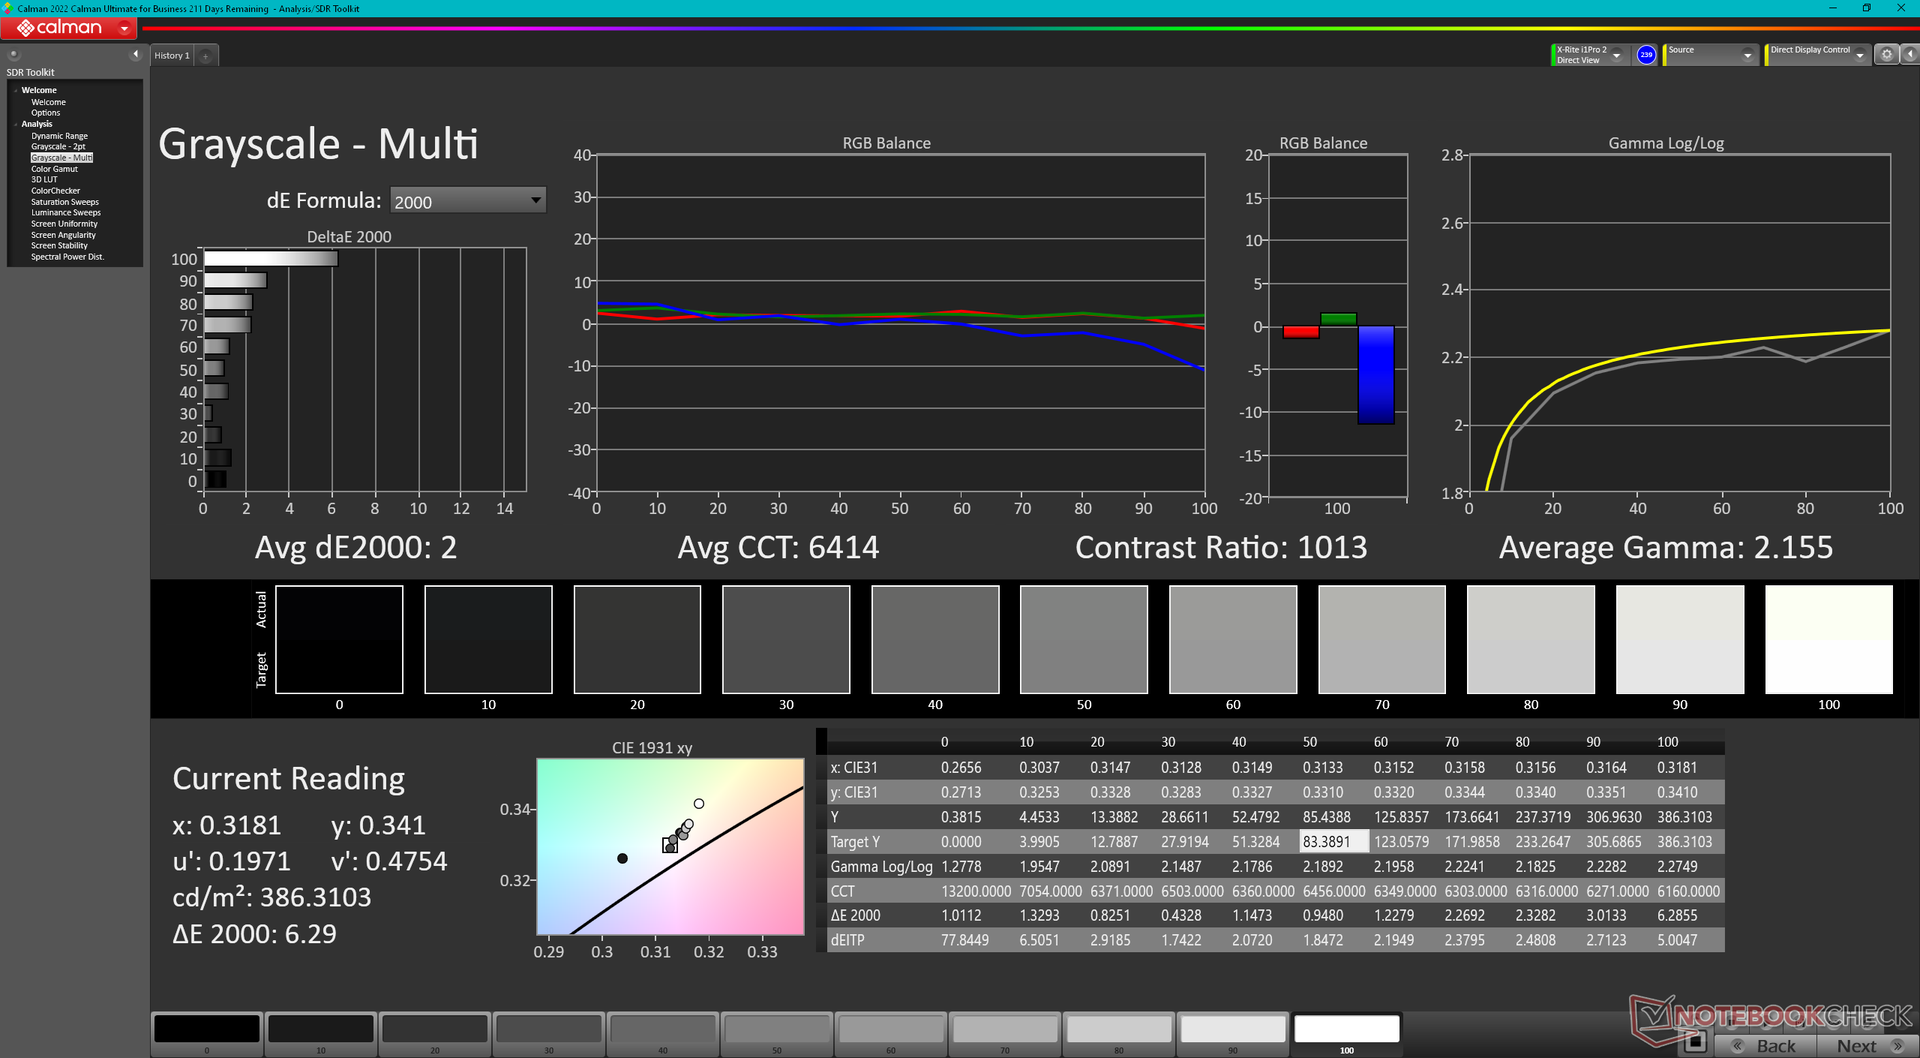
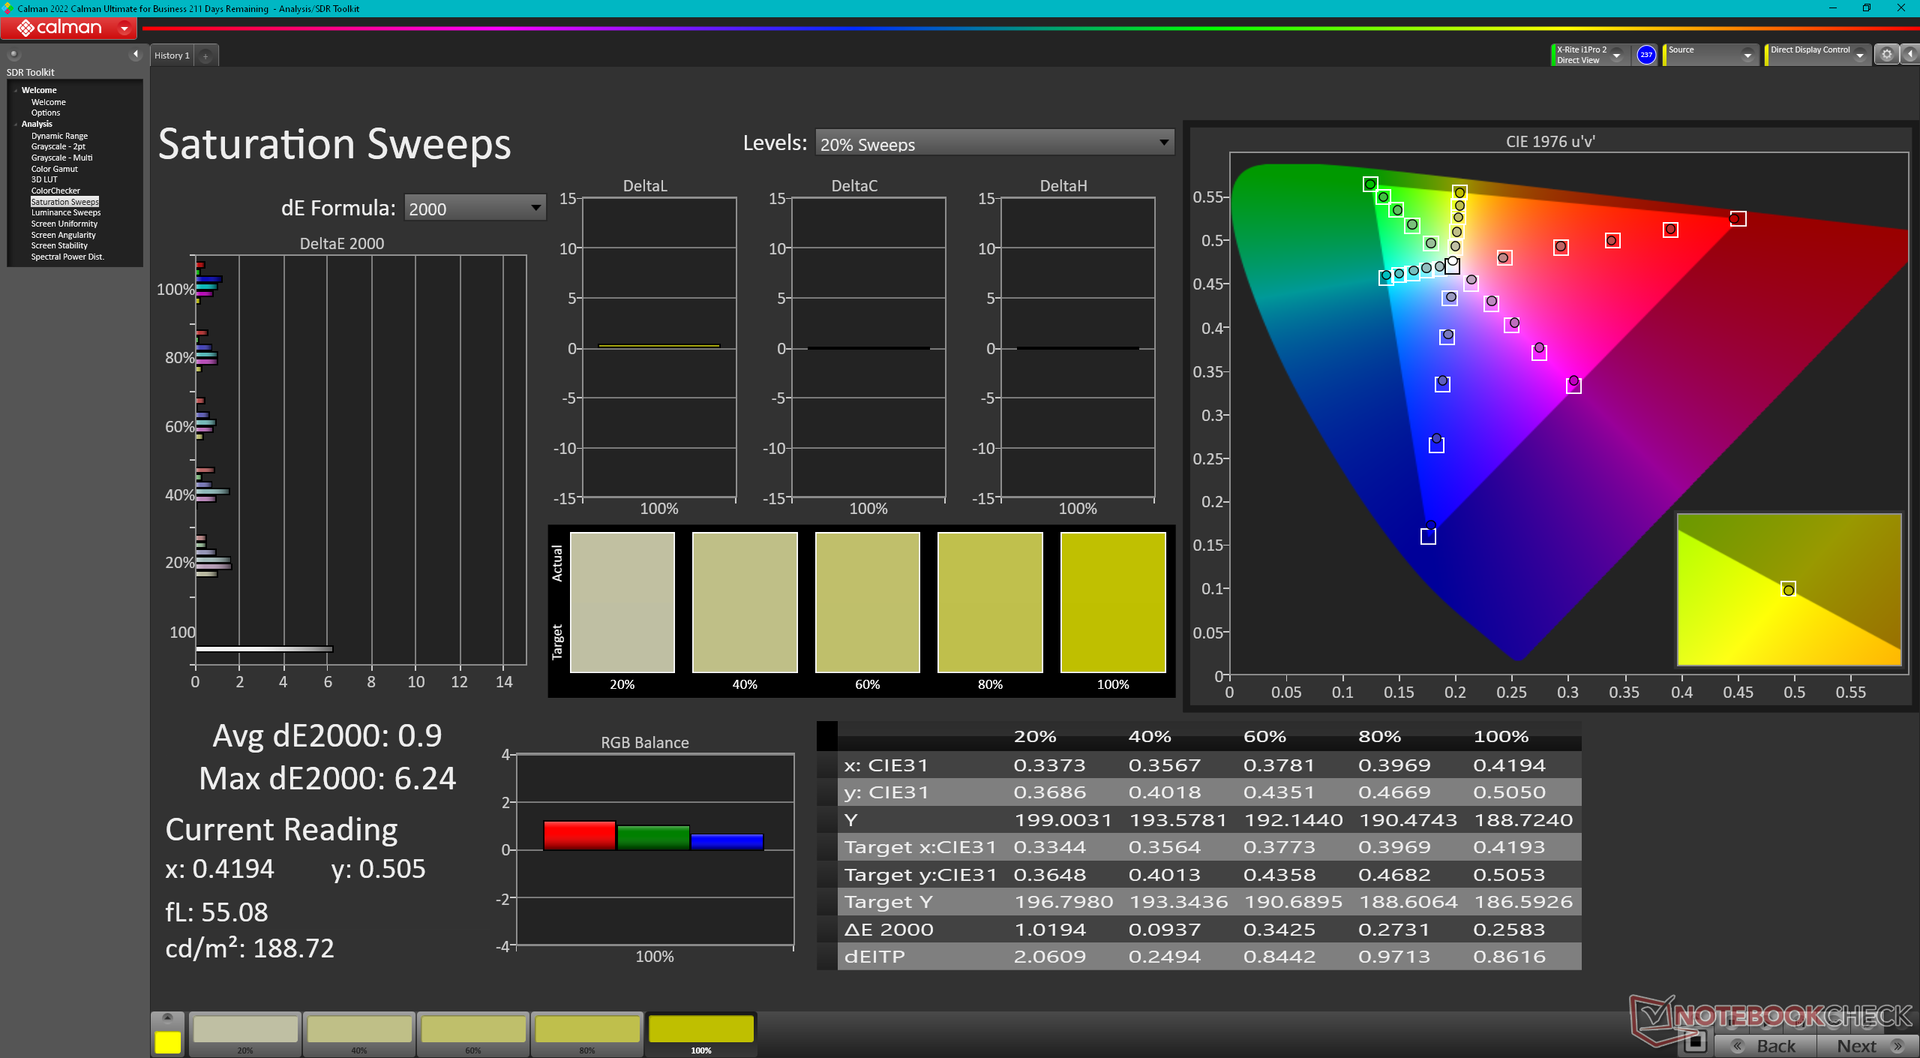
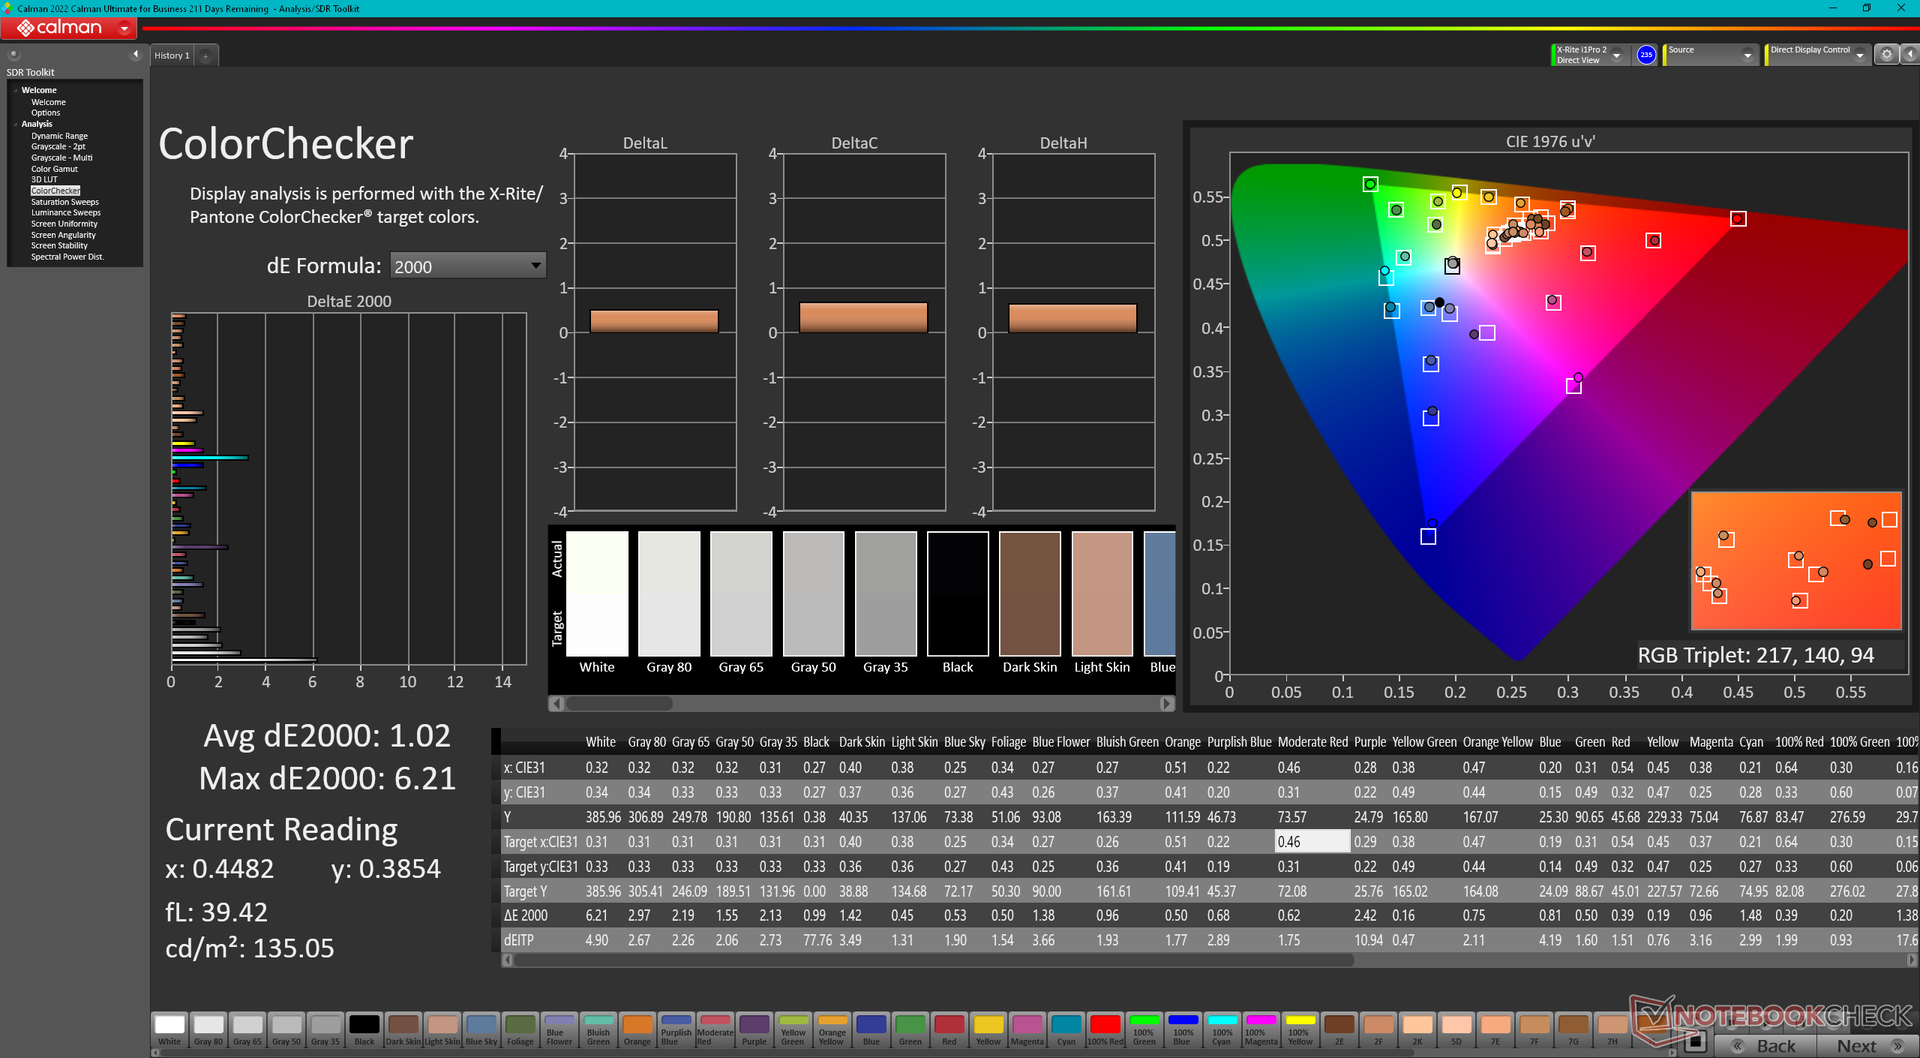
La pantalla está configurada por defecto con colores P3. Aunque la precisión del color no es mala, el modelo no viene calibrado de fábrica, a diferencia de la Serie MSI Creator. Recomendamos aplicar nuestro perfil ICM calibrado más arriba para obtener colores más precisos del panel, especialmente porque cubre sRGB y P3 por completo. Con nuestro colorímetro X-Rite conseguimos reducir los valores DeltaE medios de escala de grises y color a sólo 2 y 1,02, respectivamente.
Tiempos de respuesta del display
| ↔ Tiempo de respuesta de Negro a Blanco | ||
|---|---|---|
| 6.4 ms ... subida ↗ y bajada ↘ combinada | ↗ 2.8 ms subida | 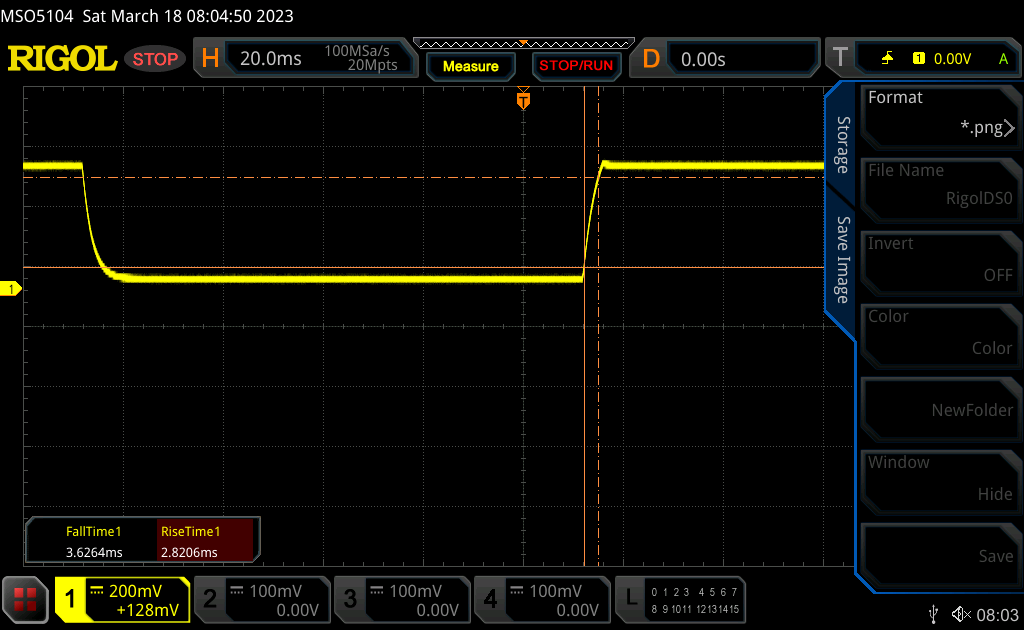 |
| ↘ 3.6 ms bajada | ||
| La pantalla mostró tiempos de respuesta muy rápidos en nuestros tests y debería ser adecuada para juegos frenéticos. En comparación, todos los dispositivos de prueba van de ##min### (mínimo) a 240 (máximo) ms. » 20 % de todos los dispositivos son mejores. Esto quiere decir que el tiempo de respuesta medido es mejor que la media (19.8 ms) de todos los dispositivos testados. | ||
| ↔ Tiempo de respuesta 50% Gris a 80% Gris | ||
| 4.2 ms ... subida ↗ y bajada ↘ combinada | ↗ 1.9 ms subida | 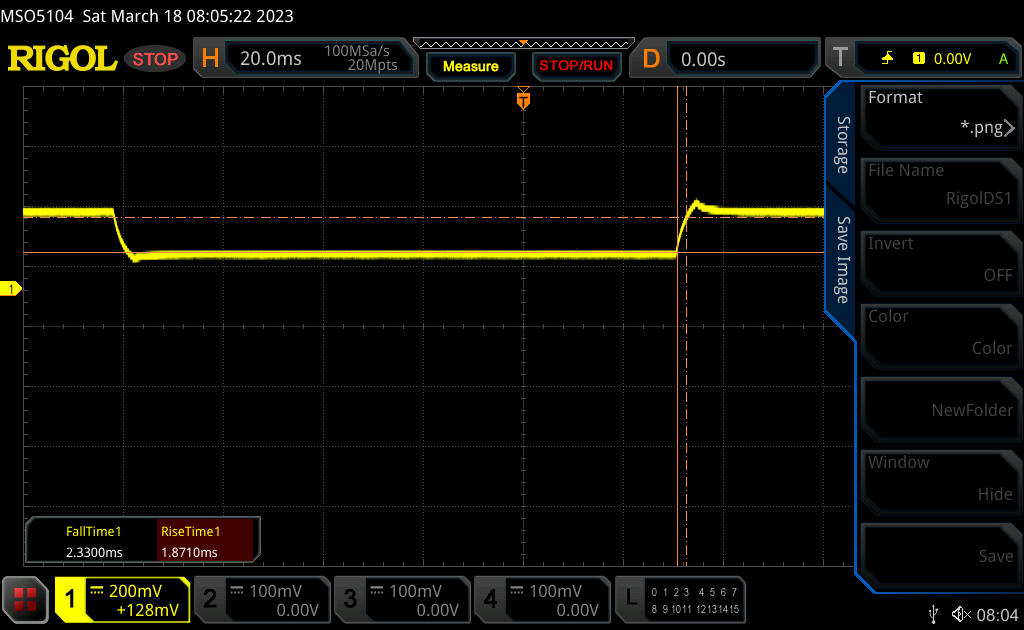 |
| ↘ 2.3 ms bajada | ||
| La pantalla mostró tiempos de respuesta muy rápidos en nuestros tests y debería ser adecuada para juegos frenéticos. En comparación, todos los dispositivos de prueba van de ##min### (mínimo) a 636 (máximo) ms. » 16 % de todos los dispositivos son mejores. Esto quiere decir que el tiempo de respuesta medido es mejor que la media (30.9 ms) de todos los dispositivos testados. | ||
Parpadeo de Pantalla / PWM (Pulse-Width Modulation)
| Parpadeo de Pantalla / PWM no detectado |  | ||
Comparación: 52 % de todos los dispositivos testados no usaron PWM para atenuar el display. Si se usó, medimos una media de 7744 (mínimo: 5 - máxmo: 343500) Hz. | |||
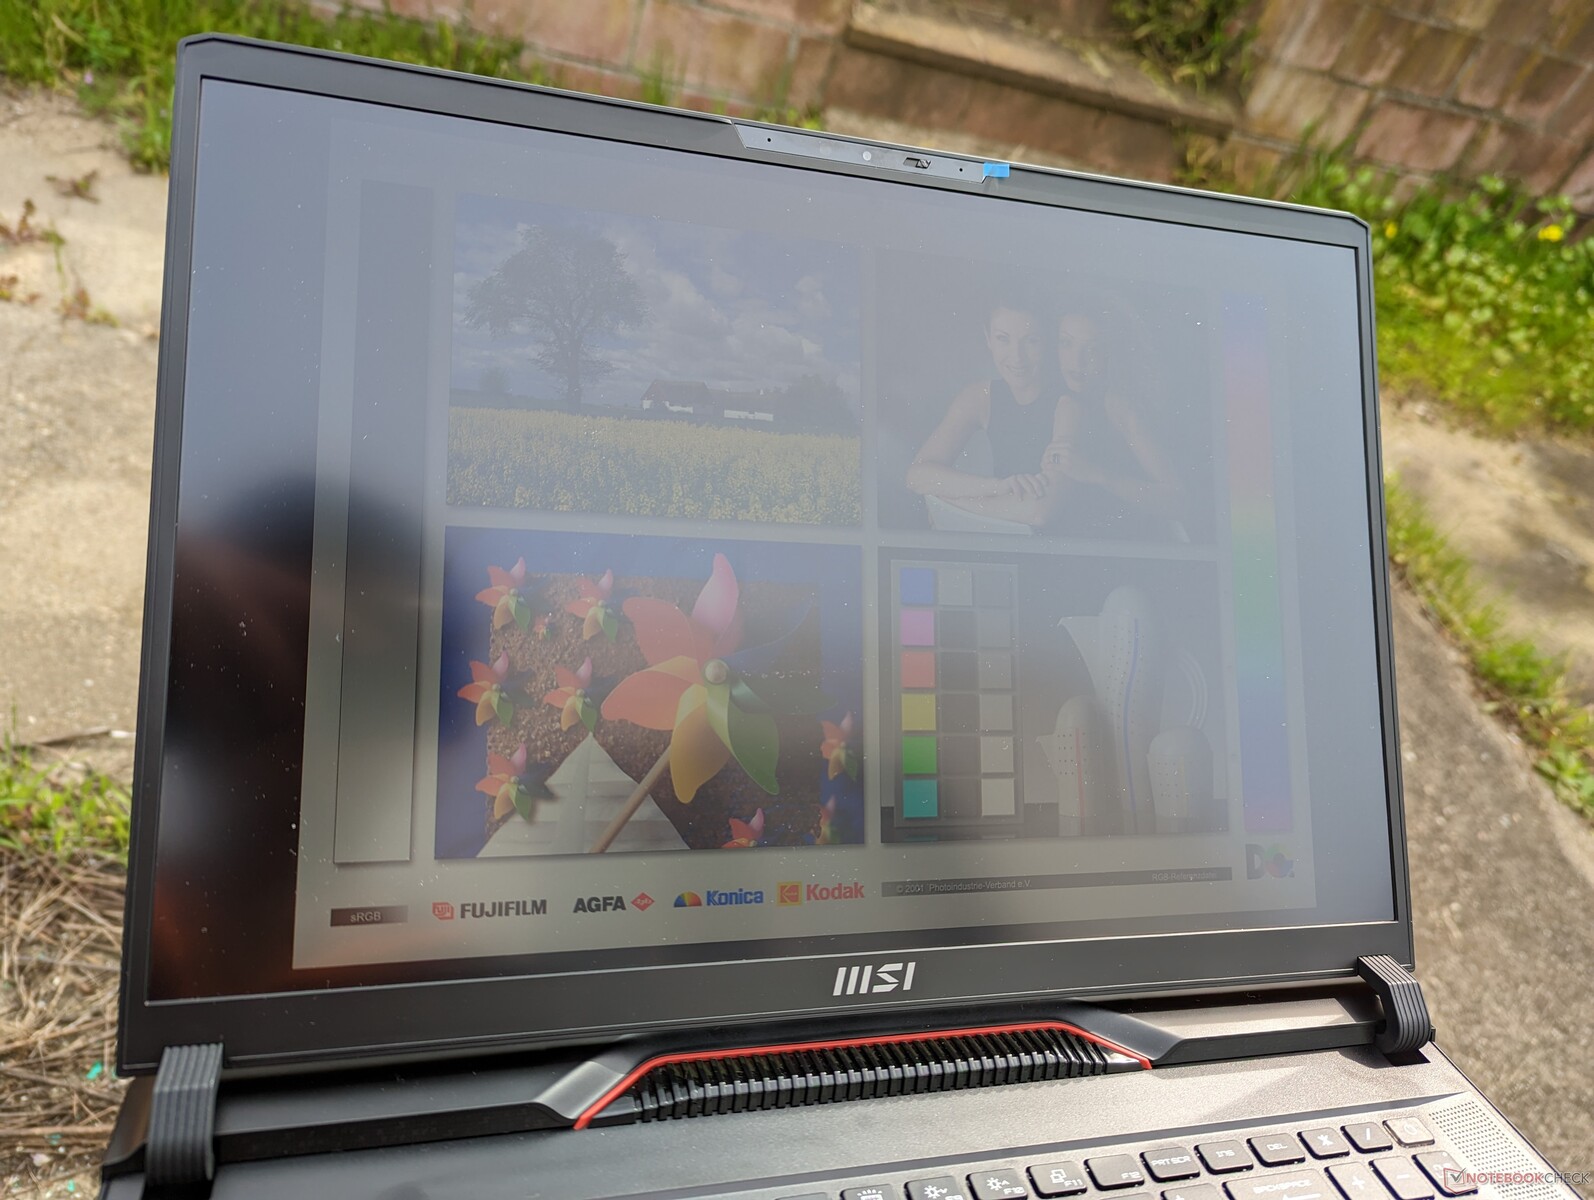
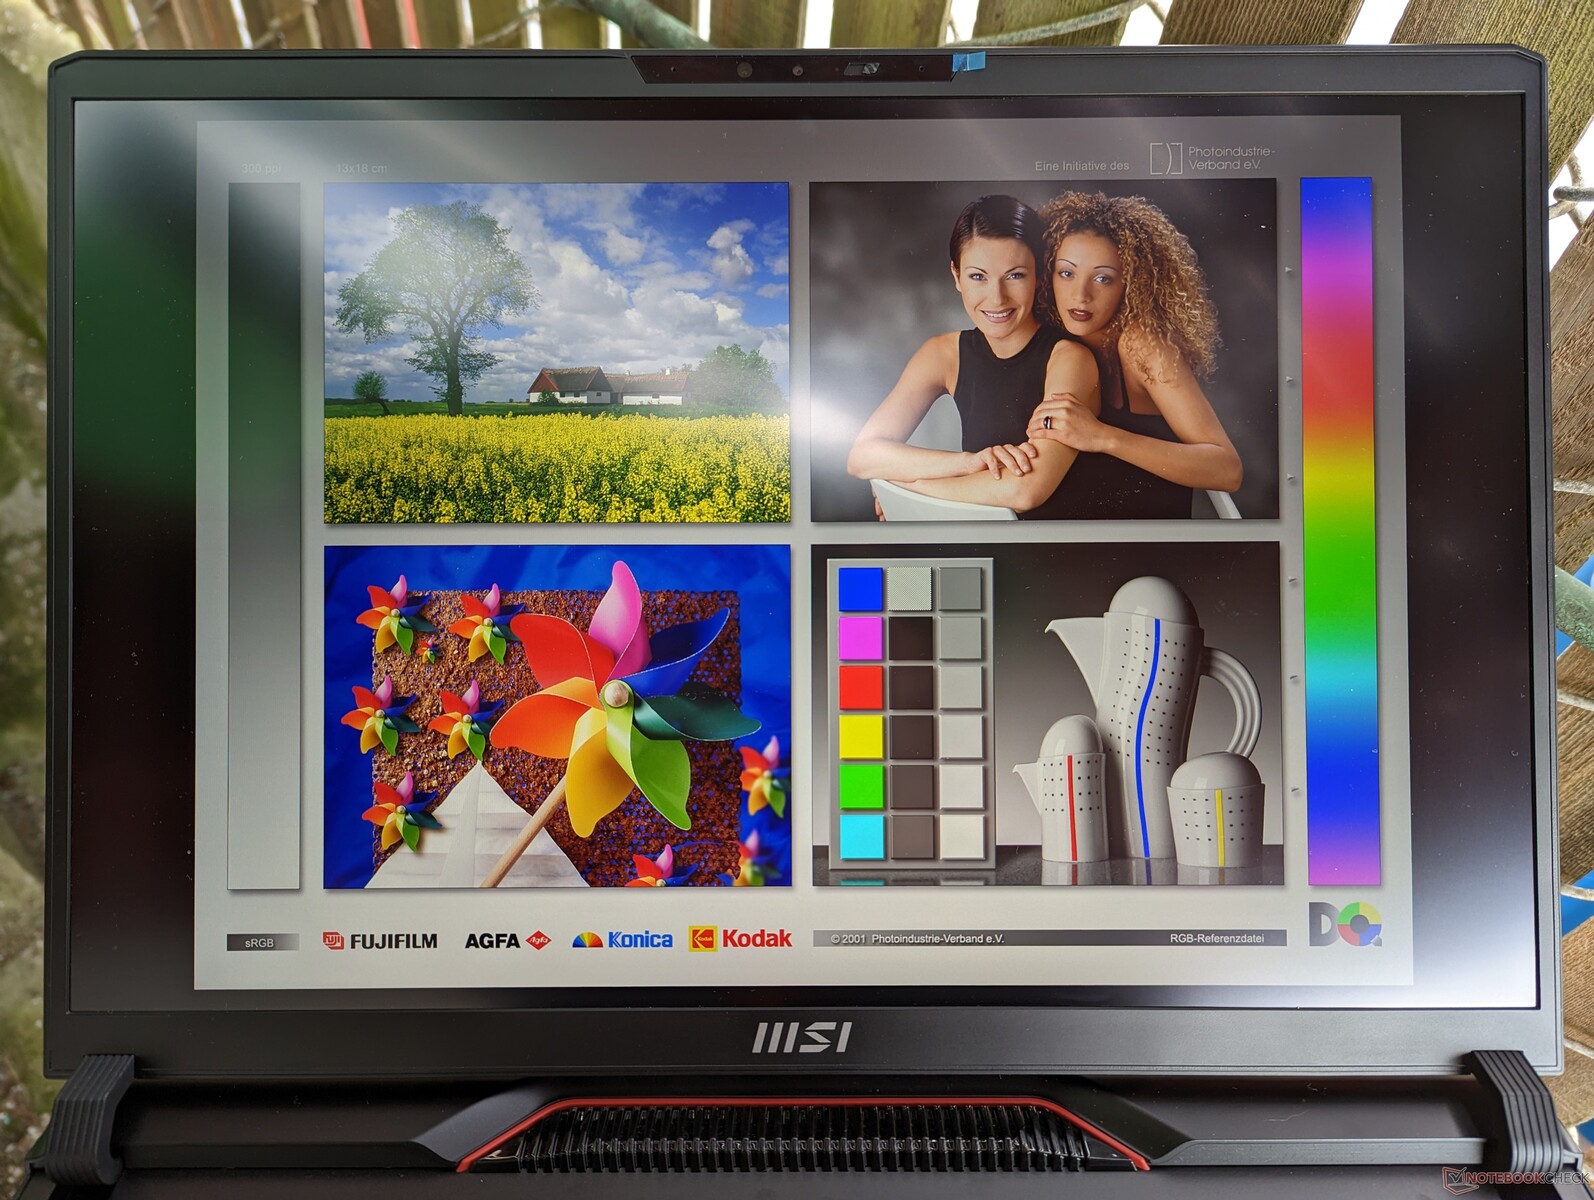
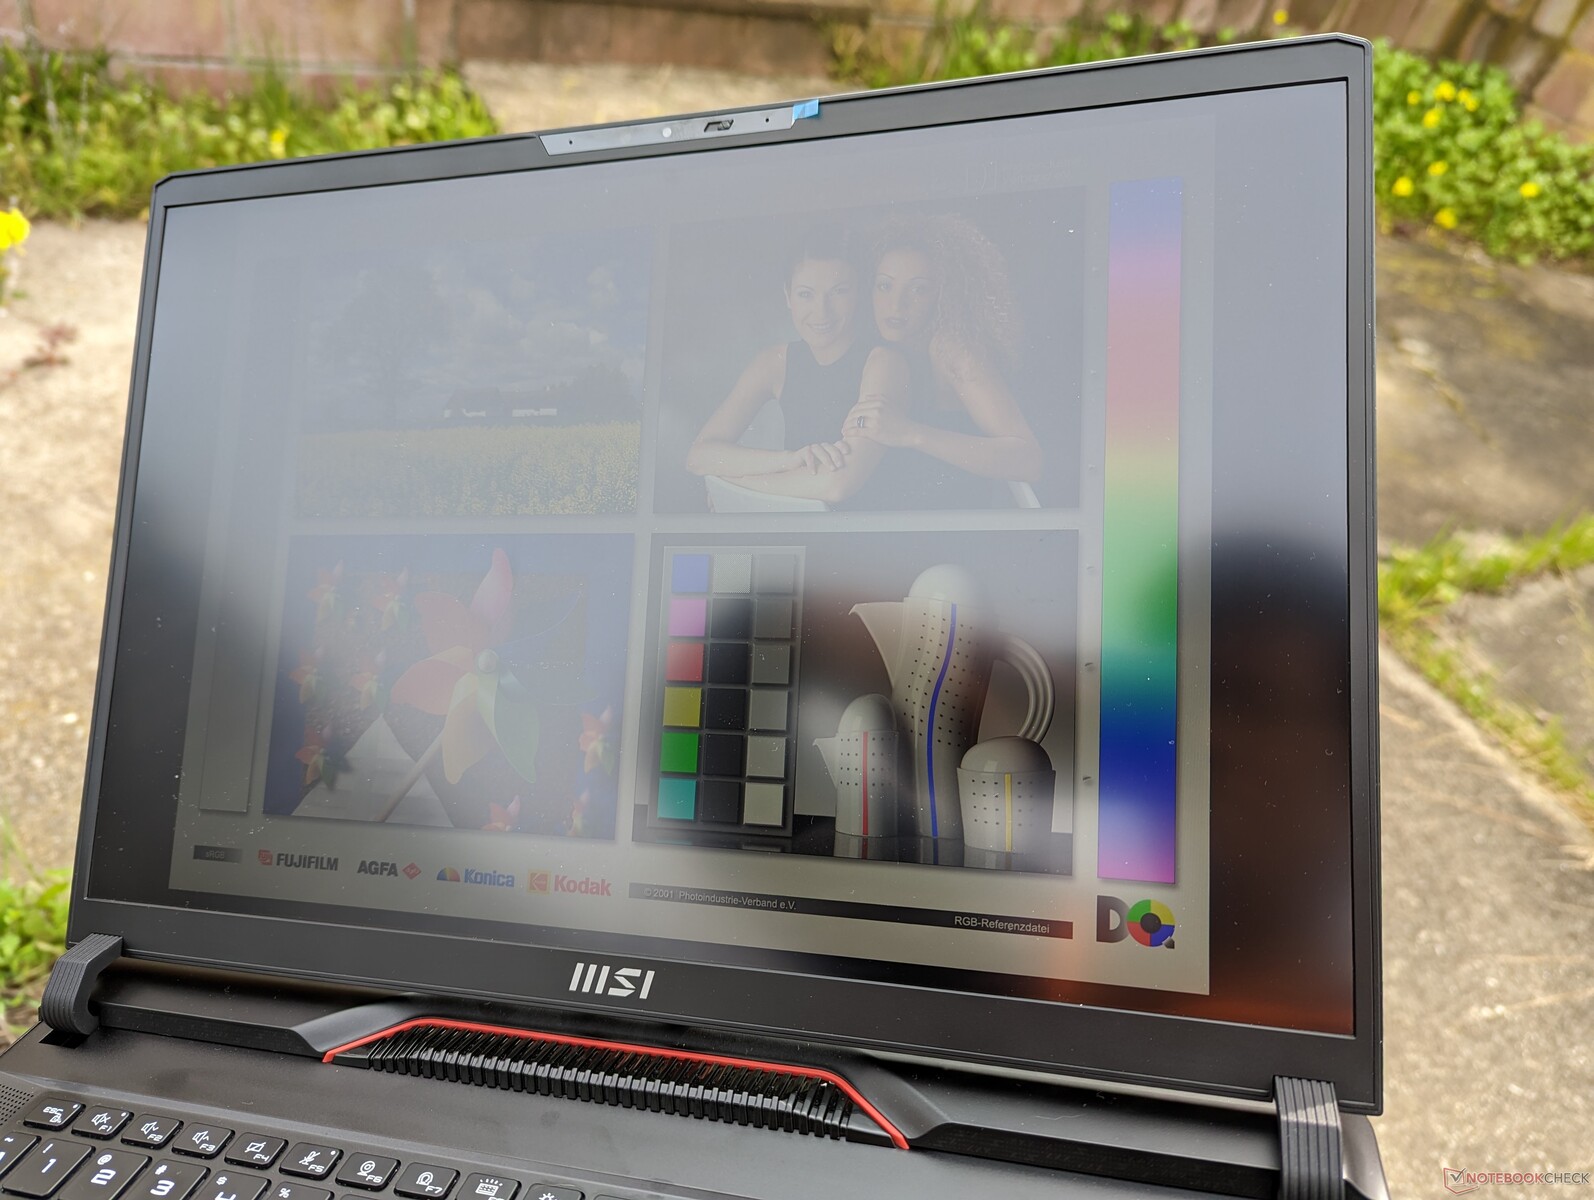
La visibilidad en exteriores sigue siendo prácticamente la misma que en la GE77. El panel mini-LED delTitan GT77 es aún más brillante en 1,5 veces para una mejor visibilidad en exteriores, pero el modelo en sí es mucho más grande que nuestro GE78.
Rendimiento - Intel 13th Gen + Mobile GeForce RTX 40
Condiciones de ensayo
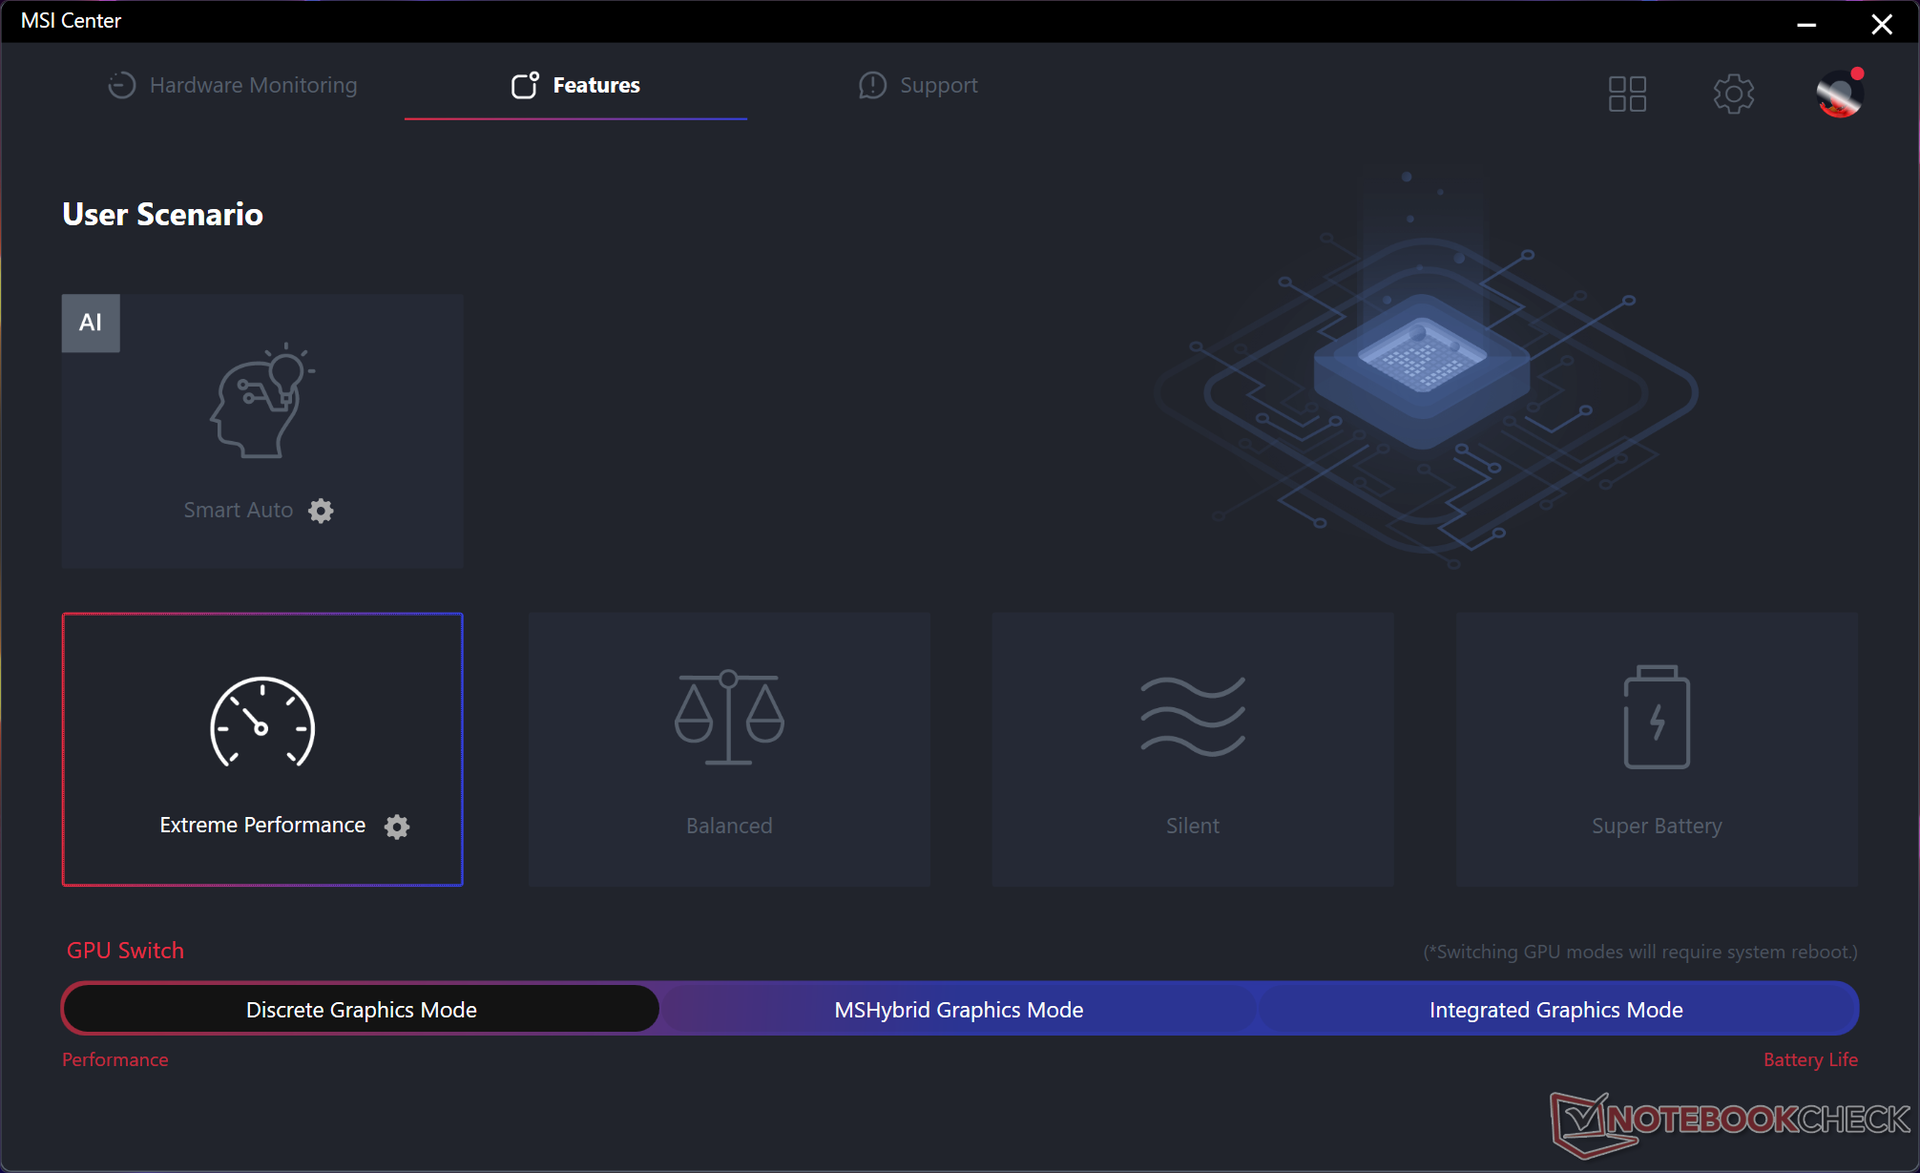
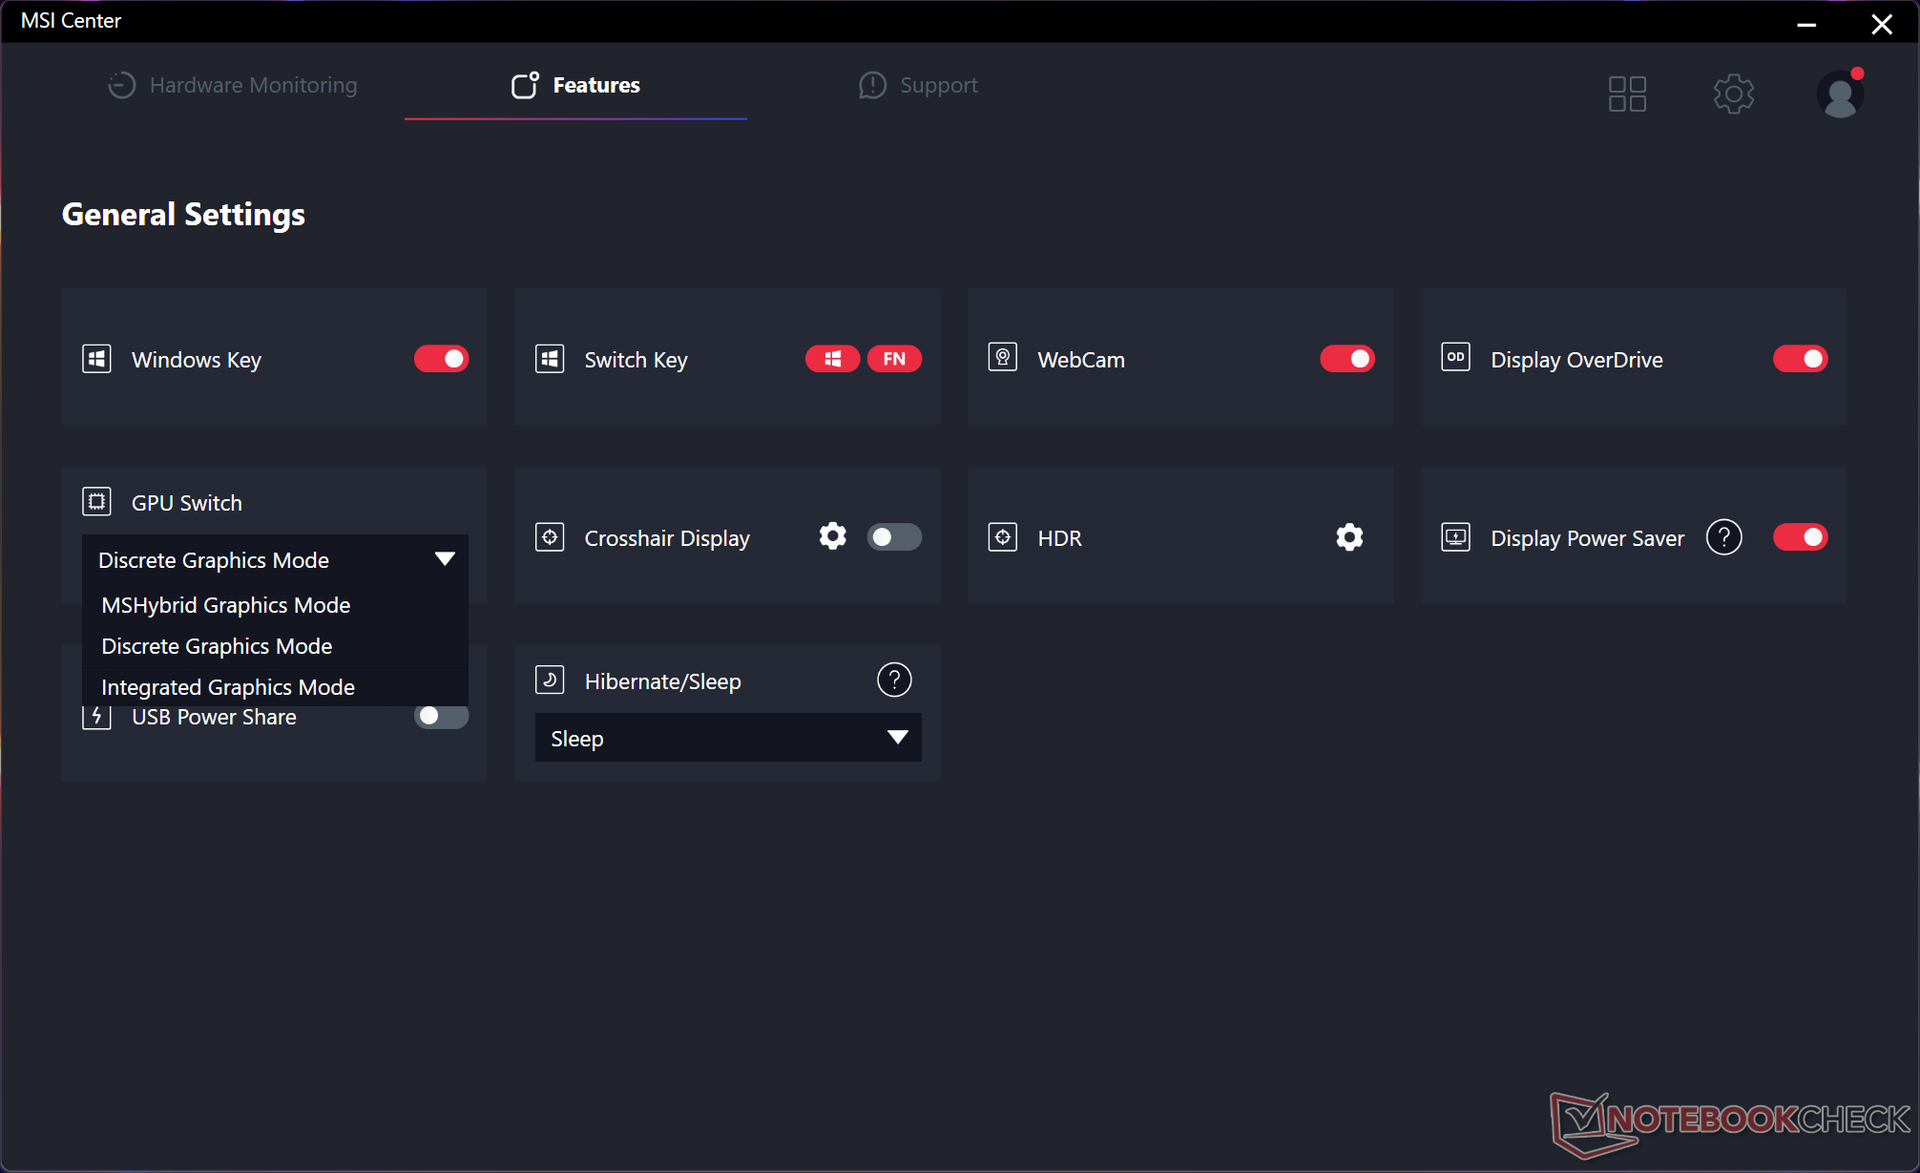
Pusimos nuestra unidad en modo Rendimiento Extremo, modo Ventilador Automático, modo Gráficos Discretos y modo Mejor Rendimiento de Windows antes de ejecutar los benchmarks a continuación. Lamentablemente, los modos de energía de MSI no se sincronizan con Windows, por lo que es posible tener MSI Center en modo de rendimiento extremo y Windows en modo de ahorro de energía simultáneamente.
Hay otro modo de ventilador disponible llamado modo Cooler Boost que eleva los ventiladores a sus RPM más altas independientemente de la actividad en pantalla. Esto no necesariamente mejora el rendimiento, sin embargo, como nuestra sección de prueba de estrés a continuación se mostrará.
Ten en cuenta que MSI Center se pondrá automáticamente en modo Rendimiento Extremo cuando se ejecute en modo Gráficos Discretos incluso cuando le digas al software que se ejecute en modo Equilibrado. Sería mejor simplemente desactivar cualquier opción de modo de rendimiento si son incompatibles con la selección de GPU actual para evitar confusiones.
Advanced Optimus no está soportado, por lo que se requiere un reinicio al cambiar entre la GPU discreta (MUX) y el modo MS Hybrid. G-Sync no es compatible con la pantalla interna.
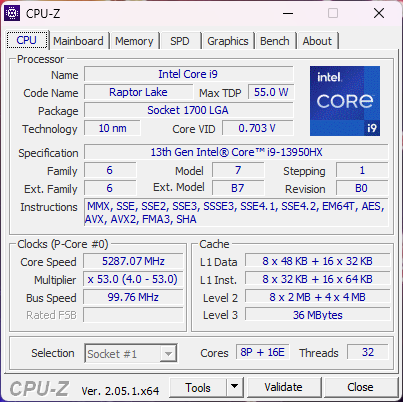
Procesador
El rendimiento bruto de la CPU es uno de los más rápidos de cualquier portátil, independientemente de su tamaño o fabricante. La 13ª generación Core i9-13950HX de nuestro MSI superaría al último Zen 4 Ryzen 9 7945HX del competidor Asus ROG Strix G17 G713PI hasta en un 5% y un 15% en las pruebas multihilo y monohilo, respectivamente. Las mejoras interanuales con respecto al anterior 12ª generación Core i9-12900HX en el GE77 del año pasado también es significativa: un 45%.
Por muy impresionante que sea el Core i9-13950HX, es posible que los compradores potenciales quieran tener en cuenta el Core i9-13900HX de menor potencia Core i9-13900HX ya que las diferencias de rendimiento entre ambos procesadores son de apenas un 5%.
Cinebench R15 Multi Loop
Cinebench R23: Multi Core | Single Core
Cinebench R20: CPU (Multi Core) | CPU (Single Core)
Cinebench R15: CPU Multi 64Bit | CPU Single 64Bit
Blender: v2.79 BMW27 CPU
7-Zip 18.03: 7z b 4 | 7z b 4 -mmt1
Geekbench 5.5: Multi-Core | Single-Core
HWBOT x265 Benchmark v2.2: 4k Preset
LibreOffice : 20 Documents To PDF
R Benchmark 2.5: Overall mean
* ... más pequeño es mejor
AIDA64: FP32 Ray-Trace | FPU Julia | CPU SHA3 | CPU Queen | FPU SinJulia | FPU Mandel | CPU AES | CPU ZLib | FP64 Ray-Trace | CPU PhotoWorxx
| Performance rating | |
| Asus ROG Strix G17 G713PI | |
| Eluktronics Mech-17 GP2 | |
| MSI GE78HX 13VH-070US | |
| MSI Titan GT77 HX 13VI | |
| Medio Intel Core i9-13950HX | |
| MSI Raider GE77 HX 12UHS | |
| Razer Blade 17 Early 2022 | |
| AIDA64 / FP32 Ray-Trace | |
| Asus ROG Strix G17 G713PI | |
| MSI Titan GT77 HX 13VI | |
| MSI GE78HX 13VH-070US | |
| Eluktronics Mech-17 GP2 | |
| Medio Intel Core i9-13950HX (17993 - 28957, n=9) | |
| MSI Raider GE77 HX 12UHS | |
| Razer Blade 17 Early 2022 | |
| AIDA64 / FPU Julia | |
| Asus ROG Strix G17 G713PI | |
| MSI Titan GT77 HX 13VI | |
| MSI GE78HX 13VH-070US | |
| Eluktronics Mech-17 GP2 | |
| Medio Intel Core i9-13950HX (89362 - 144303, n=9) | |
| MSI Raider GE77 HX 12UHS | |
| Razer Blade 17 Early 2022 | |
| AIDA64 / CPU SHA3 | |
| Asus ROG Strix G17 G713PI | |
| MSI Titan GT77 HX 13VI | |
| Eluktronics Mech-17 GP2 | |
| MSI GE78HX 13VH-070US | |
| Medio Intel Core i9-13950HX (4518 - 7093, n=9) | |
| MSI Raider GE77 HX 12UHS | |
| Razer Blade 17 Early 2022 | |
| AIDA64 / CPU Queen | |
| Asus ROG Strix G17 G713PI | |
| Eluktronics Mech-17 GP2 | |
| MSI GE78HX 13VH-070US | |
| MSI Titan GT77 HX 13VI | |
| Medio Intel Core i9-13950HX (131931 - 140103, n=8) | |
| MSI Raider GE77 HX 12UHS | |
| Razer Blade 17 Early 2022 | |
| AIDA64 / FPU SinJulia | |
| Asus ROG Strix G17 G713PI | |
| Eluktronics Mech-17 GP2 | |
| MSI Titan GT77 HX 13VI | |
| MSI GE78HX 13VH-070US | |
| Medio Intel Core i9-13950HX (12318 - 17057, n=9) | |
| MSI Raider GE77 HX 12UHS | |
| Razer Blade 17 Early 2022 | |
| AIDA64 / FPU Mandel | |
| Asus ROG Strix G17 G713PI | |
| MSI Titan GT77 HX 13VI | |
| MSI GE78HX 13VH-070US | |
| Eluktronics Mech-17 GP2 | |
| Medio Intel Core i9-13950HX (44372 - 71038, n=9) | |
| MSI Raider GE77 HX 12UHS | |
| Razer Blade 17 Early 2022 | |
| AIDA64 / CPU AES | |
| Eluktronics Mech-17 GP2 | |
| MSI Raider GE77 HX 12UHS | |
| Asus ROG Strix G17 G713PI | |
| Medio Intel Core i9-13950HX (99981 - 204491, n=9) | |
| MSI Titan GT77 HX 13VI | |
| MSI GE78HX 13VH-070US | |
| Razer Blade 17 Early 2022 | |
| AIDA64 / CPU ZLib | |
| Asus ROG Strix G17 G713PI | |
| MSI GE78HX 13VH-070US | |
| MSI Titan GT77 HX 13VI | |
| Eluktronics Mech-17 GP2 | |
| Medio Intel Core i9-13950HX (1263 - 2069, n=9) | |
| MSI Raider GE77 HX 12UHS | |
| Razer Blade 17 Early 2022 | |
| AIDA64 / FP64 Ray-Trace | |
| Asus ROG Strix G17 G713PI | |
| MSI Titan GT77 HX 13VI | |
| MSI GE78HX 13VH-070US | |
| Eluktronics Mech-17 GP2 | |
| Medio Intel Core i9-13950HX (9649 - 15573, n=9) | |
| MSI Raider GE77 HX 12UHS | |
| Razer Blade 17 Early 2022 | |
| AIDA64 / CPU PhotoWorxx | |
| MSI GE78HX 13VH-070US | |
| Medio Intel Core i9-13950HX (40233 - 50864, n=9) | |
| MSI Raider GE77 HX 12UHS | |
| Eluktronics Mech-17 GP2 | |
| MSI Titan GT77 HX 13VI | |
| Razer Blade 17 Early 2022 | |
| Asus ROG Strix G17 G713PI | |
Rendimiento del sistema
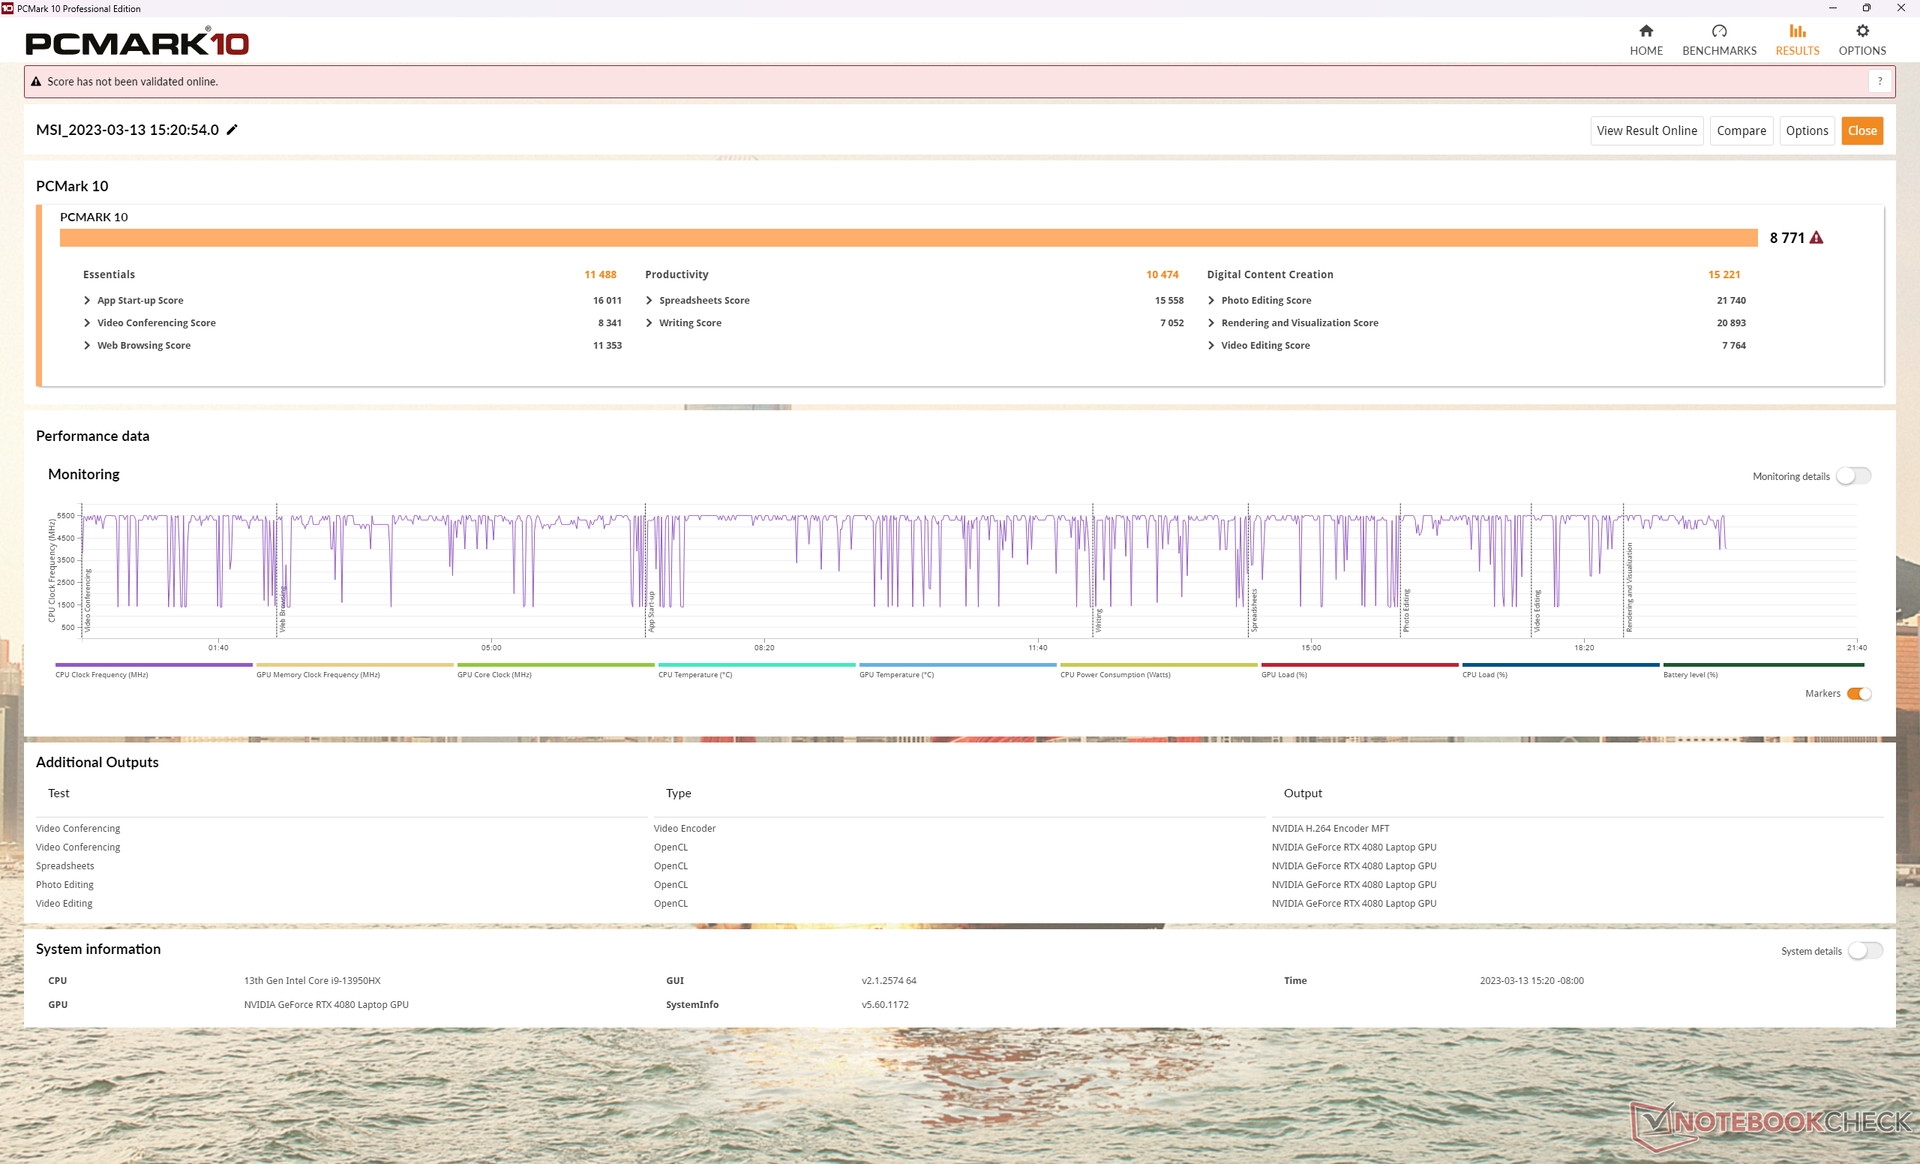
Los resultados de PCMark 10 son sistemáticamente superiores a los del GE77 con hardware de última generación, especialmente en la subprueba de contenido digital, en la que se favorece el rendimiento de la GPU.
Hemos experimentado un problema en nuestra unidad que a veces no se despierta de la suspensión que entonces requeriría un reinicio duro cada vez. Al parecer, el problema se producía con más frecuencia en el modo dGPU que en el modo MS Hybrid.
CrossMark: Overall | Productivity | Creativity | Responsiveness
| PCMark 10 / Score | |
| Eluktronics Mech-17 GP2 | |
| MSI Titan GT77 HX 13VI | |
| MSI GE78HX 13VH-070US | |
| Medio Intel Core i9-13950HX, NVIDIA GeForce RTX 4080 Laptop GPU (7888 - 8771, n=2) | |
| Asus ROG Strix G17 G713PI | |
| Razer Blade 17 Early 2022 | |
| MSI Raider GE77 HX 12UHS | |
| PCMark 10 / Essentials | |
| Eluktronics Mech-17 GP2 | |
| MSI Titan GT77 HX 13VI | |
| MSI GE78HX 13VH-070US | |
| Medio Intel Core i9-13950HX, NVIDIA GeForce RTX 4080 Laptop GPU (11078 - 11488, n=2) | |
| Asus ROG Strix G17 G713PI | |
| Razer Blade 17 Early 2022 | |
| MSI Raider GE77 HX 12UHS | |
| PCMark 10 / Productivity | |
| Asus ROG Strix G17 G713PI | |
| Eluktronics Mech-17 GP2 | |
| MSI GE78HX 13VH-070US | |
| MSI Titan GT77 HX 13VI | |
| MSI Raider GE77 HX 12UHS | |
| Medio Intel Core i9-13950HX, NVIDIA GeForce RTX 4080 Laptop GPU (8271 - 10474, n=2) | |
| Razer Blade 17 Early 2022 | |
| PCMark 10 / Digital Content Creation | |
| MSI Titan GT77 HX 13VI | |
| Eluktronics Mech-17 GP2 | |
| MSI GE78HX 13VH-070US | |
| Medio Intel Core i9-13950HX, NVIDIA GeForce RTX 4080 Laptop GPU (14535 - 15221, n=2) | |
| Razer Blade 17 Early 2022 | |
| MSI Raider GE77 HX 12UHS | |
| Asus ROG Strix G17 G713PI | |
| CrossMark / Overall | |
| Eluktronics Mech-17 GP2 | |
| MSI Raider GE77 HX 12UHS | |
| MSI Titan GT77 HX 13VI | |
| Asus ROG Strix G17 G713PI | |
| MSI GE78HX 13VH-070US | |
| Razer Blade 17 Early 2022 | |
| Medio Intel Core i9-13950HX, NVIDIA GeForce RTX 4080 Laptop GPU (1592 - 1899, n=2) | |
| CrossMark / Productivity | |
| MSI Raider GE77 HX 12UHS | |
| Eluktronics Mech-17 GP2 | |
| MSI Titan GT77 HX 13VI | |
| Asus ROG Strix G17 G713PI | |
| MSI GE78HX 13VH-070US | |
| Razer Blade 17 Early 2022 | |
| Medio Intel Core i9-13950HX, NVIDIA GeForce RTX 4080 Laptop GPU (1509 - 1846, n=2) | |
| CrossMark / Creativity | |
| Eluktronics Mech-17 GP2 | |
| MSI Titan GT77 HX 13VI | |
| MSI Raider GE77 HX 12UHS | |
| Asus ROG Strix G17 G713PI | |
| MSI GE78HX 13VH-070US | |
| Medio Intel Core i9-13950HX, NVIDIA GeForce RTX 4080 Laptop GPU (1780 - 2035, n=2) | |
| Razer Blade 17 Early 2022 | |
| CrossMark / Responsiveness | |
| MSI Raider GE77 HX 12UHS | |
| MSI Titan GT77 HX 13VI | |
| Eluktronics Mech-17 GP2 | |
| MSI GE78HX 13VH-070US | |
| Asus ROG Strix G17 G713PI | |
| Razer Blade 17 Early 2022 | |
| Medio Intel Core i9-13950HX, NVIDIA GeForce RTX 4080 Laptop GPU (1342 - 1681, n=2) | |
| PCMark 10 Score | 8771 puntos | |
ayuda | ||
| AIDA64 / Memory Copy | |
| MSI GE78HX 13VH-070US | |
| Medio Intel Core i9-13950HX (61938 - 78813, n=9) | |
| MSI Raider GE77 HX 12UHS | |
| Eluktronics Mech-17 GP2 | |
| MSI Titan GT77 HX 13VI | |
| Razer Blade 17 Early 2022 | |
| Asus ROG Strix G17 G713PI | |
| AIDA64 / Memory Read | |
| MSI GE78HX 13VH-070US | |
| Medio Intel Core i9-13950HX (62368 - 86831, n=9) | |
| Eluktronics Mech-17 GP2 | |
| MSI Raider GE77 HX 12UHS | |
| MSI Titan GT77 HX 13VI | |
| Razer Blade 17 Early 2022 | |
| Asus ROG Strix G17 G713PI | |
| AIDA64 / Memory Write | |
| MSI GE78HX 13VH-070US | |
| Medio Intel Core i9-13950HX (59501 - 80441, n=9) | |
| Eluktronics Mech-17 GP2 | |
| MSI Raider GE77 HX 12UHS | |
| MSI Titan GT77 HX 13VI | |
| Asus ROG Strix G17 G713PI | |
| Razer Blade 17 Early 2022 | |
| AIDA64 / Memory Latency | |
| MSI Titan GT77 HX 13VI | |
| Medio Intel Core i9-13950HX (84.4 - 99.5, n=9) | |
| Eluktronics Mech-17 GP2 | |
| Asus ROG Strix G17 G713PI | |
| MSI GE78HX 13VH-070US | |
| MSI Raider GE77 HX 12UHS | |
* ... más pequeño es mejor
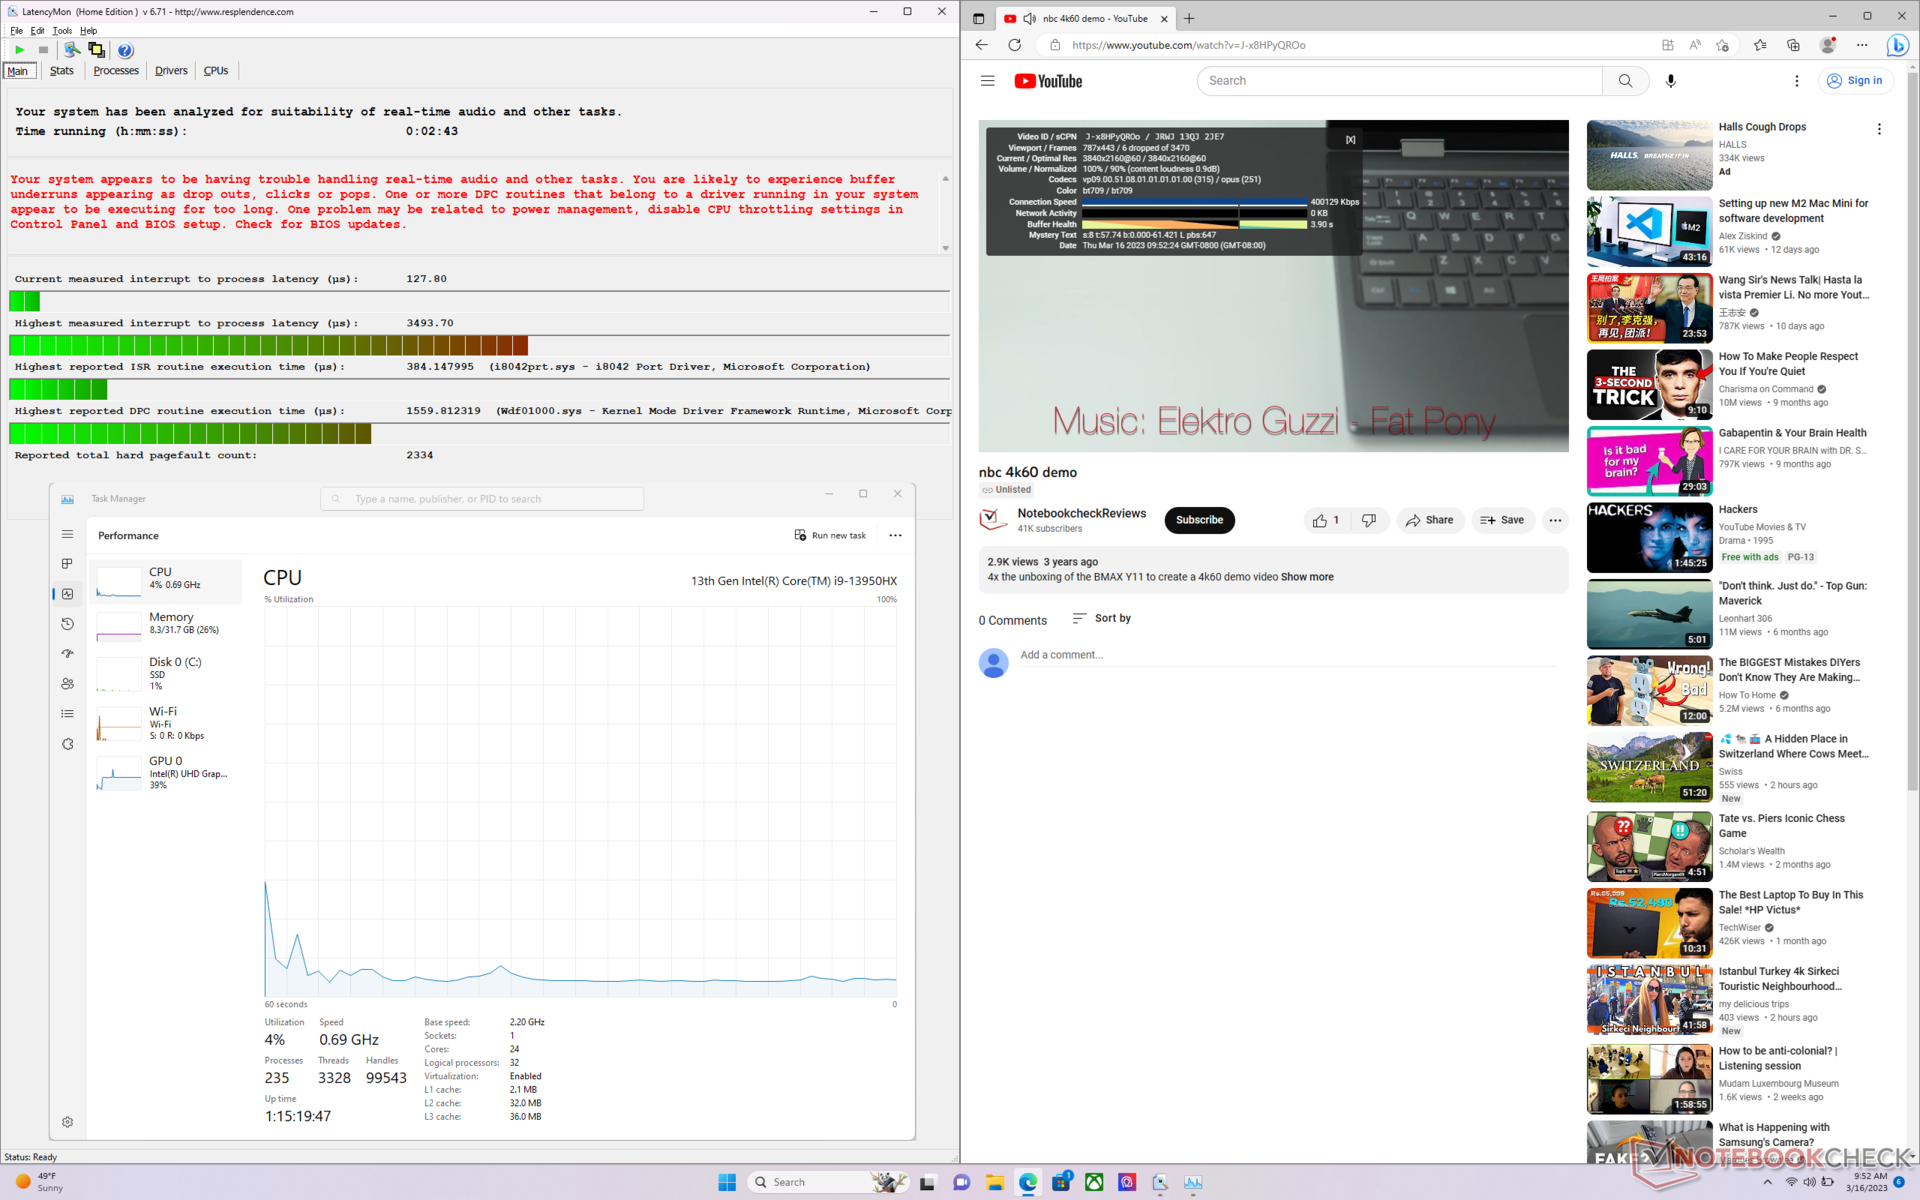
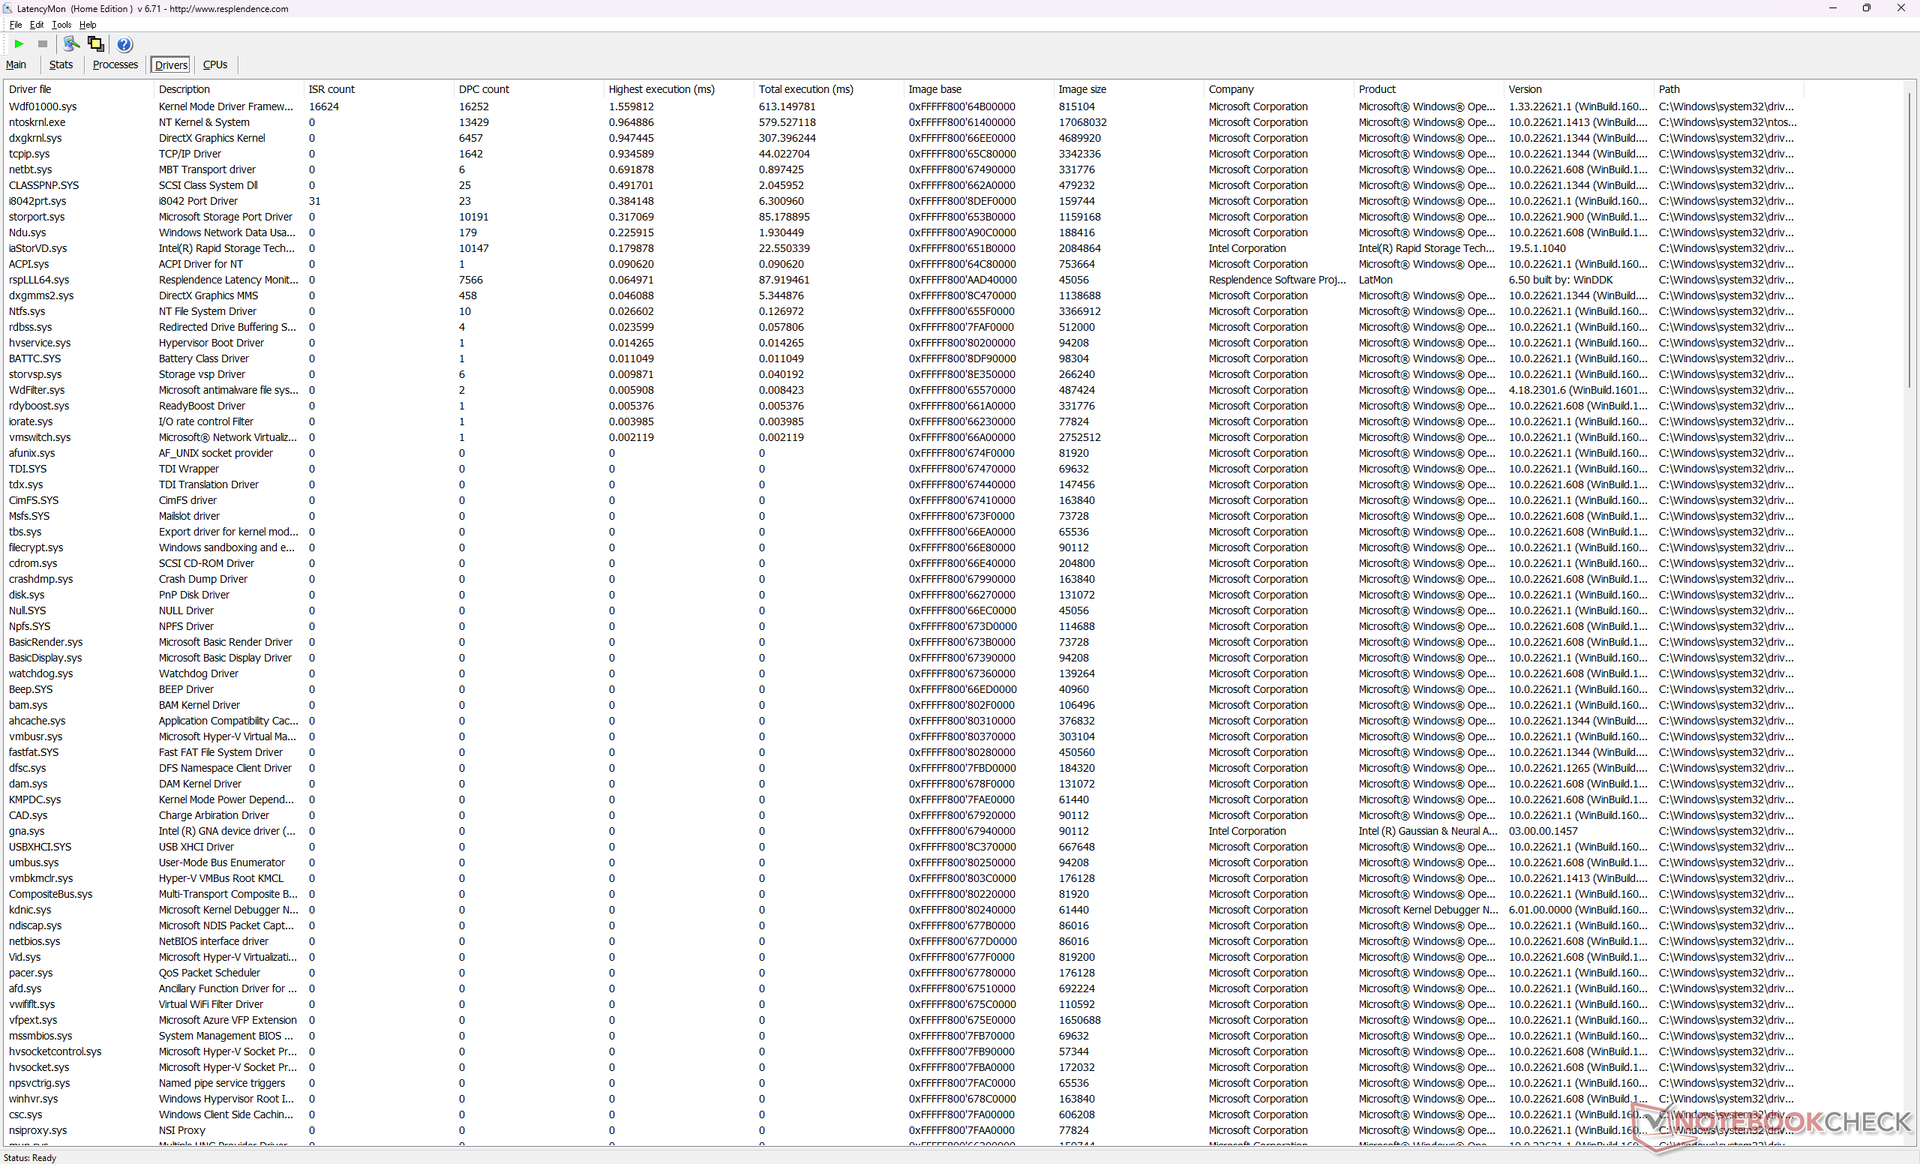
Latencia del CPD
LatencyMon revela problemas de DPC al abrir varias pestañas del navegador de nuestra página de inicio, incluso cuando se establece sólo en la iGPU. Nvidia ha reconocido un error en sus últimos controladores gráficos que también resulta en altas latencias DPC.
la reproducción de vídeo 4K a 60 FPS es imperfecta, con 6 fotogramas perdidos durante nuestro vídeo de prueba de un minuto de duración. Repetir la prueba no mejoraría nuestros resultados.
| DPC Latencies / LatencyMon - interrupt to process latency (max), Web, Youtube, Prime95 | |
| MSI Titan GT77 HX 13VI | |
| MSI GE78HX 13VH-070US | |
| MSI Raider GE77 HX 12UHS | |
| Asus ROG Strix G17 G713PI | |
| Eluktronics Mech-17 GP2 | |
| Razer Blade 17 Early 2022 | |
* ... más pequeño es mejor
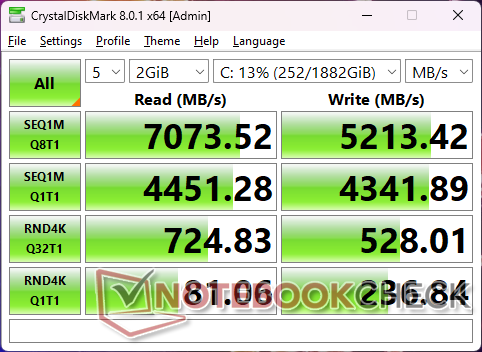
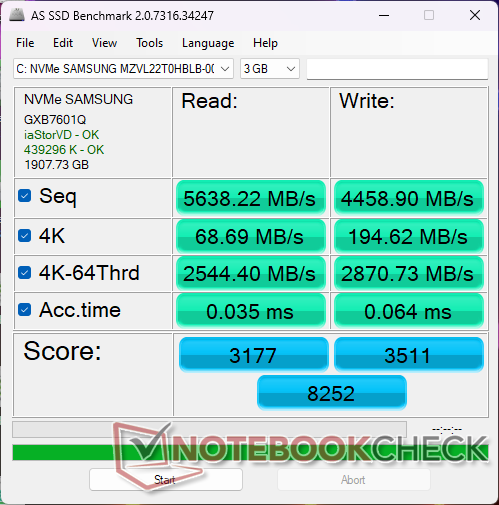
Dispositivos de almacenamiento: preparados para las SSD PCIe5
Nuestra unidad de prueba se entrega con un 2 TB Samsung PM9A1 que es uno de los SSD NVMe PCIe4 x4 más rápidos disponibles. La unidad no tuvo problemas para mantener tasas de transferencia de más de 7000 MB/s incluso bajo estrés, como muestran los resultados de nuestro bucle DiskSpd. Esto es de esperar ya que el GE78 puede soportar SSDs PCIe5 aún más rápidos una vez que estén ampliamente disponibles.

| Drive Performance rating - Percent | |
| MSI Raider GE77 HX 12UHS | |
| Razer Blade 17 Early 2022 | |
| MSI GE78HX 13VH-070US | |
| MSI Titan GT77 HX 13VI | |
| Eluktronics Mech-17 GP2 | |
| Asus ROG Strix G17 G713PI | |
* ... más pequeño es mejor
Disk Throttling: DiskSpd Read Loop, Queue Depth 8
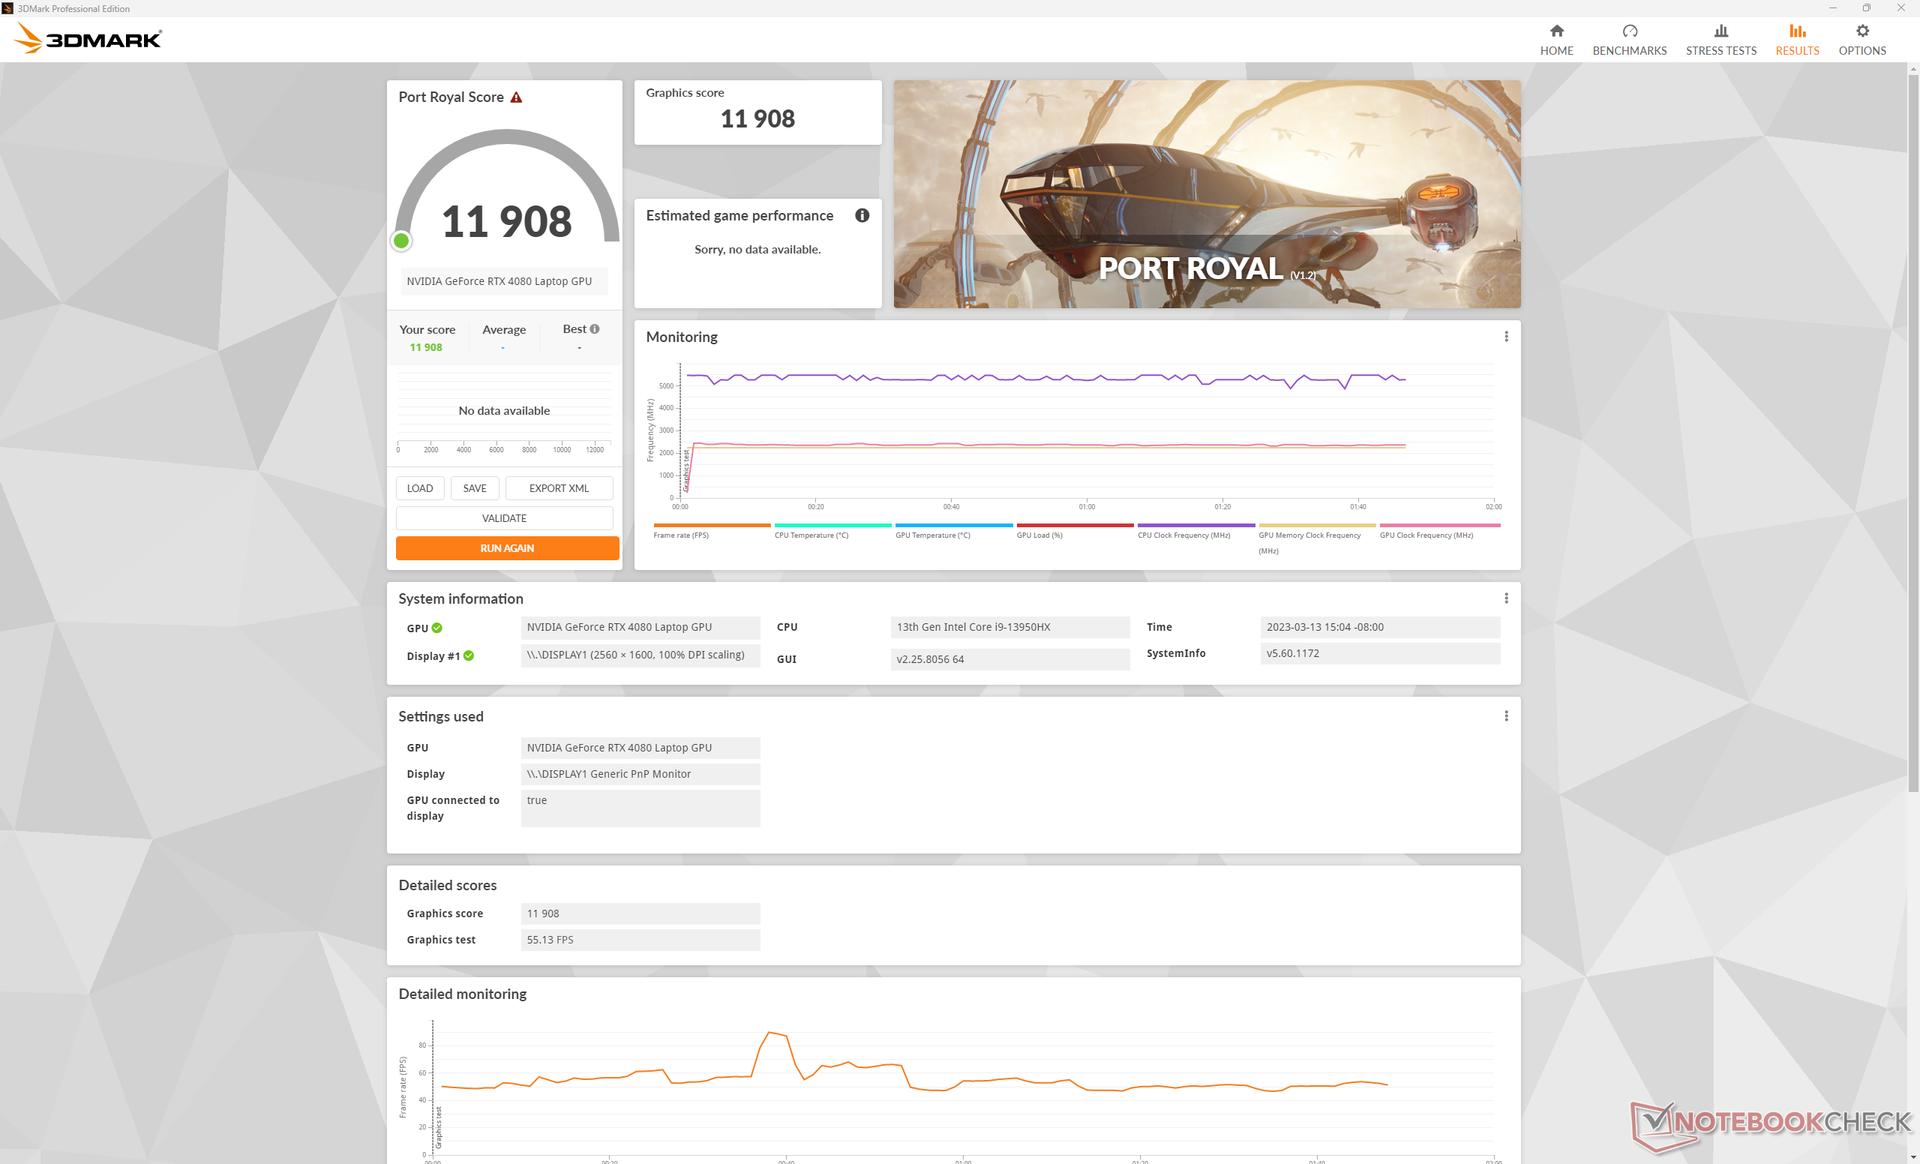
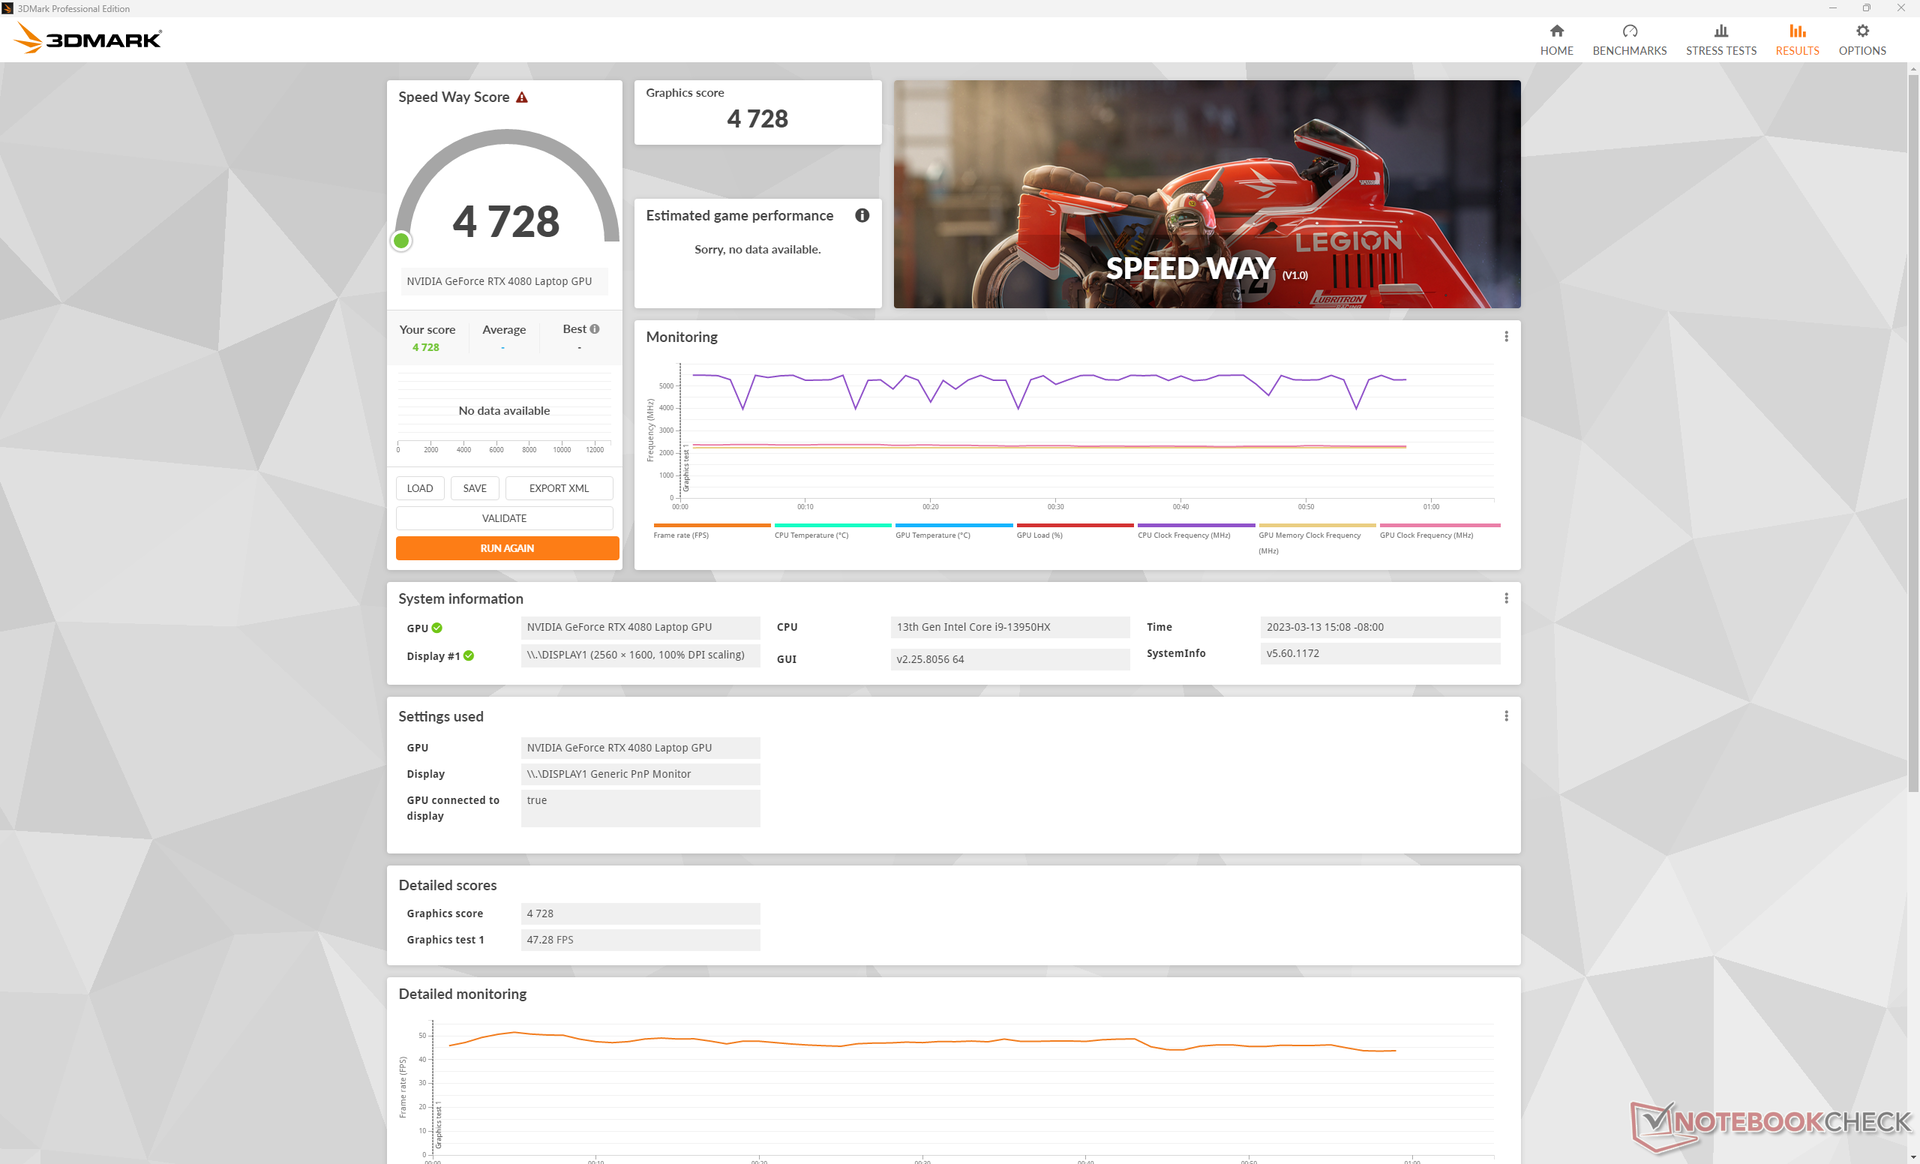
Rendimiento de la GPU - Gráficos de 175 W
El modelo ofrece actualmente tres opciones de GPU móviles: la GeForce RTX 4070, 4080o 4090. El salto de la 4070 a la 4080 aumentará el rendimiento entre un 40 y un 60 por ciento, mientras que el salto de la 4080 a la 4090 sólo lo hará en un 10 por ciento. Saber cómo se comparan estas tres GPU móviles te ayudará a decidir qué configuración GE78 comprar.
Nuestra configuración RTX 4080 ofrece entre un 30 y un 50 por ciento más de rendimiento bruto que la configuración rTX 3080 Ti para portátiles de la GE77 del año pasado. Si el título es compatible con DLSS 3, como Cyberpunk 2077, el rendimiento puede llegar a ser entre 2 y 3 veces más rápido. Recomendamos consultar nuestra página dedicada a la RTX 4080 para móviles para ver más pruebas y comparaciones relacionadas con la serie GeForce 40 para móviles.
La RTX 4080 para móviles no debe compararse directamente con la rTX 4080 de sobremesa de sobremesa, que consume mucha más energía y es 1,5 veces más rápida.
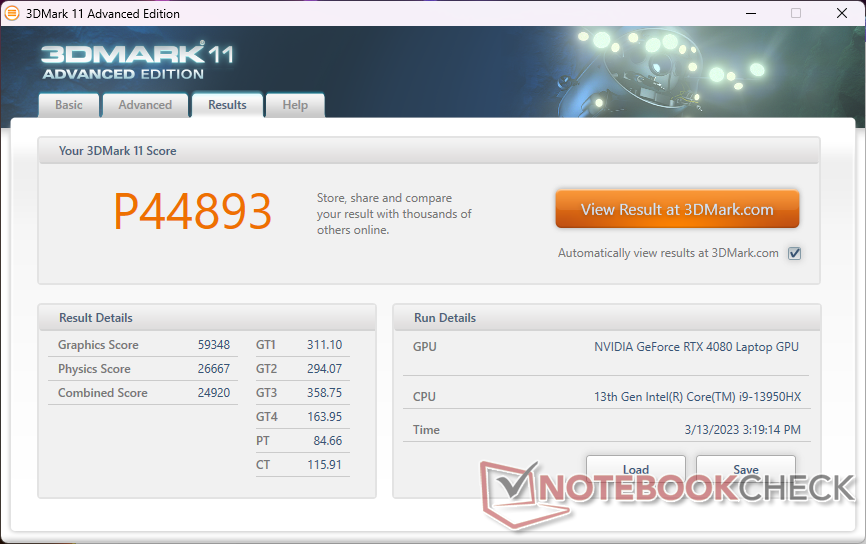
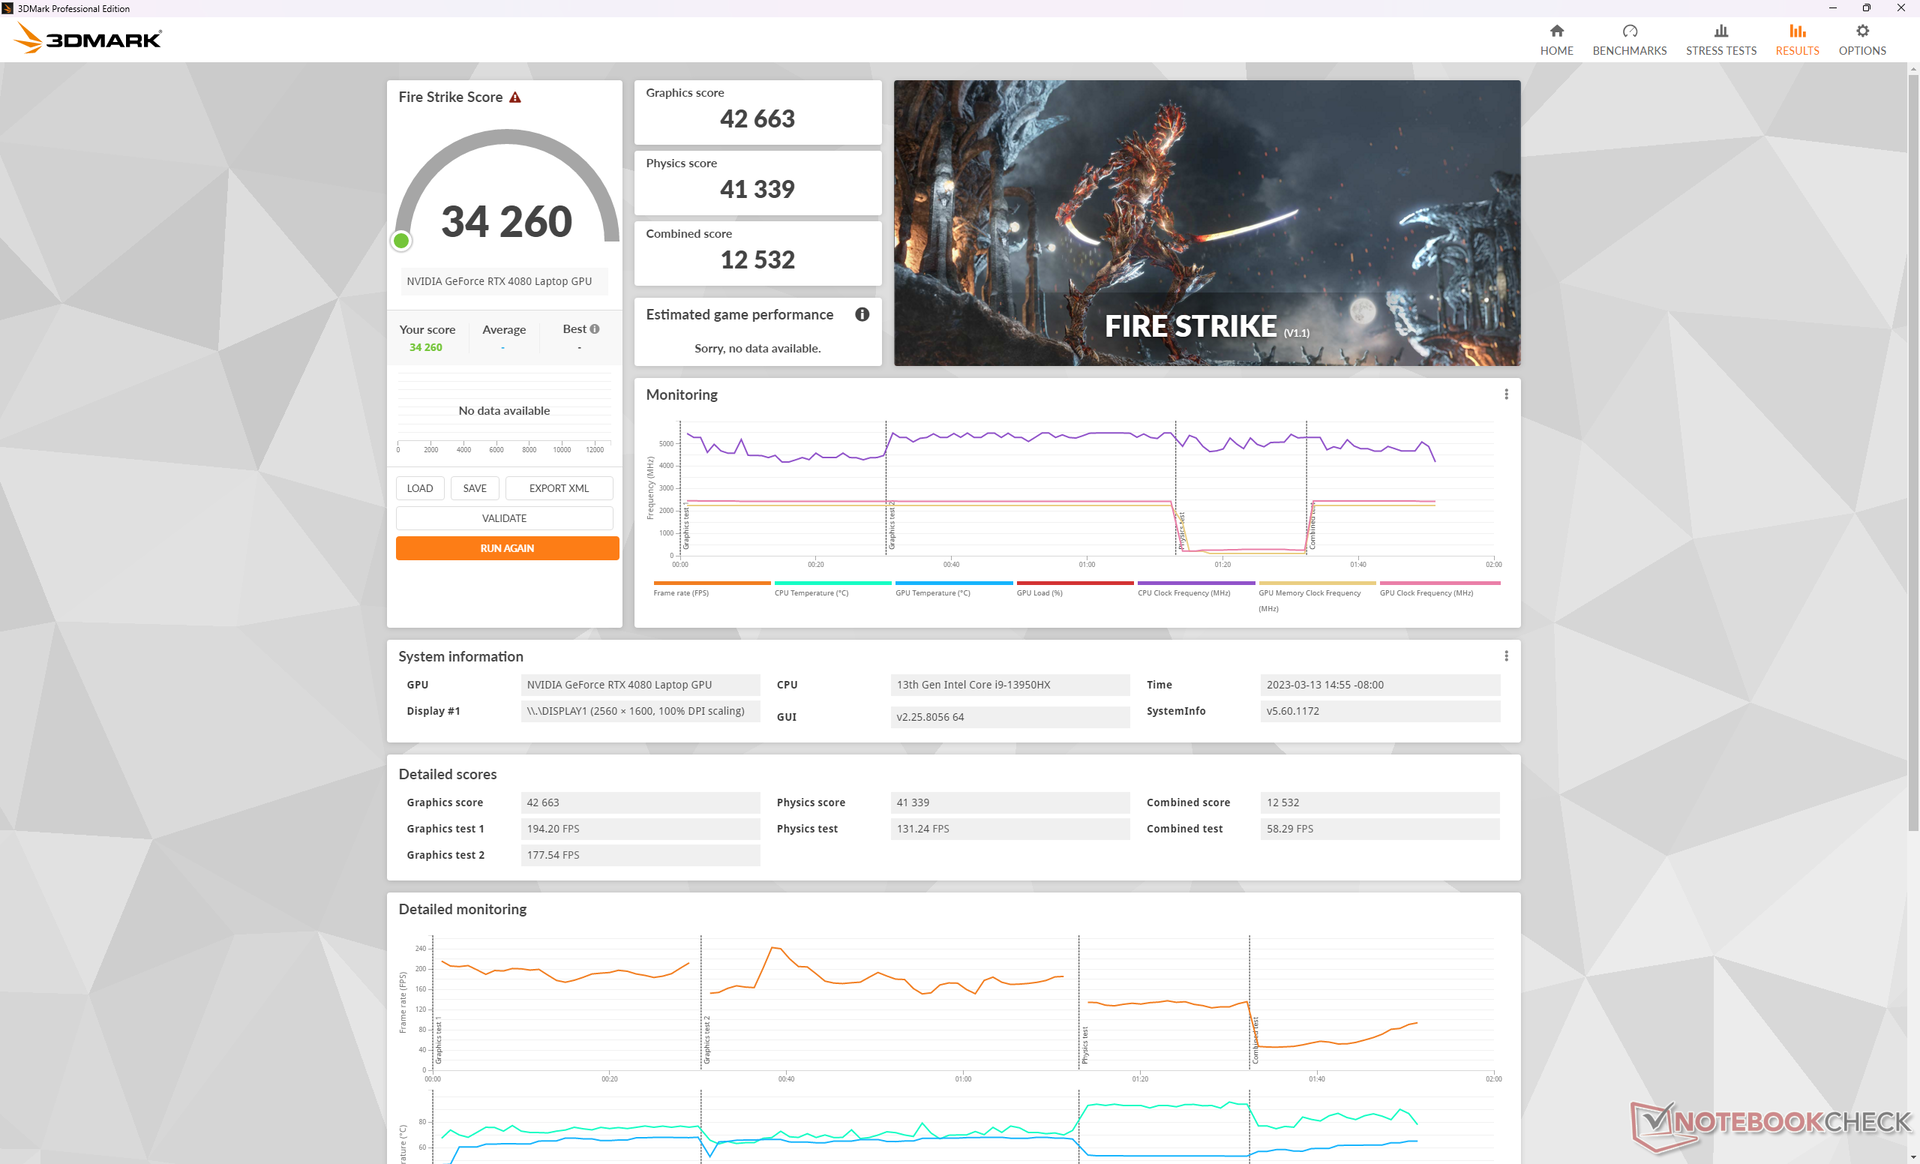
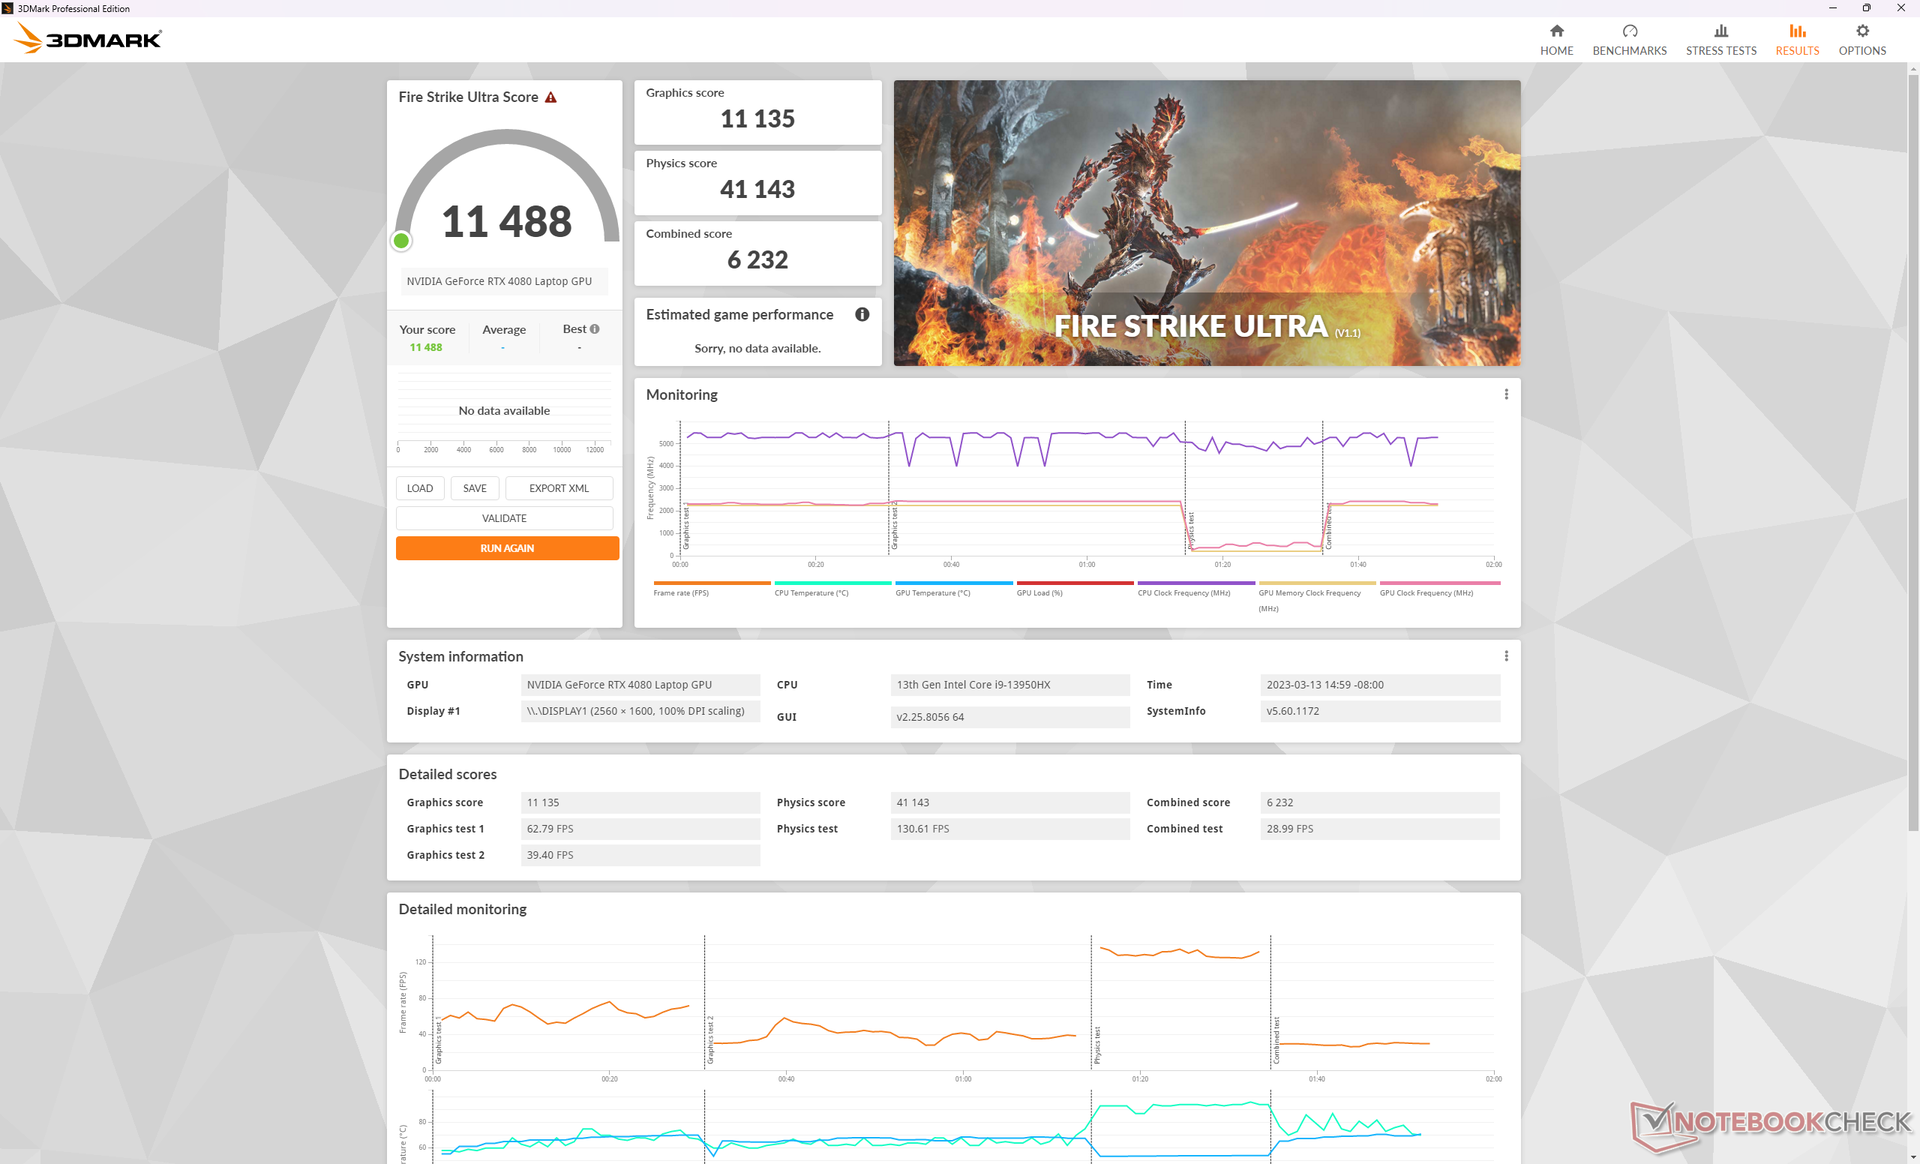
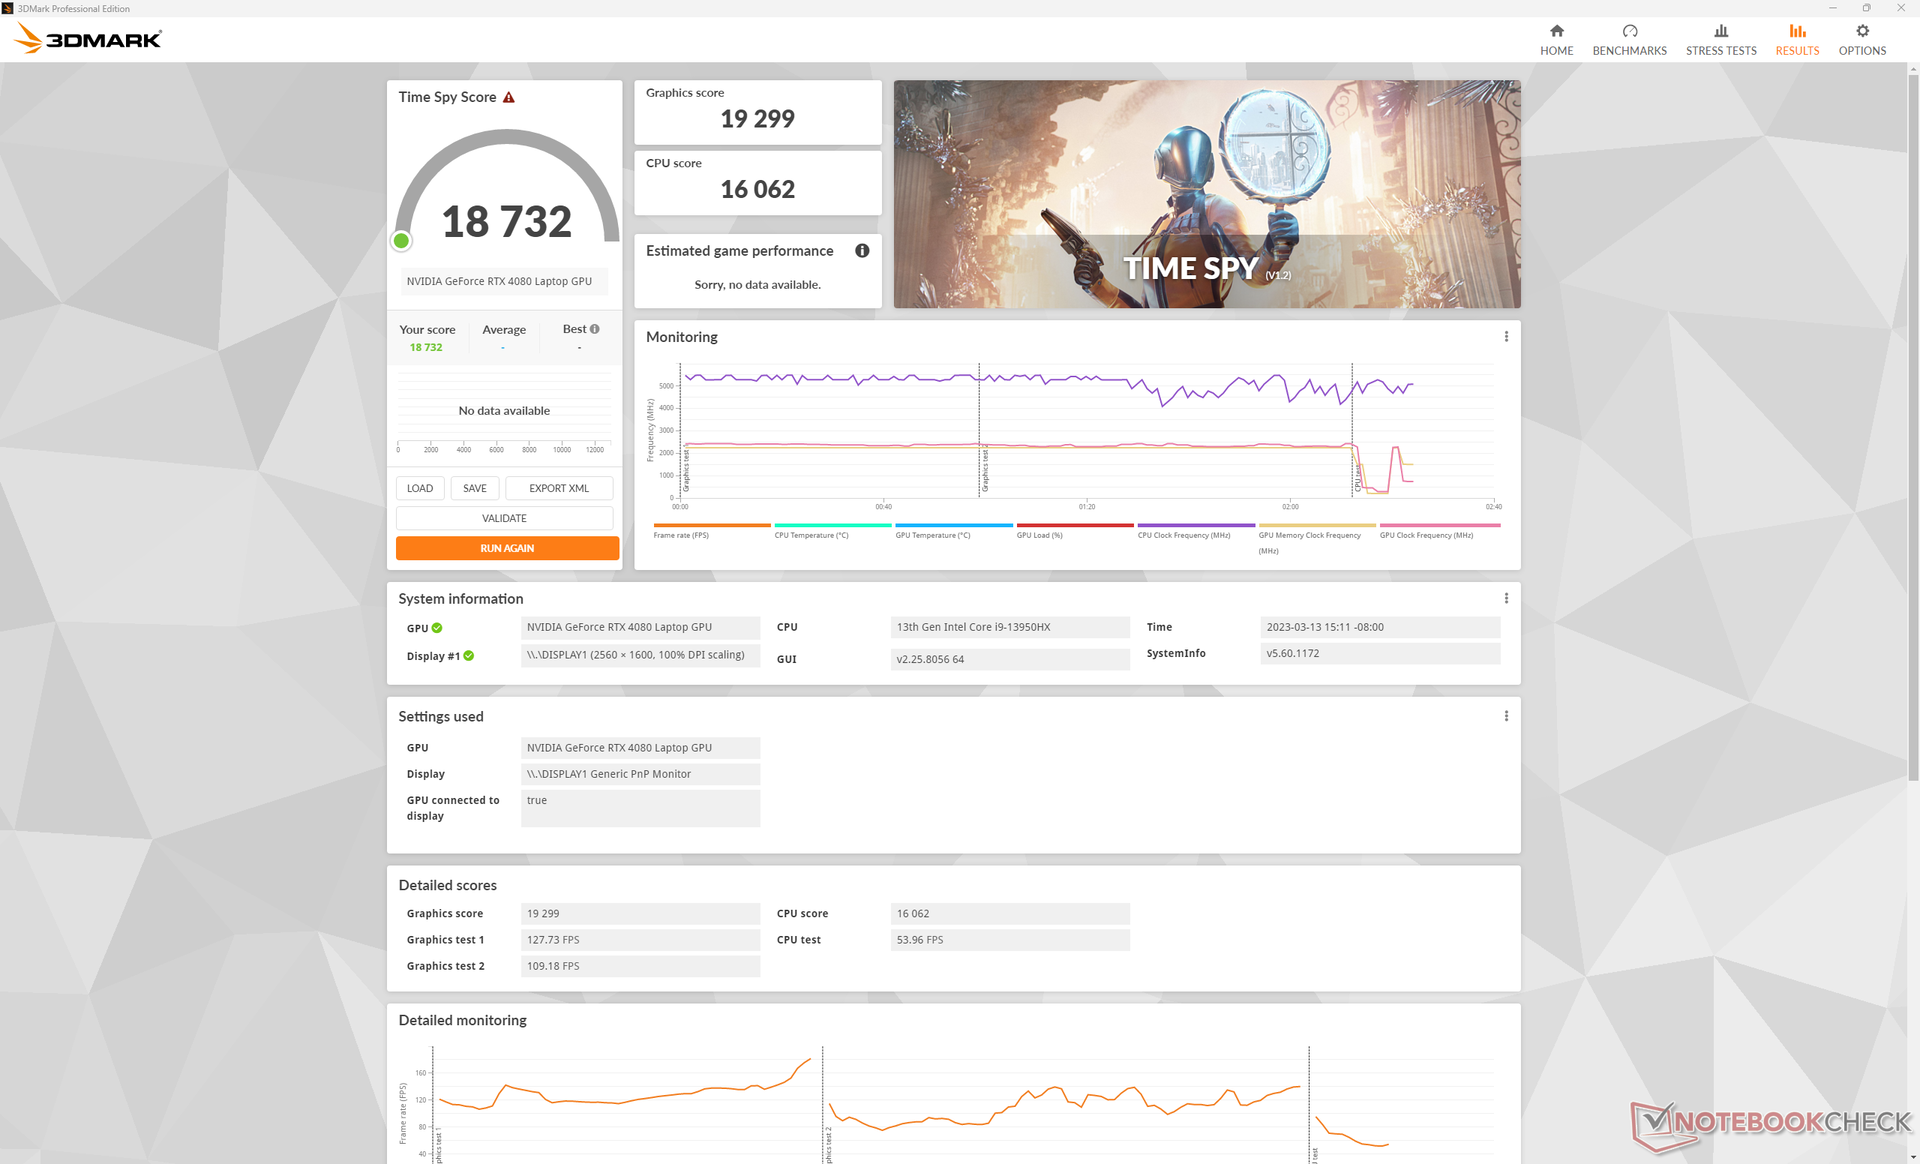
| 3DMark 11 Performance | 44893 puntos | |
| 3DMark Fire Strike Score | 34260 puntos | |
| 3DMark Time Spy Score | 18732 puntos | |
ayuda | ||
* ... más pequeño es mejor
| The Witcher 3 - 1920x1080 Ultra Graphics & Postprocessing (HBAO+) | |
| KFA2 GeForce RTX 4080 SG | |
| Eluktronics Mech-17 GP2 | |
| MSI GE78HX 13VH-070US | |
| MSI Raider GE77 HX 12UHS | |
| Alienware m17 R5 (R9 6900HX, RX 6850M XT) | |
| Asus ROG Strix G17 G713PI | |
| Corsair Voyager a1600 | |
| MSI Katana 17 B13VFK | |
| Schenker Compact 17 | |
| Schenker XMG Core 15 (M22) | |
| HP Omen 15-en0375ng | |
Witcher 3 FPS Chart
| bajo | medio | alto | ultra | QHD | 4K | |
|---|---|---|---|---|---|---|
| GTA V (2015) | 172.9 | 170 | 164.7 | 102.9 | 103.7 | 144.6 |
| The Witcher 3 (2015) | 605.7 | 539.8 | 382.9 | 175.9 | 129.4 | |
| Dota 2 Reborn (2015) | 180.4 | 161.7 | 154.8 | 145.6 | 142.6 | |
| Final Fantasy XV Benchmark (2018) | 180.4 | 166.9 | 148.5 | 131.6 | 76.2 | |
| X-Plane 11.11 (2018) | 174.1 | 157.4 | 126.8 | 110 | ||
| Strange Brigade (2018) | 324 | 272 | 267 | 258 | 237 | 121.5 |
| Cyberpunk 2077 1.6 (2022) | 149.2 | 142.6 | 136.8 | 135.8 | 88.6 | 40.2 |
| F1 22 (2022) | 237 | 235 | 228 | 115.4 | 77.4 | 39 |
Emisiones - One Loud Gamer
Ruido del sistema
Los ventiladores internos están casi siempre activos sin importar la carga en pantalla. Pudimos registrar un zumbido silencioso de 24,2 dB(A) contra un fondo silencioso de 23,4 dB(A) cuando simplemente estaba en reposo en modo de ahorro de energía. Si se navega por internet o se hace streaming de vídeo, el ruido del ventilador suele rondar entre los 25 y 31 dB(A). No es tan alto como para distraer, pero se nota. Máquinas de la competencia como elEluktronics Mech-17 o el Asus ROG Strix G17 G713PI se comportarían de forma similar.
Jugar en modo Rendimiento (o modo Extremo) induciría un ruido de ventilador de poco más de 56 dB(A) que está en el extremo superior del espectro cuando se trata de portátiles de juego. Los portátiles Eluktronics y Asus antes mencionados, por ejemplo, serían notablemente más silenciosos con 51 y 46 dB(A), respectivamente, bajo cargas de juego similares.
Activar el modo Cooler Boost elevará las RPM del ventilador hasta el límite absoluto sin importar la carga en pantalla para un nivel de ruido cercano a los 60 dB(A). El rendimiento de juego, sin embargo, no es necesariamente más rápido, por lo que el modo Cooler Boost es más un control de temperatura que de rendimiento. Hemos tenido observaciones similares en otros portátiles MSI con la misma característica Cooler Boost.
Ruido
| Ocioso |
| 24.2 / 25.6 / 31 dB(A) |
| Carga |
| 43.3 / 59.1 dB(A) |
 | ||
30 dB silencioso 40 dB(A) audible 50 dB(A) ruidosamente alto |
||
min: | ||
| MSI GE78HX 13VH-070US GeForce RTX 4080 Laptop GPU, i9-13950HX, Samsung PM9A1 MZVL22T0HBLB | Eluktronics Mech-17 GP2 GeForce RTX 4090 Laptop GPU, i9-13900HX, Samsung PM9A1 MZVL21T0HCLR | Asus ROG Strix G17 G713PI GeForce RTX 4070 Laptop GPU, R9 7945HX, WD PC SN560 SDDPNQE-1T00 | MSI Titan GT77 HX 13VI GeForce RTX 4090 Laptop GPU, i9-13950HX, Samsung PM9A1 MZVL22T0HBLB | MSI Raider GE77 HX 12UHS GeForce RTX 3080 Ti Laptop GPU, i9-12900HX, Samsung PM9A1 MZVL22T0HBLB | Razer Blade 17 Early 2022 GeForce RTX 3080 Ti Laptop GPU, i9-12900H, Samsung PM9A1 MZVL21T0HCLR | |
|---|---|---|---|---|---|---|
| Noise | -1% | 1% | -7% | -15% | -3% | |
| apagado / medio ambiente * (dB) | 23.4 | 25.2 -8% | 25 -7% | 24.6 -5% | 26 -11% | 26 -11% |
| Idle Minimum * (dB) | 24.2 | 28 -16% | 26 -7% | 29.2 -21% | 26 -7% | 26 -7% |
| Idle Average * (dB) | 25.6 | 28 -9% | 29 -13% | 29.2 -14% | 34 -33% | 27 -5% |
| Idle Maximum * (dB) | 31 | 30.4 2% | 30 3% | 29.2 6% | 46 -48% | 32 -3% |
| Load Average * (dB) | 43.3 | 41 5% | 46 -6% | 50.7 -17% | 50 -15% | 50 -15% |
| Witcher 3 ultra * (dB) | 56.3 | 50.7 10% | 46 18% | 53.3 5% | 55 2% | 51 9% |
| Load Maximum * (dB) | 59.1 | 52.6 11% | 47 20% | 61 -3% | 57 4% | 51 14% |
* ... más pequeño es mejor
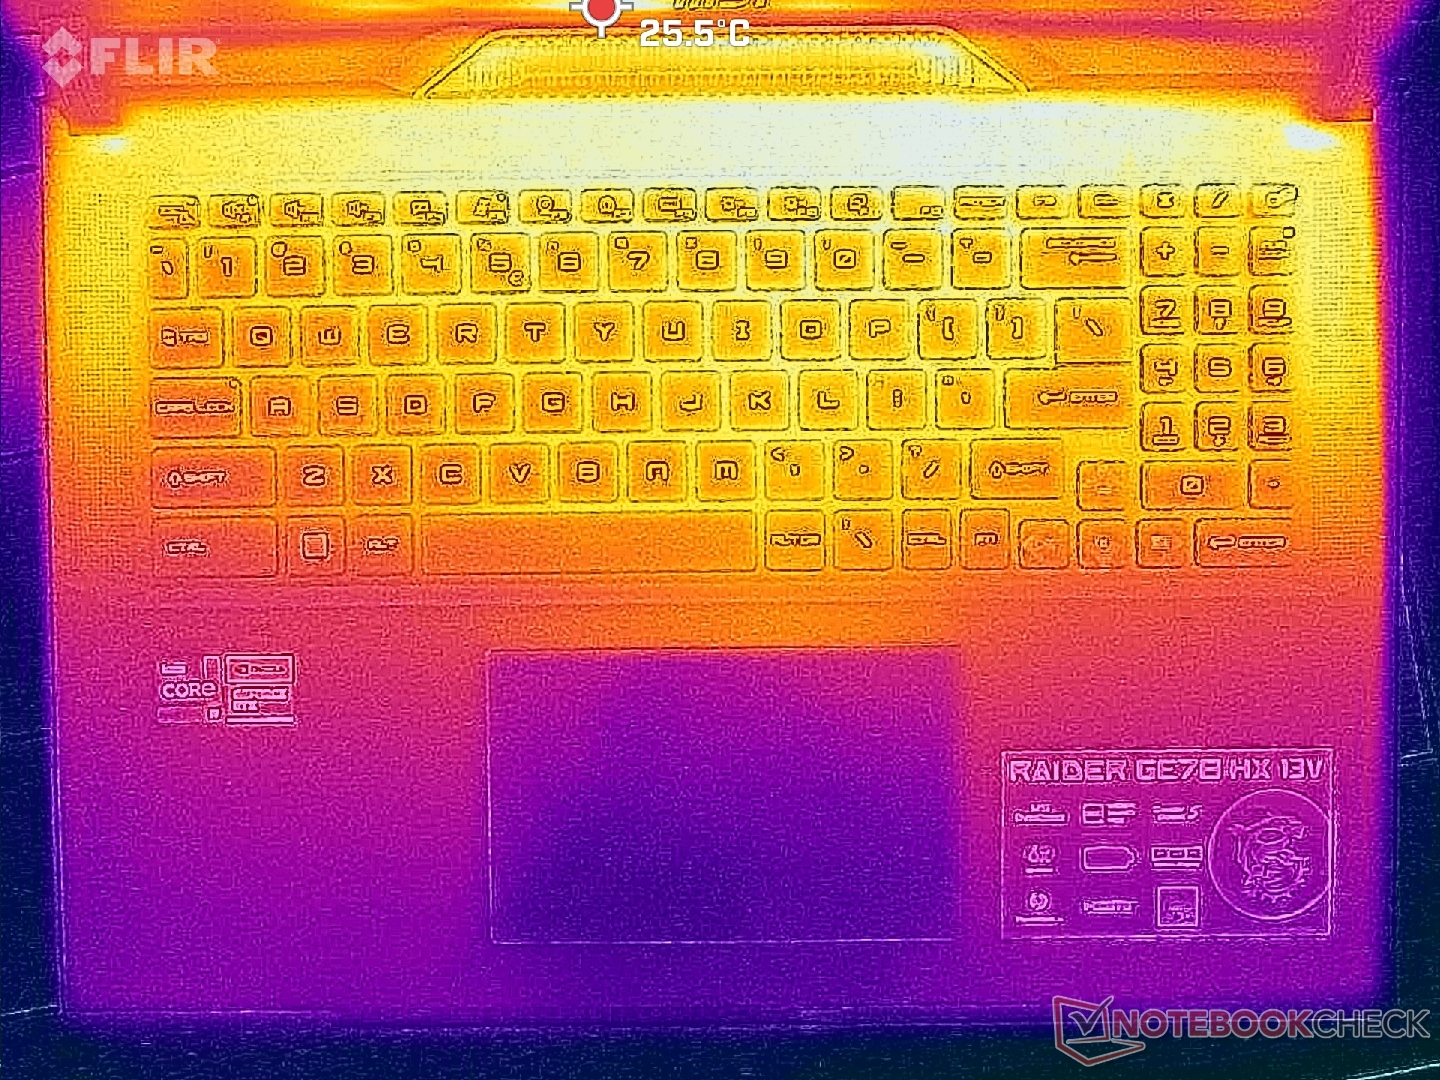
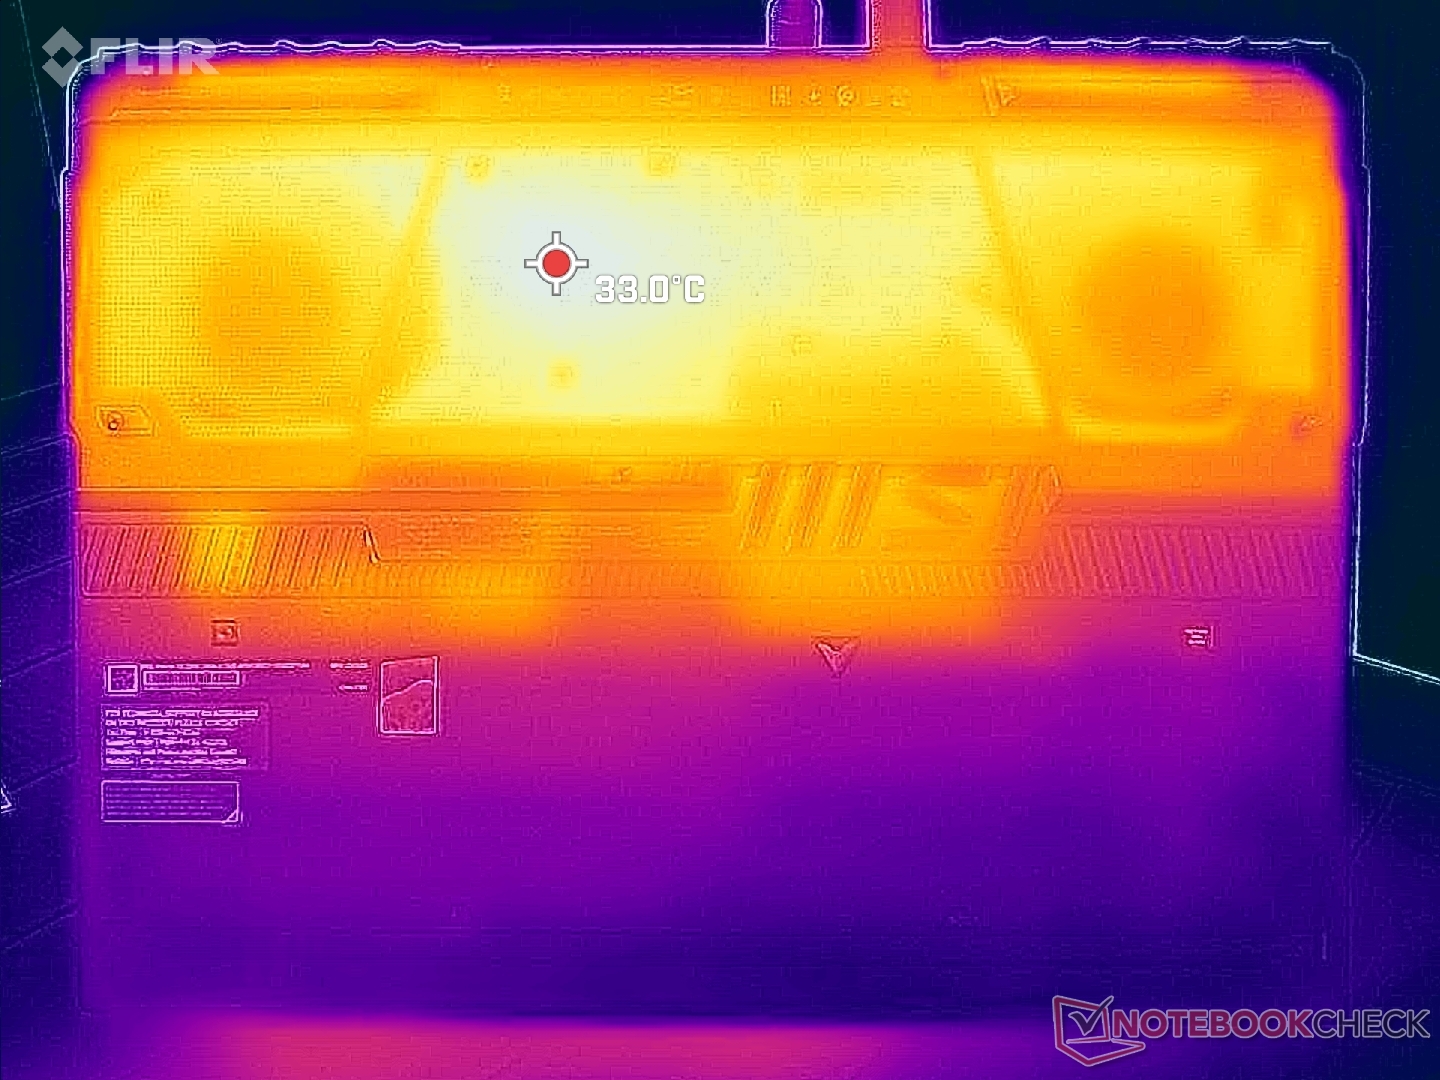
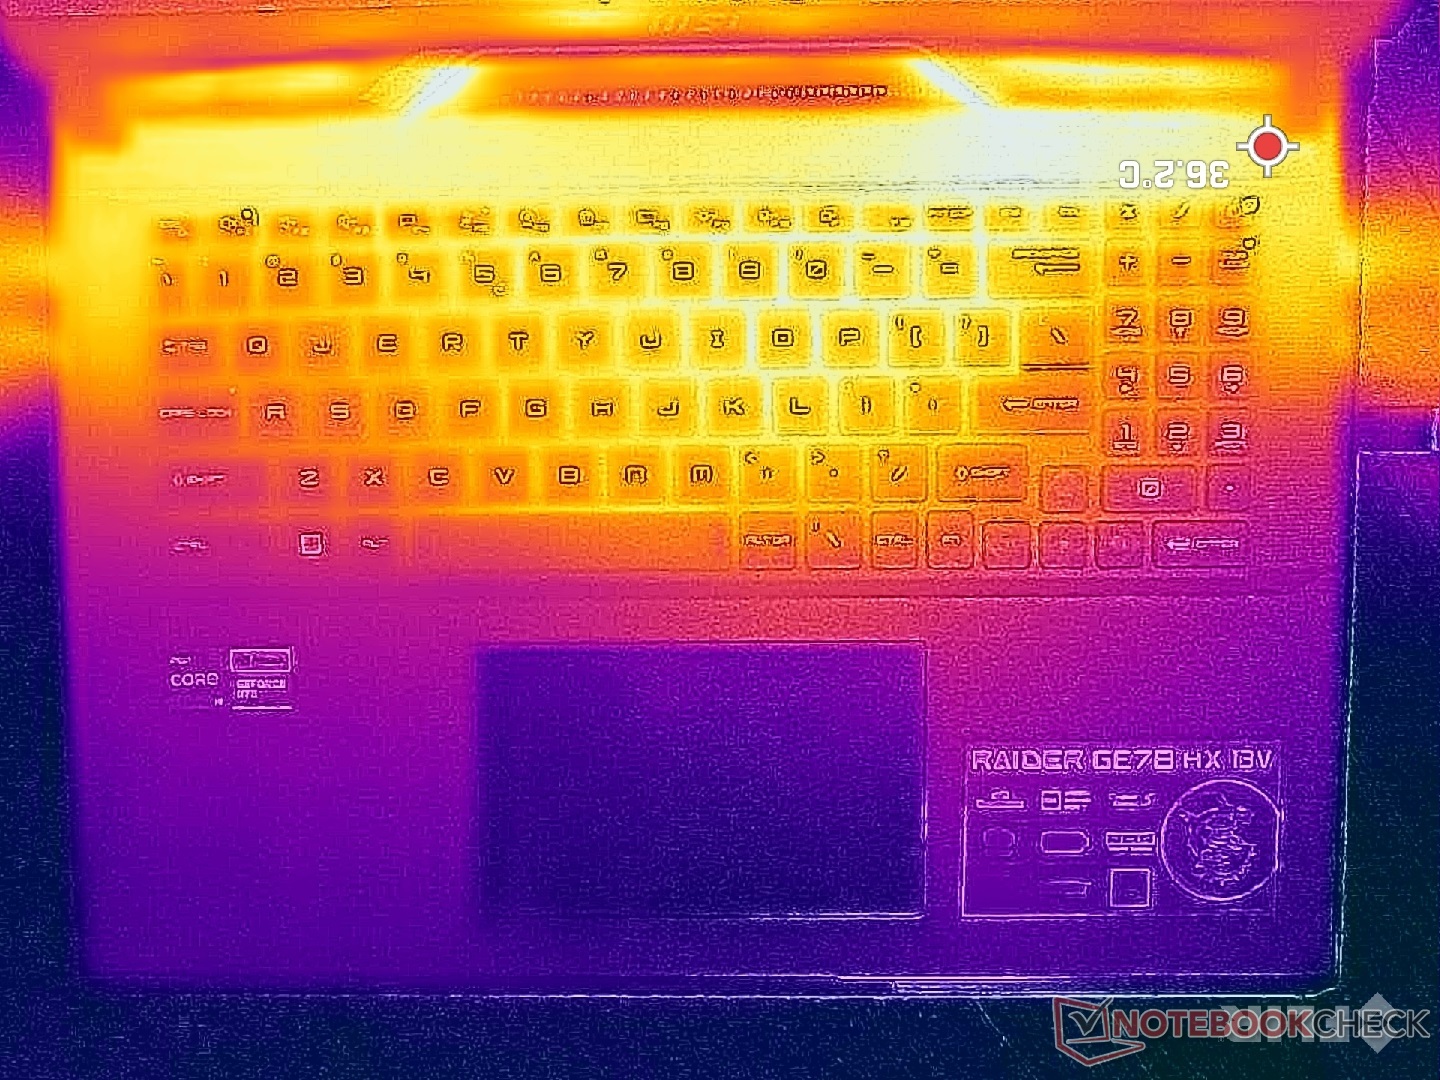
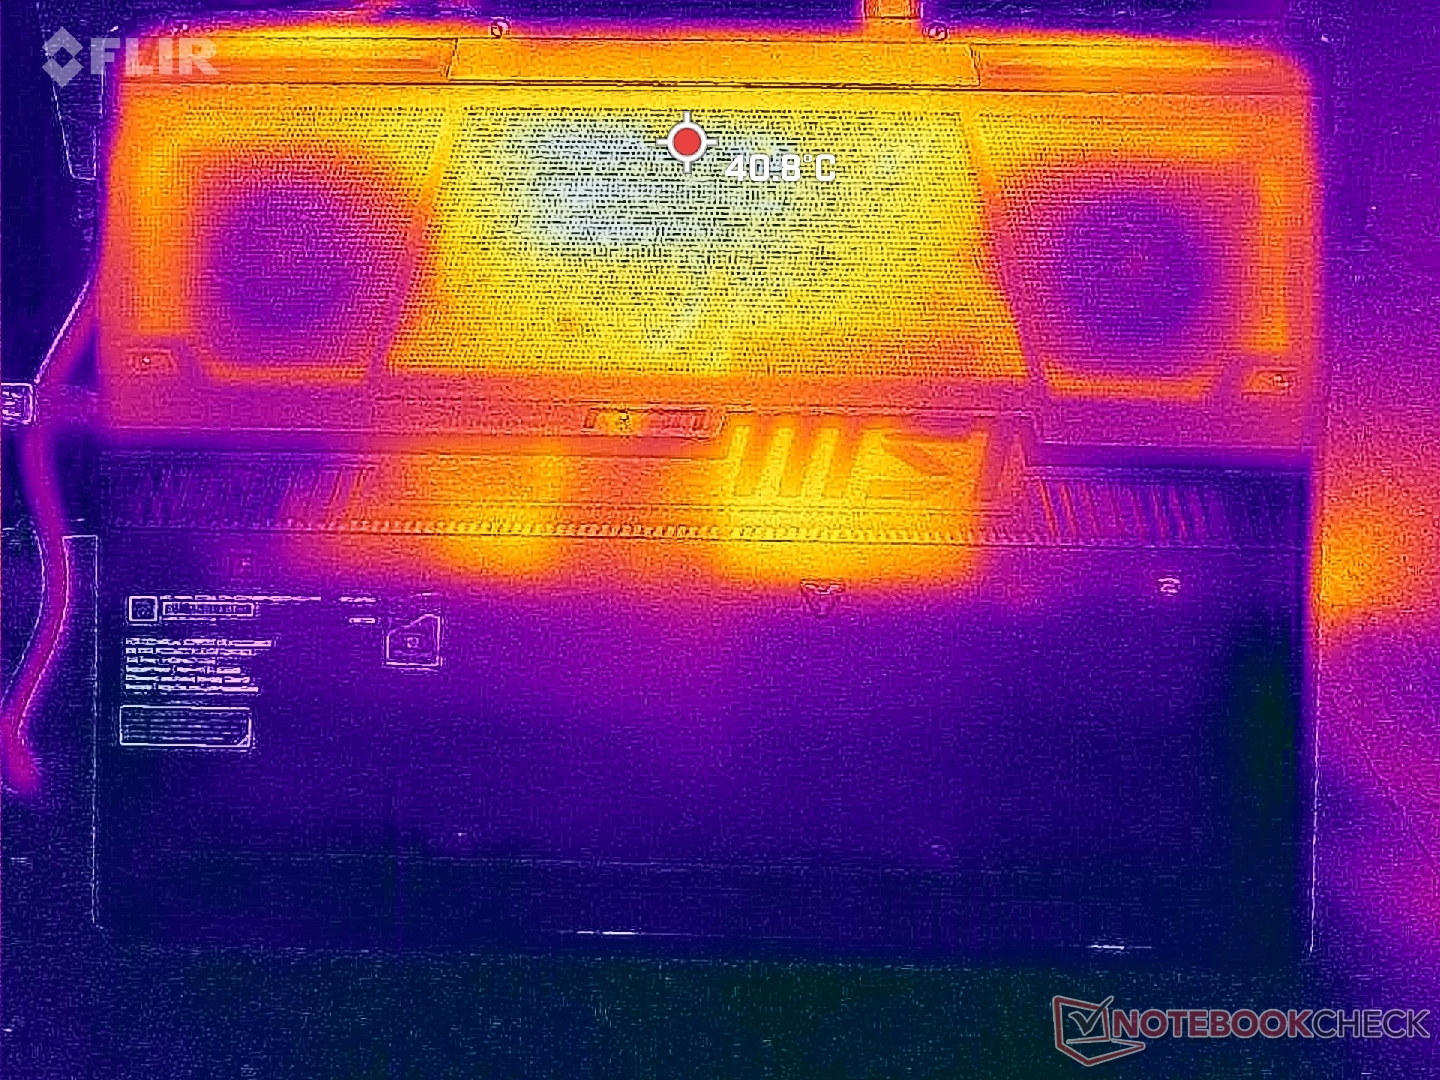
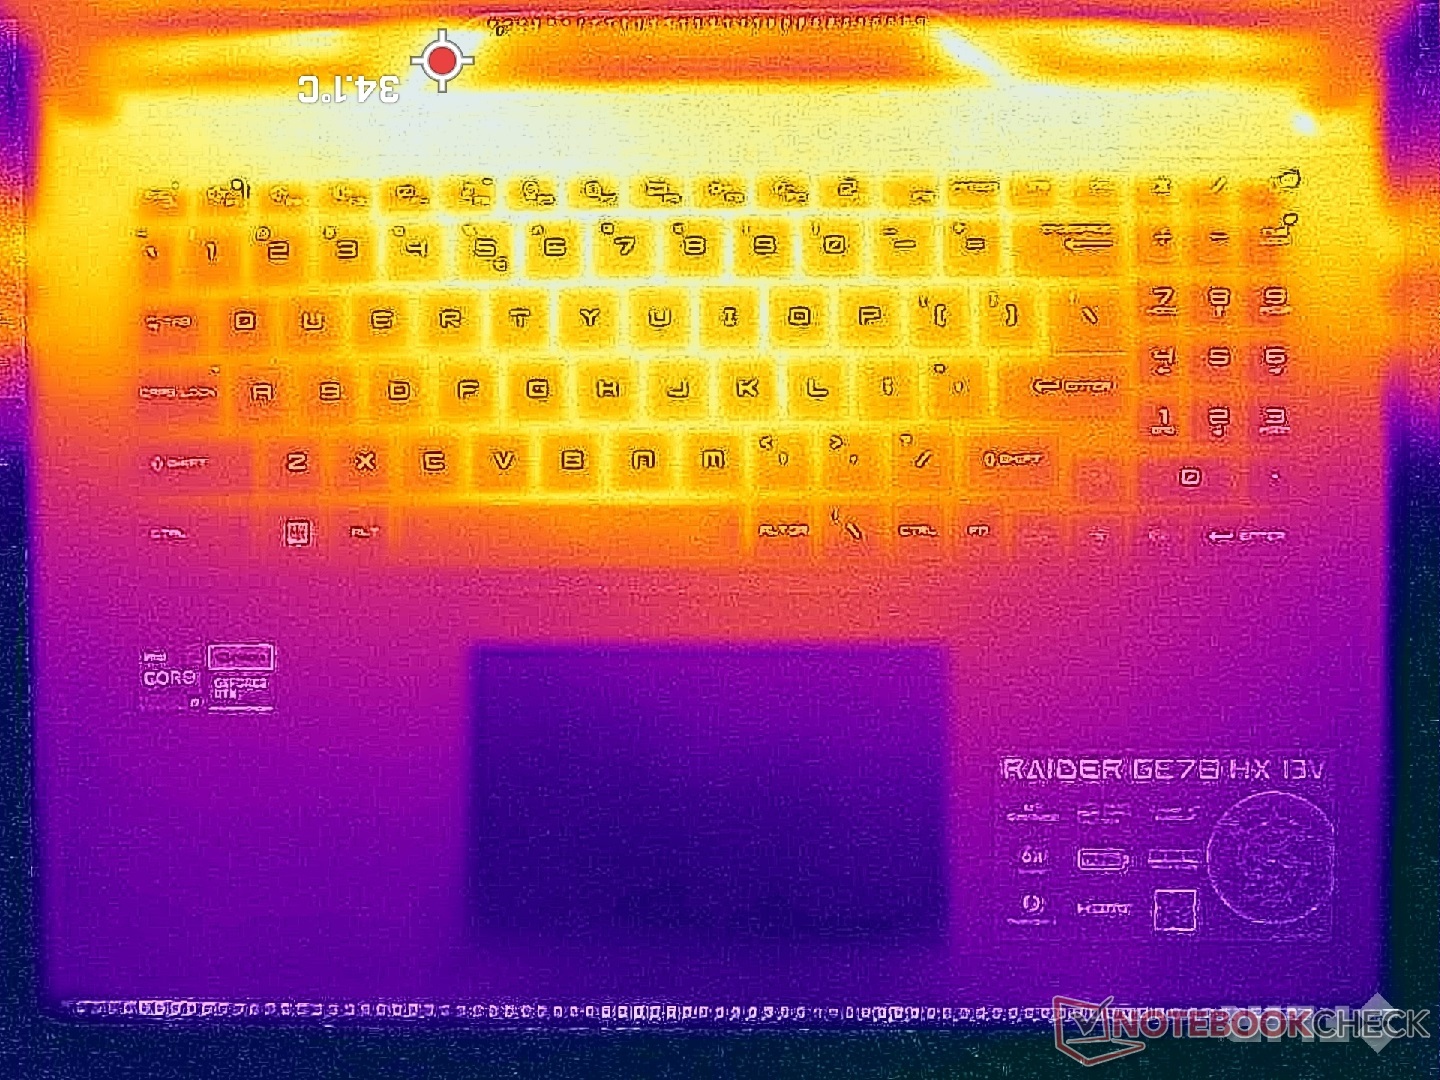
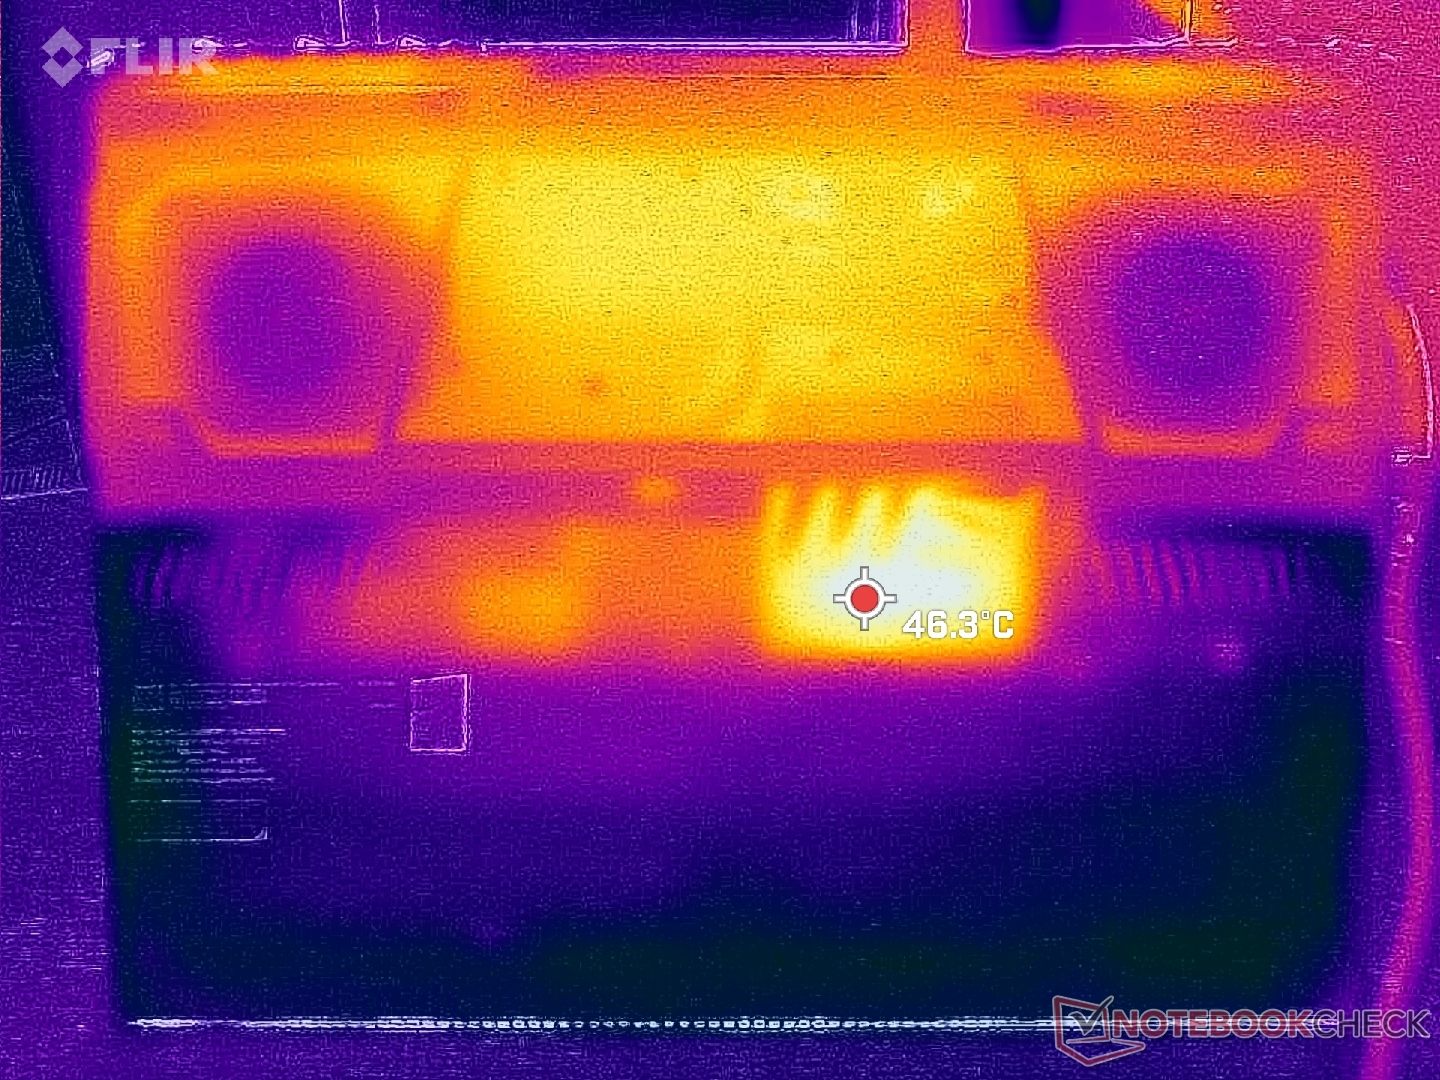
Temperatura
Las temperaturas superficiales no suelen ser un problema en los modelos GE y GT de MSI, ya que su diseño es mayoritariamente de plástico y más grueso. La temperatura media de la superficie al jugar en el GE78, por ejemplo, es de unos 32 C tanto en la parte superior como en la inferior, frente a los 43 C a 44 C del Razer Blade 17.
Los puntos calientes del sistema se encuentran hacia la parte trasera del chasis y lejos de la parte delantera, como muestran los mapas de temperatura de abajo. Por lo tanto, las palmas o los dedos no deberían sentirse incómodamente calientes mientras se teclea o se juega.
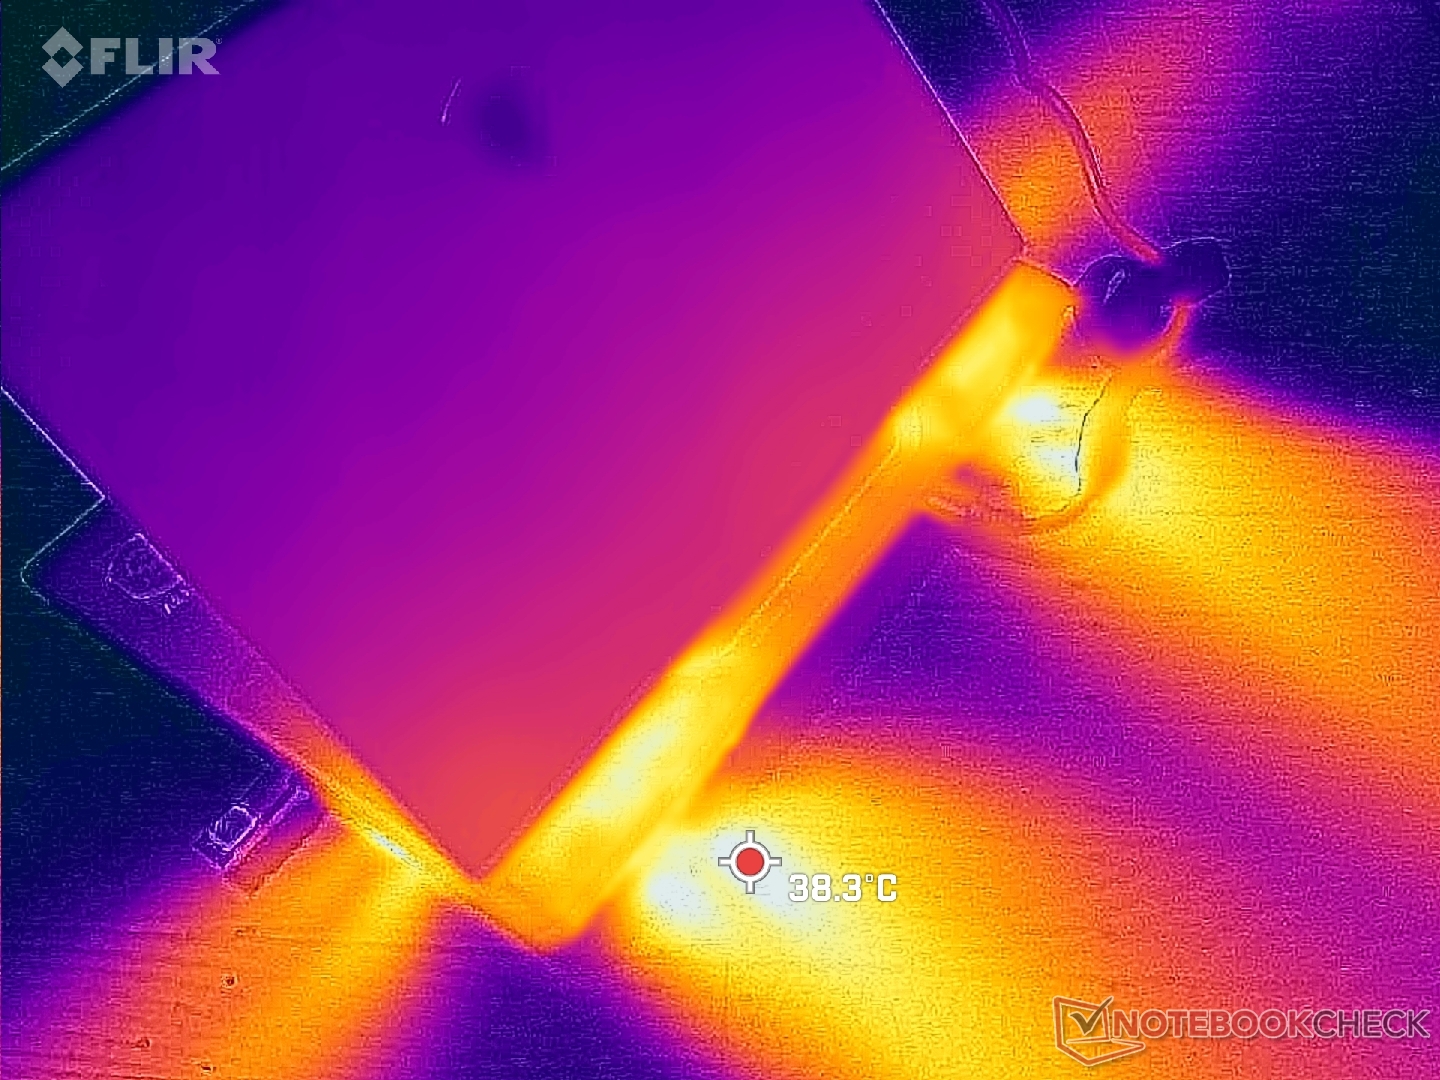
(+) La temperatura máxima en la parte superior es de 37.4 °C / 99 F, frente a la media de 40.4 °C / 105 F, que oscila entre 21.2 y 68.8 °C para la clase Gaming.
(±) El fondo se calienta hasta un máximo de 45 °C / 113 F, frente a la media de 43.2 °C / 110 F
(+) En reposo, la temperatura media de la parte superior es de 25.7 °C / 78# F, frente a la media del dispositivo de 33.9 °C / 93 F.
(+) Jugando a The Witcher 3, la temperatura media de la parte superior es de 30.5 °C / 87 F, frente a la media del dispositivo de 33.9 °C / 93 F.
(+) El reposamanos y el panel táctil están a una temperatura inferior a la de la piel, con un máximo de 24.6 °C / 76.3 F y, por tanto, son fríos al tacto.
(+) La temperatura media de la zona del reposamanos de dispositivos similares fue de 28.8 °C / 83.8 F (+4.2 °C / 7.5 F).
| MSI GE78HX 13VH-070US Intel Core i9-13950HX, NVIDIA GeForce RTX 4080 Laptop GPU | Eluktronics Mech-17 GP2 Intel Core i9-13900HX, NVIDIA GeForce RTX 4090 Laptop GPU | Asus ROG Strix G17 G713PI AMD Ryzen 9 7945HX, NVIDIA GeForce RTX 4070 Laptop GPU | MSI Titan GT77 HX 13VI Intel Core i9-13950HX, NVIDIA GeForce RTX 4090 Laptop GPU | MSI Raider GE77 HX 12UHS Intel Core i9-12900HX, NVIDIA GeForce RTX 3080 Ti Laptop GPU | Razer Blade 17 Early 2022 Intel Core i9-12900H, NVIDIA GeForce RTX 3080 Ti Laptop GPU | |
|---|---|---|---|---|---|---|
| Heat | 1% | -5% | 5% | -33% | -24% | |
| Maximum Upper Side * (°C) | 37.4 | 39 -4% | 42 -12% | 40.6 -9% | 53 -42% | 50 -34% |
| Maximum Bottom * (°C) | 45 | 44 2% | 41 9% | 41.1 9% | 58 -29% | 56 -24% |
| Idle Upper Side * (°C) | 29.8 | 31 -4% | 33 -11% | 26.2 12% | 38 -28% | 36 -21% |
| Idle Bottom * (°C) | 32.4 | 29.8 8% | 34 -5% | 30.3 6% | 43 -33% | 38 -17% |
* ... más pequeño es mejor
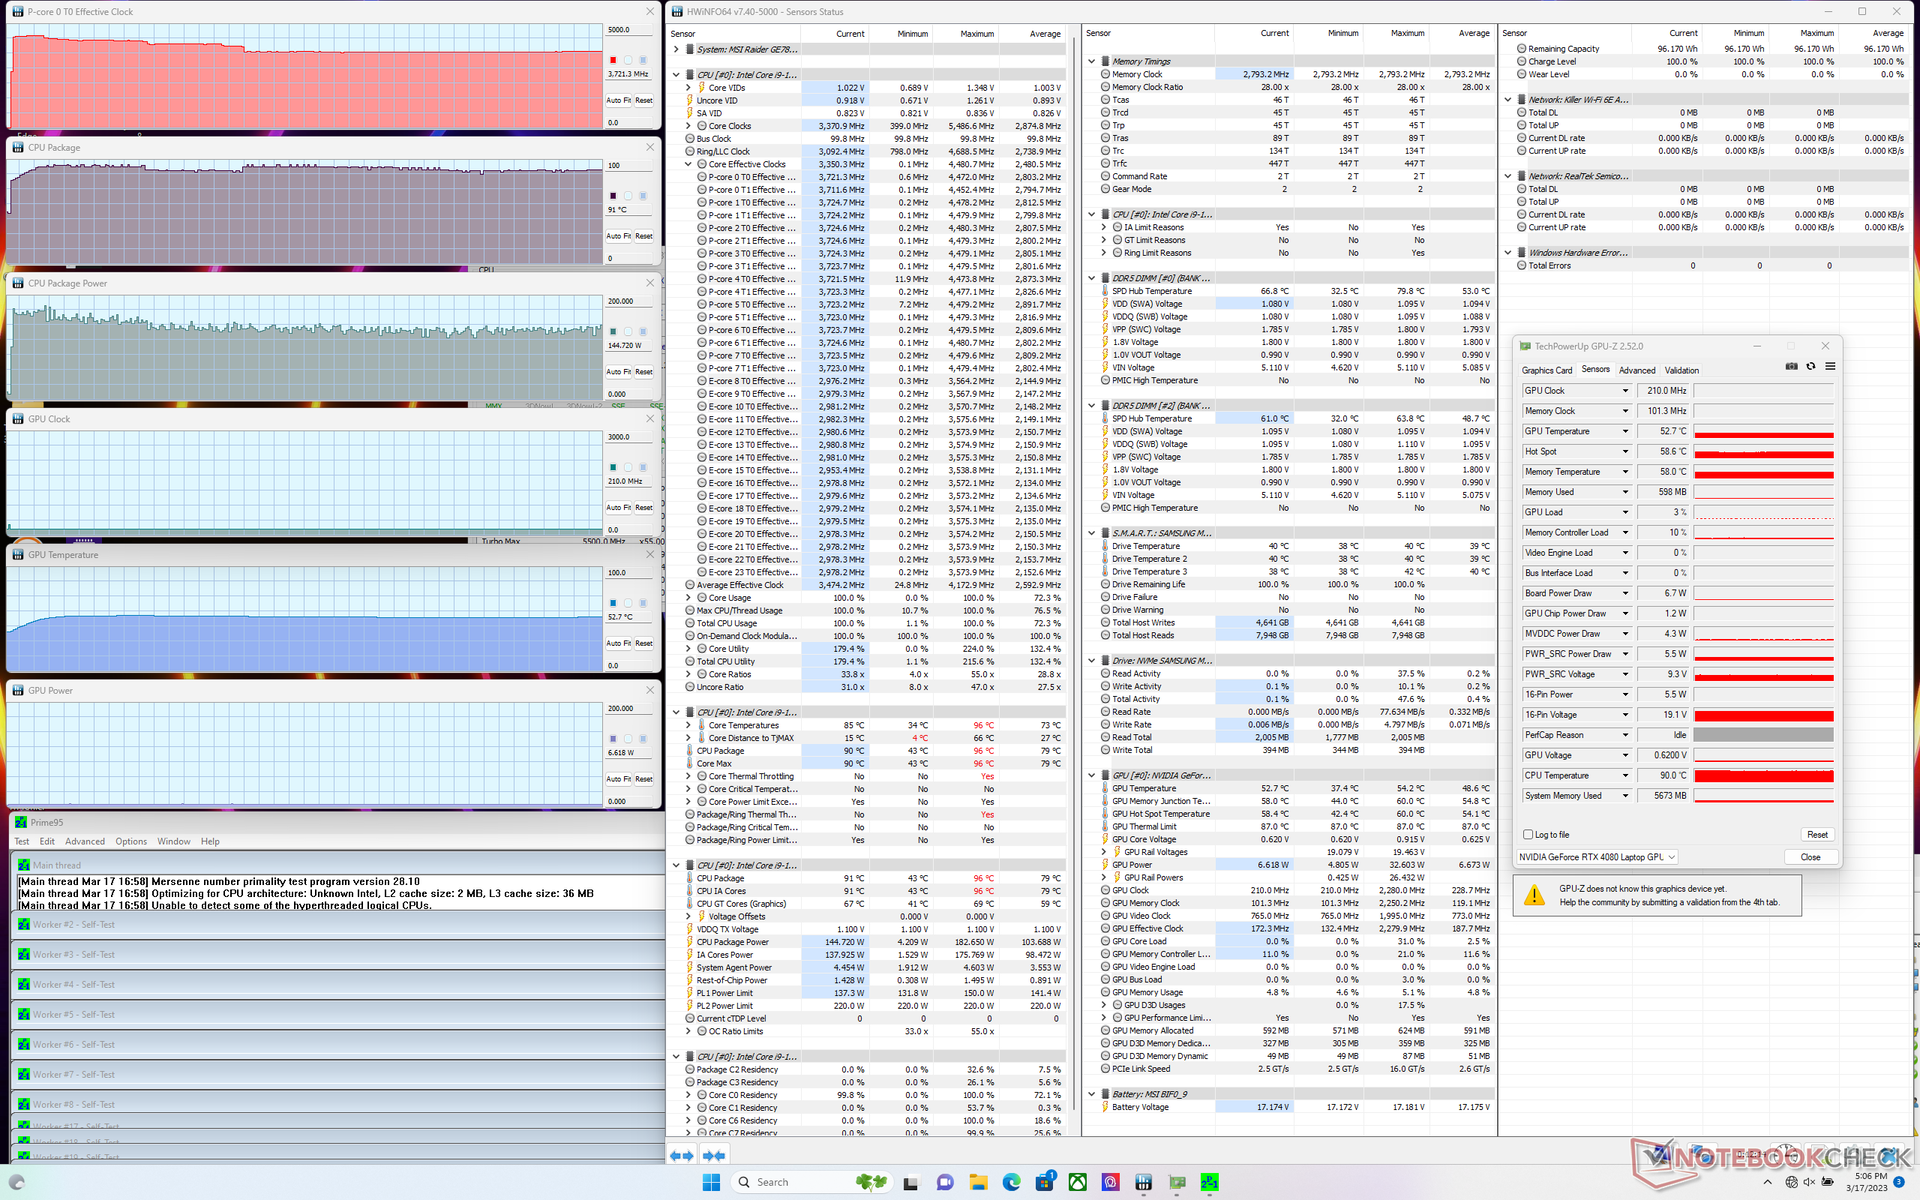
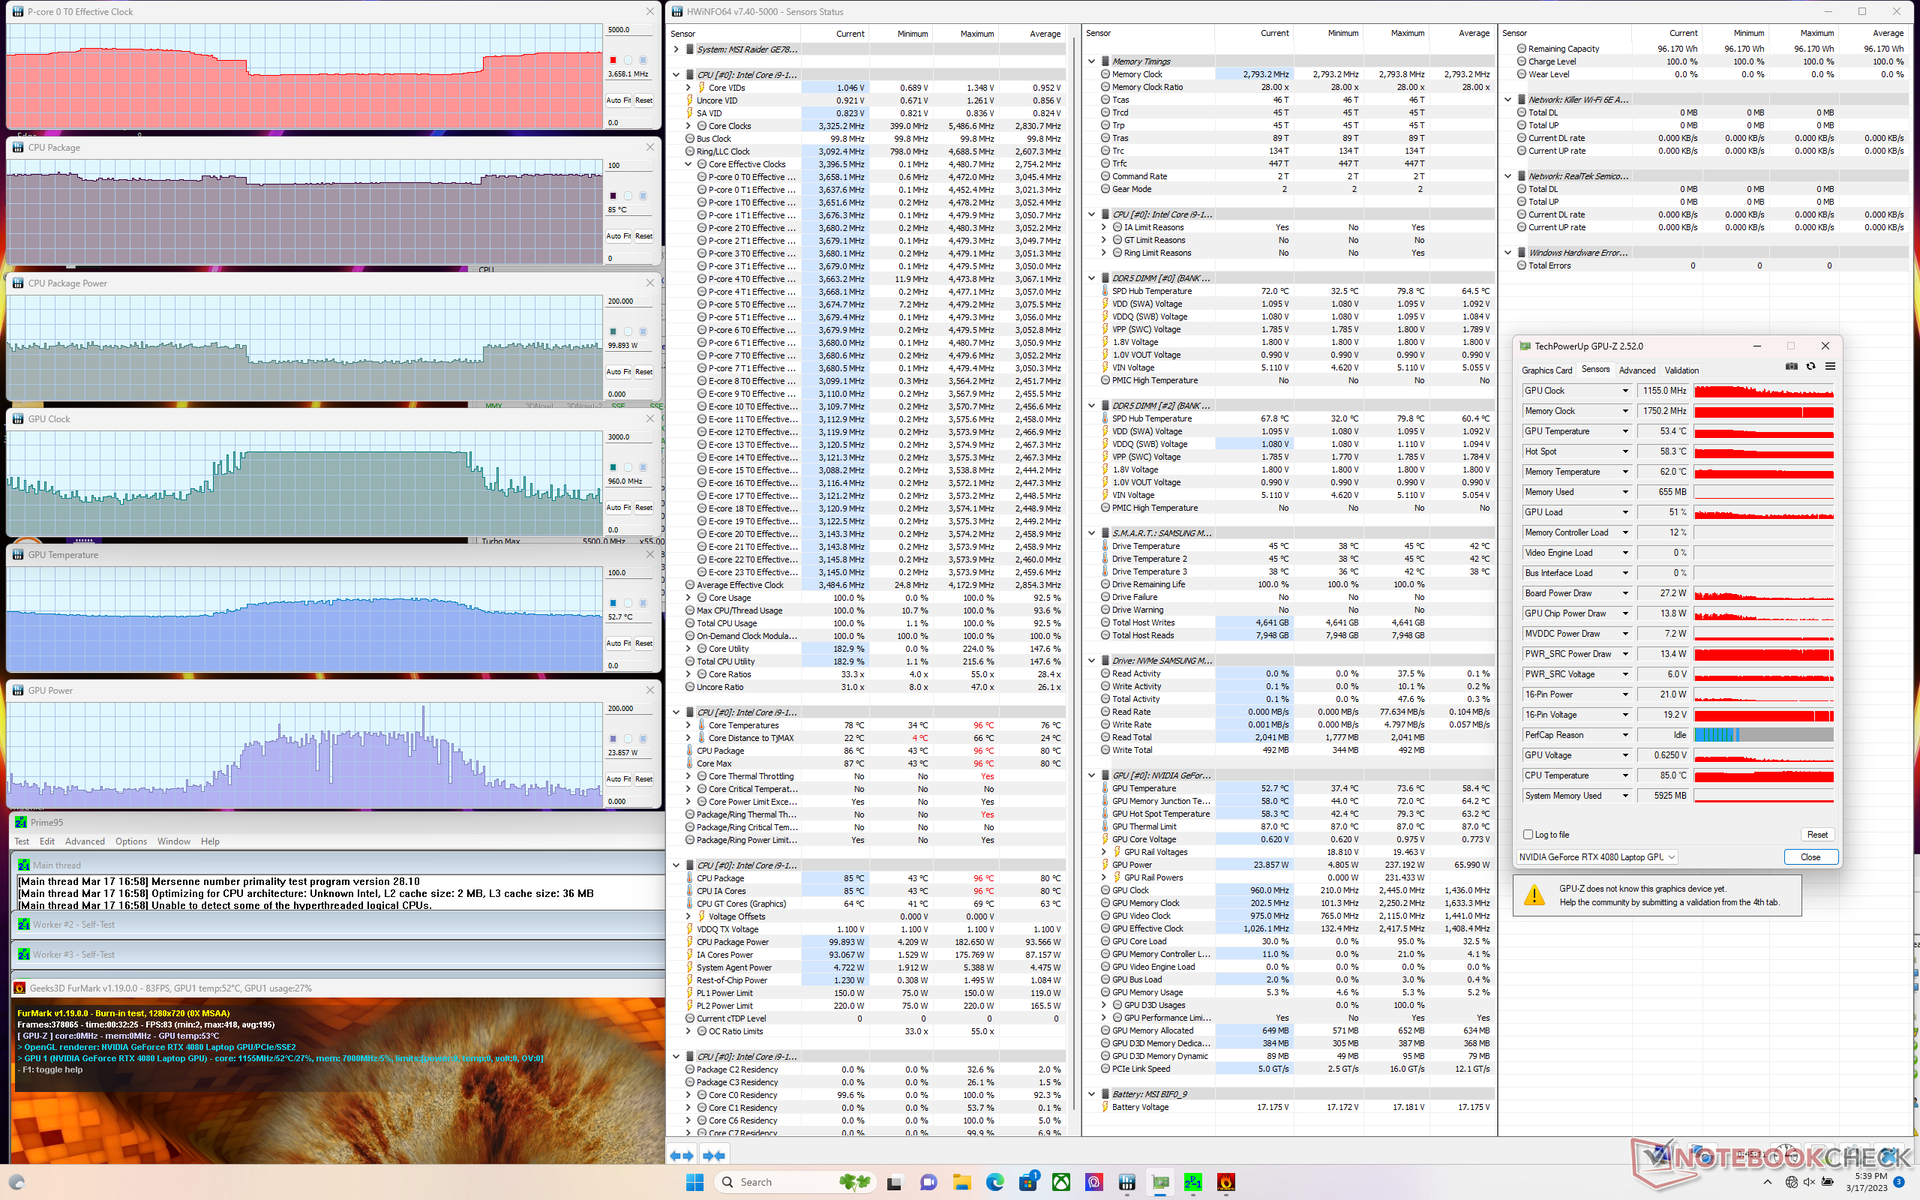
Prueba de resistencia
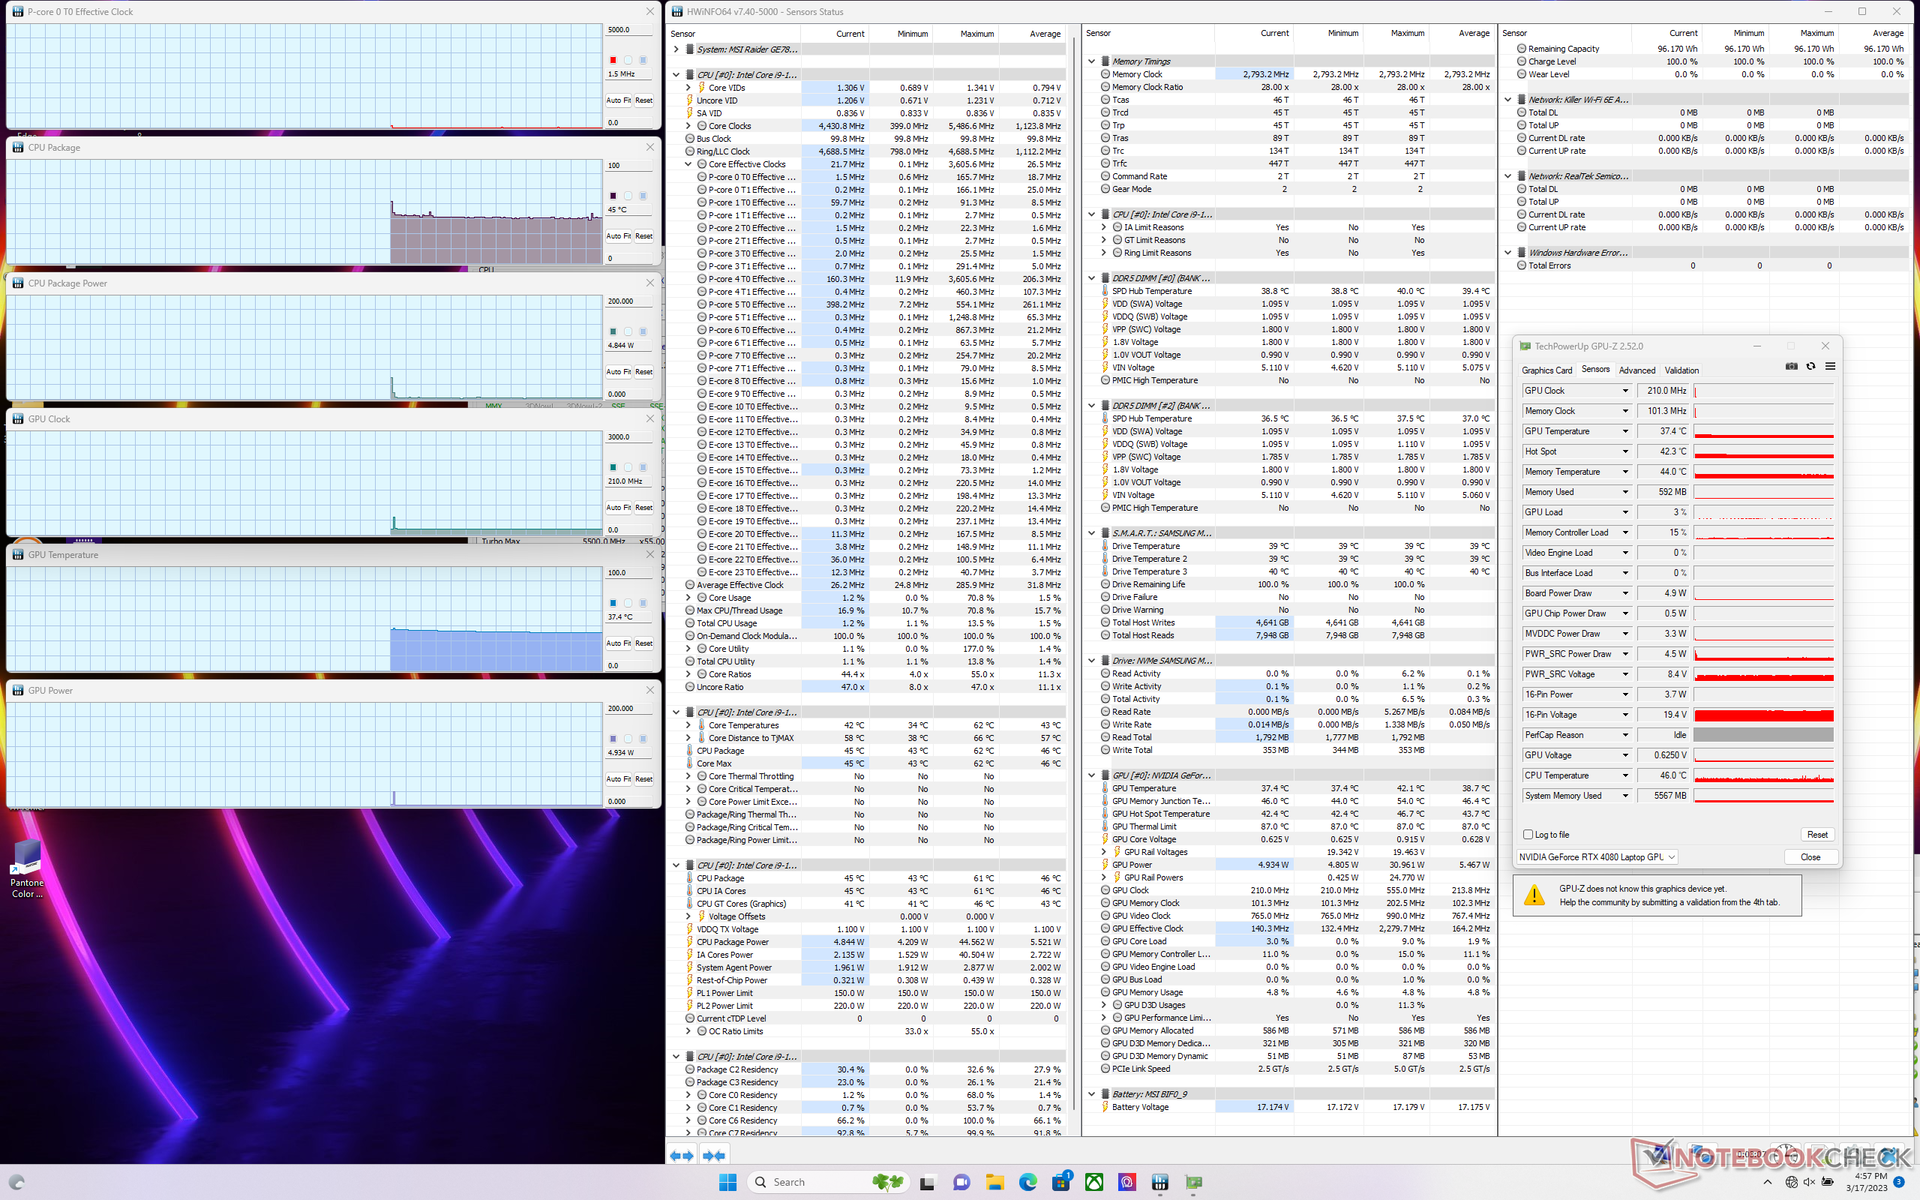
Cuando se ejecuta Prime95 para estresar la CPU, las frecuencias de reloj y el consumo de la placa aumentan a 4,5 GHz y 173 W, respectivamente, durante unos segundos o hasta alcanzar una temperatura del núcleo de 95 C. A partir de entonces, las frecuencias de reloj y el consumo de la placa caen constantemente hasta estabilizarse en unos 3,7 GHz y 144 W, respectivamente. La temperatura del núcleo se mantendría muy alta en 91 C, lo que significa que hay muy poco margen para cualquier rendimiento adicional del procesador. Repitiendo esta misma prueba en elRazer Blade 16 con una CPU Core i9 similar resultaría en frecuencias medias más lentas y una temperatura del núcleo más fresca de ~3.2 GHz y 82 C, respectivamente. La serie Intel Core i9 de 13ª generación puede ser rápida, pero las temperaturas del núcleo serán altas en general.
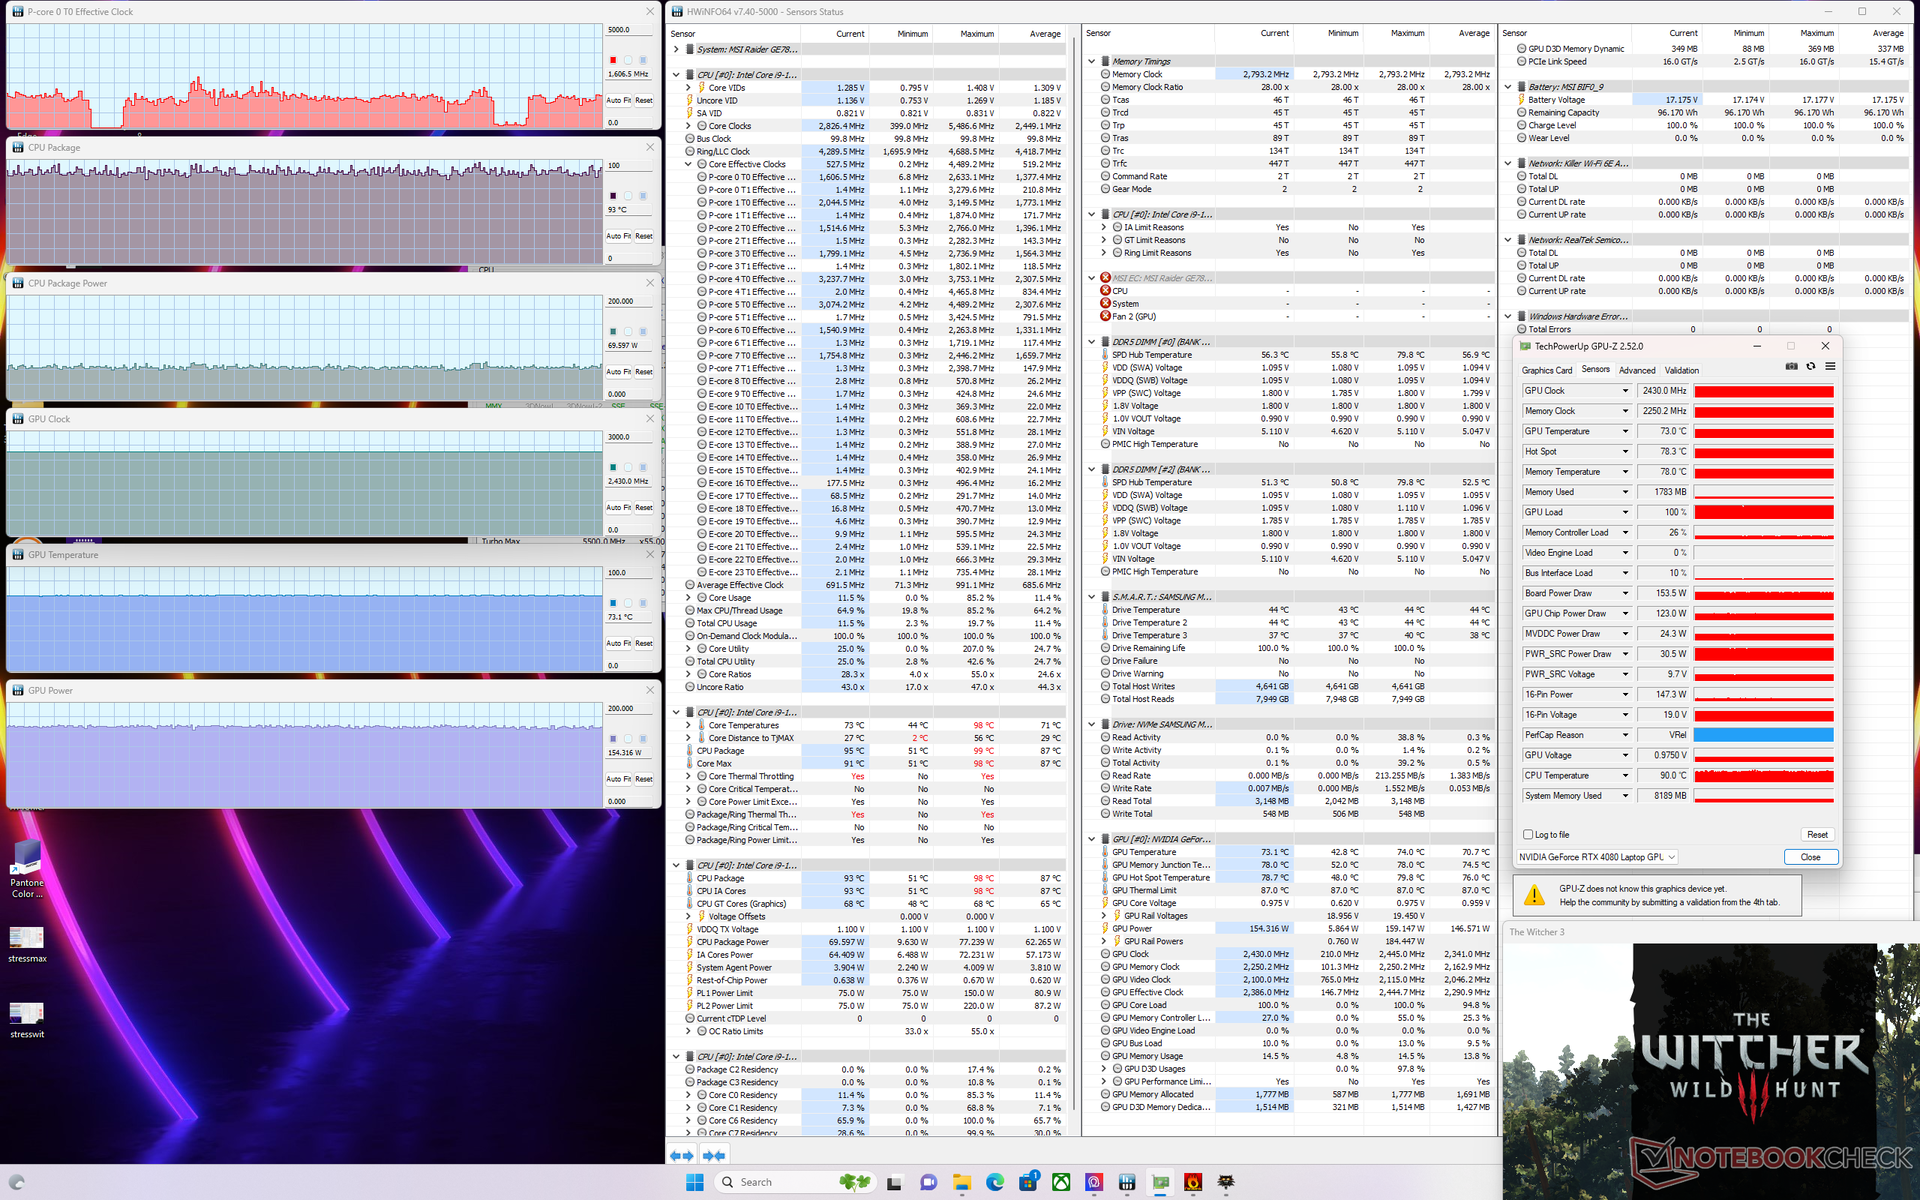
Si se ejecuta Witcher 3 para representar las cargas típicas de los juegos daría como resultado una velocidad de reloj de la GPU estable, una temperatura de la GPU y un consumo de energía de la placa de 2430 MHz, 73 C y 156 W, respectivamente. Los resultados serían idénticos si Cooler Boost estuviera activado. Esperamos que el consumo de la placa se acerque a 175 W si se configura con la GPU RTX 4090 más rápida.
El uso de la batería limita el rendimiento, como era de esperar. Fire Strike a pilas arrojaría unas puntuaciones de física y gráficos de sólo 18881 y 22232 puntos, respectivamente, frente a 41339 y 42663 puntos con la red eléctrica.
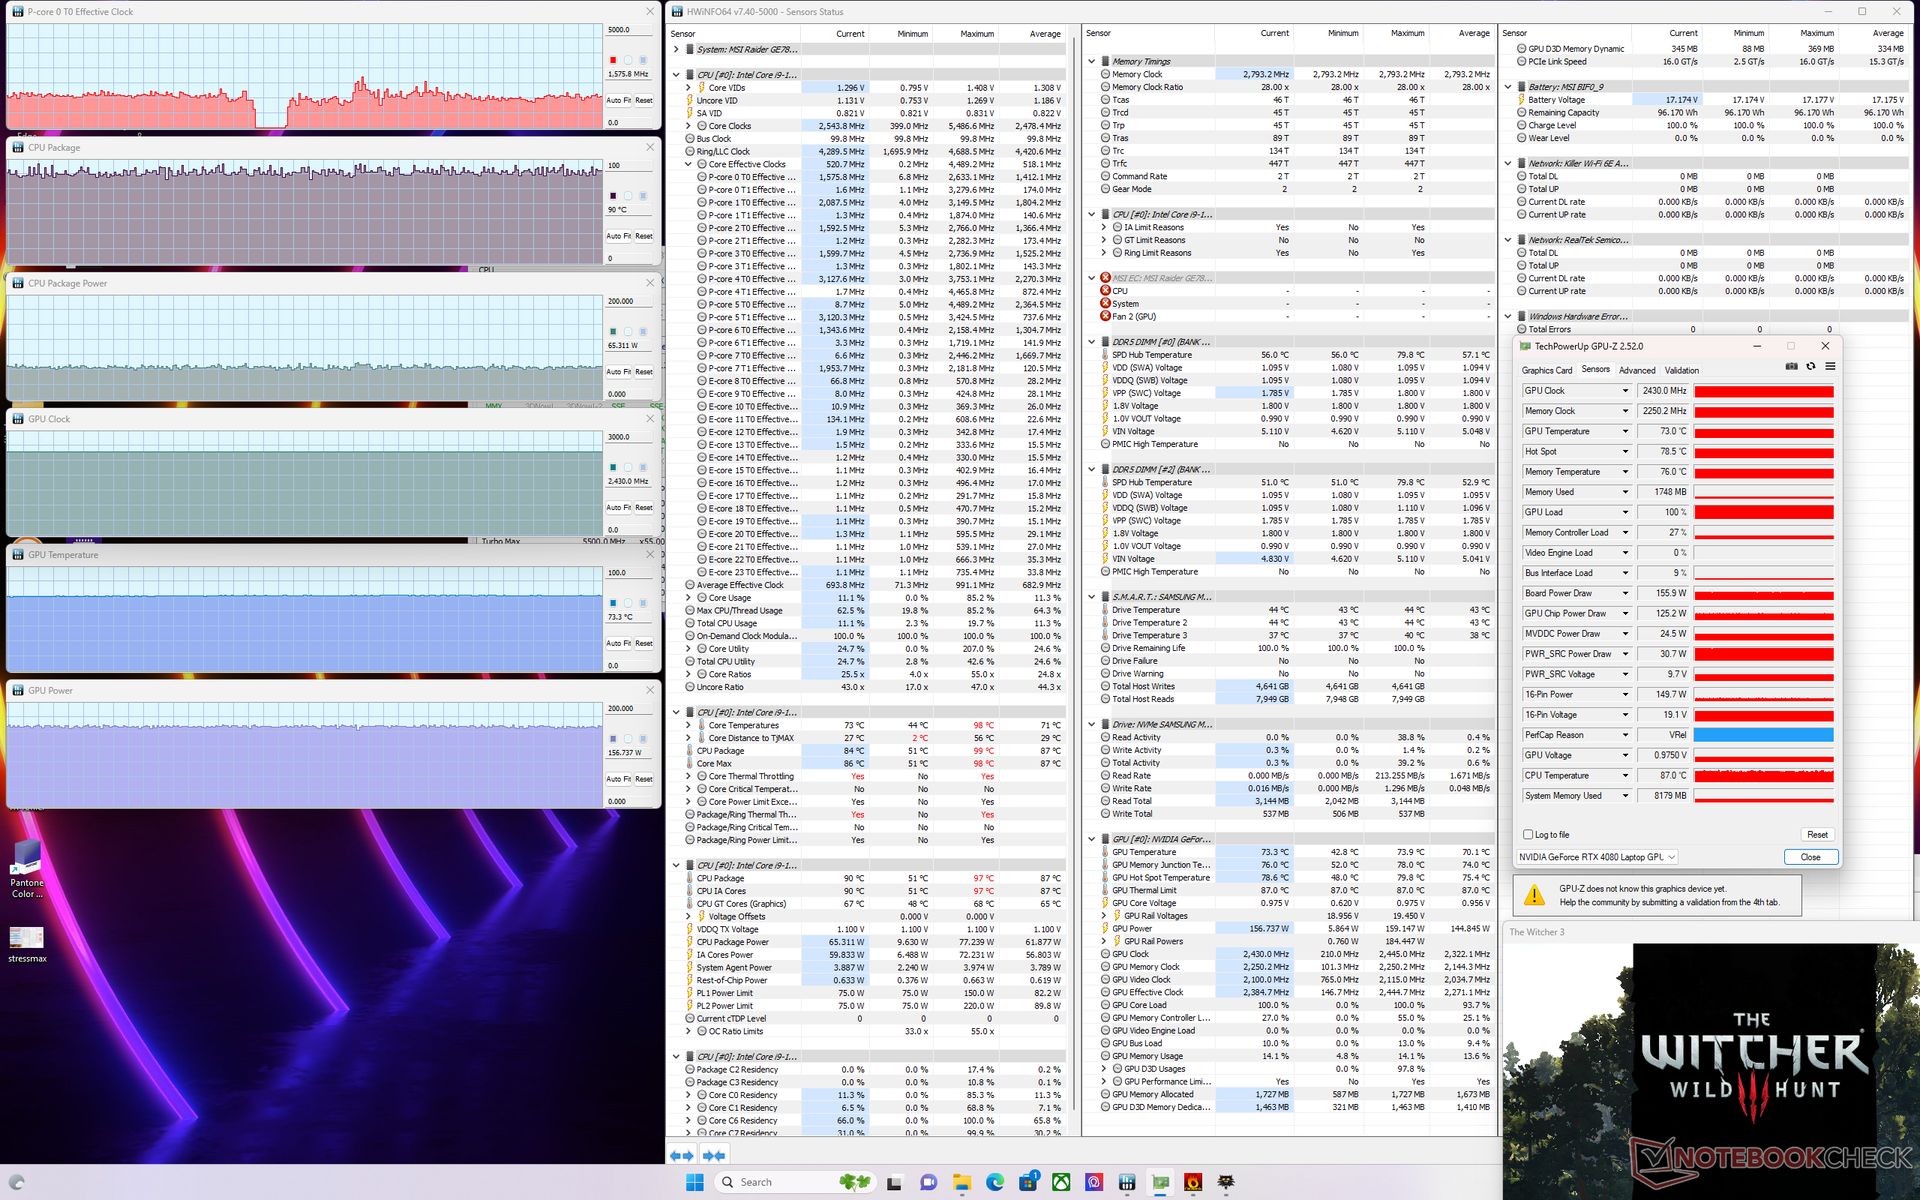
| RelojCPU (GHz) | Reloj GPU (MHz) | Temperatura mediaCPU (°C) | Temperatura media GPU (°C) | |
| Sistema en reposo | -- | -- | 45 | 37 |
| Prime95Stress | 3,7 | -- | 91 | 53 |
| Prime95+ FurMark Stress | 2,4 - 3,7 | 960 - 2360 | 82 - 85 | 53 - 60 |
| Witcher 3 Tensión | ~1,6 | 2430 | 93 | 73 |
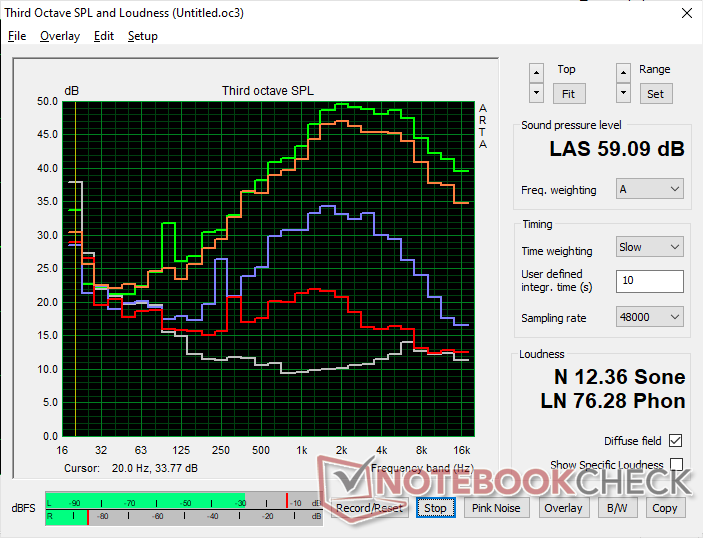
Altavoces
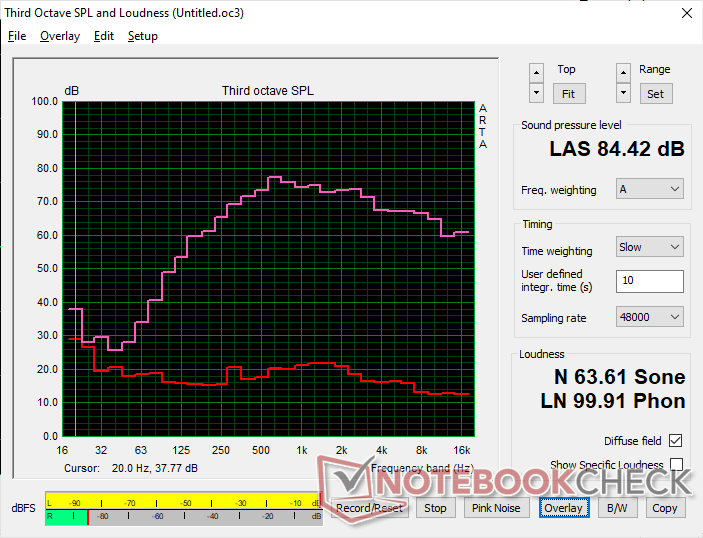
MSI GE78HX 13VH-070US análisis de audio
(+) | los altavoces pueden reproducir a un volumen relativamente alto (#84.4 dB)
Graves 100 - 315 Hz
(±) | lubina reducida - en promedio 8.3% inferior a la mediana
(±) | la linealidad de los graves es media (9.3% delta a frecuencia anterior)
Medios 400 - 2000 Hz
(±) | medias más altas - de media 6.8% más altas que la mediana
(+) | los medios son lineales (3.4% delta a la frecuencia anterior)
Altos 2 - 16 kHz
(+) | máximos equilibrados - a sólo 2% de la mediana
(+) | los máximos son lineales (2.6% delta a la frecuencia anterior)
Total 100 - 16.000 Hz
(+) | el sonido global es lineal (12% de diferencia con la mediana)
En comparación con la misma clase
» 12% de todos los dispositivos probados de esta clase eran mejores, 4% similares, 84% peores
» El mejor tuvo un delta de 6%, la media fue 18%, el peor fue ###max##%
En comparación con todos los dispositivos probados
» 9% de todos los dispositivos probados eran mejores, 2% similares, 88% peores
» El mejor tuvo un delta de 4%, la media fue 23%, el peor fue ###max##%
Apple MacBook Pro 16 2021 M1 Pro análisis de audio
(+) | los altavoces pueden reproducir a un volumen relativamente alto (#84.7 dB)
Graves 100 - 315 Hz
(+) | buen bajo - sólo 3.8% lejos de la mediana
(+) | el bajo es lineal (5.2% delta a la frecuencia anterior)
Medios 400 - 2000 Hz
(+) | medios equilibrados - a sólo 1.3% de la mediana
(+) | los medios son lineales (2.1% delta a la frecuencia anterior)
Altos 2 - 16 kHz
(+) | máximos equilibrados - a sólo 1.9% de la mediana
(+) | los máximos son lineales (2.7% delta a la frecuencia anterior)
Total 100 - 16.000 Hz
(+) | el sonido global es lineal (4.6% de diferencia con la mediana)
En comparación con la misma clase
» 0% de todos los dispositivos probados de esta clase eran mejores, 0% similares, 100% peores
» El mejor tuvo un delta de 5%, la media fue 17%, el peor fue ###max##%
En comparación con todos los dispositivos probados
» 0% de todos los dispositivos probados eran mejores, 0% similares, 100% peores
» El mejor tuvo un delta de 4%, la media fue 23%, el peor fue ###max##%
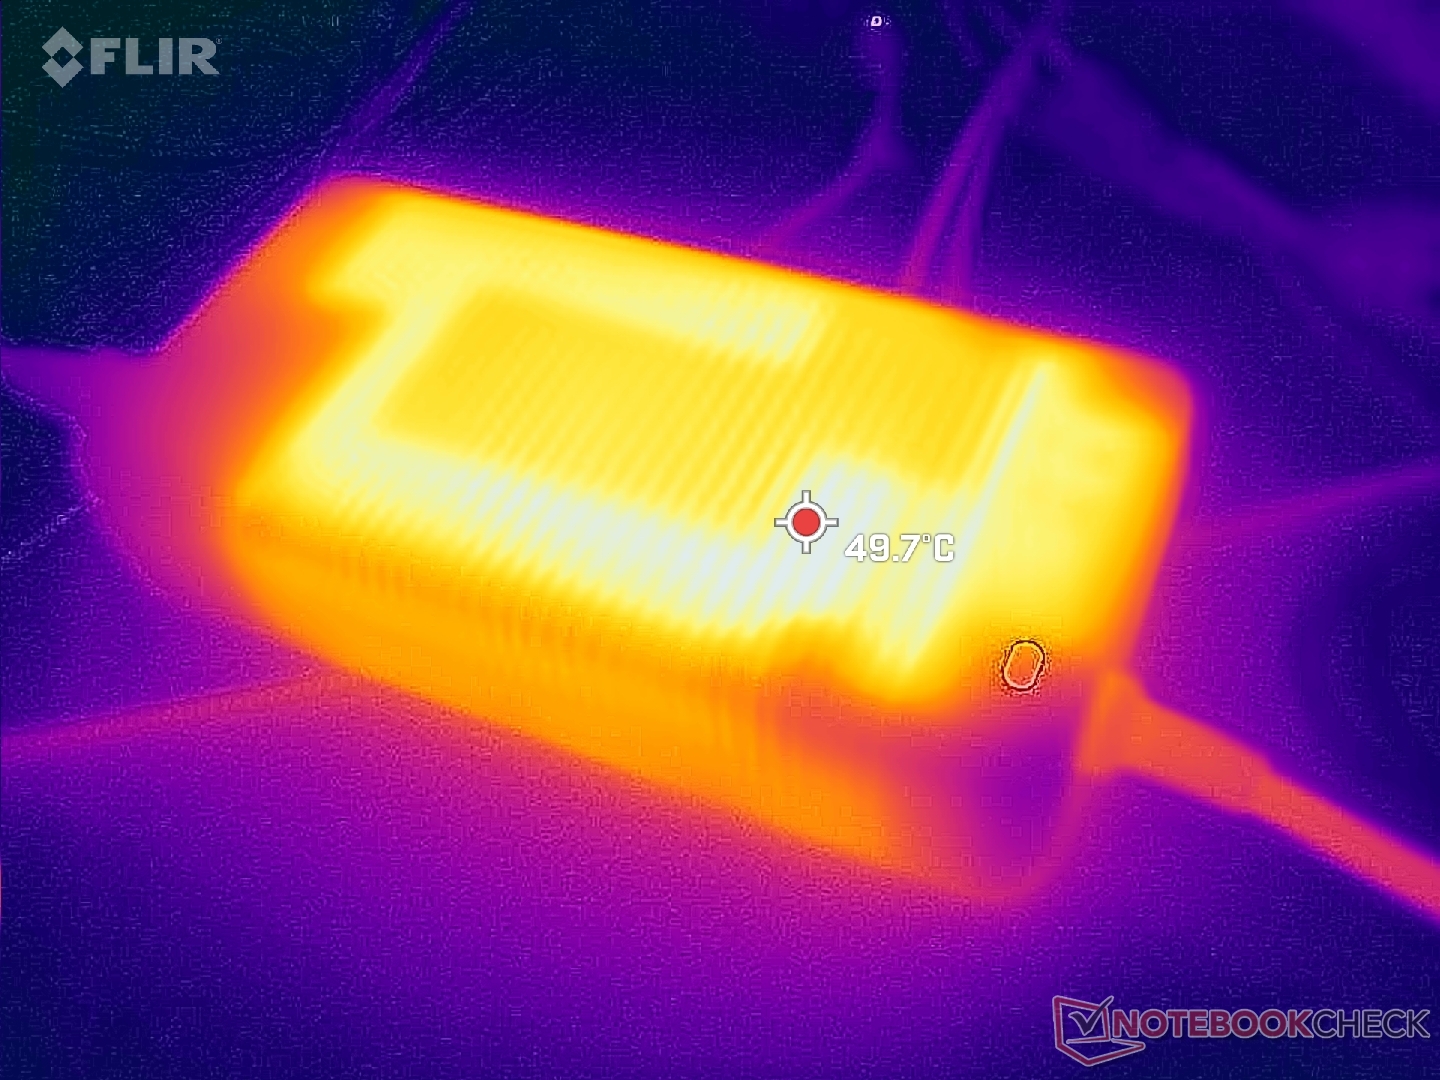
Gestión de la energía - Ladrillo de gran potencia y alto consumo
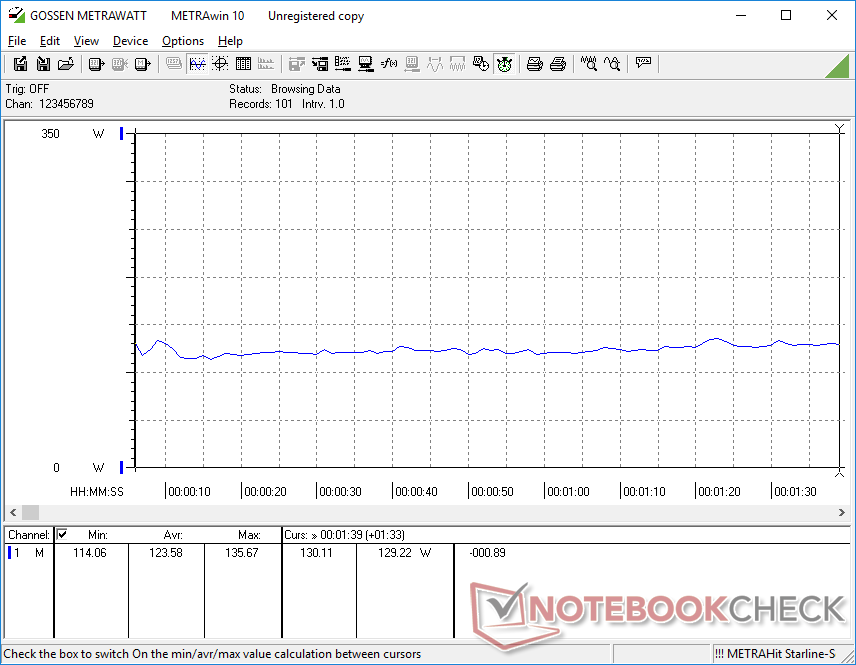
Consumo de energía
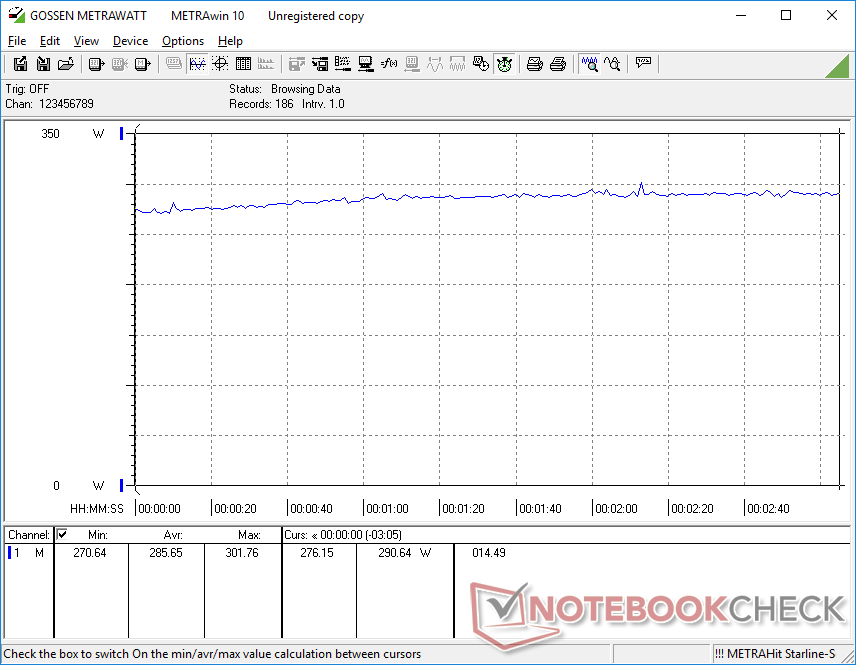
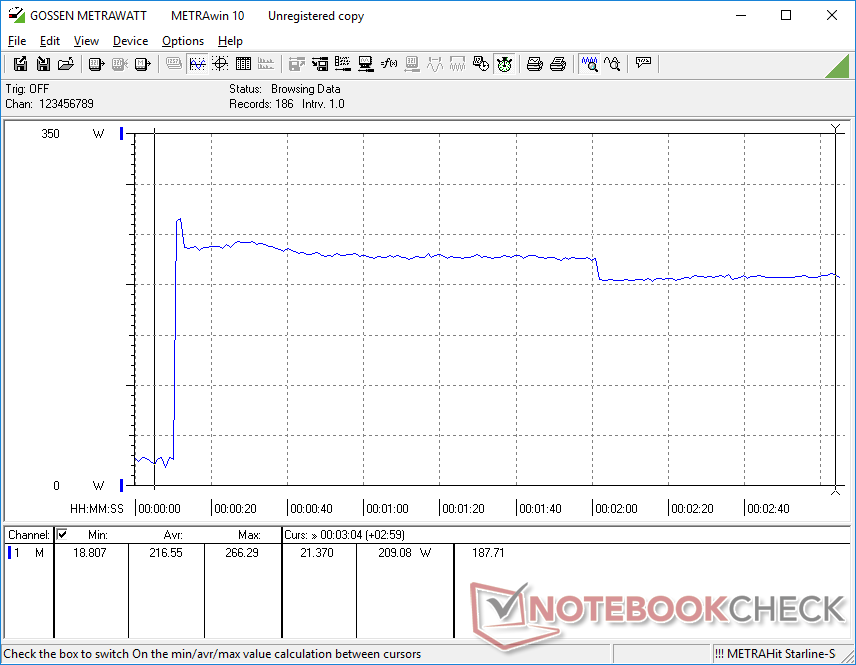
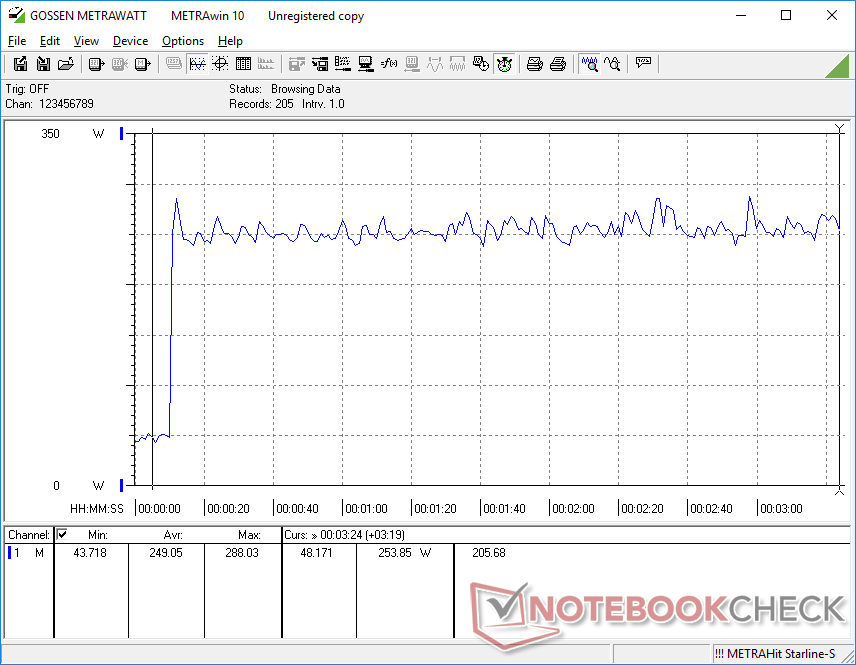
El consumo de energía es ahora incluso superior al de los portátiles que funcionan con CPU Intel de 12ª generación y GPU GeForce 30, que ya eran bastante elevados de por sí. Por ejemplo, los juegos consumen 286 W frente a los 247 W del GE77. Sin embargo, el rendimiento de la GPU por vatio sigue siendo mejor en la serie GeForce 40, así que al menos el aumento del consumo es relativamente menor.
Ejecutar Prime95 en un monitor externo consumiría un 32% más de energía que en el GE77 con cargas similares, lo que supone un aumento del 40% al 45% en el rendimiento bruto del procesador. El rendimiento de la CPU por vatio es, por tanto, apenas superior al pasar de la 12ª a la 13ª generación de la serie Core-H.
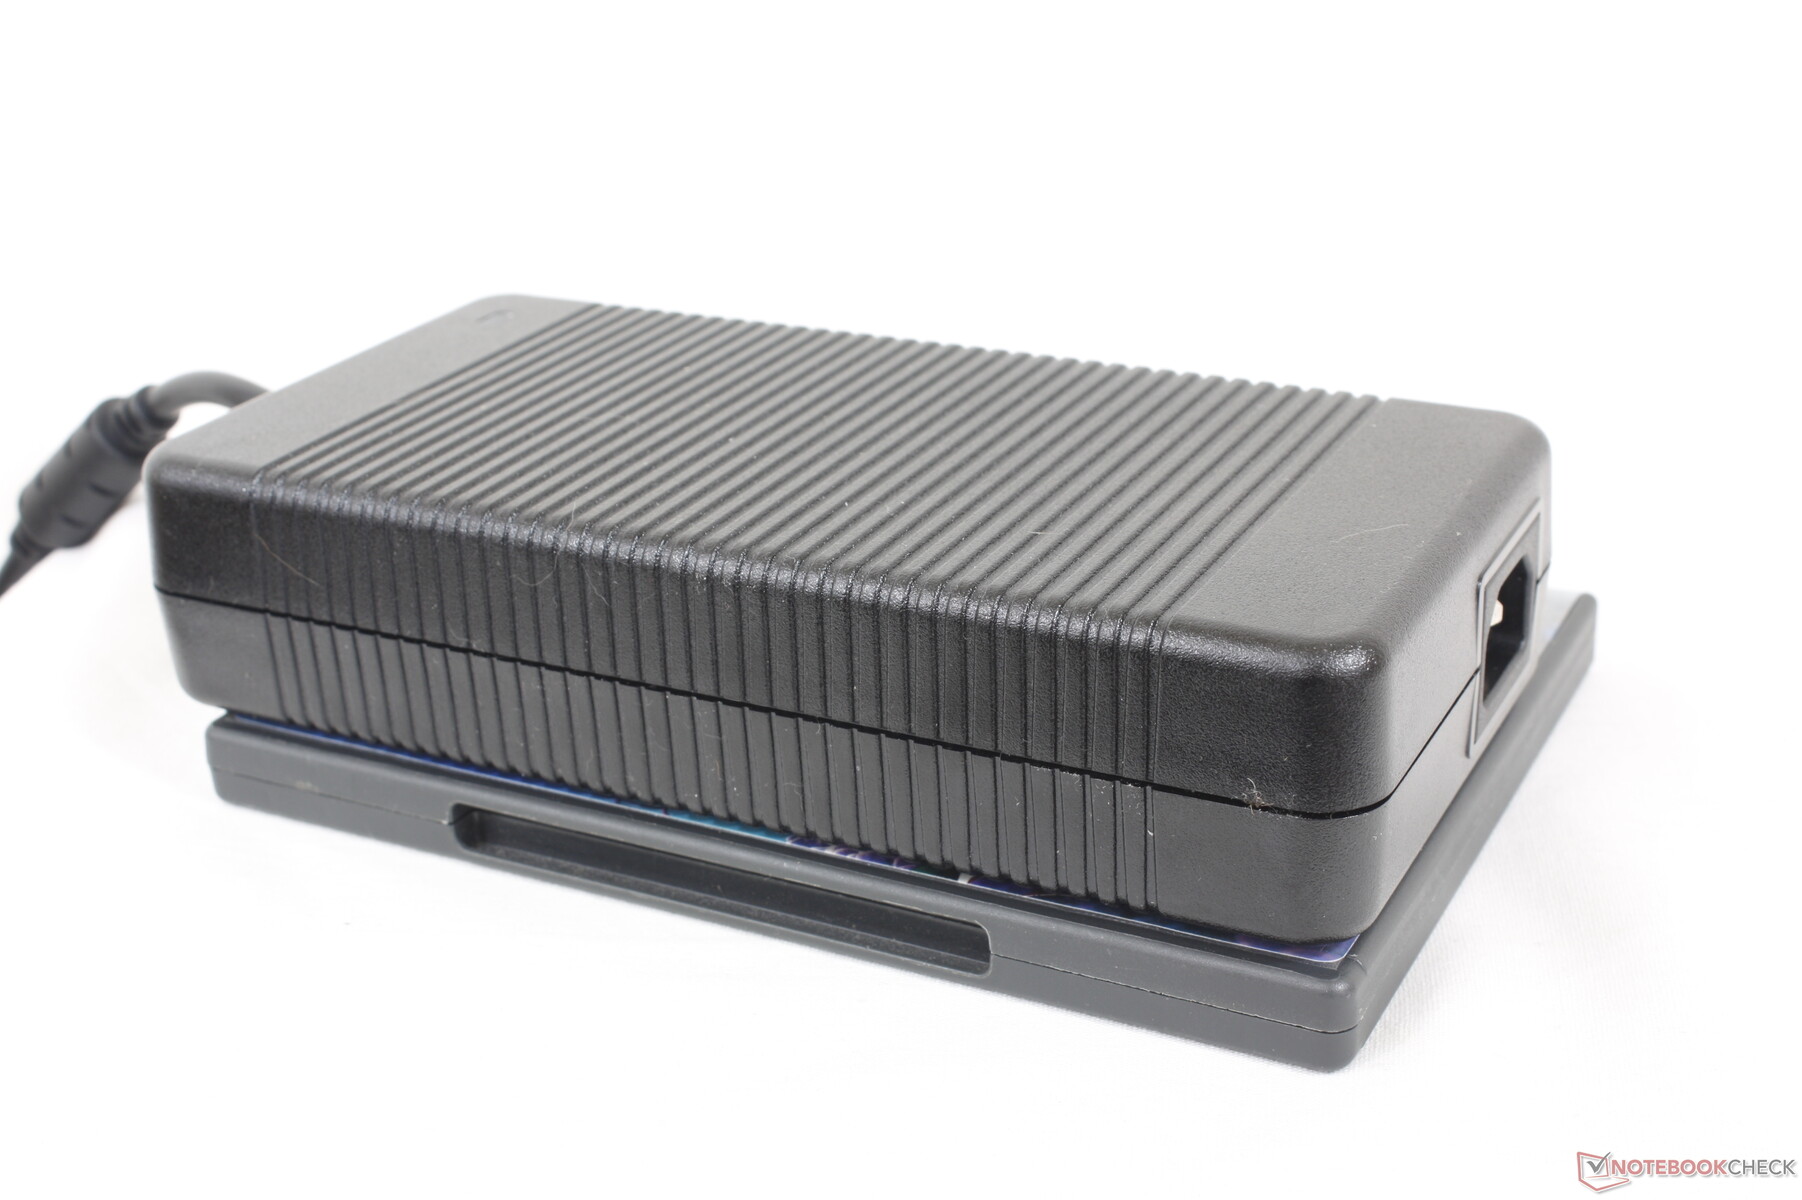
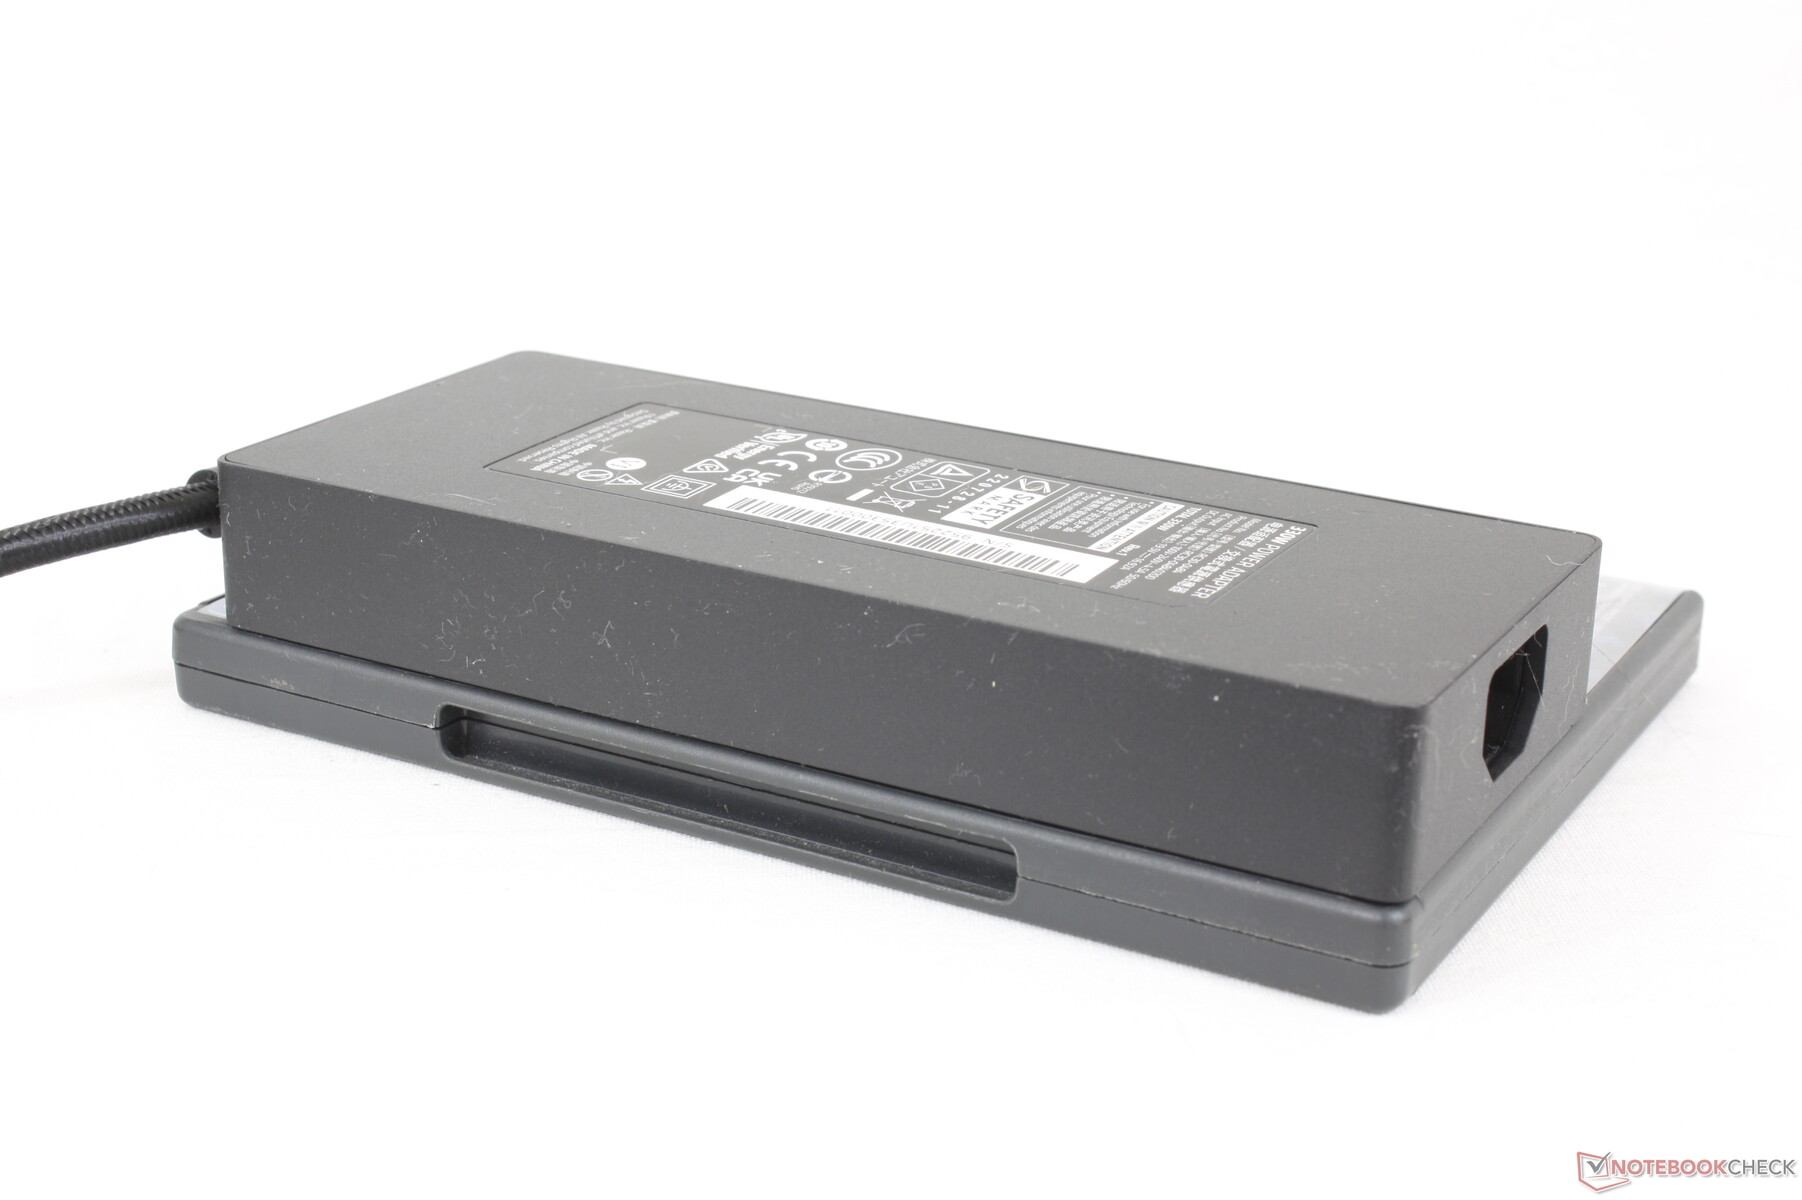
Registramos un consumo máximo temporal de 288 W del voluminoso adaptador de CA de 330 W (~19.9 x 9.8 x 4.2 cm) cuando la CPU y la GPU se someten a Prime95 y FurMark simultáneamente. A diferencia de Razer, MSI aún no ha migrado a la carga GaN, por lo que su adaptador de 330 W es notablemente más grande y pesado que la solución de 330 W de Razer.
| Off / Standby | |
| Ocioso | |
| Carga |
|
Clave:
min: | |
| MSI GE78HX 13VH-070US i9-13950HX, GeForce RTX 4080 Laptop GPU, Samsung PM9A1 MZVL22T0HBLB, IPS, 2560x1600, 17" | Eluktronics Mech-17 GP2 i9-13900HX, GeForce RTX 4090 Laptop GPU, Samsung PM9A1 MZVL21T0HCLR, IPS, 2560x1600, 17" | Asus ROG Strix G17 G713PI R9 7945HX, GeForce RTX 4070 Laptop GPU, WD PC SN560 SDDPNQE-1T00, IPS, 2560x1440, 17.3" | MSI Titan GT77 HX 13VI i9-13950HX, GeForce RTX 4090 Laptop GPU, Samsung PM9A1 MZVL22T0HBLB, Mini-LED, 3840x2160, 17.3" | MSI Raider GE77 HX 12UHS i9-12900HX, GeForce RTX 3080 Ti Laptop GPU, Samsung PM9A1 MZVL22T0HBLB, IPS, 3840x2160, 17.3" | Razer Blade 17 Early 2022 i9-12900H, GeForce RTX 3080 Ti Laptop GPU, Samsung PM9A1 MZVL21T0HCLR, IPS, 3840x2160, 17.3" | |
|---|---|---|---|---|---|---|
| Power Consumption | 1% | 15% | 2% | 5% | 6% | |
| Idle Minimum * (Watt) | 16.1 | 14 13% | 15 7% | 14 13% | 13 19% | 17 -6% |
| Idle Average * (Watt) | 24 | 19.3 20% | 20 17% | 21.6 10% | 19 21% | 23 4% |
| Idle Maximum * (Watt) | 34 | 36.8 -8% | 29 15% | 24.8 27% | 29 15% | 34 -0% |
| Load Average * (Watt) | 123.6 | 117.2 5% | 121 2% | 122.5 1% | 143 -16% | 120 3% |
| Witcher 3 ultra * (Watt) | 286 | 304 -6% | 179.8 37% | 265 7% | 247 14% | 229 20% |
| Load Maximum * (Watt) | 285.7 | 342.5 -20% | 246 14% | 418 -46% | 352 -23% | 243 15% |
* ... más pequeño es mejor
Power Consumption Witcher 3 / Stresstest
Power Consumption external Monitor
Duración de la batería
Los tiempos de ejecución son bastante buenos teniendo en cuenta el exigente hardware que contiene. Hemos sido capaces de registrar algo más de 6 horas de navegación WLAN real con el perfil de energía equilibrado y la iGPU activa. Competidores como elEluktronics Mech-17 GP2 o Asus ROG Strix G17 G713PI durarían entre una y dos horas menos, respectivamente, en condiciones similares.
La carga de vacío a plena capacidad tarda unas 2,5 horas, una hora más que en la mayoría de los Ultrabooks. Aunque MSI dice que soporta carga PD, no pudimos cargar nuestra unidad de pruebas por ninguno de los tres puertos USB-C.
| MSI GE78HX 13VH-070US i9-13950HX, GeForce RTX 4080 Laptop GPU, 99 Wh | Eluktronics Mech-17 GP2 i9-13900HX, GeForce RTX 4090 Laptop GPU, 99 Wh | Asus ROG Strix G17 G713PI R9 7945HX, GeForce RTX 4070 Laptop GPU, 90 Wh | MSI Titan GT77 HX 13VI i9-13950HX, GeForce RTX 4090 Laptop GPU, 99.9 Wh | MSI Raider GE77 HX 12UHS i9-12900HX, GeForce RTX 3080 Ti Laptop GPU, 99.99 Wh | Razer Blade 17 Early 2022 i9-12900H, GeForce RTX 3080 Ti Laptop GPU, 82 Wh | |
|---|---|---|---|---|---|---|
| Duración de Batería | -16% | -32% | -10% | 19% | -9% | |
| Reader / Idle (h) | 7.3 | 9.8 34% | 7.1 -3% | |||
| WiFi v1.3 (h) | 6.1 | 5.1 -16% | 4.3 -30% | 5.3 -13% | 5.4 -11% | 3.8 -38% |
| Load (h) | 1.5 | 1 -33% | 1.4 -7% | 2 33% | 1.7 13% | |
| H.264 (h) | 2.8 | 6 | 6.5 | 4.8 | ||
| Witcher 3 ultra (h) | 1.1 |
Pro
Contra
Veredicto - Excelente mejora del rendimiento interanual
En cuanto a las prestaciones, el GE78 ofrece una mejora significativa con respecto al GE77 a cambio de un consumo ligeramente superior. Sin embargo, tendrás que hacerte con las configuraciones RTX 4080 o 4090 para ver las ventajas de rendimiento, ya que la RTX 4070 está más cerca en rendimiento de la antigua RTX 3080 Ti.
En cuanto al diseño, algunos usuarios preferirán el aspecto minimalista 16:9 del antiguo GE77 al GE78 de inspiración retro 16:10, y viceversa. No diríamos que uno es mejor que el otro en términos estéticos, pero daríamos ventaja al GE78 por sus bisagras más fuertes y sus teclas y clickpad más grandes.
El MSI GE78 es un gran paso adelante con respecto al GE77 en términos de rendimiento. Sin embargo, algunas de sus características no están a la altura de la competencia, sobre todo si tenemos en cuenta que su precio es superior a los 3000 dólares.
Esperemos que los problemas que experimentamos en nuestra unidad no sean generalizados en las unidades de venta al por menor. La congelación al despertar del sueño, el fuerte sangrado de luz y los problemas de latencia DPC son problemas que no deberían estar presentes en un modelo caro como el GE78. La falta de G-Sync, Advanced Optimus y la delgada carga GaN también son desafortunadas cuando hay alternativas como el Serie Razer Blade ya las ofrecen por defecto.
Precio y disponibilidad
MSI GE78HX 13VH-070US
- 03/21/2023 v7 (old)
Allen Ngo
Transparencia
La selección de los dispositivos que se van a reseñar corre a cargo de nuestro equipo editorial. La muestra de prueba fue proporcionada al autor en calidad de préstamo por el fabricante o el minorista a los efectos de esta reseña. El prestamista no tuvo ninguna influencia en esta reseña, ni el fabricante recibió una copia de la misma antes de su publicación. No había ninguna obligación de publicar esta reseña. Como empresa de medios independiente, Notebookcheck no está sujeta a la autoridad de fabricantes, minoristas o editores.
Así es como prueba Notebookcheck
Cada año, Notebookcheck revisa de forma independiente cientos de portátiles y smartphones utilizando procedimientos estandarizados para asegurar que todos los resultados son comparables. Hemos desarrollado continuamente nuestros métodos de prueba durante unos 20 años y hemos establecido los estándares de la industria en el proceso. En nuestros laboratorios de pruebas, técnicos y editores experimentados utilizan equipos de medición de alta calidad. Estas pruebas implican un proceso de validación en varias fases. Nuestro complejo sistema de clasificación se basa en cientos de mediciones y puntos de referencia bien fundamentados, lo que mantiene la objetividad.Price comparison

