Análisis del Asus ROG Zephyrus Duo 16: Un portátil para juegos inusual con una buena duración de la batería

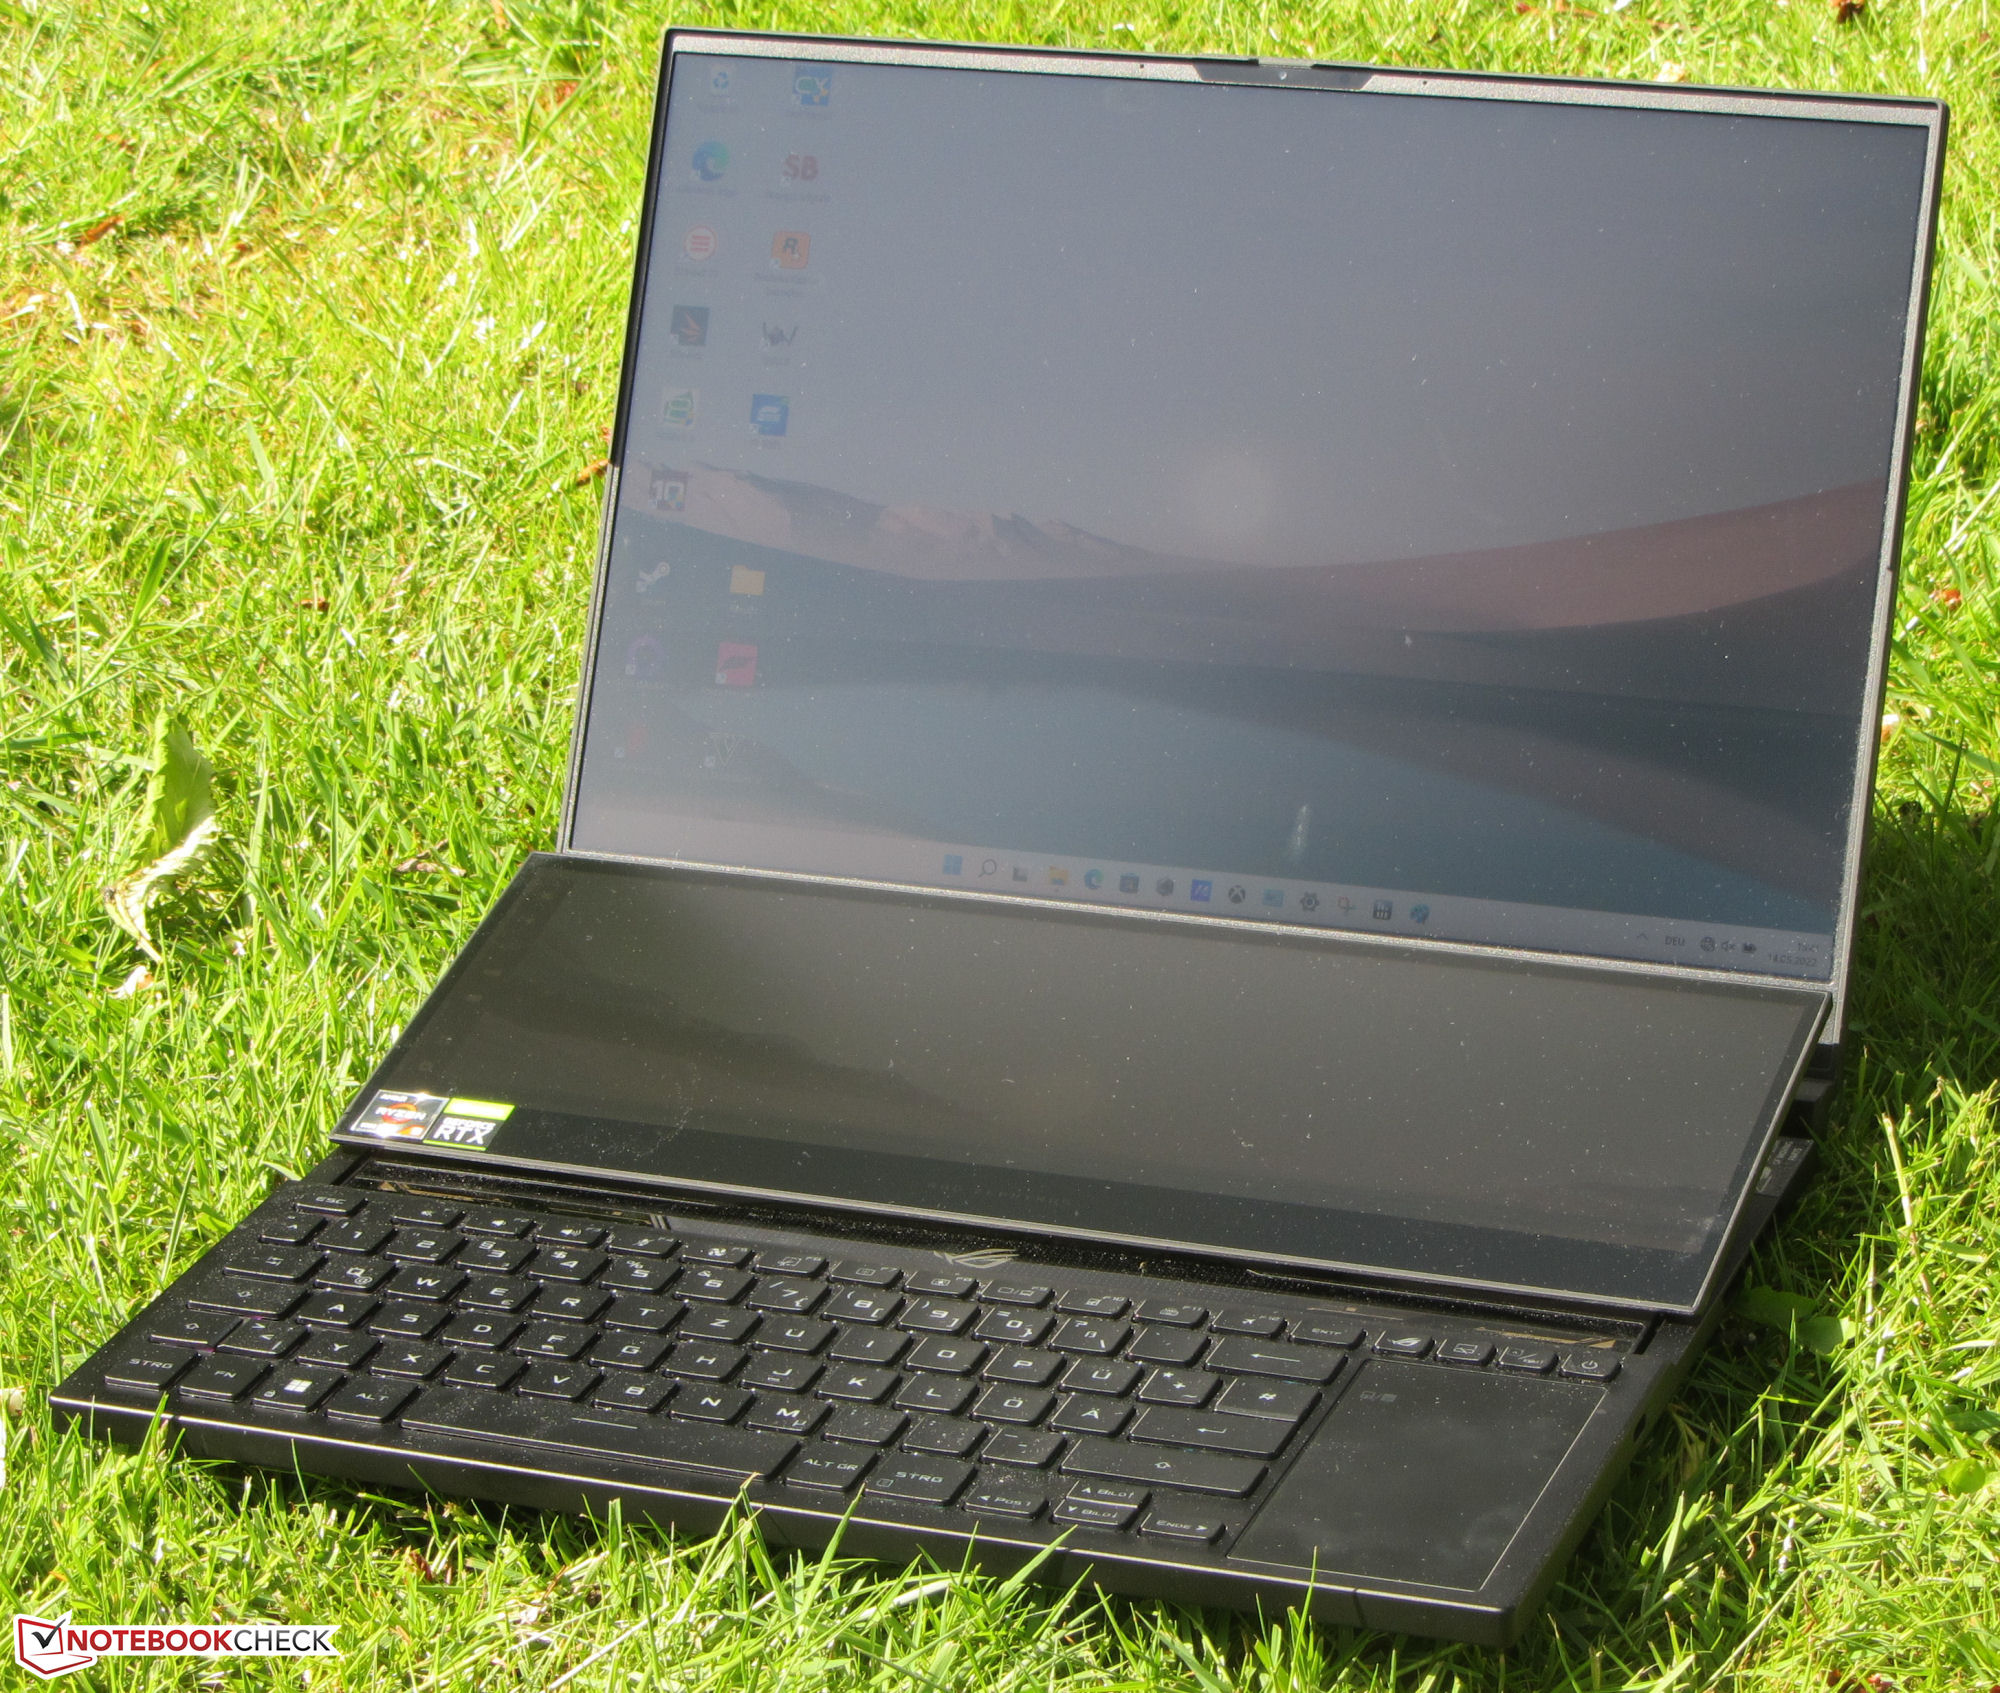
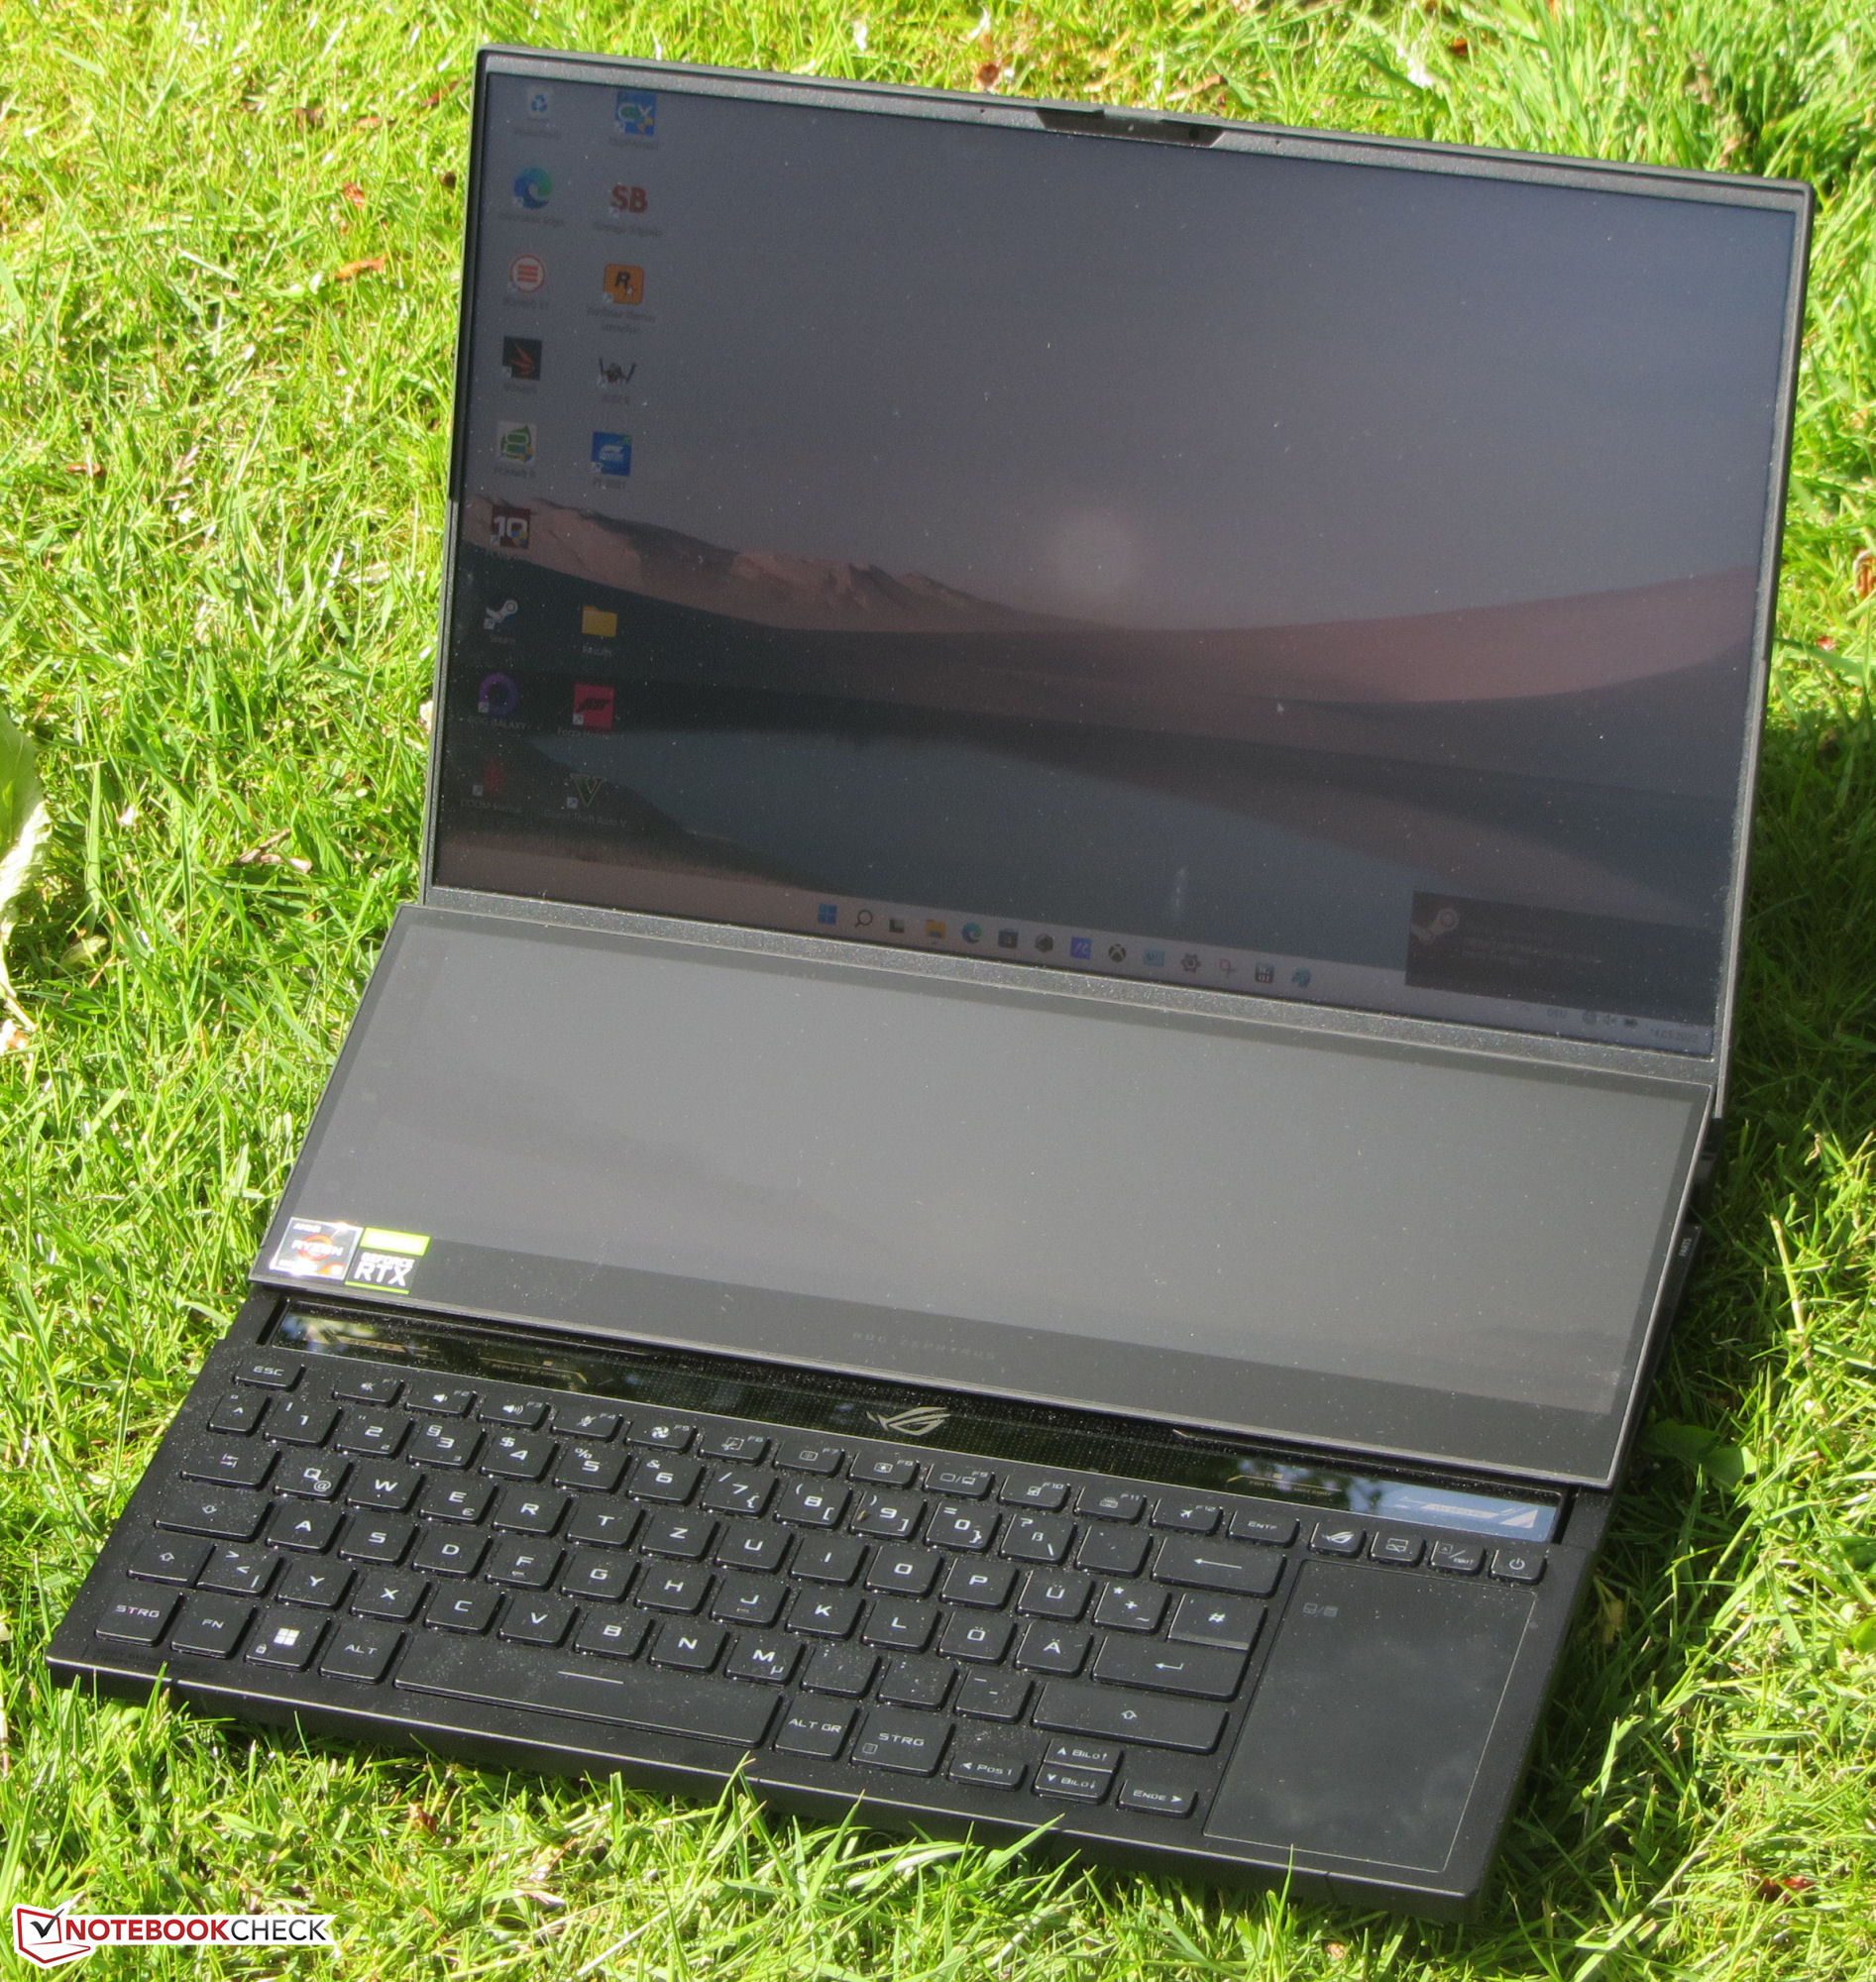
Con el Zephyrus Duo 16, Asus presenta un portátil para jugadores, streamers y creadores de contenidos, cuya característica más llamativa salta a la vista: Situado encima del teclado, hay una segunda pantalla que incluye la funcionalidad de pantalla táctil (Screenpad Plus). Entre los competidores se encuentran dispositivos como el Razer Blade 15 modelo avanzado, elGigabyte Aero 16 YE5, elMSI GE76 Raider, elMedion Erazer Beast X30y el Apple MacBook Pro 16 2021.
Posibles contendientes en la comparación
Valoración | Fecha | Modelo | Peso | Altura | Tamaño | Resolución | Precio |
|---|---|---|---|---|---|---|---|
| 88.2 % v7 (old) | 05/2022 | Asus ROG Zephyrus Duo 16 GX650RX R9 6900HX, GeForce RTX 3080 Ti Laptop GPU | 2.6 kg | 20.5 mm | 16.00" | 3840x2400 | |
| 92.5 % v7 (old) | 11/2021 | Apple MacBook Pro 16 2021 M1 Max M1 Max, M1 Max 32-Core GPU | 2.2 kg | 16.8 mm | 16.20" | 3456x2234 | |
| 88.3 % v7 (old) | 05/2022 | Razer Blade 15 Advanced Model Early 2022 i7-12800H, GeForce RTX 3080 Ti Laptop GPU | 2.1 kg | 16.99 mm | 15.60" | 1920x1080 | |
| 87.5 % v7 (old) | 01/2022 | MSI GE76 Raider i9-12900HK, GeForce RTX 3080 Ti Laptop GPU | 3 kg | 26 mm | 17.30" | 1920x1080 | |
| 86.7 % v7 (old) | 05/2022 | Medion Erazer Beast X30 i9-12900HK, GeForce RTX 3080 Ti Laptop GPU | 2.2 kg | 23 mm | 17.30" | 2560x1440 | |
| 84.7 % v7 (old) | 03/2022 | Gigabyte Aero 16 YE5 i9-12900HK, GeForce RTX 3080 Ti Laptop GPU | 2.3 kg | 22.4 mm | 16.00" | 3840x2400 |
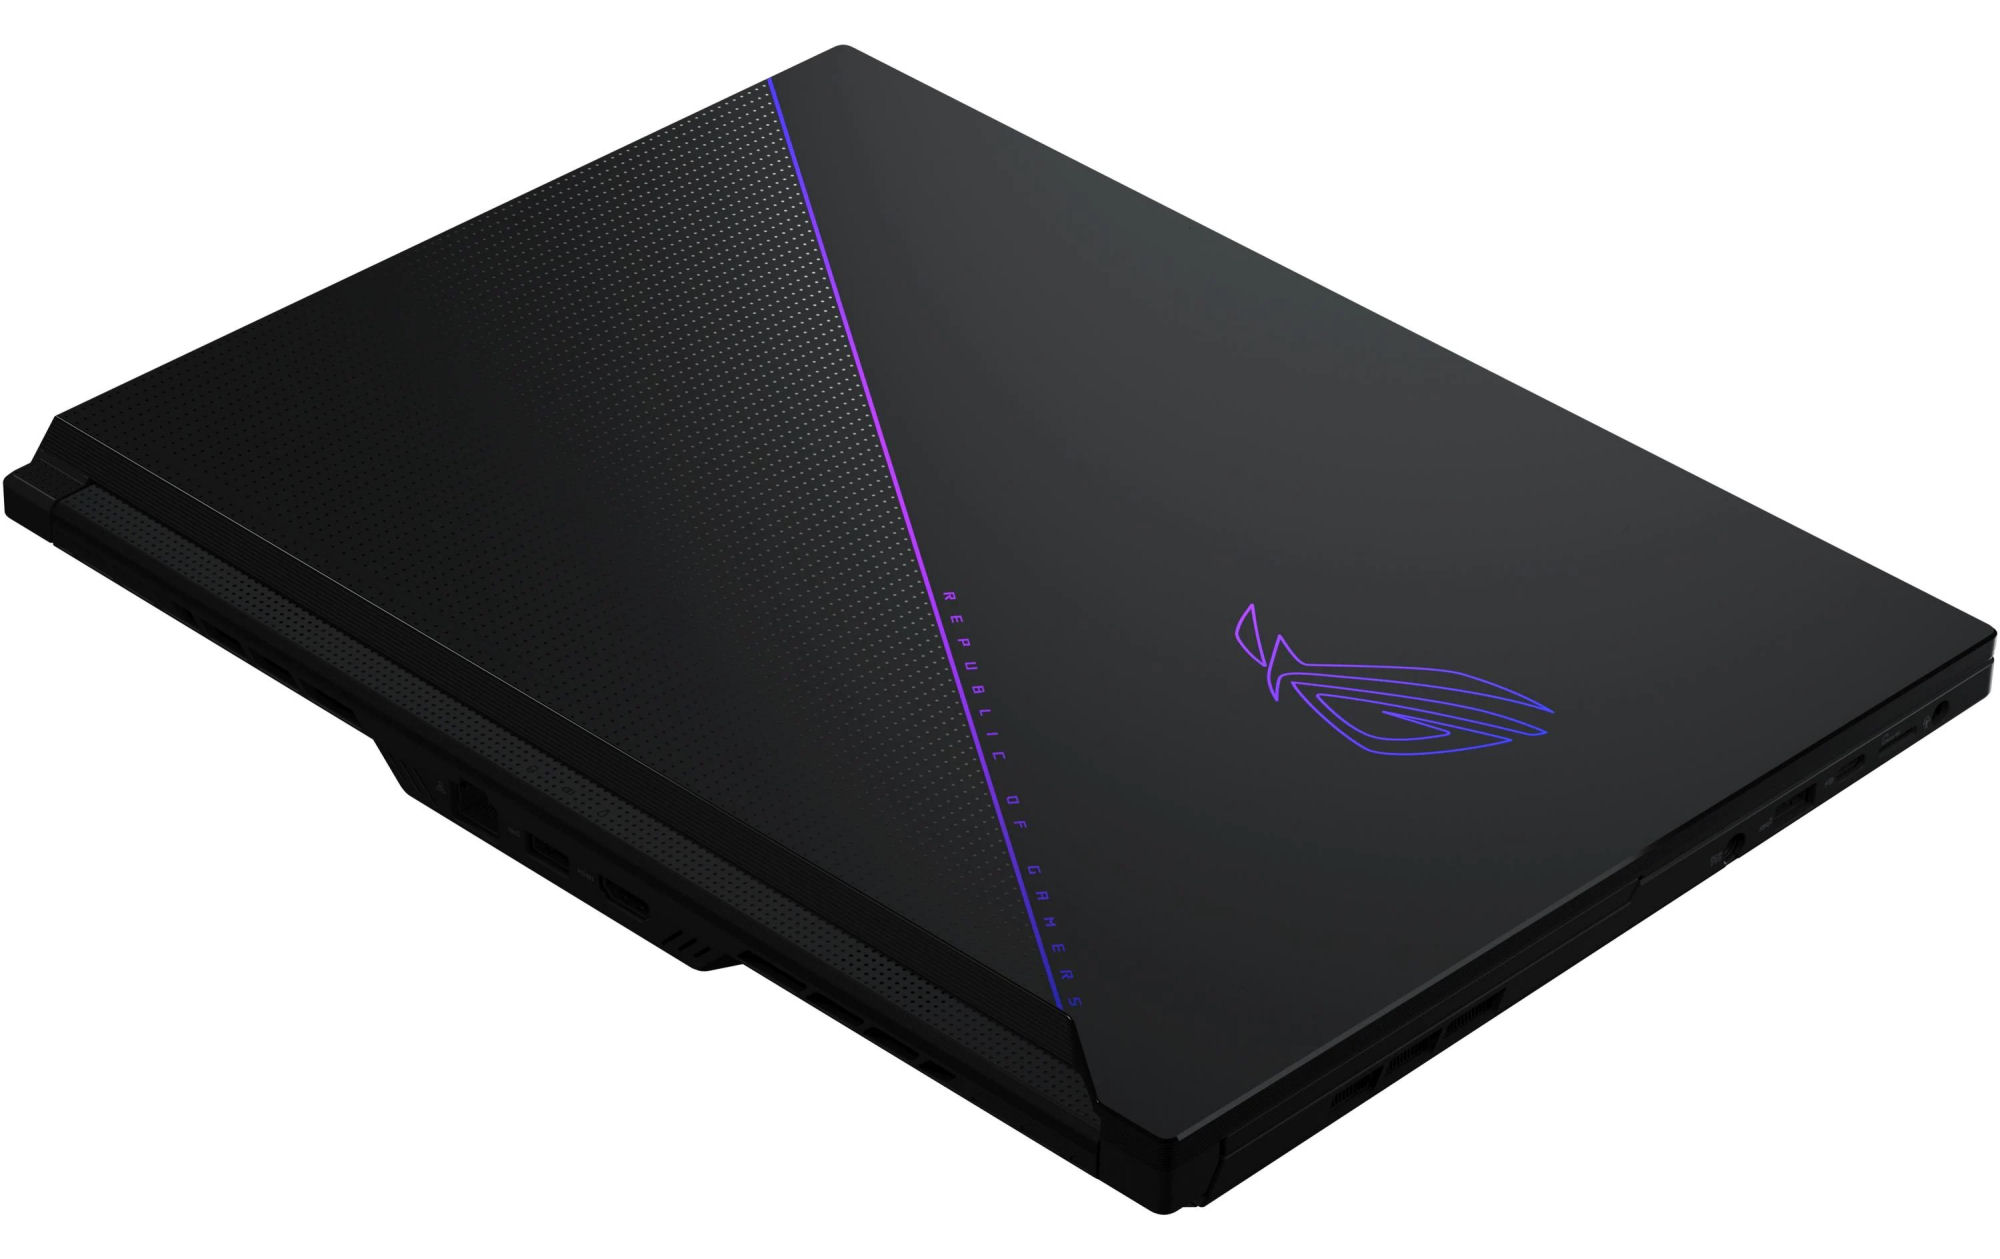
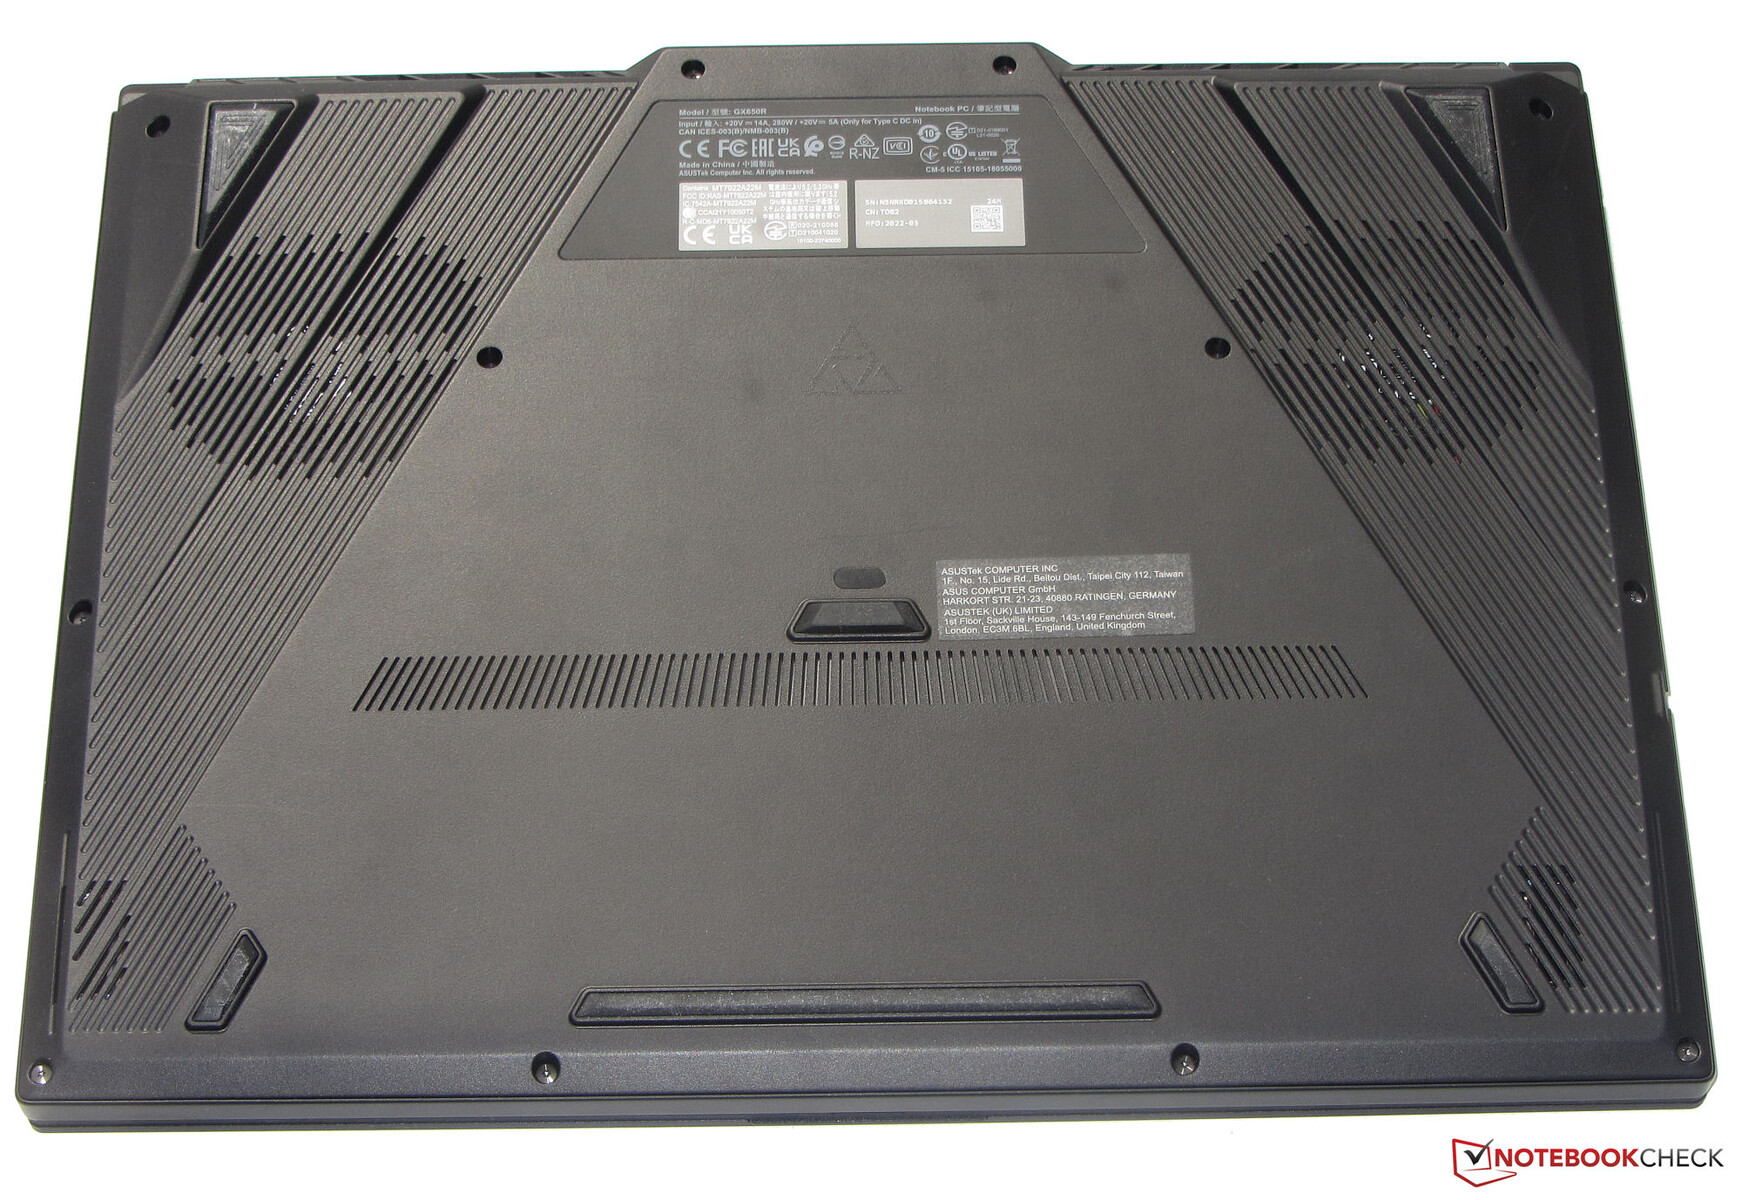
Caja - GX650 con una robusta caja metálica
La carcasa de metal negro mate ofrece una buena mano de obra. No hay huecos aparentes ni bordes afilados perceptibles. Otro punto positivo es que la unidad base no se puede deformar. Por otro lado, la tapa podría ser un poco más rígida. Las bisagras son capaces de mantener la tapa firmemente en su posición. El ángulo máximo de apertura es de unos 130 grados, y se puede abrir la tapa con una sola mano
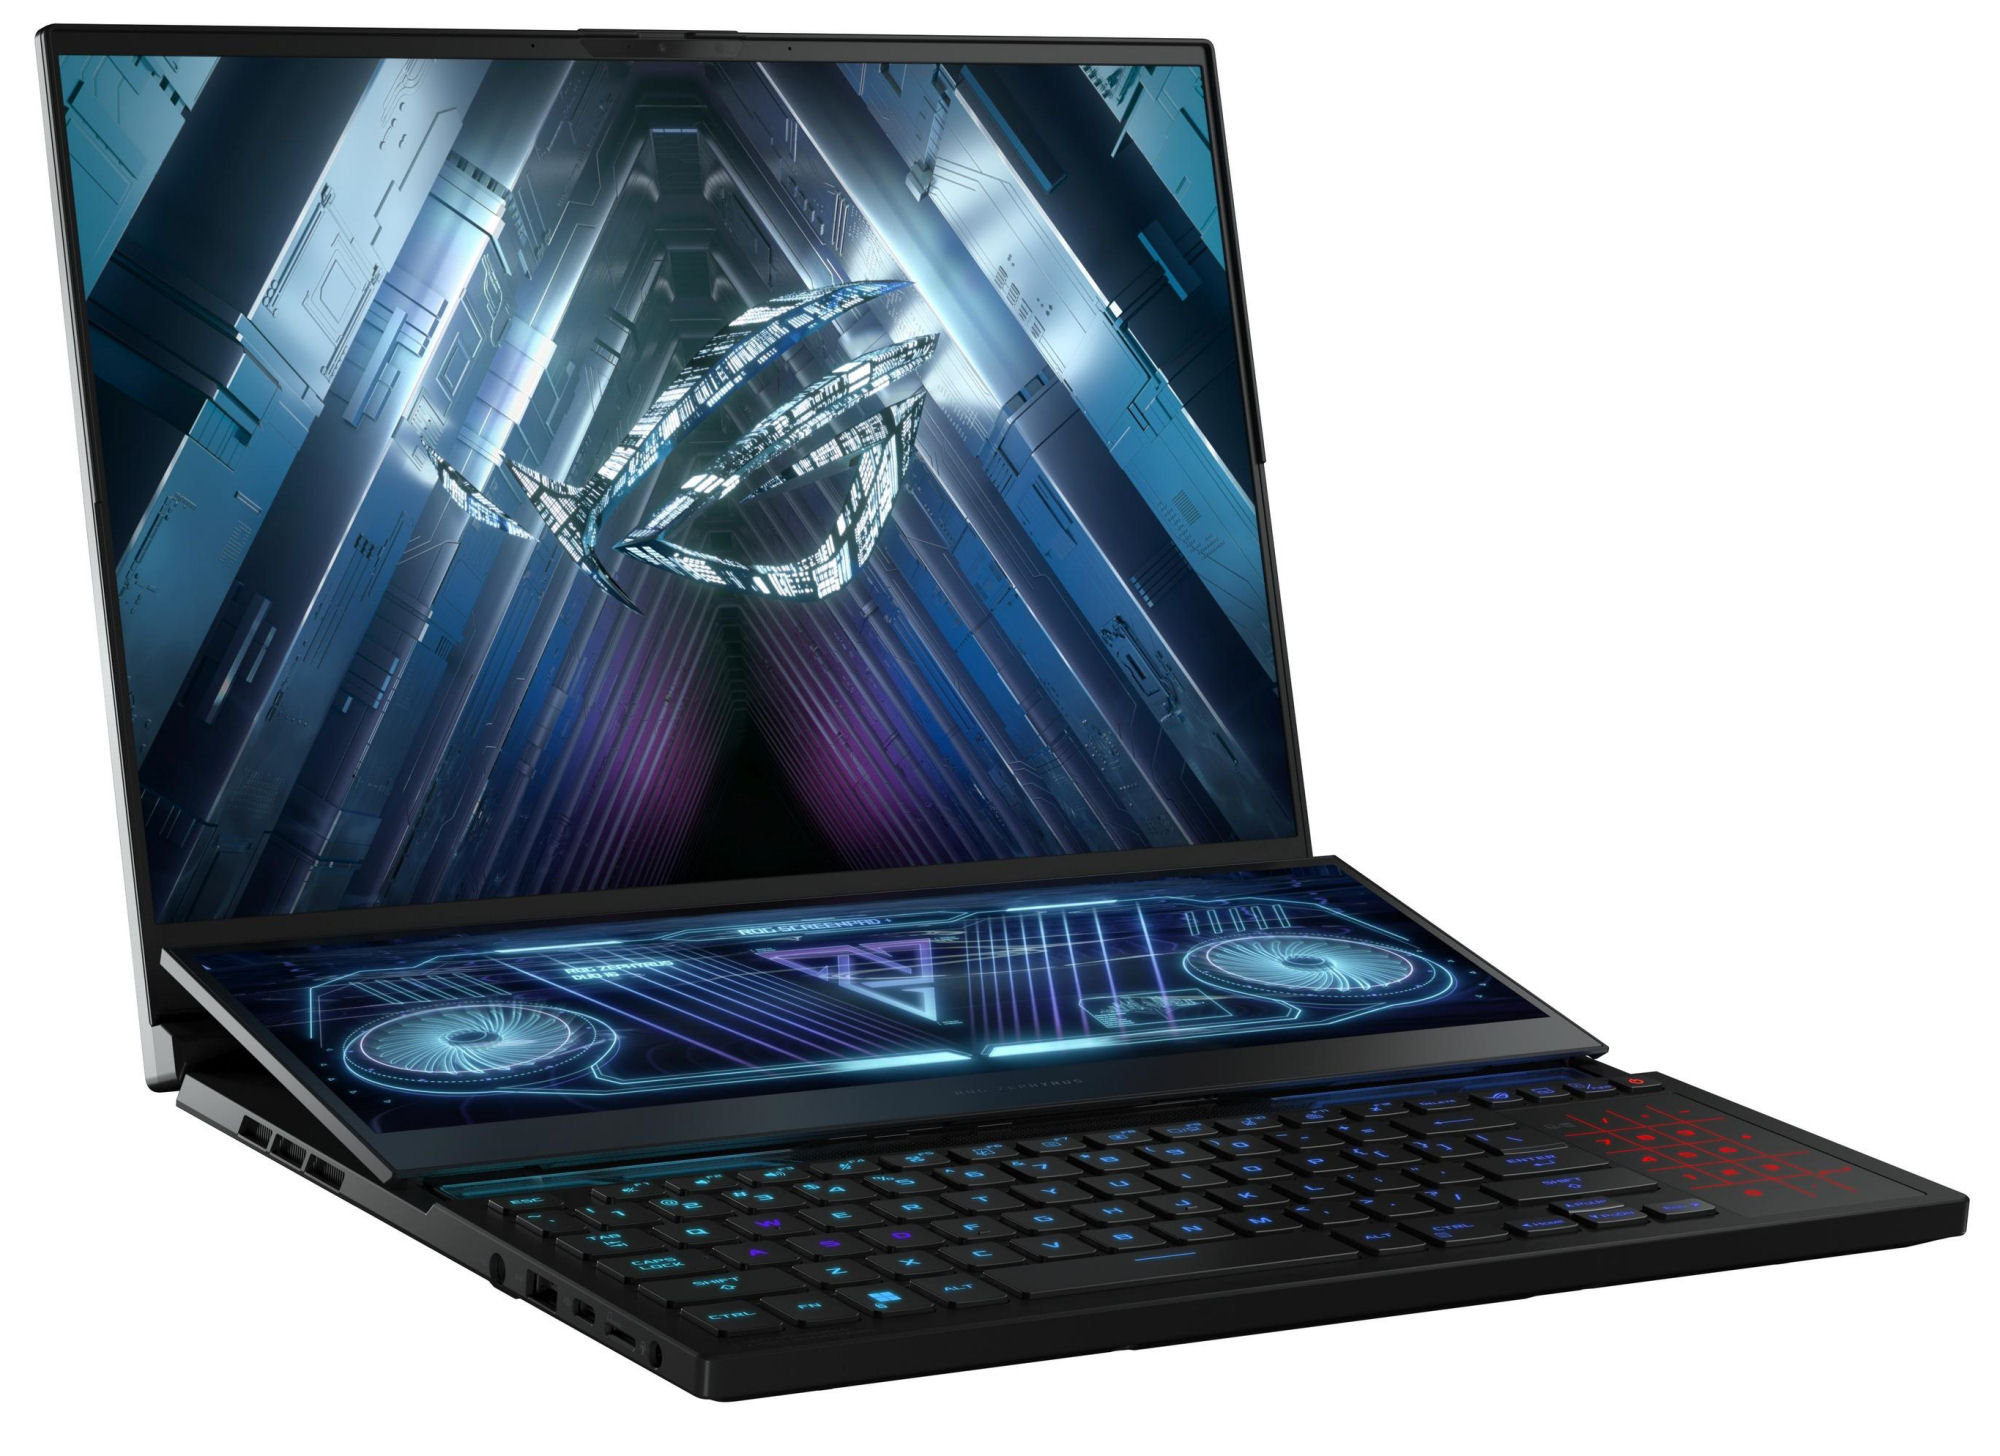
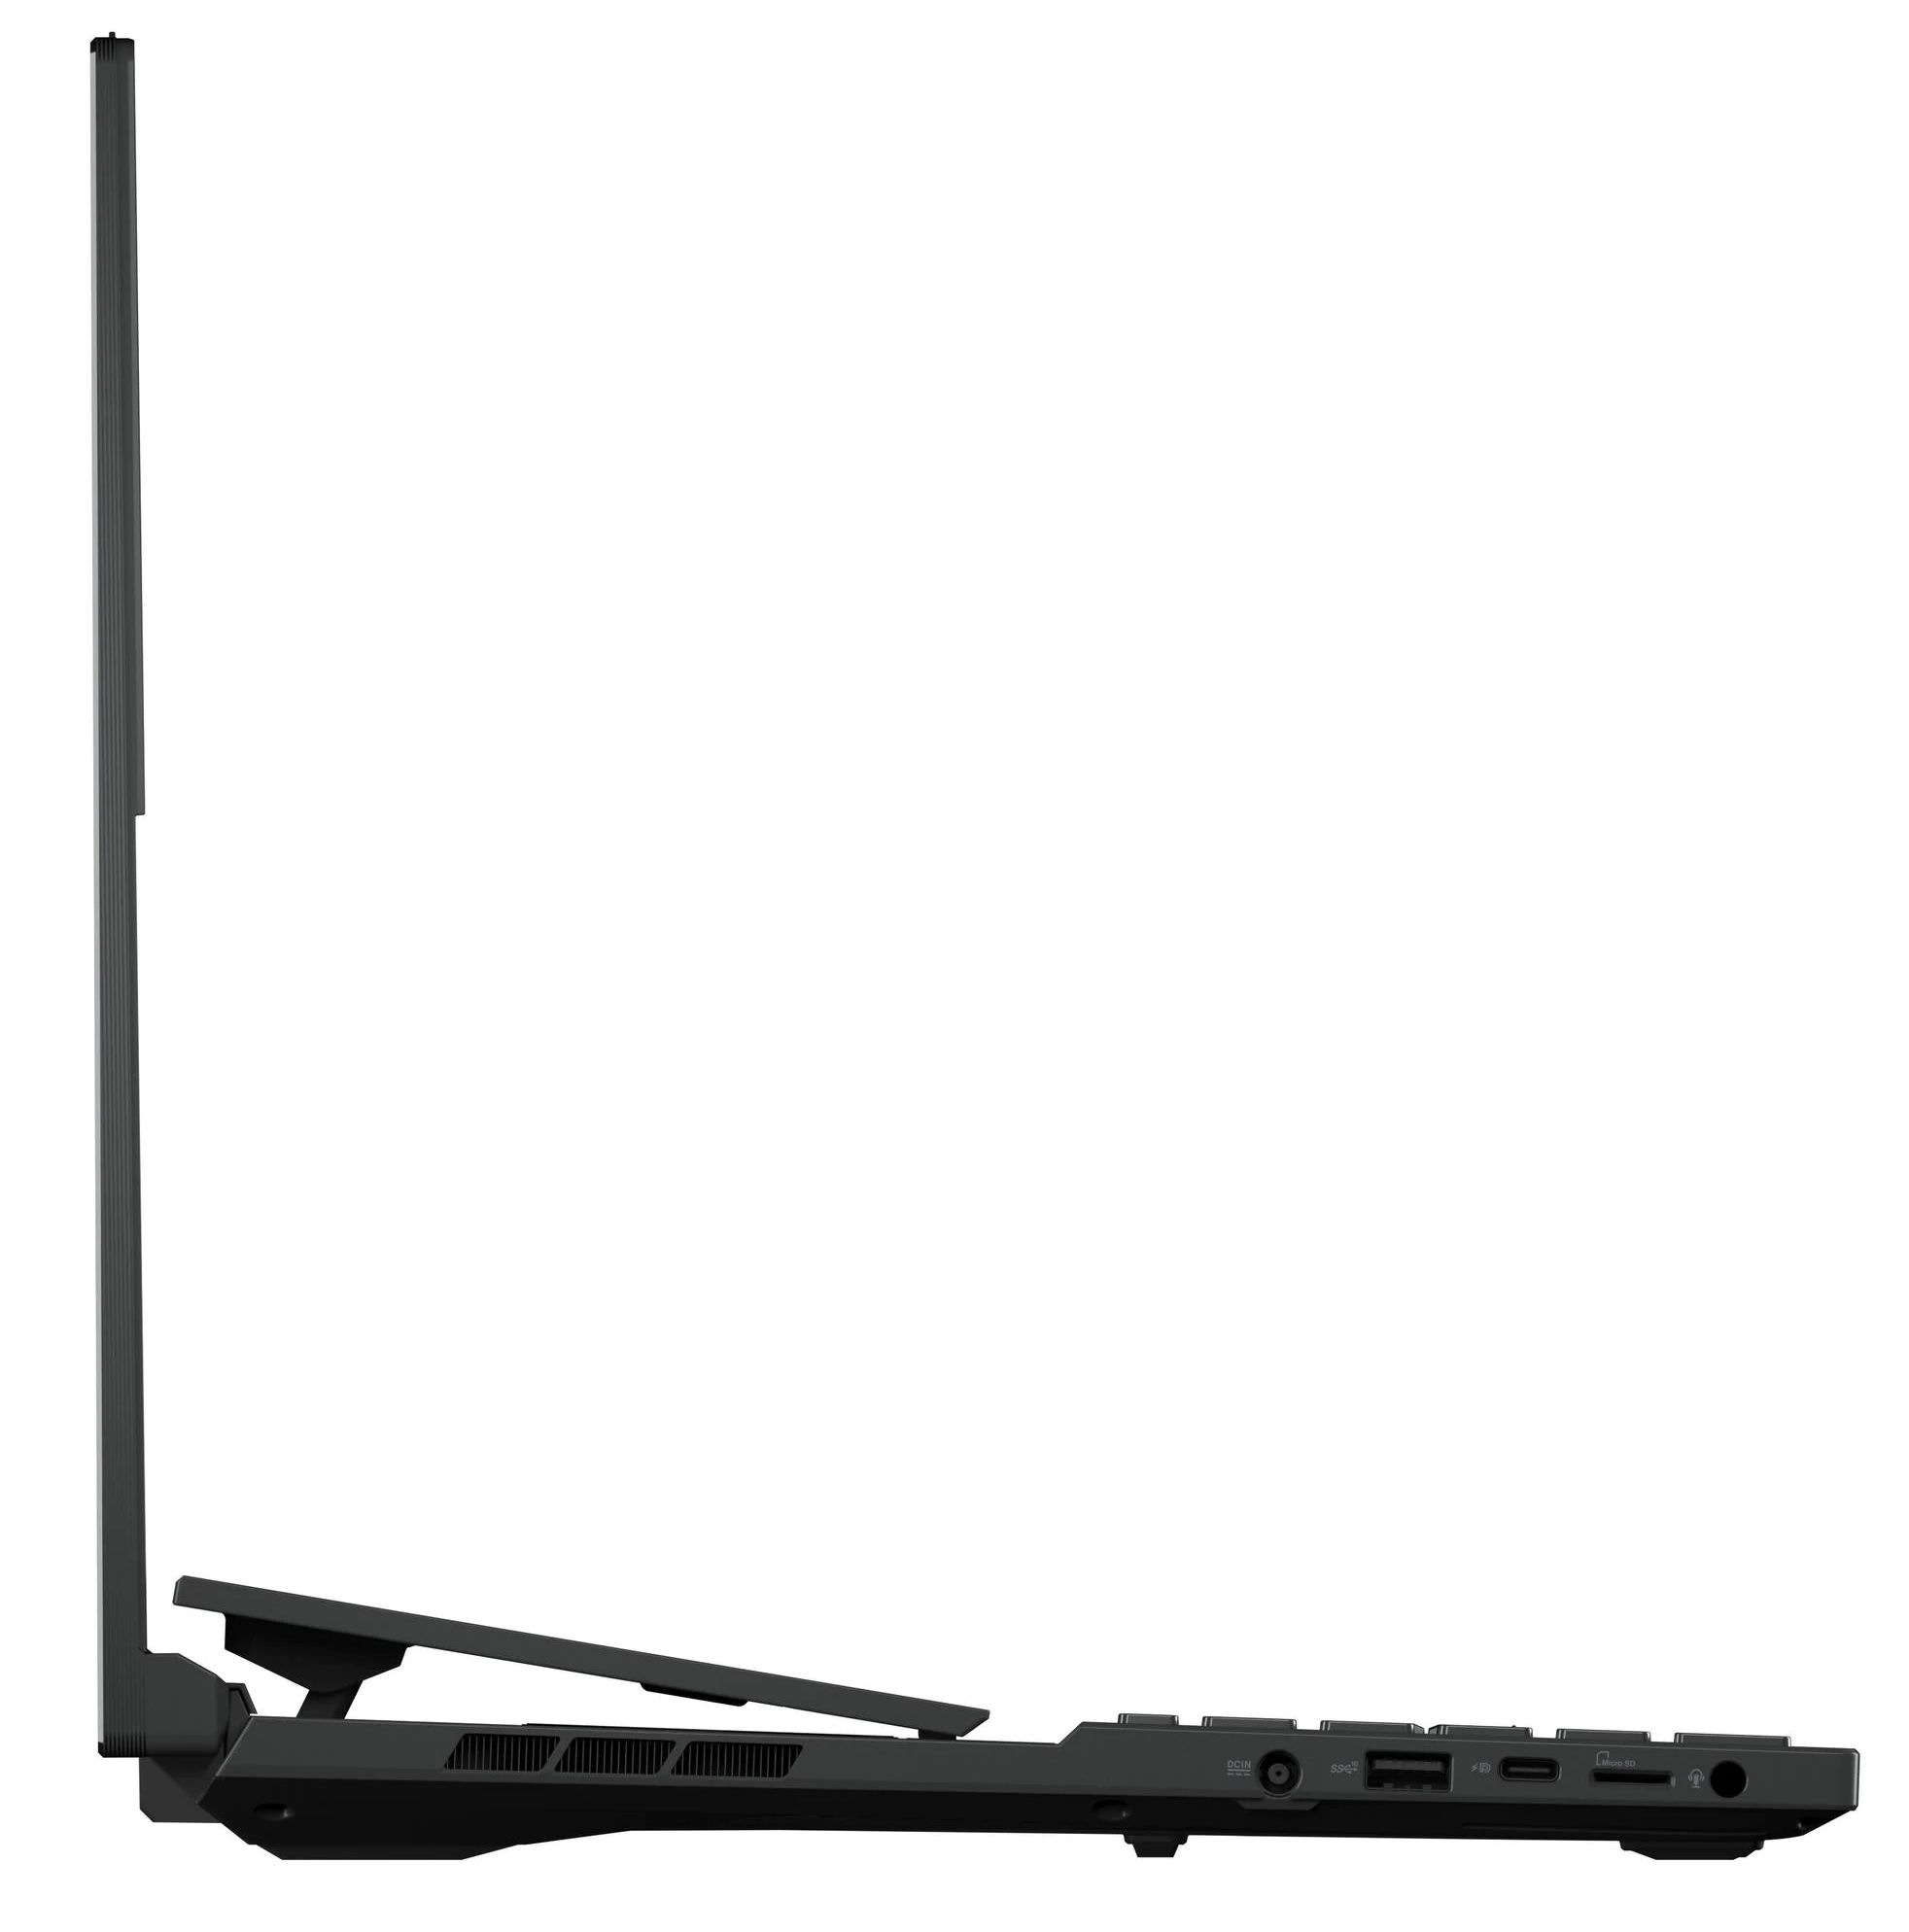
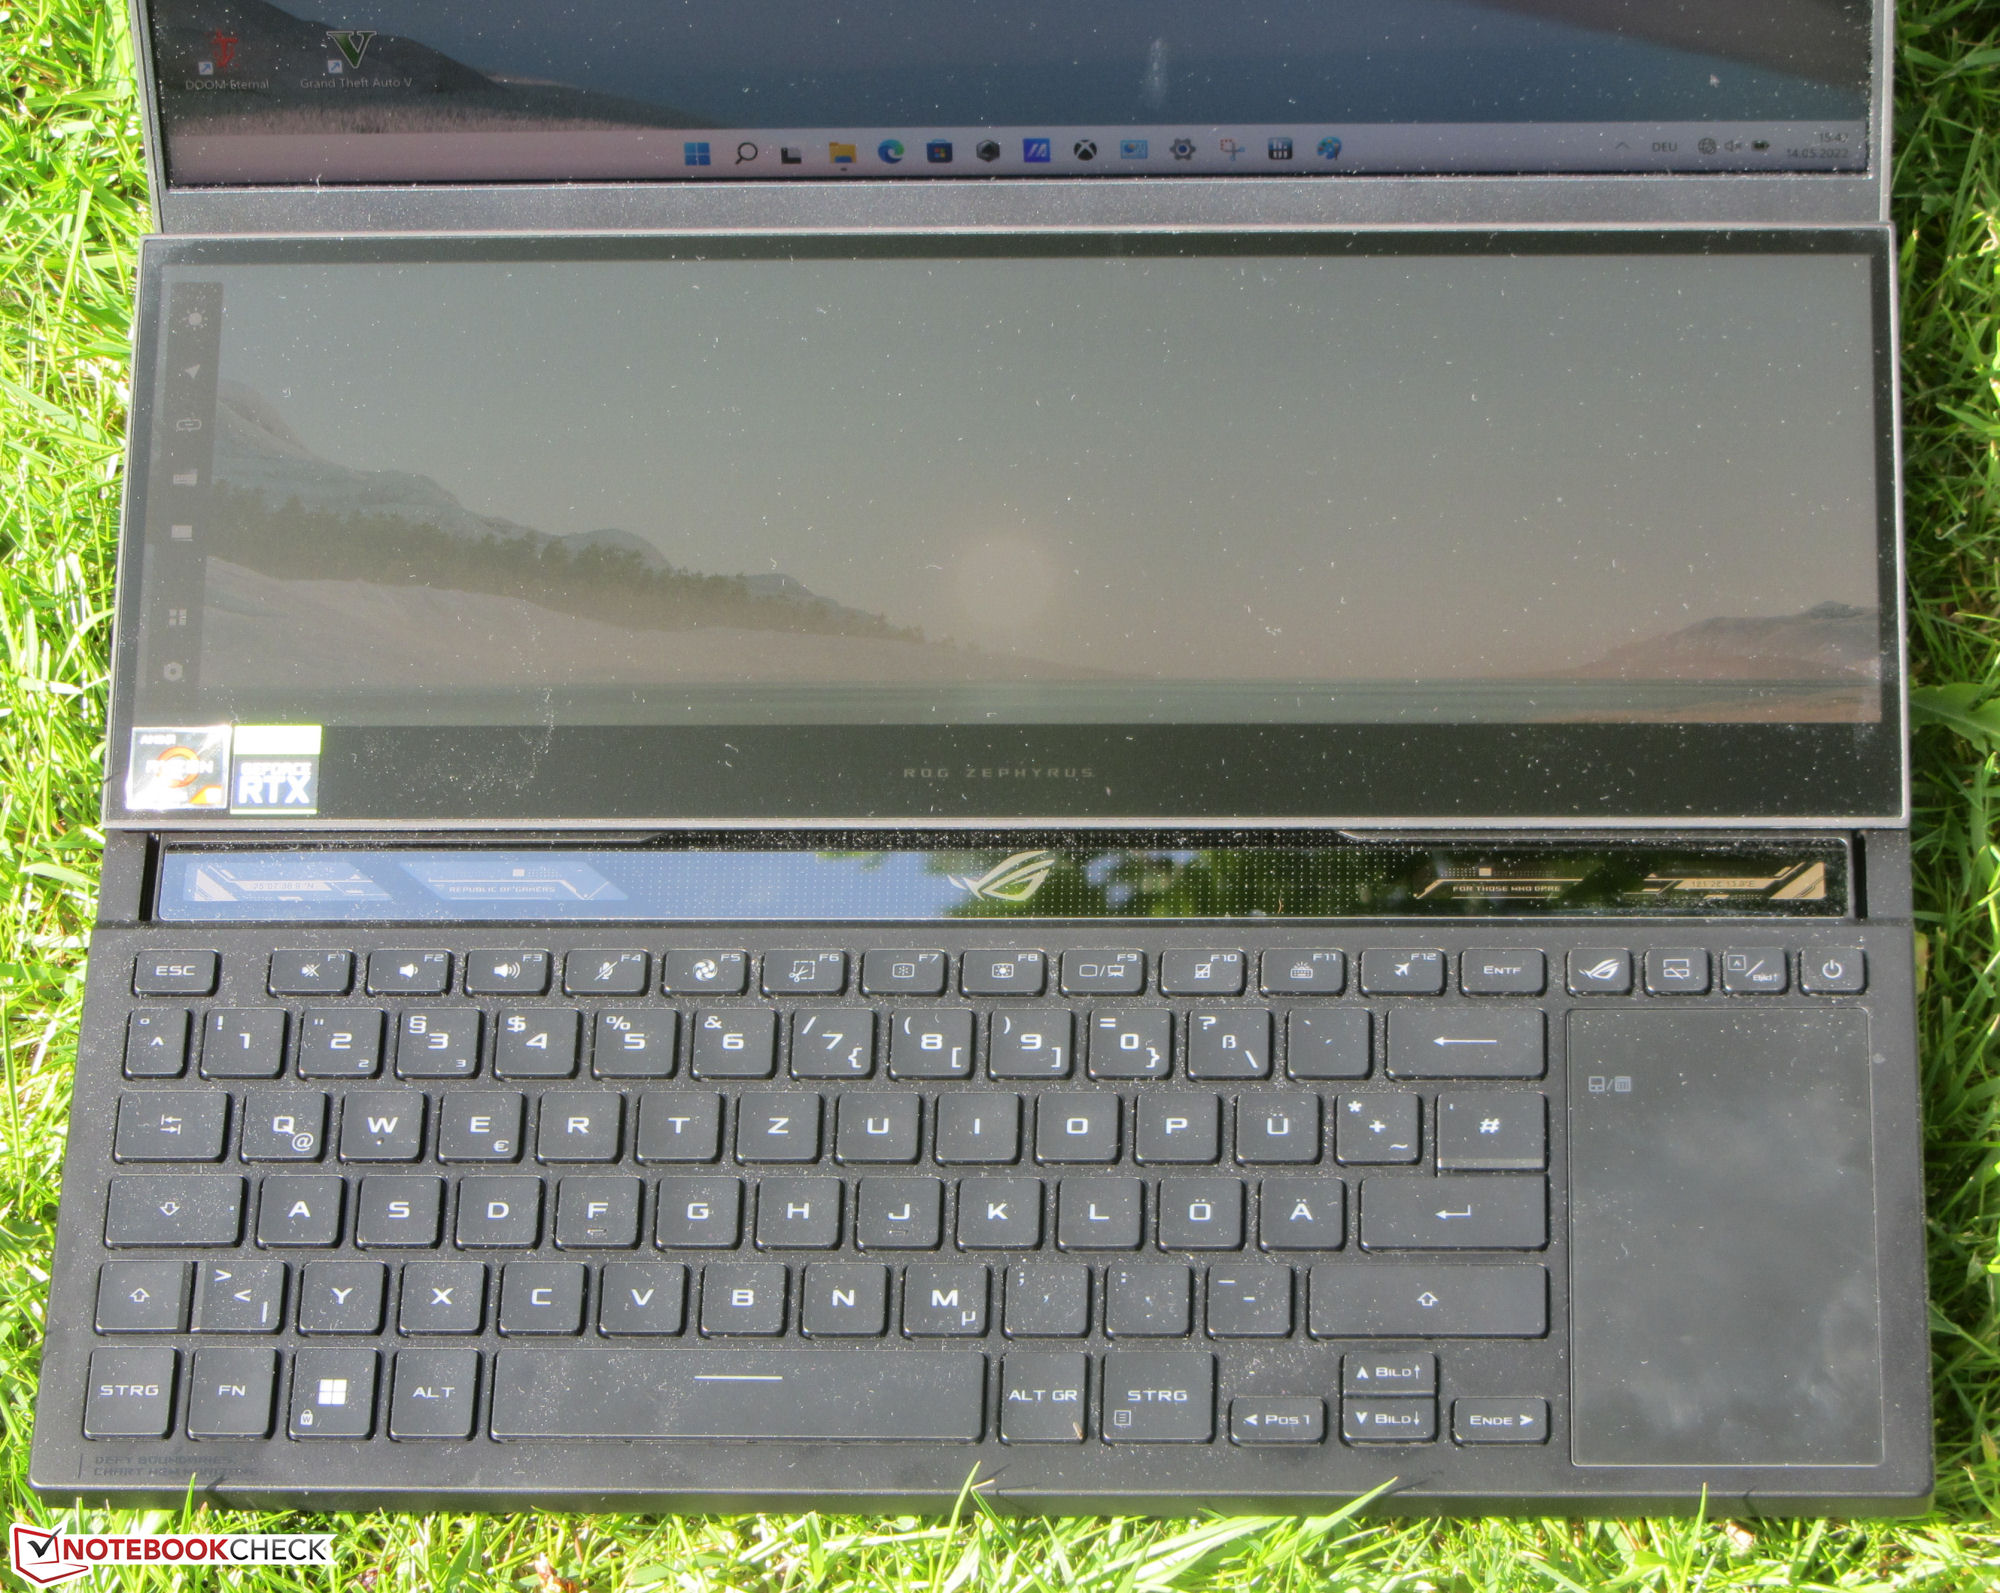
Una vez que se abre la tapa de la pantalla, el Screenpad, una segunda pantalla con funcionalidad táctil, se eleva en un ángulo fijo de unos 15 grados hacia el usuario. Además, se desplaza unos 2 cm (~0,8 pulgadas) hacia la pantalla principal. El hueco resultante muestra una placa de plástico transparente que permite ver el interior de la carcasa en algunos lugares. La elevación del Screenpad no sólo tiene razones ergonómicas, sino que también hay aberturas de ventilación debajo de la pantalla para permitir el flujo de aire en la carcasa.
El Zephyrus es uno de los portátiles más pesados de nuestra comparativa. Sólo el MSI GE76 Raideres más pesado. Las dimensiones también resultan ligeramente más grandes que las de otros portátiles comparables de 16 pulgadas, como el MacBook Pro 16.
Equipamiento - El Zephyrus no ofrece Thunderbolt 4
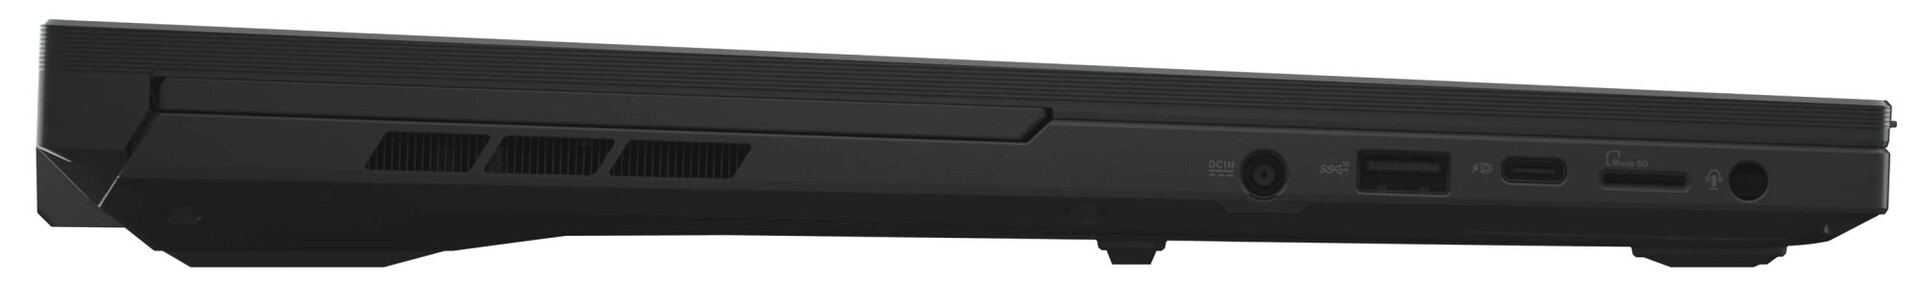
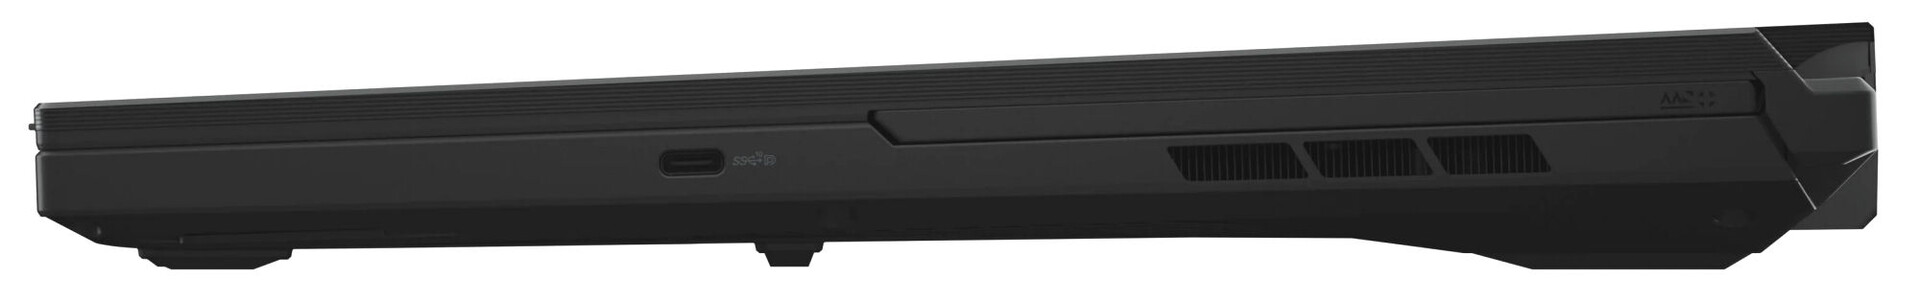
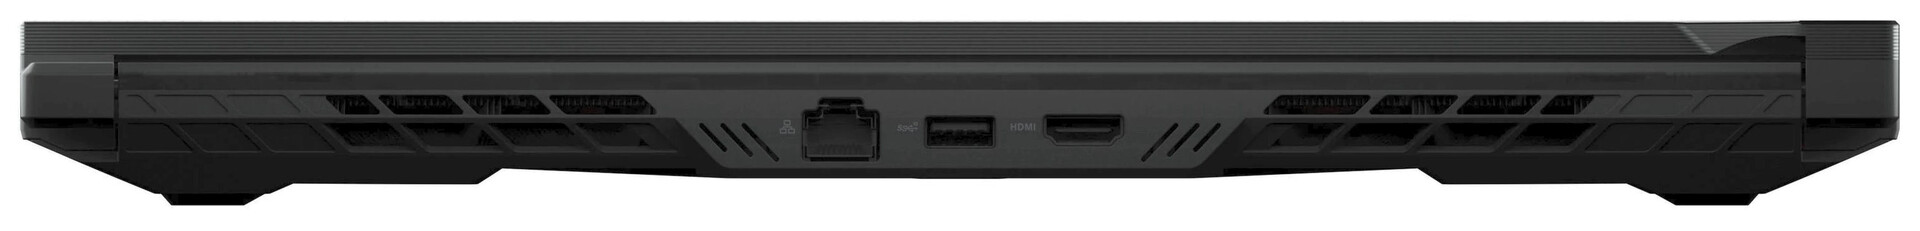
Las cuatro conexiones USB (2x USB-A, 2x USB-C) soportan el estándar USB 3.2 Gen 2. Uno de los dos puertos USB-C ofrece Power Delivery, y ambos puertos soportan DisplayPort por USB-C. Con esto, el portátil ofrece tres puertos de salida de vídeo junto con la conexión HDMI 2.1. Las conexiones se completan con un puerto de audio combinado y un puerto Gigabit Ethernet.
Lector de tarjetas SD
El lector de tarjetas de almacenamiento MicroSD es uno de los modelos más rápidos, con tasas de transferencia máximas de 155 MB/s (transfiriendo 250 archivos de imagen jpg de unos 5 MB cada uno) y 185 MB/s (copiando grandes bloques de datos) utilizando nuestra tarjeta de almacenamiento de referencia AV PRO microSD 128 GB V60.
| SD Card Reader | |
| average JPG Copy Test (av. of 3 runs) | |
| Razer Blade 15 Advanced Model Early 2022 (AV PRO microSD 128 GB V60) | |
| Asus ROG Zephyrus Duo 16 GX650RX (AV PRO microSD 128 GB V60) | |
| Media de la clase Gaming (20.9 - 210, n=54, últimos 2 años) | |
| MSI GE76 Raider (AV PRO microSD 128 GB V60) | |
| Medion Erazer Beast X30 (AV PRO microSD 128 GB V60) | |
| maximum AS SSD Seq Read Test (1GB) | |
| Asus ROG Zephyrus Duo 16 GX650RX (AV PRO microSD 128 GB V60) | |
| Media de la clase Gaming (25.5 - 261, n=51, últimos 2 años) | |
| Medion Erazer Beast X30 (AV PRO microSD 128 GB V60) | |
Comunicación
Las tasas de transferencia WLAN determinadas en condiciones óptimas (sin dispositivos WLAN adicionales cerca y con el portátil y el PC servidor muy próximos) resultan excelentes y se corresponden con las capacidades del chip WiFi (Mediatek MT7922; 802.11 ax, WiFi 6E). De las conexiones de red por cable se encarga un chip Gigabit Ethernet (RTL8125) de Realtek.
Cámara web
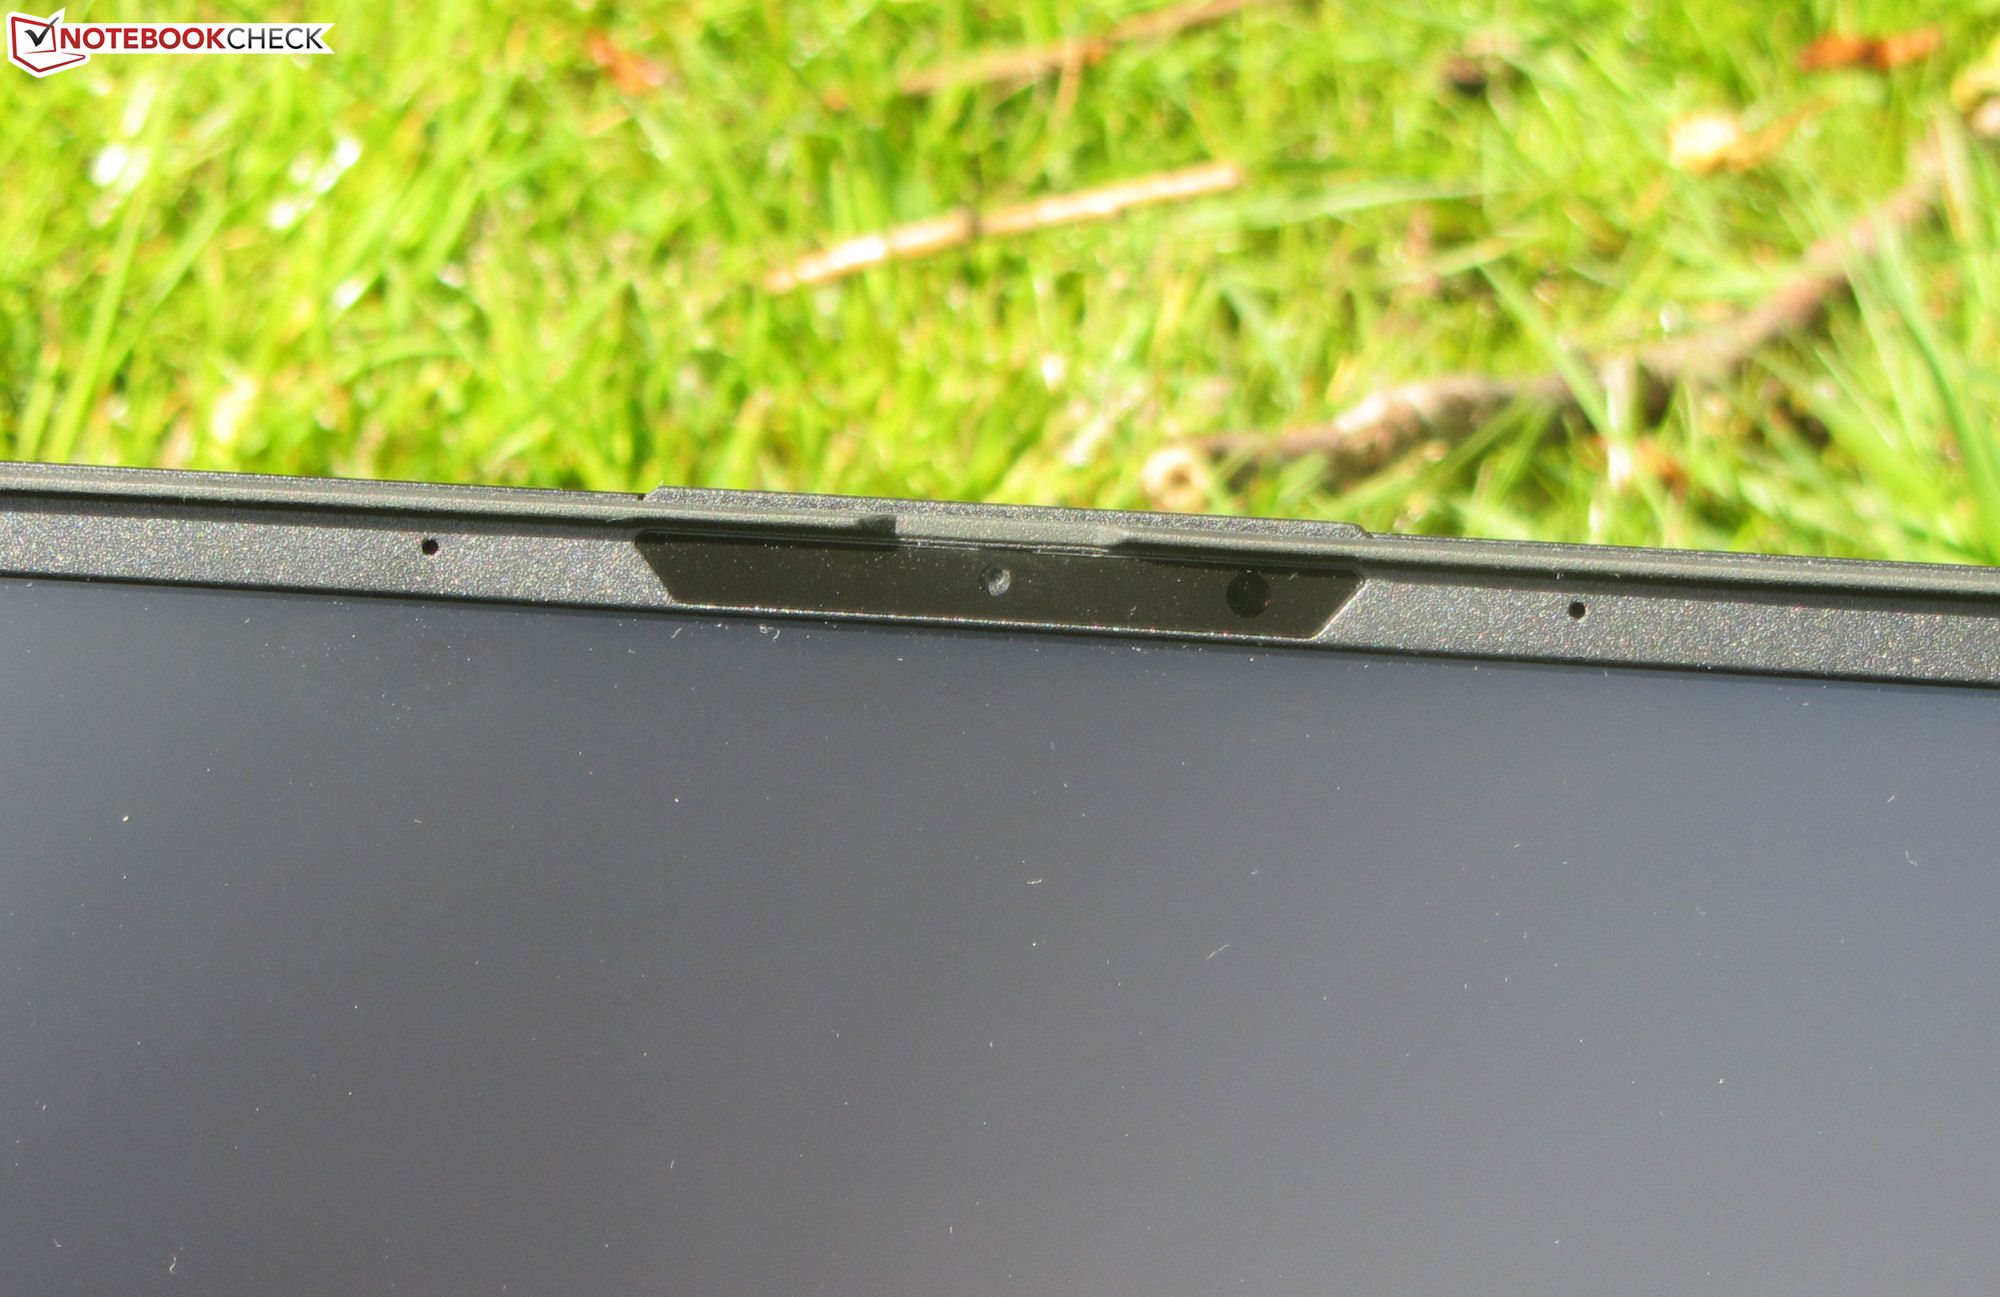
La cámara web de 0,9 MP del Zephyrus produce imágenes con una resolución máxima de 1280 x 720 píxeles. Carece de precisión cromática, y los colores se desvían significativamente del objetivo. La cámara no posee una cubierta mecánica.

")
")
Accesorios
Además de la documentación habitual (manual de inicio rápido e información sobre la garantía), el portátil también incluye un reposamanos de goma.
Mantenimiento
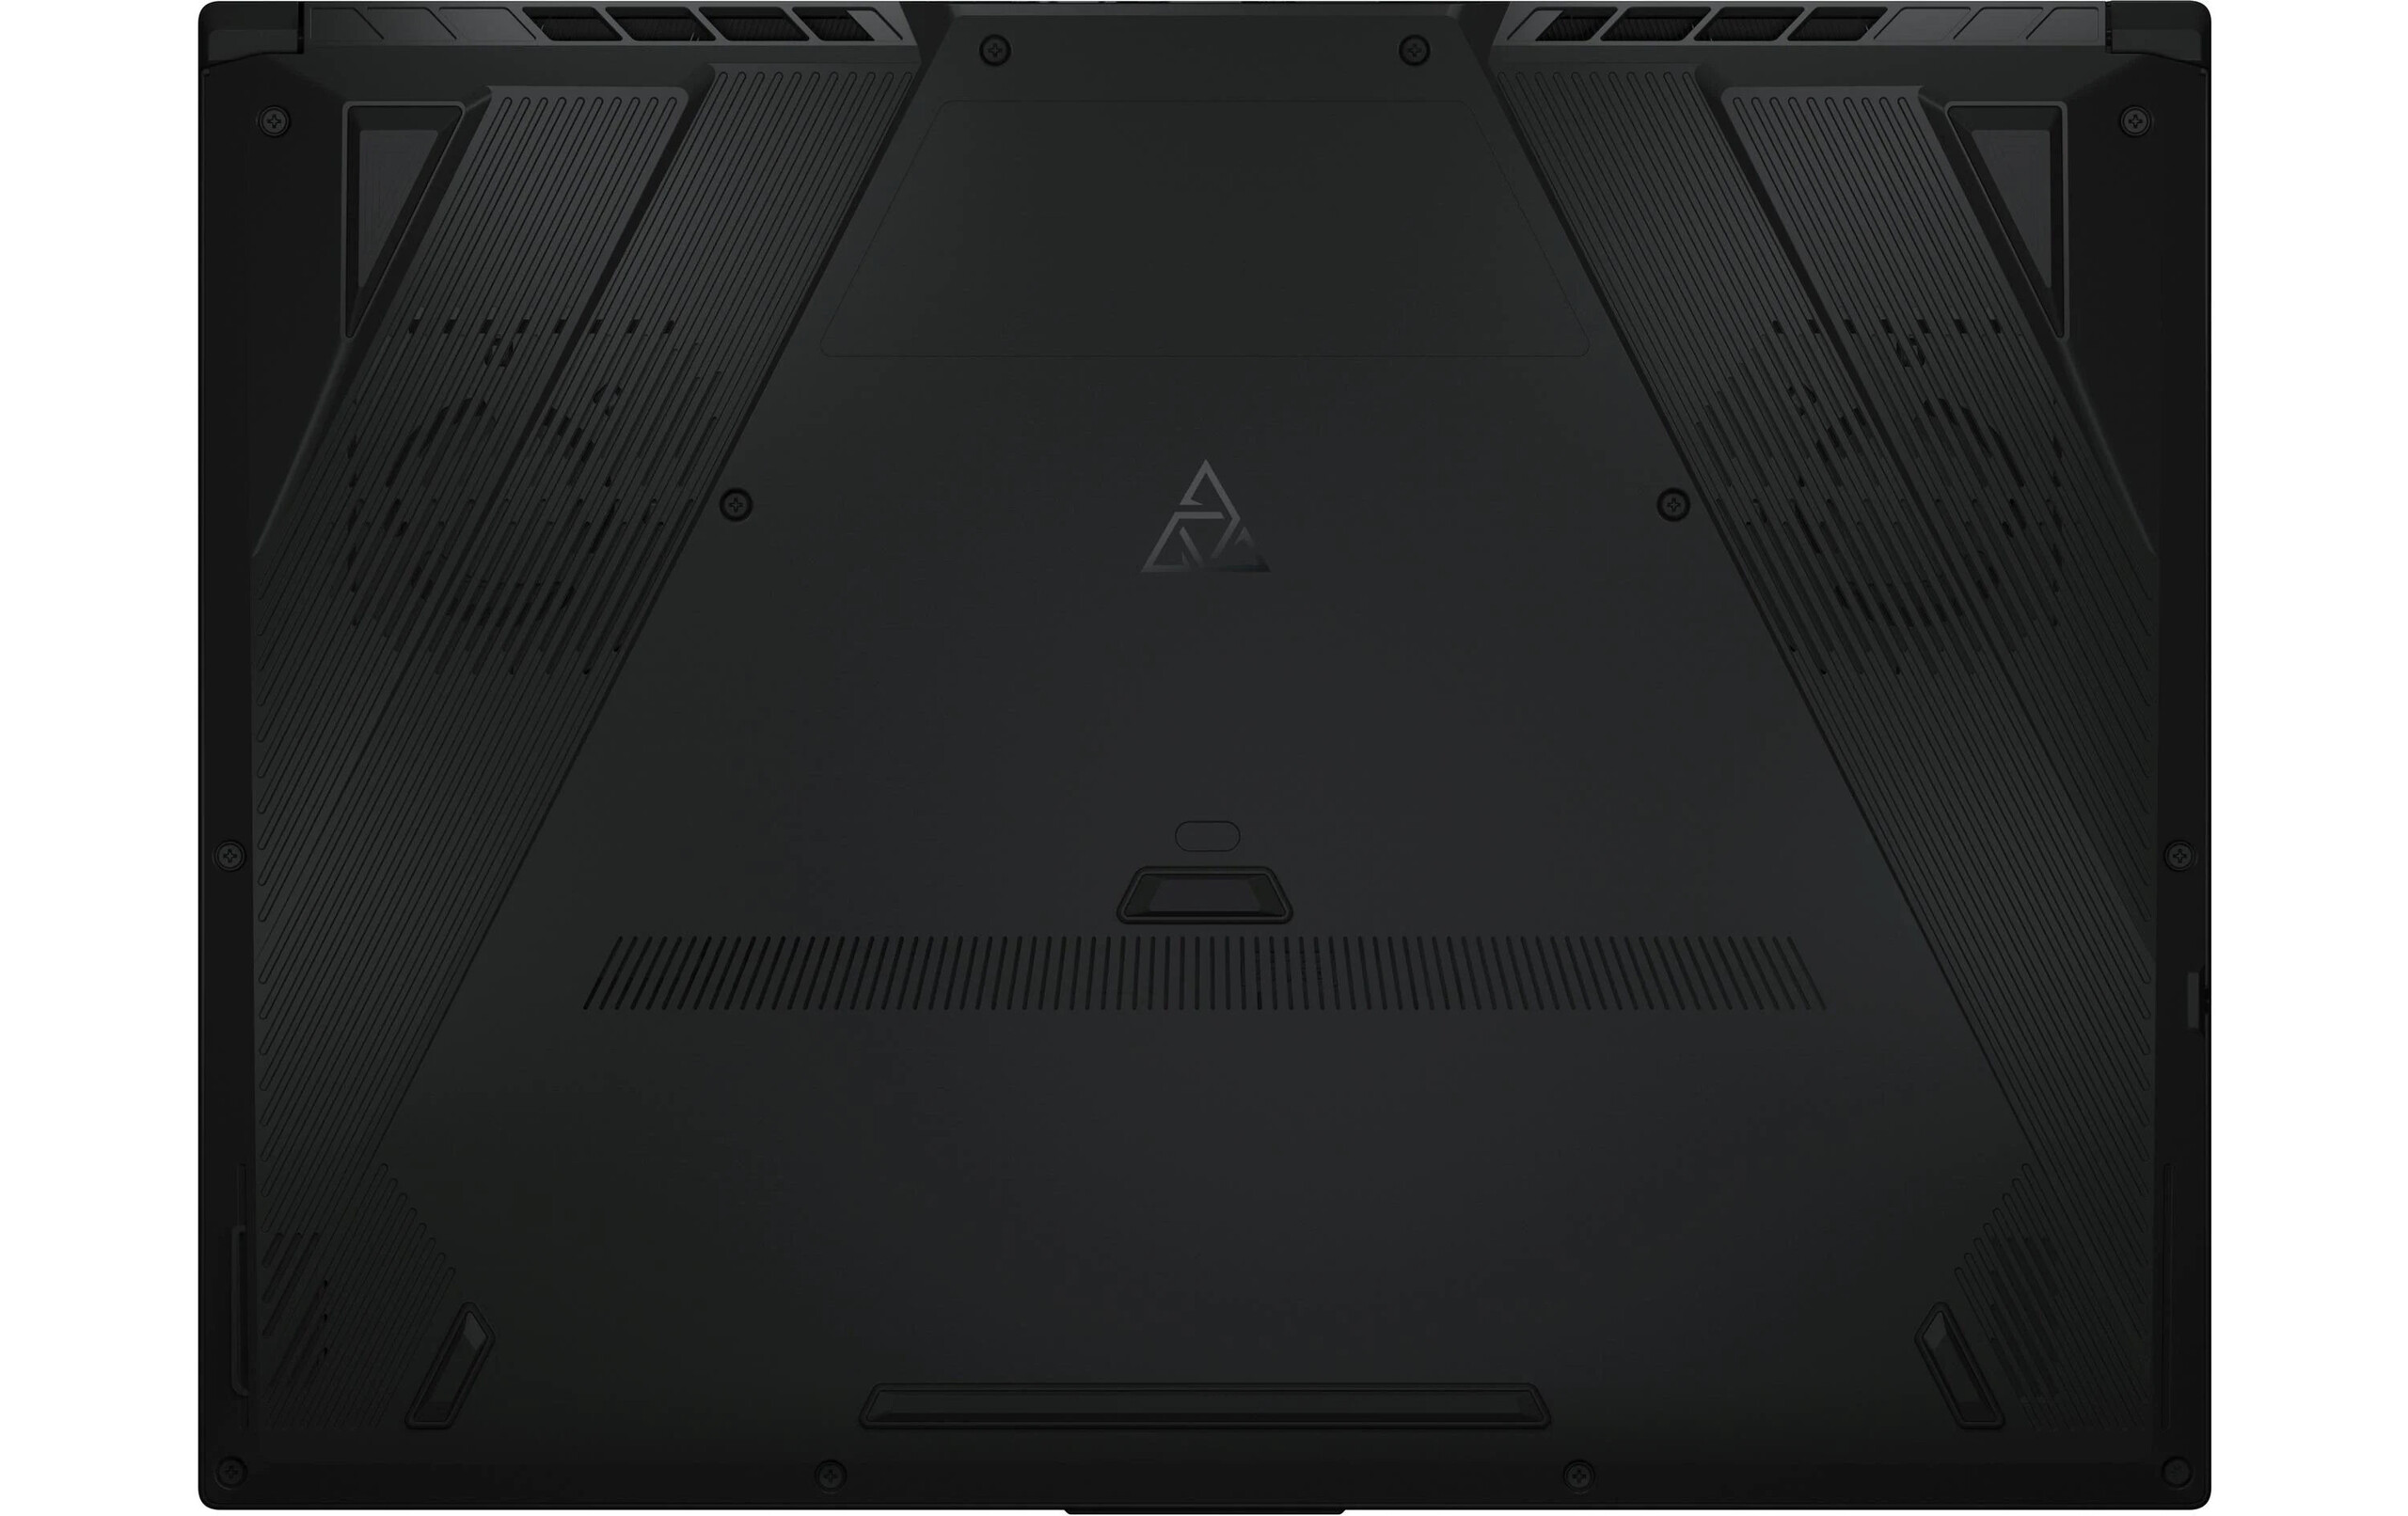
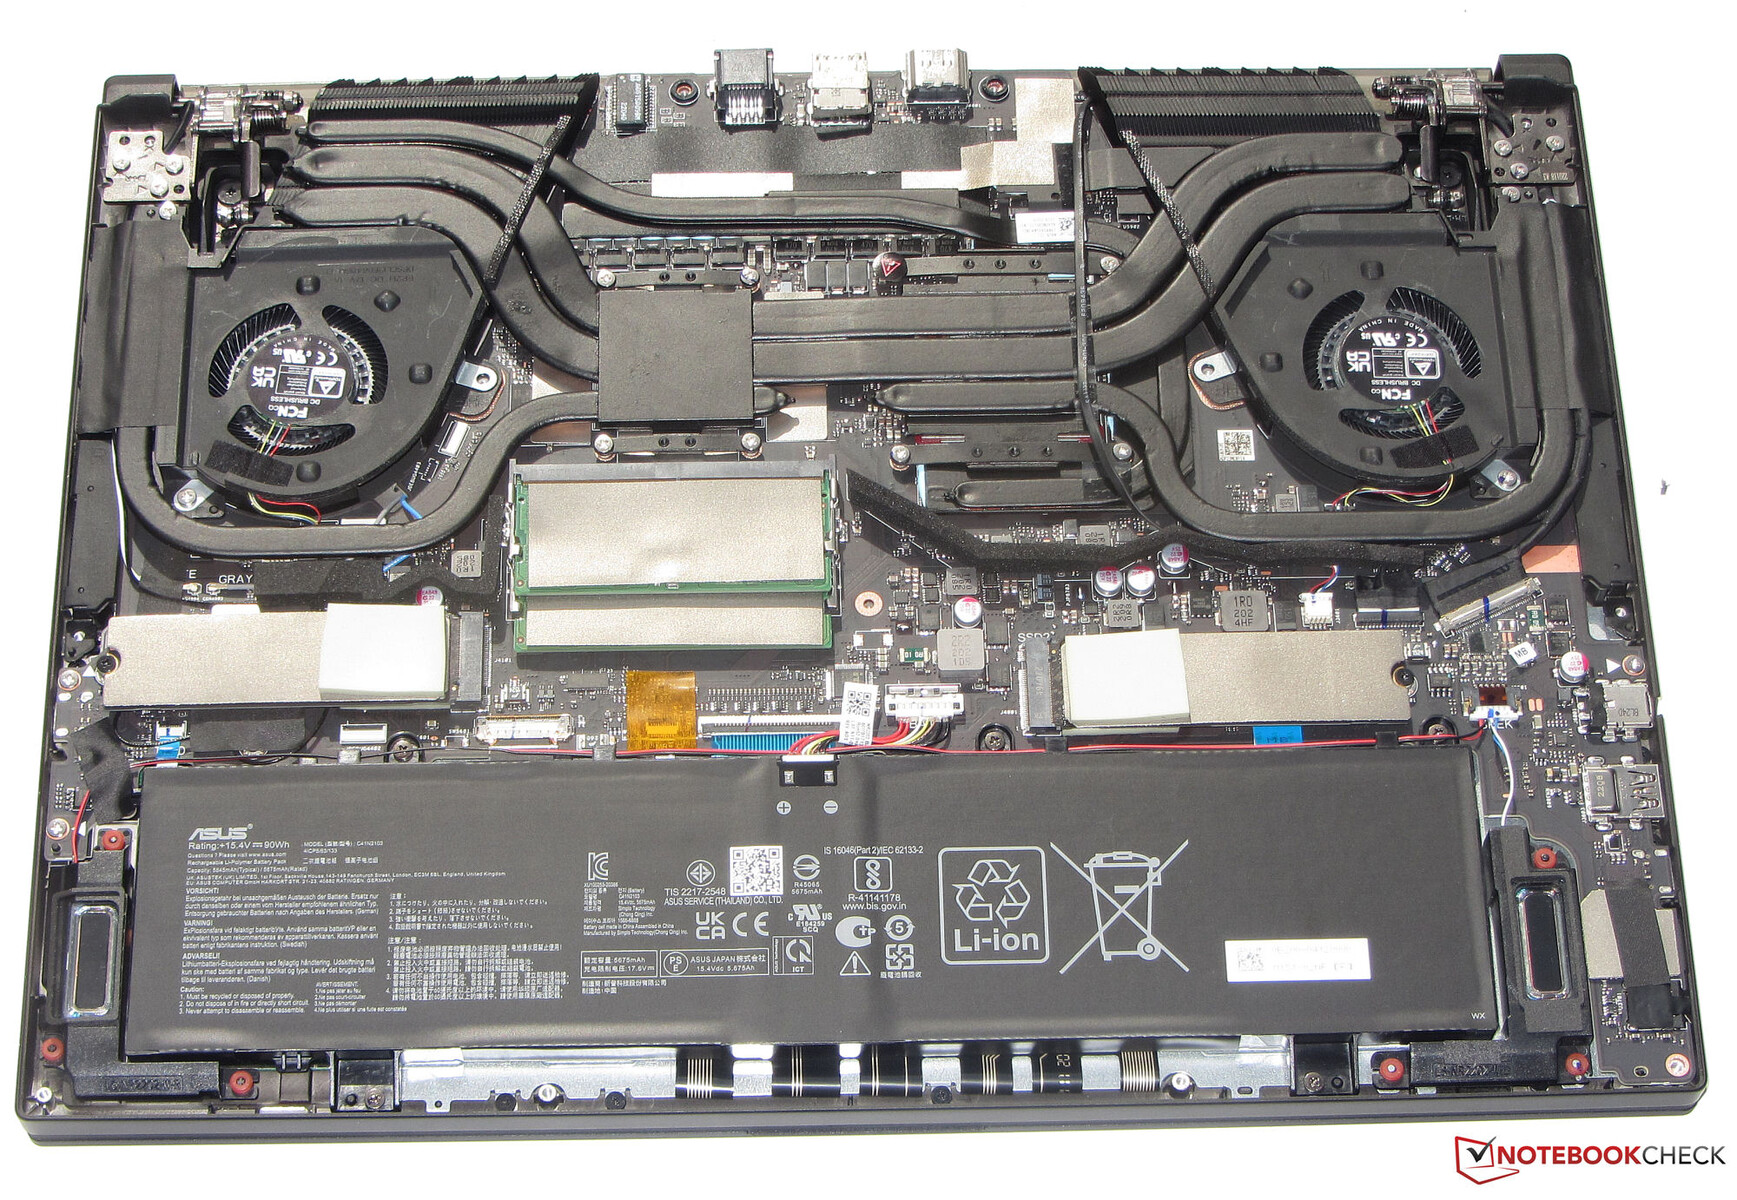
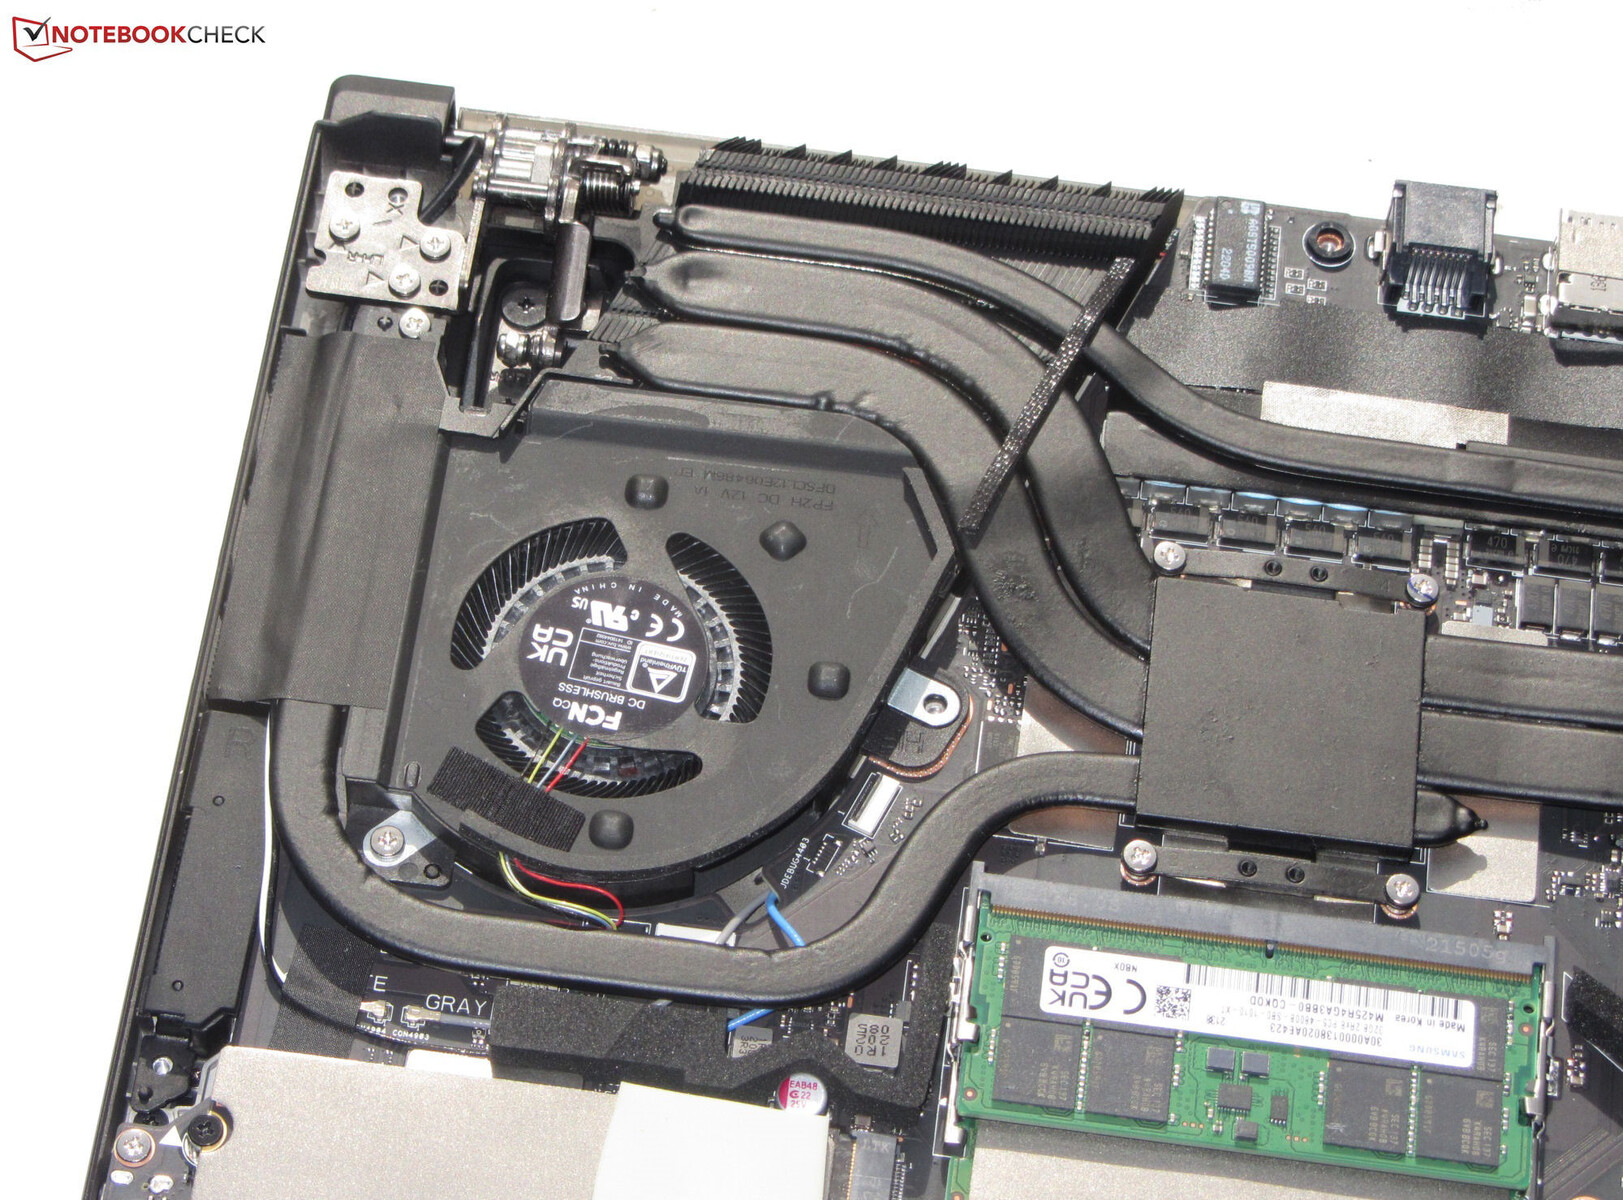
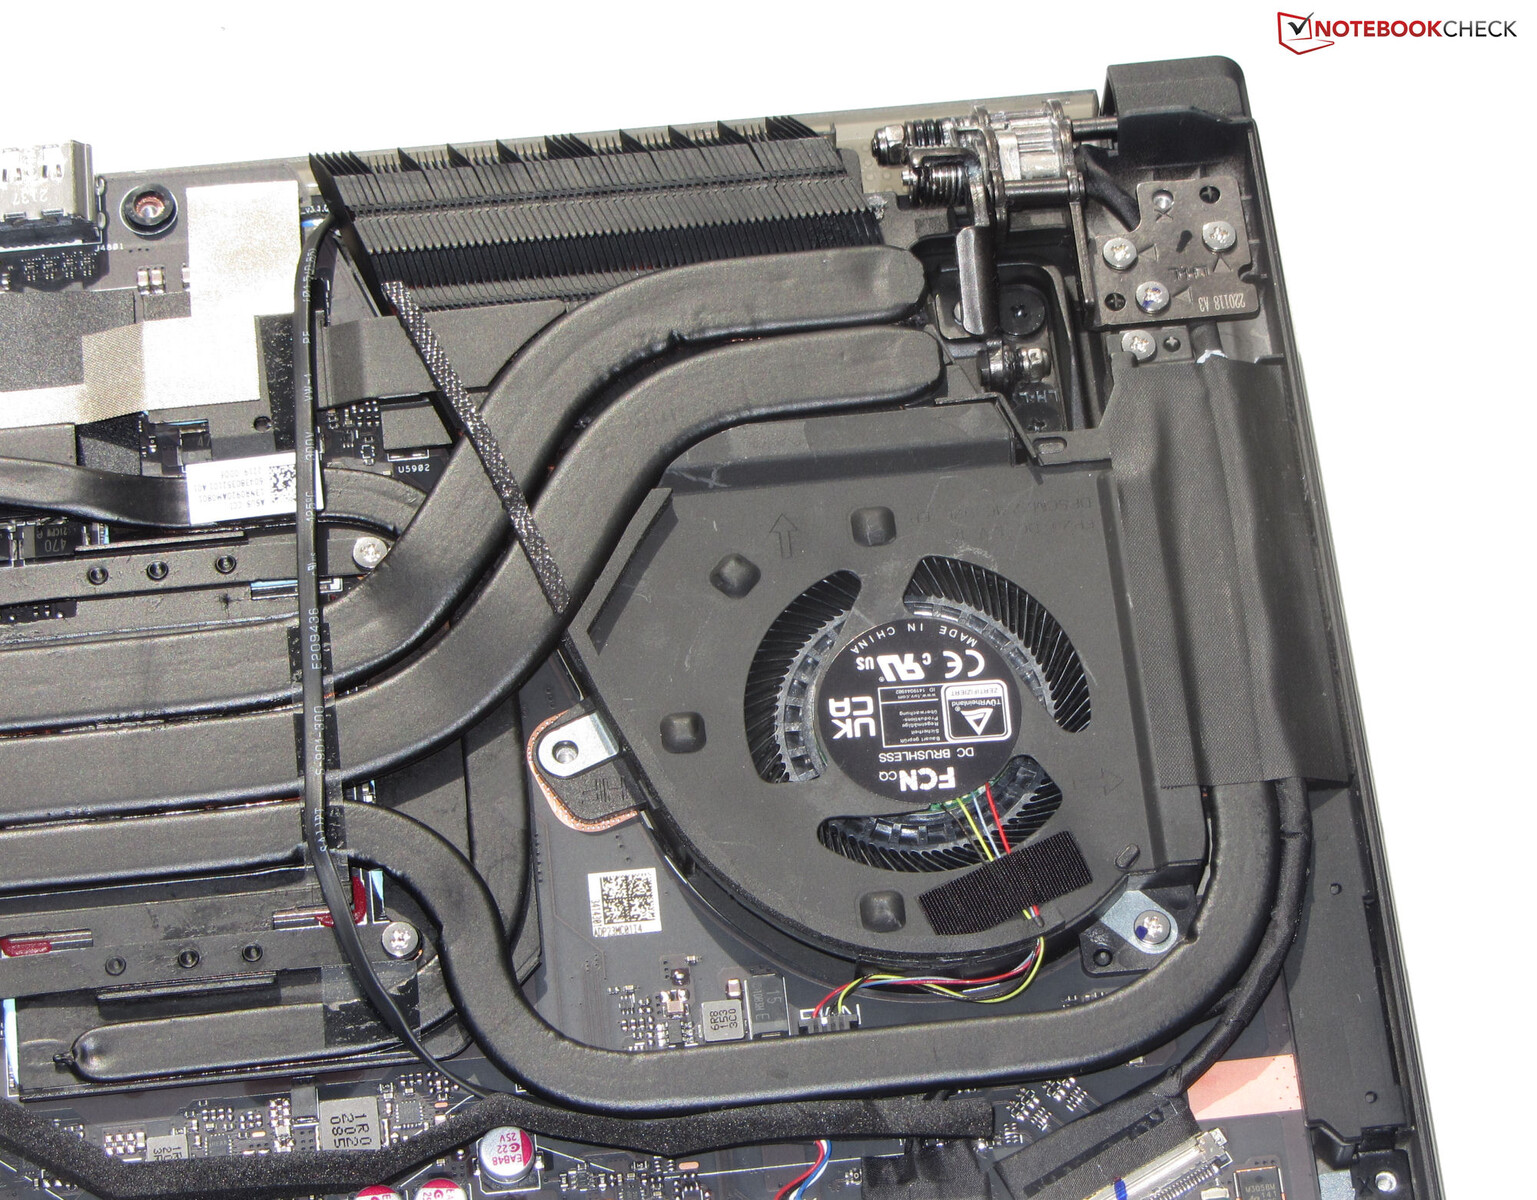
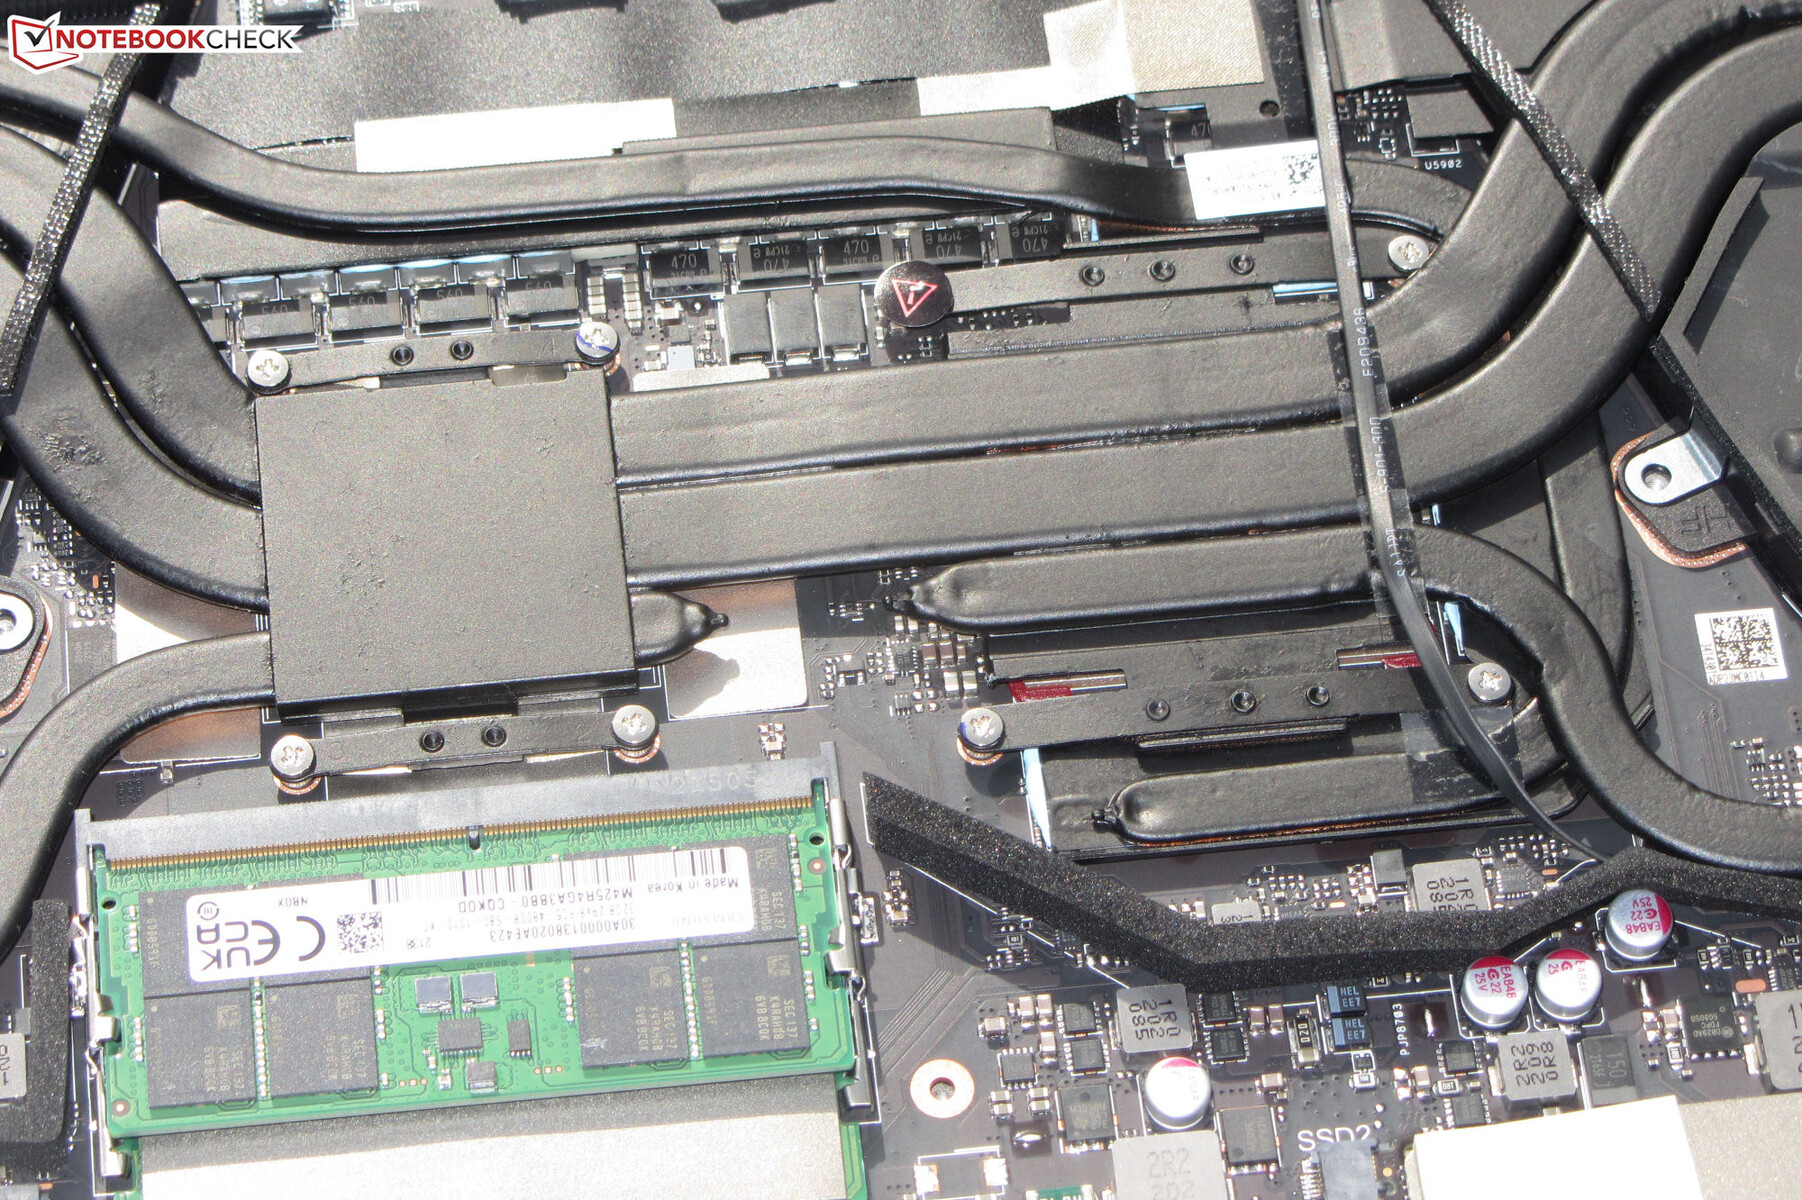
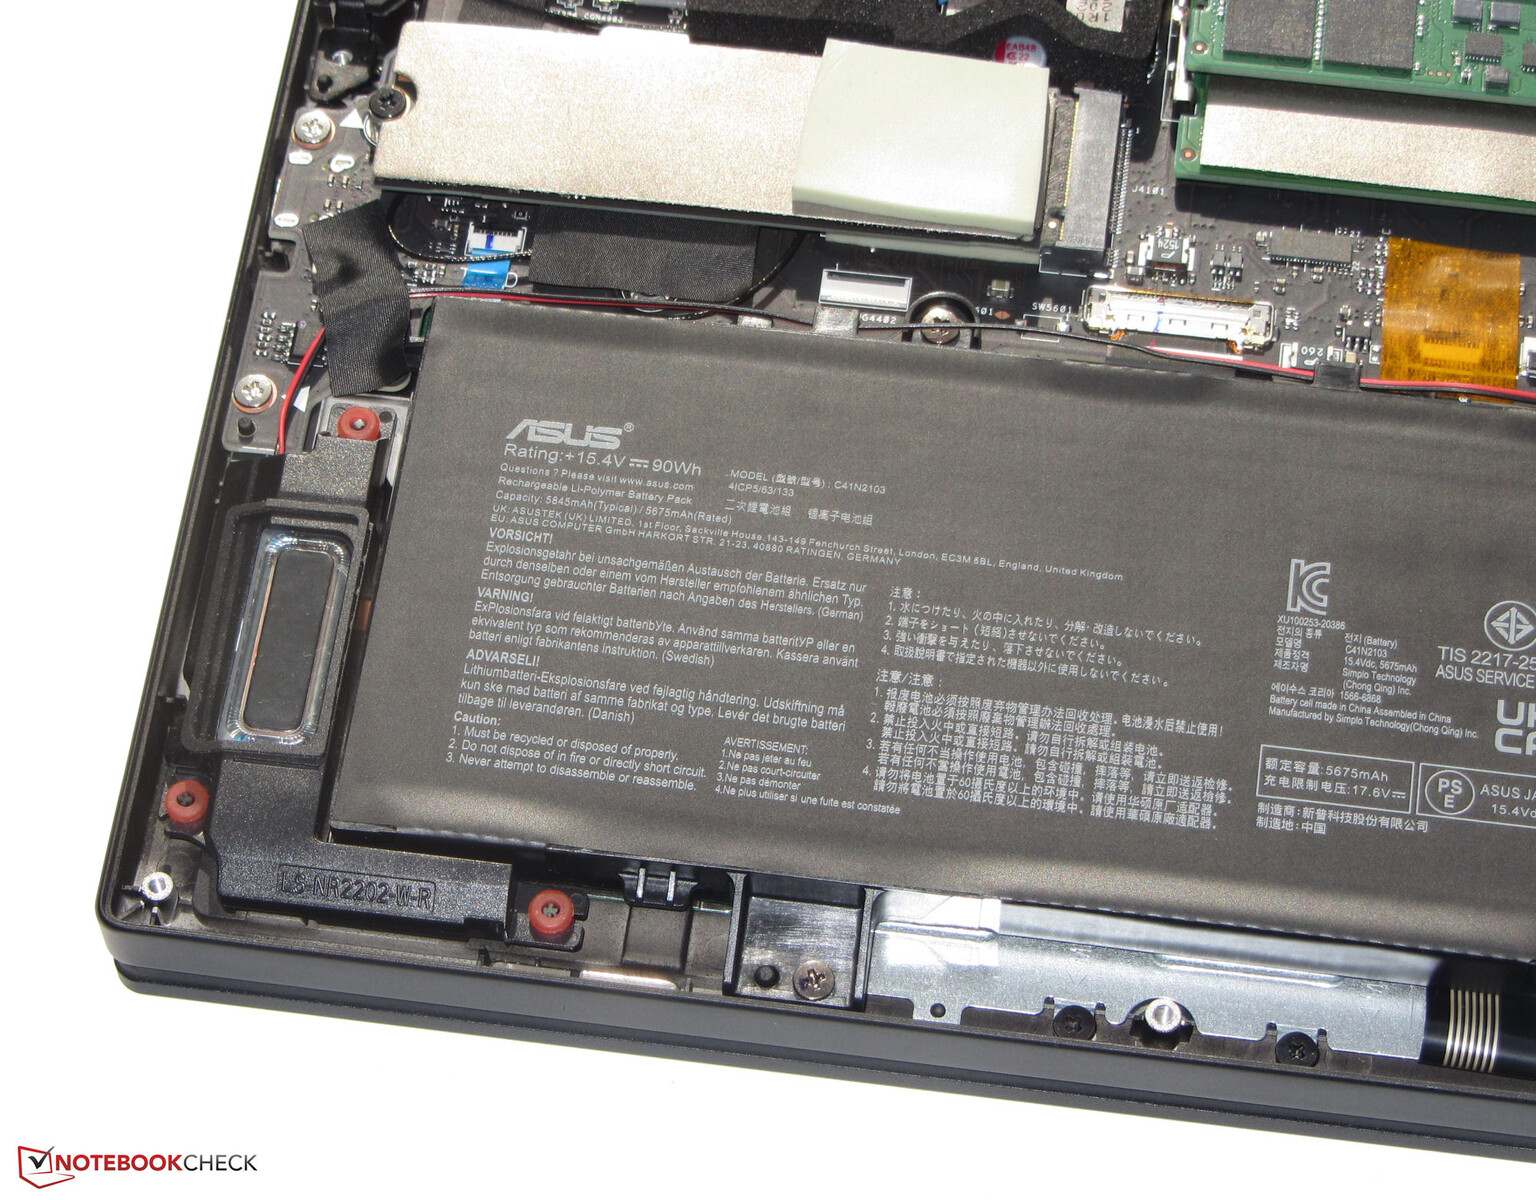
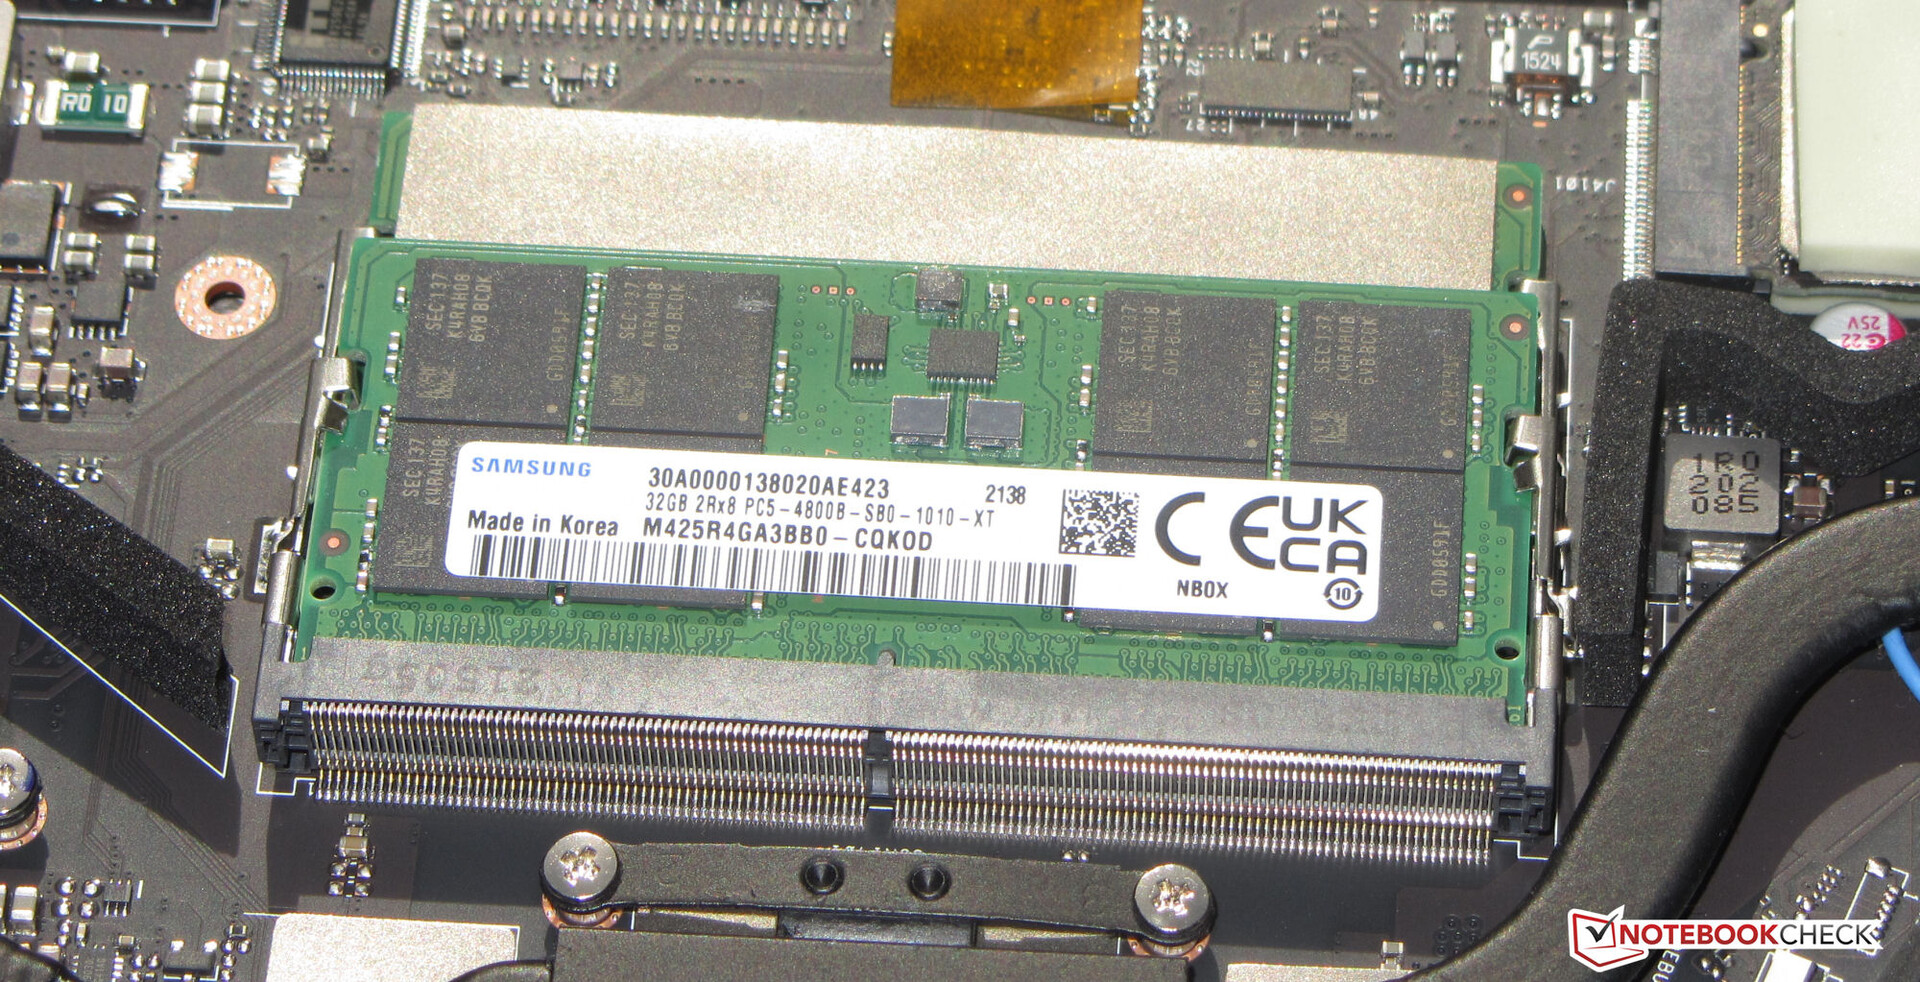
Para sacar la parte inferior de la caja, primero hay que quitar los tornillos de la parte inferior. Pero hay que prestar atención, ya que uno de los tornillos del centro de la carcasa está cubierto por una pequeña placa de goma. La parte trasera de la caja también se mantiene en su lugar por algunos clips que se pueden aflojar con un poco de cuidado o con la ayuda de una herramienta de palanca plana. Después de quitar el fondo de la caja, se tiene acceso a los bancos de memoria de trabajo (ambos ocupados), los dos SSD (PCIe 4), los ventiladores y la batería.
Garantía
Asus ofrece una garantía de 2 años para el Zephyrus. Una extensión de la garantía a 3 años costará 129 euros más.
Dispositivos de entrada - Una segunda pantalla para el portátil Asus
Teclado
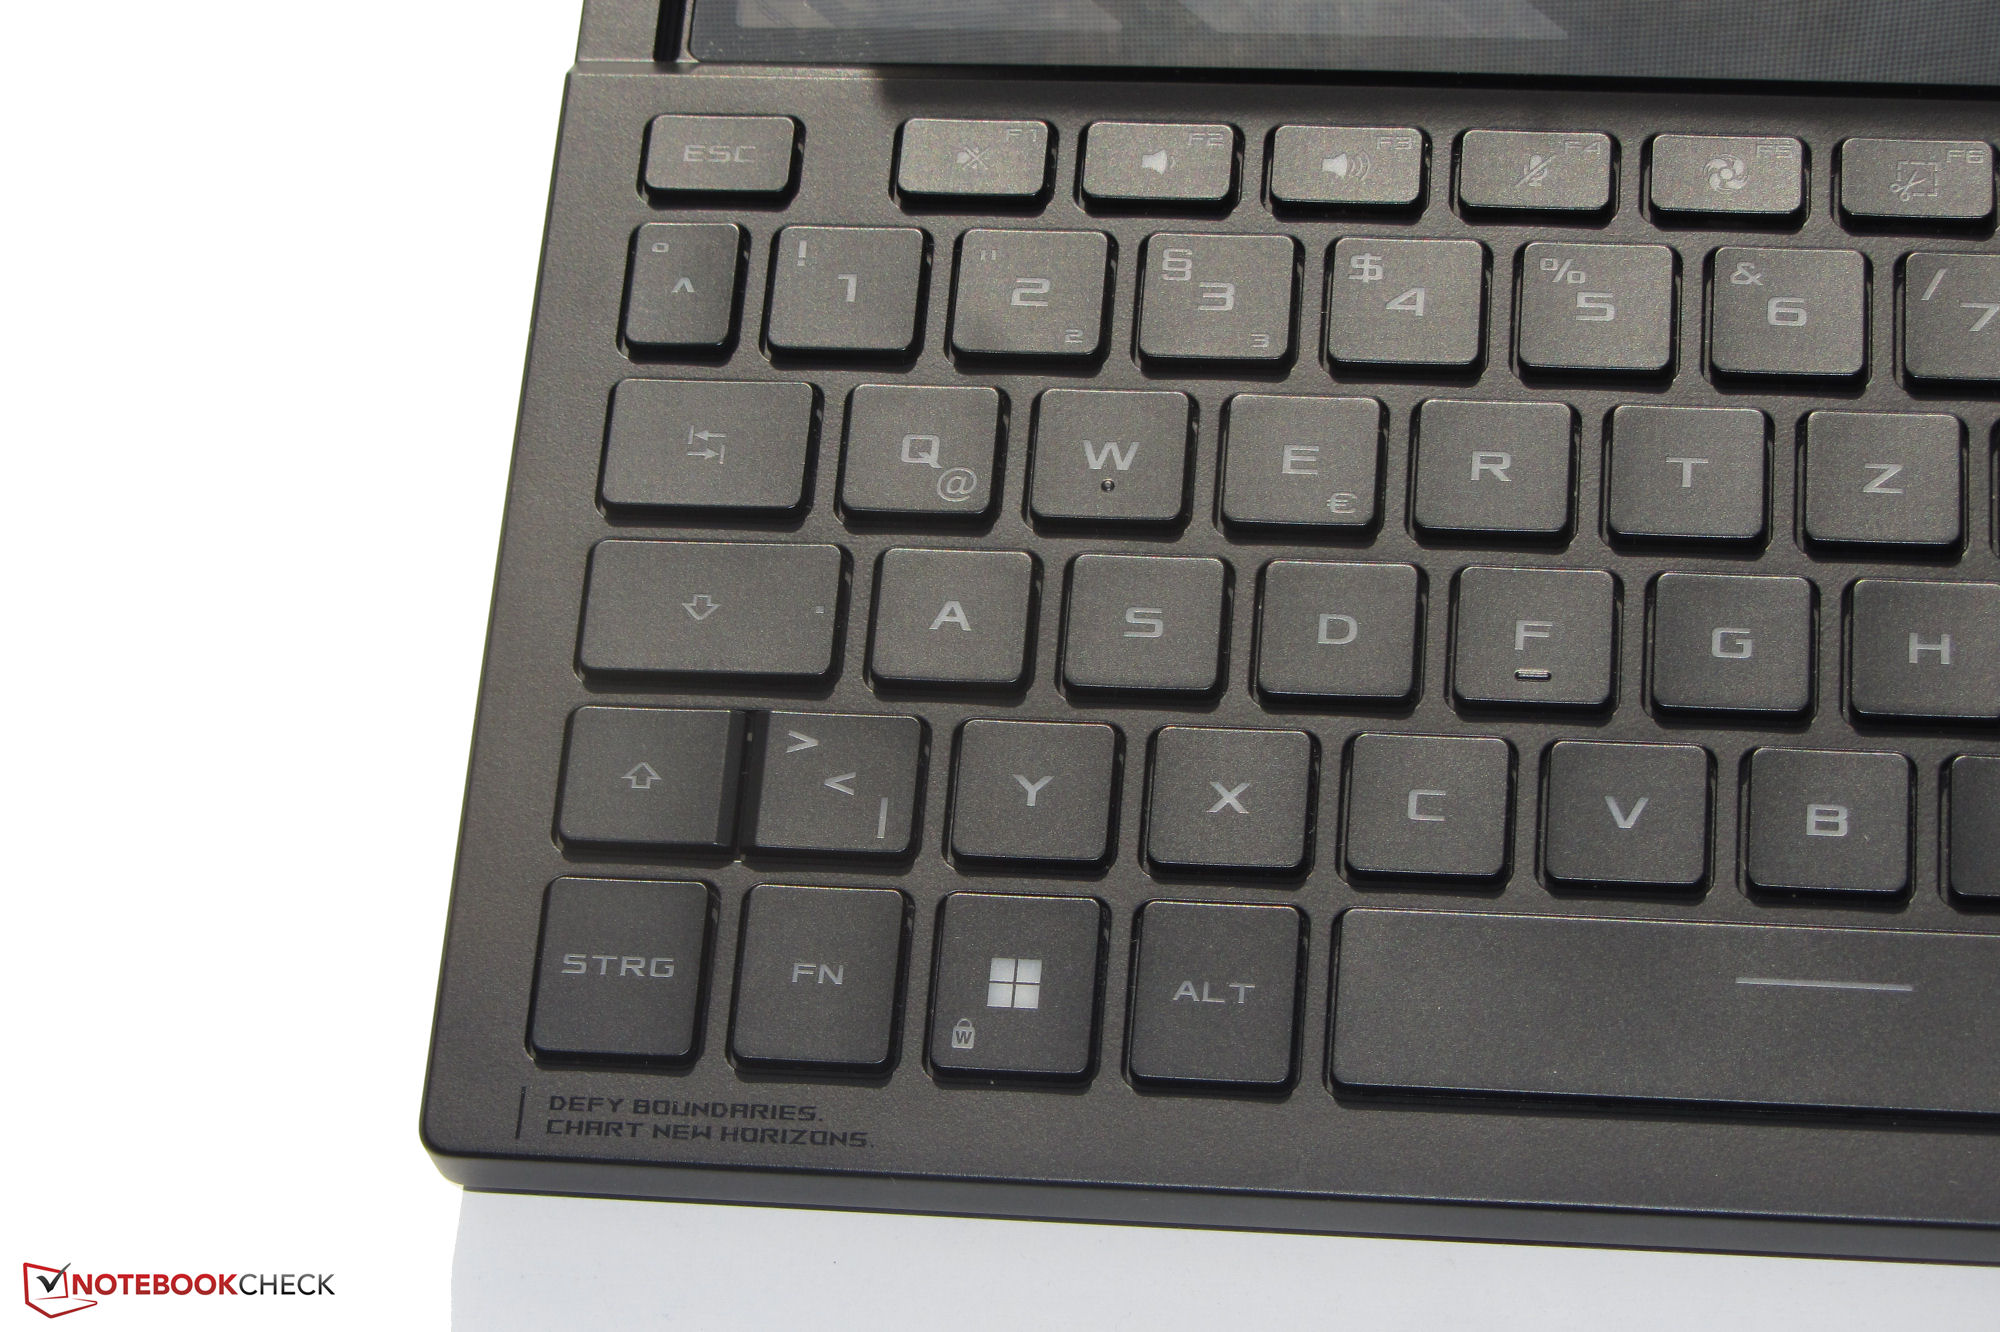
El teclado sólo permite escribir cómodamente si se utiliza el reposamanos de goma incluido (profundidad: ~5,5 cm, 2,2 pulgadas, en ángulo). Aunque hace un trabajo bastante bueno, realmente sólo funciona en una superficie fija. Las suaves teclas del teclado chiclet iluminado tienen un recorrido corto y un punto de presión claro. La resistencia de las teclas está bien, y el teclado no se dobla al escribir. La iluminación RGB de tres pasos se controla mediante una tecla de función. En general, Asus ofrece aquí un teclado adecuado para las tareas cotidianas.
Teclado táctil
Un Clickpad multitáctil (~5,8 x 9,6 cm, ~2,3 x 3,8 in) en orientación vertical sirve como sustituto del ratón. Su superficie lisa facilita el deslizamiento de los dedos. La almohadilla tiene un recorrido corto y un punto de presión claro. Al tocar el símbolo correspondiente en la almohadilla, aparece un teclado numérico.
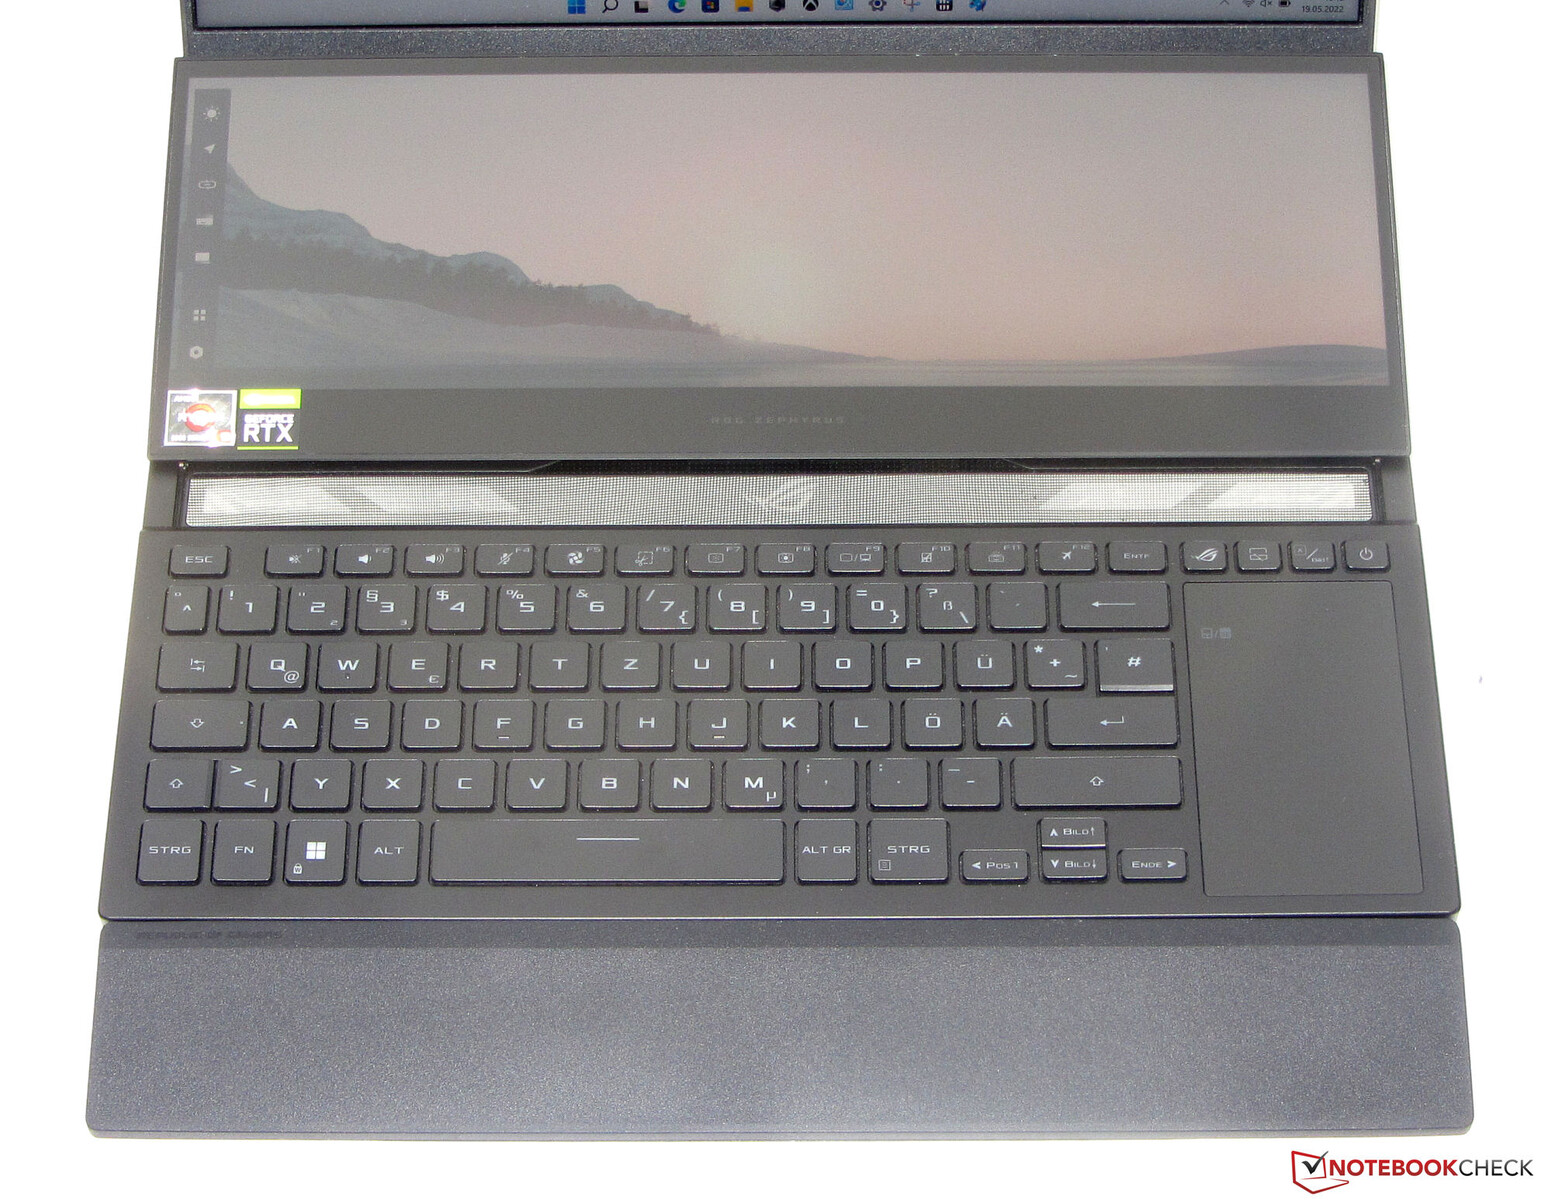
Asus Screenpad Plus
Hay una opción de entrada adicional en forma de Screenpad Plus (14 pulgadas, 3840 x 1100 píxeles, mate), que es una segunda pantalla que incluye la funcionalidad de pantalla táctil (soporte para lápices de entrada activa). Se comporta como cualquier otra pantalla externa conectada y puede encenderse y apagarse mediante una tecla independiente.
El Screenpad ofrece la posibilidad de trasladar las aplicaciones o sus elementos de navegación a la pantalla táctil. Esto último depende de si la aplicación lo admite. Por ejemplo, podemos mover la ventana de chat al Screenpad, mientras se ejecuta un juego en la pantalla principal.
Hay varias pequeñas aplicaciones preinstaladas que dan una idea de las posibilidades del Screenpad. Por ejemplo, hay una calculadora y un campo para la introducción de datos manuscritos, y una aplicación de teclas rápidas que agrupa funciones de uso frecuente, como cortar, copiar y pegar.

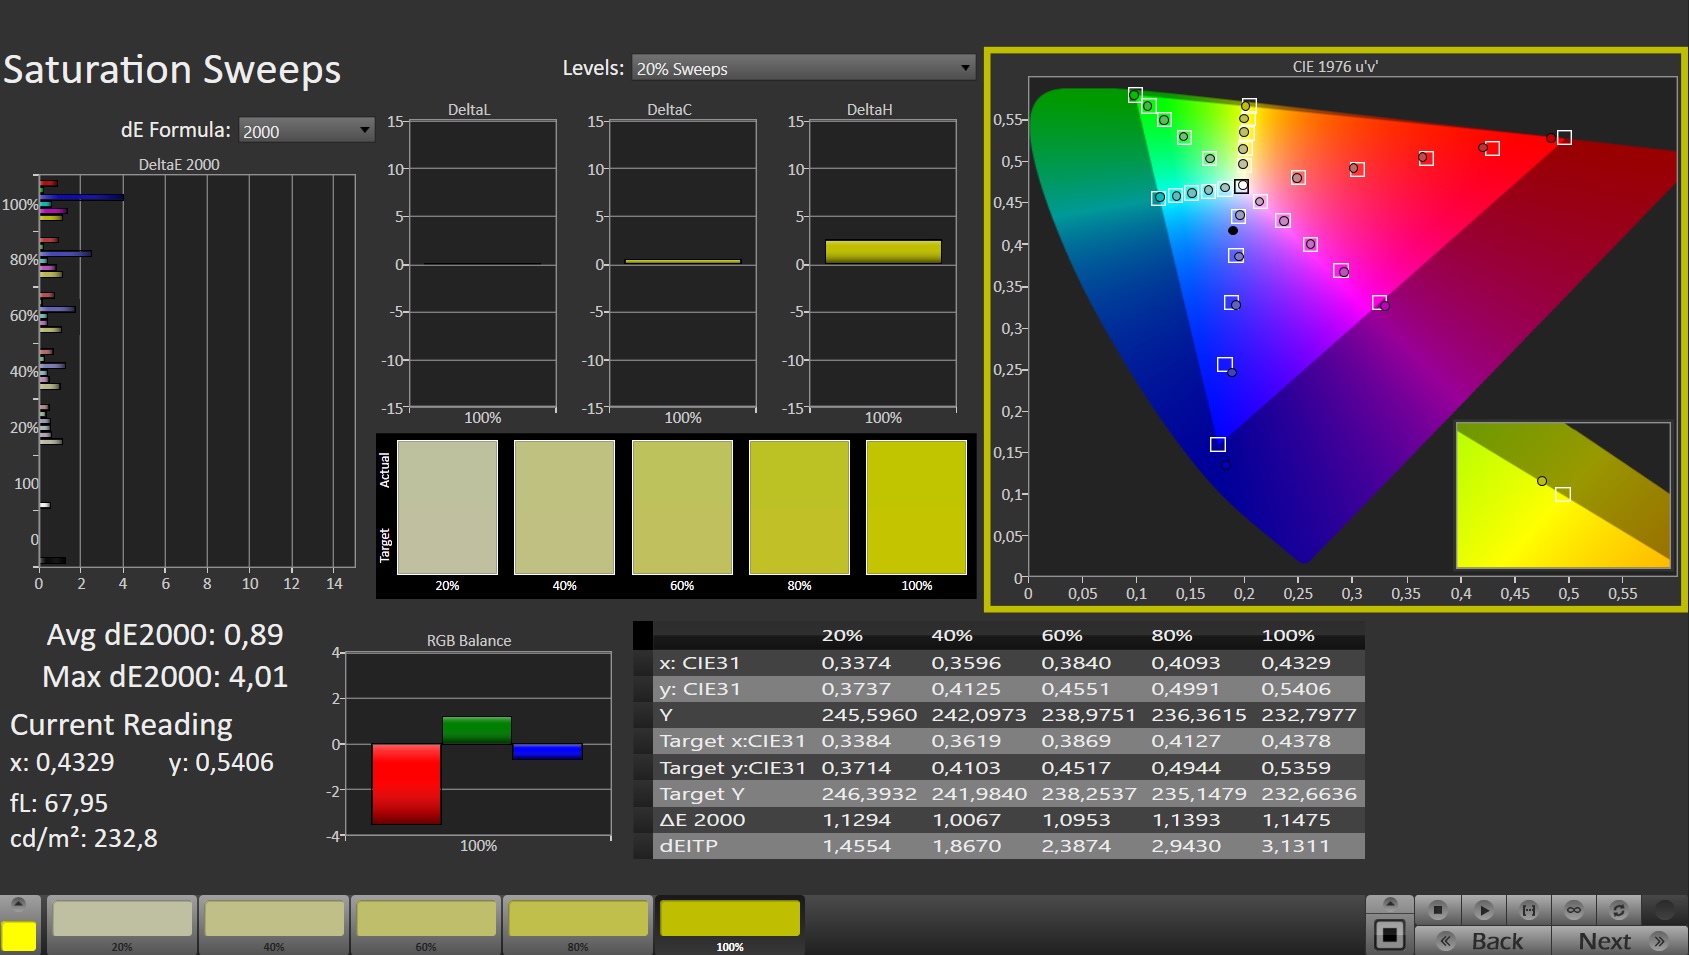
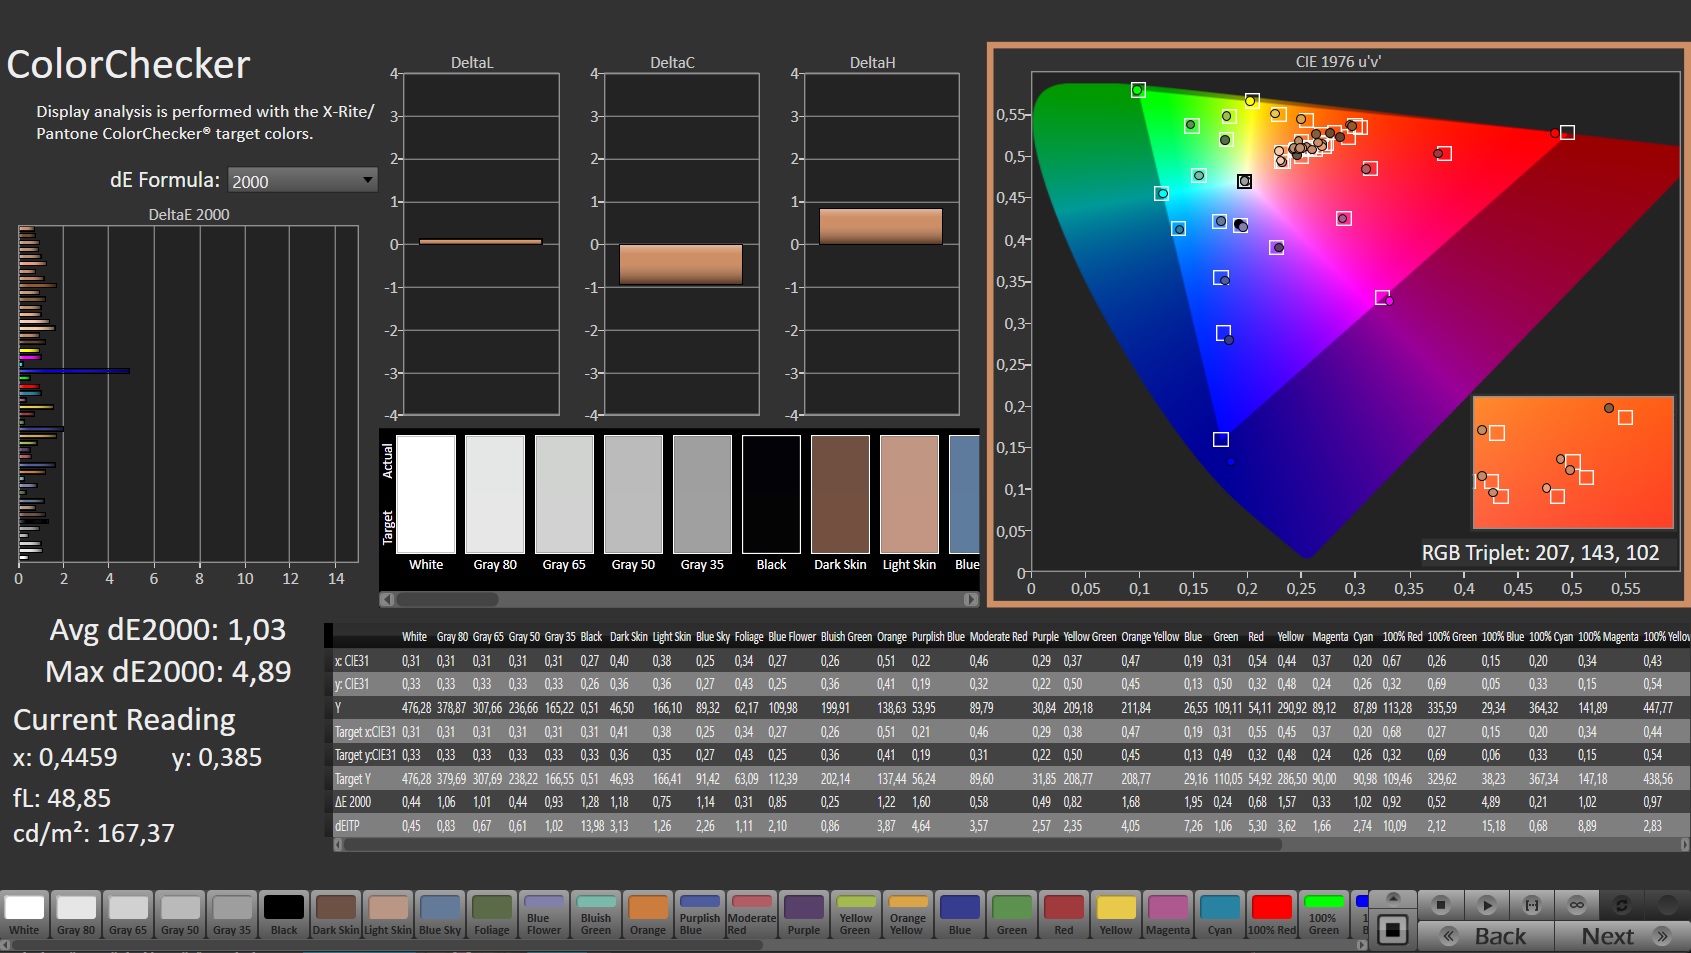
Pantalla - Buena reproducción del color
El brillo (433,9 cd/m²) y el contraste (1043:1) de la pantalla mate de 16 pulgadas (3840 x 2400 píxeles) cumplen los requisitos. Los puntos positivos son los rápidos tiempos de respuesta y la ausencia de parpadeo PWM.
La pantalla es compatible con la tecnología FreeSync de AMD, que ajusta dinámicamente las tasas de refresco de la pantalla y las tasas de fotogramas de la GPU entre sí. De este modo, se supone que la imagen creada es lo más fluida posible, especialmente durante los juegos de ordenador.
| |||||||||||||||||||||||||
iluminación: 88 %
Brillo con batería: 459 cd/m²
Contraste: 1043:1 (Negro: 0.44 cd/m²)
ΔE ColorChecker Calman: 2.97 | ∀{0.5-29.43 Ø4.71}
calibrated: 1.03
ΔE Greyscale Calman: 4.9 | ∀{0.09-98 Ø4.96}
86.3% AdobeRGB 1998 (Argyll 3D)
99.9% sRGB (Argyll 3D)
98% Display P3 (Argyll 3D)
Gamma: 2.235
CCT: 6775 K
| Asus ROG Zephyrus Duo 16 GX650RX BOE NE160QAM-NX1, IPS-Level, 3840x2400, 16" | Apple MacBook Pro 16 2021 M1 Max Mini-LED, 3456x2234, 16.2" | Razer Blade 15 Advanced Model Early 2022 TL156VDXP02-0, IPS, 1920x1080, 15.6" | MSI GE76 Raider AU Optronics B173HAN05.4 (AUOE295), IPS-Level, 1920x1080, 17.3" | Medion Erazer Beast X30 BOE CQ NE173QHM-NZ3, IPS, 2560x1440, 17.3" | Gigabyte Aero 16 YE5 Samsung SDC416B, AMOLED, 3840x2400, 16" | |
|---|---|---|---|---|---|---|
| Display | -23% | -22% | -18% | |||
| Display P3 Coverage (%) | 98 | 65.3 -33% | 63.1 -36% | 67.7 -31% | ||
| sRGB Coverage (%) | 99.9 | 85.1 -15% | 94 -6% | 97.6 -2% | ||
| AdobeRGB 1998 Coverage (%) | 86.3 | 67.4 -22% | 65.2 -24% | 69.2 -20% | ||
| Response Times | -9% | -5% | -26% | 74% | ||
| Response Time Grey 50% / Grey 80% * (ms) | 14.6 ? | 4.3 ? 71% | 5.6 ? 62% | 14.7 ? -1% | 2.4 ? 84% | |
| Response Time Black / White * (ms) | 5.6 ? | 10.5 ? -88% | 9.6 ? -71% | 8.4 ? -50% | 2 ? 64% | |
| PWM Frequency (Hz) | 60 ? | |||||
| Screen | 329% | 27% | 20% | 3% | 456% | |
| Brightness middle (cd/m²) | 459 | 507 10% | 330 -28% | 290 -37% | 377 -18% | 368 -20% |
| Brightness (cd/m²) | 434 | 494 14% | 315 -27% | 290 -33% | 352 -19% | 368 -15% |
| Brightness Distribution (%) | 88 | 96 9% | 89 1% | 96 9% | 86 -2% | 93 6% |
| Black Level * (cd/m²) | 0.44 | 0.02 95% | 0.24 45% | 0.23 48% | 0.32 27% | 0.01 98% |
| Contrast (:1) | 1043 | 25350 2330% | 1375 32% | 1261 21% | 1178 13% | 36800 3428% |
| Colorchecker dE 2000 * | 2.97 | 1.4 53% | 1.47 51% | 1.59 46% | 2.91 2% | 2.33 22% |
| Colorchecker dE 2000 max. * | 8.13 | 2.8 66% | 2.73 66% | 3.17 61% | 6.78 17% | 4.34 47% |
| Colorchecker dE 2000 calibrated * | 1.03 | 0.63 39% | 0.87 16% | 1.3 -26% | ||
| Greyscale dE 2000 * | 4.9 | 2.3 53% | 1.8 63% | 2.5 49% | 3.4 31% | 0.8 84% |
| Gamma | 2.235 98% | 2.27 97% | 2.282 96% | 2.253 98% | 2.109 104% | 2.119 104% |
| CCT | 6775 96% | 6792 96% | 6499 100% | 6640 98% | 7273 89% | 6569 99% |
| Media total (Programa/Opciones) | 329% /
329% | -2% /
11% | -2% /
8% | -14% /
-6% | 265% /
380% |
* ... más pequeño es mejor
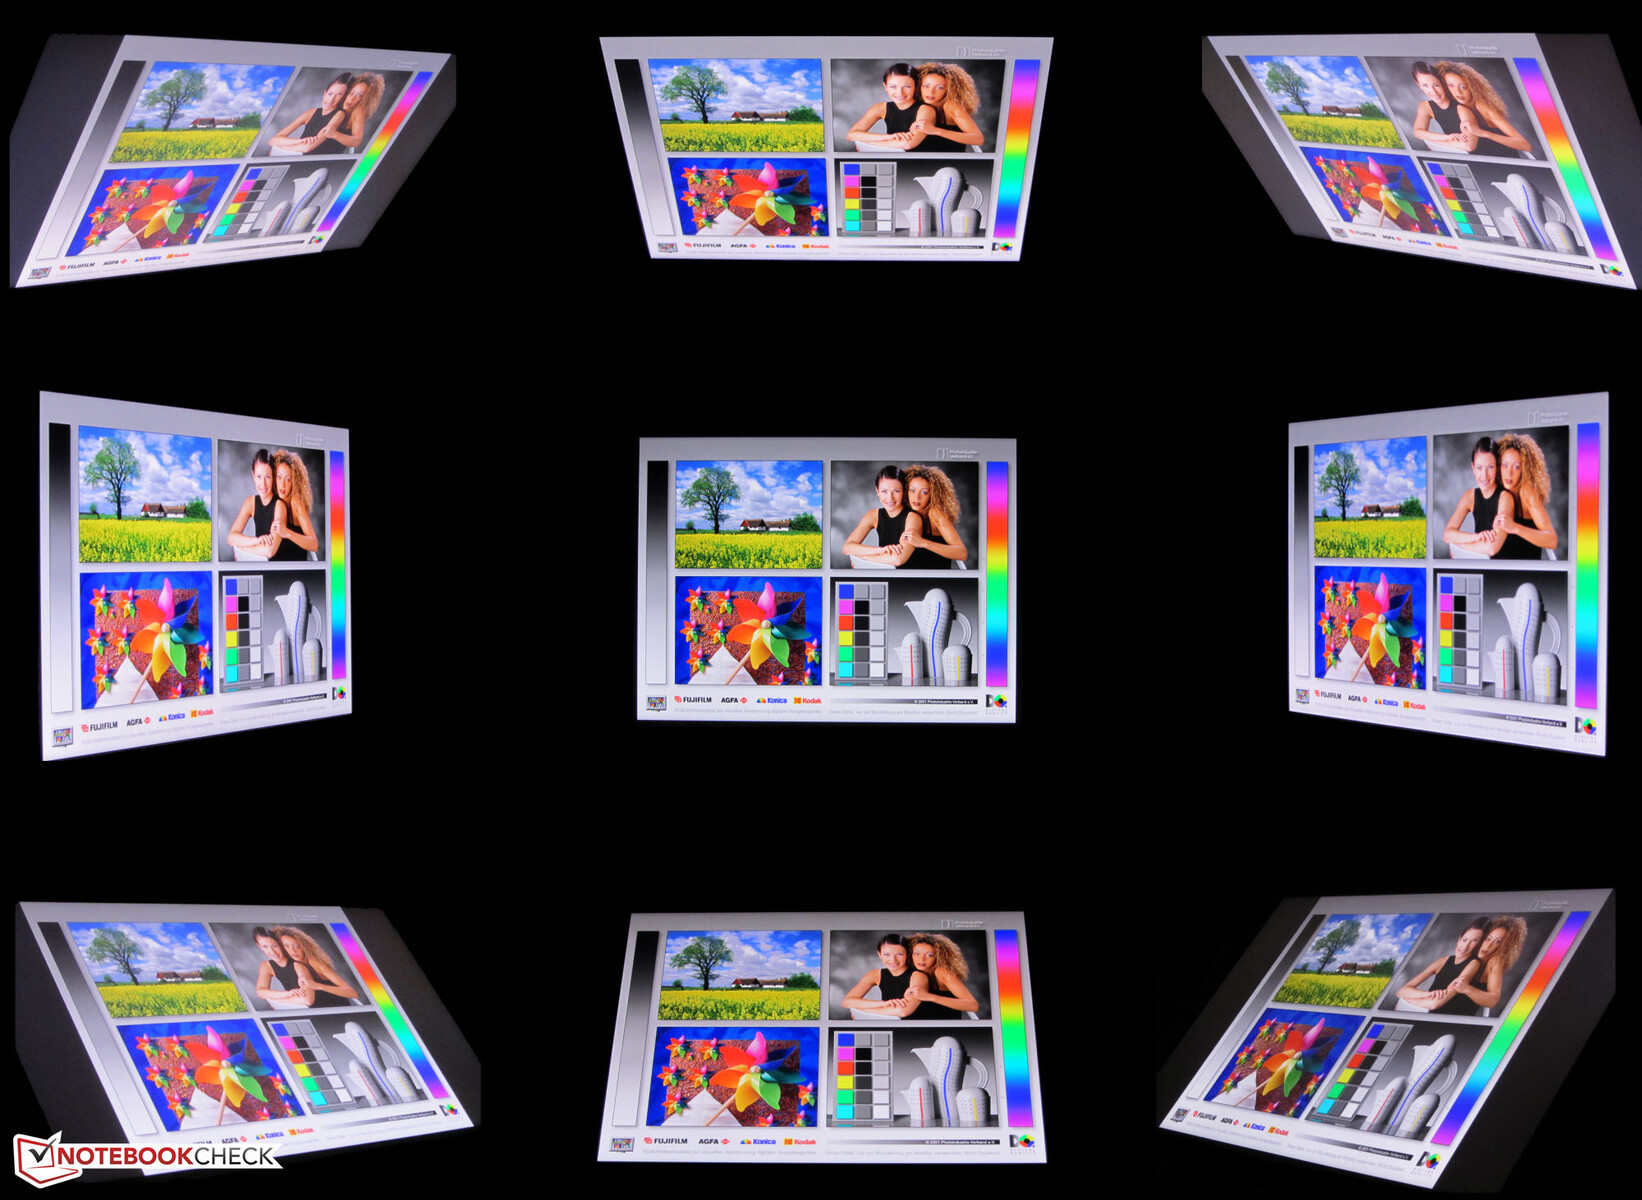
La certificación X Rite Pantone de la pantalla garantiza una reproducción del color muy natural. En consecuencia, la pantalla de color es bastante precisa ya en el estado de entrega. Aunque la desviación del color se mantiene dentro de los límites previstos, una calibración sigue aportando mejoras significativas. La pantalla es capaz de mostrar los espacios de color sRGB (99,9%) y DCI-P3 (98%) casi por completo, y también se cubre el 86% del espacio de color AdobeRGB.


Tiempos de respuesta del display
| ↔ Tiempo de respuesta de Negro a Blanco | ||
|---|---|---|
| 5.6 ms ... subida ↗ y bajada ↘ combinada | ↗ 2 ms subida | 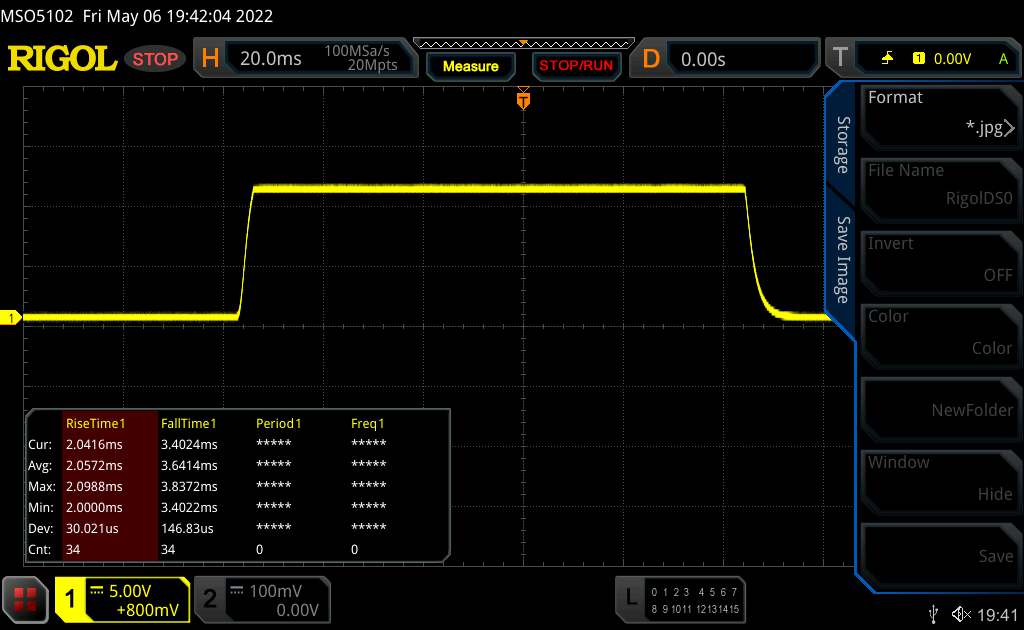 |
| ↘ 3.6 ms bajada | ||
| La pantalla mostró tiempos de respuesta muy rápidos en nuestros tests y debería ser adecuada para juegos frenéticos. En comparación, todos los dispositivos de prueba van de ##min### (mínimo) a 240 (máximo) ms. » 18 % de todos los dispositivos son mejores. Esto quiere decir que el tiempo de respuesta medido es mejor que la media (19.8 ms) de todos los dispositivos testados. | ||
| ↔ Tiempo de respuesta 50% Gris a 80% Gris | ||
| 14.6 ms ... subida ↗ y bajada ↘ combinada | ↗ 6.7 ms subida | 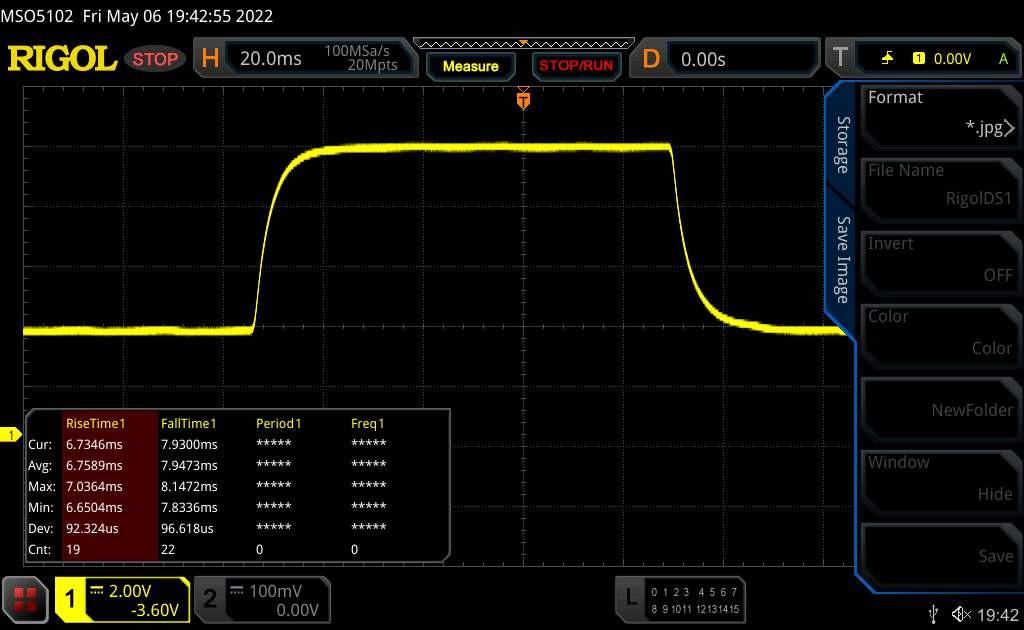 |
| ↘ 7.9 ms bajada | ||
| La pantalla mostró buenos tiempos de respuesta en nuestros tests pero podría ser demasiado lenta para los jugones competitivos. En comparación, todos los dispositivos de prueba van de ##min### (mínimo) a 636 (máximo) ms. » 29 % de todos los dispositivos son mejores. Esto quiere decir que el tiempo de respuesta medido es mejor que la media (31 ms) de todos los dispositivos testados. | ||
Parpadeo de Pantalla / PWM (Pulse-Width Modulation)
| Parpadeo de Pantalla / PWM no detectado | 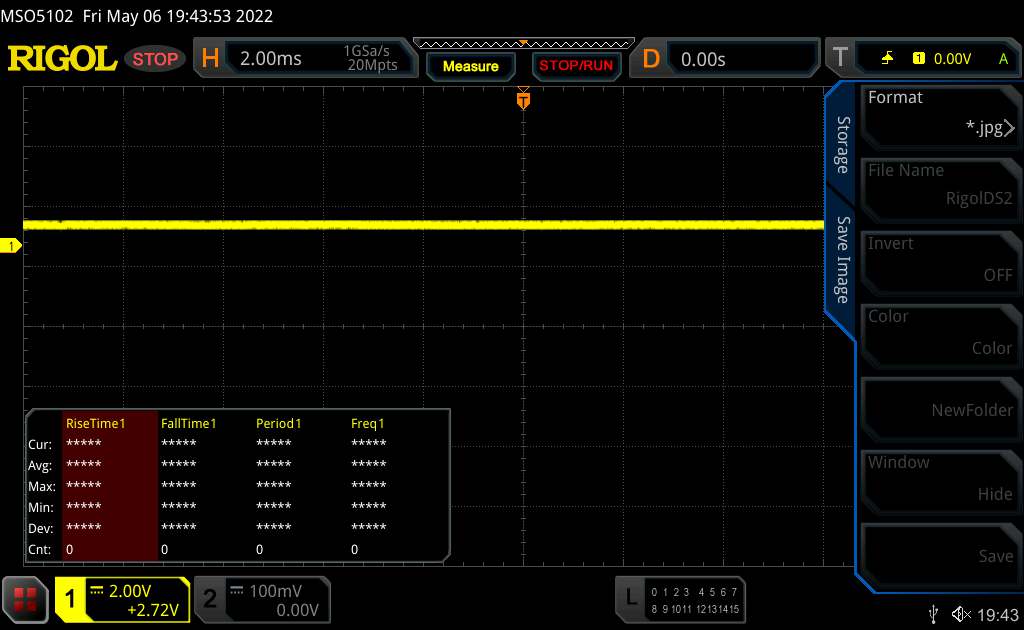 | ||
Comparación: 52 % de todos los dispositivos testados no usaron PWM para atenuar el display. Si se usó, medimos una media de 7754 (mínimo: 5 - máxmo: 343500) Hz. | |||
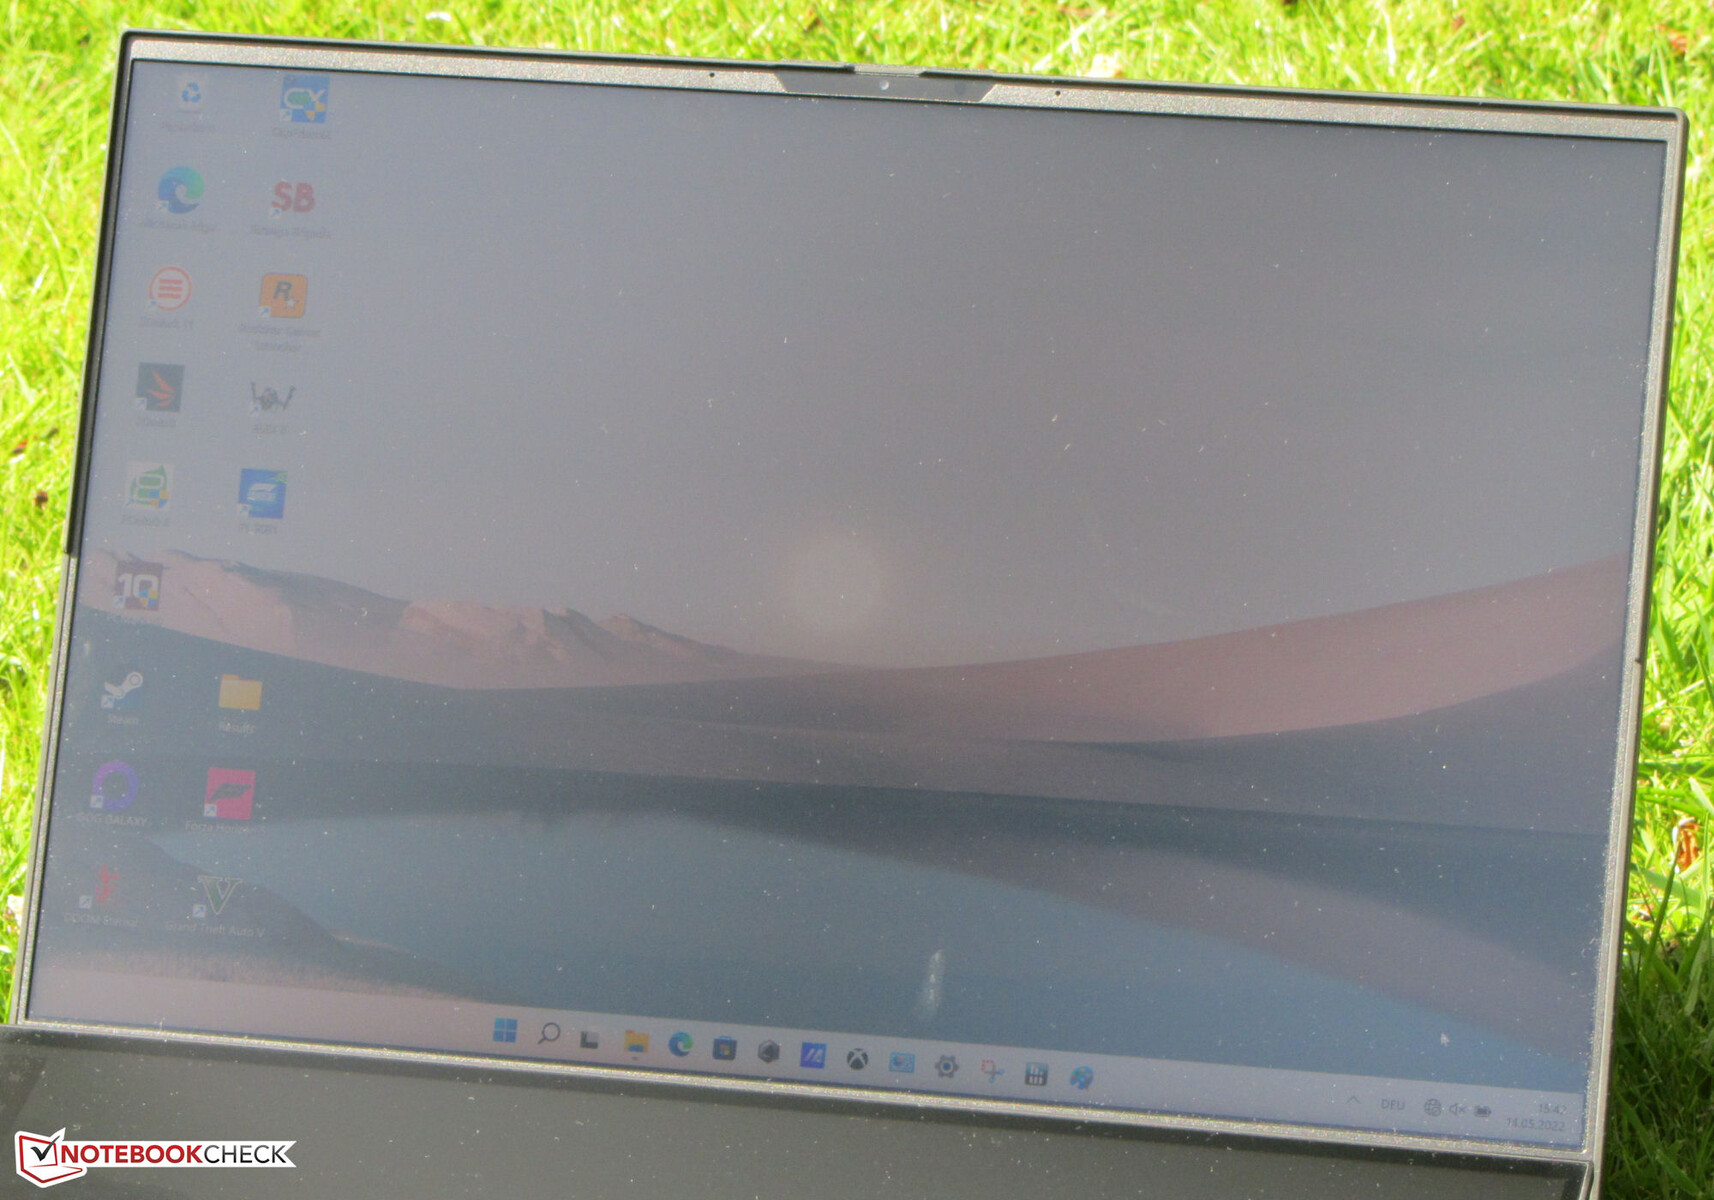
Los ángulos de visión del panel IPS son estables, y se puede leer desde cualquier ángulo. La pantalla puede leerse en exteriores, si la luz del sol no es demasiado intensa.
Performance - Rembrandt se encuentra con Ampere
Con el Zephyrus Duo 16 GX650RX, Asus ofrece un portátil de 16 pulgadas que se posiciona principalmente como un portátil para juegos. Sin embargo, el dispositivo también está dirigido a los streamers y creadores de contenido.
Condiciones de la prueba
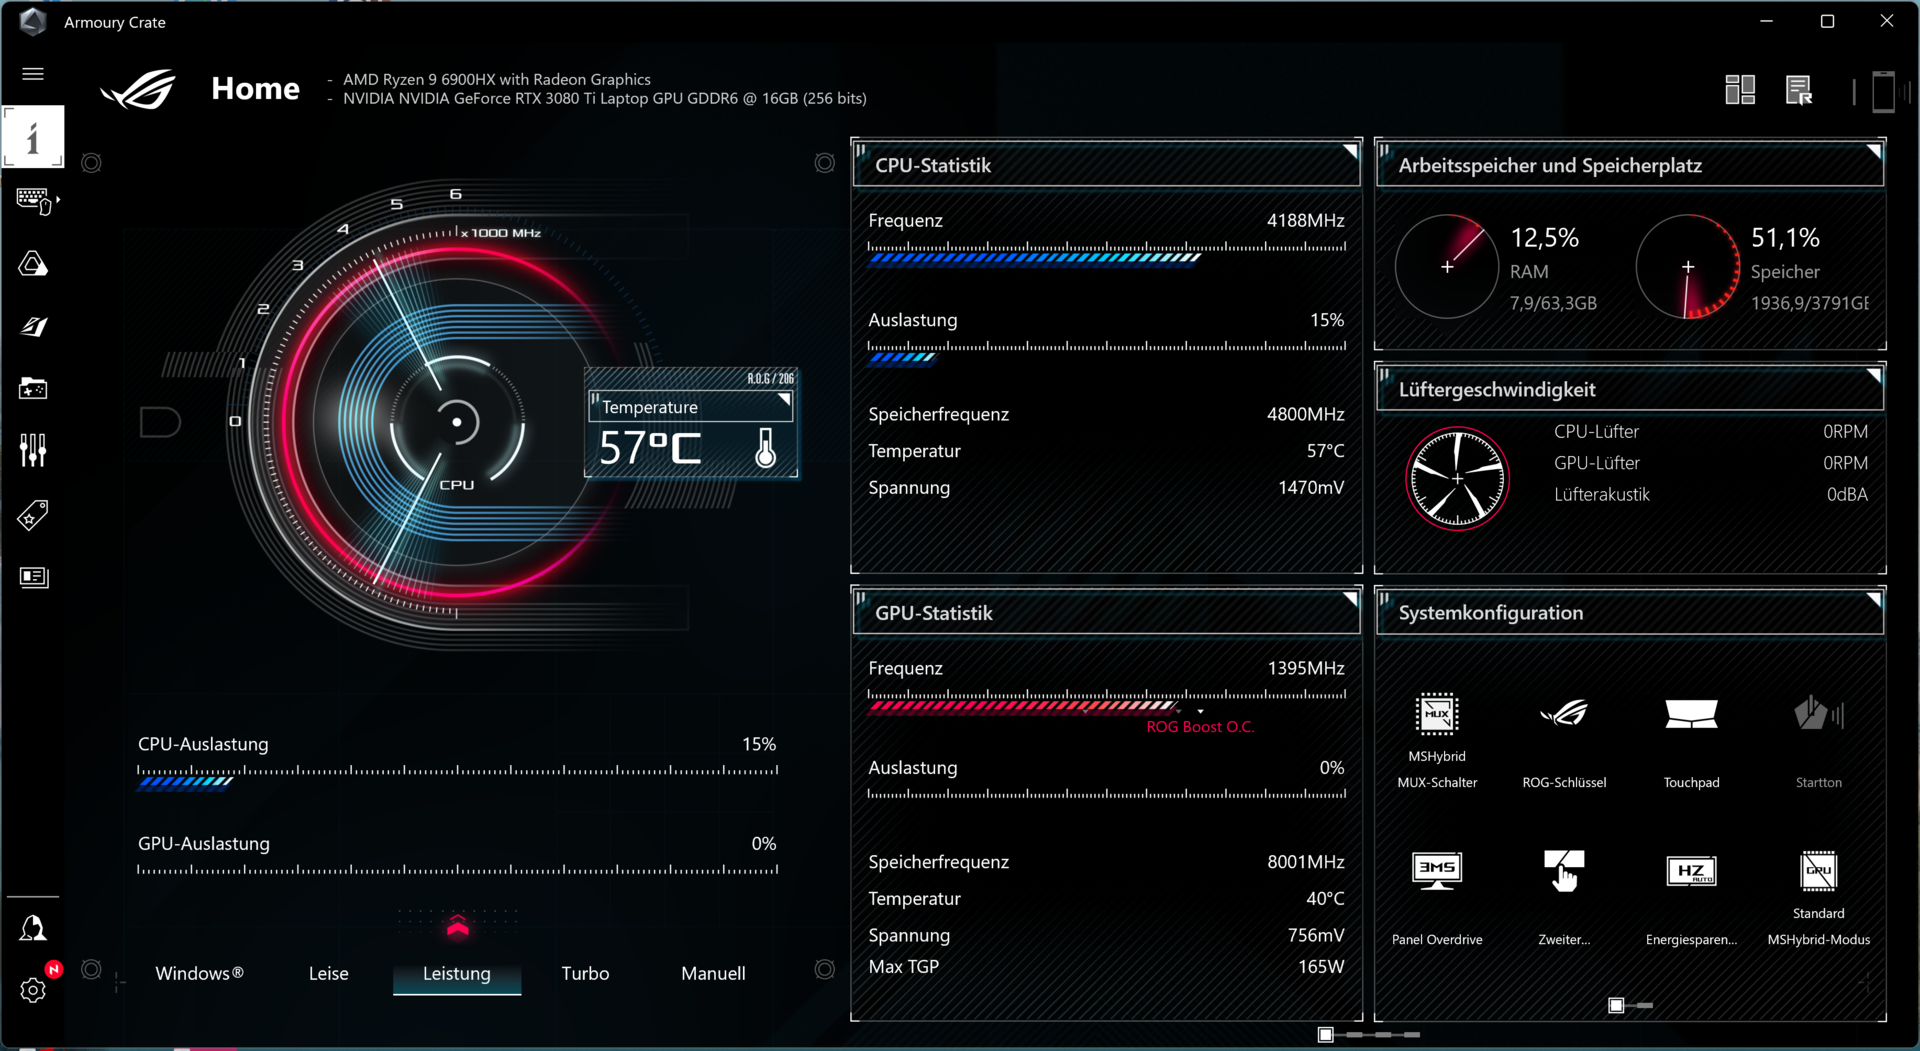
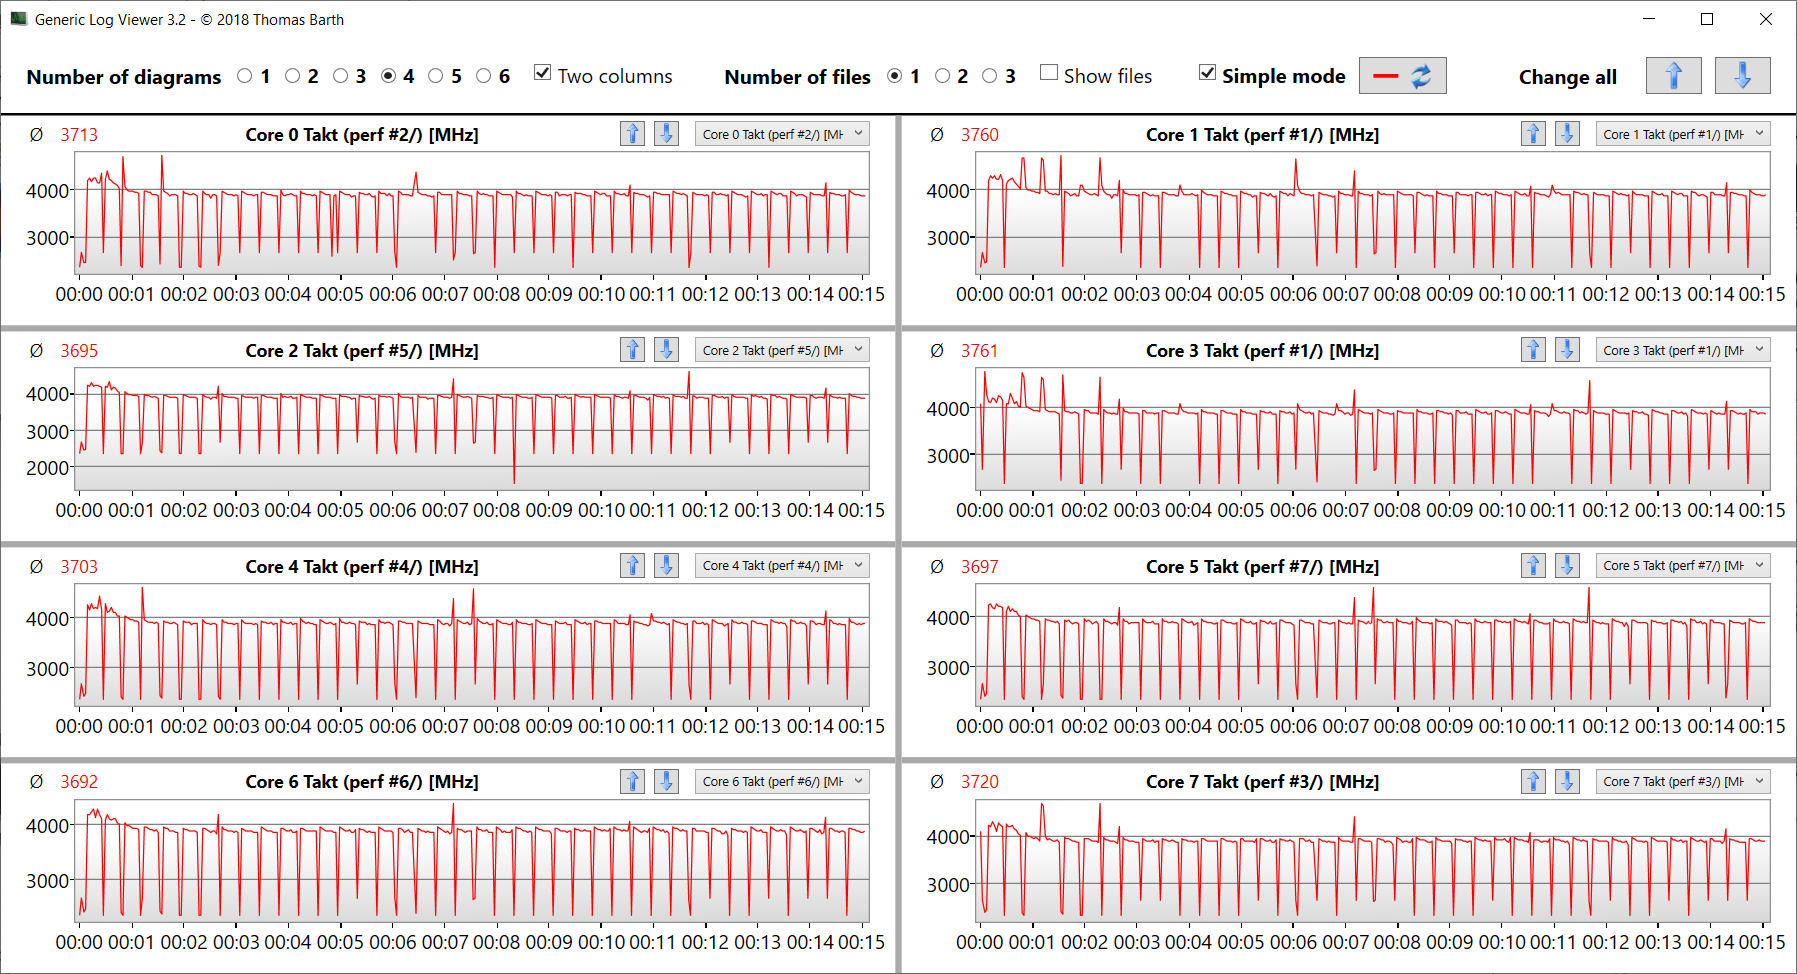
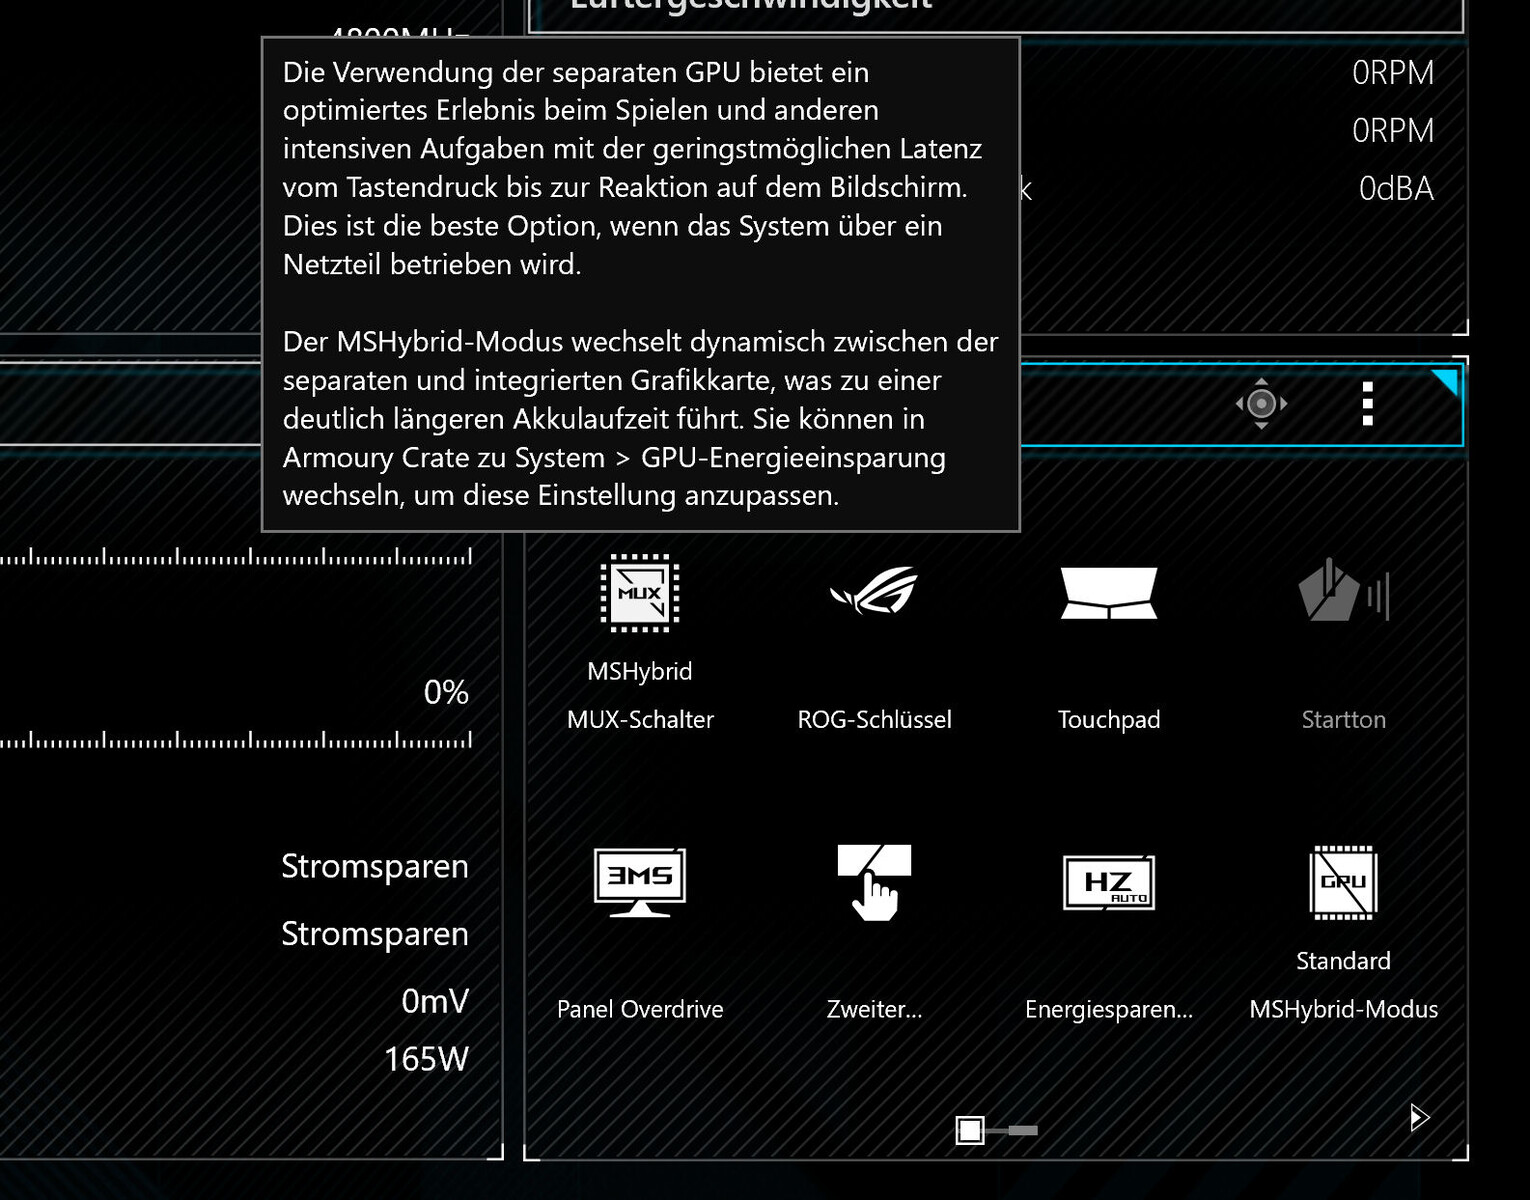
El portátil ofrece tres perfiles de rendimiento específicos del fabricante ("Silencio", "Rendimiento" y "Turbo"), y puedes cambiar entre ellos utilizando la combinación de teclas "Fn" + "F5". El perfil "Turbo" sólo se puede utilizar en funcionamiento de red. Nuestras pruebas de batería se realizaron con el perfil "Silencioso" y todos los benchmarks con el perfil "Rendimiento" activado.
| Rendimiento | Turbo | Silencioso | |
|---|---|---|---|
| Límite de potencia 1 | 80 vatios | 100 vatios | 70 vatios |
| Límite de potencia 2 | 80 vatios | 125 vatios | 70 vatios |
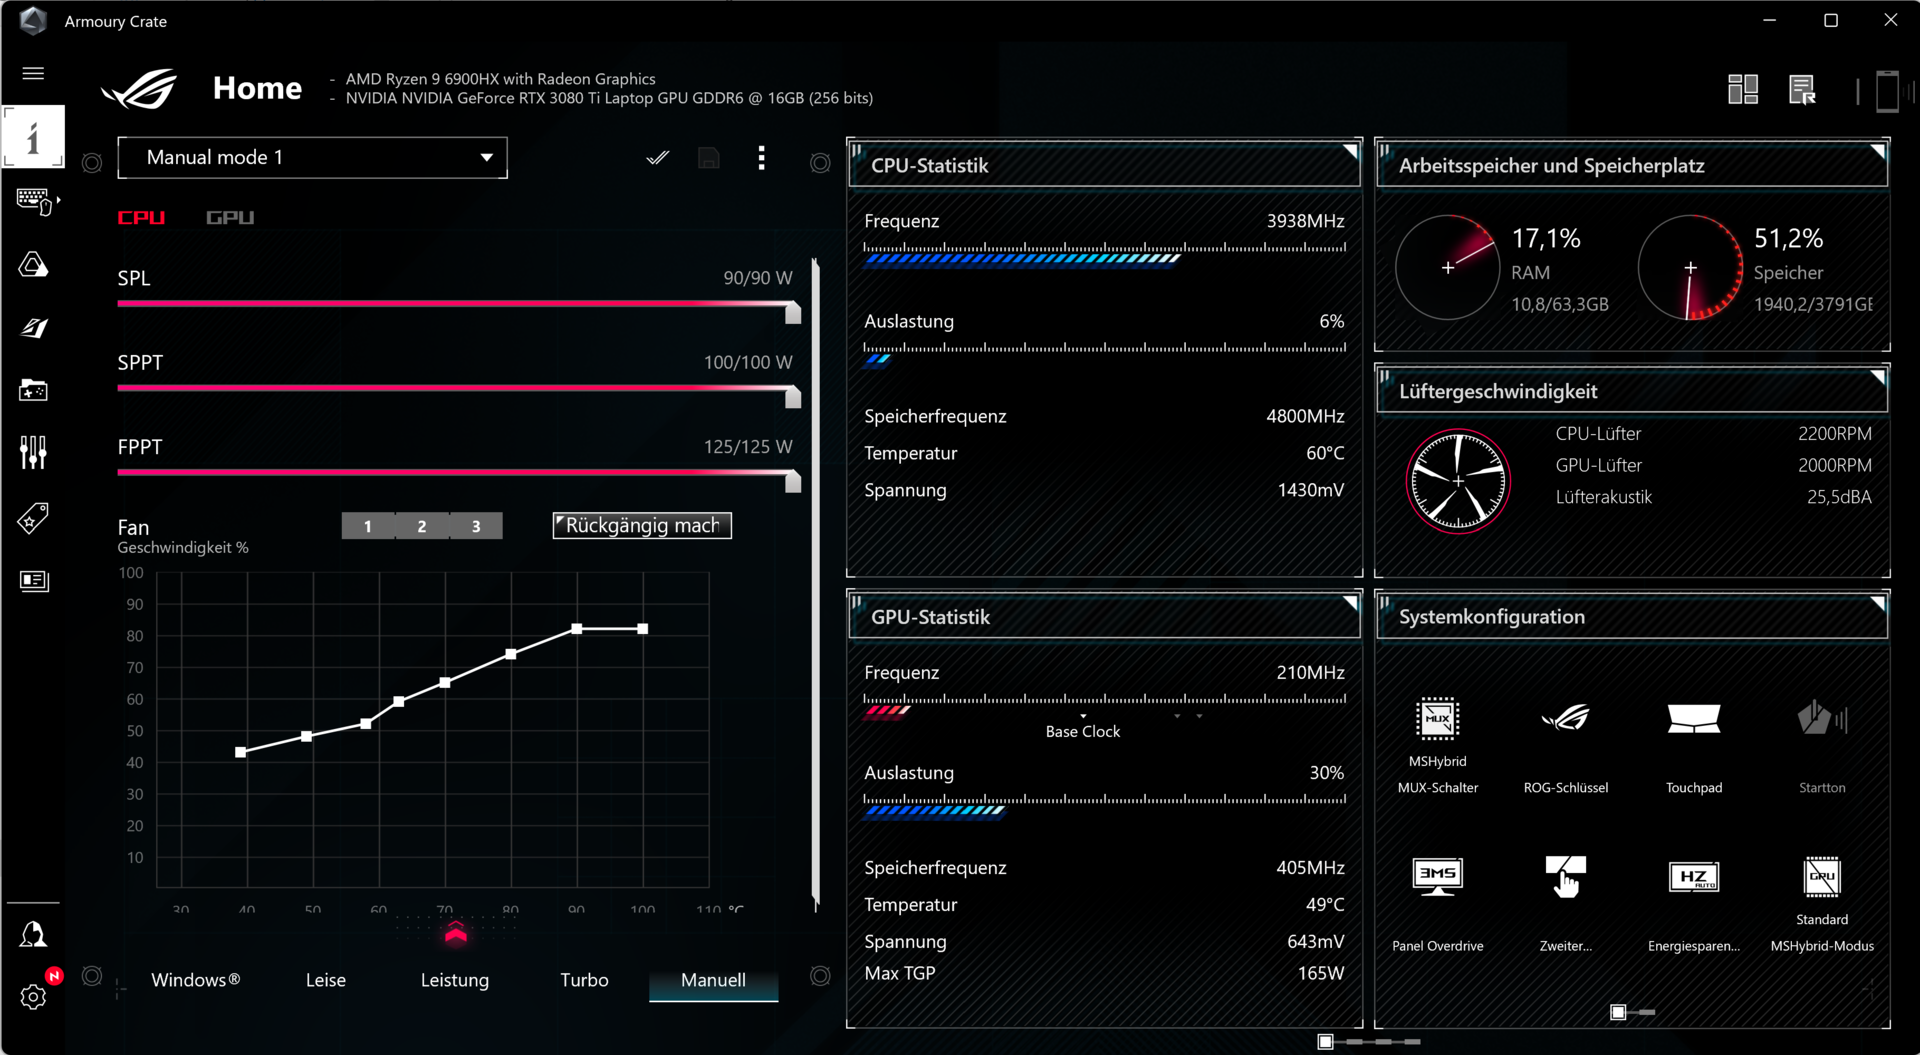
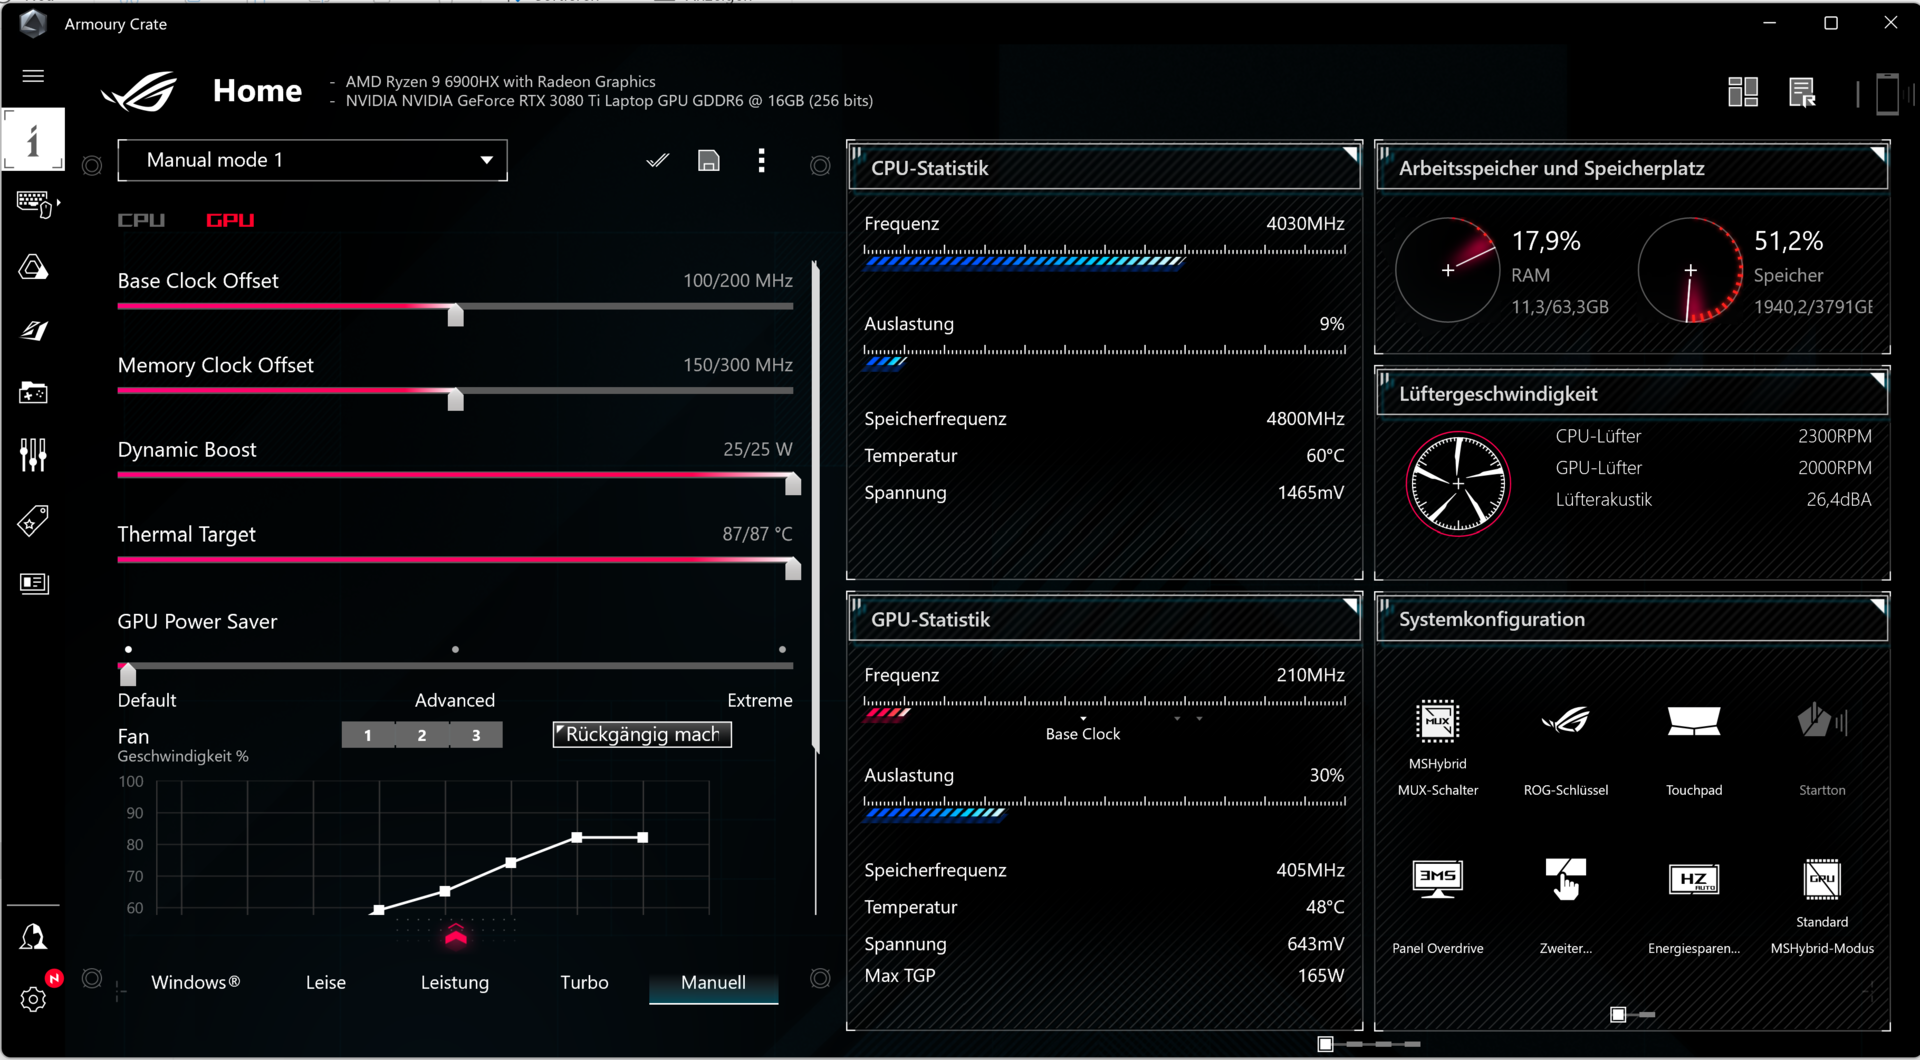
El software Armoury Crate preinstalado permite crear perfiles individuales ("Manual"). Por ejemplo, configuramos individualmente los límites de potencia de la CPU y el boost dinámico de la GPU. También puedes hacer overclocking en el almacenamiento de gráficos.
Procesador
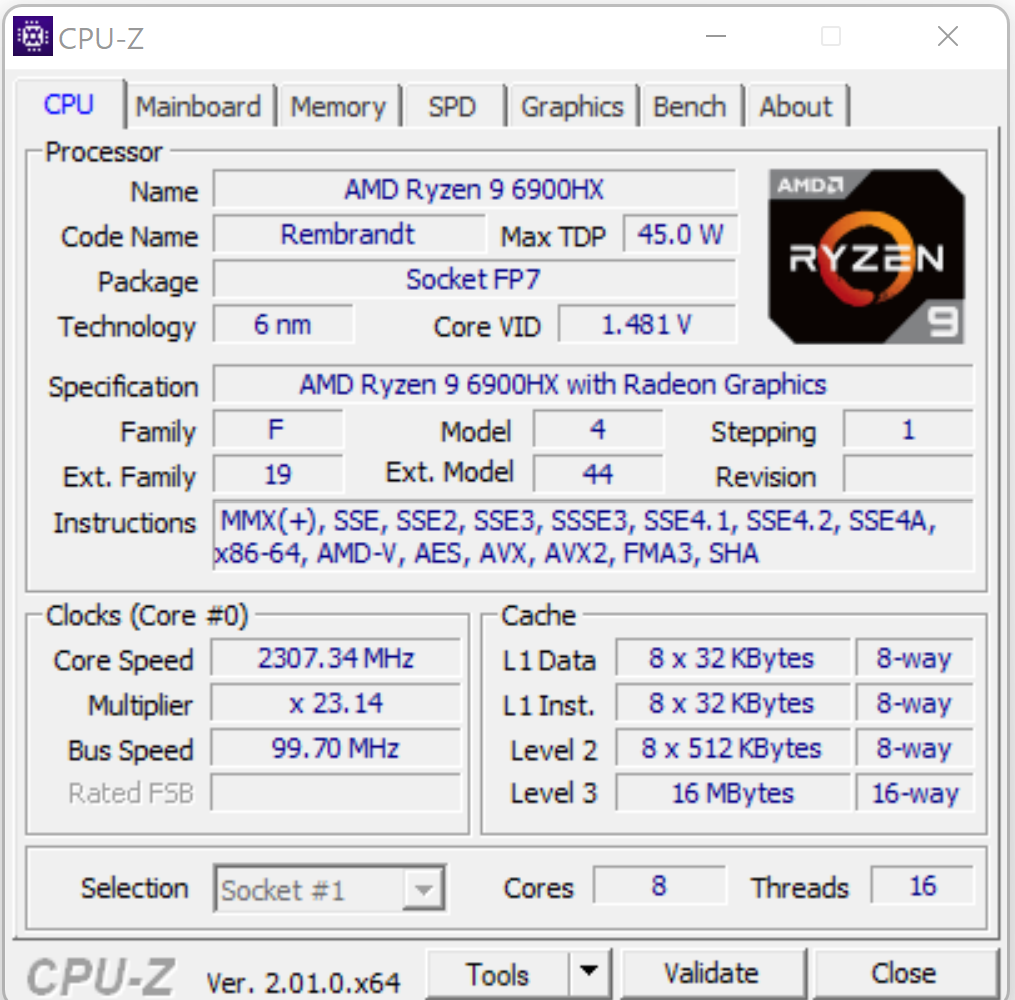
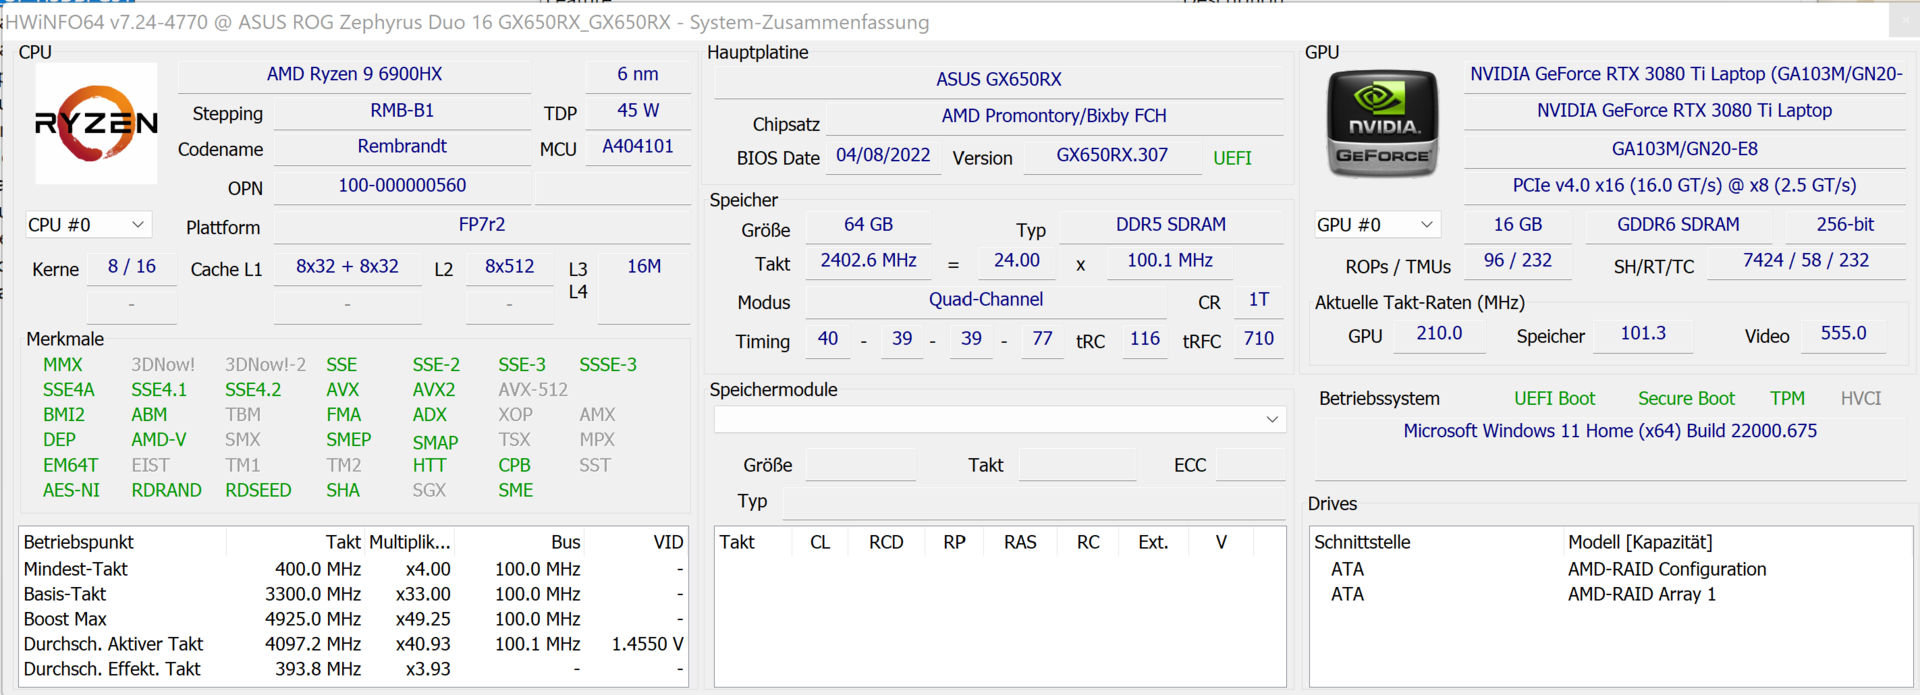
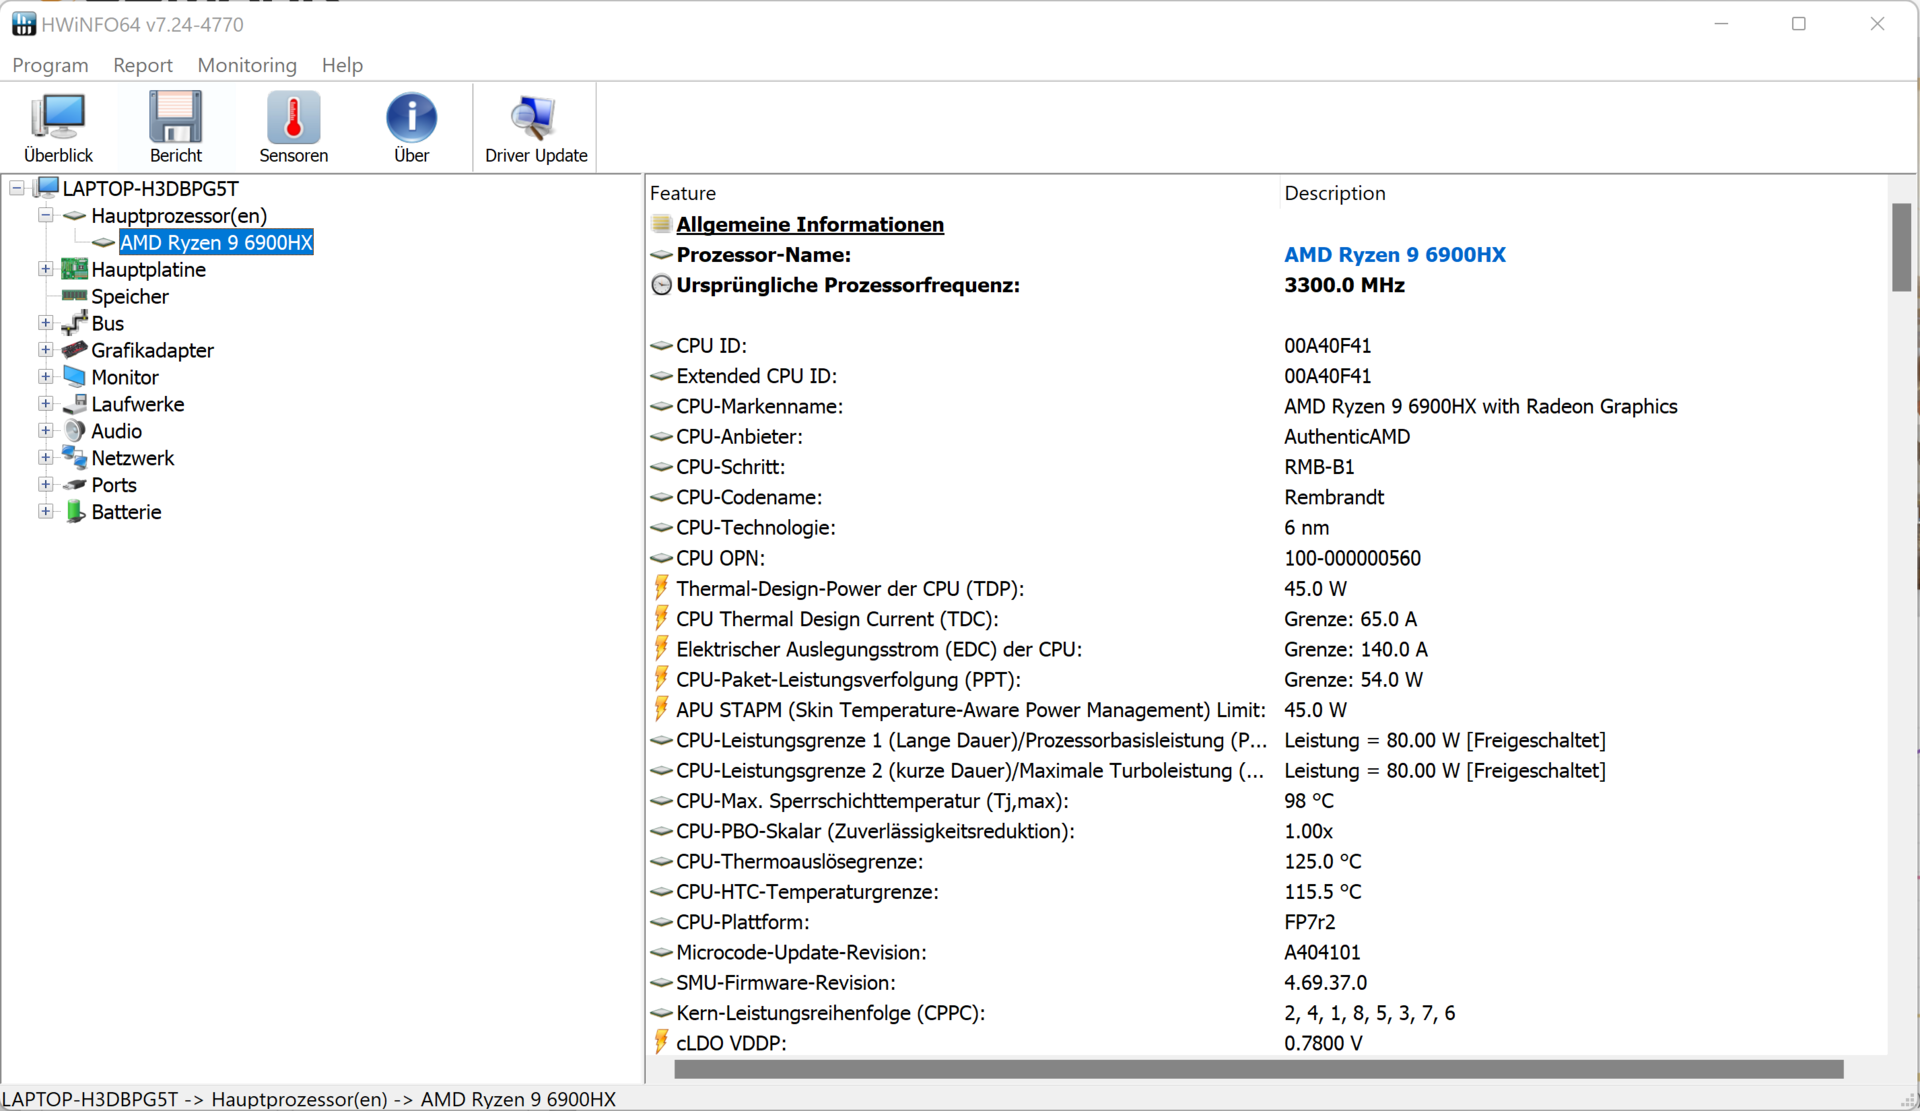
El segmento de la CPU del Ryzen 9-6900HX(Rembrandt) consiste en un procesador octa-core que funciona a una velocidad de reloj básica de 3,3 GHz. La velocidad puede aumentarse hasta 4,9 GHz mediante Turbo. Soporta multithreading simultáneo (dos hilos por núcleo).
La prueba multihilo del benchmark Cinebench R15 se ejecuta brevemente a velocidades de reloj entre 4 y 4,4 GHz, y la prueba de hilo único entre 3,1 y 4,7 GHz. En funcionamiento en batería, la CPU funciona entre 3 y 4,1 GHz (multihilo) y entre 2 y 4,7 GHz (monohilo).
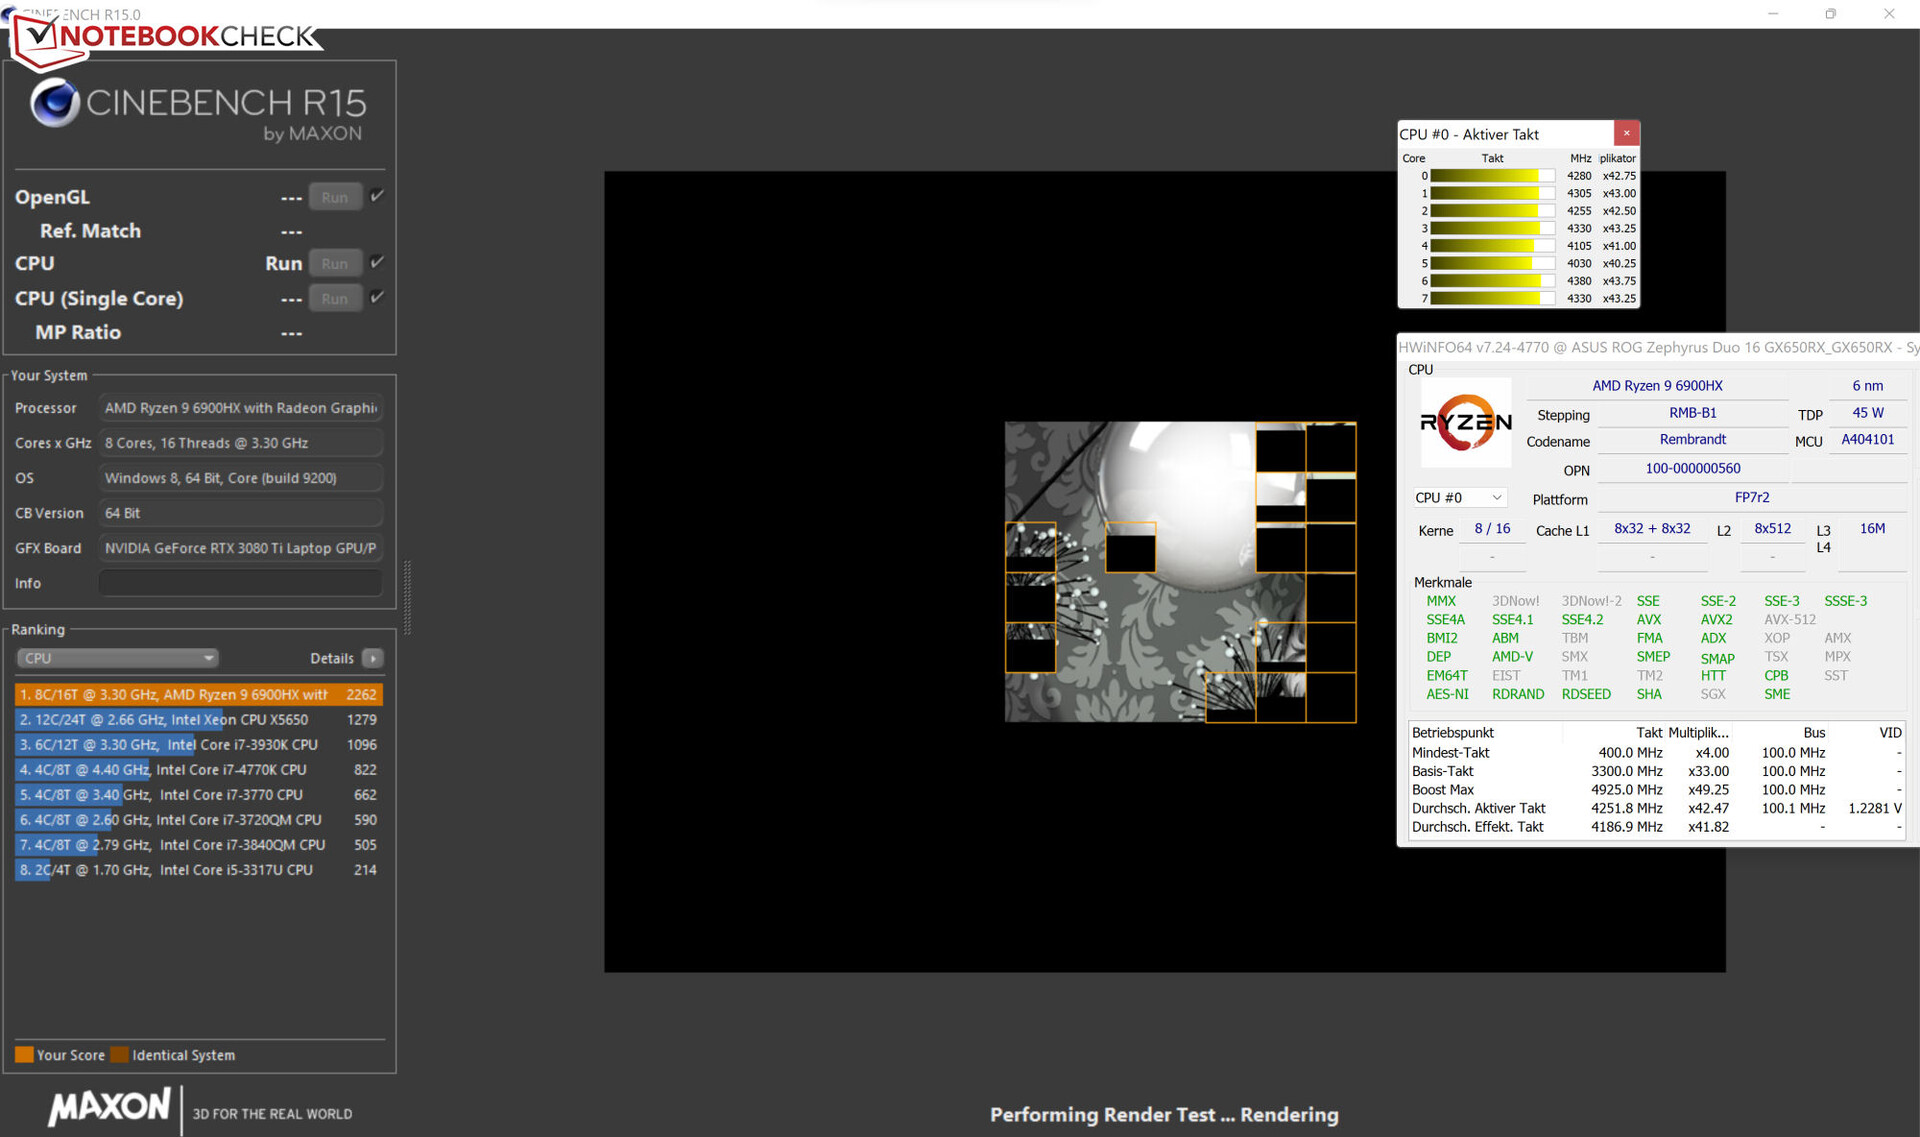
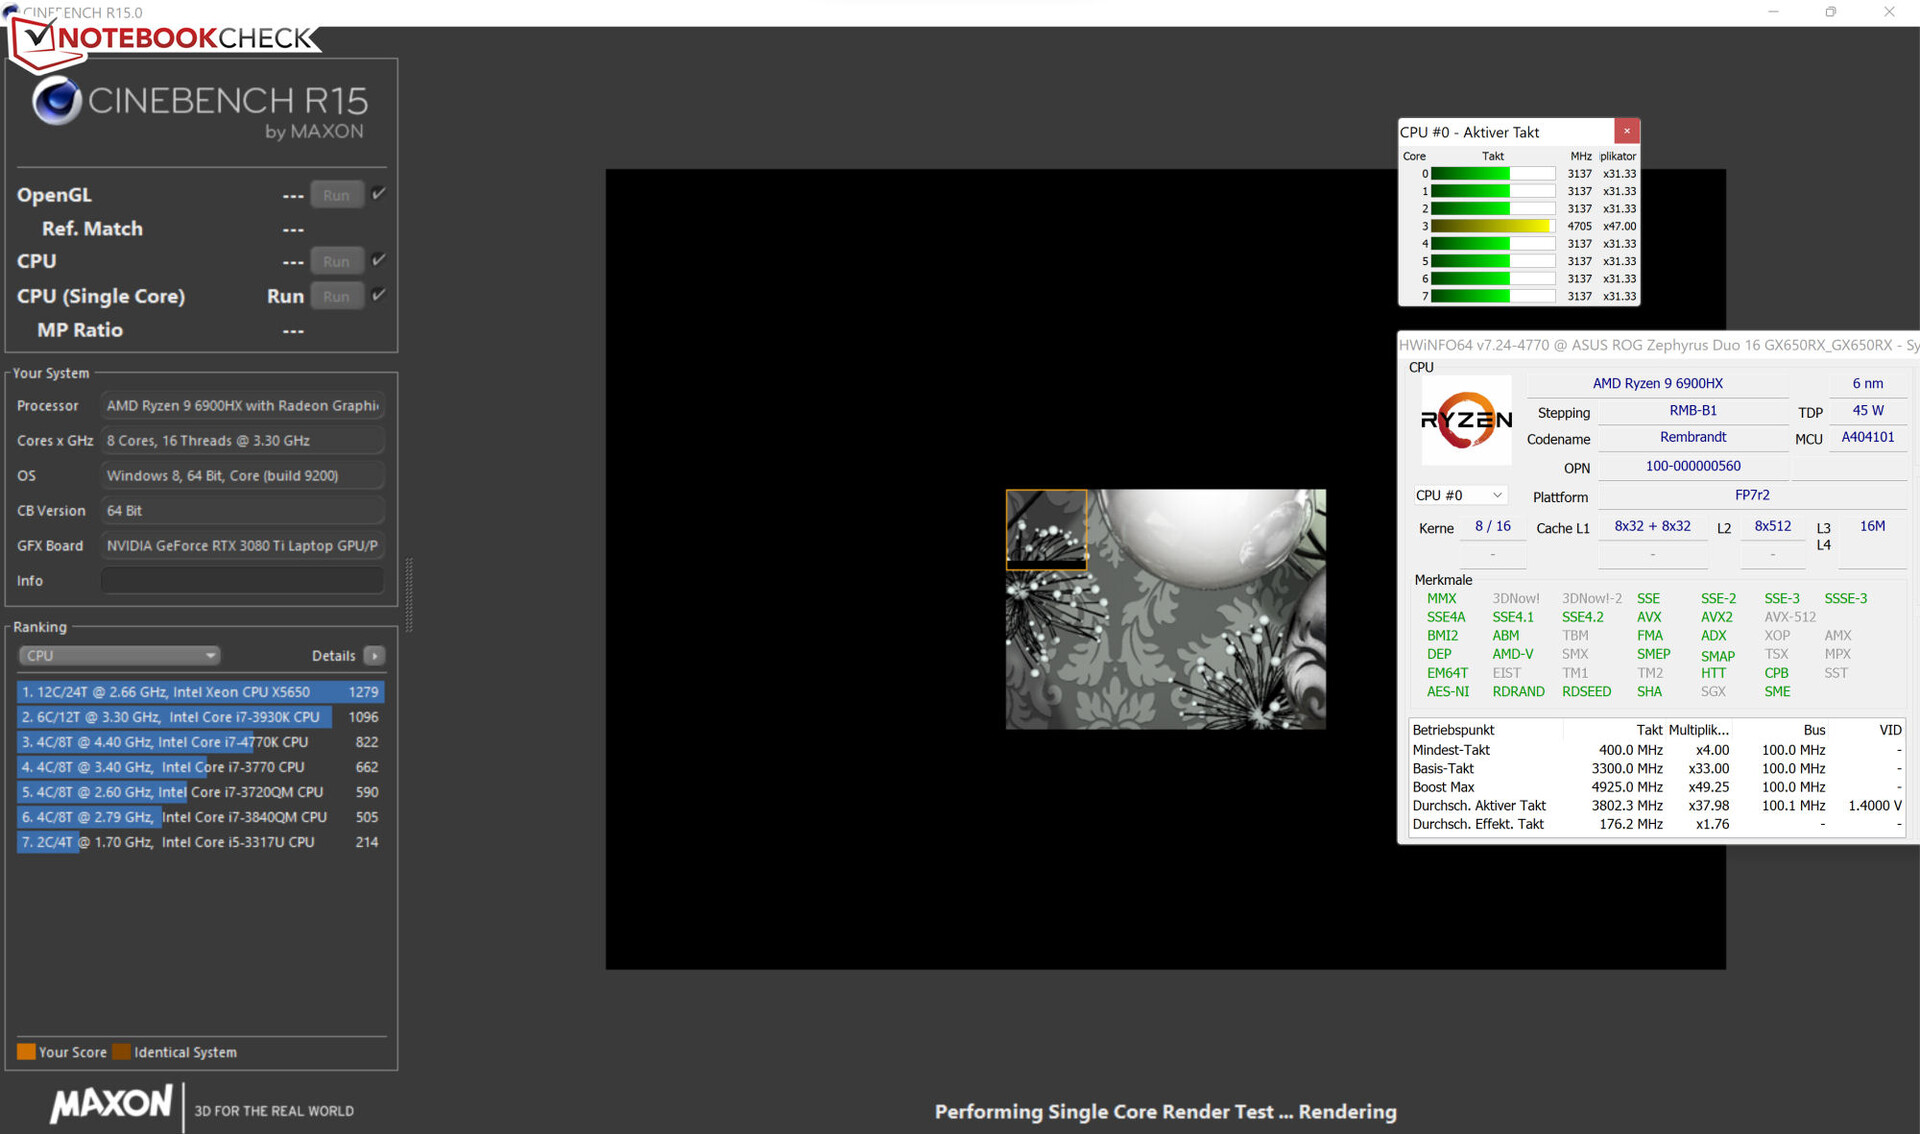
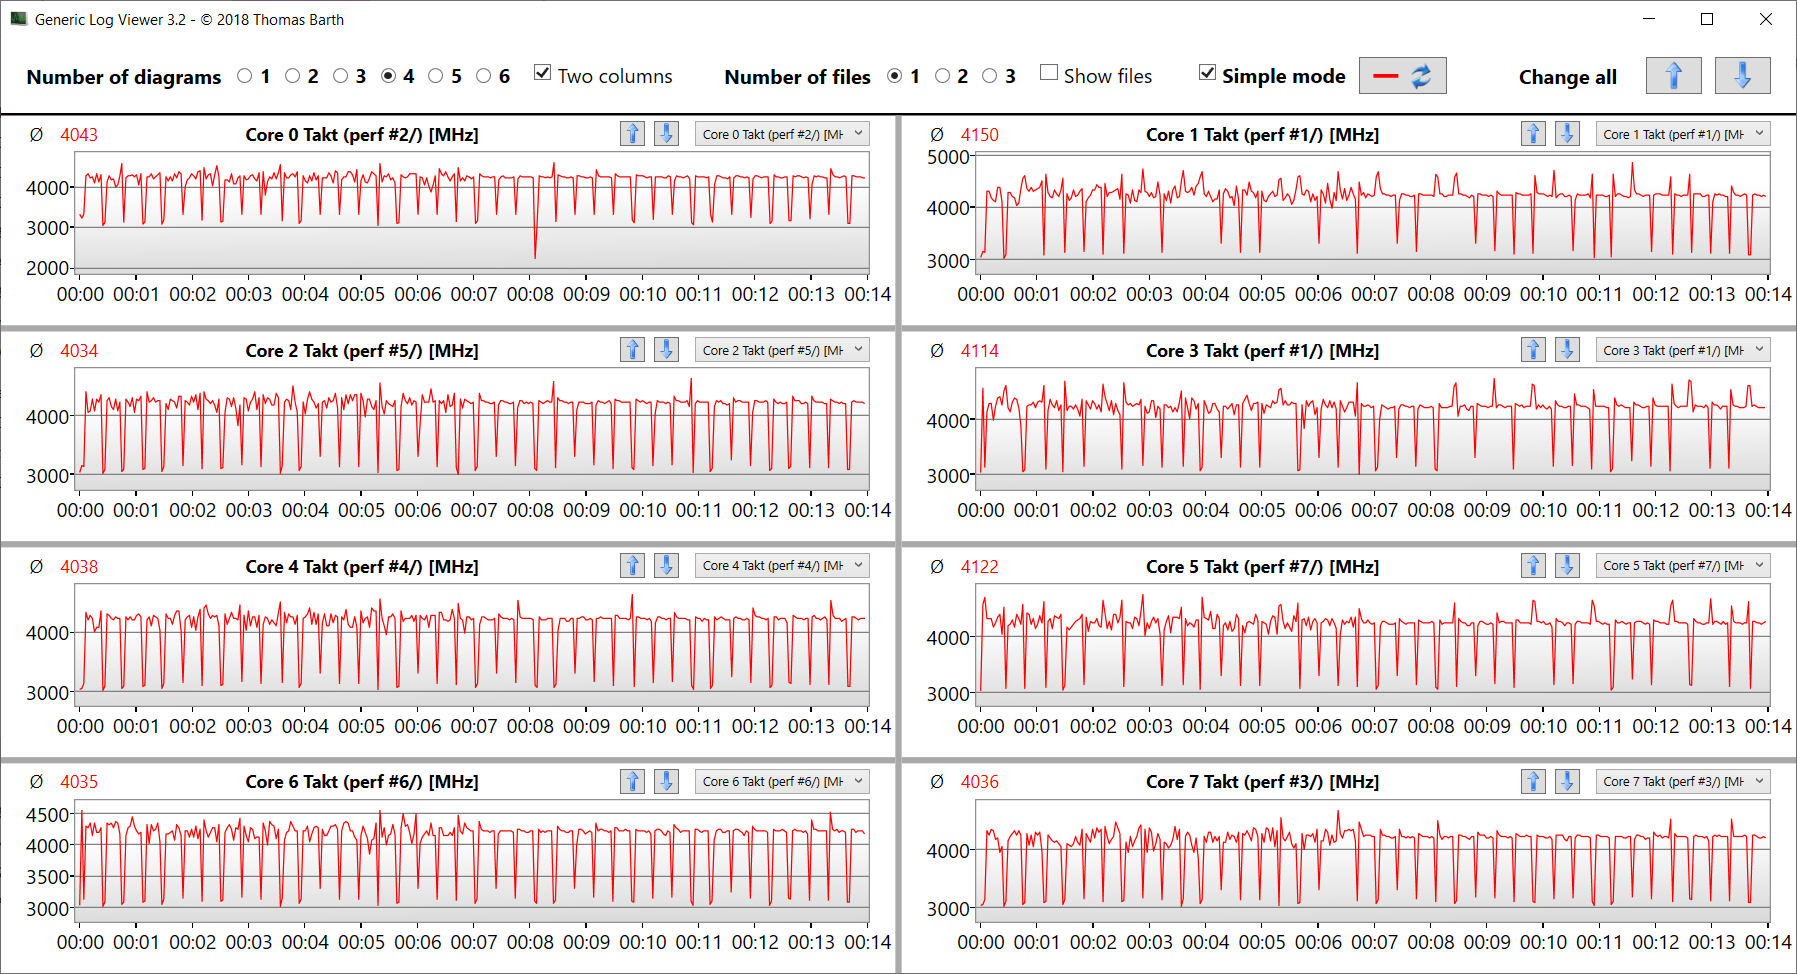
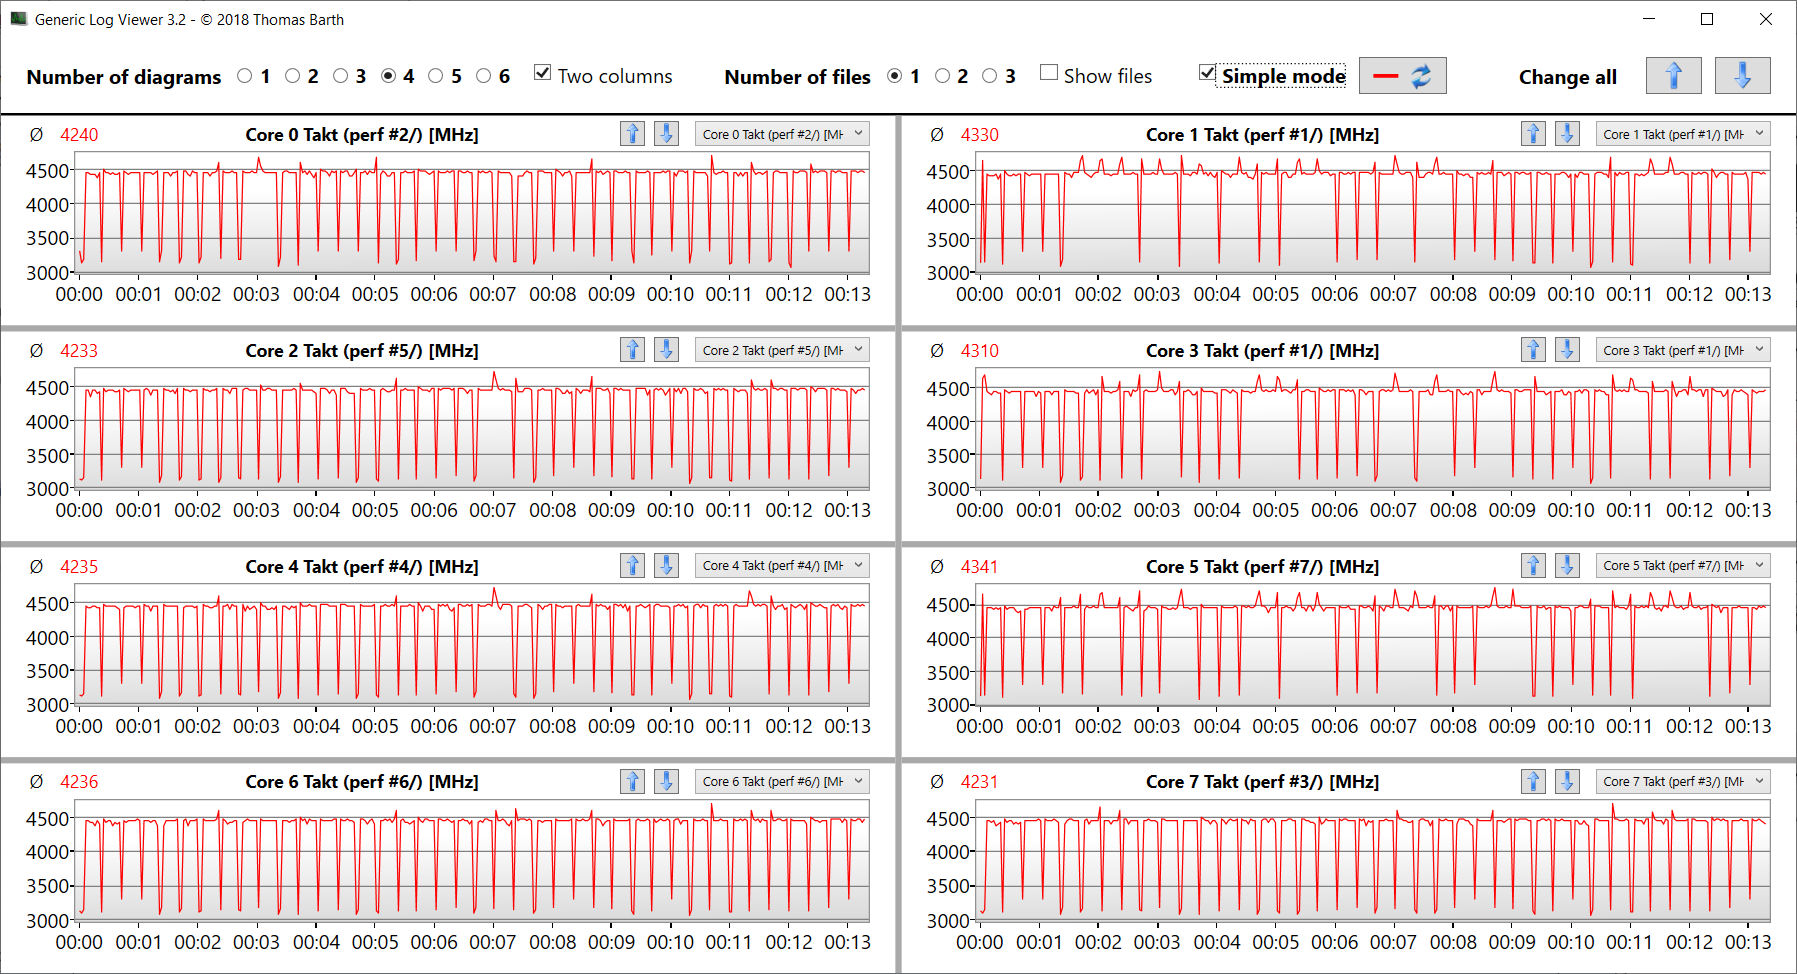
Evaluamos si el Turbo de la CPU se utiliza constantemente en el funcionamiento de la red ejecutando la prueba multihilo del benchmark Cinebench R15 durante al menos 30 minutos en un bucle constante. El Turbo se utiliza a un nivel alto. Utilizando el perfil de rendimiento "Turbo", la velocidad de reloj puede aumentar ligeramente.
Cinebench R15 Multi Constant Load Test
| CPU Performance rating - Percent | |
| Media de la clase Gaming | |
| MSI GE76 Raider | |
| Gigabyte Aero 16 YE5 | |
| Medion Erazer Beast X30 | |
| Asus ROG Zephyrus Duo 16 GX650RX | |
| Asus ROG Zephyrus Duo 16 GX650RX | |
| Asus ROG Zephyrus Duo 16 GX650RX | |
| Apple MacBook Pro 16 2021 M1 Max -5! | |
| Medio AMD Ryzen 9 6900HX | |
| Razer Blade 15 Advanced Model Early 2022 | |
| Cinebench R23 | |
| Multi Core | |
| Media de la clase Gaming (10488 - 42661, n=107, últimos 2 años) | |
| Medion Erazer Beast X30 | |
| MSI GE76 Raider | |
| Gigabyte Aero 16 YE5 | |
| Asus ROG Zephyrus Duo 16 GX650RX (Turbo) | |
| Asus ROG Zephyrus Duo 16 GX650RX | |
| Asus ROG Zephyrus Duo 16 GX650RX (Leise) | |
| Medio AMD Ryzen 9 6900HX (9709 - 15100, n=19) | |
| Apple MacBook Pro 16 2021 M1 Max | |
| Razer Blade 15 Advanced Model Early 2022 | |
| Single Core | |
| Media de la clase Gaming (1166 - 2415, n=107, últimos 2 años) | |
| Gigabyte Aero 16 YE5 | |
| MSI GE76 Raider | |
| Razer Blade 15 Advanced Model Early 2022 | |
| Medion Erazer Beast X30 | |
| Asus ROG Zephyrus Duo 16 GX650RX (Leise) | |
| Asus ROG Zephyrus Duo 16 GX650RX (Turbo) | |
| Asus ROG Zephyrus Duo 16 GX650RX | |
| Medio AMD Ryzen 9 6900HX (1516 - 1616, n=19) | |
| Apple MacBook Pro 16 2021 M1 Max | |
| Cinebench R20 | |
| CPU (Multi Core) | |
| Media de la clase Gaming (4029 - 16433, n=106, últimos 2 años) | |
| Medion Erazer Beast X30 | |
| Gigabyte Aero 16 YE5 | |
| MSI GE76 Raider | |
| Asus ROG Zephyrus Duo 16 GX650RX (Turbo) | |
| Asus ROG Zephyrus Duo 16 GX650RX | |
| Asus ROG Zephyrus Duo 16 GX650RX (Leise) | |
| Medio AMD Ryzen 9 6900HX (3742 - 5813, n=19) | |
| Razer Blade 15 Advanced Model Early 2022 | |
| Apple MacBook Pro 16 2021 M1 Max | |
| CPU (Single Core) | |
| Media de la clase Gaming (442 - 913, n=106, últimos 2 años) | |
| MSI GE76 Raider | |
| Razer Blade 15 Advanced Model Early 2022 | |
| Gigabyte Aero 16 YE5 | |
| Asus ROG Zephyrus Duo 16 GX650RX (Turbo) | |
| Asus ROG Zephyrus Duo 16 GX650RX (Leise) | |
| Medio AMD Ryzen 9 6900HX (595 - 631, n=19) | |
| Medion Erazer Beast X30 | |
| Asus ROG Zephyrus Duo 16 GX650RX | |
| Apple MacBook Pro 16 2021 M1 Max | |
| Cinebench R15 | |
| CPU Multi 64Bit | |
| Media de la clase Gaming (1578 - 6330, n=105, últimos 2 años) | |
| MSI GE76 Raider | |
| Medion Erazer Beast X30 | |
| Gigabyte Aero 16 YE5 | |
| Asus ROG Zephyrus Duo 16 GX650RX (Turbo) | |
| Asus ROG Zephyrus Duo 16 GX650RX | |
| Asus ROG Zephyrus Duo 16 GX650RX (Leise) | |
| Medio AMD Ryzen 9 6900HX (1588 - 2411, n=19) | |
| Apple MacBook Pro 16 2021 M1 Max (Rosetta 2) | |
| Razer Blade 15 Advanced Model Early 2022 | |
| CPU Single 64Bit | |
| Media de la clase Gaming (188.8 - 350, n=106, últimos 2 años) | |
| Gigabyte Aero 16 YE5 | |
| MSI GE76 Raider | |
| Asus ROG Zephyrus Duo 16 GX650RX (Turbo) | |
| Medio AMD Ryzen 9 6900HX (241 - 261, n=19) | |
| Asus ROG Zephyrus Duo 16 GX650RX | |
| Asus ROG Zephyrus Duo 16 GX650RX (Leise) | |
| Razer Blade 15 Advanced Model Early 2022 | |
| Medion Erazer Beast X30 | |
| Apple MacBook Pro 16 2021 M1 Max (Rosetta 2) | |
| Blender - v2.79 BMW27 CPU | |
| Razer Blade 15 Advanced Model Early 2022 | |
| Asus ROG Zephyrus Duo 16 GX650RX (Leise) | |
| Medio AMD Ryzen 9 6900HX (212 - 357, n=21) | |
| Asus ROG Zephyrus Duo 16 GX650RX | |
| Asus ROG Zephyrus Duo 16 GX650RX (Turbo) | |
| Gigabyte Aero 16 YE5 | |
| Apple MacBook Pro 16 2021 M1 Max (Blender 3.0 beta for mac) | |
| MSI GE76 Raider | |
| Medion Erazer Beast X30 | |
| Media de la clase Gaming (79 - 330, n=104, últimos 2 años) | |
| 7-Zip 18.03 | |
| 7z b 4 | |
| Media de la clase Gaming (33491 - 148086, n=105, últimos 2 años) | |
| Medion Erazer Beast X30 | |
| MSI GE76 Raider | |
| Gigabyte Aero 16 YE5 | |
| Asus ROG Zephyrus Duo 16 GX650RX (Turbo) | |
| Asus ROG Zephyrus Duo 16 GX650RX | |
| Asus ROG Zephyrus Duo 16 GX650RX (Leise) | |
| Medio AMD Ryzen 9 6900HX (49526 - 65336, n=20) | |
| Razer Blade 15 Advanced Model Early 2022 | |
| 7z b 4 -mmt1 | |
| Media de la clase Gaming (4199 - 7436, n=105, últimos 2 años) | |
| Gigabyte Aero 16 YE5 | |
| MSI GE76 Raider | |
| Asus ROG Zephyrus Duo 16 GX650RX (Turbo) | |
| Razer Blade 15 Advanced Model Early 2022 | |
| Asus ROG Zephyrus Duo 16 GX650RX (Leise) | |
| Medio AMD Ryzen 9 6900HX (5090 - 6070, n=20) | |
| Asus ROG Zephyrus Duo 16 GX650RX | |
| Medion Erazer Beast X30 | |
| Geekbench 5.5 | |
| Multi-Core | |
| Media de la clase Gaming (6460 - 28263, n=105, últimos 2 años) | |
| Gigabyte Aero 16 YE5 | |
| MSI GE76 Raider | |
| Apple MacBook Pro 16 2021 M1 Max | |
| Medion Erazer Beast X30 | |
| Asus ROG Zephyrus Duo 16 GX650RX (Turbo) | |
| Asus ROG Zephyrus Duo 16 GX650RX | |
| Asus ROG Zephyrus Duo 16 GX650RX (Leise) | |
| Medio AMD Ryzen 9 6900HX (8313 - 10490, n=21) | |
| Razer Blade 15 Advanced Model Early 2022 | |
| Single-Core | |
| Media de la clase Gaming (986 - 2474, n=105, últimos 2 años) | |
| MSI GE76 Raider | |
| Gigabyte Aero 16 YE5 | |
| Razer Blade 15 Advanced Model Early 2022 | |
| Apple MacBook Pro 16 2021 M1 Max | |
| Asus ROG Zephyrus Duo 16 GX650RX (Turbo) | |
| Medion Erazer Beast X30 | |
| Asus ROG Zephyrus Duo 16 GX650RX | |
| Medio AMD Ryzen 9 6900HX (1523 - 1652, n=21) | |
| Asus ROG Zephyrus Duo 16 GX650RX (Leise) | |
| HWBOT x265 Benchmark v2.2 - 4k Preset | |
| Media de la clase Gaming (11.5 - 44.4, n=105, últimos 2 años) | |
| Medion Erazer Beast X30 | |
| MSI GE76 Raider | |
| Asus ROG Zephyrus Duo 16 GX650RX (Turbo) | |
| Gigabyte Aero 16 YE5 | |
| Asus ROG Zephyrus Duo 16 GX650RX | |
| Asus ROG Zephyrus Duo 16 GX650RX (Leise) | |
| Medio AMD Ryzen 9 6900HX (12.6 - 18.7, n=20) | |
| Razer Blade 15 Advanced Model Early 2022 | |
| LibreOffice - 20 Documents To PDF | |
| Medio AMD Ryzen 9 6900HX (44.8 - 81.7, n=20) | |
| Media de la clase Gaming (33.2 - 88.8, n=105, últimos 2 años) | |
| Medion Erazer Beast X30 | |
| Asus ROG Zephyrus Duo 16 GX650RX (Leise) | |
| Asus ROG Zephyrus Duo 16 GX650RX | |
| Asus ROG Zephyrus Duo 16 GX650RX (Turbo) | |
| Razer Blade 15 Advanced Model Early 2022 | |
| Gigabyte Aero 16 YE5 | |
| MSI GE76 Raider | |
| R Benchmark 2.5 - Overall mean | |
| Medion Erazer Beast X30 | |
| Medio AMD Ryzen 9 6900HX (0.4627 - 0.4974, n=20) | |
| Asus ROG Zephyrus Duo 16 GX650RX (Leise) | |
| Asus ROG Zephyrus Duo 16 GX650RX | |
| Asus ROG Zephyrus Duo 16 GX650RX (Turbo) | |
| Razer Blade 15 Advanced Model Early 2022 | |
| Media de la clase Gaming (0.3439 - 0.759, n=106, últimos 2 años) | |
| MSI GE76 Raider | |
| Gigabyte Aero 16 YE5 | |
* ... más pequeño es mejor
| Performance rating - Percent | |
| Media de la clase Gaming | |
| Asus ROG Zephyrus Duo 16 GX650RX | |
| Asus ROG Zephyrus Duo 16 GX650RX | |
| Asus ROG Zephyrus Duo 16 GX650RX | |
| Medio AMD Ryzen 9 6900HX | |
| MSI GE76 Raider | |
| Medion Erazer Beast X30 | |
| Gigabyte Aero 16 YE5 | |
| Razer Blade 15 Advanced Model Early 2022 | |
Rendimiento del sistema
El sistema, que funciona sin problemas, ofrece un rendimiento suficiente para los juegos, la edición de vídeo y el renderizado durante los próximos años. Las tasas de transferencia de la memoria de trabajo integrada se mantienen por debajo de los valores de portátiles comparables que están equipados con almacenamiento DDR5-4800. Esto va acompañado de muy buenos resultados en PC-Mark.
| PCMark 8 Home Score Accelerated v2 | 4418 puntos | |
| PCMark 8 Creative Score Accelerated v2 | 5798 puntos | |
| PCMark 8 Work Score Accelerated v2 | 4622 puntos | |
| PCMark 10 Score | 6351 puntos | |
ayuda | ||
CrossMark: Overall | Productivity | Creativity | Responsiveness
| PCMark 10 / Score | |
| Media de la clase Gaming (5828 - 12414, n=93, últimos 2 años) | |
| MSI GE76 Raider | |
| Gigabyte Aero 16 YE5 | |
| Razer Blade 15 Advanced Model Early 2022 | |
| Medion Erazer Beast X30 | |
| Asus ROG Zephyrus Duo 16 GX650RX | |
| PCMark 10 / Essentials | |
| Gigabyte Aero 16 YE5 | |
| MSI GE76 Raider | |
| Media de la clase Gaming (8810 - 11935, n=97, últimos 2 años) | |
| Razer Blade 15 Advanced Model Early 2022 | |
| Medion Erazer Beast X30 | |
| Asus ROG Zephyrus Duo 16 GX650RX | |
| PCMark 10 / Productivity | |
| Media de la clase Gaming (6845 - 25323, n=95, últimos 2 años) | |
| MSI GE76 Raider | |
| Gigabyte Aero 16 YE5 | |
| Razer Blade 15 Advanced Model Early 2022 | |
| Medion Erazer Beast X30 | |
| Asus ROG Zephyrus Duo 16 GX650RX | |
| PCMark 10 / Digital Content Creation | |
| Media de la clase Gaming (7602 - 19954, n=95, últimos 2 años) | |
| MSI GE76 Raider | |
| Gigabyte Aero 16 YE5 | |
| Medion Erazer Beast X30 | |
| Razer Blade 15 Advanced Model Early 2022 | |
| Asus ROG Zephyrus Duo 16 GX650RX | |
| CrossMark / Overall | |
| Gigabyte Aero 16 YE5 | |
| Media de la clase Gaming (1366 - 2409, n=94, últimos 2 años) | |
| Razer Blade 15 Advanced Model Early 2022 | |
| Medion Erazer Beast X30 | |
| Asus ROG Zephyrus Duo 16 GX650RX | |
| Apple MacBook Pro 16 2021 M1 Max | |
| CrossMark / Productivity | |
| Gigabyte Aero 16 YE5 | |
| Media de la clase Gaming (1386 - 2254, n=94, últimos 2 años) | |
| Razer Blade 15 Advanced Model Early 2022 | |
| Asus ROG Zephyrus Duo 16 GX650RX | |
| Medion Erazer Beast X30 | |
| Apple MacBook Pro 16 2021 M1 Max | |
| CrossMark / Creativity | |
| Media de la clase Gaming (1343 - 2786, n=94, últimos 2 años) | |
| Gigabyte Aero 16 YE5 | |
| Apple MacBook Pro 16 2021 M1 Max | |
| Medion Erazer Beast X30 | |
| Razer Blade 15 Advanced Model Early 2022 | |
| Asus ROG Zephyrus Duo 16 GX650RX | |
| CrossMark / Responsiveness | |
| Gigabyte Aero 16 YE5 | |
| Asus ROG Zephyrus Duo 16 GX650RX | |
| Media de la clase Gaming (1226 - 2334, n=94, últimos 2 años) | |
| Razer Blade 15 Advanced Model Early 2022 | |
| Medion Erazer Beast X30 | |
| Apple MacBook Pro 16 2021 M1 Max | |
| AIDA64 / Memory Copy | |
| Media de la clase Gaming (21750 - 129946, n=105, últimos 2 años) | |
| MSI GE76 Raider (v6.50.5800) | |
| Gigabyte Aero 16 YE5 (v6.50.5800) | |
| Razer Blade 15 Advanced Model Early 2022 (v6.50.5800) | |
| Medion Erazer Beast X30 (v6.50.5800) | |
| Asus ROG Zephyrus Duo 16 GX650RX | |
| Medio AMD Ryzen 9 6900HX (47938 - 53345, n=20) | |
| AIDA64 / Memory Read | |
| Media de la clase Gaming (22956 - 118858, n=105, últimos 2 años) | |
| Medion Erazer Beast X30 (v6.50.5800) | |
| Gigabyte Aero 16 YE5 (v6.50.5800) | |
| MSI GE76 Raider (v6.50.5800) | |
| Razer Blade 15 Advanced Model Early 2022 (v6.50.5800) | |
| Asus ROG Zephyrus Duo 16 GX650RX (v6.50.5800) | |
| Medio AMD Ryzen 9 6900HX (43892 - 53321, n=20) | |
| AIDA64 / Memory Write | |
| Media de la clase Gaming (22297 - 135096, n=105, últimos 2 años) | |
| Razer Blade 15 Advanced Model Early 2022 (v6.50.5800) | |
| Medion Erazer Beast X30 (v6.50.5800) | |
| MSI GE76 Raider (v6.50.5800) | |
| Gigabyte Aero 16 YE5 (v6.50.5800) | |
| Asus ROG Zephyrus Duo 16 GX650RX (v6.50.5800) | |
| Medio AMD Ryzen 9 6900HX (51085 - 57202, n=20) | |
| AIDA64 / Memory Latency | |
| Media de la clase Gaming (75.3 - 259, n=105, últimos 2 años) | |
| Razer Blade 15 Advanced Model Early 2022 (v6.50.5800) | |
| MSI GE76 Raider (v6.50.5800) | |
| Asus ROG Zephyrus Duo 16 GX650RX (v6.50.5800) | |
| Gigabyte Aero 16 YE5 (v6.50.5800) | |
| Medio AMD Ryzen 9 6900HX (80.7 - 120.6, n=20) | |
| Medion Erazer Beast X30 (v6.50.5800) | |
* ... más pequeño es mejor
Latencias del CPD
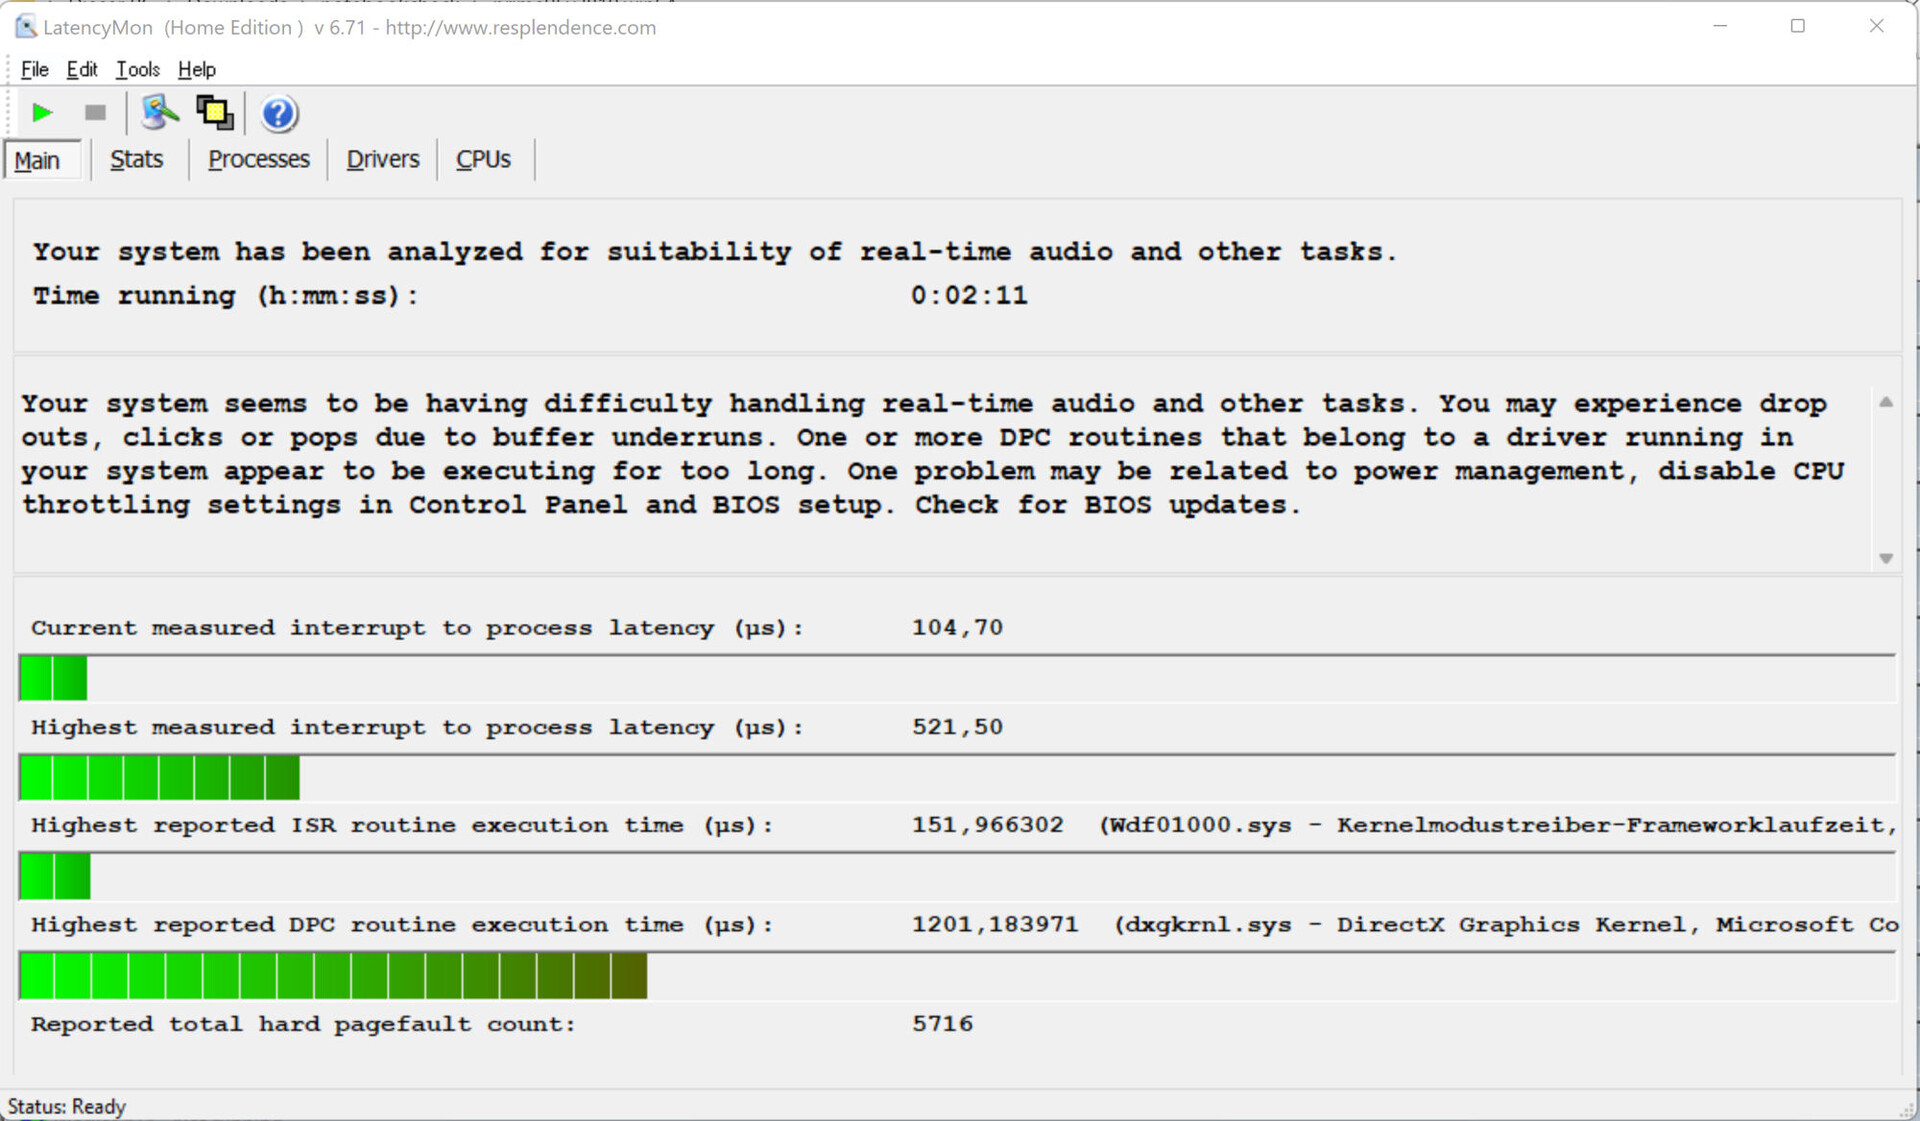
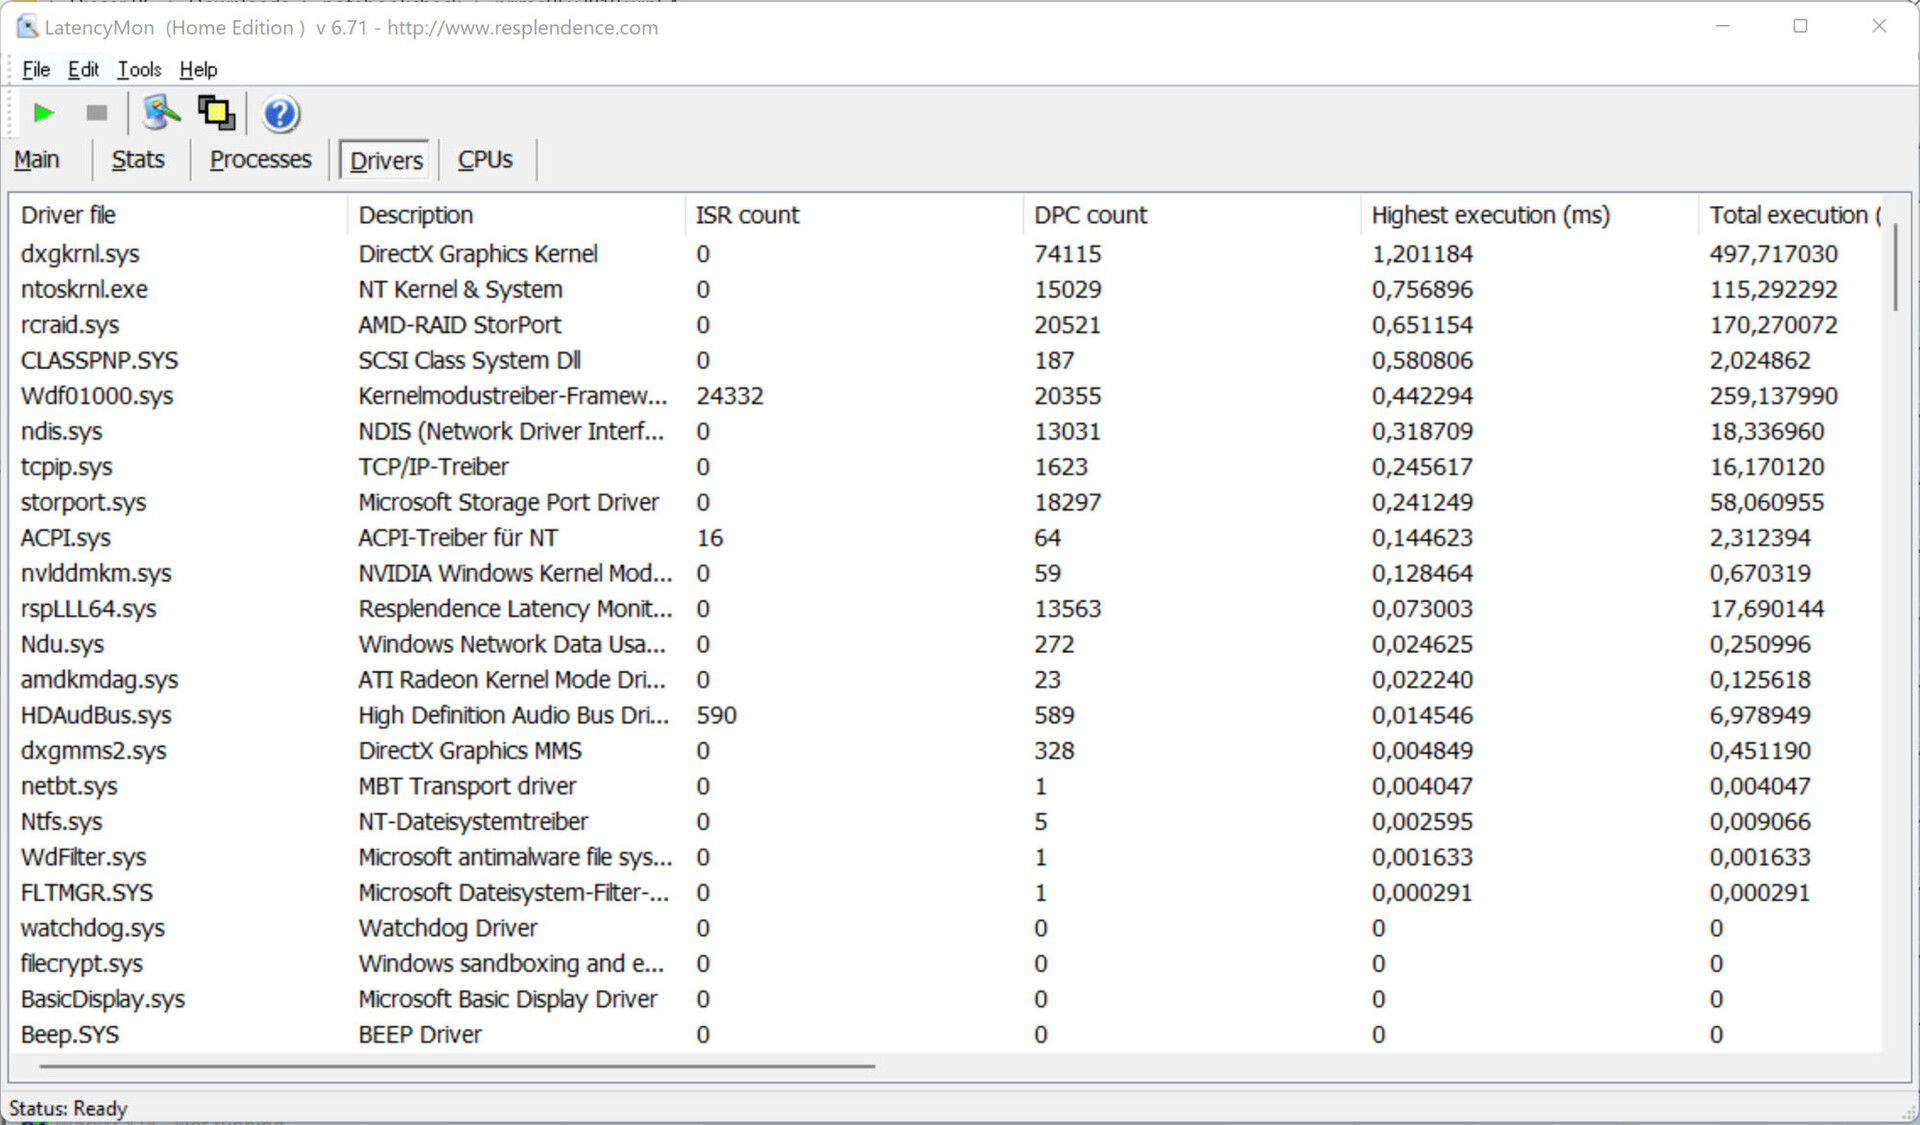
La prueba estandarizada de Latency Monitor (navegación web, reproducción de vídeo 4k, Prime95 de alta carga) reveló algunos retrasos llamativos en las latencias del CPD. El sistema no parece adecuado para el procesamiento de vídeo y audio en tiempo real. Sin embargo, las futuras actualizaciones de software podrían suponer algunas mejoras o incluso empeorar las cosas.
| DPC Latencies / LatencyMon - interrupt to process latency (max), Web, Youtube, Prime95 | |
| Razer Blade 15 Advanced Model Early 2022 | |
| MSI GE76 Raider | |
| Medion Erazer Beast X30 | |
| Gigabyte Aero 16 YE5 | |
| Asus ROG Zephyrus Duo 16 GX650RX | |
* ... más pequeño es mejor
Solución de almacenamiento
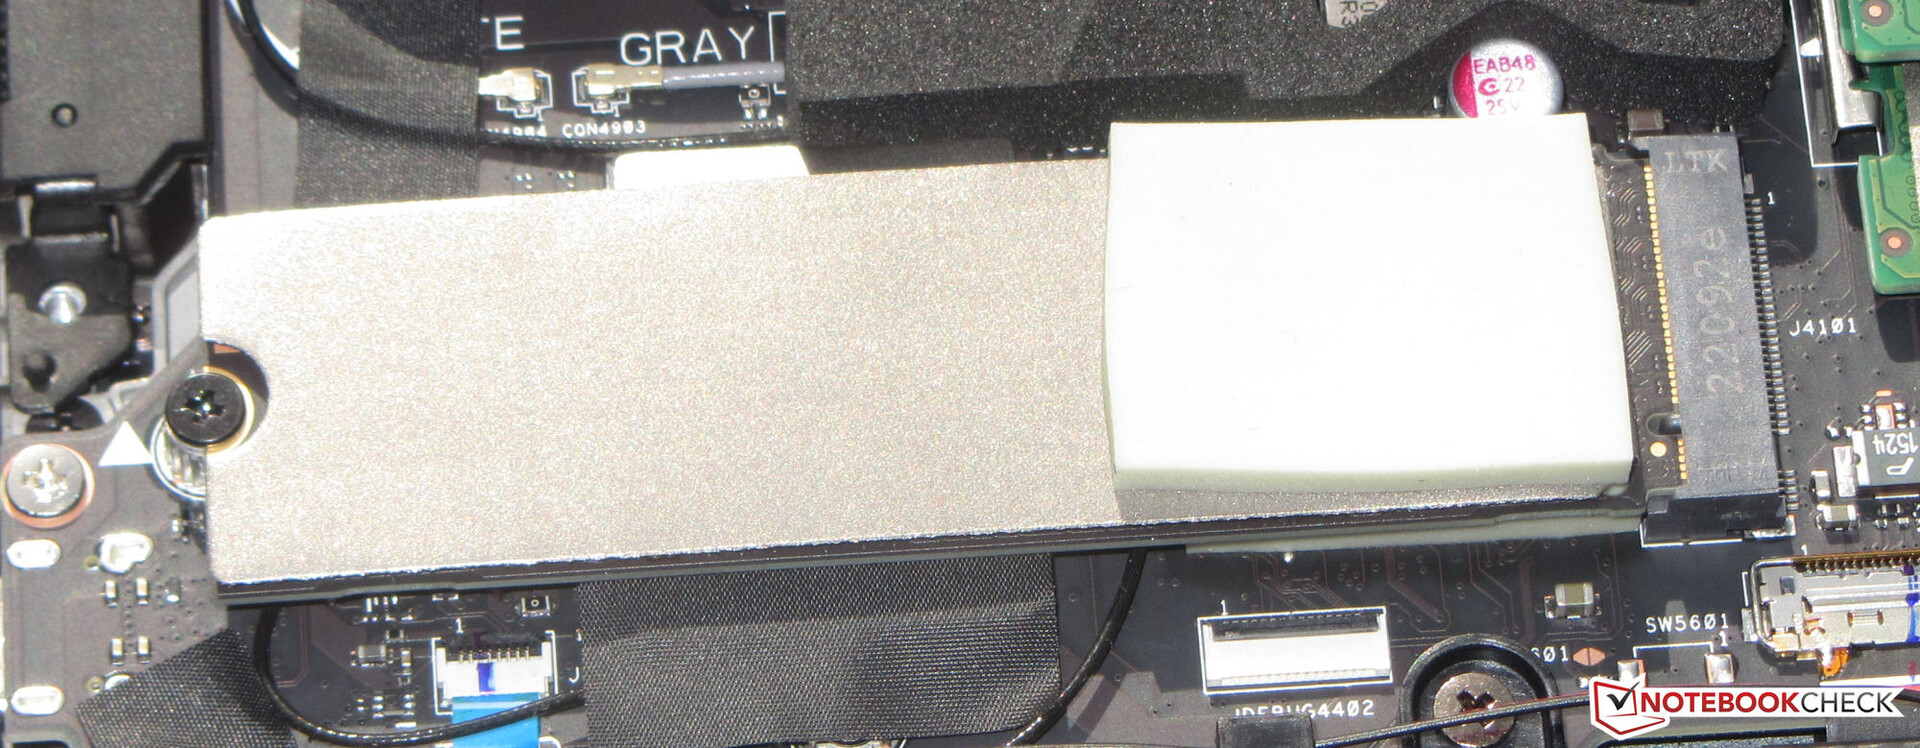
Dos SSD PCIe 4 (M.2-2280) con una capacidad de almacenamiento de 2 TB se combinan en una matriz RAID 0, por lo que el sistema operativo ve las dos SSD como una única SSD de 4 TB. Todos los datos que se almacenan se distribuyen entre ambas SSD. Las altas tasas de transferencia resultantes y los cortos tiempos de carga son óptimos para los juegos.

| Drive Performance rating - Percent | |
| Gigabyte Aero 16 YE5 | |
| Asus ROG Zephyrus Duo 16 GX650RX | |
| MSI GE76 Raider | |
| Razer Blade 15 Advanced Model Early 2022 | |
| Medion Erazer Beast X30 | |
| Media de la clase Gaming | |
* ... más pequeño es mejor
Constant Performance Reading: DiskSpd Read Loop, Queue Depth 8
Tarjeta gráfica
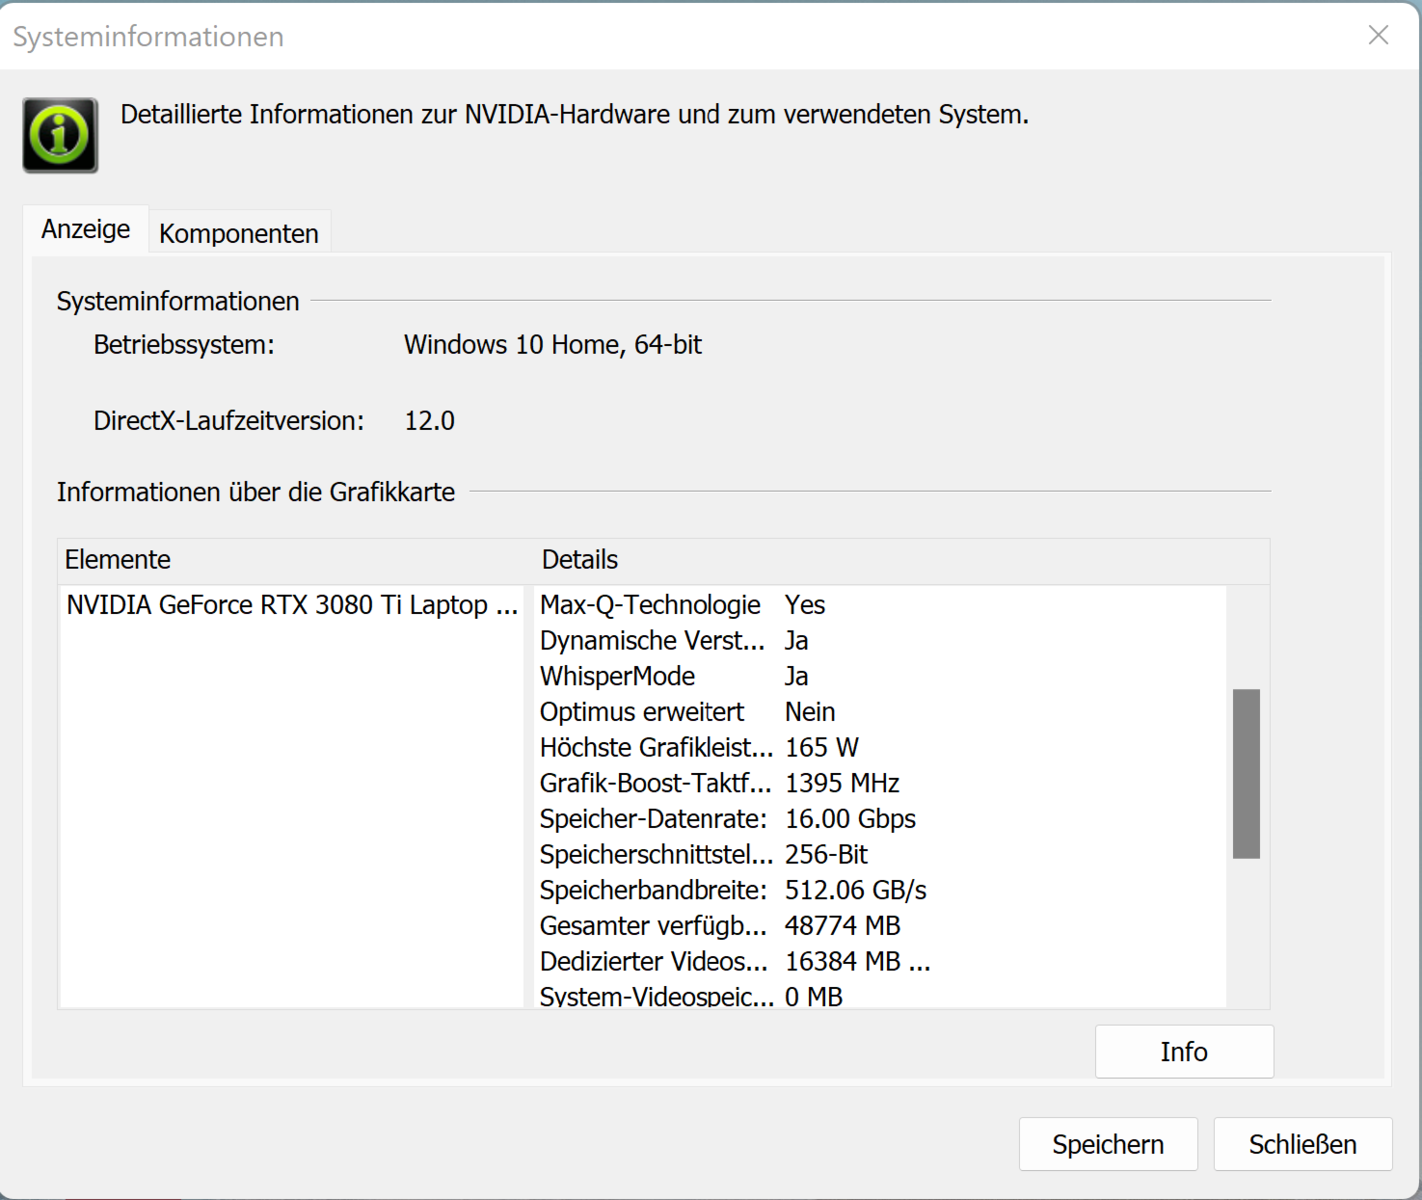
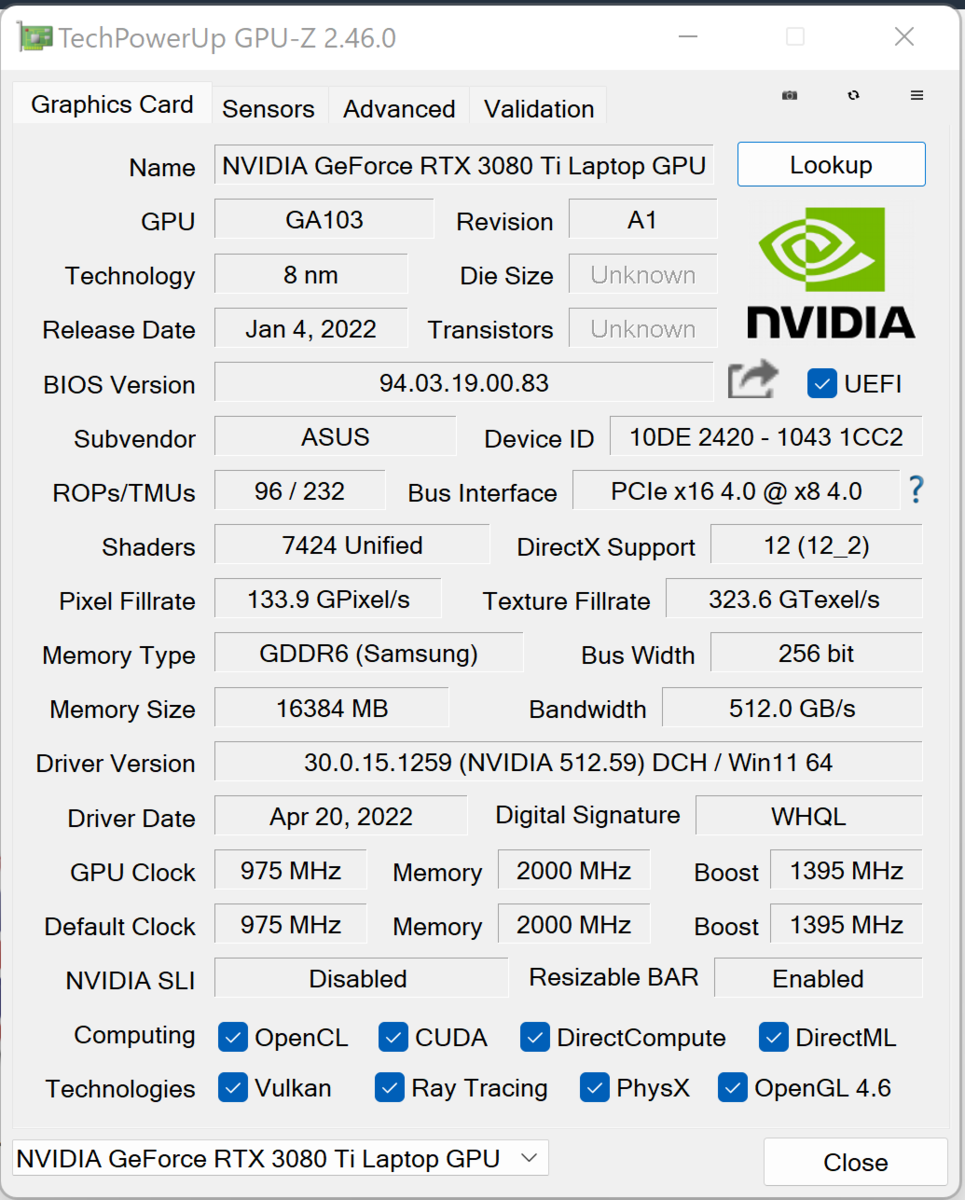
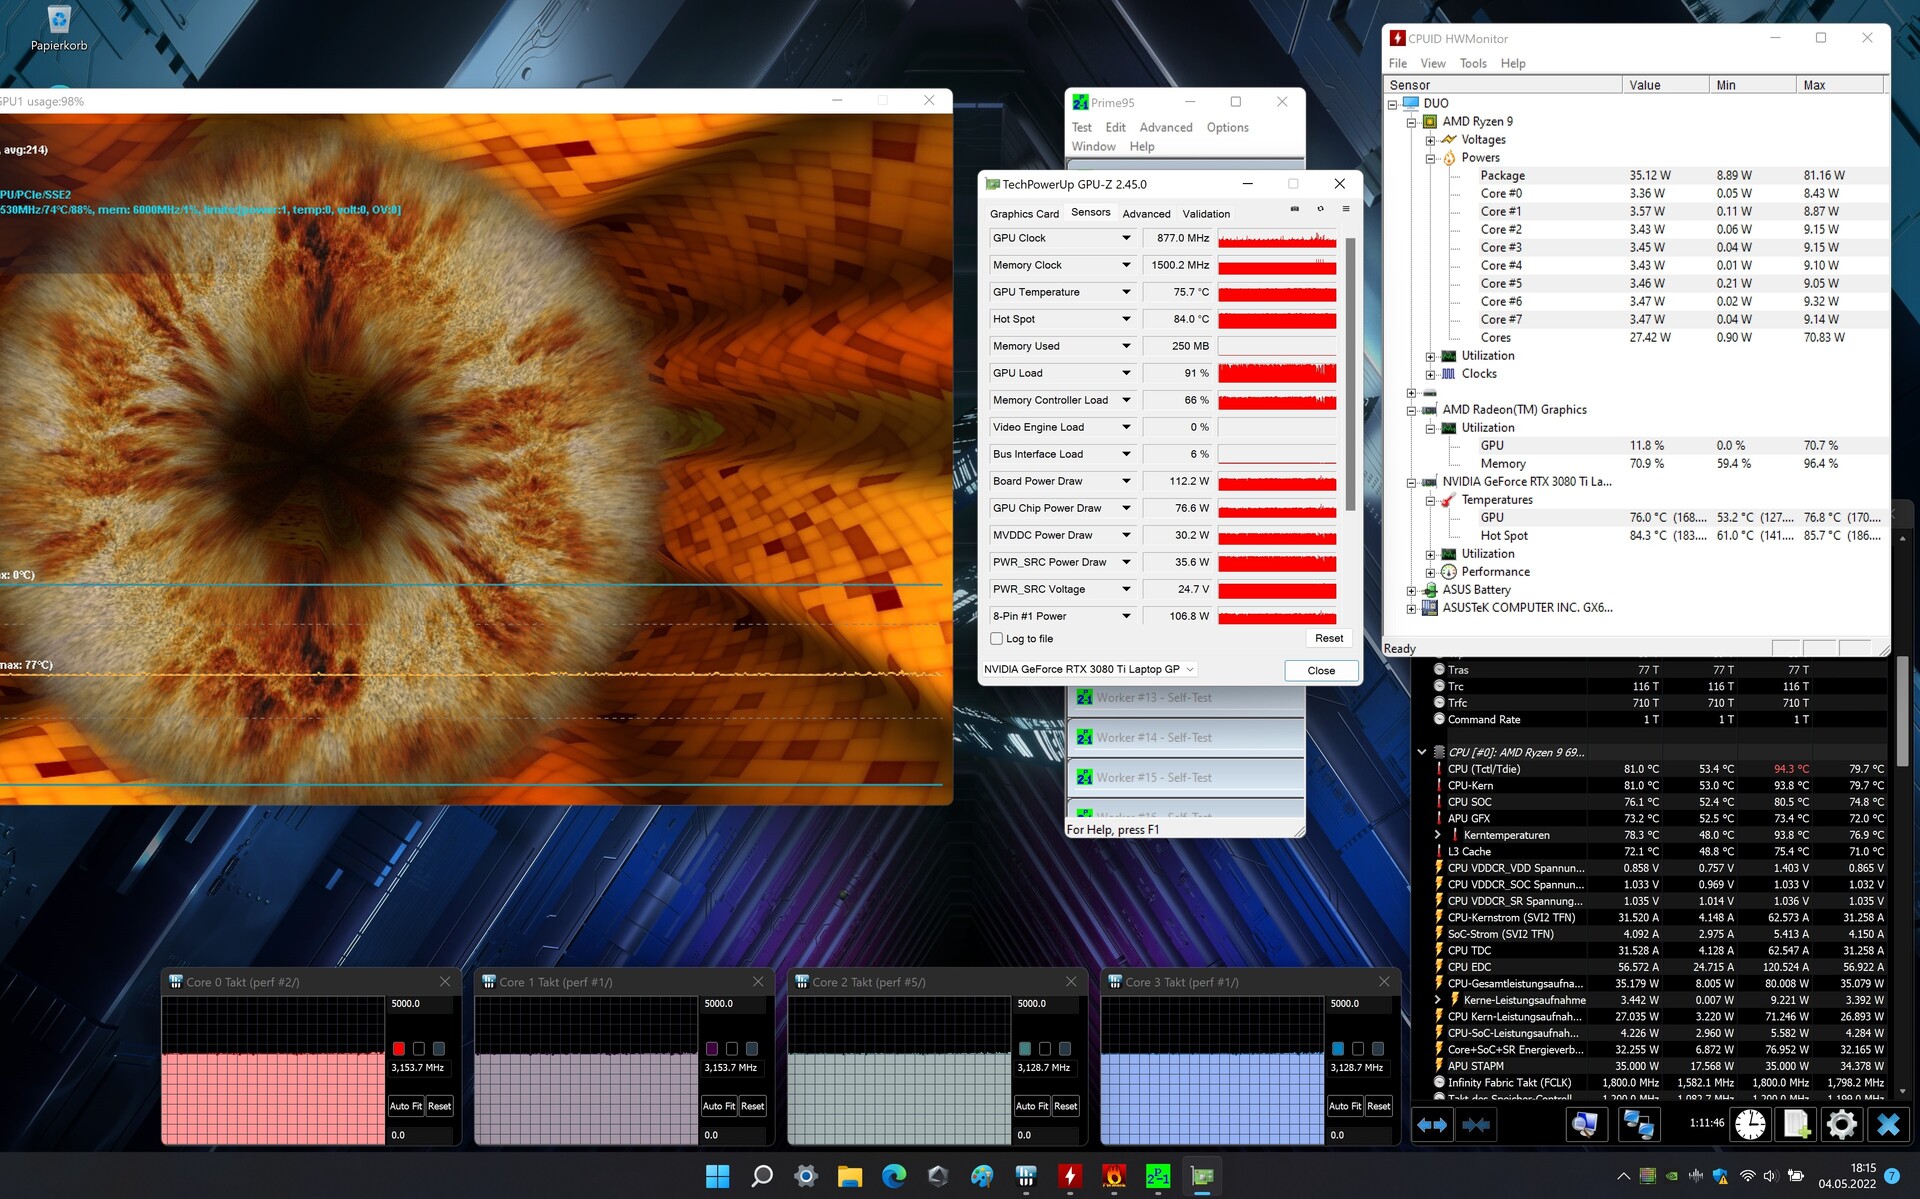
El rendimiento real de una GPU RTX 3000 depende de varios factores: la refrigeración, el equipo de almacenamiento y el TGP máximo que un fabricante configure dentro de los límites definidos por Nvidia. Asus permite que el GeForce RTX 3080 Ti para portátilesuna TGP máxima de 165 vatios (140 vatios + 25 vatios de aumento dinámico). La GPU es capaz de utilizar el rápido almacenamiento gráfico GDDR6 (16.384 MB).
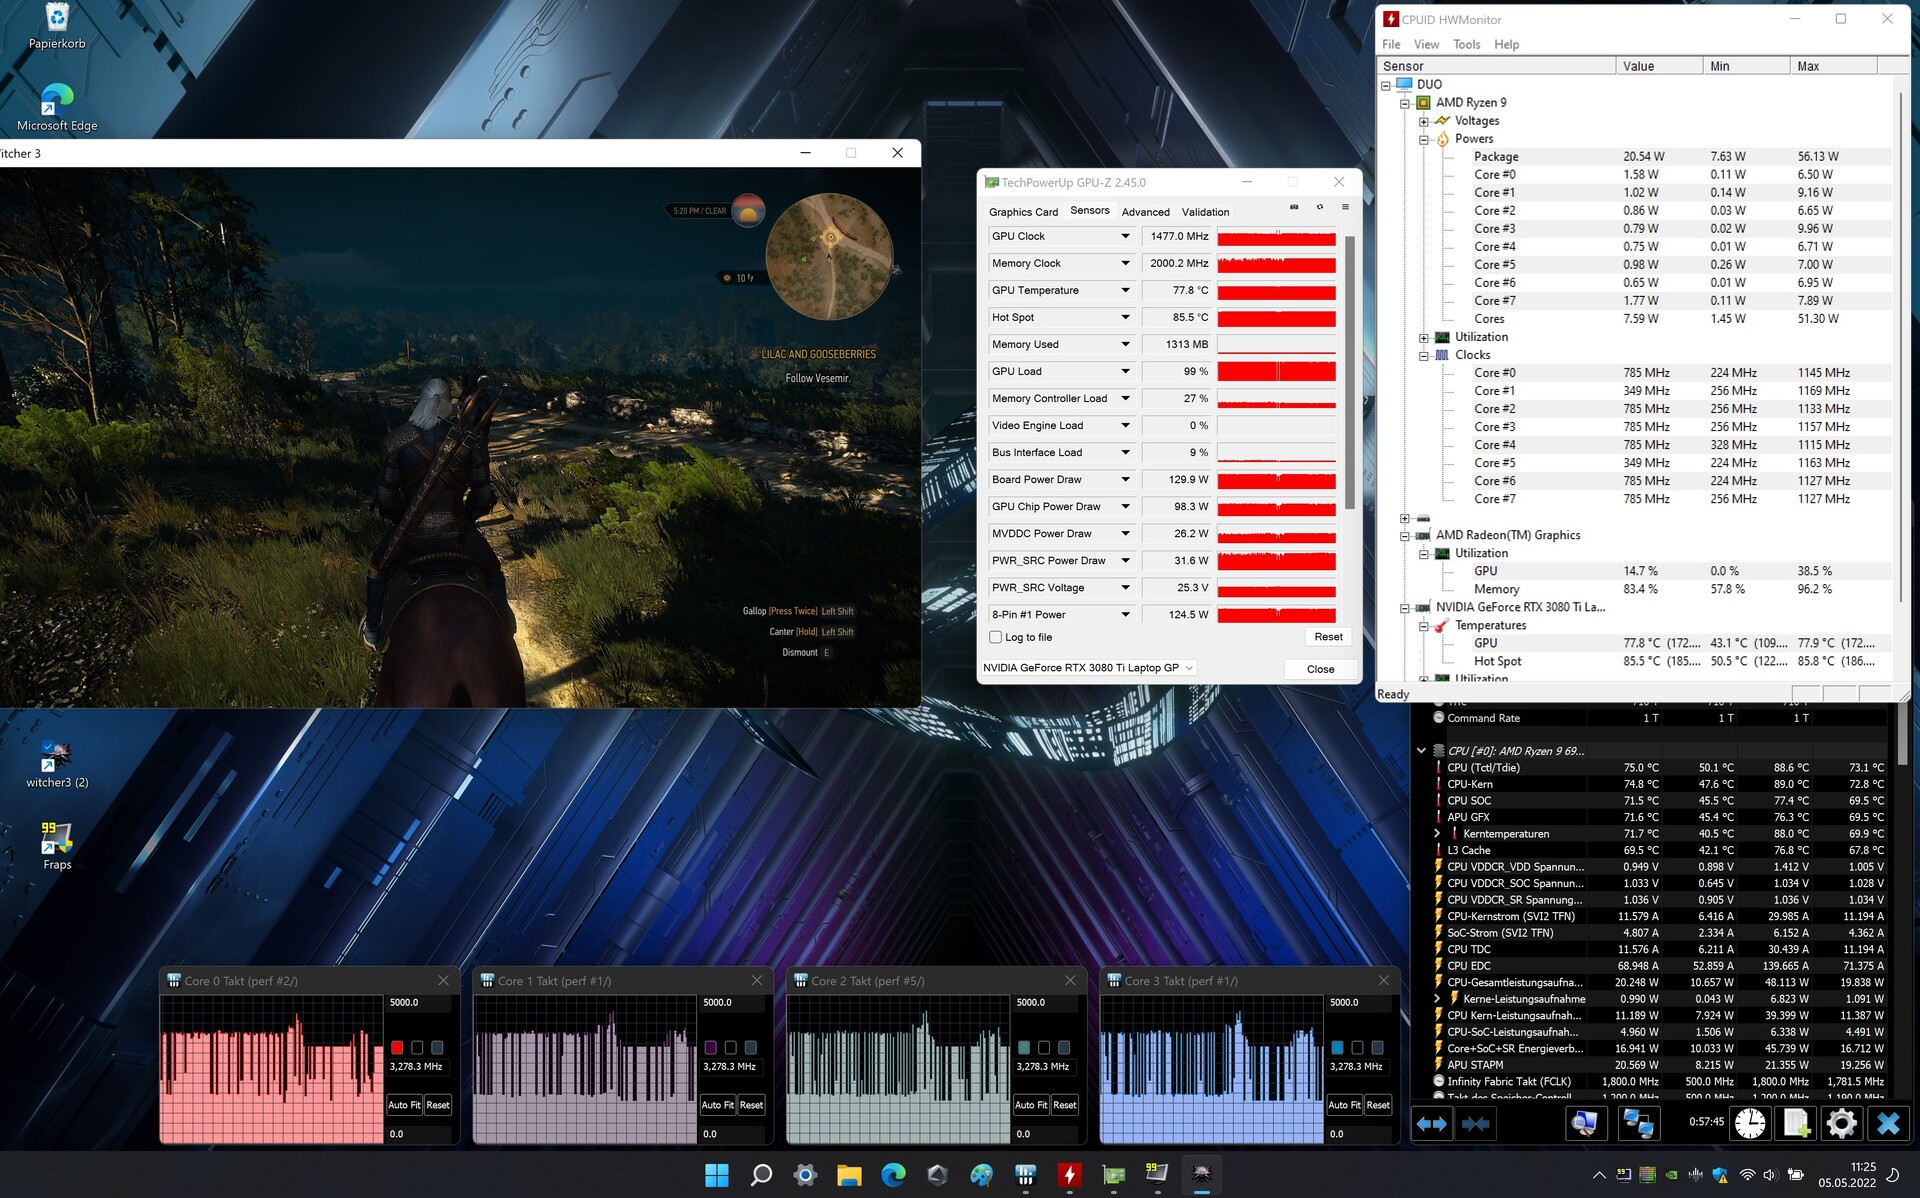
Según Asus, el boost dinámico (10 vatios máximo) sólo está disponible si se selecciona el perfil de rendimiento "Turbo", y la prueba Witcher 3 lo confirma. El máximo (25 vatios) tendría que activarse usando el software Armoury Crate (perfil "Manual"). Los resultados del benchmark se sitúan justo por encima de la media de la RTX 3080 Ti que hemos determinado hasta ahora.
Pero esto no es el final. También existe la opción de salida de imagen directa a través de la GPU GeForce (Armoury Crate, interruptor MUX: GPU independiente). En combinación con un aumento manual del boost dinámico a 25 vatios, el rendimiento gráfico aumenta notablemente.

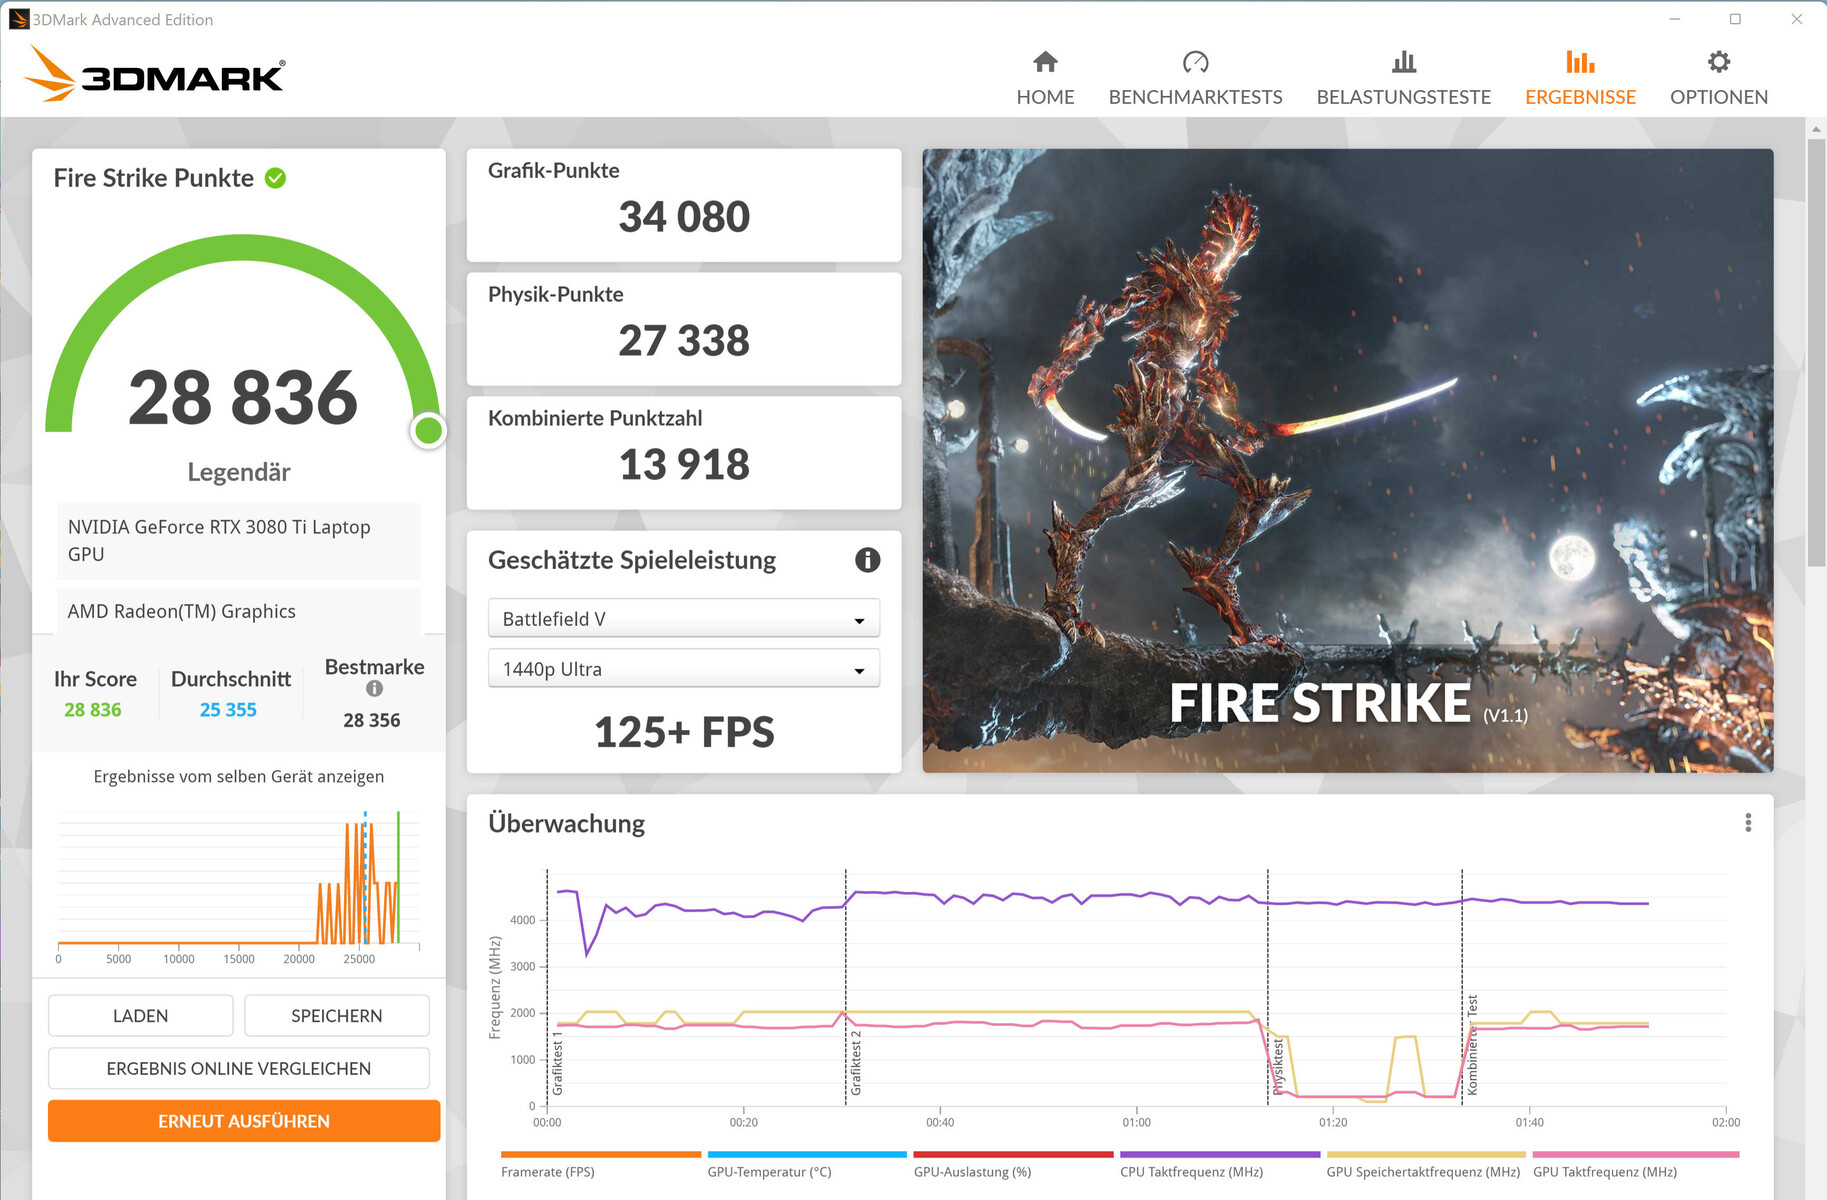
| 3DMark 11 Performance | 31771 puntos | |
| 3DMark Cloud Gate Standard Score | 47119 puntos | |
| 3DMark Fire Strike Score | 24278 puntos | |
ayuda | ||
| 3DMark Performance rating - Percent | |
| Media de la clase Gaming -2! | |
| MSI GE76 Raider -25! | |
| Asus ROG Zephyrus Duo 16 GX650RX -25! | |
| Medio NVIDIA GeForce RTX 3080 Ti Laptop GPU | |
| Medion Erazer Beast X30 -25! | |
| Asus ROG Zephyrus Duo 16 GX650RX -2! | |
| Asus ROG Zephyrus Duo 16 GX650RX -25! | |
| Gigabyte Aero 16 YE5 -1! | |
| Razer Blade 15 Advanced Model Early 2022 -25! | |
| Asus ROG Zephyrus Duo 16 GX650RX -25! | |
| 3DMark 11 - 1280x720 Performance GPU | |
| Media de la clase Gaming (21841 - 80022, n=104, últimos 2 años) | |
| MSI GE76 Raider | |
| Asus ROG Zephyrus Duo 16 GX650RX (Turbo) | |
| Asus ROG Zephyrus Duo 16 GX650RX (sep. GPU, 25W) | |
| Medion Erazer Beast X30 | |
| Asus ROG Zephyrus Duo 16 GX650RX | |
| Medio NVIDIA GeForce RTX 3080 Ti Laptop GPU (13920 - 45841, n=45) | |
| Gigabyte Aero 16 YE5 | |
| Razer Blade 15 Advanced Model Early 2022 | |
| Asus ROG Zephyrus Duo 16 GX650RX (Leise) | |
Rendimiento de los juegos
El hardware lleva todos los juegos actuales con fluidez a la pantalla en resolución FHD a QHD y ajustes máximos. Usar la resolución de pantalla completa de 3840 x 2400 pixeles requiere ajustes reducidos a veces. Las tasas de fotogramas rondan la media de la RTX 3080 Ti. La salida de imagen directa a través de la GPU GeForce (interruptor MUX: GPU separada) en combinación con un aumento del boost dinámico a 25 vatios lleva a un ligero aumento de las tasas de frames.
Las bajas frecuencias de cuadro cuando se activa el perfil "Silencioso" se deben al "Modo Susurro 2.0" de la GPU GeForce, que se supone que mantiene el nivel de ruido lo más bajo posible mientras el nivel de frecuencia de cuadro sigue siendo suficiente para un juego (al menos de 30 a 60 fps). Esto significa que la GPU no tiene que funcionar a plena potencia, por lo que produce menos calor y permite que los ventiladores sean más silenciosos.
| The Witcher 3 | |
| 1920x1080 Ultra Graphics & Postprocessing (HBAO+) | |
| Media de la clase Gaming (104.7 - 240, n=7, últimos 2 años) | |
| MSI GE76 Raider | |
| Asus ROG Zephyrus Duo 16 GX650RX (sep. GPU, 25W) | |
| Asus ROG Zephyrus Duo 16 GX650RX (Turbo) | |
| Medion Erazer Beast X30 | |
| Medio NVIDIA GeForce RTX 3080 Ti Laptop GPU (30 - 130.6, n=43) | |
| Asus ROG Zephyrus Duo 16 GX650RX | |
| Gigabyte Aero 16 YE5 | |
| Razer Blade 15 Advanced Model Early 2022 | |
| Asus ROG Zephyrus Duo 16 GX650RX (Leise) | |
| 3840x2160 Ultra Graphics & Postprocessing (HBAO+) | |
| Media de la clase Gaming (112.4 - 114.8, n=2, últimos 2 años) | |
| Medio NVIDIA GeForce RTX 3080 Ti Laptop GPU (44.8 - 62.7, n=5) | |
| Asus ROG Zephyrus Duo 16 GX650RX | |
| Gigabyte Aero 16 YE5 | |
| Dota 2 Reborn | |
| 1920x1080 ultra (3/3) best looking | |
| Gigabyte Aero 16 YE5 | |
| MSI GE76 Raider | |
| Media de la clase Gaming (84.8 - 248, n=107, últimos 2 años) | |
| Medion Erazer Beast X30 | |
| Medio NVIDIA GeForce RTX 3080 Ti Laptop GPU (29.9 - 170.5, n=45) | |
| Asus ROG Zephyrus Duo 16 GX650RX (sep. GPU, 25W) | |
| Asus ROG Zephyrus Duo 16 GX650RX (Turbo) | |
| Asus ROG Zephyrus Duo 16 GX650RX | |
| Razer Blade 15 Advanced Model Early 2022 | |
| Asus ROG Zephyrus Duo 16 GX650RX (Leise) | |
| 3840x2160 ultra (3/3) best looking | |
| Media de la clase Gaming (114.9 - 199.2, n=32, últimos 2 años) | |
| Medio NVIDIA GeForce RTX 3080 Ti Laptop GPU (70.8 - 155.6, n=19) | |
| Gigabyte Aero 16 YE5 | |
| Asus ROG Zephyrus Duo 16 GX650RX (Leise) | |
| Asus ROG Zephyrus Duo 16 GX650RX (Turbo) | |
| Asus ROG Zephyrus Duo 16 GX650RX | |
| X-Plane 11.11 | |
| 3840x2160 high (fps_test=3) | |
| Media de la clase Gaming (60 - 124.1, n=32, últimos 2 años) | |
| Medio NVIDIA GeForce RTX 3080 Ti Laptop GPU (32.9 - 109.5, n=20) | |
| Gigabyte Aero 16 YE5 | |
| Asus ROG Zephyrus Duo 16 GX650RX (Turbo) | |
| Asus ROG Zephyrus Duo 16 GX650RX | |
| Asus ROG Zephyrus Duo 16 GX650RX (Leise) | |
| 1920x1080 high (fps_test=3) | |
| MSI GE76 Raider | |
| Gigabyte Aero 16 YE5 | |
| Medio NVIDIA GeForce RTX 3080 Ti Laptop GPU (32.6 - 127, n=45) | |
| Medion Erazer Beast X30 | |
| Media de la clase Gaming (55.5 - 143.5, n=109, últimos 2 años) | |
| Razer Blade 15 Advanced Model Early 2022 | |
| Asus ROG Zephyrus Duo 16 GX650RX (sep. GPU, 25W) | |
| Asus ROG Zephyrus Duo 16 GX650RX (Turbo) | |
| Asus ROG Zephyrus Duo 16 GX650RX | |
| Asus ROG Zephyrus Duo 16 GX650RX (Leise) | |
| Final Fantasy XV Benchmark | |
| 3840x2160 High Quality | |
| Media de la clase Gaming (49.1 - 111.8, n=33, últimos 2 años) | |
| Asus ROG Zephyrus Duo 16 GX650RX (1.3, sep. GPU, 25W) | |
| Asus ROG Zephyrus Duo 16 GX650RX (1.3, Turbo) | |
| Medio NVIDIA GeForce RTX 3080 Ti Laptop GPU (35.1 - 61.2, n=18) | |
| Asus ROG Zephyrus Duo 16 GX650RX (1.3) | |
| Asus ROG Zephyrus Duo 16 GX650RX (1.3, Leise) | |
| Gigabyte Aero 16 YE5 (1.3) | |
| 1920x1080 High Quality | |
| Media de la clase Gaming (41 - 215, n=95, últimos 2 años) | |
| MSI GE76 Raider | |
| Asus ROG Zephyrus Duo 16 GX650RX (1.3, sep. GPU, 25W) | |
| Asus ROG Zephyrus Duo 16 GX650RX (1.3, Turbo) | |
| Medio NVIDIA GeForce RTX 3080 Ti Laptop GPU (30.7 - 140.6, n=42) | |
| Asus ROG Zephyrus Duo 16 GX650RX (1.3) | |
| Razer Blade 15 Advanced Model Early 2022 (1.3) | |
| Medion Erazer Beast X30 (1.3) | |
| Gigabyte Aero 16 YE5 (1.3) | |
| GTA V | |
| 3840x2160 Highest AA:4xMSAA + FX AF:16x | |
| Media de la clase Gaming (53.9 - 123.2, n=25, últimos 2 años) | |
| Asus ROG Zephyrus Duo 16 GX650RX (Turbo) | |
| Asus ROG Zephyrus Duo 16 GX650RX | |
| Medio NVIDIA GeForce RTX 3080 Ti Laptop GPU (37.7 - 67.2, n=14) | |
| Gigabyte Aero 16 YE5 | |
| 1920x1080 Highest AA:4xMSAA + FX AF:16x | |
| Media de la clase Gaming (48.3 - 186.9, n=94, últimos 2 años) | |
| MSI GE76 Raider | |
| Gigabyte Aero 16 YE5 | |
| Medio NVIDIA GeForce RTX 3080 Ti Laptop GPU (30 - 139.2, n=42) | |
| Medion Erazer Beast X30 | |
| Asus ROG Zephyrus Duo 16 GX650RX (sep. GPU, 25W) | |
| Asus ROG Zephyrus Duo 16 GX650RX (Turbo) | |
| Asus ROG Zephyrus Duo 16 GX650RX | |
| Razer Blade 15 Advanced Model Early 2022 | |
| Asus ROG Zephyrus Duo 16 GX650RX (Leise) | |
| F1 2021 | |
| 3840x2160 Ultra High Preset + Raytracing AA:T AF:16x | |
| MSI GE76 Raider | |
| Asus ROG Zephyrus Duo 16 GX650RX (874931, sep. GPU, 25W) | |
| Asus ROG Zephyrus Duo 16 GX650RX (874931, Turbo) | |
| Medio NVIDIA GeForce RTX 3080 Ti Laptop GPU (41.1 - 70.2, n=18) | |
| Asus ROG Zephyrus Duo 16 GX650RX (874931) | |
| Asus ROG Zephyrus Duo 16 GX650RX (874931, Leise) | |
| Gigabyte Aero 16 YE5 (852849) | |
| 1920x1080 Ultra High Preset + Raytracing AA:T AF:16x | |
| MSI GE76 Raider | |
| Asus ROG Zephyrus Duo 16 GX650RX (874931, sep. GPU, 25W) | |
| Asus ROG Zephyrus Duo 16 GX650RX (874931, Turbo) | |
| Asus ROG Zephyrus Duo 16 GX650RX (874931) | |
| Medion Erazer Beast X30 (874931) | |
| Medio NVIDIA GeForce RTX 3080 Ti Laptop GPU (30.2 - 160.6, n=30) | |
| Gigabyte Aero 16 YE5 (852849) | |
| Asus ROG Zephyrus Duo 16 GX650RX (874931, Leise) | |
| Strange Brigade | |
| 3840x2160 ultra AA:ultra AF:16 | |
| Media de la clase Gaming (83 - 187.2, n=34, últimos 2 años) | |
| Asus ROG Zephyrus Duo 16 GX650RX (1.47.22.14 D3D12, Turbo) | |
| Medio NVIDIA GeForce RTX 3080 Ti Laptop GPU (61.7 - 100.7, n=15) | |
| Asus ROG Zephyrus Duo 16 GX650RX (1.47.22.14 D3D12) | |
| Gigabyte Aero 16 YE5 (1.47.22.14 D3D12) | |
| 1920x1080 ultra AA:ultra AF:16 | |
| Media de la clase Gaming (76.3 - 458, n=87, últimos 2 años) | |
| MSI GE76 Raider (1.47.22.14 D3D12) | |
| Asus ROG Zephyrus Duo 16 GX650RX (1.47.22.14 D3D12, sep. GPU, 25W) | |
| Medion Erazer Beast X30 (1.47.22.14 D3D12) | |
| Asus ROG Zephyrus Duo 16 GX650RX (1.47.22.14 D3D12, Turbo) | |
| Medio NVIDIA GeForce RTX 3080 Ti Laptop GPU (42.3 - 224, n=41) | |
| Asus ROG Zephyrus Duo 16 GX650RX (1.47.22.14 D3D12) | |
| Gigabyte Aero 16 YE5 (1.47.22.14 D3D12) | |
| Razer Blade 15 Advanced Model Early 2022 (1.47.22.14 D3D12) | |
| Asus ROG Zephyrus Duo 16 GX650RX (1.47.22.14 D3D12, Leise) | |
| Cyberpunk 2077 1.6 | |
| 1920x1080 Ray Tracing Ultra Preset (DLSS off) | |
| Gigabyte Aero 16 YE5 | |
| Medio NVIDIA GeForce RTX 3080 Ti Laptop GPU (39.2 - 49.9, n=7) | |
| Asus ROG Zephyrus Duo 16 GX650RX | |
| 3840x2160 Ultra Preset | |
| Medio NVIDIA GeForce RTX 3080 Ti Laptop GPU (19.6 - 32.4, n=6) | |
| Asus ROG Zephyrus Duo 16 GX650RX | |
| Gigabyte Aero 16 YE5 | |
| 1920x1080 Ultra Preset | |
| Asus ROG Zephyrus Duo 16 GX650RX | |
| Medio NVIDIA GeForce RTX 3080 Ti Laptop GPU (54 - 144.1, n=16) | |
| Gigabyte Aero 16 YE5 | |
| Far Cry 6 | |
| 1920x1080 Ultra Graphics Quality + HD Textures AA:T | |
| Media de la clase Gaming (n=1últimos 2 años) | |
| MSI GE76 Raider | |
| Medio NVIDIA GeForce RTX 3080 Ti Laptop GPU (71.3 - 114, n=6) | |
| Asus ROG Zephyrus Duo 16 GX650RX | |
| Asus ROG Zephyrus Duo 16 GX650RX | |
| 3840x2160 Ultra Graphics Quality + HD Textures AA:T | |
| MSI GE76 Raider | |
| Medio NVIDIA GeForce RTX 3080 Ti Laptop GPU (46.2 - 57, n=4) | |
| Asus ROG Zephyrus Duo 16 GX650RX | |
| 1920x1080 Ultra Graphics Quality + HD Textures + DXR AA:T | |
| Media de la clase Gaming (n=1últimos 2 años) | |
| Medio NVIDIA GeForce RTX 3080 Ti Laptop GPU (91 - 92, n=3) | |
| MSI GE76 Raider | |
| Rainbow Six Extraction | |
| 1920x1080 Ultra Preset (with Fixed Resolution Quality) | |
| Asus ROG Zephyrus Duo 16 GX650RX | |
| Medion Erazer Beast X30 | |
| Medio NVIDIA GeForce RTX 3080 Ti Laptop GPU (128 - 169, n=3) | |
| Gigabyte Aero 16 YE5 | |
| 3840x2160 Ultra Preset (with Fixed Resolution Quality) | |
| Asus ROG Zephyrus Duo 16 GX650RX | |
| Medio NVIDIA GeForce RTX 3080 Ti Laptop GPU (44 - 57, n=2) | |
| Gigabyte Aero 16 YE5 | |
| Ghostwire Tokyo | |
| 1920x1080 Highest Settings | |
| Asus ROG Zephyrus Duo 16 GX650RX | |
| Medio NVIDIA GeForce RTX 3080 Ti Laptop GPU (125 - 143.3, n=2) | |
| Medion Erazer Beast X30 | |
| 3840x2160 Highest Settings | |
| Asus ROG Zephyrus Duo 16 GX650RX | |
| Medio NVIDIA GeForce RTX 3080 Ti Laptop GPU (n=1) | |
| 1920x1080 Highest Settings + Maximum Ray Tracing | |
| Medion Erazer Beast X30 | |
| Medio NVIDIA GeForce RTX 3080 Ti Laptop GPU (66.1 - 68.3, n=2) | |
| Asus ROG Zephyrus Duo 16 GX650RX | |
| Tiny Tina's Wonderlands | |
| 1920x1080 Badass Preset (DX12) | |
| Medio NVIDIA GeForce RTX 3080 Ti Laptop GPU (100.7 - 110.5, n=4) | |
| Asus ROG Zephyrus Duo 16 GX650RX | |
| Medion Erazer Beast X30 | |
| Media de la clase Gaming (55 - 159.4, n=4, últimos 2 años) | |
| 3840x2160 Badass Preset (DX12) | |
| Media de la clase Gaming (n=1últimos 2 años) | |
| Medio NVIDIA GeForce RTX 3080 Ti Laptop GPU (40.1 - 43.9, n=2) | |
| Asus ROG Zephyrus Duo 16 GX650RX | |
| Guardians of the Galaxy | |
| 1920x1080 Ultra Preset | |
| MSI GE76 Raider | |
| Medio NVIDIA GeForce RTX 3080 Ti Laptop GPU (112 - 155, n=3) | |
| Asus ROG Zephyrus Duo 16 GX650RX | |
| 3840x2160 Ultra Preset | |
| MSI GE76 Raider | |
| Medio NVIDIA GeForce RTX 3080 Ti Laptop GPU (60 - 75, n=2) | |
| Asus ROG Zephyrus Duo 16 GX650RX | |
| 1920x1080 Ultra Preset + Ultra Ray-Tracing | |
| MSI GE76 Raider | |
| Medio NVIDIA GeForce RTX 3080 Ti Laptop GPU (82 - 104, n=2) | |
| Asus ROG Zephyrus Duo 16 GX650RX | |
| Alan Wake Remastered | |
| 3840x2160 High Preset | |
| MSI GE76 Raider | |
| Medio NVIDIA GeForce RTX 3080 Ti Laptop GPU (71.6 - 89, n=2) | |
| Asus ROG Zephyrus Duo 16 GX650RX | |
| 1920x1080 High Preset | |
| MSI GE76 Raider | |
| Medio NVIDIA GeForce RTX 3080 Ti Laptop GPU (118.8 - 155, n=2) | |
| Asus ROG Zephyrus Duo 16 GX650RX | |
| Dying Light 2 | |
| 1920x1080 High Quality Raytracing | |
| Asus ROG Zephyrus Duo 16 GX650RX | |
| Medio NVIDIA GeForce RTX 3080 Ti Laptop GPU (33.4 - 42.3, n=5) | |
| Gigabyte Aero 16 YE5 | |
| 3840x2160 High Quality | |
| Asus ROG Zephyrus Duo 16 GX650RX | |
| Medio NVIDIA GeForce RTX 3080 Ti Laptop GPU (27.3 - 31, n=2) | |
| Gigabyte Aero 16 YE5 | |
| 1920x1080 High Quality | |
| Medio NVIDIA GeForce RTX 3080 Ti Laptop GPU (69.2 - 88.4, n=5) | |
| Asus ROG Zephyrus Duo 16 GX650RX | |
| Gigabyte Aero 16 YE5 | |
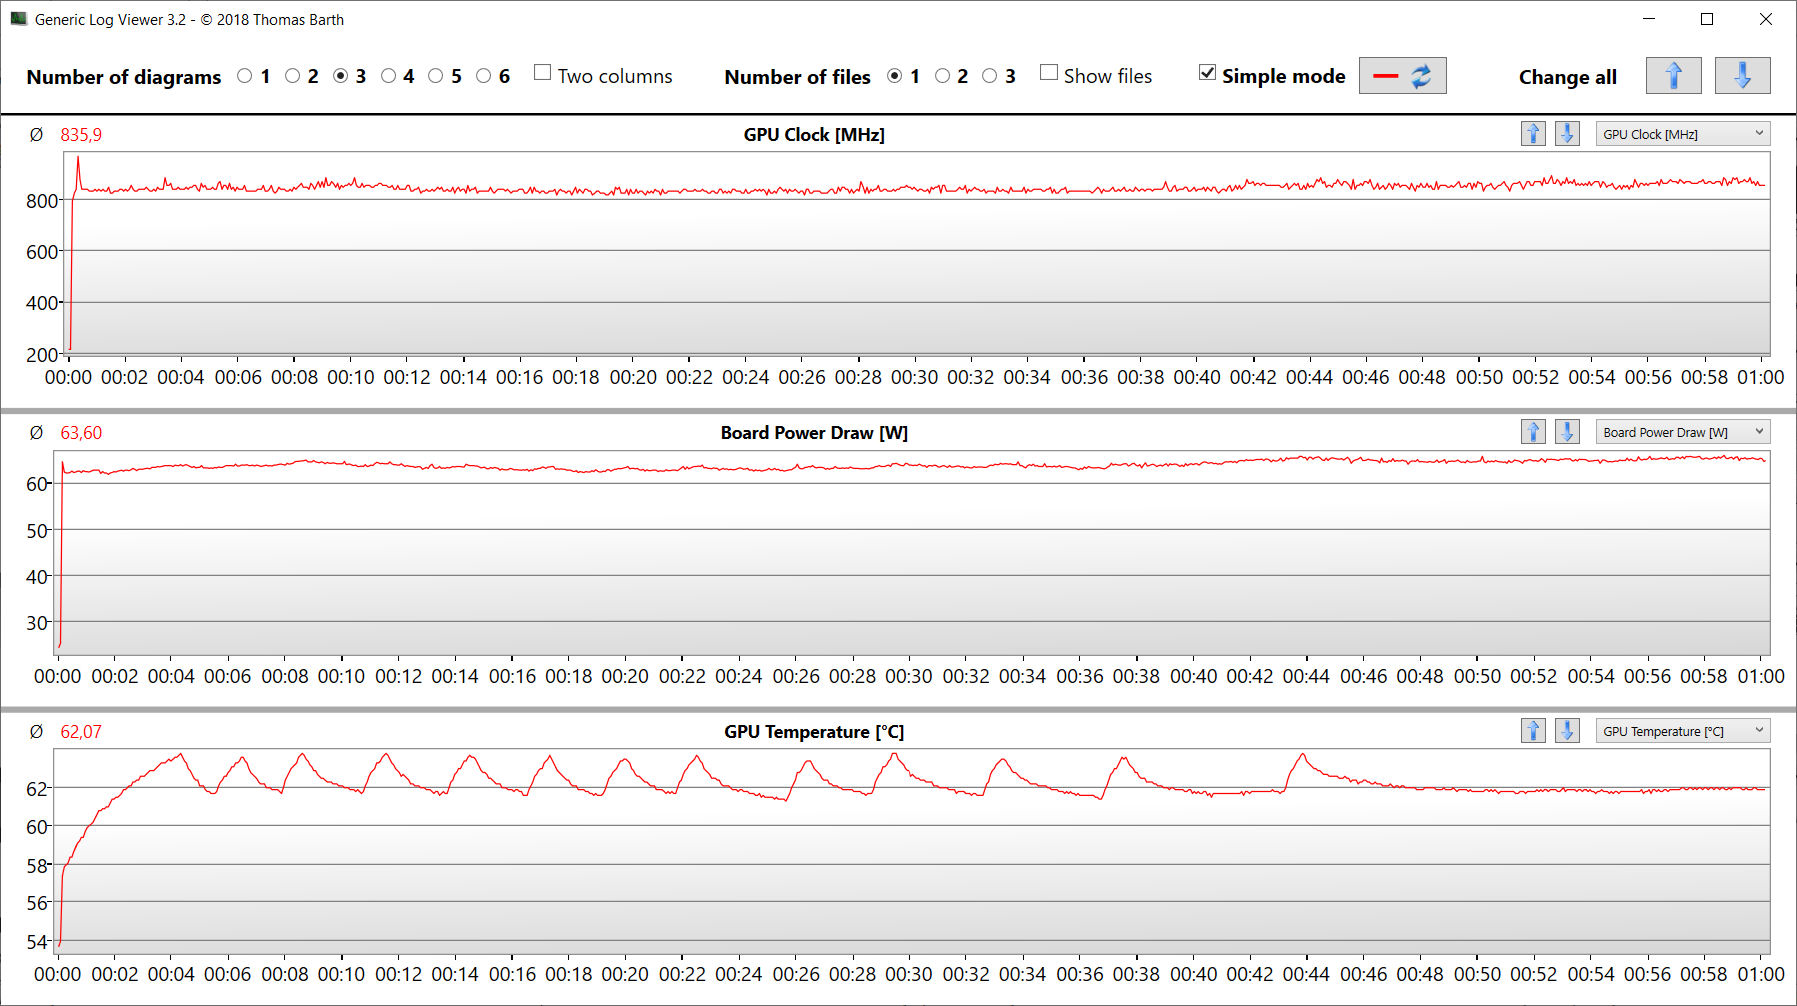
Para evaluar si las frecuencias de cuadro se mantienen bastante constantes durante un periodo de tiempo más largo, dejamos que el juego"The Witcher 3" se ejecutara durante unos 60 minutos en resolución Full-HD y con los ajustes de máxima calidad, sin mover el personaje del juego. No notamos ninguna caída en la velocidad de fotogramas.
The Witcher 3 FPS Chart
| bajo | medio | alto | ultra | QHD | 4K | |
|---|---|---|---|---|---|---|
| GTA V (2015) | 180.4 | 175.4 | 158.9 | 101.5 | 92.2 | 101.5 |
| The Witcher 3 (2015) | 345 | 298 | 197.9 | 111.1 | 80.5 | |
| Dota 2 Reborn (2015) | 133.8 | 122.2 | 114.8 | 111.3 | 89.2 | |
| Final Fantasy XV Benchmark (2018) | 177.8 | 138.7 | 108 | 84.6 | 51.4 | |
| X-Plane 11.11 (2018) | 112.9 | 95.1 | 78.2 | 66.1 | ||
| Far Cry 5 (2018) | 146 | 124 | 120 | 111 | 104 | 60 |
| Strange Brigade (2018) | 359 | 229 | 198.8 | 182.4 | 140.2 | 84.5 |
| F1 2021 (2021) | 330 | 275 | 225 | 130.2 | 102.5 | 60 |
| Alan Wake Remastered (2021) | 142.4 | 123.4 | 118.8 | 114.4 | 71.6 | |
| Far Cry 6 (2021) | 116.2 | 100.3 | 90.9 | 71.3 | 75.2 | 46.2 |
| Guardians of the Galaxy (2021) | 118 | 113 | 112 | 112 | 103 | 60 |
| Rainbow Six Extraction (2022) | 243 | 207 | 202 | 169 | 113 | 57 |
| Dying Light 2 (2022) | 106.9 | 88.4 | 77.6 | 55.8 | 31 | |
| Cyberpunk 2077 1.6 (2022) | 136.3 | 119.6 | 98.3 | 99.1 | 53.7 | 25.2 |
| Ghostwire Tokyo (2022) | 148.1 | 146.8 | 143.8 | 143.3 | 110.6 | 59.9 |
| Tiny Tina's Wonderlands (2022) | 192.7 | 167.3 | 128.9 | 104.3 | 73.5 | 40.1 |
Emisiones - Asus ROG 16 con un desarrollo de ruido y calor aceptable
Emisiones acústicas
Durante el funcionamiento diario con tareas de oficina e Internet, los dos ventiladores se lo toman con calma, produciendo muy poco ruido. A veces, incluso permanecen apagados. Por otro lado, a plena carga se vuelven ruidosos con un nivel máximo de ruido de 50 dB(A) durante la prueba de estrés y de 48 dB(A) durante la prueba Witcher 3. Aunque el desarrollo del ruido puede reducirse seleccionando el perfil "Silencioso", esto sucede a costa del rendimiento informático.
Ruido
| Ocioso |
| 26 / 27 / 29 dB(A) |
| Carga |
| 41 / 50 dB(A) |
 | ||
30 dB silencioso 40 dB(A) audible 50 dB(A) ruidosamente alto |
||
min: | ||
| Asus ROG Zephyrus Duo 16 GX650RX R9 6900HX, GeForce RTX 3080 Ti Laptop GPU | Apple MacBook Pro 16 2021 M1 Max M1 Max, M1 Max 32-Core GPU | Razer Blade 15 Advanced Model Early 2022 i7-12800H, GeForce RTX 3080 Ti Laptop GPU | MSI GE76 Raider i9-12900HK, GeForce RTX 3080 Ti Laptop GPU | Medion Erazer Beast X30 i9-12900HK, GeForce RTX 3080 Ti Laptop GPU | Gigabyte Aero 16 YE5 i9-12900HK, GeForce RTX 3080 Ti Laptop GPU | |
|---|---|---|---|---|---|---|
| Noise | 10% | 4% | -11% | -8% | -9% | |
| apagado / medio ambiente * (dB) | 26 | 24.2 7% | 26 -0% | 26 -0% | 26 -0% | 25 4% |
| Idle Minimum * (dB) | 26 | 24.2 7% | 26 -0% | 26 -0% | 27 -4% | 30 -15% |
| Idle Average * (dB) | 27 | 24.2 10% | 27 -0% | 27 -0% | 29 -7% | 32 -19% |
| Idle Maximum * (dB) | 29 | 24.2 17% | 29 -0% | 40 -38% | 34 -17% | 33 -14% |
| Load Average * (dB) | 41 | 42.9 -5% | 37 10% | 50 -22% | 48 -17% | 45 -10% |
| Witcher 3 ultra * (dB) | 48 | 39.5 18% | 44 8% | 53 -10% | 51 -6% | 50 -4% |
| Load Maximum * (dB) | 50 | 42.9 14% | 45 10% | 53 -6% | 53 -6% | 52 -4% |
* ... más pequeño es mejor
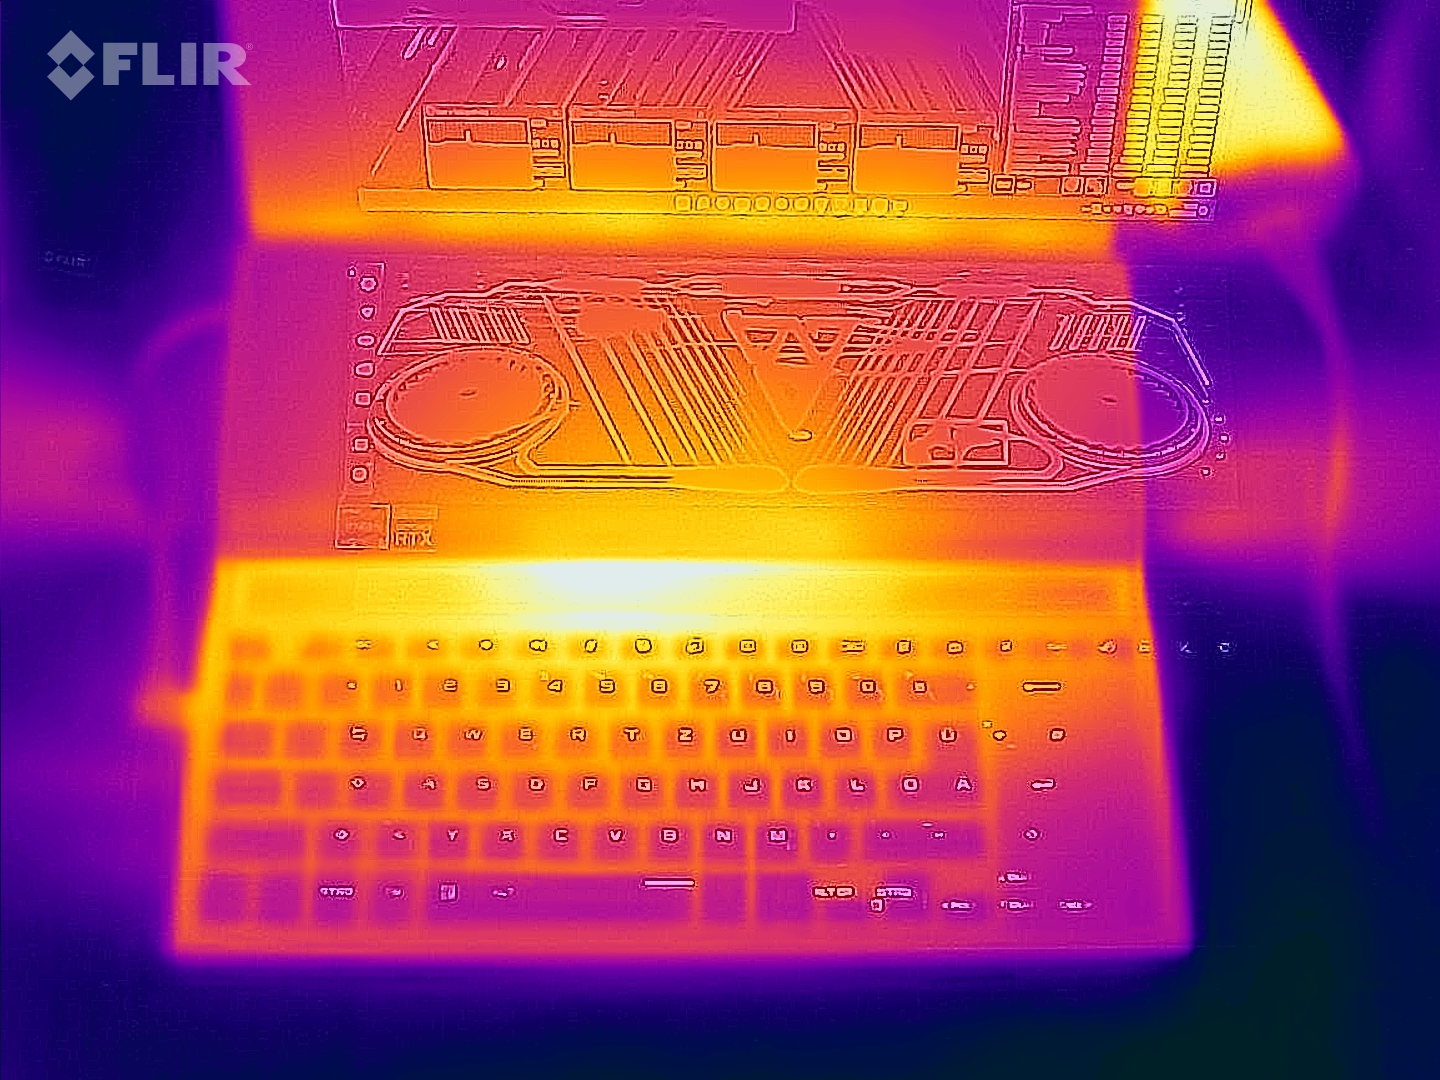
Temperaturas
Durante el funcionamiento diario (oficina, Internet), las temperaturas de la carcasa se mantienen dentro del rango verde. Bajo carga (test de estrés, Witcher 3 test), el portátil se calienta sin llegar a ser excesivamente caliente. Las temperaturas de la CPU están dentro de niveles aceptables.
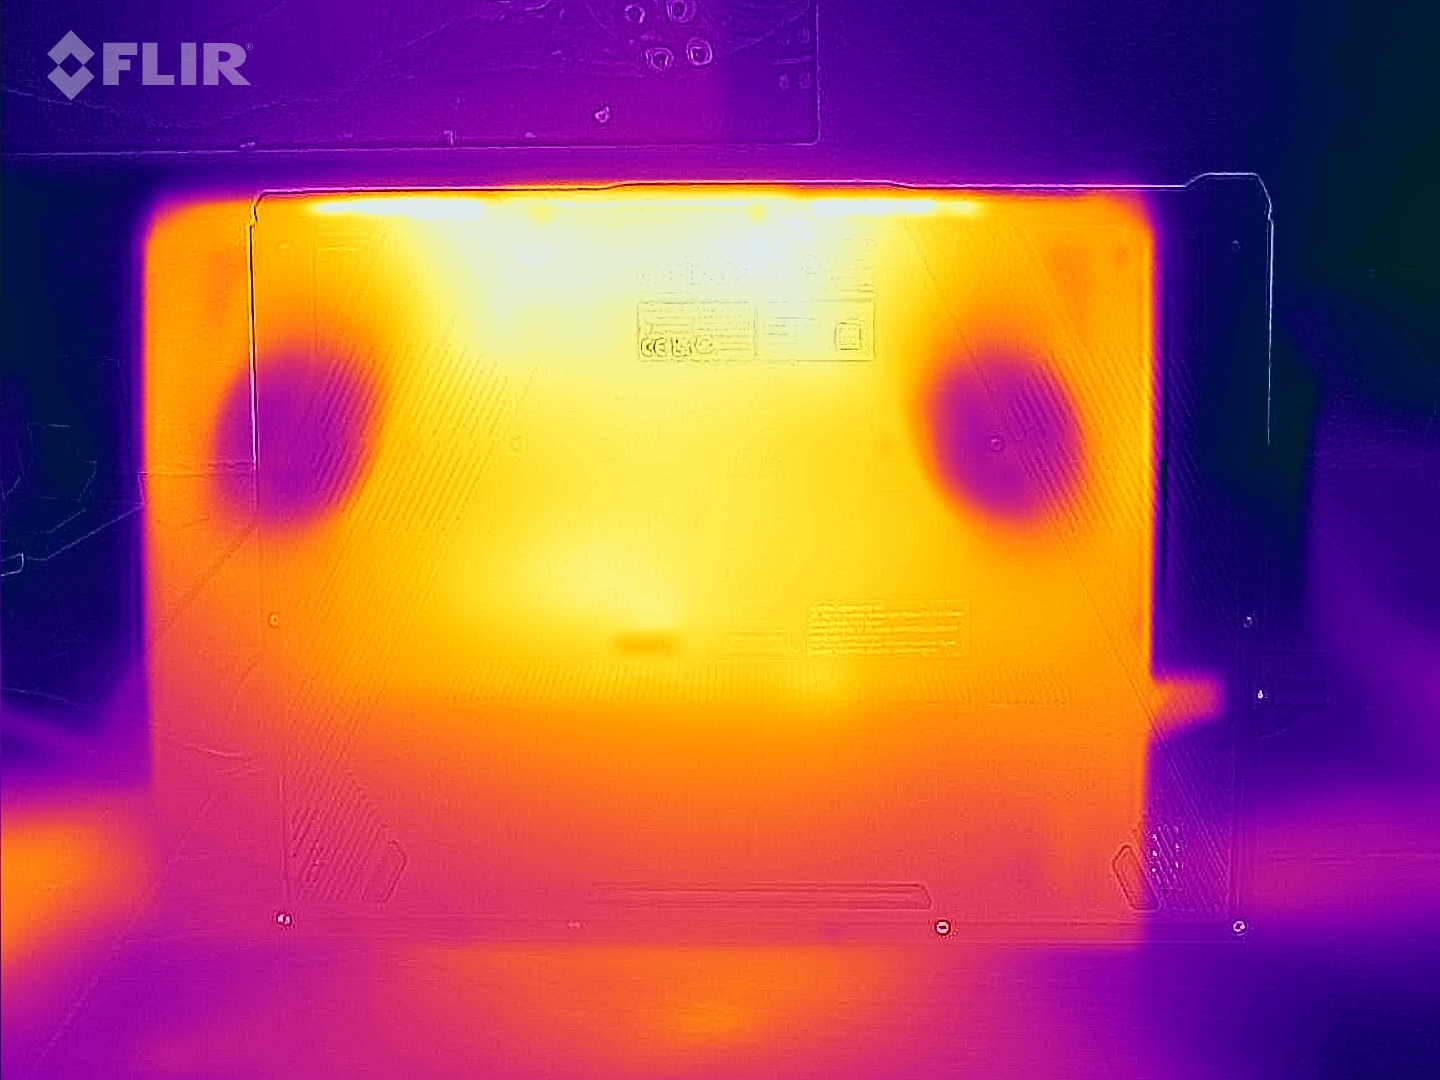
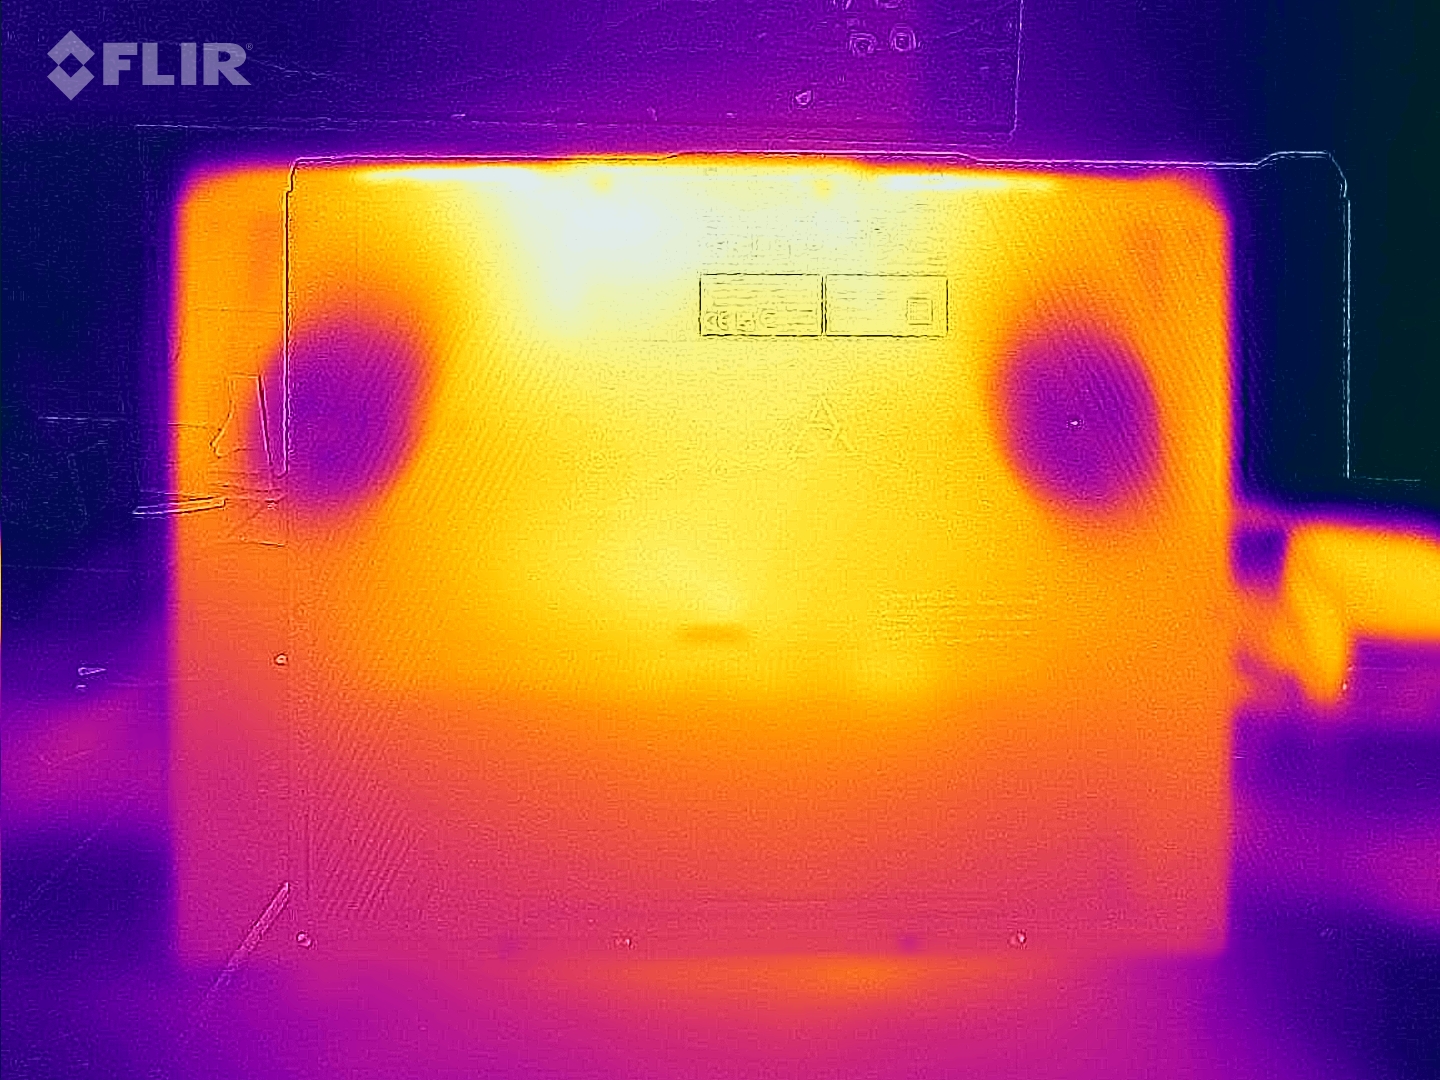
(±) La temperatura máxima en la parte superior es de 45 °C / 113 F, frente a la media de 40.4 °C / 105 F, que oscila entre 21.2 y 68.8 °C para la clase Gaming.
(-) El fondo se calienta hasta un máximo de 50 °C / 122 F, frente a la media de 43.2 °C / 110 F
(+) En reposo, la temperatura media de la parte superior es de 29.8 °C / 86# F, frente a la media del dispositivo de 33.9 °C / 93 F.
(-) Jugando a The Witcher 3, la temperatura media de la parte superior es de 40.1 °C / 104 F, frente a la media del dispositivo de 33.9 °C / 93 F.
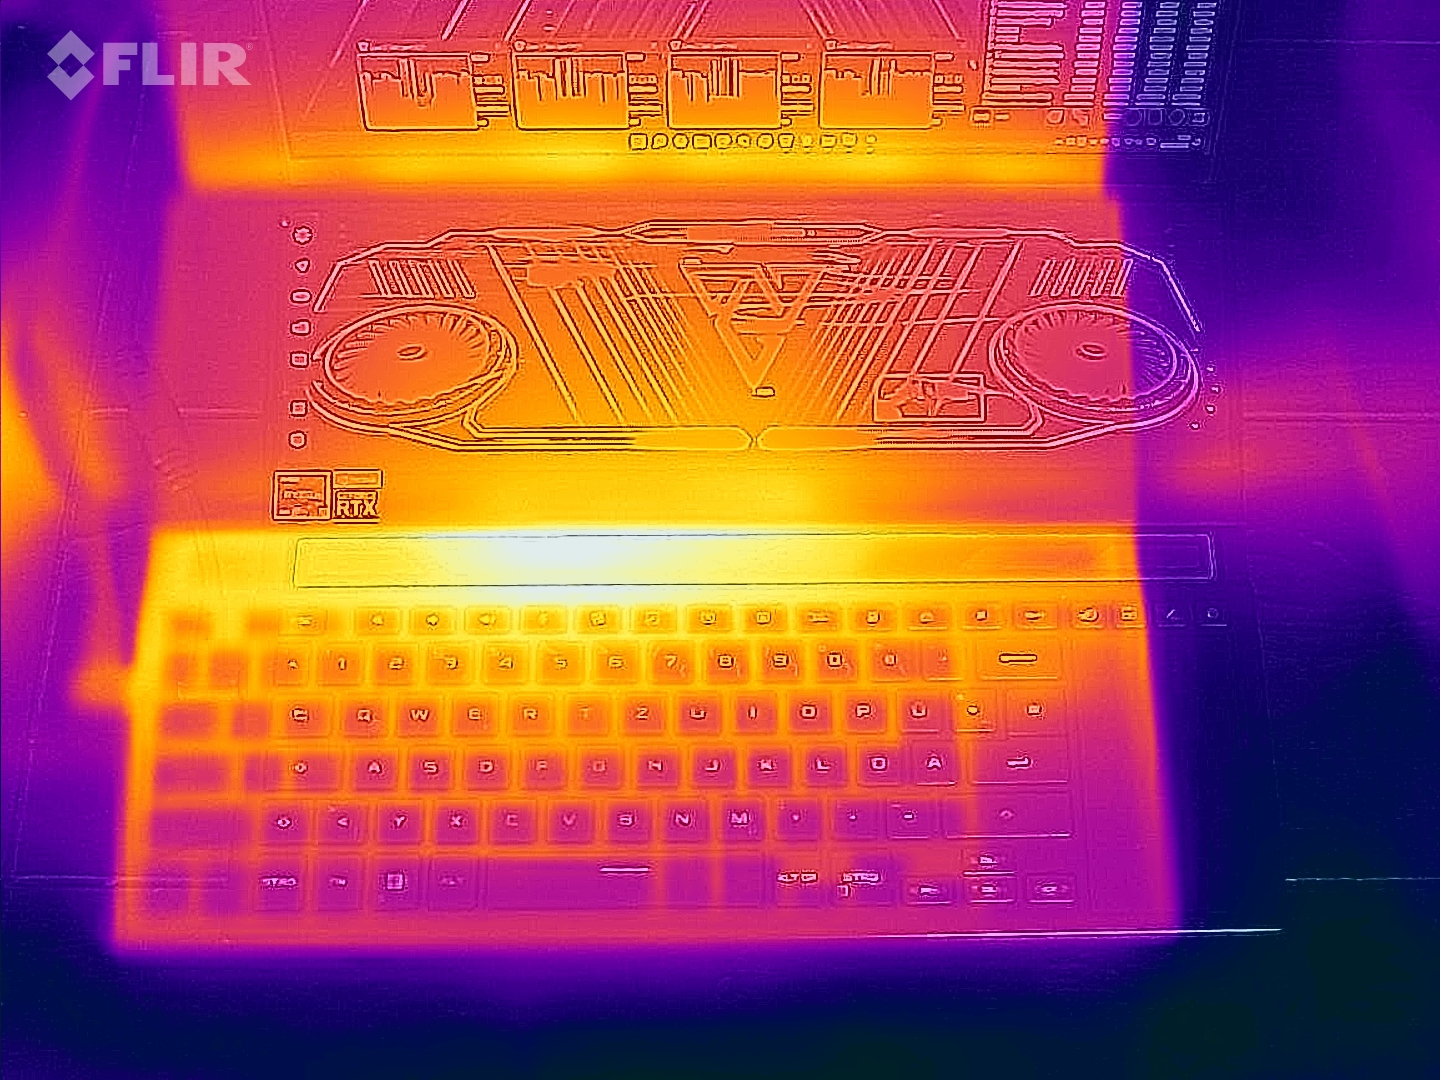
(-) El reposamanos y el touchpad pueden calentarse mucho al tacto con un máximo de 42 °C / 107.6 F.
(-) La temperatura media de la zona del reposamanos de dispositivos similares fue de 28.8 °C / 83.8 F (-13.2 °C / -23.8 F).
| Asus ROG Zephyrus Duo 16 GX650RX AMD Ryzen 9 6900HX, NVIDIA GeForce RTX 3080 Ti Laptop GPU | Apple MacBook Pro 16 2021 M1 Max Apple M1 Max, Apple M1 Max 32-Core GPU | Razer Blade 15 Advanced Model Early 2022 Intel Core i7-12800H, NVIDIA GeForce RTX 3080 Ti Laptop GPU | MSI GE76 Raider Intel Core i9-12900HK, NVIDIA GeForce RTX 3080 Ti Laptop GPU | Medion Erazer Beast X30 Intel Core i9-12900HK, NVIDIA GeForce RTX 3080 Ti Laptop GPU | Gigabyte Aero 16 YE5 Intel Core i9-12900HK, NVIDIA GeForce RTX 3080 Ti Laptop GPU | |
|---|---|---|---|---|---|---|
| Heat | 20% | -12% | -1% | -13% | -5% | |
| Maximum Upper Side * (°C) | 45 | 42.3 6% | 53 -18% | 43 4% | 55 -22% | 49 -9% |
| Maximum Bottom * (°C) | 50 | 41.7 17% | 53 -6% | 47 6% | 62 -24% | 55 -10% |
| Idle Upper Side * (°C) | 33 | 23.9 28% | 36 -9% | 33 -0% | 32 3% | 33 -0% |
| Idle Bottom * (°C) | 33 | 23.9 28% | 38 -15% | 37 -12% | 36 -9% | 33 -0% |
* ... más pequeño es mejor
Prueba de esfuerzo
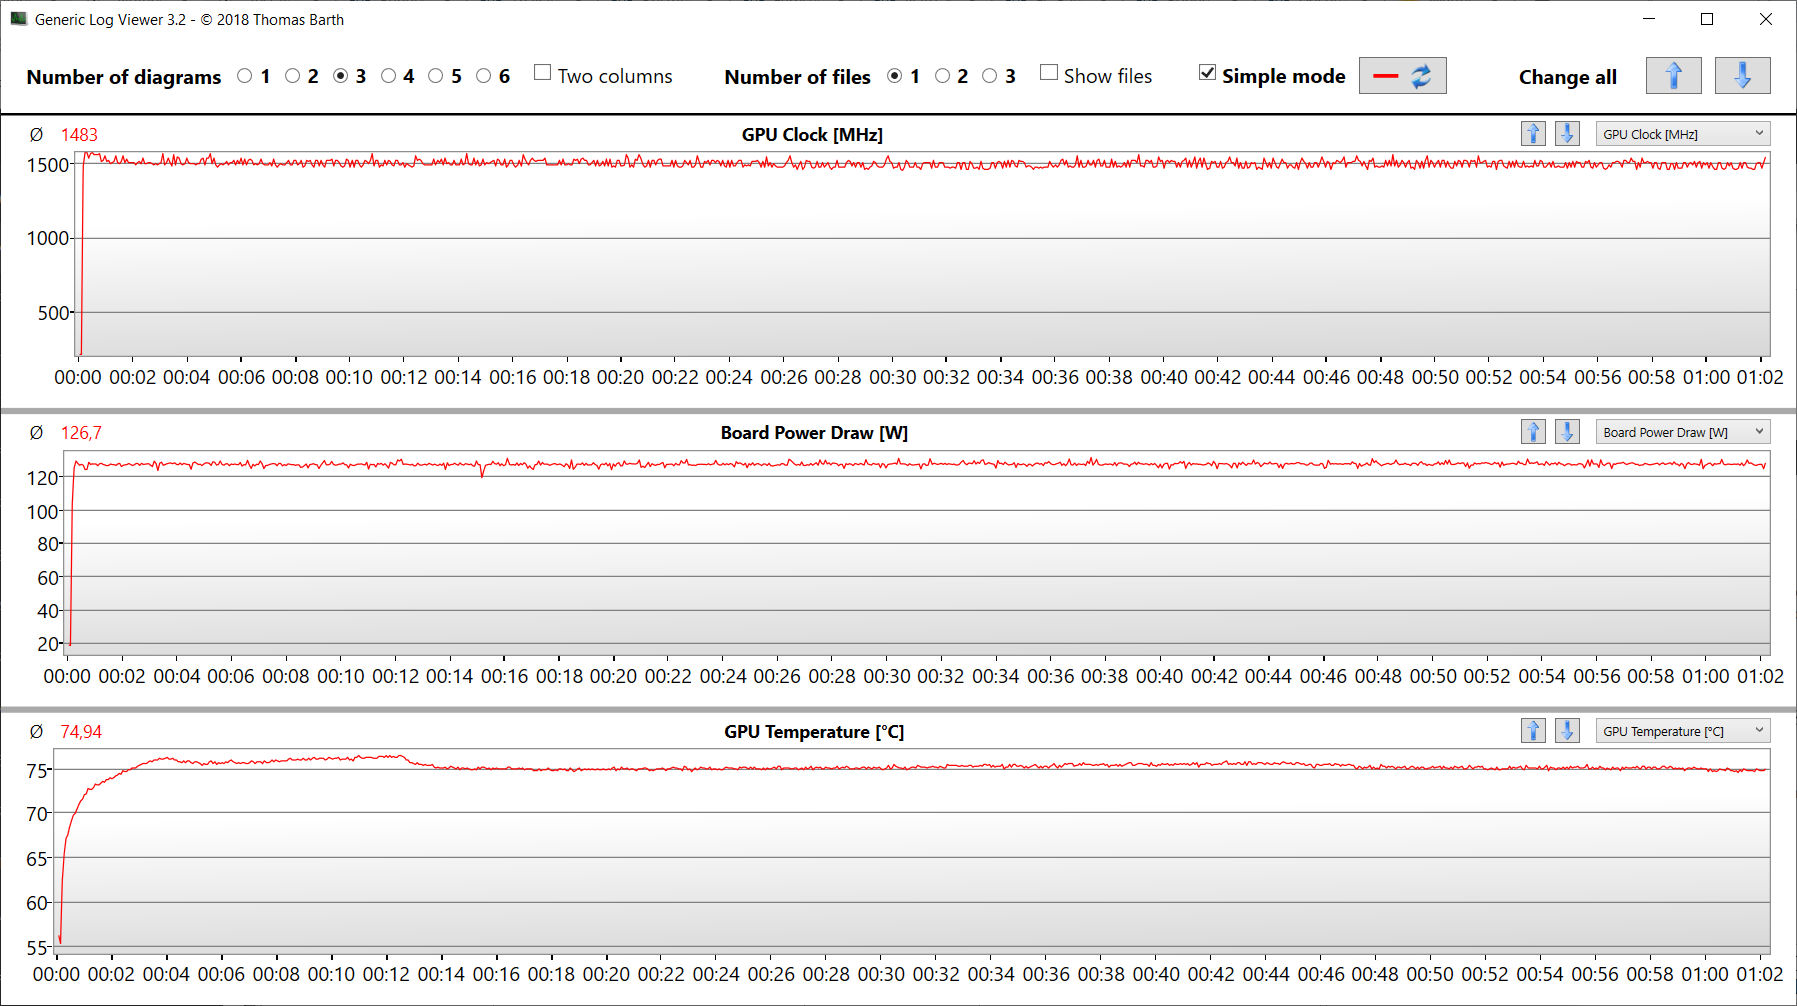
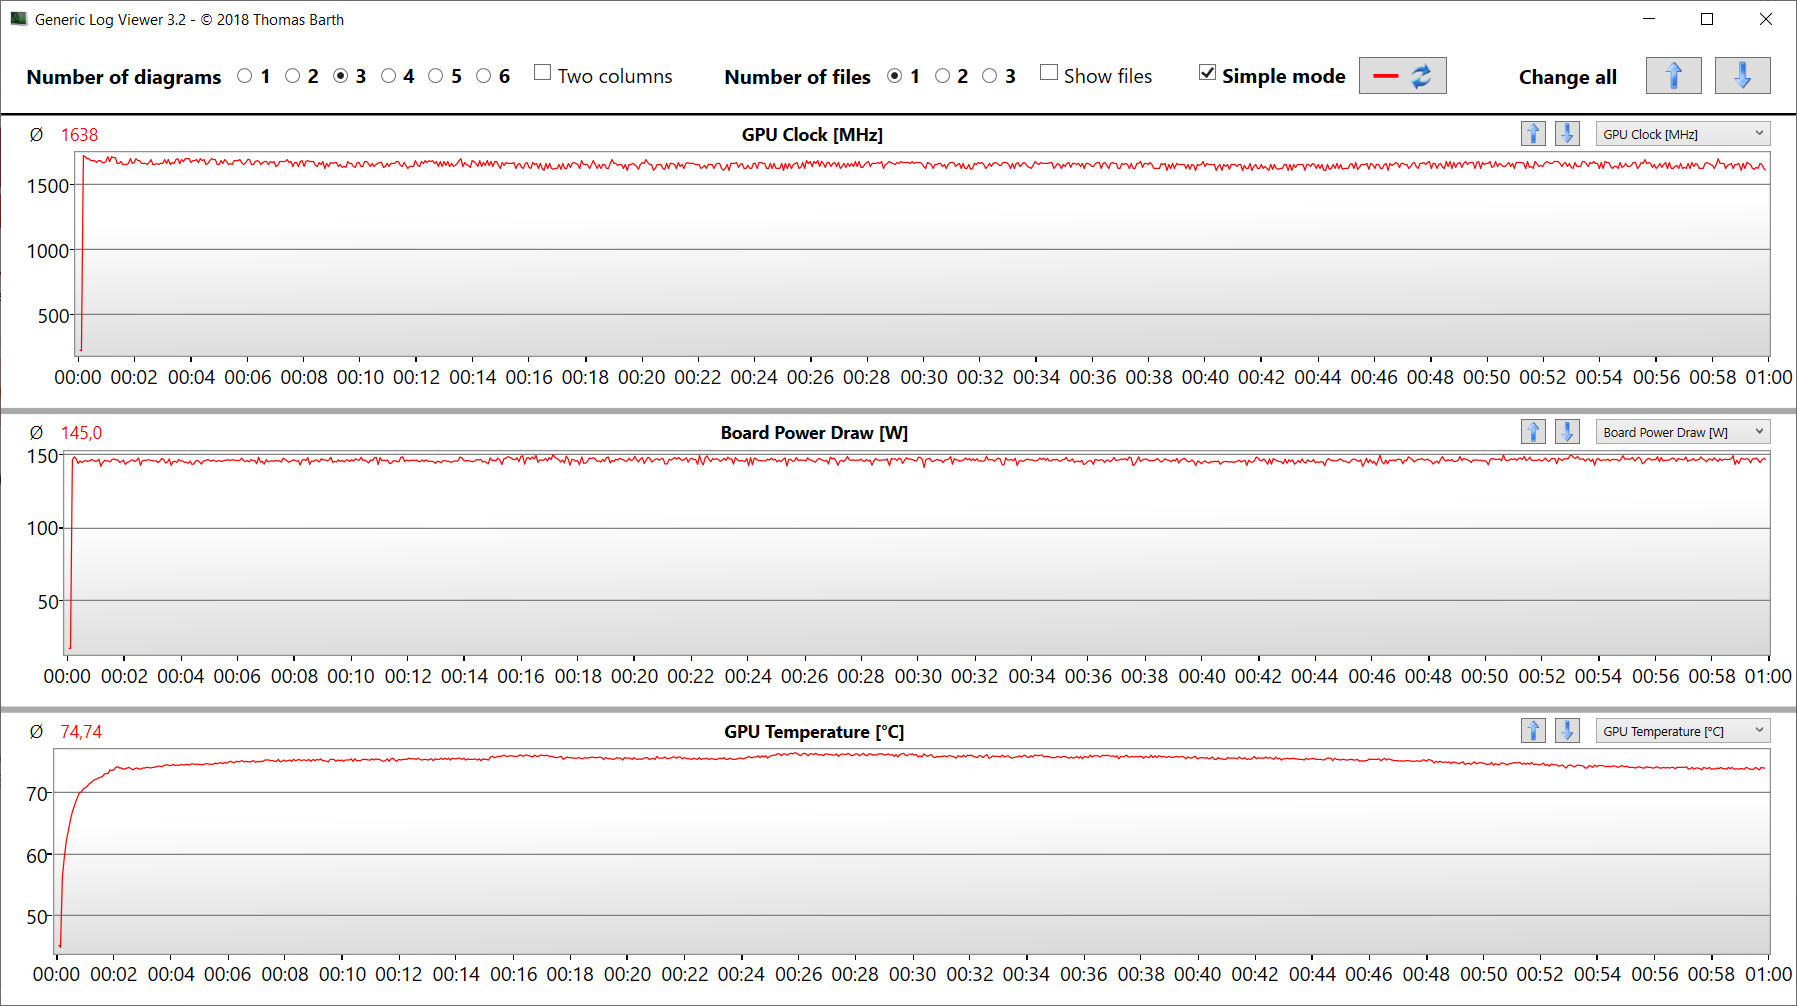
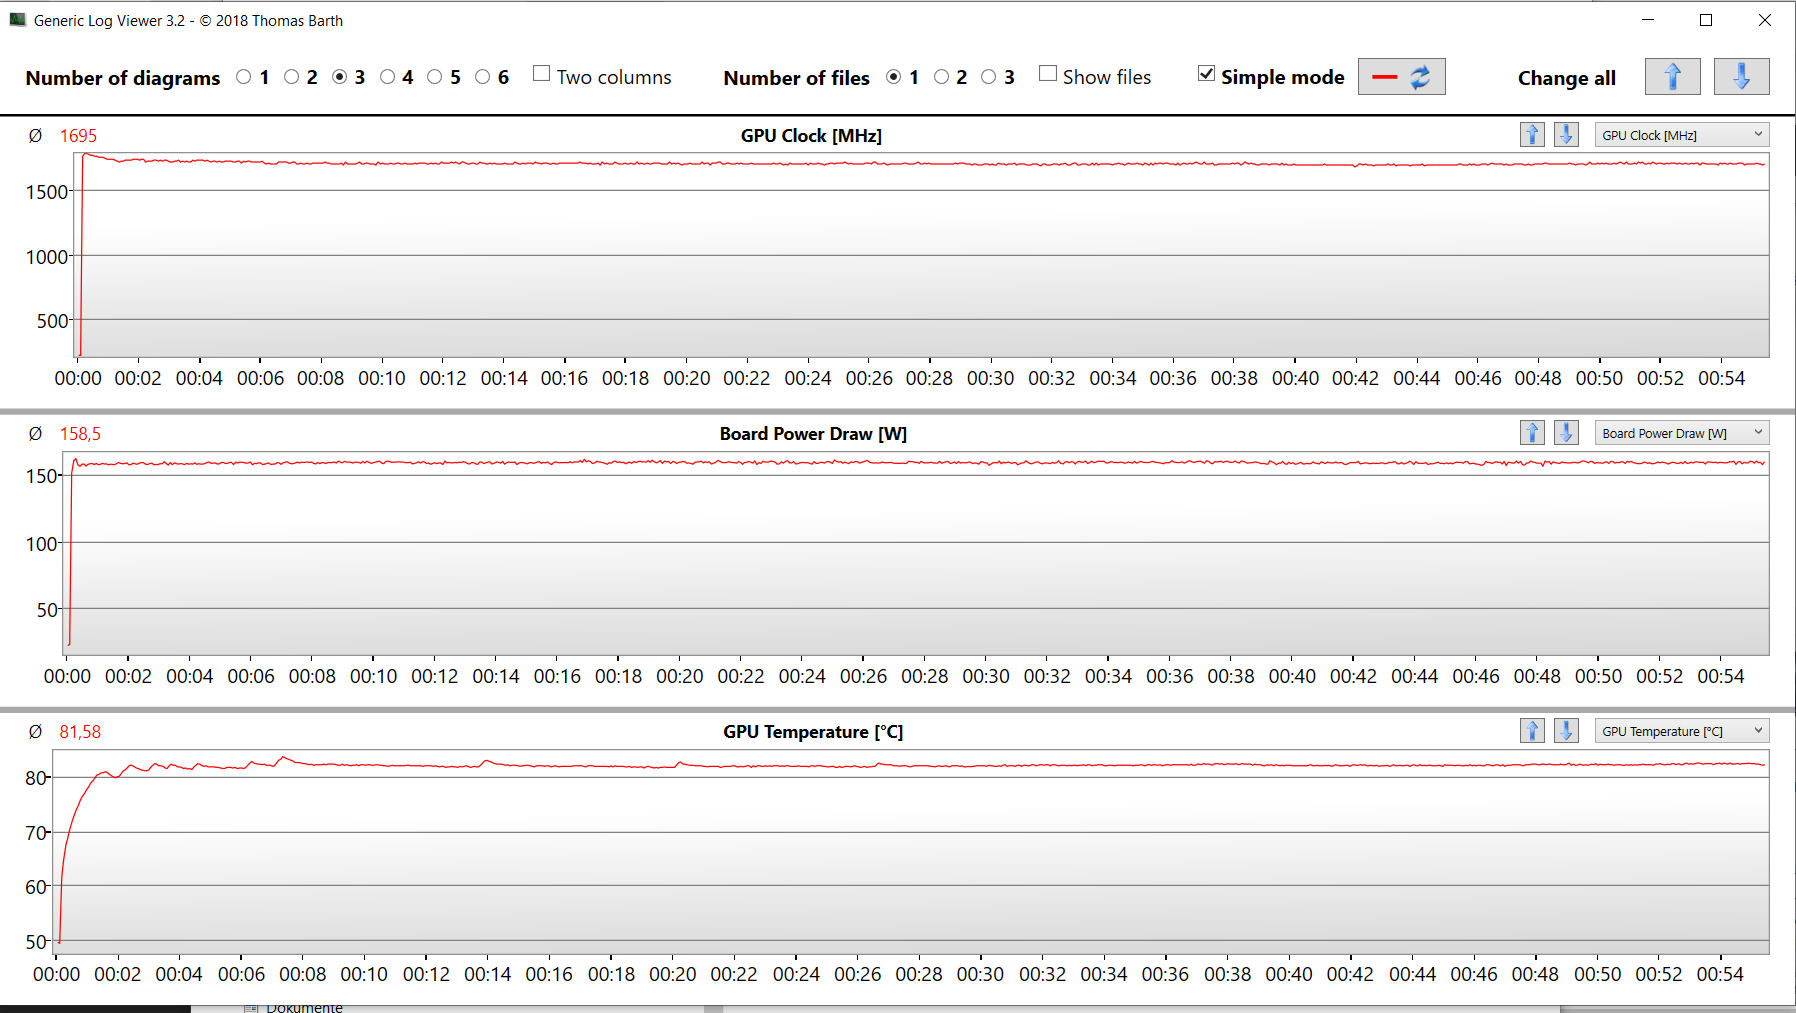
Al principio de la prueba de estrés, con Prime95 y Furmark funcionando durante al menos una hora, la CPU (de 4 a 4,1 GHz) y la GPU (de 1.000 a 1.600 MHz) funcionan a altas velocidades de reloj. Al continuar, los valores bajan a entre 3 y 3,1 GHz (CPU) y entre 850 y 900 MHz (GPU). La prueba de estrés representa un escenario extremo y la utilizamos para evaluar si el sistema se mantiene estable a plena carga.
Altavoces
Los altavoces estéreo producen un sonido decente, aunque le vendrían bien más graves. Para una mejor experiencia de sonido, se recomienda utilizar auriculares o altavoces externos.
Asus ROG Zephyrus Duo 16 GX650RX análisis de audio
(±) | la sonoridad del altavoz es media pero buena (80 dB)
Graves 100 - 315 Hz
(±) | lubina reducida - en promedio 8.9% inferior a la mediana
(±) | la linealidad de los graves es media (12.4% delta a frecuencia anterior)
Medios 400 - 2000 Hz
(±) | medias más altas - de media 6.8% más altas que la mediana
(+) | los medios son lineales (4.3% delta a la frecuencia anterior)
Altos 2 - 16 kHz
(±) | máximos reducidos - de media 6% inferior a la mediana
(±) | la linealidad de los máximos es media (7.3% delta a frecuencia anterior)
Total 100 - 16.000 Hz
(±) | la linealidad del sonido global es media (16.5% de diferencia con la mediana)
En comparación con la misma clase
» 42% de todos los dispositivos probados de esta clase eran mejores, 7% similares, 51% peores
» El mejor tuvo un delta de 6%, la media fue 18%, el peor fue ###max##%
En comparación con todos los dispositivos probados
» 28% de todos los dispositivos probados eran mejores, 6% similares, 66% peores
» El mejor tuvo un delta de 4%, la media fue 23%, el peor fue ###max##%
Gestión de la energía - El Zephyrus Duo ofrece una buena duración de la batería
Consumo de energía
Durante el funcionamiento en vacío, el GX650 tiene un consumo de energía ligeramente superior al de la mayoría de los competidores de Windows. Sin embargo, ninguno de los otros competidores puede alcanzar los bajos valores del MacBook Pro 16. La prueba de estrés o test Witcher-3 lleva a un aumento del consumo del Zephyrus hasta un máximo de 256 vatios o 186,5 vatios de media, que son valores normales para el hardware utilizado aquí. Mientras que el consumo de energía se mantiene constante durante la prueba de Witcher 3, desciende ligeramente durante el transcurso de la prueba de estrés. Con una potencia de 280 vatios, la fuente de alimentación incluida tiene un tamaño suficiente.
| Off / Standby | |
| Ocioso | |
| Carga |
|
Clave:
min: | |
| Asus ROG Zephyrus Duo 16 GX650RX R9 6900HX, GeForce RTX 3080 Ti Laptop GPU | Apple MacBook Pro 16 2021 M1 Max M1 Max, M1 Max 32-Core GPU | Razer Blade 15 Advanced Model Early 2022 i7-12800H, GeForce RTX 3080 Ti Laptop GPU | MSI GE76 Raider i9-12900HK, GeForce RTX 3080 Ti Laptop GPU | Medion Erazer Beast X30 i9-12900HK, GeForce RTX 3080 Ti Laptop GPU | Gigabyte Aero 16 YE5 i9-12900HK, GeForce RTX 3080 Ti Laptop GPU | Media de la clase Gaming | |
|---|---|---|---|---|---|---|---|
| Power Consumption | 42% | 16% | 4% | 9% | -15% | 13% | |
| Idle Minimum * (Watt) | 19 | 5.4 72% | 17 11% | 12 37% | 12 37% | 26 -37% | 13 ? 32% |
| Idle Average * (Watt) | 24 | 16.4 32% | 19 21% | 17 29% | 16 33% | 30 -25% | 19 ? 21% |
| Idle Maximum * (Watt) | 31 | 16.7 46% | 25 19% | 28 10% | 22 29% | 37 -19% | 24.6 ? 21% |
| Load Average * (Watt) | 104 | 94 10% | 108 -4% | 118 -13% | 118 -13% | 127 -22% | 110.7 ? -6% |
| Witcher 3 ultra * (Watt) | 186.5 | 104 44% | 150 20% | 252 -35% | 223 -20% | 176 6% | |
| Load Maximum * (Watt) | 256 | 135 47% | 179 30% | 272 -6% | 290 -13% | 236 8% | 259 ? -1% |
* ... más pequeño es mejor
Power Consumption The Witcher 3 / Stress Test
Power Consumption With External Monitor
Duración de la batería
En la prueba WLAN en la que se cargan sitios web mediante un script y en la prueba de vídeo ejecutando el cortometraje Big Buck Bunny (codificación H.264, FHD) en un bucle constante, el portátil de 16 pulgadas dura 7:49 horas y 9:19 horas respectivamente. Durante ambas pruebas, las funciones de ahorro de energía del portátil están desactivadas y el brillo de la pantalla ajustado a unos 150 cd/m². Mientras se realiza la prueba de vídeo, los módulos de comunicación también se apagan.
| Asus ROG Zephyrus Duo 16 GX650RX R9 6900HX, GeForce RTX 3080 Ti Laptop GPU, 90 Wh | Apple MacBook Pro 16 2021 M1 Max M1 Max, M1 Max 32-Core GPU, 99.6 Wh | Razer Blade 15 Advanced Model Early 2022 i7-12800H, GeForce RTX 3080 Ti Laptop GPU, 80 Wh | MSI GE76 Raider i9-12900HK, GeForce RTX 3080 Ti Laptop GPU, 99.99 Wh | Medion Erazer Beast X30 i9-12900HK, GeForce RTX 3080 Ti Laptop GPU, 91.2 Wh | Gigabyte Aero 16 YE5 i9-12900HK, GeForce RTX 3080 Ti Laptop GPU, 99 Wh | Media de la clase Gaming | |
|---|---|---|---|---|---|---|---|
| Duración de Batería | 61% | -2% | -35% | 11% | -2% | -1% | |
| Reader / Idle (h) | 12.5 | 8.1 -35% | 7.7 -38% | 8.9 -29% | 8.27 ? -34% | ||
| H.264 (h) | 9.3 | 17 83% | 5.9 -37% | 6.4 -31% | 7.5 -19% | 8.32 ? -11% | |
| WiFi v1.3 (h) | 7.8 | 14.9 91% | 4.9 -37% | 5.1 -35% | 5.7 -27% | 6.4 -18% | 7.11 ? -9% |
| Load (h) | 1 | 1.1 10% | 2 100% | 2.4 140% | 1.6 60% | 1.502 ? 50% |
Pro
Contra
Veredicto - Un potente portátil para el segmento creativo
Asus anuncia el Zephyrus principalmente como un portátil para juegos, pero el concepto del portátil también está dirigido a los creadores de contenidos: El procesamiento de vídeo e imágenes, el renderizado y, por supuesto, también los juegos son las disciplinas principales. el juego 4k es posible en ajustes altos y máximos.
Aunque el Screenpad Plus debería ofrecer un cierto valor añadido en algunos escenarios de aplicación, también aumenta el peso, el precio de compra y el tamaño del portátil.
ARyzen 9-6900HXaPU y GeForce RTX 3080-Ti para portátilesofrecen el rendimiento informático necesario, y ambos componentes funcionan a una velocidad de reloj alta y constante. Dos SSD PCIe 4 (RAID 0) garantizan tiempos de carga cortos y ofrecen mucho espacio de almacenamiento (4 TB). El paquete completo se completa con 64 GB de memoria de trabajo.
El ruido y el desarrollo de calor bajo carga se sitúan en el nivel habitual para esta clase de portátil. Sin embargo, durante el funcionamiento diario el portátil sigue siendo muy silencioso. La buena pantalla de 16 pulgadas en el formato 16:10 puntúa con una excelente reproducción del color (certificación Pantone) y cubre completamente el espacio de color DCI-P3.
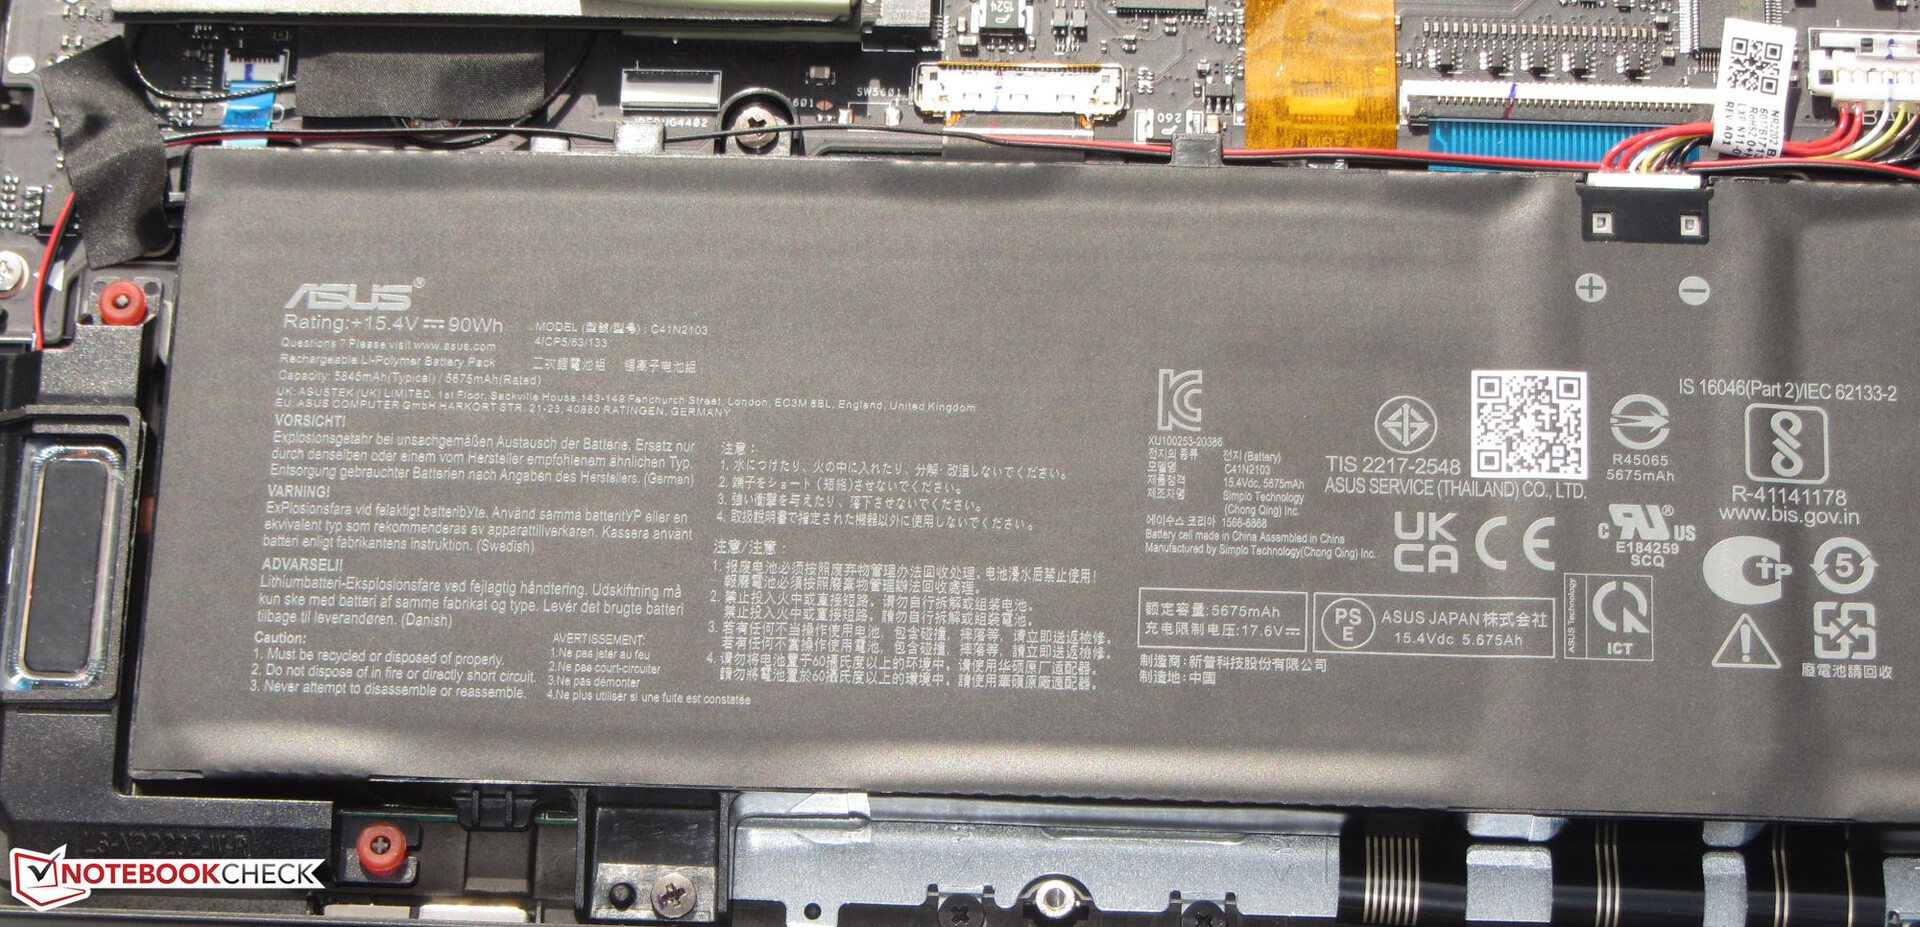
A pesar del alto rendimiento informático, no tienes que vivir con una corta duración de la batería. Una carga de la batería (90 Wh) dura una autonomía de casi 8 horas. Otro punto positivo es la posibilidad de cargar la batería con un cargador universal USB-C (45 vatios como mínimo), ya que el puerto USB-C Gen 2 izquierdo también admite Power Delivery. Esto quiere decir que no tienes que llevar necesariamente la abultada fuente de alimentación de 280W.
Una alternativa al Zephyrus sería Gigabyte Aero 16que ofrece un mayor rendimiento de la CPU y un puerto Thunderbolt 4. Las desventajas son una peor duración de la batería, una pantalla reflectante, y más desarrollo de calor. Si necesitas un rendimiento informático potente y una duración de la batería lo más larga posible, difícilmente podrás evitar el Apple MacBook Pro 16. Por otra parte, entonces no podría reemplazar o ampliar el SSD, ni la memoria de trabajo. Además, el MacBook también utiliza una pantalla reflectante.
Precio y disponibilidad
Mientras que el ROG Zephyrus Duo 16 GX650RX ya aparece en el sitio web estadounidense de Asusen el momento de esta prueba, otras tiendas online como CDW ($4097) y B&H Photo ($4000) muestran que aún no está en stock.
Asus ROG Zephyrus Duo 16 GX650RX
- 05/23/2022 v7 (old)
Sascha Mölck
Price comparison

