Análisis del Gigabyte Aero 16 YE5: Portátil compacto multimedia 4K

El Aero 16 de Gigabyte es una mezcla entre un portátil de juegos compacto, una estación de trabajo portátil y un portátil para creativos. Está equipado con unCore i9-12900HK (Alder Lake) y una NVIDIA GeForce RTX 3080 Ti Laptop GPU GPU - Benchmarks and Specs GeForce RTX 3080 Ti. Sus principales competidores son dispositivos como el Lenovo ThinkPad X1 Extreme G4, el Schenker XMG Pro 15 (Late 2021), el HP ZBook Studio 15 G8, el Apple Análisis del portátil MacBook Pro 16 2021 M1 Max: Máximo rendimiento sin ralentización Apple MacBook Pro 16 2021 M1 Max, y el Razer Blade 15 2022
Posibles contendientes en la comparación
Valoración | Fecha | Modelo | Peso | Altura | Tamaño | Resolución | Precio |
|---|---|---|---|---|---|---|---|
| 84.7 % v7 (old) | 03/2022 | Gigabyte Aero 16 YE5 i9-12900HK, GeForce RTX 3080 Ti Laptop GPU | 2.3 kg | 22.4 mm | 16.00" | 3840x2400 | |
| 88.3 % v7 (old) | 12/2021 | Lenovo ThinkPad X1 Extreme G4-20Y50040GE i9-11950H, GeForce RTX 3080 Laptop GPU | 1.9 kg | 18.2 mm | 16.00" | 3840x2400 | |
| 92.5 % v7 (old) | 11/2021 | Apple MacBook Pro 16 2021 M1 Max M1 Max, M1 Max 32-Core GPU | 2.2 kg | 16.8 mm | 16.20" | 3456x2234 | |
| 87.8 % v7 (old) | 08/2021 | HP ZBook Studio 15 G8 i9-11950H, GeForce RTX 3070 Laptop GPU | 1.9 kg | 18 mm | 15.60" | 3840x2160 | |
| 84.6 % v7 (old) | 01/2022 | Schenker XMG Pro 15 (Late 2021) i7-11800H, GeForce RTX 3080 Laptop GPU | 2 kg | 19.8 mm | 15.60" | 3840x2160 | |
| 89.1 % v7 (old) | 03/2022 | Razer Blade 15 2022 i7-12800H, GeForce RTX 3080 Ti Laptop GPU | 2.1 kg | 16.99 mm | 15.60" | 2560x1440 |
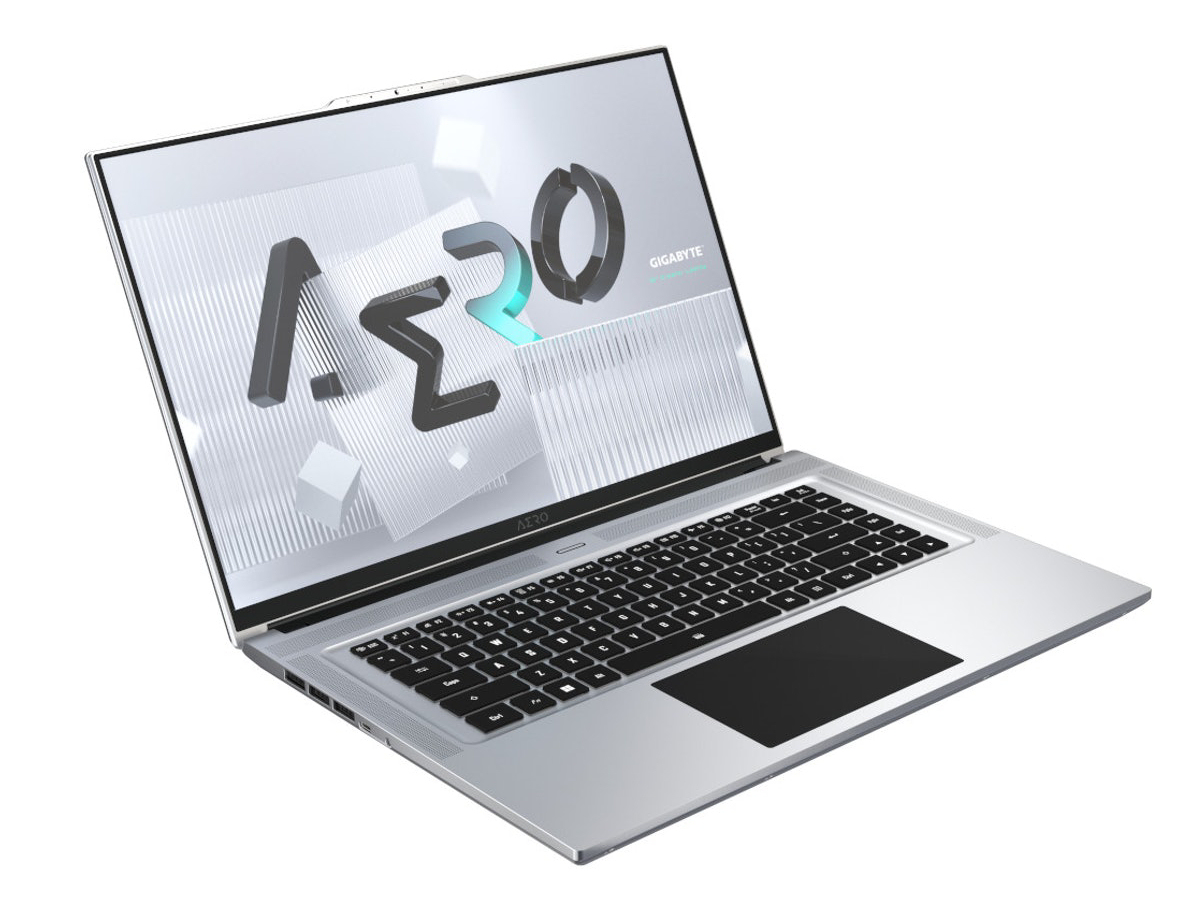
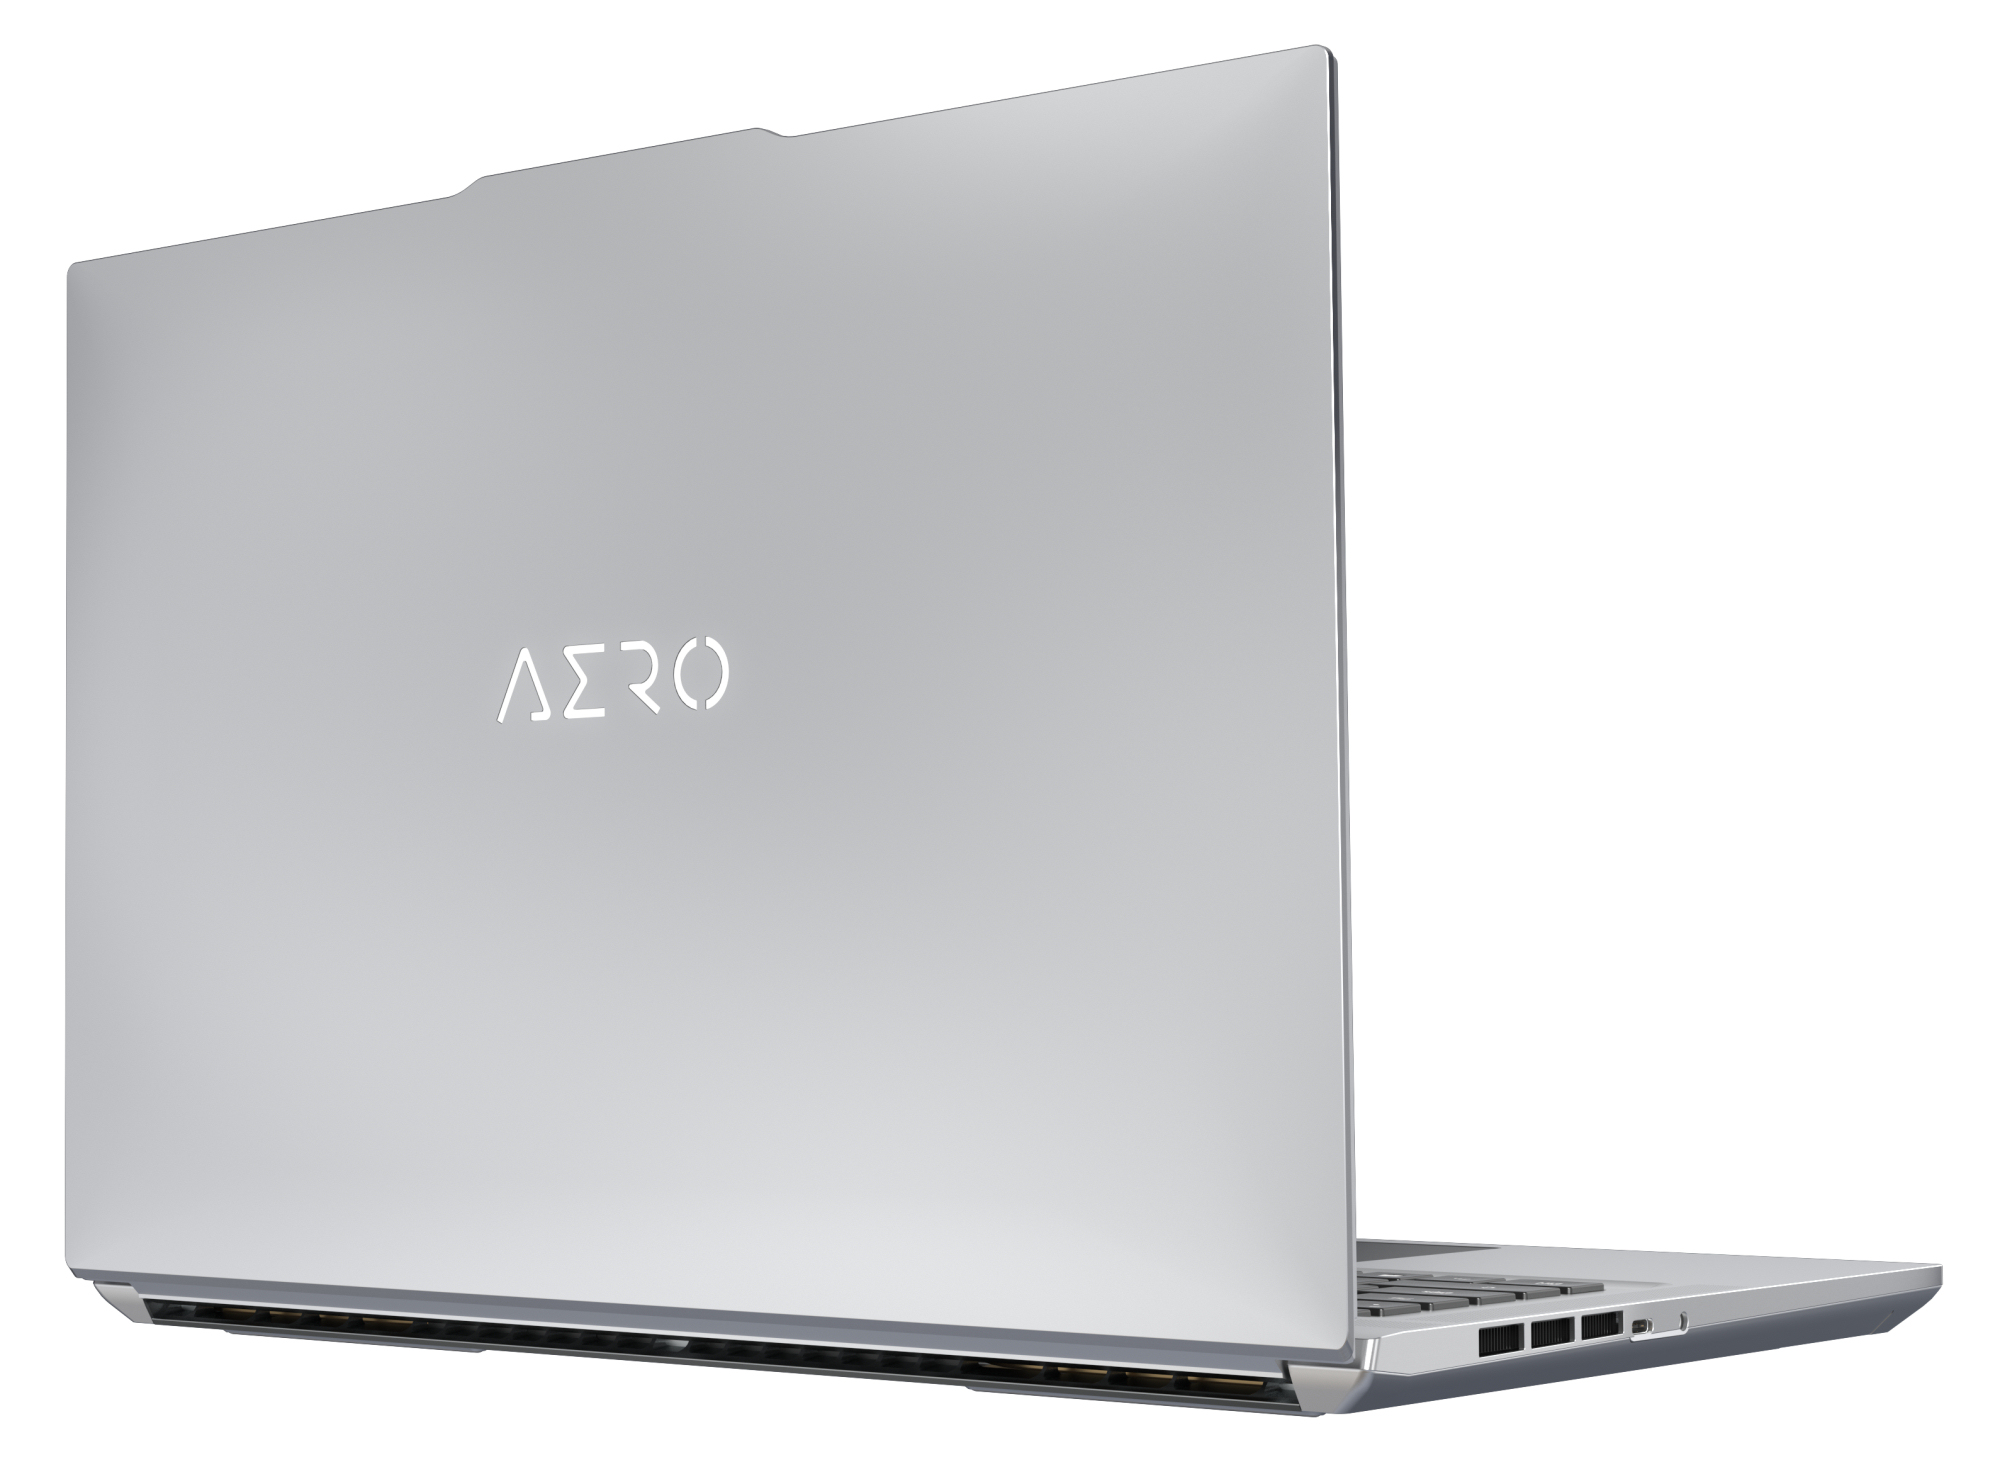
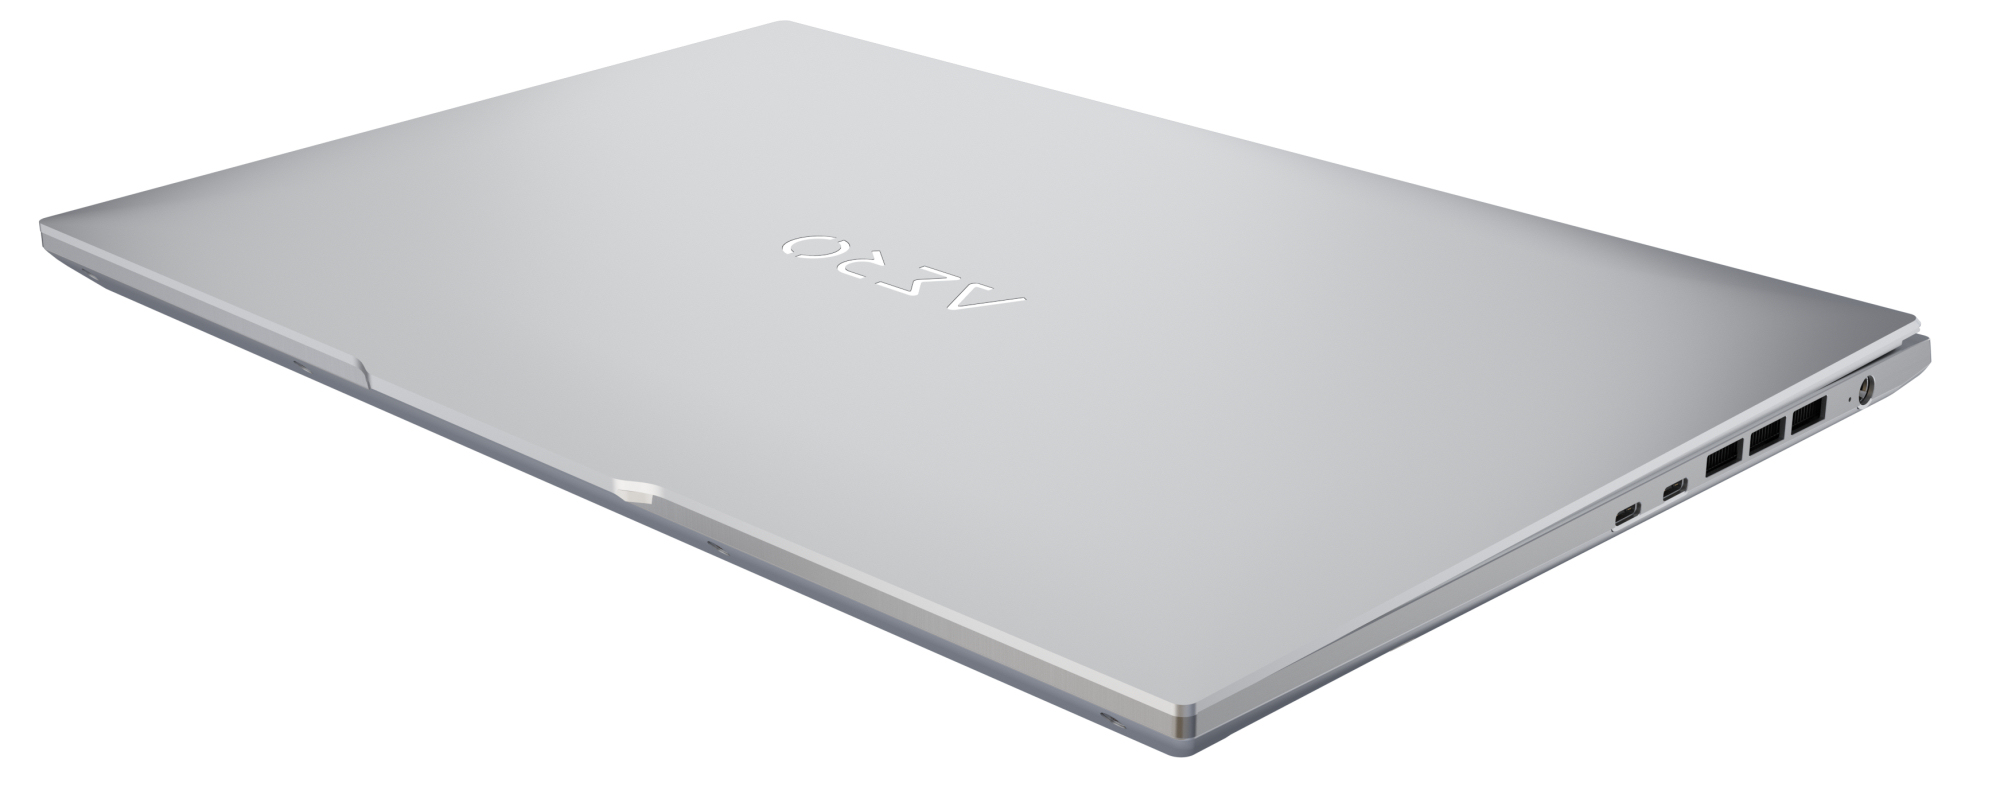
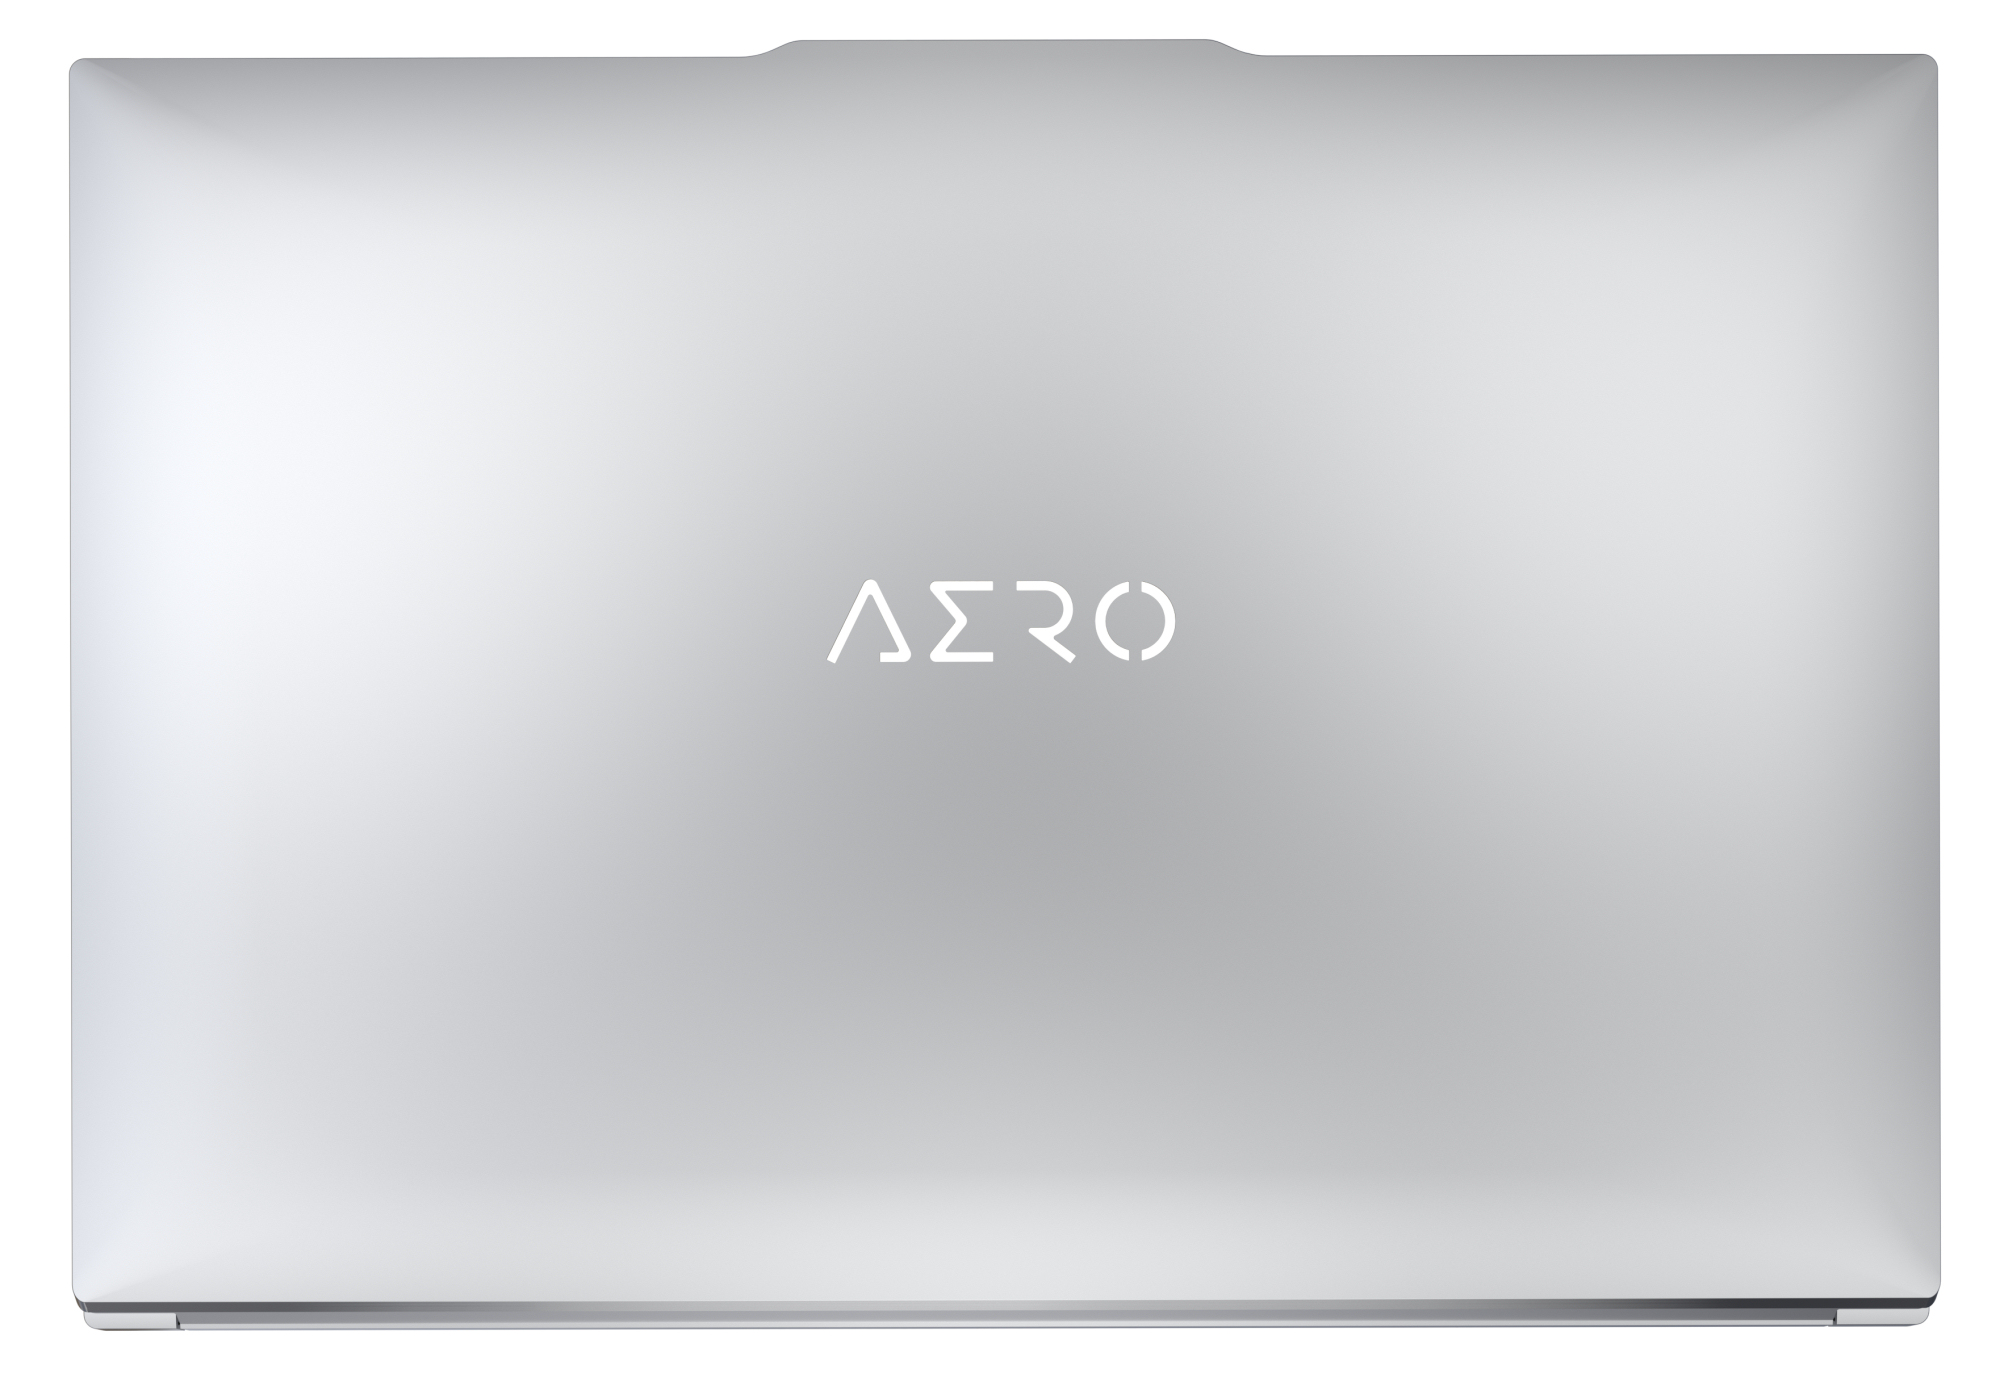
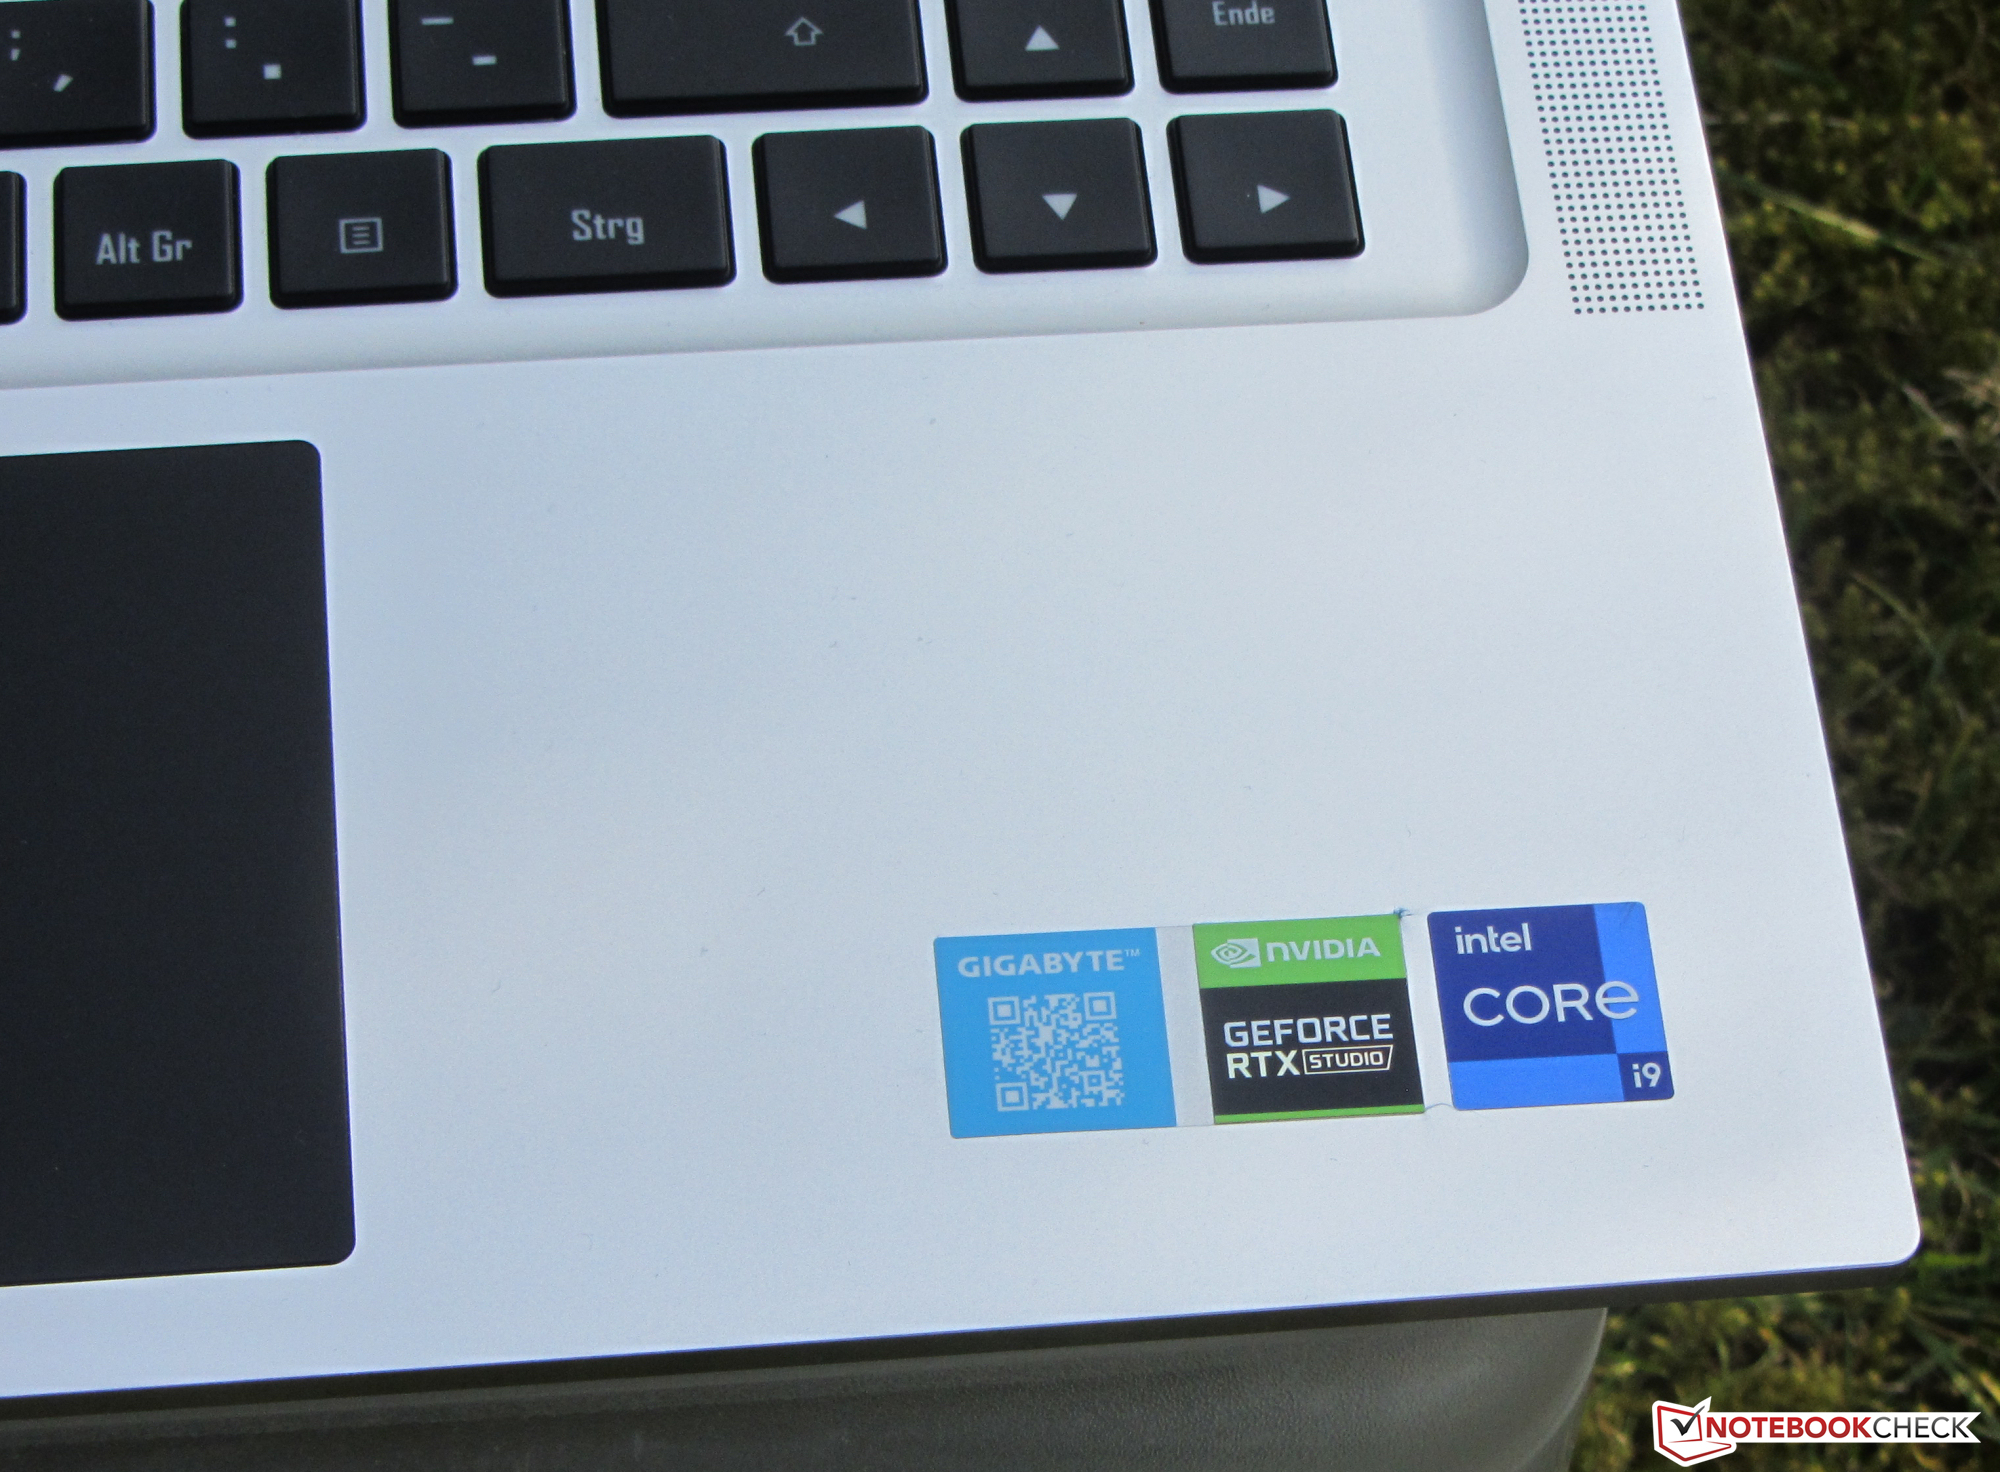
Caja - Aero con caja metálica robusta
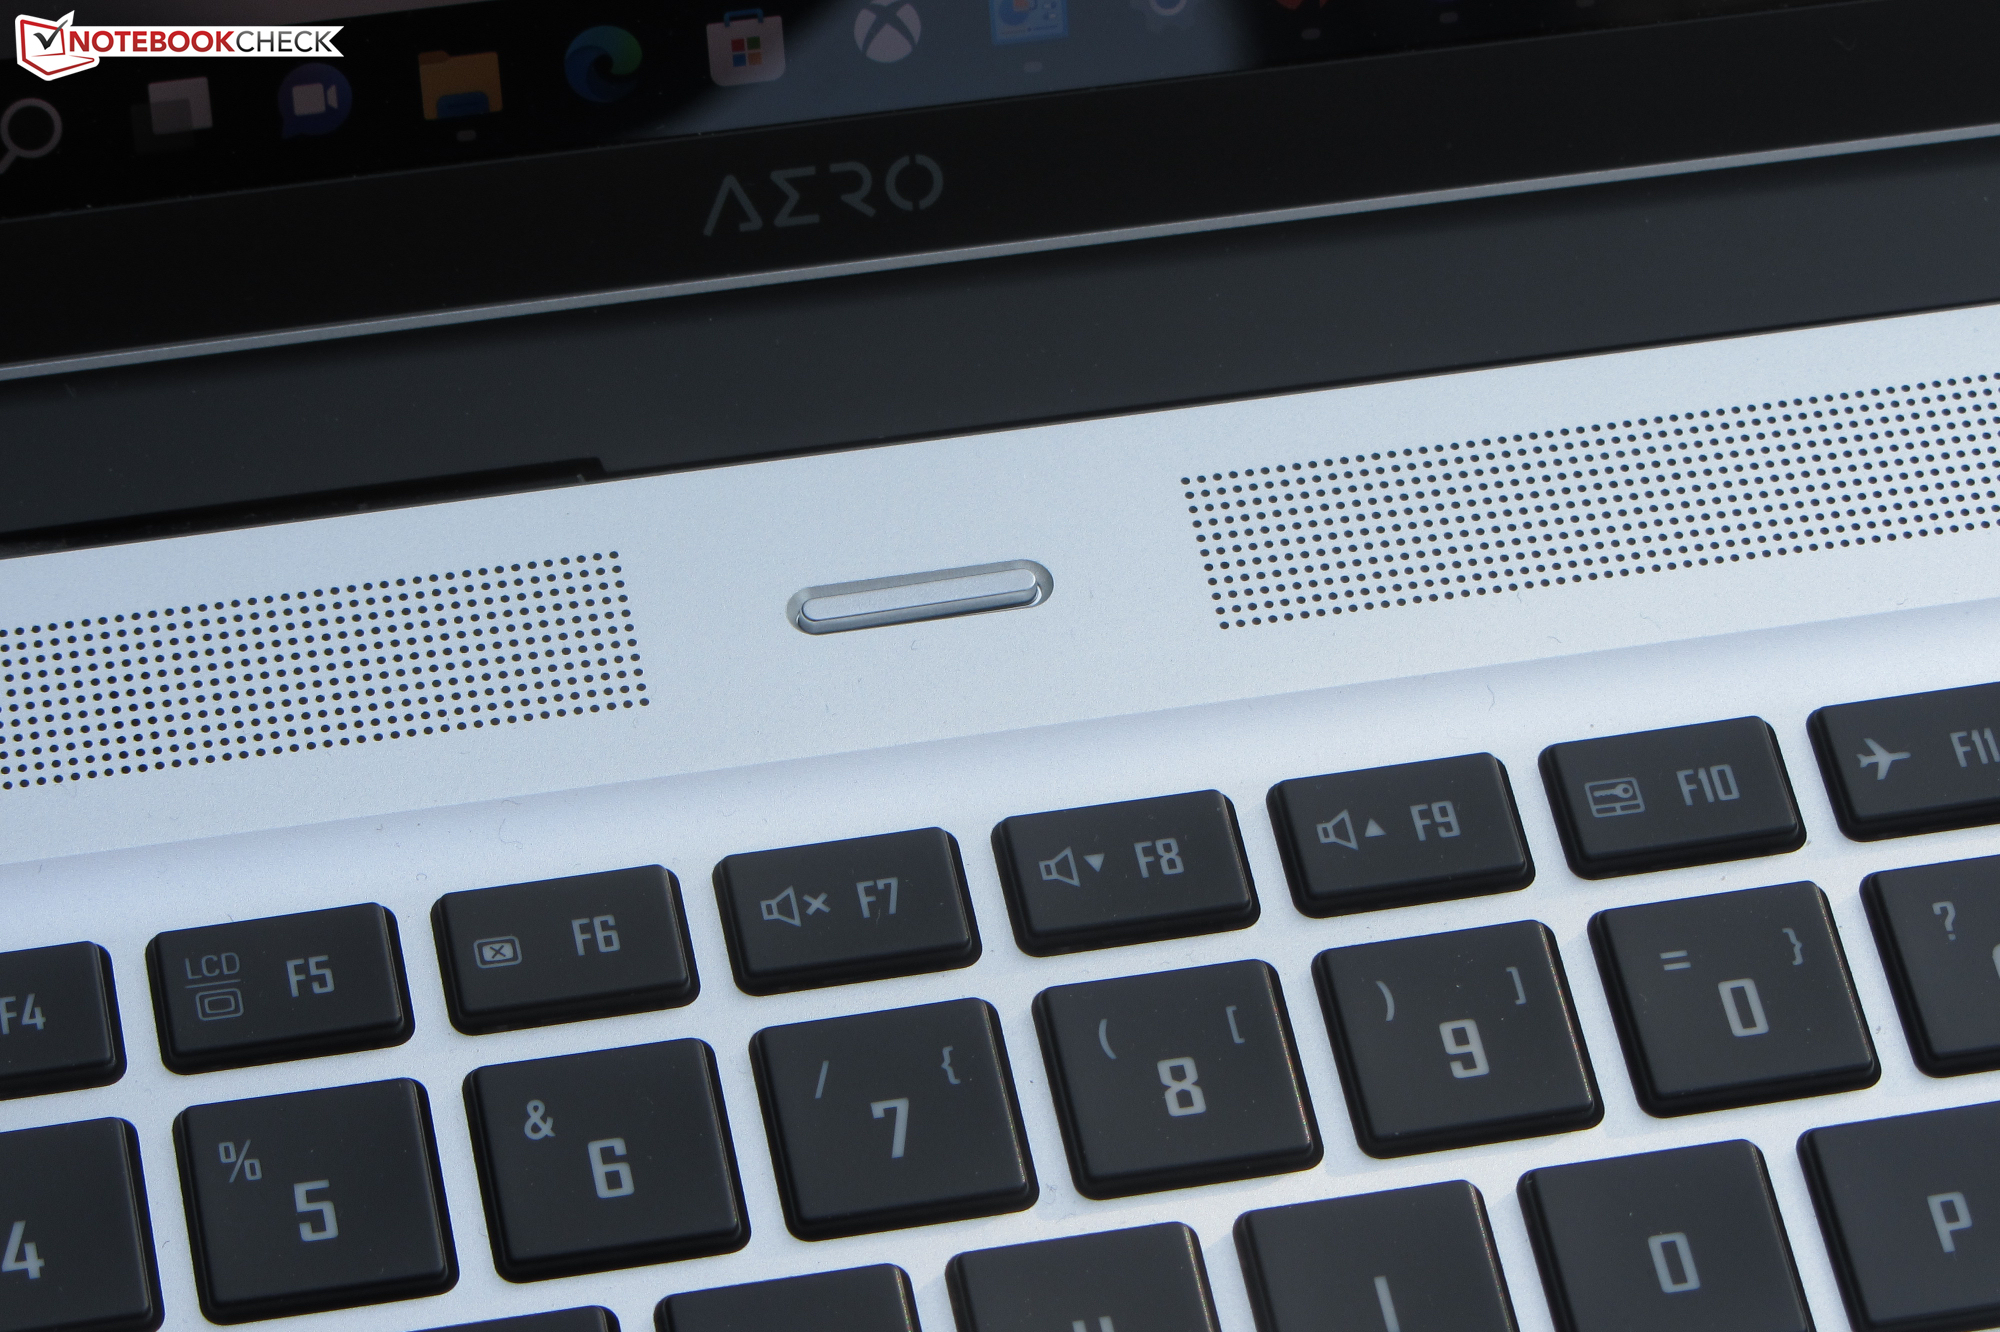
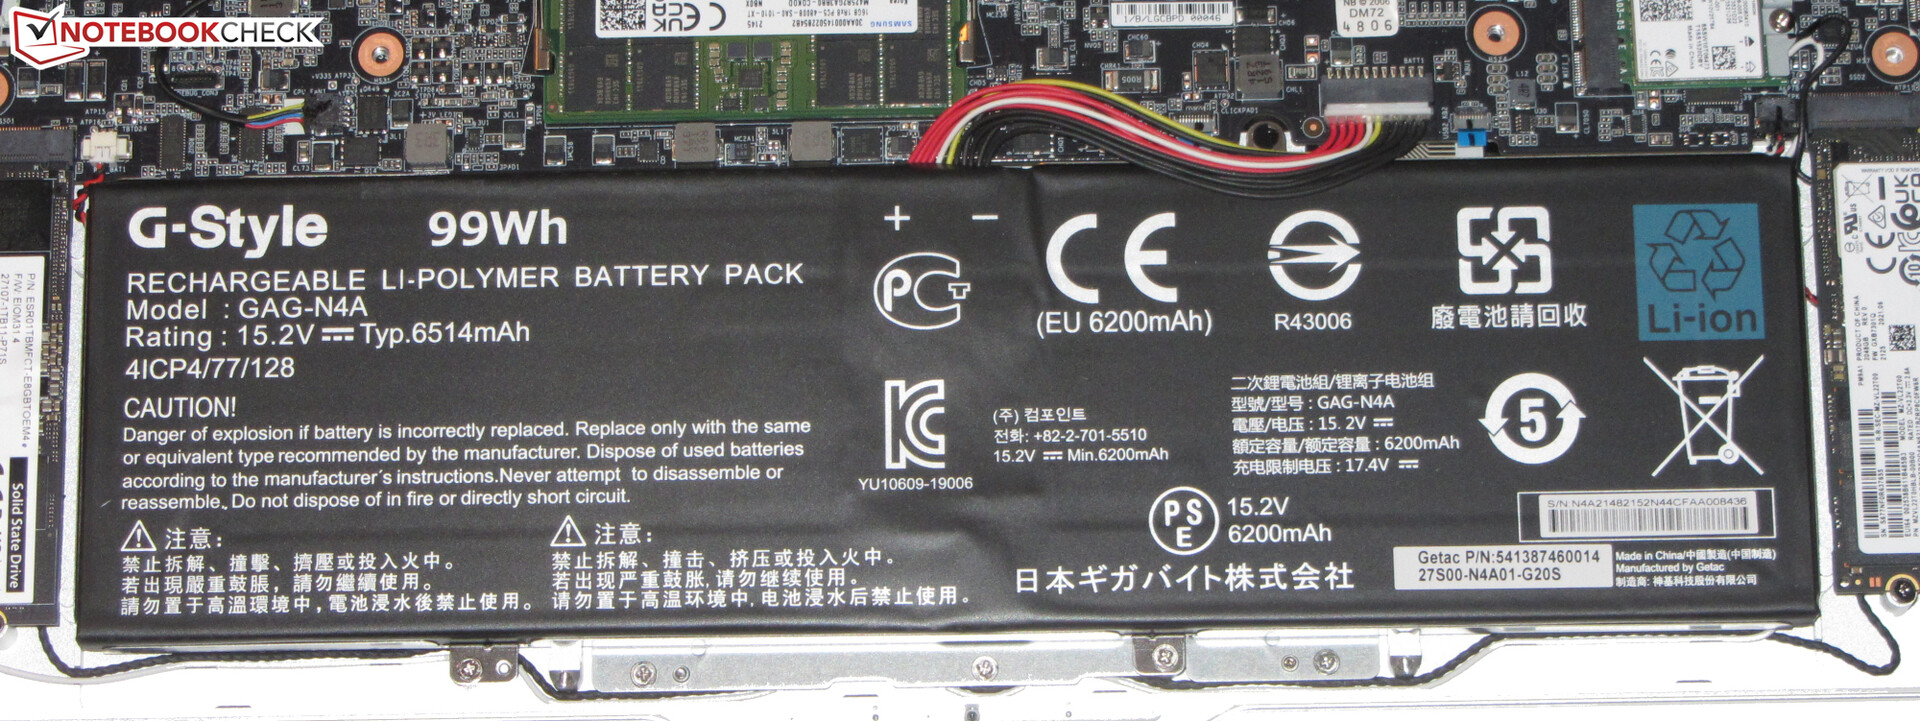
El Aero 16 presenta una carcasa compacta de metal plateado de buen aspecto con una superficie mate y lisa. Varios elementos negros, como el teclado, el trackpad, los biseles de la pantalla y la tapa de la bisagra, sirven como adornos de diseño, al igual que el logotipo de Aero retroiluminado en la parte posterior de la tapa de la pantalla. Se puede acceder fácilmente al interior retirando la tapa inferior. La batería no es reemplazable.
La calidad general de la construcción es buena. Los huecos de los paneles son consistentes, y tampoco encontramos protuberancias en los huecos. La rigidez es decente, con una base que apenas se deforma y una tapa que se deforma y dobla ligeramente. La bisagra es firme y consigue mantener la pantalla firmemente en su sitio sin que se tambalee demasiado. Su ángulo máximo de apertura es de unos 125-130° y se puede abrir y ajustar con una sola mano.
Entre nuestro grupo de pruebas, el Aero es uno de los dispositivos más grandes, y el más pesado por un pequeño margen. Con sus 2,3 kg es 400 g más pesado que el Lenovo ThinkPad X1 Extreme G4
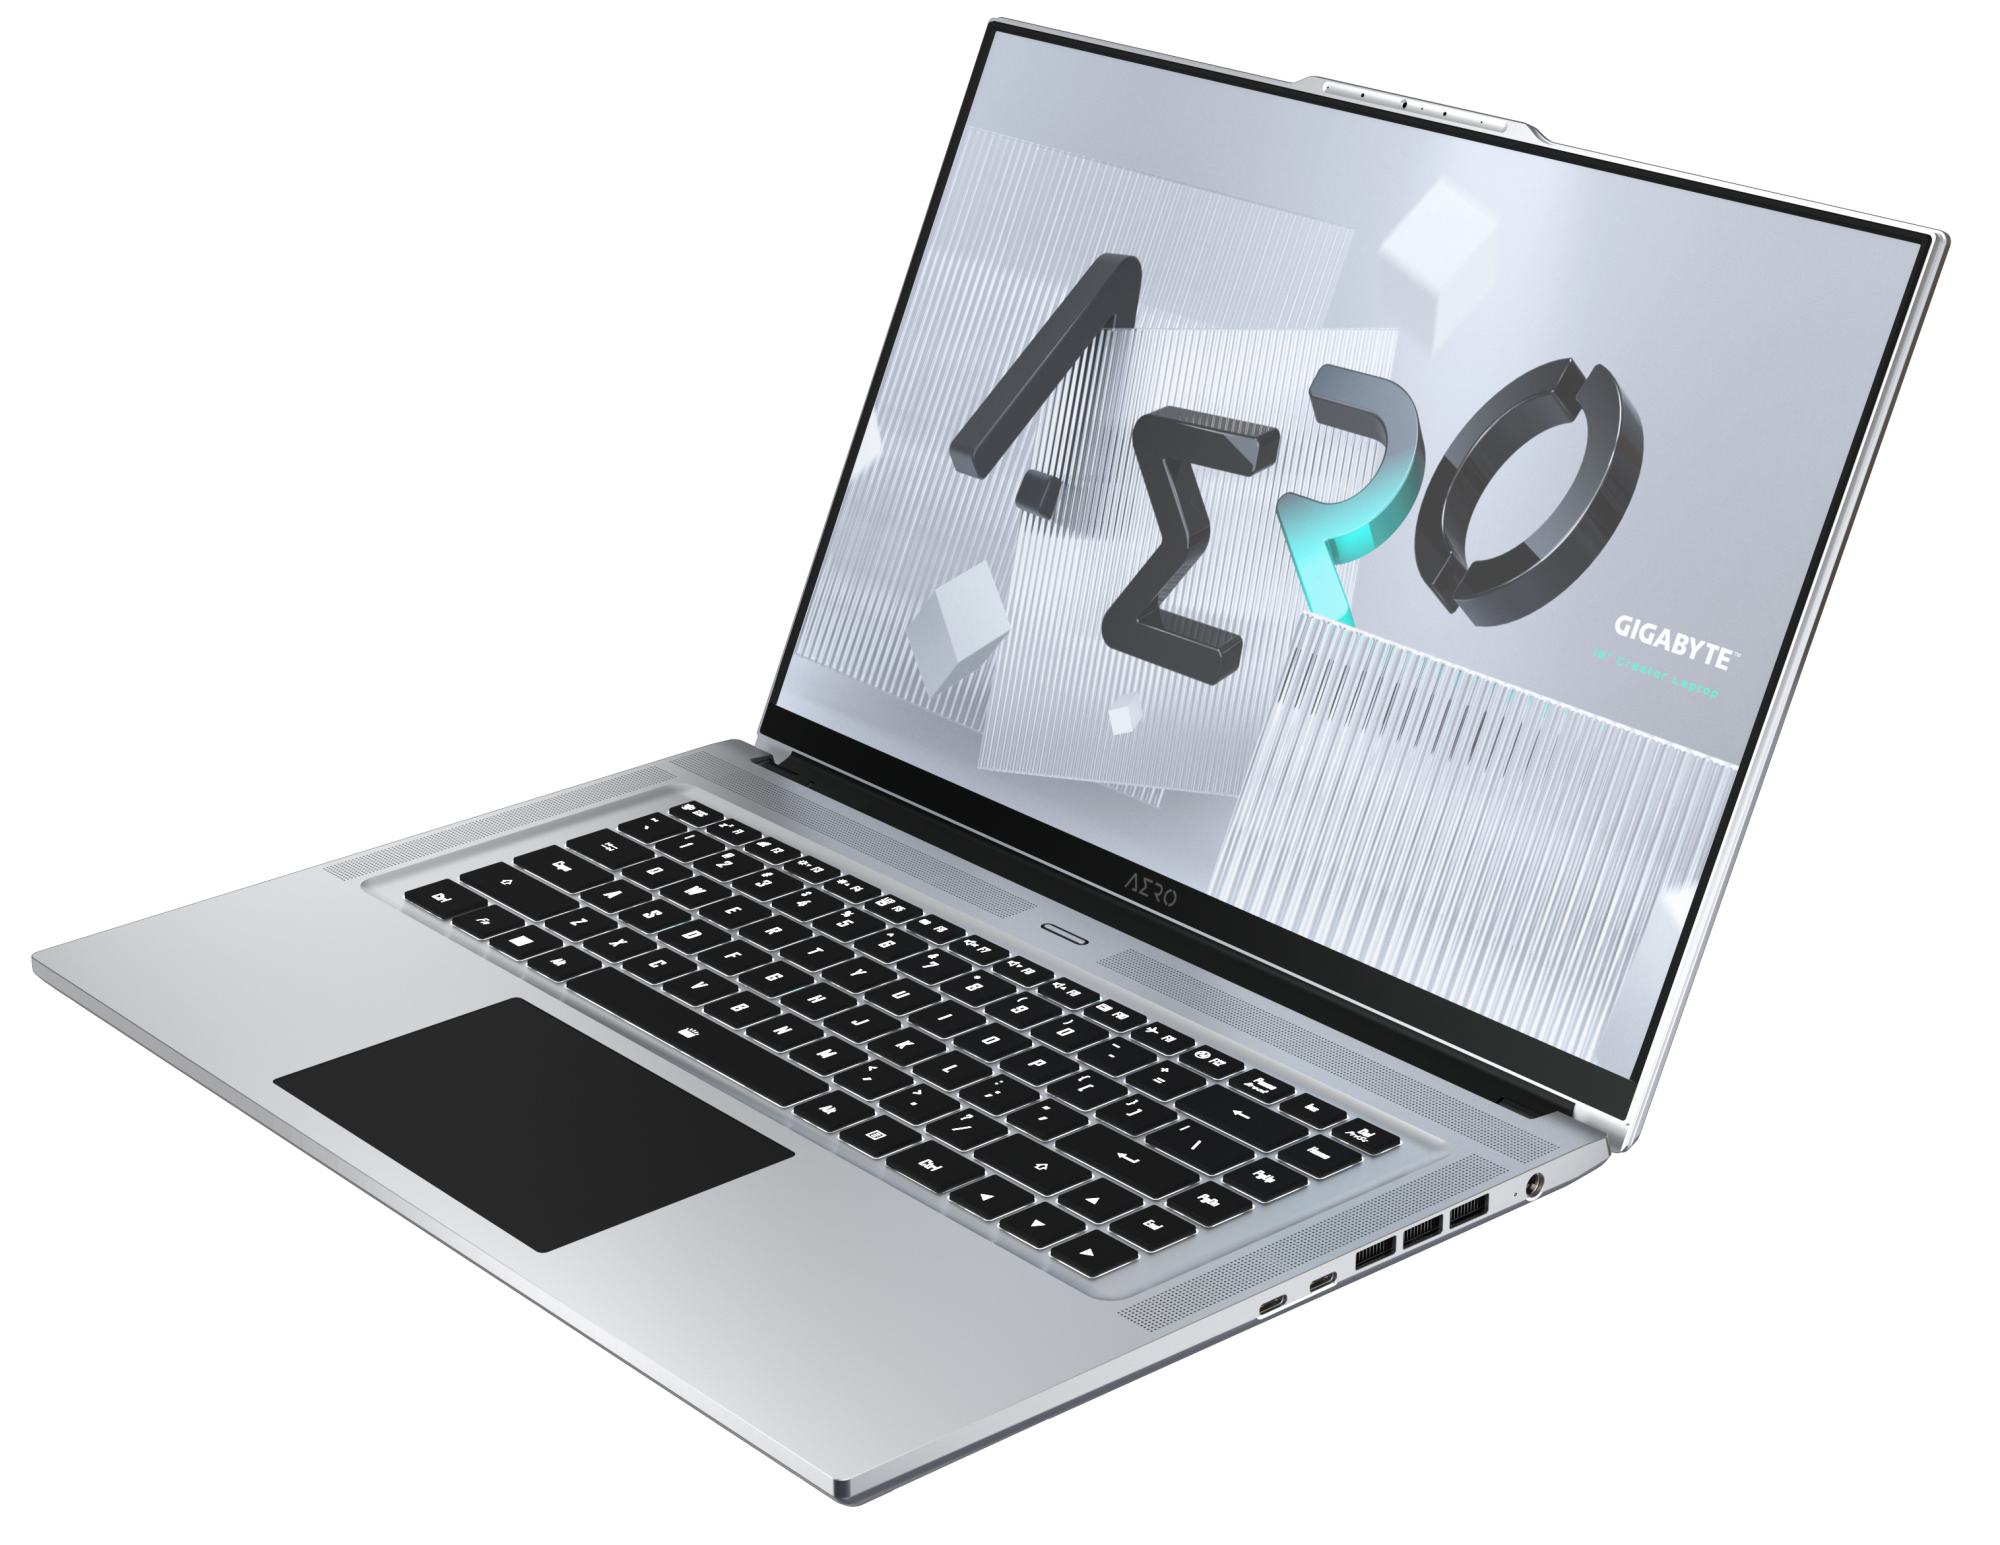
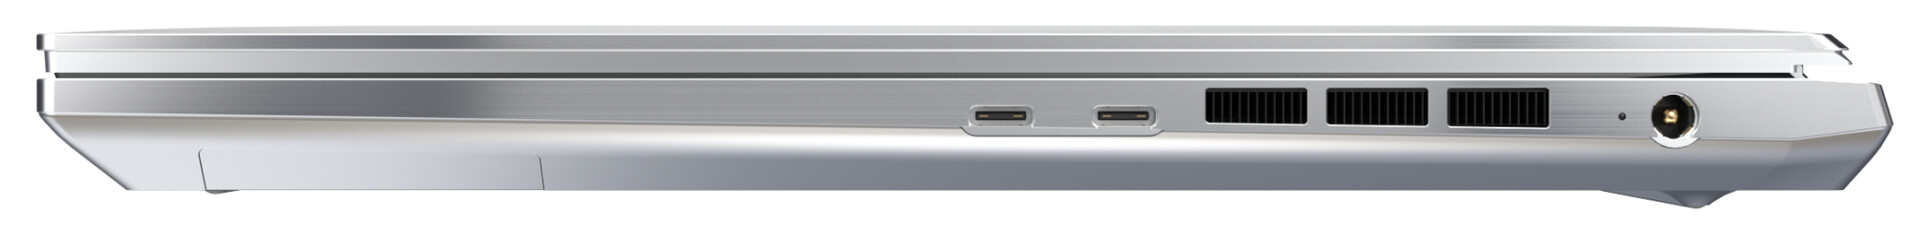
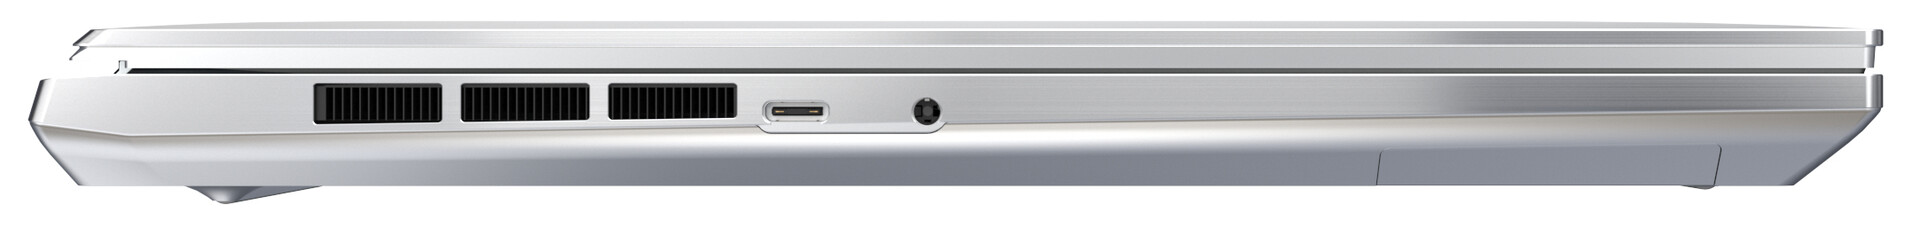
Conectividad - Portátil Gigabyte con USB-C
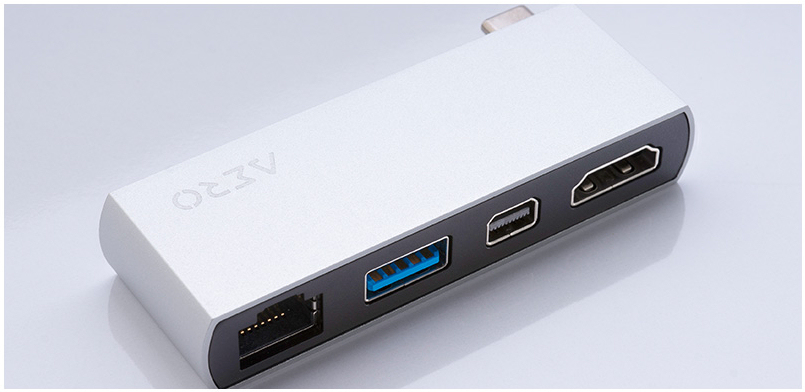
Además de un puerto de carga y una clavija de auriculares, encontramos un total de tres puertos USB-C en el dispositivo, dos de los cuales soportan Thunderbolt 4 y uno que se limita sólo a USB 3.2 Gen 2. Todos los puertos llevan una señal DisplayPort, y el puerto Thunderbolt 4 trasero también es compatible con Power Delivery para cargar la batería con una fuente de alimentación USB-C, que tiene que tener una potencia nominal de 45 W o más. El hub Aero incluido añade otros puertos más comunes, como HDMI, Mini DisplayPort, USB-A y Ethernet.
Comunicación
El módem Wi-Fi AX210 incorporado está fabricado por Intel y soporta 802.11a/b/g/n/ac/ax. Sus tasas de transferencia de datos fueron muy buenas en general bajo condiciones ideales (sin otros dispositivos Wi-Fi cerca, distancia cercana entre el portátil y el servidor).
| Networking | |
| iperf3 receive AXE11000 | |
| Media de la clase Multimedia (682 - 1818, n=54, últimos 2 años) | |
| Gigabyte Aero 16 YE5 | |
| iperf3 transmit AXE11000 | |
| Gigabyte Aero 16 YE5 | |
| Media de la clase Multimedia (606 - 1978, n=54, últimos 2 años) | |
Cámara web
La cámara web de 0,9 MP funciona con una resolución de 1280 x 720 y no es especialmente precisa en cuanto al color, con una desviación DeltaE de 9. Lo ideal sería que fuera inferior a 3.


Accesorios
Además de la documentación habitual (guía de inicio rápido, folleto de información sobre la garantía), el dispositivo también viene con un concentrador USB-C.
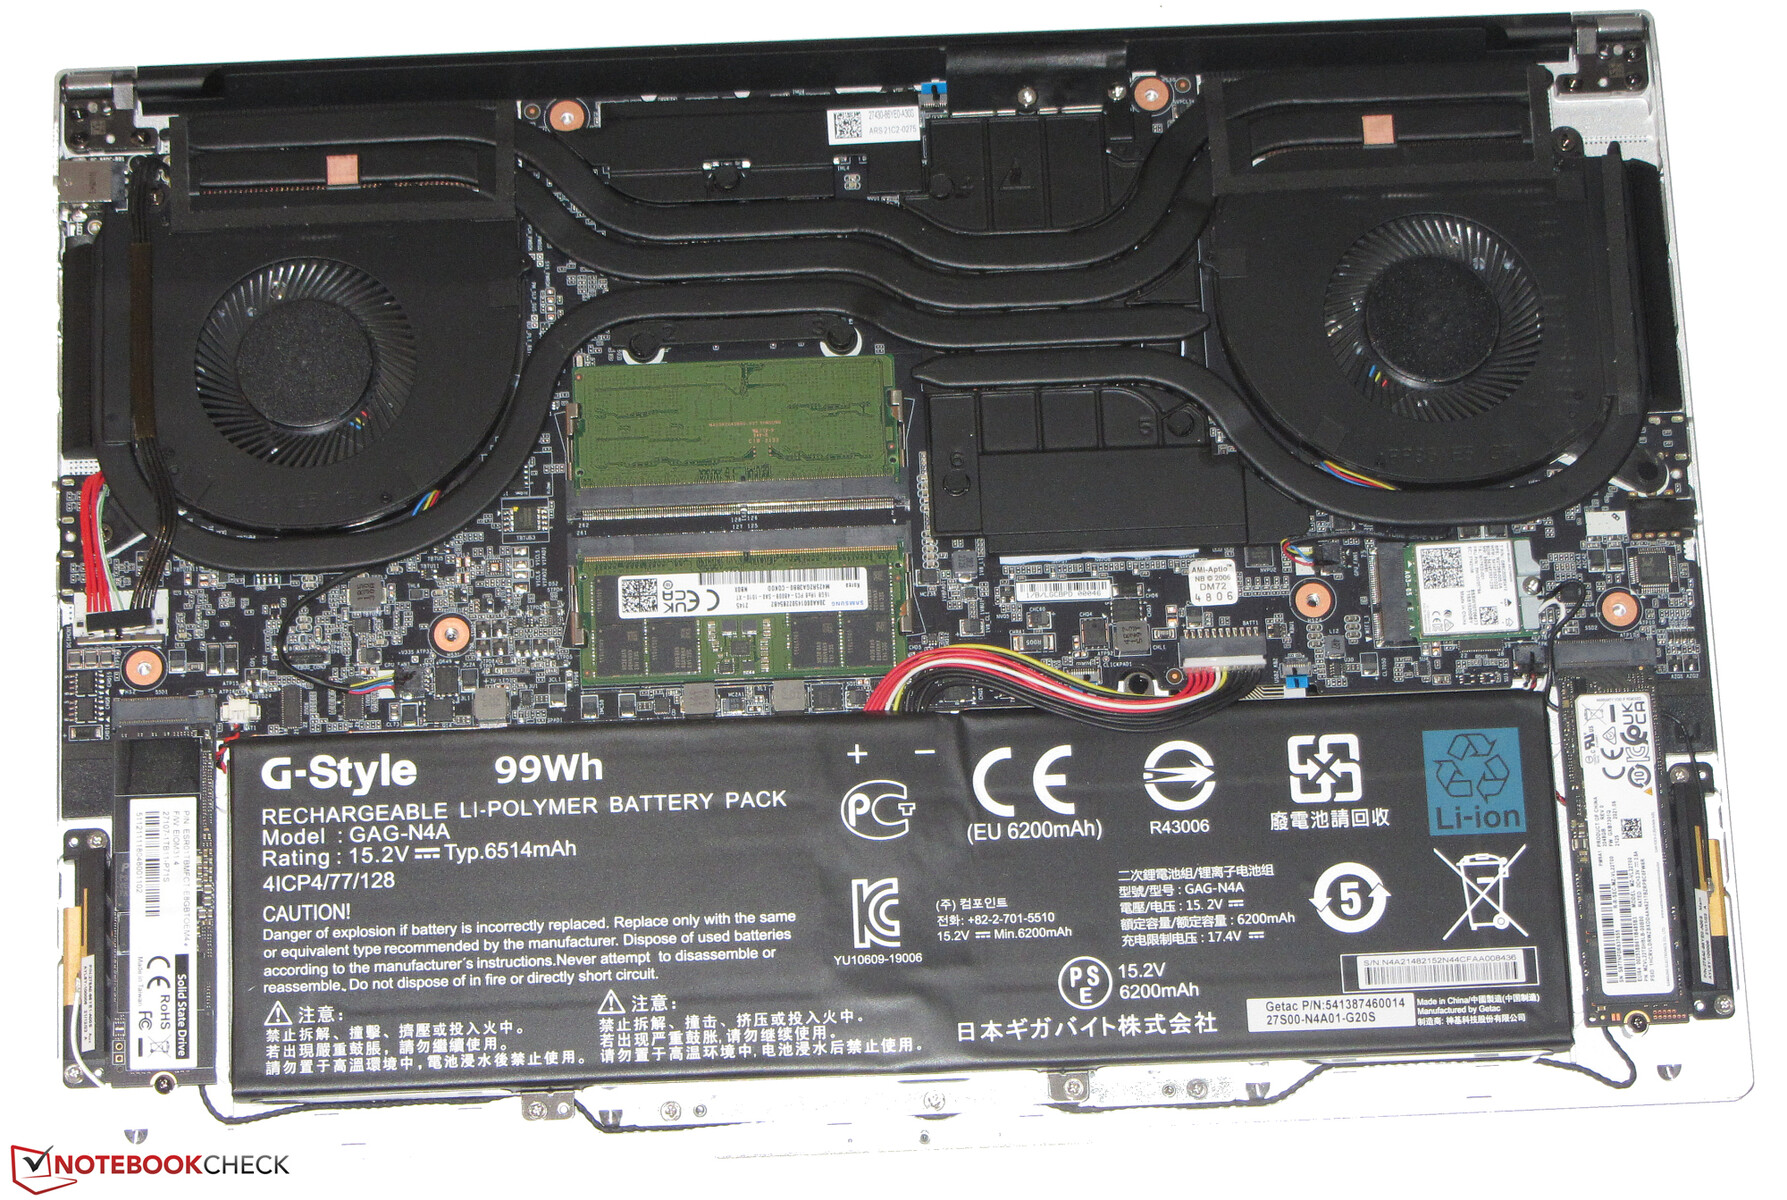
Mantenimiento
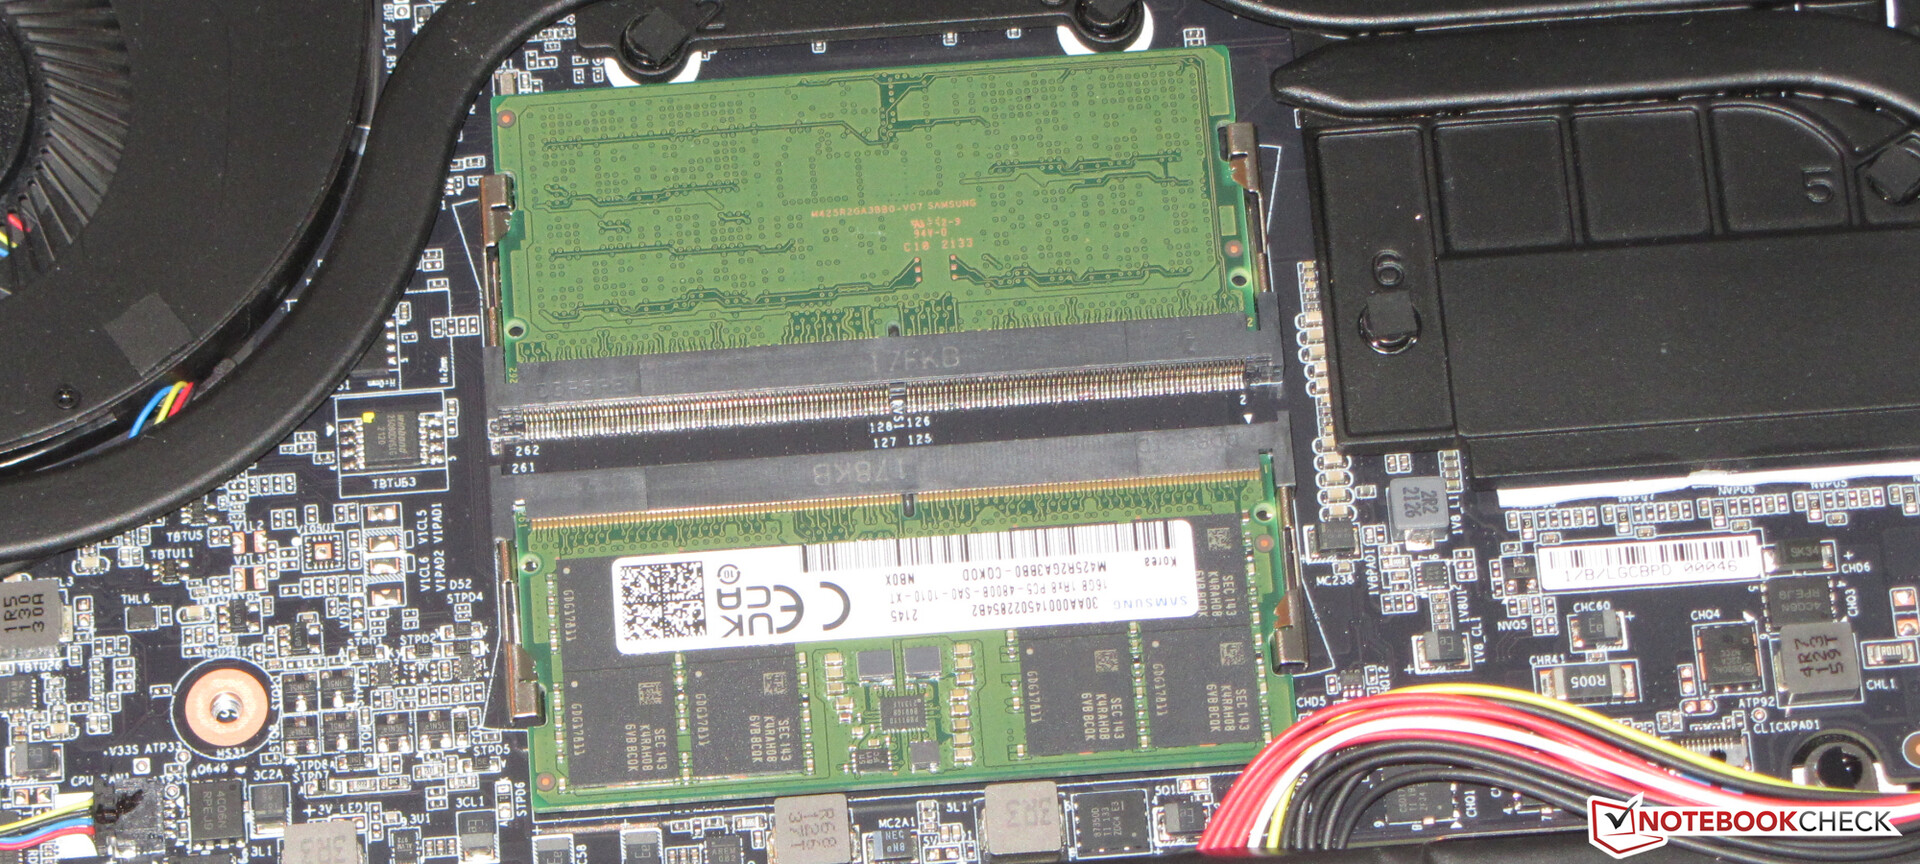
El mantenimiento y las actualizaciones son relativamente fáciles de realizar. Después de aflojar todos los tornillos de la parte inferior, la cubierta se puede quitar fácilmente con un pequeño spudger. Una vez quitada tienes acceso a ambos SSDs, el módem Wi-Fi, la RAM y los ventiladores.
Garantía
Como es habitual, los clientes europeos obtienen dos años de garantía limitada, mientras que los clientes estadounidenses vuelven a estar limitados a sólo 12 meses. Gigabyte no ofrece ninguna extensión de la garantía.
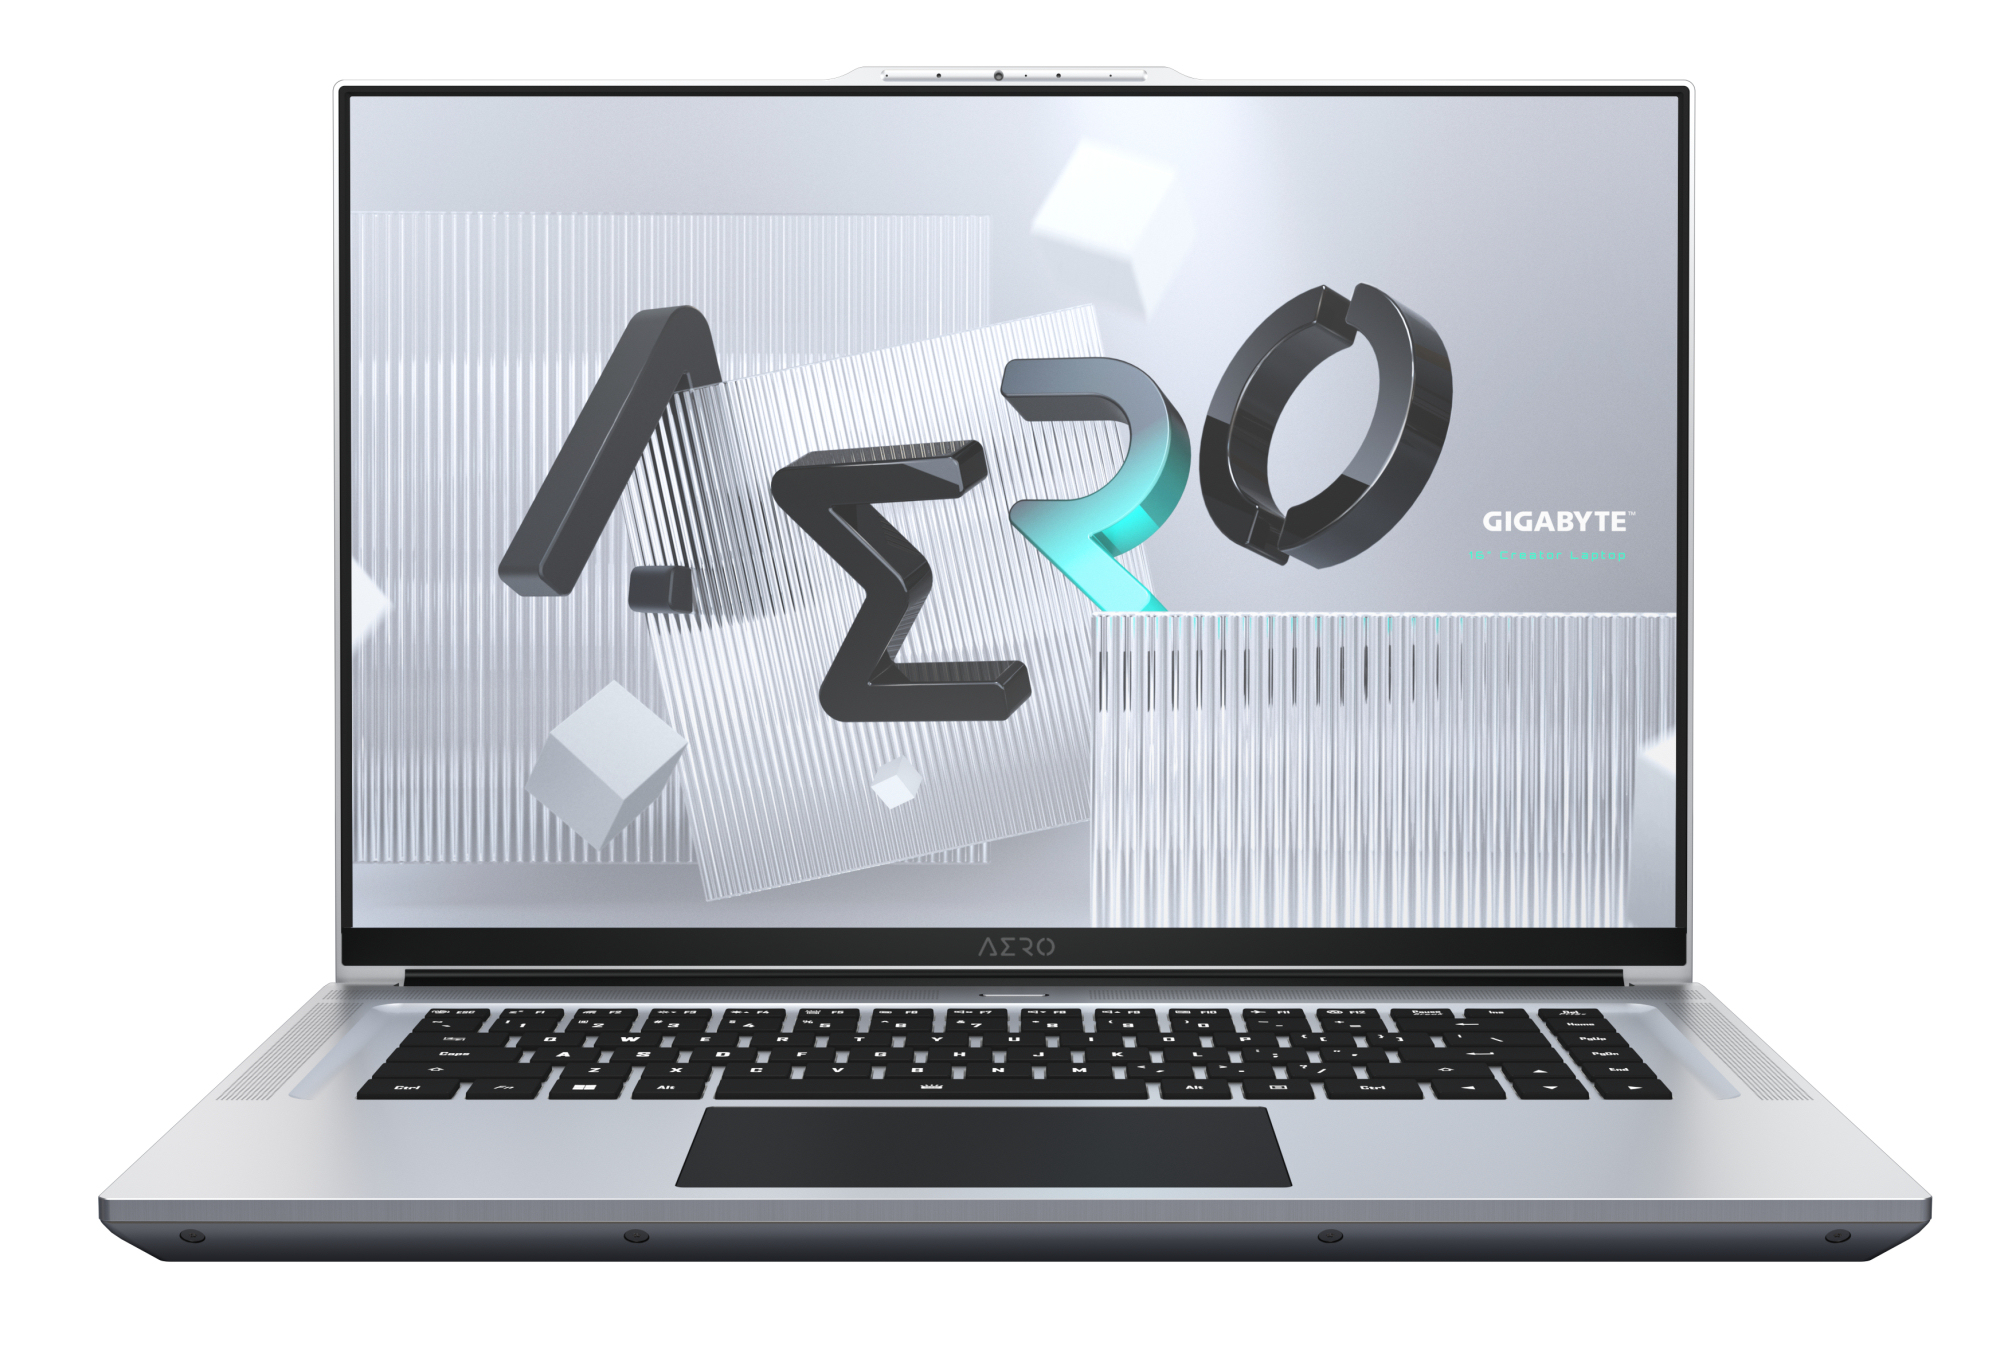
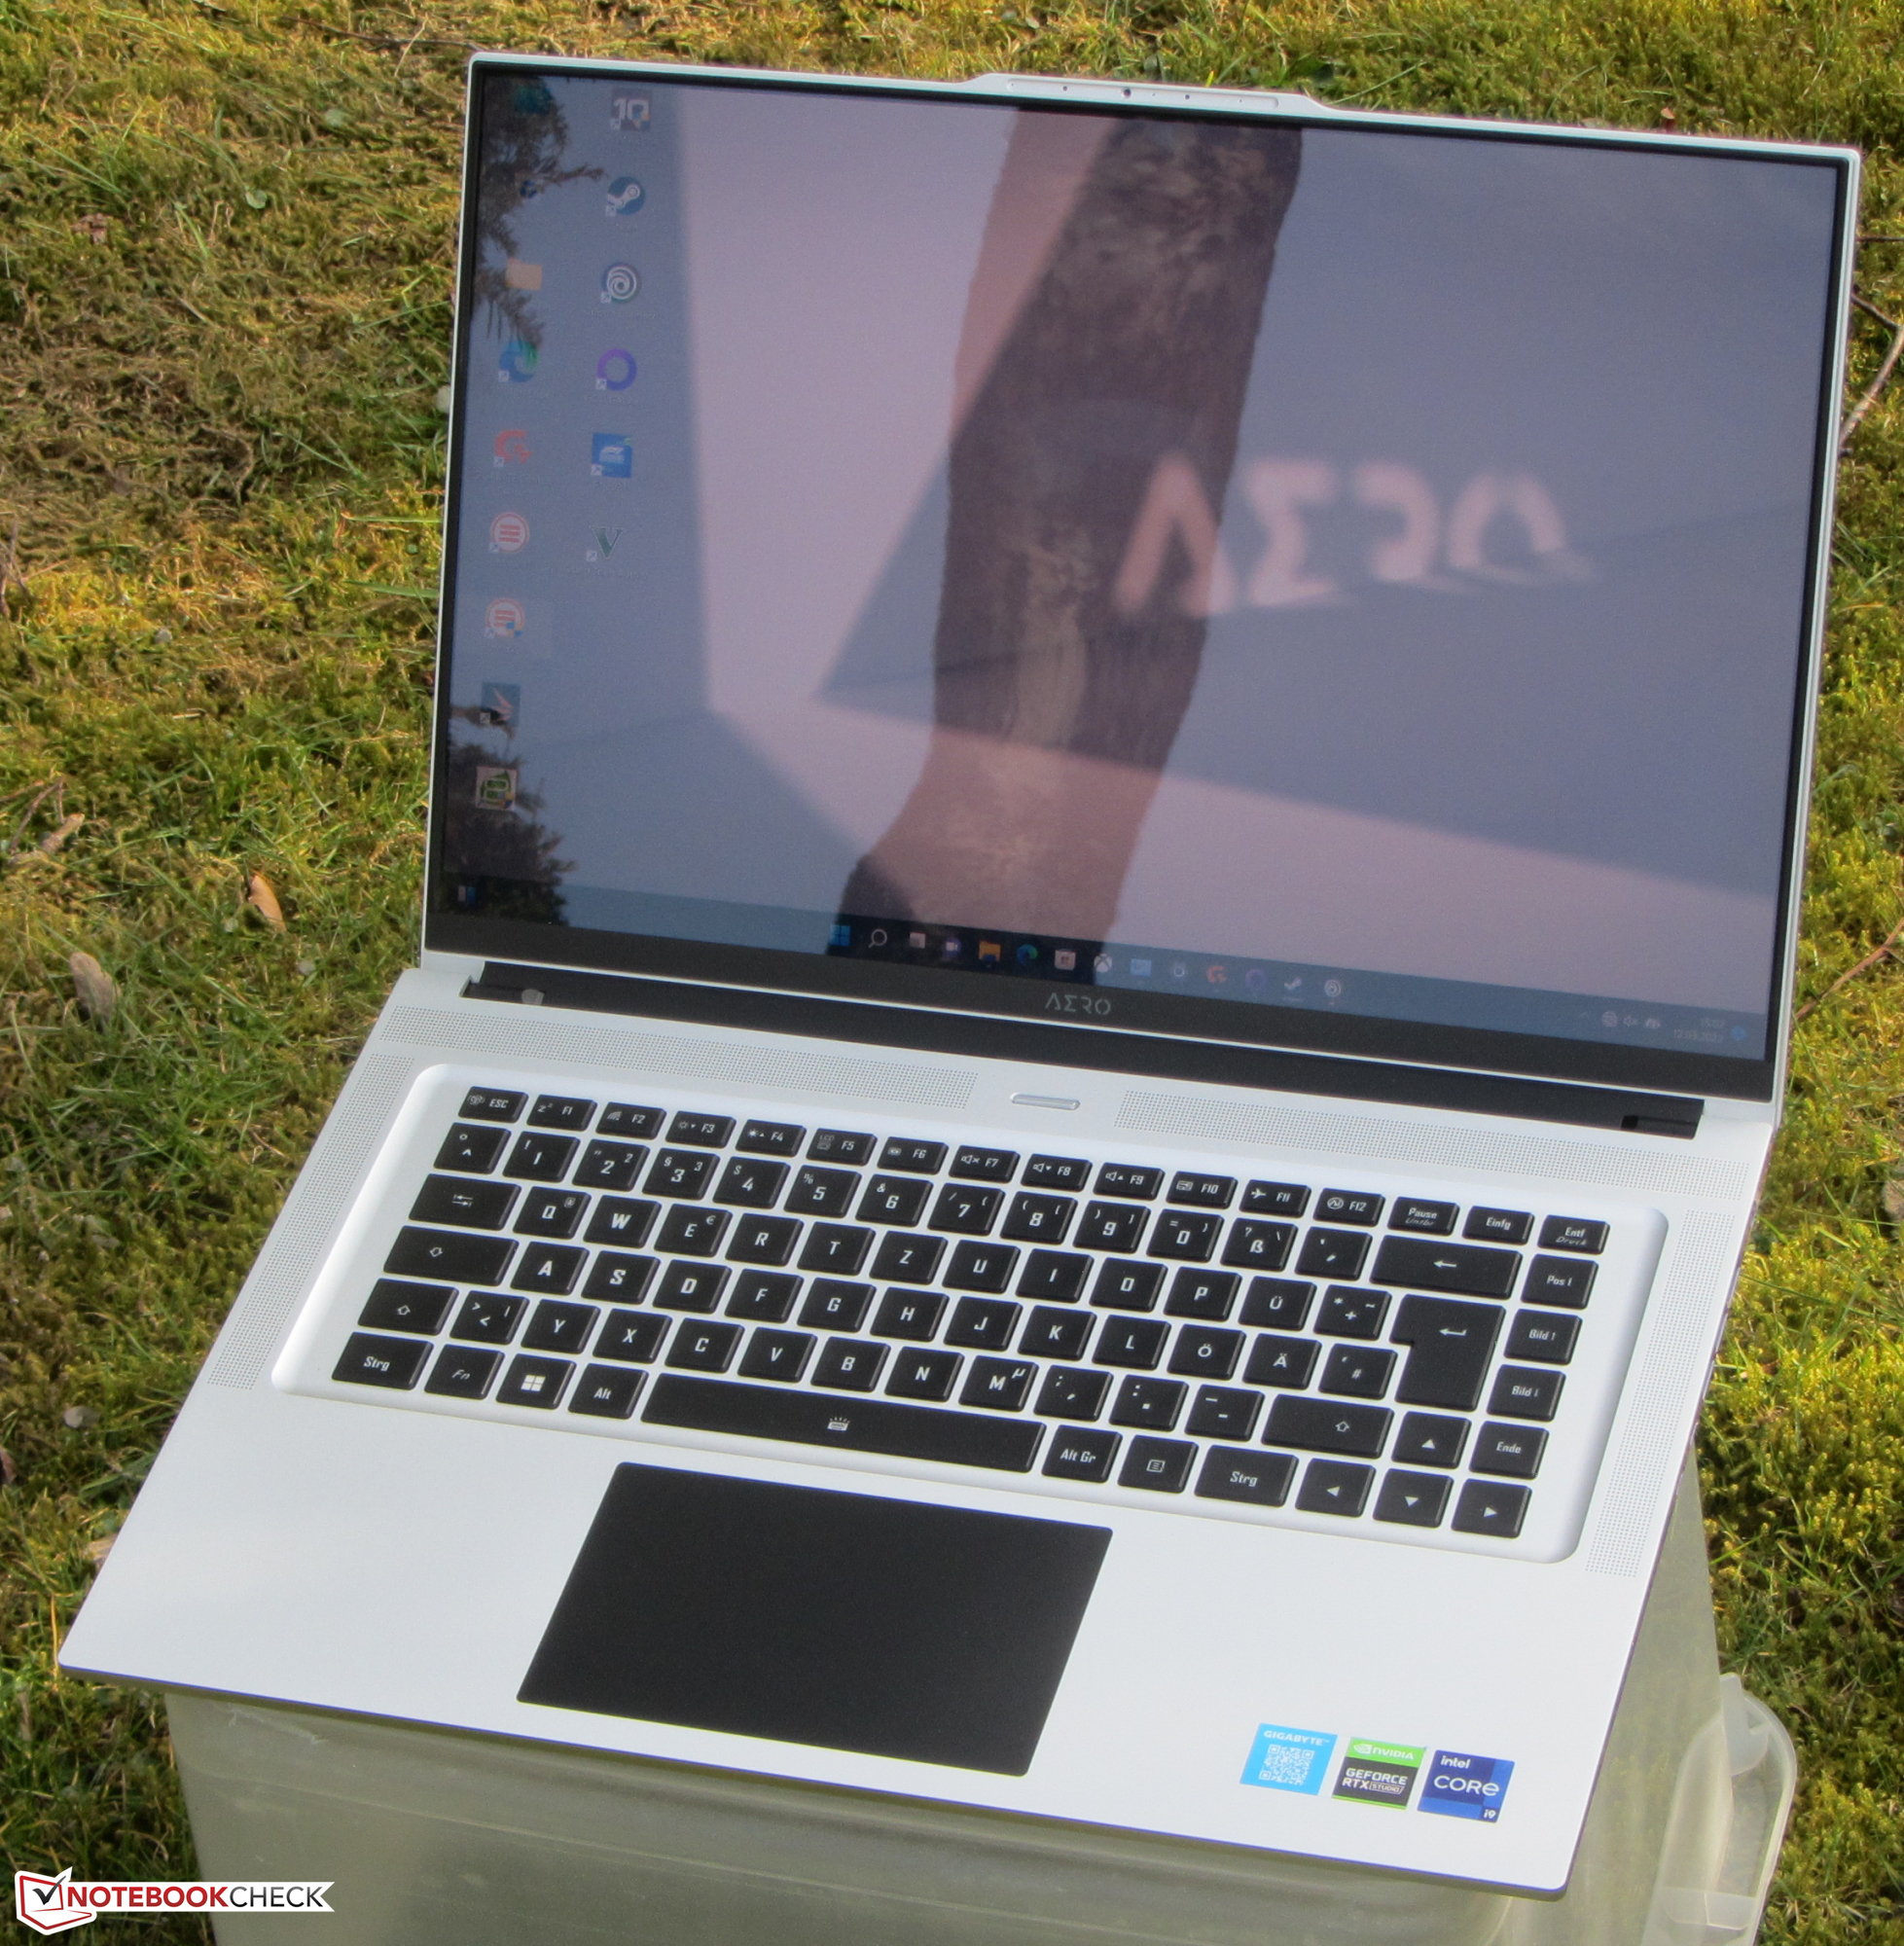
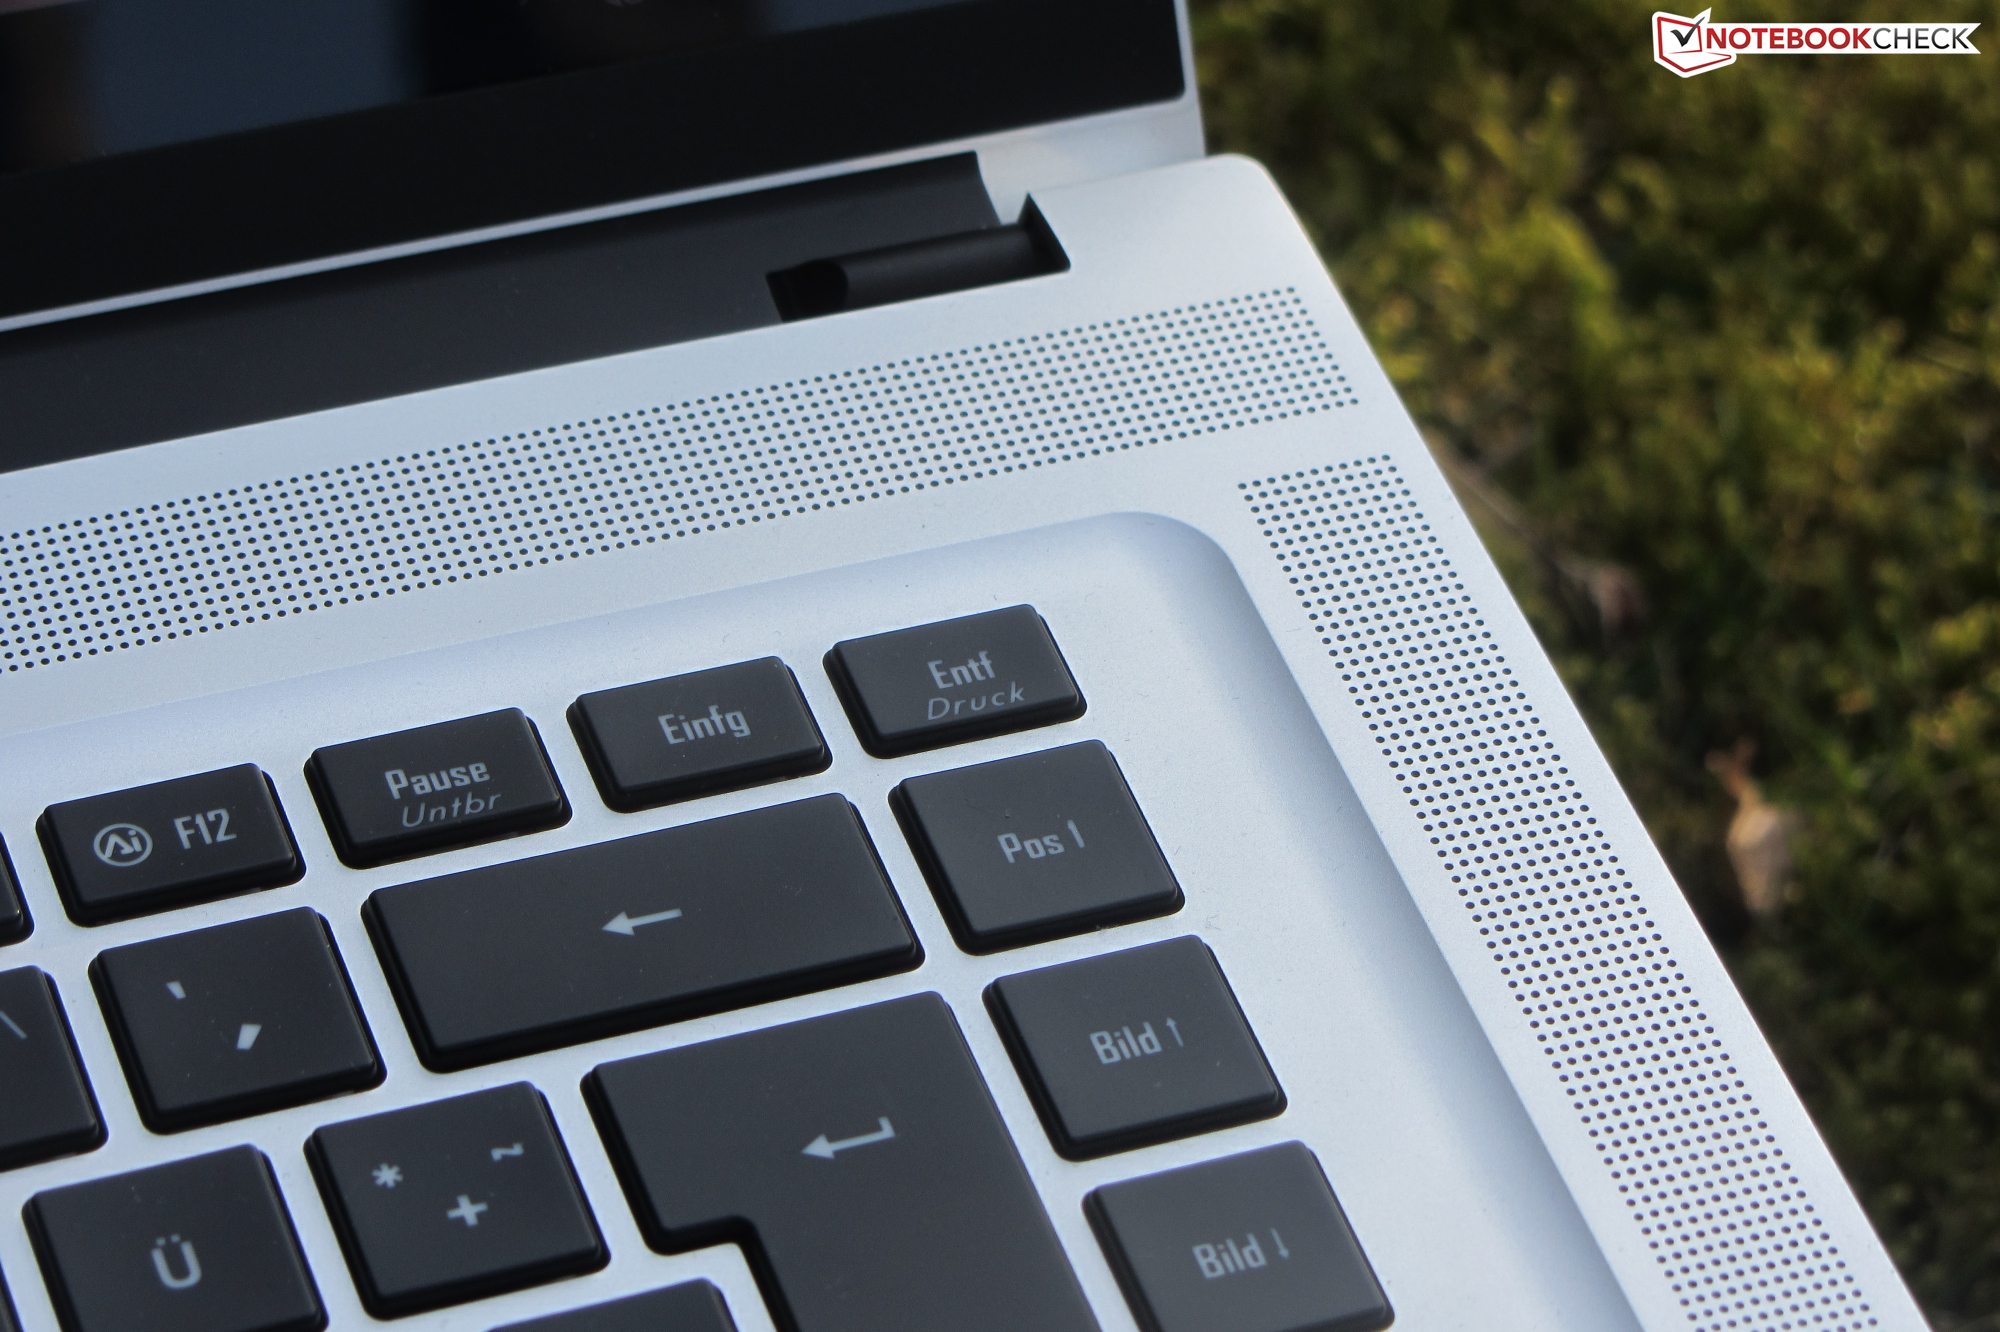
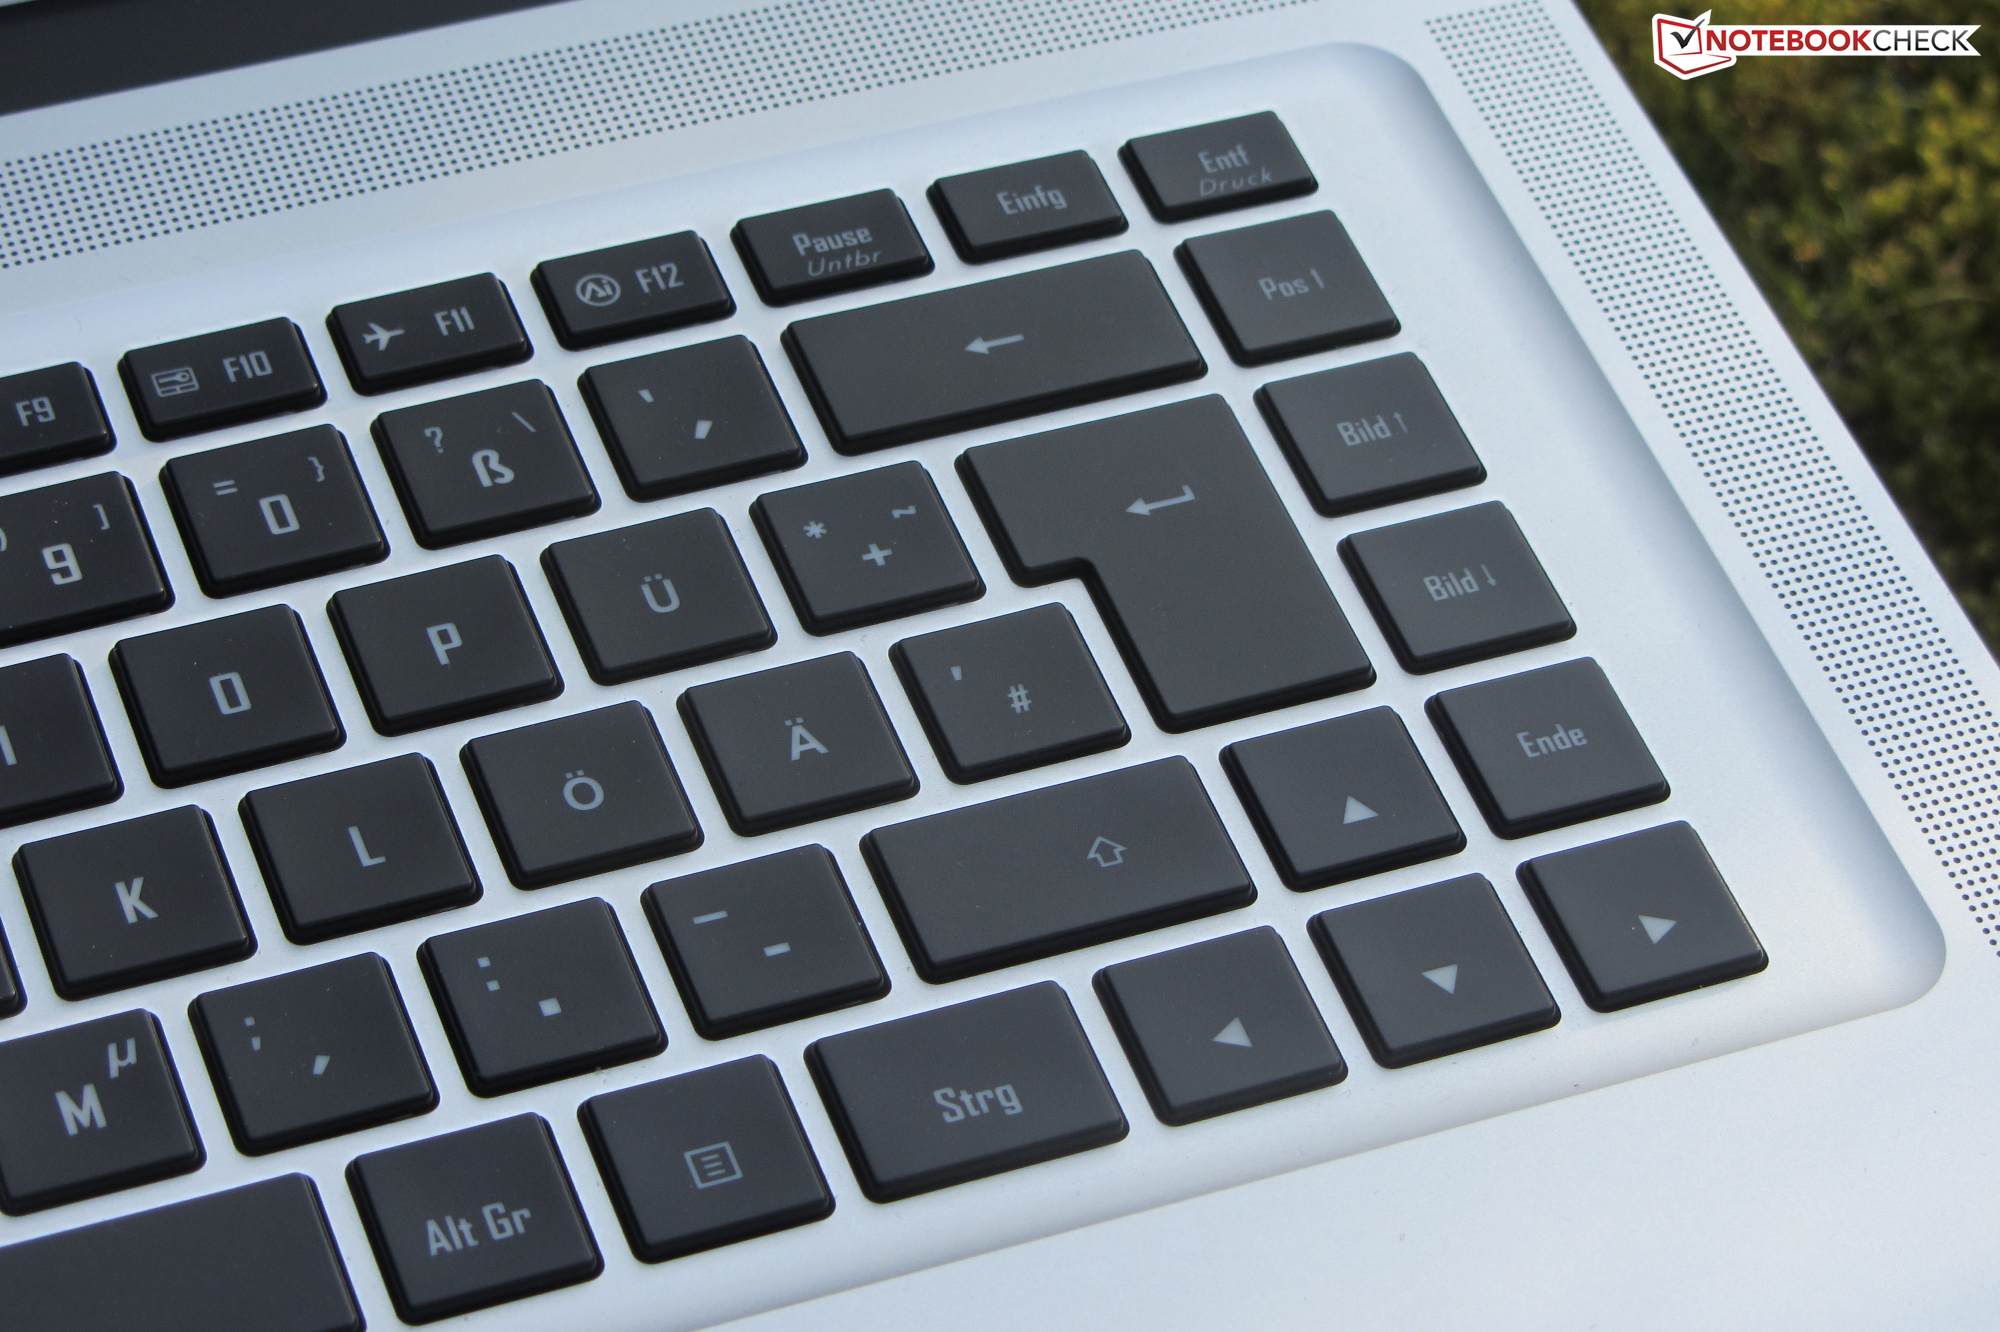
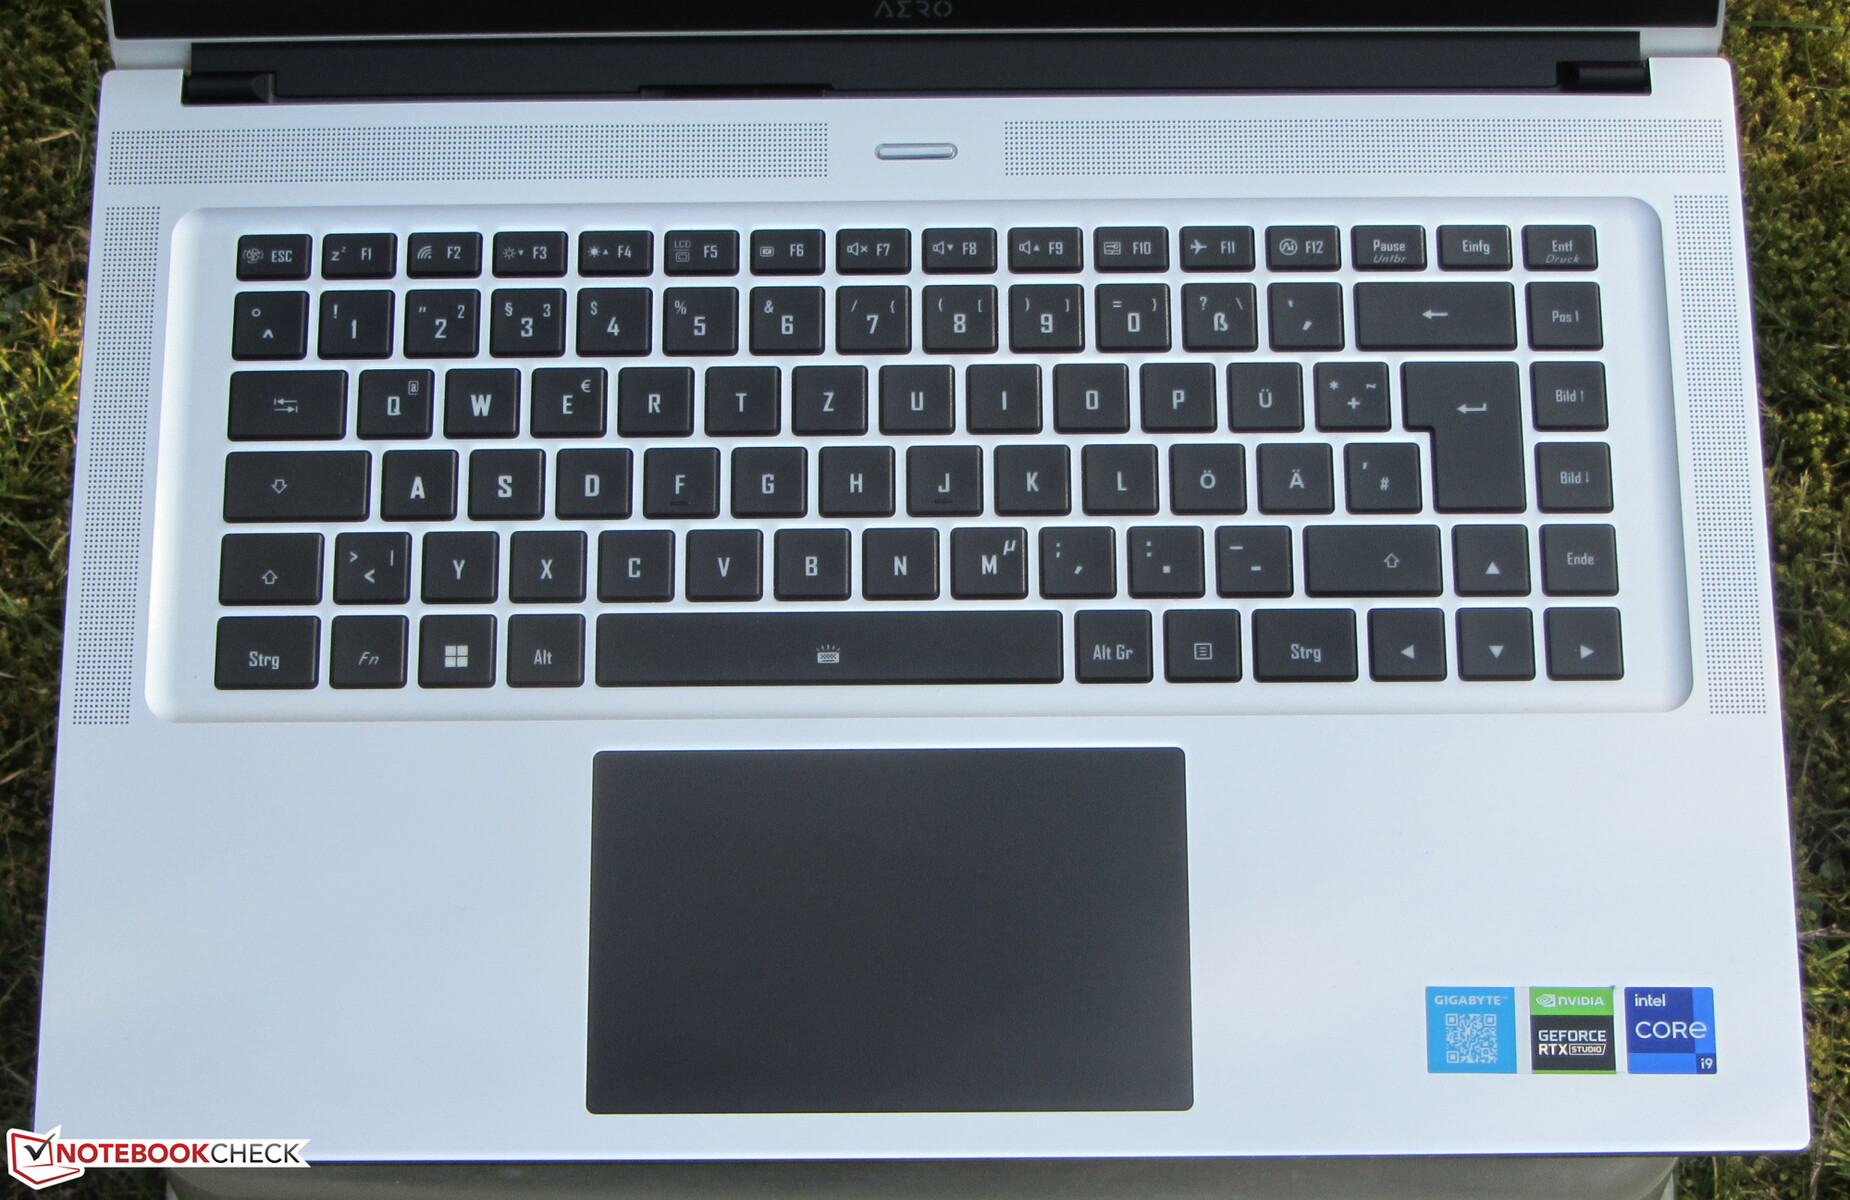
Dispositivos de entrada - Portátil Gigabyte con teclado retroiluminado
Teclado
El teclado chiclet retroiluminado es bastante suave, con un recorrido moderado de las teclas y puntos de acentuación claros con una respuesta y resistencia decentes. El teclado no se flexiona al escribir. La retroiluminación de dos niveles se controla con una tecla de función. En general, este teclado Gigabyte es decente para el uso diario.
Teclado táctil
El panel táctil multitáctil (12,1 x 7,6 cm/4,8 x 3 pulgadas) es muy suave para una gran usabilidad. Detecta la entrada del usuario hasta sus mismos bordes, y sus botones integrados presentan un recorrido bastante superficial con un claro punto de acentuación.
Pantalla - Negros profundos gracias al OLED
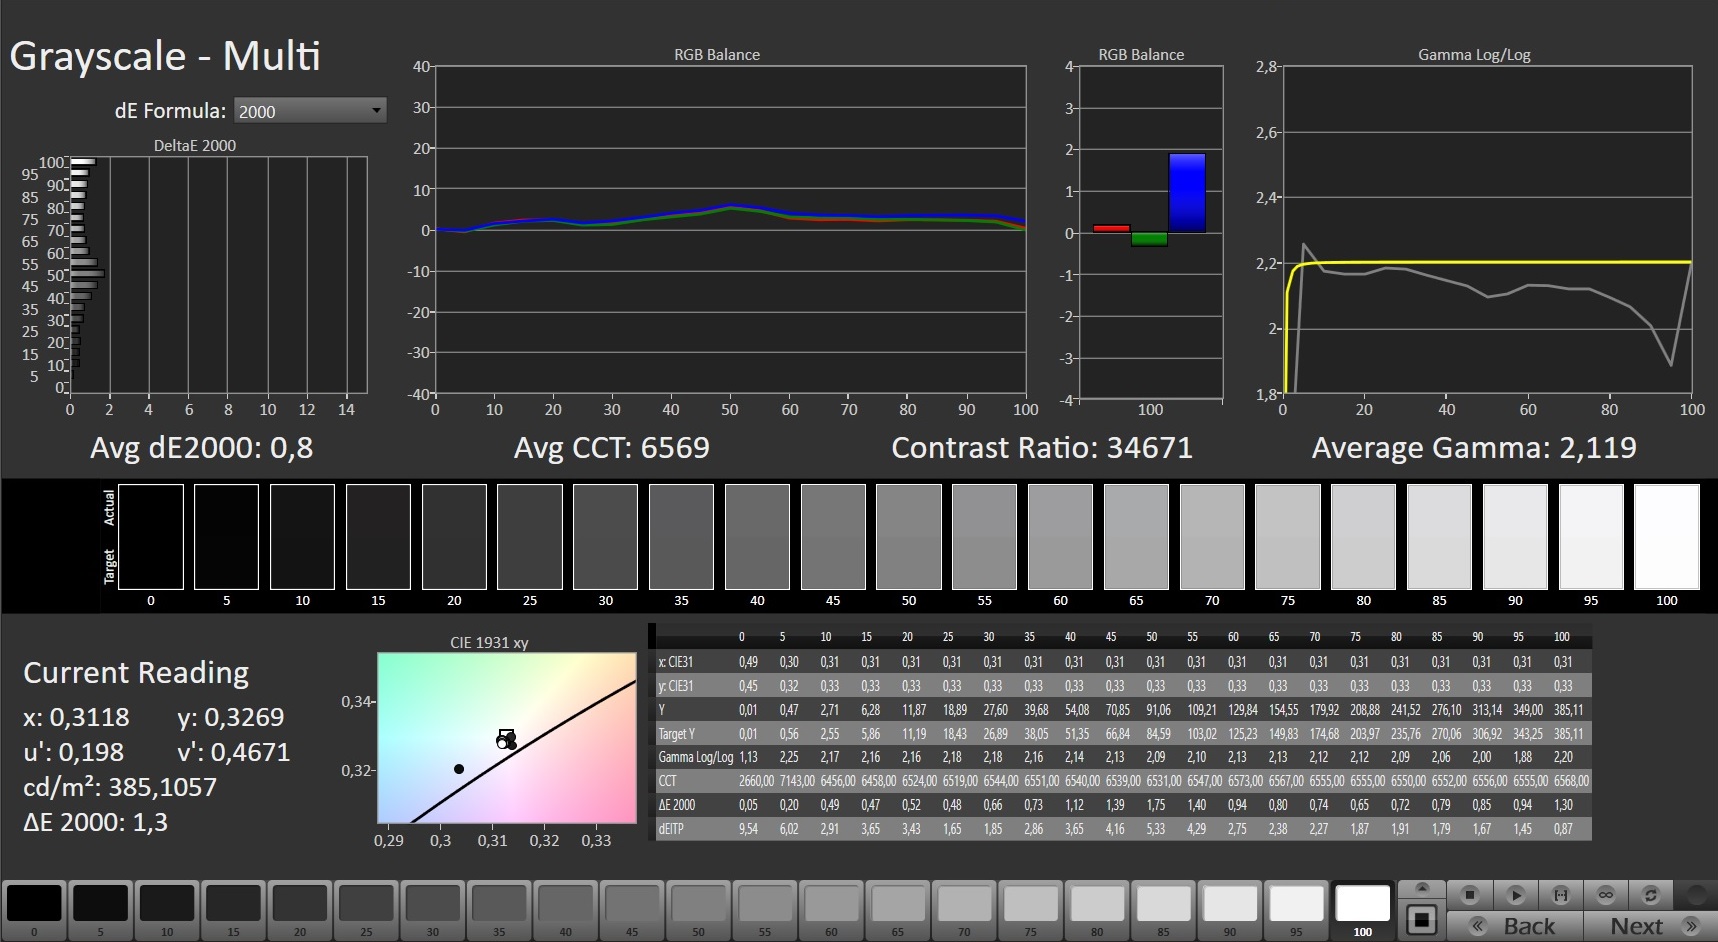
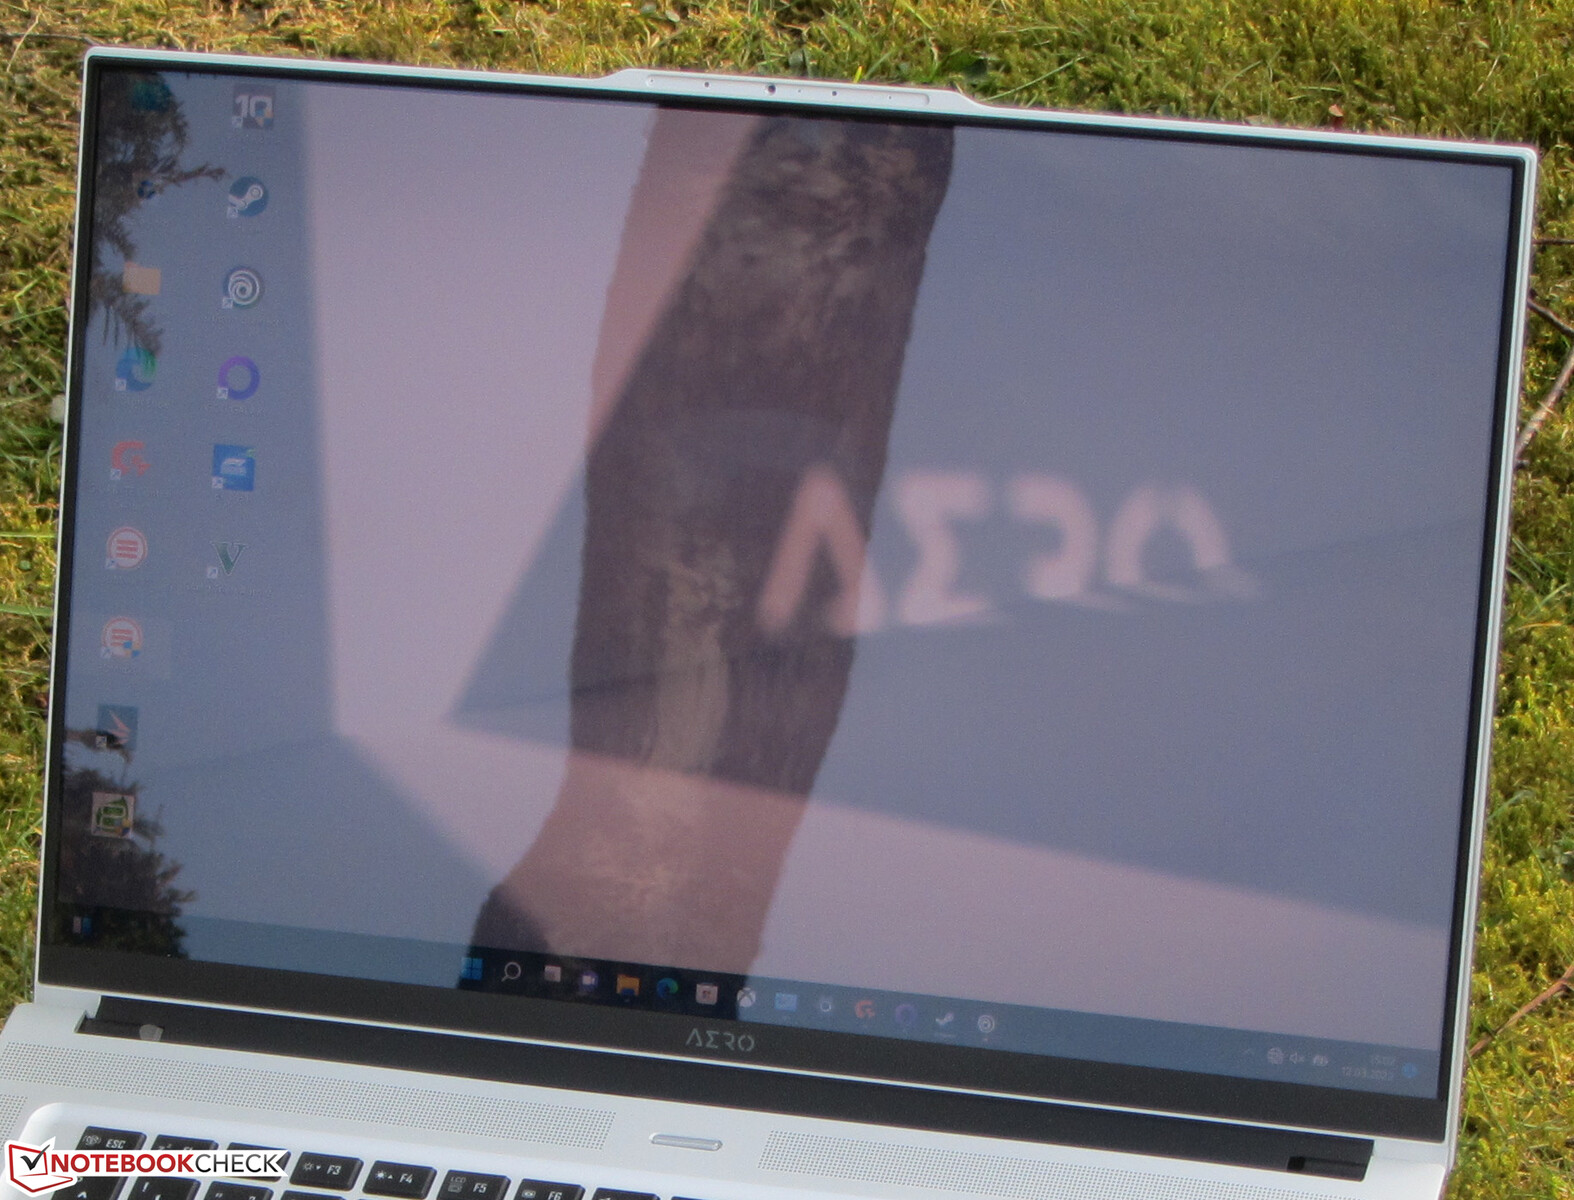
El Aero 16 viene con una pantalla OLED 4K reflectante de 16 pulgadas (3840 x 2400) con una excelente relación de contraste de 36.000:1, un nivel de negro de 0,01 y tiempos de respuesta cortos. Su brillo máximo de 367,6 nits está bien pero no se acerca a algunos de sus competidores, como el Macbook Pro 16.
A niveles de brillo del 58 % e inferiores encontramos parpadeo PWM a 60 Hz, que aumentó a 240 Hz a niveles de brillo inferiores al 26 %. Los usuarios sensibles podrían sufrir dolores de cabeza y fatiga visual debido a esta baja frecuencia.
| |||||||||||||||||||||||||
iluminación: 93 %
Brillo con batería: 368 cd/m²
Contraste: 36800:1 (Negro: 0.01 cd/m²)
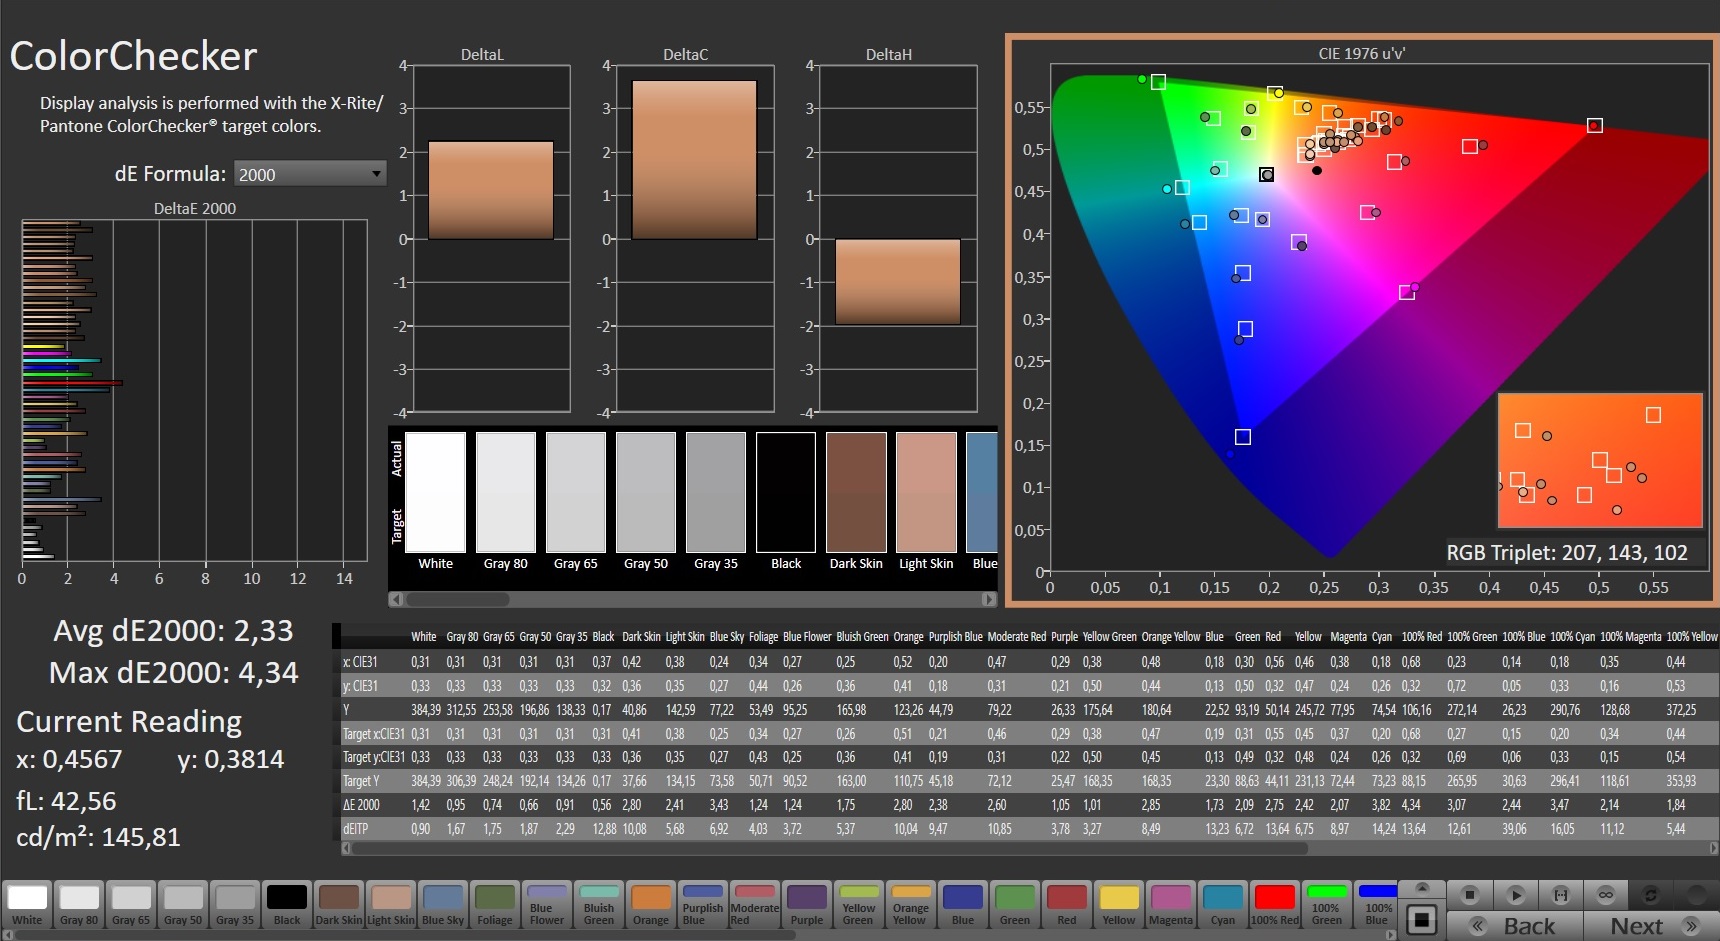
ΔE ColorChecker Calman: 2.33 | ∀{0.5-29.43 Ø4.71}
ΔE Greyscale Calman: 0.8 | ∀{0.09-98 Ø4.96}
Gamma: 2.119
CCT: 6569 K
| Gigabyte Aero 16 YE5 Samsung SDC416B, AMOLED, 3840x2400, 16" | Apple MacBook Pro 16 2021 M1 Max Mini-LED, 3456x2234, 16.2" | HP ZBook Studio 15 G8 SDC4145, OLED, 3840x2160, 15.6" | Schenker XMG Pro 15 (Late 2021) Samsung ATNA56WR14-0, OLED, 3840x2160, 15.6" | Razer Blade 15 2022 Sharp LQ156T1JW03, IPS, 2560x1440, 15.6" | Lenovo ThinkPad X1 Extreme G4-20Y5CTO1WW (3050 Ti) LP160UQ1-SPB1, IPS LED, 3840x2400, 16" | |
|---|---|---|---|---|---|---|
| Display | ||||||
| Display P3 Coverage (%) | 99.9 | 81.2 | 99.1 | 84.3 | ||
| sRGB Coverage (%) | 100 | 97.7 | 99.9 | 98.3 | ||
| AdobeRGB 1998 Coverage (%) | 95.3 | 89.1 | 86.8 | 97.8 | ||
| Response Times | -10% | -7% | -490% | -2200% | ||
| Response Time Grey 50% / Grey 80% * (ms) | 2.4 ? | 2.4 ? -0% | 3.2 ? -33% | 14.4 ? -500% | 60 ? -2400% | |
| Response Time Black / White * (ms) | 2 ? | 2.4 ? -20% | 1.6 ? 20% | 11.6 ? -480% | 42 ? -2000% | |
| PWM Frequency (Hz) | 60 ? | 240.4 ? | 60 ? | |||
| Screen | -21% | -70% | -58% | -328% | -587% | |
| Brightness middle (cd/m²) | 368 | 507 38% | 379.6 3% | 443 20% | 286 -22% | 639 74% |
| Brightness (cd/m²) | 368 | 494 34% | 380 3% | 434 18% | 271 -26% | 612 66% |
| Brightness Distribution (%) | 93 | 96 3% | 95 2% | 94 1% | 89 -4% | 84 -10% |
| Black Level * (cd/m²) | 0.01 | 0.02 -100% | 0.02 -100% | 0.25 -2400% | 0.47 -4600% | |
| Contrast (:1) | 36800 | 25350 -31% | 22150 -40% | 1144 -97% | 1360 -96% | |
| Colorchecker dE 2000 * | 2.33 | 1.4 40% | 5.15 -121% | 3.73 -60% | 2.74 -18% | 2.2 6% |
| Colorchecker dE 2000 max. * | 4.34 | 2.8 35% | 7.79 -79% | 8.12 -87% | 5.21 -20% | 5.3 -22% |
| Greyscale dE 2000 * | 0.8 | 2.3 -187% | 2.6 -225% | 2.5 -213% | 1.1 -38% | 1.7 -113% |
| Gamma | 2.119 104% | 2.27 97% | 1.99 111% | 2.001 110% | 2.2 100% | 2.31 95% |
| CCT | 6569 99% | 6792 96% | 6166 105% | 6522 100% | 6408 101% | 6390 102% |
| Colorchecker dE 2000 calibrated * | 3.1 | 2.52 | 1.4 | |||
| Media total (Programa/Opciones) | -21% /
-21% | -40% /
-55% | -33% /
-47% | -409% /
-361% | -1394% /
-910% |
* ... más pequeño es mejor
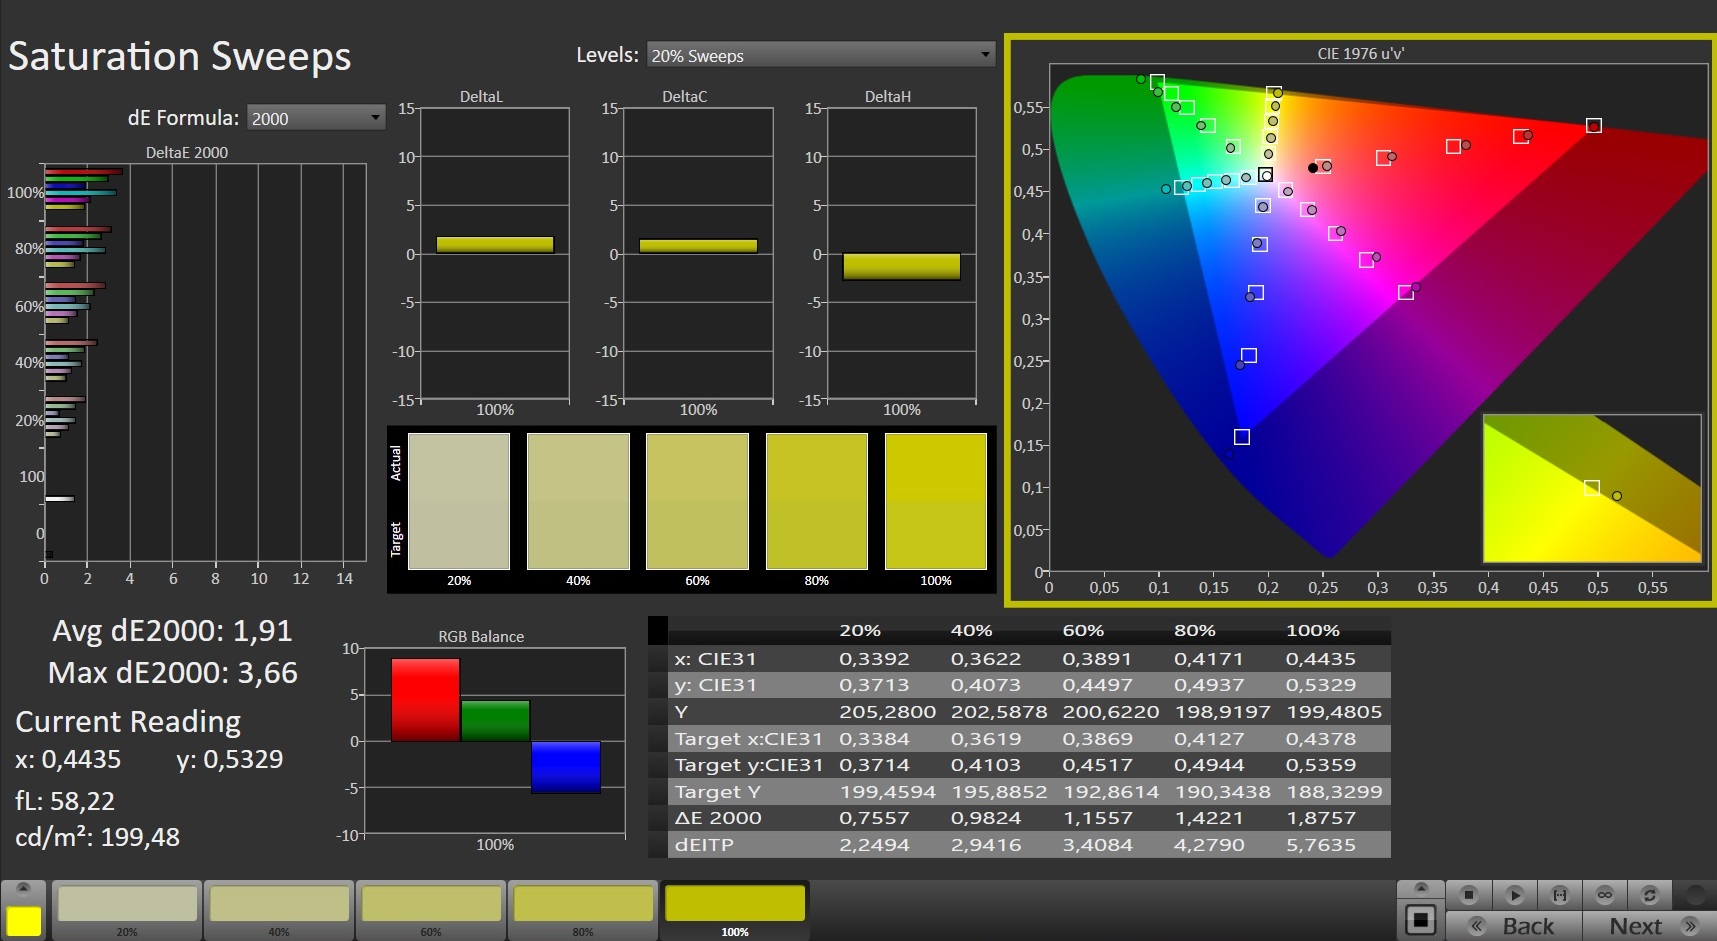
La pantalla está certificada por X-Rite Pantone para garantizar una representación natural del color y, como era de esperar, las desviaciones de color fueron muy pequeñas e imperceptibles al sacarla de la caja. Tampoco encontramos evidencia de un tinte azul. En este punto de la revisión, normalmente le presentaríamos y comentaríamos nuestras lecturas de cobertura del espacio de color. Sin embargo, hemos decidido retenerlas por el momento ya que difieren enormemente de las especificaciones oficiales de Gigabyte y no podemos descartar problemas con nuestro equipo de pruebas en este momento.
Tiempos de respuesta del display
| ↔ Tiempo de respuesta de Negro a Blanco | ||
|---|---|---|
| 2 ms ... subida ↗ y bajada ↘ combinada | ↗ 1 ms subida | 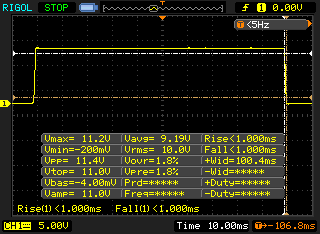 |
| ↘ 1 ms bajada | ||
| La pantalla mostró tiempos de respuesta muy rápidos en nuestros tests y debería ser adecuada para juegos frenéticos. En comparación, todos los dispositivos de prueba van de ##min### (mínimo) a 240 (máximo) ms. » 11 % de todos los dispositivos son mejores. Esto quiere decir que el tiempo de respuesta medido es mejor que la media (19.8 ms) de todos los dispositivos testados. | ||
| ↔ Tiempo de respuesta 50% Gris a 80% Gris | ||
| 2.4 ms ... subida ↗ y bajada ↘ combinada | ↗ 1.2 ms subida | 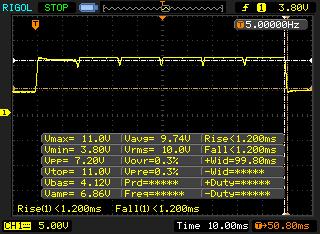 |
| ↘ 1.2 ms bajada | ||
| La pantalla mostró tiempos de respuesta muy rápidos en nuestros tests y debería ser adecuada para juegos frenéticos. En comparación, todos los dispositivos de prueba van de ##min### (mínimo) a 636 (máximo) ms. » 11 % de todos los dispositivos son mejores. Esto quiere decir que el tiempo de respuesta medido es mejor que la media (31 ms) de todos los dispositivos testados. | ||
Parpadeo de Pantalla / PWM (Pulse-Width Modulation)
| Parpadeo de Pantalla / PWM detectado | 60 Hz | ≤ 58 % de brillo | 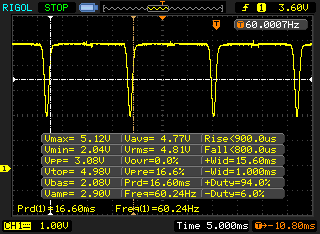 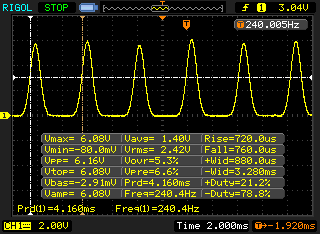 |
La retroiluminación del display parpadea a 60 Hz (seguramente usa PWM - Pulse-Width Modulation) a un brillo del 58 % e inferior. Sobre este nivel de brillo no debería darse parpadeo / PWM. La frecuencia de 60 Hz es bajísima, por lo que el parpadeo puede causar fatiga visual y cefaleas cuando se usa mucho tiempo. Comparación: 52 % de todos los dispositivos testados no usaron PWM para atenuar el display. Si se usó, medimos una media de 7754 (mínimo: 5 - máxmo: 343500) Hz. | |||
El panel ofrece ángulos de visión muy amplios y es fácilmente legible desde cualquier posición. En exteriores, nos pareció que el revestimiento reflectante dificultaba drásticamente la usabilidad.

Rendimiento: un portátil Gigabyte con un rendimiento de vanguardia
El Gigabyte Aero 16 es un potente y compacto portátil de 16 pulgadas con una gran versatilidad de uso en todos los ámbitos. Su certificación GeForce RTX Studio garantiza un alto rendimiento, controladores optimizados, buena compatibilidad de software y una gran cobertura del espacio de color.
Condiciones de la prueba
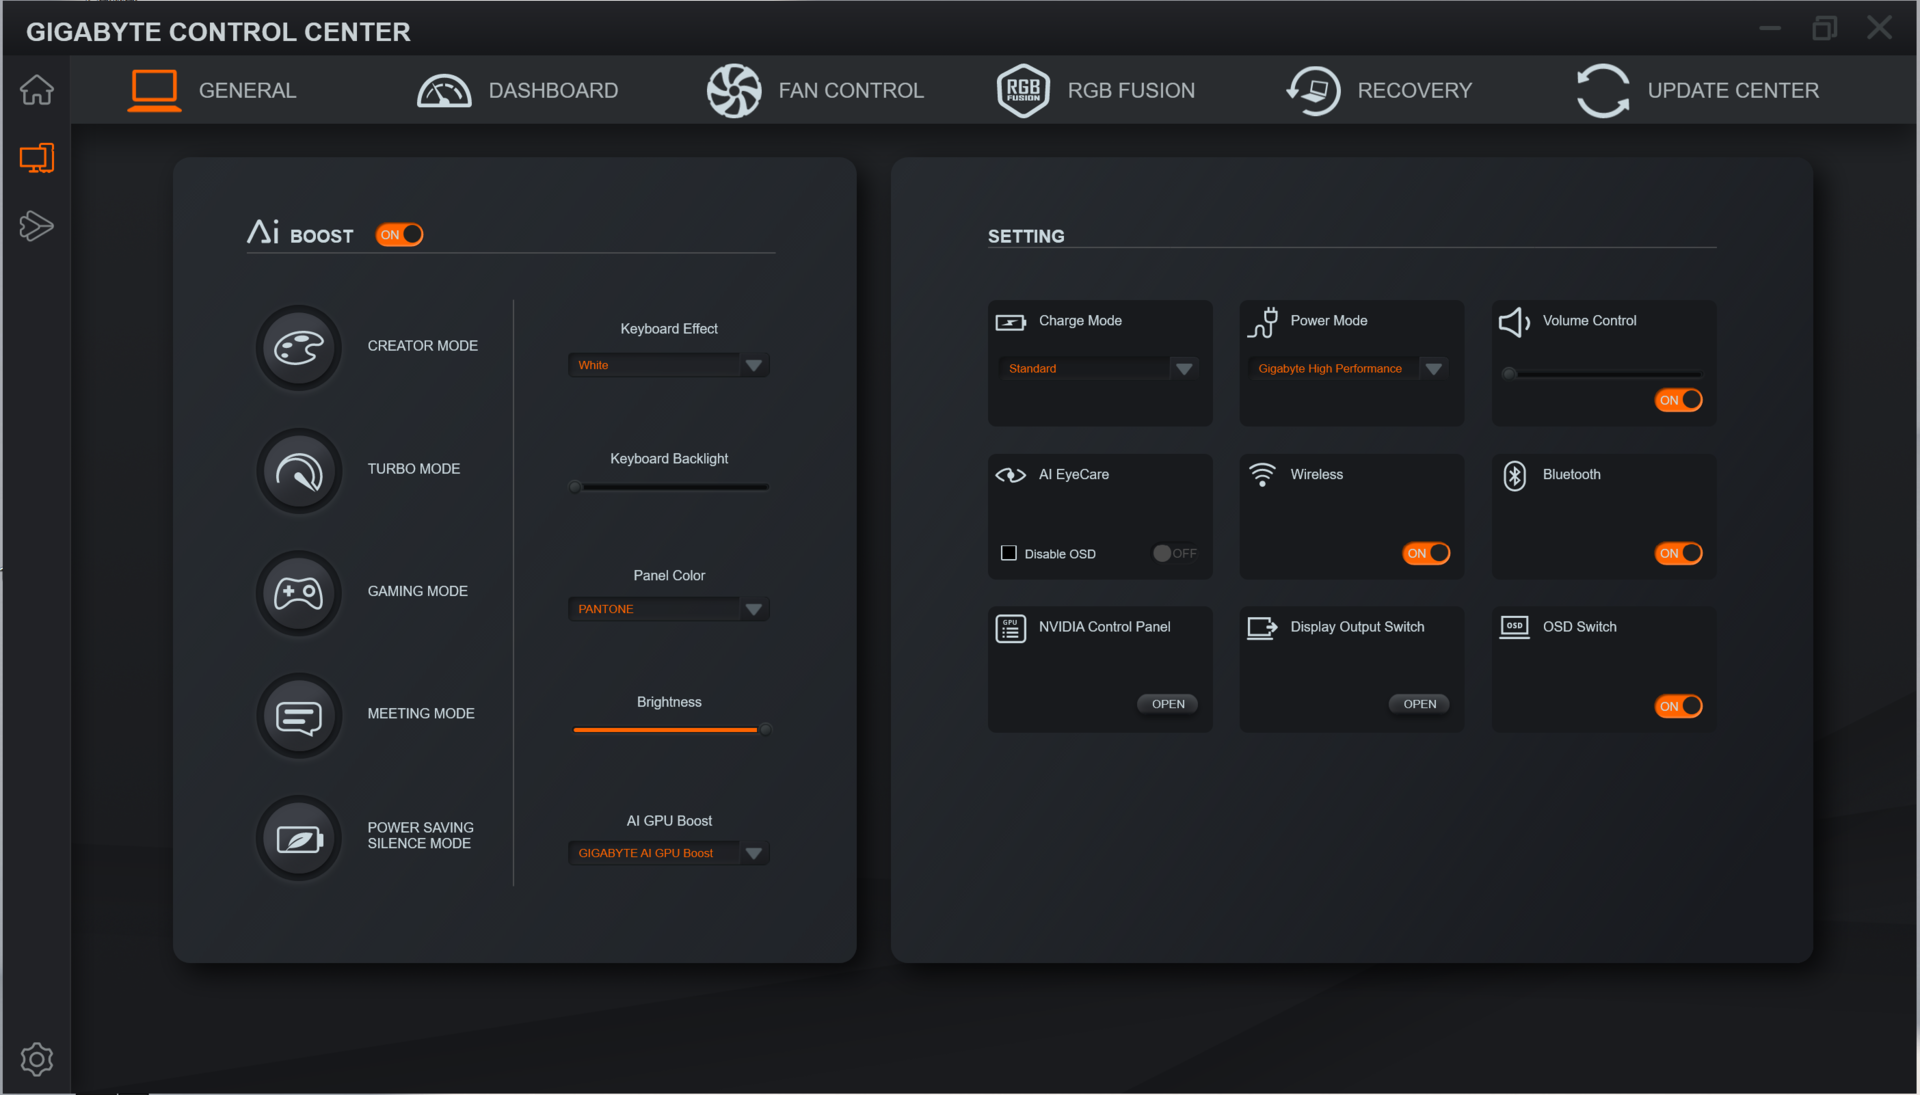
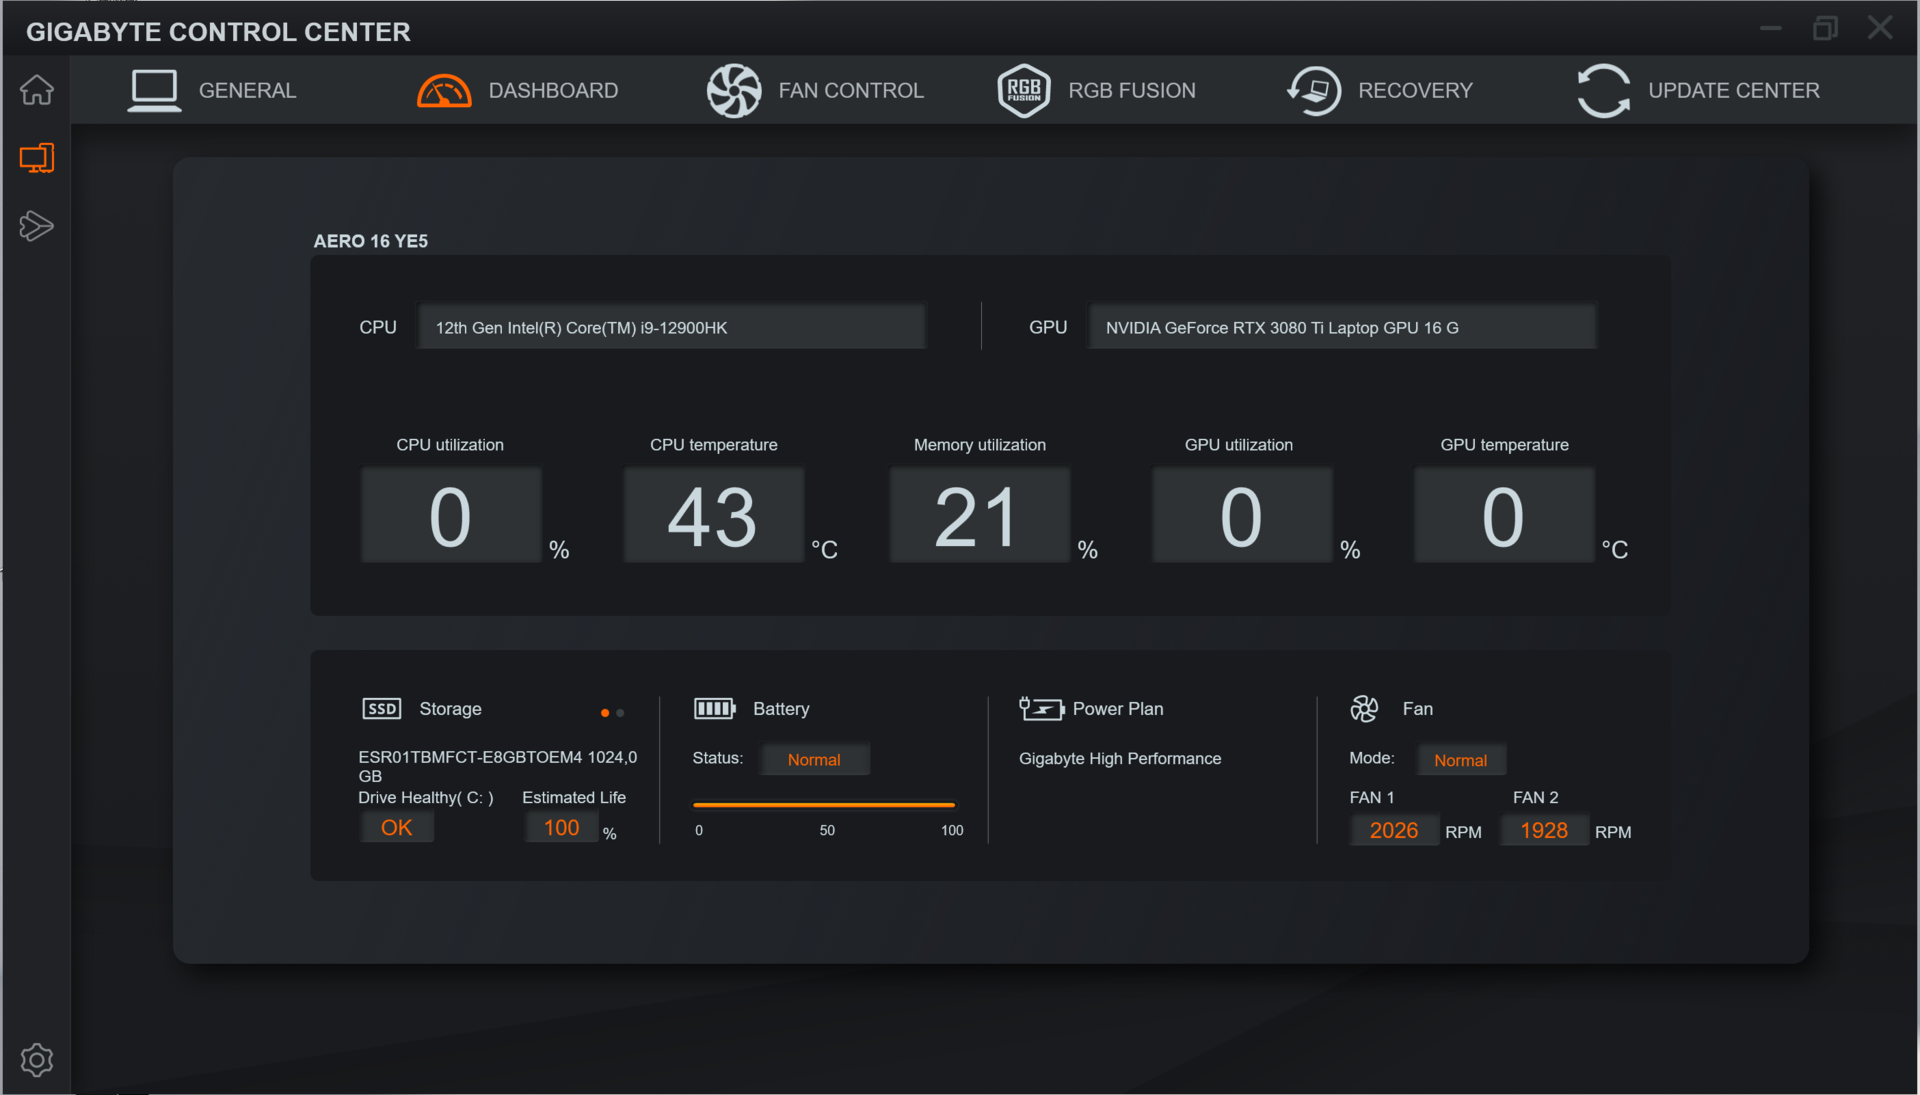
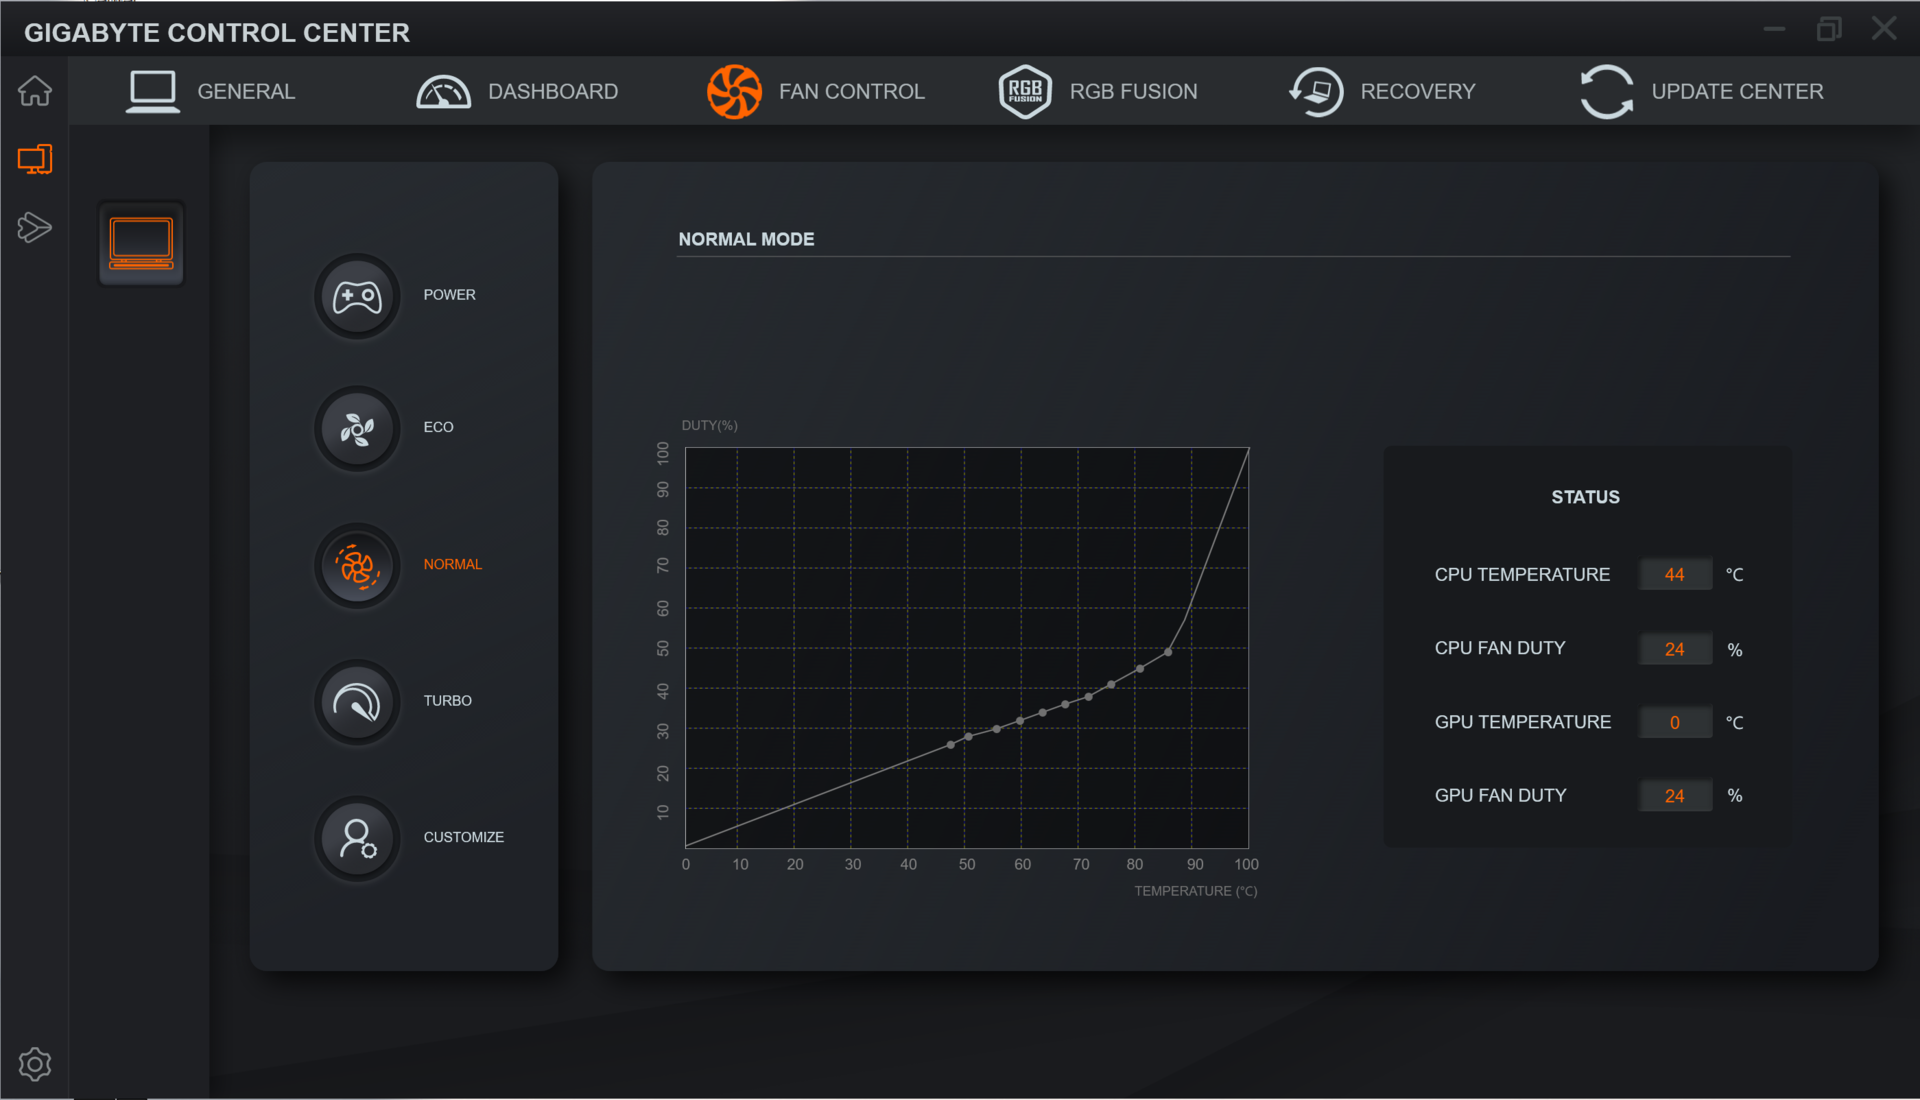
El dispositivo viene con el Gigabyte Control Center precargado, que ofrece varios perfiles de rendimiento. Estos no sólo afectan al rendimiento de la CPU y la GPU, sino también al brillo y la temperatura de color del display. Decidimos confiar nuestro destino al modo AI incluido, permitiendo que el Centro de Control tome esa decisión y elija el mejor perfil para nosotros.
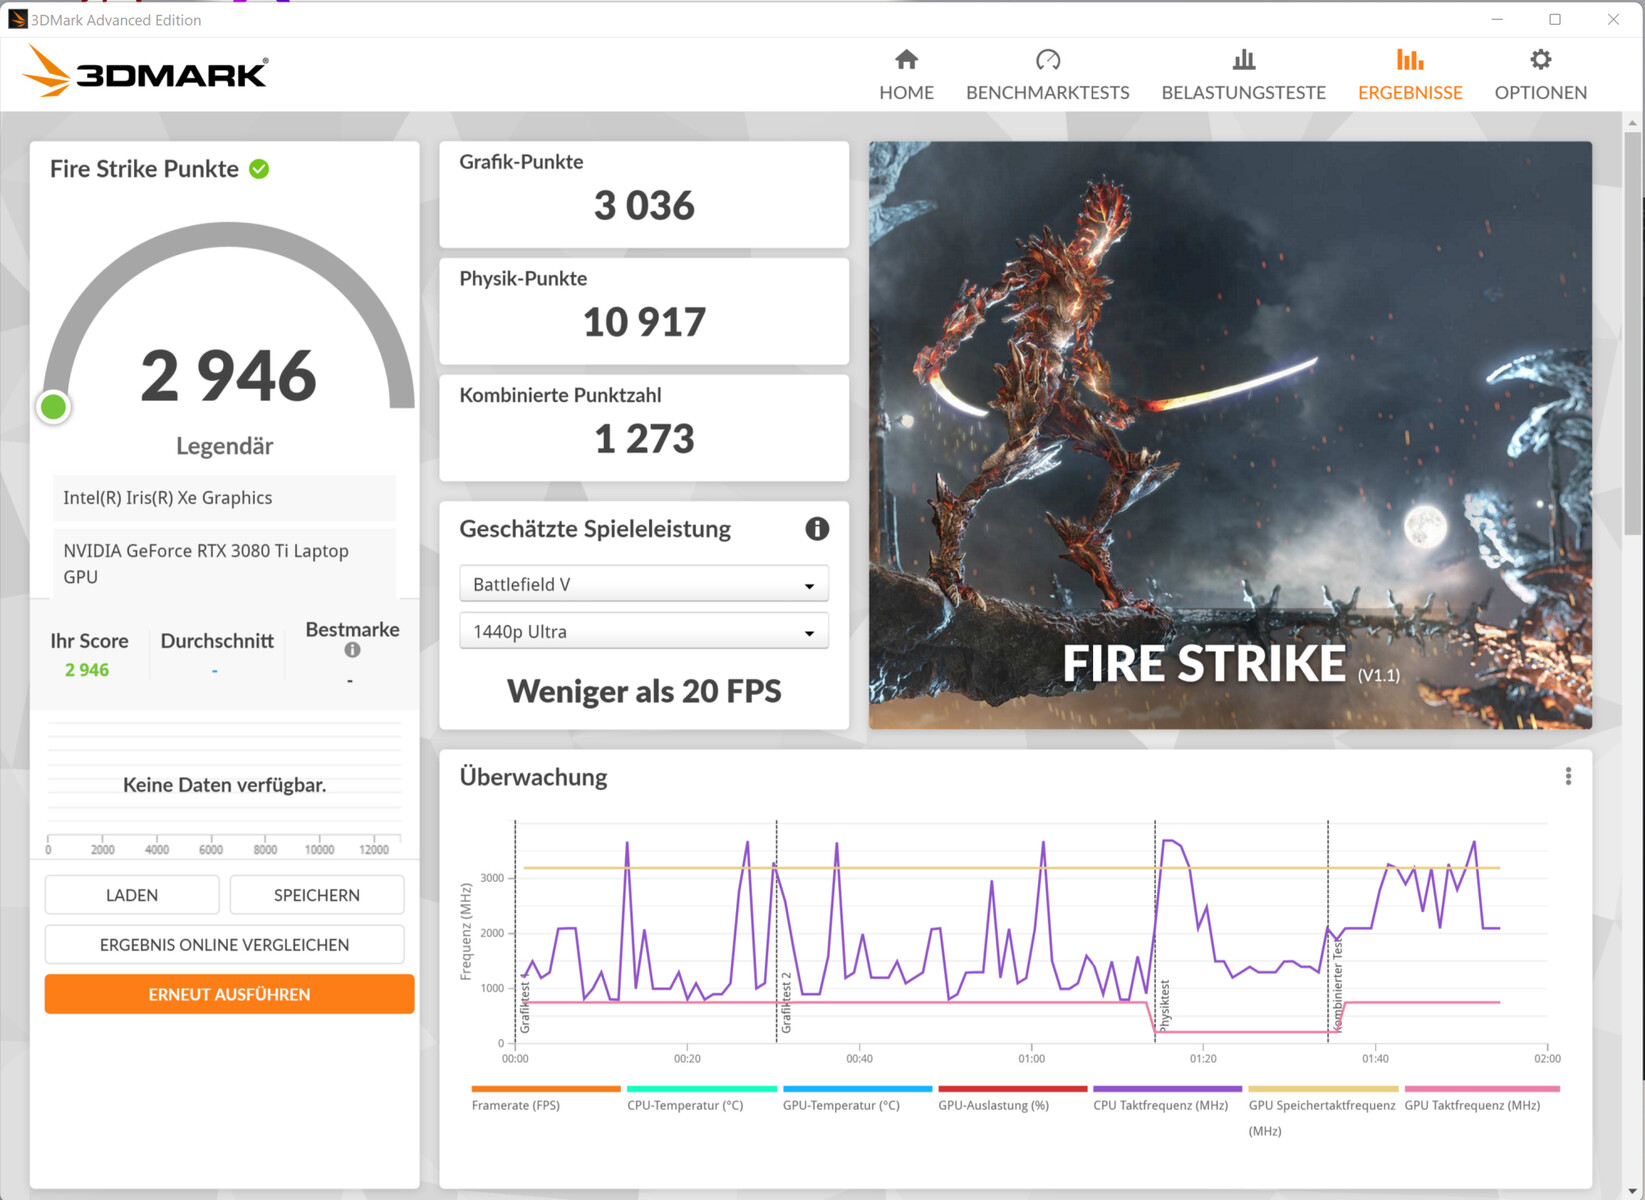
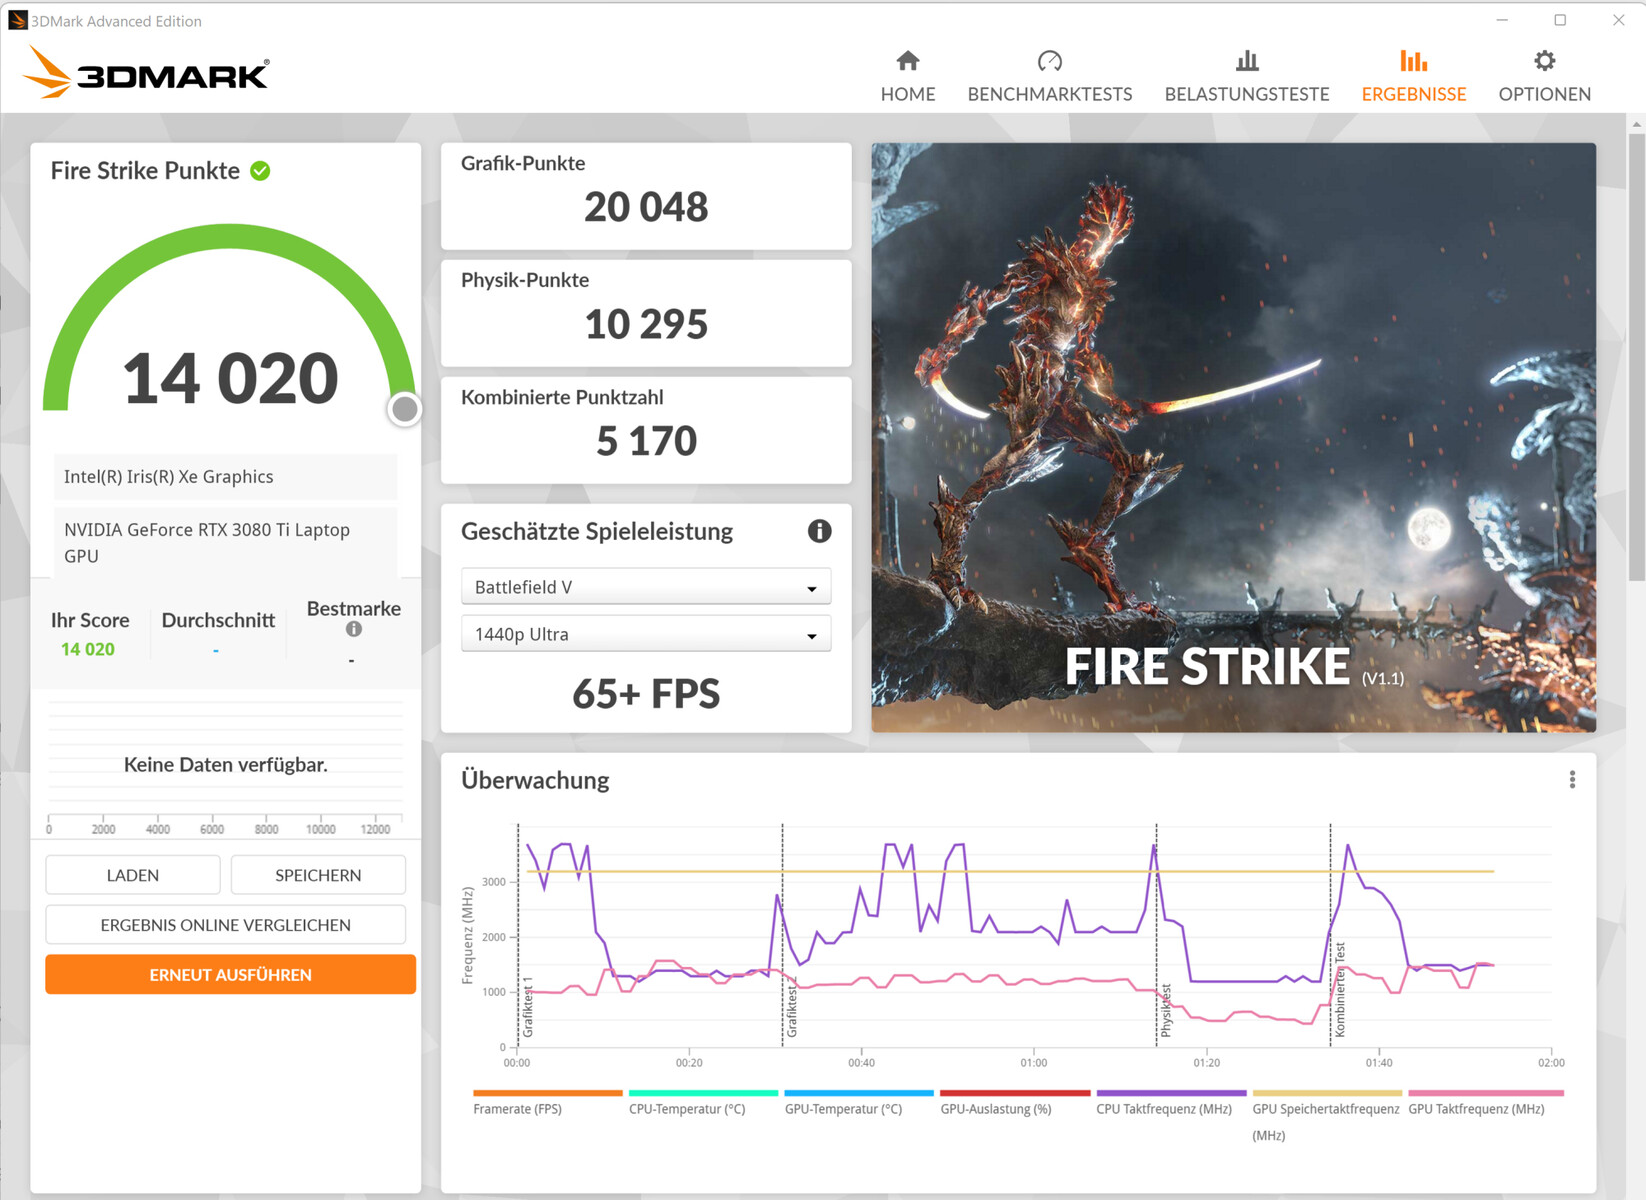
Además, ejecutamos algunos benchmarks con el "Modo Silencio de Ahorro de Energía" y el "Modo Turbo" activados manualmente. Este último no es especialmente adecuado para largos periodos de tiempo, ya que eleva los ventiladores a su máxima velocidad de forma instantánea y permanente.
| Modo creador | Modo turbo | Modo juego | Modo reunión | Modo silencio de ahorro de energía | |
|---|---|---|---|---|---|
| Límite de potencia 1 | 86 vatios | 86 vatios | 62 vatios | 15 vatios | 15 vatios |
| Límite de potencia 2 | 115 vatios | 115 vatios | 115 vatios | 30 vatios | 30 vatios |
Procesador
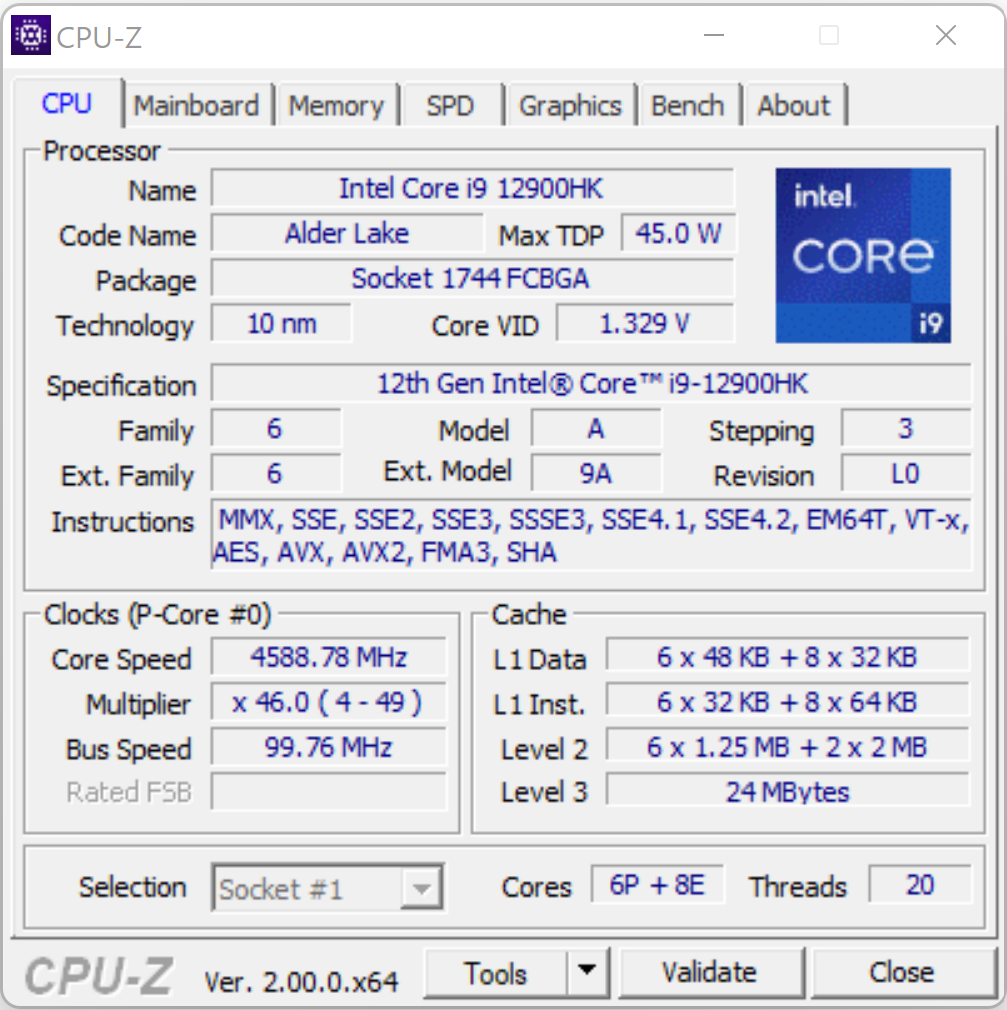
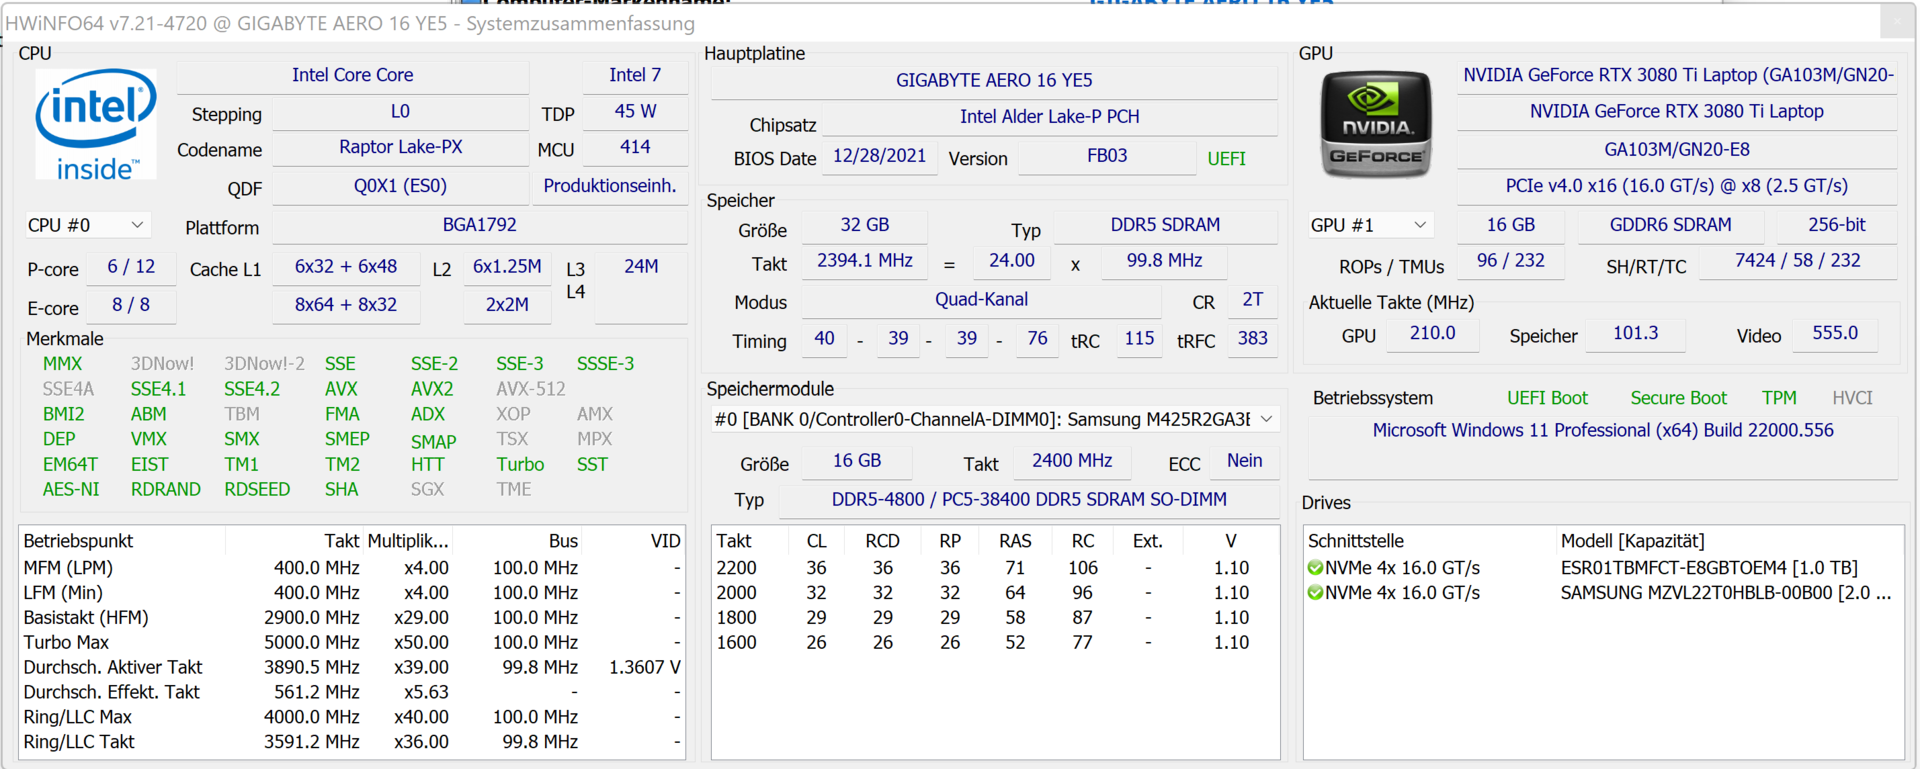
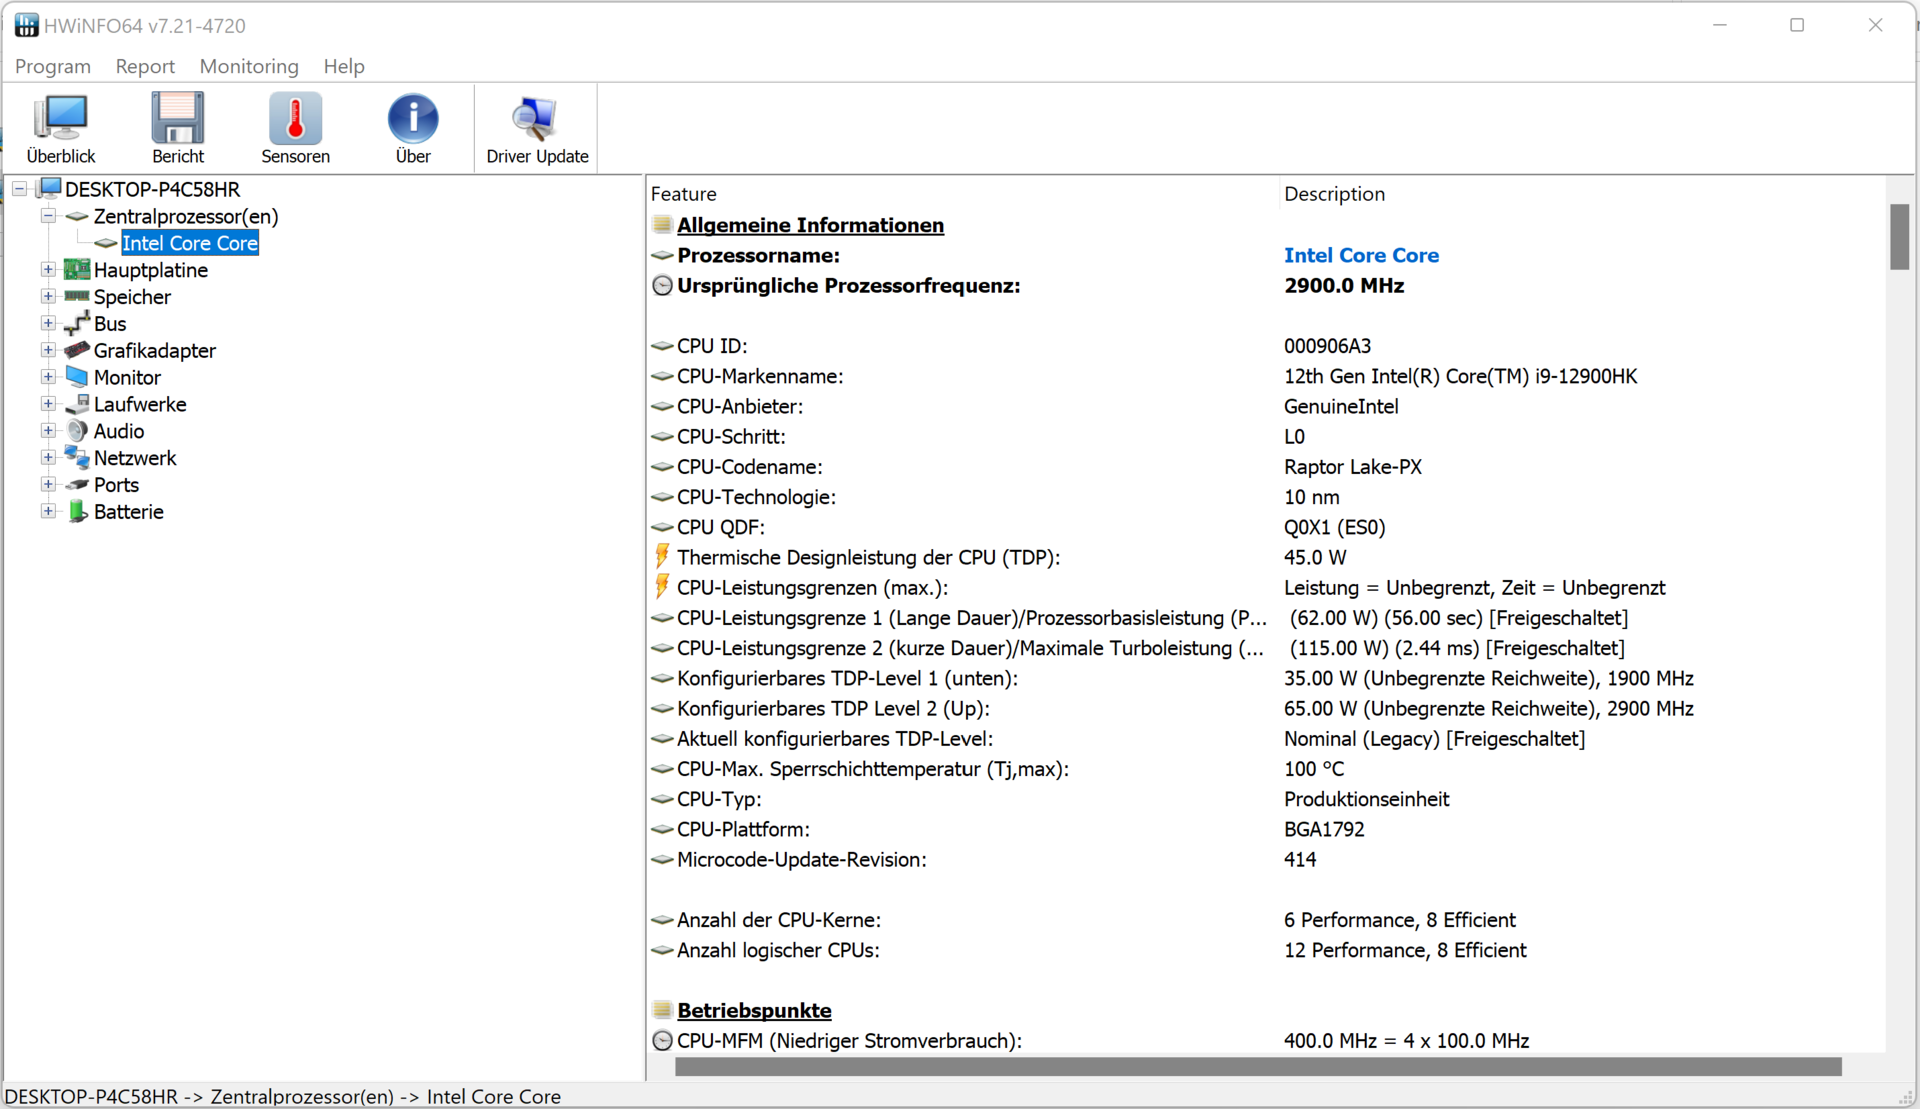
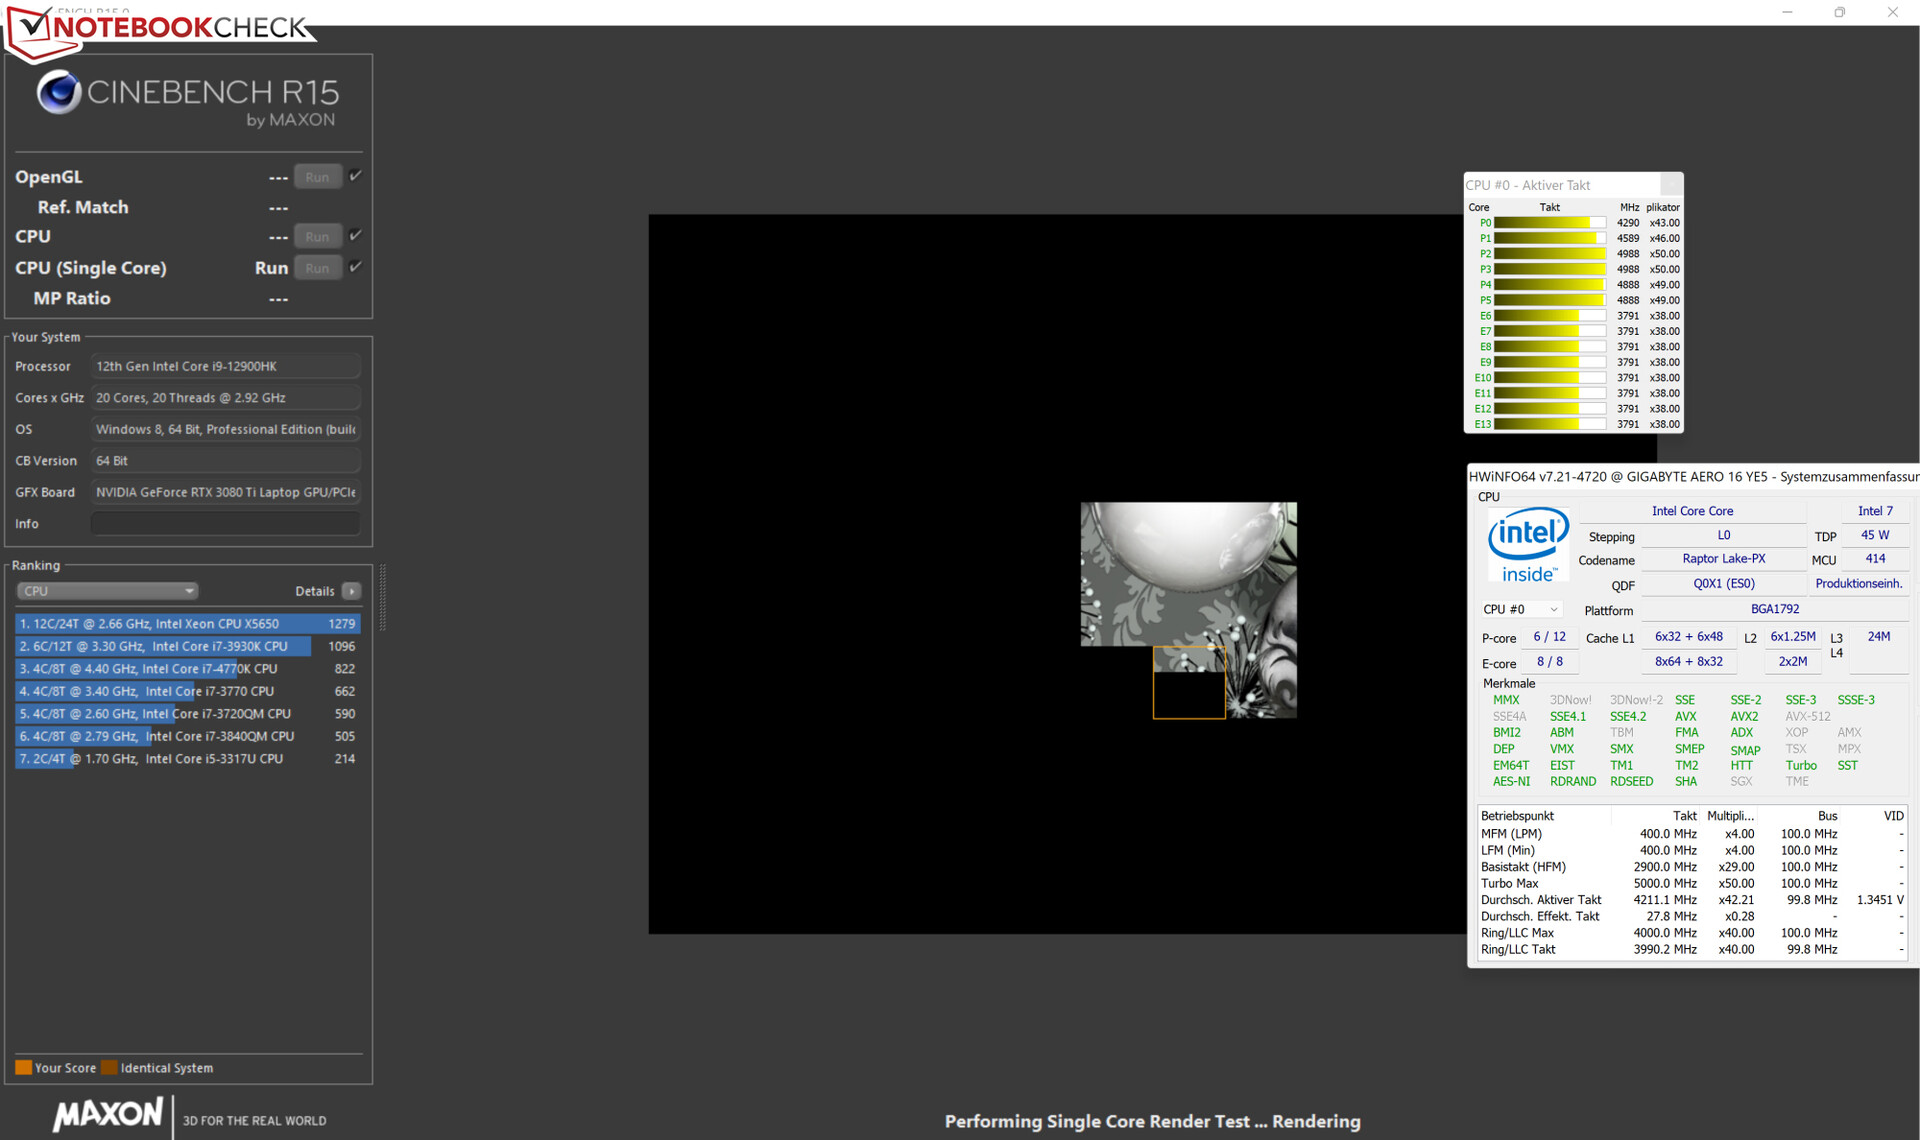
El Alder LakeCore i9-12900HK de Intel cuenta con seis núcleos de rendimiento con Hyperthreading que funcionan a entre 2,5 y 5 GHz, así como ocho núcleos de eficiencia sin Hyperthreading que funcionan a entre 1,8 y 3,8 GHz. En conjunto, esto supone un total de 20 núcleos de CPU disponibles. Gracias a un multiplicador desbloqueado, la CPU también puede ser overclockeada con bastante facilidad.
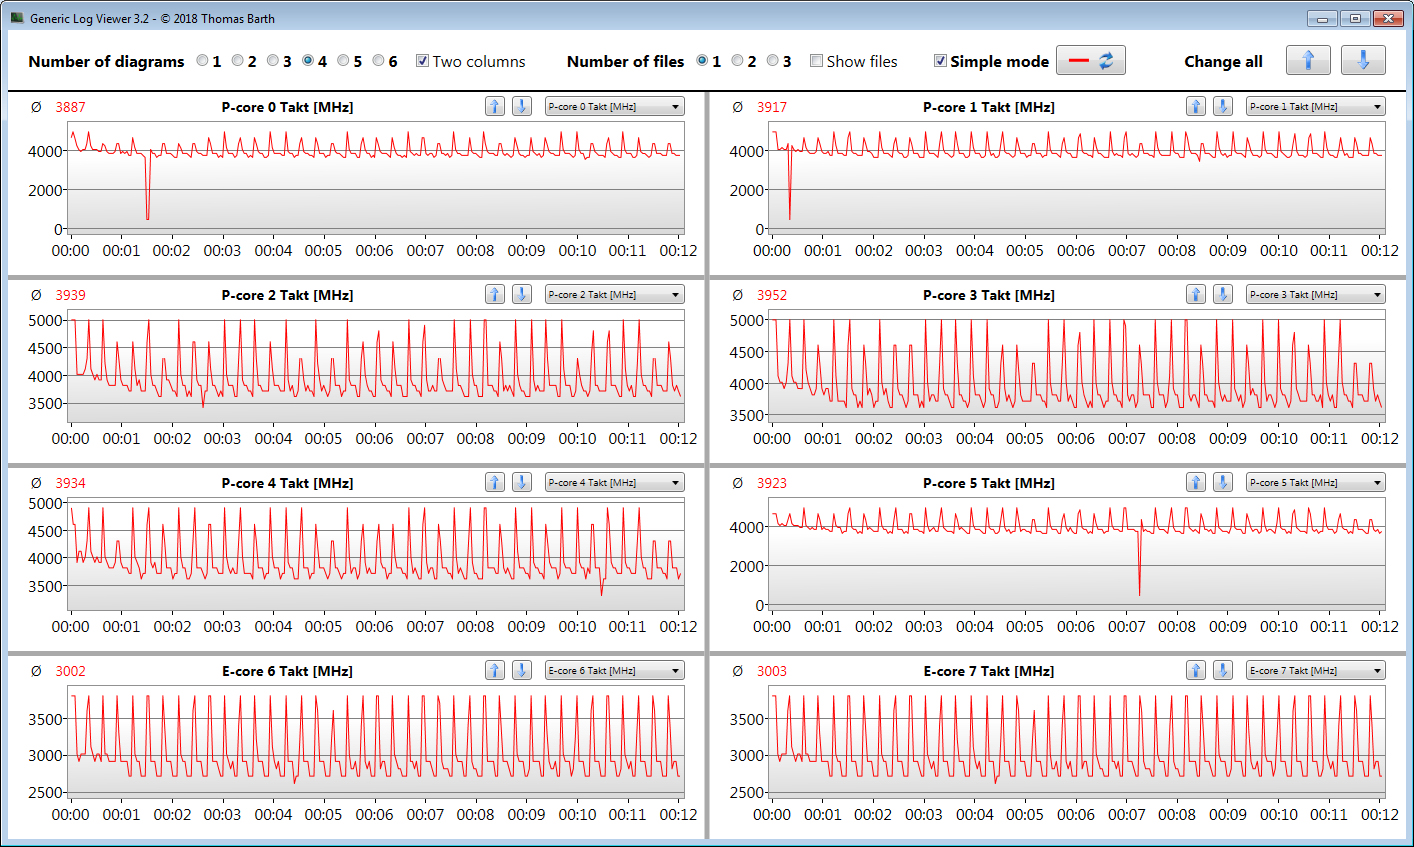
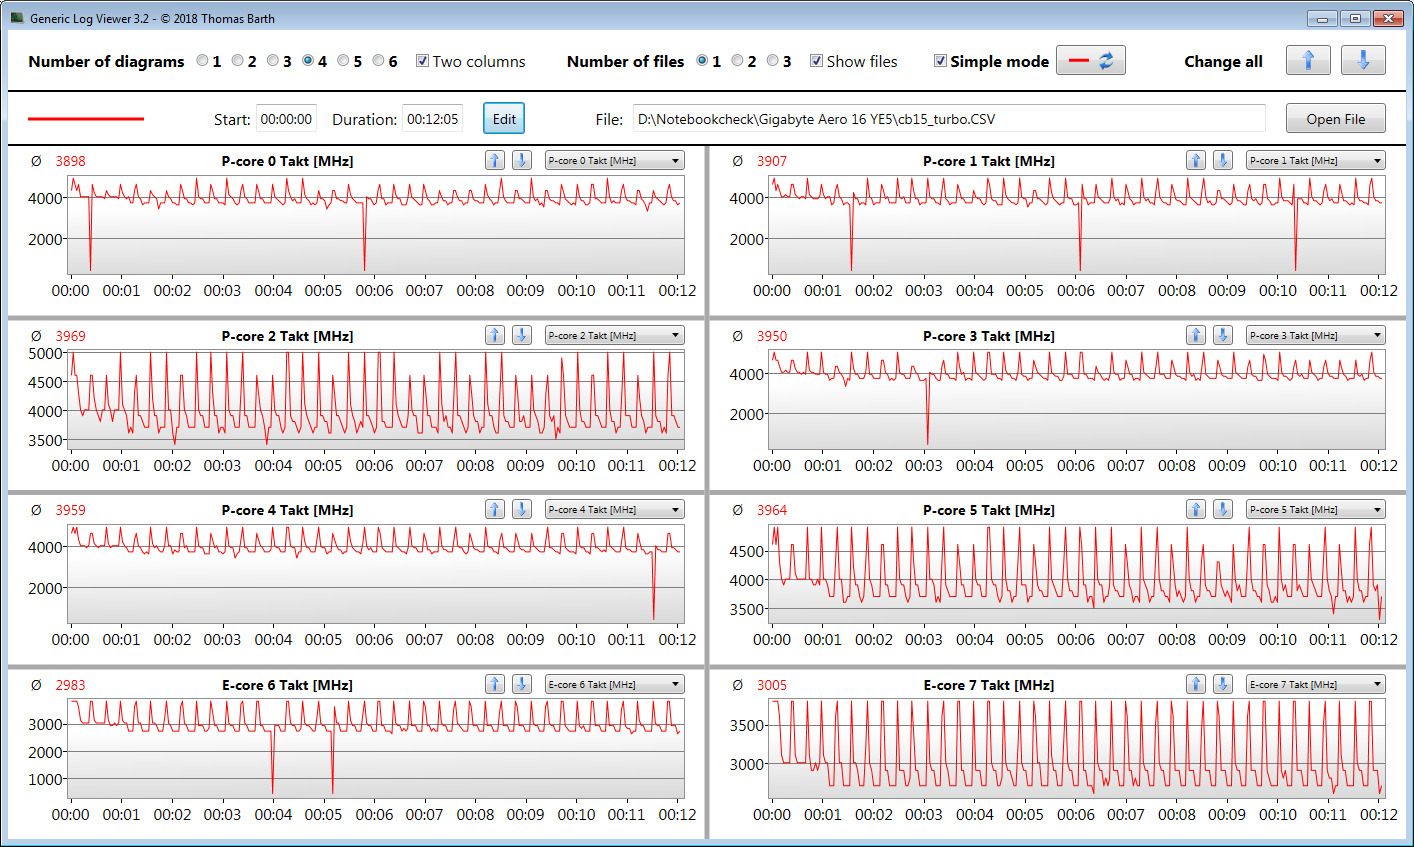
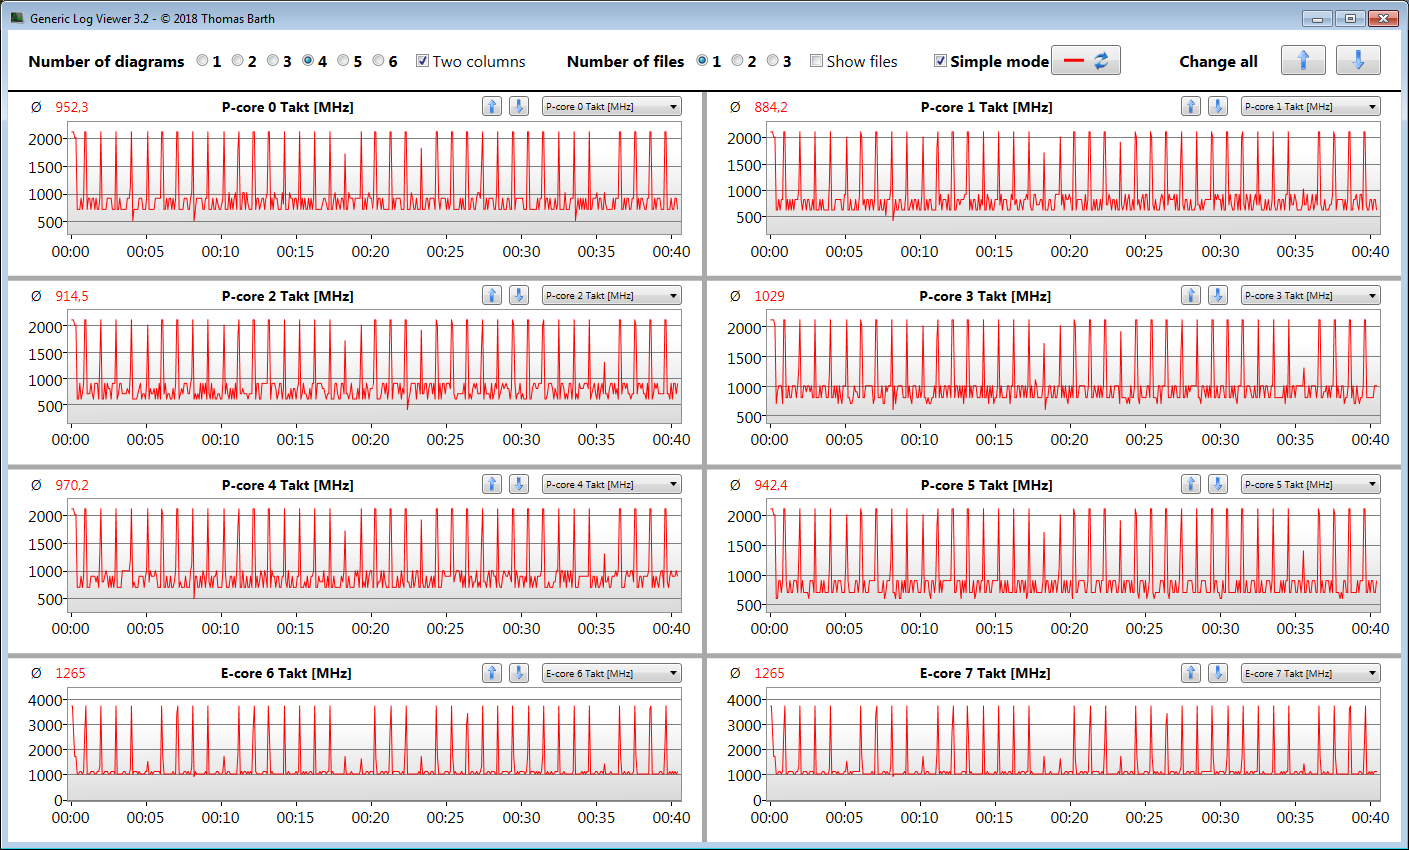
Al ejecutar nuestro benchmark CineBench R15, la CPU funcionó a velocidades de reloj muy altas (multihilo: núcleos P 4-4,1 GHz, núcleos E: 3-3,1 GHz) o incluso máximas (un solo hilo: núcleos P 4,3-5 GHz, núcleos E: 3,8 GHz). En batería, éstas se redujeron considerablemente.
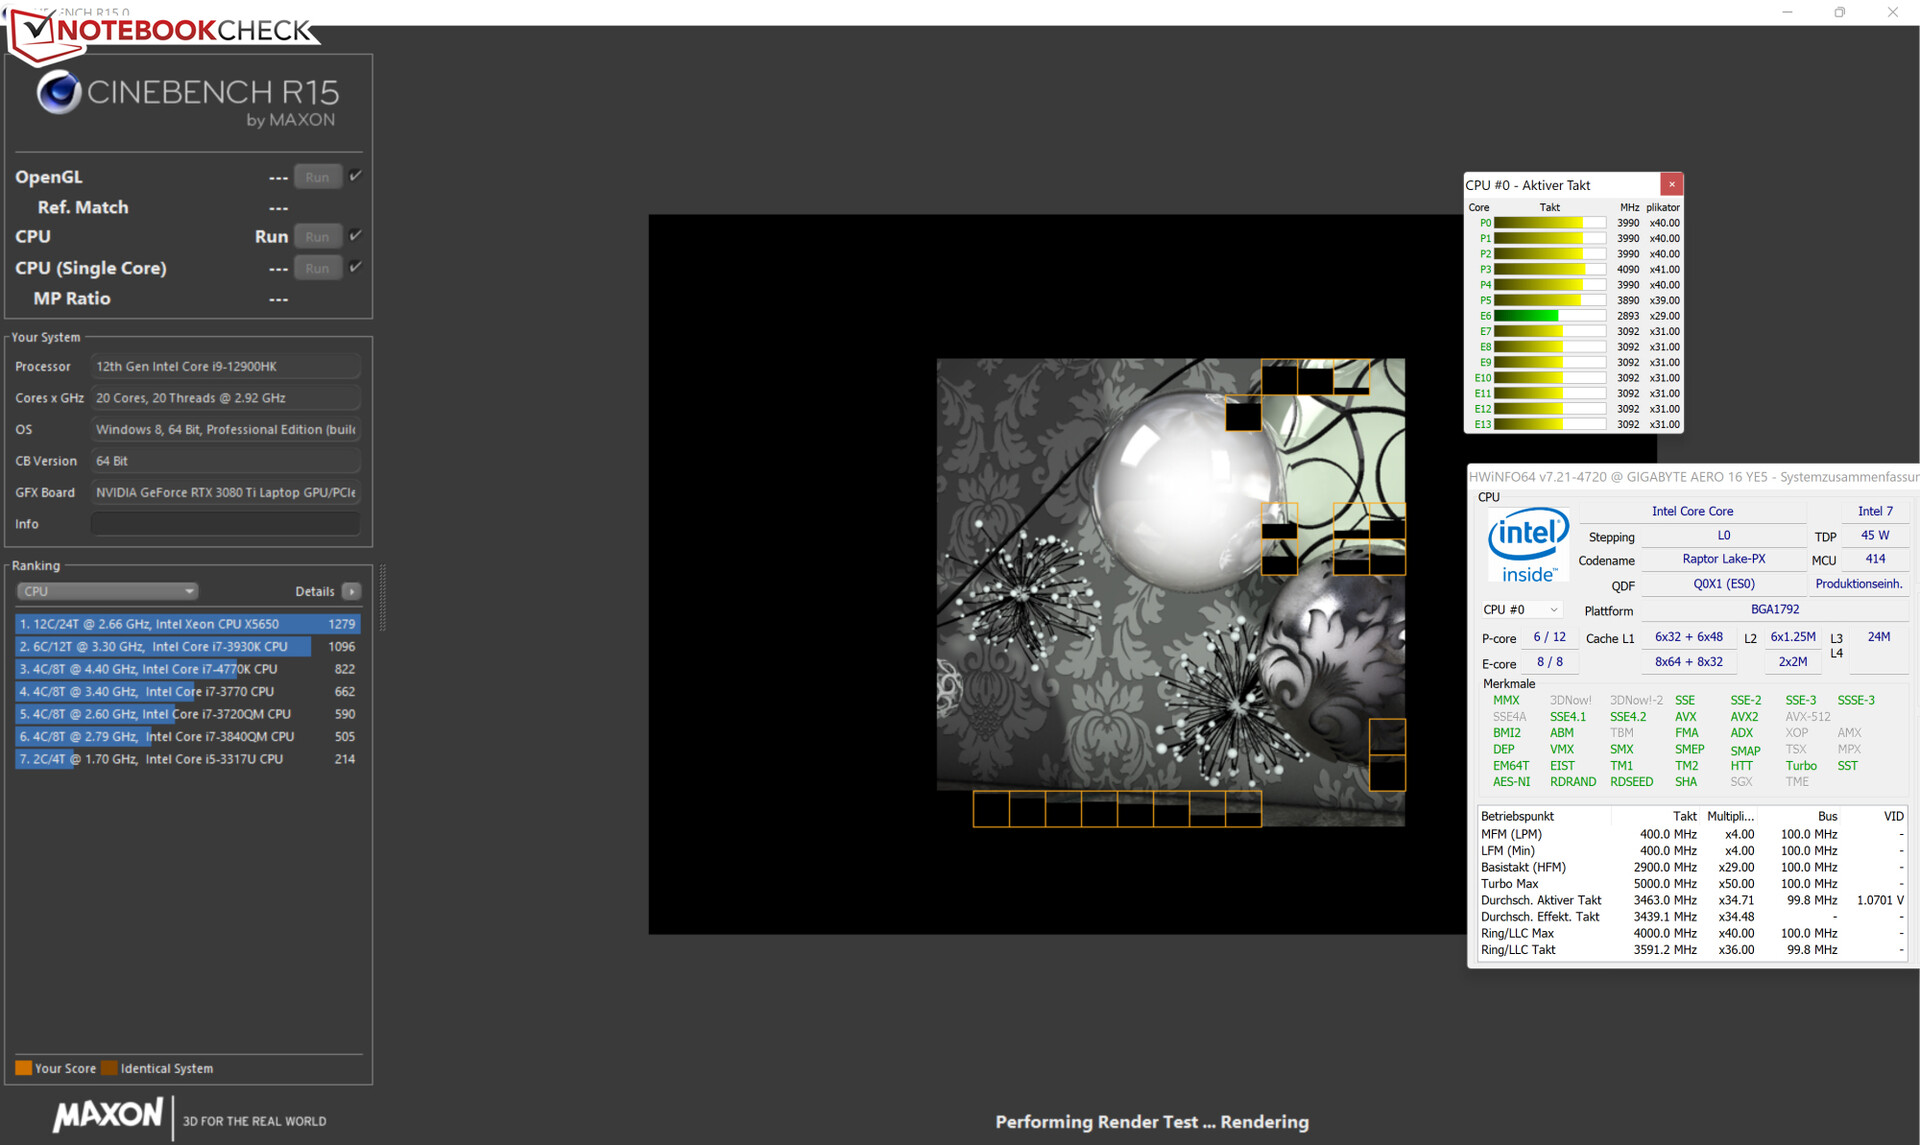
Ejecutamos la prueba multihilo CineBench R15 durante al menos 30 minutos en bucle para determinar si un procesador es capaz de utilizar altas velocidades de reloj turbo bajo carga sostenida. El Aero 16 consiguió mantener su alto nivel de rendimiento inicial tanto en los núcleos de rendimiento como en los de eficiencia. Activar el "Modo Turbo" manualmente no tuvo ningún efecto positivo.
Cinebench R15 Multi Loop
| Cinebench R23 | |
| Multi Core | |
| Gigabyte Aero 16 YE5 (Turbo Mode) | |
| Gigabyte Aero 16 YE5 | |
| Media de la clase Multimedia (4861 - 33362, n=74, últimos 2 años) | |
| Medio Intel Core i9-12900HK (4796 - 19282, n=14) | |
| Razer Blade 15 2022 | |
| Schenker XMG Pro 15 (Late 2021) | |
| Apple MacBook Pro 16 2021 M1 Max | |
| HP ZBook Studio 15 G8 | |
| Lenovo ThinkPad X1 Extreme G4-20Y50040GE | |
| Gigabyte Aero 16 YE5 (Silence Mode) | |
| Single Core | |
| Media de la clase Multimedia (1128 - 2459, n=66, últimos 2 años) | |
| Gigabyte Aero 16 YE5 | |
| Gigabyte Aero 16 YE5 (Turbo Mode) | |
| Razer Blade 15 2022 | |
| Medio Intel Core i9-12900HK (819 - 1940, n=15) | |
| Lenovo ThinkPad X1 Extreme G4-20Y50040GE | |
| HP ZBook Studio 15 G8 | |
| Apple MacBook Pro 16 2021 M1 Max | |
| Schenker XMG Pro 15 (Late 2021) | |
| Gigabyte Aero 16 YE5 (Silence Mode) | |
| Cinebench R20 | |
| CPU (Multi Core) | |
| Gigabyte Aero 16 YE5 (Turbo Mode) | |
| Gigabyte Aero 16 YE5 | |
| Media de la clase Multimedia (1887 - 12912, n=57, últimos 2 años) | |
| Medio Intel Core i9-12900HK (1828 - 7366, n=14) | |
| Razer Blade 15 2022 | |
| Schenker XMG Pro 15 (Late 2021) | |
| HP ZBook Studio 15 G8 | |
| Lenovo ThinkPad X1 Extreme G4-20Y50040GE | |
| Apple MacBook Pro 16 2021 M1 Max | |
| Gigabyte Aero 16 YE5 (Silence Mode) | |
| CPU (Single Core) | |
| Gigabyte Aero 16 YE5 (Turbo Mode) | |
| Media de la clase Multimedia (425 - 853, n=57, últimos 2 años) | |
| Razer Blade 15 2022 | |
| Gigabyte Aero 16 YE5 | |
| Medio Intel Core i9-12900HK (316 - 739, n=14) | |
| Lenovo ThinkPad X1 Extreme G4-20Y50040GE | |
| HP ZBook Studio 15 G8 | |
| Schenker XMG Pro 15 (Late 2021) | |
| Apple MacBook Pro 16 2021 M1 Max | |
| Gigabyte Aero 16 YE5 (Silence Mode) | |
| Cinebench R15 | |
| CPU Multi 64Bit | |
| Gigabyte Aero 16 YE5 (Turbo Mode) | |
| Gigabyte Aero 16 YE5 | |
| Media de la clase Multimedia (856 - 5224, n=61, últimos 2 años) | |
| Medio Intel Core i9-12900HK (965 - 2944, n=14) | |
| Razer Blade 15 2022 | |
| Lenovo ThinkPad X1 Extreme G4-20Y50040GE (BIOS 1.13) | |
| Lenovo ThinkPad X1 Extreme G4-20Y50040GE (BIOS 1.10) | |
| Schenker XMG Pro 15 (Late 2021) | |
| HP ZBook Studio 15 G8 | |
| Apple MacBook Pro 16 2021 M1 Max (Rosetta 2) | |
| Gigabyte Aero 16 YE5 (Silence Mode) | |
| CPU Single 64Bit | |
| Media de la clase Multimedia (184.8 - 326, n=59, últimos 2 años) | |
| Gigabyte Aero 16 YE5 | |
| Gigabyte Aero 16 YE5 (Turbo Mode) | |
| Razer Blade 15 2022 | |
| Lenovo ThinkPad X1 Extreme G4-20Y50040GE | |
| Medio Intel Core i9-12900HK (119 - 279, n=14) | |
| HP ZBook Studio 15 G8 | |
| Schenker XMG Pro 15 (Late 2021) | |
| Apple MacBook Pro 16 2021 M1 Max (Rosetta 2) | |
| Gigabyte Aero 16 YE5 (Silence Mode) | |
| Blender - v2.79 BMW27 CPU | |
| HP ZBook Studio 15 G8 | |
| Media de la clase Multimedia (100 - 557, n=58, últimos 2 años) | |
| Schenker XMG Pro 15 (Late 2021) | |
| Razer Blade 15 2022 | |
| Medio Intel Core i9-12900HK (172.5 - 483, n=13) | |
| Gigabyte Aero 16 YE5 | |
| Apple MacBook Pro 16 2021 M1 Max (Blender 3.0 beta for mac) | |
| Gigabyte Aero 16 YE5 (Turbo Mode) | |
| 7-Zip 18.03 | |
| 7z b 4 | |
| Gigabyte Aero 16 YE5 (Turbo Mode) | |
| Gigabyte Aero 16 YE5 | |
| Medio Intel Core i9-12900HK (25736 - 75564, n=14) | |
| Razer Blade 15 2022 | |
| Media de la clase Multimedia (26062 - 130368, n=55, últimos 2 años) | |
| Schenker XMG Pro 15 (Late 2021) | |
| HP ZBook Studio 15 G8 | |
| Gigabyte Aero 16 YE5 (Silence Mode) | |
| 7z b 4 -mmt1 | |
| Gigabyte Aero 16 YE5 | |
| Gigabyte Aero 16 YE5 (Turbo Mode) | |
| Media de la clase Multimedia (3666 - 7545, n=56, últimos 2 años) | |
| HP ZBook Studio 15 G8 | |
| Razer Blade 15 2022 | |
| Schenker XMG Pro 15 (Late 2021) | |
| Medio Intel Core i9-12900HK (2898 - 6186, n=14) | |
| Gigabyte Aero 16 YE5 (Silence Mode) | |
| Geekbench 5.5 | |
| Multi-Core | |
| Gigabyte Aero 16 YE5 (Turbo Mode) | |
| Gigabyte Aero 16 YE5 | |
| Media de la clase Multimedia (4652 - 20422, n=56, últimos 2 años) | |
| Apple MacBook Pro 16 2021 M1 Max | |
| Razer Blade 15 2022 | |
| Medio Intel Core i9-12900HK (5869 - 14294, n=13) | |
| Schenker XMG Pro 15 (Late 2021) | |
| Lenovo ThinkPad X1 Extreme G4-20Y50040GE | |
| HP ZBook Studio 15 G8 | |
| Gigabyte Aero 16 YE5 (Silence Mode) | |
| Single-Core | |
| Media de la clase Multimedia (805 - 2974, n=56, últimos 2 años) | |
| Gigabyte Aero 16 YE5 (Turbo Mode) | |
| Gigabyte Aero 16 YE5 | |
| Apple MacBook Pro 16 2021 M1 Max | |
| Razer Blade 15 2022 | |
| HP ZBook Studio 15 G8 | |
| Medio Intel Core i9-12900HK (843 - 1918, n=13) | |
| Lenovo ThinkPad X1 Extreme G4-20Y50040GE | |
| Schenker XMG Pro 15 (Late 2021) | |
| Gigabyte Aero 16 YE5 (Silence Mode) | |
| HWBOT x265 Benchmark v2.2 - 4k Preset | |
| Gigabyte Aero 16 YE5 (Turbo Mode) | |
| Media de la clase Multimedia (5.26 - 36.1, n=56, últimos 2 años) | |
| Gigabyte Aero 16 YE5 | |
| Razer Blade 15 2022 | |
| Medio Intel Core i9-12900HK (5.33 - 21.6, n=14) | |
| Schenker XMG Pro 15 (Late 2021) | |
| HP ZBook Studio 15 G8 | |
| Lenovo ThinkPad X1 Extreme G4-20Y50040GE | |
| Gigabyte Aero 16 YE5 (Silence Mode) | |
| LibreOffice - 20 Documents To PDF | |
| Gigabyte Aero 16 YE5 (Silence Mode) | |
| Razer Blade 15 2022 | |
| Media de la clase Multimedia (23.9 - 146.7, n=57, últimos 2 años) | |
| Schenker XMG Pro 15 (Late 2021) | |
| HP ZBook Studio 15 G8 | |
| Medio Intel Core i9-12900HK (34.8 - 89.1, n=14) | |
| Gigabyte Aero 16 YE5 | |
| Lenovo ThinkPad X1 Extreme G4-20Y50040GE | |
| Gigabyte Aero 16 YE5 (Turbo Mode) | |
| R Benchmark 2.5 - Overall mean | |
| Gigabyte Aero 16 YE5 (Silence Mode) | |
| HP ZBook Studio 15 G8 | |
| Schenker XMG Pro 15 (Late 2021) | |
| Lenovo ThinkPad X1 Extreme G4-20Y50040GE | |
| Medio Intel Core i9-12900HK (0.4155 - 0.994, n=14) | |
| Razer Blade 15 2022 | |
| Media de la clase Multimedia (0.3604 - 0.947, n=56, últimos 2 años) | |
| Gigabyte Aero 16 YE5 (Turbo Mode) | |
| Gigabyte Aero 16 YE5 | |
* ... más pequeño es mejor
AIDA64: FP32 Ray-Trace | FPU Julia | CPU SHA3 | CPU Queen | FPU SinJulia | FPU Mandel | CPU AES | CPU ZLib | FP64 Ray-Trace | CPU PhotoWorxx
| Performance rating | |
| Media de la clase Multimedia | |
| Schenker XMG Pro 15 (Late 2021) | |
| Lenovo ThinkPad X1 Extreme G4-20Y50040GE | |
| HP ZBook Studio 15 G8 | |
| Gigabyte Aero 16 YE5 | |
| Gigabyte Aero 16 YE5 | |
| Medio Intel Core i9-12900HK | |
| Razer Blade 15 2022 | |
| Gigabyte Aero 16 YE5 | |
| AIDA64 / FP32 Ray-Trace | |
| Media de la clase Multimedia (2214 - 50388, n=53, últimos 2 años) | |
| Schenker XMG Pro 15 (Late 2021) (v6.50.5800) | |
| Lenovo ThinkPad X1 Extreme G4-20Y50040GE (v6.50.5800) | |
| HP ZBook Studio 15 G8 (v6.33.5700) | |
| Medio Intel Core i9-12900HK (2677 - 13948, n=15) | |
| Gigabyte Aero 16 YE5 (v6.50.5800, Turbo Mode) | |
| Gigabyte Aero 16 YE5 (v6.50.5800) | |
| Razer Blade 15 2022 (v6.50.5800) | |
| Gigabyte Aero 16 YE5 (v6.50.5800, Silence Mode) | |
| AIDA64 / FPU Julia | |
| Media de la clase Multimedia (12867 - 201874, n=54, últimos 2 años) | |
| Schenker XMG Pro 15 (Late 2021) (v6.50.5800) | |
| Lenovo ThinkPad X1 Extreme G4-20Y50040GE (v6.50.5800) | |
| HP ZBook Studio 15 G8 (v6.33.5700) | |
| Medio Intel Core i9-12900HK (12762 - 70764, n=15) | |
| Gigabyte Aero 16 YE5 (v6.50.5800, Turbo Mode) | |
| Gigabyte Aero 16 YE5 (v6.50.5800) | |
| Razer Blade 15 2022 (v6.50.5800) | |
| Gigabyte Aero 16 YE5 (v6.50.5800, Silence Mode) | |
| AIDA64 / CPU SHA3 | |
| Schenker XMG Pro 15 (Late 2021) (v6.50.5800) | |
| Lenovo ThinkPad X1 Extreme G4-20Y50040GE (v6.50.5800) | |
| HP ZBook Studio 15 G8 (v6.33.5700) | |
| Media de la clase Multimedia (626 - 8623, n=54, últimos 2 años) | |
| Gigabyte Aero 16 YE5 (v6.50.5800, Turbo Mode) | |
| Gigabyte Aero 16 YE5 (v6.50.5800) | |
| Medio Intel Core i9-12900HK (841 - 3504, n=15) | |
| Razer Blade 15 2022 (v6.50.5800) | |
| Gigabyte Aero 16 YE5 (v6.50.5800, Silence Mode) | |
| AIDA64 / CPU Queen | |
| Gigabyte Aero 16 YE5 (v6.50.5800, Turbo Mode) | |
| Gigabyte Aero 16 YE5 (v6.50.5800) | |
| HP ZBook Studio 15 G8 (v6.33.5700) | |
| Lenovo ThinkPad X1 Extreme G4-20Y50040GE (v6.50.5800) | |
| Medio Intel Core i9-12900HK (60202 - 107161, n=15) | |
| Razer Blade 15 2022 (v6.50.5800) | |
| Schenker XMG Pro 15 (Late 2021) (v6.50.5800) | |
| Media de la clase Multimedia (13483 - 181505, n=41, últimos 2 años) | |
| Gigabyte Aero 16 YE5 (v6.50.5800, Silence Mode) | |
| AIDA64 / FPU SinJulia | |
| Lenovo ThinkPad X1 Extreme G4-20Y50040GE (v6.50.5800) | |
| Gigabyte Aero 16 YE5 (v6.50.5800, Turbo Mode) | |
| HP ZBook Studio 15 G8 (v6.33.5700) | |
| Schenker XMG Pro 15 (Late 2021) (v6.50.5800) | |
| Gigabyte Aero 16 YE5 (v6.50.5800) | |
| Razer Blade 15 2022 (v6.50.5800) | |
| Medio Intel Core i9-12900HK (3225 - 10402, n=15) | |
| Media de la clase Multimedia (886 - 28794, n=54, últimos 2 años) | |
| Gigabyte Aero 16 YE5 (v6.50.5800, Silence Mode) | |
| AIDA64 / FPU Mandel | |
| Media de la clase Multimedia (6395 - 105740, n=53, últimos 2 años) | |
| Schenker XMG Pro 15 (Late 2021) (v6.50.5800) | |
| Lenovo ThinkPad X1 Extreme G4-20Y50040GE (v6.50.5800) | |
| HP ZBook Studio 15 G8 (v6.33.5700) | |
| Medio Intel Core i9-12900HK (7417 - 34233, n=15) | |
| Gigabyte Aero 16 YE5 (v6.50.5800, Turbo Mode) | |
| Gigabyte Aero 16 YE5 (v6.50.5800) | |
| Razer Blade 15 2022 (v6.50.5800) | |
| Gigabyte Aero 16 YE5 (v6.50.5800, Silence Mode) | |
| AIDA64 / CPU AES | |
| Lenovo ThinkPad X1 Extreme G4-20Y50040GE (v6.50.5800) | |
| Schenker XMG Pro 15 (Late 2021) (v6.50.5800) | |
| Gigabyte Aero 16 YE5 (v6.50.5800, Turbo Mode) | |
| Gigabyte Aero 16 YE5 (v6.50.5800) | |
| HP ZBook Studio 15 G8 (v6.33.5700) | |
| Medio Intel Core i9-12900HK (32382 - 112498, n=15) | |
| Media de la clase Multimedia (8171 - 126790, n=54, últimos 2 años) | |
| Razer Blade 15 2022 (v6.50.5800) | |
| Gigabyte Aero 16 YE5 (v6.50.5800, Silence Mode) | |
| AIDA64 / CPU ZLib | |
| Gigabyte Aero 16 YE5 (v6.50.5800, Turbo Mode) | |
| Gigabyte Aero 16 YE5 (v6.50.5800) | |
| Media de la clase Multimedia (143.8 - 2022, n=54, últimos 2 años) | |
| Medio Intel Core i9-12900HK (314 - 1209, n=15) | |
| Razer Blade 15 2022 (v6.50.5800) | |
| Lenovo ThinkPad X1 Extreme G4-20Y50040GE (v6.50.5800) | |
| Schenker XMG Pro 15 (Late 2021) (v6.50.5800) | |
| HP ZBook Studio 15 G8 (v6.33.5700) | |
| Gigabyte Aero 16 YE5 (v6.50.5800, Silence Mode) | |
| AIDA64 / FP64 Ray-Trace | |
| Media de la clase Multimedia (1014 - 26875, n=54, últimos 2 años) | |
| Schenker XMG Pro 15 (Late 2021) (v6.50.5800) | |
| Lenovo ThinkPad X1 Extreme G4-20Y50040GE (v6.50.5800) | |
| HP ZBook Studio 15 G8 (v6.33.5700) | |
| Medio Intel Core i9-12900HK (1501 - 7616, n=15) | |
| Gigabyte Aero 16 YE5 (v6.50.5800, Turbo Mode) | |
| Gigabyte Aero 16 YE5 (v6.50.5800) | |
| Razer Blade 15 2022 (v6.50.5800) | |
| Gigabyte Aero 16 YE5 (v6.50.5800, Silence Mode) | |
| AIDA64 / CPU PhotoWorxx | |
| Media de la clase Multimedia (8187 - 88154, n=54, últimos 2 años) | |
| Razer Blade 15 2022 (v6.50.5800) | |
| Gigabyte Aero 16 YE5 (v6.50.5800) | |
| Gigabyte Aero 16 YE5 (v6.50.5800, Turbo Mode) | |
| Medio Intel Core i9-12900HK (24446 - 42462, n=15) | |
| Schenker XMG Pro 15 (Late 2021) (v6.50.5800) | |
| Gigabyte Aero 16 YE5 (v6.50.5800, Silence Mode) | |
| HP ZBook Studio 15 G8 (v6.33.5700) | |
| Lenovo ThinkPad X1 Extreme G4-20Y50040GE (v6.50.5800) | |
Rendimiento del sistema
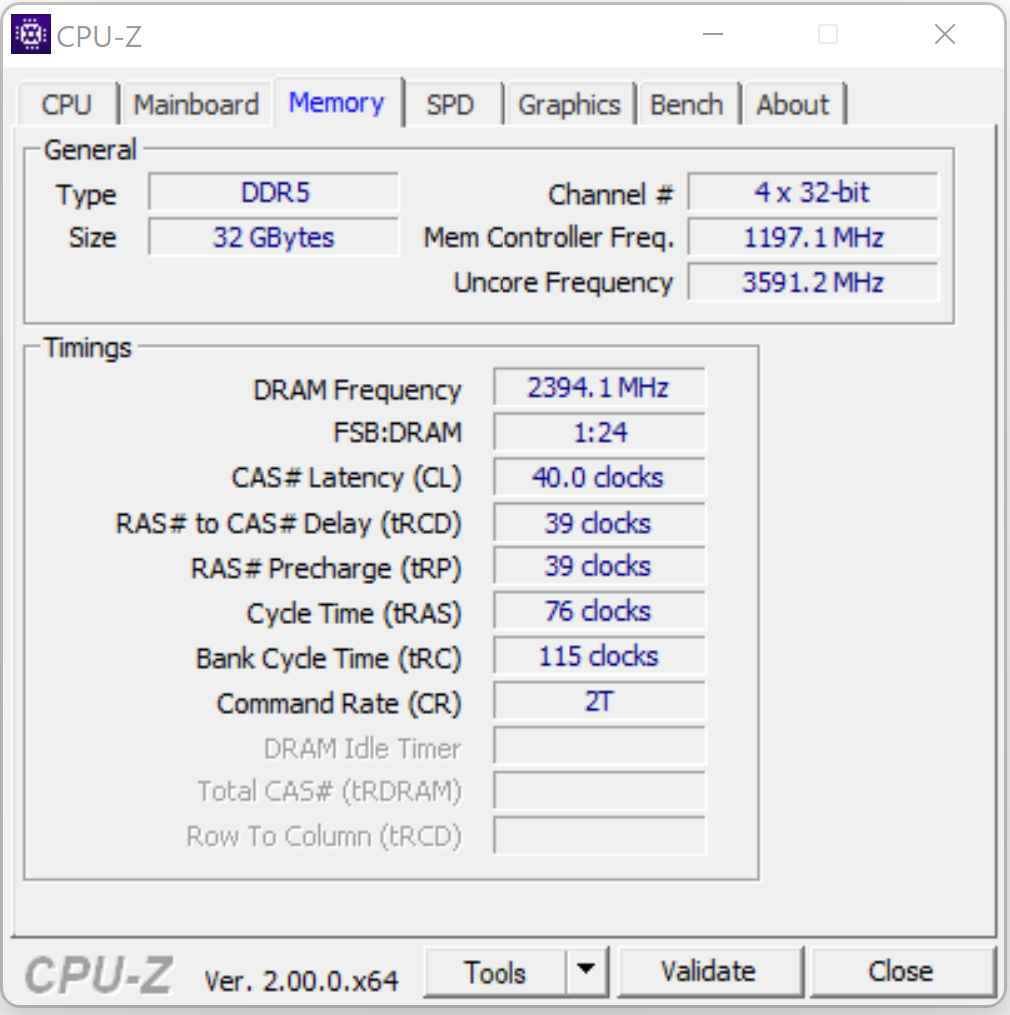
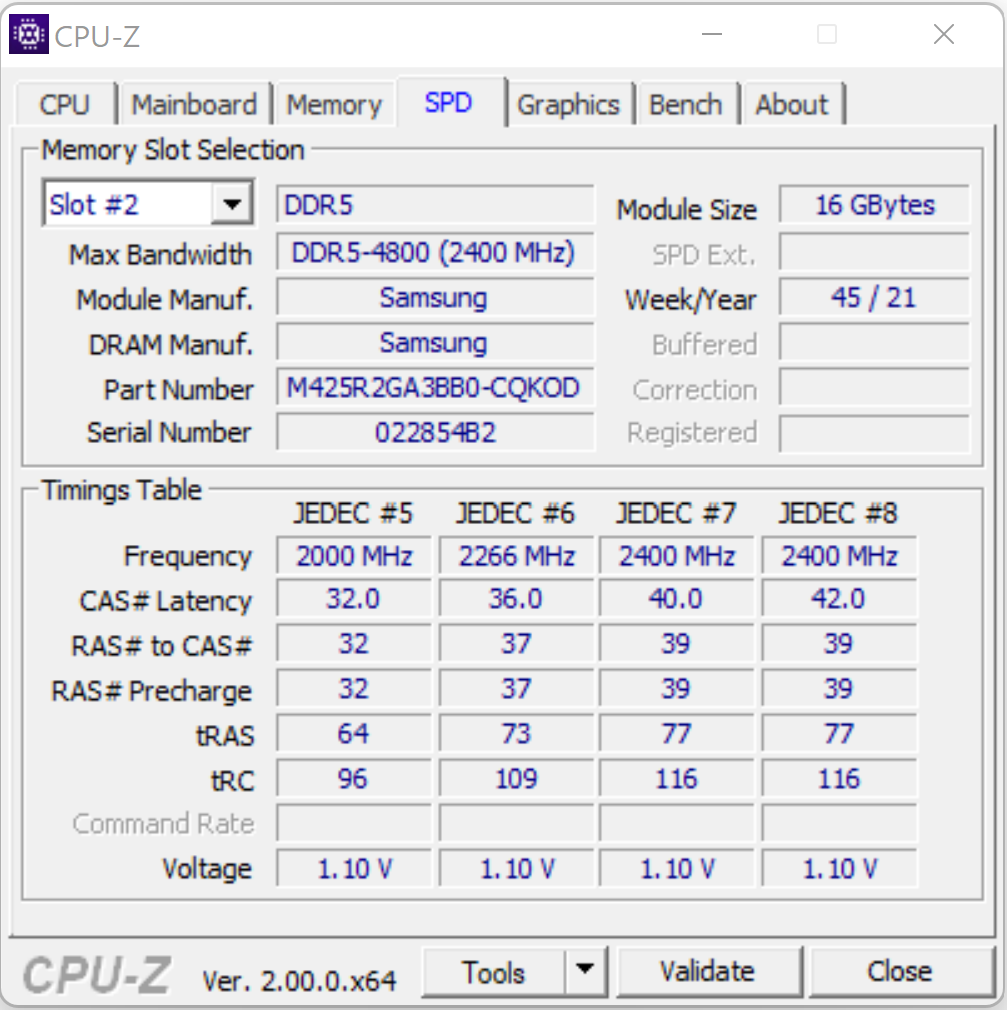
Como es lógico, el rendimiento general del sistema fue muy rápido y fluido gracias a su potente hardware interno. El ordenador hizo un trabajo fantástico en todas las pruebas de aplicaciones. El rendimiento general aumenta aún más gracias a la interfaz de memoria DDR5 de doble canal, como atestiguan los excelentes resultados del benchmark PCMark.
| PCMark 8 Home Score Accelerated v2 | 4775 puntos | |
| PCMark 8 Creative Score Accelerated v2 | 6920 puntos | |
| PCMark 8 Work Score Accelerated v2 | 5343 puntos | |
| PCMark 10 Score | 7816 puntos | |
ayuda | ||
CrossMark: Overall | Productivity | Creativity | Responsiveness
| PCMark 10 / Score | |
| Medio Intel Core i9-12900HK, NVIDIA GeForce RTX 3080 Ti Laptop GPU (7149 - 8186, n=5) | |
| Gigabyte Aero 16 YE5 | |
| Media de la clase Multimedia (4325 - 10386, n=52, últimos 2 años) | |
| Razer Blade 15 2022 | |
| Lenovo ThinkPad X1 Extreme G4-20Y50040GE | |
| PCMark 10 / Essentials | |
| Gigabyte Aero 16 YE5 | |
| Medio Intel Core i9-12900HK, NVIDIA GeForce RTX 3080 Ti Laptop GPU (9870 - 11205, n=5) | |
| Razer Blade 15 2022 | |
| Lenovo ThinkPad X1 Extreme G4-20Y50040GE | |
| Media de la clase Multimedia (8025 - 11664, n=51, últimos 2 años) | |
| PCMark 10 / Productivity | |
| Media de la clase Multimedia (7323 - 18233, n=51, últimos 2 años) | |
| Gigabyte Aero 16 YE5 | |
| Medio Intel Core i9-12900HK, NVIDIA GeForce RTX 3080 Ti Laptop GPU (9173 - 10422, n=5) | |
| Razer Blade 15 2022 | |
| Lenovo ThinkPad X1 Extreme G4-20Y50040GE | |
| PCMark 10 / Digital Content Creation | |
| Medio Intel Core i9-12900HK, NVIDIA GeForce RTX 3080 Ti Laptop GPU (10951 - 13098, n=5) | |
| Razer Blade 15 2022 | |
| Gigabyte Aero 16 YE5 | |
| Media de la clase Multimedia (3651 - 16240, n=51, últimos 2 años) | |
| Lenovo ThinkPad X1 Extreme G4-20Y50040GE | |
| CrossMark / Overall | |
| Gigabyte Aero 16 YE5 | |
| Media de la clase Multimedia (866 - 2728, n=60, últimos 2 años) | |
| Medio Intel Core i9-12900HK, NVIDIA GeForce RTX 3080 Ti Laptop GPU (970 - 2138, n=5) | |
| Lenovo ThinkPad X1 Extreme G4-20Y50040GE | |
| Apple MacBook Pro 16 2021 M1 Max | |
| CrossMark / Productivity | |
| Gigabyte Aero 16 YE5 | |
| Media de la clase Multimedia (931 - 2489, n=60, últimos 2 años) | |
| Medio Intel Core i9-12900HK, NVIDIA GeForce RTX 3080 Ti Laptop GPU (921 - 2038, n=5) | |
| Lenovo ThinkPad X1 Extreme G4-20Y50040GE | |
| Apple MacBook Pro 16 2021 M1 Max | |
| CrossMark / Creativity | |
| Gigabyte Aero 16 YE5 | |
| Media de la clase Multimedia (907 - 3465, n=60, últimos 2 años) | |
| Apple MacBook Pro 16 2021 M1 Max | |
| Medio Intel Core i9-12900HK, NVIDIA GeForce RTX 3080 Ti Laptop GPU (1007 - 2210, n=5) | |
| Lenovo ThinkPad X1 Extreme G4-20Y50040GE | |
| CrossMark / Responsiveness | |
| Gigabyte Aero 16 YE5 | |
| Medio Intel Core i9-12900HK, NVIDIA GeForce RTX 3080 Ti Laptop GPU (1012 - 2234, n=5) | |
| Lenovo ThinkPad X1 Extreme G4-20Y50040GE | |
| Media de la clase Multimedia (605 - 2024, n=60, últimos 2 años) | |
| Apple MacBook Pro 16 2021 M1 Max | |
| AIDA64 / Memory Copy | |
| Media de la clase Multimedia (11299 - 132135, n=54, últimos 2 años) | |
| Razer Blade 15 2022 | |
| Gigabyte Aero 16 YE5 | |
| Medio Intel Core i9-12900HK (42967 - 62959, n=15) | |
| Lenovo ThinkPad X1 Extreme G4-20Y50040GE | |
| AIDA64 / Memory Read | |
| Media de la clase Multimedia (11624 - 174586, n=54, últimos 2 años) | |
| Razer Blade 15 2022 | |
| Gigabyte Aero 16 YE5 | |
| Medio Intel Core i9-12900HK (44419 - 66989, n=15) | |
| Lenovo ThinkPad X1 Extreme G4-20Y50040GE | |
| AIDA64 / Memory Write | |
| Media de la clase Multimedia (11755 - 134998, n=54, últimos 2 años) | |
| Razer Blade 15 2022 | |
| Gigabyte Aero 16 YE5 | |
| Medio Intel Core i9-12900HK (42144 - 65268, n=15) | |
| Lenovo ThinkPad X1 Extreme G4-20Y50040GE | |
| AIDA64 / Memory Latency | |
| Media de la clase Multimedia (7 - 535, n=53, últimos 2 años) | |
| Gigabyte Aero 16 YE5 | |
| Lenovo ThinkPad X1 Extreme G4-20Y50040GE | |
| Medio Intel Core i9-12900HK (79.9 - 109, n=15) | |
| Razer Blade 15 2022 | |
* ... más pequeño es mejor
Latencias del CPD
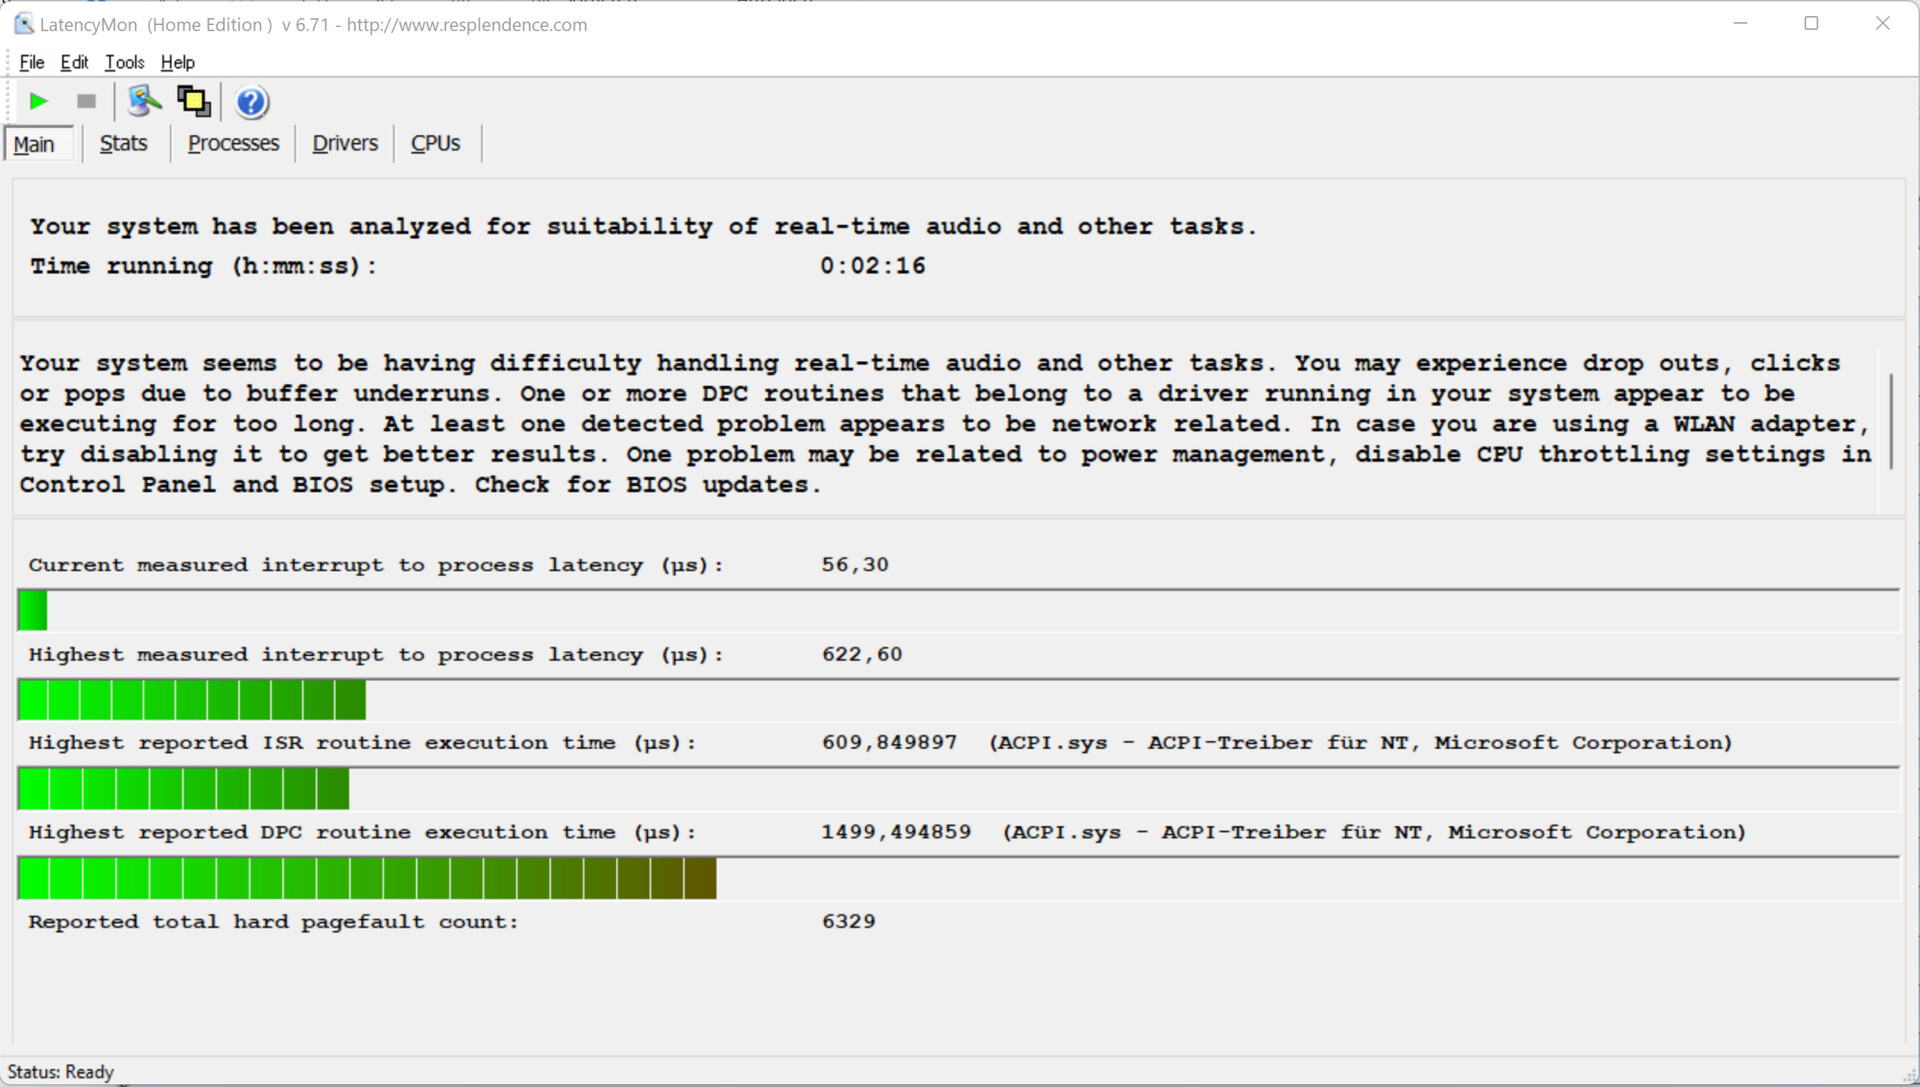
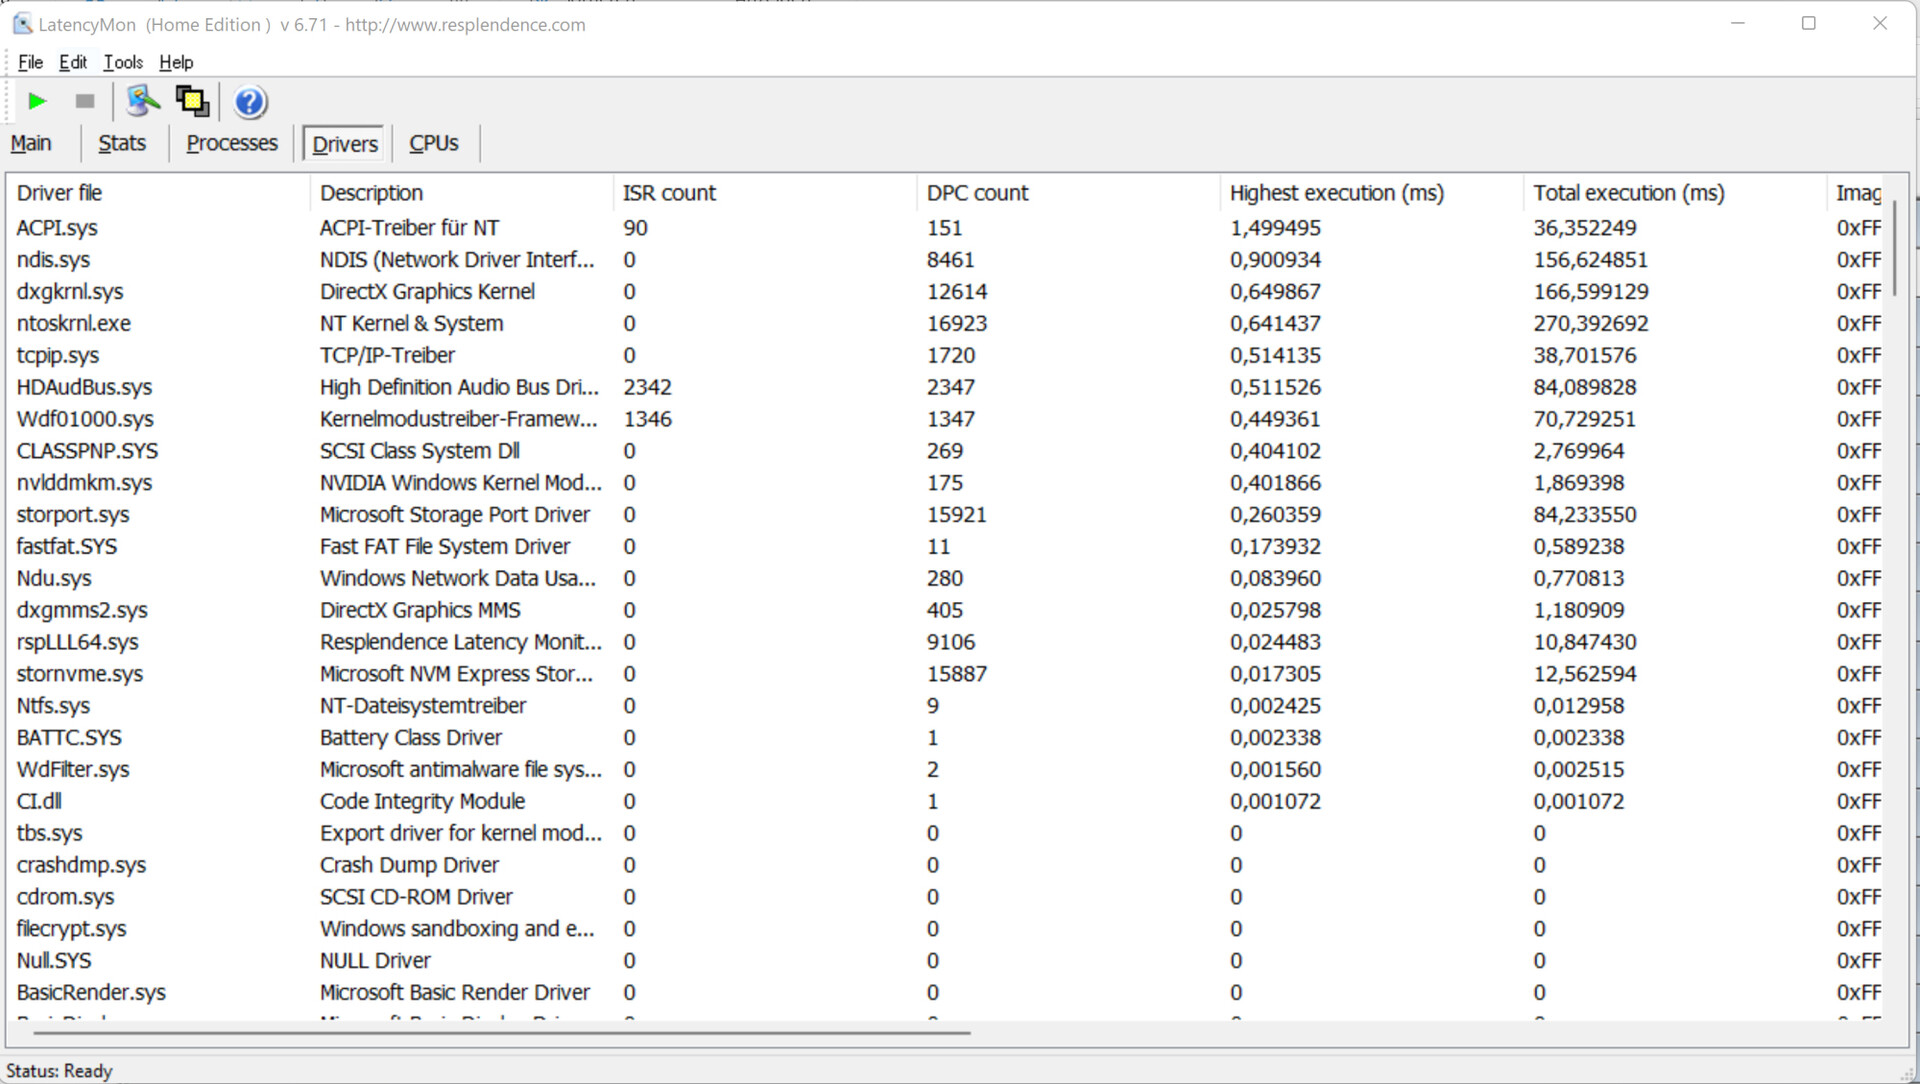
En nuestra prueba de monitorización de latencia estandarizada (navegación por la web, reproducción de vídeo 4K, Prime95 de alta carga) pudimos detectar algunas inconsistencias de latencia DPC. El Aero 16 no parece ser especialmente adecuado para la edición de vídeo y audio. Dicho esto, algunos de sus competidores sufren de latencias DPC aún más altas. En el pasado, descubrimos que las latencias DPC pueden mejorarse con actualizaciones de software a lo largo del tiempo. Por desgracia, también es posible lo contrario.
| DPC Latencies / LatencyMon - interrupt to process latency (max), Web, Youtube, Prime95 | |
| Lenovo ThinkPad X1 Extreme G4-20Y50040GE | |
| HP ZBook Studio 15 G8 | |
| Razer Blade 15 2022 | |
| Schenker XMG Pro 15 (Late 2021) | |
| Gigabyte Aero 16 YE5 | |
* ... más pequeño es mejor
Dispositivos de almacenamiento
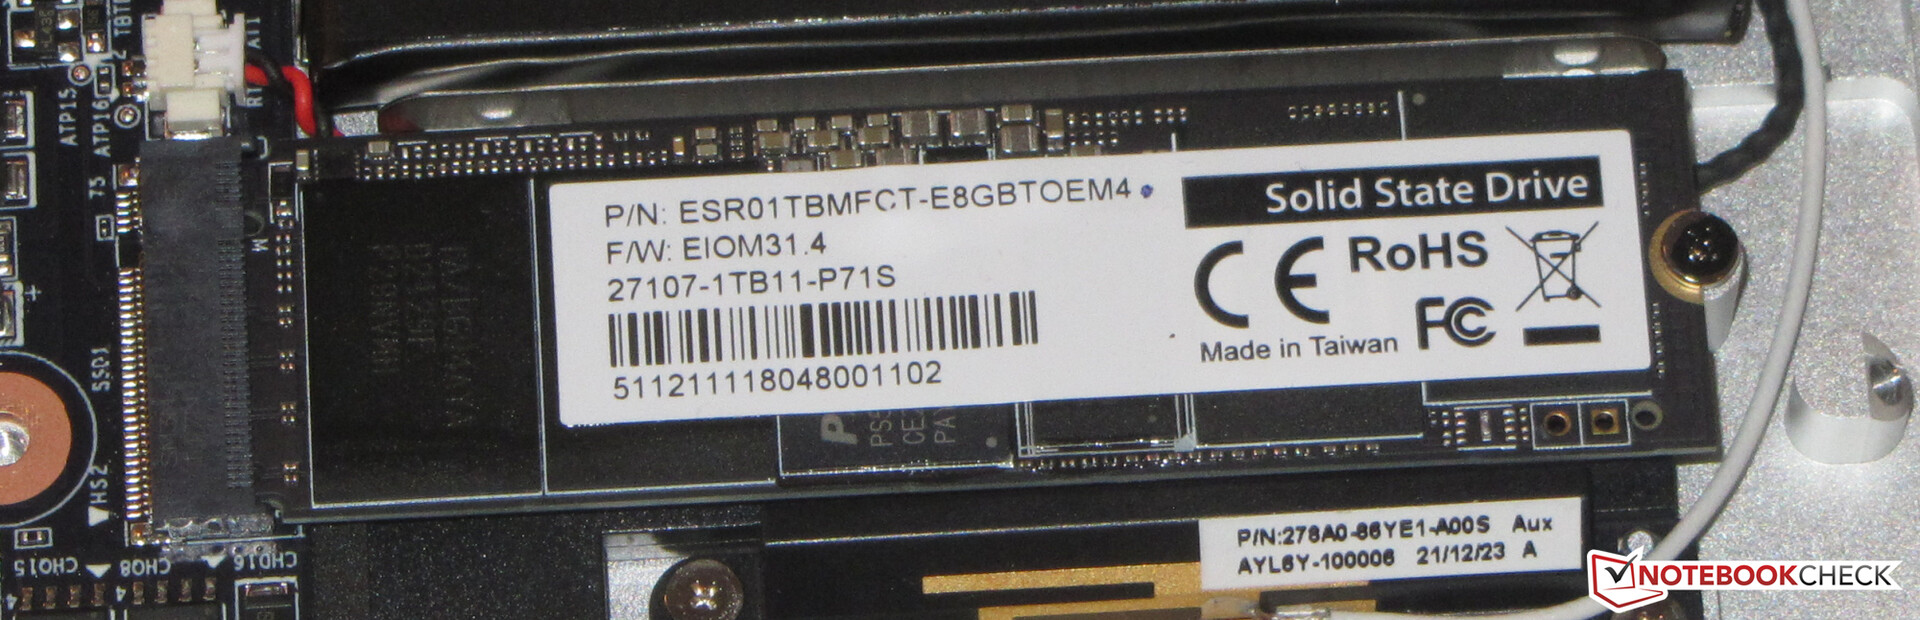
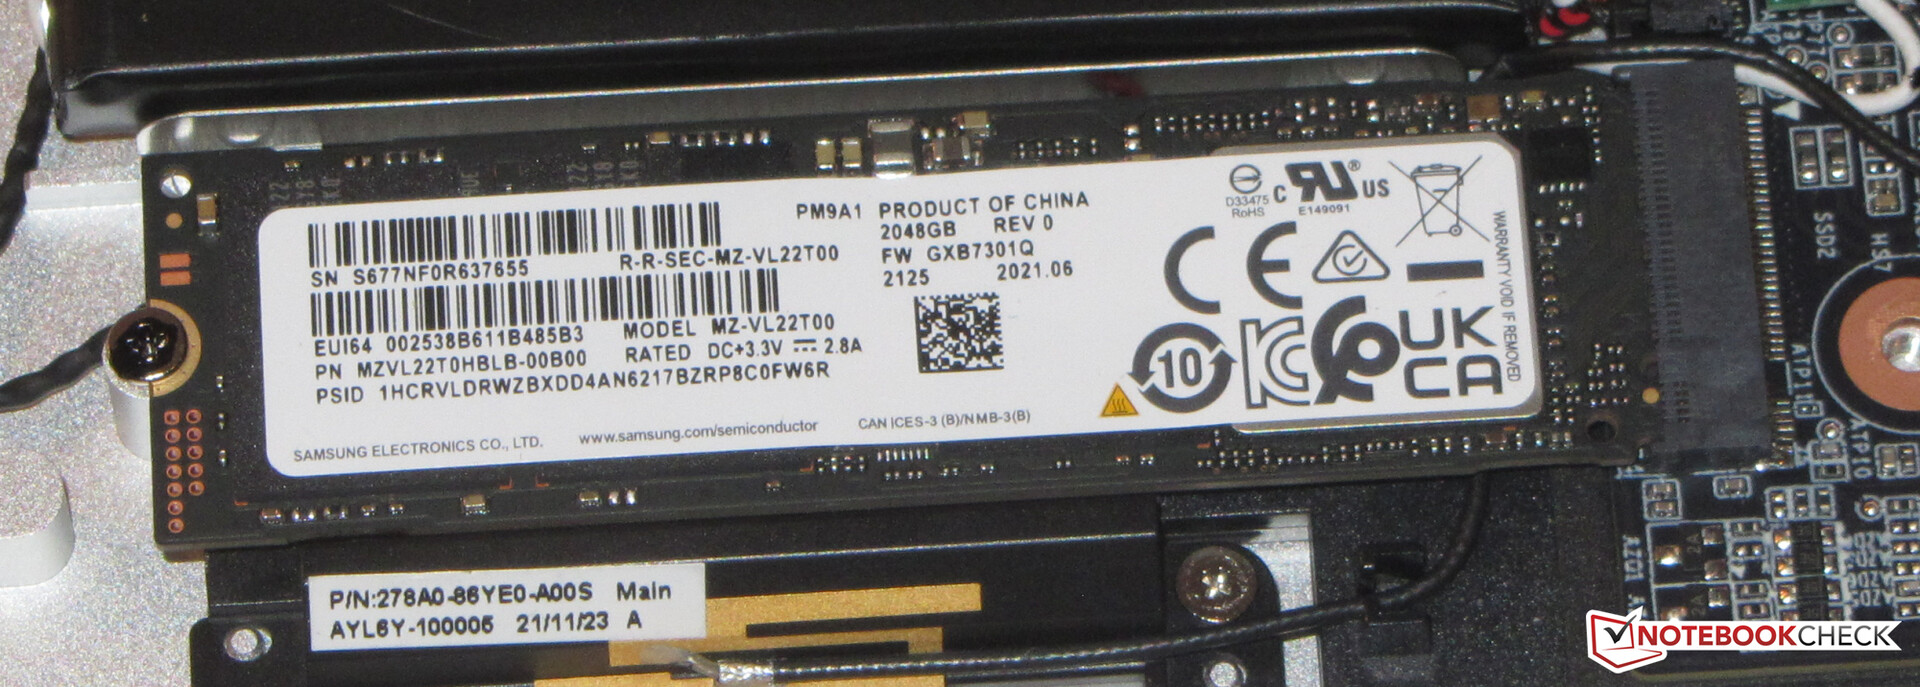
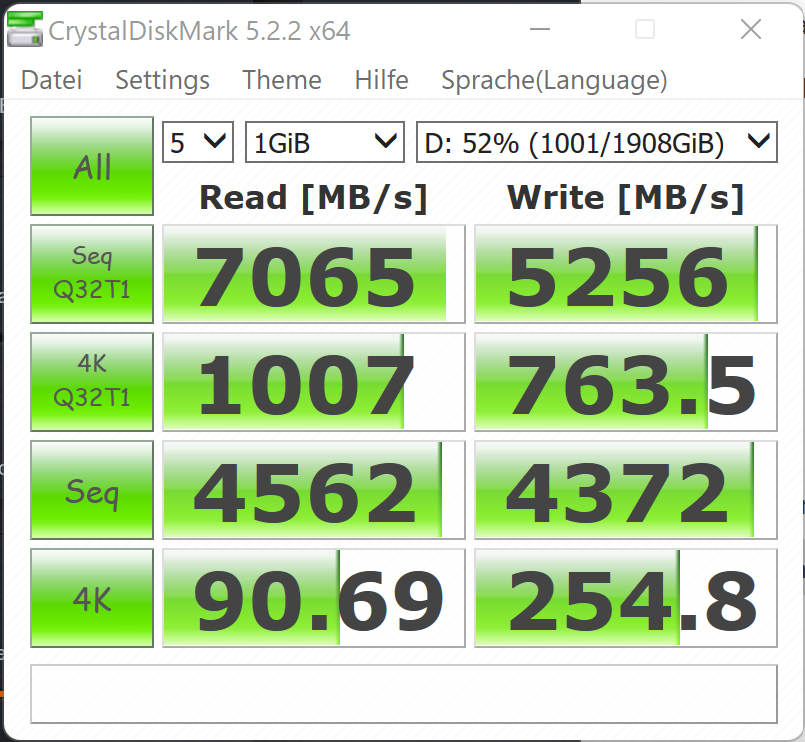
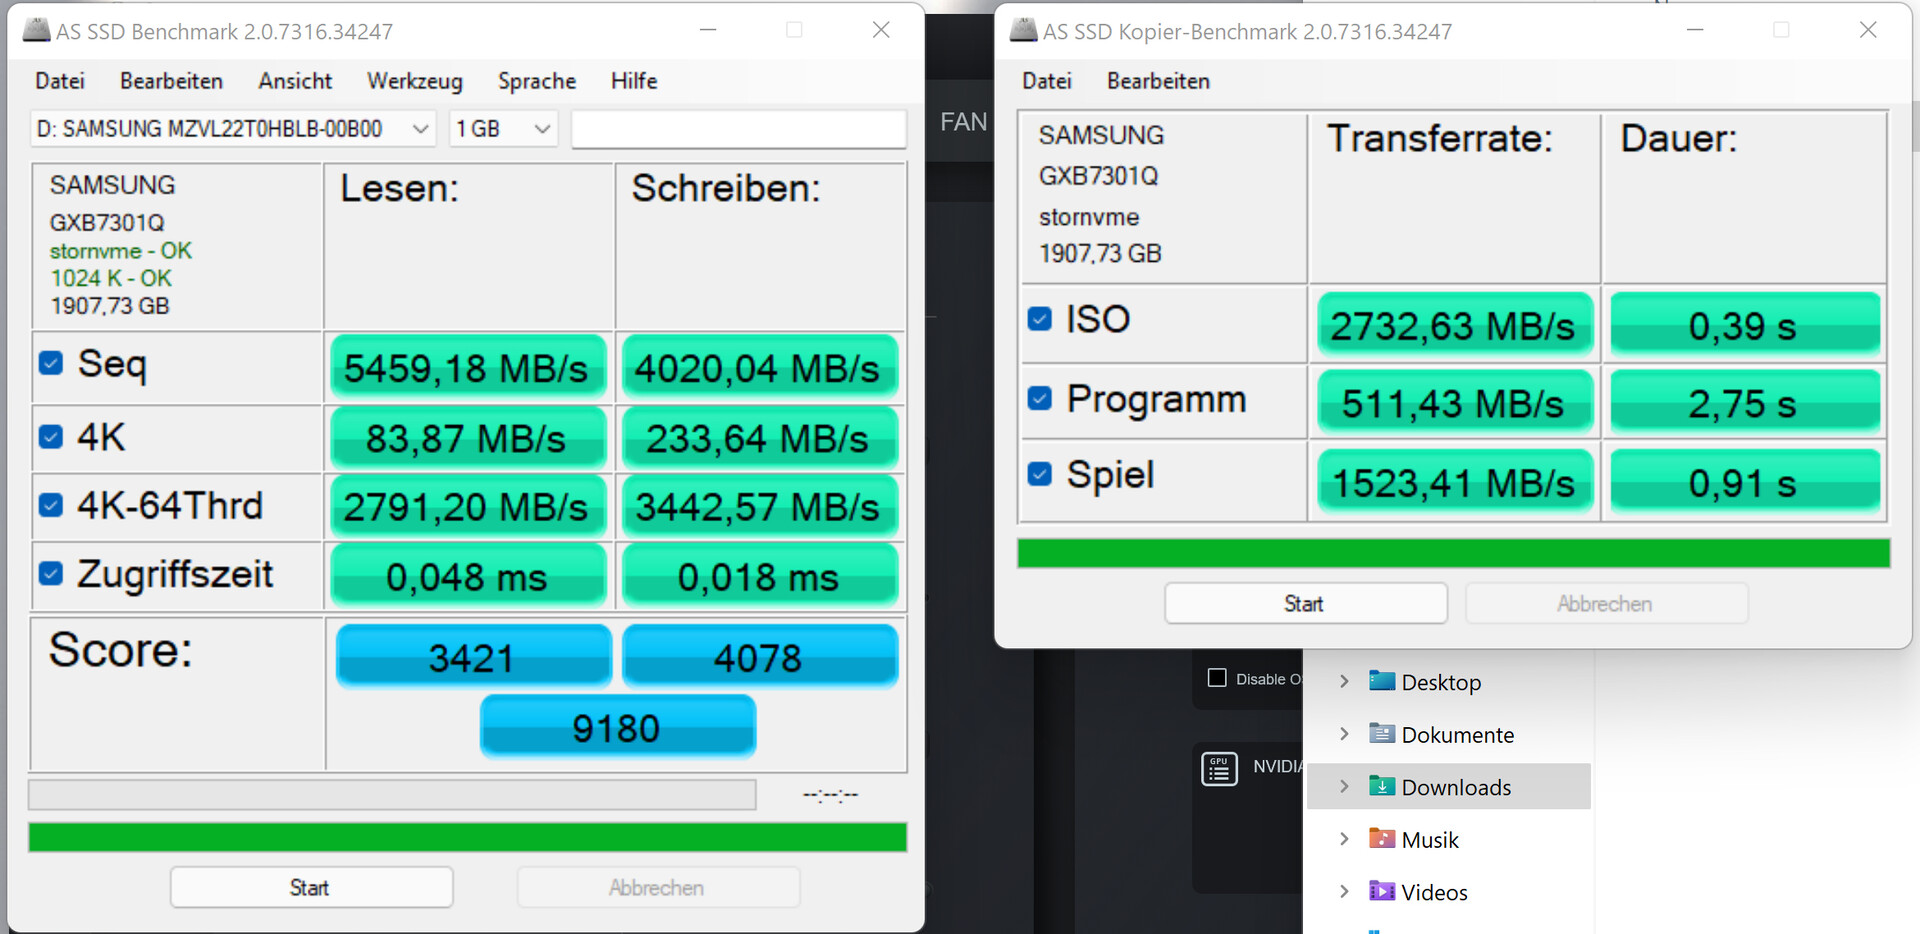
Nuestra unidad de análisis venía con dos SSDs instalados, un Samsung M.2-2280 de 2 TB y un Phison M.2-2280 de 1 TB, este último utilizado para el sistema operativo. Gracias a su interfaz PCIe 4.0 ambos SSDs rindieron admirablemente y muy rápido.

* ... más pequeño es mejor
Sustained Read: DiskSpd Read Loop, Queue Depth 8
Rendimiento gráfico
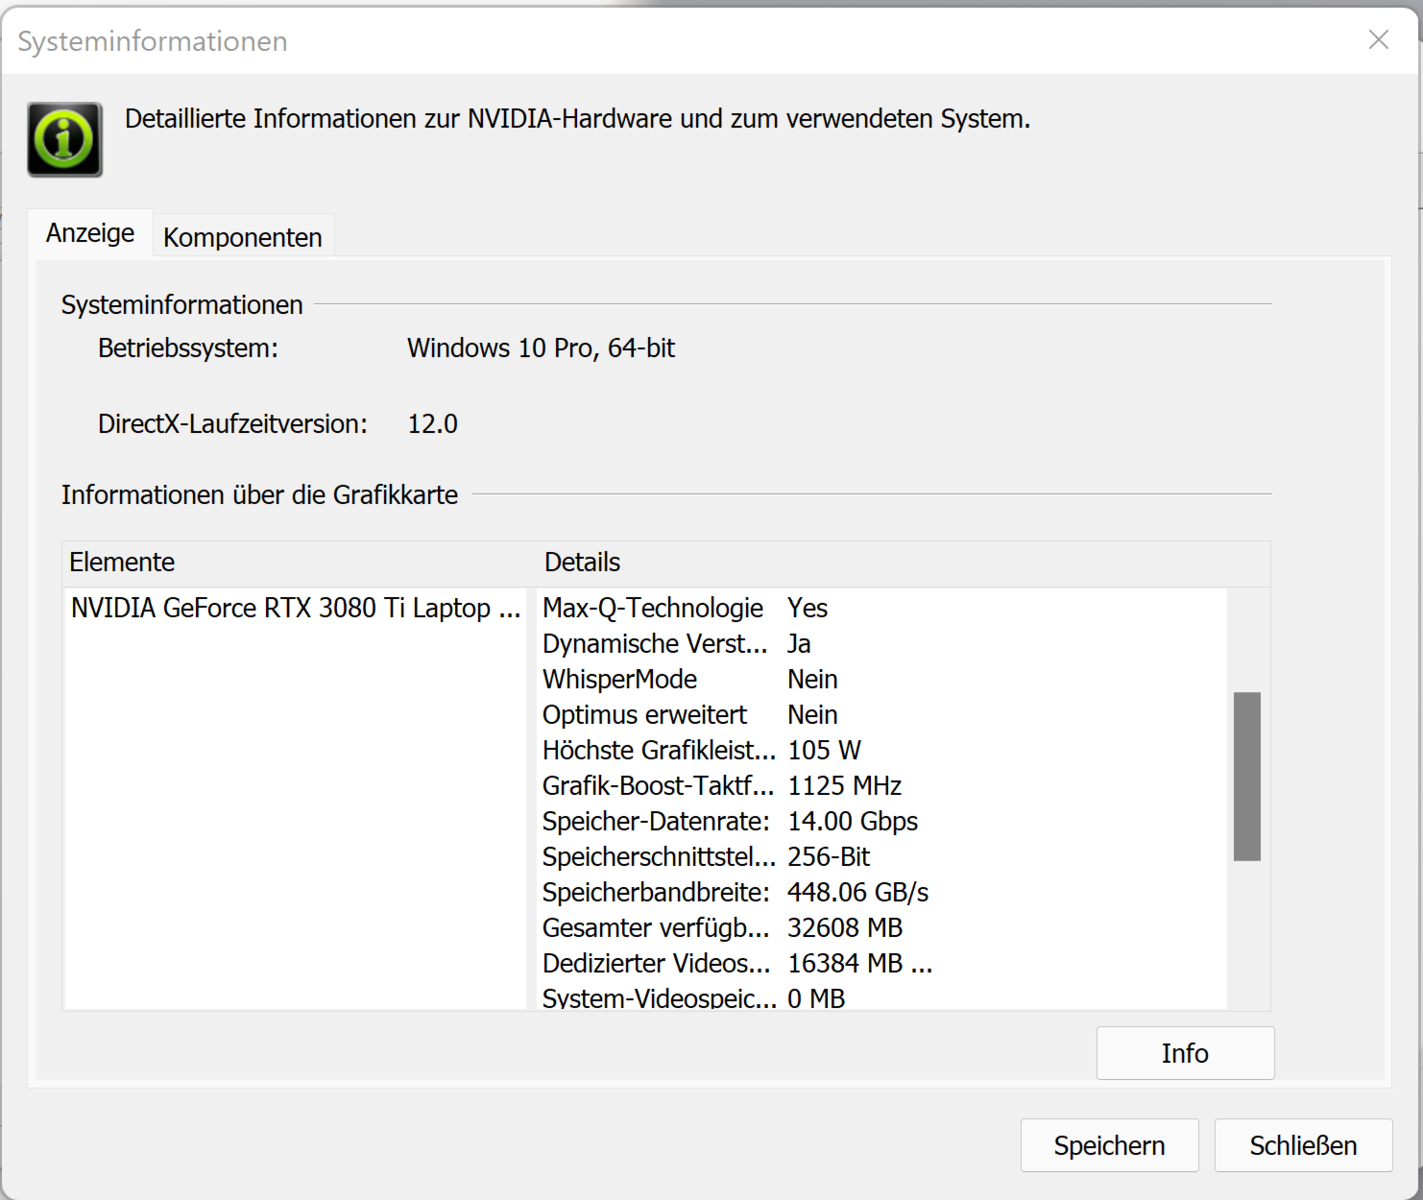
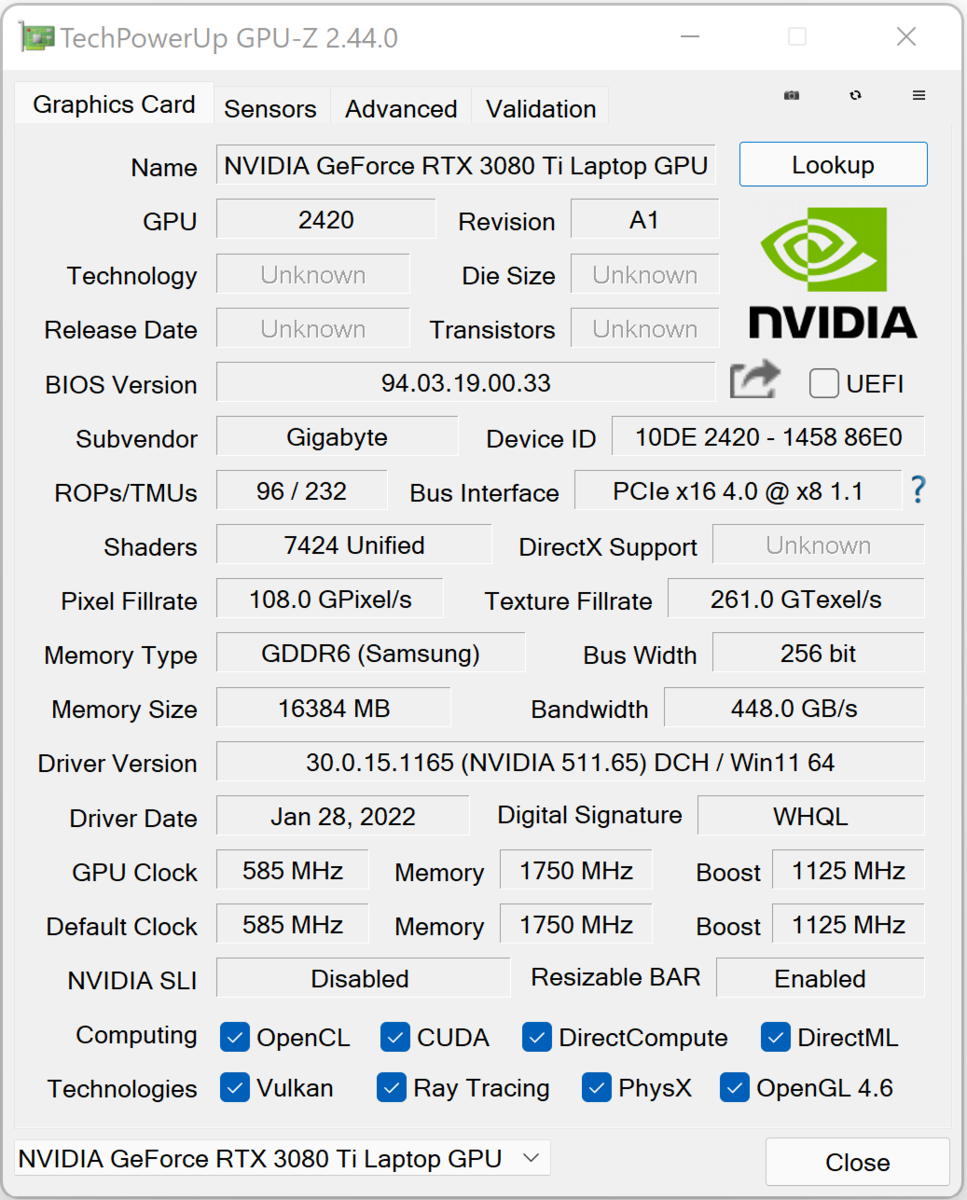
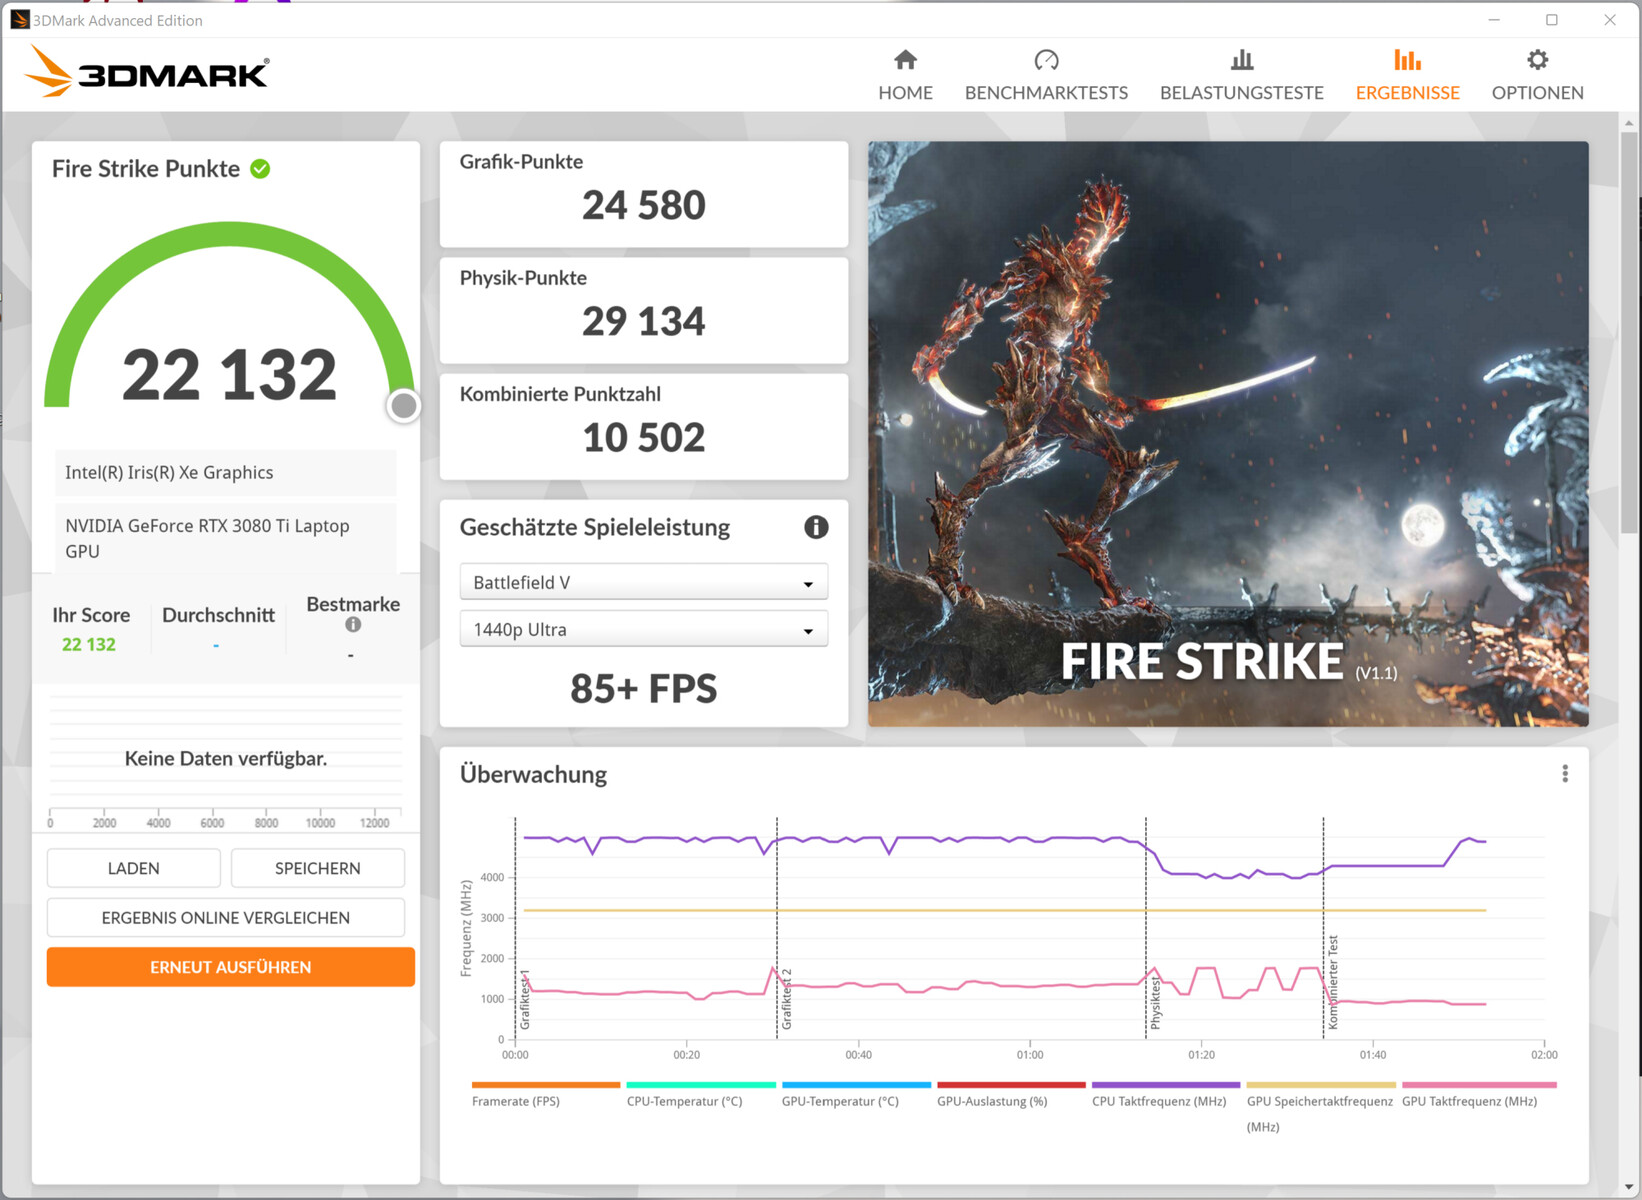
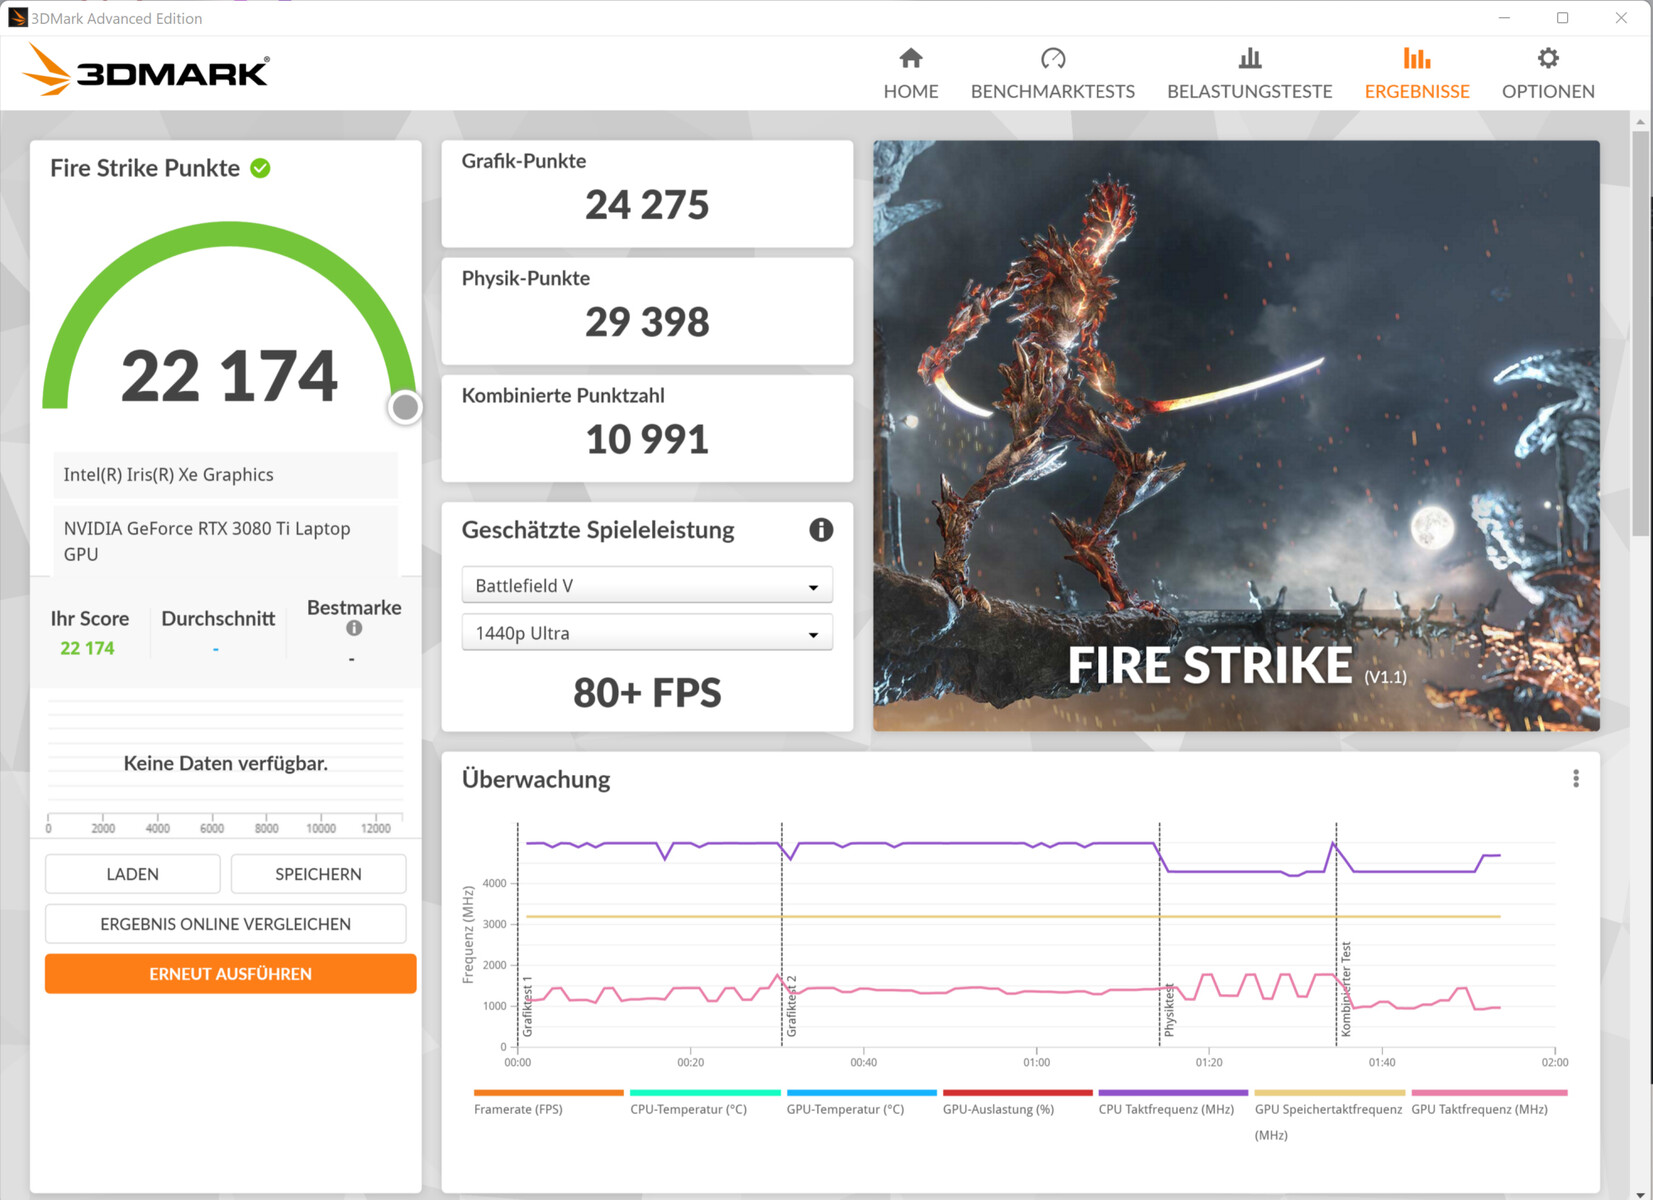
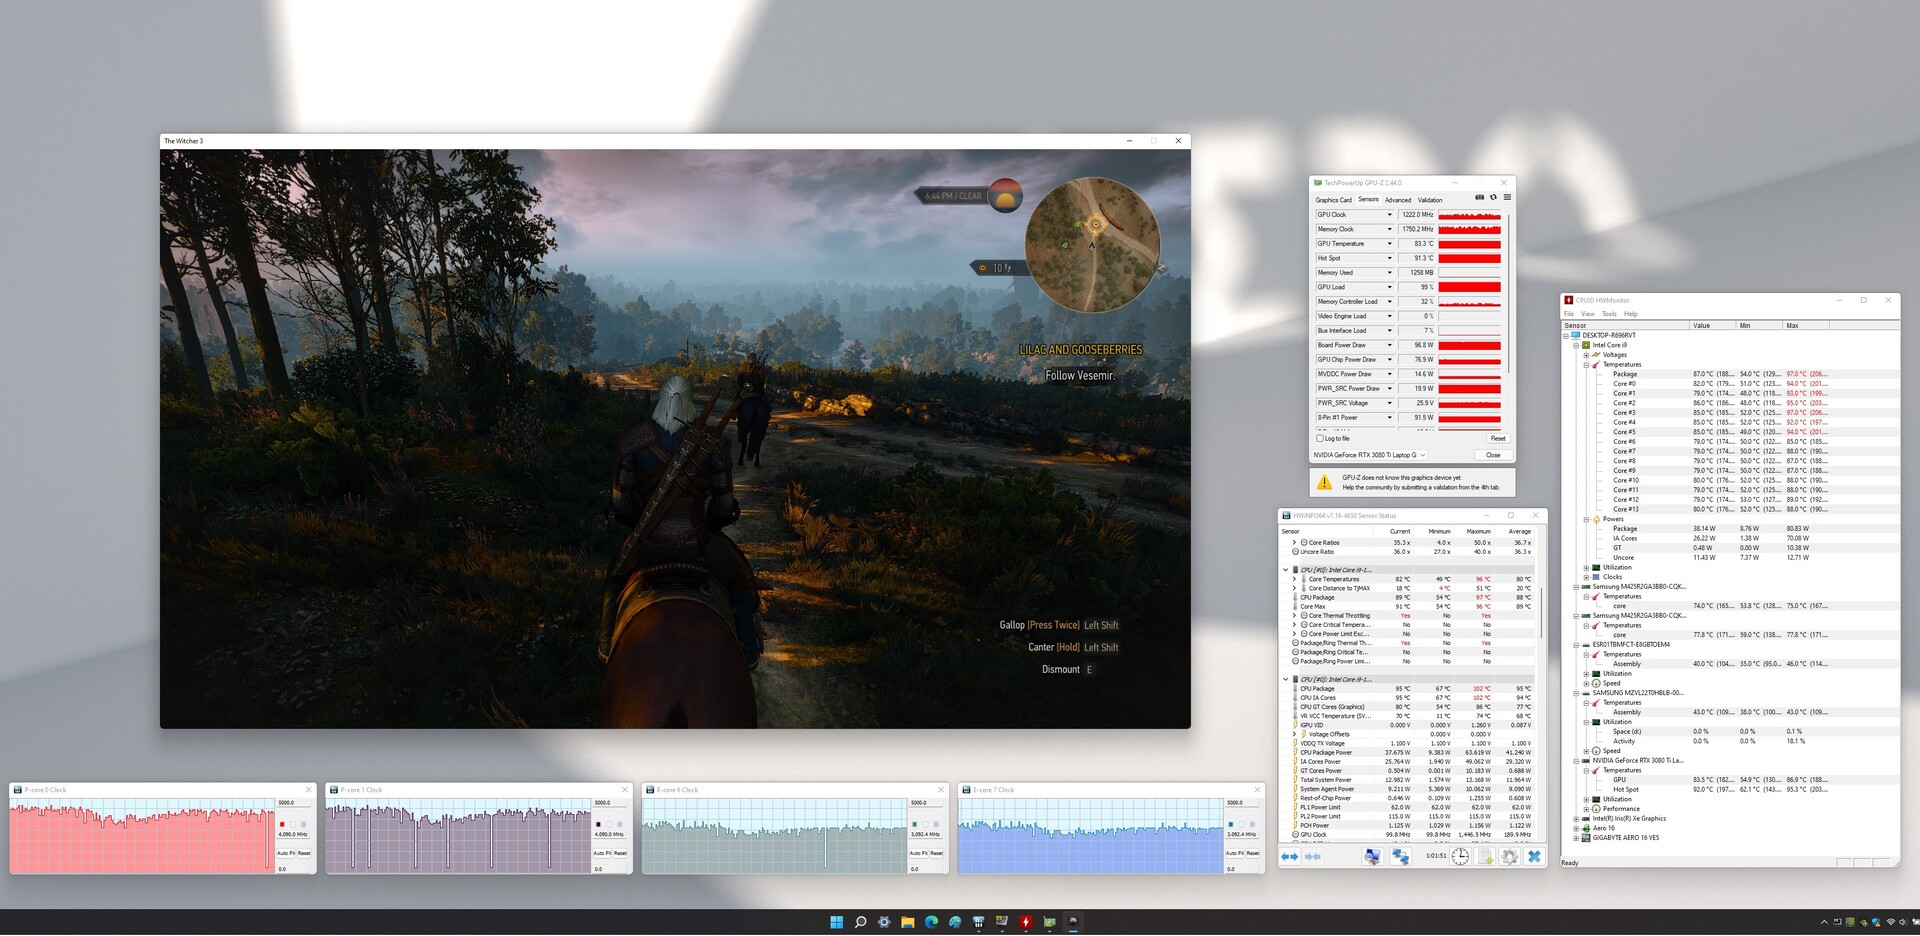
Como sabemos, el rendimiento real de una RTX 3000 depende de varios factores, como la refrigeración, la configuración de la memoria y el TGP máximo establecido por el OEM dentro de los límites predefinidos por Nvidia. En la Aero 16, Gigabyte optó por una GPUGeForce RTX 3080 Ti Laptop con un TGP máximo de 105 W (90 W + 15 W Dynamic Boost).
En nuestras pruebas, la unidad fue más lenta que la media de todos los dispositivos equipados con RTX 3080 Ti probados anteriormente, gracias a su TGP comparativamente bajo. Además, nuestra prueba Witcher 3 reveló que este TGP máximo no puede mantenerse durante largos periodos de tiempo. El Razer Blade 15, que está equipado con exactamente la misma GPU, rindió notablemente mejor, entre otras cosas gracias a sus 5 W adicionales de TGP.
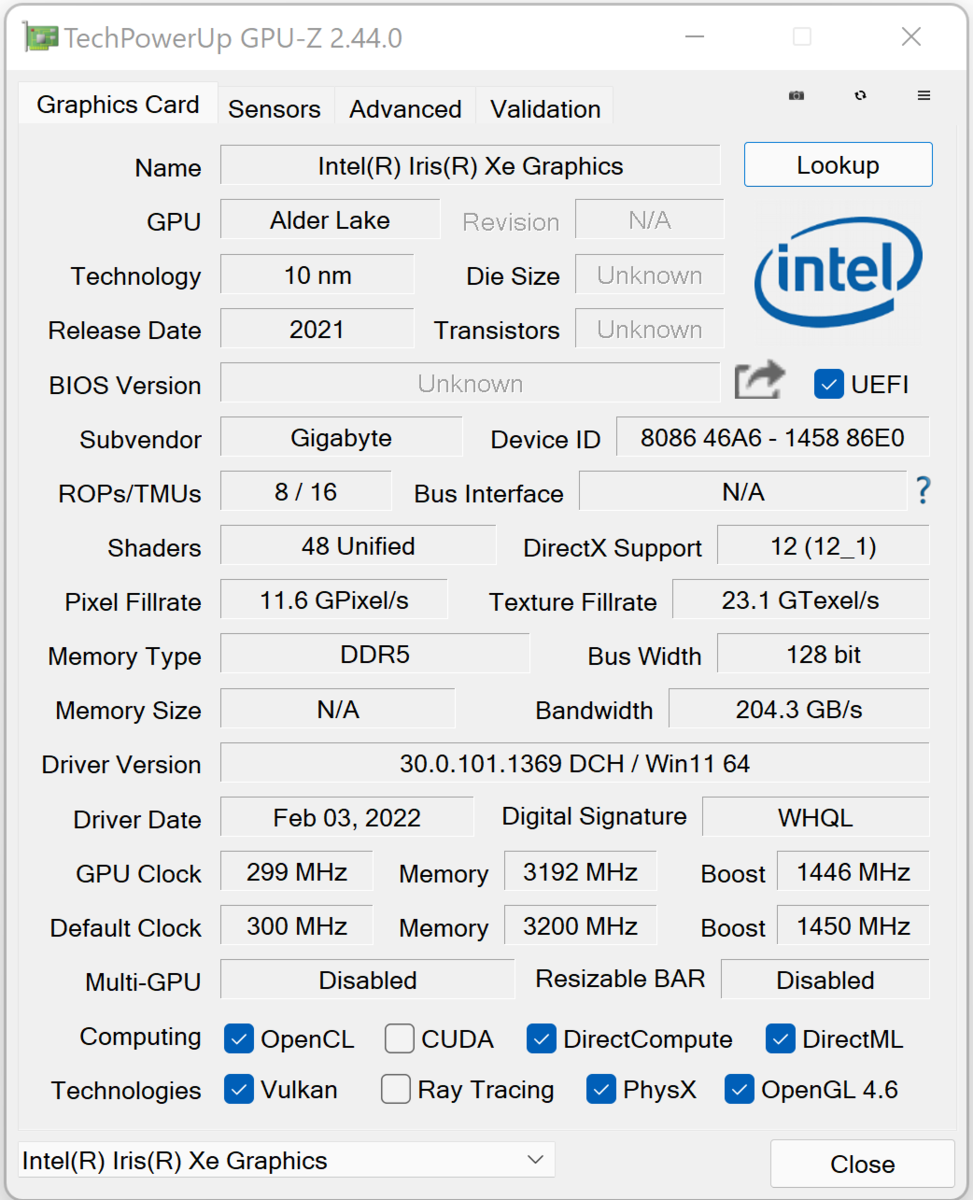
La GPU tiene acceso a un total de 16 GB de VRAM GDDR6, y el portátil soporta el cambio dinámico de GPU bajo demanda entre la GPU dedicada y la integradaIris Xe Graphics G7 (Nvidia Optimus).
| 3DMark 06 Standard Score | 55891 puntos | |
| 3DMark 11 Performance | 30249 puntos | |
| 3DMark Cloud Gate Standard Score | 45491 puntos | |
| 3DMark Fire Strike Score | 22132 puntos | |
| 3DMark Time Spy Score | 9875 puntos | |
ayuda | ||
| 3DMark 11 - 1280x720 Performance GPU | |
| Medio NVIDIA GeForce RTX 3080 Ti Laptop GPU (13920 - 45841, n=45) | |
| Razer Blade 15 2022 | |
| Schenker XMG Pro 15 (Late 2021) | |
| Gigabyte Aero 16 YE5 (Turbo Mode) | |
| Lenovo ThinkPad X1 Extreme G4-20Y50040GE | |
| Gigabyte Aero 16 YE5 | |
| Gigabyte Aero 16 YE5 (Silence Mode) | |
| HP ZBook Studio 15 G8 | |
| Media de la clase Multimedia (3749 - 60002, n=55, últimos 2 años) | |
| SPECviewperf 2020 | |
| 3840x2160 3ds Max (3dsmax-07) | |
| Medio NVIDIA GeForce RTX 3080 Ti Laptop GPU (69.5 - 144, n=7) | |
| Gigabyte Aero 16 YE5 | |
| Gigabyte Aero 16 YE5 (Turbo Mode) | |
| Gigabyte Aero 16 YE5 (Silence Mode) | |
| 3840x2160 CATIA (catia-06) | |
| Medio NVIDIA GeForce RTX 3080 Ti Laptop GPU (30.3 - 69.6, n=7) | |
| Gigabyte Aero 16 YE5 | |
| Gigabyte Aero 16 YE5 (Turbo Mode) | |
| Gigabyte Aero 16 YE5 (Silence Mode) | |
| 3840x2160 Creo (creo-03) | |
| Gigabyte Aero 16 YE5 (Turbo Mode) | |
| Medio NVIDIA GeForce RTX 3080 Ti Laptop GPU (49 - 93.3, n=7) | |
| Gigabyte Aero 16 YE5 | |
| Gigabyte Aero 16 YE5 (Silence Mode) | |
| 3840x2160 Energy (energy-03) | |
| Medio NVIDIA GeForce RTX 3080 Ti Laptop GPU (27.7 - 118.7, n=7) | |
| Gigabyte Aero 16 YE5 | |
| Gigabyte Aero 16 YE5 (Turbo Mode) | |
| Gigabyte Aero 16 YE5 (Silence Mode) | |
| 3840x2160 Maya (maya-06) | |
| Medio NVIDIA GeForce RTX 3080 Ti Laptop GPU (137.4 - 345, n=7) | |
| Gigabyte Aero 16 YE5 (Turbo Mode) | |
| Gigabyte Aero 16 YE5 | |
| Gigabyte Aero 16 YE5 (Silence Mode) | |
| 3840x2160 Medical (medical-03) | |
| Medio NVIDIA GeForce RTX 3080 Ti Laptop GPU (13.2 - 34.3, n=7) | |
| Gigabyte Aero 16 YE5 | |
| Gigabyte Aero 16 YE5 (Turbo Mode) | |
| Gigabyte Aero 16 YE5 (Silence Mode) | |
| 3840x2160 Siemens NX (snx-04) | |
| Medio NVIDIA GeForce RTX 3080 Ti Laptop GPU (15.5 - 21.1, n=7) | |
| Gigabyte Aero 16 YE5 (Turbo Mode) | |
| Gigabyte Aero 16 YE5 | |
| Gigabyte Aero 16 YE5 (Silence Mode) | |
| 3840x2160 Solidworks (solidworks-05) | |
| Medio NVIDIA GeForce RTX 3080 Ti Laptop GPU (87.9 - 255, n=4) | |
| Gigabyte Aero 16 YE5 | |
| Gigabyte Aero 16 YE5 (Turbo Mode) | |
| Gigabyte Aero 16 YE5 (Silence Mode) | |
| 1920x1080 3ds Max (3dsmax-07) | |
| Medio NVIDIA GeForce RTX 3080 Ti Laptop GPU (99.2 - 153, n=6) | |
| Gigabyte Aero 16 YE5 | |
| Gigabyte Aero 16 YE5 (Turbo Mode) | |
| Media de la clase Multimedia (n=1últimos 2 años) | |
| Gigabyte Aero 16 YE5 (Silence Mode) | |
| 1920x1080 CATIA (catia-06) | |
| Medio NVIDIA GeForce RTX 3080 Ti Laptop GPU (51.8 - 78.7, n=6) | |
| Media de la clase Multimedia (n=1últimos 2 años) | |
| Gigabyte Aero 16 YE5 (Turbo Mode) | |
| Gigabyte Aero 16 YE5 | |
| Gigabyte Aero 16 YE5 (Silence Mode) | |
| 1920x1080 Creo (creo-03) | |
| Gigabyte Aero 16 YE5 (Turbo Mode) | |
| Media de la clase Multimedia (n=1últimos 2 años) | |
| Medio NVIDIA GeForce RTX 3080 Ti Laptop GPU (55.3 - 114.7, n=6) | |
| Gigabyte Aero 16 YE5 | |
| Gigabyte Aero 16 YE5 (Silence Mode) | |
| 1920x1080 Energy (energy-03) | |
| Media de la clase Multimedia (n=1últimos 2 años) | |
| Medio NVIDIA GeForce RTX 3080 Ti Laptop GPU (19.6 - 27, n=6) | |
| Gigabyte Aero 16 YE5 | |
| Gigabyte Aero 16 YE5 (Turbo Mode) | |
| Gigabyte Aero 16 YE5 (Silence Mode) | |
| 1920x1080 Maya (maya-06) | |
| Medio NVIDIA GeForce RTX 3080 Ti Laptop GPU (248 - 456, n=6) | |
| Gigabyte Aero 16 YE5 (Turbo Mode) | |
| Gigabyte Aero 16 YE5 | |
| Gigabyte Aero 16 YE5 (Silence Mode) | |
| 1920x1080 Medical (medical-03) | |
| Medio NVIDIA GeForce RTX 3080 Ti Laptop GPU (33 - 40.2, n=6) | |
| Gigabyte Aero 16 YE5 | |
| Gigabyte Aero 16 YE5 (Turbo Mode) | |
| Media de la clase Multimedia (n=1últimos 2 años) | |
| Gigabyte Aero 16 YE5 (Silence Mode) | |
| 1920x1080 Siemens NX (snx-04) | |
| Media de la clase Multimedia (n=1últimos 2 años) | |
| Gigabyte Aero 16 YE5 (Turbo Mode) | |
| Medio NVIDIA GeForce RTX 3080 Ti Laptop GPU (18.1 - 25, n=6) | |
| Gigabyte Aero 16 YE5 | |
| Gigabyte Aero 16 YE5 (Silence Mode) | |
| 1920x1080 Solidworks (solidworks-05) | |
| Media de la clase Multimedia (n=1últimos 2 años) | |
| Gigabyte Aero 16 YE5 | |
| Gigabyte Aero 16 YE5 (Turbo Mode) | |
| Medio NVIDIA GeForce RTX 3080 Ti Laptop GPU (174.7 - 211, n=3) | |
| Gigabyte Aero 16 YE5 (Silence Mode) | |
| Geekbench 5.5 - OpenCL Score | |
| Medio NVIDIA GeForce RTX 3080 Ti Laptop GPU (88580 - 151633, n=41) | |
| Gigabyte Aero 16 YE5 (Turbo Mode) | |
| Gigabyte Aero 16 YE5 | |
| Razer Blade 15 2022 | |
| Lenovo ThinkPad X1 Extreme G4-20Y50040GE | |
| Gigabyte Aero 16 YE5 (Silence Mode) | |
| Schenker XMG Pro 15 (Late 2021) | |
| Media de la clase Multimedia (11562 - 217159, n=56, últimos 2 años) | |
| Apple MacBook Pro 16 2021 M1 Max | |
| GFXBench | |
| on screen Aztec Ruins High Tier Onscreen | |
| Apple MacBook Pro 16 2021 M1 Max | |
| Gigabyte Aero 16 YE5 (DX11) | |
| Medio NVIDIA GeForce RTX 3080 Ti Laptop GPU (n=1) | |
| Media de la clase Multimedia (36.8 - 133.5, n=10, últimos 2 años) | |
| 2560x1440 Aztec Ruins High Tier Offscreen | |
| Apple MacBook Pro 16 2021 M1 Max | |
| Medio NVIDIA GeForce RTX 3080 Ti Laptop GPU (262 - 328, n=2) | |
| Gigabyte Aero 16 YE5 (DX11) | |
| Media de la clase Multimedia (73.3 - 516, n=11, últimos 2 años) | |
| on screen Aztec Ruins Normal Tier Onscreen | |
| Gigabyte Aero 16 YE5 (DX11) | |
| Medio NVIDIA GeForce RTX 3080 Ti Laptop GPU (n=1) | |
| Apple MacBook Pro 16 2021 M1 Max | |
| Media de la clase Multimedia (52 - 177.1, n=9, últimos 2 años) | |
| 1920x1080 Aztec Ruins Normal Tier Offscreen | |
| Apple MacBook Pro 16 2021 M1 Max | |
| Gigabyte Aero 16 YE5 (DX11) | |
| Medio NVIDIA GeForce RTX 3080 Ti Laptop GPU (n=1) | |
| Media de la clase Multimedia (178.3 - 1302, n=11, últimos 2 años) | |
| V-Ray 5 Benchmark | |
| GPU RTX | |
| Medio NVIDIA GeForce RTX 3080 Ti Laptop GPU (1225 - 1915, n=19) | |
| Lenovo ThinkPad X1 Extreme G4-20Y50040GE (5.0.1) | |
| Gigabyte Aero 16 YE5 (5.0.1) | |
| Schenker XMG Pro 15 (Late 2021) (5.0.1) | |
| Media de la clase Multimedia (370 - 1956, n=5, últimos 2 años) | |
| Gigabyte Aero 16 YE5 (5.0.1, Silence Mode) | |
| GPU CUDA | |
| Medio NVIDIA GeForce RTX 3080 Ti Laptop GPU (846 - 1384, n=20) | |
| Gigabyte Aero 16 YE5 (5.0.1, Turbo Mode) | |
| Gigabyte Aero 16 YE5 (5.0.1) | |
| Schenker XMG Pro 15 (Late 2021) (5.0.1) | |
| Media de la clase Multimedia (335 - 1482, n=5, últimos 2 años) | |
| Lenovo ThinkPad X1 Extreme G4-20Y50040GE (5.0.1) | |
| Gigabyte Aero 16 YE5 (5.0.1, Silence Mode) | |
| CPU | |
| Gigabyte Aero 16 YE5 (5.0.1, Turbo Mode) | |
| Medio NVIDIA GeForce RTX 3080 Ti Laptop GPU (3692 - 15811, n=25) | |
| Gigabyte Aero 16 YE5 (5.0.1) | |
| Razer Blade 15 2022 (5.0.1) | |
| Schenker XMG Pro 15 (Late 2021) | |
| Lenovo ThinkPad X1 Extreme G4-20Y50040GE (5.0.1) | |
| Media de la clase Multimedia (3126 - 14552, n=24, últimos 2 años) | |
| Gigabyte Aero 16 YE5 (5.0.1, Silence Mode) | |
| V-Ray Benchmark Next 4.10 | |
| GPU | |
| Medio NVIDIA GeForce RTX 3080 Ti Laptop GPU (311 - 552, n=35) | |
| Gigabyte Aero 16 YE5 (v4.10.07 ) | |
| Gigabyte Aero 16 YE5 (v4.10.07, Turbo Mode) | |
| Schenker XMG Pro 15 (Late 2021) (v4.10.07 ) | |
| Gigabyte Aero 16 YE5 (v4.10.07, Silence Mode) | |
| Media de la clase Multimedia (32 - 1191, n=53, últimos 2 años) | |
| CPU | |
| Gigabyte Aero 16 YE5 (v4.10.07, Turbo Mode) | |
| Medio NVIDIA GeForce RTX 3080 Ti Laptop GPU (5564 - 23947, n=35) | |
| Media de la clase Multimedia (4772 - 35165, n=53, últimos 2 años) | |
| Gigabyte Aero 16 YE5 (v4.10.07 ) | |
| Schenker XMG Pro 15 (Late 2021) (v4.10.07 ) | |
| Gigabyte Aero 16 YE5 (v4.10.07, Silence Mode) | |
Rendimiento de los juegos
Gracias a su potente hardware, el Aero 16 ejecuta todos los juegos actuales sin problemas en resolución FHD y con el máximo de detalles. Esto también es cierto para resoluciones más altas, aunque a veces con detalles reducidos. En general, el portátil fue ligeramente más lento que el dispositivo medio equipado con RTX 3080 Ti.
| The Witcher 3 | |
| 1920x1080 Ultra Graphics & Postprocessing (HBAO+) | |
| Medio NVIDIA GeForce RTX 3080 Ti Laptop GPU (30 - 130.6, n=43) | |
| Razer Blade 15 2022 | |
| Schenker XMG Pro 15 (Late 2021) | |
| Gigabyte Aero 16 YE5 (Turbo Mode) | |
| Gigabyte Aero 16 YE5 | |
| Lenovo ThinkPad X1 Extreme G4-20Y50040GE | |
| HP ZBook Studio 15 G8 | |
| Gigabyte Aero 16 YE5 (SIlence Mode) | |
| Media de la clase Multimedia (11 - 121, n=7, últimos 2 años) | |
| 3840x2160 High Graphics & Postprocessing (Nvidia HairWorks Off) | |
| Medio NVIDIA GeForce RTX 3080 Ti Laptop GPU (62.1 - 94.3, n=8) | |
| Schenker XMG Pro 15 (Late 2021) | |
| Media de la clase Multimedia (61 - 71, n=2, últimos 2 años) | |
| Gigabyte Aero 16 YE5 | |
| HP ZBook Studio 15 G8 | |
| Dota 2 Reborn | |
| 1920x1080 ultra (3/3) best looking | |
| Gigabyte Aero 16 YE5 | |
| Gigabyte Aero 16 YE5 (Turbo Mode) | |
| Razer Blade 15 2022 | |
| Medio NVIDIA GeForce RTX 3080 Ti Laptop GPU (29.9 - 170.5, n=45) | |
| Schenker XMG Pro 15 (Late 2021) | |
| HP ZBook Studio 15 G8 | |
| Lenovo ThinkPad X1 Extreme G4-20Y50040GE | |
| Media de la clase Multimedia (29 - 179.9, n=59, últimos 2 años) | |
| Gigabyte Aero 16 YE5 (Silence Mode) | |
| 3840x2160 ultra (3/3) best looking | |
| Media de la clase Multimedia (106.4 - 139.3, n=4, últimos 2 años) | |
| Medio NVIDIA GeForce RTX 3080 Ti Laptop GPU (70.8 - 155.6, n=19) | |
| Gigabyte Aero 16 YE5 (Turbo Mode) | |
| Schenker XMG Pro 15 (Late 2021) | |
| Gigabyte Aero 16 YE5 | |
| HP ZBook Studio 15 G8 | |
| Gigabyte Aero 16 YE5 (Silence Mode) | |
| Lenovo ThinkPad X1 Extreme G4-20Y50040GE | |
| X-Plane 11.11 | |
| 1920x1080 high (fps_test=3) | |
| Razer Blade 15 2022 | |
| Gigabyte Aero 16 YE5 | |
| Gigabyte Aero 16 YE5 (Turbo Mode) | |
| Medio NVIDIA GeForce RTX 3080 Ti Laptop GPU (32.6 - 127, n=45) | |
| Schenker XMG Pro 15 (Late 2021) | |
| HP ZBook Studio 15 G8 | |
| Lenovo ThinkPad X1 Extreme G4-20Y50040GE | |
| Gigabyte Aero 16 YE5 (Silence Mode) | |
| Media de la clase Multimedia (16.9 - 141.1, n=54, últimos 2 años) | |
| 3840x2160 high (fps_test=3) | |
| Medio NVIDIA GeForce RTX 3080 Ti Laptop GPU (32.9 - 109.5, n=20) | |
| Gigabyte Aero 16 YE5 (Turbo Mode) | |
| Gigabyte Aero 16 YE5 | |
| Media de la clase Multimedia (63.4 - 114.7, n=4, últimos 2 años) | |
| Schenker XMG Pro 15 (Late 2021) | |
| HP ZBook Studio 15 G8 | |
| Gigabyte Aero 16 YE5 (Silence Mode) | |
| Lenovo ThinkPad X1 Extreme G4-20Y50040GE | |
| Final Fantasy XV Benchmark | |
| 1920x1080 High Quality | |
| Medio NVIDIA GeForce RTX 3080 Ti Laptop GPU (30.7 - 140.6, n=42) | |
| Razer Blade 15 2022 (1.3) | |
| Schenker XMG Pro 15 (Late 2021) (1.3) | |
| Gigabyte Aero 16 YE5 (1.3, Turbo Mode) | |
| Gigabyte Aero 16 YE5 (1.3) | |
| HP ZBook Studio 15 G8 (1.3) | |
| Lenovo ThinkPad X1 Extreme G4-20Y50040GE (1.3) | |
| Media de la clase Multimedia (7.61 - 144.4, n=57, últimos 2 años) | |
| 3840x2160 High Quality | |
| Media de la clase Multimedia (42 - 83.4, n=4, últimos 2 años) | |
| Medio NVIDIA GeForce RTX 3080 Ti Laptop GPU (35.1 - 61.2, n=18) | |
| Schenker XMG Pro 15 (Late 2021) (1.3) | |
| Gigabyte Aero 16 YE5 (1.3, Turbo Mode) | |
| Gigabyte Aero 16 YE5 (1.3) | |
| Lenovo ThinkPad X1 Extreme G4-20Y50040GE (1.3) | |
| HP ZBook Studio 15 G8 (1.3) | |
| Gigabyte Aero 16 YE5 (1.3, Silence Mode) | |
| GTA V | |
| 1920x1080 Highest AA:4xMSAA + FX AF:16x | |
| Razer Blade 15 2022 | |
| Gigabyte Aero 16 YE5 (Turbo Mode) | |
| Gigabyte Aero 16 YE5 | |
| Medio NVIDIA GeForce RTX 3080 Ti Laptop GPU (30 - 139.2, n=42) | |
| Schenker XMG Pro 15 (Late 2021) | |
| Media de la clase Multimedia (7.92 - 141.6, n=55, últimos 2 años) | |
| Gigabyte Aero 16 YE5 (Silence Mode) | |
| 3840x2160 Highest AA:4xMSAA + FX AF:16x | |
| Media de la clase Multimedia (39.3 - 90.1, n=2, últimos 2 años) | |
| Medio NVIDIA GeForce RTX 3080 Ti Laptop GPU (37.7 - 67.2, n=14) | |
| Schenker XMG Pro 15 (Late 2021) | |
| Gigabyte Aero 16 YE5 (Turbo Mode) | |
| Gigabyte Aero 16 YE5 | |
| Gigabyte Aero 16 YE5 (Silence Mode) | |
| Strange Brigade | |
| 1920x1080 ultra AA:ultra AF:16 | |
| Medio NVIDIA GeForce RTX 3080 Ti Laptop GPU (42.3 - 224, n=41) | |
| Razer Blade 15 2022 (1.47.22.14 D3D12) | |
| Schenker XMG Pro 15 (Late 2021) (1.47.22.14 D3D12) | |
| Gigabyte Aero 16 YE5 (1.47.22.14 D3D12, Turbo Mode) | |
| Gigabyte Aero 16 YE5 (1.47.22.14 D3D12) | |
| Gigabyte Aero 16 YE5 (1.47.22.14 D3D12, Silence Mode) | |
| Media de la clase Multimedia (13.3 - 303, n=57, últimos 2 años) | |
| 3840x2160 ultra AA:ultra AF:16 | |
| Media de la clase Multimedia (68.4 - 151.4, n=2, últimos 2 años) | |
| Medio NVIDIA GeForce RTX 3080 Ti Laptop GPU (61.7 - 100.7, n=15) | |
| Schenker XMG Pro 15 (Late 2021) (1.47.22.14 D3D12) | |
| Gigabyte Aero 16 YE5 (1.47.22.14 D3D12, Turbo Mode) | |
| Gigabyte Aero 16 YE5 (1.47.22.14 D3D12) | |
| Gigabyte Aero 16 YE5 (1.47.22.14 D3D12, Silence Mode) | |
| F1 2021 | |
| 1920x1080 Ultra High Preset + Raytracing AA:T AF:16x | |
| Medio NVIDIA GeForce RTX 3080 Ti Laptop GPU (30.2 - 160.6, n=30) | |
| Schenker XMG Pro 15 (Late 2021) (831795) | |
| Gigabyte Aero 16 YE5 (852849, Turbo Mode) | |
| Gigabyte Aero 16 YE5 (852849) | |
| Gigabyte Aero 16 YE5 (852849, Silence Mode) | |
| 3840x2160 Ultra High Preset + Raytracing AA:T AF:16x | |
| Medio NVIDIA GeForce RTX 3080 Ti Laptop GPU (41.1 - 70.2, n=18) | |
| Gigabyte Aero 16 YE5 (852849, Turbo Mode) | |
| Schenker XMG Pro 15 (Late 2021) (831795) | |
| Gigabyte Aero 16 YE5 (852849) | |
| Gigabyte Aero 16 YE5 (852849, Silence Mode) | |
| Riders Republic | |
| 1920x1080 Ultra Preset | |
| Medio NVIDIA GeForce RTX 3080 Ti Laptop GPU (92 - 129, n=3) | |
| Schenker XMG Pro 15 (Late 2021) | |
| Gigabyte Aero 16 YE5 | |
| 3840x2160 Ultra Preset | |
| Medio NVIDIA GeForce RTX 3080 Ti Laptop GPU (39 - 56, n=2) | |
| Schenker XMG Pro 15 (Late 2021) | |
| Gigabyte Aero 16 YE5 | |
| Forza Horizon 5 | |
| 1920x1080 Extreme Preset | |
| Schenker XMG Pro 15 (Late 2021) | |
| Medio NVIDIA GeForce RTX 3080 Ti Laptop GPU (48 - 95, n=5) | |
| Gigabyte Aero 16 YE5 | |
| 3840x2160 Extreme Preset | |
| Medio NVIDIA GeForce RTX 3080 Ti Laptop GPU (38 - 61, n=2) | |
| Schenker XMG Pro 15 (Late 2021) | |
| Gigabyte Aero 16 YE5 | |
| Rainbow Six Extraction | |
| 1920x1080 Ultra Preset (with Fixed Resolution Quality) | |
| Medio NVIDIA GeForce RTX 3080 Ti Laptop GPU (128 - 169, n=3) | |
| Gigabyte Aero 16 YE5 | |
| 3840x2160 Ultra Preset (with Fixed Resolution Quality) | |
| Medio NVIDIA GeForce RTX 3080 Ti Laptop GPU (44 - 57, n=2) | |
| Gigabyte Aero 16 YE5 | |
| GRID Legends | |
| 1920x1080 Ultra Preset | |
| Medio NVIDIA GeForce RTX 3080 Ti Laptop GPU (100.4 - 102.6, n=2) | |
| Gigabyte Aero 16 YE5 | |
| 3840x2160 Ultra Preset | |
| Gigabyte Aero 16 YE5 | |
| Medio NVIDIA GeForce RTX 3080 Ti Laptop GPU (n=1) | |
| Cyberpunk 2077 1.6 | |
| 1920x1080 Ultra Preset | |
| Medio NVIDIA GeForce RTX 3080 Ti Laptop GPU (54 - 144.1, n=16) | |
| Gigabyte Aero 16 YE5 | |
| 3840x2160 Ultra Preset | |
| Medio NVIDIA GeForce RTX 3080 Ti Laptop GPU (19.6 - 32.4, n=6) | |
| Gigabyte Aero 16 YE5 | |
| 1920x1080 Ray Tracing Ultra Preset (DLSS off) | |
| Gigabyte Aero 16 YE5 | |
| Medio NVIDIA GeForce RTX 3080 Ti Laptop GPU (39.2 - 49.9, n=7) | |
| 3840x2160 Ray Tracing Ultra Preset (DLSS off) | |
| Medio NVIDIA GeForce RTX 3080 Ti Laptop GPU (9.22 - 12.3, n=3) | |
| Gigabyte Aero 16 YE5 | |
| Elex 2 | |
| 1920x1080 Ultra / On AA:SM AF:16x | |
| Gigabyte Aero 16 YE5 | |
| Medio NVIDIA GeForce RTX 3080 Ti Laptop GPU (31 - 91, n=3) | |
| 3840x2160 Ultra / On AA:SM AF:16x | |
| Gigabyte Aero 16 YE5 | |
| Medio NVIDIA GeForce RTX 3080 Ti Laptop GPU (n=1) | |
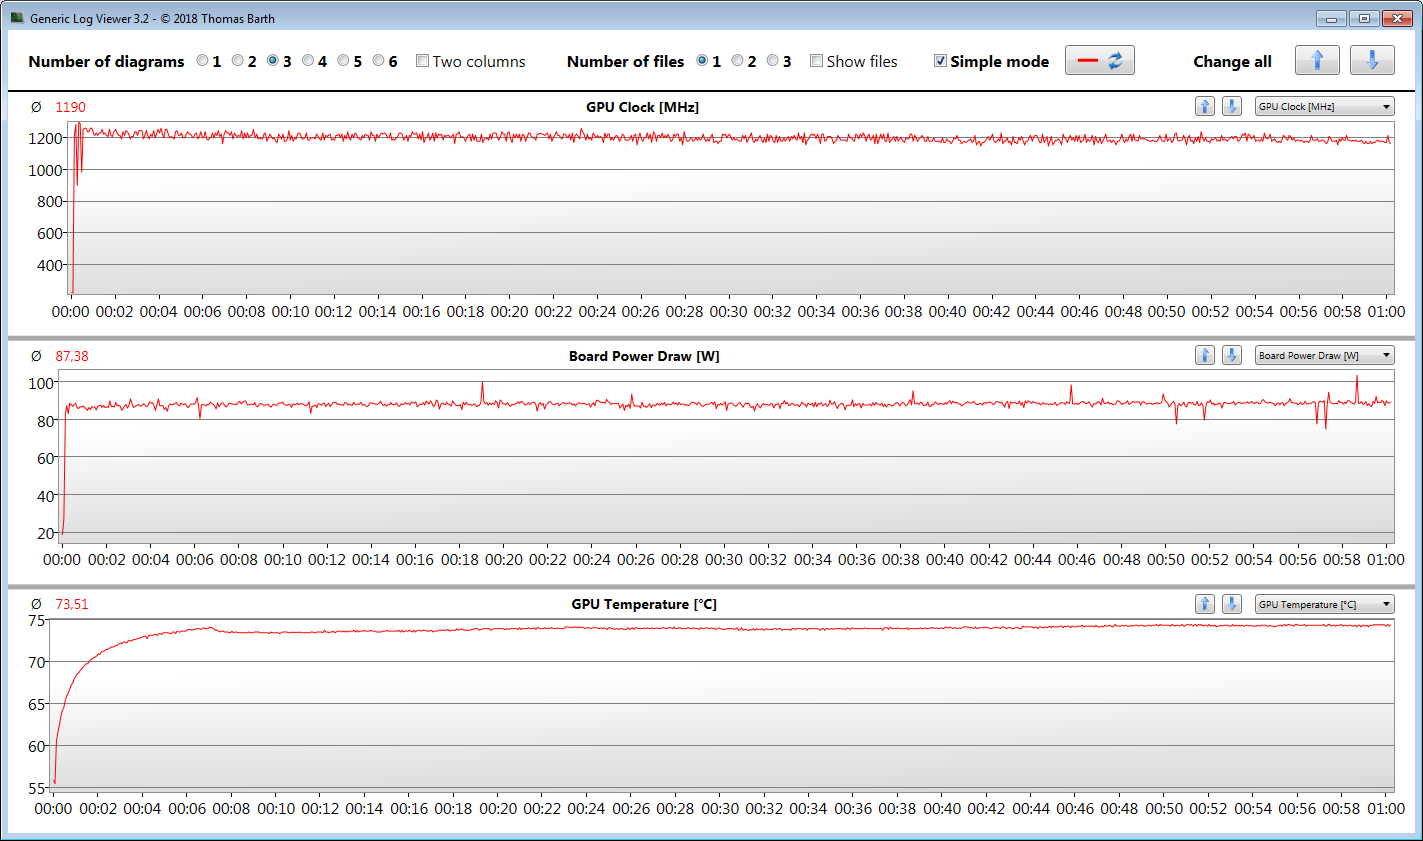
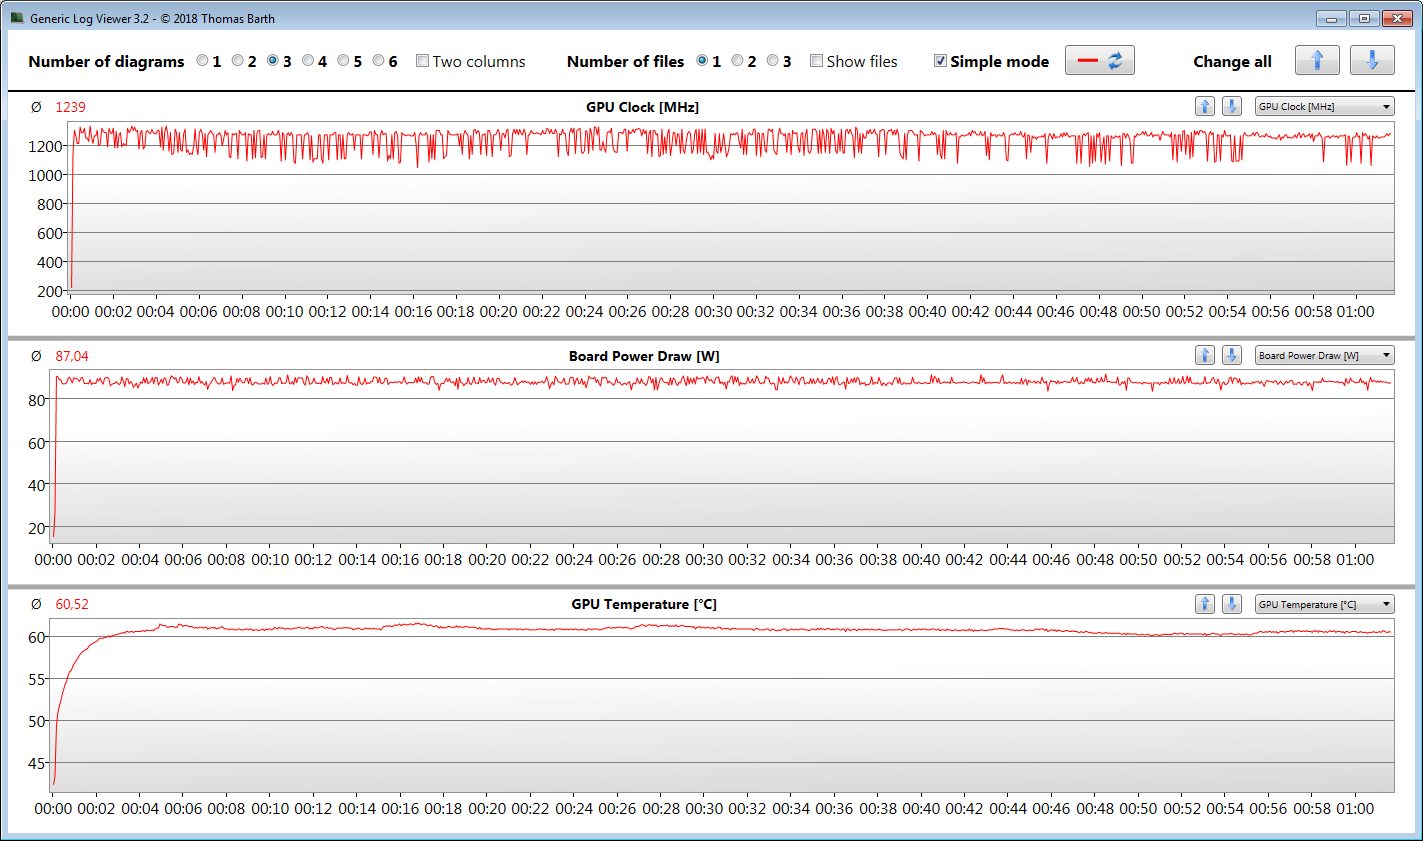
Ejecutamos Witcher 3 durante 60 minutos en FHD y con los máximos detalles para determinar si un dispositivo es capaz de mantener un alto nivel de rendimiento constante durante largos periodos de tiempo. El avatar está inmóvil durante toda la prueba para garantizar la comparabilidad. En este caso, no encontramos evidencia de disminución de la velocidad de fotogramas a lo largo de la prueba.
Witcher 3 FPS Graph
| bajo | medio | alto | ultra | QHD | 4K | |
|---|---|---|---|---|---|---|
| GTA V (2015) | 187 | 185 | 179 | 113 | 82.7 | 78.2 |
| The Witcher 3 (2015) | 408 | 278 | 144 | 92.2 | 64 | |
| Dota 2 Reborn (2015) | 191 | 176 | 168 | 160 | 112 | |
| Final Fantasy XV Benchmark (2018) | 195 | 110 | 85.8 | 64.8 | 40.1 | |
| X-Plane 11.11 (2018) | 154 | 134 | 108 | 78.6 | ||
| Far Cry 5 (2018) | 189 | 141 | 130 | 122 | 86 | 45 |
| Strange Brigade (2018) | 424 | 200 | 168 | 151 | 113 | 68.4 |
| F1 2021 (2021) | 383 | 236 | 196 | 103 | 84 | 47.3 |
| Riders Republic (2021) | 202 | 126 | 101 | 92 | 65 | 39 |
| Forza Horizon 5 (2021) | 221 | 131 | 116 | 72 | 61 | 38 |
| Rainbow Six Extraction (2022) | 185 | 160 | 157 | 128 | 87 | 44 |
| Dying Light 2 (2022) | 97.1 | 79 | 69.2 | 49.6 | 27.3 | |
| GRID Legends (2022) | 206.6 | 159.5 | 139.2 | 100.4 | 81 | 54.4 |
| Cyberpunk 2077 1.6 (2022) | 121.7 | 96.4 | 72.4 | 73.2 | 39.7 | 19.6 |
| Elex 2 (2022) | 93.5 | 89.5 | 76.5 | 70.3 | 48.1 | 28.2 |
Emisiones - Aero hace mucho ruido
Emisiones acústicas
En el uso diario (oficina, internet) ambos ventiladores son discretos y comparativamente silenciosos. Sin embargo, bajo carga, se aceleran y se vuelven muy audibles rápidamente. Desgraciadamente, también producen un notable zumbido a altas revoluciones. Las emisiones de ruido pueden reducirse significativamente seleccionando el perfil "Modo Silencio de Ahorro de Energía", aunque a costa del rendimiento.
Ruido
| Ocioso |
| 30 / 32 / 33 dB(A) |
| Carga |
| 45 / 52 dB(A) |
 | ||
30 dB silencioso 40 dB(A) audible 50 dB(A) ruidosamente alto |
||
min: | ||
| Gigabyte Aero 16 YE5 GeForce RTX 3080 Ti Laptop GPU, i9-12900HK | Lenovo ThinkPad X1 Extreme G4-20Y50040GE GeForce RTX 3080 Laptop GPU, i9-11950H | Apple MacBook Pro 16 2021 M1 Max M1 Max 32-Core GPU, M1 Max | HP ZBook Studio 15 G8 GeForce RTX 3070 Laptop GPU, i9-11950H | Schenker XMG Pro 15 (Late 2021) GeForce RTX 3080 Laptop GPU, i7-11800H | Razer Blade 15 2022 GeForce RTX 3080 Ti Laptop GPU, i7-12800H | |
|---|---|---|---|---|---|---|
| Noise | 10% | 17% | 11% | -12% | 8% | |
| apagado / medio ambiente * (dB) | 25 | 24.7 1% | 24.2 3% | 23.5 6% | 24 4% | 25.4 -2% |
| Idle Minimum * (dB) | 30 | 24.7 18% | 24.2 19% | 25.3 16% | 31 -3% | 26.2 13% |
| Idle Average * (dB) | 32 | 24.7 23% | 24.2 24% | 25.3 21% | 37 -16% | 26.2 18% |
| Idle Maximum * (dB) | 33 | 28.1 15% | 24.2 27% | 25.3 23% | 41 -24% | 28.4 14% |
| Load Average * (dB) | 45 | 42.5 6% | 42.9 5% | 41.2 8% | 56 -24% | 44.7 1% |
| Witcher 3 ultra * (dB) | 50 | 46.4 7% | 39.5 21% | 49.4 1% | 53 -6% | 44.7 11% |
| Load Maximum * (dB) | 52 | 52.1 -0% | 42.9 17% | 49.4 5% | 58 -12% | 51.9 -0% |
* ... más pequeño es mejor
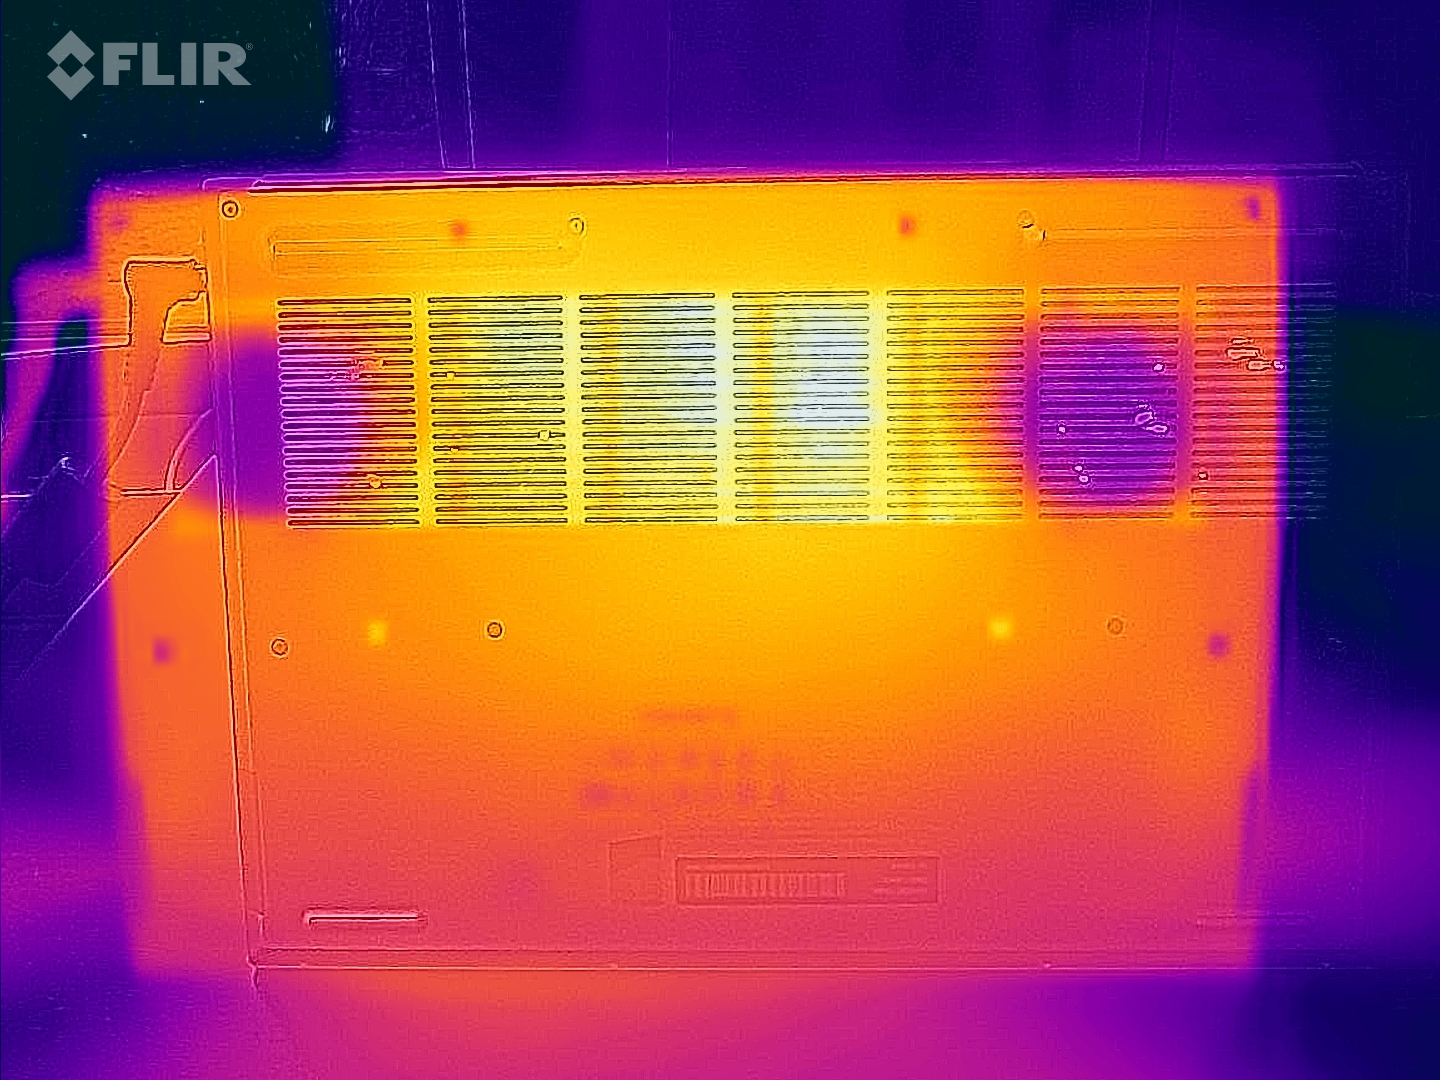
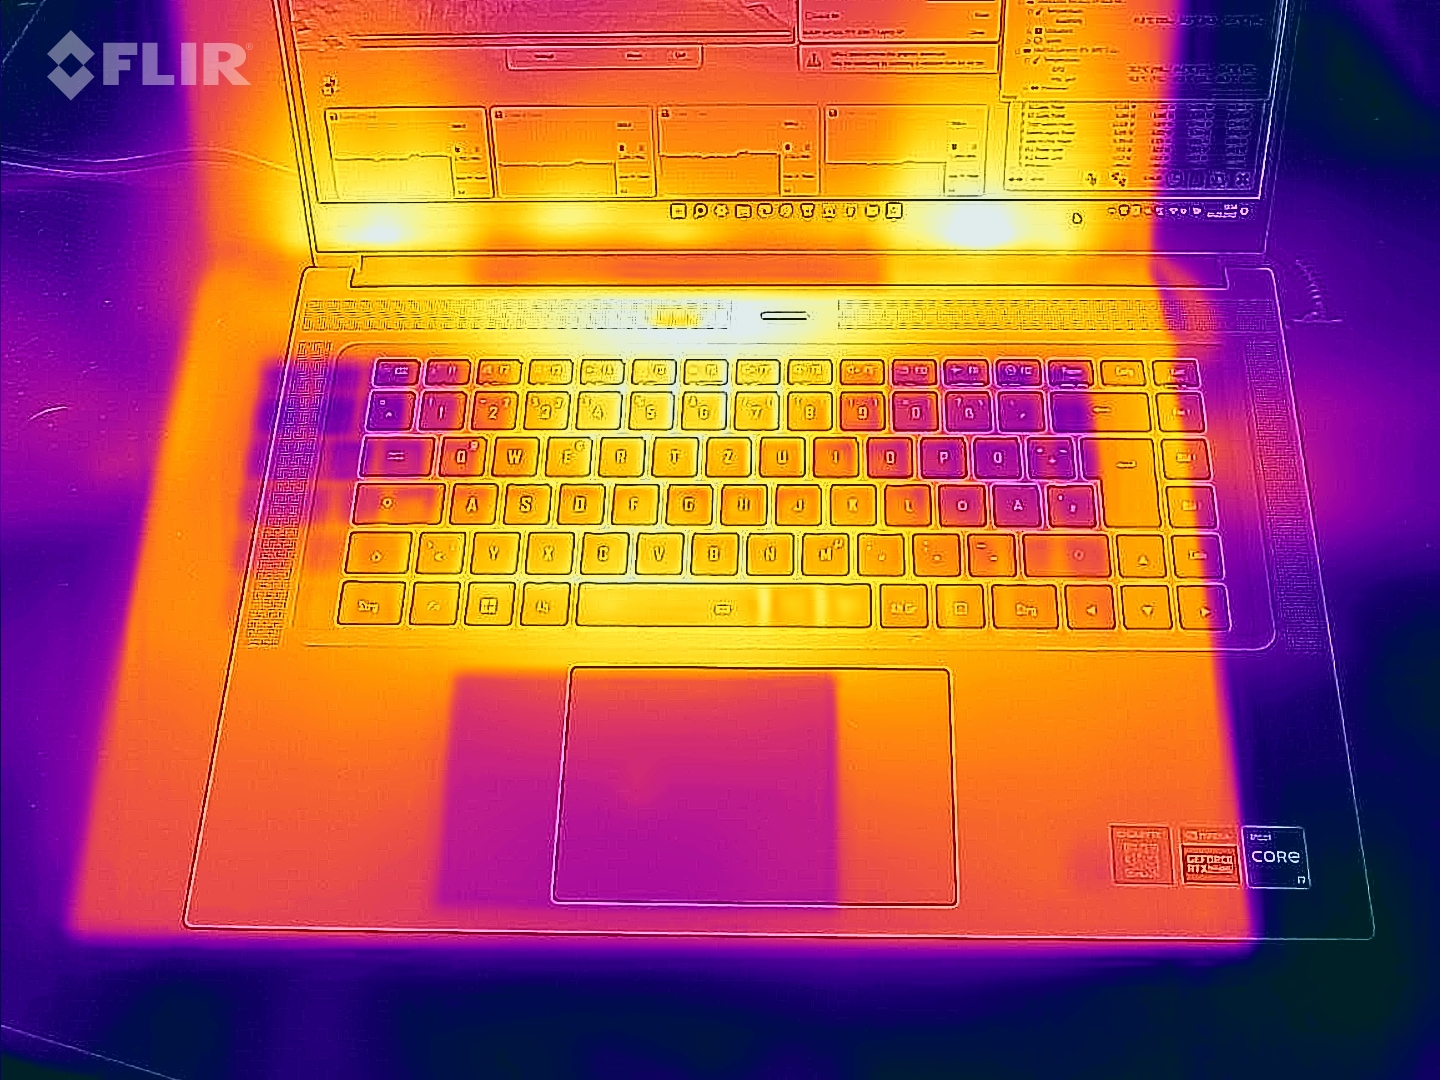
Temperatura
En el uso diario (oficina, internet) las temperaturas de la carcasa se mantienen bastante bajas. Bajo carga (prueba de estrés, Witcher 3) se calienta drásticamente con puntos calientes de hasta 60 °C.
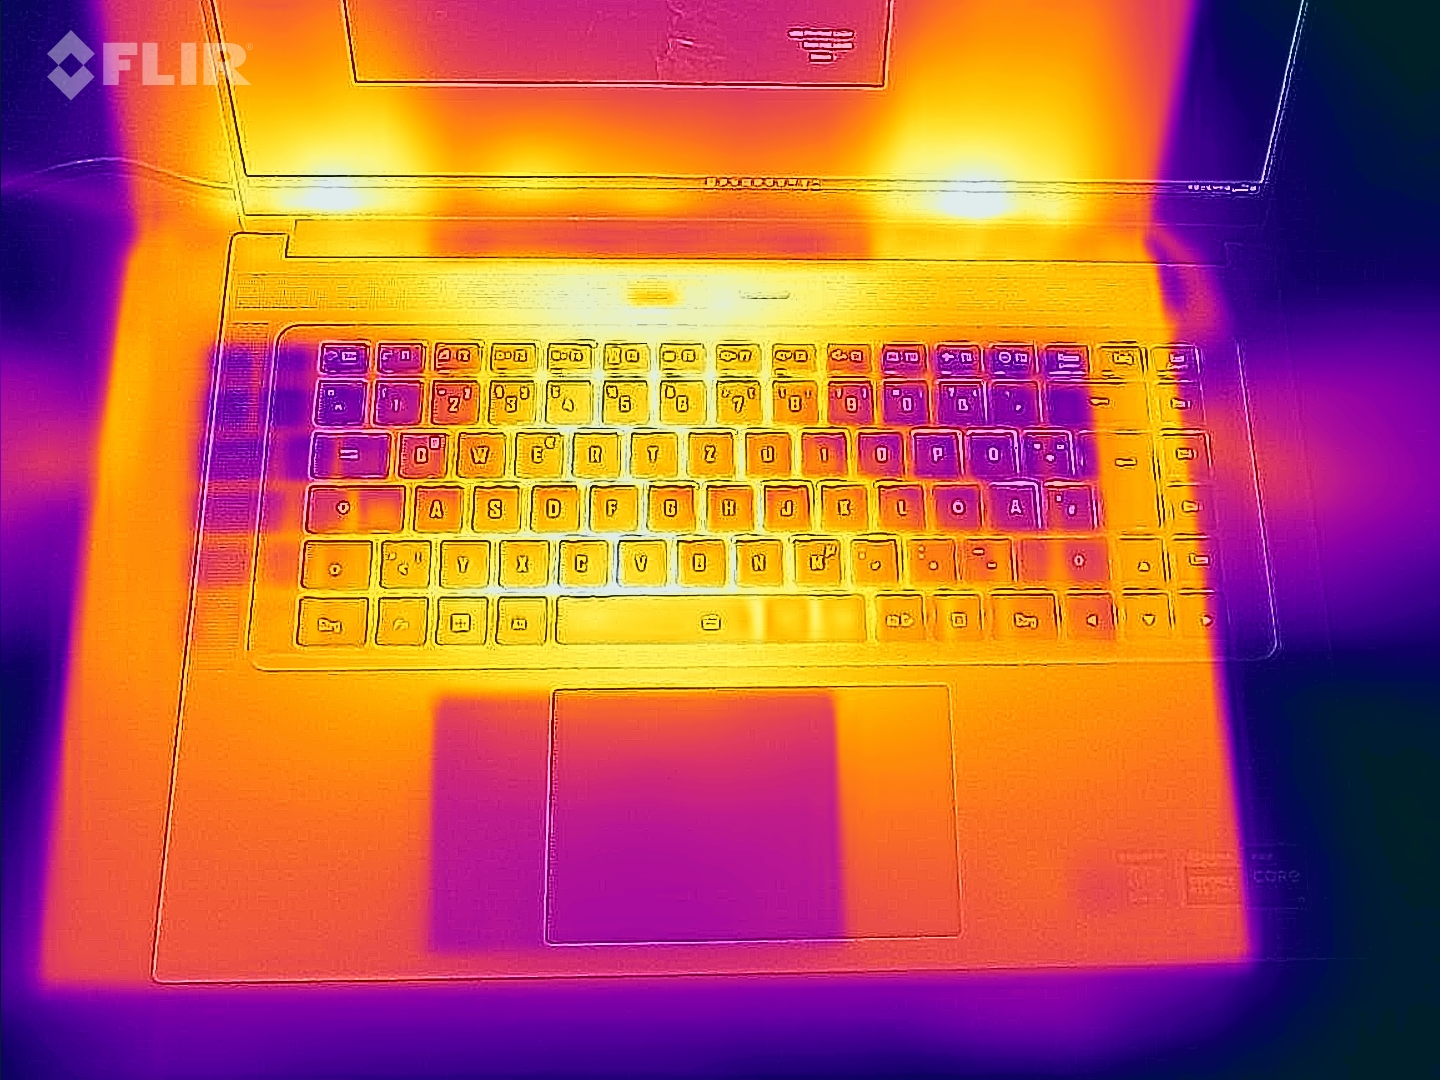
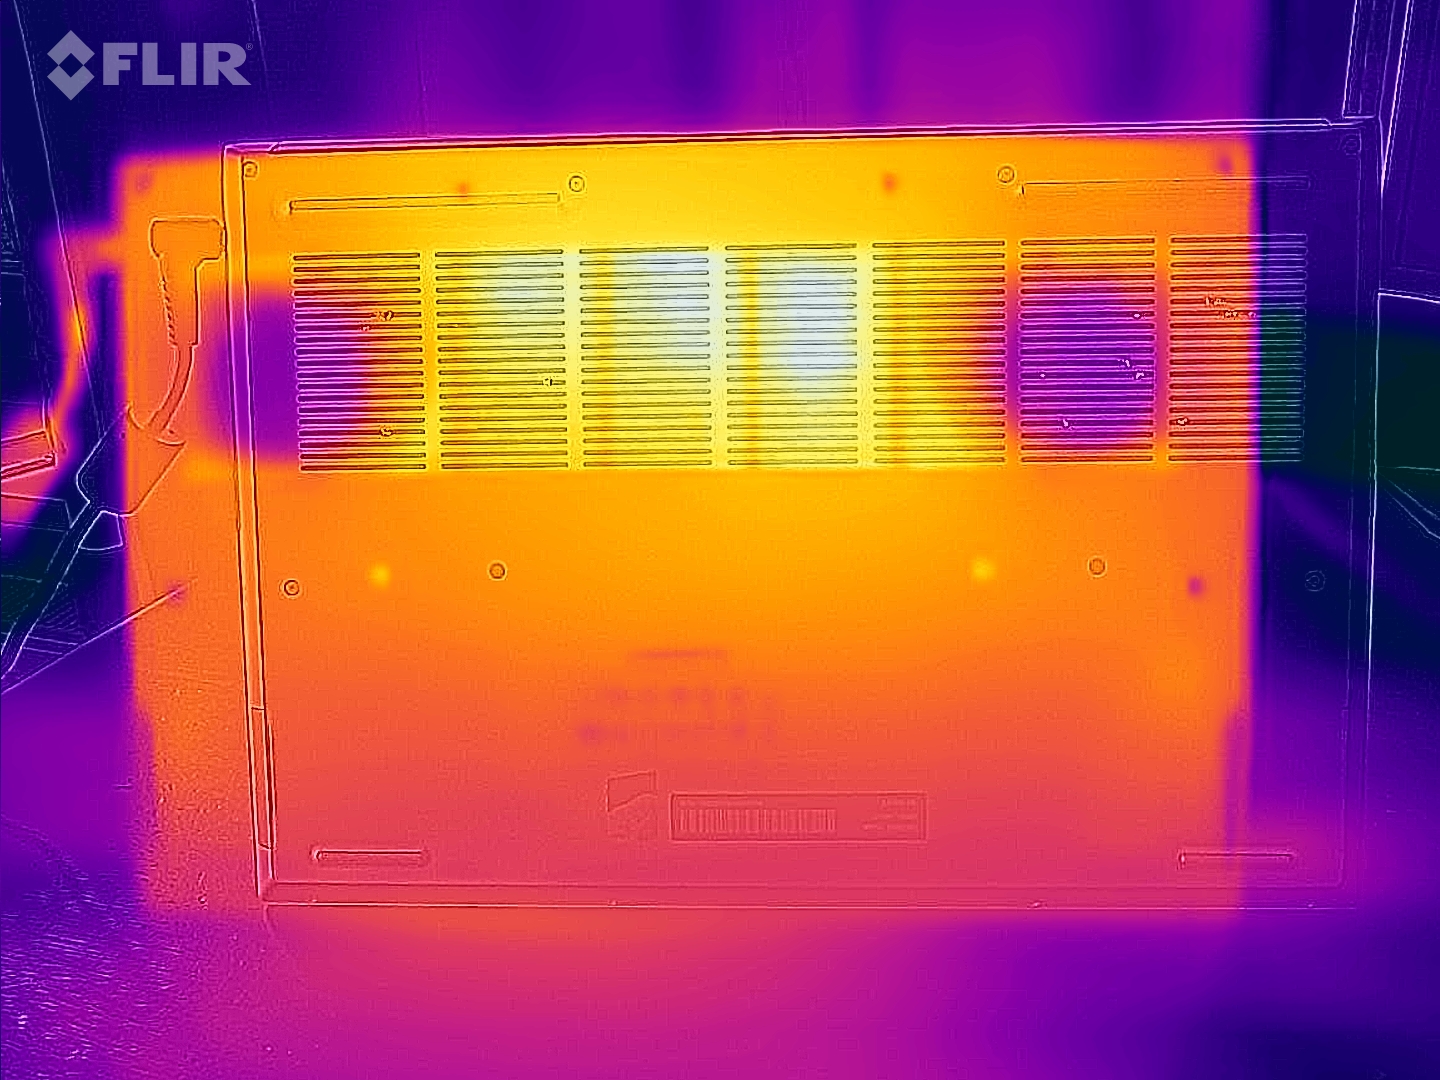
(-) La temperatura máxima en la parte superior es de 49 °C / 120 F, frente a la media de 36.8 °C / 98 F, que oscila entre 21 y 71 °C para la clase Multimedia.
(-) El fondo se calienta hasta un máximo de 55 °C / 131 F, frente a la media de 39.1 °C / 102 F
(+) En reposo, la temperatura media de la parte superior es de 31.1 °C / 88# F, frente a la media del dispositivo de 31.3 °C / 88 F.
(-) Jugando a The Witcher 3, la temperatura media de la parte superior es de 48.3 °C / 119 F, frente a la media del dispositivo de 31.3 °C / 88 F.
(-) El reposamanos y el touchpad pueden calentarse mucho al tacto con un máximo de 45 °C / 113 F.
(-) La temperatura media de la zona del reposamanos de dispositivos similares fue de 28.7 °C / 83.7 F (-16.3 °C / -29.3 F).
| Gigabyte Aero 16 YE5 Intel Core i9-12900HK, NVIDIA GeForce RTX 3080 Ti Laptop GPU | Lenovo ThinkPad X1 Extreme G4-20Y50040GE Intel Core i9-11950H, NVIDIA GeForce RTX 3080 Laptop GPU | Apple MacBook Pro 16 2021 M1 Max Apple M1 Max, Apple M1 Max 32-Core GPU | HP ZBook Studio 15 G8 Intel Core i9-11950H, NVIDIA GeForce RTX 3070 Laptop GPU | Schenker XMG Pro 15 (Late 2021) Intel Core i7-11800H, NVIDIA GeForce RTX 3080 Laptop GPU | Razer Blade 15 2022 Intel Core i7-12800H, NVIDIA GeForce RTX 3080 Ti Laptop GPU | |
|---|---|---|---|---|---|---|
| Heat | 6% | 24% | 8% | 2% | -4% | |
| Maximum Upper Side * (°C) | 49 | 51.4 -5% | 42.3 14% | 49 -0% | 44 10% | 50 -2% |
| Maximum Bottom * (°C) | 55 | 55.9 -2% | 41.7 24% | 54.2 1% | 60 -9% | 47 15% |
| Idle Upper Side * (°C) | 33 | 27.2 18% | 23.9 28% | 26.2 21% | 30 9% | 37.4 -13% |
| Idle Bottom * (°C) | 33 | 28.8 13% | 23.9 28% | 30.2 8% | 34 -3% | 38.4 -16% |
* ... más pequeño es mejor
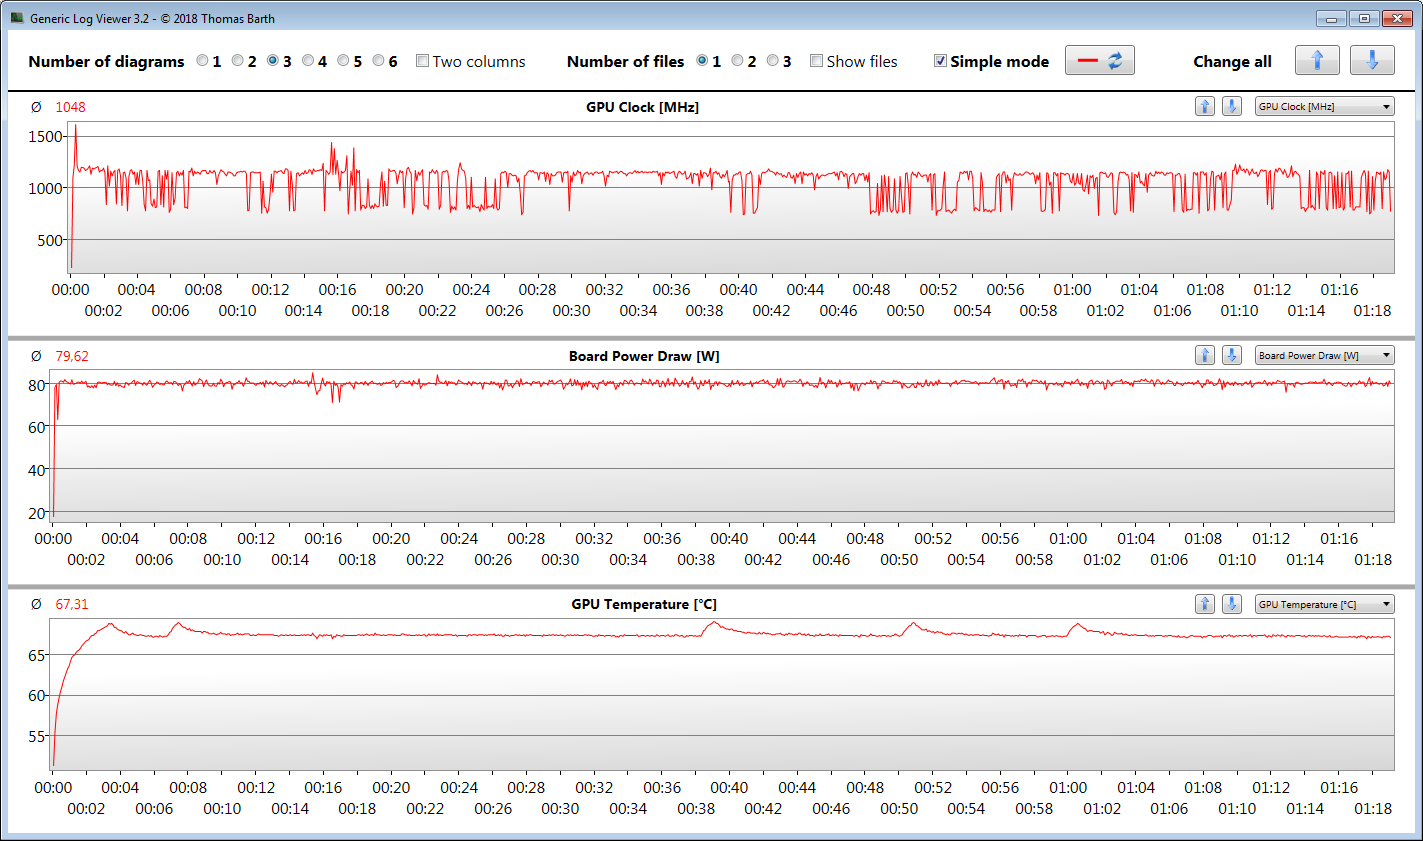
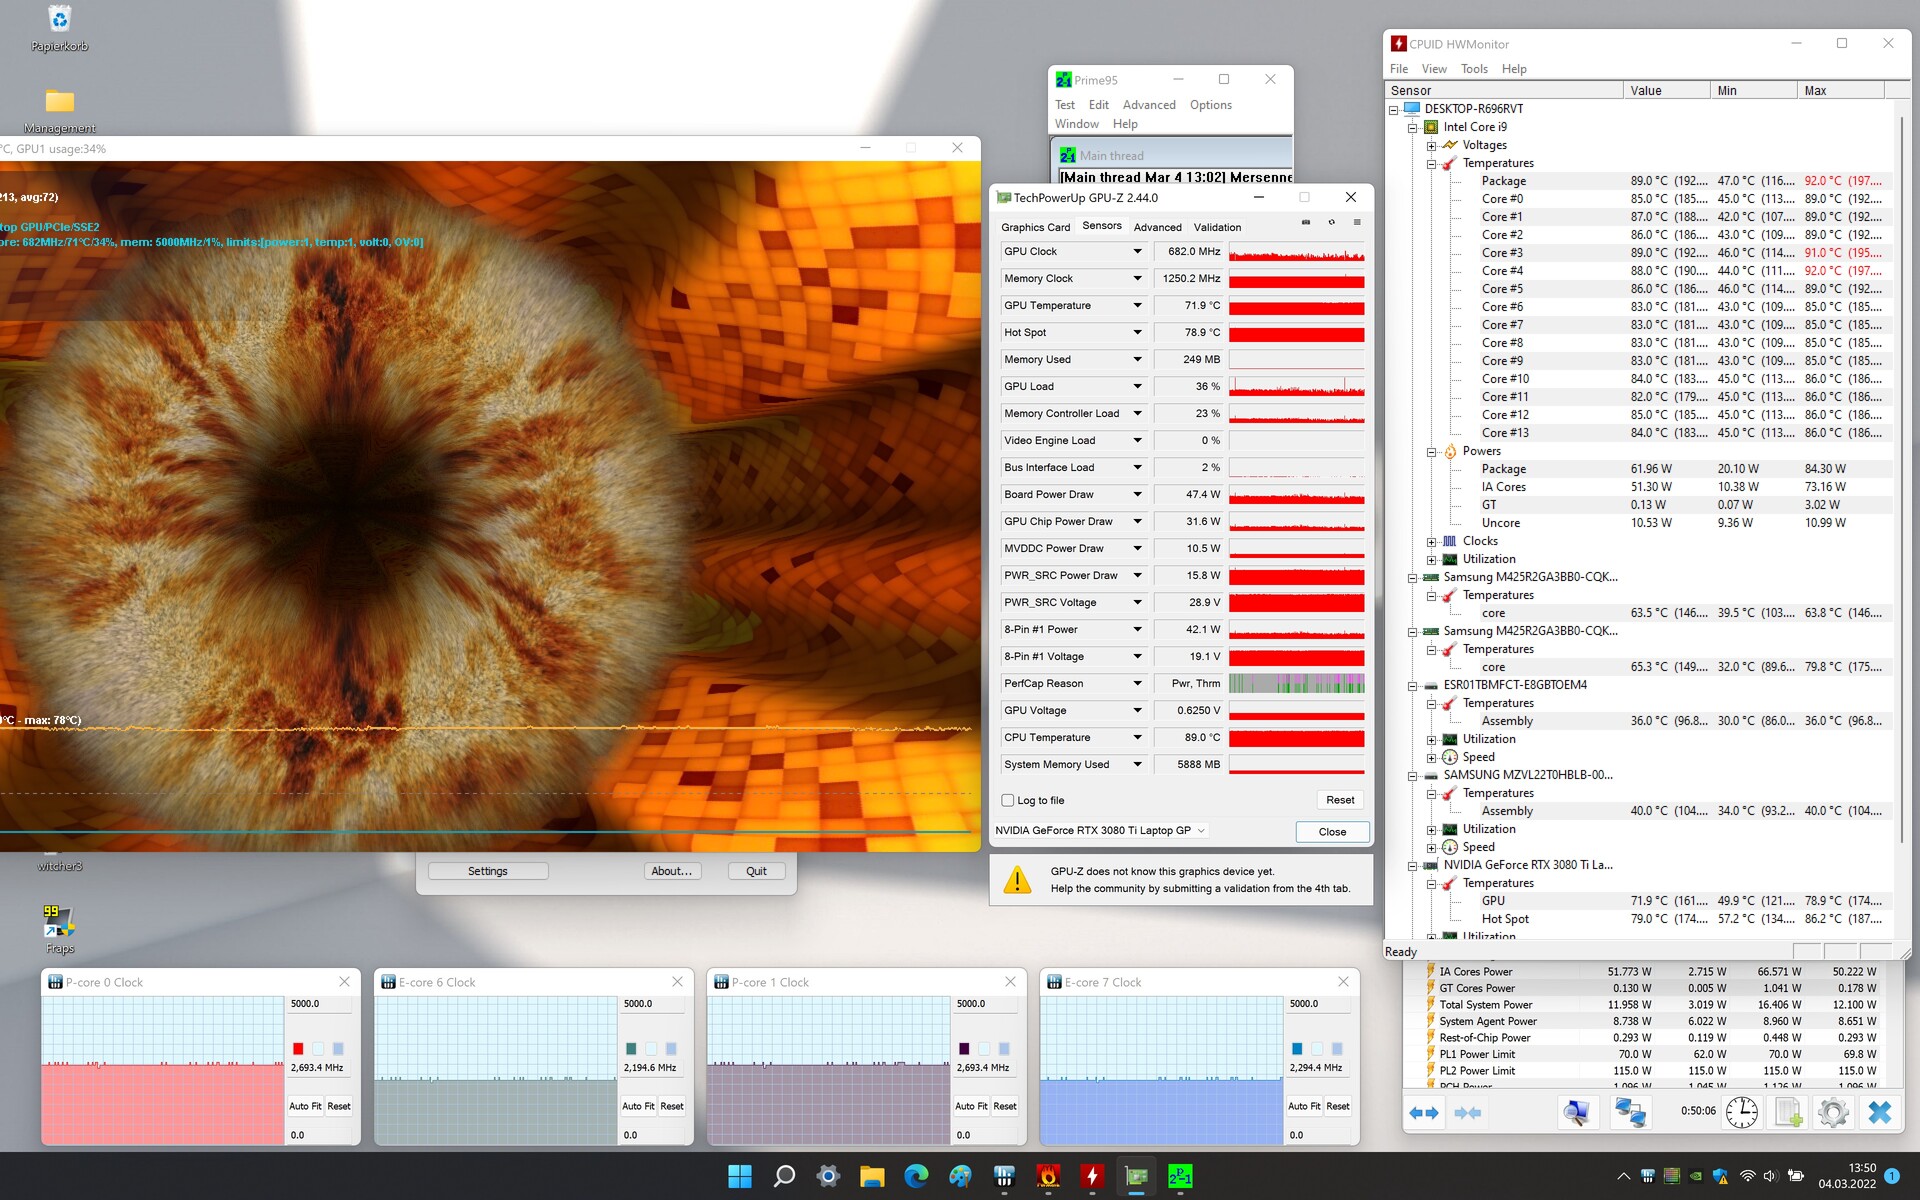
Prueba de esfuerzo
Nuestra prueba de estrés se completa con la CPU funcionando a 2,7 GHz (núcleos P) y 2,2-2,3 GHz (núcleos E) y la GPU funcionando a entre 600 y 700 MHz. Hay que tener en cuenta que nuestro test de estrés es un escenario de carga extrema que no se da en el uso diario. Utilizamos esta prueba para determinar posibles problemas de ralentización y estabilidad.
Altavoces
Los altavoces estéreo de la unidad producen un sonido decente con falta de graves y un volumen máximo comparativamente alto. Sugerimos utilizar auriculares o altavoces externos para una experiencia de audio mucho mejor.
Gigabyte Aero 16 YE5 análisis de audio
(+) | los altavoces pueden reproducir a un volumen relativamente alto (#85 dB)
Graves 100 - 315 Hz
(-) | casi sin bajos - de media 25.6% inferior a la mediana
(-) | los graves no son lineales (15.5% delta a la frecuencia anterior)
Medios 400 - 2000 Hz
(+) | medios equilibrados - a sólo 4.8% de la mediana
(+) | los medios son lineales (5.8% delta a la frecuencia anterior)
Altos 2 - 16 kHz
(+) | máximos equilibrados - a sólo 2% de la mediana
(+) | los máximos son lineales (3.1% delta a la frecuencia anterior)
Total 100 - 16.000 Hz
(±) | la linealidad del sonido global es media (16.6% de diferencia con la mediana)
En comparación con la misma clase
» 44% de todos los dispositivos probados de esta clase eran mejores, 7% similares, 50% peores
» El mejor tuvo un delta de 5%, la media fue 17%, el peor fue ###max##%
En comparación con todos los dispositivos probados
» 29% de todos los dispositivos probados eran mejores, 6% similares, 65% peores
» El mejor tuvo un delta de 4%, la media fue 23%, el peor fue ###max##%
Razer Blade 15 2022 análisis de audio
(+) | los altavoces pueden reproducir a un volumen relativamente alto (#90.9 dB)
Graves 100 - 315 Hz
(-) | casi sin bajos - de media 21% inferior a la mediana
(±) | la linealidad de los graves es media (9.7% delta a frecuencia anterior)
Medios 400 - 2000 Hz
(+) | medios equilibrados - a sólo 3.9% de la mediana
(+) | los medios son lineales (3.9% delta a la frecuencia anterior)
Altos 2 - 16 kHz
(+) | máximos equilibrados - a sólo 4.2% de la mediana
(±) | la linealidad de los máximos es media (7.8% delta a frecuencia anterior)
Total 100 - 16.000 Hz
(±) | la linealidad del sonido global es media (15.7% de diferencia con la mediana)
En comparación con la misma clase
» 37% de todos los dispositivos probados de esta clase eran mejores, 7% similares, 57% peores
» El mejor tuvo un delta de 6%, la media fue 18%, el peor fue ###max##%
En comparación con todos los dispositivos probados
» 24% de todos los dispositivos probados eran mejores, 5% similares, 71% peores
» El mejor tuvo un delta de 4%, la media fue 23%, el peor fue ###max##%
Gestión de la energía - Duración general de la batería decente
Consumo de energía
No encontramos inconsistencias con el consumo de energía del Aero 16, que se determinó que estaba en un nivel esperado para este hardware en particular. Al principio de nuestro test de estrés detectamos un breve pico de hasta 236 W, que rápidamente descendió a unos más razonables 180 W. Nuestro test de Witcher 3 se completó con un consumo medio de 184 W. En consecuencia, la fuente de alimentación de 230 W incluida tiene unas dimensiones más que adecuadas.
| Off / Standby | |
| Ocioso | |
| Carga |
|
Clave:
min: | |
| Gigabyte Aero 16 YE5 i9-12900HK, GeForce RTX 3080 Ti Laptop GPU | Lenovo ThinkPad X1 Extreme G4-20Y50040GE i9-11950H, GeForce RTX 3080 Laptop GPU | Apple MacBook Pro 16 2021 M1 Max M1 Max, M1 Max 32-Core GPU | HP ZBook Studio 15 G8 i9-11950H, GeForce RTX 3070 Laptop GPU | Schenker XMG Pro 15 (Late 2021) i7-11800H, GeForce RTX 3080 Laptop GPU | Razer Blade 15 2022 i7-12800H, GeForce RTX 3080 Ti Laptop GPU | Media de la clase Multimedia | |
|---|---|---|---|---|---|---|---|
| Power Consumption | 34% | 48% | 28% | 17% | -6% | 62% | |
| Idle Minimum * (Watt) | 26 | 12.3 53% | 5.4 79% | 11 58% | 20 23% | 33.2 -28% | 5.66 ? 78% |
| Idle Average * (Watt) | 30 | 22.8 24% | 16.4 45% | 18.8 37% | 22 27% | 36.4 -21% | 10.2 ? 66% |
| Idle Maximum * (Watt) | 37 | 13.9 62% | 16.7 55% | 31.7 14% | 26 30% | 37.6 -2% | 12.5 ? 66% |
| Load Average * (Watt) | 127 | 95.4 25% | 94 26% | 105.2 17% | 103 19% | 116.7 8% | 65.2 ? 49% |
| Witcher 3 ultra * (Watt) | 176 | 154 12% | 104 41% | 148 16% | 186 -6% | 172 2% | |
| Load Maximum * (Watt) | 236 | 170.7 28% | 135 43% | 171.8 27% | 218 8% | 228.6 3% | 113.5 ? 52% |
* ... más pequeño es mejor
Power Consumption Witcher 3 / stress test
Power Consumption with External Monitor
Duración de la batería
En nuestra prueba de Wi-Fi (carga de sitios web a través de un script) y de reproducción de vídeo (reproducción del cortometraje Big Buck Bunny codificado en H.264 en FHD en bucle), el Aero 16 consiguió una duración de la batería de 6:21 y 7:32 horas, respectivamente. Todas las funciones de ahorro de energía se desactivan durante ambas pruebas, y el brillo de la pantalla se normaliza a 150 nits. Además, también desactivamos todos los módulos de comunicación durante la prueba de reproducción de vídeo.
| Gigabyte Aero 16 YE5 i9-12900HK, GeForce RTX 3080 Ti Laptop GPU, 99 Wh | Lenovo ThinkPad X1 Extreme G4-20Y50040GE i9-11950H, GeForce RTX 3080 Laptop GPU, 90 Wh | Apple MacBook Pro 16 2021 M1 Max M1 Max, M1 Max 32-Core GPU, 99.6 Wh | HP ZBook Studio 15 G8 i9-11950H, GeForce RTX 3070 Laptop GPU, 83 Wh | Schenker XMG Pro 15 (Late 2021) i7-11800H, GeForce RTX 3080 Laptop GPU, 73 Wh | Razer Blade 15 2022 i7-12800H, GeForce RTX 3080 Ti Laptop GPU, 80 Wh | Media de la clase Multimedia | |
|---|---|---|---|---|---|---|---|
| Duración de Batería | -11% | 76% | 18% | -8% | -23% | 101% | |
| Reader / Idle (h) | 8.9 | 12.9 45% | 10.6 19% | 24.9 ? 180% | |||
| H.264 (h) | 7.5 | 6.9 -8% | 17 127% | 6.5 -13% | 17.1 ? 128% | ||
| WiFi v1.3 (h) | 6.4 | 6.8 6% | 14.9 133% | 6.2 -3% | 5.2 -19% | 4.9 -23% | 12.2 ? 91% |
| Load (h) | 1.6 | 1.1 -31% | 1.1 -31% | 1.8 13% | 1.3 -19% | 1.664 ? 4% |
Pro
Contra
Verdict Aero 16: Un portátil para jugadores y creativos
La edición de vídeo y fotos, el renderizado y los juegos son los principales casos de uso del Aero 16. Permite jugar en FHD con el máximo de detalles y jugar en resoluciones más altas con detalles reducidos. Su CPU Core i9-12900HK y la GPUGeForce RTX 3080 Ti con un TGP de 105 W garantizan altos niveles de rendimiento
El dispositivo se calienta bastante bajo carga, y hace mucho ruido que, por desgracia, incluye un notable zumbido del ventilador. Las emisiones de ruido pueden reducirse significativamente seleccionando el perfil "Modo Silencio de Ahorro de Energía", aunque a costa del rendimiento.
El Aero 16 YE5 de Gigabyte es un portátil bien hecho para jugadores y creativos. Sin embargo, no está totalmente libre de defectos.
La duración de la batería es decente para un portátil tan potente como éste con una pantalla 4K. La batería se puede cargar con la fuente de alimentación incluida o con un cargador universal USB-C, siempre que tenga una potencia nominal de al menos 45 W. La parte trasera de los dos puertos Thunderbolt 4 es compatible con Power Delivery. Además, sus dos puertos Thunderbolt 4 permiten una amplia conectividad de periféricos externos, como por ejemplo docks o incluso GPUs externas.
La pantalla OLED 16:10 integrada con una alta resolución de 3840 x 2400 es, sin duda, el punto fuerte de Aero 16. Ofrece un buen brillo y una excelente calidad de imagen. Ofrece un buen brillo, una excelente relación de contraste, amplios ángulos de visión, tiempos de respuesta cortos y una gran cobertura del espacio de color. En cambio, es brillante y sufre de parpadeo PWM por debajo de cierto umbral de brillo.
Una buena alternativa al Aero 16 es el
con más rendimiento de GPU y sin necesidad de llevar un hub o dongles adicionales. A cambio, la duración de su batería es menor. Si buscas una buena combinación entre alto rendimiento y excelente duración de la batería, el
Apple MacBook Pro 16 2021 M1 Max podría ser la mejor opción. Dicho esto, también hay que tener en cuenta que los mayores defectos del portátil Apple son la imposibilidad de actualizar tanto el SSD como la RAM.
Precio y disponibilidad
En el momento de escribir este artículo, el Gigabyte Aero 16 ya aparecía en la página web de Gigabyte https://www.gigabyte.com/Laptop/AERO-16--Intel-12th-Gen pero aún no estaba disponible para su compra en ningún sitio.
Gigabyte Aero 16 YE5
- 03/28/2022 v7 (old)
Sascha Mölck
Price comparison

