Análisis del Razer Blade 15 Advanced Model Early 2022: portátil de juegos compacto con pantalla rápida
Equipado con los últimos chips de Intel y Nvidia, el modelo de primavera Razer Blade 15 2022 promete mejoras iterativas para la popular gama de portátiles de 15 pulgadas para juegos. La principal diferencia entre el modelo analizado aquí y el blade 15 2022 analizado anteriormente es el panel de 1080p y 360 Hz, por lo que los lectores pueden quedarse con este análisis para conocer los detalles de las especificaciones físicas prácticamente idénticas. Entre los competidores directos del Blade 15 se encuentran otros portátiles para juegos de 15,6 pulgadas de alto rendimiento como el Schenker XMG Neo 15 E22y el Asus ROG Strix Scar 15y el MSI Stealth GS66 12UGS y el MSI Vector GP66 12UGS.
Otros análisis de Razer:
Posibles contendientes en la comparación
Valoración | Fecha | Modelo | Peso | Altura | Tamaño | Resolución | Precio |
|---|---|---|---|---|---|---|---|
| 88.3 % v7 (old) | 05/2022 | Razer Blade 15 Advanced Model Early 2022 i7-12800H, GeForce RTX 3080 Ti Laptop GPU | 2.1 kg | 16.99 mm | 15.60" | 1920x1080 | |
| 89.1 % v7 (old) | 03/2022 | Razer Blade 15 2022 i7-12800H, GeForce RTX 3080 Ti Laptop GPU | 2.1 kg | 16.99 mm | 15.60" | 2560x1440 | |
v (old) | 03/2022 | Schenker XMG Neo 15 E22 (Early 2022, RTX 3080 Ti) i7-12700H, GeForce RTX 3080 Ti Laptop GPU | 2.2 kg | 26.6 mm | 15.60" | 2560x1440 | |
| 86.3 % v7 (old) | 07/2021 | Asus ROG Strix Scar 15 G533QS R9 5900HX, GeForce RTX 3080 Laptop GPU | 2.3 kg | 27.2 mm | 15.60" | 2560x1440 | |
| 84.5 % v7 (old) | 02/2022 | MSI Stealth GS66 12UGS i7-12700H, GeForce RTX 3070 Ti Laptop GPU | 2.2 kg | 19.8 mm | 15.60" | 2560x1440 | |
| 86.9 % v7 (old) | 03/2022 | MSI Vector GP66 12UGS i9-12900H, GeForce RTX 3070 Ti Laptop GPU | 2.3 kg | 23.4 mm | 15.60" | 1920x1080 |
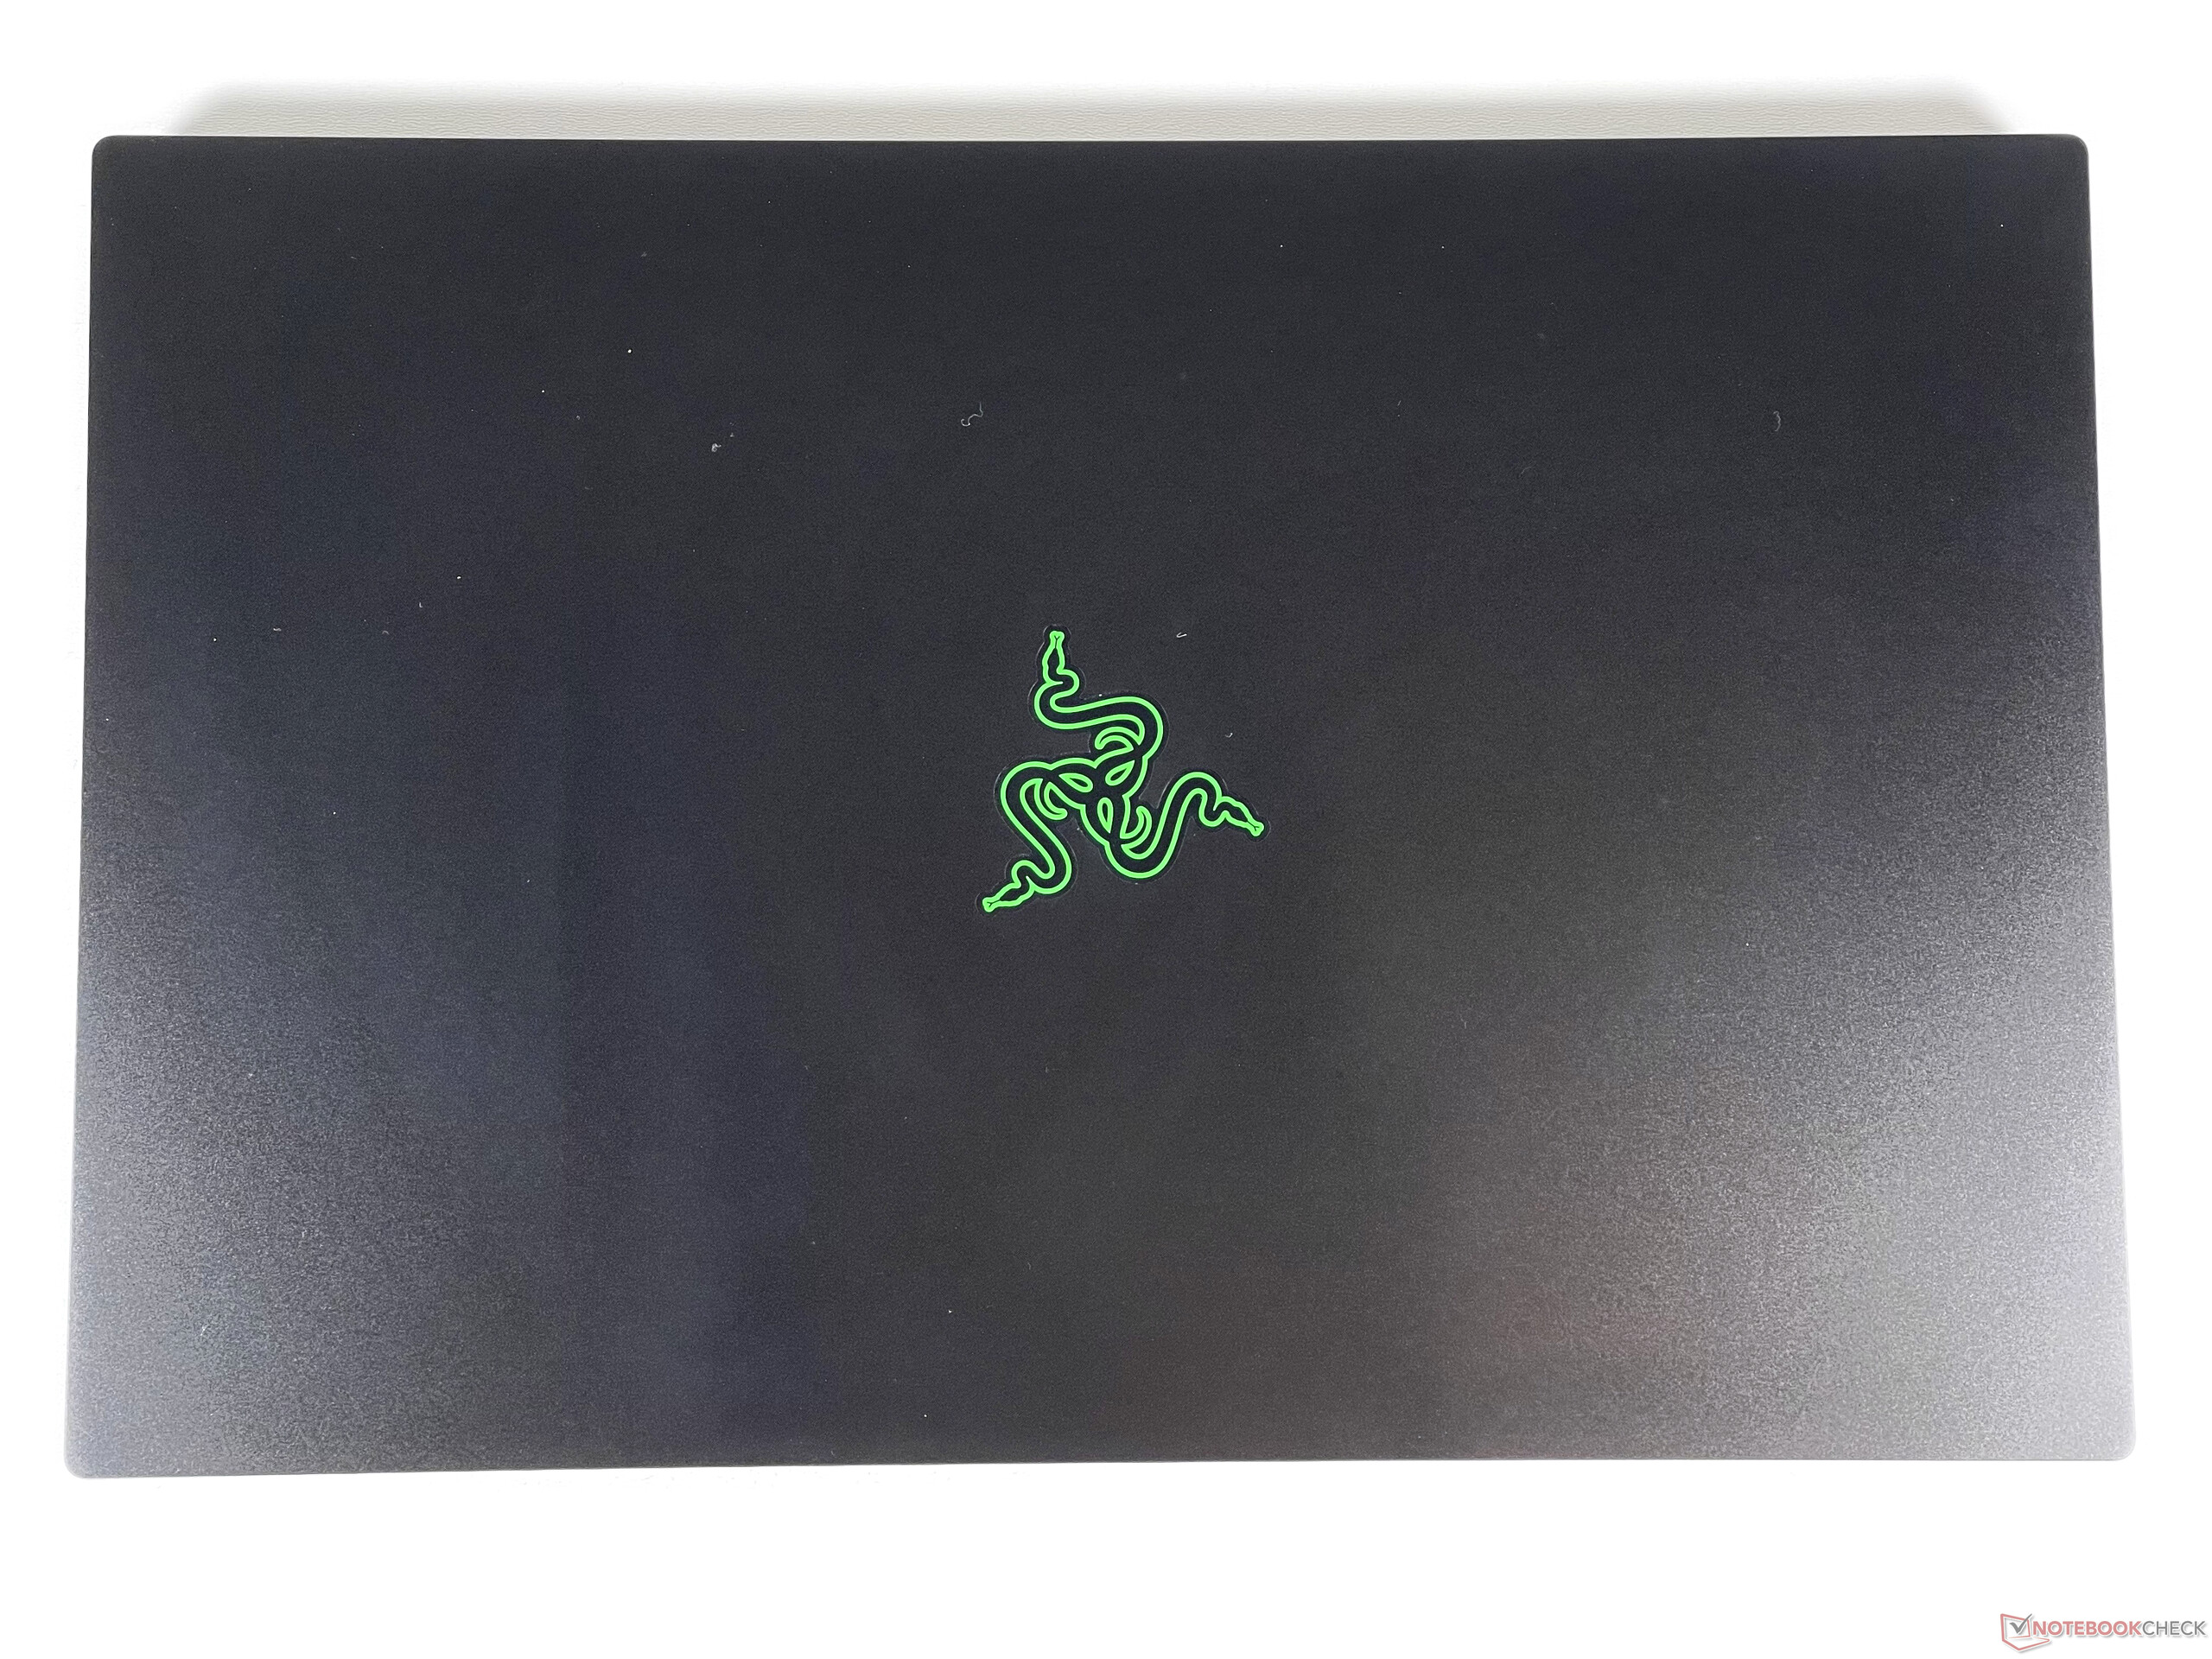
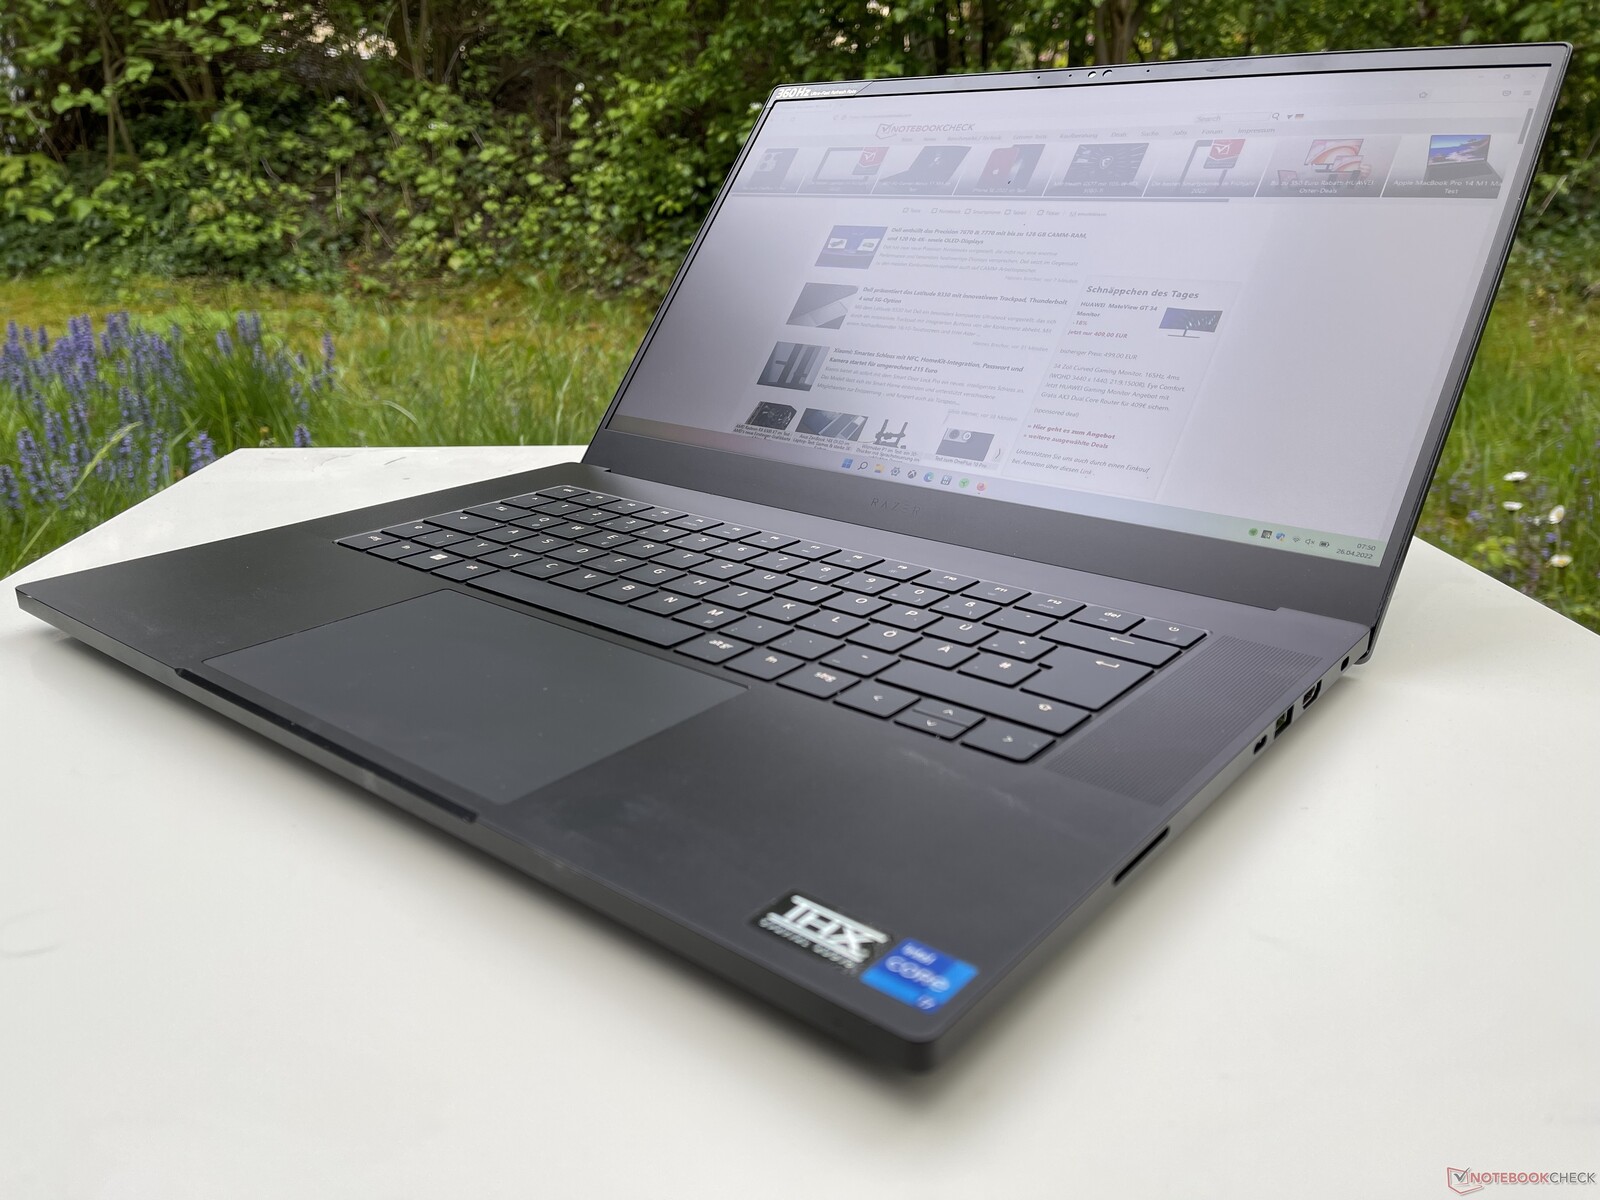
Estuche - Compacto y adecuado para viajar
En cuanto a la carcasa, volvemos a ver la conocida y deslizante construcción metálica con la que la serie Blade se hizo originalmente un nombre. La estabilidad, la fabricación y la resistencia a la torsión siguen siendo excelentes. La contrapartida es la alta susceptibilidad a las huellas dactilares
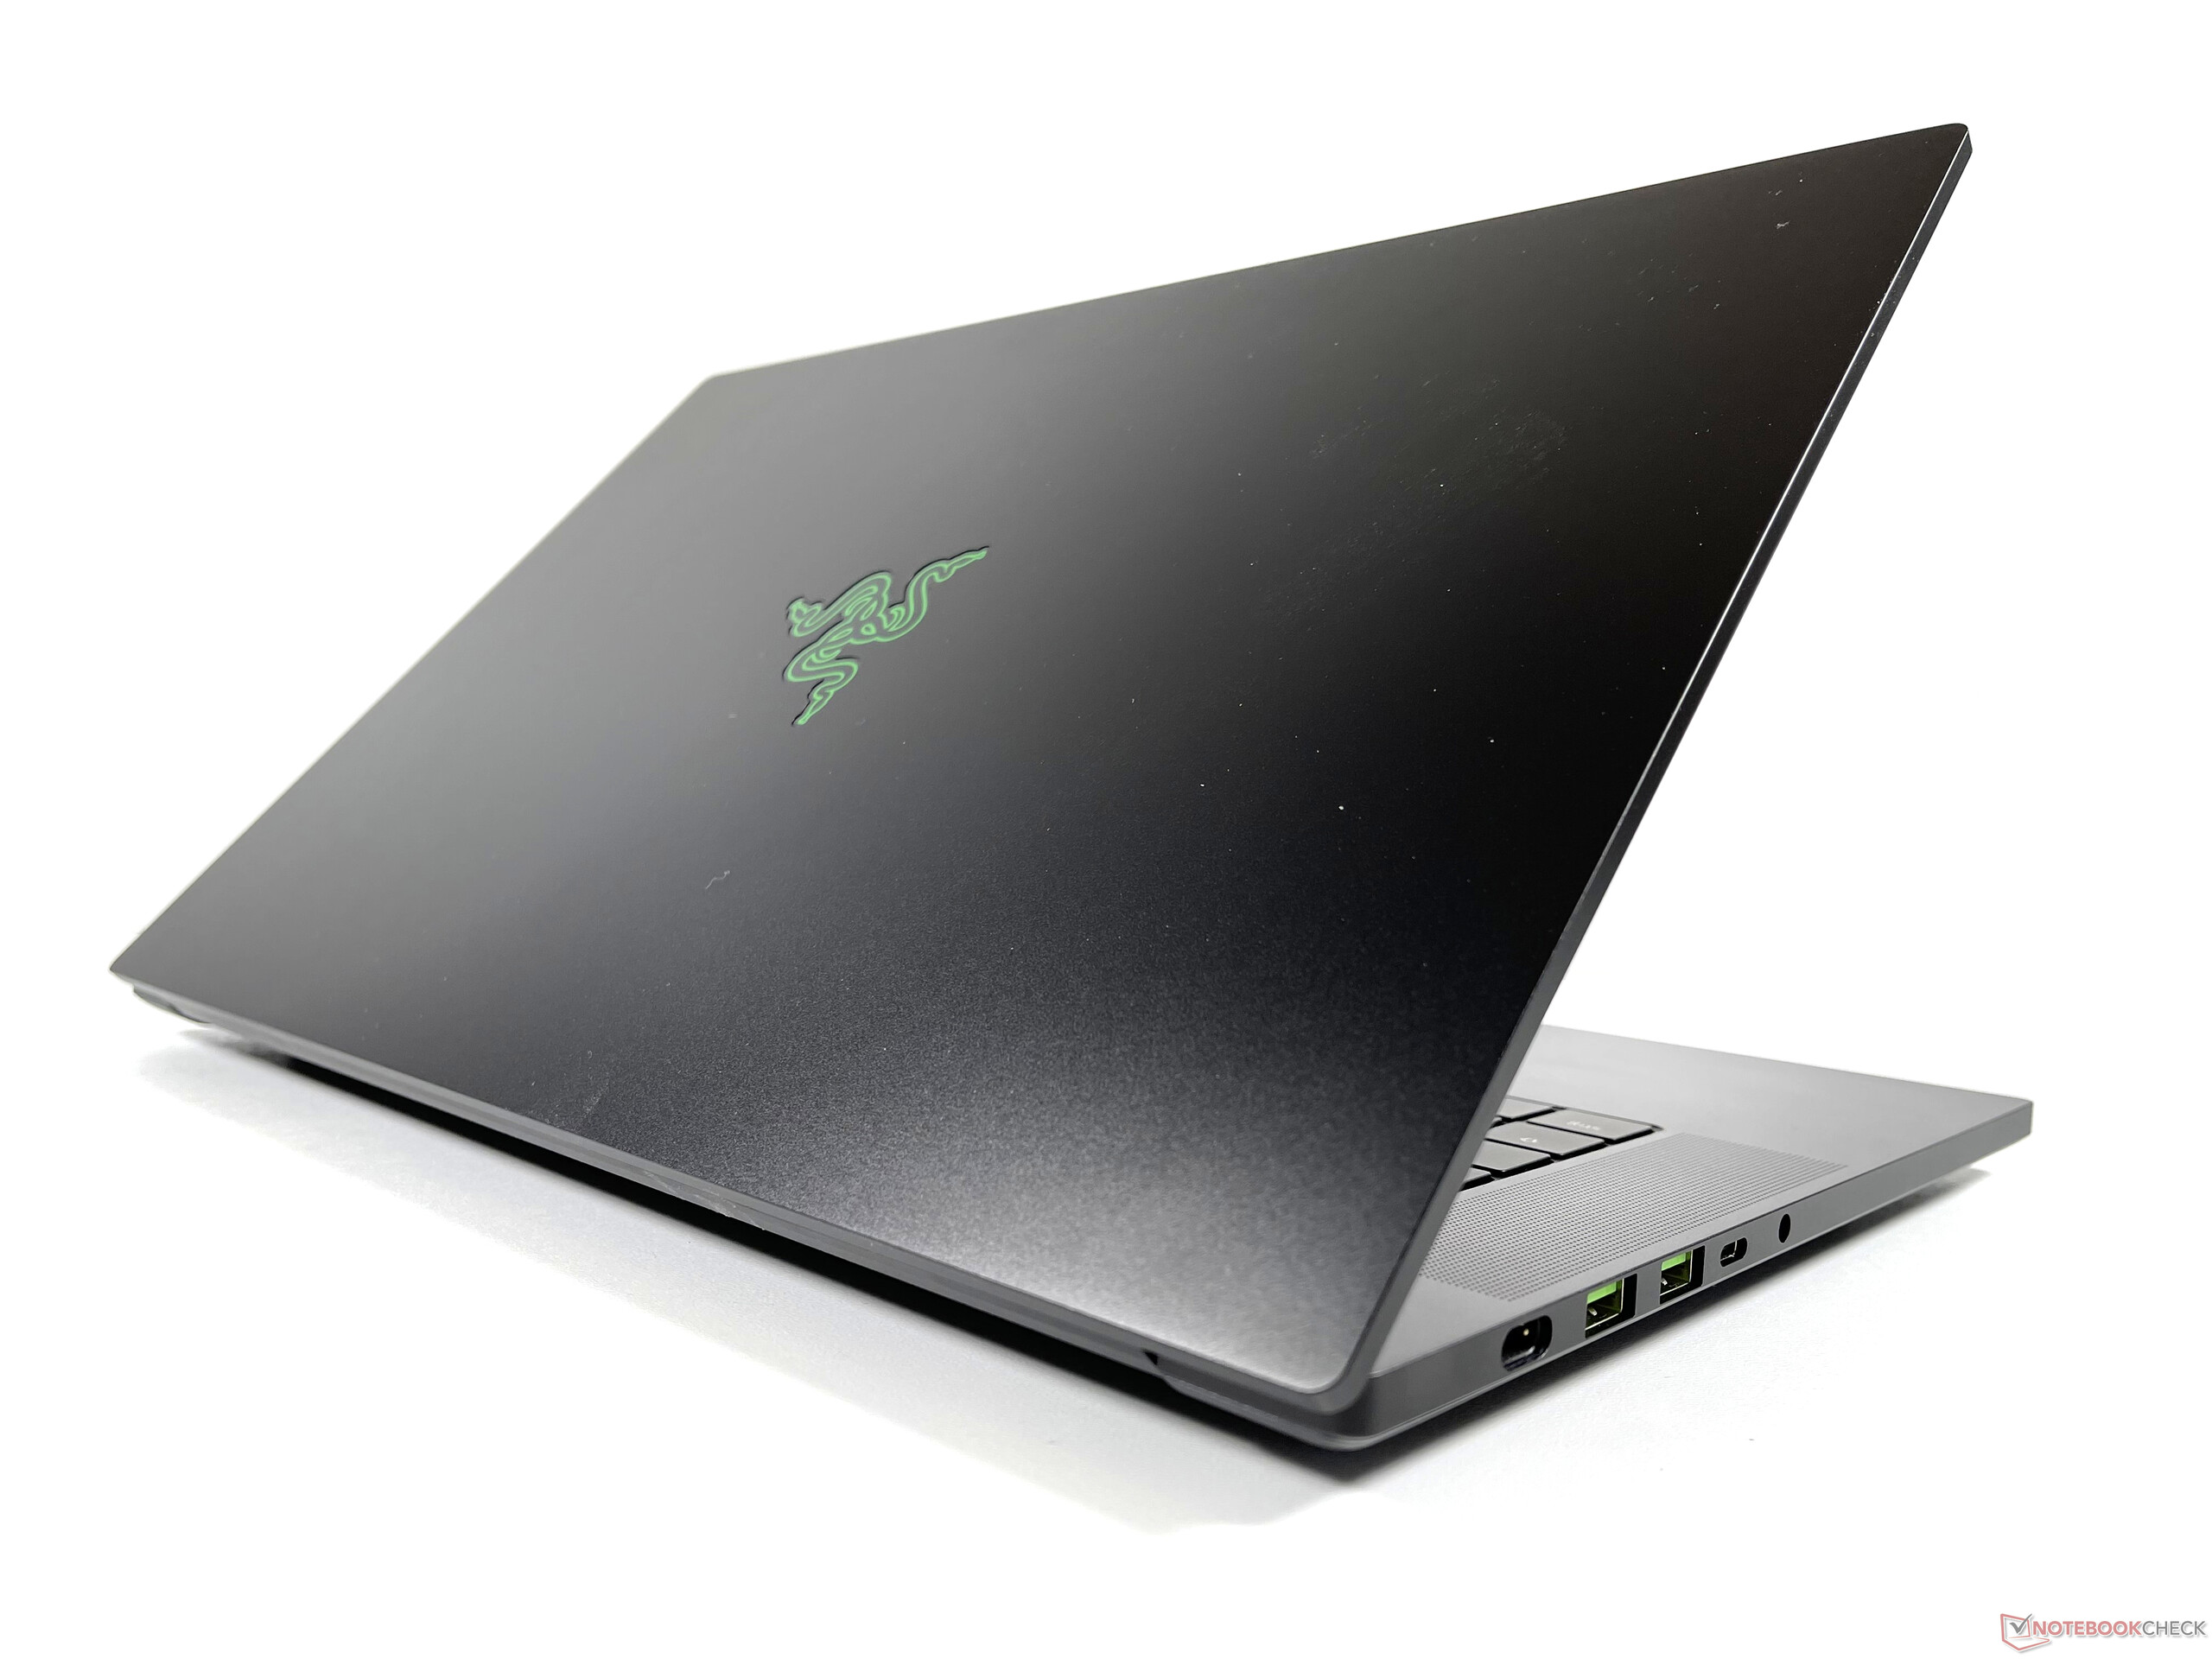
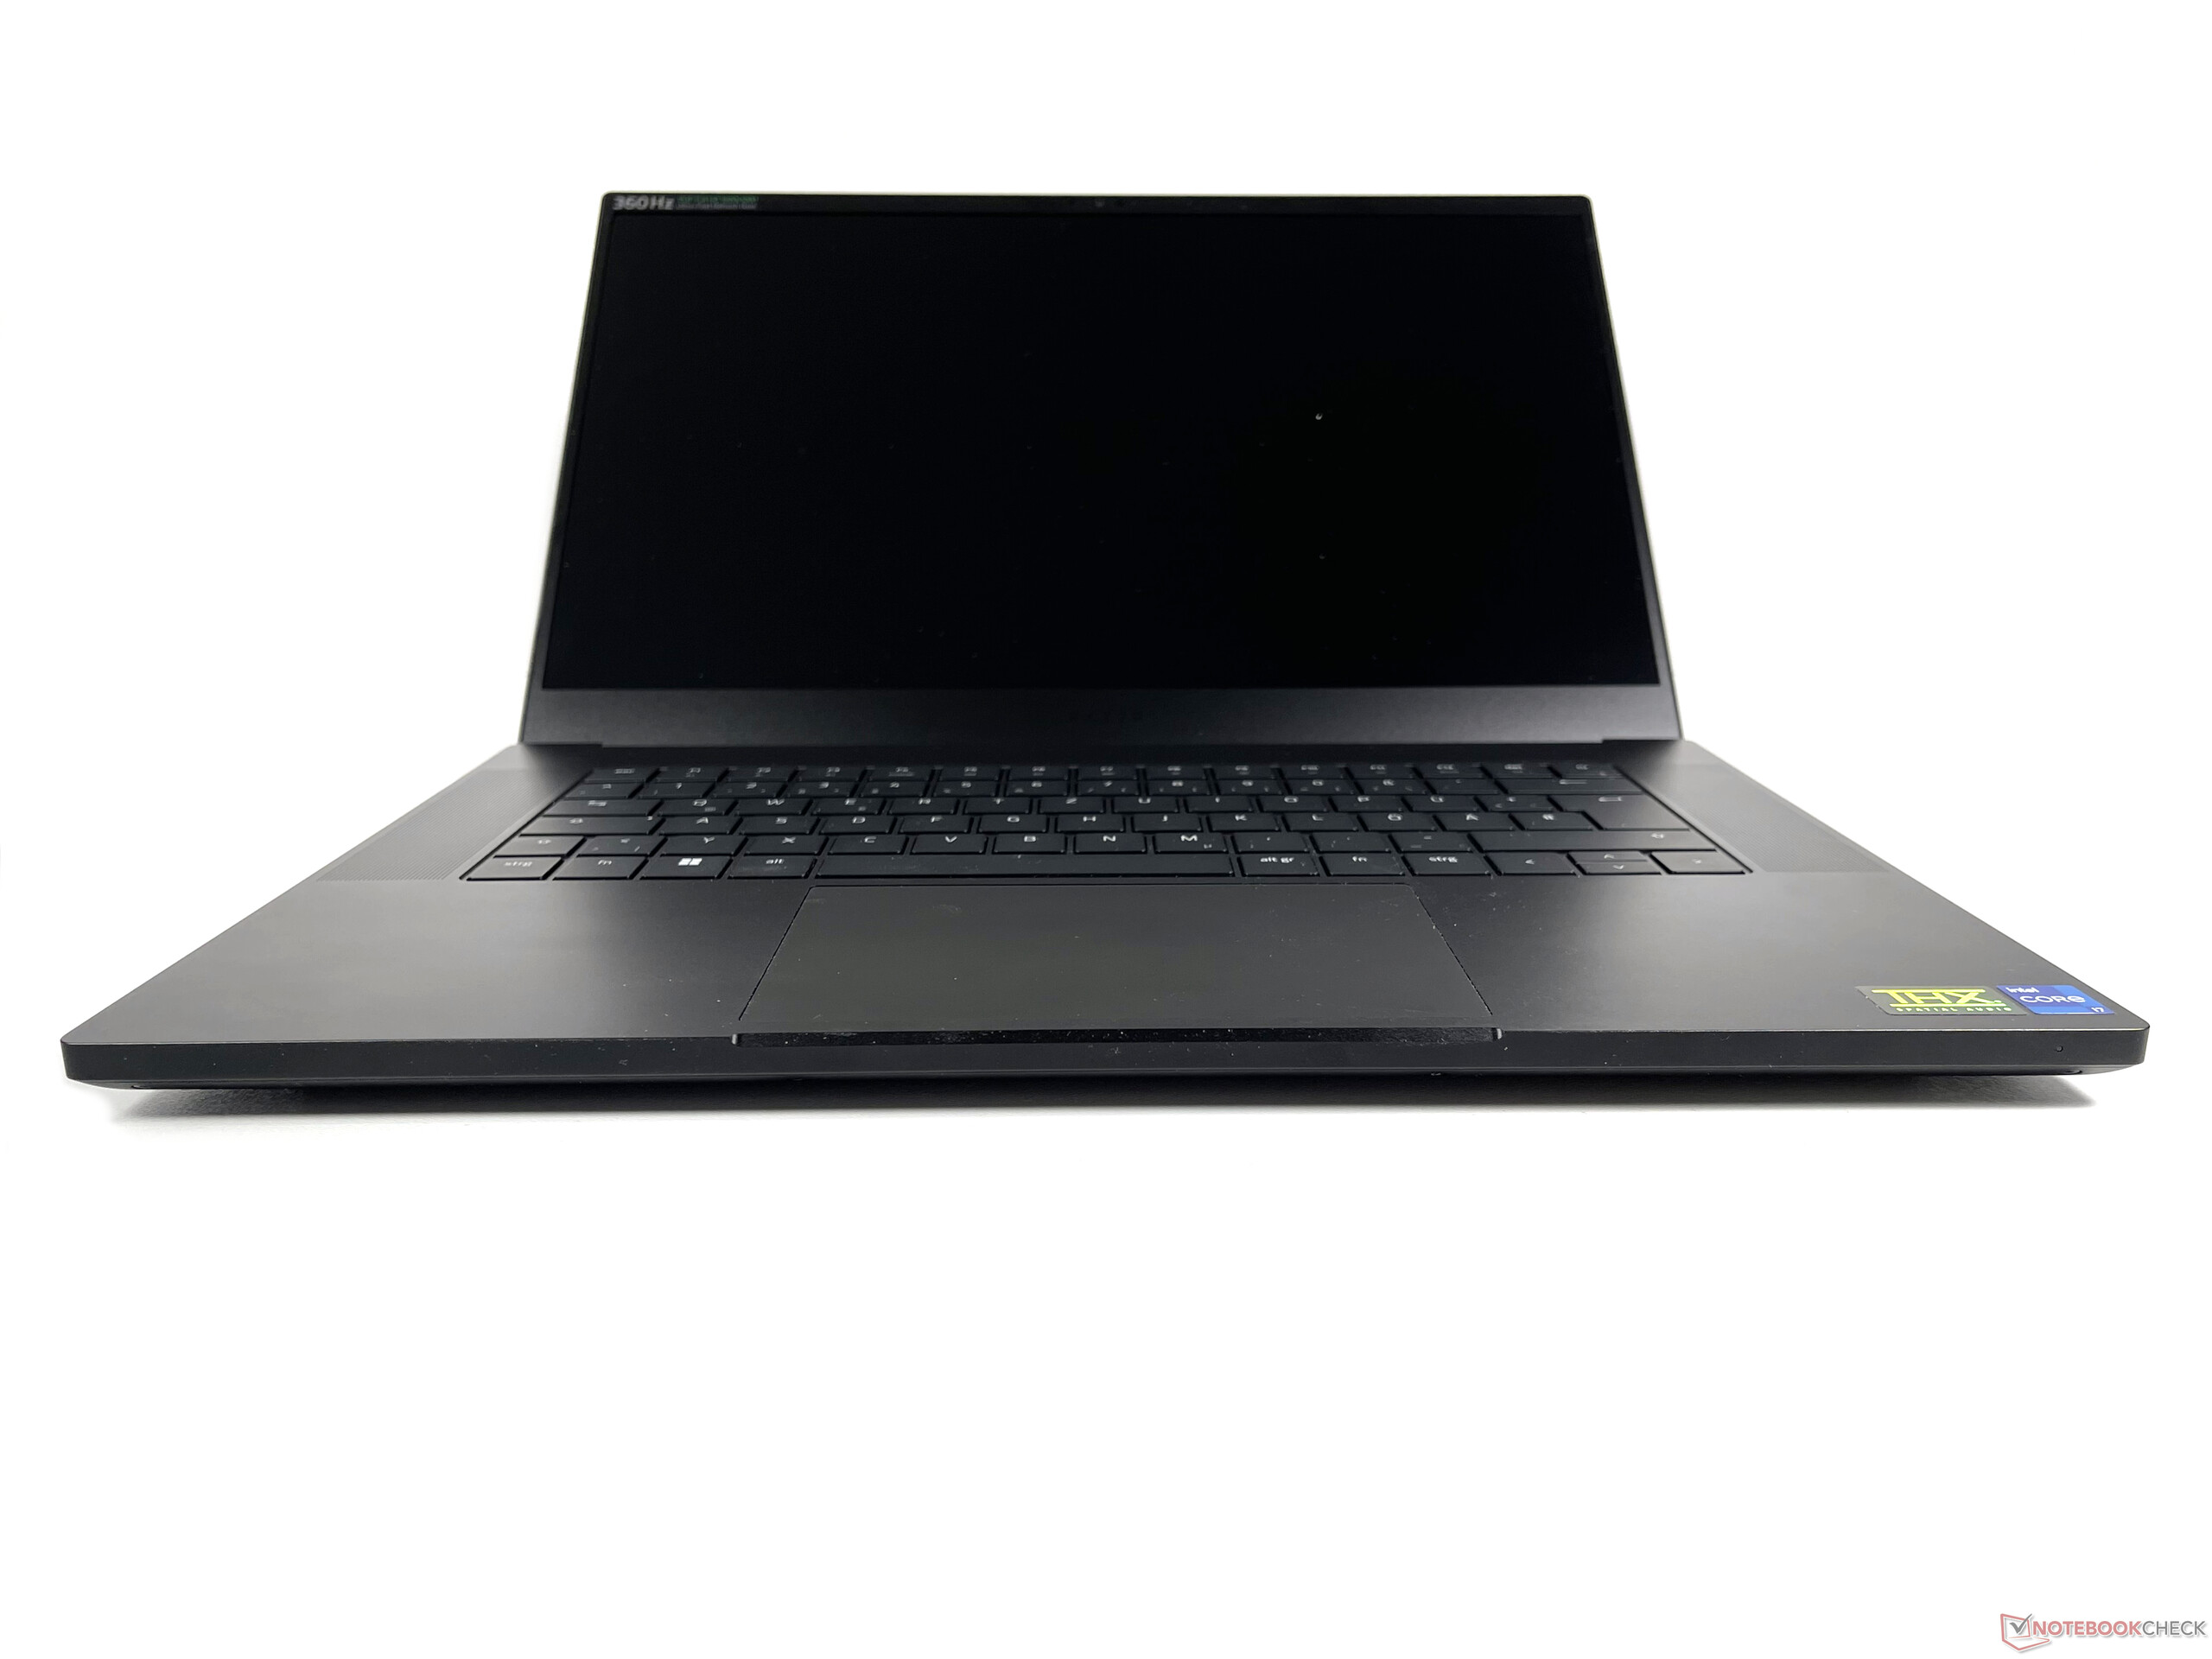
El Razer Blade 15 es un portátil muy compacto de 15,6 pulgadas y es más pequeño y delgado que la mayoría de sus competidores. En particular, el ROG Strix Scar 15 y el XMG Neo 15 E22 son significativamente más gruesos y alrededor de 100-200 g más pesados que nuestro dispositivo de análisis de 2,1 kg.
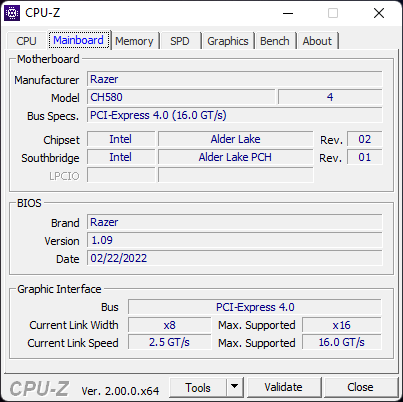
Hardware - Blade 15 con conectividad moderna
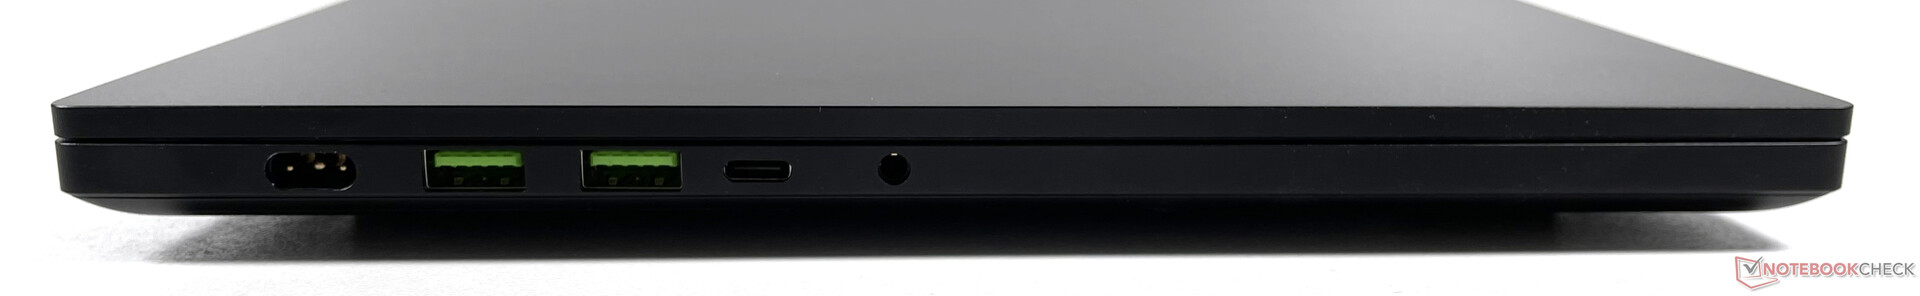
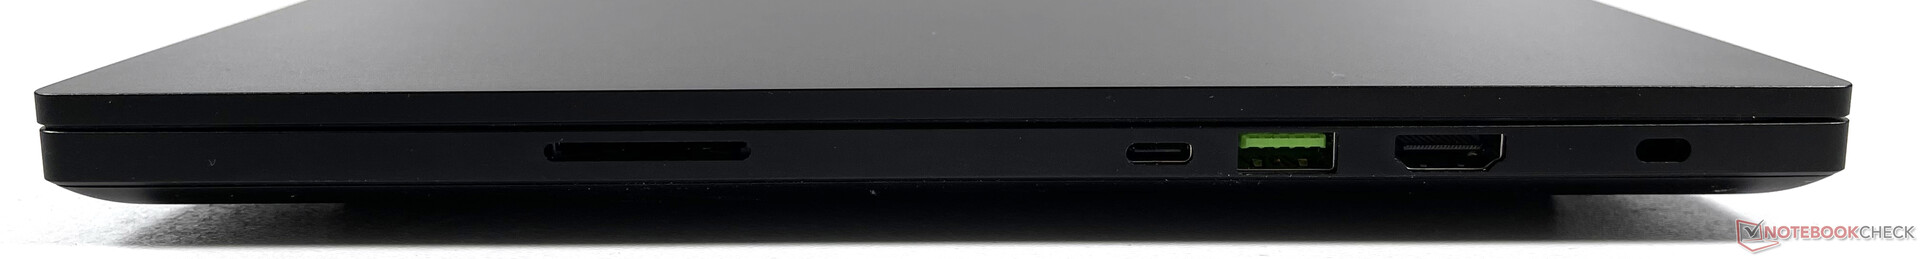
No hay grandes sorpresas en términos de conectividad. Cabe destacar el lector de tarjetas SD de pleno derecho y el puerto HDMI, que soporta la versión 2.1. A diferencia de muchos competidores, como el XMG Neo 15 E22no hay puerto LAN dedicado. Pero esto puede ser rectificado a través de un dock Thunderbolt si es necesario.
Lector de tarjetas SD
El rendimiento del lector de tarjetas SD está en un nivel alto. En la prueba de lectura secuencial AS-SSD con nuestra tarjeta microSD AV PRO 128GB V60, se produjo un error en nuestro dispositivo de revisión
| SD Card Reader - average JPG Copy Test (av. of 3 runs) | |
| Razer Blade 15 2022 (Toshiba Exceria Pro SDXC 64 GB UHS-II) | |
| Razer Blade 15 Advanced Model Early 2022 (AV PRO microSD 128 GB V60) | |
| Media de la clase Gaming (20.9 - 210, n=54, últimos 2 años) | |
| Schenker XMG Neo 15 E22 (Early 2022, RTX 3080 Ti) | |
Comunicación
El módulo integrado Killer Wi-Fi 6E 1690i ofreció velocidades de transferencia muy rápidas cuando se conectó a nuestro router de pruebas Asus GT-AXE11000. También es compatible con Bluetooth 5.2
| Networking | |
| iperf3 transmit AXE11000 | |
| Razer Blade 15 Advanced Model Early 2022 | |
| Media de la clase Gaming (560 - 1862, n=88, últimos 2 años) | |
| iperf3 receive AXE11000 | |
| Razer Blade 15 Advanced Model Early 2022 | |
| MSI Stealth GS66 12UGS | |
| Media de la clase Gaming (680 - 1745, n=88, últimos 2 años) | |
Cámara web


Mantenimiento
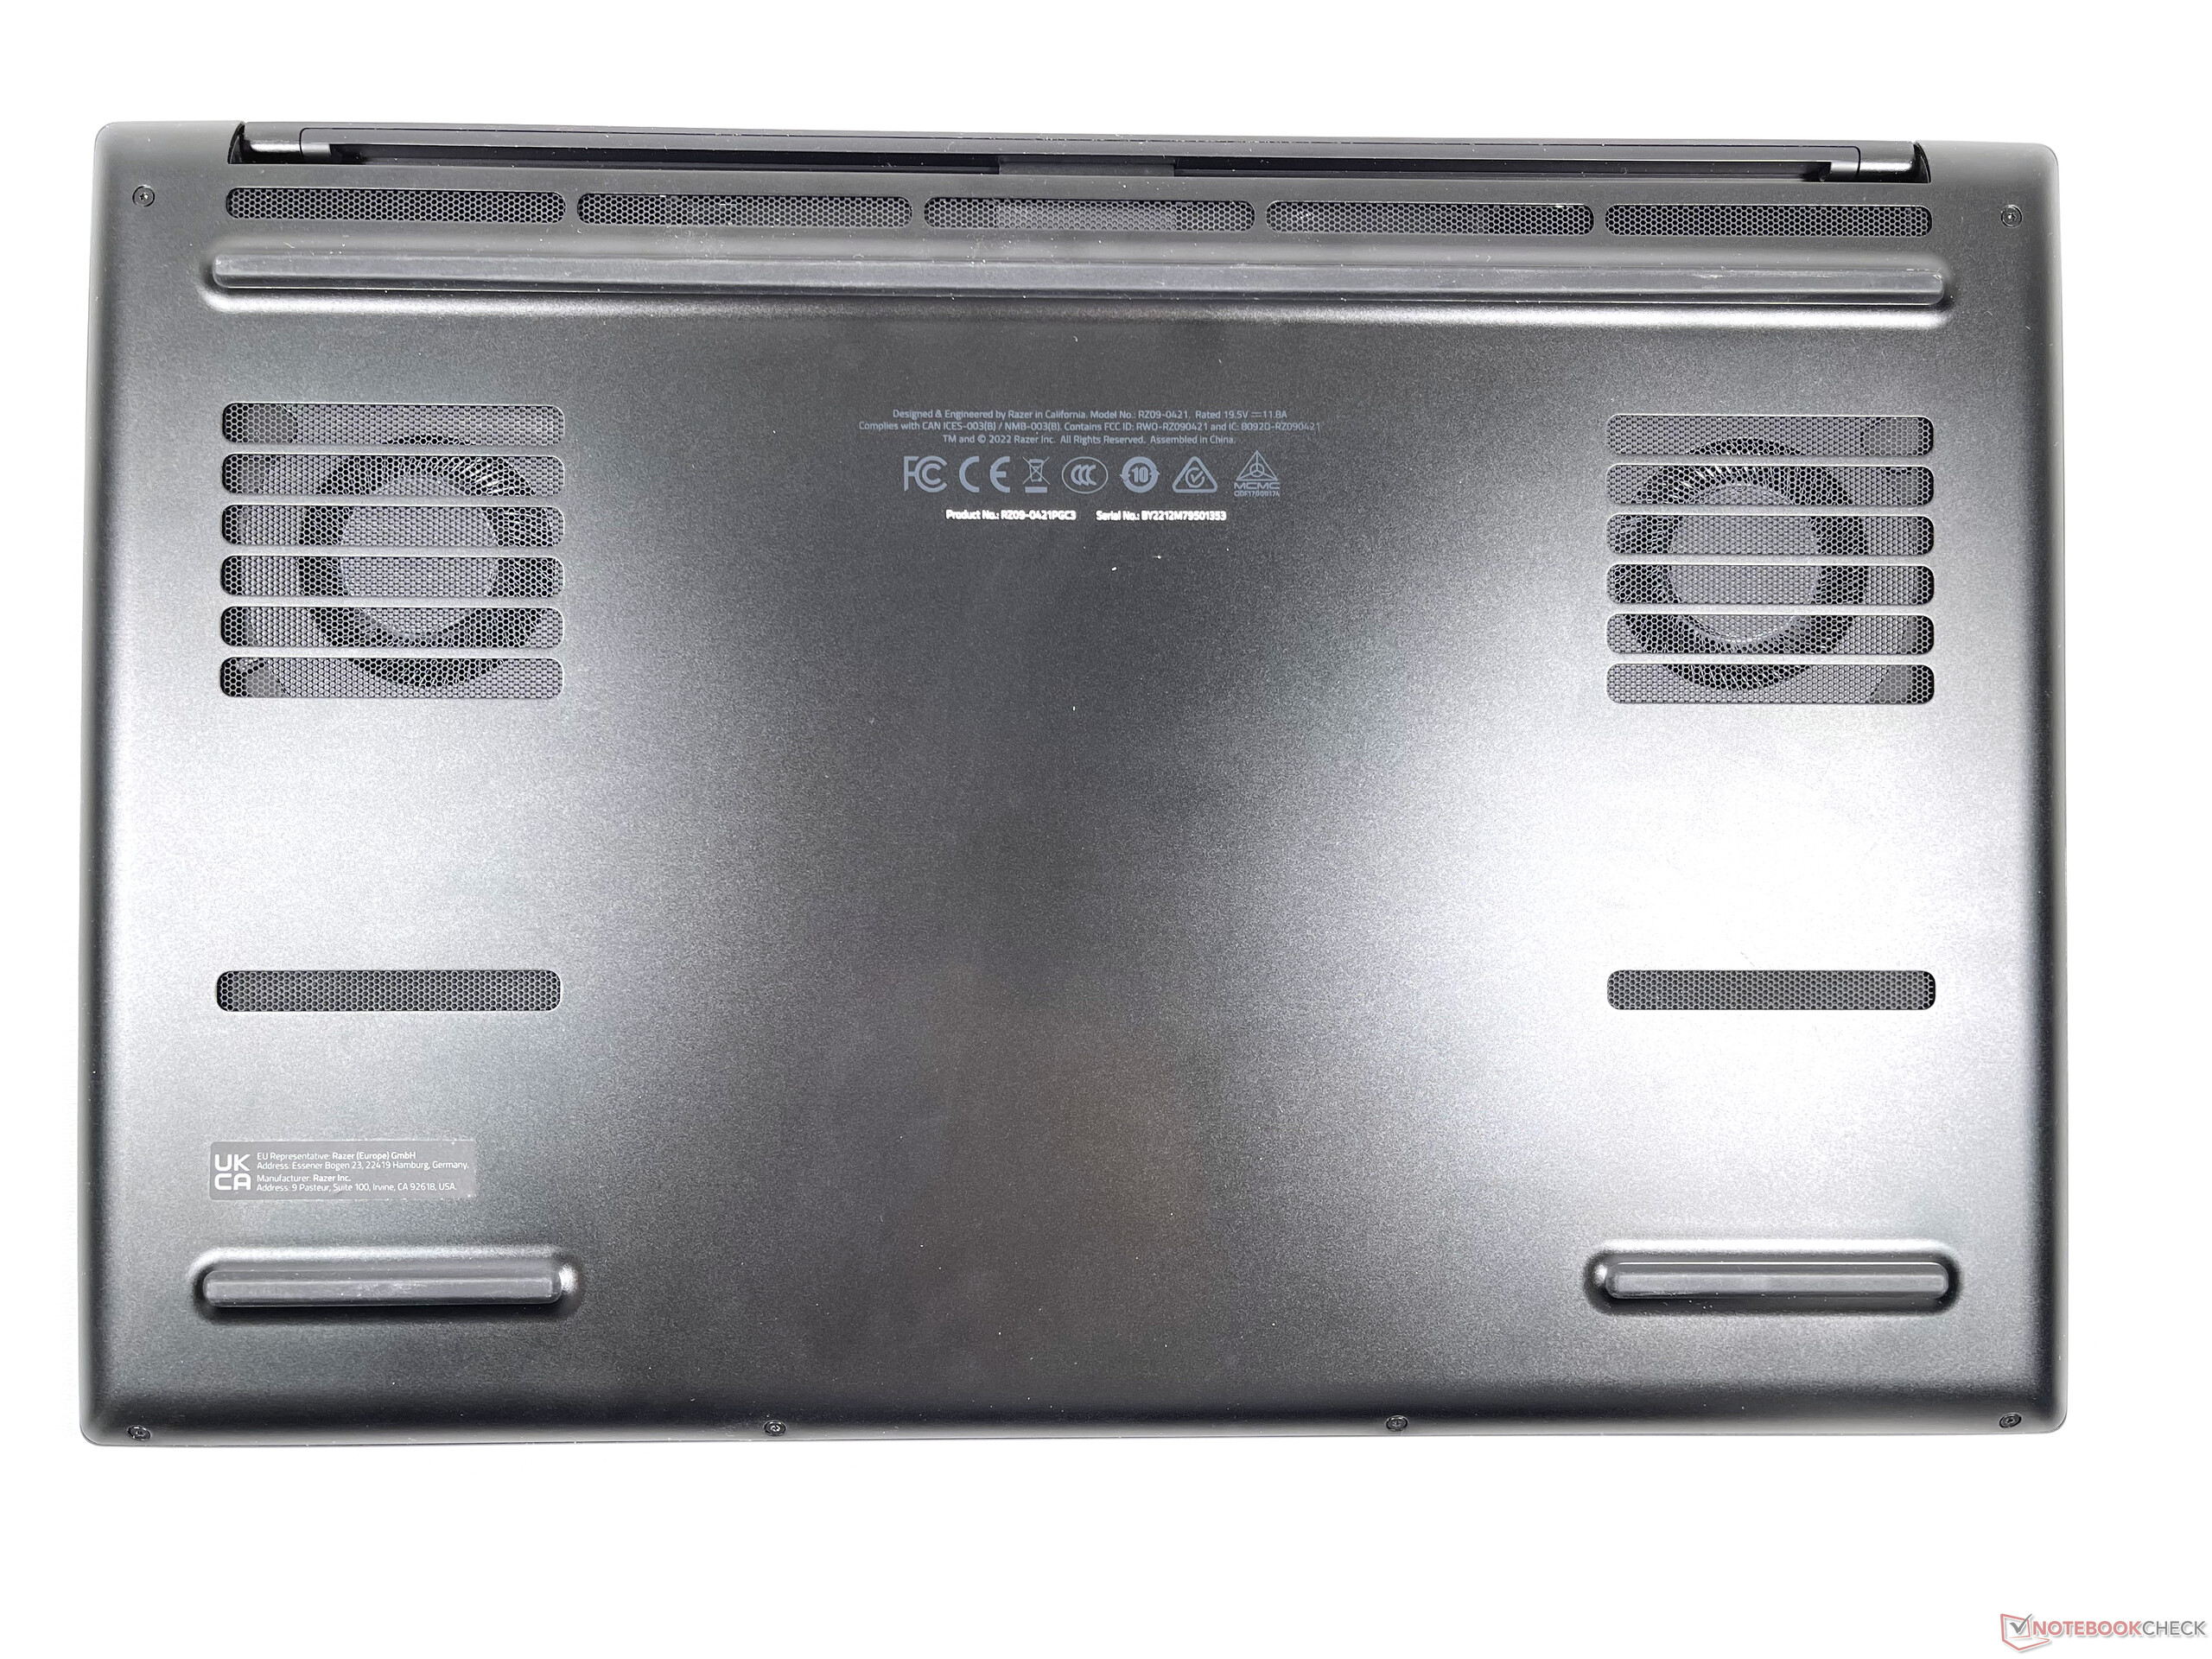
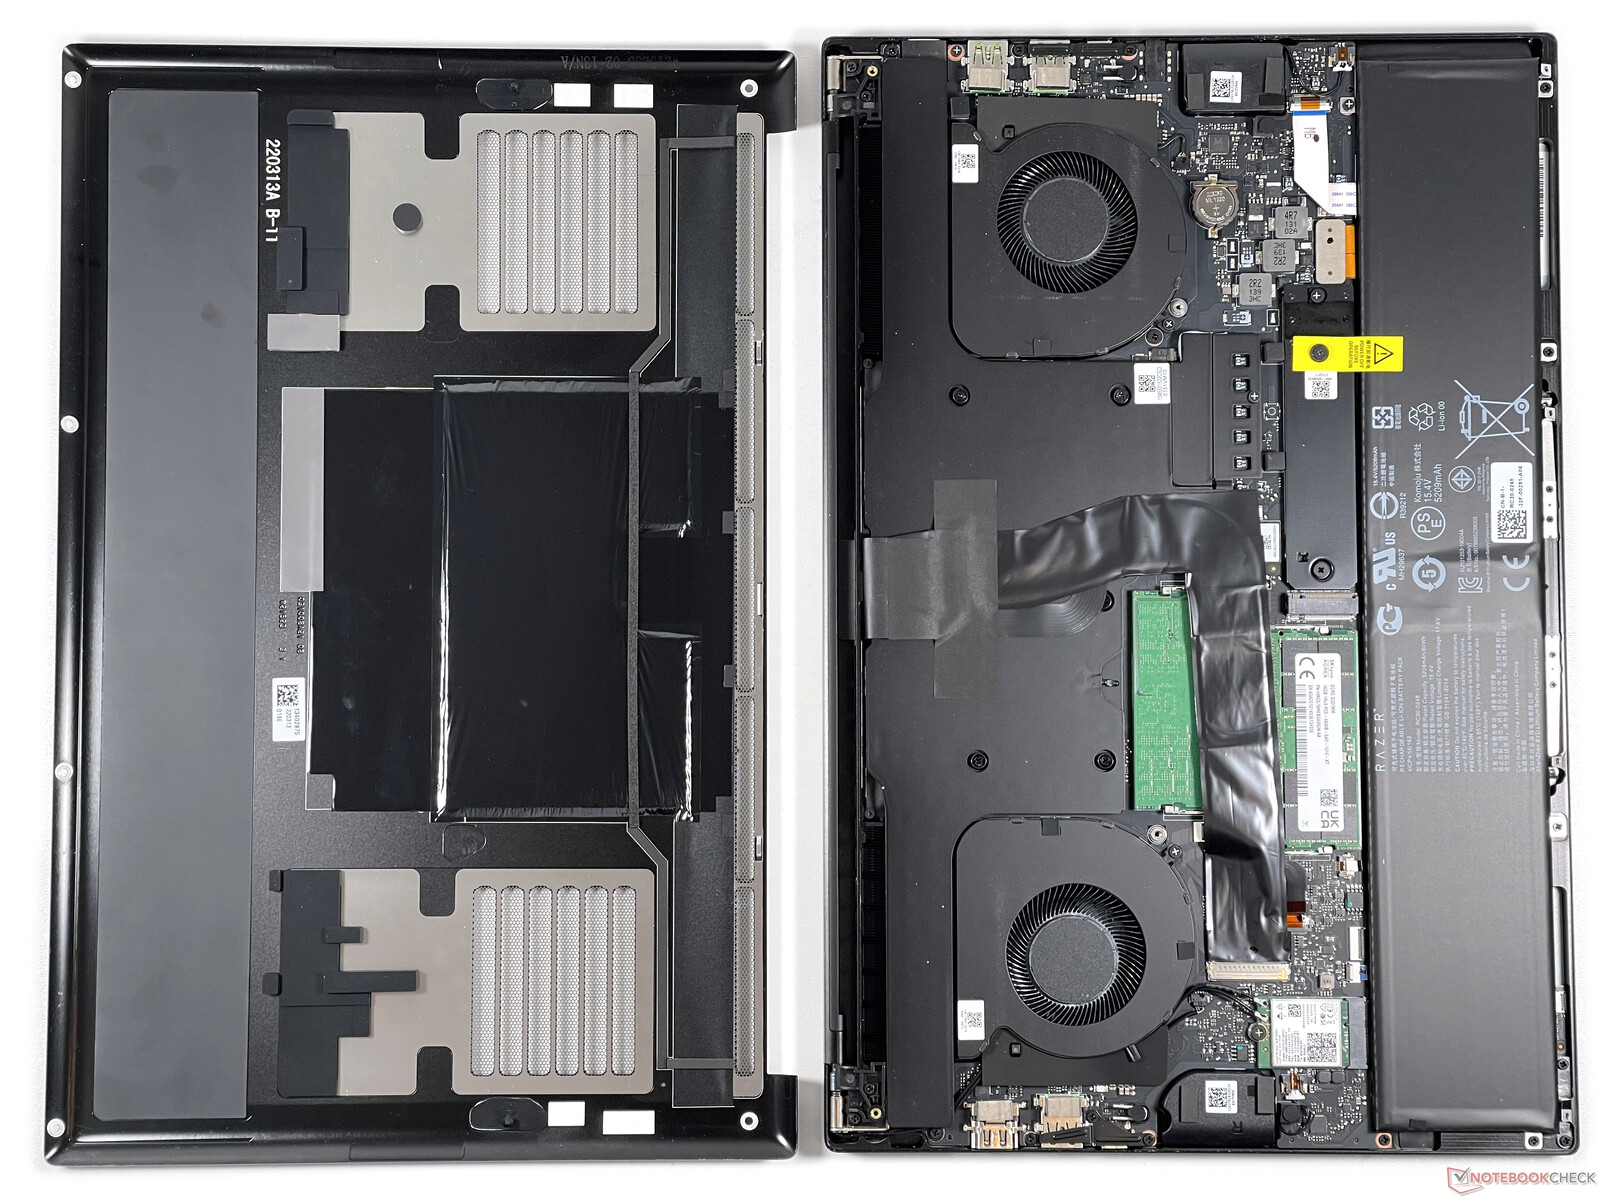
Después de quitar seis tornillos Torx (T5), uno tiene acceso a ambos módulos de RAM, la batería, el módulo WLAN y (después de quitar una cubierta adicional) el SSD M.2
Dispositivos de entrada - Gran clickpad y teclado ordenado
Teclado
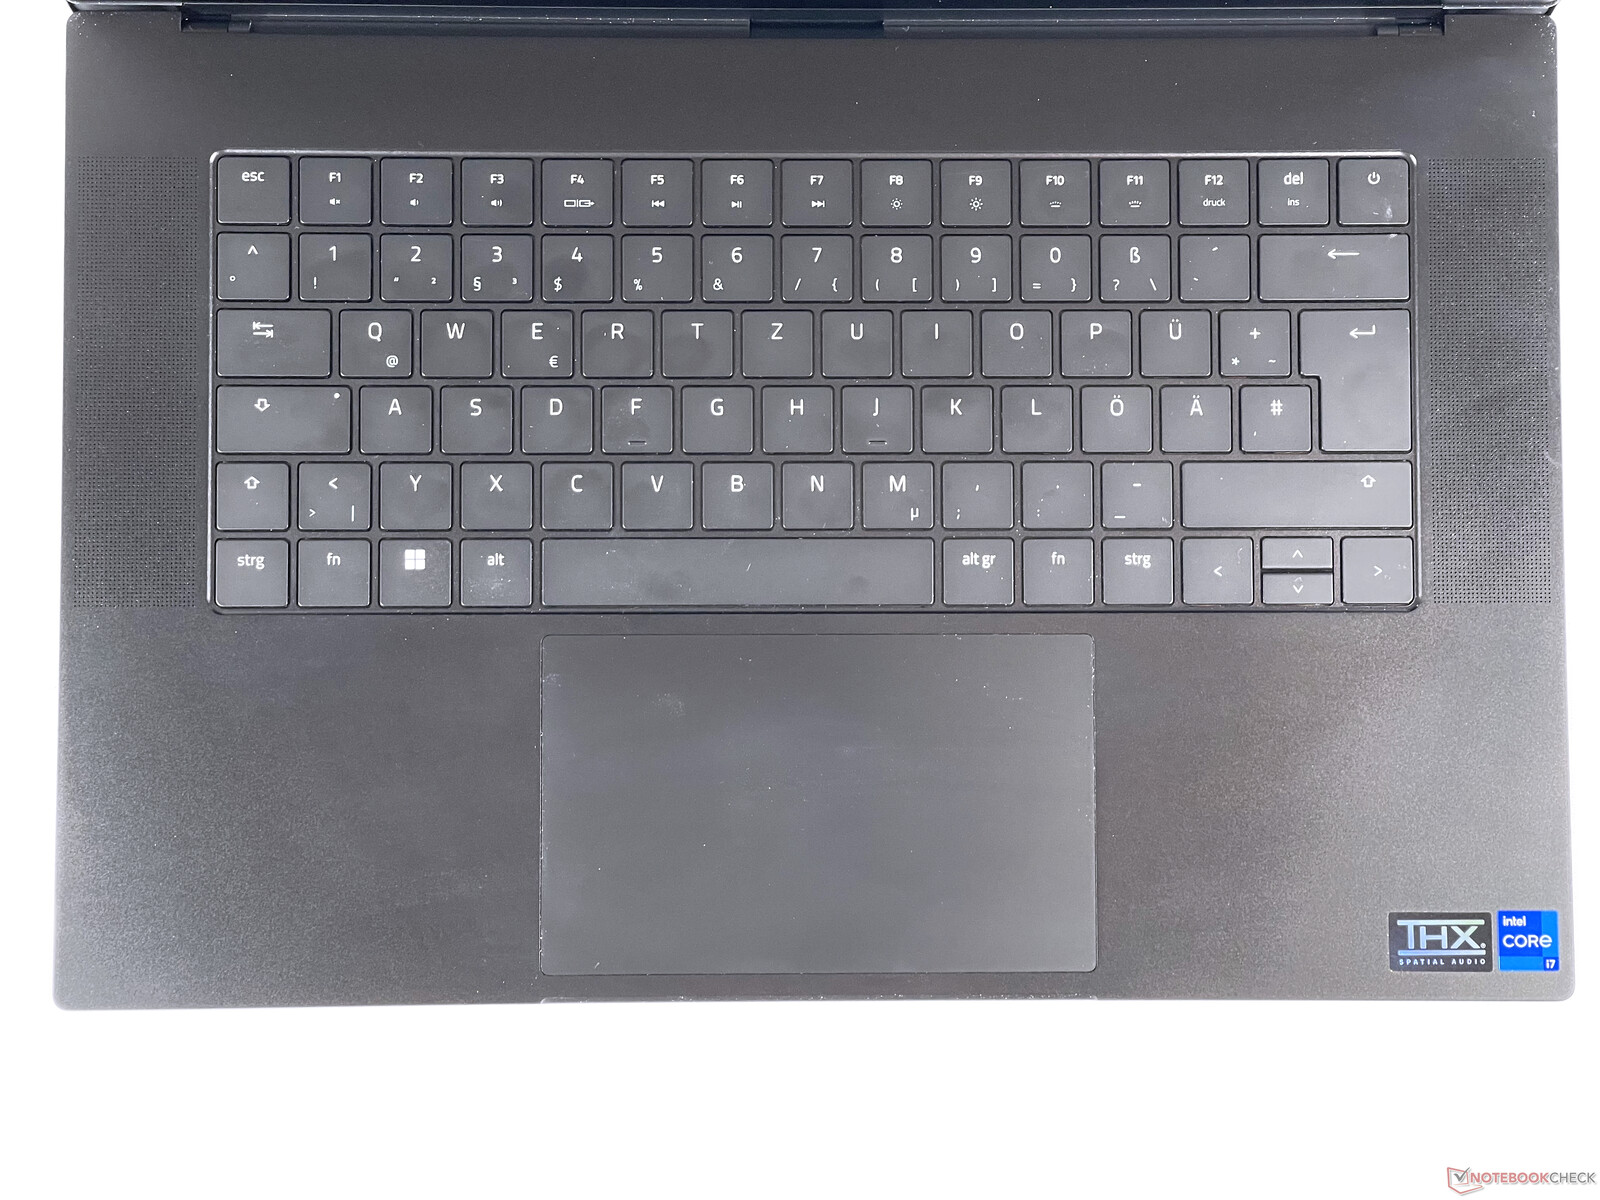
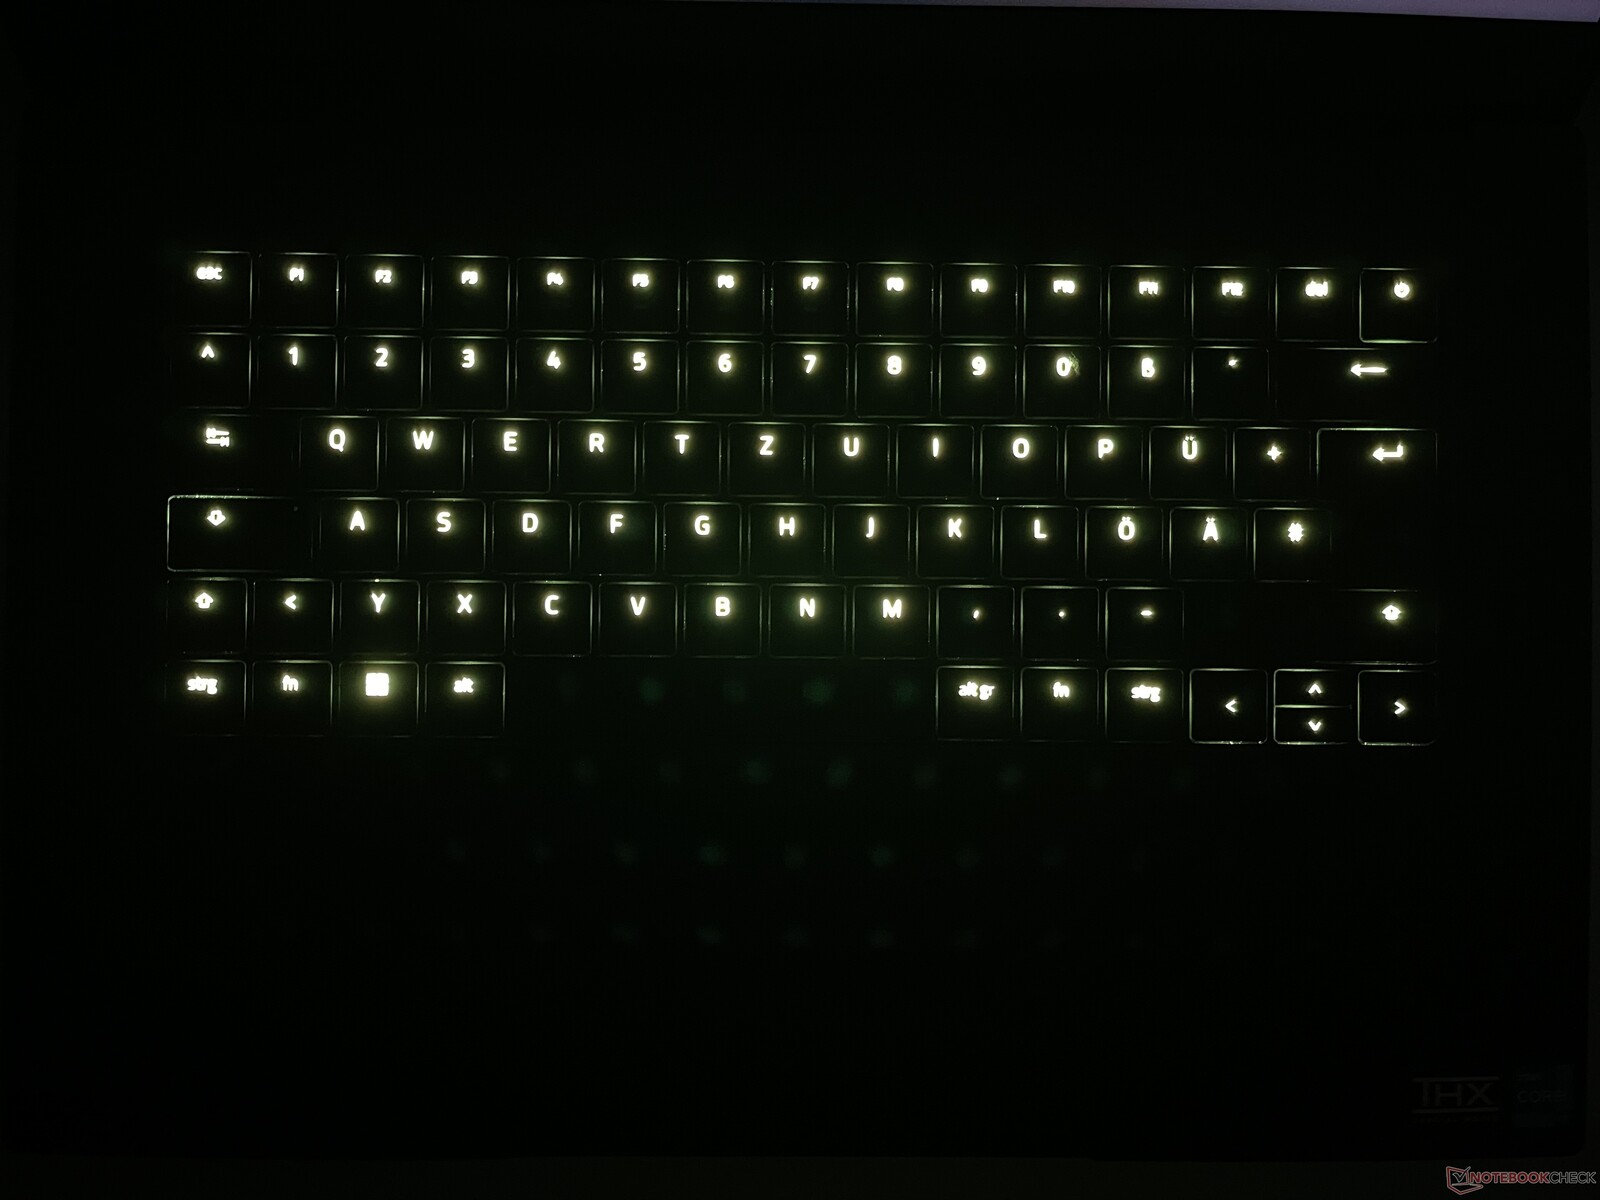
El teclado cuenta con iluminación de teclas RGB con 16 niveles de brillo (incluido el "apagado") y teclas de flecha arriba y flecha abajo de media altura, lo que permite a Razer colocar todo el teclado en un área rectangular centrada entre las aberturas de los altavoces. Las teclas ofrecen un recorrido de tecla plano y sonidos de escritura silenciosos y amortiguados. La resistencia de las teclas es moderada y el centro del teclado apenas cede al escribir.
Teclado táctil
El touchpad tiene una superficie de unos 13x8 cm y permite un excelente deslizamiento del dedo. Los clics se caracterizan por un corto recorrido de las teclas y una clara respuesta háptica
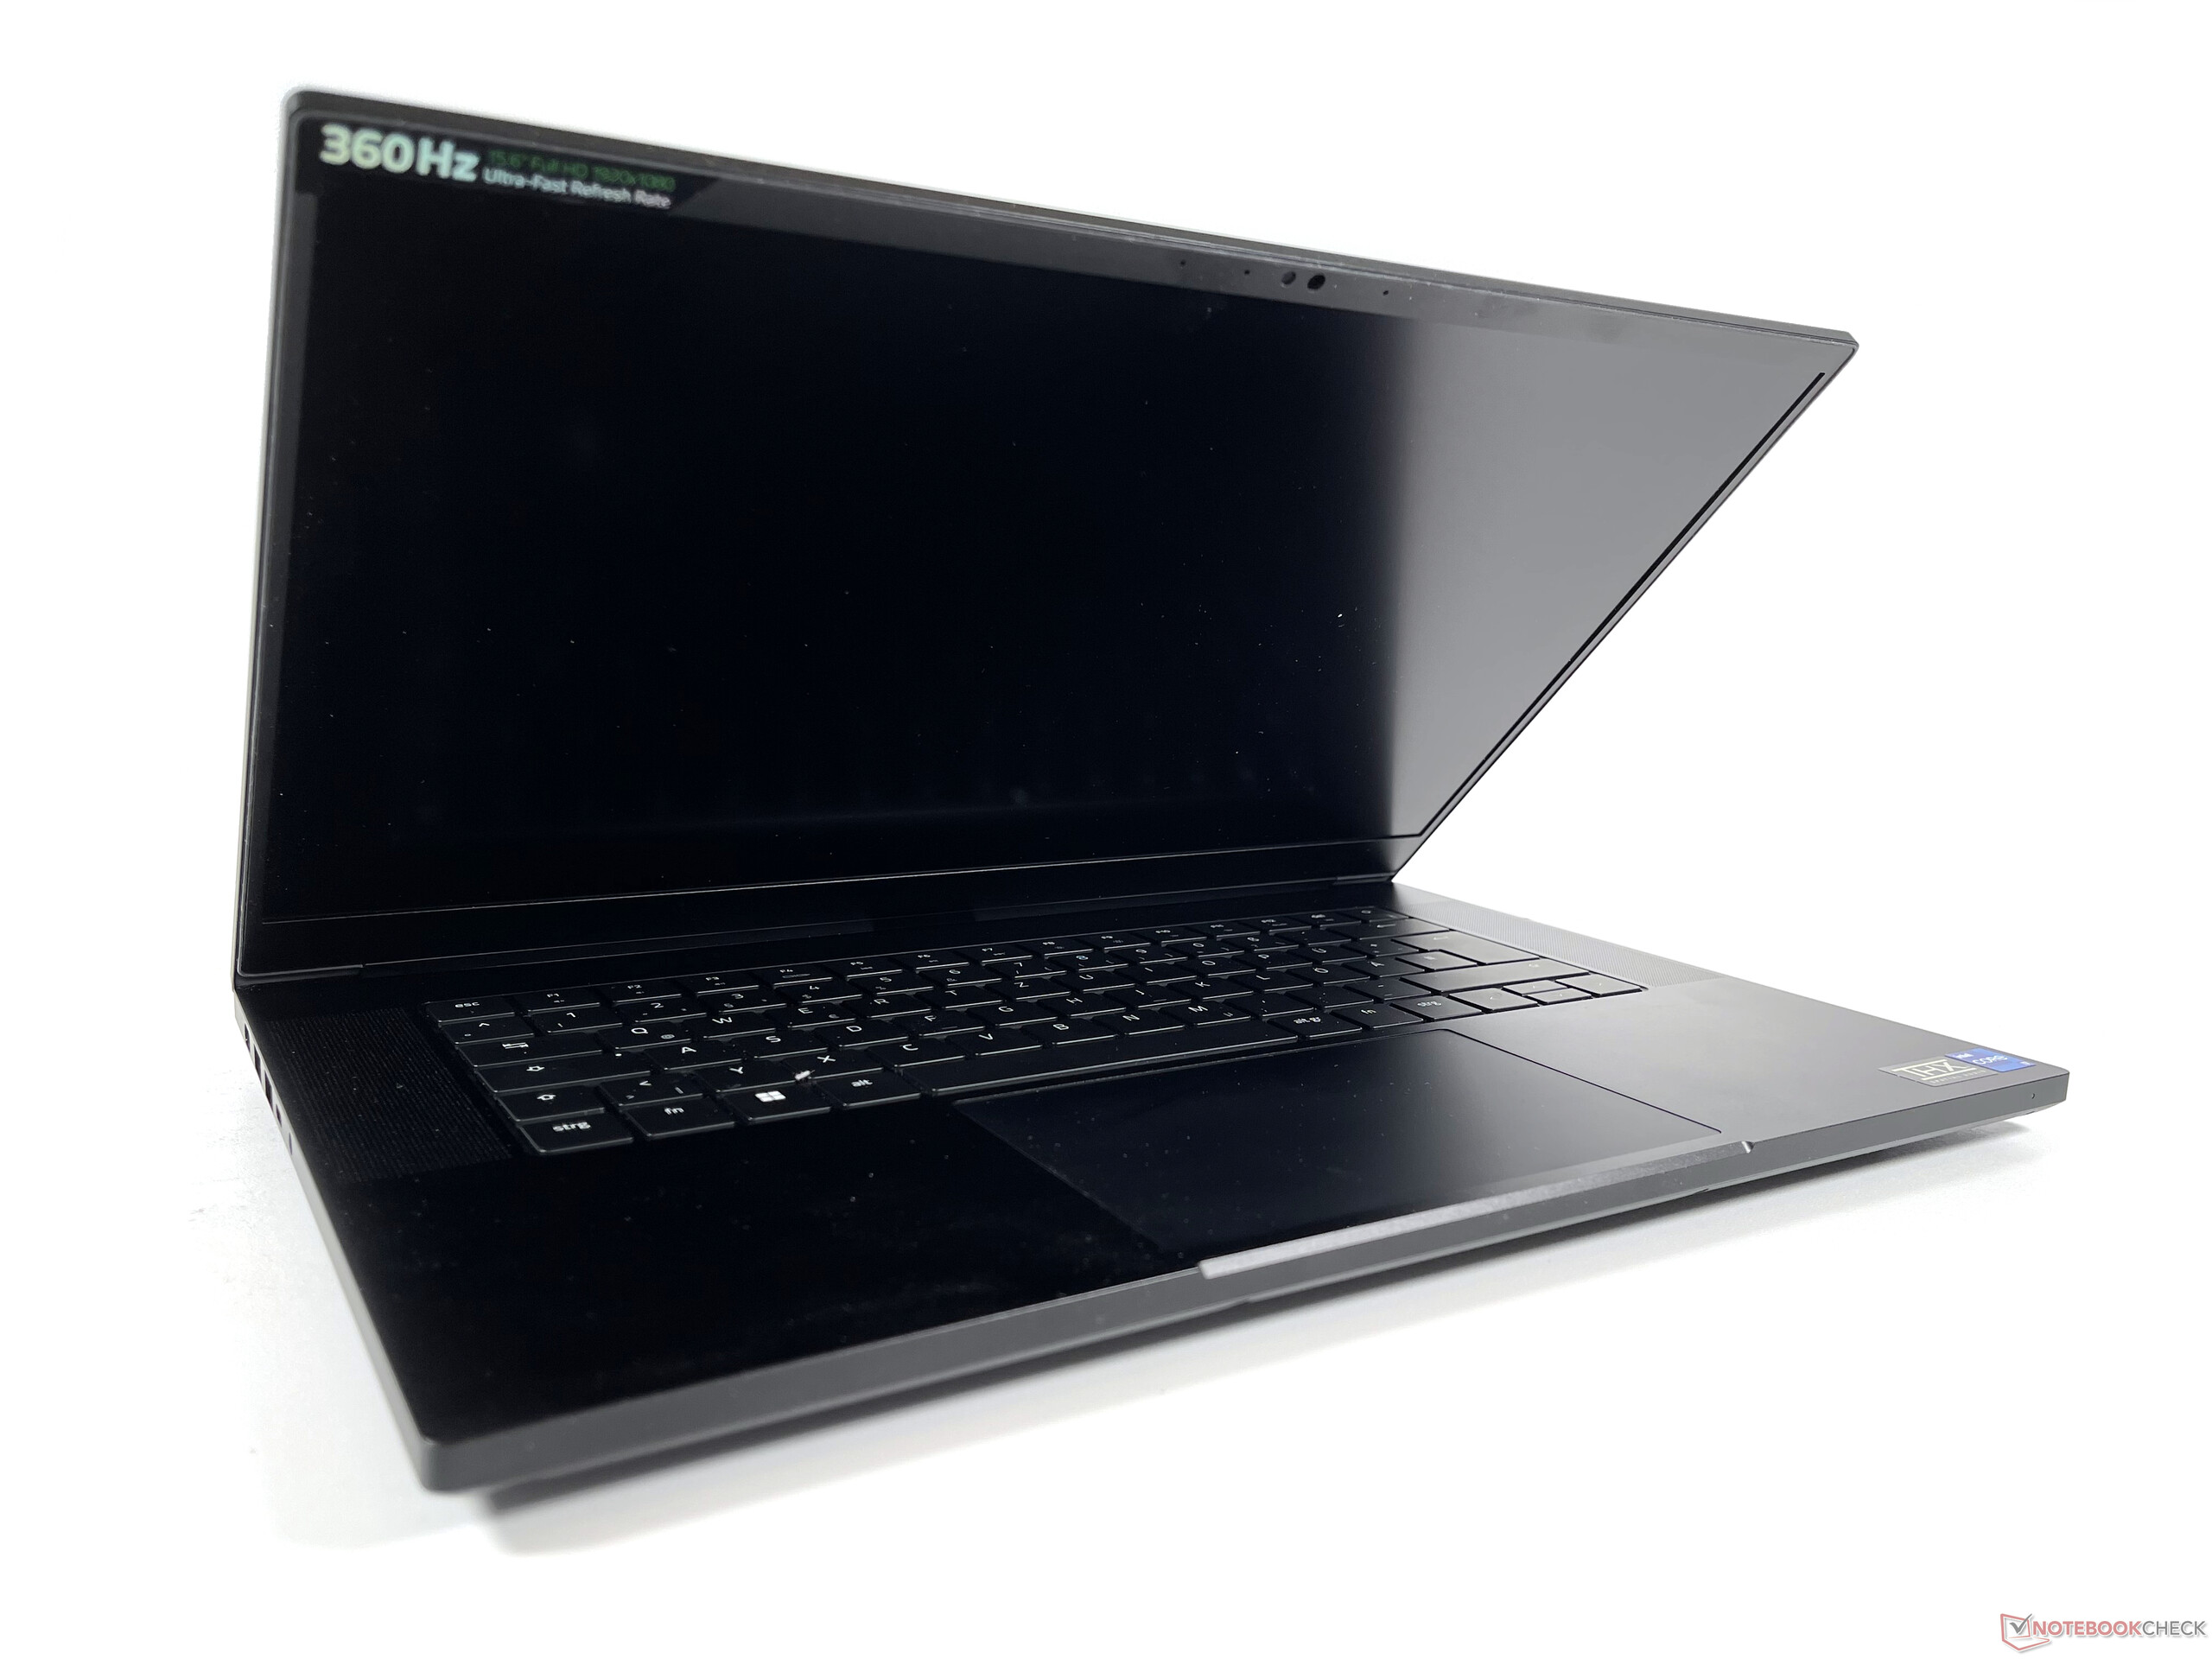
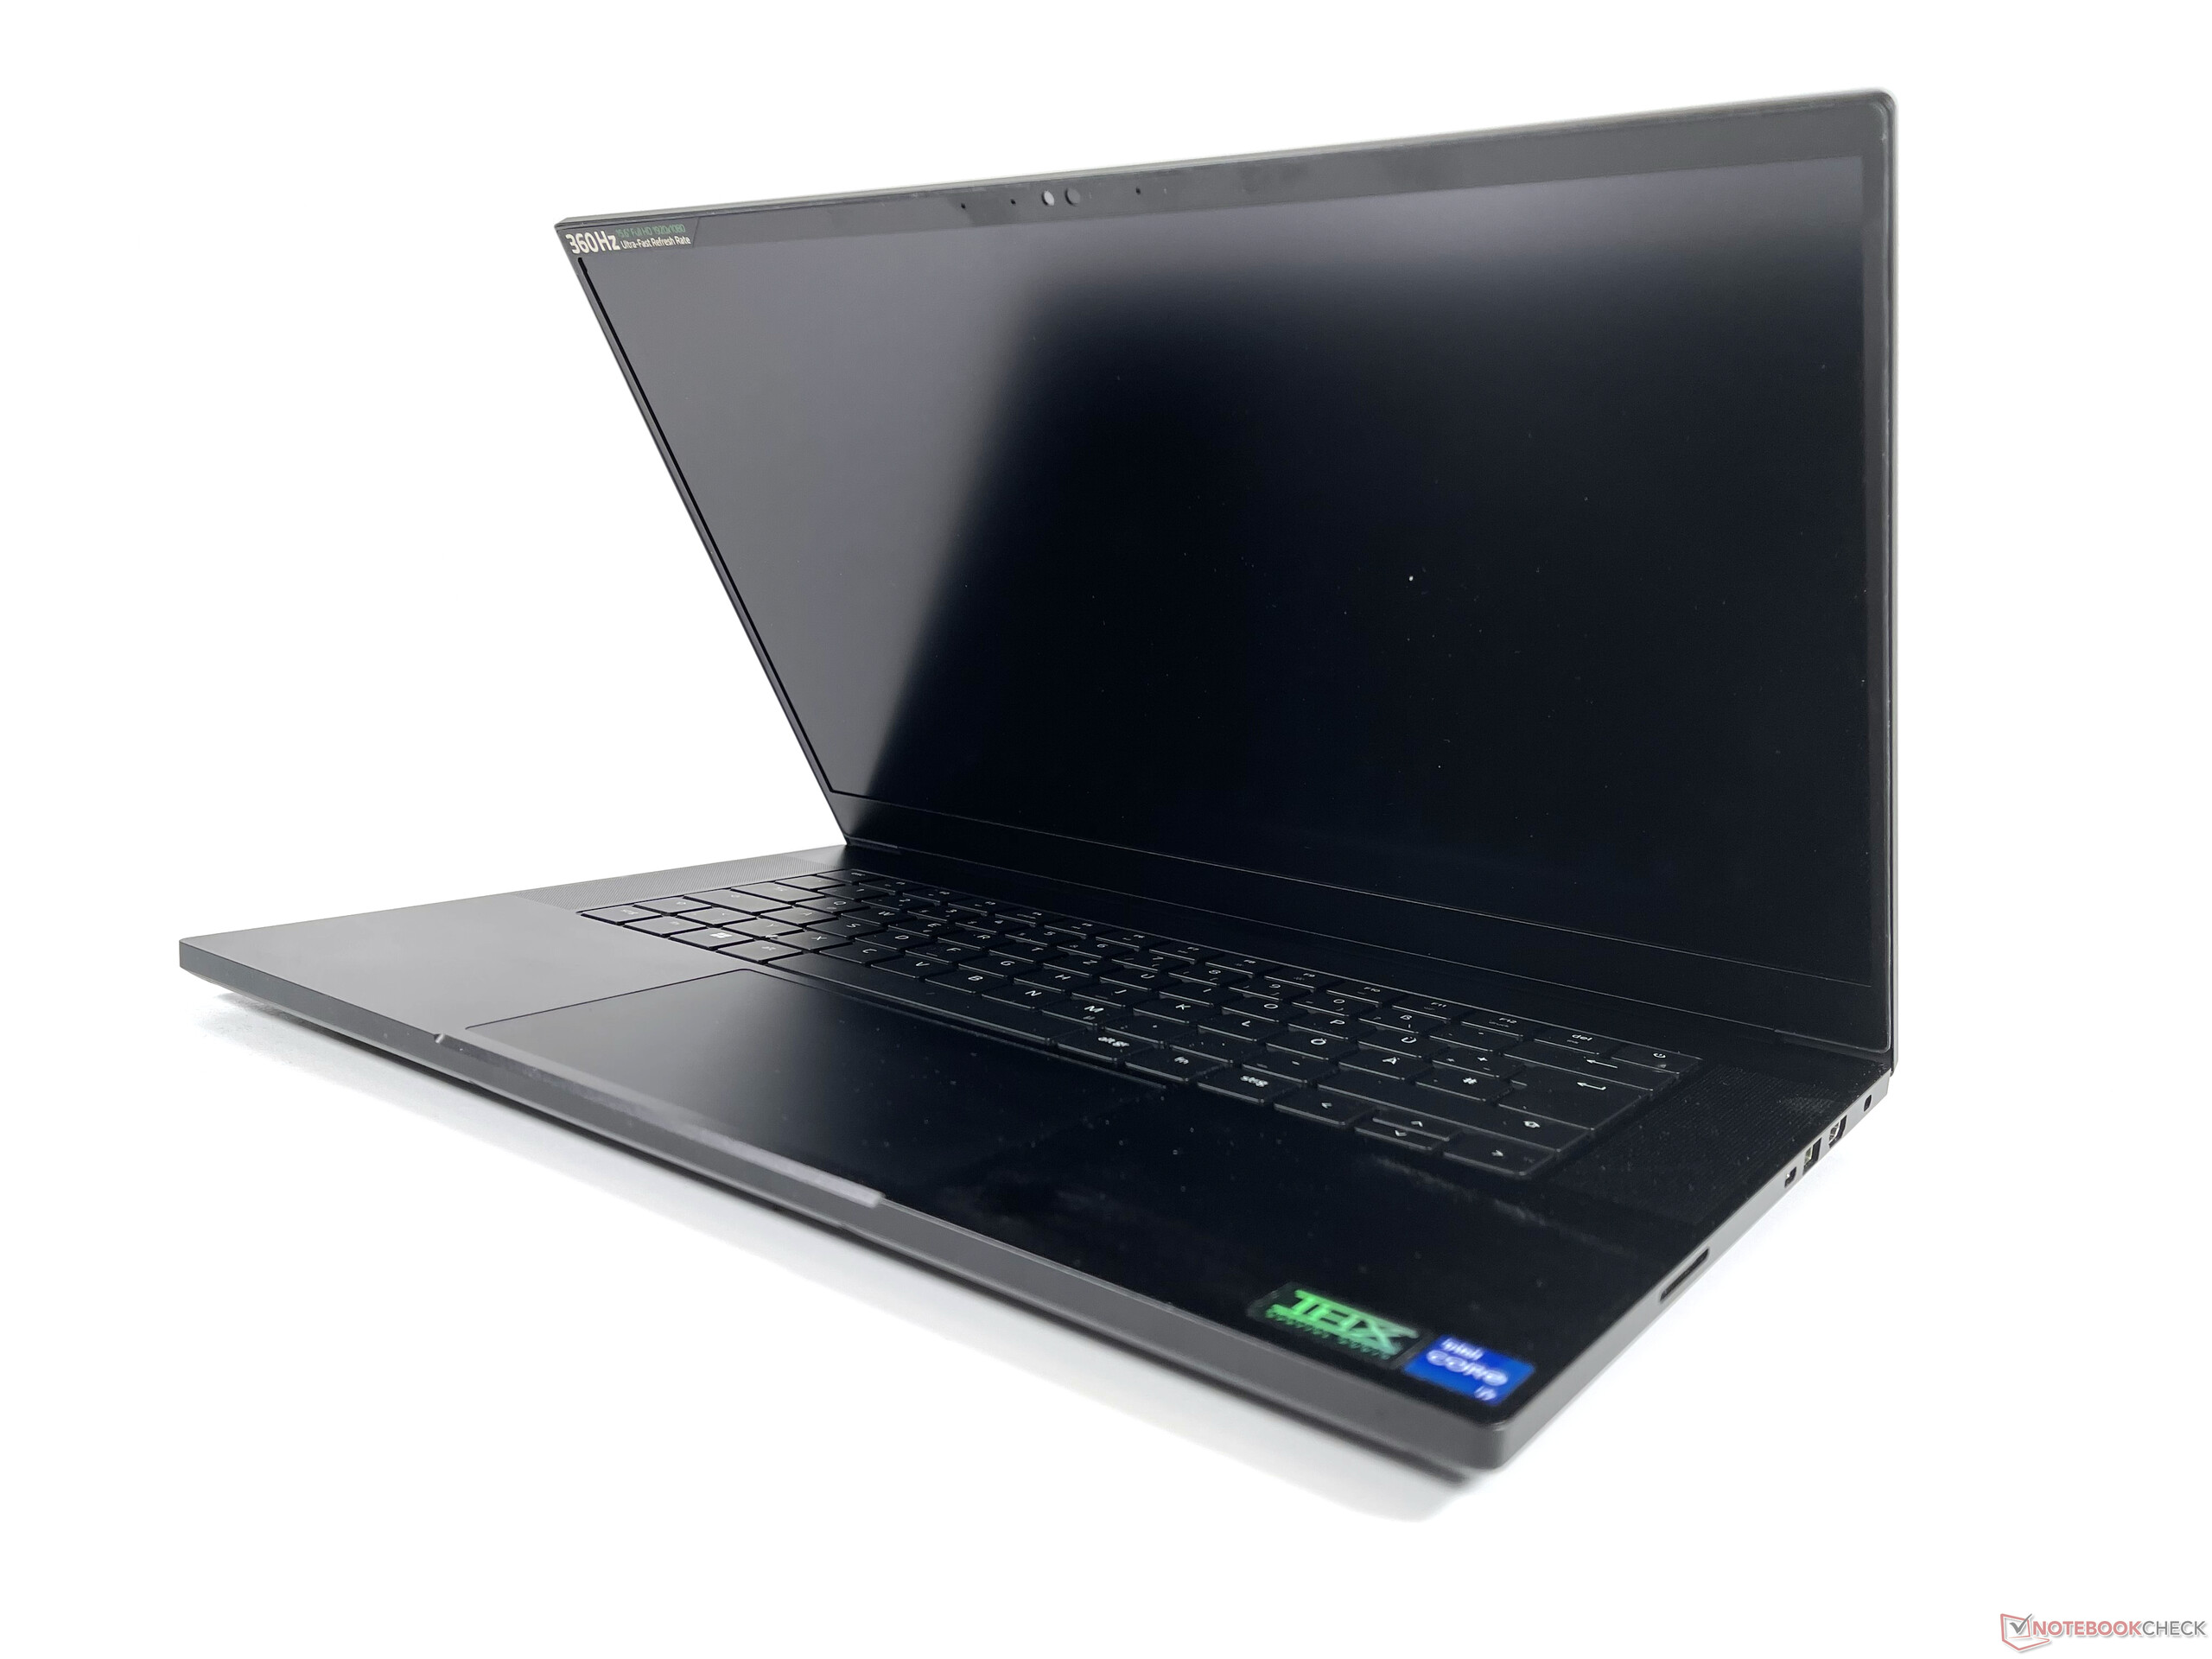
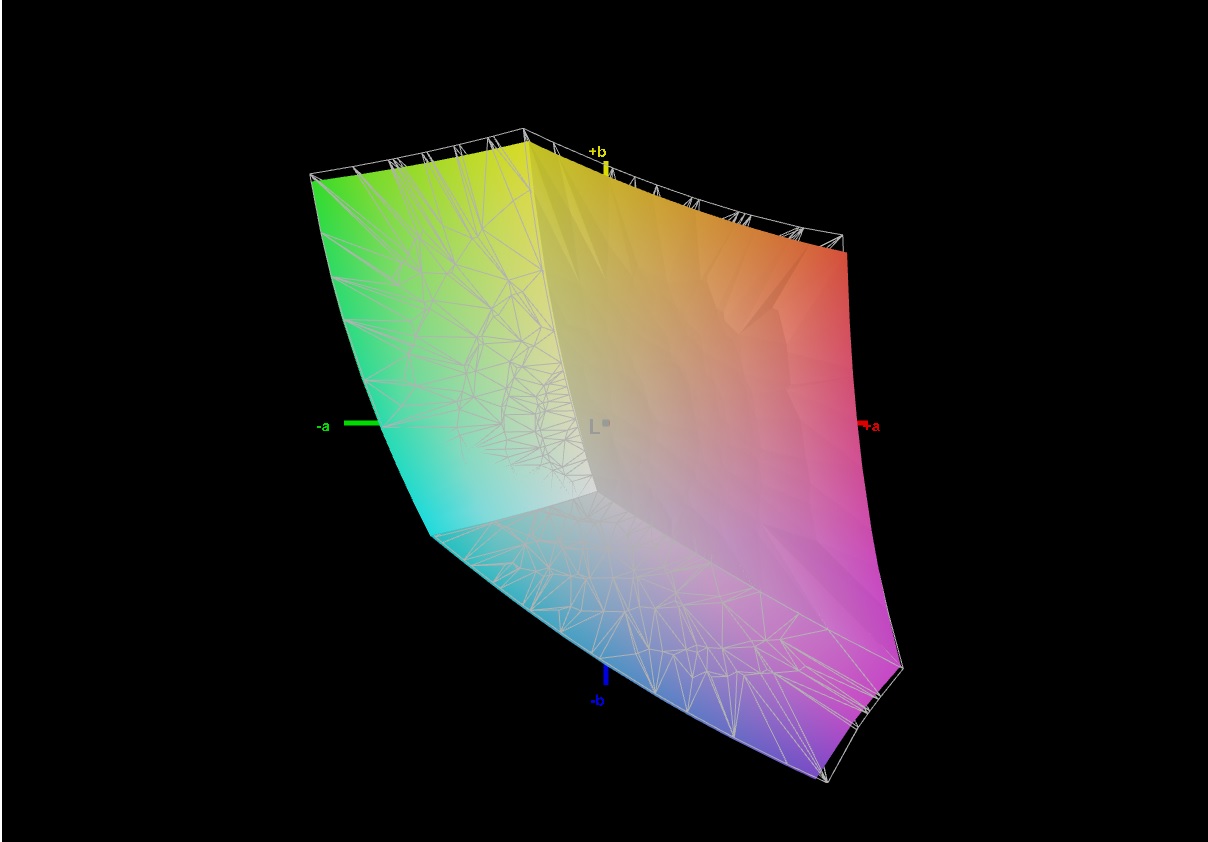
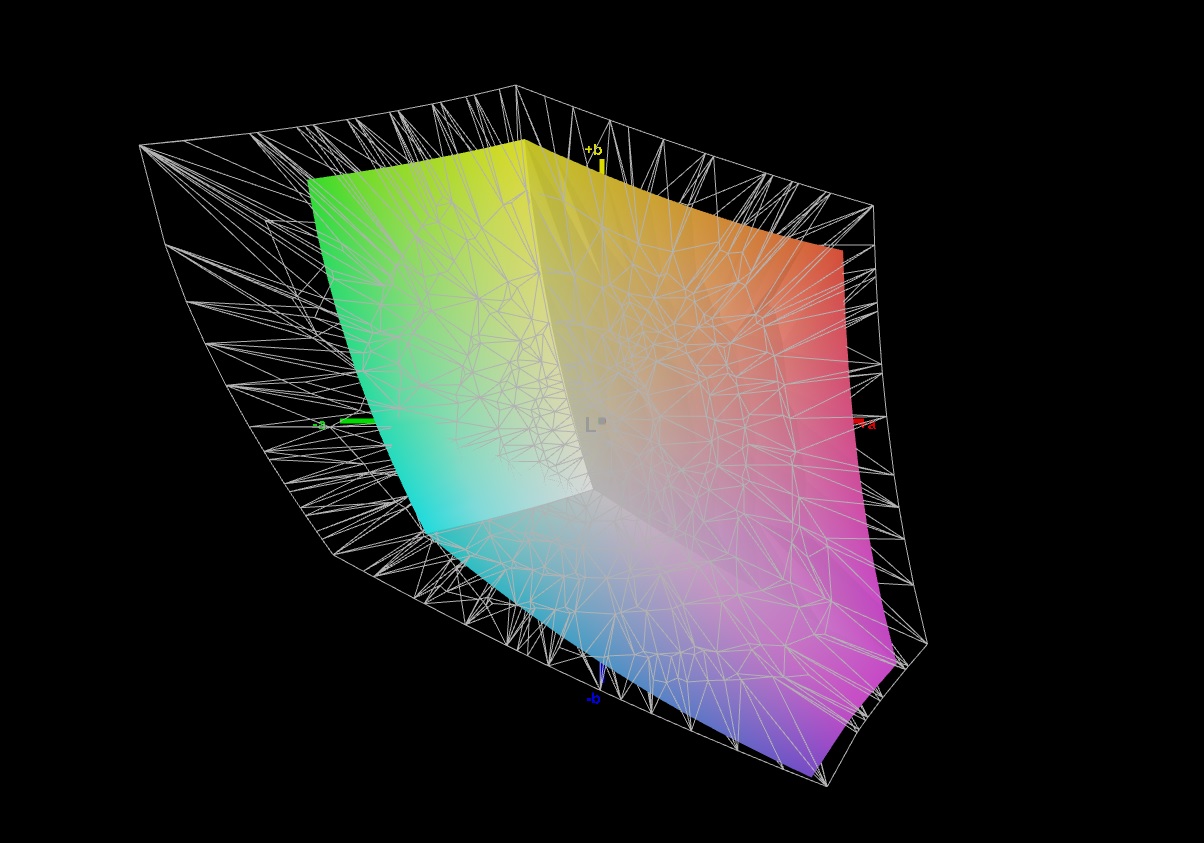
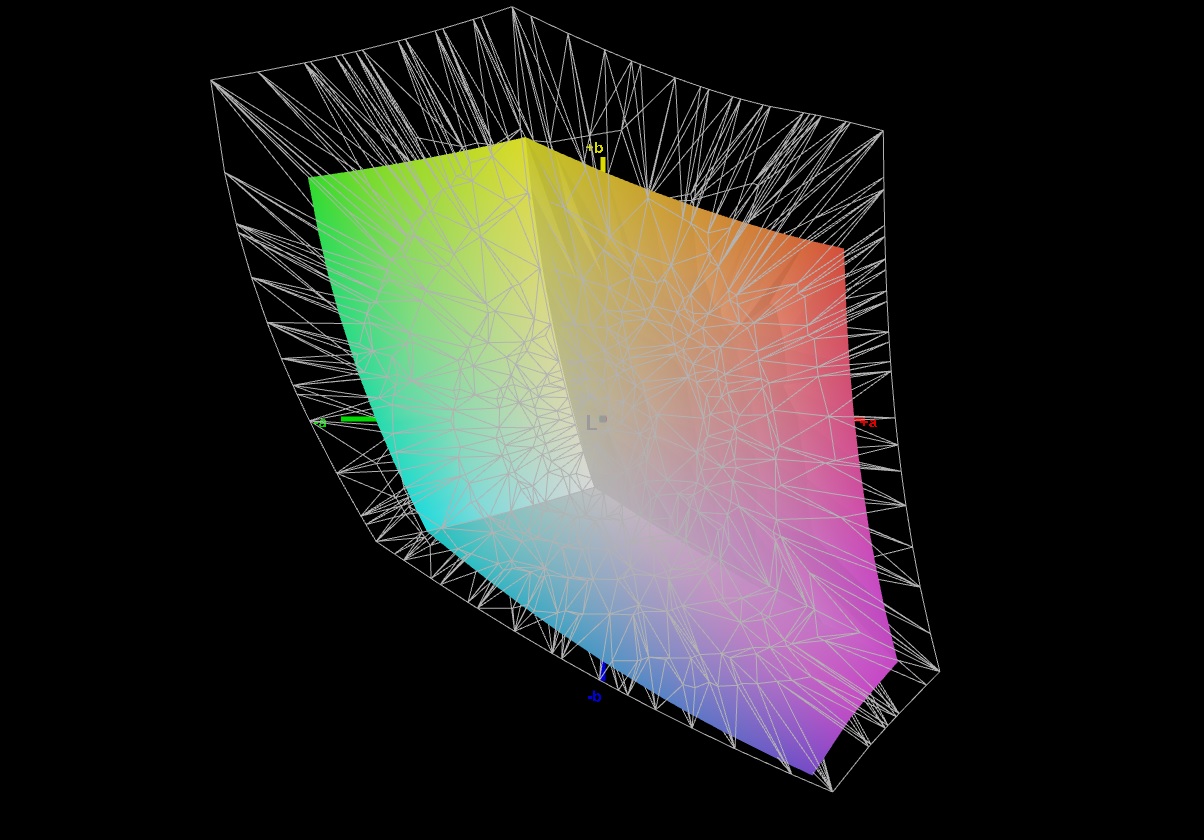
Pantalla - Panel rápido con espectro de color limitado
Nuestro dispositivo de pruebas lleva un panel IPS mate Full HD con una resolución nativa de 1920x1080 pixels y una tasa de refresco de 360 Hz. Alternativamente, hay disponibles un display QHD 240 Hz y uno 4K 144 Hz, cada uno de los cuales debería cubrir el espacio de color DCI-P3. El modelo QHD también soporta Nvidia G-Sync y Advanced Optimus.
El brillo de 315 cd/m² de media es más que suficiente para la mayoría de escenarios de aplicación y, junto con un decente valor de negro de 0.24, resulta en un contraste superior a la media de 1.375:1 en comparación con la clase. Los tiempos de respuesta de gris a gris son particularmente cortos y no pudimos detectar ningún PWM.
| |||||||||||||||||||||||||
iluminación: 89 %
Brillo con batería: 330 cd/m²
Contraste: 1375:1 (Negro: 0.24 cd/m²)
ΔE ColorChecker Calman: 1.47 | ∀{0.5-29.43 Ø4.71}
calibrated: 0.63
ΔE Greyscale Calman: 1.8 | ∀{0.09-98 Ø4.96}
67.4% AdobeRGB 1998 (Argyll 3D)
85.1% sRGB (Argyll 3D)
65.3% Display P3 (Argyll 3D)
Gamma: 2.282
CCT: 6499 K
| Razer Blade 15 Advanced Model Early 2022 TL156VDXP02-0, IPS, 1920x1080, 15.6" | Razer Blade 15 2022 Sharp LQ156T1JW03, IPS, 2560x1440, 15.6" | Schenker XMG Neo 15 E22 (Early 2022, RTX 3080 Ti) BOE0A67 (BOE CQ NE156QHM-NZ1), IPS, 2560x1440, 15.6" | Asus ROG Strix Scar 15 G533QS BOE CQ NE156QHM-NY1, IPS, 2560x1440, 15.6" | MSI Stealth GS66 12UGS Sharp LQ156T1JW04 (SHP153C), IPS-Level, 2560x1440, 15.6" | MSI Vector GP66 12UGS BOE NE156FHM-NZ3, IPS, 1920x1080, 15.6" | |
|---|---|---|---|---|---|---|
| Display | 33% | 31% | 31% | 10% | ||
| Display P3 Coverage (%) | 65.3 | 99.1 52% | 97.6 49% | 96.4 48% | 70.1 7% | |
| sRGB Coverage (%) | 85.1 | 99.9 17% | 99.9 17% | 99.7 17% | 99.5 17% | |
| AdobeRGB 1998 Coverage (%) | 67.4 | 86.8 29% | 85.3 27% | 85.6 27% | 72.1 7% | |
| Response Times | -123% | -119% | -122% | -10% | -13% | |
| Response Time Grey 50% / Grey 80% * (ms) | 4.3 ? | 14.4 ? -235% | 14.4 ? -235% | 14 ? -226% | 6 ? -40% | 5.8 ? -35% |
| Response Time Black / White * (ms) | 10.5 ? | 11.6 ? -10% | 10.8 ? -3% | 12.4 ? -18% | 8.4 ? 20% | 9.6 ? 9% |
| PWM Frequency (Hz) | ||||||
| Screen | -54% | -38% | -77% | -87% | -45% | |
| Brightness middle (cd/m²) | 330 | 286 -13% | 295 -11% | 304.3 -8% | 272 -18% | 353.1 7% |
| Brightness (cd/m²) | 315 | 271 -14% | 277 -12% | 286 -9% | 253 -20% | 325 3% |
| Brightness Distribution (%) | 89 | 89 0% | 62 -30% | 76 -15% | 87 -2% | 85 -4% |
| Black Level * (cd/m²) | 0.24 | 0.25 -4% | 0.28 -17% | 0.33 -38% | 0.25 -4% | 0.38 -58% |
| Contrast (:1) | 1375 | 1144 -17% | 1054 -23% | 922 -33% | 1088 -21% | 929 -32% |
| Colorchecker dE 2000 * | 1.47 | 2.74 -86% | 2.36 -61% | 2.76 -88% | 3.73 -154% | 2.24 -52% |
| Colorchecker dE 2000 max. * | 2.73 | 5.21 -91% | 4.24 -55% | 5.57 -104% | 9.43 -245% | 5 -83% |
| Colorchecker dE 2000 calibrated * | 0.63 | 2.52 -300% | 2.38 -278% | 0.98 -56% | 1.02 -62% | |
| Greyscale dE 2000 * | 1.8 | 1.1 39% | 3.43 -91% | 4 -122% | 6.5 -261% | 4 -122% |
| Gamma | 2.282 96% | 2.2 100% | 2.44 90% | 2.14 103% | 2.172 101% | 2.24 98% |
| CCT | 6499 100% | 6408 101% | 6266 104% | 6844 95% | 6485 100% | 6864 95% |
| Media total (Programa/Opciones) | -48% /
-45% | -79% /
-54% | -56% /
-60% | -22% /
-51% | -16% /
-28% |
* ... más pequeño es mejor
En nuestra configuración, el Razer Blade 15 sólo cubre el 85% del espacio de color sRGB. Teniendo en cuenta la afirmación del fabricante de "hasta el 100%", esperábamos más.
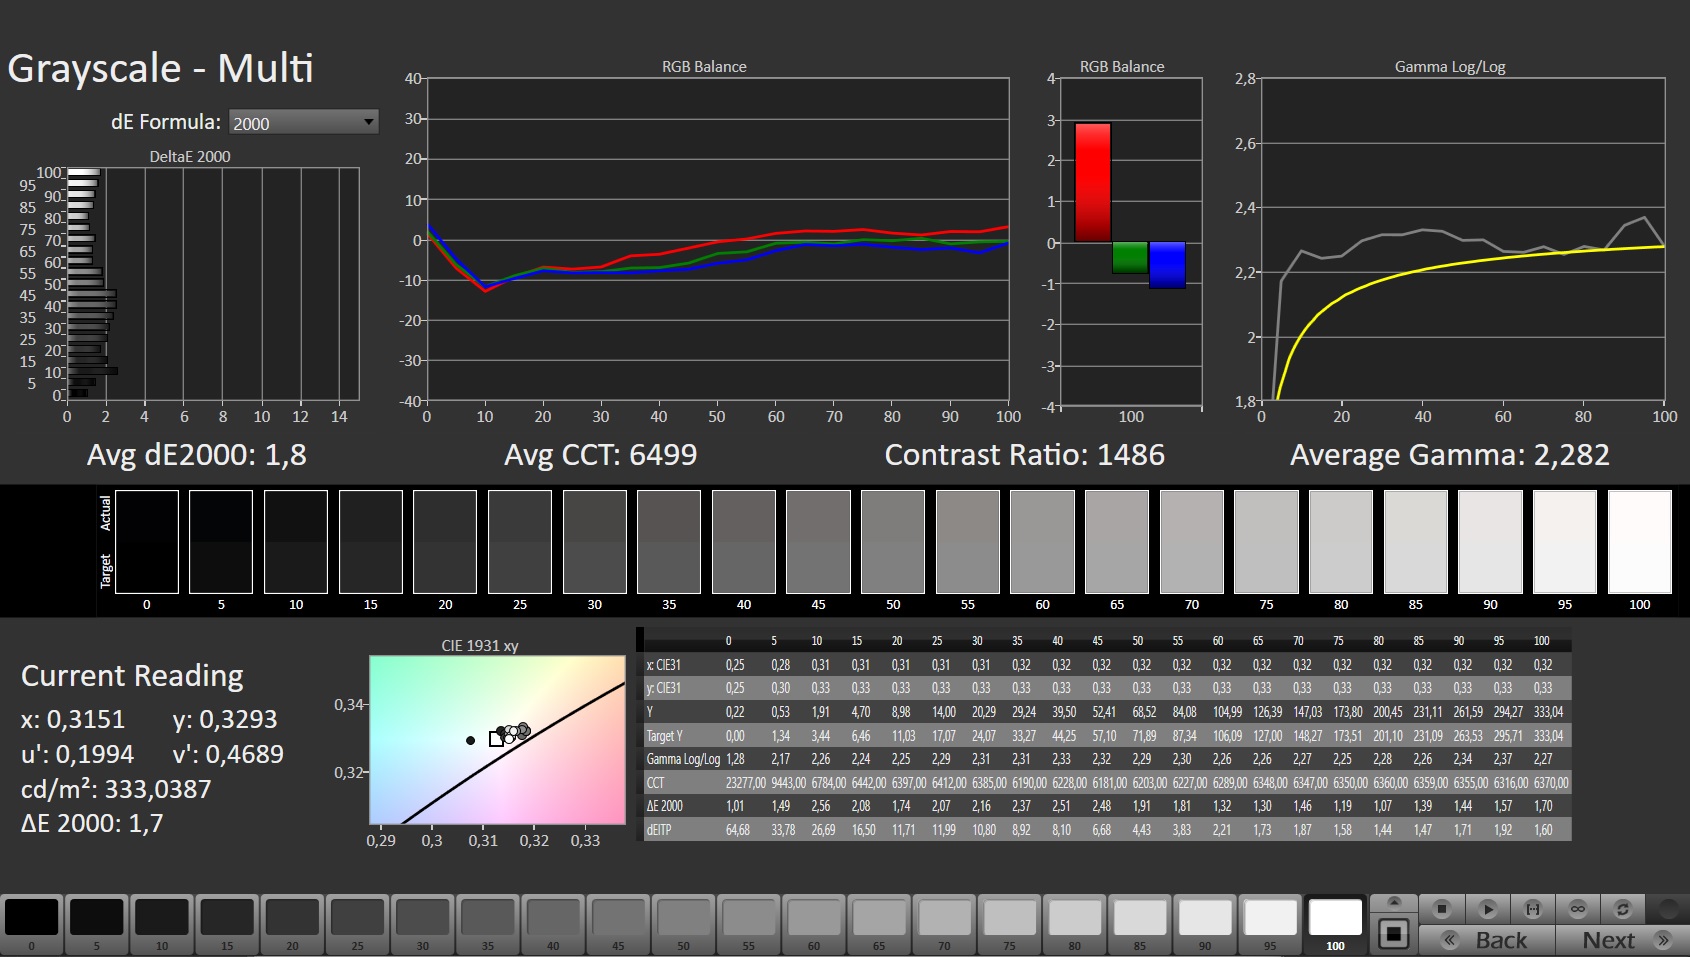
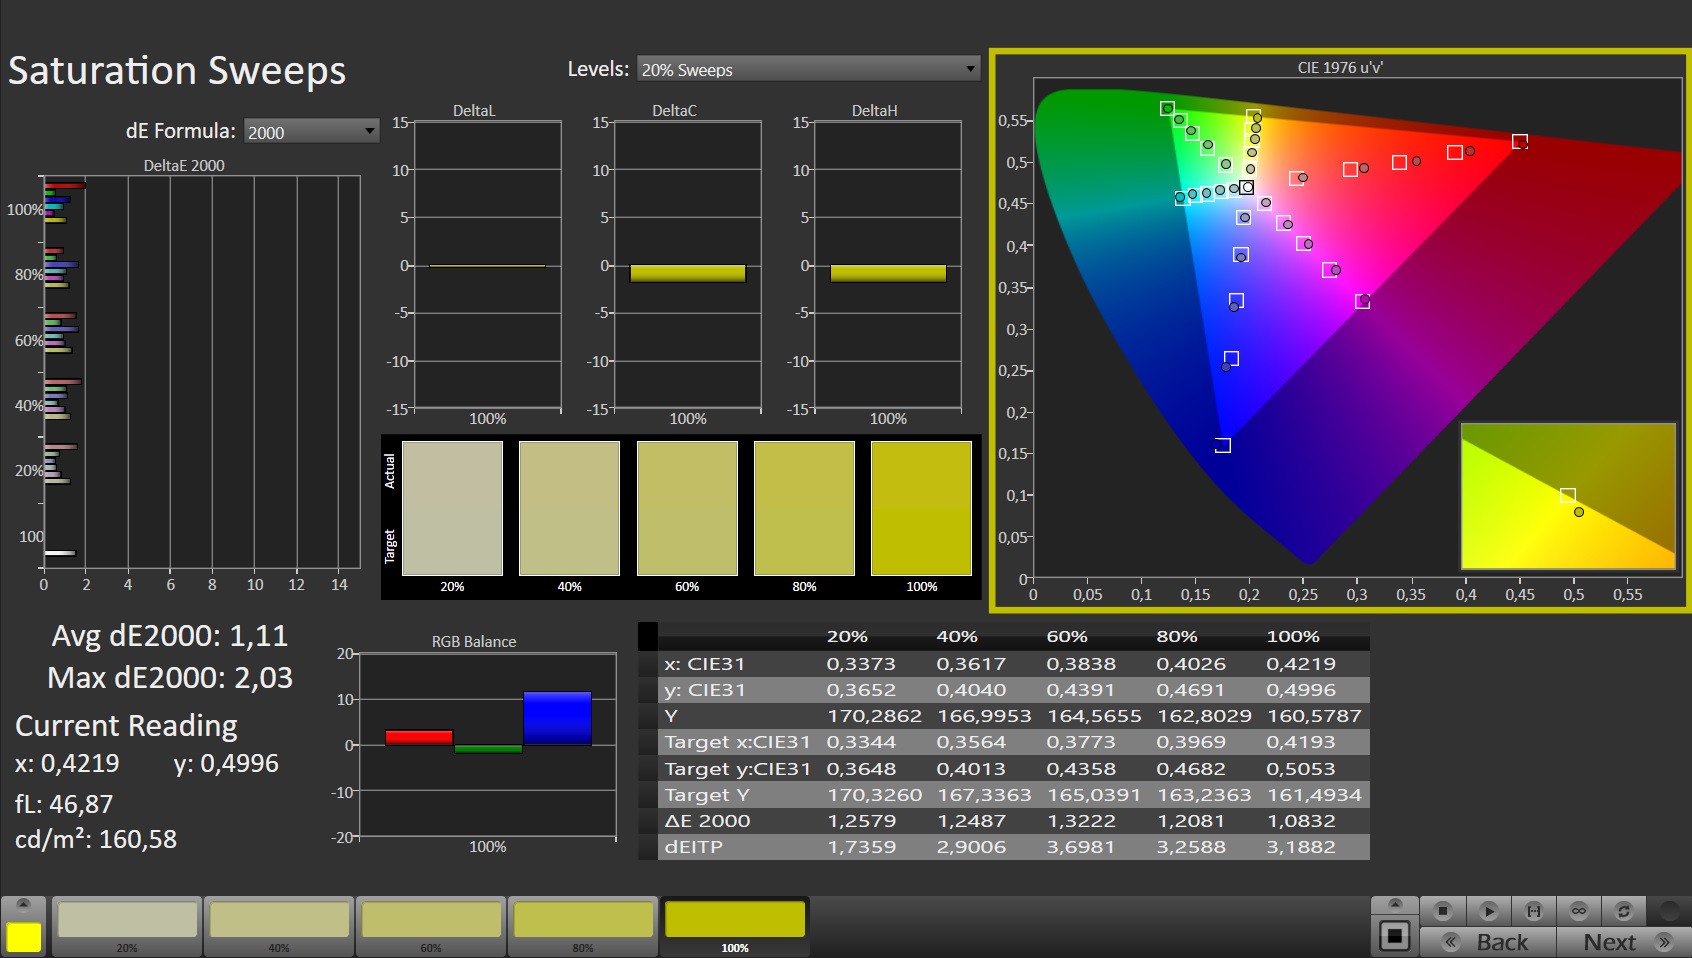
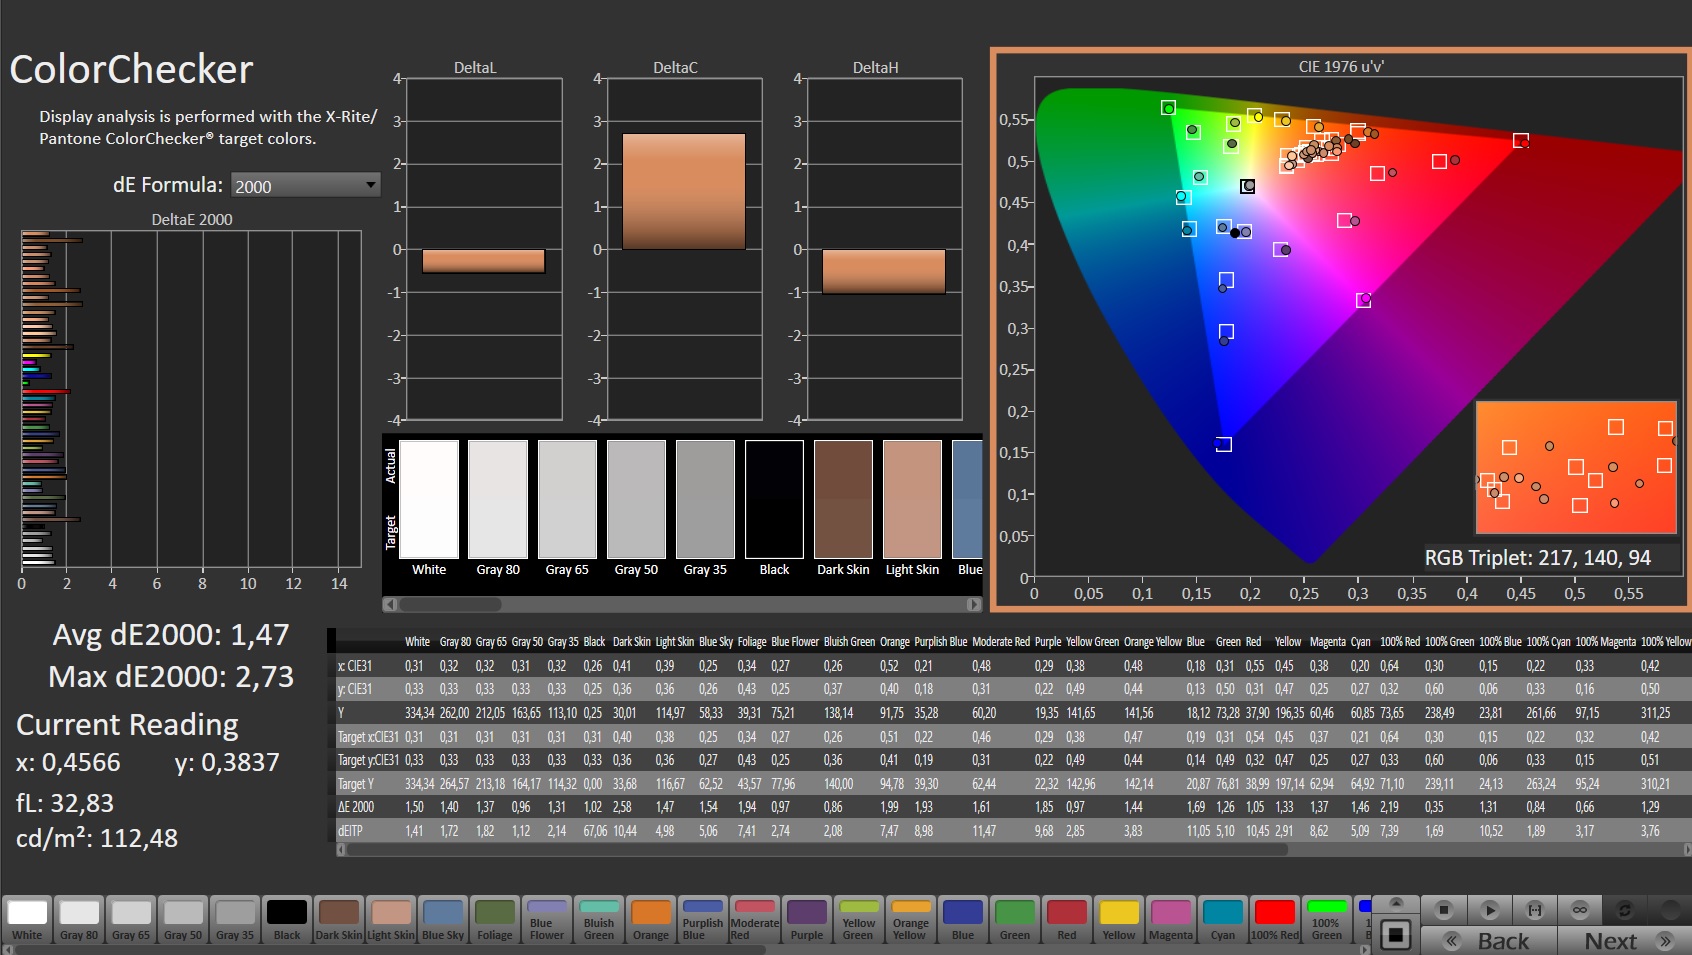
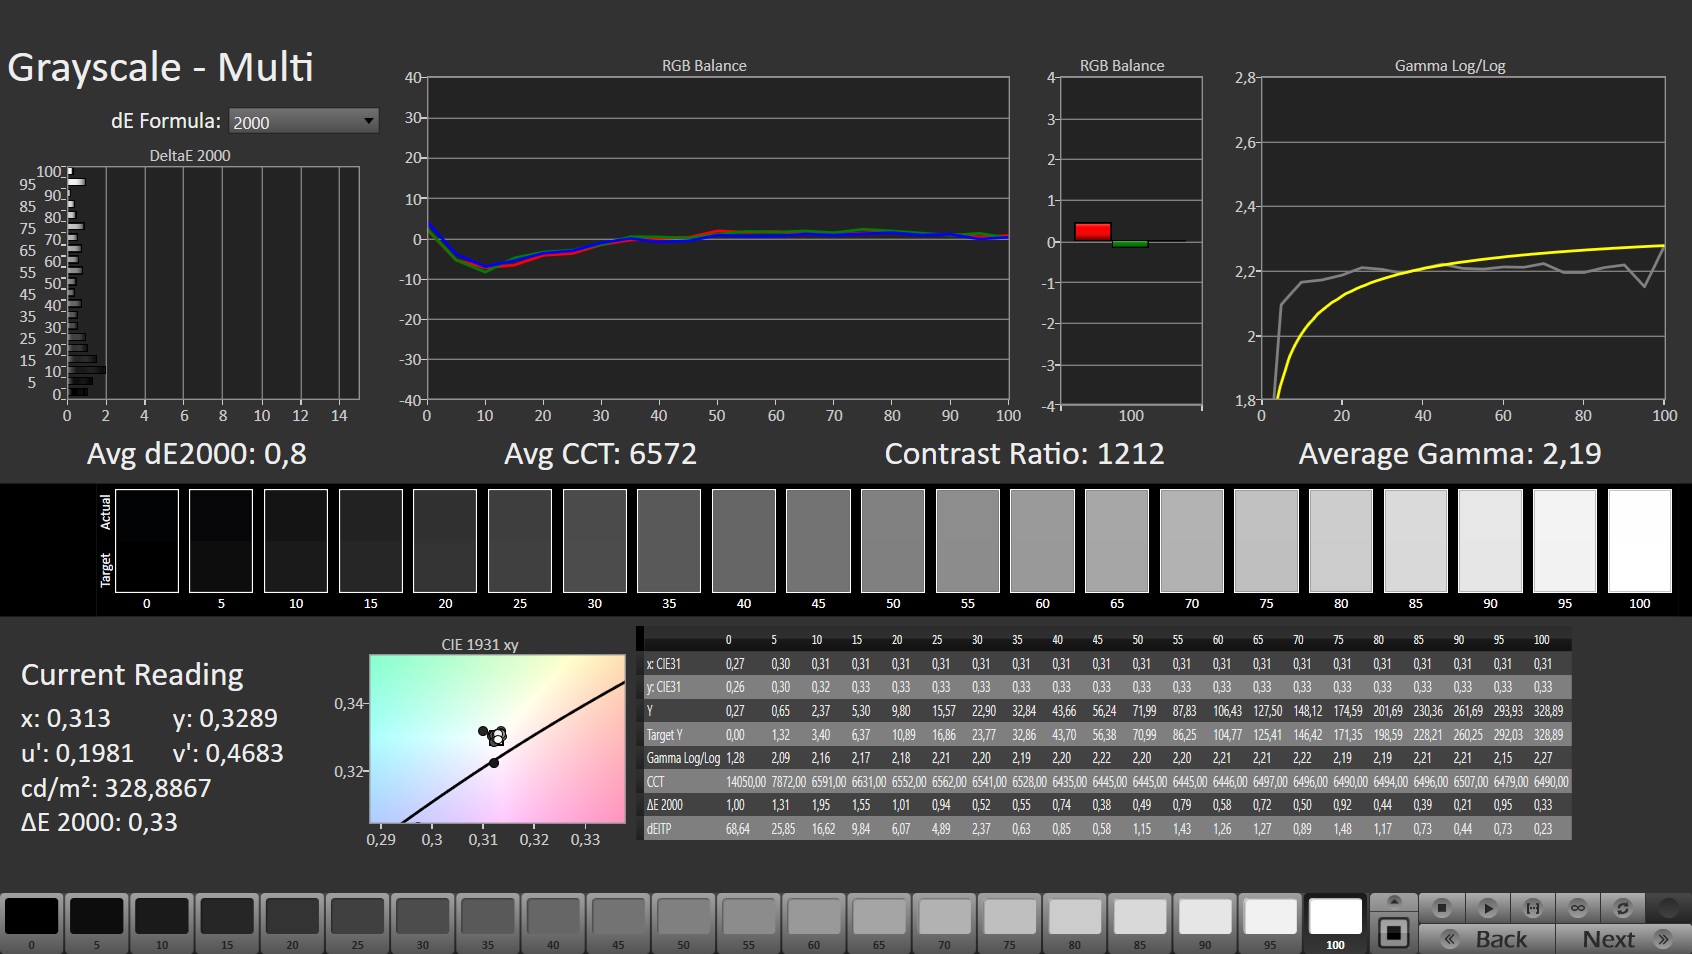
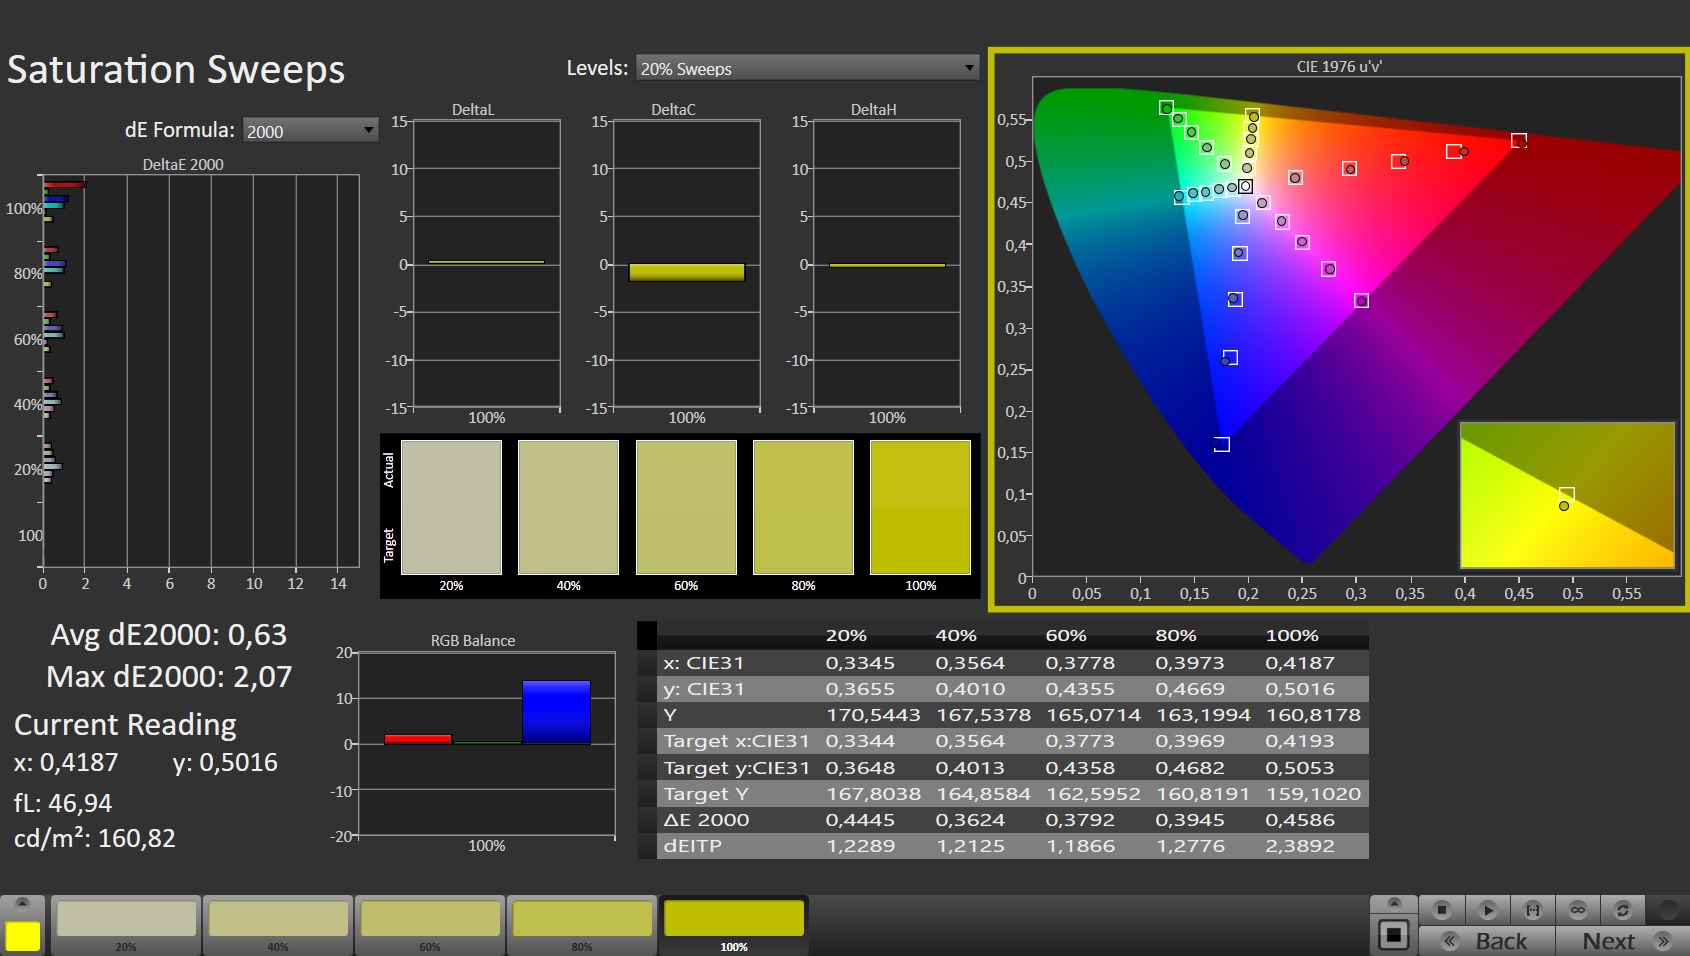
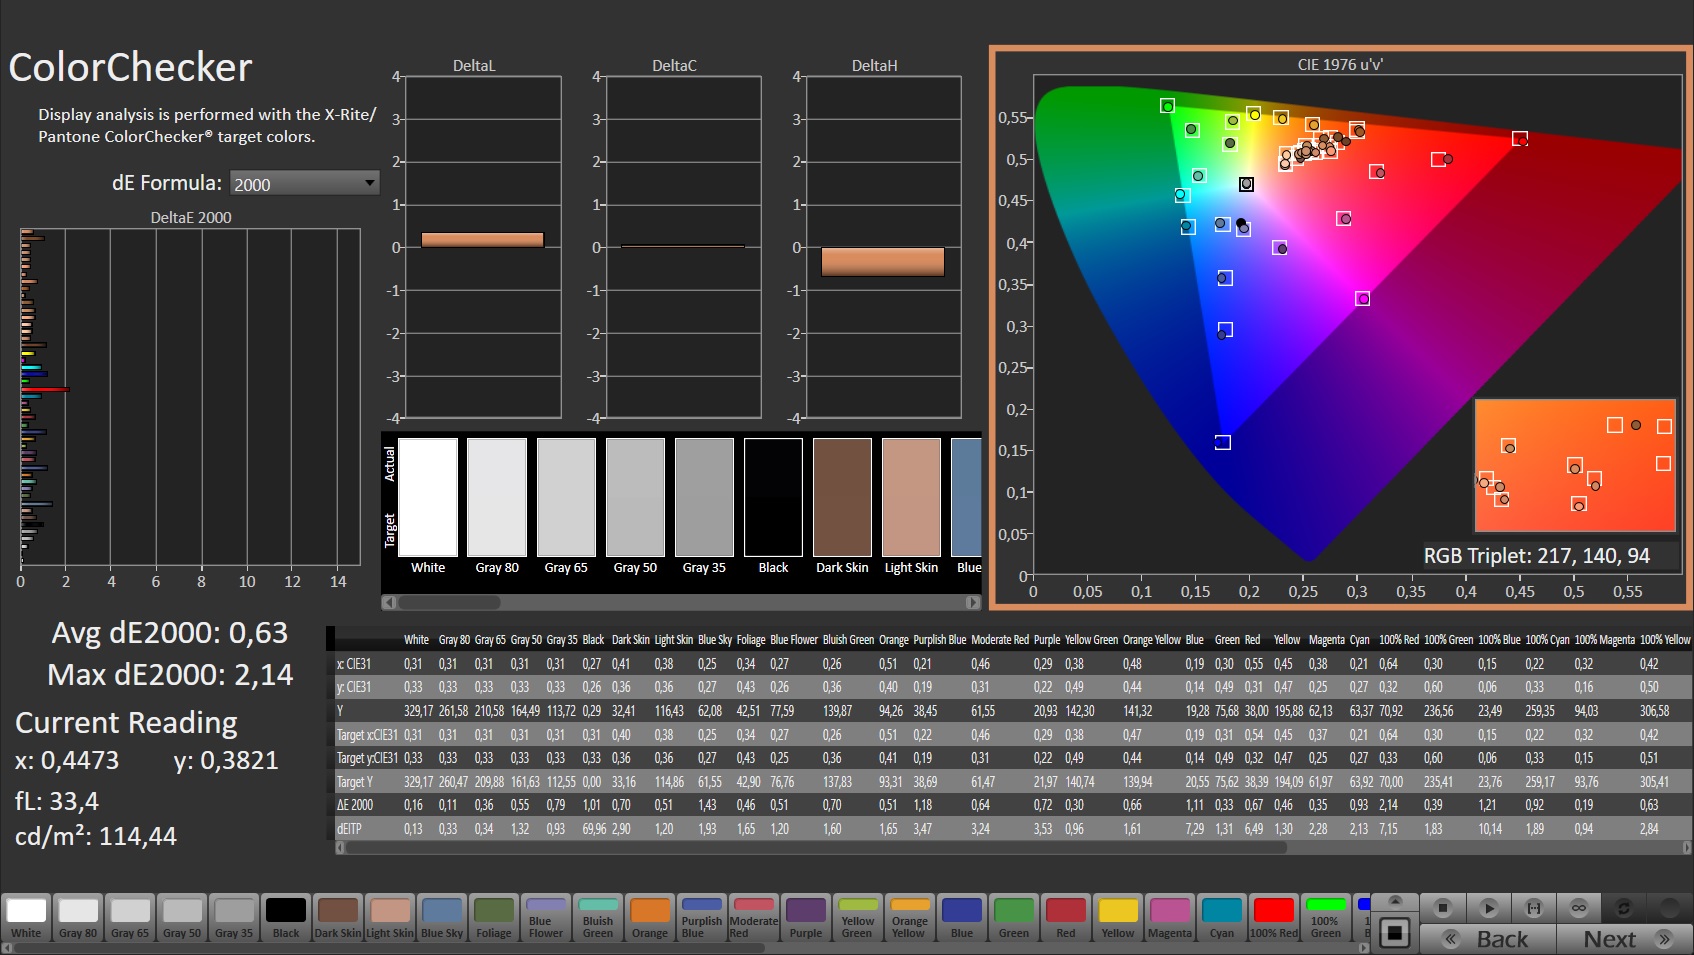
En el momento de la entrega, las desviaciones del espacio de color DeltaE de las escalas de grises y de los colores ya están en el rango ideal (menos de 3) y pueden mejorarse hasta un sólido 0,63 y 0,8 respectivamente mediante una calibración posterior
Tiempos de respuesta del display
| ↔ Tiempo de respuesta de Negro a Blanco | ||
|---|---|---|
| 10.5 ms ... subida ↗ y bajada ↘ combinada | ↗ 5.7 ms subida | 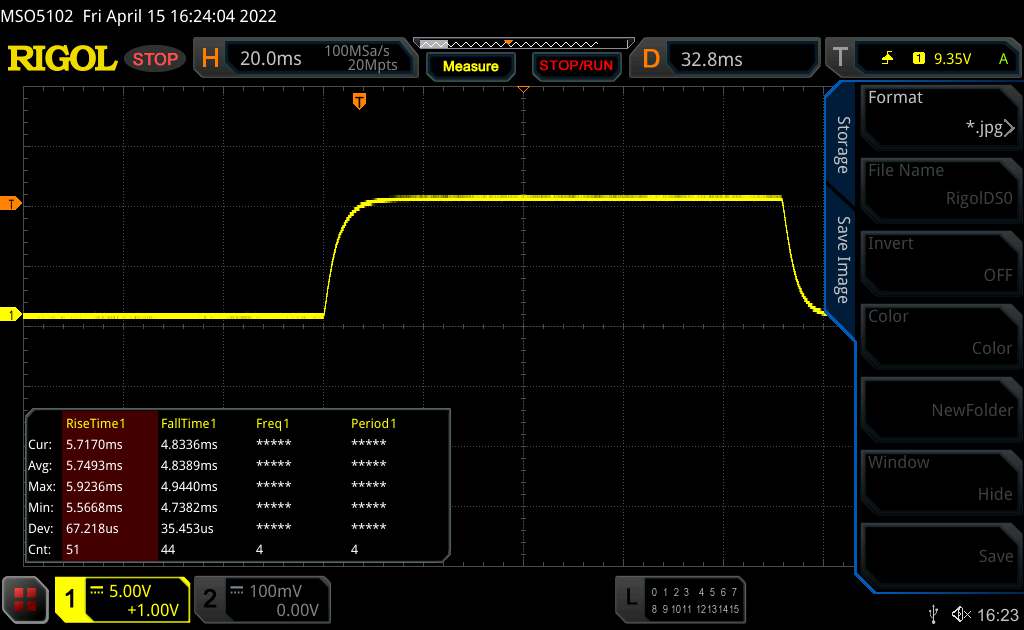 |
| ↘ 4.8 ms bajada | ||
| La pantalla mostró buenos tiempos de respuesta en nuestros tests pero podría ser demasiado lenta para los jugones competitivos. En comparación, todos los dispositivos de prueba van de ##min### (mínimo) a 240 (máximo) ms. » 29 % de todos los dispositivos son mejores. Esto quiere decir que el tiempo de respuesta medido es mejor que la media (19.8 ms) de todos los dispositivos testados. | ||
| ↔ Tiempo de respuesta 50% Gris a 80% Gris | ||
| 4.3 ms ... subida ↗ y bajada ↘ combinada | ↗ 2.4 ms subida | 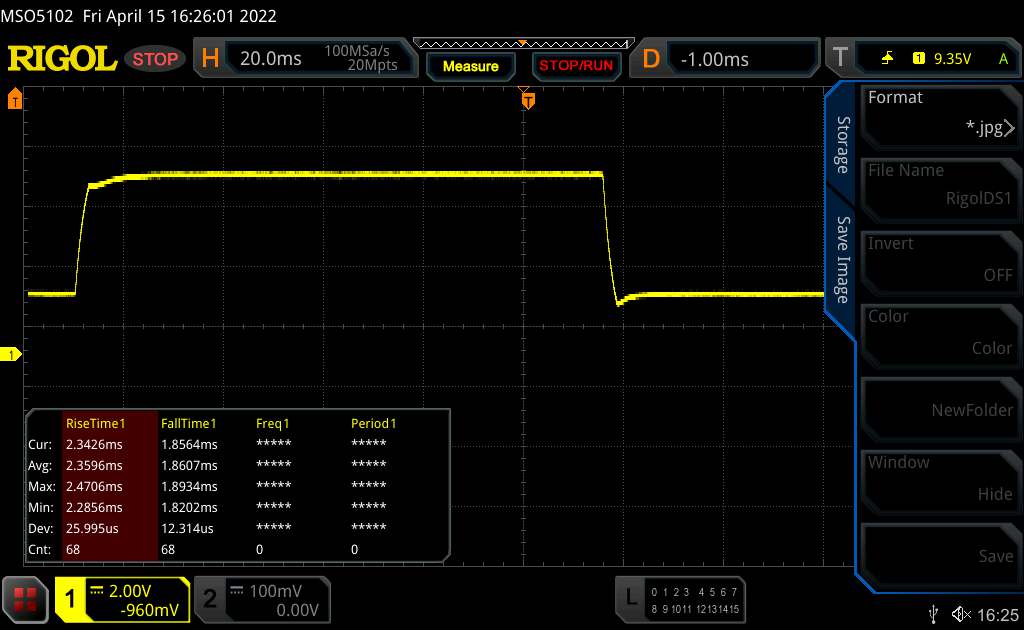 |
| ↘ 1.9 ms bajada | ||
| La pantalla mostró tiempos de respuesta muy rápidos en nuestros tests y debería ser adecuada para juegos frenéticos. En comparación, todos los dispositivos de prueba van de ##min### (mínimo) a 636 (máximo) ms. » 16 % de todos los dispositivos son mejores. Esto quiere decir que el tiempo de respuesta medido es mejor que la media (31 ms) de todos los dispositivos testados. | ||
Parpadeo de Pantalla / PWM (Pulse-Width Modulation)
| Parpadeo de Pantalla / PWM no detectado | 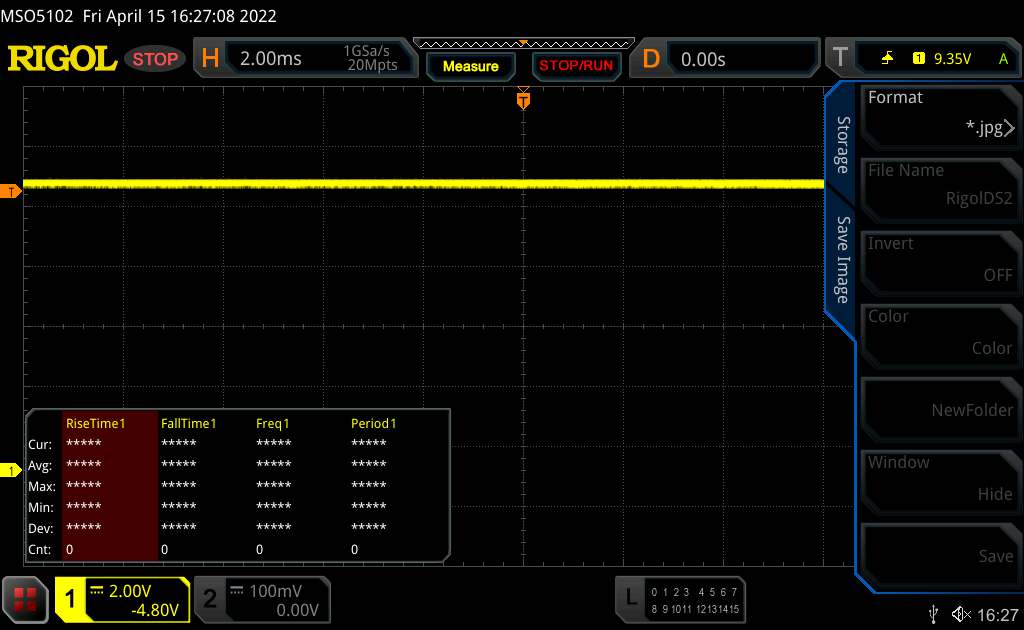 | ||
Comparación: 52 % de todos los dispositivos testados no usaron PWM para atenuar el display. Si se usó, medimos una media de 7757 (mínimo: 5 - máxmo: 343500) Hz. | |||
Gracias a un brillo de más de 300 cd/m², la pantalla también está preparada para su uso en exteriores siempre que se mantenga a la sombra
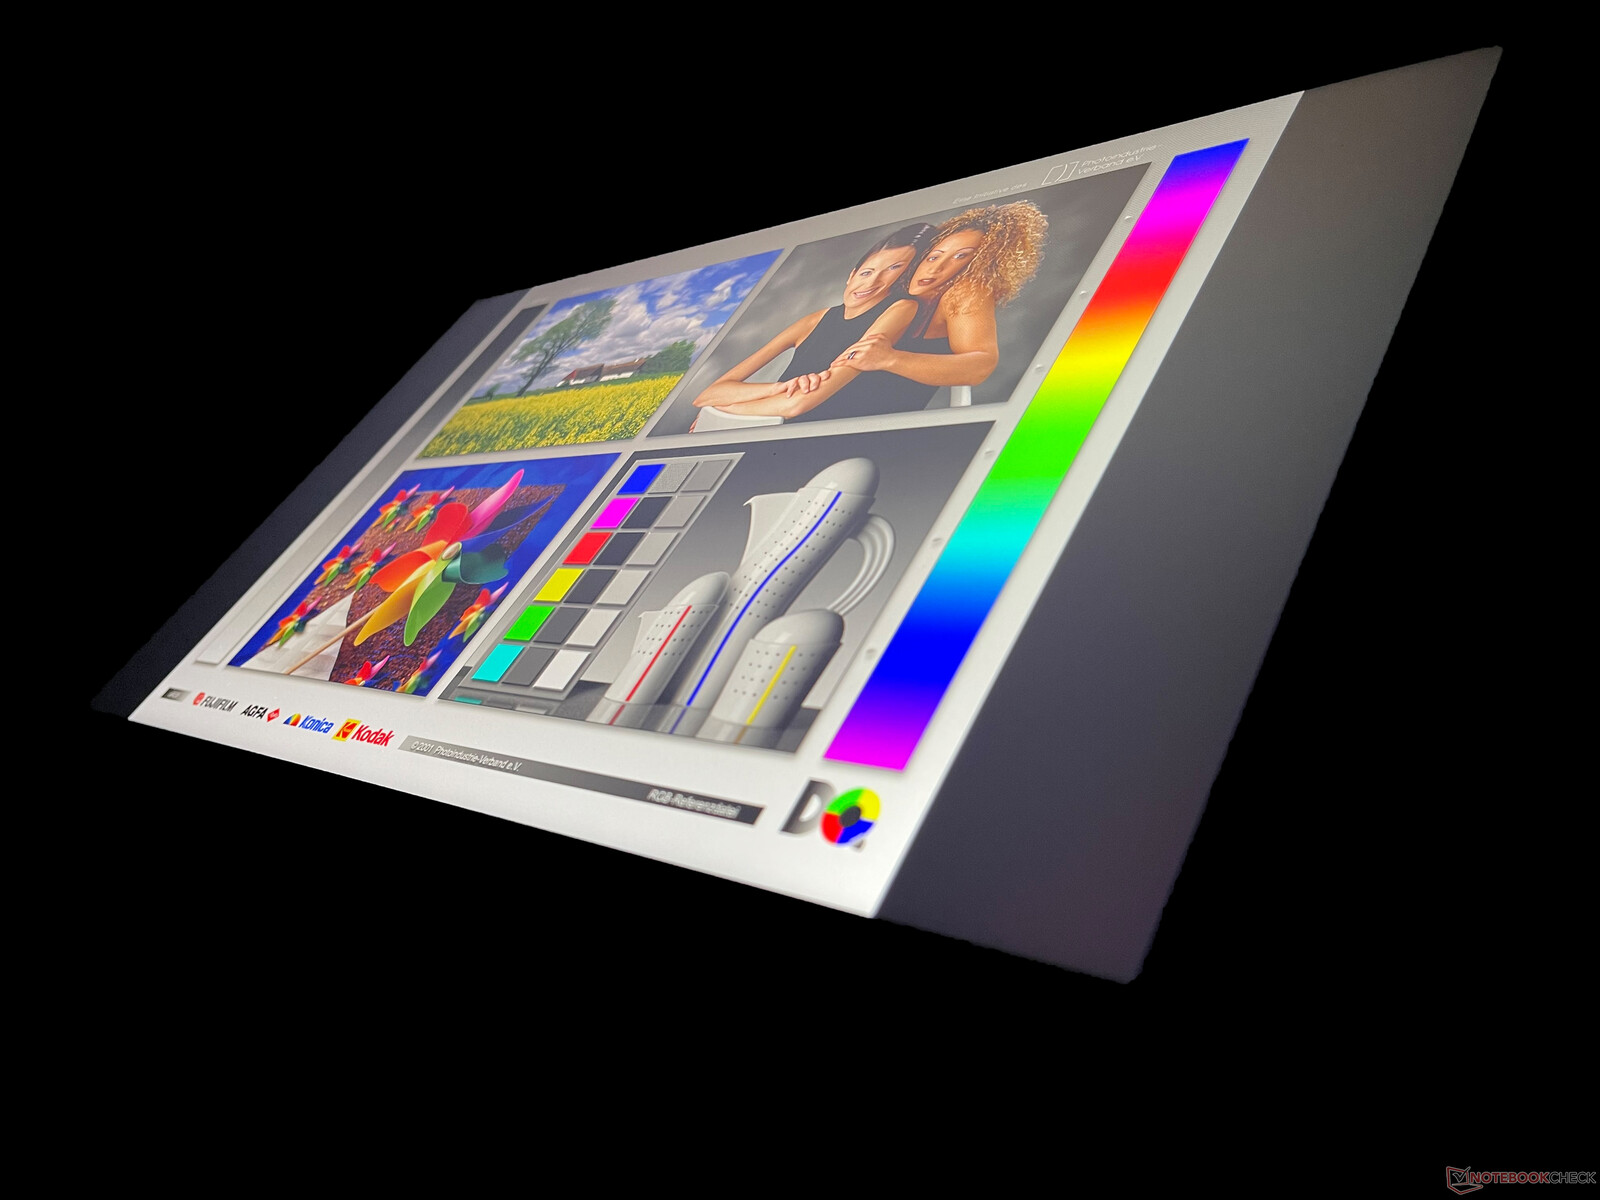
Los ángulos de visión son magníficos. Incluso en ángulos pronunciados, los colores y contrastes de la pantalla IPS apenas se distorsionan
Rendimiento: el portátil para juegos de Razer con el mejor hardware
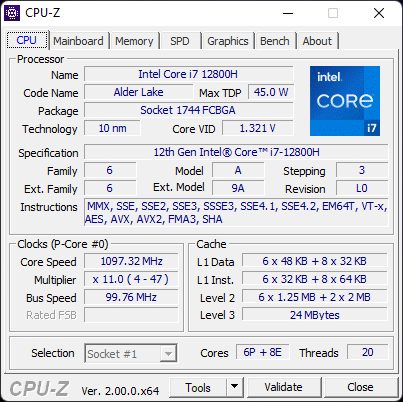
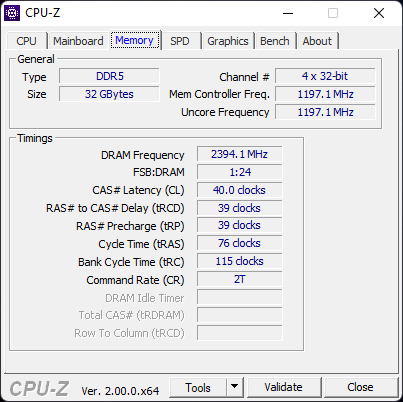
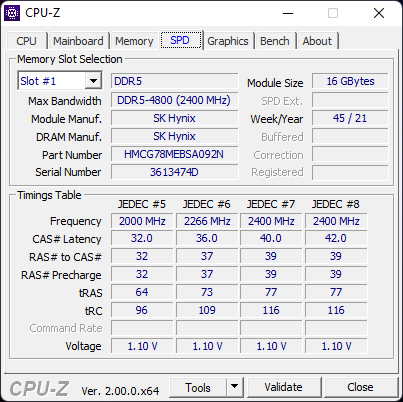
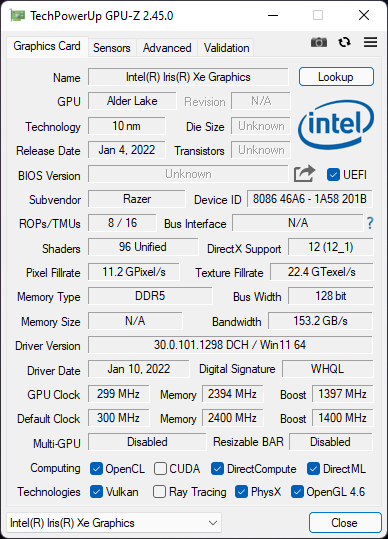
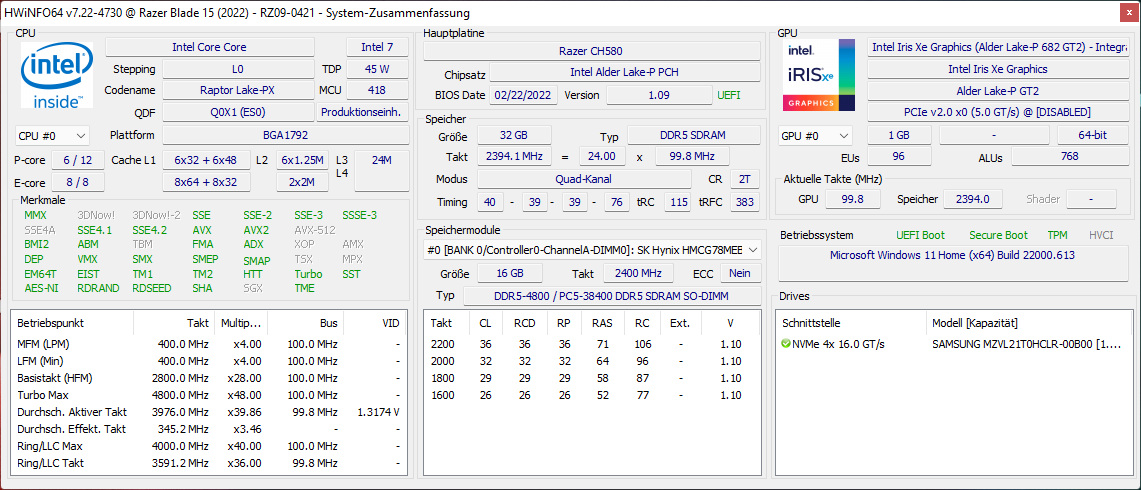
Nuestro Razer Blade 15 está equipado con un Intel Core i7-12800H y una Nvidia GeForce RTX 3080 Ti. También hay 32 GB de RAM DDR5 en modo de cuatro canales y un SSD PCIe 4.0 de 1 TB. En combinación con el panel 4K, el portátil está disponible alternativamente con el Core i9-12900H.
Condiciones de la prueba
Para obtener nuevos datos durante las pruebas, realizamos todas las mediciones con el perfil "equilibrado" de Synapse. Esto hace que la GPU trabaje con un TGP máximo de unos 95 W y también limita la CPU. Puedes encontrar las puntuaciones máximas alcanzables en nuestro otro análisis.
Procesador
El Intel Core i7-12800H es un nuevo procesador Intel de 12ª generación con soporte de memoria RAM DDR5. La funcionalidad DDR5 permite que los dos módulos de RAM funcionen en modo de cuatro canales.
El Razer Blade 15 es menos capaz de seguir el ritmo de sus competidores en términos de rendimiento de la CPU en modo "equilibrado" que sin limitaciones de rendimiento. Incluso el nominalmente más débil Core i7-12700H del XMG Neo 15 E22 vence a nuestro dispositivo de pruebas en ambos escenarios en la prueba multihilo Cinebench R15. El hecho de que algunas pruebas de un solo hilo resulten mejores se debe probablemente a que los límites de temperatura se alcanzan antes que los límites de TDP. El turbo boost sólo permanece activo durante un corto periodo de tiempo.
La prueba multihilo Cinebench R15 ofrece la misma puntuación en modo batería con el perfil que hemos seleccionado.
Cinebench R15 Multi Sustained Load
* ... más pequeño es mejor
AIDA64: FP32 Ray-Trace | FPU Julia | CPU SHA3 | CPU Queen | FPU SinJulia | FPU Mandel | CPU AES | CPU ZLib | FP64 Ray-Trace | CPU PhotoWorxx
| Performance rating | |
| Media de la clase Gaming | |
| Asus ROG Strix Scar 15 G533QS | |
| MSI Stealth GS66 12UGS | |
| Schenker XMG Neo 15 E22 (Early 2022, RTX 3080 Ti) | |
| MSI Vector GP66 12UGS | |
| Medio Intel Core i7-12800H | |
| Razer Blade 15 2022 | |
| Razer Blade 15 Advanced Model Early 2022 | |
| AIDA64 / FP32 Ray-Trace | |
| Media de la clase Gaming (10227 - 85542, n=105, últimos 2 años) | |
| Asus ROG Strix Scar 15 G533QS | |
| Schenker XMG Neo 15 E22 (Early 2022, RTX 3080 Ti) | |
| MSI Stealth GS66 12UGS | |
| Medio Intel Core i7-12800H (5839 - 15206, n=5) | |
| MSI Vector GP66 12UGS | |
| Razer Blade 15 2022 | |
| Razer Blade 15 Advanced Model Early 2022 | |
| AIDA64 / FPU Julia | |
| Media de la clase Gaming (51376 - 238426, n=105, últimos 2 años) | |
| Asus ROG Strix Scar 15 G533QS | |
| Medio Intel Core i7-12800H (27801 - 80002, n=5) | |
| Schenker XMG Neo 15 E22 (Early 2022, RTX 3080 Ti) | |
| MSI Stealth GS66 12UGS | |
| MSI Vector GP66 12UGS | |
| Razer Blade 15 2022 | |
| Razer Blade 15 Advanced Model Early 2022 | |
| AIDA64 / CPU SHA3 | |
| Media de la clase Gaming (2180 - 10115, n=105, últimos 2 años) | |
| Asus ROG Strix Scar 15 G533QS | |
| Schenker XMG Neo 15 E22 (Early 2022, RTX 3080 Ti) | |
| MSI Stealth GS66 12UGS | |
| MSI Vector GP66 12UGS | |
| Medio Intel Core i7-12800H (2013 - 3684, n=5) | |
| Razer Blade 15 2022 | |
| Razer Blade 15 Advanced Model Early 2022 | |
| AIDA64 / CPU Queen | |
| Media de la clase Gaming (49785 - 173351, n=90, últimos 2 años) | |
| MSI Vector GP66 12UGS | |
| Asus ROG Strix Scar 15 G533QS | |
| MSI Stealth GS66 12UGS | |
| Schenker XMG Neo 15 E22 (Early 2022, RTX 3080 Ti) | |
| Medio Intel Core i7-12800H (85965 - 108084, n=5) | |
| Razer Blade 15 2022 | |
| Razer Blade 15 Advanced Model Early 2022 | |
| AIDA64 / FPU SinJulia | |
| Media de la clase Gaming (4424 - 33636, n=105, últimos 2 años) | |
| Asus ROG Strix Scar 15 G533QS | |
| Schenker XMG Neo 15 E22 (Early 2022, RTX 3080 Ti) | |
| MSI Stealth GS66 12UGS | |
| MSI Vector GP66 12UGS | |
| Razer Blade 15 2022 | |
| Medio Intel Core i7-12800H (7027 - 9658, n=5) | |
| Razer Blade 15 Advanced Model Early 2022 | |
| AIDA64 / FPU Mandel | |
| Media de la clase Gaming (25115 - 128721, n=105, últimos 2 años) | |
| Asus ROG Strix Scar 15 G533QS | |
| Schenker XMG Neo 15 E22 (Early 2022, RTX 3080 Ti) | |
| MSI Stealth GS66 12UGS | |
| Medio Intel Core i7-12800H (15765 - 38179, n=5) | |
| MSI Vector GP66 12UGS | |
| Razer Blade 15 2022 | |
| Razer Blade 15 Advanced Model Early 2022 | |
| AIDA64 / CPU AES | |
| Asus ROG Strix Scar 15 G533QS | |
| Media de la clase Gaming (39258 - 247074, n=105, últimos 2 años) | |
| MSI Stealth GS66 12UGS | |
| MSI Vector GP66 12UGS | |
| Schenker XMG Neo 15 E22 (Early 2022, RTX 3080 Ti) | |
| Razer Blade 15 Advanced Model Early 2022 | |
| Medio Intel Core i7-12800H (55371 - 73928, n=5) | |
| Razer Blade 15 2022 | |
| AIDA64 / CPU ZLib | |
| Media de la clase Gaming (574 - 2531, n=105, últimos 2 años) | |
| Schenker XMG Neo 15 E22 (Early 2022, RTX 3080 Ti) | |
| MSI Vector GP66 12UGS | |
| MSI Stealth GS66 12UGS | |
| Razer Blade 15 2022 | |
| Medio Intel Core i7-12800H (701 - 1047, n=5) | |
| Asus ROG Strix Scar 15 G533QS | |
| Razer Blade 15 Advanced Model Early 2022 | |
| AIDA64 / FP64 Ray-Trace | |
| Media de la clase Gaming (5509 - 45446, n=105, últimos 2 años) | |
| Asus ROG Strix Scar 15 G533QS | |
| Schenker XMG Neo 15 E22 (Early 2022, RTX 3080 Ti) | |
| MSI Stealth GS66 12UGS | |
| Medio Intel Core i7-12800H (3257 - 8559, n=5) | |
| MSI Vector GP66 12UGS | |
| Razer Blade 15 2022 | |
| Razer Blade 15 Advanced Model Early 2022 | |
| AIDA64 / CPU PhotoWorxx | |
| Media de la clase Gaming (12271 - 89891, n=105, últimos 2 años) | |
| Razer Blade 15 2022 | |
| Schenker XMG Neo 15 E22 (Early 2022, RTX 3080 Ti) | |
| MSI Stealth GS66 12UGS | |
| Razer Blade 15 Advanced Model Early 2022 | |
| Medio Intel Core i7-12800H (31329 - 40992, n=5) | |
| MSI Vector GP66 12UGS | |
| Asus ROG Strix Scar 15 G533QS | |
Rendimiento del sistema
El rendimiento del sistema es sólido, según las pruebas PCMark 10. En el uso diario, la velocidad de funcionamiento es fluida y no hay retrasos notables, por lo que puedes utilizar el modo "equilibrado" sin preocupaciones.
CrossMark: Overall | Productivity | Creativity | Responsiveness
| PCMark 10 / Score | |
| Media de la clase Gaming (5828 - 12414, n=93, últimos 2 años) | |
| MSI Vector GP66 12UGS | |
| Razer Blade 15 2022 | |
| Medio Intel Core i7-12800H, NVIDIA GeForce RTX 3080 Ti Laptop GPU (7313 - 7744, n=3) | |
| MSI Stealth GS66 12UGS | |
| Razer Blade 15 Advanced Model Early 2022 | |
| Schenker XMG Neo 15 E22 (Early 2022, RTX 3080 Ti) | |
| Asus ROG Strix Scar 15 G533QS | |
| PCMark 10 / Essentials | |
| MSI Vector GP66 12UGS | |
| MSI Stealth GS66 12UGS | |
| Razer Blade 15 2022 | |
| Medio Intel Core i7-12800H, NVIDIA GeForce RTX 3080 Ti Laptop GPU (10597 - 10814, n=3) | |
| Media de la clase Gaming (8810 - 11935, n=97, últimos 2 años) | |
| Razer Blade 15 Advanced Model Early 2022 | |
| Asus ROG Strix Scar 15 G533QS | |
| Schenker XMG Neo 15 E22 (Early 2022, RTX 3080 Ti) | |
| PCMark 10 / Productivity | |
| Media de la clase Gaming (6845 - 25323, n=95, últimos 2 años) | |
| MSI Vector GP66 12UGS | |
| Asus ROG Strix Scar 15 G533QS | |
| Razer Blade 15 Advanced Model Early 2022 | |
| Razer Blade 15 2022 | |
| Medio Intel Core i7-12800H, NVIDIA GeForce RTX 3080 Ti Laptop GPU (9470 - 9675, n=3) | |
| MSI Stealth GS66 12UGS | |
| Schenker XMG Neo 15 E22 (Early 2022, RTX 3080 Ti) | |
| PCMark 10 / Digital Content Creation | |
| Media de la clase Gaming (7602 - 19954, n=95, últimos 2 años) | |
| MSI Vector GP66 12UGS | |
| Razer Blade 15 2022 | |
| Medio Intel Core i7-12800H, NVIDIA GeForce RTX 3080 Ti Laptop GPU (10351 - 12306, n=3) | |
| MSI Stealth GS66 12UGS | |
| Schenker XMG Neo 15 E22 (Early 2022, RTX 3080 Ti) | |
| Razer Blade 15 Advanced Model Early 2022 | |
| Asus ROG Strix Scar 15 G533QS | |
| CrossMark / Overall | |
| Media de la clase Gaming (1366 - 2409, n=94, últimos 2 años) | |
| Razer Blade 15 Advanced Model Early 2022 | |
| Medio Intel Core i7-12800H, NVIDIA GeForce RTX 3080 Ti Laptop GPU (n=1) | |
| CrossMark / Productivity | |
| Media de la clase Gaming (1386 - 2254, n=94, últimos 2 años) | |
| Razer Blade 15 Advanced Model Early 2022 | |
| Medio Intel Core i7-12800H, NVIDIA GeForce RTX 3080 Ti Laptop GPU (n=1) | |
| CrossMark / Creativity | |
| Media de la clase Gaming (1343 - 2786, n=94, últimos 2 años) | |
| Razer Blade 15 Advanced Model Early 2022 | |
| Medio Intel Core i7-12800H, NVIDIA GeForce RTX 3080 Ti Laptop GPU (n=1) | |
| CrossMark / Responsiveness | |
| Media de la clase Gaming (1226 - 2334, n=94, últimos 2 años) | |
| Razer Blade 15 Advanced Model Early 2022 | |
| Medio Intel Core i7-12800H, NVIDIA GeForce RTX 3080 Ti Laptop GPU (n=1) | |
| PCMark 8 Home Score Accelerated v2 | 6657 puntos | |
| PCMark 8 Work Score Accelerated v2 | 7009 puntos | |
| PCMark 10 Score | 7313 puntos | |
ayuda | ||
| AIDA64 / Memory Copy | |
| Media de la clase Gaming (21750 - 129946, n=105, últimos 2 años) | |
| Schenker XMG Neo 15 E22 (Early 2022, RTX 3080 Ti) | |
| Razer Blade 15 2022 | |
| MSI Stealth GS66 12UGS | |
| Razer Blade 15 Advanced Model Early 2022 | |
| Medio Intel Core i7-12800H (48643 - 62522, n=5) | |
| MSI Vector GP66 12UGS | |
| Asus ROG Strix Scar 15 G533QS | |
| AIDA64 / Memory Read | |
| Media de la clase Gaming (22956 - 118858, n=105, últimos 2 años) | |
| Schenker XMG Neo 15 E22 (Early 2022, RTX 3080 Ti) | |
| Razer Blade 15 2022 | |
| MSI Stealth GS66 12UGS | |
| Razer Blade 15 Advanced Model Early 2022 | |
| Medio Intel Core i7-12800H (56629 - 66199, n=5) | |
| MSI Vector GP66 12UGS | |
| Asus ROG Strix Scar 15 G533QS | |
| AIDA64 / Memory Write | |
| Media de la clase Gaming (22297 - 135096, n=105, últimos 2 años) | |
| MSI Stealth GS66 12UGS | |
| Razer Blade 15 2022 | |
| Razer Blade 15 Advanced Model Early 2022 | |
| Schenker XMG Neo 15 E22 (Early 2022, RTX 3080 Ti) | |
| Medio Intel Core i7-12800H (50923 - 66074, n=5) | |
| MSI Vector GP66 12UGS | |
| Asus ROG Strix Scar 15 G533QS | |
| AIDA64 / Memory Latency | |
| Media de la clase Gaming (75.3 - 259, n=105, últimos 2 años) | |
| Razer Blade 15 Advanced Model Early 2022 | |
| MSI Stealth GS66 12UGS | |
| MSI Vector GP66 12UGS | |
| Asus ROG Strix Scar 15 G533QS | |
| Medio Intel Core i7-12800H (89.3 - 95.2, n=5) | |
| Schenker XMG Neo 15 E22 (Early 2022, RTX 3080 Ti) | |
| Razer Blade 15 2022 | |
* ... más pequeño es mejor
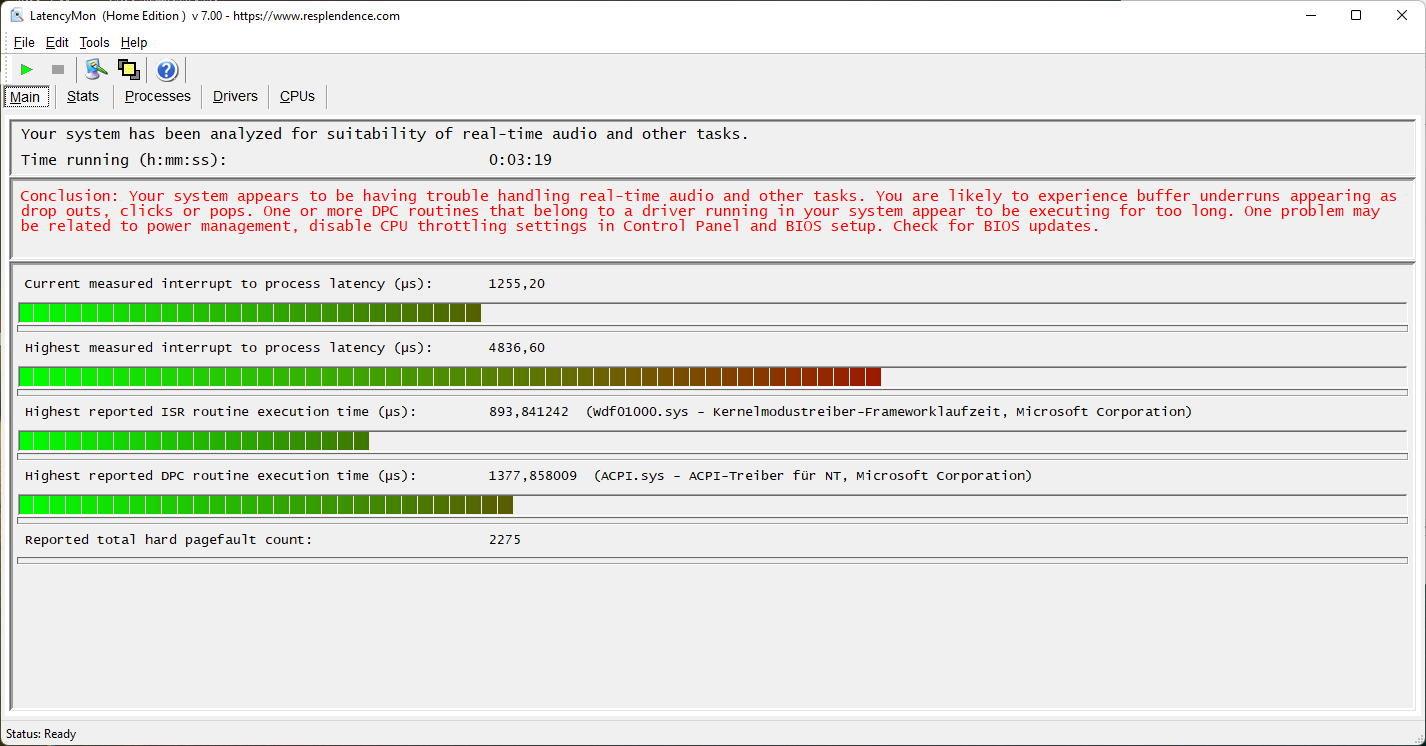
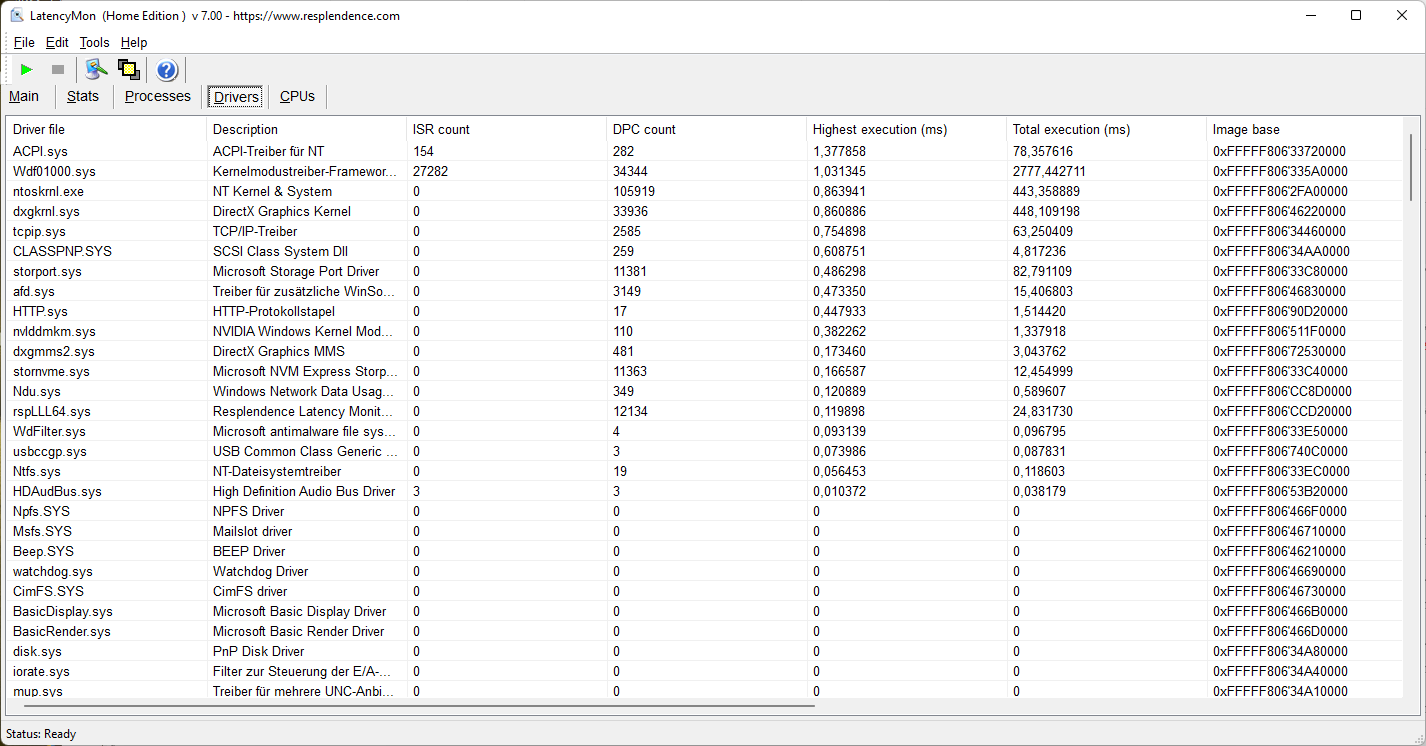
Latencias del CPD
Según LatencyMon, las latencias del DPC pueden ser demasiado altas para la edición de audio y vídeo en tiempo real en la configuración que hemos probado
| DPC Latencies / LatencyMon - interrupt to process latency (max), Web, Youtube, Prime95 | |
| Razer Blade 15 Advanced Model Early 2022 | |
| MSI Vector GP66 12UGS | |
| MSI Stealth GS66 12UGS | |
| Asus ROG Strix Scar 15 G533QS | |
| Razer Blade 15 2022 | |
| Schenker XMG Neo 15 E22 (Early 2022, RTX 3080 Ti) | |
* ... más pequeño es mejor
Dispositivos de almacenamiento
En nuestro dispositivo de análisis hay instalado un SDD M.2 Samsung PM9A1 de 1TB con PCIe 4.0, lo que da lugar a tasas de transferencia de datos muy altas. Como el SSD PCIe 4.0 "CA6-8D1024" de SSSTC se instaló en nuestro primer dispositivo de revisión Blade 15los modelos de unidad y las tasas de transferencia pueden ser diferentes.

* ... más pequeño es mejor
Sustained Read Performance: DiskSpd Read Loop, Queue Depth 8
GPU
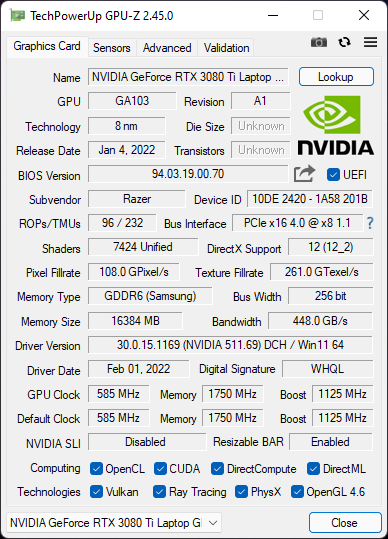
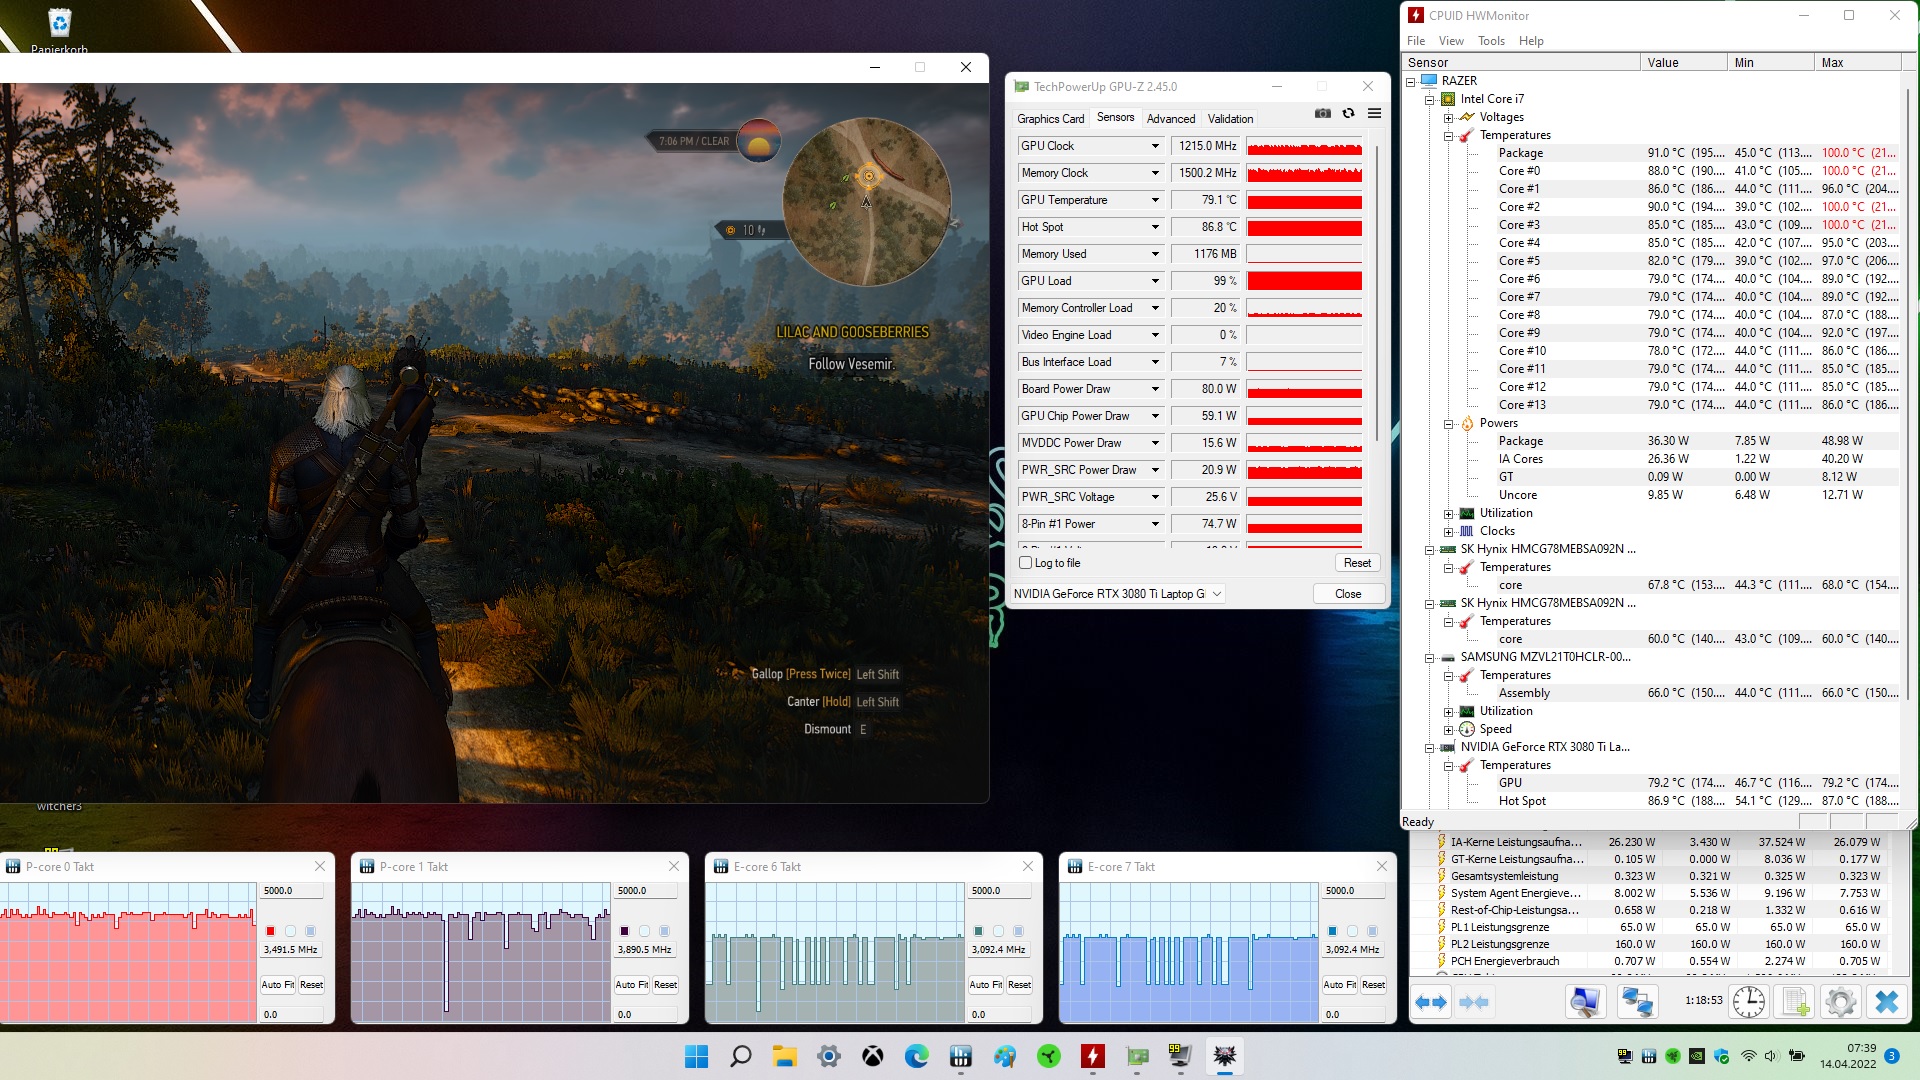
El móvil Nvidia GeForce RTX 3080 Ti con 16 GB de VRAM pertenece a la generación Ampere Refresh. Según las pruebas de 3DMark, el uso del modo "equilibrado" resulta en un déficit de rendimiento de alrededor del 10-20%. Se pueden ver pequeñas caídas en la progresión de la velocidad de fotogramas de The Witcher 3, pero esto tuvo un impacto subjetivo mínimo en la experiencia de juego.
El rendimiento es limitado en el modo de batería. En Fire Strike se obtuvieron puntuaciones de física y gráficos de 12.888 y 10.344 respectivamente en modo batería, frente a 21866 y 25240 en modo red.
| 3DMark 11 Performance | 25091 puntos | |
| 3DMark Ice Storm Standard Score | 158195 puntos | |
| 3DMark Cloud Gate Standard Score | 43351 puntos | |
| 3DMark Fire Strike Score | 21106 puntos | |
| 3DMark Time Spy Score | 9596 puntos | |
ayuda | ||
Rendimiento de los juegos
Las pruebas de Gming son naturalmente más débiles en el modo de rendimiento equilibrado. No obstante, las velocidades de fotogramas absolutas siguen siendo lo suficientemente altas para una experiencia de juego fluida, por lo que no es necesario ejecutar el Blade 15 en modo de alto rendimiento.
Witcher 3 FPS Diagram
| bajo | medio | alto | ultra | |
|---|---|---|---|---|
| GTA V (2015) | 178.7 | 170.7 | 153.4 | 92.4 |
| The Witcher 3 (2015) | 316 | 200 | 155.5 | 89.3 |
| Dota 2 Reborn (2015) | 59.9 | 59.9 | 59.9 | 59.9 |
| Final Fantasy XV Benchmark (2018) | 148.3 | 119.4 | 90.4 | |
| X-Plane 11.11 (2018) | 124.3 | 109.5 | 93.4 | |
| Strange Brigade (2018) | 361 | 212 | 167.6 | 149.8 |
Emisiones - Carcasa termoconductora
Ruido
Los ventiladores son lentos y permiten que los componentes se calienten un poco antes de entrar en acción. En particular, el nivel medio de ruido bajo carga es perceptiblemente inferior en modo equilibrado. El nivel de ruido de nuestro primer Blade 15 (modo: máximo rendimiento) estaba dentro del rango habitual. No se detectó ningún ruido de bobina en nuestro dispositivo de prueba.
Ruido
| Ocioso |
| 26 / 27 / 29 dB(A) |
| Carga |
| 37 / 45 dB(A) |
 | ||
30 dB silencioso 40 dB(A) audible 50 dB(A) ruidosamente alto |
||
min: | ||
| Razer Blade 15 Advanced Model Early 2022 i7-12800H, GeForce RTX 3080 Ti Laptop GPU | Razer Blade 15 2022 i7-12800H, GeForce RTX 3080 Ti Laptop GPU | Schenker XMG Neo 15 E22 (Early 2022, RTX 3080 Ti) i7-12700H, GeForce RTX 3080 Ti Laptop GPU | Asus ROG Strix Scar 15 G533QS R9 5900HX, GeForce RTX 3080 Laptop GPU | MSI Stealth GS66 12UGS i7-12700H, GeForce RTX 3070 Ti Laptop GPU | MSI Vector GP66 12UGS i9-12900H, GeForce RTX 3070 Ti Laptop GPU | |
|---|---|---|---|---|---|---|
| Noise | -5% | -2% | -8% | -12% | -2% | |
| apagado / medio ambiente * (dB) | 26 | 25.4 2% | 24 8% | 25.5 2% | 24 8% | 22.9 12% |
| Idle Minimum * (dB) | 26 | 26.2 -1% | 24 8% | 25.5 2% | 31 -19% | 23.4 10% |
| Idle Average * (dB) | 27 | 26.2 3% | 24 11% | 25.5 6% | 32 -19% | 23.4 13% |
| Idle Maximum * (dB) | 29 | 28.4 2% | 27.76 4% | 37.1 -28% | 35 -21% | 27.4 6% |
| Load Average * (dB) | 37 | 44.7 -21% | 38.81 -5% | 39.2 -6% | 48 -30% | 36 3% |
| Witcher 3 ultra * (dB) | 44 | 44.7 -2% | 54.2 -23% | 50.5 -15% | 43 2% | 58.2 -32% |
| Load Maximum * (dB) | 45 | 51.9 -15% | 54.18 -20% | 51.8 -15% | 48 -7% | 58 -29% |
* ... más pequeño es mejor
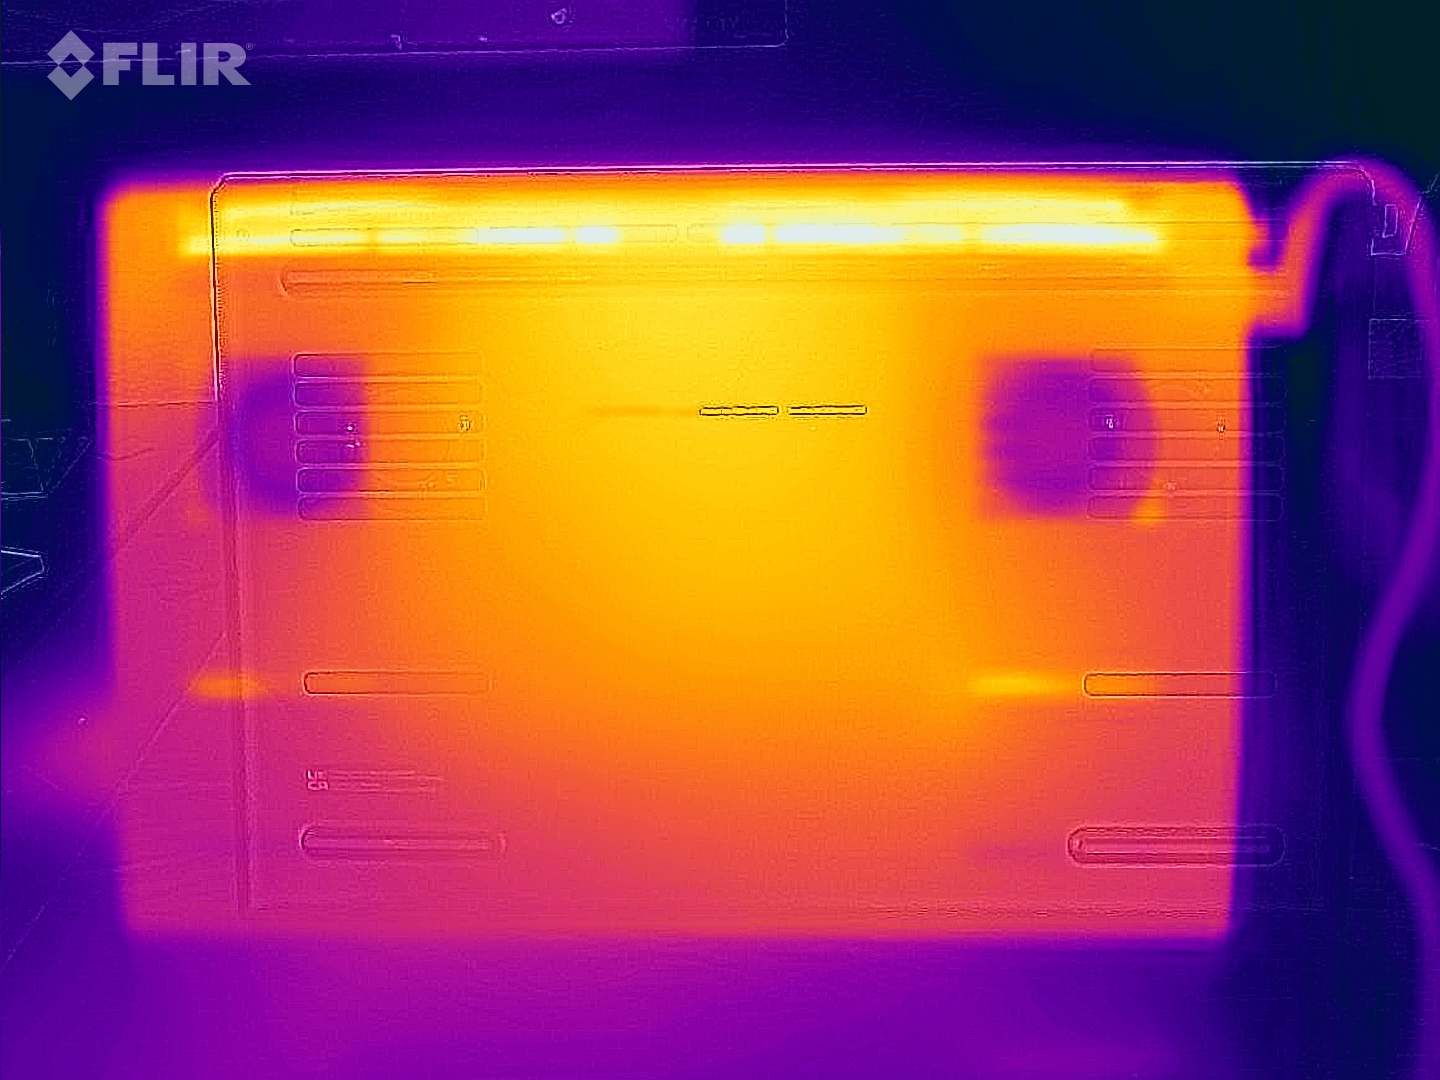
Temperatura
Debido a la construcción metálica y a los potentes componentes, la carcasa se calienta relativamente bajo una carga moderada. El portátil también se calienta mucho a través de las superficies de control cuando se juega a The Witcher 3, por ejemplo.
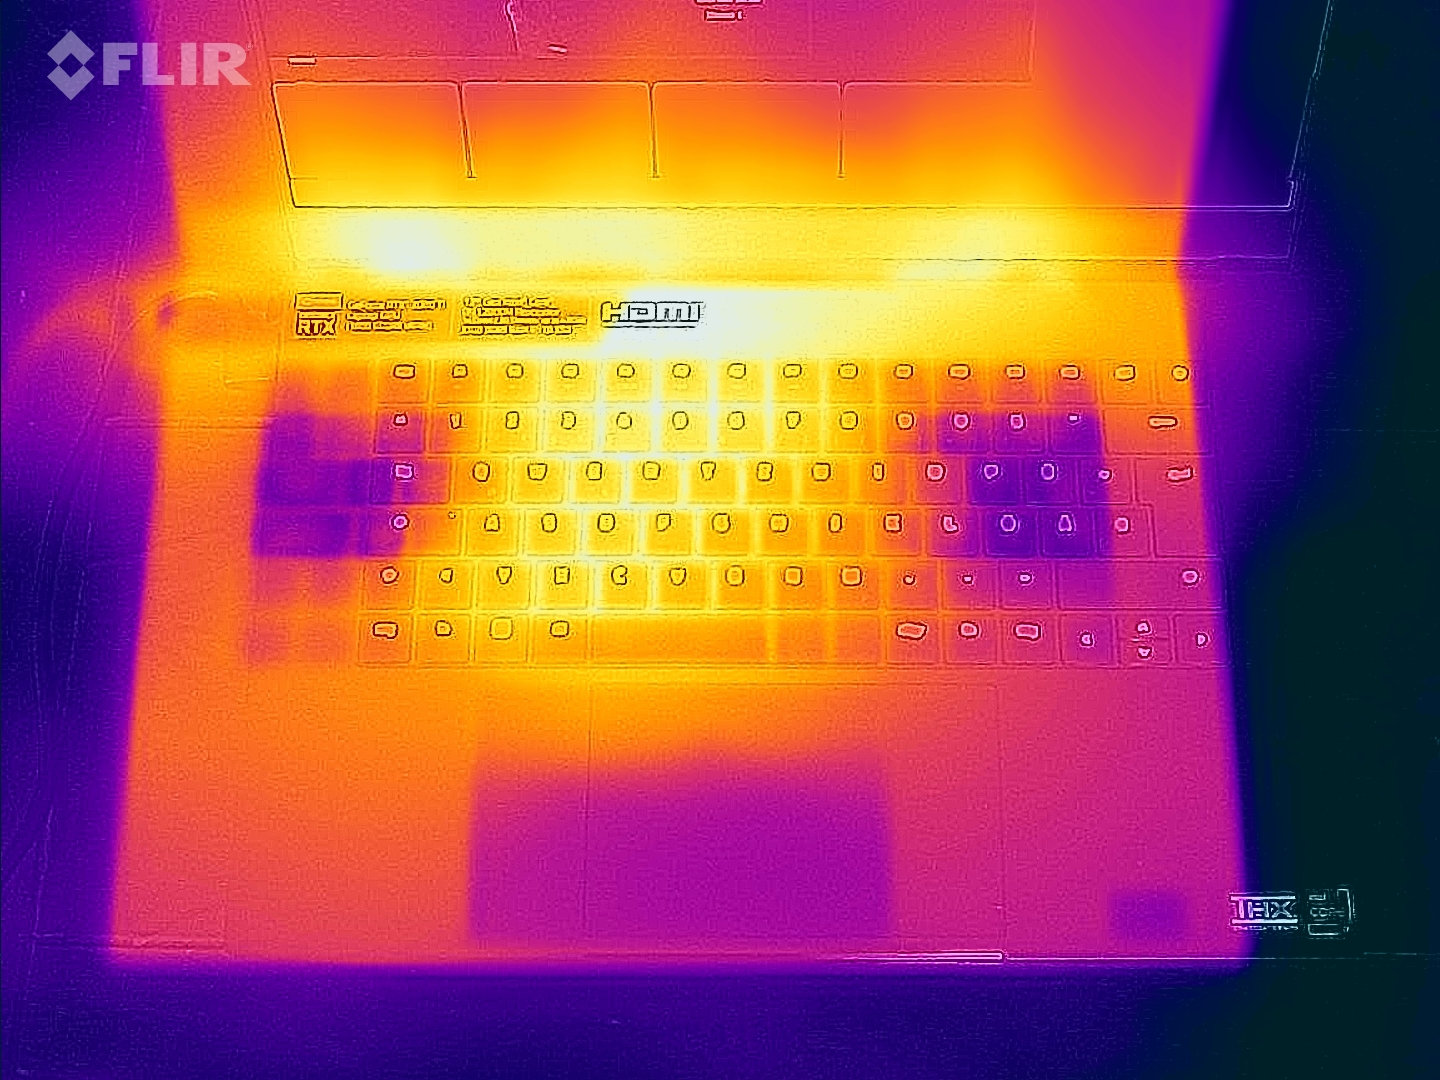
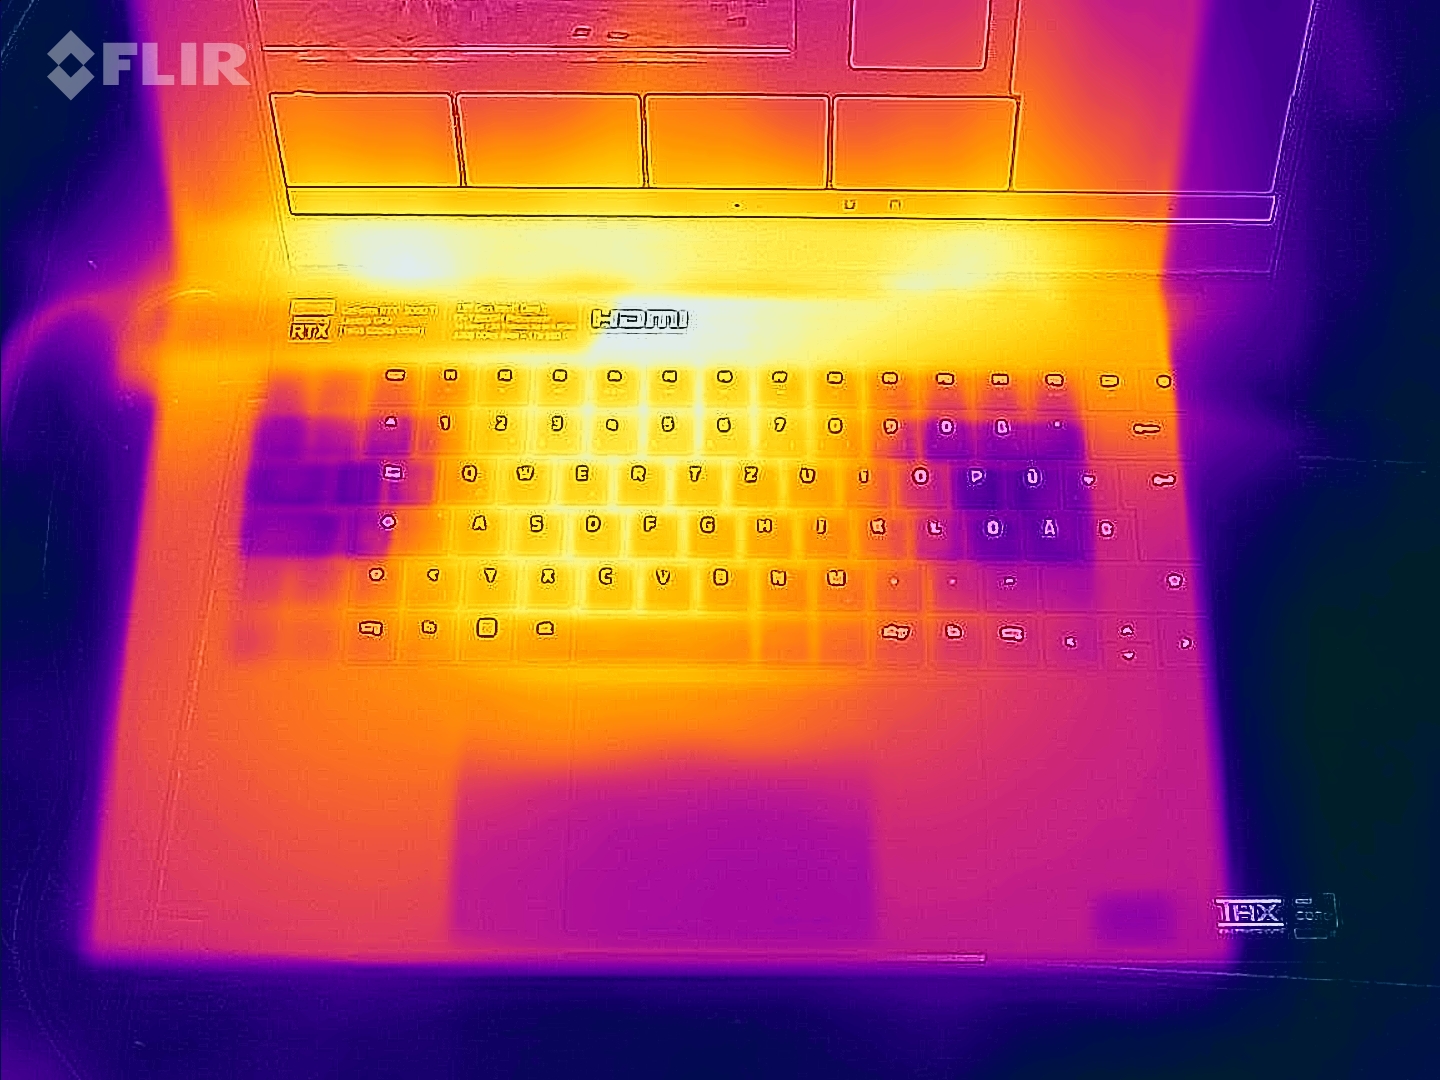
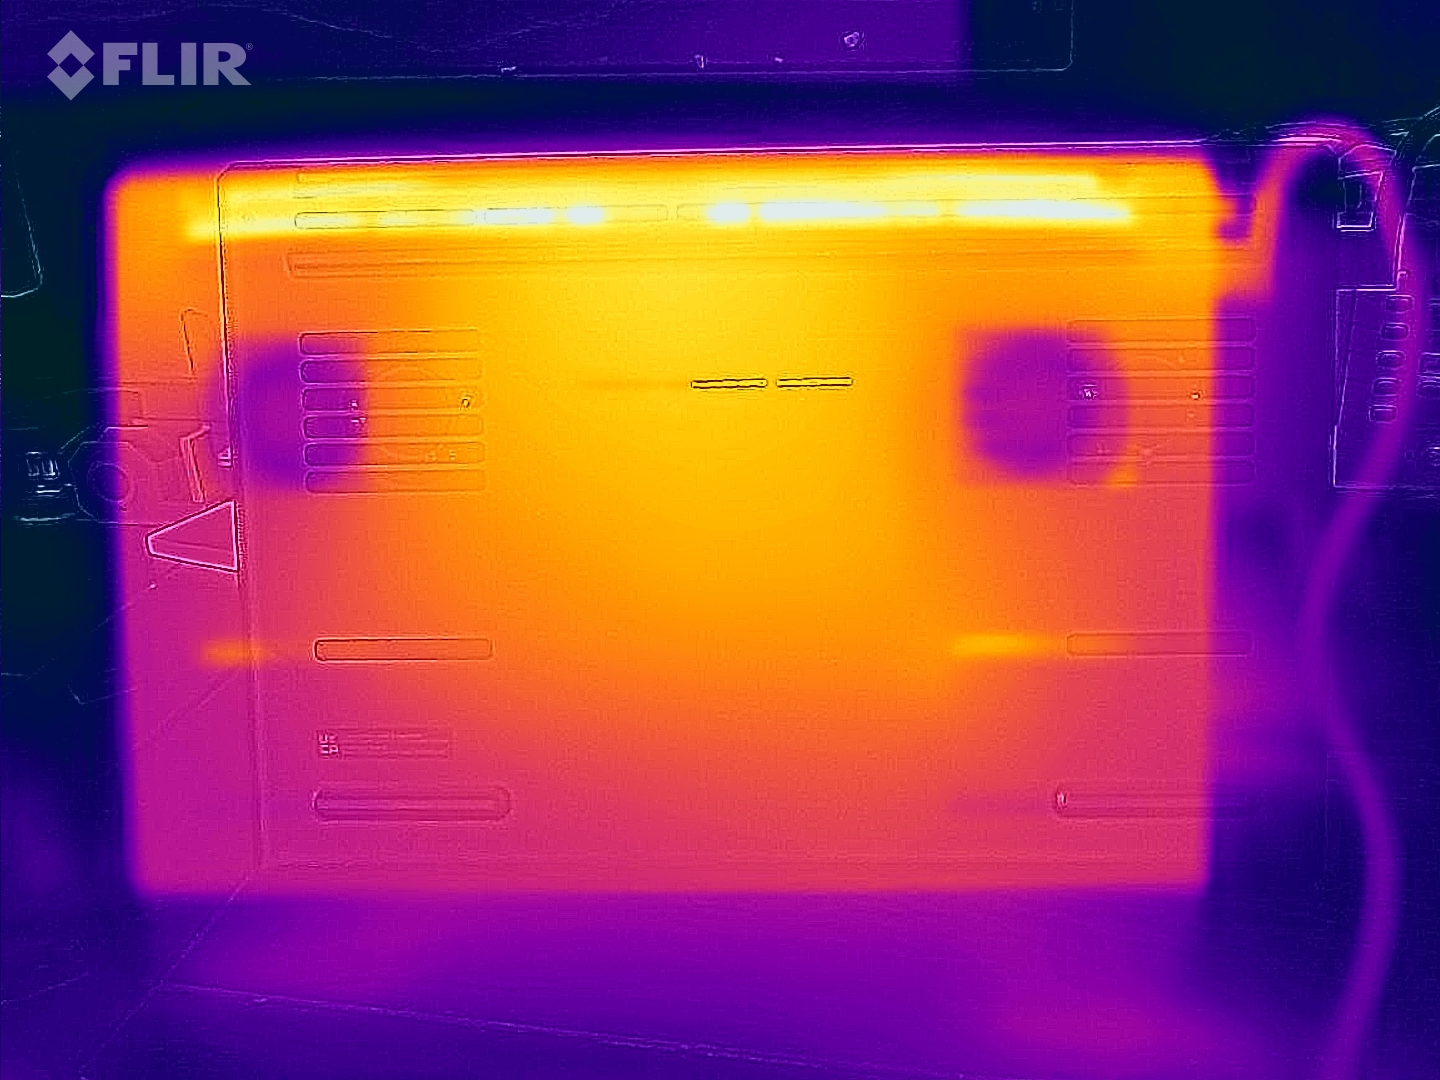
(-) La temperatura máxima en la parte superior es de 53 °C / 127 F, frente a la media de 40.4 °C / 105 F, que oscila entre 21.2 y 68.8 °C para la clase Gaming.
(-) El fondo se calienta hasta un máximo de 53 °C / 127 F, frente a la media de 43.2 °C / 110 F
(±) En reposo, la temperatura media de la parte superior es de 33.2 °C / 92# F, frente a la media del dispositivo de 33.9 °C / 93 F.
(-) Jugando a The Witcher 3, la temperatura media de la parte superior es de 45.2 °C / 113 F, frente a la media del dispositivo de 33.9 °C / 93 F.
(-) El reposamanos y el touchpad pueden calentarse mucho al tacto con un máximo de 43 °C / 109.4 F.
(-) La temperatura media de la zona del reposamanos de dispositivos similares fue de 28.8 °C / 83.8 F (-14.2 °C / -25.6 F).
| Razer Blade 15 Advanced Model Early 2022 Intel Core i7-12800H, NVIDIA GeForce RTX 3080 Ti Laptop GPU | Razer Blade 15 2022 Intel Core i7-12800H, NVIDIA GeForce RTX 3080 Ti Laptop GPU | Schenker XMG Neo 15 E22 (Early 2022, RTX 3080 Ti) Intel Core i7-12700H, NVIDIA GeForce RTX 3080 Ti Laptop GPU | Asus ROG Strix Scar 15 G533QS AMD Ryzen 9 5900HX, NVIDIA GeForce RTX 3080 Laptop GPU | MSI Stealth GS66 12UGS Intel Core i7-12700H, NVIDIA GeForce RTX 3070 Ti Laptop GPU | MSI Vector GP66 12UGS Intel Core i9-12900H, NVIDIA GeForce RTX 3070 Ti Laptop GPU | |
|---|---|---|---|---|---|---|
| Heat | 3% | -3% | 8% | 11% | 12% | |
| Maximum Upper Side * (°C) | 53 | 50 6% | 52 2% | 43.4 18% | 54 -2% | 40.2 24% |
| Maximum Bottom * (°C) | 53 | 47 11% | 68 -28% | 48.2 9% | 59 -11% | 43.8 17% |
| Idle Upper Side * (°C) | 36 | 37.4 -4% | 32 11% | 35.2 2% | 26 28% | 34.8 3% |
| Idle Bottom * (°C) | 38 | 38.4 -1% | 36 5% | 37 3% | 27 29% | 37 3% |
* ... más pequeño es mejor
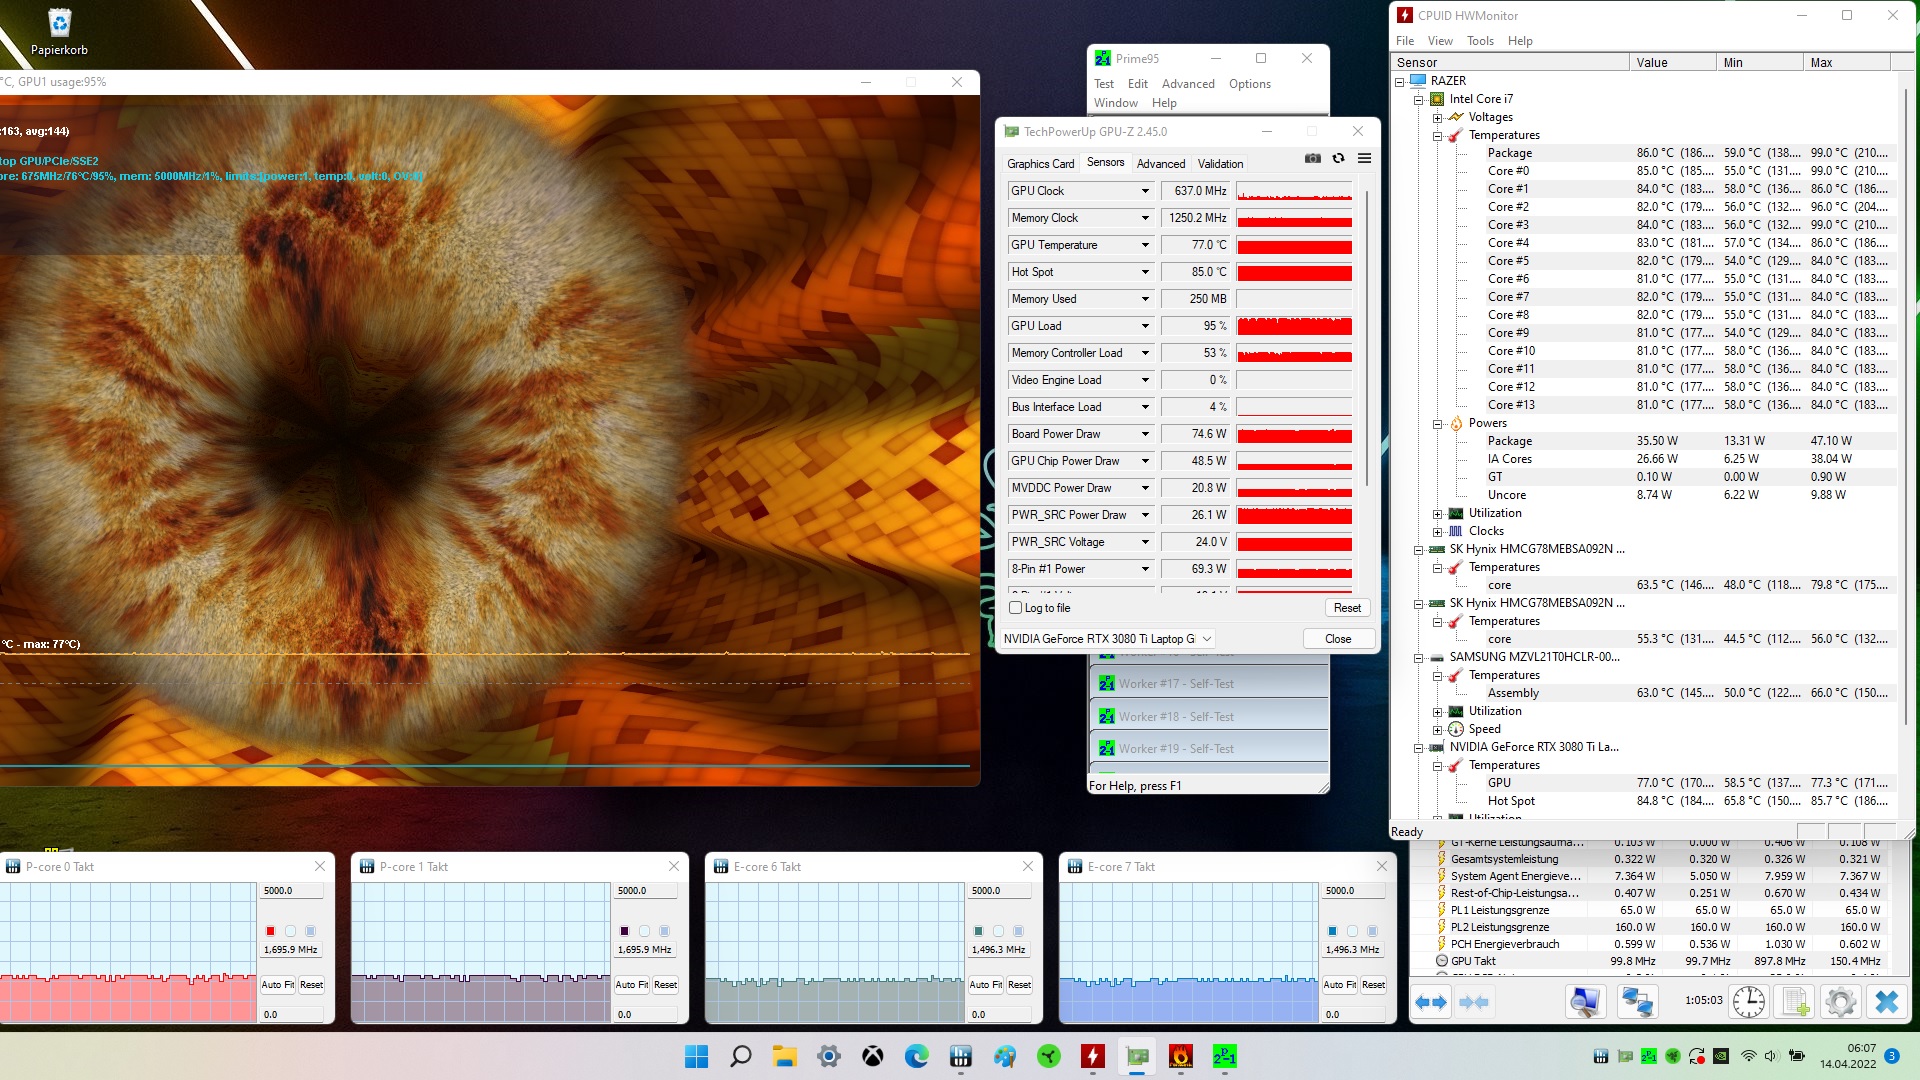
Prueba de esfuerzo
En nuestra prueba de estrés, cargamos el sistema simultáneamente con Prime95 y FurMark. La CPU comenzó la prueba con velocidades de reloj de los núcleos P y E de unos 2 y 1,9 GHz, respectivamente, y se estabilizó a 1,7 y 1,5 GHz, respectivamente, y a unos 85°C durante largos periodos de tiempo. La GPU empezó a unos 1.100 MHz y acabó estabilizándose a 640 MHz y a una temperatura del núcleo de 77°C
Altavoces
Los altavoces no están bien afinados. El diagrama de ruido rosa muestra la caída de frecuencia significativamente más plana del MacBook Pro 16, que es uno de los mejores portátiles en esta disciplina. Los dispositivos de audio externos pueden conectarse por Bluetooth, USB o el puerto de 3,5 mm
Razer Blade 15 Advanced Model Early 2022 análisis de audio
(+) | los altavoces pueden reproducir a un volumen relativamente alto (#92 dB)
Graves 100 - 315 Hz
(-) | casi sin bajos - de media 21.8% inferior a la mediana
(±) | la linealidad de los graves es media (9.2% delta a frecuencia anterior)
Medios 400 - 2000 Hz
(+) | medios equilibrados - a sólo 4.1% de la mediana
(+) | los medios son lineales (3.4% delta a la frecuencia anterior)
Altos 2 - 16 kHz
(+) | máximos equilibrados - a sólo 3.3% de la mediana
(+) | los máximos son lineales (6.8% delta a la frecuencia anterior)
Total 100 - 16.000 Hz
(±) | la linealidad del sonido global es media (15% de diferencia con la mediana)
En comparación con la misma clase
» 32% de todos los dispositivos probados de esta clase eran mejores, 6% similares, 62% peores
» El mejor tuvo un delta de 6%, la media fue 18%, el peor fue ###max##%
En comparación con todos los dispositivos probados
» 21% de todos los dispositivos probados eran mejores, 4% similares, 75% peores
» El mejor tuvo un delta de 4%, la media fue 23%, el peor fue ###max##%
Apple MacBook Pro 16 2021 M1 Pro análisis de audio
(+) | los altavoces pueden reproducir a un volumen relativamente alto (#84.7 dB)
Graves 100 - 315 Hz
(+) | buen bajo - sólo 3.8% lejos de la mediana
(+) | el bajo es lineal (5.2% delta a la frecuencia anterior)
Medios 400 - 2000 Hz
(+) | medios equilibrados - a sólo 1.3% de la mediana
(+) | los medios son lineales (2.1% delta a la frecuencia anterior)
Altos 2 - 16 kHz
(+) | máximos equilibrados - a sólo 1.9% de la mediana
(+) | los máximos son lineales (2.7% delta a la frecuencia anterior)
Total 100 - 16.000 Hz
(+) | el sonido global es lineal (4.6% de diferencia con la mediana)
En comparación con la misma clase
» 0% de todos los dispositivos probados de esta clase eran mejores, 0% similares, 100% peores
» El mejor tuvo un delta de 5%, la media fue 17%, el peor fue ###max##%
En comparación con todos los dispositivos probados
» 0% de todos los dispositivos probados eran mejores, 0% similares, 100% peores
» El mejor tuvo un delta de 4%, la media fue 23%, el peor fue ###max##%
Gestión de la energía - No hay registros de tiempo de ejecución
Consumo de energía
Los valores de consumo en inactivo de 19 W de media son significativamente menores que los del anteriormente analizado Razer Blade 15 (36.4 W). Esto se debe probablemente al perfil de rendimiento más económico y a la menor resolución de pantalla. En el Witcher 3el consumo general es un 13% inferior.
El consumo máximo de la fuente de alimentación de 230 W durante la ejecución simultánea de Prime95 y FurMark fue de 179 W. La fuente de alimentación de 230 W está suficientemente dimensionada.
| Off / Standby | |
| Ocioso | |
| Carga |
|
Clave:
min: | |
| Razer Blade 15 Advanced Model Early 2022 i7-12800H, GeForce RTX 3080 Ti Laptop GPU | Razer Blade 15 2022 i7-12800H, GeForce RTX 3080 Ti Laptop GPU | Schenker XMG Neo 15 E22 (Early 2022, RTX 3080 Ti) i7-12700H, GeForce RTX 3080 Ti Laptop GPU | Asus ROG Strix Scar 15 G533QS R9 5900HX, GeForce RTX 3080 Laptop GPU | MSI Stealth GS66 12UGS i7-12700H, GeForce RTX 3070 Ti Laptop GPU | MSI Vector GP66 12UGS i9-12900H, GeForce RTX 3070 Ti Laptop GPU | Media de la clase Gaming | |
|---|---|---|---|---|---|---|---|
| Power Consumption | -48% | -14% | -2% | 5% | -34% | -4% | |
| Idle Minimum * (Watt) | 17 | 33.2 -95% | 14 18% | 11.2 34% | 11 35% | 17.5 -3% | 13 ? 24% |
| Idle Average * (Watt) | 19 | 36.4 -92% | 18 5% | 16.4 14% | 16 16% | 20.1 -6% | 19 ? -0% |
| Idle Maximum * (Watt) | 25 | 37.6 -50% | 19 24% | 29.4 -18% | 23 8% | 47.3 -89% | 24.6 ? 2% |
| Load Average * (Watt) | 108 | 116.7 -8% | 115 -6% | 106.2 2% | 110 -2% | 107.3 1% | 110.7 ? -3% |
| Witcher 3 ultra * (Watt) | 150 | 172 -15% | 228 -52% | 189 -26% | 151 -1% | 225 -50% | |
| Load Maximum * (Watt) | 179 | 228.6 -28% | 307 -72% | 213.6 -19% | 230 -28% | 277.7 -55% | 259 ? -45% |
* ... más pequeño es mejor
Power Consumption Witcher 3 / Stress test
{
Duración de la batería
En nuestra prueba de WLAN en el mundo real, el Blade 15 logra una duración de 4:53 h. Casi ningún competidor puede seguir el ritmo de las 7:20 h del Asus ROG Strix Scar 15mientras que el MSI Vector GP66 también ofrece una mayor duración a pesar de tener una batería más pequeña (65 Wh frente a 80 Wh).
| Razer Blade 15 Advanced Model Early 2022 i7-12800H, GeForce RTX 3080 Ti Laptop GPU, 80 Wh | Razer Blade 15 2022 i7-12800H, GeForce RTX 3080 Ti Laptop GPU, 80 Wh | Schenker XMG Neo 15 E22 (Early 2022, RTX 3080 Ti) i7-12700H, GeForce RTX 3080 Ti Laptop GPU, 93 Wh | Asus ROG Strix Scar 15 G533QS R9 5900HX, GeForce RTX 3080 Laptop GPU, 90 Wh | MSI Stealth GS66 12UGS i7-12700H, GeForce RTX 3070 Ti Laptop GPU, 99.9 Wh | MSI Vector GP66 12UGS i9-12900H, GeForce RTX 3070 Ti Laptop GPU, 65 Wh | Media de la clase Gaming | |
|---|---|---|---|---|---|---|---|
| Duración de Batería | 0% | 48% | 19% | -5% | -12% | 16% | |
| Reader / Idle (h) | 8.1 | 11.1 37% | 7.8 -4% | 7.9 -2% | 8.27 ? 2% | ||
| H.264 (h) | 5.9 | 6.9 17% | 8.32 ? 41% | ||||
| WiFi v1.3 (h) | 4.9 | 4.9 0% | 6.7 37% | 7.3 49% | 5.4 10% | 5.7 16% | 7.11 ? 45% |
| Load (h) | 2 | 3.8 90% | 1.4 -30% | 1.6 -20% | 1 -50% | 1.502 ? -25% |
Pro
Contra
Veredicto
El Blade 15 es un portátil muy compacto y bien hecho. La conectividad es tan moderna como los nuevos chips de Intel y Nvidia y se completa con un rápido lector de tarjetas SD. La pantalla ofrece una representación visual increíblemente fluida y un brillo máximo decente, pero a diferencia del modelo QHD, se echa en falta Advanced Optimus y la cobertura del espacio de color podría ser un poco mejor. Sin embargo, teniendo en cuenta el grupo objetivo, esto último es aceptable
Las pruebas de rendimiento en modo "equilibrado" ofrecen una imagen interesante. En la práctica, el rendimiento es a menudo más que suficiente y el nivel de ruido es significativamente menor. Sin embargo, las superficies de la carcasa siguen calentándose mucho.
Si buscas un portátil para juegos elegante y compacto con una pantalla excepcionalmente rápida, no busques más. Sin embargo, los usuarios sensibles a la temperatura deberían tener cuidado aquí
Otro punto criticable son los altavoces: Muchos portátiles más baratos ofrecen mejor sonido
El ROG Strix Scar 15 de Asus es una alternativa menos compacta, basada en AMD, al Razer Blade 15 con una duración de batería mucho mayor. Para los usuarios que se desplazan a menudo y necesitan mucho rendimiento, el Razer Blade 15 puede seguir siendo la elección correcta.
Precio y disponibilidad
Nuestra configuración del Razer Blade 15 está actualmente disponible en B&H Photo Video por 3.699,99 dólares o a través de la página web oficial de Razer https://www.razer.com/gaming-laptops/Razer-Blade-15/RZ09-0421PEC3-R3U1 por el mismo precio.
Razer Blade 15 Advanced Model Early 2022
- 05/04/2022 v7 (old)
Marius Schell
Price comparison

