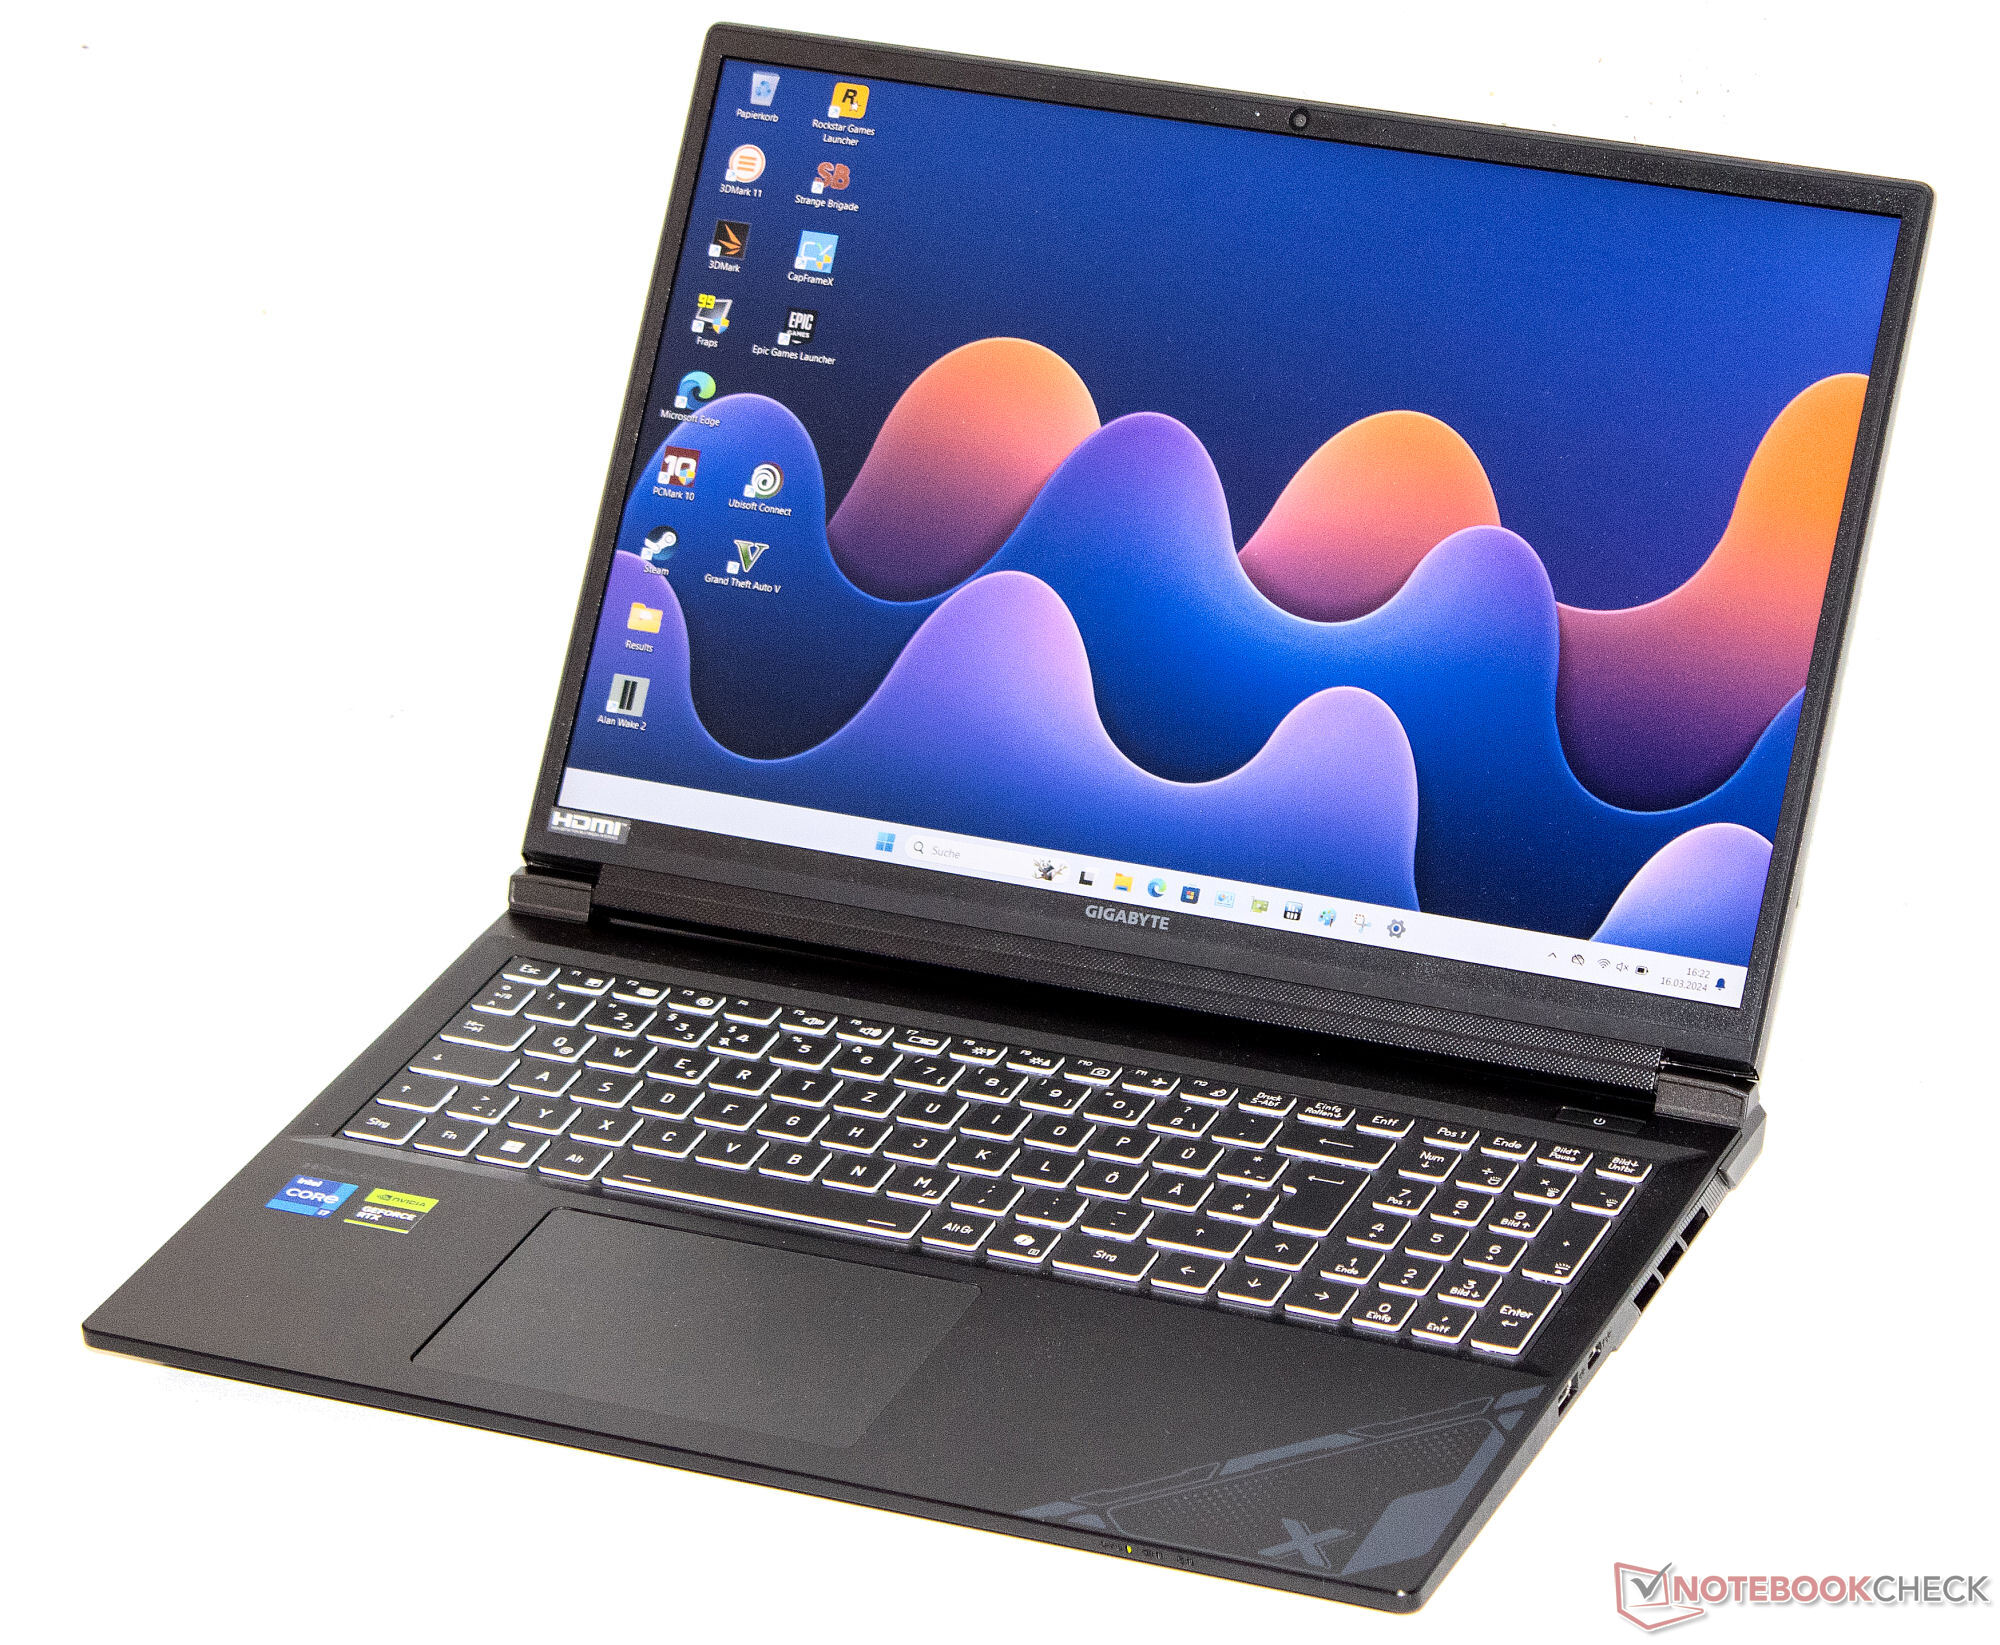
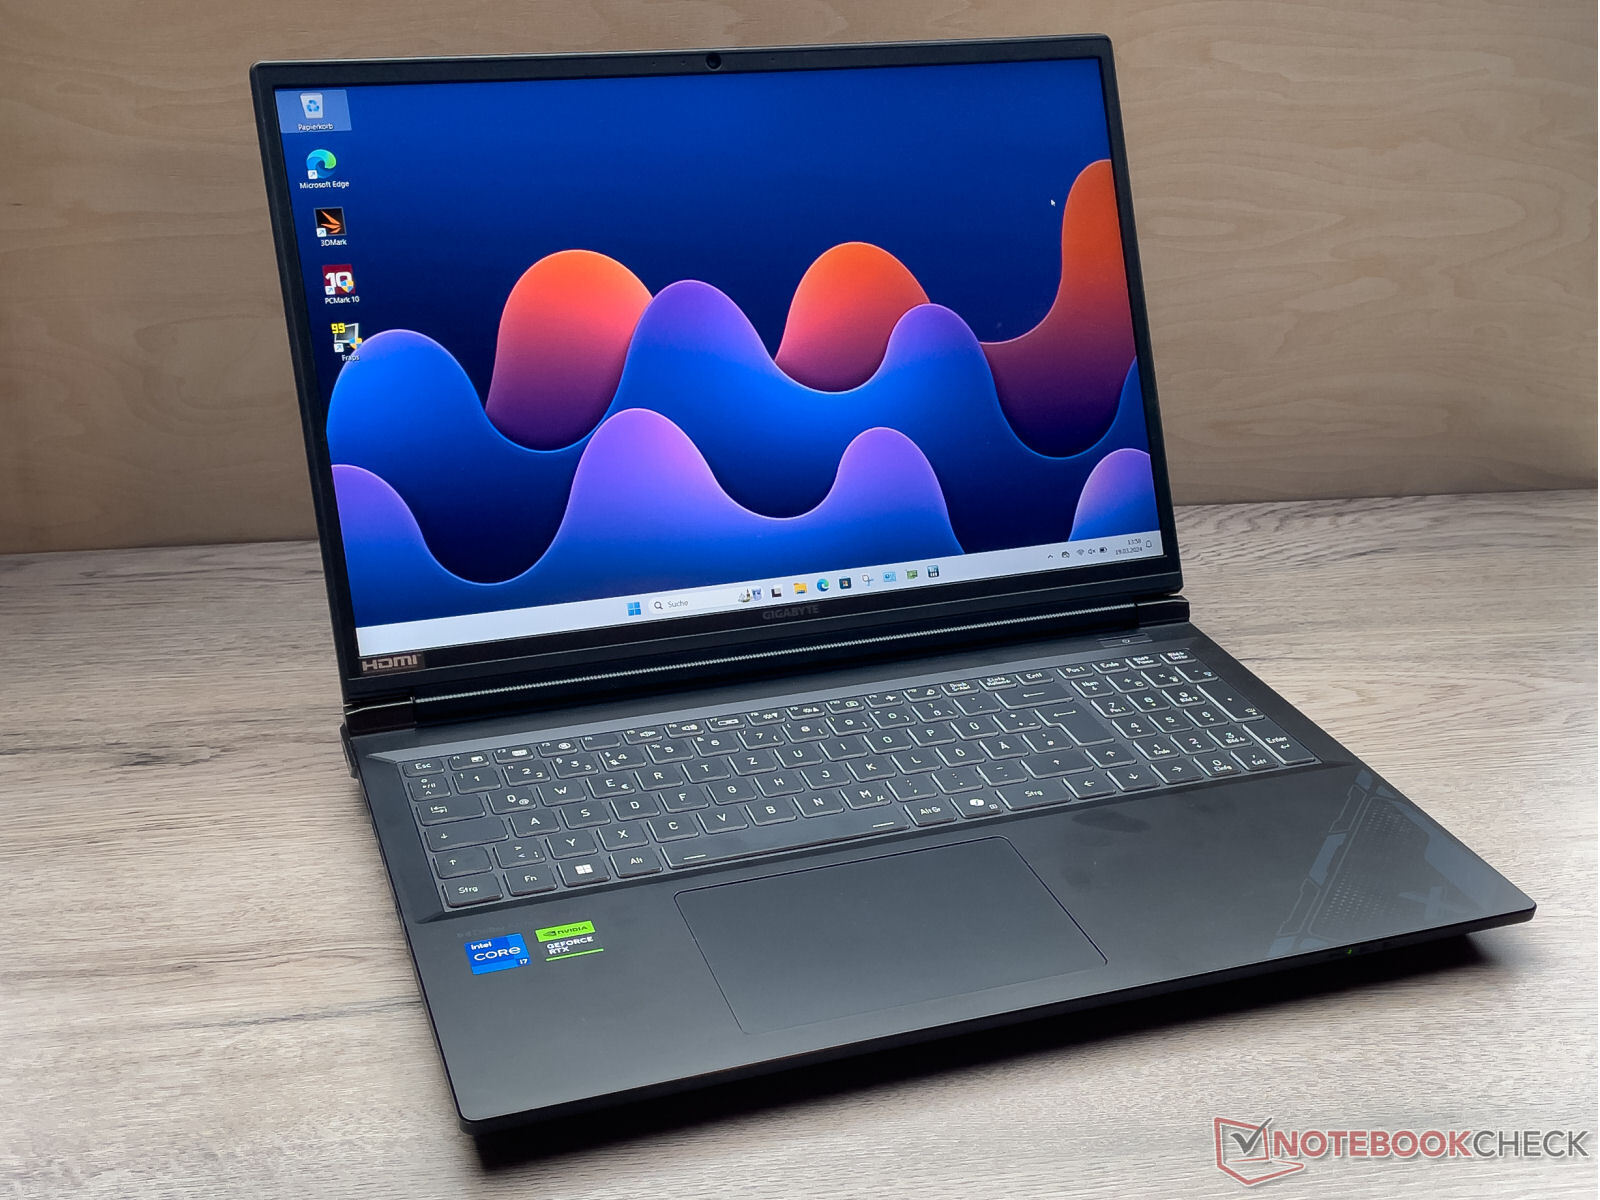
Análisis del Gigabyte G6X 9KG (2024): Portátil de juegos asequible con RTX 4060

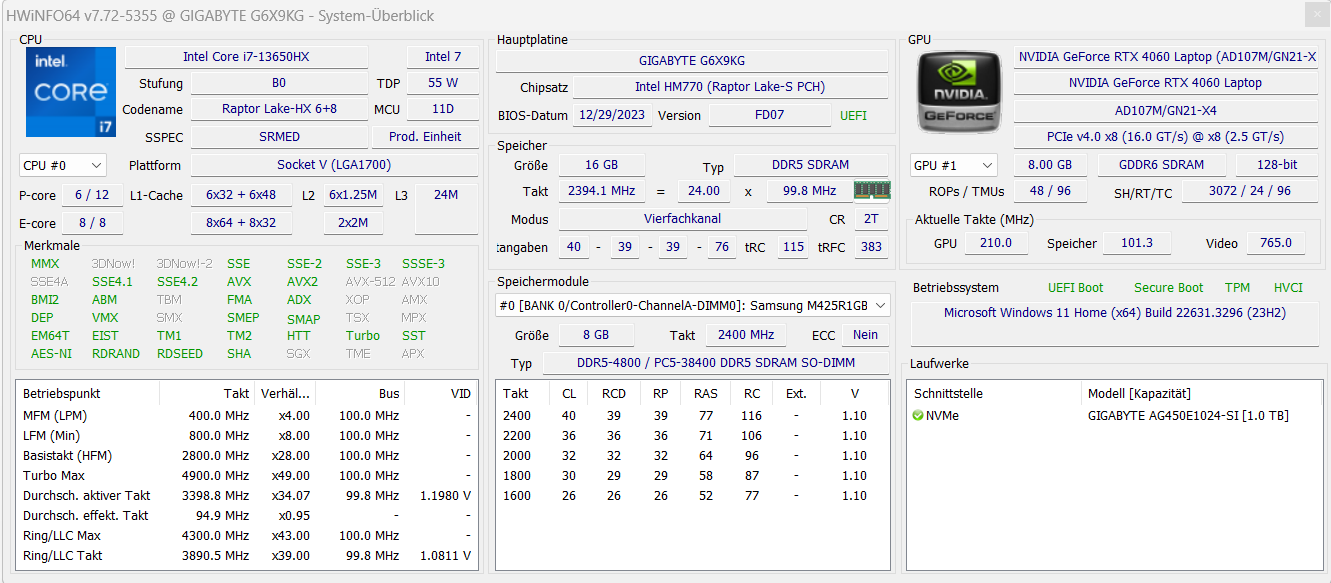
El Gigabyte G6X 9KG se encuentra entre los portátiles para juegos asequibles con un precio de poco menos de 1.350 euros. El portátil está equipado con el procesador Intel Core i7-13650HX Raptor Lake-HX y una CPU Nvidia GeForce RTX 4060 GPU para portátiles Ada Lovelace.
La competencia incluye portátiles como el Dell G16, Lenovo Legion 5 16IRX G9, MSI Raider GE68HX 13VFy Asus TUF Gaming A16 FA617XS.
Posibles contendientes en la comparación
Valoración | Fecha | Modelo | Peso | Altura | Tamaño | Resolución | Precio |
|---|---|---|---|---|---|---|---|
| 83.2 % v7 (old) | 03/2024 | Gigabyte G6X 9KG (2024) i7-13650HX, GeForce RTX 4060 Laptop GPU | 2.6 kg | 25.1 mm | 16.00" | 1920x1200 | |
| 85.5 % v7 (old) | 02/2024 | Dell G16, i7-13650HX, RTX 4060 i7-13650HX, GeForce RTX 4060 Laptop GPU | 2.8 kg | 25.65 mm | 16.00" | 2560x1600 | |
| 89.1 % v7 (old) | 02/2024 | Lenovo Legion 5 16IRX G9 i7-14650HX, GeForce RTX 4060 Laptop GPU | 2.4 kg | 25.2 mm | 16.00" | 2560x1600 | |
| 86.9 % v7 (old) | 10/2023 | MSI Raider GE68HX 13VF i9-13950HX, GeForce RTX 4060 Laptop GPU | 2.7 kg | 27.9 mm | 16.00" | 1900x1200 | |
| 86.9 % v7 (old) | 06/2023 | Asus TUF Gaming A16 FA617XS R9 7940HS, Radeon RX 7600S | 2.2 kg | 22.1 mm | 16.00" | 1920x1200 |
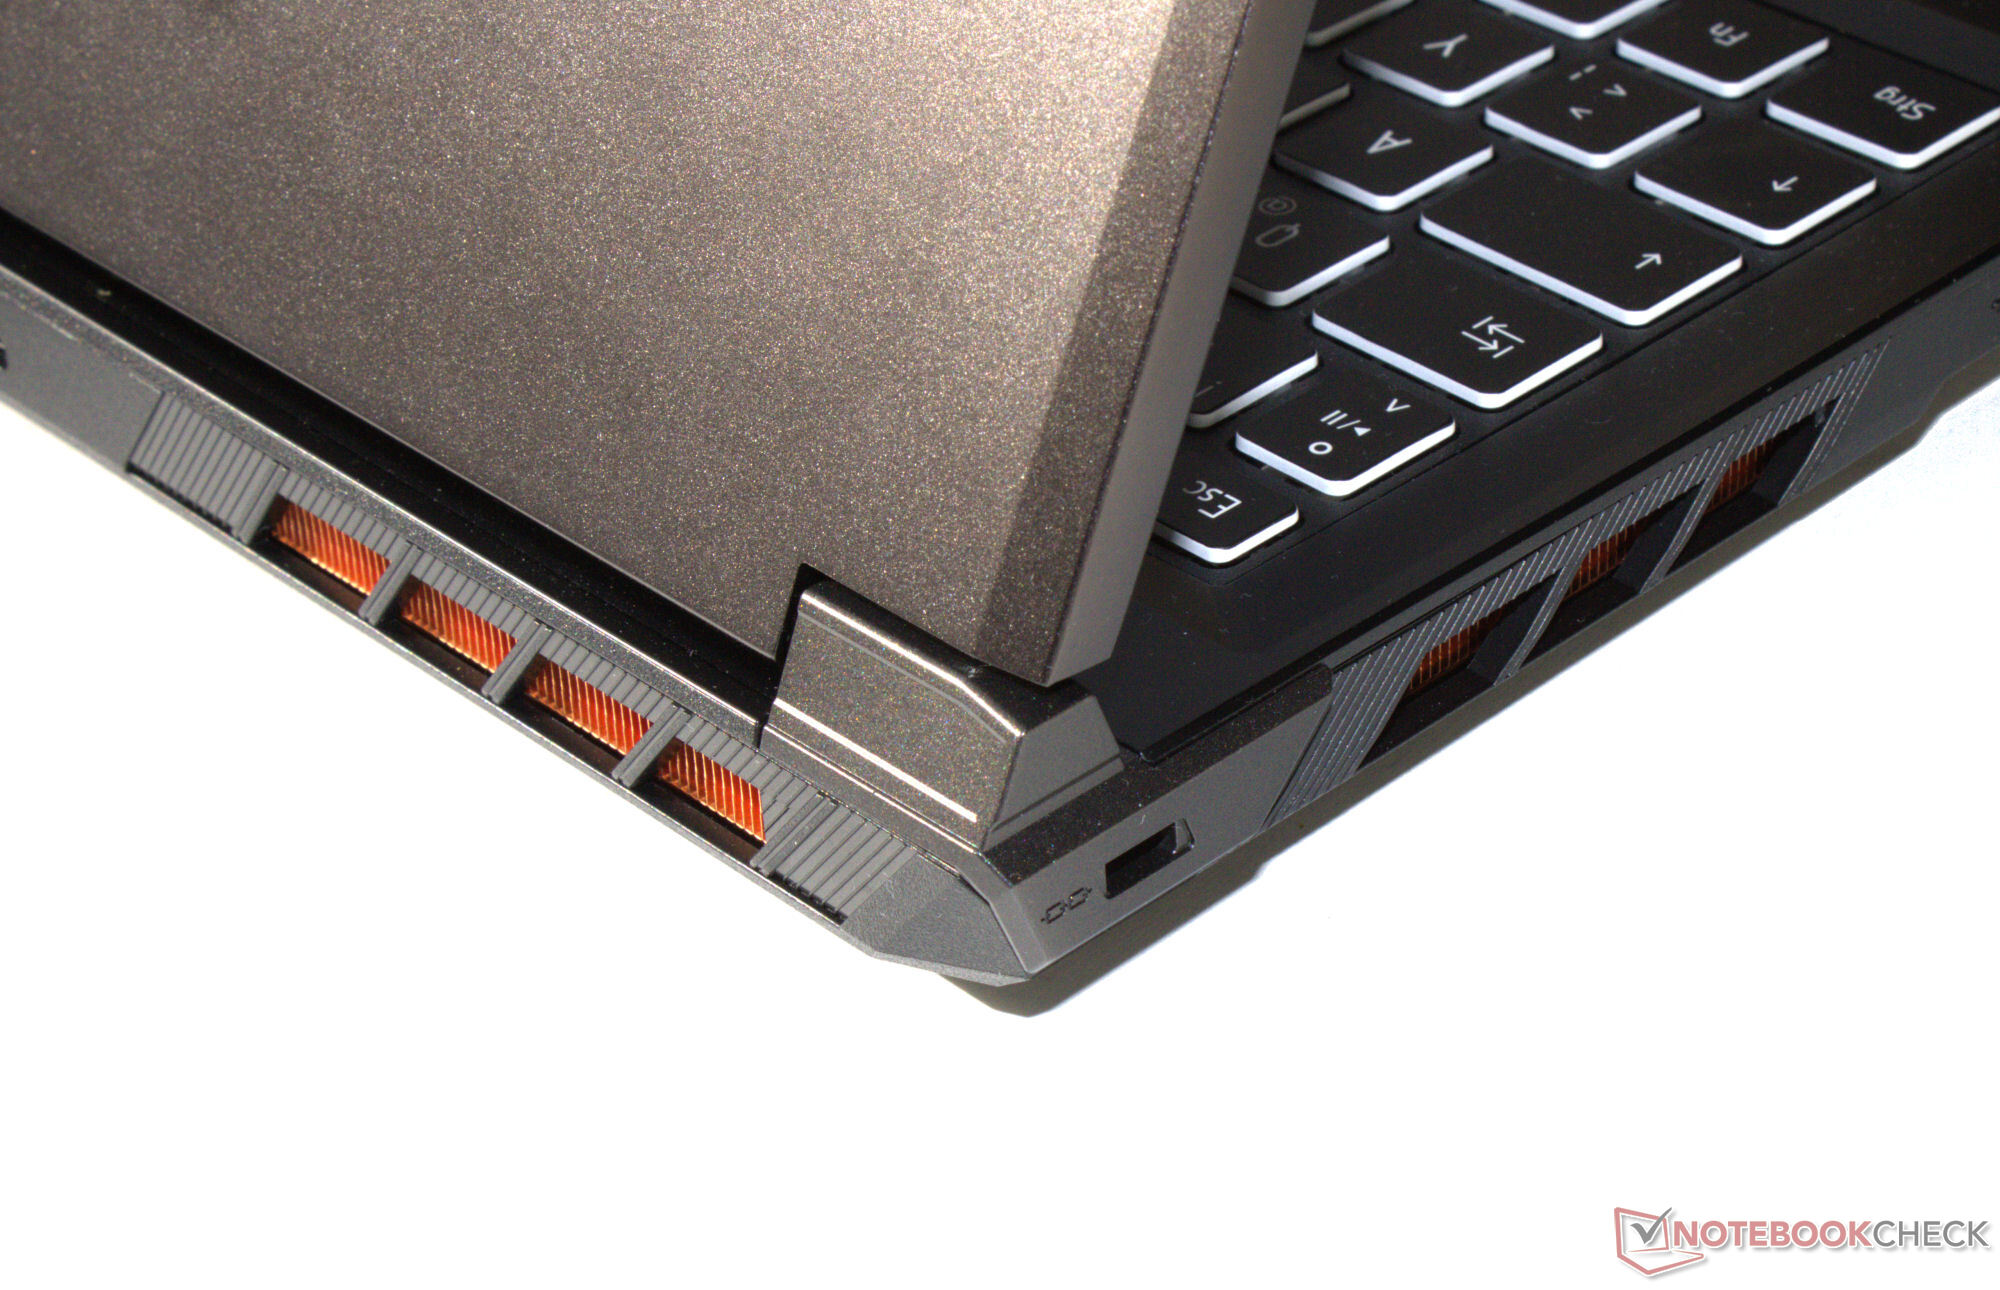
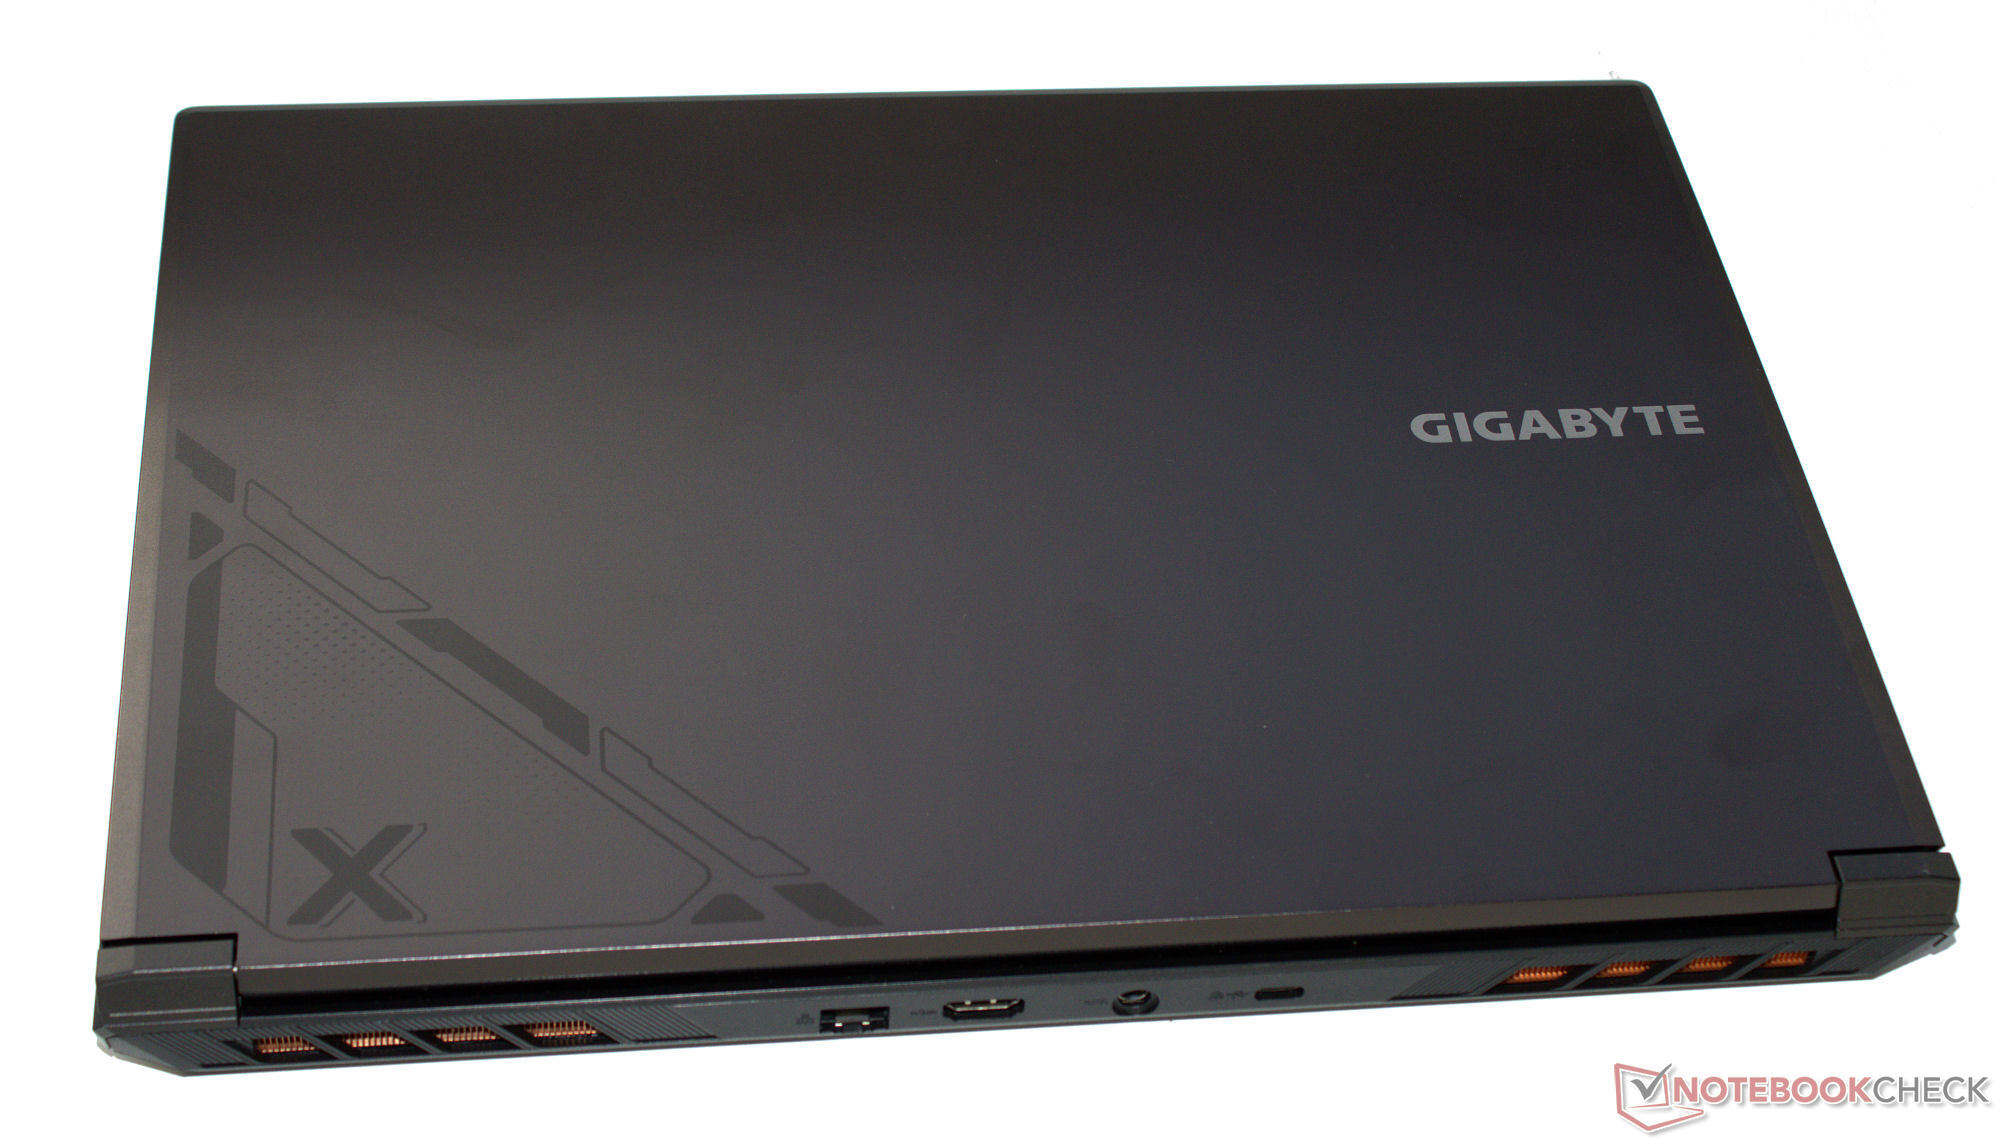
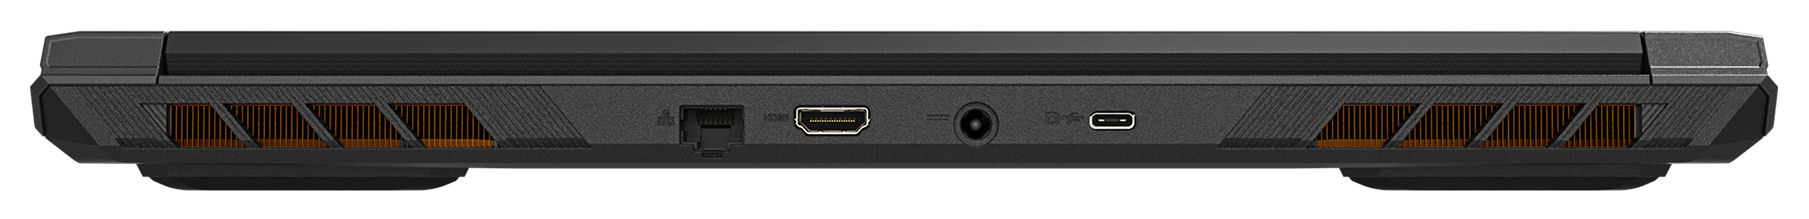
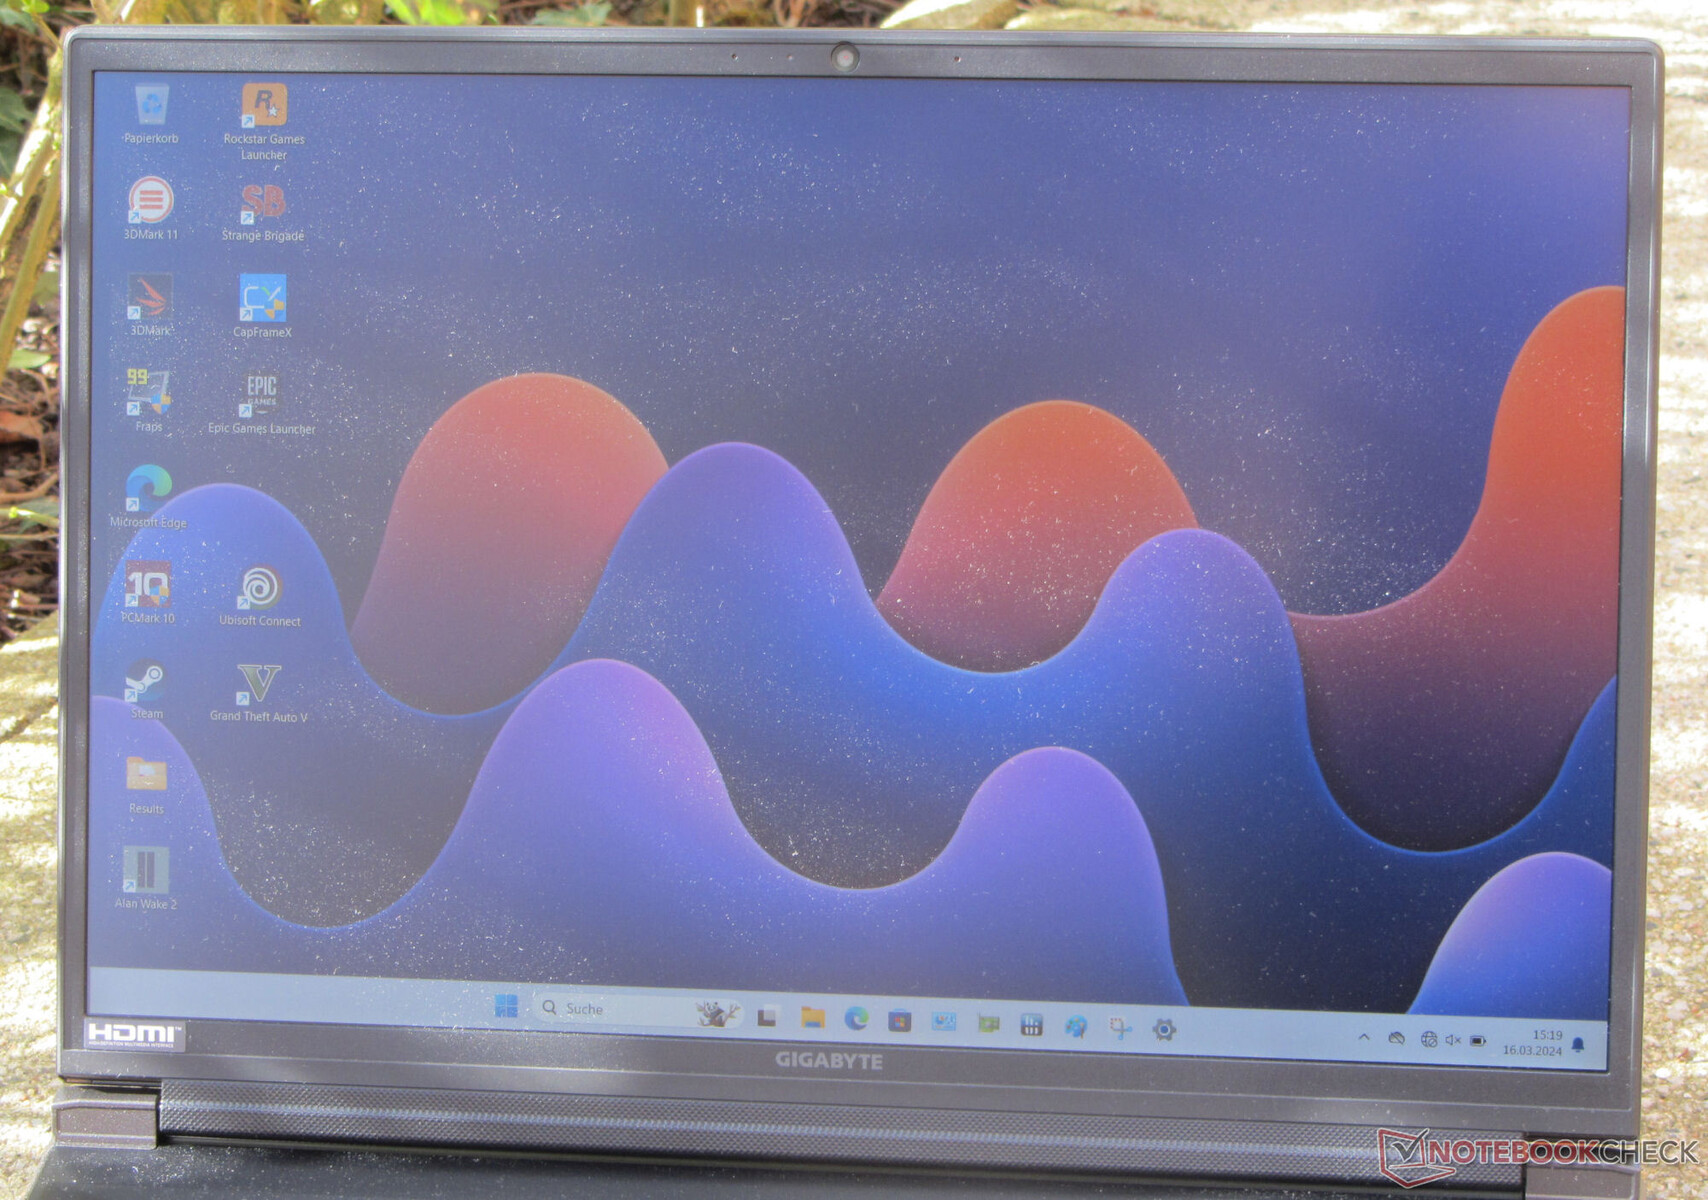
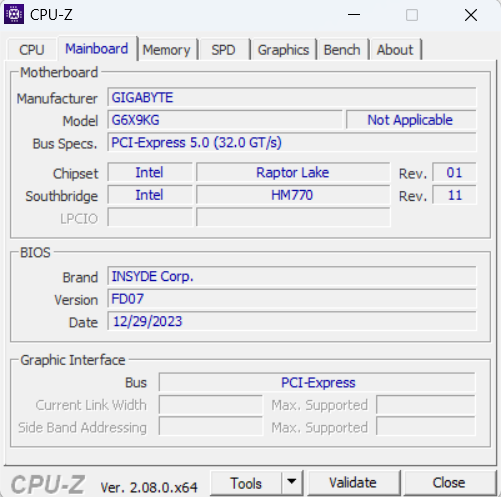
Carcasa y características: El G6X carece de Thunderbolt 4
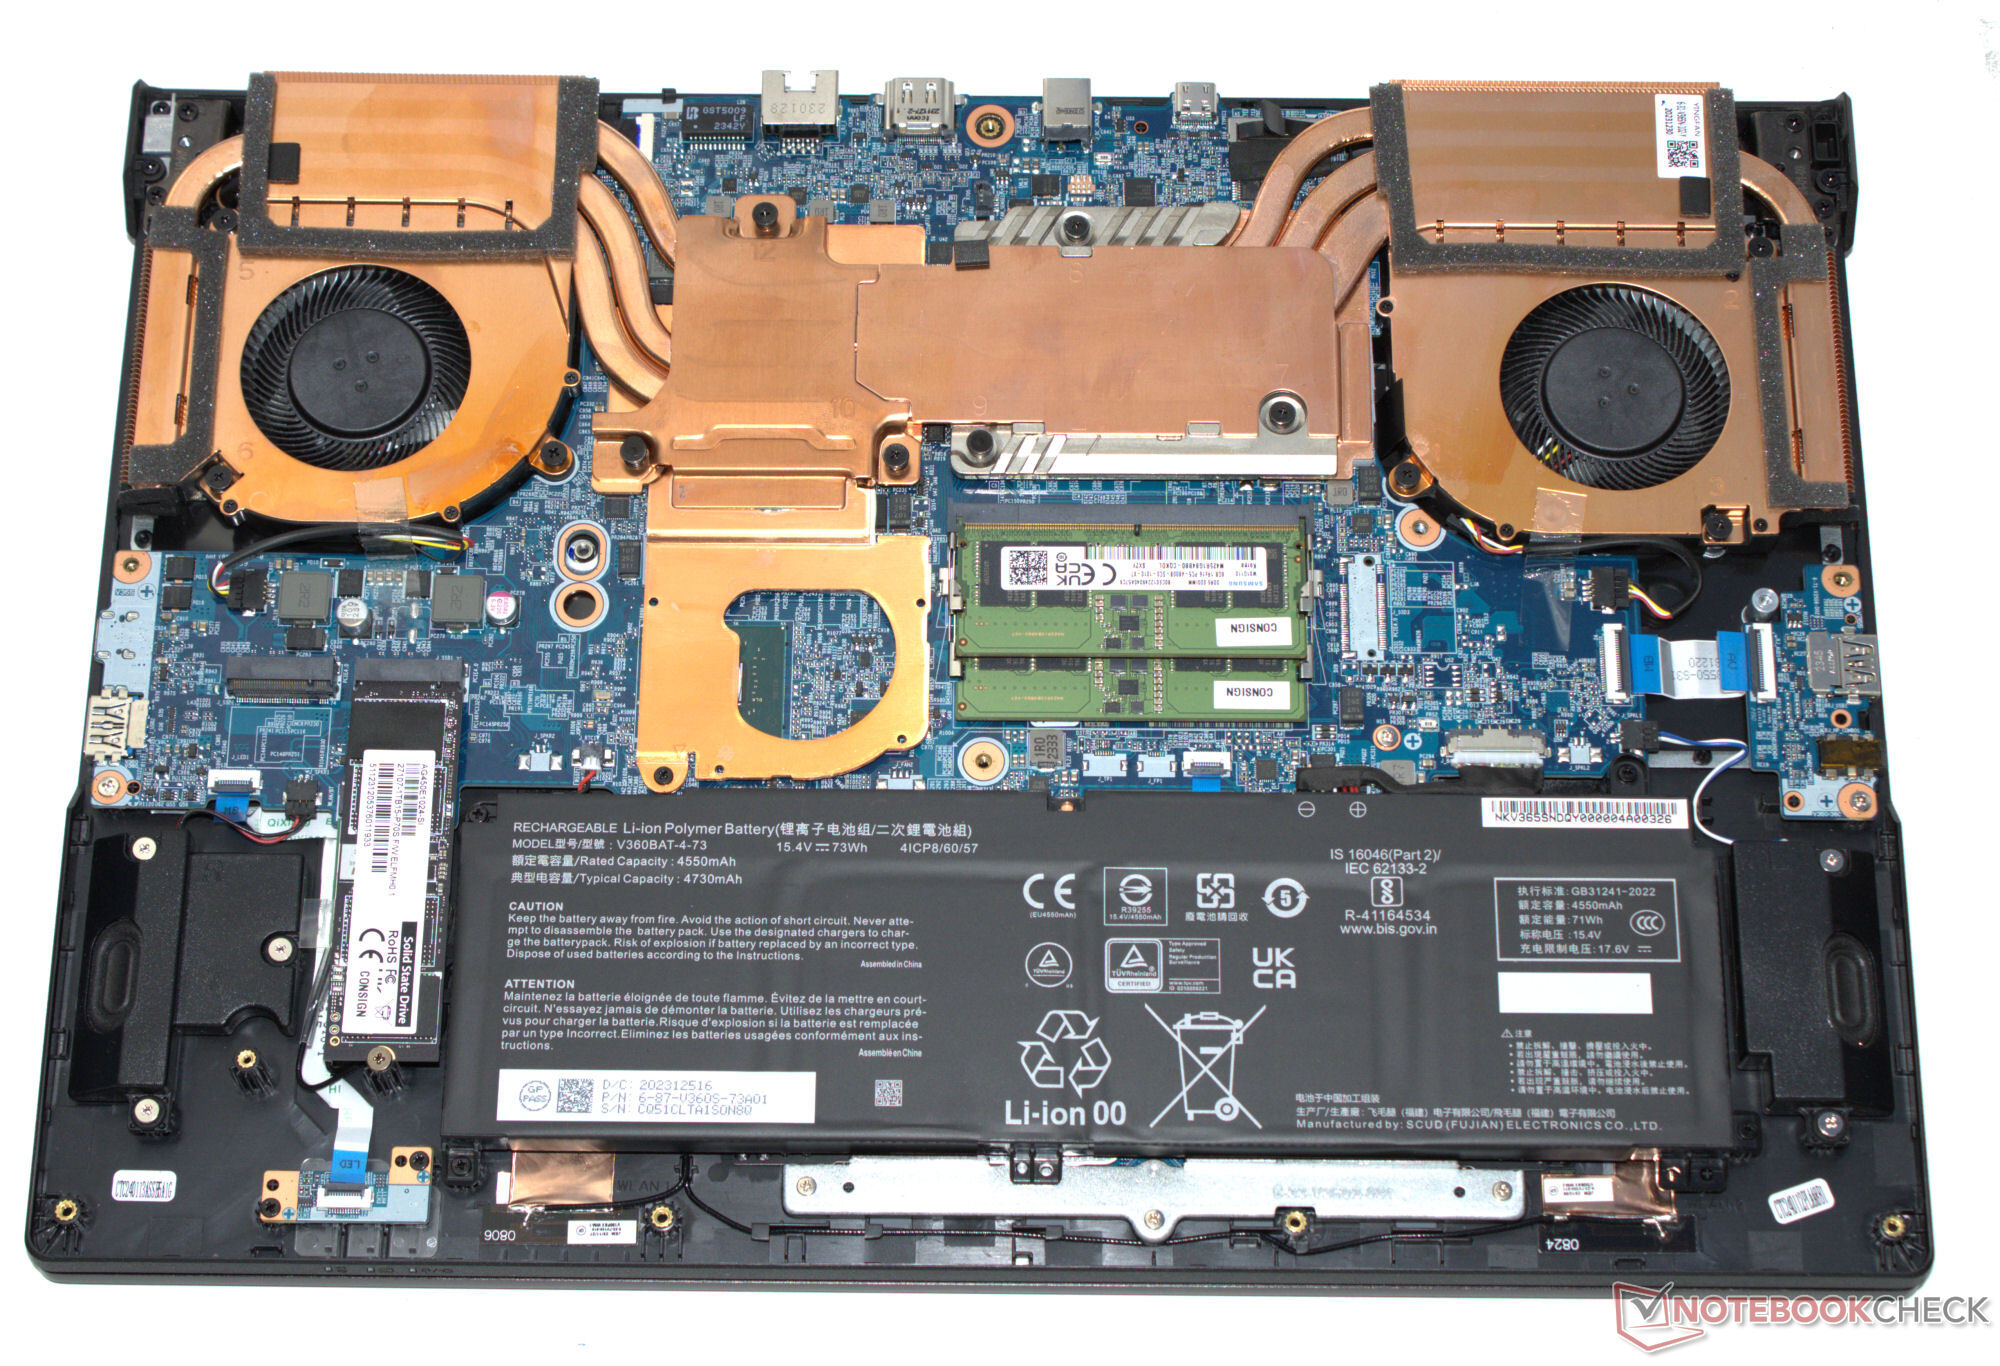
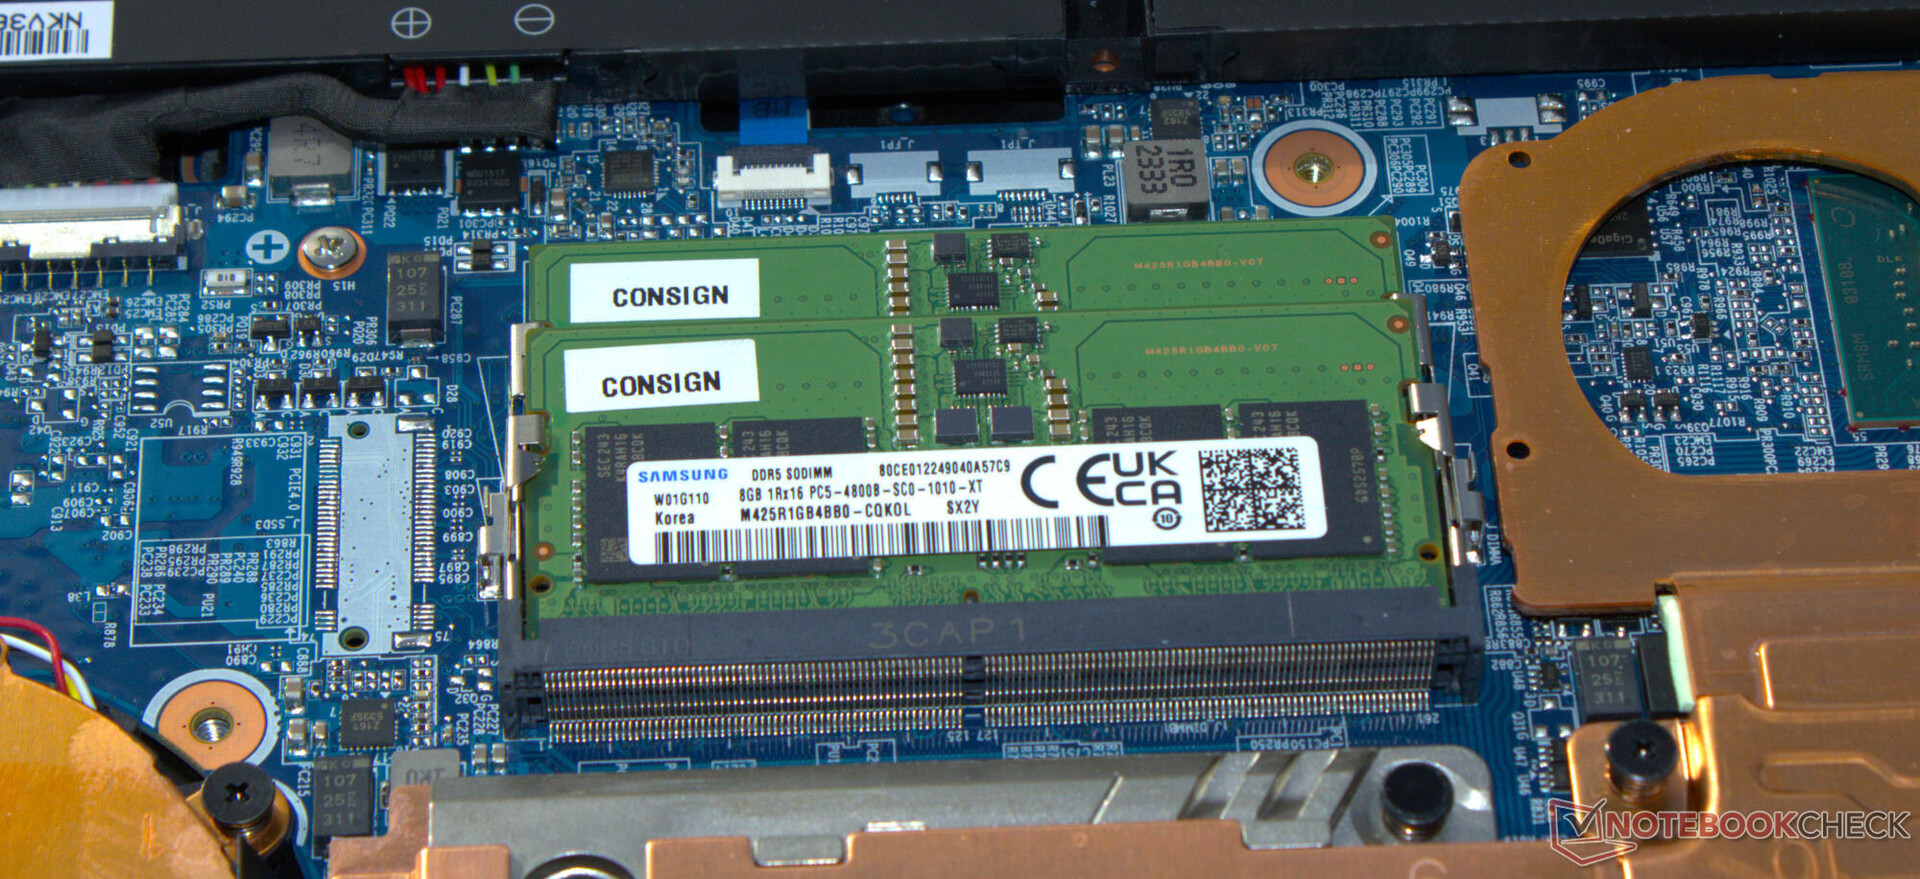
La unidad base del chasis gris mate ("Gunmetal Grey") de la G6X es de plástico, mientras que para la parte posterior de la tapa se utiliza aluminio. No se aprecian defectos de fabricación; la estabilidad y la rigidez parecen buenas. La batería y los demás componentes internos son accesibles tras retirar la carcasa base.
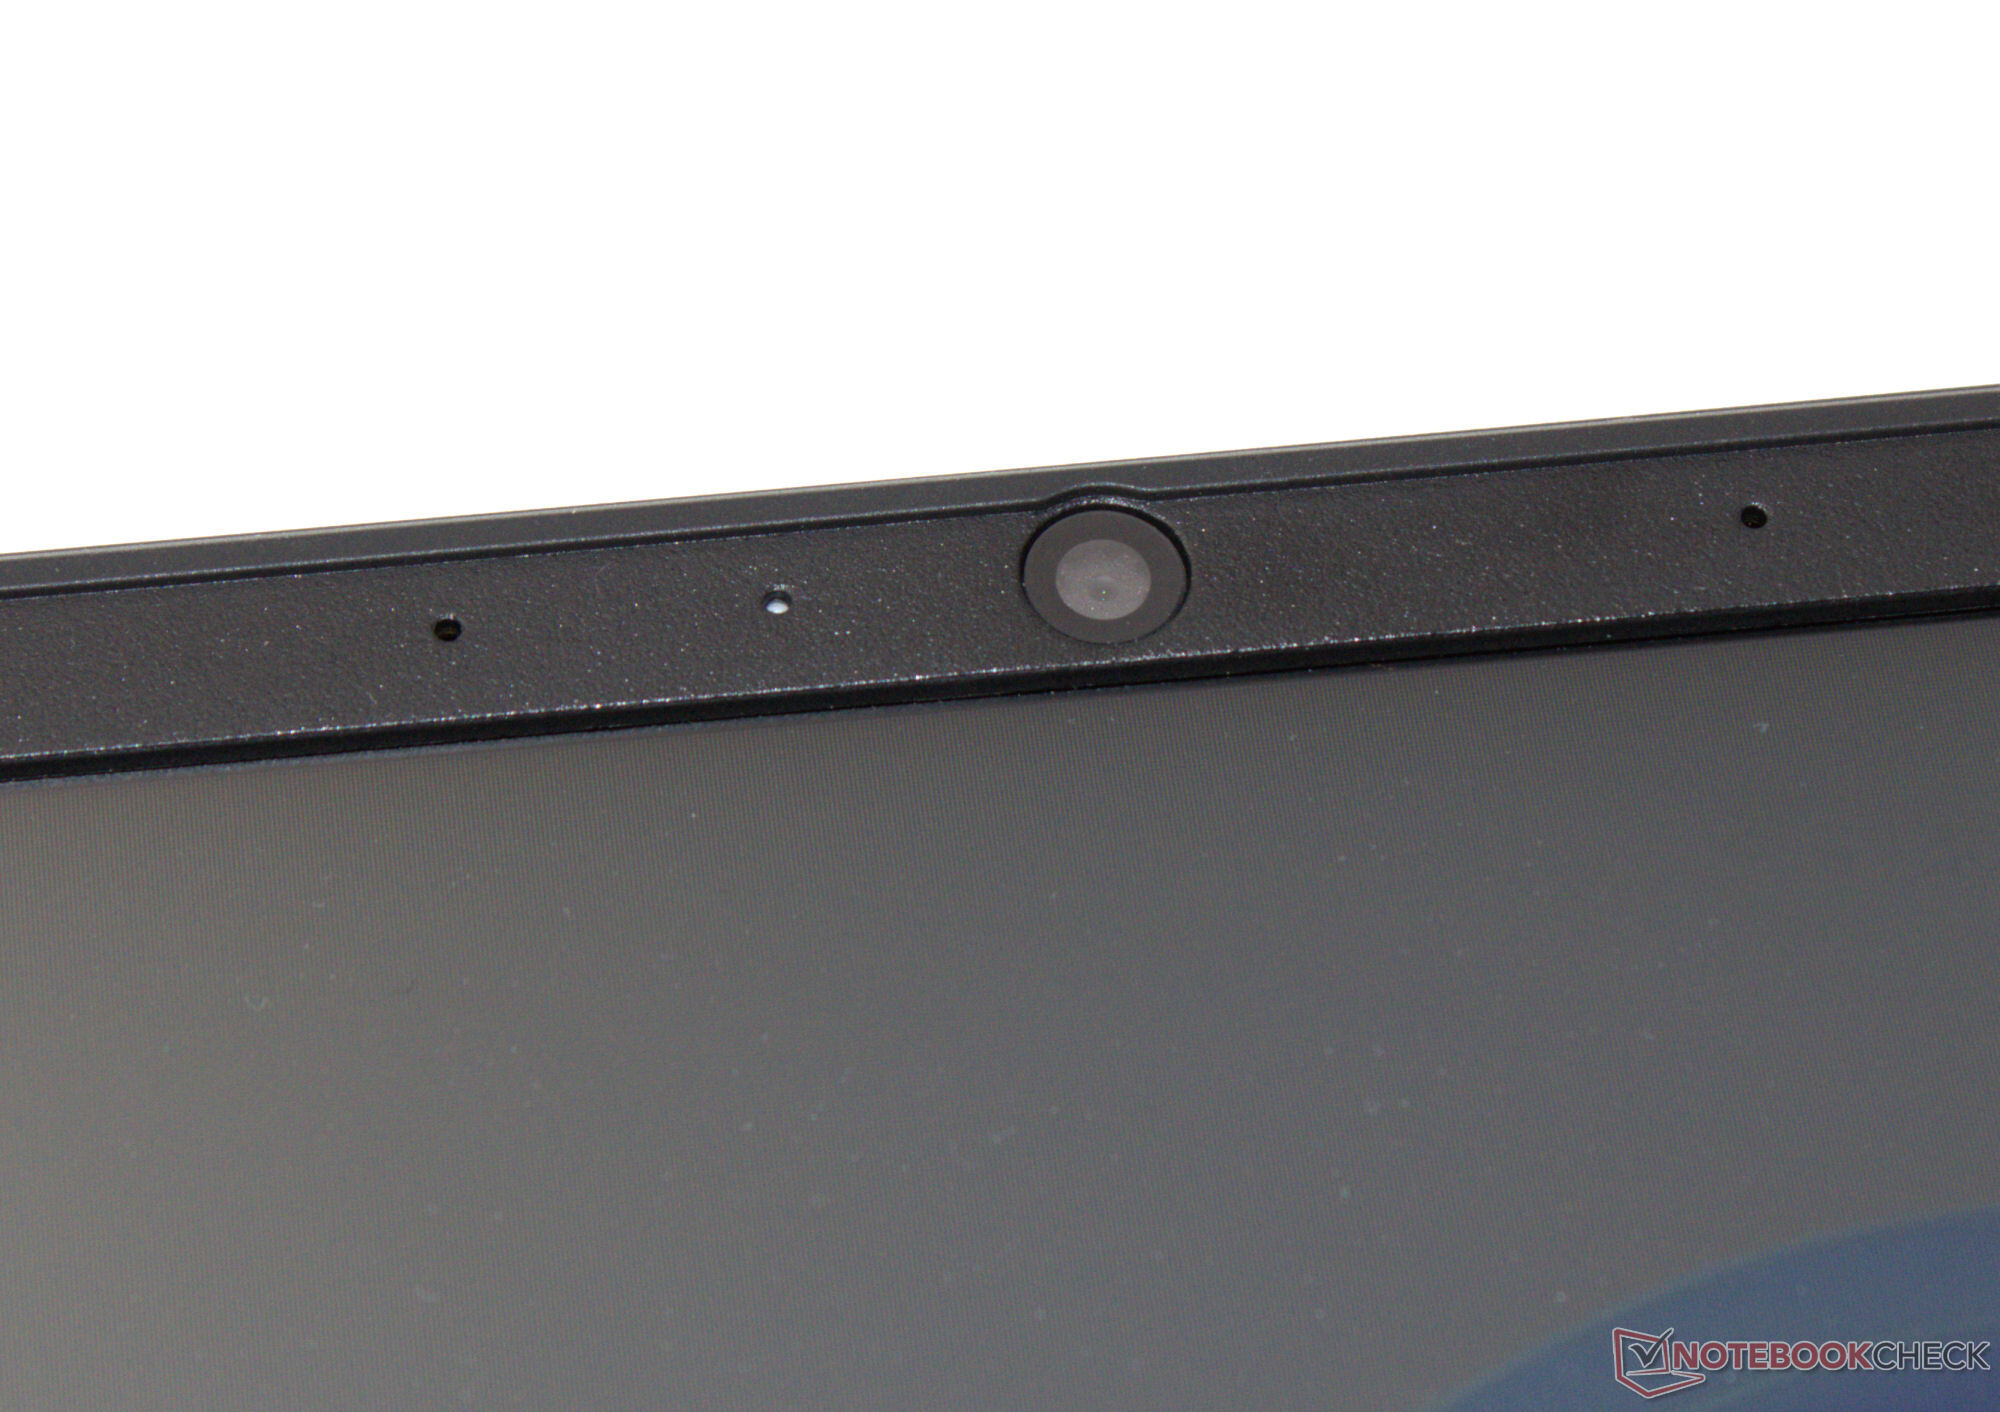
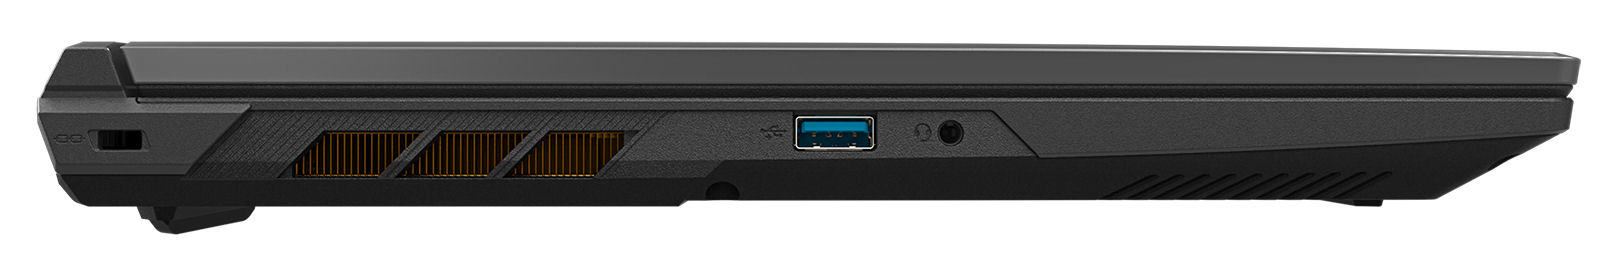
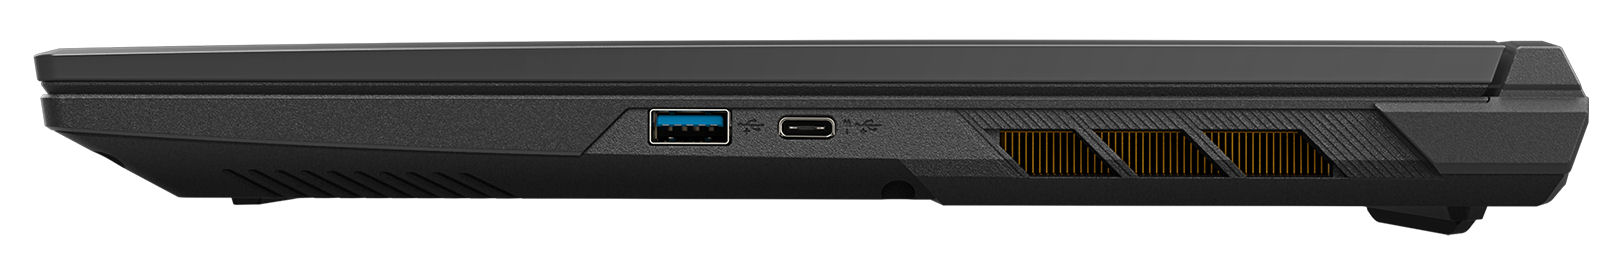
El Gigabyte G6X 9KG tiene un puerto USB 3.2 Gen 1 y un puerto USB 3.2 Gen 2 Tipo-A y dos puertos USB 3.2 Gen 2 Tipo-C que ofrecen individualmente Power Delivery y DisplayPort-out. En total, el G6X tiene dos salidas de vídeo (1x HDMI, 1x DP). No hay lector de tarjetas de memoria. La cámara web de 1280 x 720 0,9 MP ofrece un rendimiento estándar.
Conseguimos un excelente rendimiento de datos Wi-Fi en condiciones de prueba óptimas en las que no hay dispositivos Wi-Fi en las inmediaciones y a una corta distancia de 1 m entre el portátil y el PC servidor. El portátil utiliza un chip Intel AX211 Wi-Fi 6E. De las conexiones por cable se encarga un controlador Realtek RTL8168/8111.

 GeForce RTX 4060 Laptop GPU, i7-13650HX, Gigabyte AG450E1024-SI")
 GeForce RTX 4060 Laptop GPU, i7-13650HX, Gigabyte AG450E1024-SI")
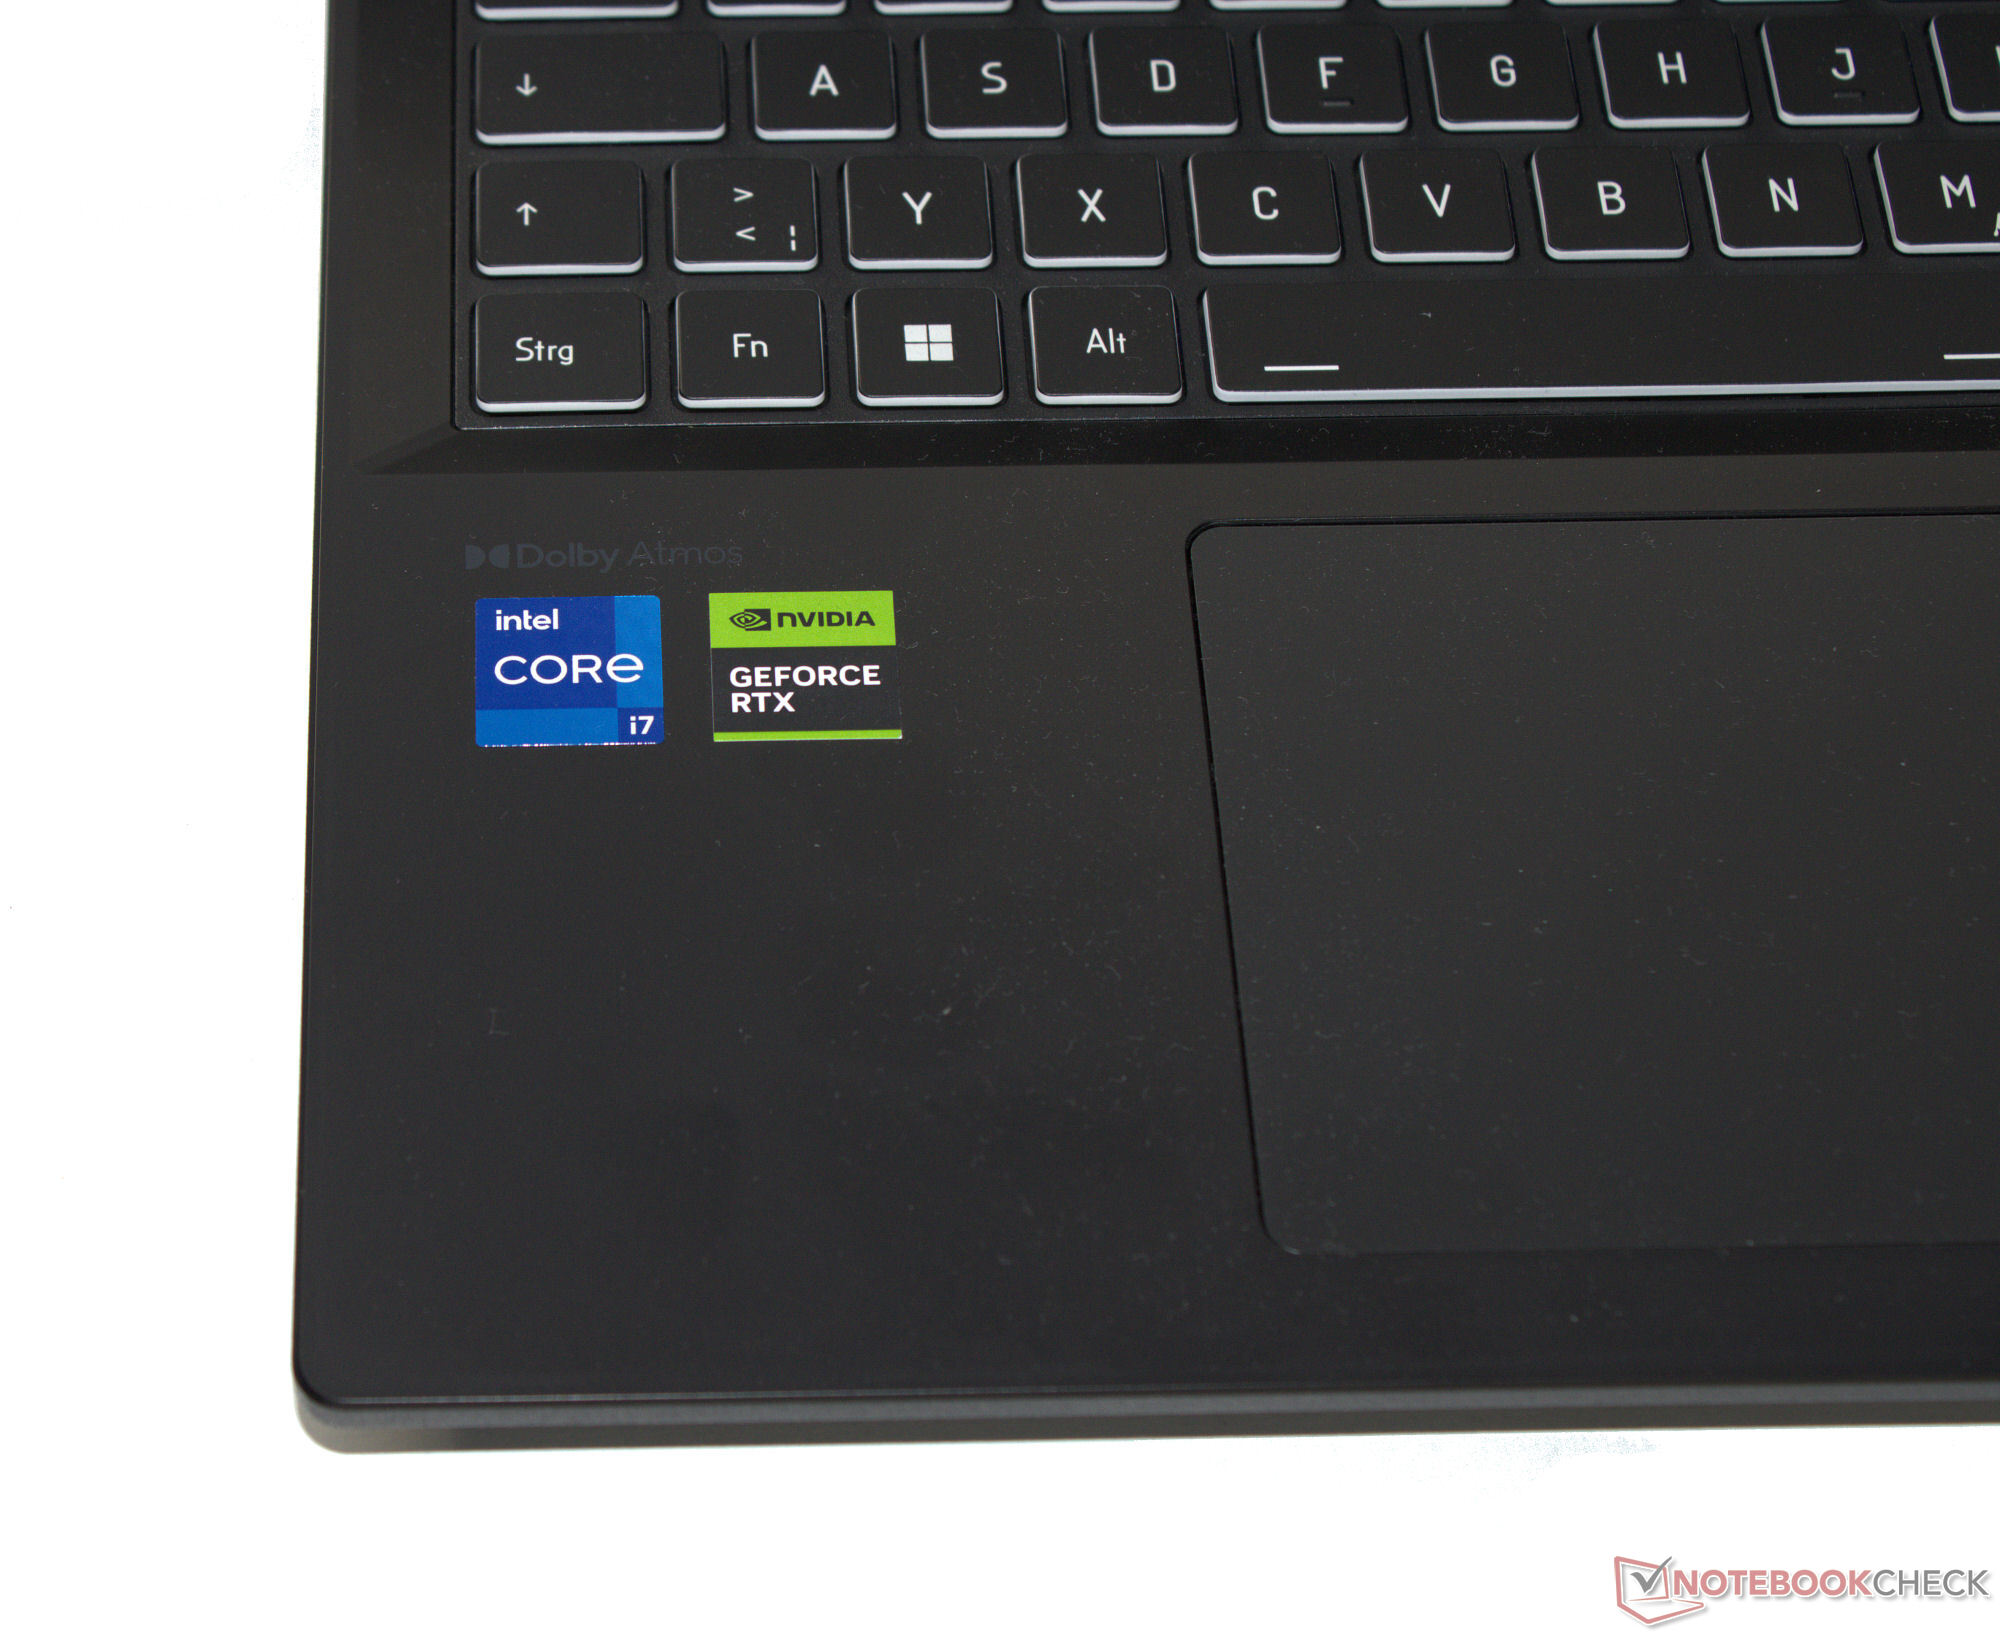
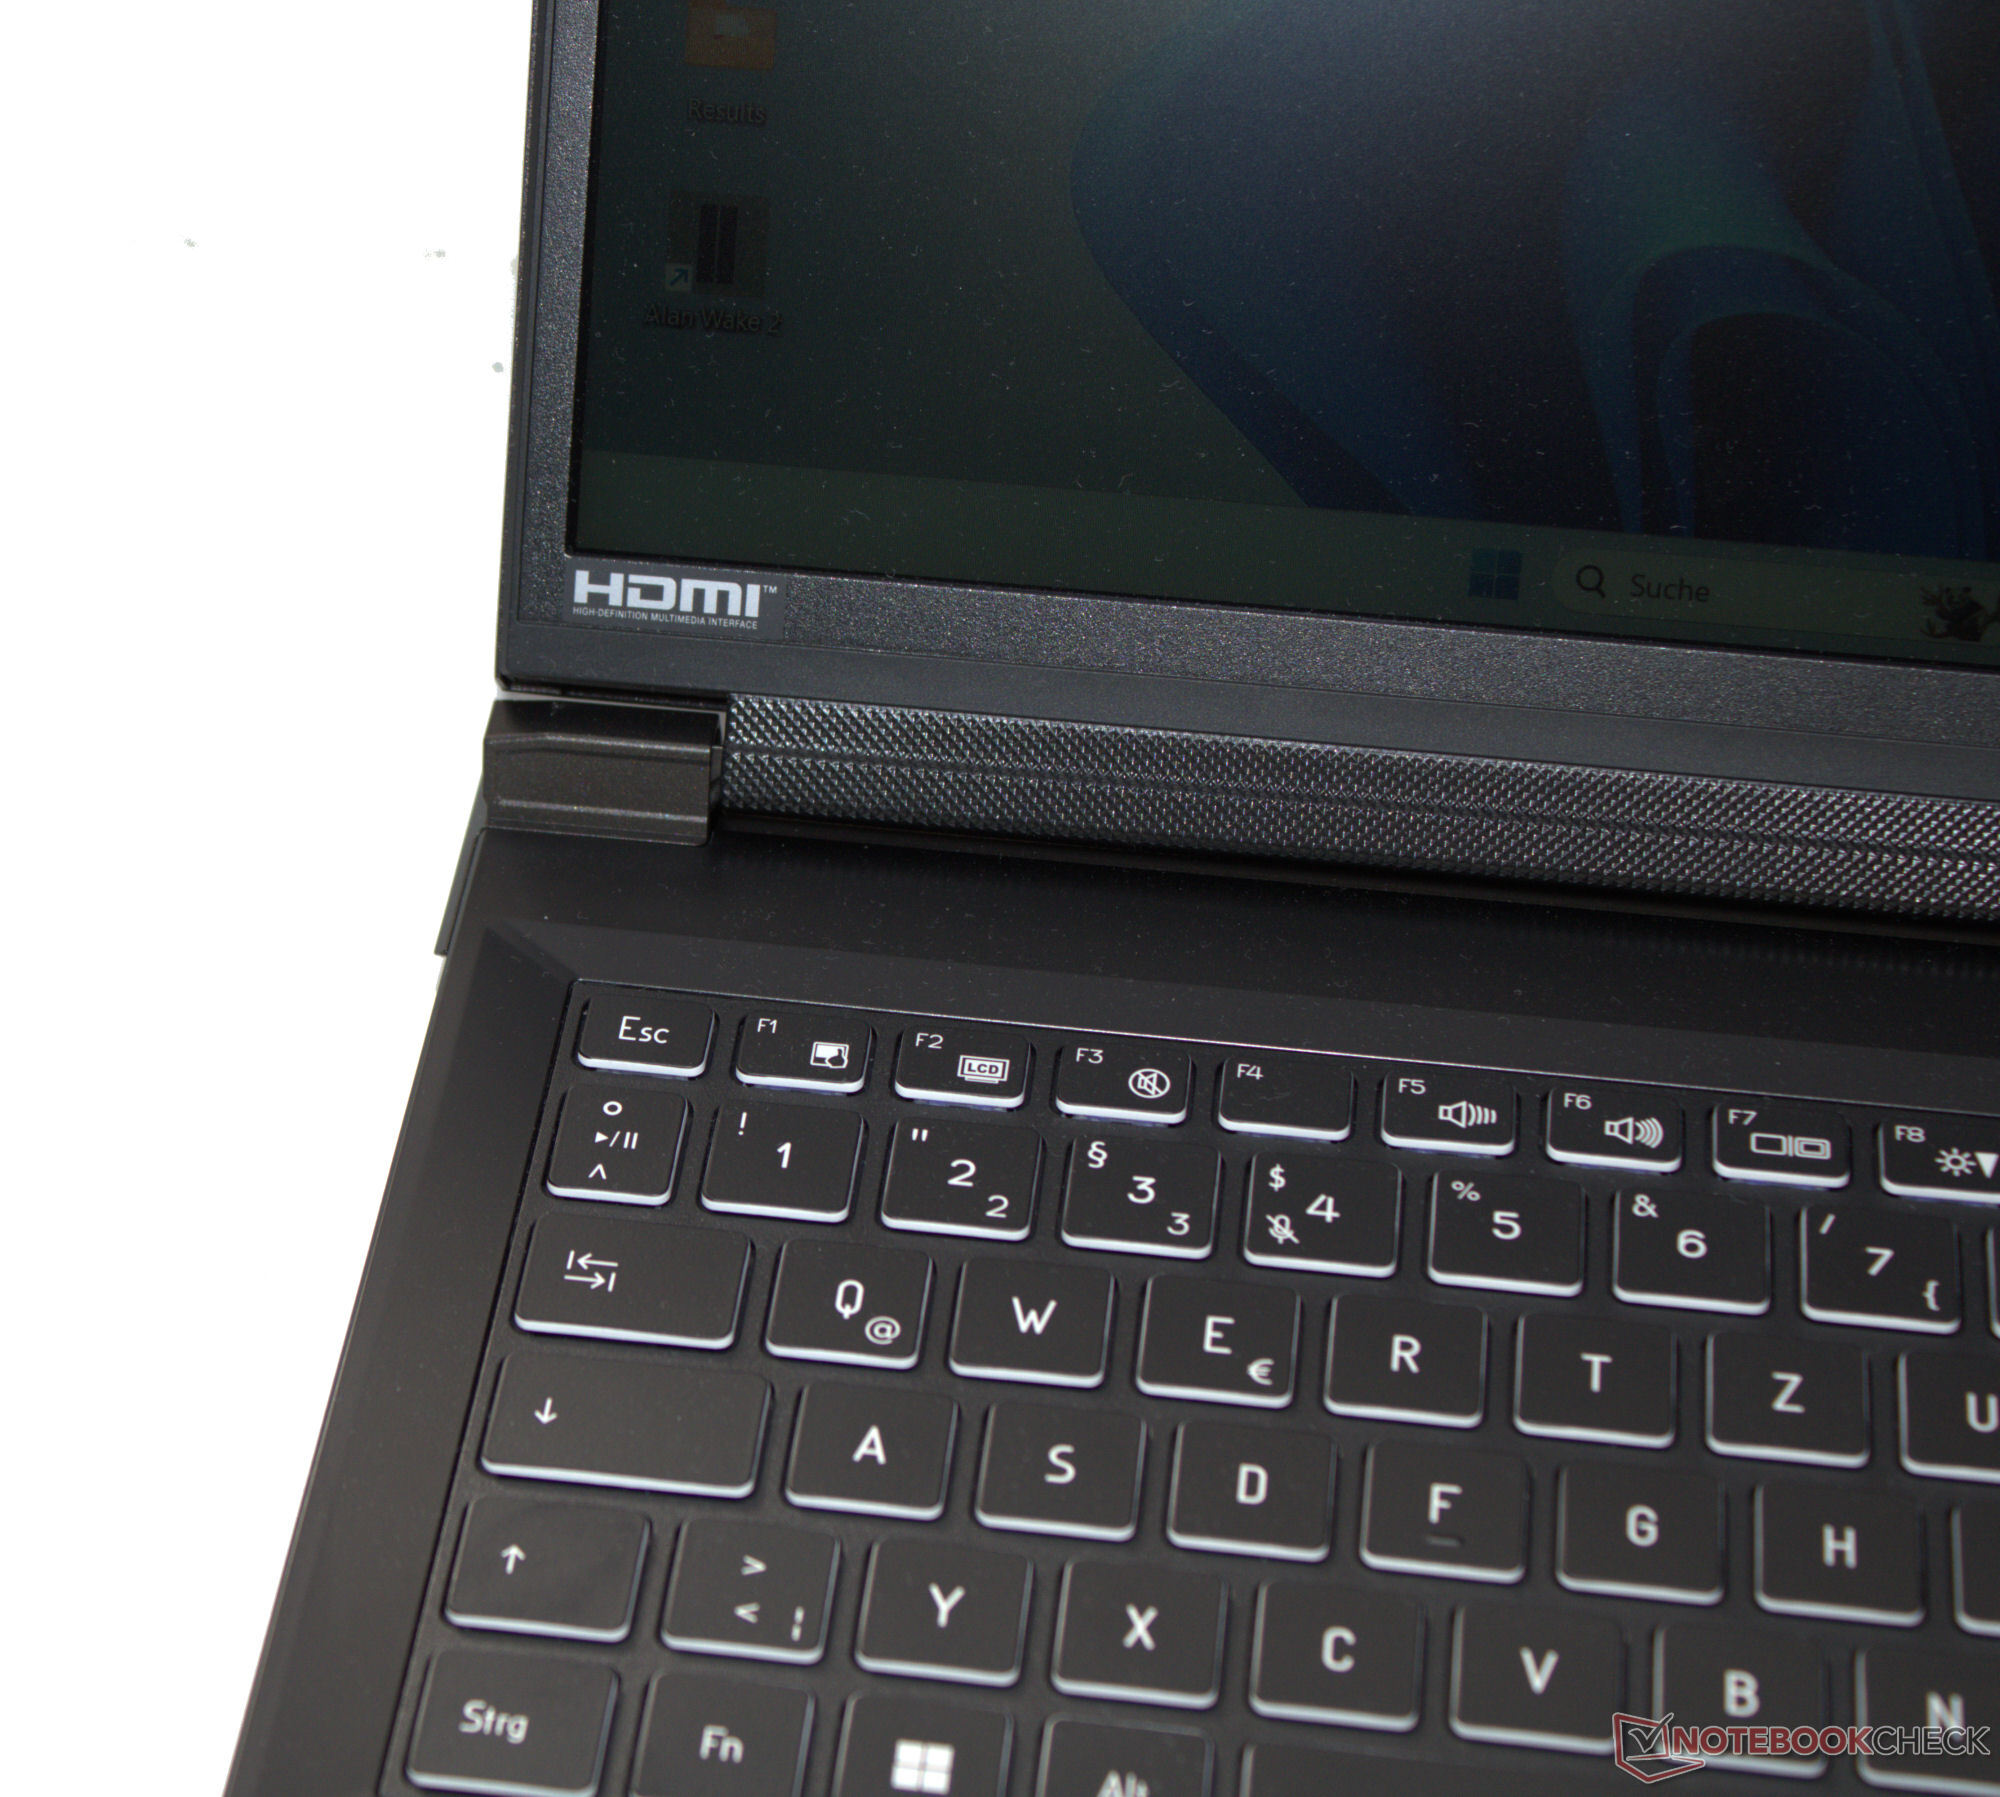
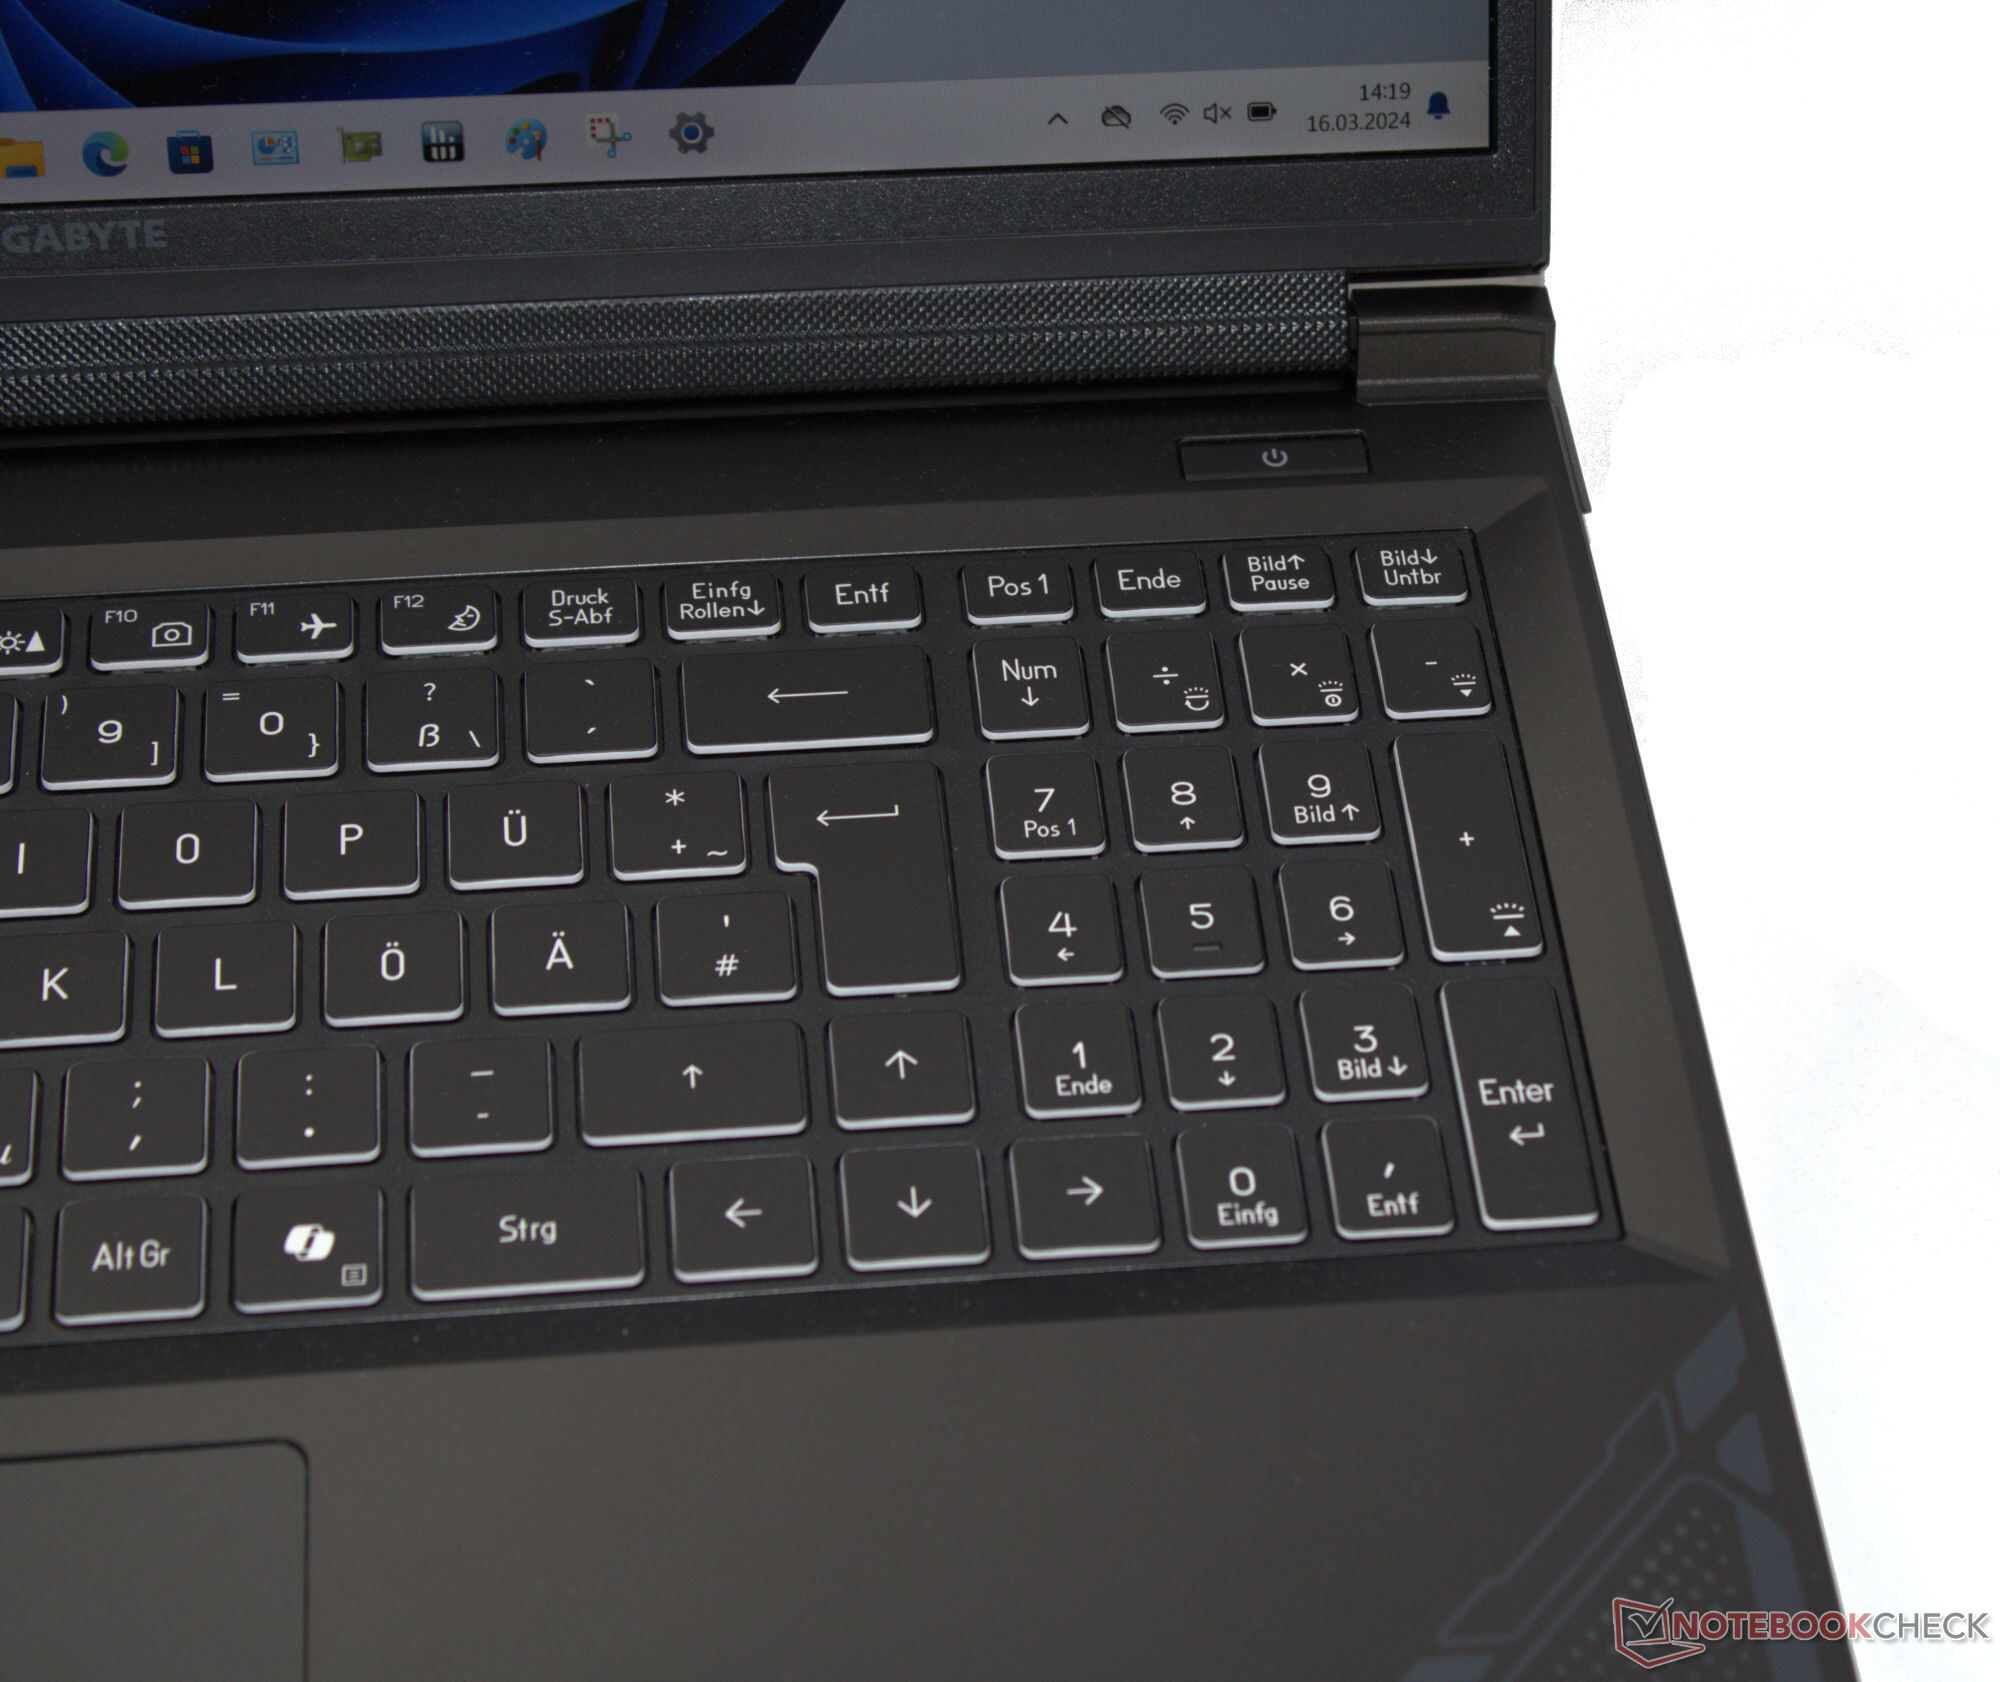
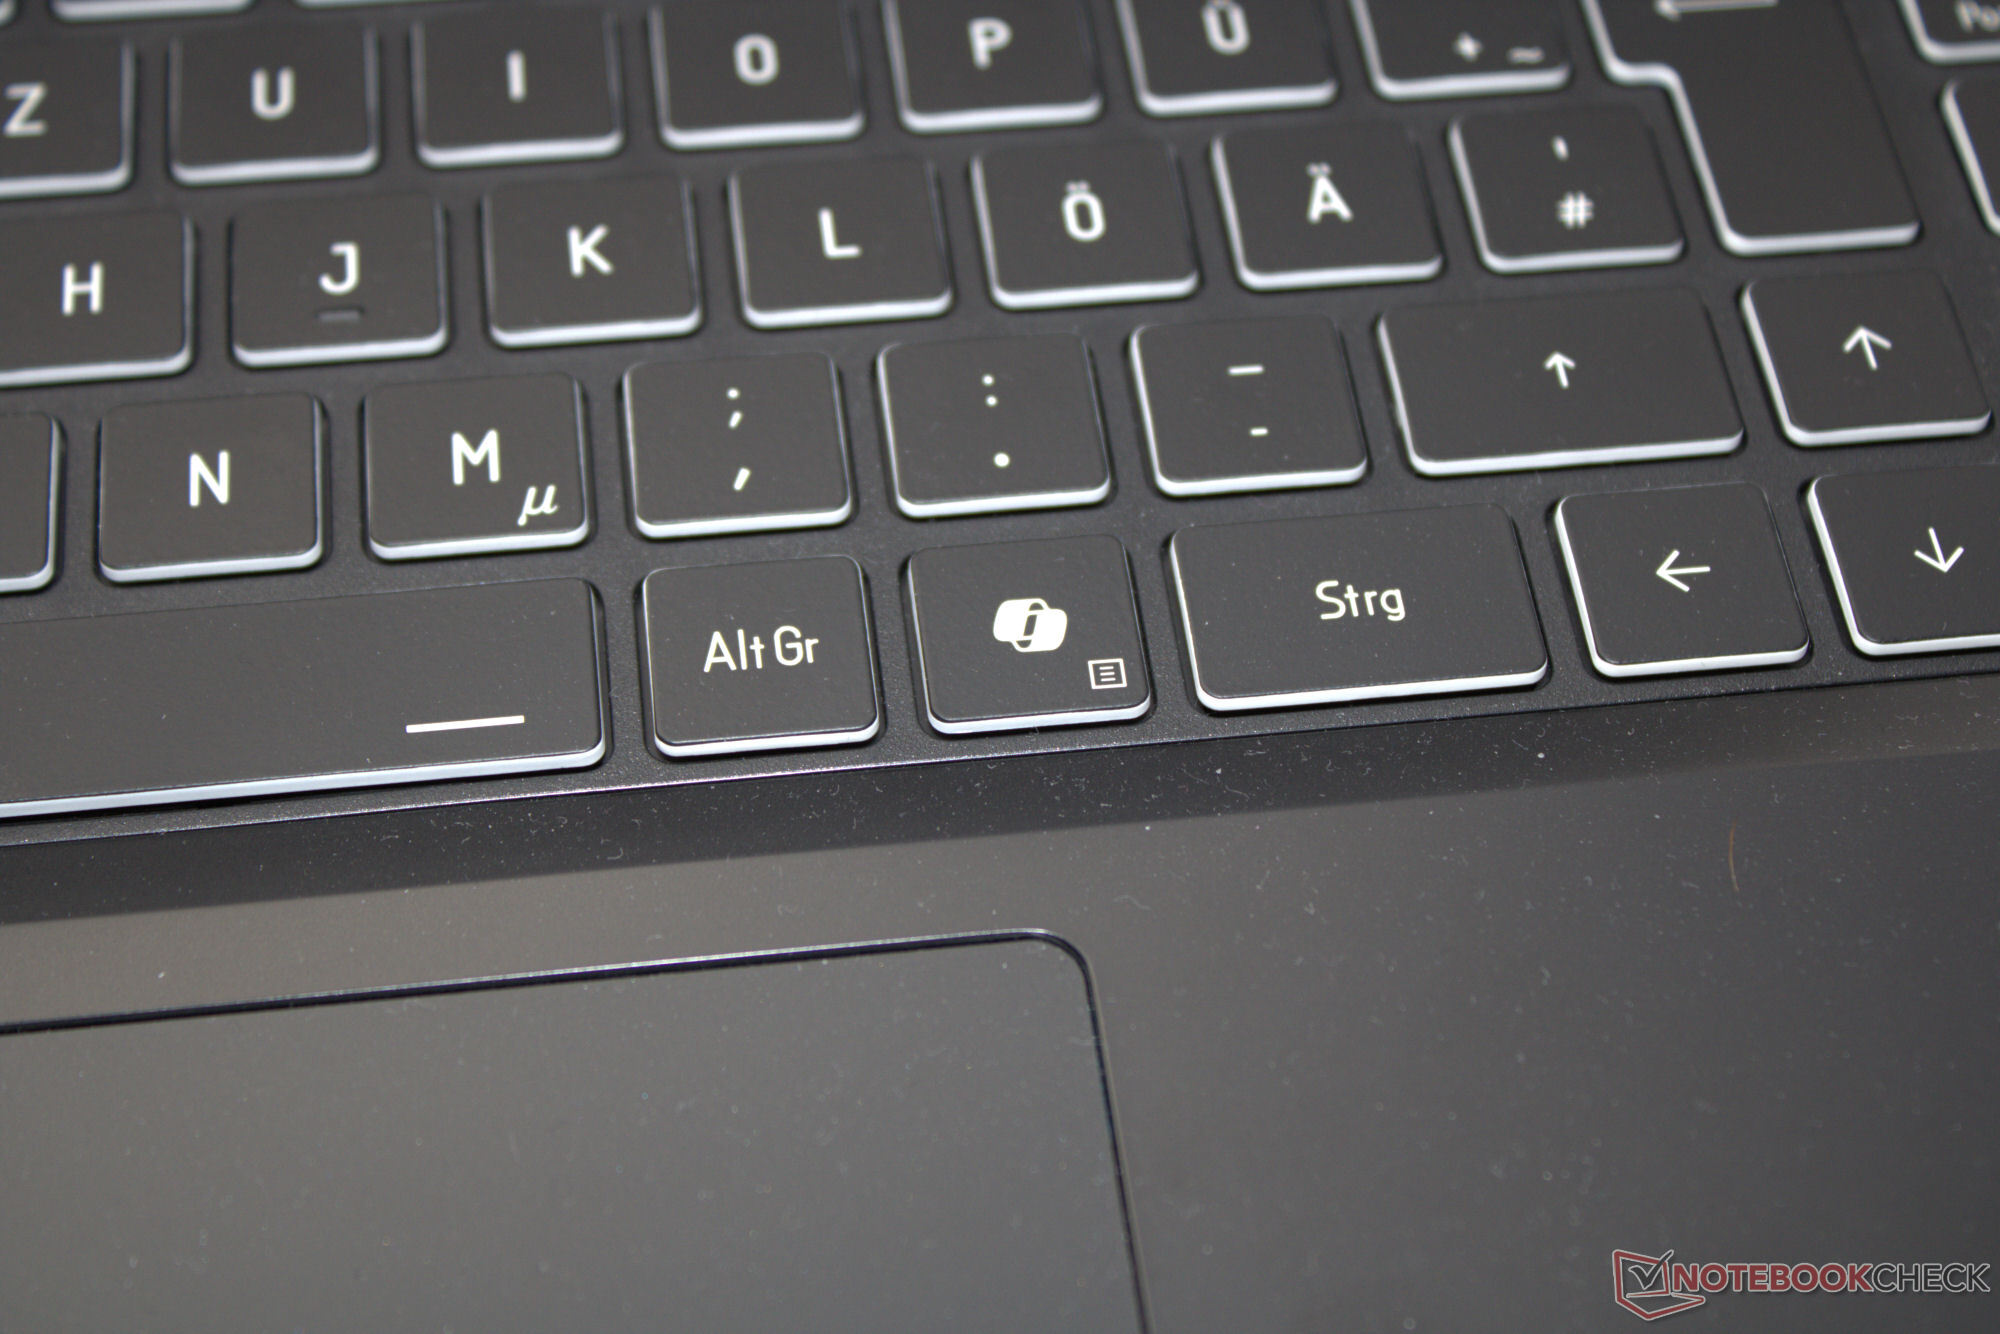
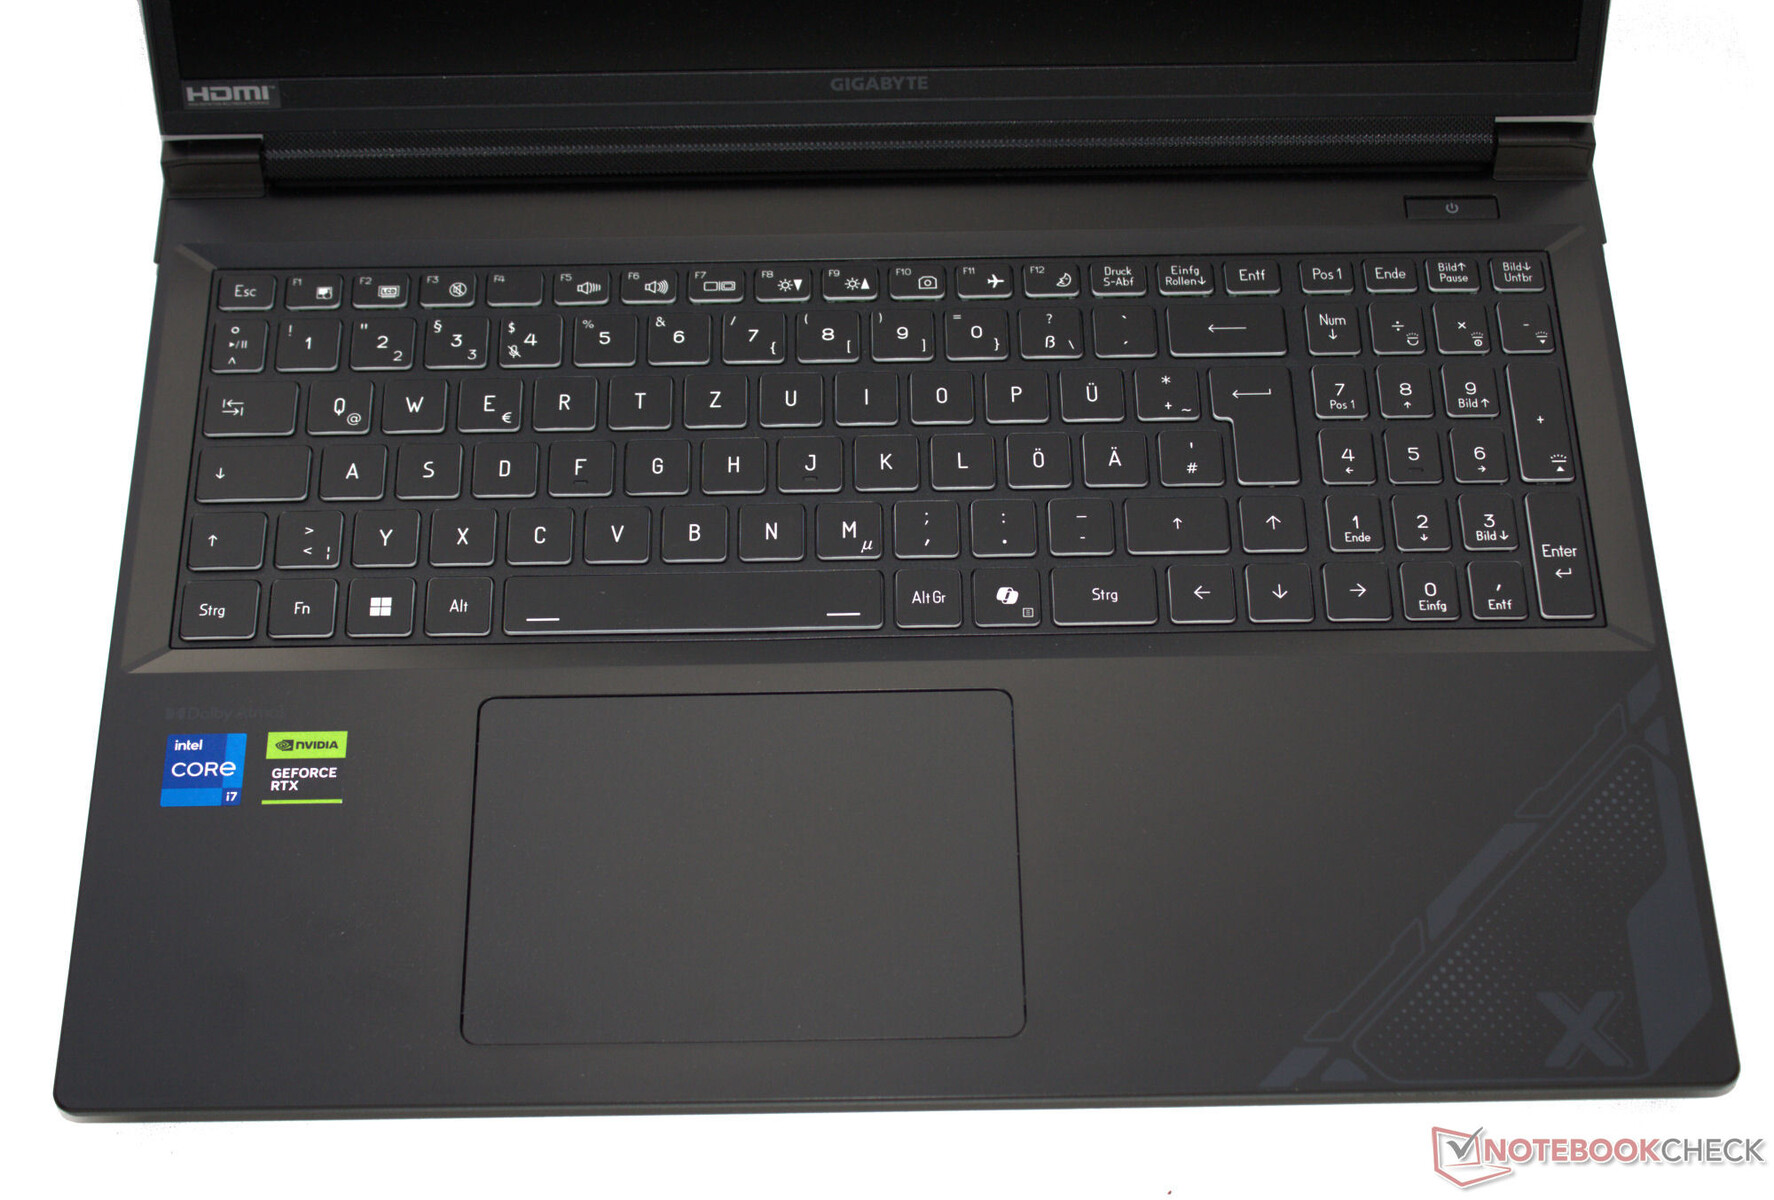
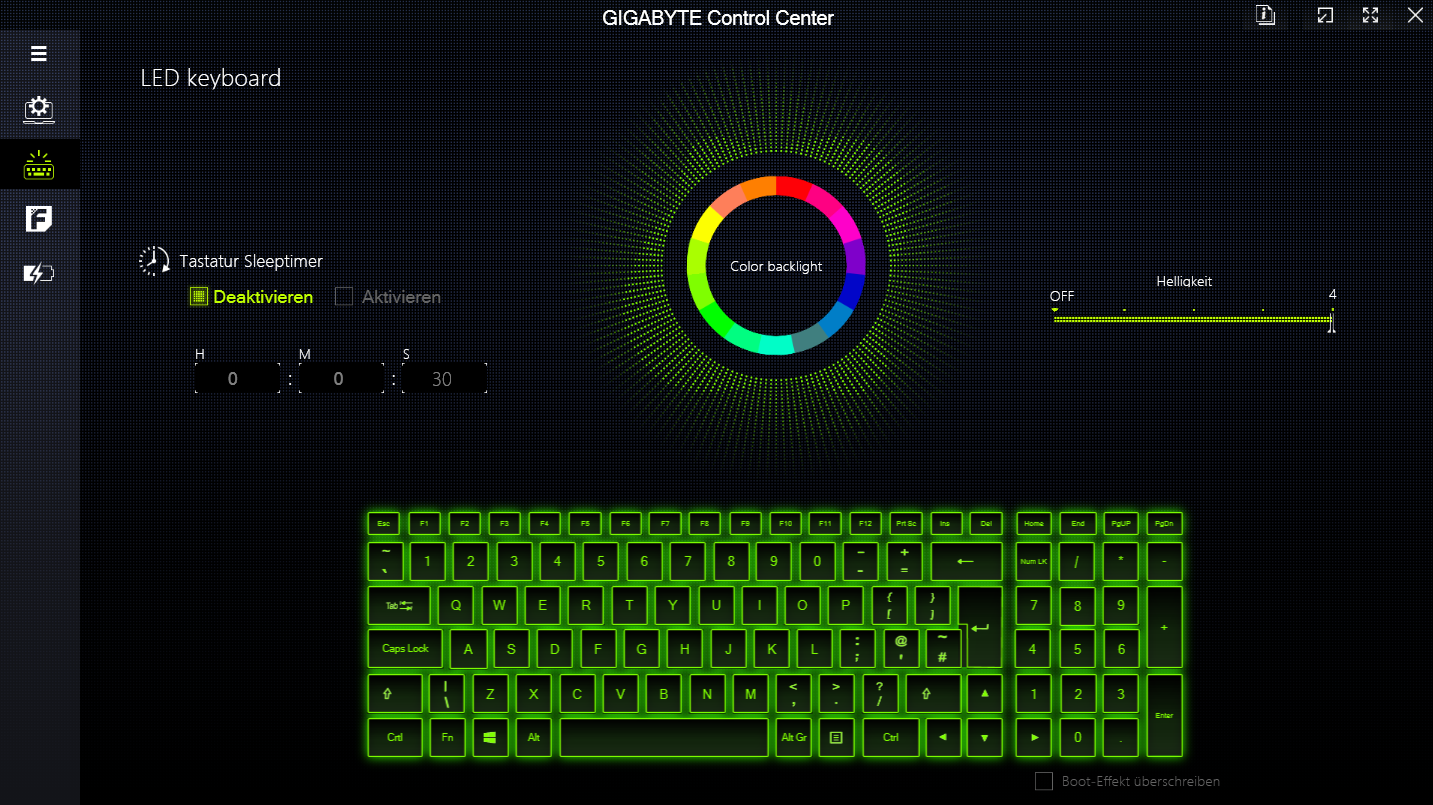
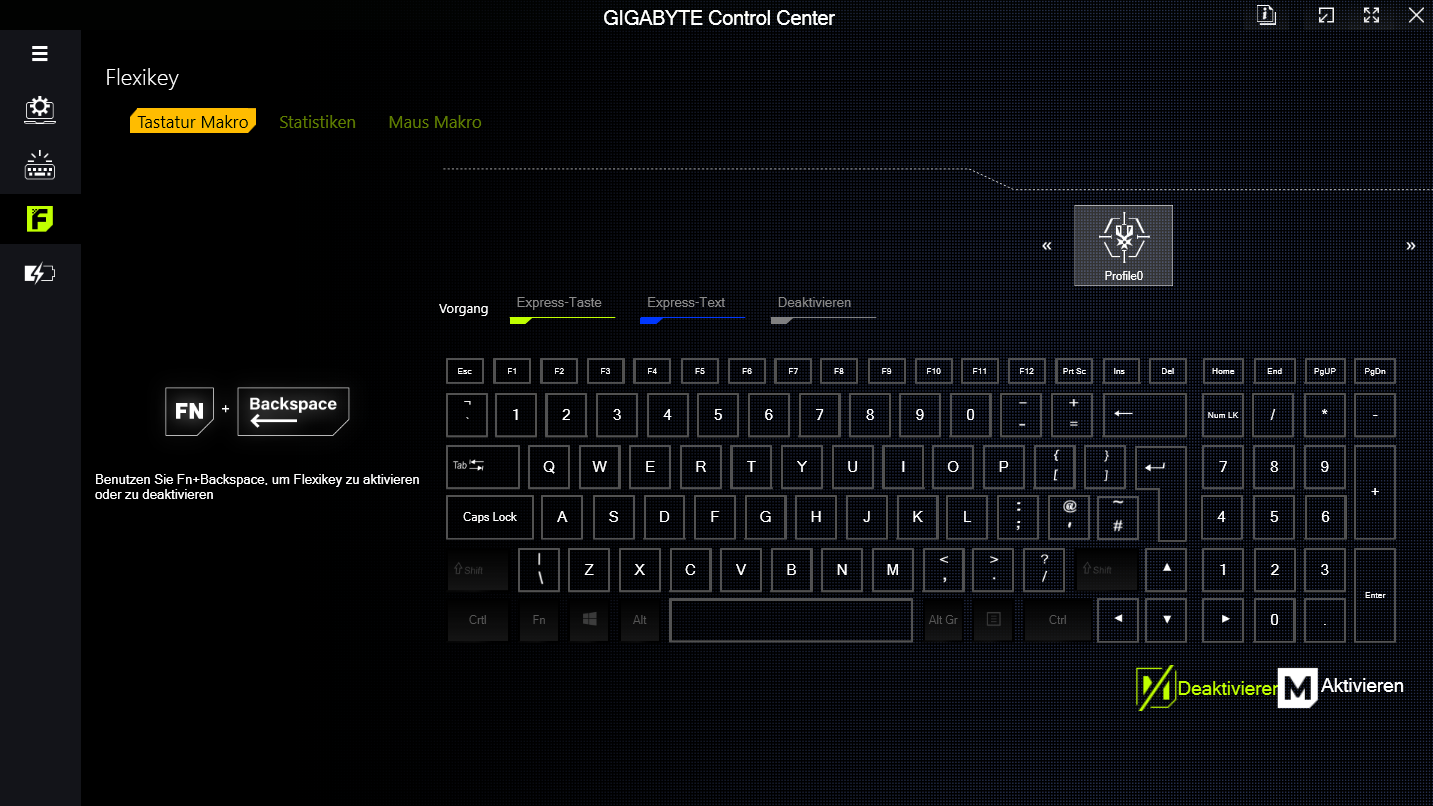
Dispositivos de entrada: Teclado retroiluminado adecuado para el uso diario
El G6X's luce un teclado chiclet con teclado numérico, iluminación RGB y teclas planas y suaves que se adaptan a las necesidades de escritura diarias. El teclado cede ligeramente al escribir, pero esto no es un problema.
La resistencia de las teclas se siente nítida. Un aspecto positivo es que las teclas de flecha son de tamaño normal.
Un touchpad multitáctil (12,1 cm x 8,5 cm) con un recorrido corto y un punto de presión claro sirve como sustituto del ratón.
Pantalla: FHD+ 165 Hz sin PWM
El panel 16:10 de 165 Hz con una resolución de 1920 x 1200 no muestra parpadeo PWM en ningún ajuste de brillo.
El brillo y el contraste de la pantalla mate de 16 pulgadas cumplen los respectivos objetivos anunciados (> 300 cd/m² y 1.000:1). Gigabyte no ofrece otras opciones de pantalla para el G6X.
| |||||||||||||||||||||||||
iluminación: 81 %
Brillo con batería: 353 cd/m²
Contraste: 1681:1 (Negro: 0.21 cd/m²)
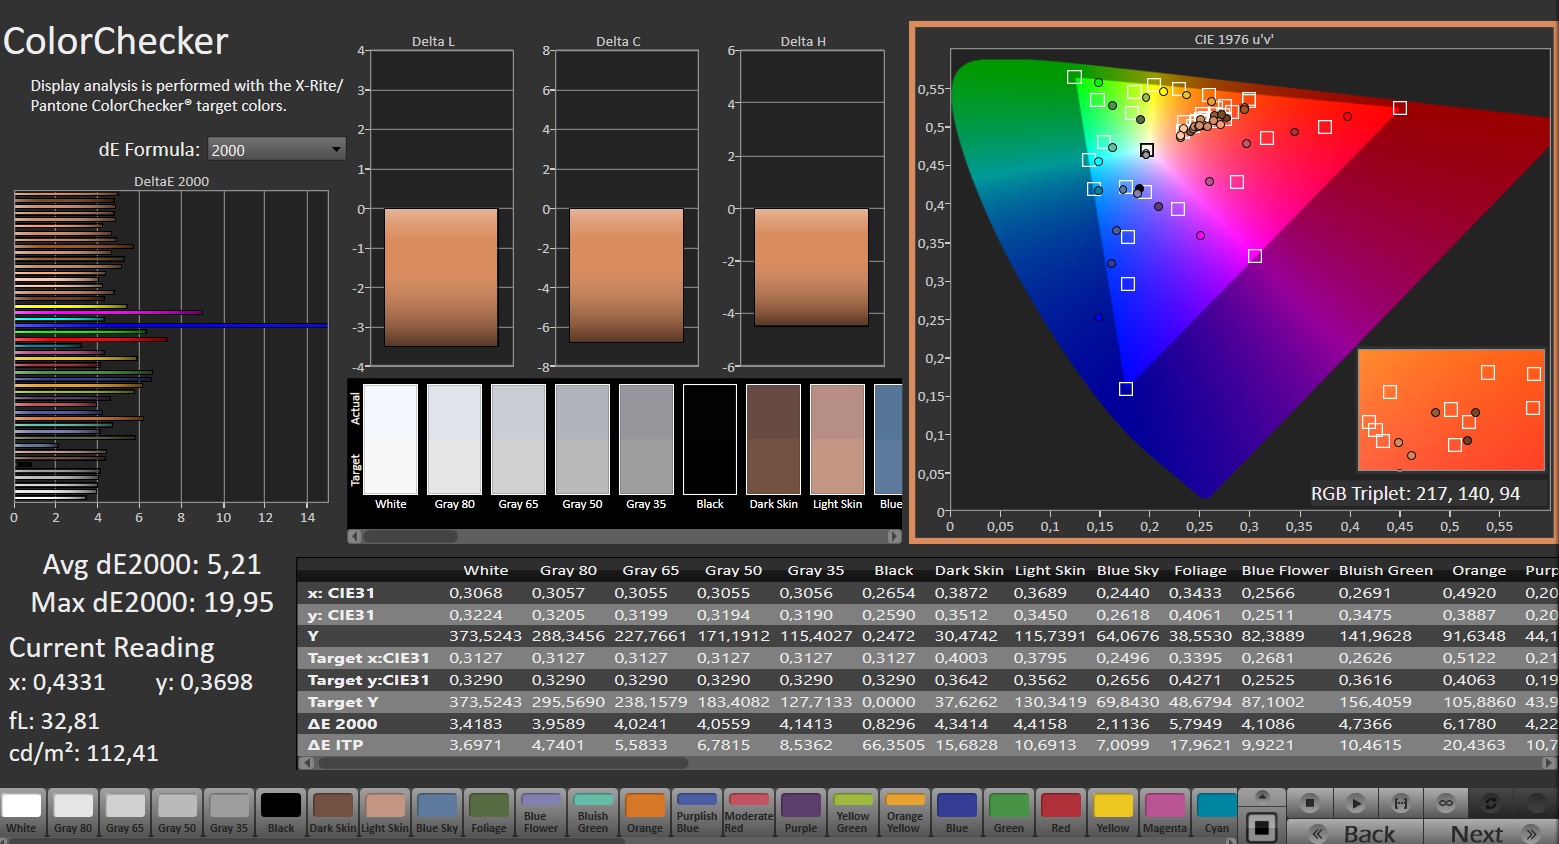
ΔE ColorChecker Calman: 5.21 | ∀{0.5-29.43 Ø4.71}
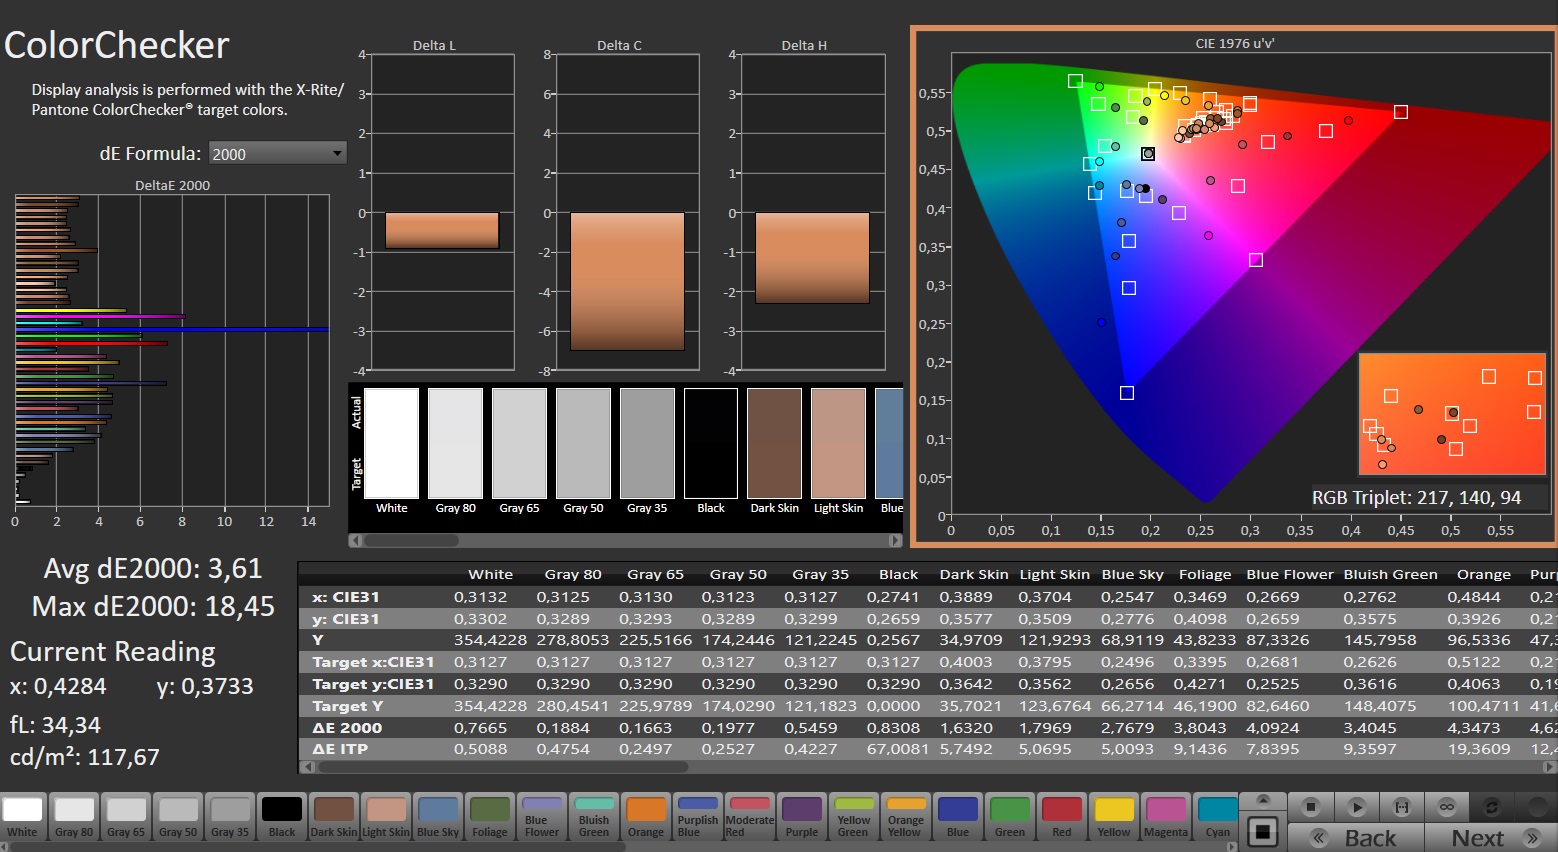
calibrated: 3.61
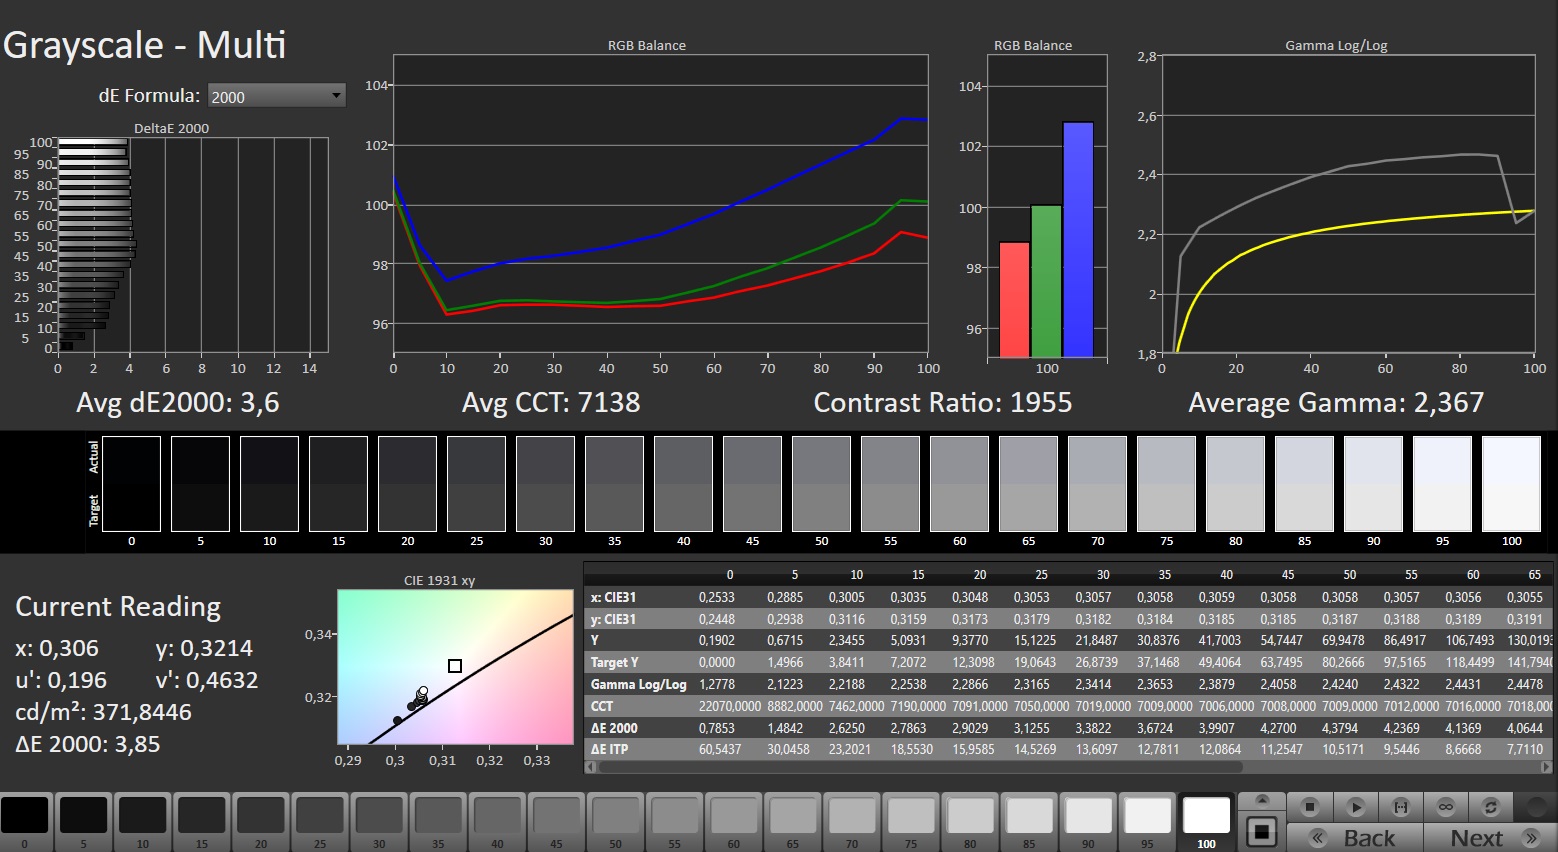
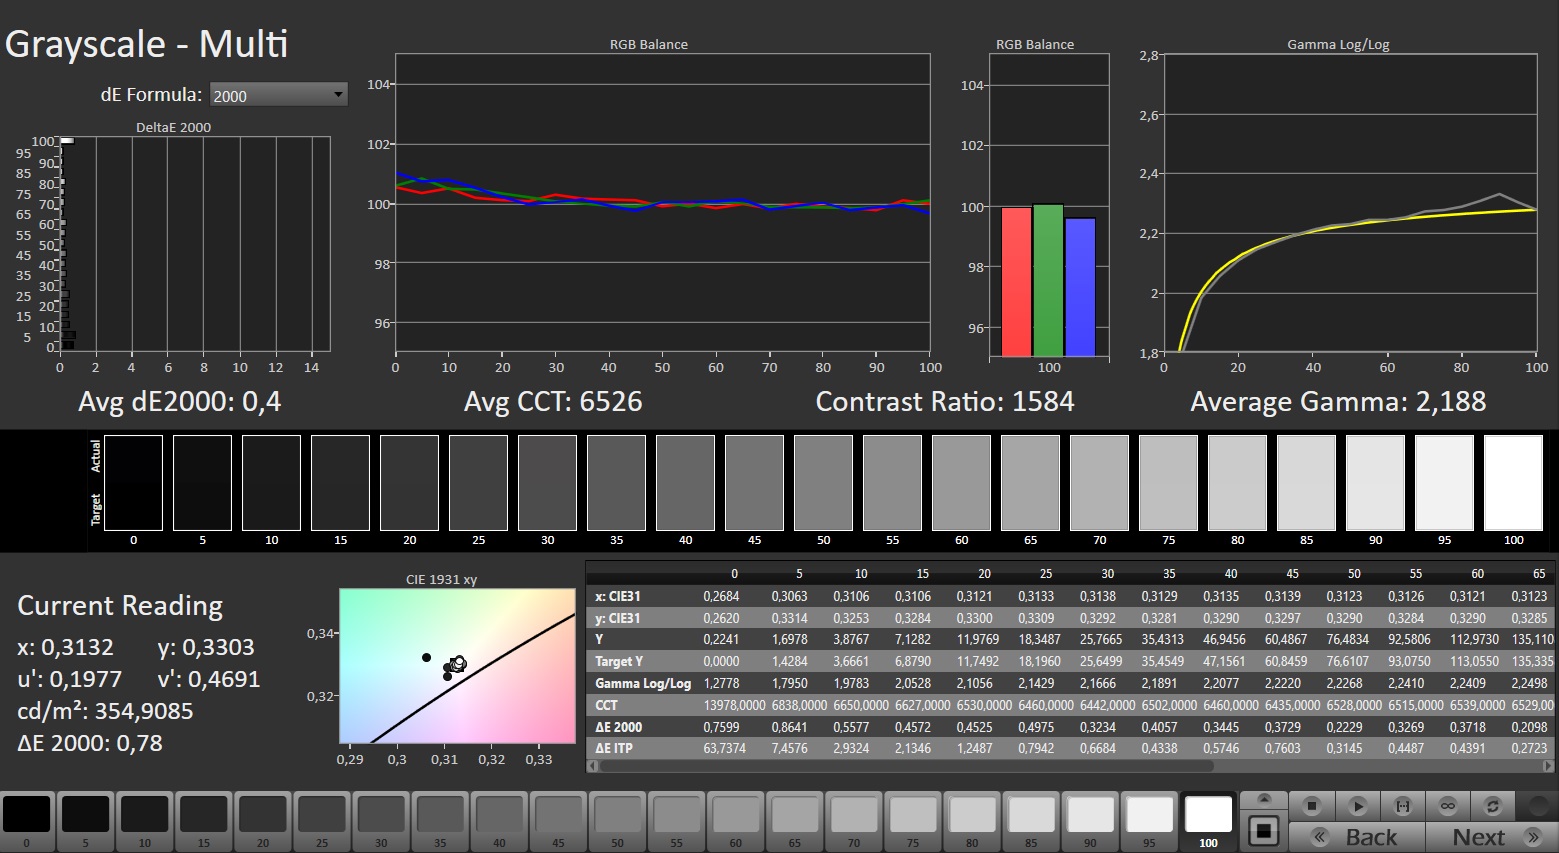
ΔE Greyscale Calman: 3.6 | ∀{0.09-98 Ø4.96}
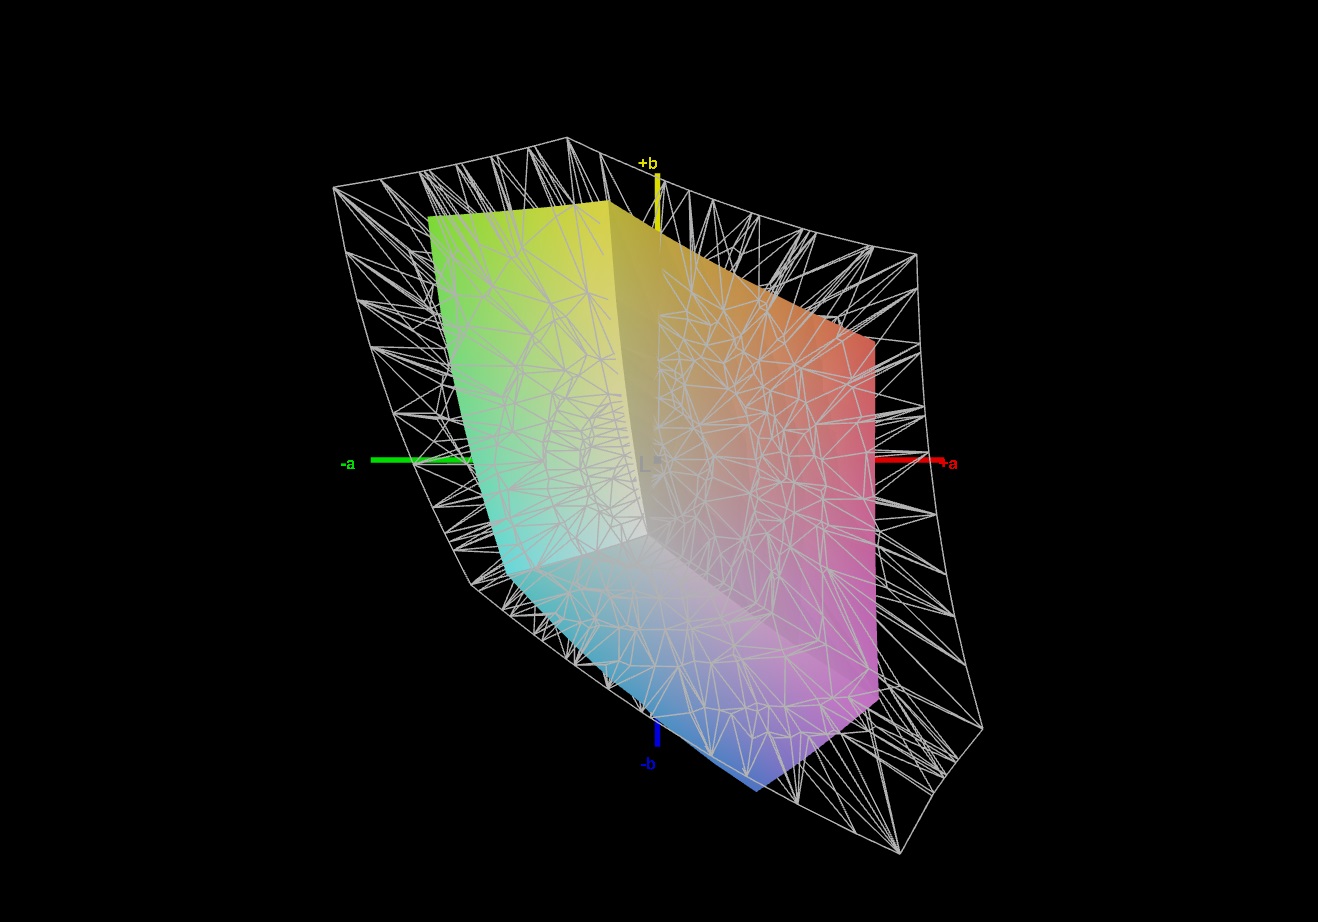
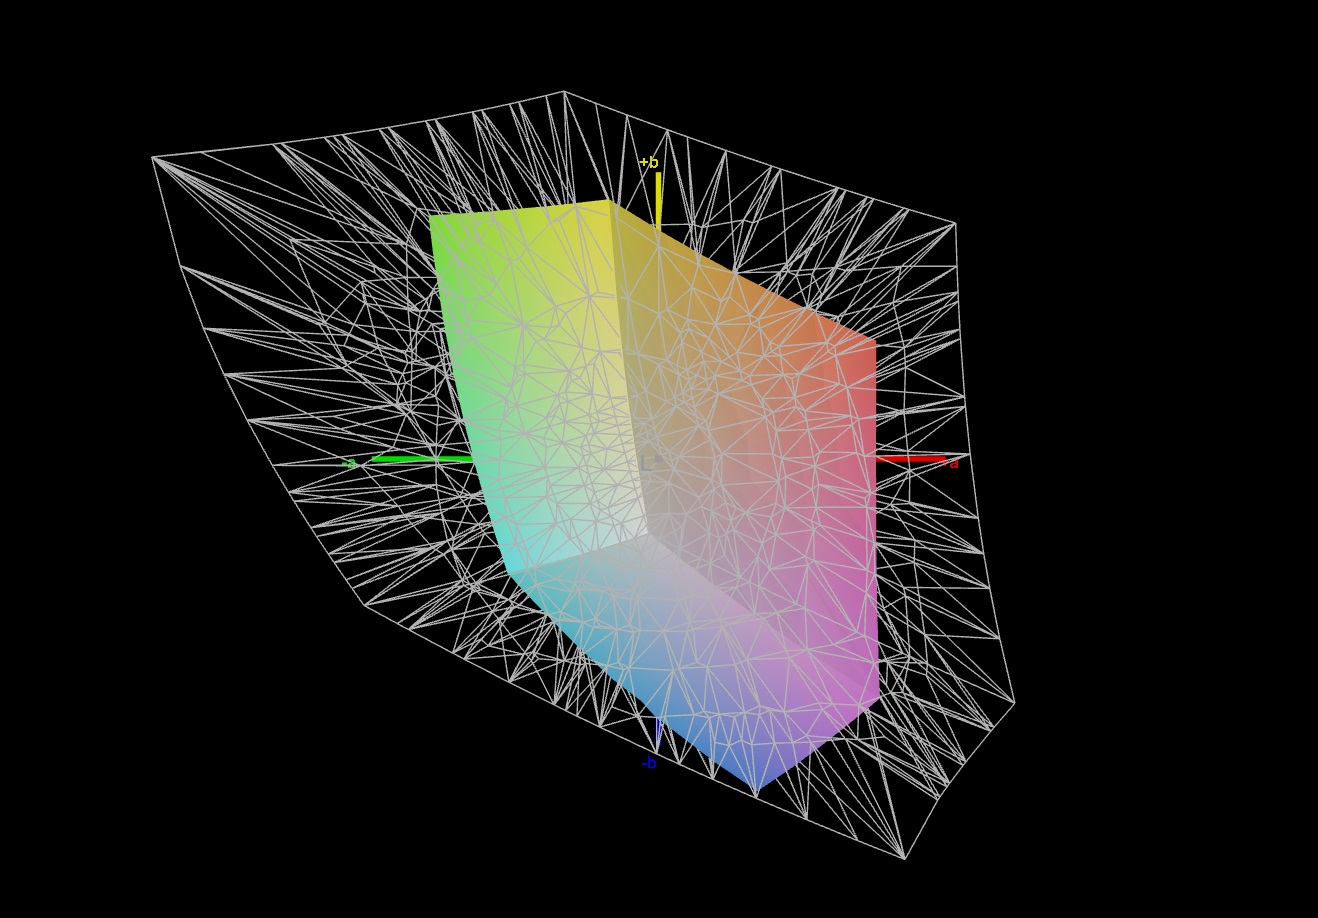
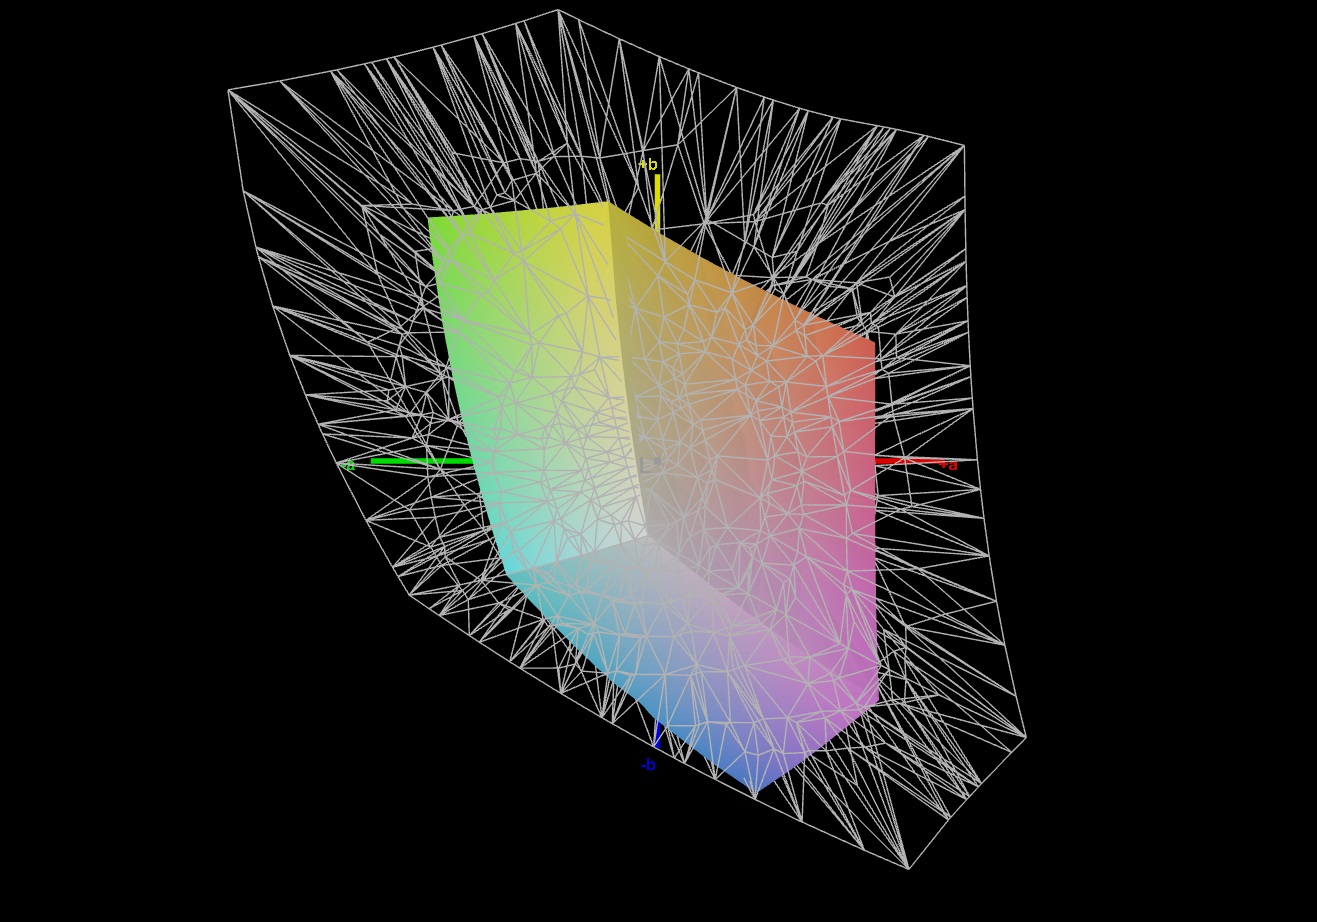
43.3% AdobeRGB 1998 (Argyll 3D)
62.4% sRGB (Argyll 3D)
41.8% Display P3 (Argyll 3D)
Gamma: 2.367
CCT: 7138 K
| Gigabyte G6X 9KG (2024) BOE NE160WUM-NX6, IPS, 1920x1200, 16" | Dell G16, i7-13650HX, RTX 4060 Chi Mei CMN161D (160GME), IPS, 2560x1600, 16" | Lenovo Legion 5 16IRX G9 NE160QDM-NZ3, IPS, 2560x1600, 16" | MSI Raider GE68HX 13VF Chi Mei N160JME-GTK, IPS, 1900x1200, 16" | Asus TUF Gaming A16 FA617XS BOE NE160WUM-NX2, IPS, 1920x1200, 16" | |
|---|---|---|---|---|---|
| Display | 60% | 68% | -0% | 62% | |
| Display P3 Coverage (%) | 41.8 | 67.5 61% | 72.4 73% | 41.6 0% | 69.3 66% |
| sRGB Coverage (%) | 62.4 | 98.5 58% | 100 60% | 62.2 0% | 97.3 56% |
| AdobeRGB 1998 Coverage (%) | 43.3 | 69.3 60% | 74.1 71% | 43 -1% | 70.7 63% |
| Response Times | 67% | 65% | 23% | 58% | |
| Response Time Grey 50% / Grey 80% * (ms) | 40.5 ? | 7.6 ? 81% | 12.5 ? 69% | 17.3 ? 57% | 15.6 ? 61% |
| Response Time Black / White * (ms) | 21.6 ? | 10.4 ? 52% | 8.7 ? 60% | 24.2 ? -12% | 10 ? 54% |
| PWM Frequency (Hz) | |||||
| Screen | 15% | 39% | -2% | 25% | |
| Brightness middle (cd/m²) | 353 | 369 5% | 526 49% | 300.9 -15% | 301 -15% |
| Brightness (cd/m²) | 318 | 344 8% | 500 57% | 302 -5% | 294 -8% |
| Brightness Distribution (%) | 81 | 89 10% | 87 7% | 93 15% | 94 16% |
| Black Level * (cd/m²) | 0.21 | 0.26 -24% | 0.33 -57% | 0.31 -48% | 0.21 -0% |
| Contrast (:1) | 1681 | 1419 -16% | 1594 -5% | 971 -42% | 1433 -15% |
| Colorchecker dE 2000 * | 5.21 | 3.04 42% | 1.2 77% | 4.6 12% | 1.79 66% |
| Colorchecker dE 2000 max. * | 19.95 | 5.56 72% | 2.1 89% | 17.6 12% | 3.48 83% |
| Colorchecker dE 2000 calibrated * | 3.61 | 2.35 35% | 1 72% | 2.04 43% | 1.2 67% |
| Greyscale dE 2000 * | 3.6 | 3.38 6% | 1.3 64% | 3.3 8% | 2.5 31% |
| Gamma | 2.367 93% | 2.47 89% | 2.23 99% | 2.09 105% | 2.265 97% |
| CCT | 7138 91% | 6040 108% | 6391 102% | 7151 91% | 6157 106% |
| Media total (Programa/Opciones) | 47% /
32% | 57% /
49% | 7% /
2% | 48% /
38% |
* ... más pequeño es mejor
La pantalla muestra una reproducción del color mediocre de fábrica: Con una desviación de alrededor de 5,2, no se cumple el objetivo deltaE 2000 de < 3. El calibrado reduce la desviación a 3,6 y garantiza unos tonos de gris más equilibrados.
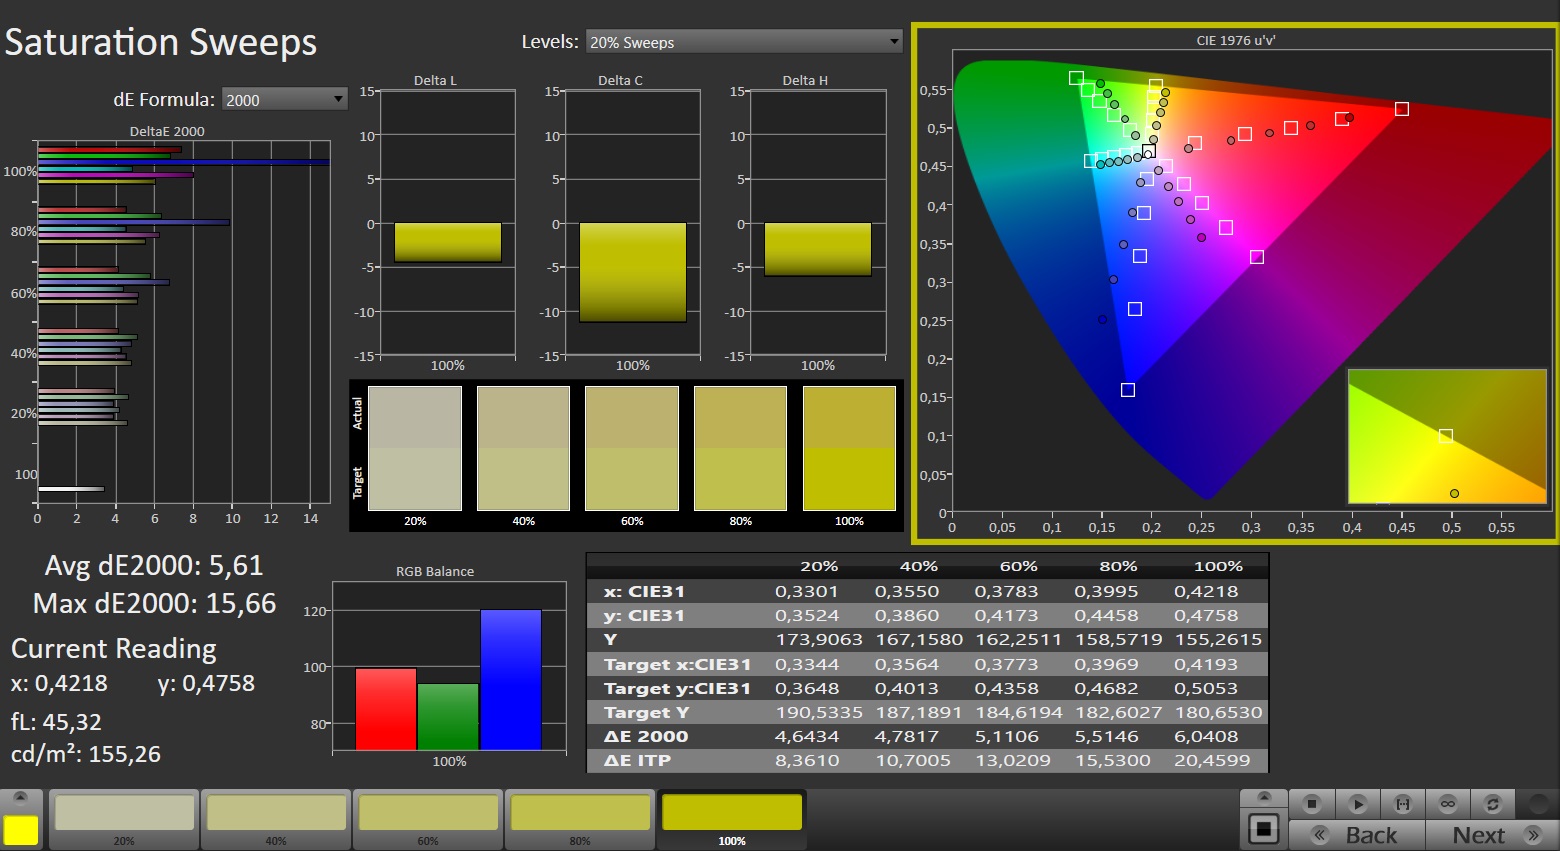
El panel no puede reproducir completamente los espacios de color AdobeRGB, sRGB y DCI-P3. En este aspecto, los competidores del G6X ofrecen mejores pantallas.

Tiempos de respuesta del display
| ↔ Tiempo de respuesta de Negro a Blanco | ||
|---|---|---|
| 21.6 ms ... subida ↗ y bajada ↘ combinada | ↗ 11.1 ms subida | 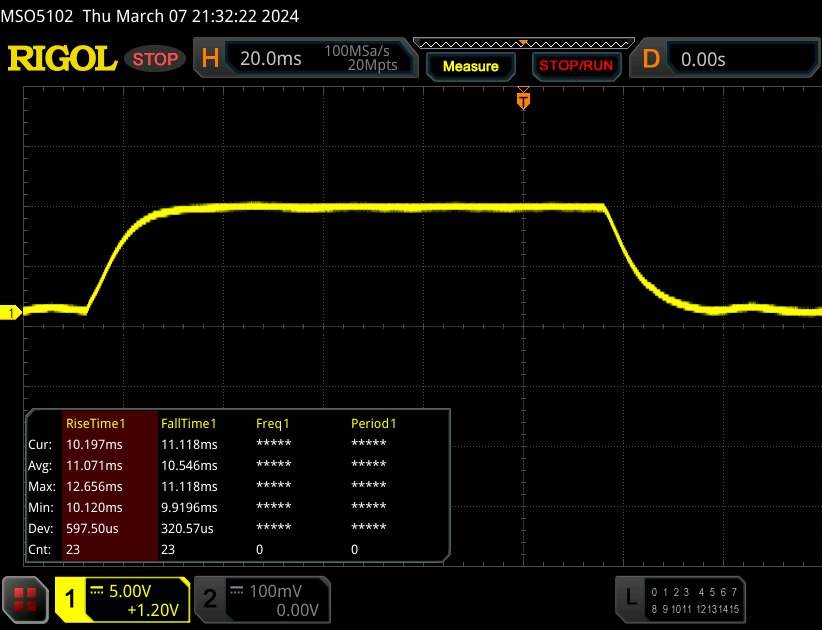 |
| ↘ 10.5 ms bajada | ||
| La pantalla mostró buenos tiempos de respuesta en nuestros tests pero podría ser demasiado lenta para los jugones competitivos. En comparación, todos los dispositivos de prueba van de ##min### (mínimo) a 240 (máximo) ms. » 48 % de todos los dispositivos son mejores. Eso quiere decir que el tiempo de respuesta es similar al dispositivo testado medio (19.8 ms). | ||
| ↔ Tiempo de respuesta 50% Gris a 80% Gris | ||
| 40.5 ms ... subida ↗ y bajada ↘ combinada | ↗ 19 ms subida | 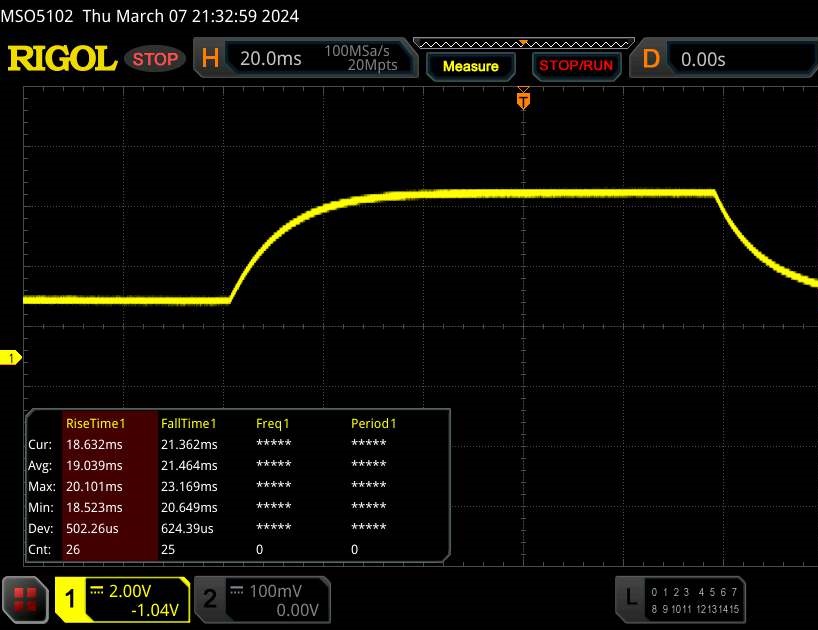 |
| ↘ 21.5 ms bajada | ||
| La pantalla mostró tiempos de respuesta lentos en nuestros tests y podría ser demasiado lenta para los jugones. En comparación, todos los dispositivos de prueba van de ##min### (mínimo) a 636 (máximo) ms. » 64 % de todos los dispositivos son mejores. Eso quiere decir que el tiempo de respuesta es peor que la media (30.9 ms) de todos los dispositivos testados. | ||
Parpadeo de Pantalla / PWM (Pulse-Width Modulation)
| Parpadeo de Pantalla / PWM no detectado |  | ||
Comparación: 52 % de todos los dispositivos testados no usaron PWM para atenuar el display. Si se usó, medimos una media de 7744 (mínimo: 5 - máxmo: 343500) Hz. | |||
El panel IPS ofrece ángulos de visión relativamente estables que pueden leerse desde posiciones extremas. Es posible utilizar la pantalla en exteriores si el sol no es demasiado brillante.
Rendimiento: Raptor Lake y Ada Lovelace impulsan el 16 pulgadas
Gigabyte ofrece un portátil para juegos de gama media con el G6X 9KG. Raptor Lake-HX y Ada Lovelace proporcionan la potencia de cálculo necesaria.
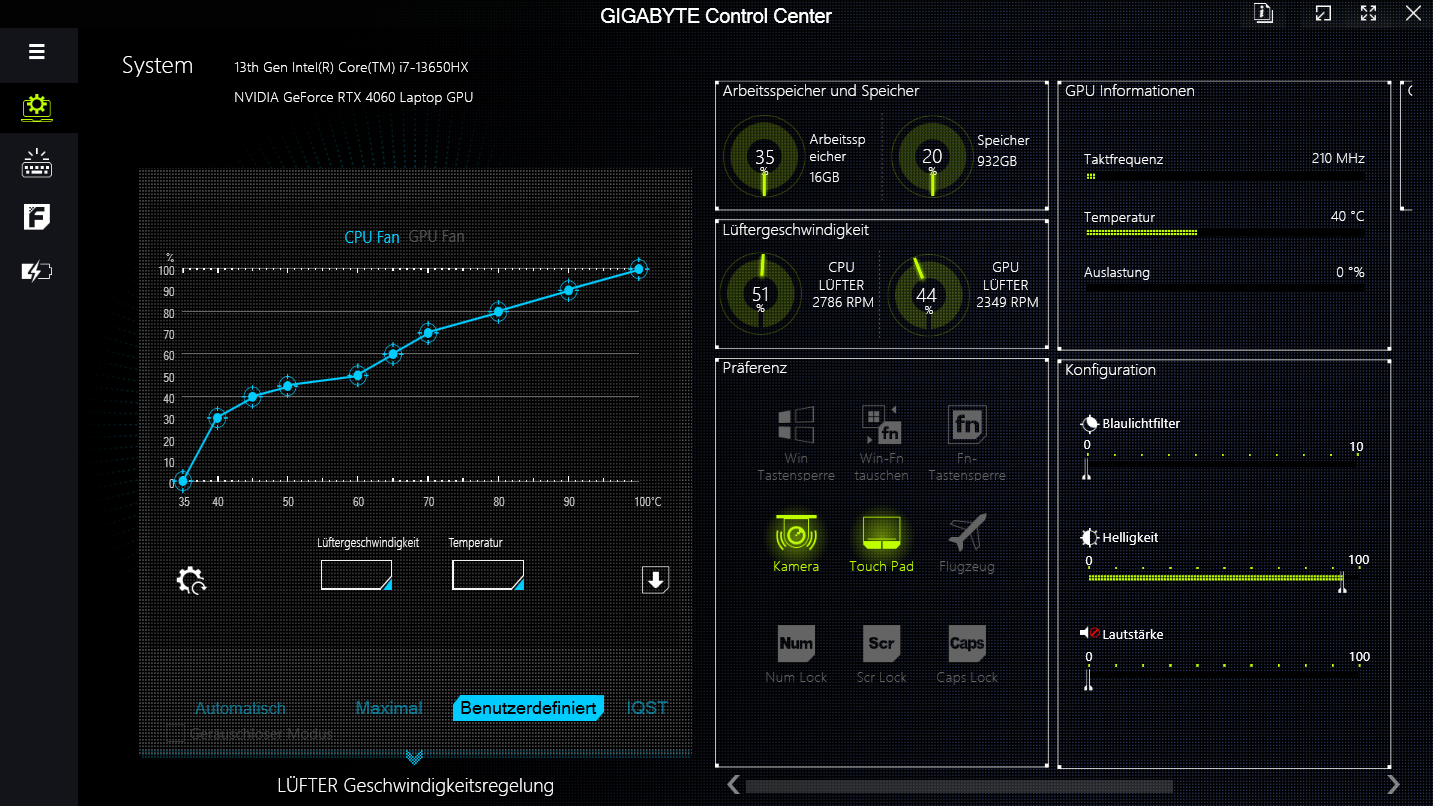
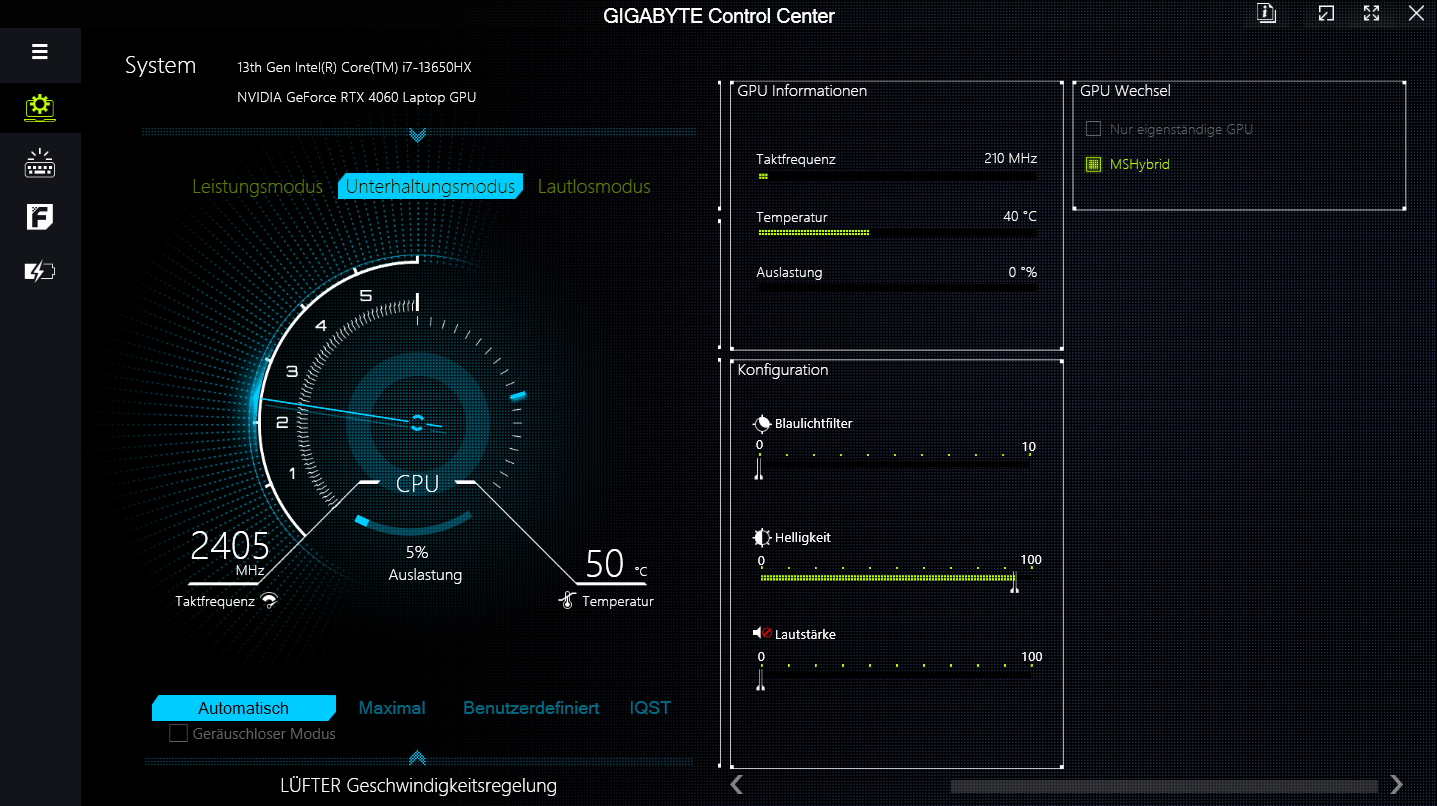
Condiciones de la prueba
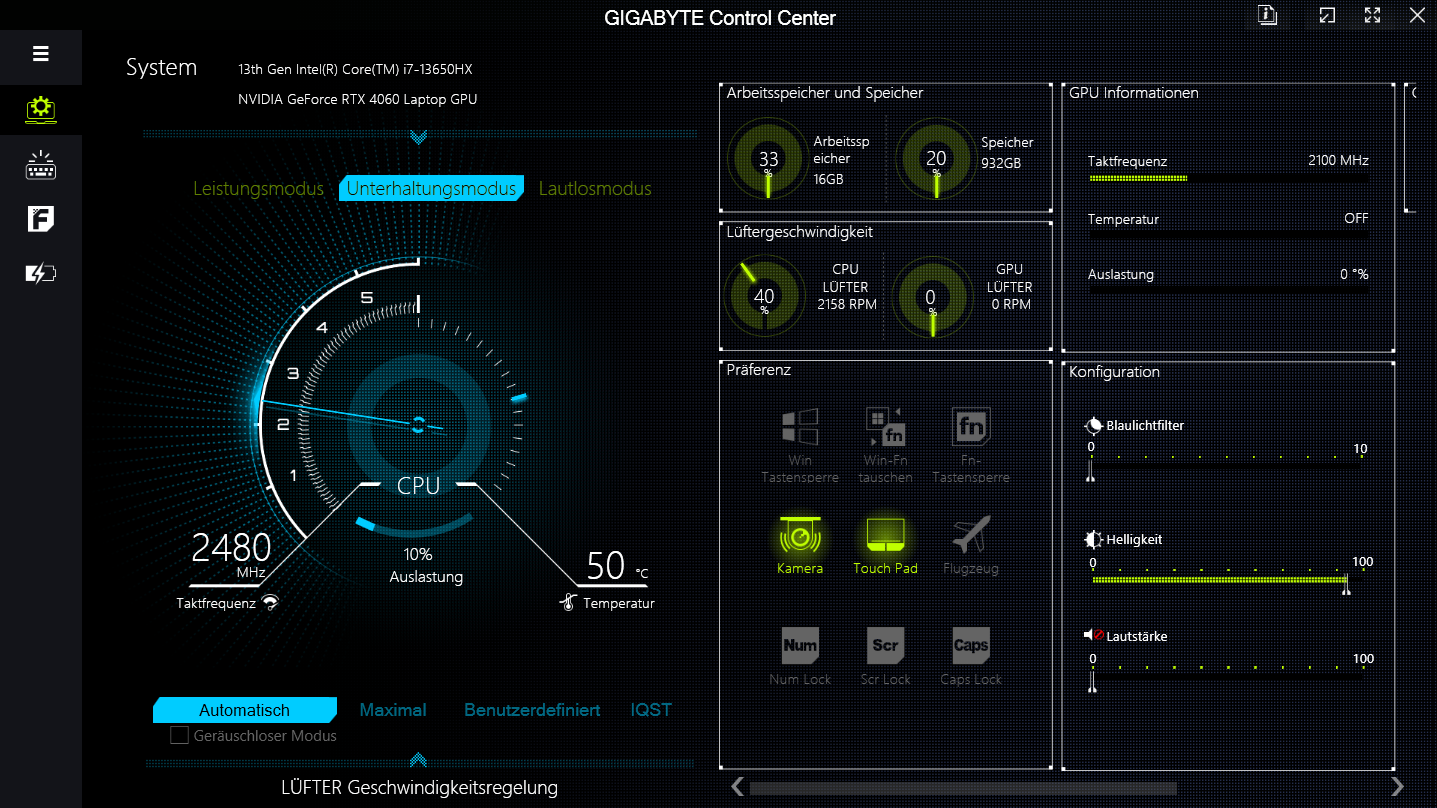
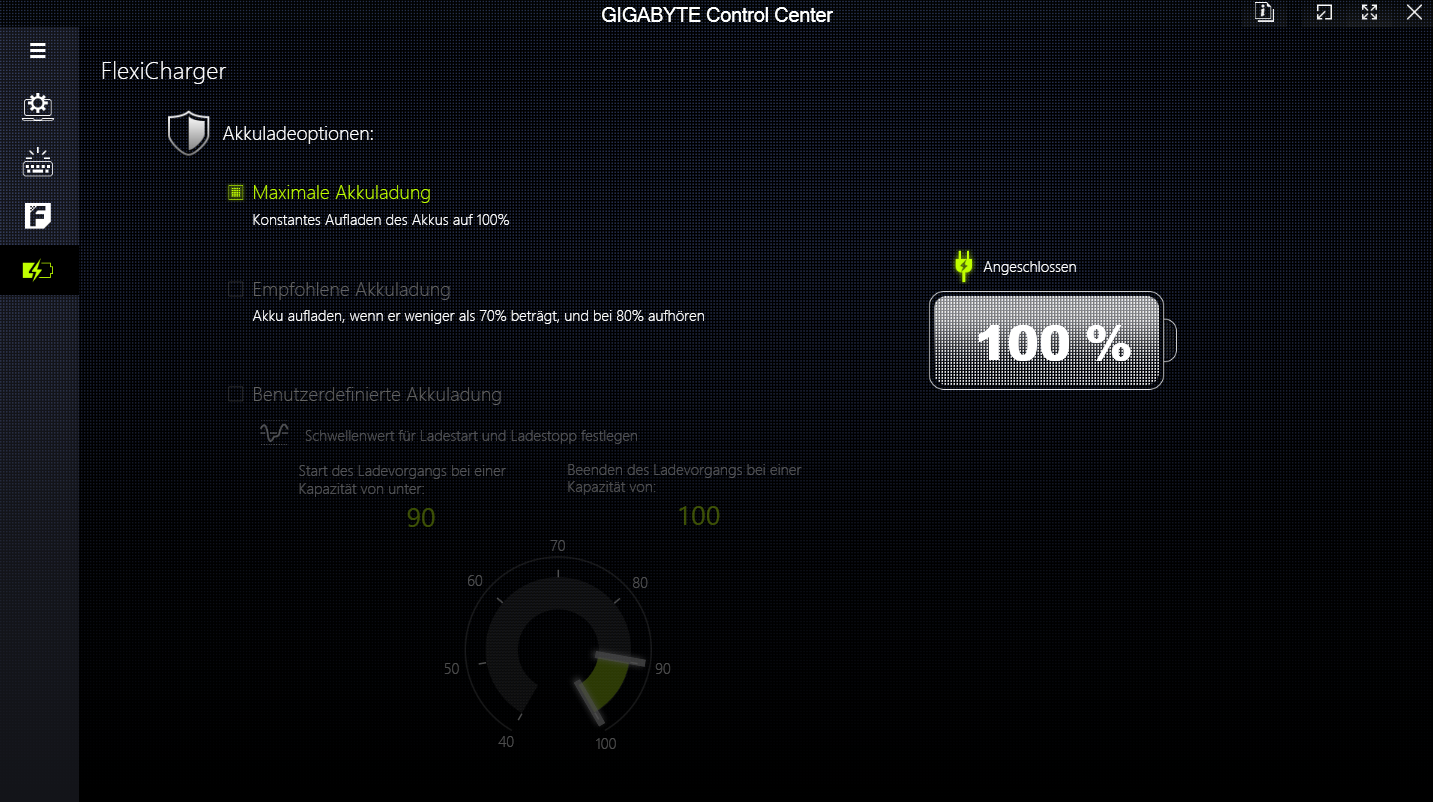
El G6X ofrece tres modos de rendimiento específicos del fabricante (véase la tabla siguiente), entre los que se puede cambiar a través de la aplicación Centro de control. El "modo Entretenimiento" se utilizó para los puntos de referencia, mientras que el "modo Silencio" se empleó para las pruebas de batería. Ambos modos ofrecen control automático del ventilador.
| Modo de rendimiento | Modo de entretenimiento | Modo silencioso (= dGPU apagada) | |
|---|---|---|---|
| Límite de potencia 1 (HWInfo) | 135 W | 55 W | 25 W |
| Límite de potencia 2 (HWInfo) | 155 W | 115 W | 30 W |
| Ruido (El Witcher 3 1080p Ultra) | 55 dB(A) | 51 dB(A) | 33 dB(A) |
| Rendimiento (El Witcher 3 1080p Ultra) | ~102 fps | ~100 fps | 4 fps |
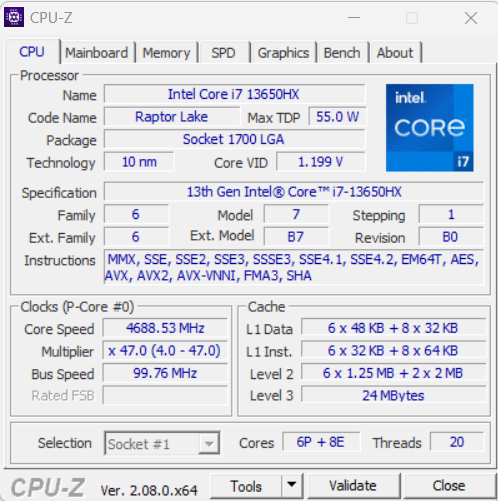
Procesador
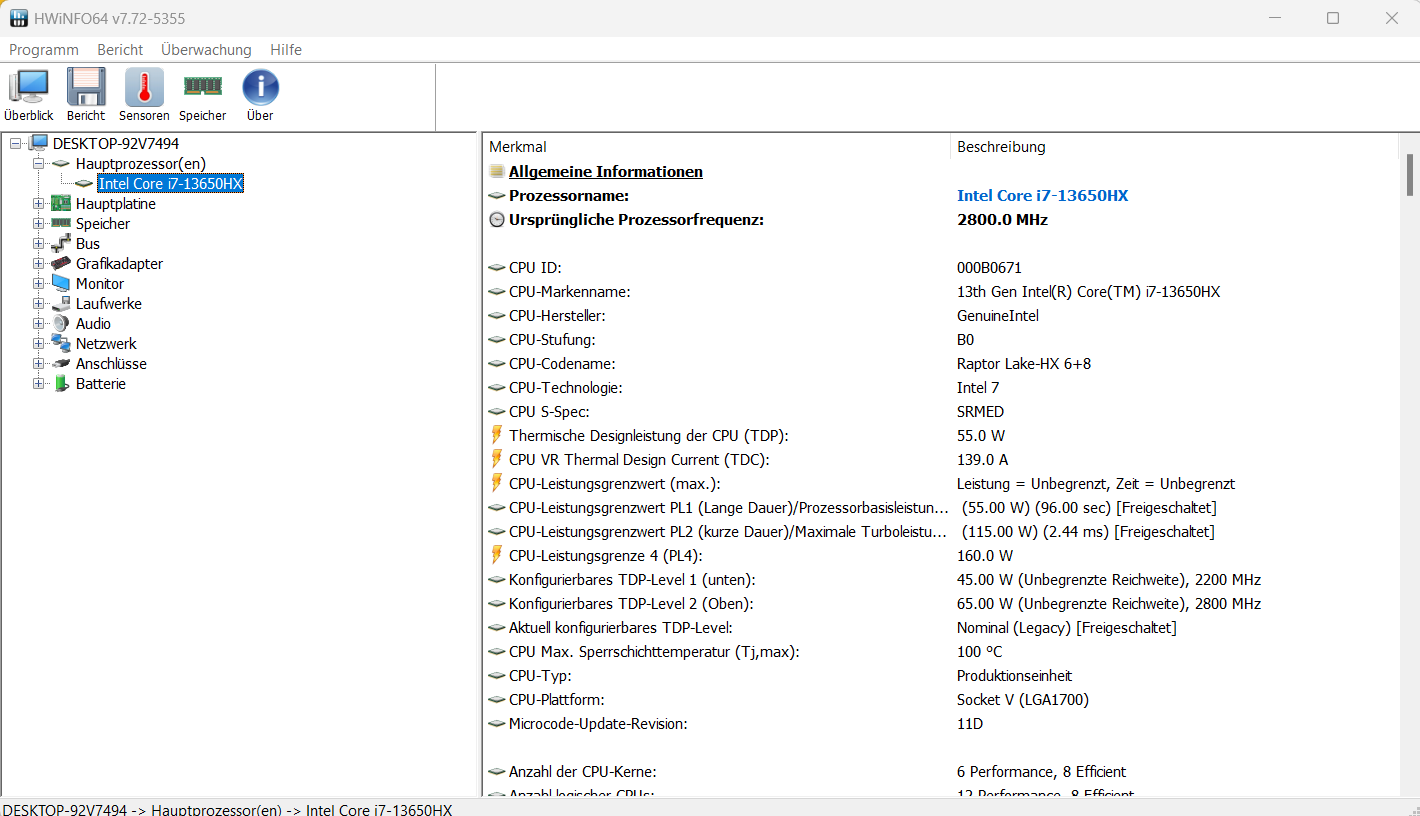
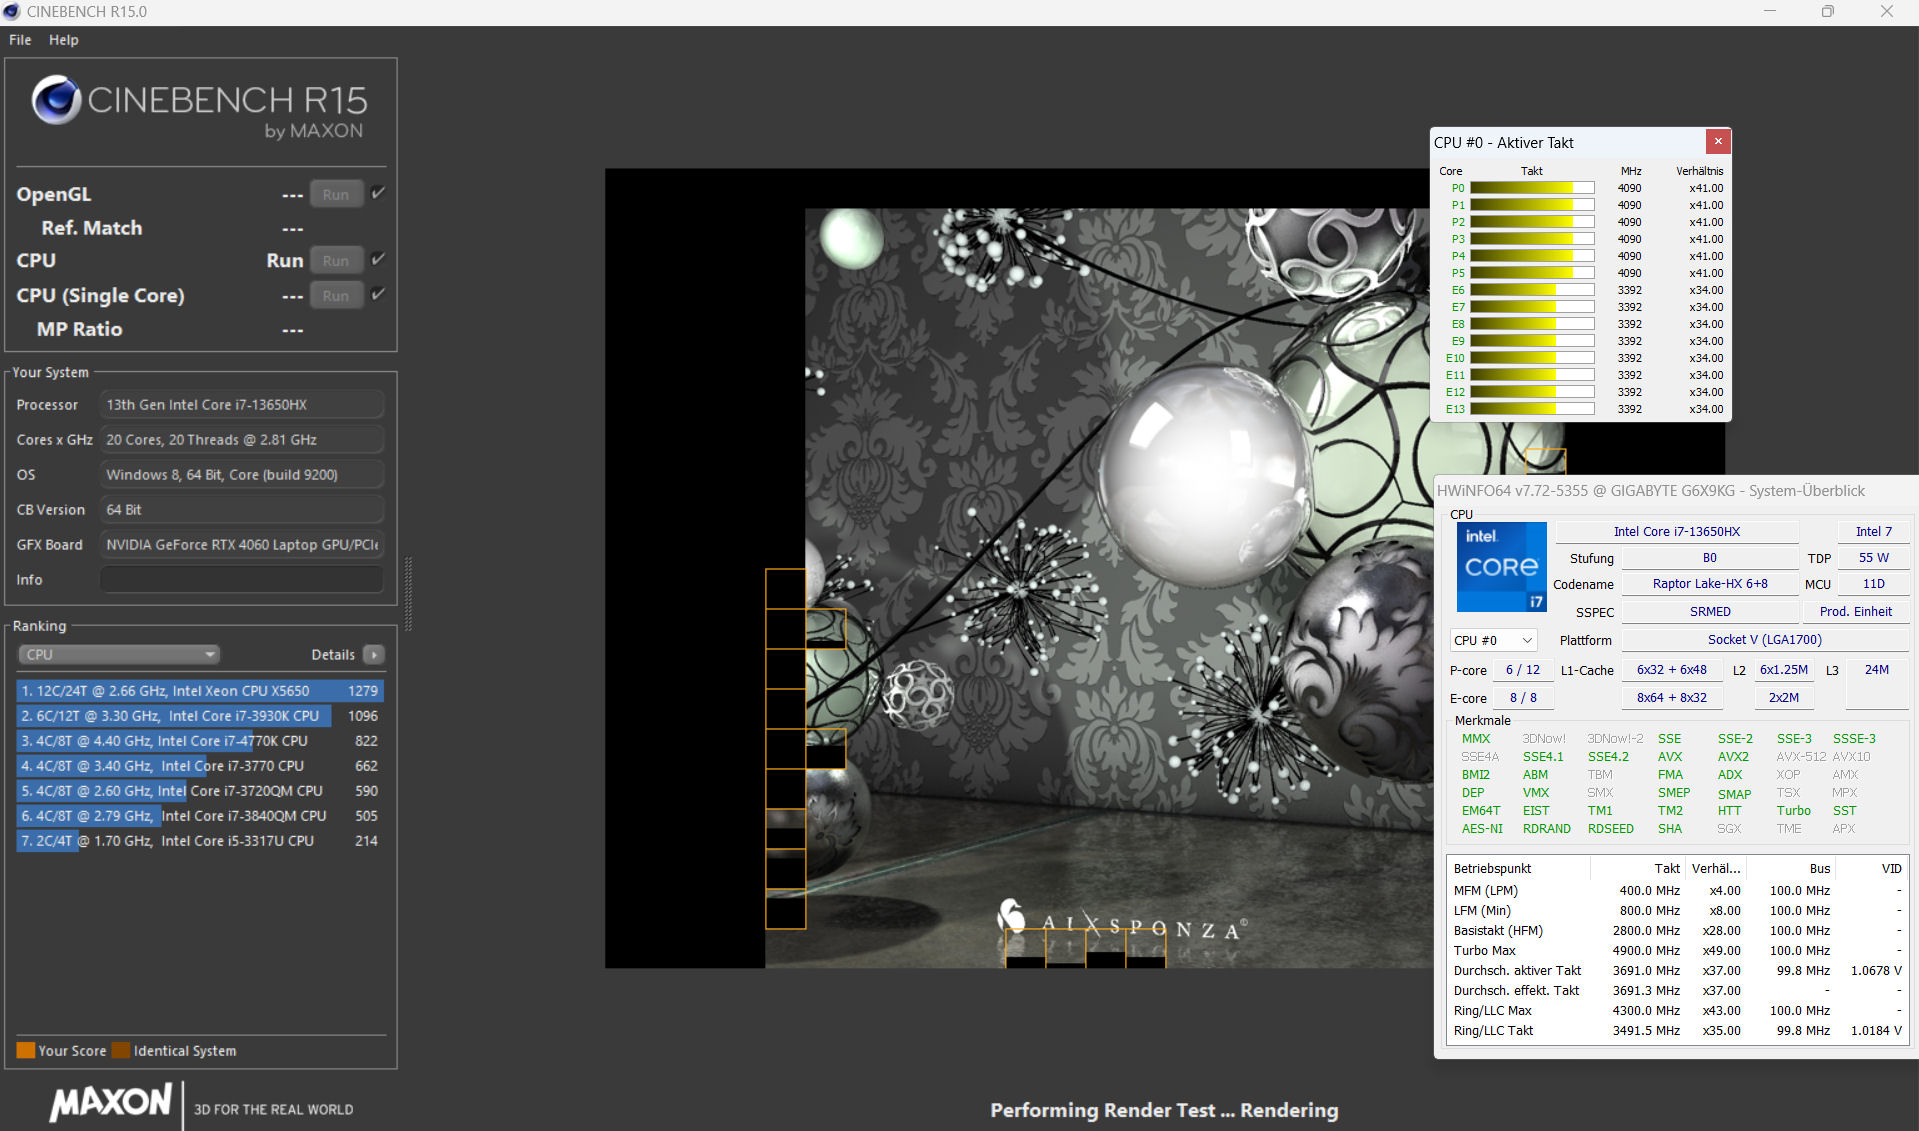
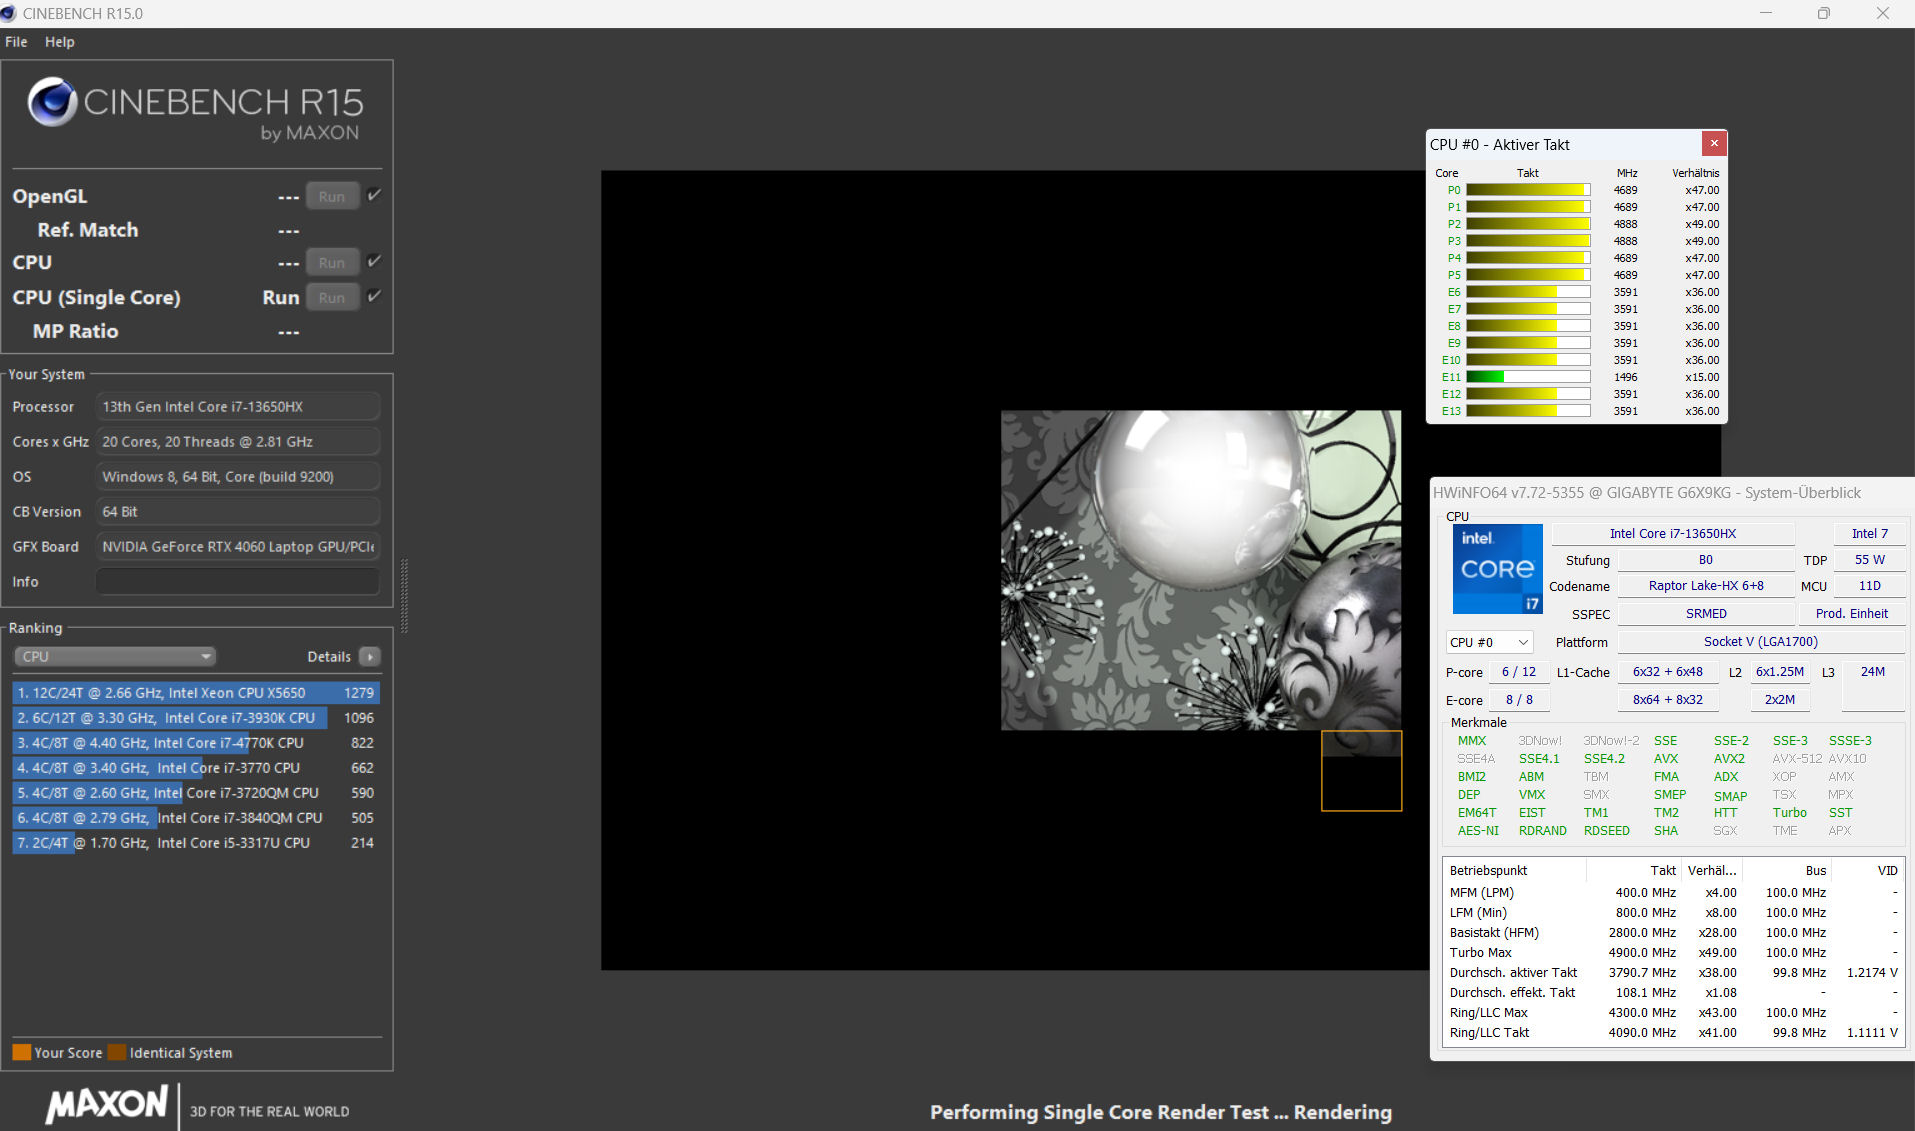
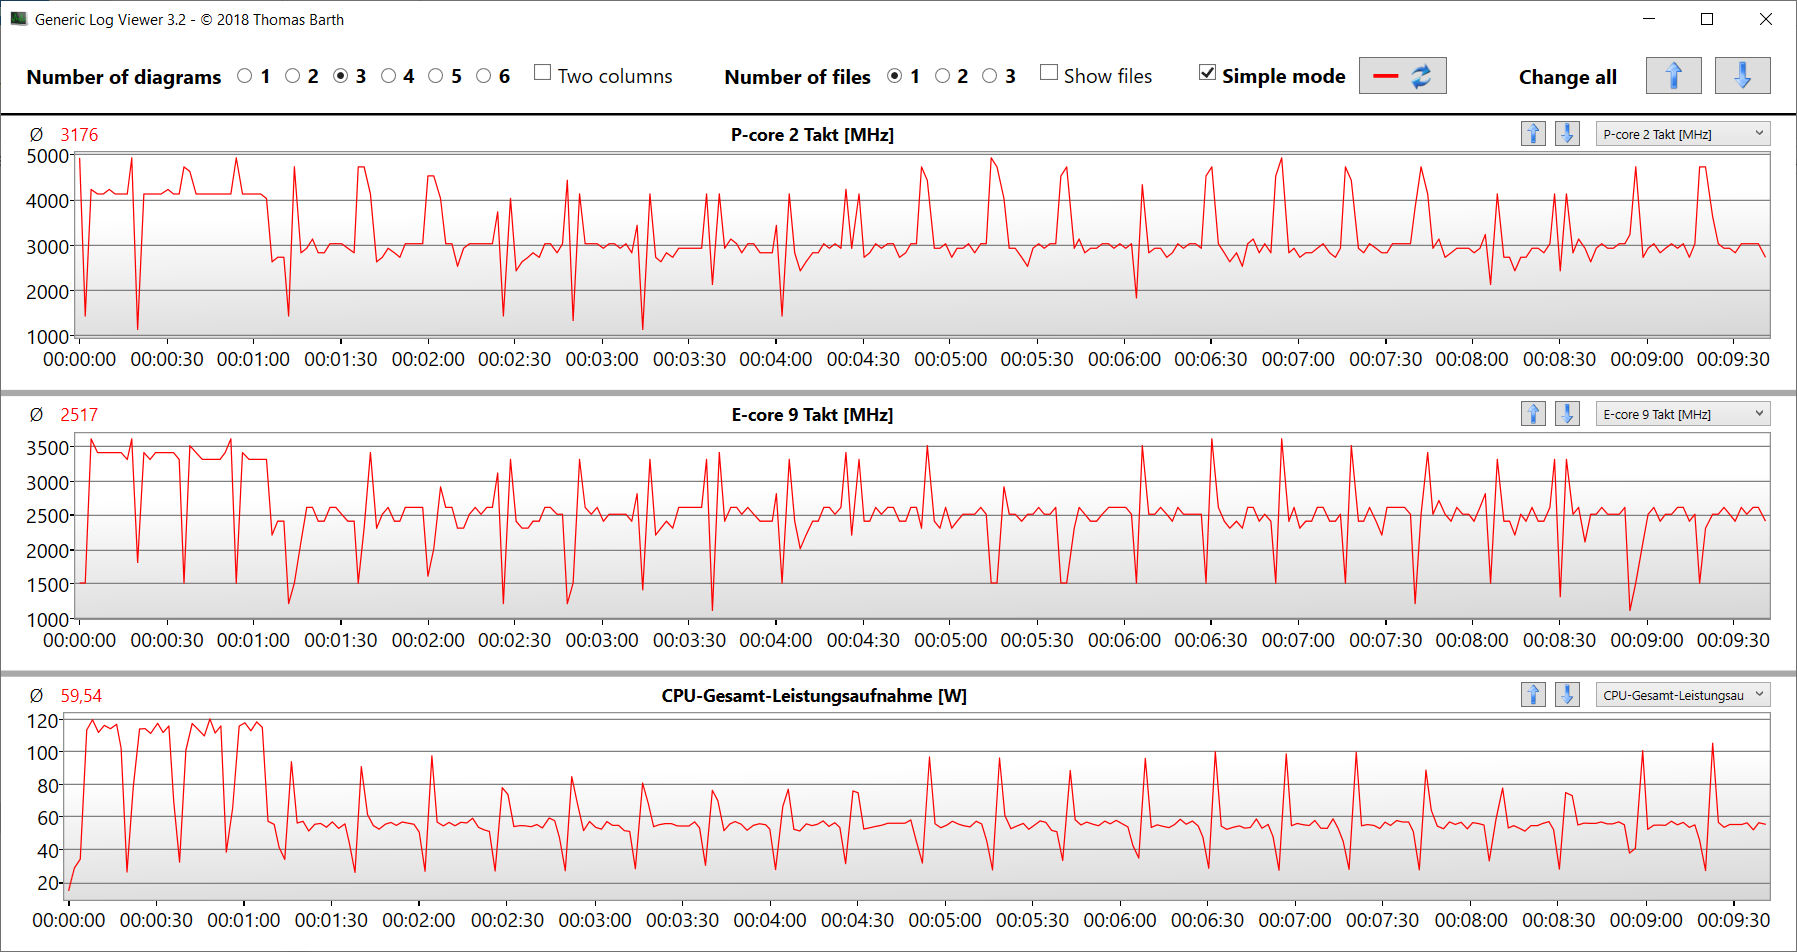
Los 14 núcleos de CPU del Core i7-13650HX (6P+8E) alcanzan velocidades de reloj máximas de 4,9 GHz (P) y 3,6 GHz (E). La carga continua de varios hilos (bucle multinúcleo de Cinebench R15) hace que la velocidad de reloj caiga de la cuarta a la quinta ejecución. Después, se mantiene un nivel bastante constante. El modo Rendimiento garantiza valores permanentemente superiores.
Los valores de referencia están ligeramente por debajo de la media de la CPU, pero el modo Rendimiento da lugar a pequeñas ganancias. En el modo batería, el rendimiento más relevante de un solo subproceso en Cinebench R15 cae en menor medida (168 puntos) que el rendimiento multihilo (1.225 puntos).
Cinebench R15 Multi-core loop test
| LibreOffice - 20 Documents To PDF | |
| Dell G16, i7-13650HX, RTX 4060 (6.3.4.2) | |
| Media de la clase Gaming (33.2 - 88.8, n=102, últimos 2 años) | |
| Medio Intel Core i7-13650HX (38.9 - 58.8, n=5) | |
| Lenovo Legion 5 16IRX G9 (6.3.4.2) | |
| Asus TUF Gaming A16 FA617XS | |
| Gigabyte G6X 9KG (2024) (6.3.4.2) | |
| MSI Raider GE68HX 13VF | |
* ... más pequeño es mejor
AIDA64: FP32 Ray-Trace | FPU Julia | CPU SHA3 | CPU Queen | FPU SinJulia | FPU Mandel | CPU AES | CPU ZLib | FP64 Ray-Trace | CPU PhotoWorxx
| Performance rating | |
| MSI Raider GE68HX 13VF | |
| Media de la clase Gaming | |
| Asus TUF Gaming A16 FA617XS | |
| Lenovo Legion 5 16IRX G9 | |
| Dell G16, i7-13650HX, RTX 4060 | |
| Medio Intel Core i7-13650HX | |
| Gigabyte G6X 9KG (2024) | |
| AIDA64 / FP32 Ray-Trace | |
| Media de la clase Gaming (10227 - 85542, n=102, últimos 2 años) | |
| Asus TUF Gaming A16 FA617XS (v6.75.6100) | |
| MSI Raider GE68HX 13VF (v6.85.6300) | |
| Lenovo Legion 5 16IRX G9 (v6.92.6600) | |
| Dell G16, i7-13650HX, RTX 4060 (v6.92.6600) | |
| Medio Intel Core i7-13650HX (13404 - 20012, n=5) | |
| Gigabyte G6X 9KG (2024) (v6.92.6600) | |
| AIDA64 / FPU Julia | |
| Media de la clase Gaming (51376 - 372155, n=102, últimos 2 años) | |
| MSI Raider GE68HX 13VF (v6.85.6300) | |
| Asus TUF Gaming A16 FA617XS (v6.75.6100) | |
| Lenovo Legion 5 16IRX G9 (v6.92.6600) | |
| Dell G16, i7-13650HX, RTX 4060 (v6.92.6600) | |
| Medio Intel Core i7-13650HX (68241 - 97317, n=5) | |
| Gigabyte G6X 9KG (2024) (v6.92.6600) | |
| AIDA64 / CPU SHA3 | |
| MSI Raider GE68HX 13VF (v6.85.6300) | |
| Media de la clase Gaming (2180 - 10115, n=102, últimos 2 años) | |
| Asus TUF Gaming A16 FA617XS (v6.75.6100) | |
| Dell G16, i7-13650HX, RTX 4060 (v6.92.6600) | |
| Lenovo Legion 5 16IRX G9 (v6.92.6600) | |
| Medio Intel Core i7-13650HX (3127 - 4487, n=5) | |
| Gigabyte G6X 9KG (2024) (v6.92.6600) | |
| AIDA64 / CPU Queen | |
| MSI Raider GE68HX 13VF (v6.85.6300) | |
| Asus TUF Gaming A16 FA617XS (v6.75.6100) | |
| Media de la clase Gaming (49785 - 173351, n=86, últimos 2 años) | |
| Gigabyte G6X 9KG (2024) (v6.92.6600) | |
| Medio Intel Core i7-13650HX (108627 - 110589, n=5) | |
| Dell G16, i7-13650HX, RTX 4060 (v6.92.6600) | |
| Lenovo Legion 5 16IRX G9 (v6.92.6600) | |
| AIDA64 / FPU SinJulia | |
| MSI Raider GE68HX 13VF (v6.85.6300) | |
| Asus TUF Gaming A16 FA617XS (v6.75.6100) | |
| Media de la clase Gaming (4424 - 33636, n=102, últimos 2 años) | |
| Lenovo Legion 5 16IRX G9 (v6.92.6600) | |
| Dell G16, i7-13650HX, RTX 4060 (v6.92.6600) | |
| Medio Intel Core i7-13650HX (9134 - 10887, n=5) | |
| Gigabyte G6X 9KG (2024) (v6.92.6600) | |
| AIDA64 / FPU Mandel | |
| Media de la clase Gaming (25115 - 196829, n=102, últimos 2 años) | |
| MSI Raider GE68HX 13VF (v6.85.6300) | |
| Asus TUF Gaming A16 FA617XS (v6.75.6100) | |
| Lenovo Legion 5 16IRX G9 (v6.92.6600) | |
| Dell G16, i7-13650HX, RTX 4060 (v6.92.6600) | |
| Medio Intel Core i7-13650HX (33391 - 48323, n=5) | |
| Gigabyte G6X 9KG (2024) (v6.92.6600) | |
| AIDA64 / CPU AES | |
| MSI Raider GE68HX 13VF (v6.85.6300) | |
| Media de la clase Gaming (39258 - 247074, n=102, últimos 2 años) | |
| Lenovo Legion 5 16IRX G9 (v6.92.6600) | |
| Asus TUF Gaming A16 FA617XS (v6.75.6100) | |
| Dell G16, i7-13650HX, RTX 4060 (v6.92.6600) | |
| Medio Intel Core i7-13650HX (64436 - 85343, n=5) | |
| Gigabyte G6X 9KG (2024) (v6.92.6600) | |
| AIDA64 / CPU ZLib | |
| MSI Raider GE68HX 13VF (v6.85.6300) | |
| Media de la clase Gaming (574 - 2531, n=102, últimos 2 años) | |
| Lenovo Legion 5 16IRX G9 (v6.92.6600) | |
| Dell G16, i7-13650HX, RTX 4060 (v6.92.6600) | |
| Medio Intel Core i7-13650HX (1136 - 1285, n=5) | |
| Gigabyte G6X 9KG (2024) (v6.92.6600) | |
| Asus TUF Gaming A16 FA617XS (v6.75.6100) | |
| AIDA64 / FP64 Ray-Trace | |
| Media de la clase Gaming (5509 - 45446, n=102, últimos 2 años) | |
| Asus TUF Gaming A16 FA617XS (v6.75.6100) | |
| MSI Raider GE68HX 13VF (v6.85.6300) | |
| Dell G16, i7-13650HX, RTX 4060 (v6.92.6600) | |
| Lenovo Legion 5 16IRX G9 (v6.92.6600) | |
| Medio Intel Core i7-13650HX (7270 - 10900, n=5) | |
| Gigabyte G6X 9KG (2024) (v6.92.6600) | |
| AIDA64 / CPU PhotoWorxx | |
| MSI Raider GE68HX 13VF (v6.85.6300) | |
| Media de la clase Gaming (12271 - 89891, n=102, últimos 2 años) | |
| Medio Intel Core i7-13650HX (36170 - 43289, n=5) | |
| Gigabyte G6X 9KG (2024) (v6.92.6600) | |
| Dell G16, i7-13650HX, RTX 4060 (v6.92.6600) | |
| Lenovo Legion 5 16IRX G9 (v6.92.6600) | |
| Asus TUF Gaming A16 FA617XS (v6.75.6100) | |
Rendimiento del sistema
El Gigabyte G6X funciona sin problemas y no le falta potencia de cálculo. El portátil maneja juegos, streaming y renderizado sin problemas.
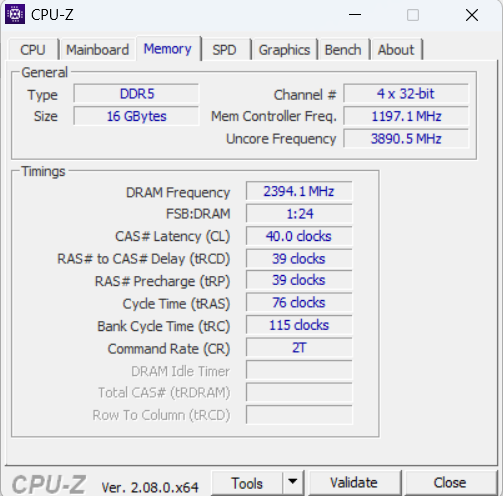
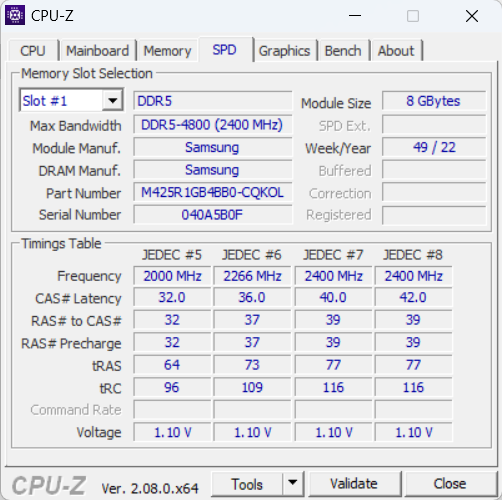
Las tasas de transferencia de la RAM están a un nivel normal para una RAM DDR5-4800.
CrossMark: Overall | Productivity | Creativity | Responsiveness
WebXPRT 3: Overall
WebXPRT 4: Overall
Mozilla Kraken 1.1: Total
| PCMark 10 / Score | |
| Media de la clase Gaming (5828 - 12414, n=93, últimos 2 años) | |
| MSI Raider GE68HX 13VF | |
| Asus TUF Gaming A16 FA617XS | |
| Lenovo Legion 5 16IRX G9 | |
| Gigabyte G6X 9KG (2024) | |
| Dell G16, i7-13650HX, RTX 4060 | |
| Medio Intel Core i7-13650HX, NVIDIA GeForce RTX 4060 Laptop GPU (6984 - 7613, n=3) | |
| PCMark 10 / Essentials | |
| MSI Raider GE68HX 13VF | |
| Asus TUF Gaming A16 FA617XS | |
| Lenovo Legion 5 16IRX G9 | |
| Media de la clase Gaming (8810 - 11935, n=97, últimos 2 años) | |
| Medio Intel Core i7-13650HX, NVIDIA GeForce RTX 4060 Laptop GPU (9532 - 11151, n=3) | |
| Gigabyte G6X 9KG (2024) | |
| Dell G16, i7-13650HX, RTX 4060 | |
| PCMark 10 / Productivity | |
| Media de la clase Gaming (6845 - 25323, n=95, últimos 2 años) | |
| Asus TUF Gaming A16 FA617XS | |
| Gigabyte G6X 9KG (2024) | |
| Medio Intel Core i7-13650HX, NVIDIA GeForce RTX 4060 Laptop GPU (9961 - 10204, n=3) | |
| Dell G16, i7-13650HX, RTX 4060 | |
| MSI Raider GE68HX 13VF | |
| Lenovo Legion 5 16IRX G9 | |
| PCMark 10 / Digital Content Creation | |
| Media de la clase Gaming (7602 - 19954, n=95, últimos 2 años) | |
| MSI Raider GE68HX 13VF | |
| Lenovo Legion 5 16IRX G9 | |
| Asus TUF Gaming A16 FA617XS | |
| Dell G16, i7-13650HX, RTX 4060 | |
| Gigabyte G6X 9KG (2024) | |
| Medio Intel Core i7-13650HX, NVIDIA GeForce RTX 4060 Laptop GPU (8323 - 11686, n=3) | |
| CrossMark / Overall | |
| Lenovo Legion 5 16IRX G9 | |
| Media de la clase Gaming (1366 - 2409, n=94, últimos 2 años) | |
| MSI Raider GE68HX 13VF | |
| Gigabyte G6X 9KG (2024) | |
| Medio Intel Core i7-13650HX, NVIDIA GeForce RTX 4060 Laptop GPU (1839 - 1951, n=3) | |
| Dell G16, i7-13650HX, RTX 4060 | |
| Asus TUF Gaming A16 FA617XS | |
| CrossMark / Productivity | |
| Lenovo Legion 5 16IRX G9 | |
| Gigabyte G6X 9KG (2024) | |
| Media de la clase Gaming (1386 - 2254, n=94, últimos 2 años) | |
| MSI Raider GE68HX 13VF | |
| Medio Intel Core i7-13650HX, NVIDIA GeForce RTX 4060 Laptop GPU (1730 - 1864, n=3) | |
| Dell G16, i7-13650HX, RTX 4060 | |
| Asus TUF Gaming A16 FA617XS | |
| CrossMark / Creativity | |
| Lenovo Legion 5 16IRX G9 | |
| MSI Raider GE68HX 13VF | |
| Media de la clase Gaming (1343 - 2786, n=94, últimos 2 años) | |
| Gigabyte G6X 9KG (2024) | |
| Medio Intel Core i7-13650HX, NVIDIA GeForce RTX 4060 Laptop GPU (2020 - 2063, n=3) | |
| Dell G16, i7-13650HX, RTX 4060 | |
| Asus TUF Gaming A16 FA617XS | |
| CrossMark / Responsiveness | |
| Gigabyte G6X 9KG (2024) | |
| Lenovo Legion 5 16IRX G9 | |
| Medio Intel Core i7-13650HX, NVIDIA GeForce RTX 4060 Laptop GPU (1544 - 1907, n=3) | |
| Media de la clase Gaming (1226 - 2334, n=94, últimos 2 años) | |
| Dell G16, i7-13650HX, RTX 4060 | |
| MSI Raider GE68HX 13VF | |
| Asus TUF Gaming A16 FA617XS | |
| WebXPRT 3 / Overall | |
| MSI Raider GE68HX 13VF | |
| Media de la clase Gaming (220 - 532, n=98, últimos 2 años) | |
| Lenovo Legion 5 16IRX G9 | |
| Gigabyte G6X 9KG (2024) | |
| Medio Intel Core i7-13650HX, NVIDIA GeForce RTX 4060 Laptop GPU (268 - 302, n=3) | |
| Dell G16, i7-13650HX, RTX 4060 | |
| WebXPRT 4 / Overall | |
| MSI Raider GE68HX 13VF | |
| Media de la clase Gaming (165 - 354, n=98, últimos 2 años) | |
| Lenovo Legion 5 16IRX G9 | |
| Medio Intel Core i7-13650HX, NVIDIA GeForce RTX 4060 Laptop GPU (260 - 276, n=2) | |
| Asus TUF Gaming A16 FA617XS | |
| Gigabyte G6X 9KG (2024) | |
| Mozilla Kraken 1.1 / Total | |
| Gigabyte G6X 9KG (2024) | |
| Medio Intel Core i7-13650HX, NVIDIA GeForce RTX 4060 Laptop GPU (507 - 511, n=3) | |
| Dell G16, i7-13650HX, RTX 4060 | |
| Asus TUF Gaming A16 FA617XS | |
| Lenovo Legion 5 16IRX G9 | |
| Media de la clase Gaming (391 - 590, n=100, últimos 2 años) | |
| MSI Raider GE68HX 13VF | |
* ... más pequeño es mejor
| PCMark 10 Score | 7613 puntos | |
ayuda | ||
| AIDA64 / Memory Copy | |
| MSI Raider GE68HX 13VF | |
| Media de la clase Gaming (21750 - 129946, n=102, últimos 2 años) | |
| Medio Intel Core i7-13650HX (59266 - 66372, n=5) | |
| Gigabyte G6X 9KG (2024) | |
| Lenovo Legion 5 16IRX G9 | |
| Asus TUF Gaming A16 FA617XS | |
| Dell G16, i7-13650HX, RTX 4060 | |
| AIDA64 / Memory Read | |
| MSI Raider GE68HX 13VF | |
| Media de la clase Gaming (22956 - 118858, n=102, últimos 2 años) | |
| Lenovo Legion 5 16IRX G9 | |
| Medio Intel Core i7-13650HX (67305 - 71022, n=5) | |
| Gigabyte G6X 9KG (2024) | |
| Dell G16, i7-13650HX, RTX 4060 | |
| Asus TUF Gaming A16 FA617XS | |
| AIDA64 / Memory Write | |
| Media de la clase Gaming (22297 - 135096, n=102, últimos 2 años) | |
| MSI Raider GE68HX 13VF | |
| Asus TUF Gaming A16 FA617XS | |
| Medio Intel Core i7-13650HX (58028 - 68225, n=5) | |
| Gigabyte G6X 9KG (2024) | |
| Dell G16, i7-13650HX, RTX 4060 | |
| Lenovo Legion 5 16IRX G9 | |
| AIDA64 / Memory Latency | |
| Media de la clase Gaming (75.3 - 165.4, n=102, últimos 2 años) | |
| Dell G16, i7-13650HX, RTX 4060 | |
| Asus TUF Gaming A16 FA617XS | |
| Gigabyte G6X 9KG (2024) | |
| Lenovo Legion 5 16IRX G9 | |
| Medio Intel Core i7-13650HX (83.7 - 90.8, n=5) | |
| MSI Raider GE68HX 13VF | |
* ... más pequeño es mejor
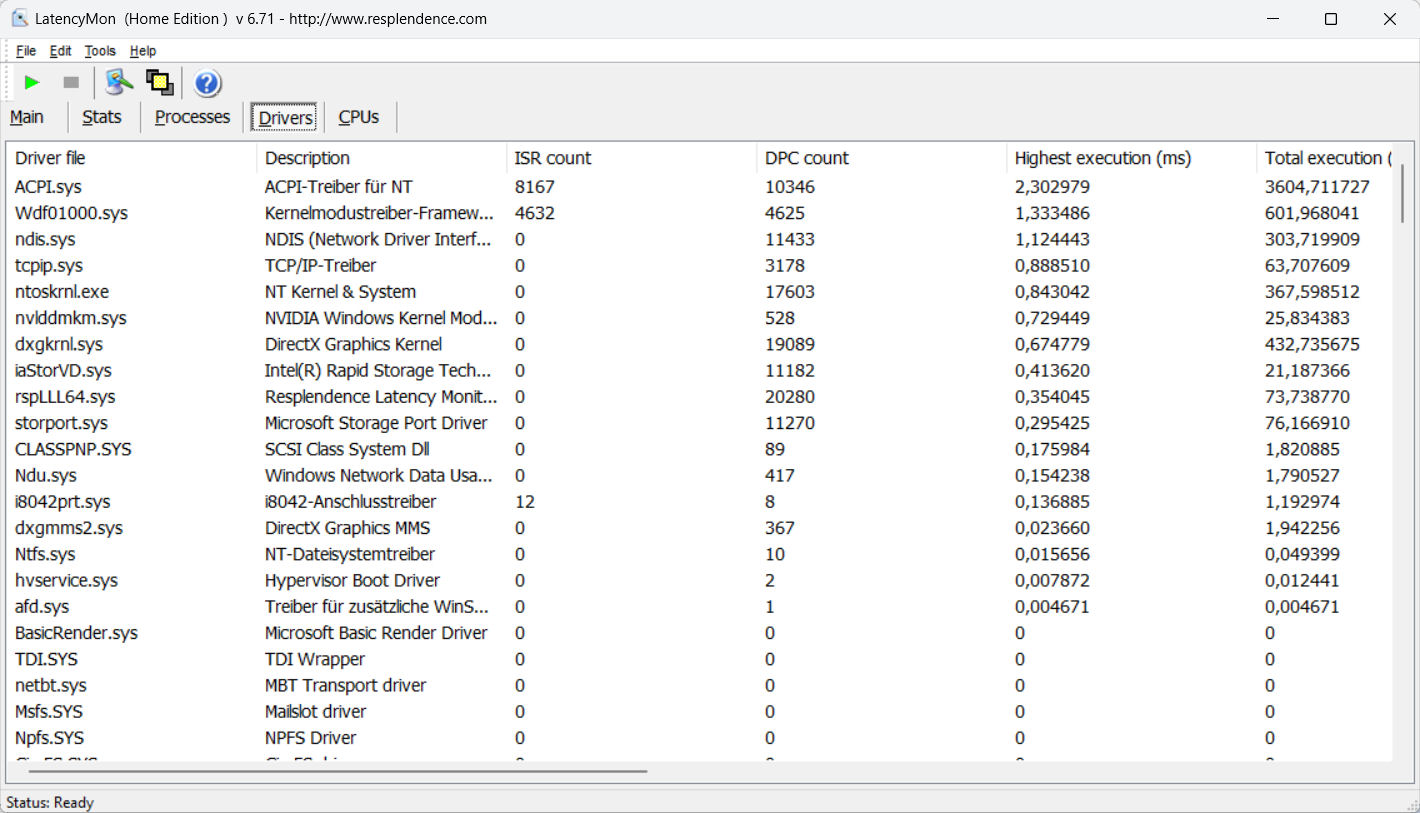
Latencia del CPD
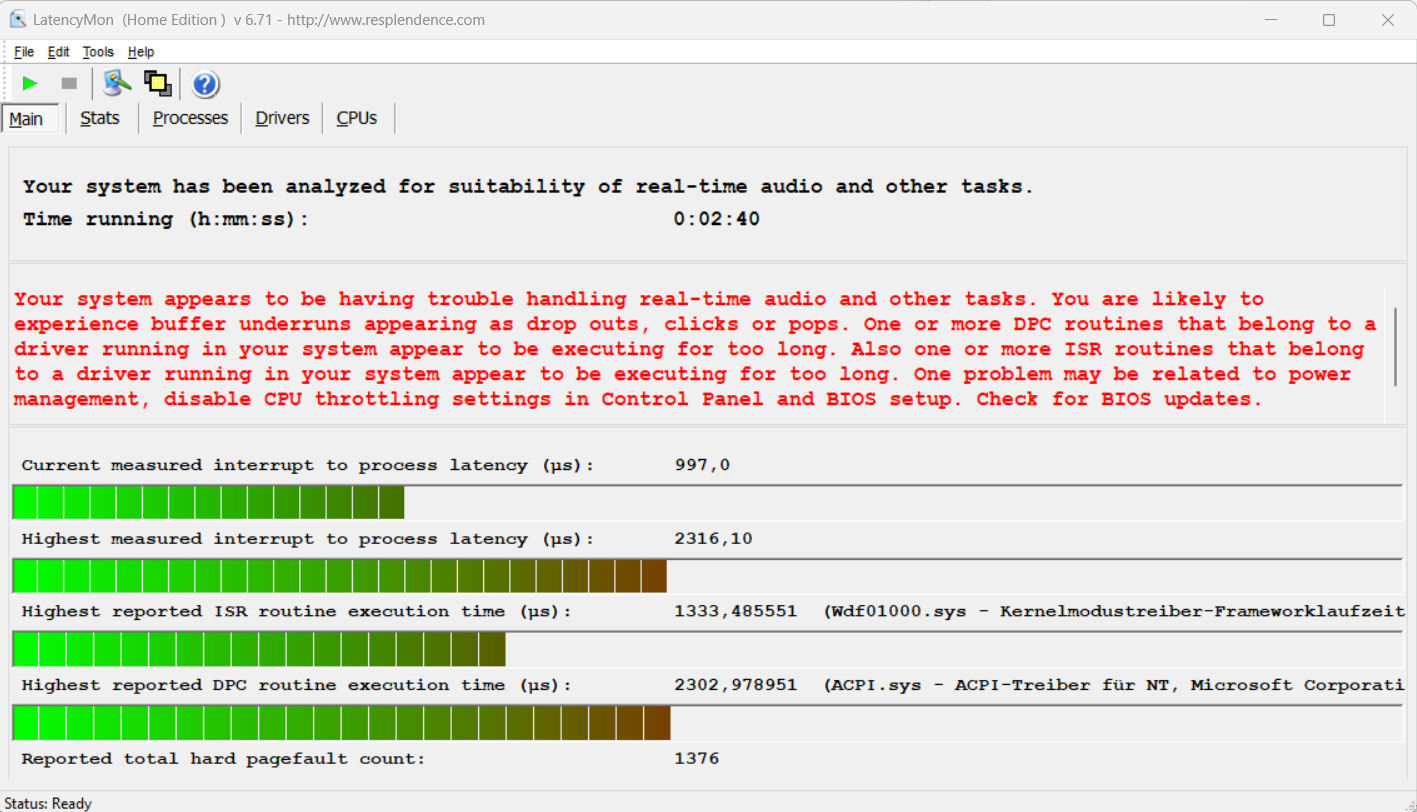
La prueba estandarizada LatencyMon (navegación web, reproducción de vídeo 4k, Prime95 High-Load) reveló anomalías. El sistema no parece adecuado para la edición de vídeo y audio en tiempo real. Futuras actualizaciones del software podrían suponer mejoras o incluso deterioros.
| DPC Latencies / LatencyMon - interrupt to process latency (max), Web, Youtube, Prime95 | |
| MSI Raider GE68HX 13VF | |
| Gigabyte G6X 9KG (2024) | |
| Lenovo Legion 5 16IRX G9 | |
| Asus TUF Gaming A16 FA617XS | |
| Dell G16, i7-13650HX, RTX 4060 | |
* ... más pequeño es mejor
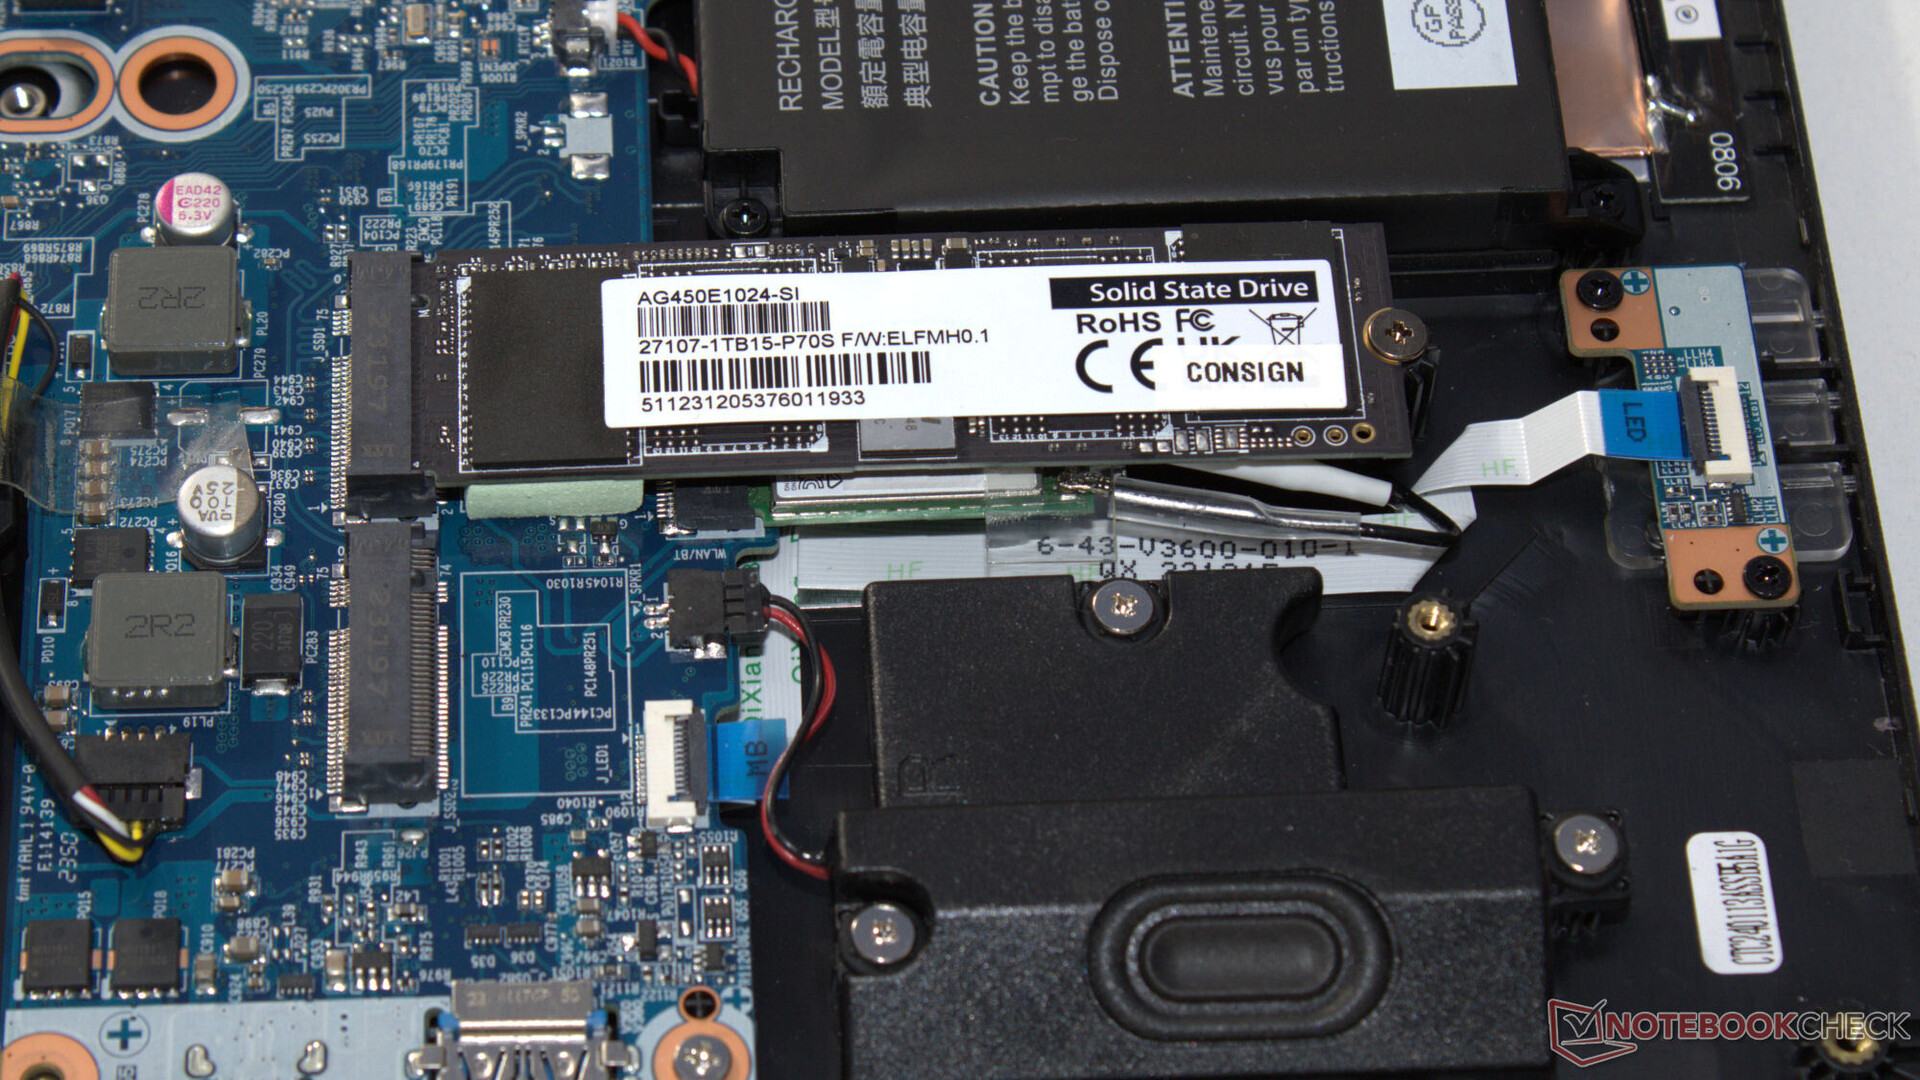
Almacenamiento masivo
El G6X puede alojar un total de dos unidades SSD M.2 2280 PCIe Gen 4. No admite RAID. La unidad SSD Gigabyte de 1 TB de nuestro dispositivo de pruebas ofrece muy buenas velocidades de datos.
No observamos ningún problema de estrangulamiento térmico, lo cual es positivo.

* ... más pequeño es mejor
Disk Throttling: DiskSpd Read Loop, Queue Depth 8
Tarjeta gráfica
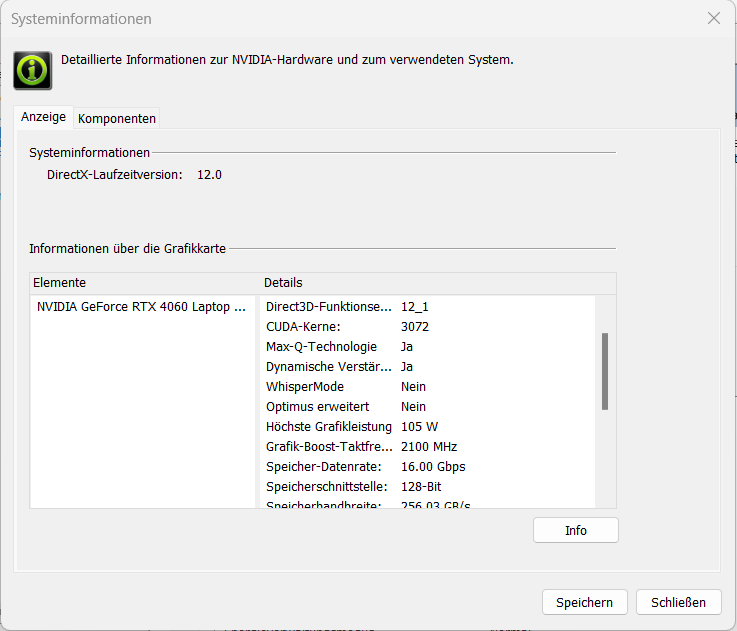
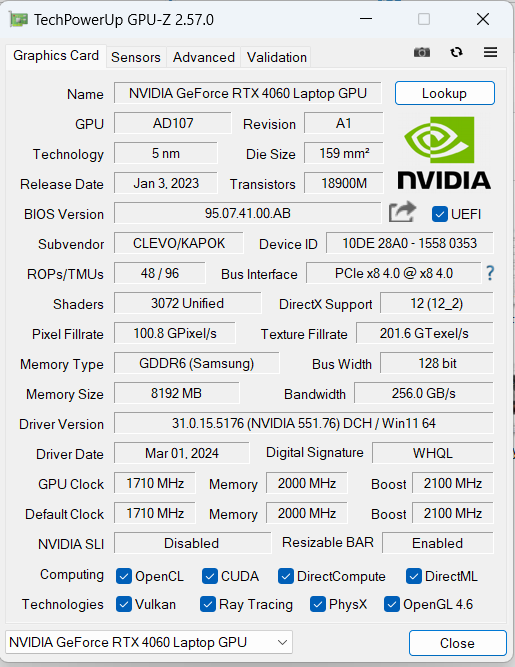
Gigabyte instala una GeForce GPU RTX 4060 para portátiles (3.424 sombreadores, bus de 128 bits, 8 GB GDDR6) en el G6X 9KG. La RTX 4060 es un modelo de gama media de la actual gama de GPU de Nvidia.
Los valores de los bancos de pruebas y las frecuencias de cuadro están por encima de la media de la RTX 4060. El modo de rendimiento proporciona un pequeño plus en el mejor de los casos. El cambio entre los modos dGPU y Optimus requiere un reinicio, ya que Advanced Optimus no es compatible.
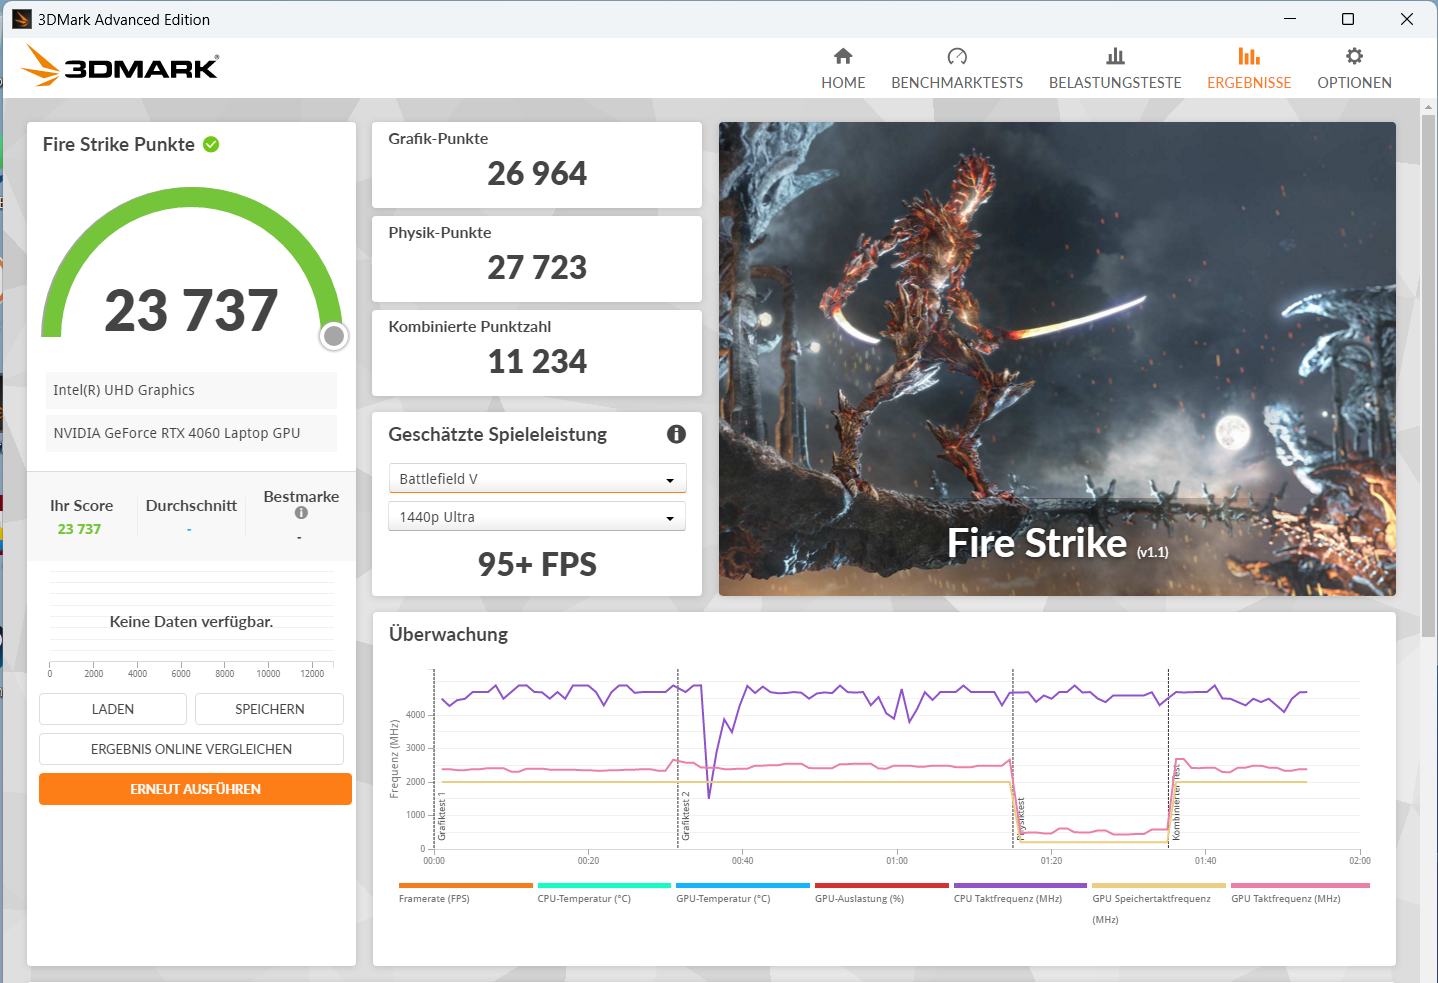
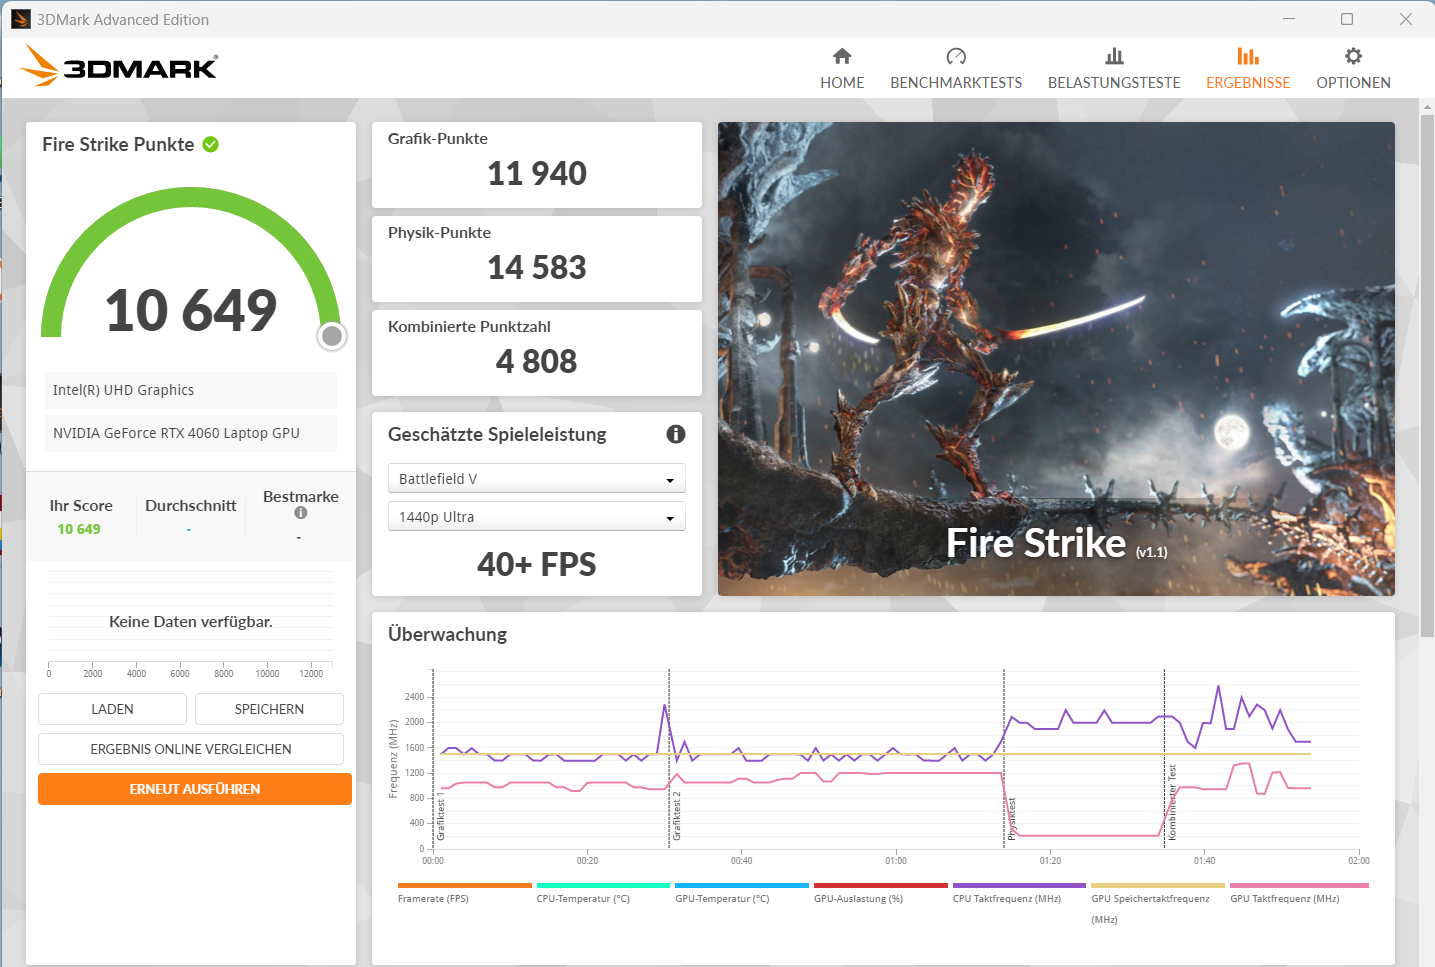
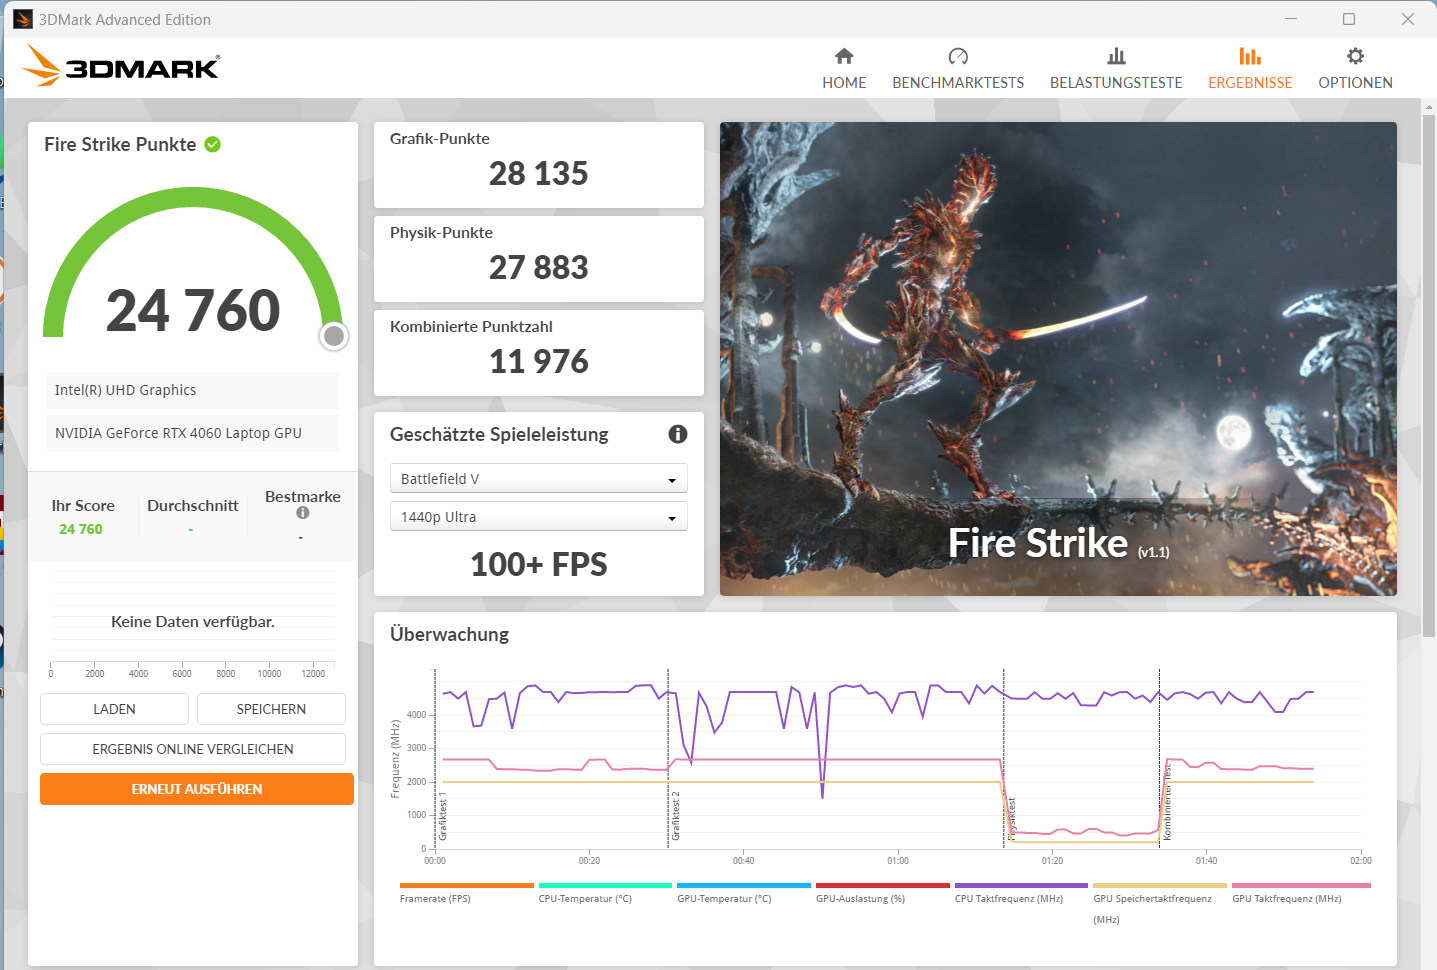
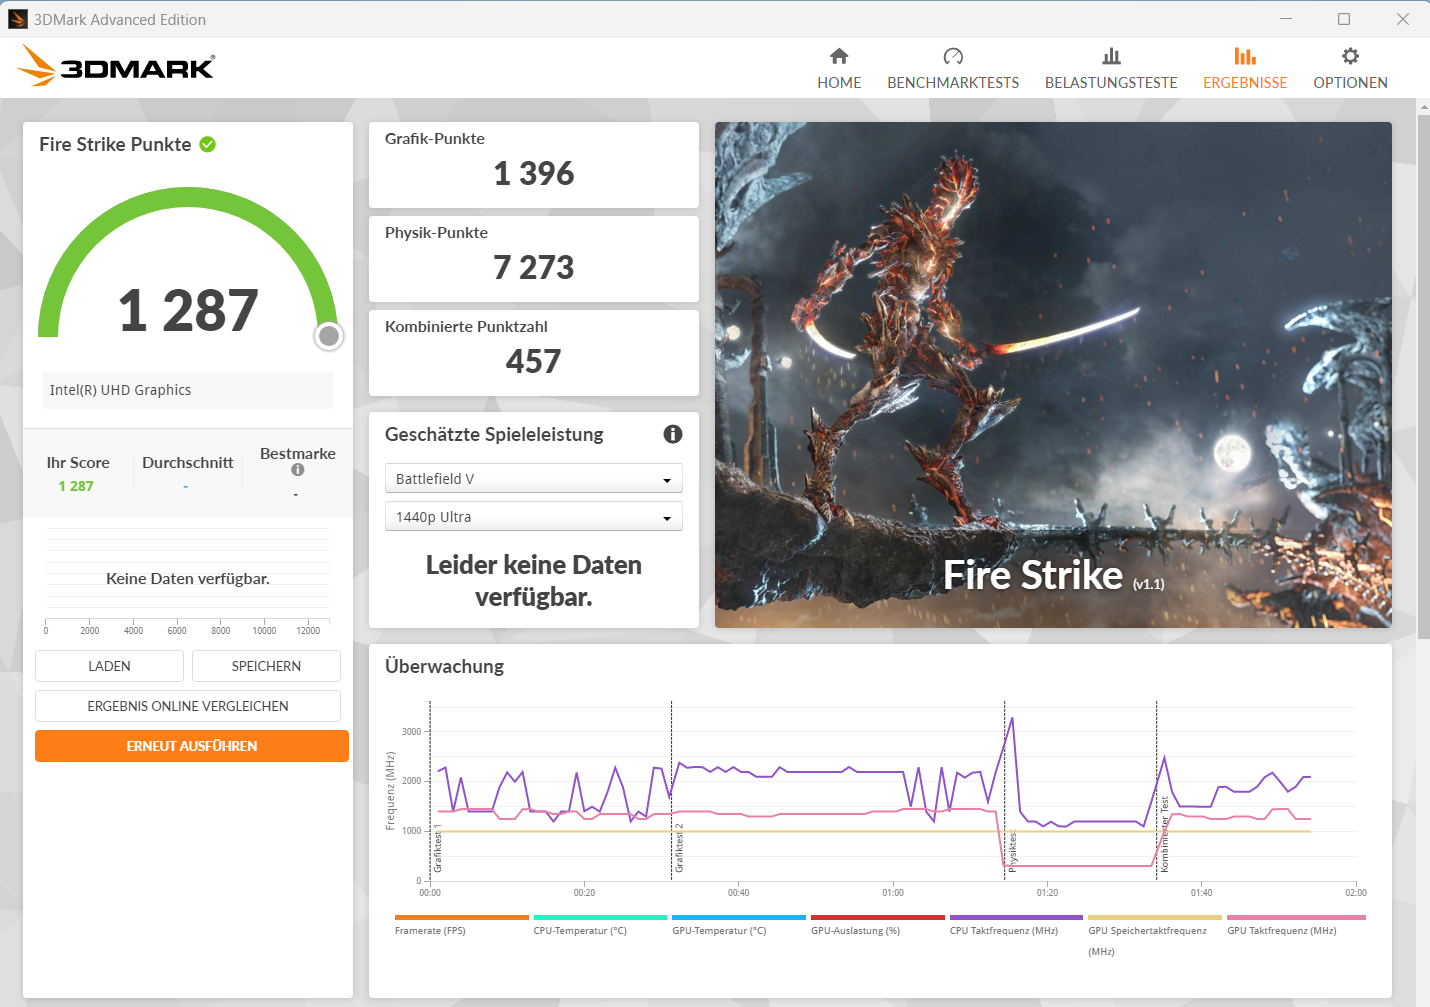
| 3DMark 11 Performance | 30293 puntos | |
| 3DMark Fire Strike Score | 23737 puntos | |
| 3DMark Time Spy Score | 10260 puntos | |
ayuda | ||
* ... más pequeño es mejor
| The Witcher 3 - 1920x1080 Ultra Graphics & Postprocessing (HBAO+) | |
| Media de la clase Gaming (104.7 - 240, n=7, últimos 2 años) | |
| Dell G16, i7-13650HX, RTX 4060 | |
| MSI Raider GE68HX 13VF | |
| Medio NVIDIA GeForce RTX 4060 Laptop GPU (77 - 159.7, n=42) | |
| Gigabyte G6X 9KG (2024) | |
| Asus TUF Gaming A16 FA617XS (neu) | |
| Lenovo Legion 5 16IRX G9 | |
| Final Fantasy XV Benchmark - 1920x1080 High Quality | |
| Media de la clase Gaming (64.2 - 215, n=91, últimos 2 años) | |
| Lenovo Legion 5 16IRX G9 (1.3) | |
| Dell G16, i7-13650HX, RTX 4060 (1.3) | |
| MSI Raider GE68HX 13VF (1.3) | |
| Gigabyte G6X 9KG (2024) (1.3) | |
| Medio NVIDIA GeForce RTX 4060 Laptop GPU (75.1 - 109.8, n=51) | |
| Asus TUF Gaming A16 FA617XS (1.3) | |
| Strange Brigade - 1920x1080 ultra AA:ultra AF:16 | |
| Media de la clase Gaming (113.6 - 458, n=83, últimos 2 años) | |
| Lenovo Legion 5 16IRX G9 | |
| Dell G16, i7-13650HX, RTX 4060 (1.47.22.14 D3D12) | |
| MSI Raider GE68HX 13VF (1.47.22.14 D3D12) | |
| Gigabyte G6X 9KG (2024) (1.47.22.14 D3D12) | |
| Medio NVIDIA GeForce RTX 4060 Laptop GPU (135.3 - 210, n=50) | |
| Asus TUF Gaming A16 FA617XS (1.47.22.14 D3D12) | |
| Cyberpunk 2077 | |
| 1920x1080 Ultra Preset (FSR off) | |
| Media de la clase Gaming (17.7 - 169.9, n=112, últimos 2 años) | |
| Lenovo Legion 5 16IRX G9 | |
| Medio NVIDIA GeForce RTX 4060 Laptop GPU (56.4 - 93.1, n=31) | |
| Dell G16, i7-13650HX, RTX 4060 | |
| Gigabyte G6X 9KG (2024) | |
| 1920x1080 Ray Tracing Ultra Preset (DLSS off) | |
| Media de la clase Gaming (19.8 - 84.9, n=32, últimos 2 años) | |
| Medio NVIDIA GeForce RTX 4060 Laptop GPU (23.6 - 37.4, n=21) | |
| Gigabyte G6X 9KG (2024) | |
| 1920x1080 Ultra Preset (FSR2 on) | |
| Media de la clase Gaming (58 - 173.1, n=7, últimos 2 años) | |
| Gigabyte G6X 9KG (2024) | |
| Medio NVIDIA GeForce RTX 4060 Laptop GPU (68.5 - 92.4, n=4) | |
| Skull & Bones - 1920x1080 Ultra High Preset AA:T | |
| Gigabyte G6X 9KG (2024) | |
| Medio NVIDIA GeForce RTX 4060 Laptop GPU (65 - 73, n=5) | |
| Last Epoch - 1920x1080 Ultra Preset AA:T | |
| Gigabyte G6X 9KG (2024) | |
| Medio NVIDIA GeForce RTX 4060 Laptop GPU (120.4 - 122.8, n=2) | |
| Media de la clase Gaming (n=1últimos 2 años) | |
| Helldivers 2 - 1920x1080 Ultra Preset | |
| Media de la clase Gaming (18.4 - 153.8, n=5, últimos 2 años) | |
| Gigabyte G6X 9KG (2024) | |
| Medio NVIDIA GeForce RTX 4060 Laptop GPU (82.3 - 85.6, n=2) | |
| Ready or Not - 1920x1080 Epic Preset | |
| Medio NVIDIA GeForce RTX 4060 Laptop GPU (131.5 - 133.7, n=2) | |
| Gigabyte G6X 9KG (2024) | |
The Witcher 3 FPS chart
| bajo | medio | alto | ultra | |
|---|---|---|---|---|
| GTA V (2015) | 183.6 | 180.4 | 174.6 | 115.2 |
| The Witcher 3 (2015) | 400.9 | 306.6 | 186.5 | 100 |
| Dota 2 Reborn (2015) | 183.7 | 164.4 | 157.6 | 142.4 |
| Final Fantasy XV Benchmark (2018) | 186.5 | 139.3 | 101.5 | |
| X-Plane 11.11 (2018) | 155.1 | 132.7 | 107.1 | |
| Strange Brigade (2018) | 473 | 263 | 209 | 182.2 |
| Cyberpunk 2077 (2023) | 118.3 | 94.8 | 81.1 | 69.7 |
| Ready or Not (2023) | 218 | 152.4 | 147.6 | 131.5 |
| Helldivers 2 (2024) | 123.9 | 97.6 | 88.5 | 85.6 |
| Skull & Bones (2024) | 125 | 111 | 97 | 73 |
| Last Epoch (2024) | 195.5 | 184.6 | 164.1 | 122.8 |
Emisiones y energía: La G6X ofrece buenos tiempos de funcionamiento
Emisiones sonoras
El nivel de presión sonora (SPL) se eleva hasta 54 dB(A) a plena carga (modo Entretenimiento). El SPL puede subir más en el modo Rendimiento. Se puede conseguir un funcionamiento mucho más silencioso con el modo Silencio.
Sin embargo, esto se consigue notablemente a expensas del rendimiento, ya que no es así como funciona la dGPU. En general, se recomienda el modo Entretenimiento para el uso diario. Más allá de la carga completa, el desarrollo del ruido se mantiene en un nivel moderado.
Ruido
| Ocioso |
| 30 / 32 / 35 dB(A) |
| Carga |
| 51 / 54 dB(A) |
 | ||
30 dB silencioso 40 dB(A) audible 50 dB(A) ruidosamente alto |
||
min: | ||
| Gigabyte G6X 9KG (2024) i7-13650HX, GeForce RTX 4060 Laptop GPU | Dell G16, i7-13650HX, RTX 4060 i7-13650HX, GeForce RTX 4060 Laptop GPU | Lenovo Legion 5 16IRX G9 i7-14650HX, GeForce RTX 4060 Laptop GPU | MSI Raider GE68HX 13VF i9-13950HX, GeForce RTX 4060 Laptop GPU | Asus TUF Gaming A16 FA617XS R9 7940HS, Radeon RX 7600S | |
|---|---|---|---|---|---|
| Noise | 21% | 7% | 2% | 11% | |
| apagado / medio ambiente * (dB) | 26 | 23 12% | 24 8% | 23.3 10% | 25 4% |
| Idle Minimum * (dB) | 30 | 23 23% | 24 20% | 25 17% | 25 17% |
| Idle Average * (dB) | 32 | 23 28% | 28.8 10% | 31.3 2% | 26 19% |
| Idle Maximum * (dB) | 35 | 27.96 20% | 32 9% | 37.5 -7% | 28 20% |
| Load Average * (dB) | 51 | 27.96 45% | 45.5 11% | 44 14% | 43 16% |
| Witcher 3 ultra * (dB) | 51 | 47.89 6% | 53.1 -4% | 57 -12% | 51 -0% |
| Load Maximum * (dB) | 54 | 47.89 11% | 55.7 -3% | 60.1 -11% | 53 2% |
* ... más pequeño es mejor
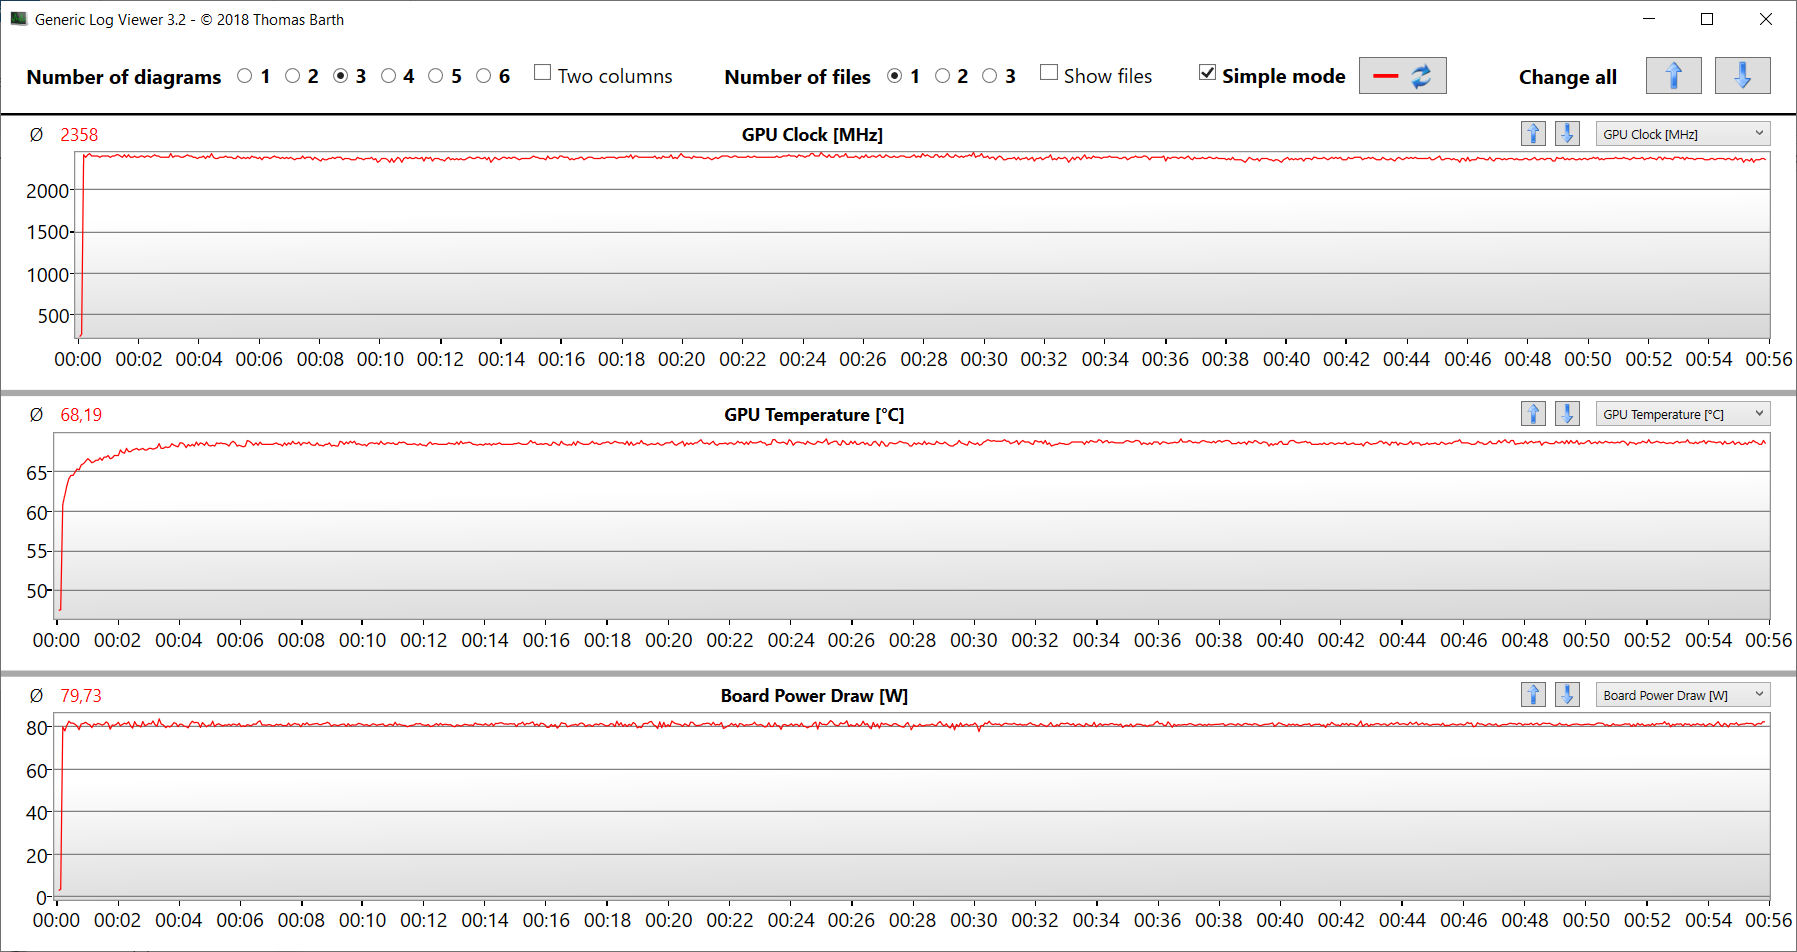
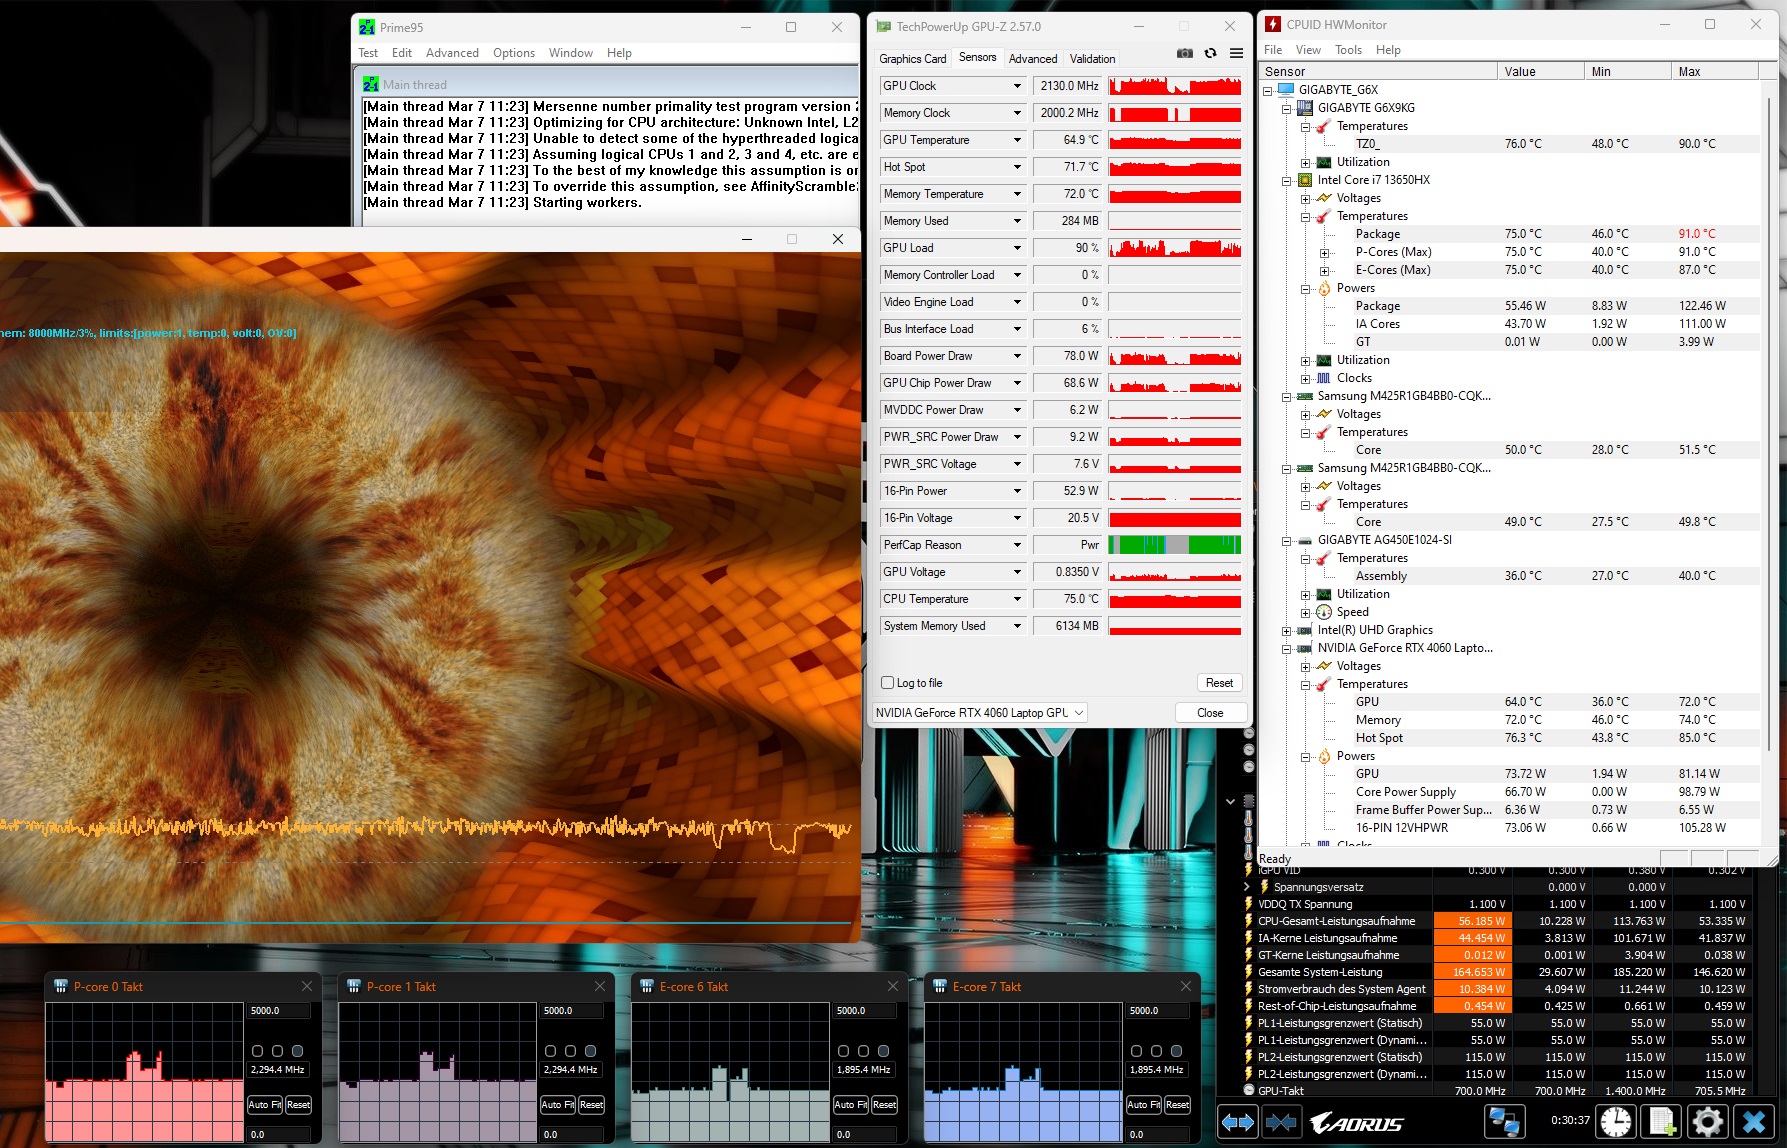
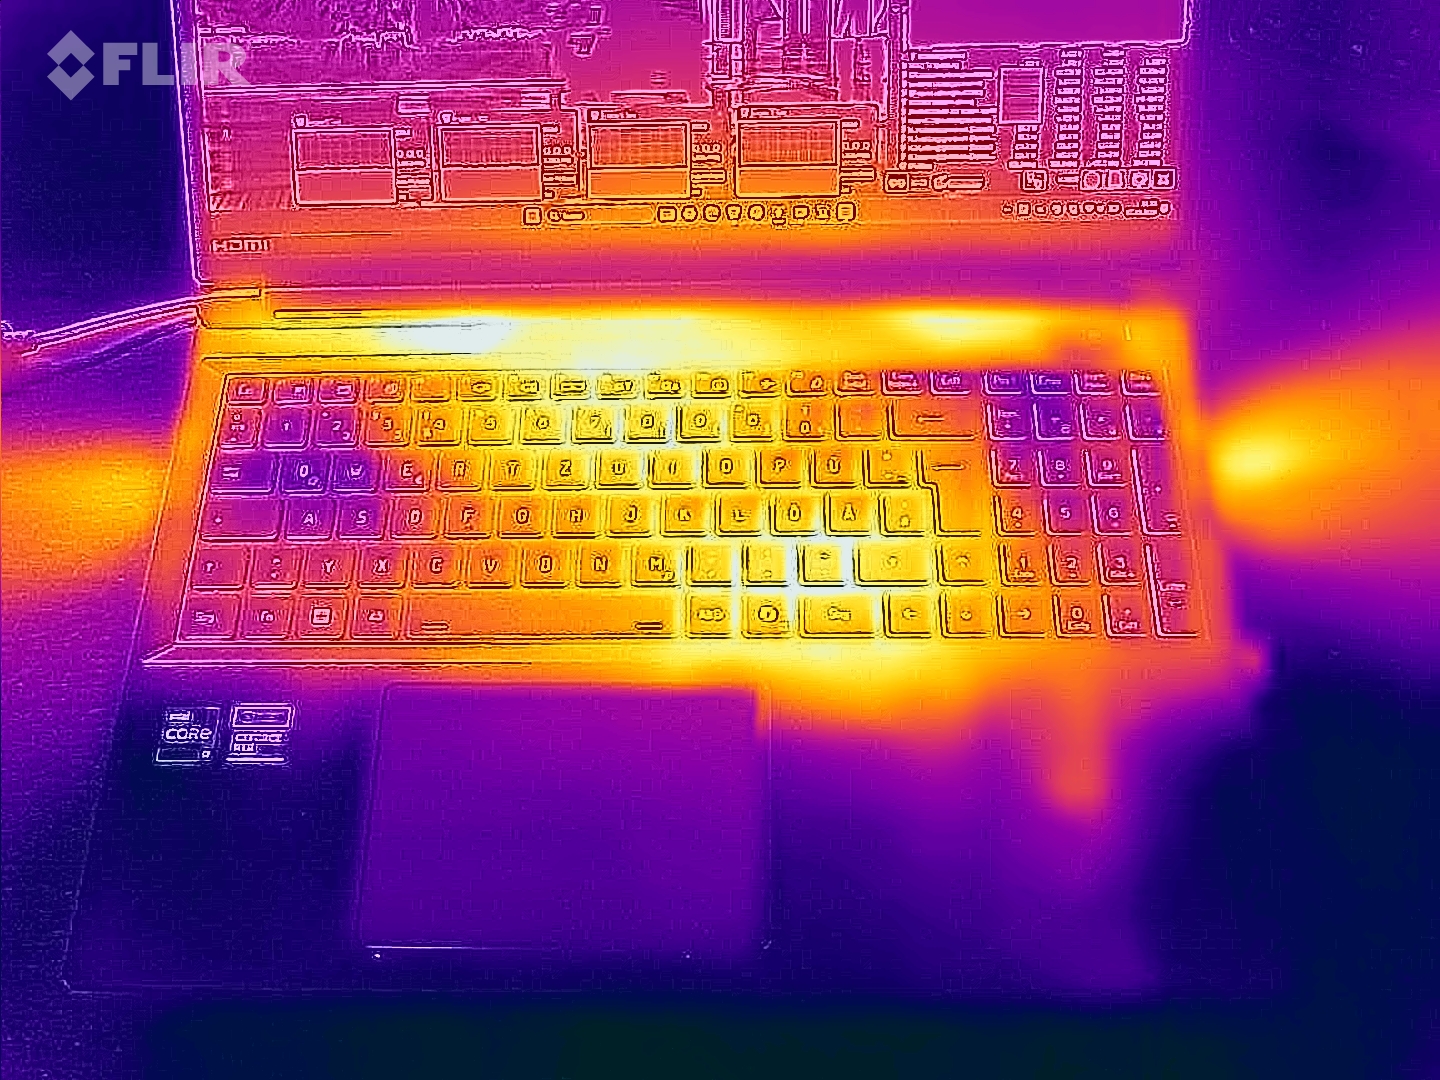
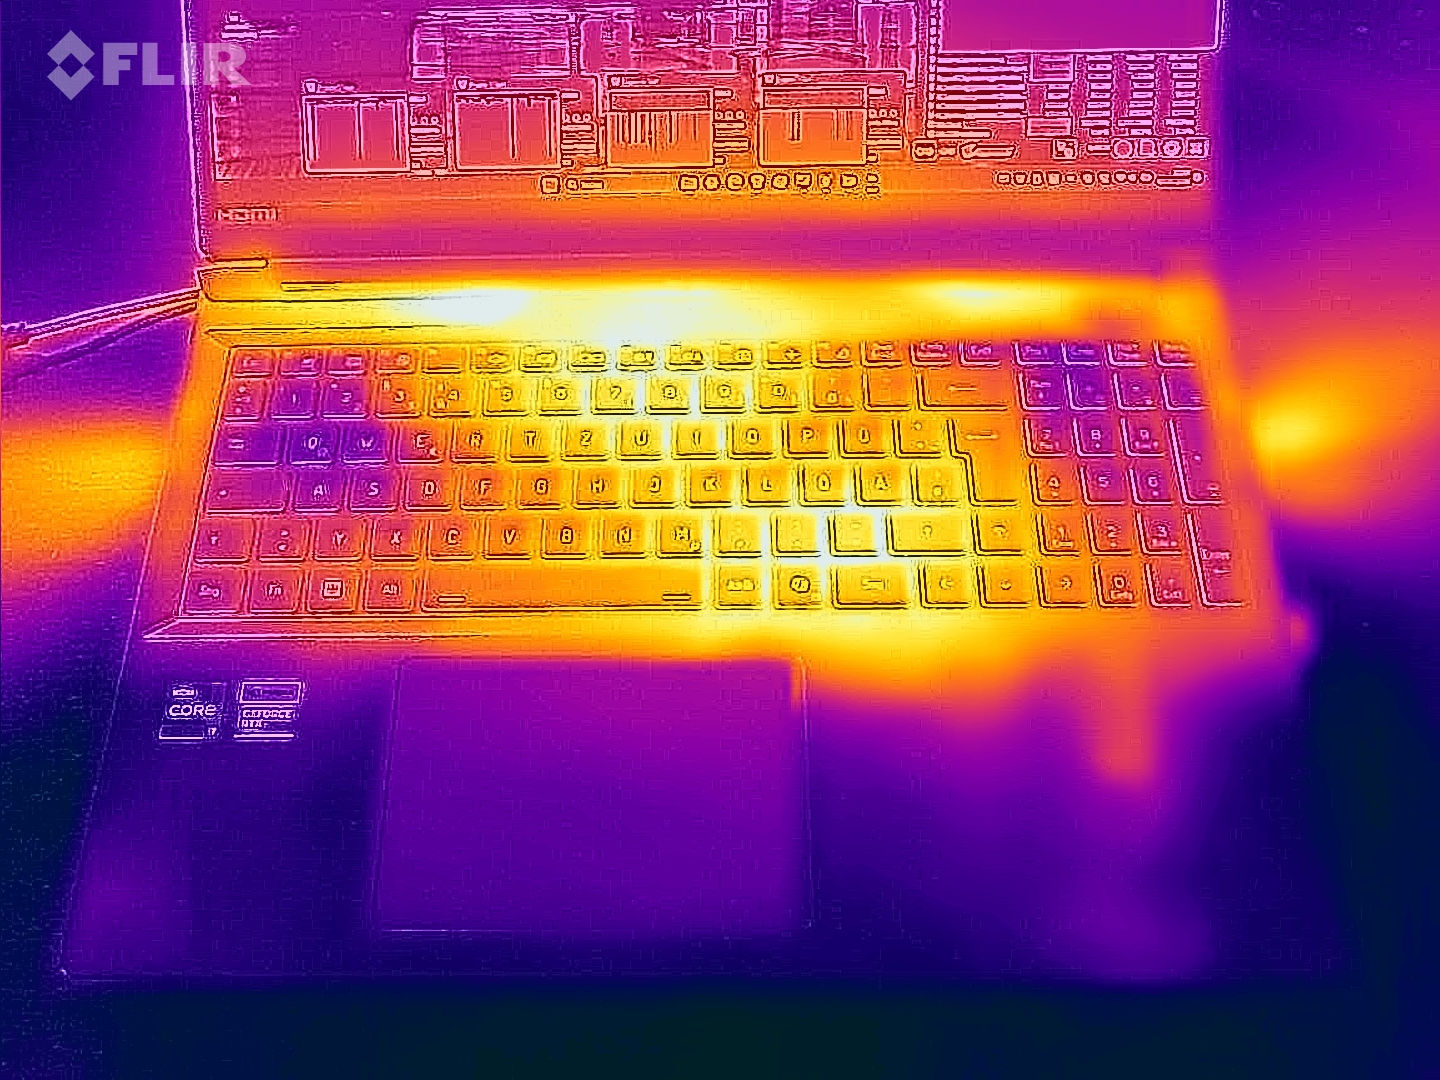
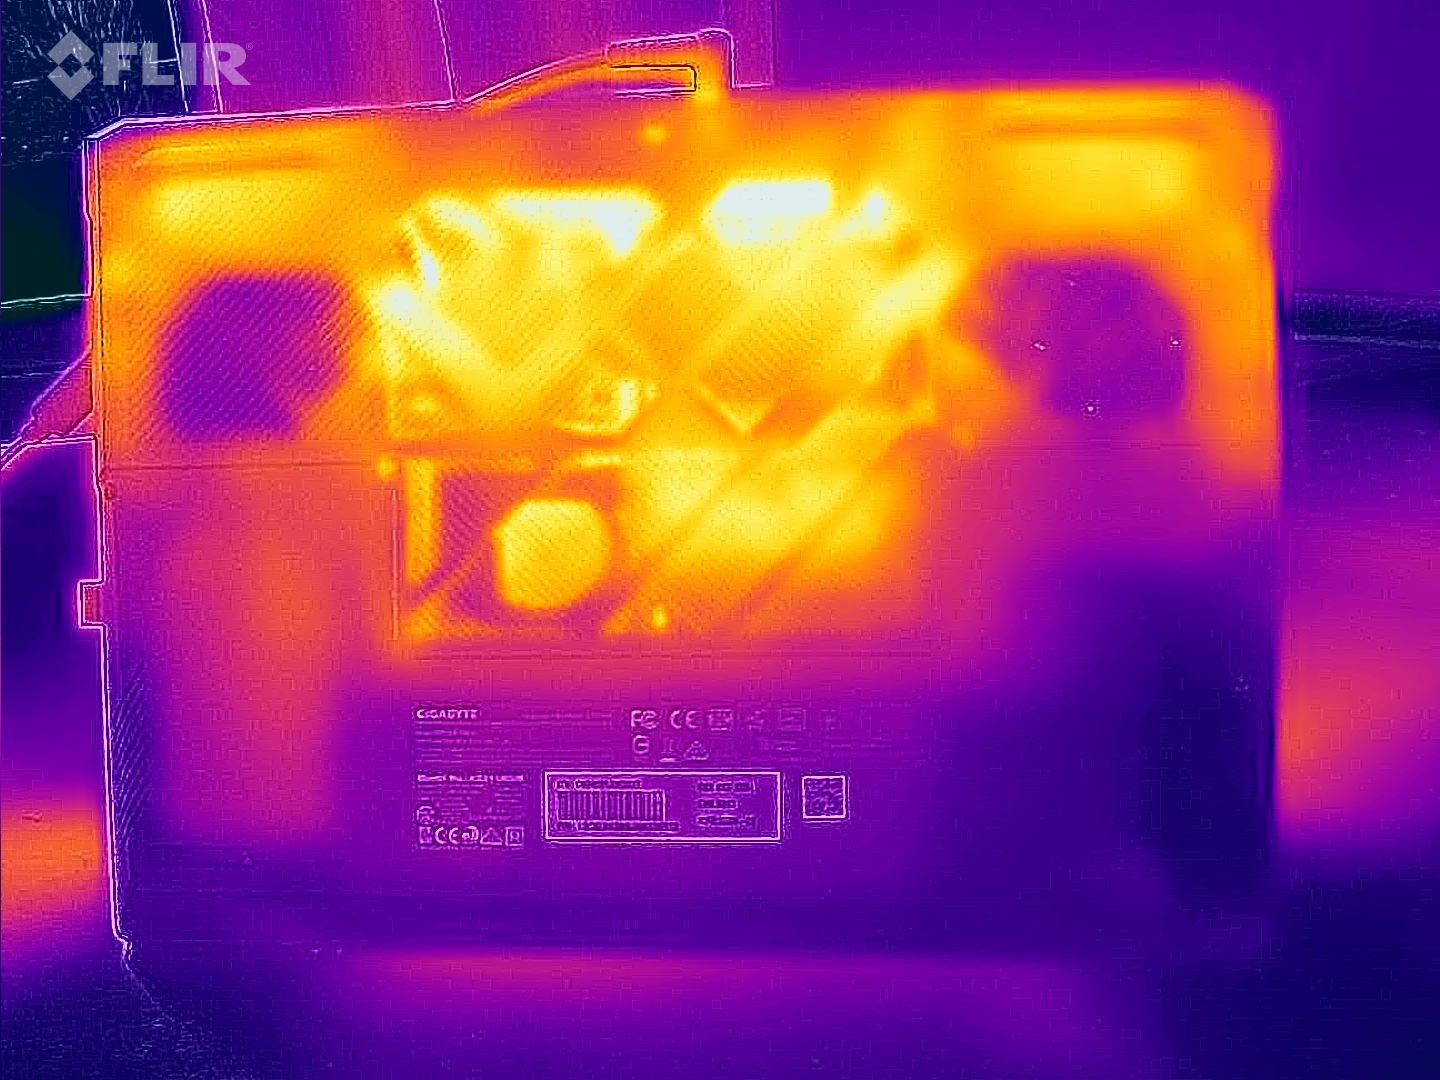
Temperatura
Las pruebas de estrés y Witcher 3 garantizan un calentamiento moderado del portátil en el mejor de los casos. Ocasionalmente se alcanzan valores por debajo de los 40 °C. En el uso cotidiano (Office, navegación por Internet), los valores se mantienen en la franja verde.
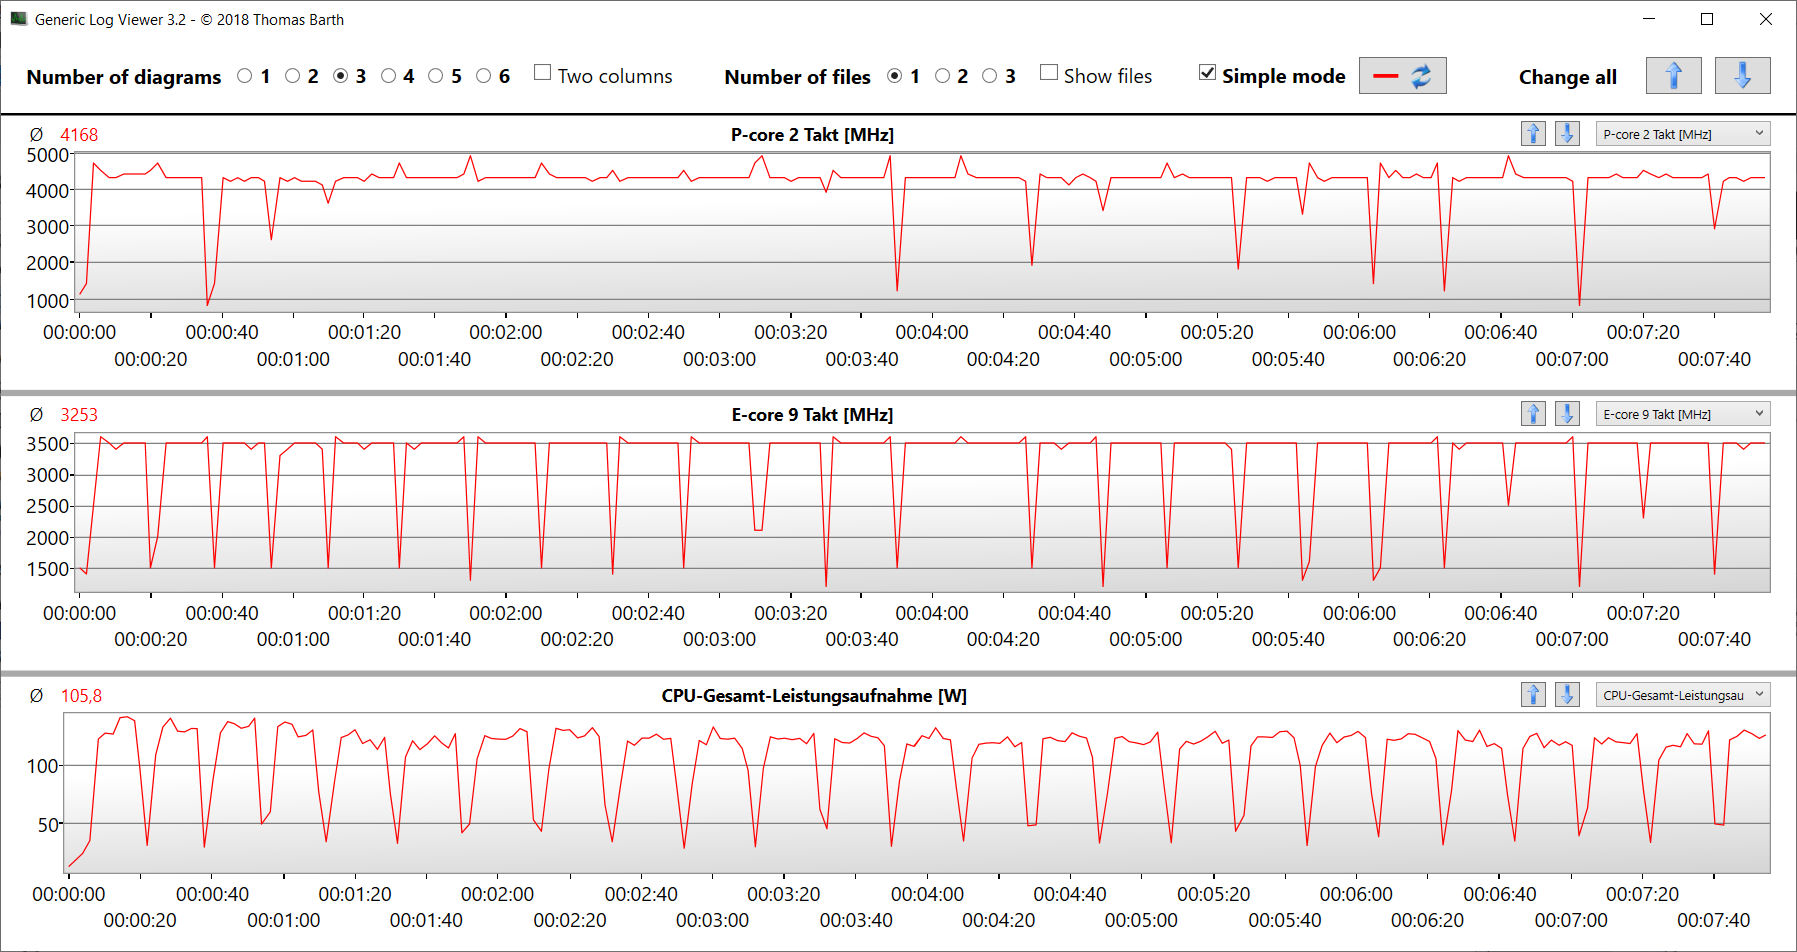
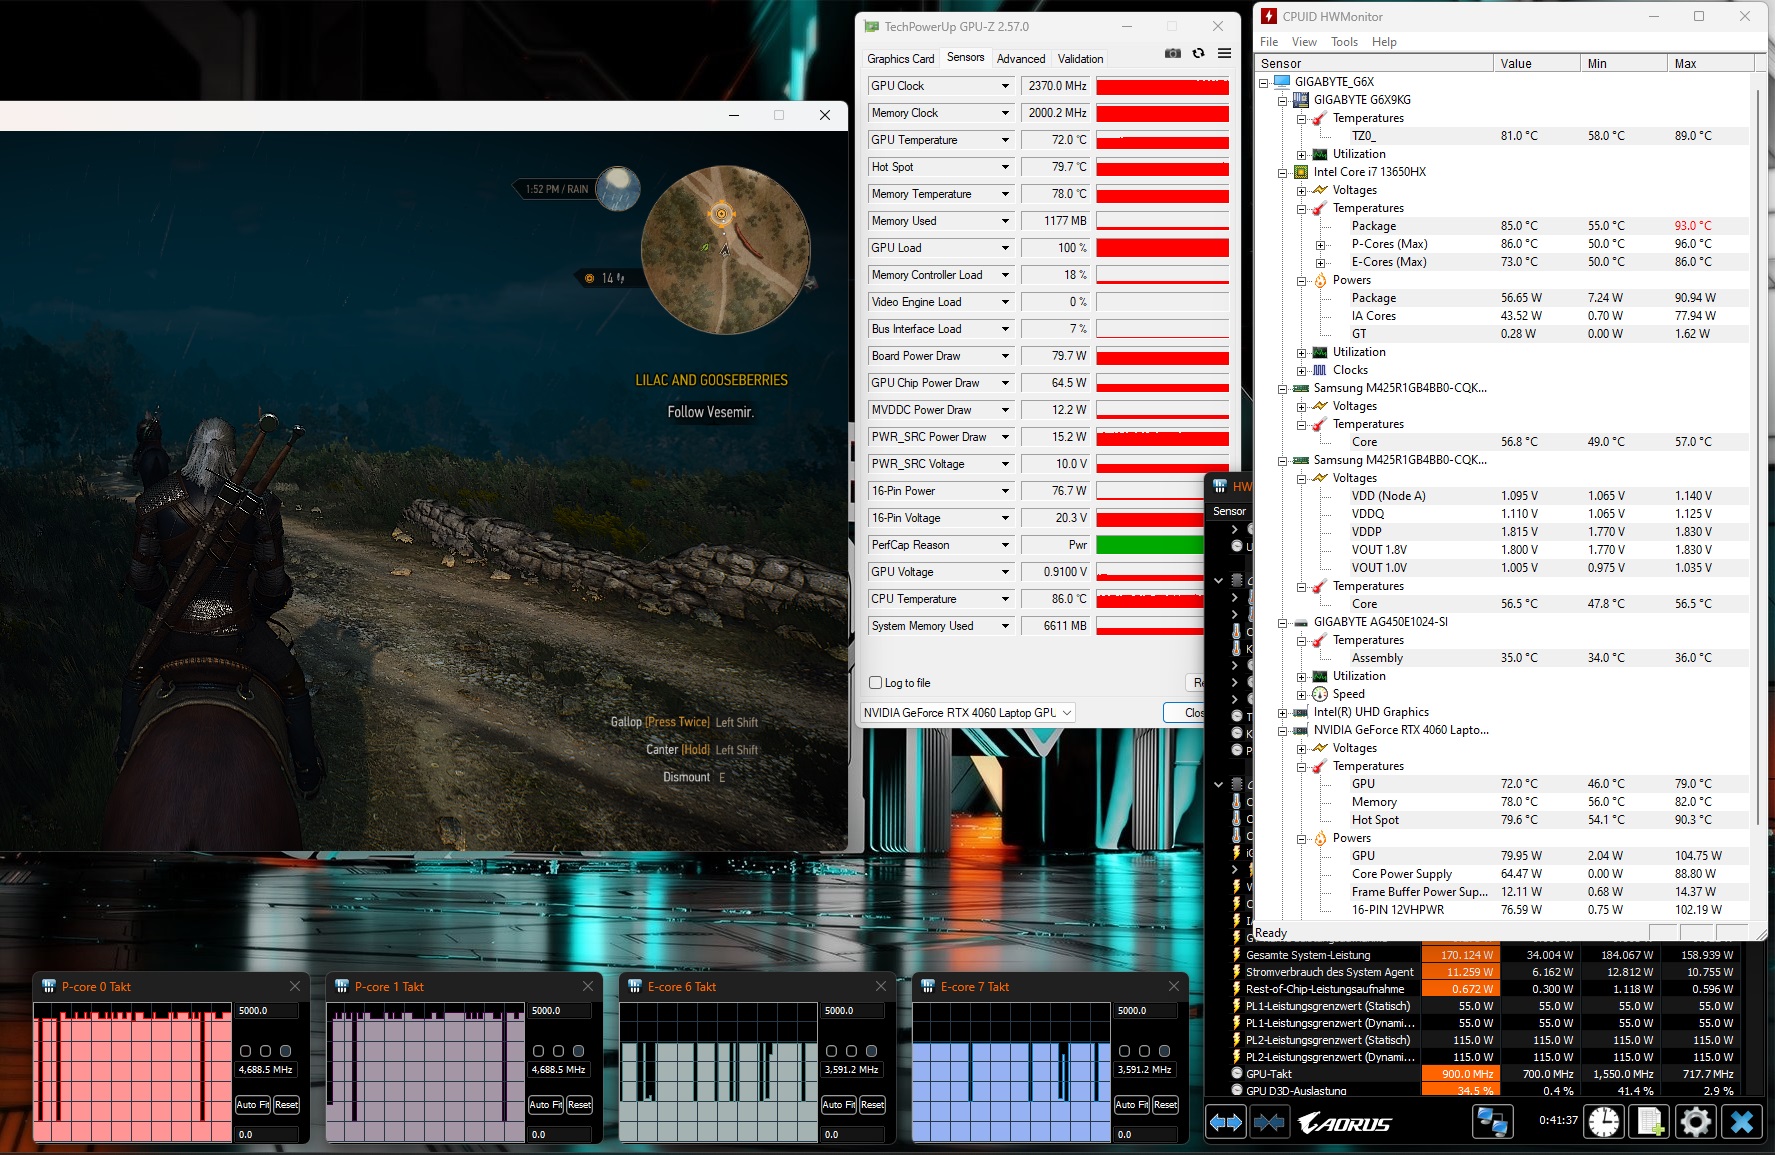
El escenario de prueba de estrés extremo (Prime95 y FurMark en funcionamiento continuo) comprueba la estabilidad del sistema a plena carga. La CPU del G6X funciona inicialmente a plena potencia, pero reduce rápidamente la velocidad de reloj al nivel de reloj base. La velocidad de reloj de la GPU cae de 2,3 GHz-2,6 GHz a 1,9-2,1 GHz.
(±) La temperatura máxima en la parte superior es de 41 °C / 106 F, frente a la media de 40.4 °C / 105 F, que oscila entre 21.2 y 68.8 °C para la clase Gaming.
(±) El fondo se calienta hasta un máximo de 43 °C / 109 F, frente a la media de 43.2 °C / 110 F
(+) En reposo, la temperatura media de la parte superior es de 29.6 °C / 85# F, frente a la media del dispositivo de 33.9 °C / 93 F.
(±) Jugando a The Witcher 3, la temperatura media de la parte superior es de 34.9 °C / 95 F, frente a la media del dispositivo de 33.9 °C / 93 F.
(+) El reposamanos y el panel táctil están a una temperatura inferior a la de la piel, con un máximo de 28 °C / 82.4 F y, por tanto, son fríos al tacto.
(±) La temperatura media de la zona del reposamanos de dispositivos similares fue de 28.8 °C / 83.8 F (+0.8 °C / 1.4 F).
| Gigabyte G6X 9KG (2024) i7-13650HX, GeForce RTX 4060 Laptop GPU | Dell G16, i7-13650HX, RTX 4060 i7-13650HX, GeForce RTX 4060 Laptop GPU | Lenovo Legion 5 16IRX G9 i7-14650HX, GeForce RTX 4060 Laptop GPU | MSI Raider GE68HX 13VF i9-13950HX, GeForce RTX 4060 Laptop GPU | Asus TUF Gaming A16 FA617XS R9 7940HS, Radeon RX 7600S | |
|---|---|---|---|---|---|
| Heat | -15% | 2% | 4% | -4% | |
| Maximum Upper Side * (°C) | 41 | 49 -20% | 40.4 1% | 41.4 -1% | 53 -29% |
| Maximum Bottom * (°C) | 43 | 58 -35% | 43.8 -2% | 45.4 -6% | 48 -12% |
| Idle Upper Side * (°C) | 32 | 35 -9% | 30.3 5% | 29.8 7% | 30 6% |
| Idle Bottom * (°C) | 37 | 35 5% | 35.3 5% | 31.4 15% | 30 19% |
* ... más pequeño es mejor

Altavoz
Los altavoces estéreo producen un sonido decente en general. Sin embargo, hay una falta de graves.
Gigabyte G6X 9KG (2024) análisis de audio
(+) | los altavoces pueden reproducir a un volumen relativamente alto (#82 dB)
Graves 100 - 315 Hz
(-) | casi sin bajos - de media 24.9% inferior a la mediana
(±) | la linealidad de los graves es media (13.7% delta a frecuencia anterior)
Medios 400 - 2000 Hz
(+) | medios equilibrados - a sólo 4.1% de la mediana
(+) | los medios son lineales (5.4% delta a la frecuencia anterior)
Altos 2 - 16 kHz
(+) | máximos equilibrados - a sólo 2.2% de la mediana
(±) | la linealidad de los máximos es media (7.4% delta a frecuencia anterior)
Total 100 - 16.000 Hz
(±) | la linealidad del sonido global es media (17.2% de diferencia con la mediana)
En comparación con la misma clase
» 47% de todos los dispositivos probados de esta clase eran mejores, 11% similares, 42% peores
» El mejor tuvo un delta de 6%, la media fue 18%, el peor fue ###max##%
En comparación con todos los dispositivos probados
» 32% de todos los dispositivos probados eran mejores, 8% similares, 60% peores
» El mejor tuvo un delta de 4%, la media fue 23%, el peor fue ###max##%
Dell G16, i7-13650HX, RTX 4060 análisis de audio
(±) | la sonoridad del altavoz es media pero buena (80.55 dB)
Graves 100 - 315 Hz
(-) | casi sin bajos - de media 25.1% inferior a la mediana
(-) | los graves no son lineales (18.9% delta a la frecuencia anterior)
Medios 400 - 2000 Hz
(±) | medias más altas - de media 8% más altas que la mediana
(+) | los medios son lineales (5.9% delta a la frecuencia anterior)
Altos 2 - 16 kHz
(+) | máximos equilibrados - a sólo 3.5% de la mediana
(±) | la linealidad de los máximos es media (8.6% delta a frecuencia anterior)
Total 100 - 16.000 Hz
(±) | la linealidad del sonido global es media (23.4% de diferencia con la mediana)
En comparación con la misma clase
» 85% de todos los dispositivos probados de esta clase eran mejores, 5% similares, 11% peores
» El mejor tuvo un delta de 6%, la media fue 18%, el peor fue ###max##%
En comparación con todos los dispositivos probados
» 70% de todos los dispositivos probados eran mejores, 6% similares, 24% peores
» El mejor tuvo un delta de 4%, la media fue 23%, el peor fue ###max##%
Consumo de energía
El consumo de energía se sitúa en un nivel normal para el hardware instalado. Mientras que la prueba Witcher 3 se ejecuta con un consumo de energía constante, la demanda fluctúa ligeramente durante la prueba de estrés.
La potencia de salida de la fuente de alimentación está por encima de la potencia nominal (180 W) durante unos minutos, pero luego se reduce al nivel de potencia nominal.
| Off / Standby | |
| Ocioso | |
| Carga |
|
Clave:
min: | |
Energieaufnahme Witcher 3 / Stresstest
Power consumption: External monitor
Duración de las pilas
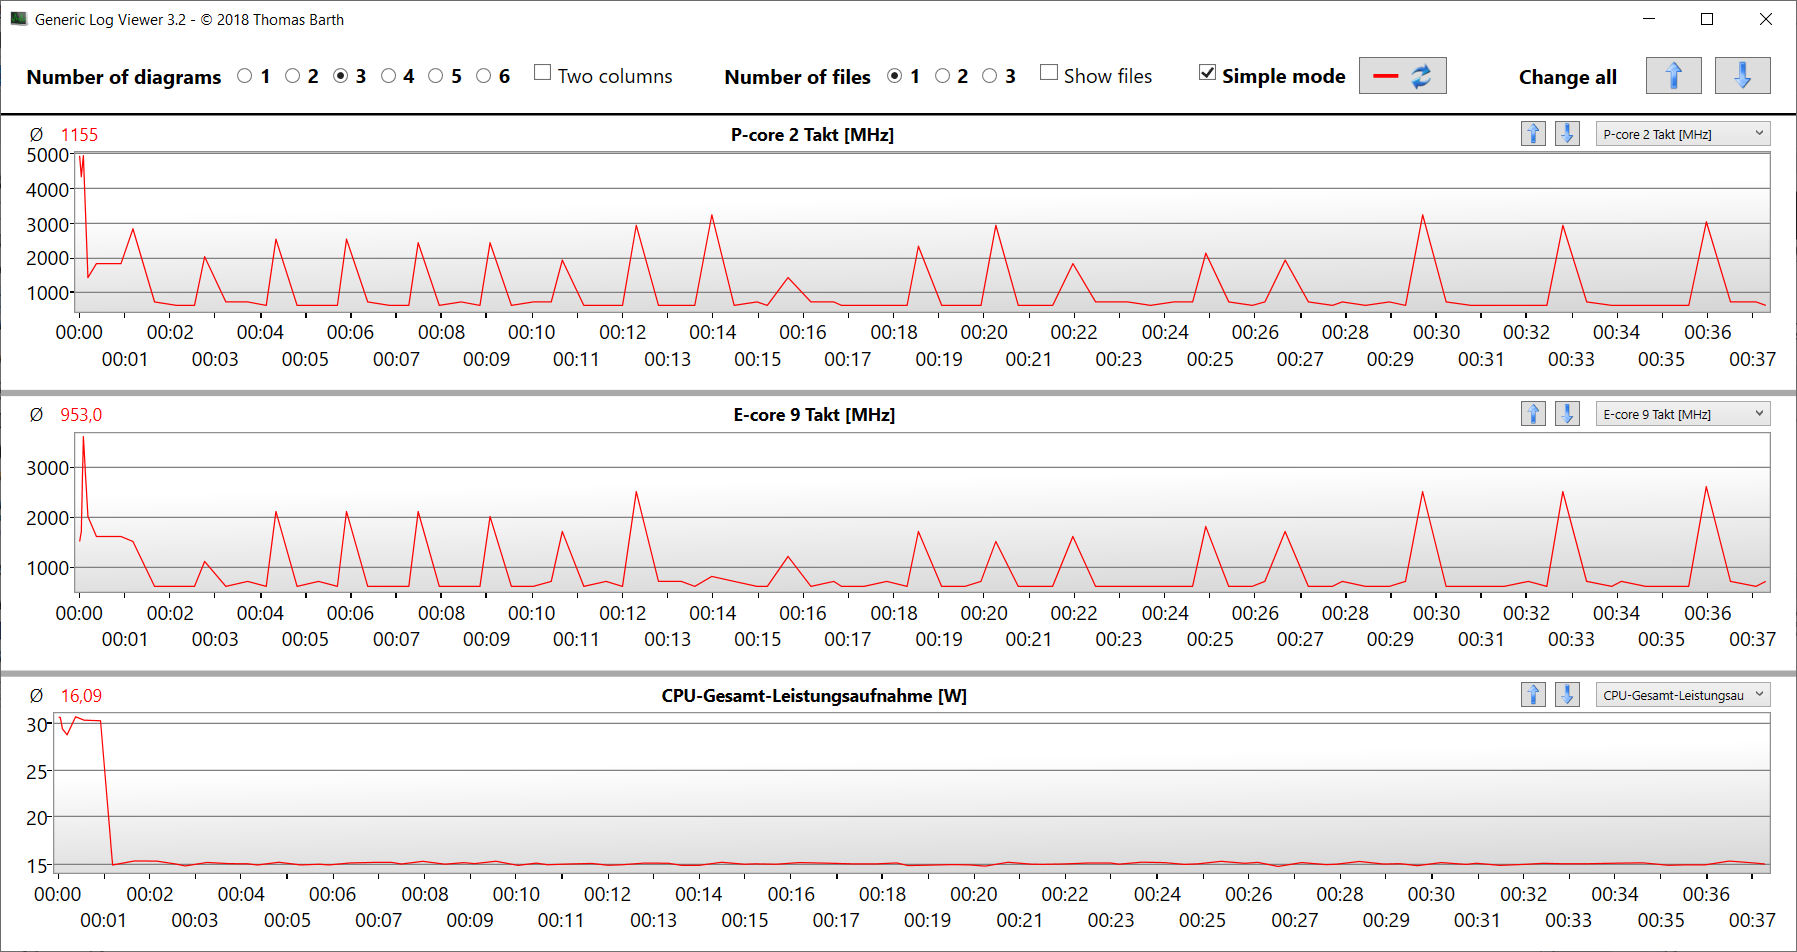
El Gigabyte G6X alcanza un tiempo de ejecución de 7:54 h en la prueba práctica de WLAN (mapeo de la carga al acceder a sitios web utilizando un script), lo que supone un buen valor y es el segundo mejor tiempo de ejecución de la comparativa.
Pro
Contra
Veredicto: Un paquete global bien redondeado
El Gigabyte G6X 9KG está diseñado para juegos FHD con configuraciones de altas a máximas, pero su Core i7-13650HX y GeForce RTX 4060 también deberían poder rendir en otros ámbitos como la edición y el renderizado de vídeo. Una rápida unidad SSD PCIe Gen 4 de 1 TB garantiza tiempos de carga cortos.
Gigabyte ofrece un portátil para juegos de gama media coherente con el G6X 9KG (2024)"
El portátil no se calienta mucho bajo carga pero puede producir mucho ruido. El perfil de energía silencioso puede contrarrestarlo, pero esto hace que la dGPU se apague. Por tanto, la buena autonomía Wi-Fi de algo menos de 8 horas no es ninguna sorpresa.
El G6X no cuenta con ningún puerto Thunderbolt o USB4 moderno. Con uno de los USB Tipo-C compatible con Power Delivery, la fuente de alimentación propietaria puede quedarse en casa para el trabajo habitual. Los dos puertos USB 3.2 Gen 2 Tipo-C también permiten una fácil integración en las configuraciones de estaciones de trabajo existentes.
La pantalla IPS mate de 16 pulgadas WUXGA 165 Hz causa una buena impresión en general, pero ofrece una cobertura insuficiente del espacio de color.
Como alternativa, el Lenovo Legion 5 16IRX G9 podría considerarse. Ofrece más rendimiento de la GPU y una pantalla más brillante con mejor cobertura del espacio de color.
Precio y disponibilidad
En EE.UU., el Gigabyte G6X 9KG (2024) está disponible en Amazon por unos 1.350 dólares.
Gigabyte G6X 9KG (2024)
- 03/22/2024 v7 (old)
Sascha Mölck
Transparencia
La selección de los dispositivos que se van a reseñar corre a cargo de nuestro equipo editorial. La muestra de prueba fue proporcionada al autor en calidad de préstamo por el fabricante o el minorista a los efectos de esta reseña. El prestamista no tuvo ninguna influencia en esta reseña, ni el fabricante recibió una copia de la misma antes de su publicación. No había ninguna obligación de publicar esta reseña. Como empresa de medios independiente, Notebookcheck no está sujeta a la autoridad de fabricantes, minoristas o editores.
Así es como prueba Notebookcheck
Cada año, Notebookcheck revisa de forma independiente cientos de portátiles y smartphones utilizando procedimientos estandarizados para asegurar que todos los resultados son comparables. Hemos desarrollado continuamente nuestros métodos de prueba durante unos 20 años y hemos establecido los estándares de la industria en el proceso. En nuestros laboratorios de pruebas, técnicos y editores experimentados utilizan equipos de medición de alta calidad. Estas pruebas implican un proceso de validación en varias fases. Nuestro complejo sistema de clasificación se basa en cientos de mediciones y puntos de referencia bien fundamentados, lo que mantiene la objetividad.Price comparison
