Análisis de Lenovo Legion 5i 16 G9 - El rápido portátil para juegos con Raptor Lake-HX y un motor de IA
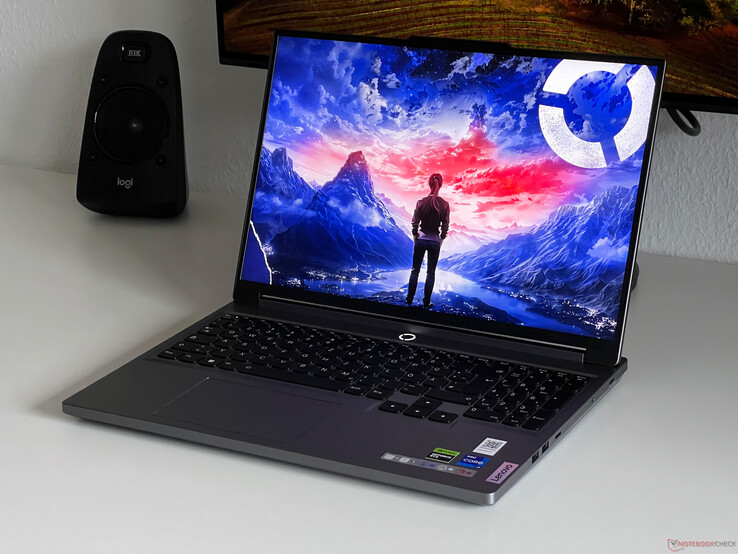
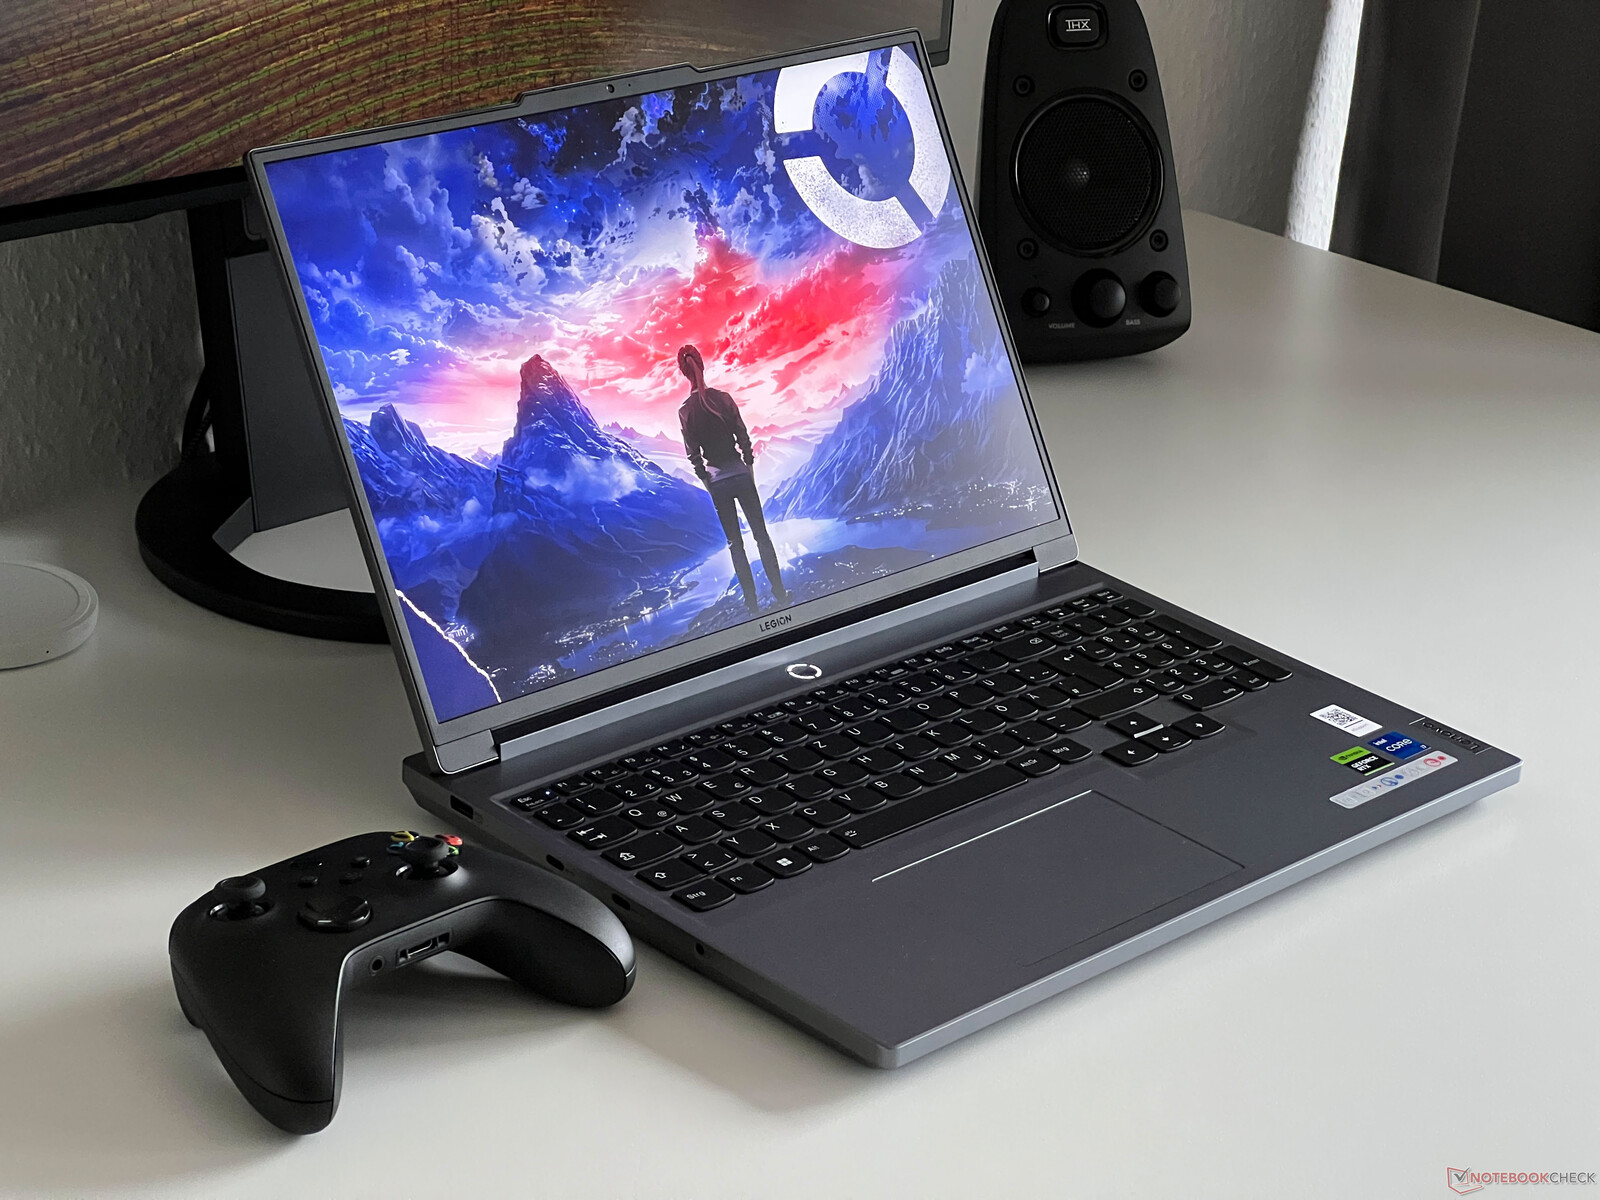
Lenovo acaba de presentar su nuevo portátil para juegos, el Legion 5i 16 G9, en el CES de este año, y ya hemos tenido la oportunidad de probarlo. El portátil para juegos de gama media de Lenovo se sitúa justo entre la serie LOQ, más barata, y la Legion 5 Pro, más cara. Con su nuevo procesador Raptor-Lake-HX, el Core i7-14650HXuna versión de 115 vatios del Portátil RTX 4060 (que incluye Advanced Optimus) y un rápido panel WQXGA de 240 Hz, el nuevo Legion 5i 16 se centra por completo en el rendimiento, dejando de lado aspectos como la amplia iluminación de la carcasa. Además, el fabricante hace uso de un chip de IA especial: supuestamente, el AI Engine+ de Lenovo mejorará aún más la experiencia de juego de los usuarios.
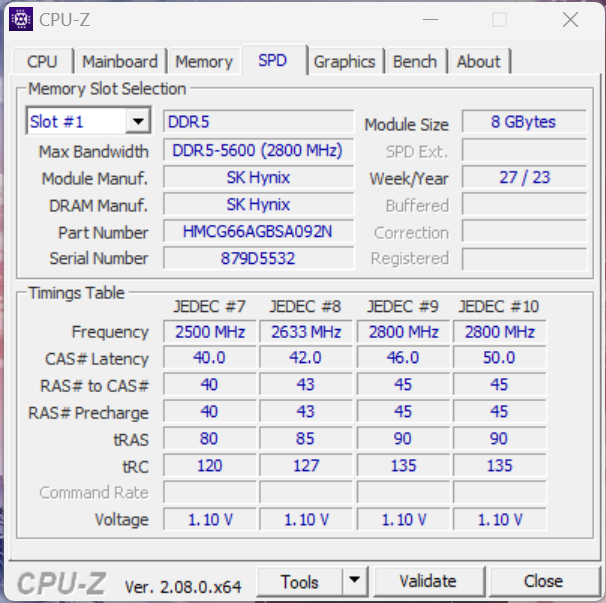
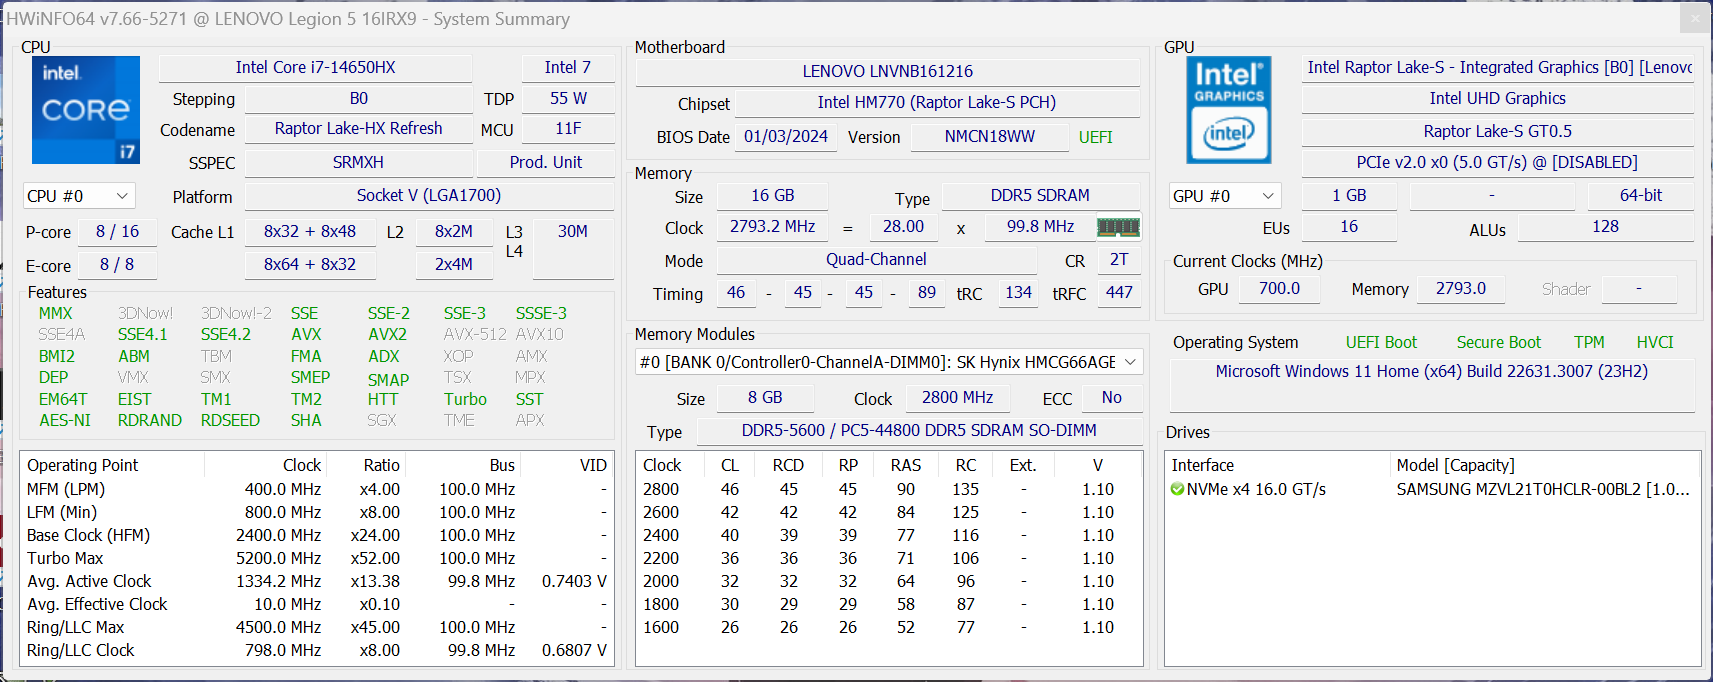
Hemos probado la versión del Legion 5i 16IRX G9 con procesador Core-i7, portátil RTX 4060, pantalla de 240-Hz, 16 GB de RAM, así como una unidad SSD PCIe de 1 TB por 1.610 dólares.
Posibles contendientes en la comparación
Valoración | Fecha | Modelo | Peso | Altura | Tamaño | Resolución | Precio |
|---|---|---|---|---|---|---|---|
| 89.1 % v7 (old) | 02/2024 | Lenovo Legion 5 16IRX G9 i7-14650HX, GeForce RTX 4060 Laptop GPU | 2.4 kg | 25.2 mm | 16.00" | 2560x1600 | |
| 89.2 % v7 (old) | 10/2023 | Schenker XMG CORE 16 (L23) R7 7840HS, GeForce RTX 4070 Laptop GPU | 2.4 kg | 26.1 mm | 16.00" | 2560x1600 | |
| 85.1 % v7 (old) | 09/2023 | HP Victus 16-r0077ng i7-13700H, GeForce RTX 4070 Laptop GPU | 2.4 kg | 24 mm | 16.10" | 1920x1080 | |
| 87.3 % v7 (old) | 09/2023 | Lenovo LOQ 16IRH8 i7-13620H, GeForce RTX 4060 Laptop GPU | 2.7 kg | 25.9 mm | 16.00" | 2560x1600 | |
| 87.7 % v7 (old) | 08/2023 | Lenovo Legion Slim 5 16APH8 R7 7840HS, GeForce RTX 4060 Laptop GPU | 2.4 kg | 25.2 mm | 16.00" | 2560x1600 | |
| 85.6 % v7 (old) | 09/2023 | HP Victus 16-r0076TX i5-13500HX, GeForce RTX 4050 Laptop GPU | 2.3 kg | 22.9 mm | 16.10" | 1920x1080 | |
| 88.3 % v7 (old) | 09/2023 | Alienware m16 R1 Intel i7-13700HX, GeForce RTX 4060 Laptop GPU | 3 kg | 25.4 mm | 16.00" | 2560x1600 | |
| 87.9 % v7 (old) | 05/2023 | Lenovo Legion Pro 5 16IRX8 i7-13700HX, GeForce RTX 4060 Laptop GPU | 2.5 kg | 26.8 mm | 16.00" | 2560x1600 |
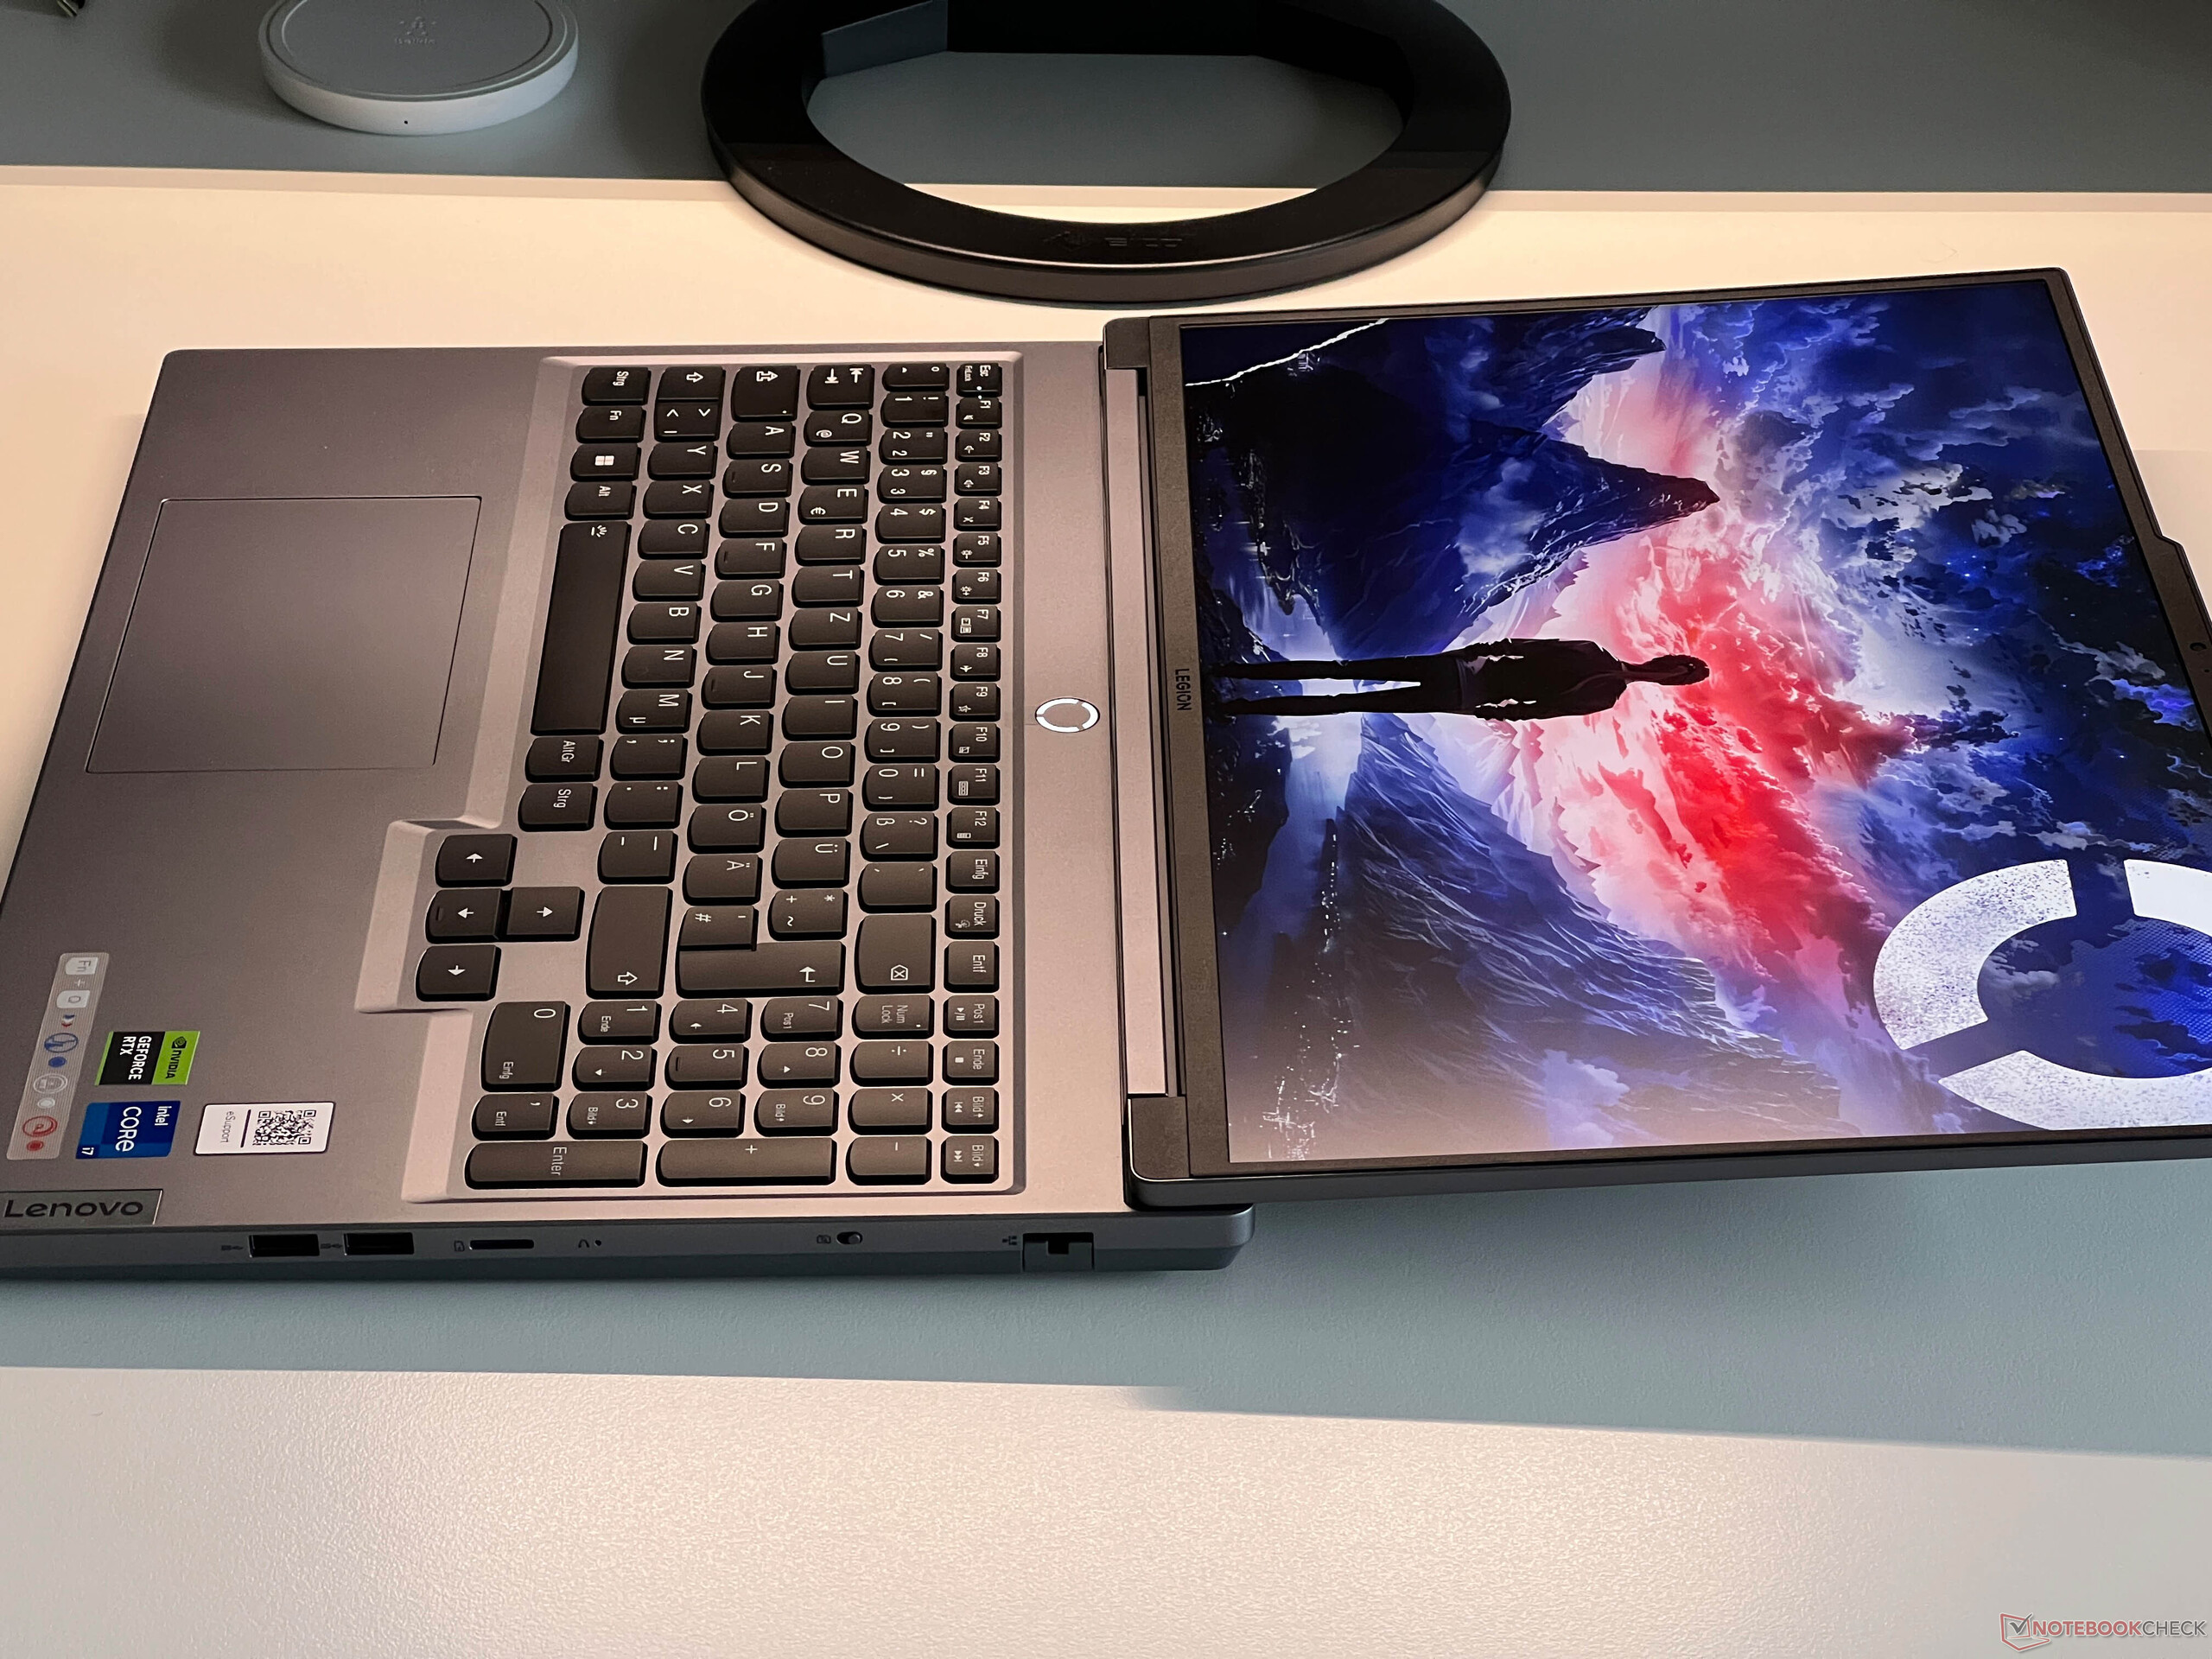
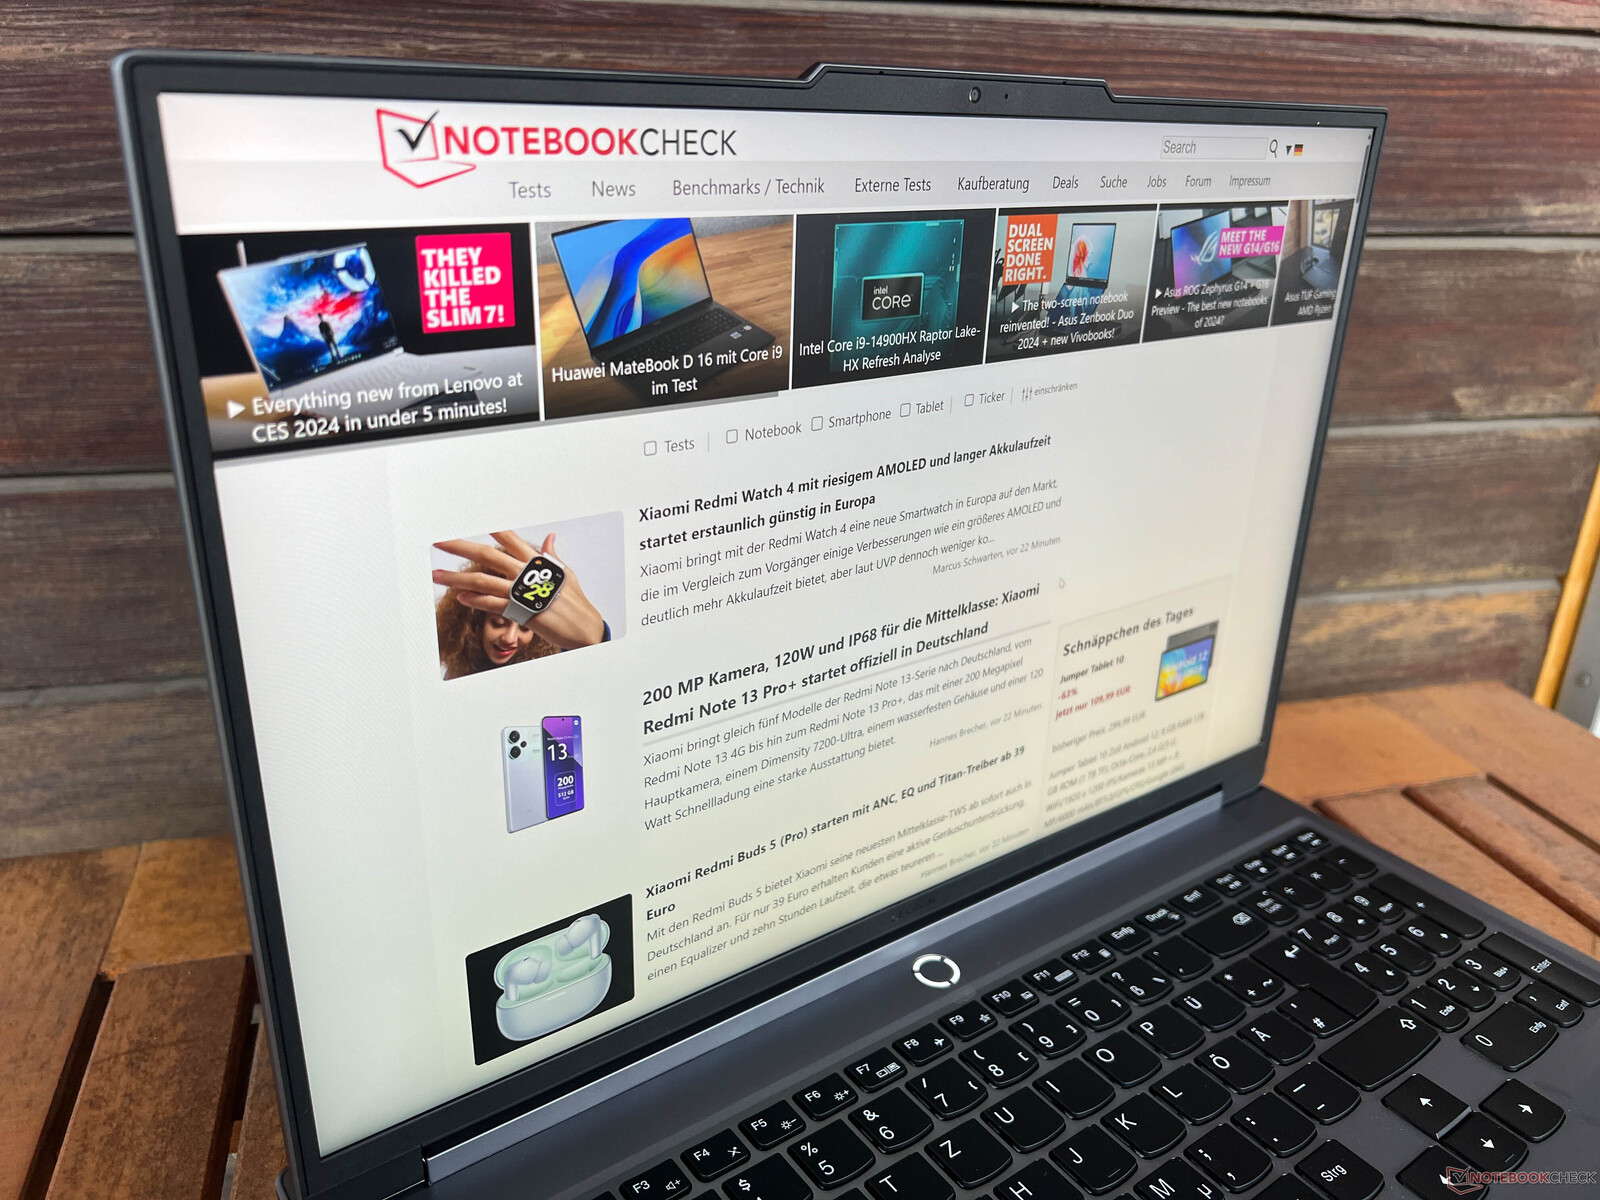
Caja - La Legion cuenta en parte con aluminio
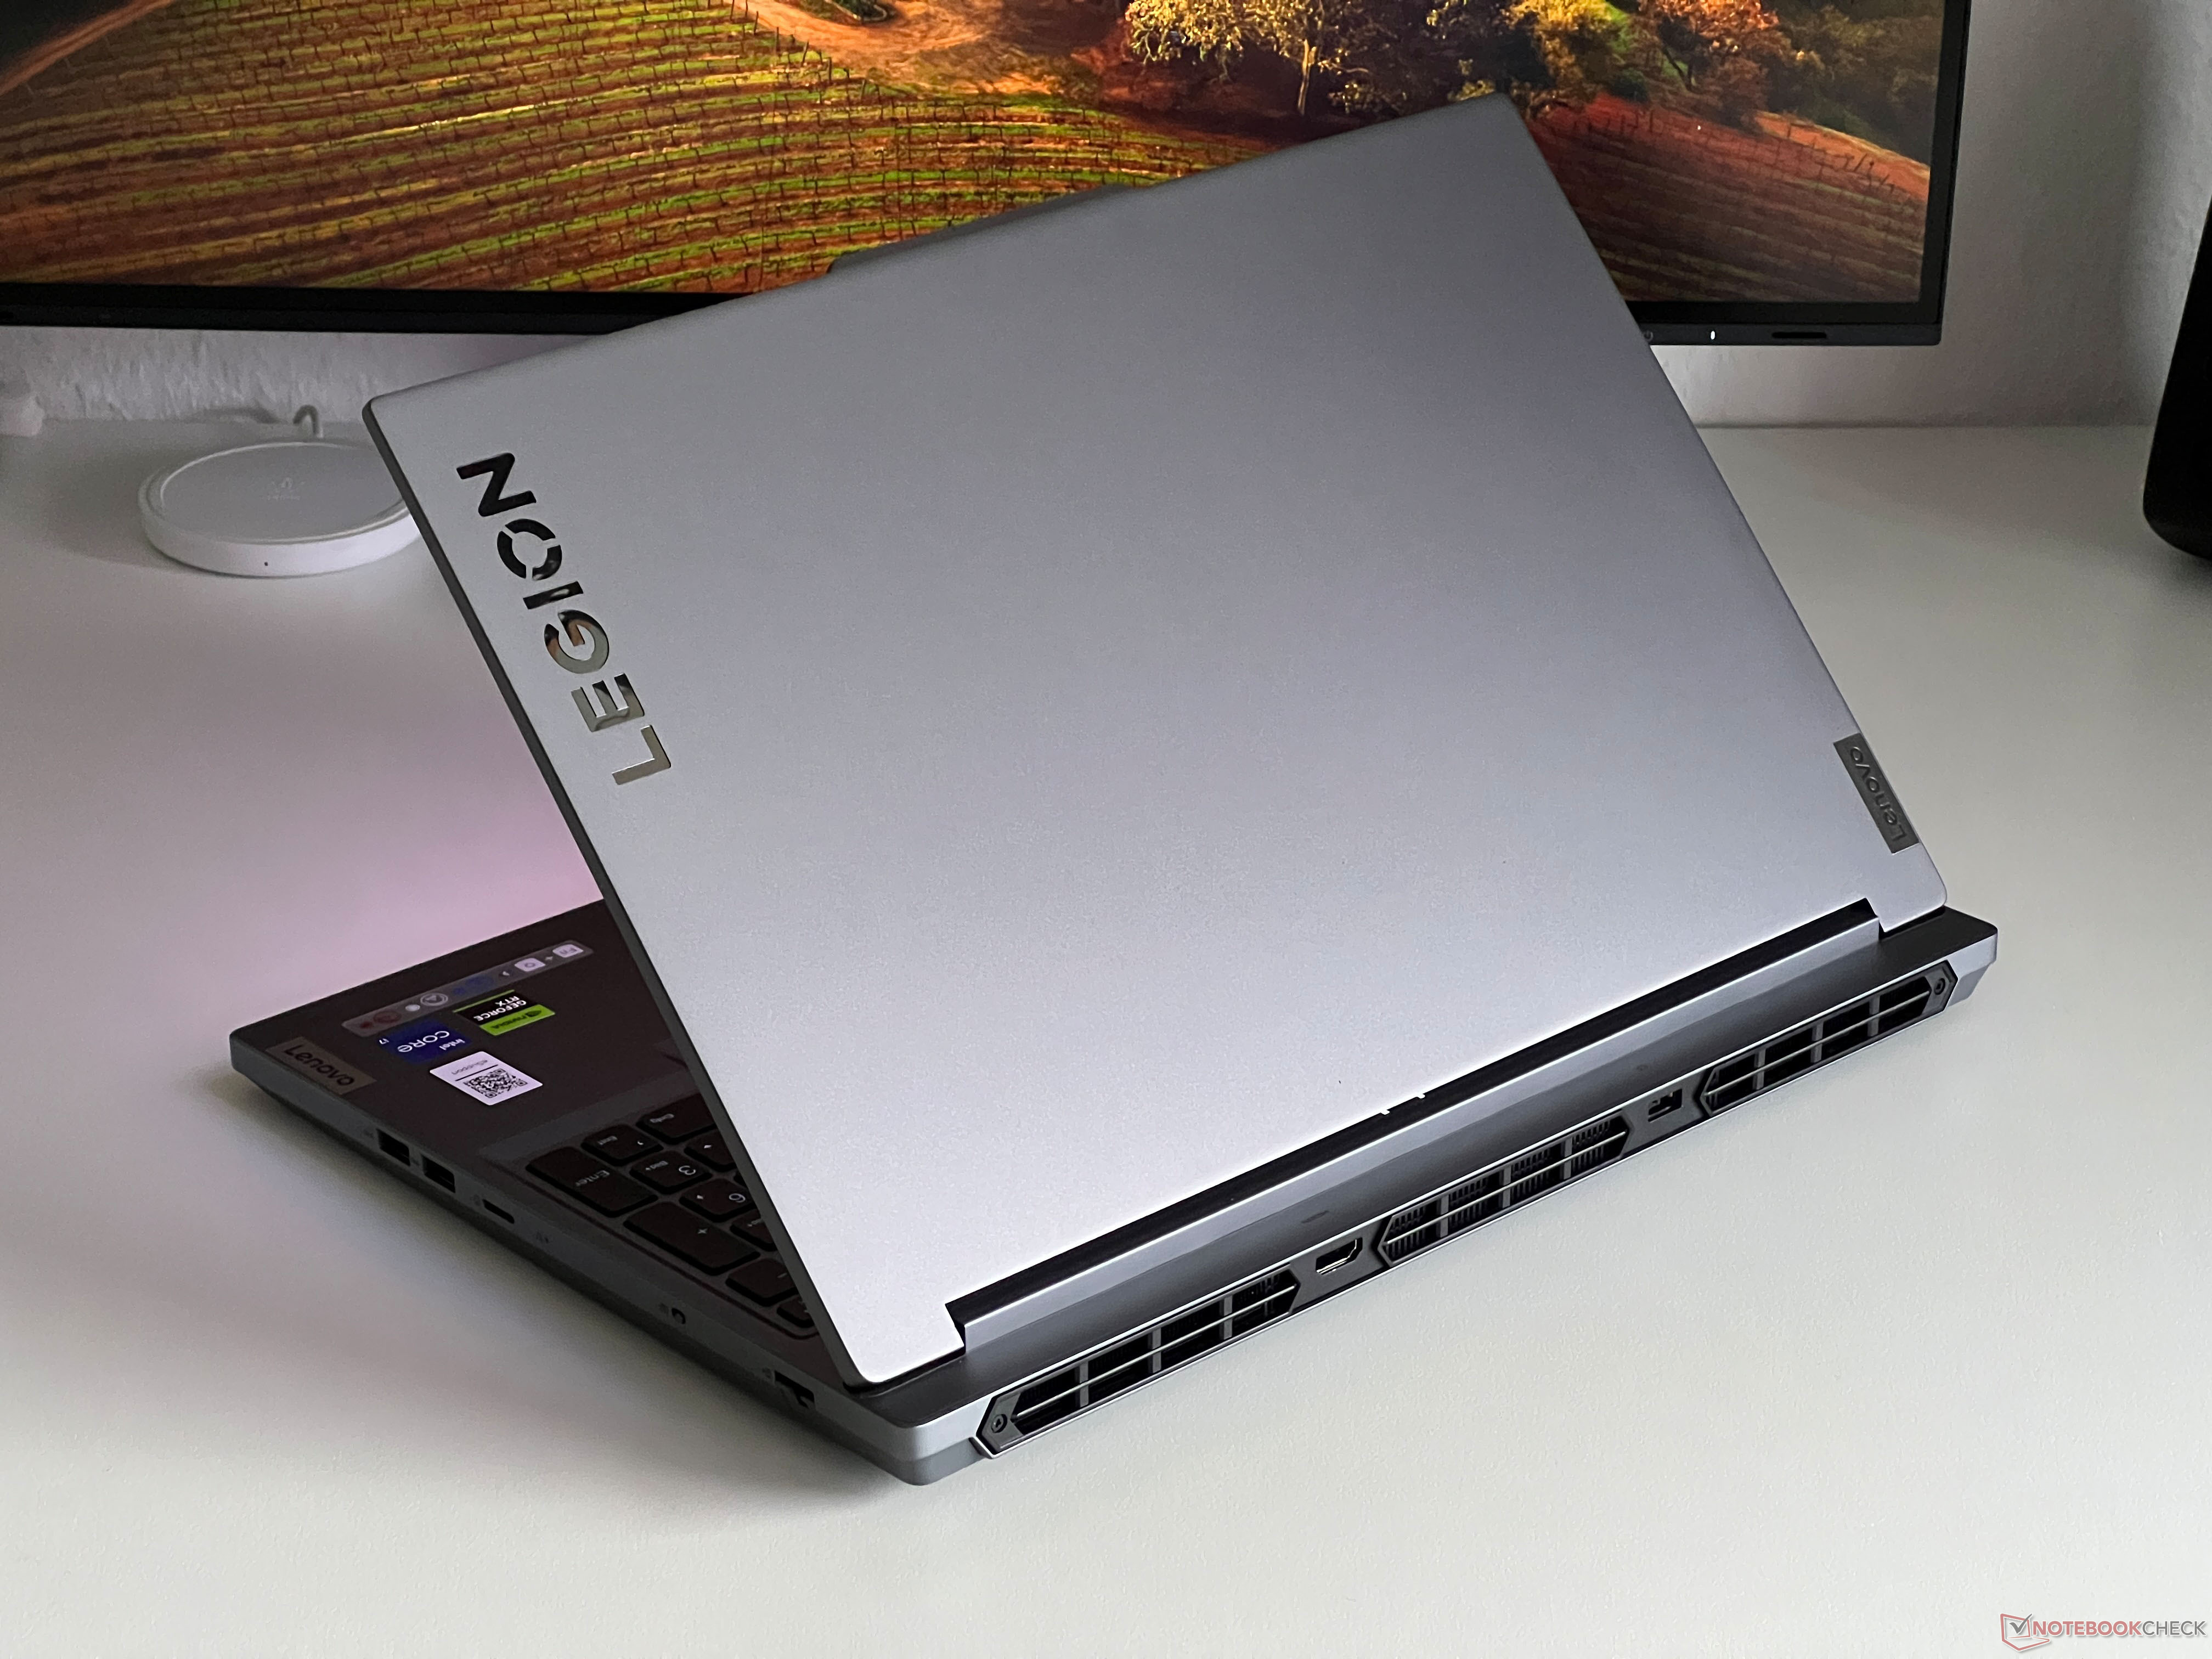
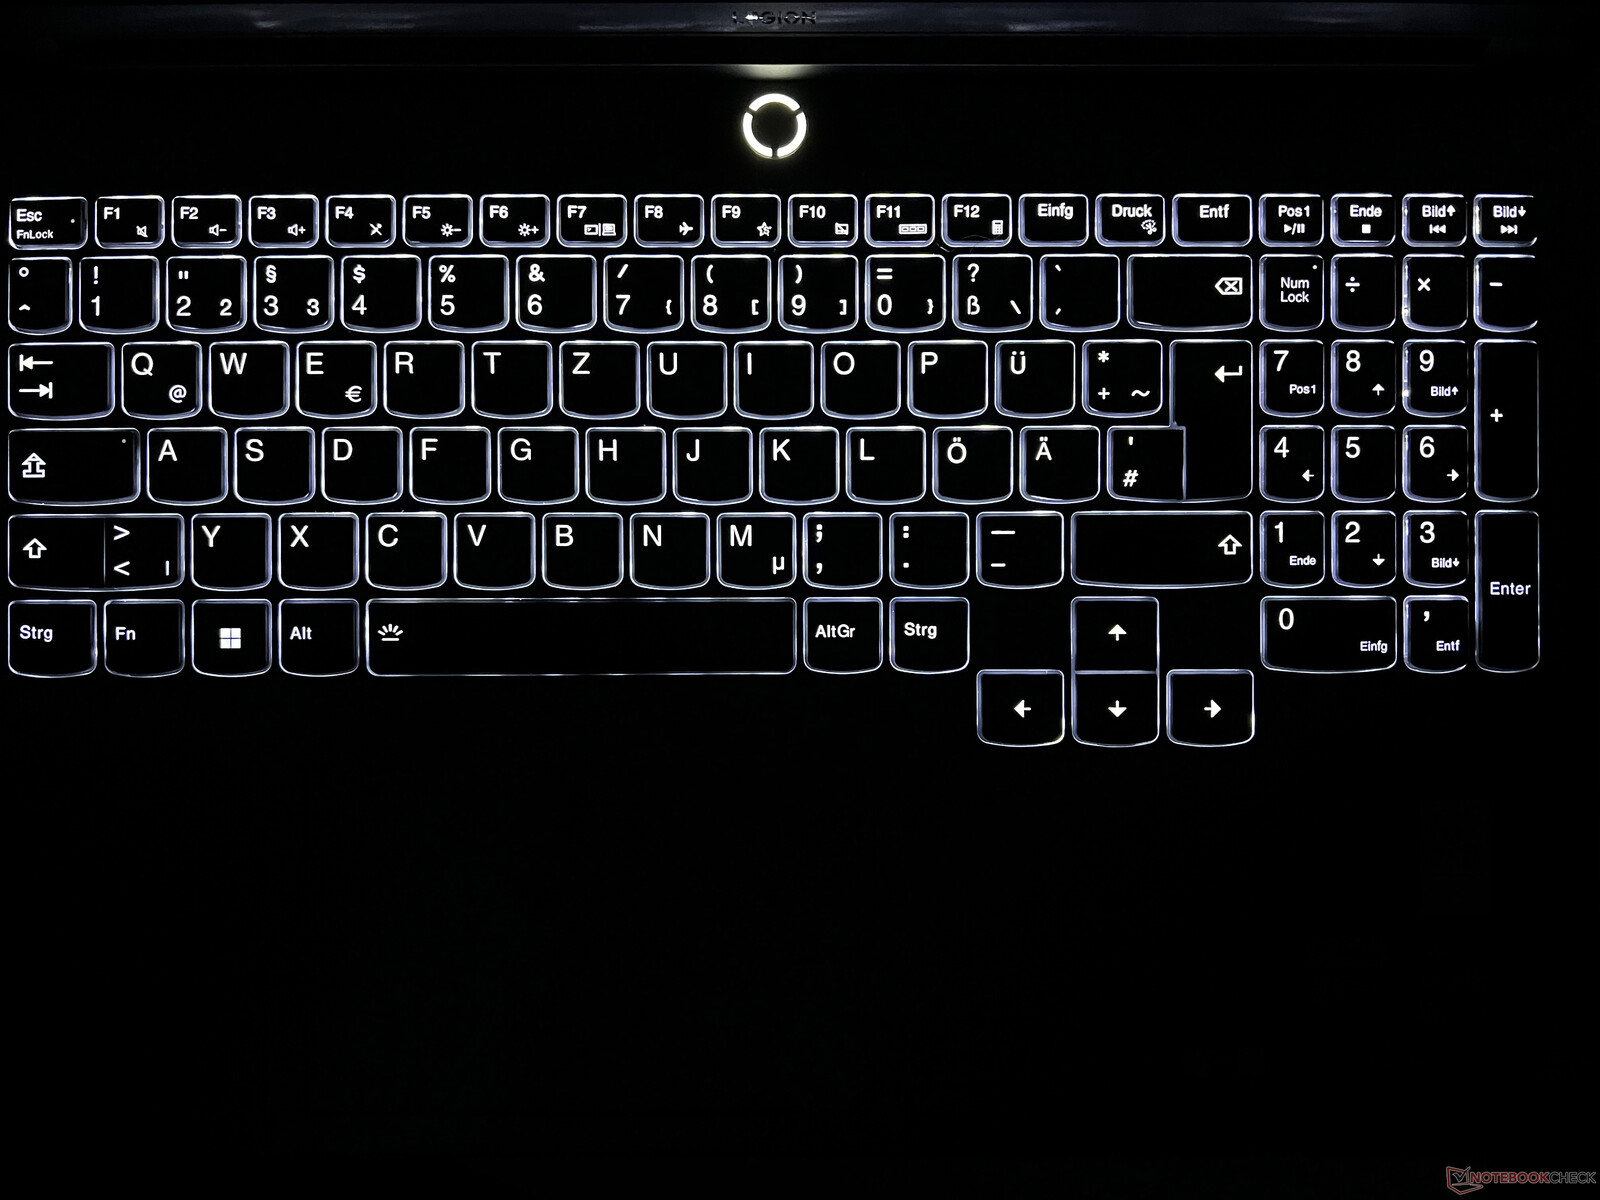
La carcasa del dispositivo es muy elegante para tratarse de un portátil para juegos y si prefiere que las cosas sean más llamativas, entonces el Legion 5i puede decepcionarle. Aparte de su teclado y biseles negros, no presenta más contrastes de color y, además, Lenovo ha decidido no instalar ninguna iluminación en la carcasa. Sólo el LED de estado que rodea el botón de encendido se ilumina en cuatro colores que dependen del perfil de energía que se esté utilizando. Al menos esto significa que también puede utilizar el portátil en entornos más profesionales, como en la universidad.
En cuanto a la calidad, la carcasa tiene un tacto bastante de gama alta, a pesar de que sólo la tapa está hecha de aluminio. La unidad base está hecha completamente de plástico, pero la parte superior sigue teniendo un tacto muy agradable. Sólo la parte inferior de la carcasa es un poco más rugosa, lo que le da una sensación un poco más barata. Una ventaja que tiene la carcasa es lo poco que atrae la suciedad y las marcas de huellas dactilares. Su estabilidad es buena en conjunto, pero esto no es una sorpresa debido a lo gruesa que es la unidad base (máx. 2 cm en la parte trasera). Las bisagras de la pantalla están bien ajustadas y permiten abrir el portátil con una sola mano; su ángulo máximo de apertura es de 180 grados.
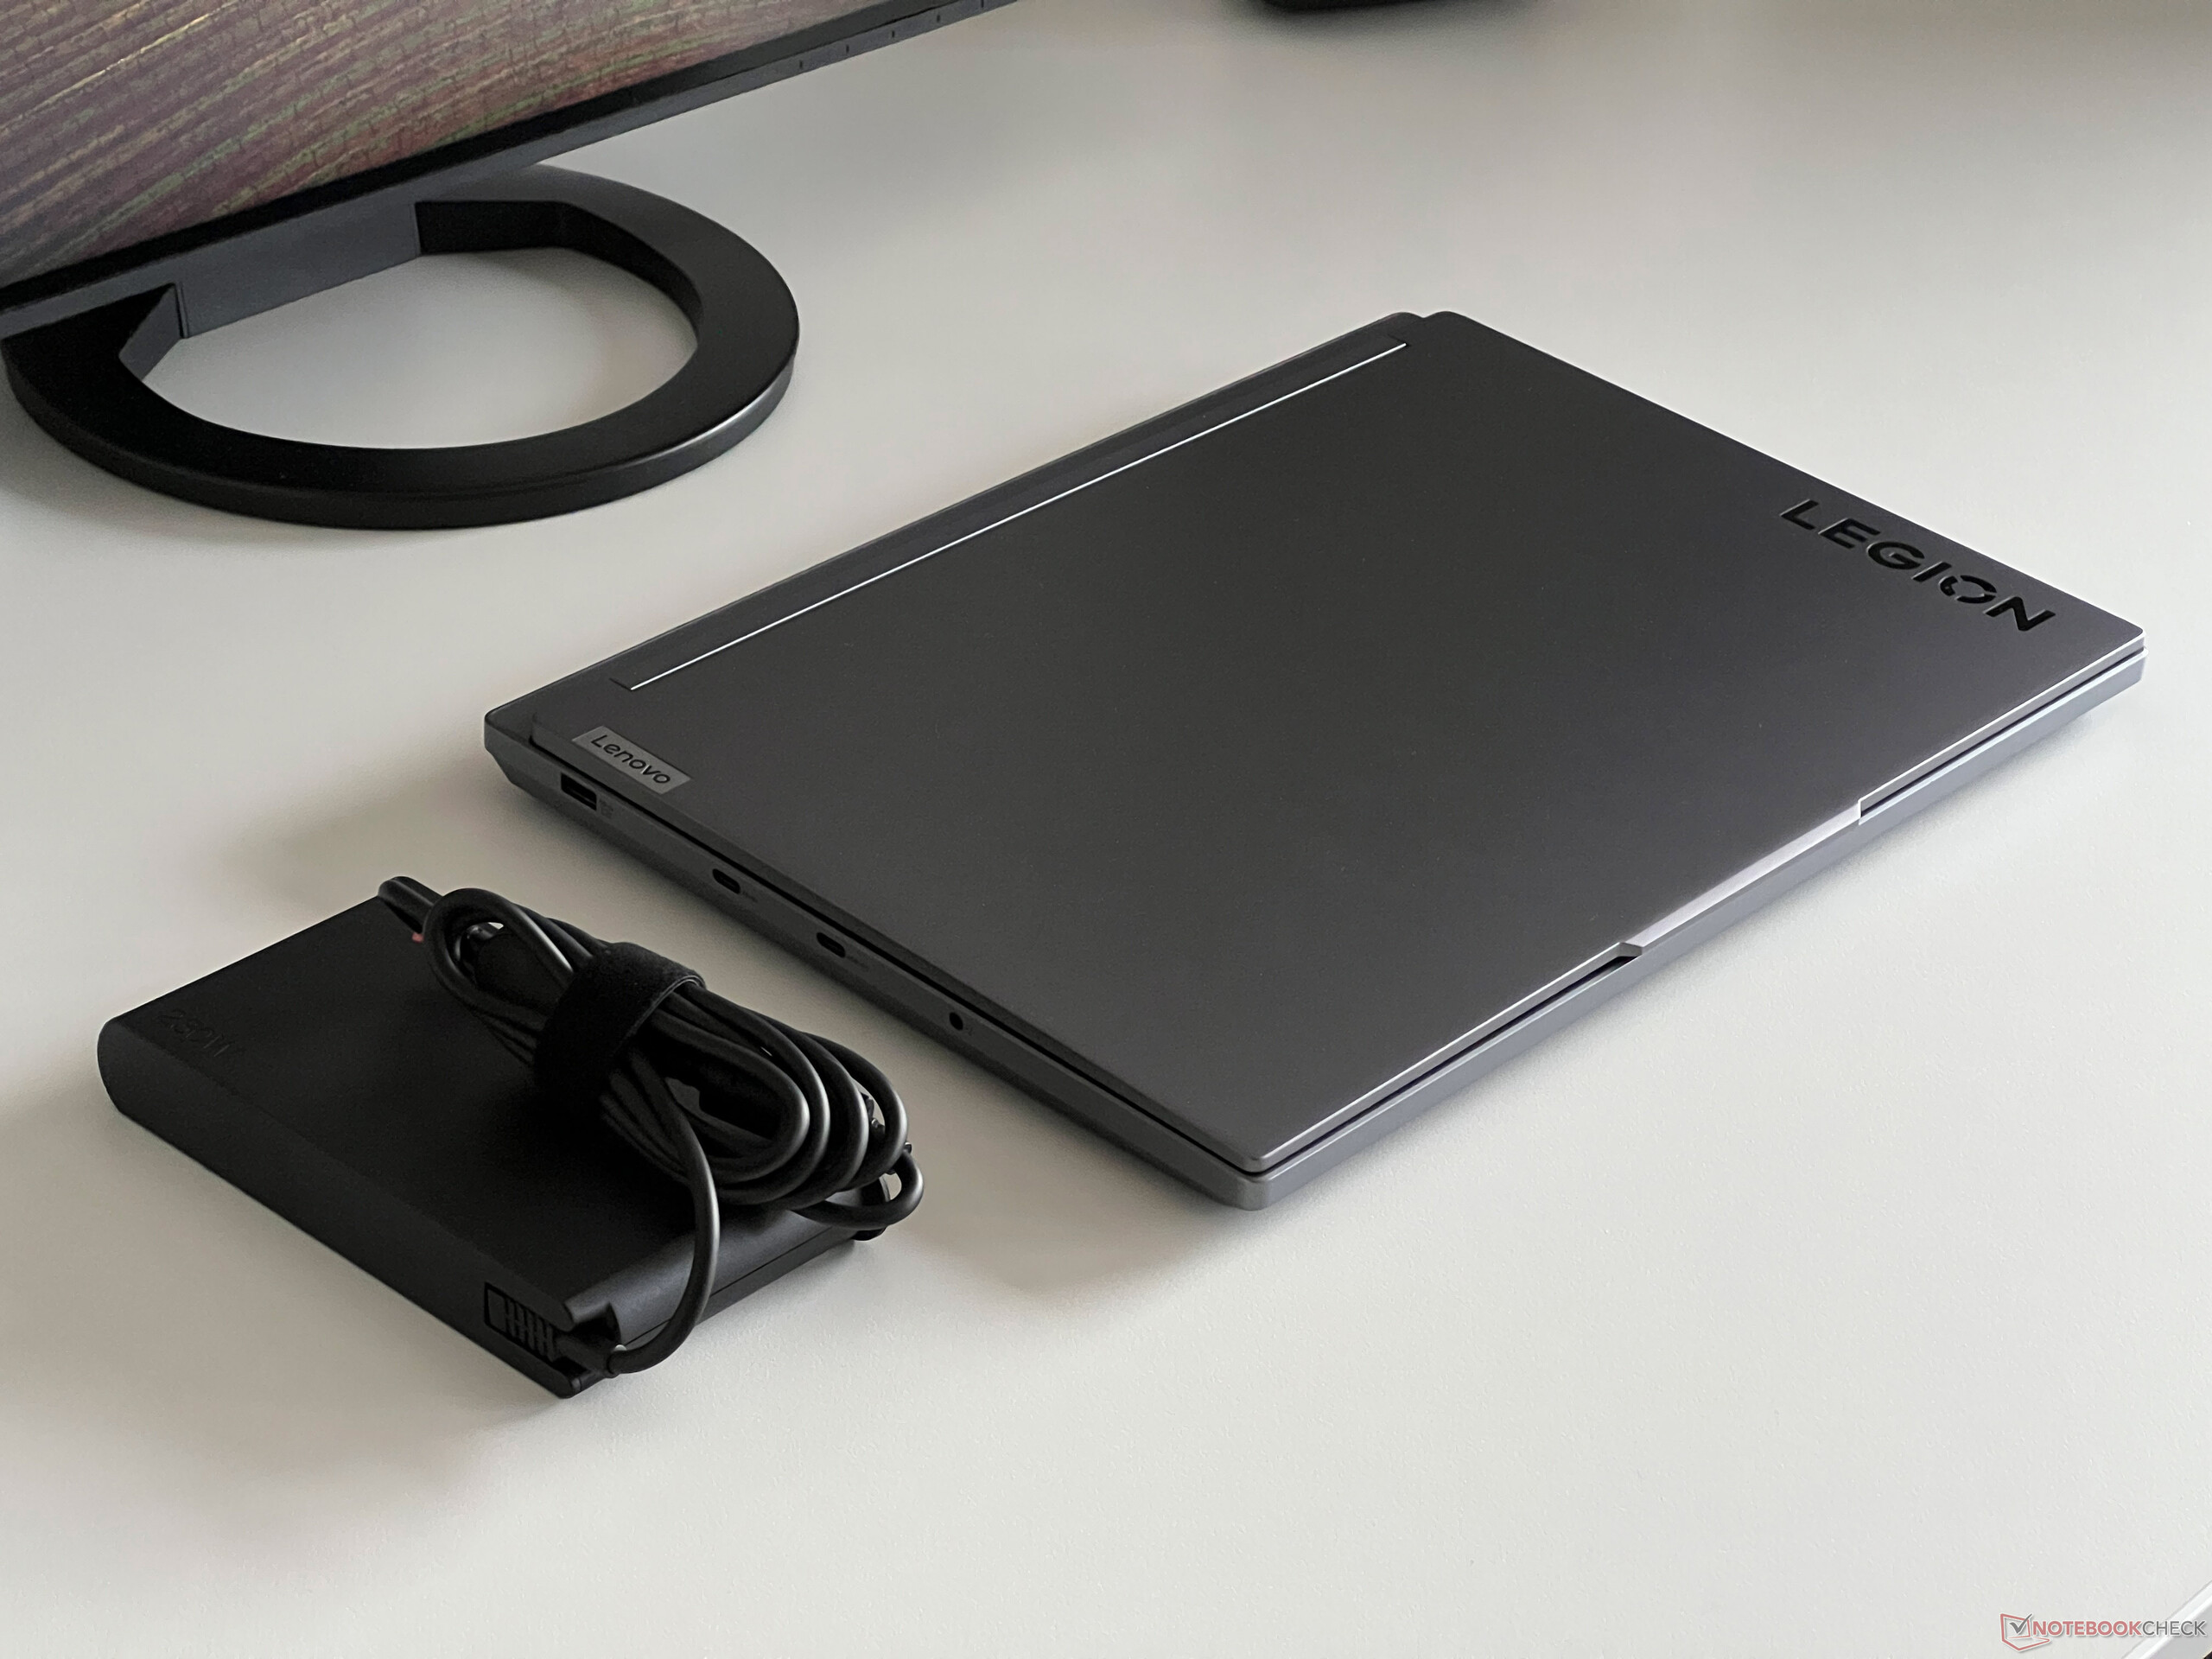
Con un peso de 2,4 kg, no es ni mucho menos tan ligera como una pluma, pero dentro del campo de la comparación, nuestra muestra de prueba rinde bien. Además, su tamaño la convierte en uno de los modelos más compactos. Tendrá que prever 869 gramos adicionales para la fuente de alimentación de 230 vatios.
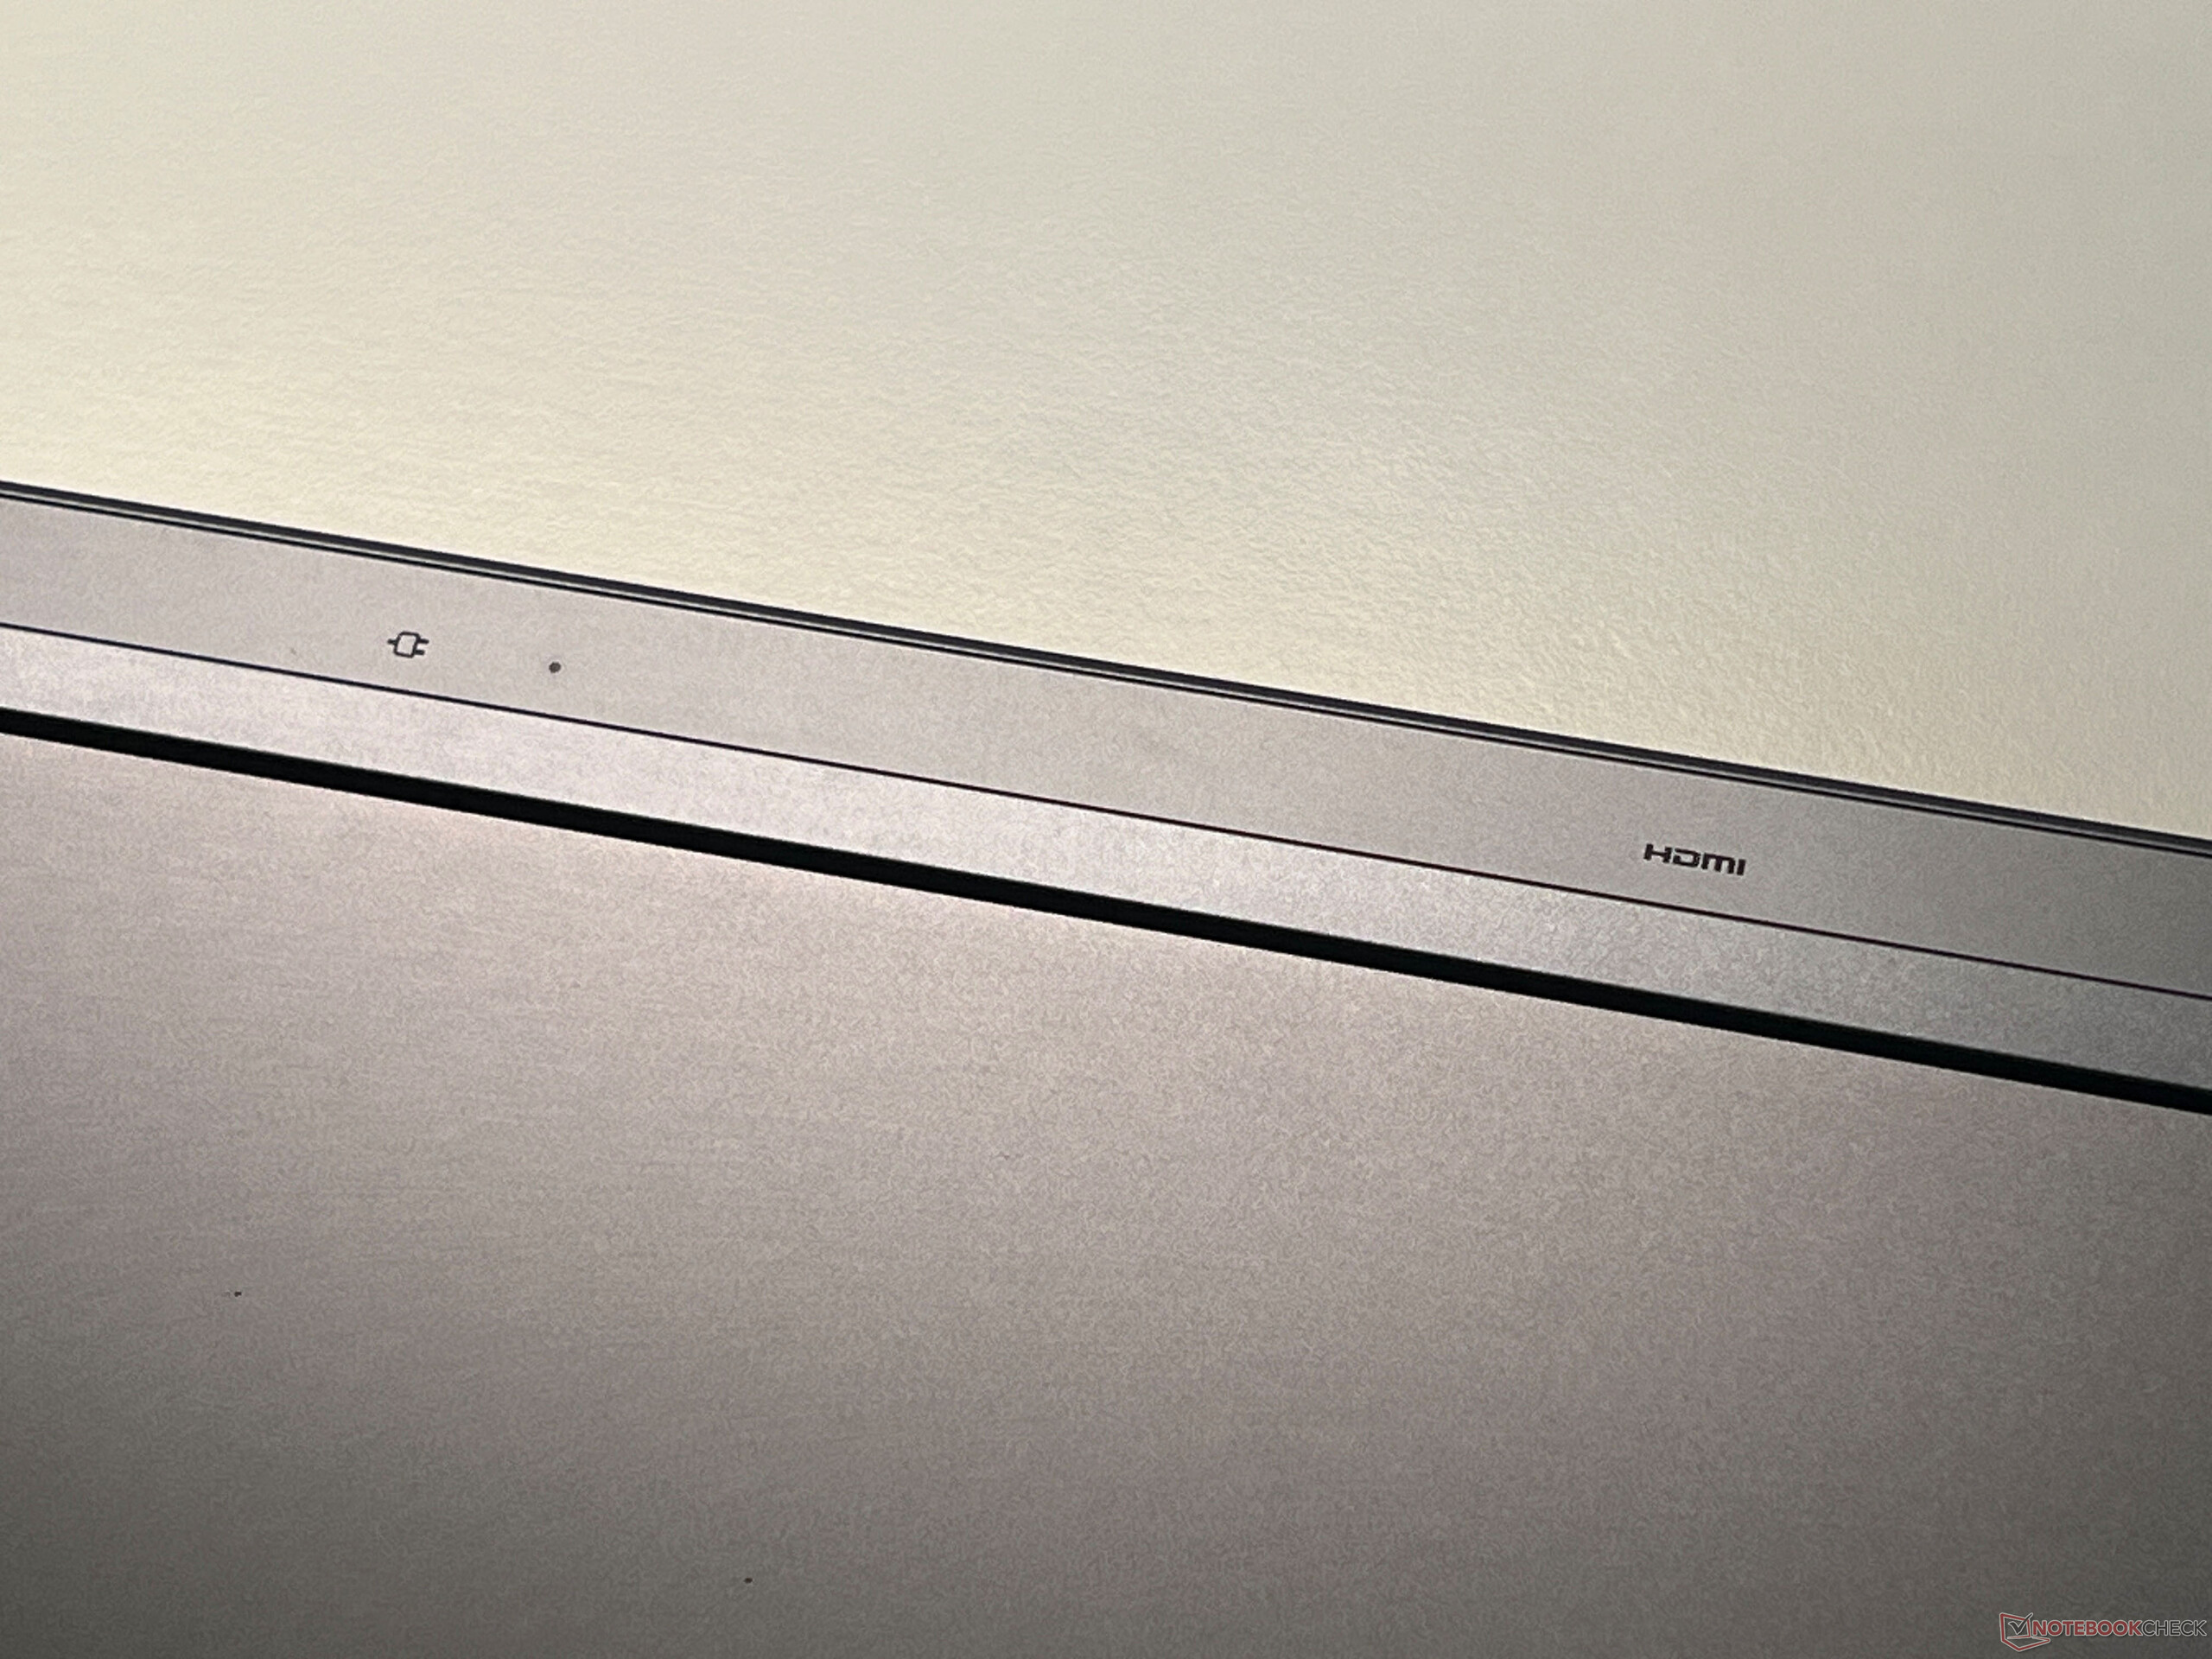
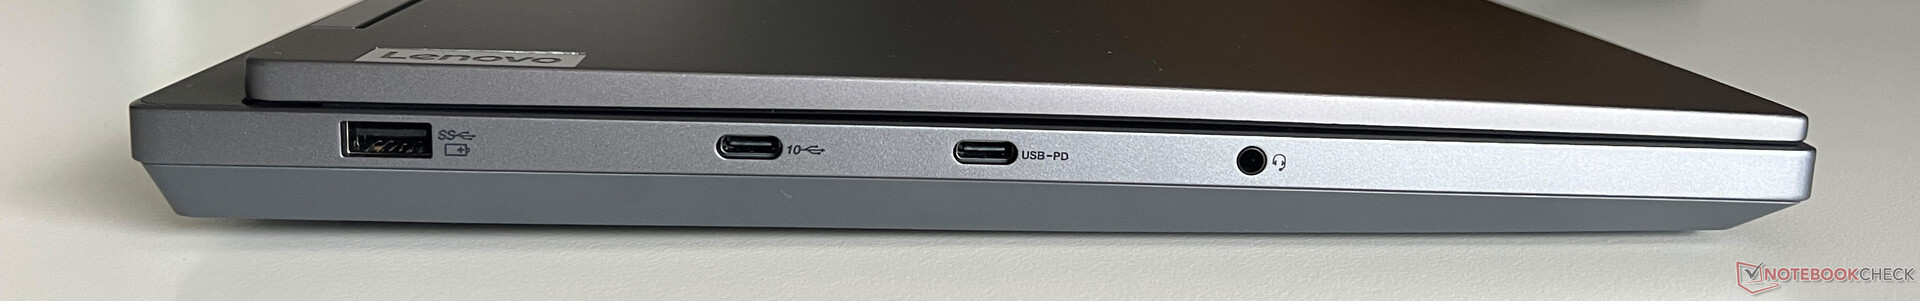
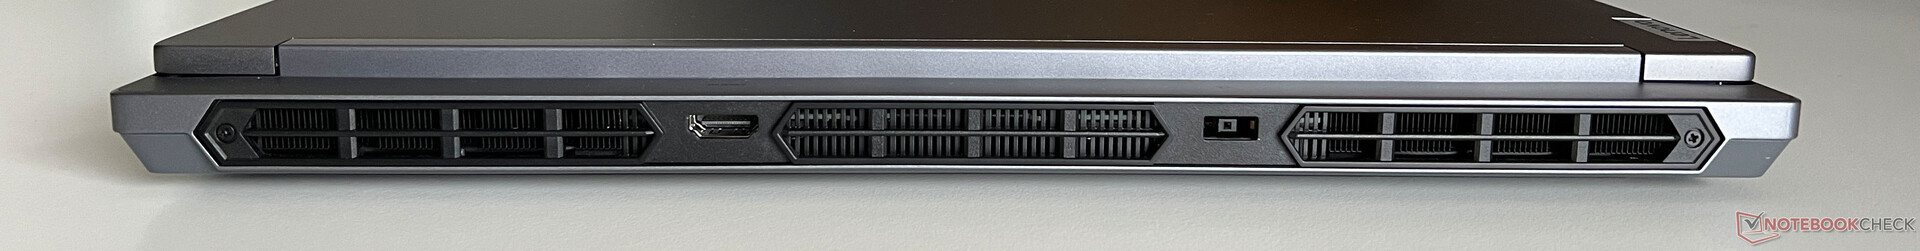
Conectividad - Lenovo ha renunciado a Thunderbolt
En el Legion 5i 16 (así como en el Legion Pro 5i), Lenovo ha decidido no instalar Thunderbolt 4 pero, a cambio, presenta una buena selección de puertos repartidos por los tres lados. La parte trasera alberga la conexión de alimentación y el puerto HDMI, la izquierda cuenta con tres puertos USB y hay otras dos conexiones USB en el lado derecho. Todas las salidas de vídeo se conectan a través de la dGPU, lo que significa que la GPU Nvidia está siempre activa cuando se conecta un monitor externo.
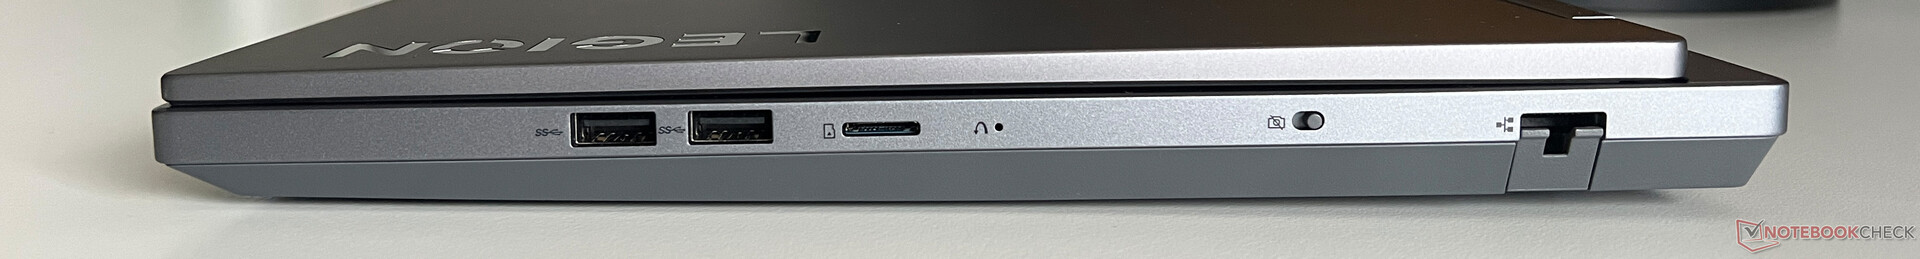
Lector de tarjetas SD
El lector de tarjetas microSD situado en el lado derecho del aparato no admite tarjetas en su totalidad y no es especialmente rápido. En combinación con nuestra tarjeta de referencia (Angelibird AV Pro V60), medimos tasas de transferencia bajas, de unos 30 MB/s.
| SD Card Reader | |
| average JPG Copy Test (av. of 3 runs) | |
| Alienware m16 R1 Intel (AV PRO microSD 128 GB V60) | |
| Media de la clase Gaming (20.9 - 210, n=54, últimos 2 años) | |
| Lenovo Legion Slim 5 16APH8 (PNY EliteX-Pro60 V60 256 GB) | |
| Schenker XMG CORE 16 (L23) | |
| Lenovo Legion 5 16IRX G9 | |
| maximum AS SSD Seq Read Test (1GB) | |
| Alienware m16 R1 Intel (AV PRO microSD 128 GB V60) | |
| Media de la clase Gaming (25.5 - 261, n=51, últimos 2 años) | |
| Lenovo Legion Slim 5 16APH8 (PNY EliteX-Pro60 V60 256 GB) | |
| Schenker XMG CORE 16 (L23) | |
| Lenovo Legion 5 16IRX G9 | |
Comunicación
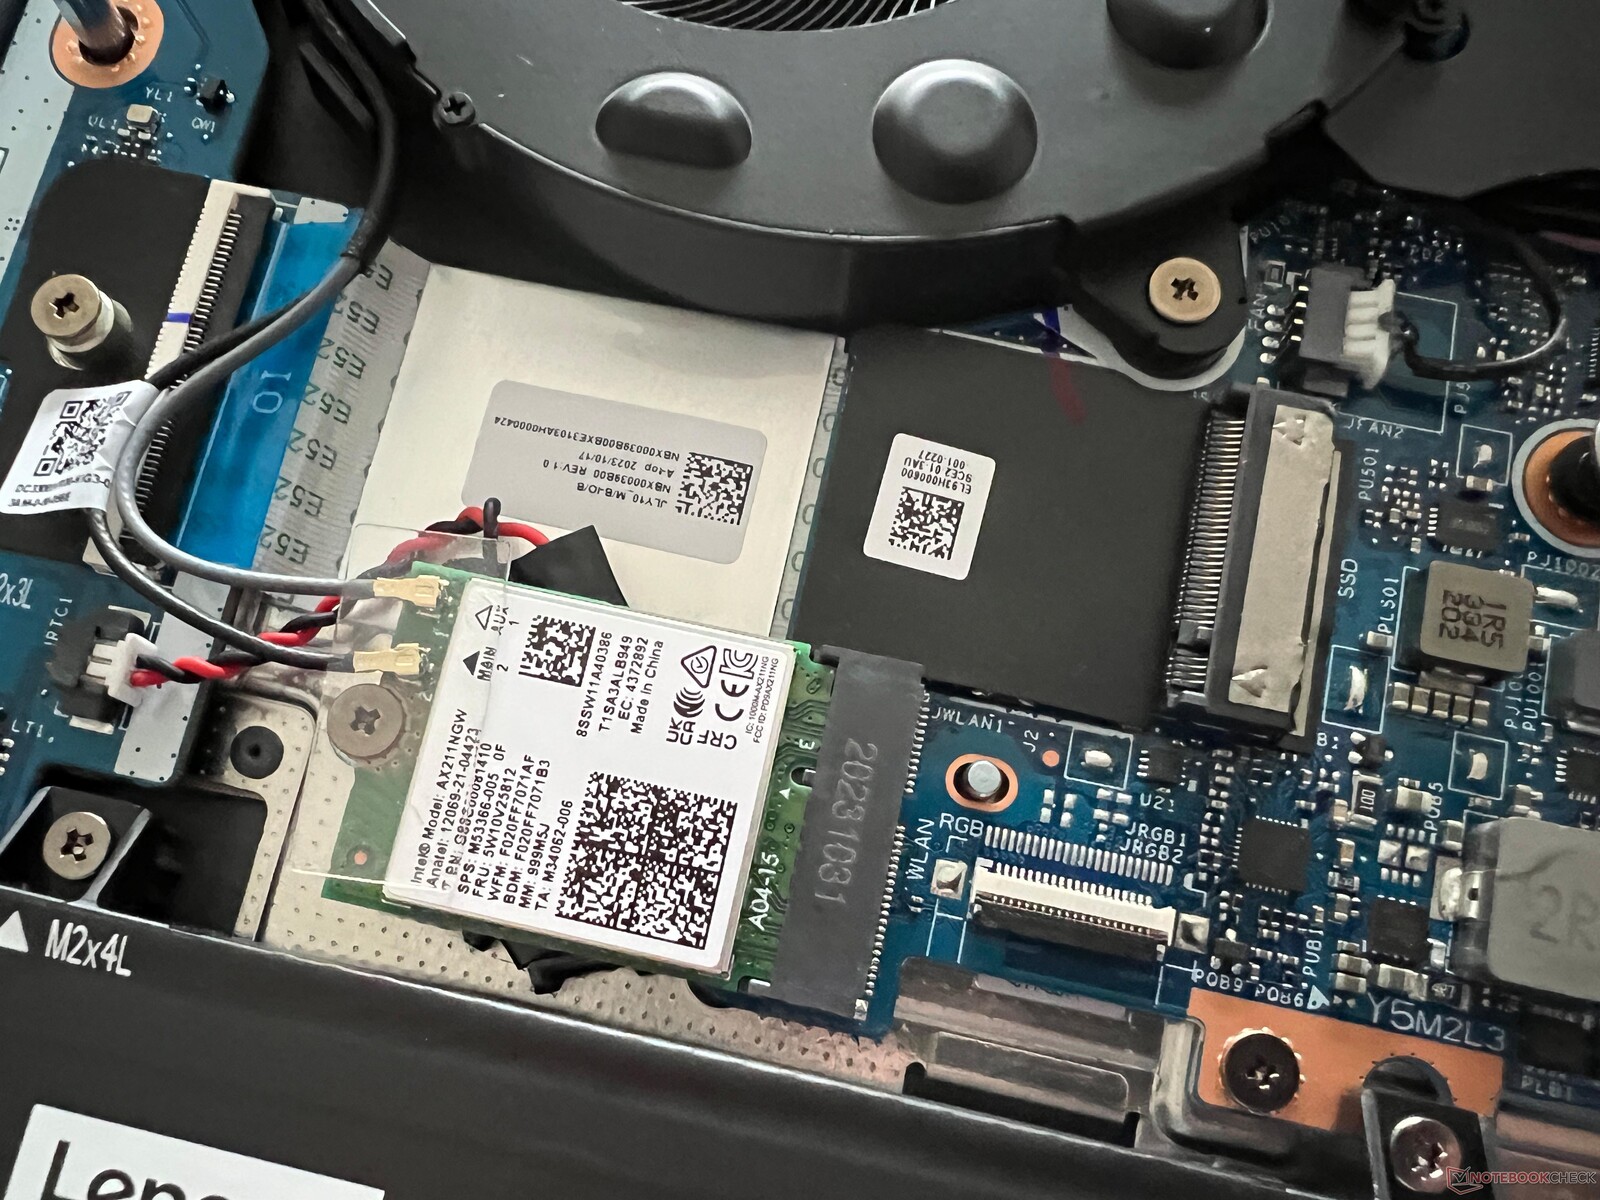
Lenovo ha equipado el Legion con el módulo WLAN AX211 de Intel que, además de Bluetooth 5.3, también domina el actual estándar Wi-Fi-6E para redes de 6 GHz. En combinación con nuestro router de referencia de Asus, sus velocidades de transferencia fueron estupendas en total, aunque la competencia seguía siendo más rápida en algunos momentos. Sin embargo, esto no debería notarse realmente en el uso práctico y, durante nuestra prueba, nunca tuvimos ningún problema con la calidad de la señal. Además, el portátil cuenta con un puerto Gigabit-Ethernet para conexiones por cable.
| Networking | |
| Lenovo Legion 5 16IRX G9 | |
| iperf3 transmit AXE11000 | |
| iperf3 receive AXE11000 | |
| Schenker XMG CORE 16 (L23) | |
| iperf3 transmit AXE11000 | |
| iperf3 receive AXE11000 | |
| HP Victus 16-r0077ng | |
| iperf3 transmit AXE11000 | |
| iperf3 receive AXE11000 | |
| Lenovo LOQ 16IRH8 | |
| iperf3 transmit AXE11000 | |
| iperf3 receive AXE11000 | |
| Lenovo Legion Slim 5 16APH8 | |
| iperf3 transmit AXE11000 | |
| iperf3 receive AXE11000 | |
| iperf3 transmit AXE11000 6GHz | |
| iperf3 receive AXE11000 6GHz | |
| HP Victus 16-r0076TX | |
| iperf3 transmit AXE11000 | |
| iperf3 receive AXE11000 | |
| iperf3 transmit AXE11000 6GHz | |
| iperf3 receive AXE11000 6GHz | |
| Alienware m16 R1 Intel | |
| iperf3 transmit AXE11000 | |
| iperf3 receive AXE11000 | |
| Lenovo Legion Pro 5 16IRX8 | |
| iperf3 transmit AXE11000 | |
| iperf3 receive AXE11000 | |
| iperf3 transmit AXE11000 6GHz | |
| iperf3 receive AXE11000 6GHz | |
Cámara web
La webcam 1080p del Legion 5i cumple su cometido, haciendo fotos decentes en condiciones de buena iluminación. Por otro lado, no admite efectos de estudio adicionales y no dispone de sensor IR para el reconocimiento facial a través de Windows Hello. Hay un interruptor en el lateral derecho que desactiva la webcam.


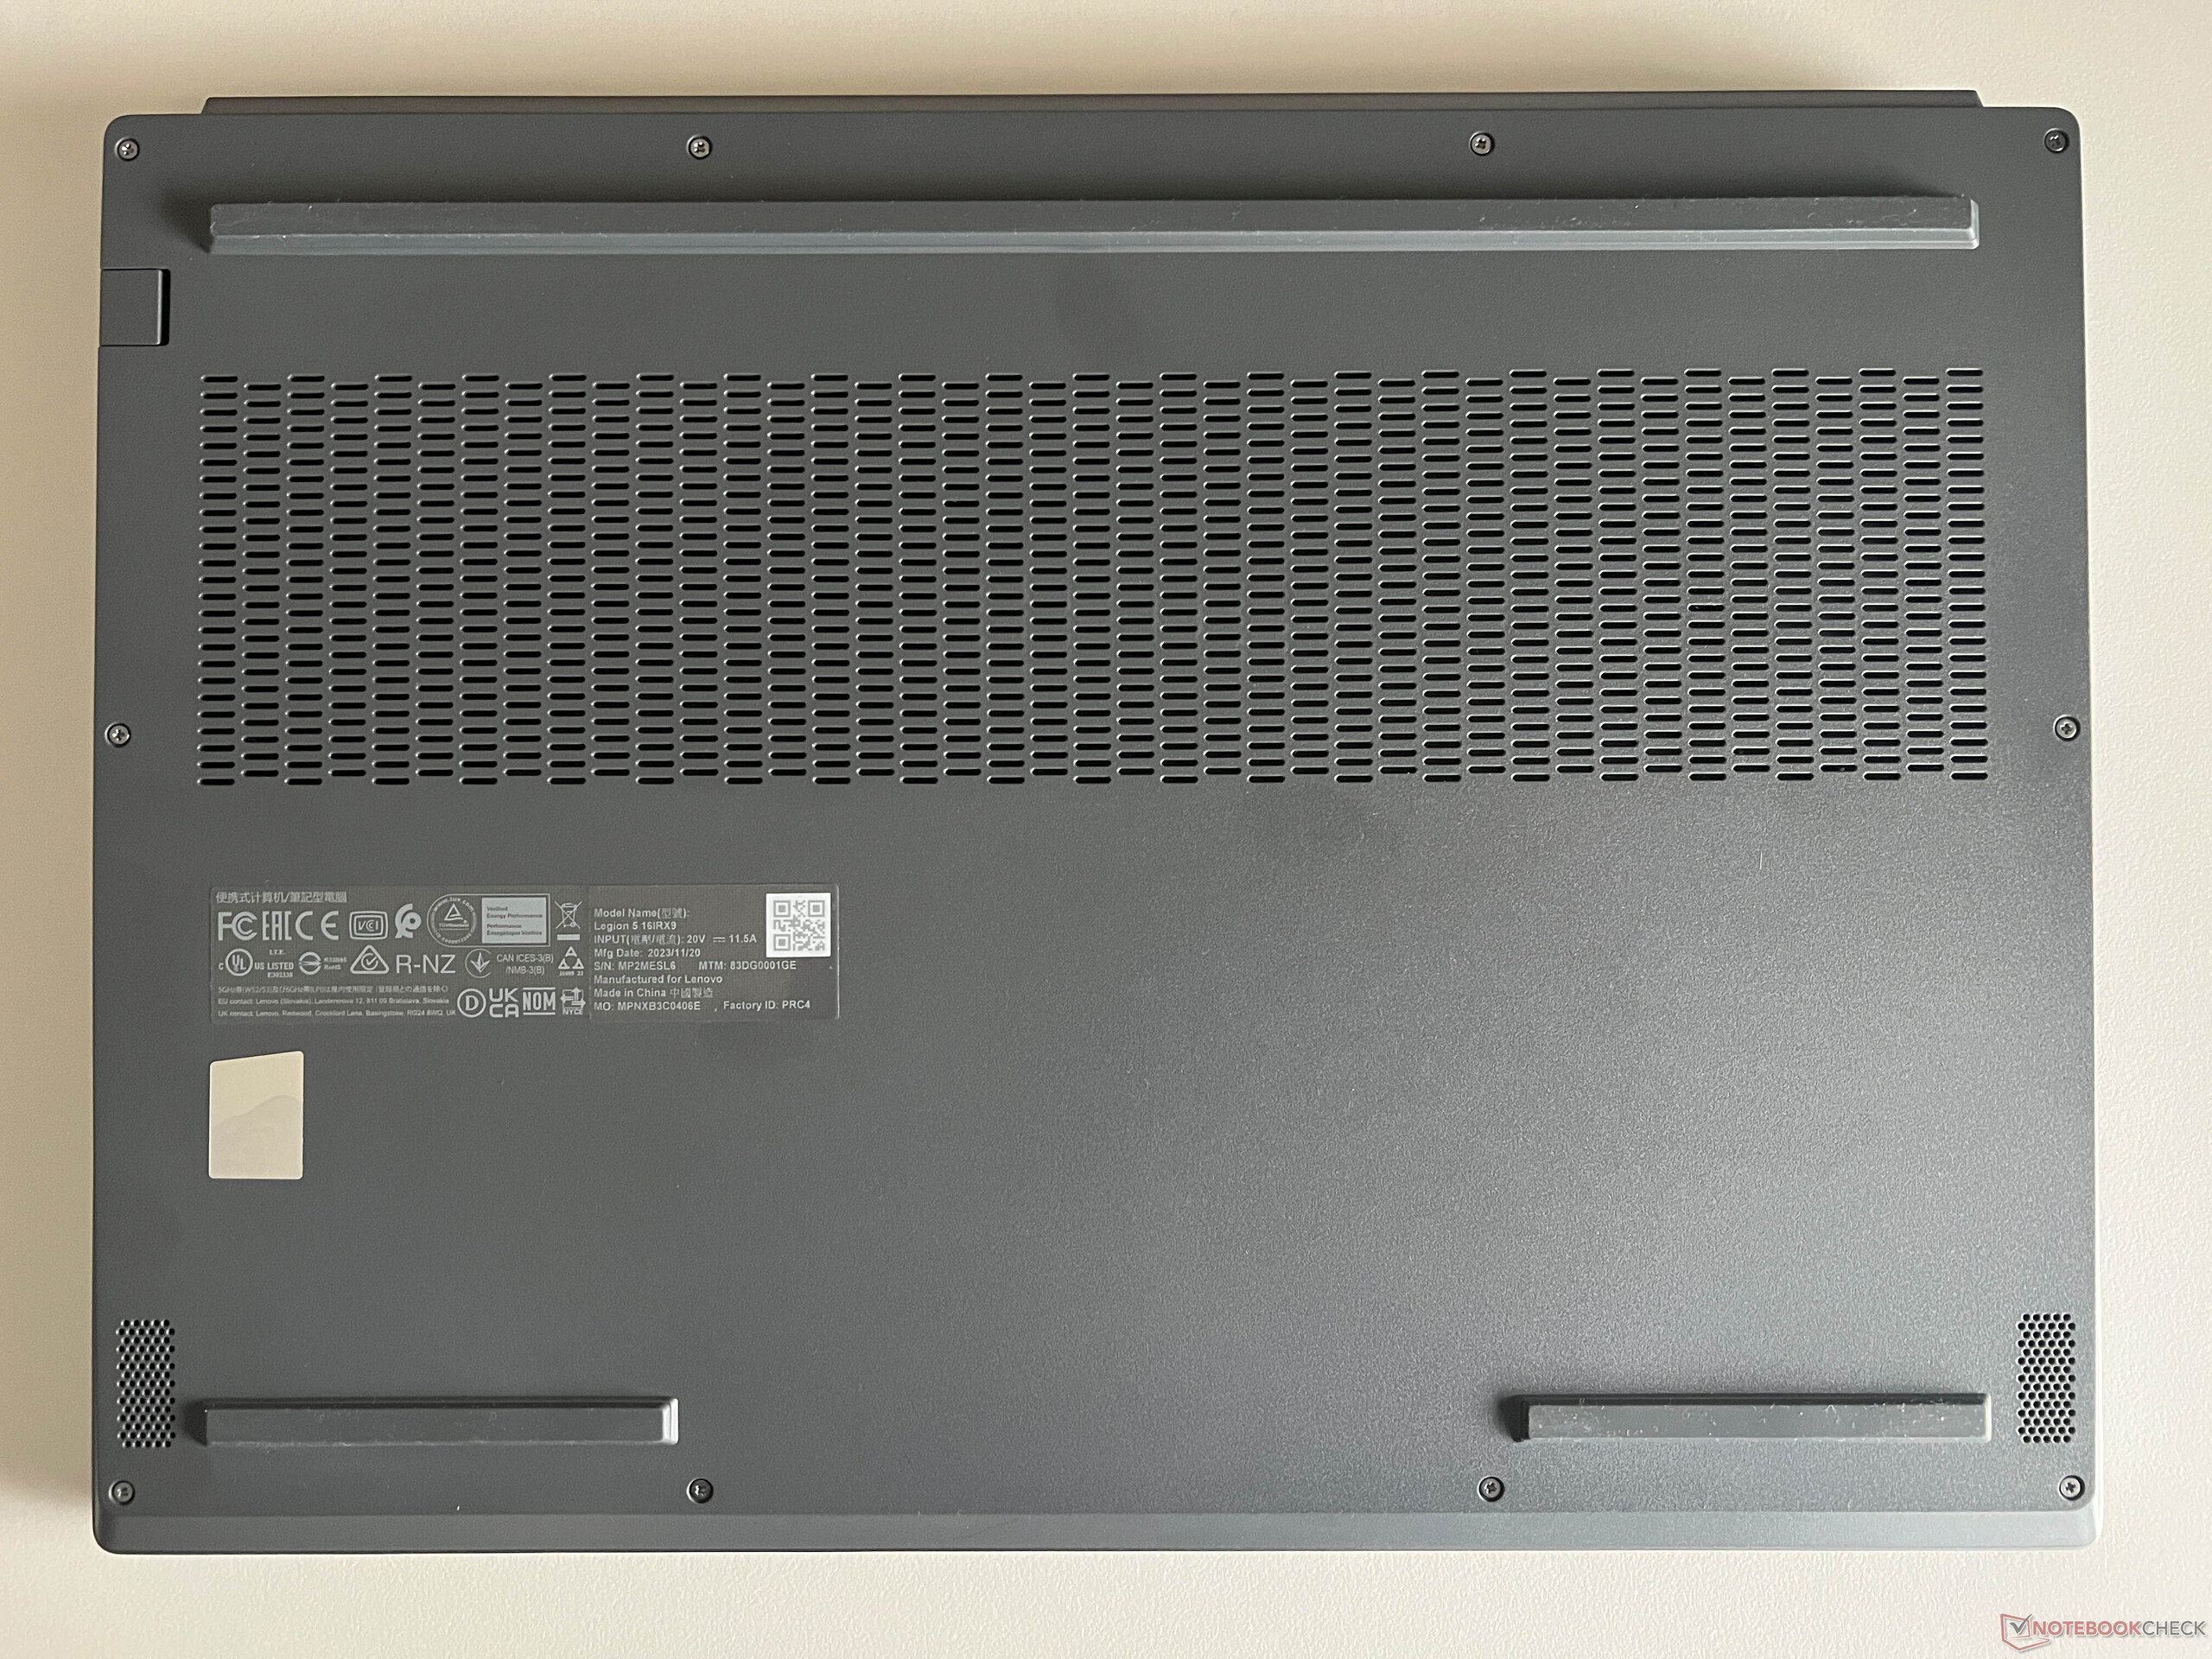
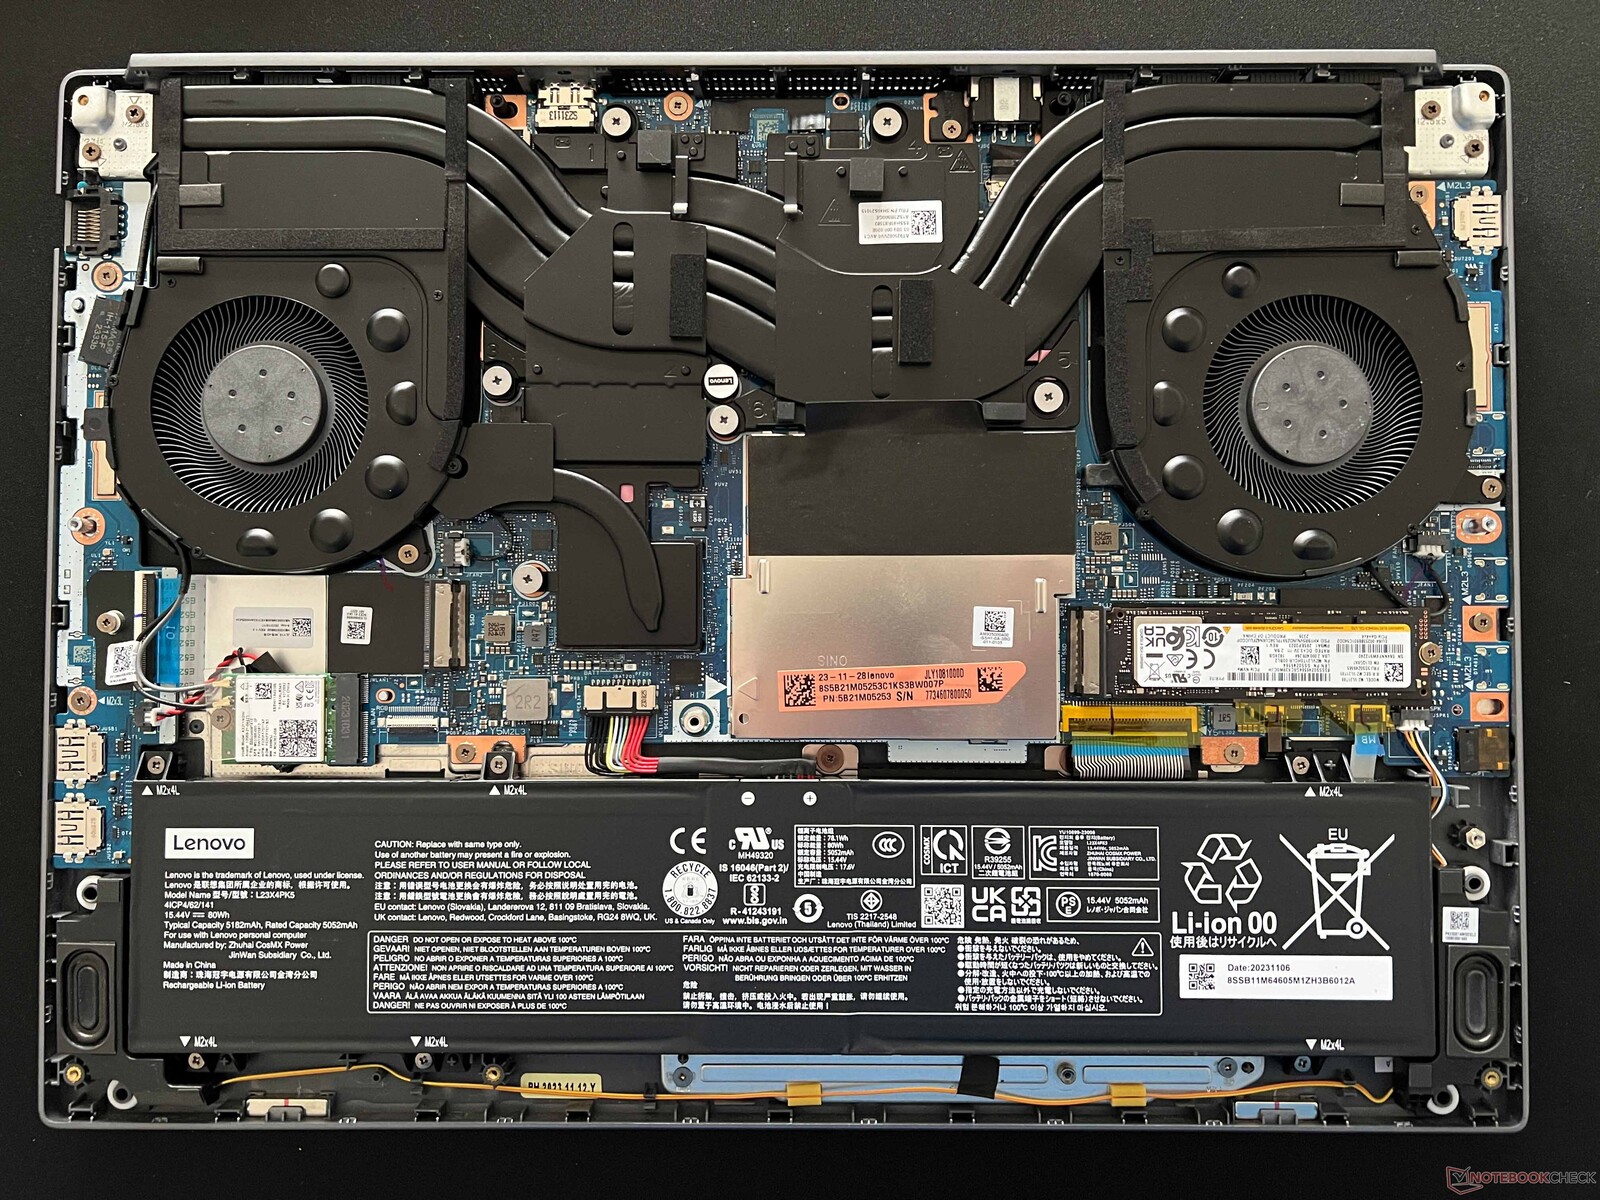
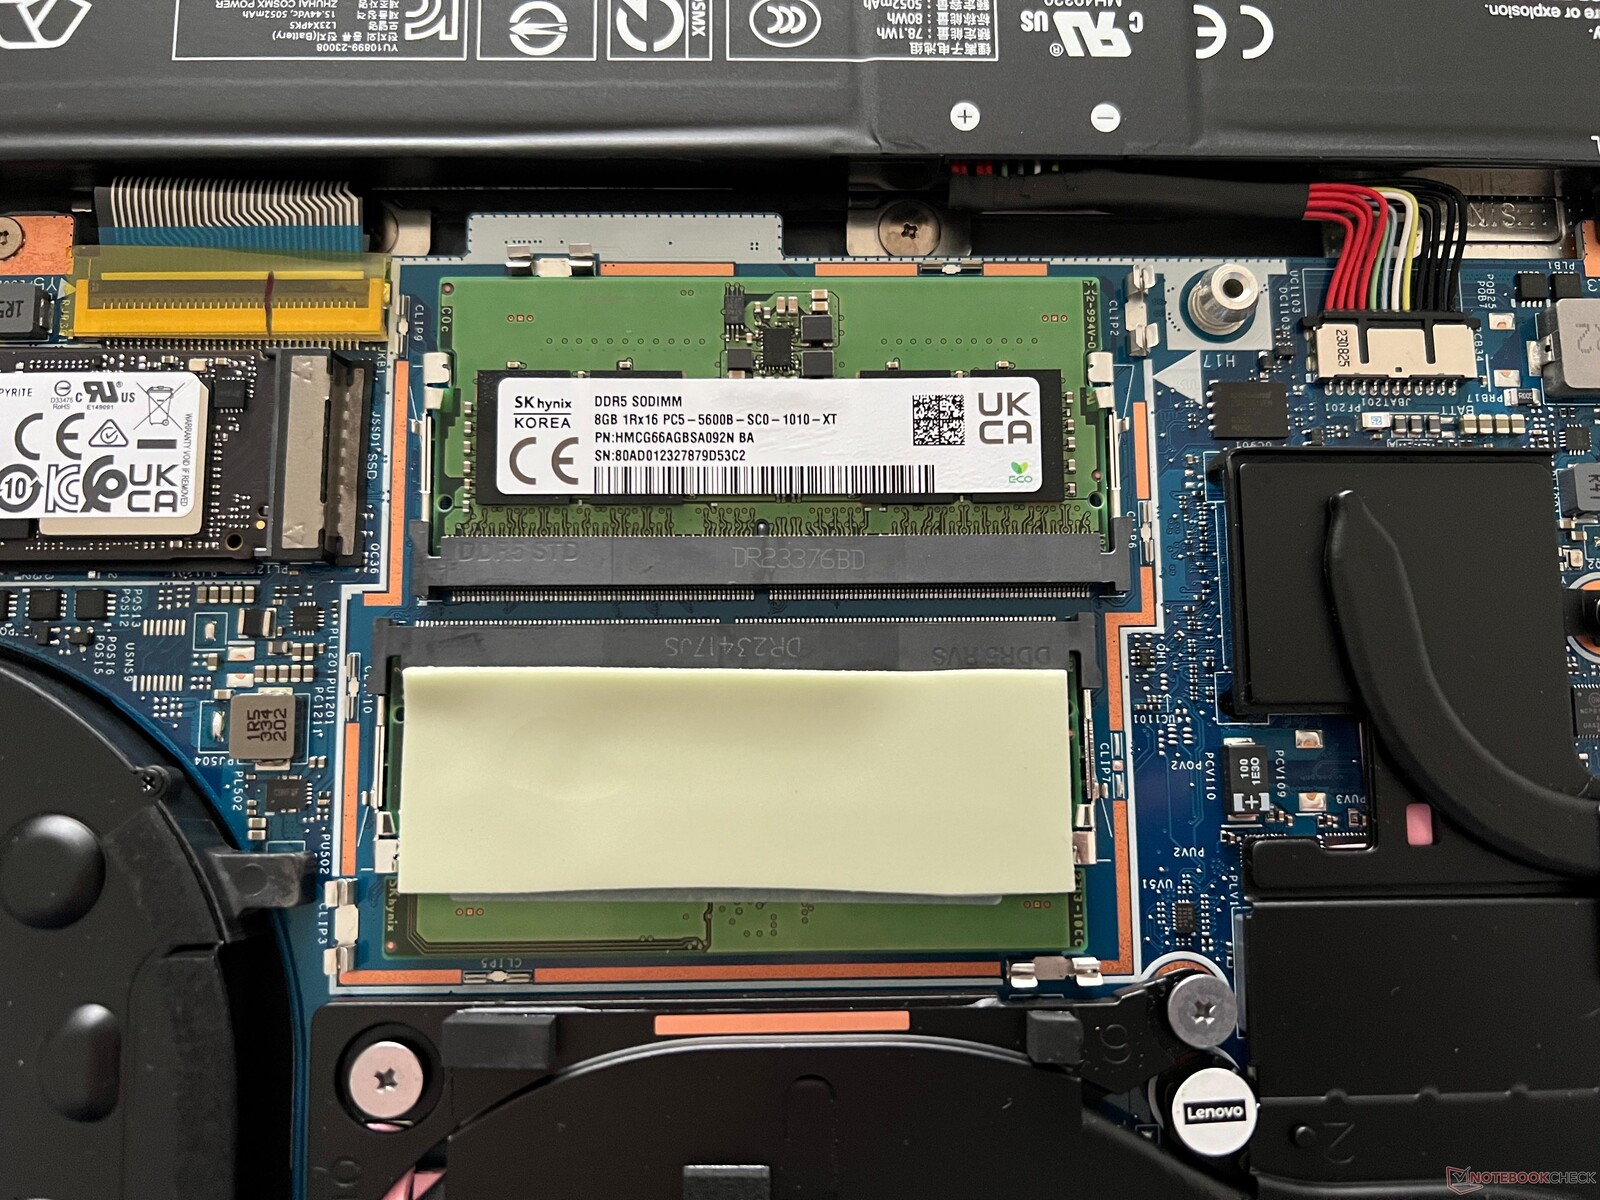
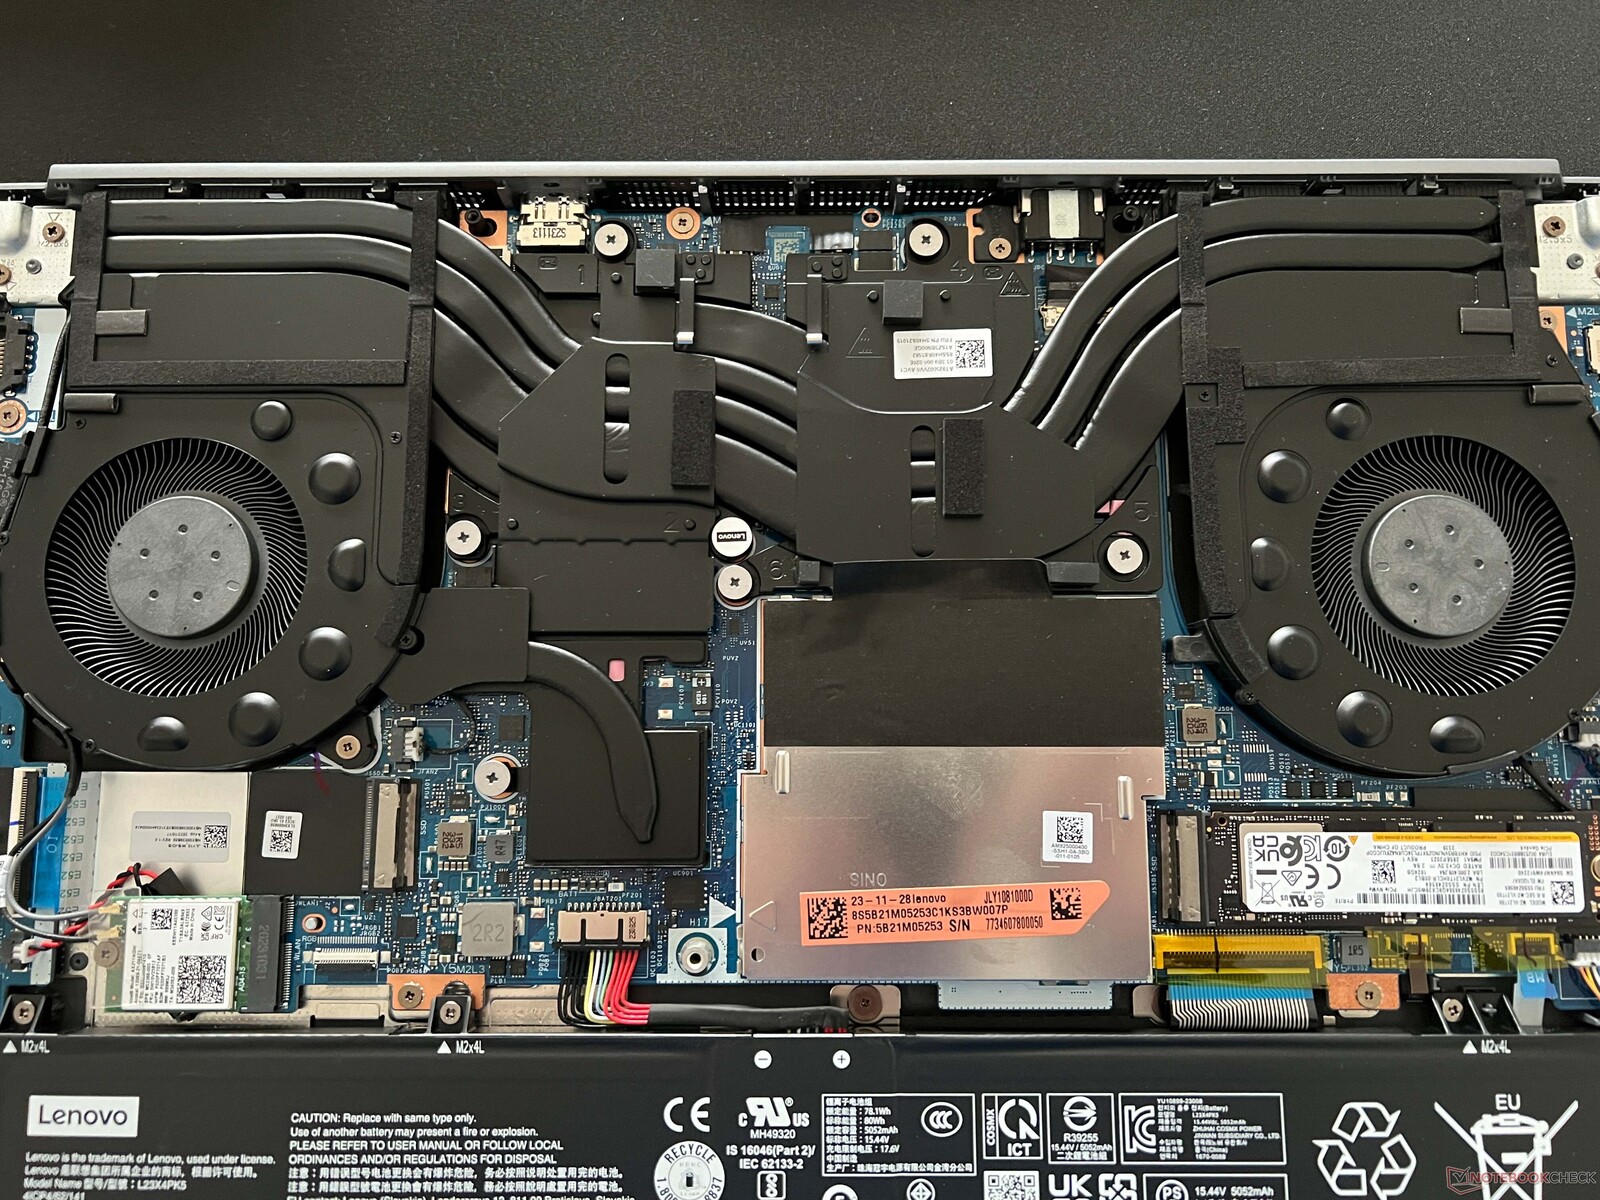
Mantenimiento
La parte inferior de la carcasa está unida mediante tornillos de estrella normales, pero queda bien sujeta cuando se retiran éstos. Deberá utilizar una herramienta adecuada para ayudar a hacer palanca y abrirla. En el interior, las opciones de mantenimiento del portátil son buenas, ya que además de las dos ranuras para RAM, también cuenta con dos ranuras para SSD M.2-2280. El módulo WLAN y la batería (atornillada) también pueden intercambiarse.
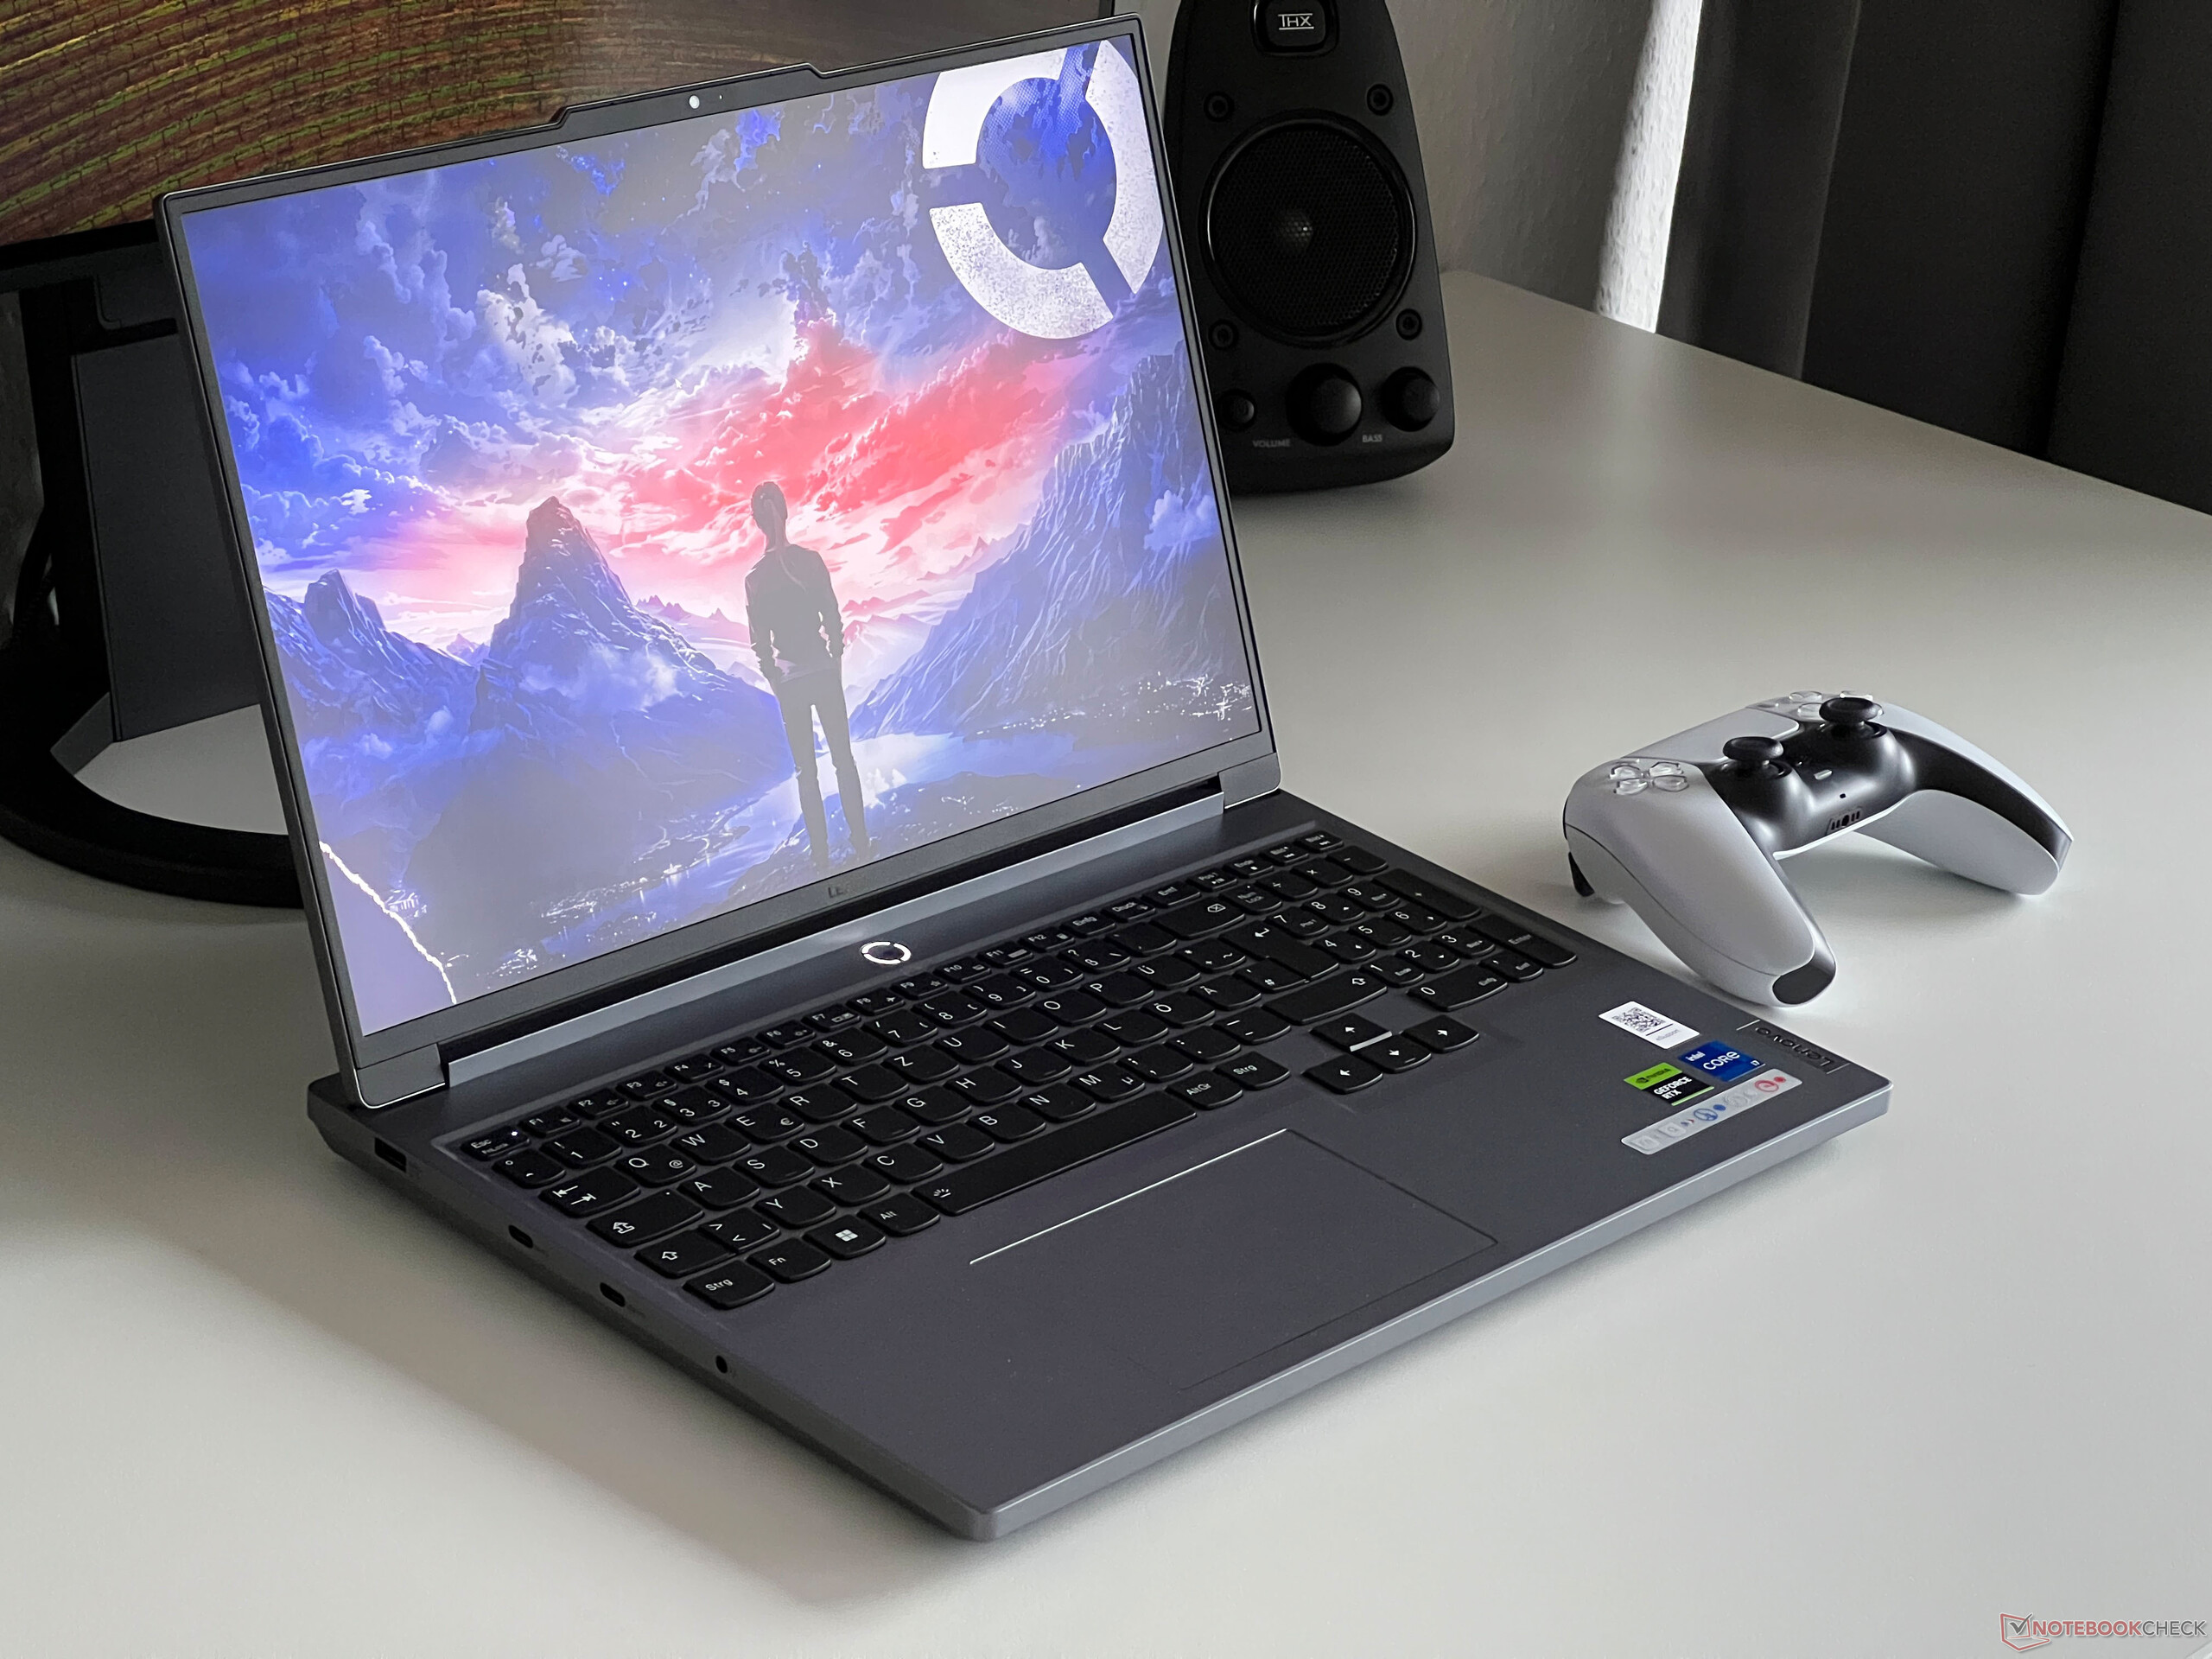
Dispositivos de entrada - Elevación de 1,5 mm sin iluminación RGB
El teclado negro -que incluye un teclado numérico dedicado y teclas de flecha desplazadas- es uno que ya conocemos de otros modelos de Legion. Sus teclas tienen una elevación de 1,5 mm y, en total, resulta cómodo escribir en ellas. Aparte de los juegos, tampoco supone ningún problema escribir textos más largos en este teclado. Nuestra configuración de prueba está equipada con un teclado retroiluminado que tiene dos ajustes de brillo; además, puede optar por uno con retroiluminación de 4 zonas en color.
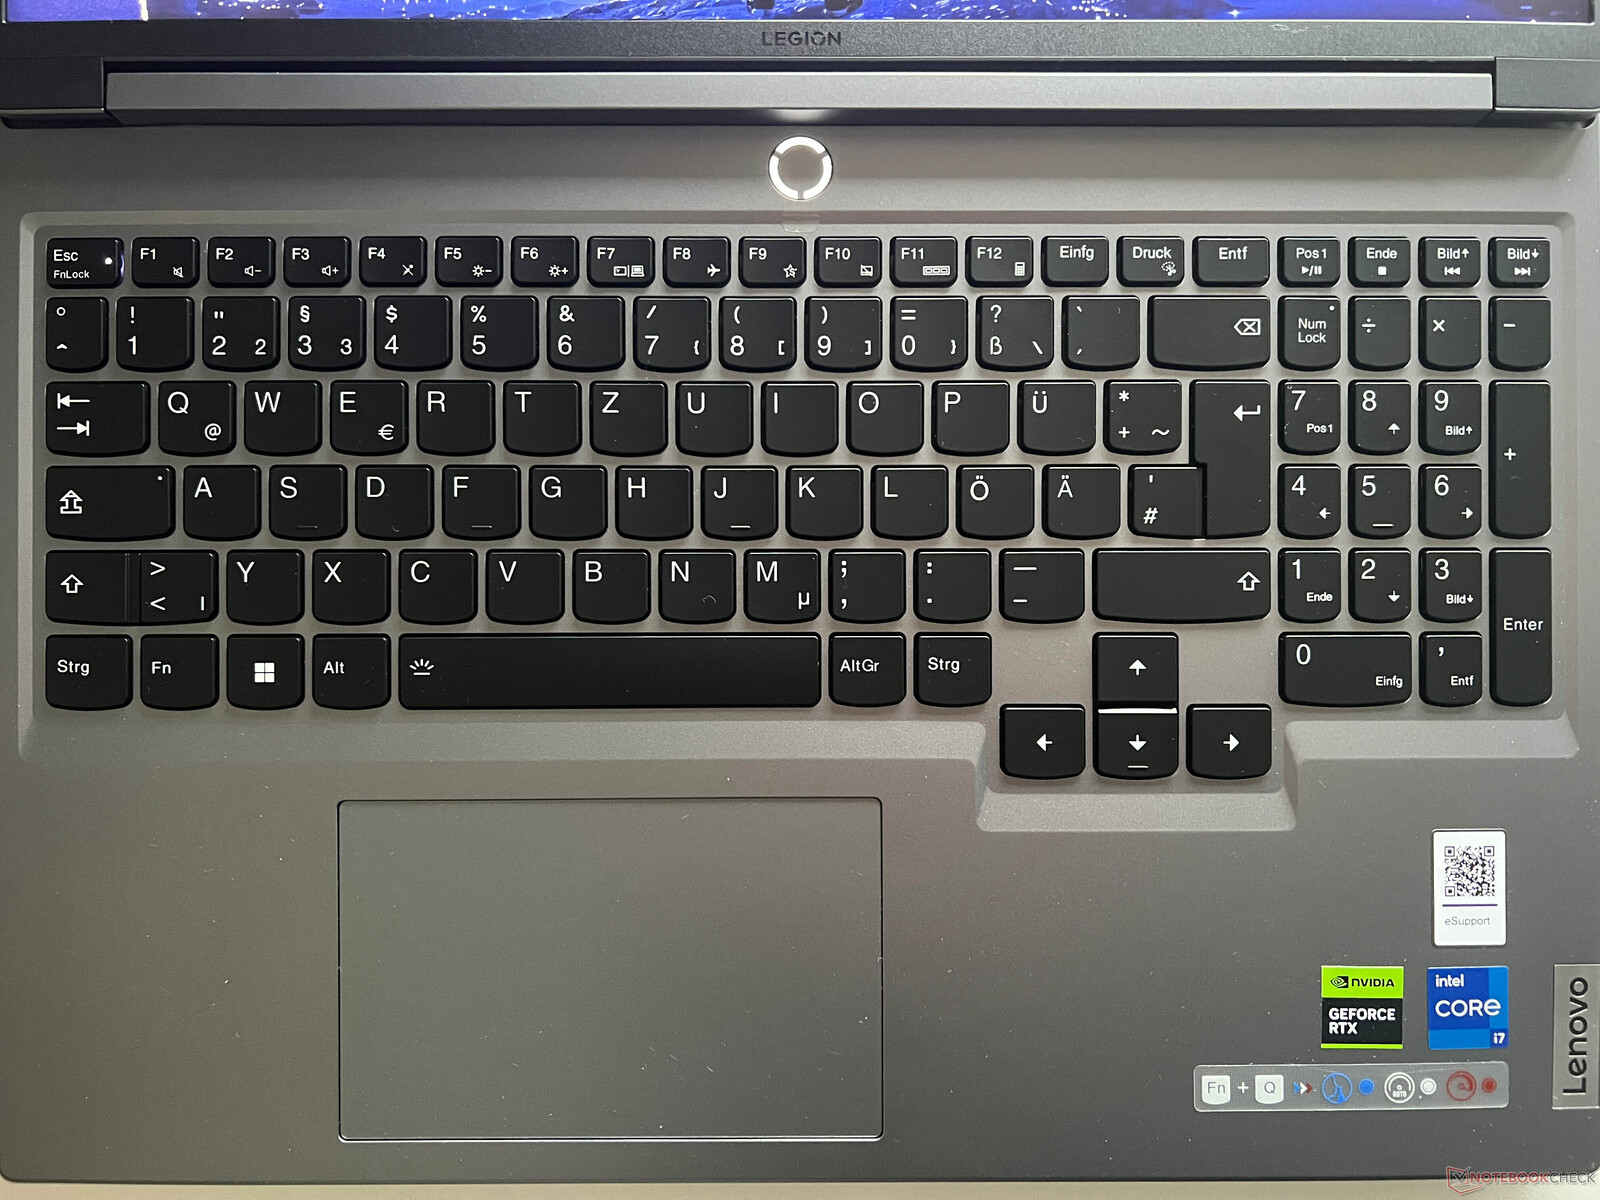
El clickpad está situado ligeramente a la izquierda y su tamaño (12 x 7,5 cm) es perfecto para el funcionamiento normal del puntero, que además funciona perfectamente. La parte inferior del pad se puede presionar, lo que, por desgracia, se traduce en un fuerte ruido. En los juegos, la mayoría de los usuarios echarán mano de todos modos de un gamepad o un ratón. Éstos pueden conectarse a ambos lados del dispositivo.
Pantalla - 240-Hz IPS
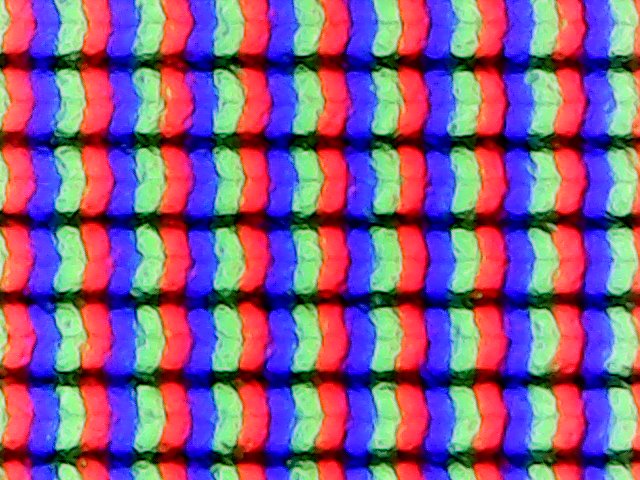
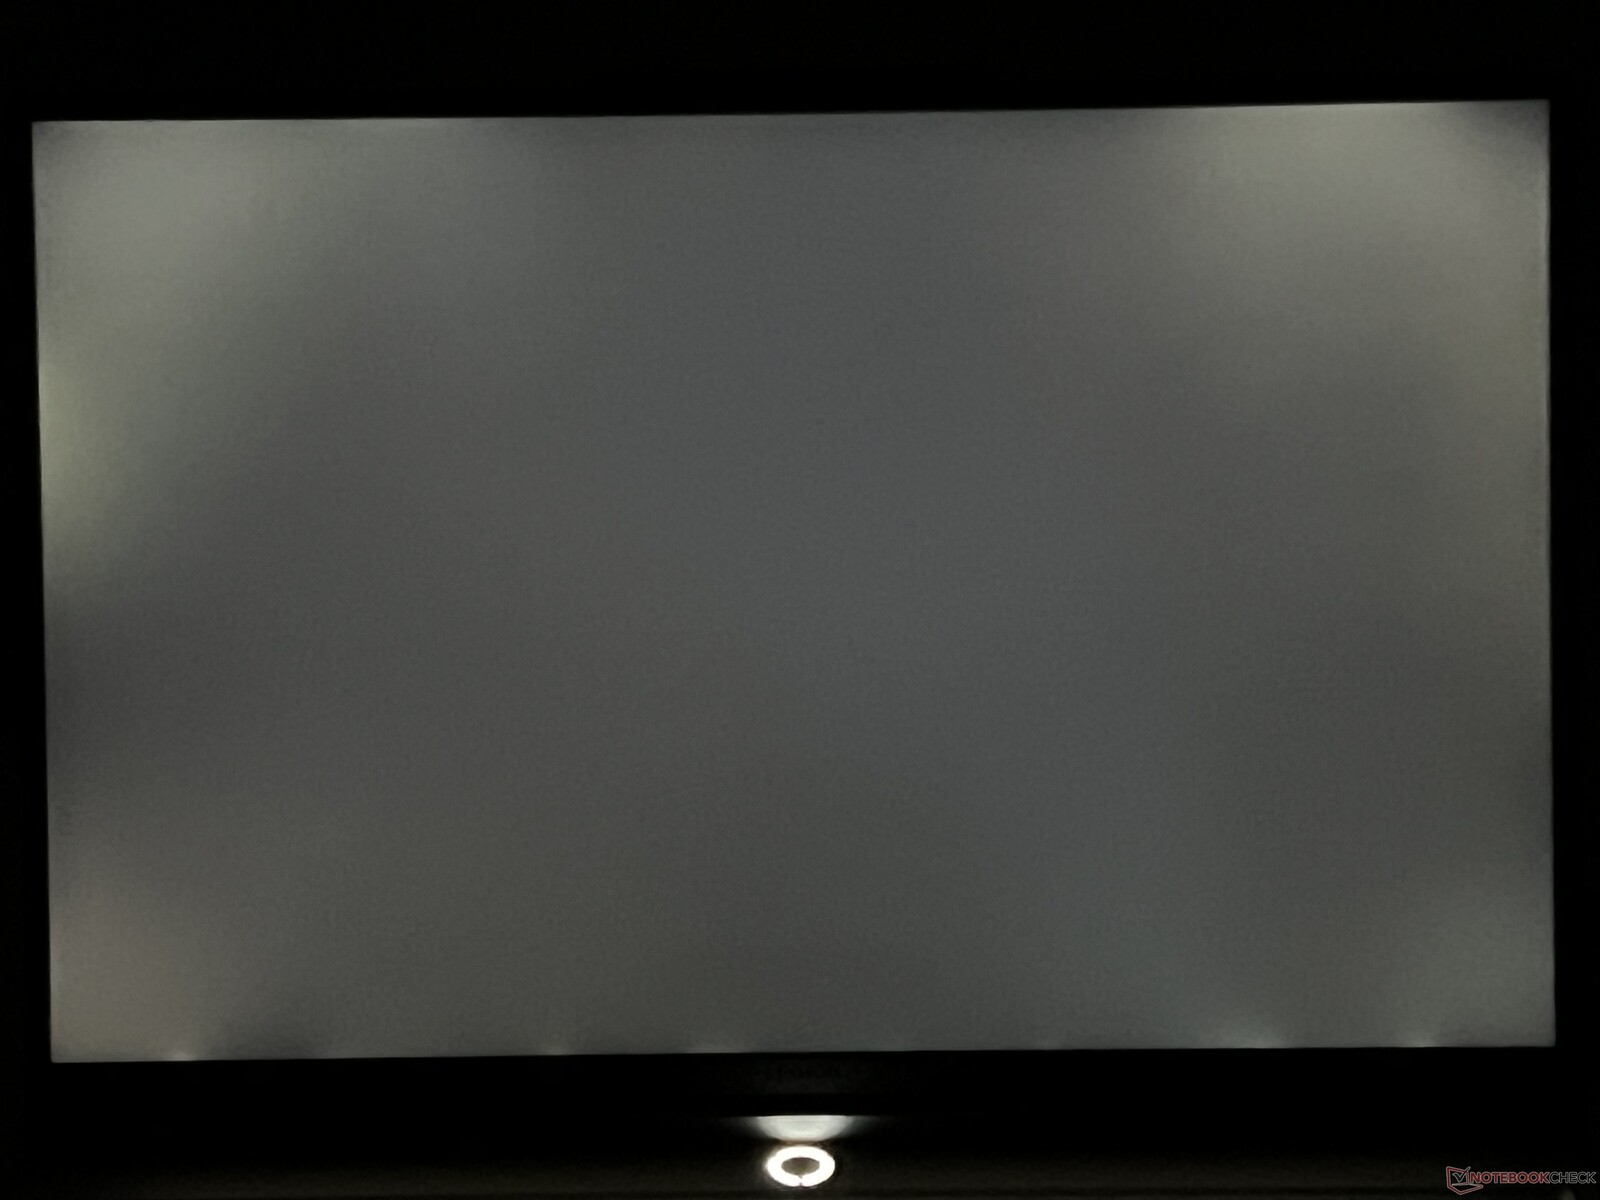
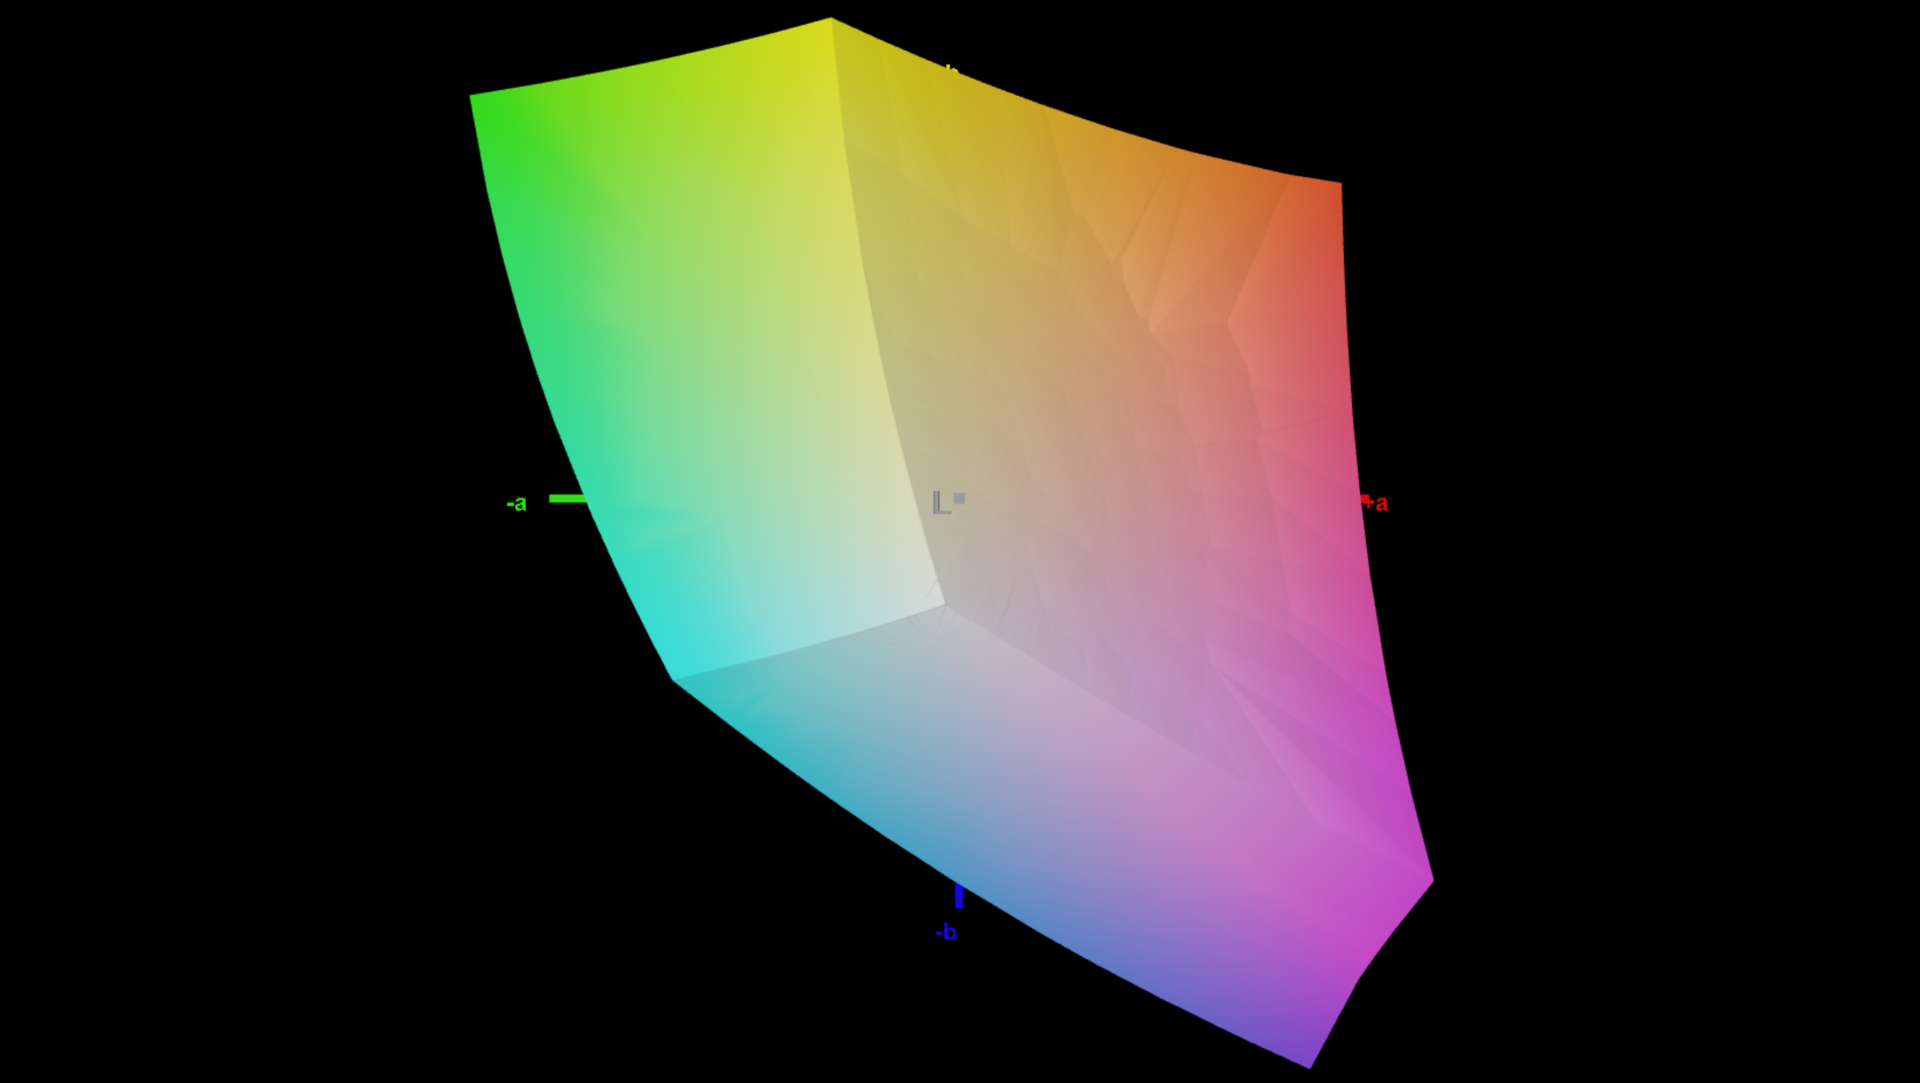
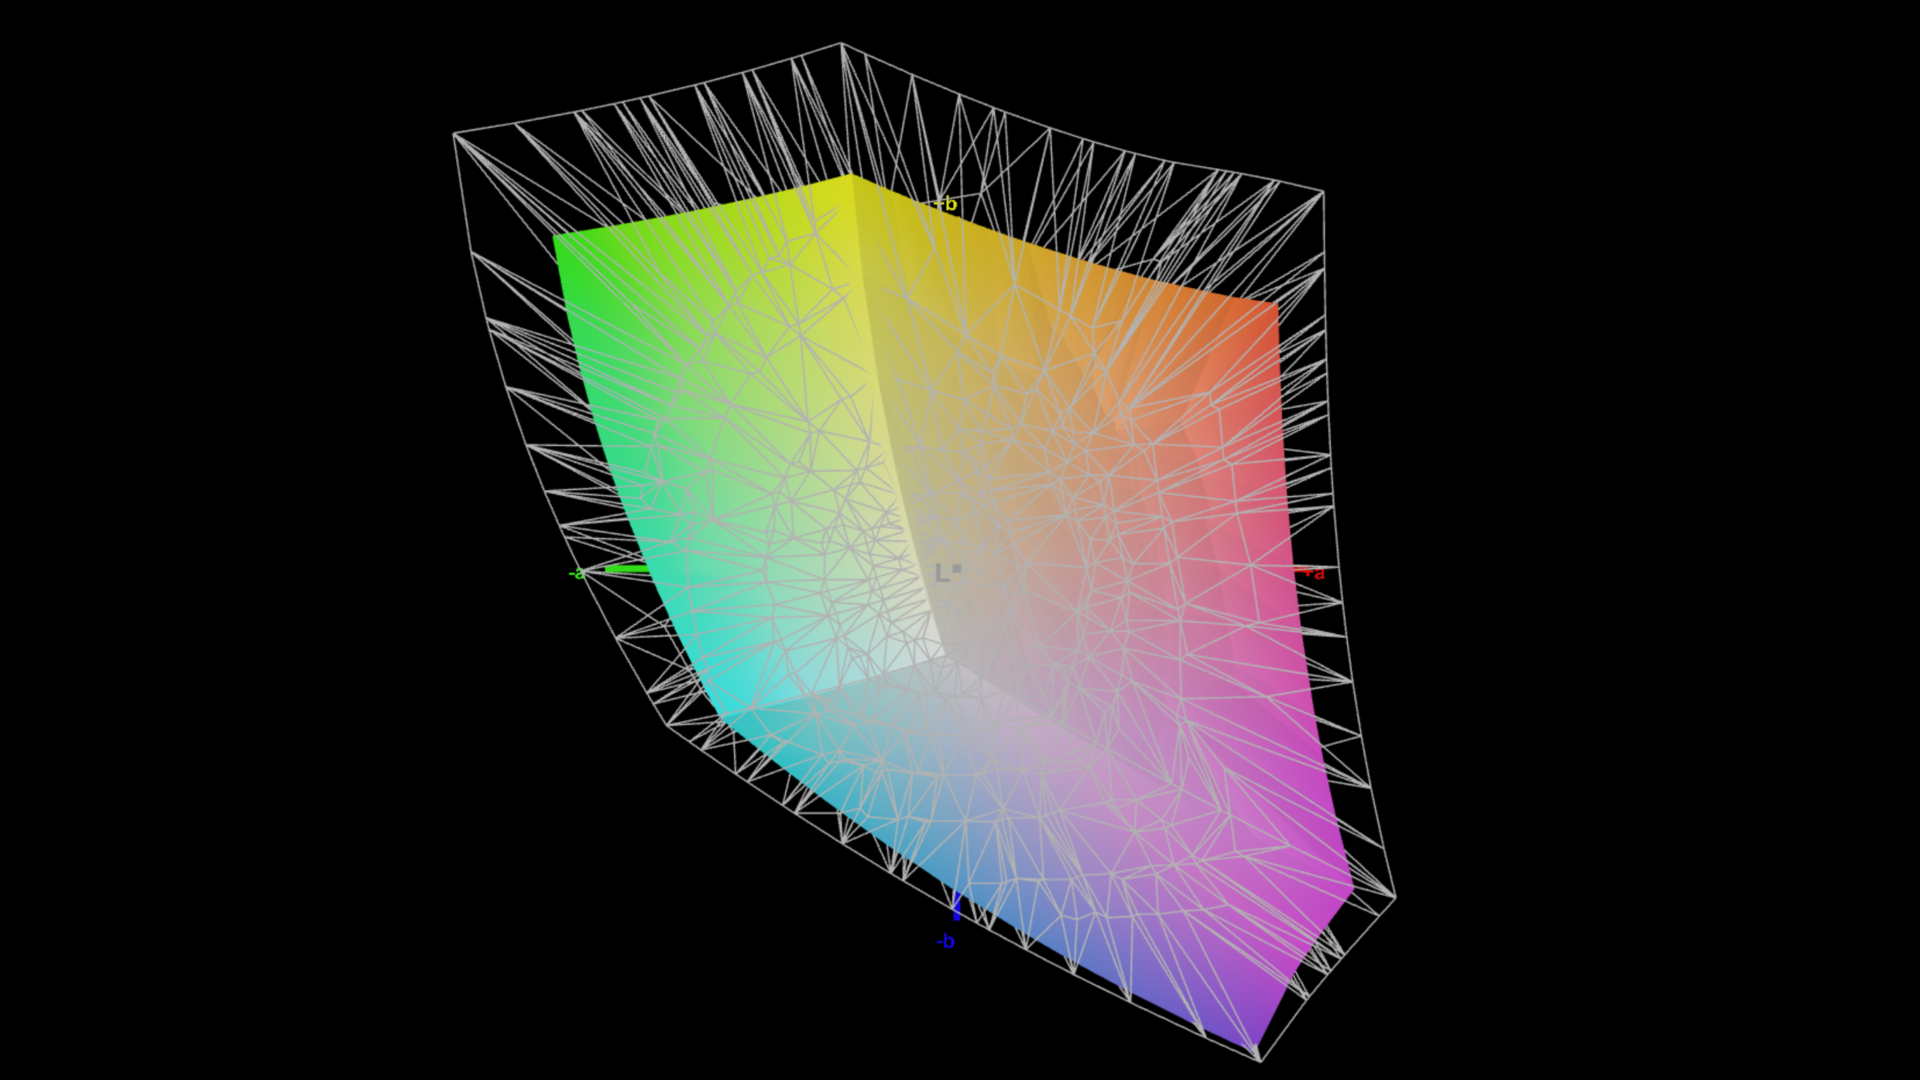
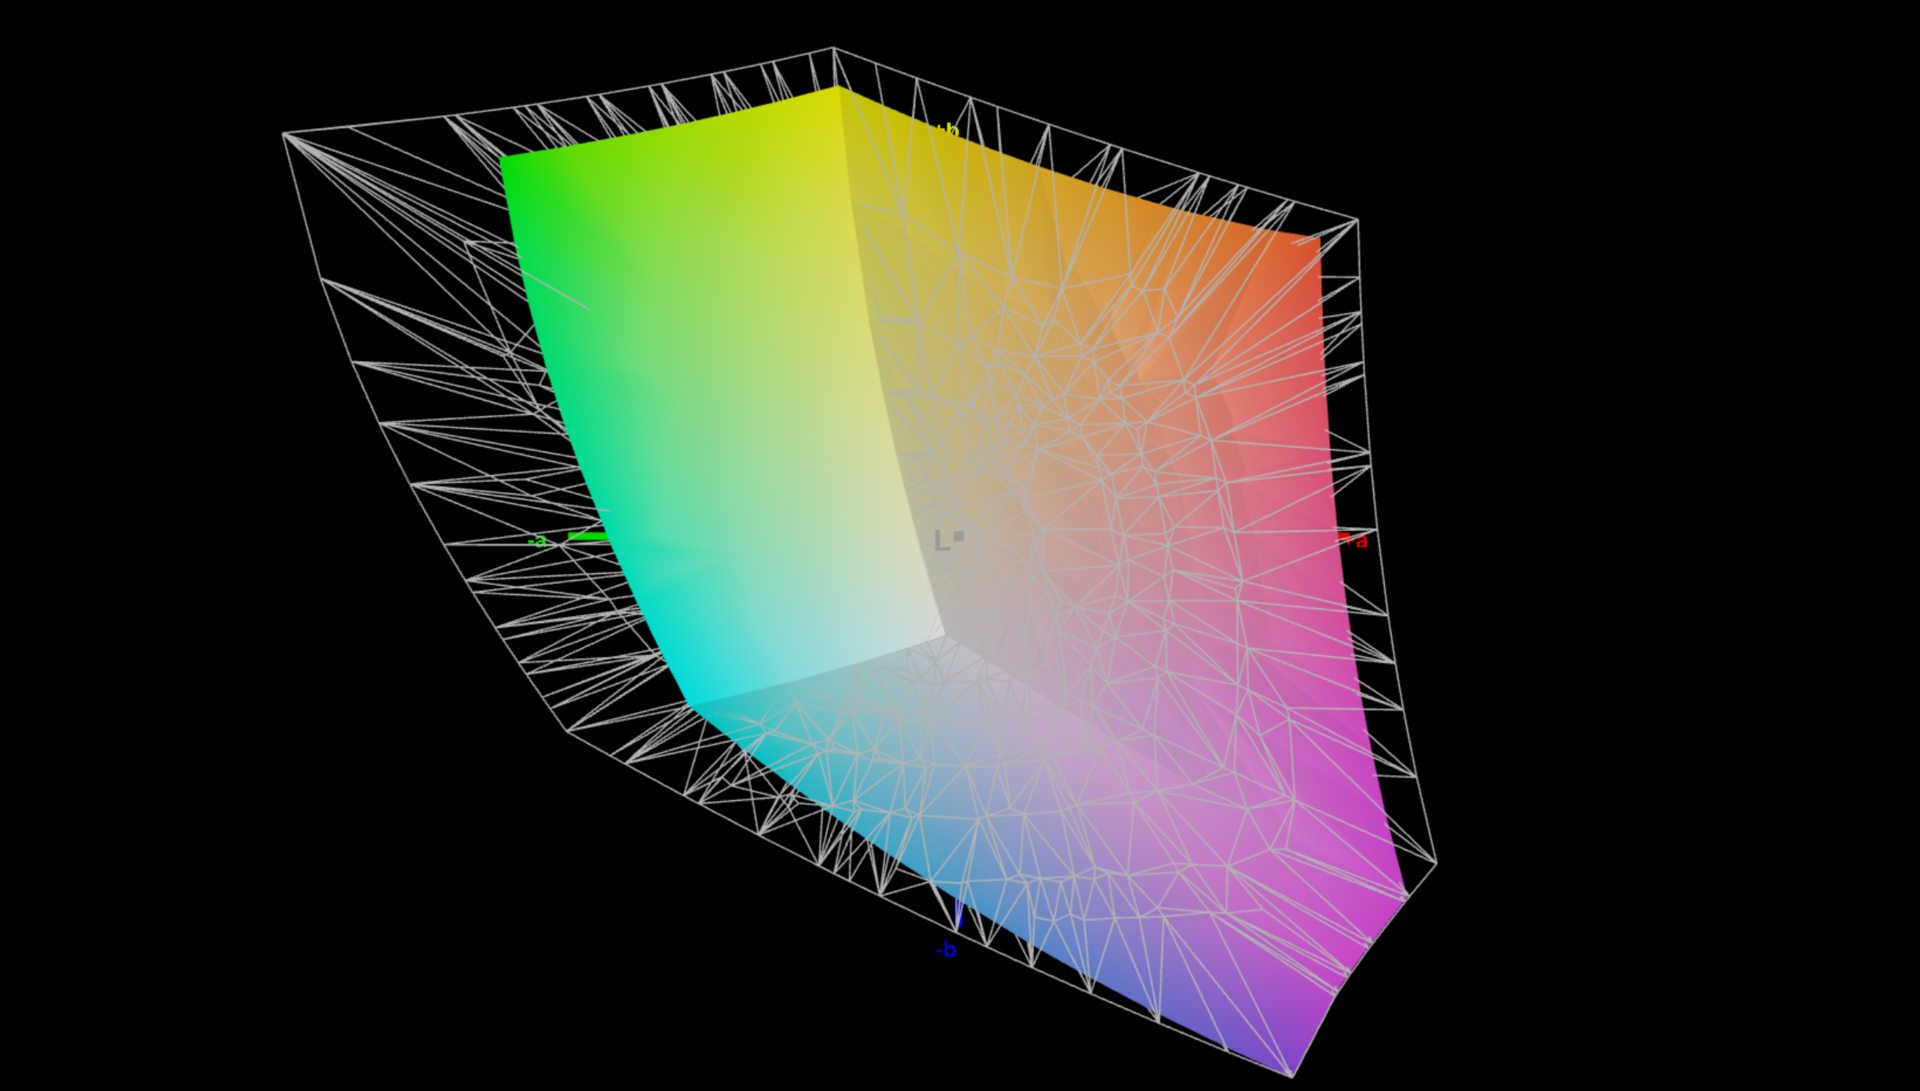
Lenovo ofrece dos pantallas WQXGA mate diferentes con una resolución de 2.560 x 1.600 píxeles. Junto a una versión con una frecuencia de actualización de 165 Hz y un brillo de 300 nits, también puede seleccionar una variante más brillante de 500 nits con una frecuencia de actualización de 240 Hz. Esta última soporta además HDR y es la que se instaló en nuestro dispositivo de pruebas. Subjetivamente, la pantalla tiene un aspecto estupendo; el contenido se ve muy nítido, los colores son vivos e incluso las zonas más claras no aparecen granuladas. Sin embargo, se notan algunos halos claros al mirar imágenes oscuras con el brillo subido.
Nuestro panel alcanzó un máximo de 528 cd/m² y una media de 500 cd/m², lo que significa que se ha alcanzado su objetivo. Su valor de negro de 0,33 está bien y su relación de contraste máxima supera los 1.500:1. La velocidad de reacción de la pantalla es rápida y está al mismo nivel que la de otros competidores IPS. En conjunto, la pantalla es adecuada para juegos y sus valores son mejores que los de la competencia. También es compatible con contenidos HDR (pero el HDR tiene que activarse manualmente a través de los ajustes de Windows).
| |||||||||||||||||||||||||
iluminación: 87 %
Brillo con batería: 519 cd/m²
Contraste: 1594:1 (Negro: 0.33 cd/m²)
ΔE ColorChecker Calman: 1.2 | ∀{0.5-29.43 Ø4.72}
calibrated: 1
ΔE Greyscale Calman: 1.3 | ∀{0.09-98 Ø4.97}
74.1% AdobeRGB 1998 (Argyll 3D)
100% sRGB (Argyll 3D)
72.4% Display P3 (Argyll 3D)
Gamma: 2.23
CCT: 6391 K
| Lenovo Legion 5 16IRX G9 NE160QDM-NZ3, IPS, 2560x1600, 16" | Schenker XMG CORE 16 (L23) BOE0AF0 (), IPS, 2560x1600, 16" | HP Victus 16-r0077ng CMN162D, IPS, 1920x1080, 16.1" | Lenovo LOQ 16IRH8 AUOC1A5 (B160QAN03.L), IPS, 2560x1600, 16" | Lenovo Legion Slim 5 16APH8 BOE NJ NE160QDM-NYC, IPS, 2560x1600, 16" | HP Victus 16-r0076TX Chi Mei CMN1629, IPS, 1920x1080, 16.1" | Alienware m16 R1 Intel BOE NE16NYB, IPS, 2560x1600, 16" | Lenovo Legion Pro 5 16IRX8 AU Optronics B160QAN03.1, IPS, 2560x1600, 16" | |
|---|---|---|---|---|---|---|---|---|
| Display | -4% | -6% | -2% | -3% | -5% | -5% | -1% | |
| Display P3 Coverage (%) | 72.4 | 68.3 -6% | 66.7 -8% | 70.5 -3% | 69.3 -4% | 67.5 -7% | 67.7 -6% | 71.2 -2% |
| sRGB Coverage (%) | 100 | 98.6 -1% | 98 -2% | 98.9 -1% | 100 0% | 97.5 -2% | 97.2 -3% | 98.8 -1% |
| AdobeRGB 1998 Coverage (%) | 74.1 | 69.6 -6% | 69 -7% | 72.6 -2% | 70 -6% | 69.7 -6% | 70 -6% | 73.3 -1% |
| Response Times | 9% | 0% | 29% | 12% | 32% | 42% | -18% | |
| Response Time Grey 50% / Grey 80% * (ms) | 12.5 ? | 13.2 ? -6% | 13.3 ? -6% | 7.2 ? 42% | 10.7 ? 14% | 6.18 ? 51% | 4 ? 68% | 14.5 ? -16% |
| Response Time Black / White * (ms) | 8.7 ? | 6.6 ? 24% | 8.2 ? 6% | 7.4 ? 15% | 7.8 ? 10% | 7.62 ? 12% | 7.3 ? 16% | 10.4 ? -20% |
| PWM Frequency (Hz) | ||||||||
| Screen | -67% | -16% | -24% | -14% | -21% | -51% | -20% | |
| Brightness middle (cd/m²) | 526 | 376 -29% | 308 -41% | 407 -23% | 371.6 -29% | 290 -45% | 306 -42% | 405.7 -23% |
| Brightness (cd/m²) | 500 | 358 -28% | 285 -43% | 369 -26% | 343 -31% | 275 -45% | 302 -40% | 368 -26% |
| Brightness Distribution (%) | 87 | 88 1% | 85 -2% | 85 -2% | 84 -3% | 82 -6% | 89 2% | 87 0% |
| Black Level * (cd/m²) | 0.33 | 0.33 -0% | 0.25 24% | 0.45 -36% | 0.44 -33% | 0.21 36% | 0.3 9% | 0.38 -15% |
| Contrast (:1) | 1594 | 1139 -29% | 1232 -23% | 904 -43% | 845 -47% | 1381 -13% | 1020 -36% | 1068 -33% |
| Colorchecker dE 2000 * | 1.2 | 2.74 -128% | 1.3 -8% | 1.43 -19% | 1.52 -27% | 1.7 -42% | 2.57 -114% | 1.65 -38% |
| Colorchecker dE 2000 max. * | 2.1 | 6.78 -223% | 2.76 -31% | 3.58 -70% | 2.68 -28% | 3.57 -70% | 4.26 -103% | 4.2 -100% |
| Colorchecker dE 2000 calibrated * | 1 | 0.88 12% | 0.92 8% | 1.07 -7% | 0.33 67% | 0.93 7% | 0.85 15% | 0.53 47% |
| Greyscale dE 2000 * | 1.3 | 3.57 -175% | 1.7 -31% | 1.13 13% | 1.2 8% | 1.5 -15% | 3.3 -154% | 1.2 8% |
| Gamma | 2.23 99% | 2.4 92% | 2.167 102% | 2.5 88% | 2.1 105% | 2.1 105% | 1.997 110% | 2.3 96% |
| CCT | 6391 102% | 7246 90% | 6767 96% | 6526 100% | 6503 100% | 6538 99% | 6895 94% | 6453 101% |
| Media total (Programa/Opciones) | -21% /
-42% | -7% /
-12% | 1% /
-12% | -2% /
-8% | 2% /
-10% | -5% /
-28% | -13% /
-16% |
* ... más pequeño es mejor


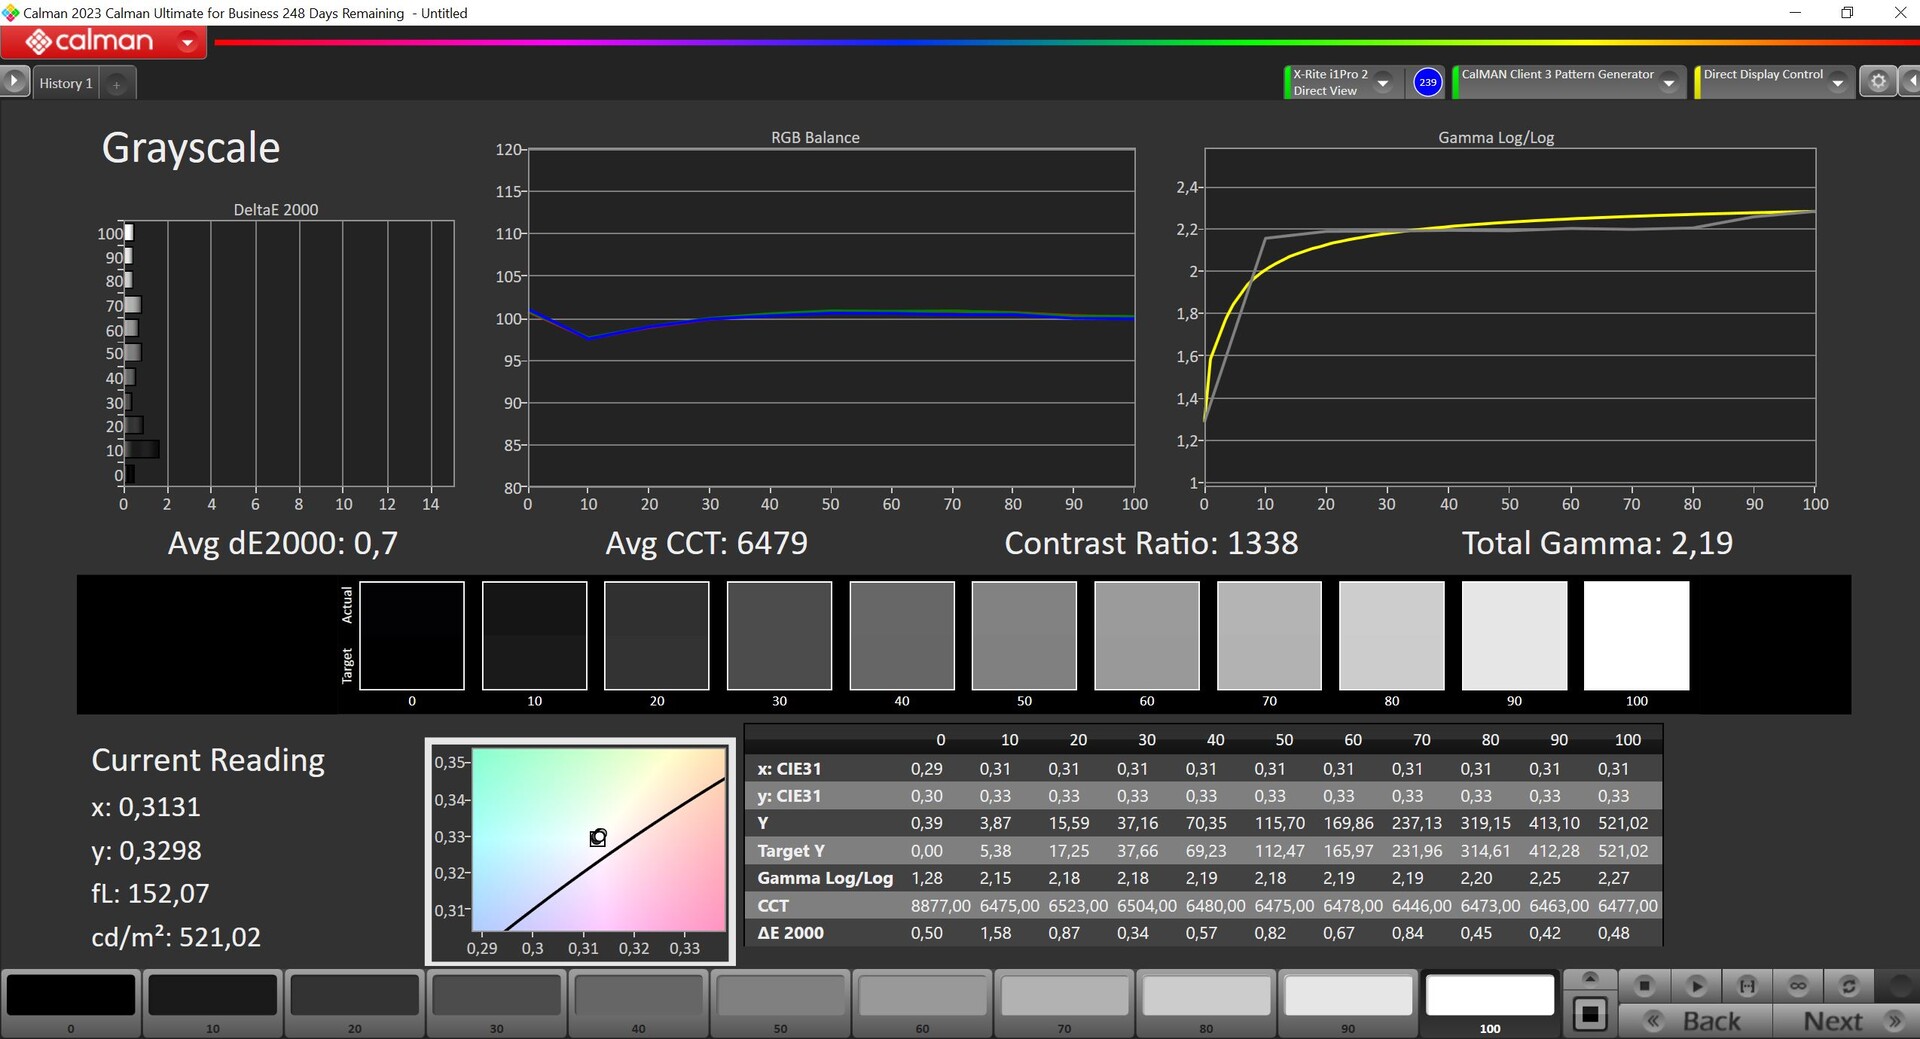
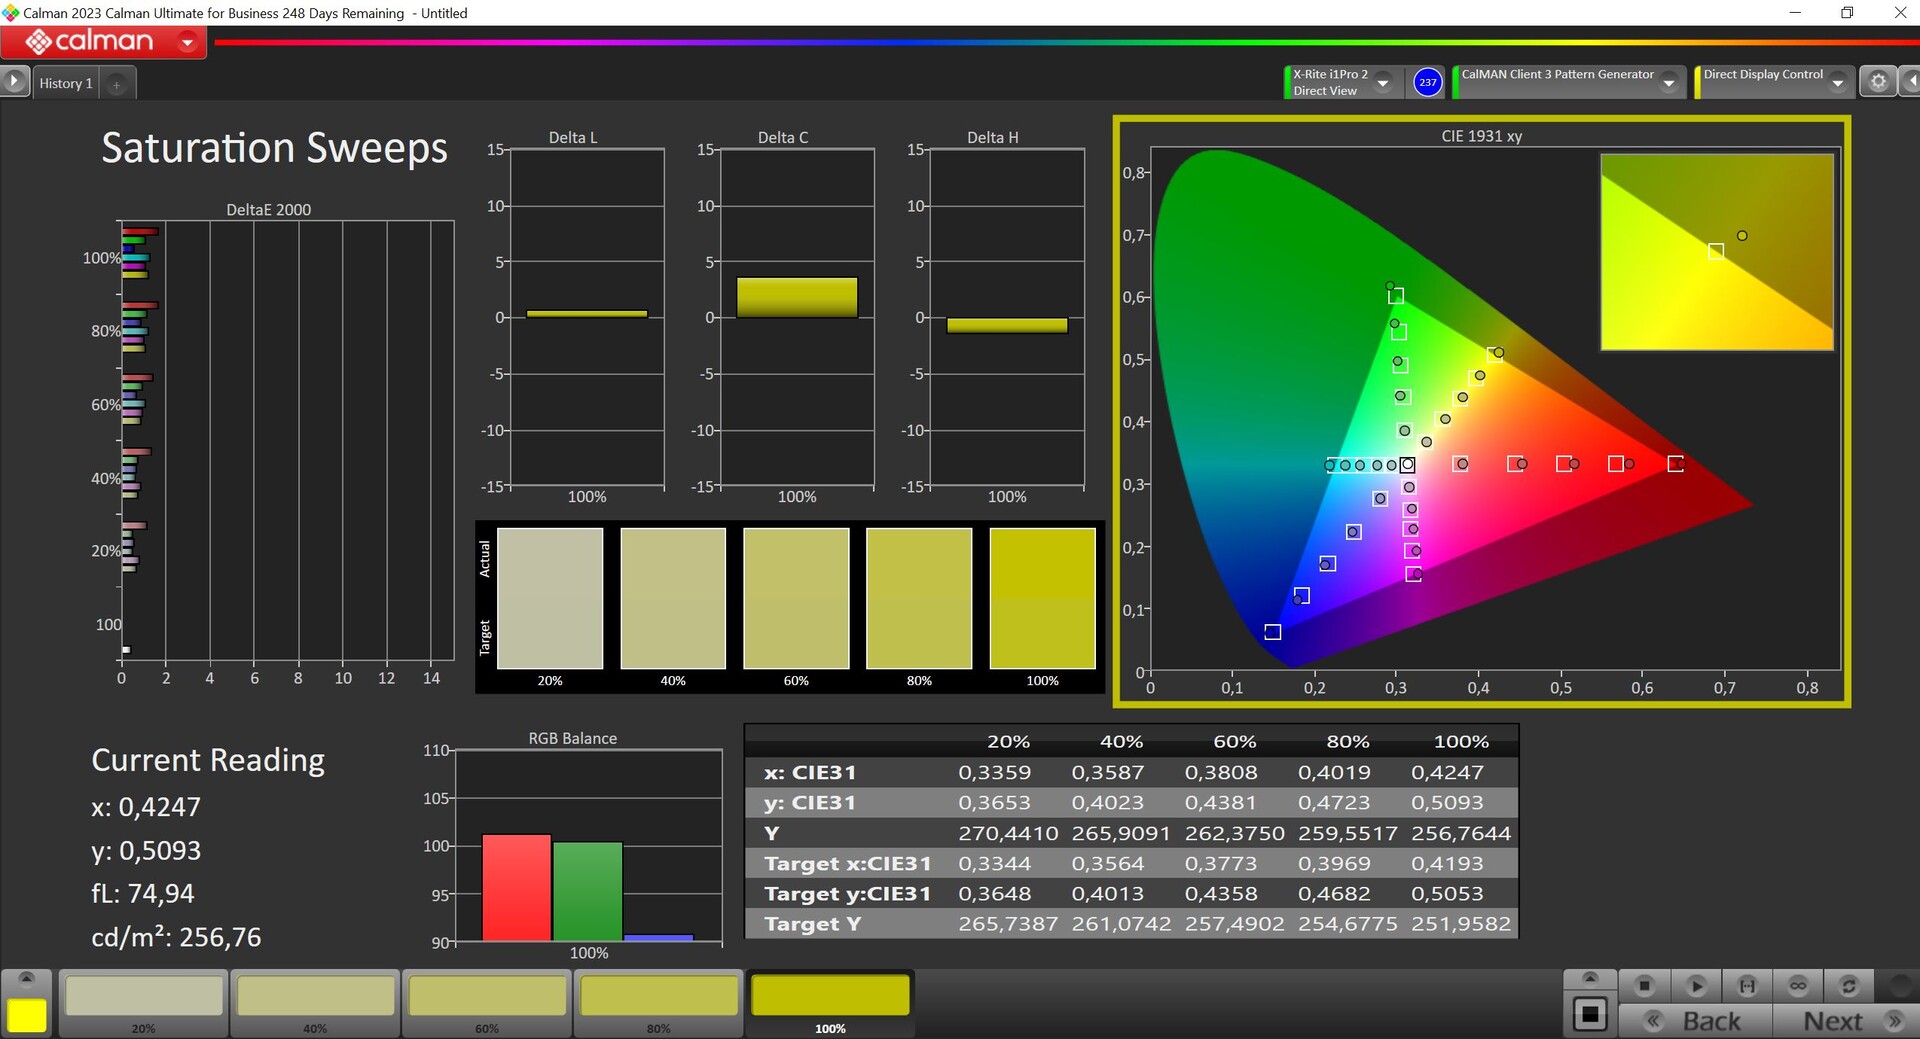
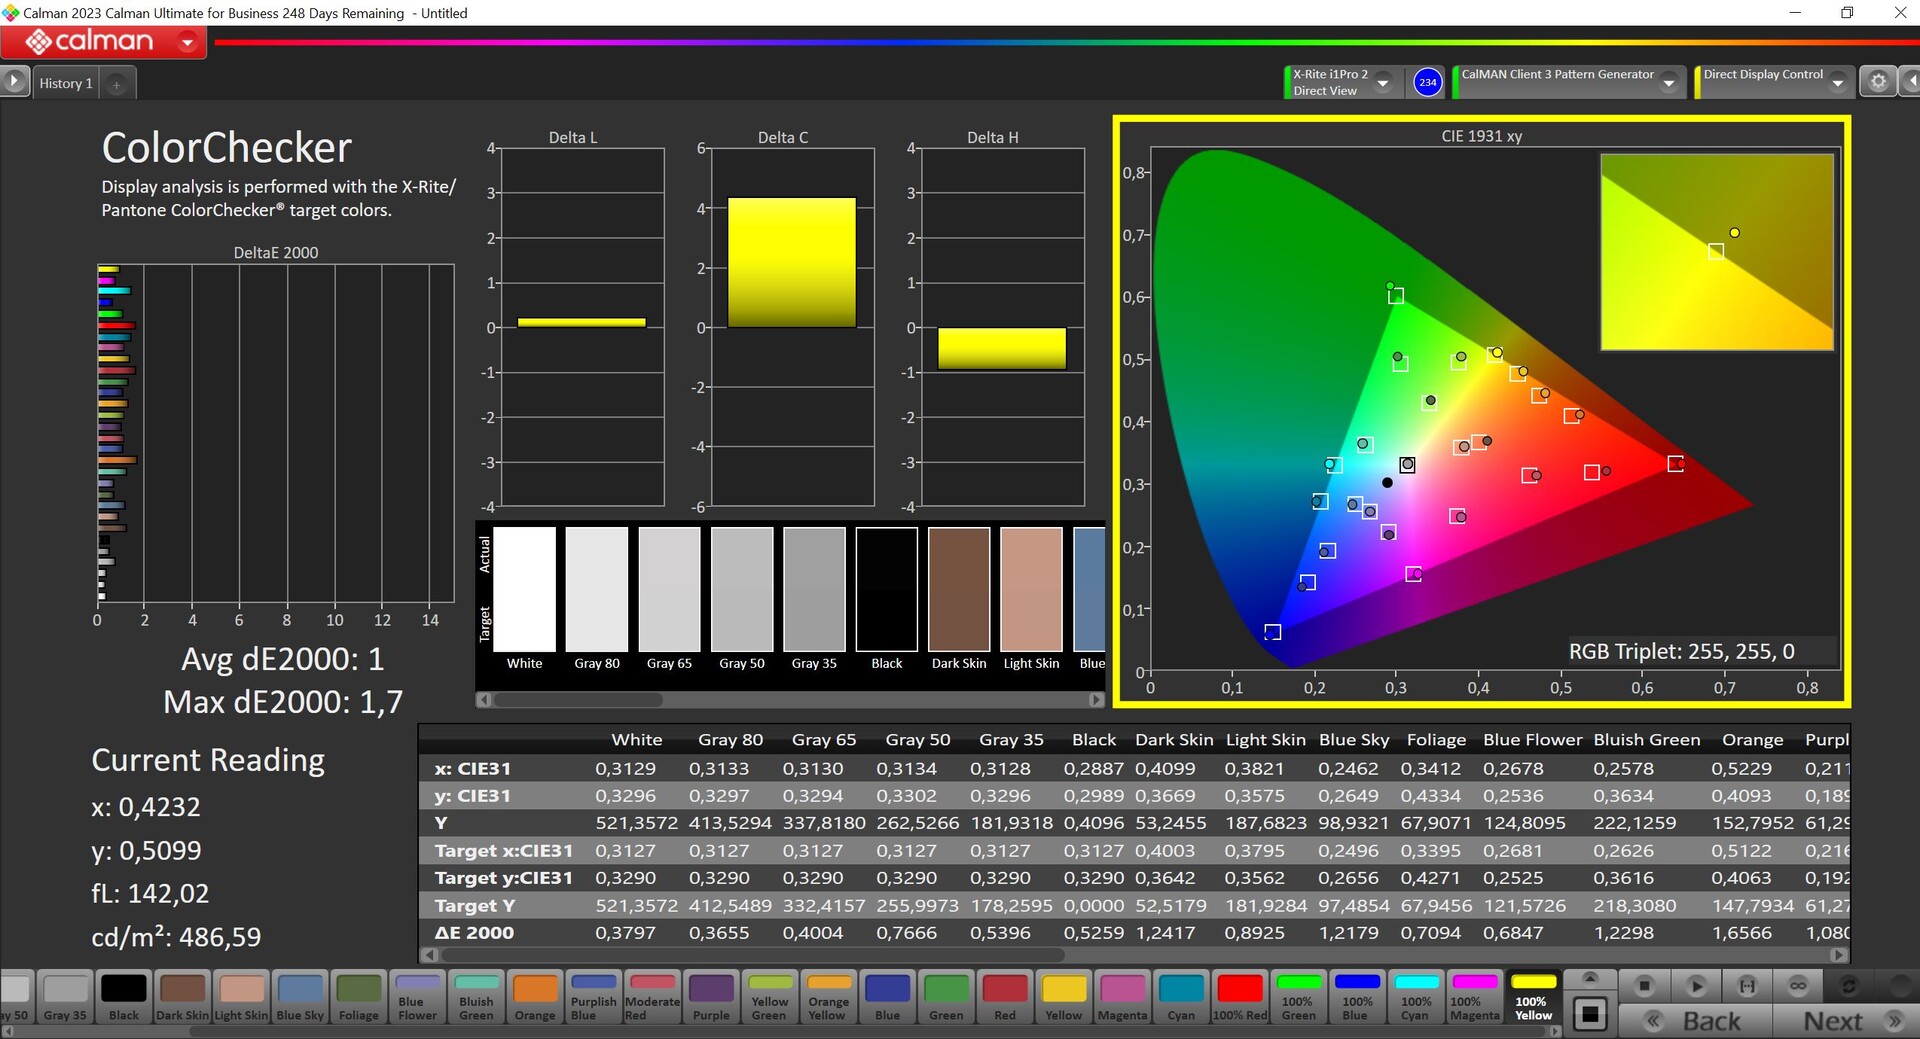
Ex funciona, la pantalla de la Legion 5i viene precalibrada y hay unos cuantos perfiles de color diferentes disponibles. La analizamos con el software profesional CalMAN (X-Rite i1 Pro2) utilizando el perfil "nativo". Su representación ya es magnífica, pues ni la escala de grises ni los colores muestran desviaciones DeltaE-2000 superiores a 3. Además, no notamos ningún matiz de color y una calibración por parte del usuario podría ser incluso superflua. Es posible que hayamos podido mejorar la calidad de la representación mediante nuestra propia calibración (puede descargarse gratuitamente más arriba), pero esto sólo es medible, no visible. Junto con su completa cobertura sRGB, el panel puede utilizarse con confianza para editar fotos o vídeo.
Tiempos de respuesta del display
| ↔ Tiempo de respuesta de Negro a Blanco | ||
|---|---|---|
| 8.7 ms ... subida ↗ y bajada ↘ combinada | ↗ 4.6 ms subida | 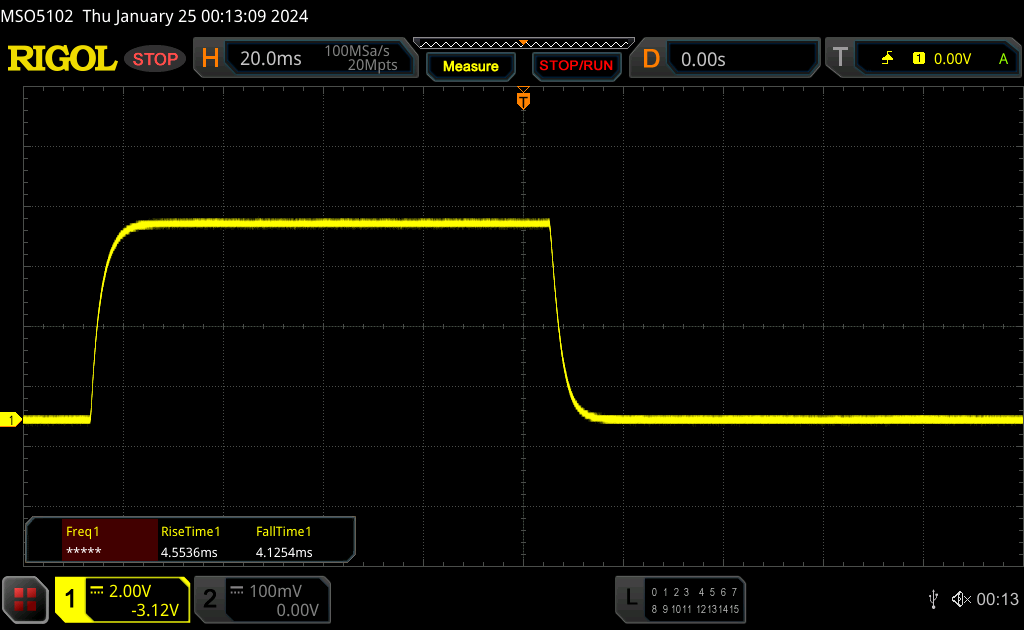 |
| ↘ 4.1 ms bajada | ||
| La pantalla mostró tiempos de respuesta rápidos en nuestros tests y debería ser adecuada para juegos. En comparación, todos los dispositivos de prueba van de ##min### (mínimo) a 240 (máximo) ms. » 24 % de todos los dispositivos son mejores. Esto quiere decir que el tiempo de respuesta medido es mejor que la media (19.8 ms) de todos los dispositivos testados. | ||
| ↔ Tiempo de respuesta 50% Gris a 80% Gris | ||
| 12.5 ms ... subida ↗ y bajada ↘ combinada | ↗ 6.1 ms subida | 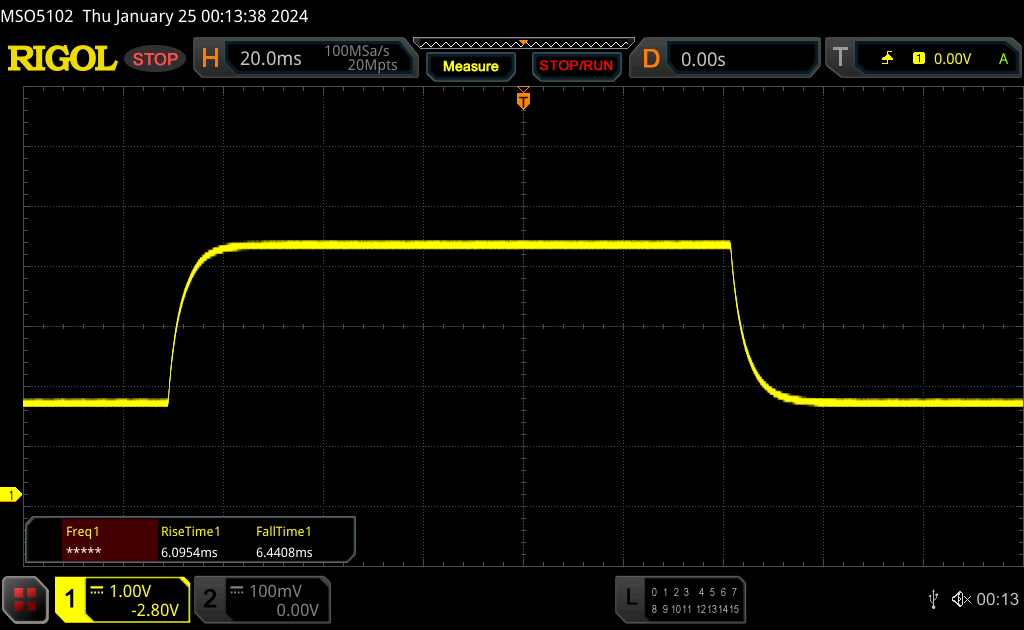 |
| ↘ 6.4 ms bajada | ||
| La pantalla mostró buenos tiempos de respuesta en nuestros tests pero podría ser demasiado lenta para los jugones competitivos. En comparación, todos los dispositivos de prueba van de ##min### (mínimo) a 636 (máximo) ms. » 26 % de todos los dispositivos son mejores. Esto quiere decir que el tiempo de respuesta medido es mejor que la media (31 ms) de todos los dispositivos testados. | ||
Parpadeo de Pantalla / PWM (Pulse-Width Modulation)
| Parpadeo de Pantalla / PWM no detectado | 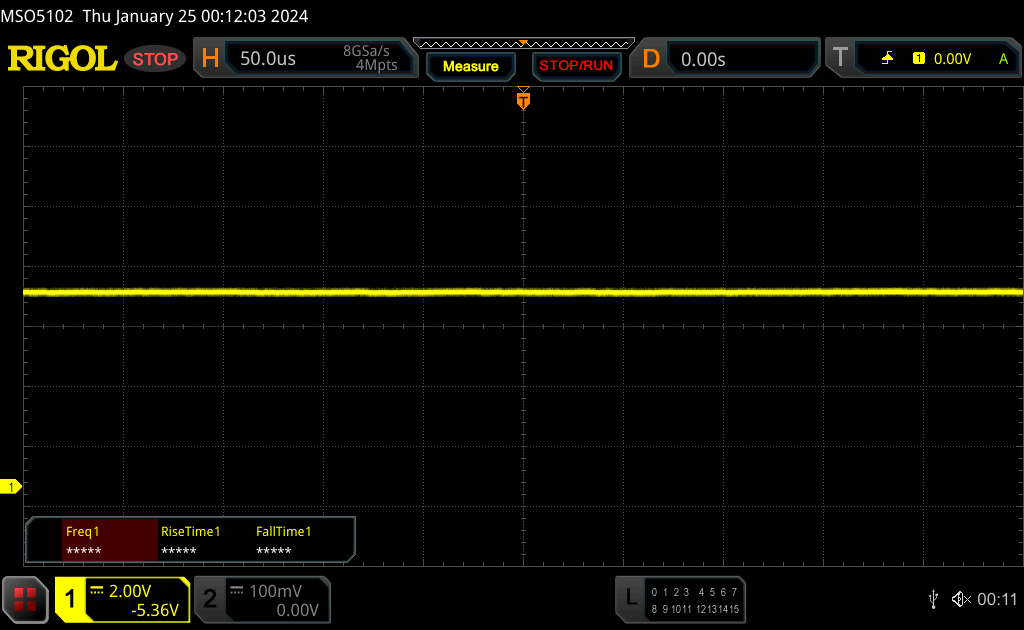 | ||
Comparación: 52 % de todos los dispositivos testados no usaron PWM para atenuar el display. Si se usó, medimos una media de 7769 (mínimo: 5 - máxmo: 343500) Hz. | |||

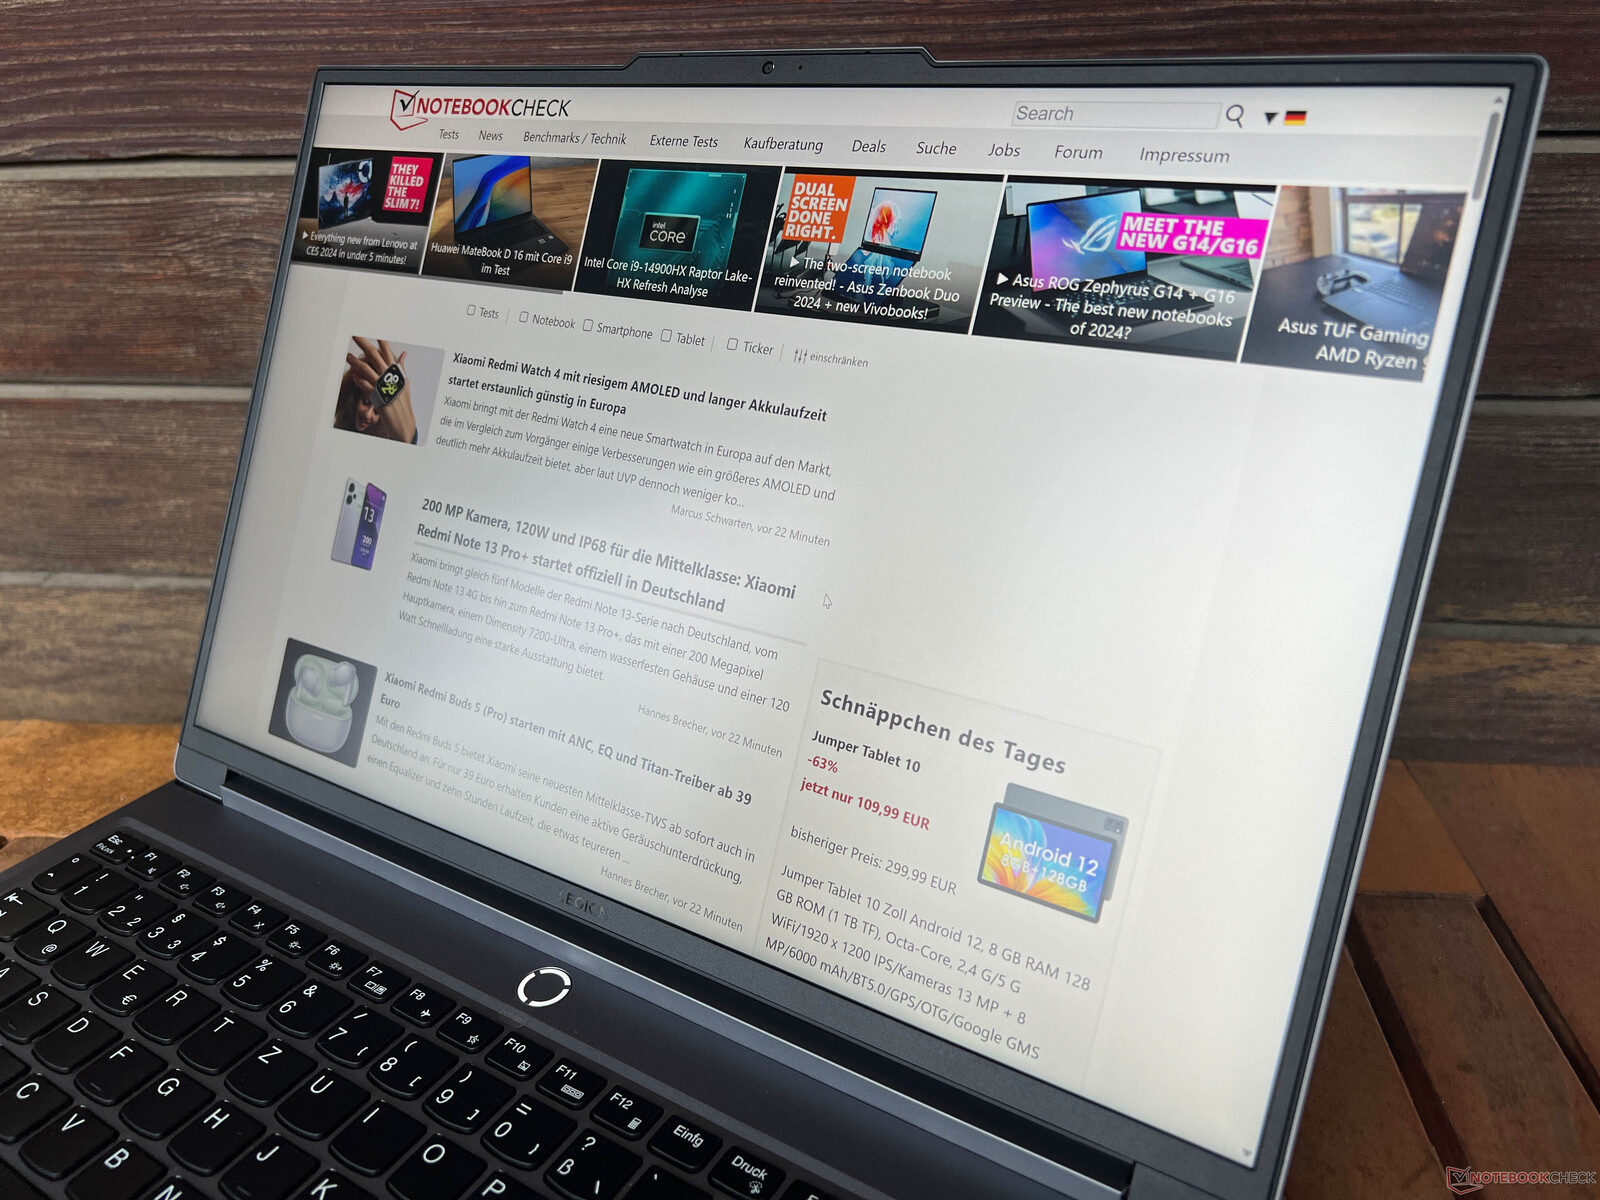
Gracias al alto brillo de la pantalla y a su superficie mate, el Legion 5i 16 puede utilizarse muy bien en exteriores o en entornos luminosos. La estabilidad del ángulo de visión de la IPS está bien, pero si se ve desde arriba en diagonal la imagen se aclara bastante.

Rendimiento - Raptor Lake-HX Refresh & Ada Lovelace
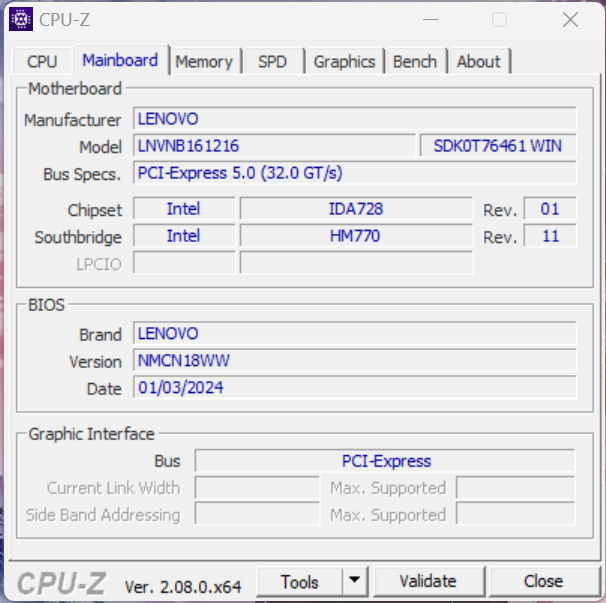
Lenovo ofrece el Legion 5i 16 G9 con cinco procesadores HX diferentes de Intel, aunque las dos variantes más débiles siguen perteneciendo a la 13ª generación del año pasado. El buque insignia puede equiparse con un Core i9-14900HX en el mejor de los casos, y nuestra muestra de prueba cuenta con el Core i7-14650HX. Las tarjetas gráficas disponibles incluyen los modelos actuales de Nvidia GeForce RTX 4050 Laptop, 4060 Laptop y 4070 Laptop con un TGP máximo de 115 vatios y un interruptor MUX para la conmutación de gráficos Advanced Optimus.
Condiciones de prueba
Lenovo ofrece tres modos de rendimiento diferentes dentro de la aplicación Vantage preinstalada, así como un modo personalizado que el usuario puede ajustar ampliamente (límites de potencia de la CPU/GPU, límite de temperatura de la CPU/GPU, aumento dinámico de la CPU/GPU). Por lo tanto, puede jugar con estos tanto como quiera. Hemos enumerado los parámetros respectivos de los tres ajustes predefinidos en la siguiente tabla(modo silencioso, modo equilibrado y modo de rendimiento).
| Perfil energético | Carga de la CPU | CB R23 Multi | Carga de la GPU | Time Spy gráficos | Cyberpunk 2077 QHD Ultra | emisiones máx. del ventilador |
|---|---|---|---|---|---|---|
| Modo silencioso | 65->55 vatios | 16.720 puntos | 65 vatios | 8.443 puntos | 35,4 fps | 34,6 dB(A) |
| Modo equilibrado | 120->70 vatios | 19.897 puntos | 80 vatios | 9.749 puntos | 43,4 fps | 49,8 dB(A) |
| Modo rendimiento | 140->100 vatios | 24.455 puntos | 125 vatios | 11.267 puntos | 49,7 fps | 55,7 dB(A) |
Hemos llevado a cabo los siguientes puntos de referencia y mediciones utilizando el modo de rendimiento, ya que el rendimiento del dispositivo para juegos en particular es mucho mayor utilizando este modo. Por supuesto, los ventiladores también acaban siendo más ruidosos, pero incluso en el modo equilibrado, los ventiladores pueden llegar a ser muy ruidosos mientras juega y es probable que necesite unos auriculares a pesar de todo, por lo que es mejor que utilice el modo de rendimiento. Los perfiles pueden seleccionarse mediante la combinación de teclas Fn+Q, con lo que el LED de estado de color del botón de encendido muestra qué modo se está utilizando en ese momento (rojo: rendimiento, blanco: equilibrado, azul: silencioso, morado: ajustado). Durante las tareas cotidianas sencillas, puede utilizar fácilmente el modo silencioso y disfrutar a menudo de un dispositivo completamente silencioso. En uso de batería, no podrá utilizar el modo de rendimiento.
Lenovo ha dotado al AI Engine+ del Legion 5i 16 de su propio chip LA1 AI que puede activarse junto con el modo equilibrado. Supuestamente, reconoce automáticamente los juegos y optimiza el rendimiento del portátil, por lo que las temperaturas y las emisiones de ruido de los ventiladores pueden aumentar. En general, sin embargo, esto no es realmente nada nuevo y ya se podía ver una función similar en modelos anteriores, en los que al jugar se activaba un cambio automático al modo de rendimiento. Por otro lado, no notamos ninguna diferencia en comparación con el modo equilibrado al utilizar este nuevo AI Engine+, y el rendimiento del dispositivo era a menudo el mismo o incluso peor que en el modo de rendimiento.
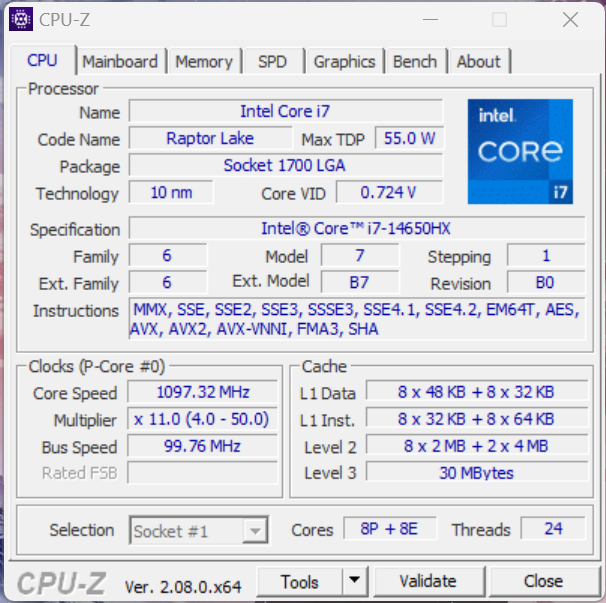
Procesador - Core i7-14650HX
El nuevo Core i7-14650HX es el sucesor del antiguo Core i7-13700HXofreciendo la misma configuración de núcleos (8x rendimiento + 8x eficiencia) con velocidades de reloj ligeramente superiores (hasta 5,2 GHz), pero en términos de su arquitectura general, nada ha cambiado. En el Legion 5i 16, la nueva CPU HX consume 140 vatios durante un breve periodo de tiempo, antes de equilibrarse en 100 vatios. El rendimiento resultante es excelente, lo que supone una ventaja del 10 % sobre la antigua 13700HX. Los modelos AMD también lo hicieron notablemente peor. En las pruebas de un solo núcleo, el Legion también salió vencedor. En el uso en batería, su consumo de energía está limitado a 50 vatios, por lo que su rendimiento multinúcleo descendió alrededor de un 40 % (CB R23 Multi: 14.202 puntos).
Encontrará más pruebas comparativas de CPU en nuestra sección técnica Procesadores mobiles - lista de benchmarks (nueva) .
Cinebench R15 Multi continuous test
Cinebench R23: Multi Core | Single Core
Cinebench R20: CPU (Multi Core) | CPU (Single Core)
Cinebench R15: CPU Multi 64Bit | CPU Single 64Bit
Blender: v2.79 BMW27 CPU
7-Zip 18.03: 7z b 4 | 7z b 4 -mmt1
Geekbench 6.7: Multi-Core | Single-Core
Geekbench 5.5: Multi-Core | Single-Core
HWBOT x265 Benchmark v2.2: 4k Preset
LibreOffice : 20 Documents To PDF
R Benchmark 2.5: Overall mean
| CPU Performance rating | |
| Media de la clase Gaming | |
| Lenovo Legion 5 16IRX G9 | |
| Alienware m16 R1 Intel | |
| Medio Intel Core i7-14650HX | |
| Lenovo Legion Pro 5 16IRX8 -2! | |
| Lenovo Legion Slim 5 16APH8 -2! | |
| Schenker XMG CORE 16 (L23) | |
| HP Victus 16-r0076TX -3! | |
| Lenovo LOQ 16IRH8 | |
| HP Victus 16-r0077ng | |
| Cinebench R23 / Multi Core | |
| Media de la clase Gaming (10488 - 40970, n=110, últimos 2 años) | |
| Lenovo Legion 5 16IRX G9 | |
| Alienware m16 R1 Intel | |
| Medio Intel Core i7-14650HX (16453 - 24455, n=2) | |
| Lenovo Legion Pro 5 16IRX8 | |
| HP Victus 16-r0076TX | |
| Schenker XMG CORE 16 (L23) | |
| Lenovo Legion Slim 5 16APH8 | |
| HP Victus 16-r0077ng | |
| Lenovo LOQ 16IRH8 | |
| Cinebench R23 / Single Core | |
| Media de la clase Gaming (1166 - 2356, n=110, últimos 2 años) | |
| Medio Intel Core i7-14650HX (1963 - 1975, n=2) | |
| Lenovo Legion 5 16IRX G9 | |
| Alienware m16 R1 Intel | |
| Lenovo LOQ 16IRH8 | |
| Lenovo Legion Slim 5 16APH8 | |
| Schenker XMG CORE 16 (L23) | |
| HP Victus 16-r0076TX | |
| HP Victus 16-r0077ng | |
| Lenovo Legion Pro 5 16IRX8 | |
| Cinebench R20 / CPU (Multi Core) | |
| Media de la clase Gaming (4029 - 16108, n=109, últimos 2 años) | |
| Lenovo Legion 5 16IRX G9 | |
| Alienware m16 R1 Intel | |
| Medio Intel Core i7-14650HX (6236 - 9349, n=2) | |
| HP Victus 16-r0076TX | |
| Lenovo Legion Pro 5 16IRX8 | |
| Lenovo Legion Slim 5 16APH8 | |
| Schenker XMG CORE 16 (L23) | |
| HP Victus 16-r0077ng | |
| Lenovo LOQ 16IRH8 | |
| Cinebench R20 / CPU (Single Core) | |
| Media de la clase Gaming (442 - 895, n=109, últimos 2 años) | |
| Medio Intel Core i7-14650HX (754 - 762, n=2) | |
| Lenovo Legion 5 16IRX G9 | |
| Alienware m16 R1 Intel | |
| Lenovo LOQ 16IRH8 | |
| Lenovo Legion Slim 5 16APH8 | |
| Schenker XMG CORE 16 (L23) | |
| Lenovo Legion Pro 5 16IRX8 | |
| HP Victus 16-r0077ng | |
| HP Victus 16-r0076TX | |
| Cinebench R15 / CPU Multi 64Bit | |
| Media de la clase Gaming (1578 - 6271, n=108, últimos 2 años) | |
| Lenovo Legion 5 16IRX G9 | |
| Medio Intel Core i7-14650HX (3142 - 3799, n=2) | |
| Lenovo Legion Pro 5 16IRX8 | |
| Alienware m16 R1 Intel | |
| HP Victus 16-r0076TX | |
| Lenovo Legion Slim 5 16APH8 | |
| Schenker XMG CORE 16 (L23) | |
| Lenovo LOQ 16IRH8 | |
| HP Victus 16-r0077ng | |
| Cinebench R15 / CPU Single 64Bit | |
| Media de la clase Gaming (188.8 - 343, n=109, últimos 2 años) | |
| Lenovo Legion 5 16IRX G9 | |
| Medio Intel Core i7-14650HX (284 - 287, n=2) | |
| Lenovo Legion Slim 5 16APH8 | |
| Alienware m16 R1 Intel | |
| Schenker XMG CORE 16 (L23) | |
| Lenovo Legion Pro 5 16IRX8 | |
| Lenovo LOQ 16IRH8 | |
| HP Victus 16-r0077ng | |
| HP Victus 16-r0076TX | |
| Blender / v2.79 BMW27 CPU | |
| Lenovo LOQ 16IRH8 | |
| HP Victus 16-r0077ng | |
| HP Victus 16-r0076TX | |
| Schenker XMG CORE 16 (L23) | |
| Lenovo Legion Slim 5 16APH8 | |
| Medio Intel Core i7-14650HX (141 - 206, n=2) | |
| Alienware m16 R1 Intel | |
| Media de la clase Gaming (80 - 330, n=107, últimos 2 años) | |
| Lenovo Legion Pro 5 16IRX8 | |
| Lenovo Legion 5 16IRX G9 | |
| 7-Zip 18.03 / 7z b 4 | |
| Lenovo Legion 5 16IRX G9 | |
| Media de la clase Gaming (33491 - 148086, n=108, últimos 2 años) | |
| Alienware m16 R1 Intel | |
| Medio Intel Core i7-14650HX (68711 - 93686, n=2) | |
| Lenovo Legion Pro 5 16IRX8 | |
| Schenker XMG CORE 16 (L23) | |
| HP Victus 16-r0076TX | |
| Lenovo Legion Slim 5 16APH8 | |
| HP Victus 16-r0077ng | |
| Lenovo LOQ 16IRH8 | |
| 7-Zip 18.03 / 7z b 4 -mmt1 | |
| Lenovo Legion 5 16IRX G9 | |
| Schenker XMG CORE 16 (L23) | |
| Medio Intel Core i7-14650HX (6364 - 6695, n=2) | |
| Lenovo Legion Slim 5 16APH8 | |
| Alienware m16 R1 Intel | |
| Media de la clase Gaming (4199 - 7436, n=108, últimos 2 años) | |
| Lenovo LOQ 16IRH8 | |
| Lenovo Legion Pro 5 16IRX8 | |
| HP Victus 16-r0077ng | |
| HP Victus 16-r0076TX | |
| Geekbench 6.7 / Multi-Core | |
| Lenovo Legion 5 16IRX G9 | |
| Media de la clase Gaming (6625 - 22104, n=109, últimos 2 años) | |
| Medio Intel Core i7-14650HX (12892 - 16010, n=2) | |
| Alienware m16 R1 Intel | |
| Schenker XMG CORE 16 (L23) | |
| Lenovo LOQ 16IRH8 | |
| HP Victus 16-r0077ng | |
| Geekbench 6.7 / Single-Core | |
| Media de la clase Gaming (1490 - 3259, n=109, últimos 2 años) | |
| Lenovo Legion 5 16IRX G9 | |
| Medio Intel Core i7-14650HX (2744 - 2761, n=2) | |
| Schenker XMG CORE 16 (L23) | |
| Alienware m16 R1 Intel | |
| Lenovo LOQ 16IRH8 | |
| HP Victus 16-r0077ng | |
| Geekbench 5.5 / Multi-Core | |
| Media de la clase Gaming (6460 - 27010, n=108, últimos 2 años) | |
| Lenovo Legion 5 16IRX G9 | |
| Medio Intel Core i7-14650HX (12584 - 16810, n=2) | |
| Alienware m16 R1 Intel | |
| Lenovo Legion Pro 5 16IRX8 | |
| HP Victus 16-r0076TX | |
| Lenovo LOQ 16IRH8 | |
| Schenker XMG CORE 16 (L23) | |
| Lenovo Legion Slim 5 16APH8 | |
| HP Victus 16-r0077ng | |
| Geekbench 5.5 / Single-Core | |
| Media de la clase Gaming (986 - 2474, n=108, últimos 2 años) | |
| Lenovo Legion Slim 5 16APH8 | |
| Schenker XMG CORE 16 (L23) | |
| Medio Intel Core i7-14650HX (1933 - 1940, n=2) | |
| Lenovo Legion 5 16IRX G9 | |
| Alienware m16 R1 Intel | |
| Lenovo LOQ 16IRH8 | |
| Lenovo Legion Pro 5 16IRX8 | |
| HP Victus 16-r0076TX | |
| HP Victus 16-r0077ng | |
| HWBOT x265 Benchmark v2.2 / 4k Preset | |
| Media de la clase Gaming (11.5 - 44.3, n=108, últimos 2 años) | |
| Lenovo Legion 5 16IRX G9 | |
| Lenovo Legion Pro 5 16IRX8 | |
| Alienware m16 R1 Intel | |
| Lenovo Legion Slim 5 16APH8 | |
| Schenker XMG CORE 16 (L23) | |
| HP Victus 16-r0076TX | |
| Medio Intel Core i7-14650HX (12.6 - 25.6, n=2) | |
| Lenovo LOQ 16IRH8 | |
| HP Victus 16-r0077ng | |
| LibreOffice / 20 Documents To PDF | |
| Schenker XMG CORE 16 (L23) | |
| HP Victus 16-r0077ng | |
| Medio Intel Core i7-14650HX (43.8 - 55.6, n=2) | |
| Media de la clase Gaming (19 - 88.8, n=108, últimos 2 años) | |
| Lenovo LOQ 16IRH8 | |
| Alienware m16 R1 Intel | |
| Lenovo Legion 5 16IRX G9 | |
| Lenovo Legion Slim 5 16APH8 | |
| Lenovo Legion Pro 5 16IRX8 | |
| R Benchmark 2.5 / Overall mean | |
| HP Victus 16-r0077ng | |
| HP Victus 16-r0076TX | |
| Lenovo Legion Pro 5 16IRX8 | |
| Lenovo LOQ 16IRH8 | |
| Alienware m16 R1 Intel | |
| Schenker XMG CORE 16 (L23) | |
| Lenovo Legion Slim 5 16APH8 | |
| Media de la clase Gaming (0.3439 - 0.759, n=109, últimos 2 años) | |
| Medio Intel Core i7-14650HX (0.4195 - 0.4244, n=2) | |
| Lenovo Legion 5 16IRX G9 | |
* ... más pequeño es mejor
AIDA64: FP32 Ray-Trace | FPU Julia | CPU SHA3 | CPU Queen | FPU SinJulia | FPU Mandel | CPU AES | CPU ZLib | FP64 Ray-Trace | CPU PhotoWorxx
| Performance rating | |
| Media de la clase Gaming | |
| Schenker XMG CORE 16 (L23) | |
| Lenovo Legion Slim 5 16APH8 | |
| Alienware m16 R1 Intel | |
| Lenovo Legion Pro 5 16IRX8 | |
| Lenovo Legion 5 16IRX G9 | |
| HP Victus 16-r0076TX | |
| Medio Intel Core i7-14650HX | |
| HP Victus 16-r0077ng | |
| Lenovo LOQ 16IRH8 | |
| AIDA64 / FP32 Ray-Trace | |
| Media de la clase Gaming (10227 - 85542, n=107, últimos 2 años) | |
| Lenovo Legion Slim 5 16APH8 | |
| Schenker XMG CORE 16 (L23) | |
| Lenovo Legion Pro 5 16IRX8 | |
| Alienware m16 R1 Intel | |
| Lenovo Legion 5 16IRX G9 | |
| Medio Intel Core i7-14650HX (13096 - 19044, n=2) | |
| HP Victus 16-r0076TX | |
| HP Victus 16-r0077ng | |
| Lenovo LOQ 16IRH8 | |
| AIDA64 / FPU Julia | |
| Media de la clase Gaming (51376 - 238426, n=107, últimos 2 años) | |
| Lenovo Legion Slim 5 16APH8 | |
| Schenker XMG CORE 16 (L23) | |
| Lenovo Legion Pro 5 16IRX8 | |
| Alienware m16 R1 Intel | |
| Lenovo Legion 5 16IRX G9 | |
| HP Victus 16-r0076TX | |
| Medio Intel Core i7-14650HX (67335 - 95271, n=2) | |
| HP Victus 16-r0077ng | |
| Lenovo LOQ 16IRH8 | |
| AIDA64 / CPU SHA3 | |
| Media de la clase Gaming (2180 - 9817, n=107, últimos 2 años) | |
| Schenker XMG CORE 16 (L23) | |
| Lenovo Legion Slim 5 16APH8 | |
| Alienware m16 R1 Intel | |
| Lenovo Legion Pro 5 16IRX8 | |
| Lenovo Legion 5 16IRX G9 | |
| HP Victus 16-r0076TX | |
| Medio Intel Core i7-14650HX (3109 - 4214, n=2) | |
| HP Victus 16-r0077ng | |
| Lenovo LOQ 16IRH8 | |
| AIDA64 / CPU Queen | |
| Lenovo Legion Slim 5 16APH8 | |
| Media de la clase Gaming (49785 - 173351, n=95, últimos 2 años) | |
| Alienware m16 R1 Intel | |
| Lenovo Legion Pro 5 16IRX8 | |
| HP Victus 16-r0076TX | |
| Schenker XMG CORE 16 (L23) | |
| Lenovo Legion 5 16IRX G9 | |
| Medio Intel Core i7-14650HX (89907 - 101500, n=2) | |
| HP Victus 16-r0077ng | |
| Lenovo LOQ 16IRH8 | |
| AIDA64 / FPU SinJulia | |
| Schenker XMG CORE 16 (L23) | |
| Lenovo Legion Slim 5 16APH8 | |
| Media de la clase Gaming (4424 - 33636, n=107, últimos 2 años) | |
| Alienware m16 R1 Intel | |
| Lenovo Legion Pro 5 16IRX8 | |
| Lenovo Legion 5 16IRX G9 | |
| Medio Intel Core i7-14650HX (9159 - 11913, n=2) | |
| HP Victus 16-r0076TX | |
| HP Victus 16-r0077ng | |
| Lenovo LOQ 16IRH8 | |
| AIDA64 / FPU Mandel | |
| Media de la clase Gaming (25115 - 128721, n=107, últimos 2 años) | |
| Lenovo Legion Slim 5 16APH8 | |
| Schenker XMG CORE 16 (L23) | |
| Lenovo Legion Pro 5 16IRX8 | |
| Alienware m16 R1 Intel | |
| Lenovo Legion 5 16IRX G9 | |
| Medio Intel Core i7-14650HX (32747 - 47097, n=2) | |
| HP Victus 16-r0076TX | |
| HP Victus 16-r0077ng | |
| Lenovo LOQ 16IRH8 | |
| AIDA64 / CPU AES | |
| Alienware m16 R1 Intel | |
| Media de la clase Gaming (39258 - 247074, n=107, últimos 2 años) | |
| Lenovo Legion Pro 5 16IRX8 | |
| Schenker XMG CORE 16 (L23) | |
| Lenovo Legion 5 16IRX G9 | |
| HP Victus 16-r0076TX | |
| Medio Intel Core i7-14650HX (63627 - 86485, n=2) | |
| Lenovo Legion Slim 5 16APH8 | |
| HP Victus 16-r0077ng | |
| Lenovo LOQ 16IRH8 | |
| AIDA64 / CPU ZLib | |
| Media de la clase Gaming (574 - 2531, n=107, últimos 2 años) | |
| Alienware m16 R1 Intel | |
| Lenovo Legion Pro 5 16IRX8 | |
| Lenovo Legion 5 16IRX G9 | |
| Medio Intel Core i7-14650HX (924 - 1289, n=2) | |
| Lenovo Legion Slim 5 16APH8 | |
| HP Victus 16-r0076TX | |
| Schenker XMG CORE 16 (L23) | |
| HP Victus 16-r0077ng | |
| Lenovo LOQ 16IRH8 | |
| AIDA64 / FP64 Ray-Trace | |
| Media de la clase Gaming (5509 - 45446, n=107, últimos 2 años) | |
| Lenovo Legion Slim 5 16APH8 | |
| Schenker XMG CORE 16 (L23) | |
| Lenovo Legion Pro 5 16IRX8 | |
| Alienware m16 R1 Intel | |
| Lenovo Legion 5 16IRX G9 | |
| Medio Intel Core i7-14650HX (7064 - 10316, n=2) | |
| HP Victus 16-r0076TX | |
| HP Victus 16-r0077ng | |
| Lenovo LOQ 16IRH8 | |
| AIDA64 / CPU PhotoWorxx | |
| Media de la clase Gaming (12271 - 89891, n=107, últimos 2 años) | |
| Schenker XMG CORE 16 (L23) | |
| HP Victus 16-r0077ng | |
| HP Victus 16-r0076TX | |
| Lenovo Legion Pro 5 16IRX8 | |
| Alienware m16 R1 Intel | |
| Medio Intel Core i7-14650HX (33763 - 34470, n=2) | |
| Lenovo Legion 5 16IRX G9 | |
| Lenovo LOQ 16IRH8 | |
| Lenovo Legion Slim 5 16APH8 | |
Rendimiento del sistema
Como era de esperar, el nuevo Legion 5i 16 es un aparato de reacción muy rápida y todas las entradas se ejecutan sin vacilar. El sistema sólo se cuelga brevemente al arrancar los juegos, pero esto tiene que ver con la conmutación gráfica Advanced Optimus. Puede evitarlo activando la conmutación Optimus normal, pero entonces no obtendrá el mejor rendimiento. Durante la prueba, nunca tuvimos ningún problema con nuestro dispositivo de prueba (cuelgues, etc.).
CrossMark: Overall | Productivity | Creativity | Responsiveness
WebXPRT 3: Overall
WebXPRT 4: Overall
Mozilla Kraken 1.1: Total
| PCMark 10 / Score | |
| Media de la clase Gaming (5828 - 11574, n=95, últimos 2 años) | |
| Schenker XMG CORE 16 (L23) | |
| Lenovo Legion Slim 5 16APH8 | |
| Lenovo Legion Pro 5 16IRX8 | |
| Lenovo Legion 5 16IRX G9 | |
| Medio Intel Core i7-14650HX, NVIDIA GeForce RTX 4060 Laptop GPU (n=1) | |
| Alienware m16 R1 Intel | |
| HP Victus 16-r0077ng | |
| Lenovo LOQ 16IRH8 | |
| HP Victus 16-r0076TX | |
| PCMark 10 / Essentials | |
| Lenovo Legion Slim 5 16APH8 | |
| Schenker XMG CORE 16 (L23) | |
| Lenovo Legion Pro 5 16IRX8 | |
| Lenovo Legion 5 16IRX G9 | |
| Medio Intel Core i7-14650HX, NVIDIA GeForce RTX 4060 Laptop GPU (n=1) | |
| Alienware m16 R1 Intel | |
| HP Victus 16-r0077ng | |
| Media de la clase Gaming (8810 - 12600, n=99, últimos 2 años) | |
| Lenovo LOQ 16IRH8 | |
| HP Victus 16-r0076TX | |
| PCMark 10 / Productivity | |
| Media de la clase Gaming (6845 - 21327, n=97, últimos 2 años) | |
| Schenker XMG CORE 16 (L23) | |
| Lenovo Legion Slim 5 16APH8 | |
| Alienware m16 R1 Intel | |
| Lenovo Legion 5 16IRX G9 | |
| Medio Intel Core i7-14650HX, NVIDIA GeForce RTX 4060 Laptop GPU (n=1) | |
| Lenovo Legion Pro 5 16IRX8 | |
| HP Victus 16-r0077ng | |
| Lenovo LOQ 16IRH8 | |
| HP Victus 16-r0076TX | |
| PCMark 10 / Digital Content Creation | |
| Media de la clase Gaming (7602 - 19657, n=97, últimos 2 años) | |
| Schenker XMG CORE 16 (L23) | |
| Lenovo Legion Pro 5 16IRX8 | |
| Lenovo Legion 5 16IRX G9 | |
| Medio Intel Core i7-14650HX, NVIDIA GeForce RTX 4060 Laptop GPU (n=1) | |
| Lenovo Legion Slim 5 16APH8 | |
| HP Victus 16-r0077ng | |
| Alienware m16 R1 Intel | |
| Lenovo LOQ 16IRH8 | |
| HP Victus 16-r0076TX | |
| CrossMark / Overall | |
| Lenovo Legion 5 16IRX G9 | |
| Medio Intel Core i7-14650HX, NVIDIA GeForce RTX 4060 Laptop GPU (n=1) | |
| Alienware m16 R1 Intel | |
| Media de la clase Gaming (1366 - 2409, n=95, últimos 2 años) | |
| Lenovo LOQ 16IRH8 | |
| Lenovo Legion Slim 5 16APH8 | |
| HP Victus 16-r0076TX | |
| Schenker XMG CORE 16 (L23) | |
| Lenovo Legion Pro 5 16IRX8 | |
| CrossMark / Productivity | |
| Alienware m16 R1 Intel | |
| Lenovo Legion 5 16IRX G9 | |
| Medio Intel Core i7-14650HX, NVIDIA GeForce RTX 4060 Laptop GPU (n=1) | |
| Lenovo LOQ 16IRH8 | |
| Media de la clase Gaming (1386 - 2254, n=95, últimos 2 años) | |
| Lenovo Legion Slim 5 16APH8 | |
| Schenker XMG CORE 16 (L23) | |
| Lenovo Legion Pro 5 16IRX8 | |
| HP Victus 16-r0076TX | |
| CrossMark / Creativity | |
| Lenovo Legion 5 16IRX G9 | |
| Medio Intel Core i7-14650HX, NVIDIA GeForce RTX 4060 Laptop GPU (n=1) | |
| Media de la clase Gaming (1343 - 2729, n=95, últimos 2 años) | |
| Alienware m16 R1 Intel | |
| Lenovo LOQ 16IRH8 | |
| Lenovo Legion Slim 5 16APH8 | |
| HP Victus 16-r0076TX | |
| Schenker XMG CORE 16 (L23) | |
| Lenovo Legion Pro 5 16IRX8 | |
| CrossMark / Responsiveness | |
| Lenovo Legion 5 16IRX G9 | |
| Medio Intel Core i7-14650HX, NVIDIA GeForce RTX 4060 Laptop GPU (n=1) | |
| Alienware m16 R1 Intel | |
| Lenovo LOQ 16IRH8 | |
| Media de la clase Gaming (1226 - 2334, n=95, últimos 2 años) | |
| Lenovo Legion Pro 5 16IRX8 | |
| Lenovo Legion Slim 5 16APH8 | |
| HP Victus 16-r0076TX | |
| Schenker XMG CORE 16 (L23) | |
| WebXPRT 3 / Overall | |
| Lenovo Legion Slim 5 16APH8 | |
| Lenovo LOQ 16IRH8 | |
| Lenovo LOQ 16IRH8 | |
| Media de la clase Gaming (220 - 532, n=100, últimos 2 años) | |
| Lenovo Legion 5 16IRX G9 | |
| Medio Intel Core i7-14650HX, NVIDIA GeForce RTX 4060 Laptop GPU (n=1) | |
| Alienware m16 R1 Intel | |
| Schenker XMG CORE 16 (L23) | |
| HP Victus 16-r0077ng | |
| HP Victus 16-r0077ng | |
| HP Victus 16-r0076TX | |
| Lenovo Legion Pro 5 16IRX8 | |
| WebXPRT 4 / Overall | |
| Media de la clase Gaming (165 - 354, n=101, últimos 2 años) | |
| Lenovo Legion 5 16IRX G9 | |
| Medio Intel Core i7-14650HX, NVIDIA GeForce RTX 4060 Laptop GPU (n=1) | |
| Alienware m16 R1 Intel | |
| Lenovo Legion Slim 5 16APH8 | |
| Lenovo Legion Pro 5 16IRX8 | |
| HP Victus 16-r0077ng | |
| HP Victus 16-r0077ng | |
| HP Victus 16-r0076TX | |
| Mozilla Kraken 1.1 / Total | |
| HP Victus 16-r0076TX | |
| HP Victus 16-r0077ng | |
| HP Victus 16-r0077ng | |
| Lenovo Legion Pro 5 16IRX8 | |
| Schenker XMG CORE 16 (L23) | |
| Lenovo LOQ 16IRH8 | |
| Lenovo LOQ 16IRH8 | |
| Alienware m16 R1 Intel | |
| Lenovo Legion Slim 5 16APH8 | |
| Lenovo Legion 5 16IRX G9 | |
| Medio Intel Core i7-14650HX, NVIDIA GeForce RTX 4060 Laptop GPU (n=1) | |
| Media de la clase Gaming (391 - 590, n=105, últimos 2 años) | |
* ... más pequeño es mejor
| PCMark 10 Score | 7645 puntos | |
ayuda | ||
| AIDA64 / Memory Copy | |
| Media de la clase Gaming (21750 - 129946, n=107, últimos 2 años) | |
| Schenker XMG CORE 16 (L23) | |
| Lenovo Legion Slim 5 16APH8 | |
| HP Victus 16-r0077ng | |
| Lenovo Legion 5 16IRX G9 | |
| Medio Intel Core i7-14650HX (58978 - 59727, n=2) | |
| Lenovo Legion Pro 5 16IRX8 | |
| Alienware m16 R1 Intel | |
| HP Victus 16-r0076TX | |
| Lenovo LOQ 16IRH8 | |
| AIDA64 / Memory Read | |
| Media de la clase Gaming (22956 - 118858, n=107, últimos 2 años) | |
| Lenovo Legion 5 16IRX G9 | |
| Medio Intel Core i7-14650HX (70720 - 71455, n=2) | |
| HP Victus 16-r0077ng | |
| Lenovo Legion Pro 5 16IRX8 | |
| Alienware m16 R1 Intel | |
| HP Victus 16-r0076TX | |
| Lenovo LOQ 16IRH8 | |
| Lenovo Legion Slim 5 16APH8 | |
| Schenker XMG CORE 16 (L23) | |
| AIDA64 / Memory Write | |
| Schenker XMG CORE 16 (L23) | |
| Lenovo Legion Slim 5 16APH8 | |
| Media de la clase Gaming (22297 - 135096, n=107, últimos 2 años) | |
| Lenovo Legion Pro 5 16IRX8 | |
| HP Victus 16-r0077ng | |
| Alienware m16 R1 Intel | |
| HP Victus 16-r0076TX | |
| Medio Intel Core i7-14650HX (51138 - 56811, n=2) | |
| Lenovo LOQ 16IRH8 | |
| Lenovo Legion 5 16IRX G9 | |
| AIDA64 / Memory Latency | |
| Lenovo LOQ 16IRH8 | |
| Media de la clase Gaming (75.3 - 259, n=107, últimos 2 años) | |
| HP Victus 16-r0076TX | |
| HP Victus 16-r0077ng | |
| Lenovo Legion Slim 5 16APH8 | |
| Medio Intel Core i7-14650HX (89.8 - 95.2, n=2) | |
| Lenovo Legion 5 16IRX G9 | |
| Alienware m16 R1 Intel | |
| Schenker XMG CORE 16 (L23) | |
| Lenovo Legion Pro 5 16IRX8 | |
* ... más pequeño es mejor
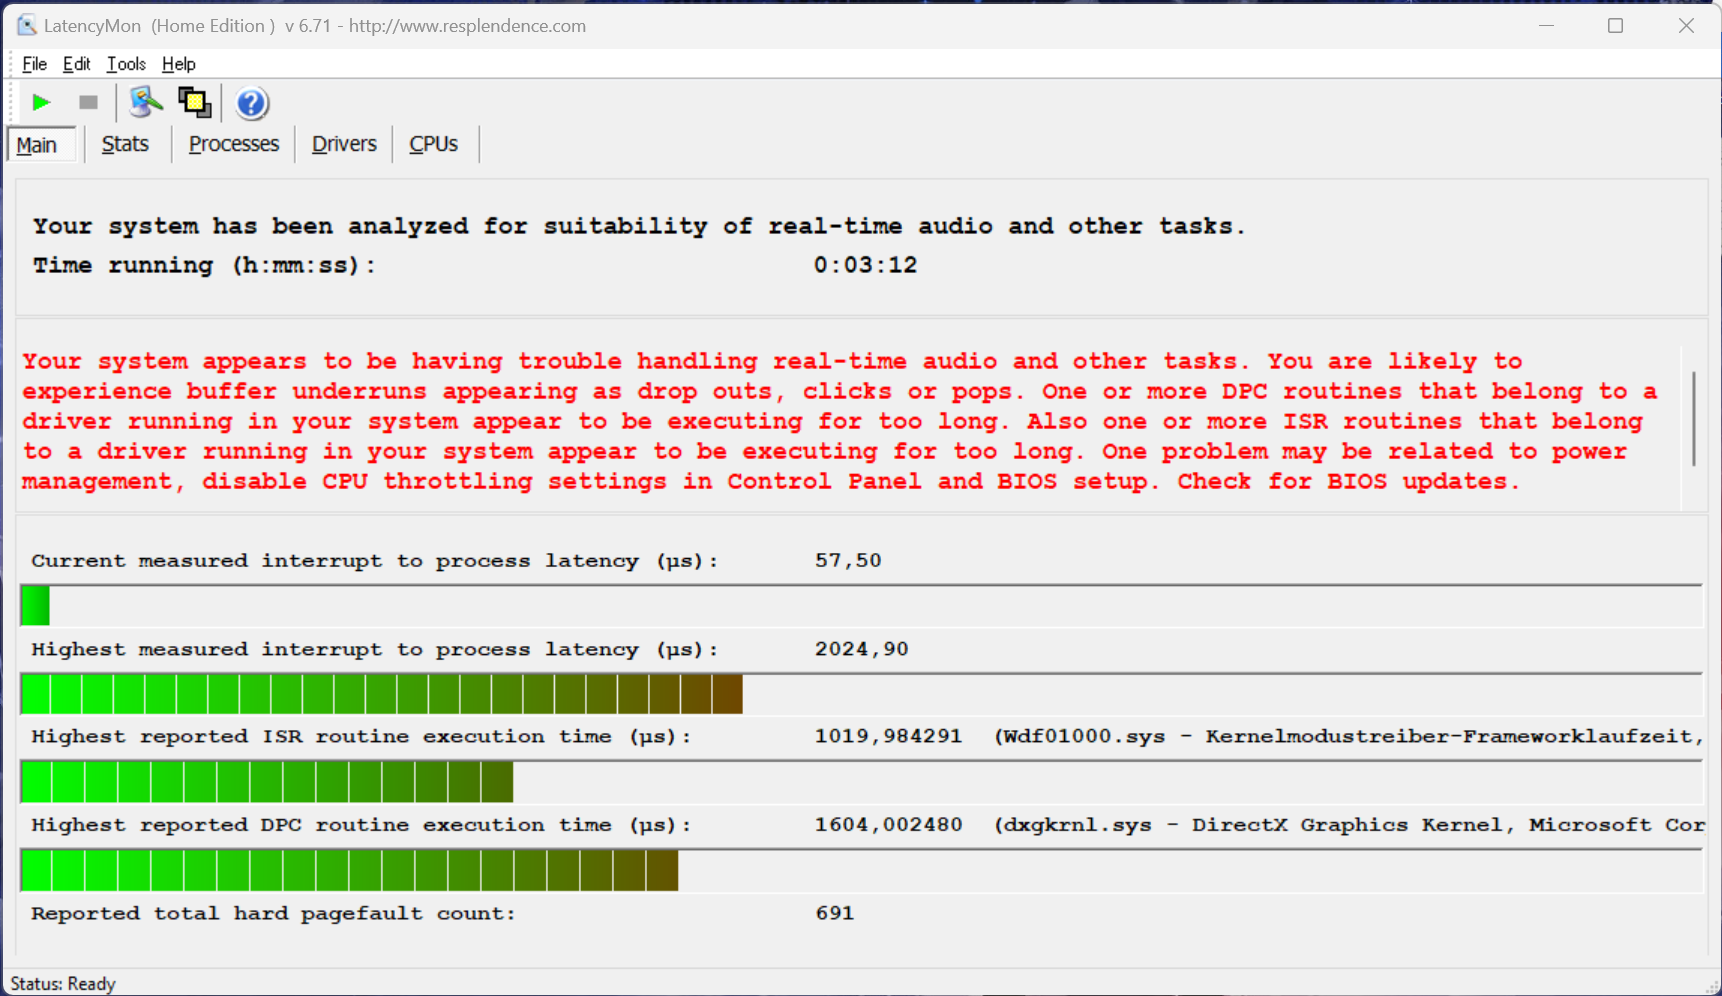
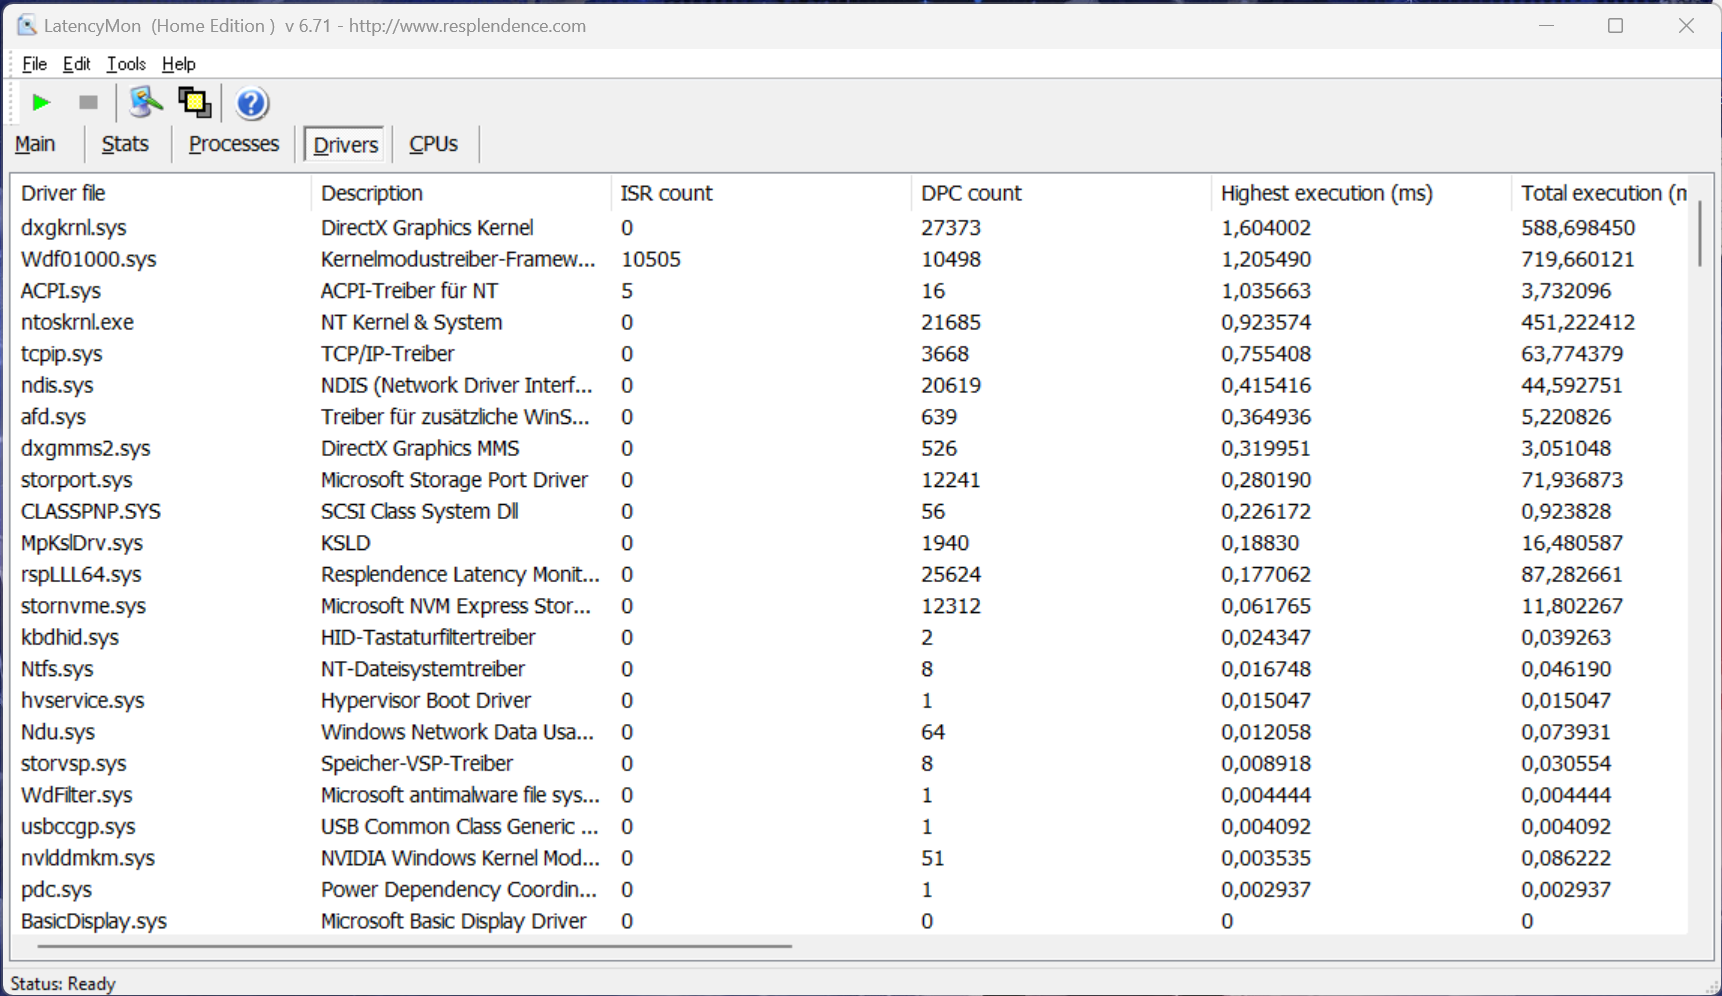
Latencia del CPD
En nuestra prueba de latencia estandarizada (navegación por Internet, reproducción 4K de YouTube, carga de la CPU), el dispositivo de prueba con la versión actual de la BIOS mostró algunas limitaciones al utilizar aplicaciones de audio en tiempo real.
| DPC Latencies / LatencyMon - interrupt to process latency (max), Web, Youtube, Prime95 | |
| Alienware m16 R1 Intel | |
| Lenovo Legion 5 16IRX G9 | |
| HP Victus 16-r0076TX | |
| HP Victus 16-r0077ng | |
| Lenovo LOQ 16IRH8 | |
| Lenovo Legion Slim 5 16APH8 | |
| Lenovo Legion Pro 5 16IRX8 | |
| Schenker XMG CORE 16 (L23) | |
* ... más pequeño es mejor
Dispositivos de almacenamiento
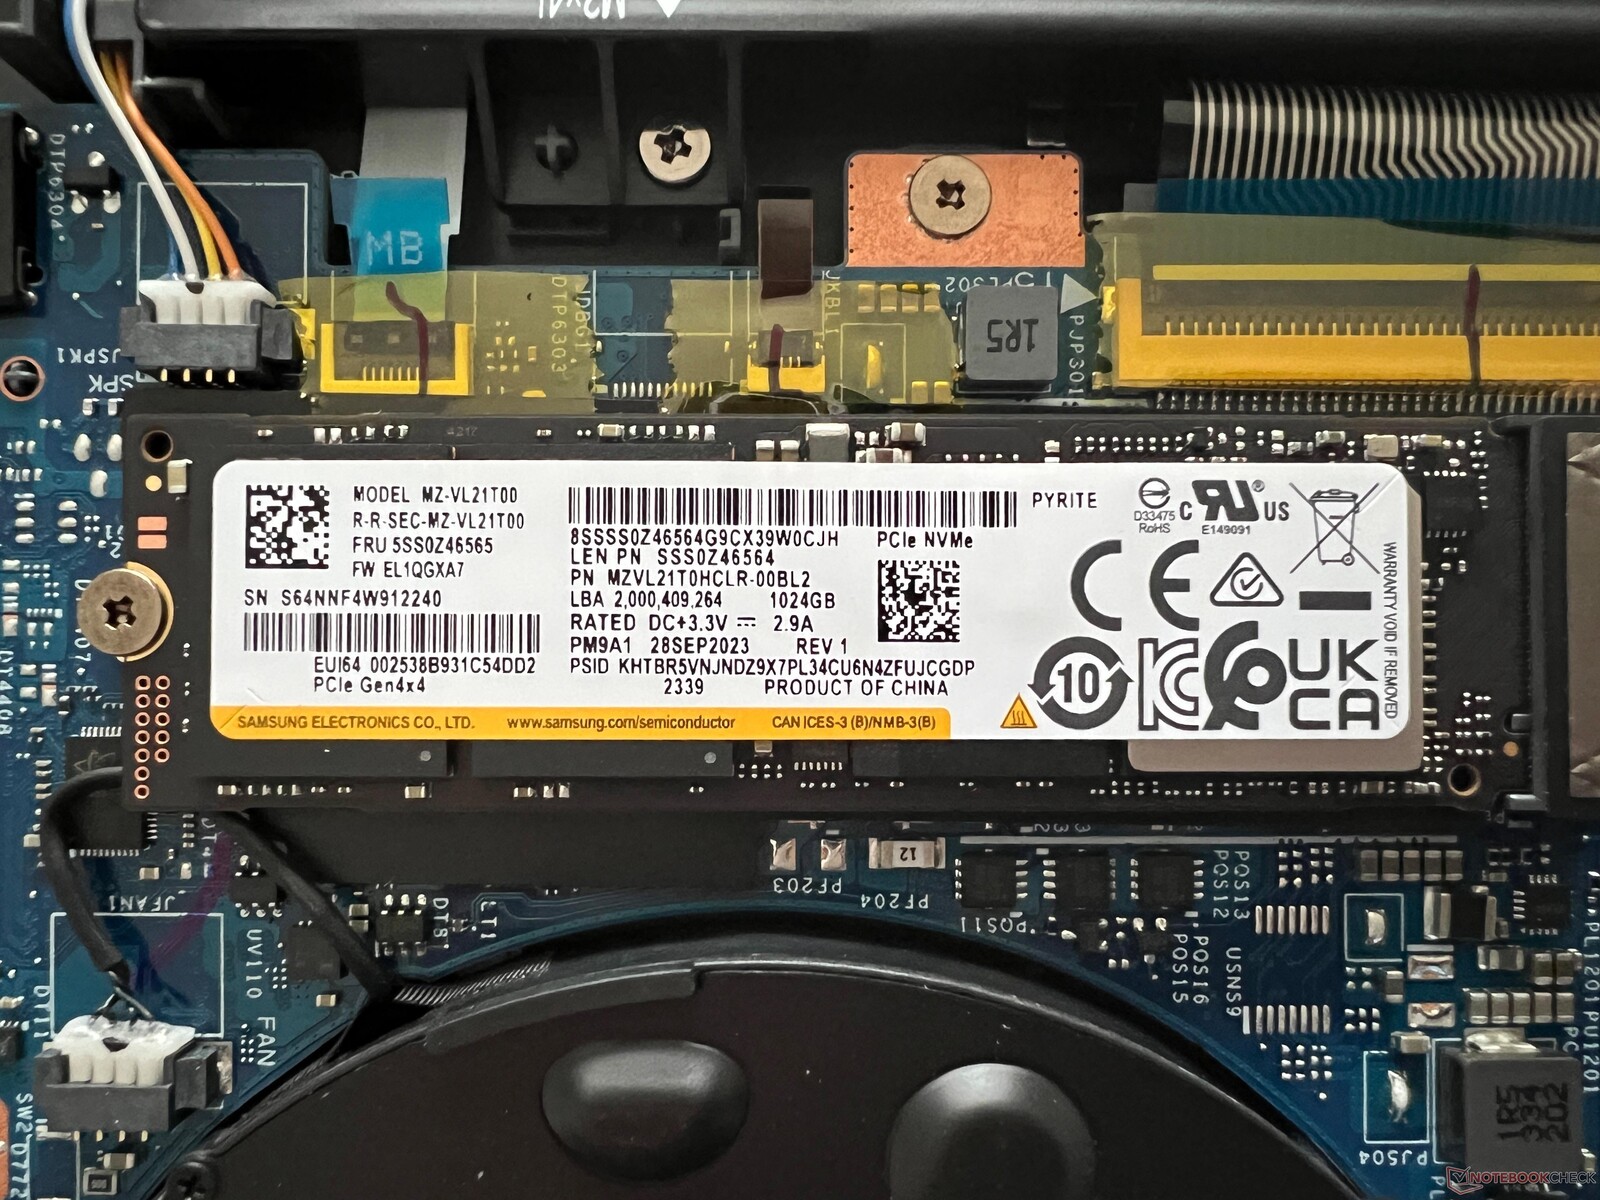
Como ya se ha mencionado, el Legion dispone de dos ranuras para SSD y nuestro dispositivo de prueba está equipado con la versión de 1 TB del Samsung PM9A1 (versión OEM del 980 Pro), lo que deja a los usuarios 888 GB libres para utilizar tras el primer arranque del portátil. El rendimiento de la unidad SSD PCIe-4.0 es excelente en general, pero bajo carga permanente, no se mantiene estable. En el uso diario, esto no debería causar ninguna limitación, pero un refrigerador adicional (o un disipador de calor) podría haber resuelto este problema. Puede encontrar más pruebas comparativas de SSD aquí.

* ... más pequeño es mejor
Reading continuous performance: DiskSpd Read Loop, Queue Depth 8
Tarjeta gráfica
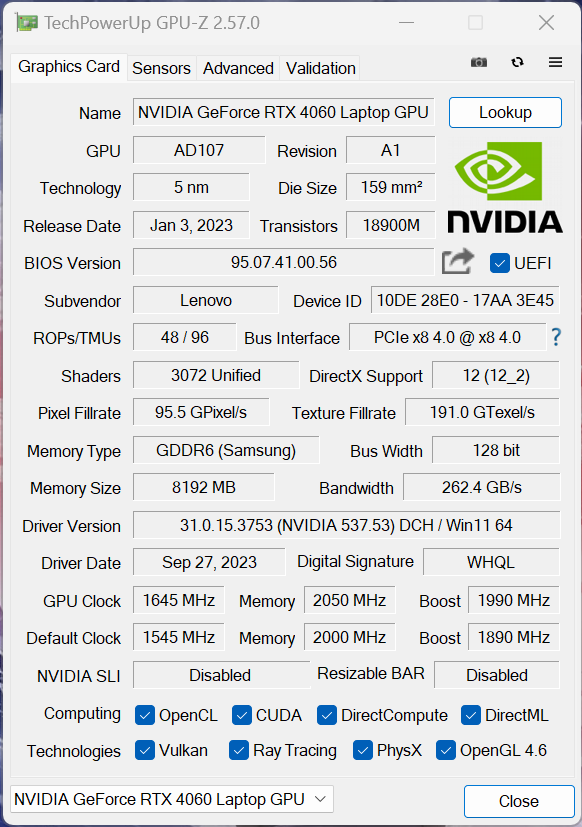
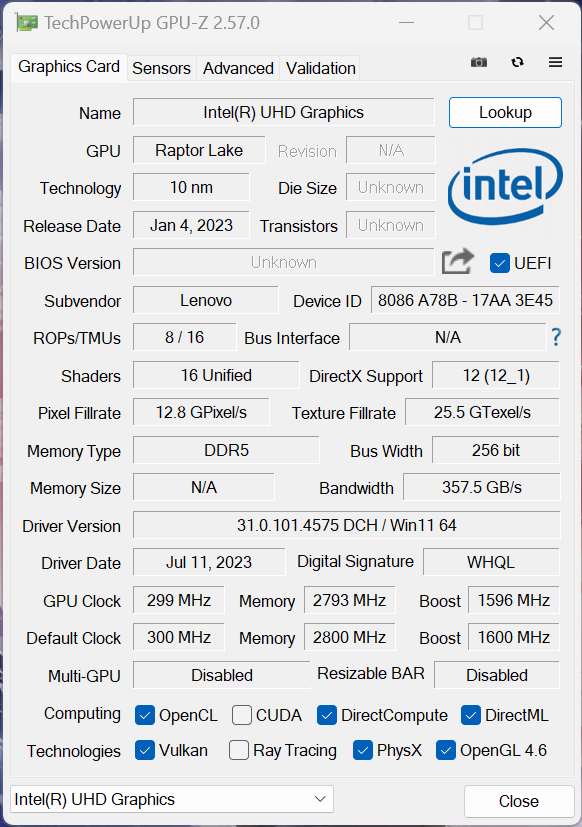
Dentro del dispositivo de prueba, Lenovo ha instalado la actual Portátil Nvidia GeForce RTX 4060 con un TGP de 115 vatios; de hecho, incluso se puede overclockear la GPU a través de la aplicación Vantage. Durante nuestra prueba, su velocidad de reloj máxima fue de 2.430 MHz. Se admite el Optimus avanzado a través de un conmutador MUX, que funcionó de forma fiable durante nuestra prueba, pero también se puede desactivar por completo la iGPU del procesador.
El portátil RTX 4060 lo hizo realmente bien en las pruebas comparativas, sólo perdiendo frente a los dos modelos RTX-4070-aunque, la diferencia con el HP Victus no es grande en absoluto. El rendimiento de la GPU se mantiene totalmente estable bajo carga permanente, pero en el uso en batería, la GPU sólo puede consumir 50 vatios. Esto supone una pérdida de rendimiento de algo más del 30 %. Encontrará más pruebas de rendimiento de la GPU en .
| 3DMark 11 Performance | 32891 puntos | |
| 3DMark Fire Strike Score | 25376 puntos | |
| 3DMark Time Spy Score | 11731 puntos | |
ayuda | ||
| Blender / v3.3 Classroom OPTIX/RTX | |
| HP Victus 16-r0076TX | |
| Alienware m16 R1 Intel | |
| HP Victus 16-r0077ng | |
| Lenovo Legion 5 16IRX G9 | |
| Medio NVIDIA GeForce RTX 4060 Laptop GPU (19 - 28, n=53) | |
| Lenovo Legion Slim 5 16APH8 | |
| Lenovo LOQ 16IRH8 | |
| Lenovo Legion Pro 5 16IRX8 | |
| Schenker XMG CORE 16 (L23) | |
| Media de la clase Gaming (9 - 32, n=109, últimos 2 años) | |
| Blender / v3.3 Classroom CUDA | |
| HP Victus 16-r0076TX | |
| Lenovo Legion Slim 5 16APH8 | |
| Medio NVIDIA GeForce RTX 4060 Laptop GPU (39 - 53, n=53) | |
| Lenovo LOQ 16IRH8 | |
| Lenovo Legion 5 16IRX G9 | |
| Lenovo Legion Pro 5 16IRX8 | |
| Alienware m16 R1 Intel | |
| HP Victus 16-r0077ng | |
| Media de la clase Gaming (15 - 233, n=110, últimos 2 años) | |
| Schenker XMG CORE 16 (L23) | |
| Blender / v3.3 Classroom CPU | |
| Lenovo LOQ 16IRH8 | |
| HP Victus 16-r0077ng | |
| HP Victus 16-r0076TX | |
| Medio NVIDIA GeForce RTX 4060 Laptop GPU (189 - 452, n=53) | |
| Lenovo Legion Slim 5 16APH8 | |
| Schenker XMG CORE 16 (L23) | |
| Lenovo Legion Pro 5 16IRX8 | |
| Alienware m16 R1 Intel | |
| Media de la clase Gaming (122 - 565, n=105, últimos 2 años) | |
| Lenovo Legion 5 16IRX G9 | |
* ... más pequeño es mejor
Rendimiento en juegos
En total, el rendimiento de juego del portátil es estupendo y está en el extremo superior para un portátil RTX 4060. Todos los juegos actuales se pueden ejecutar sin problemas en QHD y con el máximo de detalles, incluso juegos exigentes como Cyberpunk 2077 o Modern Warfare 3. Sólo el raytracing puede dar lugar a algunos problemas y sería prudente utilizar una tecnología de escalado como DLSS. Además, su rendimiento en juegos se mantiene totalmente estable, incluso en sesiones más largas. Puede encontrar más pruebas comparativas de juegos aquí.
| The Witcher 3 - 1920x1080 Ultra Graphics & Postprocessing (HBAO+) | |
| Media de la clase Gaming (95 - 240, n=8, últimos 2 años) | |
| Schenker XMG CORE 16 (L23) | |
| HP Victus 16-r0077ng | |
| Lenovo Legion Pro 5 16IRX8 | |
| Alienware m16 R1 Intel | |
| Lenovo LOQ 16IRH8 | |
| Lenovo Legion 5 16IRX G9 | |
| HP Victus 16-r0076TX | |
| Lenovo Legion Slim 5 16APH8 | |
| GTA V - 1920x1080 Highest AA:4xMSAA + FX AF:16x | |
| Media de la clase Gaming (48.3 - 186.9, n=98, últimos 2 años) | |
| Lenovo Legion 5 16IRX G9 | |
| Lenovo Legion Pro 5 16IRX8 | |
| Schenker XMG CORE 16 (L23) | |
| Lenovo LOQ 16IRH8 | |
| HP Victus 16-r0077ng | |
| Lenovo Legion Slim 5 16APH8 | |
Witcher 3 FPS diagram
| bajo | medio | alto | ultra | QHD | |
|---|---|---|---|---|---|
| GTA V (2015) | 186 | 182.8 | 120.2 | 89 | |
| The Witcher 3 (2015) | 229 | 97.2 | 83 | ||
| Dota 2 Reborn (2015) | 209 | 189.7 | 179.9 | 168.7 | |
| Final Fantasy XV Benchmark (2018) | 154.2 | 106.3 | 77.5 | ||
| X-Plane 11.11 (2018) | 180.8 | 171 | 130.9 | ||
| Far Cry 5 (2018) | 161 | 155 | 147 | 111 | |
| Strange Brigade (2018) | 243 | 210 | 130 | ||
| F1 2021 (2021) | 464 | 380 | 292 | 146.7 | 104.6 |
| F1 22 (2022) | 296 | 287 | 217 | 71.4 | 45.2 |
| F1 23 (2023) | 306 | 292 | 207 | 63.7 | 39.4 |
| Cyberpunk 2077 (2023) | 133.1 | 110.4 | 95.3 | 81.8 | 49.7 |
| Assassin's Creed Mirage (2023) | 93 | 72 | |||
| Call of Duty Modern Warfare 3 2023 (2023) | 134 | 121 | 92 | 86 | 58 |
Emisiones - Fuertes pero frescas
Emisiones sonoras
Los dos ventiladores del Legion 5i 16 tienen mucho trabajo que hacer y si no utiliza el modo silencioso, girarán a menudo durante tareas sencillas. Bajo carga elevada, el dispositivo se vuelve muy ruidoso con 55 dB(A) pero, para ser sinceros, los casi 50 dB(A) que medimos utilizando el modo equilibrado son simplemente demasiado ruidosos para jugar correctamente sin auriculares. Así que, dependiendo del juego, podría tener sentido comprobar el rendimiento en modo silencioso, ya que sus 35 dB(A) son mucho más cómodos. No notamos ningún otro ruido electrónico procedente de nuestro dispositivo de prueba.
| Perfil energético | 3DMark 06 | Witcher 3 | Cyberpunk 2077 Phantom Liberty | Prueba de estrés |
|---|---|---|---|---|
| Modo silencioso | 34,6 dB(A) | 34,6 dB(A) | 30,4 dB(A) | 34,6 dB(A) |
| Modo equilibrado | 34,6 dB(A) | 49,8 dB(A) | 49,8 dB(A) | 49,8 dB(A) |
| Modo rendimiento | 45,5 dB(A) | 55,7 dB(A) | 53,1 dB(A) | 55,7 dB(A) |
Ruido
| Ocioso |
| 24 / 28.8 / 32 dB(A) |
| Carga |
| 45.5 / 55.7 dB(A) |
 | ||
30 dB silencioso 40 dB(A) audible 50 dB(A) ruidosamente alto |
||
min: | ||
| Lenovo Legion 5 16IRX G9 GeForce RTX 4060 Laptop GPU, i7-14650HX, Samsung PM9A1 MZVL21T0HCLR | Schenker XMG CORE 16 (L23) GeForce RTX 4070 Laptop GPU, R7 7840HS, Samsung 990 Pro 1 TB | HP Victus 16-r0077ng GeForce RTX 4070 Laptop GPU, i7-13700H, Kioxia XG8 KXG80ZNV1T02 | Lenovo LOQ 16IRH8 GeForce RTX 4060 Laptop GPU, i7-13620H, Solidigm SSDPFINW512GZL | Lenovo Legion Slim 5 16APH8 GeForce RTX 4060 Laptop GPU, R7 7840HS, SK hynix PC801 HFS512GEJ9X115N | HP Victus 16-r0076TX GeForce RTX 4050 Laptop GPU, i5-13500HX, SK hynix PC801 HFS512GEJ9X101N BF | Alienware m16 R1 Intel GeForce RTX 4060 Laptop GPU, i7-13700HX, Kioxia KXG70ZNV512G | Lenovo Legion Pro 5 16IRX8 GeForce RTX 4060 Laptop GPU, i7-13700HX, SK hynix PC801 HFS512GEJ9X115N | |
|---|---|---|---|---|---|---|---|---|
| Noise | 8% | 2% | 4% | 10% | 9% | 2% | 12% | |
| apagado / medio ambiente * (dB) | 24 | 23 4% | 25 -4% | 23 4% | 22.9 5% | 21.57 10% | 25 -4% | 23 4% |
| Idle Minimum * (dB) | 24 | 23 4% | 28 -17% | 23 4% | 23.1 4% | 23.68 1% | 25 -4% | 23.1 4% |
| Idle Average * (dB) | 28.8 | 28.48 1% | 29 -1% | 23 20% | 23.1 20% | 23.68 18% | 26 10% | 23.1 20% |
| Idle Maximum * (dB) | 32 | 28.48 11% | 30 6% | 27.66 14% | 27.7 13% | 23.68 26% | 27 16% | 26.6 17% |
| Load Average * (dB) | 45.5 | 30 34% | 43 5% | 53.62 -18% | 33.3 27% | 39.44 13% | 52 -14% | 34.7 24% |
| Witcher 3 ultra * (dB) | 53.1 | 54.12 -2% | 46 13% | 53.5 -1% | 54 -2% | 55.4 -4% | 51 4% | 47.6 10% |
| Load Maximum * (dB) | 55.7 | 54.12 3% | 48 14% | 53.5 4% | 54 3% | 55.37 1% | 53 5% | 54.8 2% |
* ... más pequeño es mejor
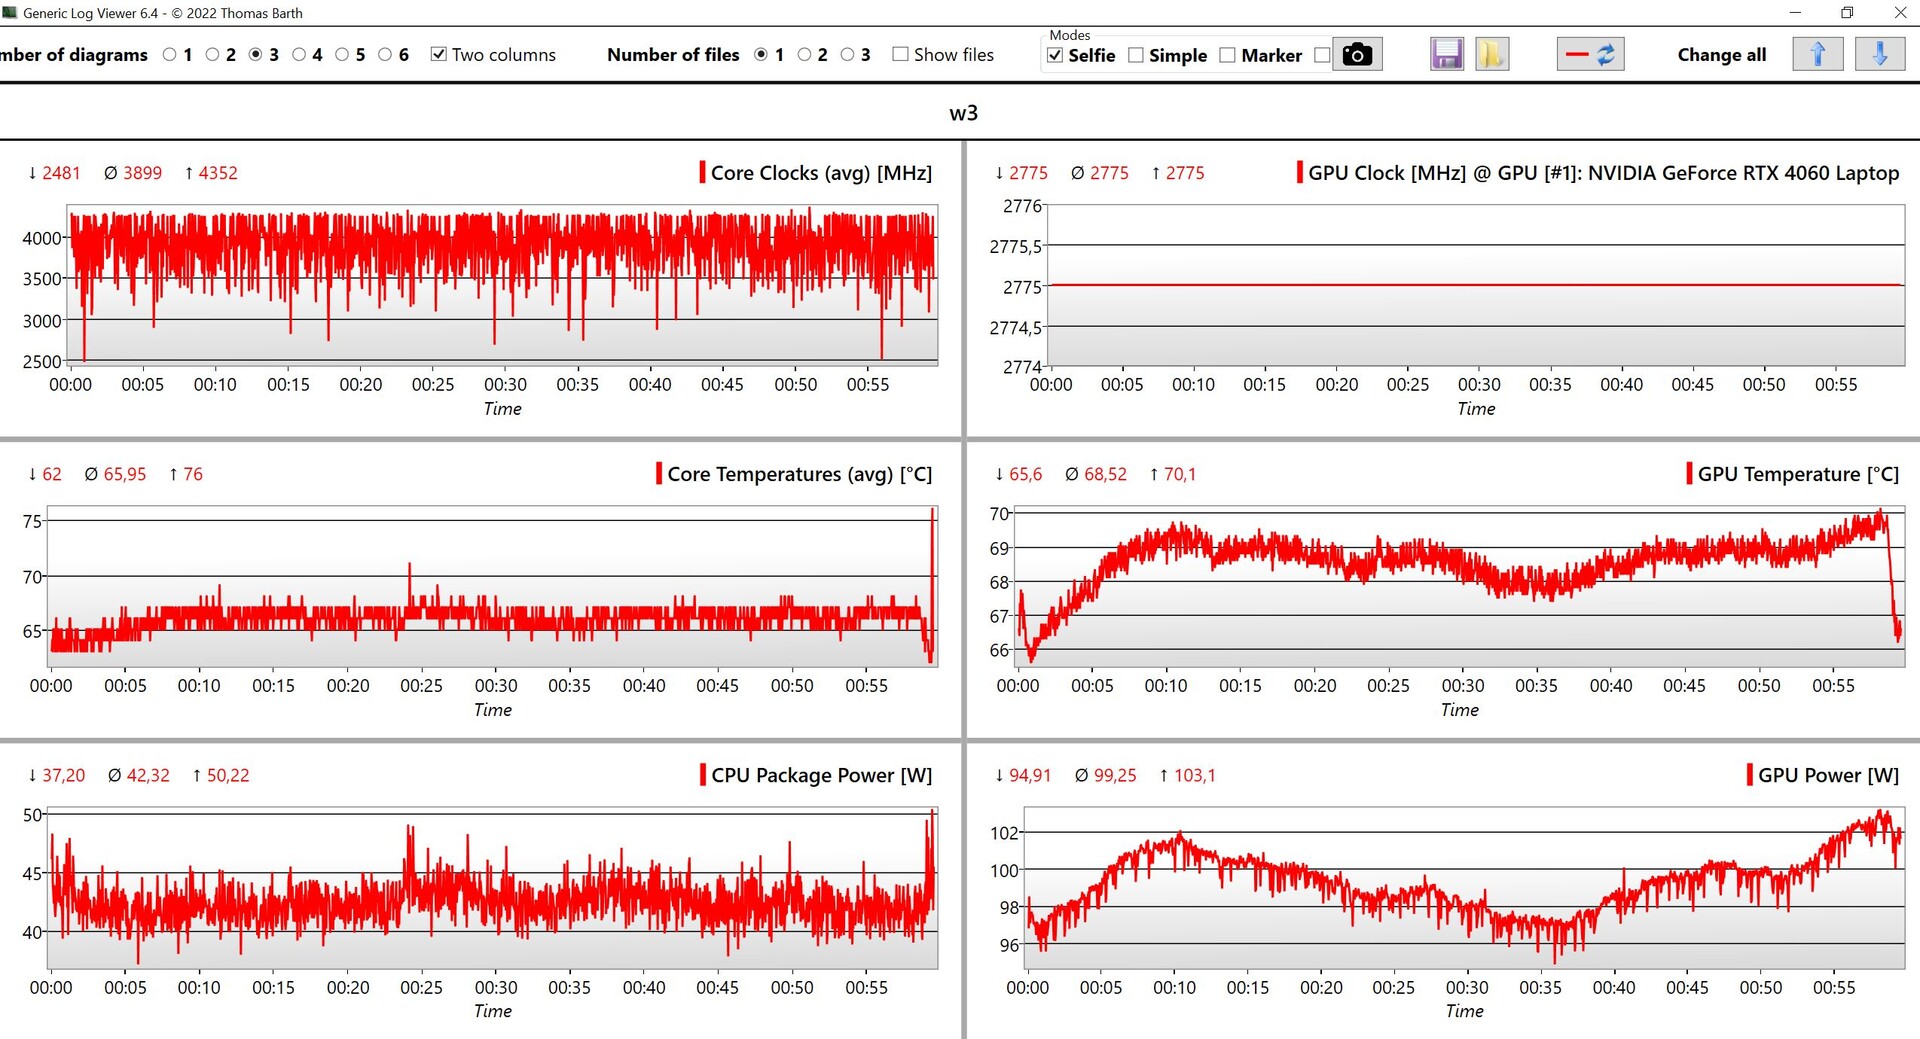
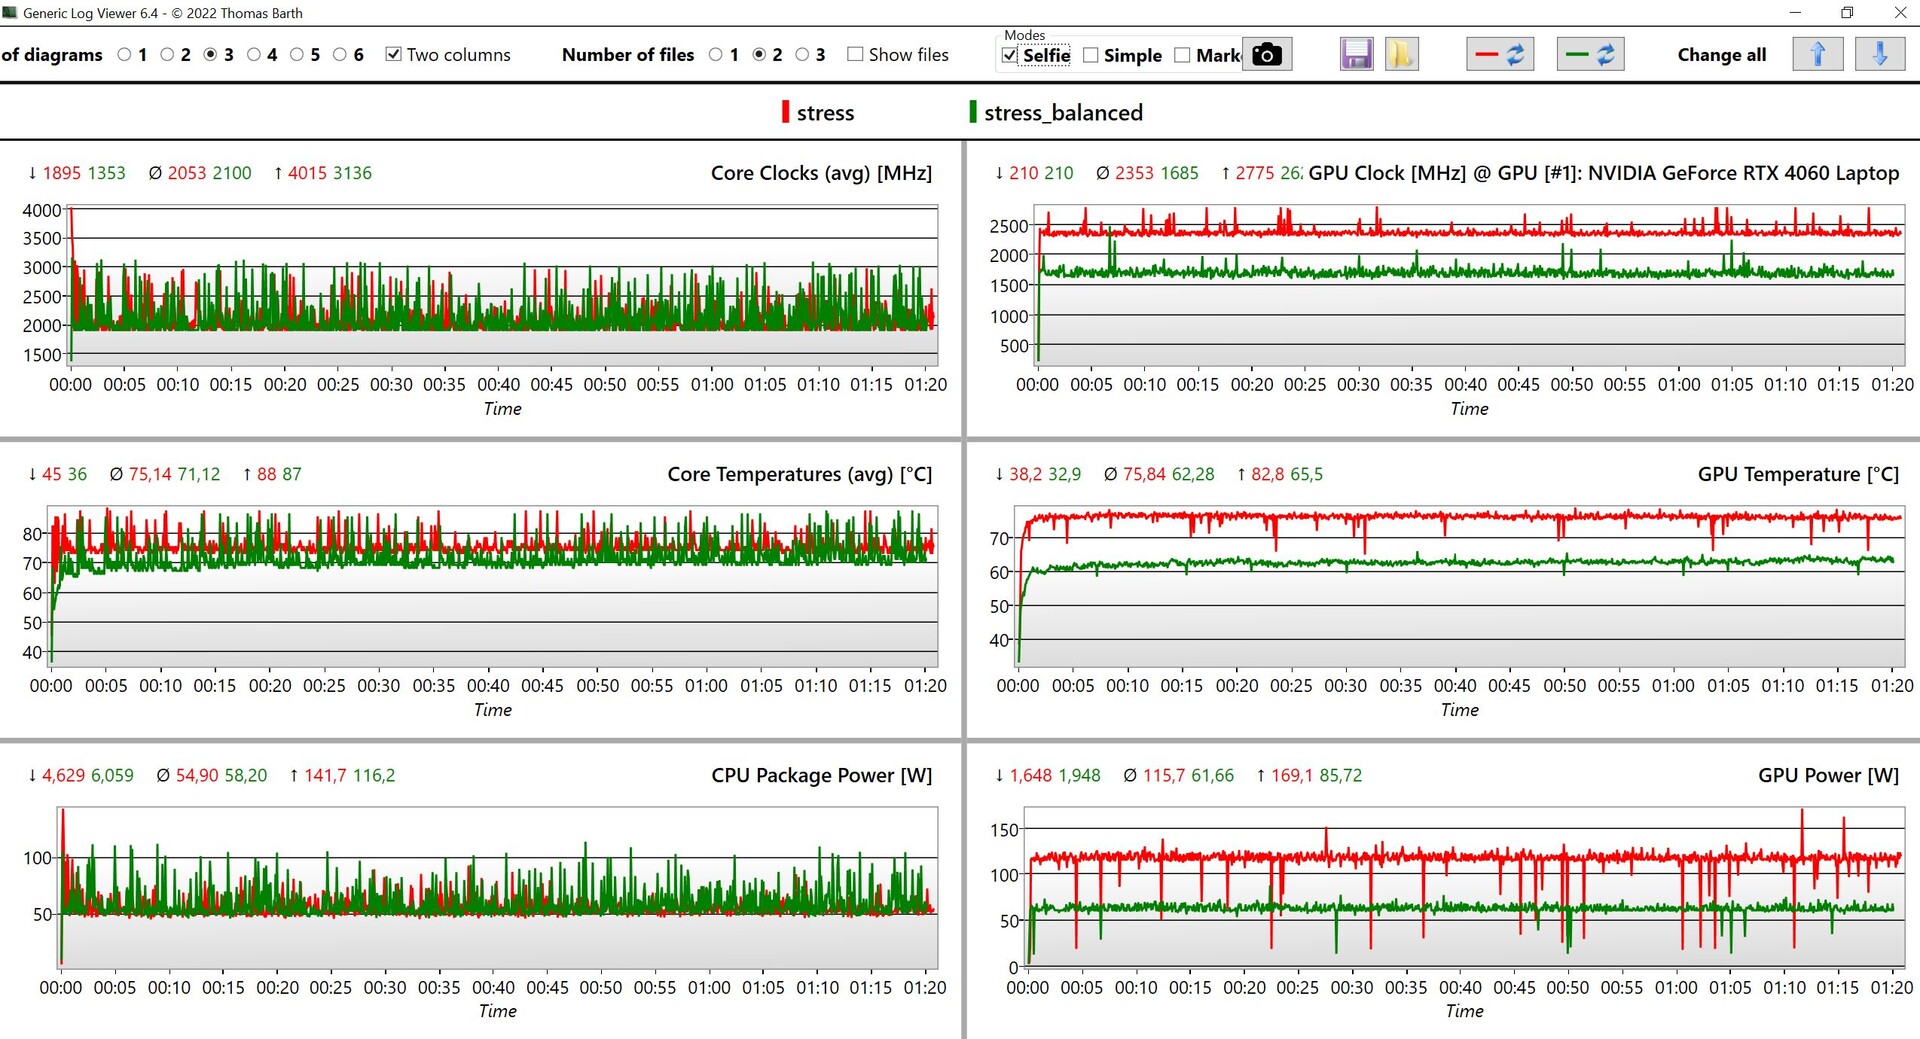
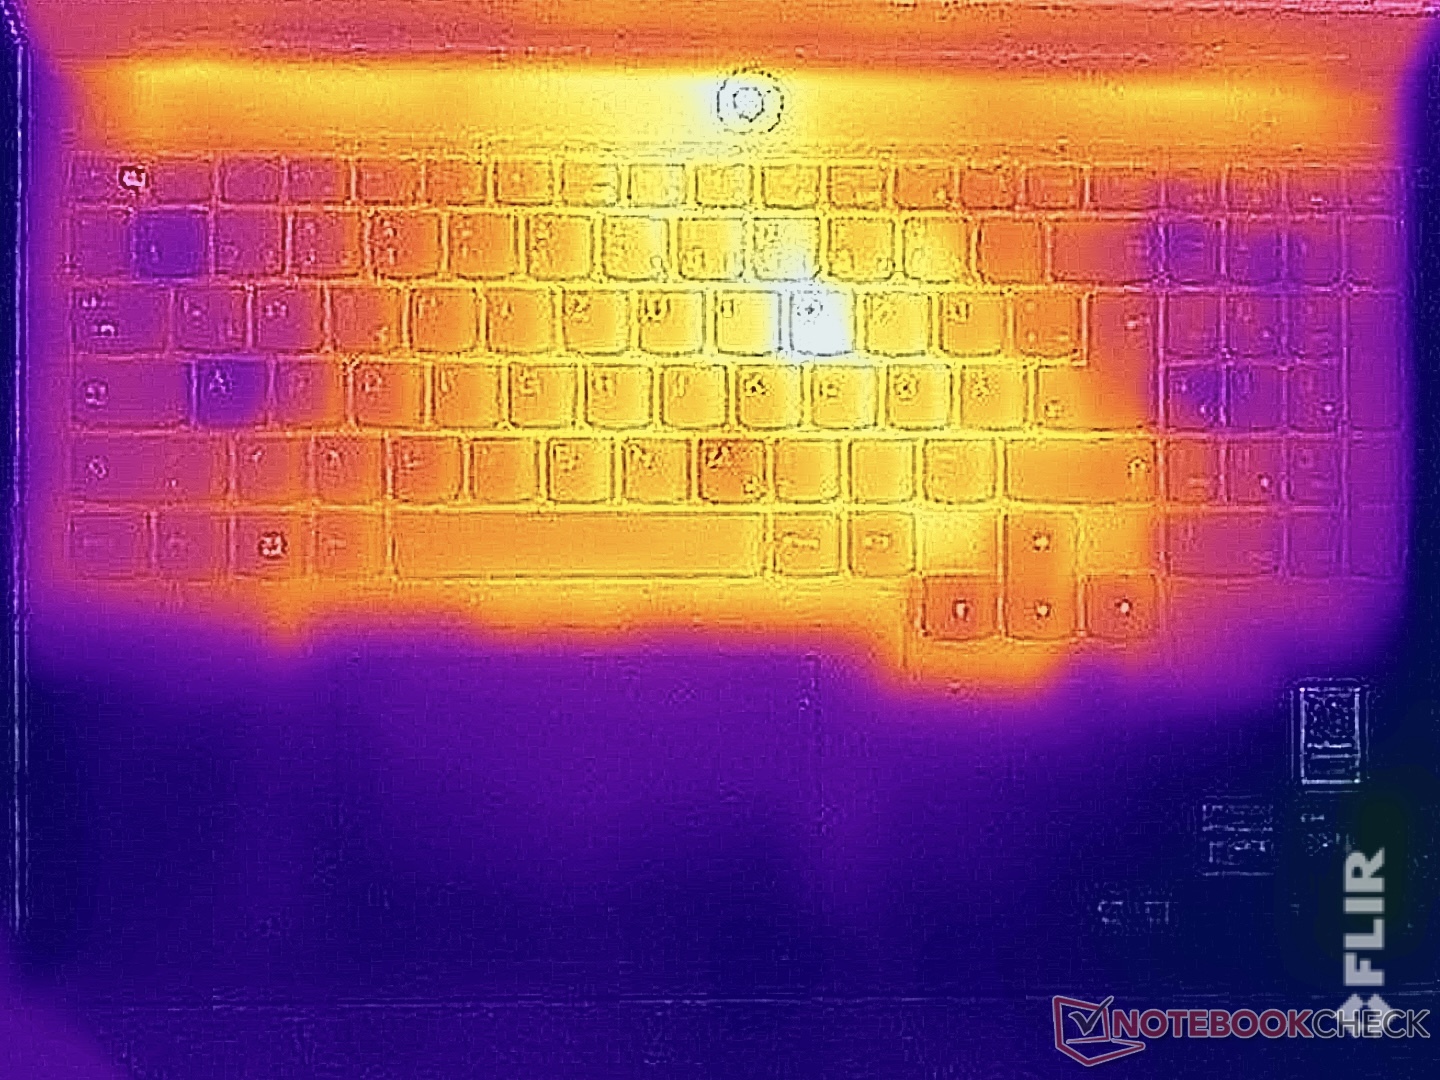
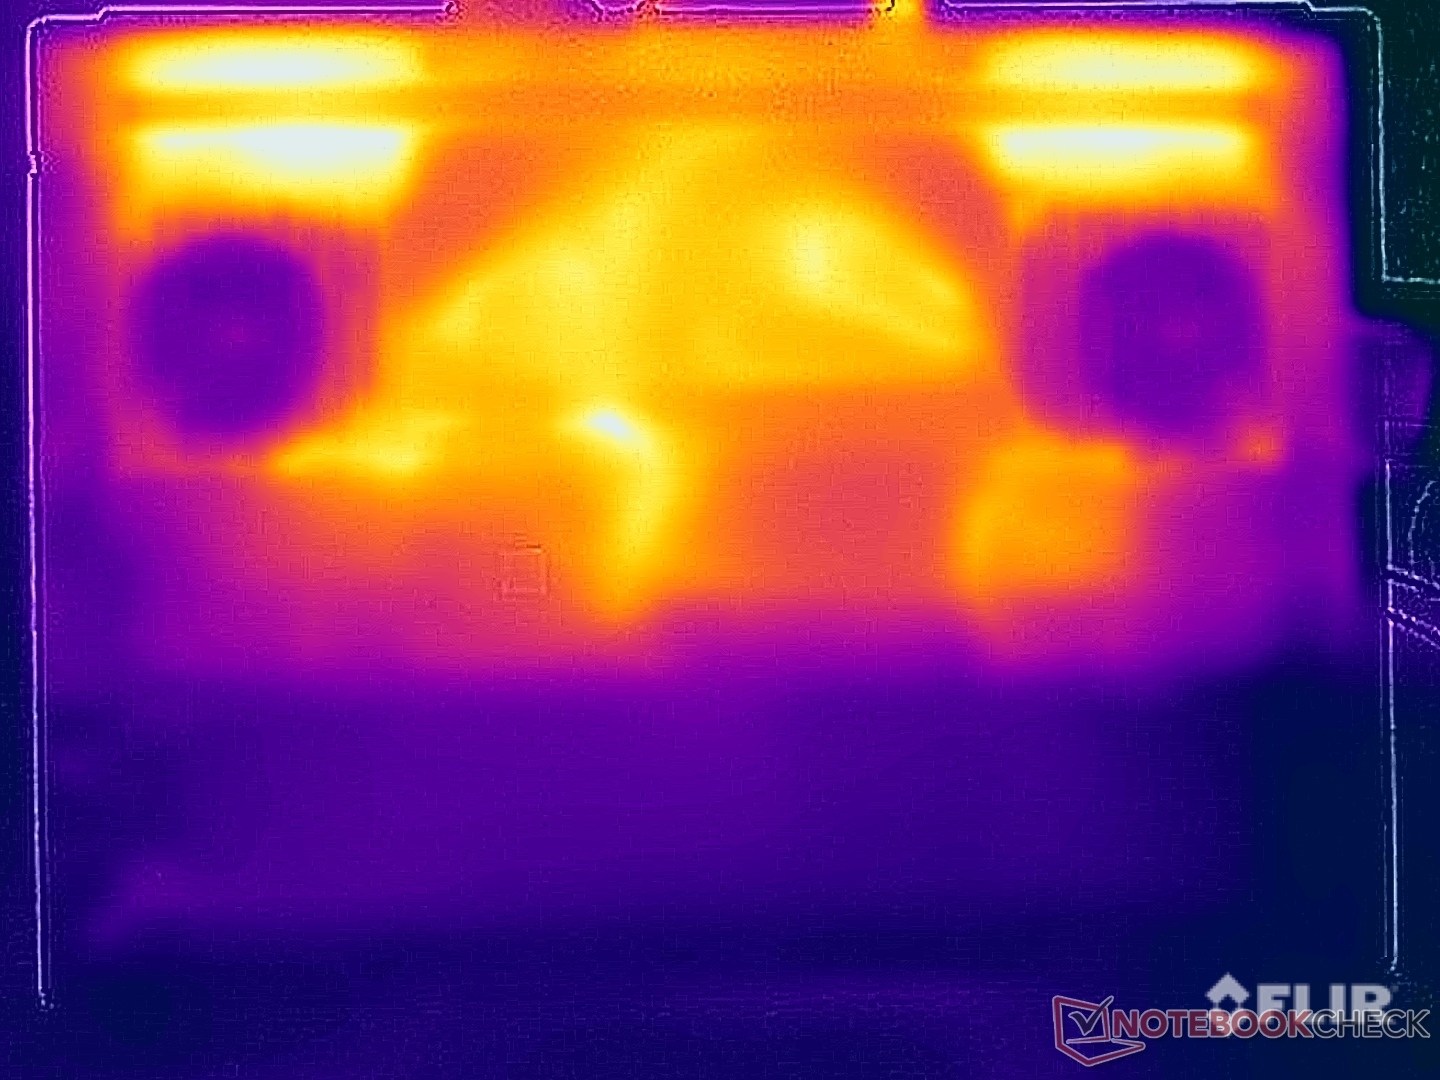
Temperatura
Algunos puntos de la Legion ya se calientan notablemente en modo inactivo pero, a su vez, sus bajas temperaturas superficiales bajo carga nos sorprendieron. Incluso durante la prueba de estrés, sólo medimos algo más de 40 °C en la parte superior y en la parte inferior de la unidad base, notamos algo más de 43 °C. Se trata de unos resultados magníficos y no hay restricciones a la hora de manipular el dispositivo.
Además de utilizar el modo de rendimiento, también realizamos la prueba de estrés utilizando el modo equilibrado y hemos reunido los resultados en el siguiente diagrama. En ambos perfiles, se puede ver cuánto fluctúa el consumo del procesador, pero la GPU se mantiene constante y aquí es donde se aprecia la clara diferencia entre los dos perfiles. En el modo de rendimiento, la GPU funciona a 115 vatios y en el modo equilibrado medimos algo más de 60 vatios.
(±) La temperatura máxima en la parte superior es de 40.4 °C / 105 F, frente a la media de 40.4 °C / 105 F, que oscila entre 21.2 y 68.8 °C para la clase Gaming.
(±) El fondo se calienta hasta un máximo de 43.8 °C / 111 F, frente a la media de 43.2 °C / 110 F
(+) En reposo, la temperatura media de la parte superior es de 28 °C / 82# F, frente a la media del dispositivo de 33.9 °C / 93 F.
(±) Jugando a The Witcher 3, la temperatura media de la parte superior es de 33.2 °C / 92 F, frente a la media del dispositivo de 33.9 °C / 93 F.
(+) El reposamanos y el panel táctil están a una temperatura inferior a la de la piel, con un máximo de 26.9 °C / 80.4 F y, por tanto, son fríos al tacto.
(±) La temperatura media de la zona del reposamanos de dispositivos similares fue de 28.8 °C / 83.8 F (+1.9 °C / 3.4 F).
| Lenovo Legion 5 16IRX G9 Intel Core i7-14650HX, NVIDIA GeForce RTX 4060 Laptop GPU | Schenker XMG CORE 16 (L23) AMD Ryzen 7 7840HS, NVIDIA GeForce RTX 4070 Laptop GPU | HP Victus 16-r0077ng Intel Core i7-13700H, NVIDIA GeForce RTX 4070 Laptop GPU | Lenovo LOQ 16IRH8 Intel Core i7-13620H, NVIDIA GeForce RTX 4060 Laptop GPU | Lenovo Legion Slim 5 16APH8 AMD Ryzen 7 7840HS, NVIDIA GeForce RTX 4060 Laptop GPU | HP Victus 16-r0076TX Intel Core i5-13500HX, NVIDIA GeForce RTX 4050 Laptop GPU | Alienware m16 R1 Intel Intel Core i7-13700HX, NVIDIA GeForce RTX 4060 Laptop GPU | Lenovo Legion Pro 5 16IRX8 Intel Core i7-13700HX, NVIDIA GeForce RTX 4060 Laptop GPU | |
|---|---|---|---|---|---|---|---|---|
| Heat | -3% | -13% | -6% | 9% | -3% | -18% | -4% | |
| Maximum Upper Side * (°C) | 40.4 | 46 -14% | 51 -26% | 48 -19% | 40.6 -0% | 48 -19% | 49 -21% | 42.8 -6% |
| Maximum Bottom * (°C) | 43.8 | 44 -0% | 54 -23% | 59 -35% | 42 4% | 48 -10% | 48 -10% | 50 -14% |
| Idle Upper Side * (°C) | 30.3 | 32 -6% | 37 -22% | 28 8% | 27.8 8% | 29.6 2% | 40 -32% | 29.6 2% |
| Idle Bottom * (°C) | 35.3 | 33 7% | 29 18% | 28 21% | 26.6 25% | 30.2 14% | 39 -10% | 34 4% |
* ... más pequeño es mejor
Altavoces
Los dos altavoces estéreo (de 2 vatios cada uno) sólo ofrecen un sonido medio suficiente para algunos vídeos y música de fondo. Sin embargo, de todas formas no se beneficiará de los altavoces cuando juegue, ya que los ventiladores son demasiado ruidosos.
Lenovo Legion 5 16IRX G9 análisis de audio
(+) | los altavoces pueden reproducir a un volumen relativamente alto (#84.4 dB)
Graves 100 - 315 Hz
(-) | casi sin bajos - de media 25.7% inferior a la mediana
(±) | la linealidad de los graves es media (8.3% delta a frecuencia anterior)
Medios 400 - 2000 Hz
(+) | medios equilibrados - a sólo 4.3% de la mediana
(+) | los medios son lineales (5.2% delta a la frecuencia anterior)
Altos 2 - 16 kHz
(+) | máximos equilibrados - a sólo 1.9% de la mediana
(+) | los máximos son lineales (2.1% delta a la frecuencia anterior)
Total 100 - 16.000 Hz
(±) | la linealidad del sonido global es media (16.1% de diferencia con la mediana)
En comparación con la misma clase
» 39% de todos los dispositivos probados de esta clase eran mejores, 6% similares, 54% peores
» El mejor tuvo un delta de 6%, la media fue 18%, el peor fue ###max##%
En comparación con todos los dispositivos probados
» 26% de todos los dispositivos probados eran mejores, 5% similares, 69% peores
» El mejor tuvo un delta de 4%, la media fue 24%, el peor fue ###max##%
Schenker XMG CORE 16 (L23) análisis de audio
(±) | la sonoridad del altavoz es media pero buena (79.4 dB)
Graves 100 - 315 Hz
(-) | casi sin bajos - de media 21.6% inferior a la mediana
(±) | la linealidad de los graves es media (11.4% delta a frecuencia anterior)
Medios 400 - 2000 Hz
(±) | medias más altas - de media 5.4% más altas que la mediana
(+) | los medios son lineales (6.7% delta a la frecuencia anterior)
Altos 2 - 16 kHz
(+) | máximos equilibrados - a sólo 2.3% de la mediana
(+) | los máximos son lineales (6.6% delta a la frecuencia anterior)
Total 100 - 16.000 Hz
(±) | la linealidad del sonido global es media (17.1% de diferencia con la mediana)
En comparación con la misma clase
» 46% de todos los dispositivos probados de esta clase eran mejores, 12% similares, 43% peores
» El mejor tuvo un delta de 6%, la media fue 18%, el peor fue ###max##%
En comparación con todos los dispositivos probados
» 31% de todos los dispositivos probados eran mejores, 8% similares, 61% peores
» El mejor tuvo un delta de 4%, la media fue 24%, el peor fue ###max##%
Alienware m16 R1 Intel análisis de audio
(+) | los altavoces pueden reproducir a un volumen relativamente alto (#87 dB)
Graves 100 - 315 Hz
(-) | casi sin bajos - de media 24% inferior a la mediana
(±) | la linealidad de los graves es media (13.5% delta a frecuencia anterior)
Medios 400 - 2000 Hz
(+) | medios equilibrados - a sólo 1.4% de la mediana
(+) | los medios son lineales (3.3% delta a la frecuencia anterior)
Altos 2 - 16 kHz
(+) | máximos equilibrados - a sólo 3.5% de la mediana
(+) | los máximos son lineales (4.6% delta a la frecuencia anterior)
Total 100 - 16.000 Hz
(+) | el sonido global es lineal (13.4% de diferencia con la mediana)
En comparación con la misma clase
» 19% de todos los dispositivos probados de esta clase eran mejores, 7% similares, 74% peores
» El mejor tuvo un delta de 6%, la media fue 18%, el peor fue ###max##%
En comparación con todos los dispositivos probados
» 14% de todos los dispositivos probados eran mejores, 4% similares, 83% peores
» El mejor tuvo un delta de 4%, la media fue 24%, el peor fue ###max##%
Gestión de la energía
Consumo de energía
No observamos grandes sorpresas en lo que respecta al consumo del dispositivo y medimos un máximo de unos 20 vatios en modo inactivo, lo que resulta aceptable dada su gran pantalla y alto brillo. Durante la prueba de estrés, su consumo máximo fue brevemente de ~247 vatios, pero luego se estabilizó inmediatamente en 230 vatios. Como resultado, la fuente de alimentación de 230 vatios estará al límite si utiliza el modo de rendimiento. En modo equilibrado, el consumo del portátil se igualó en torno a los 180 vatios.
| Off / Standby | |
| Ocioso | |
| Carga |
|
Clave:
min: | |
| Lenovo Legion 5 16IRX G9 i7-14650HX, GeForce RTX 4060 Laptop GPU, Samsung PM9A1 MZVL21T0HCLR, IPS, 2560x1600, 16" | Schenker XMG CORE 16 (L23) R7 7840HS, GeForce RTX 4070 Laptop GPU, Samsung 990 Pro 1 TB, IPS, 2560x1600, 16" | HP Victus 16-r0077ng i7-13700H, GeForce RTX 4070 Laptop GPU, Kioxia XG8 KXG80ZNV1T02, IPS, 1920x1080, 16.1" | Lenovo LOQ 16IRH8 i7-13620H, GeForce RTX 4060 Laptop GPU, Solidigm SSDPFINW512GZL, IPS, 2560x1600, 16" | Lenovo Legion Slim 5 16APH8 R7 7840HS, GeForce RTX 4060 Laptop GPU, SK hynix PC801 HFS512GEJ9X115N, IPS, 2560x1600, 16" | HP Victus 16-r0076TX i5-13500HX, GeForce RTX 4050 Laptop GPU, SK hynix PC801 HFS512GEJ9X101N BF, IPS, 1920x1080, 16.1" | Alienware m16 R1 Intel i7-13700HX, GeForce RTX 4060 Laptop GPU, Kioxia KXG70ZNV512G, IPS, 2560x1600, 16" | Lenovo Legion Pro 5 16IRX8 i7-13700HX, GeForce RTX 4060 Laptop GPU, SK hynix PC801 HFS512GEJ9X115N, IPS, 2560x1600, 16" | Medio NVIDIA GeForce RTX 4060 Laptop GPU | Media de la clase Gaming | |
|---|---|---|---|---|---|---|---|---|---|---|
| Power Consumption | 18% | 21% | 4% | 21% | 2% | 3% | -27% | 14% | -2% | |
| Idle Minimum * (Watt) | 15.4 | 11 29% | 8 48% | 17.2 -12% | 9.4 39% | 16.12 -5% | 10 35% | 24.5 -59% | 11.5 ? 25% | 13.2 ? 14% |
| Idle Average * (Watt) | 19.7 | 15.2 23% | 13 34% | 19.3 2% | 15.5 21% | 20.47 -4% | 14 29% | 29.2 -48% | 16 ? 19% | 18.9 ? 4% |
| Idle Maximum * (Watt) | 20.7 | 16 23% | 22 -6% | 21.2 -2% | 24.4 -18% | 22.11 -7% | 21 -1% | 34.3 -66% | 20.3 ? 2% | 24.5 ? -18% |
| Load Average * (Watt) | 102.6 | 64 38% | 86 16% | 90 12% | 74.1 28% | 94.8 8% | 119 -16% | 98.7 4% | 92.9 ? 9% | 108.8 ? -6% |
| Witcher 3 ultra * (Watt) | 191.3 | 179 6% | 141.8 26% | 168 12% | 112.9 41% | 166.9 13% | 186.7 2% | 178.6 7% | ||
| Load Maximum * (Watt) | 246.6 | 280 -14% | 233 6% | 211 14% | 206.5 16% | 237 4% | 323 -31% | 249.6 -1% | 210 ? 15% | 254 ? -3% |
* ... más pequeño es mejor
Power consumption Witcher 3 / stress test
Power consumption with external monitor
Tiempos de ejecución
El Legion 5i 16 tiene una batería de 80 Wh que es la de menor capacidad dentro de nuestro campo de comparación. A cambio, sus resultados no son en realidad demasiado malos y a 150 cd/m² (61 % del brillo máximo de nuestro dispositivo de prueba), un vídeo se reprodujo durante unas 9,5 horas y nuestra prueba WLAN duró unas 7,5 horas (~5,5 horas a brillo máximo). Bajo carga, el portátil ya se agota después de 46 minutos y un vídeo HDR sólo se reprodujo durante 2:14 horas con el brillo máximo. Con 240 Hz seleccionados, los tiempos de ejecución de nuestras pruebas WLAN se hundieron a 5:27 horas (150 cd/m²) y 4:33 horas (brillo máximo).
Una carga completa tarda 106 minutos con el dispositivo encendido, y el 80 % se alcanza tras unos 60 minutos. Dentro de la aplicación Vantage, también dispone de una opción llamada "carga exprés" que hace que el primer 60 % se cargue más rápidamente. Una carga completa sólo tarda 69 minutos utilizando este modo (el 80 % después de 31 minutos).
| Lenovo Legion 5 16IRX G9 i7-14650HX, GeForce RTX 4060 Laptop GPU, 80 Wh | Schenker XMG CORE 16 (L23) R7 7840HS, GeForce RTX 4070 Laptop GPU, 99 Wh | HP Victus 16-r0077ng i7-13700H, GeForce RTX 4070 Laptop GPU, 83 Wh | Lenovo LOQ 16IRH8 i7-13620H, GeForce RTX 4060 Laptop GPU, 80 Wh | Lenovo Legion Slim 5 16APH8 R7 7840HS, GeForce RTX 4060 Laptop GPU, 80 Wh | HP Victus 16-r0076TX i5-13500HX, GeForce RTX 4050 Laptop GPU, 83 Wh | Alienware m16 R1 Intel i7-13700HX, GeForce RTX 4060 Laptop GPU, 86 Wh | Lenovo Legion Pro 5 16IRX8 i7-13700HX, GeForce RTX 4060 Laptop GPU, 80 Wh | Media de la clase Gaming | |
|---|---|---|---|---|---|---|---|---|---|
| Duración de Batería | 73% | -4% | 13% | 23% | 17% | -17% | -34% | 21% | |
| H.264 (h) | 9.6 | 10.2 6% | 6.4 -33% | 7.7 -20% | 5.6 -42% | 8.28 ? -14% | |||
| WiFi v1.3 (h) | 7.4 | 8.4 14% | 7.1 -4% | 6.3 -15% | 7.1 -4% | 8.9 20% | 4.8 -35% | 3.4 -54% | 6.96 ? -6% |
| Load (h) | 0.8 | 2.4 200% | 1.5 88% | 1.2 50% | 1.2 50% | 1 25% | 0.7 -13% | 1.47 ? 84% | |
| Witcher 3 ultra (h) | 1.5 |
Pro
Contra
Veredicto - El Legion 5i 16 es todo rendimiento

En conjunto, el nuevo Lenovo Legion 5i 16 causó una muy buena impresión durante nuestra prueba. Lenovo se ha concentrado en las características más importantes, ofreciendo componentes rápidos en combinación con una excelente pantalla IPS de 240 Hz que ya representa los colores con precisión nada más sacarlo de la caja y se conforma sin PWM. Su rendimiento en juegos es estupendo y puede ejecutar los juegos actuales a las resoluciones y ajustes más altos; simplemente no podrá evitar el escalado DLSS cuando se trate de trazado de rayos. El nuevo procesador Raptor-Lake-HX no es ni mucho menos un milagro de eficiencia, pero su rendimiento es bueno.
Al mismo tiempo, la unidad de refrigeración del portátil asegura que se pueda aprovechar su rendimiento en todo momento. Además, nos gustó la dispersión en los distintos perfiles de energía, y Lenovo ofrece a los usuarios muchas opciones de personalización en lo que se refiere a los ajustes de la CPU y la GPU. Mientras se juega, el dispositivo se mantiene sorprendentemente fresco pero, a su vez, los dos ventiladores hacen bastante ruido, lo que significa que unos auriculares son un poco imprescindibles para las sesiones de juego.
Gran rendimiento y una impresionante pantalla de 240 Hz: El Legion 5i 16 de Lenovo es un rápido gamer de gama media que sitúa el rendimiento en primer plano. Sin embargo, sus funciones de IA son sólo un truco hasta ahora.
El nuevo AI Engine+ de Lenovo, que se supone que mejora el rendimiento de los juegos con la ayuda de un chip de IA, no funcionó durante nuestra prueba. Es posible que se mejore a través de una actualización, pero por el momento, es posible que desee activar el modo de rendimiento manual. Hay algunos puntos que dejan claro que Lenovo se ha ahorrado algo de dinero, ya que el portátil no cuenta con Thunderbolt ni con un puerto Ethernet de 2,5 GBit/s.
A 1.610 dólares, el nuevo Legion 5i 16 no es ninguna ganga y, por este precio, ya se pueden conseguir modelos que incorporan la RTX 4070 Laptop (especialmente portátiles a partir de 2023), pero incluso en este caso, no se puede evitar tener que hacer ciertos compromisos de visualización.
Precio y disponibilidad
El nuevo Lenovo Legion 5i 16IRX G9 puede adquirirse directamente en el sitio web de Lenovo por 1.609,99 dólares.
Lenovo Legion 5 16IRX G9
- 01/29/2024 v7 (old)
Andreas Osthoff
Transparencia
La selección de los dispositivos que se van a reseñar corre a cargo de nuestro equipo editorial. La muestra de prueba fue proporcionada al autor en calidad de préstamo por el fabricante o el minorista a los efectos de esta reseña. El prestamista no tuvo ninguna influencia en esta reseña, ni el fabricante recibió una copia de la misma antes de su publicación. No había ninguna obligación de publicar esta reseña. Como empresa de medios independiente, Notebookcheck no está sujeta a la autoridad de fabricantes, minoristas o editores.
Así es como prueba Notebookcheck
Cada año, Notebookcheck revisa de forma independiente cientos de portátiles y smartphones utilizando procedimientos estandarizados para asegurar que todos los resultados son comparables. Hemos desarrollado continuamente nuestros métodos de prueba durante unos 20 años y hemos establecido los estándares de la industria en el proceso. En nuestros laboratorios de pruebas, técnicos y editores experimentados utilizan equipos de medición de alta calidad. Estas pruebas implican un proceso de validación en varias fases. Nuestro complejo sistema de clasificación se basa en cientos de mediciones y puntos de referencia bien fundamentados, lo que mantiene la objetividad.Price comparison

