Análisis del portátil MSI Raider GE68 HX 13VF: Un cambio total de diseño

El GE68HX sucede directamente al GE67HX del año pasado, con componentes internos renovados y un nuevo diseño de chasis. Aparte de las esperadas CPU Raptor Lake-HX de 13ª generación y GPU Nvidia Ada Lovelace para sustituir a las opciones Alder Lake-HX y Ampere de 12ª generación, el nuevo modelo también ofrece una pantalla de 16:10 de 16 pulgadas más grande que la relación de aspecto 16:9 de 15,6 pulgadas.
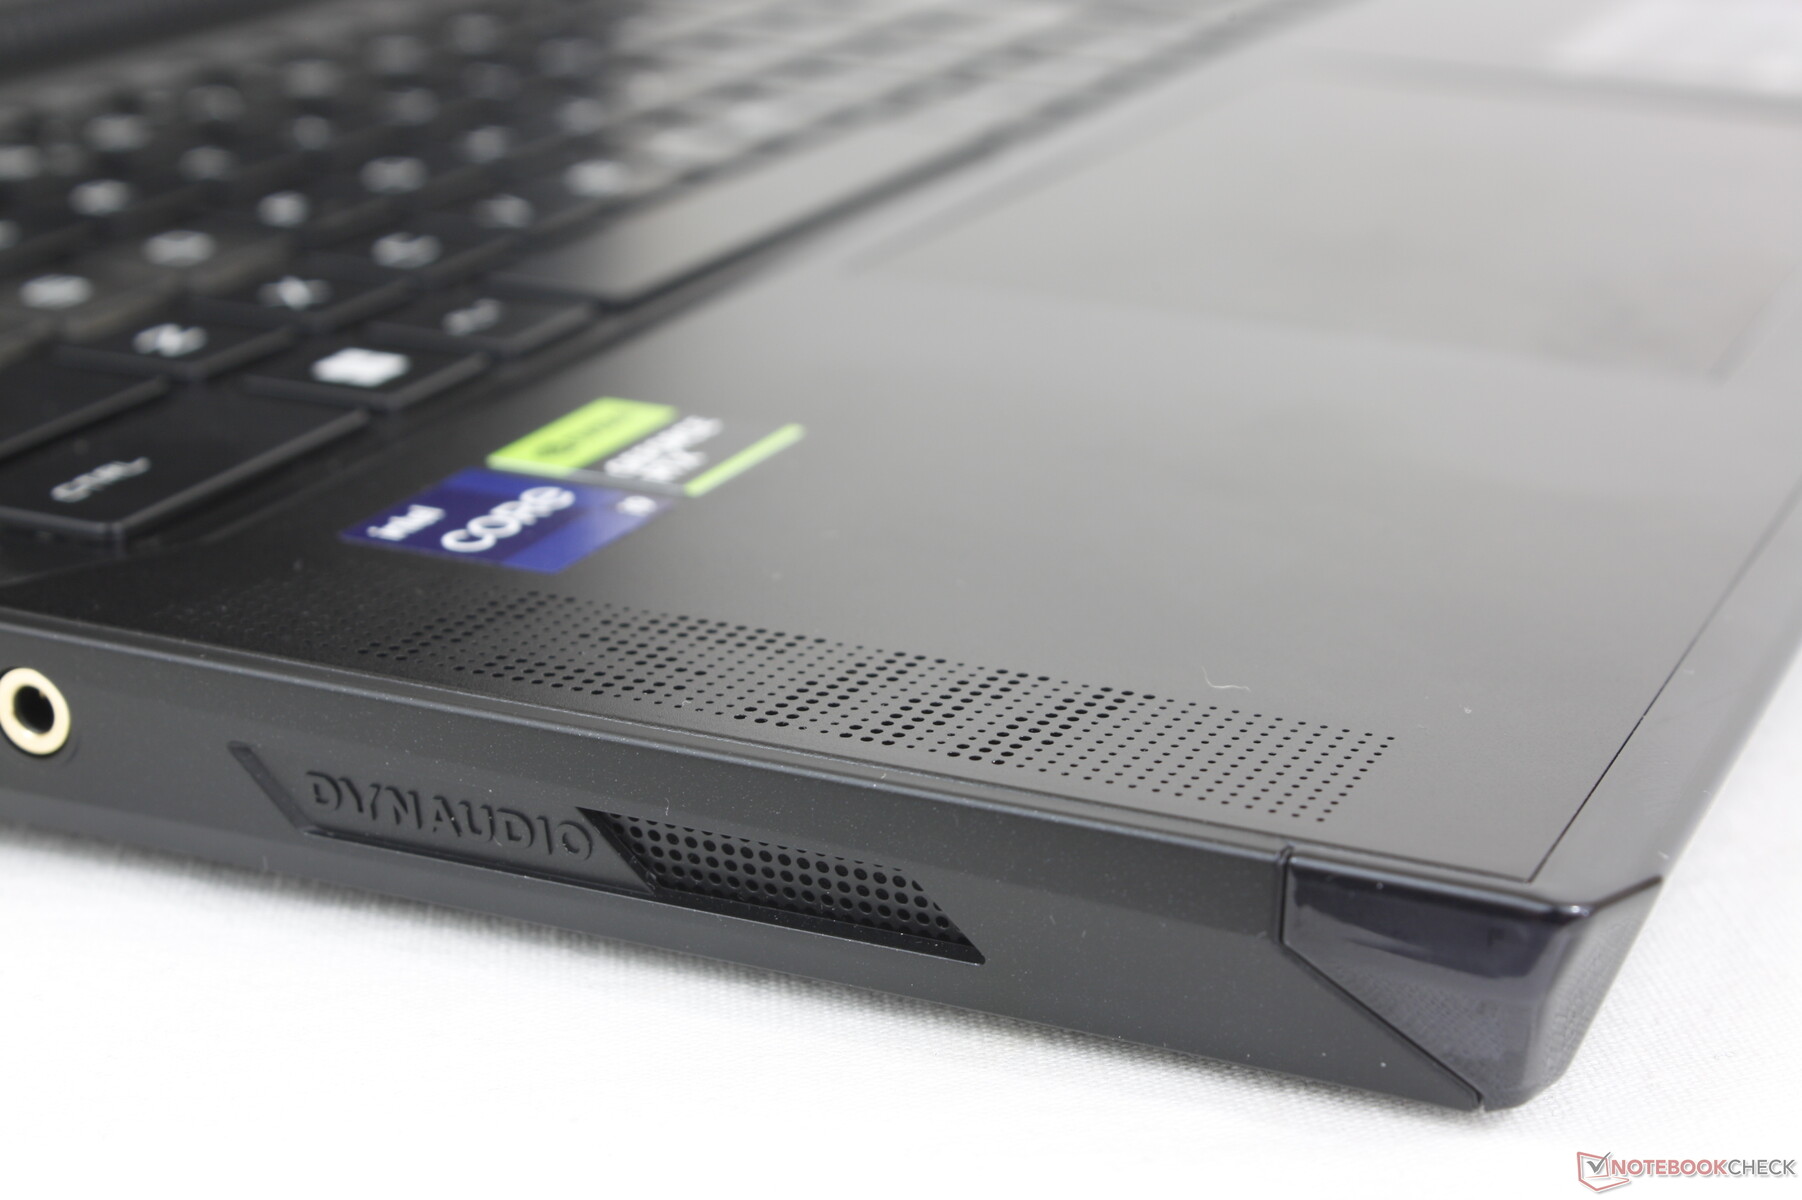
Nuestra unidad de prueba es la configuración básica con Core i7-13950HX, 140 W GeForce RTX 4060 y pantalla IPS 1080p 144 Hz, que se vende por unos 1700 dólares o 1300 dólares si está en oferta. Las versiones superiores incluyen Core i9-13980HX, RTX 4090 y pantalla 1440p 240 Hz por más de 3500 $.
Entre los competidores del GE68HX se incluyen otros portátiles para juegos de 16 pulgadas de gama alta como el HP Omen 16,Alienware m16 R1, Lenovo Legion Slim 7i 16 Gen 8o el Asus ROG Zephyrus M16.
Más opiniones sobre MSI:
Posibles contendientes en la comparación
Valoración | Fecha | Modelo | Peso | Altura | Tamaño | Resolución | Precio |
|---|---|---|---|---|---|---|---|
| 86.9 % v7 (old) | 10/2023 | MSI Raider GE68HX 13VF i9-13950HX, GeForce RTX 4060 Laptop GPU | 2.7 kg | 27.9 mm | 16.00" | 1900x1200 | |
| 87.7 % v7 (old) | 07/2022 | MSI GE67 HX 12UGS i7-12800HX, GeForce RTX 3070 Ti Laptop GPU | 2.5 kg | 23.4 mm | 15.60" | 1920x1080 | |
| 86.6 % v7 (old) | 09/2023 | HP Omen 16-xf0376ng R7 7840HS, GeForce RTX 4070 Laptop GPU | 2.4 kg | 23.5 mm | 16.10" | 1920x1080 | |
| 89.2 % v7 (old) | 08/2023 | Alienware m16 R1 AMD R9 7845HX, GeForce RTX 4080 Laptop GPU | 3.1 kg | 25.4 mm | 16.00" | 2560x1600 | |
| 90 % v7 (old) | 07/2023 | Lenovo Legion Slim 7i 16 Gen 8 i9-13900H, GeForce RTX 4070 Laptop GPU | 2.1 kg | 19.9 mm | 16.00" | 2560x1600 | |
| 89.4 % v7 (old) | 03/2023 | Asus ROG Zephyrus M16 GU604VY-NM042X i9-13900H, GeForce RTX 4090 Laptop GPU | 2.3 kg | 22.9 mm | 16.00" | 2560x1600 |
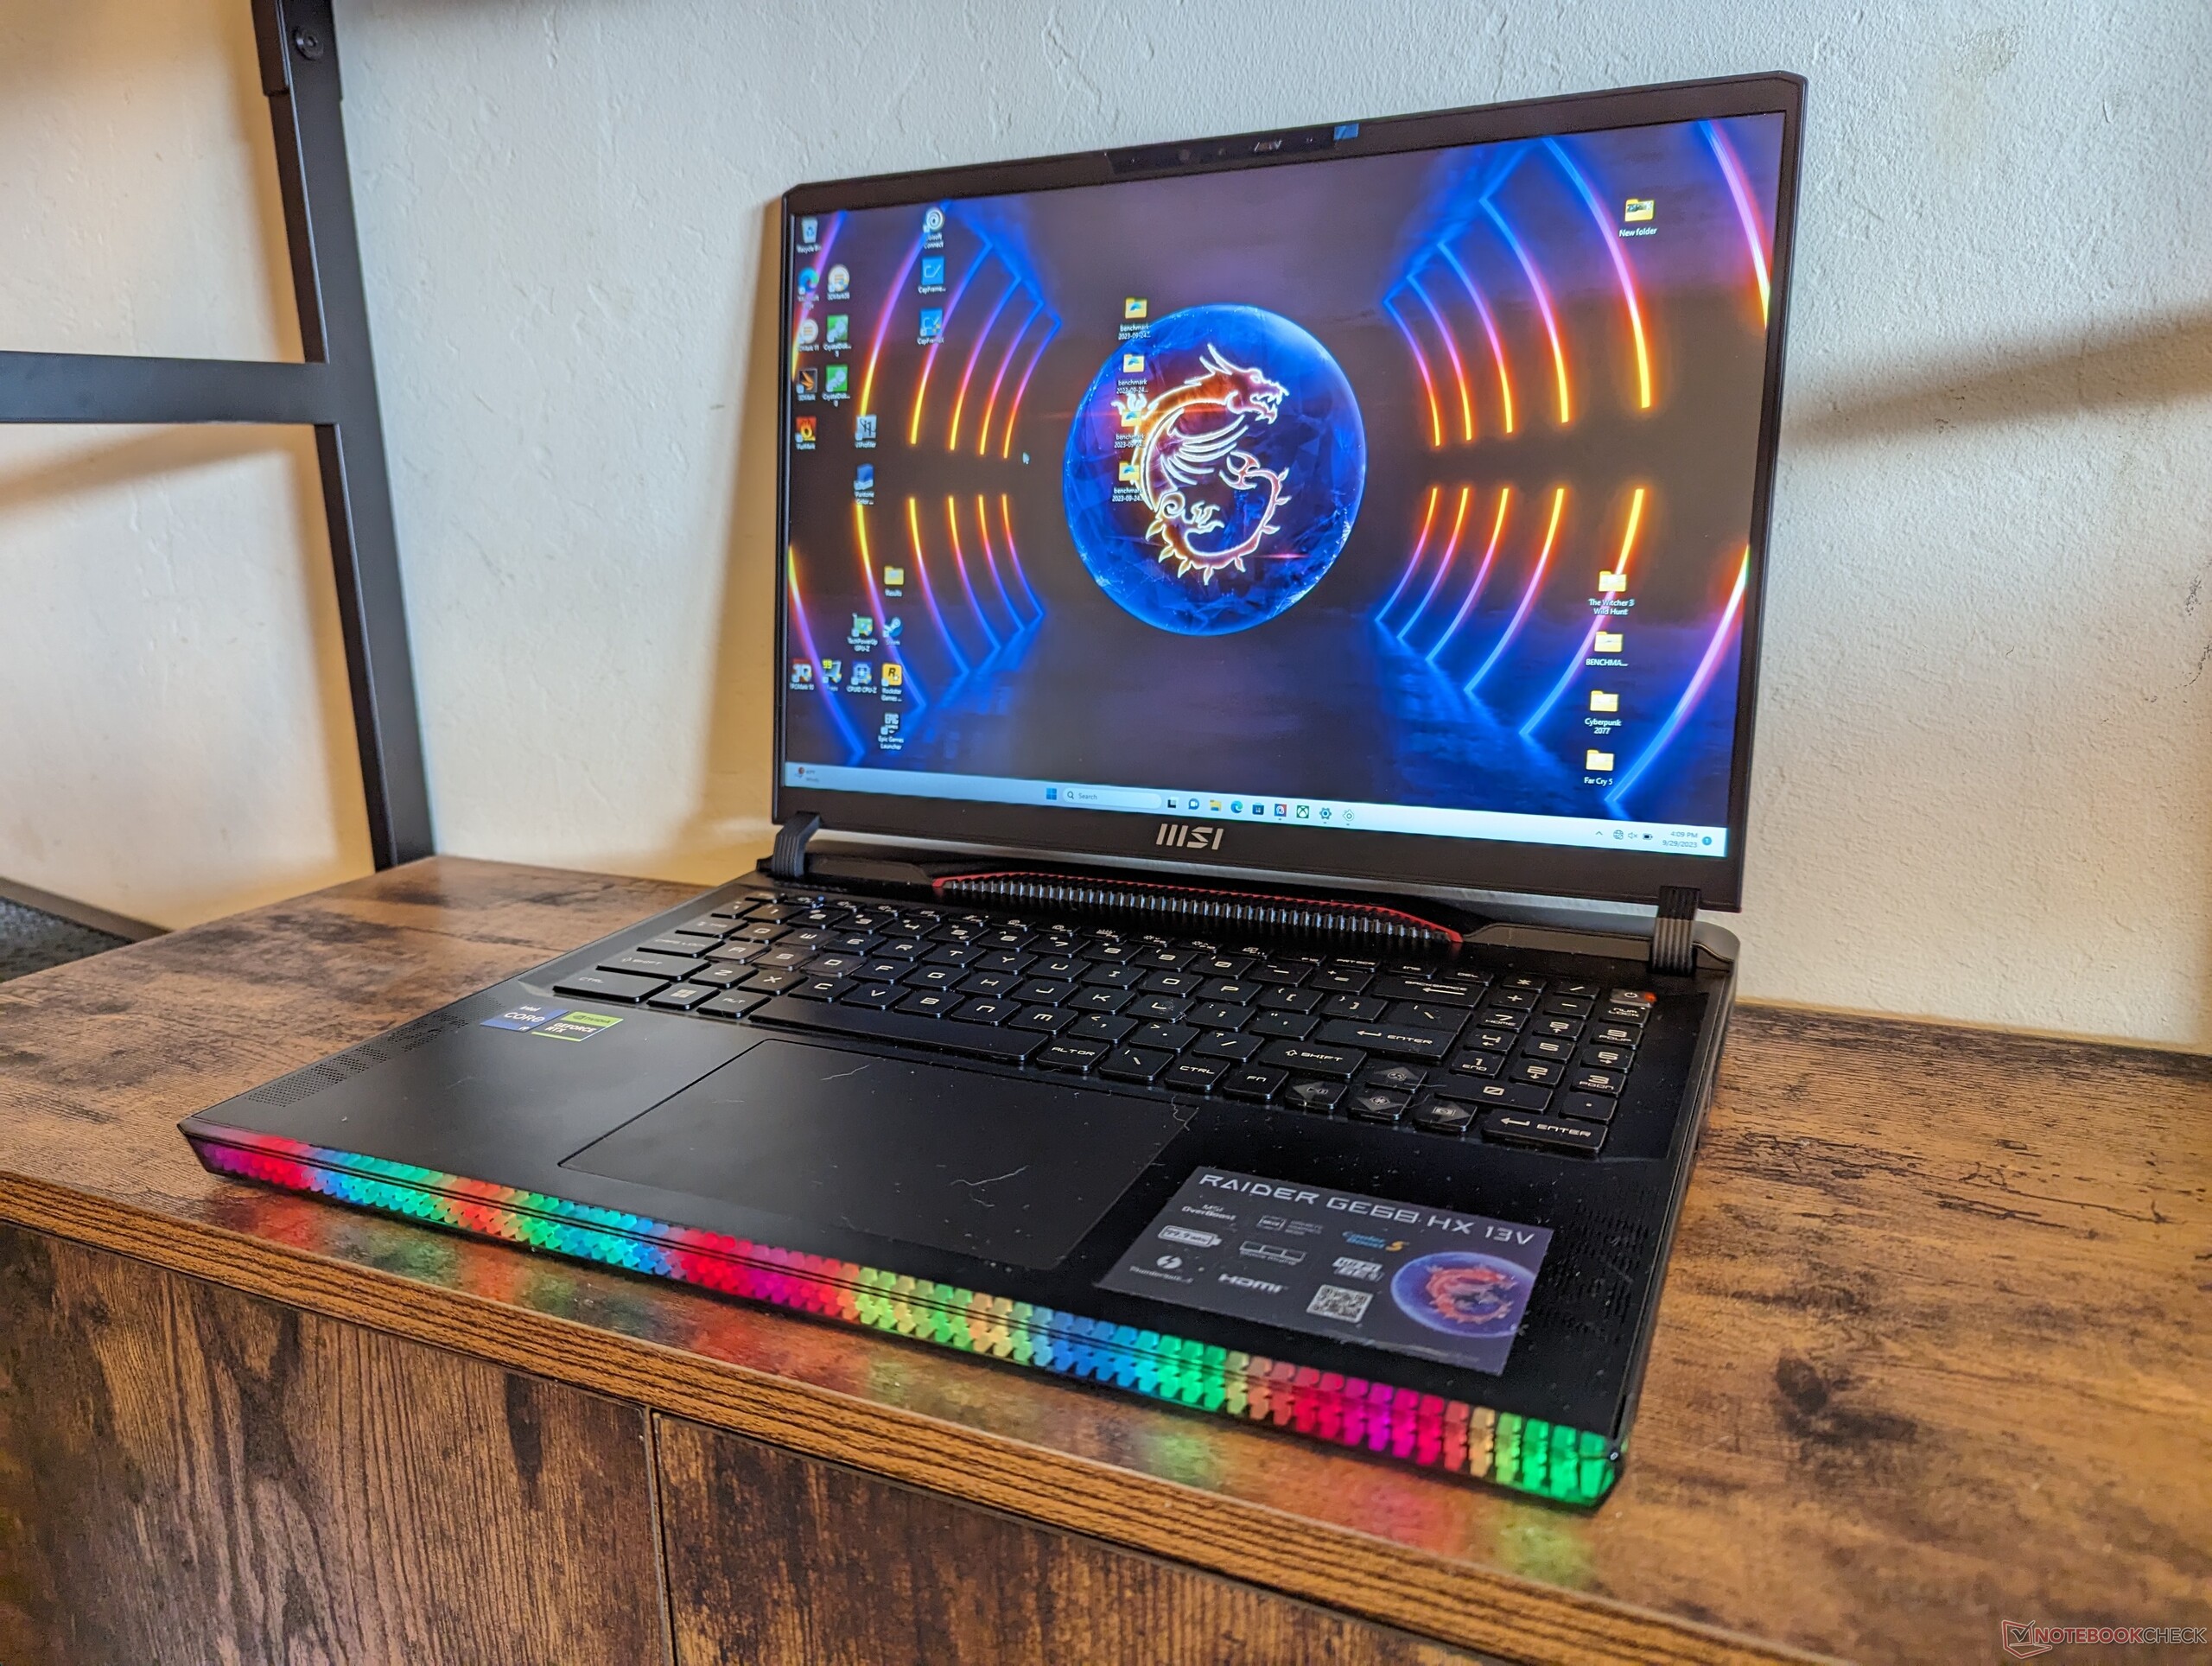
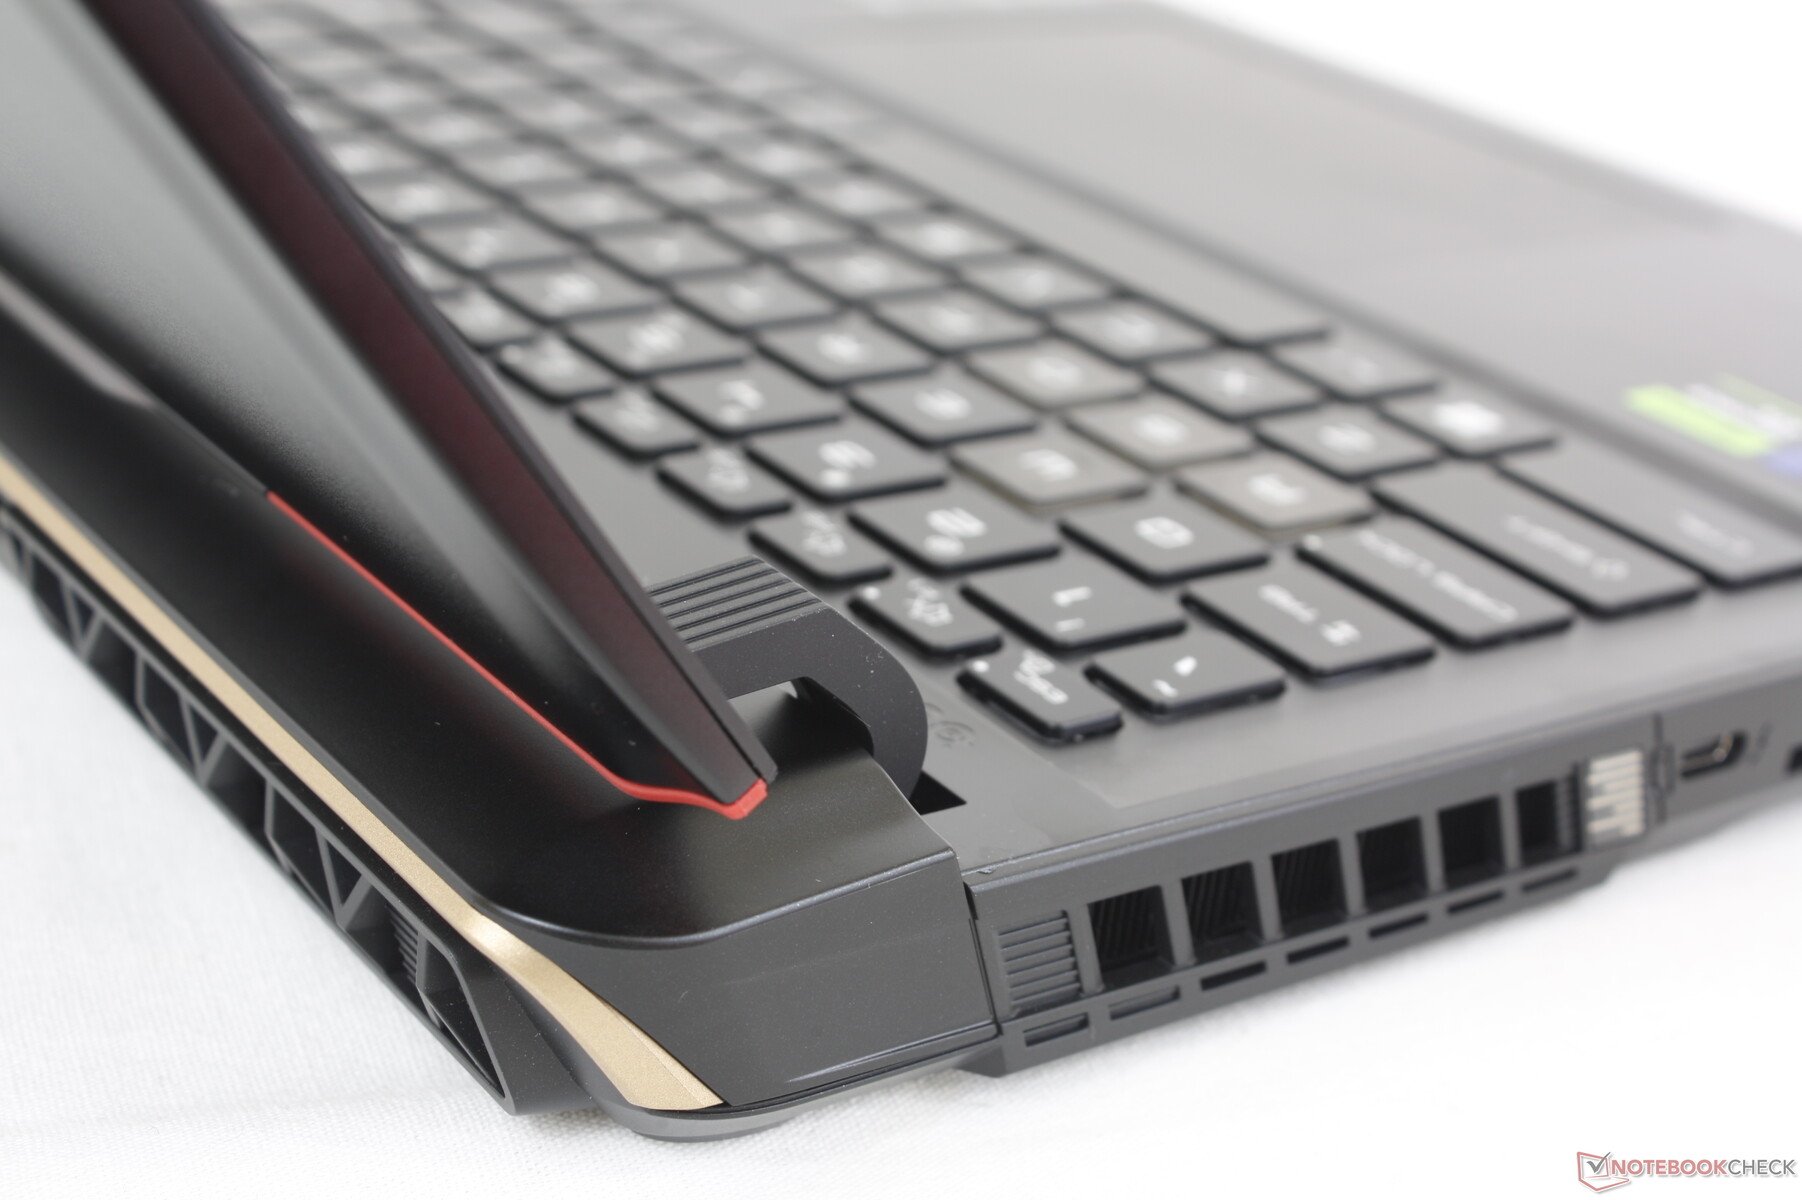
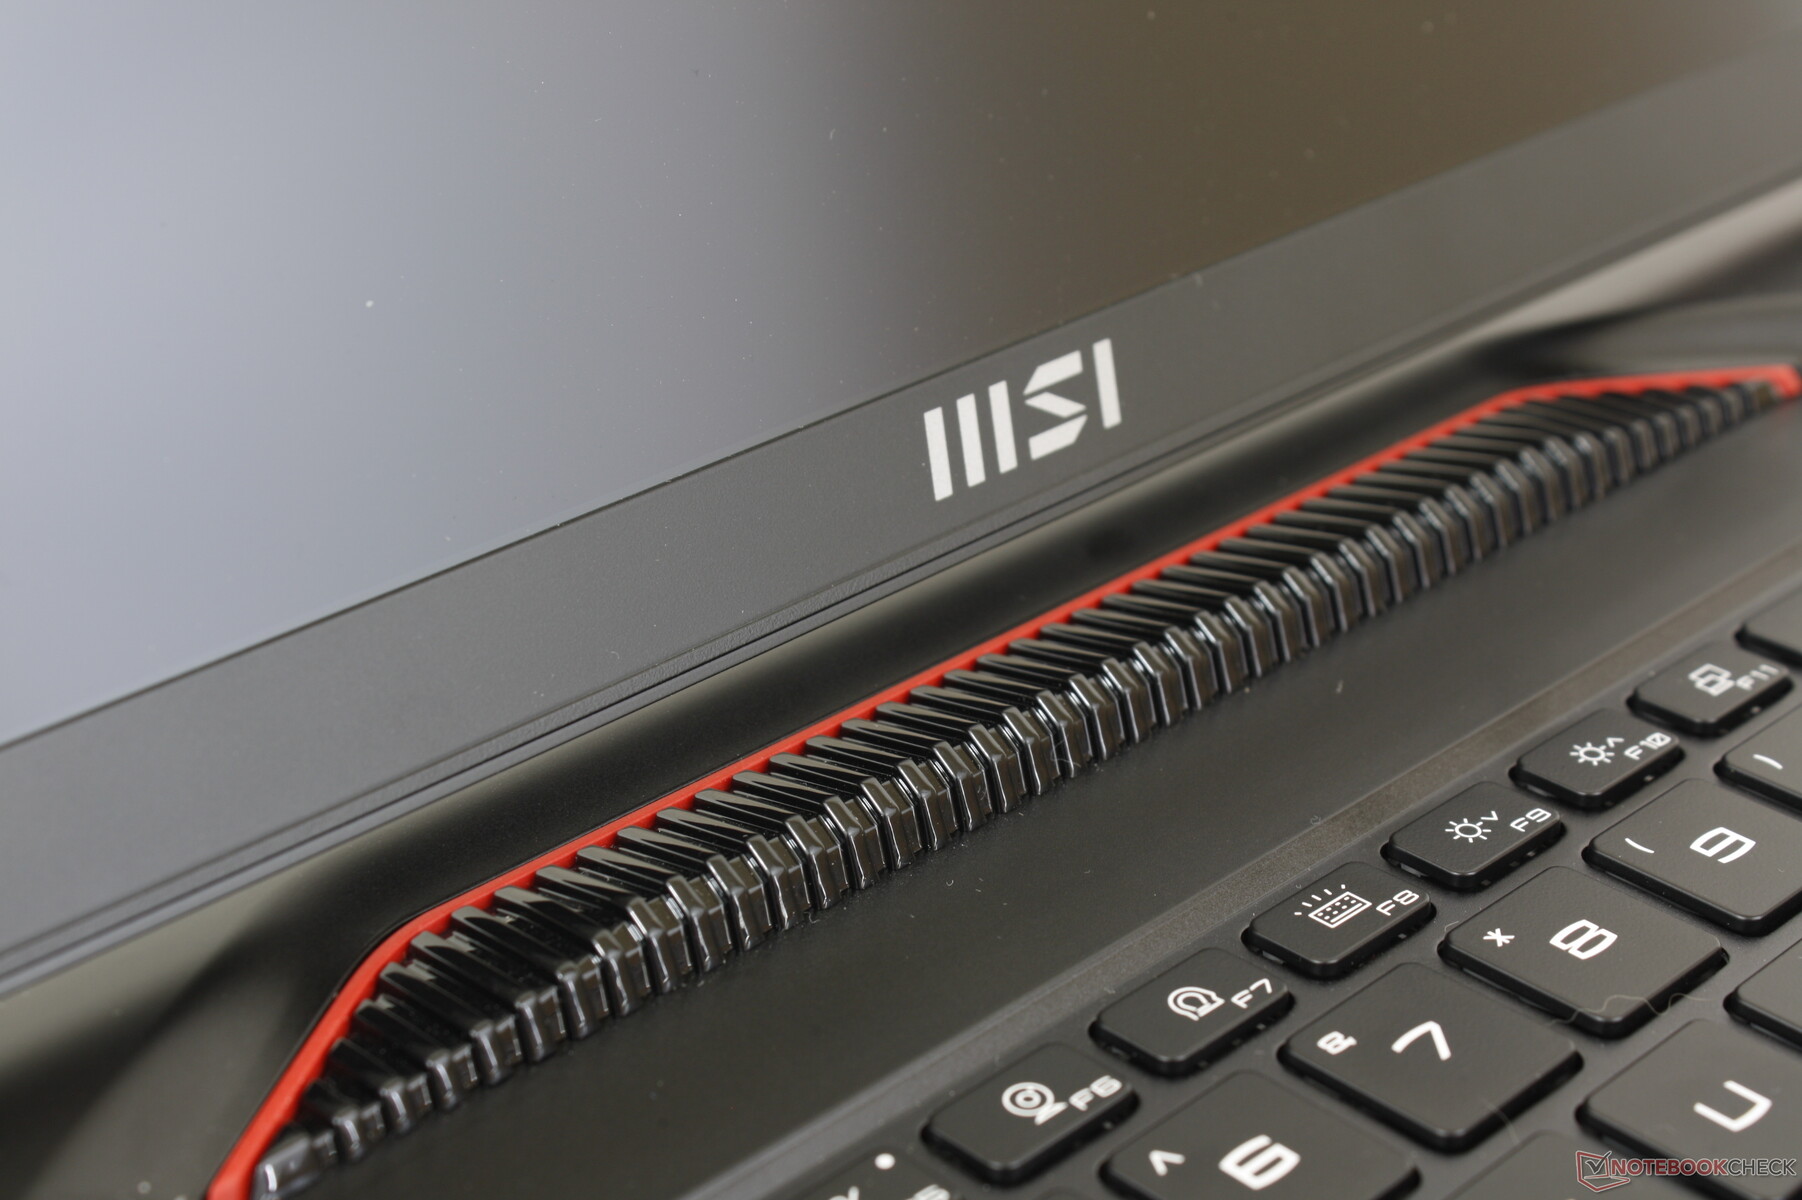
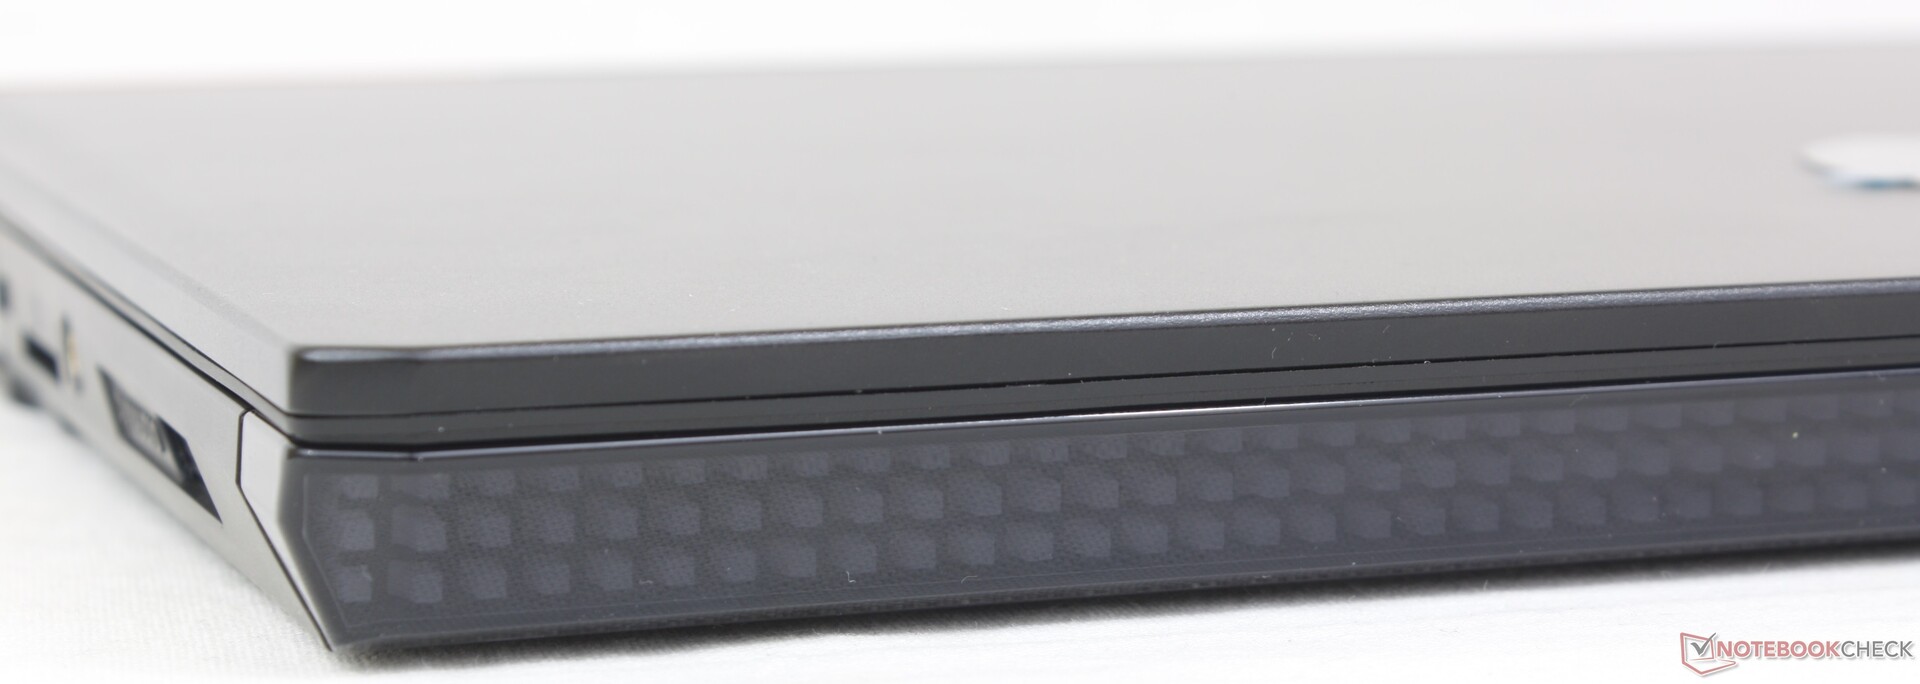
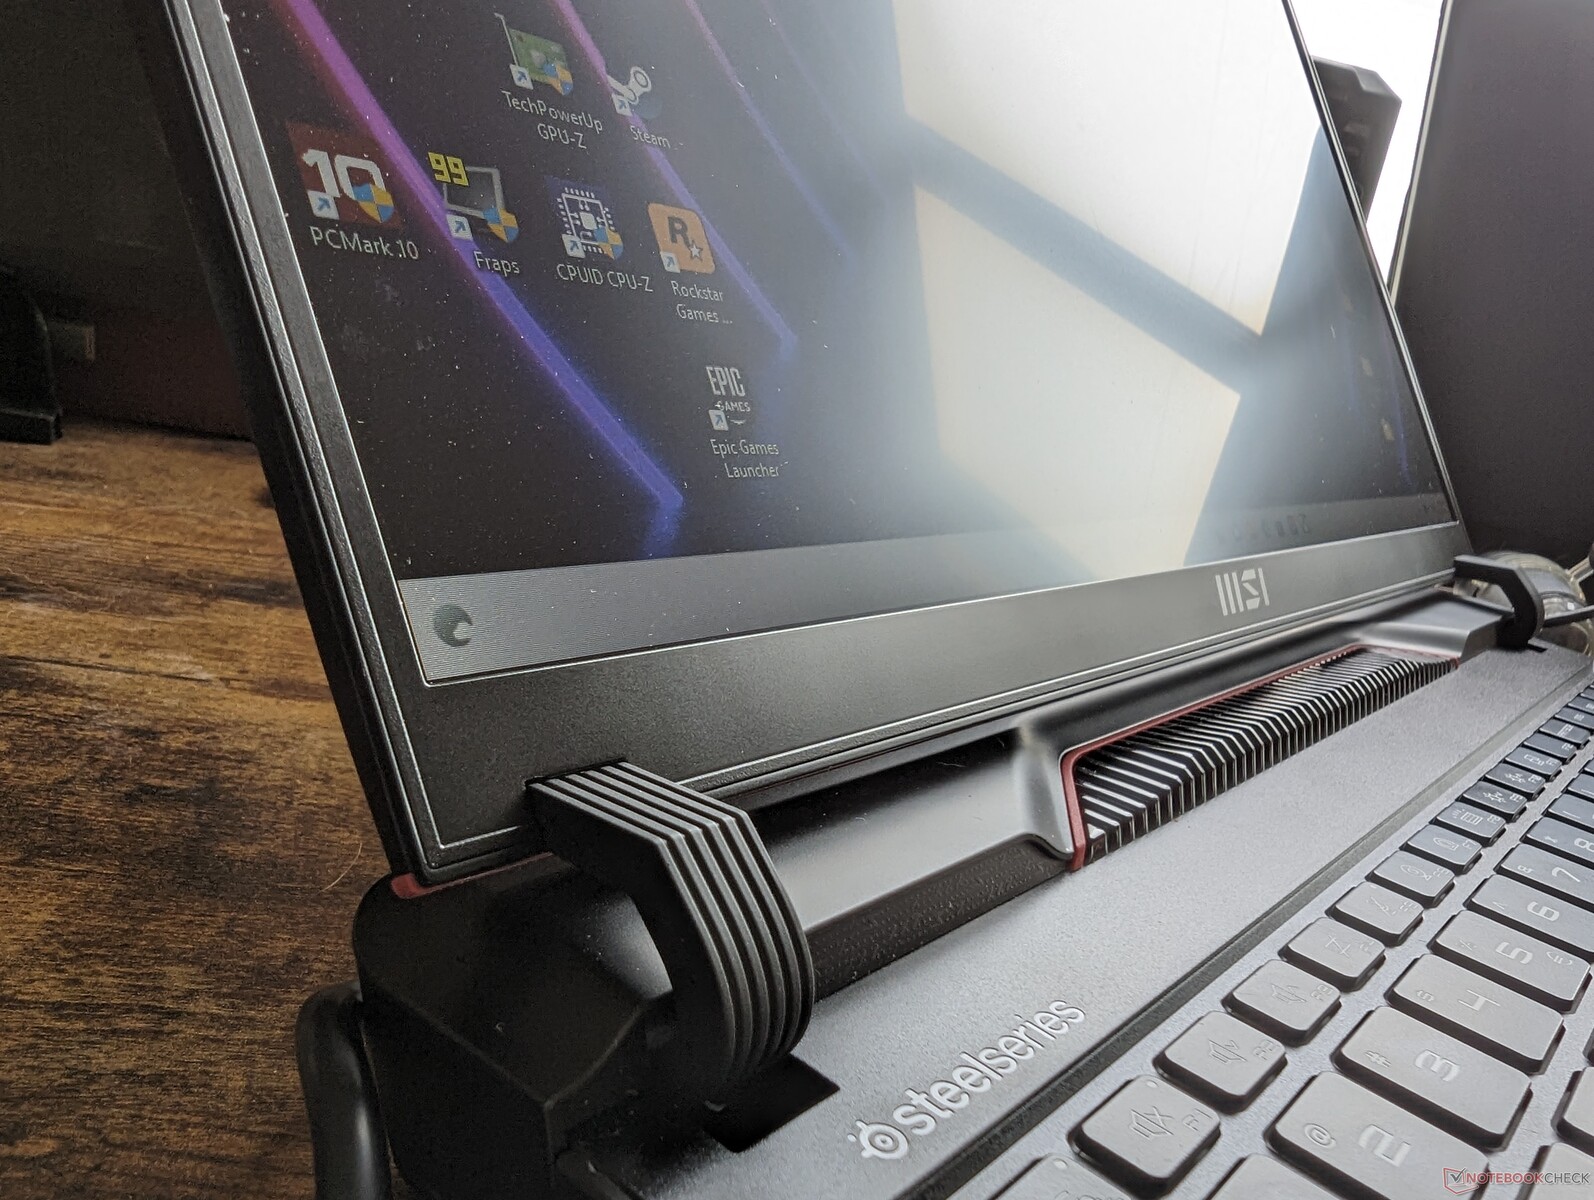
Caso - Más grande que antes
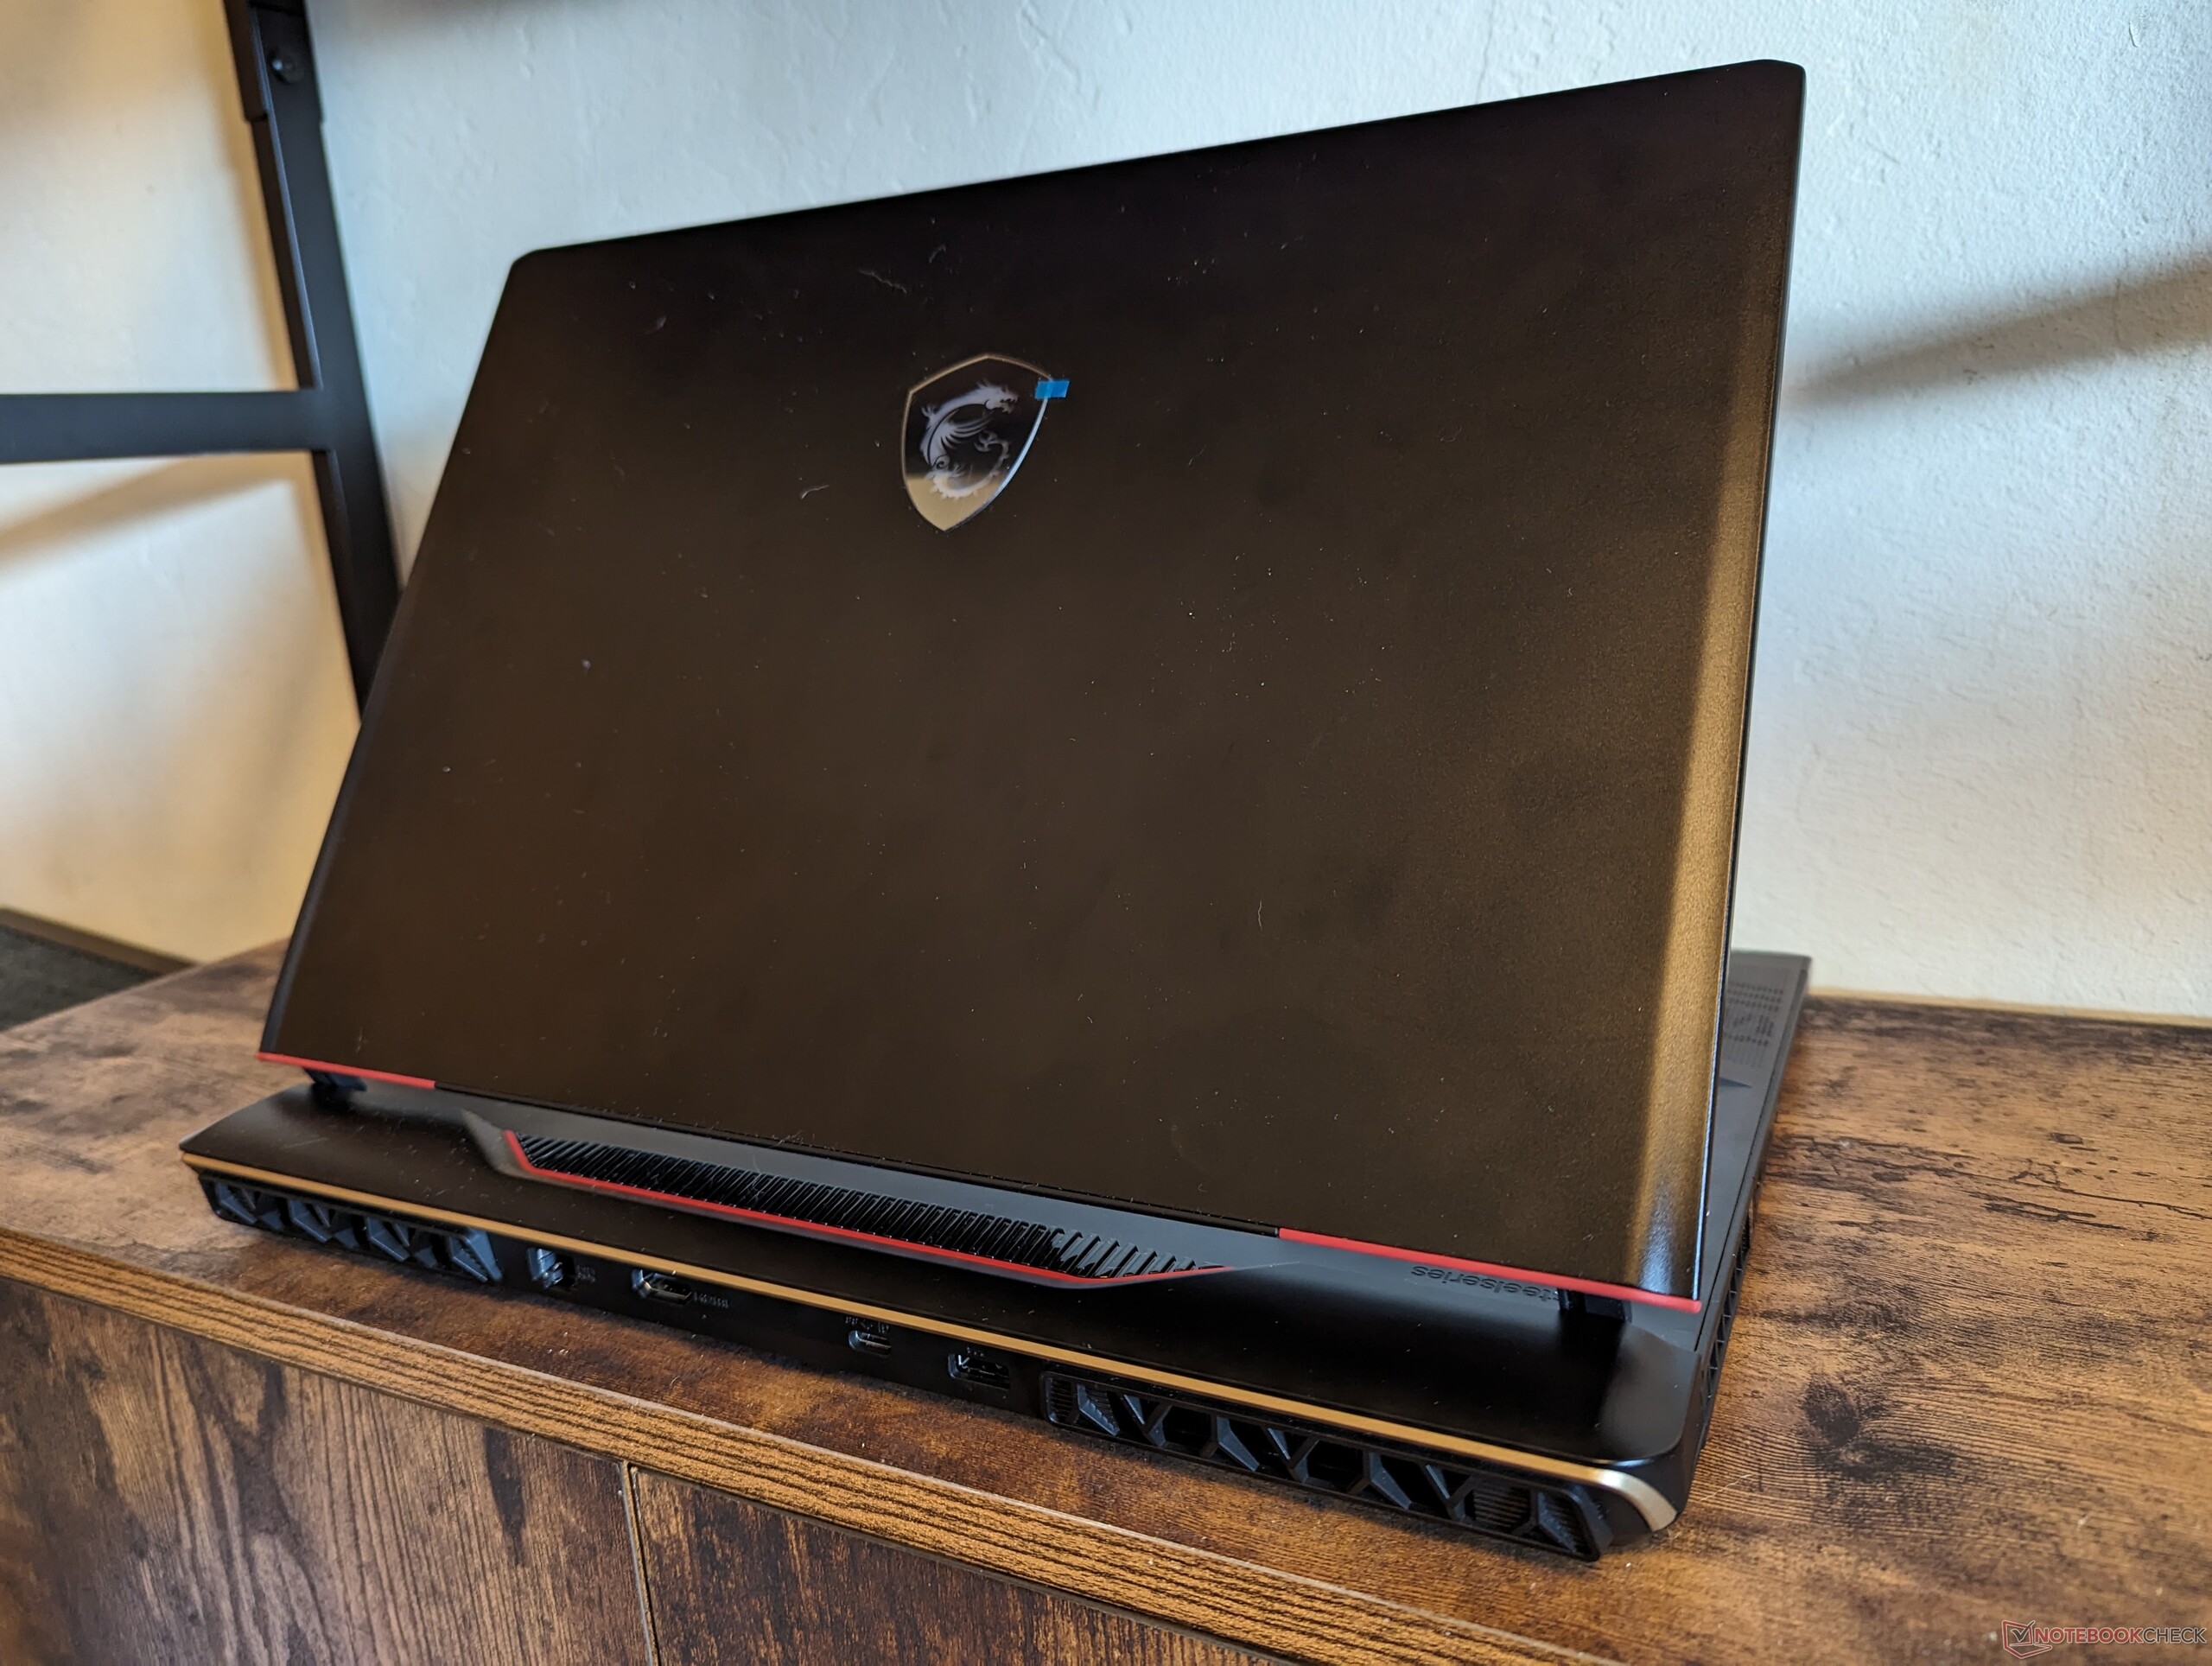
El chasis se puede describir mejor como una versión más pequeña de la 17 pulgadas Raider GE78HX. La barra de píxeles LED frontal sustituye a la iluminación continua del modelo del año pasado, mientras que la parte trasera es ahora más estilizada con adornos dorados, rojos y brillantes. Uno de los objetivos de MSI este año era crear diseños de portátiles más interesantes visualmente en lugar de la cada vez más común estética negra azabache y minimalista. El fabricante ha tenido éxito en este sentido, ya que el diseño del GE68HX es ciertamente inconfundible y muy diferente de otros portátiles para juegos de la competencia.
La rigidez del chasis es excelente a pesar de todas las curvas y piezas que componen el esqueleto no unibody. Aplicando presión por el centro del teclado o intentando retorcer las esquinas se produce muy poca flexión y ningún crujido audible. Apreciamos especialmente las bisagras más grandes y robustas en comparación con el GE67HX del año pasado para una mayor sensación de longevidad.
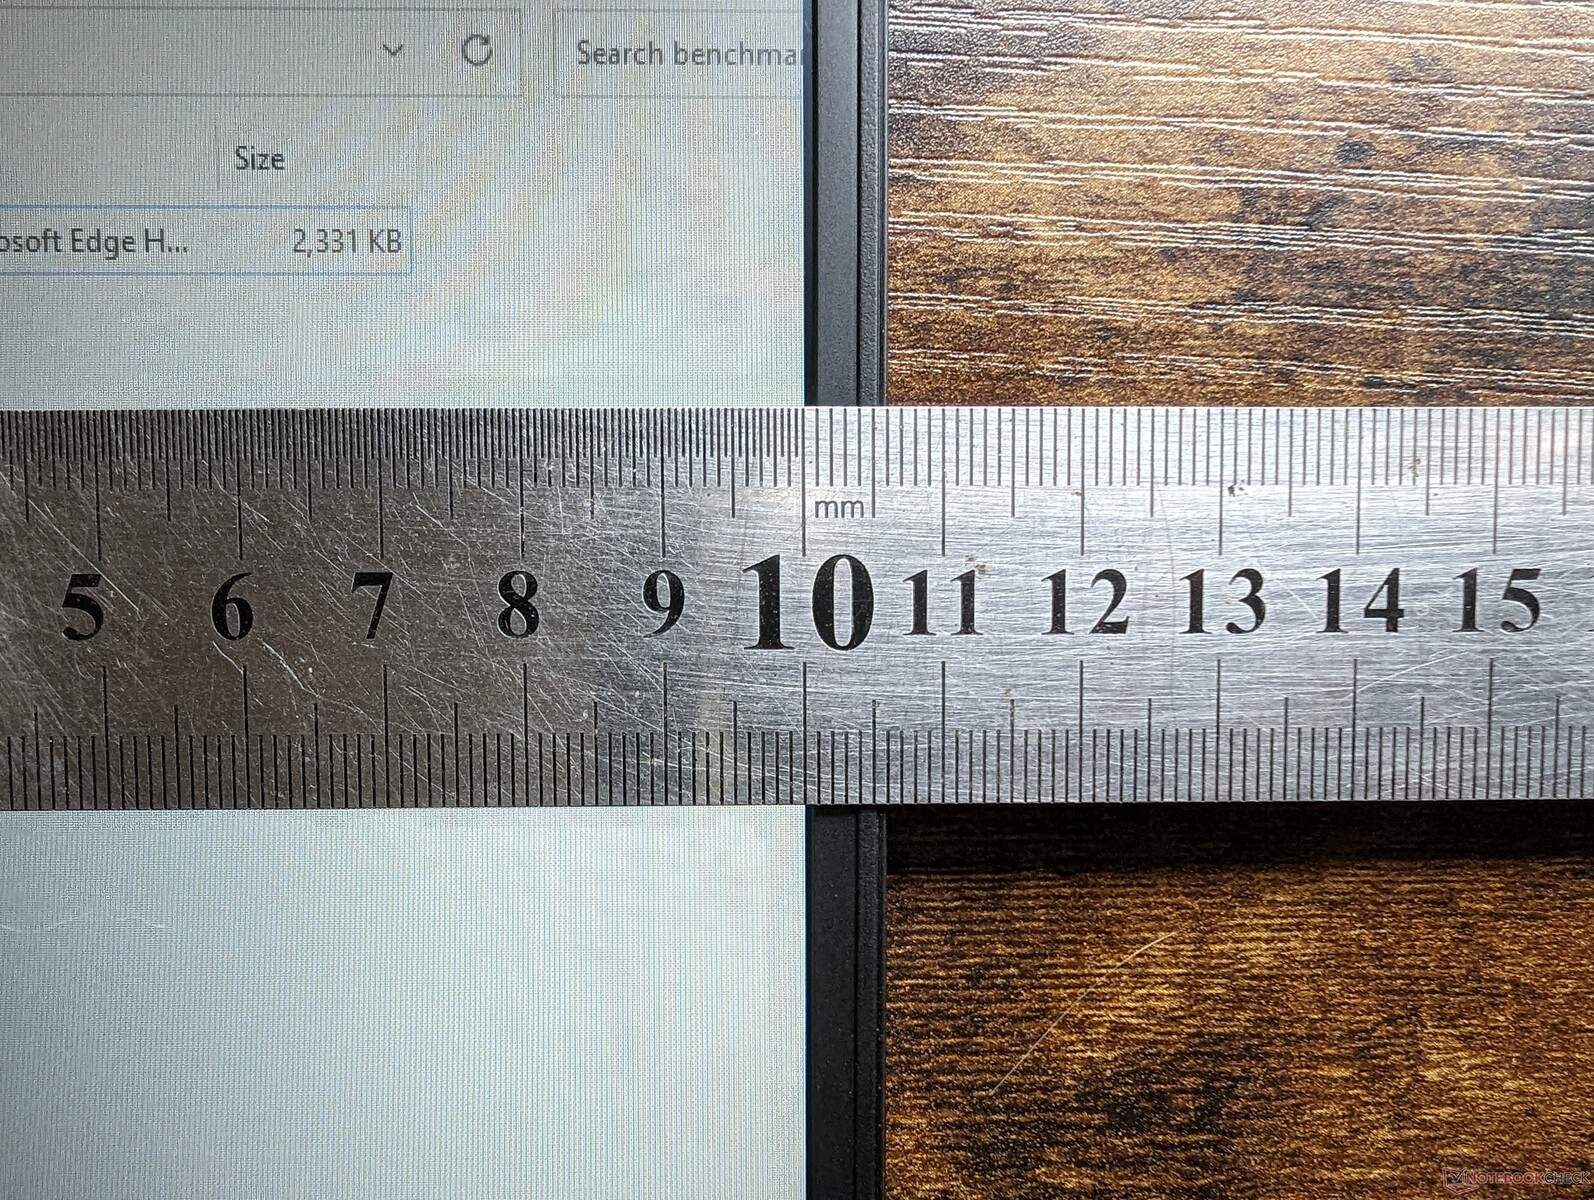
El nuevo modelo es a la vez más grande y más pesado que el GE67HX saliente por márgenes notables, como se muestra en nuestra tabla de comparación de tamaño a continuación. De hecho, el GE68HX es uno de los portátiles para juegos de 16 pulgadas más grandes y pesados del mercado.
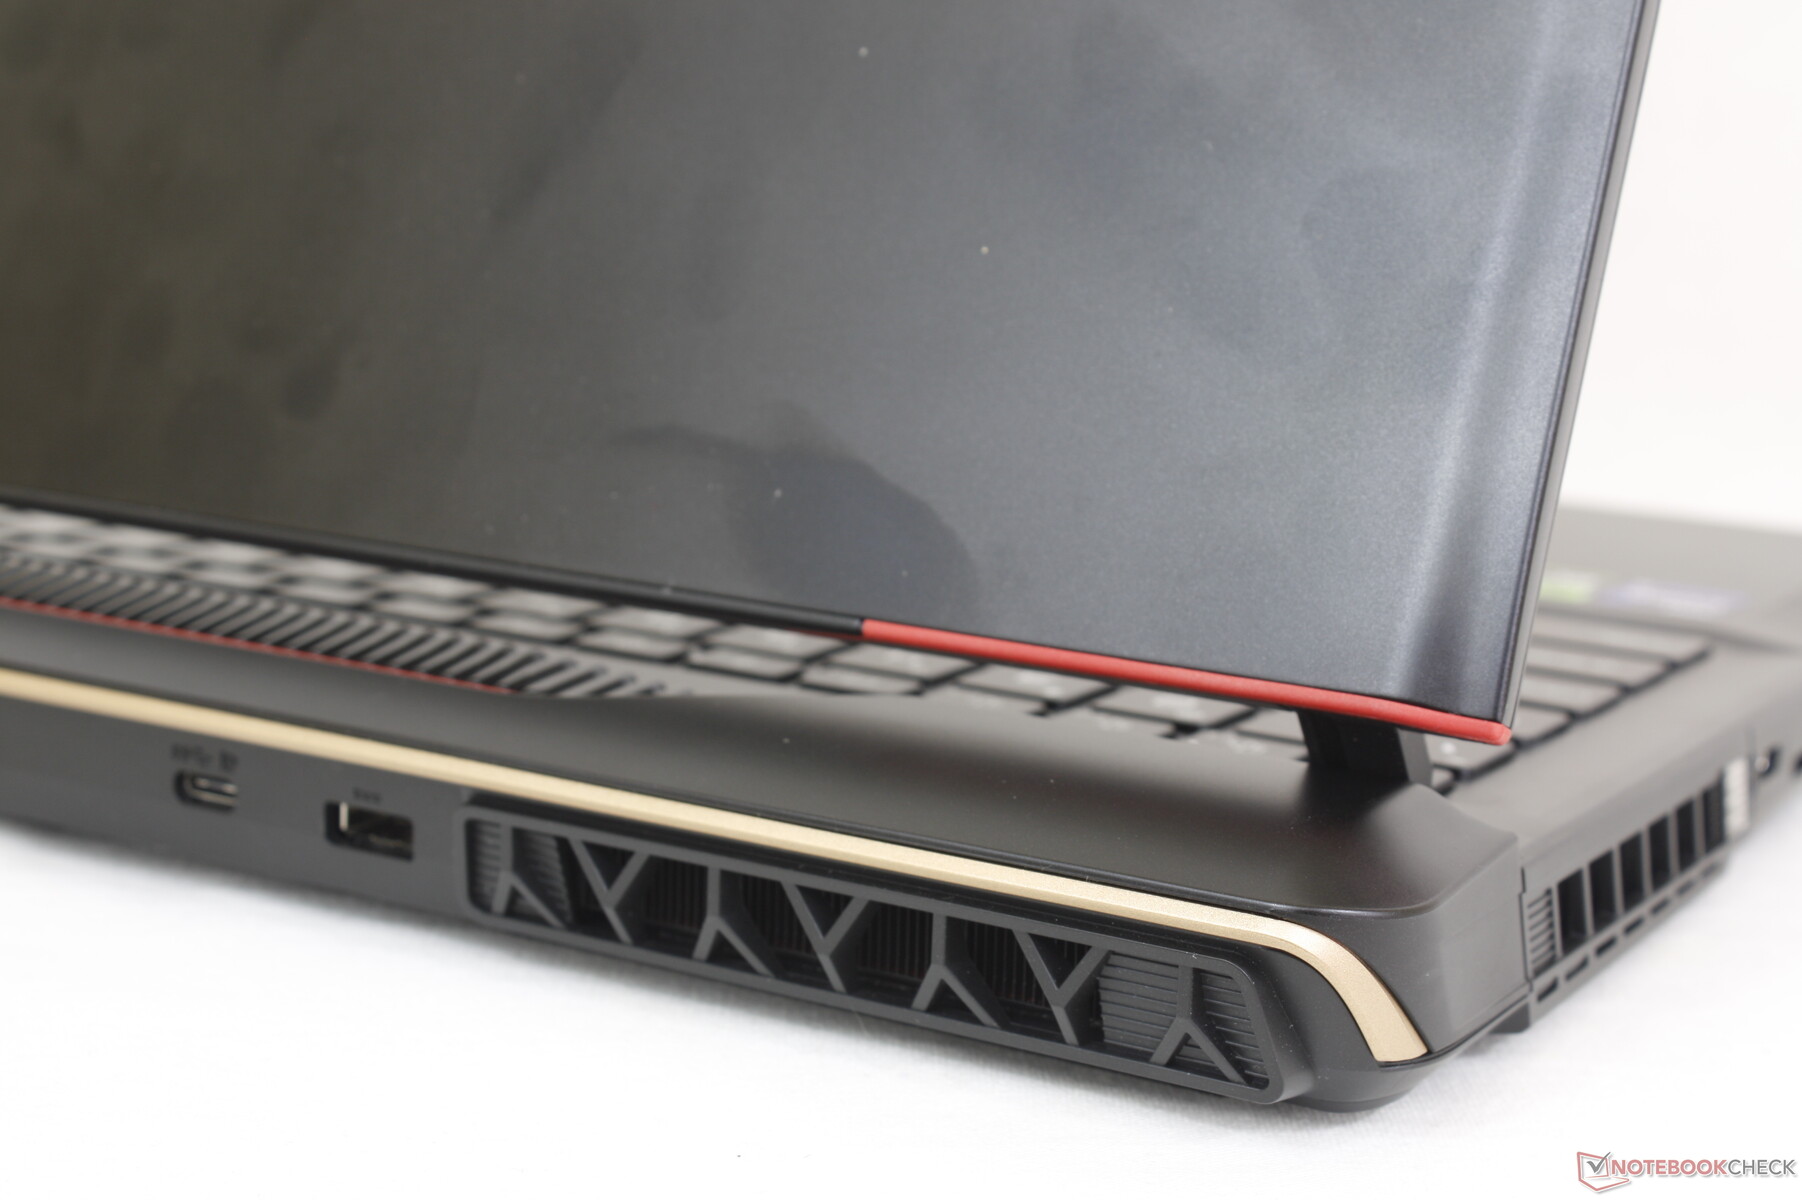
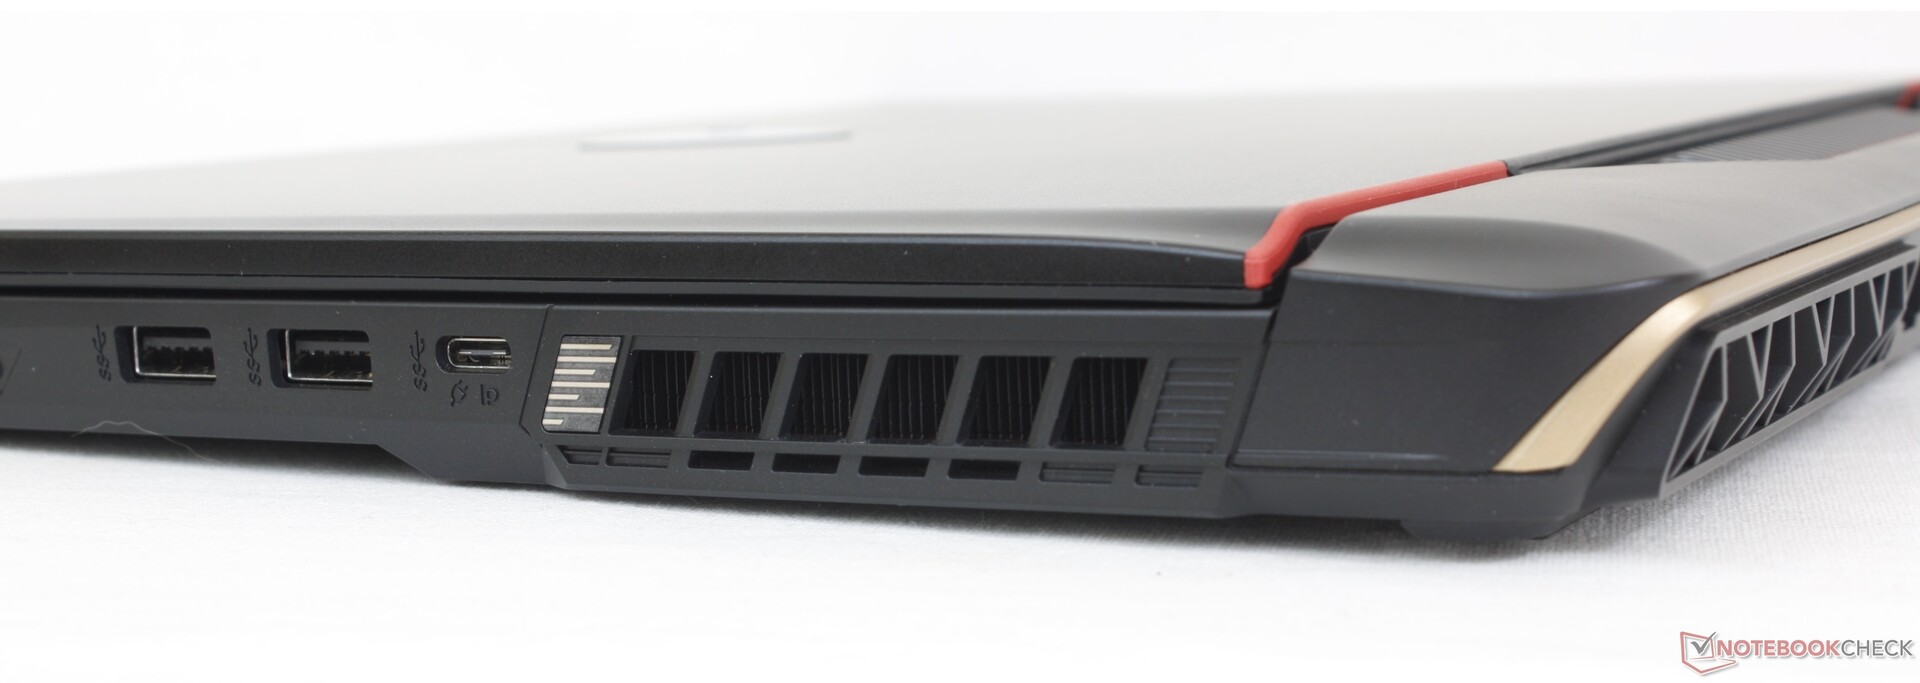
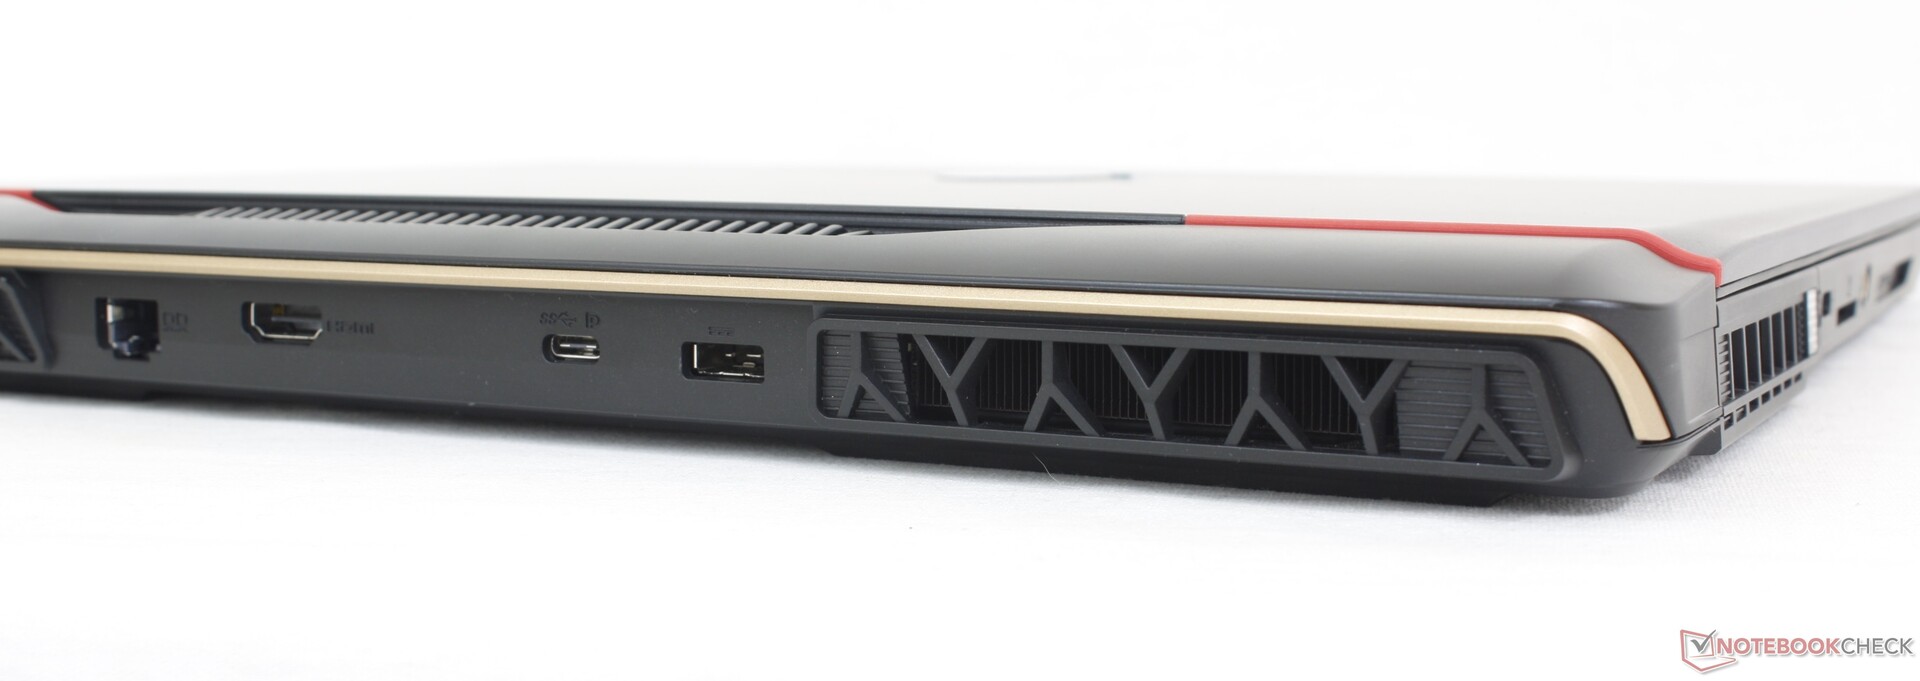
Conectividad
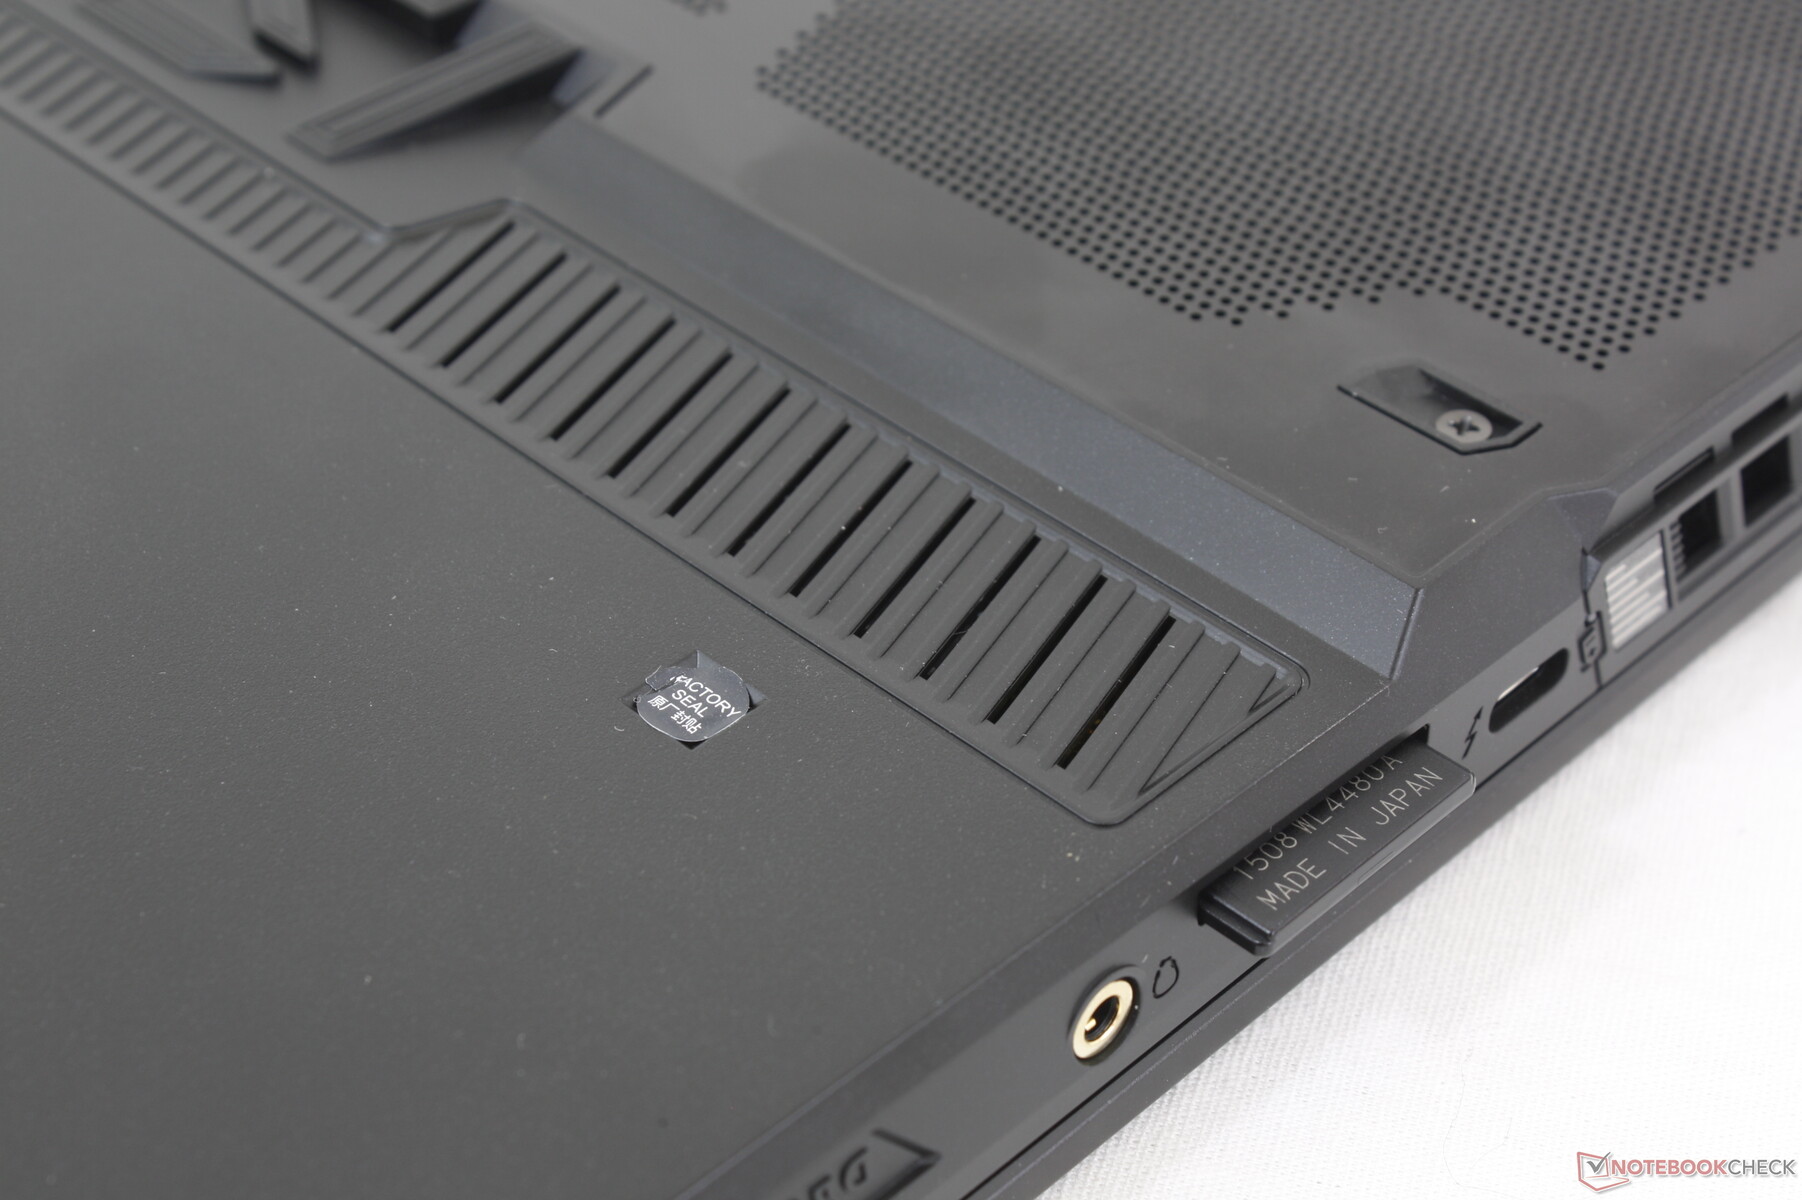
Las opciones de puerto han cambiado ligeramente con respecto al año pasado GE67HX. Mientras que el GE67HX tendría 3x puertos USB-A y 2x puertos USB-C, el GE68HX viene con 2x puertos USB-A y 3x puertos USB-C. Los tres puertos USB-C soportan Displayport, pero sólo el del borde izquierdo es compatible con Thunderbolt 4.
Extrañamente, MSI ha optado por dejar de lado el bloqueo Kensington en el diseño de este año. Tampoco hay mini-DisplayPort a diferencia delAlienware m16 R1.
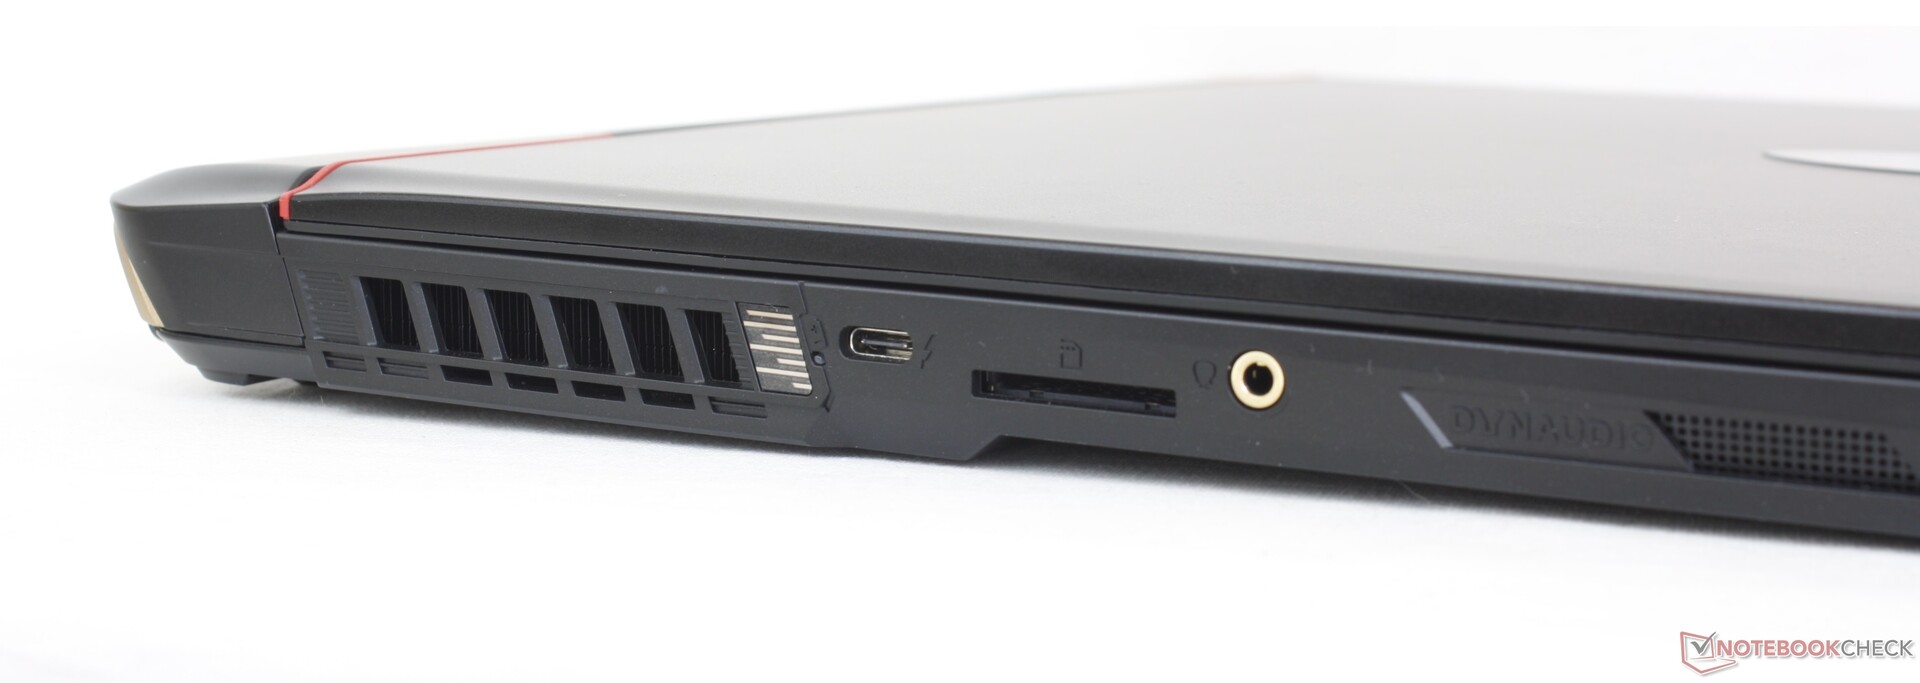
Lector de tarjetas SD
El lector de tarjetas SD integrado es un poco lento para lo que se supone que es un modelo gaming de gama media-alta. Transferir 1 GB de fotos desde nuestra tarjeta de pruebas UHS-II al escritorio tardaría algo más de 12 segundos, mientras que la misma prueba en el Alienware m16 R1 sería 2 veces más rápida.
| SD Card Reader | |
| average JPG Copy Test (av. of 3 runs) | |
| Alienware m16 R1 AMD (Toshiba Exceria Pro SDXC 64 GB UHS-II) | |
| Asus ROG Zephyrus M16 GU604VY-NM042X | |
| Lenovo Legion Slim 7i 16 Gen 8 (Toshiba Exceria Pro SDXC 64 GB UHS-II) | |
| MSI GE67 HX 12UGS (Toshiba Exceria Pro SDXC 64 GB UHS-II) | |
| MSI Raider GE68HX 13VF (Toshiba Exceria Pro SDXC 64 GB UHS-II) | |
| maximum AS SSD Seq Read Test (1GB) | |
| Alienware m16 R1 AMD (Toshiba Exceria Pro SDXC 64 GB UHS-II) | |
| Asus ROG Zephyrus M16 GU604VY-NM042X | |
| Lenovo Legion Slim 7i 16 Gen 8 (Toshiba Exceria Pro SDXC 64 GB UHS-II) | |
| MSI Raider GE68HX 13VF (Toshiba Exceria Pro SDXC 64 GB UHS-II) | |
| MSI GE67 HX 12UGS (Toshiba Exceria Pro SDXC 64 GB UHS-II) | |
Comunicación
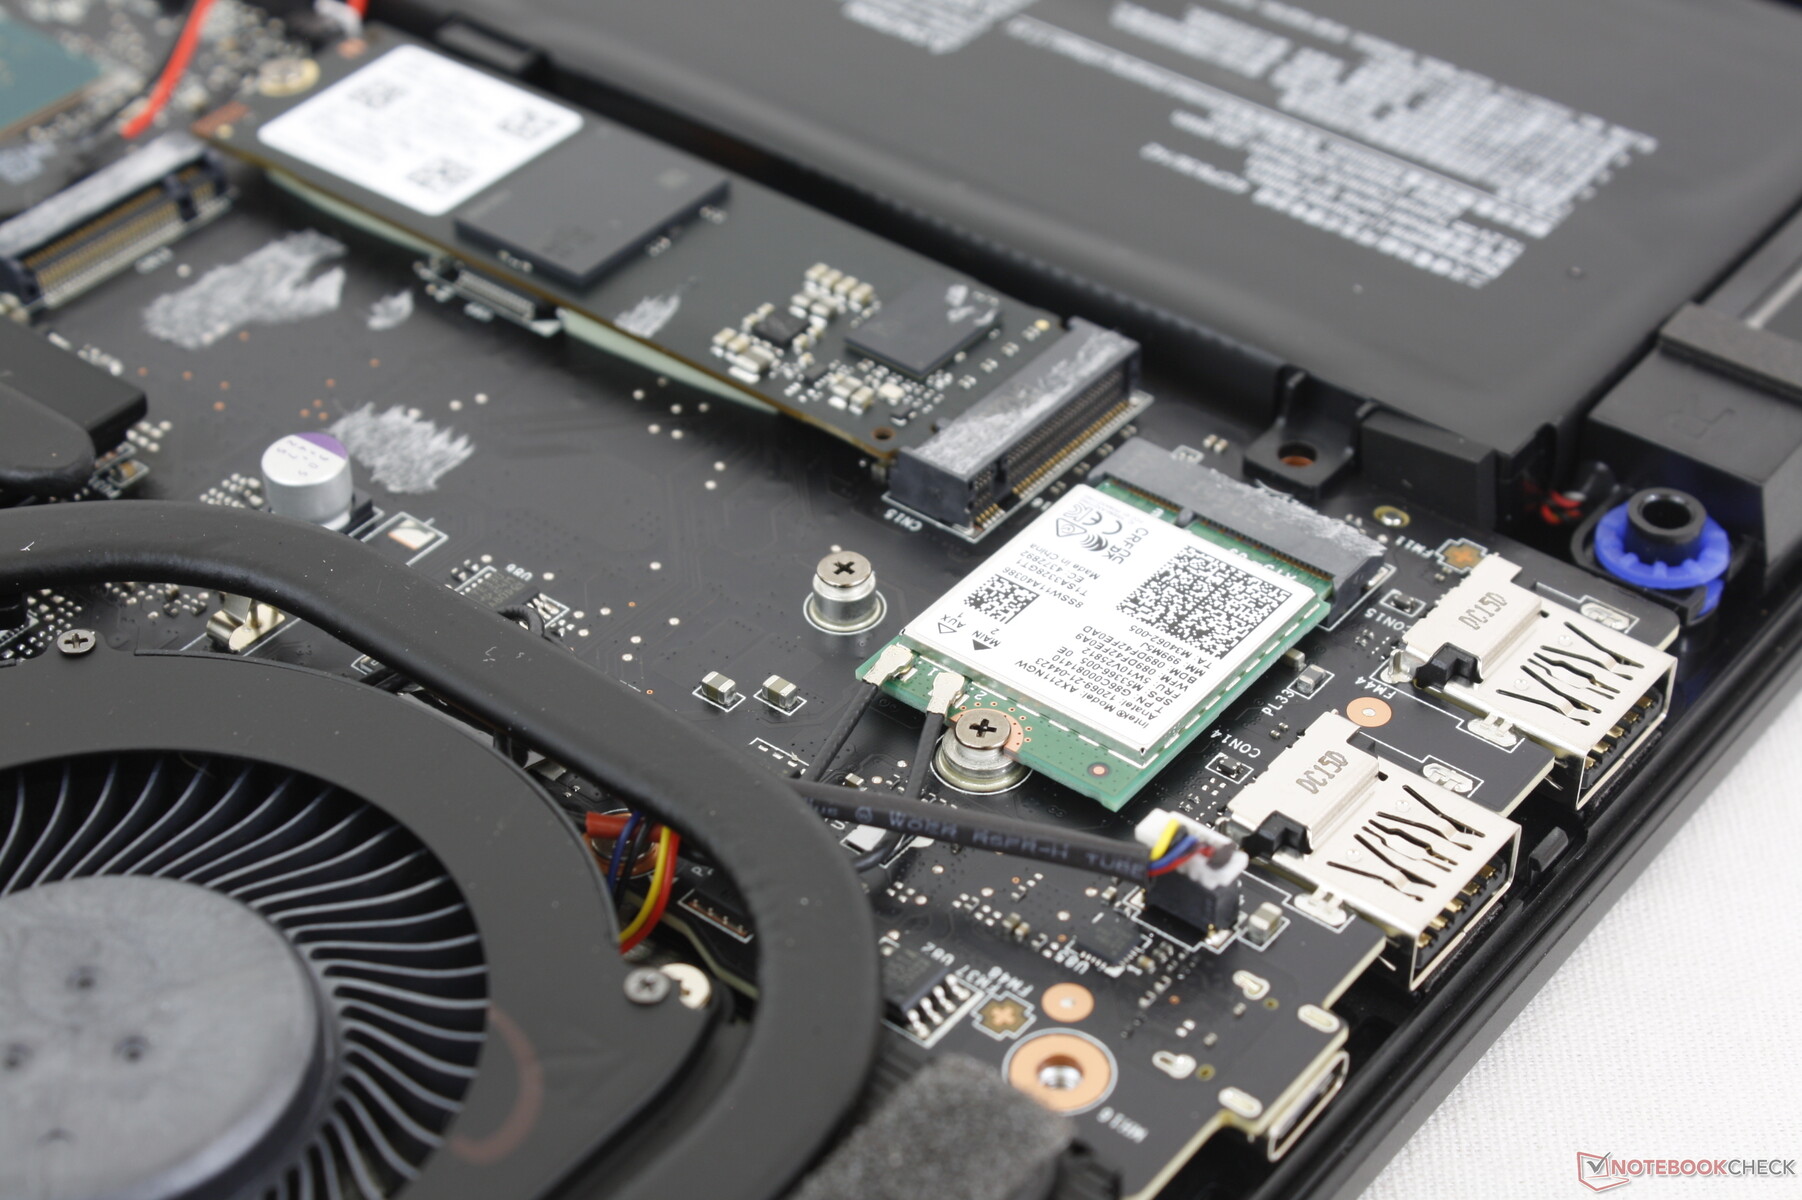
Un Intel AX211 viene de serie para Wi-Fi 6E y Bluetooth 5.3. No experimentamos problemas de conectividad al emparejarlo con nuestra red de prueba AXE11000 de 6 GHz.
| Networking | |
| iperf3 transmit AXE11000 | |
| Alienware m16 R1 AMD | |
| MSI Raider GE68HX 13VF | |
| HP Omen 16-xf0376ng | |
| Lenovo Legion Slim 7i 16 Gen 8 | |
| iperf3 receive AXE11000 | |
| HP Omen 16-xf0376ng | |
| Alienware m16 R1 AMD | |
| Lenovo Legion Slim 7i 16 Gen 8 | |
| MSI Raider GE68HX 13VF | |
| iperf3 transmit AXE11000 6GHz | |
| Alienware m16 R1 AMD | |
| Asus ROG Zephyrus M16 GU604VY-NM042X | |
| Lenovo Legion Slim 7i 16 Gen 8 | |
| MSI Raider GE68HX 13VF | |
| MSI GE67 HX 12UGS | |
| iperf3 receive AXE11000 6GHz | |
| Asus ROG Zephyrus M16 GU604VY-NM042X | |
| Alienware m16 R1 AMD | |
| Lenovo Legion Slim 7i 16 Gen 8 | |
| MSI Raider GE68HX 13VF | |
| MSI GE67 HX 12UGS | |
Cámara web
Aunque la calidad de 2 MP no ha cambiado, hay un par de diferencias en torno a la webcam. El obturador, por ejemplo, es ahora un deslizador físico junto a la lente en lugar de un interruptor electrónico en el teclado. Y en segundo lugar, se ha incorporado un sensor de infrarrojos para la función Hello.


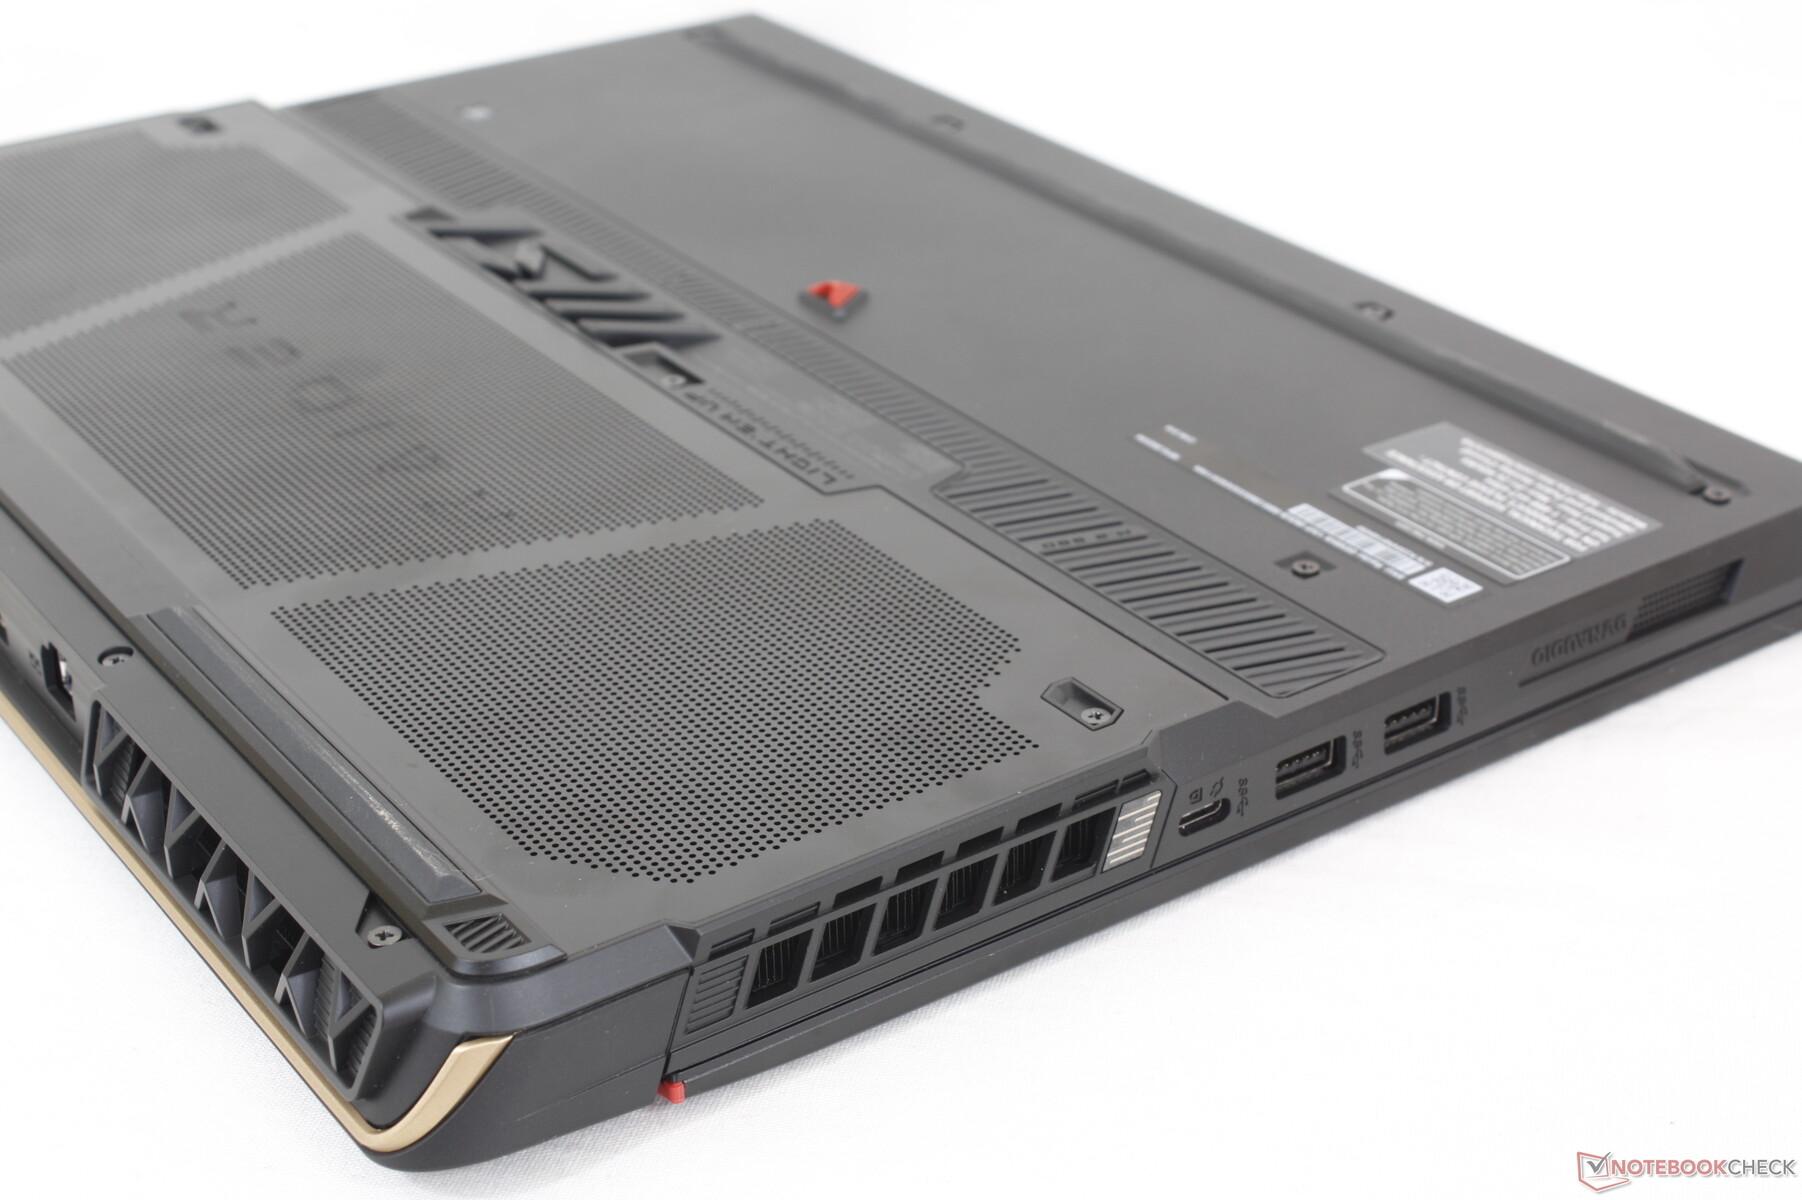
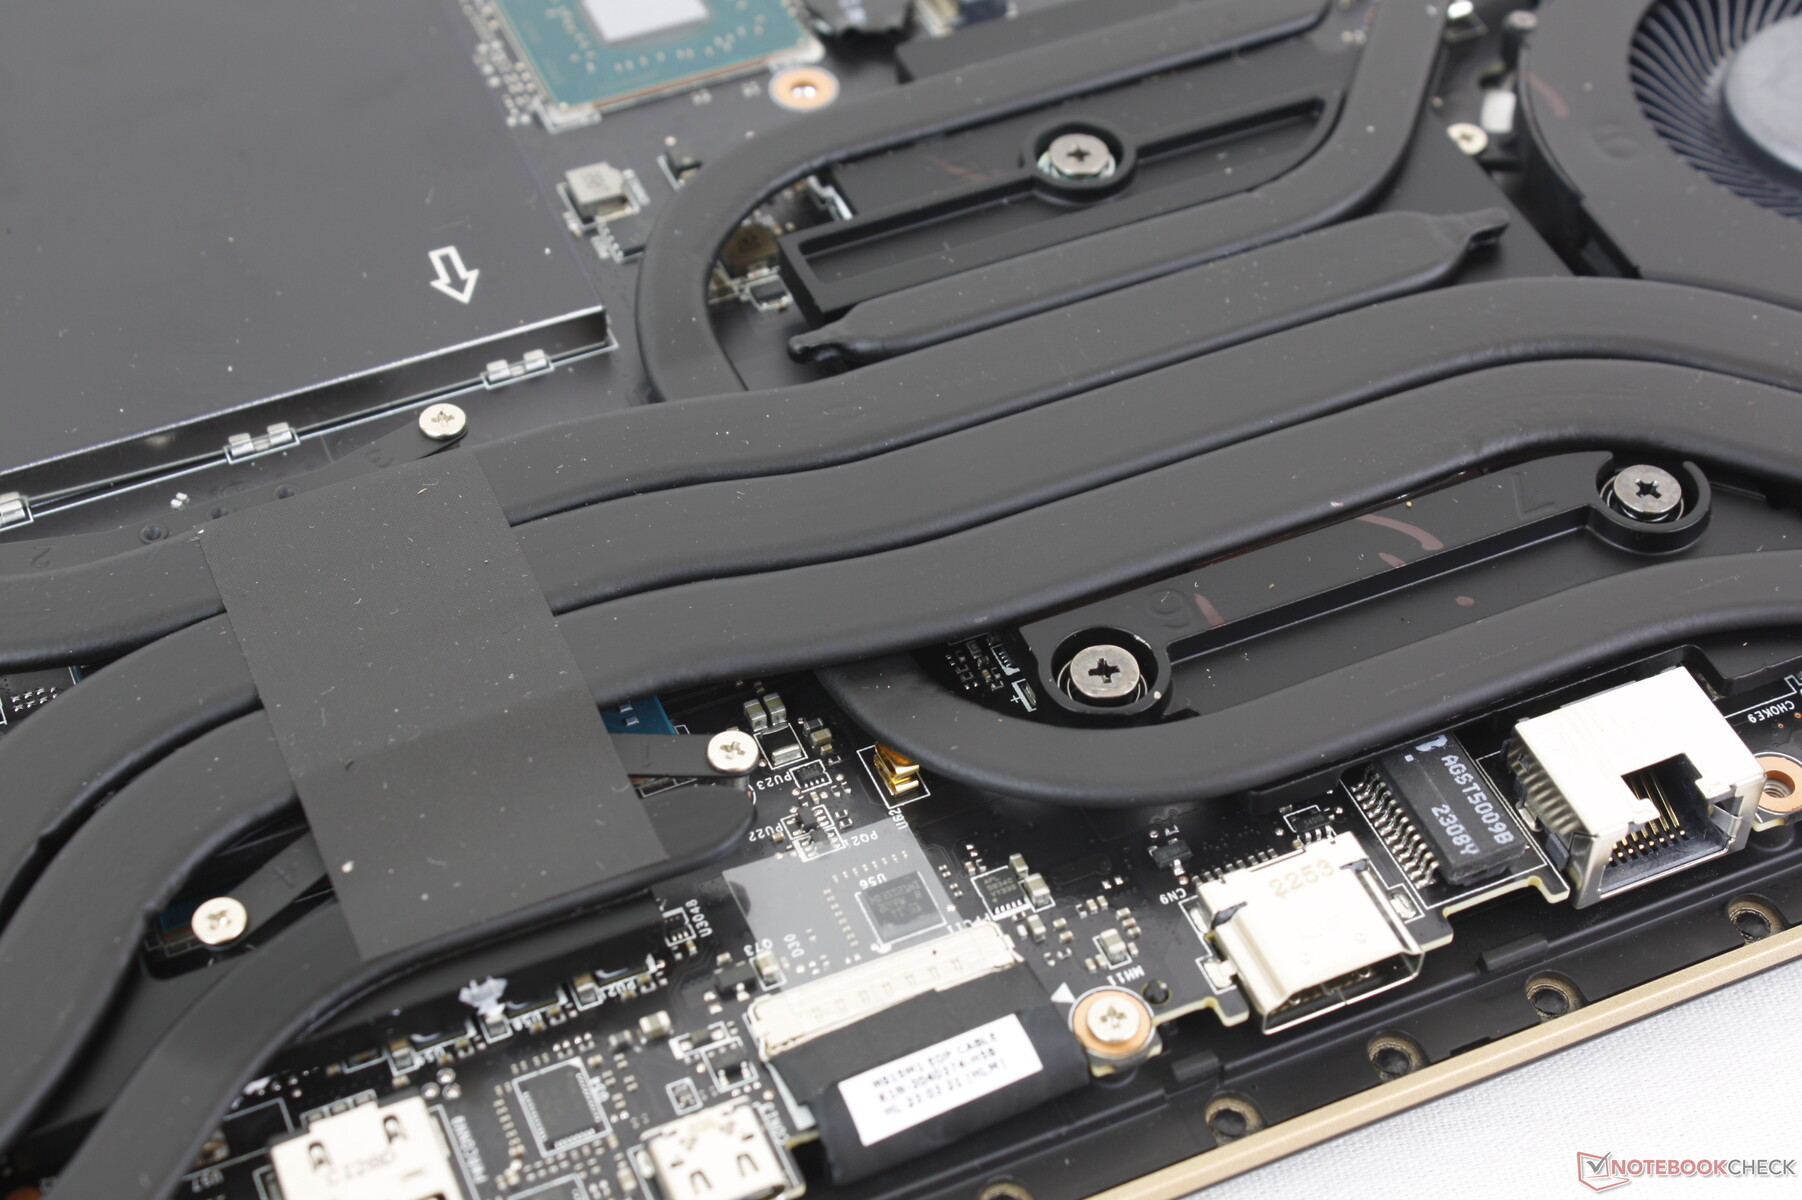
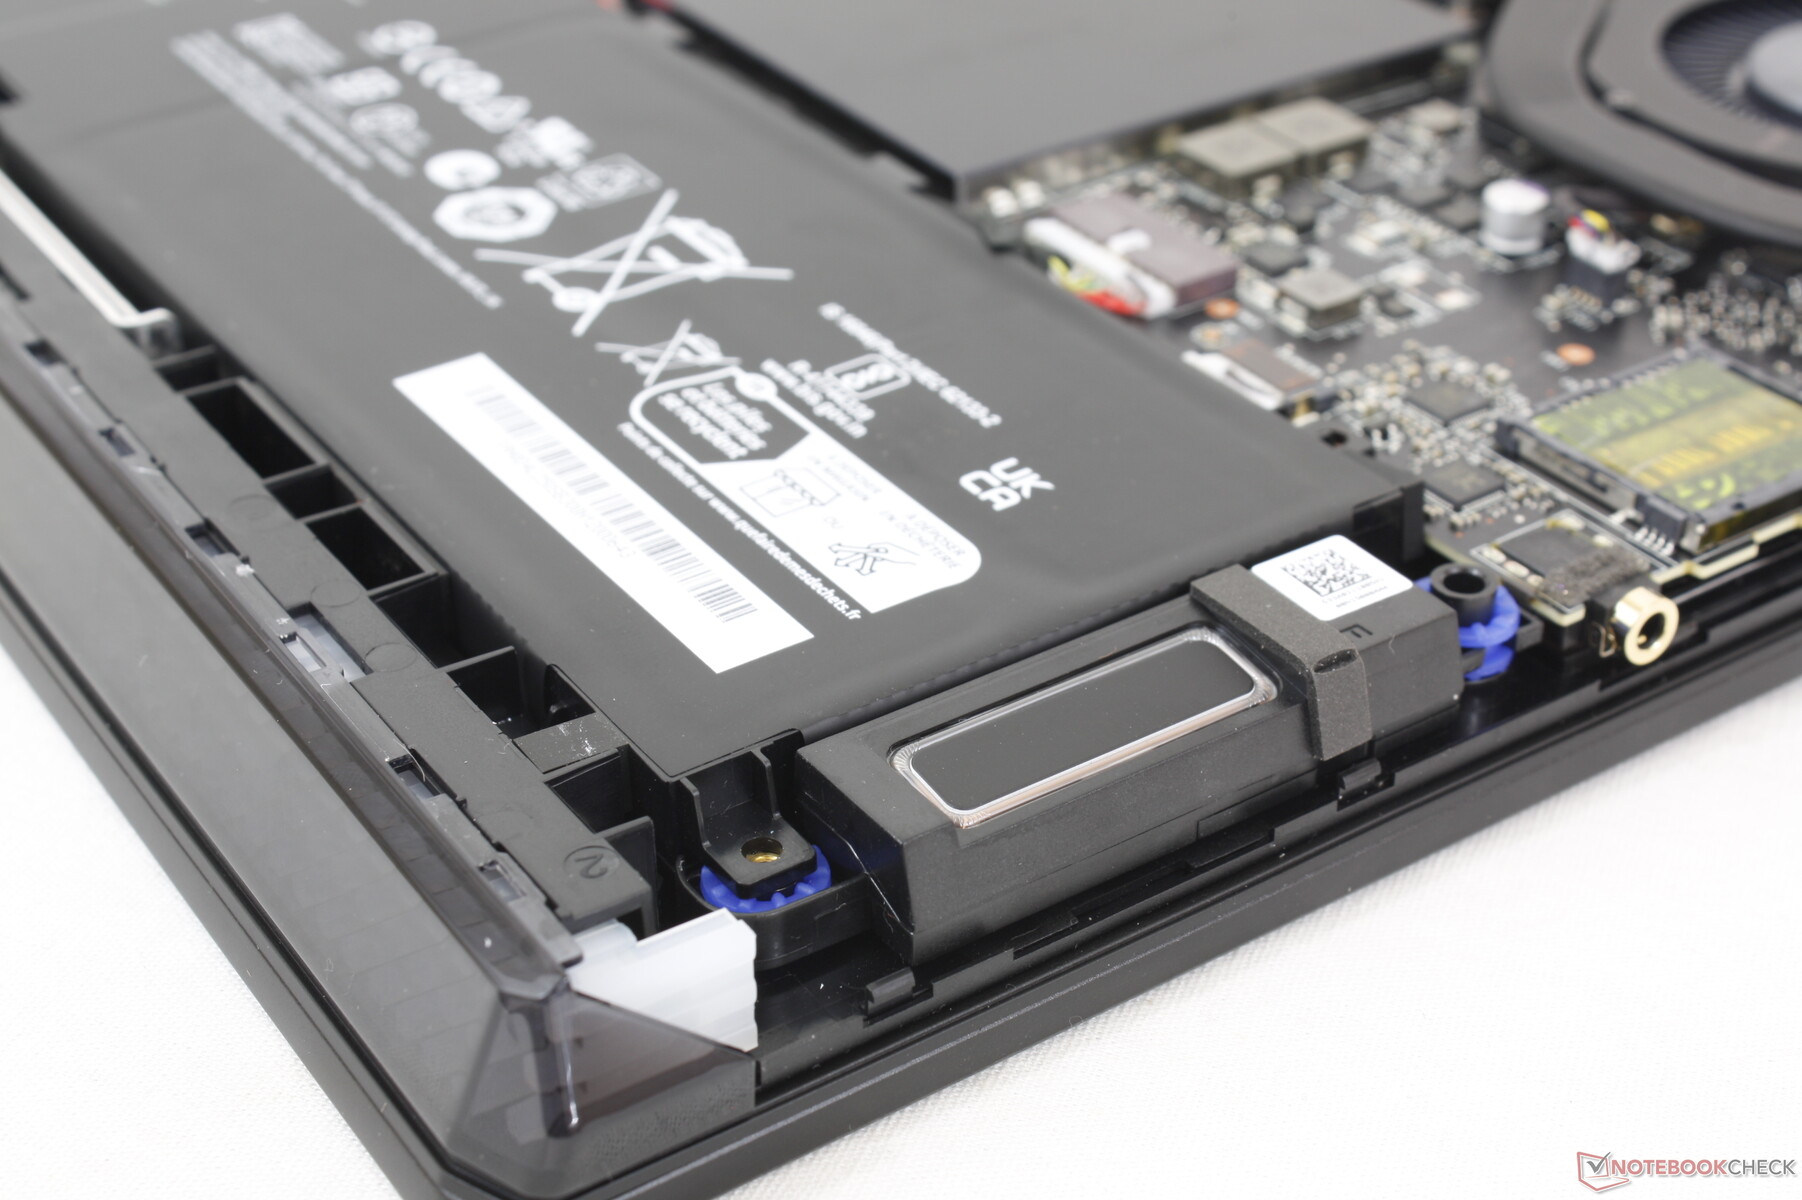
Mantenimiento
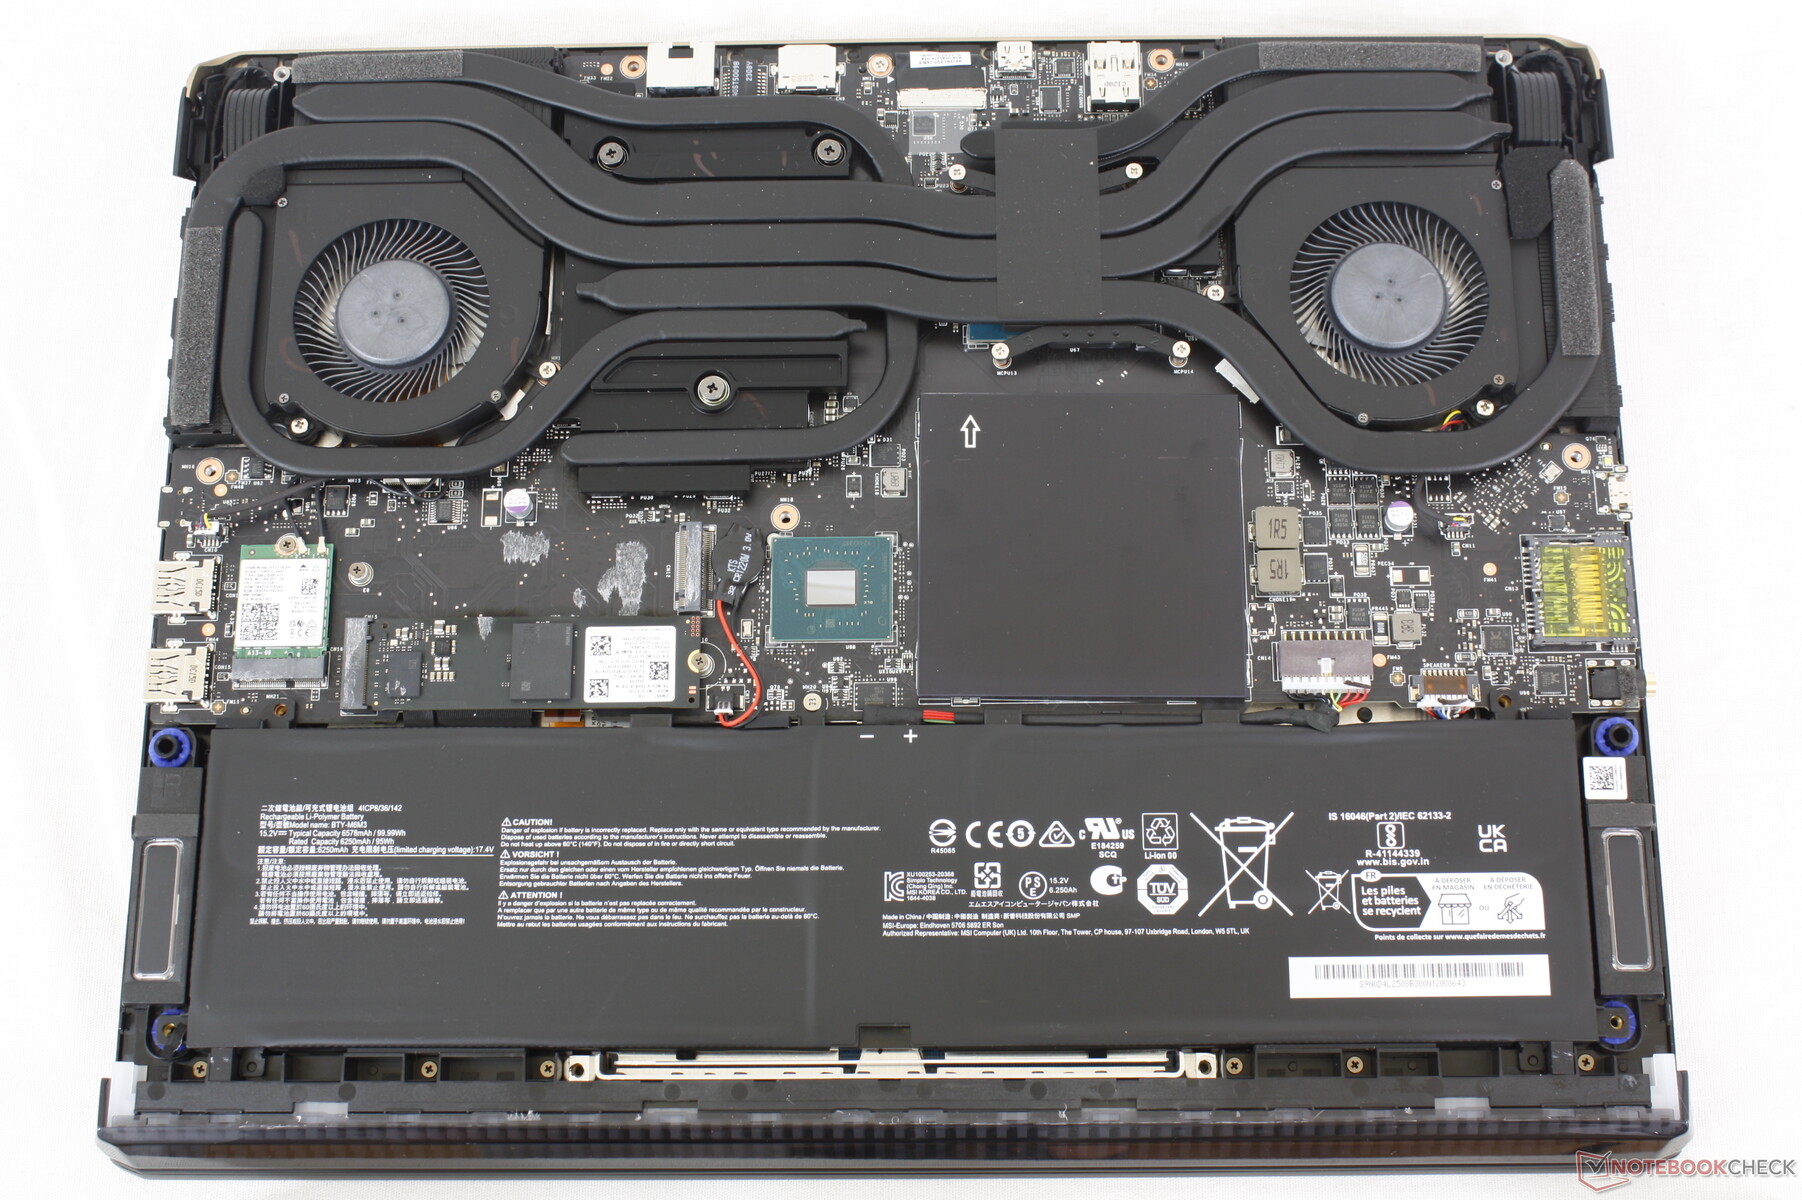
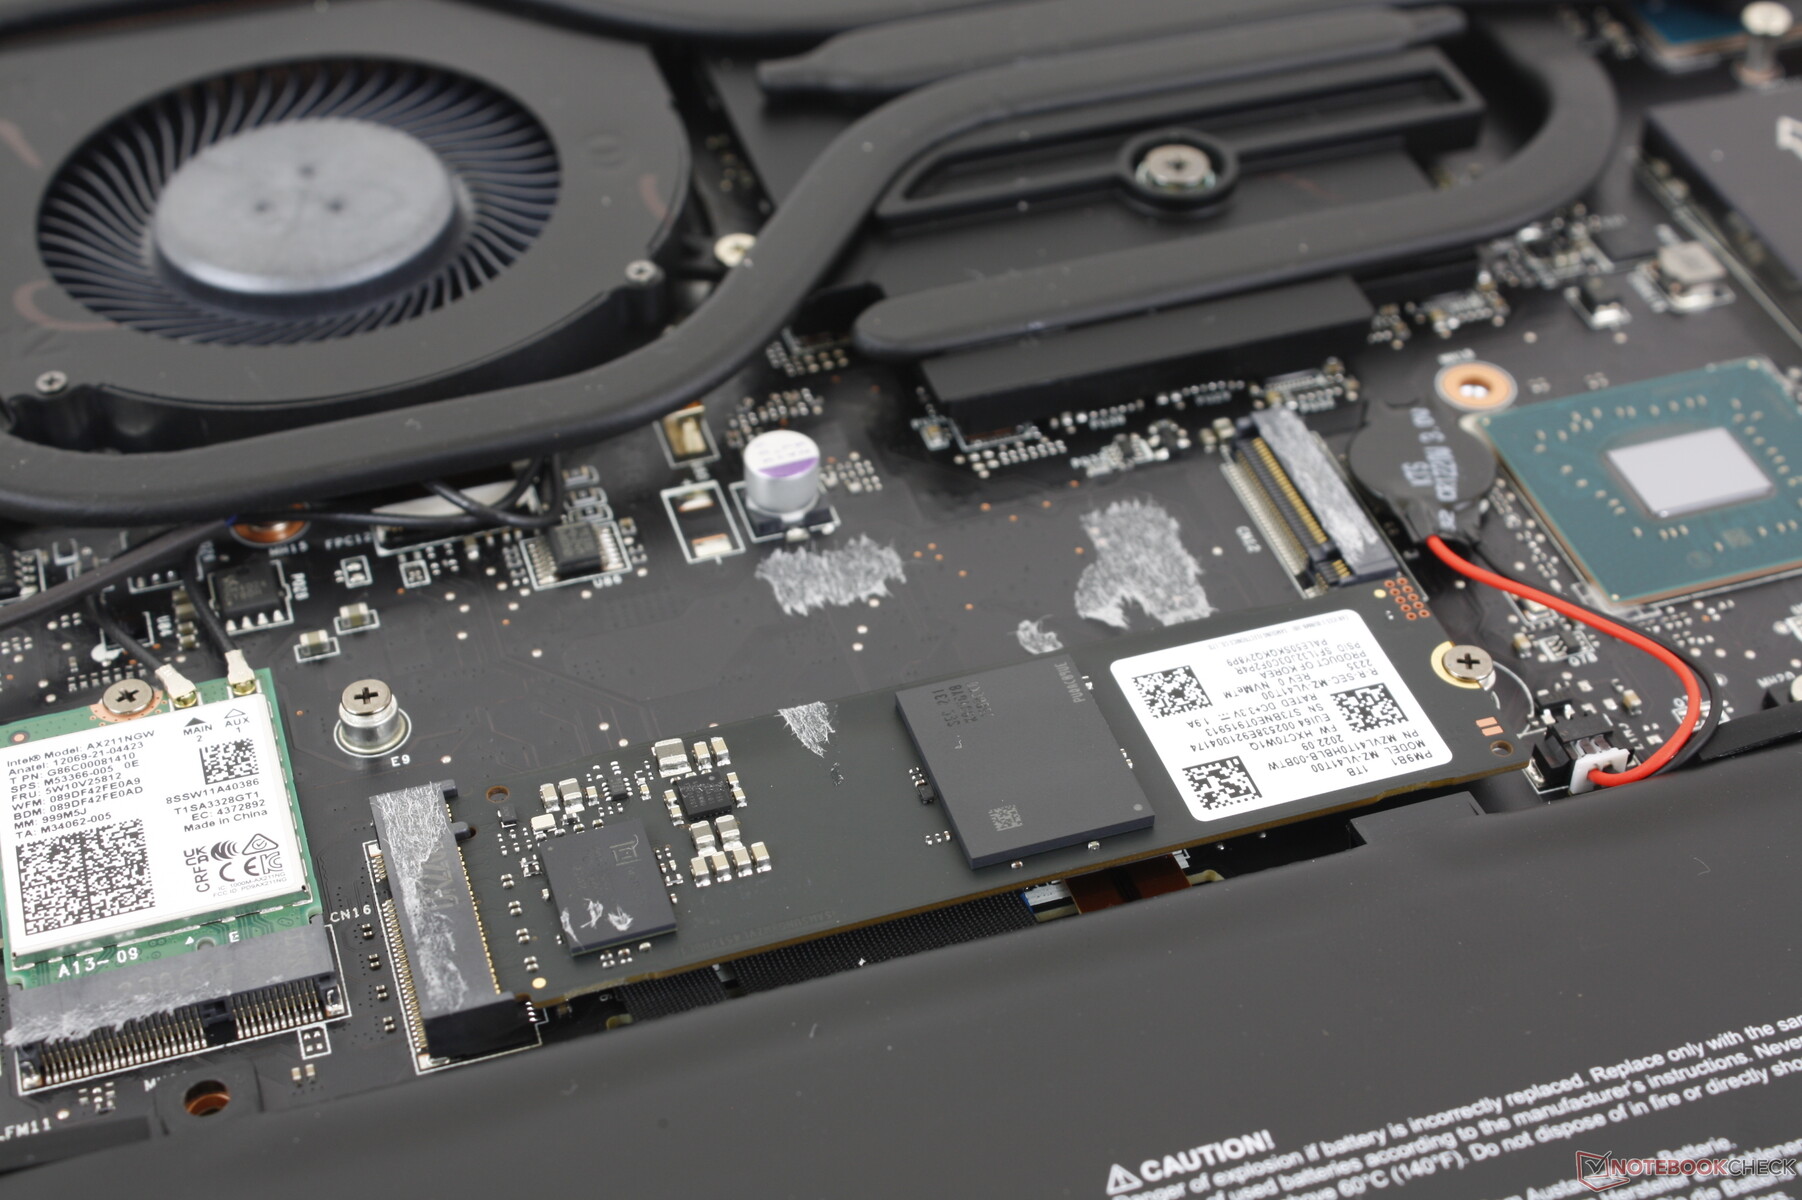
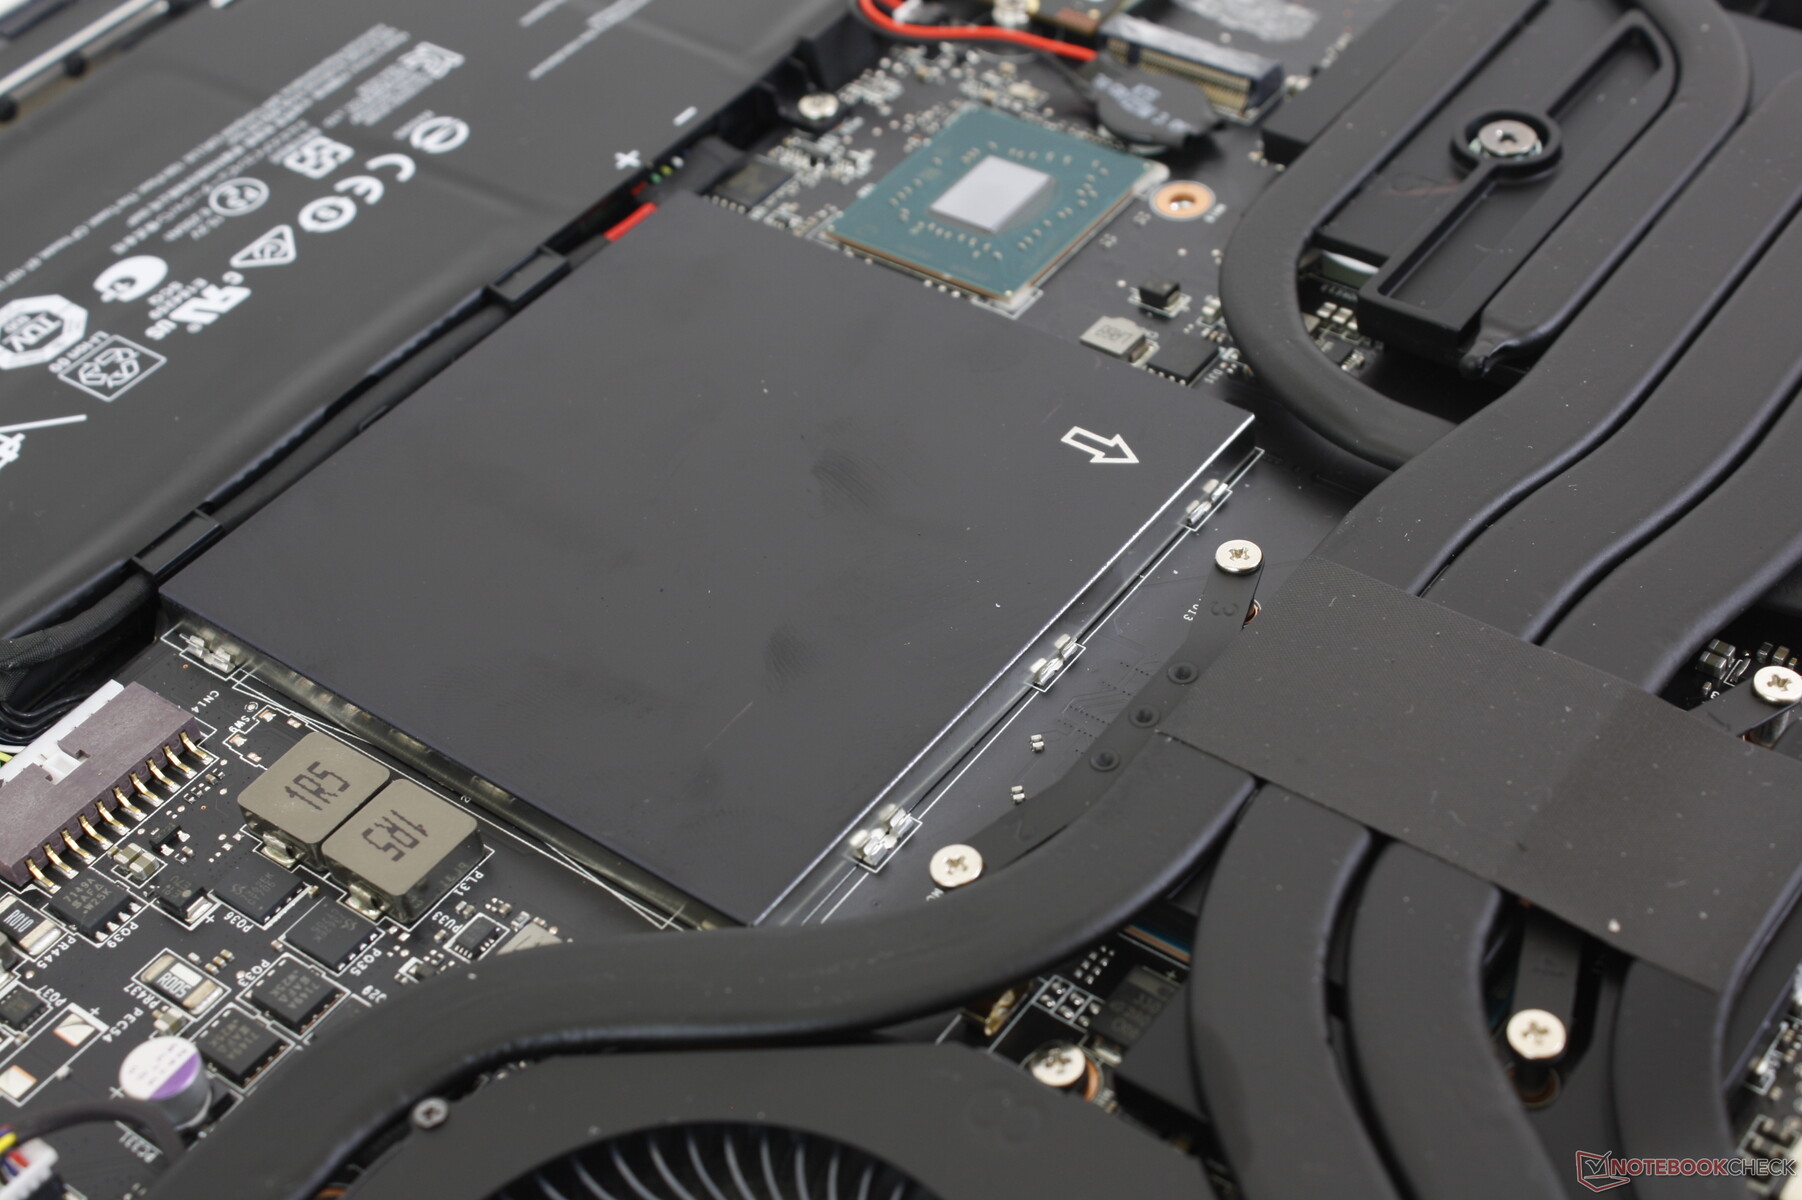
Desafortunadamente, los portátiles MSI son cada vez más difíciles de reparar hoy en día. El panel inferior está asegurado por 13 tornillos Phillips uno de los cuales está detrás de una pegatina antimanipulación para desalentar el mantenimiento por parte del usuario final. El principal problema es que los ganchos de plástico a lo largo de los bordes del panel están en ángulo y firmemente enganchados a la base, especialmente a lo largo de la parte trasera. Estos ganchos son difíciles de quitar y aún más difíciles de volver a instalar.
Los usuarios tienen acceso directo a dos bahías de almacenamiento M.2 2280, dos ranuras SODIMM DDR5, y el módulo WLAN y la batería una vez dentro.
Accesorios y garantía
La caja incluye un paño de limpieza, además del adaptador de CA y la documentación. Se aplica una garantía limitada del fabricante de un año si se adquiere en EE.UU.
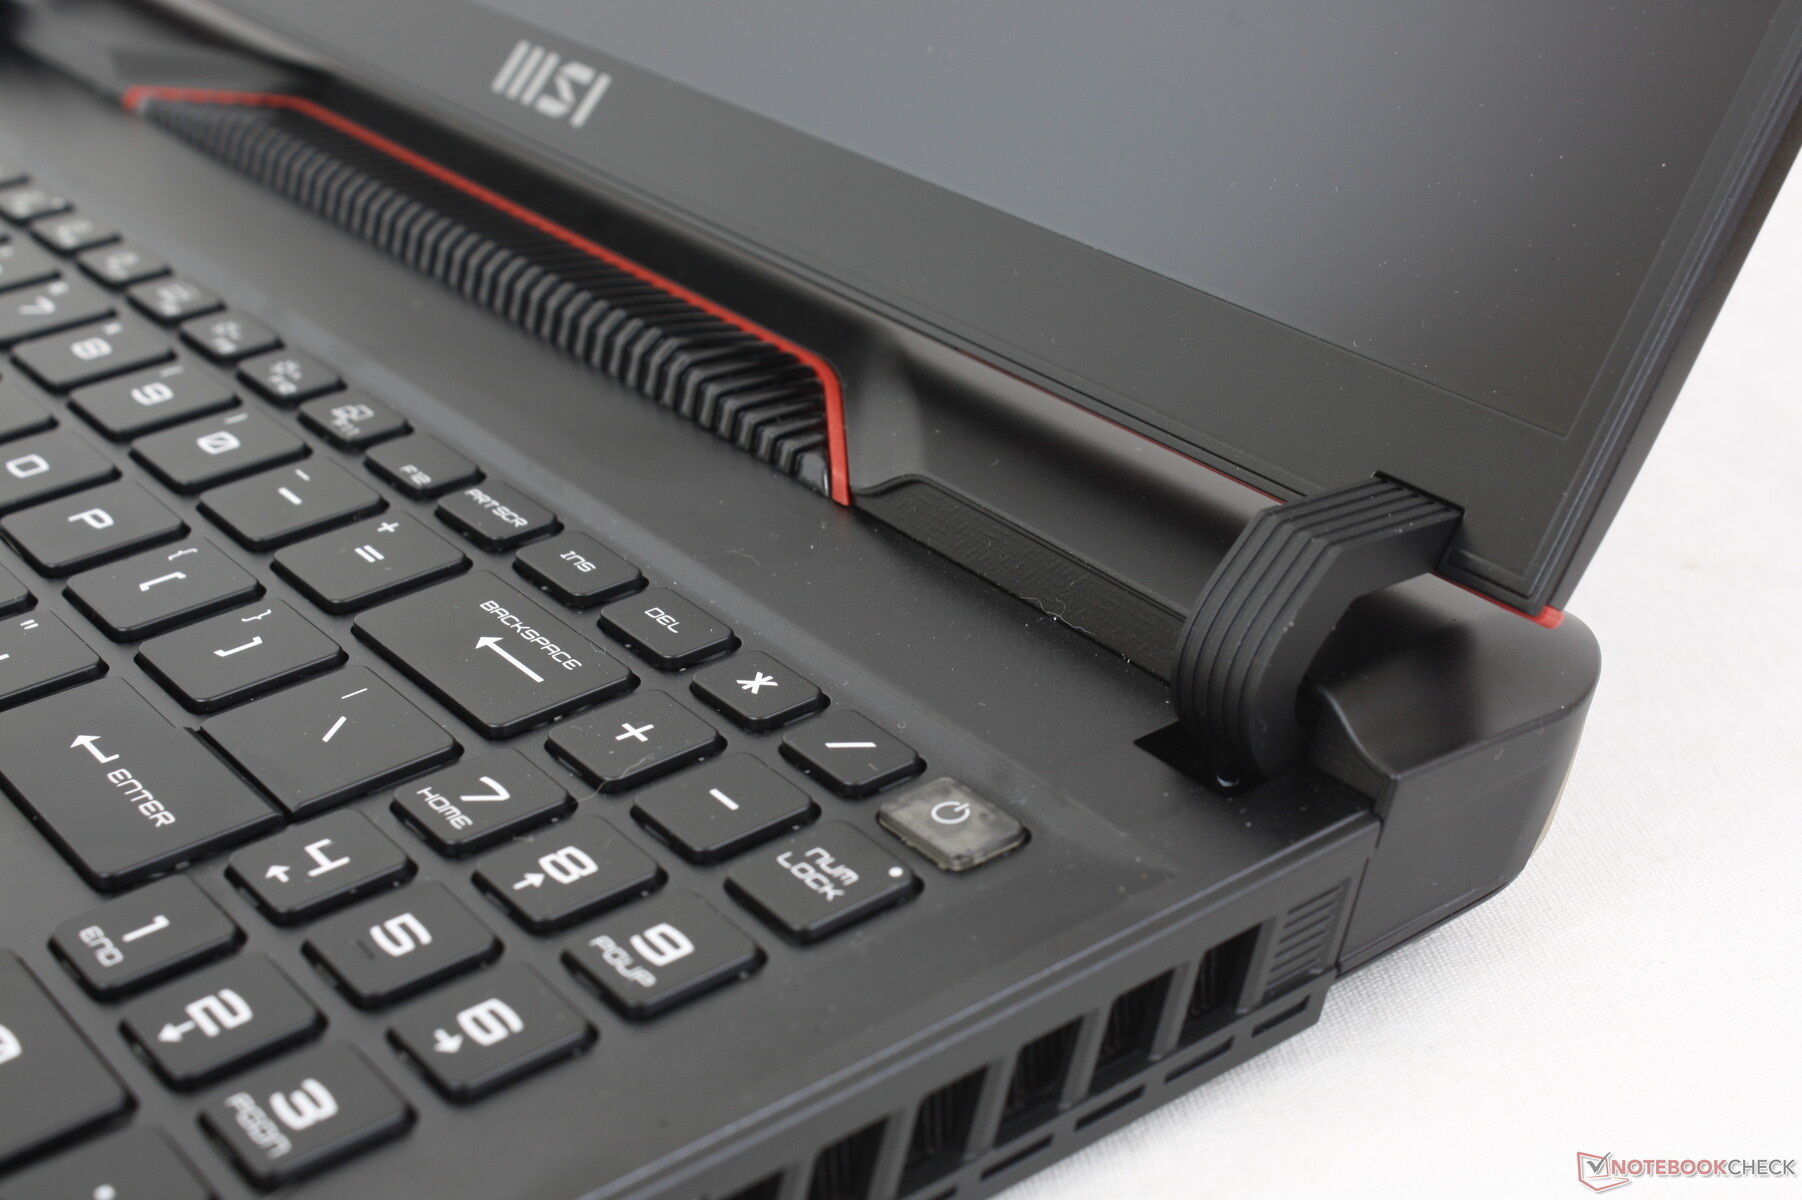
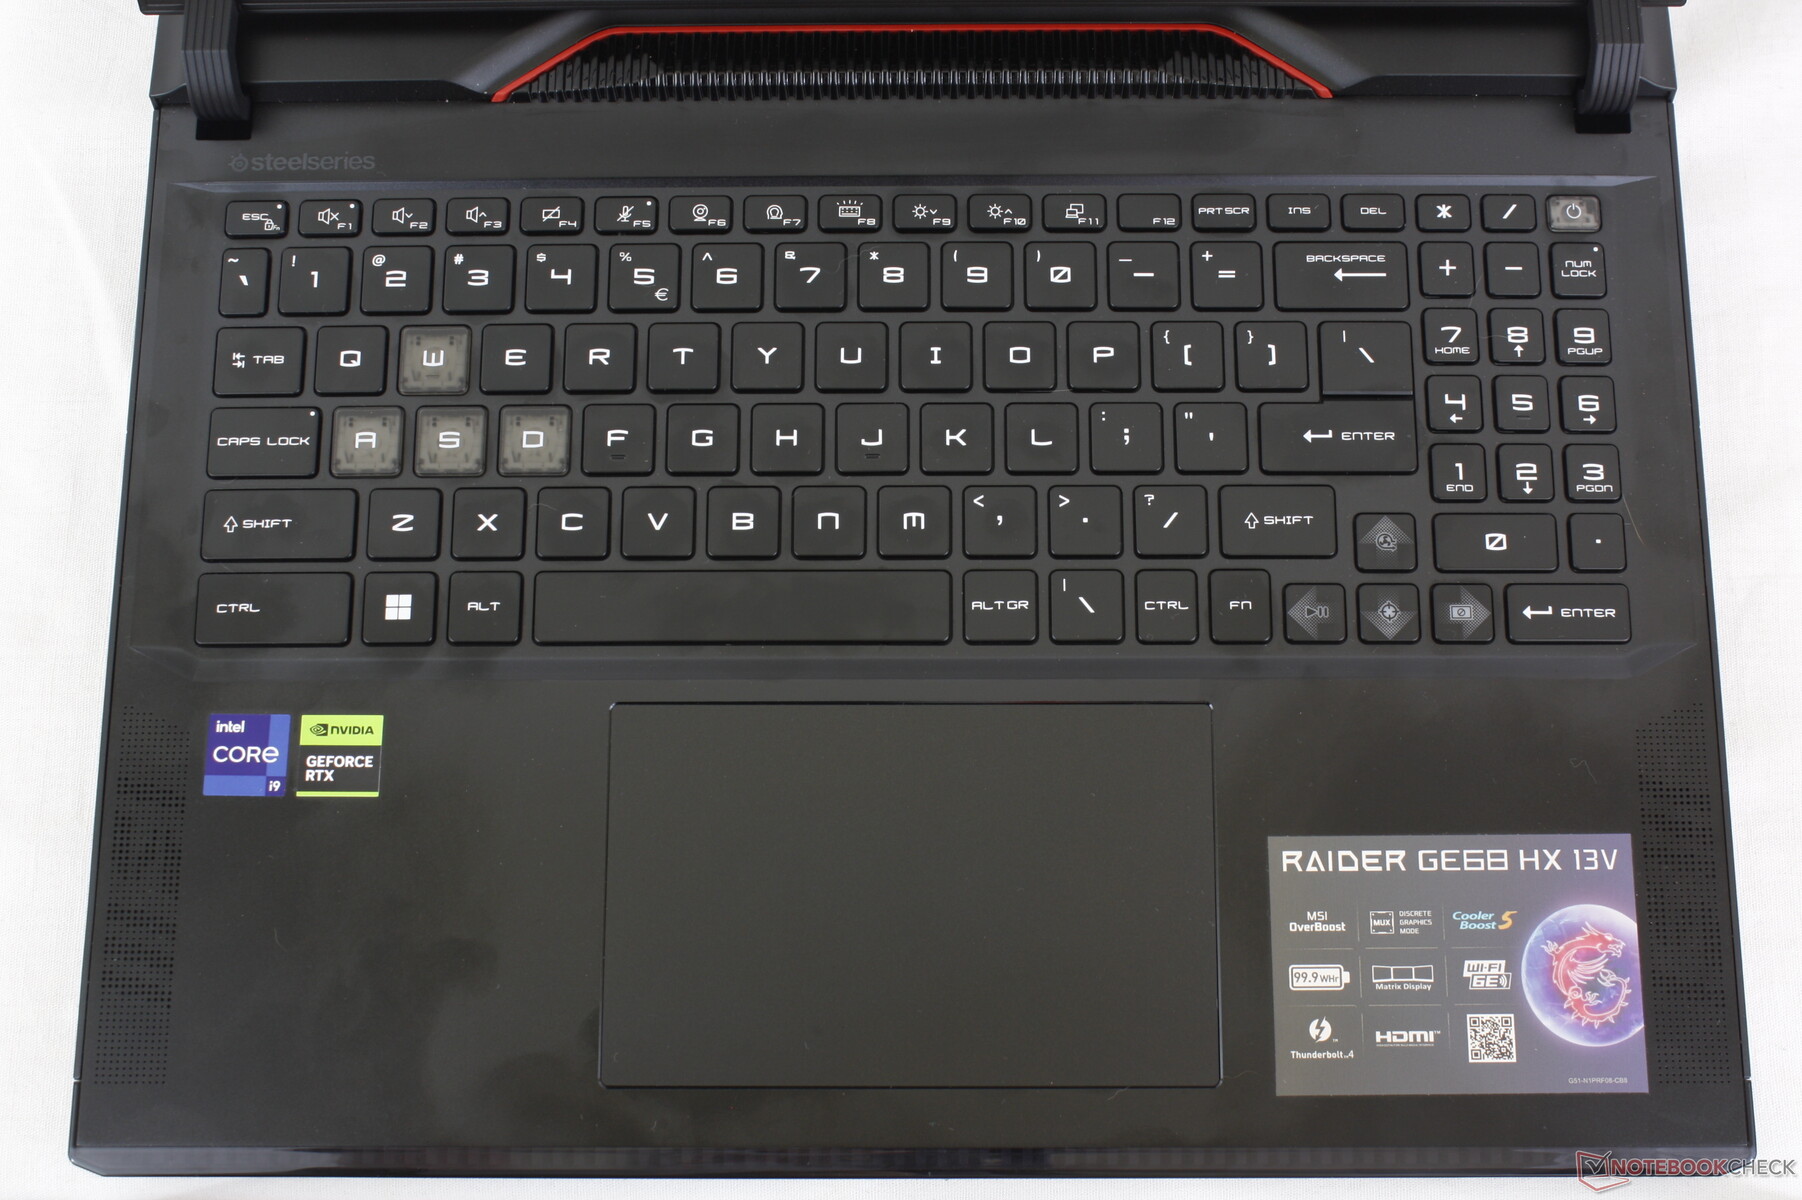
Dispositivos de entrada - Clickpad más grande y nuevo Numpad
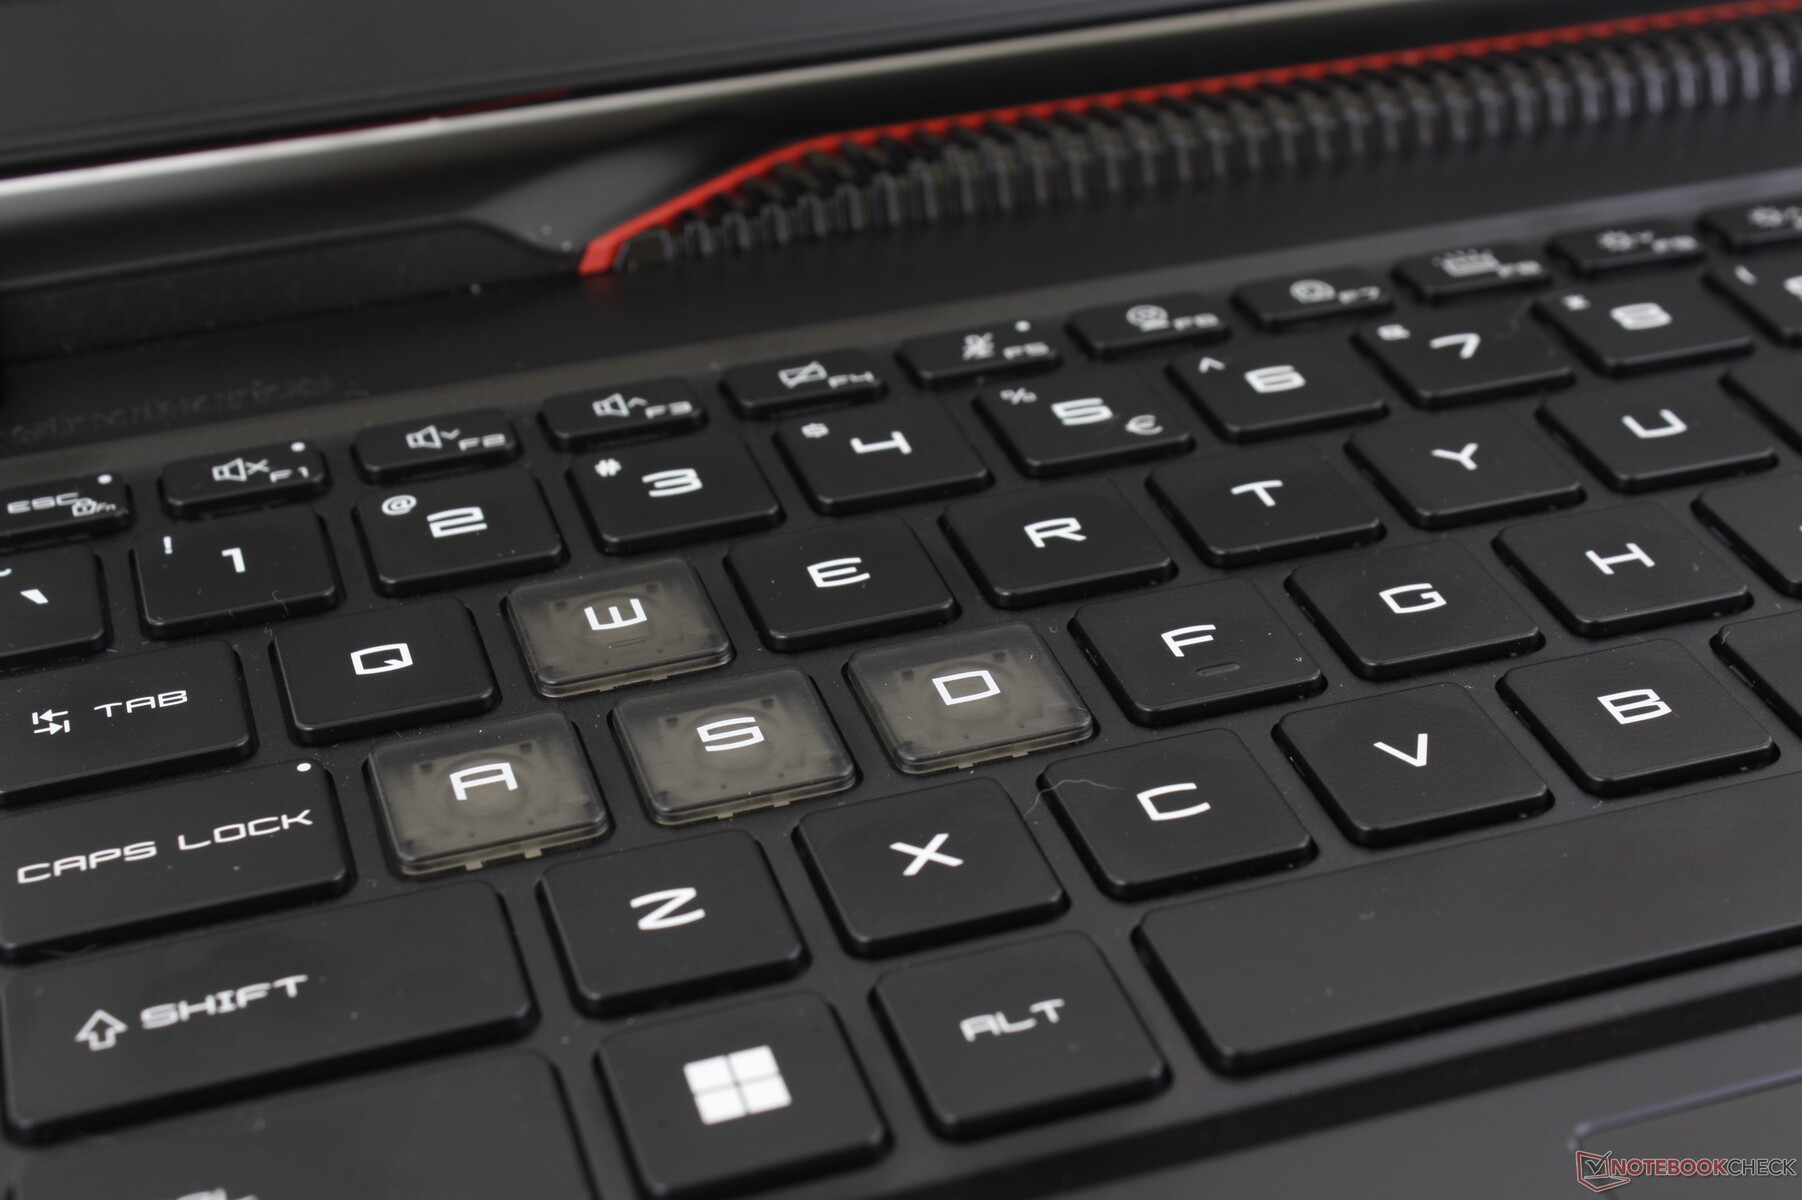
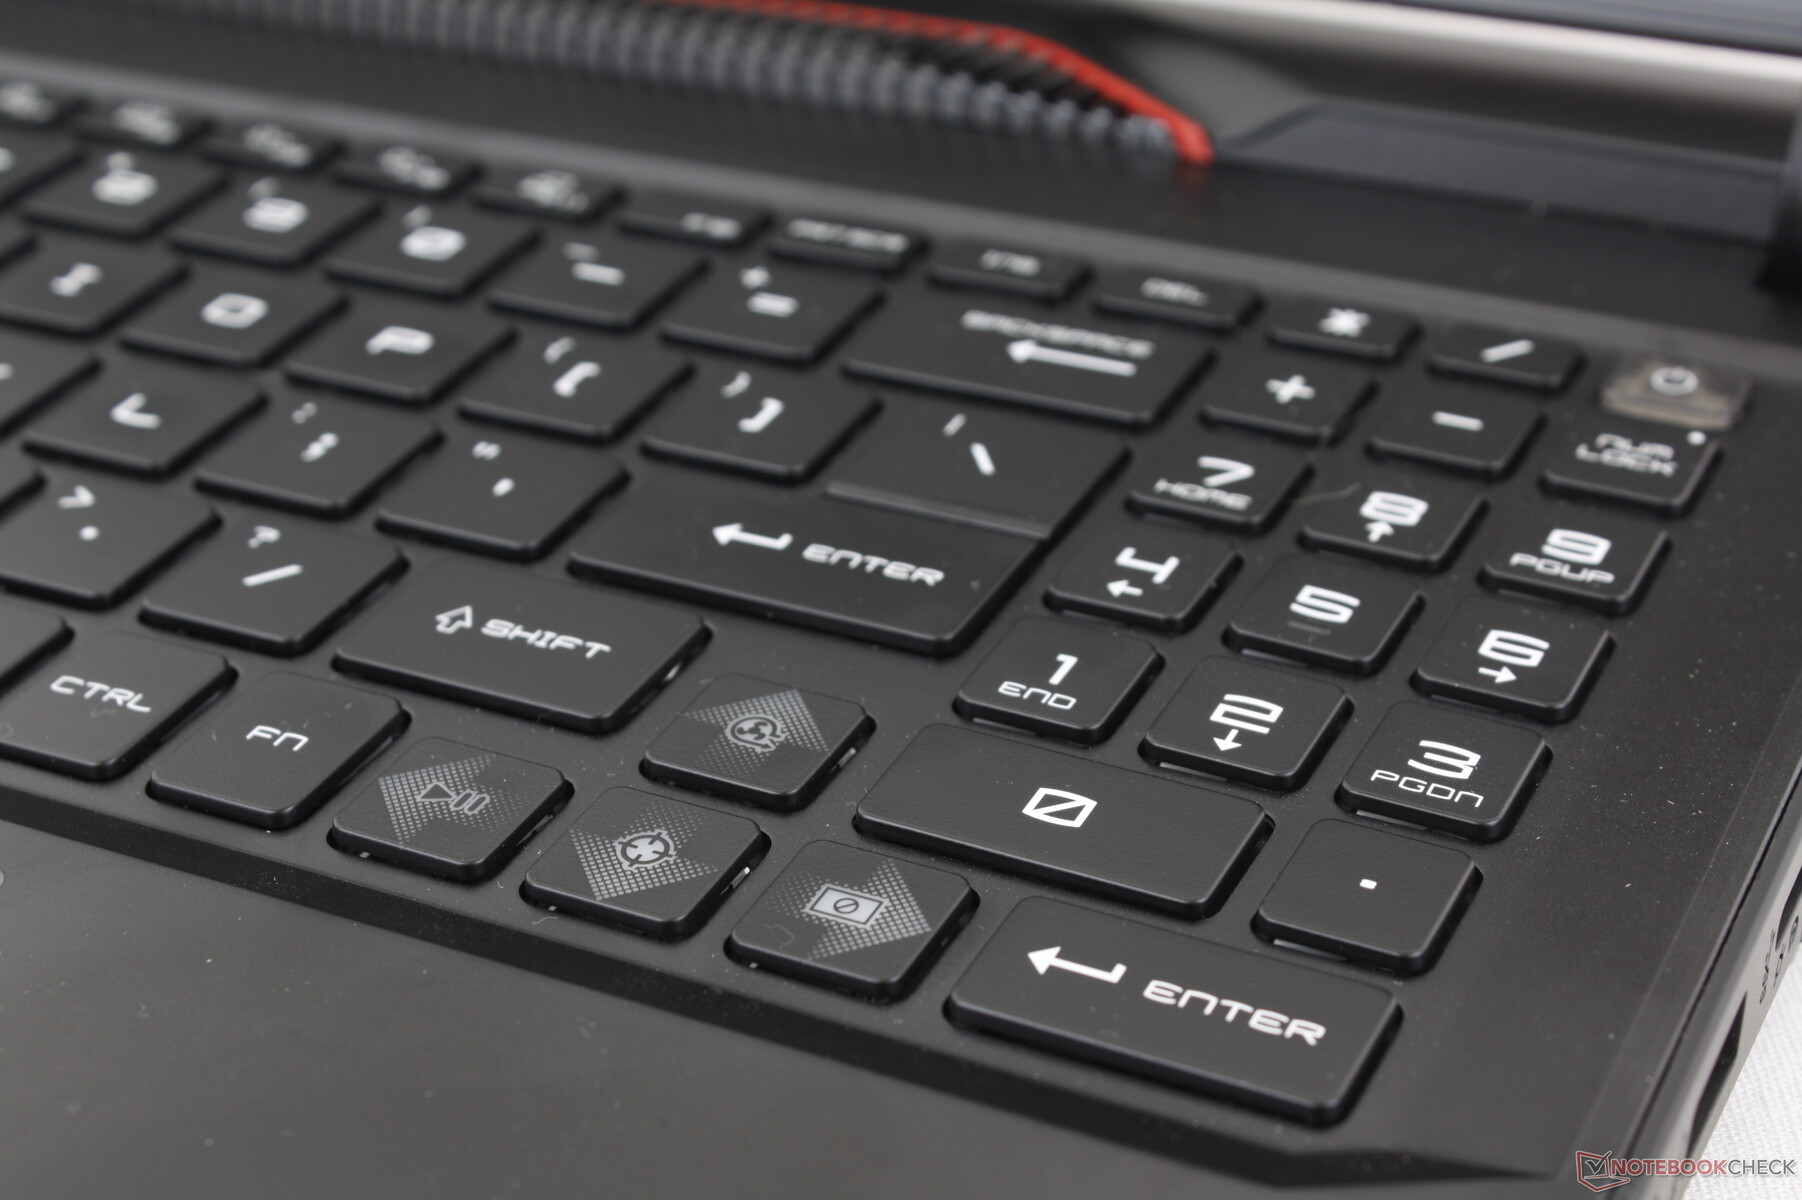
Teclado
MSI ha renovado la distribución del teclado en comparación con el GE67HX. Ahora hay un numpad integrado mientras que las teclas Ctrl y Fn ya no están incómodamente juntas. Por desgracia, las teclas de cursor se han reducido de tamaño para hacer sitio al nuevo numpad.
Por lo demás, la respuesta de las teclas es excelente, firme y uniforme entre las principales teclas QWERTY. Las teclas Space y Enter en particular son notablemente más ruidosas para una sensación más satisfactoria.
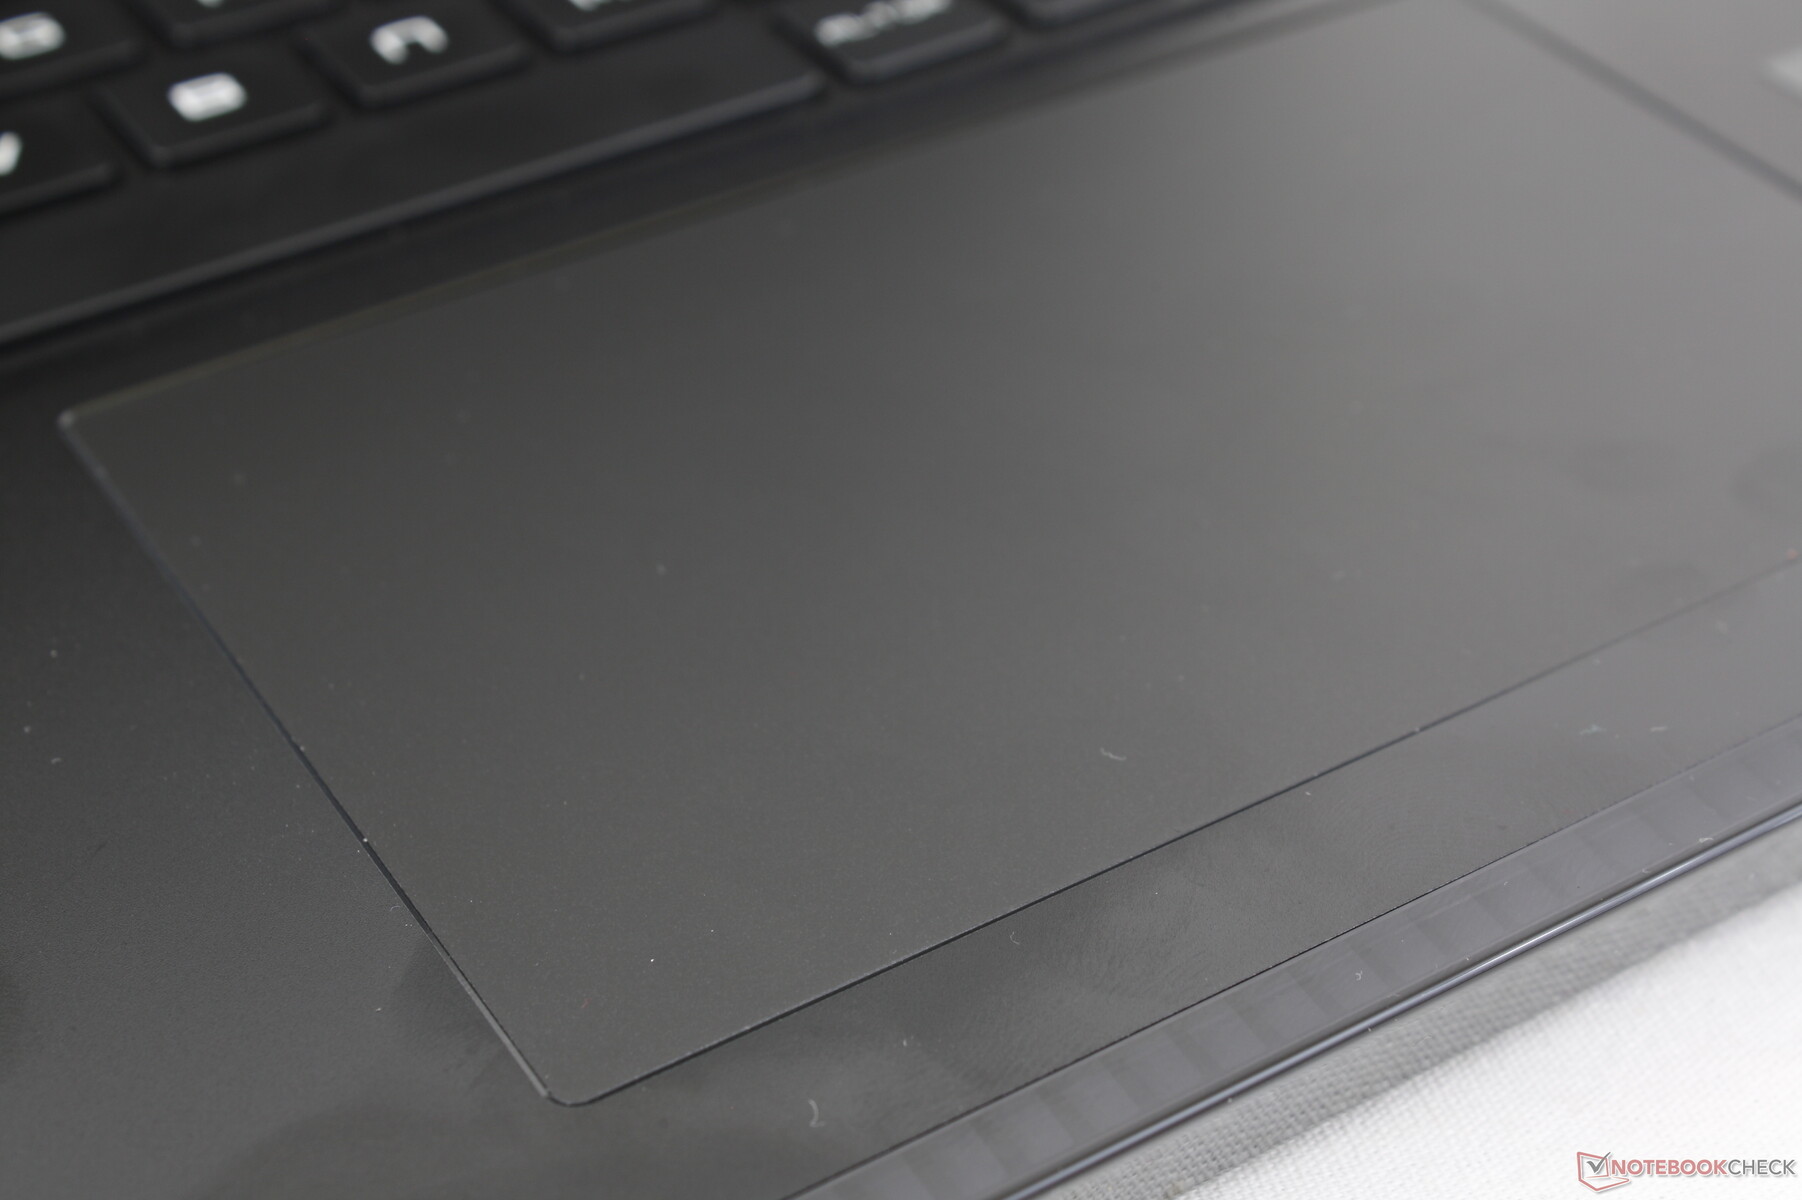
Panel táctil
El tamaño del panel de control ha aumentado significativamente desde los 10,5 x 6,5 cm del GE67HX a 13 x 8,3 cm en el GE68HX. El deslizamiento es muy suave y sensible y casi no se pega, incluso cuando se mueve a baja velocidad. El clic también es satisfactorio, pero la respuesta no es perfectamente uniforme, ya que se siente más clic cuando se presiona en el centro, mientras que las esquinas inferiores se sienten más esponjosas.
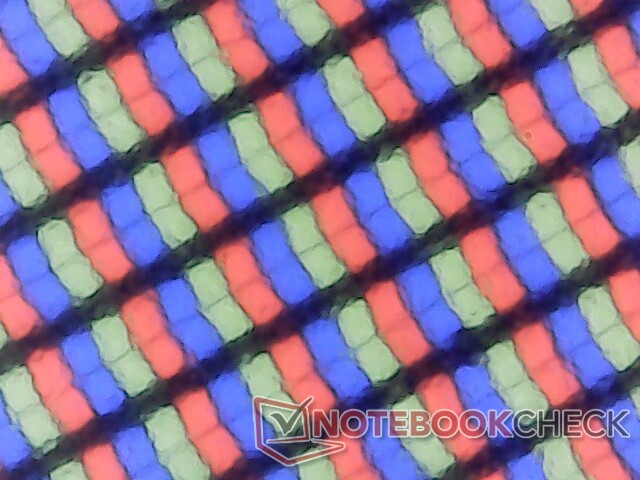
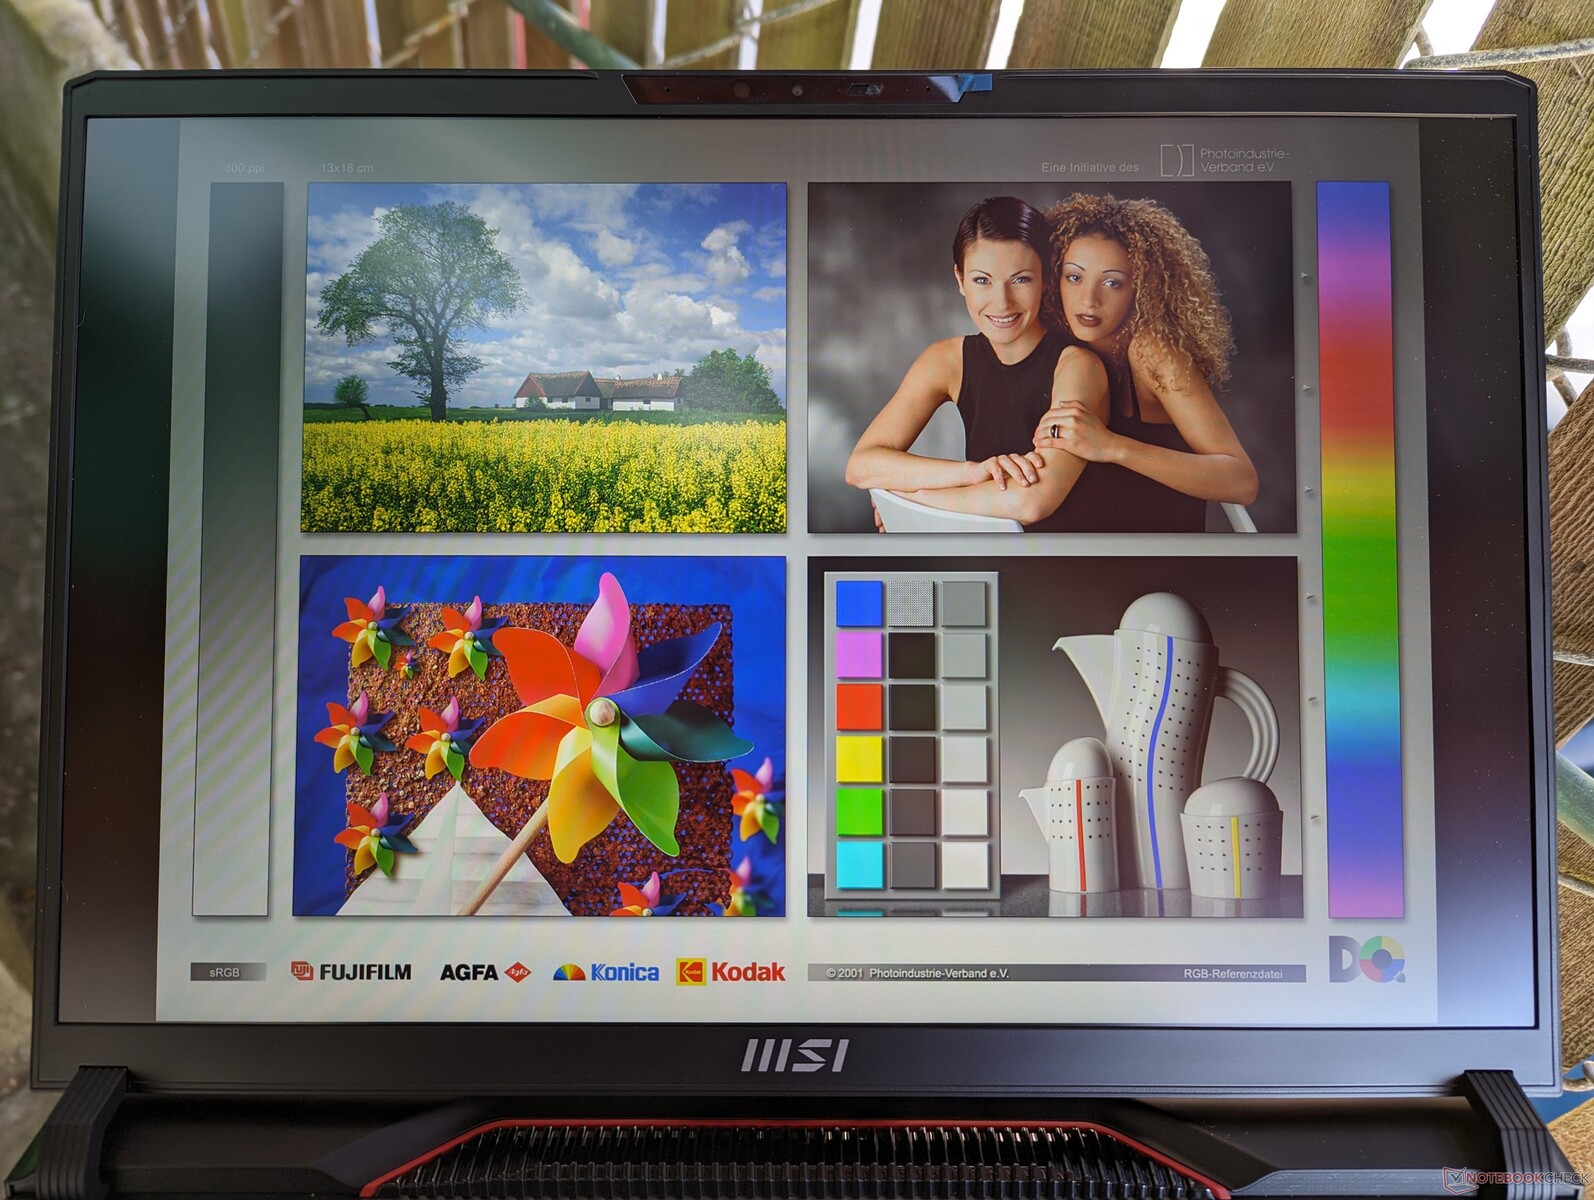
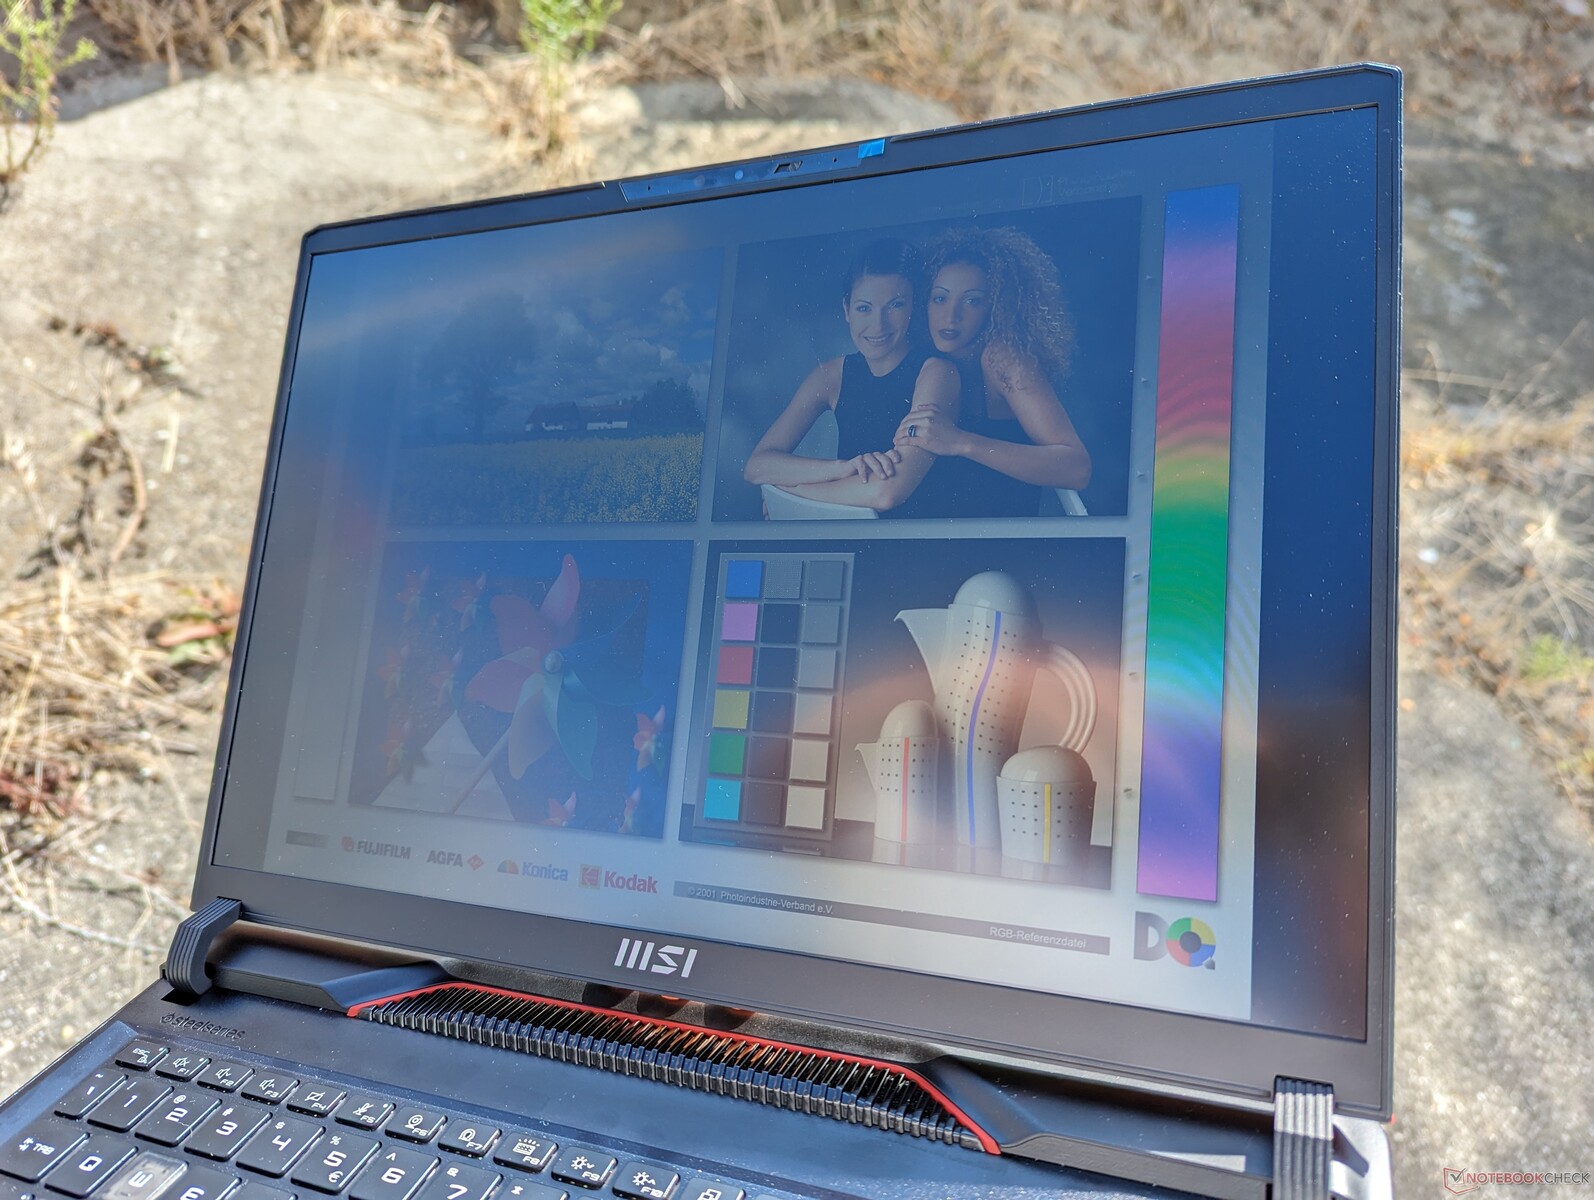
Pantalla - Colores pobres
El Raider GE68HX se suministra con dos opciones de panel diferentes. Nuestra unidad de prueba específica viene con la opción en negrita a continuación:
- 2560 x 1600, 240 Hz, 100% DCI-P3, 3 ms, IPS
- 1920 x 1200, 144 Hz, 60% sRGB, 11 ms, IPS
La opción más barata de 144 Hz no se recomienda debido a su cobertura de color más estrecha y tiempos de respuesta más lentos para un efecto fantasma más notable. Los colores menos profundos son difíciles de pasar por alto incluso si no haces mucha edición de gráficos. Este panel es más adecuado para portátiles de juego más baratos como el MSI Pulse 17 donde las gamas de color estrechas son comunes.
G-Sync está notablemente ausente en todas las configuraciones actuales del GE68HX.
| |||||||||||||||||||||||||
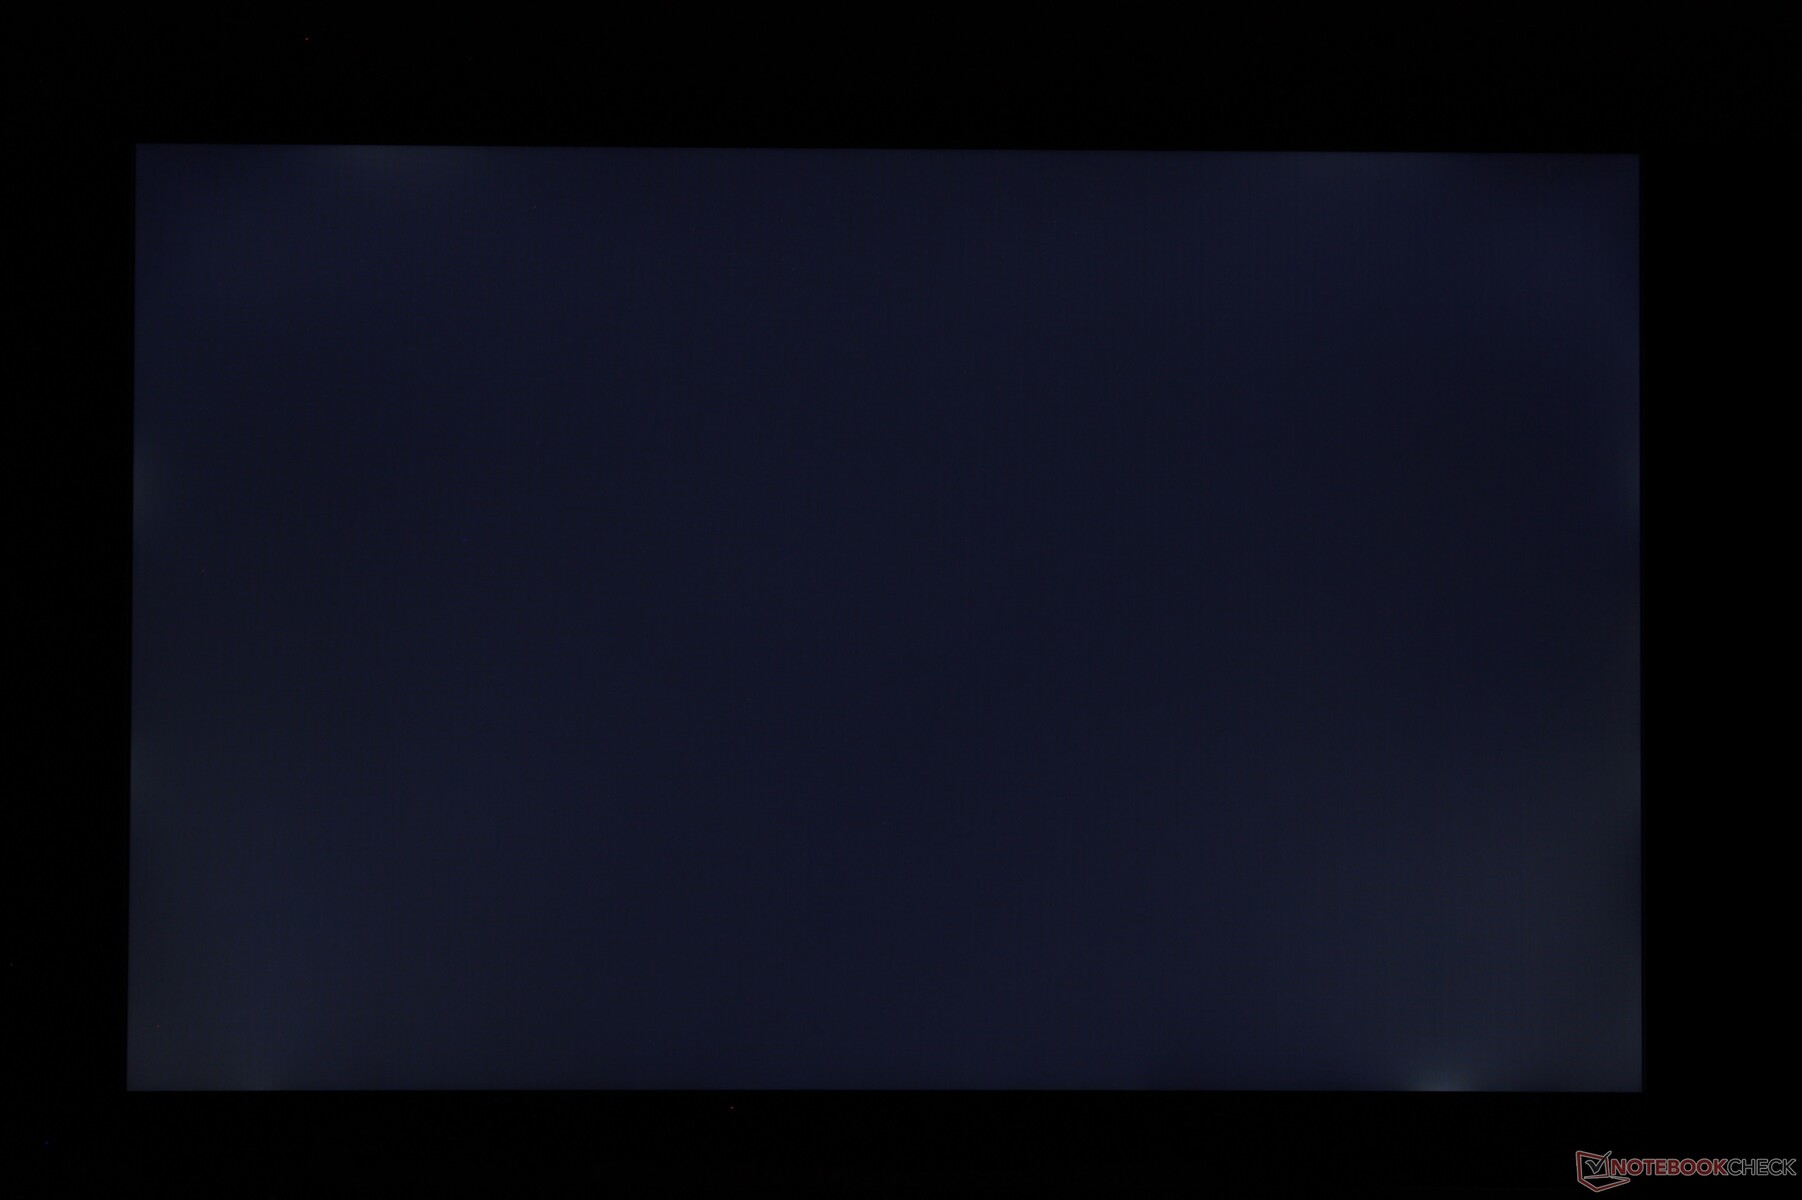
iluminación: 93 %
Brillo con batería: 300.9 cd/m²
Contraste: 971:1 (Negro: 0.31 cd/m²)
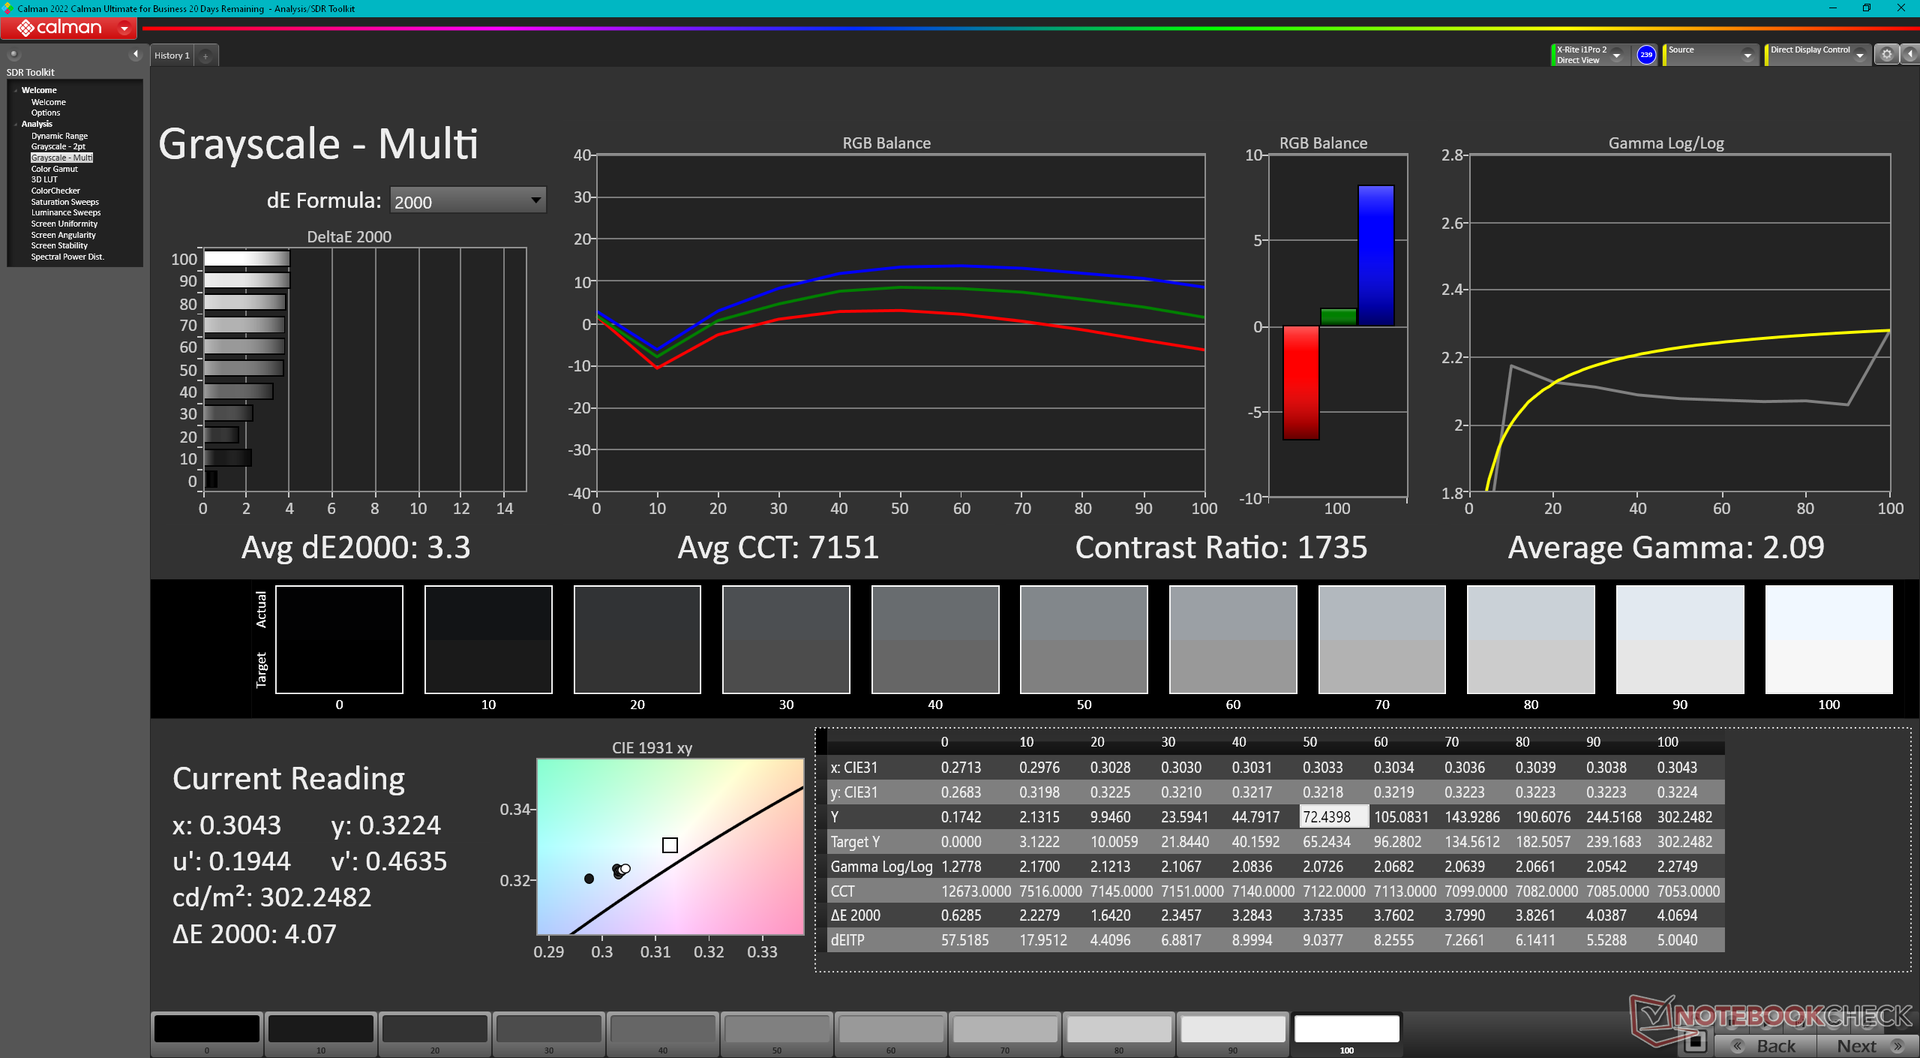
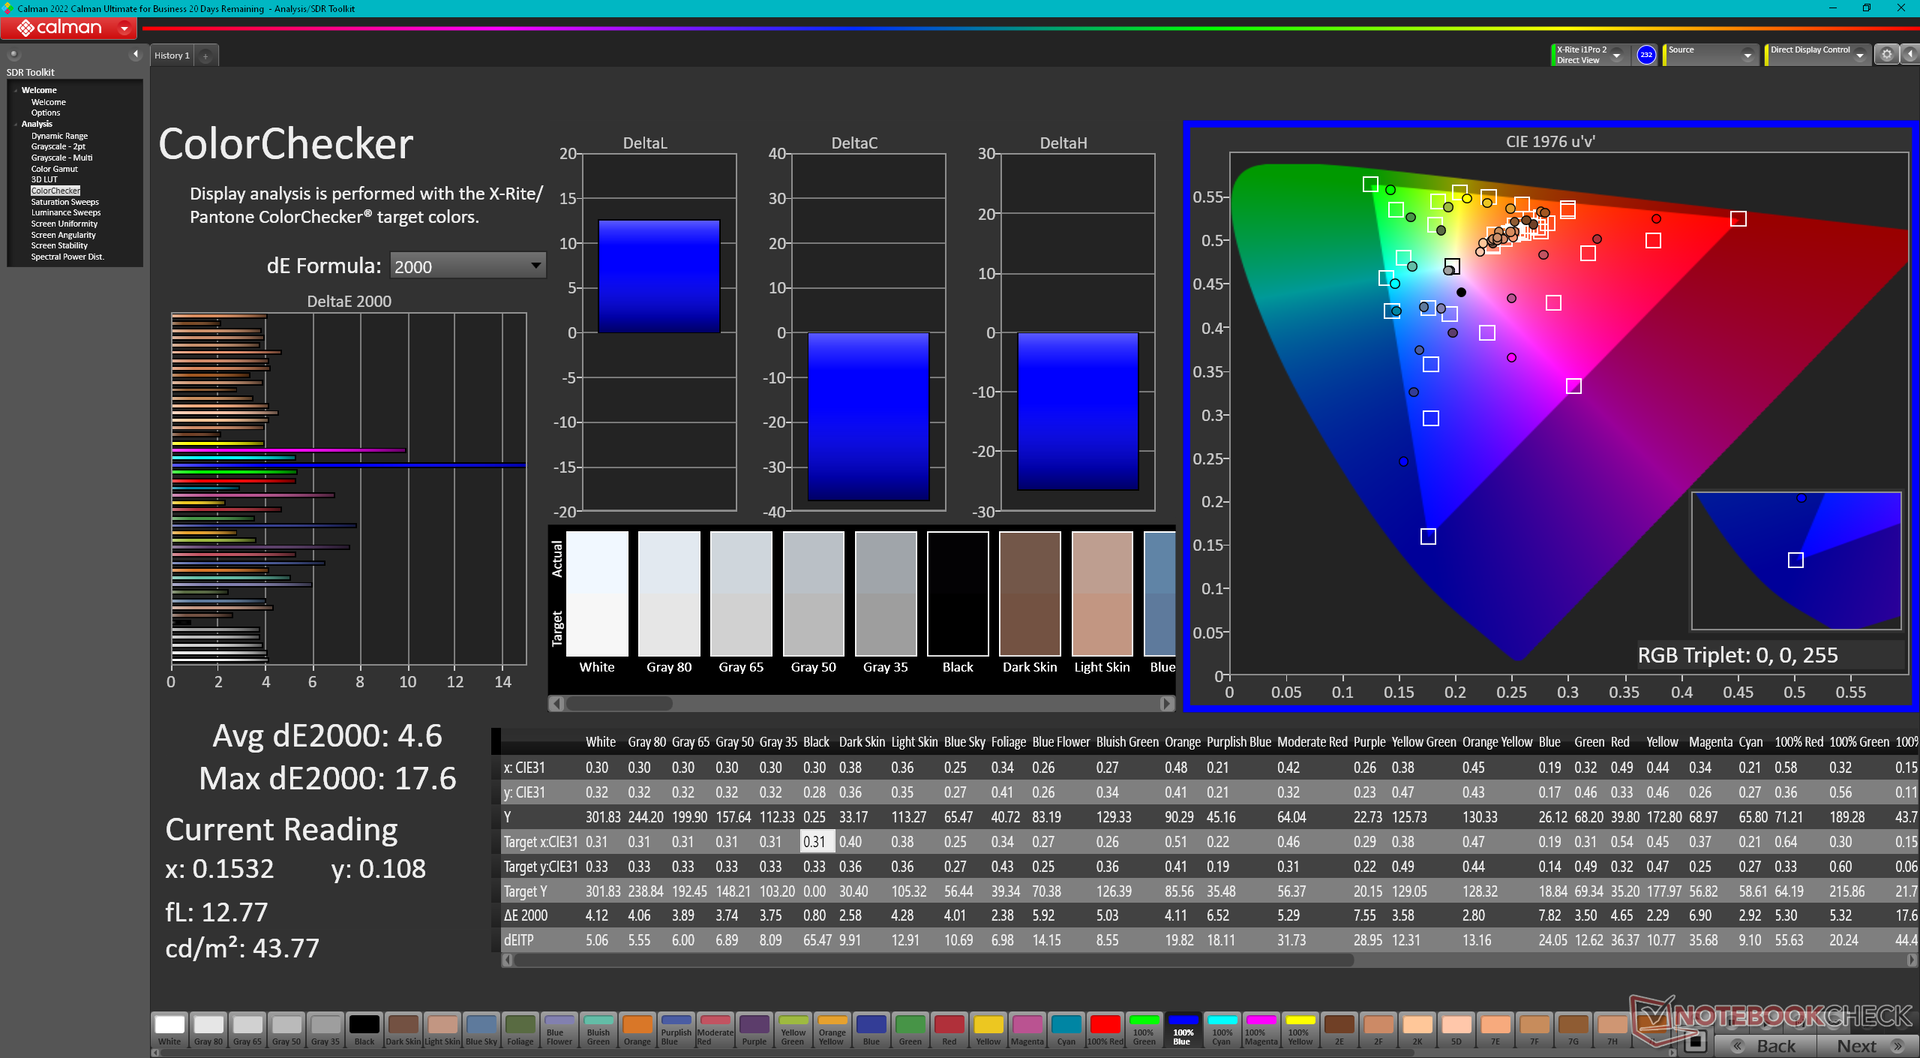
ΔE ColorChecker Calman: 4.6 | ∀{0.5-29.43 Ø4.73}
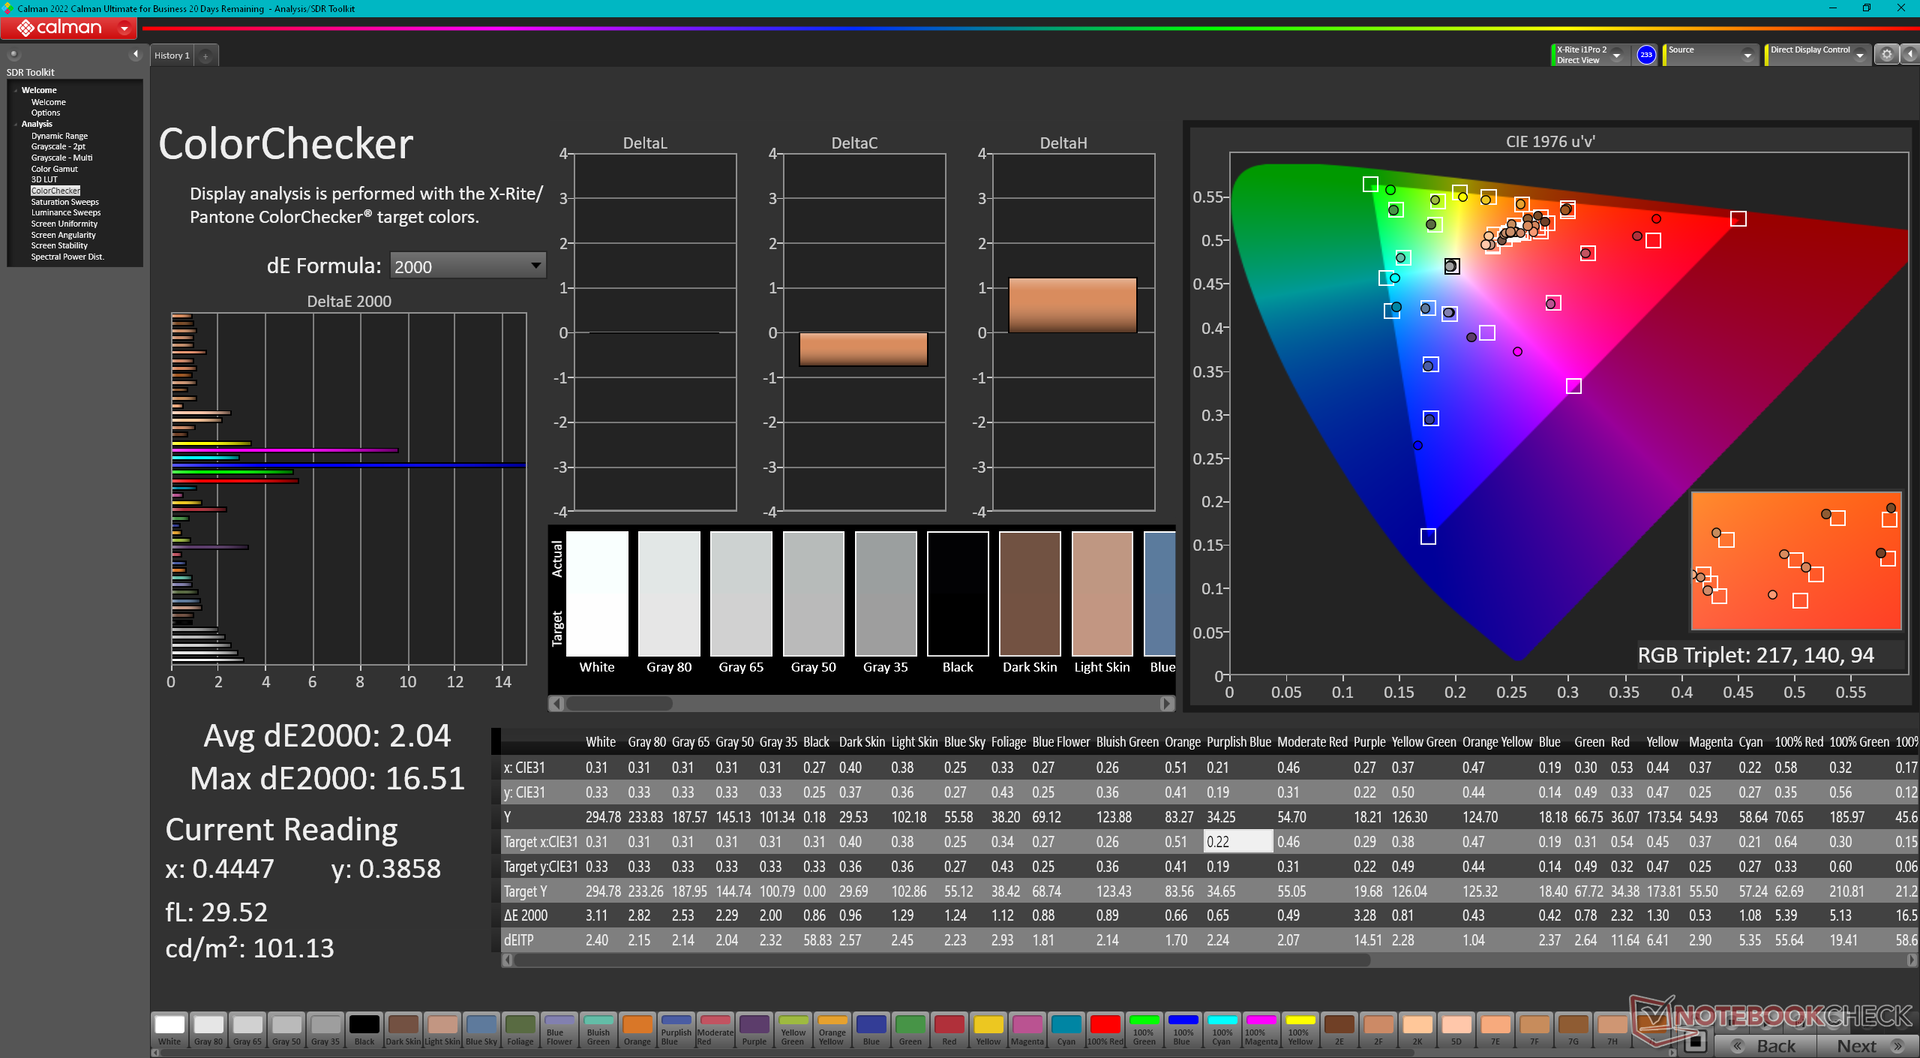
calibrated: 2.04
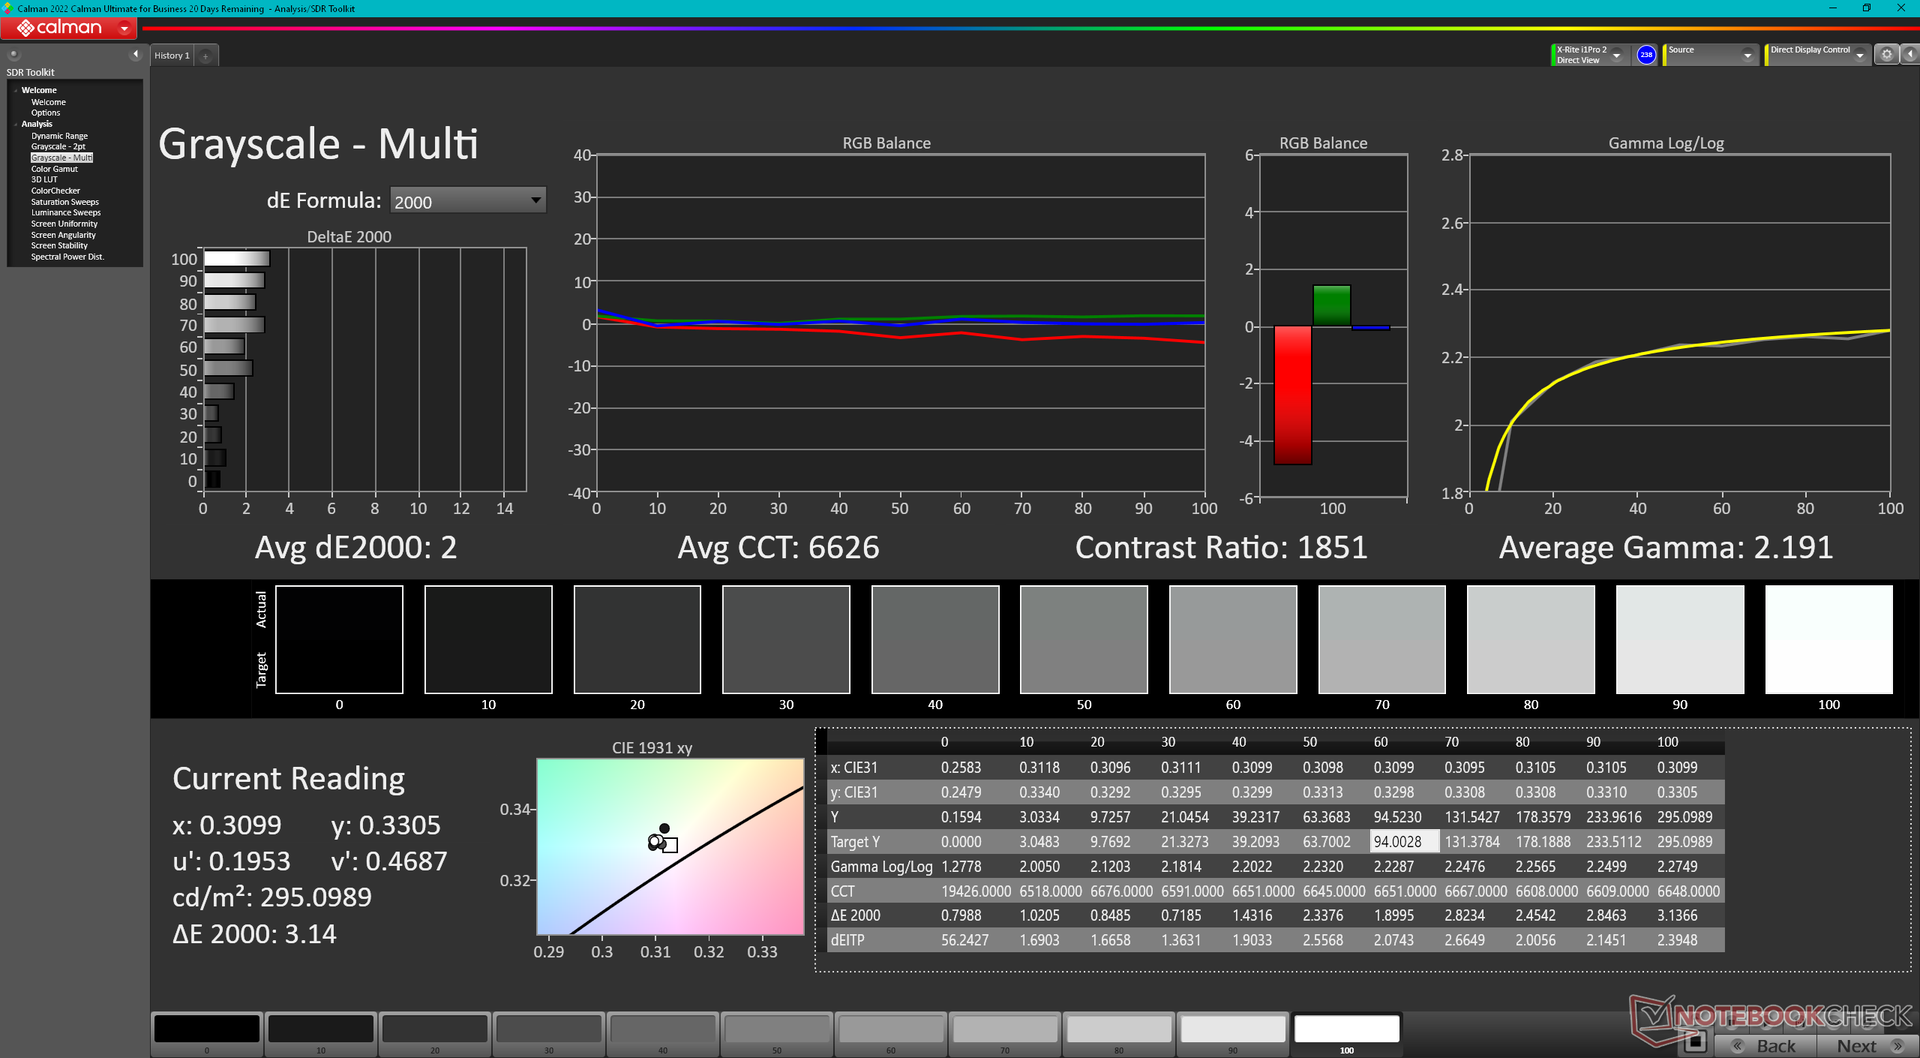
ΔE Greyscale Calman: 3.3 | ∀{0.09-98 Ø4.97}
43% AdobeRGB 1998 (Argyll 3D)
62.2% sRGB (Argyll 3D)
41.6% Display P3 (Argyll 3D)
Gamma: 2.09
CCT: 7151 K
| MSI Raider GE68HX 13VF Chi Mei N160JME-GTK, IPS, 1900x1200, 16" | MSI GE67 HX 12UGS Samsung ATNA562P02-0, OLED, 1920x1080, 15.6" | HP Omen 16-xf0376ng BOE0B81, IPS, 1920x1080, 16.1" | Alienware m16 R1 AMD BOE NE16NZ4, IPS, 2560x1600, 16" | Lenovo Legion Slim 7i 16 Gen 8 CSOT T3 MNG007DA2-3, IPS, 2560x1600, 16" | Asus ROG Zephyrus M16 GU604VY-NM042X BOE0B74 (NE160QDM-NM4, IPS, 2560x1600, 16" | |
|---|---|---|---|---|---|---|
| Display | 64% | 67% | 102% | 66% | 103% | |
| Display P3 Coverage (%) | 41.6 | 71.7 72% | 72.1 73% | 98.6 137% | 70.4 69% | 99.33 139% |
| sRGB Coverage (%) | 62.2 | 89.7 44% | 99.6 60% | 99.9 61% | 99.4 60% | 99.9 61% |
| AdobeRGB 1998 Coverage (%) | 43 | 75.2 75% | 72.3 68% | 88.9 107% | 72.5 69% | 90.01 109% |
| Response Times | 99% | 50% | 67% | 47% | -108% | |
| Response Time Grey 50% / Grey 80% * (ms) | 17.3 ? | 0.25 ? 99% | 12.3 ? 29% | 5.1 ? 71% | 12 ? 31% | 50.8 ? -194% |
| Response Time Black / White * (ms) | 24.2 ? | 0.4 ? 98% | 7.2 ? 70% | 9 ? 63% | 8.9 ? 63% | 29.6 ? -22% |
| PWM Frequency (Hz) | 480.4 ? | 12000 | ||||
| Screen | 17% | 10% | 10% | 34% | 297% | |
| Brightness middle (cd/m²) | 300.9 | 356.1 18% | 350 16% | 329 9% | 474.6 58% | 634 111% |
| Brightness (cd/m²) | 302 | 358 19% | 338 12% | 317 5% | 445 47% | 627 108% |
| Brightness Distribution (%) | 93 | 99 6% | 91 -2% | 89 -4% | 86 -8% | 92 -1% |
| Black Level * (cd/m²) | 0.31 | 0.35 -13% | 0.32 -3% | 0.39 -26% | 0.03 90% | |
| Contrast (:1) | 971 | 1000 3% | 1028 6% | 1217 25% | 21133 2076% | |
| Colorchecker dE 2000 * | 4.6 | 4.83 -5% | 3.29 28% | 3.71 19% | 2.12 54% | 0.89 81% |
| Colorchecker dE 2000 max. * | 17.6 | 7.94 55% | 8.47 52% | 7.23 59% | 4.73 73% | 1.79 90% |
| Colorchecker dE 2000 calibrated * | 2.04 | 2.23 -9% | 2.82 -38% | 0.57 72% | 0.91 55% | |
| Greyscale dE 2000 * | 3.3 | 3.1 6% | 3.2 3% | 2.2 33% | 2.8 15% | 1.13 66% |
| Gamma | 2.09 105% | 2.2 100% | 2.131 103% | 2.3 96% | 2.22 99% | 2.47 89% |
| CCT | 7151 91% | 5938 109% | 6317 103% | 6270 104% | 6542 99% | 6497 100% |
| Media total (Programa/Opciones) | 60% /
44% | 42% /
28% | 60% /
38% | 49% /
43% | 97% /
198% |
* ... más pequeño es mejor
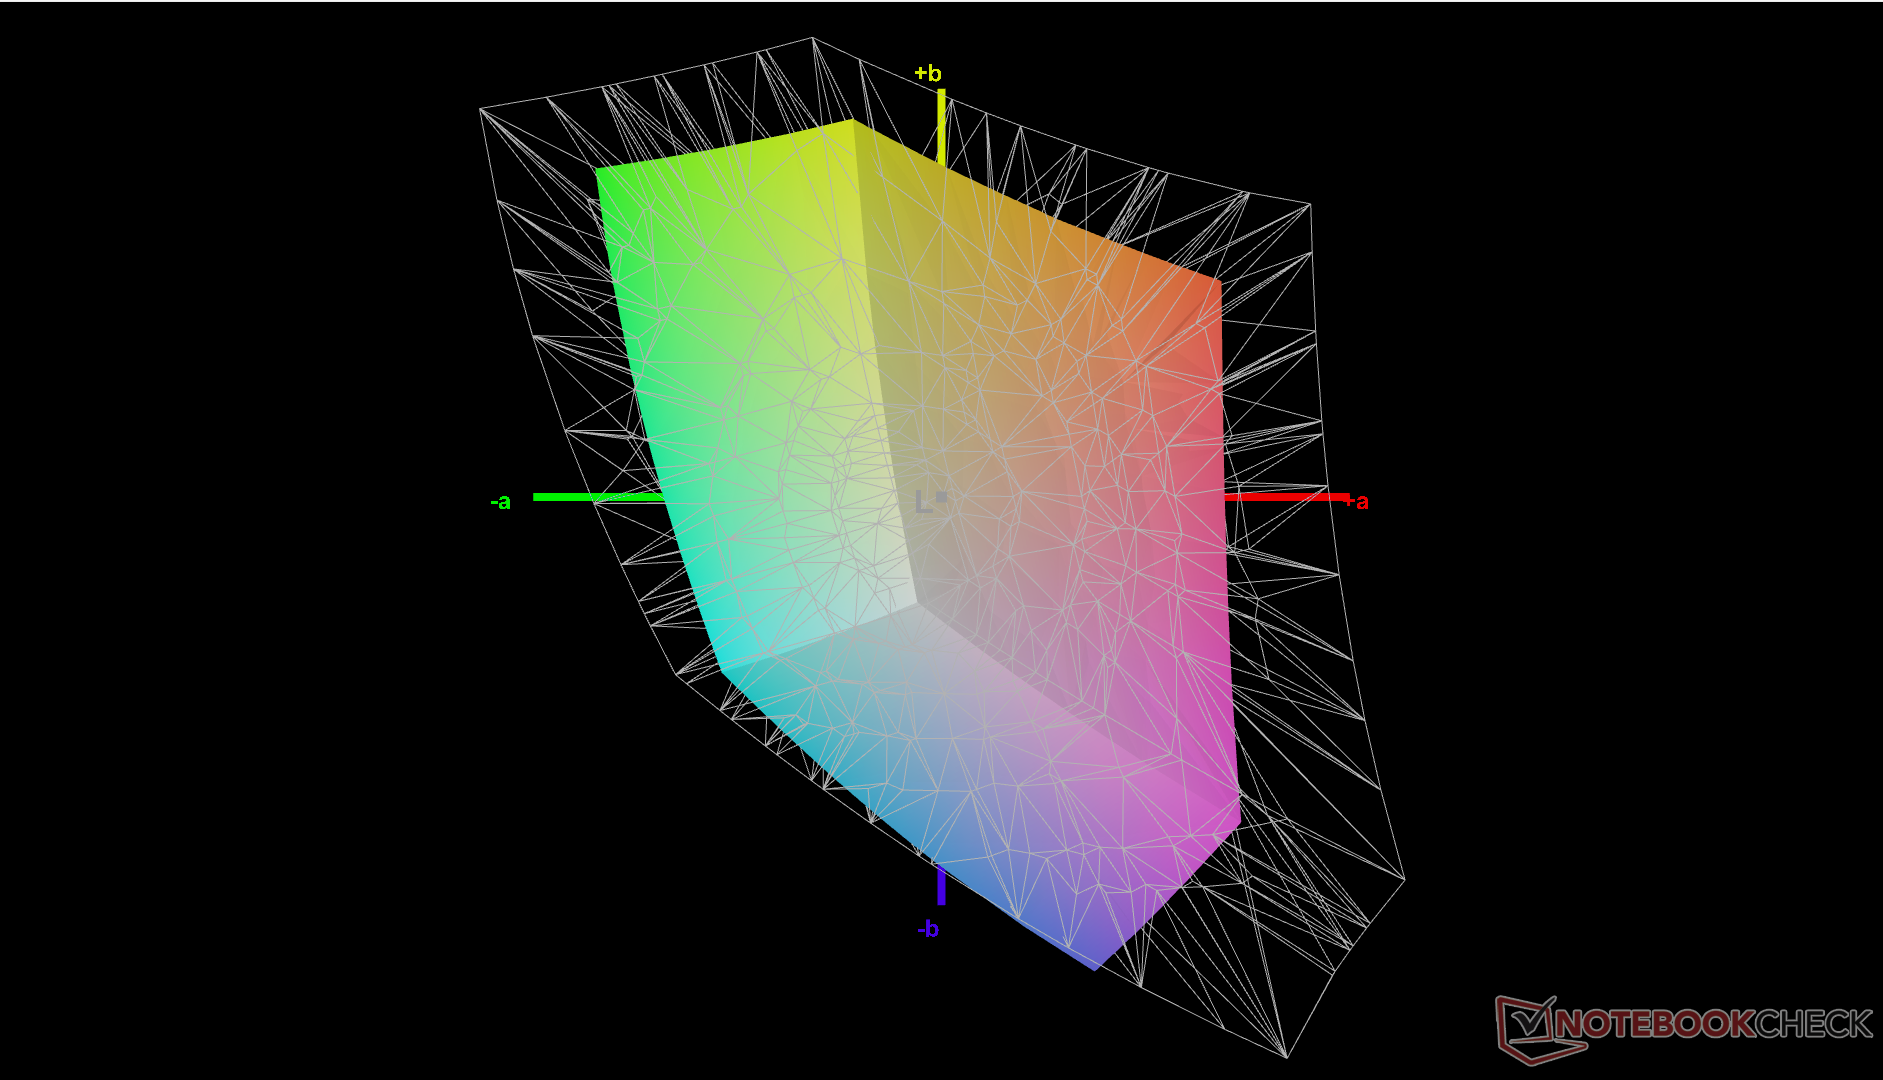
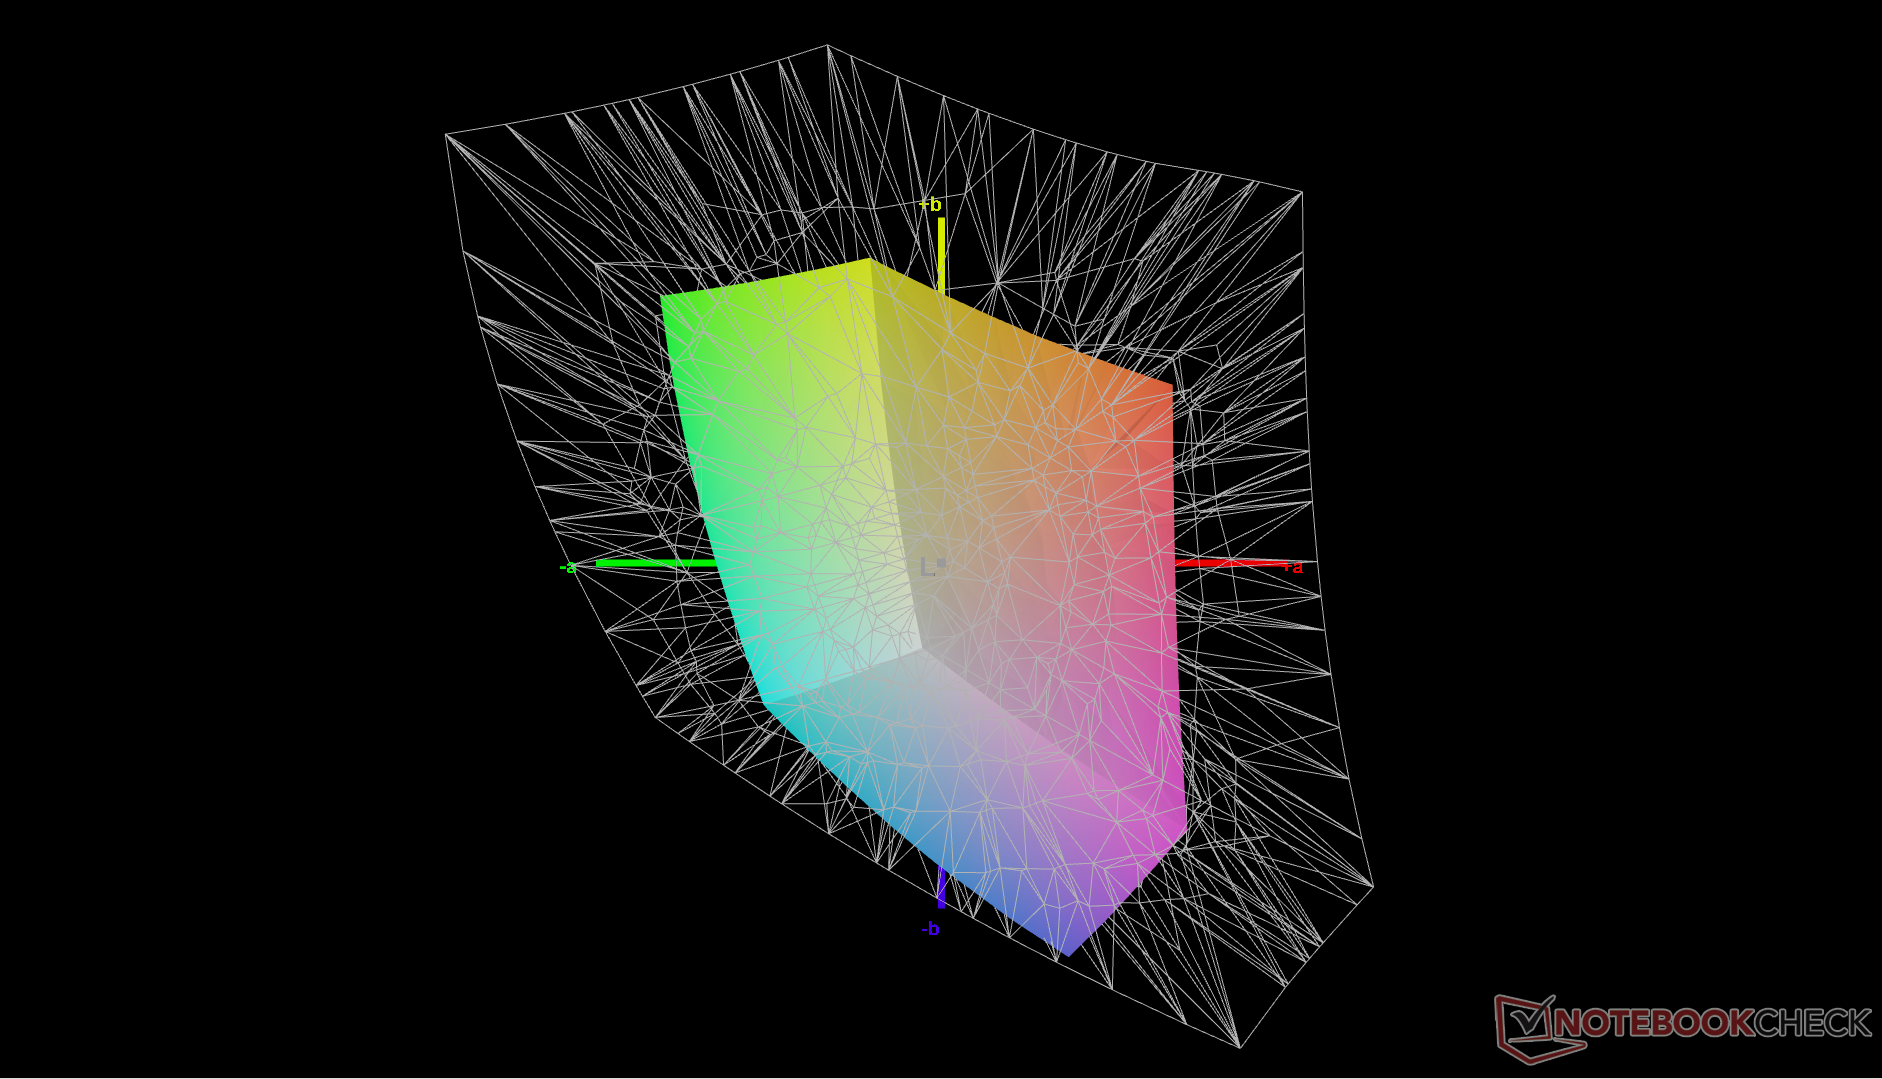
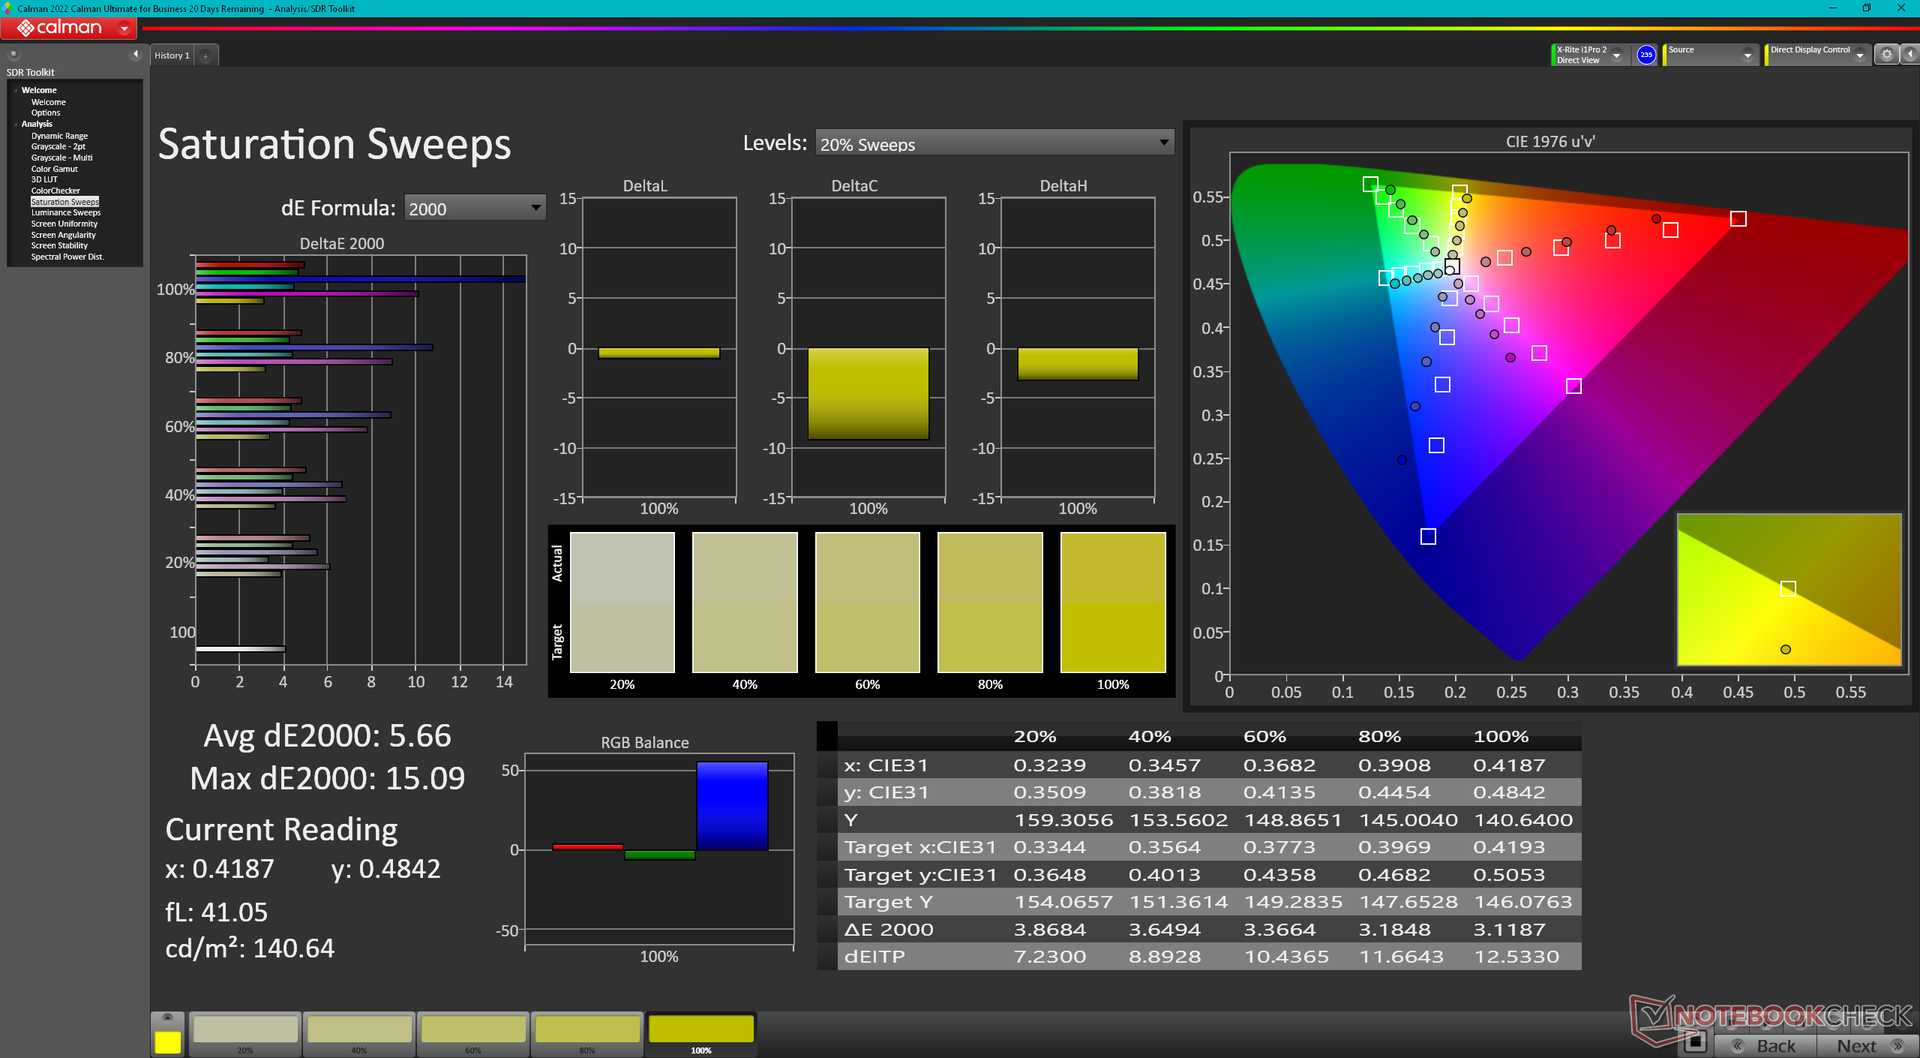
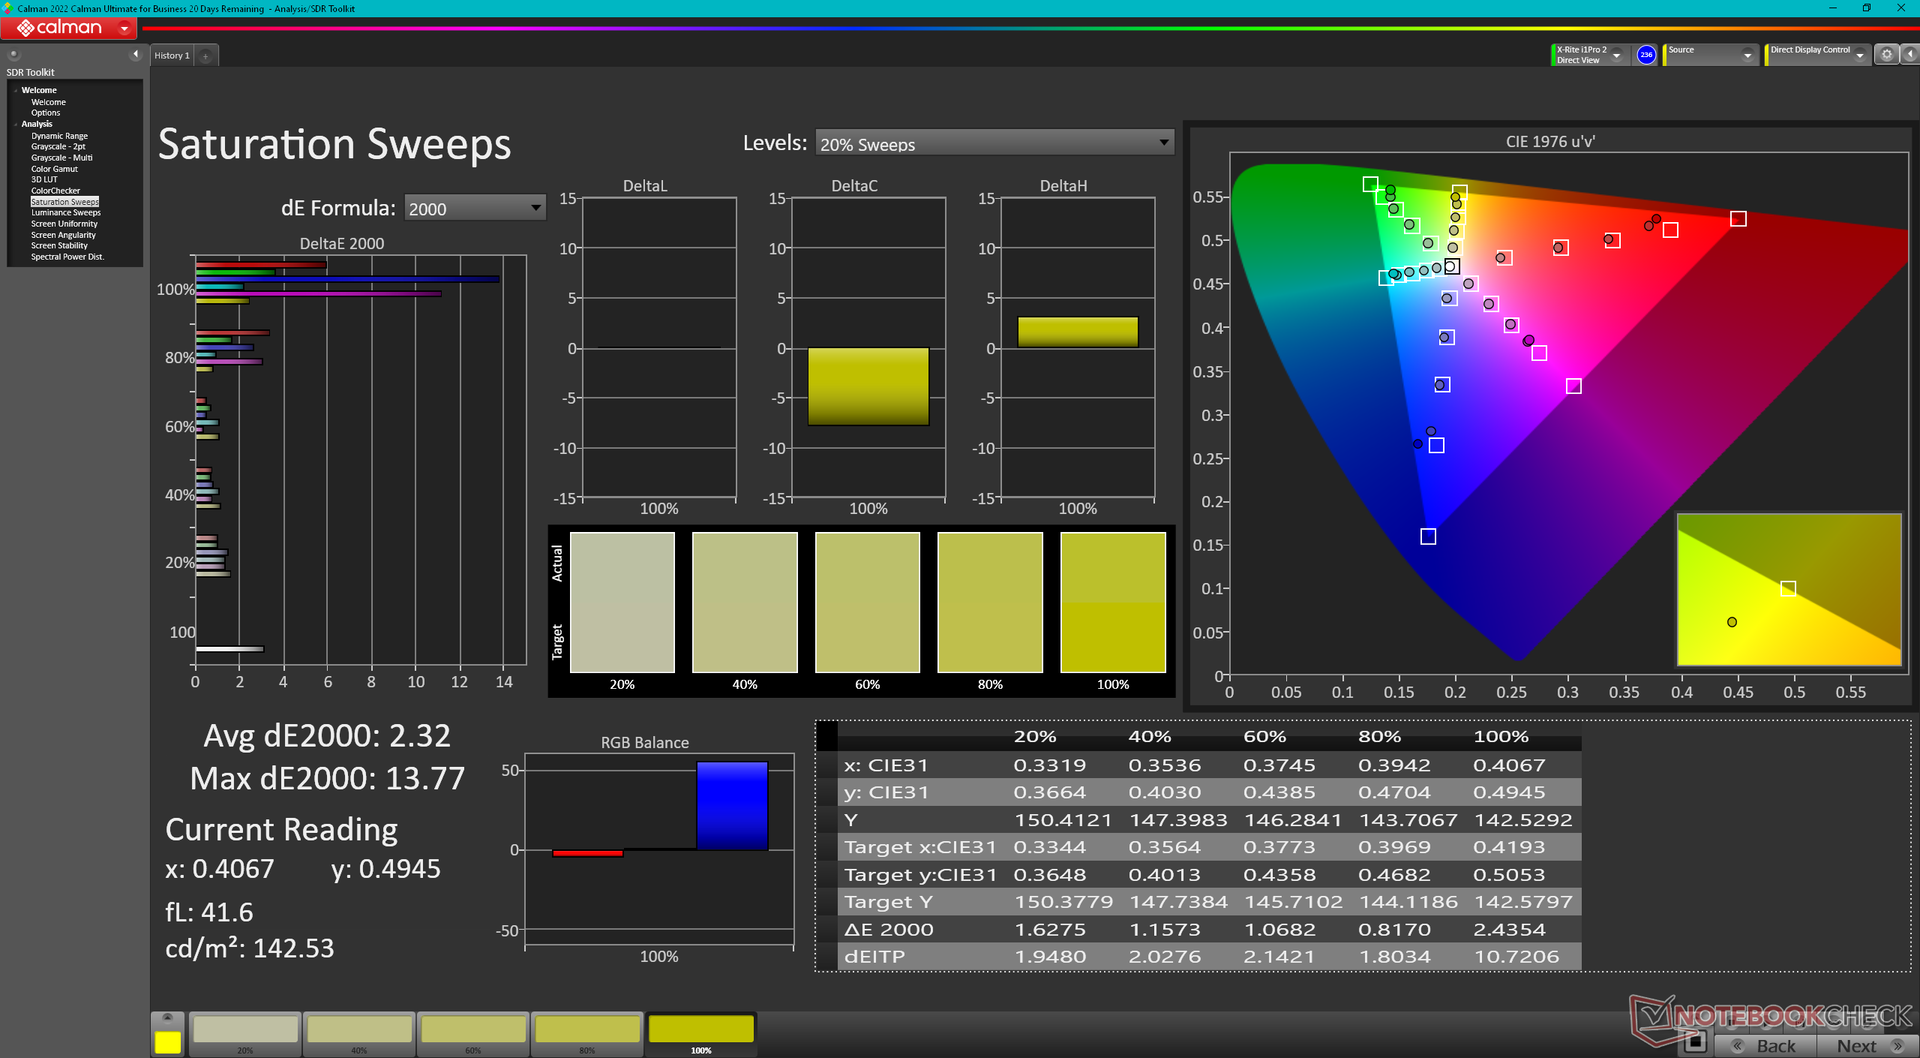
La pantalla no viene precalibrada, pero la precisión media del color no está nada mal. Calibrar el panel nosotros mismos con un colorímetro X-Rite mejoraría los valores DeltaE medios de escala de grises y color de 3,3 y 4,6 a sólo 2 y 2,04, respectivamente. Los colores seguirían siendo cada vez más imprecisos a niveles de saturación más altos por mucho que se calibrara debido al limitado espacio de color del panel. El azul es quizá el peor ejemplo, ya que aparece ligeramente violeta. Nuestro perfil ICM está disponible para su descarga gratuita.
Tiempos de respuesta del display
| ↔ Tiempo de respuesta de Negro a Blanco | ||
|---|---|---|
| 24.2 ms ... subida ↗ y bajada ↘ combinada | ↗ 10.6 ms subida | 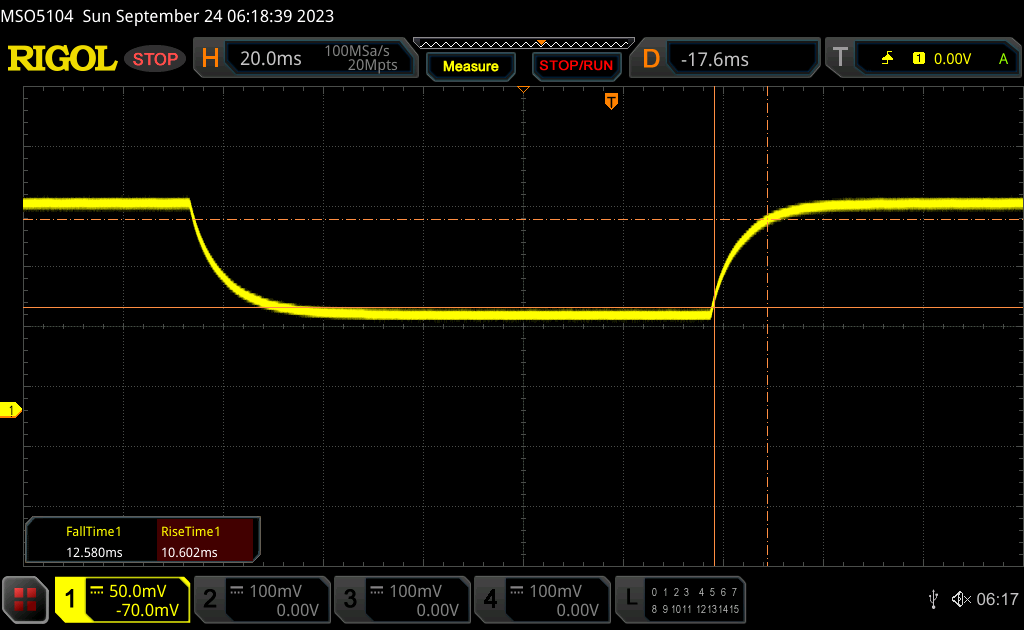 |
| ↘ 12.6 ms bajada | ||
| La pantalla mostró buenos tiempos de respuesta en nuestros tests pero podría ser demasiado lenta para los jugones competitivos. En comparación, todos los dispositivos de prueba van de ##min### (mínimo) a 240 (máximo) ms. » 57 % de todos los dispositivos son mejores. Eso quiere decir que el tiempo de respuesta es peor que la media (19.9 ms) de todos los dispositivos testados. | ||
| ↔ Tiempo de respuesta 50% Gris a 80% Gris | ||
| 17.3 ms ... subida ↗ y bajada ↘ combinada | ↗ 9.4 ms subida | 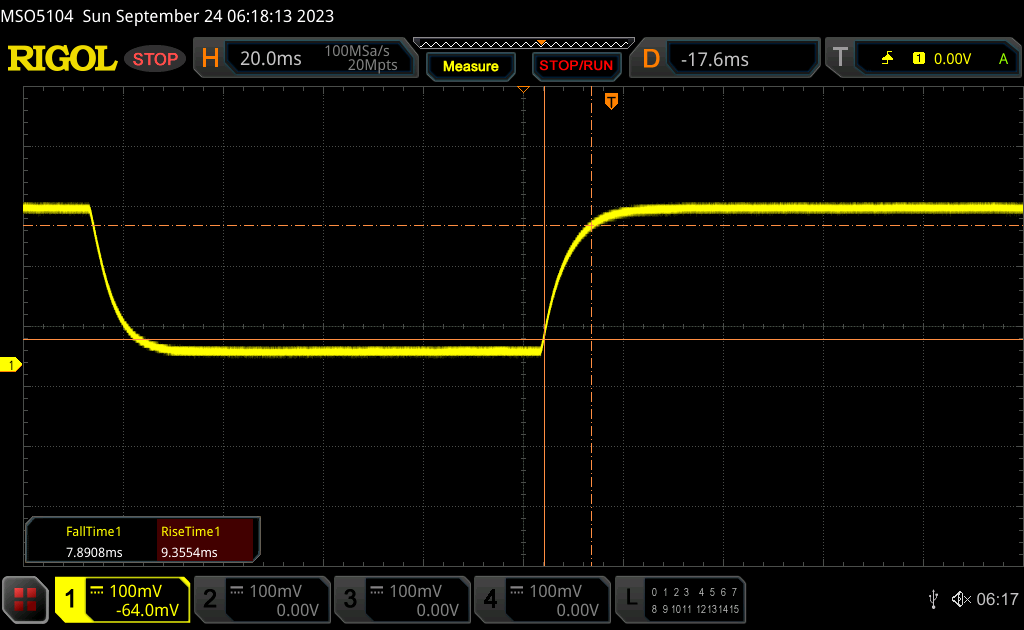 |
| ↘ 7.9 ms bajada | ||
| La pantalla mostró buenos tiempos de respuesta en nuestros tests pero podría ser demasiado lenta para los jugones competitivos. En comparación, todos los dispositivos de prueba van de ##min### (mínimo) a 636 (máximo) ms. » 31 % de todos los dispositivos son mejores. Esto quiere decir que el tiempo de respuesta medido es mejor que la media (31.1 ms) de todos los dispositivos testados. | ||
Parpadeo de Pantalla / PWM (Pulse-Width Modulation)
| Parpadeo de Pantalla / PWM no detectado | 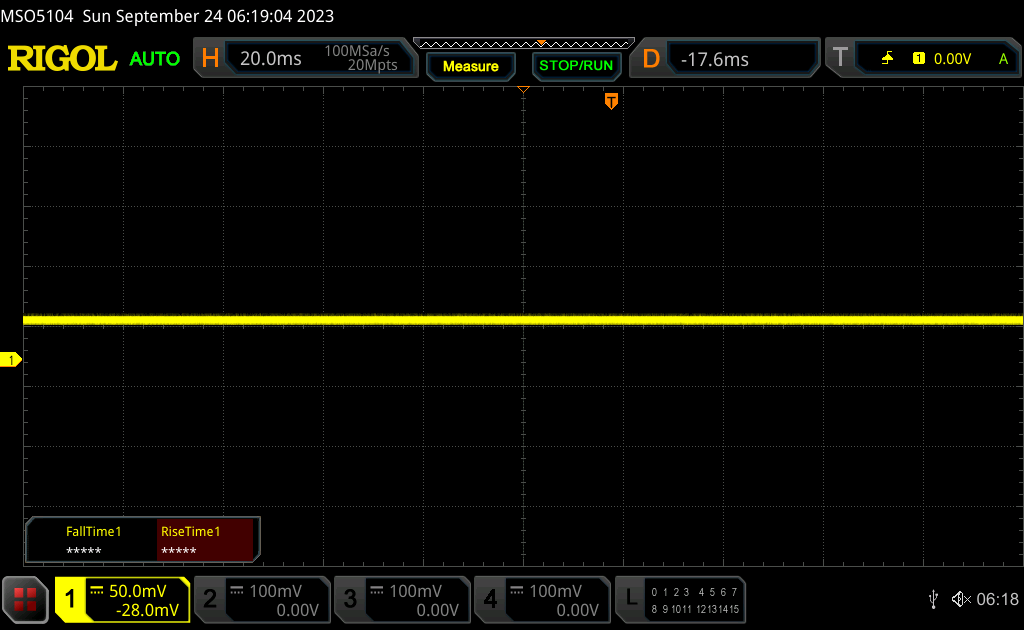 | ||
Comparación: 52 % de todos los dispositivos testados no usaron PWM para atenuar el display. Si se usó, medimos una media de 7798 (mínimo: 5 - máxmo: 343500) Hz. | |||
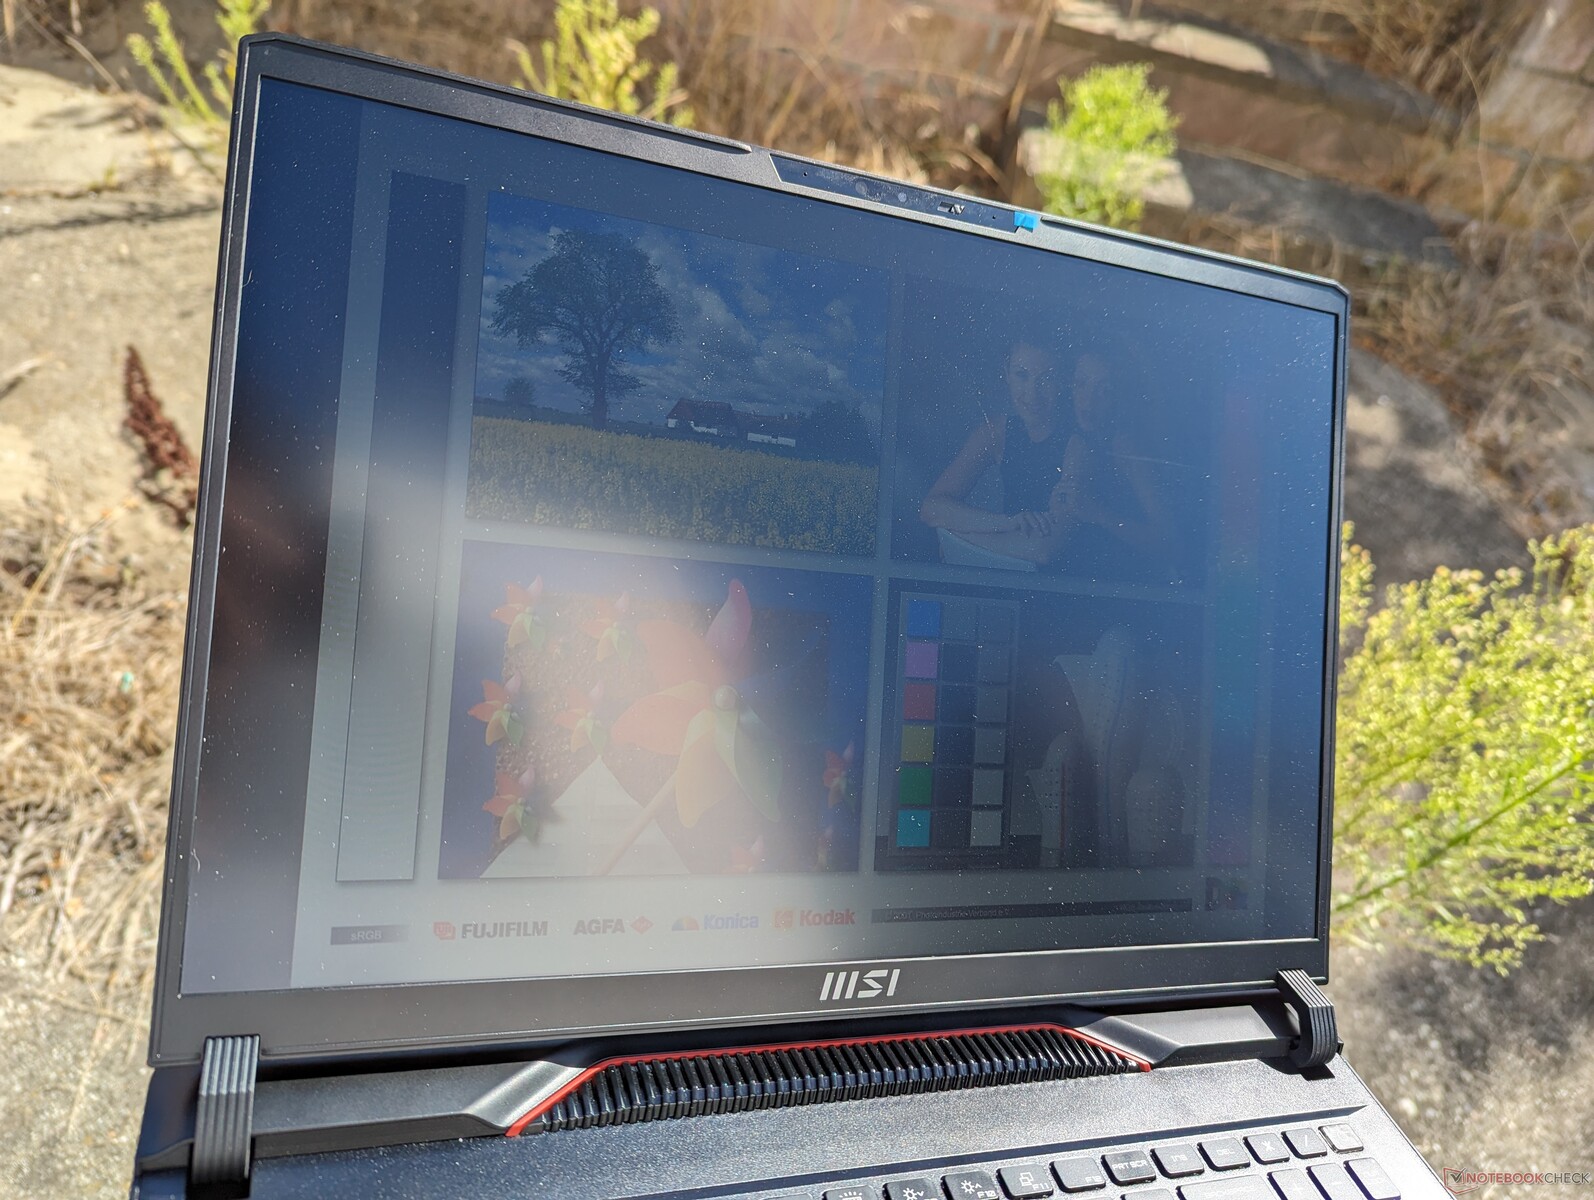
El brillo máximo de 300 nits es típico de la mayoría de portátiles para juegos. Debe evitarse la luz solar directa, pues de lo contrario los colores se destiñen. Para una mejor visibilidad en exteriores, los usuarios pueden considerar el Zephyrus M16 y su pantalla 2x más brillante.
Rendimiento: impresionante aumento interanual
Condiciones de ensayo
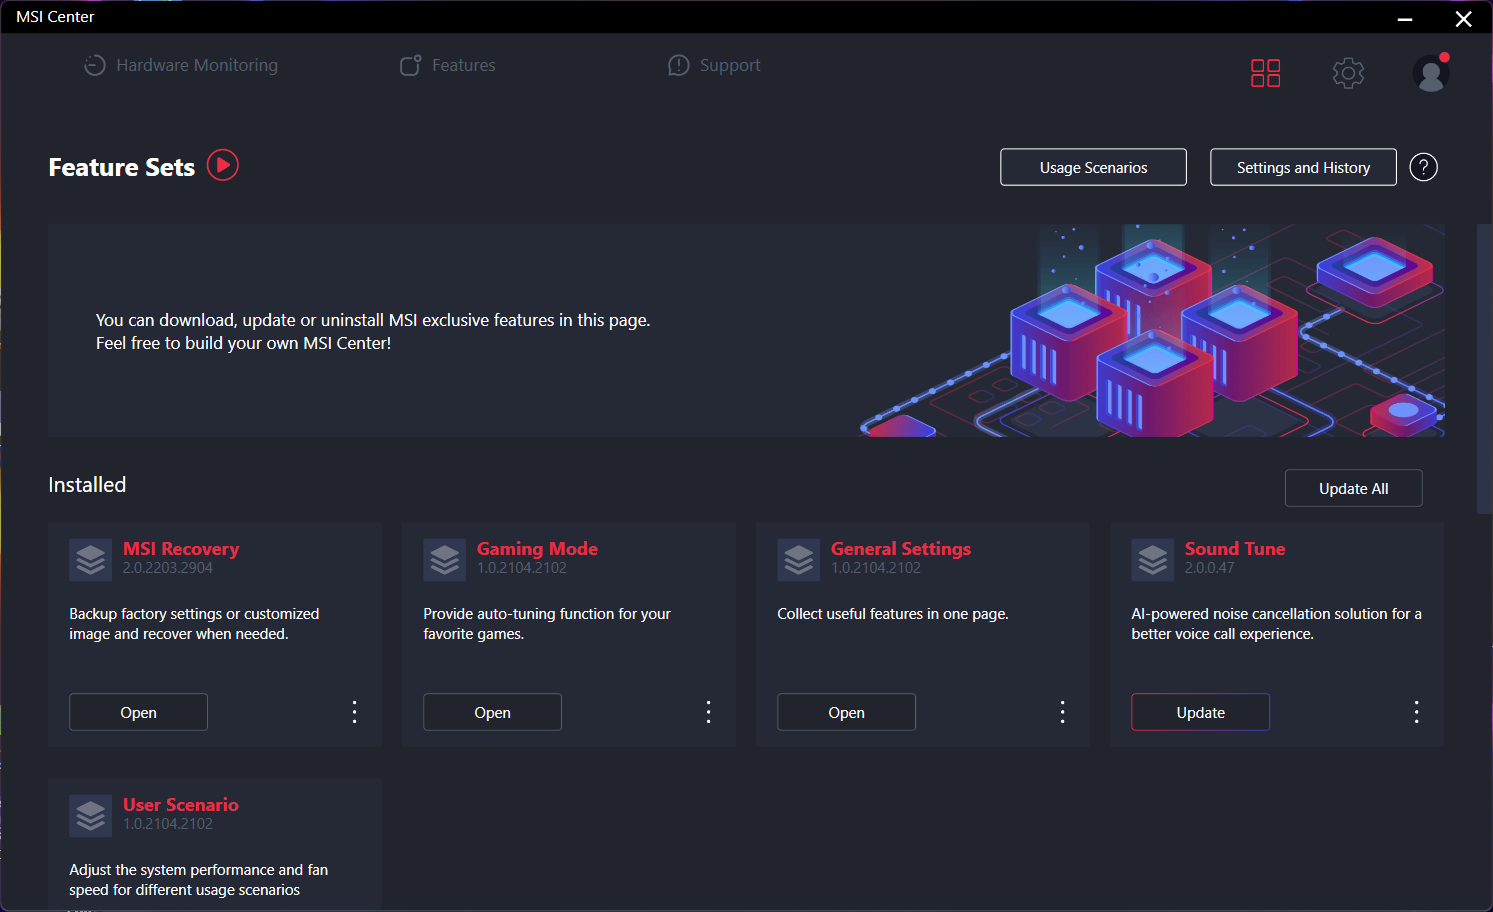
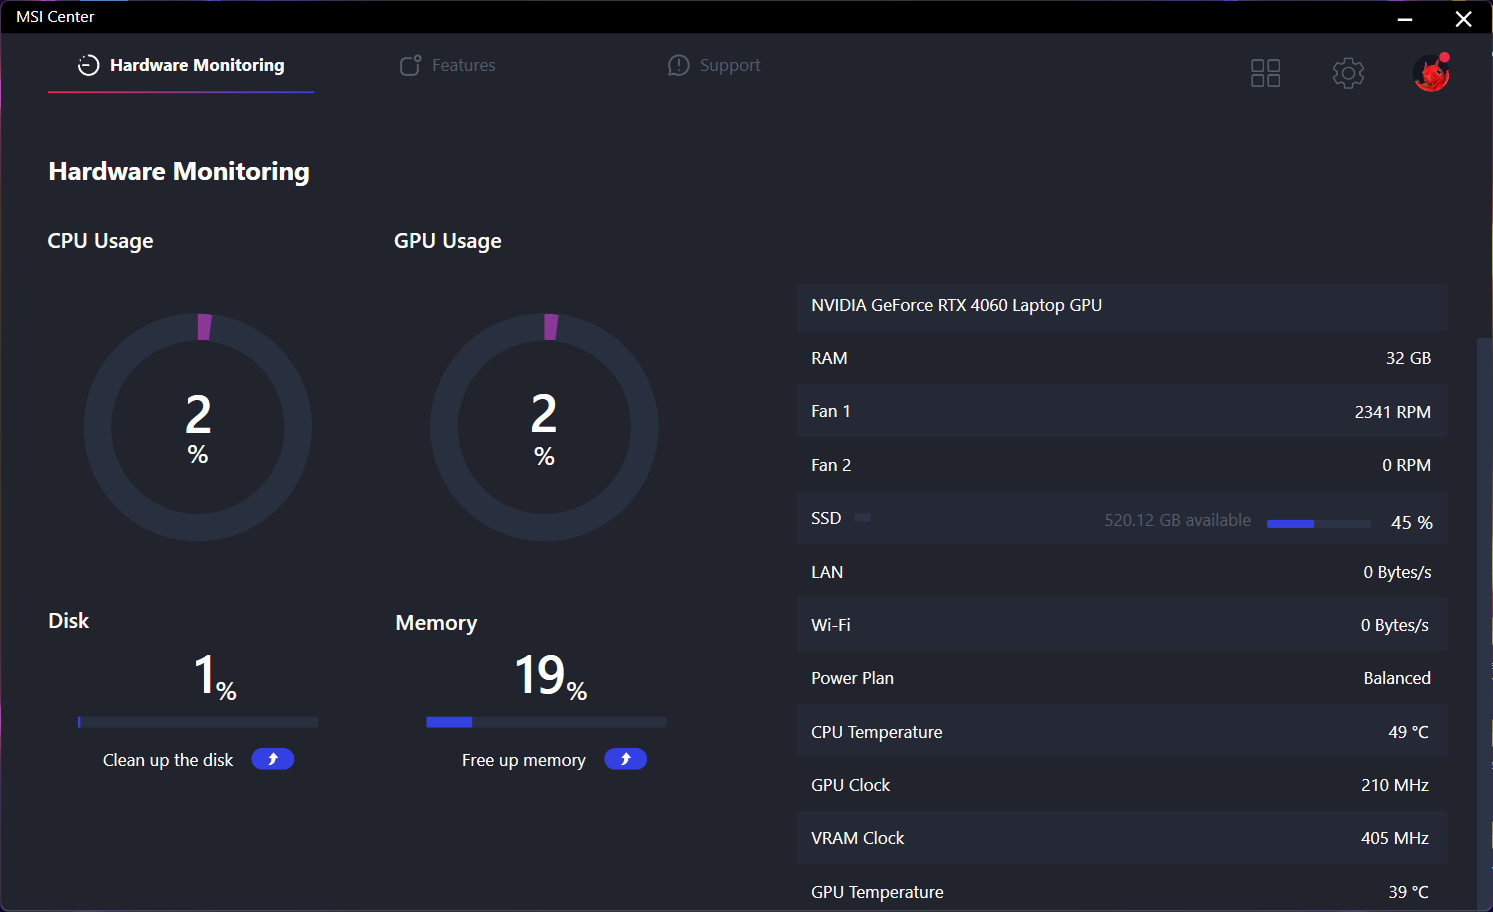
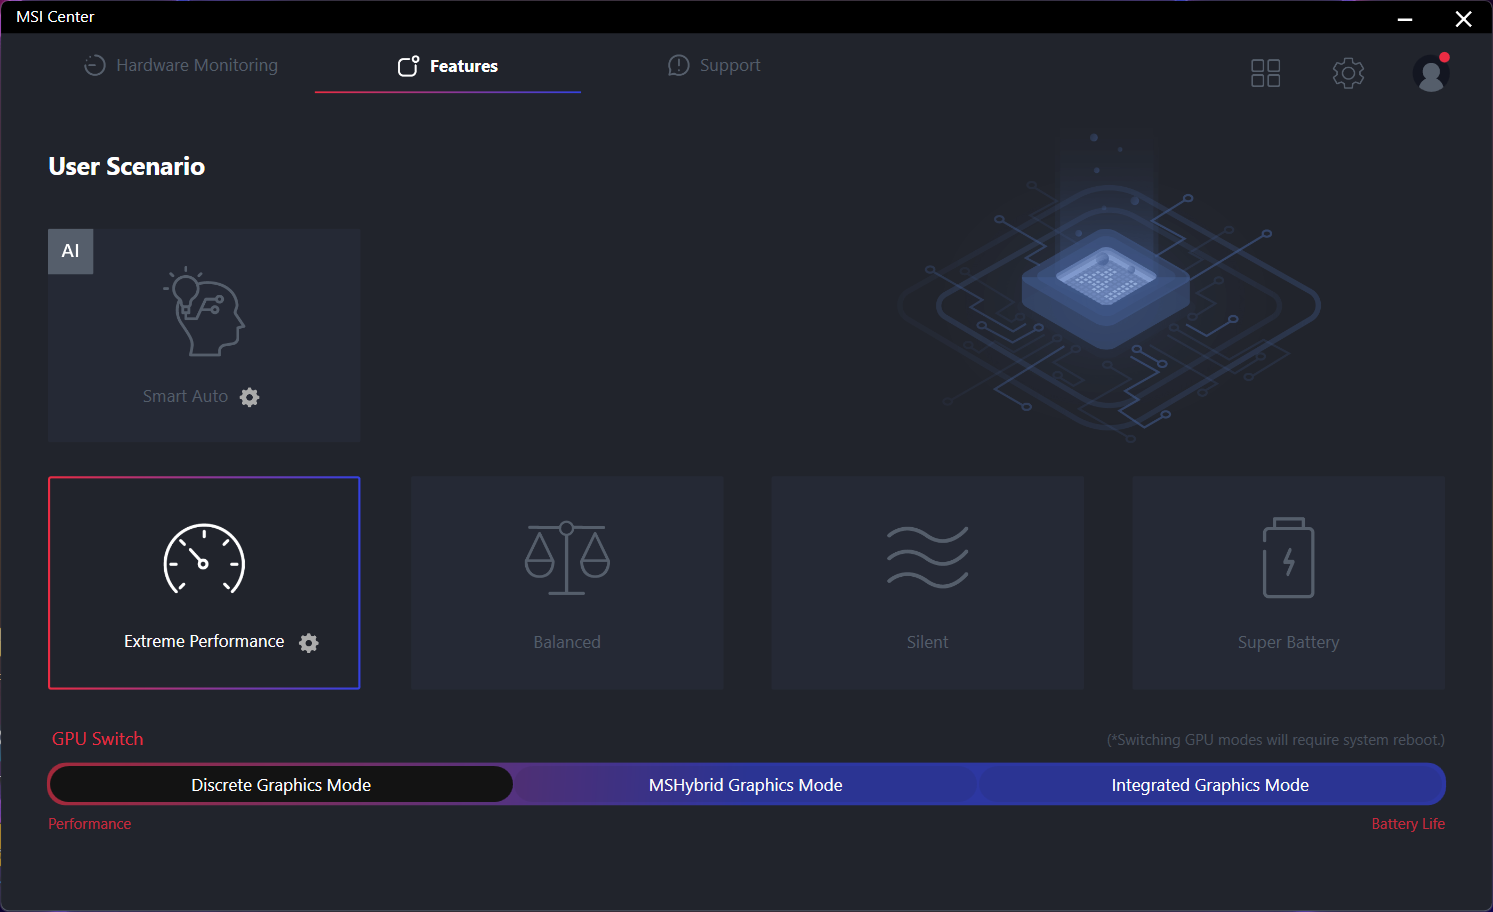
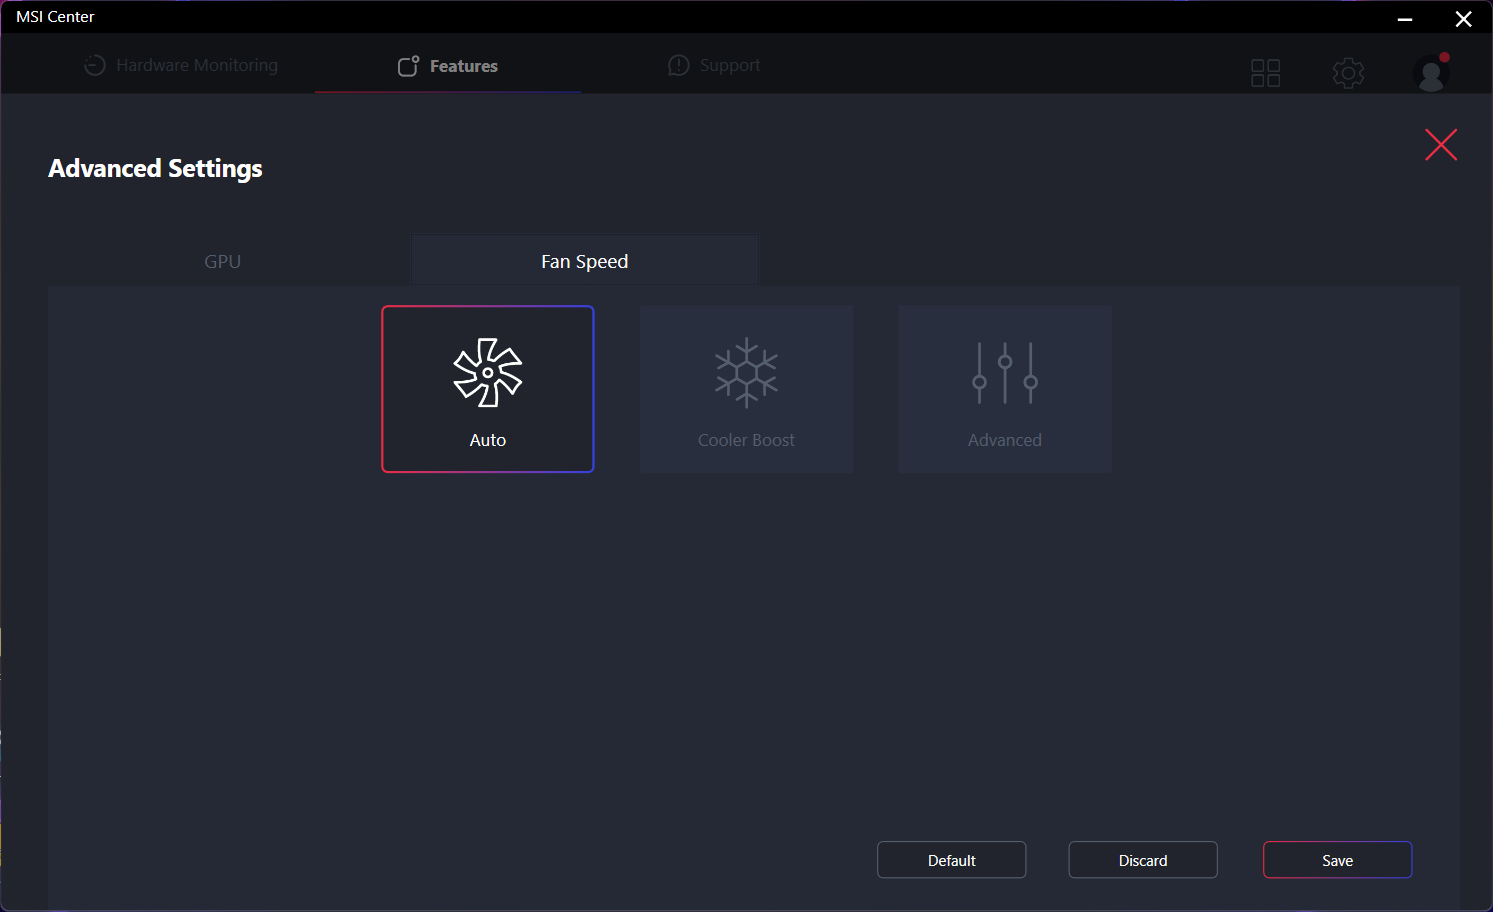
Pusimos Windows en modo Rendimiento y el Centro MSI en modo Rendimiento extremo y modo dGPU antes de ejecutar las pruebas. MSI Center es el centro de control para las actualizaciones del sistema, las constantes vitales, los perfiles de energía, los modos de GPU y mucho más. Sin embargo, los ajustes RGB son manejados por una aplicación independiente llamada SteelSeries GG.
Cooler Boost es un submenú dentro del modo de Rendimiento Extremo. Si lo activas, los ventiladores internos funcionarán a sus RPM máximas sin importar la carga en pantalla.
La configuración RTX 4060 es compatible con MUX pero no con Advanced Optimus, lo que significa que es necesario reiniciar cuando se cambia entre los modos dGPU, MSHybrid e iGPU.
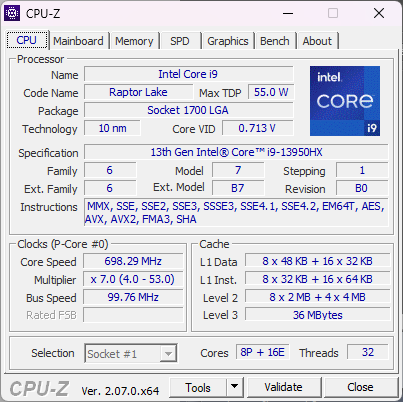
Procesador
El rendimiento de la CPU y la estabilidad de la velocidad de reloj son excelentes, con resultados entre un 5 y un 10 por ciento más rápidos que la media de los procesadoresCore i9-13950HX de nuestra base de datos o casi el doble que el Core i7-13700H que suele encontrarse en la mayoría de portátiles para juegos. Se trata de una de las CPU móviles más rápidas del mercado en este momento y compite con el Zen 4 Ryzen 9 7945HX por los tres primeros puestos.
Si te pasas al más caro Core i9-13980HX sólo se espera que aumente el rendimiento en un 5%, según lo que hemos visto con el Alienware m18 R1. Los beneficios son tan marginales que recomendamos quedarse con el Core i9-13950HX para ahorrar unos cientos de dólares.
Cinebench R15 Multi Loop
Cinebench R23: Multi Core | Single Core
Cinebench R20: CPU (Multi Core) | CPU (Single Core)
Cinebench R15: CPU Multi 64Bit | CPU Single 64Bit
Blender: v2.79 BMW27 CPU
7-Zip 18.03: 7z b 4 | 7z b 4 -mmt1
Geekbench 5.5: Multi-Core | Single-Core
HWBOT x265 Benchmark v2.2: 4k Preset
LibreOffice : 20 Documents To PDF
R Benchmark 2.5: Overall mean
* ... más pequeño es mejor
AIDA64: FP32 Ray-Trace | FPU Julia | CPU SHA3 | CPU Queen | FPU SinJulia | FPU Mandel | CPU AES | CPU ZLib | FP64 Ray-Trace | CPU PhotoWorxx
| Performance rating | |
| Alienware m16 R1 AMD | |
| MSI Raider GE68HX 13VF | |
| Medio Intel Core i9-13950HX | |
| HP Omen 16-xf0376ng | |
| Asus ROG Zephyrus M16 GU604VY-NM042X | |
| Lenovo Legion Slim 7i 16 Gen 8 | |
| MSI GE67 HX 12UGS | |
| AIDA64 / FP32 Ray-Trace | |
| Alienware m16 R1 AMD | |
| MSI Raider GE68HX 13VF | |
| HP Omen 16-xf0376ng | |
| Medio Intel Core i9-13950HX (17993 - 28957, n=9) | |
| Asus ROG Zephyrus M16 GU604VY-NM042X | |
| Lenovo Legion Slim 7i 16 Gen 8 | |
| MSI GE67 HX 12UGS | |
| AIDA64 / FPU Julia | |
| Alienware m16 R1 AMD | |
| MSI Raider GE68HX 13VF | |
| Medio Intel Core i9-13950HX (89362 - 144303, n=9) | |
| HP Omen 16-xf0376ng | |
| Asus ROG Zephyrus M16 GU604VY-NM042X | |
| Lenovo Legion Slim 7i 16 Gen 8 | |
| MSI GE67 HX 12UGS | |
| AIDA64 / CPU SHA3 | |
| Alienware m16 R1 AMD | |
| MSI Raider GE68HX 13VF | |
| Medio Intel Core i9-13950HX (4518 - 7093, n=9) | |
| HP Omen 16-xf0376ng | |
| Asus ROG Zephyrus M16 GU604VY-NM042X | |
| MSI GE67 HX 12UGS | |
| Lenovo Legion Slim 7i 16 Gen 8 | |
| AIDA64 / CPU Queen | |
| Alienware m16 R1 AMD | |
| MSI Raider GE68HX 13VF | |
| Medio Intel Core i9-13950HX (131931 - 140103, n=8) | |
| Lenovo Legion Slim 7i 16 Gen 8 | |
| Asus ROG Zephyrus M16 GU604VY-NM042X | |
| HP Omen 16-xf0376ng | |
| MSI GE67 HX 12UGS | |
| AIDA64 / FPU SinJulia | |
| Alienware m16 R1 AMD | |
| MSI Raider GE68HX 13VF | |
| HP Omen 16-xf0376ng | |
| Medio Intel Core i9-13950HX (12318 - 17057, n=9) | |
| MSI GE67 HX 12UGS | |
| Asus ROG Zephyrus M16 GU604VY-NM042X | |
| Lenovo Legion Slim 7i 16 Gen 8 | |
| AIDA64 / FPU Mandel | |
| Alienware m16 R1 AMD | |
| MSI Raider GE68HX 13VF | |
| HP Omen 16-xf0376ng | |
| Medio Intel Core i9-13950HX (44372 - 71038, n=9) | |
| Asus ROG Zephyrus M16 GU604VY-NM042X | |
| Lenovo Legion Slim 7i 16 Gen 8 | |
| MSI GE67 HX 12UGS | |
| AIDA64 / CPU AES | |
| Medio Intel Core i9-13950HX (99981 - 204491, n=9) | |
| MSI Raider GE68HX 13VF | |
| MSI GE67 HX 12UGS | |
| Alienware m16 R1 AMD | |
| Asus ROG Zephyrus M16 GU604VY-NM042X | |
| Lenovo Legion Slim 7i 16 Gen 8 | |
| HP Omen 16-xf0376ng | |
| AIDA64 / CPU ZLib | |
| MSI Raider GE68HX 13VF | |
| Alienware m16 R1 AMD | |
| Medio Intel Core i9-13950HX (1263 - 2069, n=9) | |
| MSI GE67 HX 12UGS | |
| Lenovo Legion Slim 7i 16 Gen 8 | |
| Asus ROG Zephyrus M16 GU604VY-NM042X | |
| HP Omen 16-xf0376ng | |
| AIDA64 / FP64 Ray-Trace | |
| Alienware m16 R1 AMD | |
| MSI Raider GE68HX 13VF | |
| HP Omen 16-xf0376ng | |
| Medio Intel Core i9-13950HX (9649 - 15573, n=9) | |
| Asus ROG Zephyrus M16 GU604VY-NM042X | |
| Lenovo Legion Slim 7i 16 Gen 8 | |
| MSI GE67 HX 12UGS | |
| AIDA64 / CPU PhotoWorxx | |
| MSI Raider GE68HX 13VF | |
| Asus ROG Zephyrus M16 GU604VY-NM042X | |
| Medio Intel Core i9-13950HX (40233 - 50864, n=9) | |
| HP Omen 16-xf0376ng | |
| MSI GE67 HX 12UGS | |
| Alienware m16 R1 AMD | |
| Lenovo Legion Slim 7i 16 Gen 8 | |
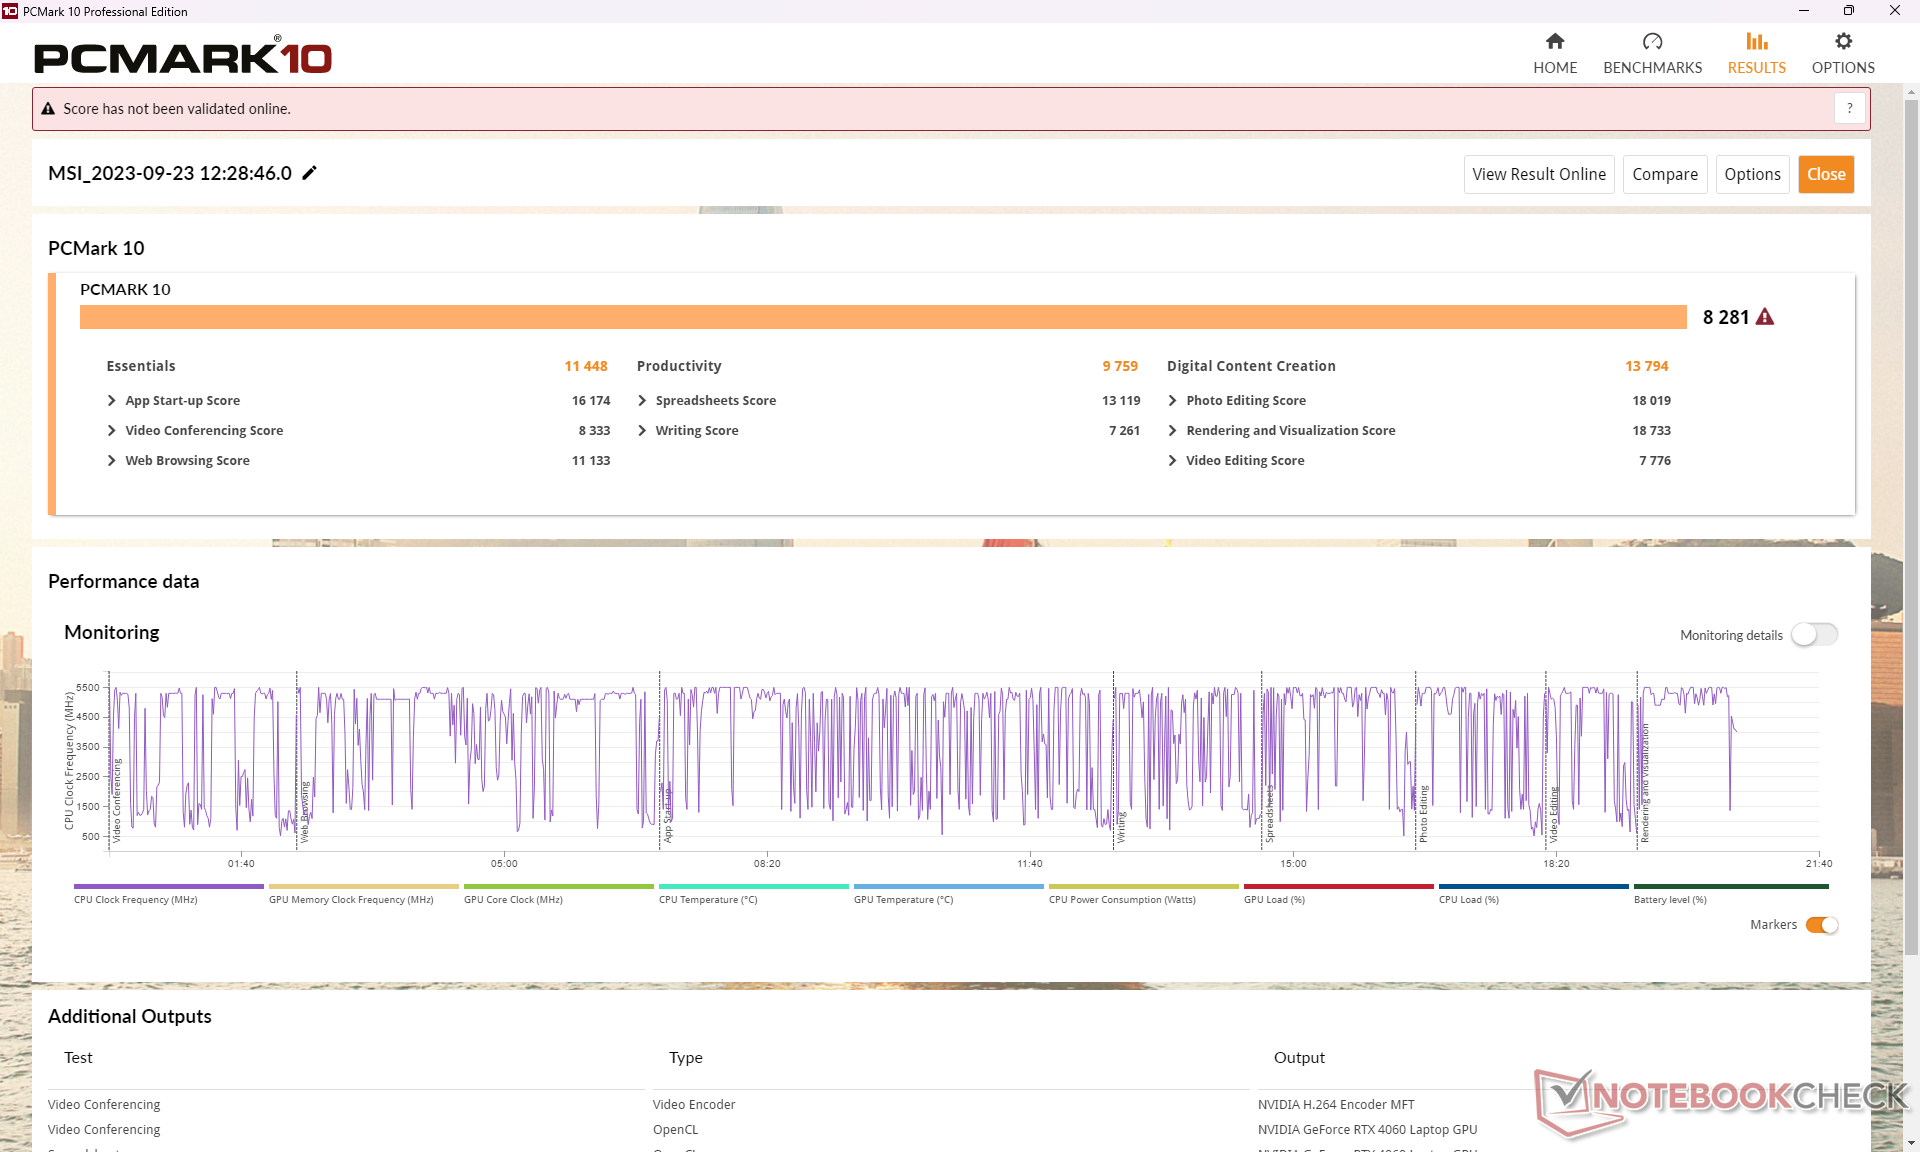
Rendimiento del sistema
Las pruebas PCMark son comparables a las de otros portátiles para juegos de 16 pulgadas como el Alienware m16 R1 o el Lenovo Legion Slim 7i 16 por apenas unos puntos porcentuales. No experimentamos problemas al despertar del reposo u otros problemas notables con nuestra unidad de prueba durante las pruebas.
CrossMark: Overall | Productivity | Creativity | Responsiveness
| PCMark 10 / Score | |
| Alienware m16 R1 AMD | |
| Lenovo Legion Slim 7i 16 Gen 8 | |
| MSI Raider GE68HX 13VF | |
| Medio Intel Core i9-13950HX, NVIDIA GeForce RTX 4060 Laptop GPU (n=1) | |
| Asus ROG Zephyrus M16 GU604VY-NM042X | |
| HP Omen 16-xf0376ng | |
| MSI GE67 HX 12UGS | |
| PCMark 10 / Essentials | |
| Asus ROG Zephyrus M16 GU604VY-NM042X | |
| Alienware m16 R1 AMD | |
| MSI Raider GE68HX 13VF | |
| Medio Intel Core i9-13950HX, NVIDIA GeForce RTX 4060 Laptop GPU (n=1) | |
| Lenovo Legion Slim 7i 16 Gen 8 | |
| HP Omen 16-xf0376ng | |
| MSI GE67 HX 12UGS | |
| PCMark 10 / Productivity | |
| Asus ROG Zephyrus M16 GU604VY-NM042X | |
| Lenovo Legion Slim 7i 16 Gen 8 | |
| Alienware m16 R1 AMD | |
| HP Omen 16-xf0376ng | |
| MSI GE67 HX 12UGS | |
| MSI Raider GE68HX 13VF | |
| Medio Intel Core i9-13950HX, NVIDIA GeForce RTX 4060 Laptop GPU (n=1) | |
| PCMark 10 / Digital Content Creation | |
| Alienware m16 R1 AMD | |
| MSI Raider GE68HX 13VF | |
| Medio Intel Core i9-13950HX, NVIDIA GeForce RTX 4060 Laptop GPU (n=1) | |
| Lenovo Legion Slim 7i 16 Gen 8 | |
| HP Omen 16-xf0376ng | |
| MSI GE67 HX 12UGS | |
| Asus ROG Zephyrus M16 GU604VY-NM042X | |
| CrossMark / Overall | |
| Alienware m16 R1 AMD | |
| Lenovo Legion Slim 7i 16 Gen 8 | |
| MSI GE67 HX 12UGS | |
| Asus ROG Zephyrus M16 GU604VY-NM042X | |
| MSI Raider GE68HX 13VF | |
| Medio Intel Core i9-13950HX, NVIDIA GeForce RTX 4060 Laptop GPU (n=1) | |
| CrossMark / Productivity | |
| Lenovo Legion Slim 7i 16 Gen 8 | |
| Alienware m16 R1 AMD | |
| MSI GE67 HX 12UGS | |
| Asus ROG Zephyrus M16 GU604VY-NM042X | |
| MSI Raider GE68HX 13VF | |
| Medio Intel Core i9-13950HX, NVIDIA GeForce RTX 4060 Laptop GPU (n=1) | |
| CrossMark / Creativity | |
| MSI Raider GE68HX 13VF | |
| Medio Intel Core i9-13950HX, NVIDIA GeForce RTX 4060 Laptop GPU (n=1) | |
| Asus ROG Zephyrus M16 GU604VY-NM042X | |
| Alienware m16 R1 AMD | |
| MSI GE67 HX 12UGS | |
| Lenovo Legion Slim 7i 16 Gen 8 | |
| CrossMark / Responsiveness | |
| MSI GE67 HX 12UGS | |
| Lenovo Legion Slim 7i 16 Gen 8 | |
| Alienware m16 R1 AMD | |
| Asus ROG Zephyrus M16 GU604VY-NM042X | |
| MSI Raider GE68HX 13VF | |
| Medio Intel Core i9-13950HX, NVIDIA GeForce RTX 4060 Laptop GPU (n=1) | |
| PCMark 10 Score | 8281 puntos | |
ayuda | ||
| AIDA64 / Memory Copy | |
| MSI Raider GE68HX 13VF | |
| Medio Intel Core i9-13950HX (61938 - 78813, n=9) | |
| Asus ROG Zephyrus M16 GU604VY-NM042X | |
| HP Omen 16-xf0376ng | |
| MSI GE67 HX 12UGS | |
| Alienware m16 R1 AMD | |
| Lenovo Legion Slim 7i 16 Gen 8 | |
| AIDA64 / Memory Read | |
| MSI Raider GE68HX 13VF | |
| Medio Intel Core i9-13950HX (62368 - 86831, n=9) | |
| Asus ROG Zephyrus M16 GU604VY-NM042X | |
| HP Omen 16-xf0376ng | |
| MSI GE67 HX 12UGS | |
| Alienware m16 R1 AMD | |
| Lenovo Legion Slim 7i 16 Gen 8 | |
| AIDA64 / Memory Write | |
| HP Omen 16-xf0376ng | |
| MSI Raider GE68HX 13VF | |
| Medio Intel Core i9-13950HX (59501 - 80441, n=9) | |
| Asus ROG Zephyrus M16 GU604VY-NM042X | |
| MSI GE67 HX 12UGS | |
| Alienware m16 R1 AMD | |
| Lenovo Legion Slim 7i 16 Gen 8 | |
| AIDA64 / Memory Latency | |
| MSI GE67 HX 12UGS | |
| Alienware m16 R1 AMD | |
| HP Omen 16-xf0376ng | |
| Medio Intel Core i9-13950HX (84.4 - 99.5, n=9) | |
| Asus ROG Zephyrus M16 GU604VY-NM042X | |
| MSI Raider GE68HX 13VF | |
| Lenovo Legion Slim 7i 16 Gen 8 | |
* ... más pequeño es mejor
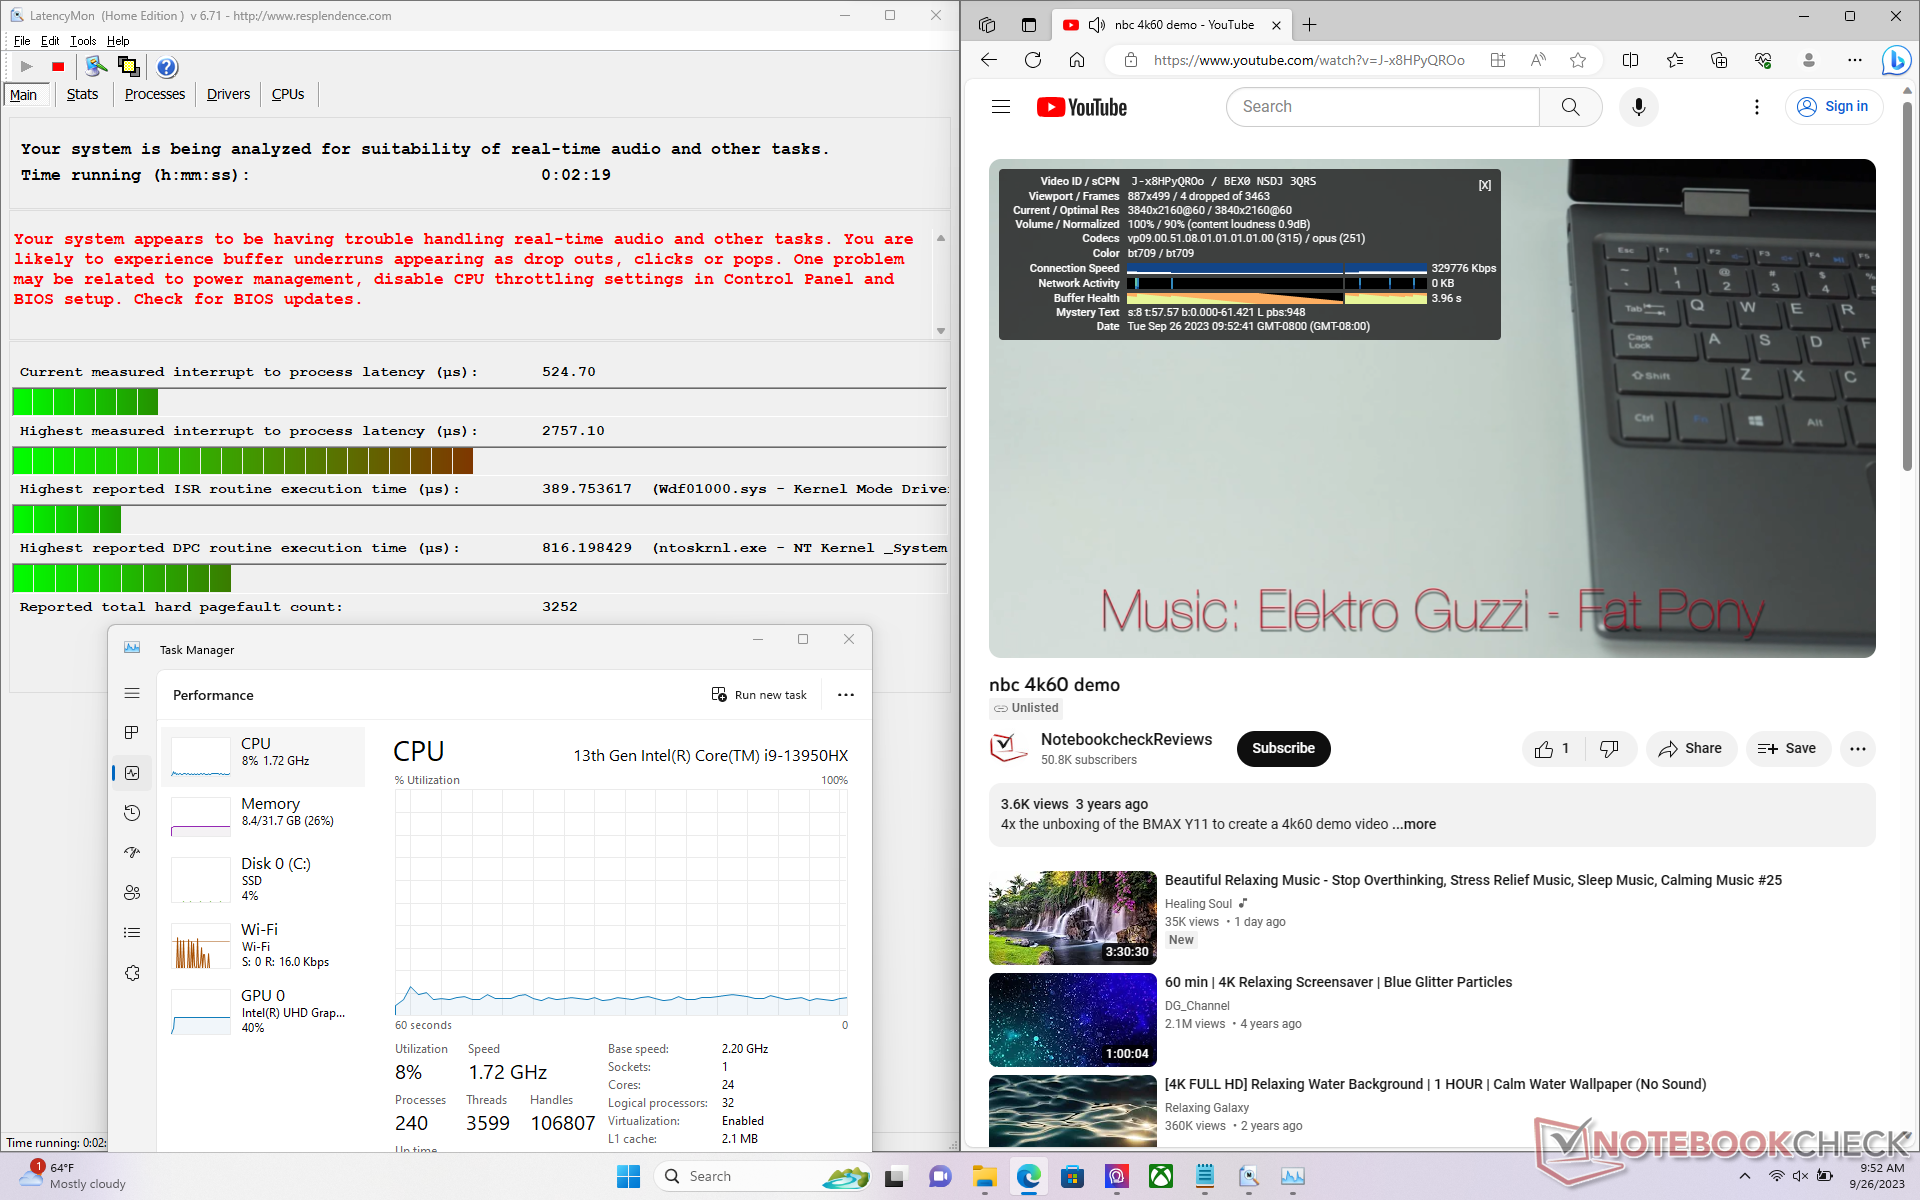
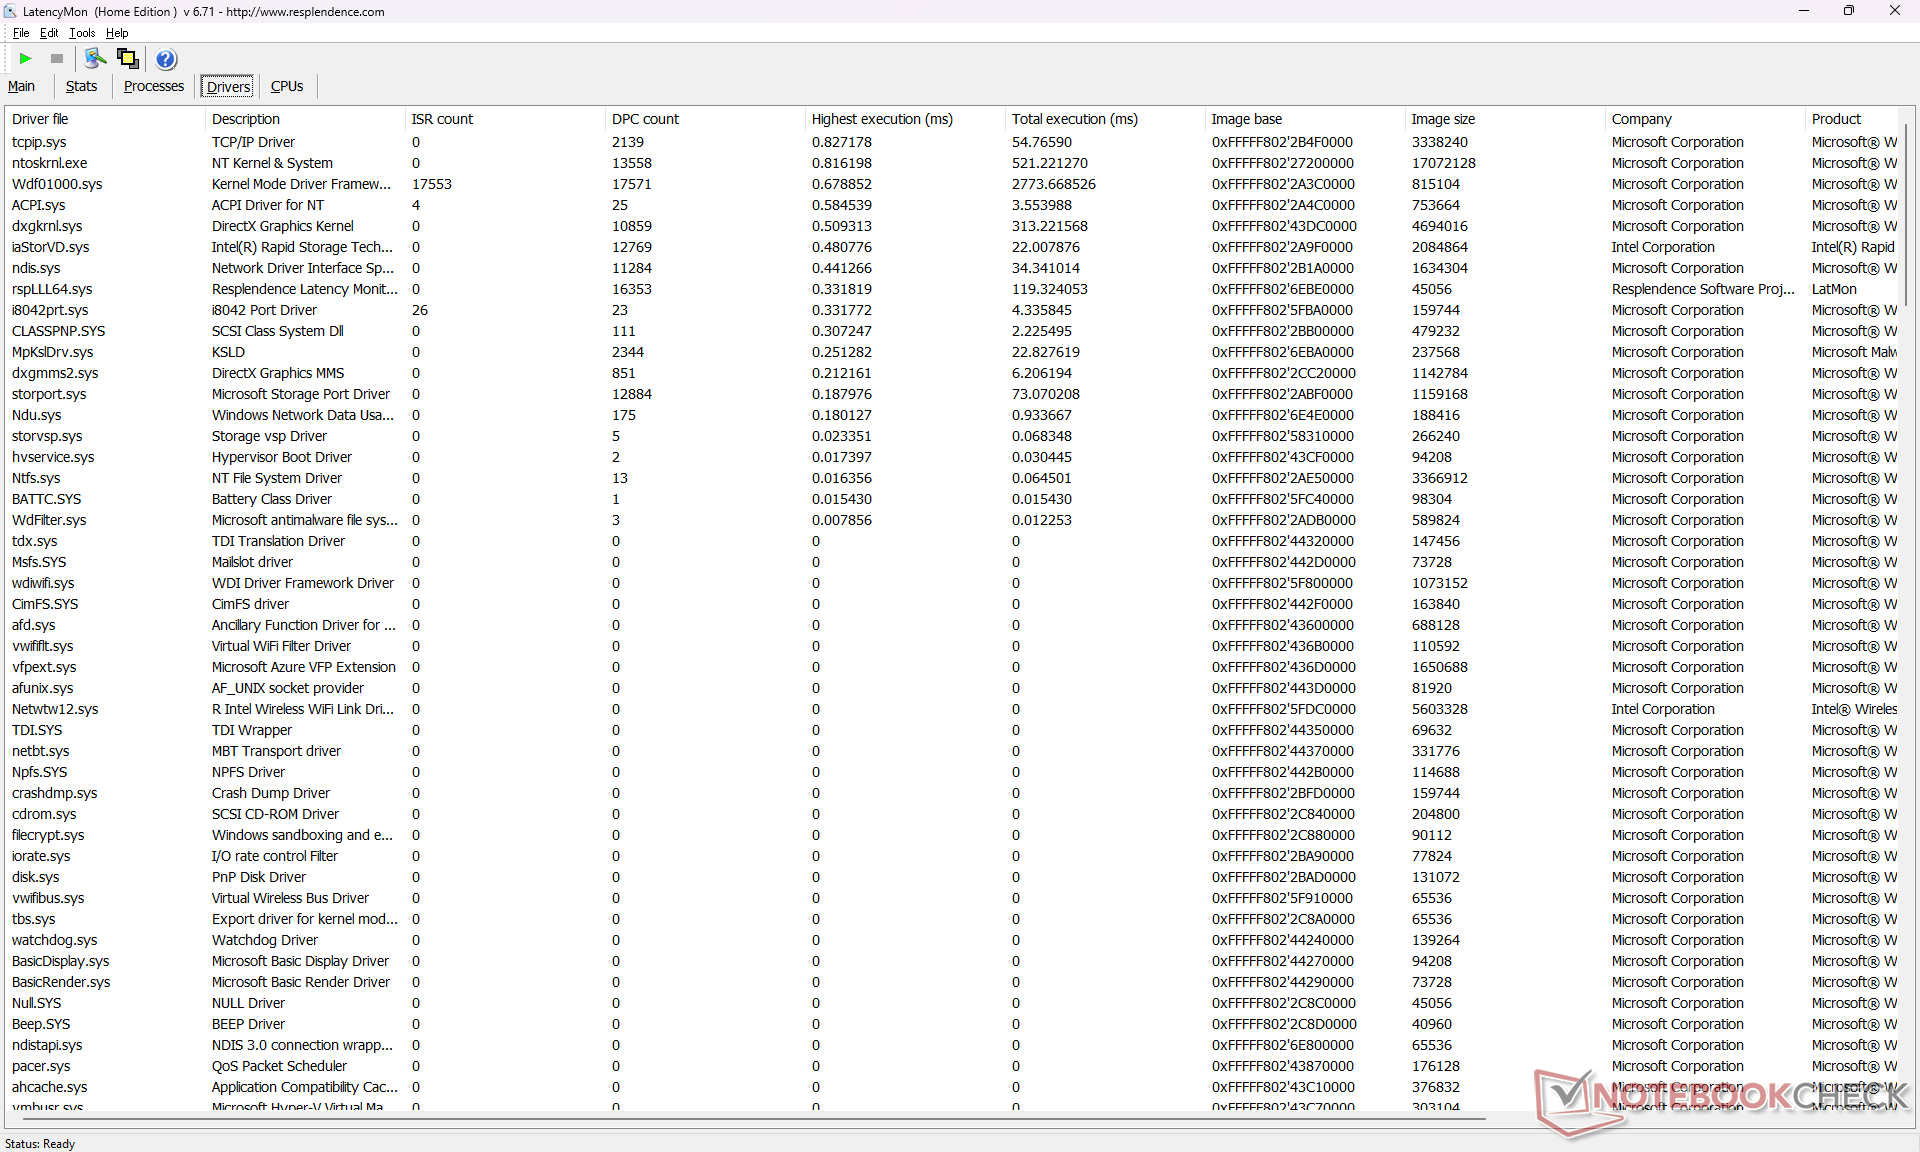
Latencia del CPD
LatencyMon revela problemas de CPD al abrir varias pestañas del navegador de nuestra página de inicio. la reproducción de vídeo 4K a 60 FPS es imperfecta, con 4 fotogramas perdidos durante una ventana de 60 segundos.
| DPC Latencies / LatencyMon - interrupt to process latency (max), Web, Youtube, Prime95 | |
| Lenovo Legion Slim 7i 16 Gen 8 | |
| Asus ROG Zephyrus M16 GU604VY-NM042X | |
| MSI Raider GE68HX 13VF | |
| HP Omen 16-xf0376ng | |
| Alienware m16 R1 AMD | |
| MSI GE67 HX 12UGS | |
* ... más pequeño es mejor
Dispositivos de almacenamiento
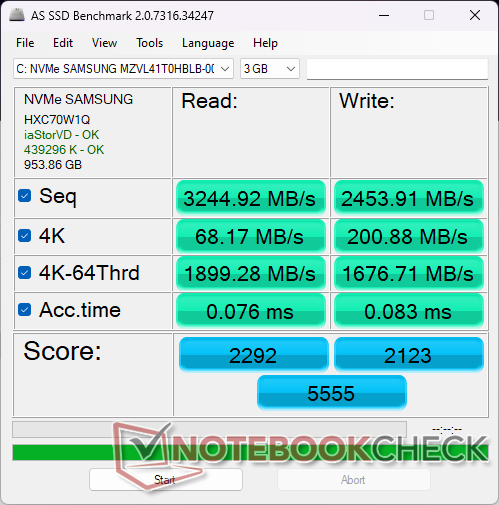
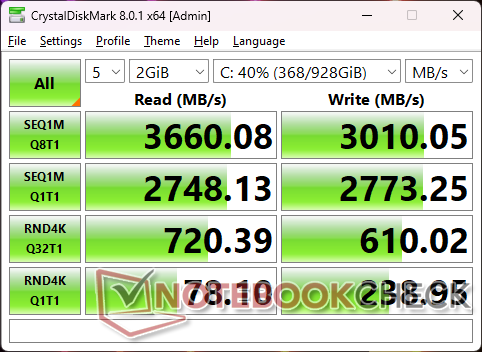
Nuestra unidad se entrega con el modelo más barato de 1 TB Samsung PM9B1 en lugar de la más cara Samsung PM9A1, probablemente para ahorrar costes. El PM9B1 es casi la mitad de rápido, con velocidades máximas de lectura secuencial de unos 3600 MB/s frente a los ~7000 MB/s del PM9A1. No obstante, el rendimiento del SSD es estable sin ralentizaciones.

| Drive Performance rating - Percent | |
| MSI GE67 HX 12UGS | |
| Lenovo Legion Slim 7i 16 Gen 8 | |
| Alienware m16 R1 AMD | |
| Asus ROG Zephyrus M16 GU604VY-NM042X | |
| HP Omen 16-xf0376ng | |
| MSI Raider GE68HX 13VF -11! | |
* ... más pequeño es mejor
Disk Throttling: DiskSpd Read Loop, Queue Depth 8
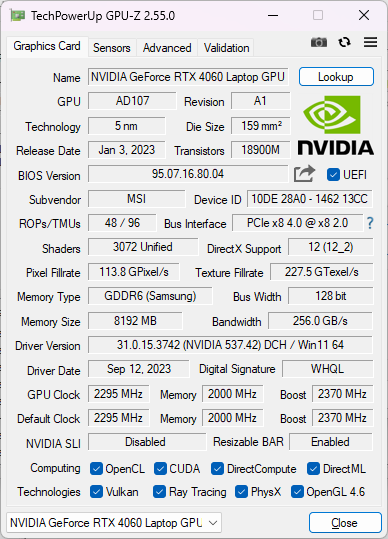
Rendimiento de la GPU
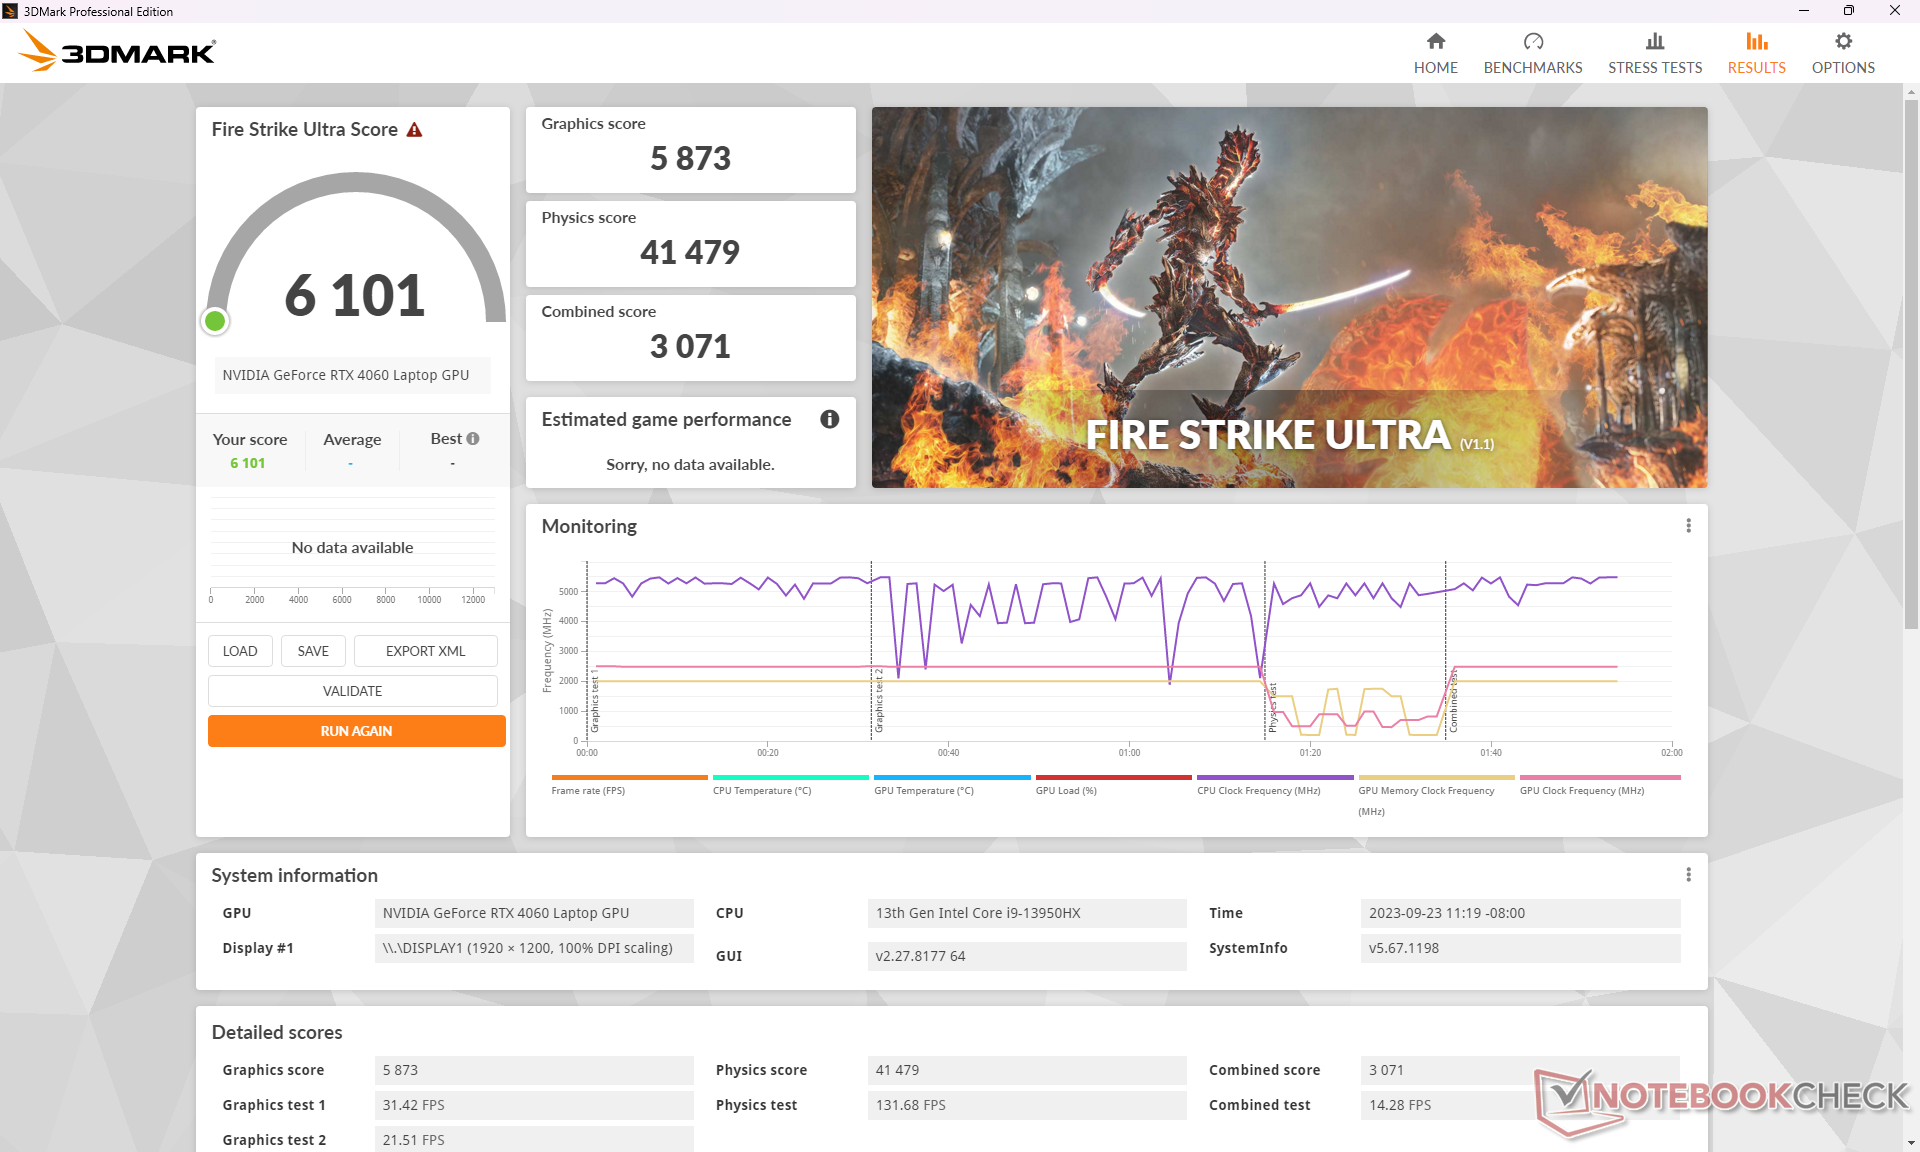
Nuestro RTX 4060 ofrece unos resultados ligeramente superiores a la media de portátiles de juego de nuestra base de datos equipados con la misma GPU. La actualización a la RTX 4070, 4080 o 4090 aumentará el rendimiento entre un 10 y un 20 por ciento, entre un 60 y un 80 por ciento, y entre un 80 y un 100 por ciento, respectivamente, con respecto a la RTX 4060. La diferencia de rendimiento es mayor entre la RTX 4070 y la 4080.
MSI ha programado MSI Center para cambiar automáticamente al modo de rendimiento extremo cuando detecta que 3DMark se está ejecutando y, por desgracia, no hay manera fácil de desactivar esto. Encontramos esto frustrante ya que le quita el control al usuario final. El cambio automático no se produciría al ejecutar juegos.
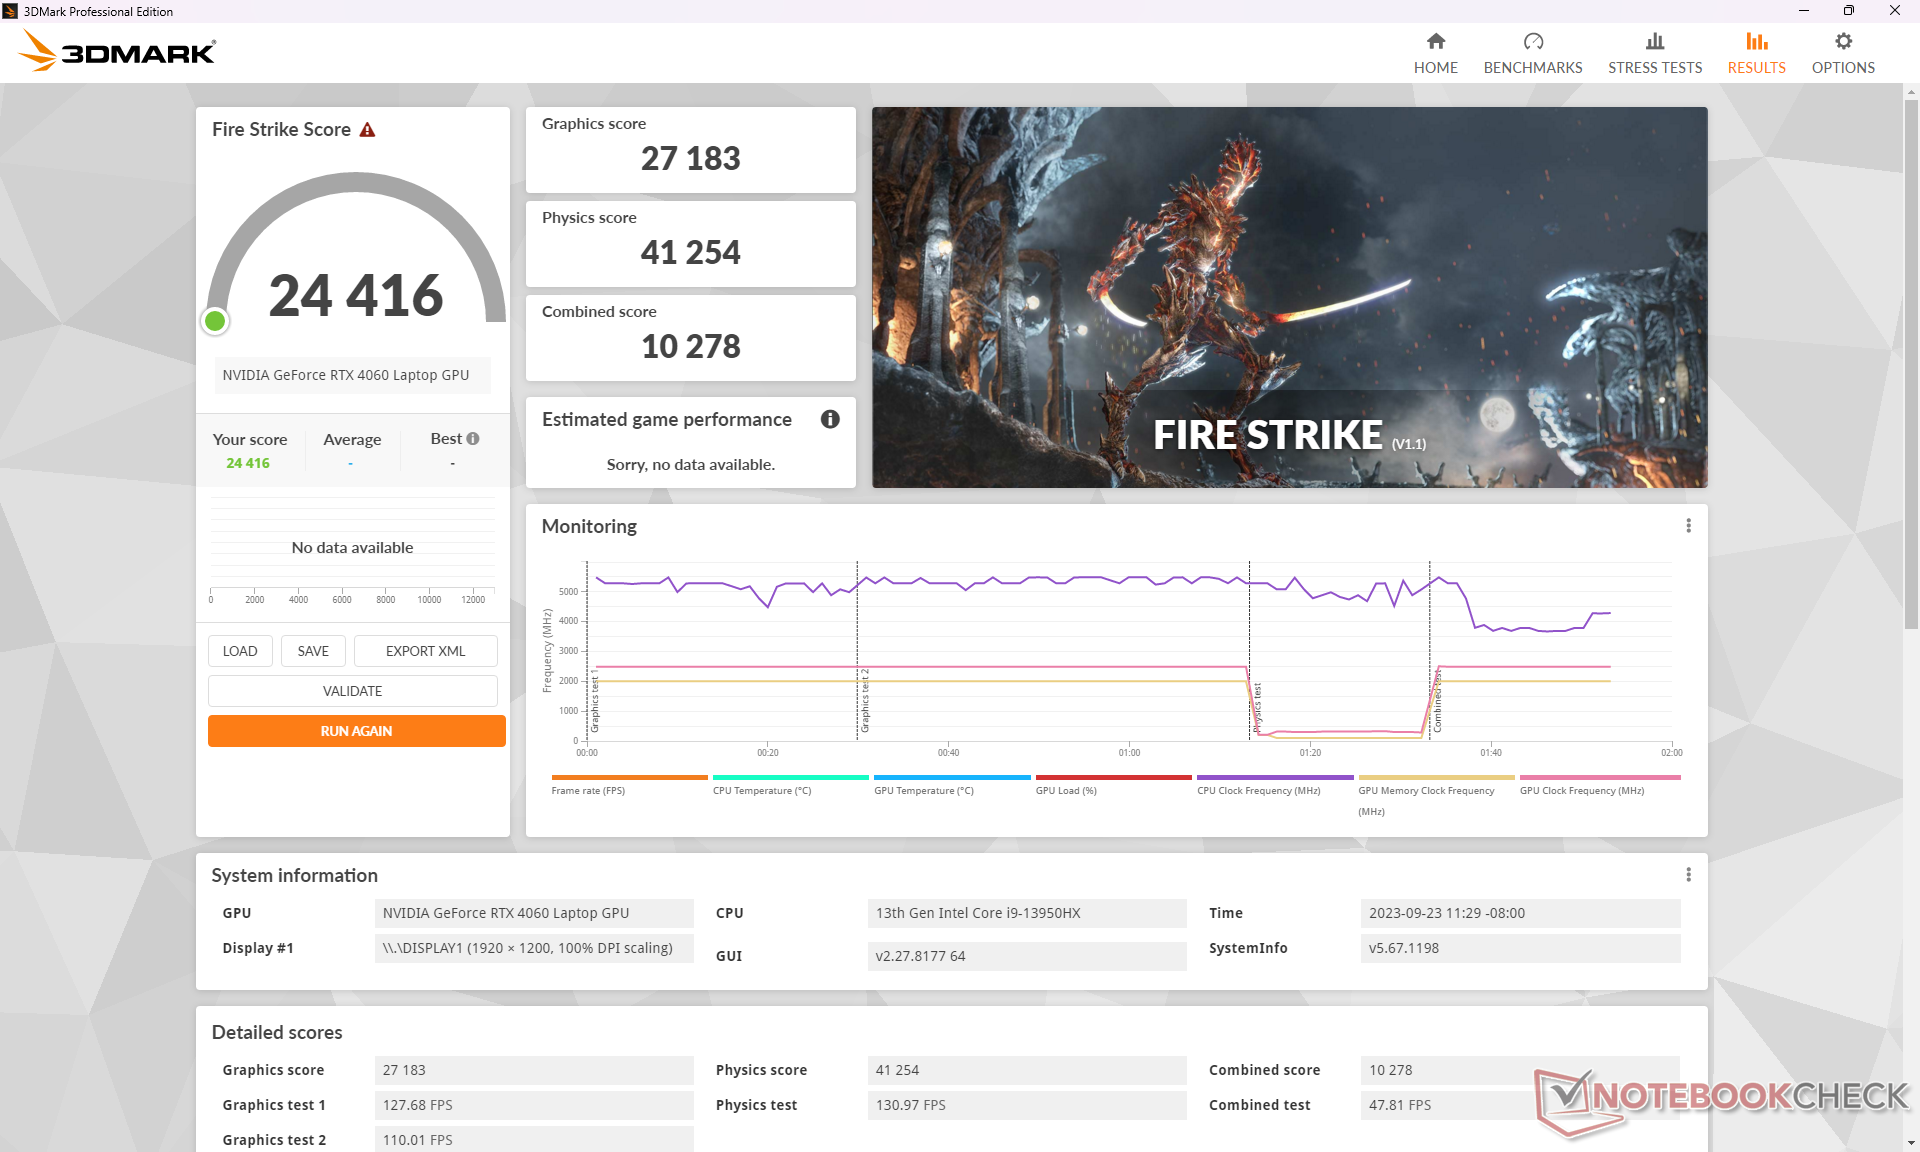
Activar Cooler Boost no parece afectar significativamente al rendimiento de la CPU o la GPU, como muestran nuestros resultados en Fire Strike. Por lo tanto, la función no es vital para el máximo rendimiento y sólo se recomienda si se desean temperaturas de funcionamiento más frías.
| Perfil de potencia | Fire Strike Gráficos | Fire Strike Física | Puntuación combinada |
| Modo de rendimiento extremo (Cooler Boost activado) | 27127 | 41525 | 11480 |
| Modo de rendimiento extremo (Cooler Boost desactivado) | 27183 (0%) | 41254 (-1%) | 10278 (-10%) |
| Batería | 19528 (-28%) | 18623 (-55%) | 5986 (-48%) |
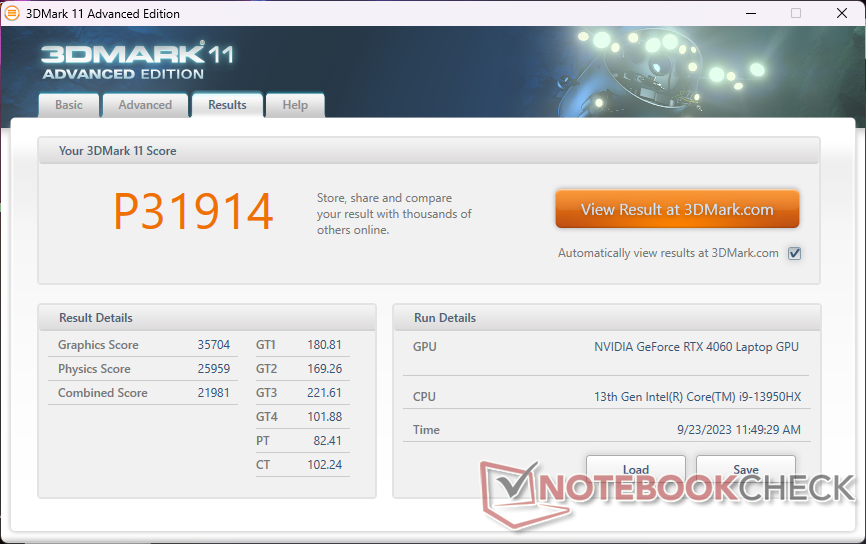
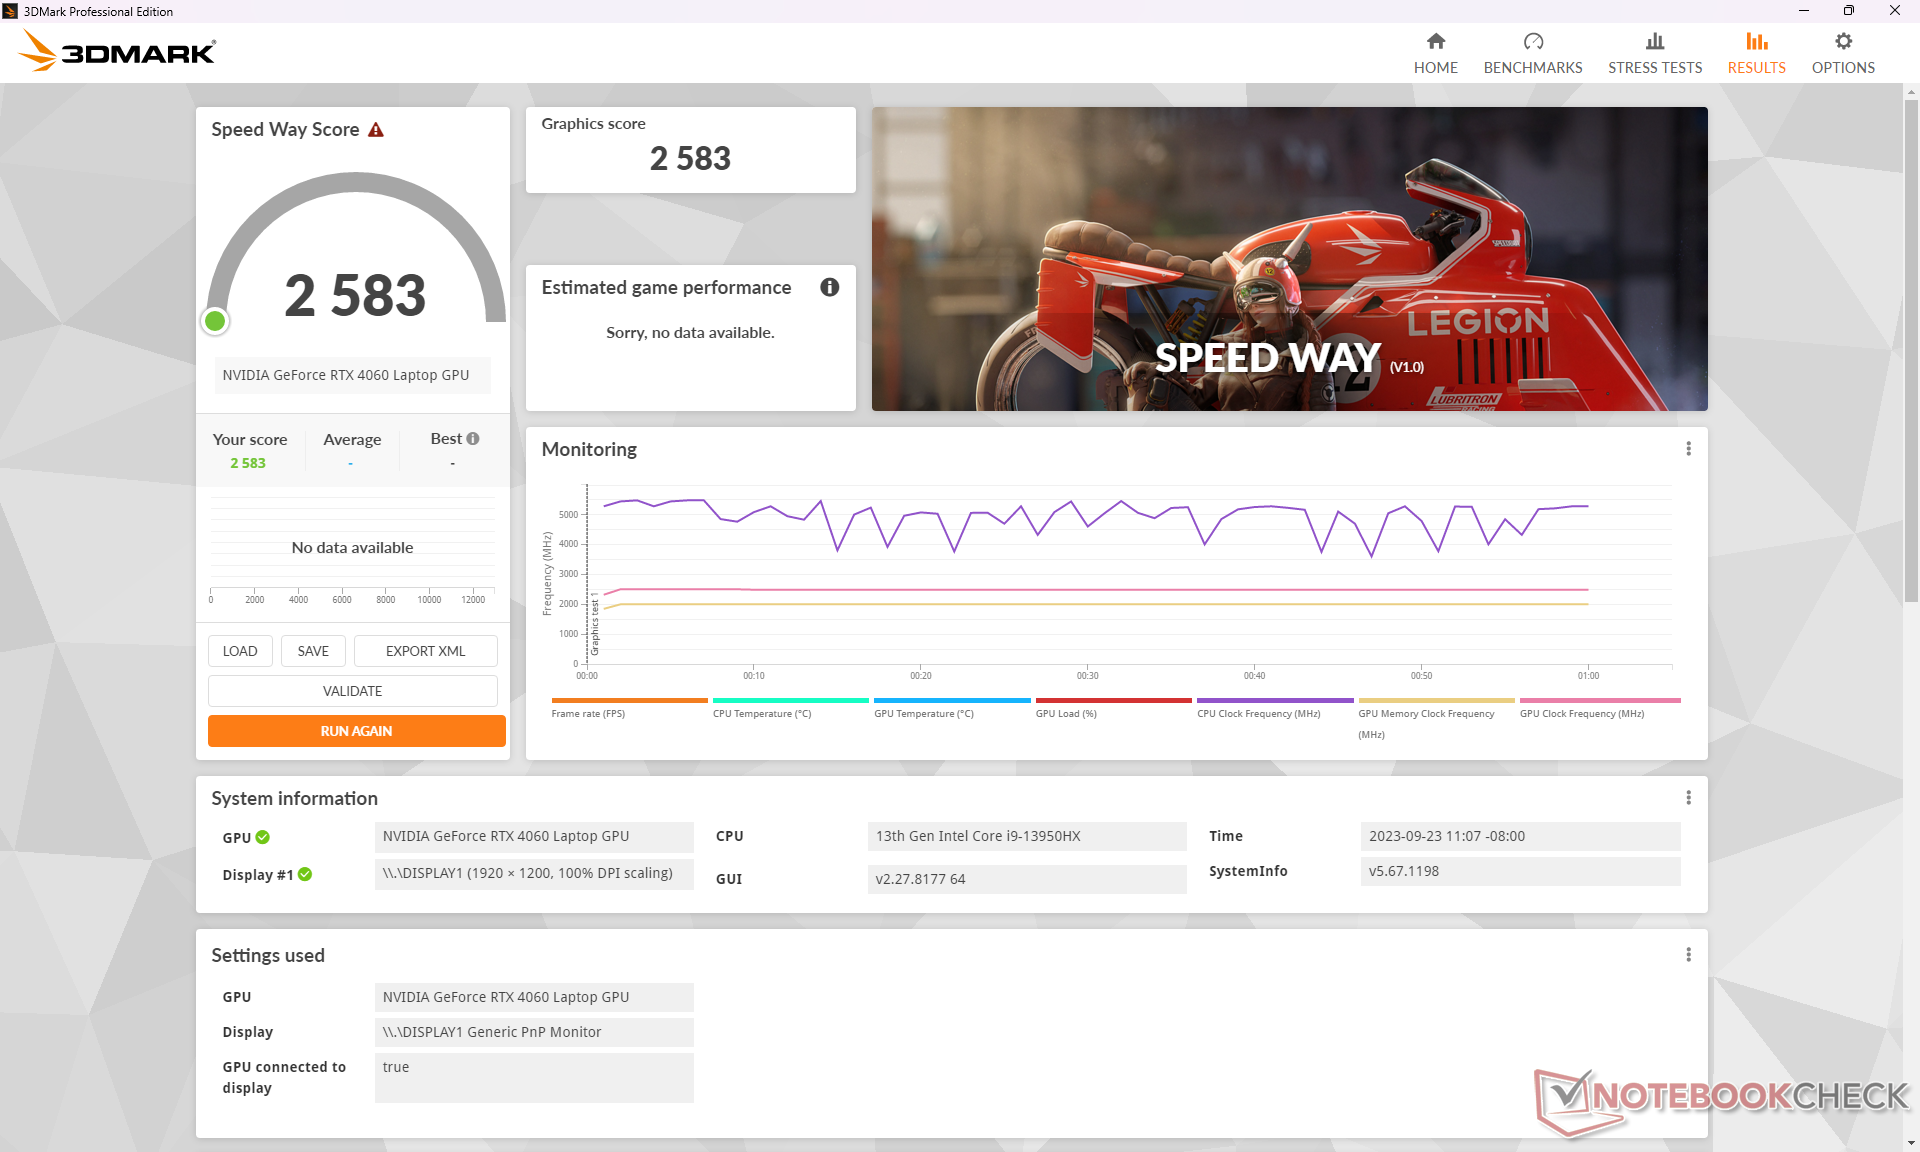
| 3DMark 11 Performance | 31914 puntos | |
| 3DMark Fire Strike Score | 24416 puntos | |
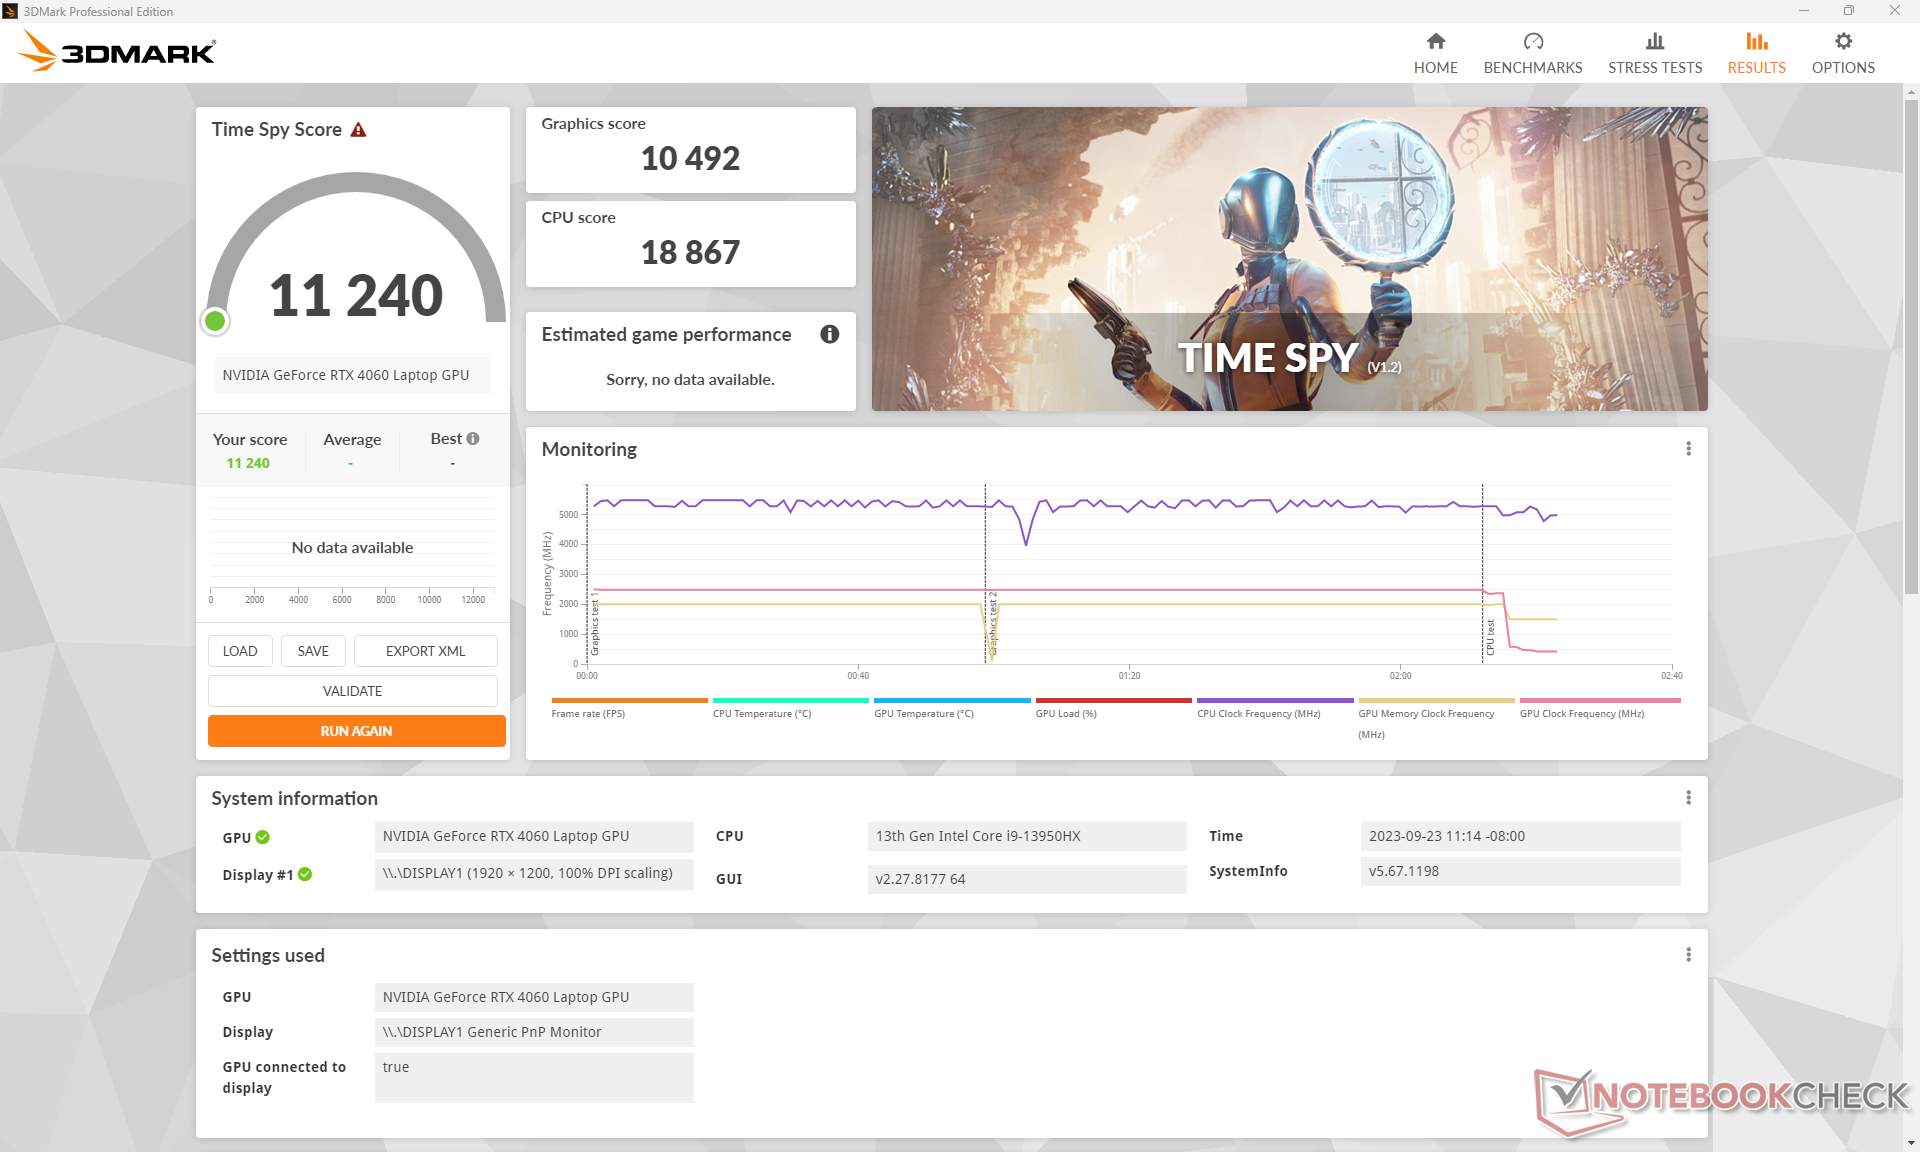
| 3DMark Time Spy Score | 11240 puntos | |
ayuda | ||
* ... más pequeño es mejor
Rendimiento en juegos
Al igual que la RTX 2060 y RTX 3060 antes que ella, la RTX 4060 es perfecta para jugar a 1080p60. Todos los juegos probados funcionan muy bien a 1080p con los ajustes máximos, pero los juegos más nuevos y exigentes como Ratchet and Clank Rift Apart tienden a caer por debajo de los 60 FPS. Se recomiendan ajustes más bajos o DLSS en estos casos, especialmente porque la pantalla principal carece de soporte G-Sync.
| Tiny Tina's Wonderlands | |
| 1920x1080 Low Preset (DX12) | |
| Alienware m16 R1 AMD | |
| Lenovo Legion Slim 7i 16 Gen 8 | |
| MSI Raider GE68HX 13VF | |
| Medio NVIDIA GeForce RTX 4060 Laptop GPU (164.4 - 235, n=9) | |
| 1920x1080 Medium Preset (DX12) | |
| Alienware m16 R1 AMD | |
| Lenovo Legion Slim 7i 16 Gen 8 | |
| MSI Raider GE68HX 13VF | |
| Medio NVIDIA GeForce RTX 4060 Laptop GPU (116 - 192.3, n=9) | |
| 1920x1080 High Preset (DX12) | |
| Alienware m16 R1 AMD | |
| Lenovo Legion Slim 7i 16 Gen 8 | |
| MSI Raider GE68HX 13VF | |
| Medio NVIDIA GeForce RTX 4060 Laptop GPU (86.6 - 121.2, n=10) | |
| 1920x1080 Badass Preset (DX12) | |
| Asus Zephyrus Duo 16 GX650PY-NM006W | |
| Alienware m16 R1 AMD | |
| Lenovo Legion Slim 7i 16 Gen 8 | |
| MSI Raider GE68HX 13VF | |
| Medio NVIDIA GeForce RTX 4060 Laptop GPU (67.5 - 92.7, n=11) | |
| Ratchet & Clank Rift Apart | |
| 1920x1080 Low Preset | |
| Medio NVIDIA GeForce RTX 4060 Laptop GPU (84.7 - 86, n=3) | |
| MSI Raider GE68HX 13VF | |
| 1920x1080 Medium Preset AA:T | |
| MSI Raider GE68HX 13VF | |
| Medio NVIDIA GeForce RTX 4060 Laptop GPU (73.4 - 75, n=4) | |
| 1920x1080 High Preset AA:T | |
| Medio NVIDIA GeForce RTX 4060 Laptop GPU (59 - 60.6, n=4) | |
| MSI Raider GE68HX 13VF | |
| 1920x1080 Very High Preset AA:T | |
| Medio NVIDIA GeForce RTX 4060 Laptop GPU (51.6 - 54.8, n=4) | |
| MSI Raider GE68HX 13VF | |
Witcher 3 FPS Chart
| bajo | medio | alto | ultra | |
|---|---|---|---|---|
| The Witcher 3 (2015) | 556.3 | 364.9 | 213.1 | 103.5 |
| Dota 2 Reborn (2015) | 232 | 207 | 199 | 182.2 |
| Final Fantasy XV Benchmark (2018) | 223 | 151.3 | 103.2 | |
| X-Plane 11.11 (2018) | 209 | 184 | 141.1 | |
| Far Cry 5 (2018) | 191 | 158 | 147 | 138 |
| Strange Brigade (2018) | 487 | 291 | 232 | 194 |
| Cyberpunk 2077 1.6 (2022) | 129.1 | 103 | 88.3 | 80.4 |
| Tiny Tina's Wonderlands (2022) | 233.9 | 184.6 | 116.5 | 88.3 |
| F1 22 (2022) | 288 | 271 | 206 | 65.5 |
| Ratchet & Clank Rift Apart (2023) | 84.7 | 75 | 59 | 51.6 |
Emisiones
Ruido del sistema: se recomienda el modo equilibrado en la mayoría de los casos
El ruido del ventilador es mixto. Los dos ventiladores son muy sensibles a las cargas en pantalla, lo que significa que aumentarán brusca y rápidamente al iniciar aplicaciones o navegar por la web, incluso con el perfil de energía equilibrado. También se oye el ruido del ventilador en modo silencioso, pero las pulsaciones son mucho menos frecuentes. En general, los usuarios pueden esperar un nivel de ruido en el rango de 25 a 38 dB(A) cuando navegan o transmiten vídeo, incluso en modo silencioso.
El ruido del ventilador al jugar puede variar mucho dependiendo del perfil de potencia seleccionado. Si se ejecuta Witcher 3 en los modos Equilibrado o Rendimiento Extremo resultaría en un nivel de ruido de 46,2 dB(A) o 57 dB(A), respectivamente. Si se activa Cooler Boost, el máximo se dispararía aún más hasta los 60,1 dB(A) para ser uno de los portátiles de juego de 16 pulgadas más ruidosos. Afortunadamente, la pérdida de rendimiento gráfico al jugar en modo equilibrado es muy marginal, por lo que los ajustes de Rendimiento Extremo y Cooler Boost sólo se recomiendan si quieres temperaturas de funcionamiento más frías o si vas a overclockear la GPU manualmente.
Ruido
| Ocioso |
| 25 / 31.3 / 37.5 dB(A) |
| Carga |
| 44 / 60.1 dB(A) |
 | ||
30 dB silencioso 40 dB(A) audible 50 dB(A) ruidosamente alto |
||
min: | ||
| MSI Raider GE68HX 13VF GeForce RTX 4060 Laptop GPU, i9-13950HX, Samsung PM9B1 1024GB MZVL41T0HBLB | MSI GE67 HX 12UGS GeForce RTX 3070 Ti Laptop GPU, i7-12800HX, Samsung PM9A1 MZVL21T0HCLR | HP Omen 16-xf0376ng GeForce RTX 4070 Laptop GPU, R7 7840HS, WDC PC SN810 512GB | Alienware m16 R1 AMD GeForce RTX 4080 Laptop GPU, R9 7845HX, Kioxia XG8 KXG80ZNV1T02 | Lenovo Legion Slim 7i 16 Gen 8 GeForce RTX 4070 Laptop GPU, i9-13900H, Samsung PM9A1 MZVL21T0HCLR | Asus ROG Zephyrus M16 GU604VY-NM042X GeForce RTX 4090 Laptop GPU, i9-13900H, Samsung PM9A1 MZVL22T0HBLB | |
|---|---|---|---|---|---|---|
| Noise | 12% | 9% | 12% | 16% | 5% | |
| apagado / medio ambiente * (dB) | 23.3 | 22.7 3% | 24 -3% | 22.9 2% | 22.8 2% | 24 -3% |
| Idle Minimum * (dB) | 25 | 22.9 8% | 25 -0% | 22.9 8% | 23.6 6% | 24 4% |
| Idle Average * (dB) | 31.3 | 22.9 27% | 29 7% | 29.7 5% | 23.6 25% | 29.96 4% |
| Idle Maximum * (dB) | 37.5 | 22.9 39% | 32 15% | 29.7 21% | 25.7 31% | 34.27 9% |
| Load Average * (dB) | 44 | 44.4 -1% | 44 -0% | 29.8 32% | 27.6 37% | 35.89 18% |
| Witcher 3 ultra * (dB) | 57 | 55.7 2% | 44 23% | 54.7 4% | 54.4 5% | 57.5 -1% |
| Load Maximum * (dB) | 60.1 | 57.4 4% | 46 23% | 54.7 9% | 54.4 9% | 57.54 4% |
* ... más pequeño es mejor
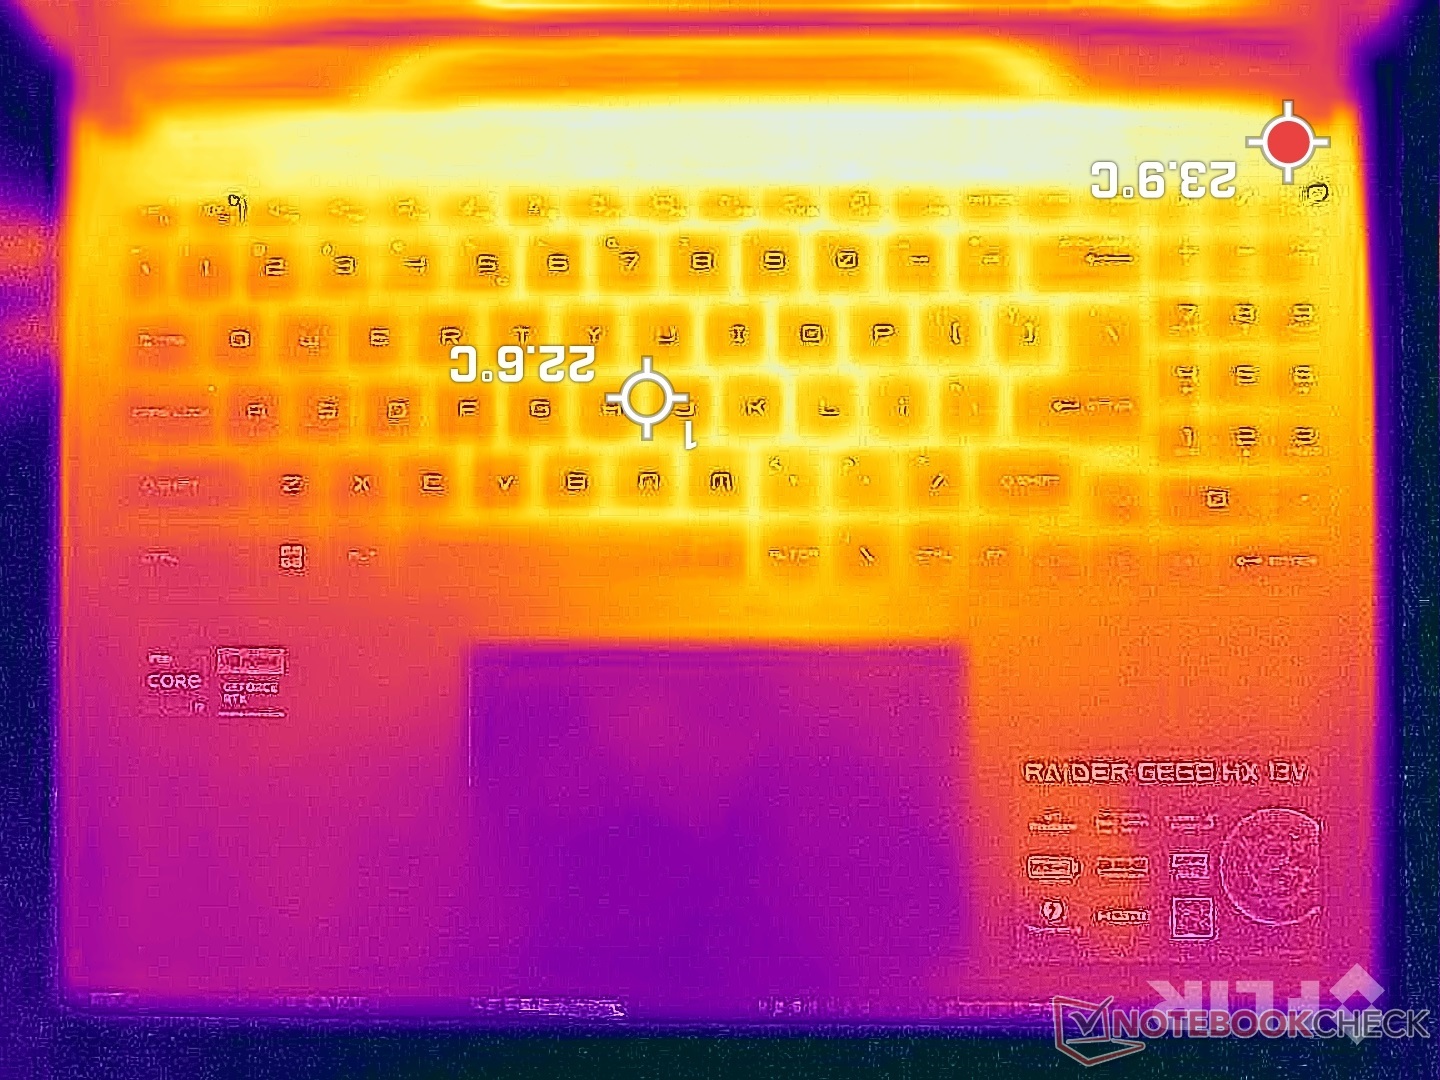
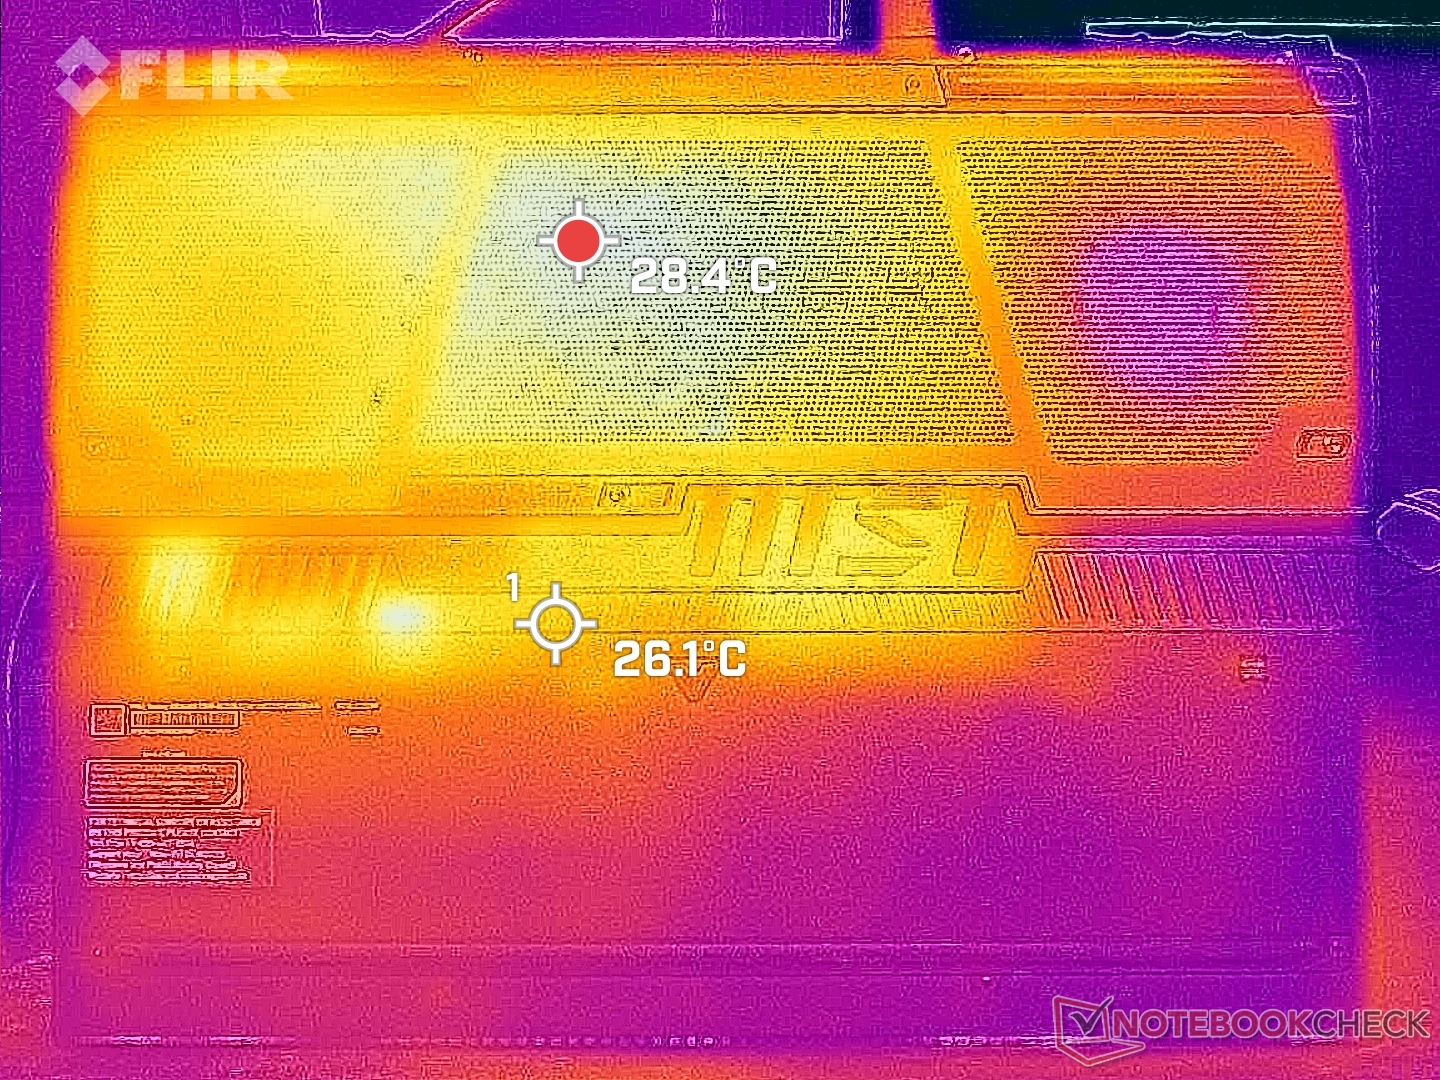
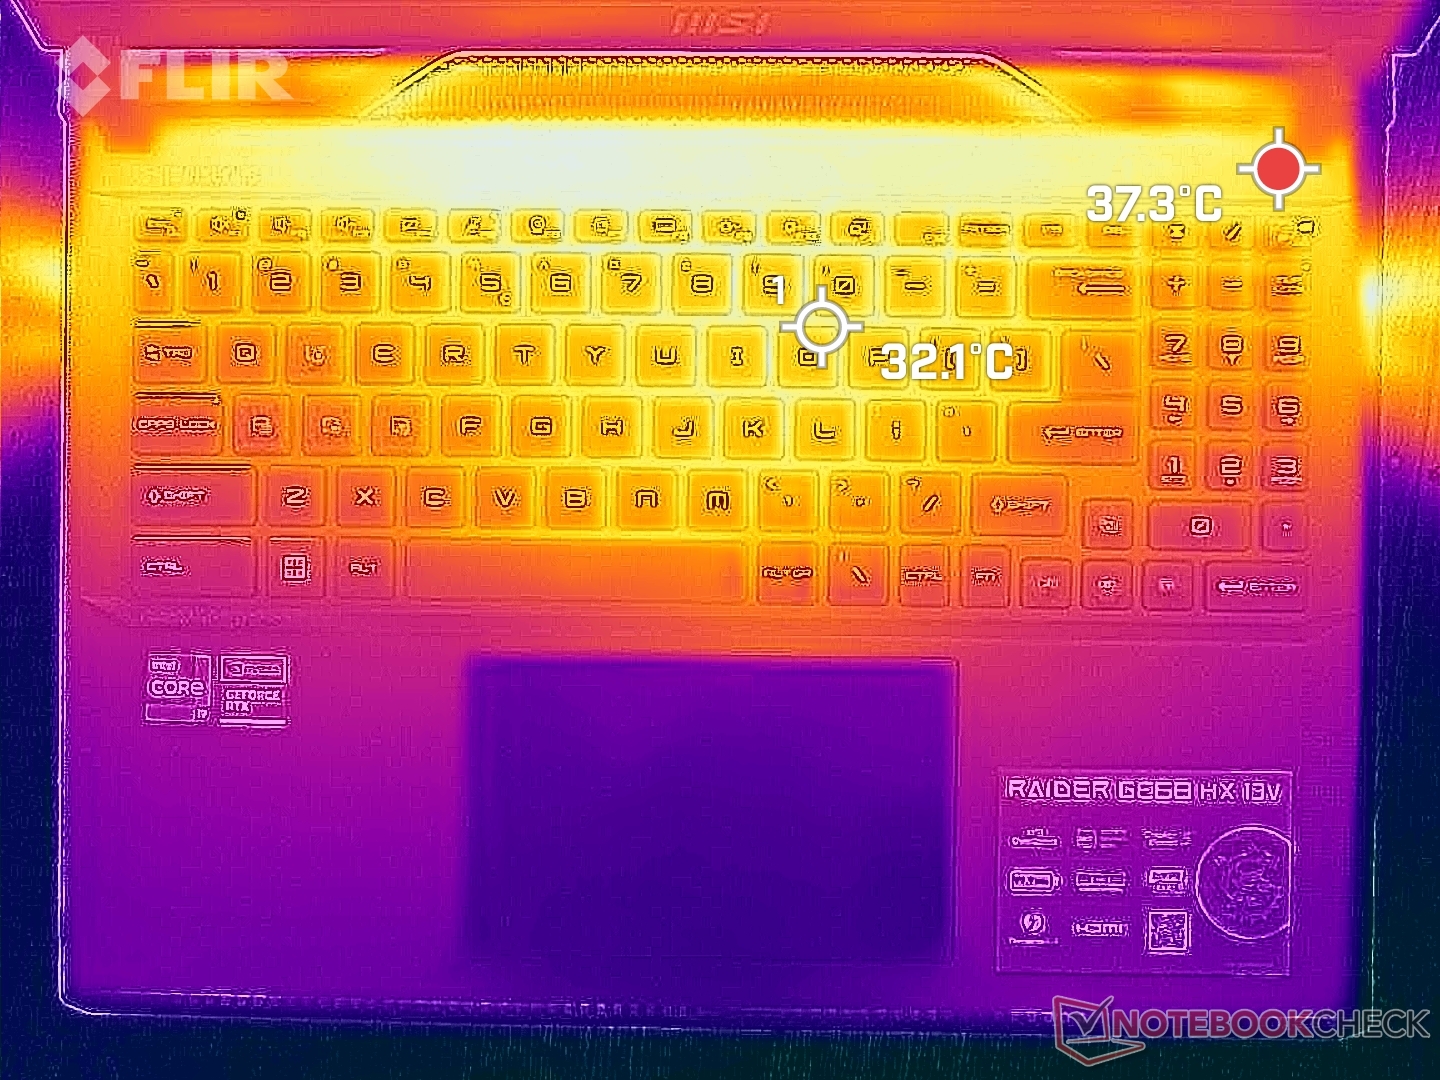
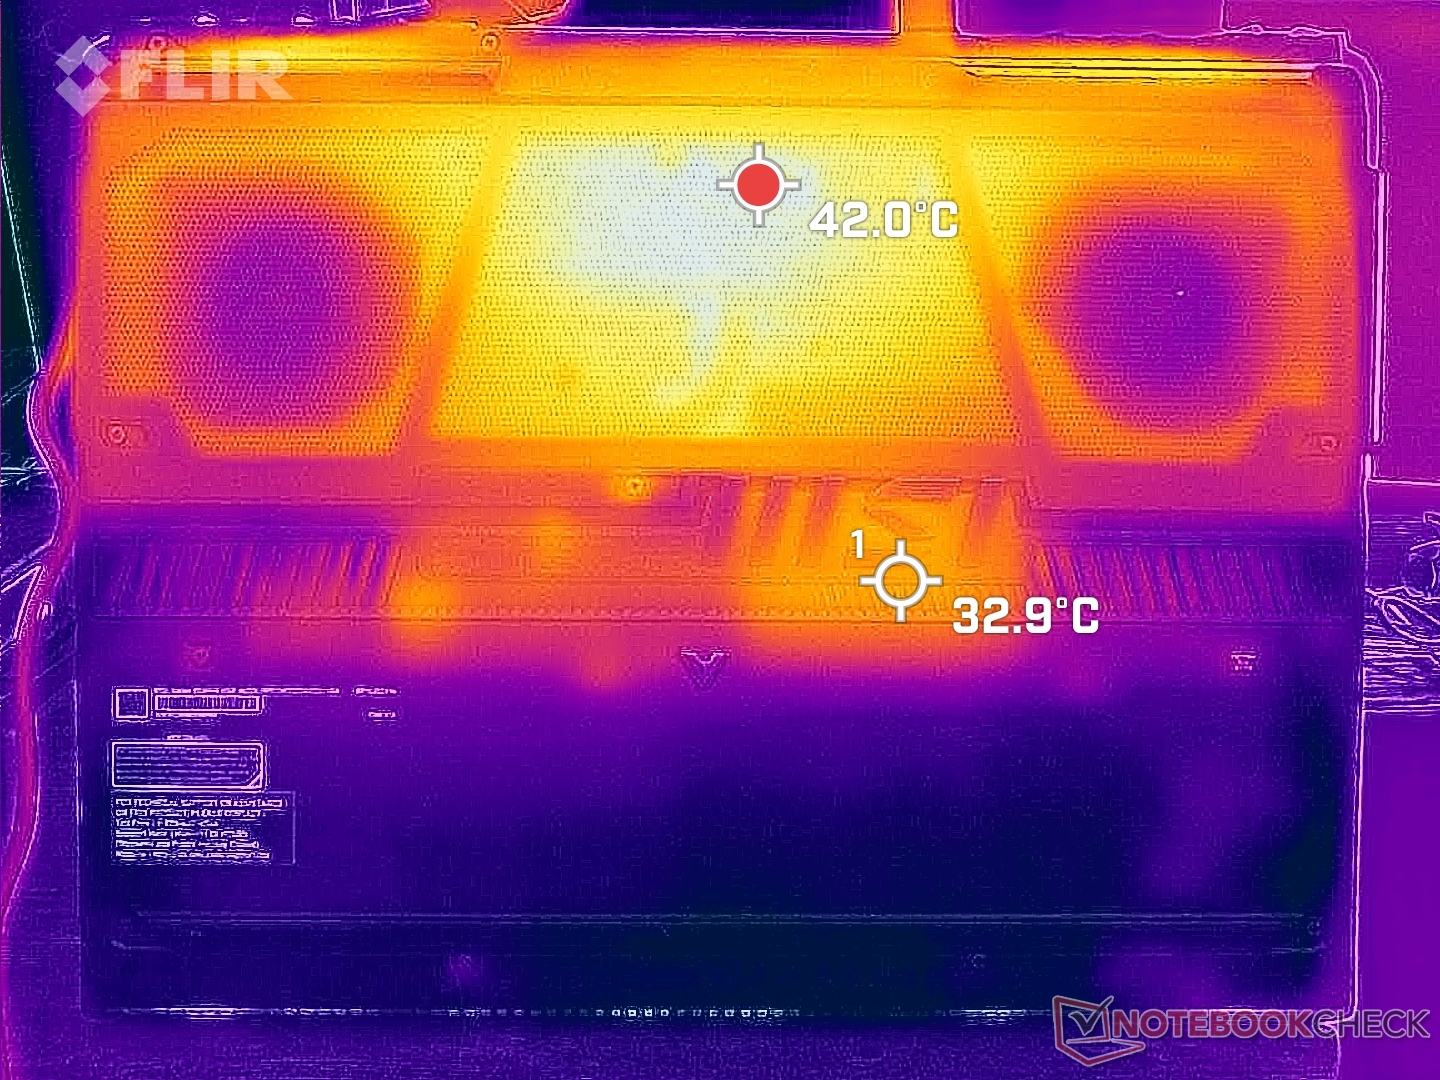
Temperatura
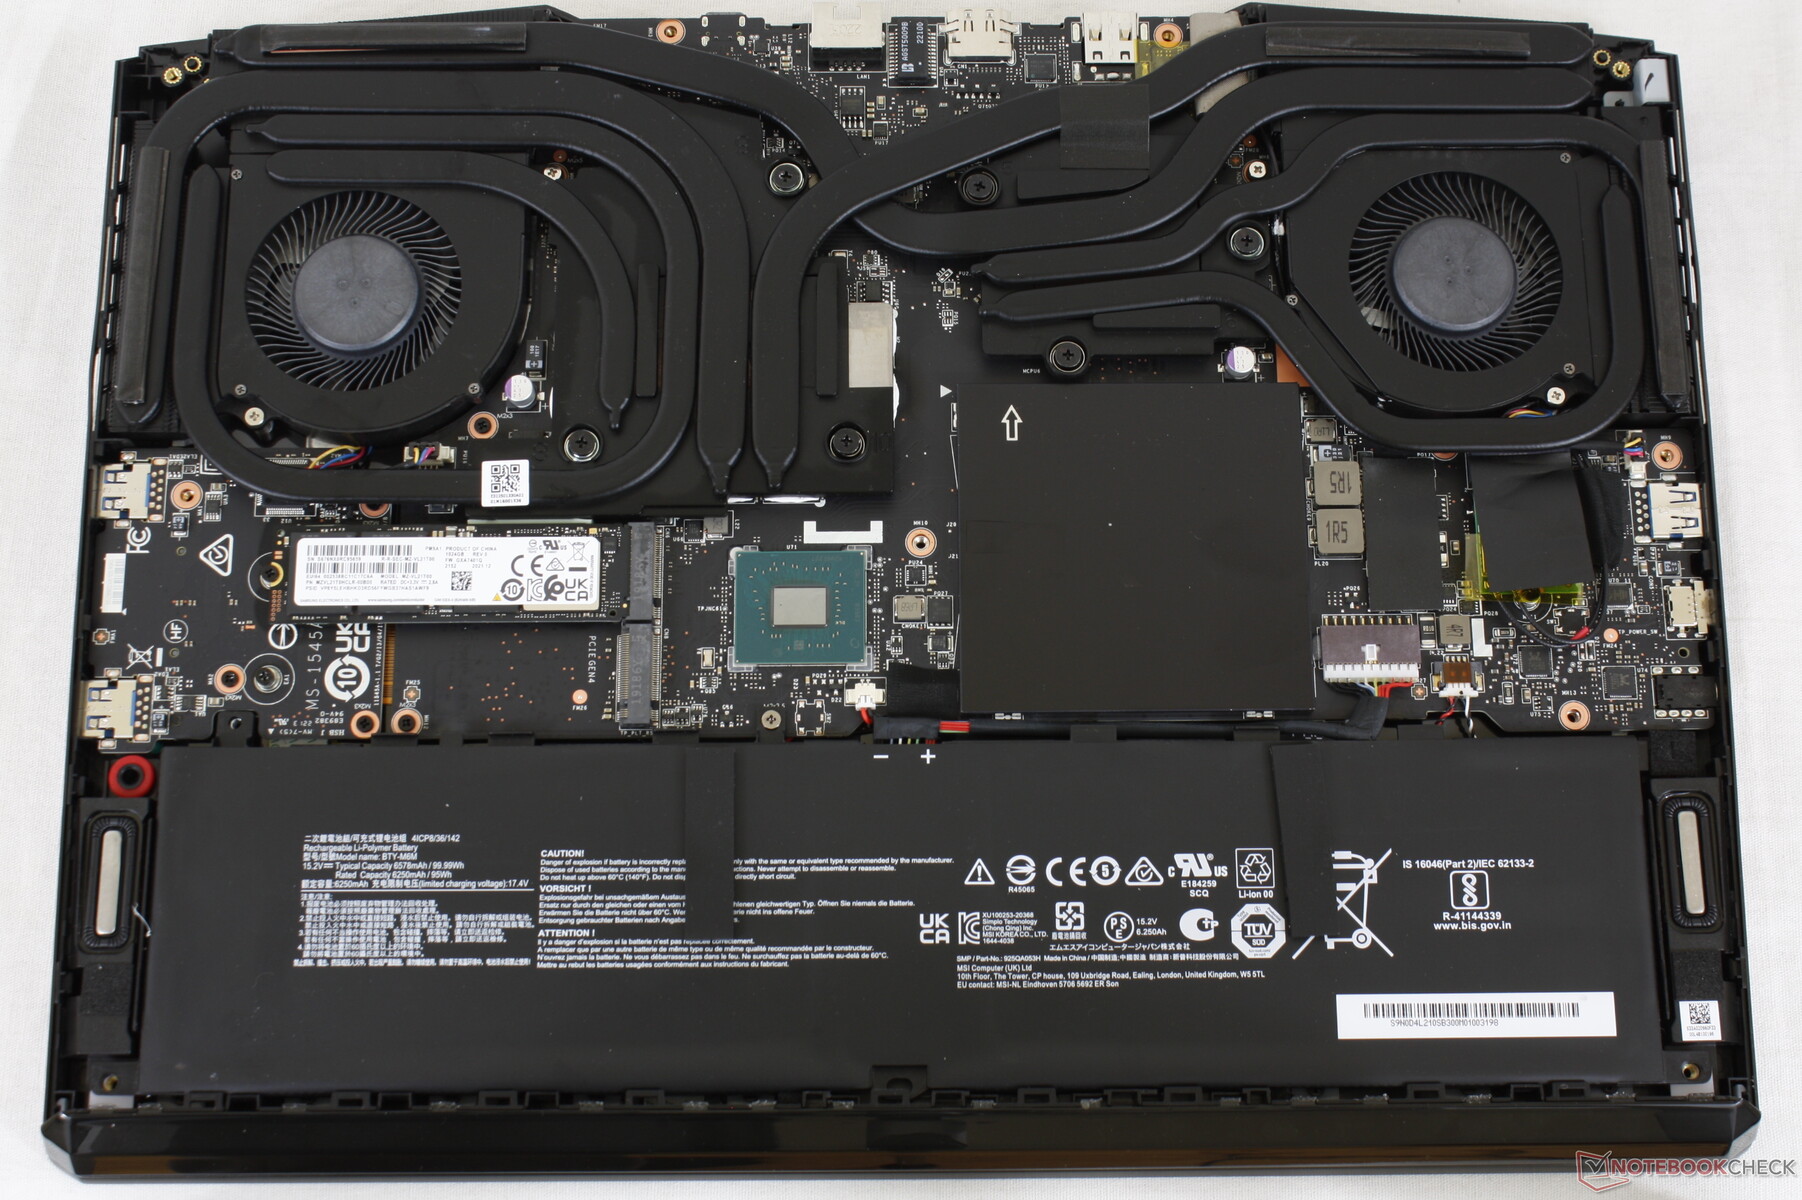
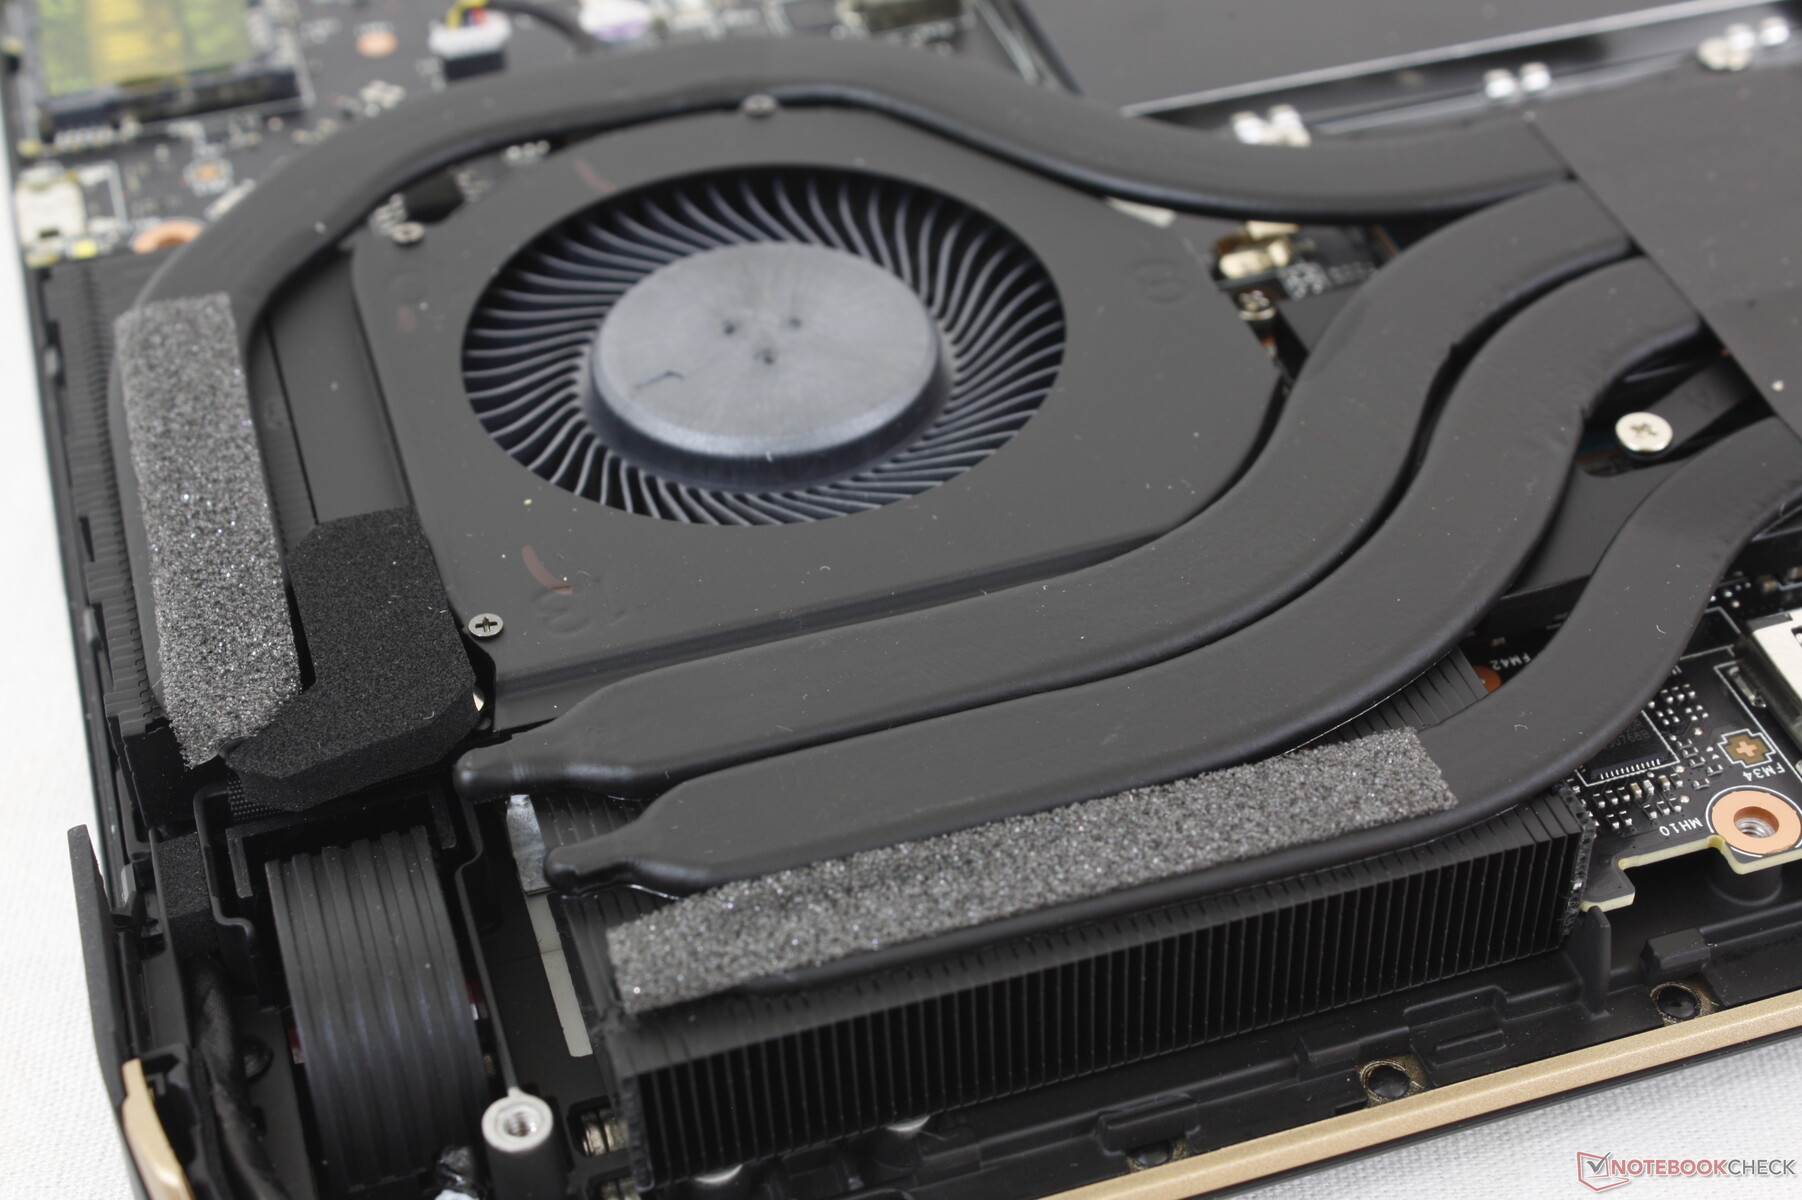
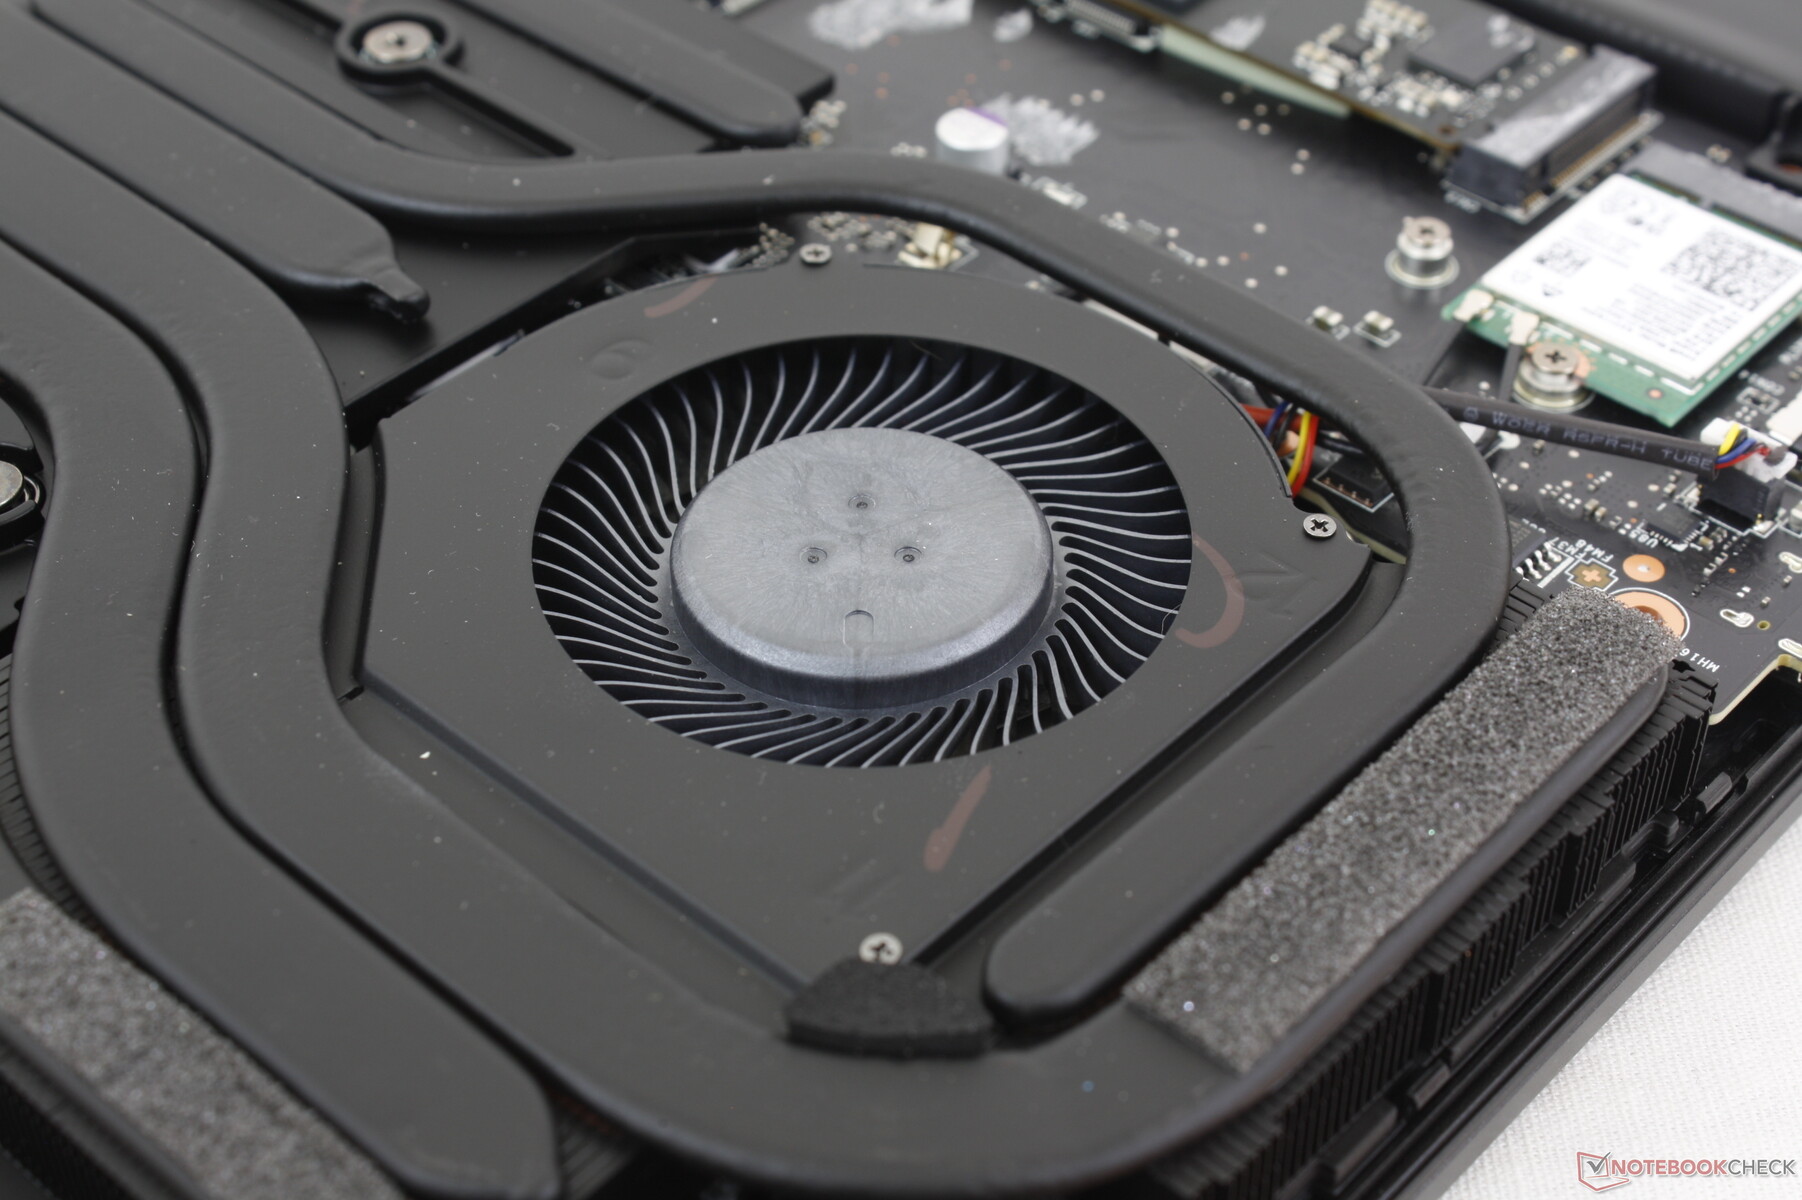
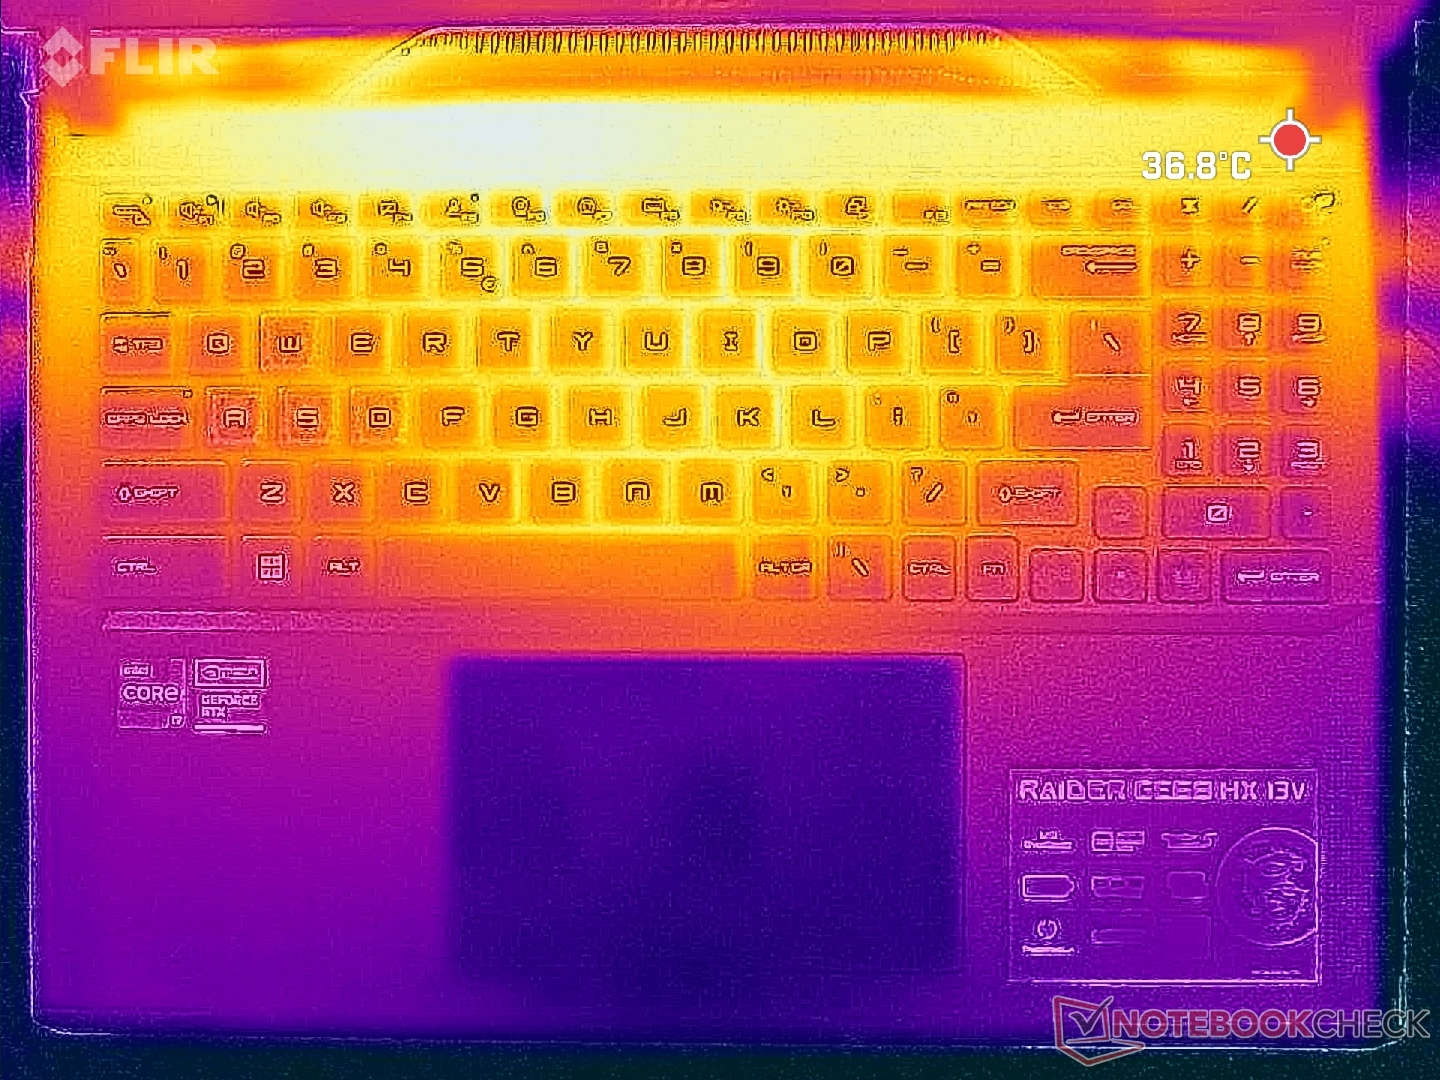
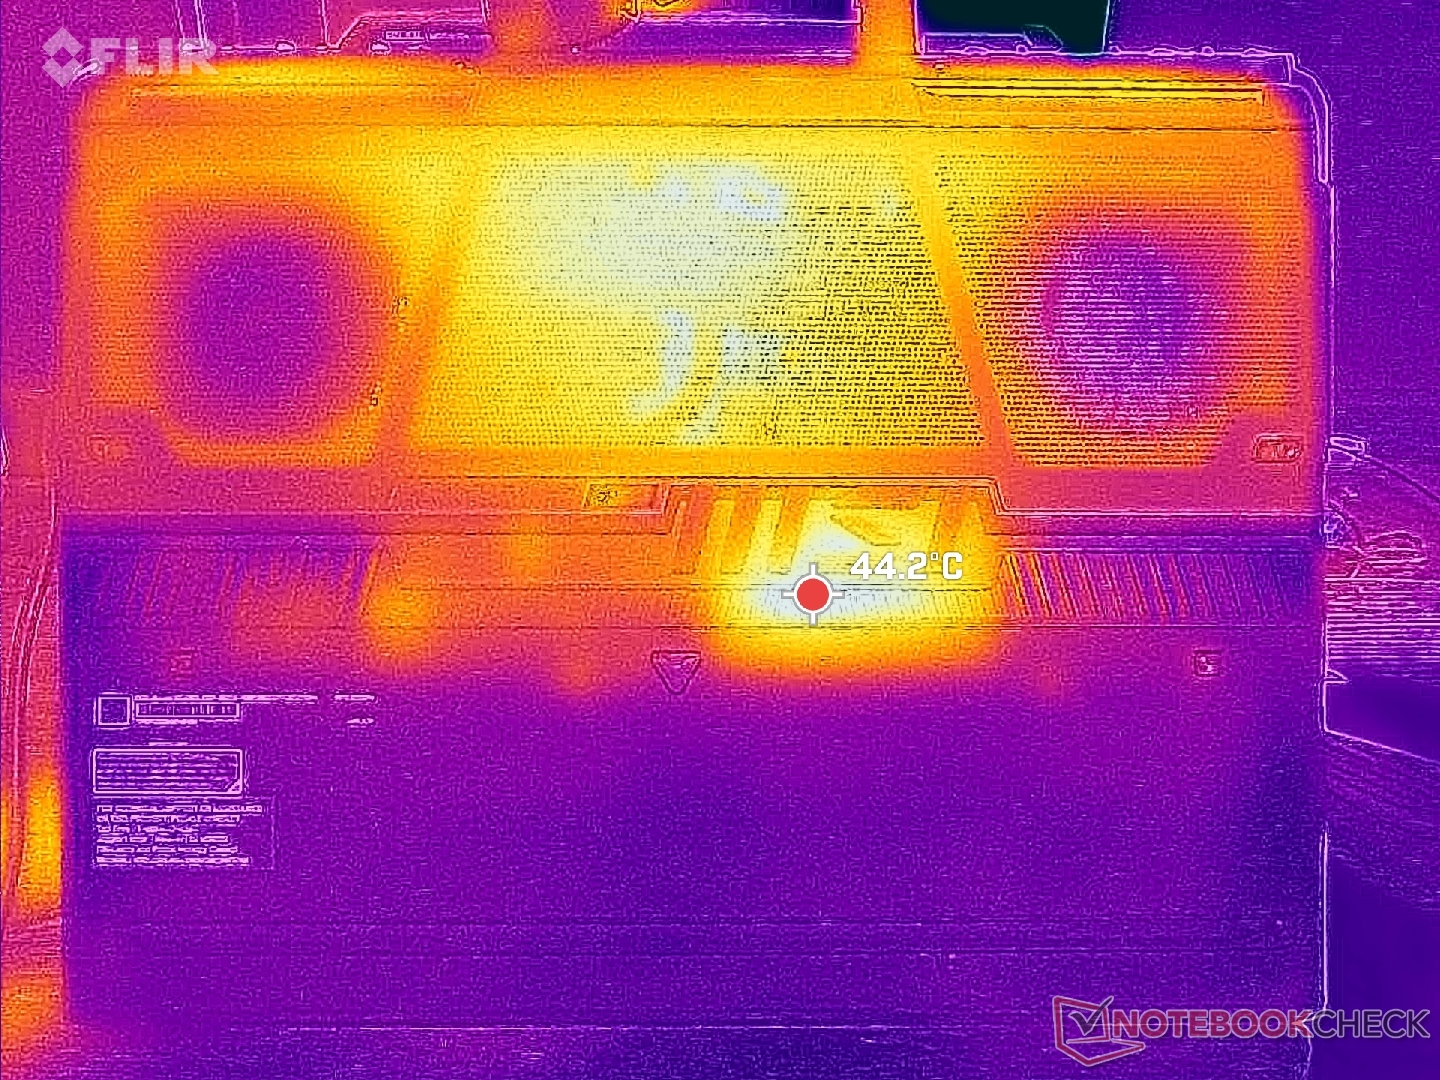
El desarrollo de la temperatura superficial es simétrico debido a cómo está diseñada la solución de refrigeración. El centro del teclado puede alcanzar hasta 40 C que es mucho más frío que lo que registramos en el HP Omen 16 o el Legion Slim 7i 16 G8 donde los puntos calientes pueden ser de hasta 45 a 50 C cada uno. Los ventiladores generalmente más ruidosos y la construcción más gruesa del GE68HX juegan a favor de MSI desde esta perspectiva.
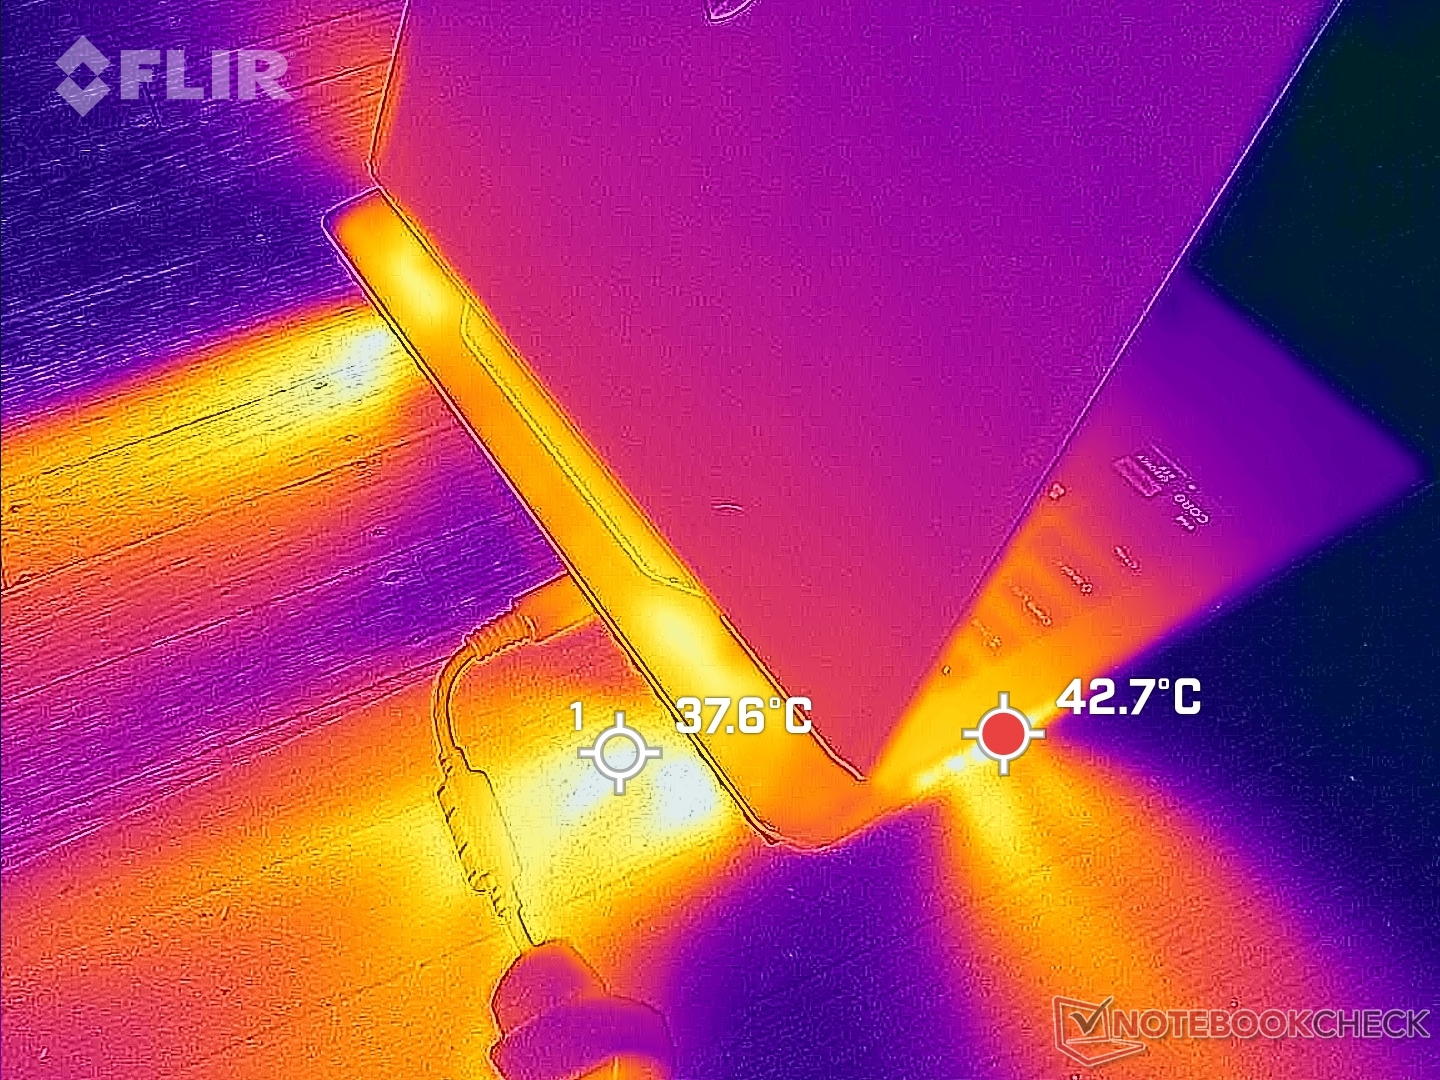
(±) La temperatura máxima en la parte superior es de 41.4 °C / 107 F, frente a la media de 40.4 °C / 105 F, que oscila entre 21.2 y 68.8 °C para la clase Gaming.
(-) El fondo se calienta hasta un máximo de 45.4 °C / 114 F, frente a la media de 43.2 °C / 110 F
(+) En reposo, la temperatura media de la parte superior es de 27.7 °C / 82# F, frente a la media del dispositivo de 33.9 °C / 93 F.
(±) Jugando a The Witcher 3, la temperatura media de la parte superior es de 34 °C / 93 F, frente a la media del dispositivo de 33.9 °C / 93 F.
(+) El reposamanos y el panel táctil están a una temperatura inferior a la de la piel, con un máximo de 29.6 °C / 85.3 F y, por tanto, son fríos al tacto.
(±) La temperatura media de la zona del reposamanos de dispositivos similares fue de 28.8 °C / 83.8 F (-0.8 °C / -1.5 F).
| MSI Raider GE68HX 13VF Intel Core i9-13950HX, NVIDIA GeForce RTX 4060 Laptop GPU | MSI GE67 HX 12UGS Intel Core i7-12800HX, NVIDIA GeForce RTX 3070 Ti Laptop GPU | HP Omen 16-xf0376ng AMD Ryzen 7 7840HS, NVIDIA GeForce RTX 4070 Laptop GPU | Alienware m16 R1 AMD AMD Ryzen 9 7845HX, NVIDIA GeForce RTX 4080 Laptop GPU | Lenovo Legion Slim 7i 16 Gen 8 Intel Core i9-13900H, NVIDIA GeForce RTX 4070 Laptop GPU | Asus ROG Zephyrus M16 GU604VY-NM042X Intel Core i9-13900H, NVIDIA GeForce RTX 4090 Laptop GPU | |
|---|---|---|---|---|---|---|
| Heat | 9% | -12% | -10% | -6% | -6% | |
| Maximum Upper Side * (°C) | 41.4 | 34.4 17% | 49 -18% | 48 -16% | 49.8 -20% | 50 -21% |
| Maximum Bottom * (°C) | 45.4 | 42 7% | 57 -26% | 39 14% | 48.8 -7% | 58 -28% |
| Idle Upper Side * (°C) | 29.8 | 24 19% | 31 -4% | 37 -24% | 29.4 1% | 26 13% |
| Idle Bottom * (°C) | 31.4 | 33.2 -6% | 31 1% | 36.2 -15% | 30 4% | 28 11% |
* ... más pequeño es mejor
Prueba de resistencia
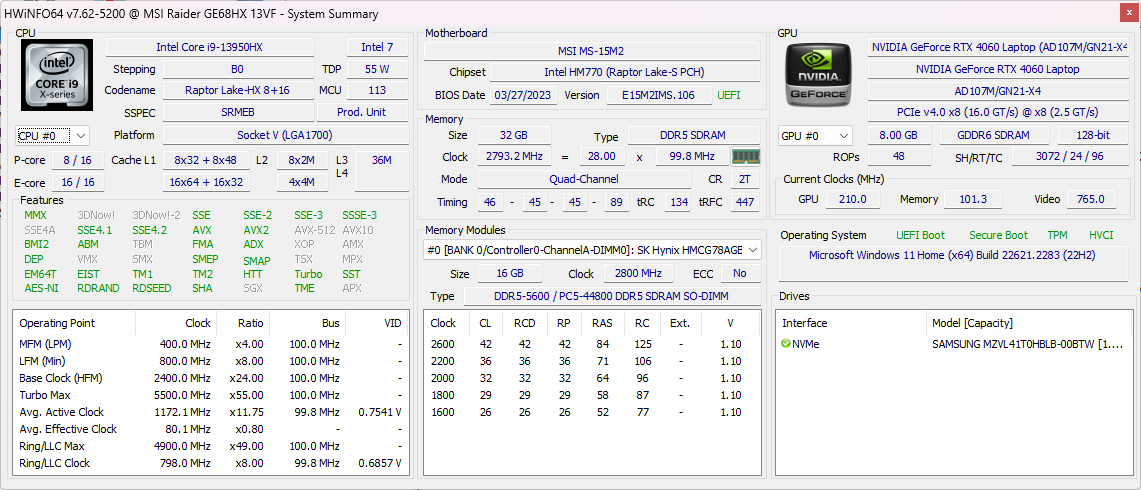
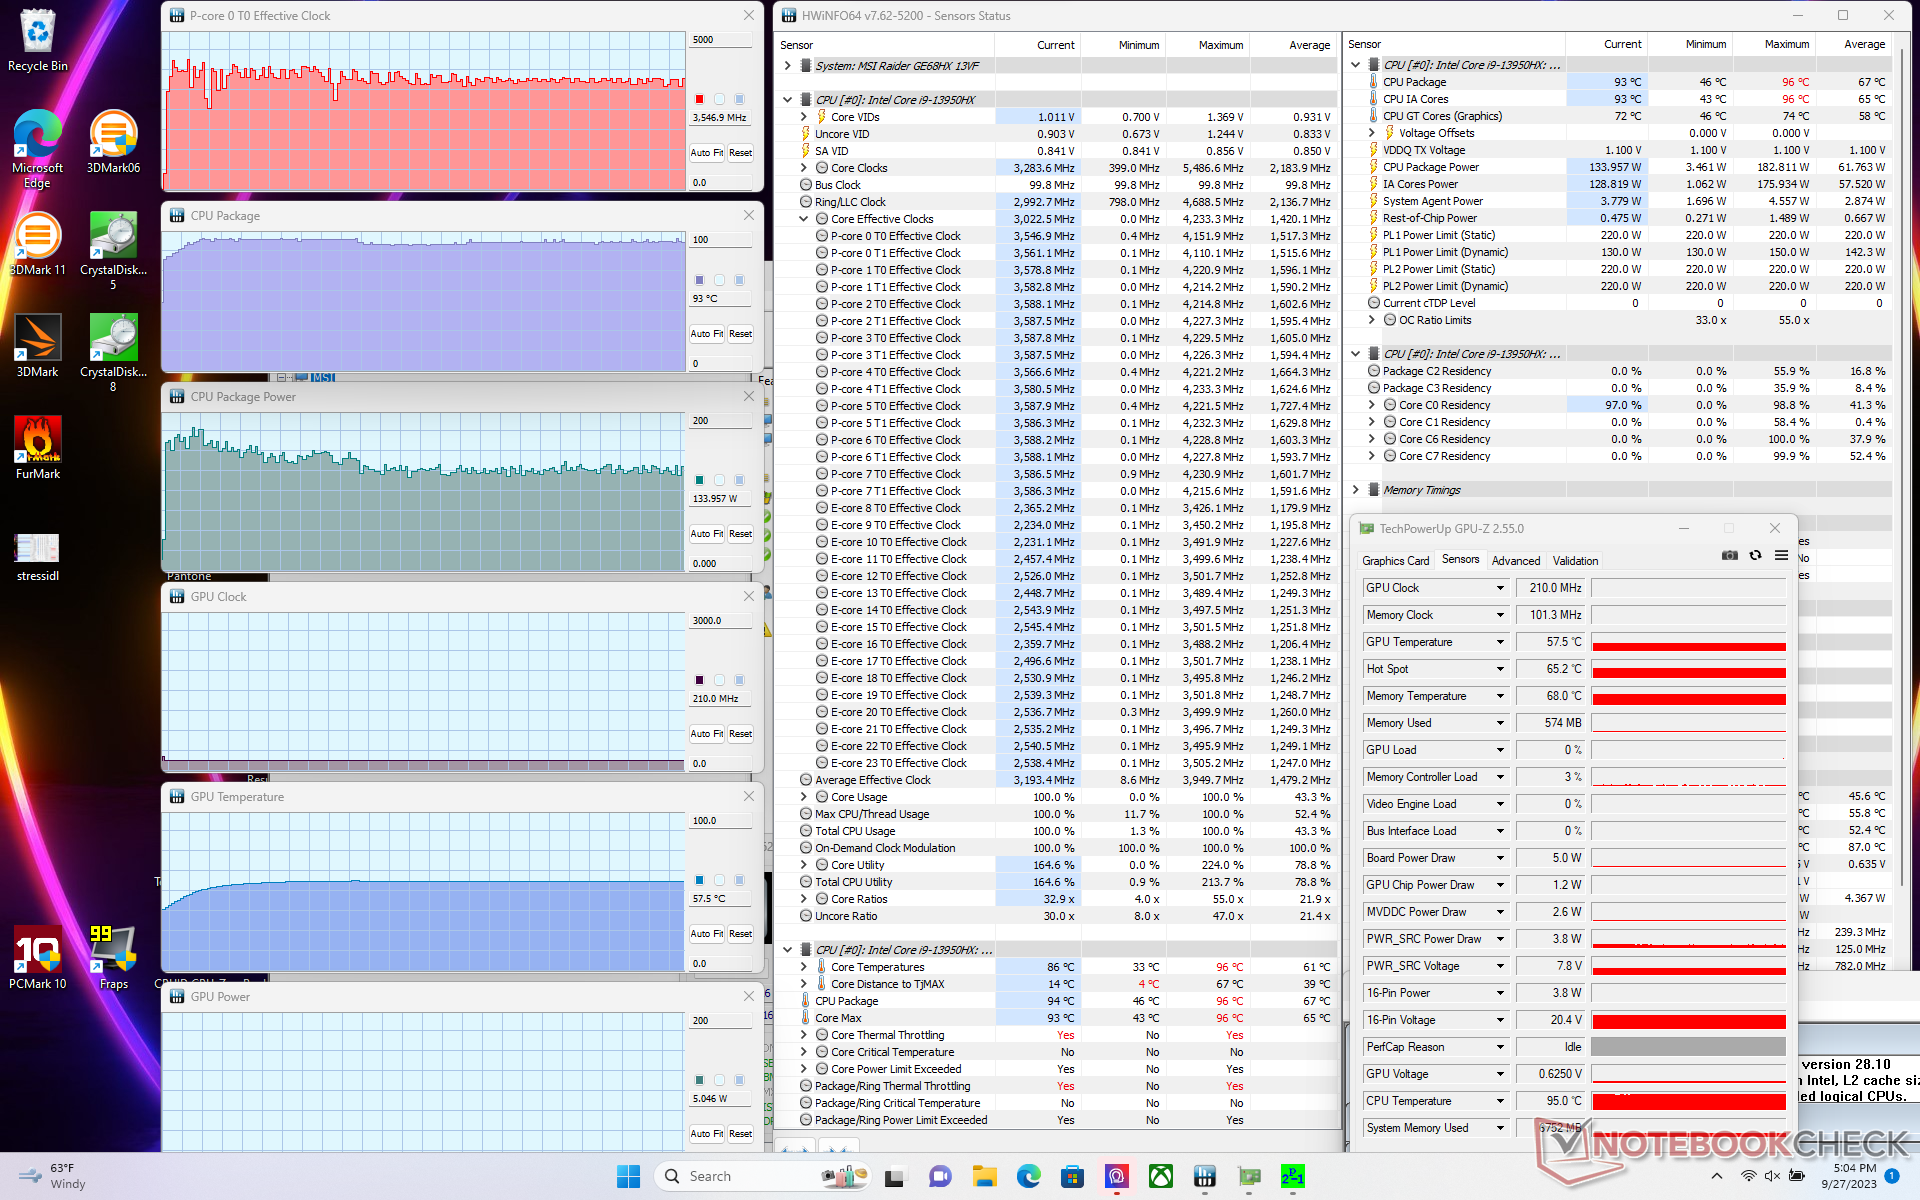
La CPU aumentaría a 4.1 GHz y 183 W al iniciar el estrés Prime95 antes de establecerse en 3.6 GHz, 134 W, y 93 C sólo unos segundos después. Repitiendo esta prueba en el modelo del año pasado con el antiguo Core i7-12800HX de 12ª generación se obtendría una potencia de paquete de CPU mucho menor, de sólo 55 W, para mostrar lo mucho más exigente que puede ser la nueva CPU de 13ª generación.
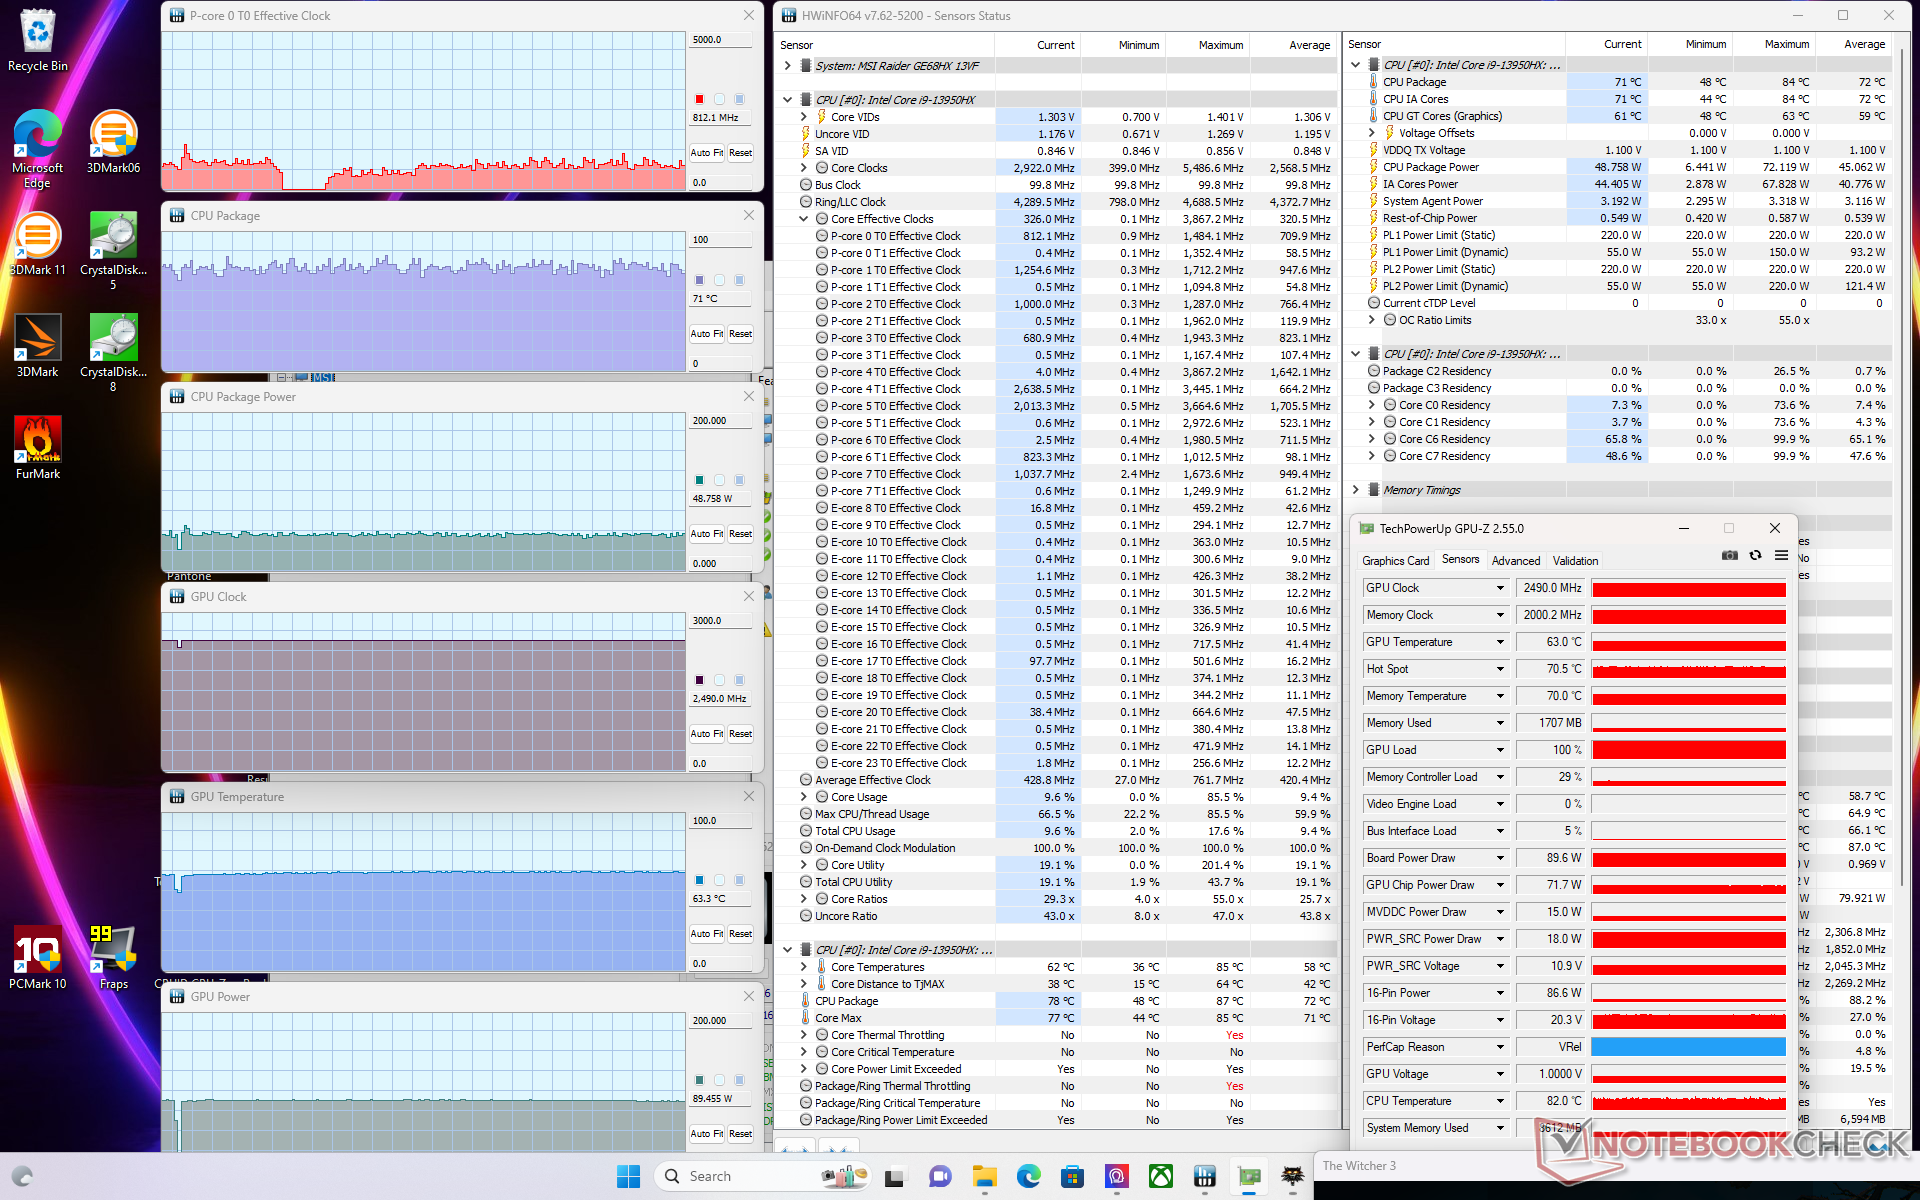
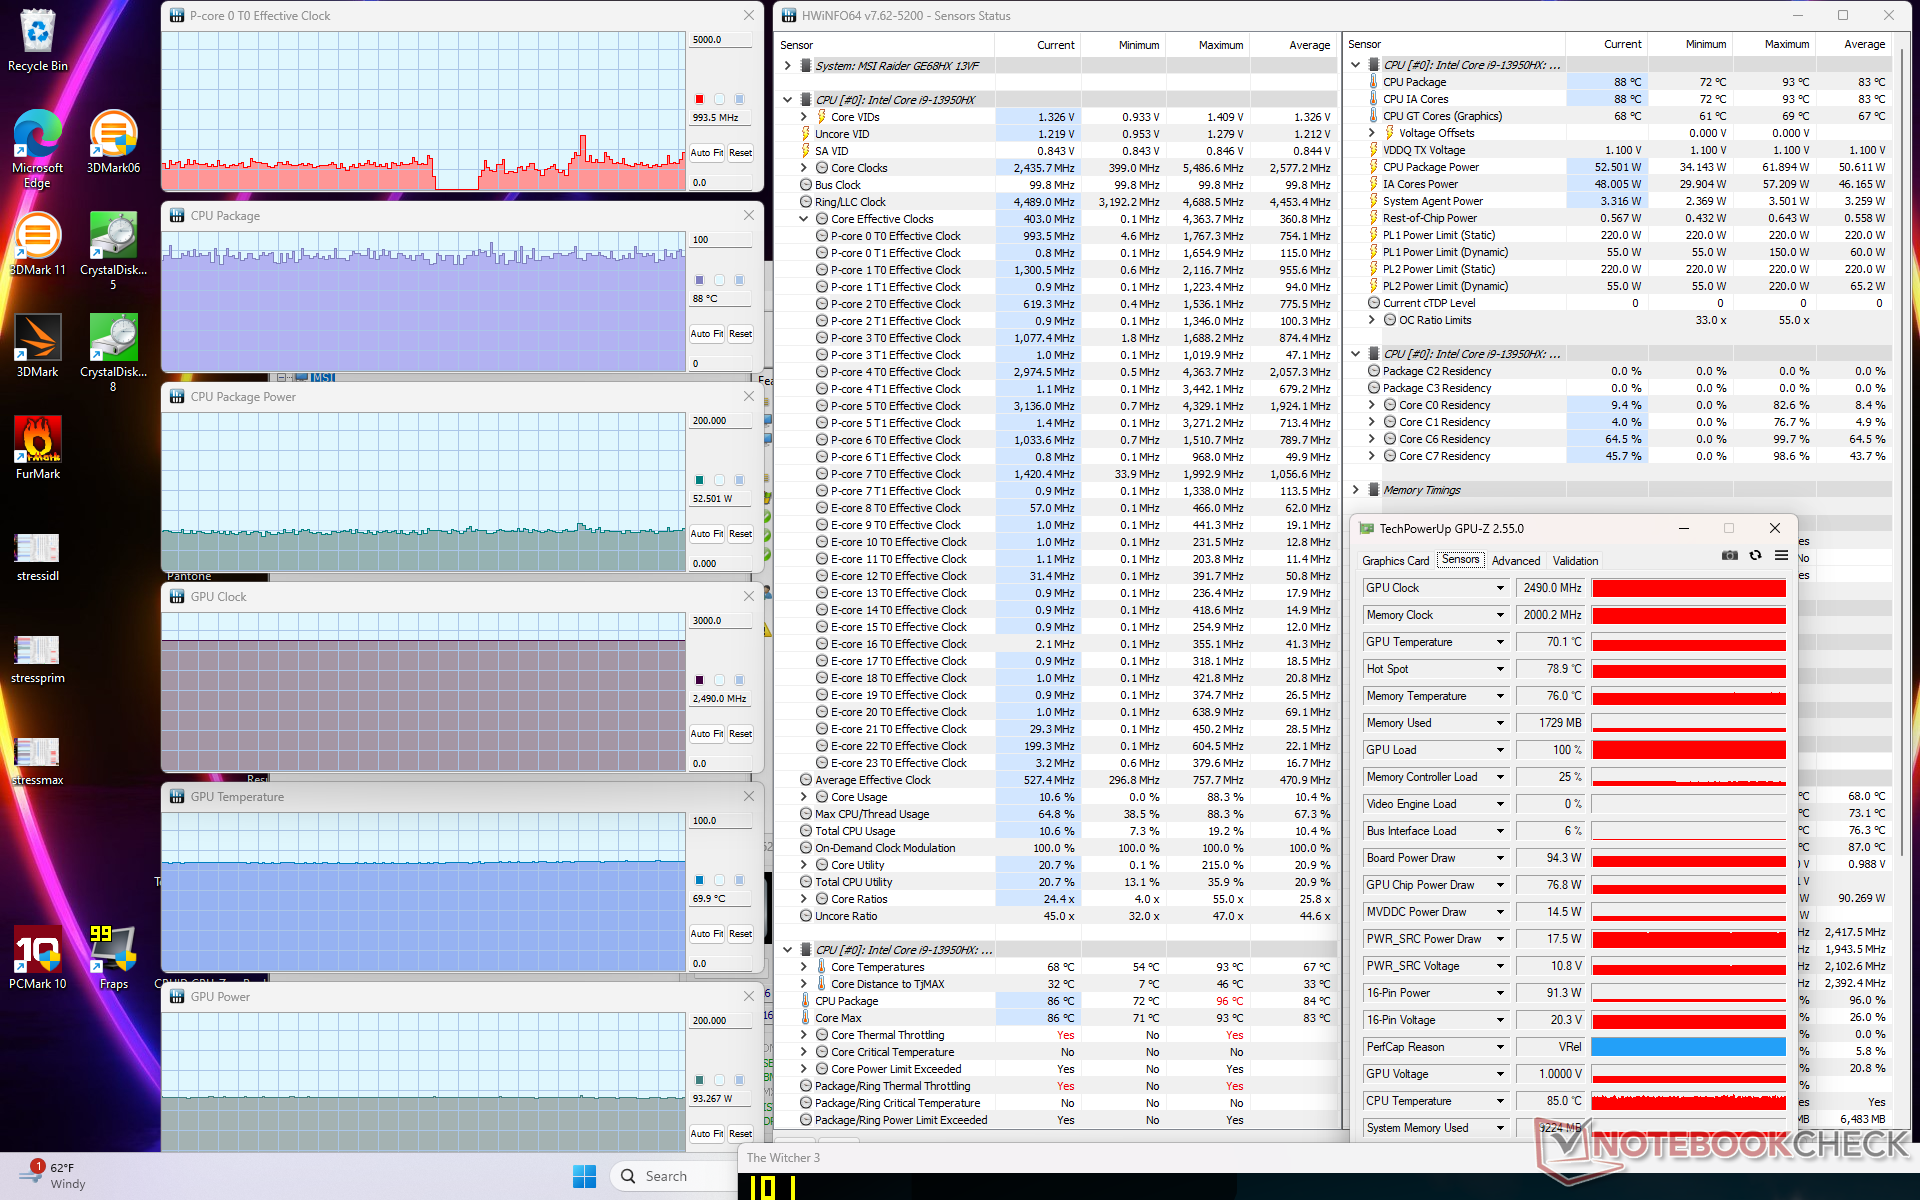
La velocidad de reloj y la temperatura de la GPU se estabilizarían en 2475 MHz y 84 C cuando se ejecuta Witcher 3 en modo equilibrado. Curiosamente, la velocidad de reloj aumentaría sólo ligeramente a 2490 MHz si se ejecuta en modo Rendimiento Extremo, mientras que la temperatura de la GPU disminuiría de manera más significativa a 70 C o incluso sólo 63 C si Cooler Boost está activo, como se muestra en nuestras capturas de pantalla y la tabla a continuación. La mayoría de los portátiles MSI para juegos presentan resultados similares. Por tanto, se recomienda jugar en modo Equilibrado ya que el impacto en el rendimiento de la GPU es muy marginal en relación con las inmensas diferencias de ruido del ventilador entre los perfiles de energía preestablecidos. Las diferencias de rendimiento entre los modos Equilibrado y Rendimiento suelen ser más significativas en otros portátiles para juegos como los de la serie Asus Zephyrus.
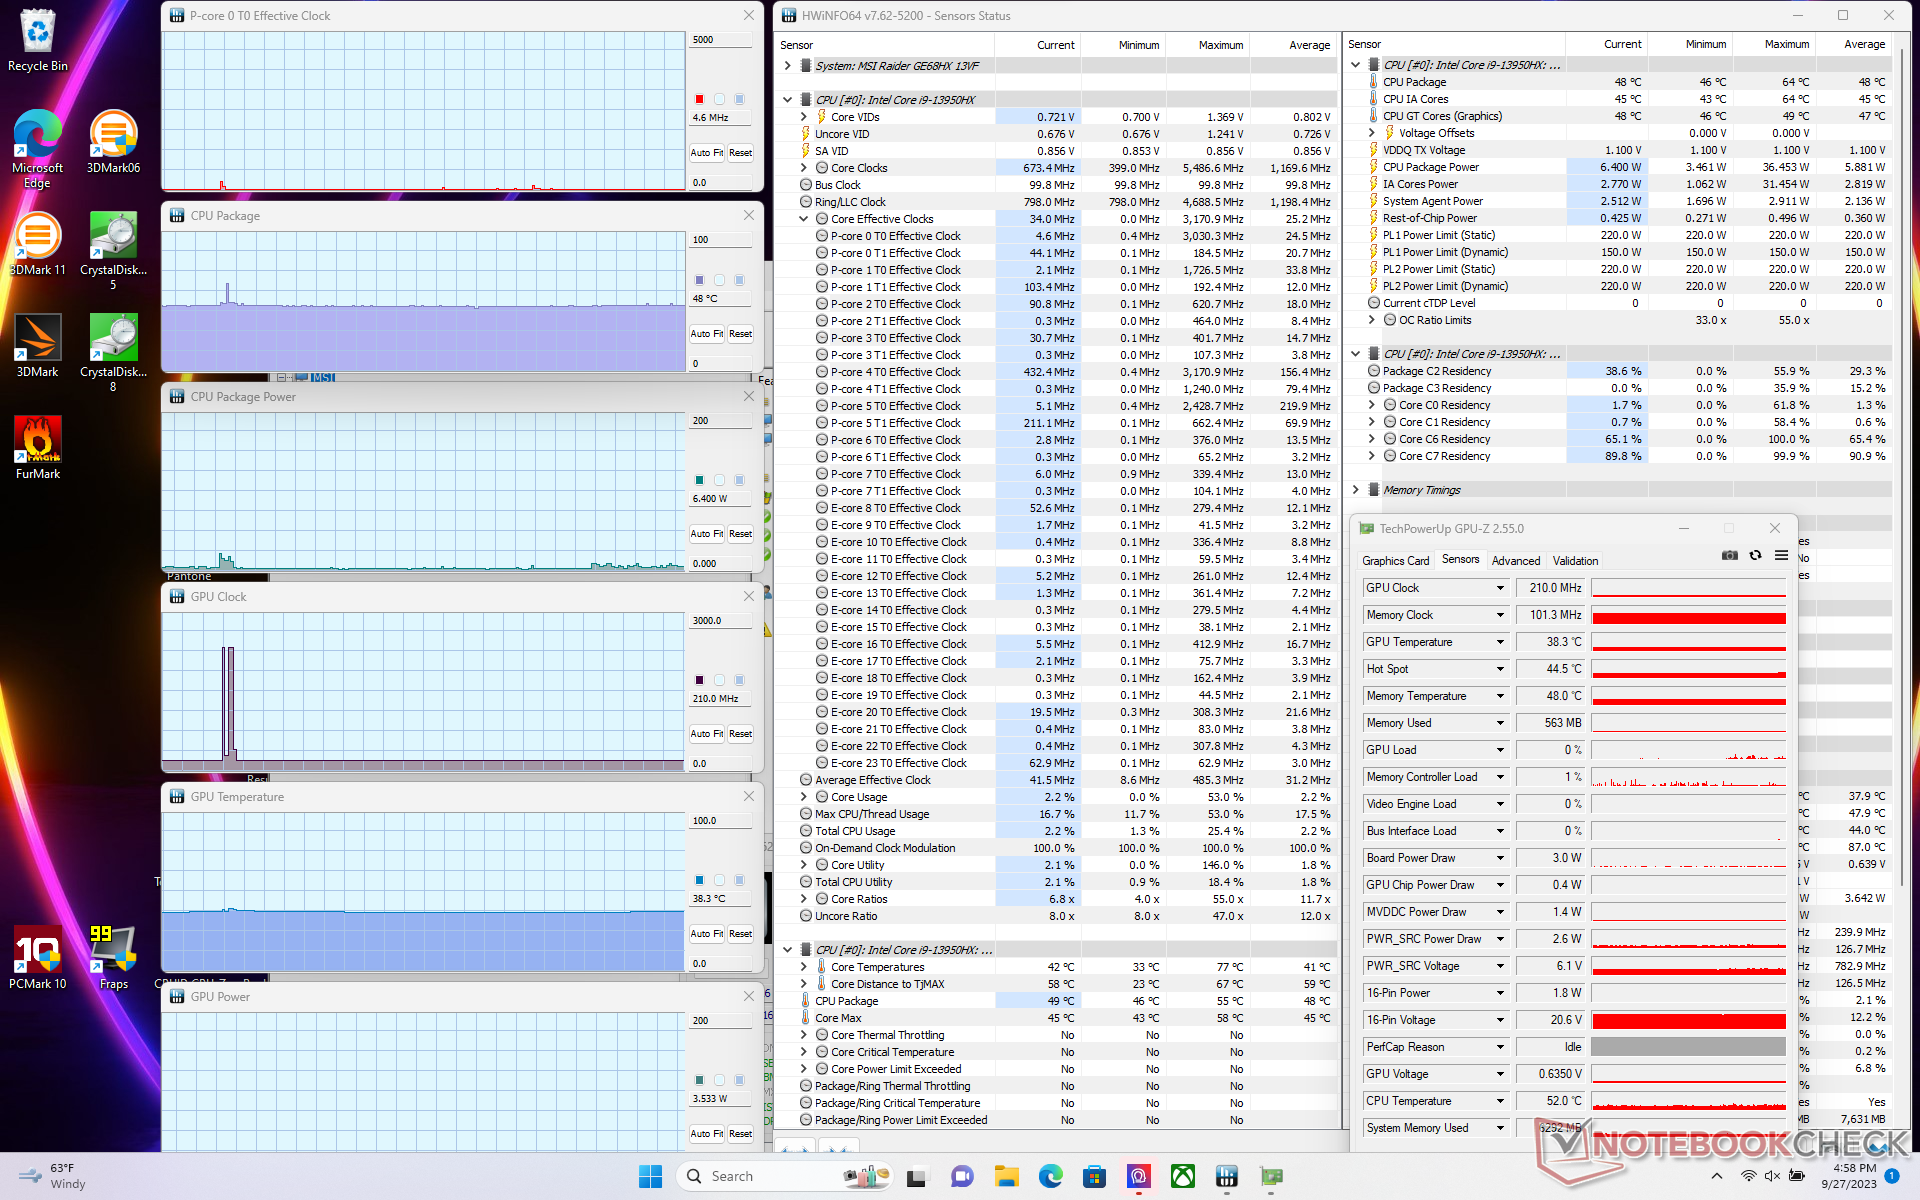
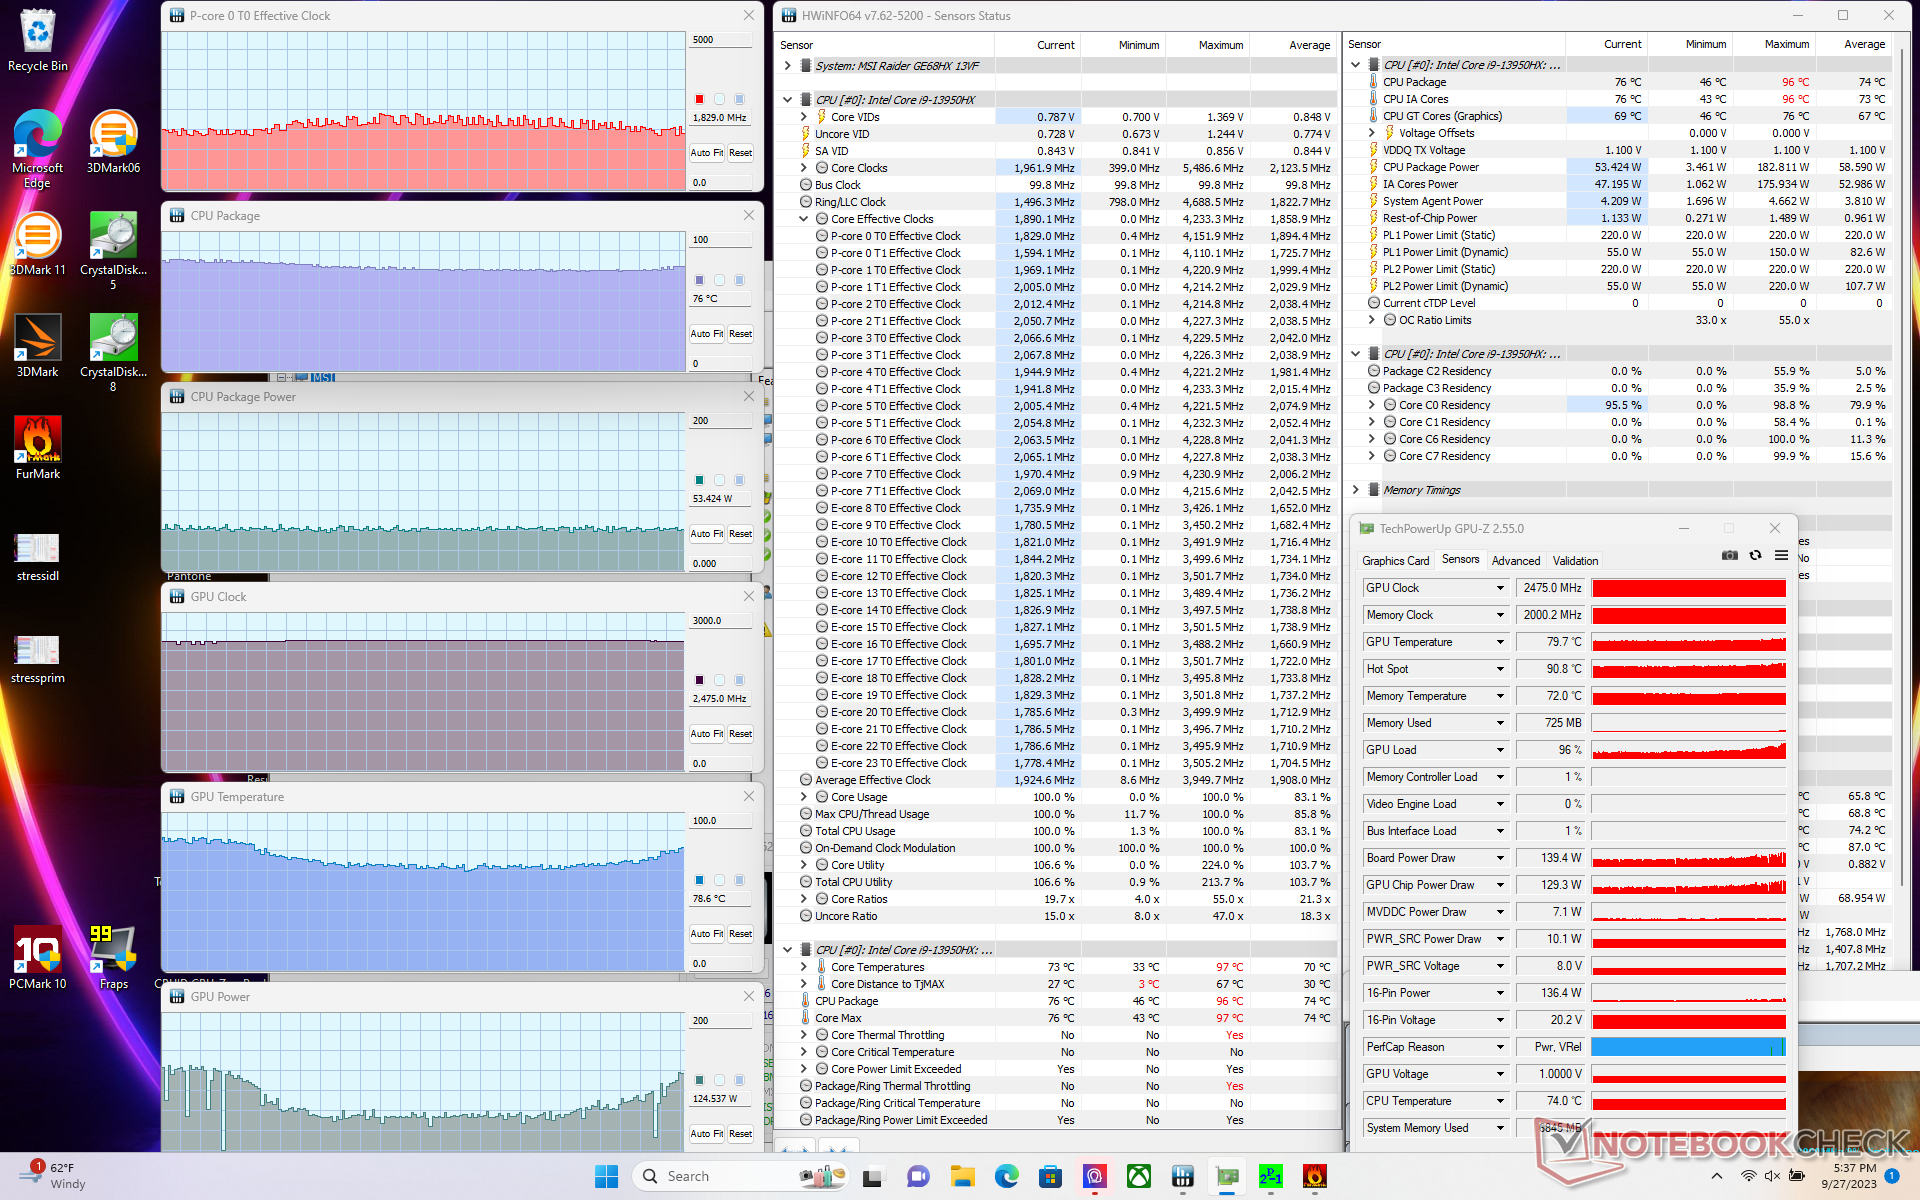
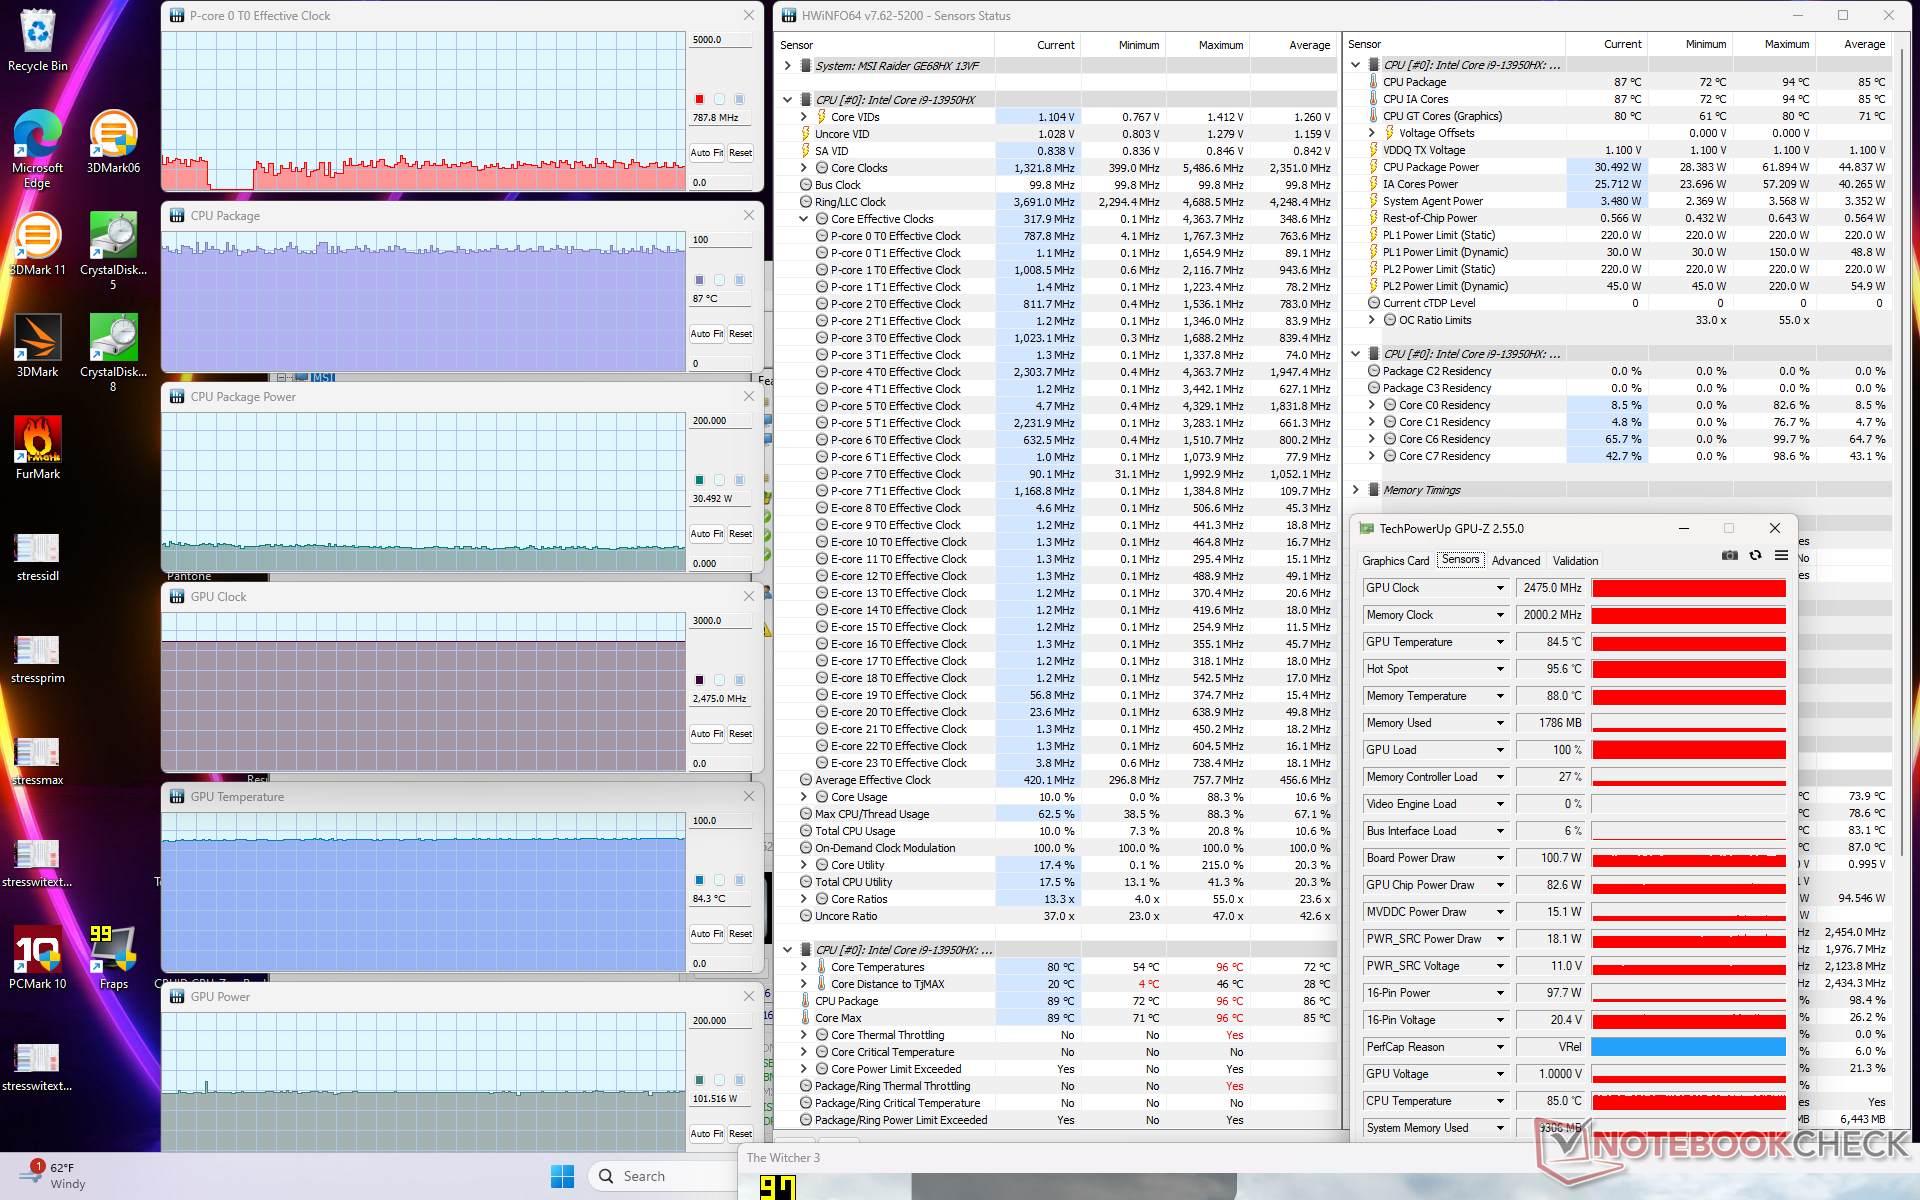
| RelojCPU (GHz) | Reloj GPU (MHz) | Temperatura mediaCPU (°C) | Temperatura media GPU (°C) | |
| Sistema en reposo | -- | -- | 48 | 38 |
| Prime95 Stress (modo de rendimiento extremo con Cooler Boost desactivado) | ~3,6 | -- | 93 | 58 |
| Tensión Prime95+ FurMark (modo de rendimiento extremo con Cooler Boost desactivado) | ~1,9 | 2475 | 73 - 78 | 63 - 81 |
| Witcher 3 Tensión (modoequilibrado) | ~0,8 | 2475 | 87 | 84 |
| Witcher 3 Estrés (modo Rendimiento extremo conCooler Boost desactivado) | ~0,8 | 2490 | 88 | 70 |
| Witcher 3 Tensión (modo de rendimiento extremo con Cooler Boostactivado) | ~0,8 | 2490 | 71 | 63 |
Altavoces
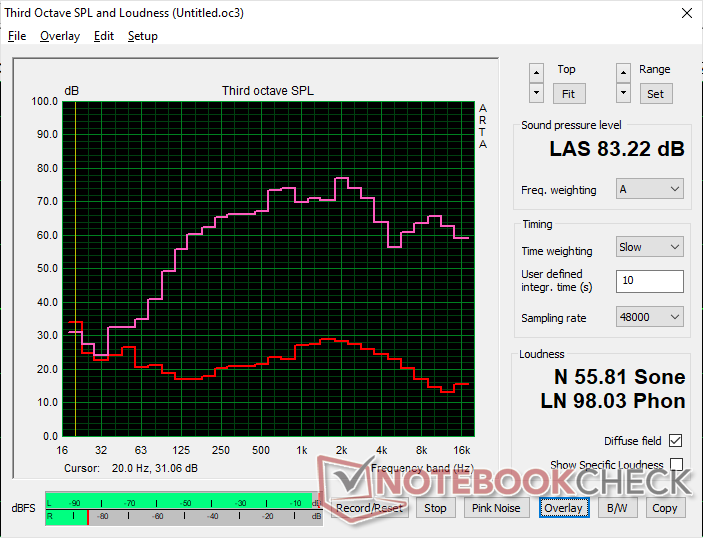
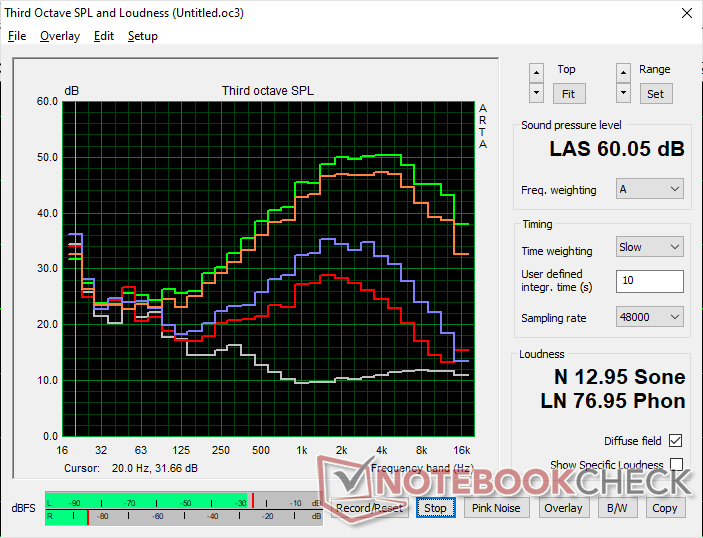
MSI Raider GE68HX 13VF análisis de audio
(+) | los altavoces pueden reproducir a un volumen relativamente alto (#83.2 dB)
Graves 100 - 315 Hz
(±) | lubina reducida - en promedio 6% inferior a la mediana
(±) | la linealidad de los graves es media (9.5% delta a frecuencia anterior)
Medios 400 - 2000 Hz
(±) | medias más altas - de media 5.6% más altas que la mediana
(+) | los medios son lineales (5.8% delta a la frecuencia anterior)
Altos 2 - 16 kHz
(+) | máximos equilibrados - a sólo 4.5% de la mediana
(±) | la linealidad de los máximos es media (9.5% delta a frecuencia anterior)
Total 100 - 16.000 Hz
(+) | el sonido global es lineal (13.3% de diferencia con la mediana)
En comparación con la misma clase
» 19% de todos los dispositivos probados de esta clase eran mejores, 5% similares, 76% peores
» El mejor tuvo un delta de 6%, la media fue 18%, el peor fue ###max##%
En comparación con todos los dispositivos probados
» 14% de todos los dispositivos probados eran mejores, 3% similares, 83% peores
» El mejor tuvo un delta de 4%, la media fue 24%, el peor fue ###max##%
Apple MacBook Pro 16 2021 M1 Pro análisis de audio
(+) | los altavoces pueden reproducir a un volumen relativamente alto (#84.7 dB)
Graves 100 - 315 Hz
(+) | buen bajo - sólo 3.8% lejos de la mediana
(+) | el bajo es lineal (5.2% delta a la frecuencia anterior)
Medios 400 - 2000 Hz
(+) | medios equilibrados - a sólo 1.3% de la mediana
(+) | los medios son lineales (2.1% delta a la frecuencia anterior)
Altos 2 - 16 kHz
(+) | máximos equilibrados - a sólo 1.9% de la mediana
(+) | los máximos son lineales (2.7% delta a la frecuencia anterior)
Total 100 - 16.000 Hz
(+) | el sonido global es lineal (4.6% de diferencia con la mediana)
En comparación con la misma clase
» 0% de todos los dispositivos probados de esta clase eran mejores, 0% similares, 100% peores
» El mejor tuvo un delta de 5%, la media fue 17%, el peor fue ###max##%
En comparación con todos los dispositivos probados
» 0% de todos los dispositivos probados eran mejores, 0% similares, 100% peores
» El mejor tuvo un delta de 4%, la media fue 24%, el peor fue ###max##%
Gestión de la energía: mayor rendimiento, mayor consumo
Consumo de energía
El consumo de energía al ralentí en el escritorio es aproximadamente el mismo que en el modelo del año pasado. En reposo en modo iGPU con los LED apagados se ahorrarían hasta 8 W en comparación con el reposo en modo dGPU con los LED frontales activos.
Si se ejecuta Witcher 3 requeriría un 22% menos de energía que el GE67HX con RTX 3070 Ti del año pasado, lo que se corresponde con el rendimiento gráfico bruto entre un 10 y un 15% inferior de nuestra RTX 4060. Por el contrario, la ejecución de Prime95 exigiría un 21% más de energía que antes para un aumento del 35 al 40% en el rendimiento multihilo.
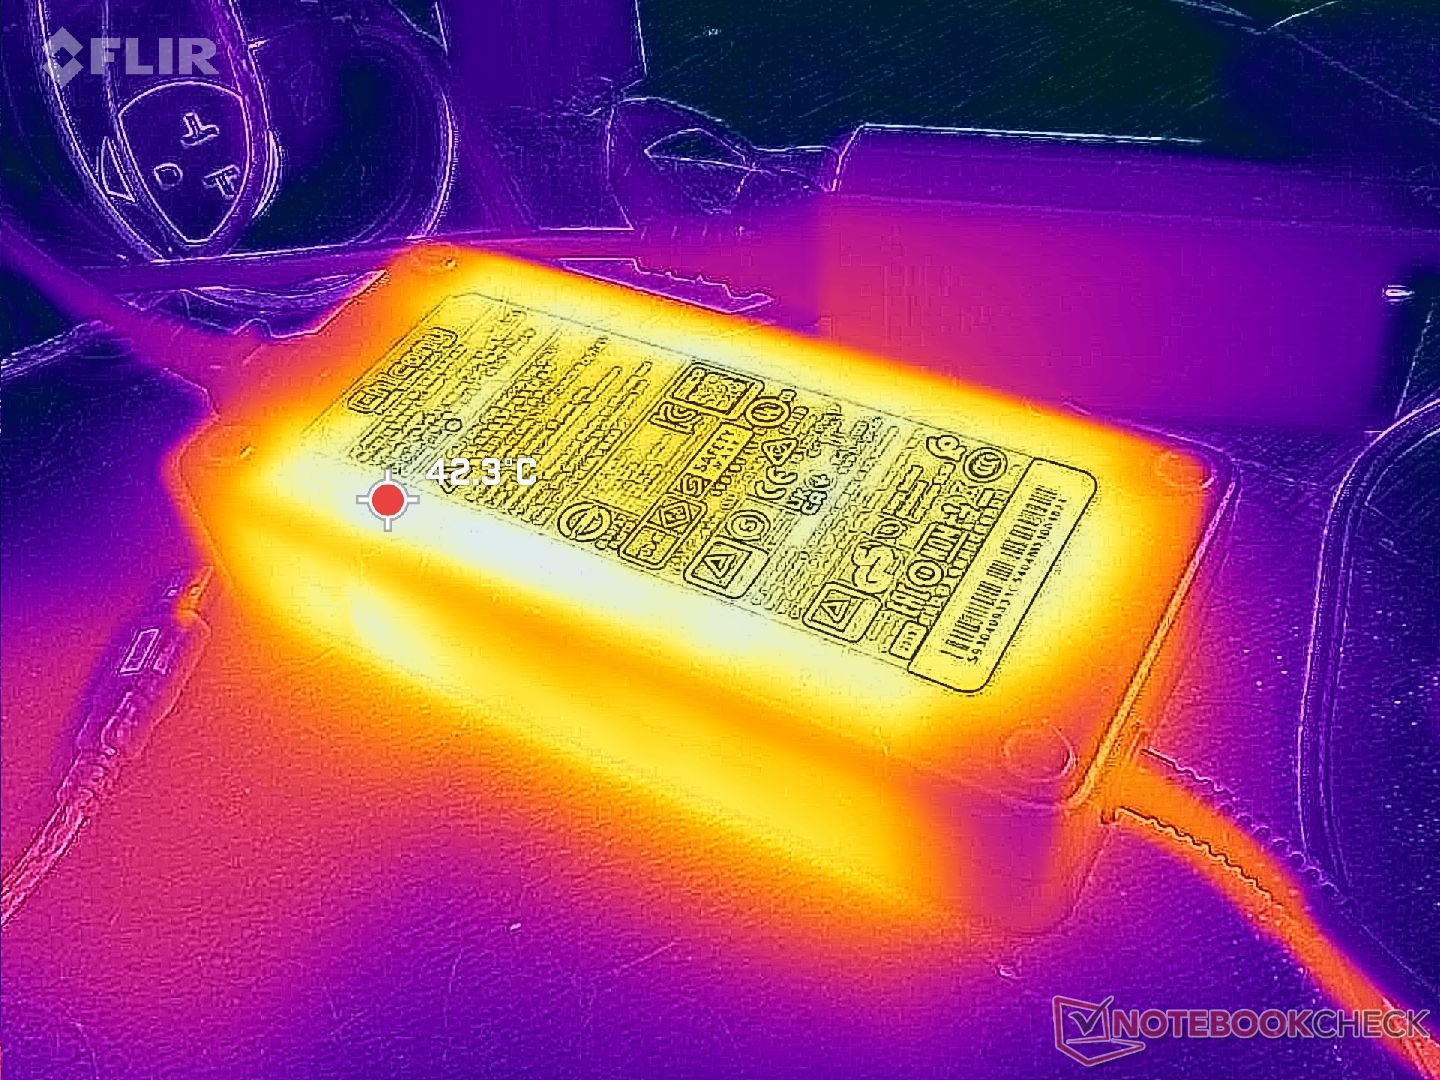
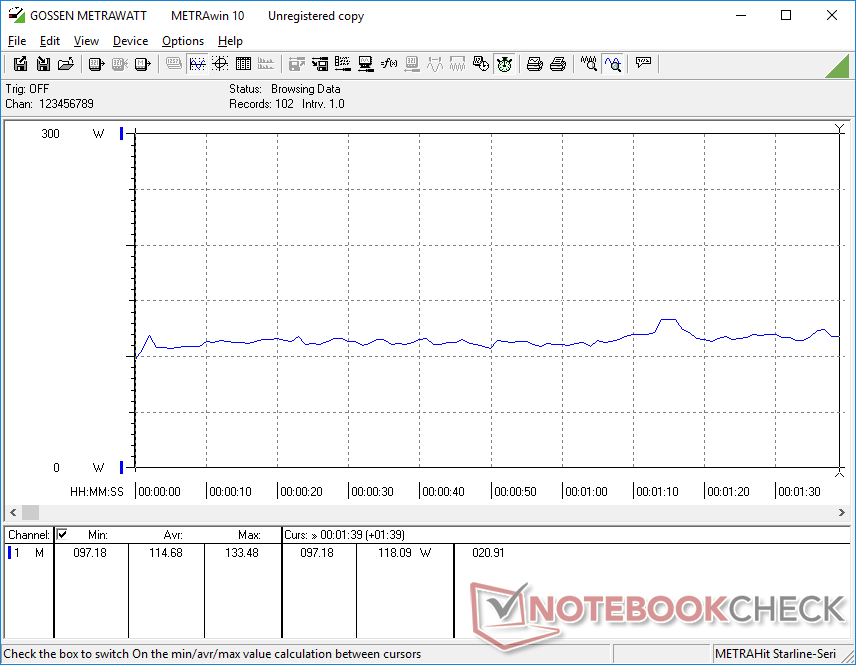
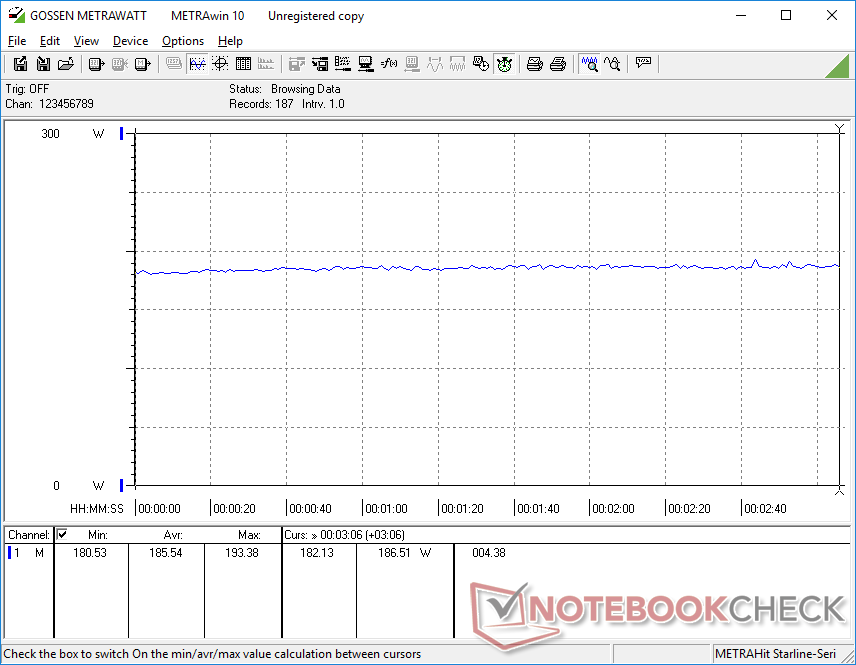
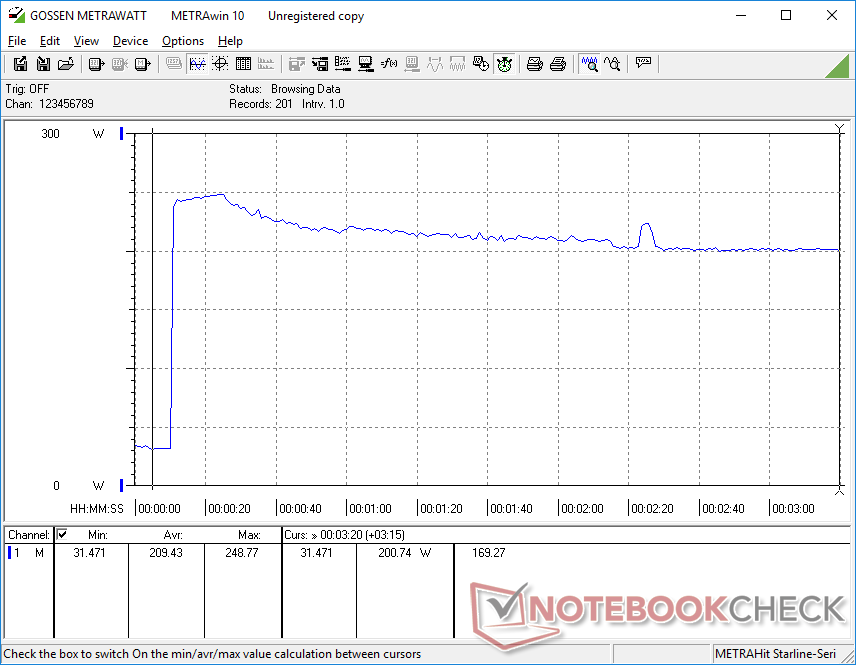
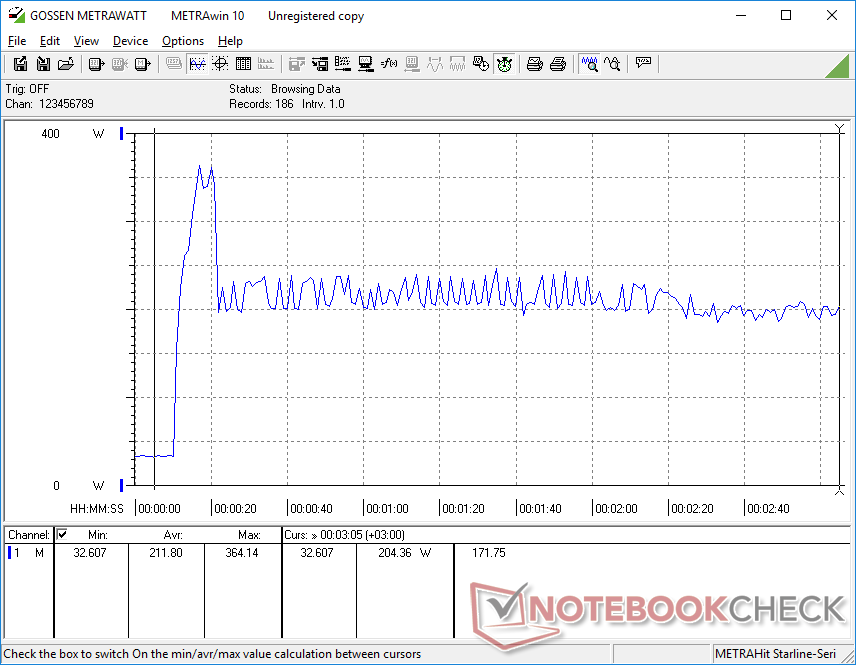
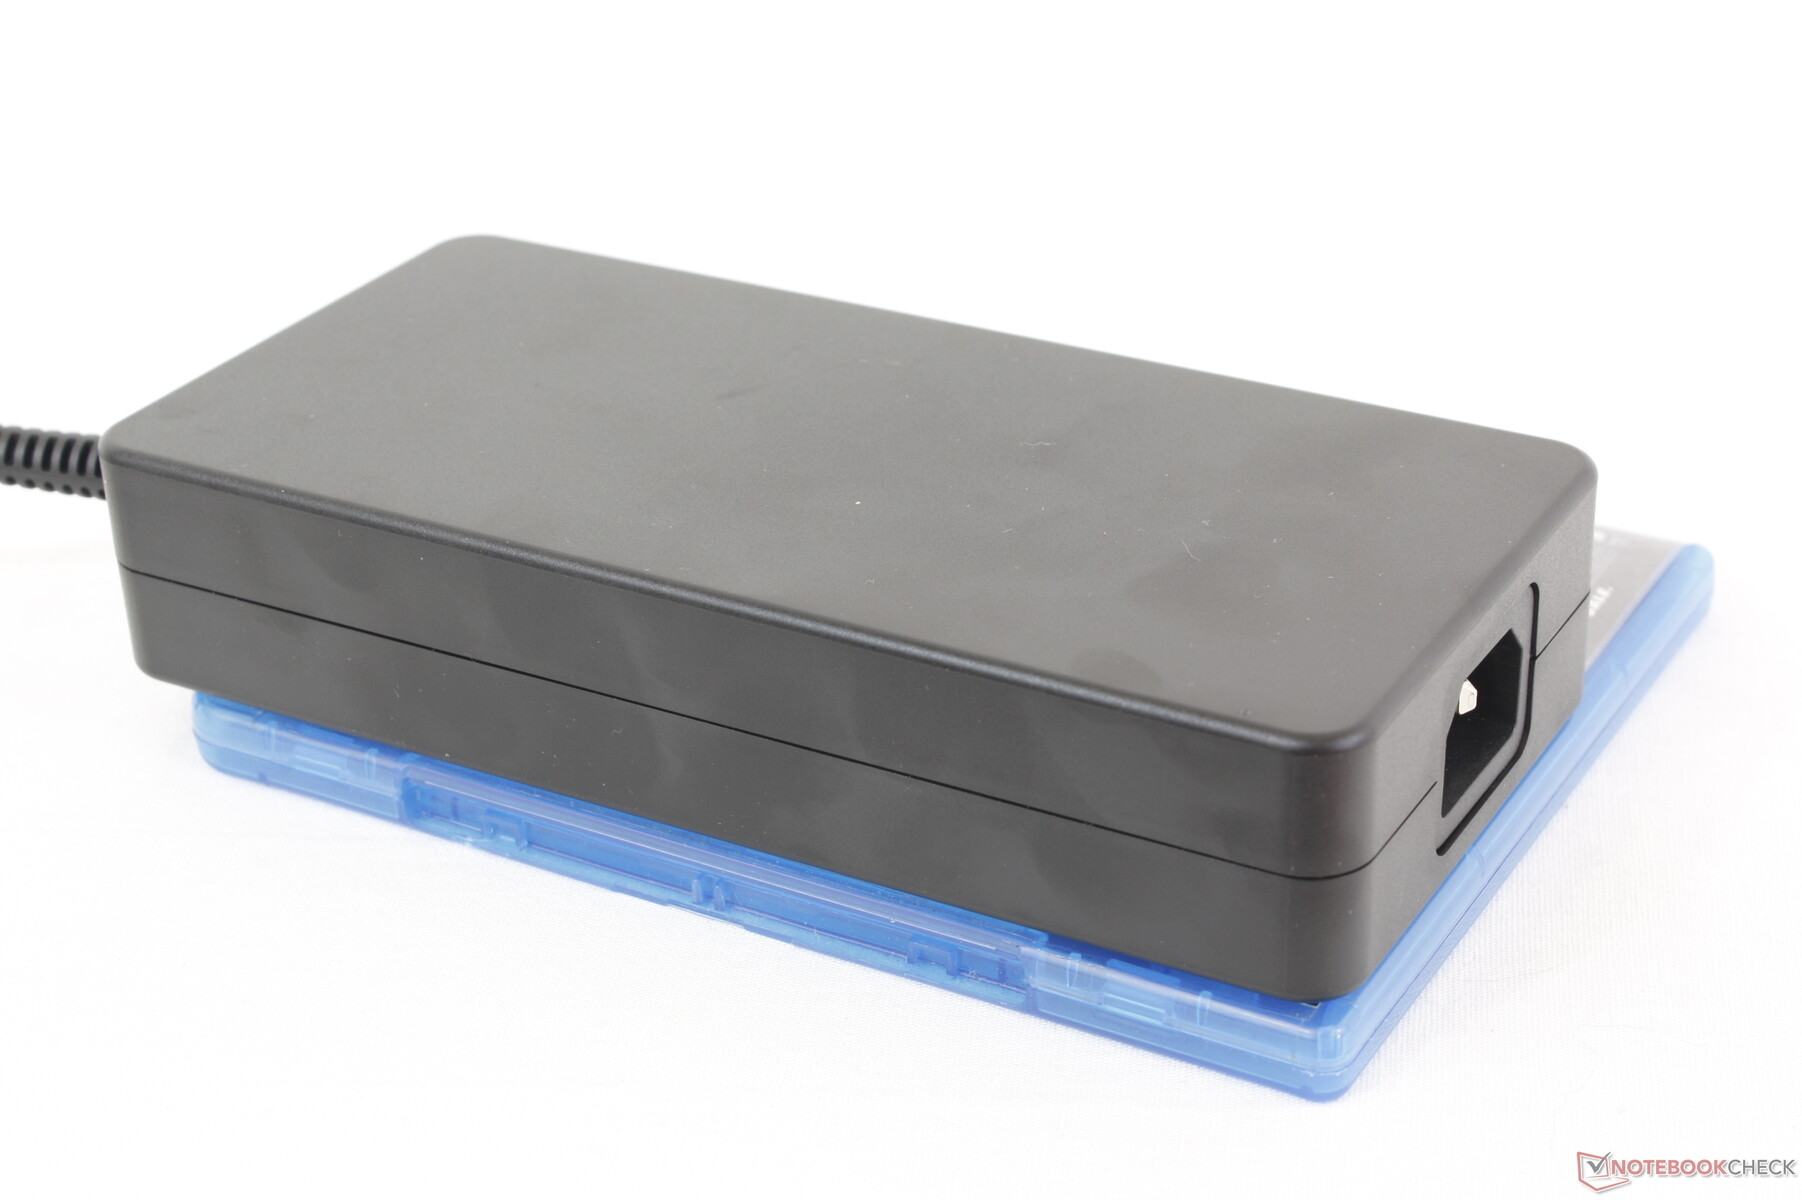
Registramos un consumo máximo temporal de 365 W del gran adaptador de CA de 280 W (~18 x 8,5 x 3,5 cm) al iniciar tanto Prime95 como el estrés de FurMark. Esta tasa caería y se estabilizaría en unos 204 W tras unos pocos segundos como muestran los gráficos de abajo. MSI aún no ha adoptado la carga GaN, a diferencia de los últimos portátiles Razer Blade.
| Off / Standby | |
| Ocioso | |
| Carga |
|
Clave:
min: | |
| MSI Raider GE68HX 13VF i9-13950HX, GeForce RTX 4060 Laptop GPU, Samsung PM9B1 1024GB MZVL41T0HBLB, IPS, 1900x1200, 16" | MSI GE67 HX 12UGS i7-12800HX, GeForce RTX 3070 Ti Laptop GPU, Samsung PM9A1 MZVL21T0HCLR, OLED, 1920x1080, 15.6" | HP Omen 16-xf0376ng R7 7840HS, GeForce RTX 4070 Laptop GPU, WDC PC SN810 512GB, IPS, 1920x1080, 16.1" | Alienware m16 R1 AMD R9 7845HX, GeForce RTX 4080 Laptop GPU, Kioxia XG8 KXG80ZNV1T02, IPS, 2560x1600, 16" | Lenovo Legion Slim 7i 16 Gen 8 i9-13900H, GeForce RTX 4070 Laptop GPU, Samsung PM9A1 MZVL21T0HCLR, IPS, 2560x1600, 16" | Asus ROG Zephyrus M16 GU604VY-NM042X i9-13900H, GeForce RTX 4090 Laptop GPU, Samsung PM9A1 MZVL22T0HBLB, IPS, 2560x1600, 16" | |
|---|---|---|---|---|---|---|
| Power Consumption | 1% | 34% | -81% | -12% | -4% | |
| Idle Minimum * (Watt) | 15.8 | 16.1 -2% | 9 43% | 39 -147% | 22 -39% | 20 -27% |
| Idle Average * (Watt) | 19.4 | 17.1 12% | 14 28% | 44.6 -130% | 29 -49% | 24 -24% |
| Idle Maximum * (Watt) | 27.3 | 26.6 3% | 20 27% | 68.1 -149% | 39.5 -45% | 25 8% |
| Load Average * (Watt) | 114.7 | 116.3 -1% | 84 27% | 129.8 -13% | 98.7 14% | 107 7% |
| Witcher 3 ultra * (Watt) | 185.5 | 237 -28% | 140.9 24% | 285 -54% | 171.8 7% | 208 -12% |
| Load Maximum * (Watt) | 364.2 | 291.1 20% | 176 52% | 327.3 10% | 213.2 41% | 267 27% |
* ... más pequeño es mejor
Power Consumption Witcher 3 / Stresstest
Power Consumption external Monitor
Duración de la batería
La capacidad de la batería es tan alta como legalmente puede ser con 99.9 Wh. La duración es muy buena para un portátil de juegos de 16 pulgadas, con algo más de 6,5 horas de navegación WLAN real con el perfil de energía equilibrado y la iGPU activa. Es uno de los portátiles para juegos de 16 pulgadas que más ha durado de los que hemos probado hasta la fecha.
Por desgracia, la carga de vacío a pleno rendimiento es relativamente lenta, con 2,5 horas frente a las 1,5 horas de la mayoría de portátiles. Además, ninguno de nuestros adaptadores USB-C AC cargó el portátil por ninguno de los tres puertos USB-C a pesar de que MSI anuncia Power Delivery.
| MSI Raider GE68HX 13VF i9-13950HX, GeForce RTX 4060 Laptop GPU, 99.9 Wh | MSI GE67 HX 12UGS i7-12800HX, GeForce RTX 3070 Ti Laptop GPU, 99.9 Wh | HP Omen 16-xf0376ng R7 7840HS, GeForce RTX 4070 Laptop GPU, 83 Wh | Alienware m16 R1 AMD R9 7845HX, GeForce RTX 4080 Laptop GPU, 86 Wh | Lenovo Legion Slim 7i 16 Gen 8 i9-13900H, GeForce RTX 4070 Laptop GPU, 99.9 Wh | Asus ROG Zephyrus M16 GU604VY-NM042X i9-13900H, GeForce RTX 4090 Laptop GPU, 90 Wh | |
|---|---|---|---|---|---|---|
| Duración de Batería | -2% | -16% | -52% | -42% | 12% | |
| Reader / Idle (h) | 8.8 | 8.4 -5% | 4 -55% | 5.1 -42% | ||
| WiFi v1.3 (h) | 6.8 | 5.6 -18% | 5.7 -16% | 3.7 -46% | 4.4 -35% | 4.3 -37% |
| Load (h) | 1.8 | 2.1 17% | 0.8 -56% | 0.9 -50% | 2.9 61% | |
| H.264 (h) | 4.8 |
Pro
Contra
Veredicto - No está mal, pero no da en el blanco
Aunque apreciamos que el fabricante tome una dirección diferente en el diseño de sus portátiles de juego, creemos firmemente que los cambios no deberían ir en detrimento de la facilidad de mantenimiento del usuario final. El GE68HX es más difícil de abrir que el diseño del año pasado y esto puede ser especialmente problemático en un portátil de juego en el que es más probable que los propietarios añadan RAM y almacenamiento adicionales por sí mismos. En segundo lugar, el nuevo diseño es notablemente más grueso y pesado que el aspecto más "limpio" del GE67HX, lo que puede no sentar bien a muchos usuarios.
El nuevo chasis tiene algunas ventajas. En primer lugar, las bisagras parecen más robustas que antes, mientras que el resto del chasis es igual de resistente. En segundo lugar, las temperaturas del núcleo son más bajas que en el GE67HX, lo que mejora el potencial de overclocking. El rendimiento es incluso ligeramente superior al esperado con el perfil de potencia y los ajustes por defecto. Por último, algunos usuarios apreciarán el mayor tamaño del clickpad y el nuevo teclado numérico para aplicaciones distintas de los juegos.
El rendimiento y las temperaturas se benefician del diseño más grueso del chasis, pero no todos estarán contentos con el mayor peso, la mayor dificultad de mantenimiento y las opciones de pantalla de gama baja, teniendo en cuenta el elevado precio de partida.
A partir de $1700 USD, sin embargo, los recortes en colores de pantalla, G-Sync y rendimiento SSD parecen innecesarios para un modelo de la serie GE de gama alta. Tales compromisos son más esperables para los modelos de gama baja de las series MSI Sword o Katana. El fabricante también se está quedando atrás en la tecnología de carga; los cargadores GaN más pequeños y portátiles de Razer pueden dar la misma potencia, mientras que el soporte de carga USB-C del GE68HX parece poco fiable.
Alternativas como elLenovo Legion Slim 7i 16 Gen 8, Asus ROG Zephyrus M16o el Razer Blade 16 no siempre ofrecen CPU Core-HX, pero son mucho más portátiles y cuentan con opciones gráficas similares y mejores pantallas.
Precio y disponibilidad
MSI Raider GE68HX 13VF
- 09/30/2023 v7 (old)
Allen Ngo
Transparencia
Nuestro equipo editorial se encarga de seleccionar los dispositivos que se someten a revisión. La muestra de prueba fue adquirida libremente por el autor a sus expensas. El prestamista no influyó en esta reseña, ni el fabricante recibió una copia de la misma antes de su publicación. No había ninguna obligación de publicar esta reseña. Como empresa de medios independiente, Notebookcheck no está sujeta a la autoridad de fabricantes, minoristas o editores.
Así es como prueba Notebookcheck
Cada año, Notebookcheck revisa de forma independiente cientos de portátiles y smartphones utilizando procedimientos estandarizados para asegurar que todos los resultados son comparables. Hemos desarrollado continuamente nuestros métodos de prueba durante unos 20 años y hemos establecido los estándares de la industria en el proceso. En nuestros laboratorios de pruebas, técnicos y editores experimentados utilizan equipos de medición de alta calidad. Estas pruebas implican un proceso de validación en varias fases. Nuestro complejo sistema de clasificación se basa en cientos de mediciones y puntos de referencia bien fundamentados, lo que mantiene la objetividad.Price comparison

