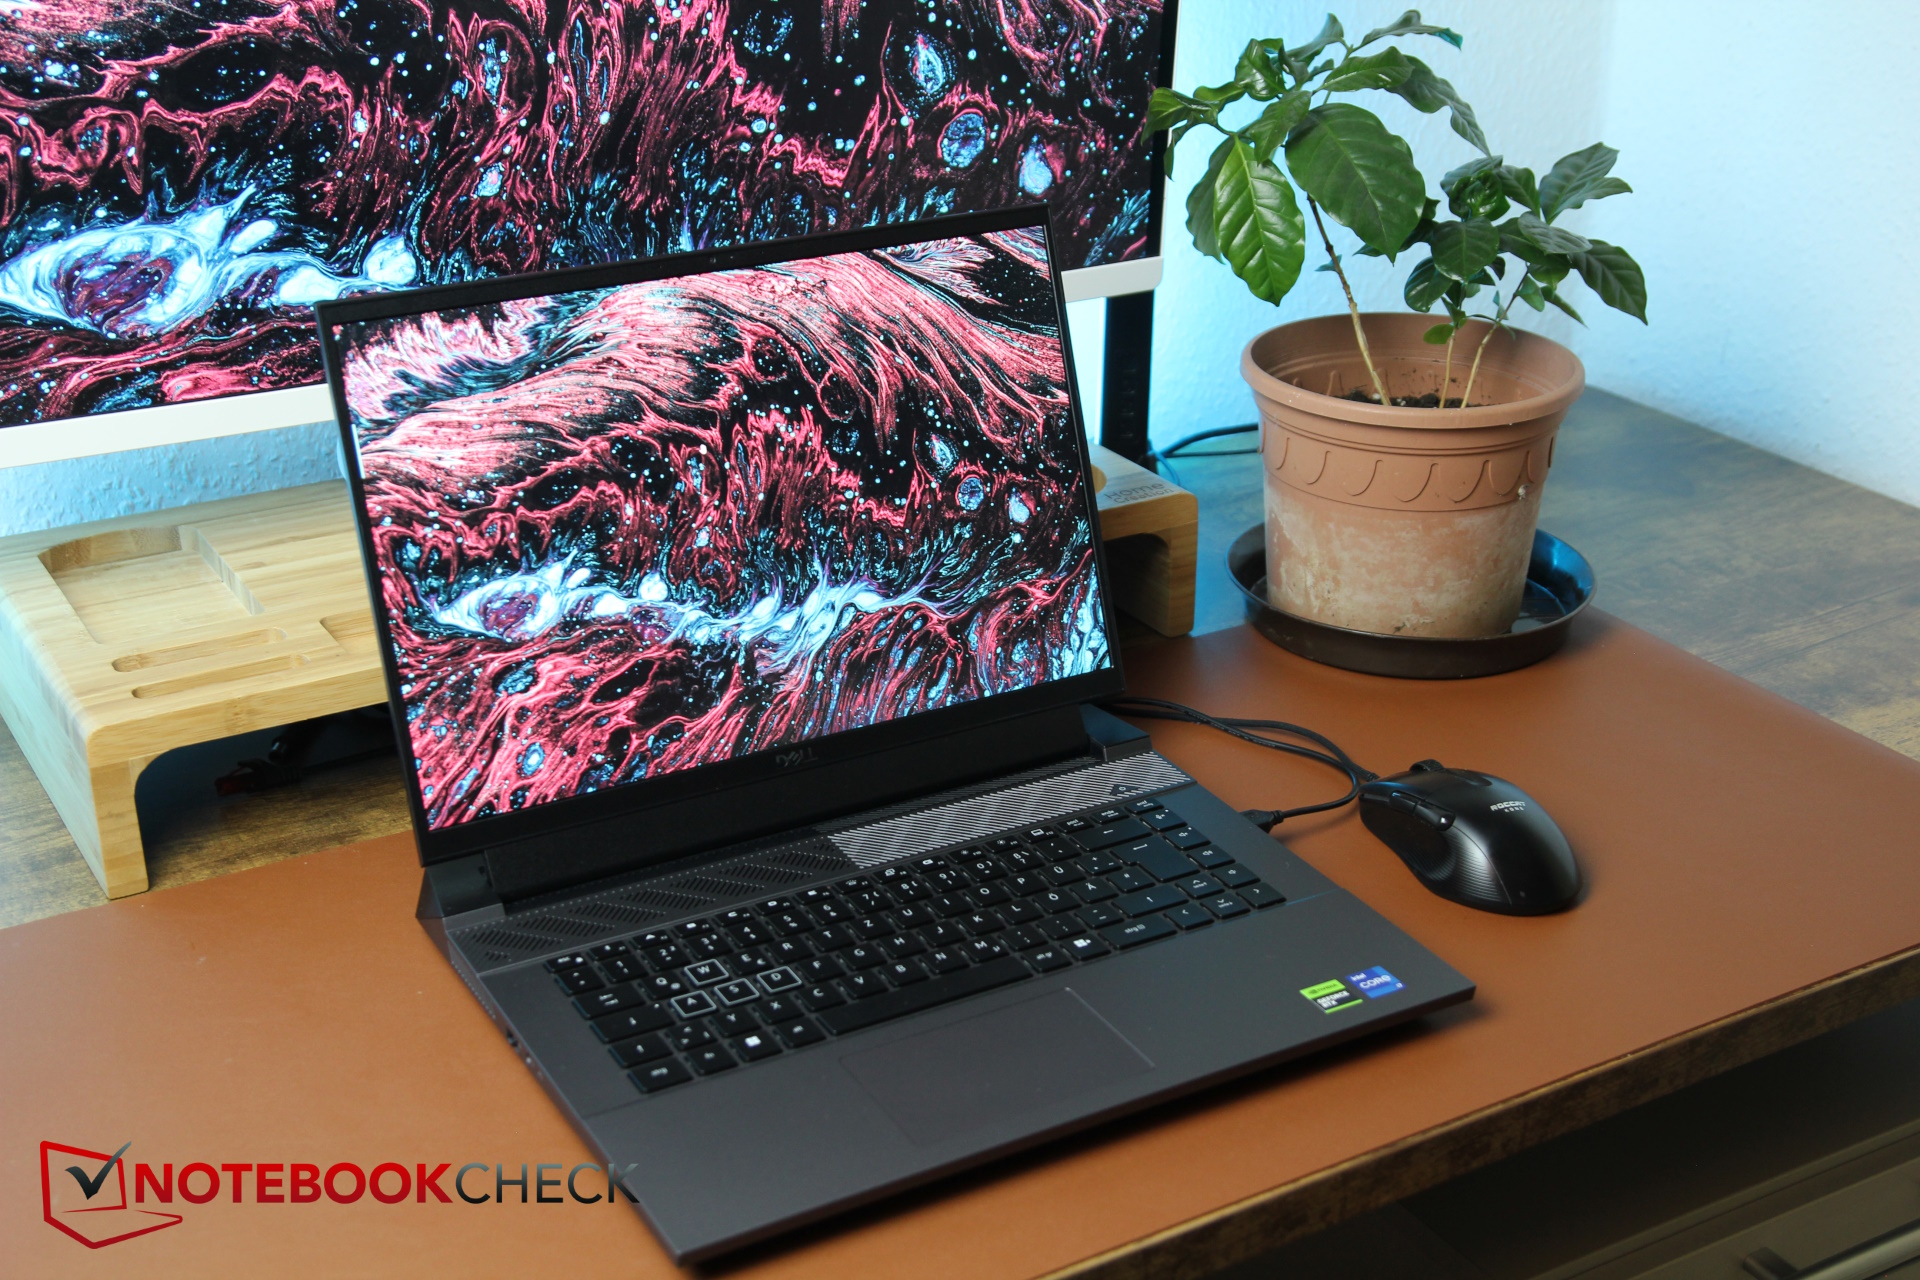
Análisis del portátil Dell G16 (2024): ¿Una alternativa Alienware asequible del mismo fabricante?
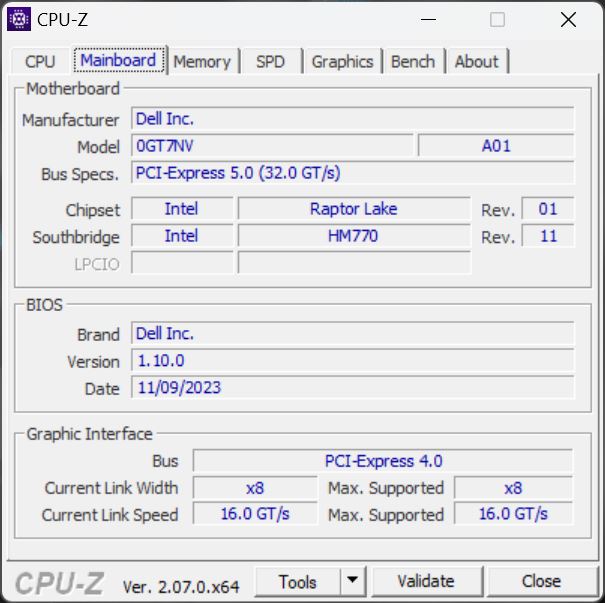
A finales de 2022, echamos un vistazo por última vez (y, casualmente, por primera vez) al modelo de 16 pulgadas de la relativamente nueva serie G, los portátiles para juegos de gama económica a media de Dell. En aquel momento, el Dell G16 estaba equipado con una CPU Intel Gen-12 y el procesador RTX 3060. En el modelo 2024, el fabricante hace el cambio a Intel Gen 13 y a la CPU RTX 4060 (hay más opciones de GPU disponibles). La pantalla ha recibido una variante ligeramente más potente como opción.
También echaremos un vistazo a si Dell ha conseguido adelgazar aún más la carcasa relativamente gruesa del portátil. Además, el G16 tiene que competir, por supuesto, con otros portátiles de gama media y económica como el MSI Raider GE68 HX 13VFy el Lenovo Legion Slim 5 16APH8 y el Lenovo LOQ 16-plus, naturalmente lo compararemos con su predecesor así como con el ligeramente más caro Alienware m16 R1.
Posibles contendientes en la comparación
Valoración | Fecha | Modelo | Peso | Altura | Tamaño | Resolución | Precio |
|---|---|---|---|---|---|---|---|
| 85.5 % v7 (old) | 02/2024 | Dell G16, i7-13650HX, RTX 4060 i7-13650HX, GeForce RTX 4060 Laptop GPU | 2.8 kg | 25.65 mm | 16.00" | 2560x1600 | |
| 86.1 % v7 (old) | 10/2022 | Dell G16 7620 i7-12700H, GeForce RTX 3060 Laptop GPU | 2.6 kg | 26.9 mm | 16.00" | 2560x1600 | |
| 86.9 % v7 (old) | 10/2023 | MSI Raider GE68HX 13VF i9-13950HX, GeForce RTX 4060 Laptop GPU | 2.7 kg | 27.9 mm | 16.00" | 1900x1200 | |
| 87.7 % v7 (old) | 08/2023 | Lenovo Legion Slim 5 16APH8 R7 7840HS, GeForce RTX 4060 Laptop GPU | 2.4 kg | 25.2 mm | 16.00" | 2560x1600 | |
| 88.3 % v7 (old) | 09/2023 | Alienware m16 R1 Intel i7-13700HX, GeForce RTX 4060 Laptop GPU | 3 kg | 25.4 mm | 16.00" | 2560x1600 | |
| 87.3 % v7 (old) | 09/2023 | Lenovo LOQ 16IRH8 i7-13620H, GeForce RTX 4060 Laptop GPU | 2.7 kg | 25.9 mm | 16.00" | 2560x1600 |
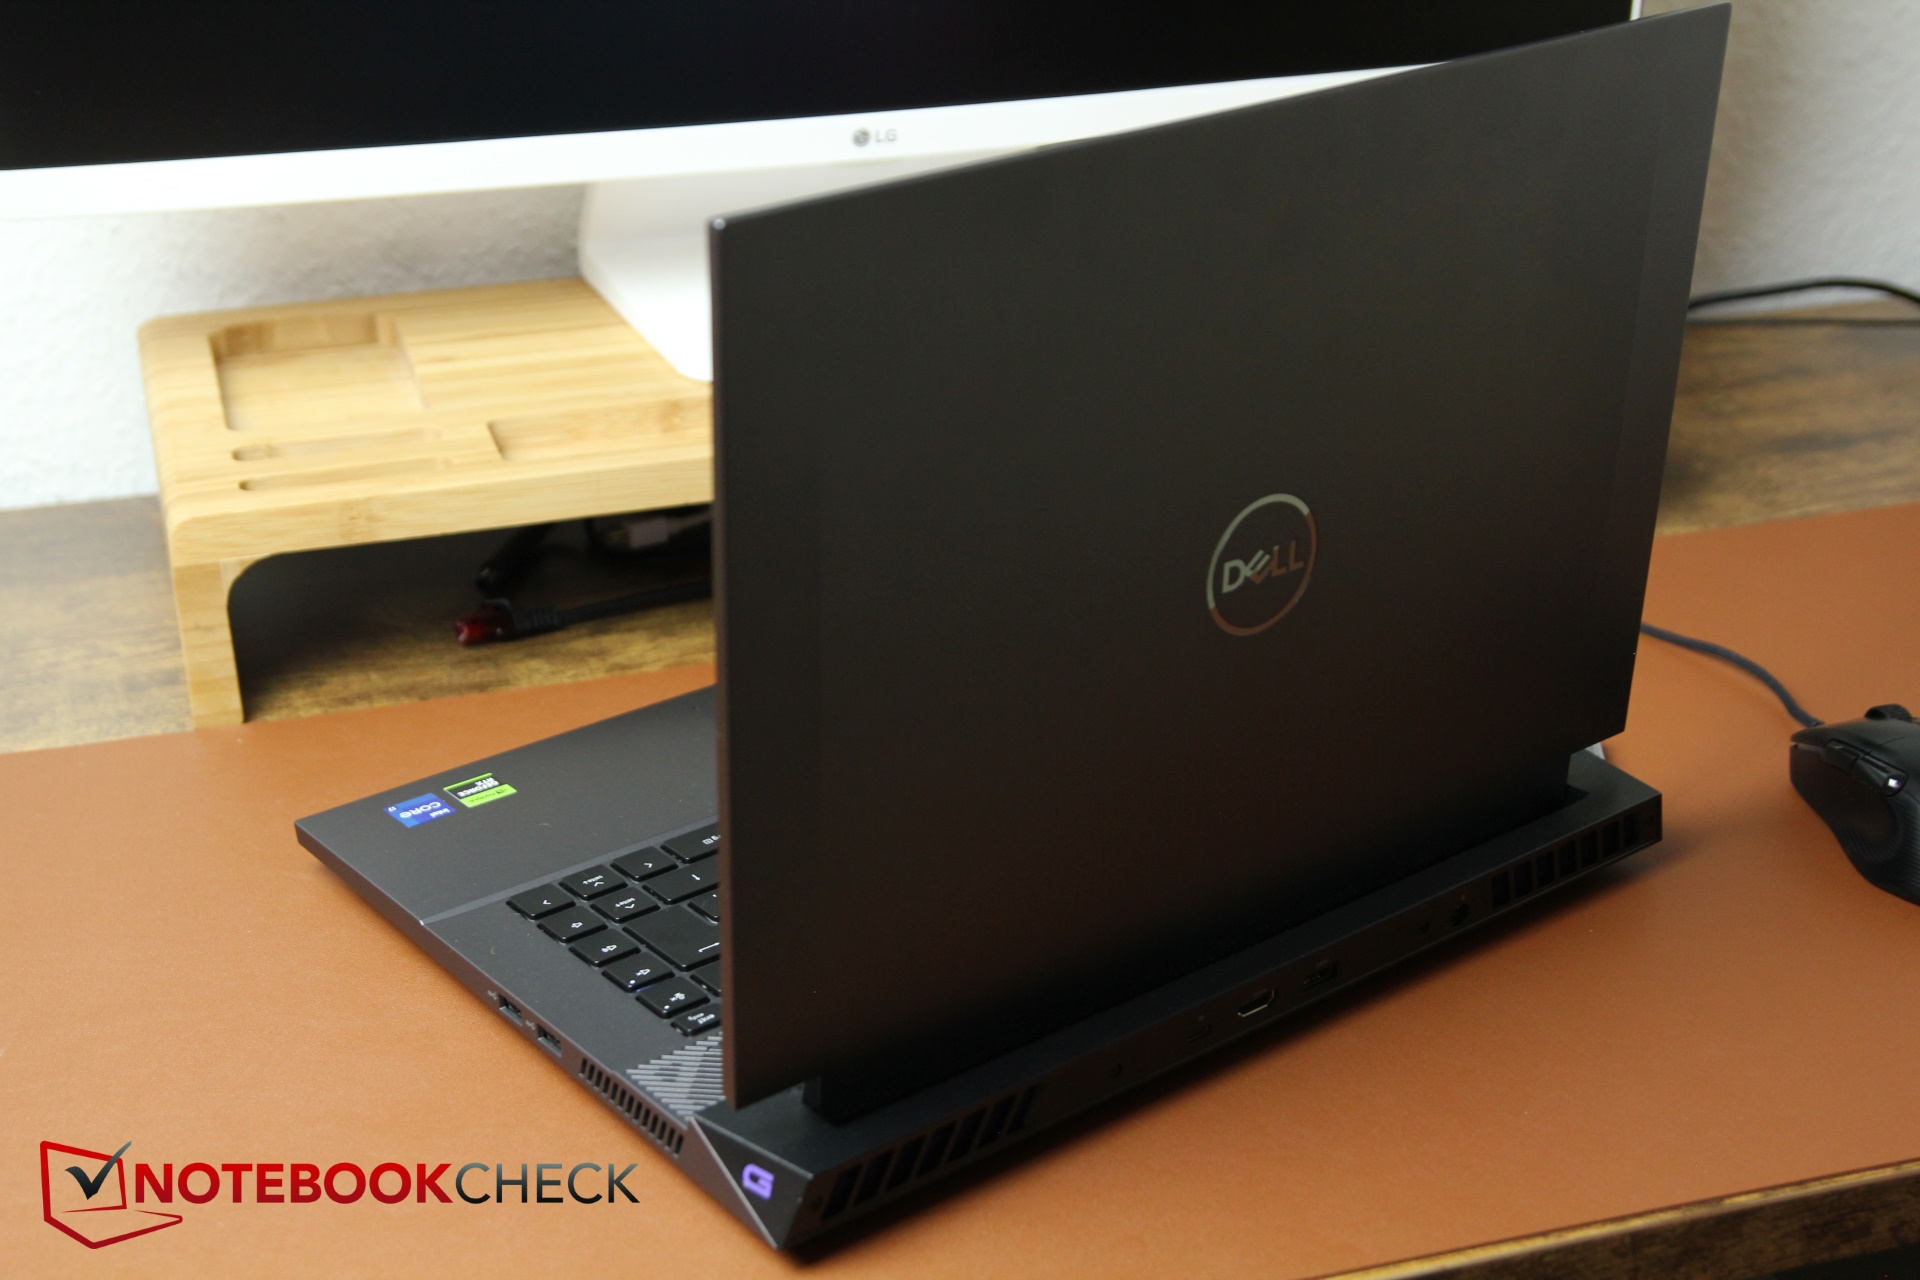
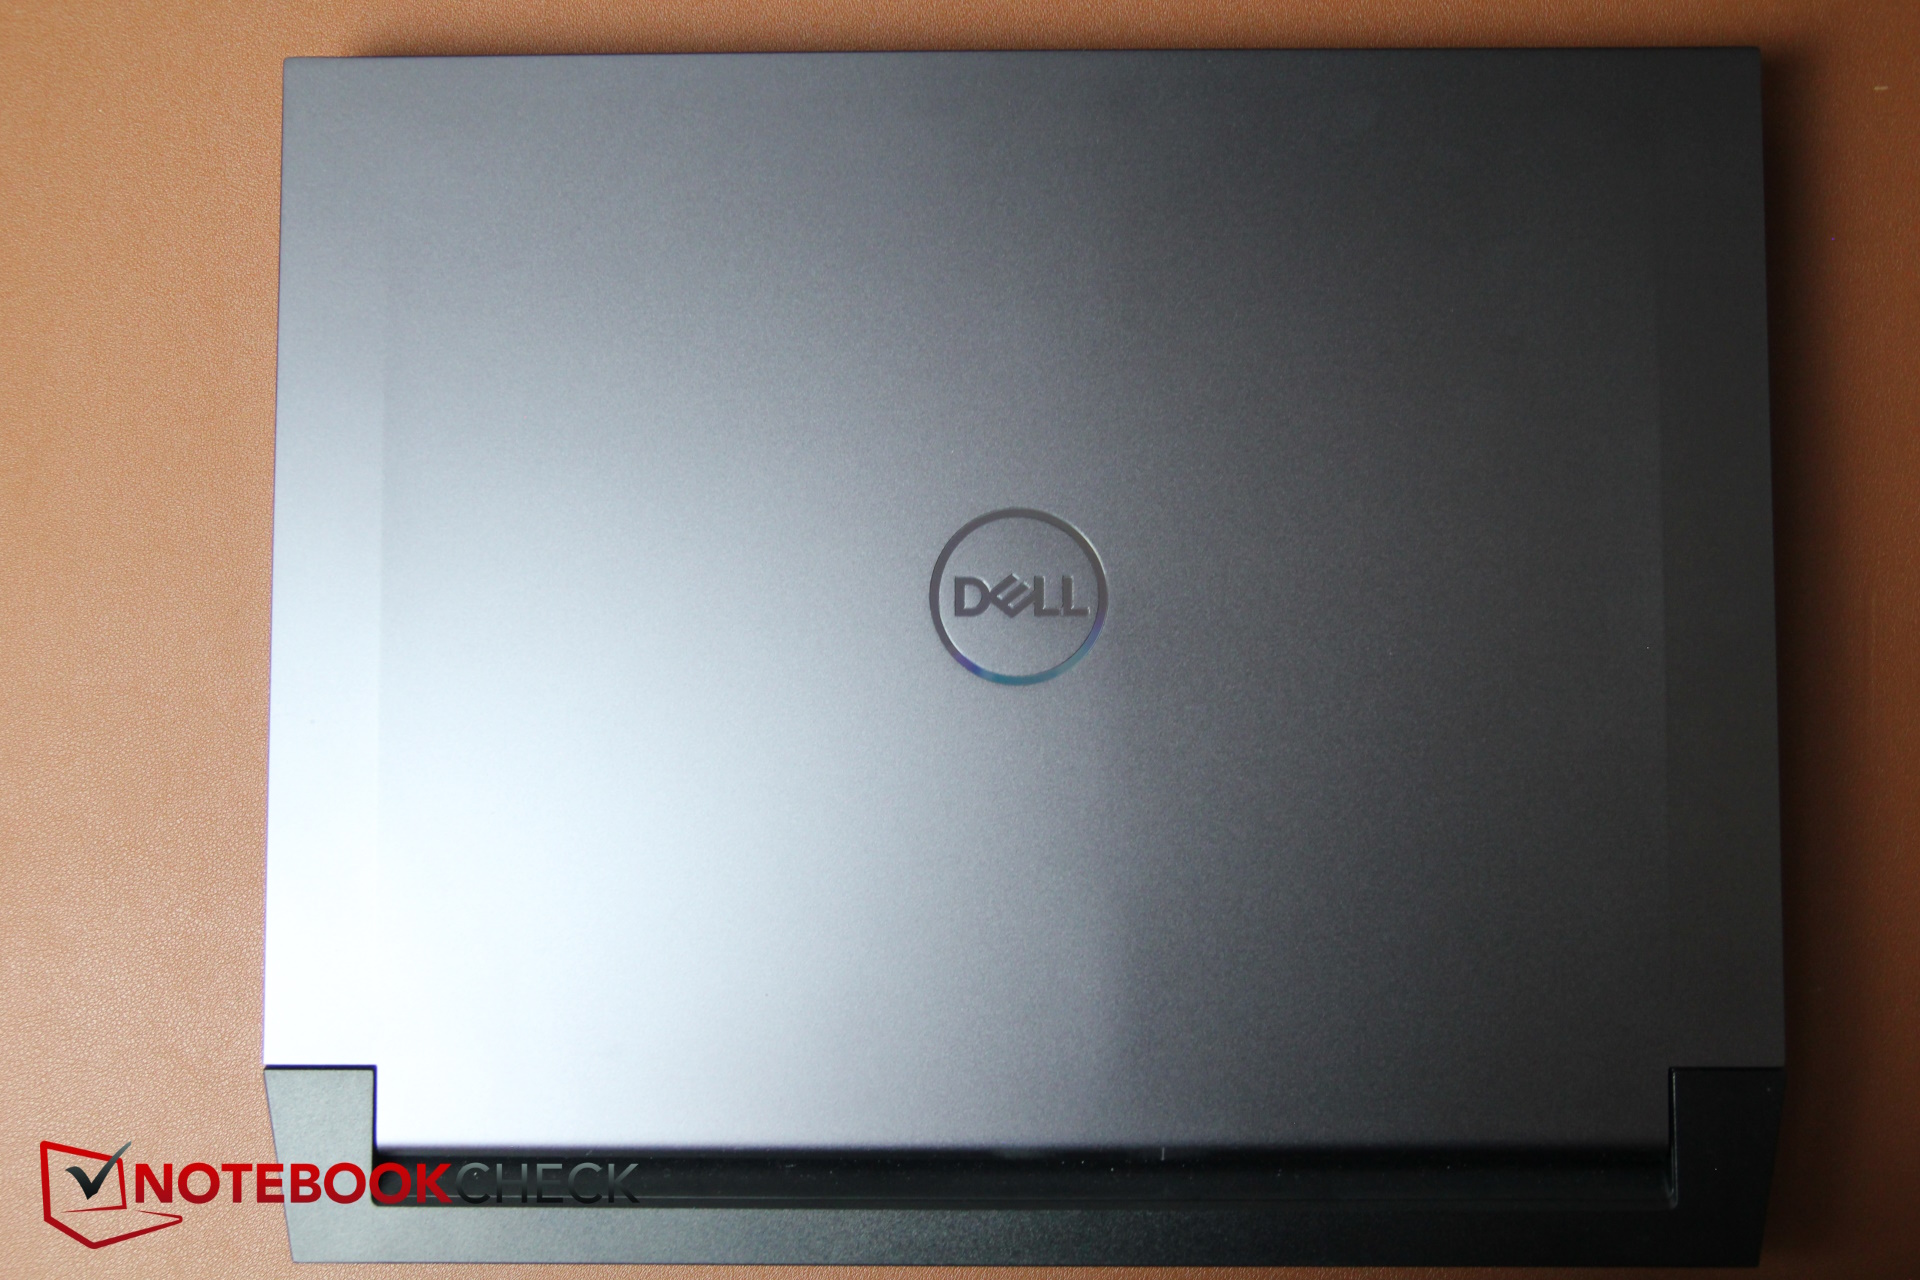
Caja - Tapa de aluminio y el resto es de plástico gris
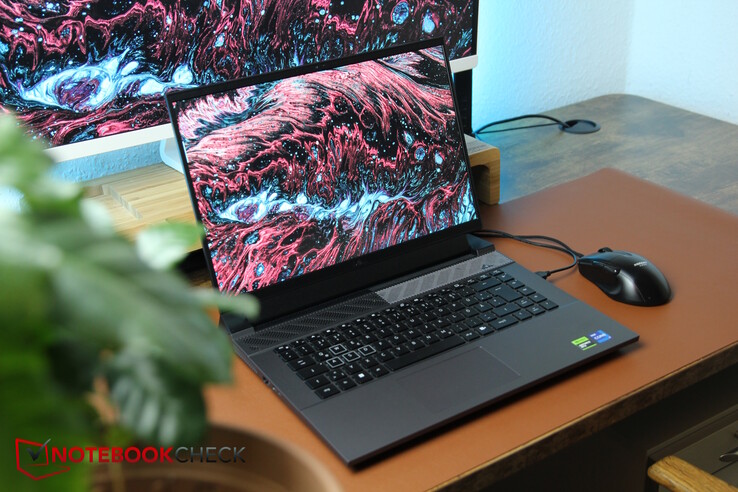
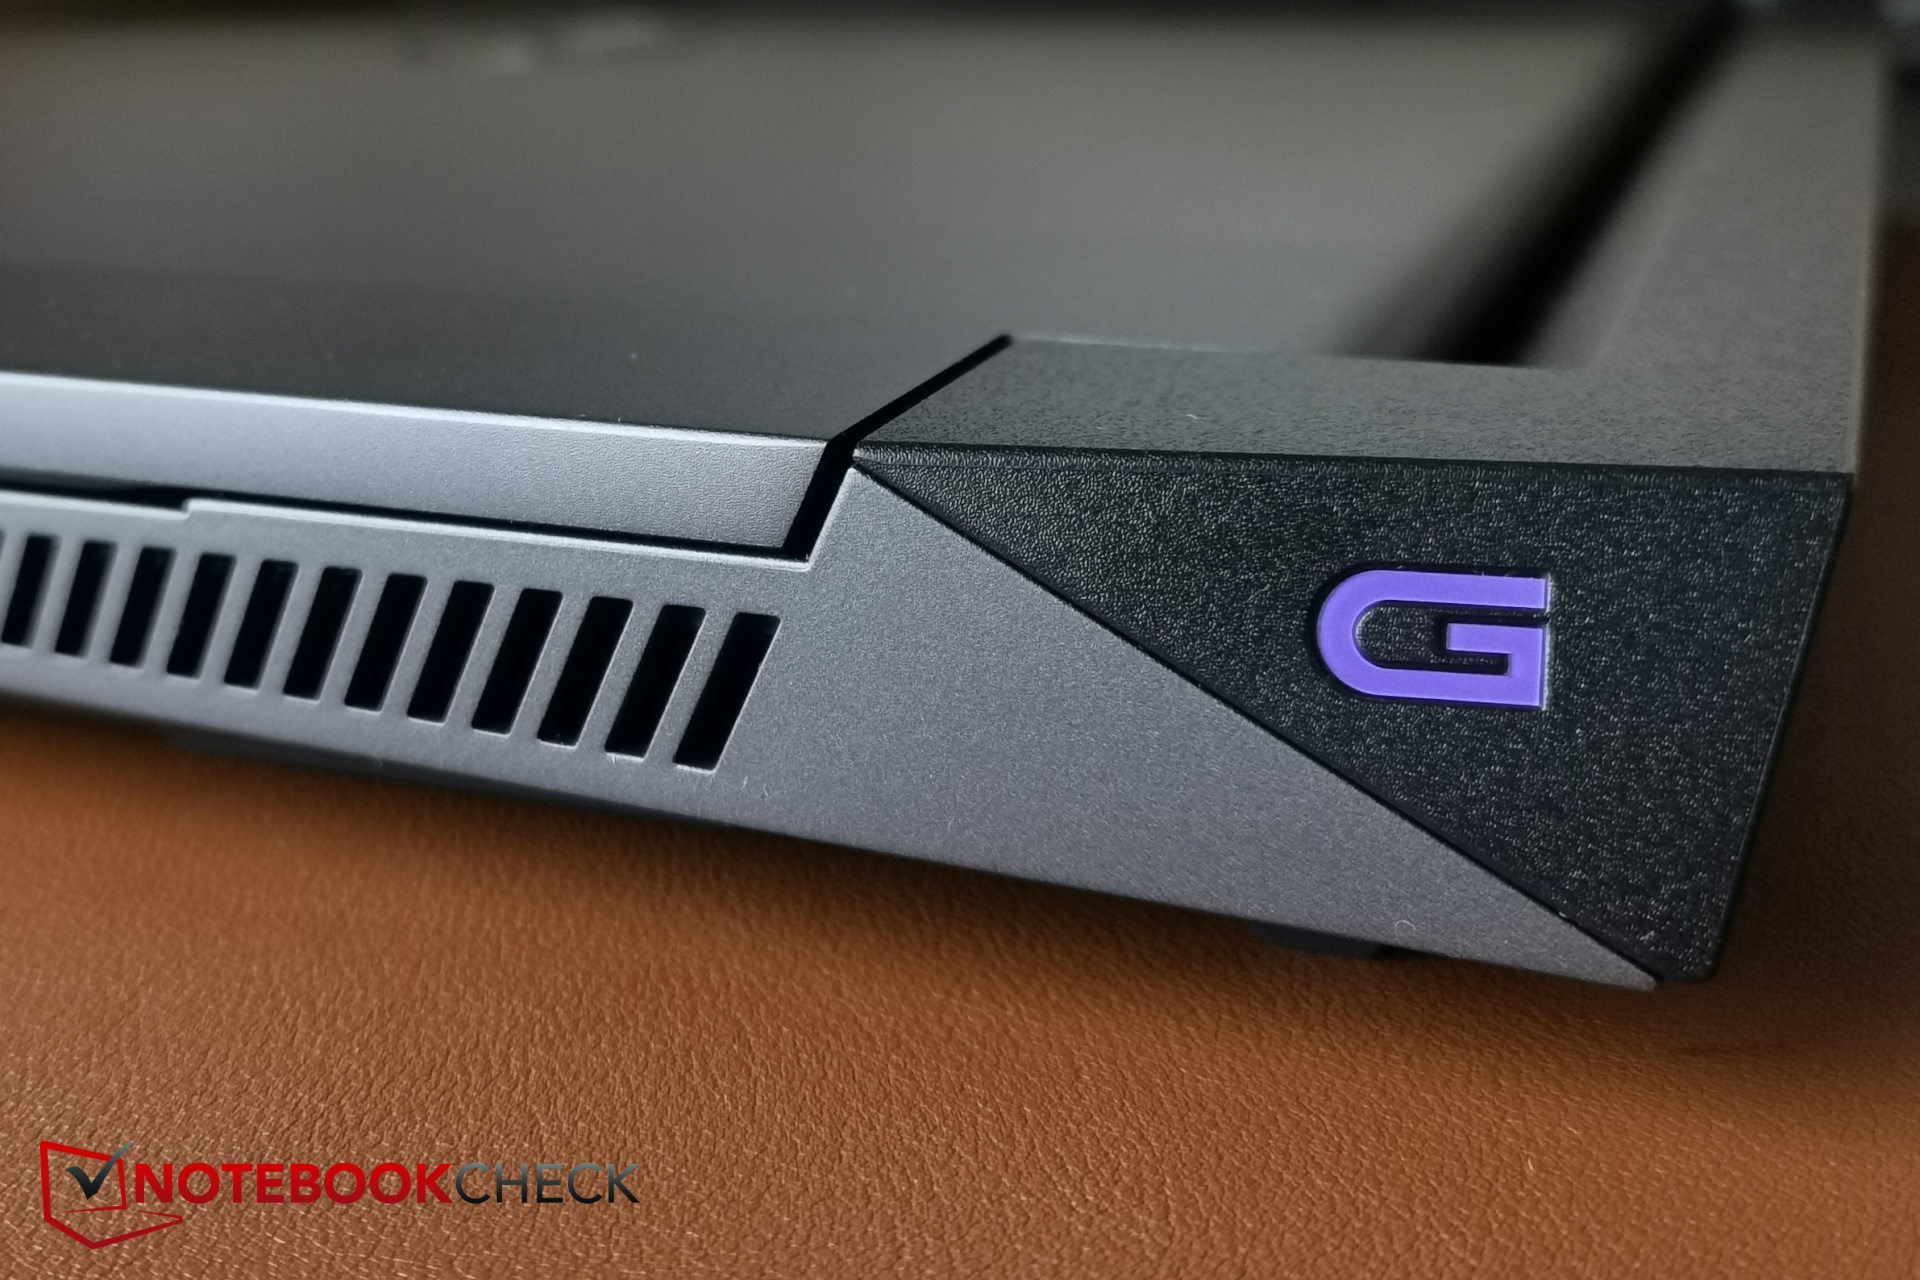
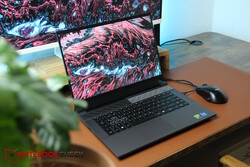
La carcasa del portátil, que difiere de la de su predecesor, está fabricada en su mayor parte con plástico gris; sólo la tapa utiliza aluminio, lo que le confiere una buena estabilidad. La unidad base también es estable y apenas se puede torcer. La larga bisagra mantiene bien la pantalla en su sitio, sin embargo, notamos algunos ligeros ruidos de fricción y chirridos al abrirla y cerrarla. Esperemos que esto no afecte a la longevidad del dispositivo. Su construcción es decente pero no parece de tan alta calidad como los modelos más caros de Dell y Alienware.
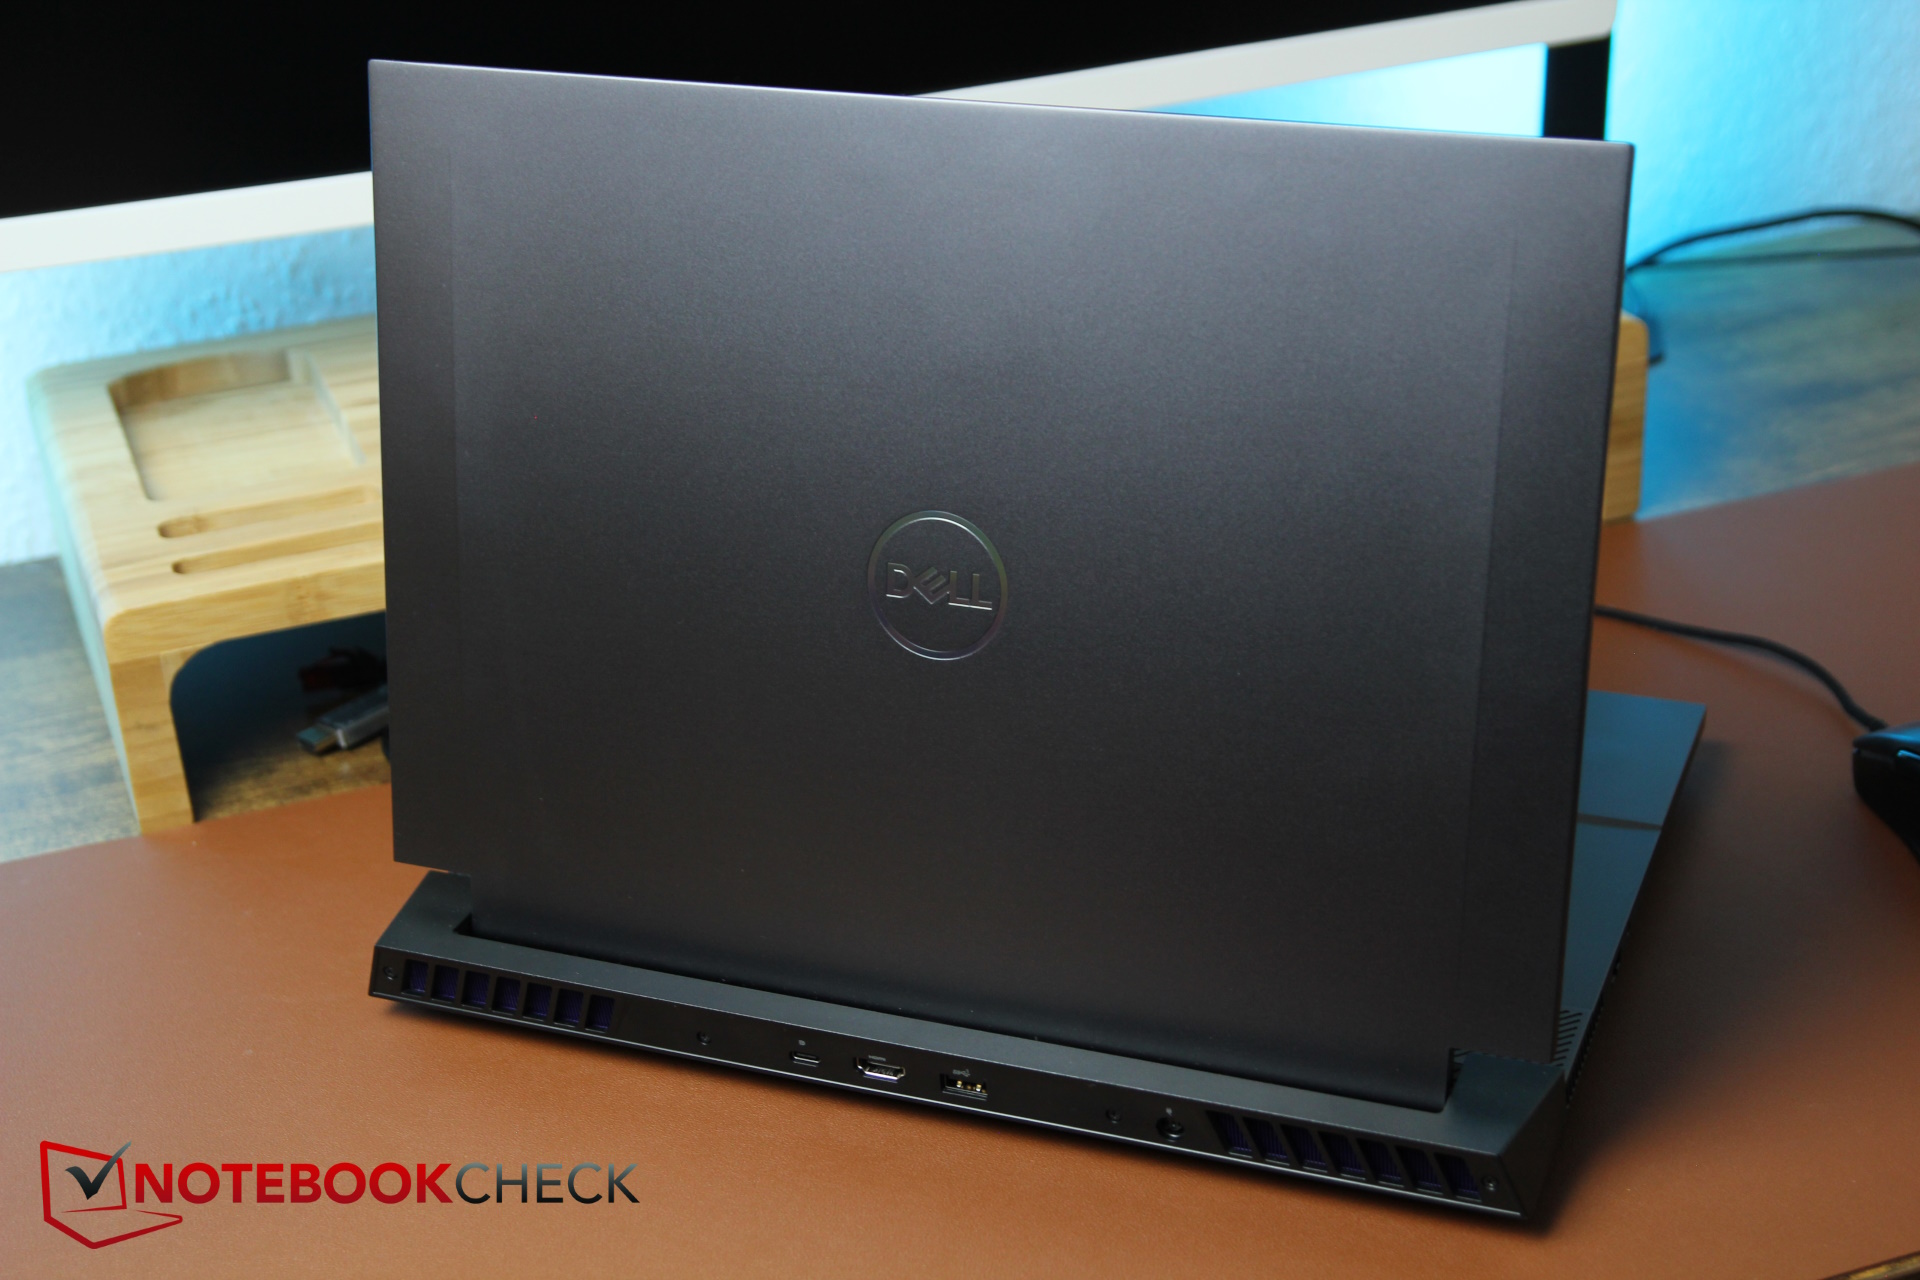
El logotipo de Dell destaca en la parte superior del portátil y, aparte de esto, no presenta ningún acento de color adicional. Sin embargo, tampoco tiene un aspecto terriblemente elegante, lo que se debe principalmente a la unidad de refrigeración que sobresale hacia la parte trasera. En general, el G16 no parece muy elegante, sino más bien tosco y pesado.
El más caro Alienware m16 R1 es en realidad un poco más ancho que nuestro G16 y de grosor similar. El MSI Raider GE68HX es un poco más grueso aún, mientras que el resto de sus medidas son casi idénticas. Incluso el Lenovo Legion Slim 5 no es mucho más delgado, aunque el G16 parece bastante grueso, pero el primero es ligeramente más pequeño.
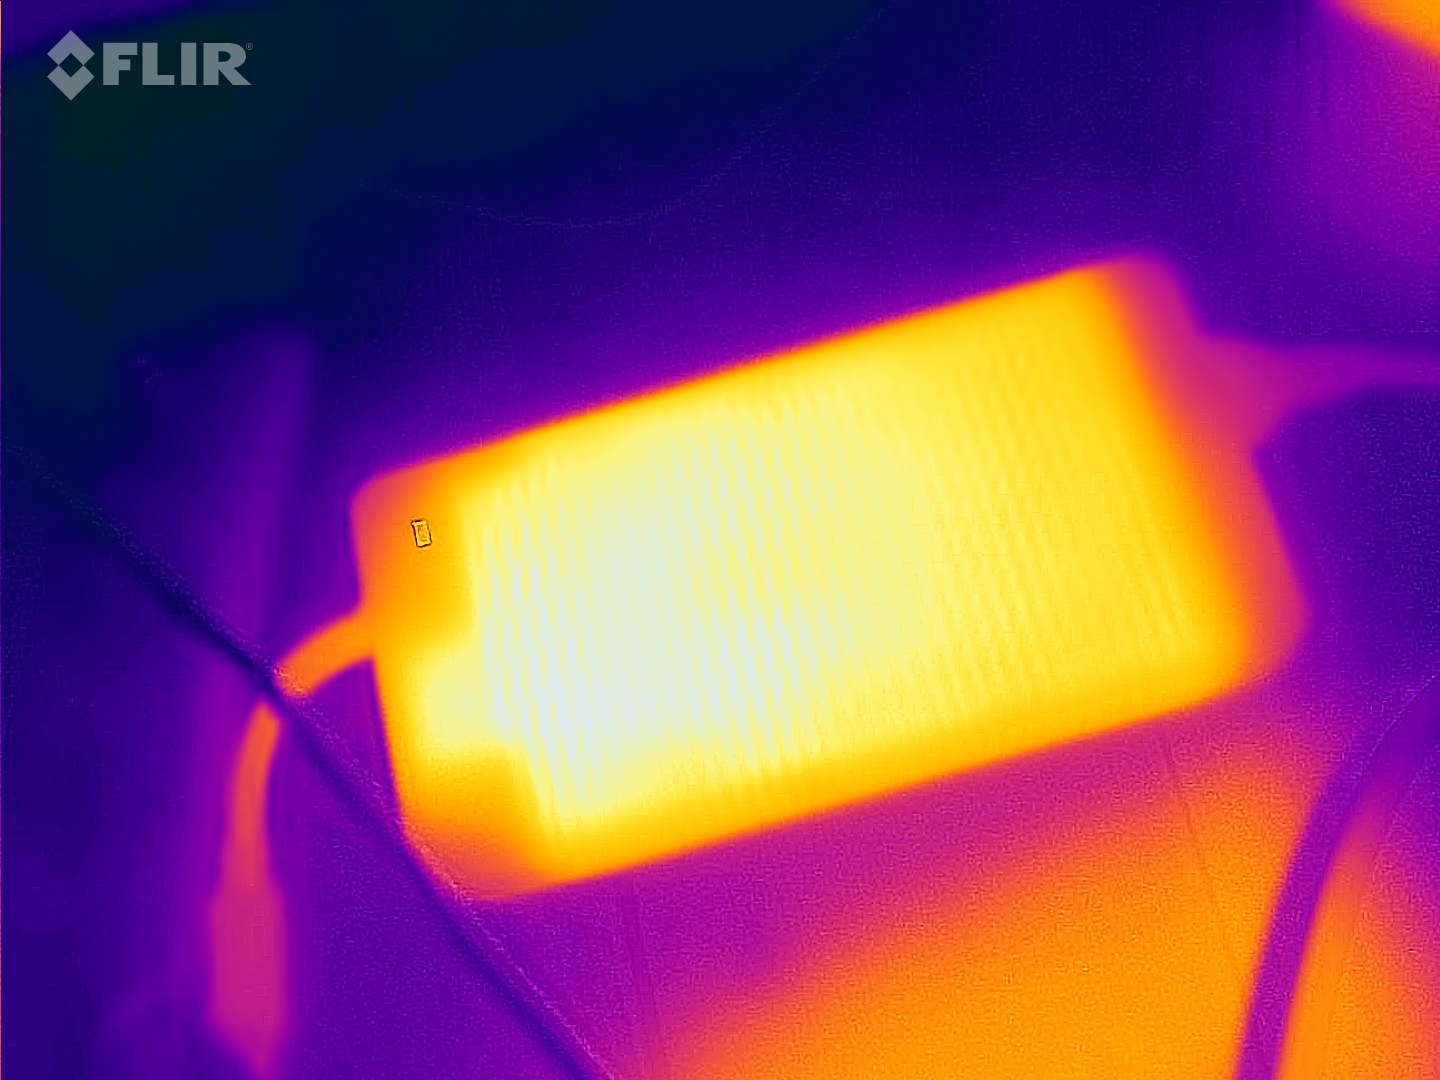
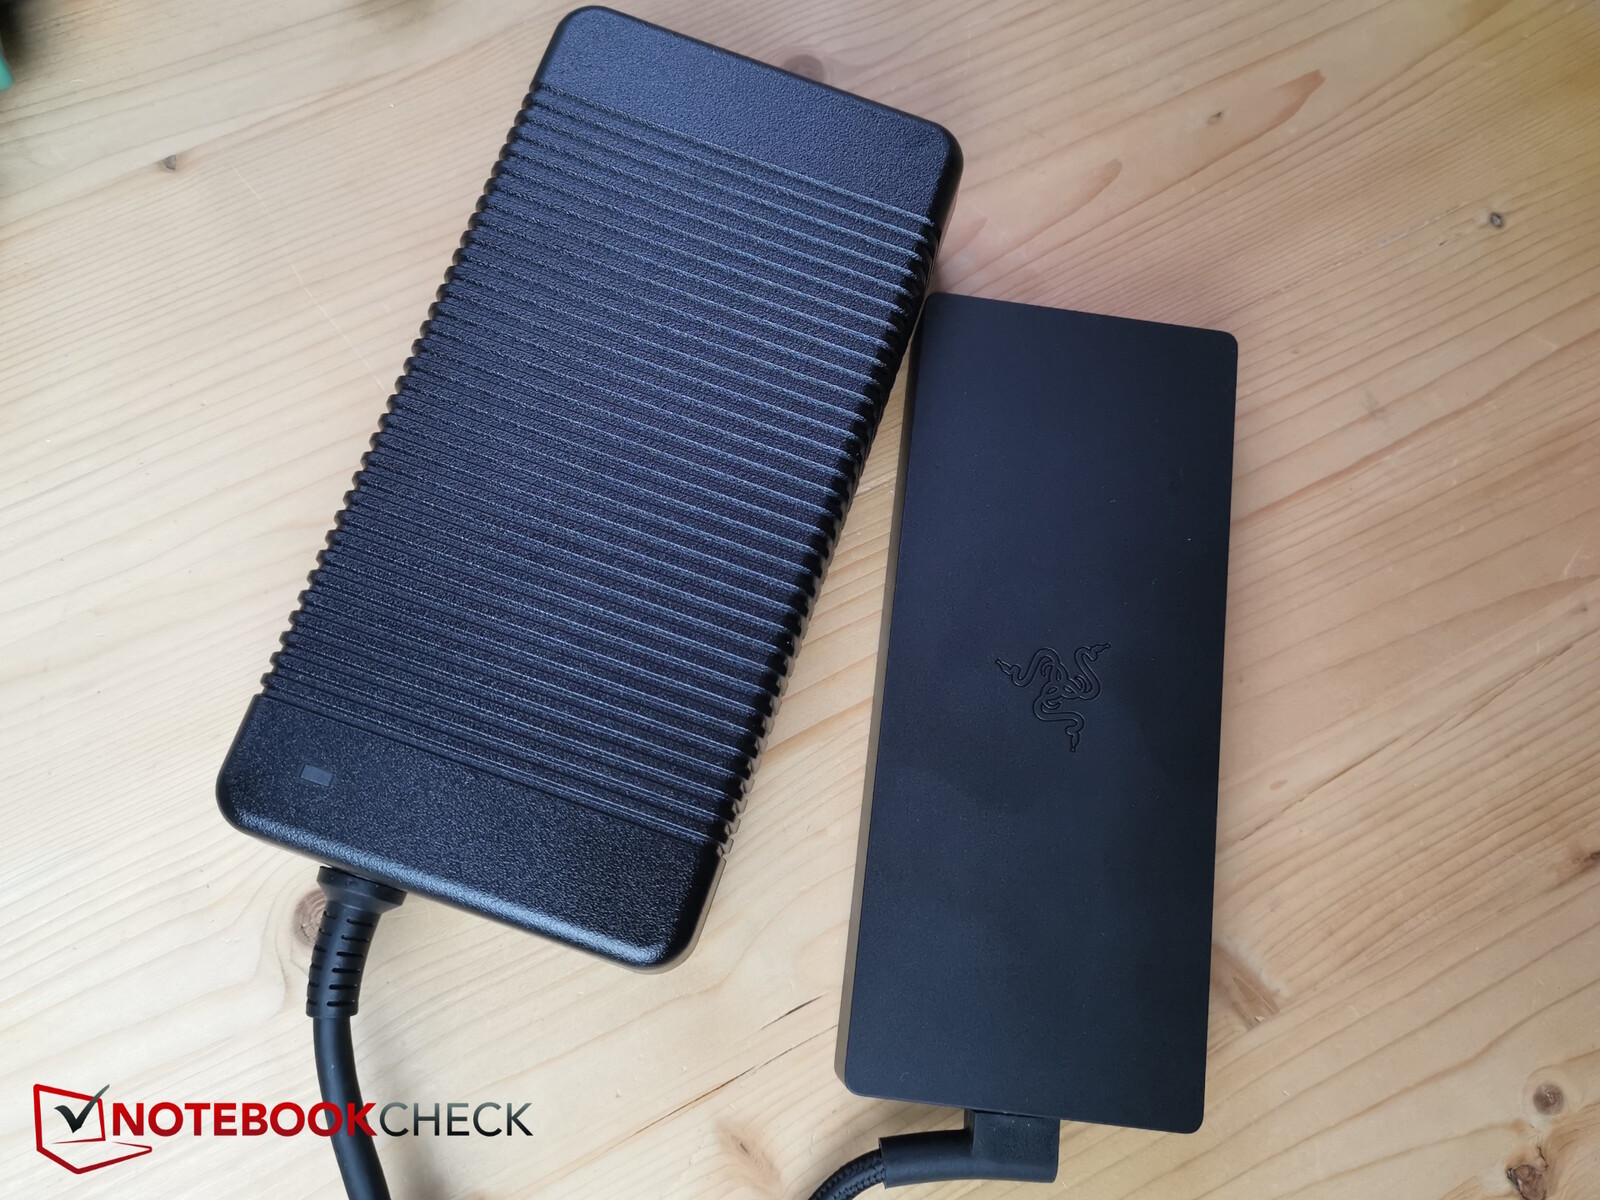
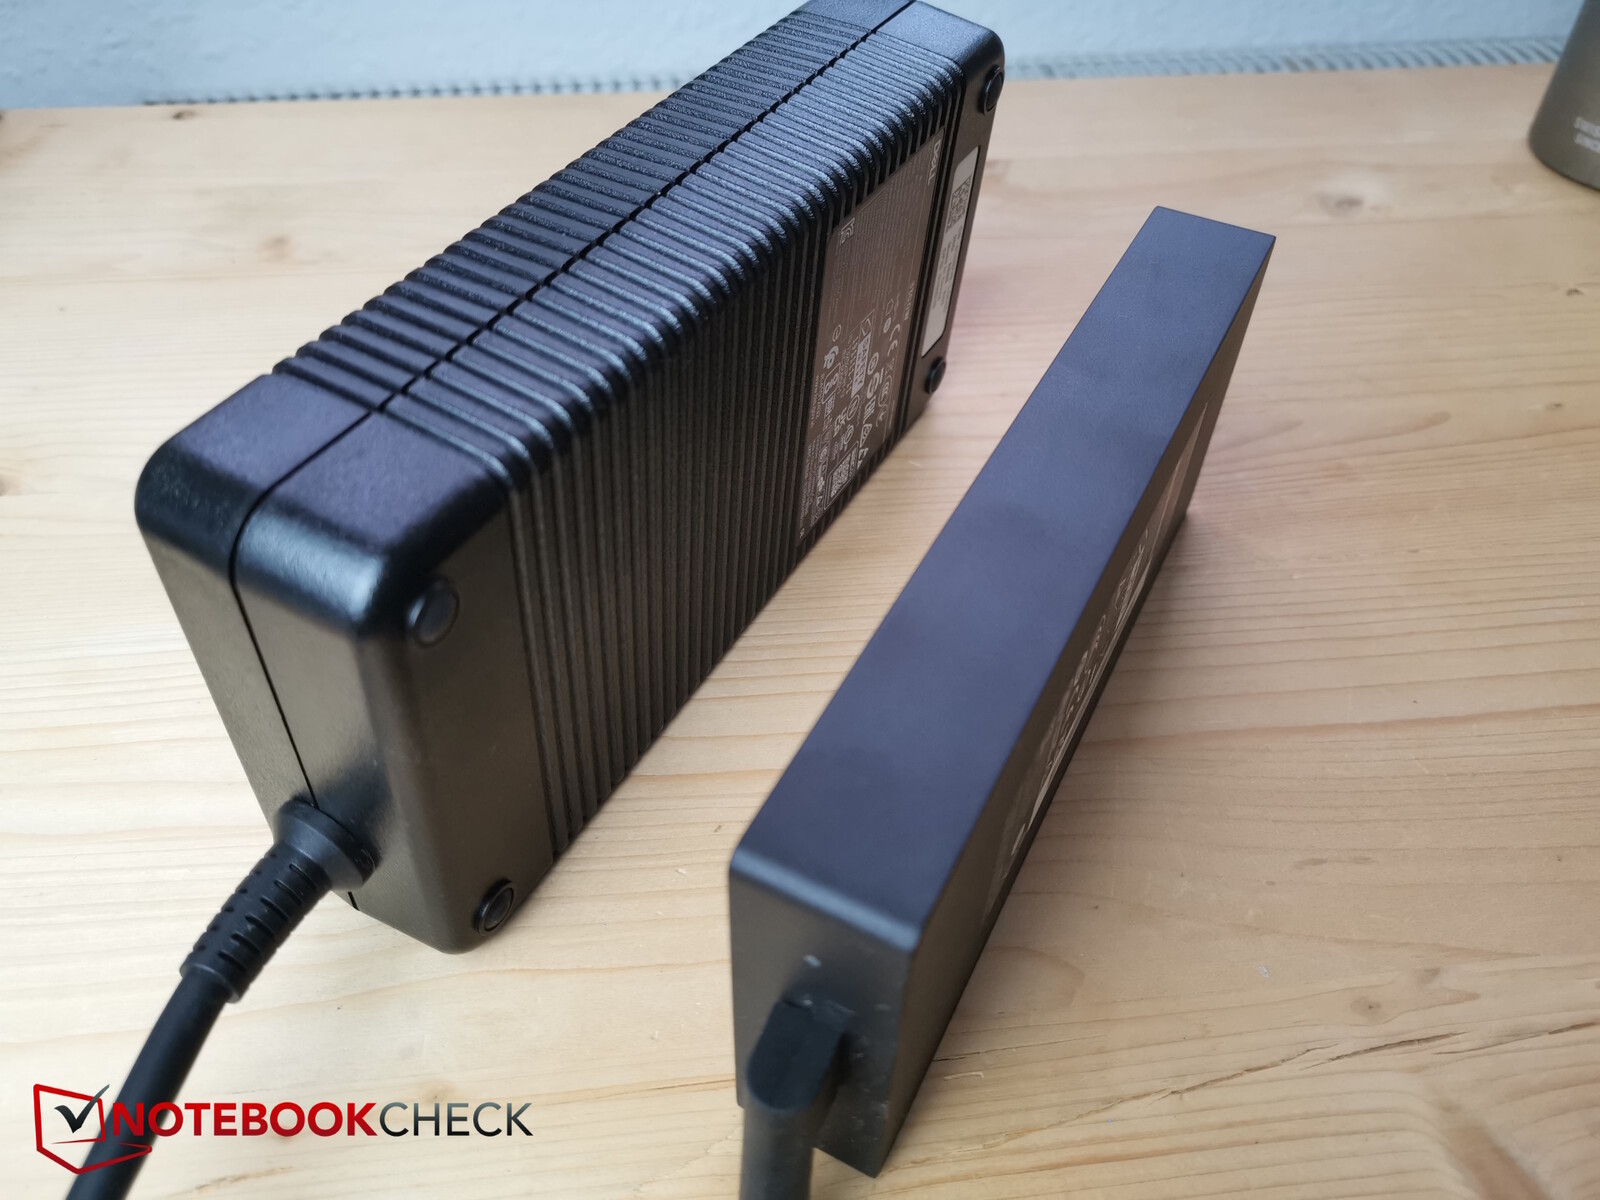
En comparación con su predecesor, este modelo es, de hecho, ligeramente más delgado pero, al mismo tiempo, ha aumentado su profundidad. También es más pesado (+ 200 g), lo que significa que el G16 es ahora el segundo gamer de 16 pulgadas más pesado con una RTX 4060, después del Alienware del mismo fabricante. Además, Dell incluso entrega la versión con una RTX 4060 con una enorme y pesada fuente de alimentación de 330 vatios, que por sí sola pesa más de 1,5 kg.
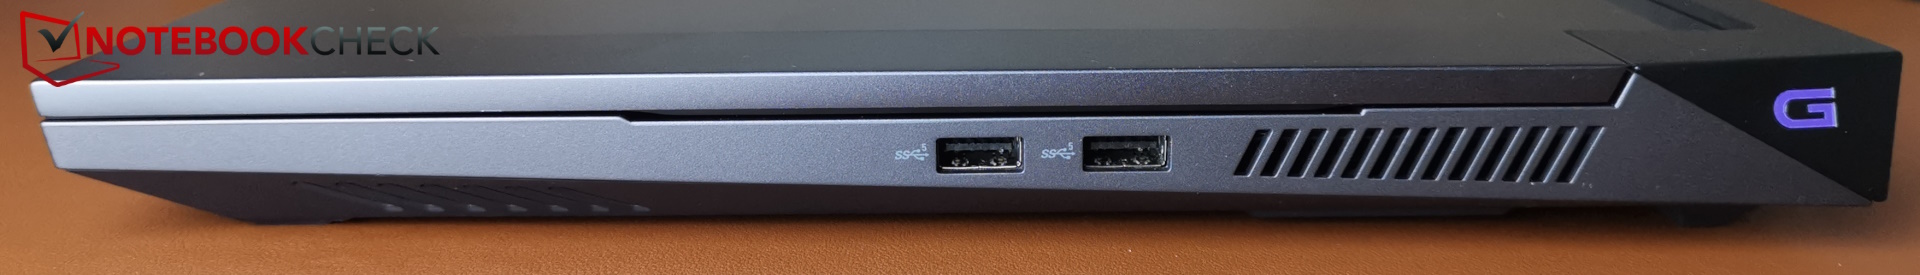
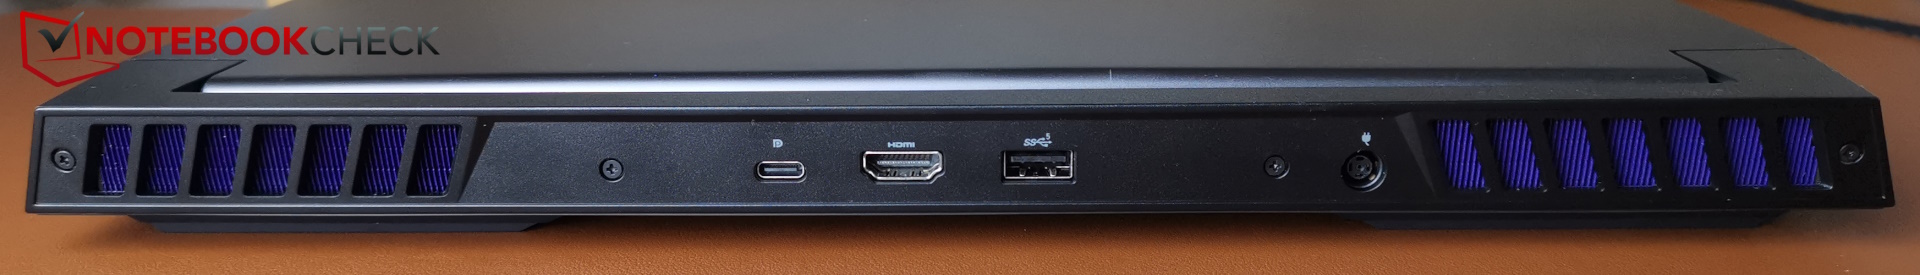
Conectividad - Thunderbolt no en todos los modelos G16
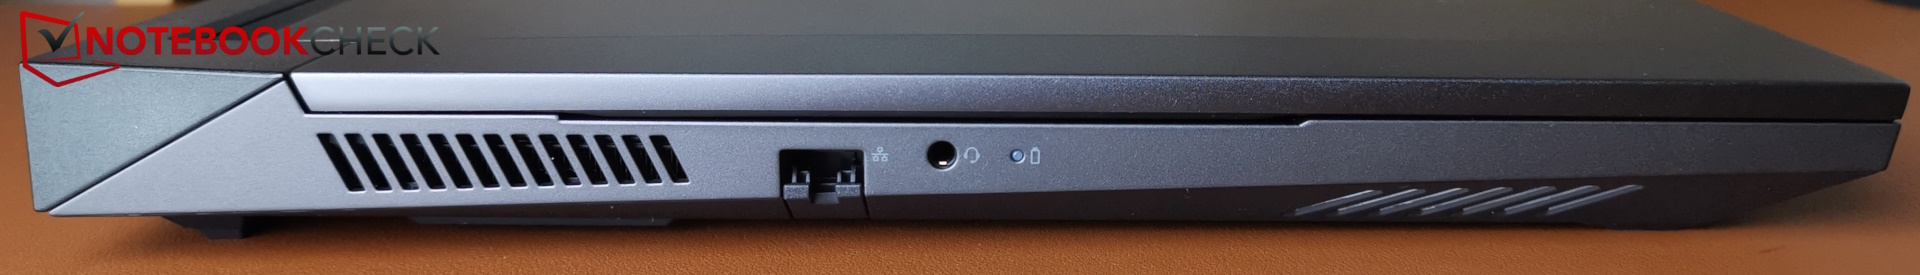
La disposición de los puertos del portátil sigue siendo la misma, con una excepción: En la parte trasera, las conexiones se han barajado un poco. Mientras que el puerto HDMI tenía mucho espacio en el modelo predecesor, ahora se sitúa justo entre el puerto USB-A y el puerto USB-C; el primero podría dar lugar a algunos problemas de espacio cuando se utilice con enchufes más grandes. Esta decisión de Dell es bastante cuestionable.
Precaución: El enchufe de alimentación no se asienta con mucha firmeza y cuando se mueve el portátil, se desliza con bastante facilidad. La pesada fuente de alimentación contribuye aún más a este problema.
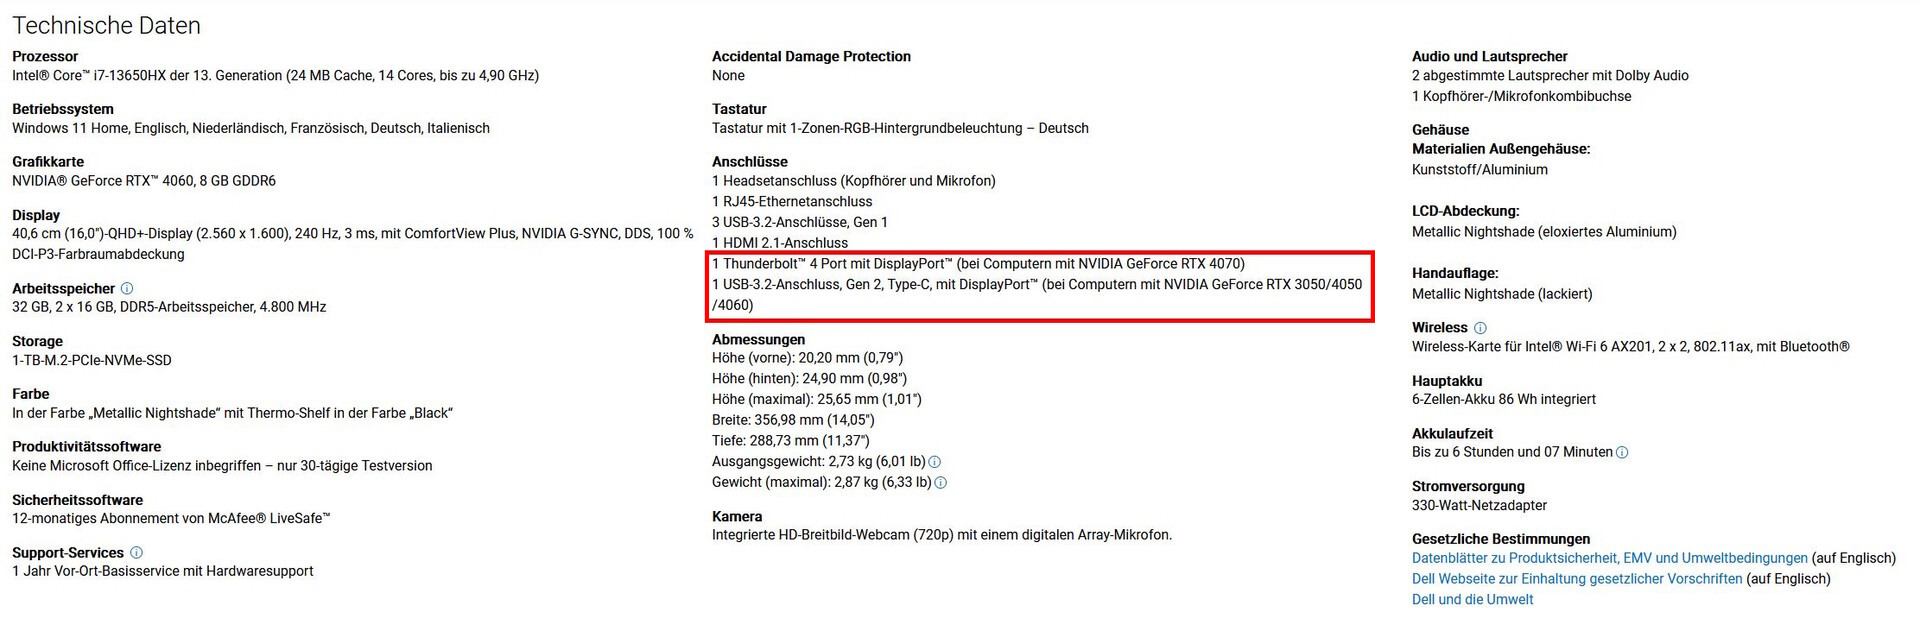
Igual de cuestionable es la compatibilidad del dispositivo con Thunderbolt (4) que se incluyó en su predecesor. Ahora, aparentemente depende de la tarjeta gráfica instalada. Según Dell, Thunderbolt no es compatible en los modelos que utilizan hasta una RTX 4060, mientras que una RTX 4070 o superior sí lo incorpora. Esto es inusual y para los clientes que compran las configuraciones más pequeñas, es frustrante. El puerto no es compatible con PowerDelivery.
Comunicación
El módulo WiFi Intel AX201 es compatible con WiFi 6 pero aún no con WiFi 6E.
Sus tasas de transferencia dentro de la banda de 5 GHz son excepcionales, mientras que sus tasas de 2,4 GHz de 210 Mb/s son decepcionantes.
Cámara web
A más tardar, su escasa webcam de 720p muestra dónde ha ahorrado Dell. Muchos competidores cuentan ya con una cámara Full-HD o mejor. También hay modelos mejores en cuanto a desviaciones de color y nitidez de imagen.


Seguridad
La G16 no cuenta realmente con ninguna función de seguridad física, ya que no dispone ni de sensor de huellas dactilares ni de bloqueo Kensington. El TPM está, por supuesto, integrado en el procesador.
Accesorios y garantía
El embalaje no incluye ningún extra. Dell ofrece a este dispositivo una garantía estándar de 12 meses con servicio básico in situ y soporte de hardware y las condiciones especiales se pueden ver en la siguiente captura de pantalla.

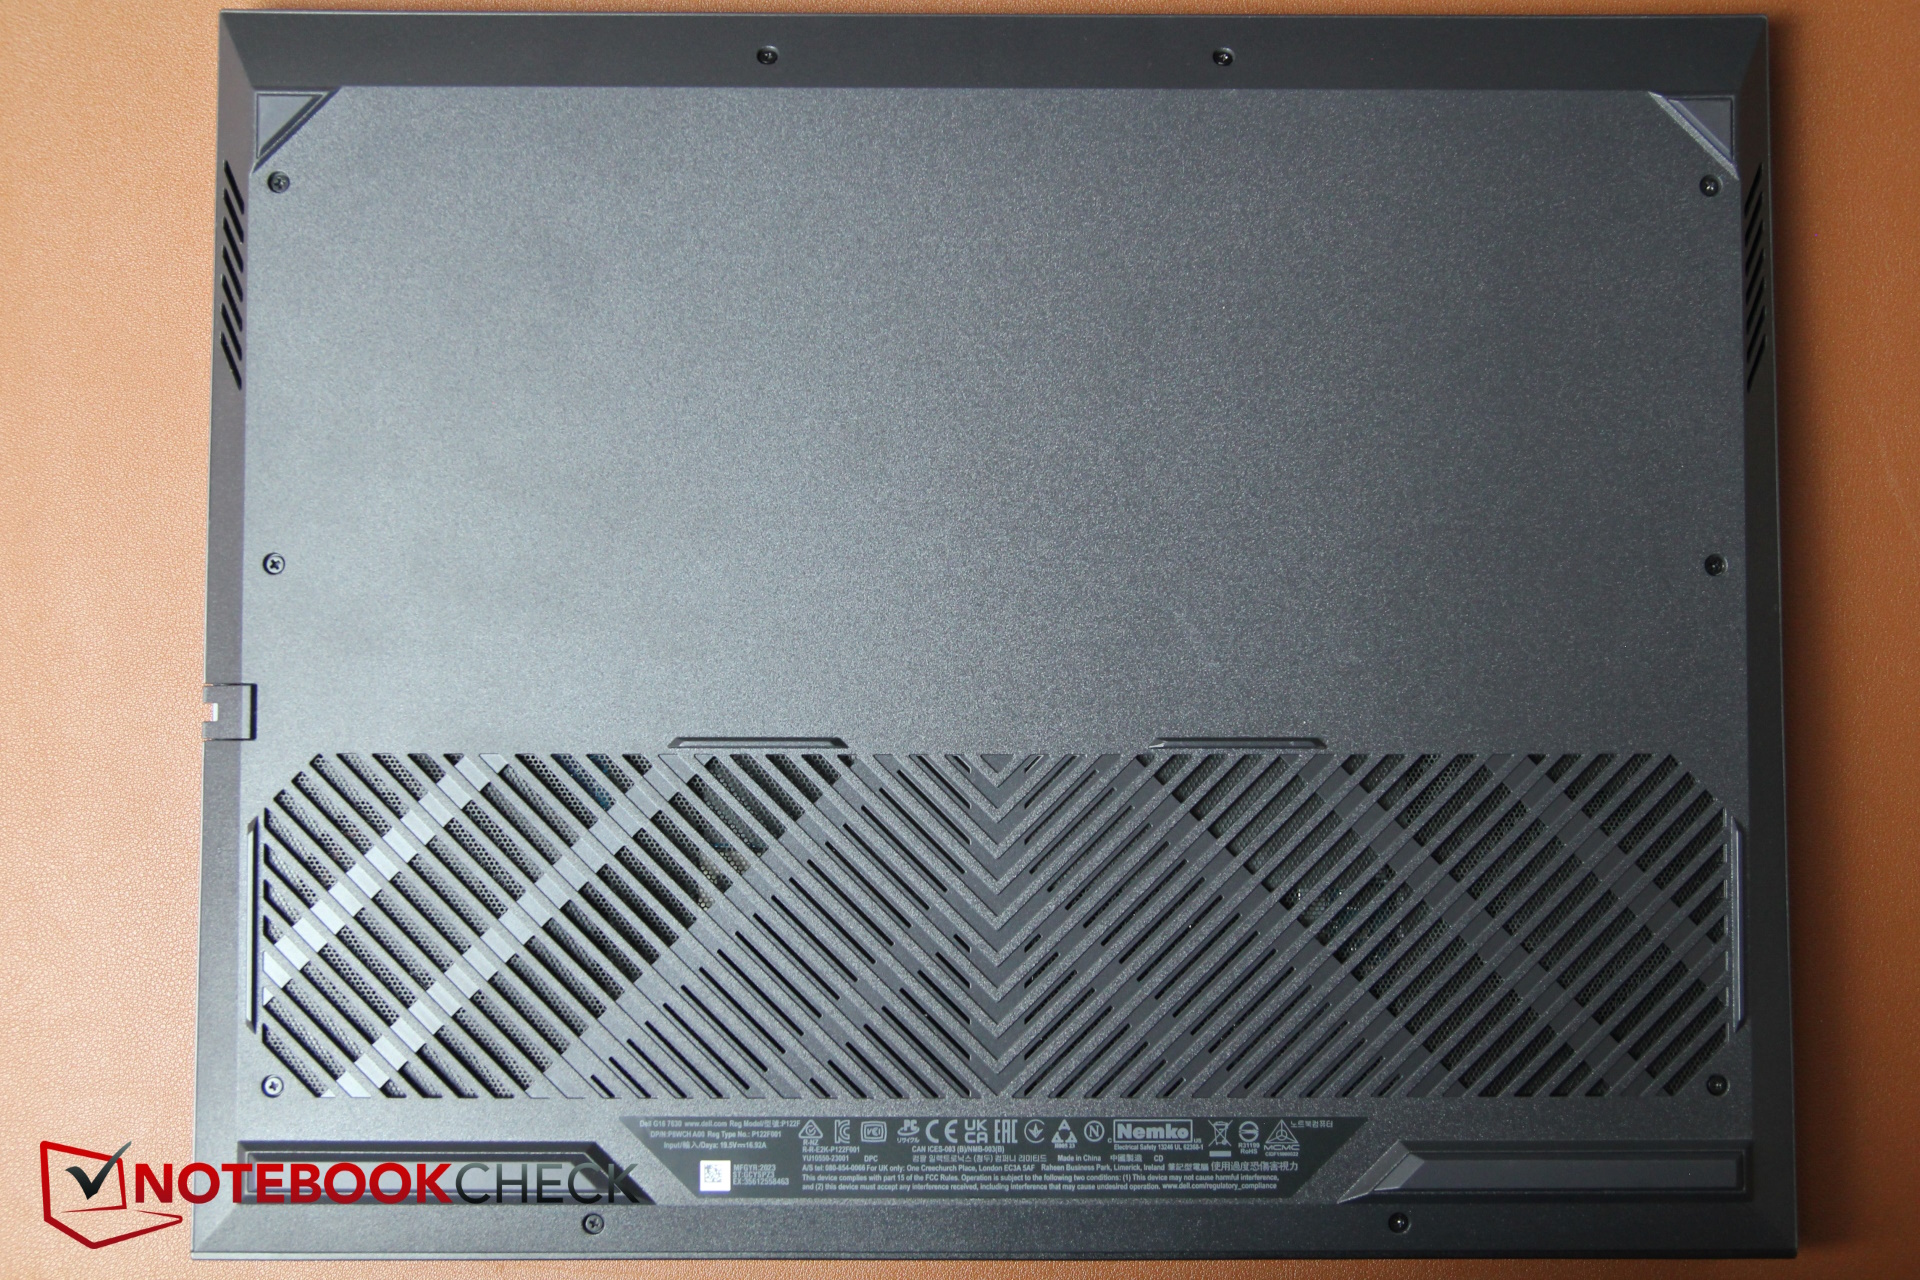
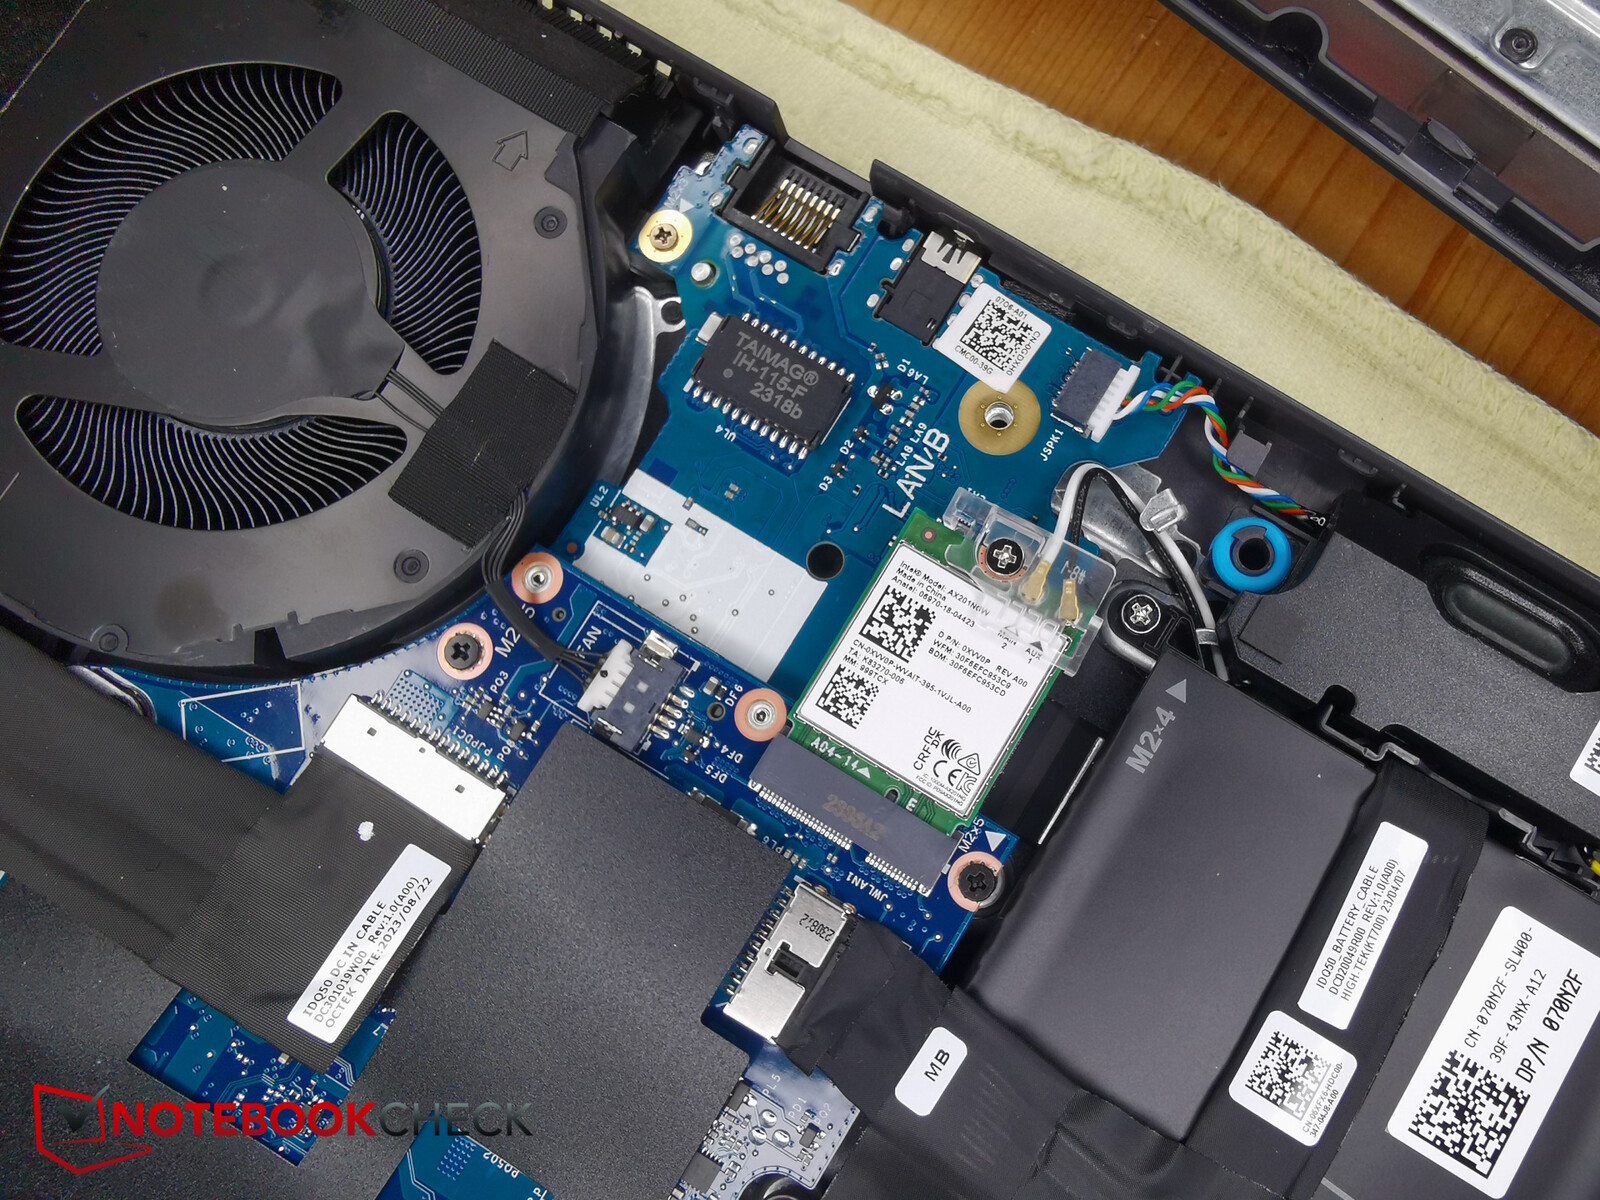
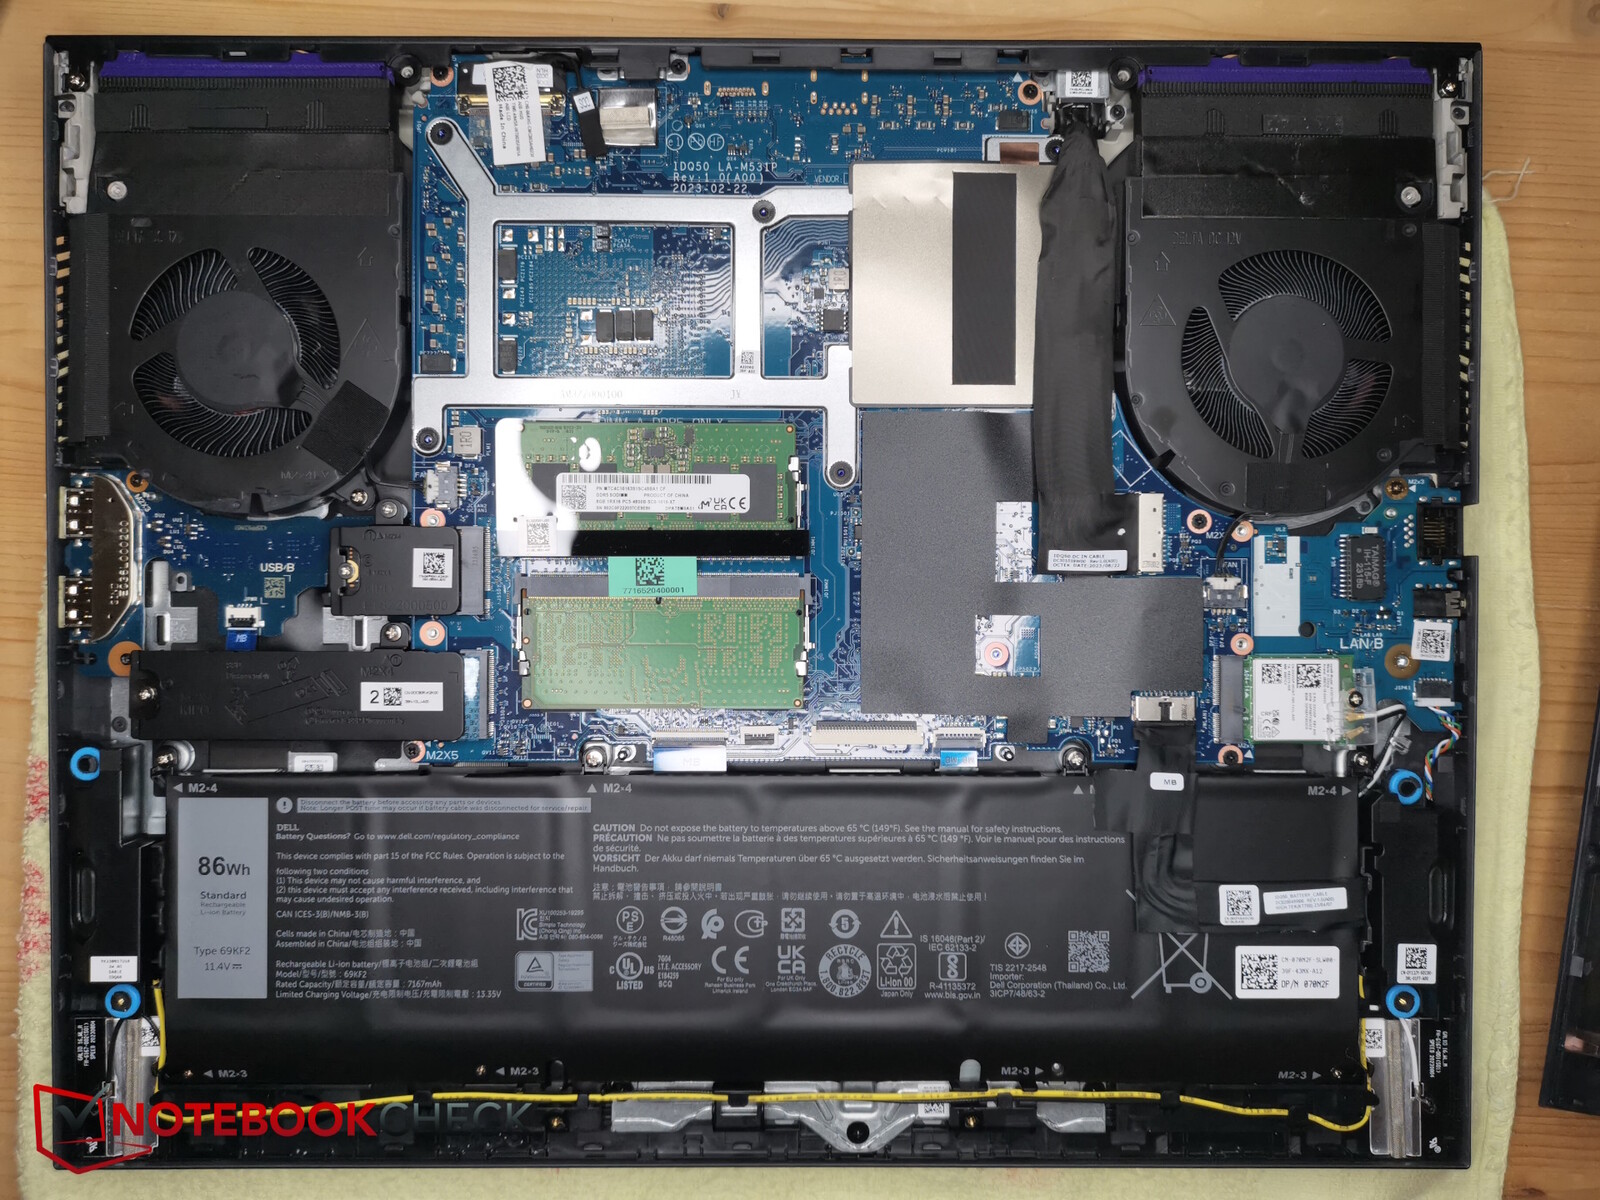
Mantenimiento
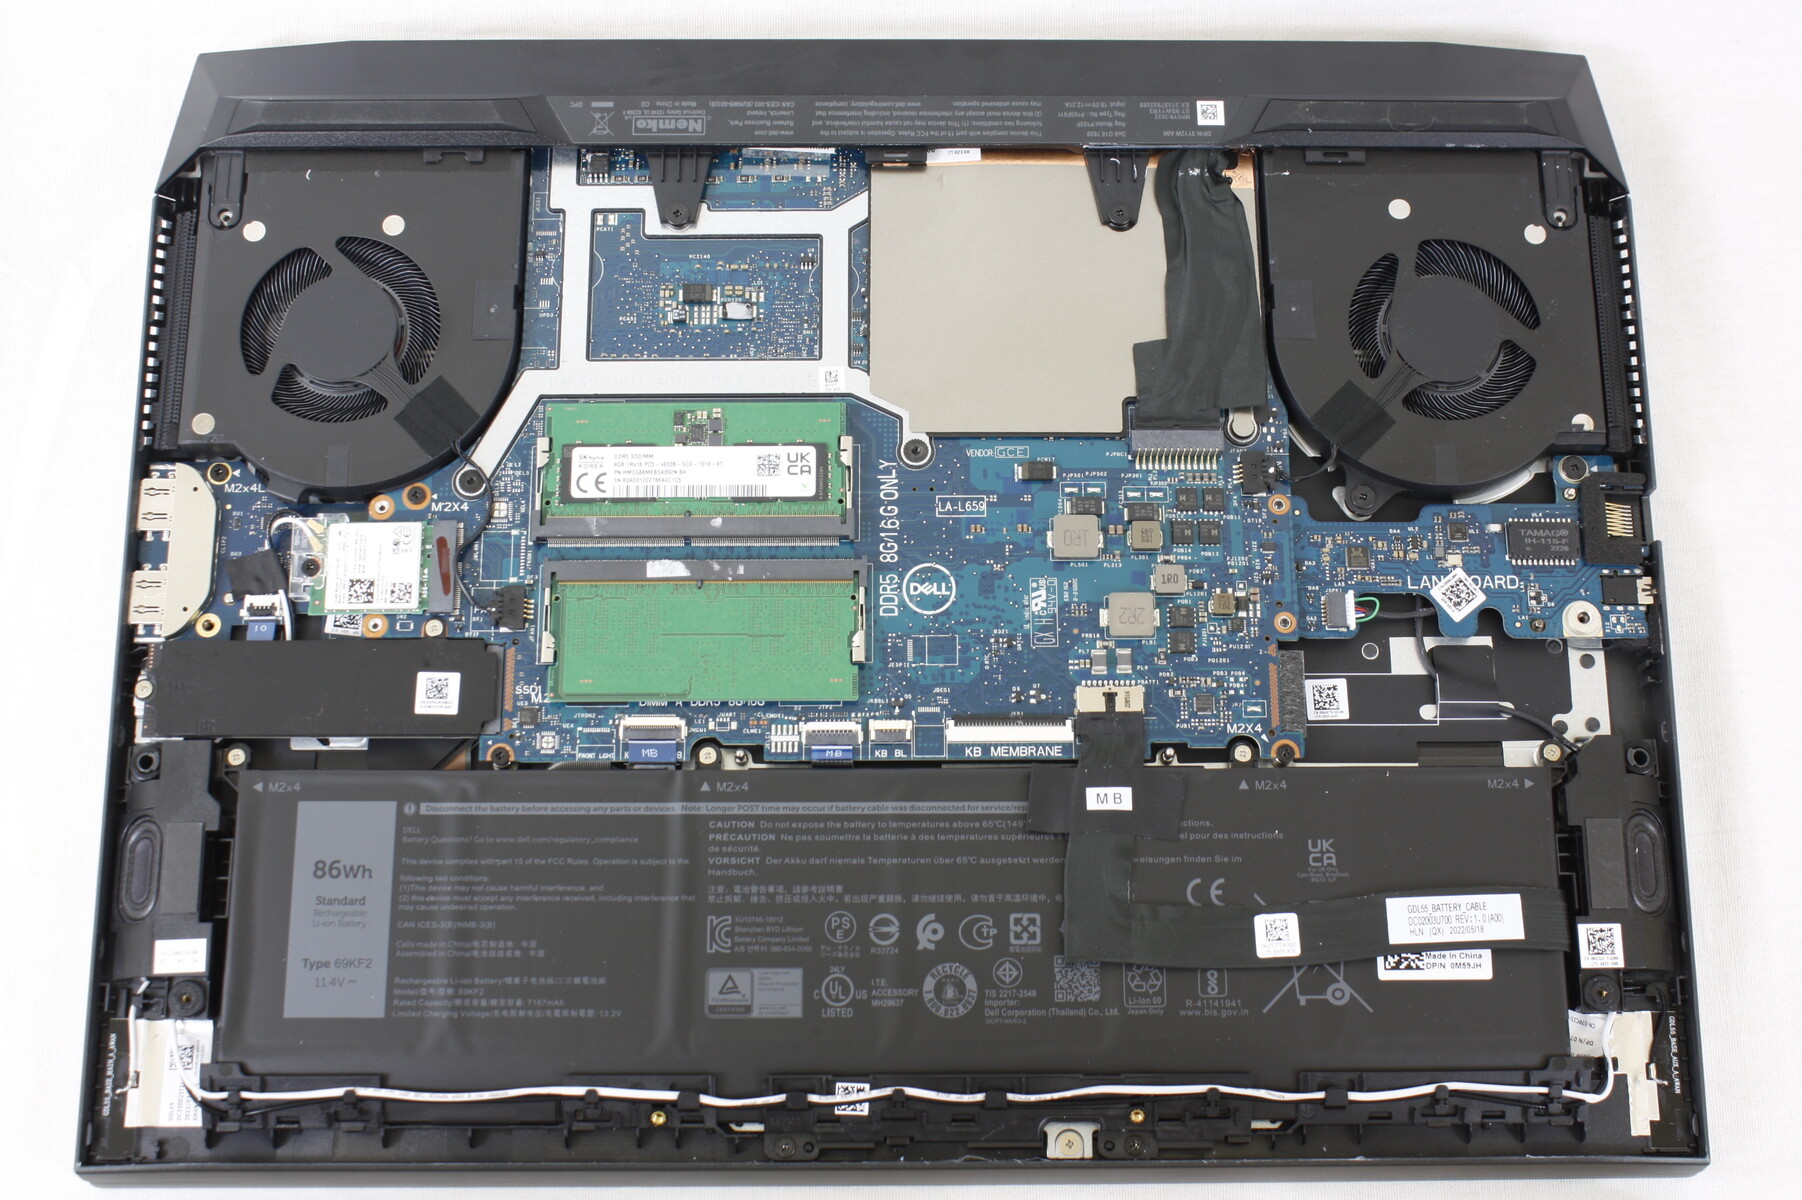
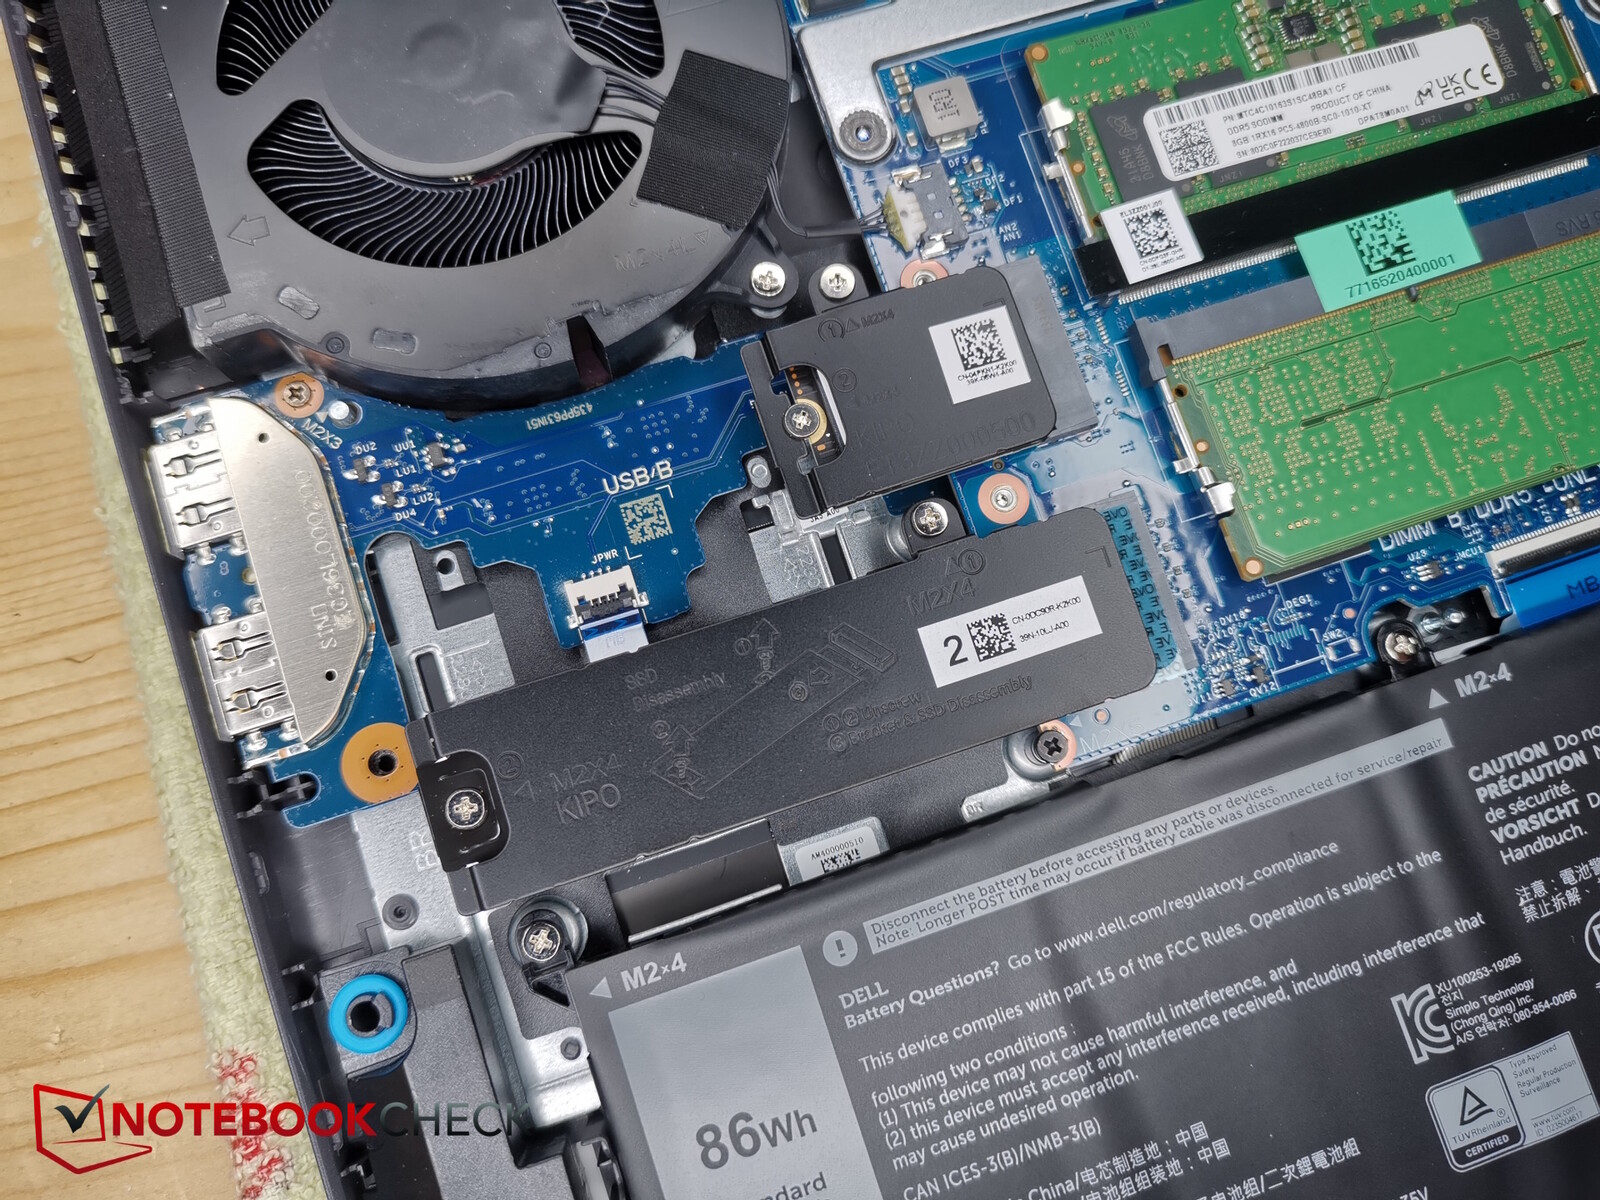
10 tornillos con cabeza en cruz sujetan la placa inferior en su sitio. Cuatro son más largos que el resto, pero no se salen de sus orificios, por lo que no hay que preocuparse de que se mezclen. Si retira los tornillos, la parte inferior de la carcasa casi se desprende sola, por lo que no necesitará ninguna herramienta adicional.
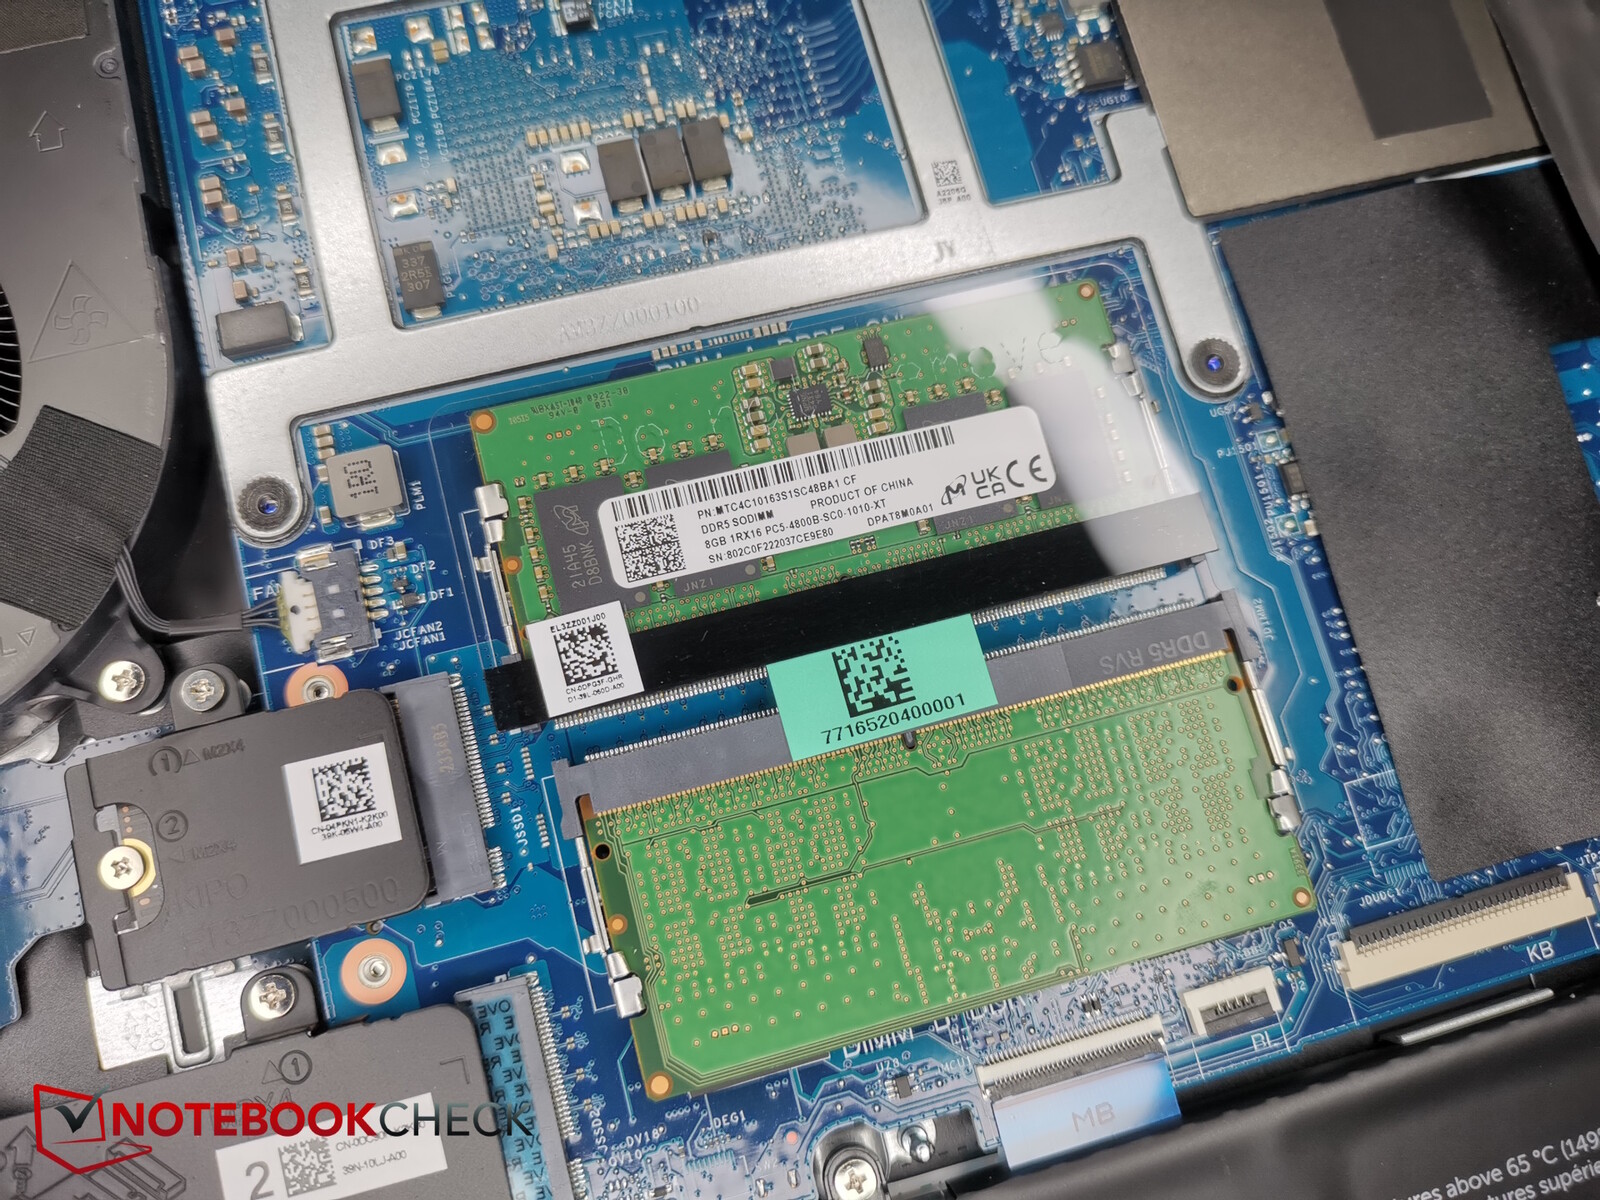
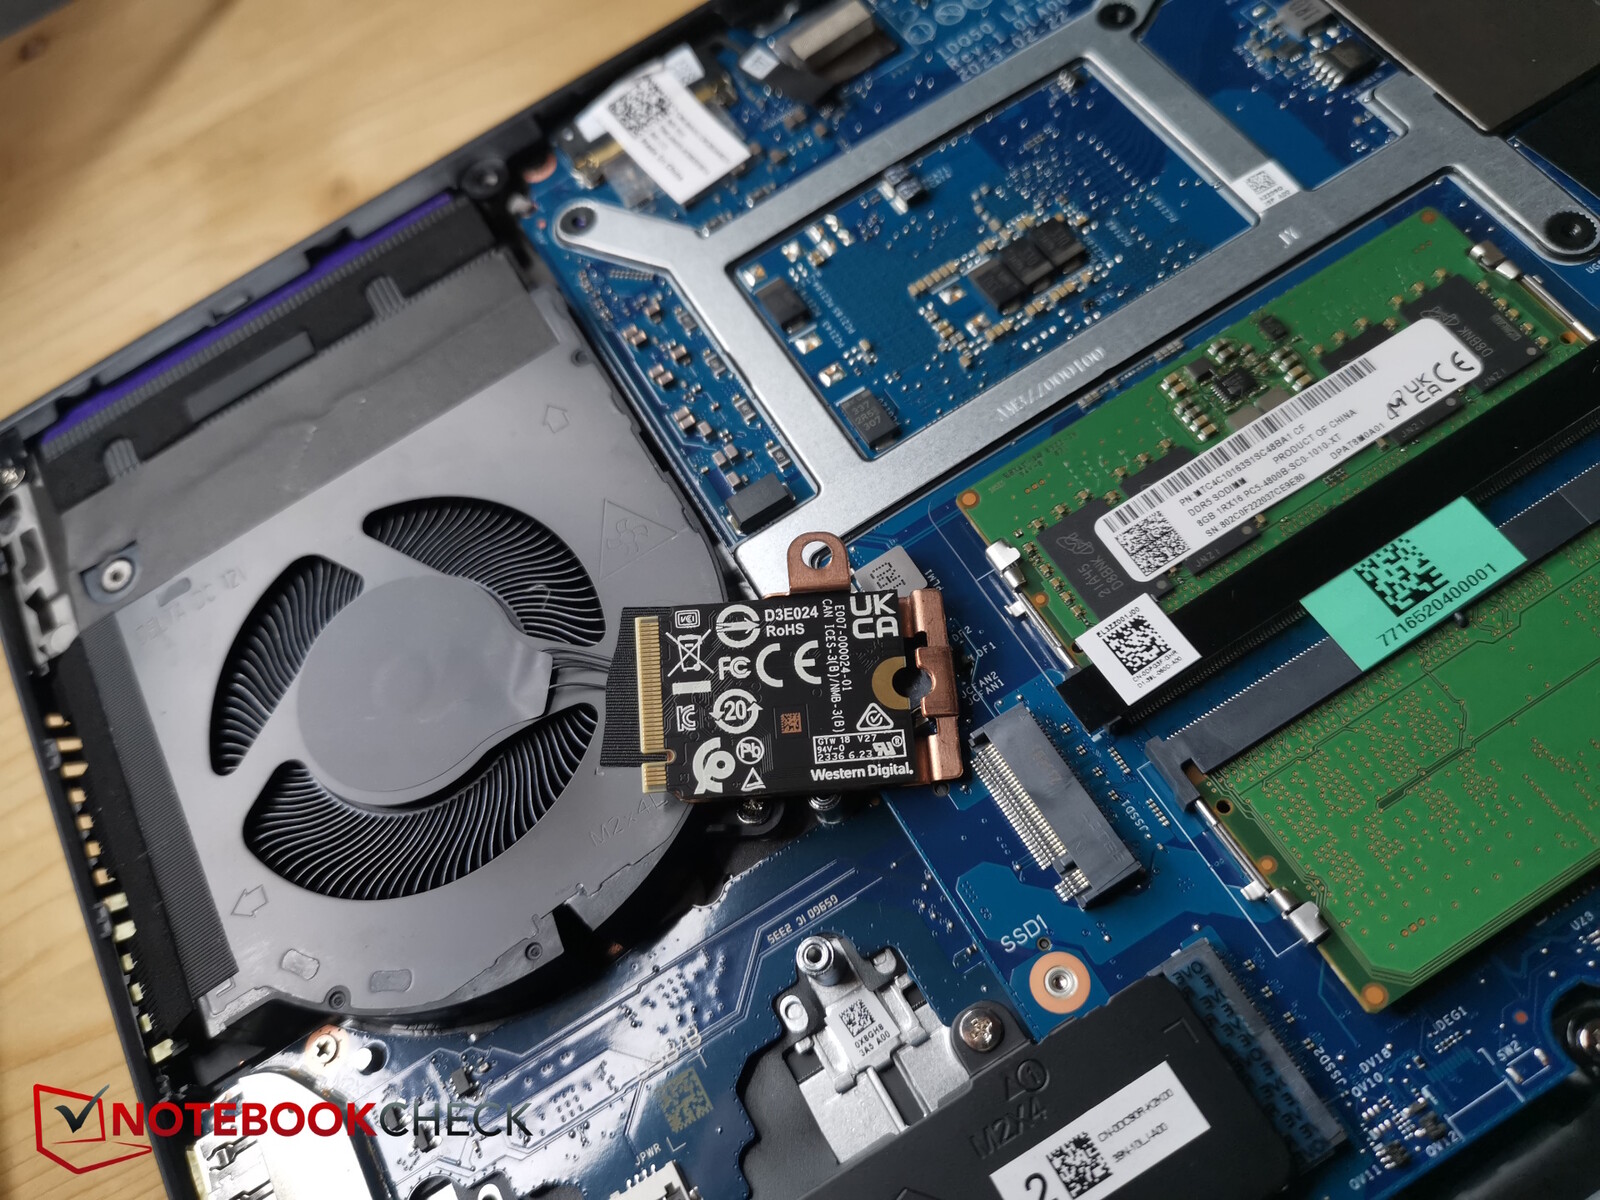
En el interior, no hay tubos de calor de cobre perceptibles como se puede ver en la mayoría de los competidores de juegos. Puede acceder a los ventiladores, a las dos ranuras de RAM, al módulo WiFi, a la batería y a las dos ranuras M.2-SSD, de las que sólo está ocupada la de formato más pequeño 2230.

Dispositivos de entrada - 5 teclas especiales configurables
Teclado
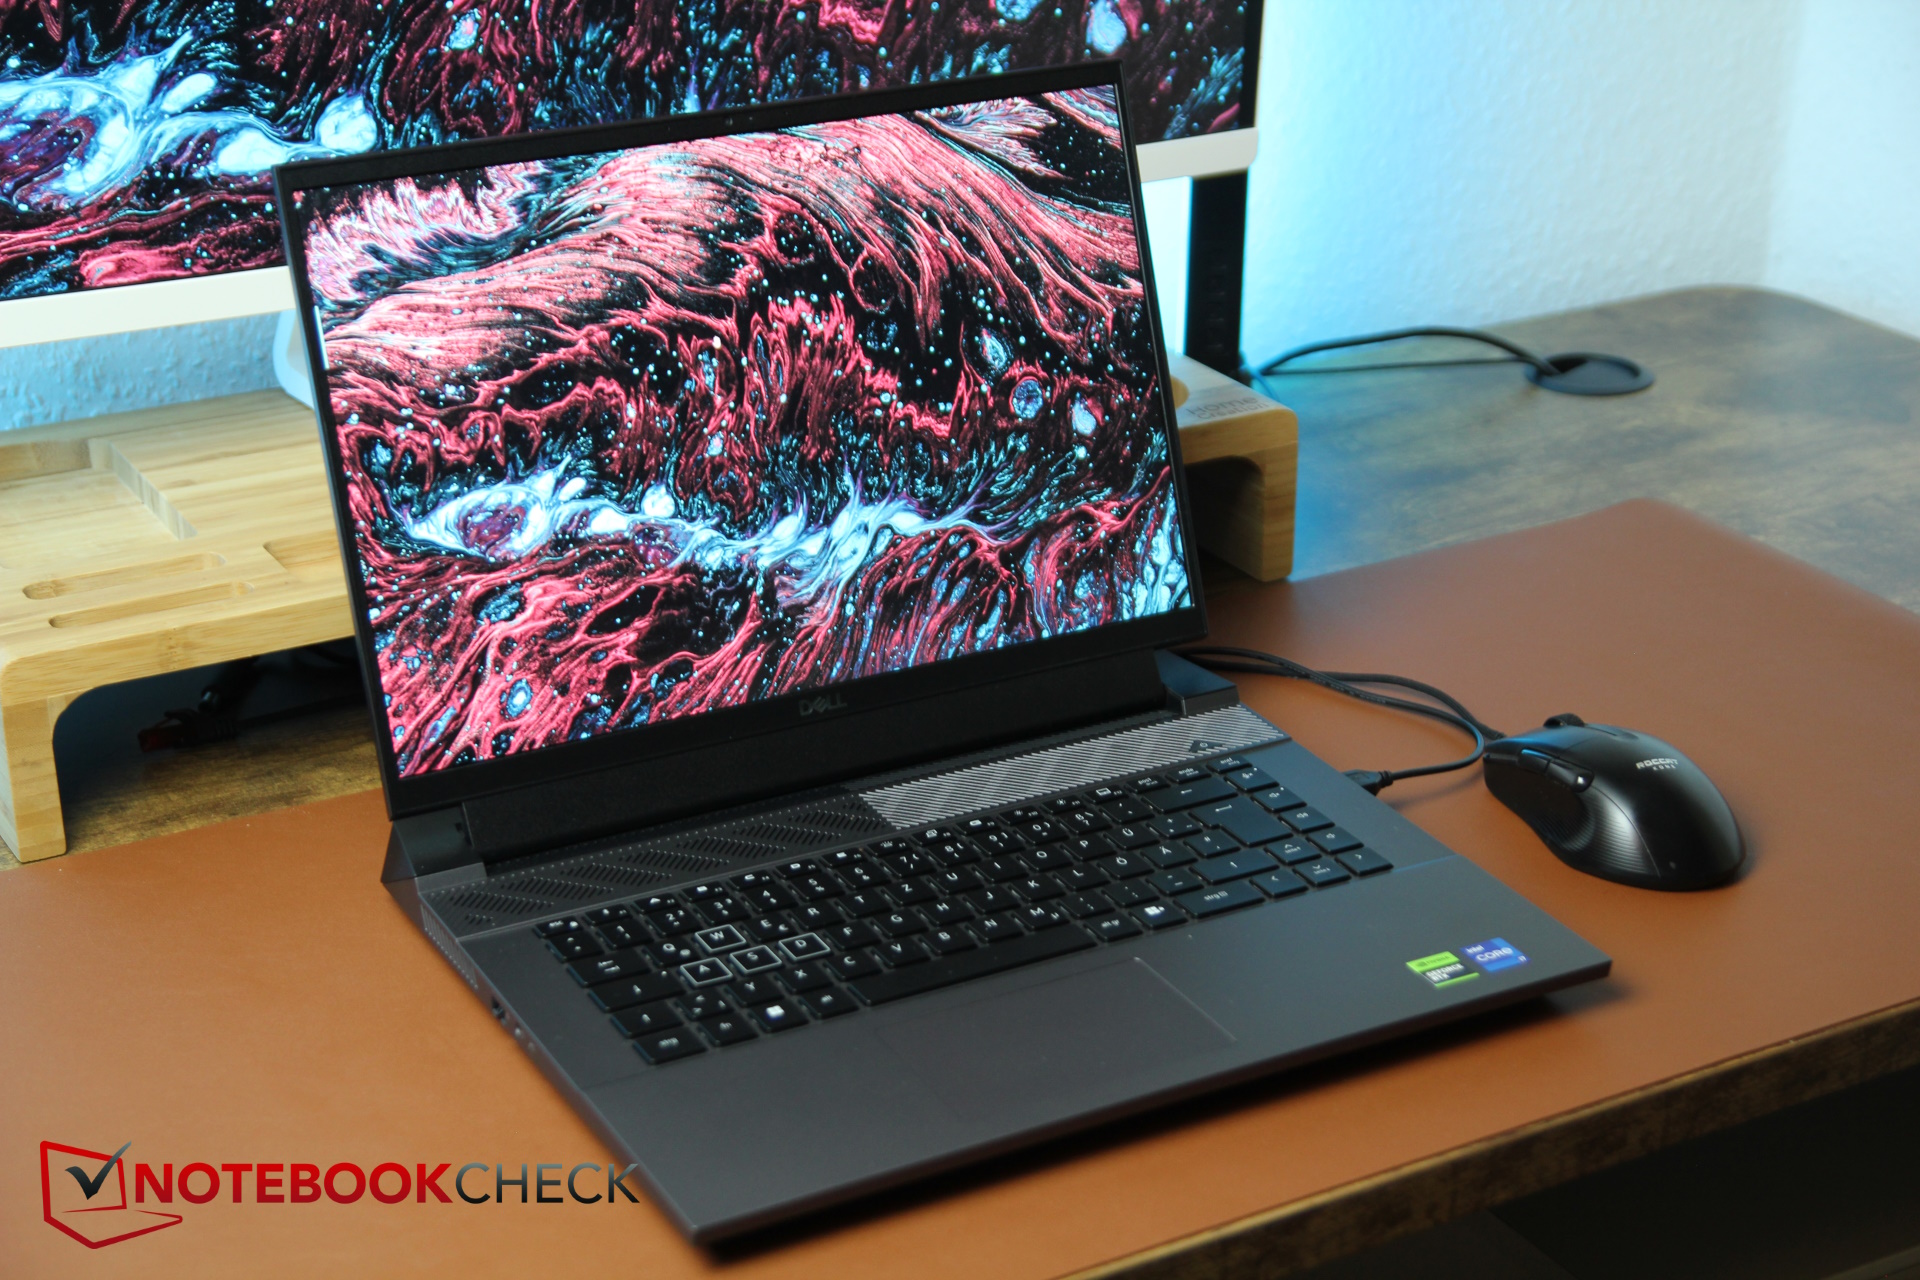
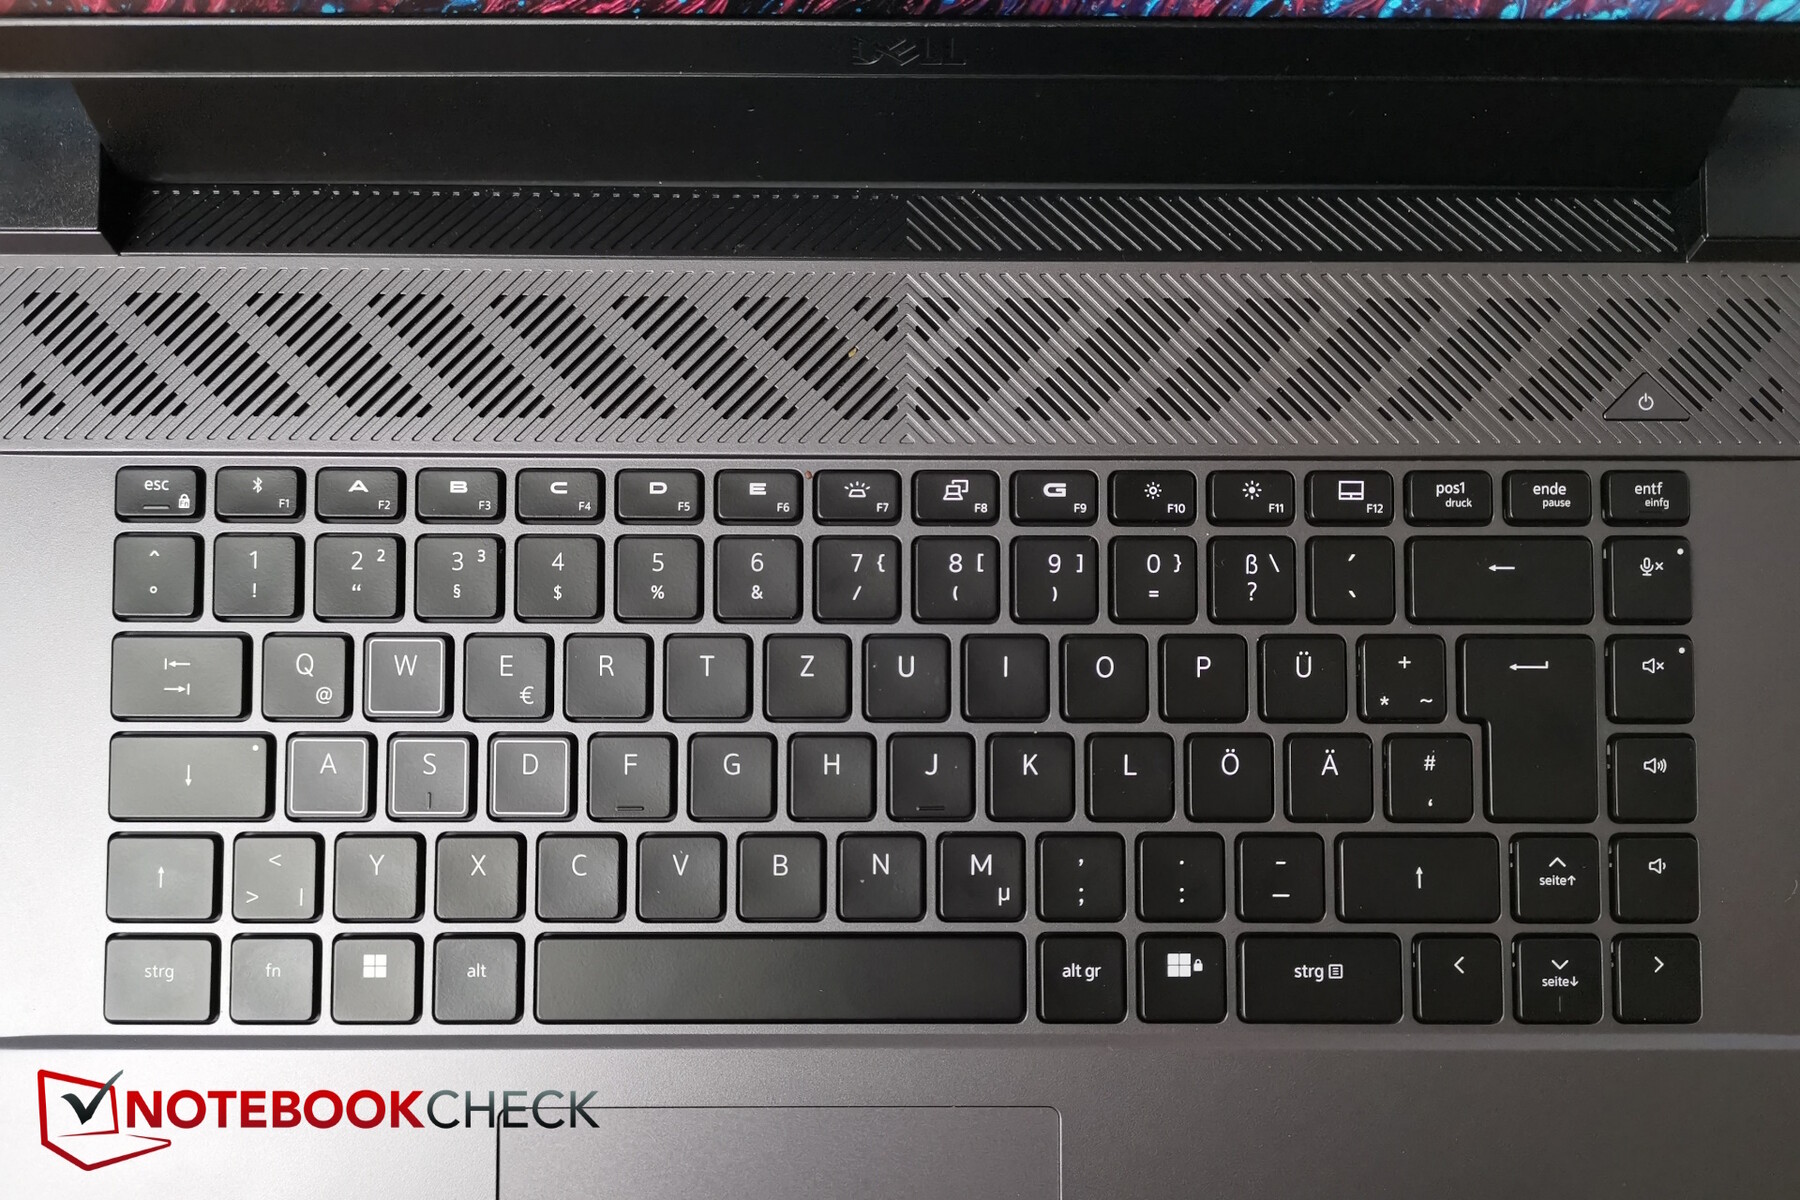
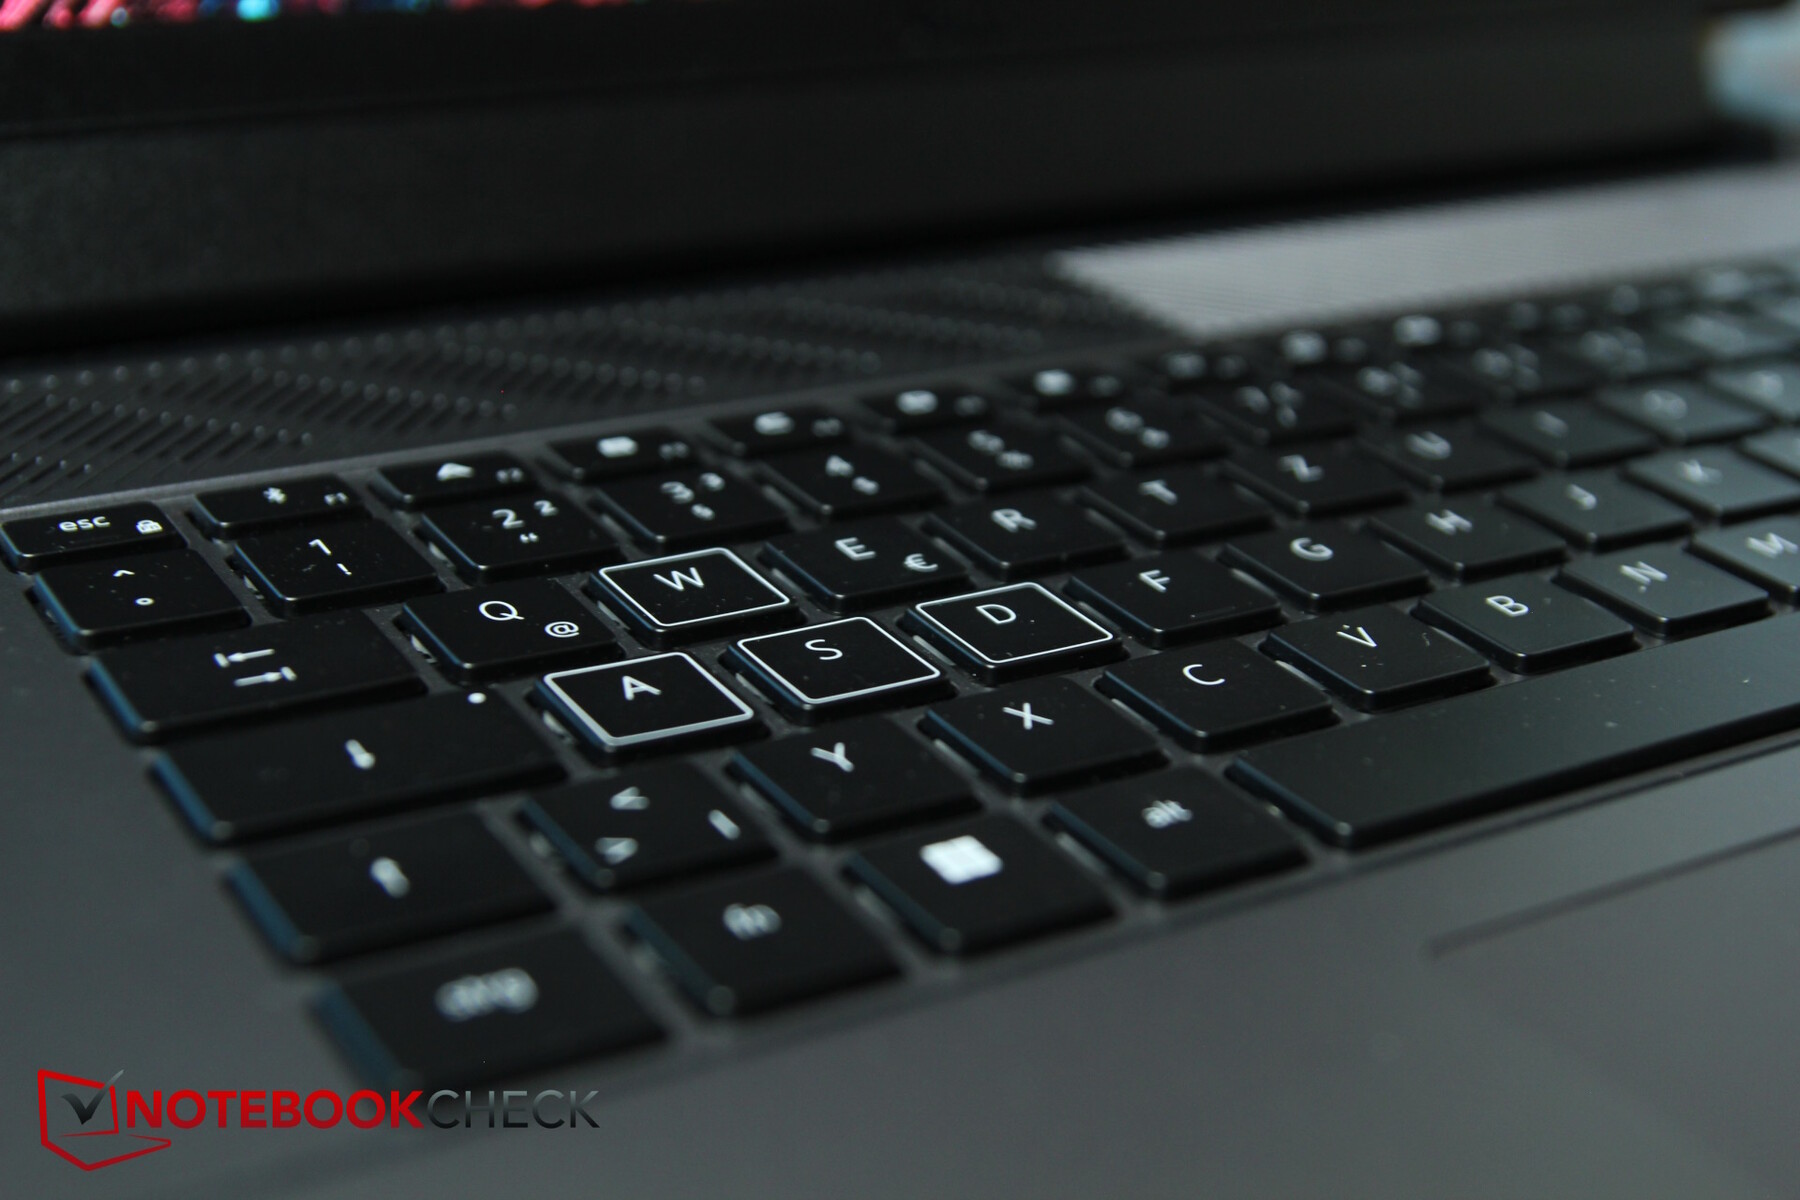
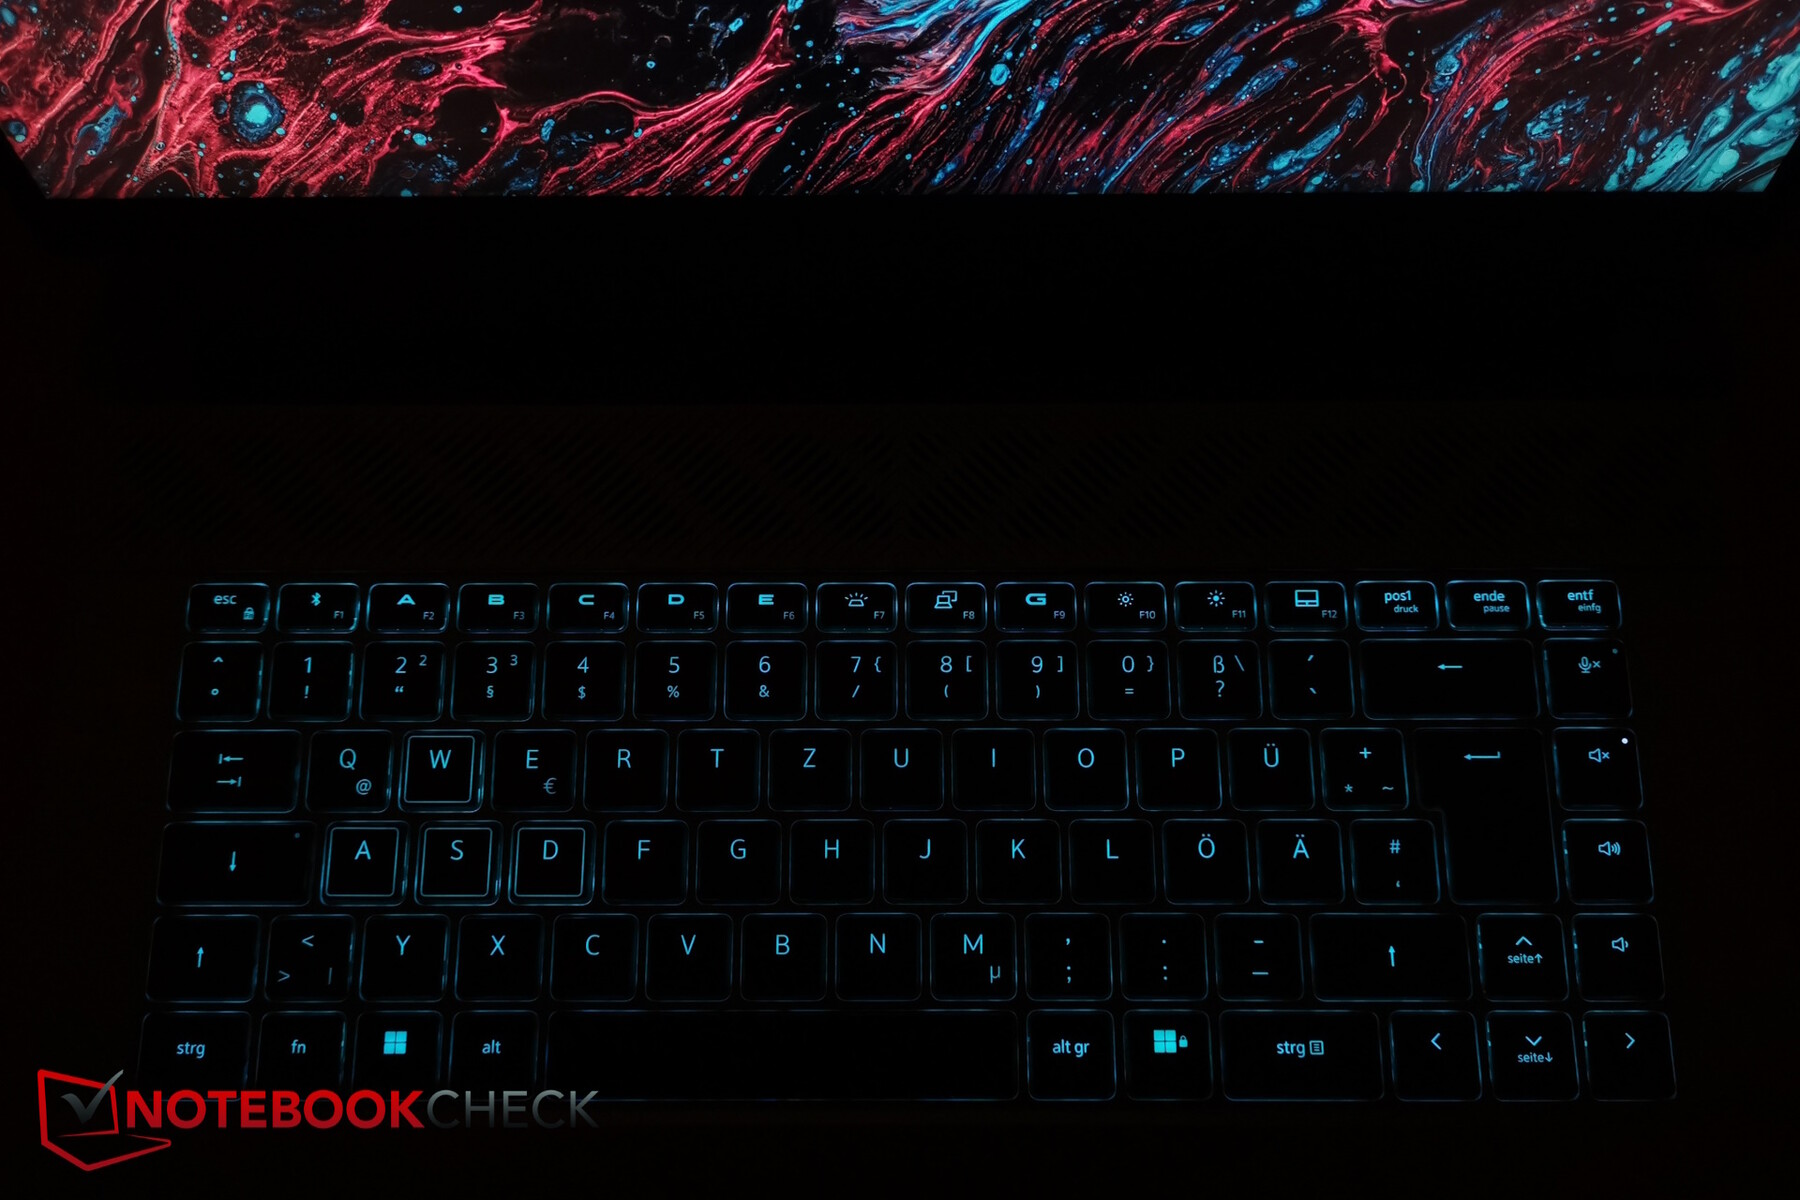
El G16 no dispone de teclado numérico, pero esto significa que todas las teclas tienen espacio suficiente, incluidas las teclas de flecha de tamaño normal. En el lado derecho, hay algunas teclas especiales (volumen, botón para silenciar el micrófono). Las teclas normales tienen un tamaño aproximado de 1,6 x 1,6 cm y las teclas F miden la mitad. Las teclas WASD presentan un contorno blanco.
Como algunas teclas especiales están situadas a la derecha, de F2 a F6 pueden configurarse manualmente, por ejemplo, con macros.
La elevación de las teclas no es muy alta, pero su respuesta es buena y se puede escribir cómoda y rápidamente con ellas. Los ruidos resultantes son muy moderados. La tecla de flecha izquierda de nuestro dispositivo de prueba suena un poco diferente a las demás teclas (de flecha): ligeramente hueca, como si algo resonara en su interior. Podría tratarse de un error de producción que, con suerte, sólo afecta a nuestro dispositivo.
El teclado dispone de una iluminación de fondo con dos niveles de intensidad. Sólo tiene una zona, pero puede seleccionar una serie de efectos RGB a través del Centro de mando (gota de lluvia, pulsante, etc.).

Panel táctil
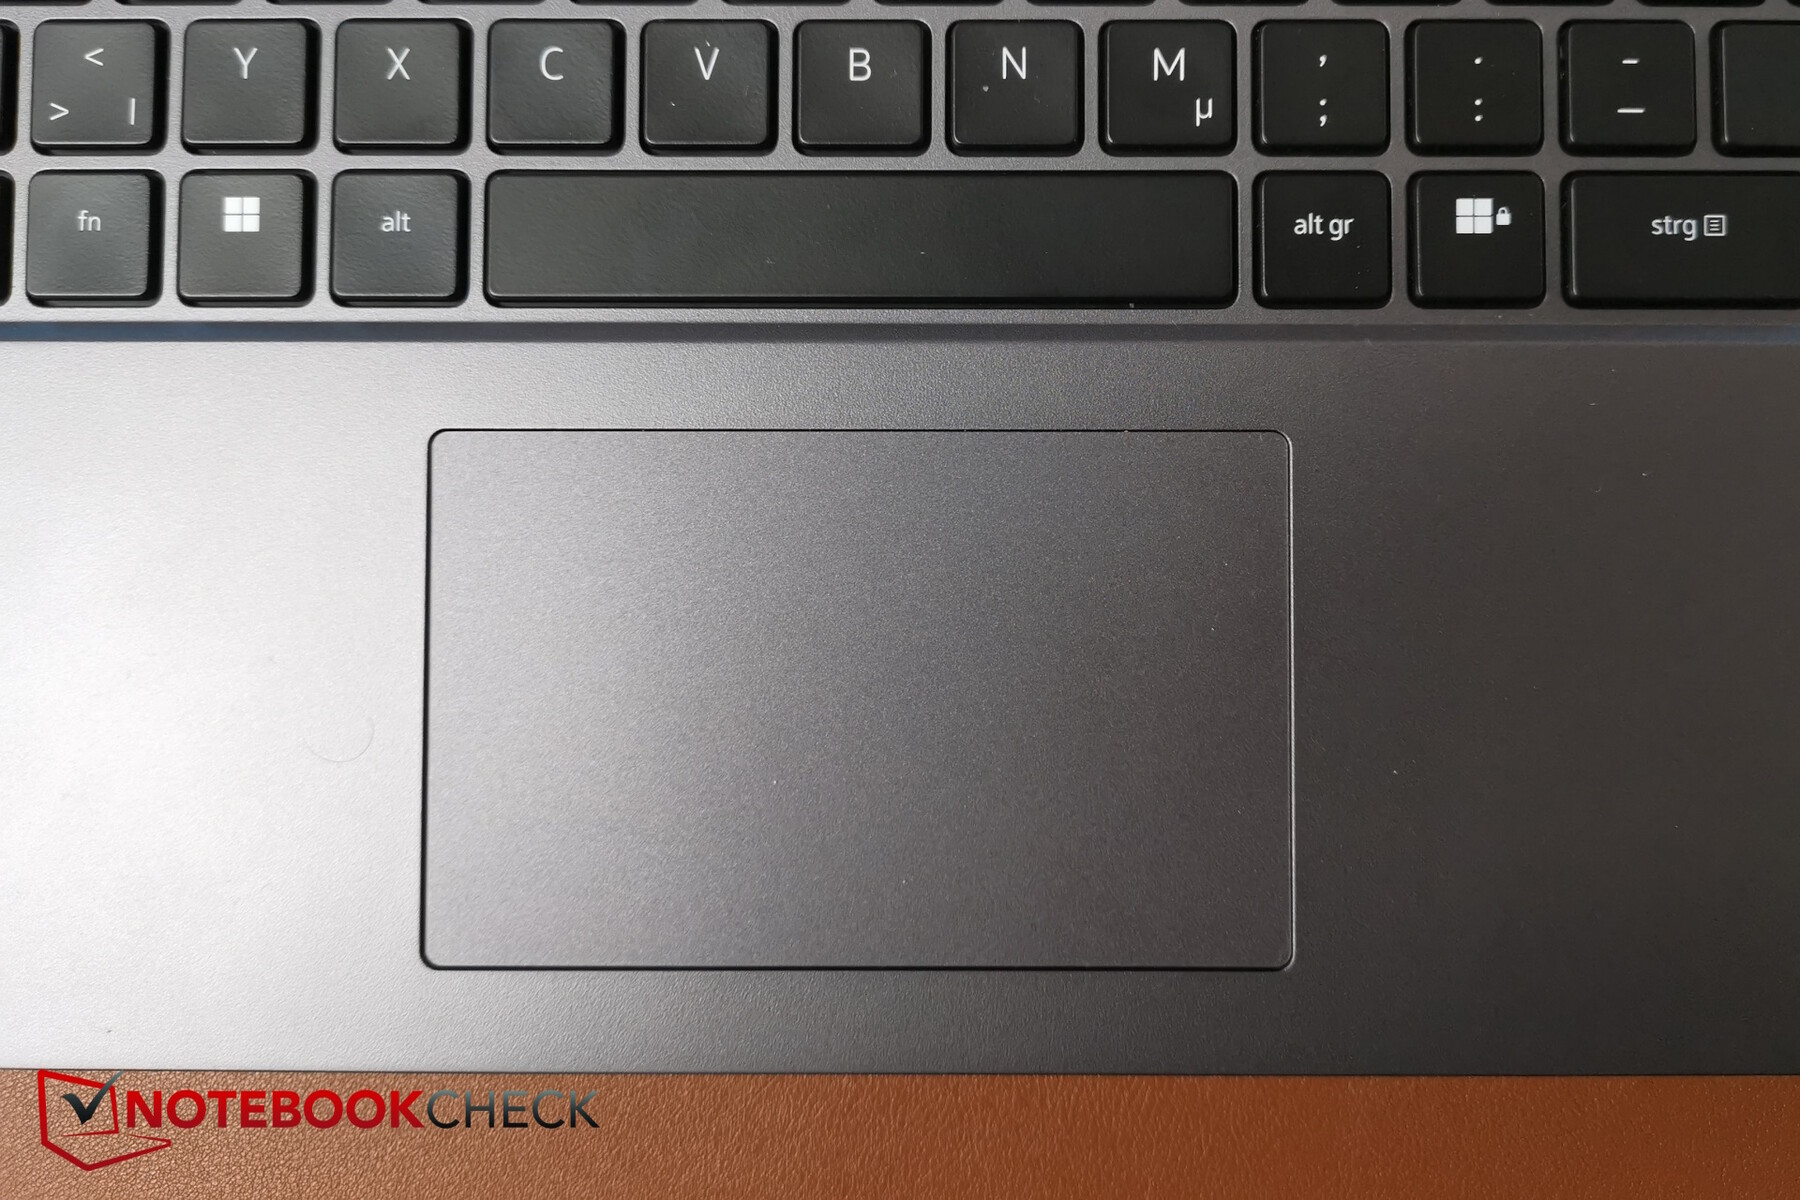
El touchpad es un poco pequeño (unos 10,5 x 6,5 cm) pero la mayoría de los jugadores utilizarán probablemente un ratón, podría suponer Dell. Su superficie es agradable y suave, pero durante los movimientos muy lentos o si los dedos están húmedos, puede pegarse un poco.
Los botones integrados se disparan de forma fiable: el ruido de clic es ligeramente más fuerte que el de los botones, pero en ningún caso resulta molesto.
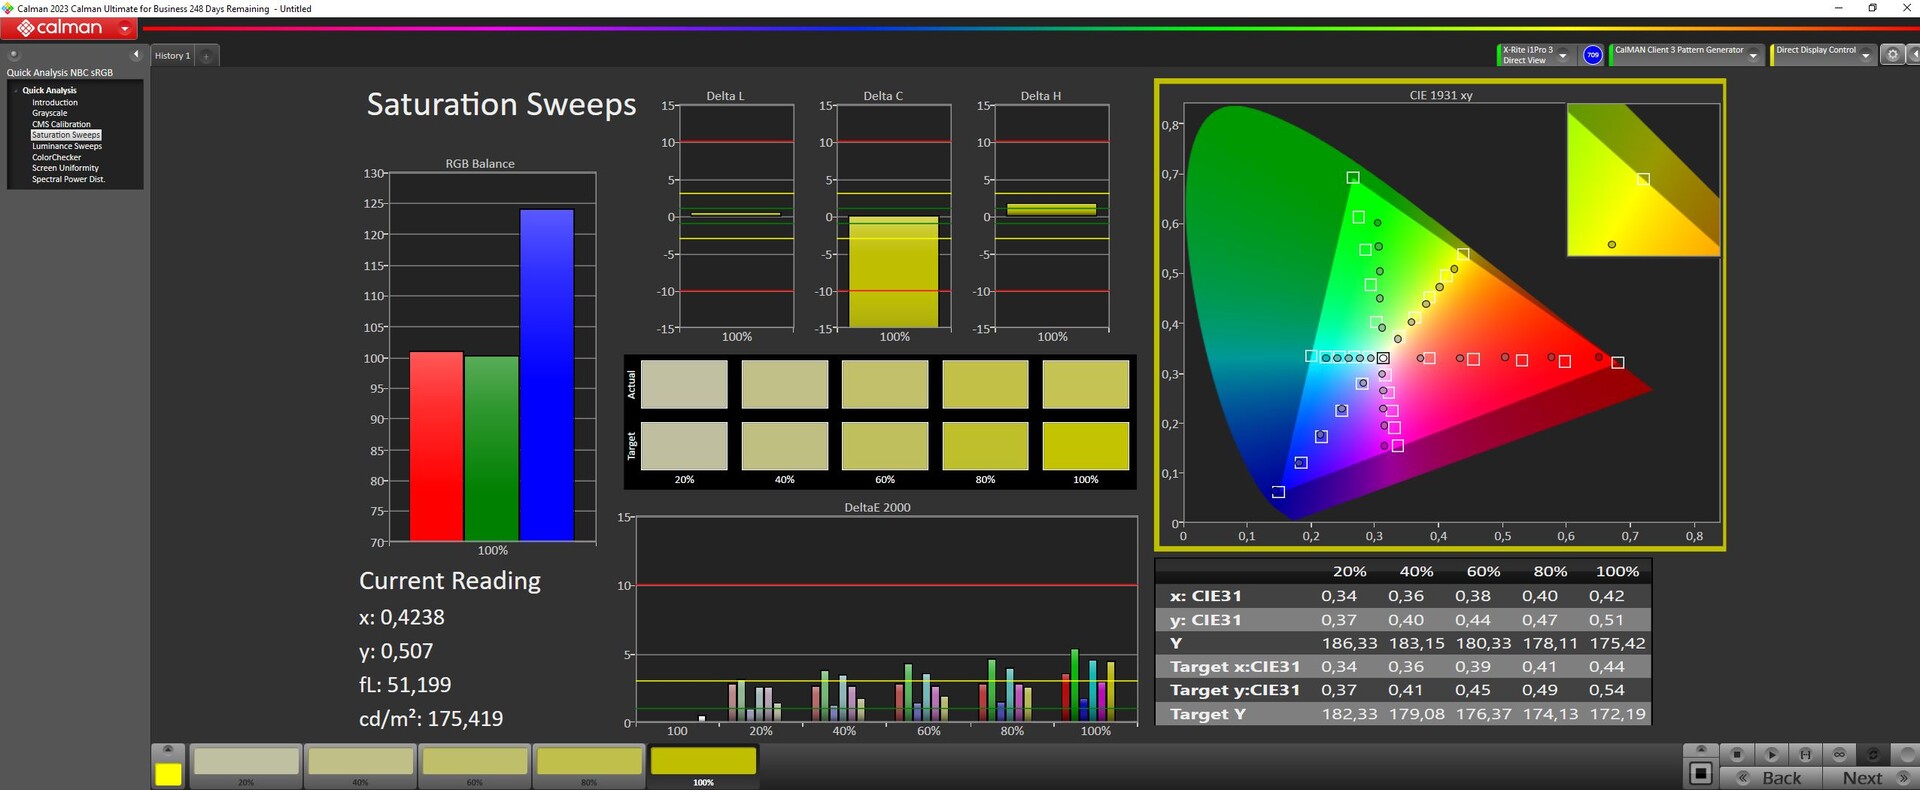
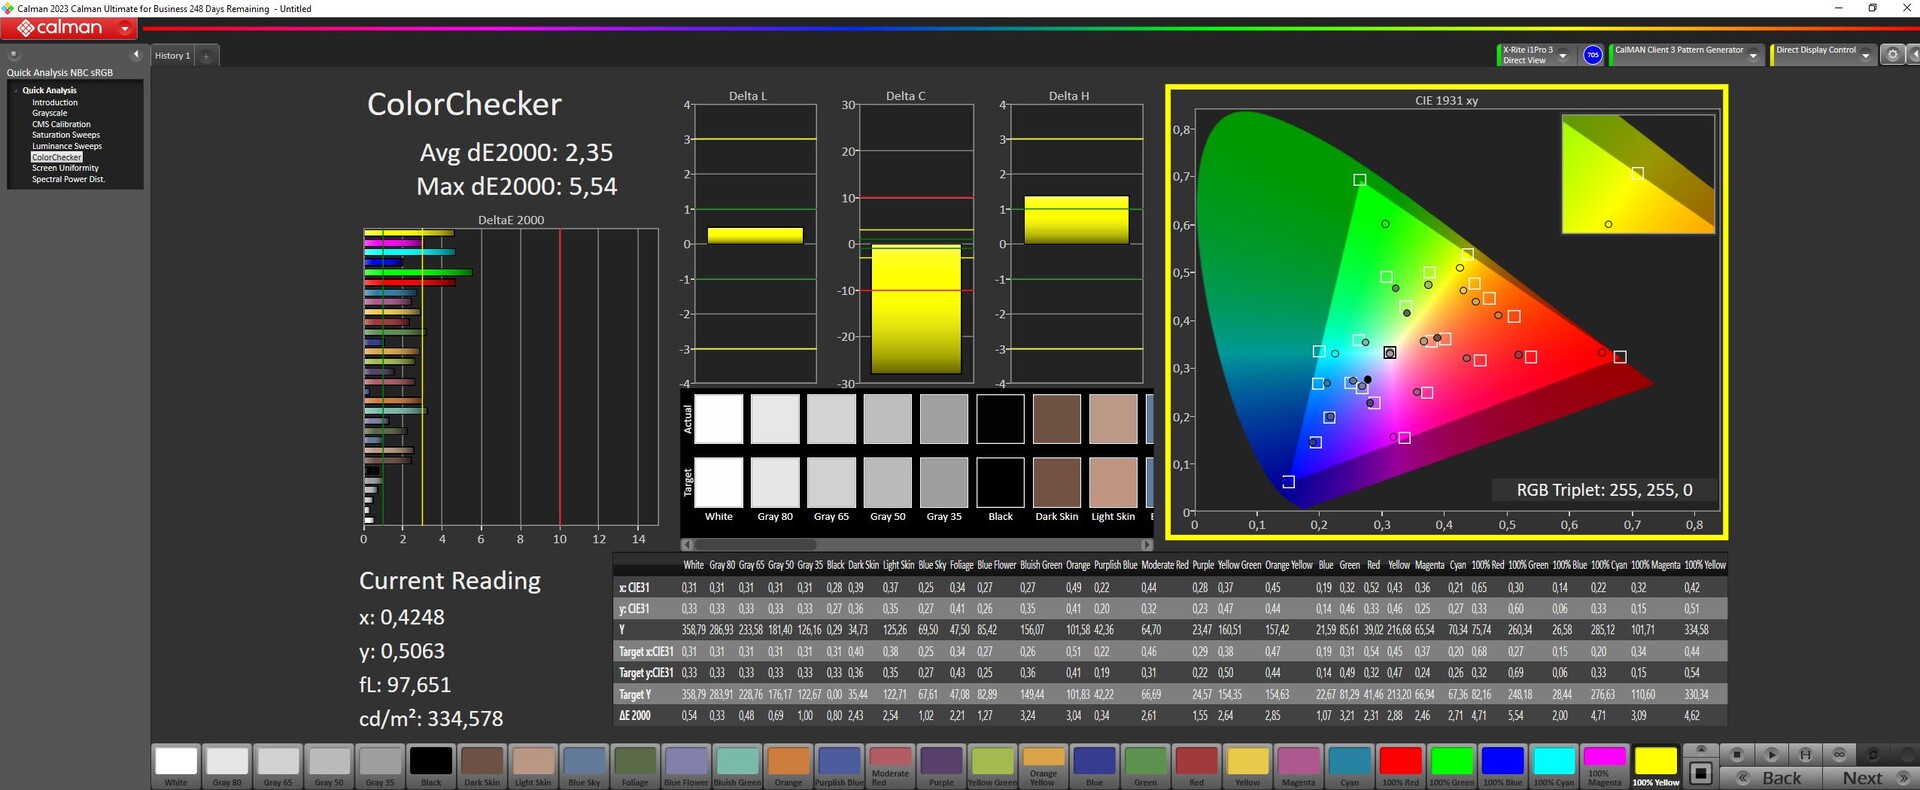
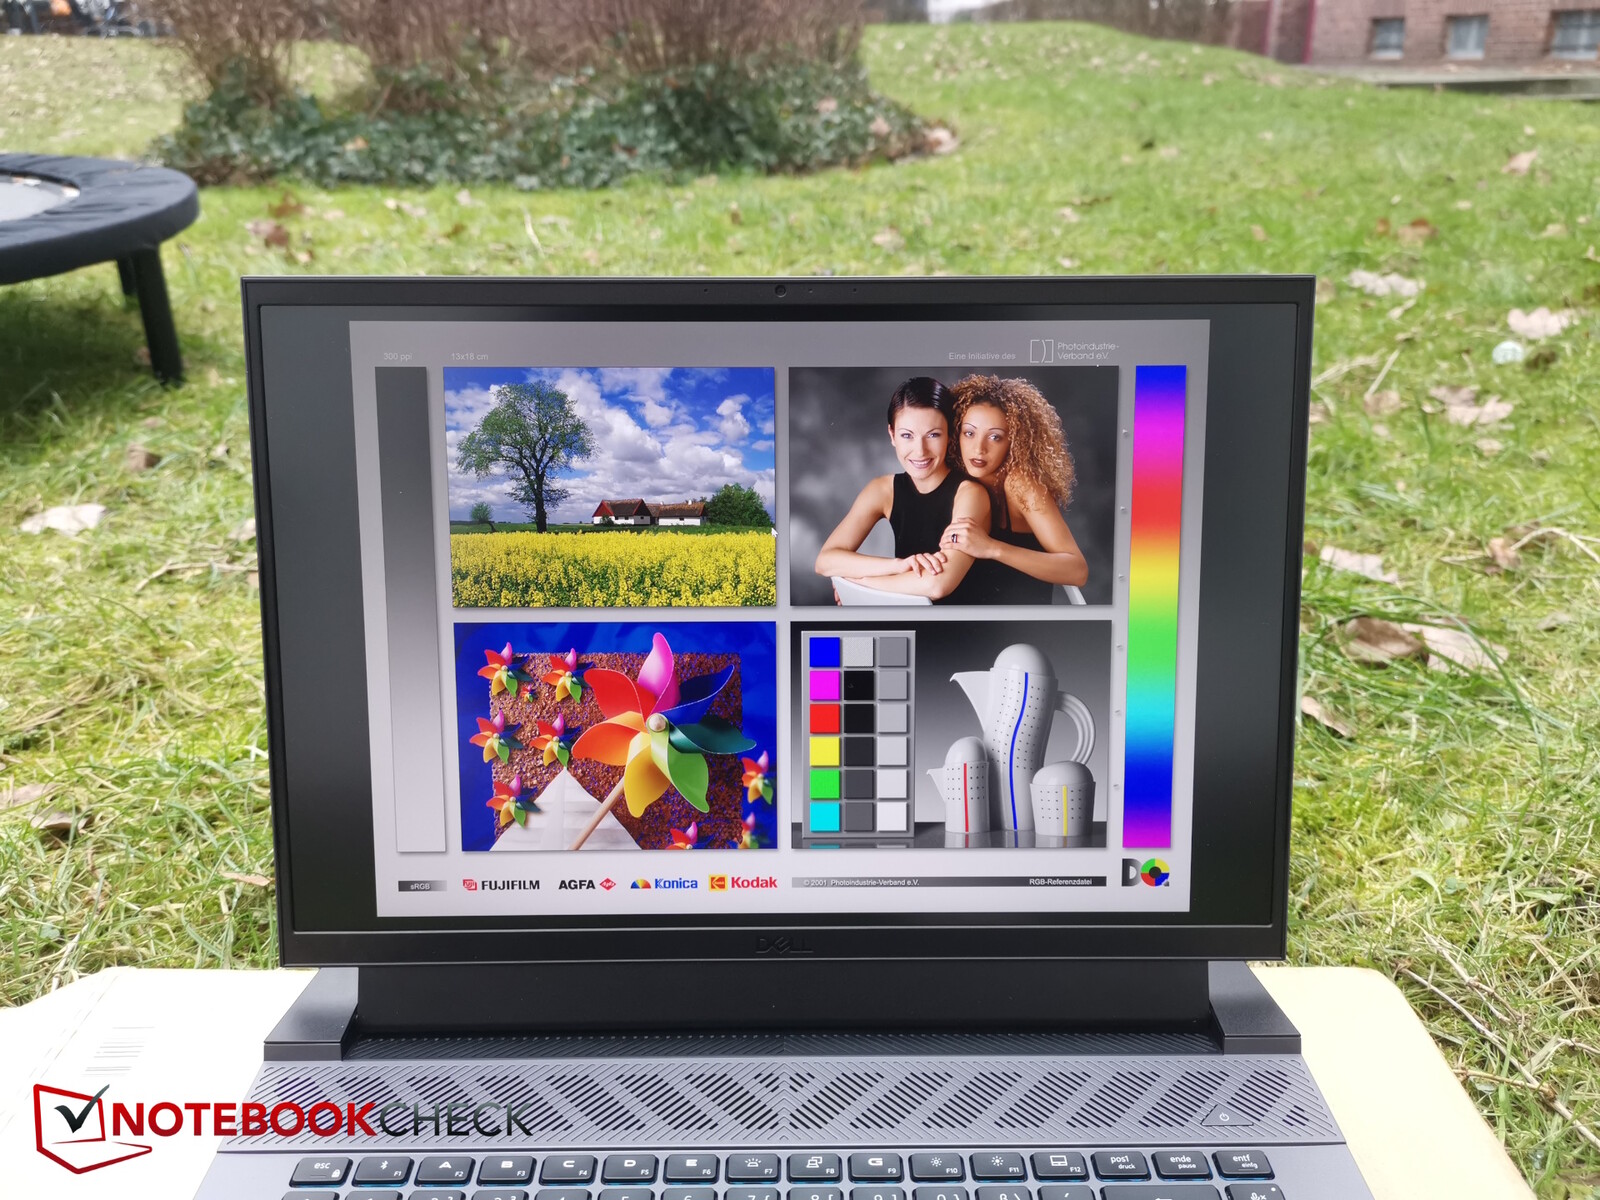
Pantalla - ¿DCI-P3 o sólo sRGB después de todo?
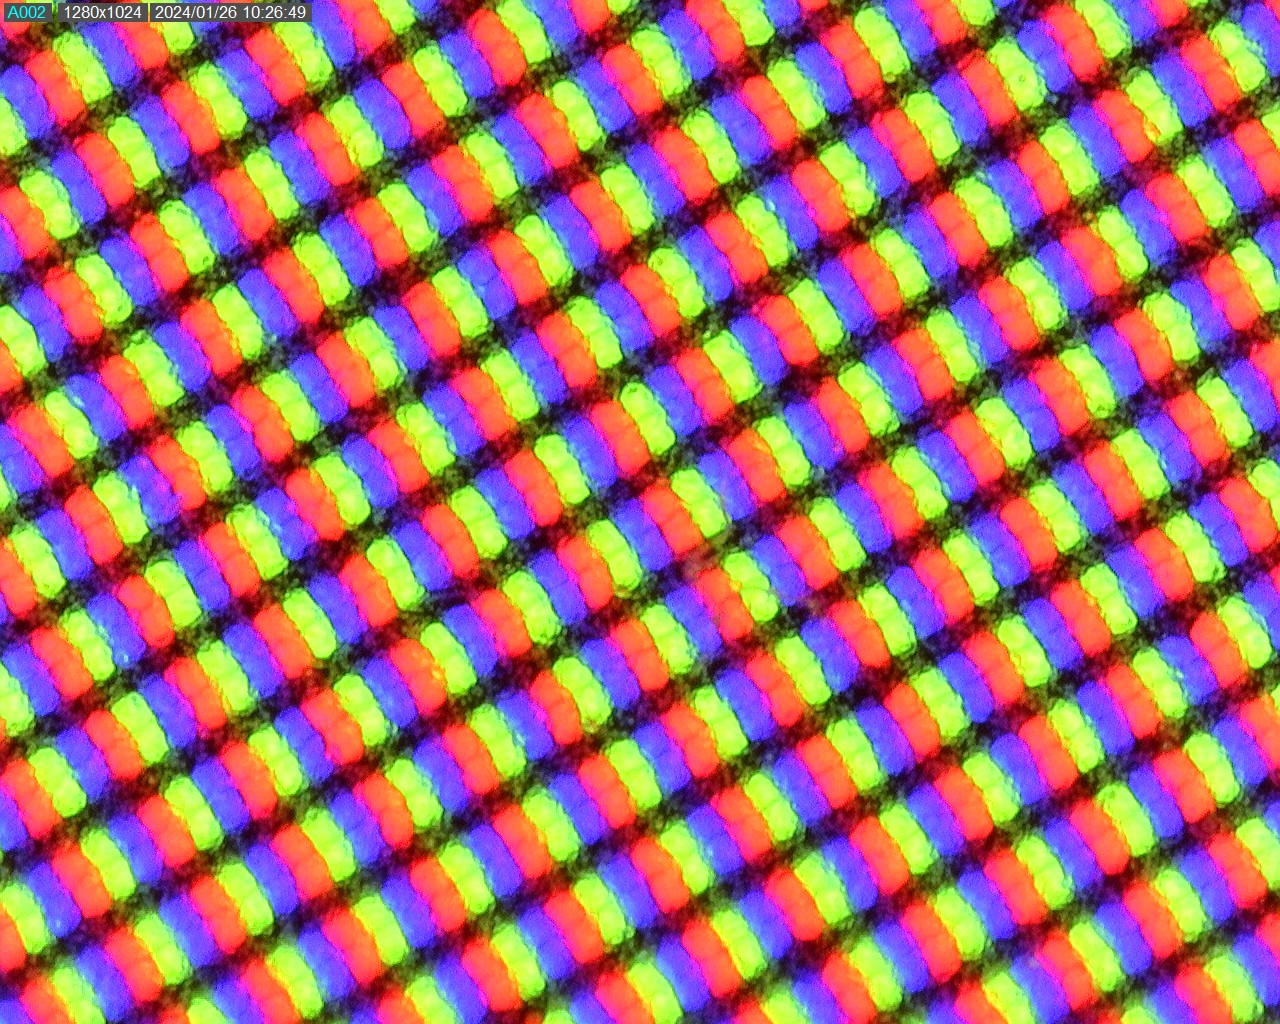
A pesar de que presenta la misma resolución, Dell ha cambiado de BOE a Chi Mei. La pantalla IPS mate tiene una resolución de 2.560 x 1.600 píxeles. Pero tenga cuidado: Aunque el sitio web sólo ofrece actualmente una pantalla para el G16 -a saber, la pantalla QHD+ (2.560 x 1.600) con una frecuencia de actualización de 240 Hz, 3 ms, NVIDIA G-SYNC y una cobertura DCI-P3 del 100 %)-, ¡nuestra muestra de prueba está equipada con un panel con la misma resolución pero una frecuencia de actualización de "sólo" 165 Hz y, lo que es más importante, sólo con cobertura sRGB y no DCI-P3! Tiene que echar un vistazo al manual del aparato https://www.dell.com/support/manuals/de-de/g-series-16-7630-laptop/dell-g16-7630-owners-manual/display?guid=guid-2bdf1814-06d3-4b69-967b-c48432875f91&lang=en-us para descubrir ambas variantes.
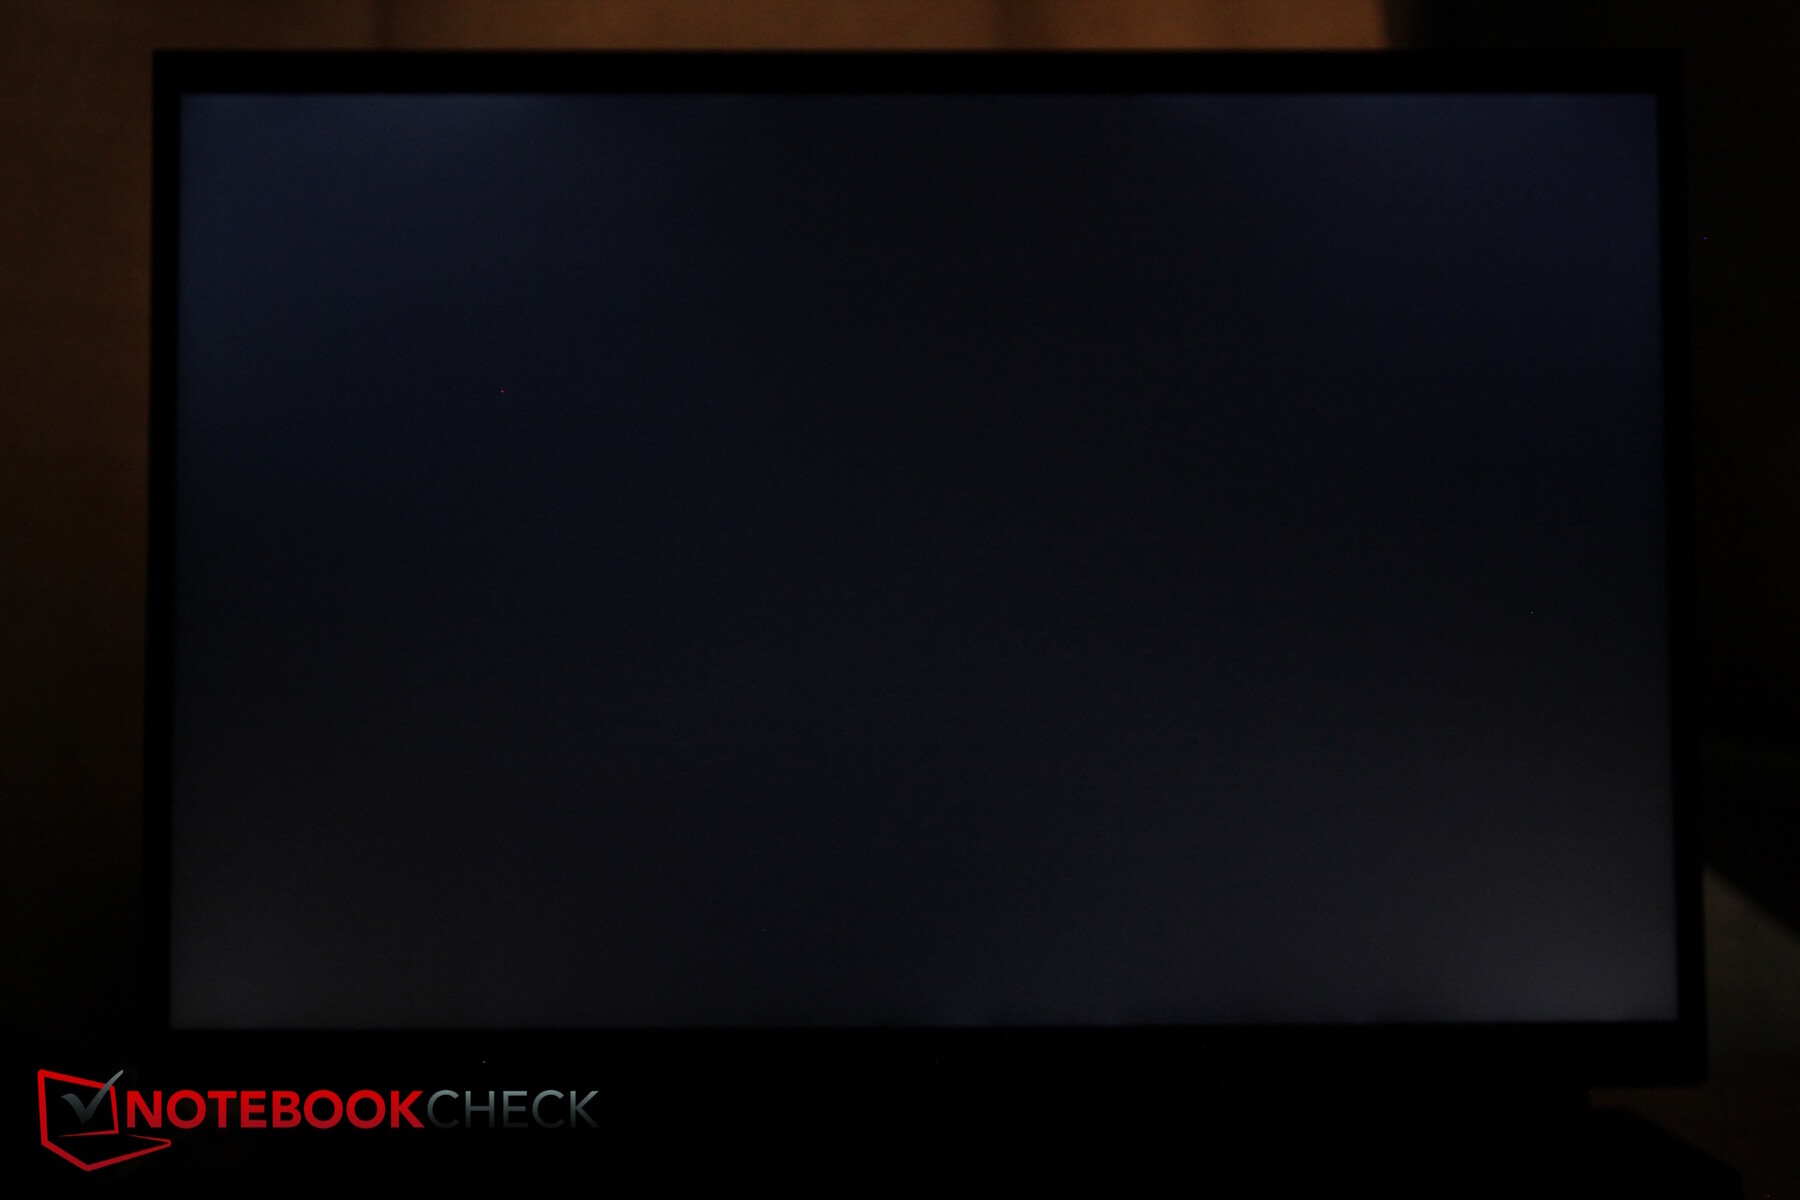
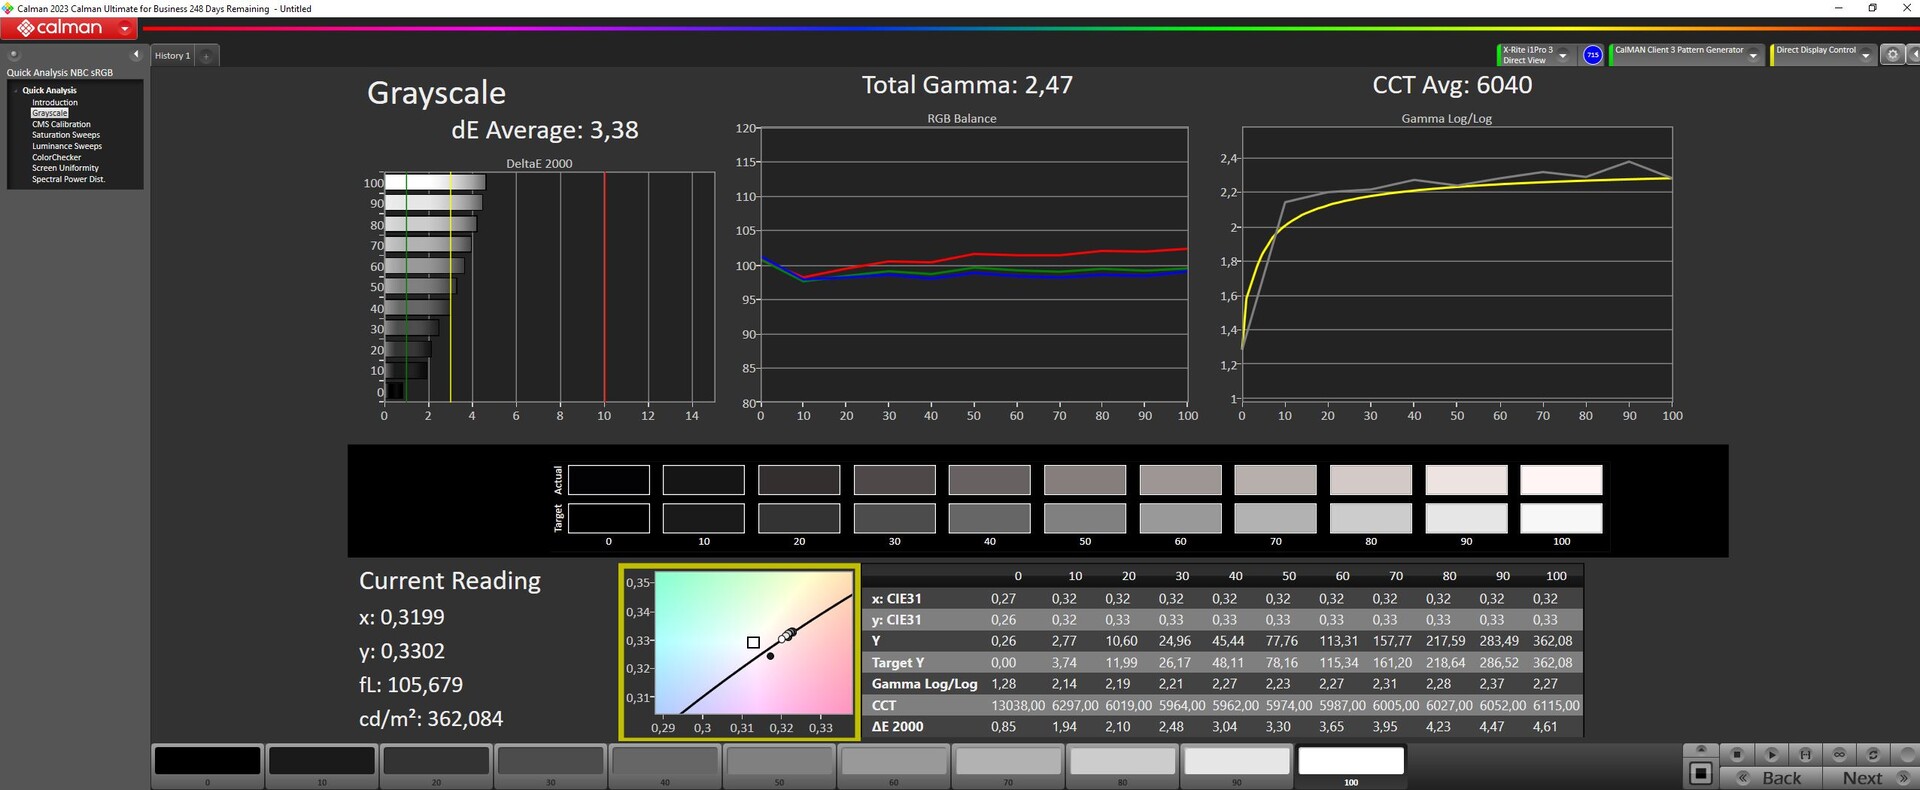
Medimos un brillo medio de 344 nits con una buena iluminación del 89 %. Sin embargo, al representar escenas oscuras, observamos cierto sangrado sutil de la retroiluminación a lo largo de prácticamente todos los bordes.
A pesar de tener el mismo brillo, la pantalla muestra un valor de negro mejorado que también beneficia a su contraste. En conjunto, se trata de una pantalla sRGB bastante buena y sus tiempos de respuesta también son bastante rápidos.
| |||||||||||||||||||||||||
iluminación: 89 %
Brillo con batería: 369 cd/m²
Contraste: 1419:1 (Negro: 0.26 cd/m²)
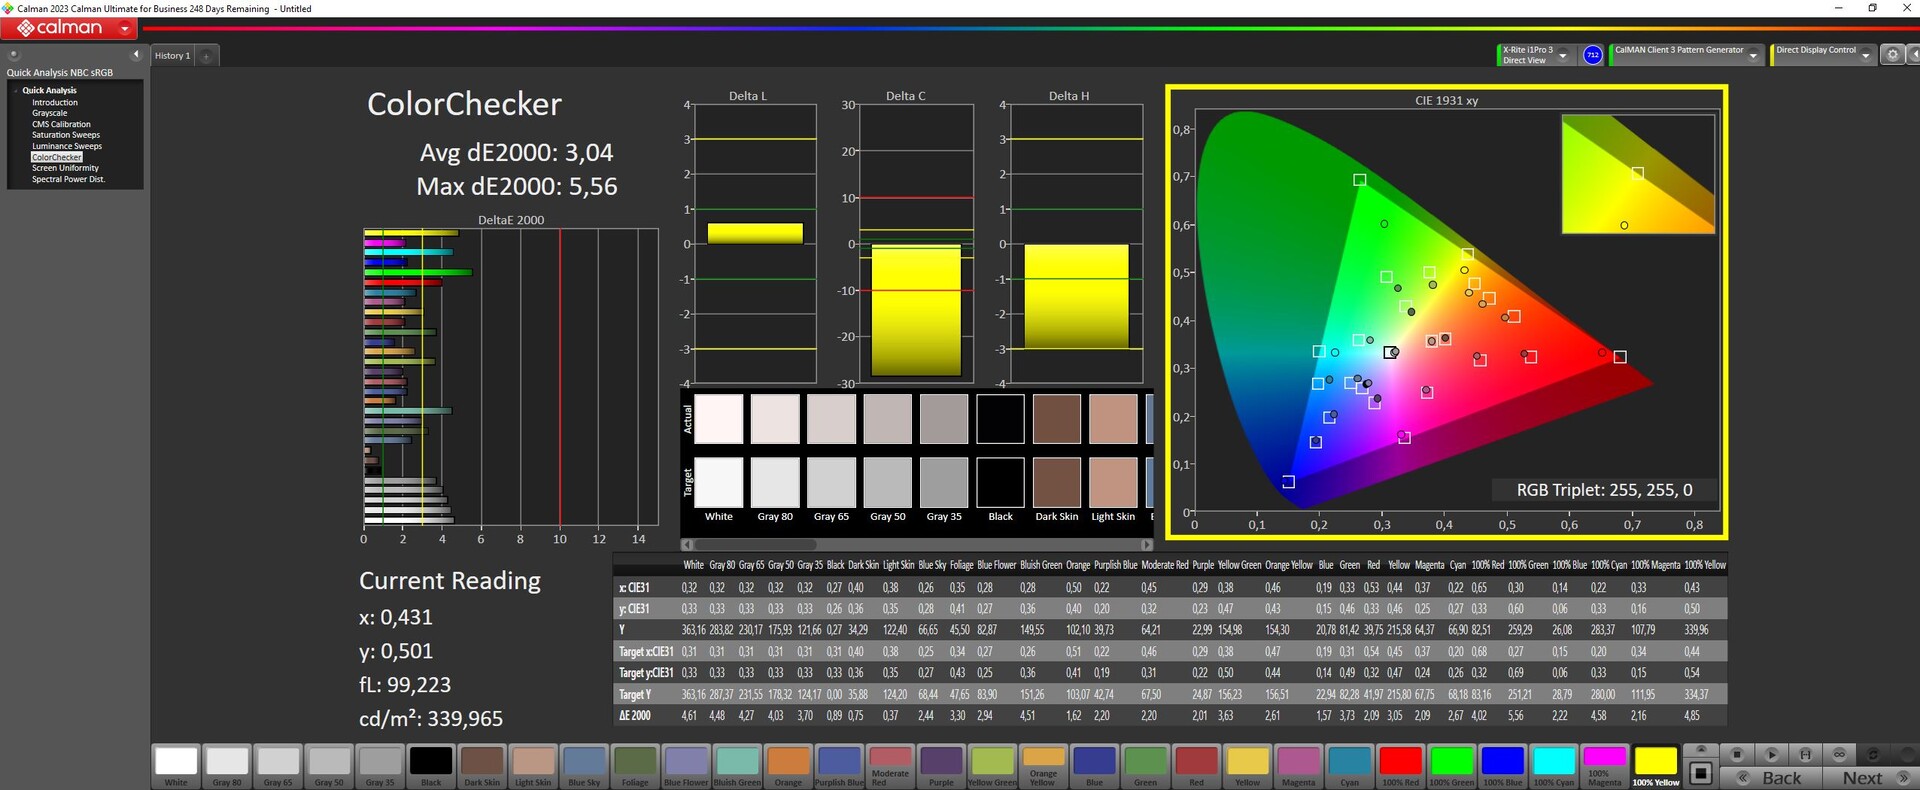
ΔE ColorChecker Calman: 3.04 | ∀{0.5-29.43 Ø4.71}
calibrated: 2.35
ΔE Greyscale Calman: 3.38 | ∀{0.09-98 Ø4.96}
69.3% AdobeRGB 1998 (Argyll 3D)
98.5% sRGB (Argyll 3D)
67.5% Display P3 (Argyll 3D)
Gamma: 2.47
CCT: 6040 K
| Dell G16, i7-13650HX, RTX 4060 Chi Mei CMN161D (160GME), IPS, 2560x1600, 16" | Dell G16 7620 BOE NE16QDM, IPS, 2560x1600, 16" | MSI Raider GE68HX 13VF Chi Mei N160JME-GTK, IPS, 1900x1200, 16" | Lenovo Legion Slim 5 16APH8 BOE NJ NE160QDM-NYC, IPS, 2560x1600, 16" | Alienware m16 R1 Intel BOE NE16NYB, IPS, 2560x1600, 16" | Lenovo LOQ 16IRH8 AUOC1A5 (B160QAN03.L), IPS, 2560x1600, 16" | |
|---|---|---|---|---|---|---|
| Display | 1% | -38% | 2% | 0% | 3% | |
| Display P3 Coverage (%) | 67.5 | 68.3 1% | 41.6 -38% | 69.3 3% | 67.7 0% | 70.5 4% |
| sRGB Coverage (%) | 98.5 | 98 -1% | 62.2 -37% | 100 2% | 97.2 -1% | 98.9 0% |
| AdobeRGB 1998 Coverage (%) | 69.3 | 70.5 2% | 43 -38% | 70 1% | 70 1% | 72.6 5% |
| Response Times | -7% | -131% | -8% | 39% | 17% | |
| Response Time Grey 50% / Grey 80% * (ms) | 7.6 ? | 8.6 ? -13% | 17.3 ? -128% | 10.7 ? -41% | 4 ? 47% | 7.2 ? 5% |
| Response Time Black / White * (ms) | 10.4 ? | 10.4 ? -0% | 24.2 ? -133% | 7.8 ? 25% | 7.3 ? 30% | 7.4 ? 29% |
| PWM Frequency (Hz) | ||||||
| Screen | 7% | -37% | 15% | 4% | 13% | |
| Brightness middle (cd/m²) | 369 | 369.4 0% | 300.9 -18% | 371.6 1% | 306 -17% | 407 10% |
| Brightness (cd/m²) | 344 | 348 1% | 302 -12% | 343 0% | 302 -12% | 369 7% |
| Brightness Distribution (%) | 89 | 83 -7% | 93 4% | 84 -6% | 89 0% | 85 -4% |
| Black Level * (cd/m²) | 0.26 | 0.32 -23% | 0.31 -19% | 0.44 -69% | 0.3 -15% | 0.45 -73% |
| Contrast (:1) | 1419 | 1154 -19% | 971 -32% | 845 -40% | 1020 -28% | 904 -36% |
| Colorchecker dE 2000 * | 3.04 | 1.78 41% | 4.6 -51% | 1.52 50% | 2.57 15% | 1.43 53% |
| Colorchecker dE 2000 max. * | 5.56 | 4.41 21% | 17.6 -217% | 2.68 52% | 4.26 23% | 3.58 36% |
| Colorchecker dE 2000 calibrated * | 2.35 | 1.22 48% | 2.04 13% | 0.33 86% | 0.85 64% | 1.07 54% |
| Greyscale dE 2000 * | 3.38 | 3.2 5% | 3.3 2% | 1.2 64% | 3.3 2% | 1.13 67% |
| Gamma | 2.47 89% | 2.2 100% | 2.09 105% | 2.1 105% | 1.997 110% | 2.5 88% |
| CCT | 6040 108% | 6750 96% | 7151 91% | 6503 100% | 6895 94% | 6526 100% |
| Media total (Programa/Opciones) | 0% /
4% | -69% /
-50% | 3% /
9% | 14% /
8% | 11% /
11% |
* ... más pequeño es mejor
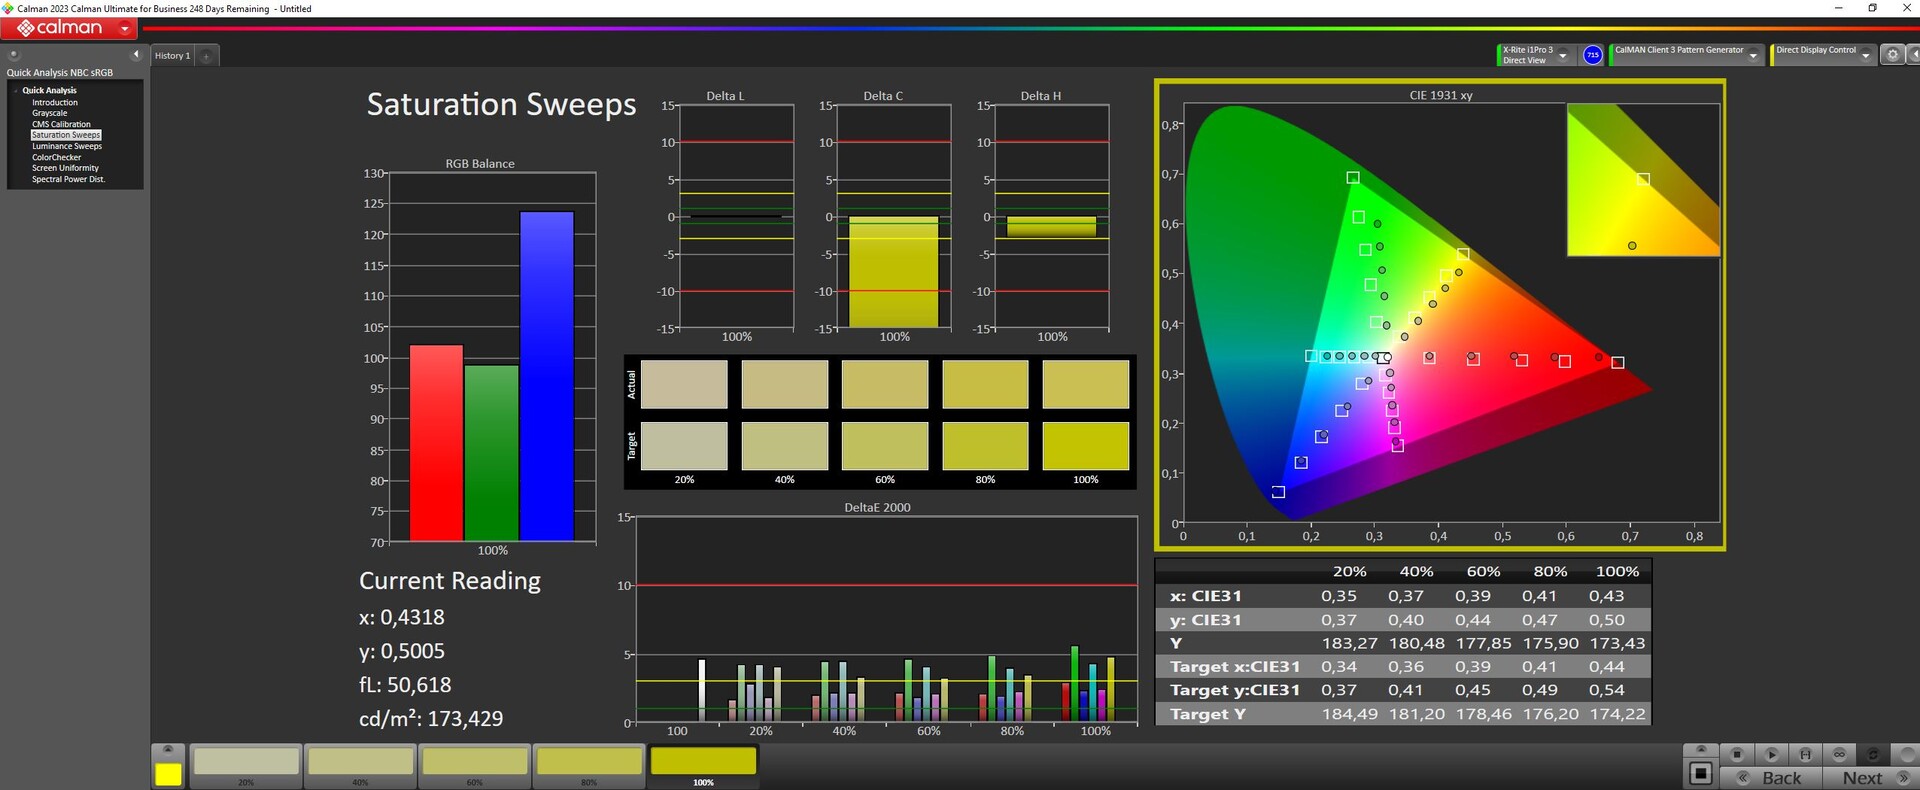
Medimos alrededor del 70 % de cobertura DisplayP3 y AdobeRGB, mientras que sRGB está cubierto casi por completo. La antigua pantalla alcanzó valores similares; se dice que la versión ofrecida en el sitio web cubre el 100 % de DCI-P3.
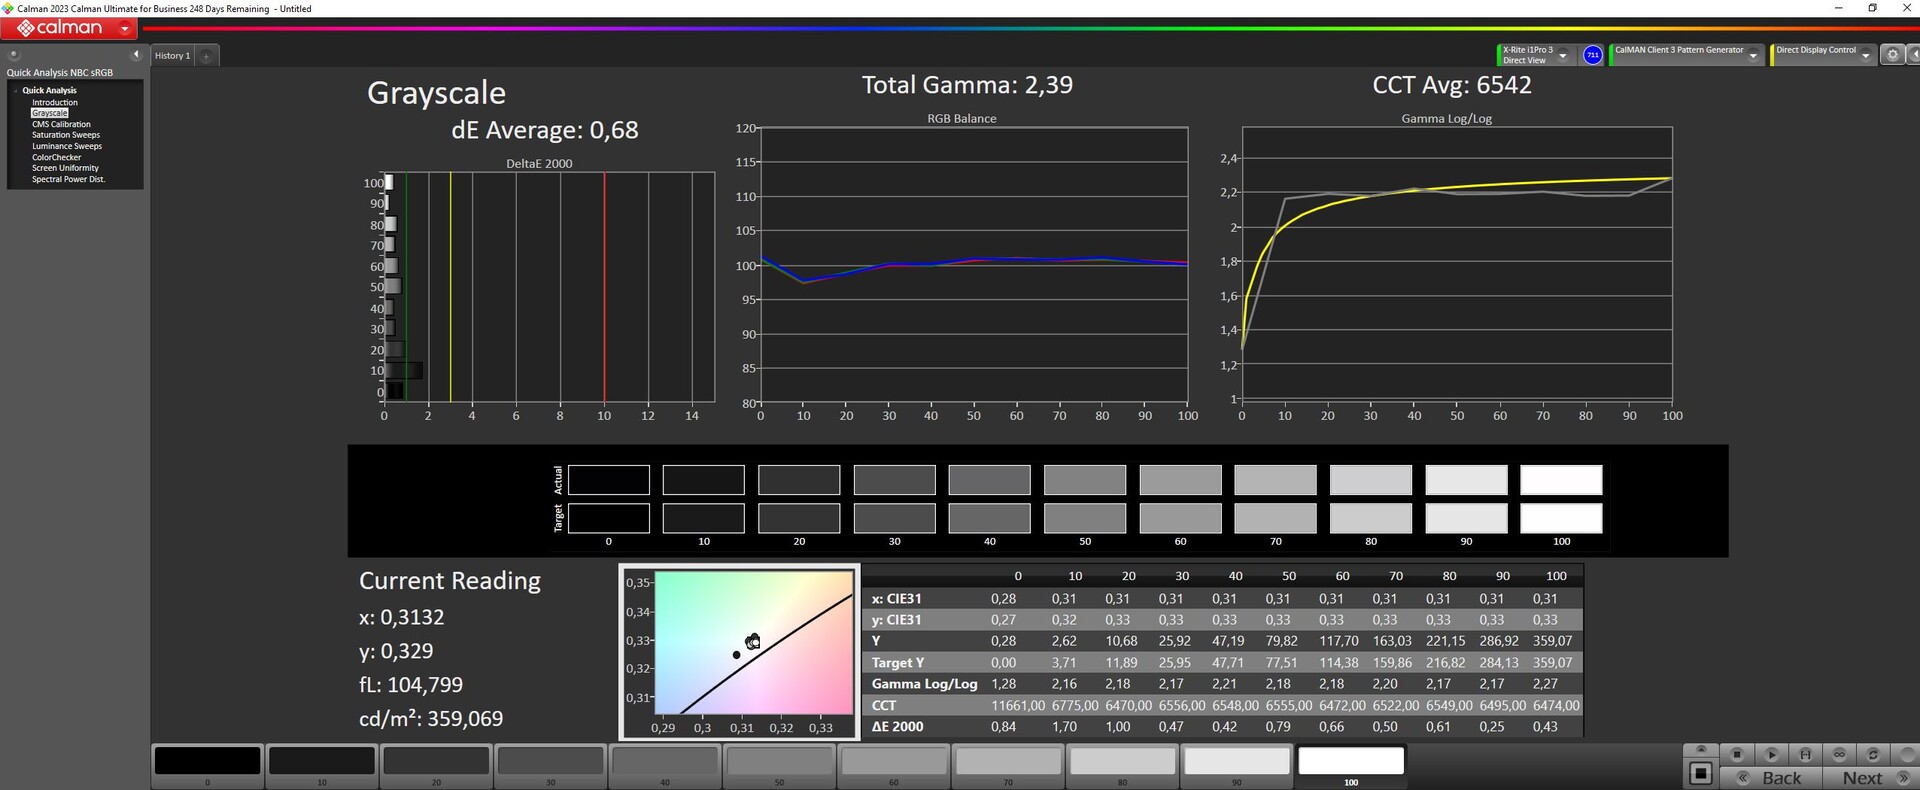
Nada más sacarla de la caja, la pantalla no está calibrada de forma óptima. Nuestra calibración utilizando un dispositivo de medición X-Rite y el software Calman mejoró completamente las desviaciones de la escala de grises, mientras que los colores no mejoraron tanto.
Tiempos de respuesta del display
| ↔ Tiempo de respuesta de Negro a Blanco | ||
|---|---|---|
| 10.4 ms ... subida ↗ y bajada ↘ combinada | ↗ 5.8 ms subida | 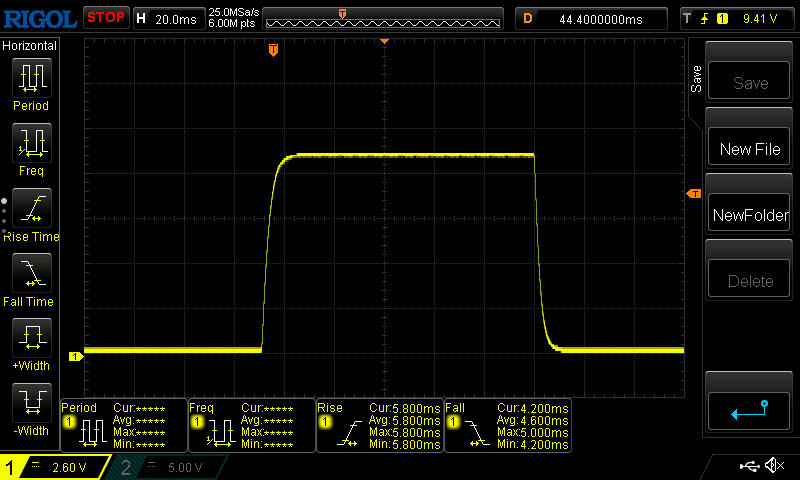 |
| ↘ 4.6 ms bajada | ||
| La pantalla mostró buenos tiempos de respuesta en nuestros tests pero podría ser demasiado lenta para los jugones competitivos. En comparación, todos los dispositivos de prueba van de ##min### (mínimo) a 240 (máximo) ms. » 28 % de todos los dispositivos son mejores. Esto quiere decir que el tiempo de respuesta medido es mejor que la media (19.8 ms) de todos los dispositivos testados. | ||
| ↔ Tiempo de respuesta 50% Gris a 80% Gris | ||
| 7.6 ms ... subida ↗ y bajada ↘ combinada | ↗ 3.8 ms subida | 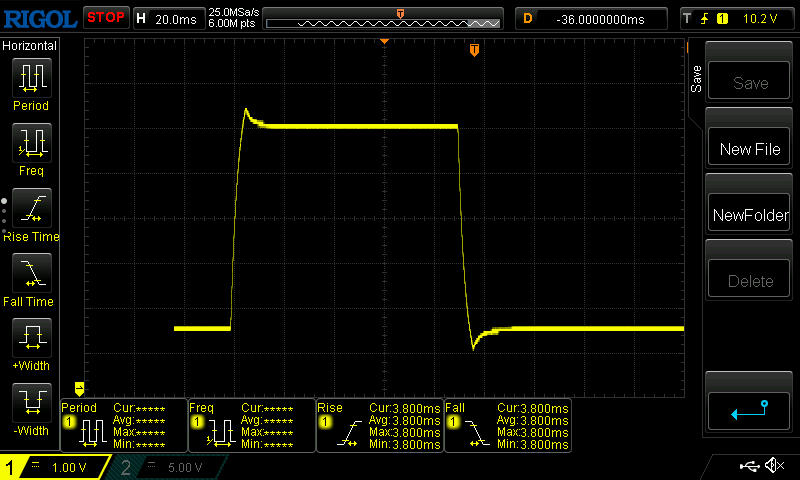 |
| ↘ 3.8 ms bajada | ||
| La pantalla mostró tiempos de respuesta muy rápidos en nuestros tests y debería ser adecuada para juegos frenéticos. En comparación, todos los dispositivos de prueba van de ##min### (mínimo) a 636 (máximo) ms. » 20 % de todos los dispositivos son mejores. Esto quiere decir que el tiempo de respuesta medido es mejor que la media (31 ms) de todos los dispositivos testados. | ||
Parpadeo de Pantalla / PWM (Pulse-Width Modulation)
| Parpadeo de Pantalla / PWM no detectado |  | ||
Comparación: 52 % de todos los dispositivos testados no usaron PWM para atenuar el display. Si se usó, medimos una media de 7757 (mínimo: 5 - máxmo: 343500) Hz. | |||
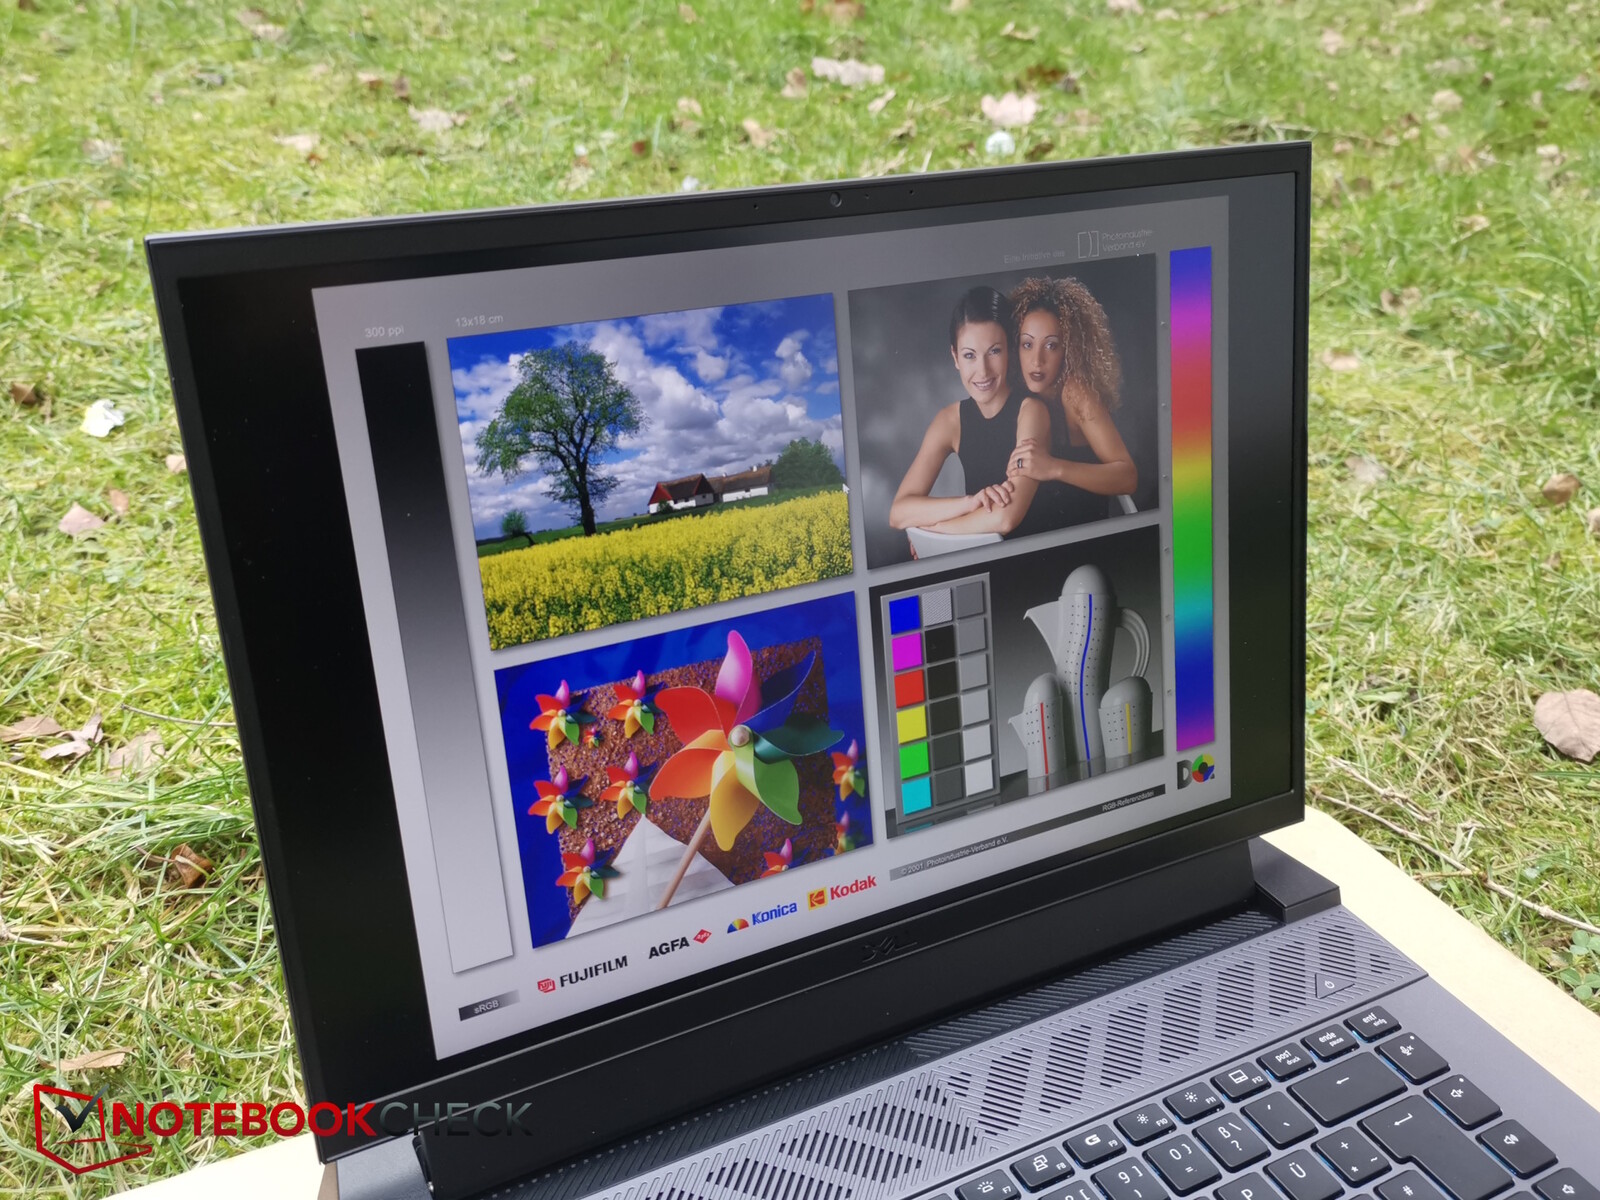
La pantalla es lo suficientemente brillante como para utilizarla en exteriores -al menos en entornos sombreados- además, su superficie mate elimina la mayoría de los grandes reflejos.

Rendimiento - La G16 es tal y como se esperaba
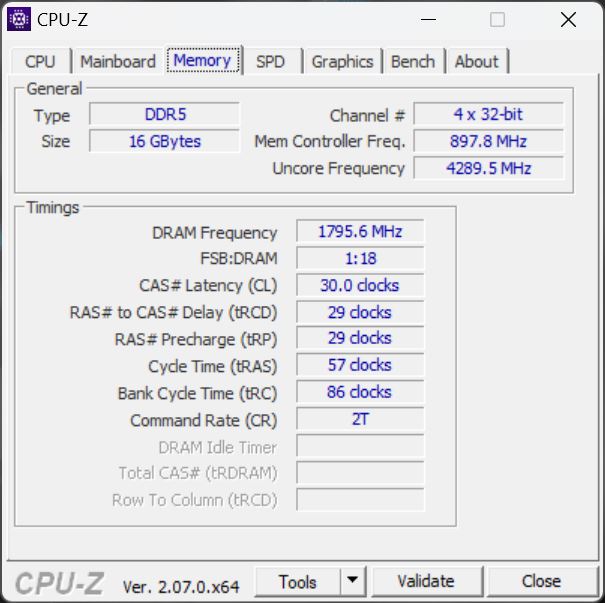
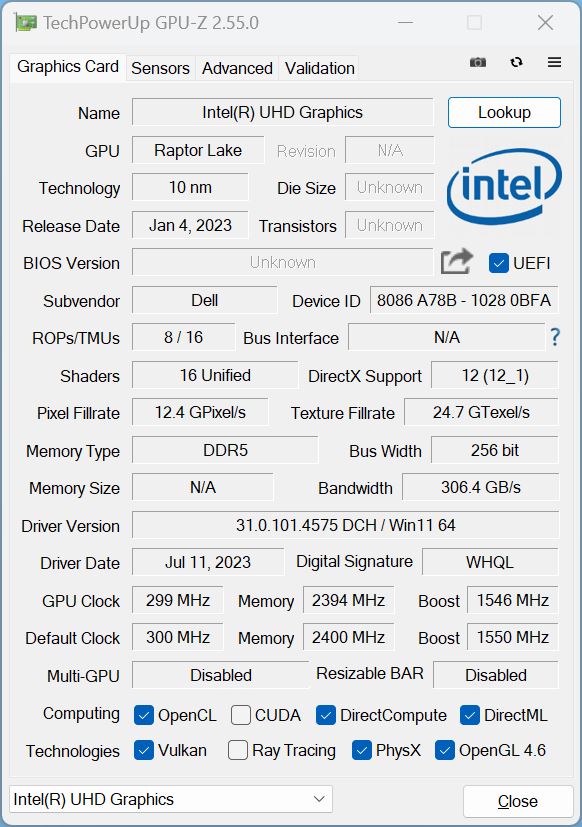
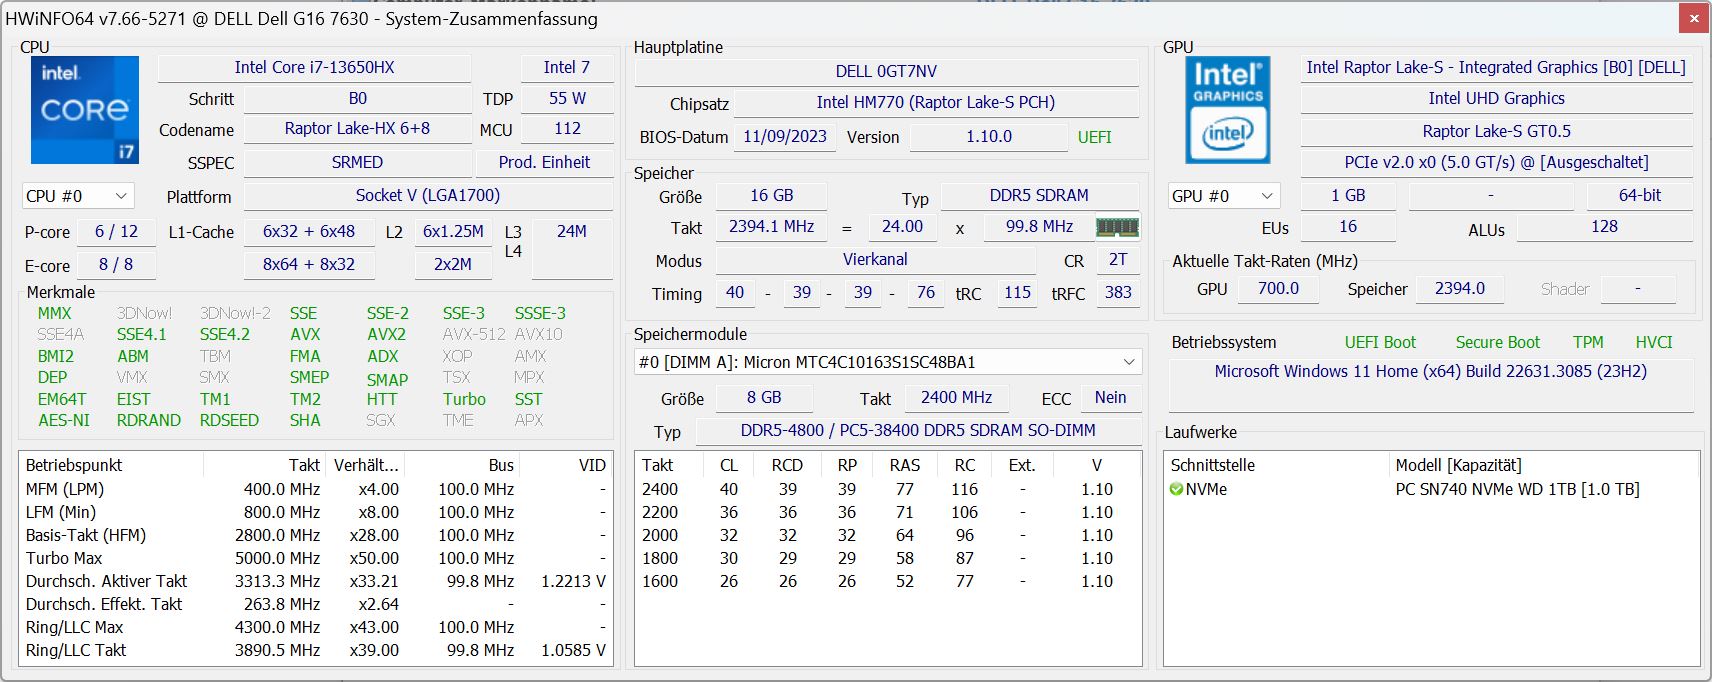
El Dell G16 es un típico portátil para juegos de gama económica-media. Su CPU es el Intel Core i7-13650HX y a esto se añade una RTX 4060 de 140 vatios, 16 GB de RAM y una SSD NVMe de 1 TB. Como resultado, la mayoría de los juegos actuales deberían poder jugarse en Full HD. La pantalla 16:10, entre decente y buena, complementa la configuración de hardware del portátil.
Condiciones de prueba
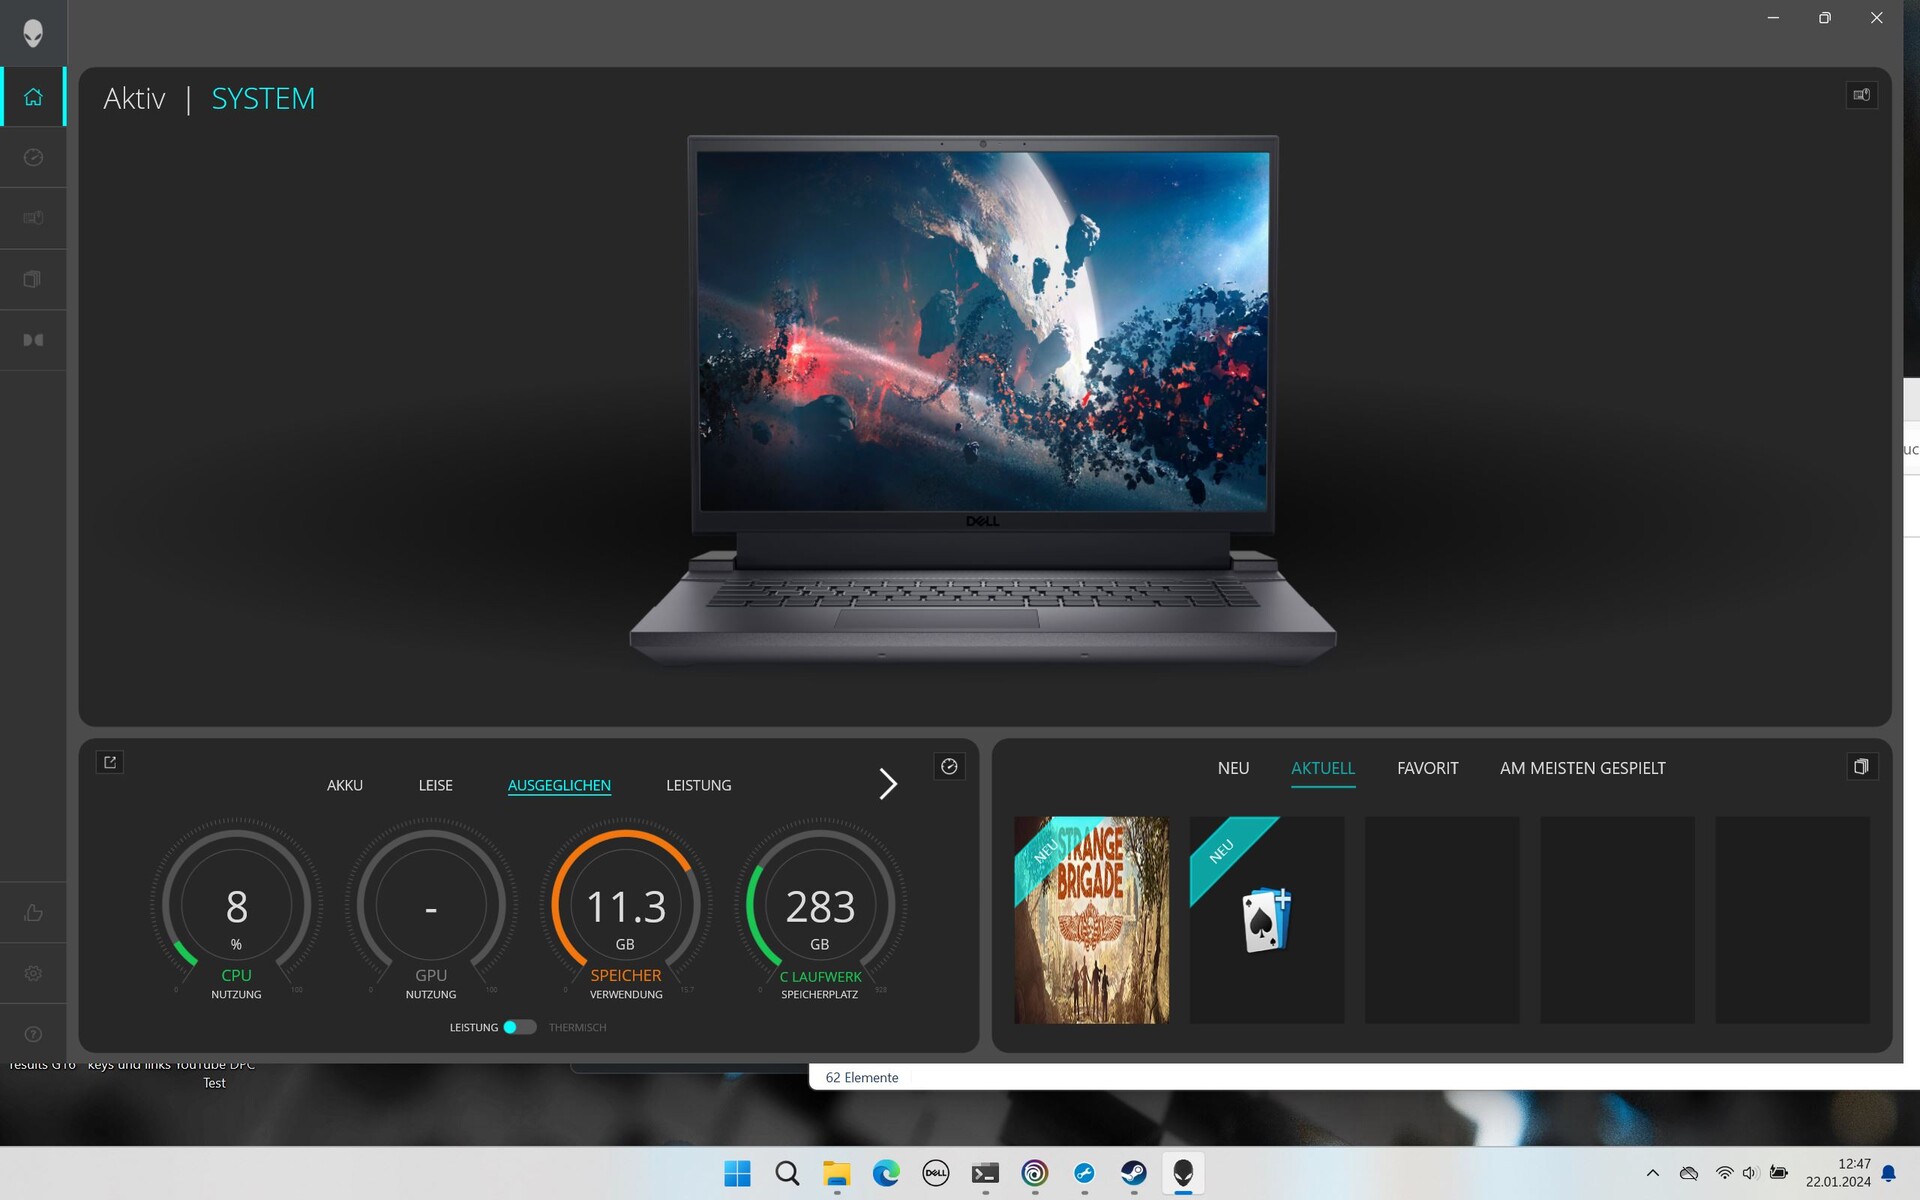
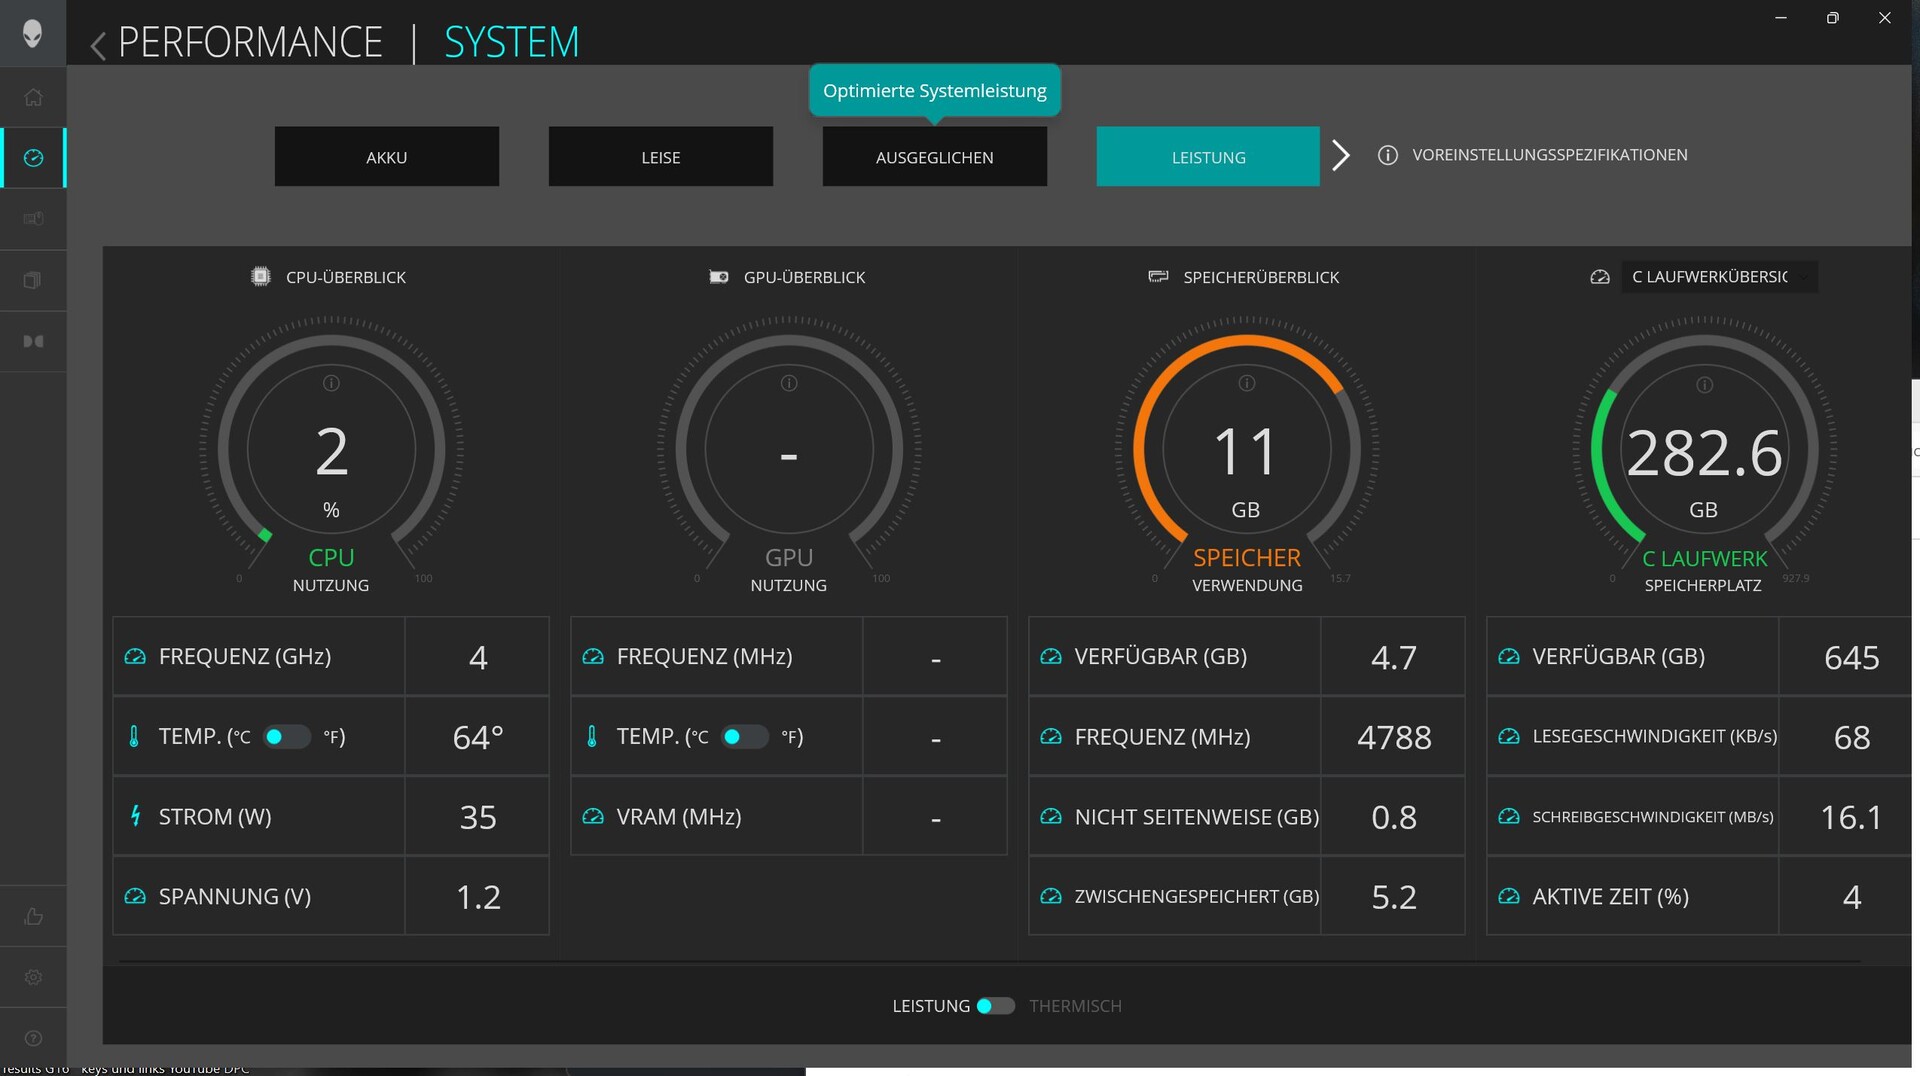
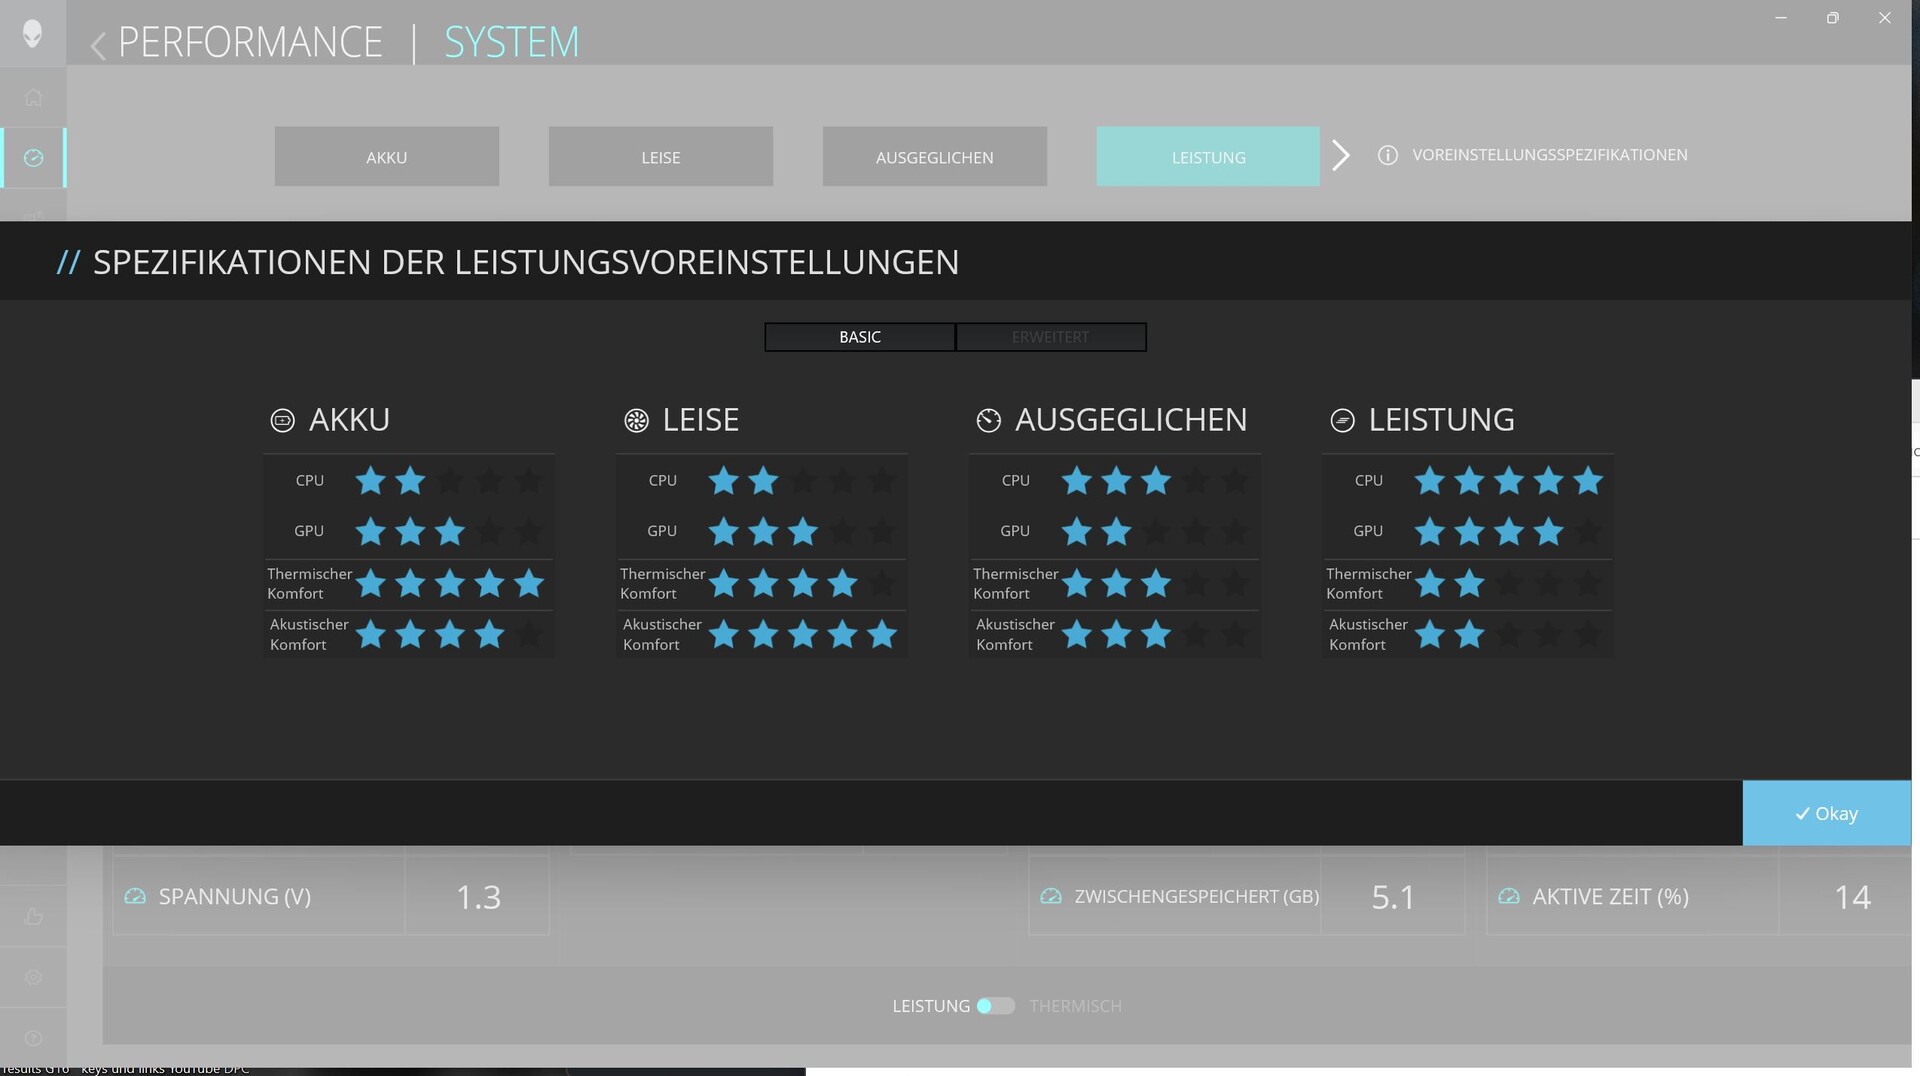
Dell ha preinstalado al menos dos aplicaciones (véase McAffee) en el G16. Una es My Dell, que también viene preinstalada en sus modelos no gaming, y la otra es el Alienware Command Center en los modelos Alienware. My Dell incluye el servicio, las actualizaciones, etc., mientras que el Centro de Comandos permite configurar diferentes modos de rendimiento(batería, silencioso, equilibrado, rendimiento, manual), la iluminación de las teclas y otras opciones.
A pesar de muchos años de desarrollo, el Centro de Comandos aún no está totalmente desarrollado. Por ejemplo, la ventana no se puede maximizar correctamente; todavía se puede ver el escritorio en la parte inferior.
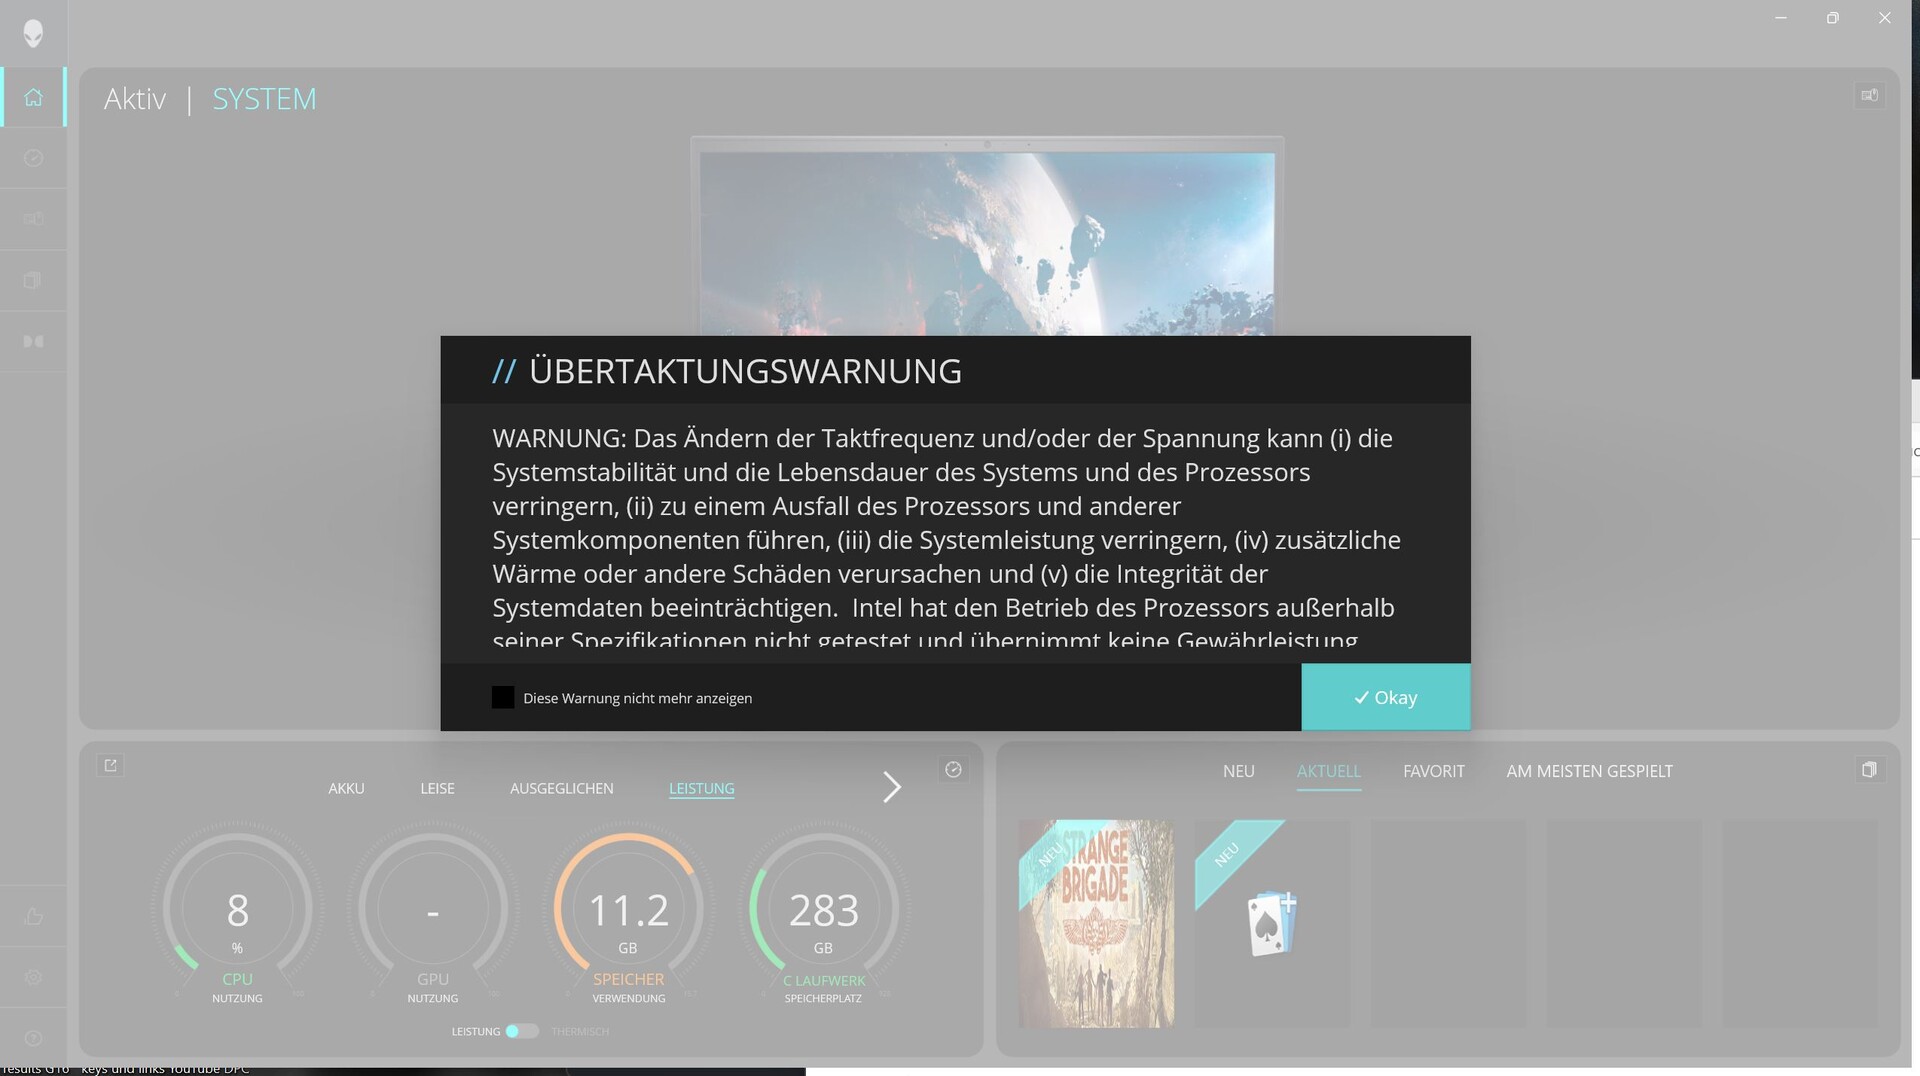
Probablemente, otro fallo es que recibimos un aviso en cuanto cambiamos al modo de rendimiento. Esto es muy inquietante, ya que sugiere que la garantía podría quedar anulada si el hardware se utiliza fuera de las especificaciones recomendadas. Sin embargo, sospechamos que la advertencia se refiere al modo manual, no al modo de rendimiento especificado por la propia Dell: ¡muy confuso!
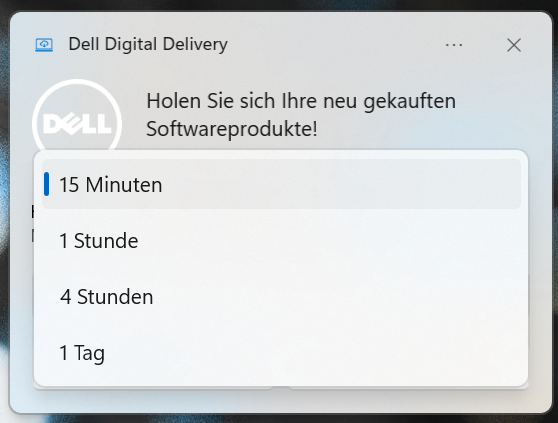
Lo que resulta molesto, sin embargo, es que McAffee no sólo está preinstalado, sino que Dell también nos envía regularmente un mensaje pidiéndonos que utilicemos este servicio (lo hemos desinstalado) y este mensaje sigue apareciendo todos los días como muy tarde.

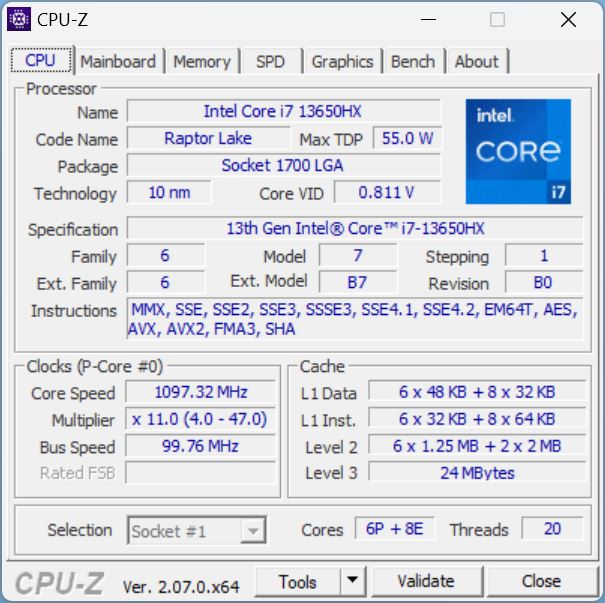
Procesador
El portátil Dell alberga una CPU Raptor-Lake, la Intel Core i7-13650HX con 14 núcleos (6 P, 8 E) y 20 hilos. Los núcleos P pueden alcanzar individualmente una velocidad de reloj de hasta 4,9 GHz y la velocidad de reloj base de los núcleos de eficiencia es de 1,9 GHz. Sólo puede obtener el más potente i9-13900HX en combinación con la RTX 4070que cuesta bastante más.
Durante el bucle Cinebench-R15, la G16 funcionó a niveles de rendimiento constantemente altos sin sufrir ninguna pérdida de rendimiento después de las primeras ejecuciones.
En todas nuestras pruebas comparativas de CPU, el i7-13650HX rindió aproximadamente al nivel esperado y entre un 15 y un 19 % más rápido que el i7-12700H de su predecesor.
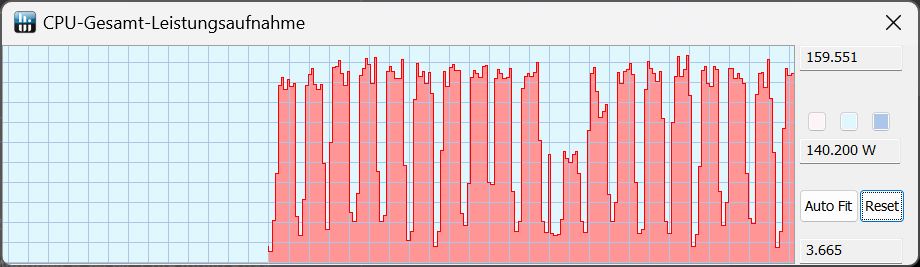
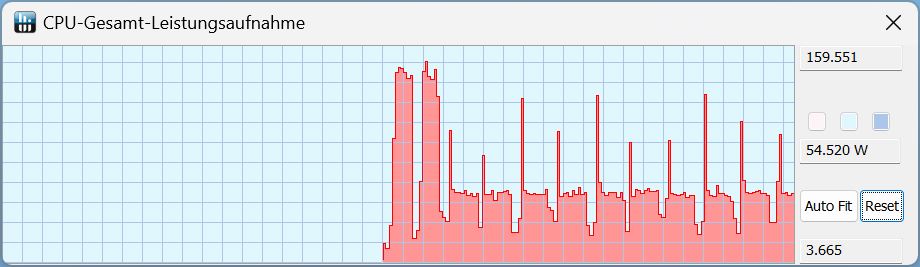
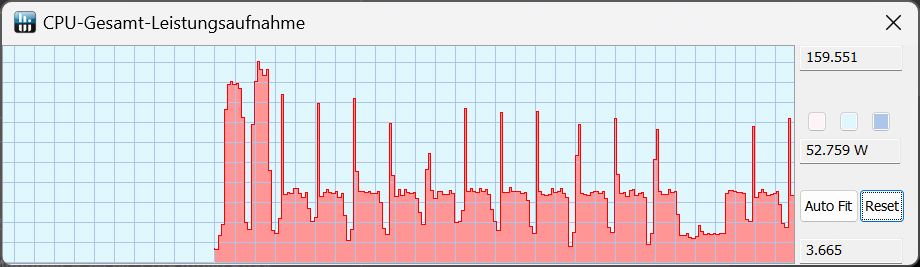
Utilizando los modos rendimiento, equilibrado y silencioso, el portátil alcanzó unos valores de consumo de energía de 159 vatios al principio de una ejecución de Cinebench, lo que dio como resultado la misma puntuación utilizando todos los modos cuando se midieron una sola vez. Durante el transcurso posterior, este TDP sólo se mantuvo constante utilizando el modo rendimiento. En todos los demás modos, el TDP se hundió a unos 50 vatios a partir de la segunda ejecución.
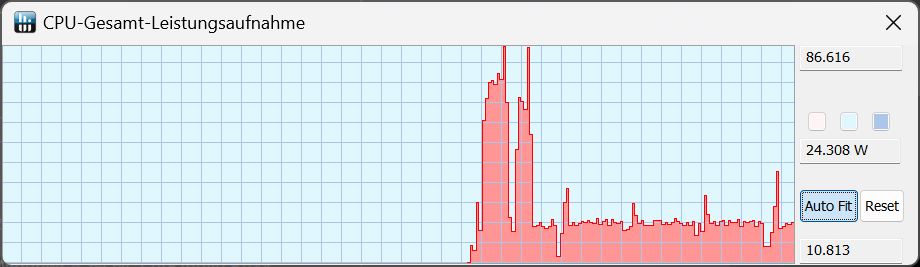
Si desconecta el portátil de la corriente, el sistema pasa automáticamente al modo batería. Sólo alcanzó un TDP de salida de 86 vatios durante Cinebench R15 Multi, y después de la primera ejecución, el TDP cayó a sólo 24 vatios.
Cinebench R15 Multi continuous test
Cinebench R23: Multi Core | Single Core
Cinebench R20: CPU (Multi Core) | CPU (Single Core)
Cinebench R15: CPU Multi 64Bit | CPU Single 64Bit
Blender: v2.79 BMW27 CPU
7-Zip 18.03: 7z b 4 | 7z b 4 -mmt1
Geekbench 6.7: Multi-Core | Single-Core
Geekbench 5.5: Multi-Core | Single-Core
HWBOT x265 Benchmark v2.2: 4k Preset
LibreOffice : 20 Documents To PDF
R Benchmark 2.5: Overall mean
| CPU Performance rating | |
| MSI Raider GE68HX 13VF | |
| Media de la clase Gaming | |
| Alienware m16 R1 Intel | |
| Medio Intel Core i7-13650HX | |
| Dell G16, i7-13650HX, RTX 4060 | |
| Lenovo Legion Slim 5 16APH8 -2! | |
| Lenovo LOQ 16IRH8 | |
| Dell G16 7620 -2! | |
| Cinebench R23 / Multi Core | |
| MSI Raider GE68HX 13VF | |
| Media de la clase Gaming (10488 - 42661, n=107, últimos 2 años) | |
| Alienware m16 R1 Intel | |
| Dell G16, i7-13650HX, RTX 4060 | |
| Medio Intel Core i7-13650HX (18744 - 21006, n=6) | |
| Dell G16 7620 | |
| Lenovo Legion Slim 5 16APH8 | |
| Lenovo LOQ 16IRH8 | |
| Cinebench R23 / Single Core | |
| MSI Raider GE68HX 13VF | |
| Media de la clase Gaming (1166 - 2415, n=107, últimos 2 años) | |
| Alienware m16 R1 Intel | |
| Dell G16, i7-13650HX, RTX 4060 | |
| Lenovo LOQ 16IRH8 | |
| Medio Intel Core i7-13650HX (1693 - 1903, n=6) | |
| Lenovo Legion Slim 5 16APH8 | |
| Dell G16 7620 | |
| Cinebench R20 / CPU (Multi Core) | |
| MSI Raider GE68HX 13VF | |
| Media de la clase Gaming (4029 - 16433, n=106, últimos 2 años) | |
| Alienware m16 R1 Intel | |
| Dell G16, i7-13650HX, RTX 4060 | |
| Medio Intel Core i7-13650HX (7197 - 8021, n=5) | |
| Lenovo Legion Slim 5 16APH8 | |
| Dell G16 7620 | |
| Lenovo LOQ 16IRH8 | |
| Cinebench R20 / CPU (Single Core) | |
| MSI Raider GE68HX 13VF | |
| Media de la clase Gaming (442 - 913, n=106, últimos 2 años) | |
| Alienware m16 R1 Intel | |
| Dell G16, i7-13650HX, RTX 4060 | |
| Medio Intel Core i7-13650HX (700 - 728, n=5) | |
| Lenovo LOQ 16IRH8 | |
| Lenovo Legion Slim 5 16APH8 | |
| Dell G16 7620 | |
| Cinebench R15 / CPU Multi 64Bit | |
| MSI Raider GE68HX 13VF | |
| Media de la clase Gaming (1578 - 6330, n=105, últimos 2 años) | |
| Alienware m16 R1 Intel | |
| Medio Intel Core i7-13650HX (2864 - 3147, n=5) | |
| Dell G16, i7-13650HX, RTX 4060 | |
| Lenovo Legion Slim 5 16APH8 | |
| Dell G16 7620 | |
| Lenovo LOQ 16IRH8 | |
| Cinebench R15 / CPU Single 64Bit | |
| MSI Raider GE68HX 13VF | |
| Media de la clase Gaming (188.8 - 350, n=106, últimos 2 años) | |
| Lenovo Legion Slim 5 16APH8 | |
| Alienware m16 R1 Intel | |
| Dell G16, i7-13650HX, RTX 4060 | |
| Medio Intel Core i7-13650HX (256 - 275, n=5) | |
| Lenovo LOQ 16IRH8 | |
| Dell G16 7620 | |
| Blender / v2.79 BMW27 CPU | |
| Lenovo LOQ 16IRH8 | |
| Lenovo Legion Slim 5 16APH8 | |
| Dell G16 7620 | |
| Medio Intel Core i7-13650HX (158 - 226, n=5) | |
| Dell G16, i7-13650HX, RTX 4060 | |
| Alienware m16 R1 Intel | |
| Media de la clase Gaming (79 - 330, n=104, últimos 2 años) | |
| MSI Raider GE68HX 13VF | |
| 7-Zip 18.03 / 7z b 4 | |
| MSI Raider GE68HX 13VF | |
| Media de la clase Gaming (33491 - 148086, n=105, últimos 2 años) | |
| Alienware m16 R1 Intel | |
| Medio Intel Core i7-13650HX (73927 - 80057, n=5) | |
| Dell G16, i7-13650HX, RTX 4060 | |
| Lenovo Legion Slim 5 16APH8 | |
| Dell G16 7620 | |
| Lenovo LOQ 16IRH8 | |
| 7-Zip 18.03 / 7z b 4 -mmt1 | |
| MSI Raider GE68HX 13VF | |
| Lenovo Legion Slim 5 16APH8 | |
| Media de la clase Gaming (4199 - 7436, n=105, últimos 2 años) | |
| Alienware m16 R1 Intel | |
| Medio Intel Core i7-13650HX (5828 - 6125, n=5) | |
| Dell G16, i7-13650HX, RTX 4060 | |
| Lenovo LOQ 16IRH8 | |
| Dell G16 7620 | |
| Geekbench 6.7 / Multi-Core | |
| MSI Raider GE68HX 13VF | |
| Media de la clase Gaming (6625 - 22850, n=106, últimos 2 años) | |
| Alienware m16 R1 Intel | |
| Medio Intel Core i7-13650HX (13554 - 14378, n=3) | |
| Dell G16, i7-13650HX, RTX 4060 | |
| Lenovo LOQ 16IRH8 | |
| Geekbench 6.7 / Single-Core | |
| MSI Raider GE68HX 13VF | |
| Media de la clase Gaming (1490 - 3259, n=106, últimos 2 años) | |
| Alienware m16 R1 Intel | |
| Lenovo LOQ 16IRH8 | |
| Dell G16, i7-13650HX, RTX 4060 | |
| Medio Intel Core i7-13650HX (2505 - 2595, n=3) | |
| Geekbench 5.5 / Multi-Core | |
| MSI Raider GE68HX 13VF | |
| Media de la clase Gaming (6460 - 28263, n=105, últimos 2 años) | |
| Alienware m16 R1 Intel | |
| Medio Intel Core i7-13650HX (12509 - 14778, n=5) | |
| Dell G16, i7-13650HX, RTX 4060 | |
| Lenovo LOQ 16IRH8 | |
| Dell G16 7620 | |
| Lenovo Legion Slim 5 16APH8 | |
| Geekbench 5.5 / Single-Core | |
| Media de la clase Gaming (986 - 2474, n=105, últimos 2 años) | |
| MSI Raider GE68HX 13VF | |
| Lenovo Legion Slim 5 16APH8 | |
| Dell G16, i7-13650HX, RTX 4060 | |
| Alienware m16 R1 Intel | |
| Medio Intel Core i7-13650HX (1810 - 1866, n=5) | |
| Lenovo LOQ 16IRH8 | |
| Dell G16 7620 | |
| HWBOT x265 Benchmark v2.2 / 4k Preset | |
| MSI Raider GE68HX 13VF | |
| Media de la clase Gaming (11.5 - 44.4, n=105, últimos 2 años) | |
| Alienware m16 R1 Intel | |
| Lenovo Legion Slim 5 16APH8 | |
| Medio Intel Core i7-13650HX (18.9 - 23.6, n=5) | |
| Dell G16, i7-13650HX, RTX 4060 | |
| Dell G16 7620 | |
| Lenovo LOQ 16IRH8 | |
| LibreOffice / 20 Documents To PDF | |
| Dell G16 7620 | |
| Dell G16, i7-13650HX, RTX 4060 | |
| Media de la clase Gaming (33.2 - 88.8, n=105, últimos 2 años) | |
| Medio Intel Core i7-13650HX (38.9 - 58.8, n=5) | |
| Lenovo LOQ 16IRH8 | |
| Alienware m16 R1 Intel | |
| Lenovo Legion Slim 5 16APH8 | |
| MSI Raider GE68HX 13VF | |
| R Benchmark 2.5 / Overall mean | |
| Dell G16 7620 | |
| Lenovo LOQ 16IRH8 | |
| Alienware m16 R1 Intel | |
| Lenovo Legion Slim 5 16APH8 | |
| Medio Intel Core i7-13650HX (0.4217 - 0.4461, n=6) | |
| Media de la clase Gaming (0.3439 - 0.759, n=106, últimos 2 años) | |
| Dell G16, i7-13650HX, RTX 4060 | |
| Dell G16, i7-13650HX, RTX 4060 | |
| MSI Raider GE68HX 13VF | |
* ... más pequeño es mejor
AIDA64: FP32 Ray-Trace | FPU Julia | CPU SHA3 | CPU Queen | FPU SinJulia | FPU Mandel | CPU AES | CPU ZLib | FP64 Ray-Trace | CPU PhotoWorxx
| Performance rating | |
| MSI Raider GE68HX 13VF | |
| Media de la clase Gaming | |
| Lenovo Legion Slim 5 16APH8 | |
| Alienware m16 R1 Intel | |
| Dell G16, i7-13650HX, RTX 4060 | |
| Medio Intel Core i7-13650HX | |
| Dell G16 7620 | |
| Lenovo LOQ 16IRH8 | |
| AIDA64 / FP32 Ray-Trace | |
| Media de la clase Gaming (10227 - 85542, n=105, últimos 2 años) | |
| Lenovo Legion Slim 5 16APH8 | |
| MSI Raider GE68HX 13VF | |
| Alienware m16 R1 Intel | |
| Dell G16, i7-13650HX, RTX 4060 | |
| Medio Intel Core i7-13650HX (13404 - 20012, n=5) | |
| Dell G16 7620 | |
| Lenovo LOQ 16IRH8 | |
| AIDA64 / FPU Julia | |
| Media de la clase Gaming (51376 - 238426, n=105, últimos 2 años) | |
| MSI Raider GE68HX 13VF | |
| Lenovo Legion Slim 5 16APH8 | |
| Alienware m16 R1 Intel | |
| Dell G16, i7-13650HX, RTX 4060 | |
| Medio Intel Core i7-13650HX (68241 - 97317, n=5) | |
| Dell G16 7620 | |
| Lenovo LOQ 16IRH8 | |
| AIDA64 / CPU SHA3 | |
| MSI Raider GE68HX 13VF | |
| Media de la clase Gaming (2180 - 10115, n=105, últimos 2 años) | |
| Lenovo Legion Slim 5 16APH8 | |
| Alienware m16 R1 Intel | |
| Dell G16, i7-13650HX, RTX 4060 | |
| Medio Intel Core i7-13650HX (3127 - 4487, n=5) | |
| Dell G16 7620 | |
| Lenovo LOQ 16IRH8 | |
| AIDA64 / CPU Queen | |
| MSI Raider GE68HX 13VF | |
| Lenovo Legion Slim 5 16APH8 | |
| Media de la clase Gaming (49785 - 173351, n=90, últimos 2 años) | |
| Alienware m16 R1 Intel | |
| Medio Intel Core i7-13650HX (108627 - 110589, n=5) | |
| Dell G16, i7-13650HX, RTX 4060 | |
| Dell G16 7620 | |
| Lenovo LOQ 16IRH8 | |
| AIDA64 / FPU SinJulia | |
| MSI Raider GE68HX 13VF | |
| Lenovo Legion Slim 5 16APH8 | |
| Media de la clase Gaming (4424 - 33636, n=105, últimos 2 años) | |
| Alienware m16 R1 Intel | |
| Dell G16, i7-13650HX, RTX 4060 | |
| Medio Intel Core i7-13650HX (9134 - 10887, n=5) | |
| Dell G16 7620 | |
| Lenovo LOQ 16IRH8 | |
| AIDA64 / FPU Mandel | |
| Media de la clase Gaming (25115 - 128721, n=105, últimos 2 años) | |
| MSI Raider GE68HX 13VF | |
| Lenovo Legion Slim 5 16APH8 | |
| Alienware m16 R1 Intel | |
| Dell G16, i7-13650HX, RTX 4060 | |
| Medio Intel Core i7-13650HX (33391 - 48323, n=5) | |
| Dell G16 7620 | |
| Lenovo LOQ 16IRH8 | |
| AIDA64 / CPU AES | |
| Alienware m16 R1 Intel | |
| MSI Raider GE68HX 13VF | |
| Media de la clase Gaming (39258 - 247074, n=105, últimos 2 años) | |
| Dell G16, i7-13650HX, RTX 4060 | |
| Medio Intel Core i7-13650HX (64436 - 85343, n=5) | |
| Dell G16 7620 | |
| Lenovo Legion Slim 5 16APH8 | |
| Lenovo LOQ 16IRH8 | |
| AIDA64 / CPU ZLib | |
| MSI Raider GE68HX 13VF | |
| Media de la clase Gaming (574 - 2531, n=105, últimos 2 años) | |
| Alienware m16 R1 Intel | |
| Dell G16, i7-13650HX, RTX 4060 | |
| Medio Intel Core i7-13650HX (1136 - 1285, n=5) | |
| Lenovo Legion Slim 5 16APH8 | |
| Dell G16 7620 | |
| Lenovo LOQ 16IRH8 | |
| AIDA64 / FP64 Ray-Trace | |
| Media de la clase Gaming (5509 - 45446, n=105, últimos 2 años) | |
| Lenovo Legion Slim 5 16APH8 | |
| MSI Raider GE68HX 13VF | |
| Alienware m16 R1 Intel | |
| Dell G16, i7-13650HX, RTX 4060 | |
| Medio Intel Core i7-13650HX (7270 - 10900, n=5) | |
| Dell G16 7620 | |
| Lenovo LOQ 16IRH8 | |
| AIDA64 / CPU PhotoWorxx | |
| MSI Raider GE68HX 13VF | |
| Media de la clase Gaming (12271 - 89891, n=105, últimos 2 años) | |
| Medio Intel Core i7-13650HX (36170 - 43289, n=5) | |
| Dell G16, i7-13650HX, RTX 4060 | |
| Alienware m16 R1 Intel | |
| Dell G16 7620 | |
| Lenovo LOQ 16IRH8 | |
| Lenovo Legion Slim 5 16APH8 | |
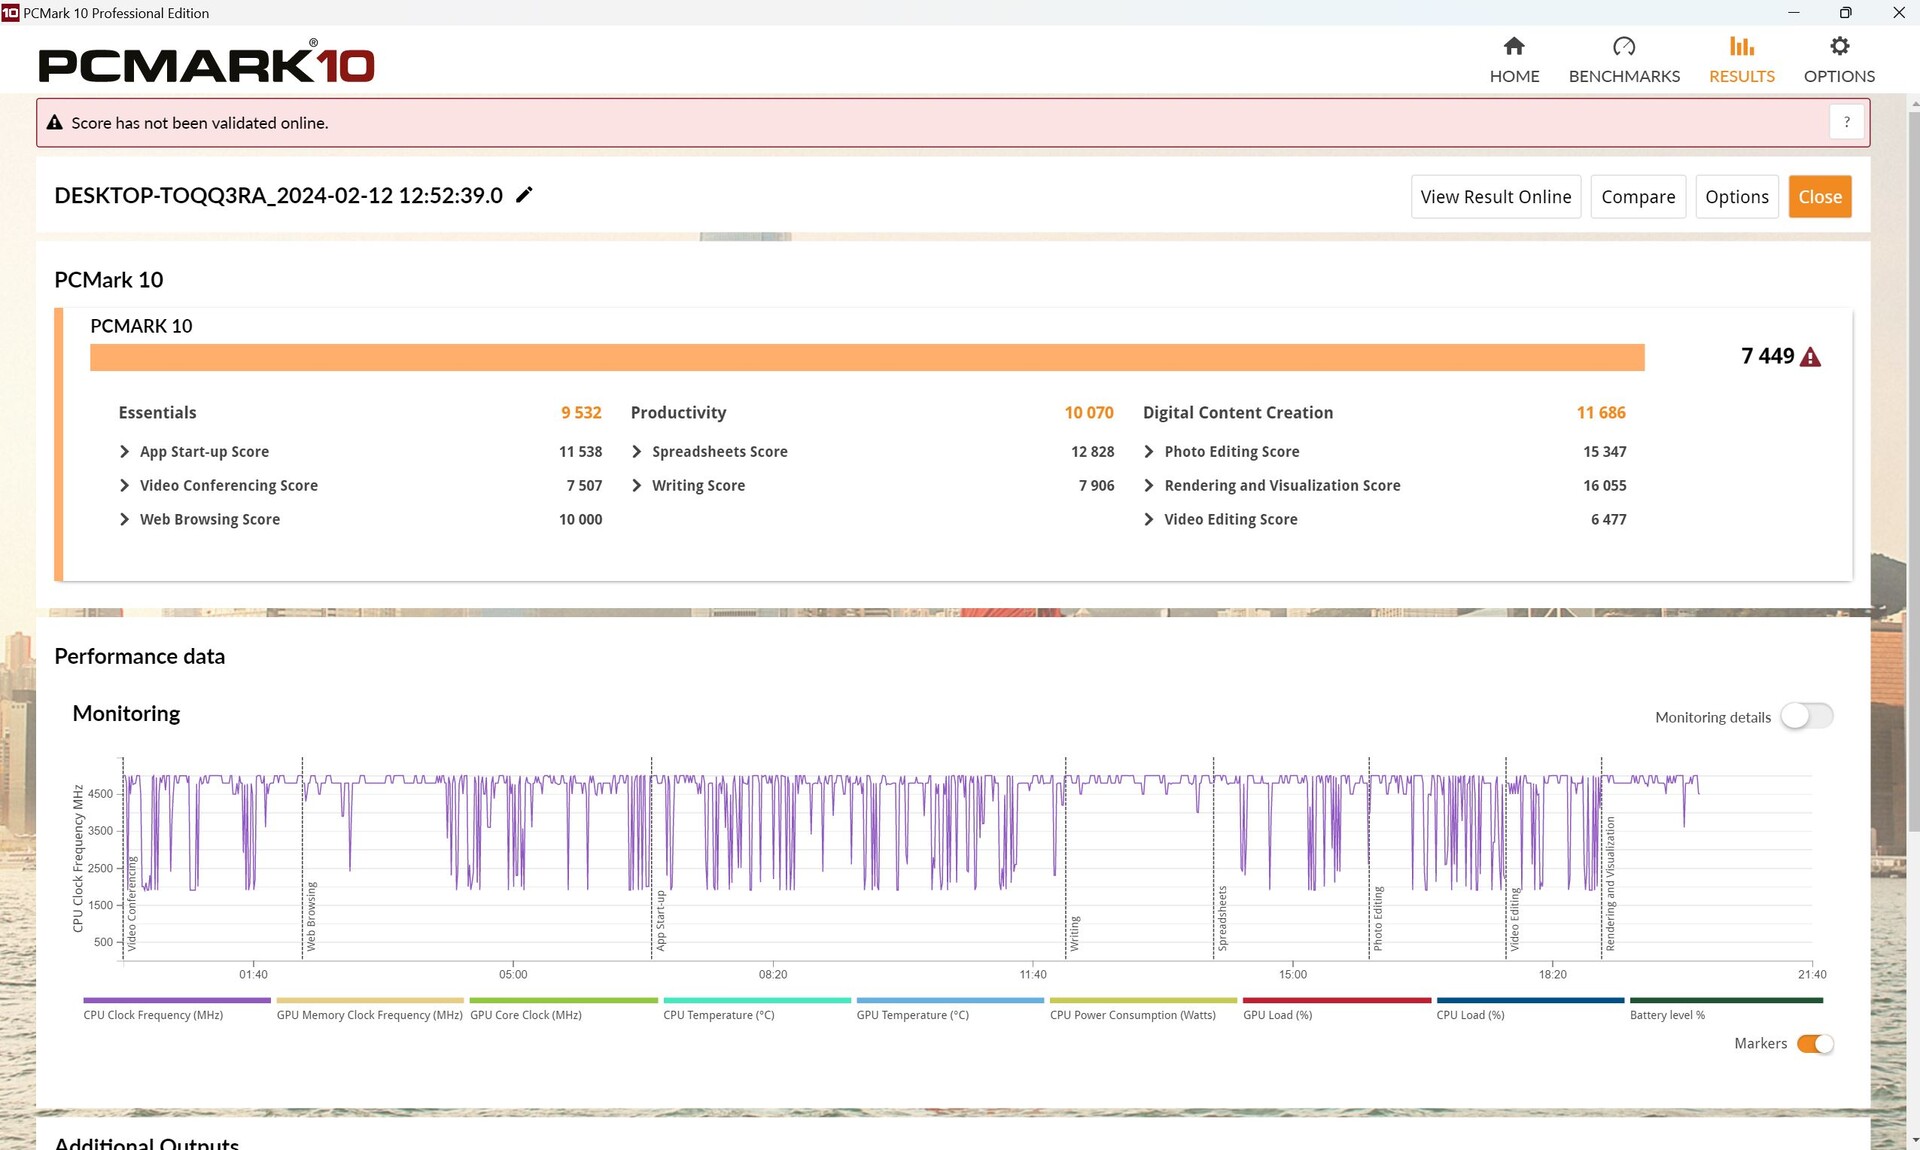
Rendimiento del sistema
El G16 lo hizo bien en general durante PCMark 10, pero mostró algunas debilidades en la subprueba Essentials. Lo mismo puede decirse de la prueba Productividad de CrossMark. En todas las pruebas, nuestro modelo de pruebas consiguió situarse ligeramente por encima de todos los portátiles de nuestra base de datos que presentan la misma configuración de CPU/GPU, por lo que estos valores atípicos no son demasiado significativos.
CrossMark: Overall | Productivity | Creativity | Responsiveness
WebXPRT 3: Overall
WebXPRT 4: Overall
Mozilla Kraken 1.1: Total
| PCMark 10 / Score | |
| Media de la clase Gaming (5828 - 12414, n=93, últimos 2 años) | |
| MSI Raider GE68HX 13VF | |
| Lenovo Legion Slim 5 16APH8 | |
| Dell G16, i7-13650HX, RTX 4060 | |
| Medio Intel Core i7-13650HX, NVIDIA GeForce RTX 4060 Laptop GPU (6984 - 7613, n=3) | |
| Alienware m16 R1 Intel | |
| Dell G16 7620 | |
| Lenovo LOQ 16IRH8 | |
| PCMark 10 / Essentials | |
| MSI Raider GE68HX 13VF | |
| Lenovo Legion Slim 5 16APH8 | |
| Alienware m16 R1 Intel | |
| Media de la clase Gaming (8810 - 11935, n=97, últimos 2 años) | |
| Medio Intel Core i7-13650HX, NVIDIA GeForce RTX 4060 Laptop GPU (9532 - 11151, n=3) | |
| Dell G16 7620 | |
| Lenovo LOQ 16IRH8 | |
| Dell G16, i7-13650HX, RTX 4060 | |
| PCMark 10 / Productivity | |
| Media de la clase Gaming (6845 - 25323, n=95, últimos 2 años) | |
| Lenovo Legion Slim 5 16APH8 | |
| Medio Intel Core i7-13650HX, NVIDIA GeForce RTX 4060 Laptop GPU (9961 - 10204, n=3) | |
| Dell G16, i7-13650HX, RTX 4060 | |
| MSI Raider GE68HX 13VF | |
| Alienware m16 R1 Intel | |
| Dell G16 7620 | |
| Lenovo LOQ 16IRH8 | |
| PCMark 10 / Digital Content Creation | |
| Media de la clase Gaming (7602 - 19954, n=95, últimos 2 años) | |
| MSI Raider GE68HX 13VF | |
| Lenovo Legion Slim 5 16APH8 | |
| Dell G16, i7-13650HX, RTX 4060 | |
| Dell G16 7620 | |
| Medio Intel Core i7-13650HX, NVIDIA GeForce RTX 4060 Laptop GPU (8323 - 11686, n=3) | |
| Alienware m16 R1 Intel | |
| Lenovo LOQ 16IRH8 | |
| CrossMark / Overall | |
| Alienware m16 R1 Intel | |
| Media de la clase Gaming (1366 - 2409, n=94, últimos 2 años) | |
| MSI Raider GE68HX 13VF | |
| Lenovo LOQ 16IRH8 | |
| Medio Intel Core i7-13650HX, NVIDIA GeForce RTX 4060 Laptop GPU (1839 - 1951, n=3) | |
| Dell G16, i7-13650HX, RTX 4060 | |
| Lenovo Legion Slim 5 16APH8 | |
| Dell G16 7620 | |
| CrossMark / Productivity | |
| Alienware m16 R1 Intel | |
| Lenovo LOQ 16IRH8 | |
| Media de la clase Gaming (1386 - 2254, n=94, últimos 2 años) | |
| MSI Raider GE68HX 13VF | |
| Medio Intel Core i7-13650HX, NVIDIA GeForce RTX 4060 Laptop GPU (1730 - 1864, n=3) | |
| Lenovo Legion Slim 5 16APH8 | |
| Dell G16, i7-13650HX, RTX 4060 | |
| Dell G16 7620 | |
| CrossMark / Creativity | |
| MSI Raider GE68HX 13VF | |
| Media de la clase Gaming (1343 - 2786, n=94, últimos 2 años) | |
| Alienware m16 R1 Intel | |
| Medio Intel Core i7-13650HX, NVIDIA GeForce RTX 4060 Laptop GPU (2020 - 2063, n=3) | |
| Lenovo LOQ 16IRH8 | |
| Dell G16, i7-13650HX, RTX 4060 | |
| Lenovo Legion Slim 5 16APH8 | |
| Dell G16 7620 | |
| CrossMark / Responsiveness | |
| Alienware m16 R1 Intel | |
| Lenovo LOQ 16IRH8 | |
| Medio Intel Core i7-13650HX, NVIDIA GeForce RTX 4060 Laptop GPU (1544 - 1907, n=3) | |
| Media de la clase Gaming (1226 - 2334, n=94, últimos 2 años) | |
| Dell G16, i7-13650HX, RTX 4060 | |
| MSI Raider GE68HX 13VF | |
| Dell G16 7620 | |
| Lenovo Legion Slim 5 16APH8 | |
| WebXPRT 3 / Overall | |
| MSI Raider GE68HX 13VF | |
| Lenovo Legion Slim 5 16APH8 | |
| Lenovo LOQ 16IRH8 | |
| Lenovo LOQ 16IRH8 | |
| Media de la clase Gaming (220 - 532, n=98, últimos 2 años) | |
| Alienware m16 R1 Intel | |
| Medio Intel Core i7-13650HX, NVIDIA GeForce RTX 4060 Laptop GPU (268 - 302, n=3) | |
| Dell G16 7620 | |
| Dell G16, i7-13650HX, RTX 4060 | |
| WebXPRT 4 / Overall | |
| MSI Raider GE68HX 13VF | |
| Media de la clase Gaming (165 - 354, n=98, últimos 2 años) | |
| Alienware m16 R1 Intel | |
| Medio Intel Core i7-13650HX, NVIDIA GeForce RTX 4060 Laptop GPU (260 - 276, n=2) | |
| Lenovo Legion Slim 5 16APH8 | |
| Dell G16 7620 | |
| Mozilla Kraken 1.1 / Total | |
| Dell G16 7620 | |
| Medio Intel Core i7-13650HX, NVIDIA GeForce RTX 4060 Laptop GPU (507 - 511, n=3) | |
| Lenovo LOQ 16IRH8 | |
| Lenovo LOQ 16IRH8 | |
| Dell G16, i7-13650HX, RTX 4060 | |
| Alienware m16 R1 Intel | |
| Lenovo Legion Slim 5 16APH8 | |
| Media de la clase Gaming (391 - 590, n=100, últimos 2 años) | |
| MSI Raider GE68HX 13VF | |
* ... más pequeño es mejor
| PCMark 10 Score | 7449 puntos | |
ayuda | ||
| AIDA64 / Memory Copy | |
| MSI Raider GE68HX 13VF | |
| Media de la clase Gaming (21750 - 129946, n=105, últimos 2 años) | |
| Lenovo Legion Slim 5 16APH8 | |
| Medio Intel Core i7-13650HX (59266 - 66372, n=5) | |
| Dell G16, i7-13650HX, RTX 4060 | |
| Alienware m16 R1 Intel | |
| Dell G16 7620 | |
| Lenovo LOQ 16IRH8 | |
| AIDA64 / Memory Read | |
| MSI Raider GE68HX 13VF | |
| Media de la clase Gaming (22956 - 118858, n=105, últimos 2 años) | |
| Medio Intel Core i7-13650HX (67305 - 71022, n=5) | |
| Alienware m16 R1 Intel | |
| Dell G16, i7-13650HX, RTX 4060 | |
| Dell G16 7620 | |
| Lenovo LOQ 16IRH8 | |
| Lenovo Legion Slim 5 16APH8 | |
| AIDA64 / Memory Write | |
| Lenovo Legion Slim 5 16APH8 | |
| MSI Raider GE68HX 13VF | |
| Media de la clase Gaming (22297 - 135096, n=105, últimos 2 años) | |
| Medio Intel Core i7-13650HX (58028 - 68225, n=5) | |
| Alienware m16 R1 Intel | |
| Dell G16, i7-13650HX, RTX 4060 | |
| Dell G16 7620 | |
| Lenovo LOQ 16IRH8 | |
| AIDA64 / Memory Latency | |
| Lenovo LOQ 16IRH8 | |
| Media de la clase Gaming (75.3 - 259, n=105, últimos 2 años) | |
| Dell G16 7620 | |
| Lenovo Legion Slim 5 16APH8 | |
| Dell G16, i7-13650HX, RTX 4060 | |
| Medio Intel Core i7-13650HX (83.7 - 90.8, n=5) | |
| Alienware m16 R1 Intel | |
| MSI Raider GE68HX 13VF | |
* ... más pequeño es mejor
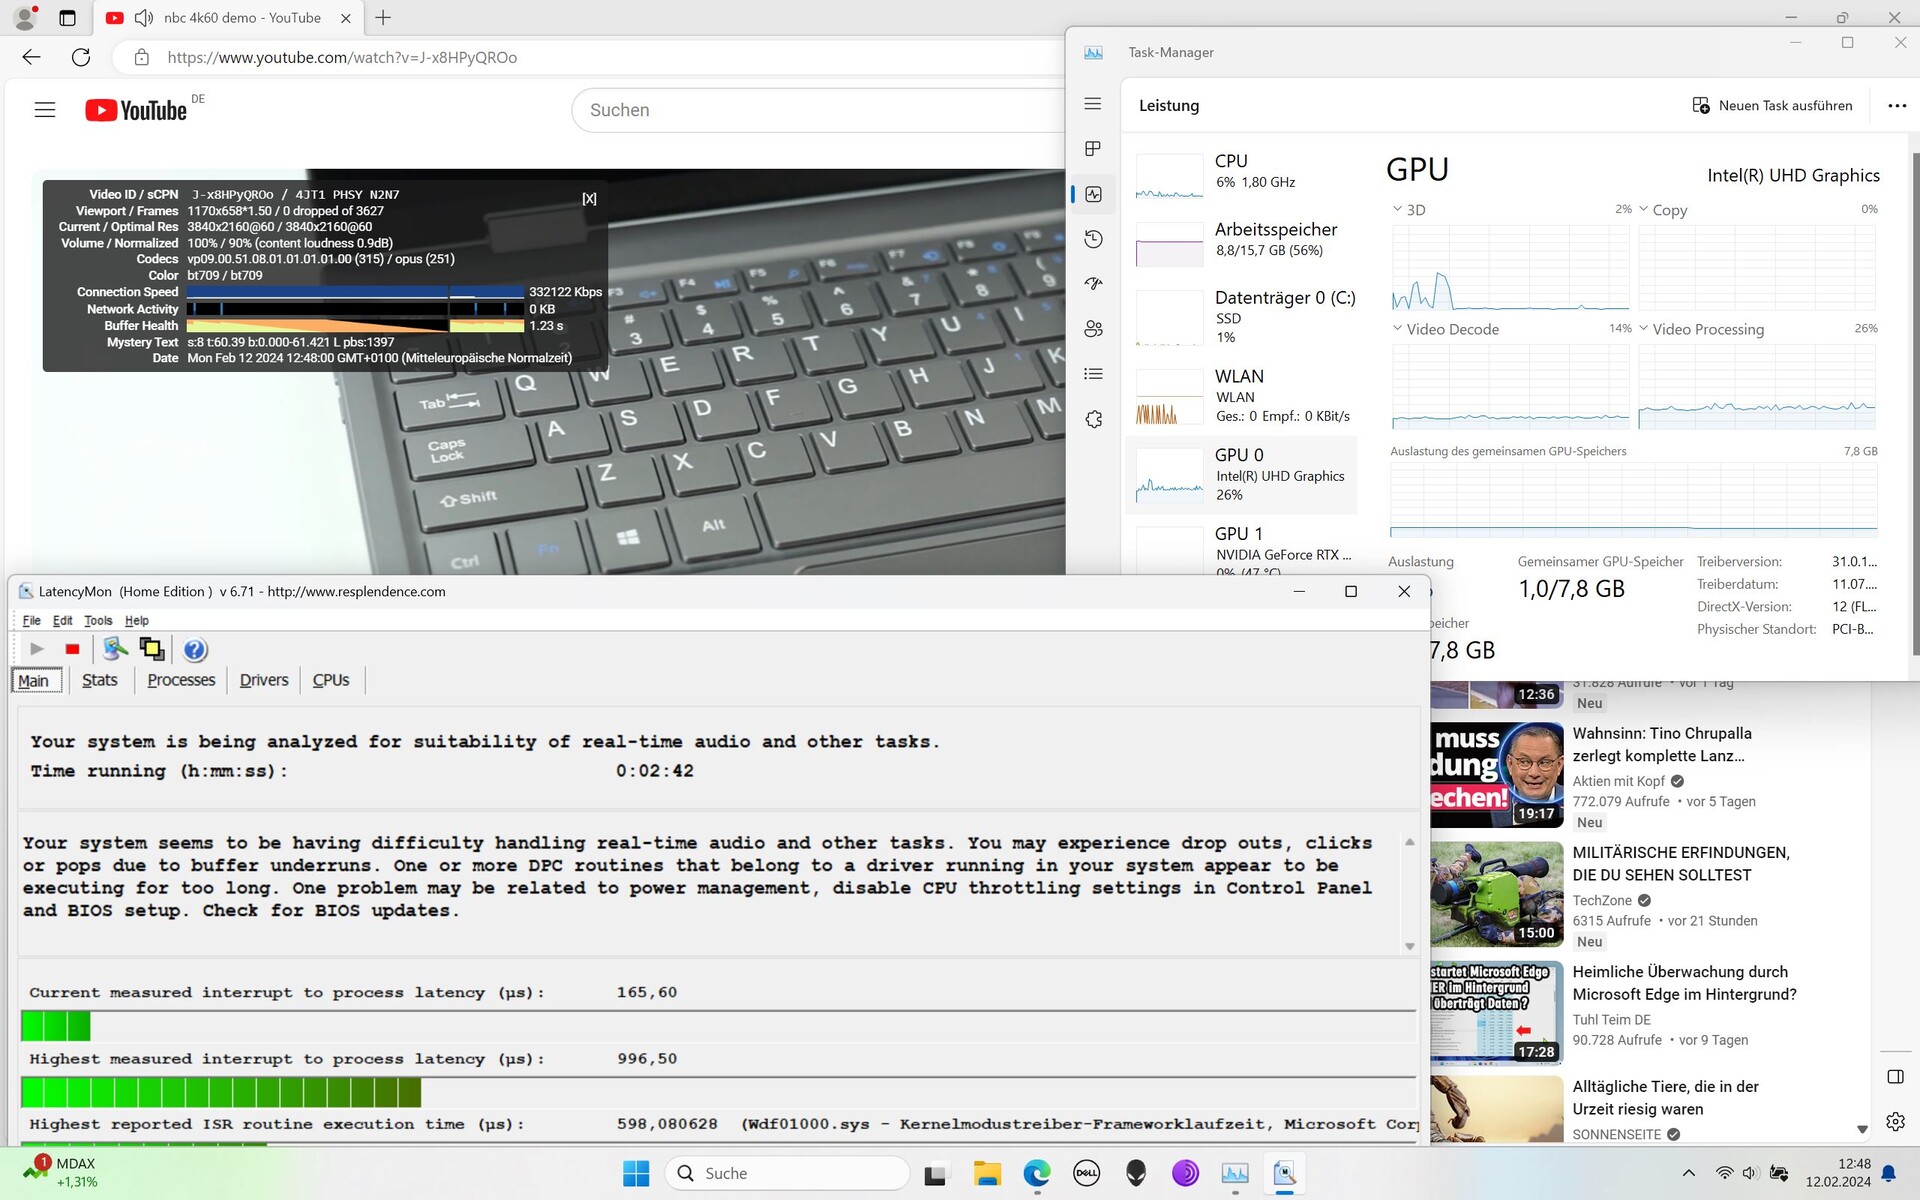
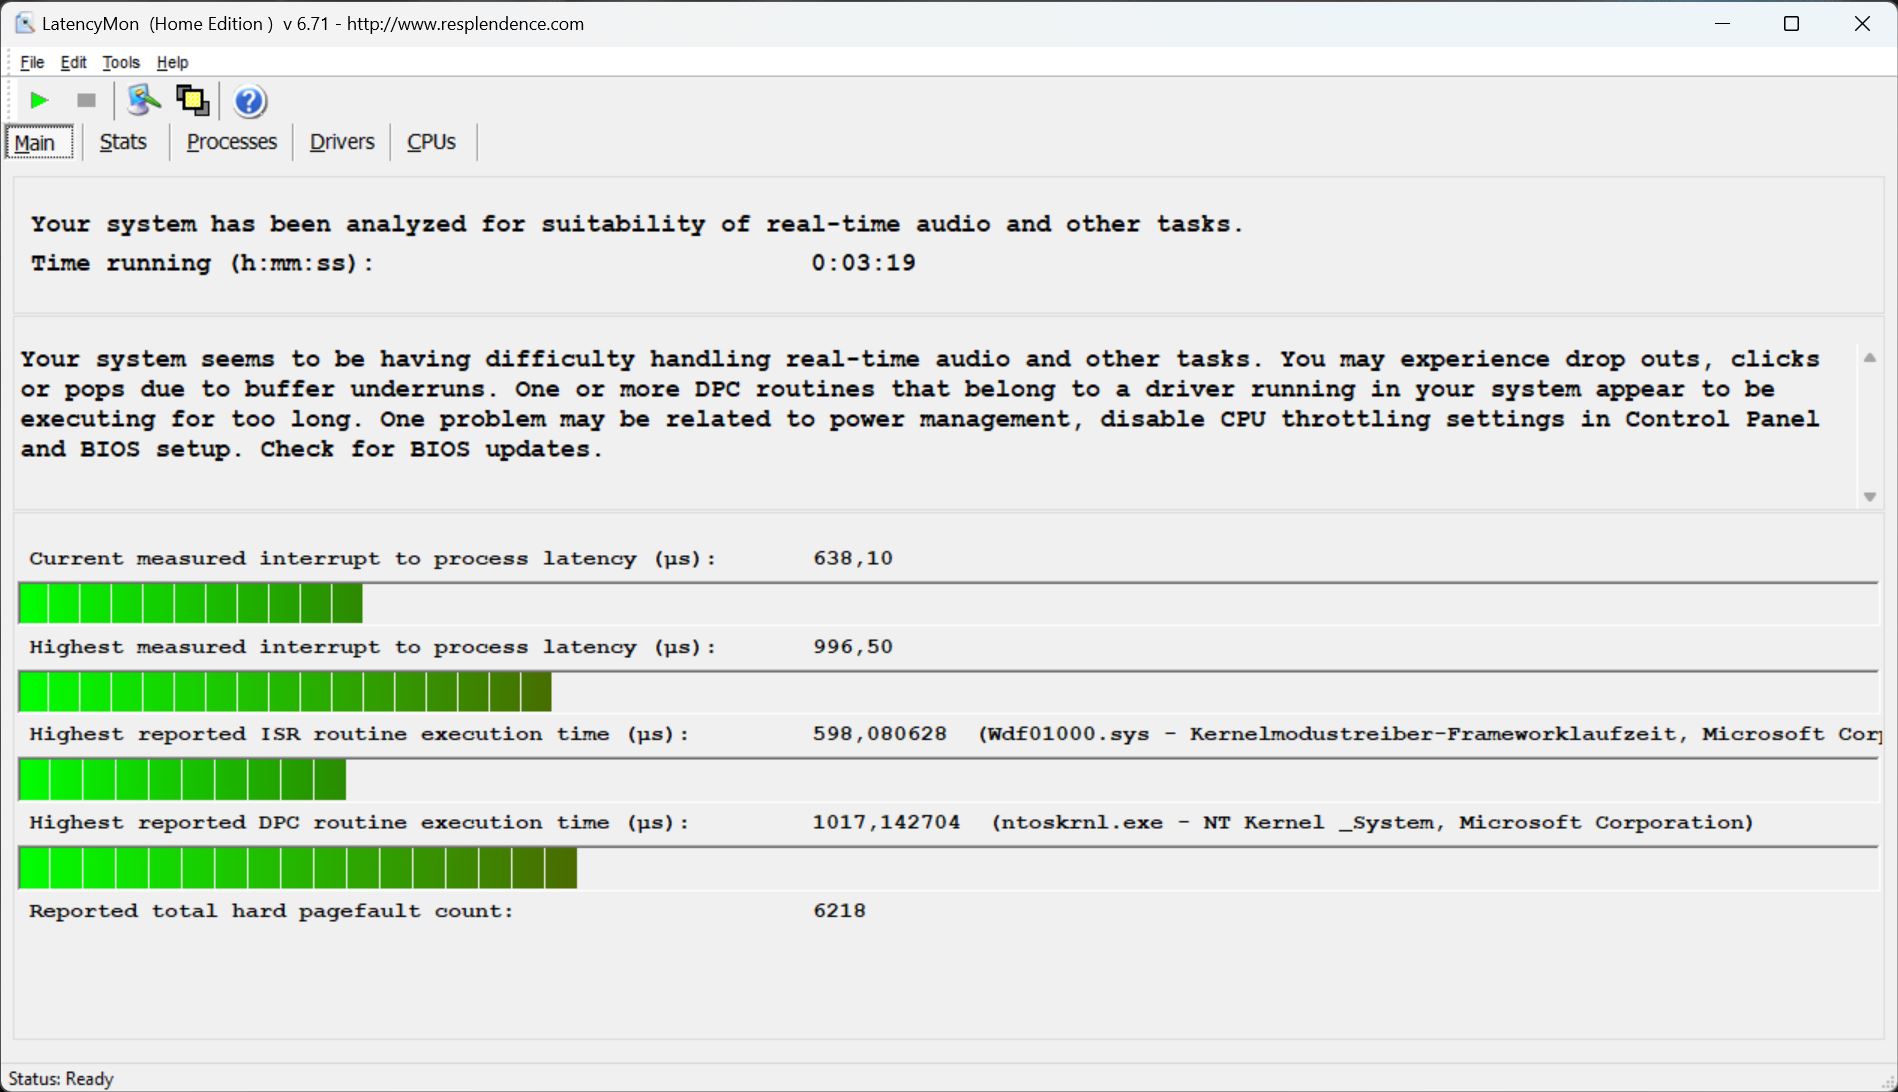
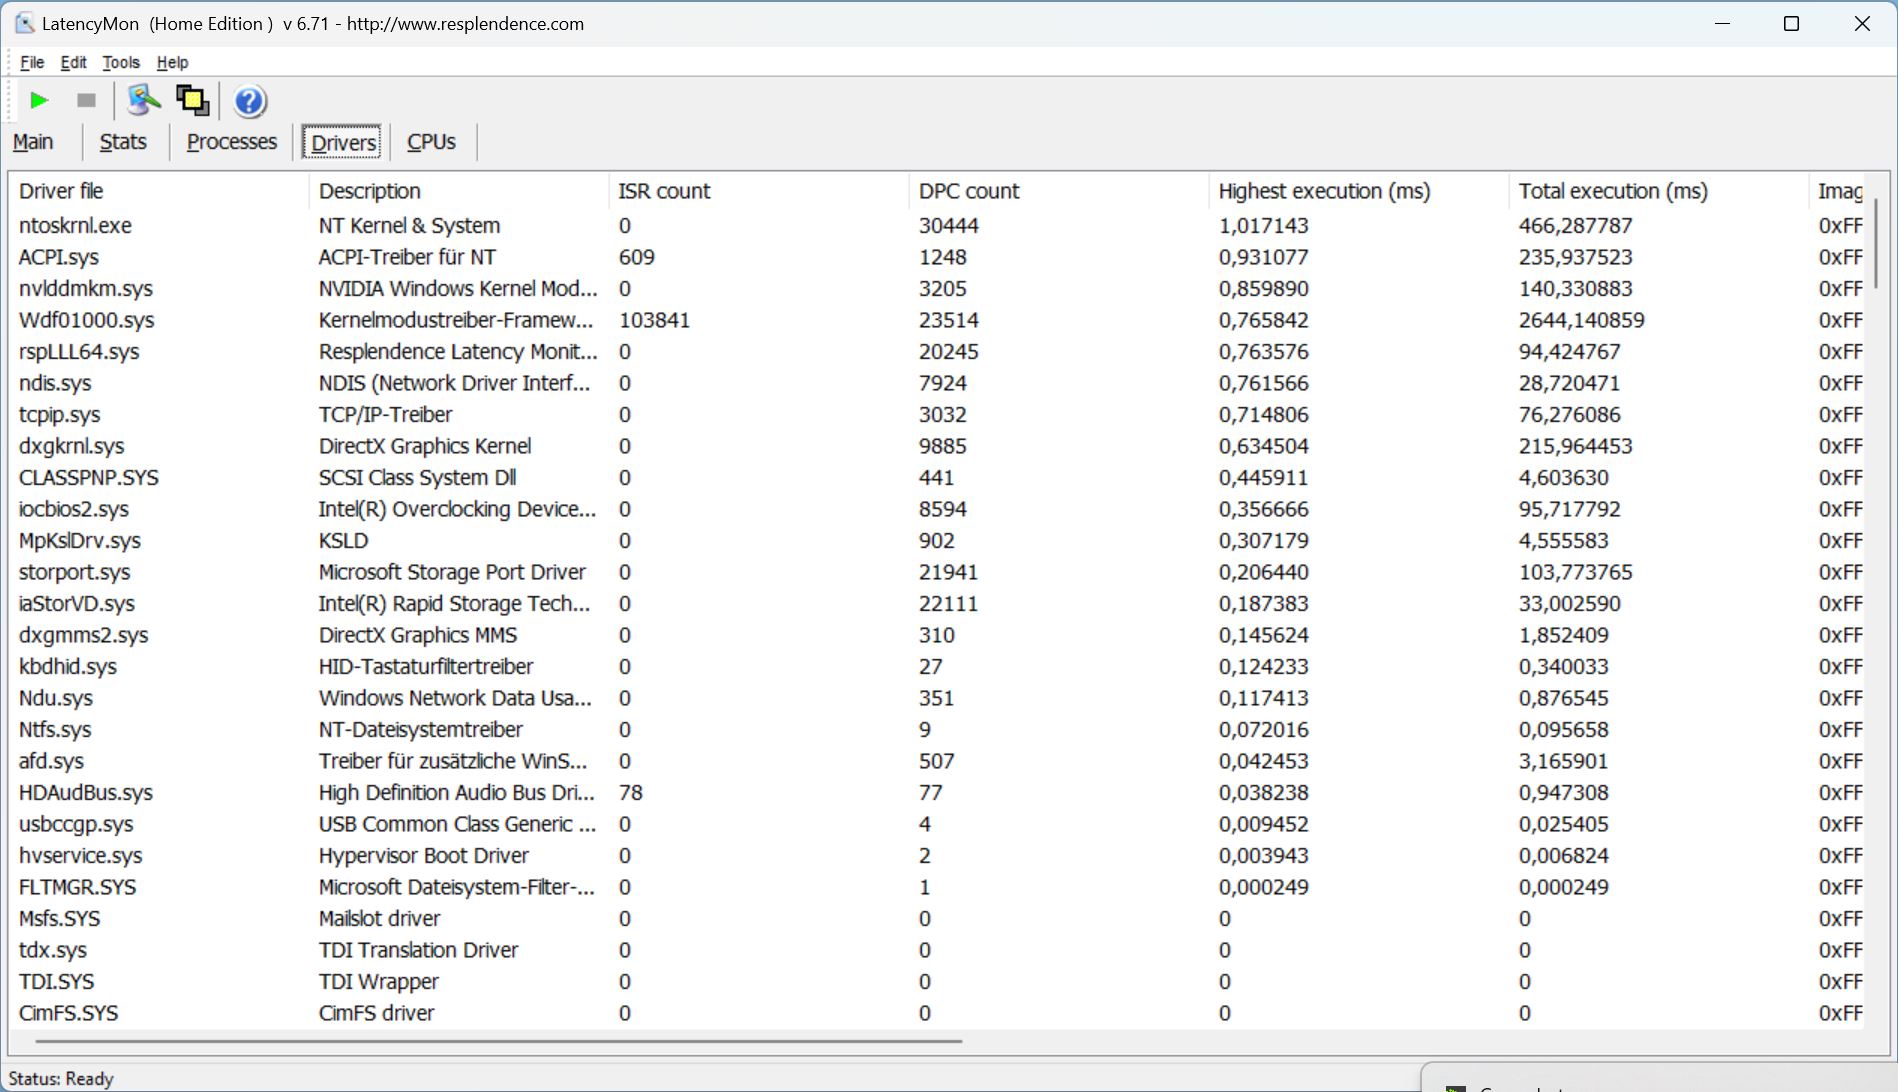
Latencia del CPD
Al abrir nuestra página web, el portátil mostró algunas ligeras latencias, pero el software LatencyMon no las marcó como críticas. Esto no cambió al abrir varias pestañas. Sus latencias aumentaron ligeramente al reproducir nuestro vídeo 4K/60-fps de YouTube, lo que llevó a nuestra herramienta de medición a indicar algunos problemas. En comparación, sin embargo, estas latencias son bastante bajas y el vídeo de prueba se reprodujo sin ninguna caída de fotogramas.
| DPC Latencies / LatencyMon - interrupt to process latency (max), Web, Youtube, Prime95 | |
| Alienware m16 R1 Intel | |
| MSI Raider GE68HX 13VF | |
| Lenovo LOQ 16IRH8 | |
| Lenovo Legion Slim 5 16APH8 | |
| Dell G16, i7-13650HX, RTX 4060 | |
| Dell G16 7620 | |
* ... más pequeño es mejor
Dispositivos de almacenamiento
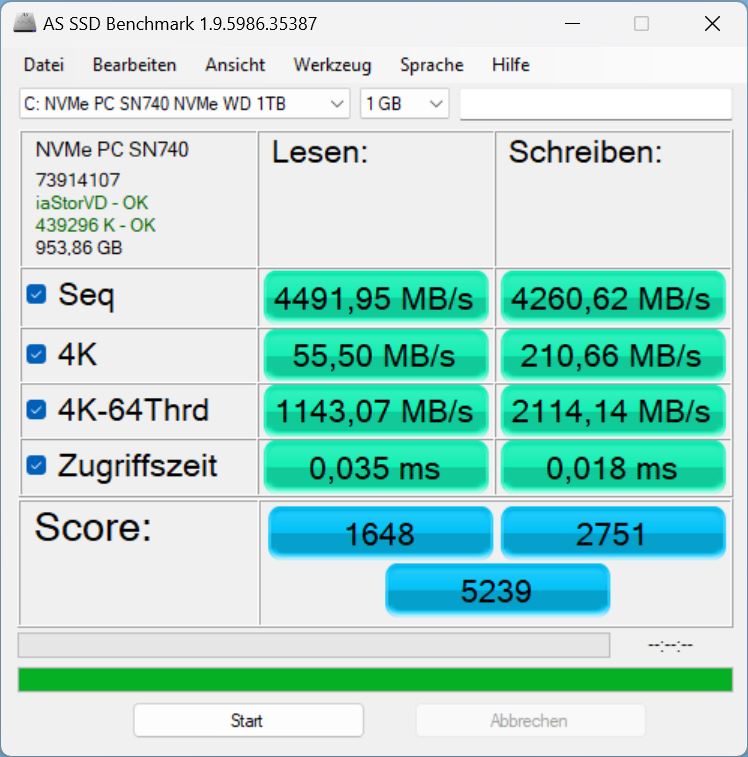
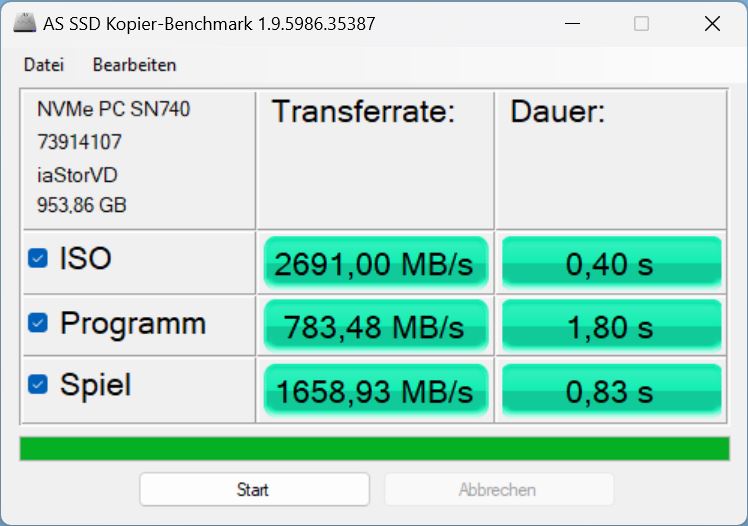
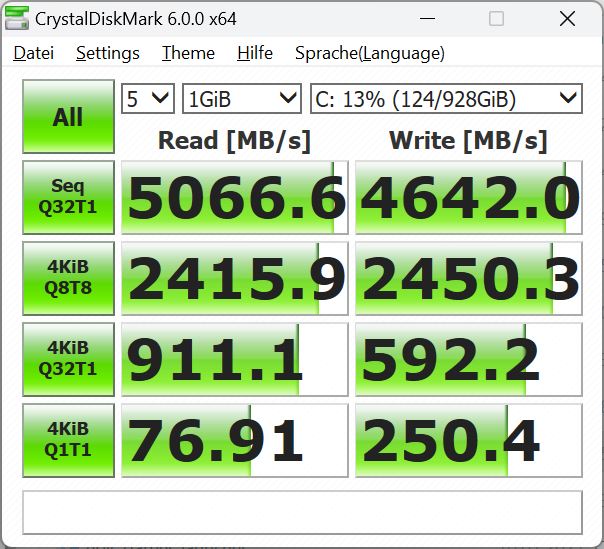
Dell ha instalado un SN740 de Western Digital con el pequeño factor de forma M.2 2230. También hay libre una segunda ranura M.2-2280 más grande. La PCIe-4-NVMe ocupa la posición 142 en nuestra Lista de mejores SSD. Su rendimiento es realmente mejor que el de las SSD del MSI Raider o el Lenovo LOQ 16. Sin embargo, a diferencia de estos y otros competidores, el medio de almacenamiento del G16 se estrangula térmicamente al cabo de muy poco tiempo.
Sus tasas de transferencia caen entonces a más de la mitad. Por cierto, su predecesor tenía instalado un modelo más rápido, aunque también se vio afectado por problemas de estrangulamiento. Sin embargo, éstos comenzaron mucho más tarde.

* ... más pequeño es mejor
Reading continuous performance: DiskSpd Read Loop, Queue Depth 8
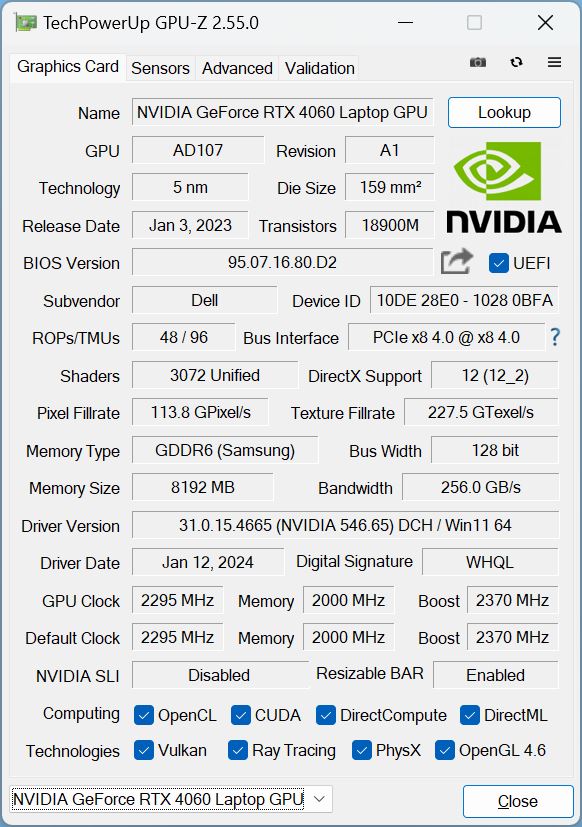
Tarjeta gráfica
Dell ha dotado a la G16 de una RTX 4060 de 140 vatios. Soporta los modos Whisper Mode, Max-Q, Dynamic Boost e incluso Advanced Optimus. Sin embargo, este último resulta molesto con bastante frecuencia, ya que el proceso de cambio de gráficos tarda unos buenos segundos durante cada aplicación 3D (arranque y cierre), durante los cuales la pantalla se congela.
Aún así, su rendimiento durante el 3DMarks sintético fue como esperábamos, si no ligeramente mejor. Su ventaja sobre el predecesor del portátil con la RTX 3060 y el i7-12700H es de alrededor del 22 %.
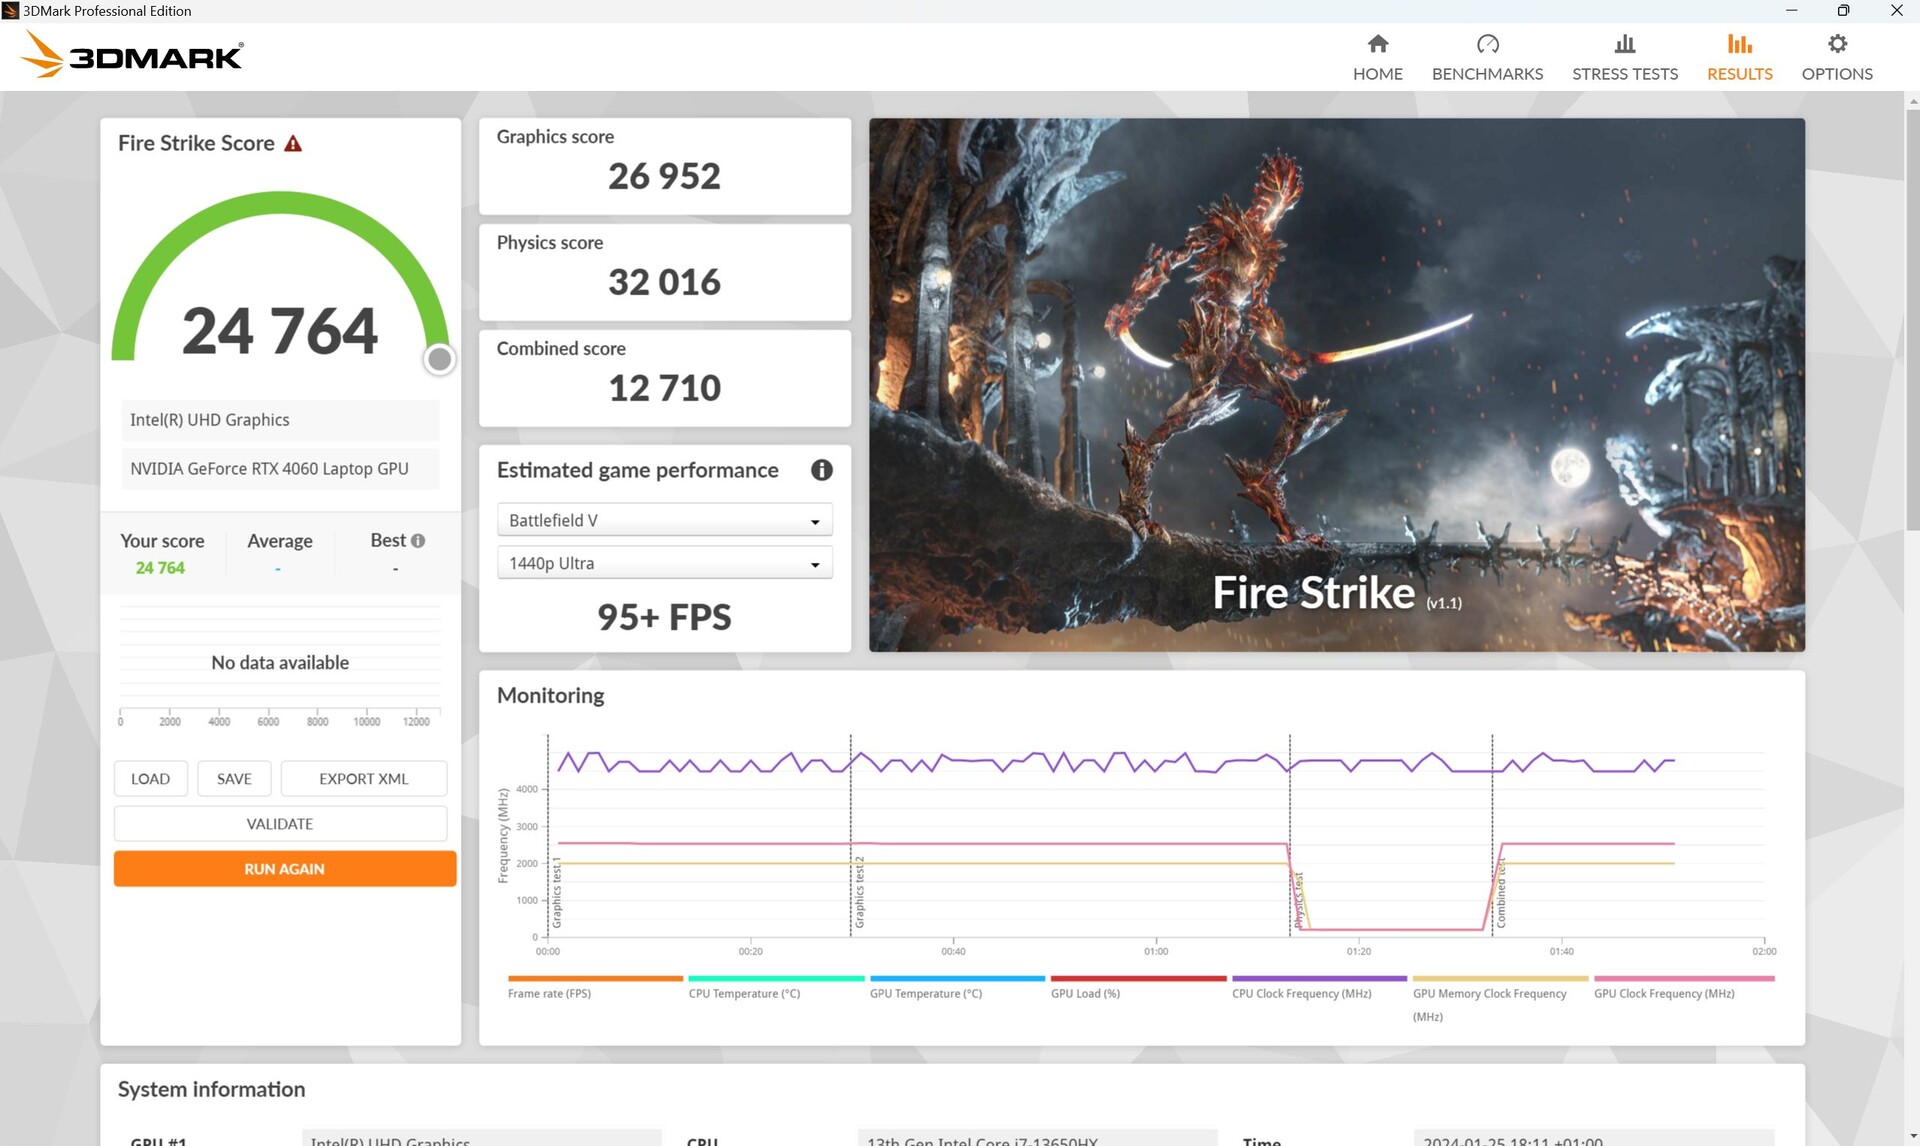
Desconectado de la corriente, su rendimiento 3D cayó menos drásticamente de lo esperado. En otra ejecución de Fire Strike, medimos una caída de alrededor del 20 %.
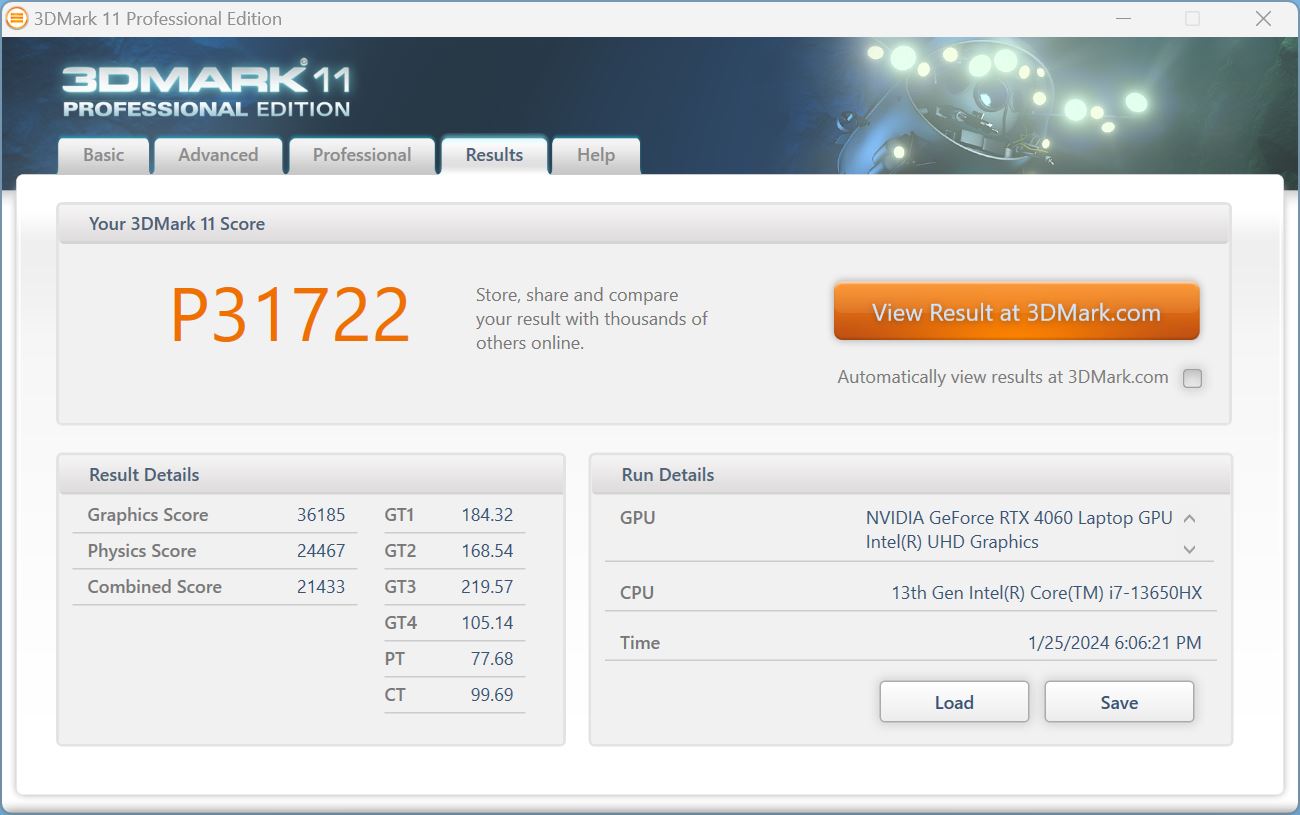
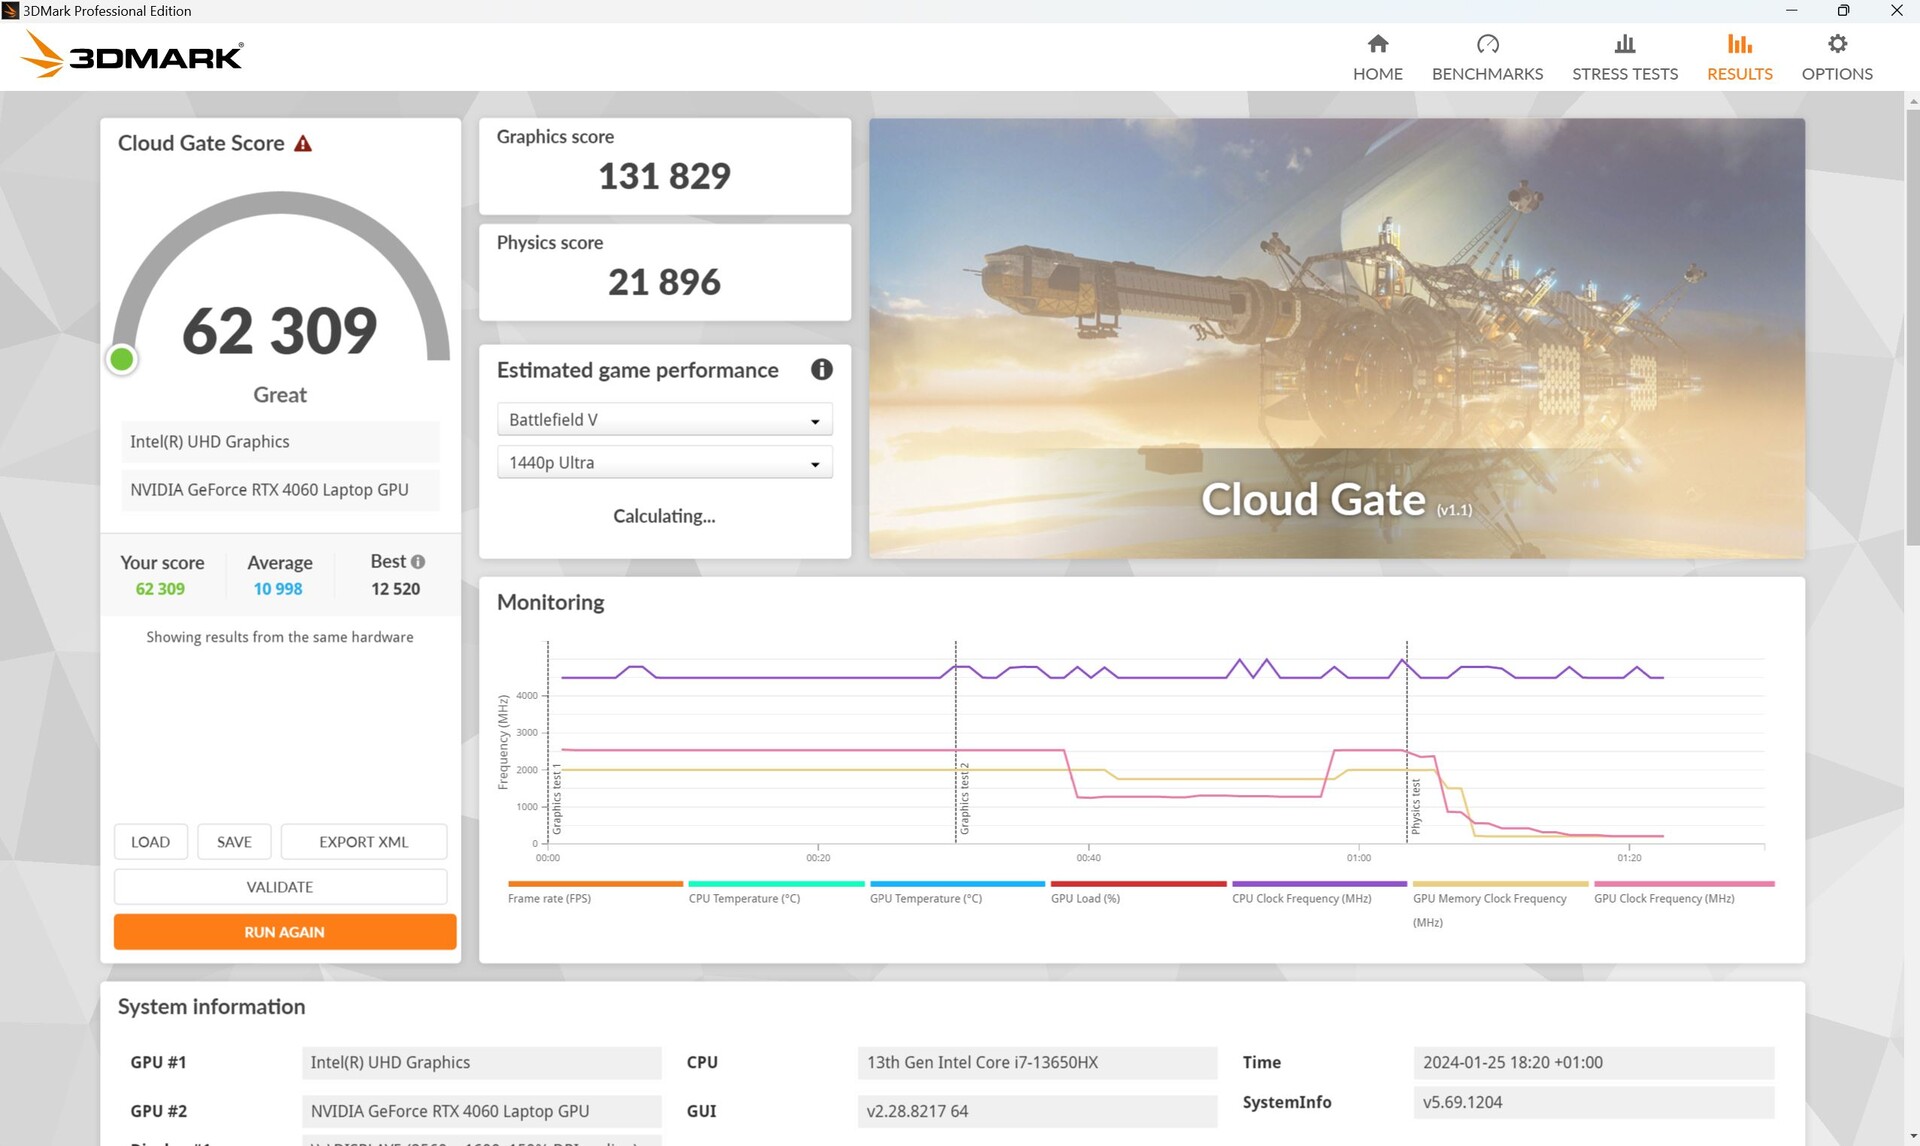
| 3DMark 11 Performance | 31722 puntos | |
| 3DMark Cloud Gate Standard Score | 62309 puntos | |
| 3DMark Fire Strike Score | 24764 puntos | |
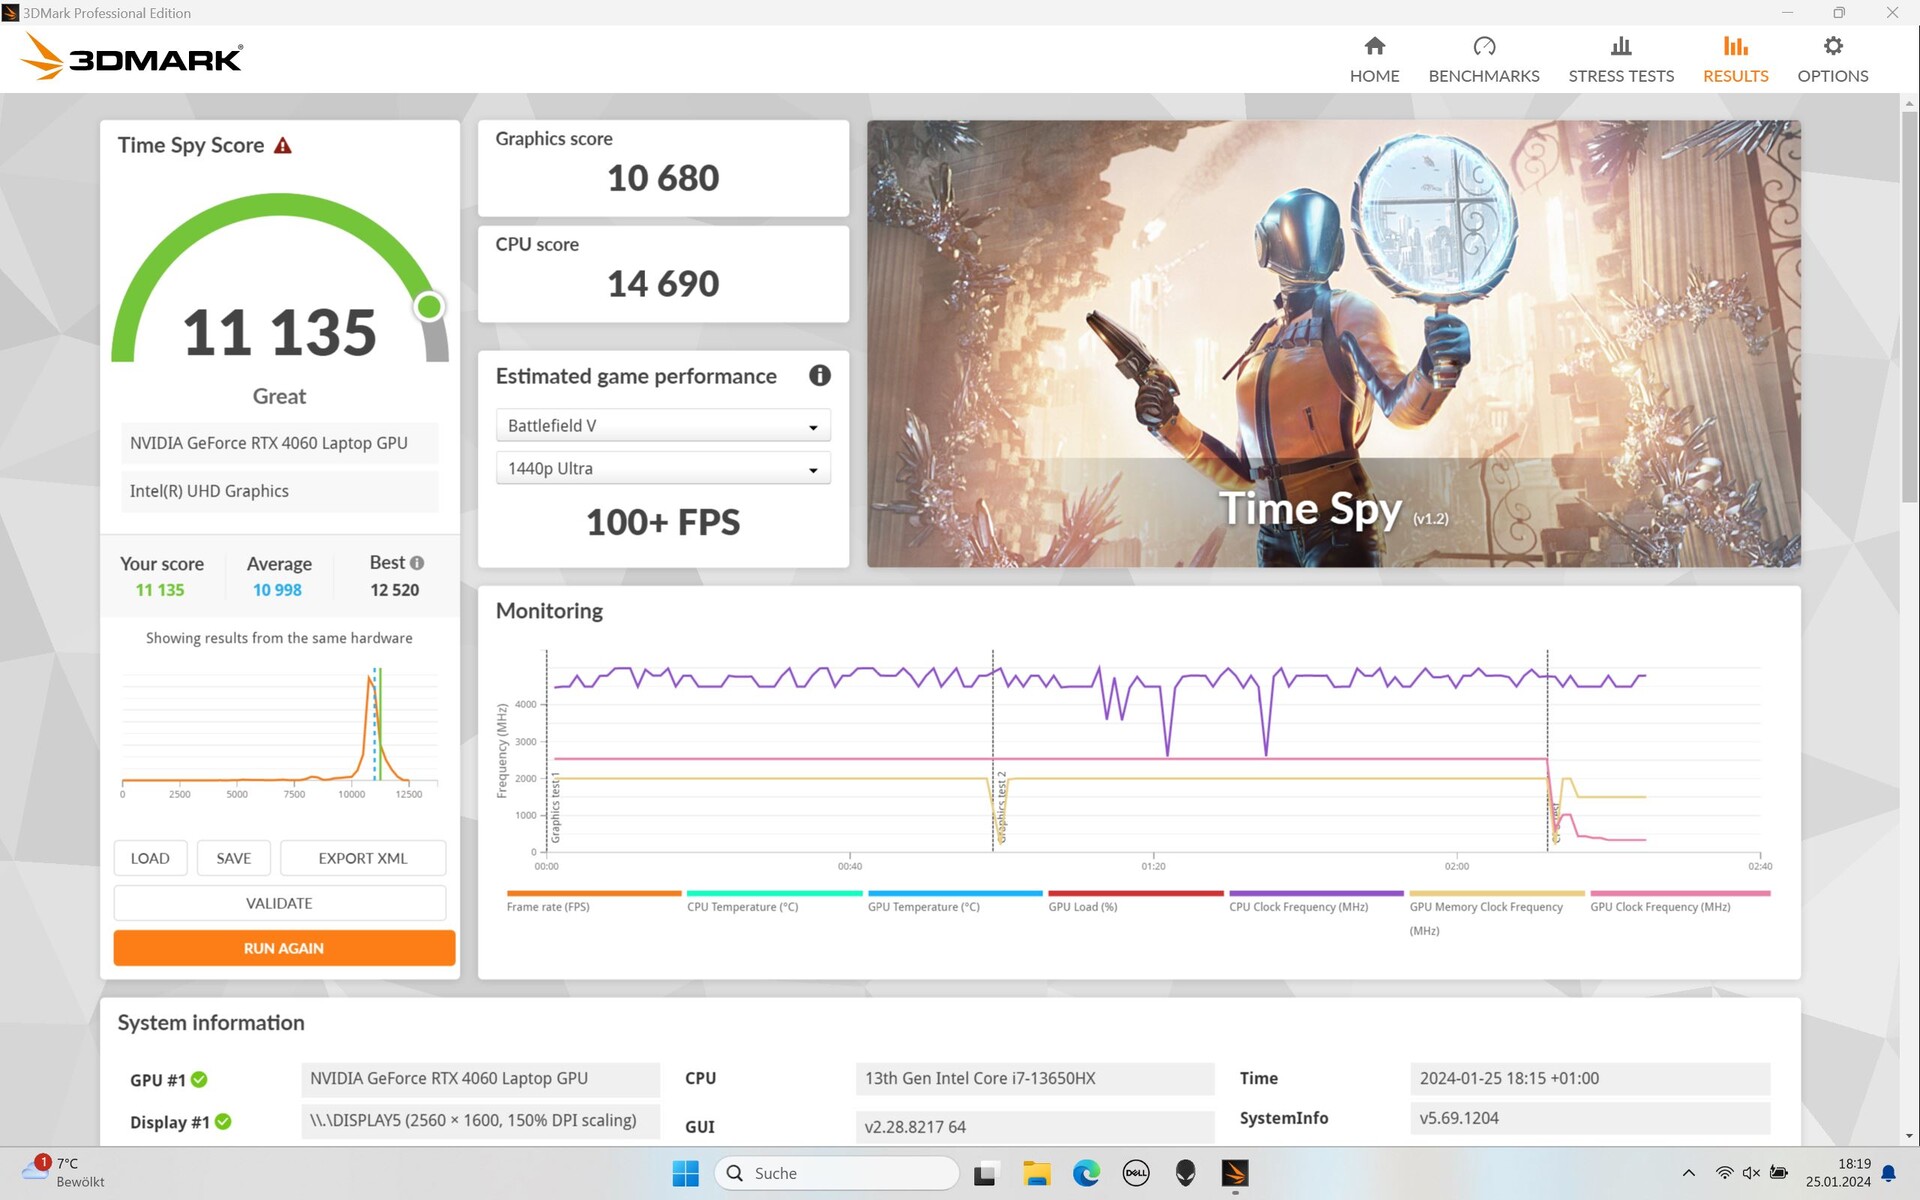
| 3DMark Time Spy Score | 11135 puntos | |
ayuda | ||
* ... más pequeño es mejor
Rendimiento en juegos
Cuando activamos el modo Nvidia-GPU-only para nuestros benchmarks de juegos a través del panel de control, notamos que ciertas configuraciones (e.g. Witcher 3 Full HD Ultra, Strange Brigade QHD) daban como resultado velocidades de fotogramas significativamente más bajas que en el modo Optimus o automático. Esto es bastante inusual y podría provocar cierta frustración.
Por lo demás, no podemos quejarnos del rendimiento en juegos del portátil. En comparación, nuestro G16 quedó un cinco por ciento por detrás del MSI Raider con un i9-13950HX y una RTX 4060, pero el Alienware y Lenovo LOQ quedaron justo por detrás.
En definitiva, todos los juegos actuales se pueden jugar en FHD utilizando los ajustes Ultra a más de 60fps. Usando la resolución nativa de 1.600p, a menudo no podrá lograr nada por encima de los 60fps, pero los juegos aún se ejecutan sin problemas a más de 40 fps.
| Performance rating - Percent | |
| Media de la clase Gaming | |
| MSI Raider GE68HX 13VF -1! | |
| Dell G16, i7-13650HX, RTX 4060 | |
| Lenovo LOQ 16IRH8 | |
| Alienware m16 R1 Intel -1! | |
| Dell G16 7620 | |
| Lenovo Legion Slim 5 16APH8 | |
| The Witcher 3 - 1920x1080 Ultra Graphics & Postprocessing (HBAO+) | |
| Media de la clase Gaming (104.7 - 240, n=7, últimos 2 años) | |
| Dell G16, i7-13650HX, RTX 4060 | |
| Alienware m16 R1 Intel | |
| Lenovo LOQ 16IRH8 | |
| MSI Raider GE68HX 13VF | |
| Lenovo Legion Slim 5 16APH8 | |
| Dell G16 7620 | |
| GTA V - 1920x1080 Highest AA:4xMSAA + FX AF:16x | |
| Media de la clase Gaming (48.3 - 186.9, n=94, últimos 2 años) | |
| Dell G16, i7-13650HX, RTX 4060 | |
| Lenovo LOQ 16IRH8 | |
| Dell G16 7620 | |
| Lenovo Legion Slim 5 16APH8 | |
| Final Fantasy XV Benchmark - 1920x1080 High Quality | |
| Media de la clase Gaming (41 - 215, n=95, últimos 2 años) | |
| Alienware m16 R1 Intel | |
| Dell G16, i7-13650HX, RTX 4060 | |
| MSI Raider GE68HX 13VF | |
| Lenovo LOQ 16IRH8 | |
| Lenovo Legion Slim 5 16APH8 | |
| Dell G16 7620 | |
| Strange Brigade - 1920x1080 ultra AA:ultra AF:16 | |
| Media de la clase Gaming (76.3 - 458, n=87, últimos 2 años) | |
| Dell G16, i7-13650HX, RTX 4060 | |
| MSI Raider GE68HX 13VF | |
| Alienware m16 R1 Intel | |
| Lenovo LOQ 16IRH8 | |
| Lenovo Legion Slim 5 16APH8 | |
| Dell G16 7620 | |
| Dota 2 Reborn - 1920x1080 ultra (3/3) best looking | |
| MSI Raider GE68HX 13VF | |
| Media de la clase Gaming (84.8 - 248, n=107, últimos 2 años) | |
| Alienware m16 R1 Intel | |
| Lenovo LOQ 16IRH8 | |
| Dell G16, i7-13650HX, RTX 4060 | |
| Dell G16 7620 | |
| Lenovo Legion Slim 5 16APH8 | |
En Witcher 3 Ultra, nuestra G16 ofreció su mejor rendimiento y superó las frecuencias de cuadro de la competencia desde ligeramente (Alienware) hasta considerablemente (Legion Slim 5, GPU automática).
En la tabla siguiente se enumeran los valores de fps de Witcher 3 (FHD Ultra), así como nuestras mediciones de emisión de ruido y consumo en función de los tres modos de rendimiento.
| Rendimiento modo/valor | fps inicio | fps media | emisiones sonoras | consumo |
|---|---|---|---|---|
| Rendimiento | 108 | 105,6 | 47,89 dB | 185 vatios |
| Equilibrado | 100 | 97,6 | 39 - 43 dB | 178 vatios |
| Silencioso | 99 | 97,6 | 35,52 dB | 168 vatios |
Witcher 3 FPS diagram
| bajo | medio | alto | ultra | QHD | 4K | |
|---|---|---|---|---|---|---|
| GTA V (2015) | 185.8 | 183.2 | 176.2 | 117.4 | 50.8 | |
| The Witcher 3 (2015) | 340.4 | 193.1 | 110 | 108 | 42.4 | |
| Dota 2 Reborn (2015) | 177 | 168.7 | 160.8 | 149 | 126.2 | |
| Final Fantasy XV Benchmark (2018) | 219 | 150.1 | 103.7 | 75.9 | ||
| X-Plane 11.11 (2018) | 160.4 | 144.6 | 114.9 | 119.6 | ||
| Far Cry 5 (2018) | 176 | 148 | 141 | 135 | 105 | |
| Strange Brigade (2018) | 478 | 291 | 228 | 194.9 | 129 | |
| Cyberpunk 2077 (2023) | 131.1 | 75.6 | 69.8 | 45.6 |
Emisiones - Bastante silencioso incluso jugando
Emisiones sonoras
En modo inactivo, los ventiladores están apagados cuando se utilizan todos los modos excepto el de rendimiento. En 3DMark06, nuestro escenario de carga media, el portátil tiene las mismas emisiones de ruido que en modo inactivo( modo de rendimiento, aprox. 28 dB), por lo que los ventiladores no giran más rápido.
Incluso cuando juega y está a plena carga, el Dell G16 sigue siendo notablemente más silencioso que la competencia, muy por debajo de los 50 dB, que parece ser donde su enorme sistema de refrigeración da sus frutos.
Ruido
| Ocioso |
| 23 / 23 / 27.96 dB(A) |
| Carga |
| 27.96 / 47.89 dB(A) |
 | ||
30 dB silencioso 40 dB(A) audible 50 dB(A) ruidosamente alto |
||
min: | ||
| Dell G16, i7-13650HX, RTX 4060 GeForce RTX 4060 Laptop GPU, i7-13650HX, WD PC SN740 SDDPNQD-1T00 | Dell G16 7620 GeForce RTX 3060 Laptop GPU, i7-12700H, WDC PC SN810 512GB | MSI Raider GE68HX 13VF GeForce RTX 4060 Laptop GPU, i9-13950HX, Samsung PM9B1 1024GB MZVL41T0HBLB | Lenovo Legion Slim 5 16APH8 GeForce RTX 4060 Laptop GPU, R7 7840HS, SK hynix PC801 HFS512GEJ9X115N | Alienware m16 R1 Intel GeForce RTX 4060 Laptop GPU, i7-13700HX, Kioxia KXG70ZNV512G | Lenovo LOQ 16IRH8 GeForce RTX 4060 Laptop GPU, i7-13620H, Solidigm SSDPFINW512GZL | |
|---|---|---|---|---|---|---|
| Noise | -10% | -26% | -6% | -19% | -16% | |
| apagado / medio ambiente * (dB) | 23 | 23.2 -1% | 23.3 -1% | 22.9 -0% | 25 -9% | 23 -0% |
| Idle Minimum * (dB) | 23 | 28.3 -23% | 25 -9% | 23.1 -0% | 25 -9% | 23 -0% |
| Idle Average * (dB) | 23 | 28.8 -25% | 31.3 -36% | 23.1 -0% | 26 -13% | 23 -0% |
| Idle Maximum * (dB) | 27.96 | 28.9 -3% | 37.5 -34% | 27.7 1% | 27 3% | 27.66 1% |
| Load Average * (dB) | 27.96 | 32.4 -16% | 44 -57% | 33.3 -19% | 52 -86% | 53.62 -92% |
| Witcher 3 ultra * (dB) | 47.89 | 48.3 -1% | 57 -19% | 54 -13% | 51 -6% | 53.5 -12% |
| Load Maximum * (dB) | 47.89 | 48.1 -0% | 60.1 -25% | 54 -13% | 53 -11% | 53.5 -12% |
* ... más pequeño es mejor
Temperatura
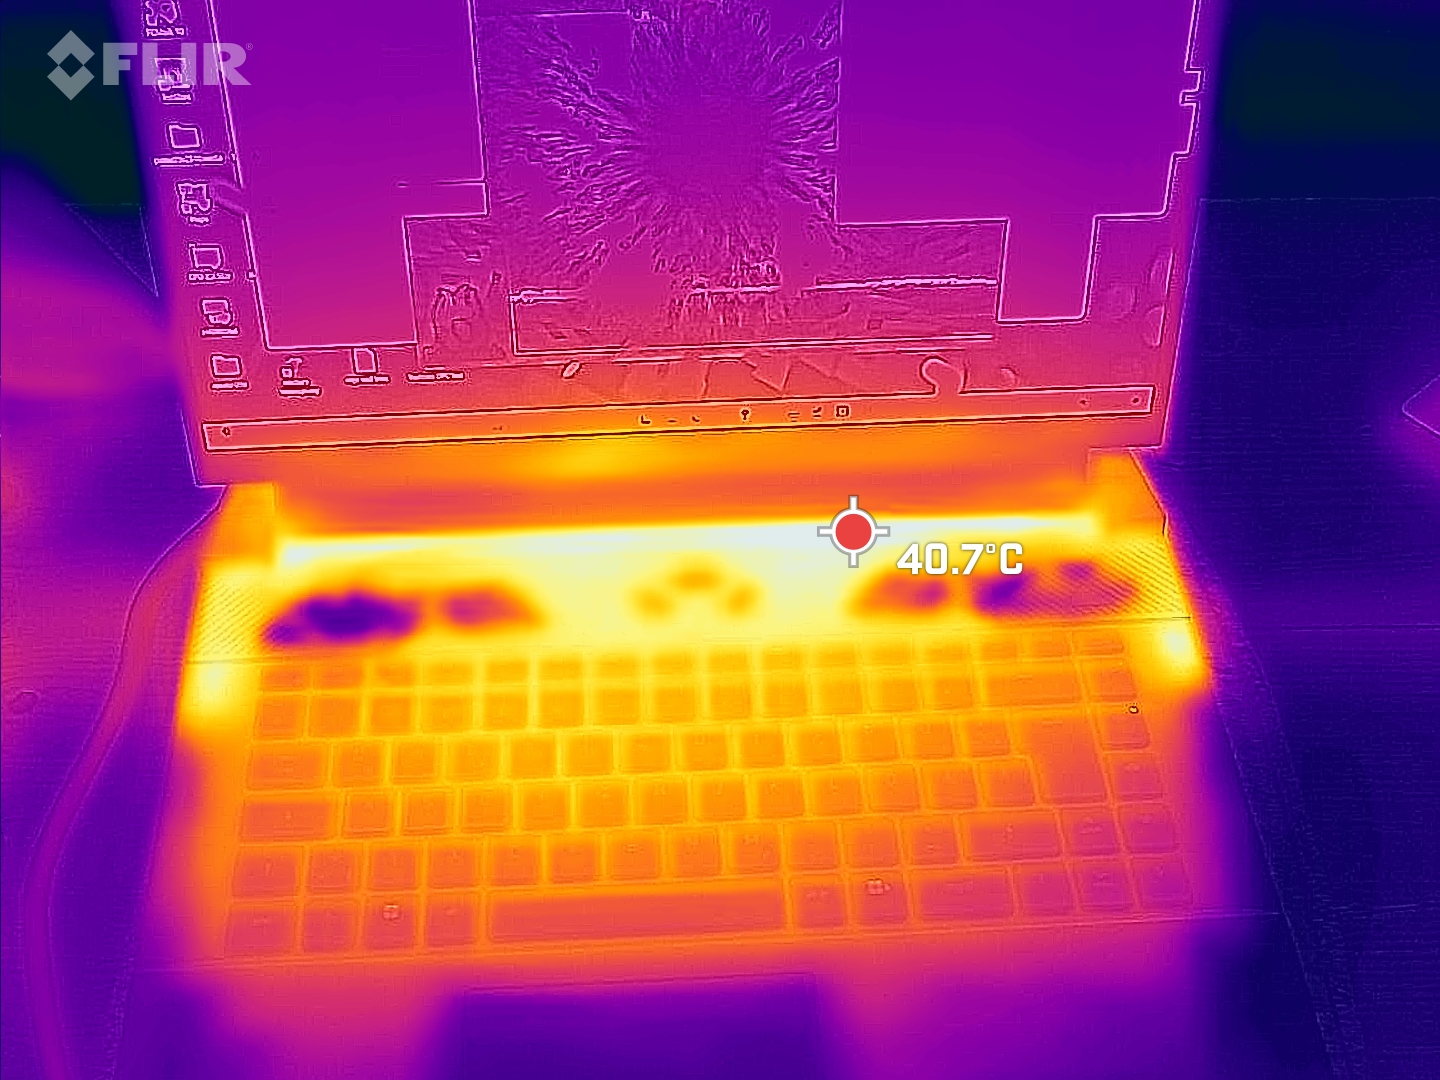
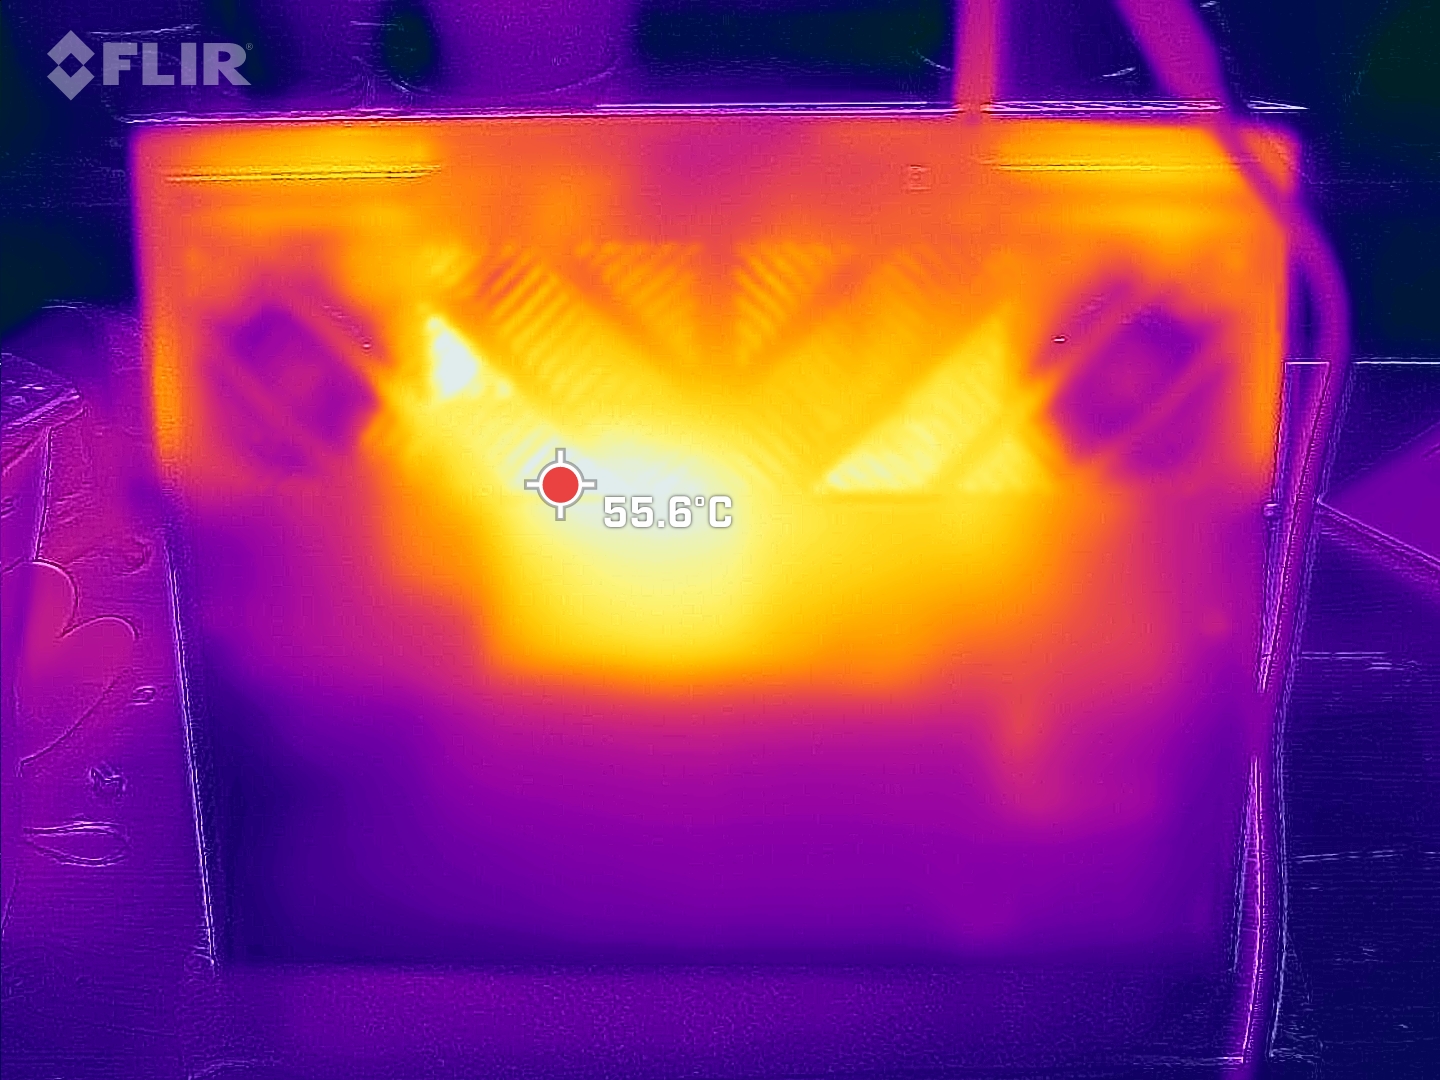
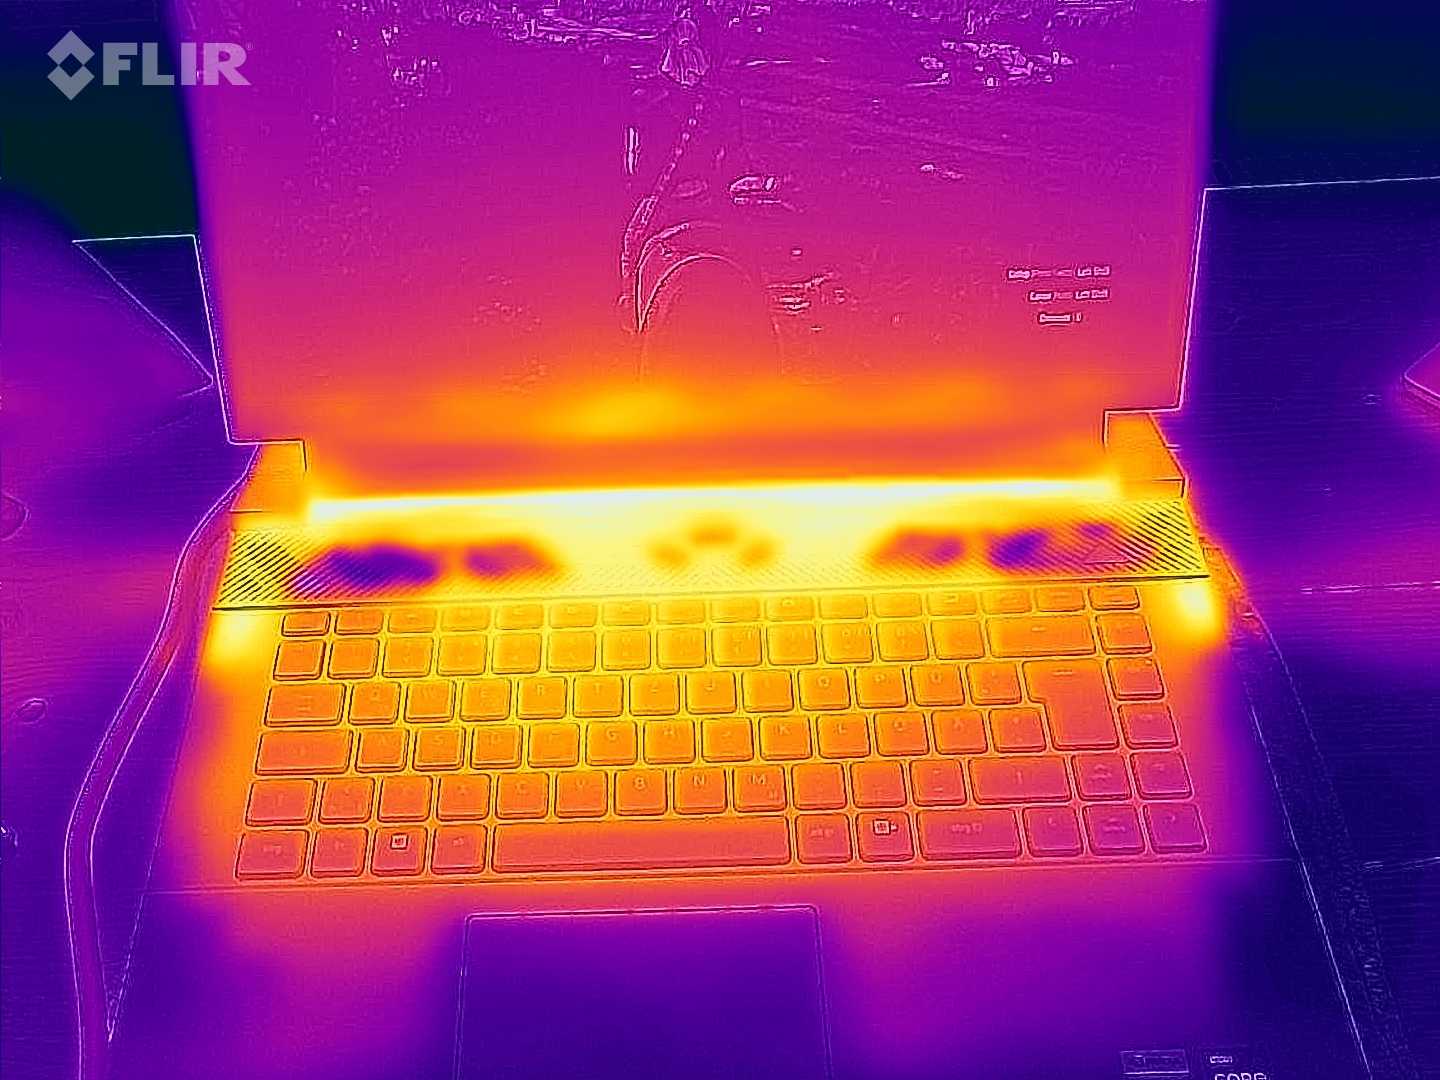
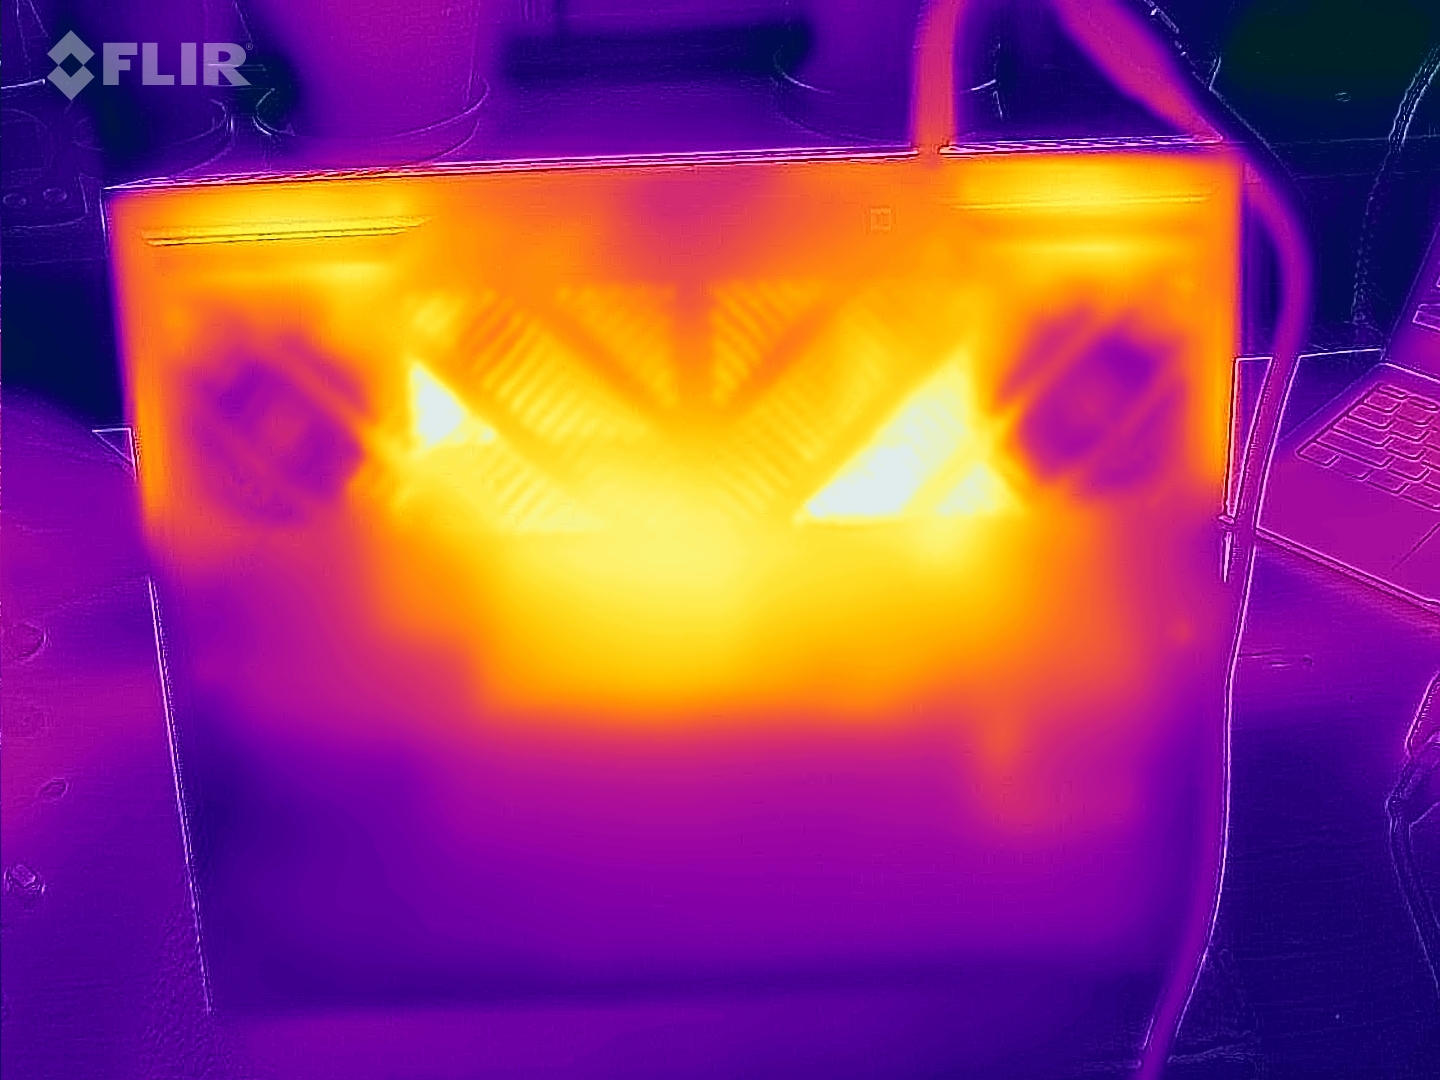
Sin embargo, las emisiones de ruido comparativamente bajas del dispositivo también tienen algunas ligeras desventajas. La superficie de la G16 tiende a calentarse más que la de sus competidoras. Hemos medido puntos calientes de hasta 58 °C en la parte inferior bajo carga máxima Sólo el Lenovo LOQ 16 y el predecesor del G16 se calientan de forma similar, mientras que los otros dispositivos de la comparación se mantienen justo por debajo de los 50 °C. Al menos los reposamanos están siempre frescos, y la zona que rodea las teclas WASD también se mantiene dentro de un rango aceptable.
(-) La temperatura máxima en la parte superior es de 49 °C / 120 F, frente a la media de 40.4 °C / 105 F, que oscila entre 21.2 y 68.8 °C para la clase Gaming.
(-) El fondo se calienta hasta un máximo de 58 °C / 136 F, frente a la media de 43.2 °C / 110 F
(+) En reposo, la temperatura media de la parte superior es de 30 °C / 86# F, frente a la media del dispositivo de 33.9 °C / 93 F.
(±) Jugando a The Witcher 3, la temperatura media de la parte superior es de 34.4 °C / 94 F, frente a la media del dispositivo de 33.9 °C / 93 F.
(+) El reposamanos y el panel táctil están a una temperatura inferior a la de la piel, con un máximo de 25 °C / 77 F y, por tanto, son fríos al tacto.
(+) La temperatura media de la zona del reposamanos de dispositivos similares fue de 28.8 °C / 83.8 F (+3.8 °C / 6.8 F).
| Dell G16, i7-13650HX, RTX 4060 Intel Core i7-13650HX, NVIDIA GeForce RTX 4060 Laptop GPU | Dell G16 7620 Intel Core i7-12700H, NVIDIA GeForce RTX 3060 Laptop GPU | MSI Raider GE68HX 13VF Intel Core i9-13950HX, NVIDIA GeForce RTX 4060 Laptop GPU | Lenovo Legion Slim 5 16APH8 AMD Ryzen 7 7840HS, NVIDIA GeForce RTX 4060 Laptop GPU | Alienware m16 R1 Intel Intel Core i7-13700HX, NVIDIA GeForce RTX 4060 Laptop GPU | Lenovo LOQ 16IRH8 Intel Core i7-13620H, NVIDIA GeForce RTX 4060 Laptop GPU | |
|---|---|---|---|---|---|---|
| Heat | 19% | 16% | 23% | -2% | 10% | |
| Maximum Upper Side * (°C) | 49 | 47.6 3% | 41.4 16% | 40.6 17% | 49 -0% | 48 2% |
| Maximum Bottom * (°C) | 58 | 54 7% | 45.4 22% | 42 28% | 48 17% | 59 -2% |
| Idle Upper Side * (°C) | 35 | 23 34% | 29.8 15% | 27.8 21% | 40 -14% | 28 20% |
| Idle Bottom * (°C) | 35 | 24.6 30% | 31.4 10% | 26.6 24% | 39 -11% | 28 20% |
* ... más pequeño es mejor
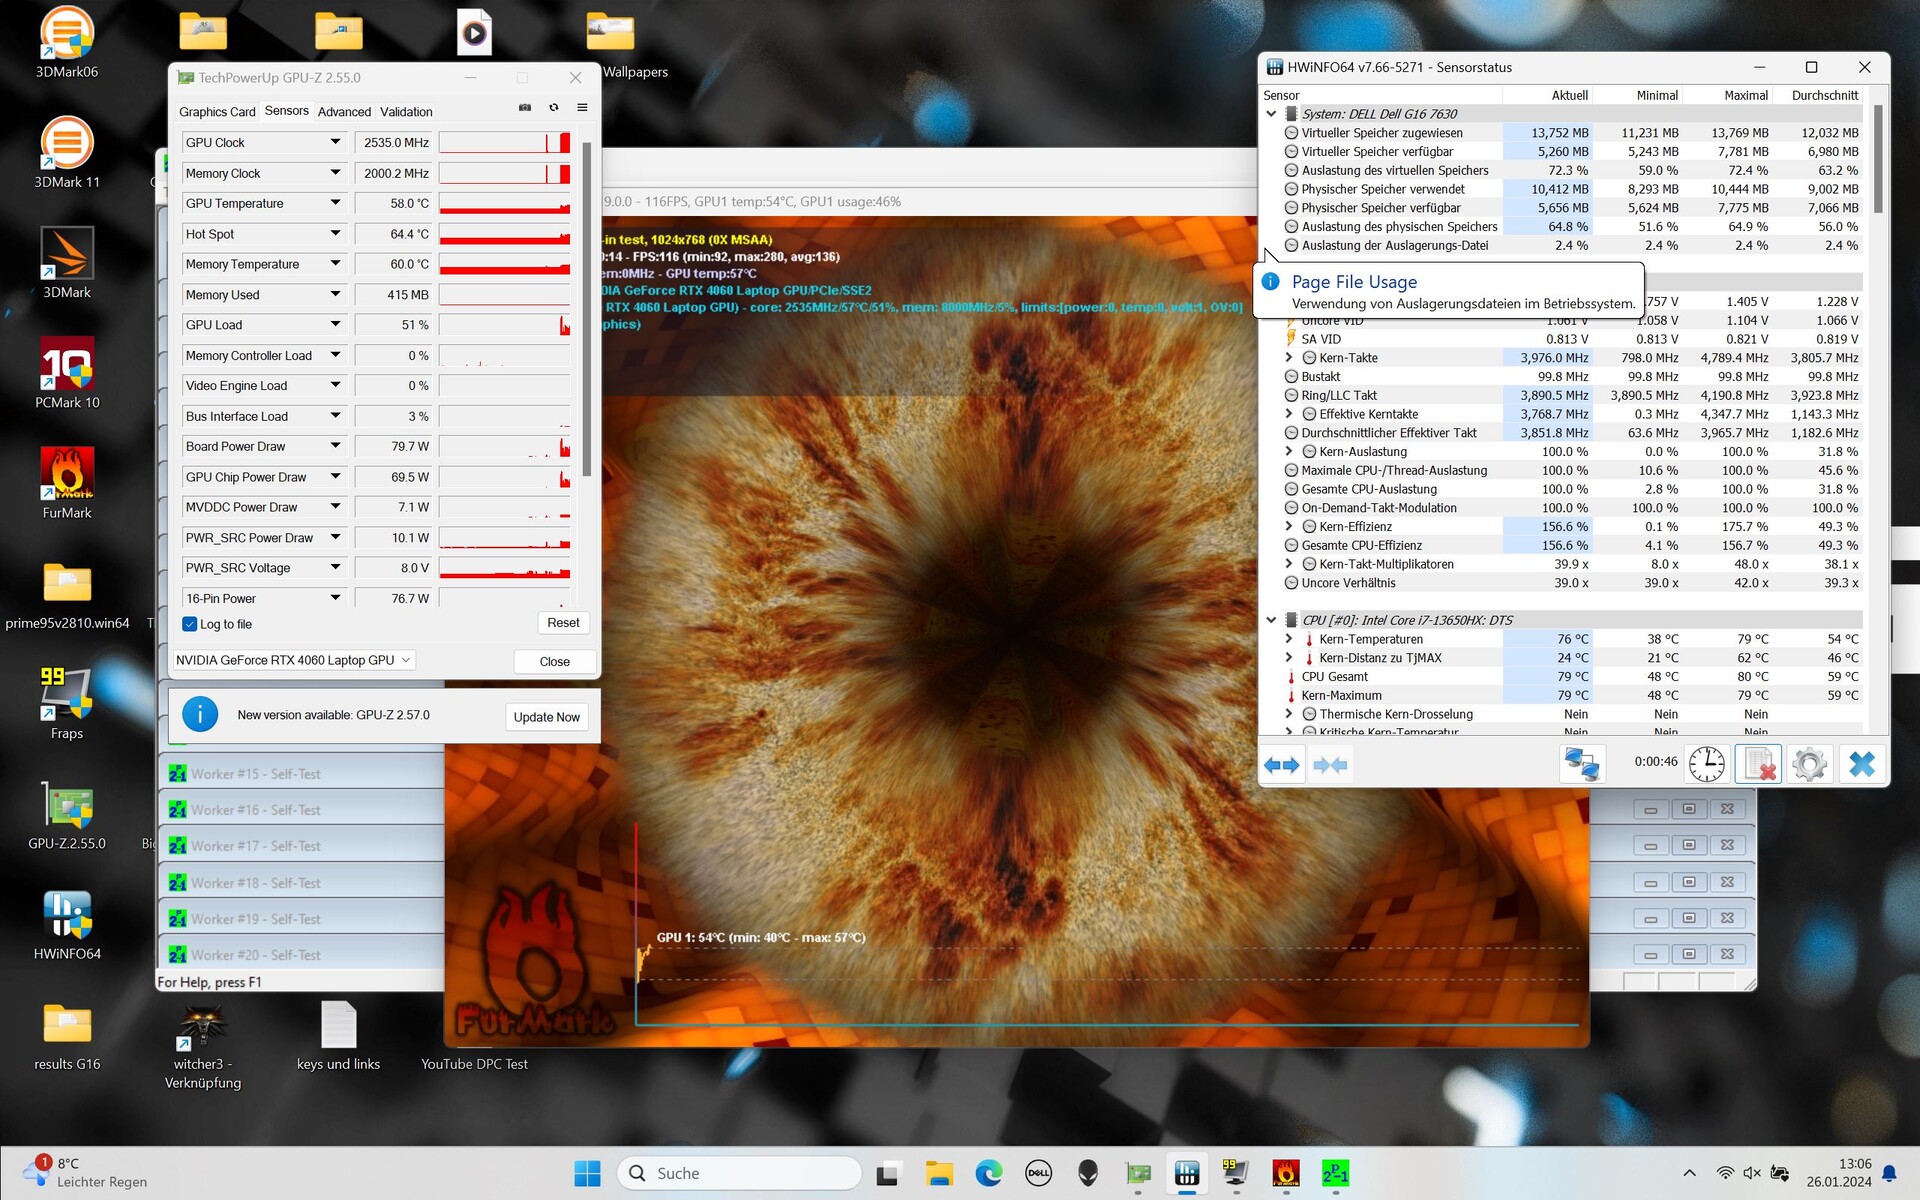
Prueba de esfuerzo
Durante la prueba de estrés, los núcleos alcanzaron brevemente los 4,1 GHz. Desgraciadamente, esto hizo que la CPU se calentara hasta los 100 °C, con lo que el consumo de energía del dispositivo bajó de sus 128 vatios originales y se estabilizó en unos 70 vatios. La velocidad de reloj de la CPU se estabilizó en torno a los 2,9 GHz y las temperaturas en torno a los 85 °C.
Por el contrario, las frecuencias de reloj de la GPU se mantuvieron bastante estables en torno a 2,4 o 2,5 GHz durante todo el tiempo de ejecución. Lo mismo puede decirse del reloj de la memoria (2 GHz). La temperatura del chip se estabilizó en torno a los 72 °C y el consumo medio de energía fue de 71 vatios.
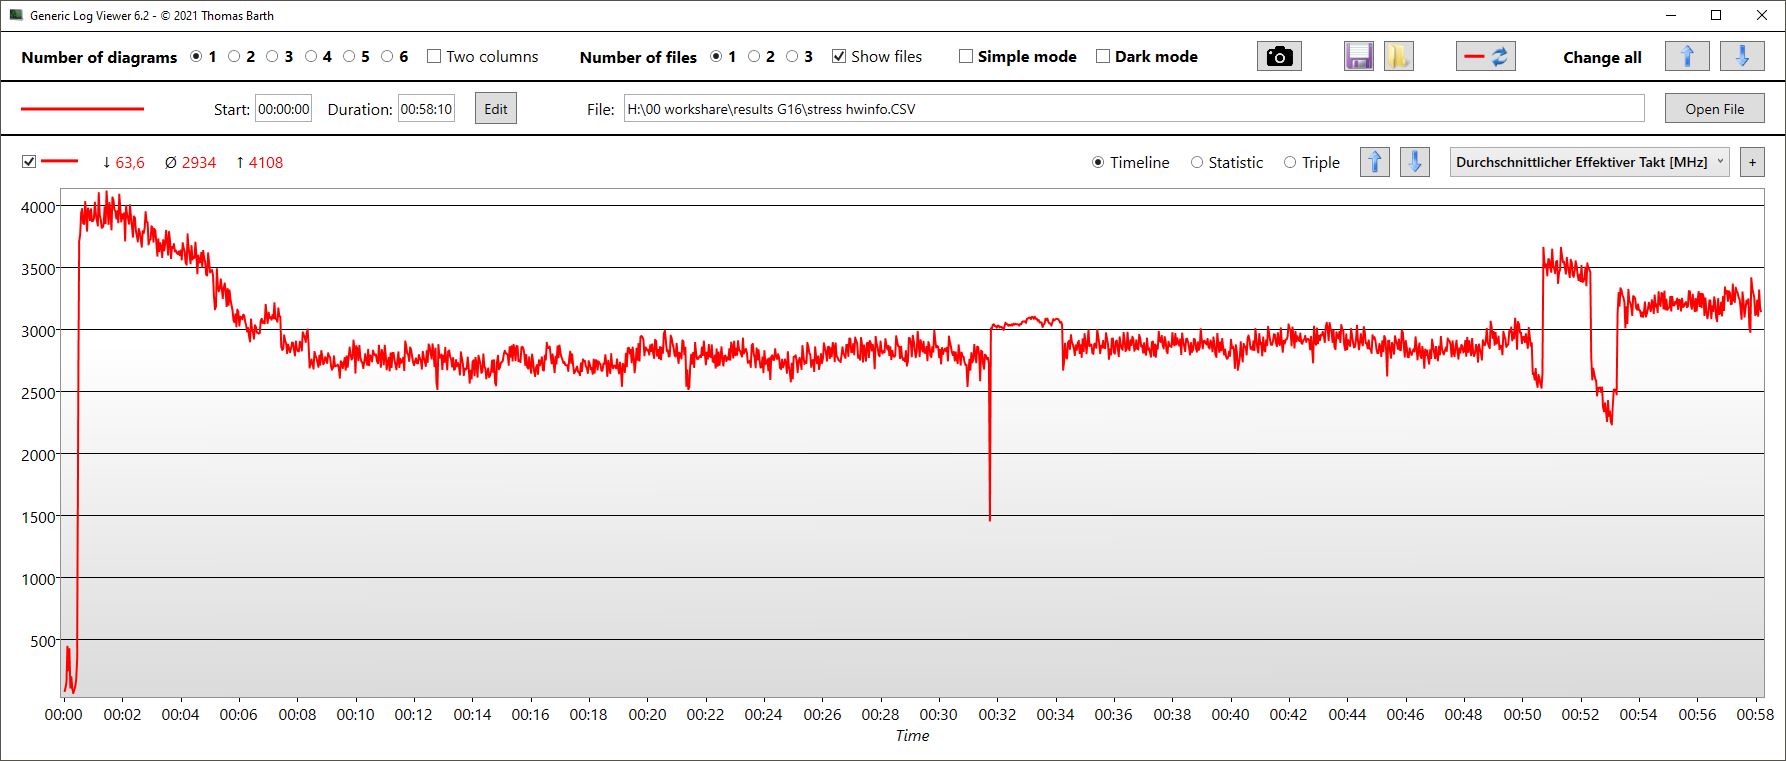
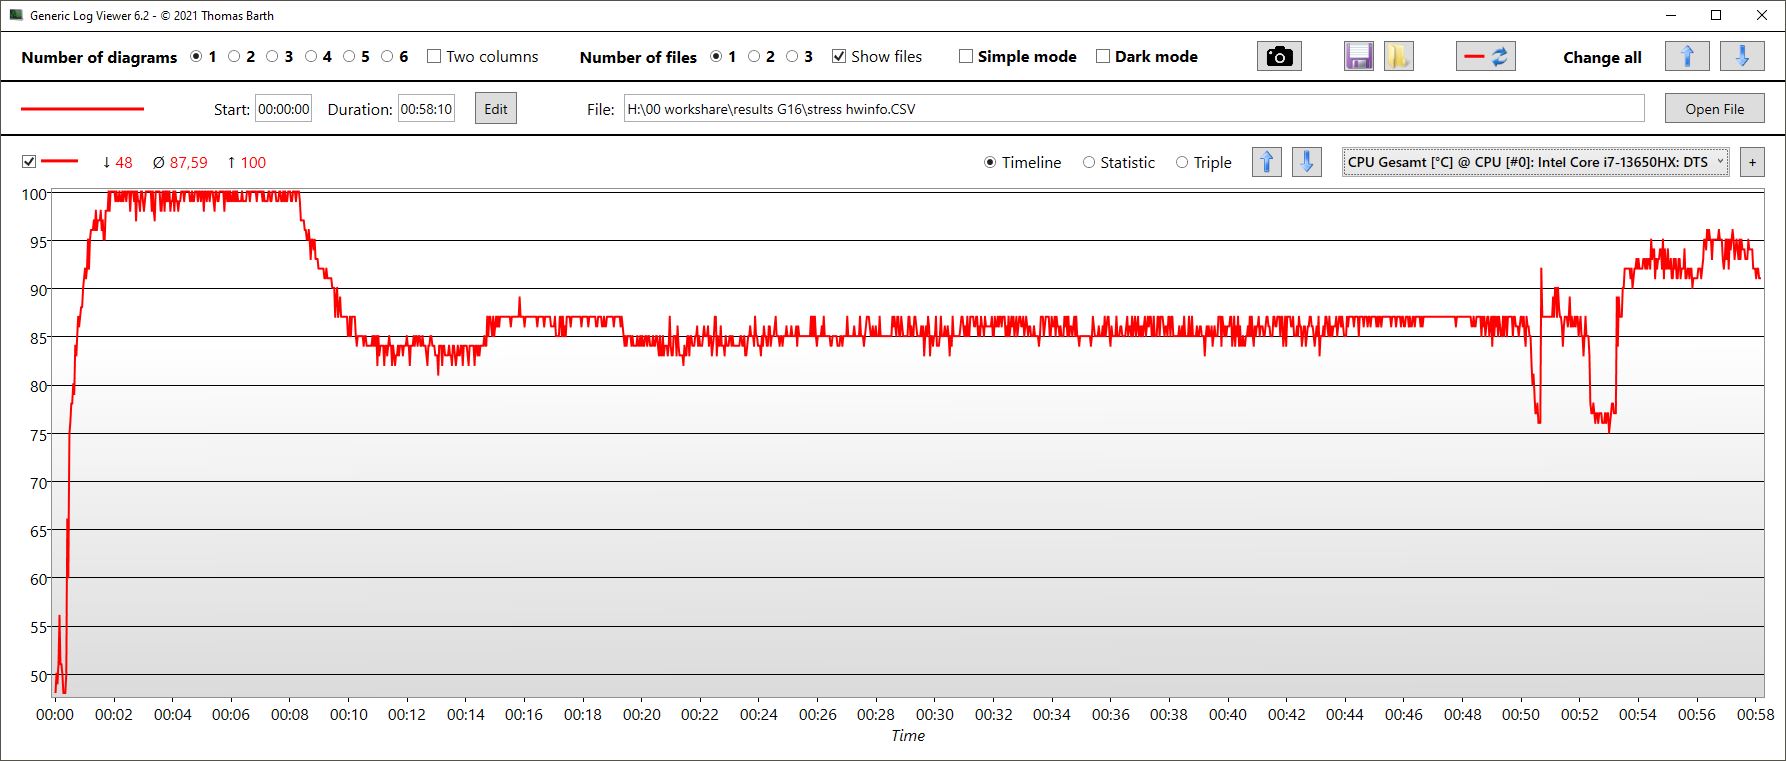
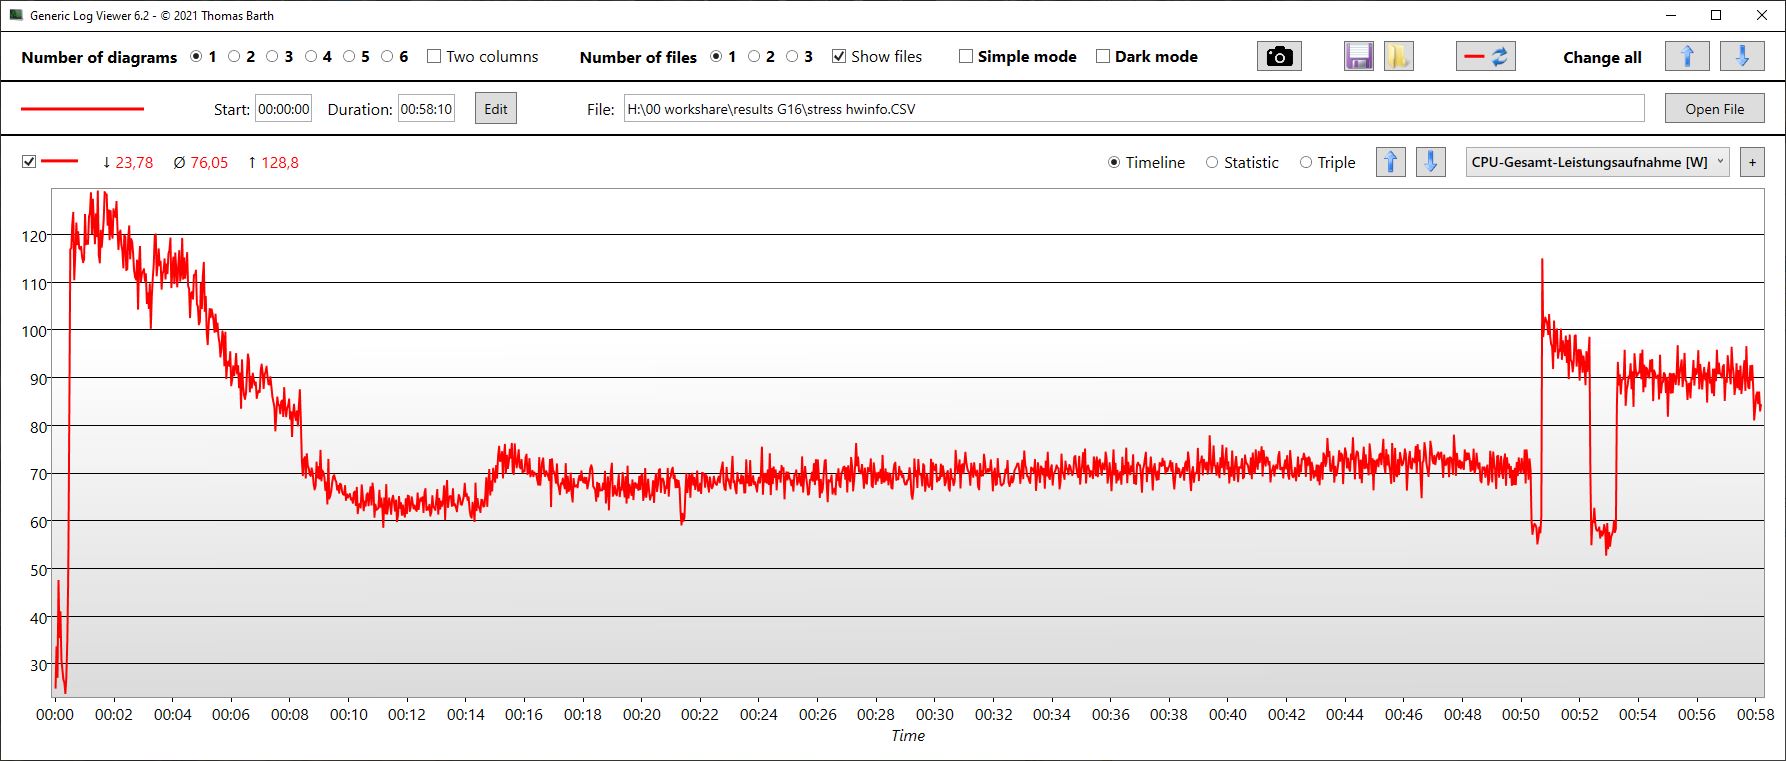
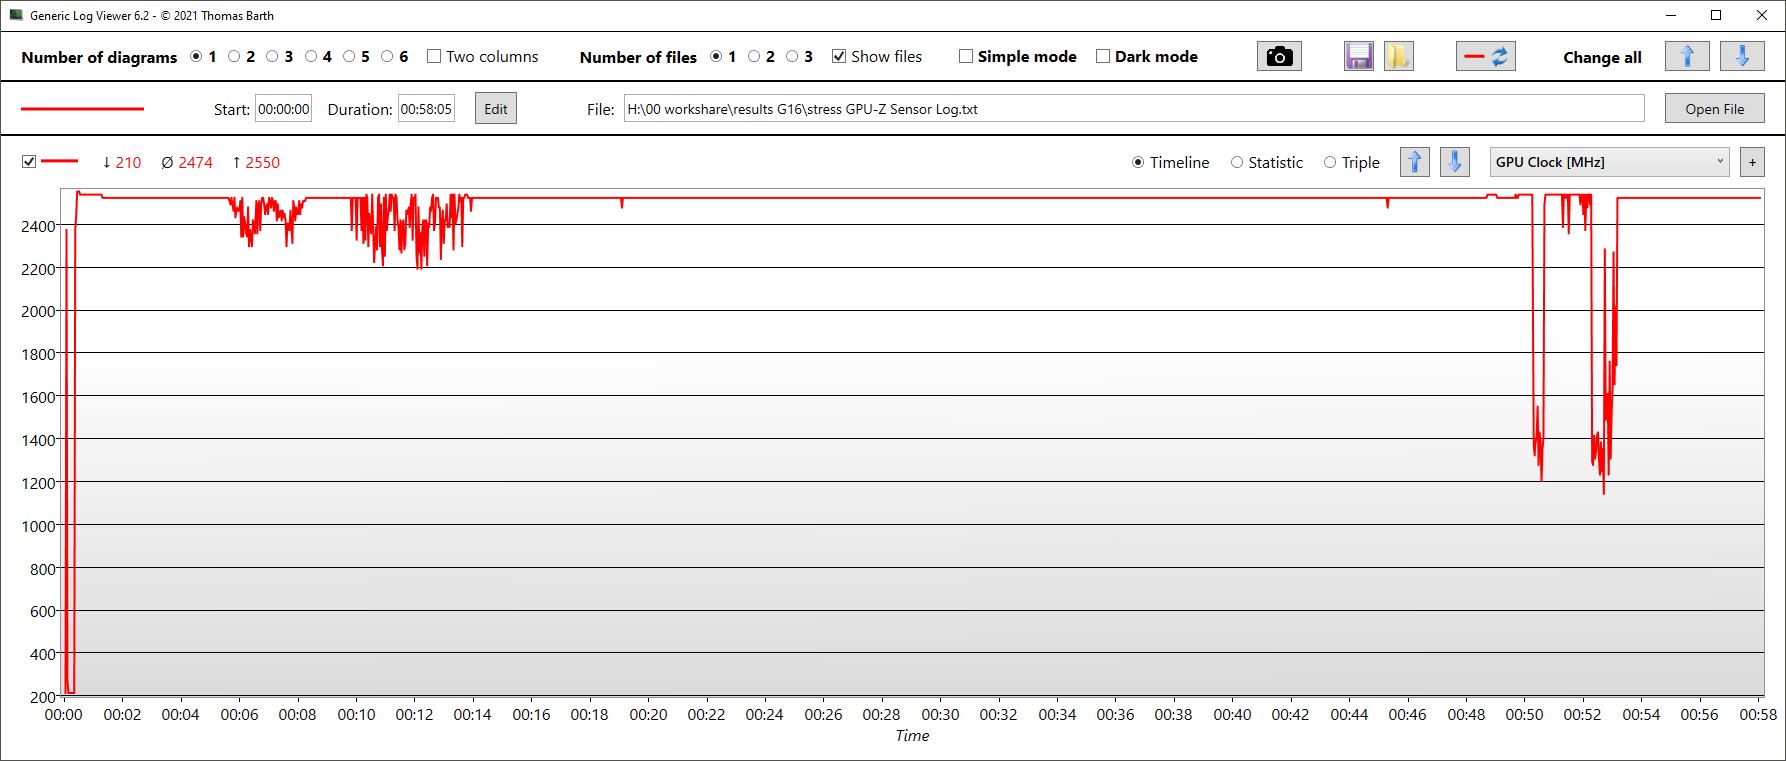
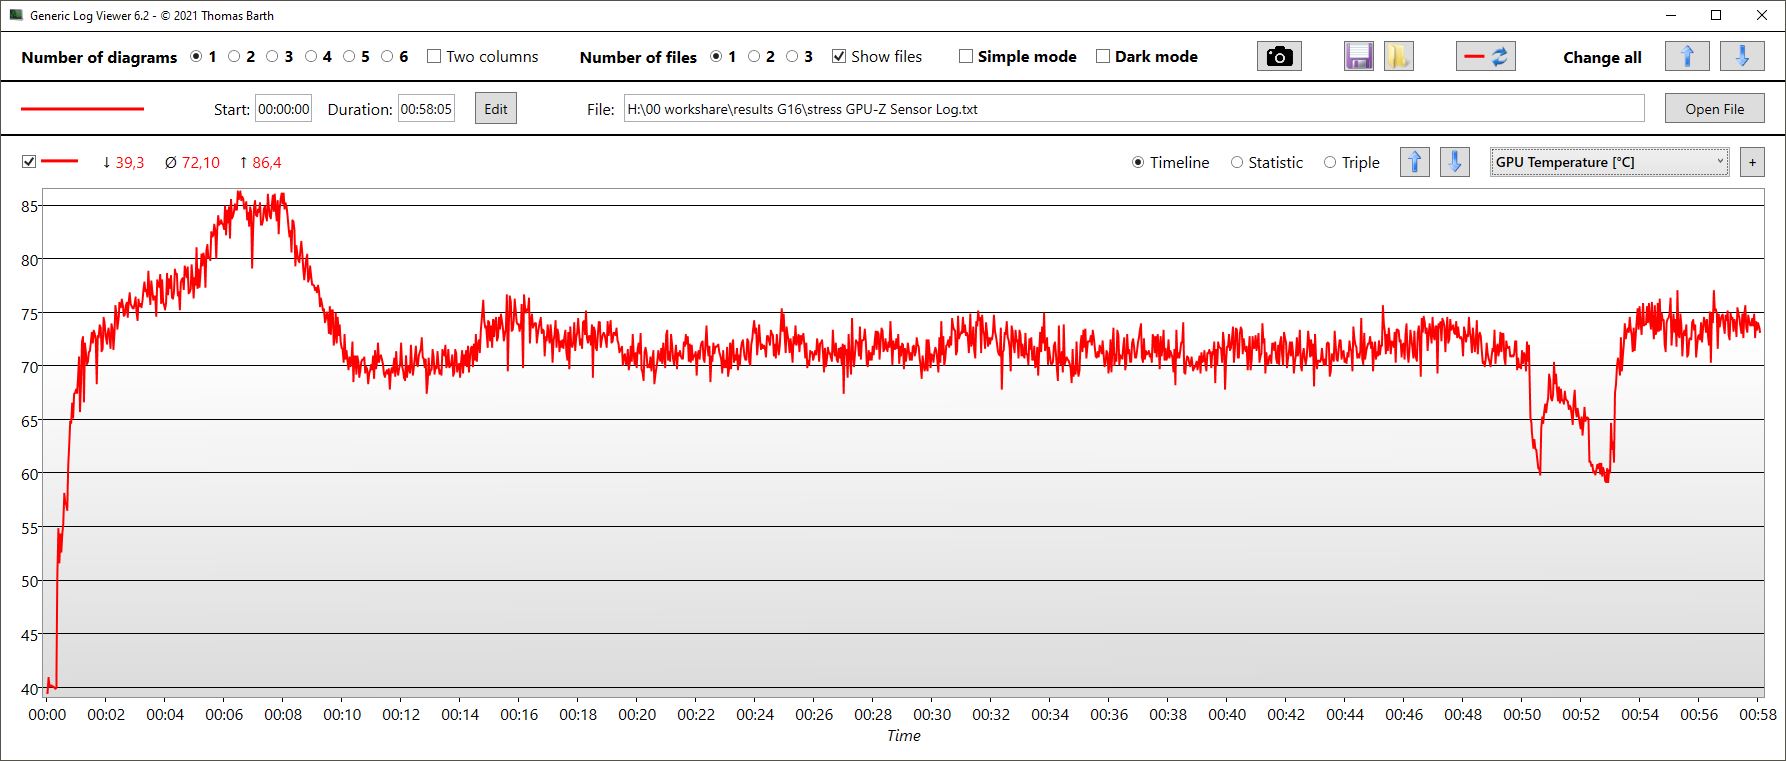
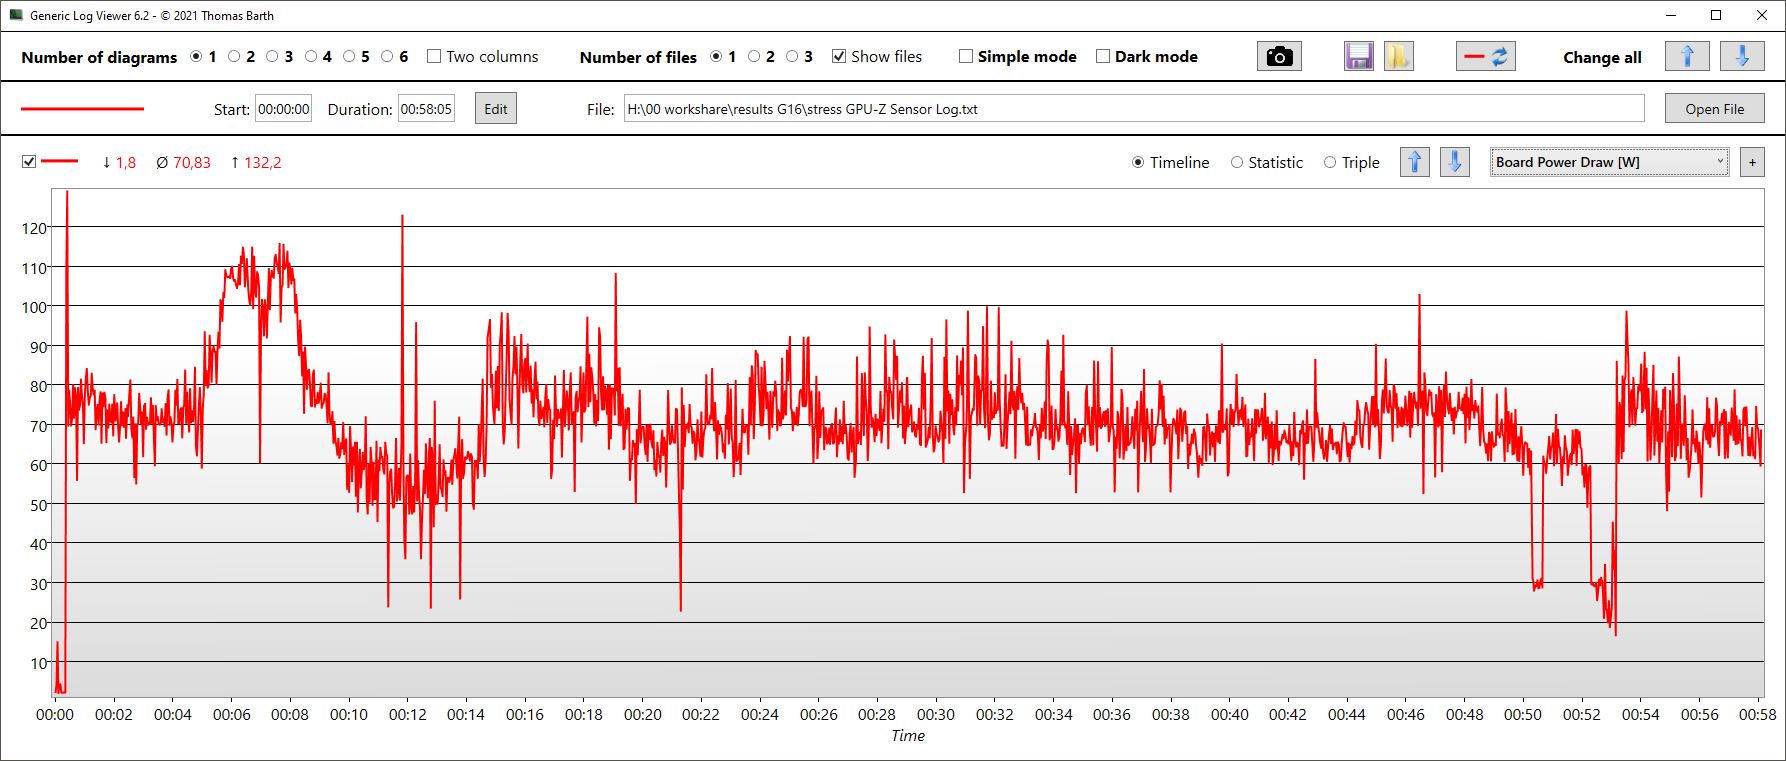
| Reloj dela CPU (GHz) | Reloj de la GPU (MHz) | Temperatura media dela CPU (°C) | Temperatura media de la GPU (°C) | |
| Prime95 + FurMark Estrés | 2,9 | 2.490 | 85 | 72 |
| Witcher 3 Estrés | 0,538 | 2.500 | 81 | 73 |
Altavoces
Los altavoces estéreo del portátil no son los mejores: Apenas hay graves, tienden a ser demasiado silenciosos e incluso los medios y agudos no son muy equilibrados ni lineales. Como conexión de audio analógica sólo dispone de una conexión para auriculares de 3,5 mm.
Dell G16, i7-13650HX, RTX 4060 análisis de audio
(±) | la sonoridad del altavoz es media pero buena (80.55 dB)
Graves 100 - 315 Hz
(-) | casi sin bajos - de media 25.1% inferior a la mediana
(-) | los graves no son lineales (18.9% delta a la frecuencia anterior)
Medios 400 - 2000 Hz
(±) | medias más altas - de media 8% más altas que la mediana
(+) | los medios son lineales (5.9% delta a la frecuencia anterior)
Altos 2 - 16 kHz
(+) | máximos equilibrados - a sólo 3.5% de la mediana
(±) | la linealidad de los máximos es media (8.6% delta a frecuencia anterior)
Total 100 - 16.000 Hz
(±) | la linealidad del sonido global es media (23.4% de diferencia con la mediana)
En comparación con la misma clase
» 85% de todos los dispositivos probados de esta clase eran mejores, 5% similares, 11% peores
» El mejor tuvo un delta de 6%, la media fue 18%, el peor fue ###max##%
En comparación con todos los dispositivos probados
» 70% de todos los dispositivos probados eran mejores, 6% similares, 24% peores
» El mejor tuvo un delta de 4%, la media fue 23%, el peor fue ###max##%
Apple MacBook Pro 16 2021 M1 Pro análisis de audio
(+) | los altavoces pueden reproducir a un volumen relativamente alto (#84.7 dB)
Graves 100 - 315 Hz
(+) | buen bajo - sólo 3.8% lejos de la mediana
(+) | el bajo es lineal (5.2% delta a la frecuencia anterior)
Medios 400 - 2000 Hz
(+) | medios equilibrados - a sólo 1.3% de la mediana
(+) | los medios son lineales (2.1% delta a la frecuencia anterior)
Altos 2 - 16 kHz
(+) | máximos equilibrados - a sólo 1.9% de la mediana
(+) | los máximos son lineales (2.7% delta a la frecuencia anterior)
Total 100 - 16.000 Hz
(+) | el sonido global es lineal (4.6% de diferencia con la mediana)
En comparación con la misma clase
» 0% de todos los dispositivos probados de esta clase eran mejores, 0% similares, 100% peores
» El mejor tuvo un delta de 5%, la media fue 17%, el peor fue ###max##%
En comparación con todos los dispositivos probados
» 0% de todos los dispositivos probados eran mejores, 0% similares, 100% peores
» El mejor tuvo un delta de 4%, la media fue 23%, el peor fue ###max##%
Gestión de la energía - La Dell G16 consigue unos resultados medios de su clase
Consumo de energía
Comparado con su rendimiento, el consumo de la G16 está más que bien. En general, el dispositivo es incluso más eficiente. Ahora consume menos que su predecesor, especialmente en reposo. Cuando juega, sólo consume alrededor de un 5 % más con un aumento simultáneo del rendimiento de alrededor del 14 %.
Al jugar, los Alienware y MSI Raider, de velocidad similar, consumen casi lo mismo, concretamente una media de 185 vatios al jugar a The Witcher 3. Su consumo máximo a corto plazo es de 255 vatios.
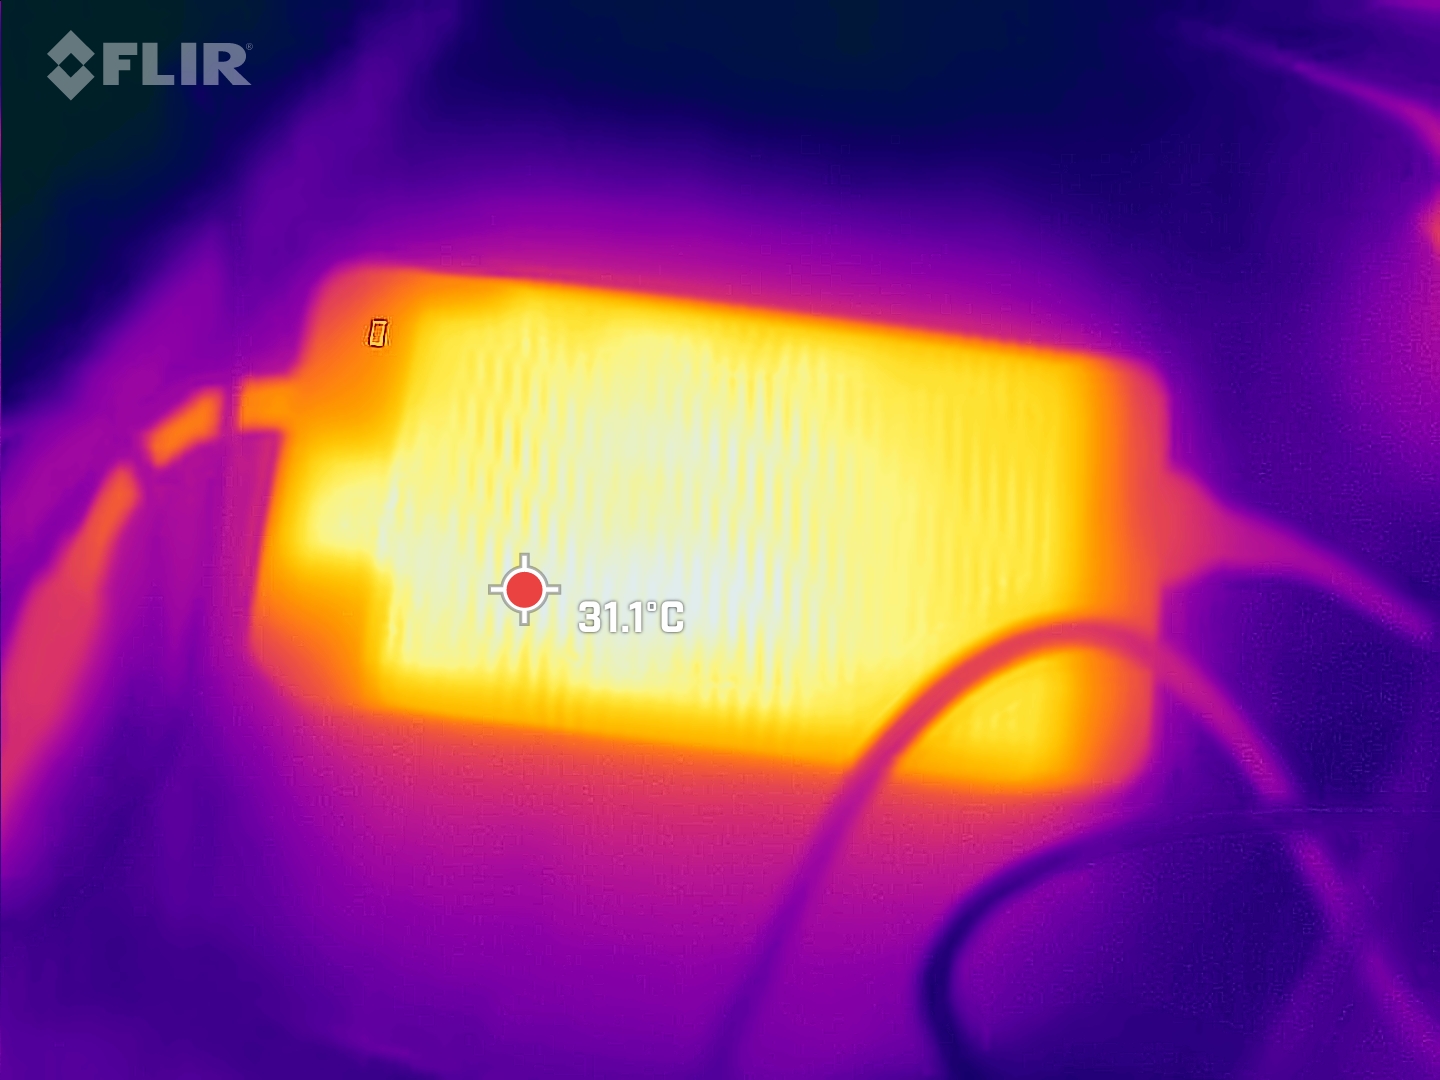
Teniendo esto en cuenta, es muy sorprendente que Dell haya incluido una enorme, tosca y pesada fuente de alimentación de 330 vatios con la G16 con una RTX 4060. Está completamente sobredimensionada para el hardware instalado. Presumiblemente, Dell simplemente envía la misma fuente de alimentación con todas las configuraciones para que también esté equipada para el i9-13900HX y la RTX 4070. Una fuente de alimentación más pequeña y ligera habría sido más conveniente para los clientes que adquieran este modelo.
| Off / Standby | |
| Ocioso | |
| Carga |
|
Clave:
min: | |
| Dell G16, i7-13650HX, RTX 4060 i7-13650HX, GeForce RTX 4060 Laptop GPU, WD PC SN740 SDDPNQD-1T00, IPS, 2560x1600, 16" | Dell G16 7620 i7-12700H, GeForce RTX 3060 Laptop GPU, WDC PC SN810 512GB, IPS, 2560x1600, 16" | MSI Raider GE68HX 13VF i9-13950HX, GeForce RTX 4060 Laptop GPU, Samsung PM9B1 1024GB MZVL41T0HBLB, IPS, 1900x1200, 16" | Lenovo Legion Slim 5 16APH8 R7 7840HS, GeForce RTX 4060 Laptop GPU, SK hynix PC801 HFS512GEJ9X115N, IPS, 2560x1600, 16" | Alienware m16 R1 Intel i7-13700HX, GeForce RTX 4060 Laptop GPU, Kioxia KXG70ZNV512G, IPS, 2560x1600, 16" | Lenovo LOQ 16IRH8 i7-13620H, GeForce RTX 4060 Laptop GPU, Solidigm SSDPFINW512GZL, IPS, 2560x1600, 16" | Medio NVIDIA GeForce RTX 4060 Laptop GPU | Media de la clase Gaming | |
|---|---|---|---|---|---|---|---|---|
| Power Consumption | -21% | -32% | 9% | -9% | -12% | -1% | -19% | |
| Idle Minimum * (Watt) | 11 | 14.4 -31% | 15.8 -44% | 9.4 15% | 10 9% | 17.2 -56% | 11.5 ? -5% | 13 ? -18% |
| Idle Average * (Watt) | 14.8 | 17.8 -20% | 19.4 -31% | 15.5 -5% | 14 5% | 19.3 -30% | 16 ? -8% | 18.7 ? -26% |
| Idle Maximum * (Watt) | 16.8 | 31.5 -88% | 27.3 -63% | 24.4 -45% | 21 -25% | 21.2 -26% | 20.3 ? -21% | 24.3 ? -45% |
| Load Average * (Watt) | 103.7 | 101.2 2% | 114.7 -11% | 74.1 29% | 119 -15% | 90 13% | 92.9 ? 10% | 110.2 ? -6% |
| Witcher 3 ultra * (Watt) | 185 | 176.9 4% | 185.5 -0% | 112.9 39% | 186.7 -1% | 168 9% | ||
| Load Maximum * (Watt) | 255 | 242.9 5% | 364.2 -43% | 206.5 19% | 323 -27% | 211 17% | 210 ? 18% | 258 ? -1% |
* ... más pequeño es mejor
Power consumption Witcher 3 / stress test
Power consumption with external monitor
Tiempos de ejecución
Dell ha instalado una batería de 86 Wh en el portátil. La competencia está equipada de forma similar. Esto es suficiente para que el G16 logre tiempos de ejecución de unas 5,5 horas (brillo máximo) a casi 6,5 horas (150 nits) al navegar por Internet o ver vídeos. Esto convierte al Dell gamer en la media de su clase.
| Dell G16, i7-13650HX, RTX 4060 i7-13650HX, GeForce RTX 4060 Laptop GPU, 86 Wh | Dell G16 7620 i7-12700H, GeForce RTX 3060 Laptop GPU, 84 Wh | MSI Raider GE68HX 13VF i9-13950HX, GeForce RTX 4060 Laptop GPU, 99.9 Wh | Lenovo Legion Slim 5 16APH8 R7 7840HS, GeForce RTX 4060 Laptop GPU, 80 Wh | Alienware m16 R1 Intel i7-13700HX, GeForce RTX 4060 Laptop GPU, 86 Wh | Lenovo LOQ 16IRH8 i7-13620H, GeForce RTX 4060 Laptop GPU, 80 Wh | Media de la clase Gaming | |
|---|---|---|---|---|---|---|---|
| Duración de Batería | -34% | 23% | 3% | -20% | 5% | 20% | |
| H.264 (h) | 6.4 | 5.6 -13% | 6.4 0% | 8.32 ? 30% | |||
| WiFi v1.3 (h) | 6.3 | 5 -21% | 6.8 8% | 7.1 13% | 4.8 -24% | 6.3 0% | 7.11 ? 13% |
| Load (h) | 1.3 | 0.7 -46% | 1.8 38% | 1.2 -8% | 1 -23% | 1.5 15% | 1.502 ? 16% |
| Reader / Idle (h) | 7.1 | 8.8 | 11.7 | 6.4 | 8.16 ? |
Pro
Contra
Veredicto - Alternativa asequible a Alienware con algunos pequeños problemas
El Dell G16 7630 parece ligeramente más elegante y asequible que la serie Alienware de Dell. Su rendimiento sigue siendo bueno y un aspecto muy positivo es lo silencioso que permanece mientras se juega en comparación con muchos competidores.
Dell ha hecho algunos ahorros en lo que se refiere a su webcam y a su construcción en especial, lo que es muy probable que sea soportable para los clientes con un presupuesto ajustado, pero sigue siendo molesto a veces: Algunos ejemplos son la conexión de alimentación del portátil que se sale poco a poco cuando el dispositivo se mueve, su voluminosa y pesada fuente de alimentación o el hecho de que sólo la versión con un procesador i9-13900HX y una RTX 4070 soporta Thunderbolt. Nuestra muestra de prueba con un i7-13650H y una RTX 4060en cambio, no lo hace y esto último carece de tanta transparencia para los clientes como los dos tipos de pantalla diferentes que solo se enumeran en el manual y que difieren únicamente en los espacios de color y las frecuencias de actualización.
El Dell G16 7630 es un portátil para juegos de gama media bastante grande y pesado que se beneficia de un buen rendimiento y un funcionamiento silencioso. En lo que respecta a su conectividad y construcción, Dell podría ser más generoso.
Si le gustan las cosas aún más elegantes y eficientes, entonces podría valer la pena echar un vistazo al ligeramente más débil Dell Inspiron 16 Plus 7630. Otra alternativa podría ser el Lenovo Legion Slim 5 y, si no tiene un presupuesto tan ajustado, el Legion Pro 5 16.
Precio y disponibilidad
El Dell G16 7630 está actualmente en oferta en Amazon por 1.401,84 dólares. Esta versión viene con un Intel Core i9-13900HX, una RTX 4070, 16 GB de RAM y un SSD de 1 TB.
Dell G16, i7-13650HX, RTX 4060
- 02/13/2024 v7 (old)
Christian Hintze
Transparencia
La selección de los dispositivos que se van a reseñar corre a cargo de nuestro equipo editorial. La muestra de prueba fue proporcionada al autor en calidad de préstamo por el fabricante o el minorista a los efectos de esta reseña. El prestamista no tuvo ninguna influencia en esta reseña, ni el fabricante recibió una copia de la misma antes de su publicación. No había ninguna obligación de publicar esta reseña. Como empresa de medios independiente, Notebookcheck no está sujeta a la autoridad de fabricantes, minoristas o editores.
Así es como prueba Notebookcheck
Cada año, Notebookcheck revisa de forma independiente cientos de portátiles y smartphones utilizando procedimientos estandarizados para asegurar que todos los resultados son comparables. Hemos desarrollado continuamente nuestros métodos de prueba durante unos 20 años y hemos establecido los estándares de la industria en el proceso. En nuestros laboratorios de pruebas, técnicos y editores experimentados utilizan equipos de medición de alta calidad. Estas pruebas implican un proceso de validación en varias fases. Nuestro complejo sistema de clasificación se basa en cientos de mediciones y puntos de referencia bien fundamentados, lo que mantiene la objetividad.Price comparison

