Acer Nitro 5 con RTX 3060 en revisión: Rápido portátil para juegos con la última CPU Intel Alder Lake

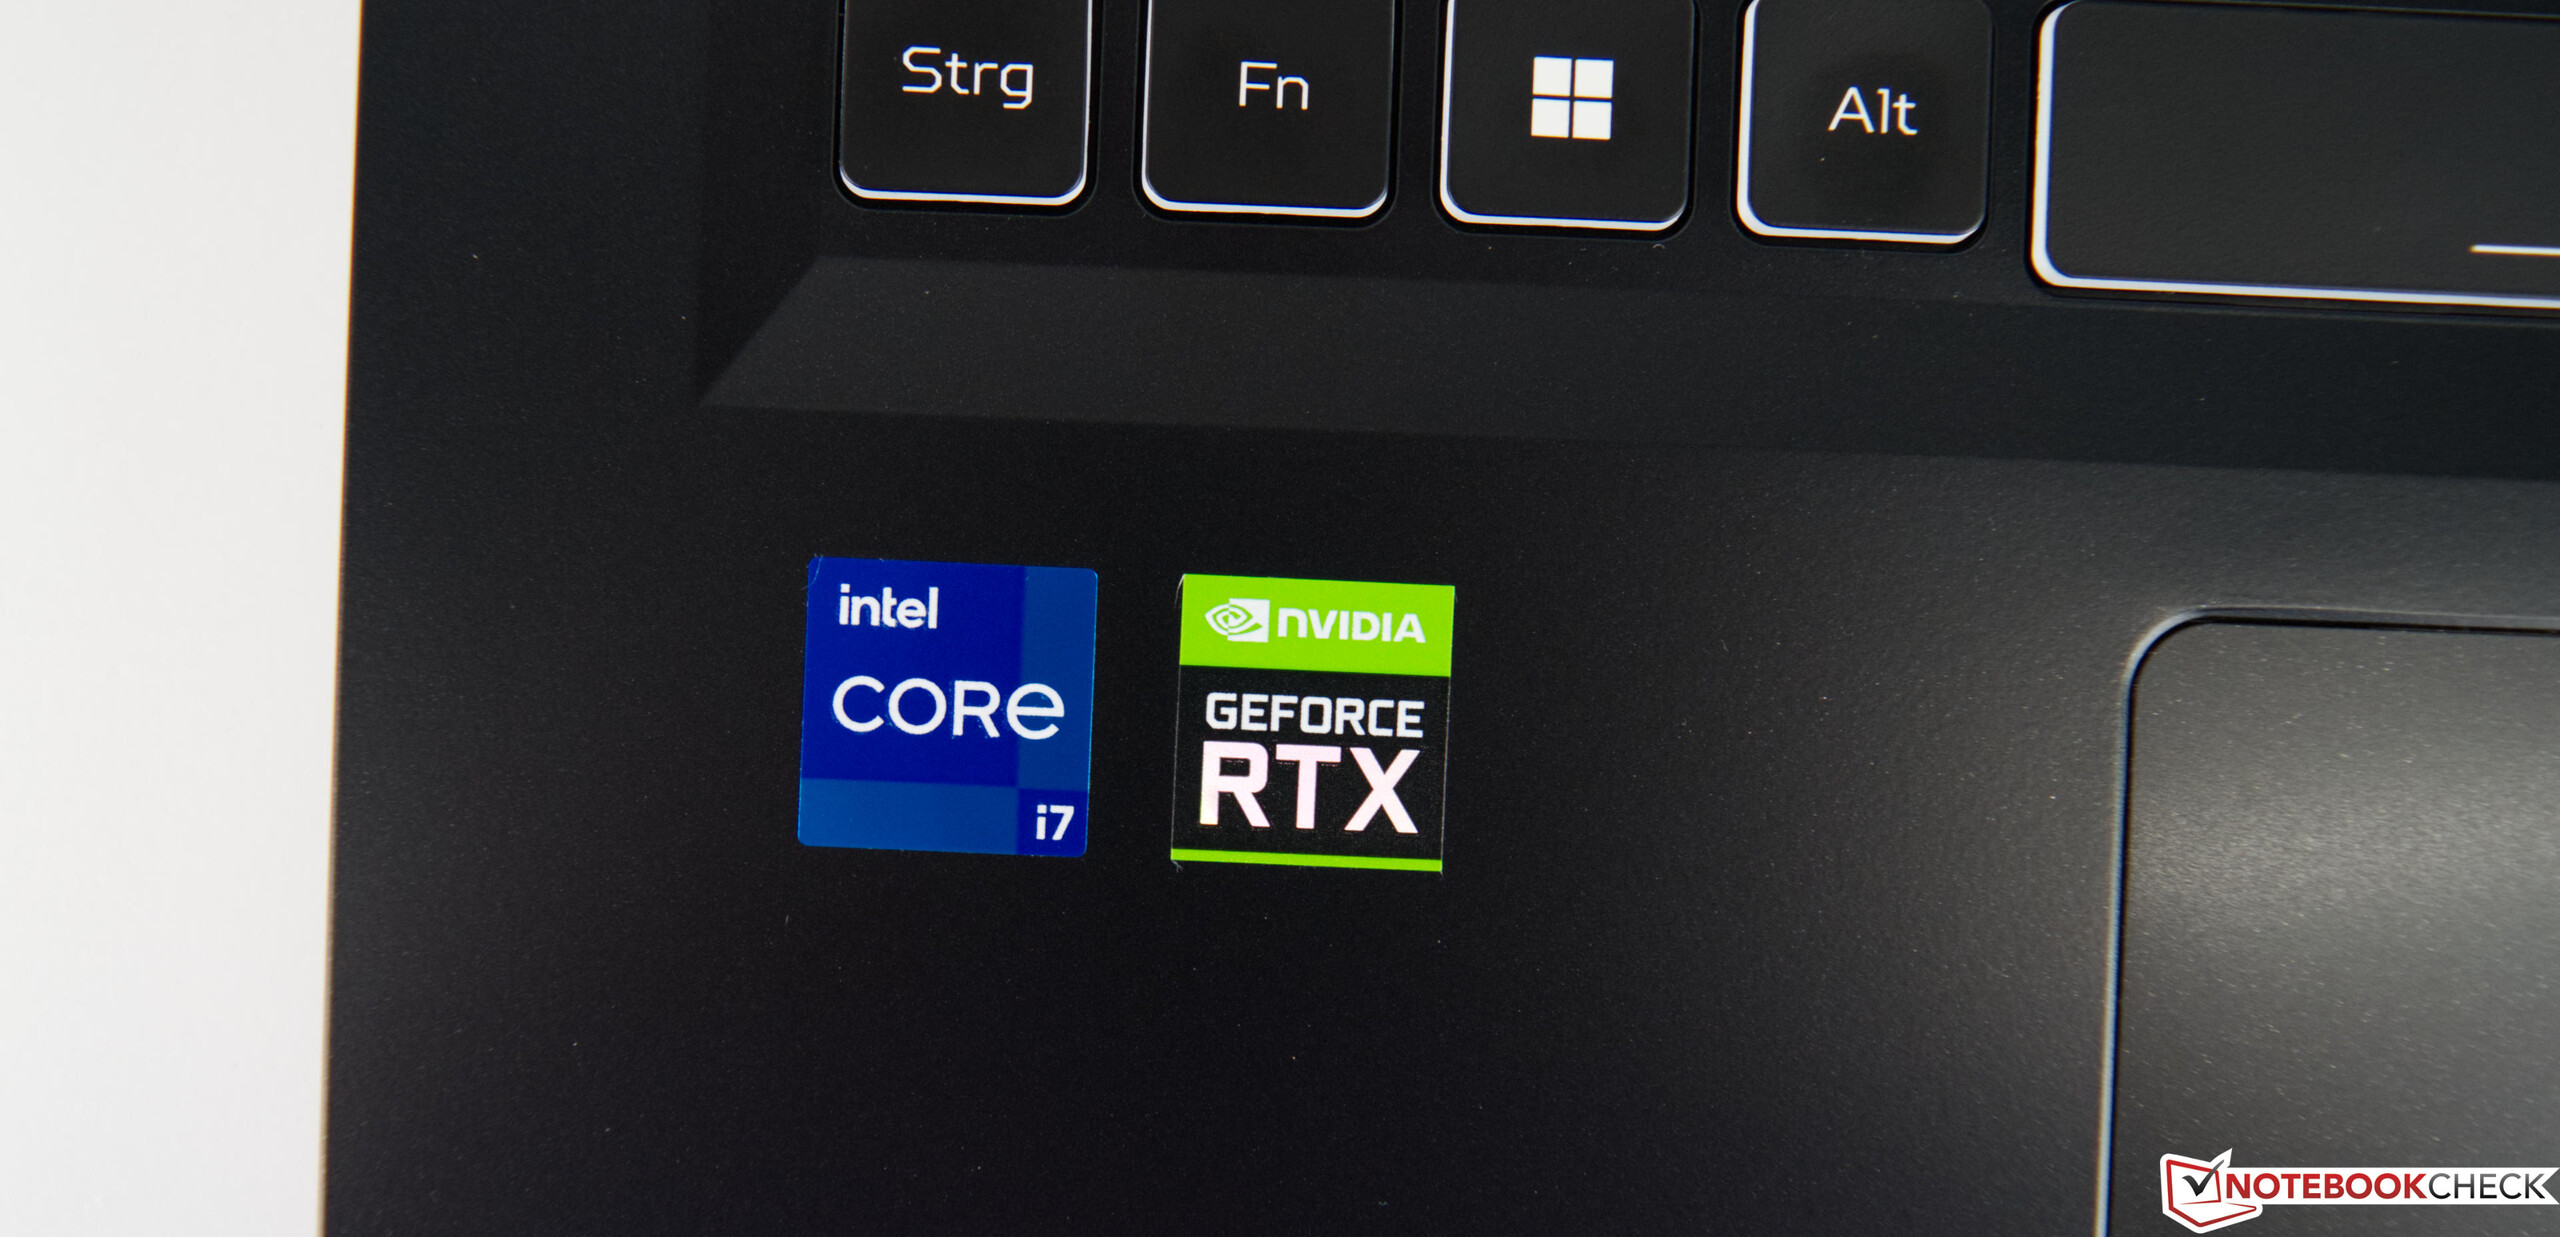
Acer siempre ha tenido portátiles de juego económicos, vendiéndolos bajo el seudónimo "Nitro" desde hace unos años. El modelo actual de Acer no es diferente y se mantiene fiel a la filosofía de la empresa. El actual Acer Nitro 5 AN517-55-738R combina unIntel Core i7-12700H y una tarjeta GPU Nvidia GeForce RTX 3060 para portátiles en una base de 17 pulgadas. La pantalla también está dirigida a los jugadores con sus 144 Hz y sus rápidos tiempos de respuesta. El dispositivo en nuestra configuración de análisis está actualmente disponible por 1.449 euros (1450 dólares) en varias tiendas online. Sin embargo, el precio de venta al público del fabricante, 1.699 euros, es significativamente superior.
El Acer Nitro AN517-55 también está disponible con la más potente Nvidia GeForce RTX 3070 Ti para portátilessin embargo, tiene un coste adicional de 300 euros en comparación con nuestra configuración de prueba
Los dispositivos equipados de forma similar se utilizan como dispositivos de comparación. La lista de los dispositivos se puede encontrar en la siguiente tabla.
Posibles contendientes en la comparación
Valoración | Fecha | Modelo | Peso | Altura | Tamaño | Resolución | Precio |
|---|---|---|---|---|---|---|---|
| 83.9 % v7 (old) | 08/2022 | Acer Nitro 5 AN517-55-738R i7-12700H, GeForce RTX 3060 Laptop GPU | 3.1 kg | 28.6 mm | 17.30" | 1920x1080 | |
| 85.2 % v7 (old) | 02/2022 | Lenovo Legion 5 17ACH6H-82JY0003GE R5 5600H, GeForce RTX 3060 Laptop GPU | 3.1 kg | 24.3 mm | 17.30" | 1920x1080 | |
| 84.1 % v7 (old) | 04/2022 | Asus TUF Gaming F17 FX707Z-HX011W i7-12700H, GeForce RTX 3060 Laptop GPU | 2.5 kg | 25 mm | 17.30" | 1920x1080 | |
| 81.3 % v7 (old) | 08/2021 | Acer Nitro 5 AN517-41-R5Z7 R7 5800H, GeForce RTX 3070 Laptop GPU | 2.7 kg | 24.9 mm | 17.30" | 1920x1080 | |
| 83.9 % v7 (old) | 06/2021 | Schenker XMG Core 17 (Early 2021) i7-10870H, GeForce RTX 3060 Laptop GPU | 2.5 kg | 30.05 mm | 17.30" | 2560x1440 | |
| 80.4 % v7 (old) | 06/2021 | MSI Katana GF76 11UE i7-11800H, GeForce RTX 3060 Laptop GPU | 2.7 kg | 25.2 mm | 17.30" | 1920x1080 |
Caja - Nada especial
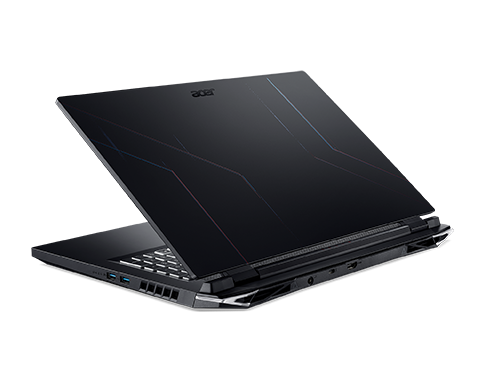
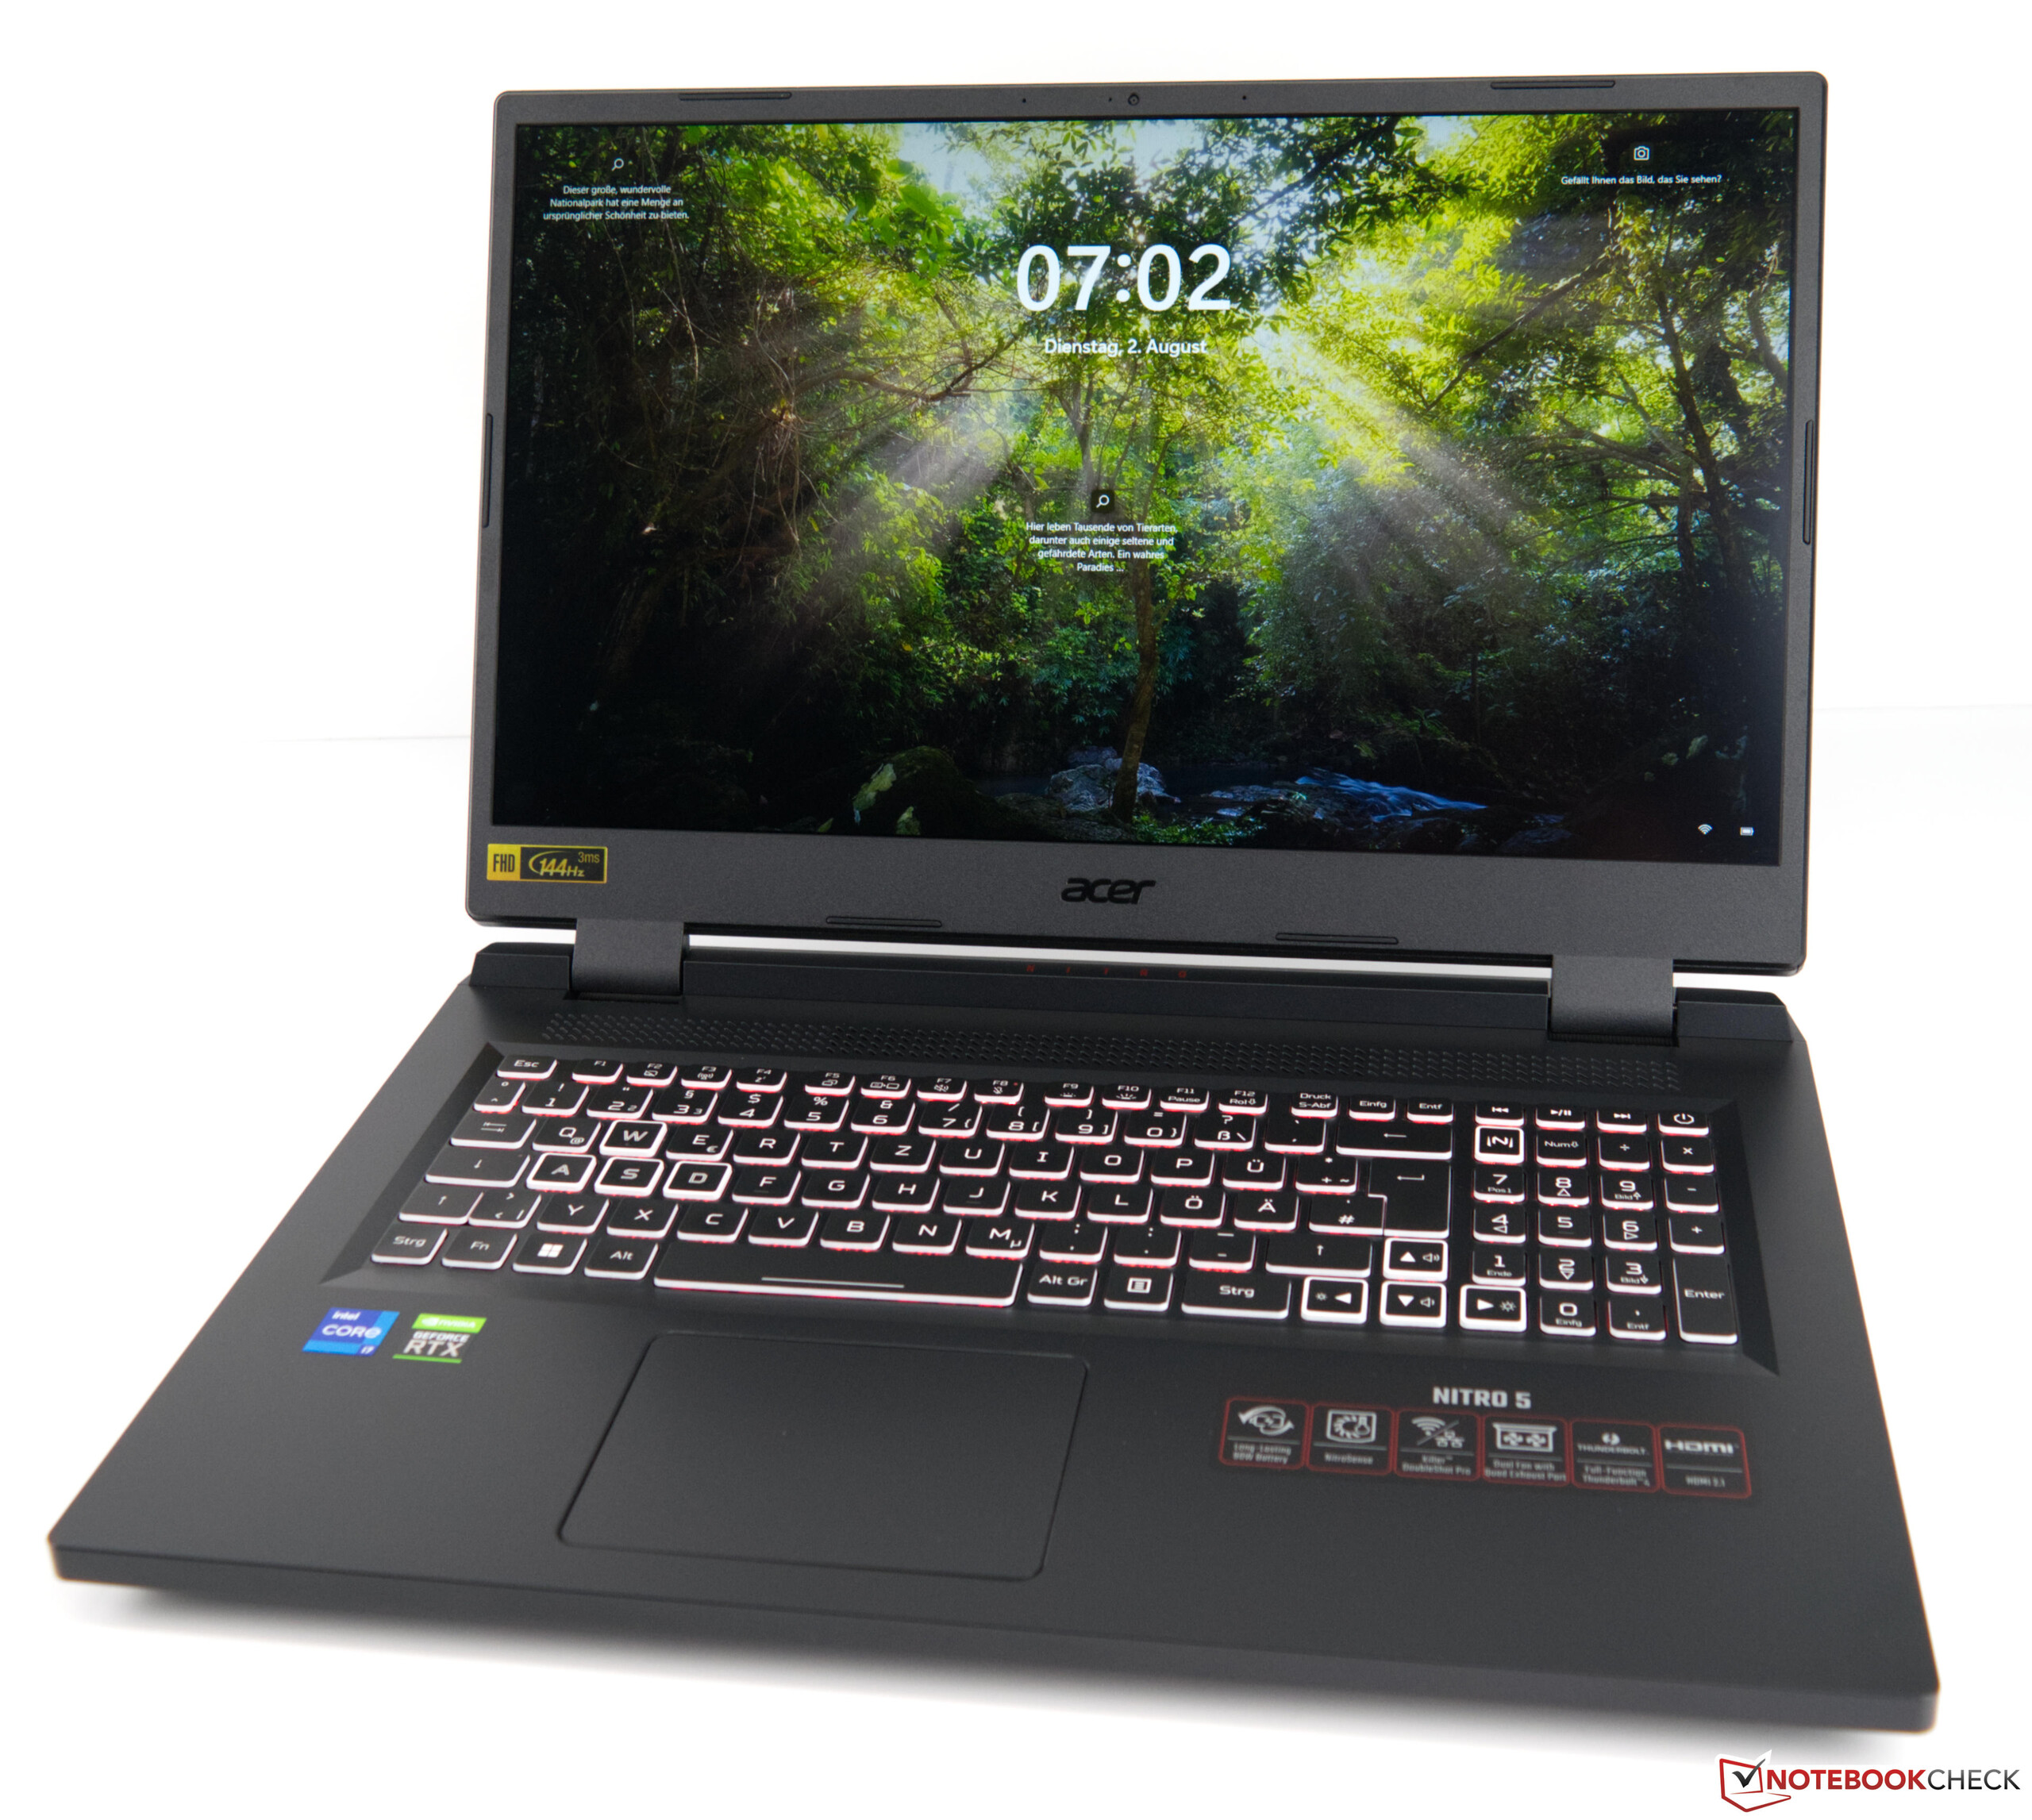
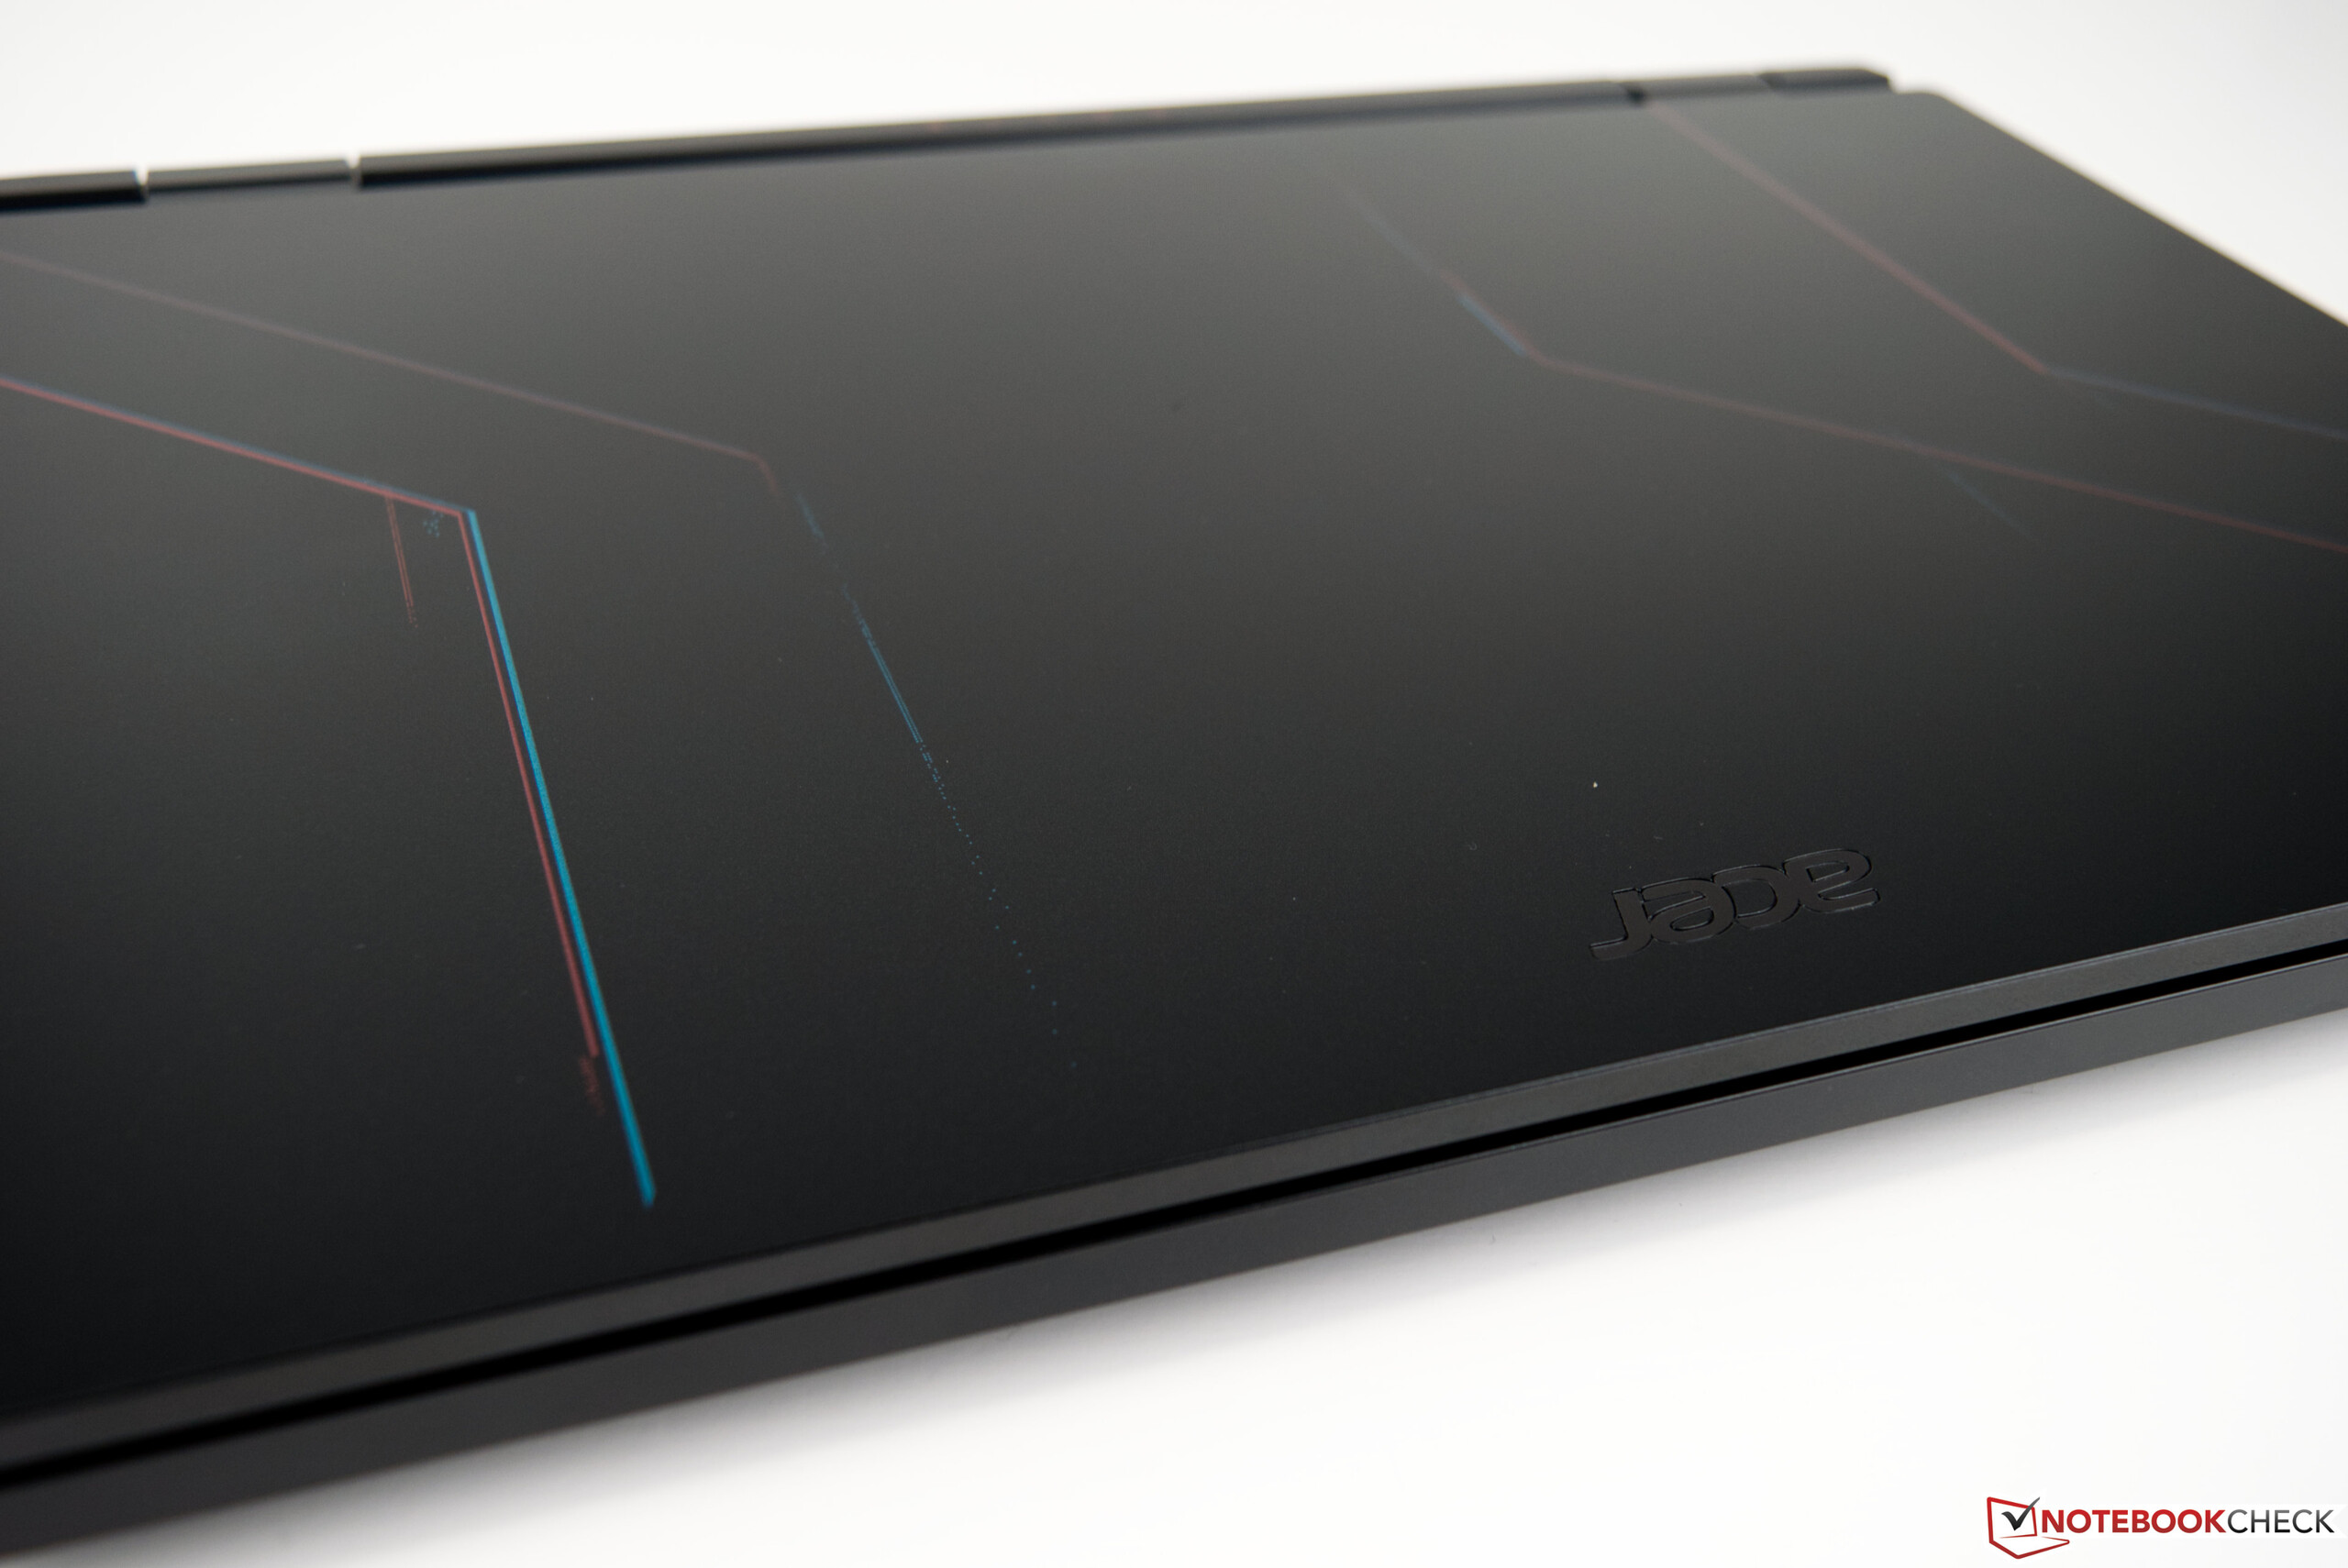
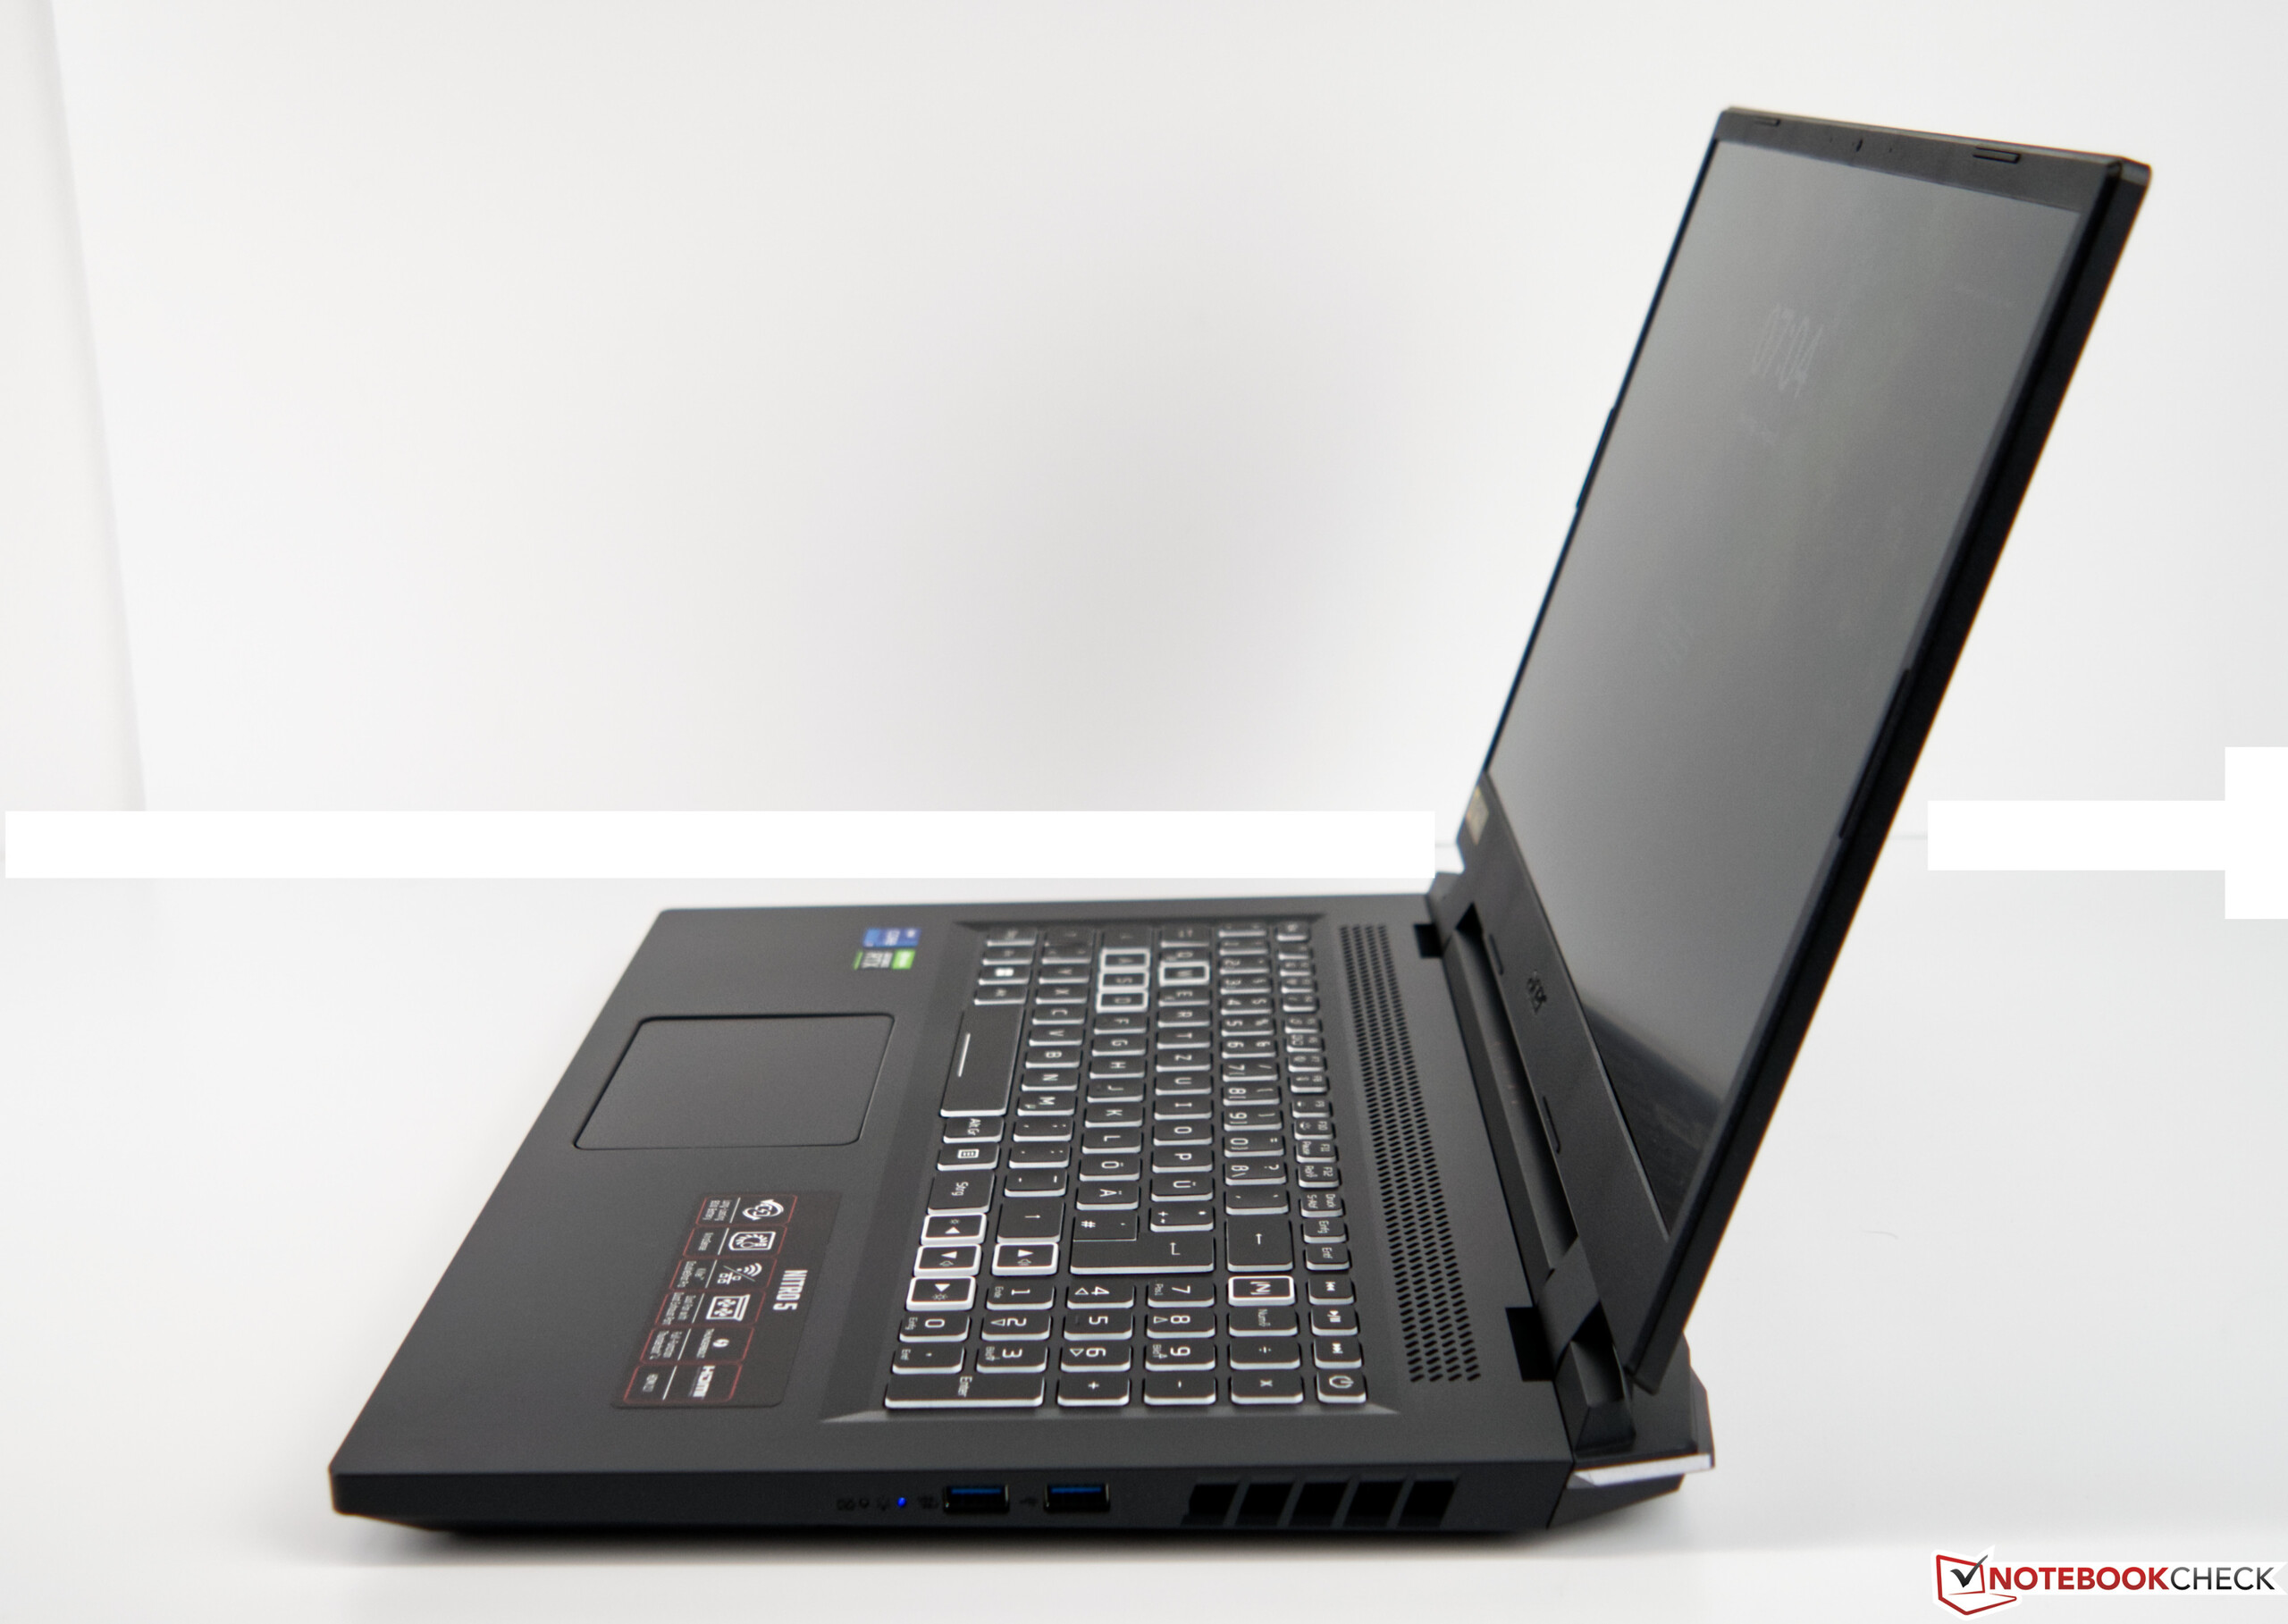
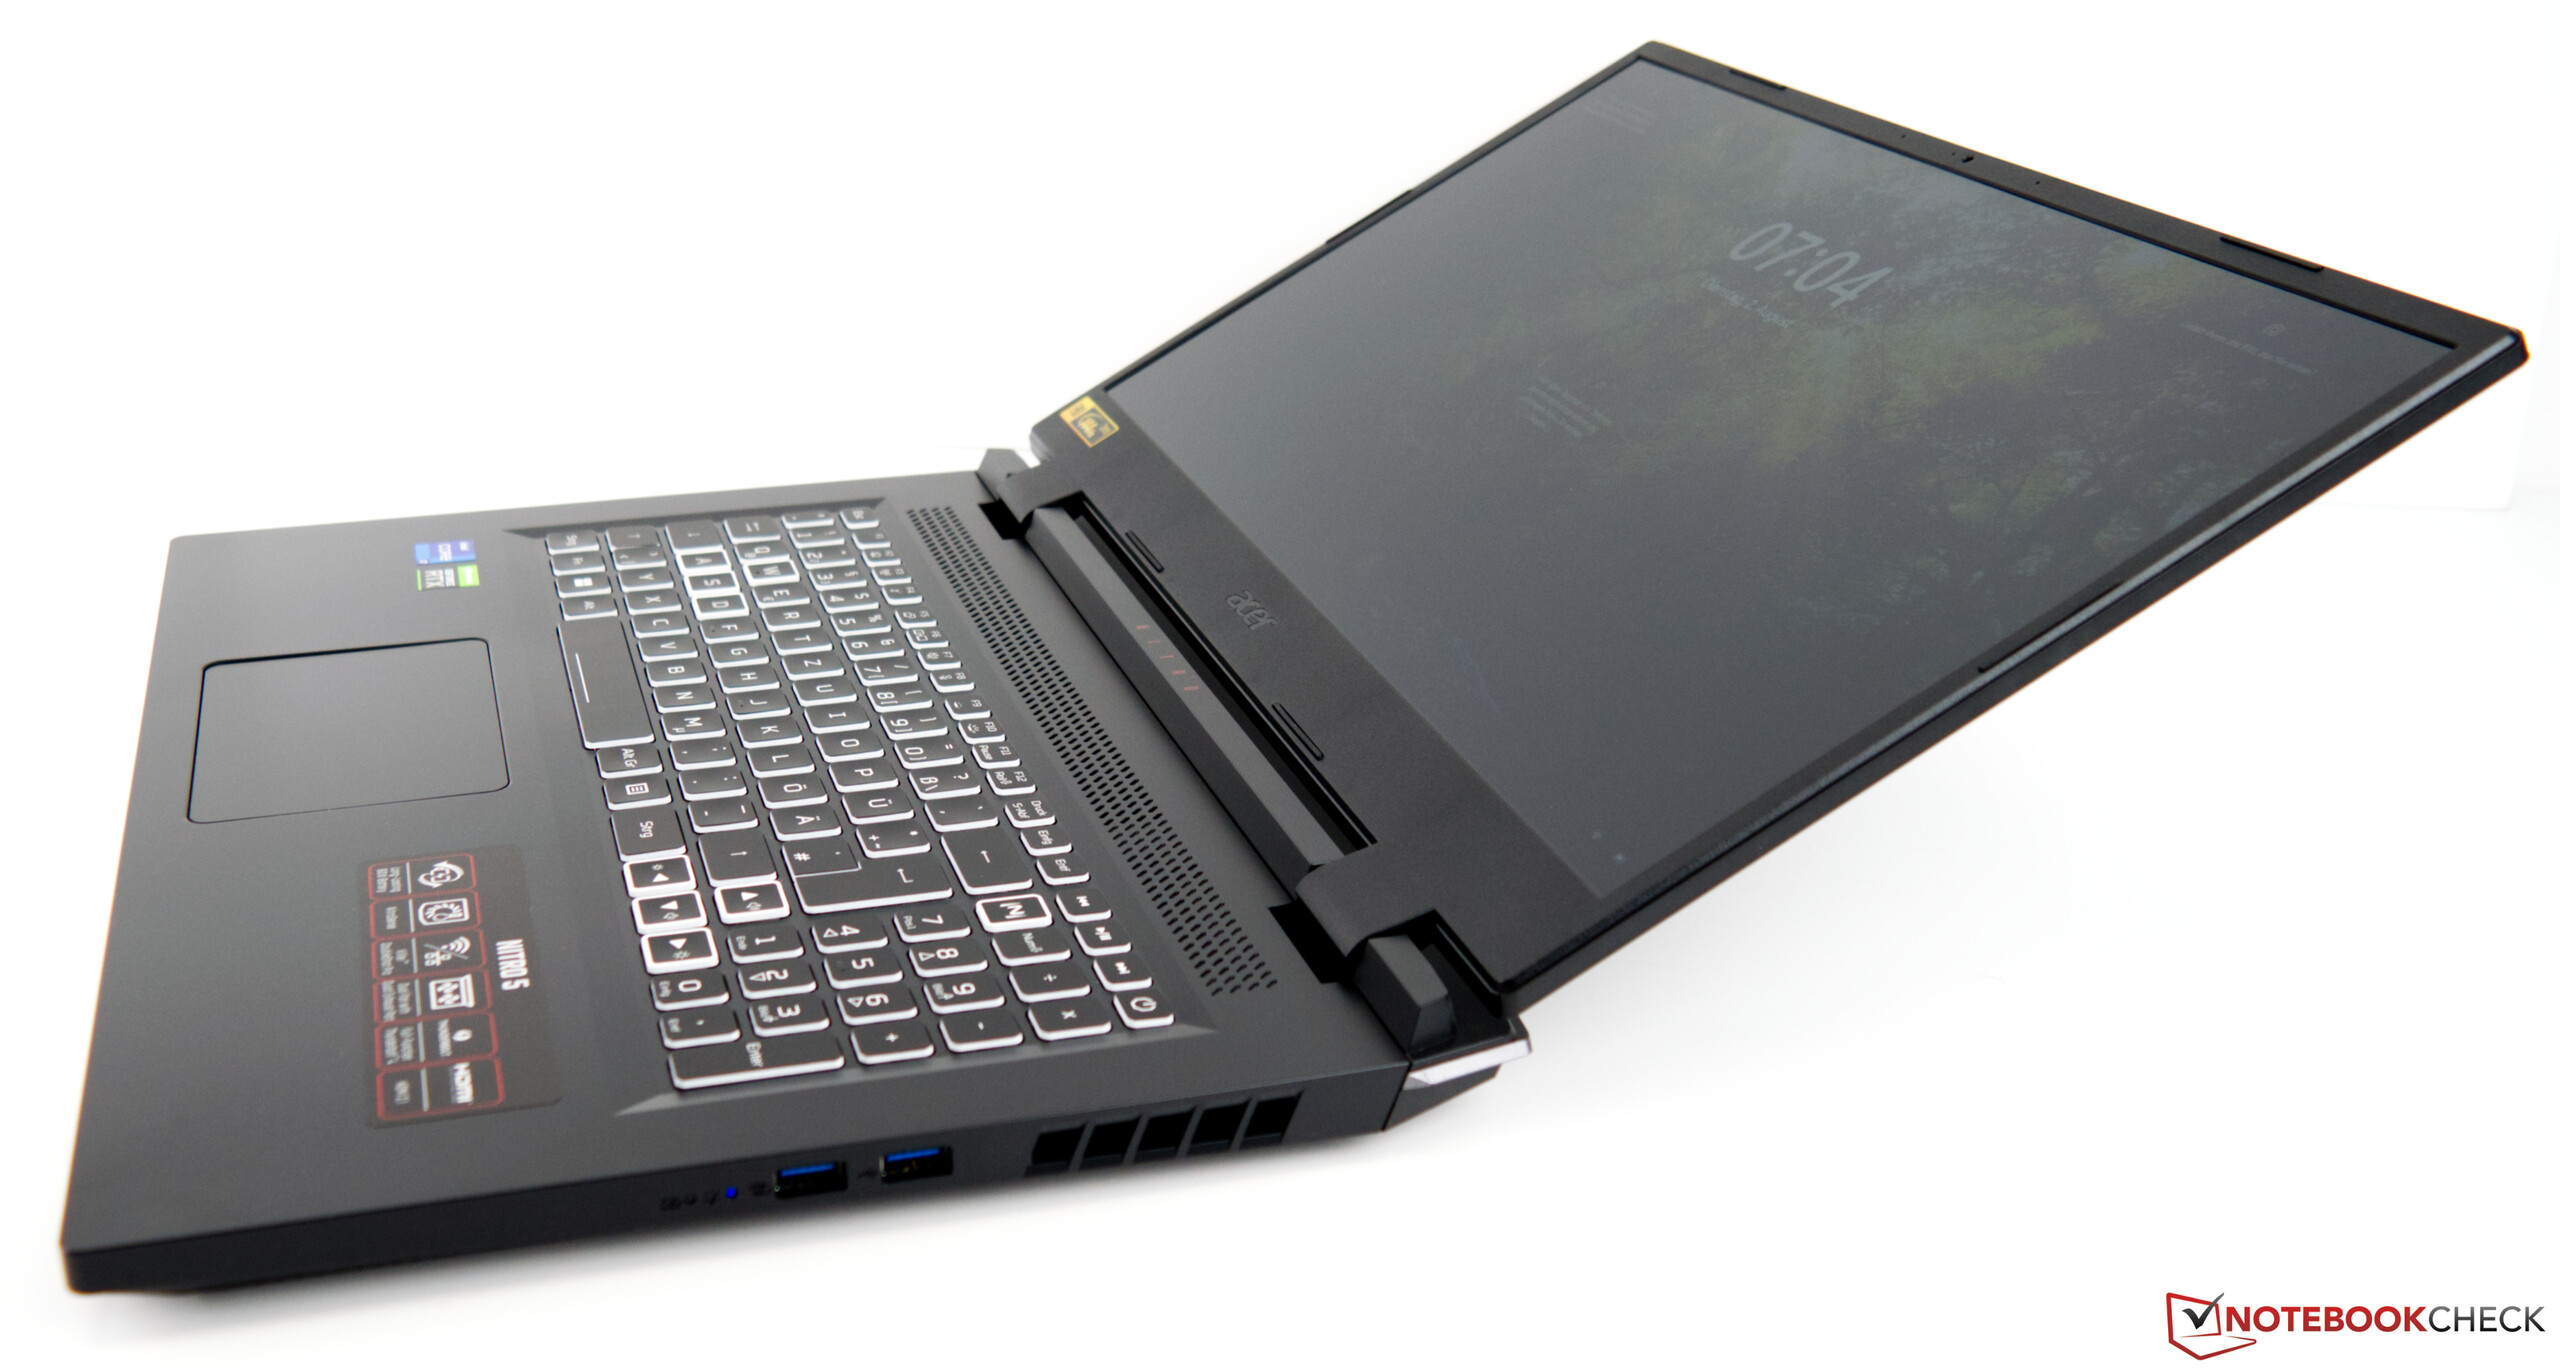
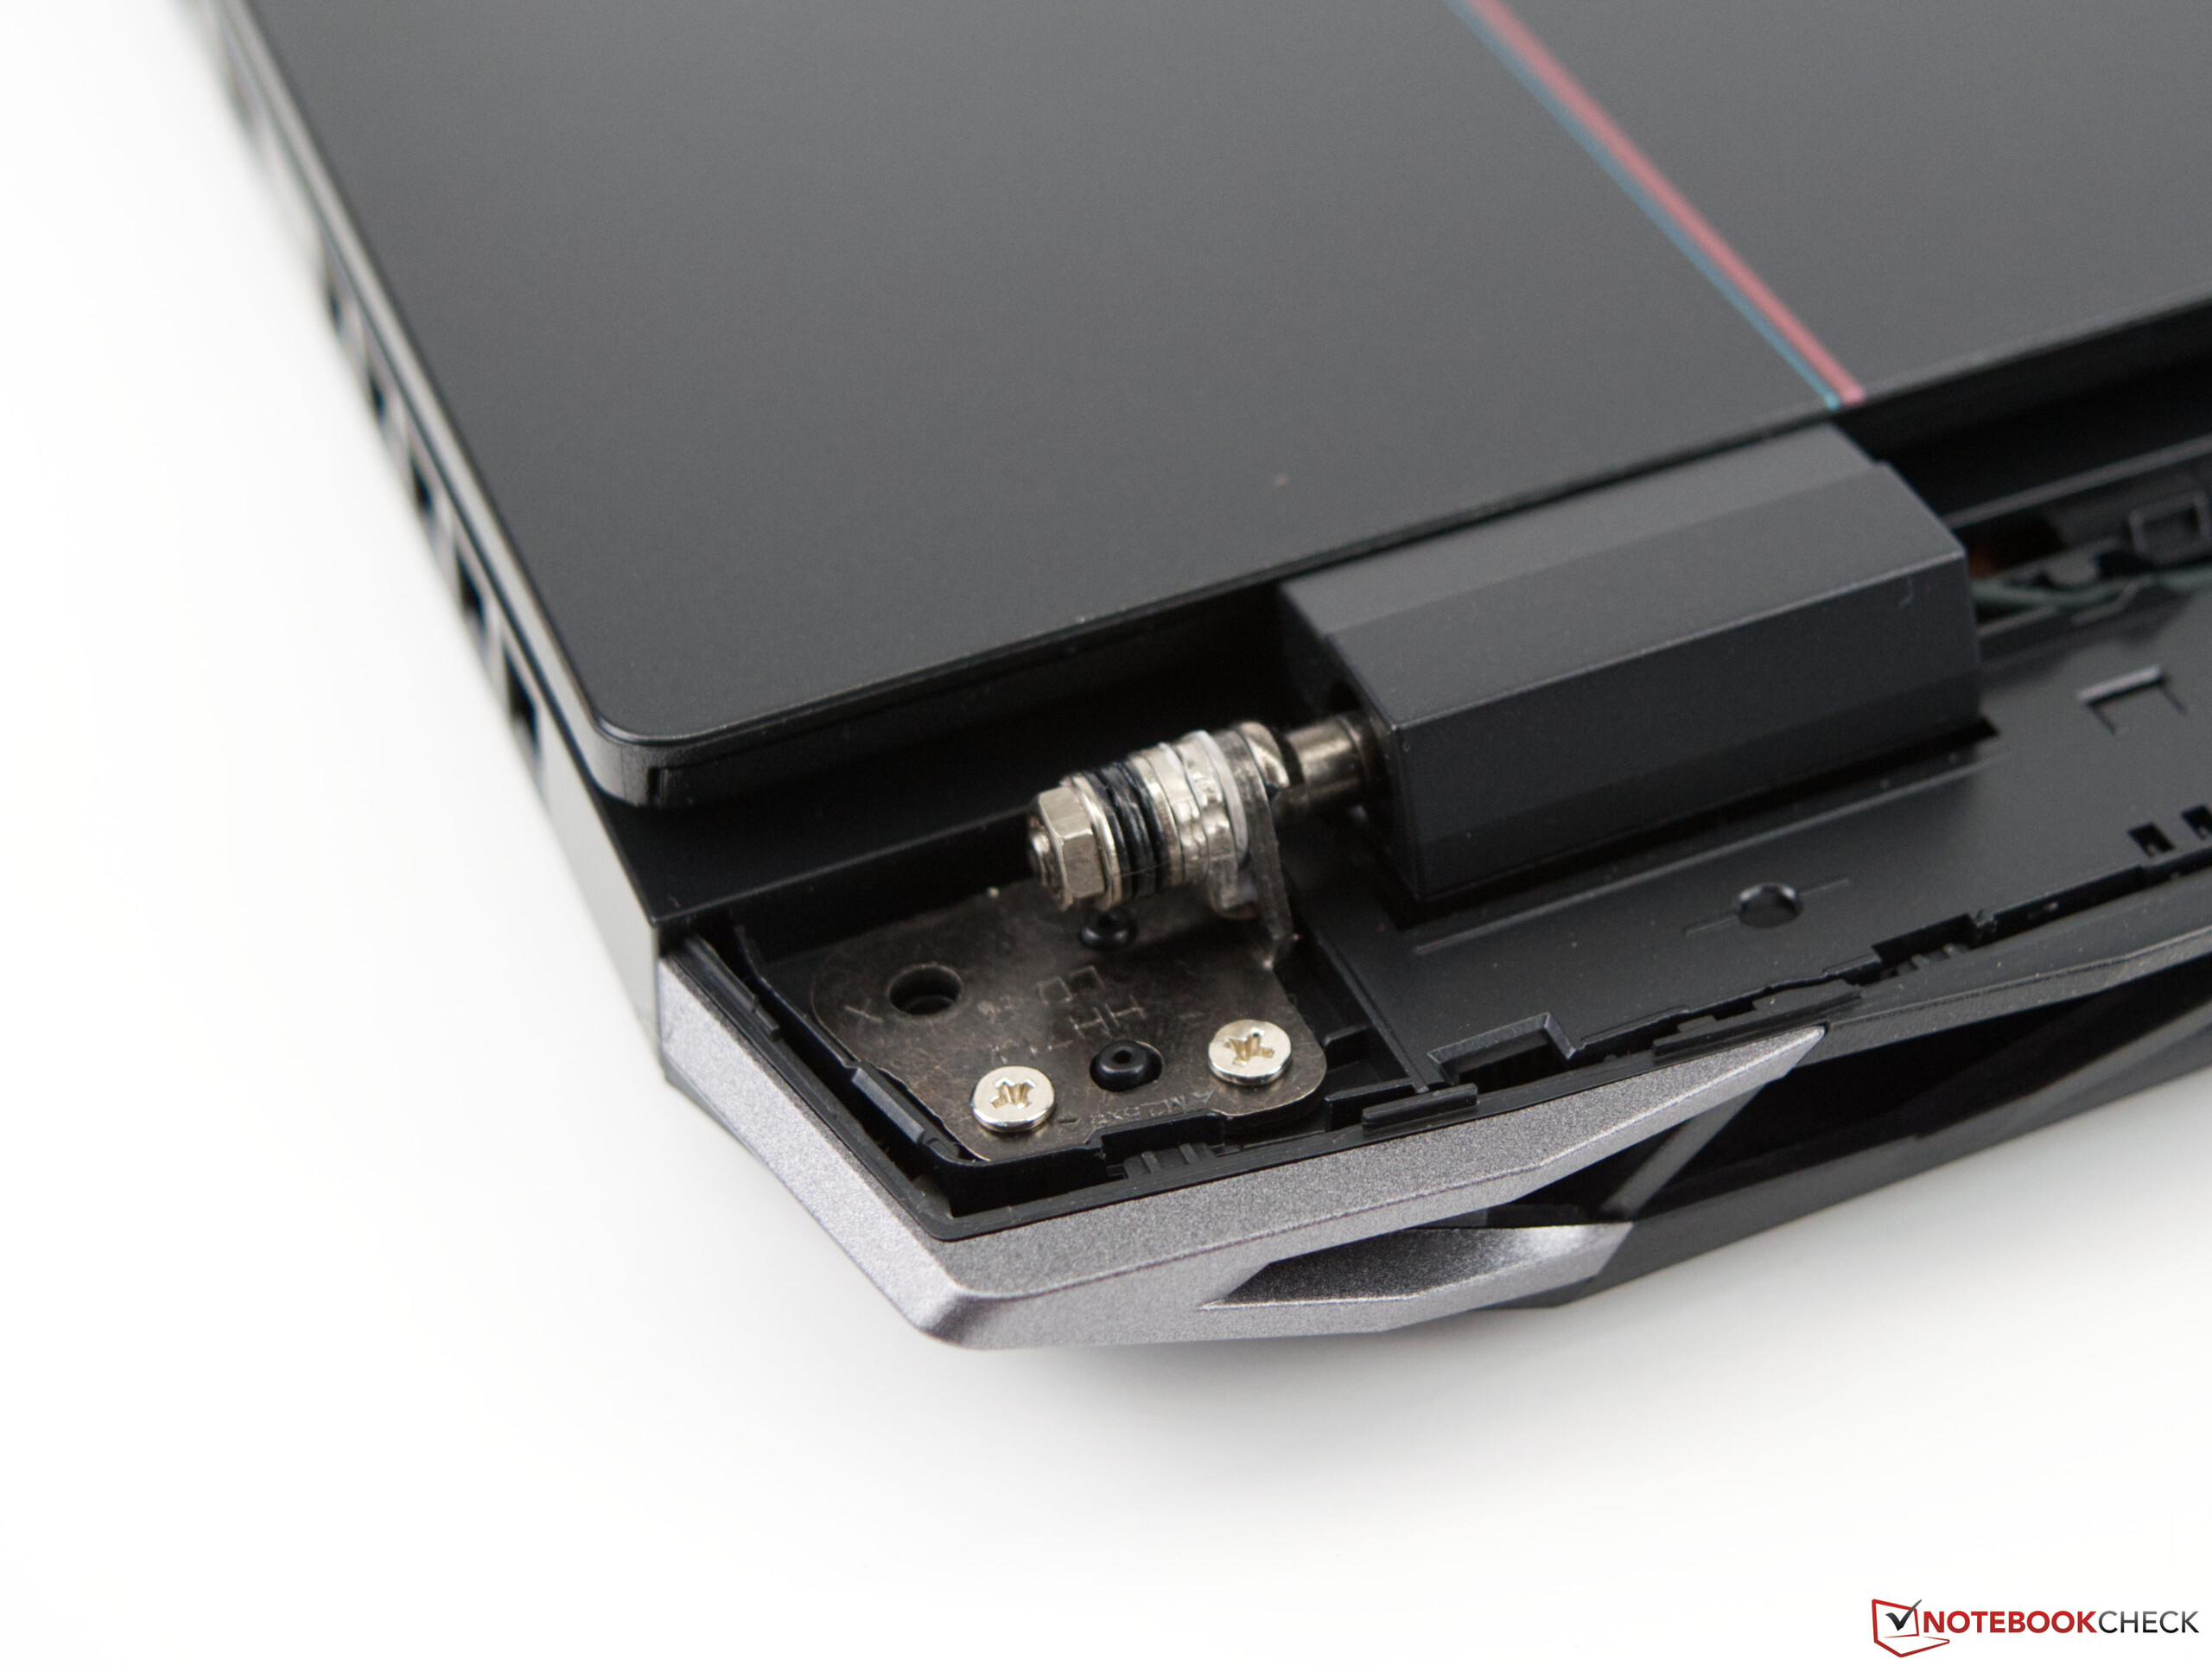
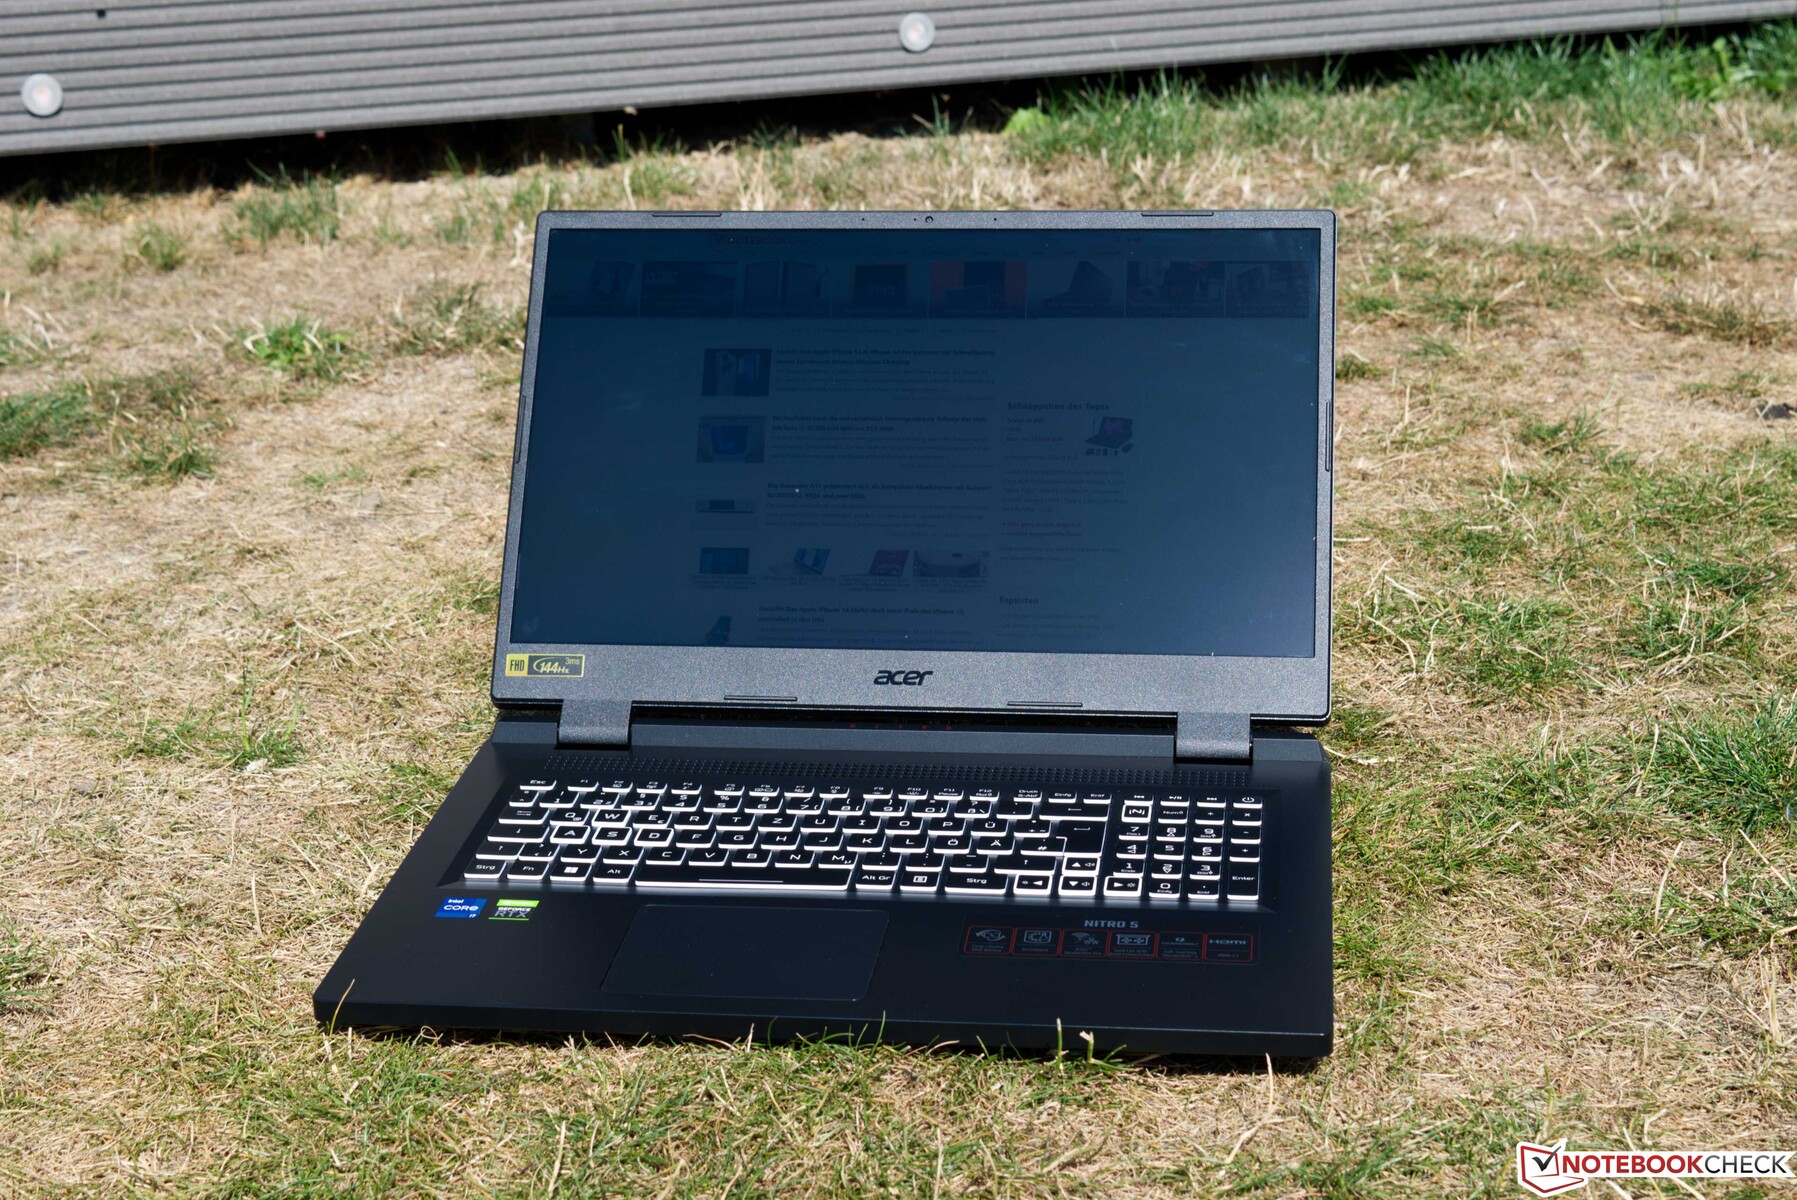
El Acer Nitro 5 AN517 es claramente reconocible como un portátil para juegos, aunque el fabricante no utilice RGB en absoluto. El dispositivo sólo ofrece resaltes visuales en la tapa de la pantalla en forma de acentos de color que aflojan la seriedad de la carcasa, por lo demás completamente negra. Debido a su tamaño, la estabilidad de la base es buena, aunque cede bajo presión selectiva. La tapa de la pantalla también podría haber tenido un poco más de rigidez, pero otros portátiles de 17 pulgadas también se pueden torcer fácilmente, lo que se debe a su tamaño. Los impactos selectivos de fuerza son bien absorbidos. El ángulo de apertura de la pantalla no llega a los 180º, pero esto no es motivo de queja. Las dos bisagras son de funcionamiento suave, por lo que la apertura con una sola mano no es un problema. Sin embargo, no se puede evitar un tambaleo relativamente grande.
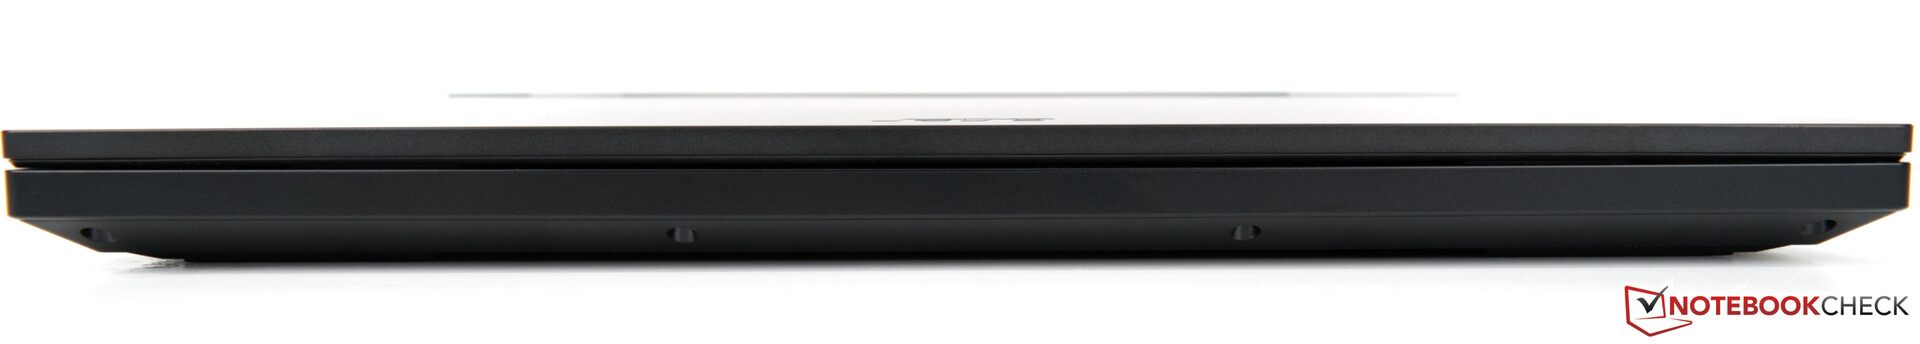
Comparación de tamaños
Con 3,1 kilogramos, el Acer Nitro 5 AN517 pertenece a los representantes más pesados de su clase. Sin embargo, el peso es aceptable para un portátil de 17 pulgadas. Su tamaño no es muy compacto debido a la voluminosa base y está en un nivel similar al del Lenovo Legion 5 17. La plana, pero fuerte fuente de alimentación de 230 vatios añade otros buenos 800 gramos a la balanza.
Equipo - Se queda un poco corto
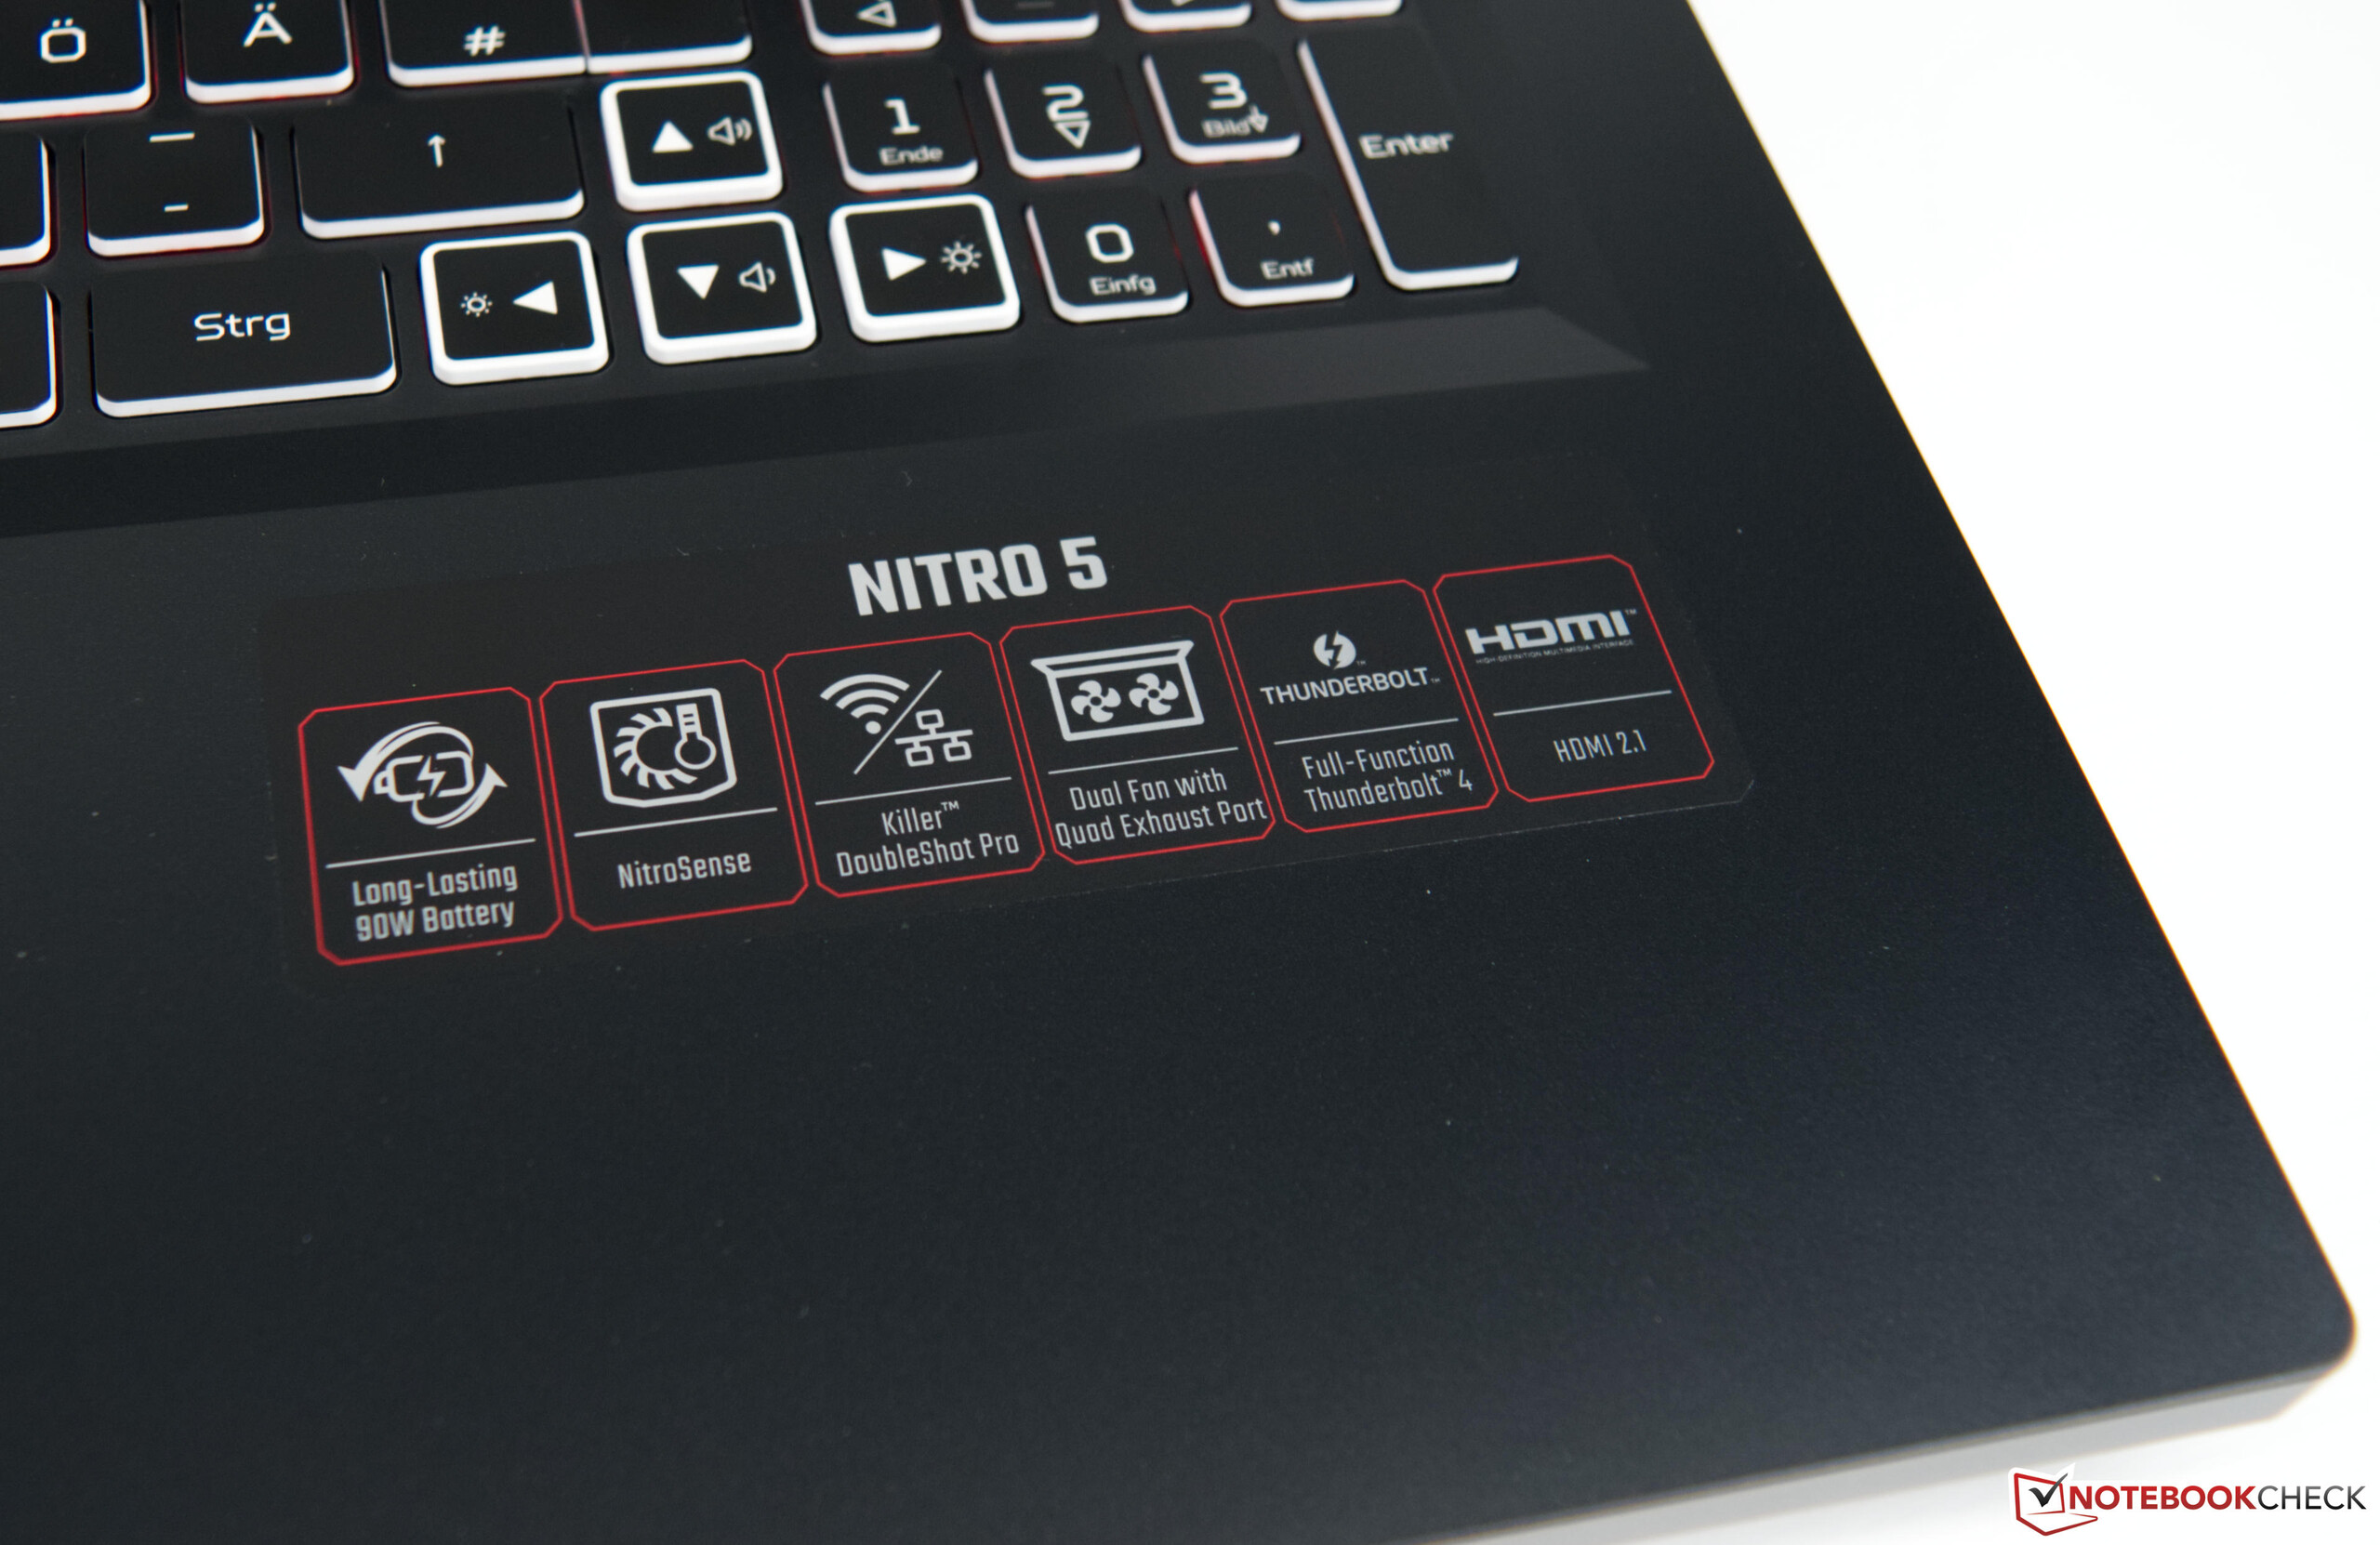
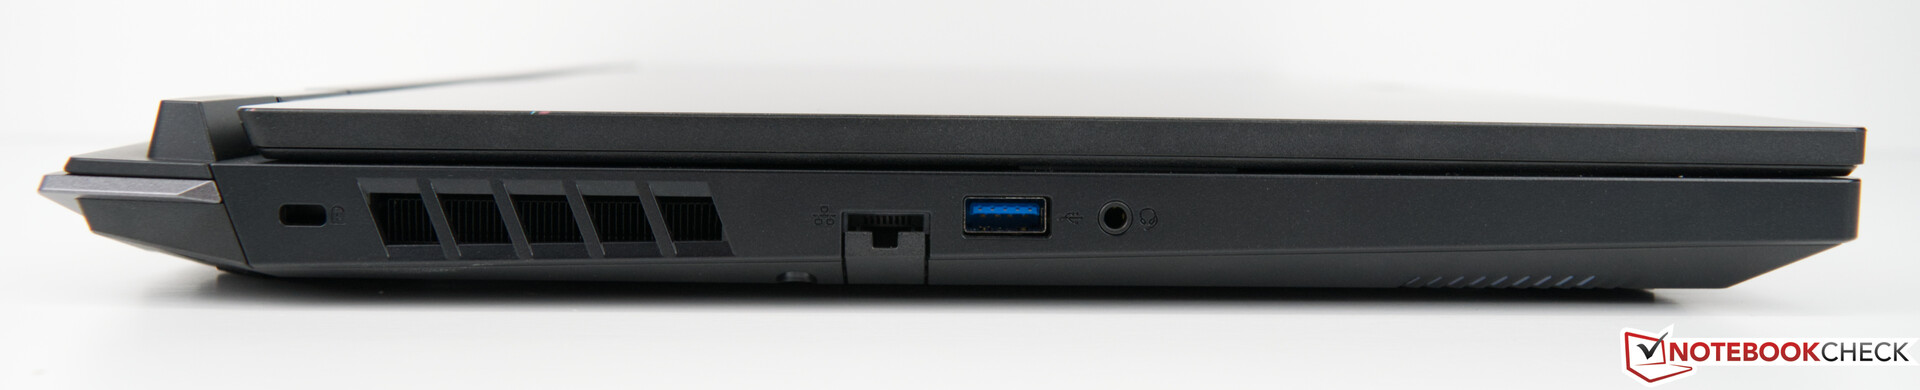
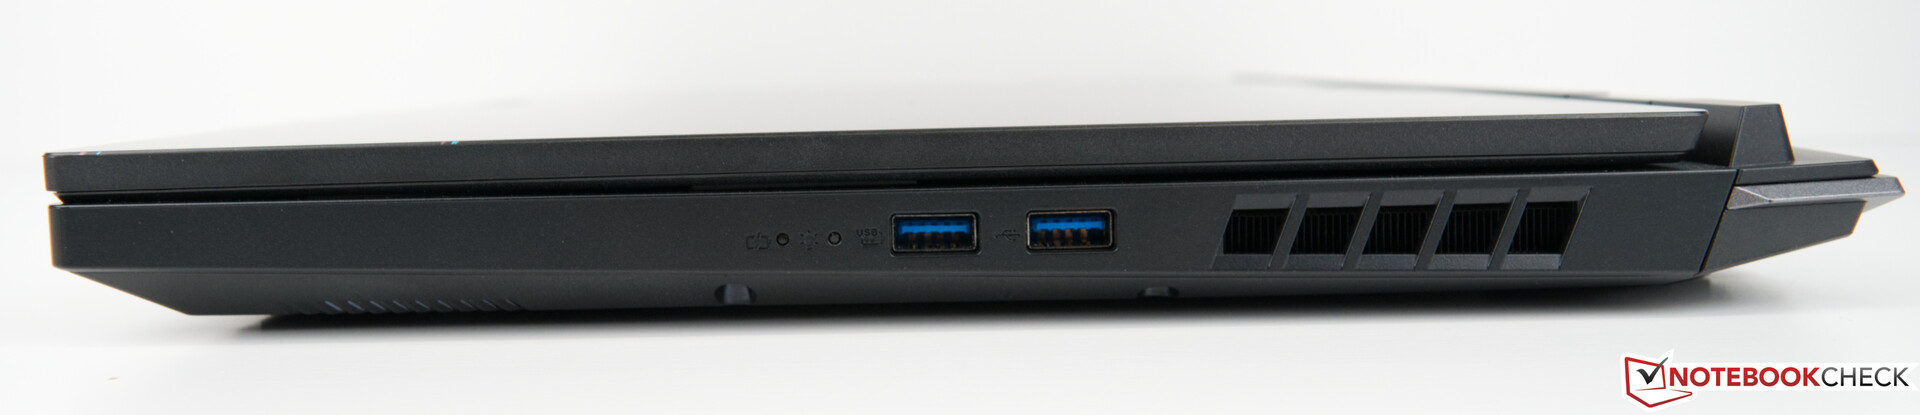
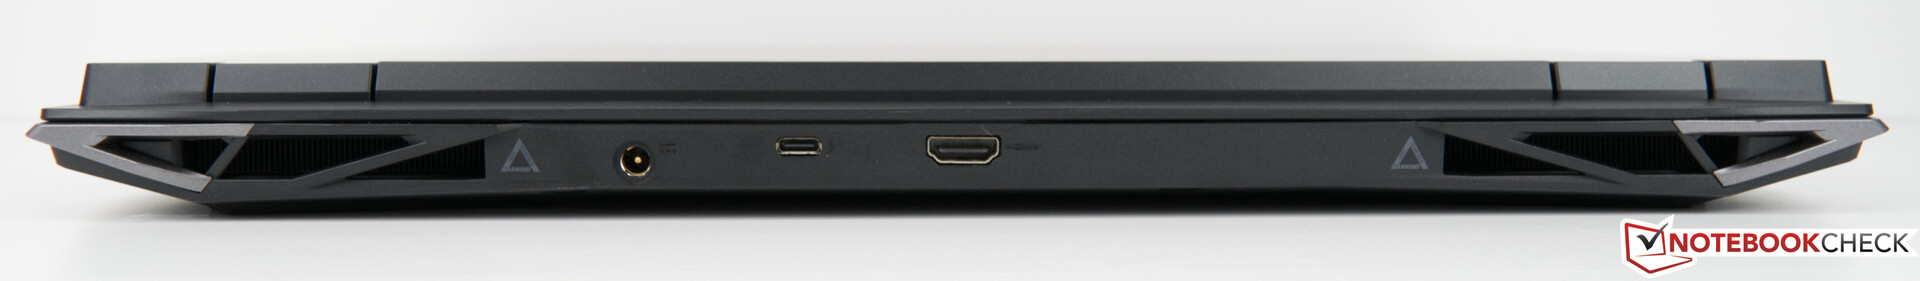
El Acer Nitro 5 AN517 ofrece una buena gama de puertos externos estándar, incluyendo Thunderbolt 4. Sin embargo, el hecho de que sólo haya 3x USB Type-A, que es meramente la media para un dispositivo de 17 pulgadas, debería verse de forma crítica. Ciertamente habría habido espacio suficiente para más puertos. También se echa en falta un lector de tarjetas SD. Aunque la distribución de los puertos es buena, no es nada recomendable dado el número de puertos y el espacio disponible.
Comunicación
El Acer Nitro 5 AN517 está equipado con un módulo WLAN Wi-Fi 6 AX1650i. En las pruebas, nuestro modelo de pruebas logró buenas tasas de transferencia tanto al enviar como al recibir datos. El Acer Nitro 5 AN517 está por tanto a la par con elSchenker XMG Core 17que ofrece velocidades casi idénticas. Como alternativa, también puede utilizar la conexión LAN GBit. Ambas conexiones de red funcionaron sin problemas durante las pruebas.
Cámara web
Casi ningún portátil para juegos ofrece una buena calidad de cámara web. Esto también es cierto para el Acer Nitro 5 AN517, aunque tiene las desviaciones Delta-E más bajas en comparación. Sin embargo, la nitidez de la imagen es tan pobre como la de los dispositivos de la comparación.


Accesorios
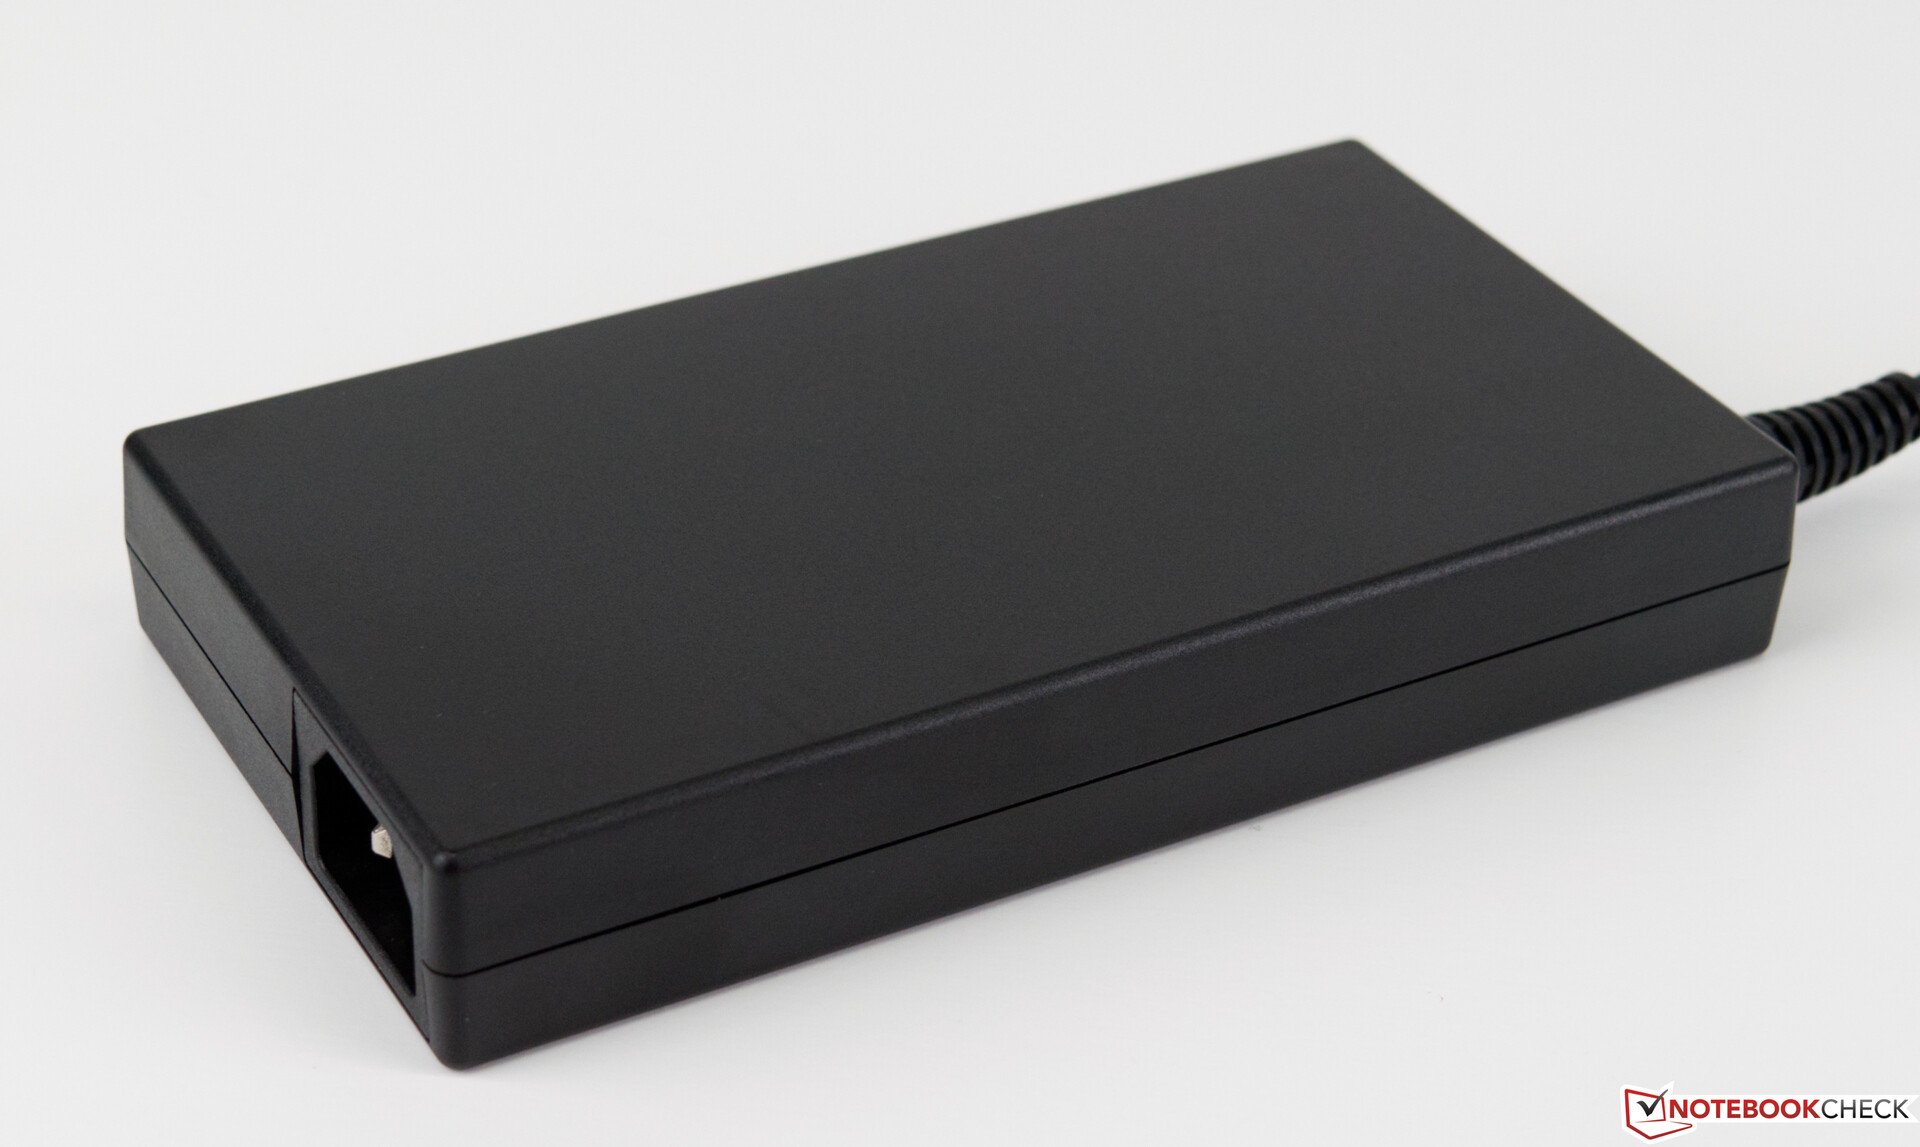
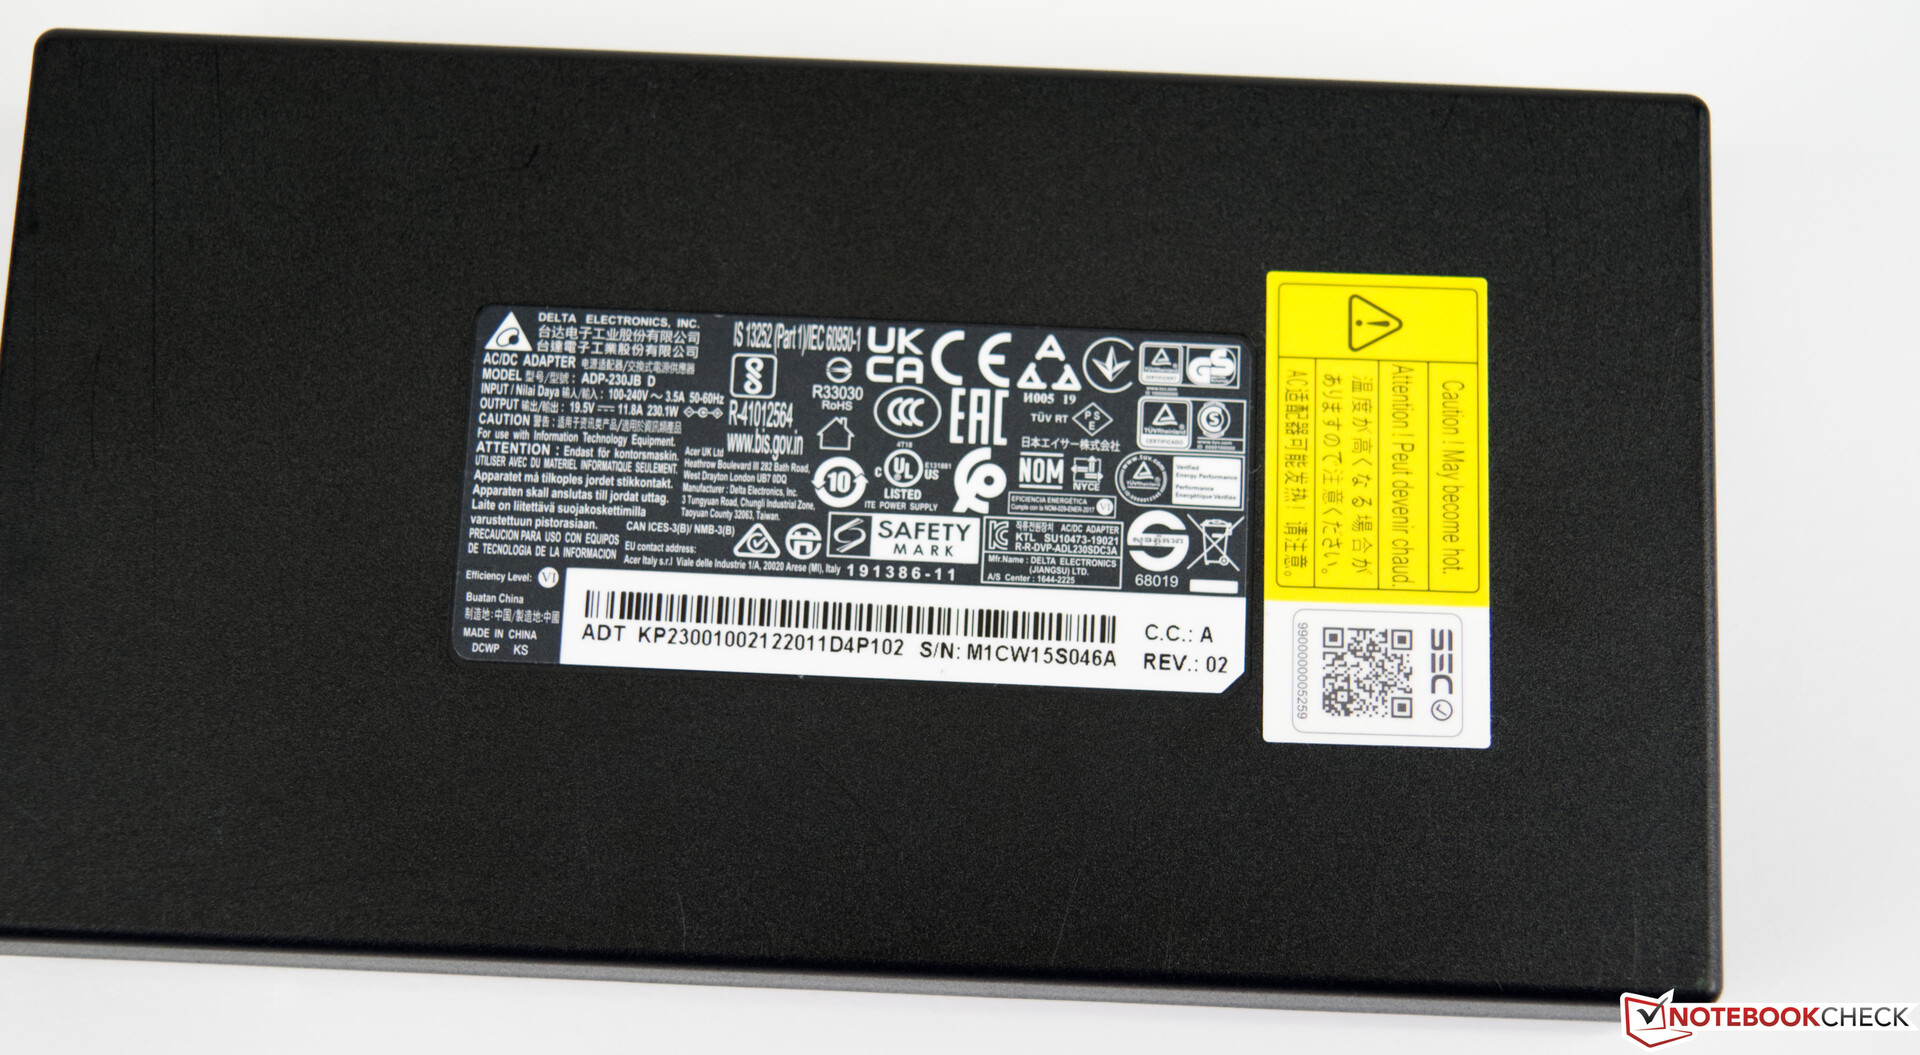
Además del portátil, los compradores reciben un pesado adaptador de corriente de casi 800 g y 230 vatios, así como algunos folletos informativos.
Mantenimiento
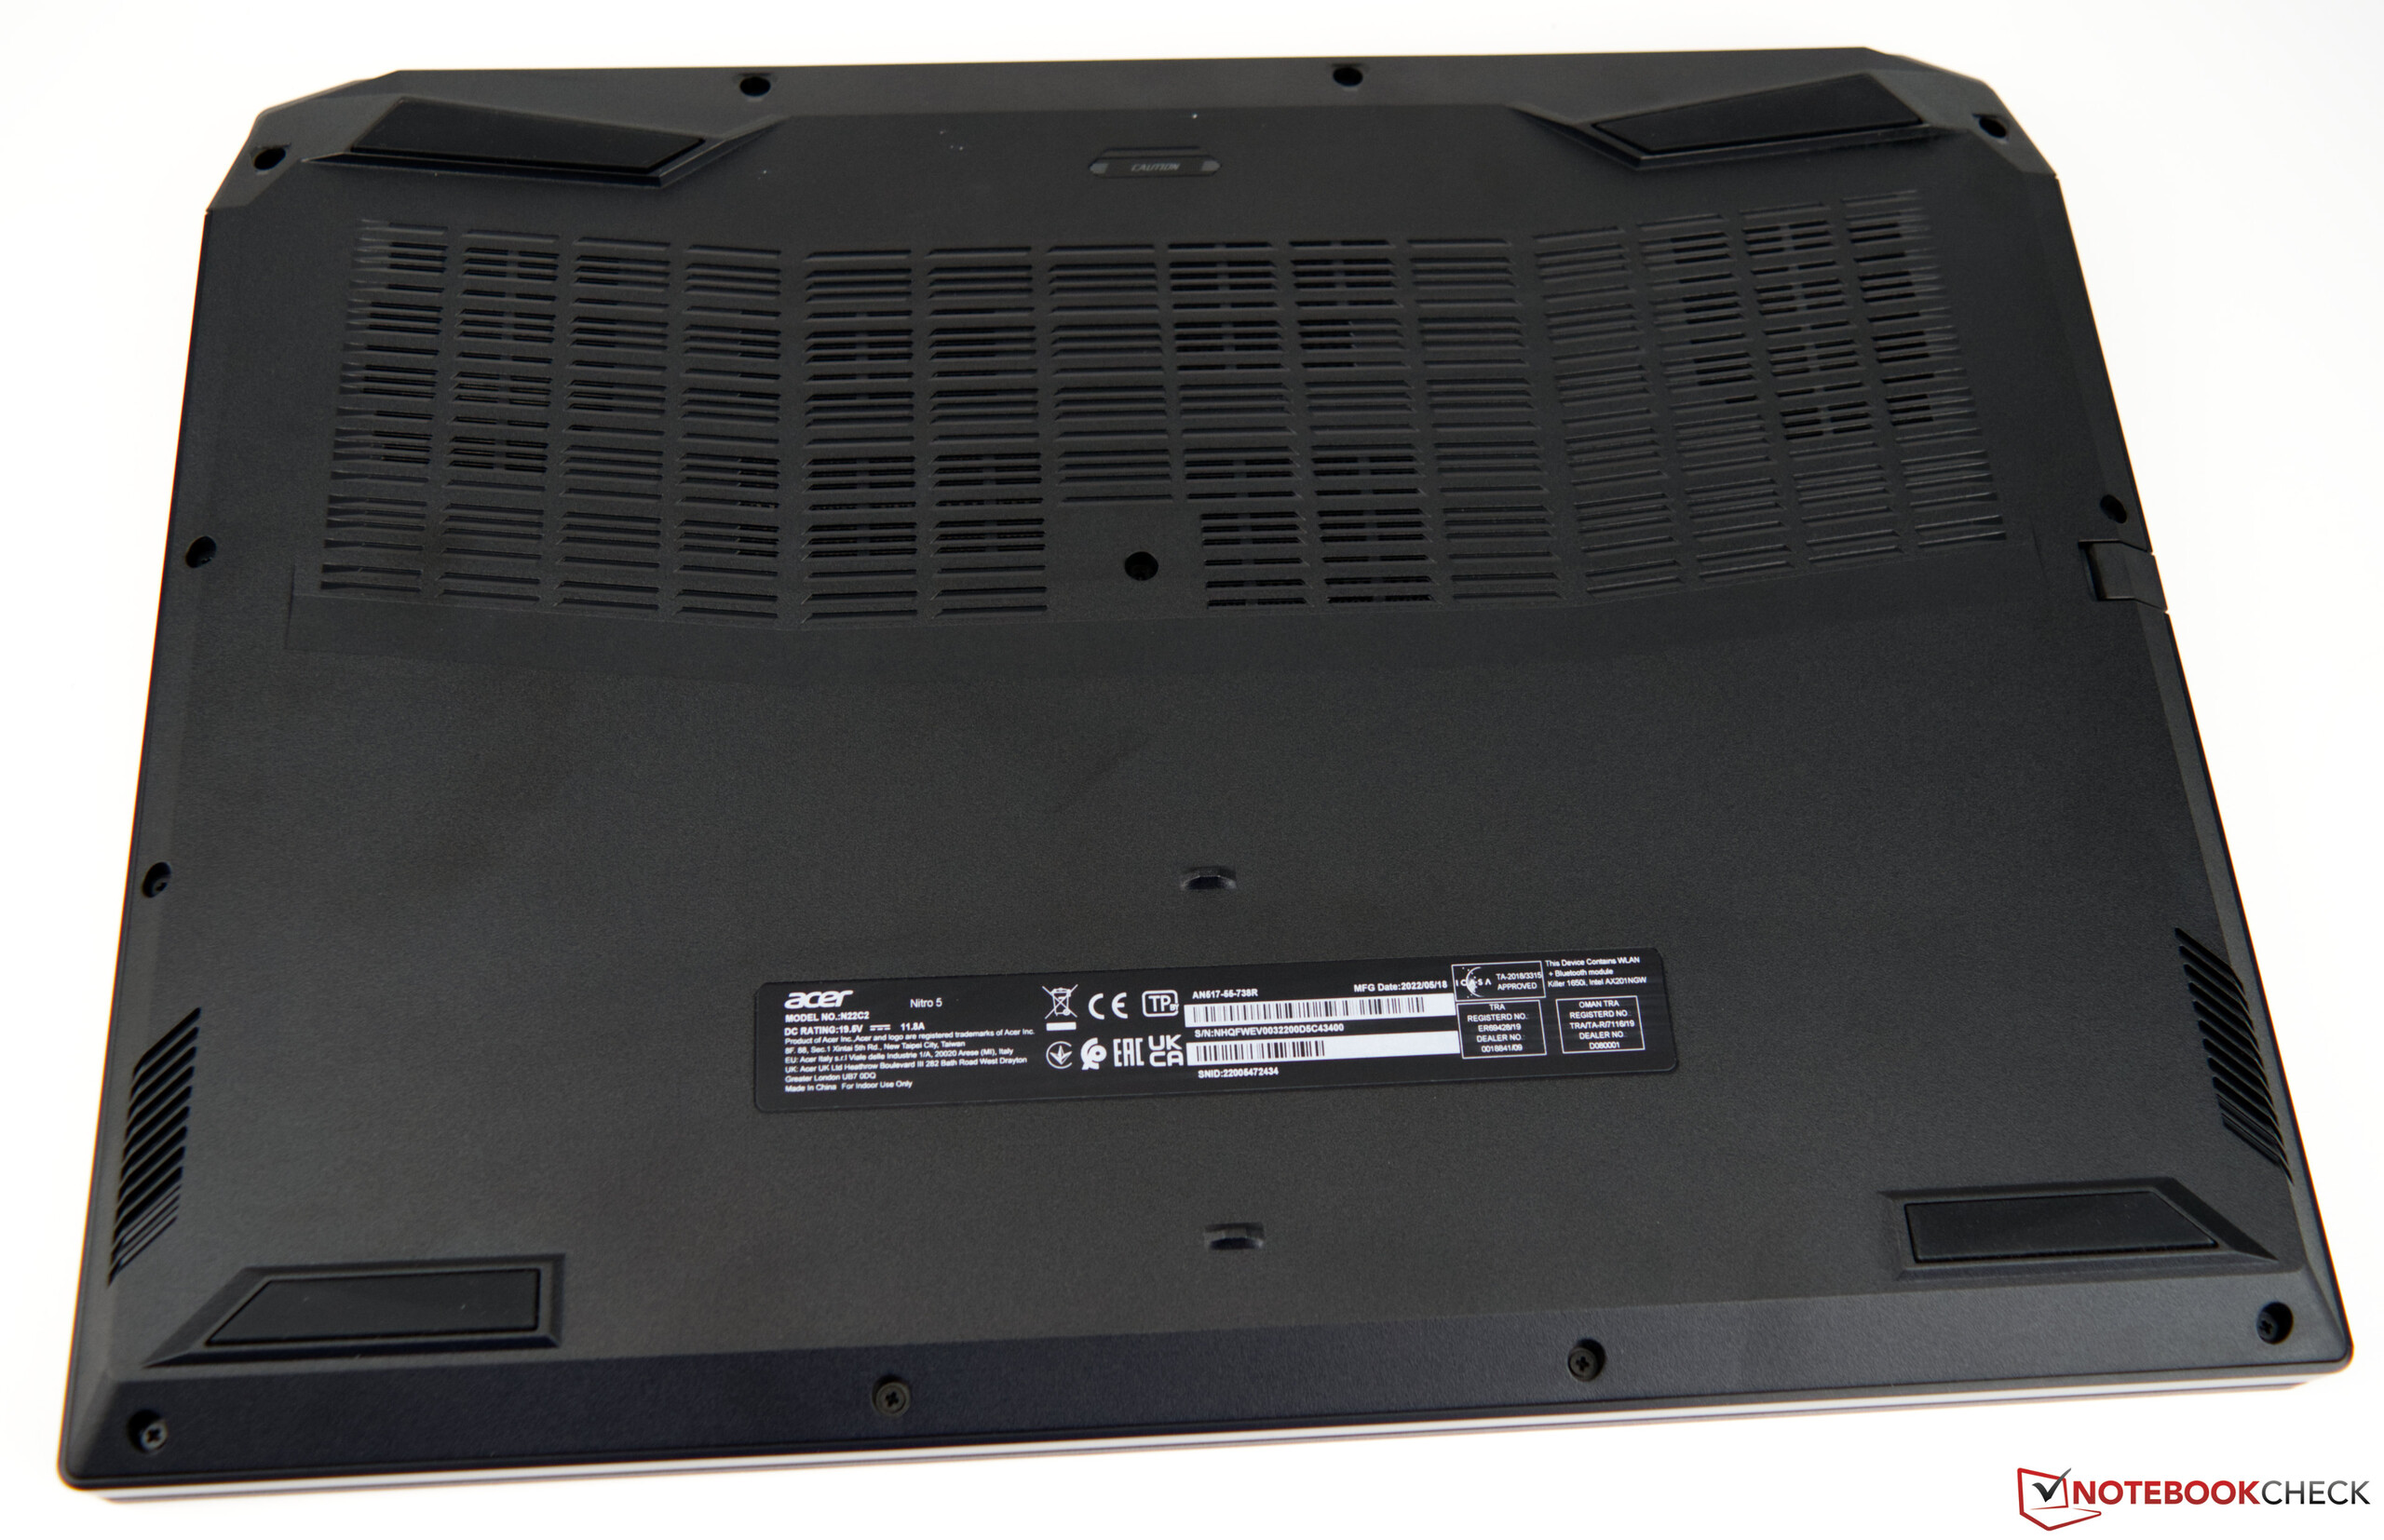
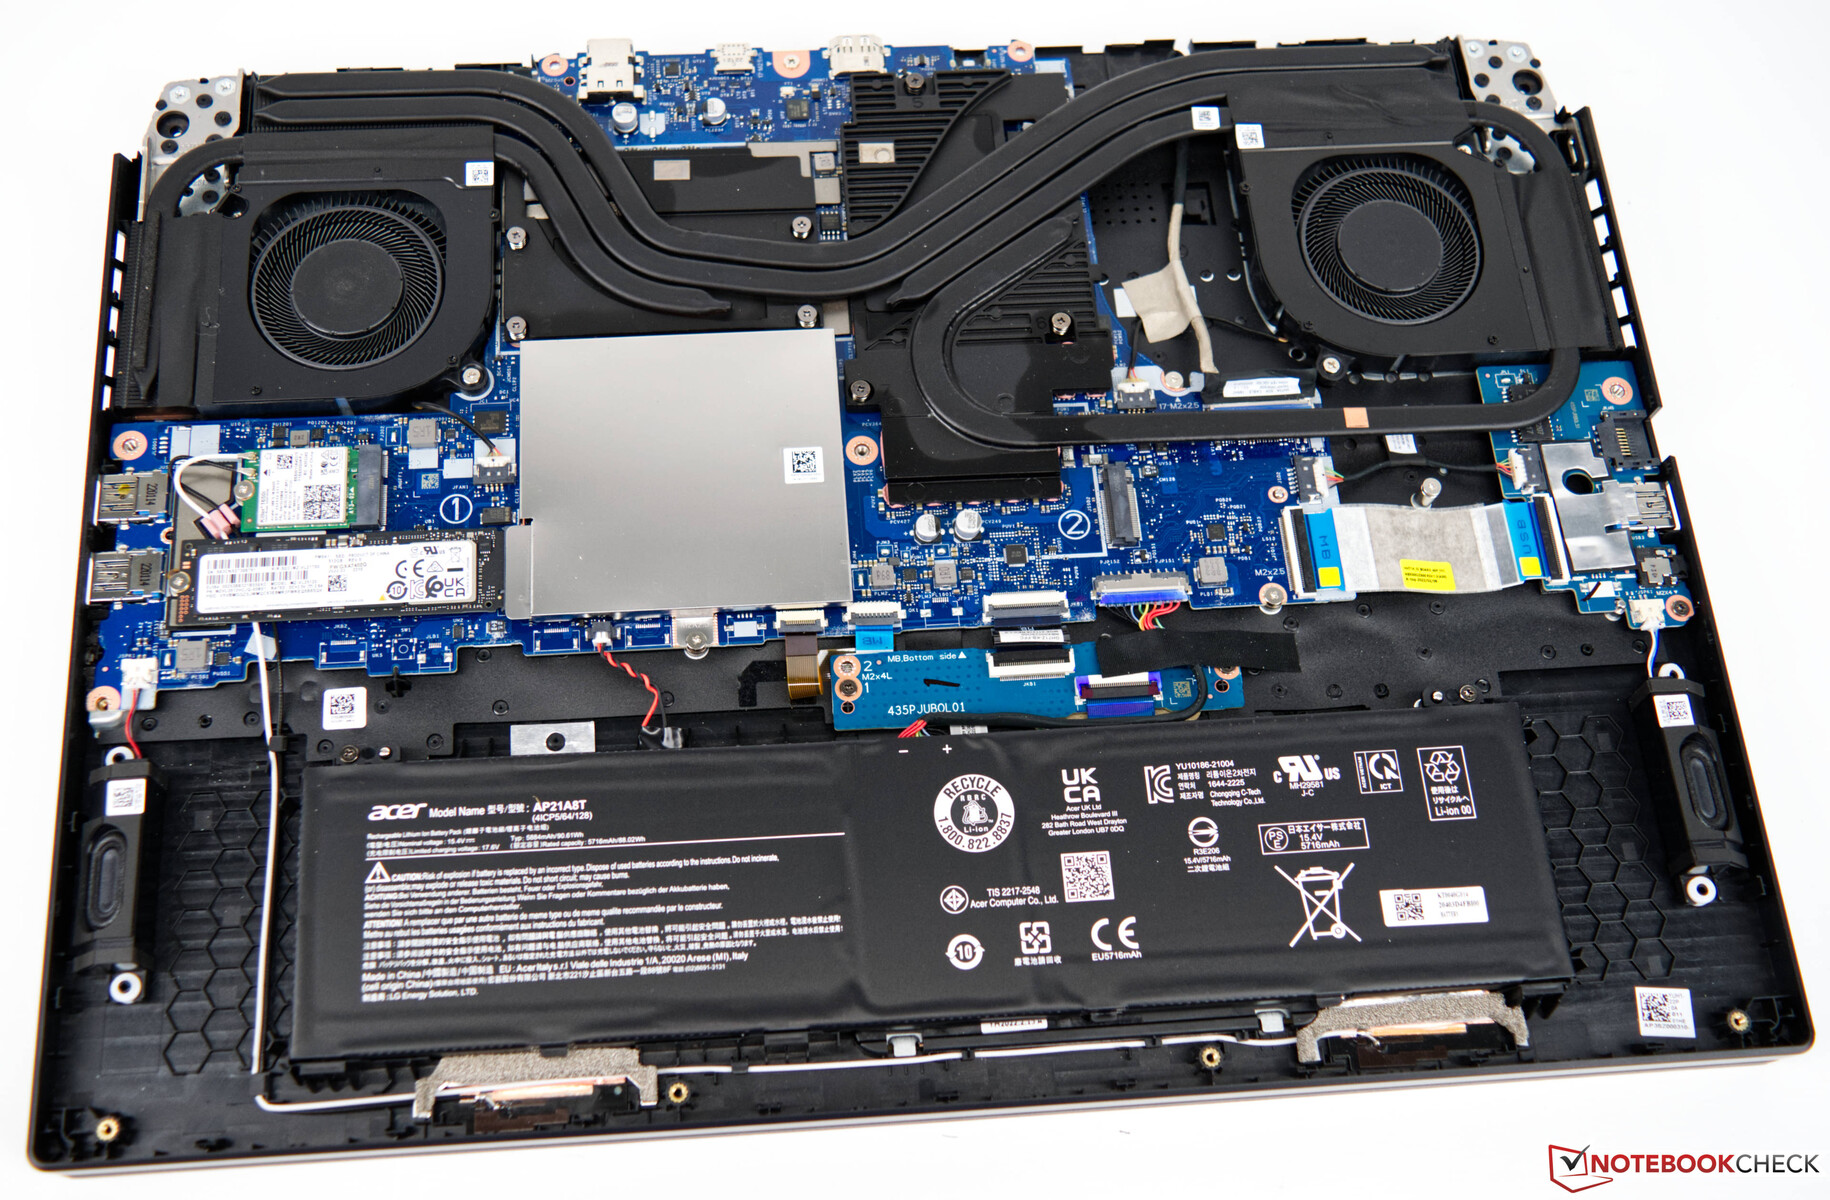
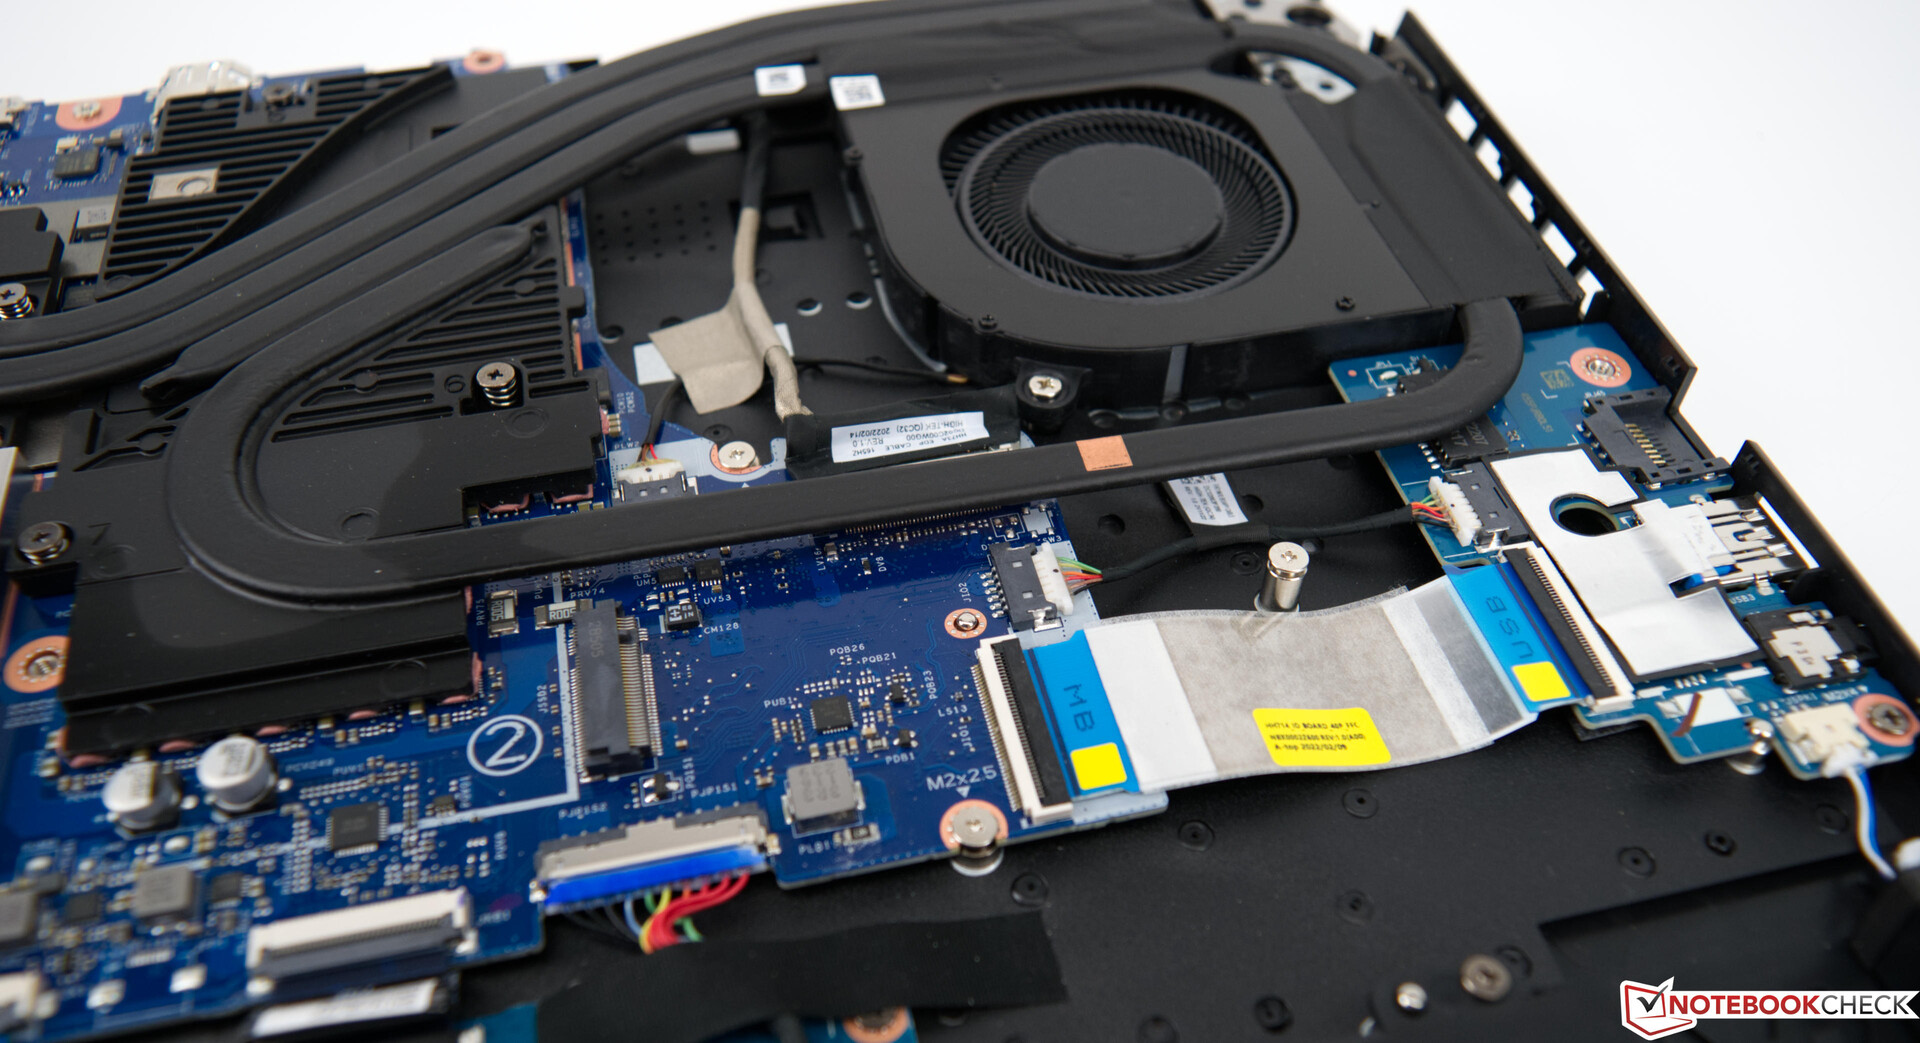
El cambio o la sustitución de la tornillería interna es fácil de llevar a cabo después de desmontar la placa base. Sin embargo, hay que tener cuidado al hacerlo: muchas abrazaderas pequeñas mantienen la tapa en su sitio incluso después de haber retirado todos los tornillos. Los huecos de nuestro dispositivo de muestra también son muy pequeños, por lo que tuvimos dificultades para hacer palanca para abrirlo con el kit de herramientas de iFixit. Internamente, se puede acceder a los componentes instalados muy fácilmente y sin necesidad de desmontarlos.
Garantía
En Alemania, Lenovo ofrece a los clientes una garantía de 24 meses que incluye el servicio de envío y devolución. Esto puede variar de una región a otra, así que asegúrese de consultar con su proveedor antes de comprar
Dispositivos de entrada - Bastante utilizables
Teclado
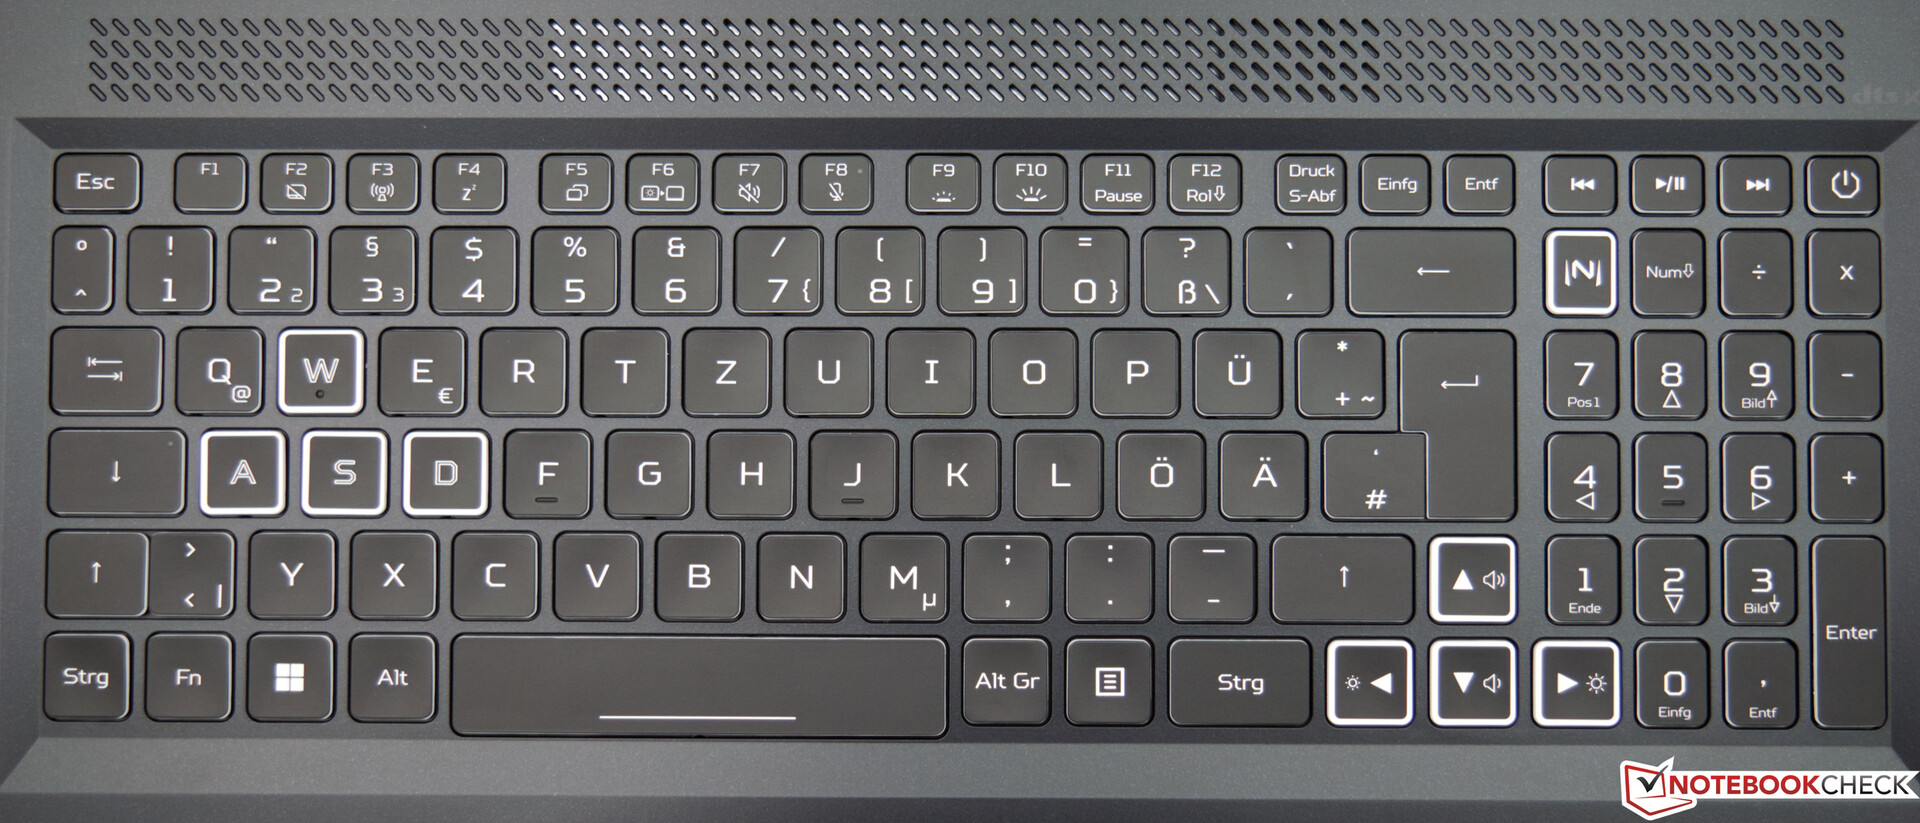
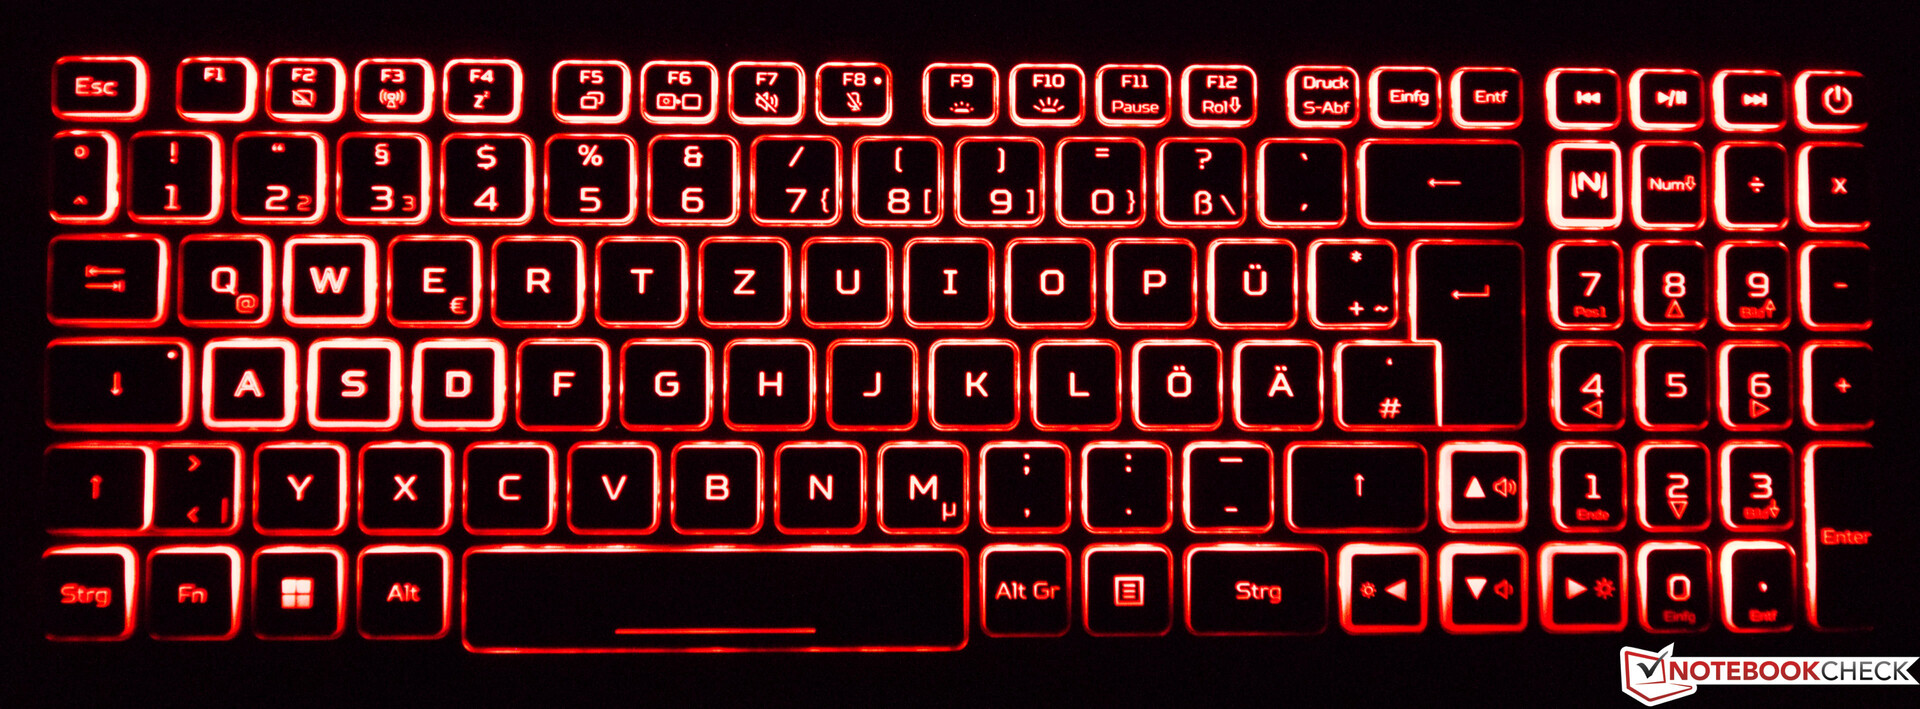
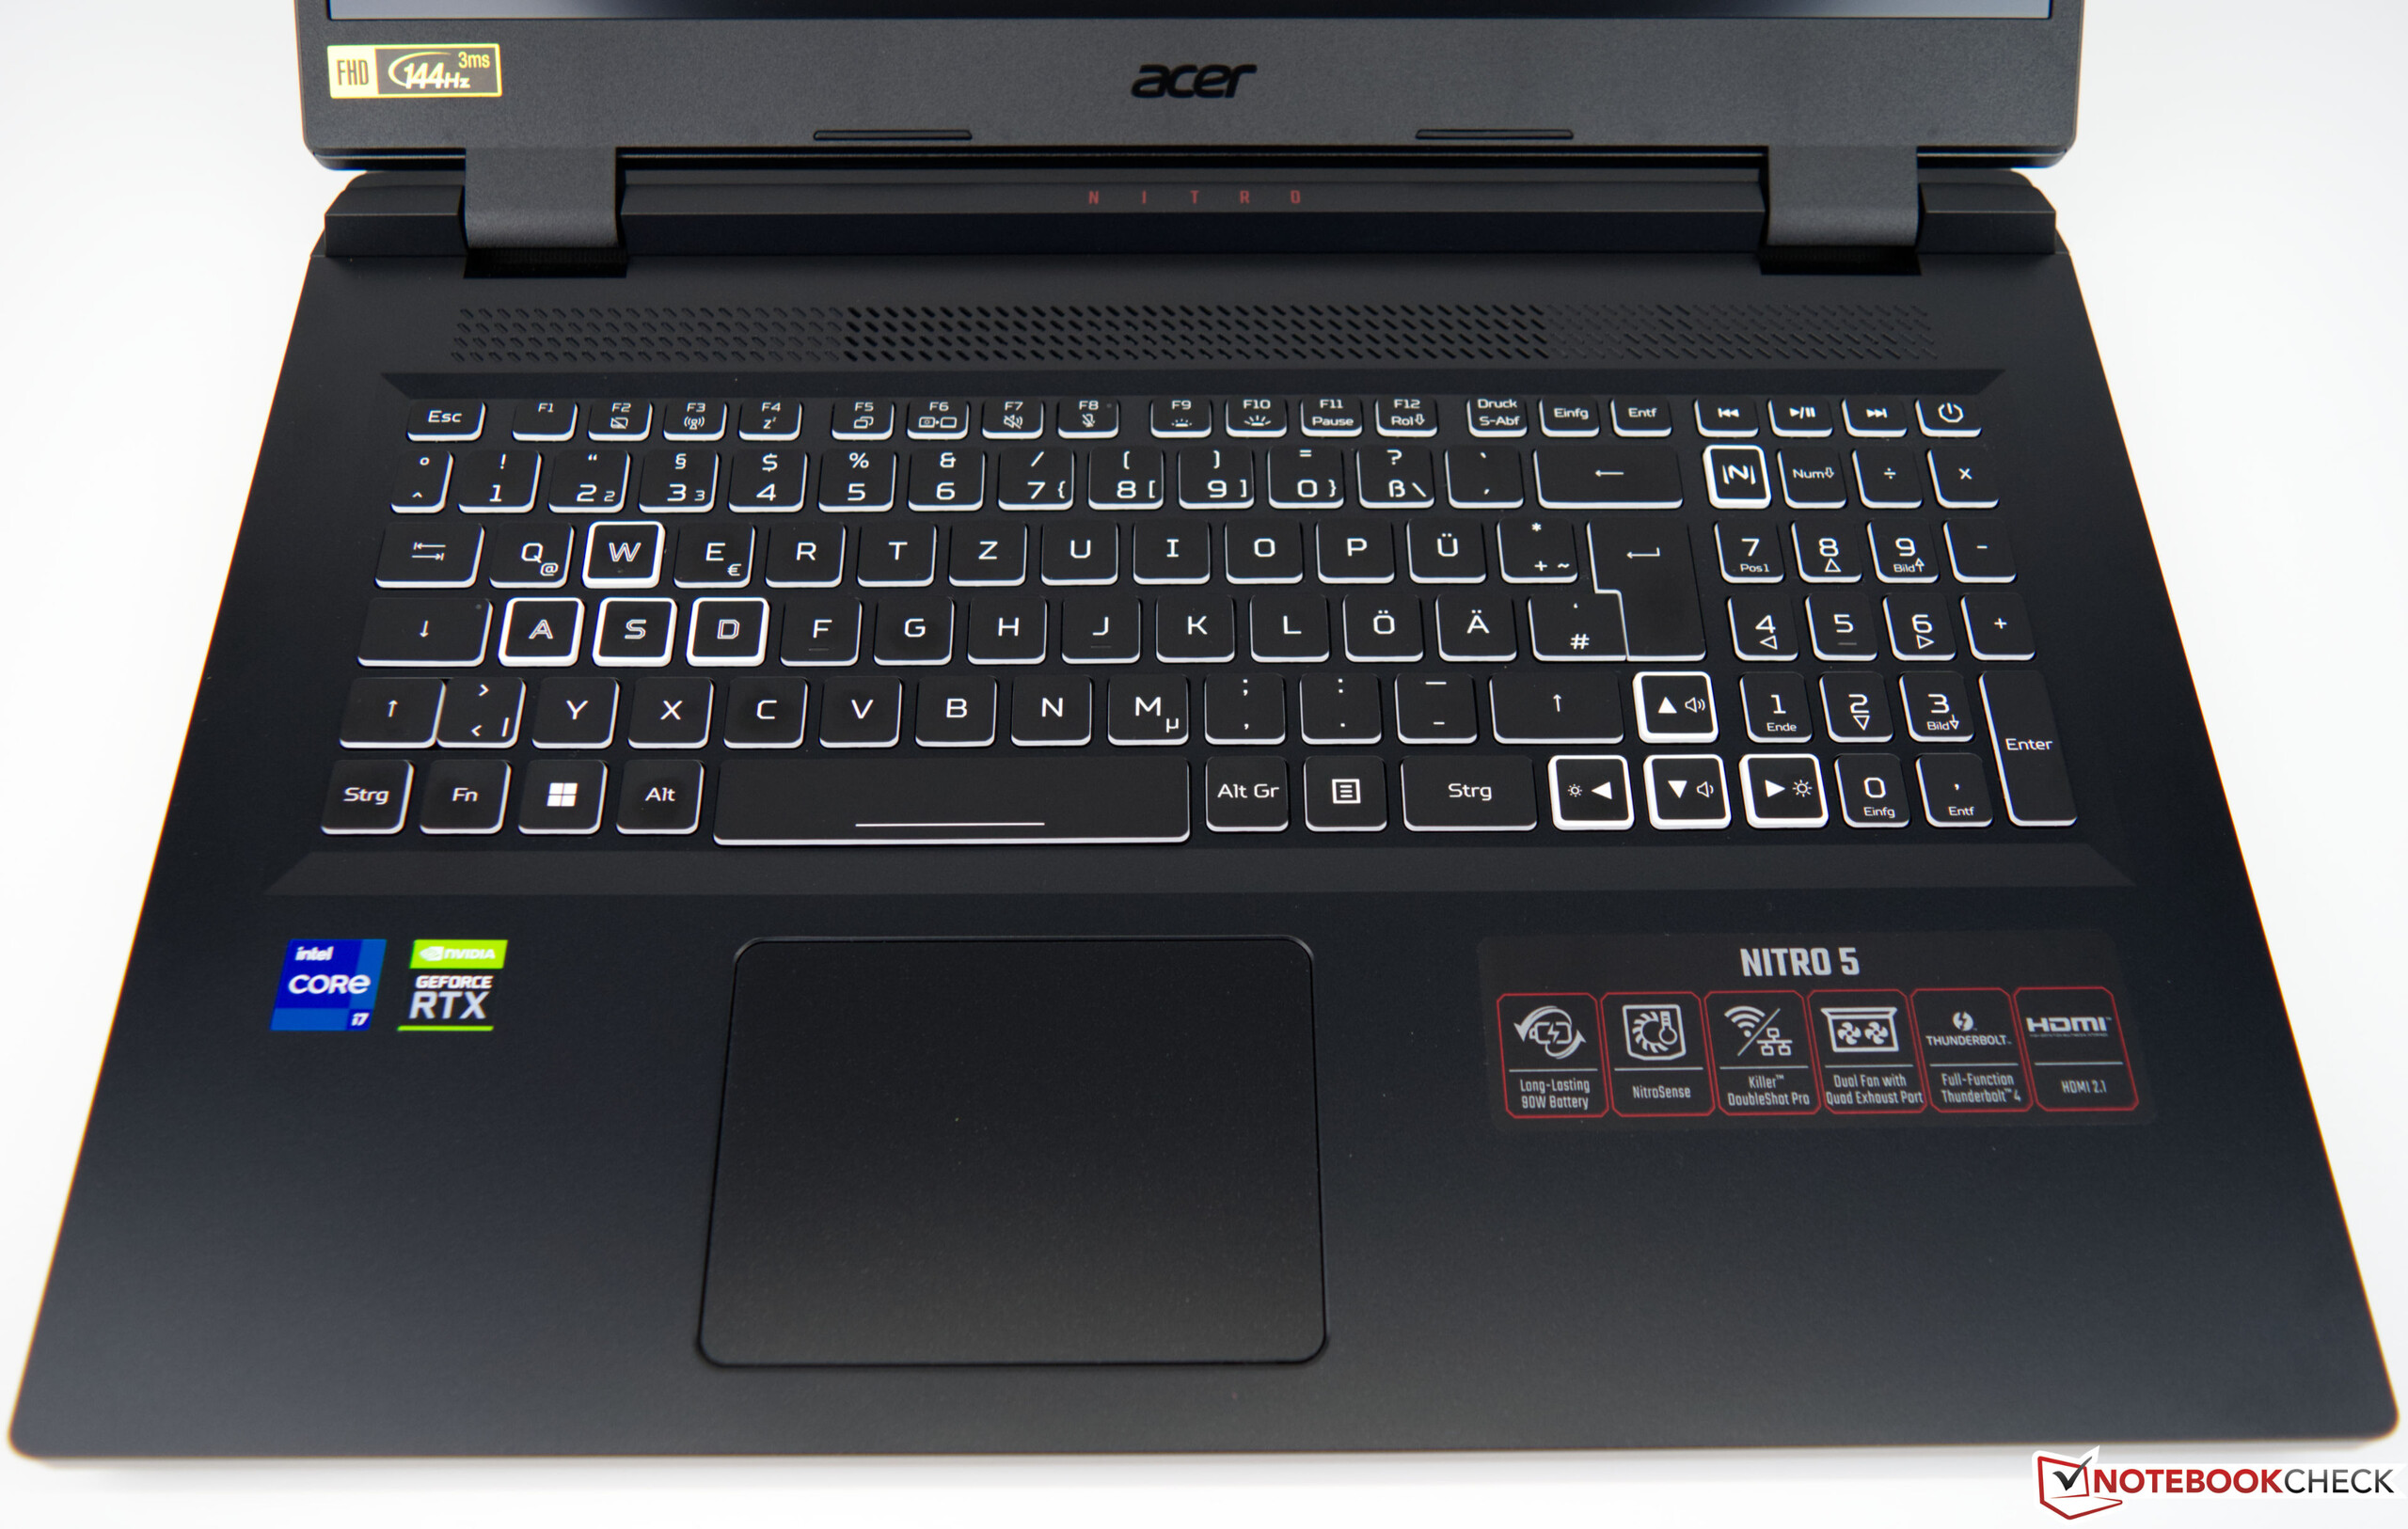
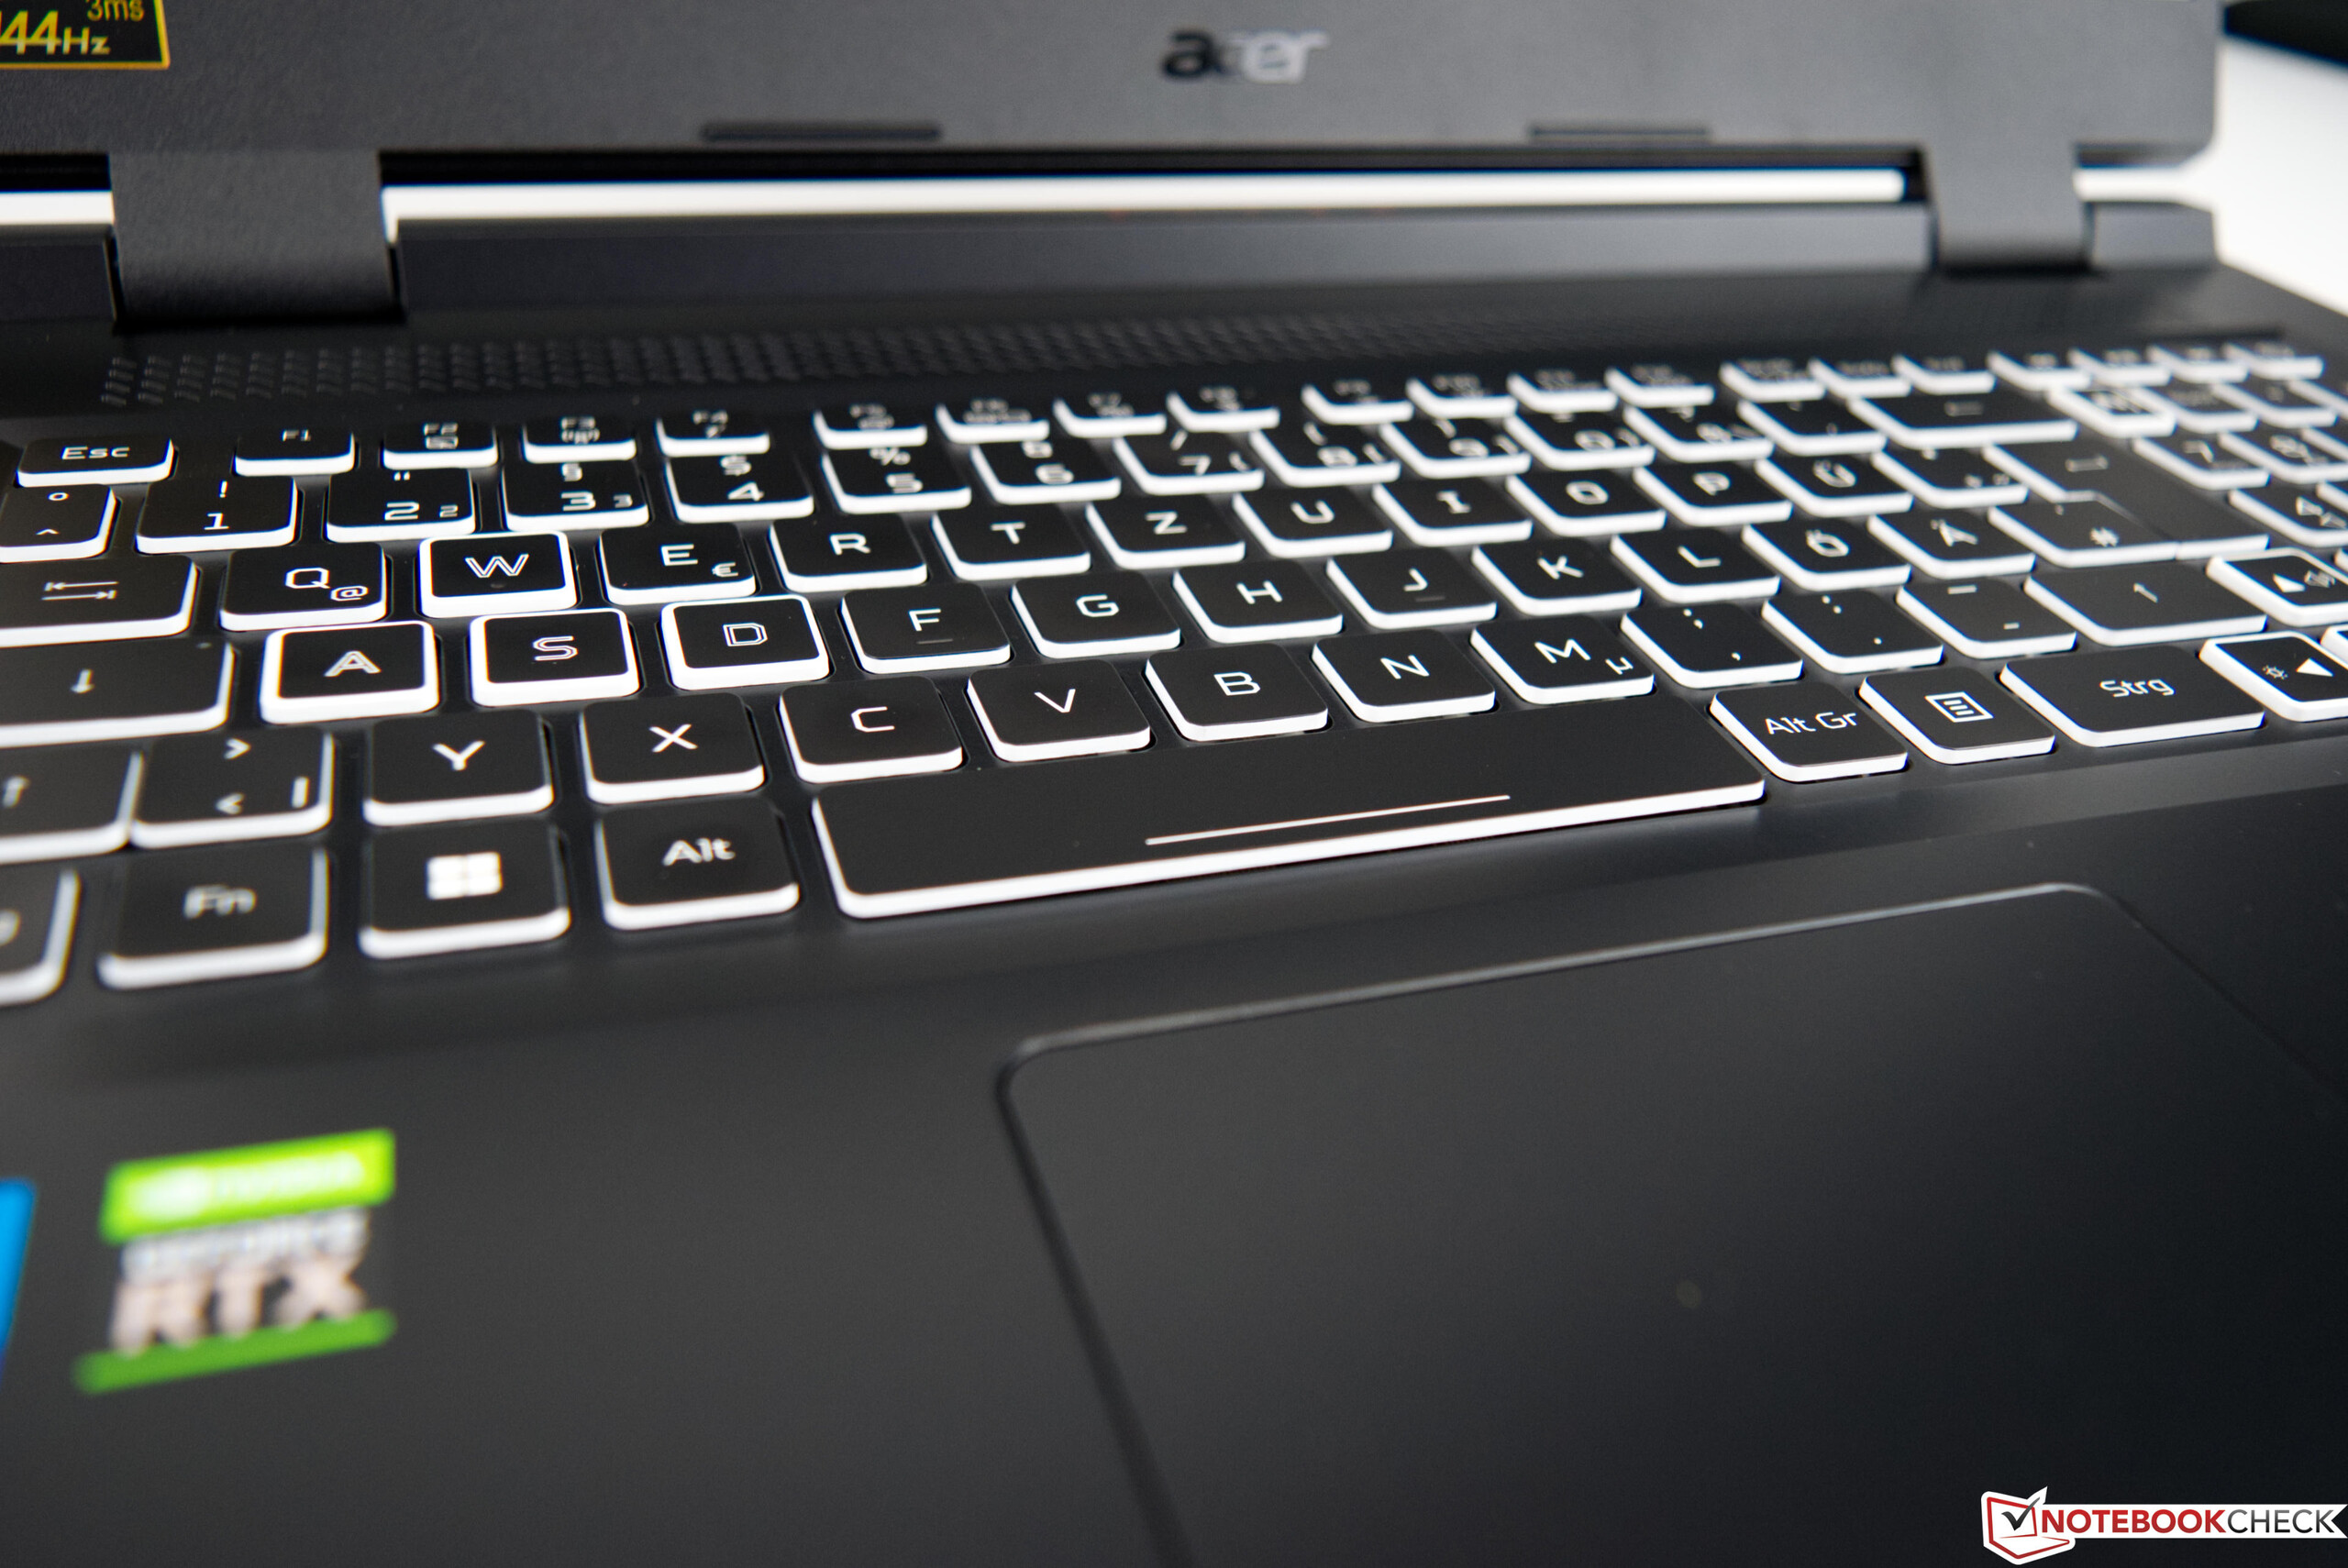
El teclado chiclet de 6 líneas del Acer Nitro 5 AN517 está bien y da una buena respuesta al escribir. Aunque la pulsación de las teclas está ligeramente amortiguada, esto no conduce a una sensación de escritura esponjosa. Con 15x15 milímetros, las teclas individuales tienen un tamaño agradable. Las teclas de función y el teclado numérico son algo más pequeñas, pero esto no causa ningún problema en la práctica. La retroiluminación RGB se puede controlar y ajustar hasta en 4 zonas a través de Nitro Sense.
Teclado táctil
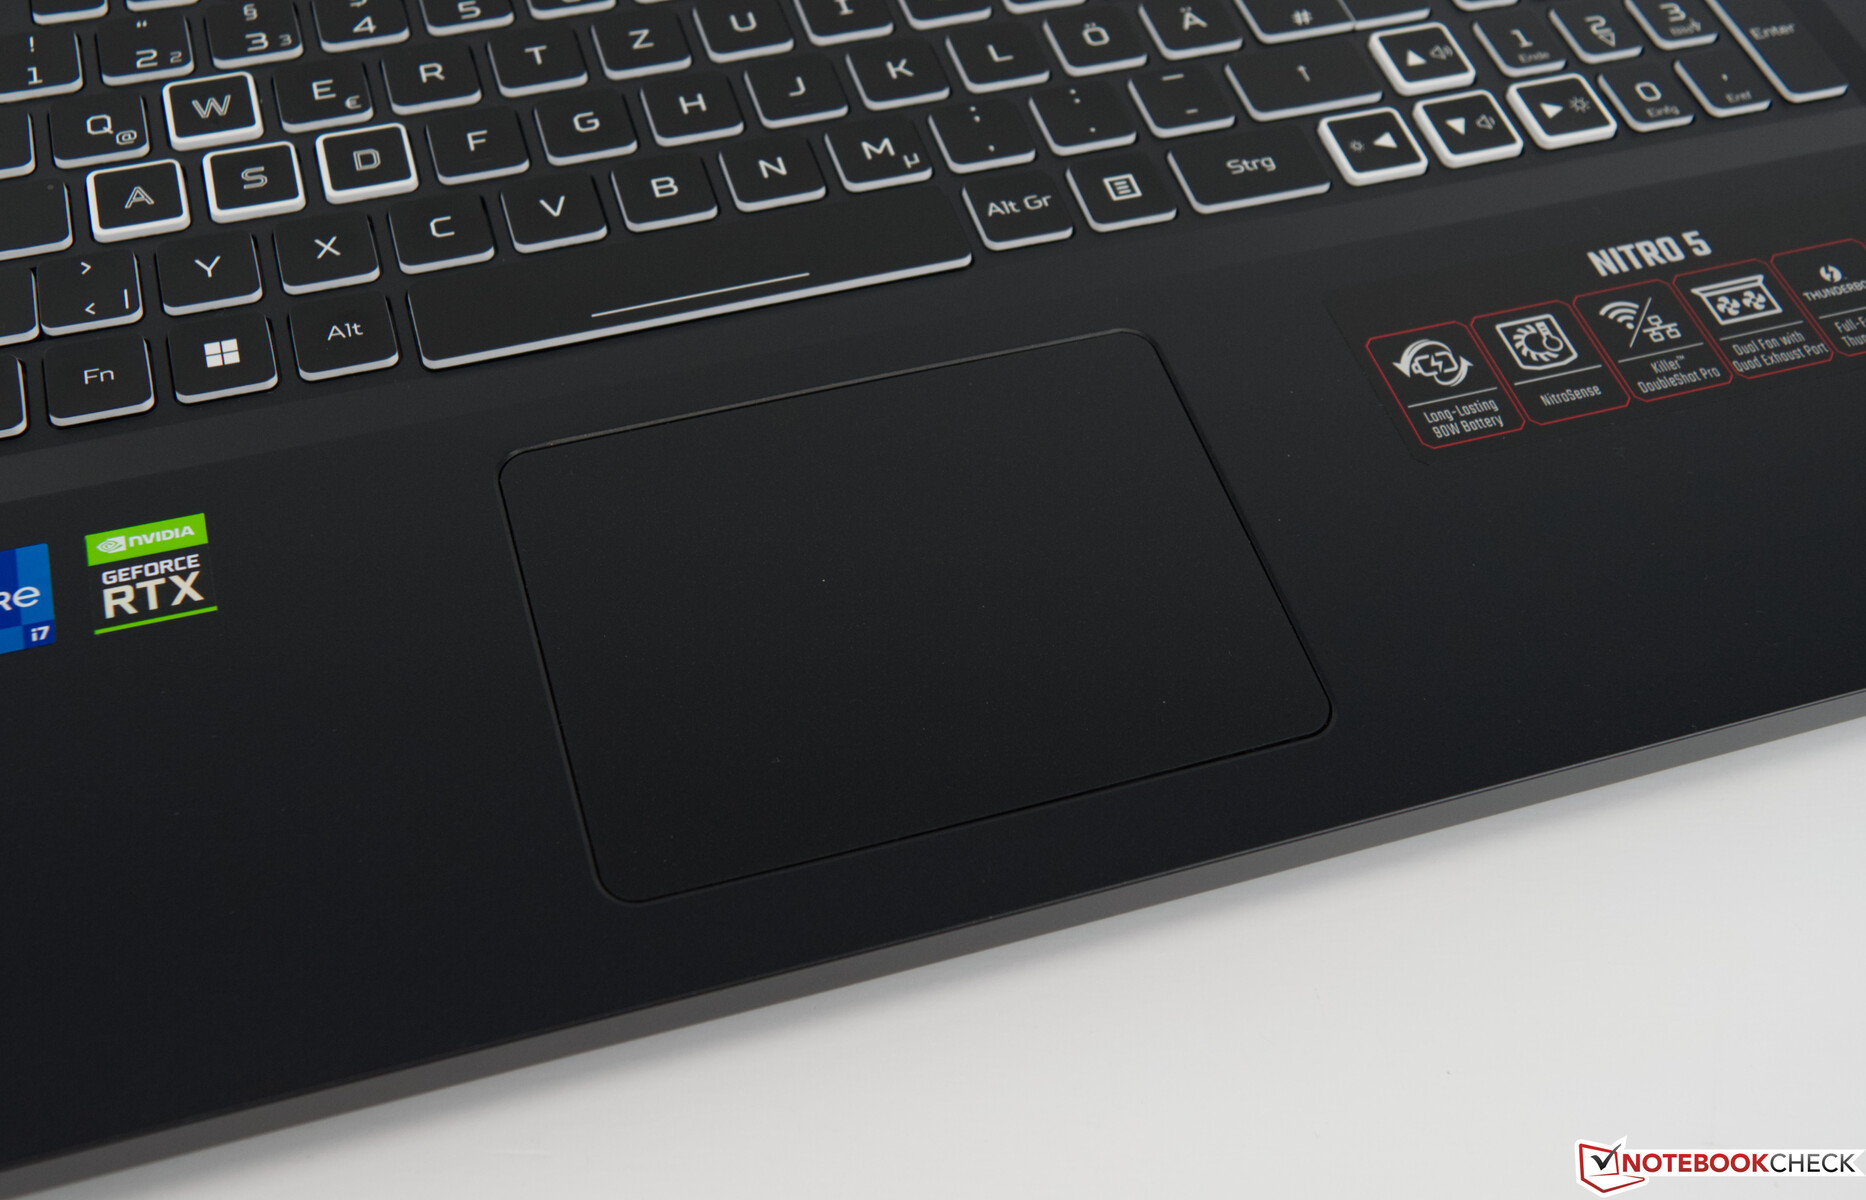
El touchpad incorporado mide 10,6x7,8 centímetros, aprovechando bien el espacio disponible. El sustituto del ratón responde en toda la superficie de entrada. La superficie lisa encaja muy bien con el concepto general. Desde el punto de vista táctil, la superficie de entrada es suave y también se adapta bien a los gestos multitáctiles debido a su tamaño. Las dos teclas de entrada están situadas en la zona inferior, y proporcionan una respuesta en forma de clics silenciosos cuando se pulsan.
Pantalla - Rápida y de 144 Hz
El Acer Nitro 5 AN517 viene con un buen panel Full HD que debería satisfacer las necesidades de la mayoría de jugadores con sus 144 Hz y sus bajos tiempos de respuesta. Sin embargo, el brillo medio de nuestro modelo de pruebas es algo más débil. Sólo medimos 278 cd/m², que no es el peor resultado en comparación directa con otros dispositivos de la competencia
El Acer Nitro 5 AN517 también pierde puntos importantes en la puntuación general debido a ligeros halos. Por otro lado, no detectamos ningún PWN, lo que puede evitar la fatiga durante largos periodos de uso
Las opciones de pantalla alternativas, como un panel QHD o 4K, no están disponibles para el Acer Nitro 5 AN517.
| |||||||||||||||||||||||||
iluminación: 89 %
Brillo con batería: 297 cd/m²
Contraste: 894:1 (Negro: 0.32 cd/m²)
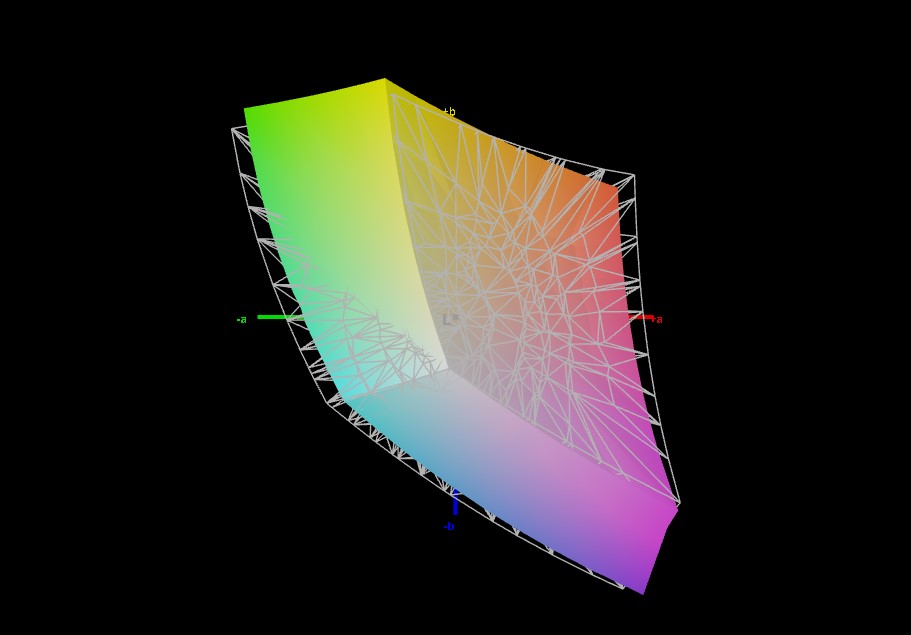
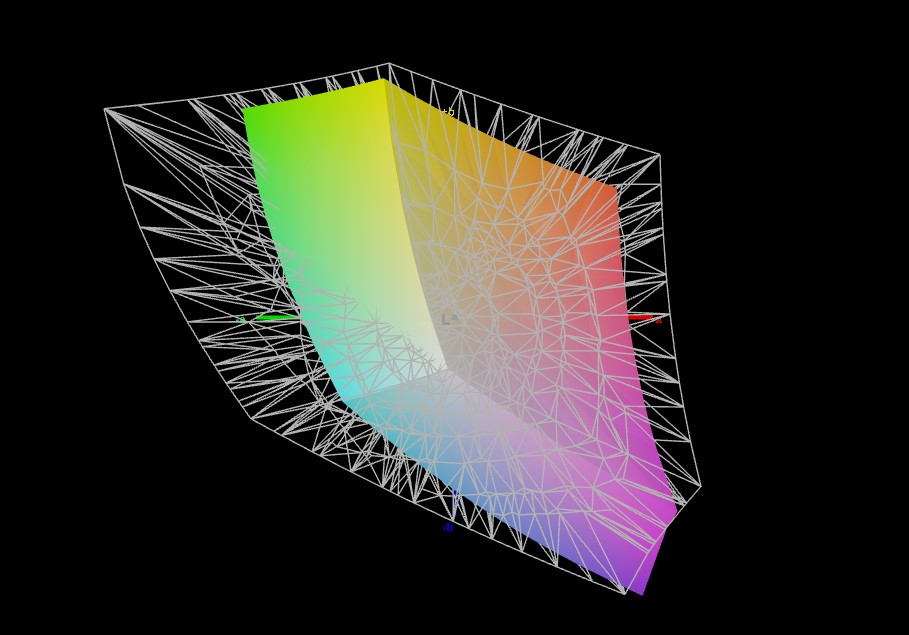
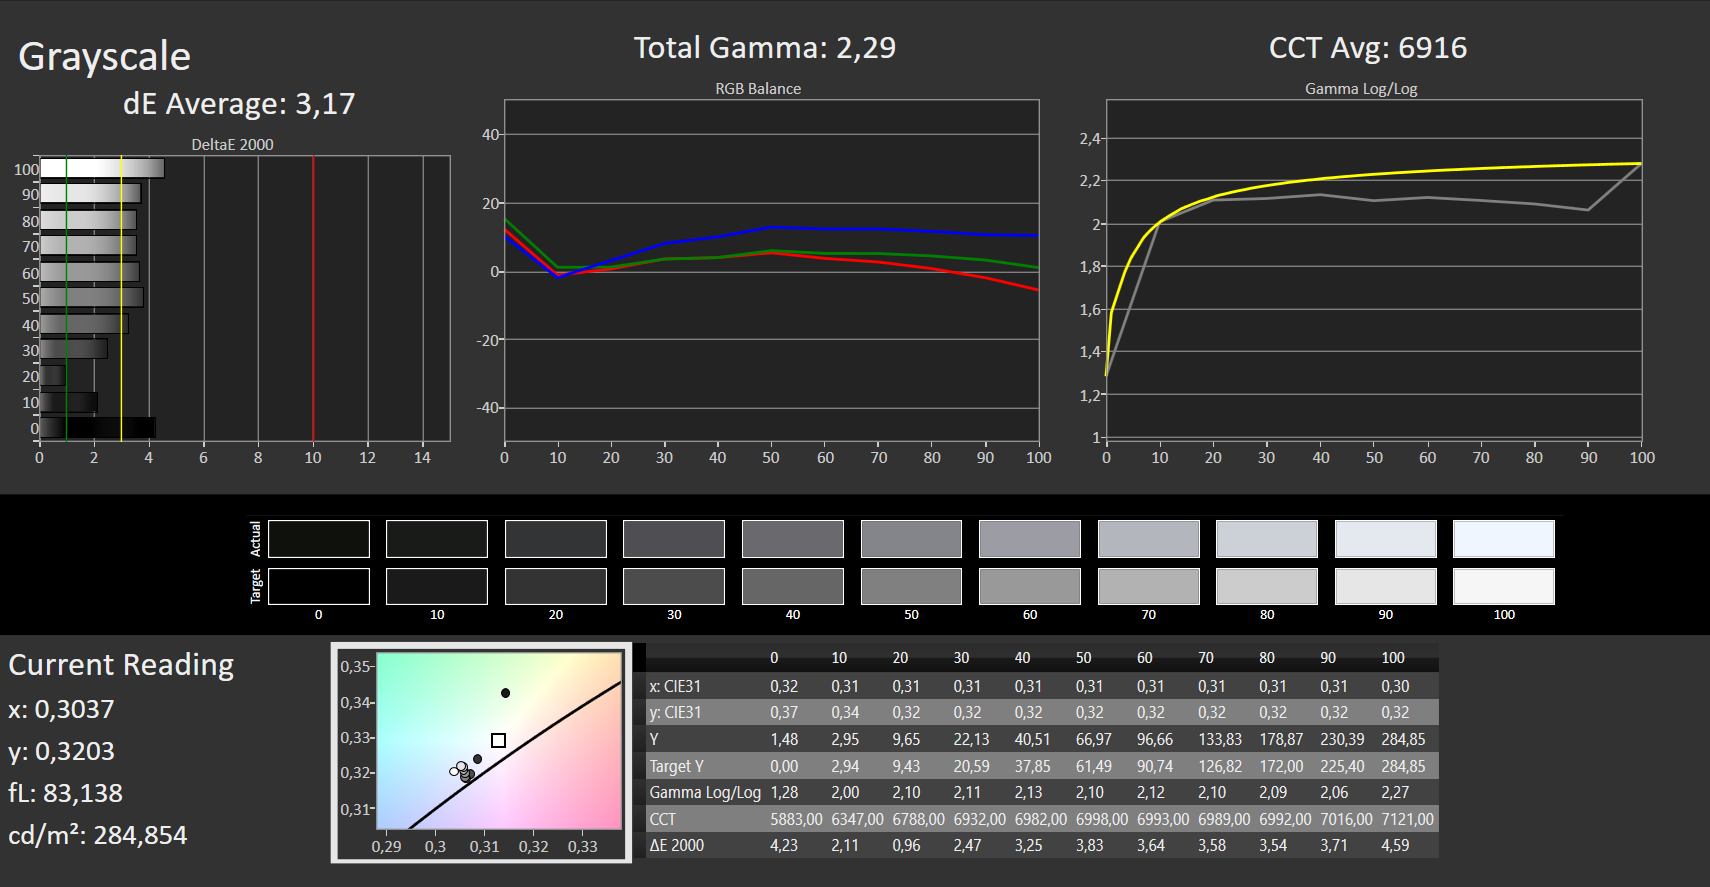
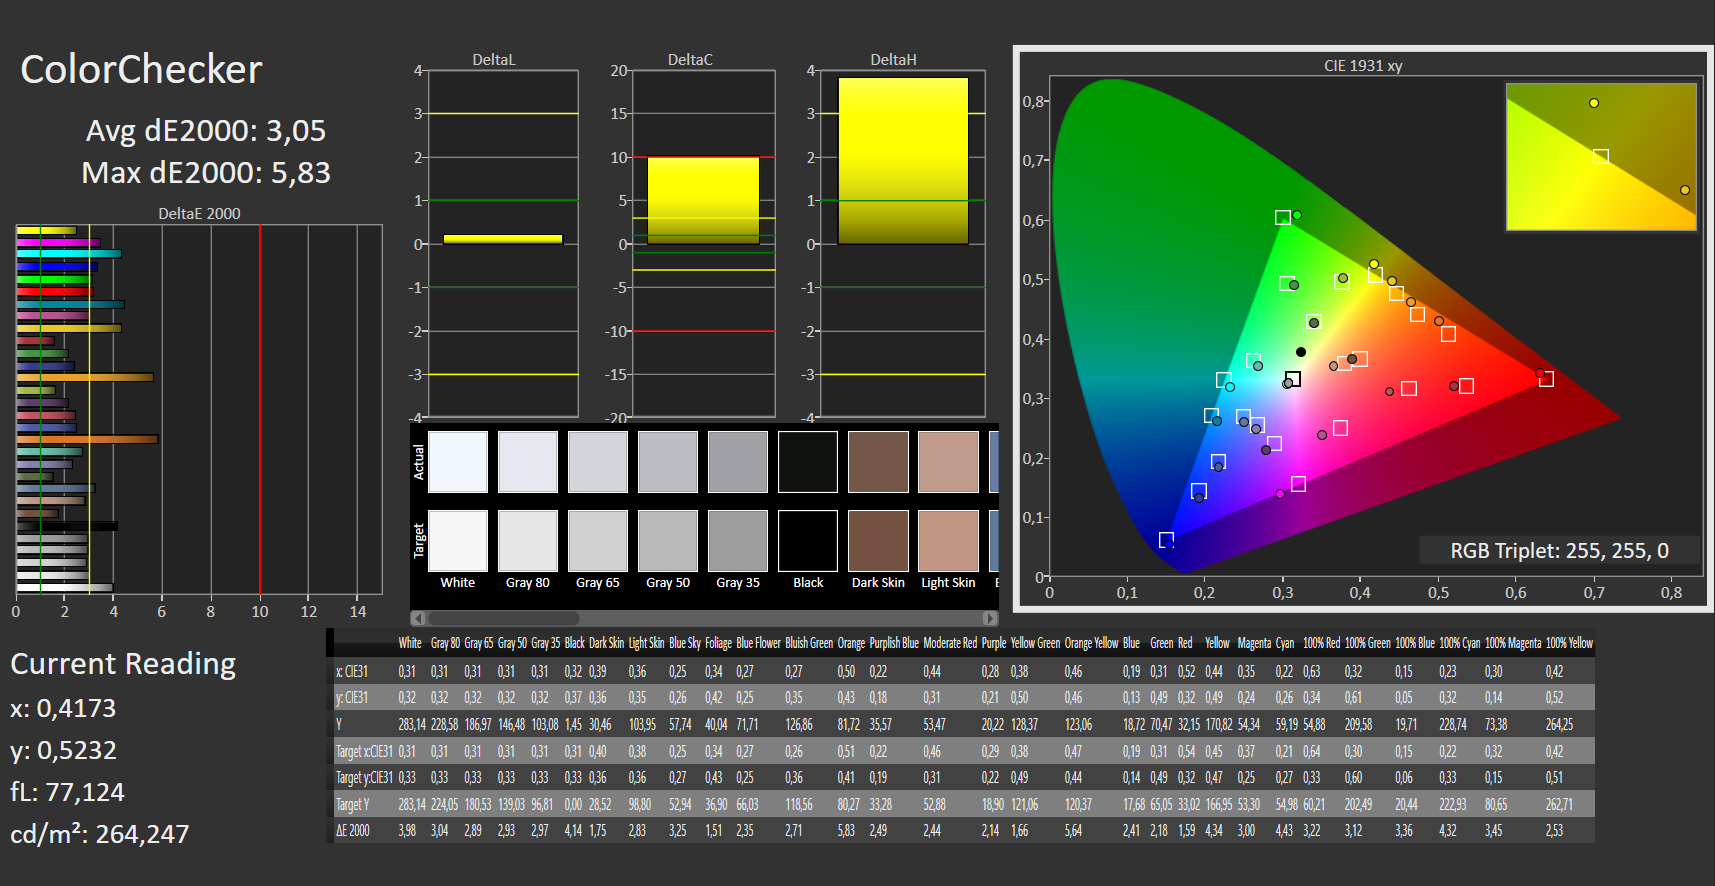
ΔE ColorChecker Calman: 3.05 | ∀{0.5-29.43 Ø4.71}
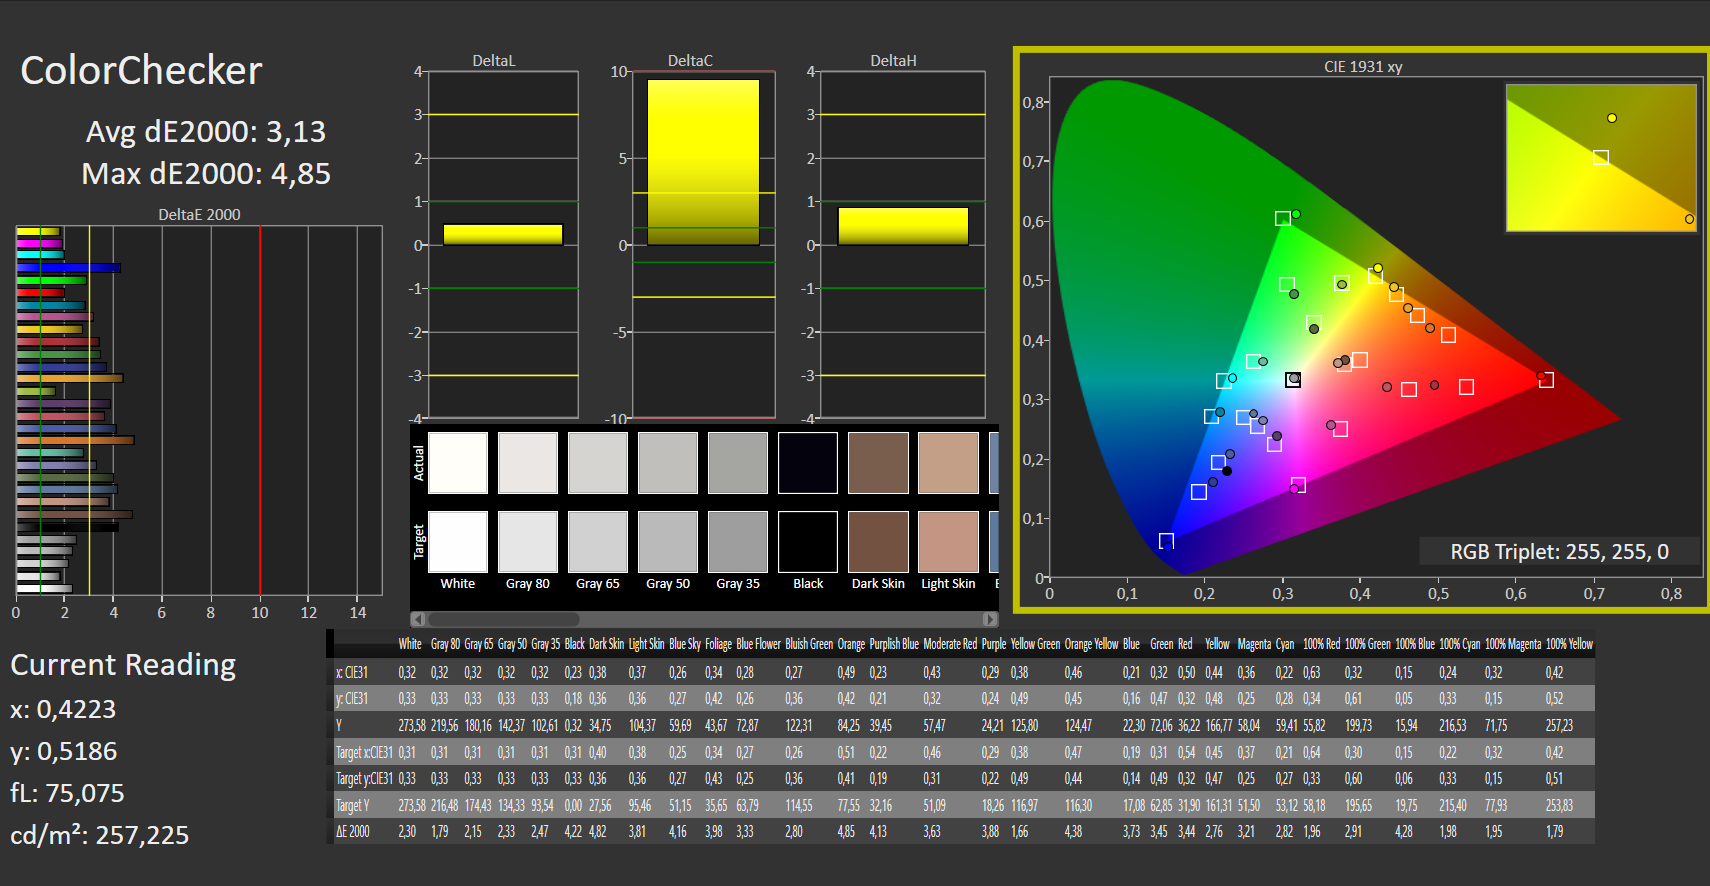
calibrated: 3.13
ΔE Greyscale Calman: 3.17 | ∀{0.09-98 Ø4.96}
60.5% AdobeRGB 1998 (Argyll 3D)
86.4% sRGB (Argyll 3D)
58.9% Display P3 (Argyll 3D)
Gamma: 2.29
CCT: 6916 K
| Acer Nitro 5 AN517-55-738R B173HAN04.0, IPS, 1920x1080, 17.3" | Lenovo Legion 5 17ACH6H-82JY0003GE LEN173FHD, IPS, 1920x1080, 17.3" | Asus TUF Gaming F17 FX707Z-HX011W AU Optronics B173HAN04.9 (AUO4B9D), IPS, 1920x1080, 17.3" | Acer Nitro 5 AN517-41-R5Z7 BOE NV173FHM-NX4, IPS, 1920x1080, 17.3" | Schenker XMG Core 17 (Early 2021) BOE CQ NE173QHM-NY2, IPS, 2560x1440, 17.3" | MSI Katana GF76 11UE AU Optronics B173HAN04.9, IPS, 1920x1080, 17.3" | |
|---|---|---|---|---|---|---|
| Display | 11% | -31% | -37% | 15% | -32% | |
| Display P3 Coverage (%) | 58.9 | 64.8 10% | 40.2 -32% | 36.7 -38% | 68.1 16% | 39.8 -32% |
| sRGB Coverage (%) | 86.4 | 97.2 13% | 59.7 -31% | 55.3 -36% | 98.5 14% | 59.5 -31% |
| AdobeRGB 1998 Coverage (%) | 60.5 | 66.7 10% | 41.5 -31% | 37.9 -37% | 69.3 15% | 41.12 -32% |
| Response Times | -82% | -412% | -138% | -103% | -369% | |
| Response Time Grey 50% / Grey 80% * (ms) | 6 ? | 15 ? -150% | 39.2 ? -553% | 18 ? -200% | 16.8 ? -180% | 36.8 ? -513% |
| Response Time Black / White * (ms) | 8 ? | 9 ? -13% | 29.6 ? -270% | 14 ? -75% | 10 ? -25% | 26 ? -225% |
| PWM Frequency (Hz) | ||||||
| Screen | 26% | -9% | -28% | 7% | -27% | |
| Brightness middle (cd/m²) | 286 | 323 13% | 287 0% | 282 -1% | 370 29% | 260 -9% |
| Brightness (cd/m²) | 278 | 305 10% | 268 -4% | 255 -8% | 333 20% | 251 -10% |
| Brightness Distribution (%) | 89 | 89 0% | 89 0% | 85 -4% | 84 -6% | 85 -4% |
| Black Level * (cd/m²) | 0.32 | 0.25 22% | 0.17 47% | 0.24 25% | 0.38 -19% | 0.26 19% |
| Contrast (:1) | 894 | 1292 45% | 1688 89% | 1175 31% | 974 9% | 1000 12% |
| Colorchecker dE 2000 * | 3.05 | 1.87 39% | 5.1 -67% | 5.91 -94% | 2.41 21% | 3.9 -28% |
| Colorchecker dE 2000 max. * | 5.83 | 4.84 17% | 8.72 -50% | 10.98 -88% | 7.32 -26% | 20.64 -254% |
| Colorchecker dE 2000 calibrated * | 3.13 | 0.92 71% | 5.1 -63% | 1.19 62% | 3.71 -19% | |
| Greyscale dE 2000 * | 3.17 | 2.57 19% | 4.24 -34% | 5.85 -85% | 3.9 -23% | 1.6 50% |
| Gamma | 2.29 96% | 2.42 91% | 2.44 90% | 2.32 95% | 2.287 96% | 2.068 106% |
| CCT | 6916 94% | 7012 93% | 6008 108% | 7372 88% | 7302 89% | 6511 100% |
| Color Space (Percent of AdobeRGB 1998) (%) | 35 | 69 | ||||
| Color Space (Percent of sRGB) (%) | 55 | 93 | ||||
| Media total (Programa/Opciones) | -15% /
8% | -151% /
-71% | -68% /
-47% | -27% /
-7% | -143% /
-77% |
* ... más pequeño es mejor
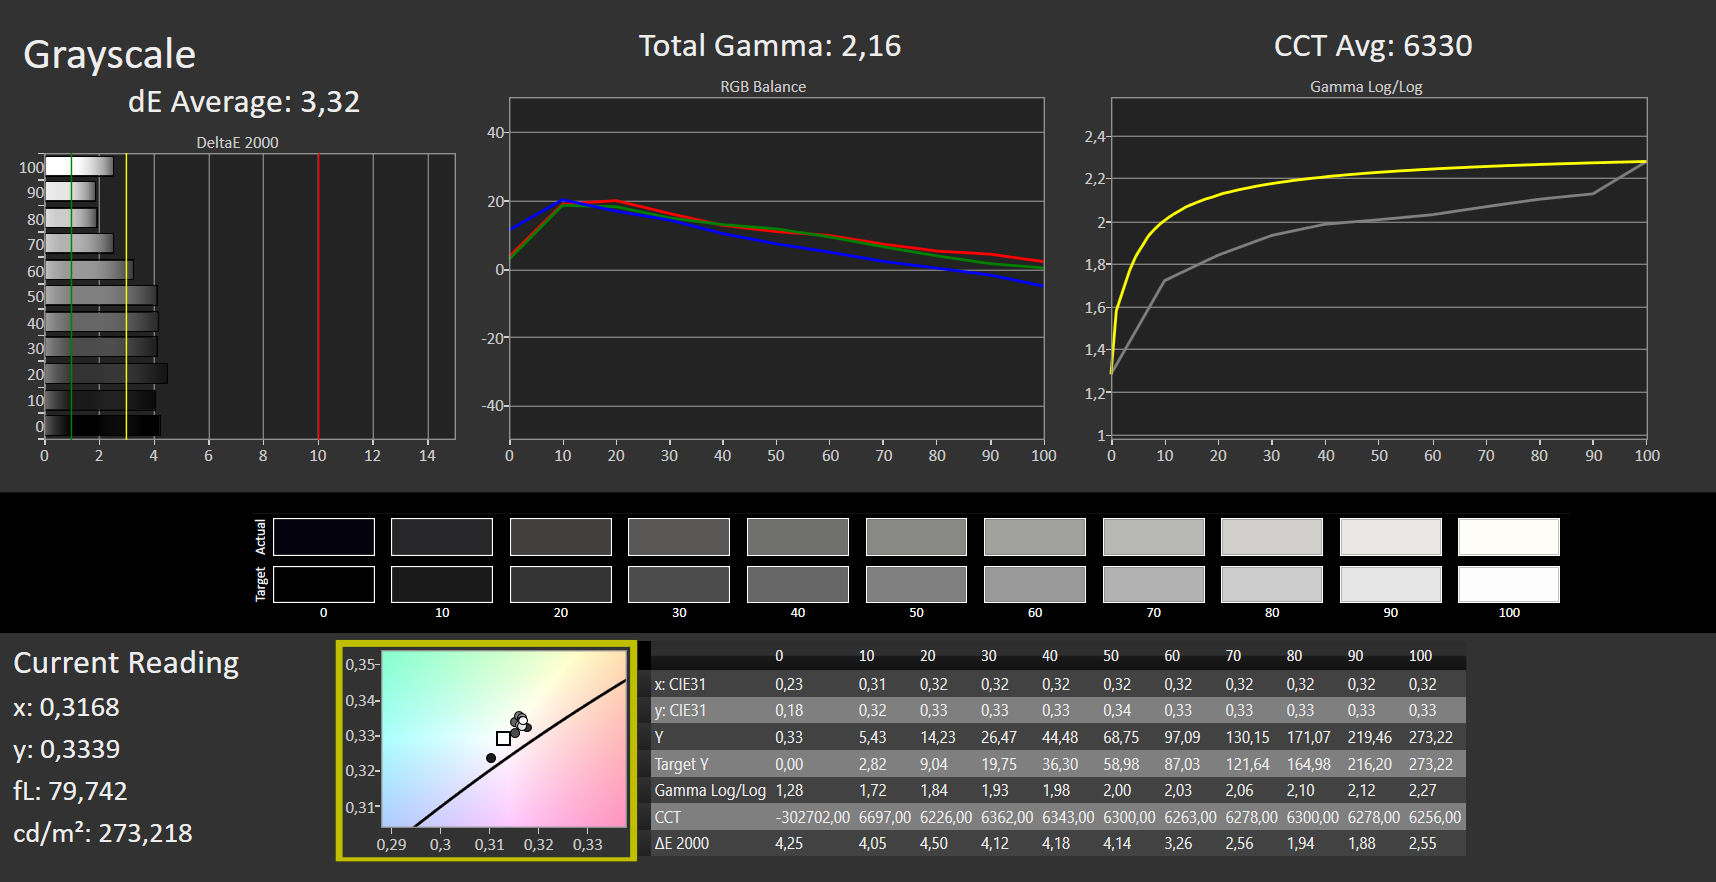
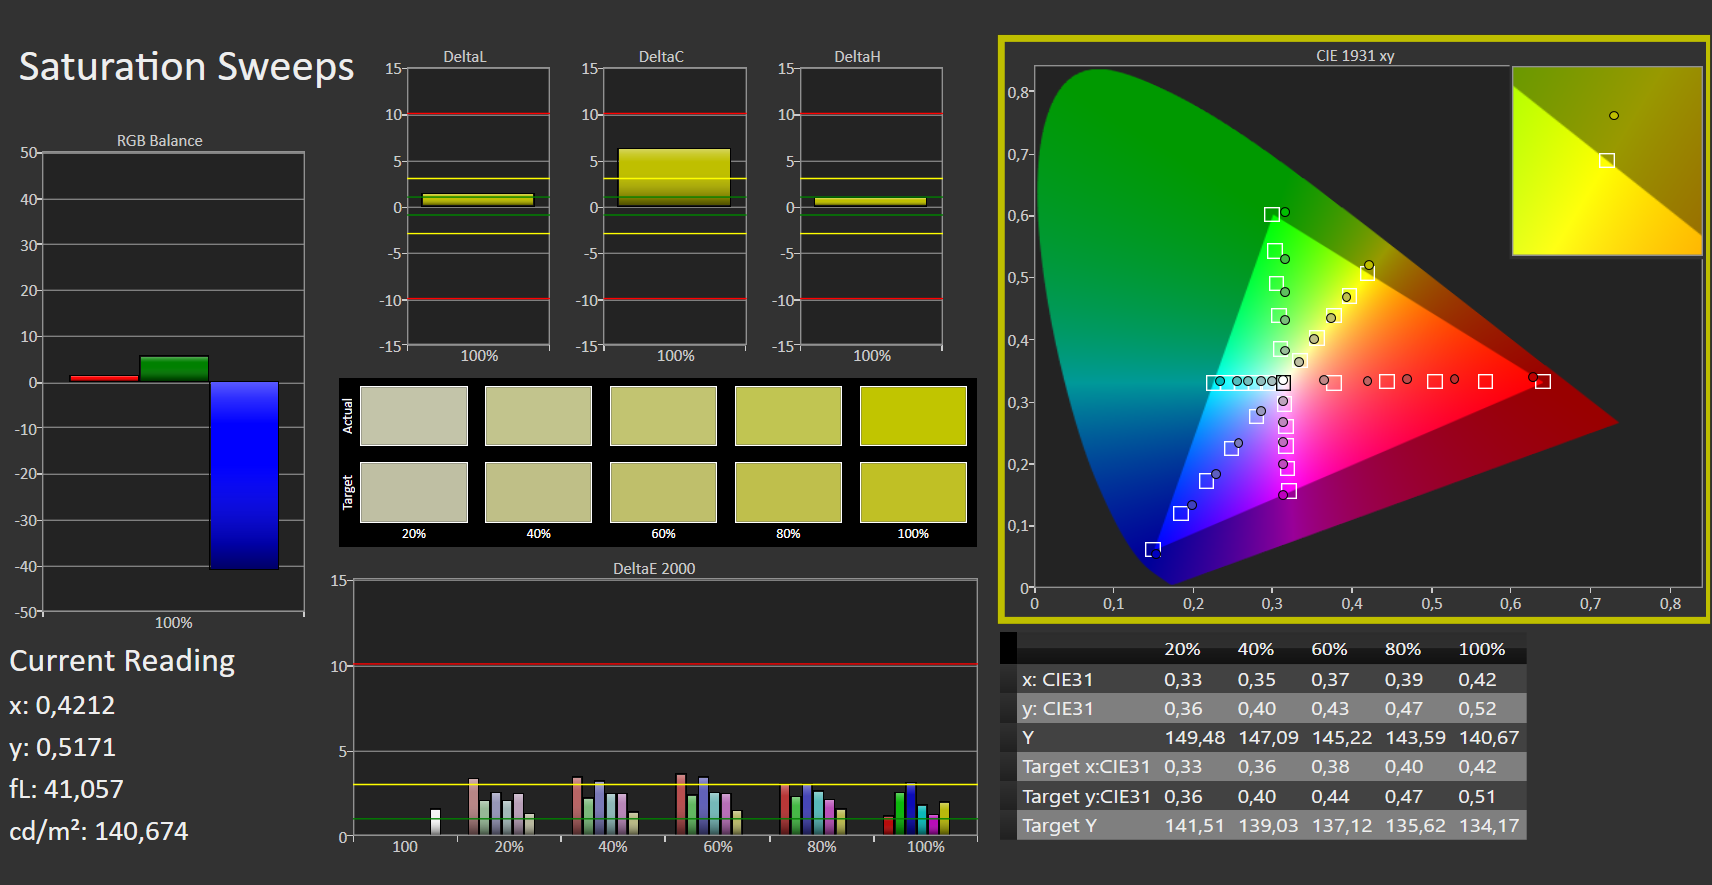
La calidad de visualización de la pantalla incorporada es subjetivamente buena y no hay grano visible a pesar de la superficie mate. En general, los valores DeltaE-2000 medidos de la escala de grises y los colores están relativamente cerca del valor objetivo de 3 en comparación con el espacio de color sRGB en el estado de entrega. Sin embargo, la competencia demuestra que puede ser mejor aquí. No pudimos conseguir ninguna mejora importante mediante la calibración manual. Sólo se redujo un poco el ligero tinte azul.
Tiempos de respuesta del display
| ↔ Tiempo de respuesta de Negro a Blanco | ||
|---|---|---|
| 8 ms ... subida ↗ y bajada ↘ combinada | ↗ 4 ms subida |  |
| ↘ 4 ms bajada | ||
| La pantalla mostró tiempos de respuesta rápidos en nuestros tests y debería ser adecuada para juegos. En comparación, todos los dispositivos de prueba van de ##min### (mínimo) a 240 (máximo) ms. » 22 % de todos los dispositivos son mejores. Esto quiere decir que el tiempo de respuesta medido es mejor que la media (19.8 ms) de todos los dispositivos testados. | ||
| ↔ Tiempo de respuesta 50% Gris a 80% Gris | ||
| 6 ms ... subida ↗ y bajada ↘ combinada | ↗ 3 ms subida |  |
| ↘ 3 ms bajada | ||
| La pantalla mostró tiempos de respuesta muy rápidos en nuestros tests y debería ser adecuada para juegos frenéticos. En comparación, todos los dispositivos de prueba van de ##min### (mínimo) a 636 (máximo) ms. » 19 % de todos los dispositivos son mejores. Esto quiere decir que el tiempo de respuesta medido es mejor que la media (31 ms) de todos los dispositivos testados. | ||
Parpadeo de Pantalla / PWM (Pulse-Width Modulation)
| Parpadeo de Pantalla / PWM no detectado |  | ||
Comparación: 52 % de todos los dispositivos testados no usaron PWM para atenuar el display. Si se usó, medimos una media de 7751 (mínimo: 5 - máxmo: 343500) Hz. | |||
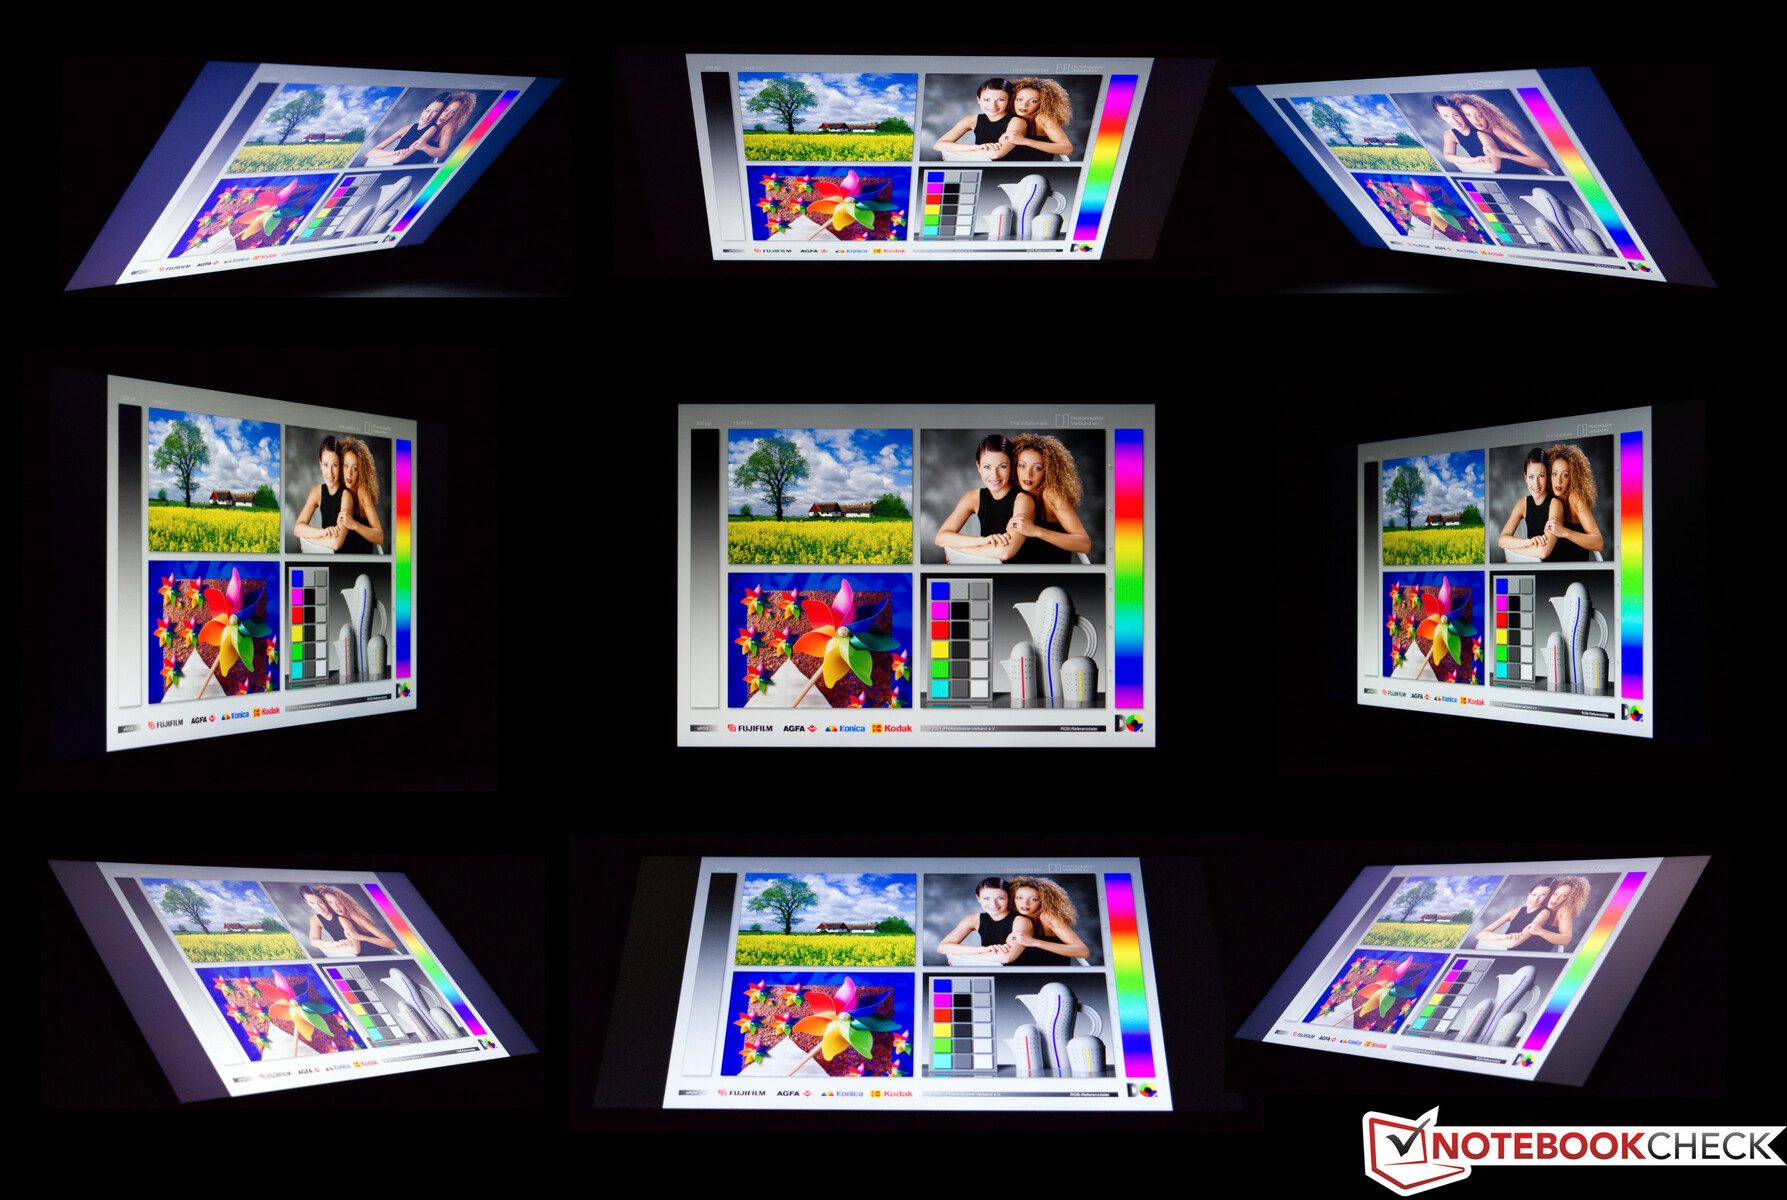
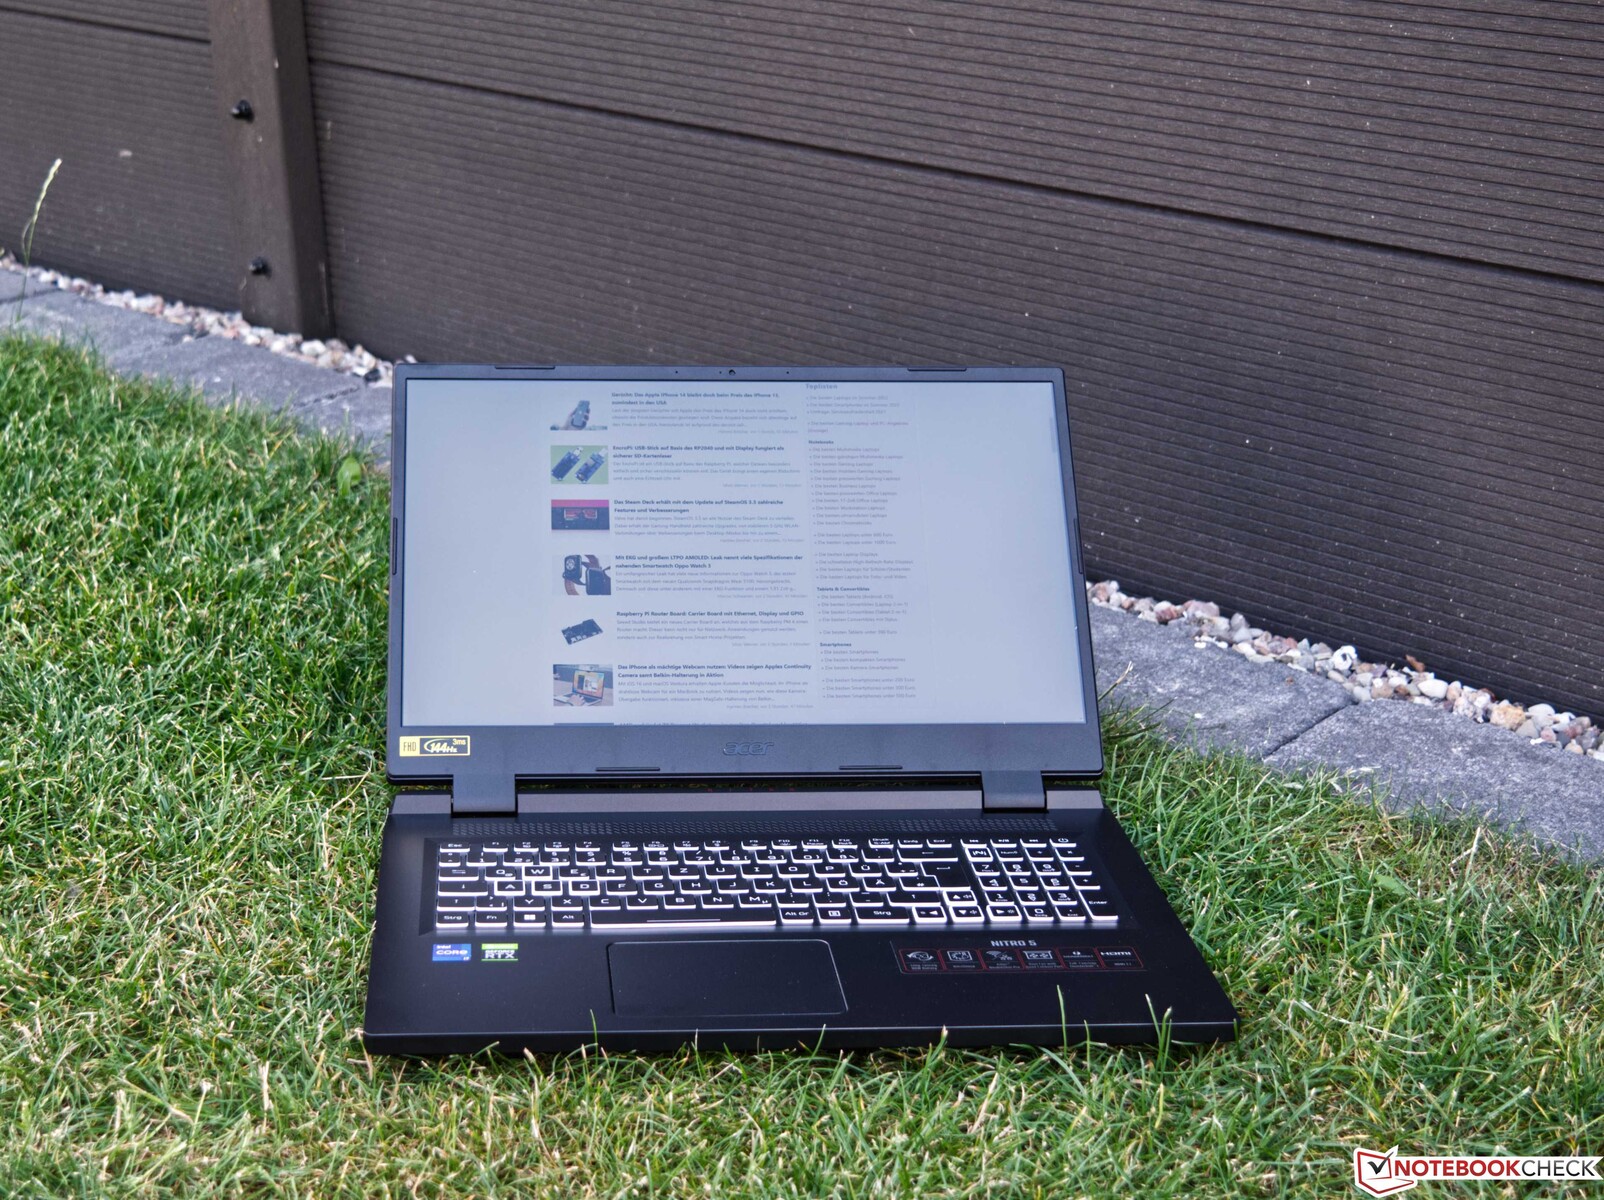
Debido a la baja luminosidad de la pantalla, no se recomienda su uso en exteriores. Si no se puede evitar, hay que buscar un lugar a la sombra. Afortunadamente, la superficie mate de la pantalla evita los molestos reflejos. Para la prueba de ángulo de visión, observamos un resultado que es típico de un panel IPS. Se puede observar un ligero cambio de color en las imágenes de las cuatro esquinas, pero no es demasiado pronunciado y no se aprecia durante el uso normal.
Rendimiento - Suficientemente rápido a pesar del límite de temperatura
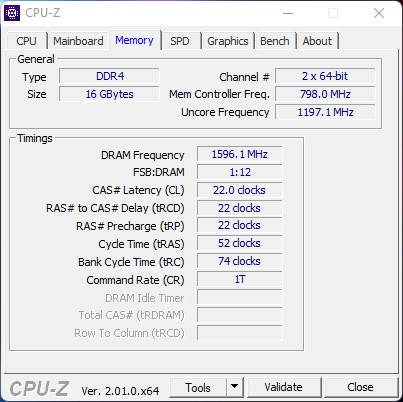
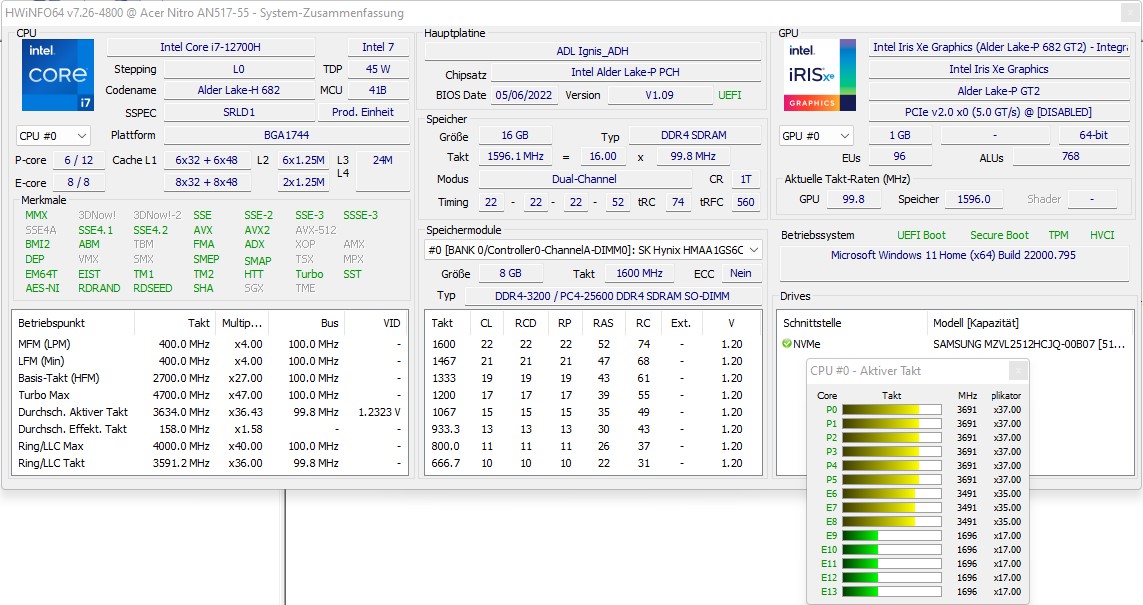
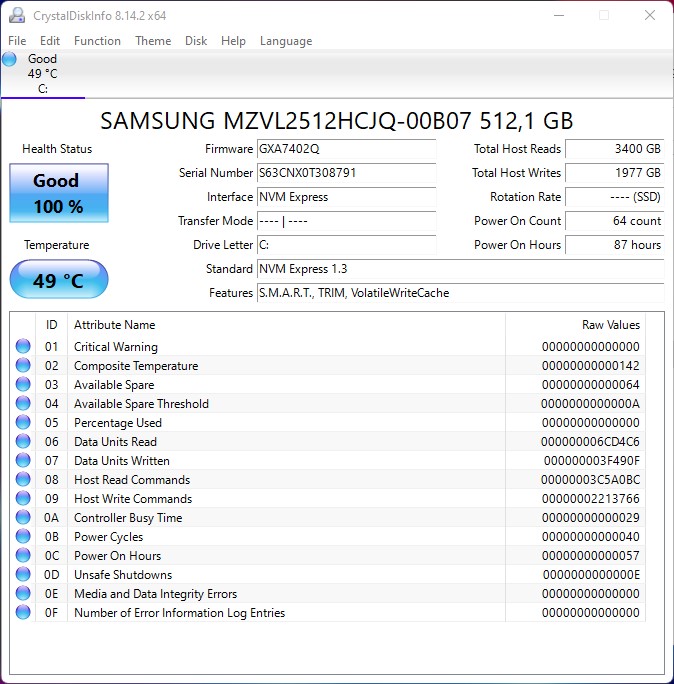
Debido a la clase de dispositivo, el rendimiento de la CPU y la GPU es decisivo. La interacción delIntel Core i7-12700H y la GPU del portátil Nvidia GeForce RTX 3060es buena y completamente suficiente para la resolución nativa de la pantalla. La memoria RAM DDR4 de 16 GB también es buena y no demasiado tacaña, por lo que no hubo problemas durante las pruebas. Sin embargo, las críticas se extienden al SSD instalado porque los 512 GB se llenan rápidamente debido al espacio exigido por los juegos actuales. Podría ser más aquí.
Condiciones de la prueba
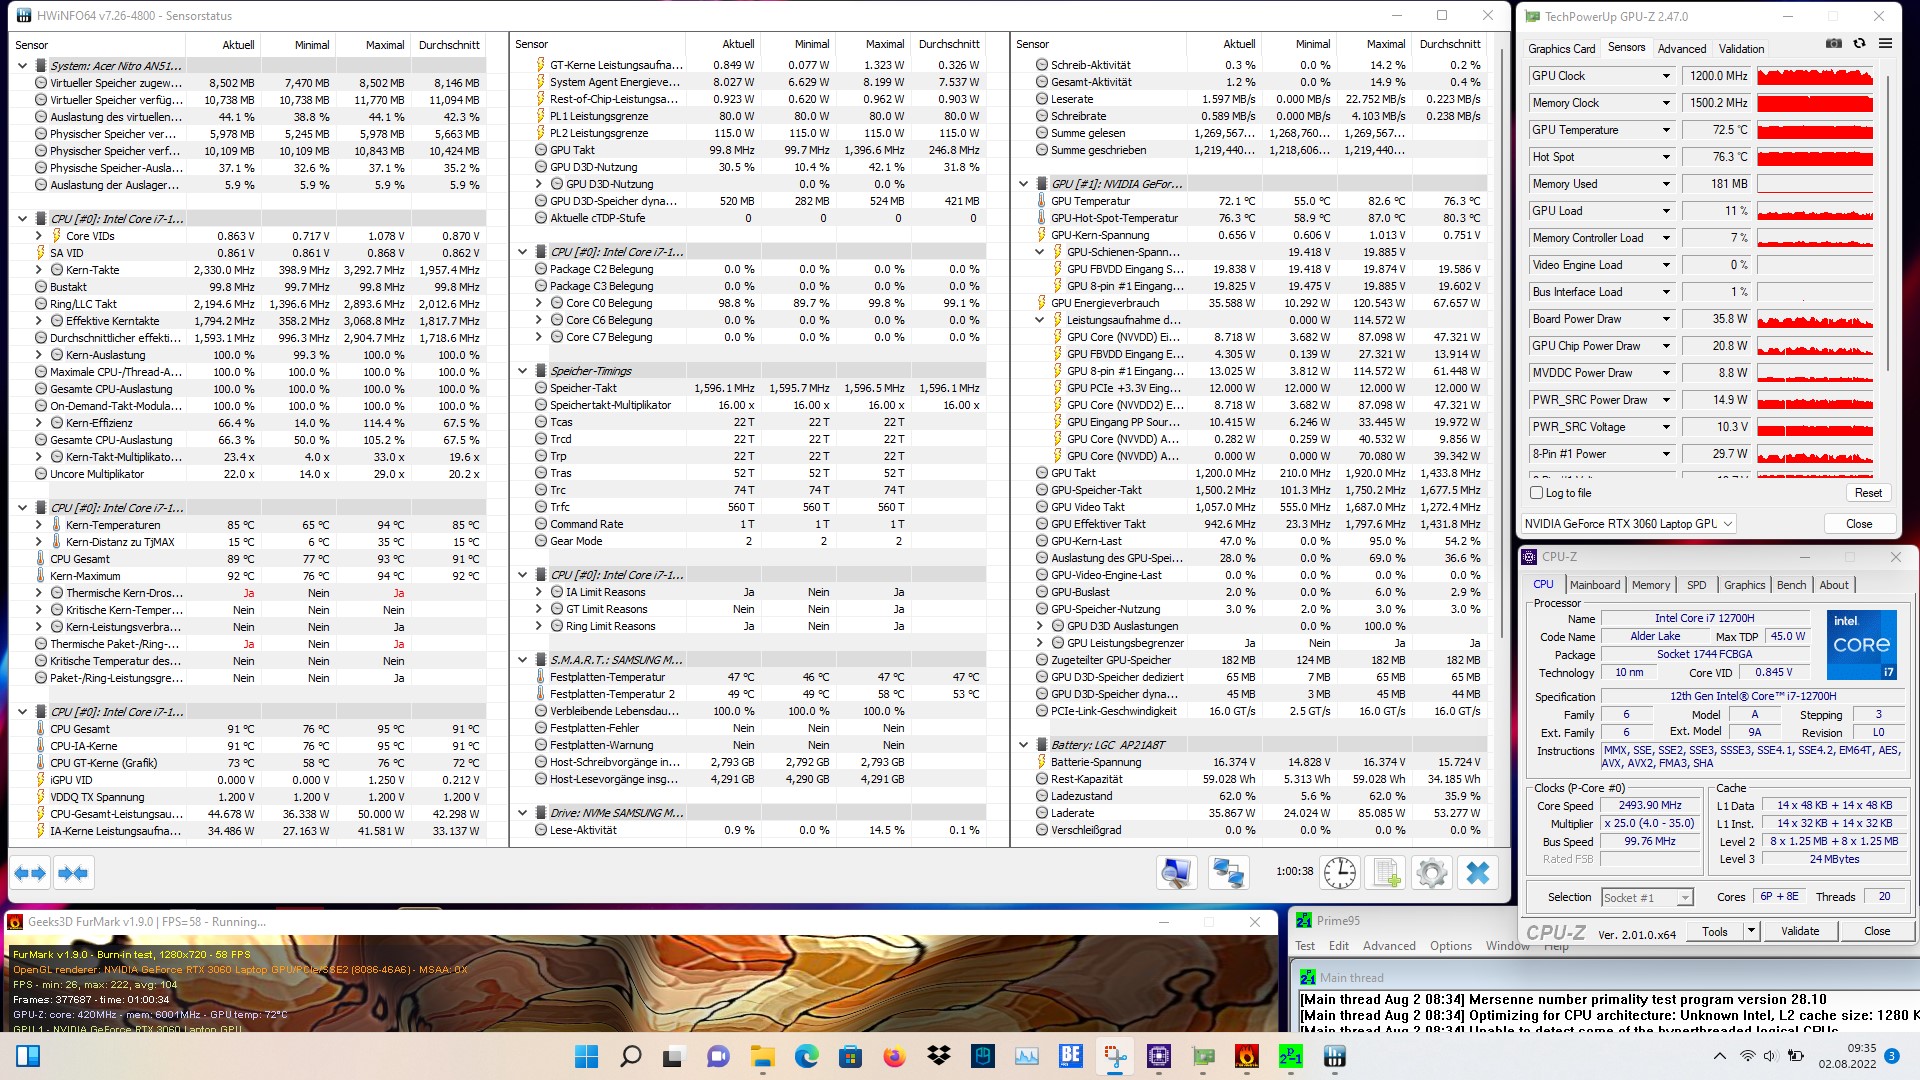
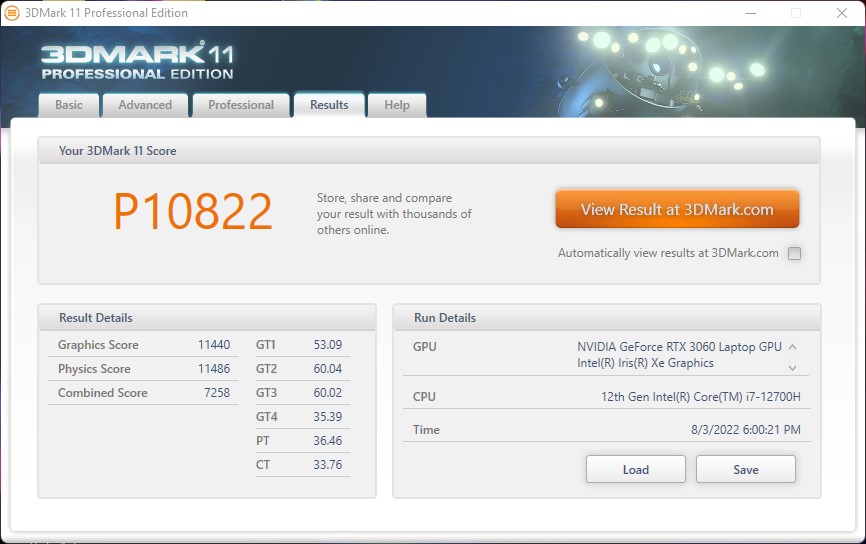
Los perfiles "Silencioso", "Estándar" y "Rendimiento" pueden seleccionarse mediante la herramienta "Nitro Sense". Realizamos todas las pruebas de la CPU y la GPU en el perfil "Estándar", ya que este perfil representa la mejor opción en términos de rendimiento y emisiones de ruido. En la sección de mediciones de volumen encontrarás más detalles sobre el motivo de nuestra elección. El TDP del procesador no estaba restringido, aunque la refrigeración marca el límite aquí. Registramos un consumo máximo de energía de unos 100 vatios para elGPU de portátil Nvidia GeForce RTX 3060. Esto deja al modelo un poco por detrás del máximo posible de 130 vatios.
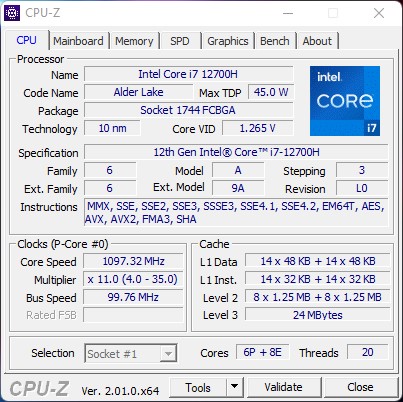
Prozessor
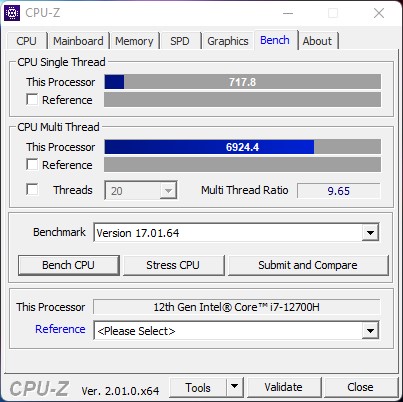
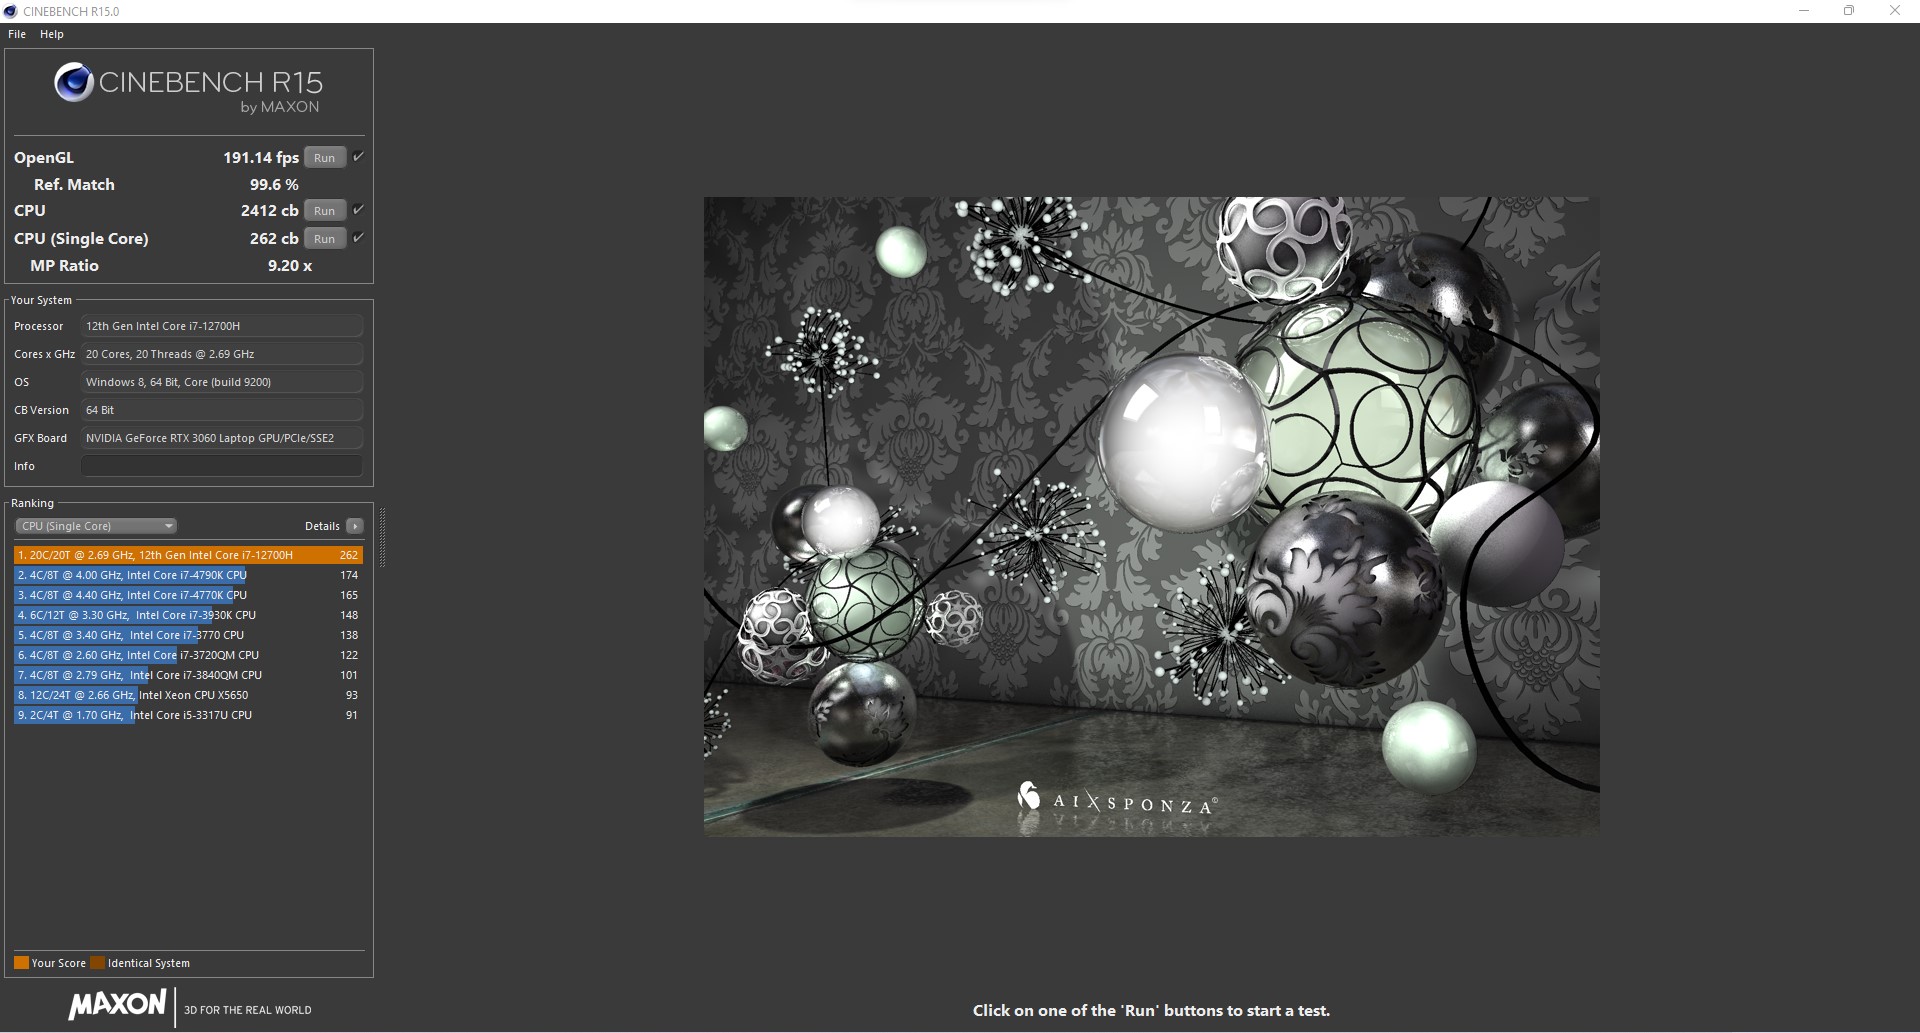
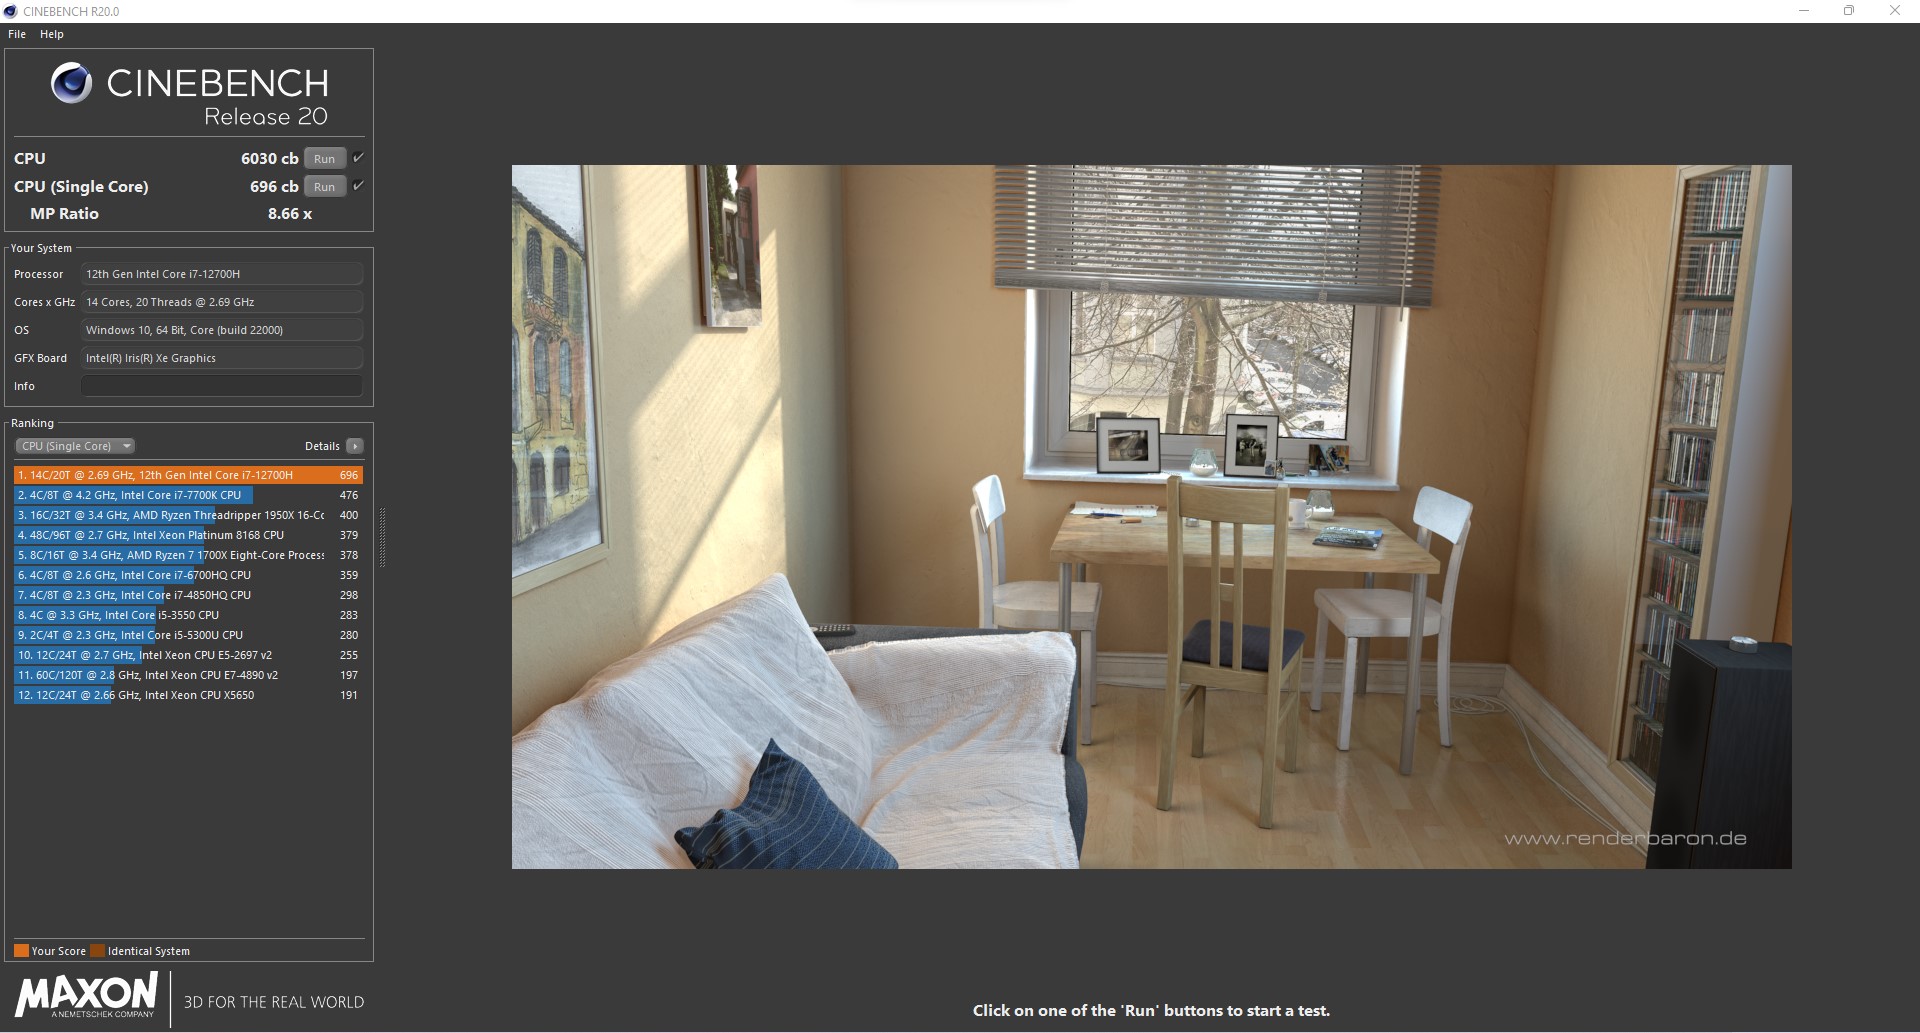
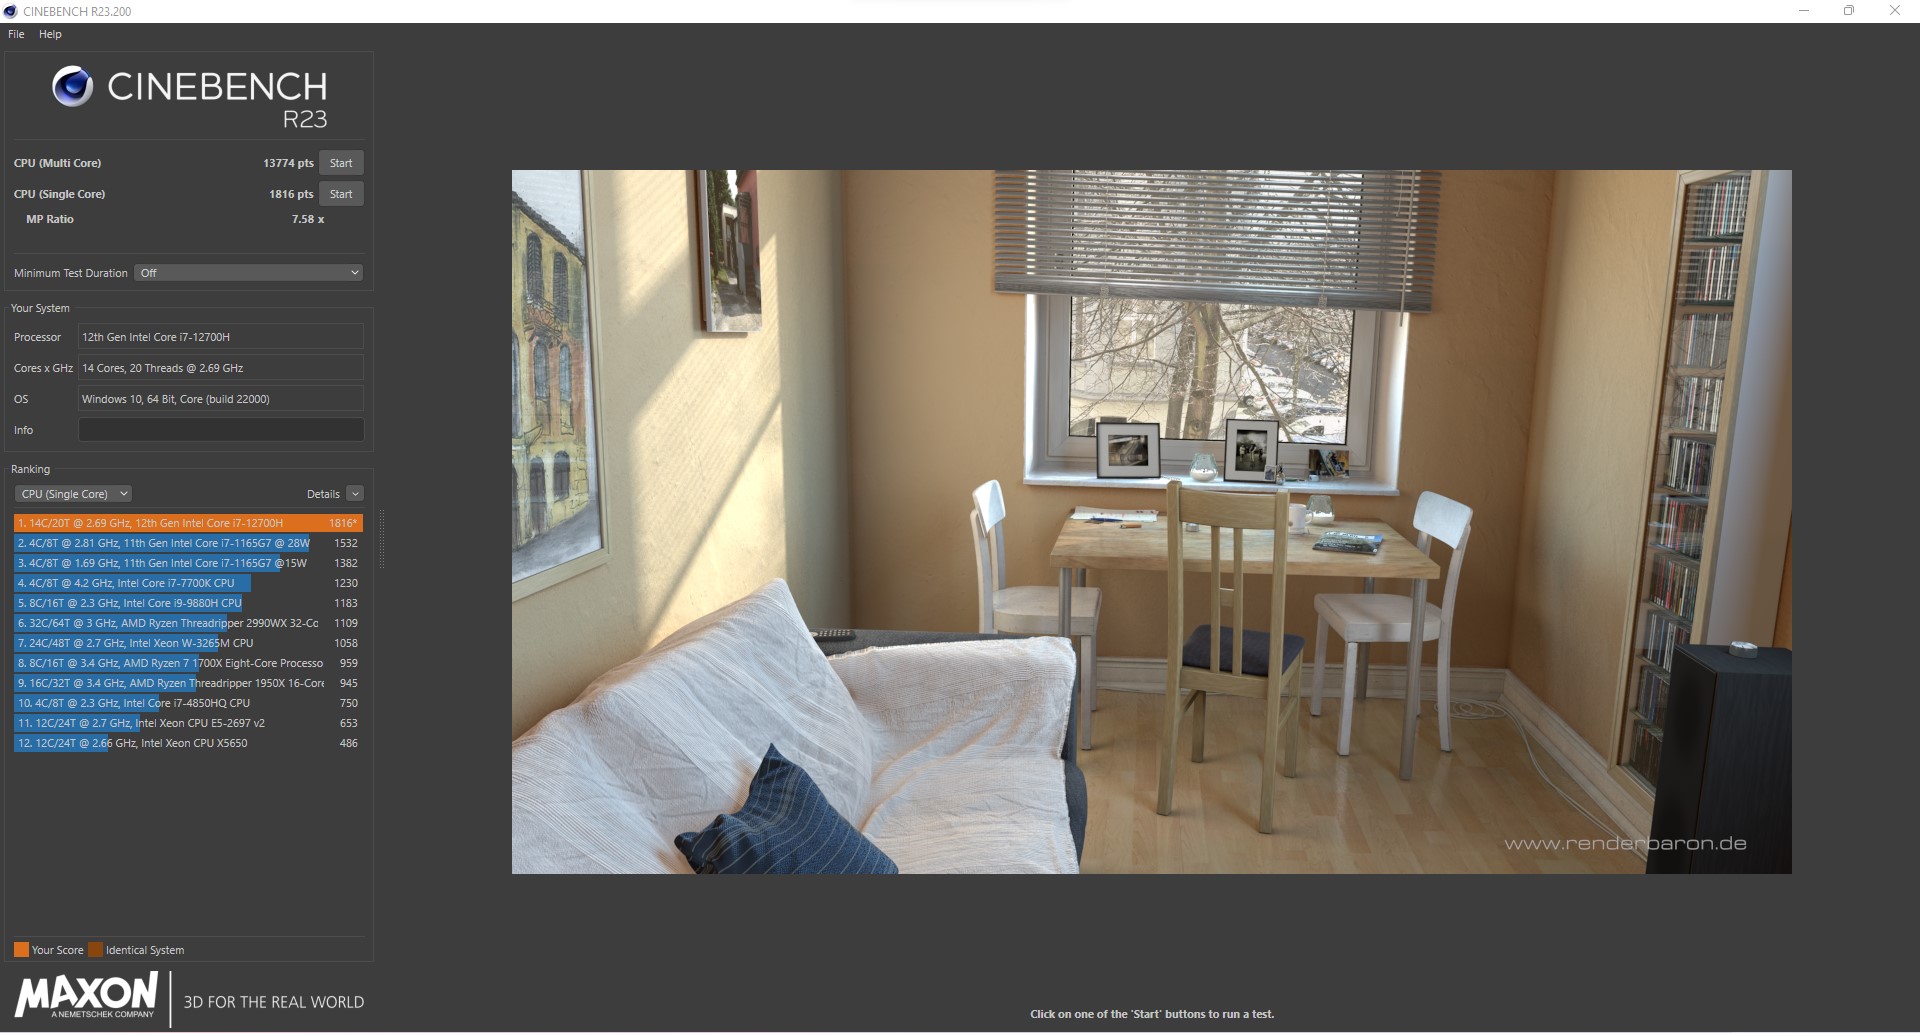
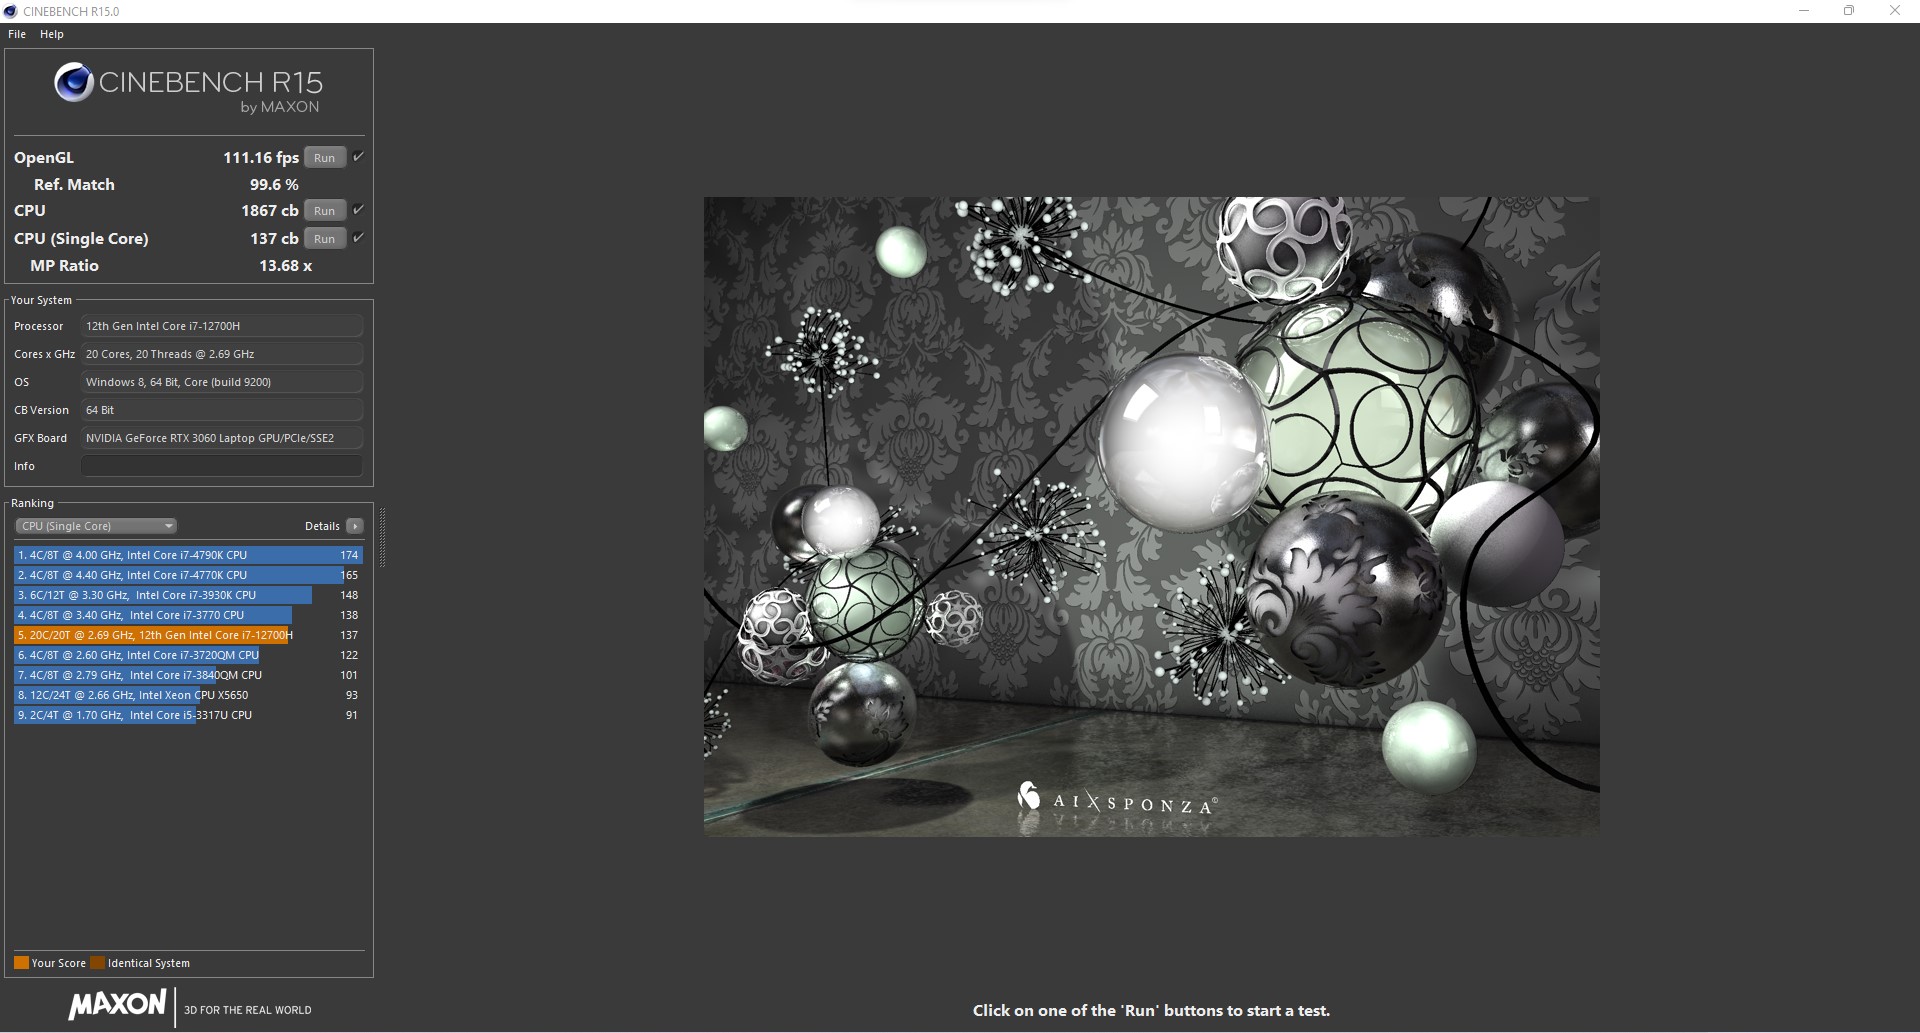
El procesadorIntel Core i7-12700Hpertenece a la arquitectura Alder-Lake-S de Intel y combina los núcleos P y E. El SoC de 45 vatios ofrece así un total de 20 hilos, que se dividen en 6 núcleos P con hyperthreading y 8 núcleos E. Con velocidades de reloj de hasta 4,7 GHz en los núcleos de rendimiento, el SoC ofrece valores de rendimiento realmente impresionantes. En comparación con el equipo similar Asus TUT Gaming F17nuestro modelo de pruebas se impone por poco en las pruebas de CPU. Ni siquiera los rivales basados en AMD pueden seguir el ritmo aquí.
Nuestro Acer Nitro 5 AN517 rinde relativamente bien en la prueba de estrés, que se ejecuta con el multibucle Cinebench R15. El rendimiento se mantiene relativamente estable y se sitúa en 2.176 puntos en 50 ejecuciones.
Para más comparaciones y pruebas, nos remitimos a nuestraTabla de comparación de CPUs.
Cinebench R15 Multi Sustained Load
Cinebench R23: Multi Core | Single Core
Cinebench R20: CPU (Multi Core) | CPU (Single Core)
Cinebench R15: CPU Multi 64Bit | CPU Single 64Bit
Blender: v2.79 BMW27 CPU
7-Zip 18.03: 7z b 4 | 7z b 4 -mmt1
Geekbench 5.5: Multi-Core | Single-Core
HWBOT x265 Benchmark v2.2: 4k Preset
LibreOffice : 20 Documents To PDF
R Benchmark 2.5: Overall mean
| CPU Performance rating | |
| Media de la clase Gaming | |
| Medio Intel Core i7-12700H | |
| Acer Nitro 5 AN517-55-738R | |
| Asus TUF Gaming F17 FX707Z-HX011W | |
| Acer Nitro 5 AN517-41-R5Z7 | |
| MSI Katana GF76 11UE | |
| Lenovo Legion 5 17ACH6H-82JY0003GE | |
| Schenker XMG Core 17 (Early 2021) | |
| Cinebench R23 / Multi Core | |
| Media de la clase Gaming (10488 - 42661, n=108, últimos 2 años) | |
| Medio Intel Core i7-12700H (4032 - 19330, n=64) | |
| Asus TUF Gaming F17 FX707Z-HX011W | |
| Acer Nitro 5 AN517-55-738R | |
| Acer Nitro 5 AN517-41-R5Z7 | |
| MSI Katana GF76 11UE | |
| Lenovo Legion 5 17ACH6H-82JY0003GE | |
| Schenker XMG Core 17 (Early 2021) | |
| Cinebench R23 / Single Core | |
| Media de la clase Gaming (1166 - 2415, n=108, últimos 2 años) | |
| Acer Nitro 5 AN517-55-738R | |
| Asus TUF Gaming F17 FX707Z-HX011W | |
| Medio Intel Core i7-12700H (778 - 1826, n=63) | |
| MSI Katana GF76 11UE | |
| Acer Nitro 5 AN517-41-R5Z7 | |
| Lenovo Legion 5 17ACH6H-82JY0003GE | |
| Schenker XMG Core 17 (Early 2021) | |
| Cinebench R20 / CPU (Multi Core) | |
| Media de la clase Gaming (4029 - 16433, n=107, últimos 2 años) | |
| Acer Nitro 5 AN517-55-738R | |
| Medio Intel Core i7-12700H (1576 - 7407, n=64) | |
| Asus TUF Gaming F17 FX707Z-HX011W | |
| Acer Nitro 5 AN517-41-R5Z7 | |
| MSI Katana GF76 11UE | |
| Lenovo Legion 5 17ACH6H-82JY0003GE | |
| Schenker XMG Core 17 (Early 2021) | |
| Cinebench R20 / CPU (Single Core) | |
| Media de la clase Gaming (442 - 913, n=107, últimos 2 años) | |
| Acer Nitro 5 AN517-55-738R | |
| Asus TUF Gaming F17 FX707Z-HX011W | |
| Medio Intel Core i7-12700H (300 - 704, n=64) | |
| MSI Katana GF76 11UE | |
| Acer Nitro 5 AN517-41-R5Z7 | |
| Lenovo Legion 5 17ACH6H-82JY0003GE | |
| Schenker XMG Core 17 (Early 2021) | |
| Cinebench R15 / CPU Multi 64Bit | |
| Media de la clase Gaming (1578 - 6330, n=106, últimos 2 años) | |
| Asus TUF Gaming F17 FX707Z-HX011W | |
| Medio Intel Core i7-12700H (1379 - 2916, n=70) | |
| Acer Nitro 5 AN517-55-738R | |
| Acer Nitro 5 AN517-41-R5Z7 | |
| MSI Katana GF76 11UE | |
| Lenovo Legion 5 17ACH6H-82JY0003GE | |
| Schenker XMG Core 17 (Early 2021) | |
| Cinebench R15 / CPU Single 64Bit | |
| Media de la clase Gaming (188.8 - 350, n=107, últimos 2 años) | |
| Acer Nitro 5 AN517-55-738R | |
| Asus TUF Gaming F17 FX707Z-HX011W | |
| Medio Intel Core i7-12700H (113 - 263, n=65) | |
| Acer Nitro 5 AN517-41-R5Z7 | |
| MSI Katana GF76 11UE | |
| Lenovo Legion 5 17ACH6H-82JY0003GE | |
| Schenker XMG Core 17 (Early 2021) | |
| Blender / v2.79 BMW27 CPU | |
| Schenker XMG Core 17 (Early 2021) | |
| Lenovo Legion 5 17ACH6H-82JY0003GE | |
| MSI Katana GF76 11UE | |
| Acer Nitro 5 AN517-41-R5Z7 | |
| Asus TUF Gaming F17 FX707Z-HX011W | |
| Acer Nitro 5 AN517-55-738R | |
| Medio Intel Core i7-12700H (168 - 732, n=63) | |
| Media de la clase Gaming (79 - 330, n=105, últimos 2 años) | |
| 7-Zip 18.03 / 7z b 4 | |
| Media de la clase Gaming (33491 - 148086, n=106, últimos 2 años) | |
| Medio Intel Core i7-12700H (22844 - 73067, n=63) | |
| Asus TUF Gaming F17 FX707Z-HX011W | |
| Acer Nitro 5 AN517-41-R5Z7 | |
| Acer Nitro 5 AN517-55-738R | |
| Lenovo Legion 5 17ACH6H-82JY0003GE | |
| MSI Katana GF76 11UE | |
| Schenker XMG Core 17 (Early 2021) | |
| 7-Zip 18.03 / 7z b 4 -mmt1 | |
| Media de la clase Gaming (4199 - 7436, n=106, últimos 2 años) | |
| Acer Nitro 5 AN517-55-738R | |
| Medio Intel Core i7-12700H (2743 - 5972, n=63) | |
| Acer Nitro 5 AN517-41-R5Z7 | |
| Asus TUF Gaming F17 FX707Z-HX011W | |
| MSI Katana GF76 11UE | |
| Schenker XMG Core 17 (Early 2021) | |
| Lenovo Legion 5 17ACH6H-82JY0003GE | |
| Geekbench 5.5 / Multi-Core | |
| Media de la clase Gaming (6460 - 28263, n=106, últimos 2 años) | |
| Acer Nitro 5 AN517-55-738R | |
| Asus TUF Gaming F17 FX707Z-HX011W | |
| Medio Intel Core i7-12700H (5144 - 13745, n=64) | |
| MSI Katana GF76 11UE | |
| Acer Nitro 5 AN517-41-R5Z7 | |
| Schenker XMG Core 17 (Early 2021) | |
| Lenovo Legion 5 17ACH6H-82JY0003GE | |
| Geekbench 5.5 / Single-Core | |
| Media de la clase Gaming (986 - 2474, n=106, últimos 2 años) | |
| Asus TUF Gaming F17 FX707Z-HX011W | |
| Medio Intel Core i7-12700H (803 - 1851, n=64) | |
| Acer Nitro 5 AN517-55-738R | |
| MSI Katana GF76 11UE | |
| Acer Nitro 5 AN517-41-R5Z7 | |
| Lenovo Legion 5 17ACH6H-82JY0003GE | |
| Schenker XMG Core 17 (Early 2021) | |
| HWBOT x265 Benchmark v2.2 / 4k Preset | |
| Media de la clase Gaming (11.5 - 44.4, n=106, últimos 2 años) | |
| Medio Intel Core i7-12700H (4.67 - 21.8, n=64) | |
| Acer Nitro 5 AN517-41-R5Z7 | |
| Asus TUF Gaming F17 FX707Z-HX011W | |
| MSI Katana GF76 11UE | |
| Lenovo Legion 5 17ACH6H-82JY0003GE | |
| Schenker XMG Core 17 (Early 2021) | |
| Acer Nitro 5 AN517-55-738R | |
| LibreOffice / 20 Documents To PDF | |
| Asus TUF Gaming F17 FX707Z-HX011W | |
| Acer Nitro 5 AN517-41-R5Z7 | |
| Schenker XMG Core 17 (Early 2021) | |
| Lenovo Legion 5 17ACH6H-82JY0003GE | |
| Acer Nitro 5 AN517-55-738R | |
| Media de la clase Gaming (33.2 - 88.8, n=106, últimos 2 años) | |
| MSI Katana GF76 11UE | |
| Medio Intel Core i7-12700H (34.2 - 95.3, n=63) | |
| R Benchmark 2.5 / Overall mean | |
| Schenker XMG Core 17 (Early 2021) | |
| MSI Katana GF76 11UE | |
| Lenovo Legion 5 17ACH6H-82JY0003GE | |
| Acer Nitro 5 AN517-41-R5Z7 | |
| Medio Intel Core i7-12700H (0.4441 - 1.052, n=63) | |
| Acer Nitro 5 AN517-55-738R | |
| Asus TUF Gaming F17 FX707Z-HX011W | |
| Media de la clase Gaming (0.3439 - 0.759, n=107, últimos 2 años) | |
* ... más pequeño es mejor
AIDA64: FP32 Ray-Trace | FPU Julia | CPU SHA3 | CPU Queen | FPU SinJulia | FPU Mandel | CPU AES | CPU ZLib | FP64 Ray-Trace | CPU PhotoWorxx
| Performance rating | |
| Media de la clase Gaming | |
| Acer Nitro 5 AN517-41-R5Z7 | |
| Medio Intel Core i7-12700H | |
| Lenovo Legion 5 17ACH6H-82JY0003GE | |
| Acer Nitro 5 AN517-55-738R | |
| Asus TUF Gaming F17 FX707Z-HX011W | |
| Schenker XMG Core 17 (Early 2021) | |
| MSI Katana GF76 11UE -9! | |
| AIDA64 / FP32 Ray-Trace | |
| Media de la clase Gaming (10227 - 85542, n=106, últimos 2 años) | |
| Acer Nitro 5 AN517-41-R5Z7 | |
| Lenovo Legion 5 17ACH6H-82JY0003GE | |
| Medio Intel Core i7-12700H (2585 - 17957, n=64) | |
| Schenker XMG Core 17 (Early 2021) | |
| Acer Nitro 5 AN517-55-738R | |
| Asus TUF Gaming F17 FX707Z-HX011W | |
| AIDA64 / FPU Julia | |
| Media de la clase Gaming (51376 - 372155, n=106, últimos 2 años) | |
| Acer Nitro 5 AN517-41-R5Z7 | |
| Lenovo Legion 5 17ACH6H-82JY0003GE | |
| Medio Intel Core i7-12700H (12439 - 90760, n=64) | |
| Schenker XMG Core 17 (Early 2021) | |
| Acer Nitro 5 AN517-55-738R | |
| Asus TUF Gaming F17 FX707Z-HX011W | |
| AIDA64 / CPU SHA3 | |
| Media de la clase Gaming (2180 - 10115, n=106, últimos 2 años) | |
| Acer Nitro 5 AN517-41-R5Z7 | |
| Medio Intel Core i7-12700H (833 - 4242, n=64) | |
| Acer Nitro 5 AN517-55-738R | |
| Lenovo Legion 5 17ACH6H-82JY0003GE | |
| Schenker XMG Core 17 (Early 2021) | |
| Asus TUF Gaming F17 FX707Z-HX011W | |
| AIDA64 / CPU Queen | |
| Media de la clase Gaming (49785 - 173351, n=90, últimos 2 años) | |
| Asus TUF Gaming F17 FX707Z-HX011W | |
| Acer Nitro 5 AN517-55-738R | |
| Acer Nitro 5 AN517-41-R5Z7 | |
| Medio Intel Core i7-12700H (57923 - 103202, n=63) | |
| Lenovo Legion 5 17ACH6H-82JY0003GE | |
| Schenker XMG Core 17 (Early 2021) | |
| AIDA64 / FPU SinJulia | |
| Media de la clase Gaming (4424 - 33636, n=106, últimos 2 años) | |
| Acer Nitro 5 AN517-41-R5Z7 | |
| Lenovo Legion 5 17ACH6H-82JY0003GE | |
| Acer Nitro 5 AN517-55-738R | |
| Medio Intel Core i7-12700H (3249 - 9939, n=64) | |
| Schenker XMG Core 17 (Early 2021) | |
| Asus TUF Gaming F17 FX707Z-HX011W | |
| AIDA64 / FPU Mandel | |
| Media de la clase Gaming (25115 - 196829, n=106, últimos 2 años) | |
| Acer Nitro 5 AN517-41-R5Z7 | |
| Lenovo Legion 5 17ACH6H-82JY0003GE | |
| Medio Intel Core i7-12700H (7135 - 44760, n=64) | |
| Schenker XMG Core 17 (Early 2021) | |
| Acer Nitro 5 AN517-55-738R | |
| Asus TUF Gaming F17 FX707Z-HX011W | |
| AIDA64 / CPU AES | |
| Acer Nitro 5 AN517-41-R5Z7 | |
| Media de la clase Gaming (39258 - 247074, n=106, últimos 2 años) | |
| Lenovo Legion 5 17ACH6H-82JY0003GE | |
| Medio Intel Core i7-12700H (31839 - 144360, n=64) | |
| Acer Nitro 5 AN517-55-738R | |
| Asus TUF Gaming F17 FX707Z-HX011W | |
| Schenker XMG Core 17 (Early 2021) | |
| AIDA64 / CPU ZLib | |
| Media de la clase Gaming (574 - 2531, n=106, últimos 2 años) | |
| Medio Intel Core i7-12700H (305 - 1171, n=64) | |
| Acer Nitro 5 AN517-55-738R | |
| Acer Nitro 5 AN517-41-R5Z7 | |
| Asus TUF Gaming F17 FX707Z-HX011W | |
| Lenovo Legion 5 17ACH6H-82JY0003GE | |
| Schenker XMG Core 17 (Early 2021) | |
| MSI Katana GF76 11UE | |
| AIDA64 / FP64 Ray-Trace | |
| Media de la clase Gaming (5509 - 45446, n=106, últimos 2 años) | |
| Acer Nitro 5 AN517-41-R5Z7 | |
| Lenovo Legion 5 17ACH6H-82JY0003GE | |
| Medio Intel Core i7-12700H (1437 - 9692, n=64) | |
| Schenker XMG Core 17 (Early 2021) | |
| Acer Nitro 5 AN517-55-738R | |
| Asus TUF Gaming F17 FX707Z-HX011W | |
| AIDA64 / CPU PhotoWorxx | |
| Media de la clase Gaming (12271 - 89891, n=106, últimos 2 años) | |
| Medio Intel Core i7-12700H (12863 - 52207, n=64) | |
| Asus TUF Gaming F17 FX707Z-HX011W | |
| Schenker XMG Core 17 (Early 2021) | |
| Acer Nitro 5 AN517-55-738R | |
| Lenovo Legion 5 17ACH6H-82JY0003GE | |
| Acer Nitro 5 AN517-41-R5Z7 | |
Rendimiento del sistema
En términos de rendimiento del sistema, el Acer Nitro 5 AN517 continúa con su sólido rendimiento en las pruebas de la CPU y asegura por poco el segundo lugar en PCMark 10. En general, el Acer Nitro 5 AN517 representa en gran medida la media de la clase de todos los portátiles para juegos probados. Subjetivamente, los valores de rendimiento dados también corresponden al hardware instalado.
CrossMark: Overall | Productivity | Creativity | Responsiveness
| PCMark 10 / Score | |
| Media de la clase Gaming (5828 - 12414, n=94, últimos 2 años) | |
| Medio Intel Core i7-12700H, NVIDIA GeForce RTX 3060 Laptop GPU (5986 - 8156, n=12) | |
| Acer Nitro 5 AN517-41-R5Z7 | |
| Acer Nitro 5 AN517-55-738R | |
| Lenovo Legion 5 17ACH6H-82JY0003GE | |
| MSI Katana GF76 11UE | |
| Asus TUF Gaming F17 FX707Z-HX011W | |
| Schenker XMG Core 17 (Early 2021) | |
| PCMark 10 / Essentials | |
| Media de la clase Gaming (8810 - 11935, n=98, últimos 2 años) | |
| Medio Intel Core i7-12700H, NVIDIA GeForce RTX 3060 Laptop GPU (9289 - 12144, n=12) | |
| Acer Nitro 5 AN517-41-R5Z7 | |
| Acer Nitro 5 AN517-55-738R | |
| MSI Katana GF76 11UE | |
| Lenovo Legion 5 17ACH6H-82JY0003GE | |
| Asus TUF Gaming F17 FX707Z-HX011W | |
| Schenker XMG Core 17 (Early 2021) | |
| PCMark 10 / Productivity | |
| Media de la clase Gaming (6845 - 25323, n=96, últimos 2 años) | |
| Acer Nitro 5 AN517-41-R5Z7 | |
| Medio Intel Core i7-12700H, NVIDIA GeForce RTX 3060 Laptop GPU (6161 - 10362, n=12) | |
| Acer Nitro 5 AN517-55-738R | |
| Lenovo Legion 5 17ACH6H-82JY0003GE | |
| MSI Katana GF76 11UE | |
| Schenker XMG Core 17 (Early 2021) | |
| Asus TUF Gaming F17 FX707Z-HX011W | |
| PCMark 10 / Digital Content Creation | |
| Media de la clase Gaming (7602 - 19954, n=96, últimos 2 años) | |
| Medio Intel Core i7-12700H, NVIDIA GeForce RTX 3060 Laptop GPU (8950 - 12554, n=12) | |
| Asus TUF Gaming F17 FX707Z-HX011W | |
| Lenovo Legion 5 17ACH6H-82JY0003GE | |
| Acer Nitro 5 AN517-55-738R | |
| Acer Nitro 5 AN517-41-R5Z7 | |
| MSI Katana GF76 11UE | |
| Schenker XMG Core 17 (Early 2021) | |
| CrossMark / Overall | |
| Media de la clase Gaming (1366 - 2409, n=95, últimos 2 años) | |
| Acer Nitro 5 AN517-55-738R | |
| Medio Intel Core i7-12700H, NVIDIA GeForce RTX 3060 Laptop GPU (1649 - 2017, n=11) | |
| Asus TUF Gaming F17 FX707Z-HX011W | |
| Lenovo Legion 5 17ACH6H-82JY0003GE | |
| CrossMark / Productivity | |
| Media de la clase Gaming (1386 - 2254, n=95, últimos 2 años) | |
| Acer Nitro 5 AN517-55-738R | |
| Medio Intel Core i7-12700H, NVIDIA GeForce RTX 3060 Laptop GPU (1536 - 1958, n=11) | |
| Asus TUF Gaming F17 FX707Z-HX011W | |
| Lenovo Legion 5 17ACH6H-82JY0003GE | |
| CrossMark / Creativity | |
| Media de la clase Gaming (1343 - 2786, n=95, últimos 2 años) | |
| Asus TUF Gaming F17 FX707Z-HX011W | |
| Medio Intel Core i7-12700H, NVIDIA GeForce RTX 3060 Laptop GPU (1816 - 2084, n=11) | |
| Acer Nitro 5 AN517-55-738R | |
| Lenovo Legion 5 17ACH6H-82JY0003GE | |
| CrossMark / Responsiveness | |
| Acer Nitro 5 AN517-55-738R | |
| Media de la clase Gaming (1226 - 2334, n=95, últimos 2 años) | |
| Medio Intel Core i7-12700H, NVIDIA GeForce RTX 3060 Laptop GPU (1210 - 2207, n=11) | |
| Asus TUF Gaming F17 FX707Z-HX011W | |
| Lenovo Legion 5 17ACH6H-82JY0003GE | |
| PCMark 10 Score | 6651 puntos | |
ayuda | ||
| AIDA64 / Memory Copy | |
| Media de la clase Gaming (21750 - 129946, n=106, últimos 2 años) | |
| Medio Intel Core i7-12700H (25615 - 80511, n=64) | |
| Asus TUF Gaming F17 FX707Z-HX011W | |
| Acer Nitro 5 AN517-55-738R | |
| Lenovo Legion 5 17ACH6H-82JY0003GE | |
| Acer Nitro 5 AN517-41-R5Z7 | |
| Schenker XMG Core 17 (Early 2021) | |
| AIDA64 / Memory Read | |
| Media de la clase Gaming (22956 - 118858, n=106, últimos 2 años) | |
| Asus TUF Gaming F17 FX707Z-HX011W | |
| Medio Intel Core i7-12700H (25586 - 79442, n=64) | |
| Lenovo Legion 5 17ACH6H-82JY0003GE | |
| Acer Nitro 5 AN517-41-R5Z7 | |
| Acer Nitro 5 AN517-55-738R | |
| Schenker XMG Core 17 (Early 2021) | |
| AIDA64 / Memory Write | |
| Media de la clase Gaming (22297 - 135096, n=106, últimos 2 años) | |
| Asus TUF Gaming F17 FX707Z-HX011W | |
| Medio Intel Core i7-12700H (23679 - 88660, n=64) | |
| Acer Nitro 5 AN517-55-738R | |
| Schenker XMG Core 17 (Early 2021) | |
| Lenovo Legion 5 17ACH6H-82JY0003GE | |
| Acer Nitro 5 AN517-41-R5Z7 | |
| AIDA64 / Memory Latency | |
| Media de la clase Gaming (75.3 - 259, n=106, últimos 2 años) | |
| Lenovo Legion 5 17ACH6H-82JY0003GE | |
| Medio Intel Core i7-12700H (76.2 - 133.9, n=62) | |
| Acer Nitro 5 AN517-41-R5Z7 | |
| Schenker XMG Core 17 (Early 2021) | |
| MSI Katana GF76 11UE | |
| Asus TUF Gaming F17 FX707Z-HX011W | |
| Acer Nitro 5 AN517-55-738R | |
* ... más pequeño es mejor
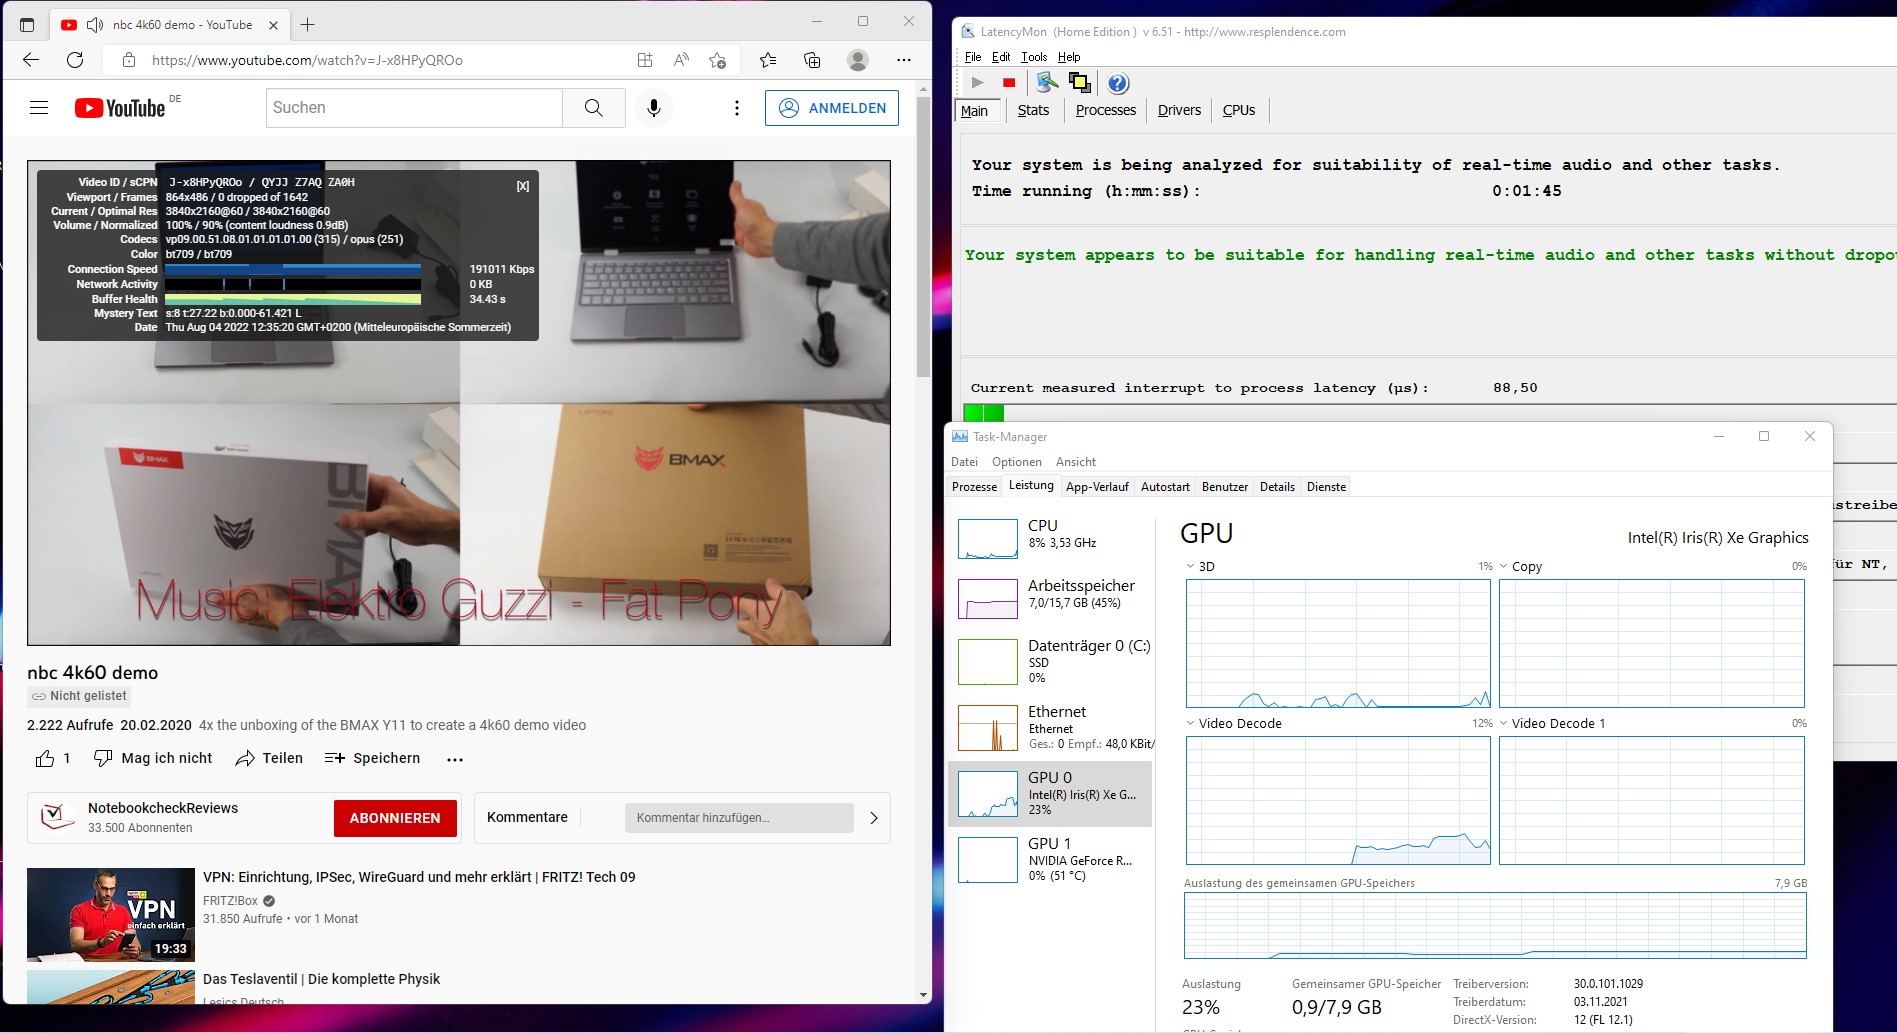
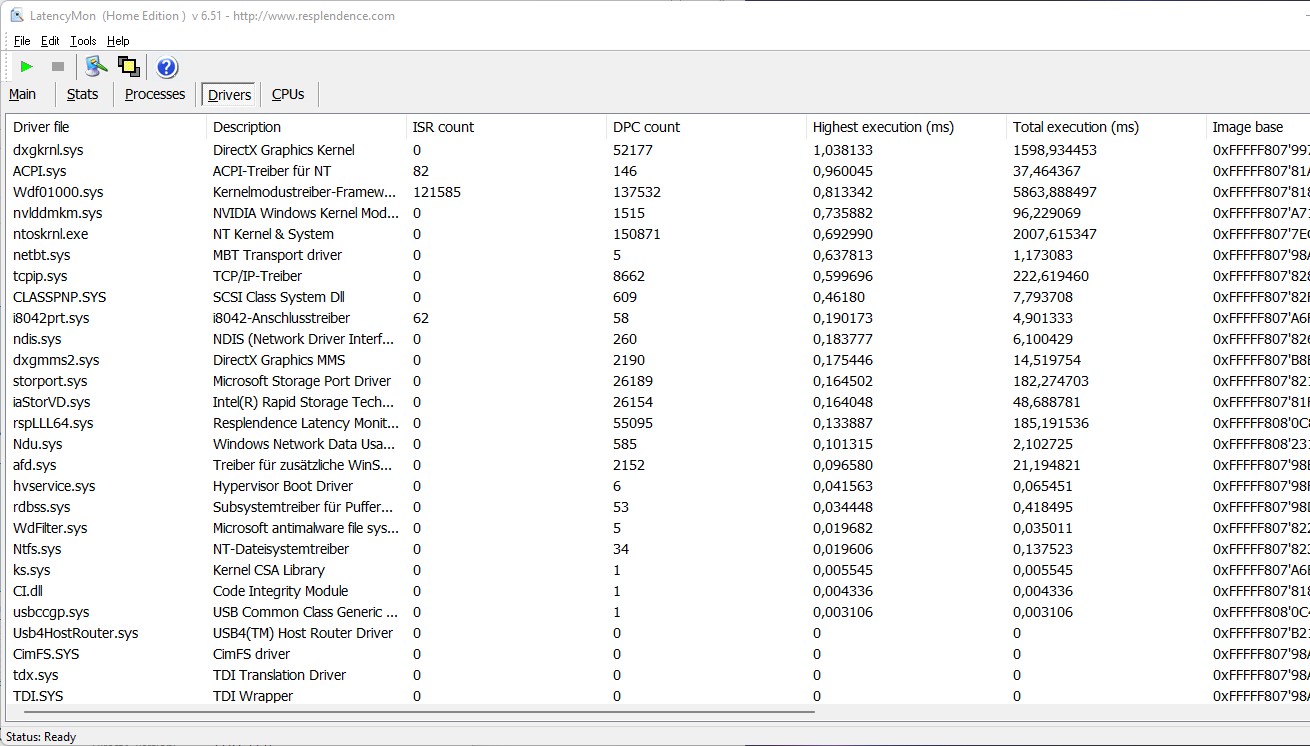
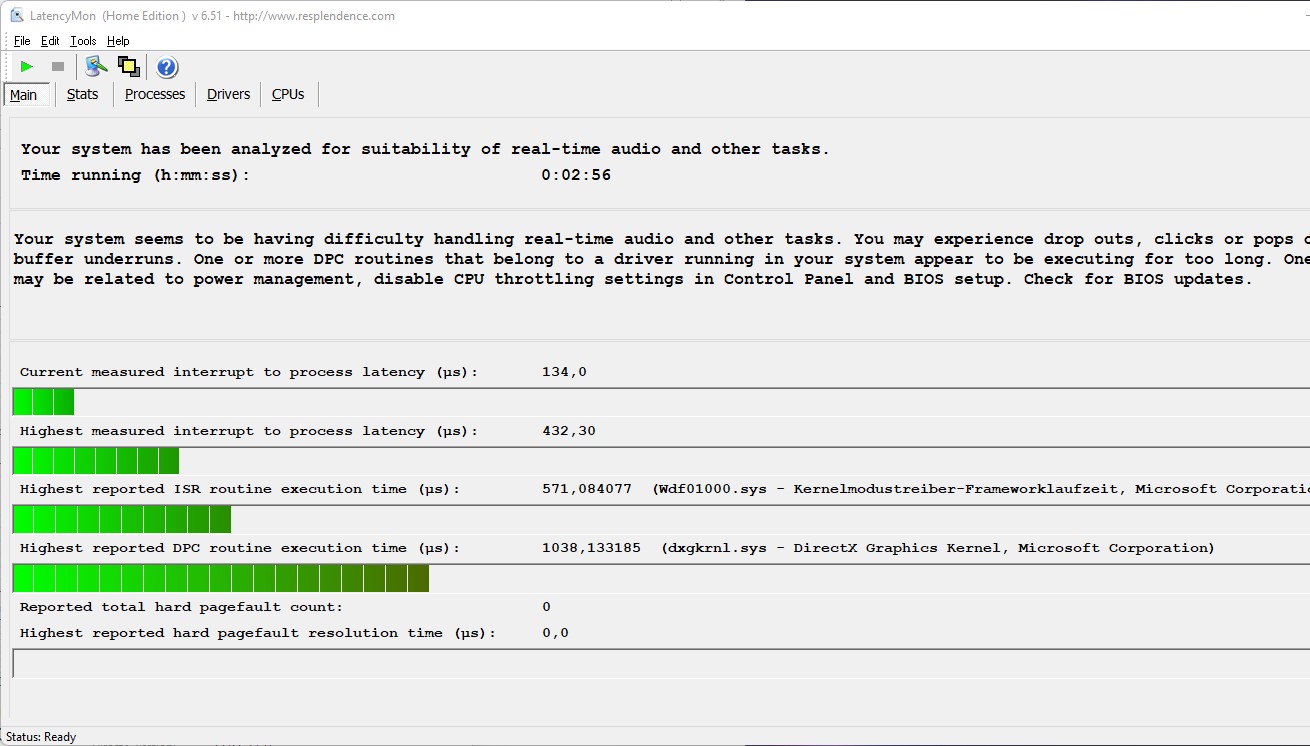
Latencia del CPD
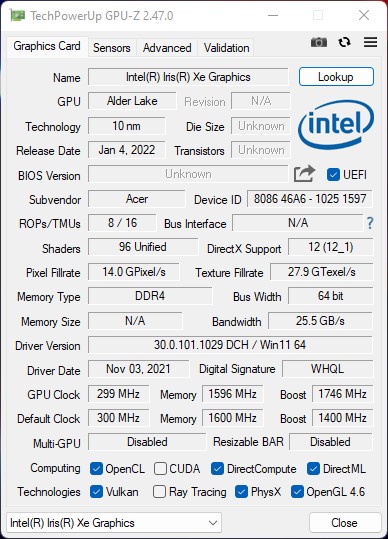
Acer tiene las latencias del CPD bastante bien controladas en el Nitro 5 AN517. Sólo aumentaron ligeramente durante el test de estrés Prime95. No hubo problemas ni saltos de frames durante la reproducción de vídeos 4K en YouTube. La iGPU del SoC se utiliza en torno al 25 por ciento durante la reproducción.
| DPC Latencies / LatencyMon - interrupt to process latency (max), Web, Youtube, Prime95 | |
| MSI Katana GF76 11UE | |
| Asus TUF Gaming F17 FX707Z-HX011W | |
| Lenovo Legion 5 17ACH6H-82JY0003GE | |
| Acer Nitro 5 AN517-41-R5Z7 | |
| Acer Nitro 5 AN517-55-738R | |
| Schenker XMG Core 17 (Early 2021) | |
* ... más pequeño es mejor
Dispositivos de almacenamiento
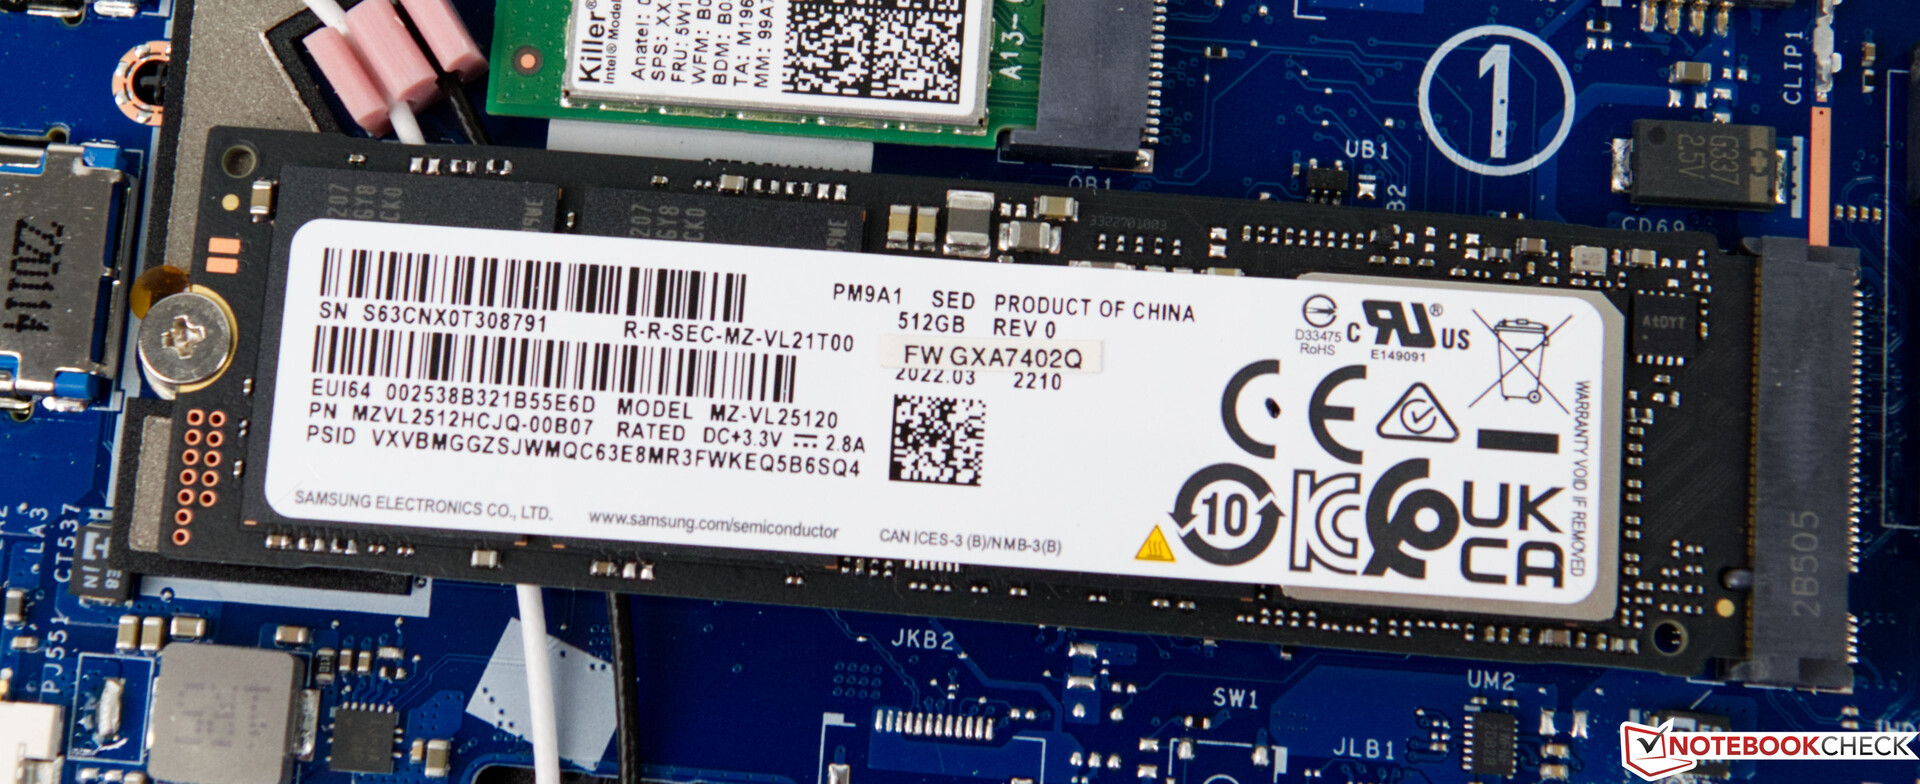
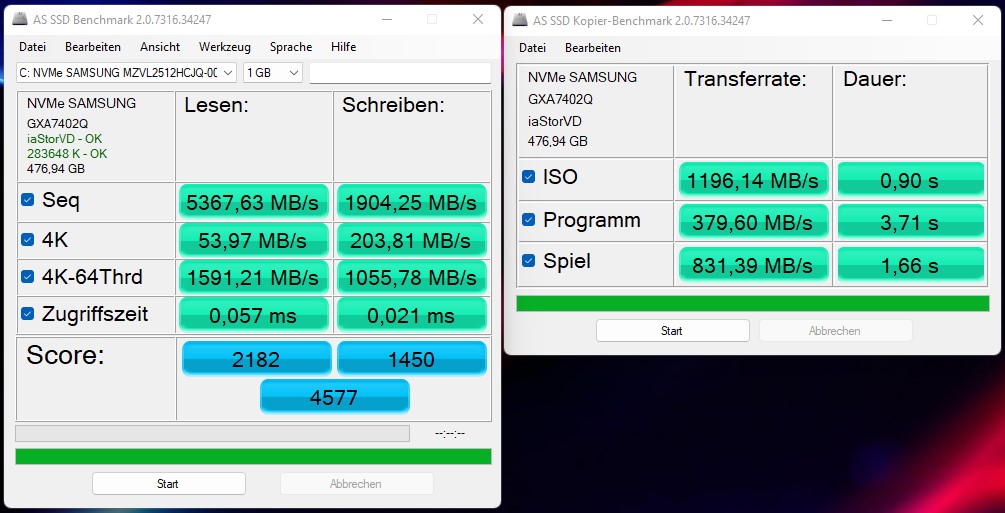
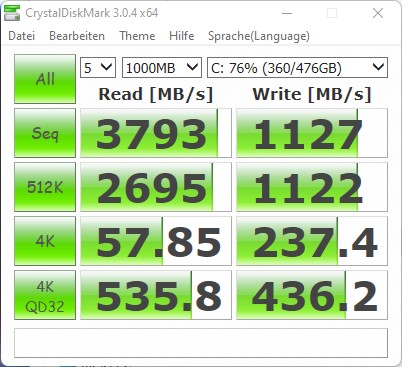
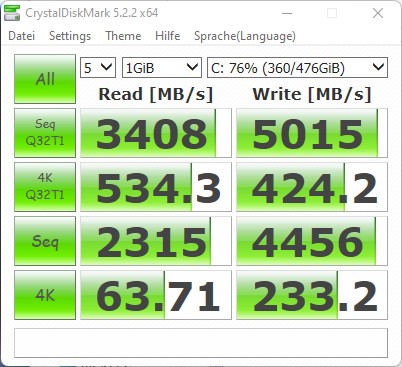
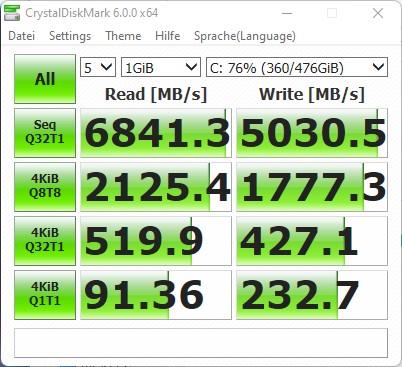
El SSD utilizado en el Acer Nitro 5 AN517 es un modelo de Samsung, que soporta PCIe 4.0 y, por lo tanto, da muy buenos valores de rendimiento en las pruebas. Sólo el tamaño de almacenamiento es un poco demasiado pequeño considerando el área de aplicación (juegos). Un modelo con al menos 1 TB sería mejor. Por suerte, sigue habiendo una ranura M.2 libre.
Para más comparaciones y pruebas, nos remitimos a nuestra tabla de comparación.

* ... más pequeño es mejor
Sustained Performance Read: DiskSpd Read Loop, Queue Depth 8
Tarjeta gráfica
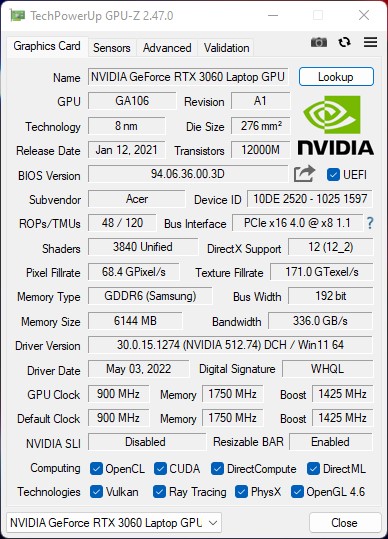
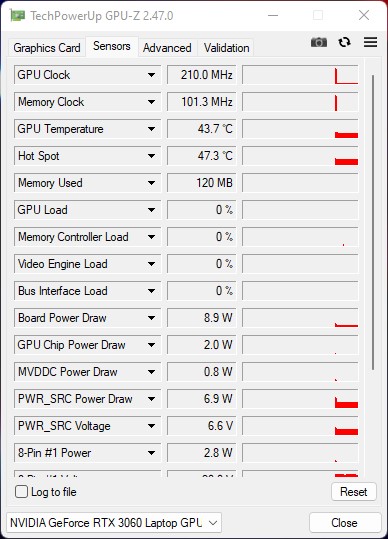
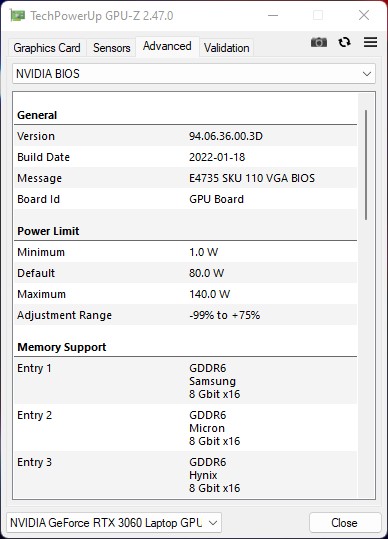
Como tarjeta gráfica se utiliza una GPU Nvidia GeForce RTX 3060 para portátiles, que ofrece un sólido rendimiento en el Acer Nitro 5 AN517 y se sitúa entre el Asus TUF Gaming F17 y el Schenker XMG Core17 en nuestras tablas. Dado que el rango de rendimiento va de 80 a 130 vatios debido al TDP configurable, a veces hay diferencias de rendimiento significativas aquí. Bajo carga, registramos algo menos de 100 vatios para la tarjeta gráfica dedicada del Acer Nitro 5 AN517. Como el portátil también tiene una iGPU, el sistema ahorra mucha energía en modo 2D. El cambio entre los dos adaptadores gráficos funciona sin problemas.
Para más comparaciones y pruebas de rendimiento, nos remitimos a nuestroGTabla de comparación de la PU.
| 3DMark 05 Standard | 48758 puntos | |
| 3DMark 06 Standard Score | 48609 puntos | |
| 3DMark Vantage P Result | 57333 puntos | |
| 3DMark 11 Performance | 20105 puntos | |
| 3DMark Ice Storm Standard Score | 119349 puntos | |
| 3DMark Cloud Gate Standard Score | 34496 puntos | |
| 3DMark Fire Strike Score | 17369 puntos | |
| 3DMark Fire Strike Extreme Score | 9418 puntos | |
| 3DMark Time Spy Score | 7847 puntos | |
ayuda | ||
Rendimiento de los juegos
En términos de rendimiento en juegos, el Acer Nitro 5 AN517 se sitúa por detrás del Asus TUF Gaming F17. Pero esta brecha se cierra con el aumento de la carga, por ejemplo en The Witcher 3, por lo que ambos dispositivos tienen aproximadamente los mismos valores de rendimiento al final. Nuestro modelo de pruebas es capaz de rendir bien en los juegos actuales, funcionando bien por encima de los 60 fps la mayor parte del tiempo.
| F1 2020 | |
| 1920x1080 High Preset AA:T AF:16x | |
| Lenovo Legion 5 17ACH6H-82JY0003GE | |
| Medio NVIDIA GeForce RTX 3060 Laptop GPU (138 - 193, n=7) | |
| MSI Katana GF76 11UE | |
| Acer Nitro 5 AN517-55-738R | |
| 1920x1080 Ultra High Preset AA:T AF:16x | |
| Lenovo Legion 5 17ACH6H-82JY0003GE | |
| Acer Nitro 5 AN517-55-738R | |
| Medio NVIDIA GeForce RTX 3060 Laptop GPU (97.6 - 142, n=7) | |
| MSI Katana GF76 11UE | |
| F1 2021 | |
| 1920x1080 High Preset AA:T AF:16x | |
| Lenovo Legion 5 17ACH6H-82JY0003GE | |
| Medio NVIDIA GeForce RTX 3060 Laptop GPU (119 - 227, n=9) | |
| Acer Nitro 5 AN517-55-738R | |
| 1920x1080 Ultra High Preset + Raytracing AA:T AF:16x | |
| Lenovo Legion 5 17ACH6H-82JY0003GE | |
| Acer Nitro 5 AN517-55-738R | |
| Medio NVIDIA GeForce RTX 3060 Laptop GPU (67 - 112.8, n=9) | |
La prueba de estrés, en la que ejecutamos The Witcher 3 con ajustes Ultra, no mostró ninguna caída de rendimiento. Por lo tanto, no es de esperar que se produzcan tasas de fotogramas no reproducibles durante largos periodos de tiempo de juego.
Witcher 3 FPS Chart
| bajo | medio | alto | ultra | |
|---|---|---|---|---|
| GTA V (2015) | 181.4 | 174.1 | 135.1 | 82.5 |
| The Witcher 3 (2015) | 297 | 233 | 154 | 83 |
| Dota 2 Reborn (2015) | 203.9 | 177.4 | 169.2 | 154.7 |
| Final Fantasy XV Benchmark (2018) | 122.5 | 99.6 | 75.7 | |
| X-Plane 11.11 (2018) | 120.1 | 100.9 | 83.5 | |
| Far Cry 5 (2018) | 128 | 102 | 95 | 94 |
| Strange Brigade (2018) | 328 | 204 | 165.5 | 142.9 |
| Far Cry New Dawn (2019) | 115 | 91 | 89 | 82 |
| Metro Exodus (2019) | 154.3 | 96.3 | 74.5 | 59.4 |
| Borderlands 3 (2019) | 133.7 | 107.4 | 84.4 | 69.3 |
| F1 2020 (2020) | 253 | 150 | 144.4 | 132.7 |
| F1 2021 (2021) | 206 | 155.2 | 142.5 | 95.5 |
Emisiones: ruidosas y calientes, pero con buena duración de la batería
Ruido del sistema
Estamos acostumbrados a los portátiles de juego ruidosos y a menudo señalamos que los dispositivos muy potentes también pueden ser muy ruidosos. Aunque el Acer Nitro 5 AN517 es silencioso en reposo, esto cambia rápidamente cuando el portátil se pone a prueba. Medimos 52,6 dB(A) bajo carga media e incluso 68,2 dB(A) en carga máxima, lo que es claramente demasiado. Estos valores se determinaron con el perfil "Rendimiento", que nos llevó a seleccionar el "Modo Estándar" para permitir emisiones de ruido razonablemente tolerables. Incluso con unos auriculares, no siempre se puede suprimir el fuerte ruido del ventilador. Por lo tanto, simplemente no podemos recomendar el perfil de rendimiento en la práctica. El Acer Nitro 5 AN517 es, con diferencia, el dispositivo más ruidoso de su clase.
Ruido
| Ocioso |
| 25.5 / 25.5 / 27 dB(A) |
| Carga |
| 52.6 / 68.2 dB(A) |
 | ||
30 dB silencioso 40 dB(A) audible 50 dB(A) ruidosamente alto |
||
min: | ||
| Acer Nitro 5 AN517-55-738R GeForce RTX 3060 Laptop GPU, i7-12700H, Samsung PM9A1 MZVL2512HCJQ | Lenovo Legion 5 17ACH6H-82JY0003GE GeForce RTX 3060 Laptop GPU, R5 5600H, Samsung PM991a MZALQ512HBLU | Asus TUF Gaming F17 FX707Z-HX011W GeForce RTX 3060 Laptop GPU, i7-12700H, SK Hynix HFM001TD3JX013N | Acer Nitro 5 AN517-41-R5Z7 GeForce RTX 3070 Laptop GPU, R7 5800H, SK Hynix BC711 1TB HFM001TD3JX016N | Schenker XMG Core 17 (Early 2021) GeForce RTX 3060 Laptop GPU, i7-10870H, Samsung SSD 970 EVO Plus 1TB | MSI Katana GF76 11UE GeForce RTX 3060 Laptop GPU, i7-11800H, Kingston OM8PCP3512F-AB | |
|---|---|---|---|---|---|---|
| Noise | 8% | 13% | -3% | -9% | -13% | |
| apagado / medio ambiente * (dB) | 25.5 | 25 2% | 24 6% | 26 -2% | 25 2% | 25 2% |
| Idle Minimum * (dB) | 25.5 | 25 2% | 24 6% | 26 -2% | 30 -18% | 33 -29% |
| Idle Average * (dB) | 25.5 | 25 2% | 24 6% | 33.1 -30% | 32 -25% | 34 -33% |
| Idle Maximum * (dB) | 27 | 30.5 -13% | 24 11% | 31.3 -16% | 36 -33% | 35 -30% |
| Load Average * (dB) | 52.6 | 37.5 29% | 42.6 19% | 49.8 5% | 53 -1% | 53 -1% |
| Load Maximum * (dB) | 68.2 | 51 25% | 46.84 31% | 49.6 27% | 54 21% | 57 16% |
| Witcher 3 ultra * (dB) | 46.84 | 51 | 49 |
* ... más pequeño es mejor
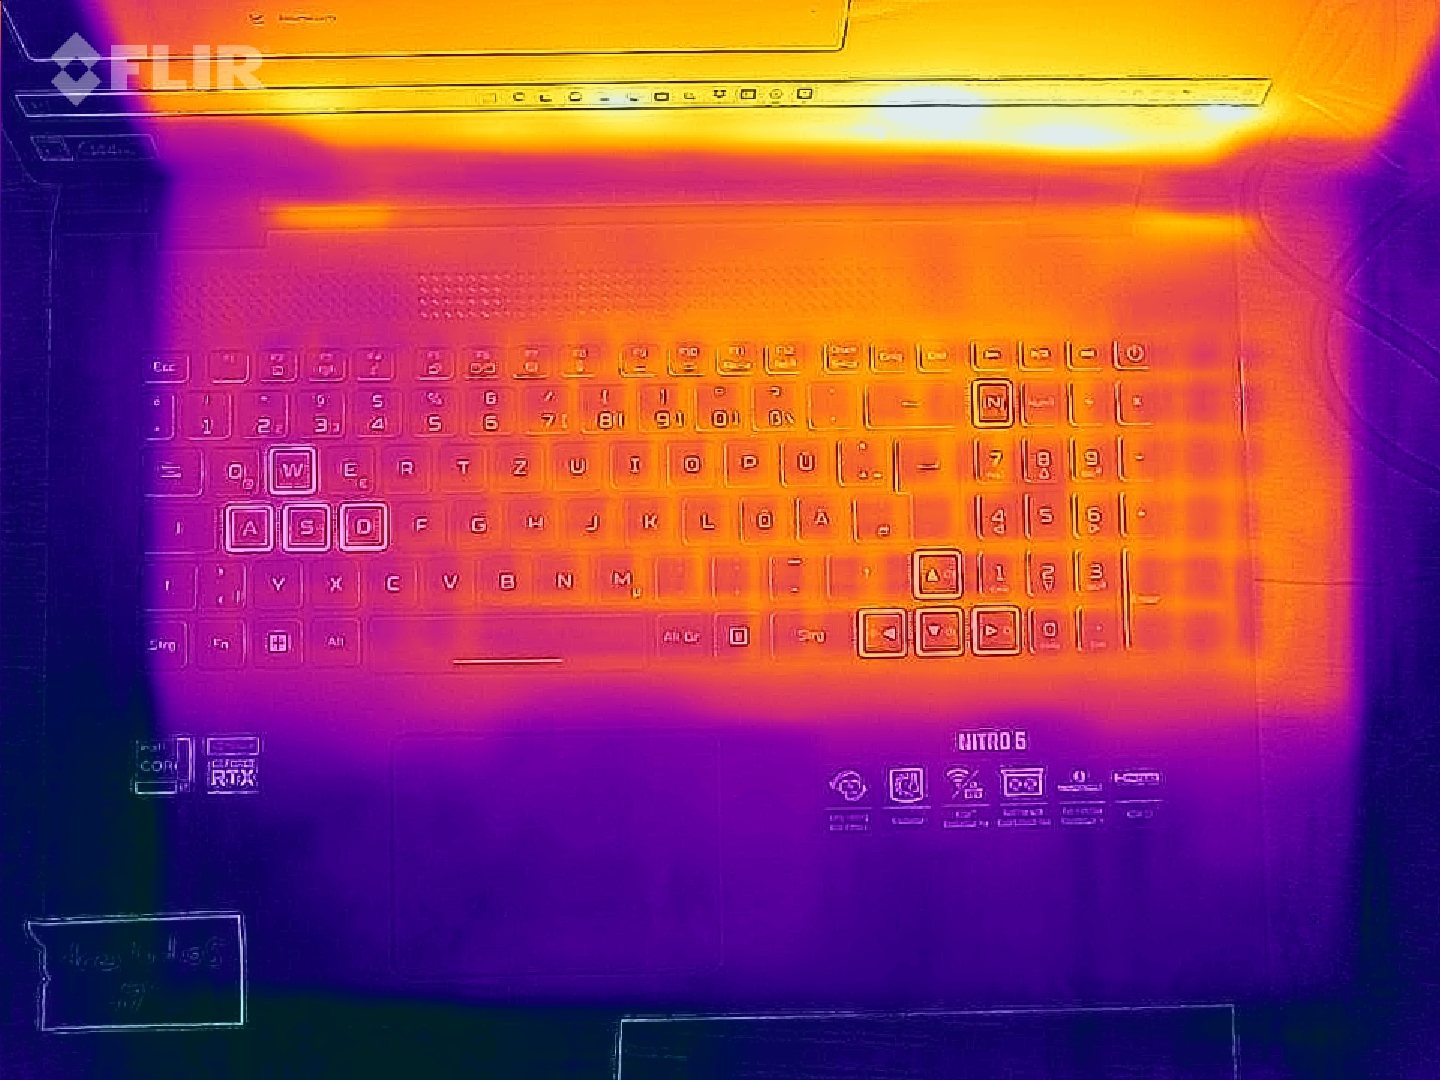
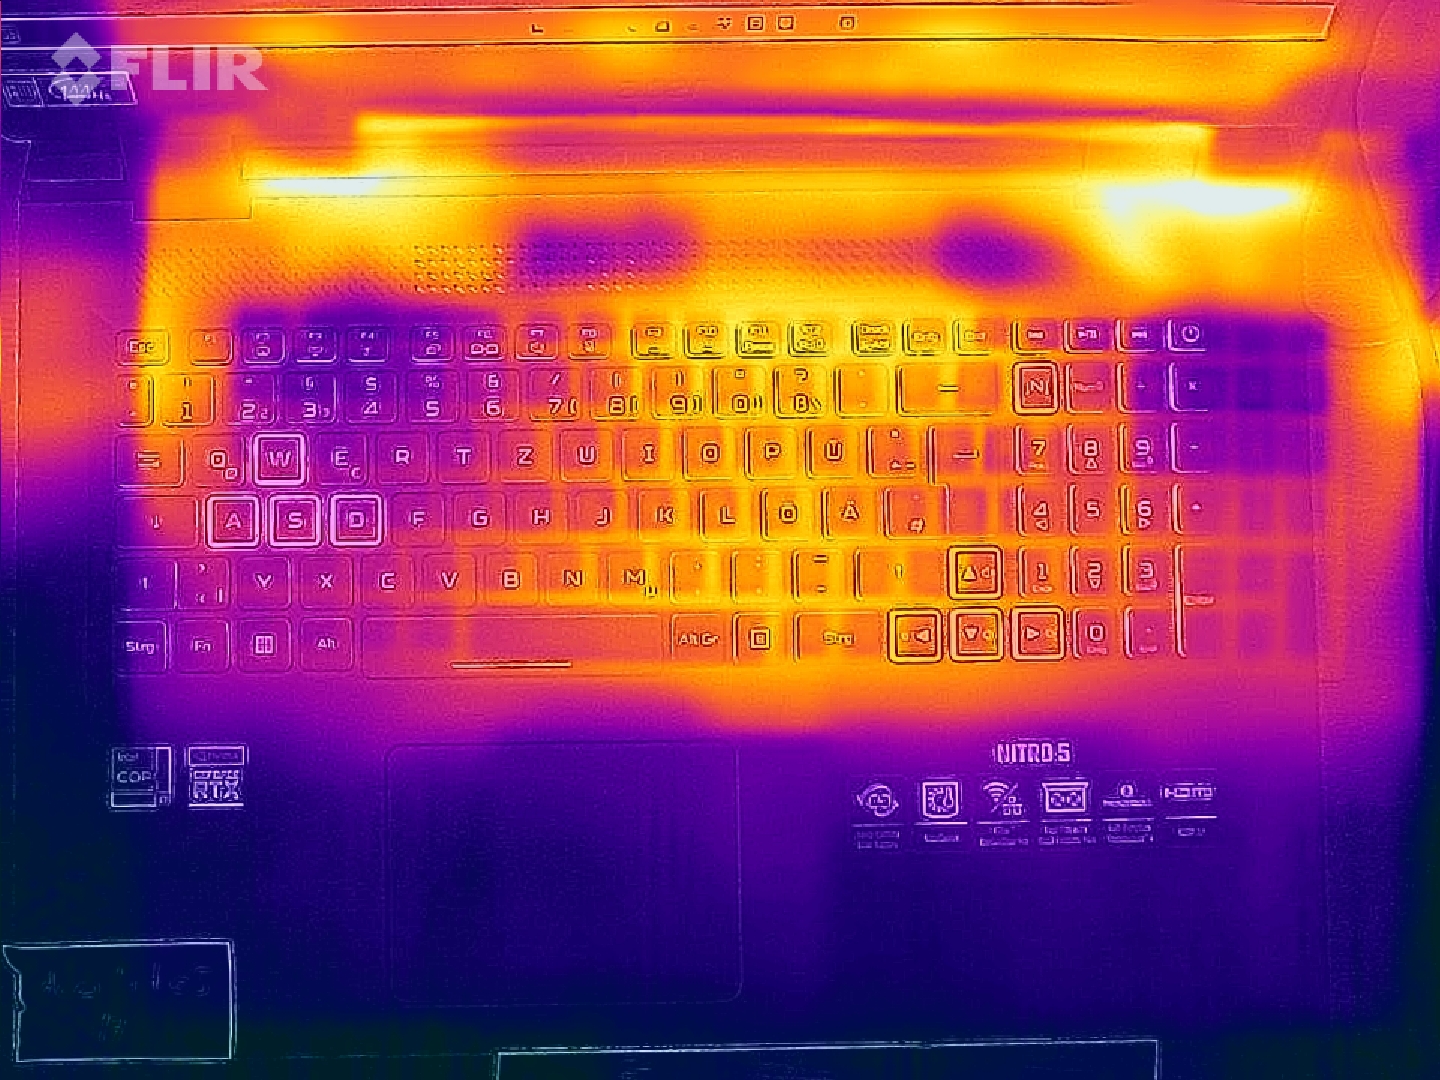
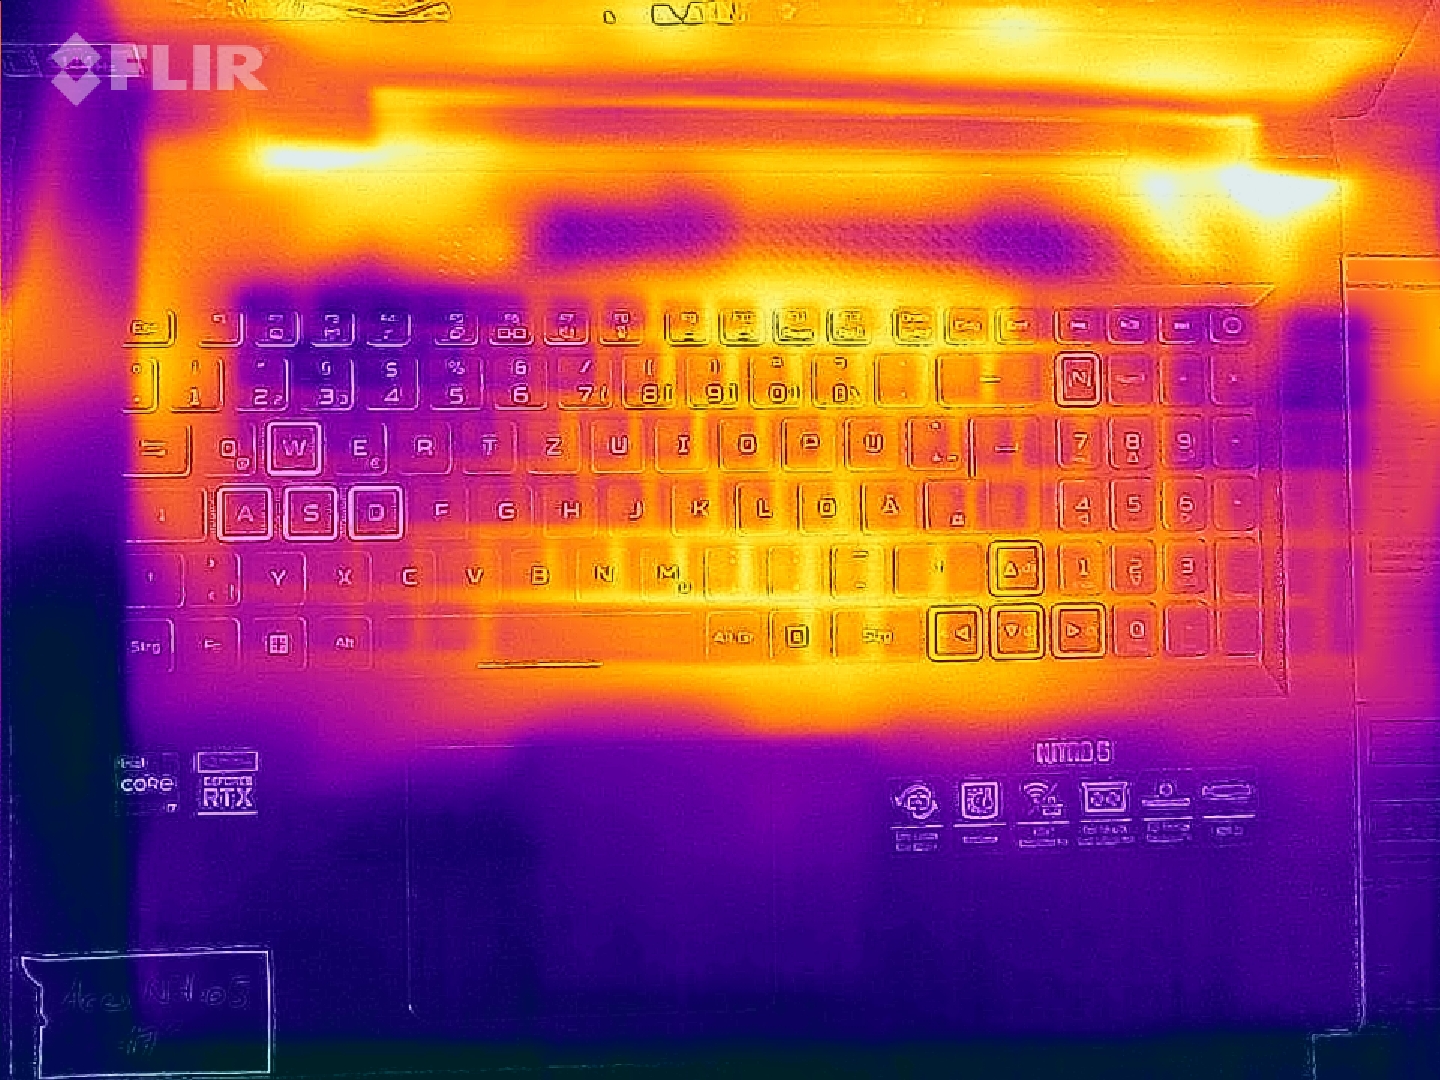
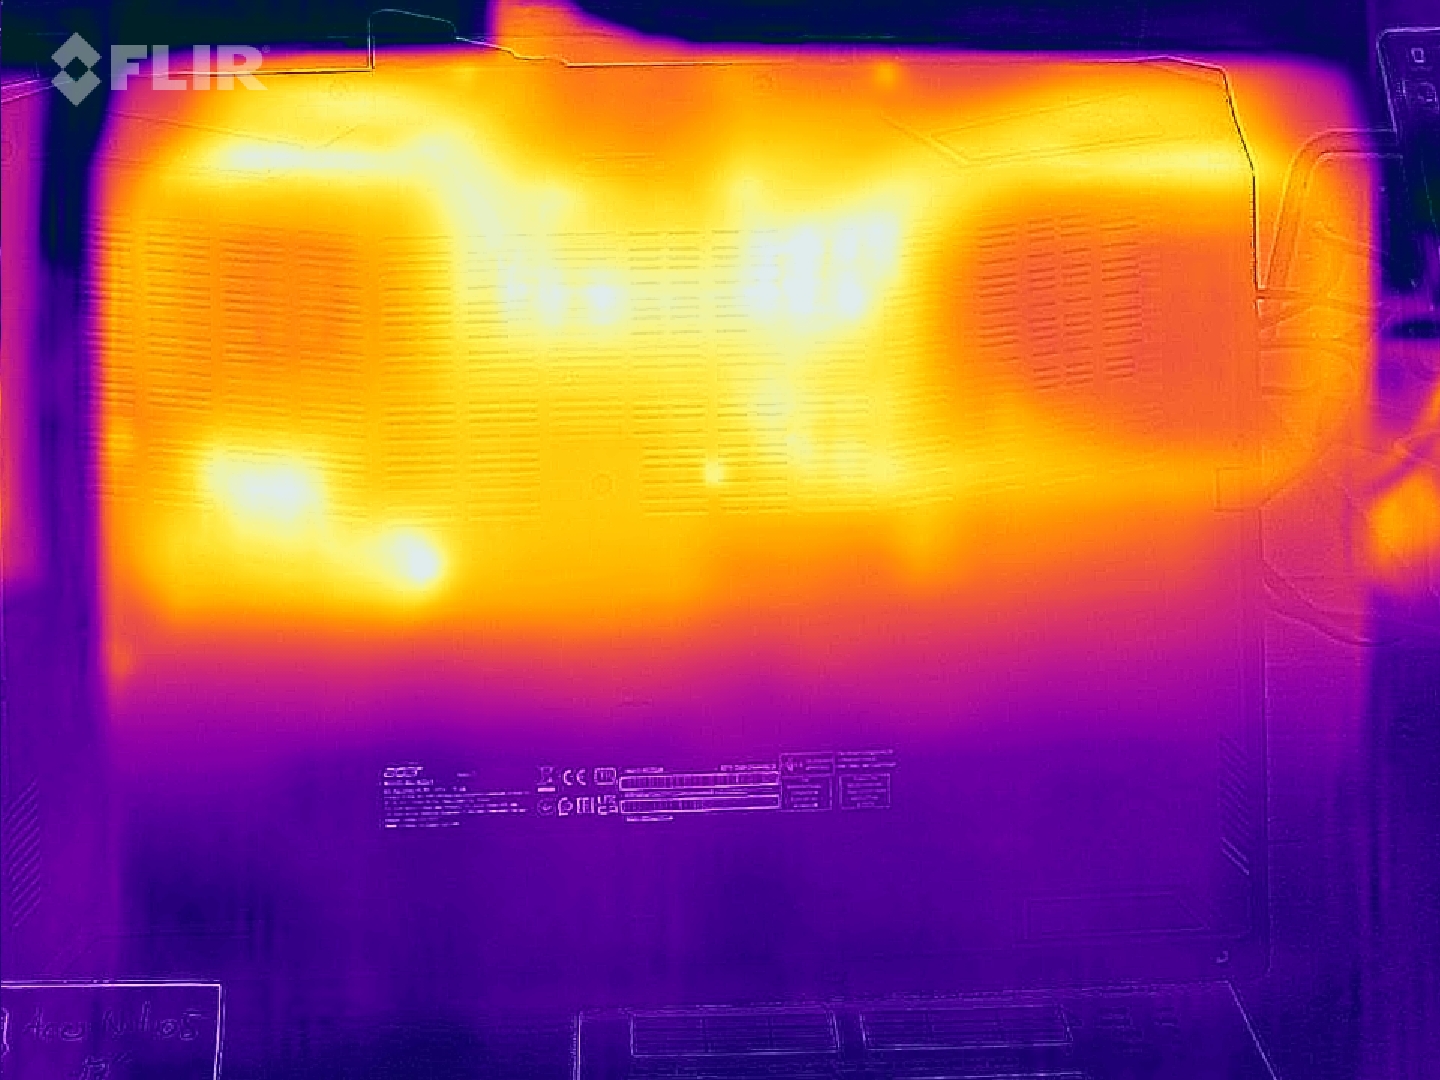
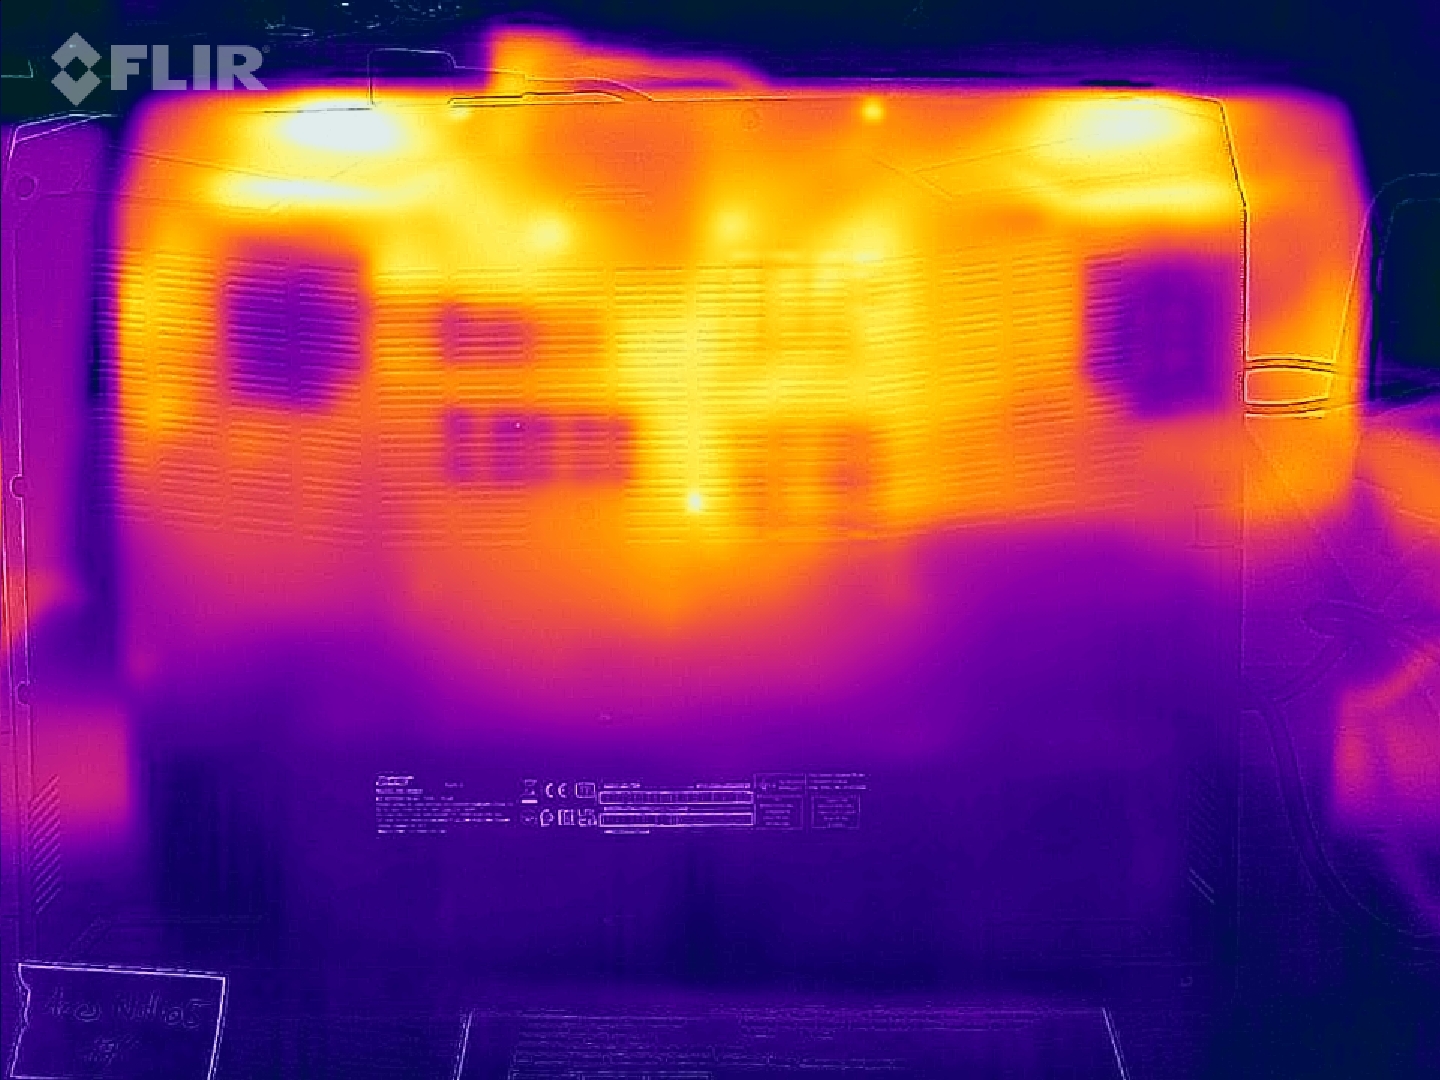
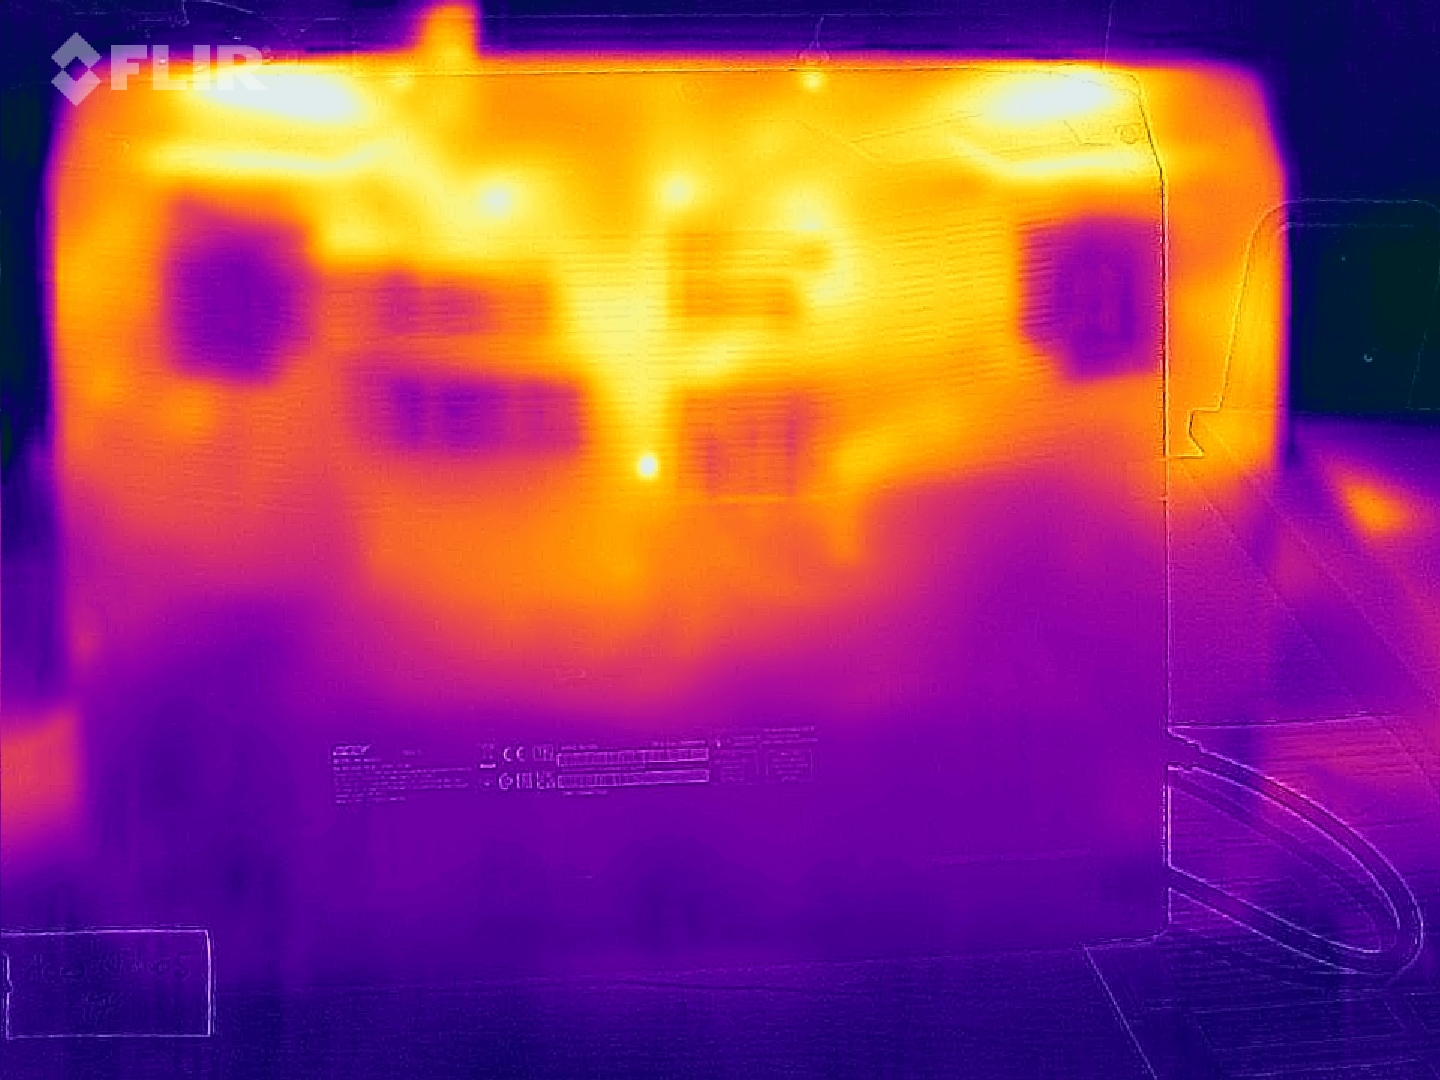
Temperatura
Las temperaturas de la carcasa no dejan mucho espacio para la crítica. En ningún momento se superan los 50 °C bajo carga. En reposo, el Acer Nitro 5 AN517 rinde ligeramente peor en comparación directa con la competencia, pero no es un gran problema.
(-) La temperatura máxima en la parte superior es de 48.3 °C / 119 F, frente a la media de 40.4 °C / 105 F, que oscila entre 21.2 y 68.8 °C para la clase Gaming.
(-) El fondo se calienta hasta un máximo de 52 °C / 126 F, frente a la media de 43.2 °C / 110 F
(+) En reposo, la temperatura media de la parte superior es de 29.1 °C / 84# F, frente a la media del dispositivo de 33.9 °C / 93 F.
(±) Jugando a The Witcher 3, la temperatura media de la parte superior es de 32.9 °C / 91 F, frente a la media del dispositivo de 33.9 °C / 93 F.
(+) El reposamanos y el panel táctil están a una temperatura inferior a la de la piel, con un máximo de 28.9 °C / 84 F y, por tanto, son fríos al tacto.
(±) La temperatura media de la zona del reposamanos de dispositivos similares fue de 28.8 °C / 83.8 F (-0.1 °C / -0.2 F).
| Acer Nitro 5 AN517-55-738R Intel Core i7-12700H, NVIDIA GeForce RTX 3060 Laptop GPU | Lenovo Legion 5 17ACH6H-82JY0003GE AMD Ryzen 5 5600H, NVIDIA GeForce RTX 3060 Laptop GPU | Asus TUF Gaming F17 FX707Z-HX011W Intel Core i7-12700H, NVIDIA GeForce RTX 3060 Laptop GPU | Acer Nitro 5 AN517-41-R5Z7 AMD Ryzen 7 5800H, NVIDIA GeForce RTX 3070 Laptop GPU | Schenker XMG Core 17 (Early 2021) Intel Core i7-10870H, NVIDIA GeForce RTX 3060 Laptop GPU | MSI Katana GF76 11UE Intel Core i7-11800H, NVIDIA GeForce RTX 3060 Laptop GPU | |
|---|---|---|---|---|---|---|
| Heat | 7% | 6% | 6% | 6% | 5% | |
| Maximum Upper Side * (°C) | 48.3 | 42.2 13% | 52 -8% | 44 9% | 44 9% | 51 -6% |
| Maximum Bottom * (°C) | 52 | 50.9 2% | 47 10% | 52.7 -1% | 50 4% | 52 -0% |
| Idle Upper Side * (°C) | 34.5 | 34.3 1% | 31 10% | 32.6 6% | 30 13% | 32 7% |
| Idle Bottom * (°C) | 35.8 | 32 11% | 31 13% | 32.1 10% | 36 -1% | 29 19% |
* ... más pequeño es mejor
Prueba de esfuerzo
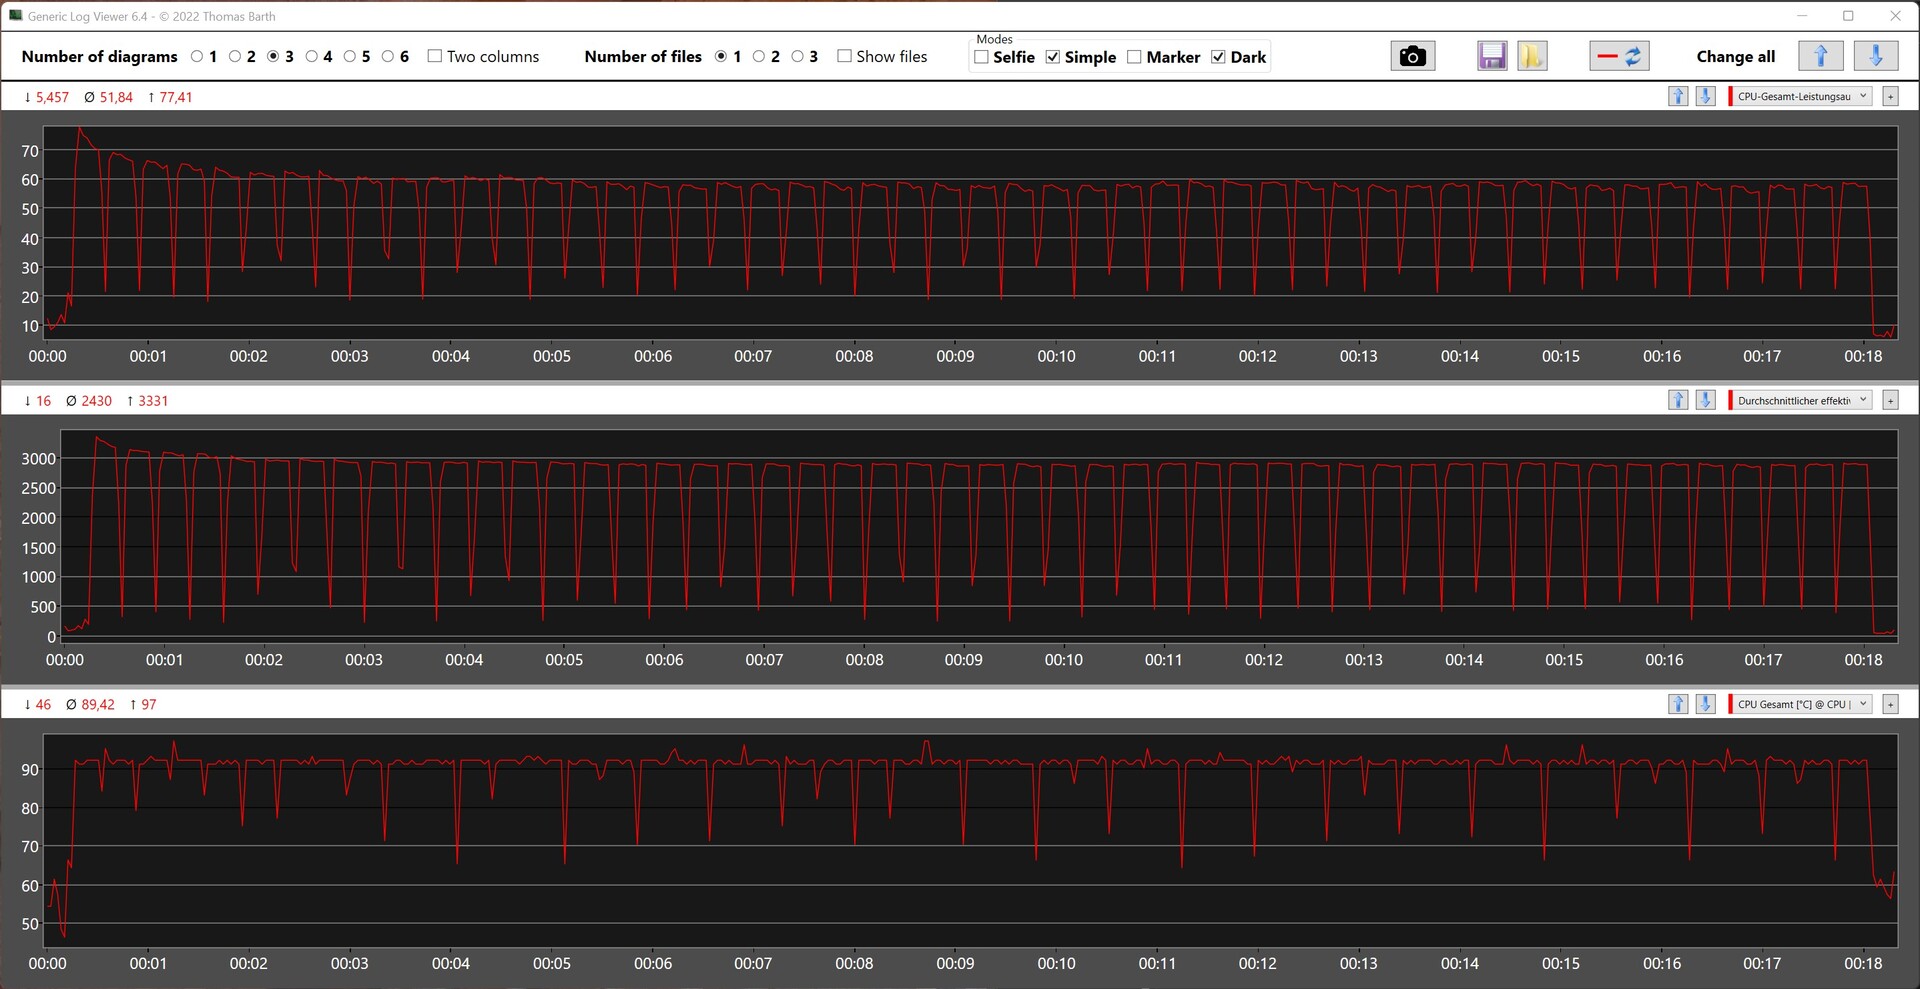
La prueba de estrés se llevó a cabo de nuevo en modo "Estándar". Aquí podemos ver que la unidad de refrigeración está simplemente sobrecargada y que el SoC no alcanza los valores PL1 y PL2 en ningún momento porque el límite térmico entra en acción para evitar una avería. Durante la prueba de estrés de una hora con Prime95 y FurMark, el SoC funcionó a unos 2 GHz y superó repetidamente los 90 °C sin problemas
En cambio, no hubo problemas con la GPU. Un benchmark después de la prueba de estrés no mostró un resultado peor comparado con el arranque en frío.
También probamos brevemente el dispositivo en modo "Rendimiento": a los pocos segundos de arrancar, el SoC se calentó hasta los 101 °C y se ralentizó. Esto significa esencialmente que hay menos potencia disponible, lo que es un criterio de noqueo para esta configuración.
Altavoces
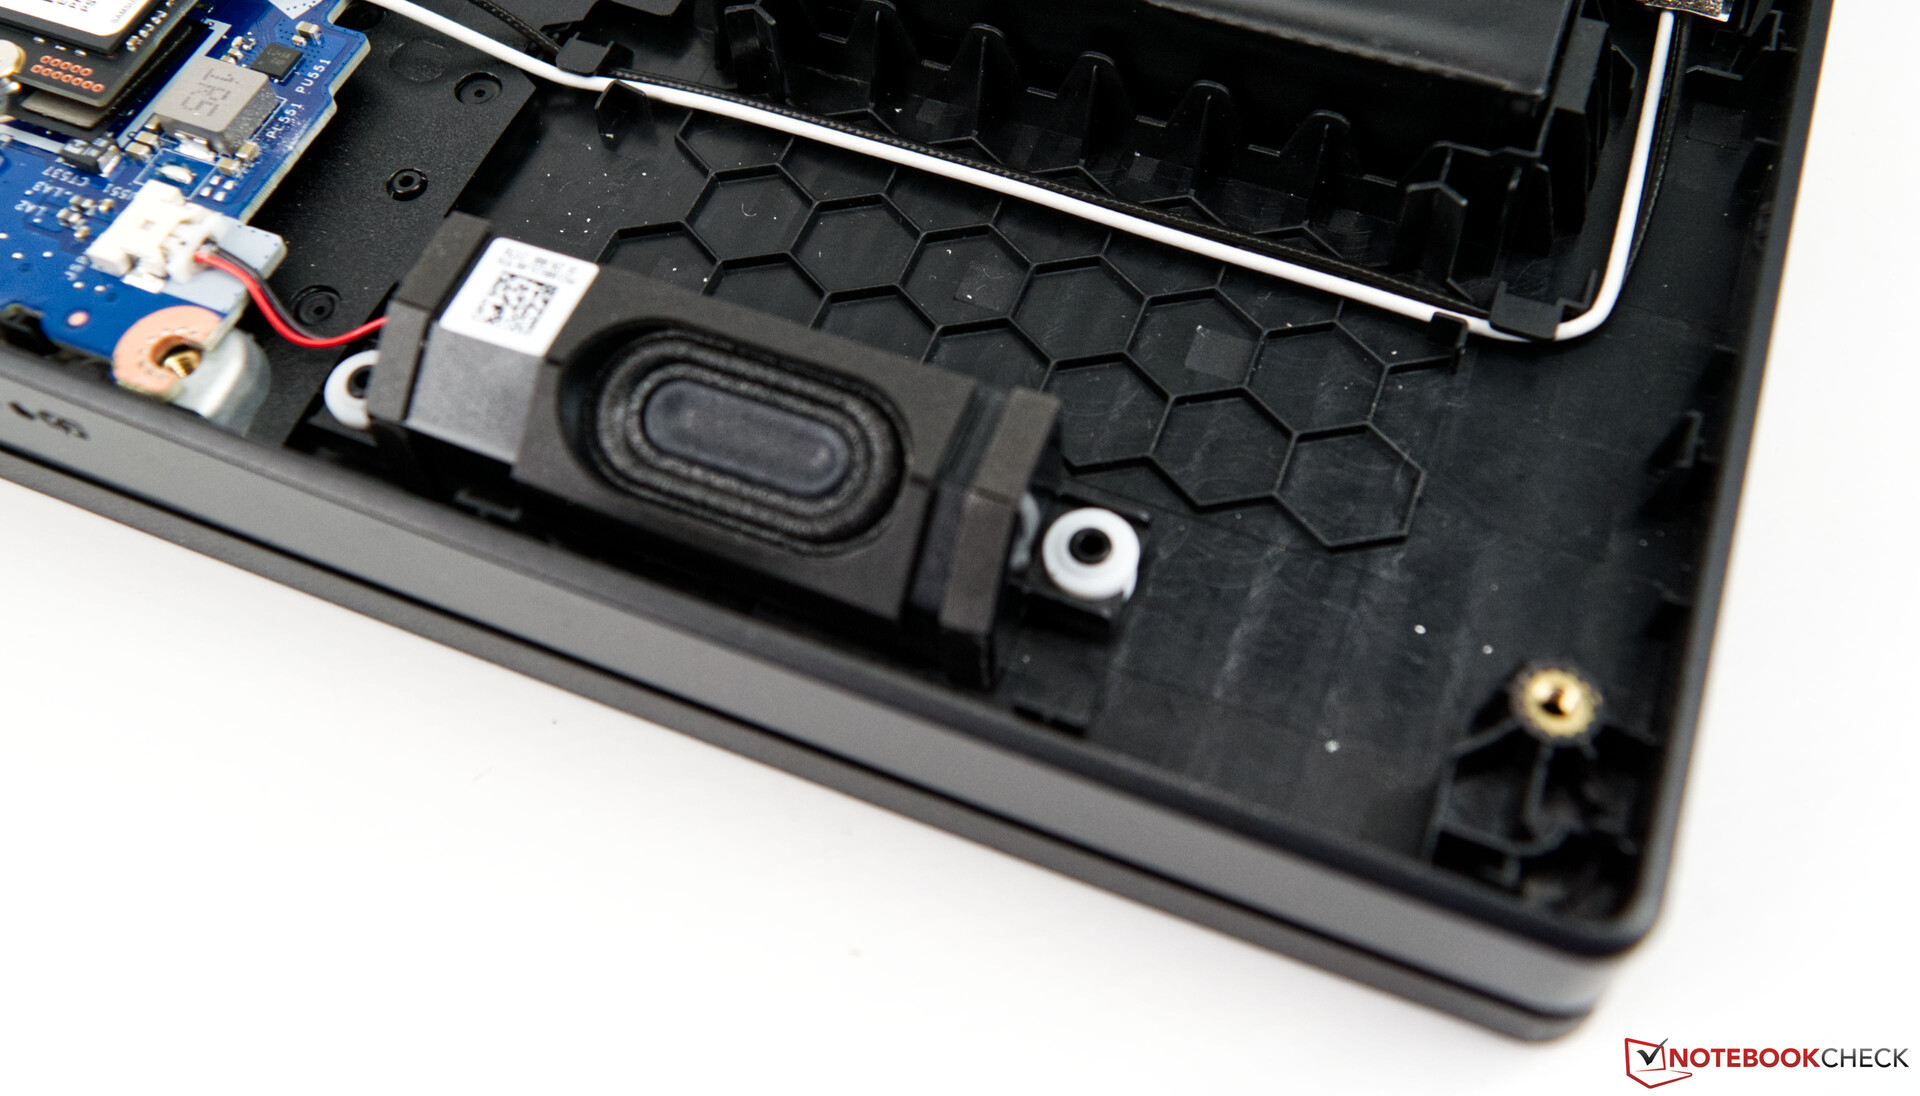
Los altavoces incorporados son sólo condicionalmente adecuados para reproducir música. Del mismo modo, los juegos no son muy divertidos si no se utilizan dispositivos de reproducción externos. Los dos altavoces están orientados hacia abajo y no ofrecen graves. Predominan claramente los agudos y los medios. El volumen es simplemente demasiado bajo para generar un mejor sonido. Definitivamente habría habido espacio suficiente para mejores altavoces, como se puede ver en esta imagen. Acer también podría haber integrado fácilmente un pequeño subwoofer. Hay suficiente espacio disponible en el interior para esto también, pero en su lugar simplemente permanece sin usar.
Acer Nitro 5 AN517-55-738R análisis de audio
(±) | la sonoridad del altavoz es media pero buena (79.3 dB)
Graves 100 - 315 Hz
(-) | casi sin bajos - de media 20.7% inferior a la mediana
(-) | los graves no son lineales (16.5% delta a la frecuencia anterior)
Medios 400 - 2000 Hz
(+) | medios equilibrados - a sólo 2.6% de la mediana
(+) | los medios son lineales (6.6% delta a la frecuencia anterior)
Altos 2 - 16 kHz
(+) | máximos equilibrados - a sólo 4.5% de la mediana
(+) | los máximos son lineales (6.6% delta a la frecuencia anterior)
Total 100 - 16.000 Hz
(±) | la linealidad del sonido global es media (17.6% de diferencia con la mediana)
En comparación con la misma clase
» 50% de todos los dispositivos probados de esta clase eran mejores, 11% similares, 38% peores
» El mejor tuvo un delta de 6%, la media fue 18%, el peor fue ###max##%
En comparación con todos los dispositivos probados
» 35% de todos los dispositivos probados eran mejores, 8% similares, 57% peores
» El mejor tuvo un delta de 4%, la media fue 23%, el peor fue ###max##%
Lenovo Legion 5 17ACH6H-82JY0003GE análisis de audio
(±) | la sonoridad del altavoz es media pero buena (78.3 dB)
Graves 100 - 315 Hz
(-) | casi sin bajos - de media 19.1% inferior a la mediana
(±) | la linealidad de los graves es media (13.8% delta a frecuencia anterior)
Medios 400 - 2000 Hz
(+) | medios equilibrados - a sólo 3% de la mediana
(+) | los medios son lineales (5% delta a la frecuencia anterior)
Altos 2 - 16 kHz
(+) | máximos equilibrados - a sólo 4.8% de la mediana
(+) | los máximos son lineales (6.7% delta a la frecuencia anterior)
Total 100 - 16.000 Hz
(±) | la linealidad del sonido global es media (15.8% de diferencia con la mediana)
En comparación con la misma clase
» 37% de todos los dispositivos probados de esta clase eran mejores, 7% similares, 56% peores
» El mejor tuvo un delta de 6%, la media fue 18%, el peor fue ###max##%
En comparación con todos los dispositivos probados
» 24% de todos los dispositivos probados eran mejores, 5% similares, 70% peores
» El mejor tuvo un delta de 4%, la media fue 23%, el peor fue ###max##%
Gestión de la energía
Consumo de energía
El Acer Nitro 5 AN517 no puede calificarse de ahorrador de energía, aunque los valores determinados en reposo son relativamente buenos y a veces significativamente mejores que los de la competencia. Bajo carga, sin embargo, registramos una media de 166 vatios, que se ve coronada por picos de hasta 235 vatios. Nuestra muestra de revisión está, pues, claramente por encima de la media de la clase.
| Off / Standby | |
| Ocioso | |
| Carga |
|
Clave:
min: | |
| Acer Nitro 5 AN517-55-738R i7-12700H, GeForce RTX 3060 Laptop GPU, Samsung PM9A1 MZVL2512HCJQ, IPS, 1920x1080, 17.3" | Lenovo Legion 5 17ACH6H-82JY0003GE R5 5600H, GeForce RTX 3060 Laptop GPU, Samsung PM991a MZALQ512HBLU, IPS, 1920x1080, 17.3" | Asus TUF Gaming F17 FX707Z-HX011W i7-12700H, GeForce RTX 3060 Laptop GPU, SK Hynix HFM001TD3JX013N, IPS, 1920x1080, 17.3" | Acer Nitro 5 AN517-41-R5Z7 R7 5800H, GeForce RTX 3070 Laptop GPU, SK Hynix BC711 1TB HFM001TD3JX016N, IPS, 1920x1080, 17.3" | Schenker XMG Core 17 (Early 2021) i7-10870H, GeForce RTX 3060 Laptop GPU, Samsung SSD 970 EVO Plus 1TB, IPS, 2560x1440, 17.3" | MSI Katana GF76 11UE i7-11800H, GeForce RTX 3060 Laptop GPU, Kingston OM8PCP3512F-AB, IPS, 1920x1080, 17.3" | Medio NVIDIA GeForce RTX 3060 Laptop GPU | Media de la clase Gaming | |
|---|---|---|---|---|---|---|---|---|
| Power Consumption | -19% | 28% | -29% | -14% | 11% | 2% | -18% | |
| Idle Minimum * (Watt) | 9.7 | 15.6 -61% | 6.6 32% | 18.7 -93% | 13 -34% | 9 7% | 10.4 ? -7% | 13 ? -34% |
| Idle Average * (Watt) | 14.6 | 20.7 -42% | 8.3 43% | 22 -51% | 16 -10% | 13 11% | 14.5 ? 1% | 19 ? -30% |
| Idle Maximum * (Watt) | 16.7 | 22.9 -37% | 11.8 29% | 25.2 -51% | 29 -74% | 20 -20% | 21.4 ? -28% | 24.6 ? -47% |
| Load Average * (Watt) | 166 | 134 19% | 119 28% | 134.7 19% | 100 40% | 102 39% | 109.3 ? 34% | 110.7 ? 33% |
| Load Maximum * (Watt) | 235 | 170 28% | 222 6% | 157 33% | 213 9% | 187 20% | 206 ? 12% | 259 ? -10% |
| Witcher 3 ultra * (Watt) | 135 | 169 | 135 | 173 | 149 |
* ... más pequeño es mejor
Power consumption Witcher 3 / Stresstest
Power consumption with an external monitor
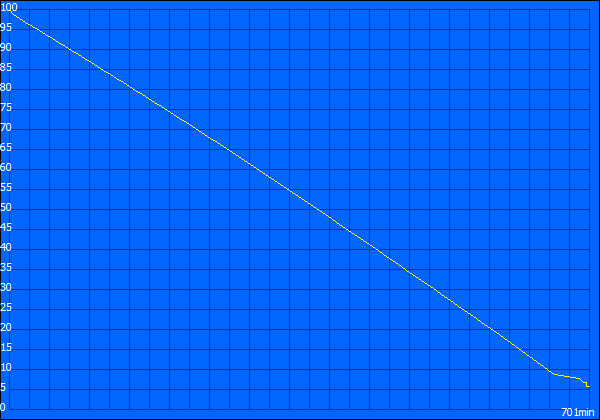
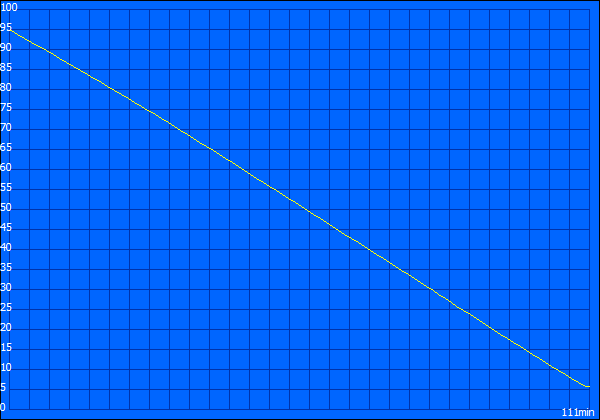
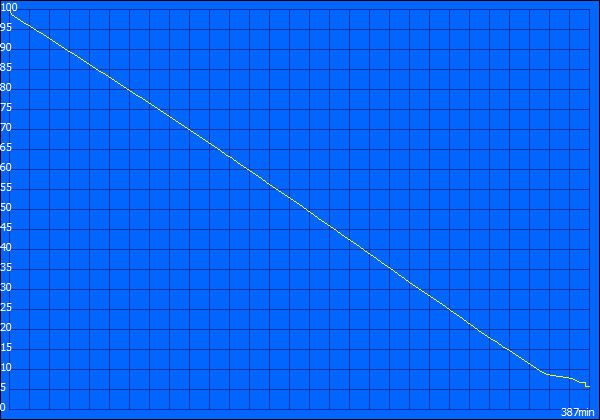
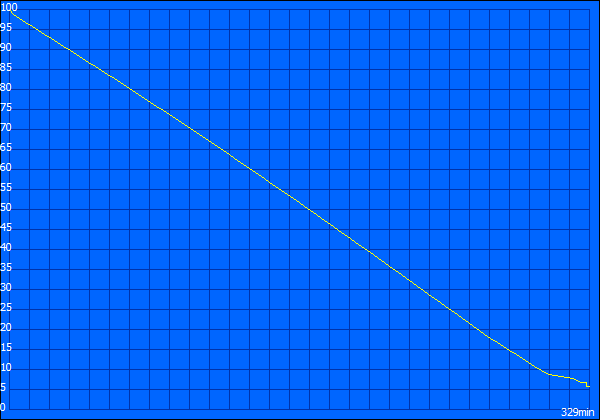
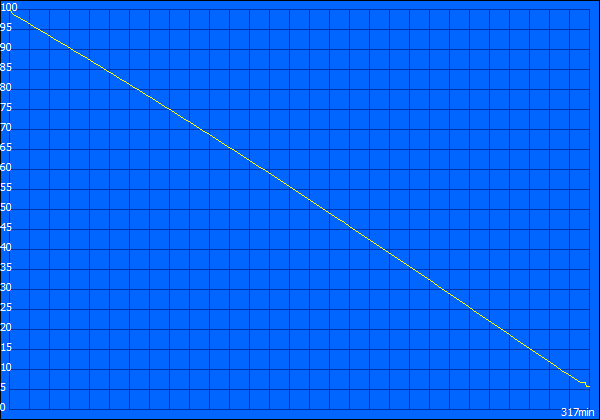
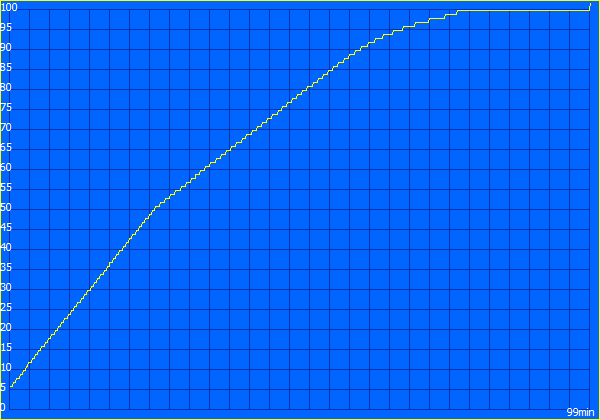
Duración de la batería
El Acer Nitro 5 AN517 funciona durante casi 6,5 horas en la prueba WLAN con una batería de 90 Wh instalada permanentemente. Este es un buen valor para un portátil de juegos, que sólo puede ser superado por elAsus TUF Gaming F17.
También es importante tener en cuenta que el rendimiento de la CPU y la GPU se ralentiza un poco en el modo de batería. El Acer Nitro 5 AN517 no es el único en este sentido, ya que otros fabricantes también han tomado un camino similar.
| Acer Nitro 5 AN517-55-738R i7-12700H, GeForce RTX 3060 Laptop GPU, 90.61 Wh | Lenovo Legion 5 17ACH6H-82JY0003GE R5 5600H, GeForce RTX 3060 Laptop GPU, 80 Wh | Asus TUF Gaming F17 FX707Z-HX011W i7-12700H, GeForce RTX 3060 Laptop GPU, 90 Wh | Acer Nitro 5 AN517-41-R5Z7 R7 5800H, GeForce RTX 3070 Laptop GPU, 57.5 Wh | Schenker XMG Core 17 (Early 2021) i7-10870H, GeForce RTX 3060 Laptop GPU, 62 Wh | MSI Katana GF76 11UE i7-11800H, GeForce RTX 3060 Laptop GPU, 53 Wh | Media de la clase Gaming | |
|---|---|---|---|---|---|---|---|
| Duración de Batería | -30% | 33% | -6% | -26% | -40% | 4% | |
| Reader / Idle (h) | 11.7 | 5.5 -53% | 10.1 -14% | 7.7 -34% | 4.8 -59% | 8.27 ? -29% | |
| H.264 (h) | 5.3 | 3.5 -34% | 7.7 45% | 7 32% | 4.7 -11% | 3.9 -26% | 8.32 ? 57% |
| WiFi v1.3 (h) | 6.5 | 4.4 -32% | 8.7 34% | 5.6 -14% | 4.9 -25% | 3.7 -43% | 7.11 ? 9% |
| Load (h) | 1.9 | 1.9 0% | 2.3 21% | 1.4 -26% | 1.3 -32% | 1.3 -32% | 1.502 ? -21% |
| Witcher 3 ultra (h) | 0.8 |
Pro
Contra
Veredicto - Inicio fuerte y final débil
El Acer Nitro 5 AN517 es un portátil para juegos con la última CPU Alder Lake y una tarjeta gráfica utilizable. El Intel Core i7-12700H es una buena elección y ofrece mucho rendimiento multihilo, pero tiene un precio. Así que no hay más límites en el SoC en forma de restricciones de potencia. Por un lado, esto es bueno y malo al mismo tiempo, porque el sistema de refrigeración alcanza muy rápidamente sus límites cuando se requiere rendimiento. Acer lo hace un poco mejor con la GPU Nvidia GeForce RTX 3060 para portátiles: Los niveles de rendimiento son suficientes para ejecutar todos los juegos actuales sin problemas. Esto es lo que importa y el Acer Nitro 5 AN517 hace exactamente eso
Por lo demás, los usuarios pueden llevar a cabo el trabajo diario bastante bien con el dispositivo si se ignora simplemente el perfil de rendimiento "Rendimiento" en la herramienta interna Nitro Sense. El volumen máximo bajo carga alcanza valores extremos que no se pueden tolerar. Pero somos conscientes de que los dispositivos potentes a menudo pueden ser ruidosos.
El Acer Nitro 5 AN517 es un moderno portátil para juegos con una rápida configuración de CPU y GPU. Sin embargo, los valores de emisión podrían ser su perdición.
Los puntos positivos son la pantalla con sus bajos tiempos de respuesta y los 144 Hz, que probablemente satisfagan a la mayoría de jugadores. En el lado de la conectividad, Thunderbolt 4 es una interfaz moderna que también está preparada para el futuro. No obstante, Acer podría haber ofrecido un poco más aquí, ya que tres puertos USB convencionales no son mucho para un portátil de 17 pulgadas. La falta de espacio no puede ser la razón aquí. Visualmente, el dispositivo parece de alta calidad, pero tiene que luchar con el conocido problema de la ligera flexión en la base y la tapa de la pantalla debido a su tamaño. Sin embargo, este problema también existe en otros portátiles de 17 pulgadas, por lo que el Acer Nitro 5 AN517 no es el único.
Precio y disponibilidad
Nuestro modelo analizado (AN517-55-738R), con su distribución de teclado específica para la región, está destinado principalmente al mercado de habla alemana y tiene un precio de venta al público de unos 1.500 dólares. Mientras que los modelos de 15 pulgadas con idéntica configuración de hardware están disponibles en todo el mundo, no hemos podido encontrar ningún modelo de 17 pulgadas fuera de Alemania. Por lo tanto, se aconseja a los compradores interesados que comprueben regularmente en línea a través de Amazon o de un distribuidor adecuado.
Acer Nitro 5 AN517-55-738R
- 10/20/2022 v7 (old)
Sebastian Bade
Price comparison

