Análisis del Lenovo IdeaPad Gaming 3 15IAH7: Uno de los portátiles más potentes con RTX 3050 Ti

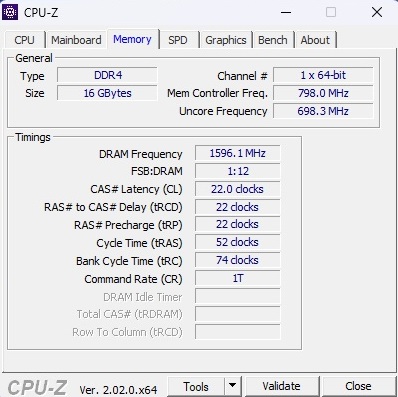
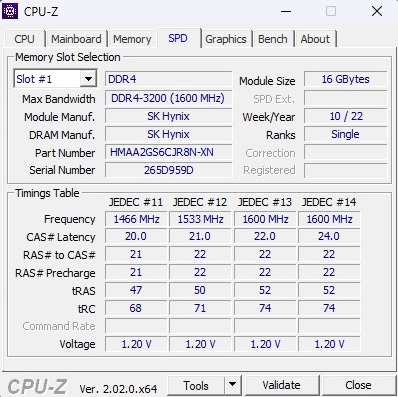
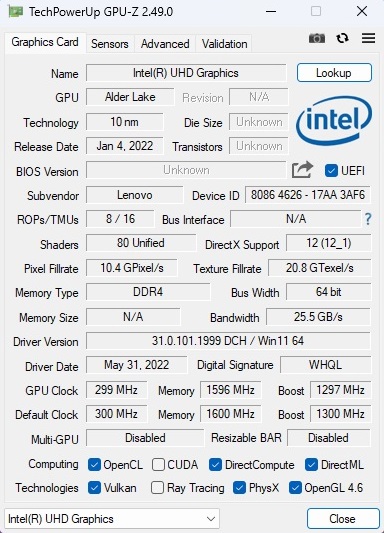
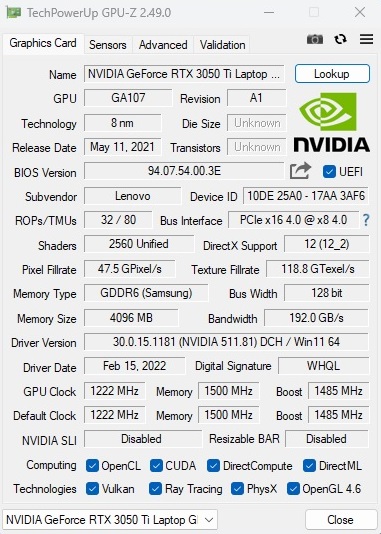
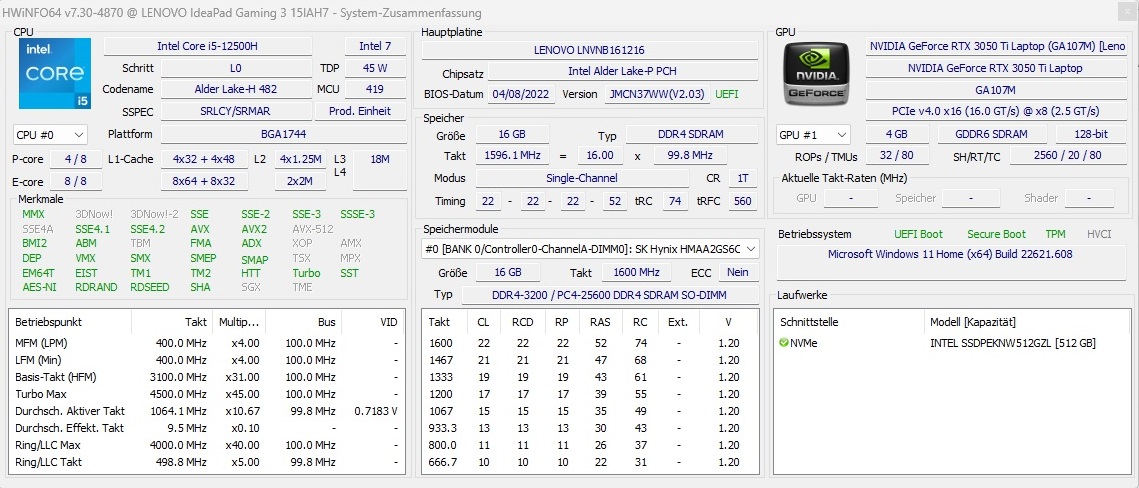
Aunque hay varios portátiles de juego disponibles en el rango de precios de unos 1.000 euros, la mayoría de ellos renuncian a una pantalla con un brillo decente y una sólida cobertura del espacio de color. Sin embargo, de vez en cuando podemos encontrar una excepción positiva como el IdeaPad Gaming 3 15IAH7 que probamos, que ofrece un Core i5-12500H, aGeForce RTX 3050 Ti, 16 GB de RAM DDR4 (lamentablemente solo en modo monocanal), y un SSD NVMe de 512 GB. La pantalla IPS de 15,6 pulgadas tiene una tasa de refresco de 165 Hz, lo que promete buenos tiempos de respuesta, y una resolución de 1920 x 1080 píxeles.
Entre los competidores del IdeaPad Gaming 3 15IAH7 se encuentran otros portátiles con la RTX 3050 Ti como el HP Victus 16-e0145ngy elDell G15 5515y el Dell Inspiron 16 Plus 7620. También incluimos el modelo hermano 15ARH7 (Ryzen 5 6600H & RTX 3050) en nuestras tablas como dispositivo de comparación.
Posibles contendientes en la comparación
Valoración | Fecha | Modelo | Peso | Altura | Tamaño | Resolución | Precio |
|---|---|---|---|---|---|---|---|
| 82.8 % v7 (old) | 10/2022 | Lenovo IdeaPad Gaming 3 15IAH7 i5-12500H, GeForce RTX 3050 Ti Laptop GPU | 2.4 kg | 26 mm | 15.60" | 1920x1080 | |
| 80.8 % v7 (old) | 09/2022 | Lenovo IdeaPad Gaming 3 15ARH7 R5 6600H, GeForce RTX 3050 4GB Laptop GPU | 2.4 kg | 21.8 mm | 15.60" | 1920x1080 | |
| 82.7 % v7 (old) | 10/2021 | Dell G15 5515 R7 5800H, GeForce RTX 3050 Ti Laptop GPU | 2.4 kg | 24.9 mm | 15.60" | 1920x1080 | |
| 82.3 % v7 (old) | 05/2022 | HP Victus 16-e0145ng R5 5600H, GeForce RTX 3050 Ti Laptop GPU | 2.4 kg | 23.5 mm | 16.10" | 1920x1080 | |
| 87.4 % v7 (old) | 08/2022 | Dell Inspiron 16 Plus 7620 i7-12700H, GeForce RTX 3050 Ti Laptop GPU | 2.1 kg | 18.99 mm | 16.00" | 3072x1920 |
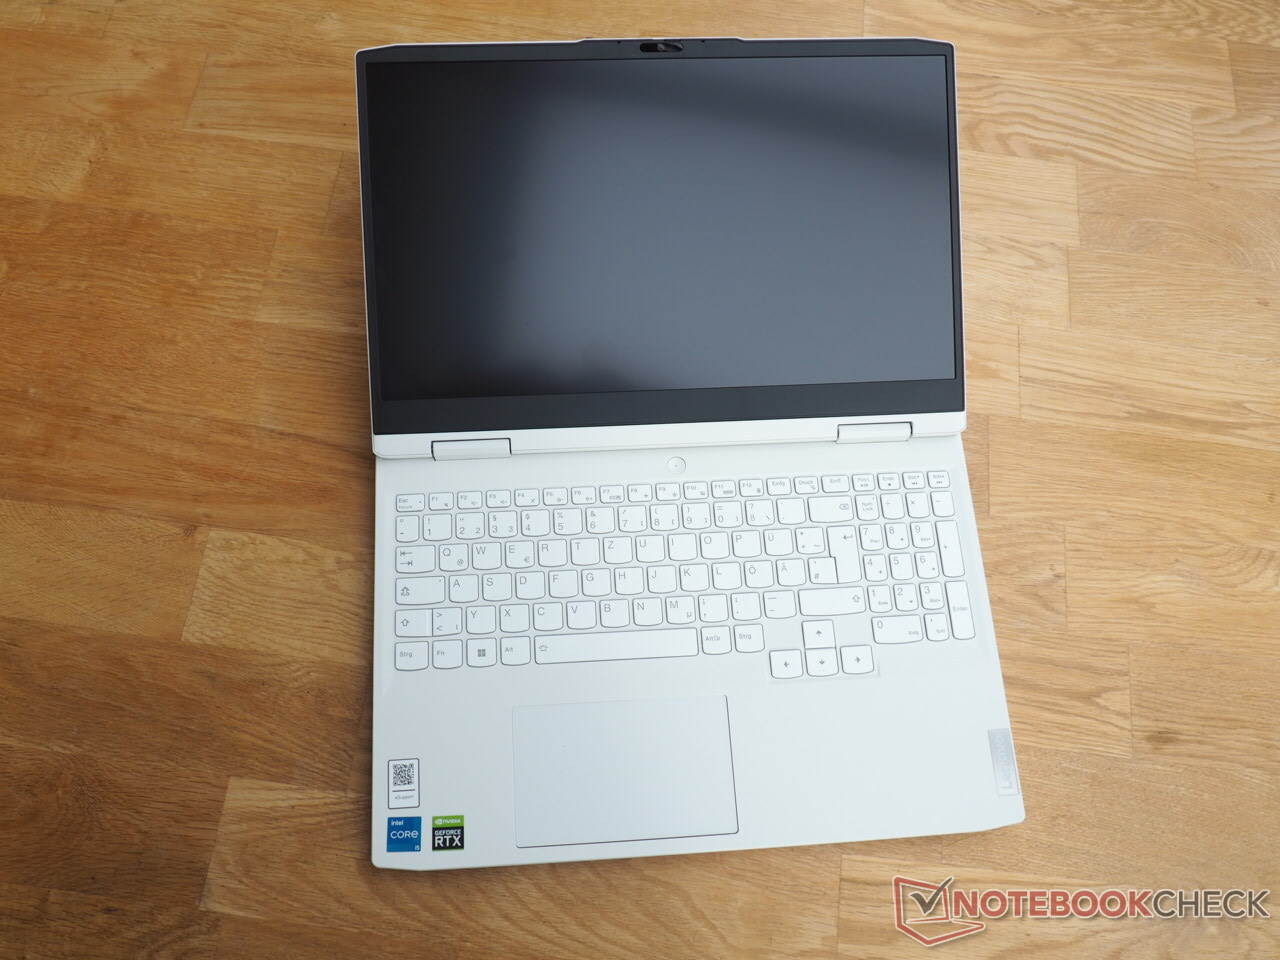
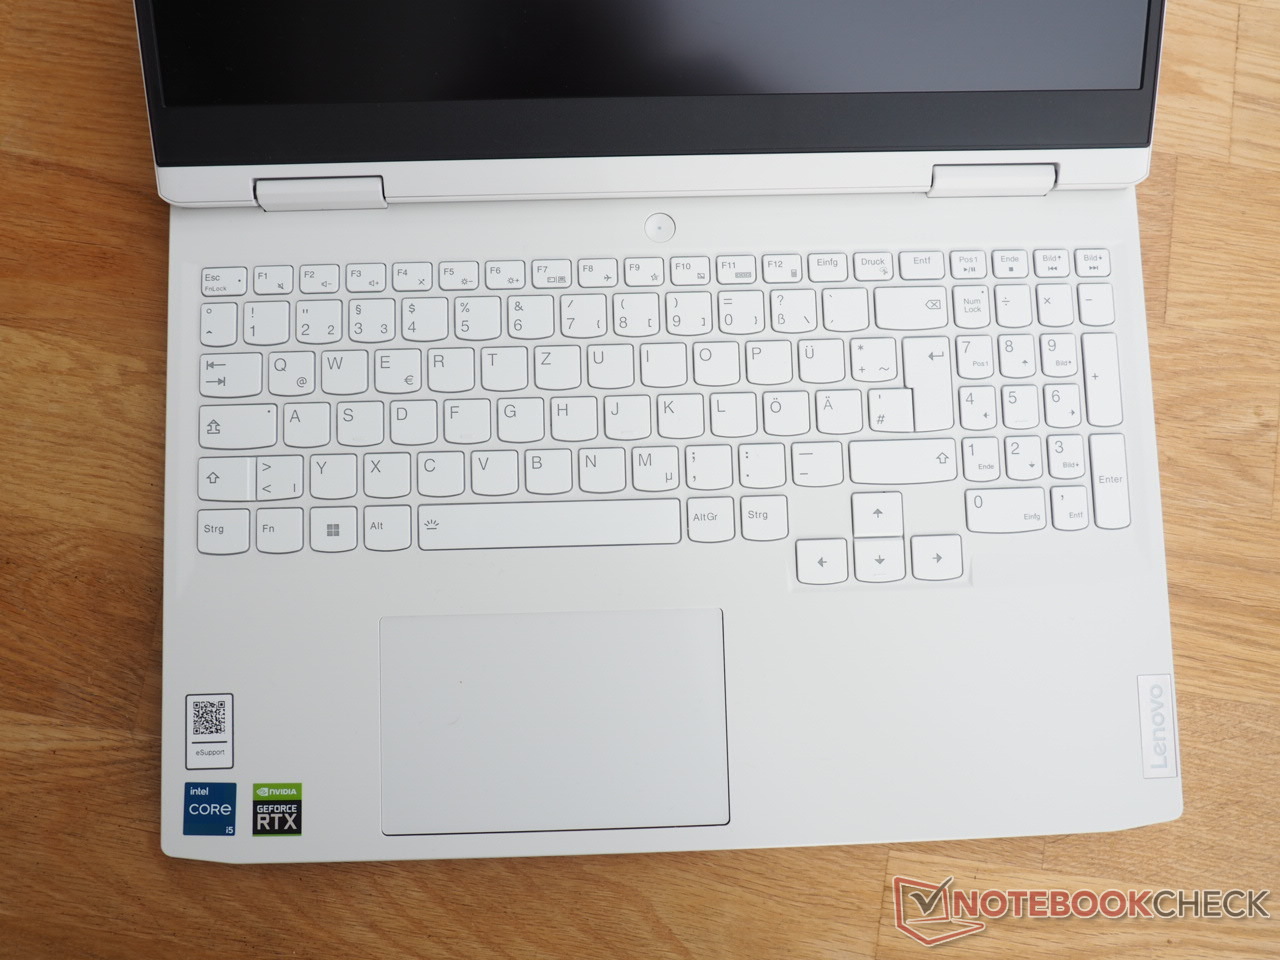
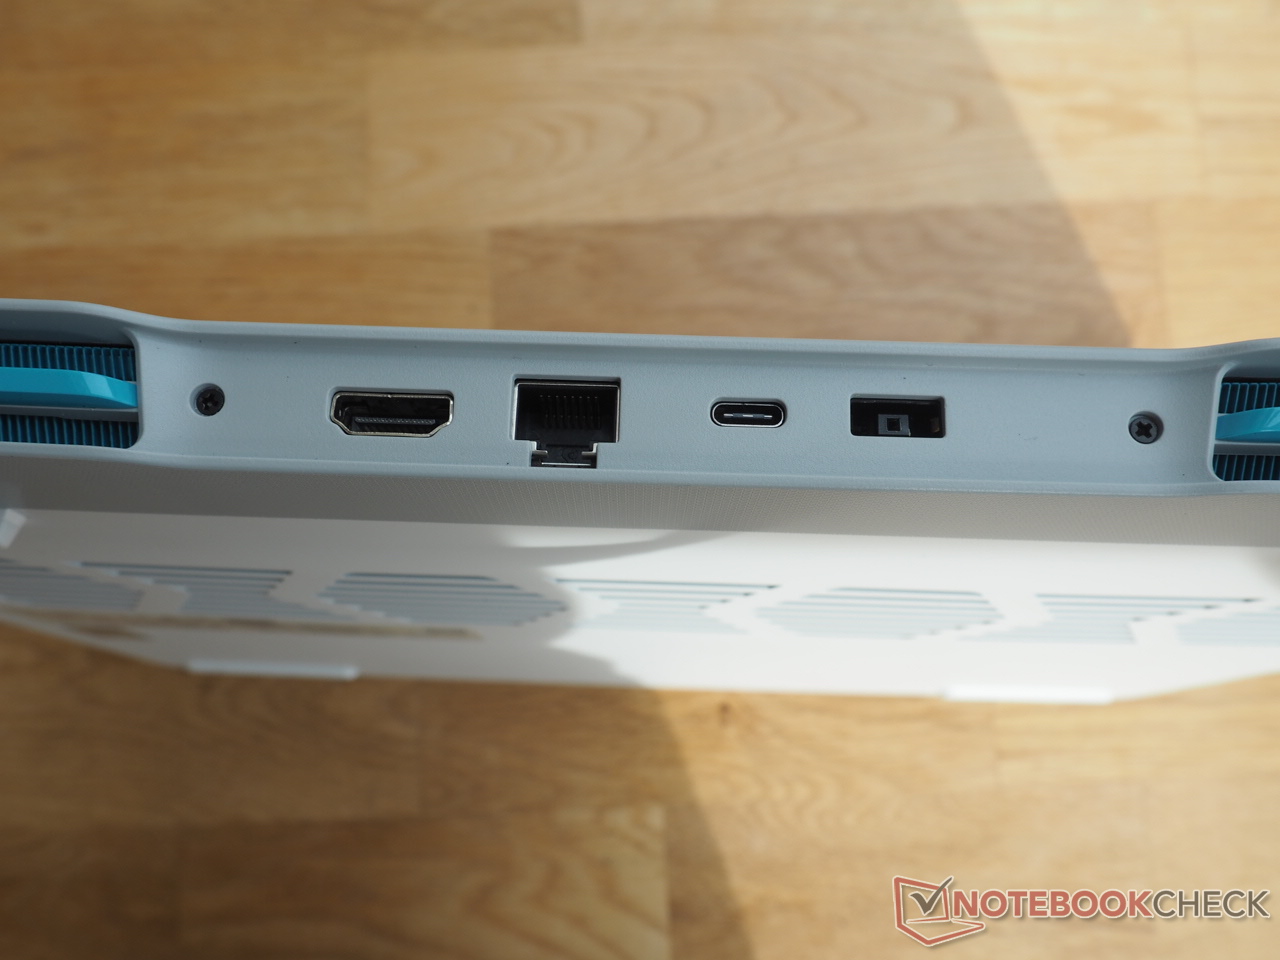
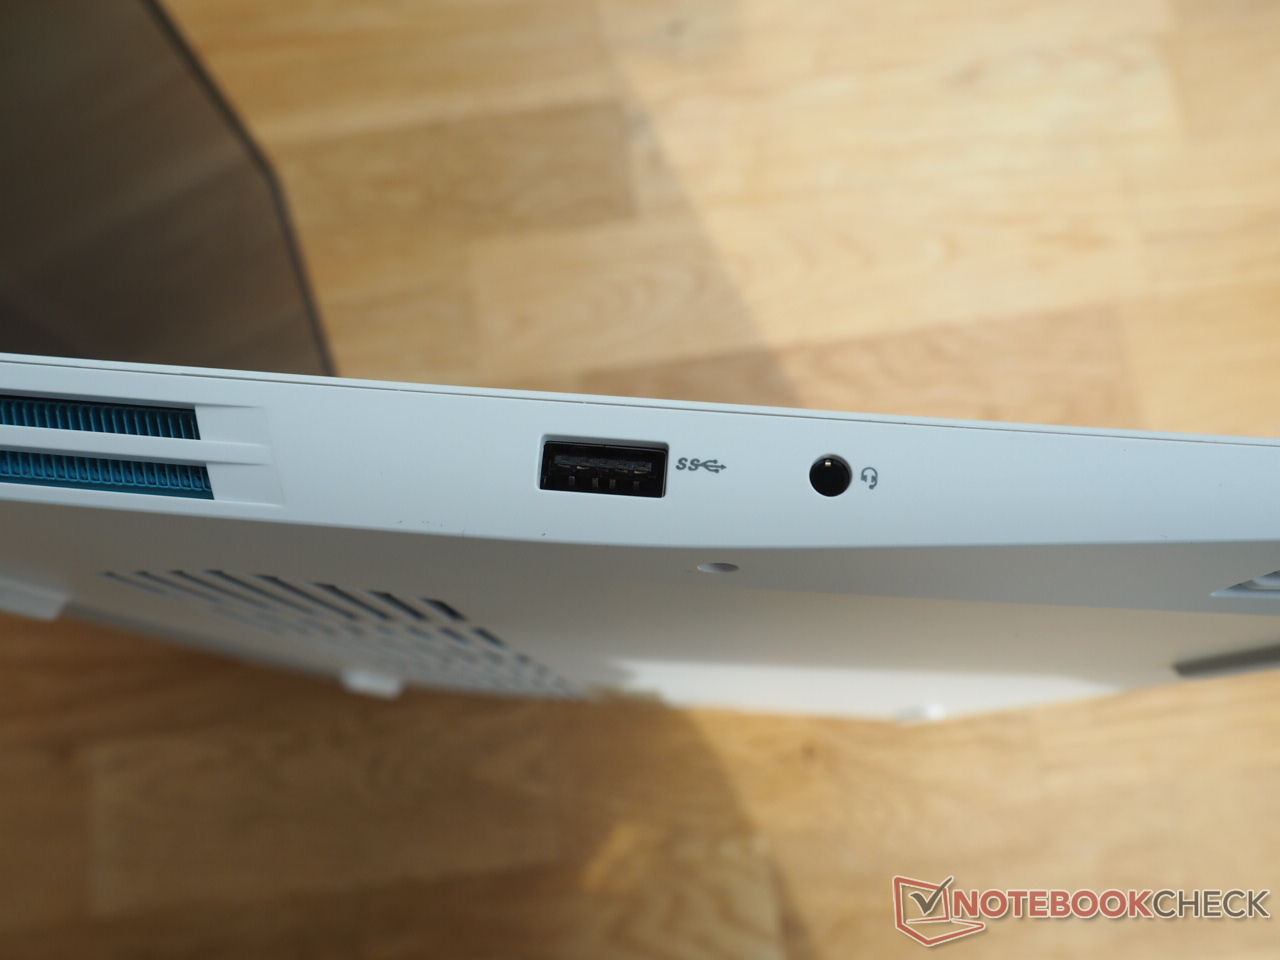
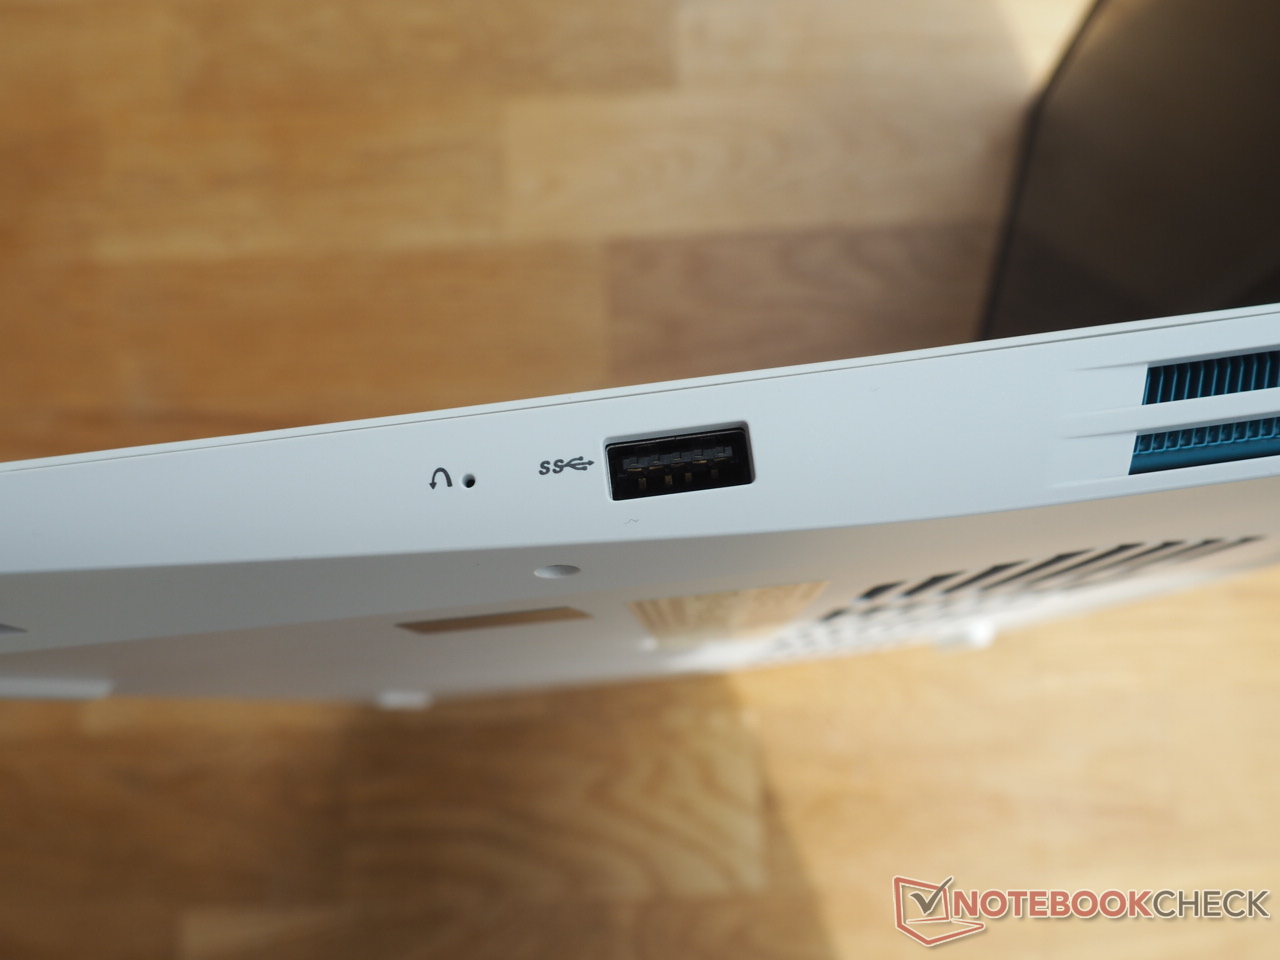
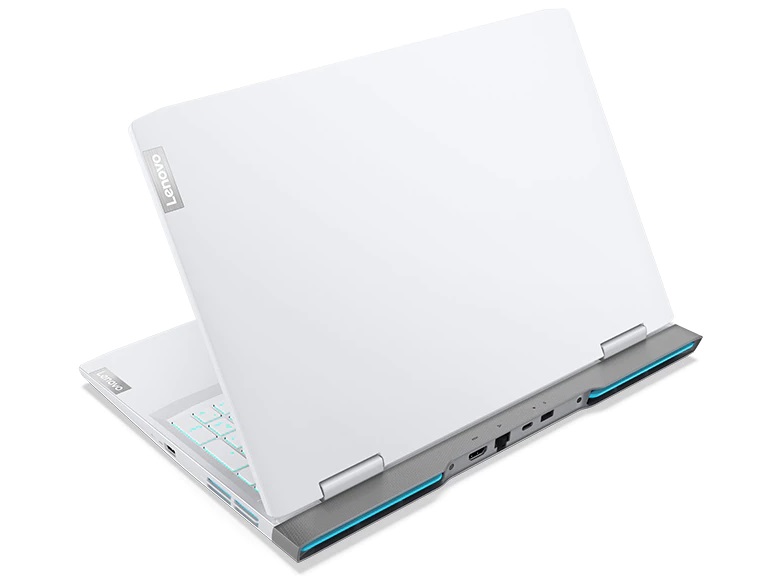
Dado que, aparte del color (blanco glaciar en lugar de gris ónix) y la distribución del teclado (alemán en lugar de estadounidense), la carcasa es idéntica al modelo hermano mencionado anteriormente, no hablaremos más de la carcasa, el equipo y los dispositivos de entrada. Puede encontrar la información correspondiente en el reseña del modelo hermano.
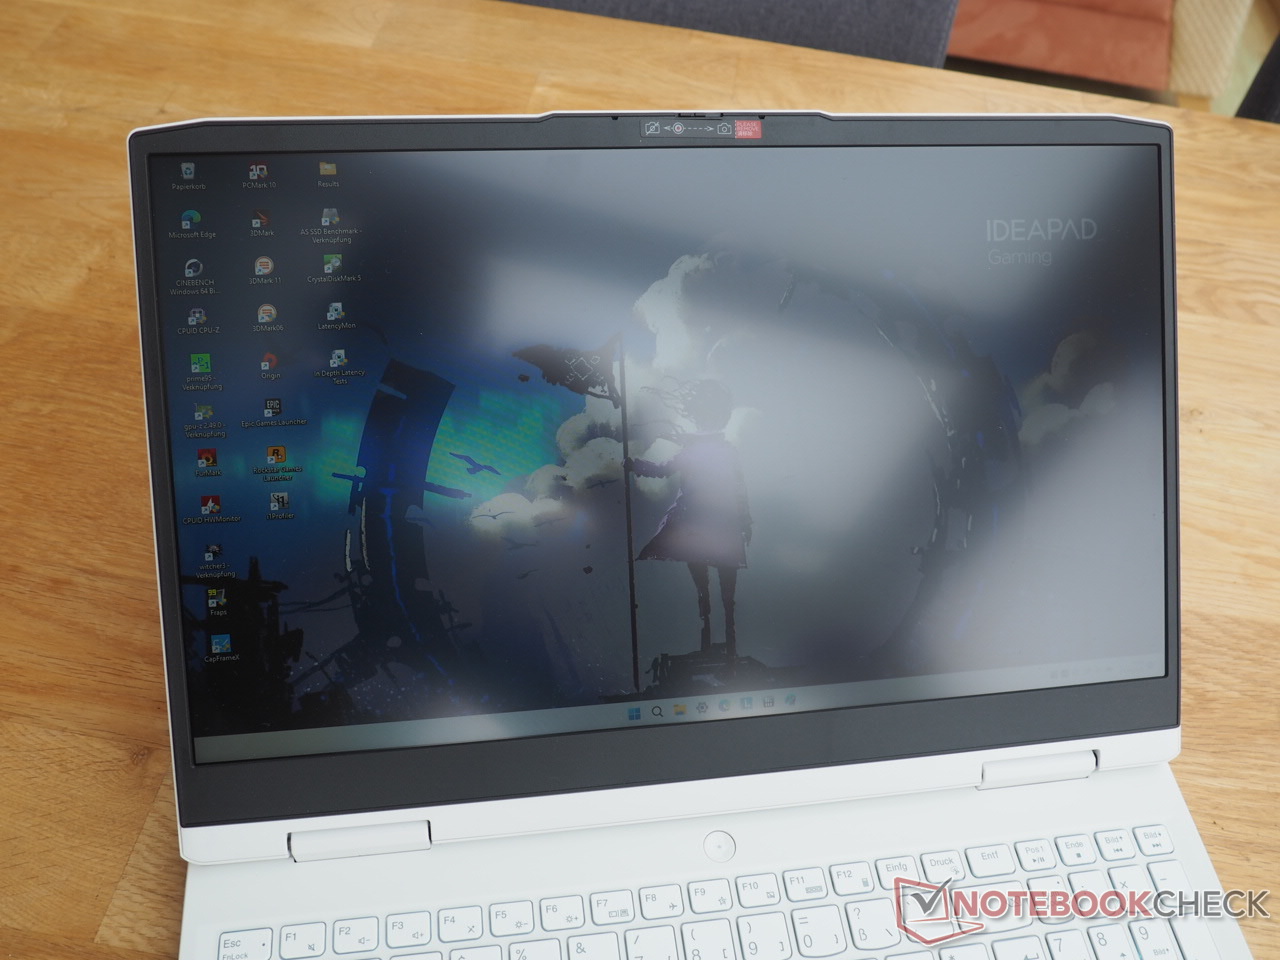
Cámara web


Mostrar
Si se observa el campo de comparación, se puede ver fácilmente que los portátiles para juegos asequibles suelen venir con una pantalla escasa.
| |||||||||||||||||||||||||
iluminación: 92 %
Brillo con batería: 338 cd/m²
Contraste: 1252:1 (Negro: 0.27 cd/m²)
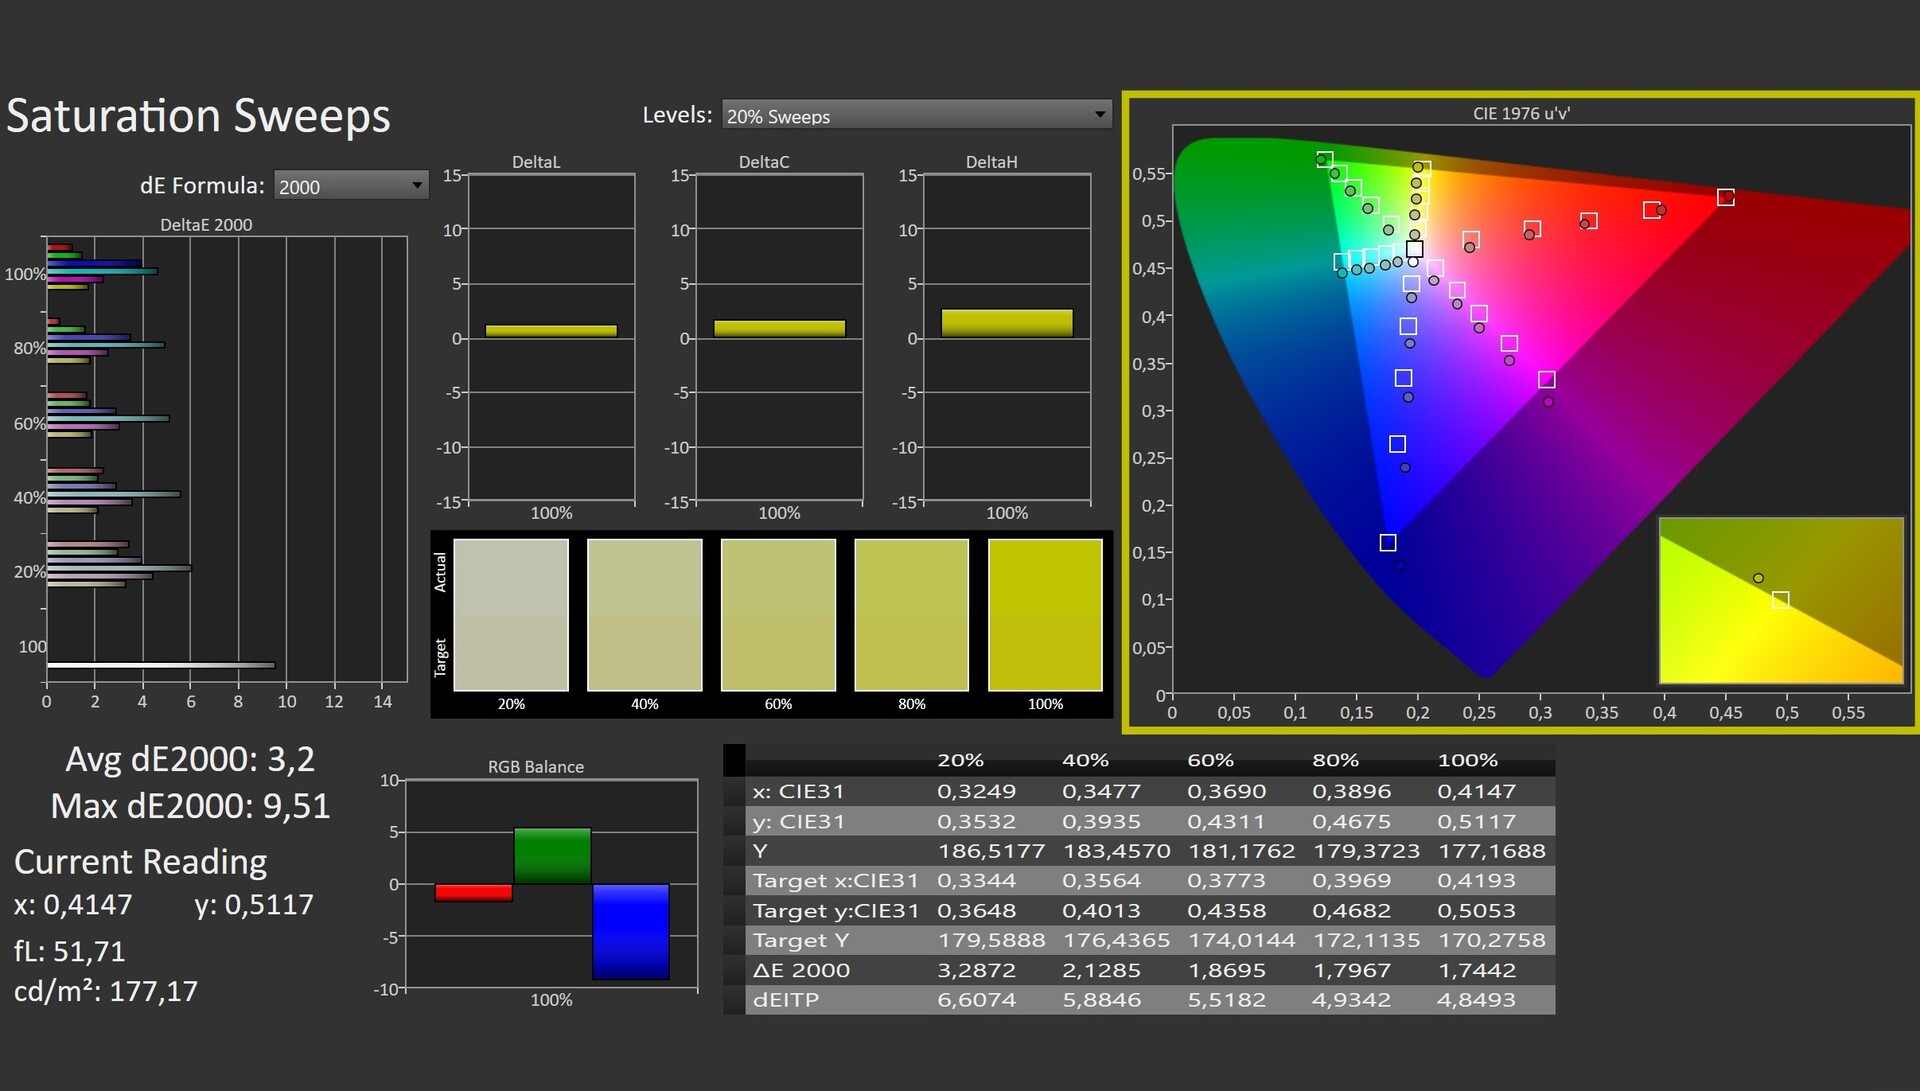
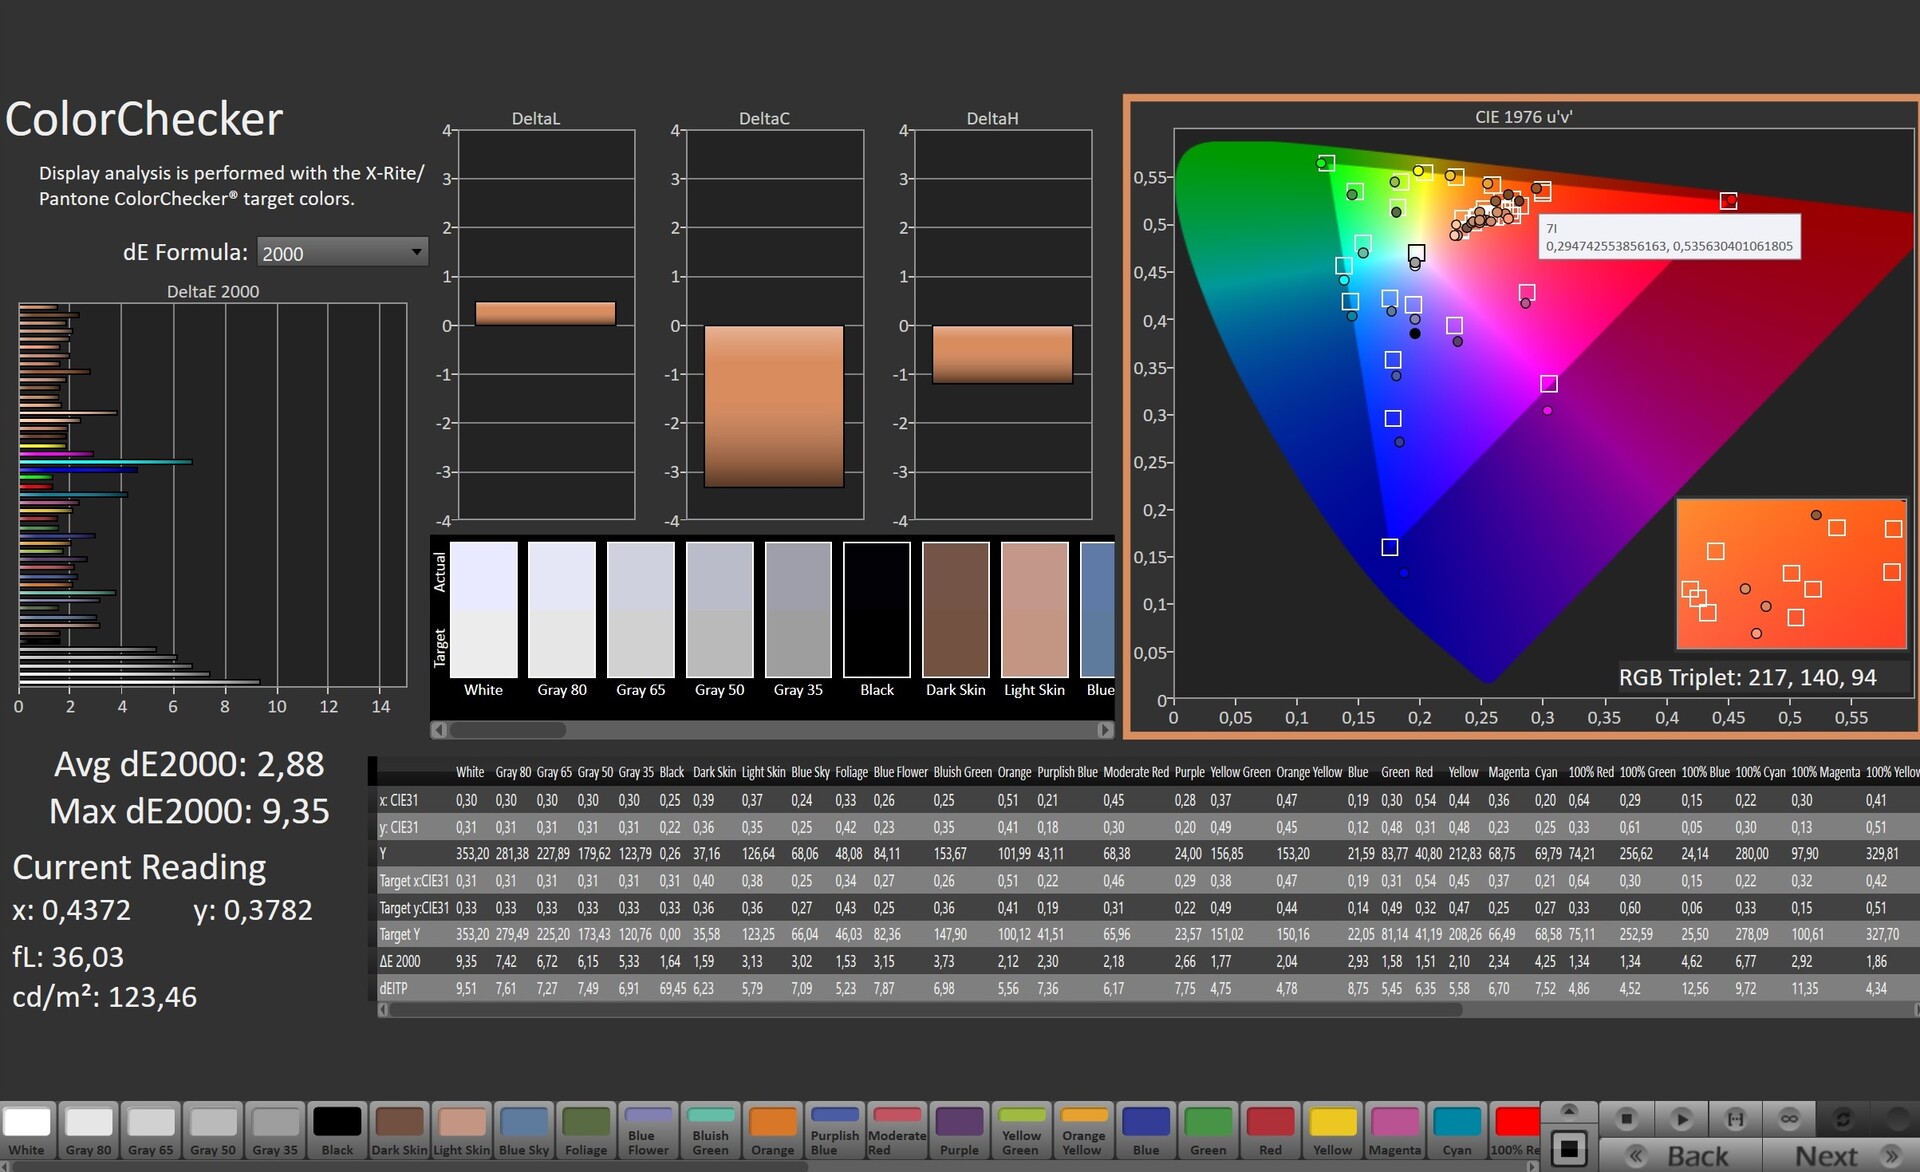
ΔE ColorChecker Calman: 2.88 | ∀{0.5-29.43 Ø4.71}
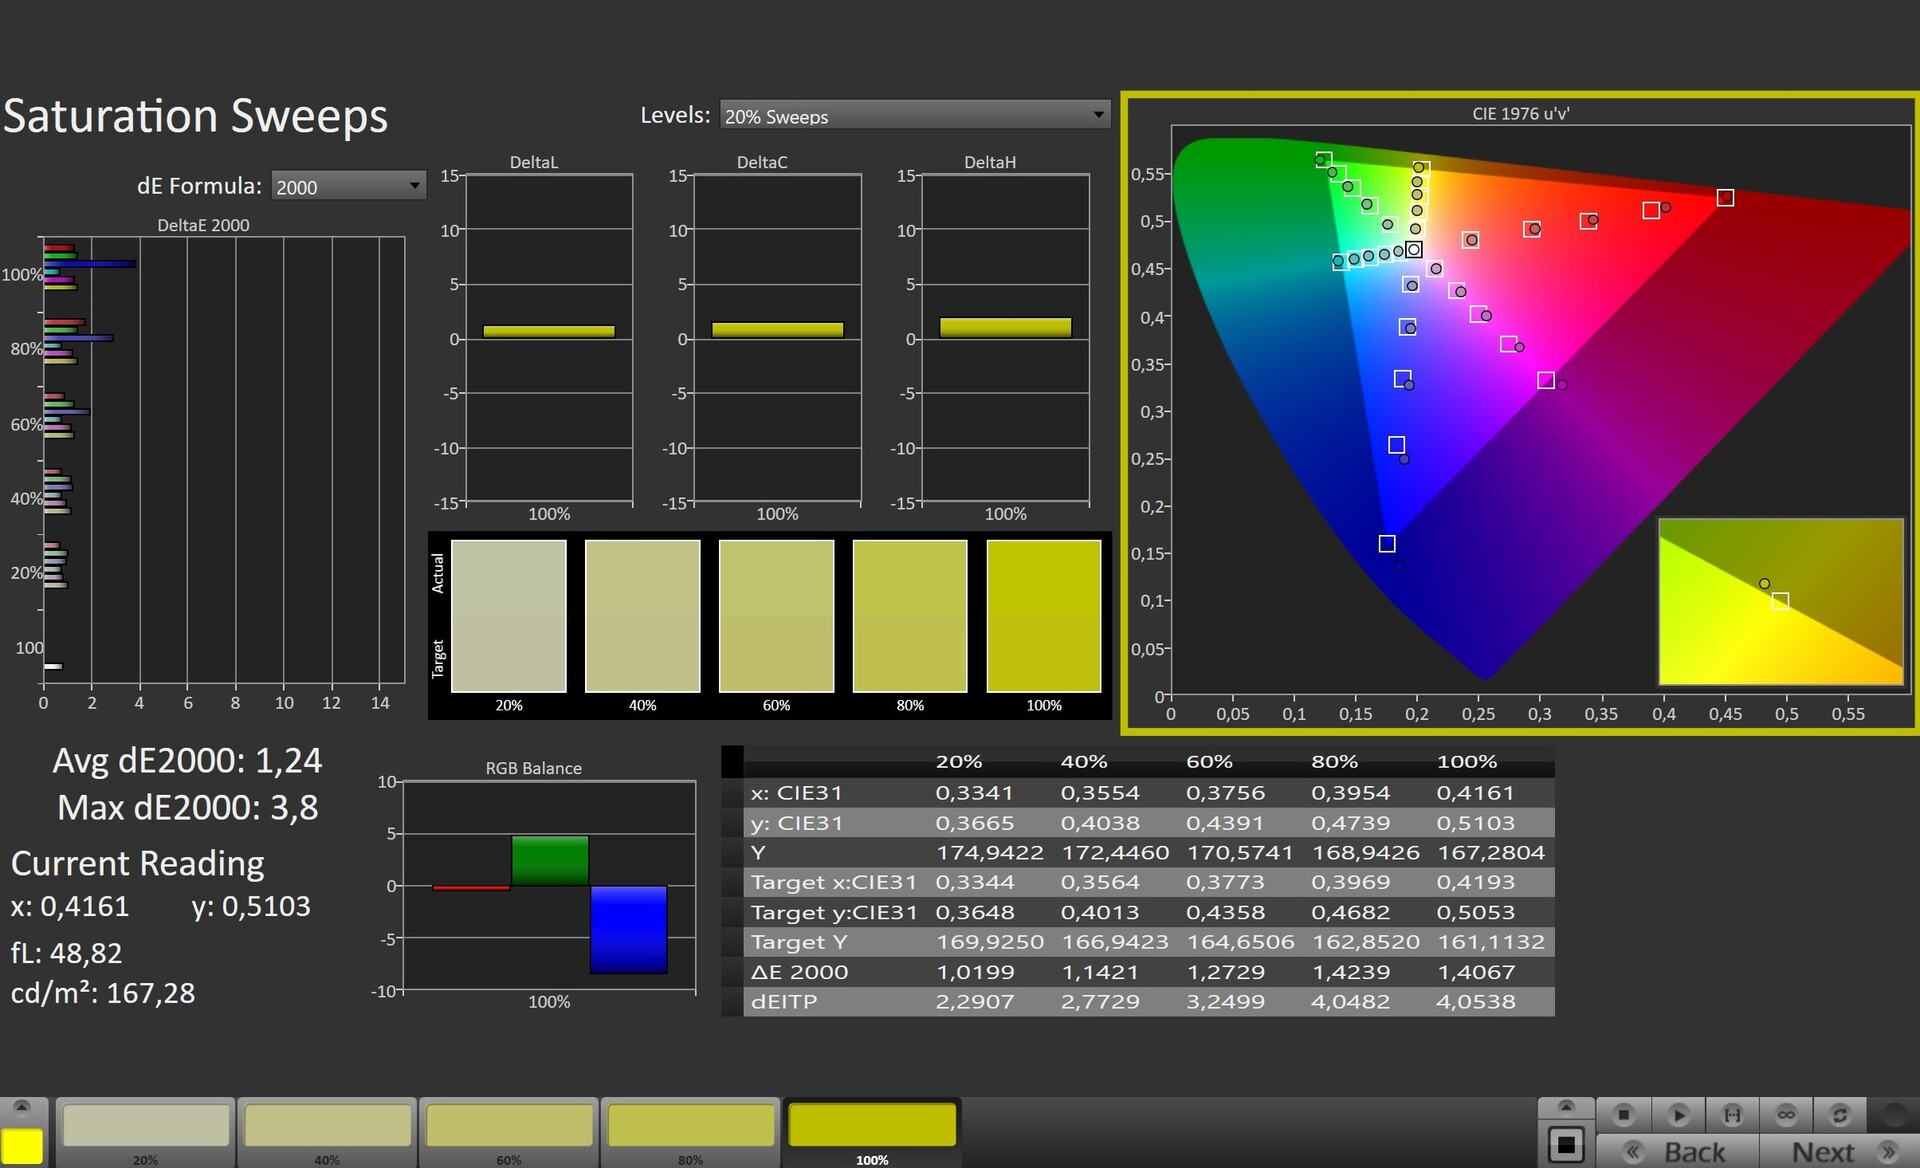
calibrated: 1.22
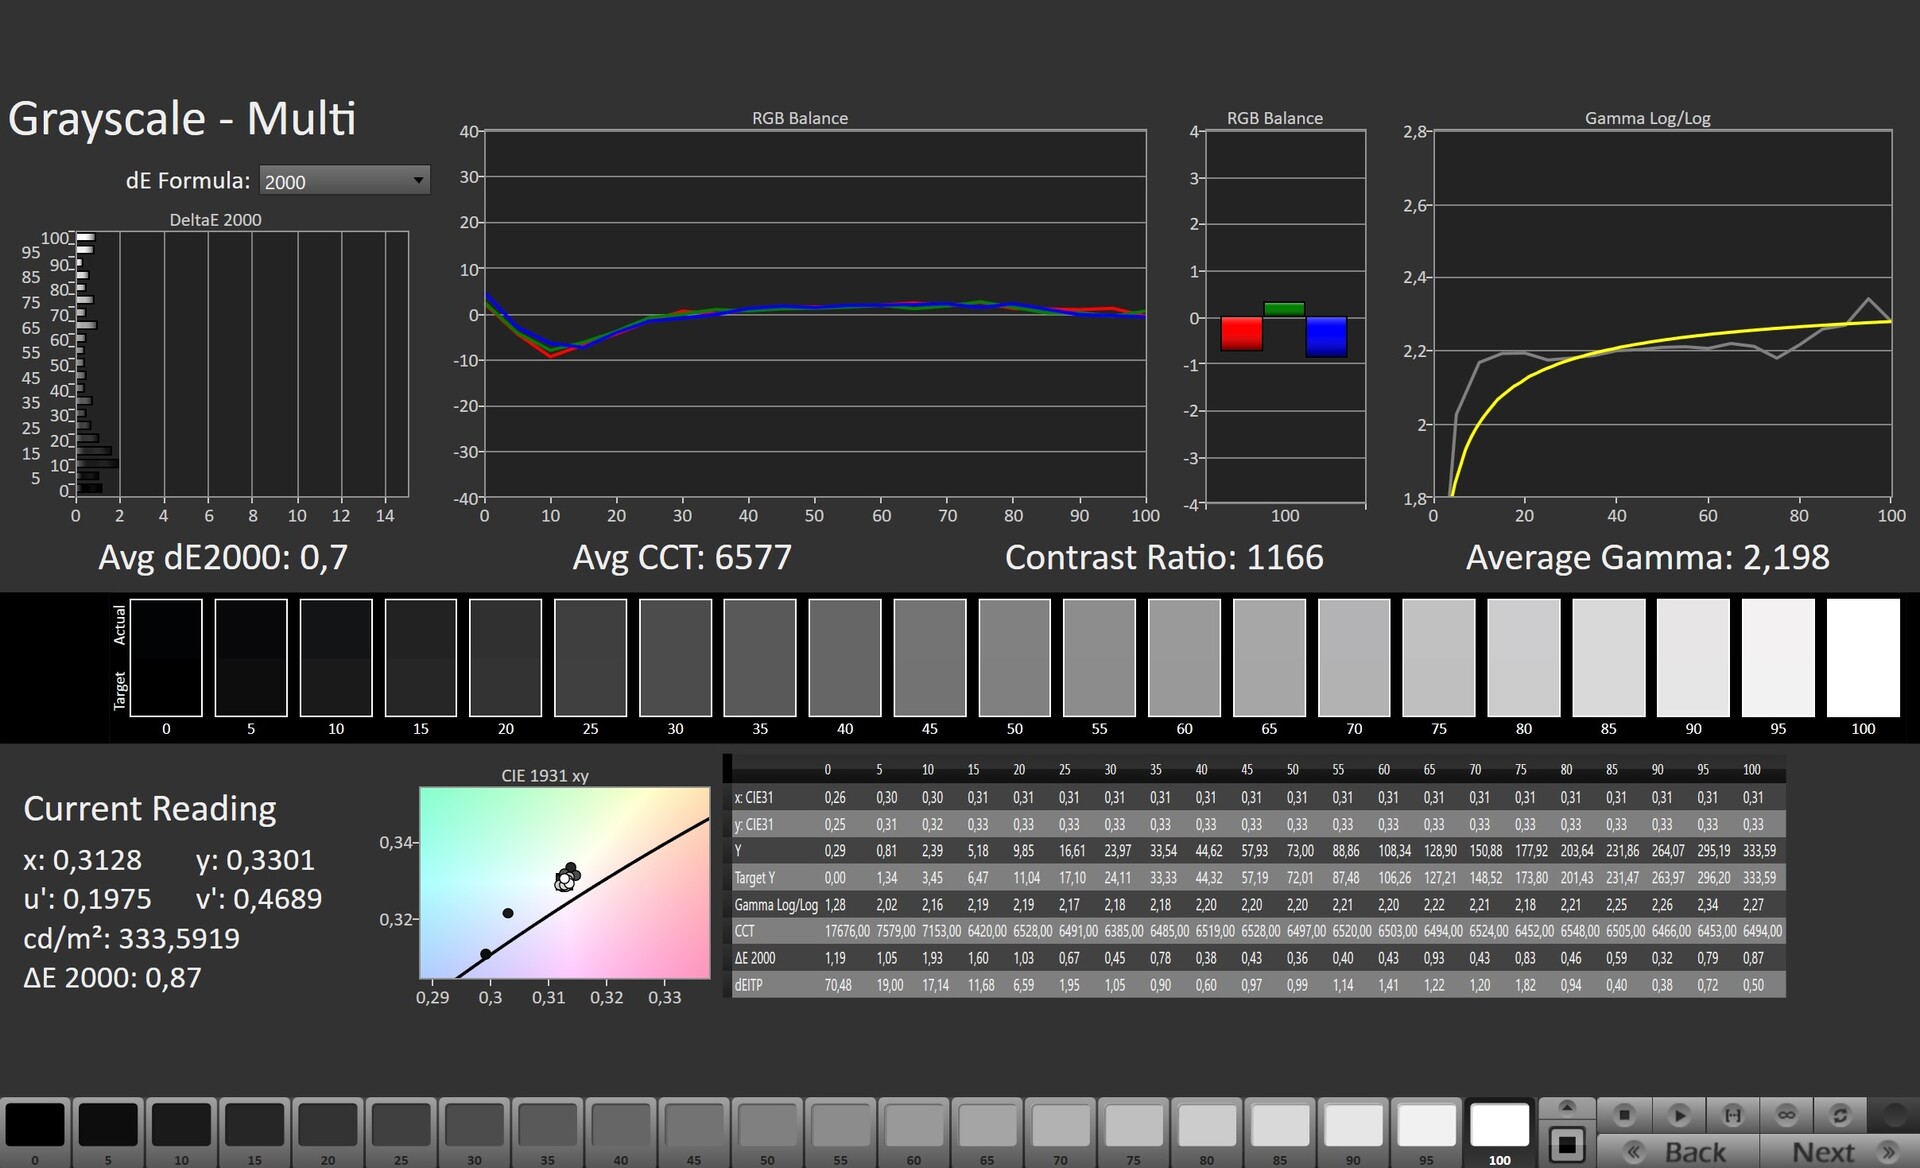
ΔE Greyscale Calman: 5 | ∀{0.09-98 Ø4.96}
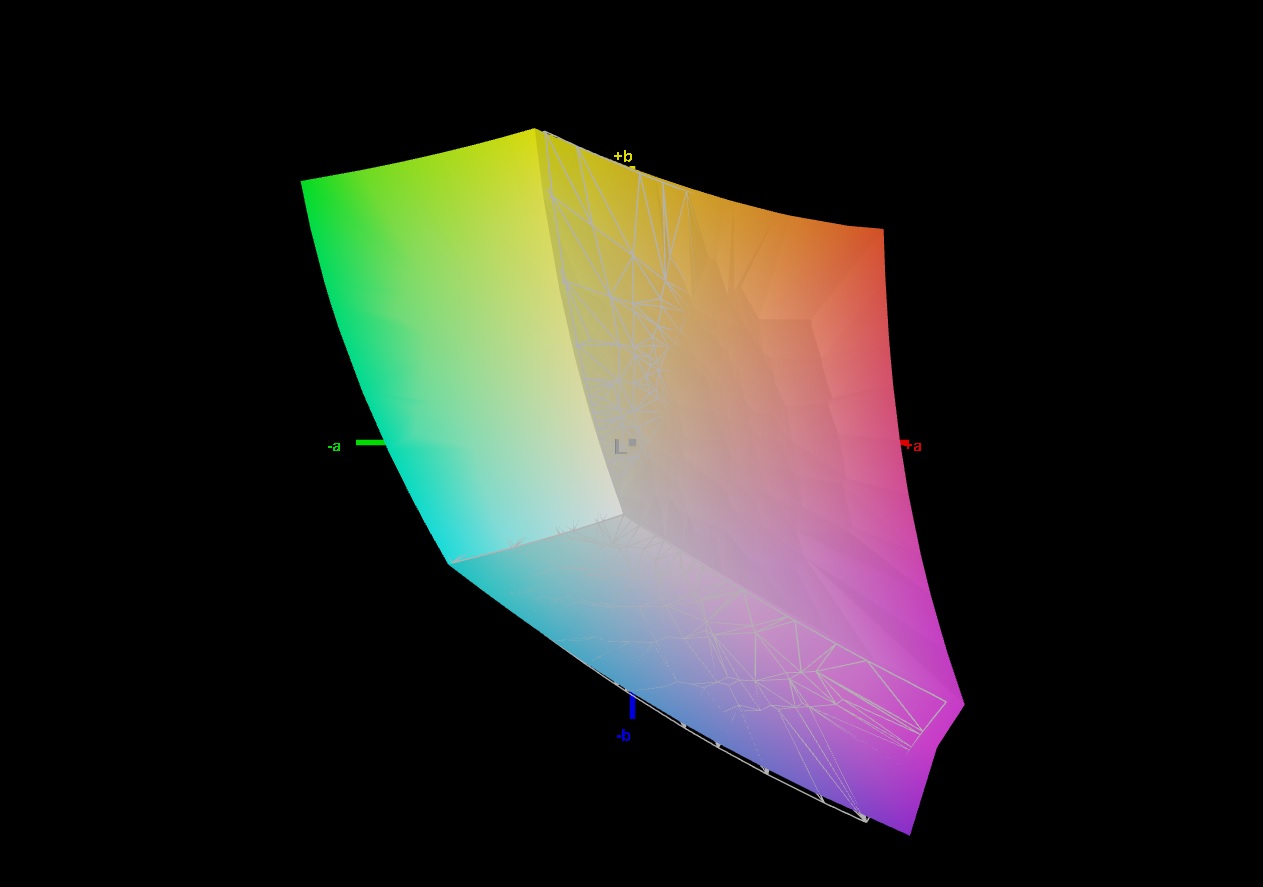
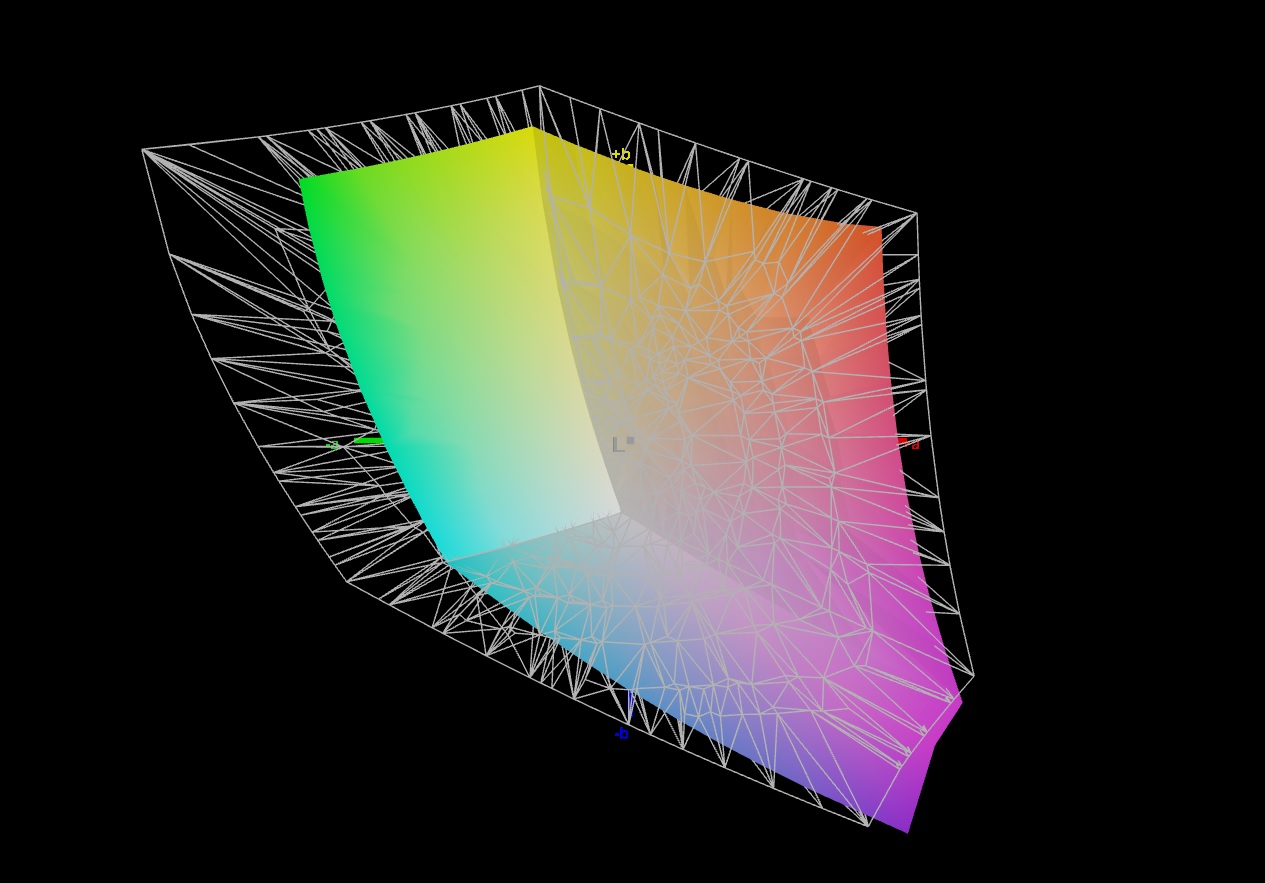
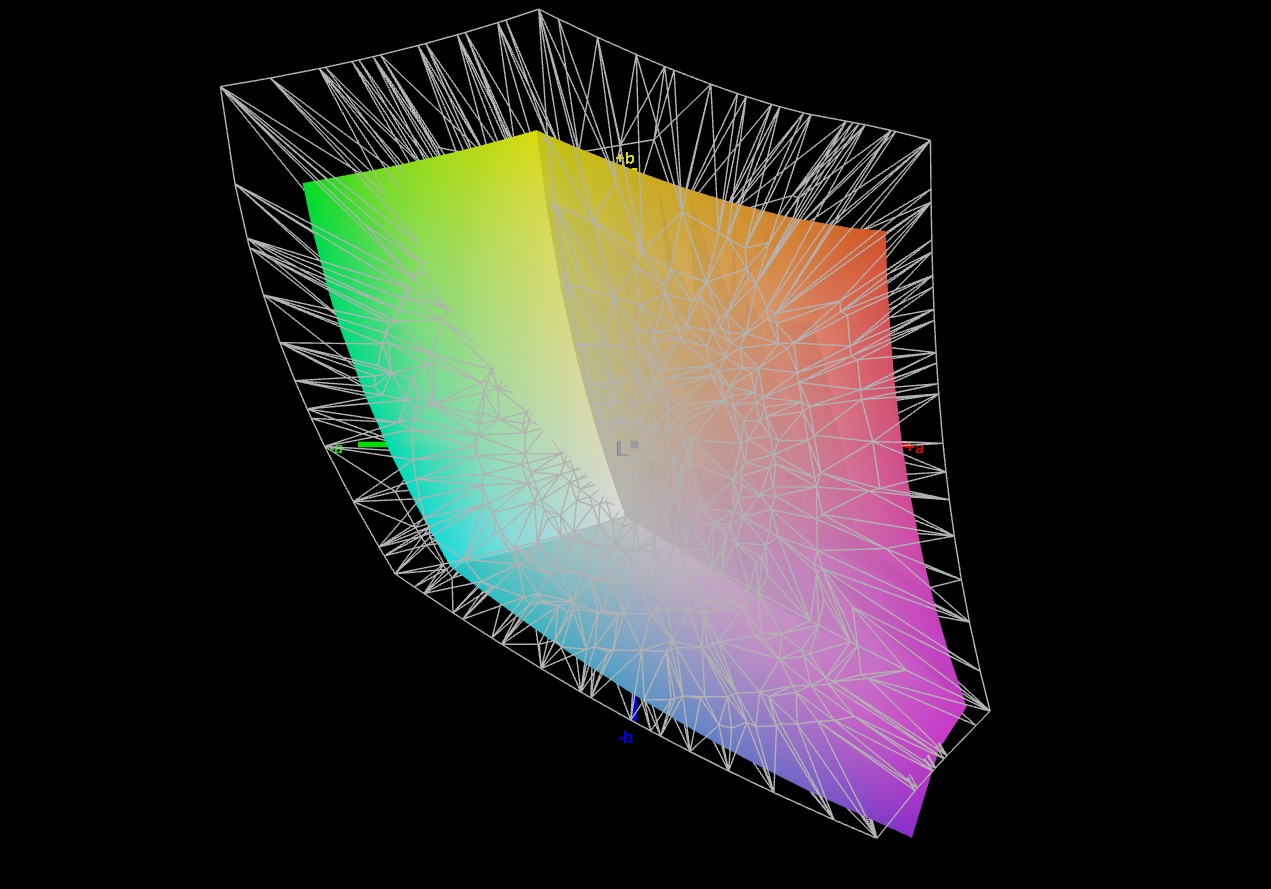
69.9% AdobeRGB 1998 (Argyll 3D)
99.2% sRGB (Argyll 3D)
69.1% Display P3 (Argyll 3D)
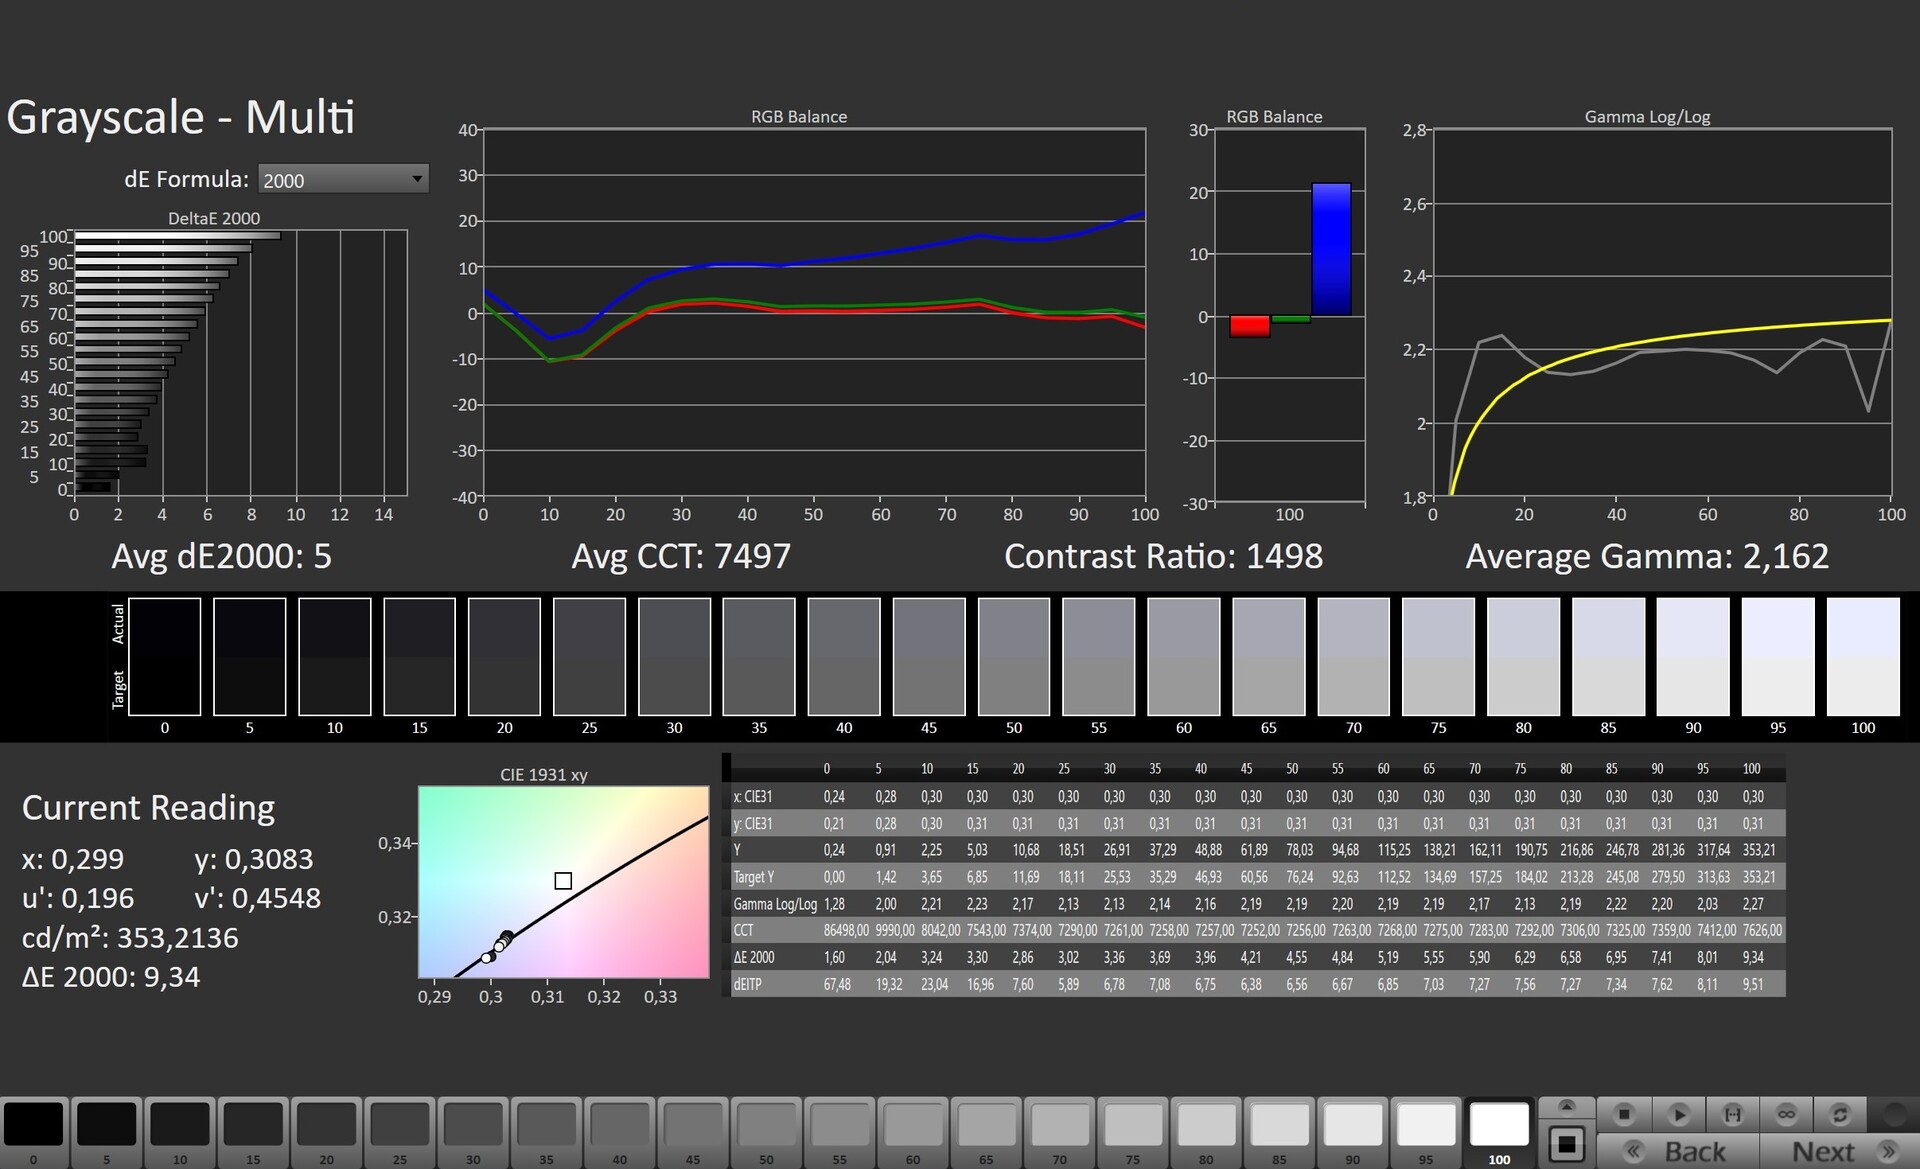
Gamma: 2.162
CCT: 7497 K
| Lenovo IdeaPad Gaming 3 15IAH7 Lenovo LEN156FHD, IPS, 1920x1080, 15.6" | Lenovo IdeaPad Gaming 3 15ARH7 LEN156FHD, IPS, 1920x1080, 15.6" | Dell G15 5515 BOE092A, IPS, 1920x1080, 15.6" | HP Victus 16-e0145ng CMN1609, IPS, 1920x1080, 16.1" | Dell Inspiron 16 Plus 7620 BOE NE16N41, IPS, 3072x1920, 16" | |
|---|---|---|---|---|---|
| Display | -42% | -43% | -39% | 2% | |
| Display P3 Coverage (%) | 69.1 | 39.4 -43% | 39.1 -43% | 41.6 -40% | 70.8 2% |
| sRGB Coverage (%) | 99.2 | 58 -42% | 56.9 -43% | 61.9 -38% | 99.5 0% |
| AdobeRGB 1998 Coverage (%) | 69.9 | 40.7 -42% | 40.4 -42% | 43 -38% | 73.2 5% |
| Response Times | -90% | -97% | -130% | -213% | |
| Response Time Grey 50% / Grey 80% * (ms) | 13 ? | 20.8 ? -60% | 25.2 ? -94% | 29.6 ? -128% | 38 ? -192% |
| Response Time Black / White * (ms) | 8.4 ? | 18.4 ? -119% | 16.8 ? -100% | 19.4 ? -131% | 28 ? -233% |
| PWM Frequency (Hz) | 200 ? | ||||
| Screen | -45% | -64% | -66% | 21% | |
| Brightness middle (cd/m²) | 338 | 287.8 -15% | 278 -18% | 257 -24% | 288.9 -15% |
| Brightness (cd/m²) | 329 | 268 -19% | 262 -20% | 239 -27% | 276 -16% |
| Brightness Distribution (%) | 92 | 86 -7% | 83 -10% | 88 -4% | 92 0% |
| Black Level * (cd/m²) | 0.27 | 0.3 -11% | 0.36 -33% | 0.25 7% | 0.26 4% |
| Contrast (:1) | 1252 | 959 -23% | 772 -38% | 1028 -18% | 1111 -11% |
| Colorchecker dE 2000 * | 2.88 | 6.3 -119% | 5.74 -99% | 6.91 -140% | 1.88 35% |
| Colorchecker dE 2000 max. * | 9.35 | 21.32 -128% | 19.63 -110% | 22.27 -138% | 4.37 53% |
| Colorchecker dE 2000 calibrated * | 1.22 | 2.53 -107% | 4.7 -285% | 3.61 -196% | 0.42 66% |
| Greyscale dE 2000 * | 5 | 4 20% | 3.1 38% | 7.5 -50% | 1.4 72% |
| Gamma | 2.162 102% | 2.21 100% | 2.011 109% | 2.125 104% | 2.3 96% |
| CCT | 7497 87% | 6762 96% | 6207 105% | 6025 108% | 6634 98% |
| Media total (Programa/Opciones) | -59% /
-51% | -68% /
-64% | -78% /
-69% | -63% /
-16% |
* ... más pequeño es mejor
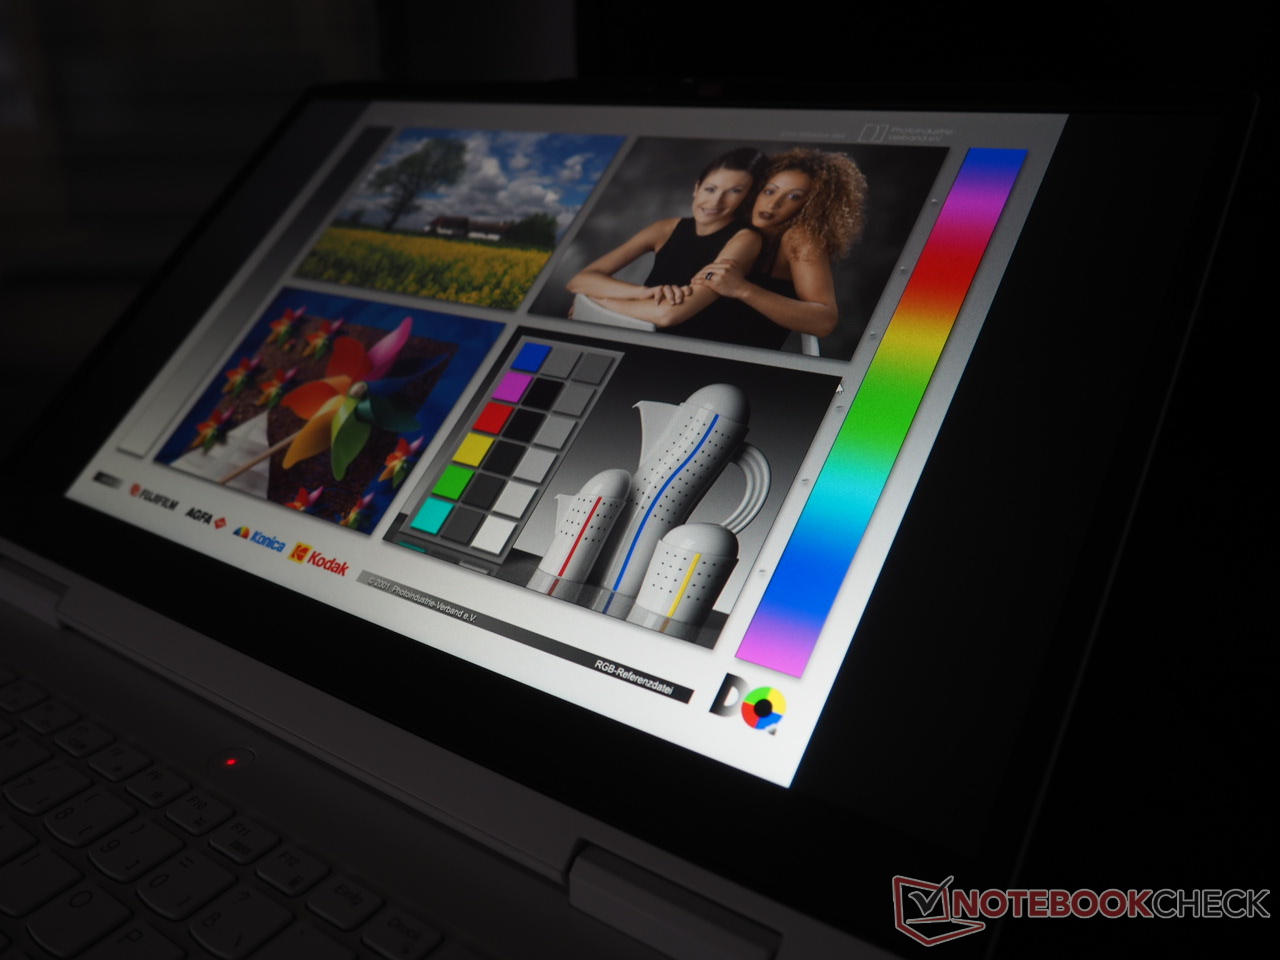
Los espacios de color pequeños y el bajo brillo son habituales en el segmento de los 1.000 euros. Pero este no es el caso del IdeaPad Gaming 15 15IAH7: Cerca del 100% de cobertura sRGB y un brillo medio de 329 cd/m² hacen justicia al precio del portátil.
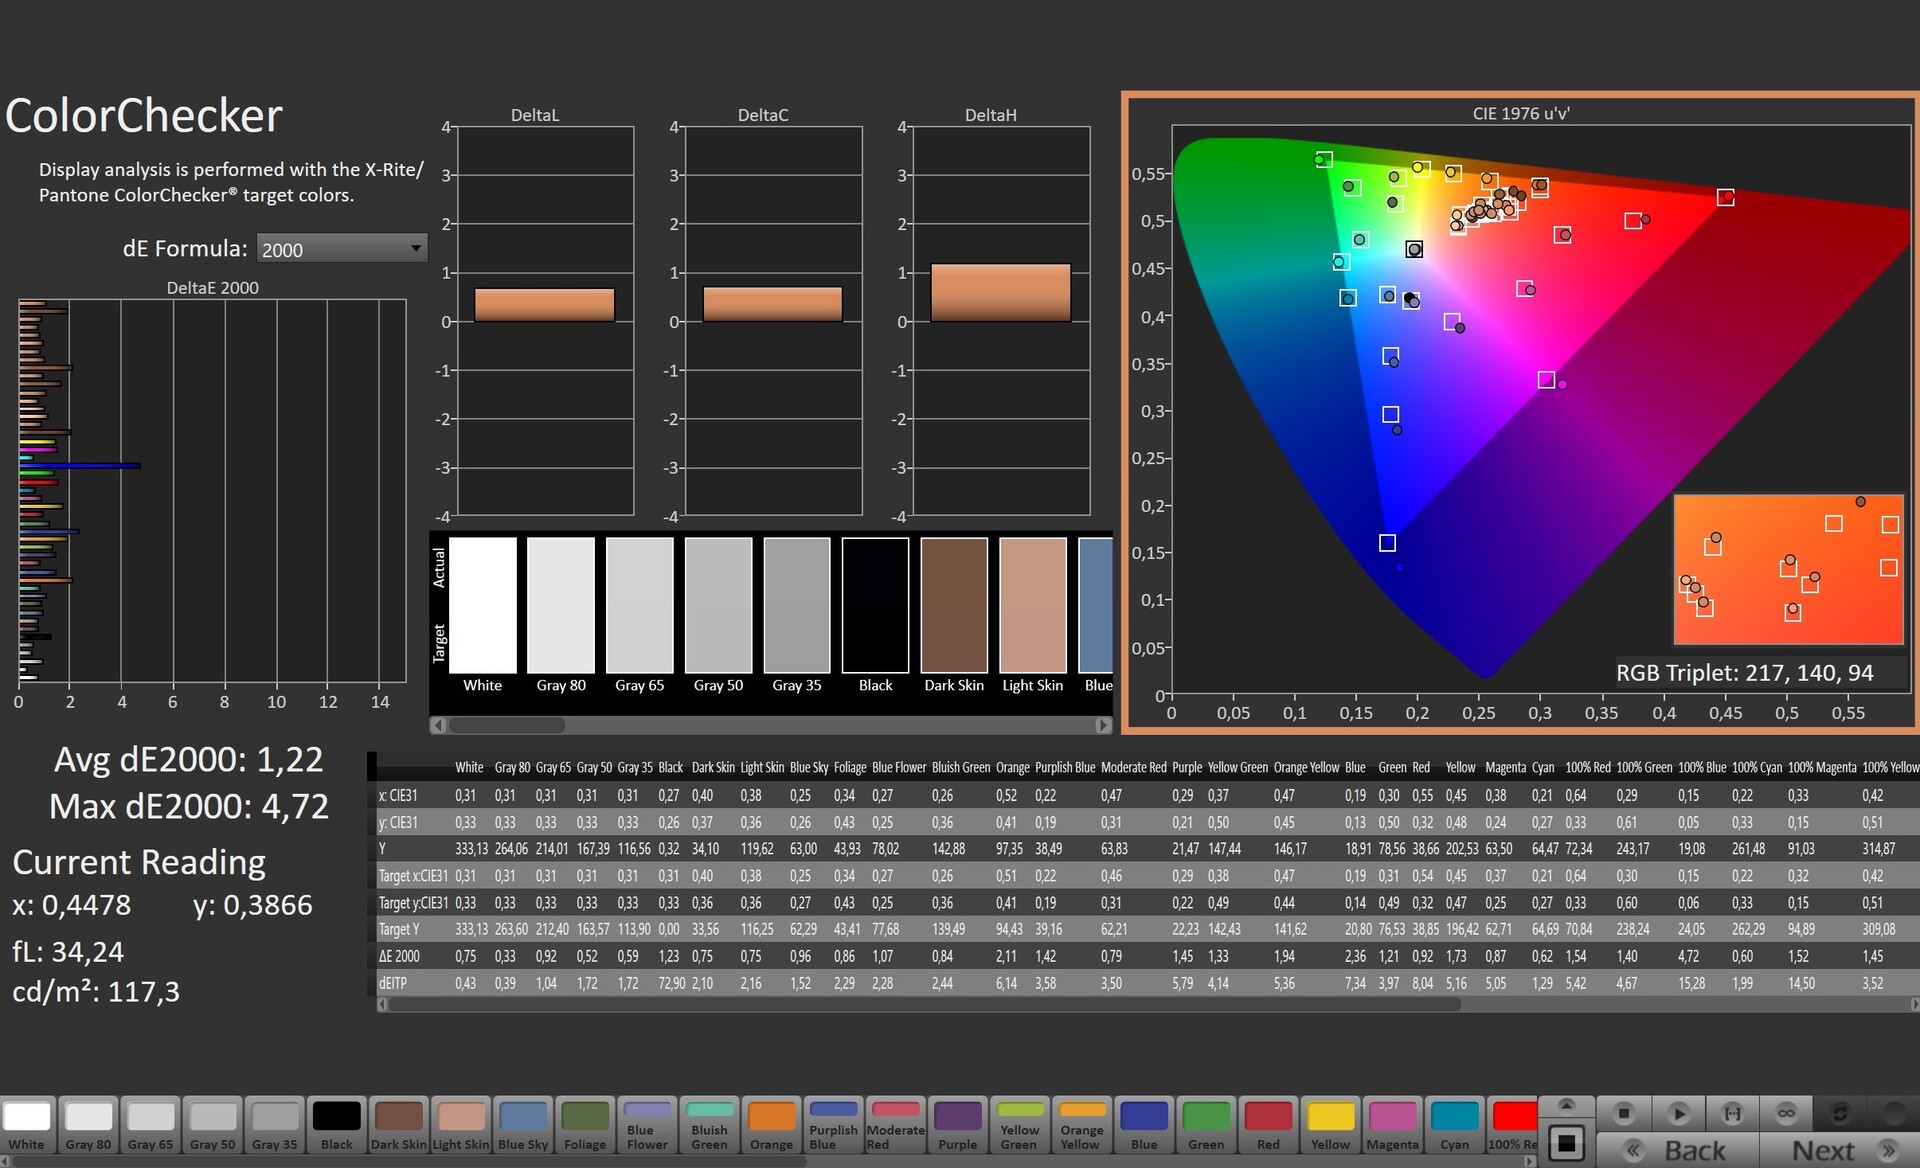
El portátil de 15 pulgadas también da una buena imagen en el resto de disciplinas. Un tiempo de respuesta de 8 a 13 ms es definitivamente un buen valor. Lo mismo ocurre con el contraste de 1252:1, que también está por encima de la media.
Lo único de lo que podría quejarse es de la precisión del color. En el estado de entrega, el panel de 165-Hz tiene un claro tinte azul. Sin embargo, esto puede corregirse con una calibración (nuestro archivo ICC está enlazado para su descarga gratuita arriba a la derecha, junto al gráfico de distribución del brillo). Nuestra unidad de prueba no muestra ningún sangrado de pantalla ni parpadeo PWM.
Tiempos de respuesta del display
| ↔ Tiempo de respuesta de Negro a Blanco | ||
|---|---|---|
| 8.4 ms ... subida ↗ y bajada ↘ combinada | ↗ 4.2 ms subida | 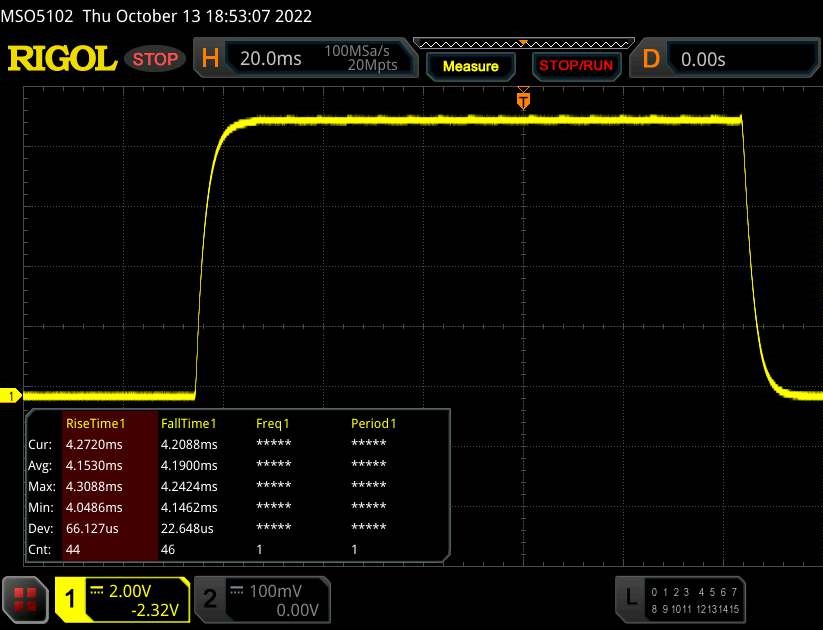 |
| ↘ 4.2 ms bajada | ||
| La pantalla mostró tiempos de respuesta rápidos en nuestros tests y debería ser adecuada para juegos. En comparación, todos los dispositivos de prueba van de ##min### (mínimo) a 240 (máximo) ms. » 24 % de todos los dispositivos son mejores. Esto quiere decir que el tiempo de respuesta medido es mejor que la media (19.8 ms) de todos los dispositivos testados. | ||
| ↔ Tiempo de respuesta 50% Gris a 80% Gris | ||
| 13 ms ... subida ↗ y bajada ↘ combinada | ↗ 6.3 ms subida | 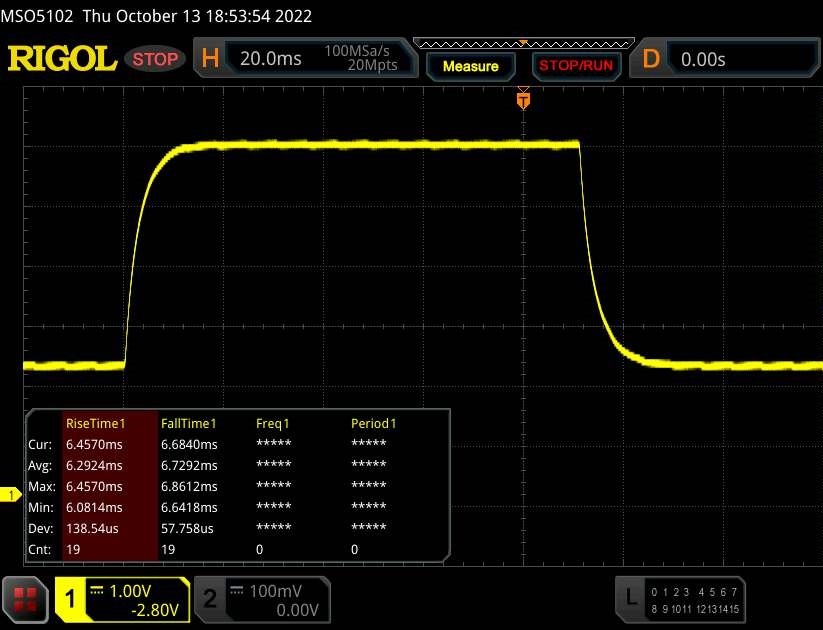 |
| ↘ 6.7 ms bajada | ||
| La pantalla mostró buenos tiempos de respuesta en nuestros tests pero podría ser demasiado lenta para los jugones competitivos. En comparación, todos los dispositivos de prueba van de ##min### (mínimo) a 636 (máximo) ms. » 27 % de todos los dispositivos son mejores. Esto quiere decir que el tiempo de respuesta medido es mejor que la media (31 ms) de todos los dispositivos testados. | ||
Parpadeo de Pantalla / PWM (Pulse-Width Modulation)
| Parpadeo de Pantalla / PWM no detectado |  | ||
Comparación: 52 % de todos los dispositivos testados no usaron PWM para atenuar el display. Si se usó, medimos una media de 7754 (mínimo: 5 - máxmo: 343500) Hz. | |||
Rendimiento
El rendimiento del IdeaPad Gaming 3 15IAH7 lo sitúa en la gama media. El procesador con muchos núcleos y 16 GB de memoria de trabajo deberían ofrecer suficientes reservas para los años futuros, aunque por razones de rendimiento, Lenovo debería haber usado RAM de doble canal en vez de un único módulo RAM. Aunque el SSD M.2 integrado sólo viene en el formato 2242, la carcasa sigue ofreciendo espacio para un SSD clásico 2280. La tarjeta gráfica deja impresiones encontradas. Por un lado, la RTX 3050 Ti ofrece una sólida relación precio-rendimiento, pero por otro lado, 4 GB de VRAM no es muy a prueba de futuro.
Condiciones de la prueba
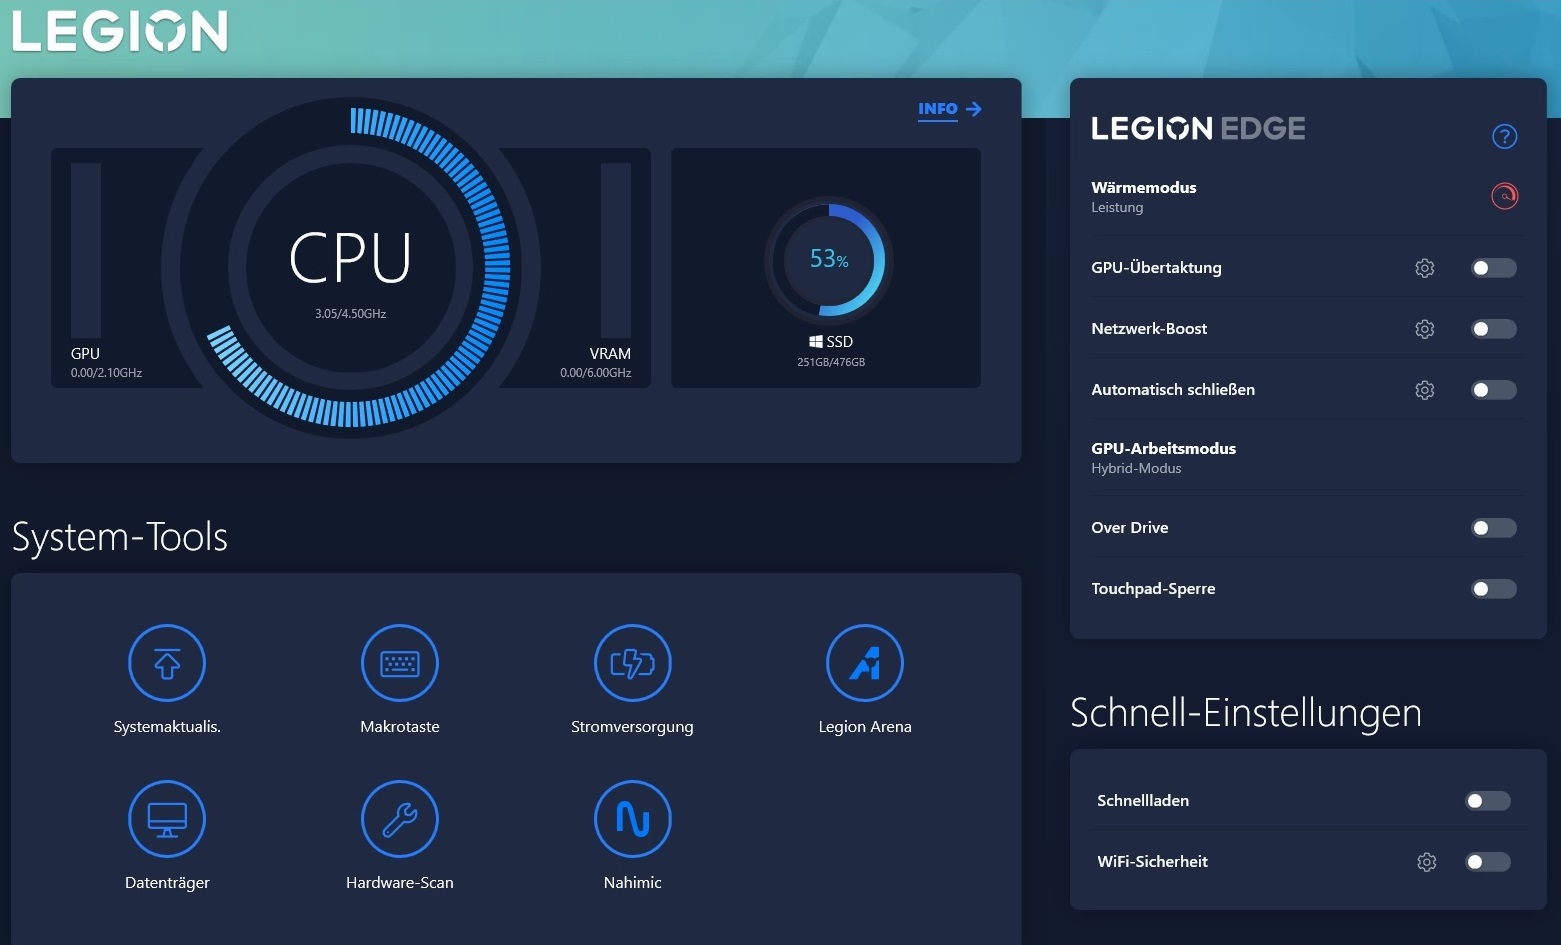
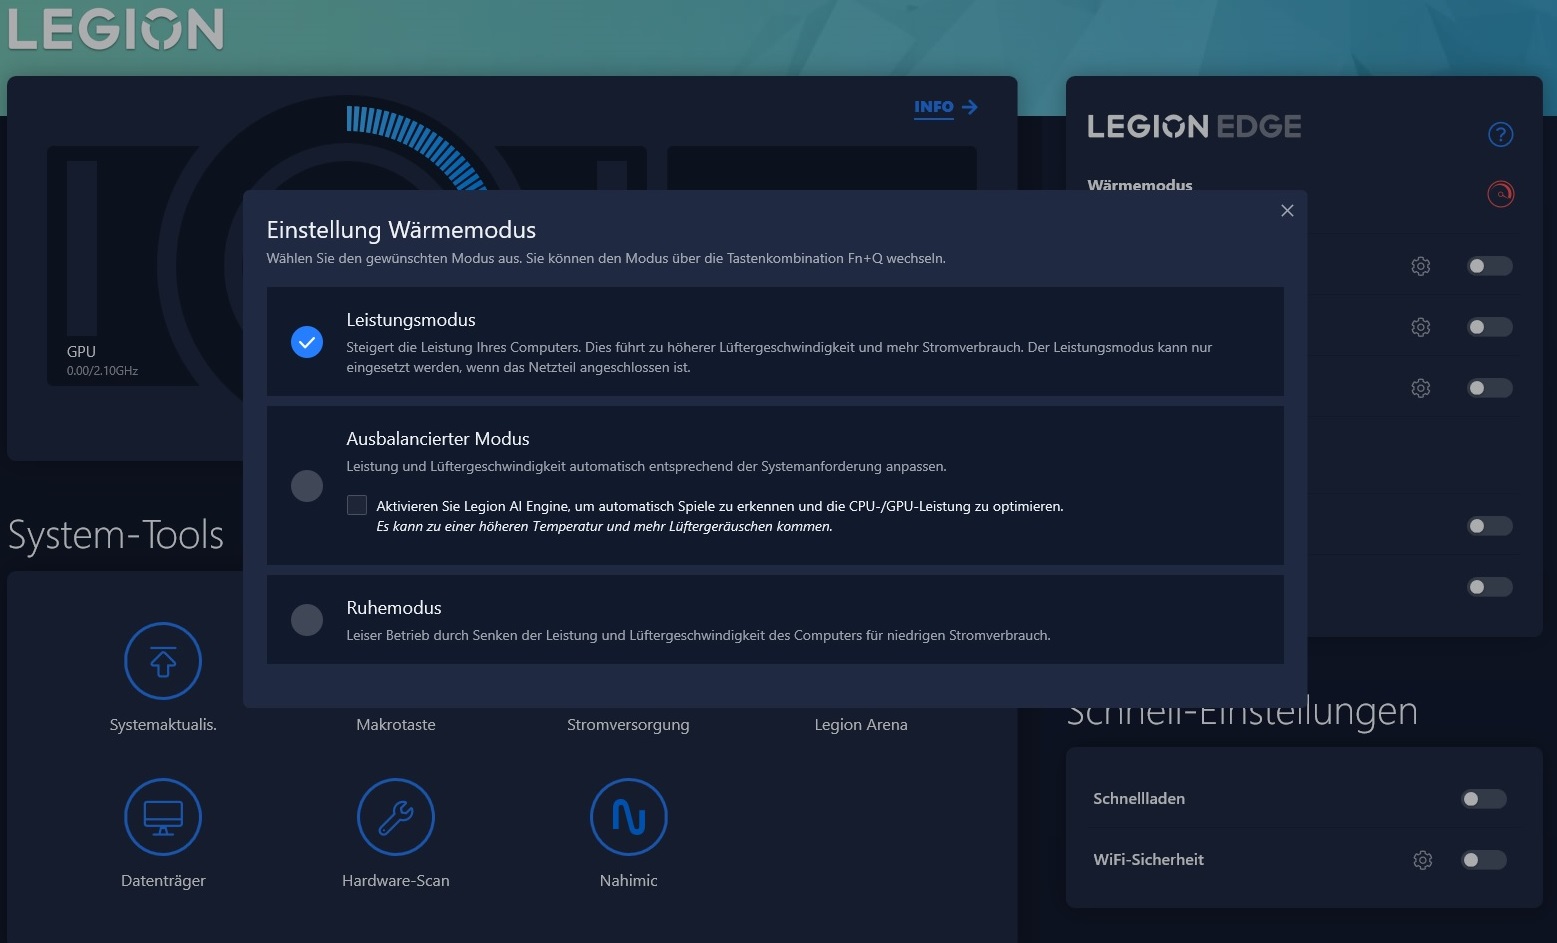
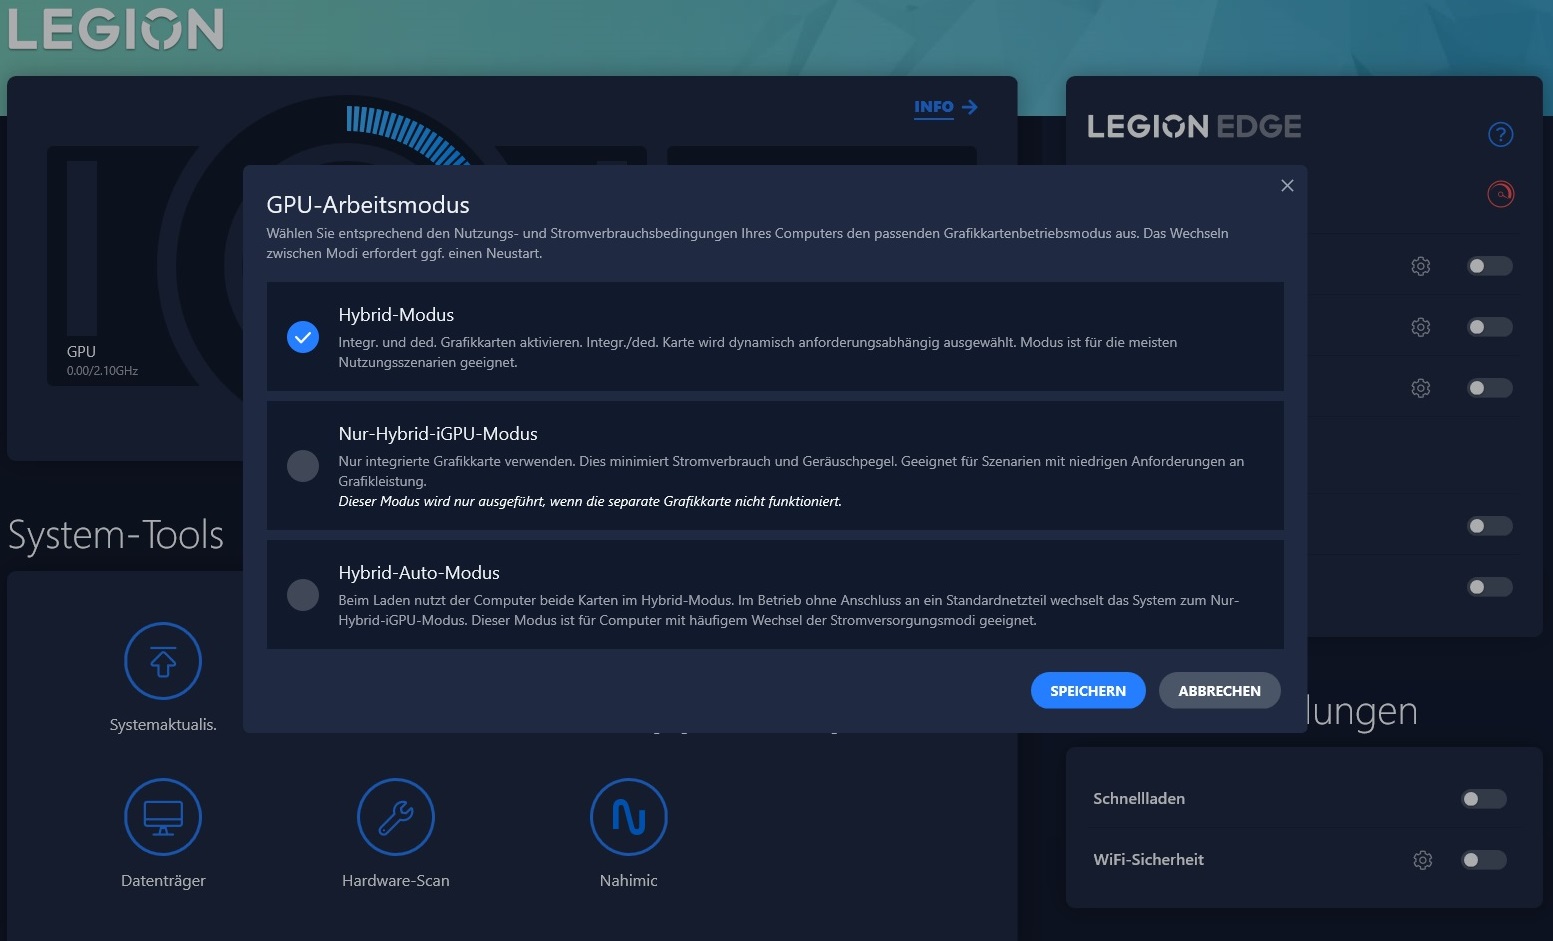
El software preinstalado Lenovo Vantage ofrece docenas de opciones de configuración, de las cuales el modo de energía y el modo de funcionamiento de la GPU son particularmente relevantes. A menos que indiquemos lo contrario, todas nuestras mediciones se realizan con el modo de Rendimiento y la conmutación gráfica híbrida normal activada. Sin embargo, teniendo en cuenta la escasa disminución de rendimiento (ver gráfico), recomendaríamos más bien usar el modo equilibrado (perfil ajustado) en la práctica. En el modo Silencioso, el funcionamiento del dispositivo vuelve a ser significativamente más silencioso. A pesar de una caída de alrededor del 30% en las tasas de fotogramas, muchos juegos siguen siendo jugables.
| El Witcher 3 (FHD/Ultra) | Nivel de ruido | Rendimiento |
| Modode rendimiento | 46 dB(A) | base (~60 FPS) |
| Modoajustado | 43 dB(A) | -7% (~56 FPS) |
| Modosilencioso | 34 dB(A) | -30% (~42 FPS) |
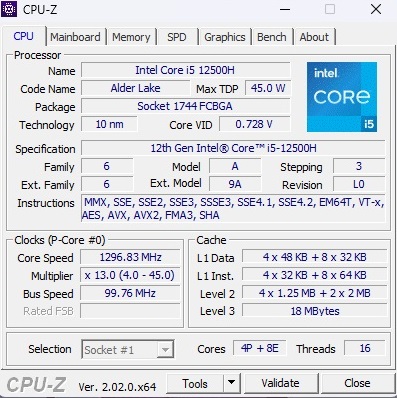
Procesador
El Core i5-12500H es un modelo de 12 núcleos de la generación Alder Lake de Intel que incluye 4 núcleos de Rendimiento (incluyendo hyperthreading) y 8 núcleos de Eficiencia (sin hyperthreading) y está especificado con un TDP de 45 vatios. En las pruebas de CPU, el chip de 10 nm ofrece un rendimiento muy bueno. Dado que el rendimiento también se mantiene estable constantemente, el IdeaPad Gaming 3 15IAH7 incluso se sitúa por delante del Core i7-12700Hdel Dell Inspiron 16 Plus después de un tiempo en el bucle Cinebench, logrando el primer puesto. Las CPUs Ryzen de los otros competidores (R5 5600H, R5 6600H Y R7 5800H) se quedan ligeramente atrás.
Cinebench R15 Multi Constant Load Test
* ... más pequeño es mejor
AIDA64: FP32 Ray-Trace | FPU Julia | CPU SHA3 | CPU Queen | FPU SinJulia | FPU Mandel | CPU AES | CPU ZLib | FP64 Ray-Trace | CPU PhotoWorxx
| Performance rating | |
| Media de la clase Gaming | |
| Dell G15 5515 | |
| Dell Inspiron 16 Plus 7620 | |
| Lenovo IdeaPad Gaming 3 15IAH7 | |
| Medio Intel Core i5-12500H | |
| Lenovo IdeaPad Gaming 3 15ARH7 | |
| HP Victus 16-e0145ng | |
| AIDA64 / FP32 Ray-Trace | |
| Media de la clase Gaming (10227 - 85542, n=105, últimos 2 años) | |
| Dell G15 5515 | |
| Lenovo IdeaPad Gaming 3 15IAH7 | |
| Dell Inspiron 16 Plus 7620 | |
| Lenovo IdeaPad Gaming 3 15ARH7 | |
| Medio Intel Core i5-12500H (6851 - 13947, n=9) | |
| HP Victus 16-e0145ng | |
| AIDA64 / FPU Julia | |
| Media de la clase Gaming (51376 - 238426, n=105, últimos 2 años) | |
| Dell G15 5515 | |
| Lenovo IdeaPad Gaming 3 15ARH7 | |
| HP Victus 16-e0145ng | |
| Lenovo IdeaPad Gaming 3 15IAH7 | |
| Dell Inspiron 16 Plus 7620 | |
| Medio Intel Core i5-12500H (29874 - 68178, n=9) | |
| AIDA64 / CPU SHA3 | |
| Media de la clase Gaming (2180 - 10115, n=105, últimos 2 años) | |
| Lenovo IdeaPad Gaming 3 15IAH7 | |
| Dell G15 5515 | |
| Medio Intel Core i5-12500H (2287 - 3337, n=9) | |
| Dell Inspiron 16 Plus 7620 | |
| Lenovo IdeaPad Gaming 3 15ARH7 | |
| HP Victus 16-e0145ng | |
| AIDA64 / CPU Queen | |
| Media de la clase Gaming (49785 - 173351, n=90, últimos 2 años) | |
| Dell G15 5515 | |
| Dell Inspiron 16 Plus 7620 | |
| Lenovo IdeaPad Gaming 3 15IAH7 | |
| Medio Intel Core i5-12500H (77935 - 80703, n=9) | |
| Lenovo IdeaPad Gaming 3 15ARH7 | |
| HP Victus 16-e0145ng | |
| AIDA64 / FPU SinJulia | |
| Media de la clase Gaming (4424 - 33636, n=105, últimos 2 años) | |
| Dell G15 5515 | |
| Lenovo IdeaPad Gaming 3 15ARH7 | |
| HP Victus 16-e0145ng | |
| Dell Inspiron 16 Plus 7620 | |
| Lenovo IdeaPad Gaming 3 15IAH7 | |
| Medio Intel Core i5-12500H (6590 - 7431, n=9) | |
| AIDA64 / FPU Mandel | |
| Media de la clase Gaming (25115 - 128721, n=105, últimos 2 años) | |
| Dell G15 5515 | |
| Lenovo IdeaPad Gaming 3 15ARH7 | |
| HP Victus 16-e0145ng | |
| Lenovo IdeaPad Gaming 3 15IAH7 | |
| Dell Inspiron 16 Plus 7620 | |
| Medio Intel Core i5-12500H (18252 - 34041, n=9) | |
| AIDA64 / CPU AES | |
| Dell G15 5515 | |
| Lenovo IdeaPad Gaming 3 15IAH7 | |
| Media de la clase Gaming (39258 - 247074, n=105, últimos 2 años) | |
| Lenovo IdeaPad Gaming 3 15ARH7 | |
| Medio Intel Core i5-12500H (50298 - 111567, n=9) | |
| Dell Inspiron 16 Plus 7620 | |
| HP Victus 16-e0145ng | |
| AIDA64 / CPU ZLib | |
| Media de la clase Gaming (574 - 2531, n=105, últimos 2 años) | |
| Dell Inspiron 16 Plus 7620 | |
| Lenovo IdeaPad Gaming 3 15IAH7 | |
| Medio Intel Core i5-12500H (746 - 924, n=9) | |
| Dell G15 5515 | |
| Lenovo IdeaPad Gaming 3 15ARH7 | |
| HP Victus 16-e0145ng | |
| AIDA64 / FP64 Ray-Trace | |
| Media de la clase Gaming (5509 - 45446, n=105, últimos 2 años) | |
| Dell G15 5515 | |
| Lenovo IdeaPad Gaming 3 15IAH7 | |
| Dell Inspiron 16 Plus 7620 | |
| Lenovo IdeaPad Gaming 3 15ARH7 | |
| Medio Intel Core i5-12500H (3848 - 7405, n=9) | |
| HP Victus 16-e0145ng | |
| AIDA64 / CPU PhotoWorxx | |
| Media de la clase Gaming (12271 - 89891, n=105, últimos 2 años) | |
| Dell Inspiron 16 Plus 7620 | |
| Medio Intel Core i5-12500H (13686 - 43813, n=9) | |
| HP Victus 16-e0145ng | |
| Lenovo IdeaPad Gaming 3 15ARH7 | |
| Dell G15 5515 | |
| Lenovo IdeaPad Gaming 3 15IAH7 | |
Rendimiento del sistema
Según PCMark 10, el rendimiento del sistema también es respetable. Con 6.755 puntos, sólo es superado por el Dell Inspiron 16 Plus. Subjetivamente, el sistema operativo responde cómodamente rápido.
CrossMark: Overall | Productivity | Creativity | Responsiveness
| PCMark 10 / Score | |
| Media de la clase Gaming (5828 - 12414, n=93, últimos 2 años) | |
| Dell Inspiron 16 Plus 7620 | |
| Lenovo IdeaPad Gaming 3 15IAH7 | |
| Lenovo IdeaPad Gaming 3 15ARH7 | |
| Dell G15 5515 | |
| HP Victus 16-e0145ng | |
| PCMark 10 / Essentials | |
| Media de la clase Gaming (8810 - 11935, n=97, últimos 2 años) | |
| Dell Inspiron 16 Plus 7620 | |
| Lenovo IdeaPad Gaming 3 15IAH7 | |
| HP Victus 16-e0145ng | |
| Dell G15 5515 | |
| Lenovo IdeaPad Gaming 3 15ARH7 | |
| PCMark 10 / Productivity | |
| Media de la clase Gaming (6845 - 25323, n=95, últimos 2 años) | |
| Lenovo IdeaPad Gaming 3 15IAH7 | |
| Dell Inspiron 16 Plus 7620 | |
| Lenovo IdeaPad Gaming 3 15ARH7 | |
| Dell G15 5515 | |
| HP Victus 16-e0145ng | |
| PCMark 10 / Digital Content Creation | |
| Media de la clase Gaming (7602 - 19954, n=95, últimos 2 años) | |
| Dell Inspiron 16 Plus 7620 | |
| Lenovo IdeaPad Gaming 3 15IAH7 | |
| HP Victus 16-e0145ng | |
| Dell G15 5515 | |
| Lenovo IdeaPad Gaming 3 15ARH7 | |
| CrossMark / Overall | |
| Media de la clase Gaming (1366 - 2409, n=94, últimos 2 años) | |
| Dell Inspiron 16 Plus 7620 | |
| Lenovo IdeaPad Gaming 3 15ARH7 | |
| CrossMark / Productivity | |
| Media de la clase Gaming (1386 - 2254, n=94, últimos 2 años) | |
| Dell Inspiron 16 Plus 7620 | |
| Lenovo IdeaPad Gaming 3 15ARH7 | |
| CrossMark / Creativity | |
| Media de la clase Gaming (1343 - 2786, n=94, últimos 2 años) | |
| Dell Inspiron 16 Plus 7620 | |
| Lenovo IdeaPad Gaming 3 15ARH7 | |
| CrossMark / Responsiveness | |
| Media de la clase Gaming (1226 - 2334, n=94, últimos 2 años) | |
| Dell Inspiron 16 Plus 7620 | |
| Lenovo IdeaPad Gaming 3 15ARH7 | |
| PCMark 10 Score | 6755 puntos | |
ayuda | ||
| AIDA64 / Memory Copy | |
| Media de la clase Gaming (21750 - 129946, n=105, últimos 2 años) | |
| Dell Inspiron 16 Plus 7620 | |
| Medio Intel Core i5-12500H (23850 - 66598, n=9) | |
| HP Victus 16-e0145ng | |
| Dell G15 5515 | |
| Lenovo IdeaPad Gaming 3 15ARH7 | |
| Lenovo IdeaPad Gaming 3 15IAH7 | |
| AIDA64 / Memory Read | |
| Media de la clase Gaming (22956 - 118858, n=105, últimos 2 años) | |
| Dell Inspiron 16 Plus 7620 | |
| Medio Intel Core i5-12500H (24879 - 68013, n=9) | |
| HP Victus 16-e0145ng | |
| Dell G15 5515 | |
| Lenovo IdeaPad Gaming 3 15ARH7 | |
| Lenovo IdeaPad Gaming 3 15IAH7 | |
| AIDA64 / Memory Write | |
| Media de la clase Gaming (22297 - 135096, n=105, últimos 2 años) | |
| Dell Inspiron 16 Plus 7620 | |
| Medio Intel Core i5-12500H (23543 - 58797, n=9) | |
| HP Victus 16-e0145ng | |
| Dell G15 5515 | |
| Lenovo IdeaPad Gaming 3 15ARH7 | |
| Lenovo IdeaPad Gaming 3 15IAH7 | |
| AIDA64 / Memory Latency | |
| Media de la clase Gaming (75.3 - 259, n=105, últimos 2 años) | |
| Medio Intel Core i5-12500H (83.8 - 114.7, n=9) | |
| Dell Inspiron 16 Plus 7620 | |
| Lenovo IdeaPad Gaming 3 15IAH7 | |
| Lenovo IdeaPad Gaming 3 15ARH7 | |
| Dell G15 5515 | |
| HP Victus 16-e0145ng | |
* ... más pequeño es mejor
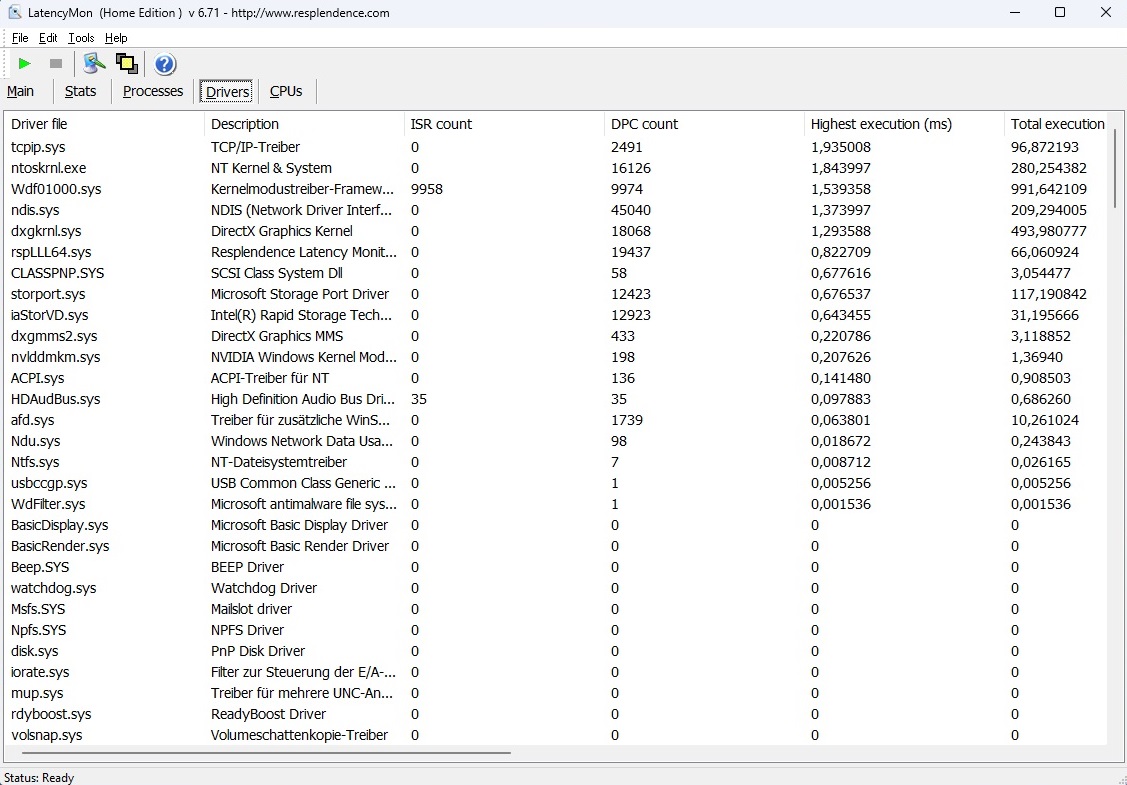
Latencias del CPD
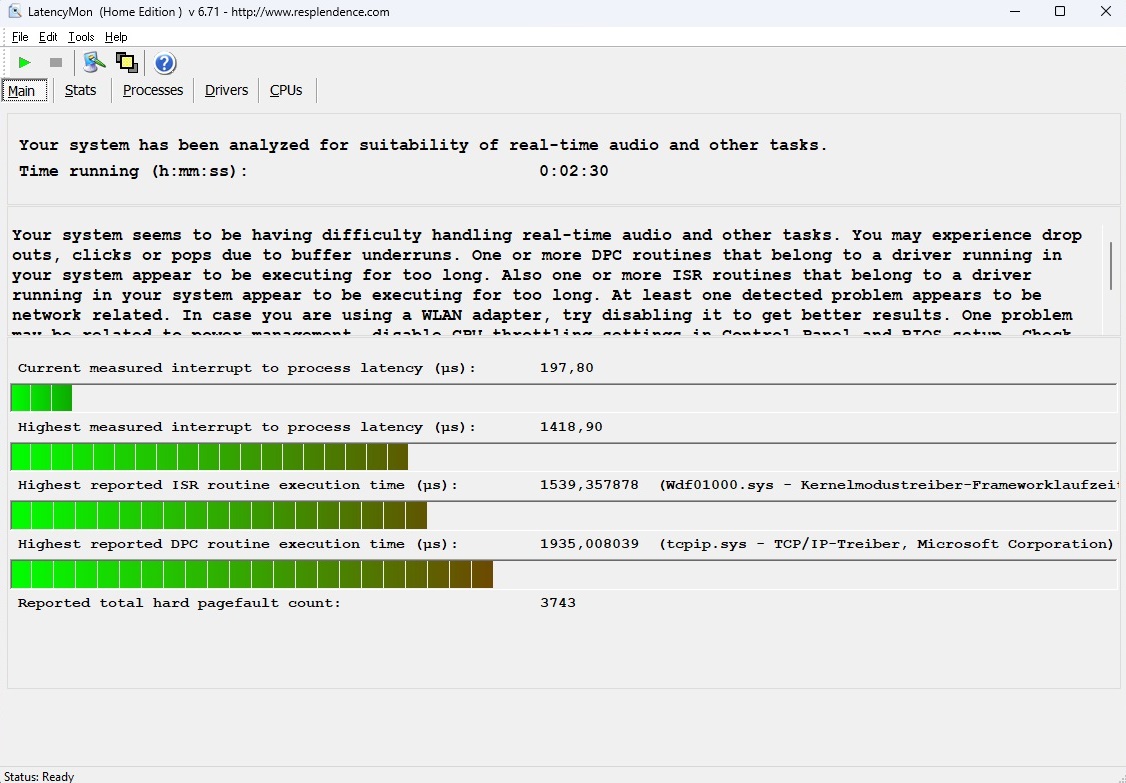
En la prueba de latencia, el portátil de 15 pulgadas no lo hace tan bien. La herramienta LatencyMon menciona posibles problemas con el procesamiento de audio y vídeo en tiempo real. Sin embargo, sólo muy pocos usuarios deberían verse afectados por estos escenarios de aplicación.
| DPC Latencies / LatencyMon - interrupt to process latency (max), Web, Youtube, Prime95 | |
| Lenovo IdeaPad Gaming 3 15IAH7 | |
| Dell Inspiron 16 Plus 7620 | |
| HP Victus 16-e0145ng | |
| Lenovo IdeaPad Gaming 3 15ARH7 | |
| Dell G15 5515 | |
* ... más pequeño es mejor
Solución de almacenamiento
El rendimiento de los SSDs termina en el medio de nuestro campo de comparación. El modelo de 512 GB de Intel (660p) no es ni particularmente rápido ni particularmente lento para una unidad NVMe. Es genial que - como la velocidad de la CPU - la velocidad del SSD también se mantenga relativamente constante.

* ... más pequeño es mejor
Constant Performance Reading: DiskSpd Read Loop, Queue Depth 8
Tarjeta gráfica
El rendimiento de las GPUs Ampere de Nvidia depende en gran medida del TGP ajustado. Lenovo se decidió por un valor relativamente alto en el IdeaPad Gaming 3, lo que beneficia los resultados de las pruebas. 85 vatios son bastante para una RTX 3050 Ti. El portátil de 15 pulgadas lo hace correspondientemente bien en las pruebas 3DMarks. Si se suman todos los valores, la RTX 3050 Ti es casi un 25% más rápida que la media actual de esta tarjeta gráfica. Hasta cierto punto, esto compensa el hecho de que ya se pueden conseguir dispositivos con la RTX 3060que incluye 6 en lugar de 4 GB de VRAM, en el segmento de los 1000 euros.
| 3DMark 11 Performance | 19254 puntos | |
| 3DMark Cloud Gate Standard Score | 48874 puntos | |
| 3DMark Fire Strike Score | 14086 puntos | |
| 3DMark Time Spy Score | 6213 puntos | |
ayuda | ||
* ... más pequeño es mejor
Rendimiento de los juegos
La tendencia positiva de las pruebas de gráficos sintéticos continúa en nuestras pruebas de juegos. Aunque el rendimiento en algunos juegos puede sufrir considerablemente por la RAM de un solo canal (por lo que recomendaríamos cambiar a 2x 8 GB), los juegos que no tienen mucha RAM también se ejecutan significativamente más rápido que en una RTX 3050 Ti con un TGP inferior.
| The Witcher 3 | |
| 1920x1080 High Graphics & Postprocessing (Nvidia HairWorks Off) | |
| Media de la clase Gaming (341 - 404, n=2, últimos 2 años) | |
| Lenovo IdeaPad Gaming 3 15IAH7 | |
| Dell Inspiron 16 Plus 7620 | |
| Lenovo IdeaPad Gaming 3 15ARH7 | |
| HP Victus 16-e0145ng | |
| Dell G15 5515 | |
| Medio NVIDIA GeForce RTX 3050 Ti Laptop GPU (30 - 110, n=26) | |
| 1920x1080 Ultra Graphics & Postprocessing (HBAO+) | |
| Media de la clase Gaming (104.7 - 240, n=7, últimos 2 años) | |
| Lenovo IdeaPad Gaming 3 15IAH7 | |
| Dell Inspiron 16 Plus 7620 | |
| Dell G15 5515 | |
| Lenovo IdeaPad Gaming 3 15ARH7 | |
| HP Victus 16-e0145ng | |
| Medio NVIDIA GeForce RTX 3050 Ti Laptop GPU (19 - 58.5, n=29) | |
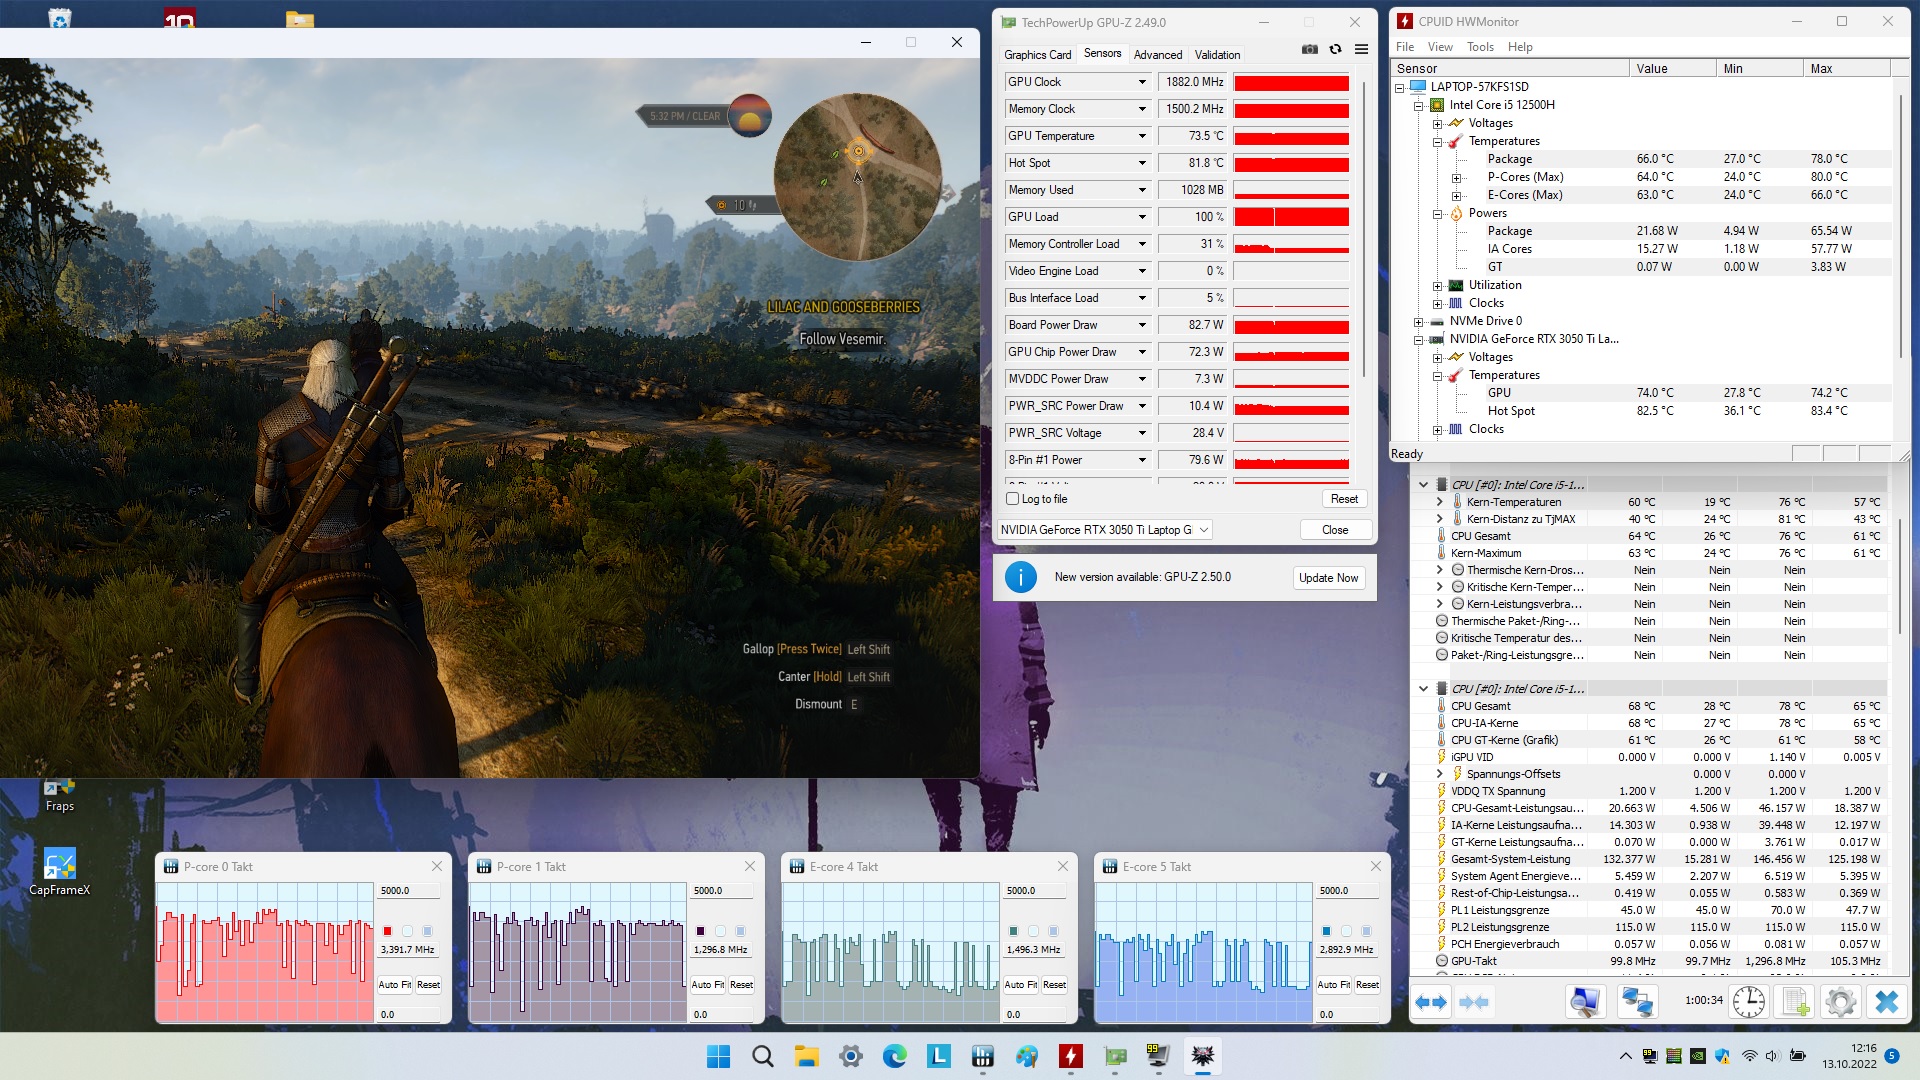
No observamos ningún comportamiento llamativo que destacara en nuestra prueba constante de 60 minutos con El Witcher 3. Básicamente, el IdeaPad Gaming 3 15IAH7 es capaz de manejar casi todos los juegos modernos con detalles altos a máximos en la resolución nativa de 1920 x 1080 píxeles, siempre que se prescinda del trazado de rayos (donde la RTX 3050 Ti muestra algunas debilidades considerables).
The Witcher 3 FPS Chart
| bajo | medio | alto | ultra | |
|---|---|---|---|---|
| GTA V (2015) | 160.7 | 130.6 | 73.5 | |
| The Witcher 3 (2015) | 173 | 110 | 58.5 | |
| Dota 2 Reborn (2015) | 145.9 | 127.3 | 113.8 | 107.8 |
| Final Fantasy XV Benchmark (2018) | 81.5 | 58.8 | ||
| X-Plane 11.11 (2018) | 109.9 | 98.1 | 81.1 | |
| Strange Brigade (2018) | 145.5 | 117.3 | 101.3 | |
| Ghostwire Tokyo (2022) | 79.5 | 76.8 | 75.9 | |
| Tiny Tina's Wonderlands (2022) | 92.1 | 67.2 | 51.7 | |
| Vampire Bloodhunt (2022) | 111.8 | 110.9 | 106.1 | |
| F1 22 (2022) | 111 | 92 | 32 | |
| The Quarry (2022) | 69.7 | 58.3 | 45.8 |
Emisiones
Emisiones acústicas
En el modo de rendimiento, el portátil de 15 pulgadas no es muy silencioso. Ya durante el funcionamiento en reposo, se oye mucho ruido de ventilador con 29 a 32 dB(A). Bajo carga, el dispositivo produce un volumen masivo de ruido con 42 a 54 dB(A), aunque otros portátiles de juego como el Victus 16 consiguen un ruido similar. Sin embargo, gracias a los otros dos modos de alimentación, el dispositivo se puede silenciar fácil y rápidamente.
Ruido
| Ocioso |
| 29 / 30 / 32 dB(A) |
| Carga |
| 42 / 54 dB(A) |
 | ||
30 dB silencioso 40 dB(A) audible 50 dB(A) ruidosamente alto |
||
min: | ||
| Lenovo IdeaPad Gaming 3 15IAH7 GeForce RTX 3050 Ti Laptop GPU, i5-12500H | Lenovo IdeaPad Gaming 3 15ARH7 GeForce RTX 3050 4GB Laptop GPU, R5 6600H | Dell G15 5515 GeForce RTX 3050 Ti Laptop GPU, R7 5800H | HP Victus 16-e0145ng GeForce RTX 3050 Ti Laptop GPU, R5 5600H | Dell Inspiron 16 Plus 7620 GeForce RTX 3050 Ti Laptop GPU, i7-12700H | |
|---|---|---|---|---|---|
| Noise | 11% | 7% | 0% | 4% | |
| apagado / medio ambiente * (dB) | 25 | 23.3 7% | 24 4% | 26 -4% | 23.3 7% |
| Idle Minimum * (dB) | 29 | 23.8 18% | 25 14% | 26 10% | 25.7 11% |
| Idle Average * (dB) | 30 | 23.8 21% | 26 13% | 28 7% | 26.1 13% |
| Idle Maximum * (dB) | 32 | 27.2 15% | 30 6% | 34 -6% | 30.6 4% |
| Load Average * (dB) | 42 | 34.8 17% | 44 -5% | 44 -5% | 46.2 -10% |
| Witcher 3 ultra * (dB) | 46 | 49.3 -7% | 44 4% | 48 -4% | 49.2 -7% |
| Load Maximum * (dB) | 54 | 49.4 9% | 48 11% | 53 2% | 49.4 9% |
* ... más pequeño es mejor
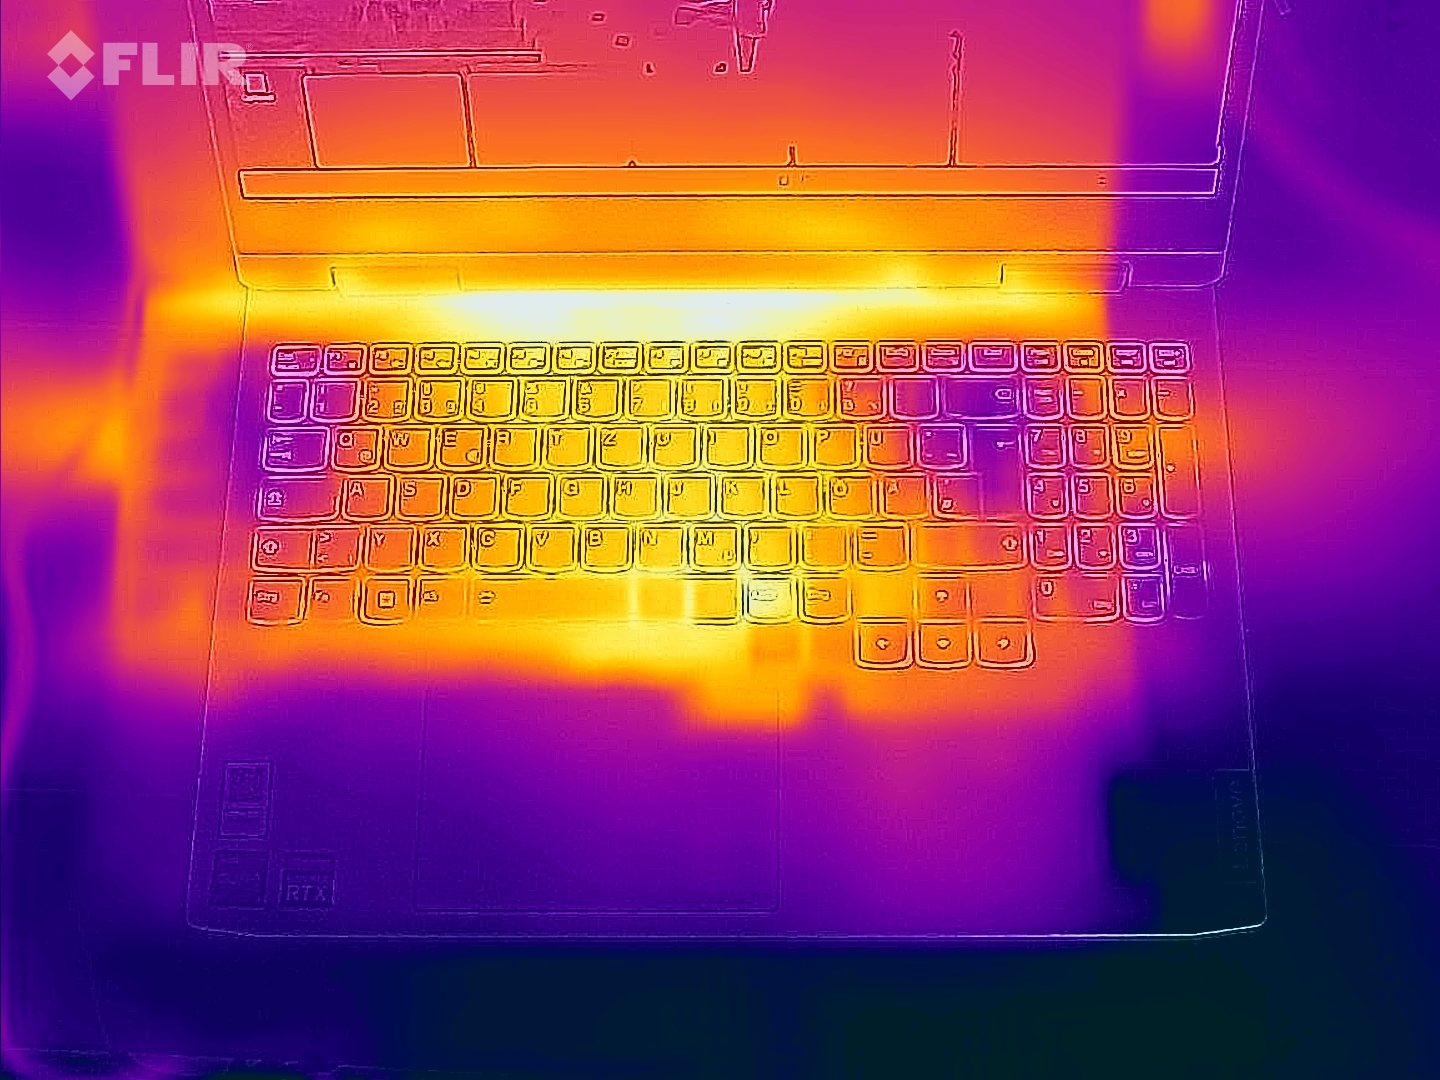
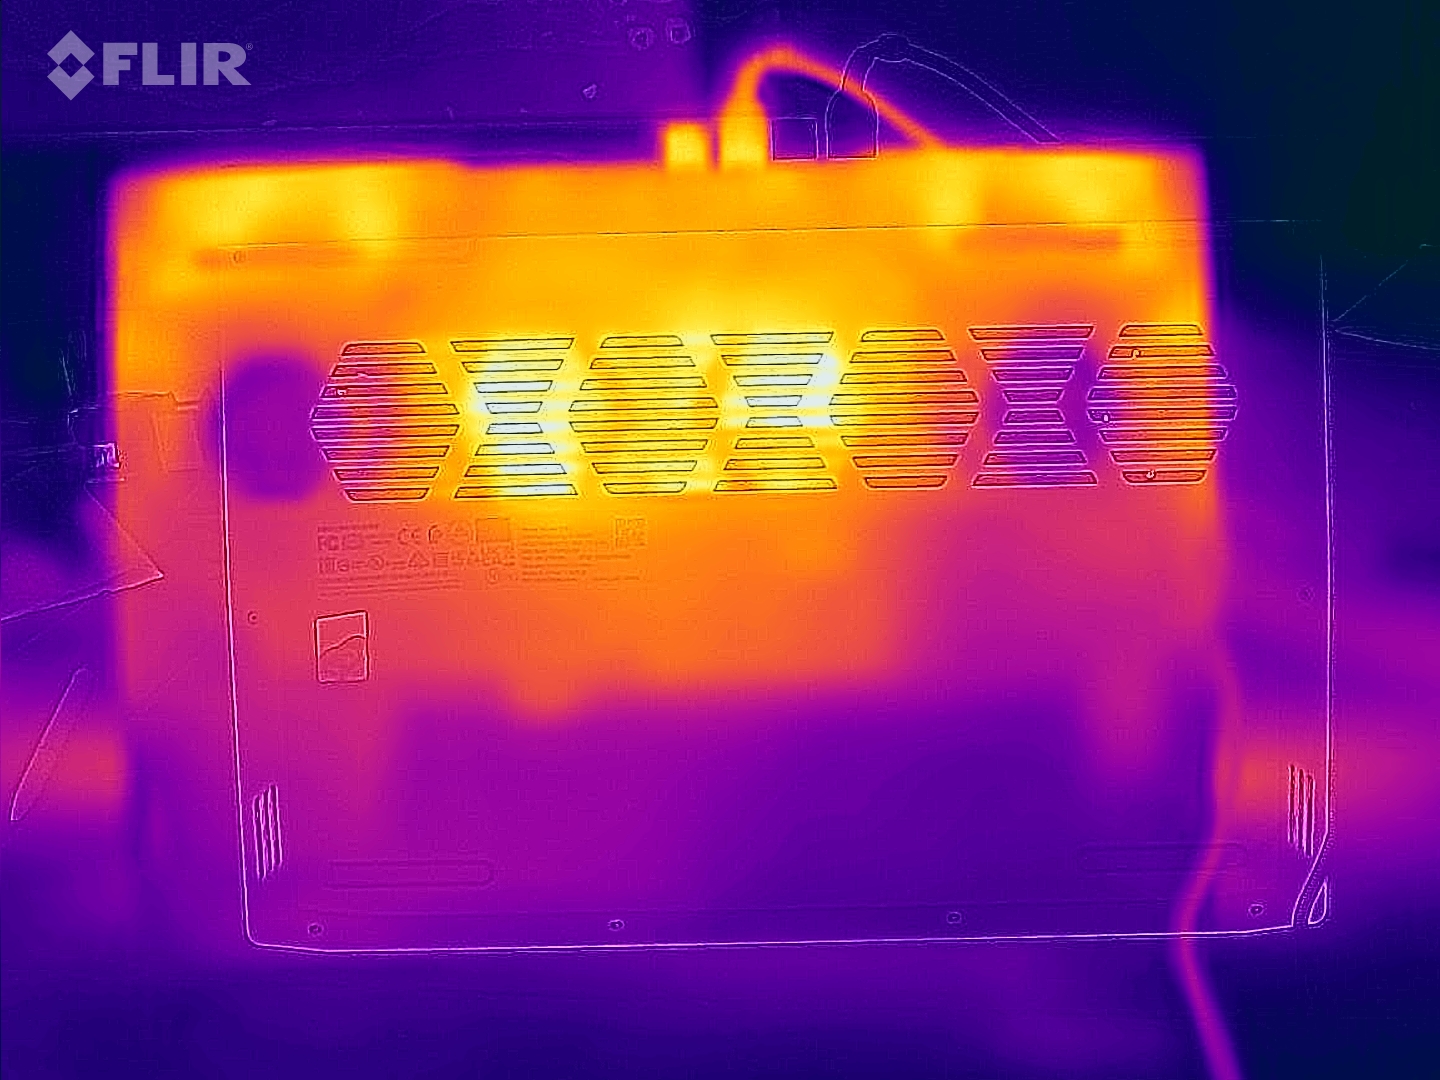
Temperaturas
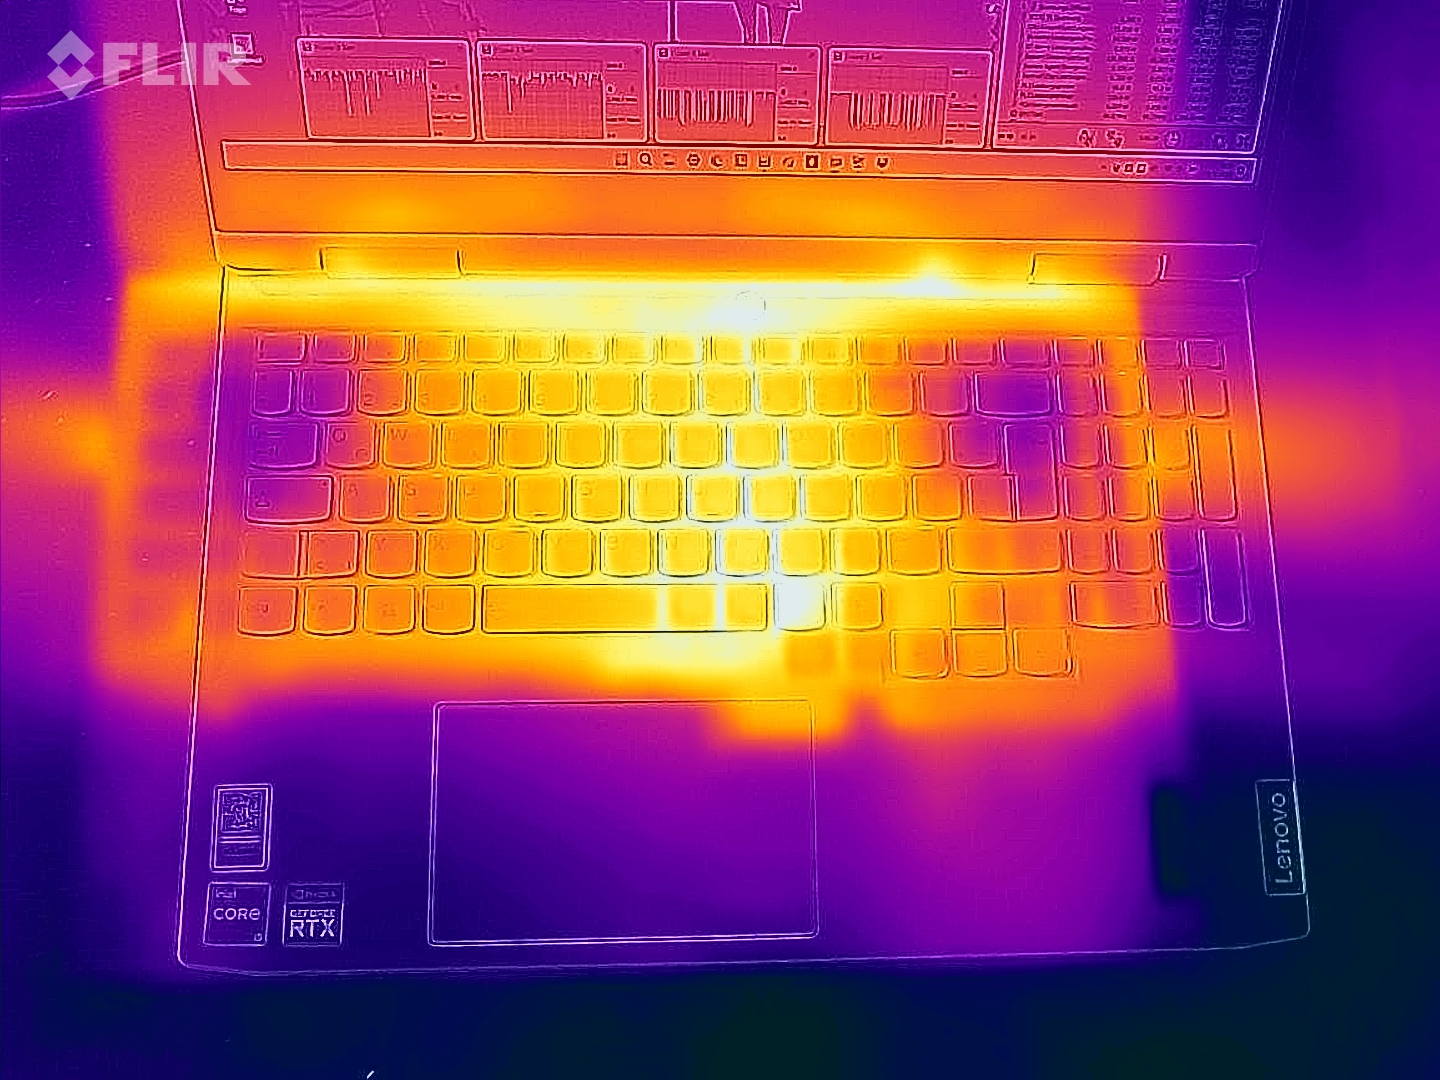
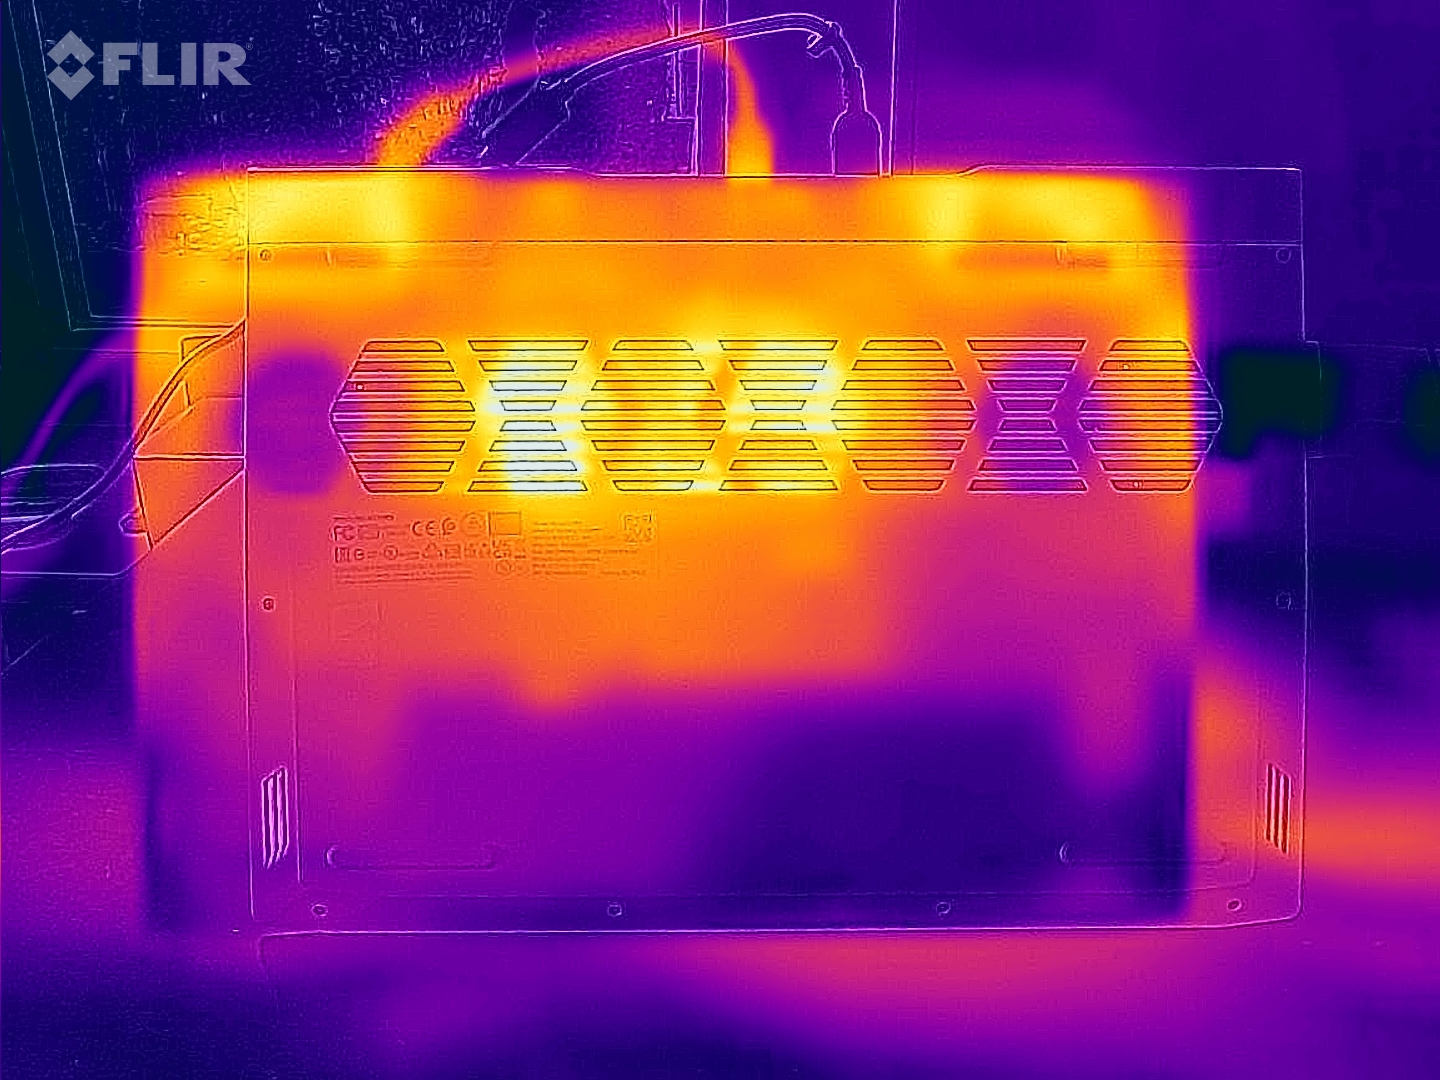
La evolución de la temperatura también es típica para un portátil de juegos. Mientras que el dispositivo Lenovo se mantiene cómodamente fresco durante el funcionamiento en inactivo, las temperaturas alcanzan hasta 47 °C en la parte superior y 52 °C en la parte inferior durante el funcionamiento 3D. Por tanto, no deberías intentar jugar con el portátil en tu regazo.
(-) La temperatura máxima en la parte superior es de 47 °C / 117 F, frente a la media de 40.4 °C / 105 F, que oscila entre 21.2 y 68.8 °C para la clase Gaming.
(-) El fondo se calienta hasta un máximo de 52 °C / 126 F, frente a la media de 43.2 °C / 110 F
(+) En reposo, la temperatura media de la parte superior es de 24.2 °C / 76# F, frente a la media del dispositivo de 33.9 °C / 93 F.
(-) Jugando a The Witcher 3, la temperatura media de la parte superior es de 39.2 °C / 103 F, frente a la media del dispositivo de 33.9 °C / 93 F.
(±) El reposamanos y el touchpad pueden calentarse mucho al tacto con un máximo de 37 °C / 98.6 F.
(-) La temperatura media de la zona del reposamanos de dispositivos similares fue de 28.8 °C / 83.8 F (-8.2 °C / -14.8 F).
| Lenovo IdeaPad Gaming 3 15IAH7 GeForce RTX 3050 Ti Laptop GPU, i5-12500H | Lenovo IdeaPad Gaming 3 15ARH7 GeForce RTX 3050 4GB Laptop GPU, R5 6600H | Dell G15 5515 GeForce RTX 3050 Ti Laptop GPU, R7 5800H | HP Victus 16-e0145ng GeForce RTX 3050 Ti Laptop GPU, R5 5600H | Dell Inspiron 16 Plus 7620 GeForce RTX 3050 Ti Laptop GPU, i7-12700H | |
|---|---|---|---|---|---|
| Heat | -3% | -3% | -25% | -8% | |
| Maximum Upper Side * (°C) | 47 | 47.6 -1% | 50 -6% | 54 -15% | 46 2% |
| Maximum Bottom * (°C) | 52 | 46.6 10% | 49 6% | 47 10% | 45.8 12% |
| Idle Upper Side * (°C) | 25 | 27.2 -9% | 26 -4% | 41 -64% | 29.2 -17% |
| Idle Bottom * (°C) | 24 | 27.2 -13% | 26 -8% | 31 -29% | 31 -29% |
* ... más pequeño es mejor
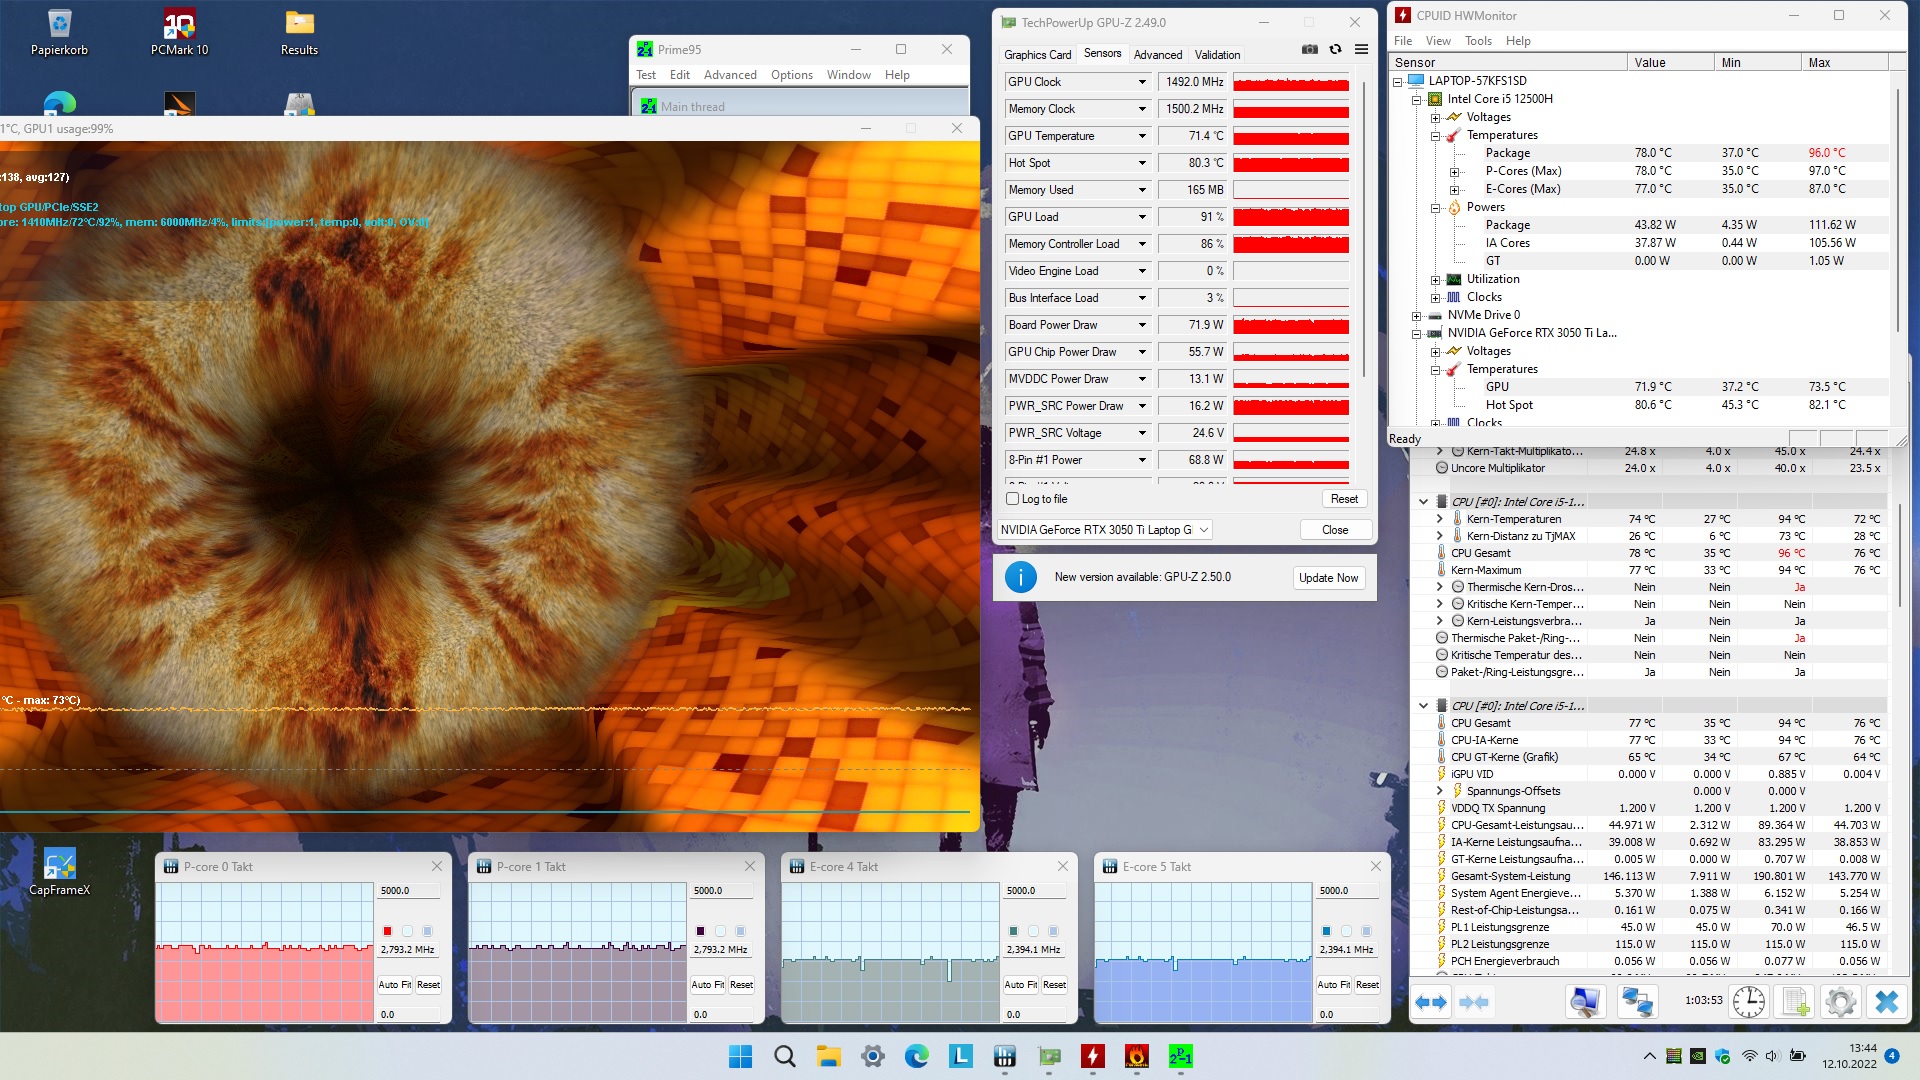
Prueba de esfuerzo
El test de estrés con una hora de FurMark y Prime95 no revela nada extraño. El portátil de 15 pulgadas se mantiene alejado de la ralentización y los valores críticos de hardware. Consideraríamos unos 71 °C para la GPU y 78 °C para la CPU a plena carga como valores moderados.
Altavoces
Lenovo IdeaPad Gaming 3 15IAH7 análisis de audio
(+) | los altavoces pueden reproducir a un volumen relativamente alto (#83 dB)
Graves 100 - 315 Hz
(-) | casi sin bajos - de media 17.1% inferior a la mediana
(±) | la linealidad de los graves es media (12.8% delta a frecuencia anterior)
Medios 400 - 2000 Hz
(±) | medias más altas - de media 5.6% más altas que la mediana
(+) | los medios son lineales (4.5% delta a la frecuencia anterior)
Altos 2 - 16 kHz
(+) | máximos equilibrados - a sólo 2% de la mediana
(+) | los máximos son lineales (4.6% delta a la frecuencia anterior)
Total 100 - 16.000 Hz
(+) | el sonido global es lineal (14.4% de diferencia con la mediana)
En comparación con la misma clase
» 27% de todos los dispositivos probados de esta clase eran mejores, 7% similares, 66% peores
» El mejor tuvo un delta de 6%, la media fue 18%, el peor fue ###max##%
En comparación con todos los dispositivos probados
» 18% de todos los dispositivos probados eran mejores, 4% similares, 78% peores
» El mejor tuvo un delta de 4%, la media fue 23%, el peor fue ###max##%
Dell G15 5515 análisis de audio
(±) | la sonoridad del altavoz es media pero buena (76 dB)
Graves 100 - 315 Hz
(-) | casi sin bajos - de media 22% inferior a la mediana
(±) | la linealidad de los graves es media (14.9% delta a frecuencia anterior)
Medios 400 - 2000 Hz
(+) | medios equilibrados - a sólo 2.8% de la mediana
(+) | los medios son lineales (3% delta a la frecuencia anterior)
Altos 2 - 16 kHz
(+) | máximos equilibrados - a sólo 1.4% de la mediana
(+) | los máximos son lineales (3.7% delta a la frecuencia anterior)
Total 100 - 16.000 Hz
(±) | la linealidad del sonido global es media (16.8% de diferencia con la mediana)
En comparación con la misma clase
» 44% de todos los dispositivos probados de esta clase eran mejores, 11% similares, 45% peores
» El mejor tuvo un delta de 6%, la media fue 18%, el peor fue ###max##%
En comparación con todos los dispositivos probados
» 30% de todos los dispositivos probados eran mejores, 8% similares, 63% peores
» El mejor tuvo un delta de 4%, la media fue 23%, el peor fue ###max##%
Gestión de la energía
Consumo de energía
El consumo de energía tampoco destaca. Aunque de media, el Gaming 3 consume algo más de energía que otros portátiles con RTX 3050 Ti, esto se debe principalmente al mayor TGP.
| Off / Standby | |
| Ocioso | |
| Carga |
|
Clave:
min: | |
| Lenovo IdeaPad Gaming 3 15IAH7 GeForce RTX 3050 Ti Laptop GPU, i5-12500H | Lenovo IdeaPad Gaming 3 15ARH7 GeForce RTX 3050 4GB Laptop GPU, R5 6600H | Dell G15 5515 GeForce RTX 3050 Ti Laptop GPU, R7 5800H | HP Victus 16-e0145ng GeForce RTX 3050 Ti Laptop GPU, R5 5600H | Dell Inspiron 16 Plus 7620 GeForce RTX 3050 Ti Laptop GPU, i7-12700H | Media de la clase Gaming | |
|---|---|---|---|---|---|---|
| Power Consumption | 8% | 7% | 5% | 6% | -55% | |
| Idle Minimum * (Watt) | 8 | 7.7 4% | 5 37% | 7 12% | 6.8 15% | 13 ? -63% |
| Idle Average * (Watt) | 10 | 9.1 9% | 9 10% | 9 10% | 9.6 4% | 19 ? -90% |
| Idle Maximum * (Watt) | 16 | 15.6 2% | 20 -25% | 15 6% | 17 -6% | 24.6 ? -54% |
| Load Average * (Watt) | 99 | 90.7 8% | 94 5% | 93 6% | 117.5 -19% | 110.7 ? -12% |
| Witcher 3 ultra * (Watt) | 144.6 | 122.9 15% | 123 15% | 134.5 7% | 113.1 22% | |
| Load Maximum * (Watt) | 168 | 155.2 8% | 172 -2% | 185 -10% | 137.4 18% | 259 ? -54% |
* ... más pequeño es mejor
Power Consumption The Witcher 3 / Stress Test
Power Consumption With External Monitor
Duración de la batería
Dependiendo del modelo, el IdeaPad ofrece una batería de 45-Wh o 60-Wh. En contraste con su hermano AMD, la versión Intel probada afortunadamente es capaz de puntuar con la batería más potente. Sin embargo, debido al mayor consumo, las diferencias se mantienen dentro de los límites. Con apenas 6 horas, la duración de la batería durante la navegación inalámbrica por Internet con un brillo de pantalla reducido a 150 cd/m² resulta incluso ligeramente inferior a la de la versión AMD. Los otros competidores también están por delante en este aspecto.
| Lenovo IdeaPad Gaming 3 15IAH7 GeForce RTX 3050 Ti Laptop GPU, i5-12500H, 60 Wh | Lenovo IdeaPad Gaming 3 15ARH7 GeForce RTX 3050 4GB Laptop GPU, R5 6600H, 45 Wh | Dell G15 5515 GeForce RTX 3050 Ti Laptop GPU, R7 5800H, 56 Wh | HP Victus 16-e0145ng GeForce RTX 3050 Ti Laptop GPU, R5 5600H, 70 Wh | Dell Inspiron 16 Plus 7620 GeForce RTX 3050 Ti Laptop GPU, i7-12700H, 86 Wh | Media de la clase Gaming | |
|---|---|---|---|---|---|---|
| Duración de Batería | 10% | 36% | 20% | 63% | 21% | |
| WiFi v1.3 (h) | 5.9 | 6.5 10% | 8 36% | 7.1 20% | 9.6 63% | 7.11 ? 21% |
| Reader / Idle (h) | 2.4 | 13.5 | 18.6 | 8.27 ? | ||
| Load (h) | 0.9 | 1.5 | 1.2 | 1.502 ? | ||
| H.264 (h) | 8.8 | 8.32 ? |
Pro
Contra
Veredicto
Si no se tiene en cuenta la mediocre calidad de la carcasa en términos de material y mano de obra, Lenovo ha creado un exitoso portátil de juegos económico con el IdeaPad Gaming 3 15IAH7.
Gracias a los elevados TDP y al constante desarrollo del rendimiento, elCore i5-12500Hy GeForce RTX 3050 Tison capaces de mostrar toda su potencia, mientras que en contraste, los competidores (en su mayoría más lentos) ofrecen una mejor duración de la batería. Sin embargo, casi ninguno de los portátiles alternativos es capaz de alcanzar la calidad de imagen del Gaming 3. La mayoría de los competidores se quedan atrás en términos de espacio de color y brillo. En nuestro campo de comparación, sólo el Dell Inspiron 16 Pluses capaz de acercarse al portátil de Lenovo.
Los que esperen una buena pantalla pero no quieran gastar demasiado dinero en un portátil de juegos deberían echar un vistazo al IdeaPad Gaming 3 15IAH7.
Precio y disponibilidad
En el momento de esta prueba, el IdeaPad Gaming 3 15IAH7 con un Core i5-12500H, GeForce RTX 3050 Ti, 8 GB de RAM y 512 GB de SSD está disponible por $1031 en BestBuy.
Lenovo IdeaPad Gaming 3 15IAH7
- 10/14/2022 v7 (old)
Florian Glaser
Price comparison

