Análisis del portátil HP Pavilion Gaming 17: Una buena pantalla a un precio económico
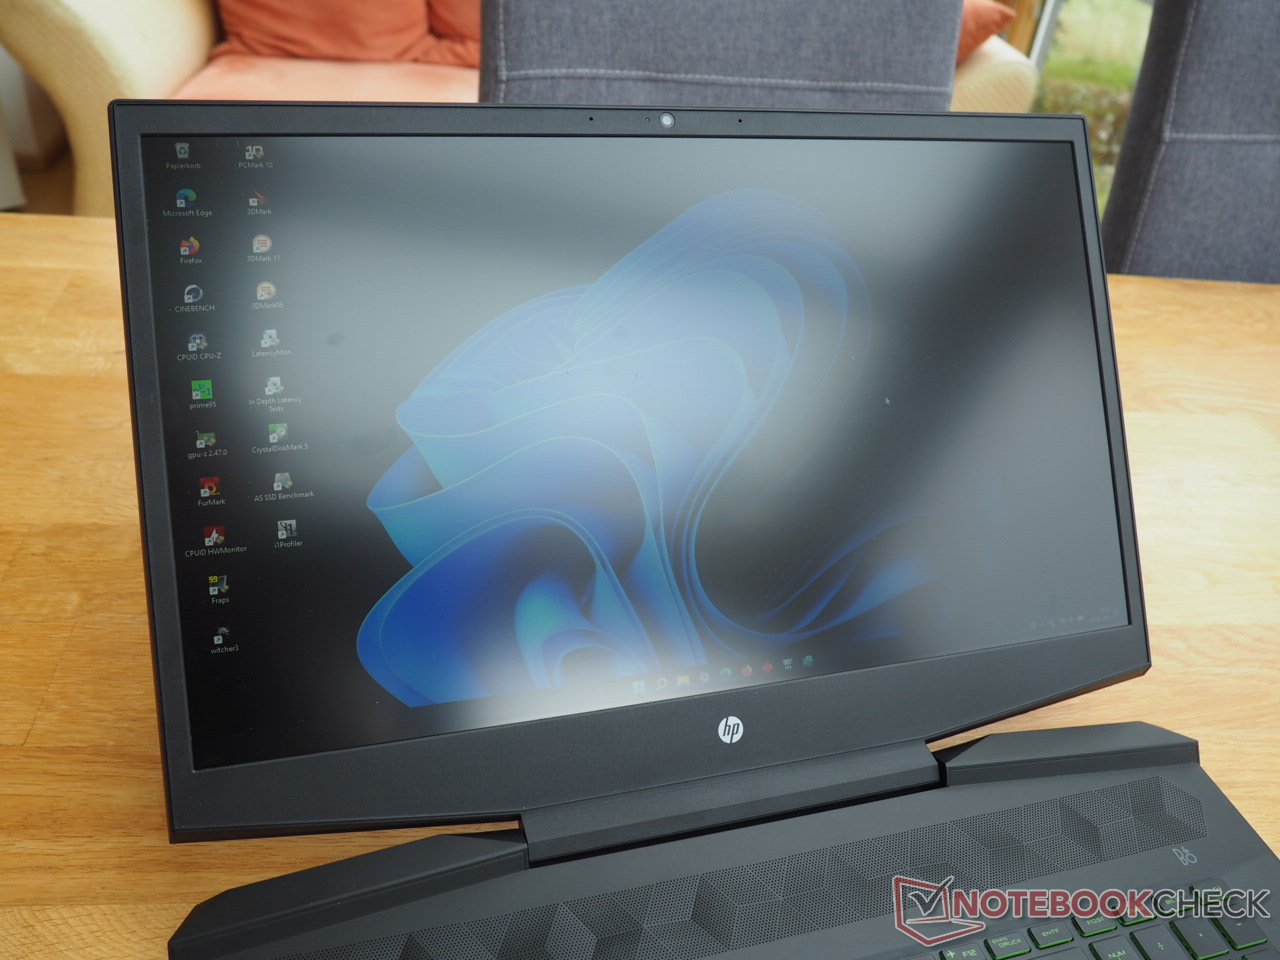
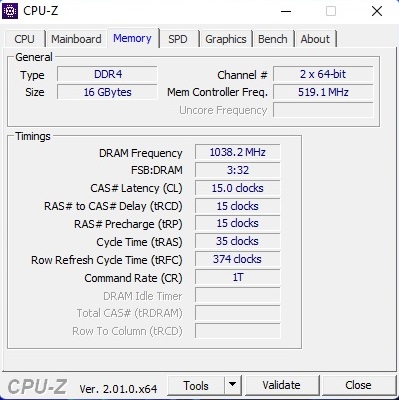
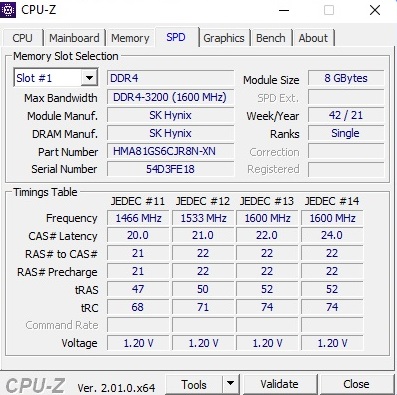
Los usuarios que busquen un portátil para juegos por menos de 1.000 euros pueden haber encontrado ya el Pavilion Gaming 17. El modelo cd2146ng que analizamos está equipado con componentes de gama media bien equilibrados, concretamente unCore i5-11300H y unaGeForce RTX 3050 Ti incluyendo 4 GB de VRAM. 16 GB de RAM DDR4 (2x 8 GB en doble canal) y un SSD NVMe de 512 GB también es decente en este rango de precios. La pantalla es más que satisfactoria: El display IPS Full HD mate soporta 144 Hz y se supone que alcanza unos 300 nits según HP. Analizaremos si esta afirmación es cierta en un momento. Mientras tanto, es una pena que nuestro modelo de pruebas carezca de un sistema operativo "real" (sólo FreeDOS está a bordo). Sin embargo, las licencias de Windows compatibles -como la de la versión 11 Pro que instalamos más tarde- se pueden comprar muy baratas en Internet
Los principales competidores del Pavilion Gaming 17 son otros portátiles económicos de 15 a 17 pulgadas equipados con la GeForce RTX 3050 Ti, como el Dell G15 5510, el Lenovo IdeaPad Gaming 3 15IHUy el propio HP Victus 16. Cada uno de estos últimos portátiles aparece en las tablas como dispositivos de comparación
Posibles contendientes en la comparación
Valoración | Fecha | Modelo | Peso | Altura | Tamaño | Resolución | Precio |
|---|---|---|---|---|---|---|---|
| 82.7 % v7 (old) | 09/2022 | HP Pavilion Gaming 17-cd2146ng i5-11300H, GeForce RTX 3050 Ti Laptop GPU | 2.8 kg | 25 mm | 17.30" | 1920x1080 | |
| 79.1 % v7 (old) | 05/2022 | Dell G15 5510-43NHT i5-10200H, GeForce RTX 3050 Ti Laptop GPU | 2.5 kg | 23.33 mm | 15.60" | 1920x1080 | |
| 79.7 % v7 (old) | 03/2022 | Lenovo Ideapad Gaming 3 15IHU-82K1002RGE i5-11300H, GeForce RTX 3050 Ti Laptop GPU | 2 kg | 24.2 mm | 15.60" | 1920x1080 | |
| 82.3 % v7 (old) | 05/2022 | HP Victus 16-e0145ng R5 5600H, GeForce RTX 3050 Ti Laptop GPU | 2.4 kg | 23.5 mm | 16.10" | 1920x1080 | |
| 81.6 % v7 (old) | 07/2019 | HP Pavilion Gaming 17-cd0085cl i7-9750H, GeForce GTX 1660 Ti Max-Q | 2.8 kg | 25 mm | 17.30" | 1920x1080 |
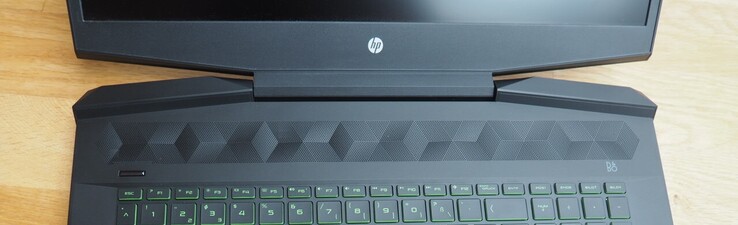
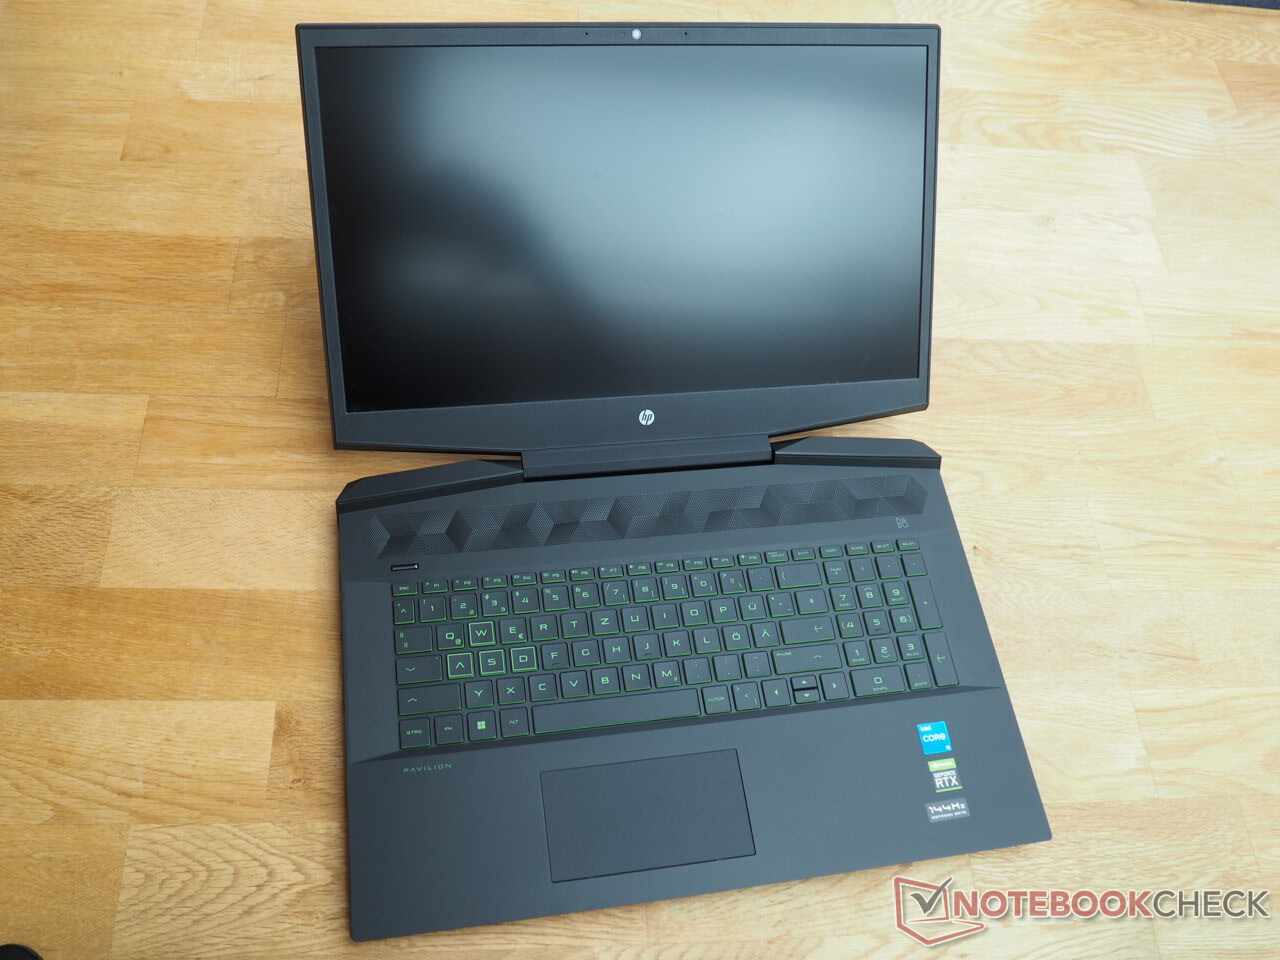
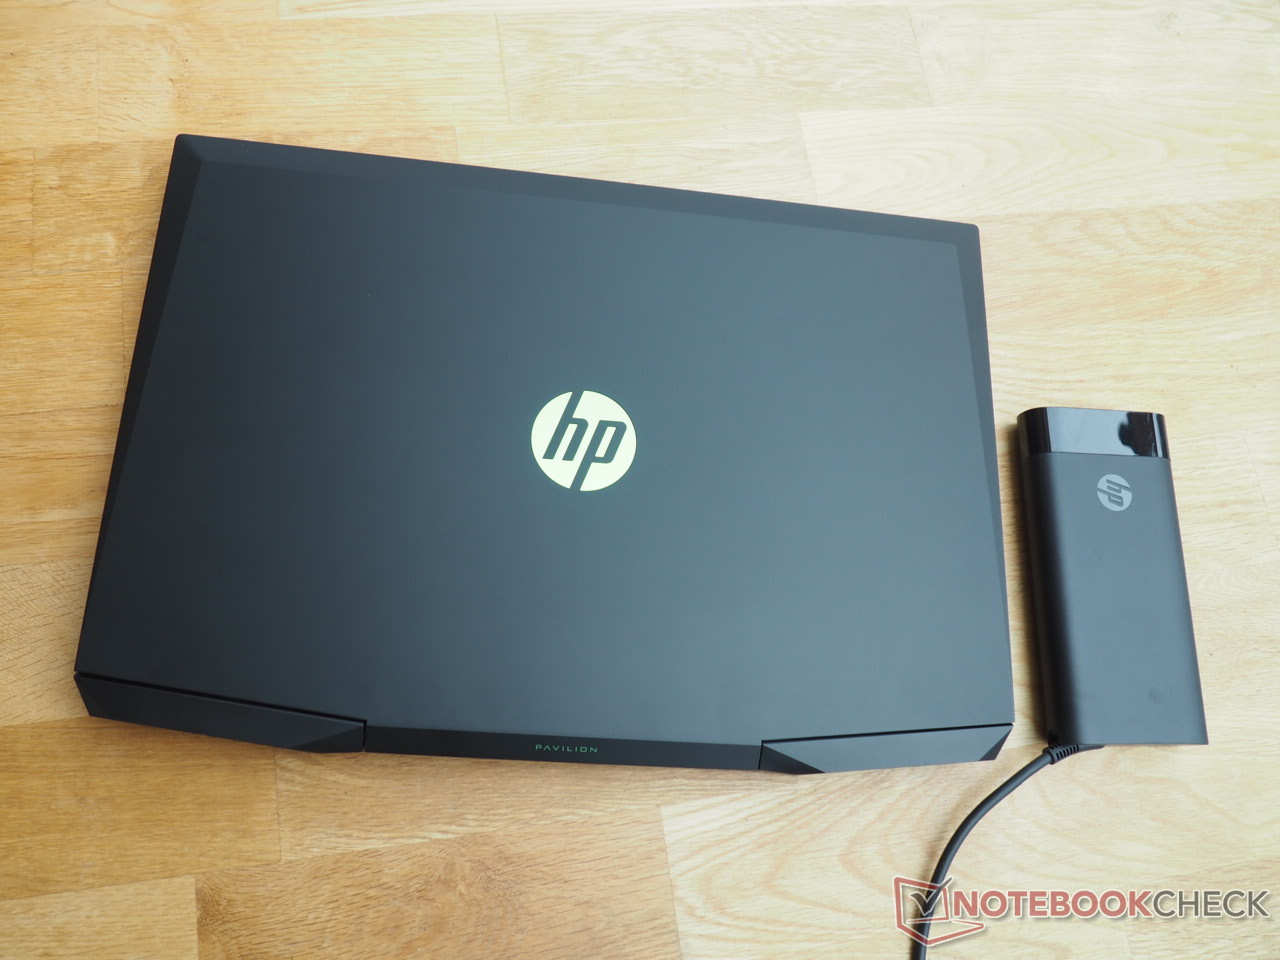
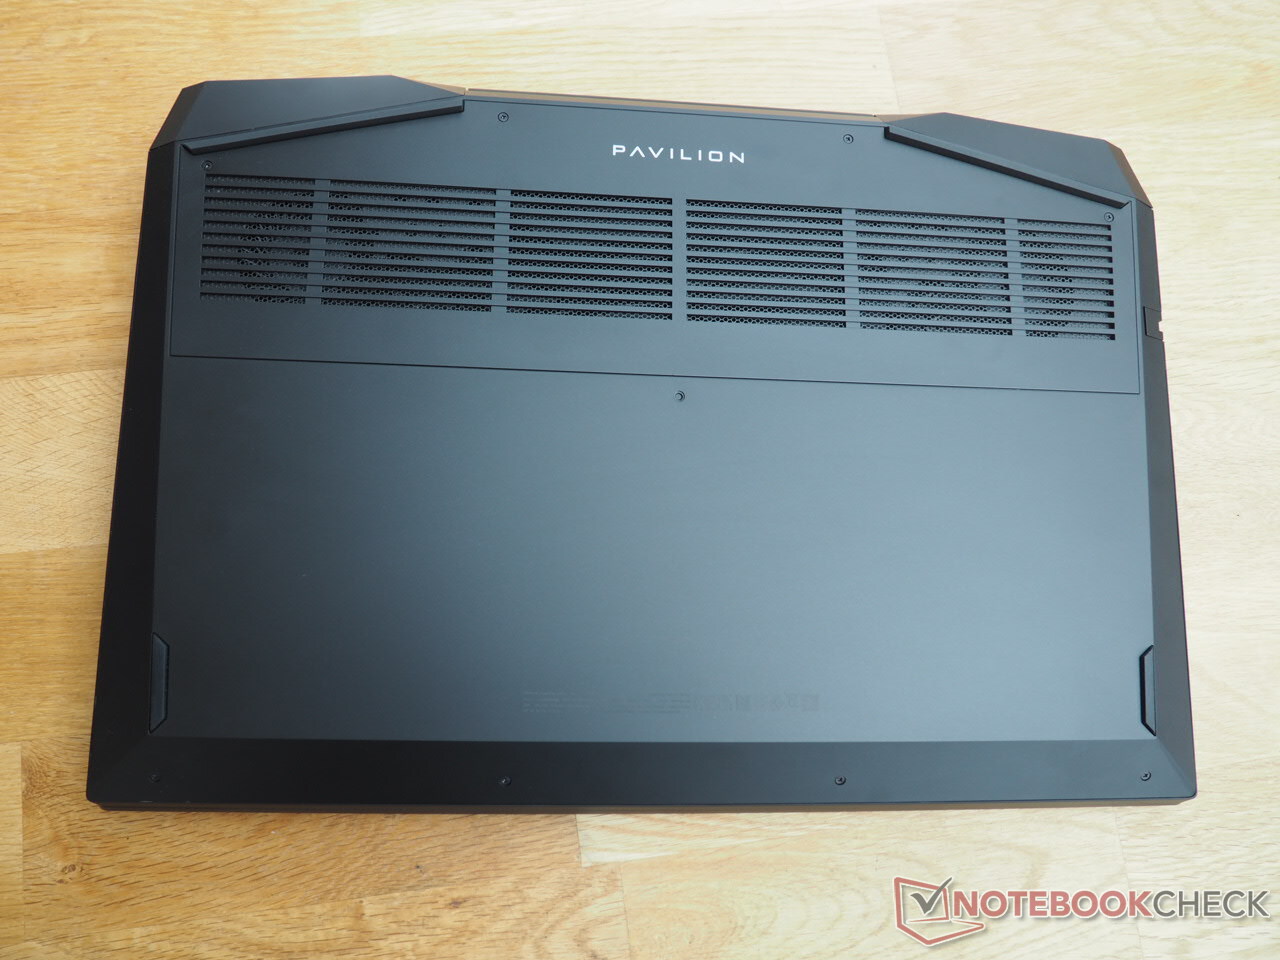
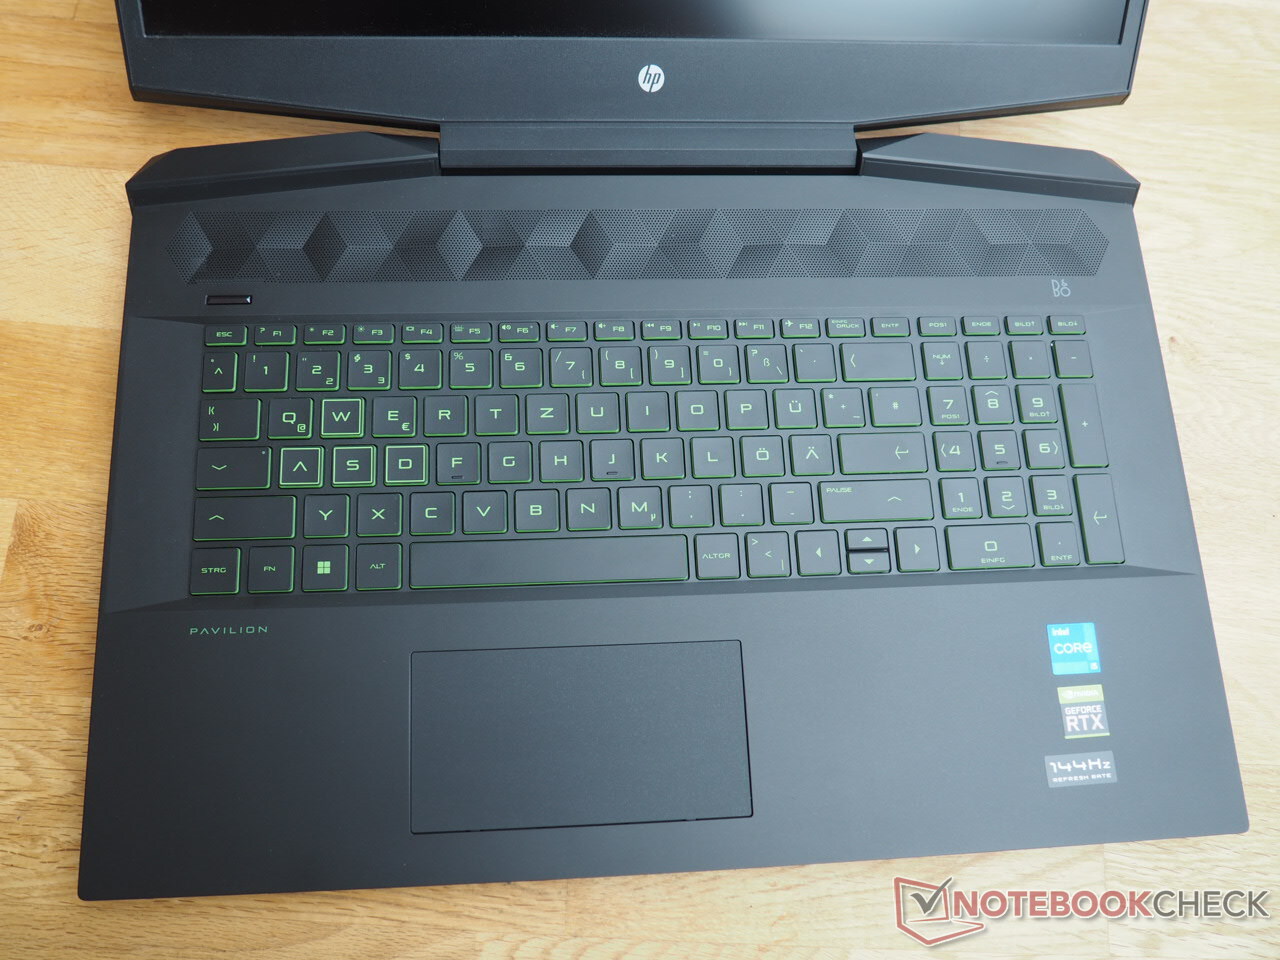
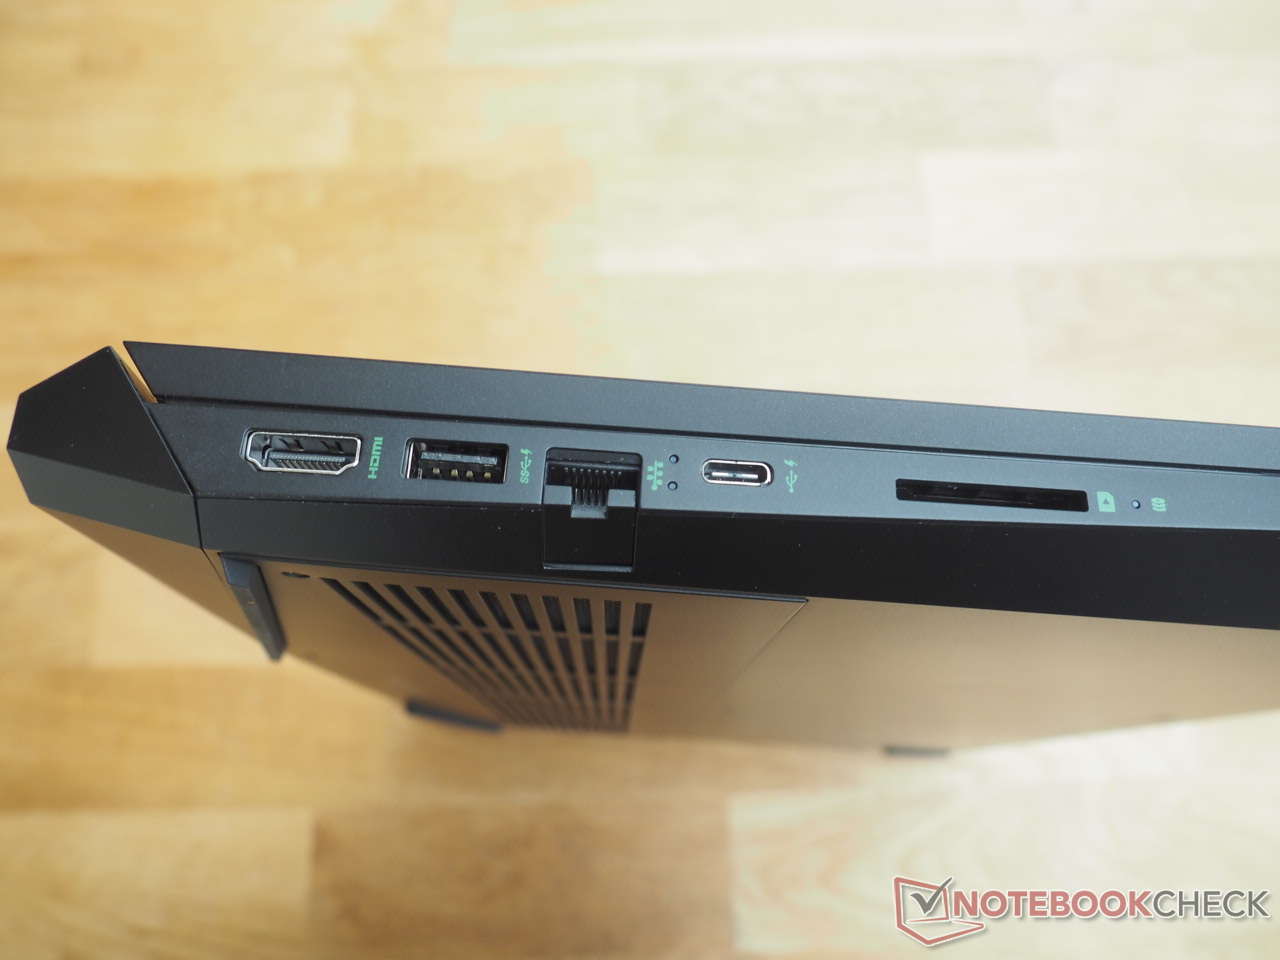
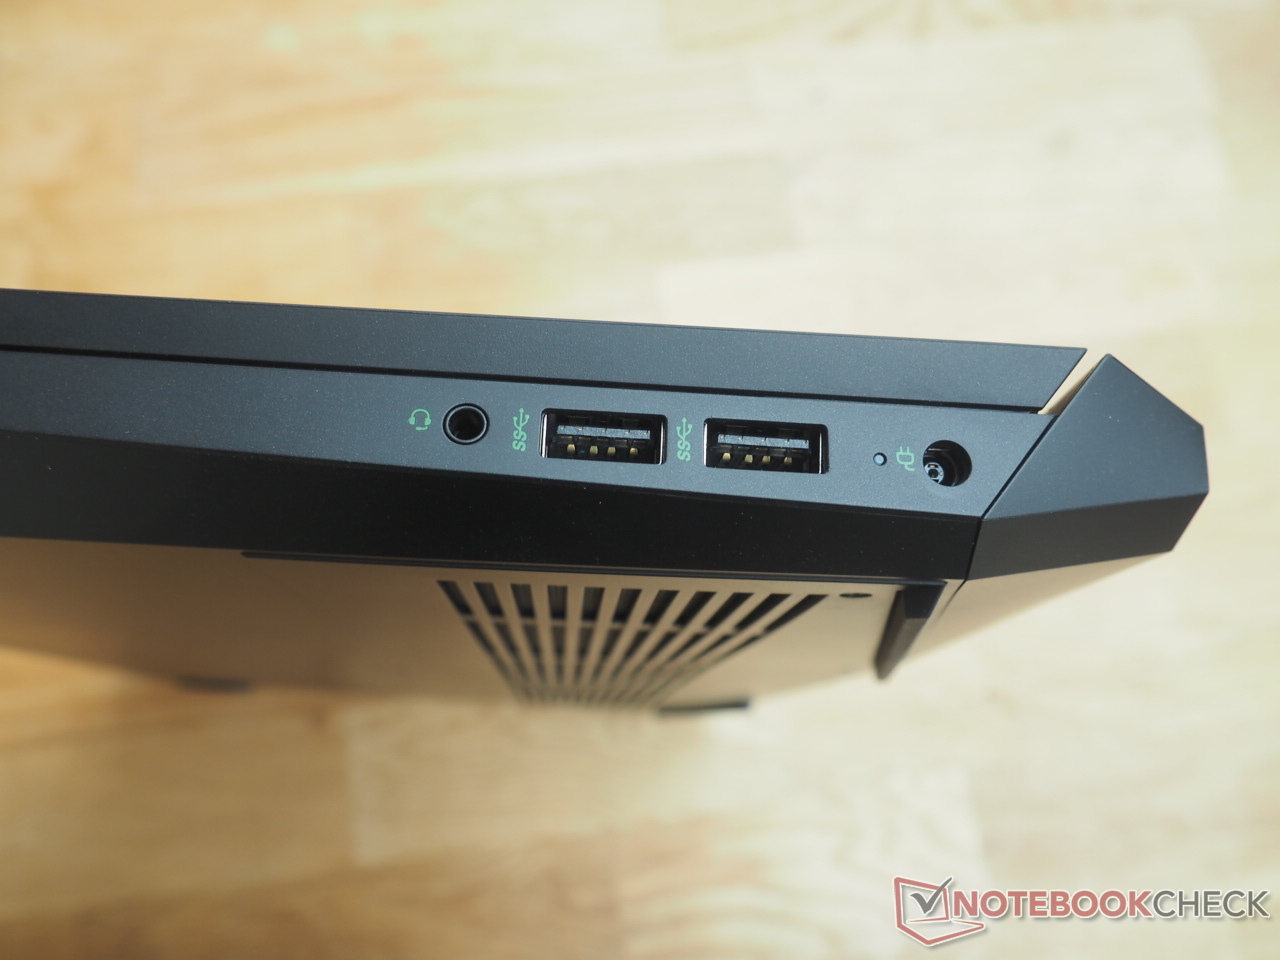
Como el chasis es externamente idéntico al del (pre)predecesor, no volveremos a hablar de la carcasa, los dispositivos de entrada y la conectividad en este artículo. Puedes encontrar la información correspondiente en nuestro análisis del Pavilion Gaming 17-cd0085cl
Lector de tarjetas SD
| SD Card Reader - average JPG Copy Test (av. of 3 runs) | |
| Media de la clase Gaming (20.9 - 210, n=54, últimos 2 años) | |
| HP Pavilion Gaming 17-cd0085cl (Toshiba Exceria Pro SDXC 64 GB UHS-II) | |
| HP Victus 16-e0145ng (AV PRO microSD 128 GB V60) | |
| HP Pavilion Gaming 17-cd2146ng (AV PRO microSD 128 GB V60) | |
Comunicación
| Networking - iperf3 receive AXE11000 | |
| Media de la clase Gaming (680 - 1745, n=88, últimos 2 años) | |
| HP Pavilion Gaming 17-cd2146ng | |
| Medio Realtek RTL8852AE (n=1) | |
| HP Victus 16-e0145ng | |
Cámara web


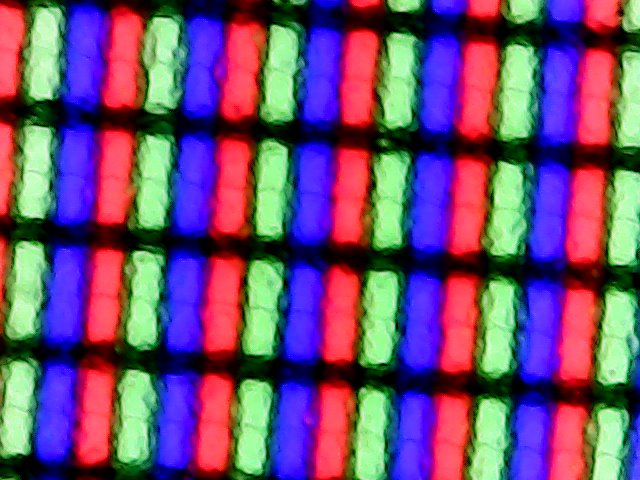
Mostrar
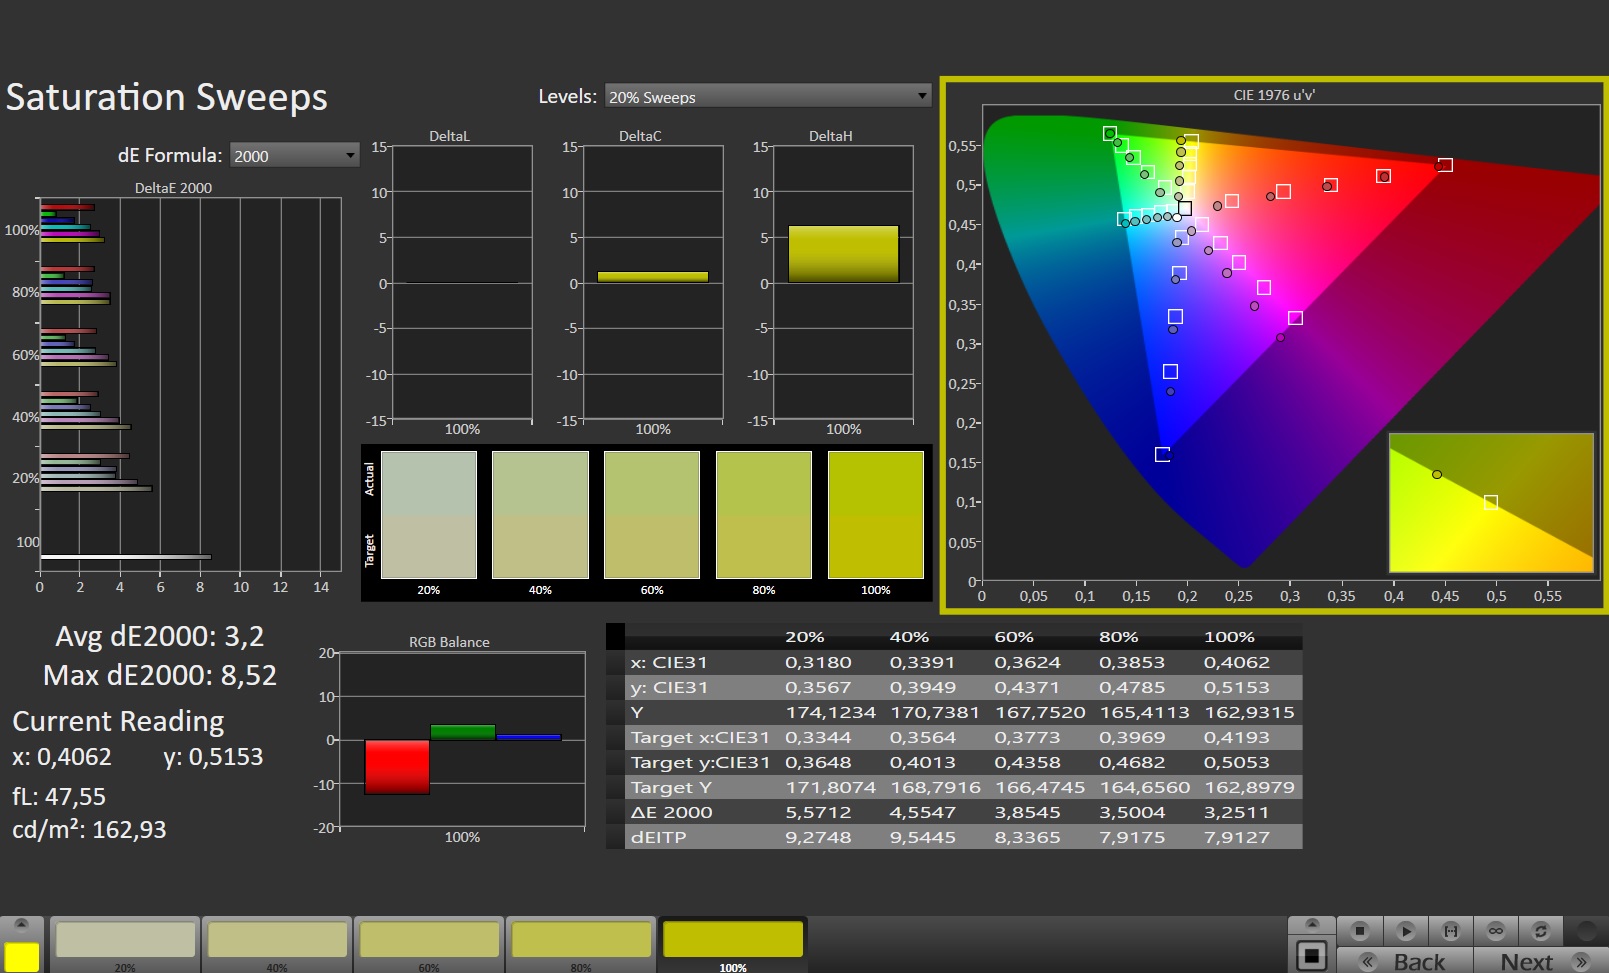
Como ya hemos dicho, es bastante raro encontrar buenas pantallas en los portátiles para juegos de menor precio. Afortunadamente, el Pavilion Gaming 17 es una de las pocas excepciones
| |||||||||||||||||||||||||
iluminación: 94 %
Brillo con batería: 328 cd/m²
Contraste: 1426:1 (Negro: 0.23 cd/m²)
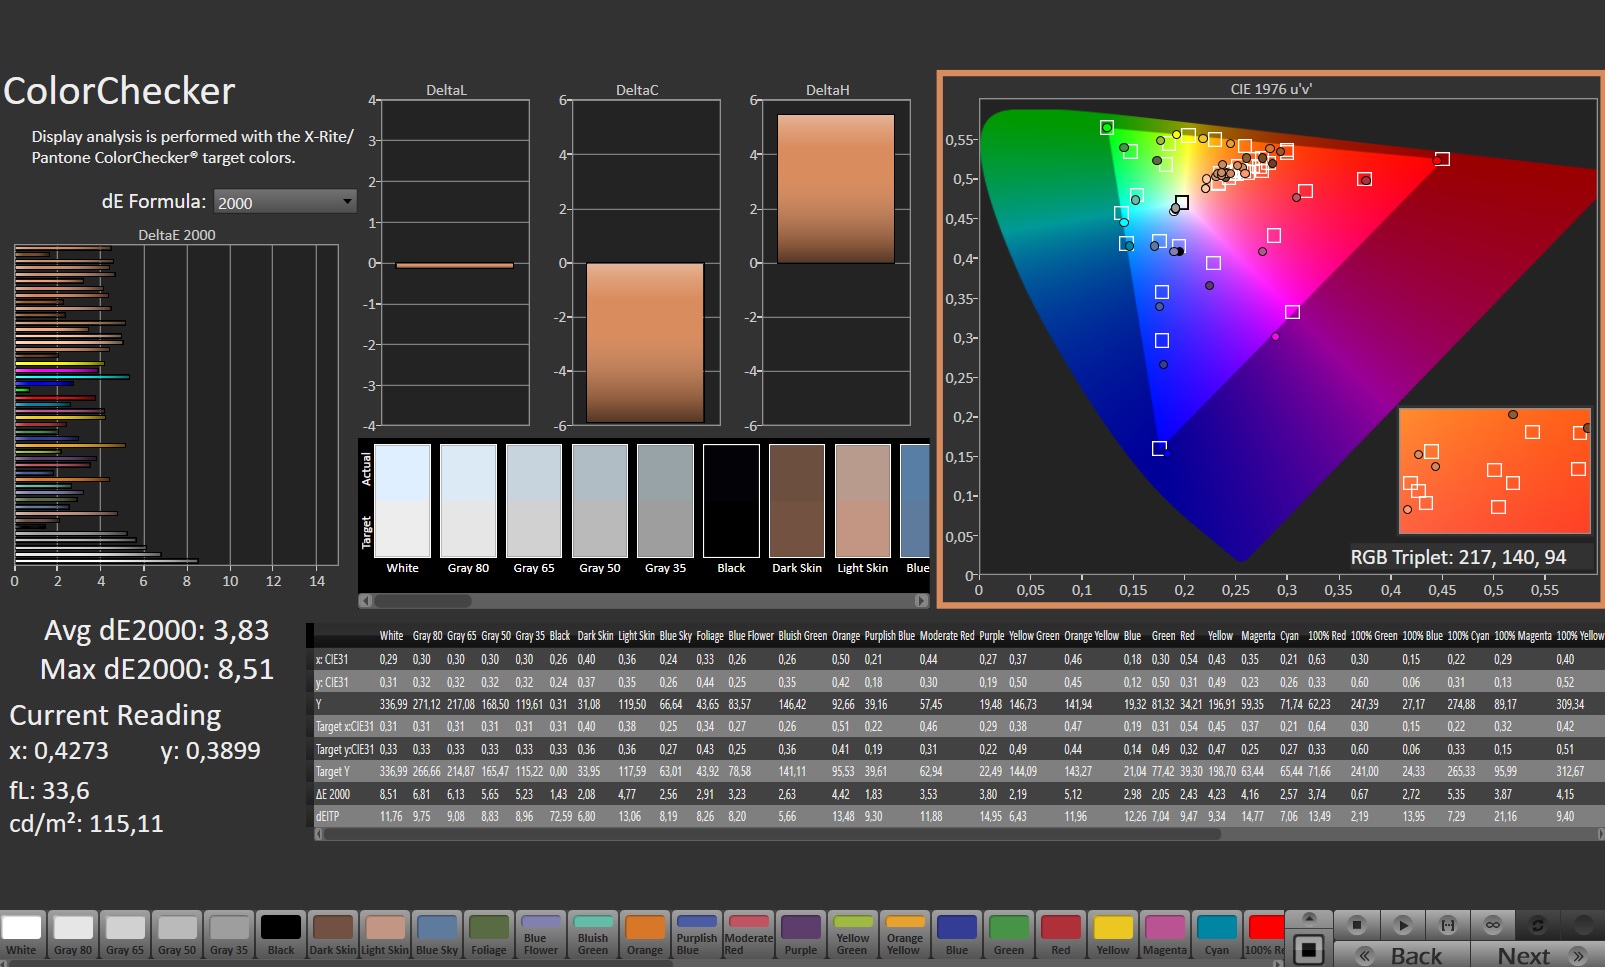
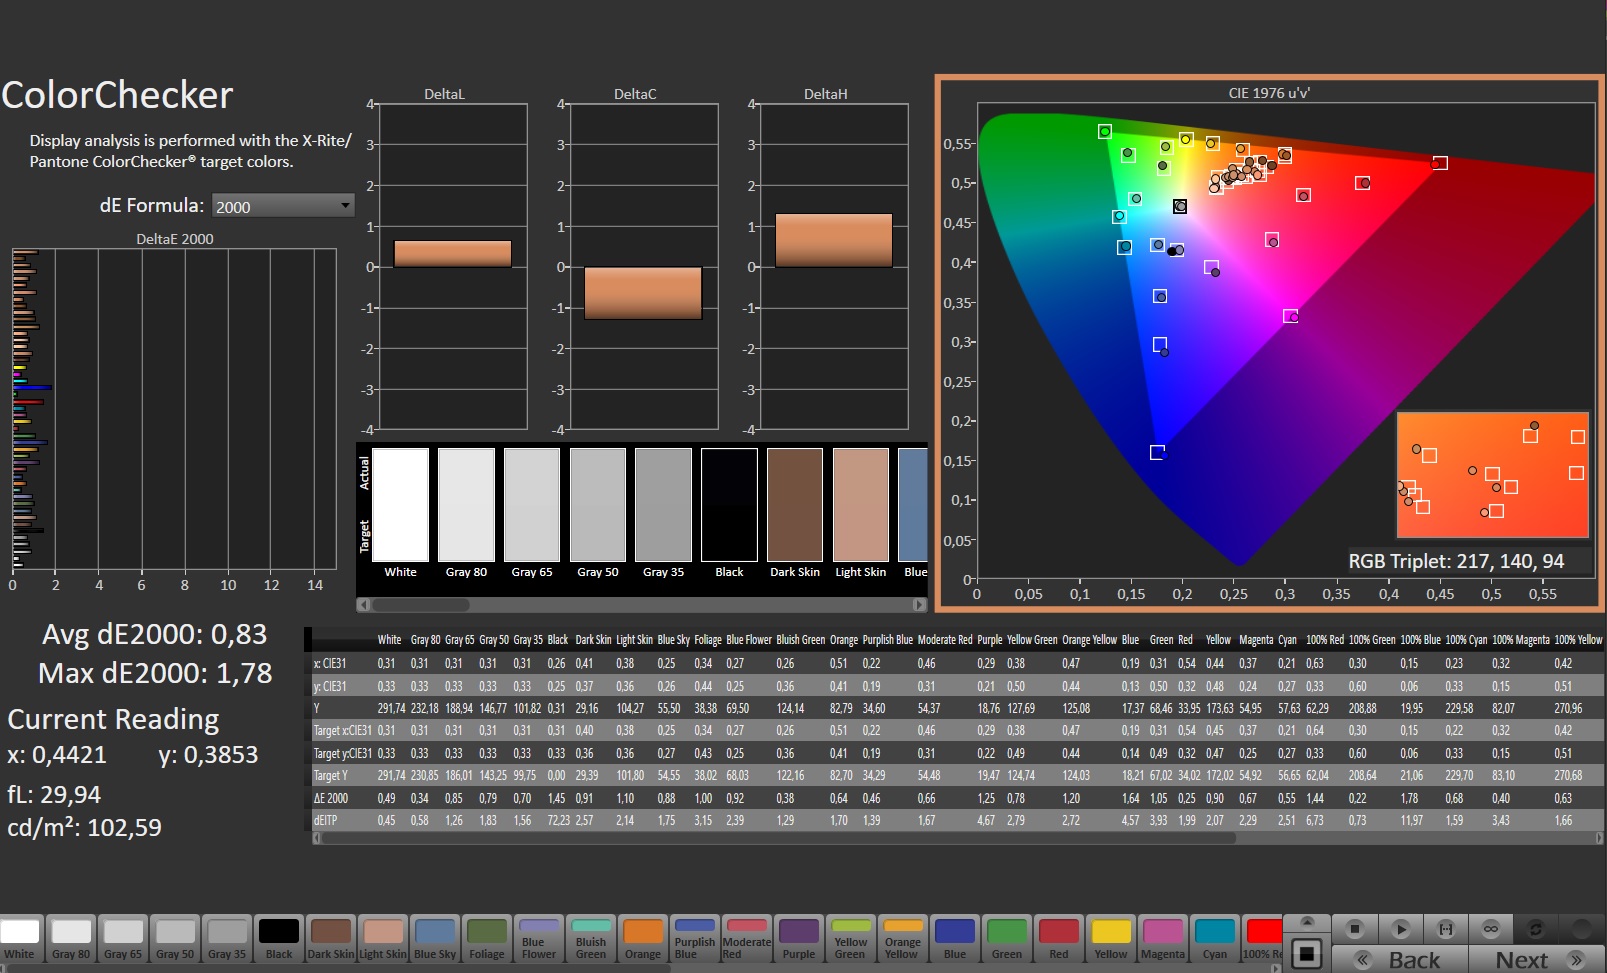
ΔE ColorChecker Calman: 3.83 | ∀{0.5-29.43 Ø4.71}
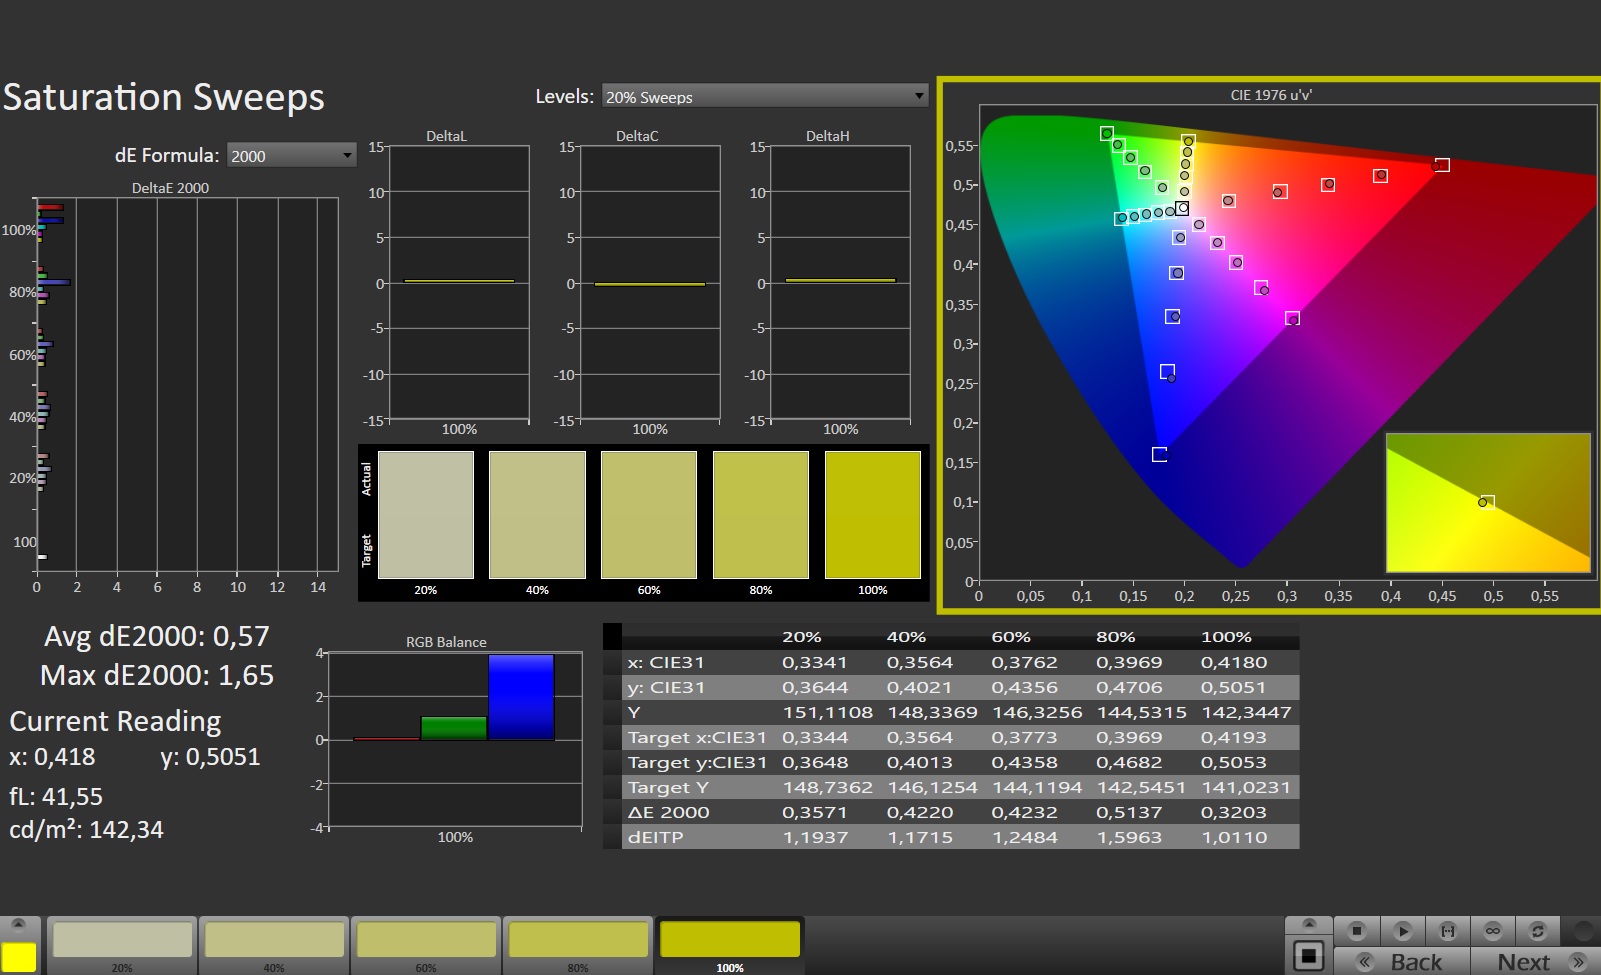
calibrated: 0.83
ΔE Greyscale Calman: 4.9 | ∀{0.09-98 Ø4.96}
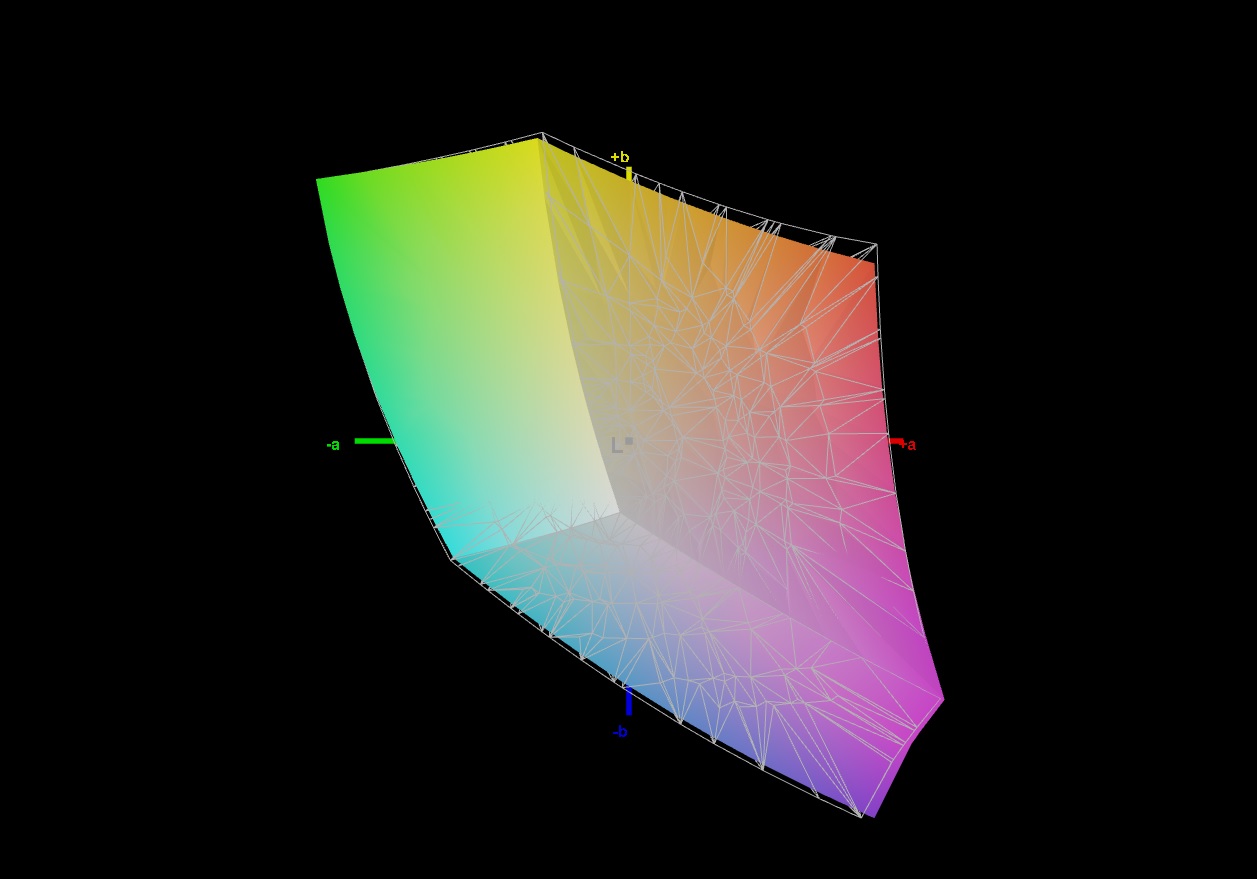
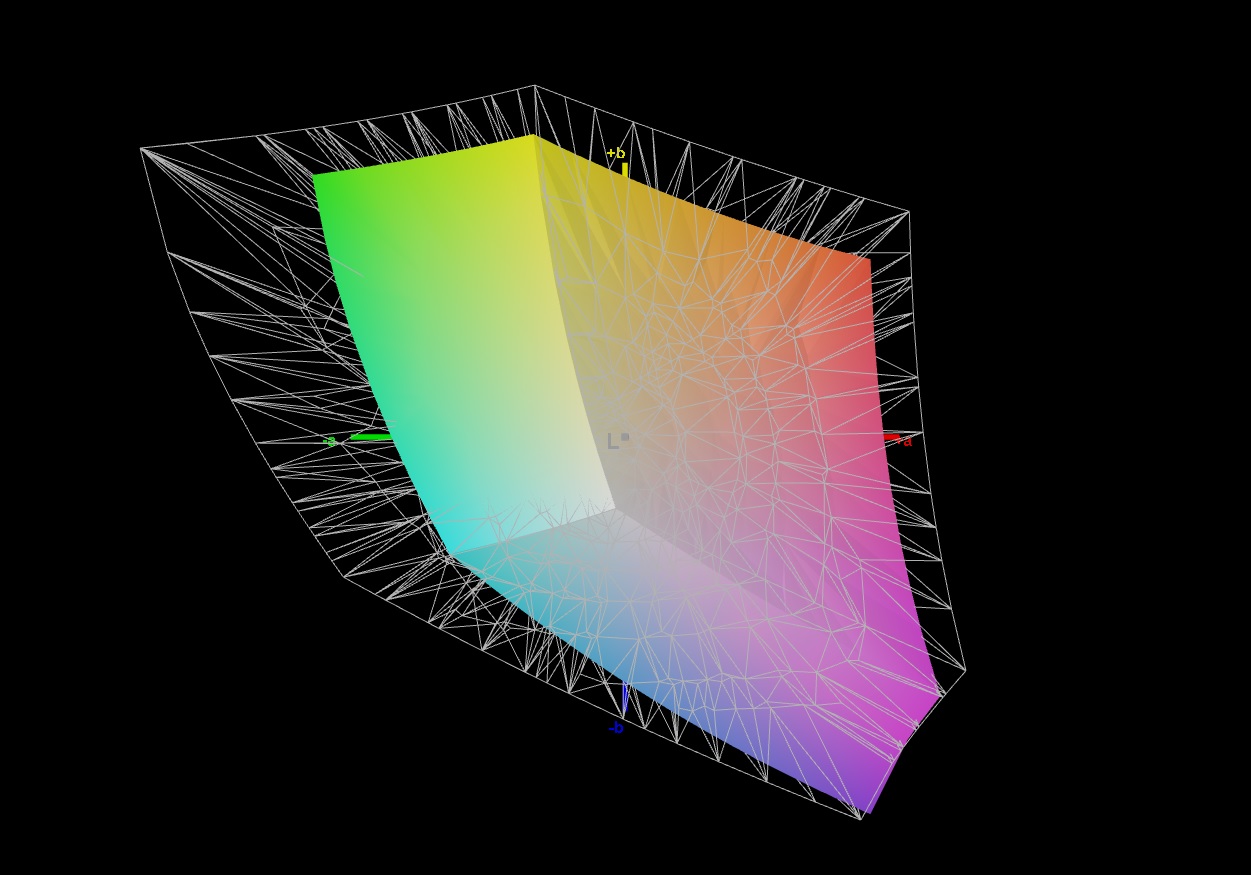
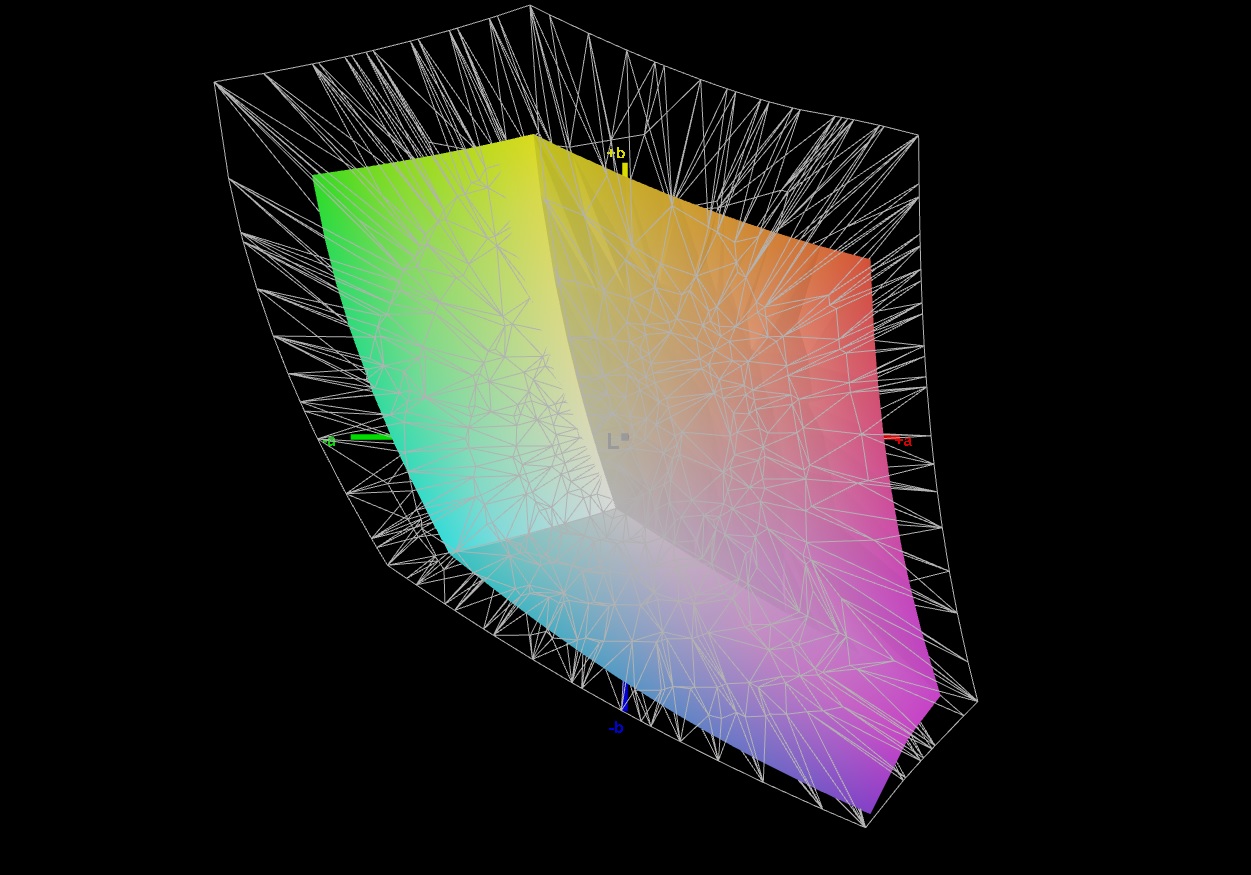
66.5% AdobeRGB 1998 (Argyll 3D)
96.8% sRGB (Argyll 3D)
64.8% Display P3 (Argyll 3D)
Gamma: 2.177
CCT: 7881 K
| HP Pavilion Gaming 17-cd2146ng LGD0611, IPS, 1920x1080, 17.3" | Dell G15 5510-43NHT Dell 156GL05, IPS, 1920x1080, 15.6" | Lenovo Ideapad Gaming 3 15IHU-82K1002RGE LEN156FHD, IPS, 1920x1080, 15.6" | HP Victus 16-e0145ng CMN1609, IPS, 1920x1080, 16.1" | HP Pavilion Gaming 17-cd0085cl BOE0825, IPS, 1920x1080, 17.3" | |
|---|---|---|---|---|---|
| Display | -37% | -38% | -36% | -4% | |
| Display P3 Coverage (%) | 64.8 | 40.8 -37% | 39.7 -39% | 41.6 -36% | 63.3 -2% |
| sRGB Coverage (%) | 96.8 | 61.4 -37% | 59.6 -38% | 61.9 -36% | 90.2 -7% |
| AdobeRGB 1998 Coverage (%) | 66.5 | 42.2 -37% | 41.1 -38% | 43 -35% | 64.3 -3% |
| Response Times | -193% | -285% | -128% | -137% | |
| Response Time Grey 50% / Grey 80% * (ms) | 12.7 ? | 35 ? -176% | 46.4 ? -265% | 29.6 ? -133% | 31.6 ? -149% |
| Response Time Black / White * (ms) | 8.7 ? | 27 ? -210% | 35.2 ? -305% | 19.4 ? -123% | 19.6 ? -125% |
| PWM Frequency (Hz) | |||||
| Screen | -117% | -77% | -80% | -40% | |
| Brightness middle (cd/m²) | 328 | 290 -12% | 307 -6% | 257 -22% | 299.6 -9% |
| Brightness (cd/m²) | 317 | 267 -16% | 292 -8% | 239 -25% | 285 -10% |
| Brightness Distribution (%) | 94 | 87 -7% | 88 -6% | 88 -6% | 86 -9% |
| Black Level * (cd/m²) | 0.23 | 1.085 -372% | 0.21 9% | 0.25 -9% | 0.33 -43% |
| Contrast (:1) | 1426 | 267 -81% | 1462 3% | 1028 -28% | 908 -36% |
| Colorchecker dE 2000 * | 3.83 | 6.5 -70% | 5.9 -54% | 6.91 -80% | 3.68 4% |
| Colorchecker dE 2000 max. * | 8.51 | 16.96 -99% | 21.6 -154% | 22.27 -162% | 8.05 5% |
| Colorchecker dE 2000 calibrated * | 0.83 | 4.11 -395% | 4.8 -478% | 3.61 -335% | 3.15 -280% |
| Greyscale dE 2000 * | 4.9 | 4.85 1% | 4.9 -0% | 7.5 -53% | 3.8 22% |
| Gamma | 2.177 101% | 2.22 99% | 2.26 97% | 2.125 104% | 2.12 104% |
| CCT | 7881 82% | 7401 88% | 6504 100% | 6025 108% | 7240 90% |
| Color Space (Percent of AdobeRGB 1998) (%) | 58.1 | ||||
| Color Space (Percent of sRGB) (%) | 89.8 | ||||
| Media total (Programa/Opciones) | -116% /
-111% | -133% /
-99% | -81% /
-77% | -60% /
-46% |
* ... más pequeño es mejor
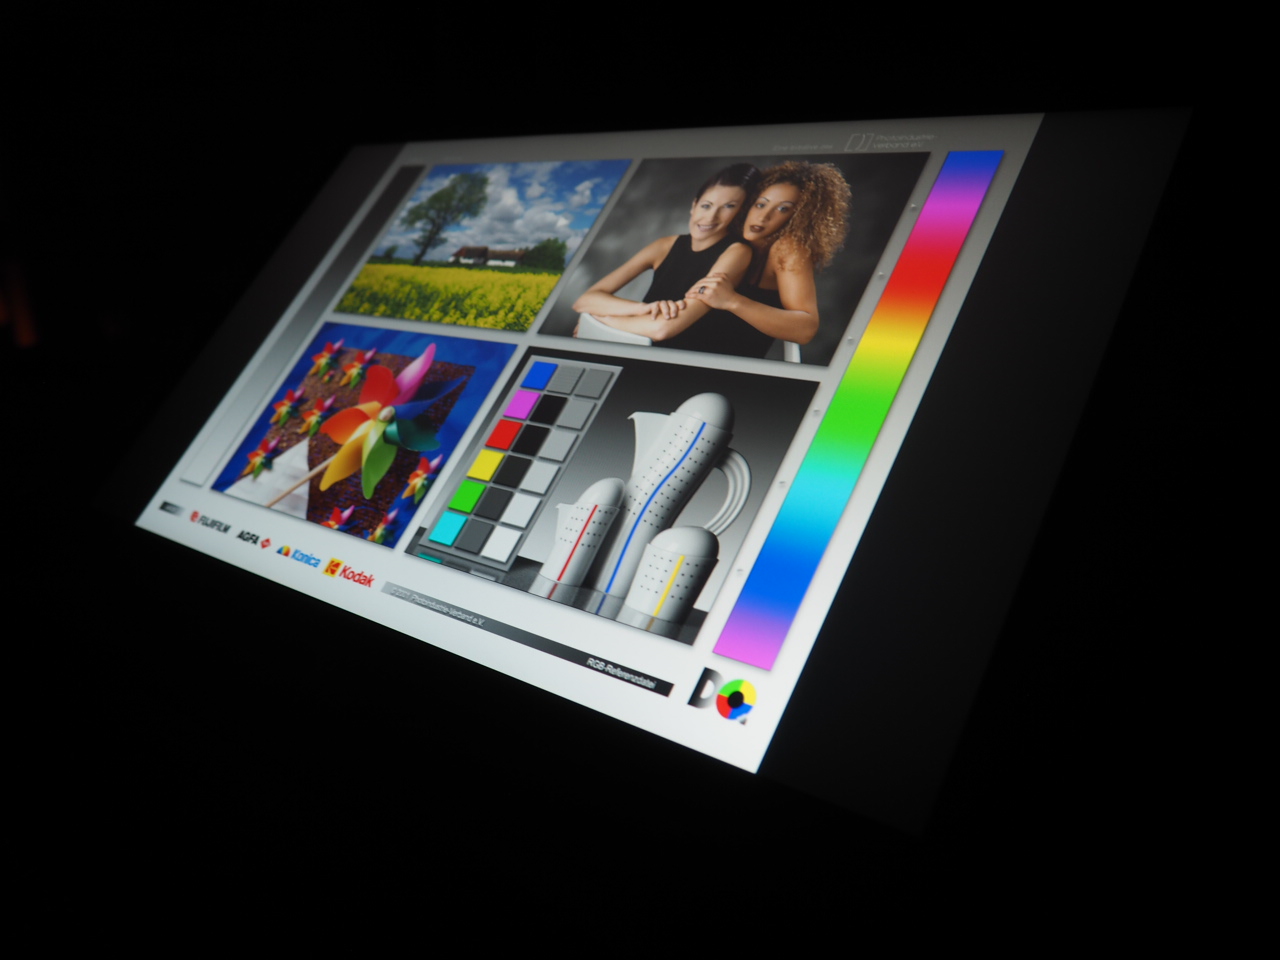
Con una cobertura sRGB registrada del 97%, que se acerca a la especificación del fabricante, el portátil HP está a pasos agigantados por delante de la competencia. Tanto el Dell G15 como el Lenovo IdeaPad Gaming 3 sólo alcanzan alrededor del 60%, resultando en una imagen mucho más pálida sin importar el contraste, que sólo tiende a ser adecuada para la oficina y la navegación por Internet, pero no para el consumo de medios (videos, películas, juegos, etc.). Por el contrario, el Pavilion 17 hace un buen papel en todas las aplicaciones
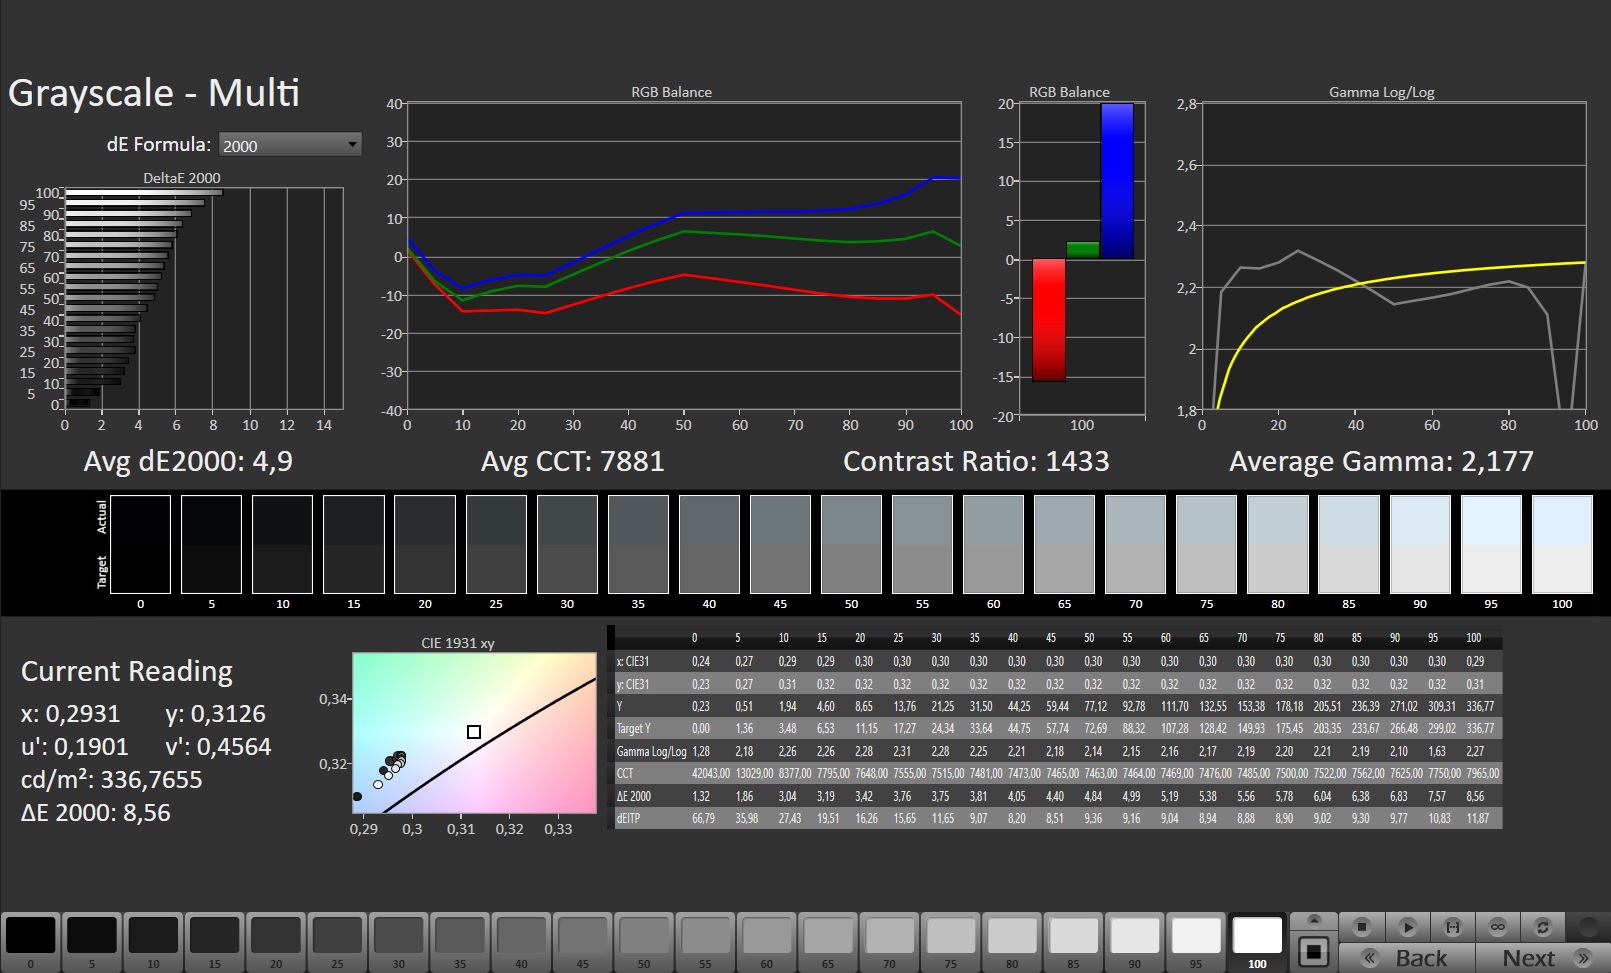
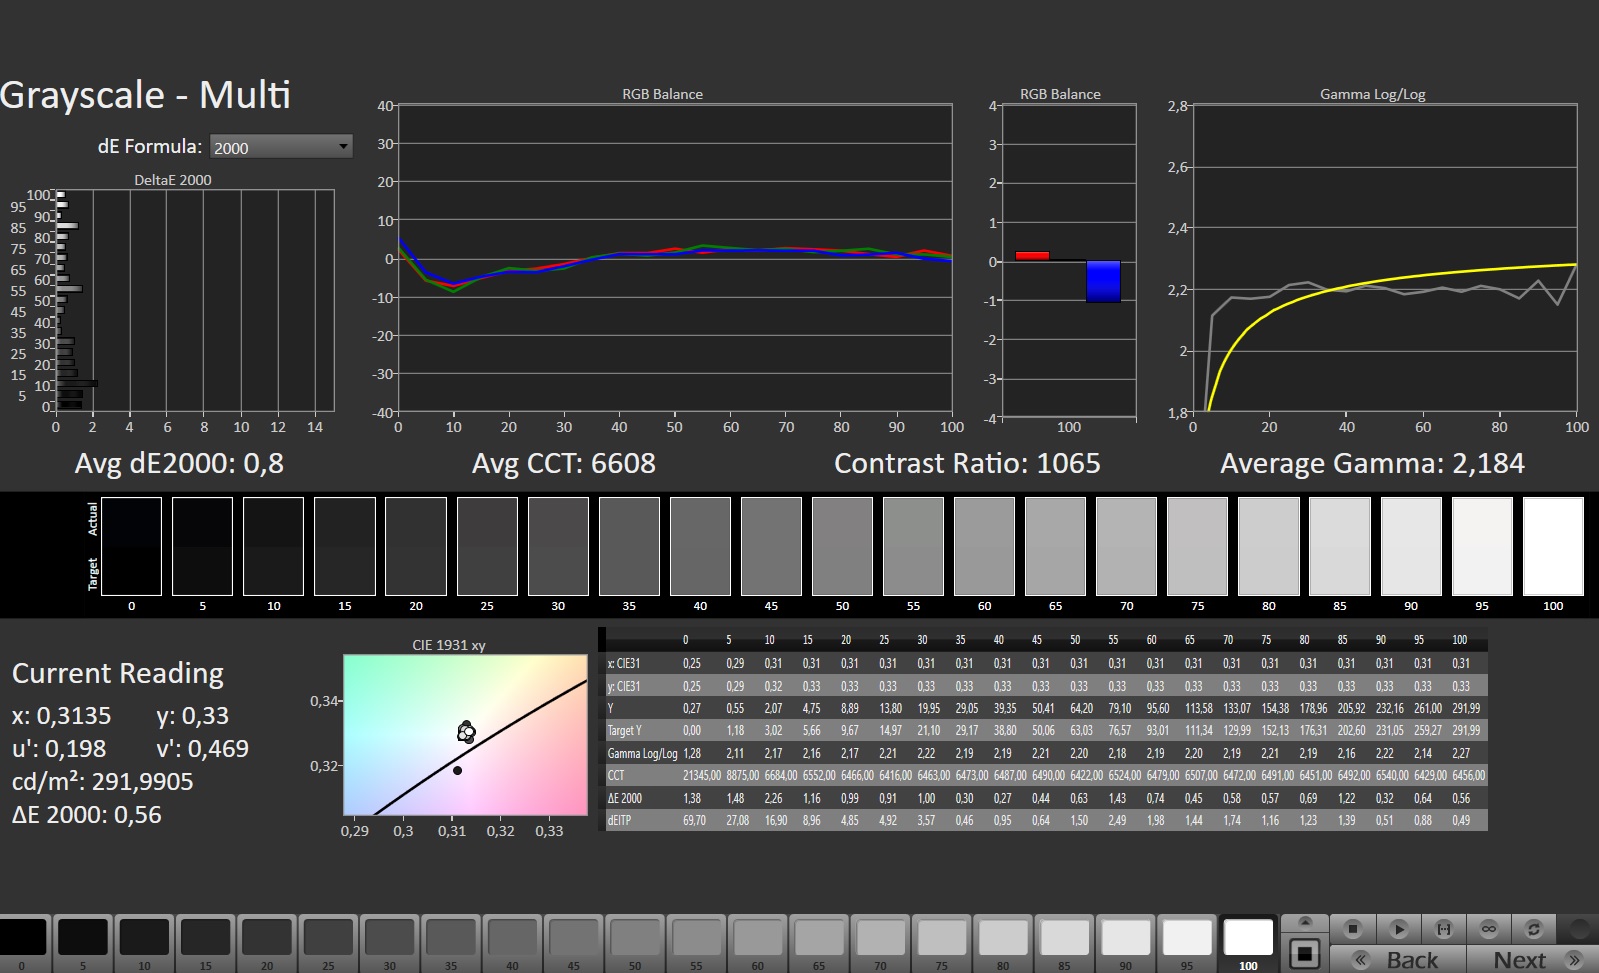
Tampoco hay nada de qué quejarse en términos de contraste. 1.426:1 es muy alto para los estándares IPS, y este valor sólo es superado por el portátil Lenovo. En lo que respecta al brillo, el Pavilion vuelve a ocupar el primer puesto. Una media de 317 cd/m² no es una tasa máxima, pero debería ser suficiente para la mayoría de las necesidades siempre que se eviten lugares especialmente luminosos o soleados. Para comparar: La competencia se mantiene por debajo de los 300 cd/m² de media
El portátil HP gana aún más puntos por sus rápidos tiempos de respuesta, que ningún competidor puede igualar. Sin embargo, el fabricante podría mejorar la precisión del color. El panel muestra un ligero tinte azul al sacarlo de la caja, que puede corregirse con el calibrado (hay un enlace a nuestro archivo ICC en la esquina superior derecha junto a la tabla de distribución del brillo). Los ángulos de visión están en línea con los estándares típicos de IPS. El dispositivo de 17 pulgadas no sufre de excesivo sangrado de pantalla o parpadeo
Tiempos de respuesta del display
| ↔ Tiempo de respuesta de Negro a Blanco | ||
|---|---|---|
| 8.7 ms ... subida ↗ y bajada ↘ combinada | ↗ 4.4 ms subida | 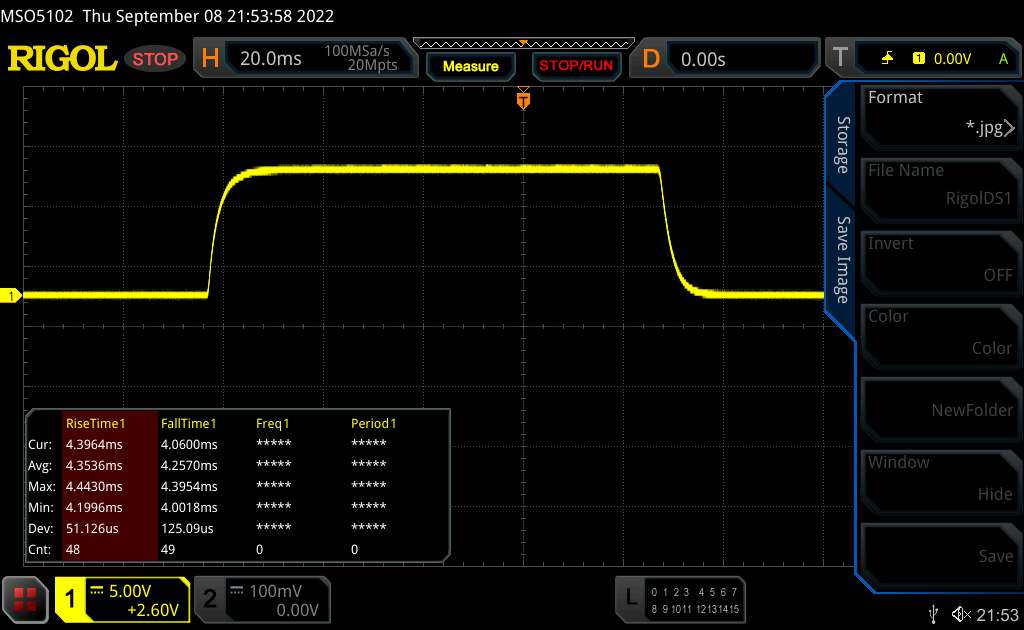 |
| ↘ 4.3 ms bajada | ||
| La pantalla mostró tiempos de respuesta rápidos en nuestros tests y debería ser adecuada para juegos. En comparación, todos los dispositivos de prueba van de ##min### (mínimo) a 240 (máximo) ms. » 24 % de todos los dispositivos son mejores. Esto quiere decir que el tiempo de respuesta medido es mejor que la media (19.8 ms) de todos los dispositivos testados. | ||
| ↔ Tiempo de respuesta 50% Gris a 80% Gris | ||
| 12.7 ms ... subida ↗ y bajada ↘ combinada | ↗ 6.1 ms subida | 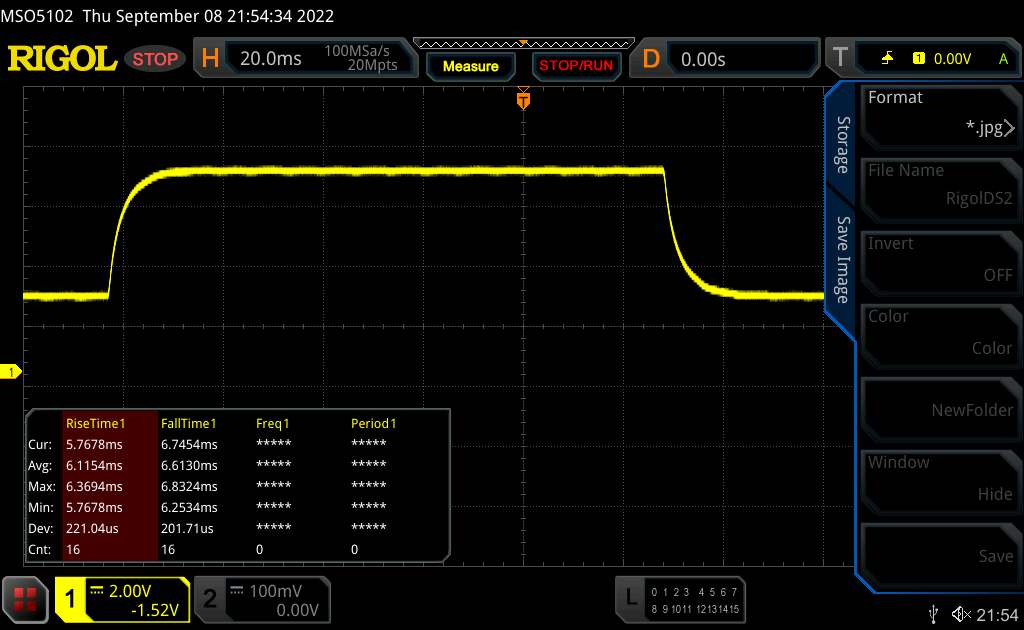 |
| ↘ 6.6 ms bajada | ||
| La pantalla mostró buenos tiempos de respuesta en nuestros tests pero podría ser demasiado lenta para los jugones competitivos. En comparación, todos los dispositivos de prueba van de ##min### (mínimo) a 636 (máximo) ms. » 26 % de todos los dispositivos son mejores. Esto quiere decir que el tiempo de respuesta medido es mejor que la media (31 ms) de todos los dispositivos testados. | ||
Parpadeo de Pantalla / PWM (Pulse-Width Modulation)
| Parpadeo de Pantalla / PWM no detectado | 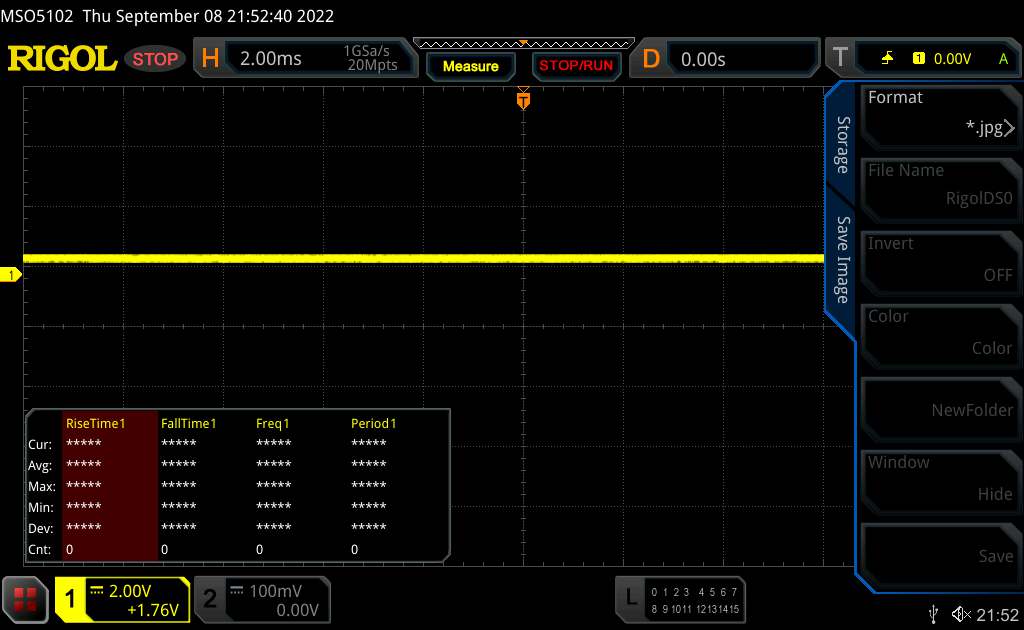 | ||
Comparación: 52 % de todos los dispositivos testados no usaron PWM para atenuar el display. Si se usó, medimos una media de 7754 (mínimo: 5 - máxmo: 343500) Hz. | |||
Rendimiento
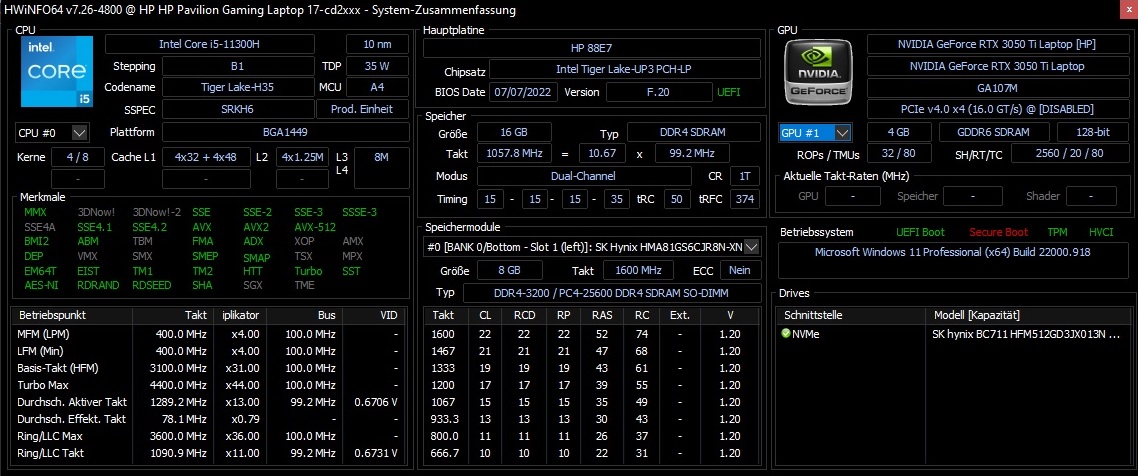
Con una CPU de cuatro núcleos y una GPU de 4 GB, el Pavilion Gaming 17 se sitúa en el segmento de la gama media. 16 GB de RAM deberían ser suficientes para los próximos años. Las cosas podrían apretarse con el SSD cuando se instalan varios juegos (grandes). No obstante, el almacenamiento y la RAM pueden intercambiarse sin problemas
Condiciones de la prueba
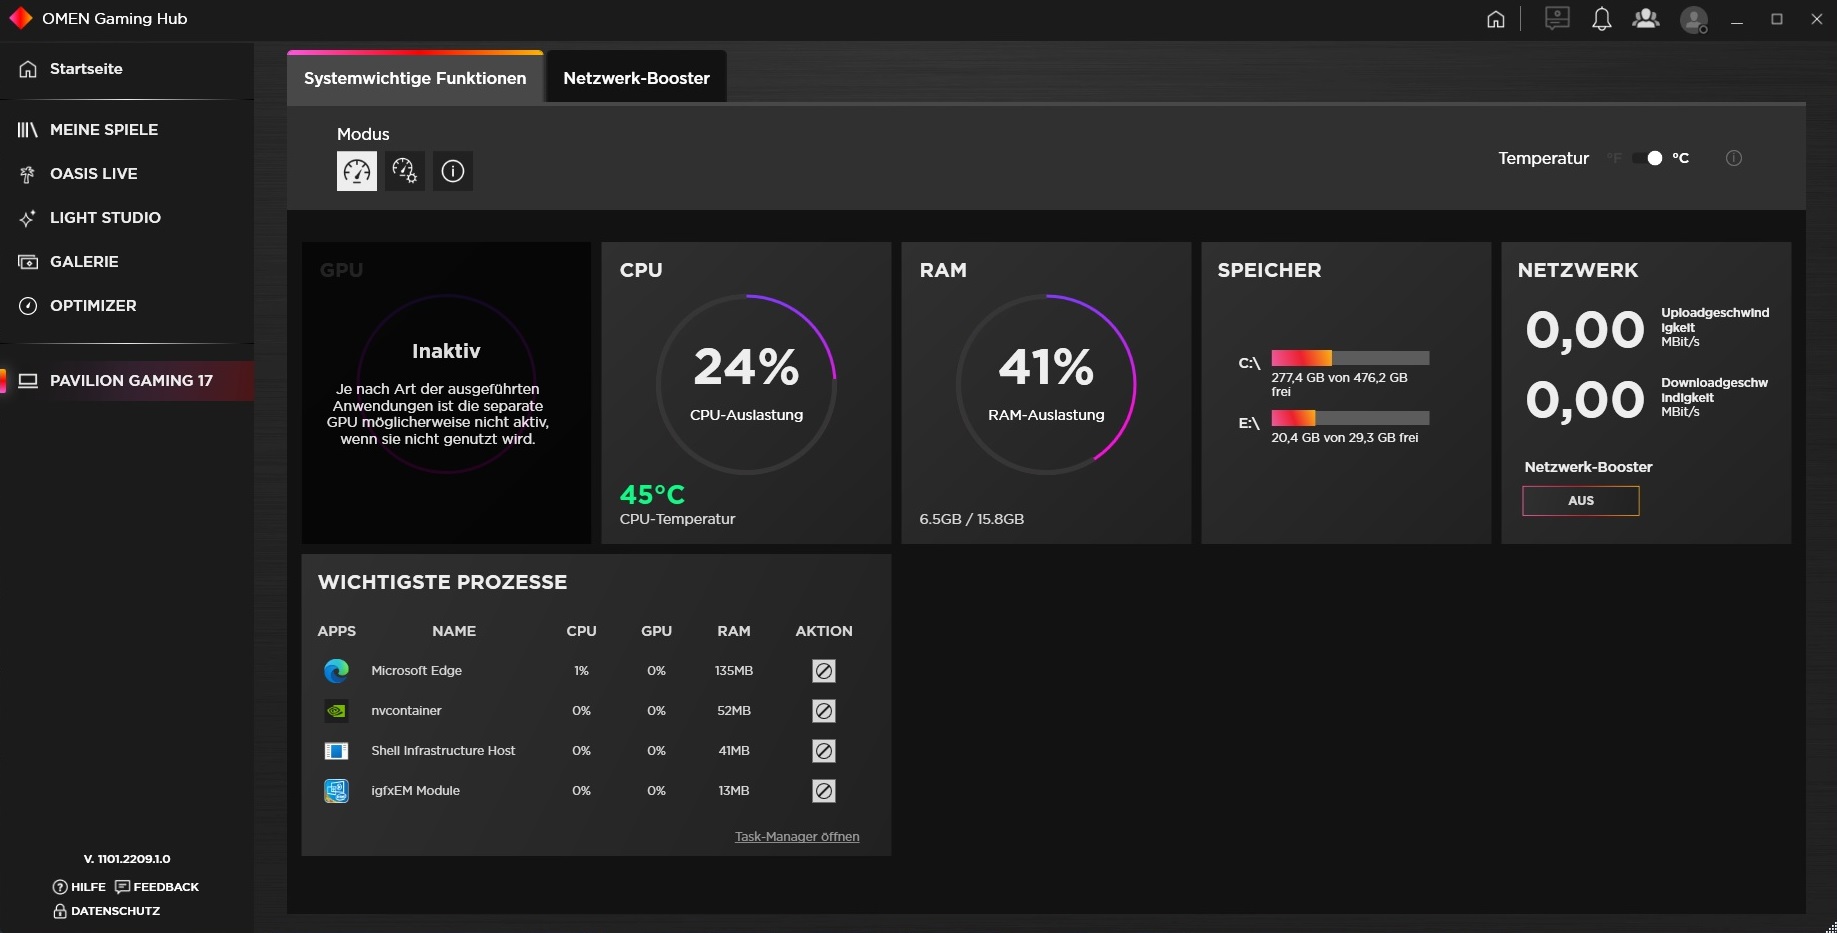
Además de los controladores y actualizaciones que instala automáticamente Windows, sólo instalamos el Omen Gaming Hub en el dispositivo. Sin embargo, en el caso del Pavilion Gaming 17, no había diferentes modos de rendimiento disponibles allí, como es por otra parte habitual en otros portátiles
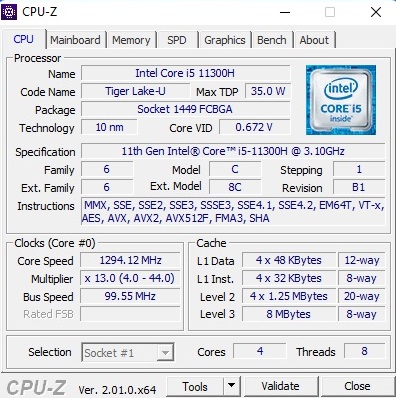
Procesador
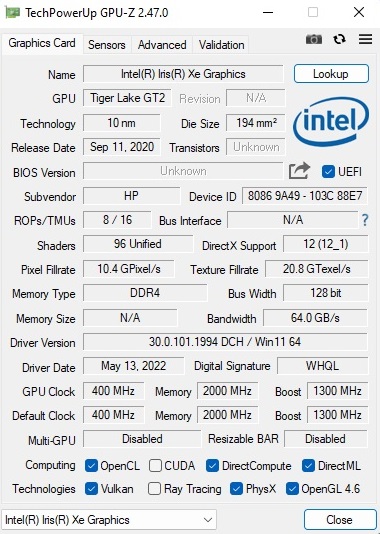
El Core i5-11300H es una potente CPU de cuatro núcleos que pertenece a la generación Tiger-Lake de Intel, que ya no es tan nueva como antes. El chip de 10 nm ofrece 8 MB de caché L3, así como hasta 8 hilos que pueden procesarse en paralelo a través de Hyper-Threading. El procesador se comportó sin problemas en nuestro curso de pruebas. Su rendimiento es similar al del Lenovo IdeaPad Gaming 3, que también está equipado con un i5-11300H. Sin embargo, cuando se trata de aplicaciones multinúcleo, la CPU no tiene ninguna oportunidad contra el antiguoCore i7-9750H y elRyzen 5 5600H (6 núcleos cada uno) en particular. No obstante, el i5-11300H es un buen modelo polivalente
Cinebench R15 Multi endurance test
* ... más pequeño es mejor
AIDA64: FP32 Ray-Trace | FPU Julia | CPU SHA3 | CPU Queen | FPU SinJulia | FPU Mandel | CPU AES | CPU ZLib | FP64 Ray-Trace | CPU PhotoWorxx
| Performance rating | |
| Media de la clase Gaming | |
| HP Victus 16-e0145ng | |
| Lenovo Ideapad Gaming 3 15IHU-82K1002RGE | |
| Medio Intel Core i5-11300H | |
| HP Pavilion Gaming 17-cd2146ng | |
| Dell G15 5510-43NHT | |
| AIDA64 / FP32 Ray-Trace | |
| Media de la clase Gaming (10227 - 85542, n=105, últimos 2 años) | |
| HP Victus 16-e0145ng | |
| Lenovo Ideapad Gaming 3 15IHU-82K1002RGE | |
| Medio Intel Core i5-11300H (6128 - 8440, n=9) | |
| HP Pavilion Gaming 17-cd2146ng | |
| Dell G15 5510-43NHT | |
| AIDA64 / FPU Julia | |
| Media de la clase Gaming (51376 - 238426, n=105, últimos 2 años) | |
| HP Victus 16-e0145ng | |
| Lenovo Ideapad Gaming 3 15IHU-82K1002RGE | |
| Dell G15 5510-43NHT | |
| Medio Intel Core i5-11300H (25739 - 33986, n=9) | |
| HP Pavilion Gaming 17-cd2146ng | |
| AIDA64 / CPU SHA3 | |
| Media de la clase Gaming (2180 - 10115, n=105, últimos 2 años) | |
| HP Victus 16-e0145ng | |
| Lenovo Ideapad Gaming 3 15IHU-82K1002RGE | |
| Medio Intel Core i5-11300H (1773 - 2286, n=9) | |
| HP Pavilion Gaming 17-cd2146ng | |
| Dell G15 5510-43NHT | |
| AIDA64 / CPU Queen | |
| Media de la clase Gaming (49785 - 173351, n=90, últimos 2 años) | |
| HP Victus 16-e0145ng | |
| Lenovo Ideapad Gaming 3 15IHU-82K1002RGE | |
| Medio Intel Core i5-11300H (41257 - 49312, n=9) | |
| Dell G15 5510-43NHT | |
| HP Pavilion Gaming 17-cd2146ng | |
| AIDA64 / FPU SinJulia | |
| Media de la clase Gaming (4424 - 33636, n=105, últimos 2 años) | |
| HP Victus 16-e0145ng | |
| Dell G15 5510-43NHT | |
| Lenovo Ideapad Gaming 3 15IHU-82K1002RGE | |
| Medio Intel Core i5-11300H (3925 - 4677, n=9) | |
| HP Pavilion Gaming 17-cd2146ng | |
| AIDA64 / FPU Mandel | |
| Media de la clase Gaming (25115 - 128721, n=105, últimos 2 años) | |
| HP Victus 16-e0145ng | |
| Lenovo Ideapad Gaming 3 15IHU-82K1002RGE | |
| Medio Intel Core i5-11300H (15820 - 20669, n=9) | |
| HP Pavilion Gaming 17-cd2146ng | |
| Dell G15 5510-43NHT | |
| AIDA64 / CPU AES | |
| Media de la clase Gaming (39258 - 247074, n=105, últimos 2 años) | |
| Lenovo Ideapad Gaming 3 15IHU-82K1002RGE | |
| Medio Intel Core i5-11300H (37694 - 71519, n=9) | |
| HP Victus 16-e0145ng | |
| HP Pavilion Gaming 17-cd2146ng | |
| Dell G15 5510-43NHT | |
| AIDA64 / CPU ZLib | |
| Media de la clase Gaming (574 - 2531, n=105, últimos 2 años) | |
| HP Victus 16-e0145ng | |
| Lenovo Ideapad Gaming 3 15IHU-82K1002RGE | |
| Medio Intel Core i5-11300H (269 - 390, n=9) | |
| Dell G15 5510-43NHT | |
| HP Pavilion Gaming 17-cd2146ng | |
| AIDA64 / FP64 Ray-Trace | |
| Media de la clase Gaming (5509 - 45446, n=105, últimos 2 años) | |
| HP Victus 16-e0145ng | |
| Lenovo Ideapad Gaming 3 15IHU-82K1002RGE | |
| Medio Intel Core i5-11300H (3322 - 4613, n=9) | |
| HP Pavilion Gaming 17-cd2146ng | |
| Dell G15 5510-43NHT | |
| AIDA64 / CPU PhotoWorxx | |
| Media de la clase Gaming (12271 - 89891, n=105, últimos 2 años) | |
| HP Pavilion Gaming 17-cd2146ng | |
| Medio Intel Core i5-11300H (9705 - 38002, n=9) | |
| HP Victus 16-e0145ng | |
| Lenovo Ideapad Gaming 3 15IHU-82K1002RGE | |
| Dell G15 5510-43NHT | |
Rendimiento del sistema
En términos de rendimiento del sistema, el portátil de 17 pulgadas se sitúa cómodamente en medio de la competencia. 5.442 puntos en PCMark 10 es un resultado sólido y absolutamente adecuado para el precio estimado
CrossMark: Overall | Productivity | Creativity | Responsiveness
| PCMark 10 / Score | |
| Media de la clase Gaming (5828 - 12414, n=93, últimos 2 años) | |
| HP Victus 16-e0145ng | |
| Lenovo Ideapad Gaming 3 15IHU-82K1002RGE | |
| Medio Intel Core i5-11300H, NVIDIA GeForce RTX 3050 Ti Laptop GPU (5442 - 5641, n=2) | |
| HP Pavilion Gaming 17-cd2146ng | |
| HP Pavilion Gaming 17-cd0085cl | |
| Dell G15 5510-43NHT | |
| PCMark 10 / Essentials | |
| Media de la clase Gaming (8810 - 11935, n=97, últimos 2 años) | |
| HP Victus 16-e0145ng | |
| HP Pavilion Gaming 17-cd0085cl | |
| HP Pavilion Gaming 17-cd2146ng | |
| Medio Intel Core i5-11300H, NVIDIA GeForce RTX 3050 Ti Laptop GPU (8524 - 8829, n=2) | |
| Lenovo Ideapad Gaming 3 15IHU-82K1002RGE | |
| Dell G15 5510-43NHT | |
| PCMark 10 / Productivity | |
| Media de la clase Gaming (6845 - 25323, n=95, últimos 2 años) | |
| Lenovo Ideapad Gaming 3 15IHU-82K1002RGE | |
| Medio Intel Core i5-11300H, NVIDIA GeForce RTX 3050 Ti Laptop GPU (7664 - 9112, n=2) | |
| HP Victus 16-e0145ng | |
| HP Pavilion Gaming 17-cd2146ng | |
| HP Pavilion Gaming 17-cd0085cl | |
| Dell G15 5510-43NHT | |
| PCMark 10 / Digital Content Creation | |
| Media de la clase Gaming (7602 - 19954, n=95, últimos 2 años) | |
| HP Victus 16-e0145ng | |
| HP Pavilion Gaming 17-cd0085cl | |
| HP Pavilion Gaming 17-cd2146ng | |
| Medio Intel Core i5-11300H, NVIDIA GeForce RTX 3050 Ti Laptop GPU (6271 - 6462, n=2) | |
| Lenovo Ideapad Gaming 3 15IHU-82K1002RGE | |
| Dell G15 5510-43NHT | |
| CrossMark / Overall | |
| Media de la clase Gaming (1366 - 2409, n=94, últimos 2 años) | |
| Lenovo Ideapad Gaming 3 15IHU-82K1002RGE | |
| Medio Intel Core i5-11300H, NVIDIA GeForce RTX 3050 Ti Laptop GPU (n=1) | |
| CrossMark / Productivity | |
| Media de la clase Gaming (1386 - 2254, n=94, últimos 2 años) | |
| Lenovo Ideapad Gaming 3 15IHU-82K1002RGE | |
| Medio Intel Core i5-11300H, NVIDIA GeForce RTX 3050 Ti Laptop GPU (n=1) | |
| CrossMark / Creativity | |
| Media de la clase Gaming (1343 - 2786, n=94, últimos 2 años) | |
| Lenovo Ideapad Gaming 3 15IHU-82K1002RGE | |
| Medio Intel Core i5-11300H, NVIDIA GeForce RTX 3050 Ti Laptop GPU (n=1) | |
| CrossMark / Responsiveness | |
| Media de la clase Gaming (1226 - 2334, n=94, últimos 2 años) | |
| Lenovo Ideapad Gaming 3 15IHU-82K1002RGE | |
| Medio Intel Core i5-11300H, NVIDIA GeForce RTX 3050 Ti Laptop GPU (n=1) | |
| PCMark 10 Score | 5442 puntos | |
ayuda | ||
| AIDA64 / Memory Copy | |
| Media de la clase Gaming (21750 - 129946, n=105, últimos 2 años) | |
| HP Victus 16-e0145ng | |
| Medio Intel Core i5-11300H (19947 - 60141, n=9) | |
| HP Pavilion Gaming 17-cd2146ng | |
| Lenovo Ideapad Gaming 3 15IHU-82K1002RGE | |
| Dell G15 5510-43NHT | |
| AIDA64 / Memory Read | |
| Media de la clase Gaming (22956 - 118858, n=105, últimos 2 años) | |
| HP Victus 16-e0145ng | |
| Medio Intel Core i5-11300H (22688 - 62684, n=9) | |
| HP Pavilion Gaming 17-cd2146ng | |
| Lenovo Ideapad Gaming 3 15IHU-82K1002RGE | |
| Dell G15 5510-43NHT | |
| AIDA64 / Memory Write | |
| Media de la clase Gaming (22297 - 135096, n=105, últimos 2 años) | |
| HP Victus 16-e0145ng | |
| Medio Intel Core i5-11300H (20959 - 65245, n=9) | |
| HP Pavilion Gaming 17-cd2146ng | |
| Lenovo Ideapad Gaming 3 15IHU-82K1002RGE | |
| Dell G15 5510-43NHT | |
| AIDA64 / Memory Latency | |
| Media de la clase Gaming (75.3 - 259, n=105, últimos 2 años) | |
| Lenovo Ideapad Gaming 3 15IHU-82K1002RGE | |
| HP Pavilion Gaming 17-cd2146ng | |
| Medio Intel Core i5-11300H (76.3 - 93.6, n=9) | |
| HP Victus 16-e0145ng | |
| Dell G15 5510-43NHT | |
* ... más pequeño es mejor
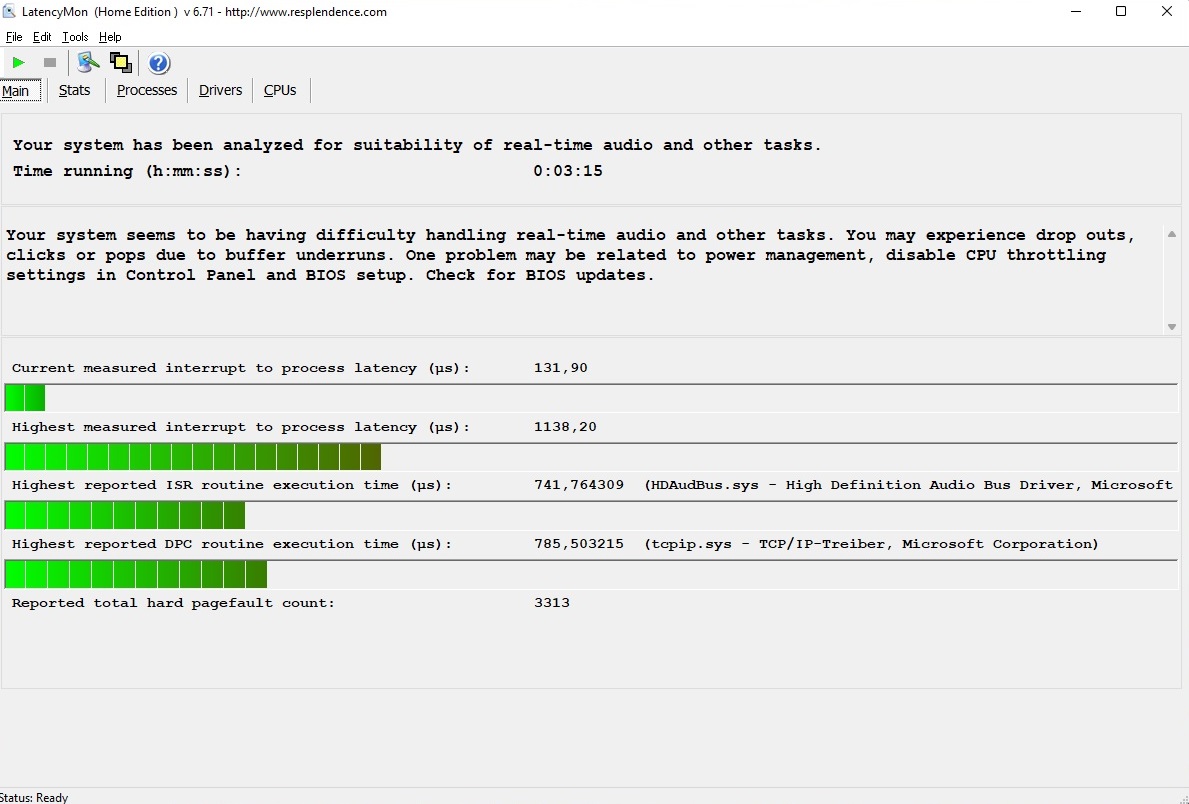
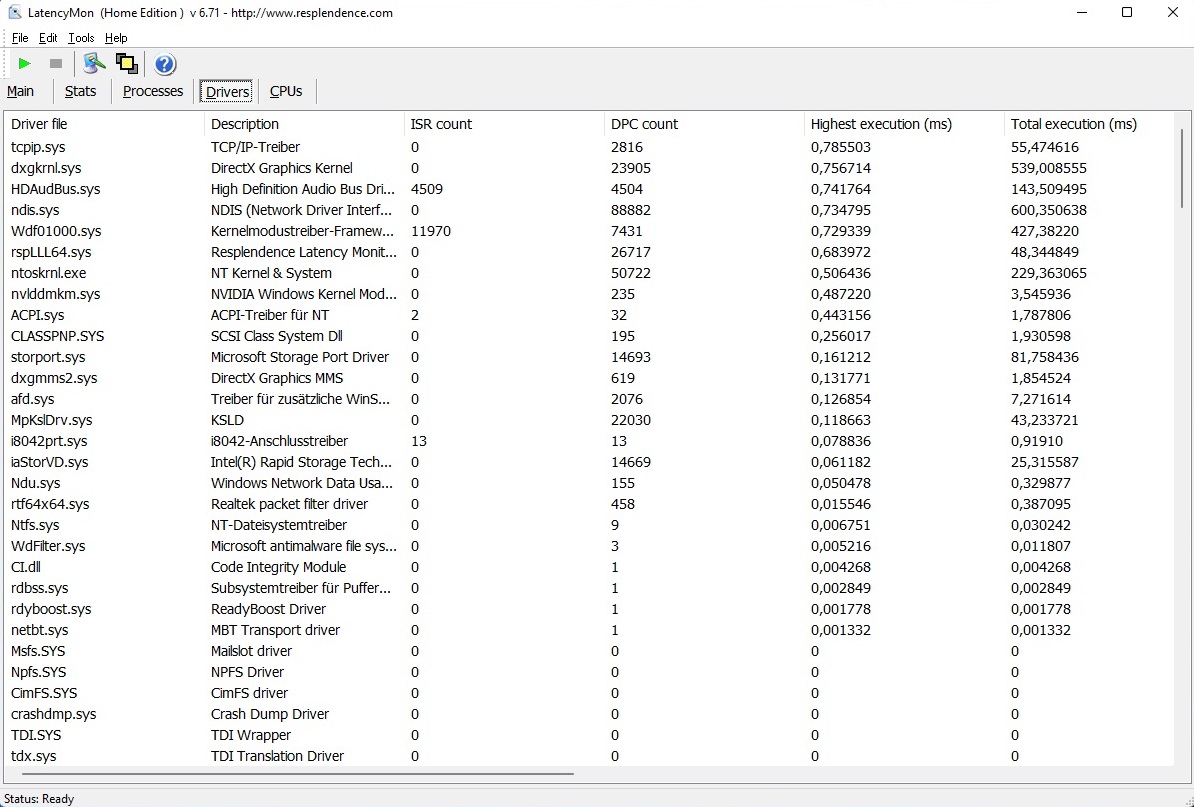
Latencias del CPD
Las cosas no son del todo óptimas cuando se trata de latencias. Como muchos otros portátiles, el Pavilion Gaming 17 no es especialmente adecuado para la edición de audio y vídeo en tiempo real según la herramienta LatencyMon
| DPC Latencies / LatencyMon - interrupt to process latency (max), Web, Youtube, Prime95 | |
| Dell G15 5510-43NHT | |
| HP Pavilion Gaming 17-cd2146ng | |
| Lenovo Ideapad Gaming 3 15IHU-82K1002RGE | |
| HP Victus 16-e0145ng | |
* ... más pequeño es mejor
Almacenamiento
Hay que destacar positivamente el rápido dispositivo de almacenamiento. HP ha equipado nuestro modelo de pruebas con una unidad PCIe de 512 GB (M.2 2280) de SK Hynix (BC711), que alcanza velocidades de lectura y escritura secuenciales de más de 2.500 MB/s, algo que sólo puede lograr el HP Victus 16. Molesta: Por desgracia, la ranura de 2,5 pulgadas existente, que contiene un "disco duro ficticio", no se puede utilizar ya que no hay un cable adecuado integrado

* ... más pequeño es mejor
Continuous load read: DiskSpd Read Loop, Queue Depth 8
Tarjeta gráfica
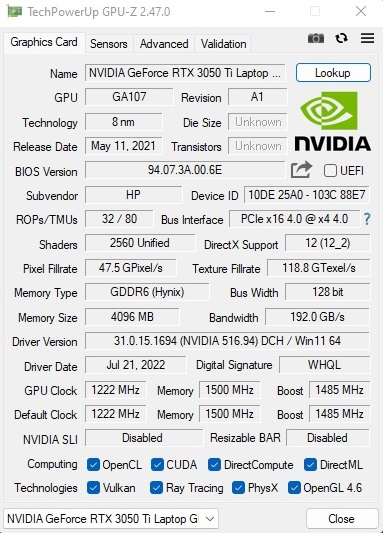
La GeForce RTX 3050 Ti de Nvidia es una tarjeta gráfica ideal para los jugadores ocasionales que no quieren jugar necesariamente a cada nuevo título con los máximos detalles. El modelo de 8 nm se basa en la última arquitectura Ampere y está equipado con 2.560 unidades de sombreado. El rendimiento de los chips Nvidia depende en gran medida del TGP especificado, que los fabricantes de portátiles pueden elegir libremente dentro de un determinado rango. En este caso, HP optó por 60 vatios, lo que corresponde a un nivel medio para la RTX 3050 Ti. No obstante, el Pavilion Gaming 17 rinde ligeramente mejor en el circuito de la GPU en comparación con la media de la 3050 Ti
| 3DMark 11 Performance | 15245 puntos | |
| 3DMark Ice Storm Standard Score | 98555 puntos | |
| 3DMark Cloud Gate Standard Score | 26005 puntos | |
| 3DMark Fire Strike Score | 11649 puntos | |
| 3DMark Time Spy Score | 5155 puntos | |
ayuda | ||
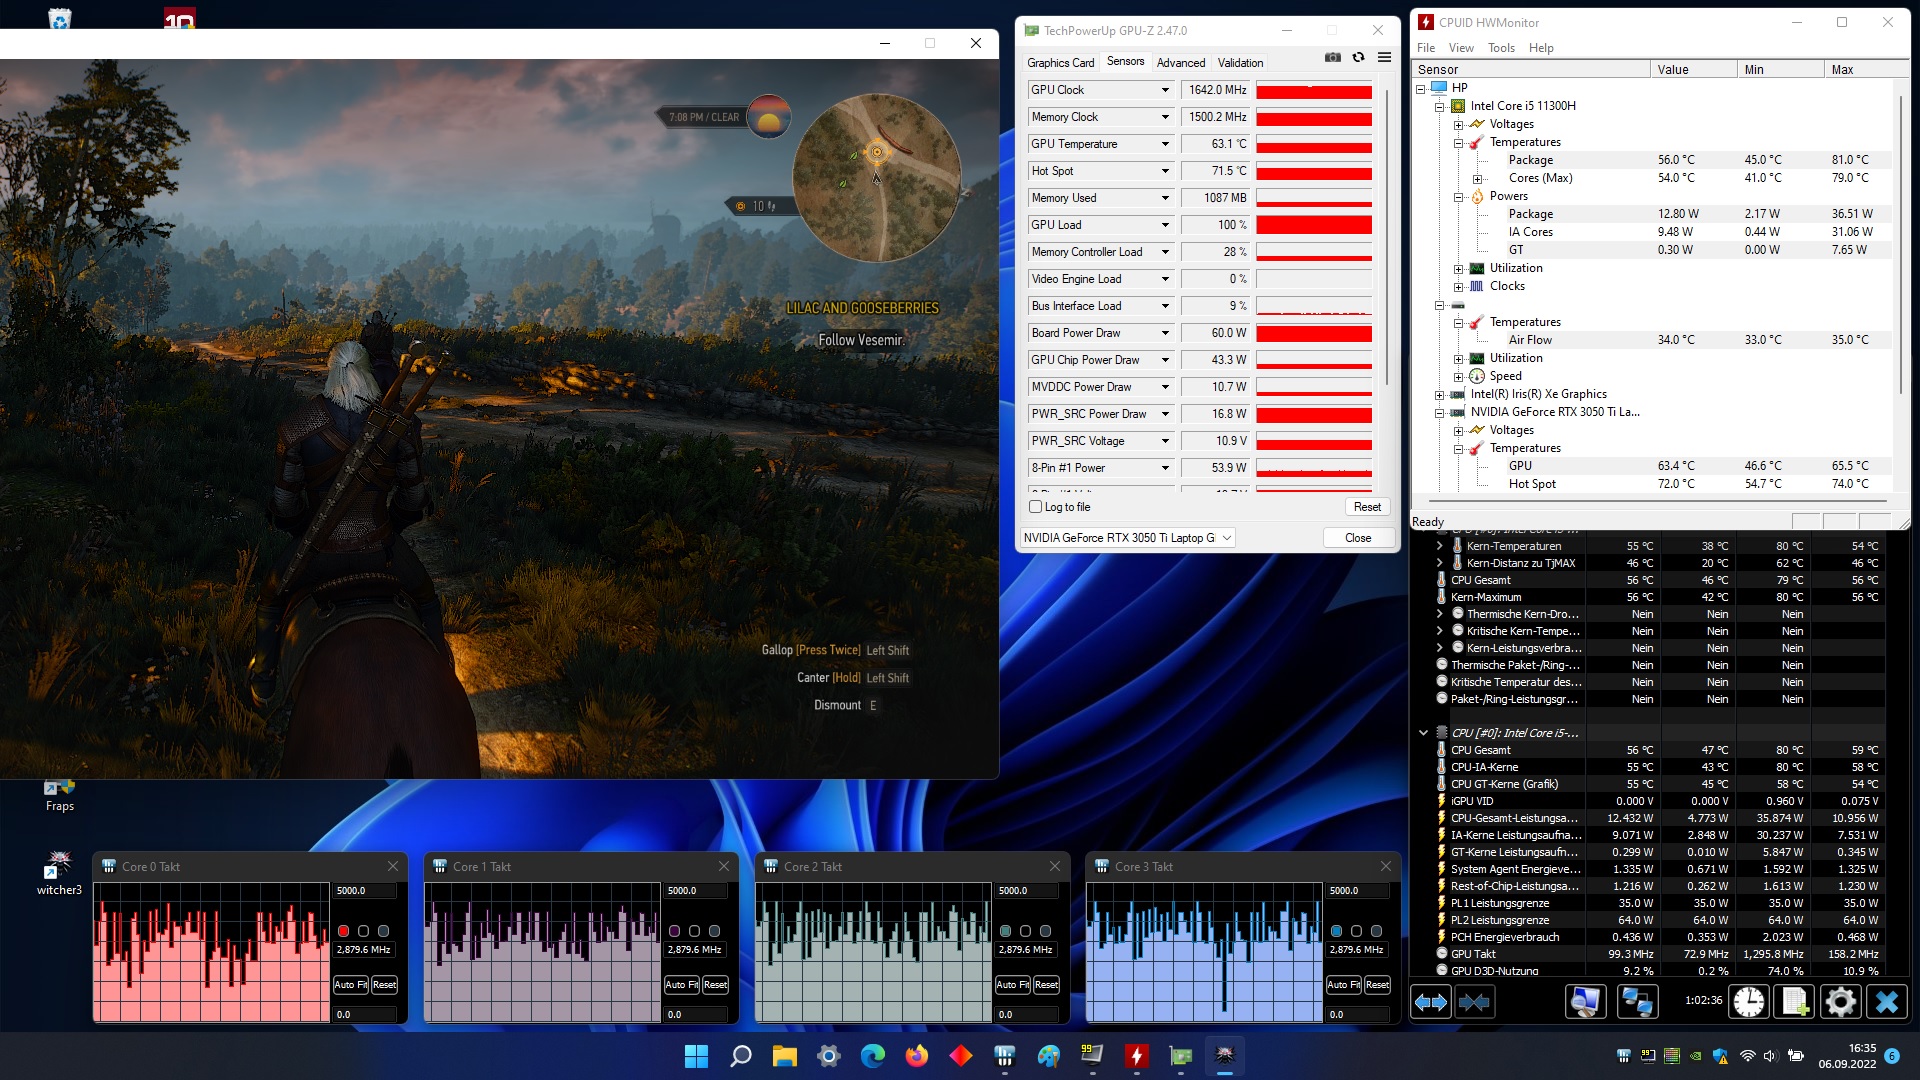
Rendimiento de los juegos
Mientras te ciñas a los 1920x1080 píxeles nativos y no conectes una pantalla externa de alta resolución, la RTX 3050 Ti ofrece un sólido rendimiento 3D. Aparte de juegos muy exigentes o moderadamente optimizados como God of Warla mayoría de los títulos actuales se ejecutan con fluidez, incluso con los ajustes máximos, aunque los 144 Hz suelen estar lejos de ser aprovechados al máximo. La GPU revela debilidades en el trazado de rayos en particular, lo que se muestra en F1 22. 4 GB de VRAM tampoco son óptimos a largo plazo. Si buscas un cierto grado de seguridad para el futuro, deberías comprar una tarjeta gráfica con al menos 6 o preferiblemente 8 GB de VRAM
| The Witcher 3 | |
| 1920x1080 High Graphics & Postprocessing (Nvidia HairWorks Off) | |
| Media de la clase Gaming (341 - 404, n=2, últimos 2 años) | |
| HP Victus 16-e0145ng | |
| HP Pavilion Gaming 17-cd2146ng | |
| HP Pavilion Gaming 17-cd0085cl | |
| Lenovo Ideapad Gaming 3 15IHU-82K1002RGE | |
| Medio NVIDIA GeForce RTX 3050 Ti Laptop GPU (30 - 110, n=26) | |
| Dell G15 5510-43NHT | |
| 1920x1080 Ultra Graphics & Postprocessing (HBAO+) | |
| Media de la clase Gaming (104.7 - 240, n=7, últimos 2 años) | |
| HP Victus 16-e0145ng | |
| Dell G15 5510-43NHT | |
| HP Pavilion Gaming 17-cd2146ng | |
| HP Pavilion Gaming 17-cd0085cl | |
| Medio NVIDIA GeForce RTX 3050 Ti Laptop GPU (19 - 58.5, n=29) | |
| Lenovo Ideapad Gaming 3 15IHU-82K1002RGE | |
No hubo irregularidades en nuestra prueba de resistencia (una hora de El Witcher 3). La velocidad de fotogramas se mantuvo bastante constante durante todo el tiempo
The Witcher 3 FPS diagram
| bajo | medio | alto | ultra | |
|---|---|---|---|---|
| GTA V (2015) | 156.1 | 119.9 | 66.9 | |
| The Witcher 3 (2015) | 170 | 94.4 | 51.4 | |
| Dota 2 Reborn (2015) | 119.7 | 108.5 | 104.8 | 100.7 |
| Final Fantasy XV Benchmark (2018) | 76 | 53.3 | ||
| X-Plane 11.11 (2018) | 87.5 | 75.3 | 64.3 | |
| Strange Brigade (2018) | 132.8 | 105.8 | 90.3 | |
| God of War (2022) | 60.7 | 48.6 | 30.6 | |
| Rainbow Six Extraction (2022) | 112 | 108 | 83 | |
| Dying Light 2 (2022) | 46.7 | 38.8 | ||
| Elden Ring (2022) | 55.4 | 53.8 | 52.7 | |
| Elex 2 (2022) | 52.2 | 50.9 | 46.1 | |
| F1 22 (2022) | 132 | 93 | 28 | |
| The Quarry (2022) | 63.1 | 51.5 | 39.7 |
Emisiones
Emisiones acústicas
Al mirar el predecesor con el Core i7-9750H y la GeForce GTX 1660 Ti Max-Qalabamos el menor desarrollo de ruido en particular. Aunque el nuevo Pavilion Gaming 17 sigue siendo uno de los portátiles de juego más silenciosos, el de 17 pulgadas ya no es realmente silencioso. En lugar de 34 a 44 dB(A), medimos entre 39 y 46 dB(A) bajo carga, lo que es claramente audible, pero no molesto. Por otro lado, el dispositivo es agradablemente silencioso con 27 a 30 dB(A) en uso inactivo, aunque los ventiladores nunca se apagan completamente. Sin embargo, esto último puede cambiarse en la BIOS deshabilitando la opción "siempre encendido". Esto hace que los ventiladores se desactiven a veces durante tareas sencillas.
Ruido
| Ocioso |
| 27 / 28 / 30 dB(A) |
| Carga |
| 39 / 46 dB(A) |
 | ||
30 dB silencioso 40 dB(A) audible 50 dB(A) ruidosamente alto |
||
min: | ||
| HP Pavilion Gaming 17-cd2146ng i5-11300H, GeForce RTX 3050 Ti Laptop GPU | Dell G15 5510-43NHT i5-10200H, GeForce RTX 3050 Ti Laptop GPU | Lenovo Ideapad Gaming 3 15IHU-82K1002RGE i5-11300H, GeForce RTX 3050 Ti Laptop GPU | HP Victus 16-e0145ng R5 5600H, GeForce RTX 3050 Ti Laptop GPU | HP Pavilion Gaming 17-cd0085cl i7-9750H, GeForce GTX 1660 Ti Max-Q | |
|---|---|---|---|---|---|
| Noise | -2% | 1% | -7% | 1% | |
| apagado / medio ambiente * (dB) | 25 | 25 -0% | 23.9 4% | 26 -4% | 28.2 -13% |
| Idle Minimum * (dB) | 27 | 25 7% | 23.9 11% | 26 4% | 30.1 -11% |
| Idle Average * (dB) | 28 | 25 11% | 26.8 4% | 28 -0% | 30.1 -8% |
| Idle Maximum * (dB) | 30 | 25 17% | 26.8 11% | 34 -13% | 30.1 -0% |
| Load Average * (dB) | 39 | 52.2 -34% | 43.5 -12% | 44 -13% | 34.2 12% |
| Witcher 3 ultra * (dB) | 44 | 43.5 1% | 48 -9% | 34.2 22% | |
| Load Maximum * (dB) | 46 | 52.2 -13% | 53.1 -15% | 53 -15% | 43.8 5% |
* ... más pequeño es mejor
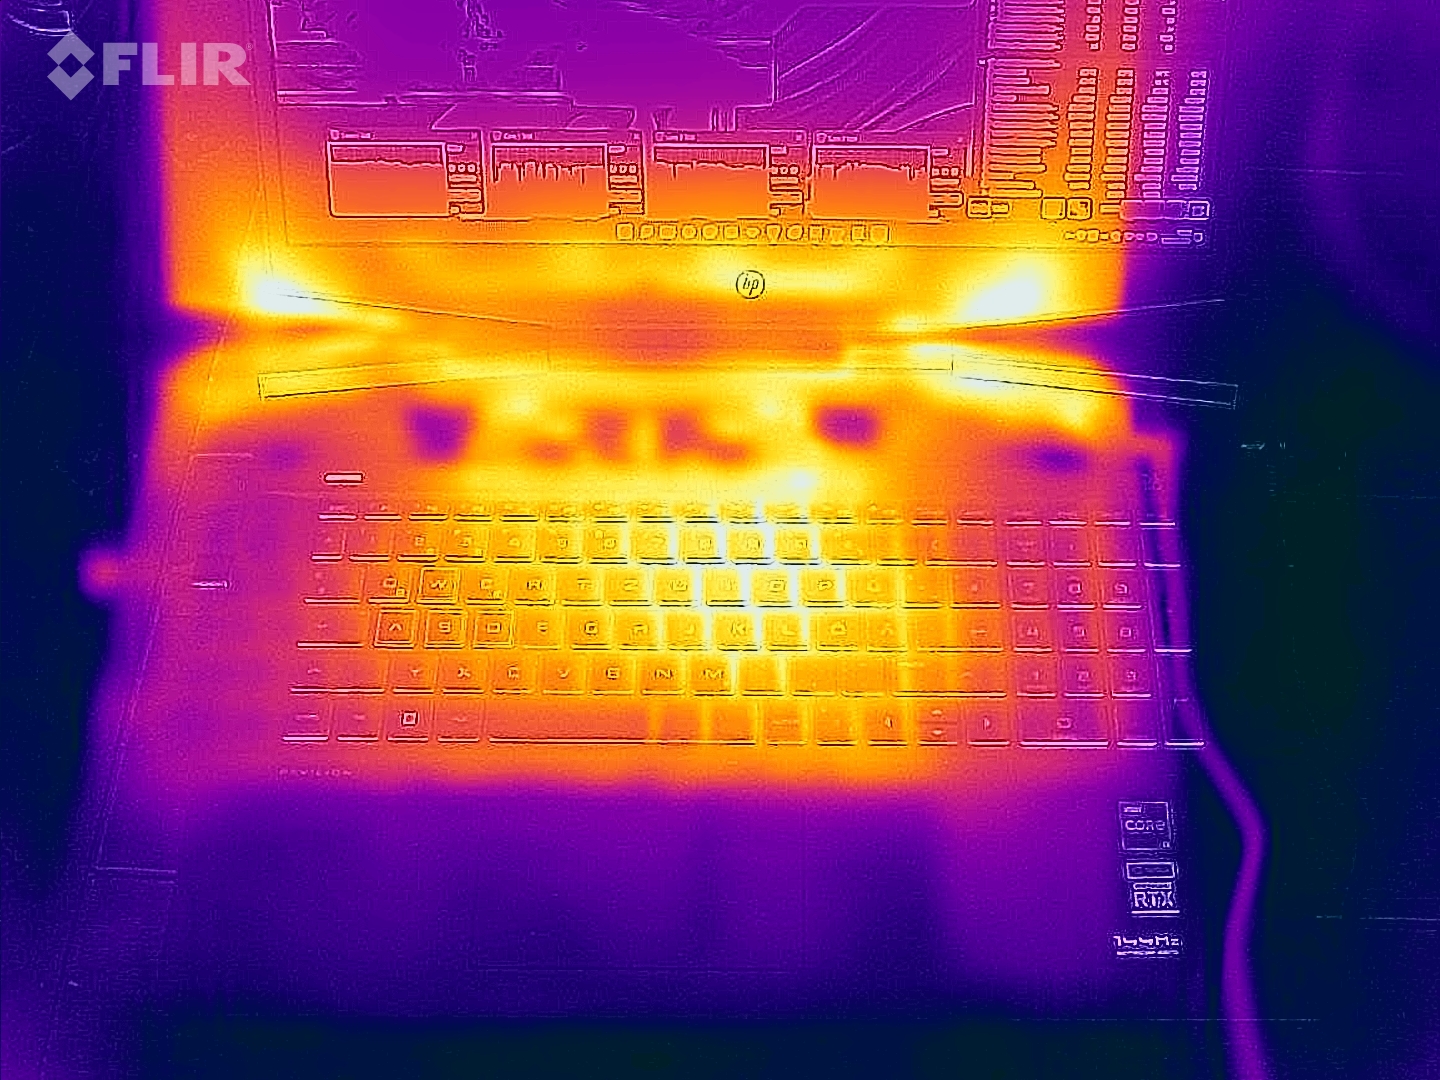
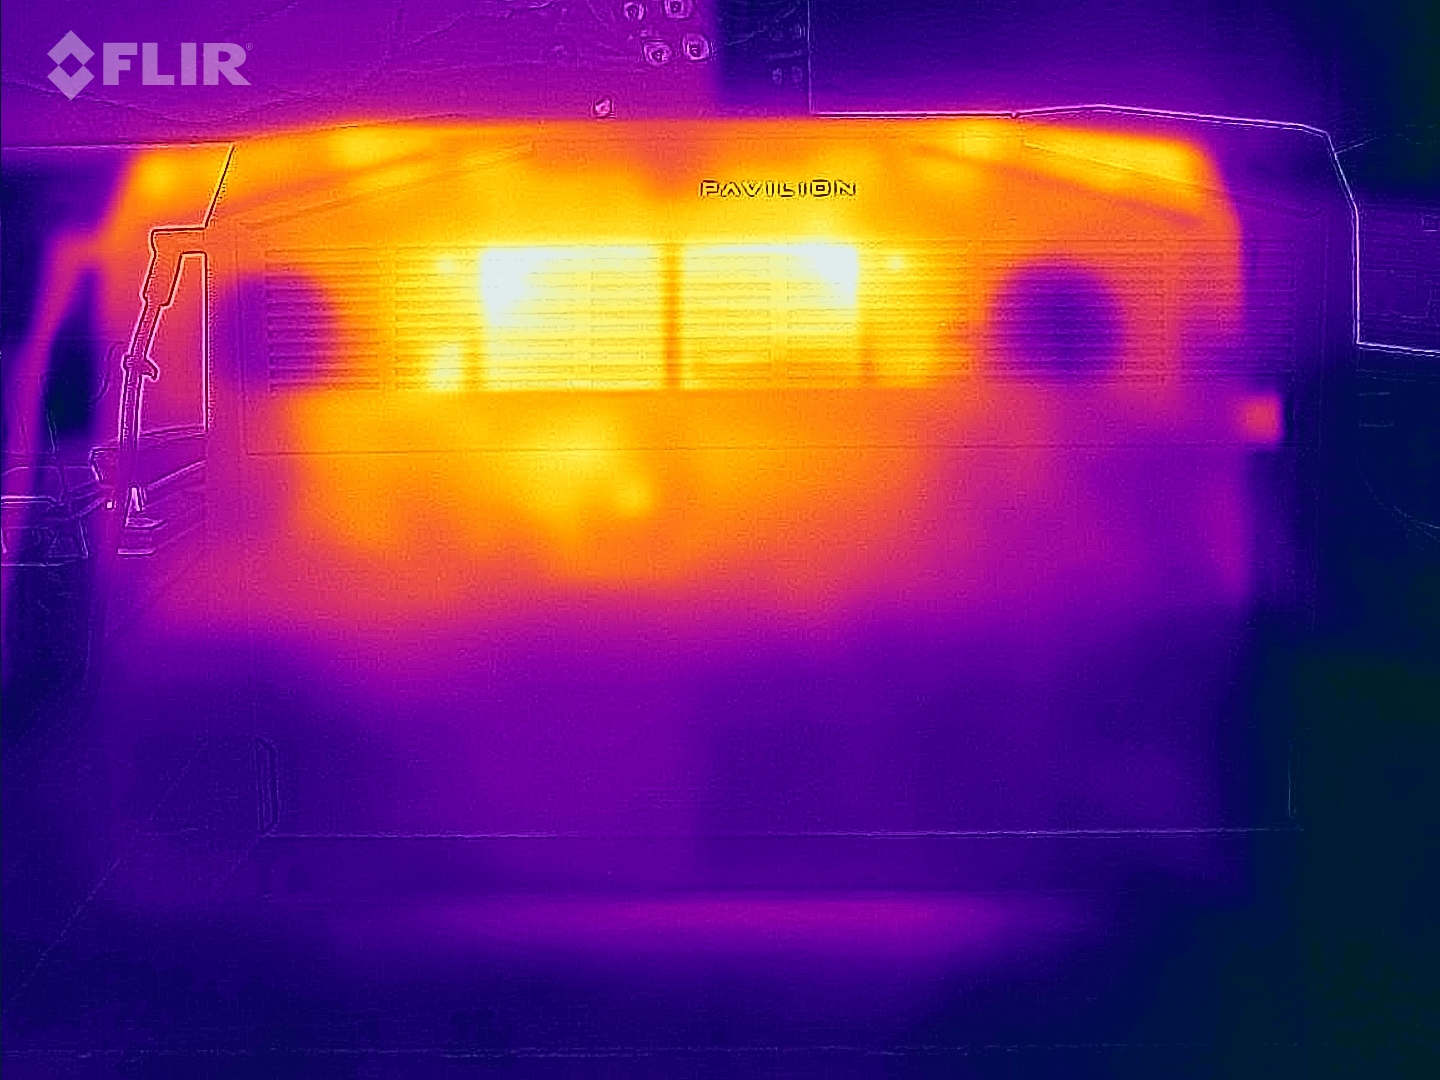
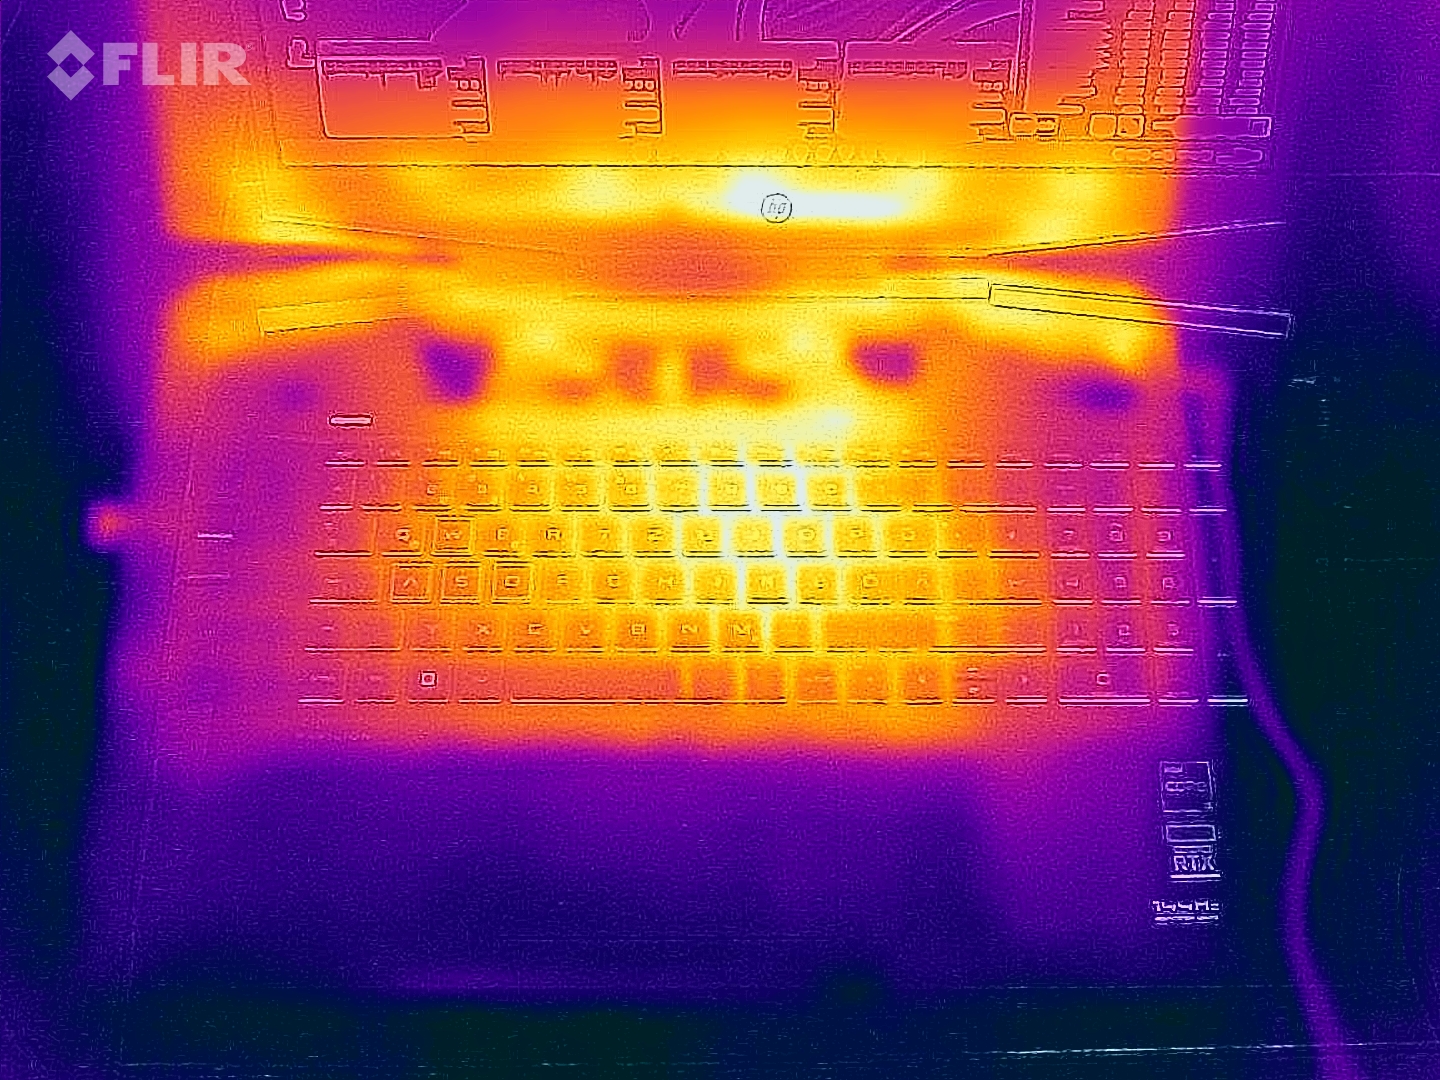
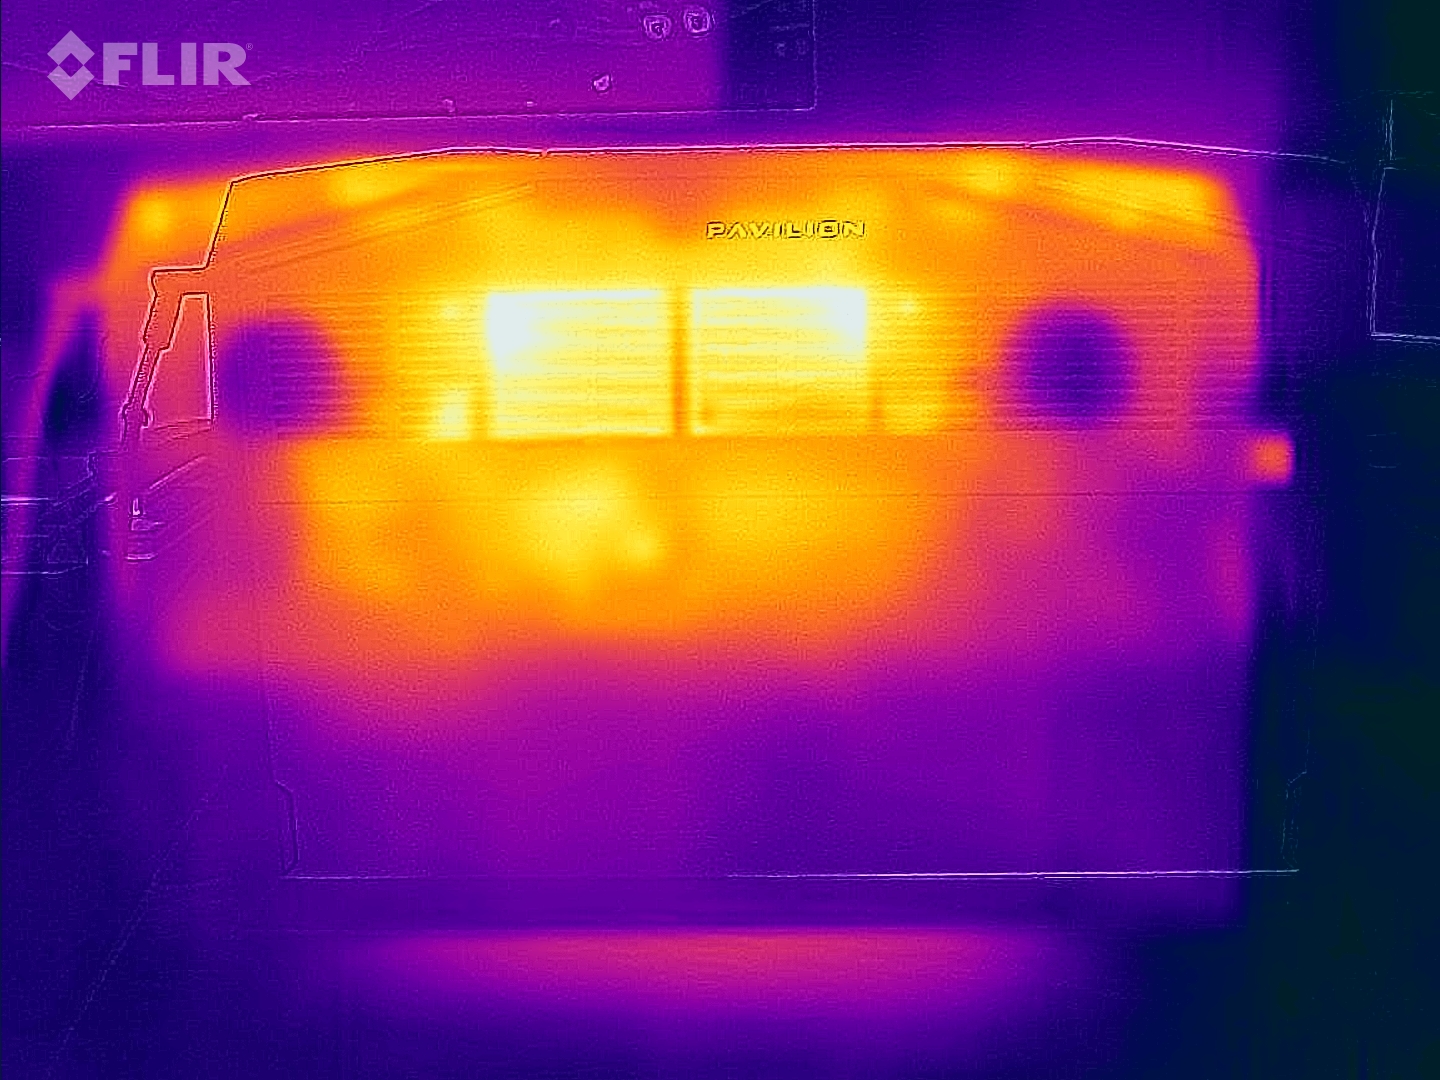
Temperatura
El desarrollo de calor del Pavilion Gaming 17 tampoco muestra nada inusual. Un máximo de 44 °C en la parte superior y 48 °C en la inferior tras 60 minutos de pruebas de estrés con las herramientas FurMark y Prime95 son típicos para el hardware integrado. Todo el chasis se mantiene por debajo de los 30 °C en inactividad, lo que lo hace agradablemente fresco
(±) La temperatura máxima en la parte superior es de 44 °C / 111 F, frente a la media de 40.4 °C / 105 F, que oscila entre 21.2 y 68.8 °C para la clase Gaming.
(-) El fondo se calienta hasta un máximo de 48 °C / 118 F, frente a la media de 43.2 °C / 110 F
(+) En reposo, la temperatura media de la parte superior es de 26.6 °C / 80# F, frente a la media del dispositivo de 33.9 °C / 93 F.
(±) Jugando a The Witcher 3, la temperatura media de la parte superior es de 36.2 °C / 97 F, frente a la media del dispositivo de 33.9 °C / 93 F.
(+) Los reposamanos y el panel táctil alcanzan como máximo la temperatura de la piel (34 °C / 93.2 F) y, por tanto, no están calientes.
(-) La temperatura media de la zona del reposamanos de dispositivos similares fue de 28.8 °C / 83.8 F (-5.2 °C / -9.4 F).
| HP Pavilion Gaming 17-cd2146ng i5-11300H, GeForce RTX 3050 Ti Laptop GPU | Dell G15 5510-43NHT i5-10200H, GeForce RTX 3050 Ti Laptop GPU | Lenovo Ideapad Gaming 3 15IHU-82K1002RGE i5-11300H, GeForce RTX 3050 Ti Laptop GPU | HP Victus 16-e0145ng R5 5600H, GeForce RTX 3050 Ti Laptop GPU | HP Pavilion Gaming 17-cd0085cl i7-9750H, GeForce GTX 1660 Ti Max-Q | |
|---|---|---|---|---|---|
| Heat | -9% | 3% | -22% | -18% | |
| Maximum Upper Side * (°C) | 44 | 45.9 -4% | 43.2 2% | 54 -23% | 42.6 3% |
| Maximum Bottom * (°C) | 48 | 51.9 -8% | 47.9 -0% | 47 2% | 49 -2% |
| Idle Upper Side * (°C) | 27 | 30.1 -11% | 24.9 8% | 41 -52% | 34 -26% |
| Idle Bottom * (°C) | 27 | 30.1 -11% | 27 -0% | 31 -15% | 39.4 -46% |
* ... más pequeño es mejor
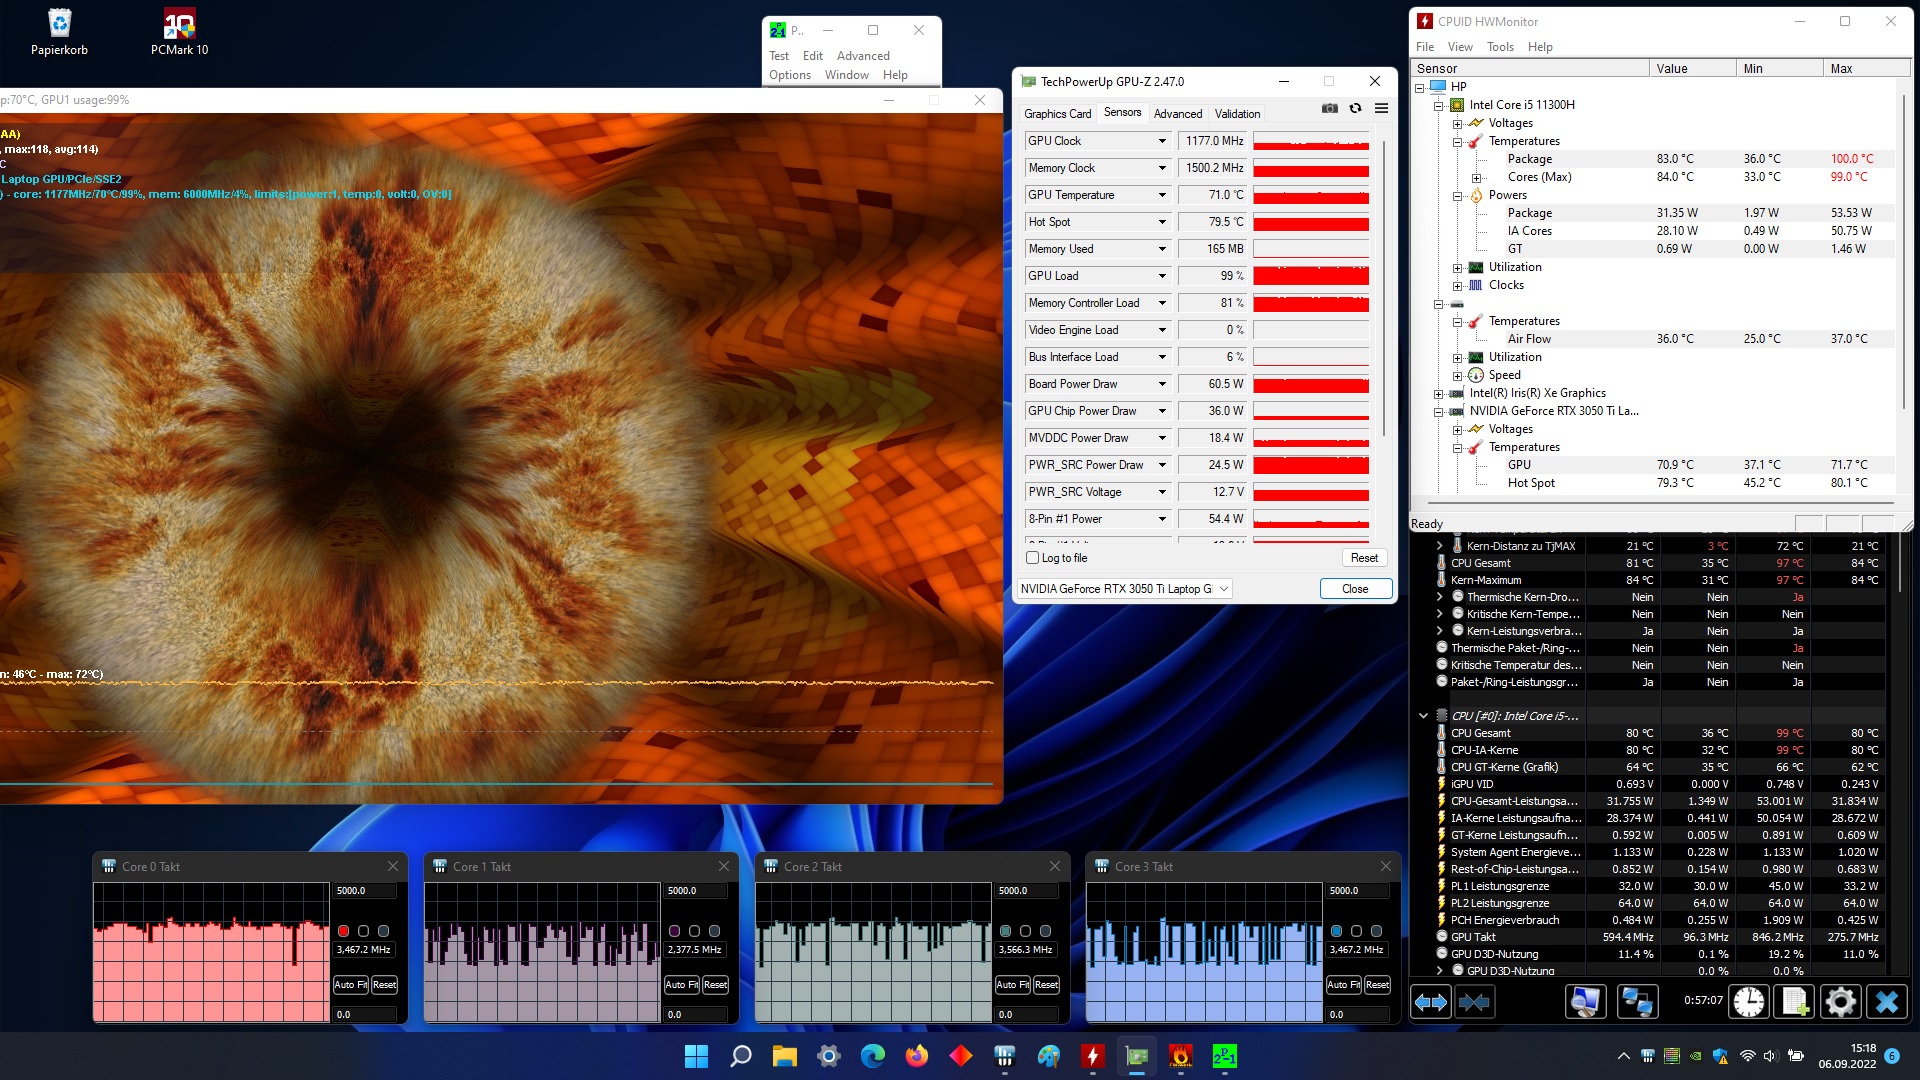
Prueba de esfuerzo
Los componentes tampoco sufren de sobrecalentamiento. Aunque el Core i5-11300H alcanza brevemente los 100 °C a plena carga (según la herramienta HWMonitor), la temperatura baja a unos aceptables 83 °C tras un rato (a una velocidad decente). La GeForce RTX 3050 Ti alcanza una temperatura media de 71 °C, que también es un valor aceptable e inofensivo
Altavoces
HP Pavilion Gaming 17-cd2146ng análisis de audio
(±) | la sonoridad del altavoz es media pero buena (80 dB)
Graves 100 - 315 Hz
(-) | casi sin bajos - de media 19.5% inferior a la mediana
(±) | la linealidad de los graves es media (11.5% delta a frecuencia anterior)
Medios 400 - 2000 Hz
(+) | medios equilibrados - a sólo 3.2% de la mediana
(+) | los medios son lineales (3.8% delta a la frecuencia anterior)
Altos 2 - 16 kHz
(±) | máximos más altos - de media 8.6% más altos que la mediana
(±) | la linealidad de los máximos es media (8% delta a frecuencia anterior)
Total 100 - 16.000 Hz
(±) | la linealidad del sonido global es media (20.5% de diferencia con la mediana)
En comparación con la misma clase
» 73% de todos los dispositivos probados de esta clase eran mejores, 5% similares, 22% peores
» El mejor tuvo un delta de 6%, la media fue 18%, el peor fue ###max##%
En comparación con todos los dispositivos probados
» 54% de todos los dispositivos probados eran mejores, 8% similares, 38% peores
» El mejor tuvo un delta de 4%, la media fue 23%, el peor fue ###max##%
HP Victus 16-e0145ng análisis de audio
(±) | la sonoridad del altavoz es media pero buena (79 dB)
Graves 100 - 315 Hz
(-) | casi sin bajos - de media 21% inferior a la mediana
(±) | la linealidad de los graves es media (12.6% delta a frecuencia anterior)
Medios 400 - 2000 Hz
(+) | medios equilibrados - a sólo 1.1% de la mediana
(+) | los medios son lineales (3.6% delta a la frecuencia anterior)
Altos 2 - 16 kHz
(+) | máximos equilibrados - a sólo 4.2% de la mediana
(+) | los máximos son lineales (5.3% delta a la frecuencia anterior)
Total 100 - 16.000 Hz
(±) | la linealidad del sonido global es media (16.2% de diferencia con la mediana)
En comparación con la misma clase
» 40% de todos los dispositivos probados de esta clase eran mejores, 7% similares, 53% peores
» El mejor tuvo un delta de 6%, la media fue 18%, el peor fue ###max##%
En comparación con todos los dispositivos probados
» 26% de todos los dispositivos probados eran mejores, 6% similares, 68% peores
» El mejor tuvo un delta de 4%, la media fue 23%, el peor fue ###max##%
Gestión de la energía
| Off / Standby | |
| Ocioso | |
| Carga |
|
Clave:
min: | |
| HP Pavilion Gaming 17-cd2146ng i5-11300H, GeForce RTX 3050 Ti Laptop GPU | Dell G15 5510-43NHT i5-10200H, GeForce RTX 3050 Ti Laptop GPU | Lenovo Ideapad Gaming 3 15IHU-82K1002RGE i5-11300H, GeForce RTX 3050 Ti Laptop GPU | HP Victus 16-e0145ng R5 5600H, GeForce RTX 3050 Ti Laptop GPU | HP Pavilion Gaming 17-cd0085cl i7-9750H, GeForce GTX 1660 Ti Max-Q | Media de la clase Gaming | |
|---|---|---|---|---|---|---|
| Power Consumption | -13% | -4% | -28% | -12% | -111% | |
| Idle Minimum * (Watt) | 3 | 4.6 -53% | 4.9 -63% | 7 -133% | 5.4 -80% | 13 ? -333% |
| Idle Average * (Watt) | 8 | 6.5 19% | 8.3 -4% | 9 -13% | 9.2 -15% | 19 ? -138% |
| Idle Maximum * (Watt) | 28 | 10.1 64% | 8.9 68% | 15 46% | 13 54% | 24.6 ? 12% |
| Load Average * (Watt) | 88 | 129 -47% | 81 8% | 93 -6% | 85.9 2% | 110.7 ? -26% |
| Witcher 3 ultra * (Watt) | 98.2 | 129 -31% | 119 -21% | 134.5 -37% | 107.9 -10% | |
| Load Maximum * (Watt) | 152 | 195 -28% | 172 -13% | 185 -22% | 182.2 -20% | 259 ? -70% |
* ... más pequeño es mejor
Energy consumption during The Witcher 3 / stress test
Energy consumption with an external monitor
Duración de la batería
No comprendemos del todo la decisión de HP de colocar una ranura de 2,5 pulgadas en lugar de una batería más grande. 52.5 Wh es bastante modesto, lo que también se nota en la duración de la batería. Algo menos de 5 horas de navegación por internet a través de Wi-Fi a brillo medio no es motivo de celebración hoy en día. La competencia está ligeramente por delante aquí
| HP Pavilion Gaming 17-cd2146ng i5-11300H, GeForce RTX 3050 Ti Laptop GPU, 52.5 Wh | Dell G15 5510-43NHT i5-10200H, GeForce RTX 3050 Ti Laptop GPU, 56 Wh | Lenovo Ideapad Gaming 3 15IHU-82K1002RGE i5-11300H, GeForce RTX 3050 Ti Laptop GPU, 45 Wh | HP Victus 16-e0145ng R5 5600H, GeForce RTX 3050 Ti Laptop GPU, 70 Wh | HP Pavilion Gaming 17-cd0085cl i7-9750H, GeForce GTX 1660 Ti Max-Q, 52.5 Wh | Media de la clase Gaming | |
|---|---|---|---|---|---|---|
| Duración de Batería | 26% | 32% | 42% | 14% | 42% | |
| WiFi v1.3 (h) | 5 | 6.3 26% | 6.6 32% | 7.1 42% | 5.7 14% | 7.11 ? 42% |
| H.264 (h) | 8.6 | 7.7 | 8.32 ? | |||
| Load (h) | 1.1 | 1.1 | 1 | 1.502 ? | ||
| Reader / Idle (h) | 11.6 | 8.27 ? |
Pro
Contra
Veredicto
HP ofrece un buen portátil económico para jugar con el Pavilion Gaming 17-cd2146ng.
A diferencia de la mayoría de los competidores, el portátil de 17 pulgadas tiene una pantalla sorprendentemente buena a la que no le falta contraste ni espacio de color. El brillo y los tiempos de respuesta también son comparativamente buenos.
El portátil de 17 pulgadas no destaca ni positiva ni negativamente en el resto de las categorías, ya sean los dispositivos de entrada, la carcasa, los puertos, las emisiones o la calidad del sonido.
En consecuencia, es difícil equivocarse al comprar el Pavilion Gaming 17. Por debajo de los 1.000 euros (~1.002 dólares), el dispositivo es una opción muy atractiva y recomendable para los jugadores preocupados por el precio.
Precio y disponibilidad
En el momento de escribir este artículo, nuestra configuración de revisión no parece estar disponible en los Estados Unidos. No obstante, puedes echar un ojo a Amazon y ver si el dispositivo aparece aquí.
HP Pavilion Gaming 17-cd2146ng
- 09/10/2022 v7 (old)
Florian Glaser
Price comparison

