Análisis del portátil Lenovo IdeaPad Gaming 3i 15 G6: Portátil de juego económico con una pantalla pobre
La serie IdeaPad Gaming de Lenovo es la puerta de entrada asequible a los portátiles para juegos de Lenovo con un enfoque en lo que es importante, es decir, el rendimiento de los juegos, sin campanas ni silbidos. El IdeaPad Gaming 3i 15 de 6ª generación está basado en el actual Intel Tiger Lake, y viene con una Nvidia GeForce RTX 3050 Ti, 16 GB de RAM, una SSD PCIe de 512 GB y una pantalla IPS FHD de 15 pulgadas. Este modelo exacto no se vende actualmente en los Estados Unidos. Sin embargo, hay un dispositivo basado en Intel Core i7-11370H con 8 GB de RAM y un SSD de 256 GB con un precio de 1.000 dólares
Posibles contendientes en la comparación
Valoración | Fecha | Modelo | Peso | Altura | Tamaño | Resolución | Precio |
|---|---|---|---|---|---|---|---|
| 79.7 % v7 (old) | 03/2022 | Lenovo Ideapad Gaming 3 15IHU-82K1002RGE i5-11300H, GeForce RTX 3050 Ti Laptop GPU | 2 kg | 24.2 mm | 15.60" | 1920x1080 | |
| 82.7 % v7 (old) | 10/2021 | Dell G15 5515 R7 5800H, GeForce RTX 3050 Ti Laptop GPU | 2.4 kg | 24.9 mm | 15.60" | 1920x1080 | |
| 81.7 % v7 (old) | 11/2021 | Gigabyte G5 GD i5-11400H, GeForce RTX 3050 4GB Laptop GPU | 2.1 kg | 31.6 mm | 15.60" | 1920x1080 | |
| 81.4 % v7 (old) | 12/2021 | Medion Erazer Deputy P25 R7 5800H, GeForce RTX 3060 Laptop GPU | 2.3 kg | 26 mm | 15.60" | 1920x1080 | |
| 83.2 % v7 (old) | 09/2021 | Schenker XMG Focus 15 i7-11800H, GeForce RTX 3050 Ti Laptop GPU | 1.9 kg | 22 mm | 15.60" | 1920x1080 | |
| 83.4 % v7 (old) | 09/2021 | Lenovo Legion 5 15ACH-82JU00C6GE-FL R7 5800H, GeForce RTX 3060 Laptop GPU | 2.5 kg | 26 mm | 15.60" | 1920x1080 |
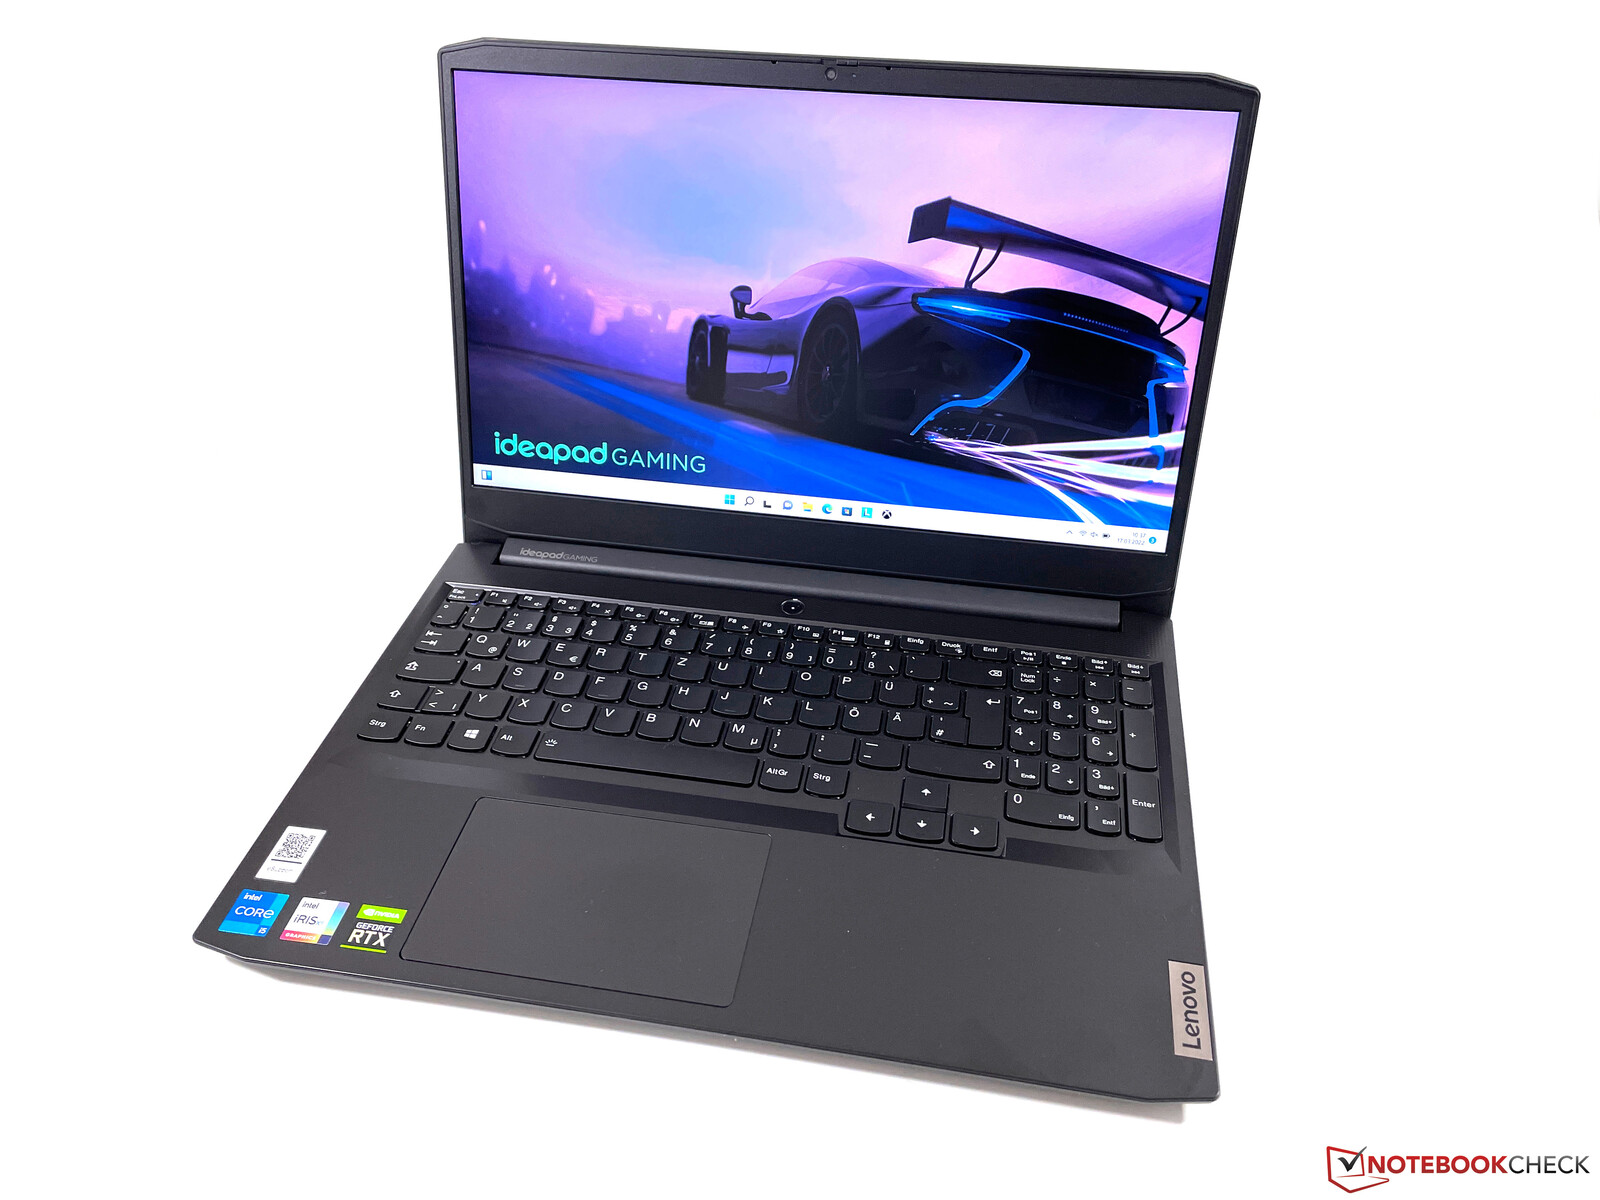
Case - Playing Hard to Get (Into)
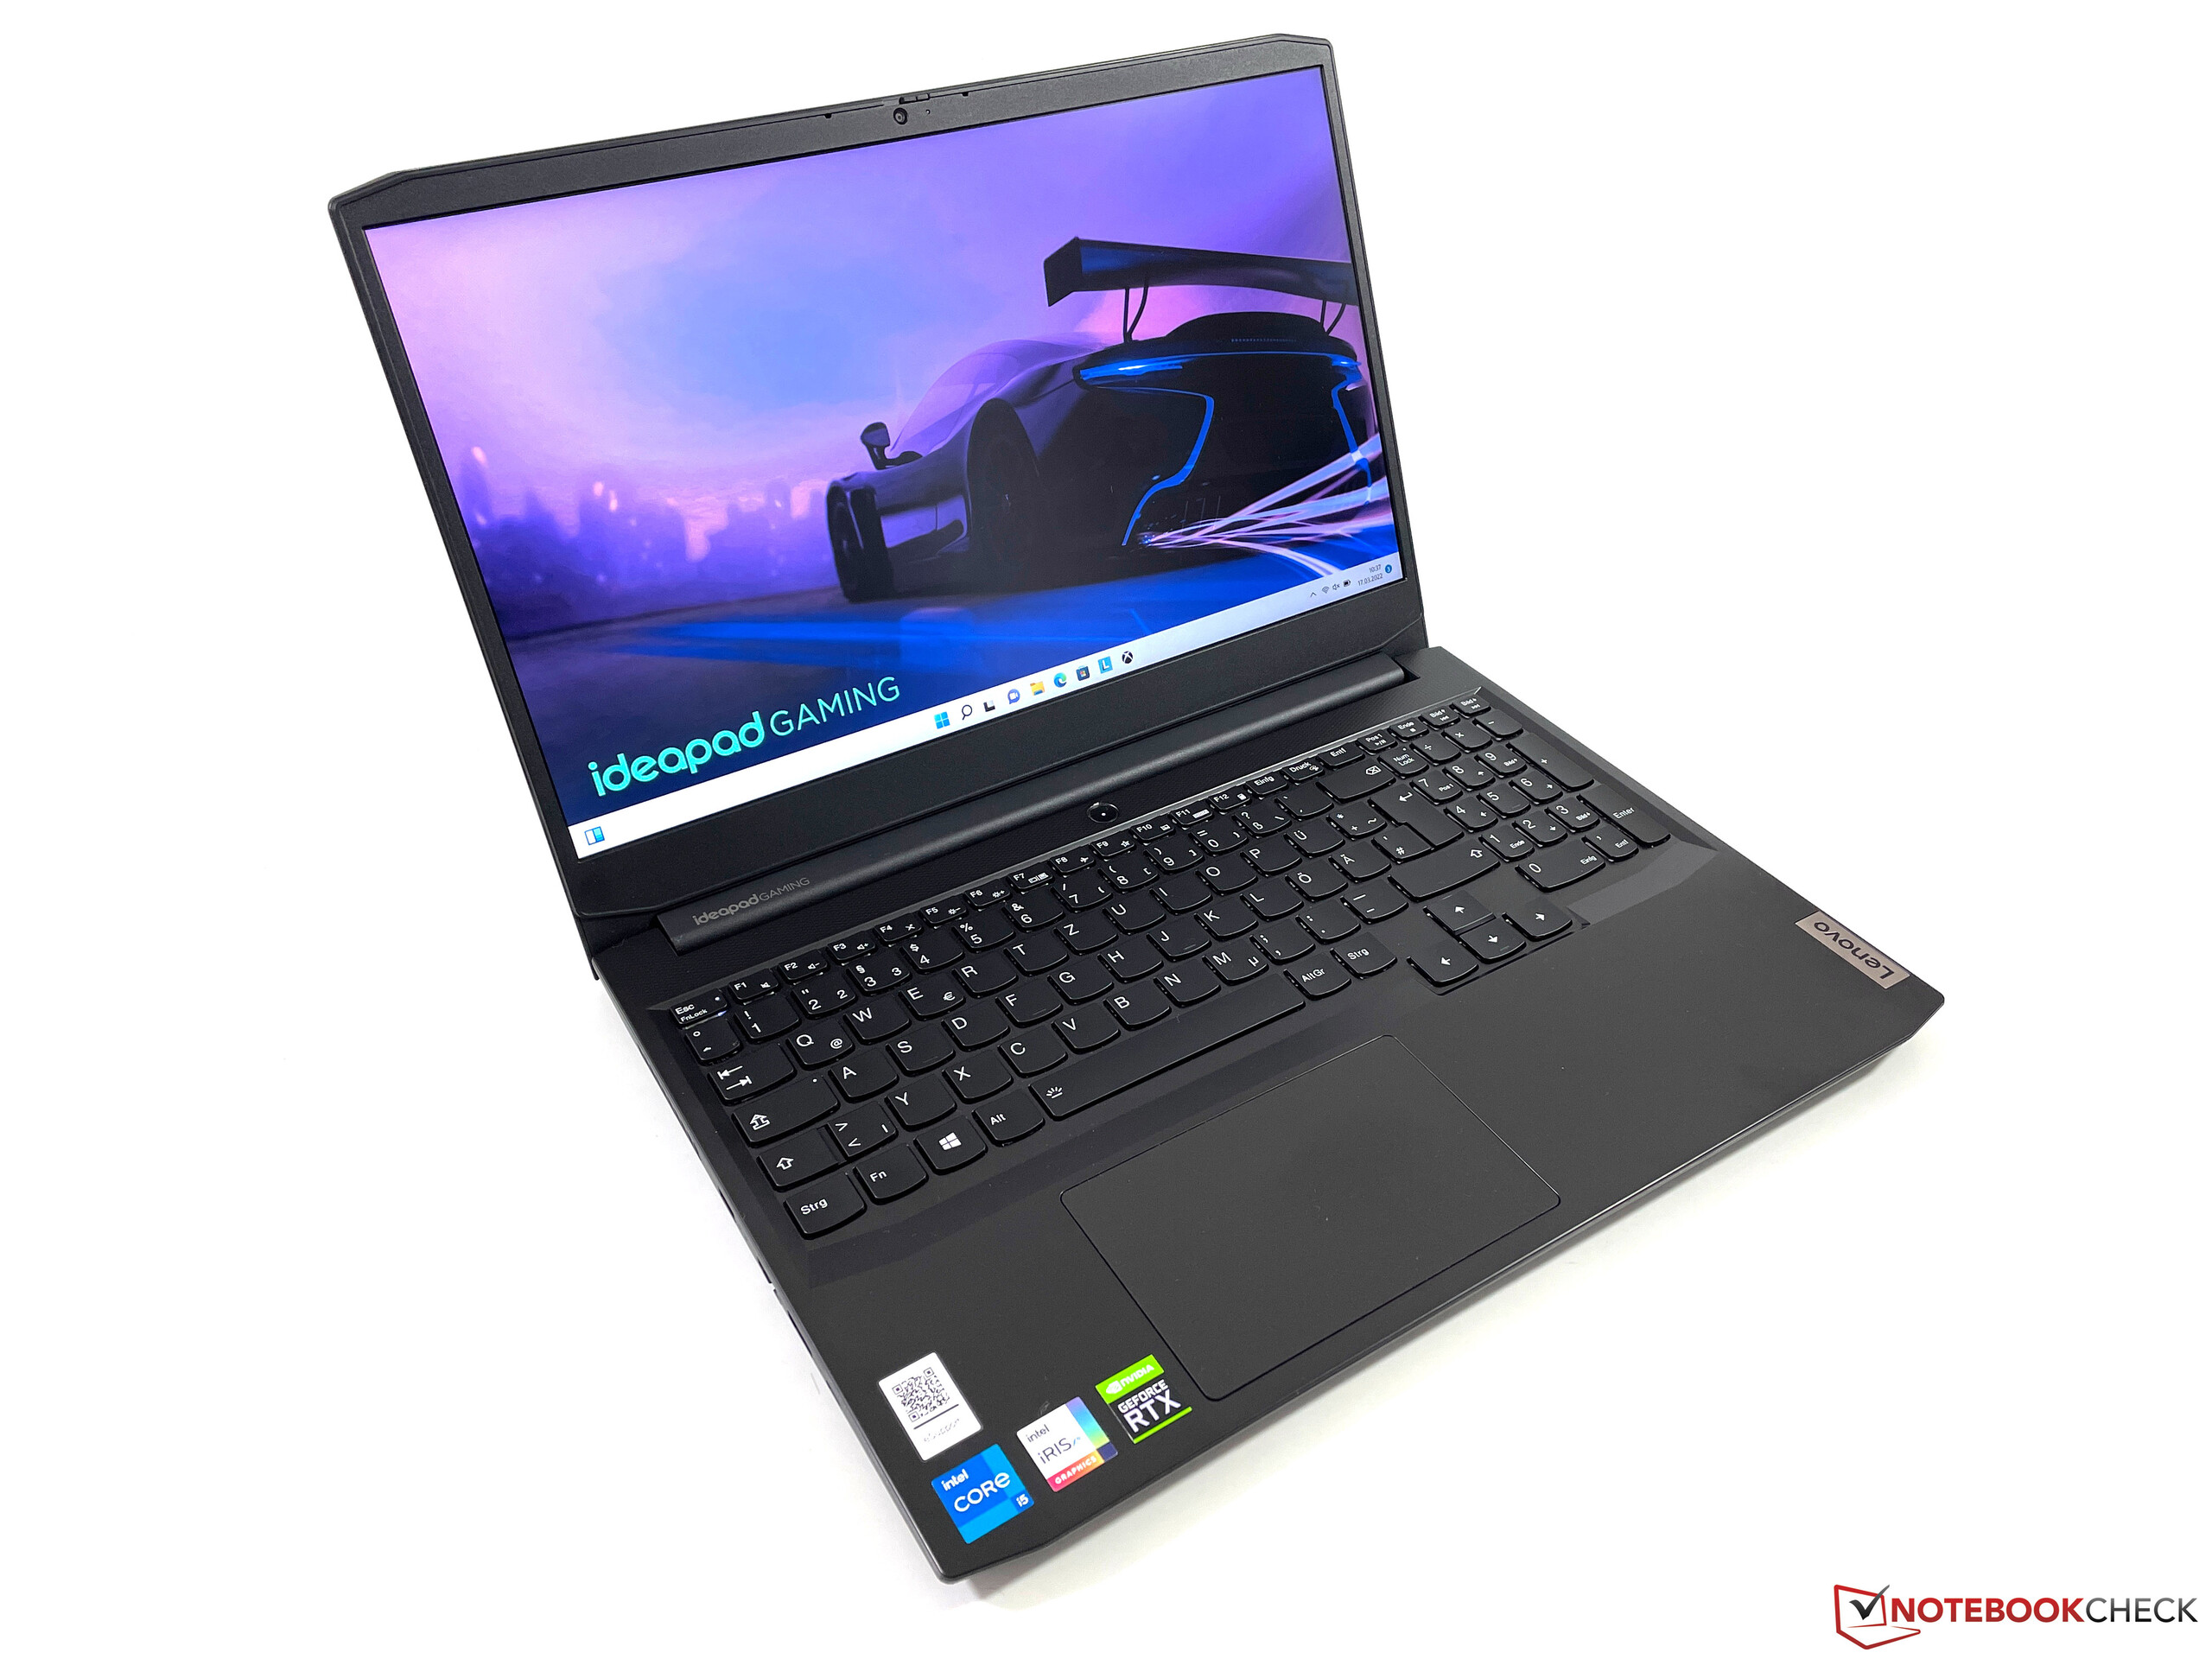
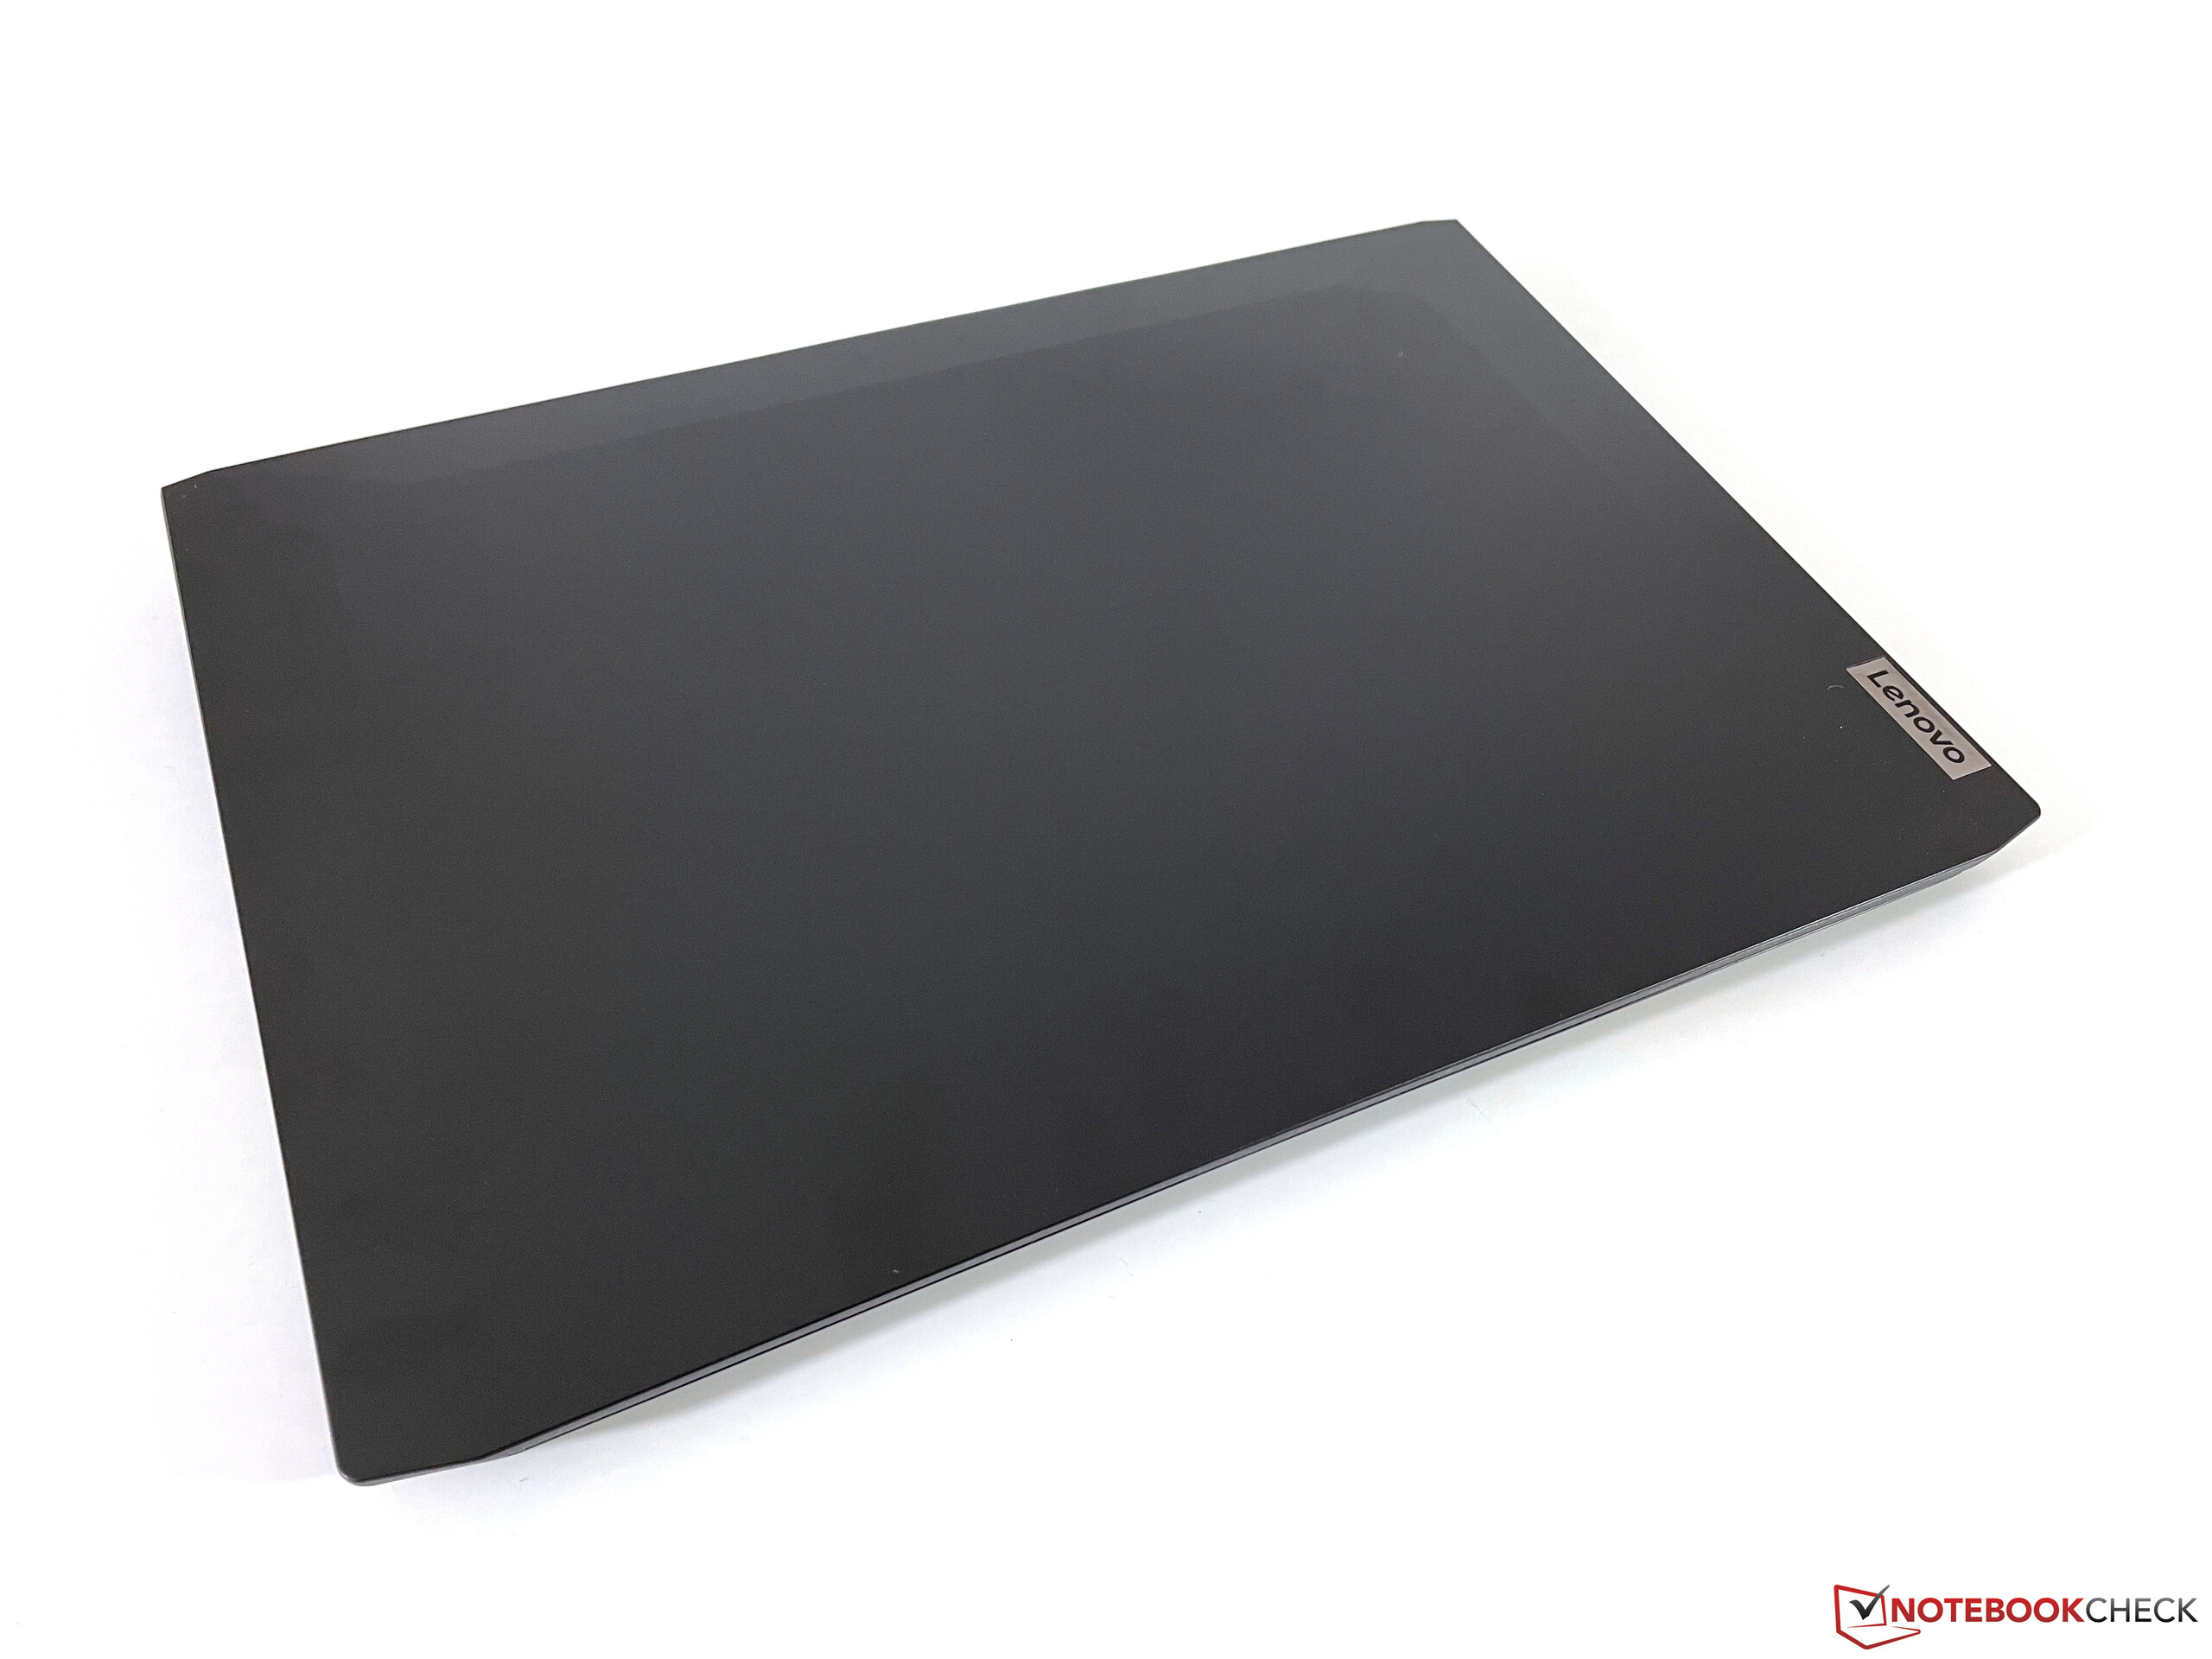
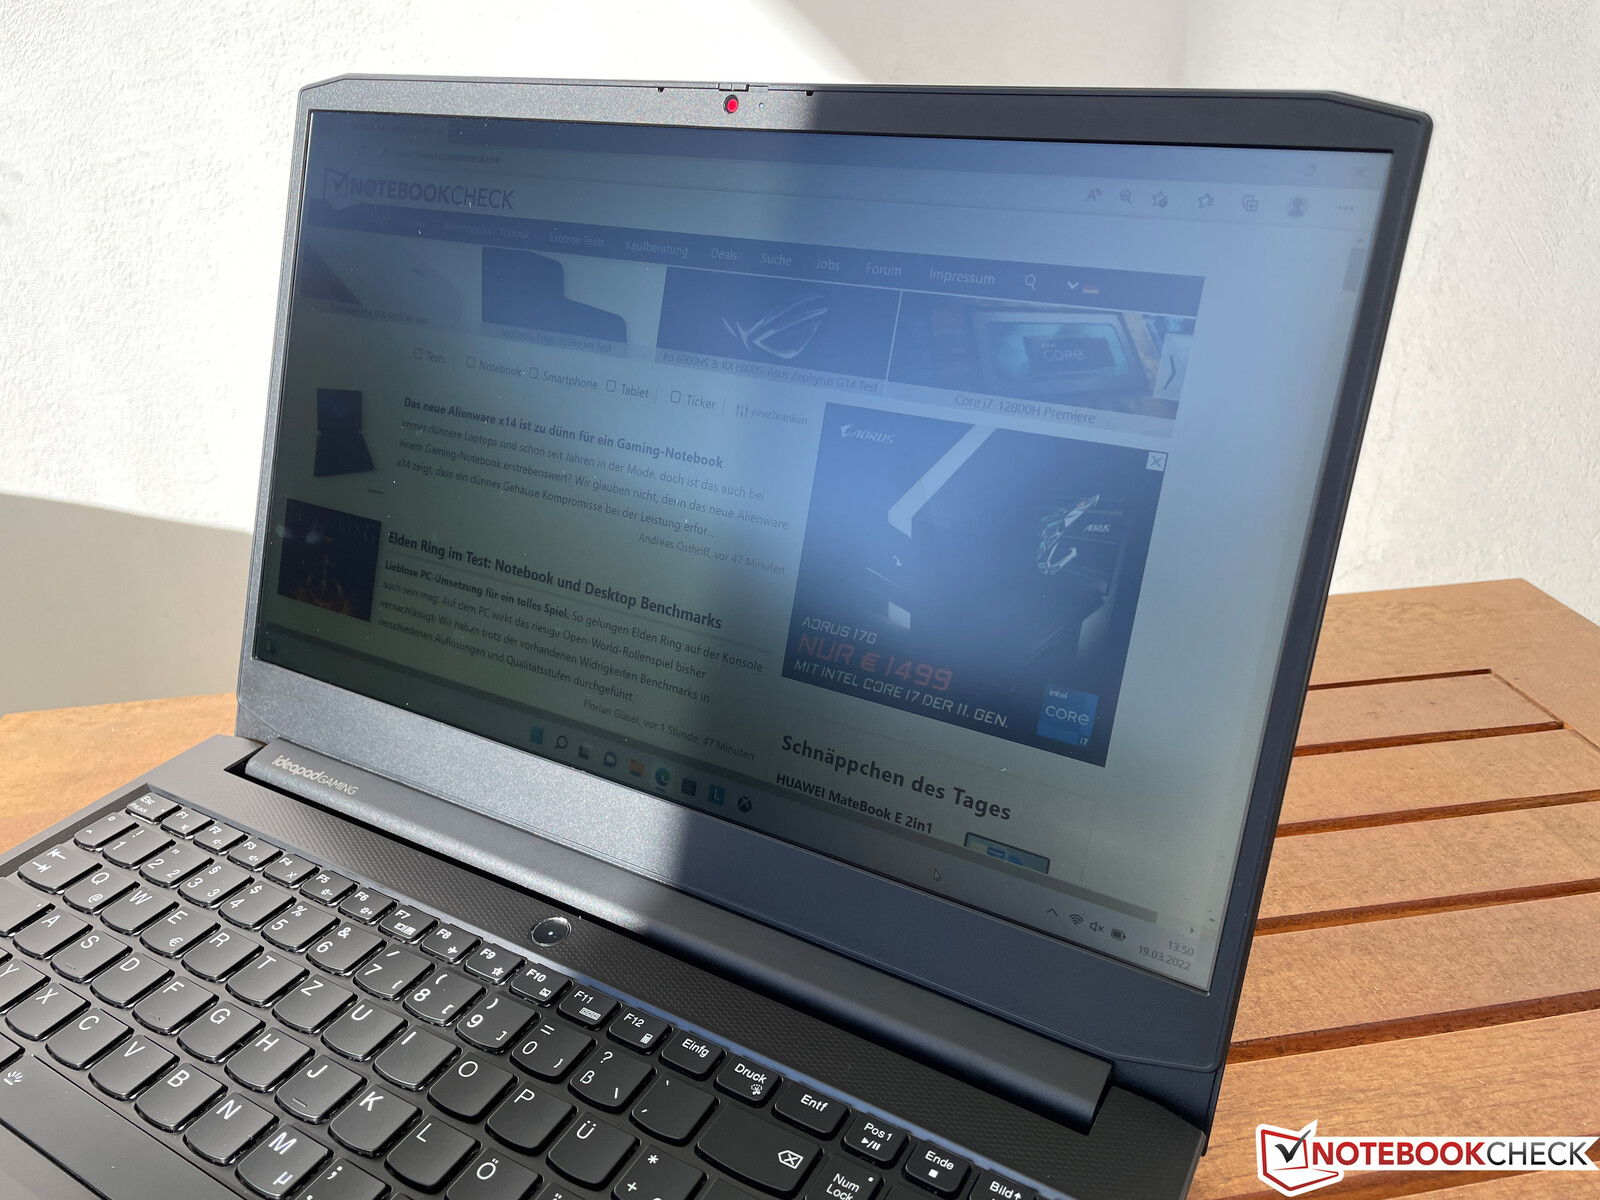
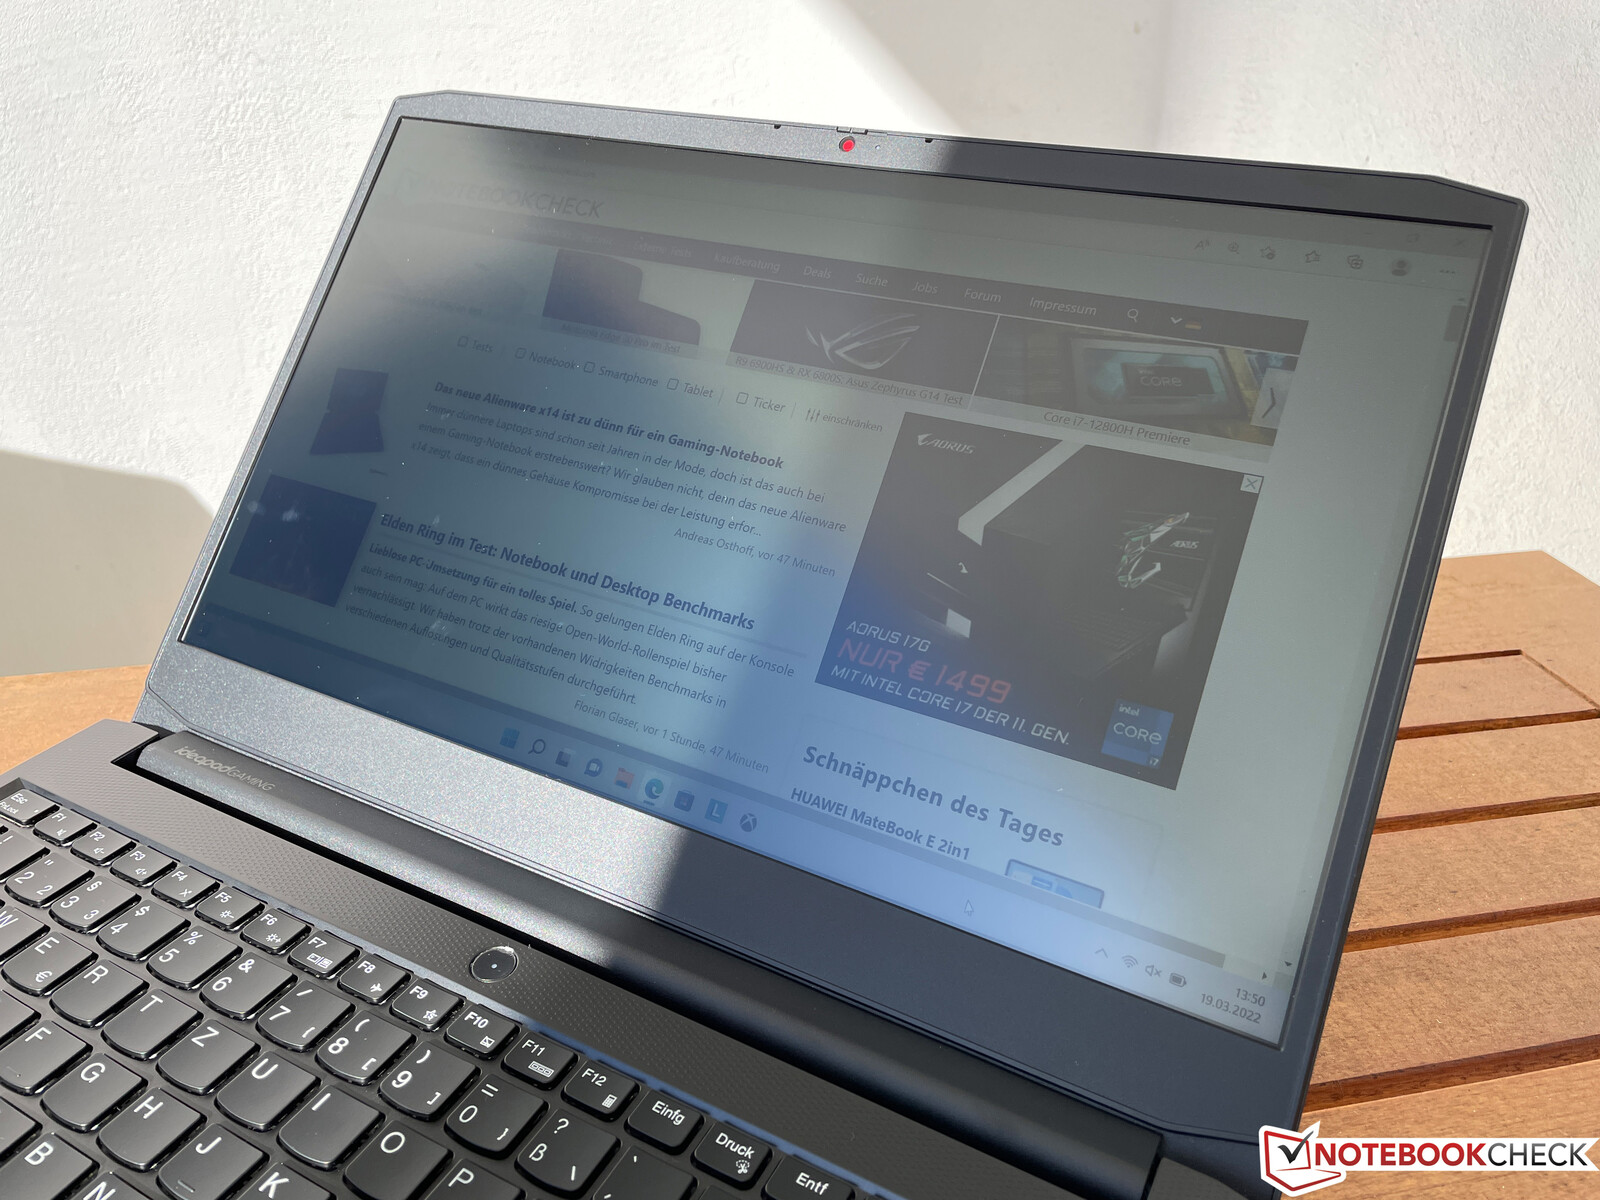
La carcasa del IdeaPad Gaming 3 está hecha completamente de plástico, y su cubierta inferior rugosa es indicativa de su bajo precio. El diseño general es utilitario y discreto. No hay elementos de diseño específicos para juegos, y el dispositivo no es reconocible como un portátil para juegos. Incluso carece de cualquier tipo de efectos de iluminación en la carcasa.
Tanto la cubierta superior como la unidad base tienen un acabado liso, susceptible a las huellas dactilares y las manchas. La rigidez de la unidad base es decente, aunque el centro del teclado puede presionarse con bastante facilidad, y toda la unidad crujió ligeramente cuando intentamos deformarla.
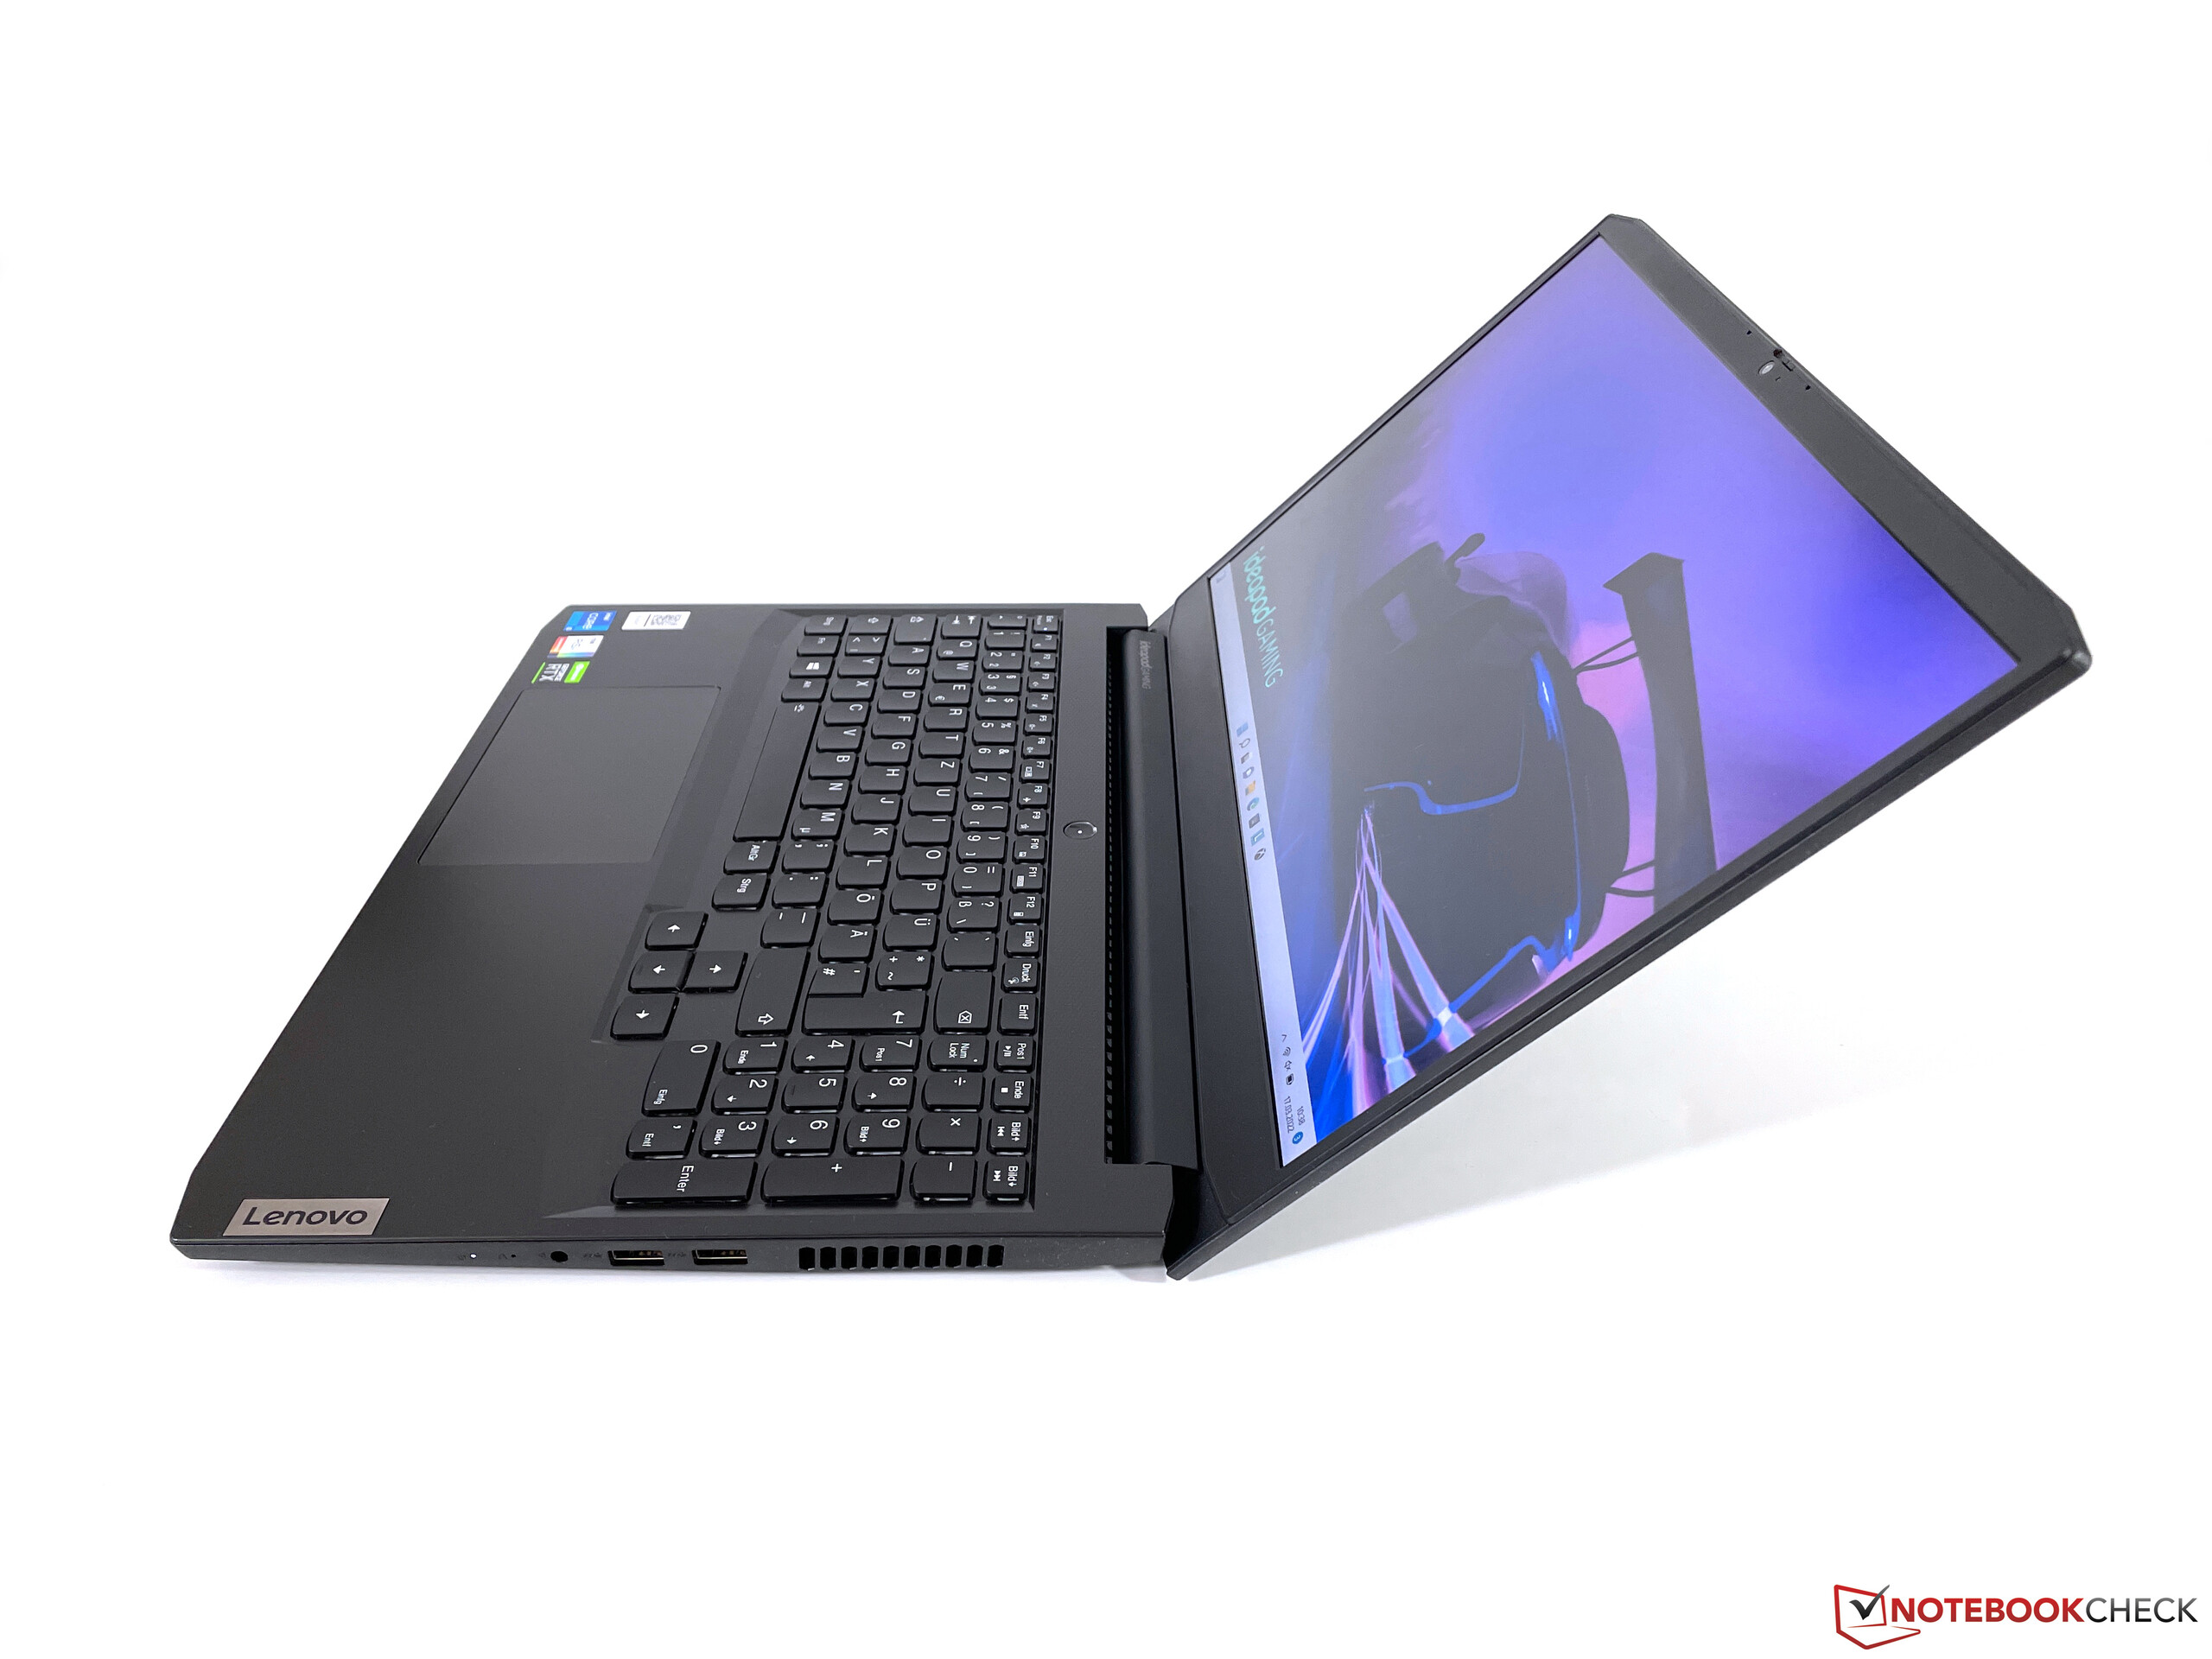
La bisagra en sí se ajusta bastante bien en general, con algunos tambaleos menores al ajustar la pantalla (ángulo máximo de apertura: 135°). La tapa de la pantalla es notablemente menos rígida que la base, y el panel mostró un efecto de ondulación muy claro cuando se aplicó presión a su parte trasera.
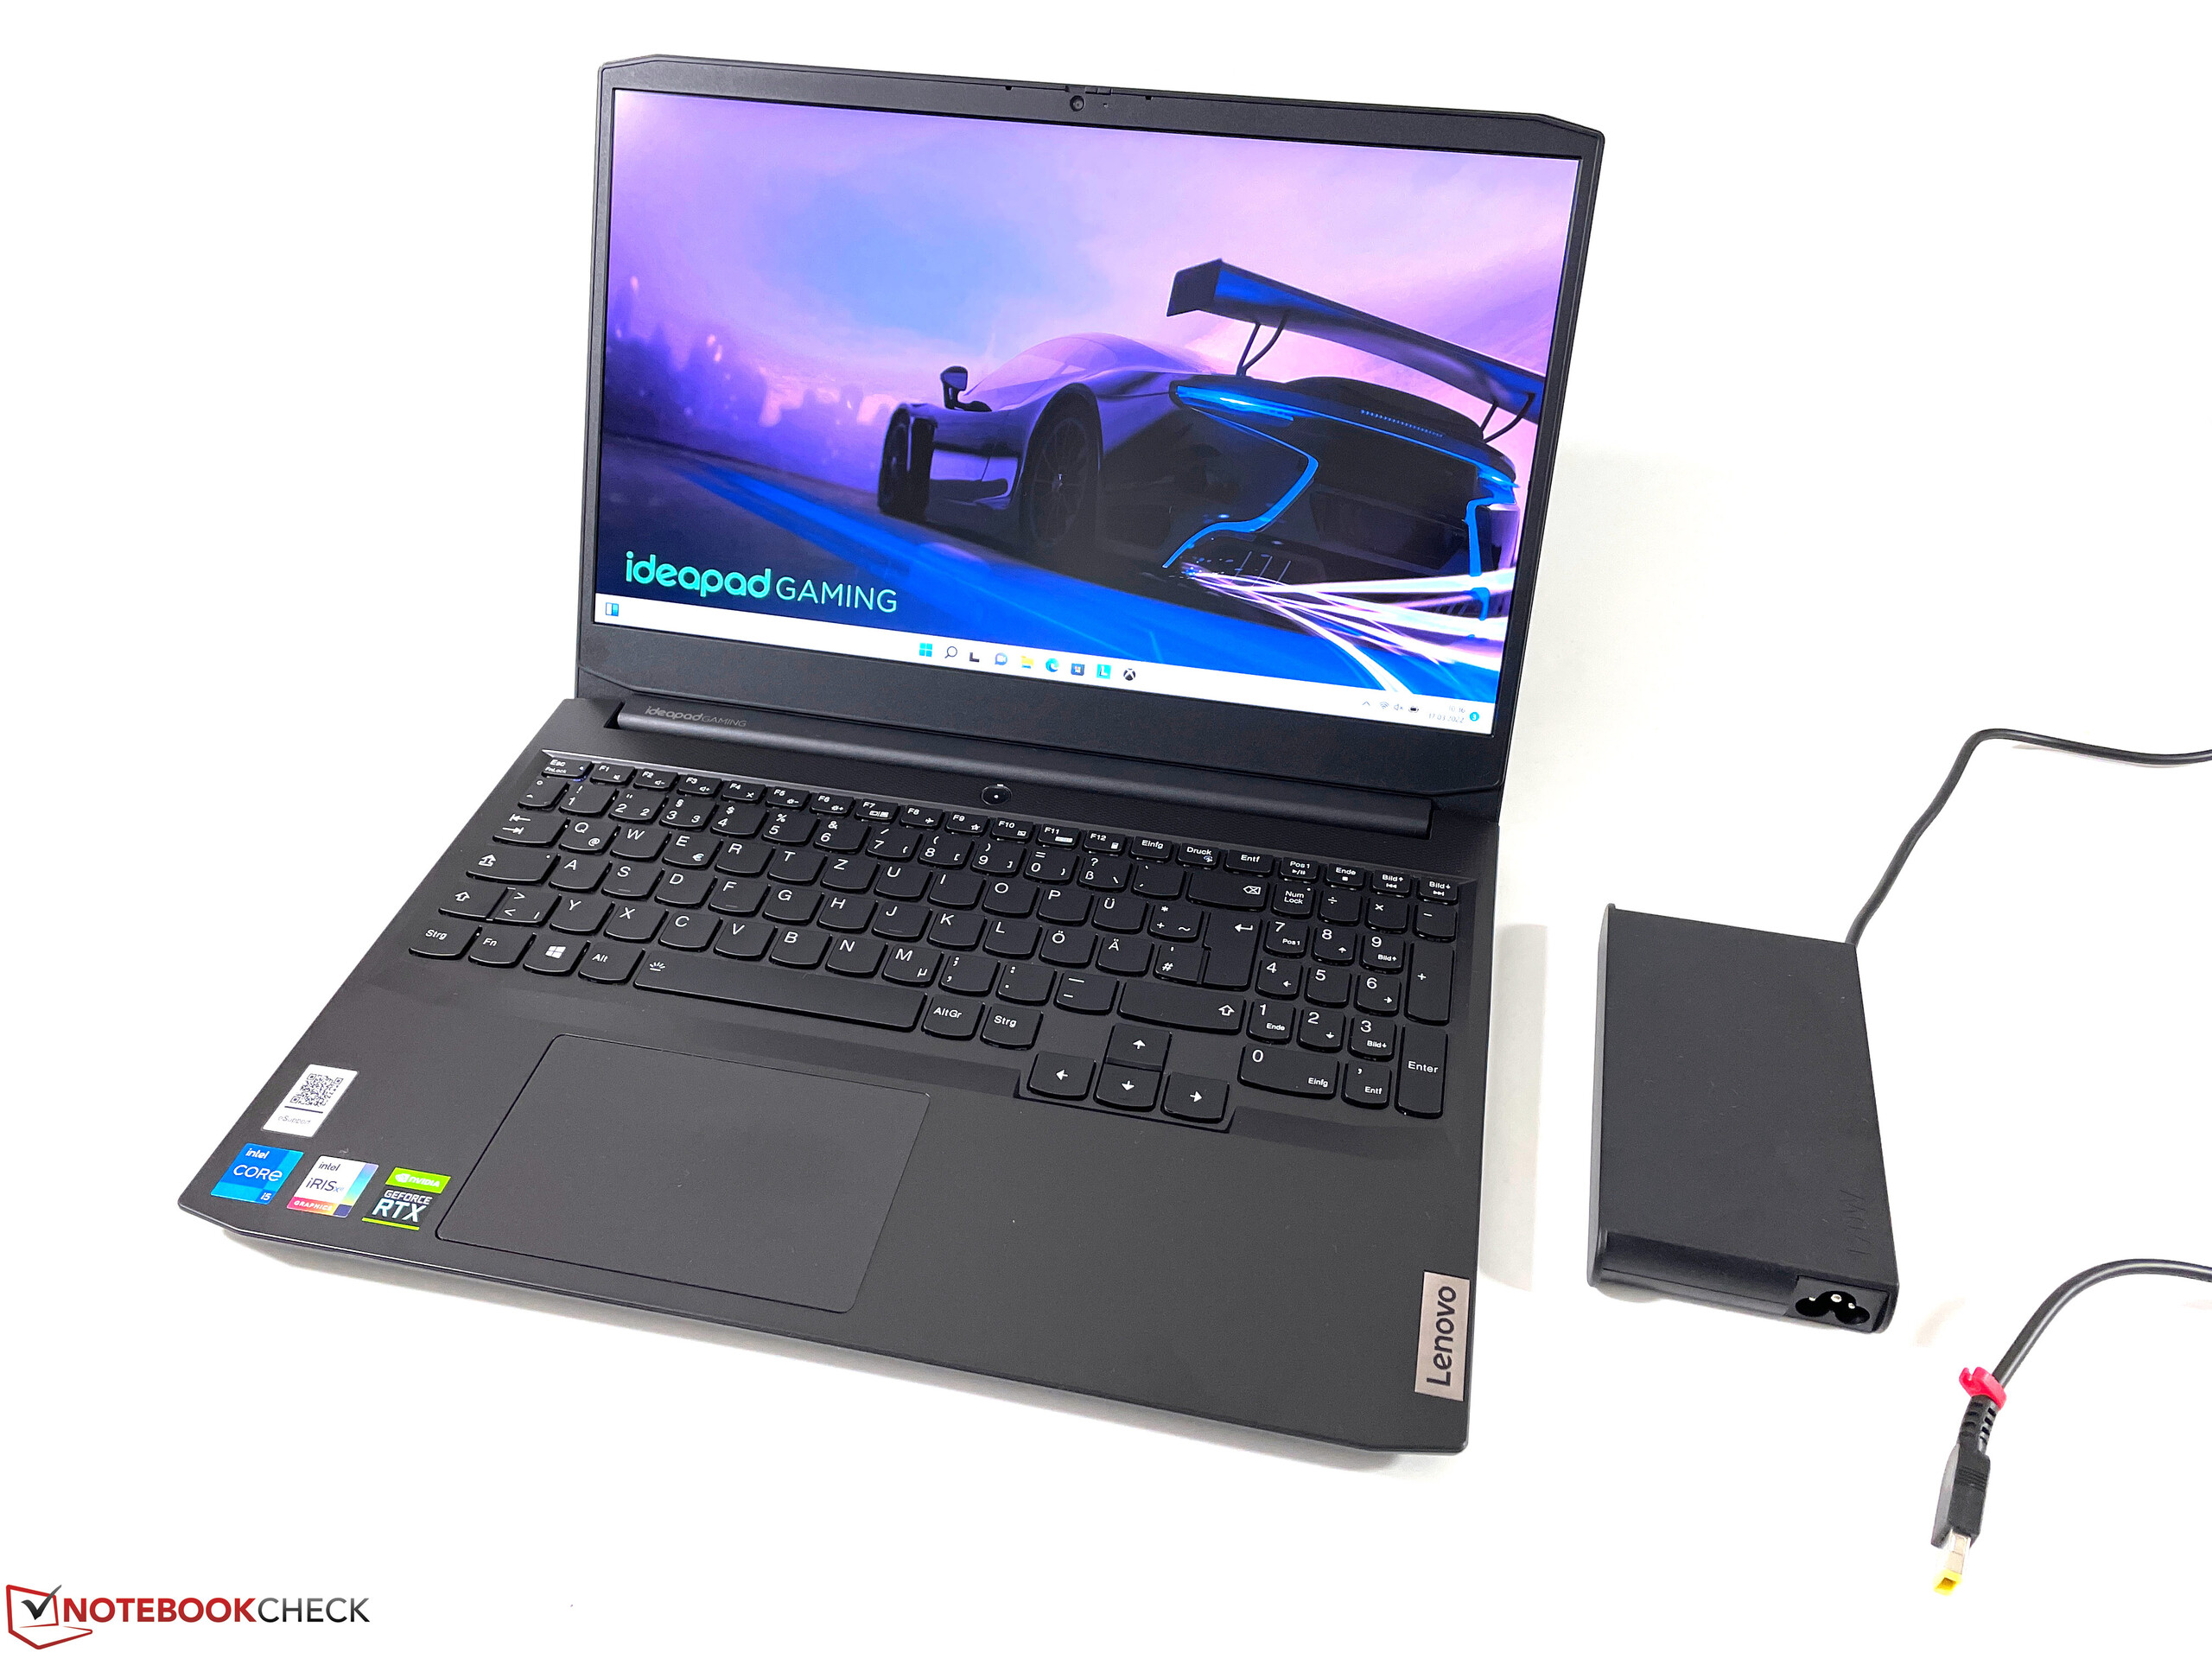
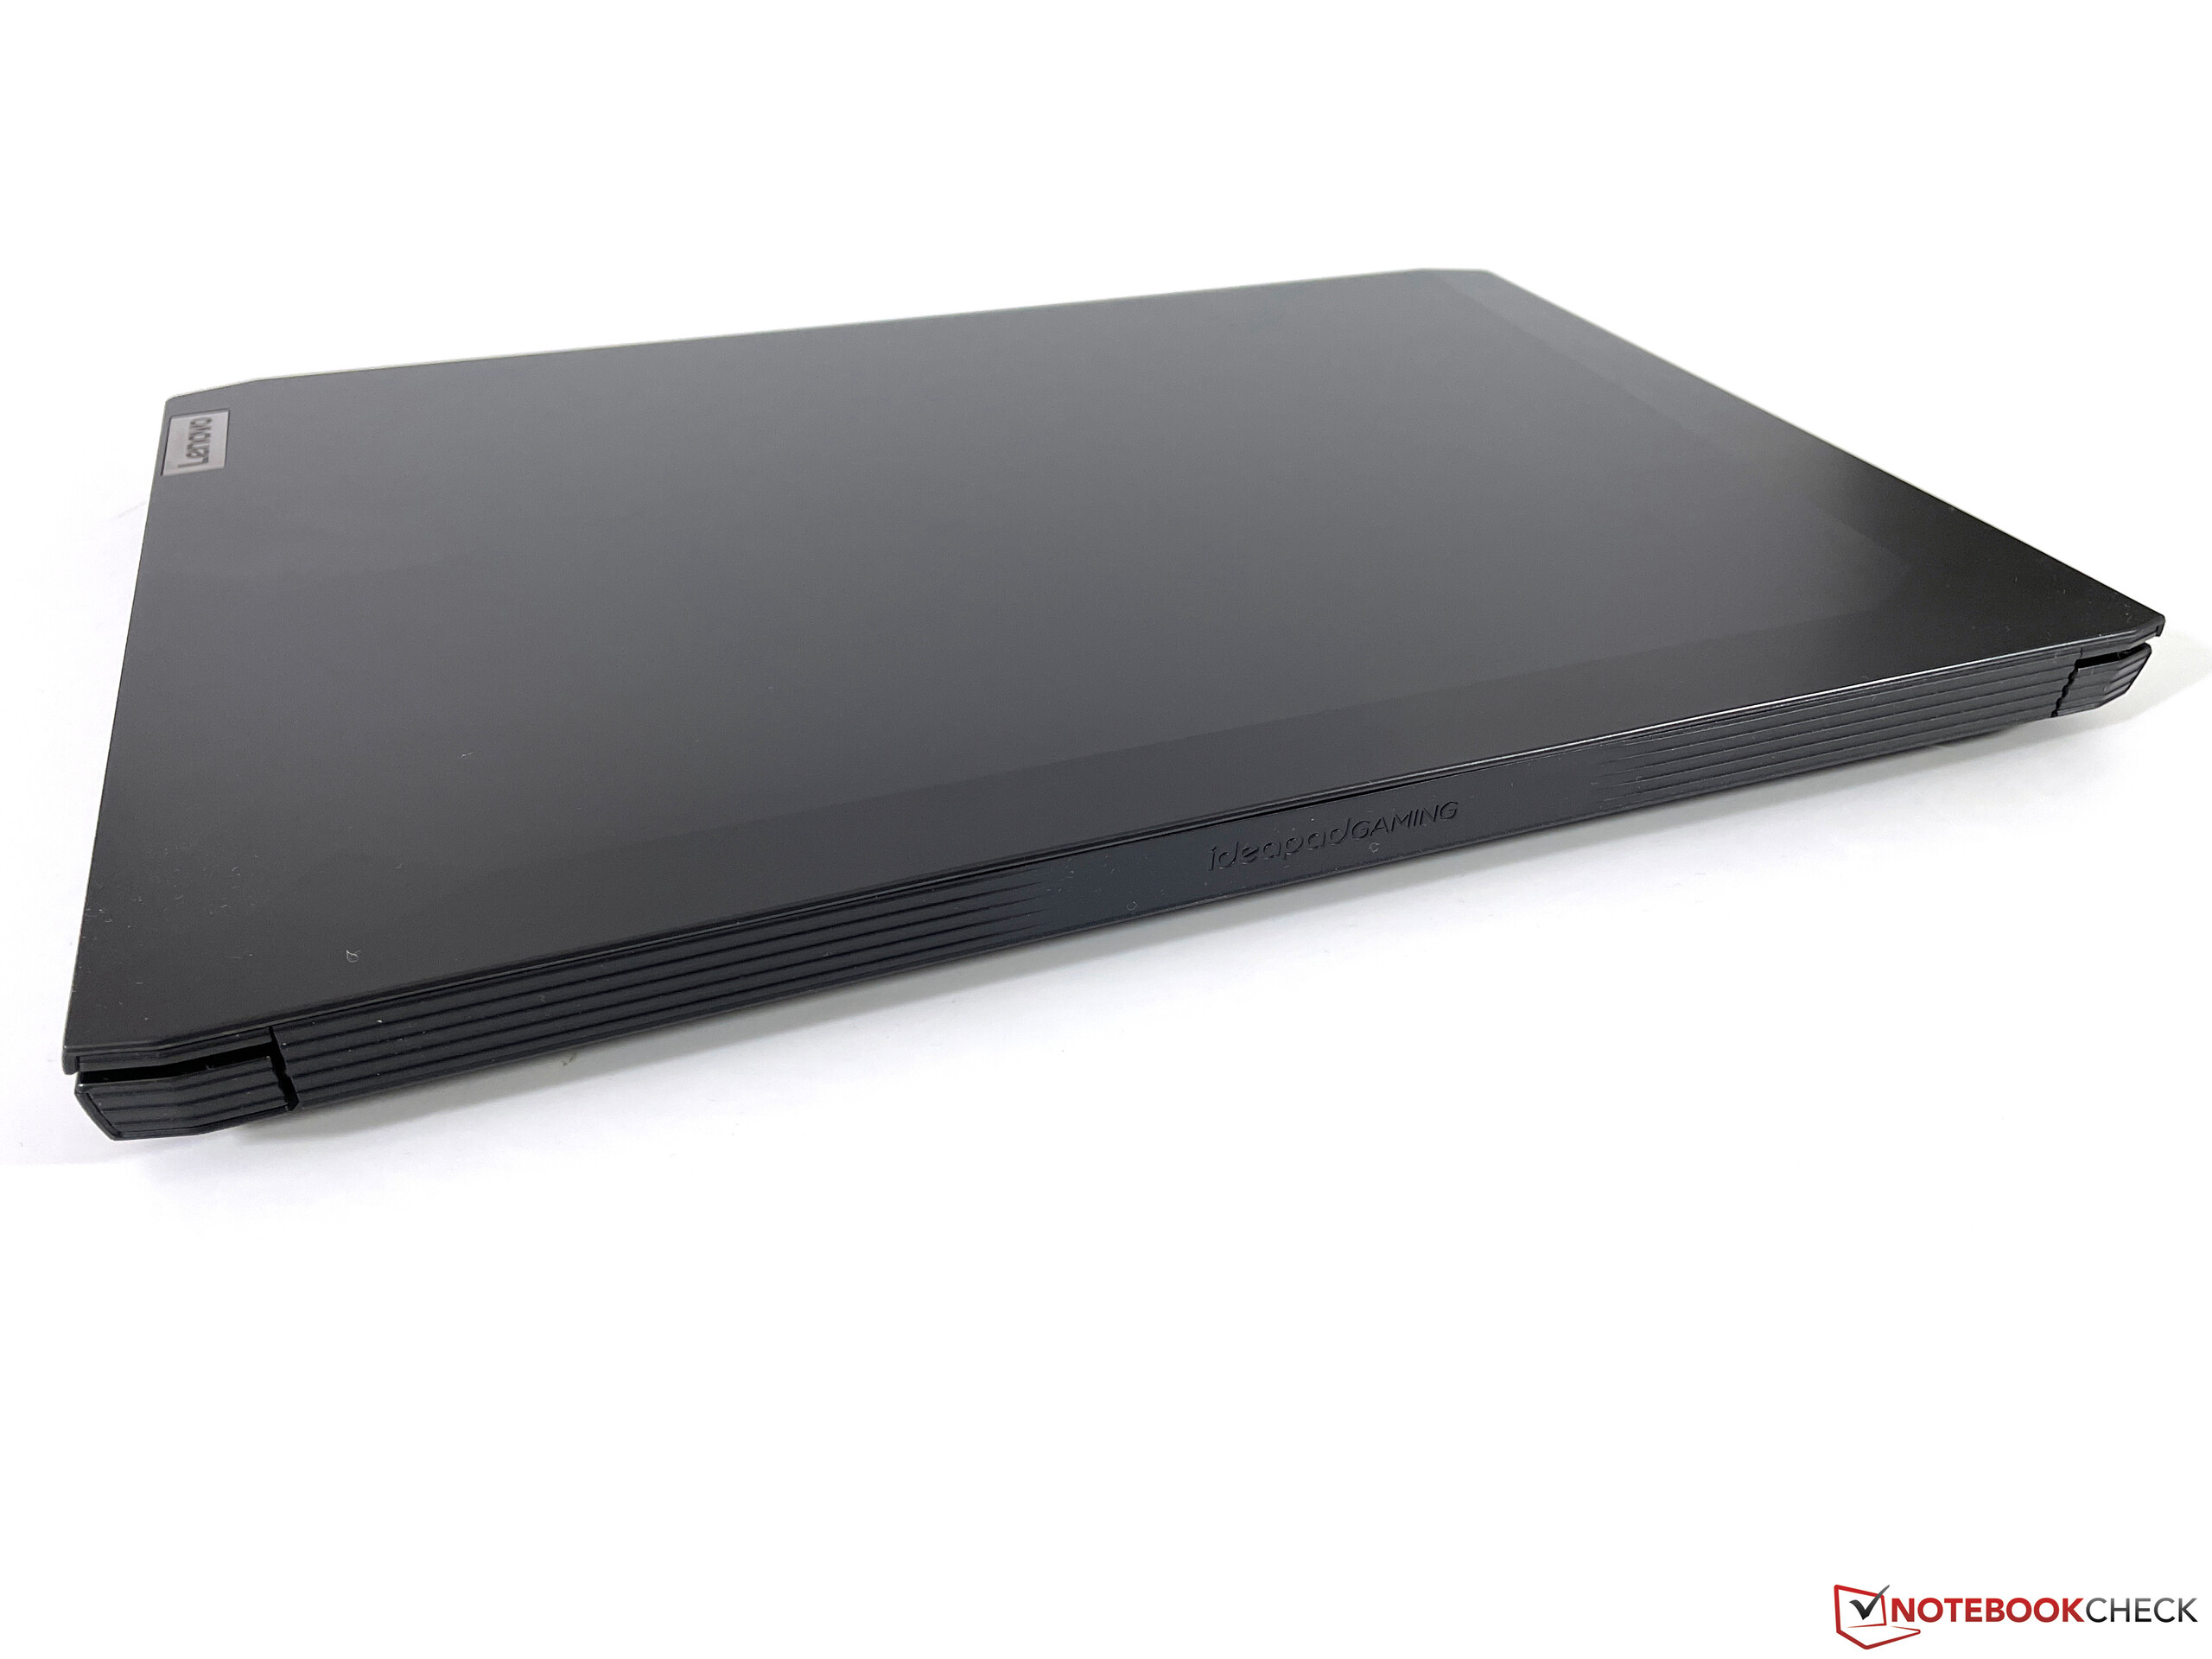
En general, el IdeaPad Gaming 3 es una de las unidades más compactas entre sus competidores, aunque las diferencias son bastante pequeñas. Con algo más de 2 kg, también es relativamente ligero. Hay que tener en cuenta que la fuente de alimentación aumenta el presupuesto de peso en más de un 25 % (500 g/1,1 lbs).
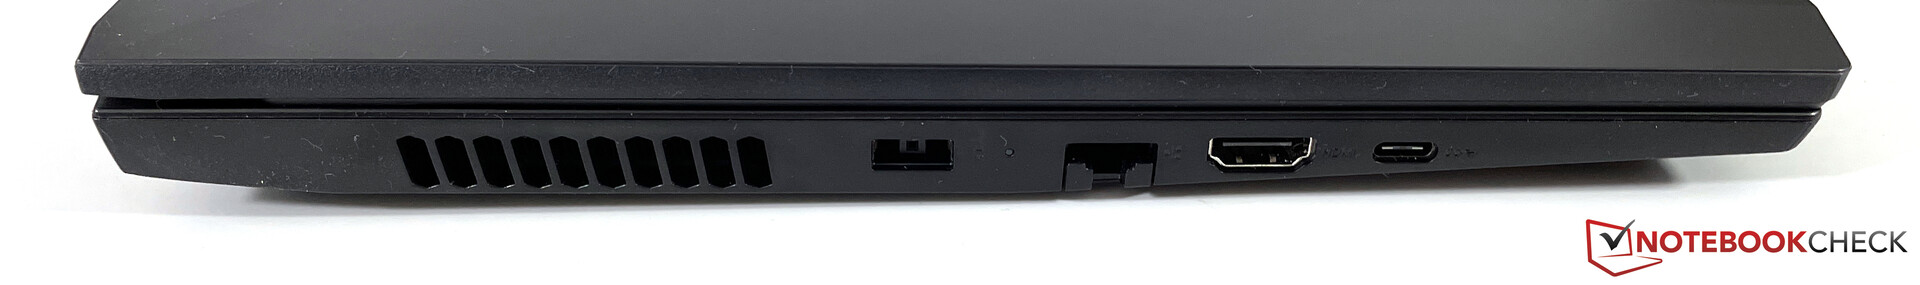
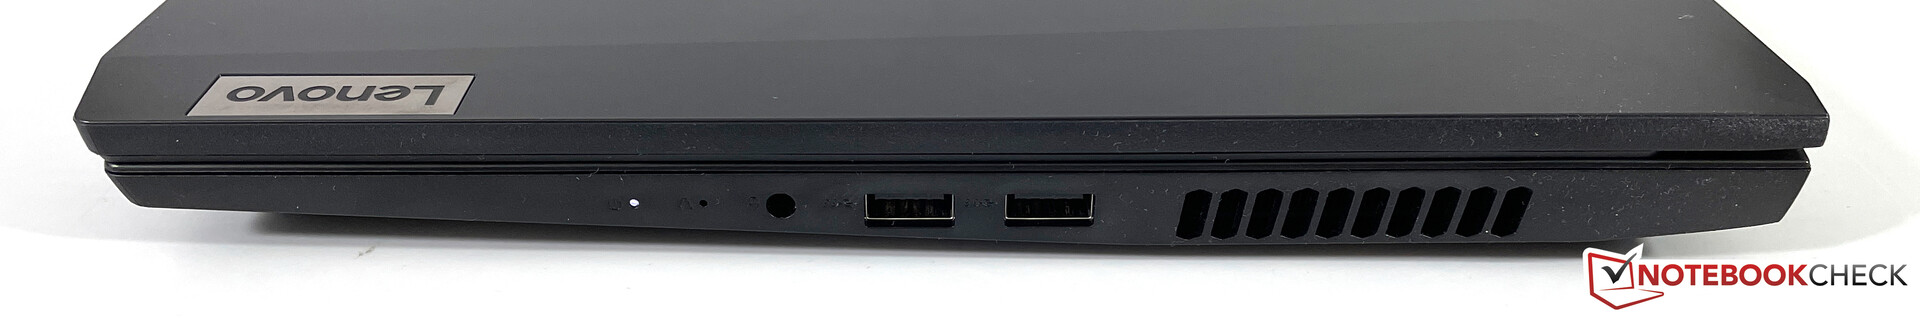
Conectividad - El IdeaPad Gaming cubre lo básico
Todos los puertos están situados hacia el centro en ambos lados. La ubicación del puerto de alimentación nos pareció particularmente difícil de manejar para los jugadores zurdos que pretenden utilizar un ratón externo. Los protocolos soportados son, una vez más, indicativos de su bajo precio. El dispositivo carece de soporte Thunderbolt y no se puede cargar a través de su puerto USB-C, ni el puerto lleva una señal DisplayPort. Tampoco se encuentra un lector de tarjetas.
Comunicación
En términos de conectividad de red, el IdeaPad Gaming 3 ofrece un puerto ethernet así como un módem Wi-Fi. Lenovo no escatimó en esta parte y optó por un módulo Intel AX201 actualizado con soporte para Wi-Fi 6 (802.11ax, 160 MHz) y Bluetooth 5.1. Las tasas de transferencia cuando se conectó a nuestro router de referencia Netgear Nighthawk AX12 fueron muy buenas, y no encontramos ningún problema de conectividad durante nuestro periodo de análisis.
Cámara web
Sobre la pantalla encontramos una webcam estándar de 720p que produce los resultados esperados. En otras palabras: su calidad de imagen es pobre incluso con una iluminación decente. Al menos la cámara ofrece un obturador de privacidad físico.


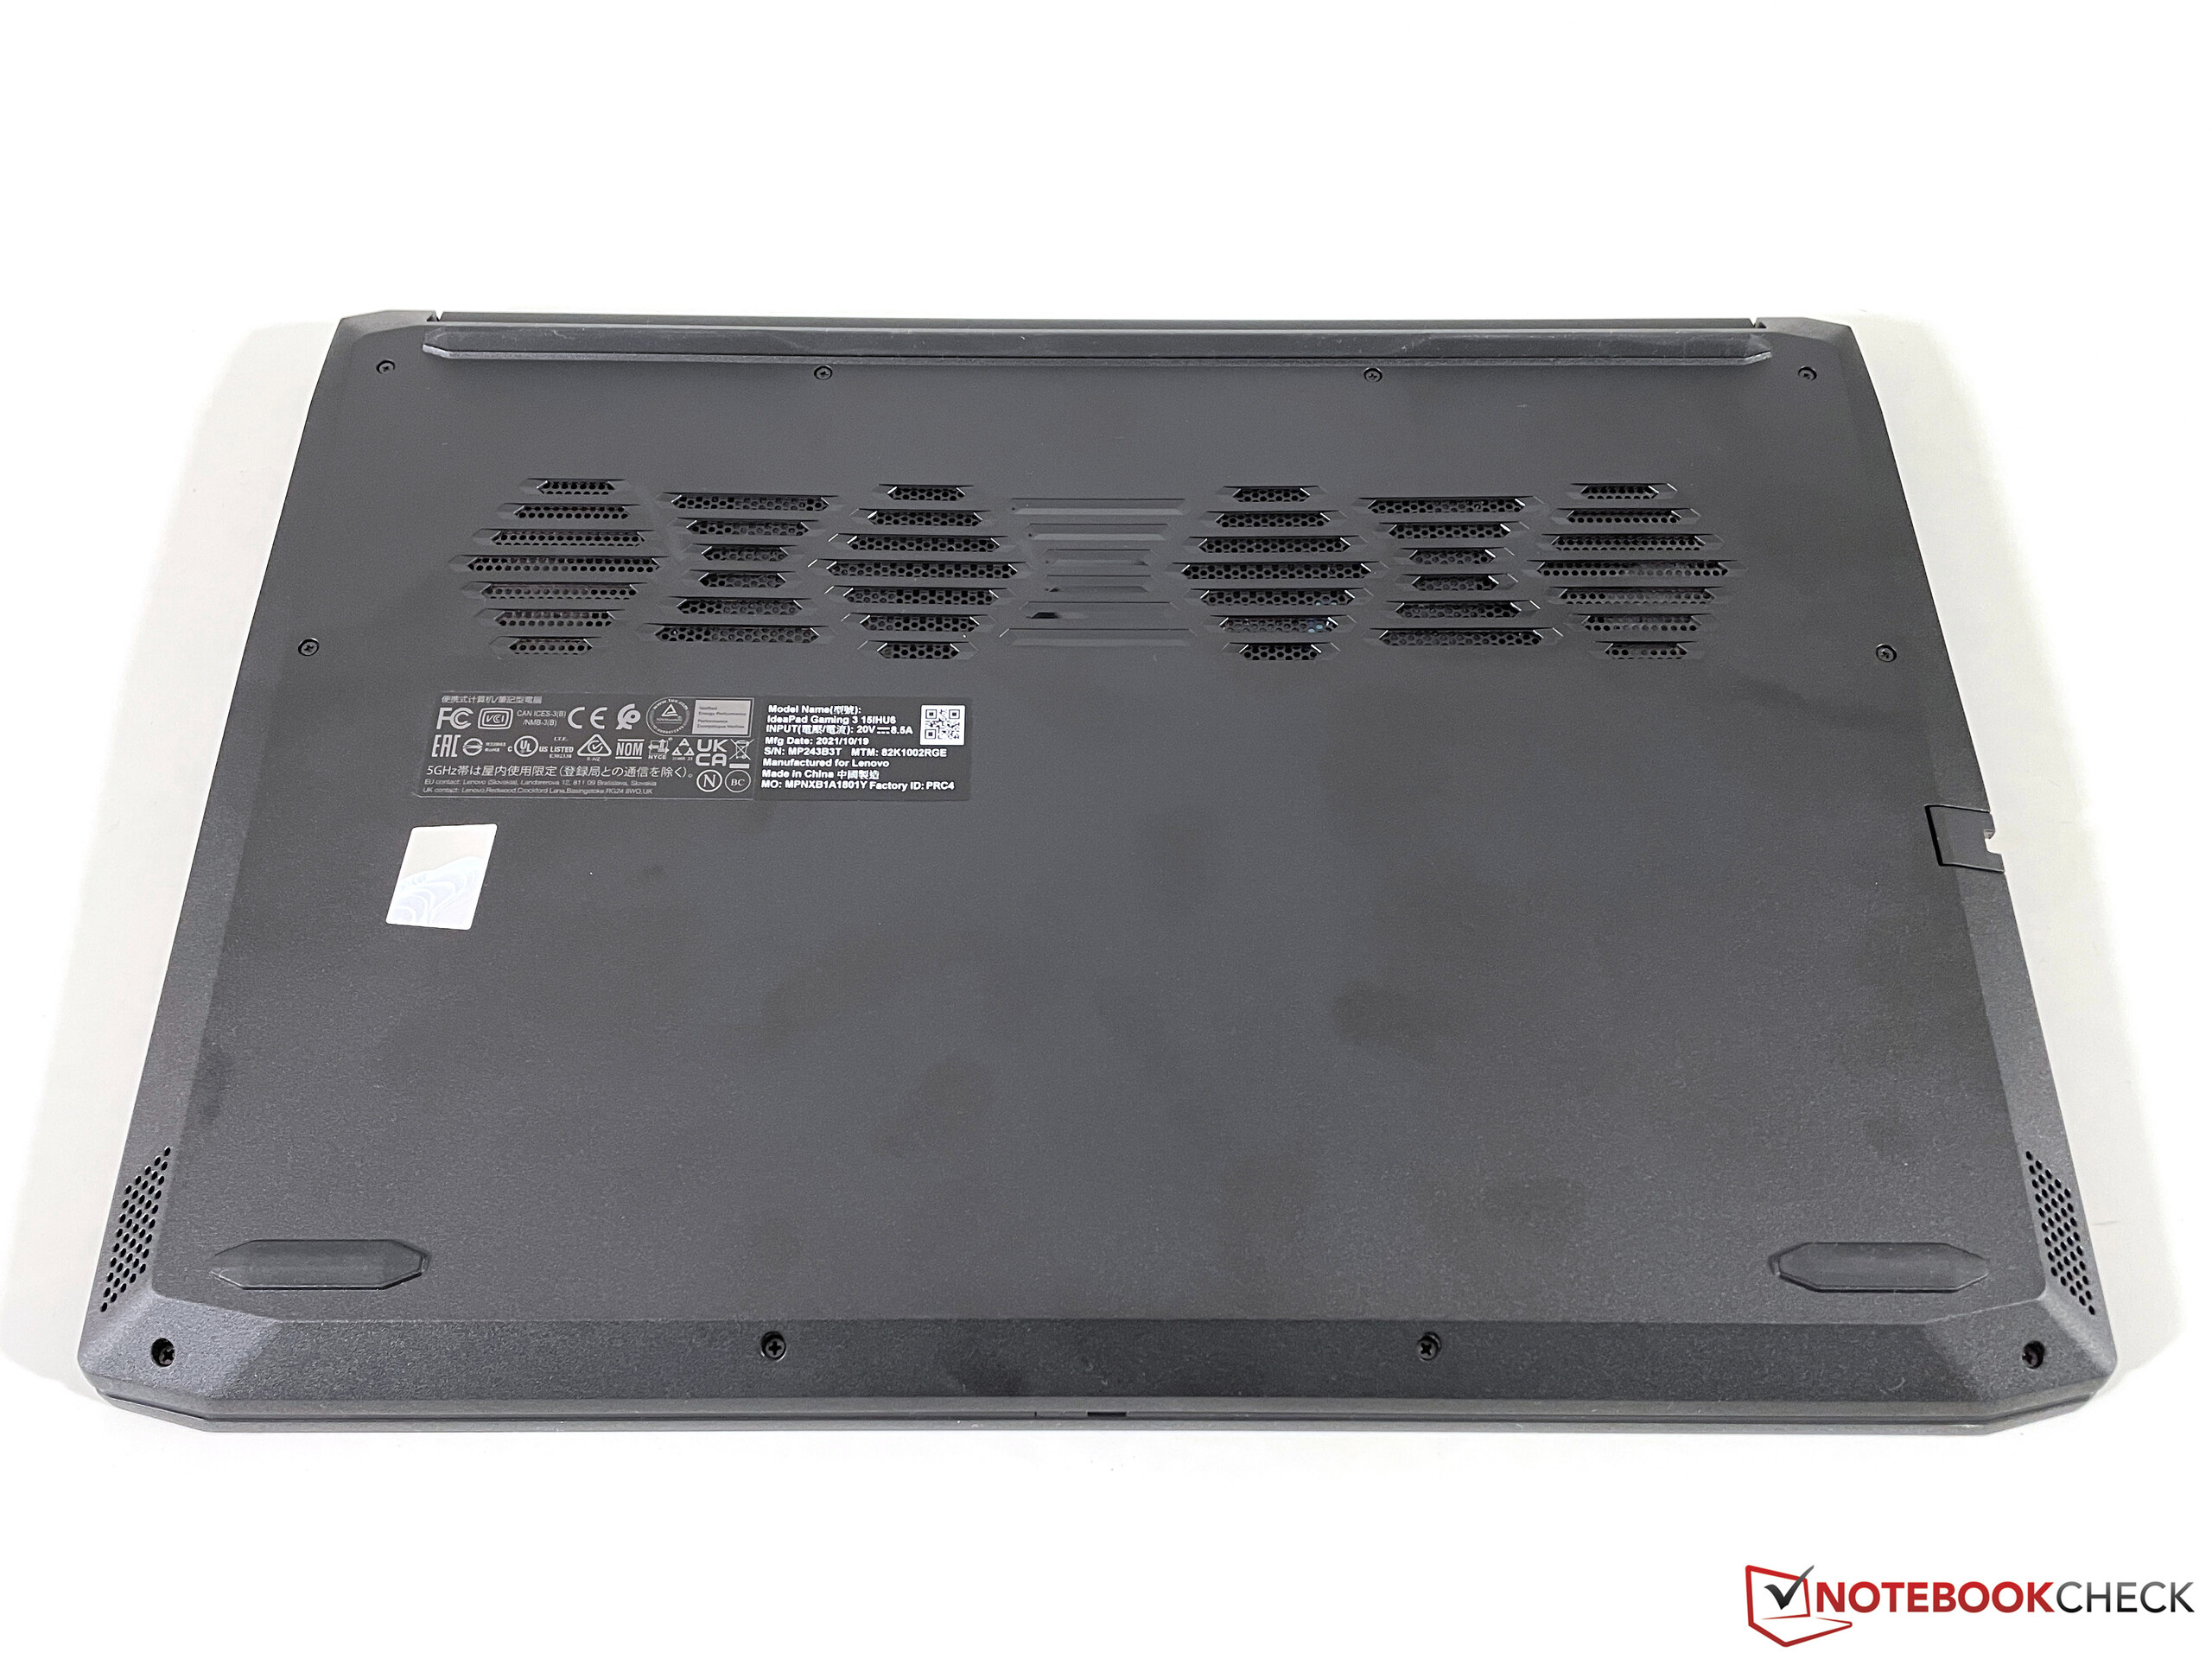
Mantenimiento
En teoría, se puede quitar todo el panel inferior para acceder a los componentes internos del IdeaPad Gaming 3. Y aunque los tornillos Philips que sujetan la cubierta en su lugar se pueden soltar fácilmente, encontramos que la cubierta inferior es imposible de quitar sin dañar la unidad base, ya sea visual o físicamente. Teniendo en cuenta que nuestra unidad de análisis era una unidad de tienda, decidimos dar por terminado el proceso.
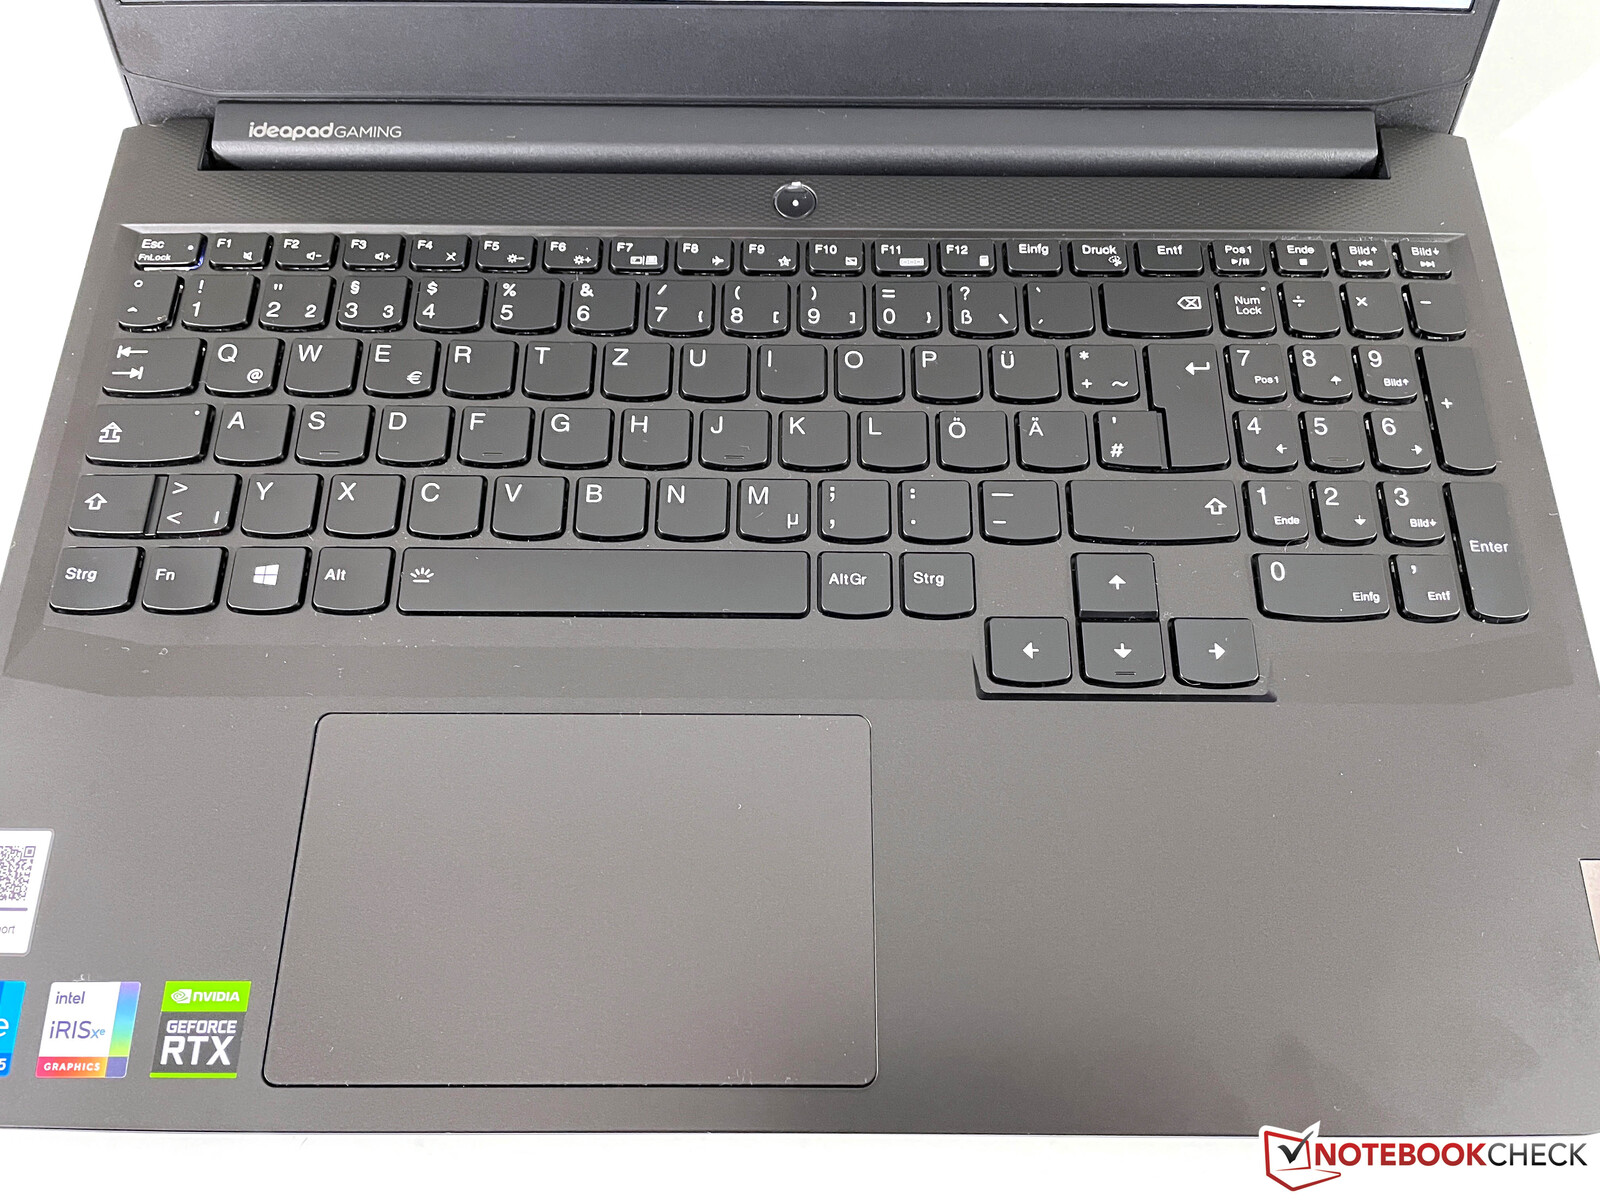
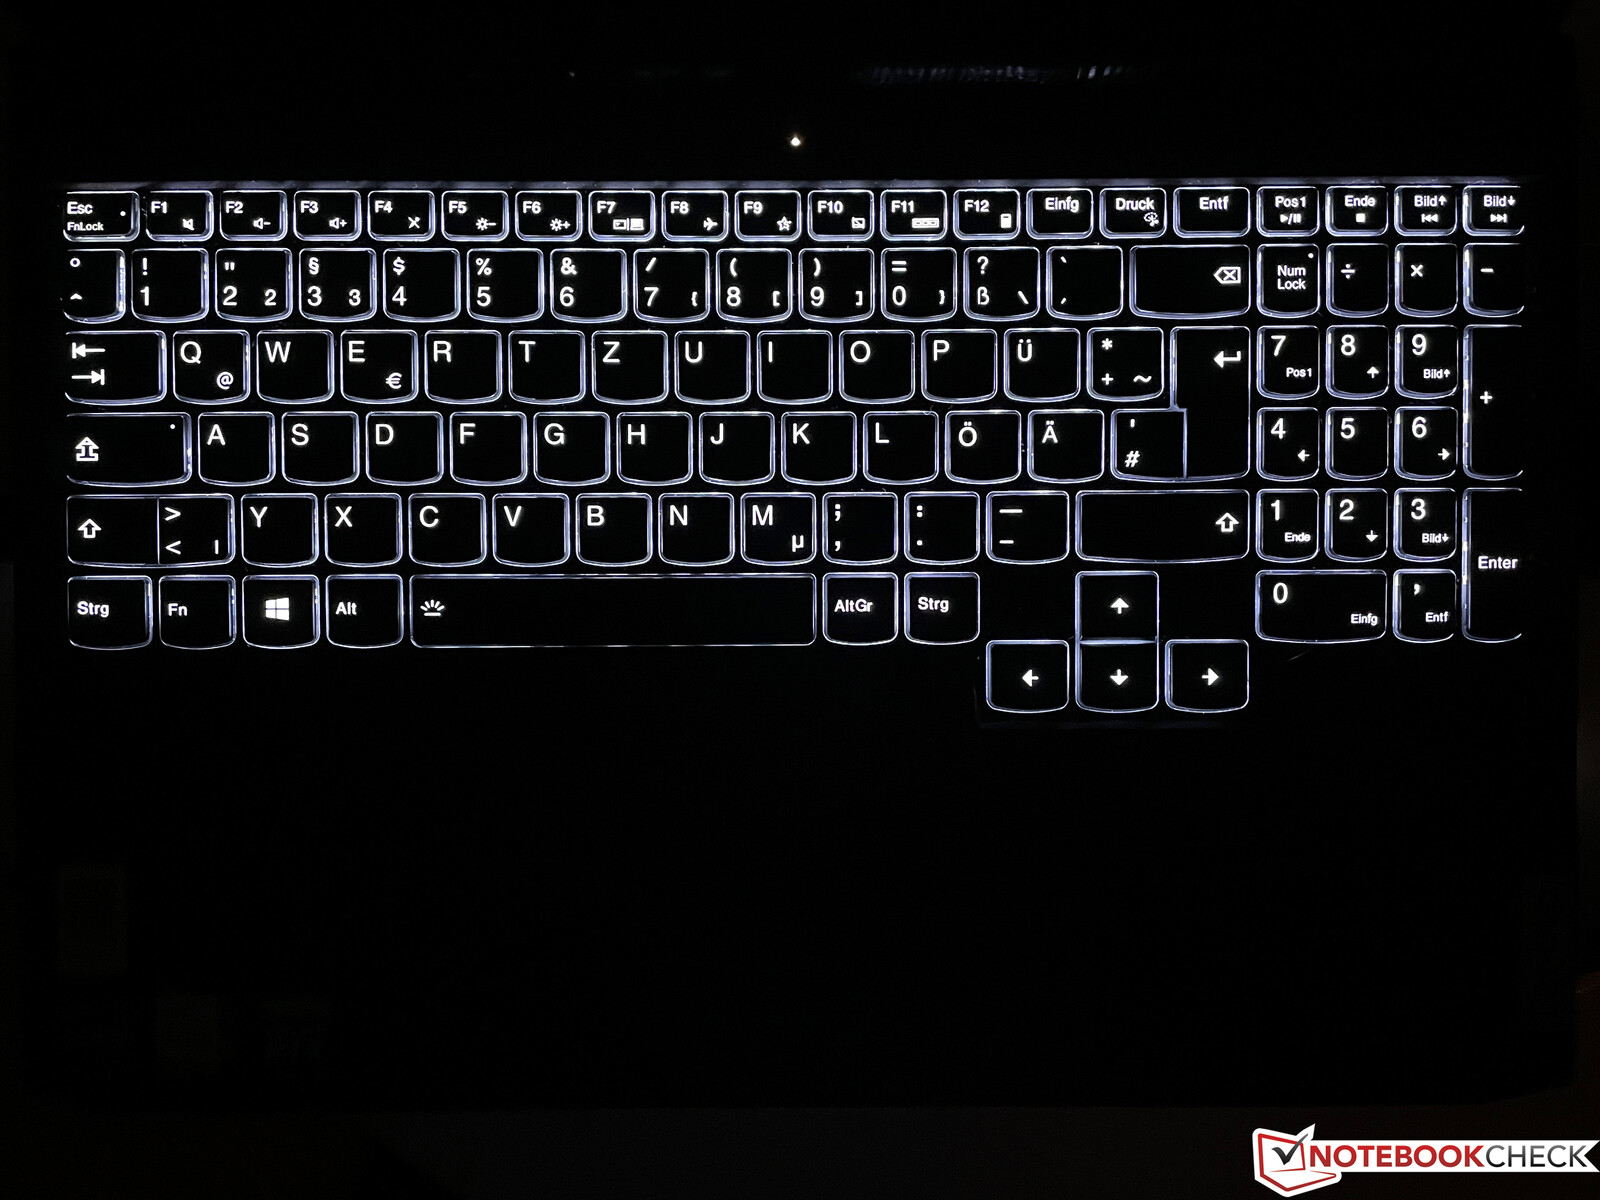
Dispositivos de entrada - IdeaPad Gaming con teclado retroiluminado
Teclado
El IdeaPad Gaming 3 viene con un teclado de tamaño completo con teclado numérico, aunque este último es comparativamente estrecho. A diferencia de otros IdeaPad, este teclado tiene un mayor recorrido (1,5 mm) que hace que escribir sea muy cómodo y agradable. Incluso cuando se compara con portátiles más caros de Legion Gaming, nuestra unidad de análisis se comportó muy bien, y no tuvimos problemas para escribir textos largos. Los jugadores se beneficiarán de las grandes teclas de cursor desplazadas. El dispositivo carece de retroiluminación RGB y viene con una retroiluminación blanca de dos niveles. No obstante, también está disponible una retroiluminación RGB de 4 zonas.
Teclado táctil
El clickpad está desplazado a la izquierda y centrado debajo de la barra espaciadora. Con 12 x 7,5 cm (4,72 x 2,95 pulgadas) es suficientemente grande, y gracias a su suave superficie la usabilidad y el control del cursor fue una brisa. En la parte inferior encontramos los botones integrados, que producen un ruido de clic fuerte y muy perceptible cuando se pulsan. El pad es compatible con el estándar de Microsoft Precision y, por lo tanto, permite realizar gestos con hasta cuatro dedos.
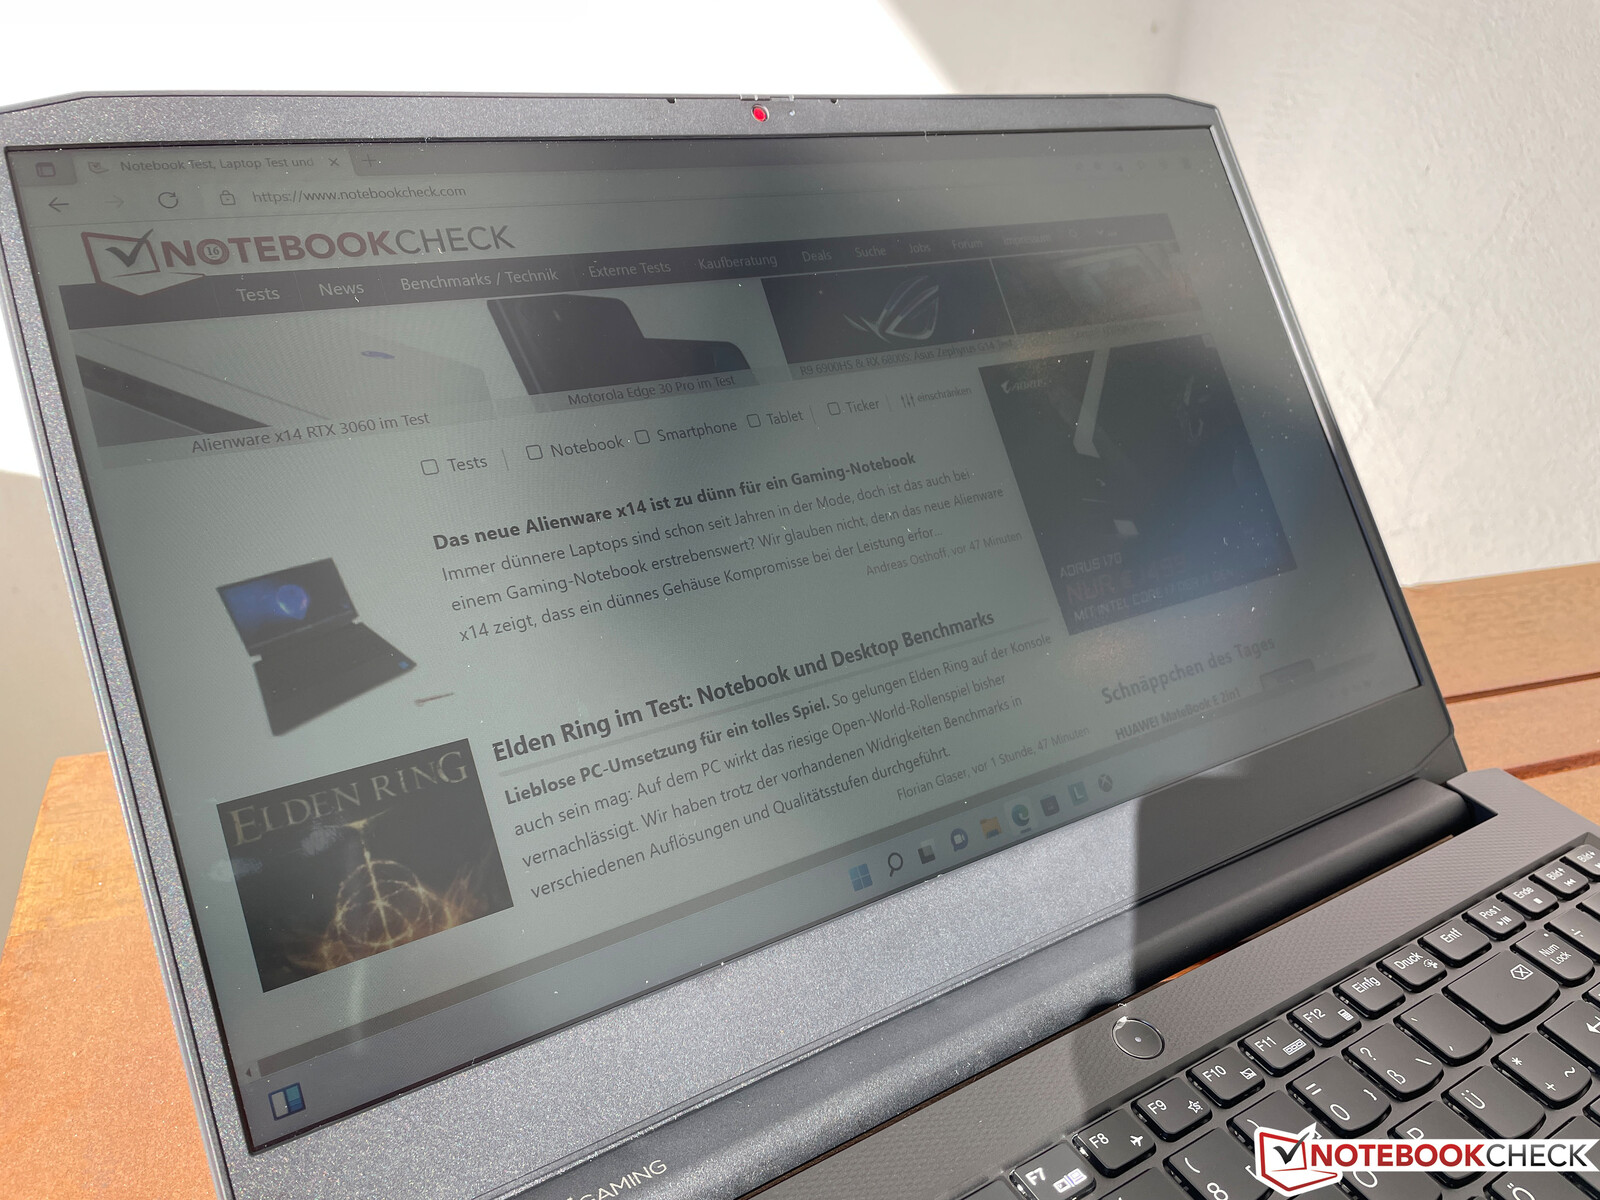
Pantalla - Panel IPS mate
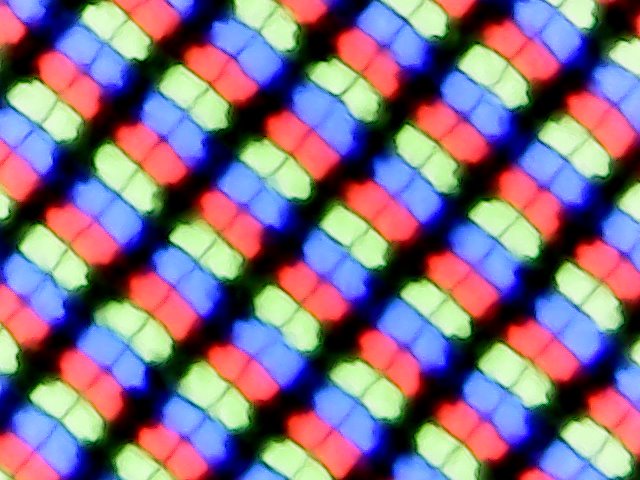

Hay un total de tres paneles 1080p diferentes disponibles para el IdeaPad Gaming 3, todos ellos mate y basados en la tecnología IPS: el display estándar de 60 Hz (250 nits) con el que estaba equipado nuestro modelo de pruebas, un panel de 120 Hz (250 nits), y un panel de 165 Hz (300 nits) con cobertura sRGB completa.
En nuestras pruebas, el display estándar alcanzó un pico de brillo superior al de Lenovo y logró unos buenos 300 nits. No obstante, subjetivamente está bien en el mejor de los casos y ciertamente es el punto más negativo del IdeaPad Gaming 3. El contenido de la pantalla es algo granuloso, cortesía del revestimiento mate de la pantalla, y los colores tampoco son particularmente fuertes. No encontramos evidencias de parpadeo PWM pero, por otro lado, los tiempos de respuesta son bastante lentos. Si es posible, recomendamos encarecidamente optar por el panel opcional de 165 Hz. Hay que tener en cuenta que no todas las opciones de pantalla están disponibles en todas las regiones.
| |||||||||||||||||||||||||
iluminación: 88 %
Brillo con batería: 307 cd/m²
Contraste: 1462:1 (Negro: 0.21 cd/m²)
ΔE ColorChecker Calman: 5.9 | ∀{0.5-29.43 Ø4.71}
calibrated: 4.8
ΔE Greyscale Calman: 4.9 | ∀{0.09-98 Ø4.96}
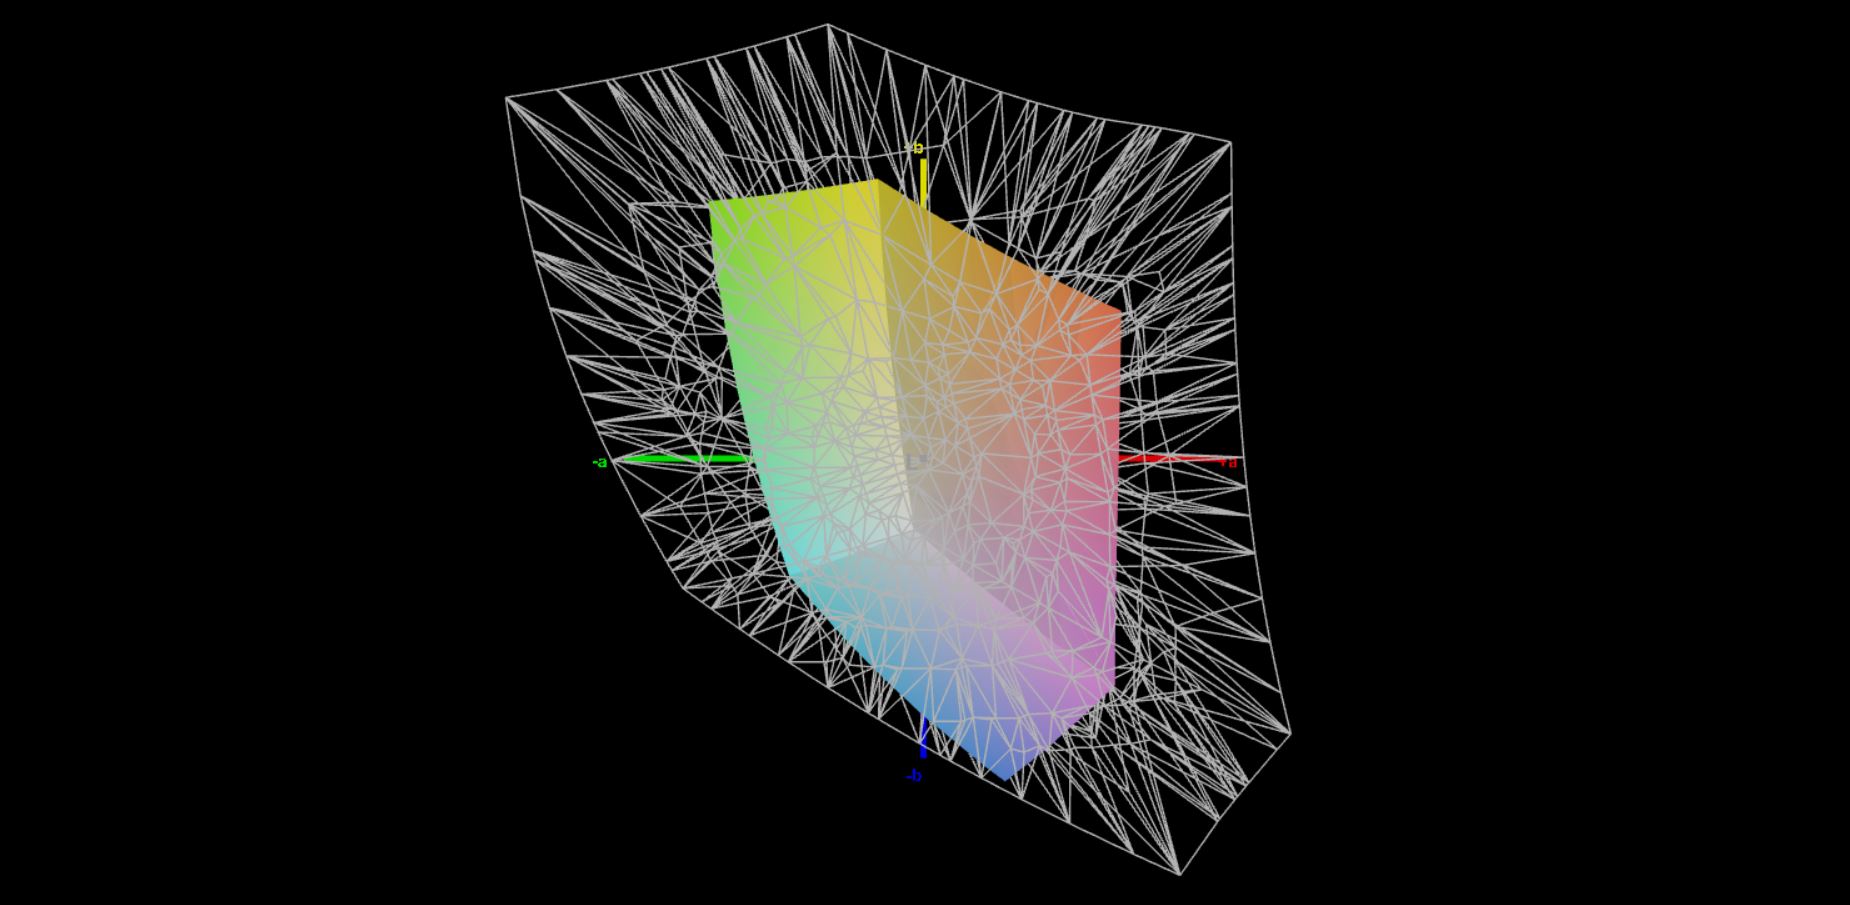
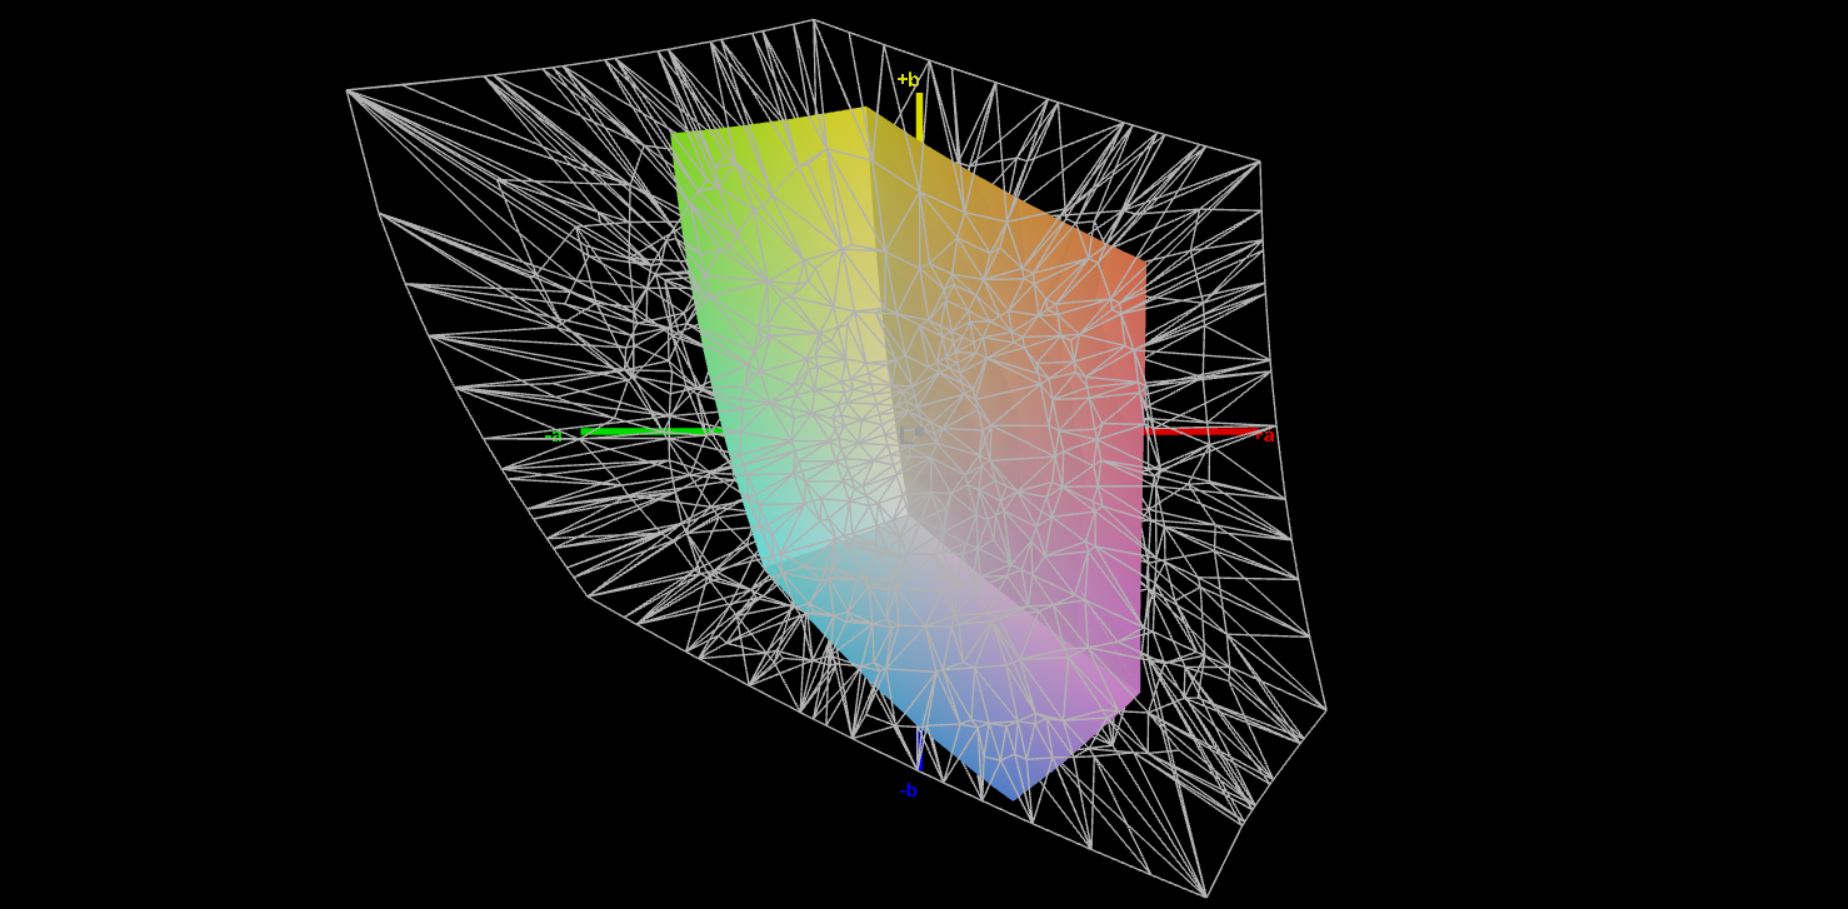
41.1% AdobeRGB 1998 (Argyll 3D)
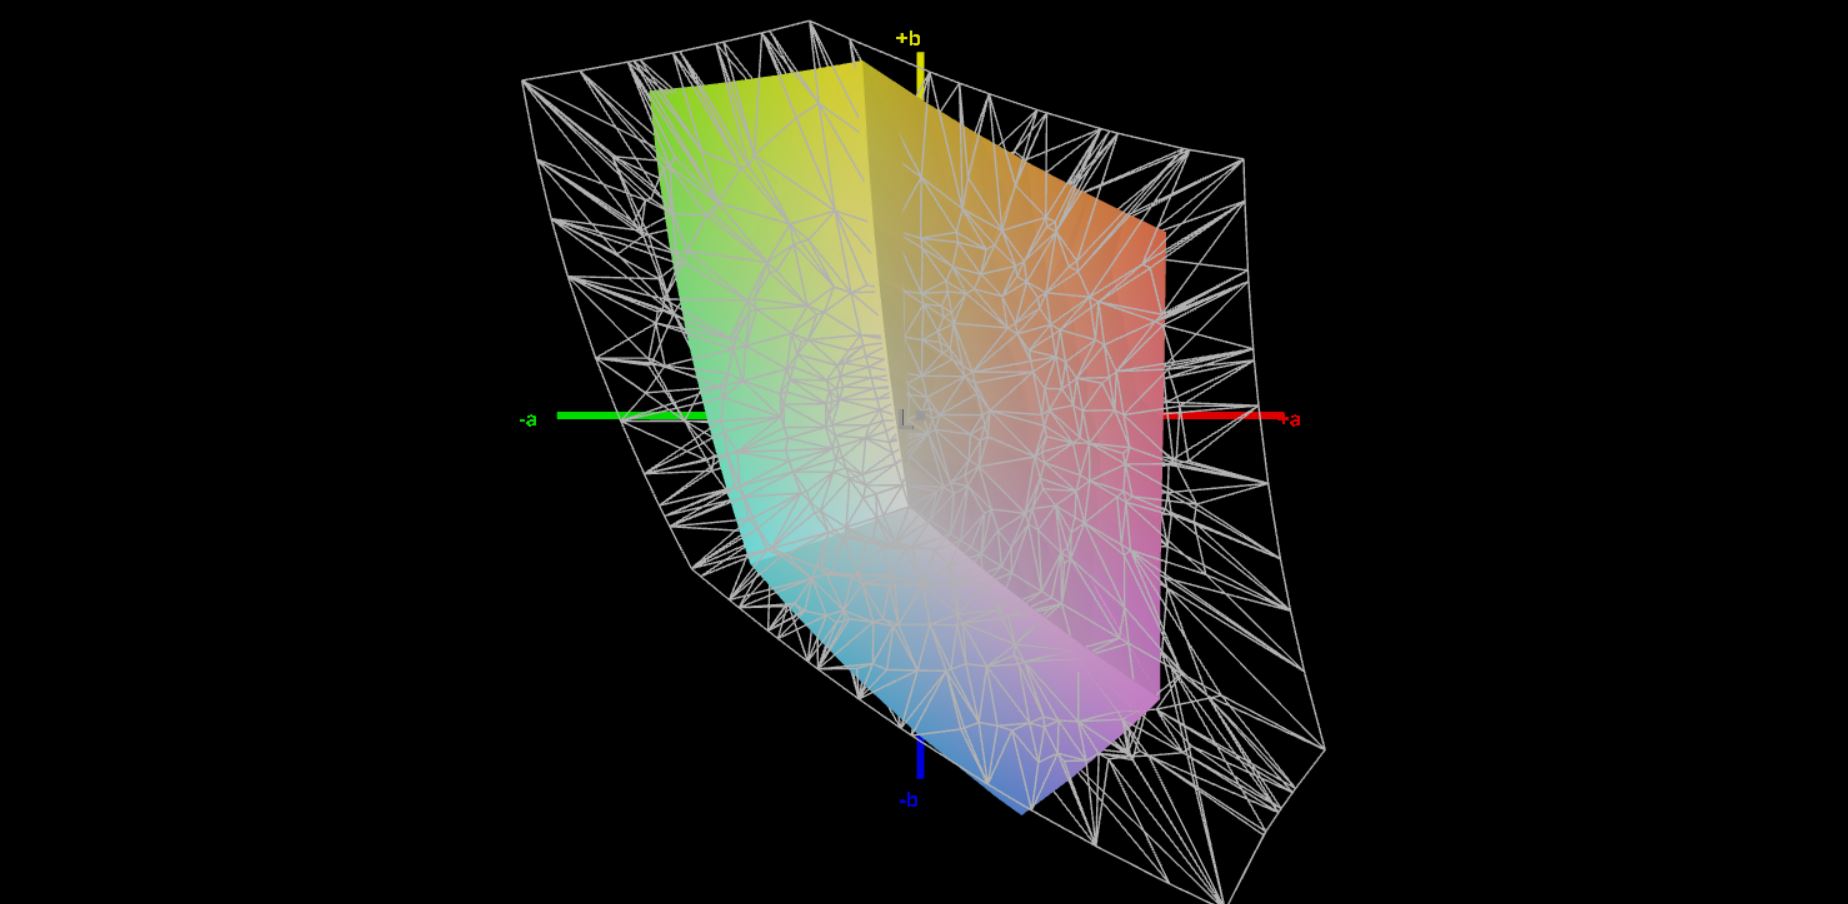
59.6% sRGB (Argyll 3D)
39.7% Display P3 (Argyll 3D)
Gamma: 2.26
CCT: 6504 K
| Lenovo Ideapad Gaming 3 15IHU-82K1002RGE LEN156FHD, IPS, 1920x1080, 15.6" | Dell G15 5515 BOE092A, IPS, 1920x1080, 15.6" | Gigabyte G5 GD Chi Mei N156HRA-EA1, IPS, 1920x1080, 15.6" | Medion Erazer Deputy P25 Panda LM156LF-2F03, IPS, 1920x1080, 15.6" | Schenker XMG Focus 15 LG Philips LP156WFG-SPB5, IPS, 1920x1080, 15.6" | Lenovo Legion 5 15ACH-82JU00C6GE-FL B156HAN12.H, , 1920x1080, 15.6" | |
|---|---|---|---|---|---|---|
| Display | -3% | 5% | 0% | 62% | 64% | |
| Display P3 Coverage (%) | 39.7 | 39.1 -2% | 41.8 5% | 39.7 0% | 64.6 63% | 65.4 65% |
| sRGB Coverage (%) | 59.6 | 56.9 -5% | 62.3 5% | 59.7 0% | 95.3 60% | 96.3 62% |
| AdobeRGB 1998 Coverage (%) | 41.1 | 40.4 -2% | 43.2 5% | 41.1 0% | 66.5 62% | 67.5 64% |
| Response Times | 49% | 30% | 14% | 68% | 73% | |
| Response Time Grey 50% / Grey 80% * (ms) | 46.4 ? | 25.2 ? 46% | 34.4 ? 26% | 40.4 ? 13% | 18 ? 61% | 13.6 ? 71% |
| Response Time Black / White * (ms) | 35.2 ? | 16.8 ? 52% | 23.2 ? 34% | 30.4 ? 14% | 8.8 ? 75% | 9.2 ? 74% |
| PWM Frequency (Hz) | 200 ? | |||||
| Screen | -10% | 10% | 8% | 23% | 15% | |
| Brightness middle (cd/m²) | 307 | 278 -9% | 261 -15% | 283 -8% | 418 36% | 350 14% |
| Brightness (cd/m²) | 292 | 262 -10% | 246 -16% | 266 -9% | 376 29% | 350 20% |
| Brightness Distribution (%) | 88 | 83 -6% | 87 -1% | 85 -3% | 83 -6% | 96 9% |
| Black Level * (cd/m²) | 0.21 | 0.36 -71% | 0.19 10% | 0.2 5% | 0.41 -95% | 0.3 -43% |
| Contrast (:1) | 1462 | 772 -47% | 1374 -6% | 1415 -3% | 1020 -30% | 1167 -20% |
| Colorchecker dE 2000 * | 5.9 | 5.74 3% | 3.9 34% | 5.32 10% | 1.67 72% | 3.9 34% |
| Colorchecker dE 2000 max. * | 21.6 | 19.63 9% | 19.26 11% | 17.68 18% | 3.88 82% | 8.2 62% |
| Colorchecker dE 2000 calibrated * | 4.8 | 4.7 2% | 3.24 32% | 3.94 18% | 0.98 80% | 1.6 67% |
| Greyscale dE 2000 * | 4.9 | 3.1 37% | 2.7 45% | 2.9 41% | 2.9 41% | 5.5 -12% |
| Gamma | 2.26 97% | 2.011 109% | 2.248 98% | 2.062 107% | 2.26 97% | 2.15 102% |
| CCT | 6504 100% | 6207 105% | 6828 95% | 7167 91% | 6209 105% | 7414 88% |
| Media total (Programa/Opciones) | 12% /
-0% | 15% /
12% | 7% /
7% | 51% /
38% | 51% /
33% |
* ... más pequeño es mejor
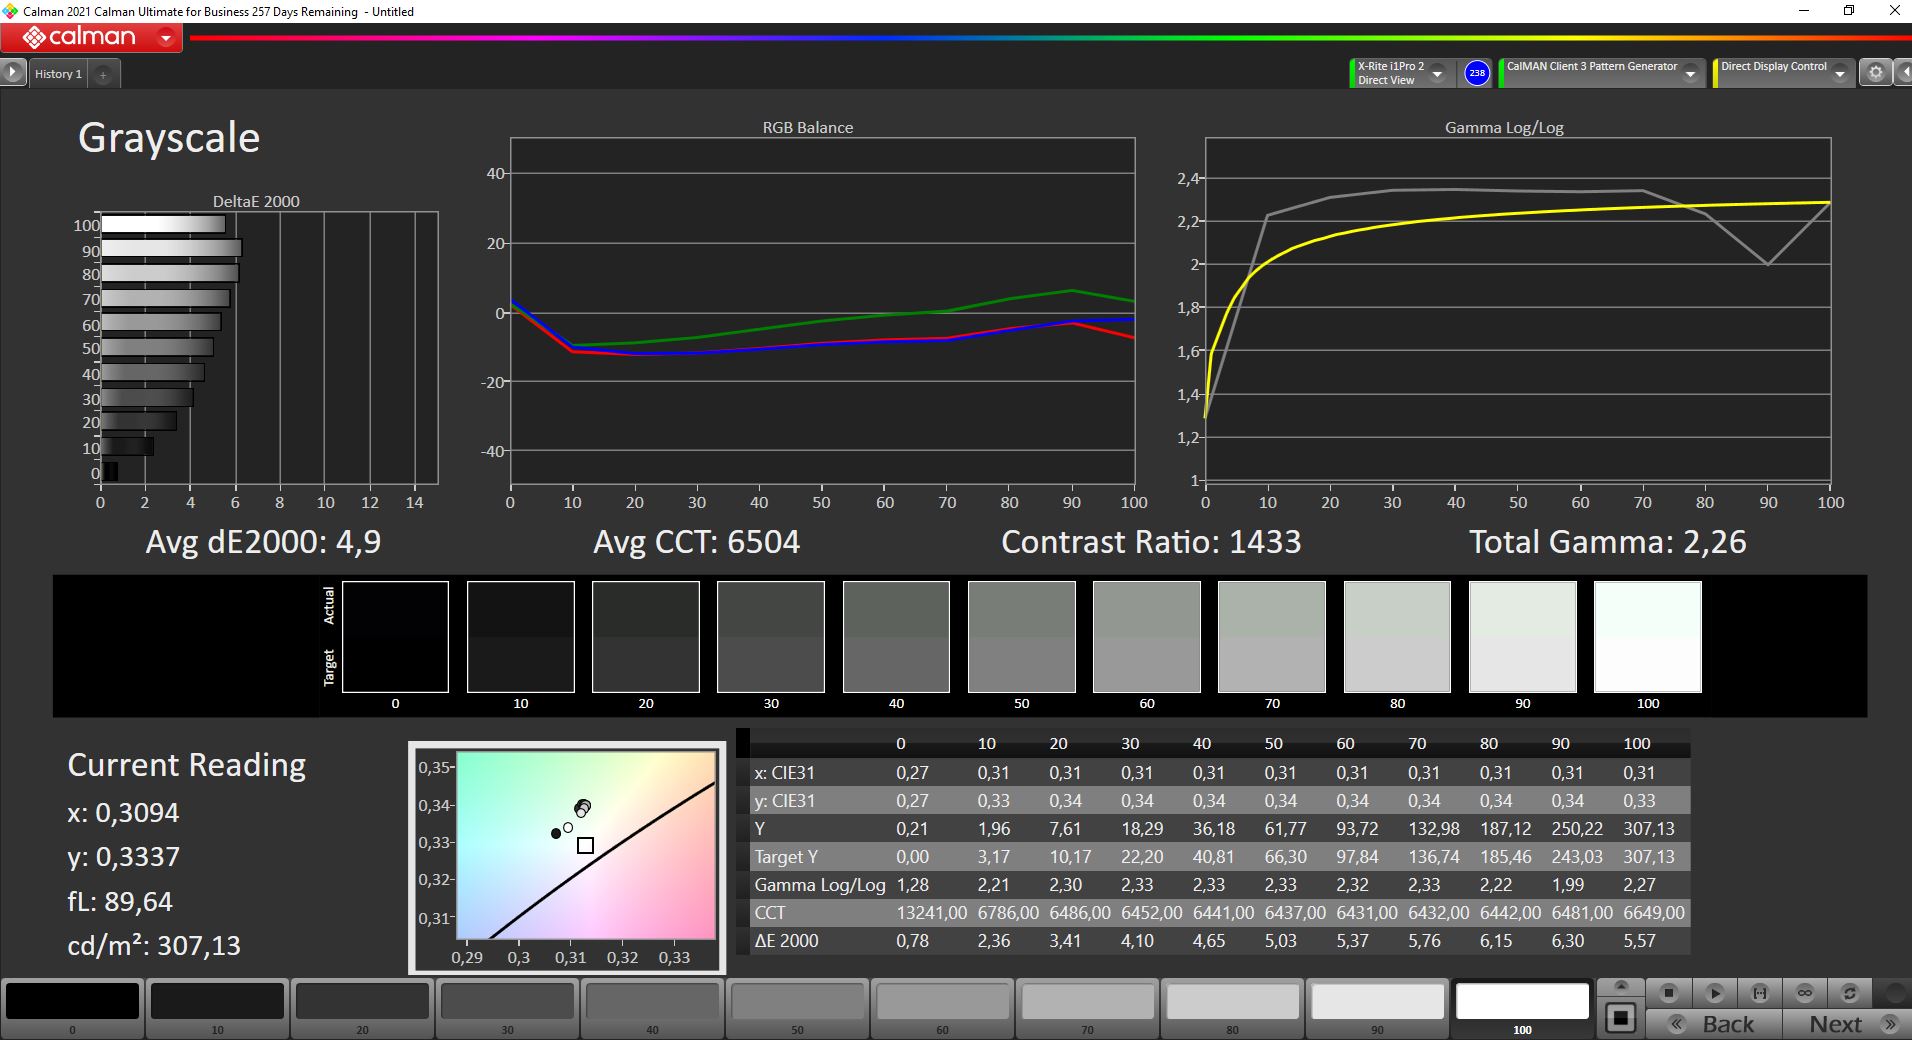
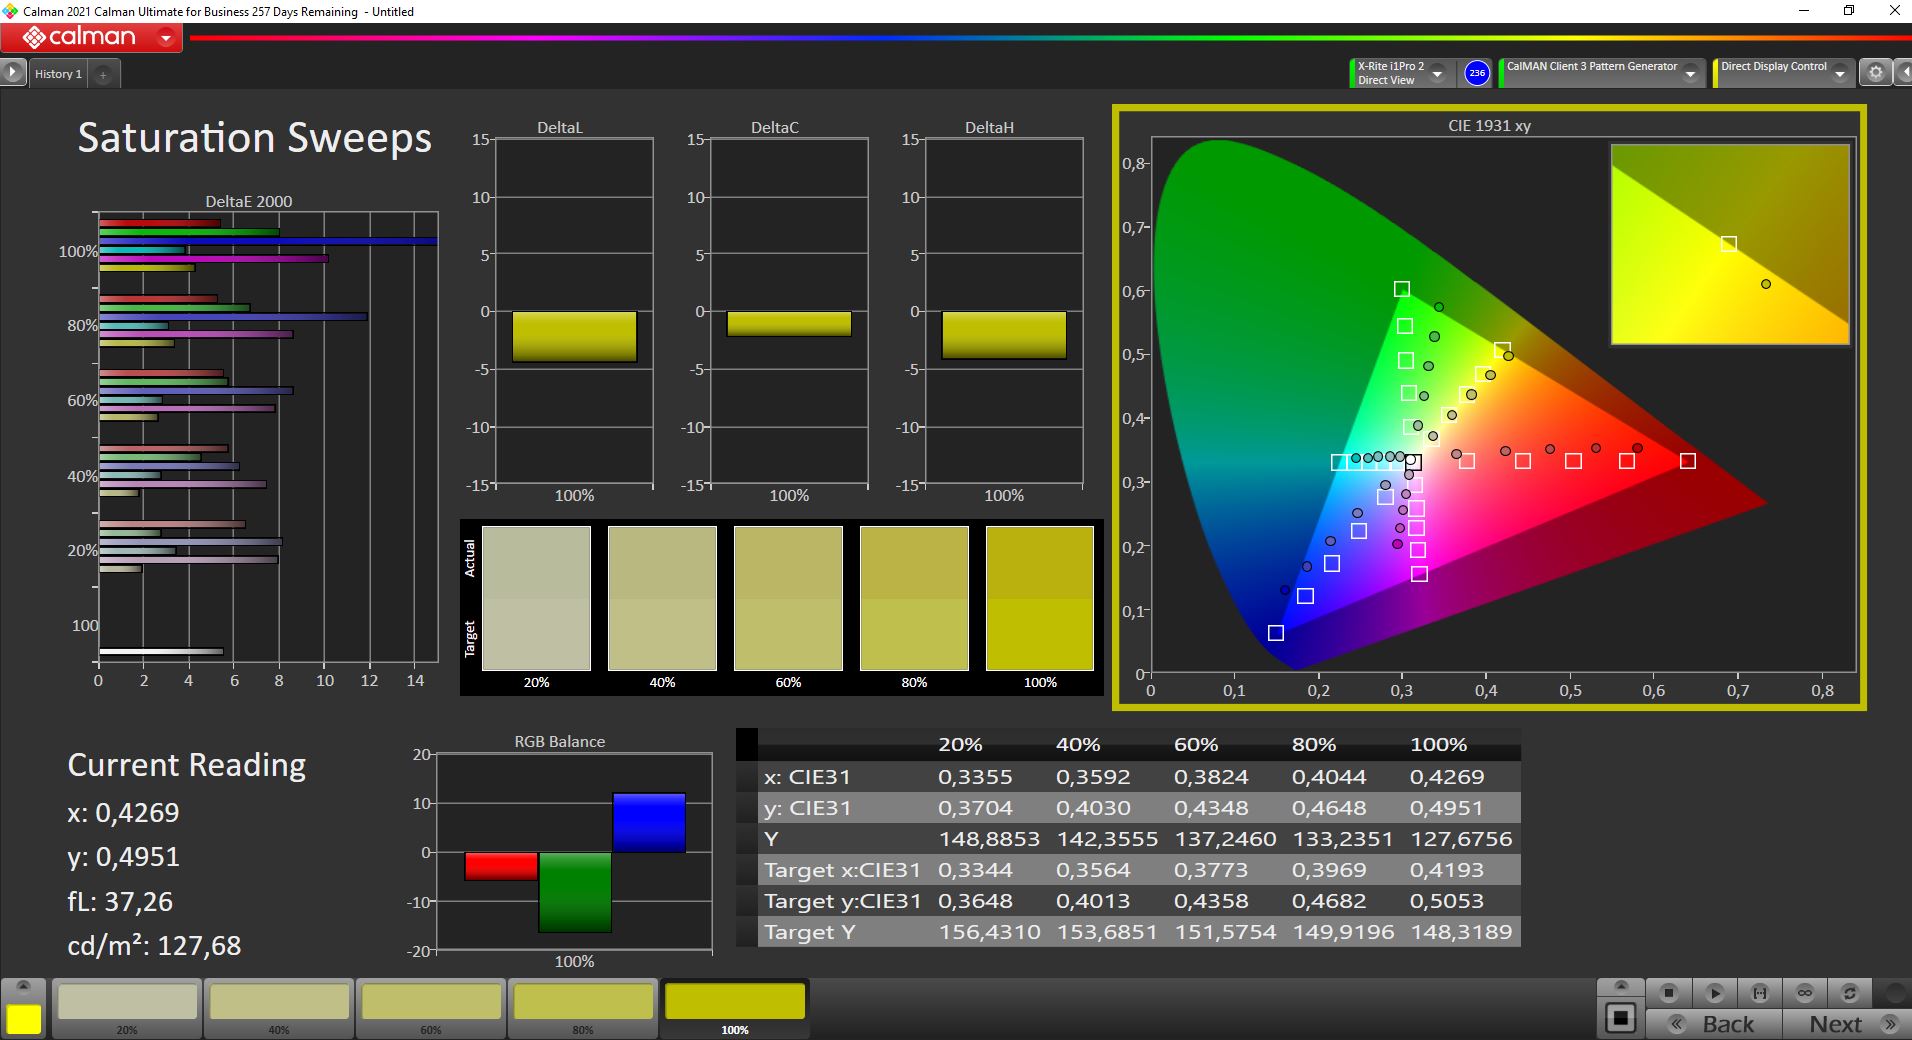
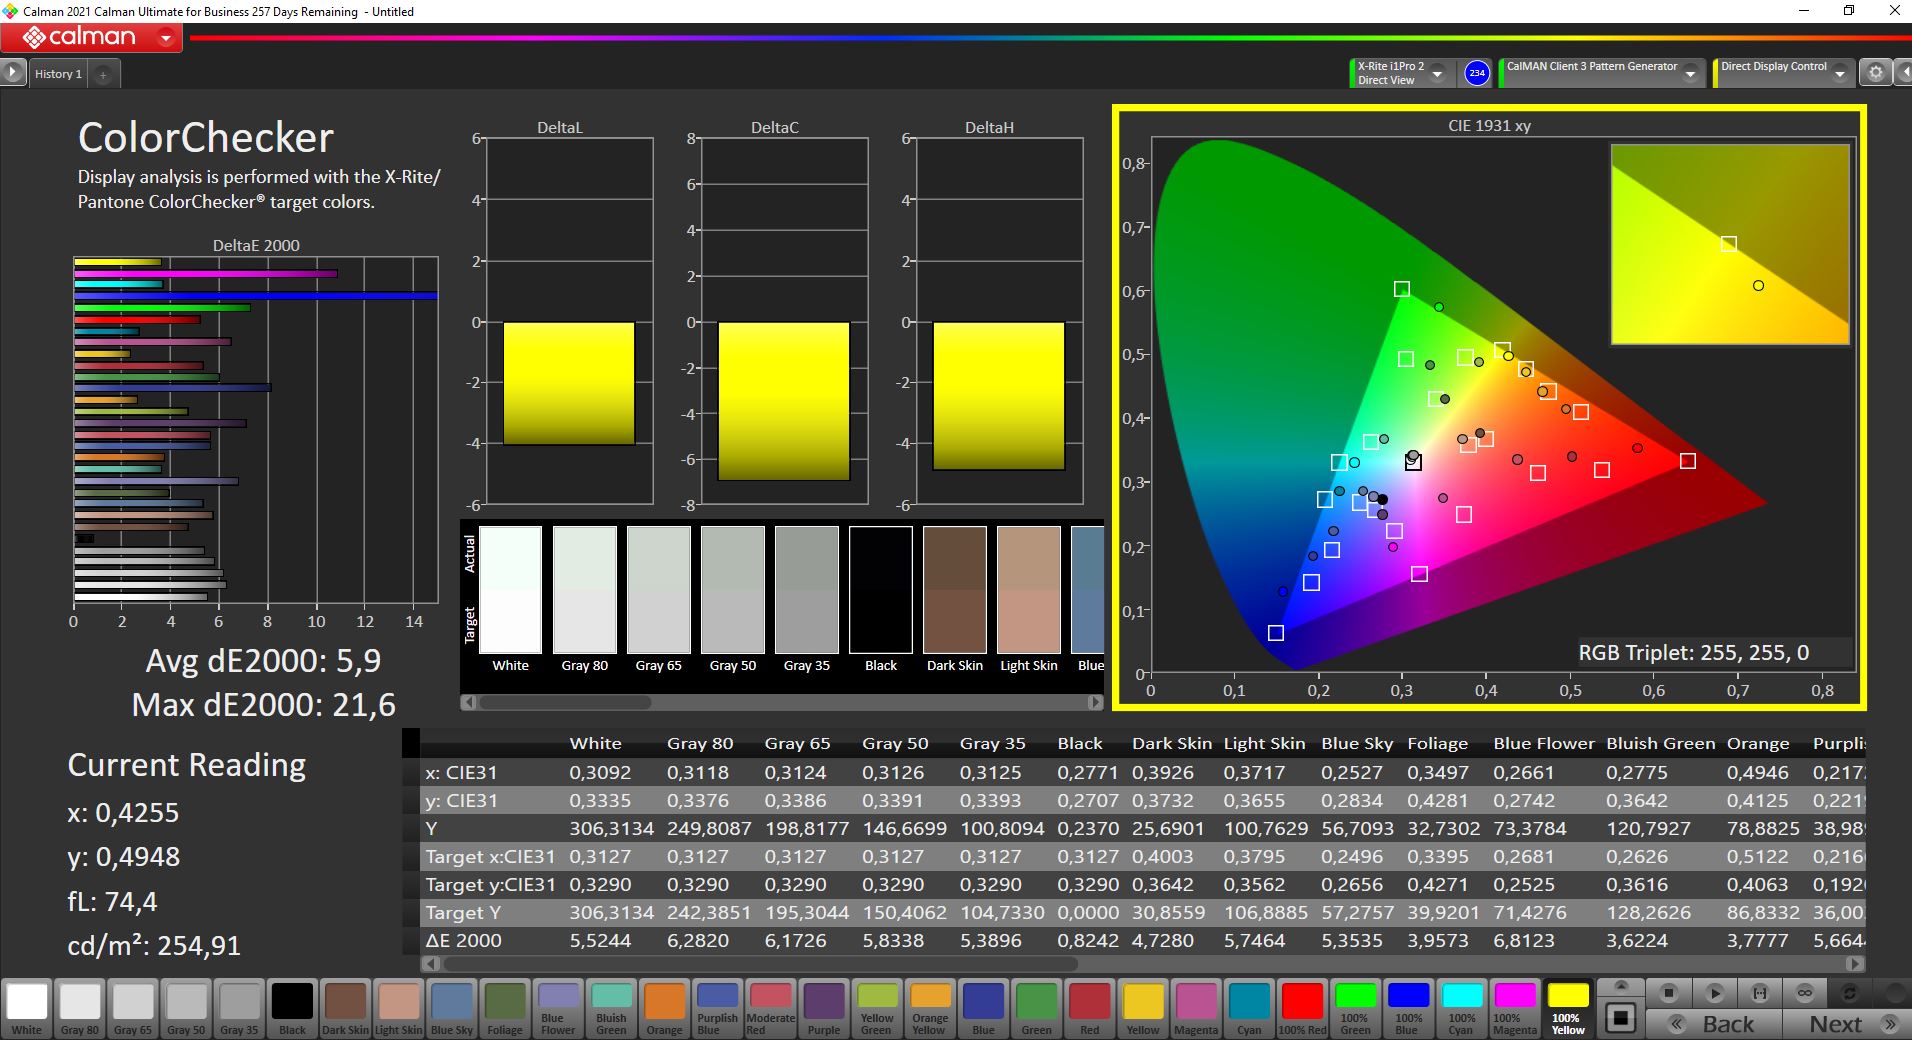
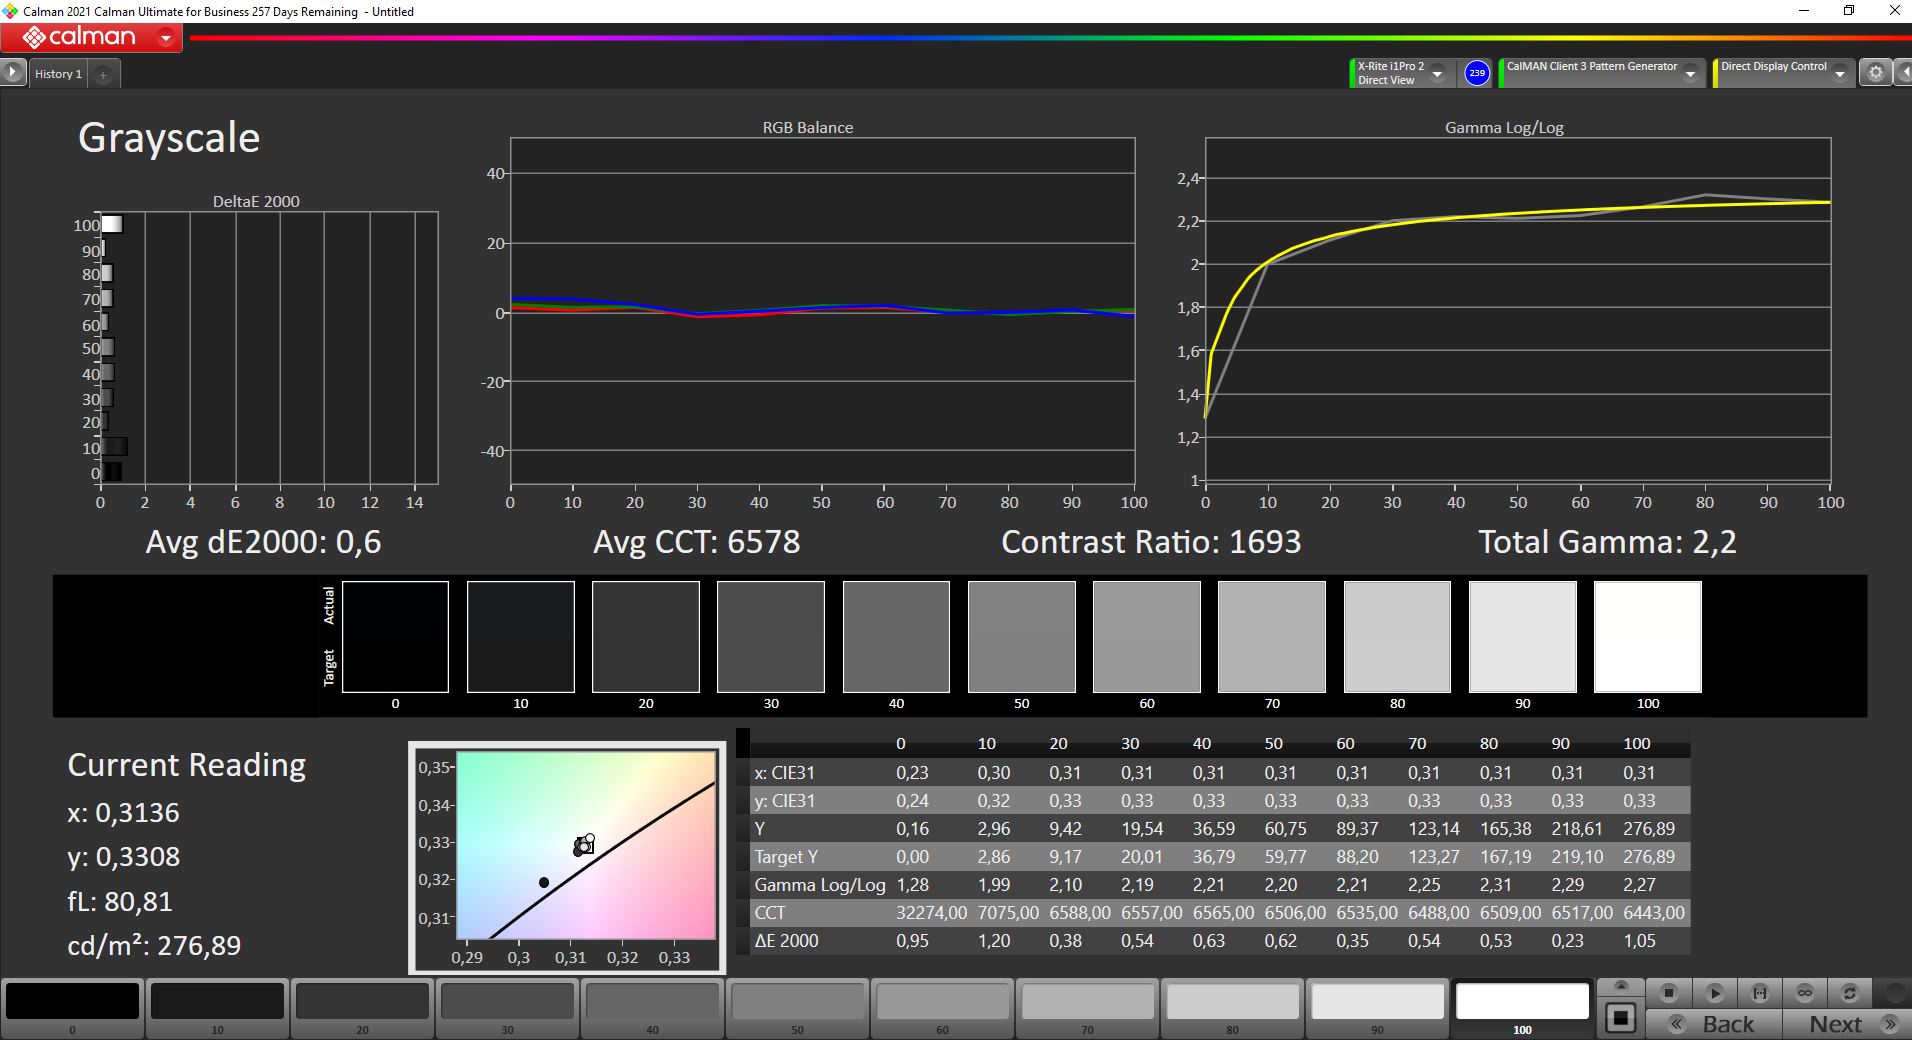
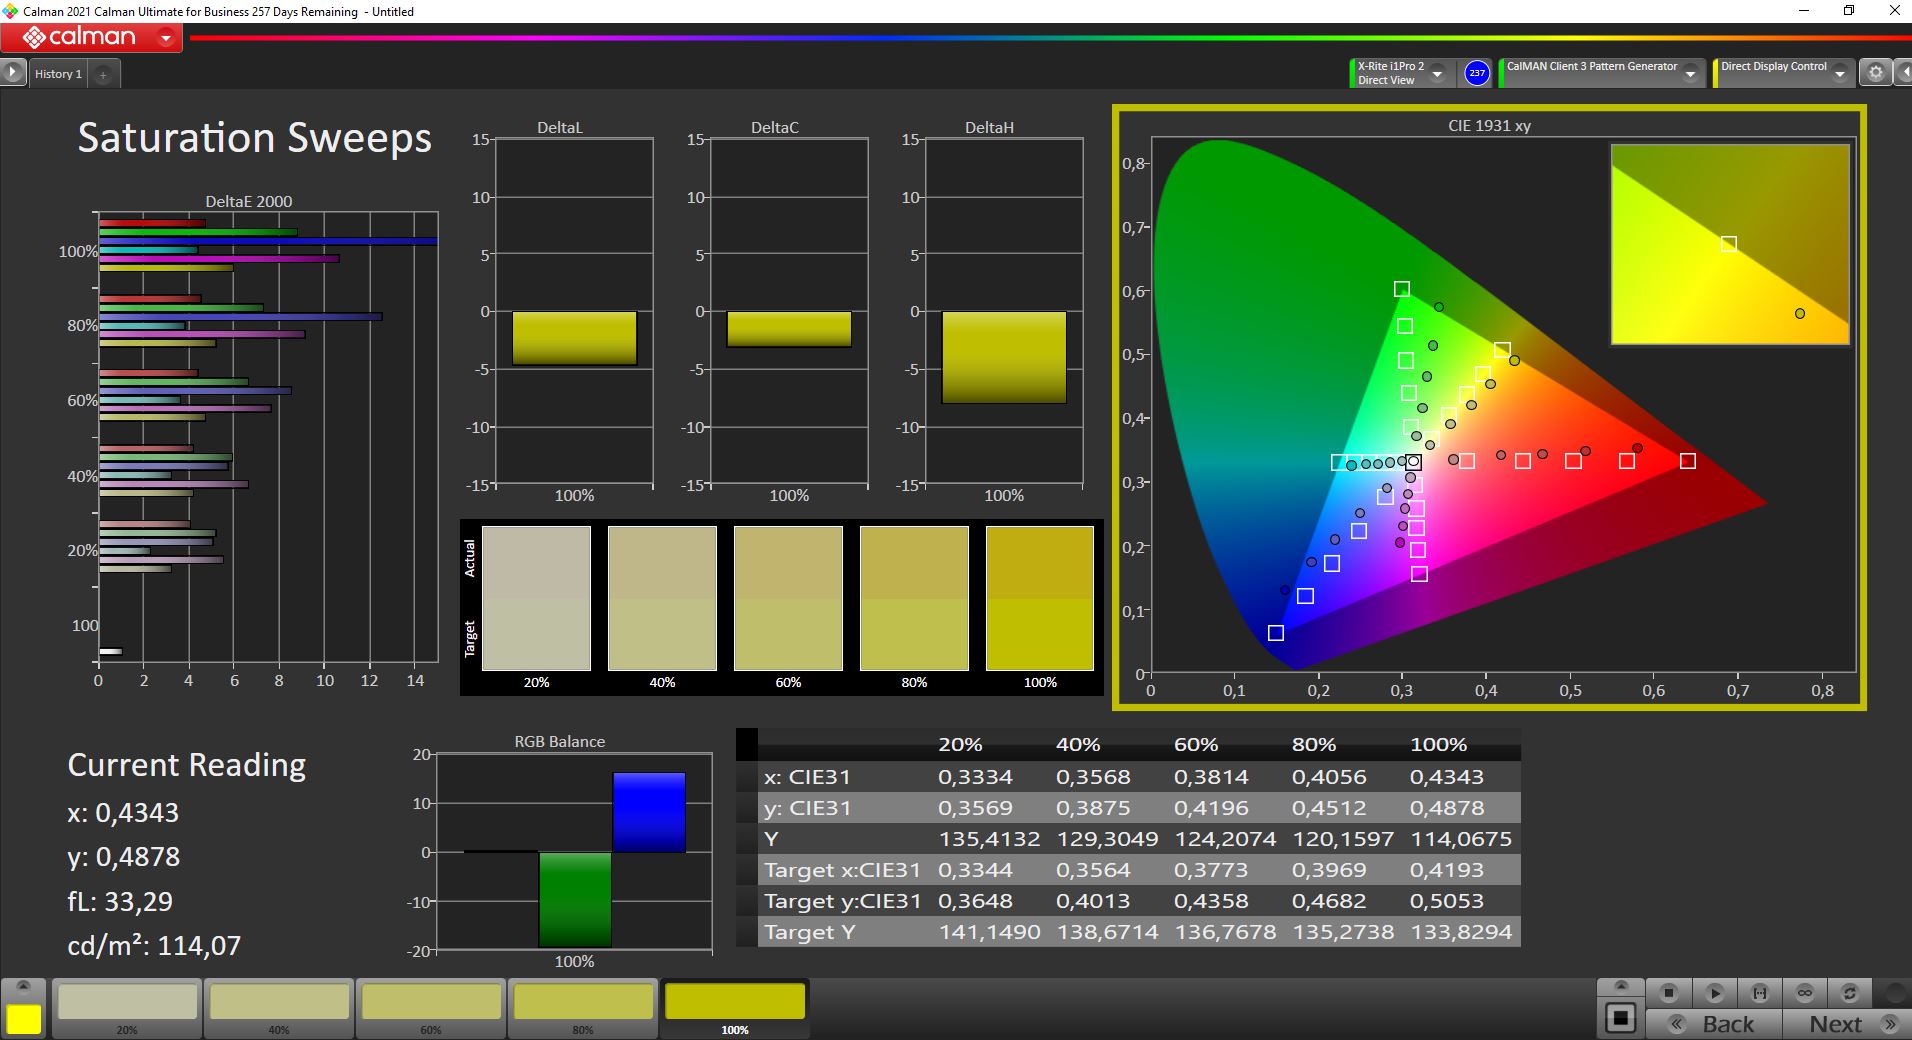
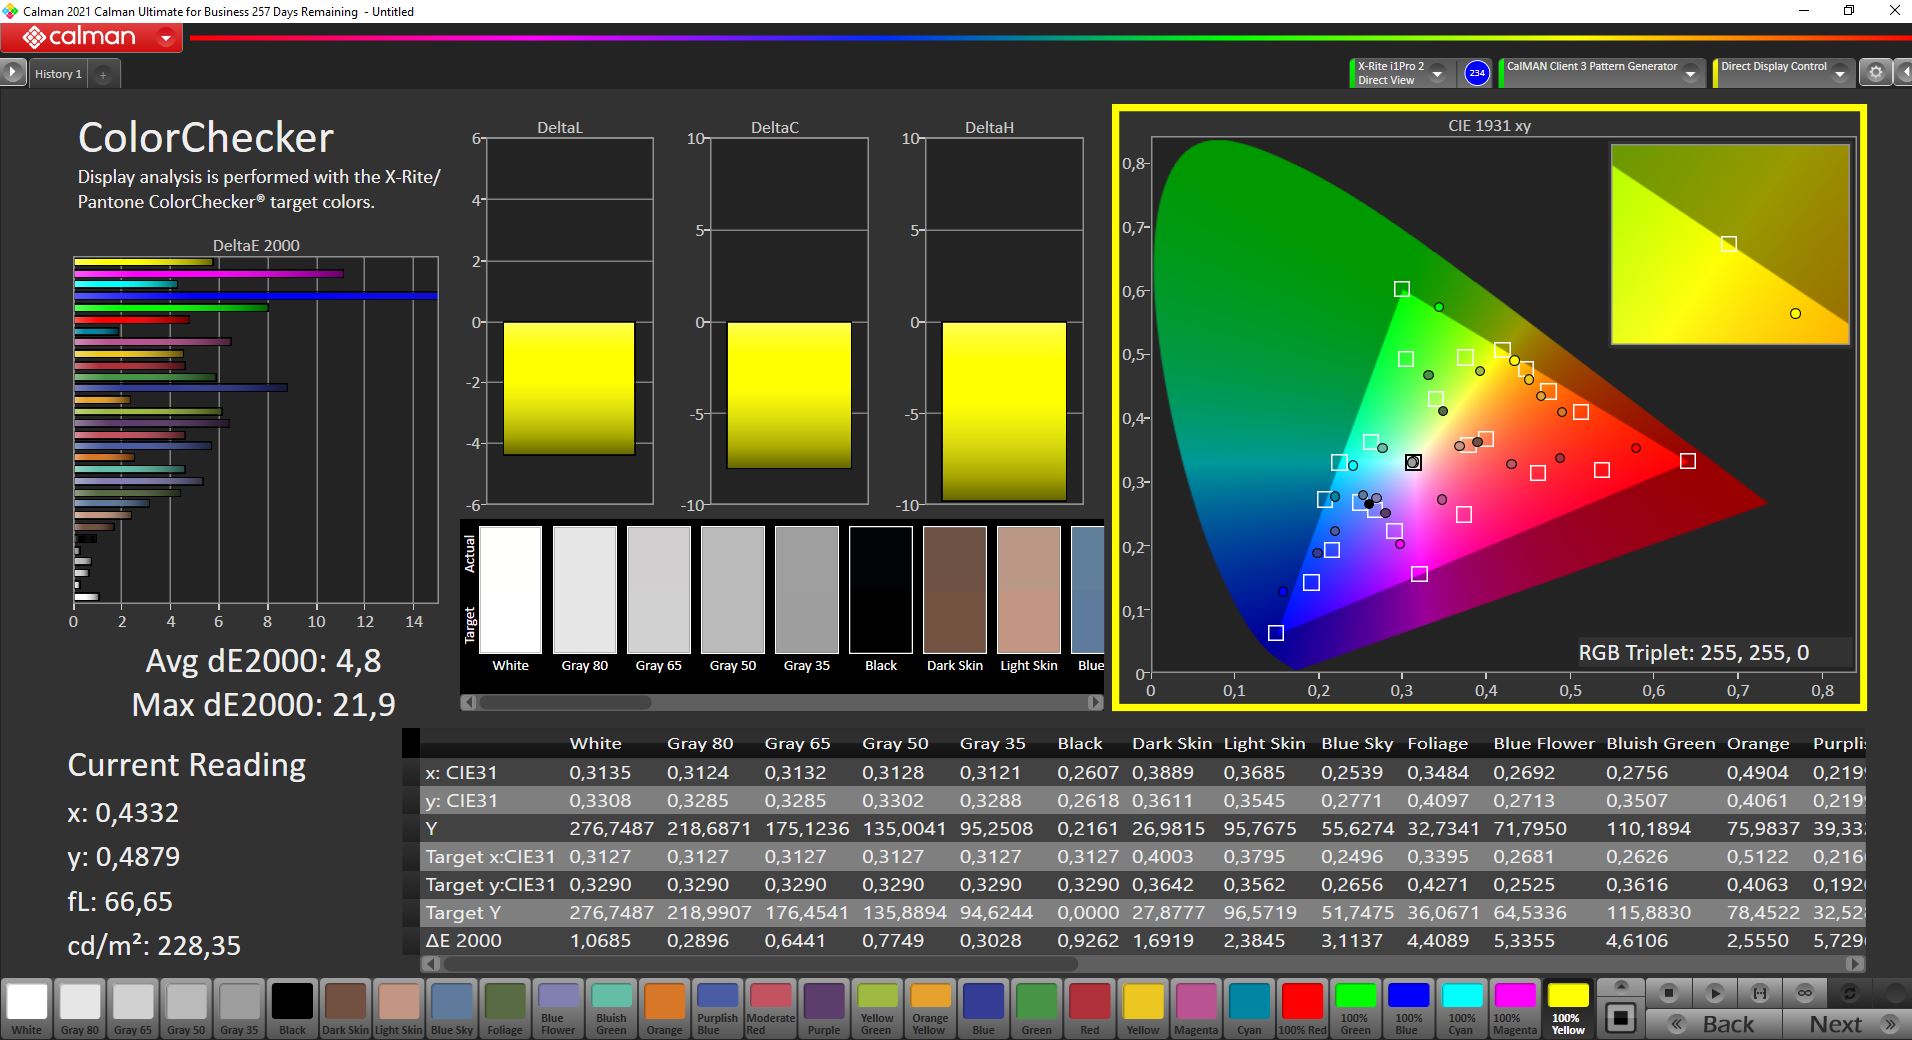
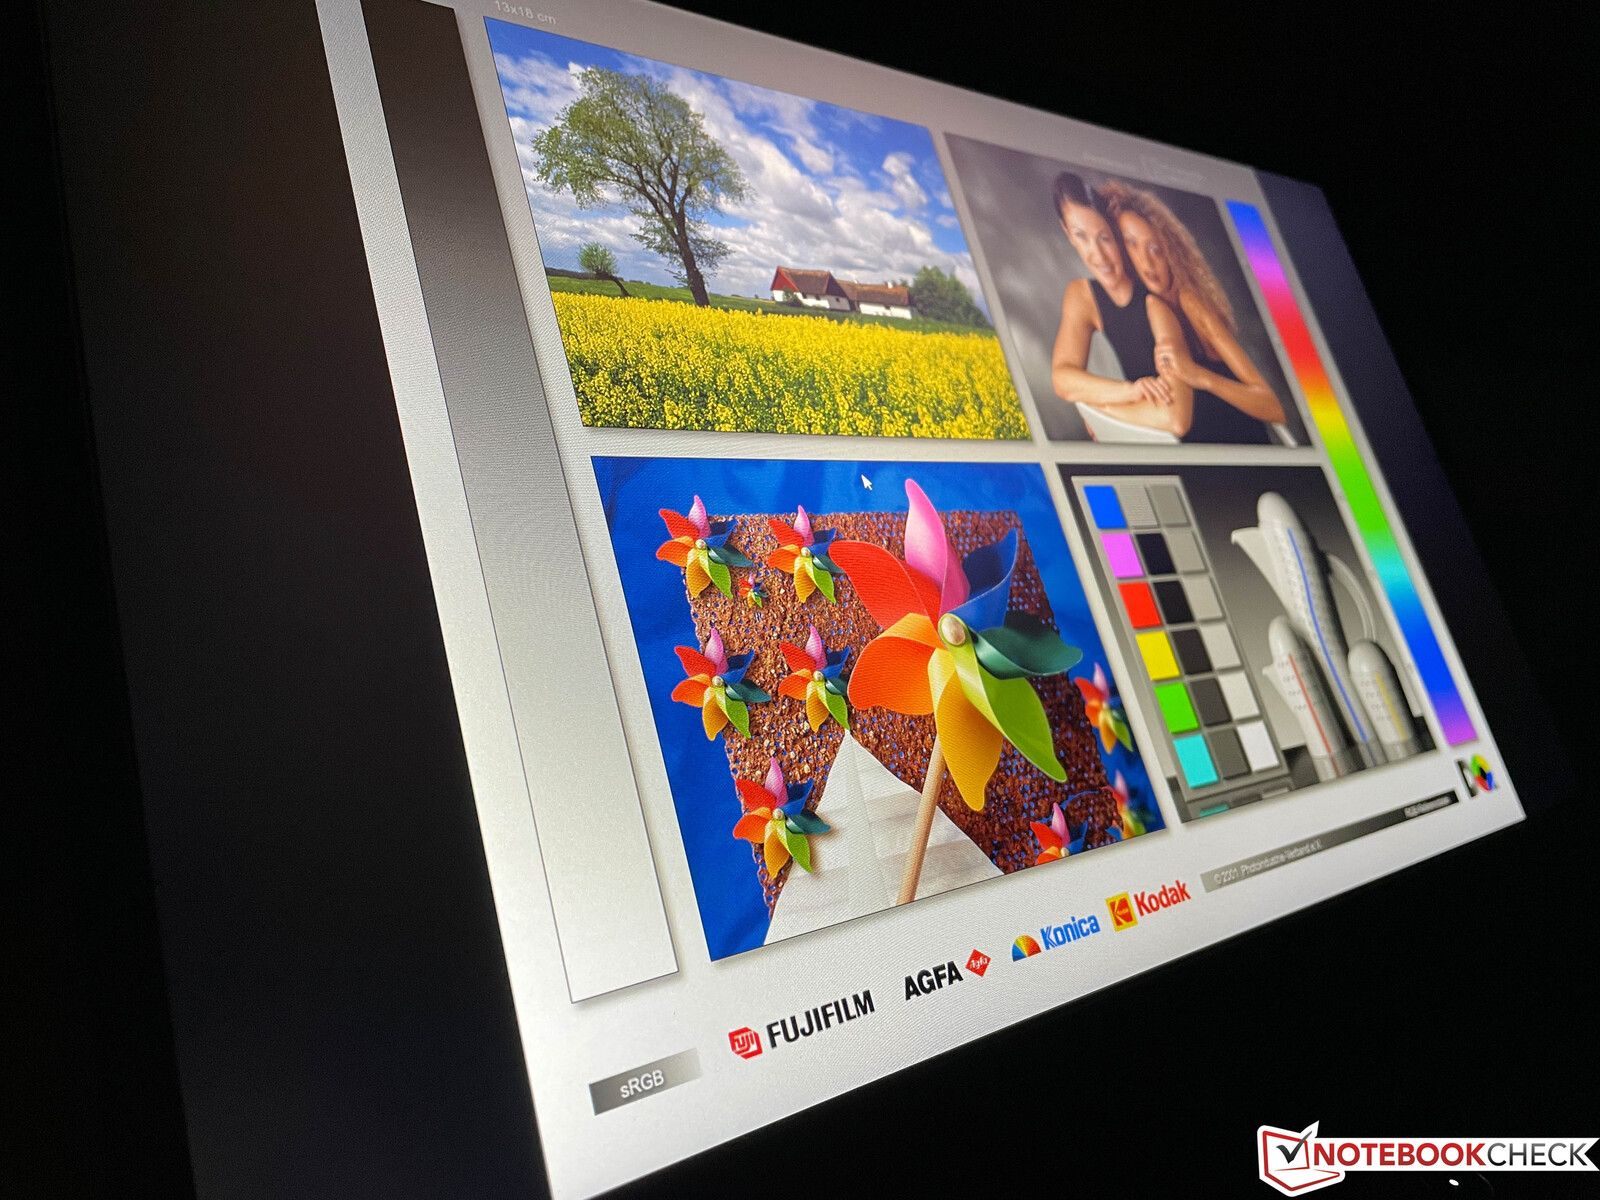
Cuando se analizó con el software profesional CalMAN (X-Rite i1 Pro 2), el bajo precio del panel IPS realmente se mostró. Mientras que su escala de grises no sufrió ninguna forma de tinte de color notable, encontramos que los colores eran extremadamente imprecisos. Fuimos capaces de mejorar la escala de grises a través de la calibración, y como siempre se puede encontrar el perfil ICC resultante para descargar arriba. Tenga en cuenta que nuestra calibración resultó en una ligera disminución en el brillo general, y que no pudimos mejorar la precisión del color del panel de la pantalla en absoluto. La pantalla es simplemente incapaz de mejorar los colores como se puede ver por su relativamente pobre cobertura del espacio de color sRGB de sólo el 60%. La pantalla no es, por tanto, adecuada para ninguna forma de edición fotográfica.
Tiempos de respuesta del display
| ↔ Tiempo de respuesta de Negro a Blanco | ||
|---|---|---|
| 35.2 ms ... subida ↗ y bajada ↘ combinada | ↗ 18.8 ms subida | 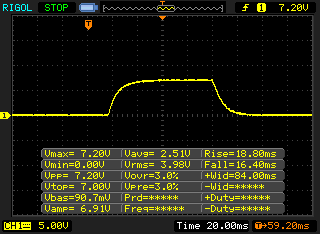 |
| ↘ 16.4 ms bajada | ||
| La pantalla mostró tiempos de respuesta lentos en nuestros tests y podría ser demasiado lenta para los jugones. En comparación, todos los dispositivos de prueba van de ##min### (mínimo) a 240 (máximo) ms. » 93 % de todos los dispositivos son mejores. Eso quiere decir que el tiempo de respuesta es peor que la media (19.8 ms) de todos los dispositivos testados. | ||
| ↔ Tiempo de respuesta 50% Gris a 80% Gris | ||
| 46.4 ms ... subida ↗ y bajada ↘ combinada | ↗ 21.2 ms subida | 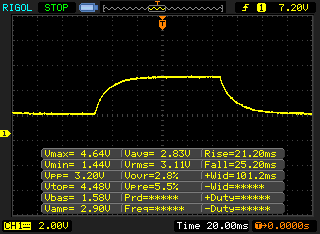 |
| ↘ 25.2 ms bajada | ||
| La pantalla mostró tiempos de respuesta lentos en nuestros tests y podría ser demasiado lenta para los jugones. En comparación, todos los dispositivos de prueba van de ##min### (mínimo) a 636 (máximo) ms. » 80 % de todos los dispositivos son mejores. Eso quiere decir que el tiempo de respuesta es peor que la media (31 ms) de todos los dispositivos testados. | ||
Parpadeo de Pantalla / PWM (Pulse-Width Modulation)
| Parpadeo de Pantalla / PWM no detectado | 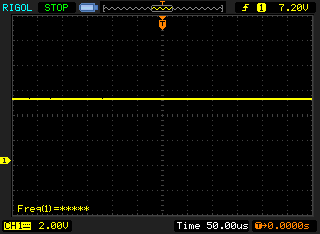 | ||
Comparación: 52 % de todos los dispositivos testados no usaron PWM para atenuar el display. Si se usó, medimos una media de 7757 (mínimo: 5 - máxmo: 343500) Hz. | |||
Gracias a su revestimiento de pantalla mate, el IdeaPad Gaming 3 puede usarse en exteriores siempre que no sea demasiado brillante. Como es típico de los paneles IPS sus ángulos de visión eran muy amplios.
Rendimiento - IdeaPad con Tiger Lake y RTX 3000
Condiciones de la prueba
El software Vantage precargado de Lenovo viene con tres perfiles de energía: Silencioso, Automático y Rendimiento. Tanto en Silencioso como en Automático, la GPU está limitada a 60 W, mientras que Rendimiento desbloquea los 90 W completos. En consecuencia, ejecutamos todas nuestras pruebas con este perfil seleccionado. Hay que tener en cuenta que el modo Rendimiento no está disponible en batería, lo que significa que nuestras pruebas de batería se realizaron en el perfil Auto.
Procesador
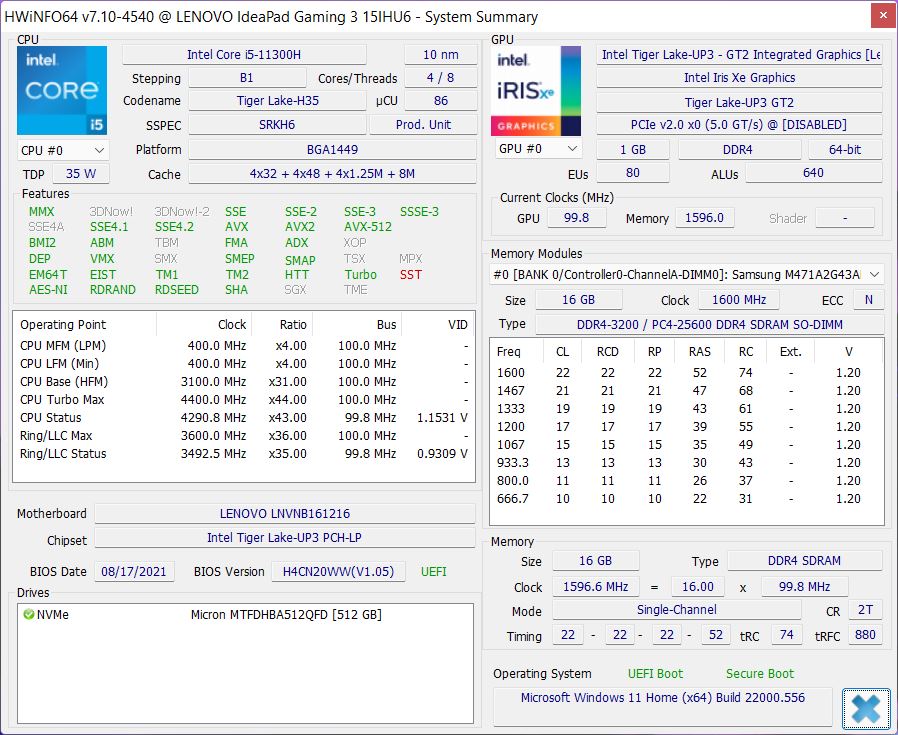
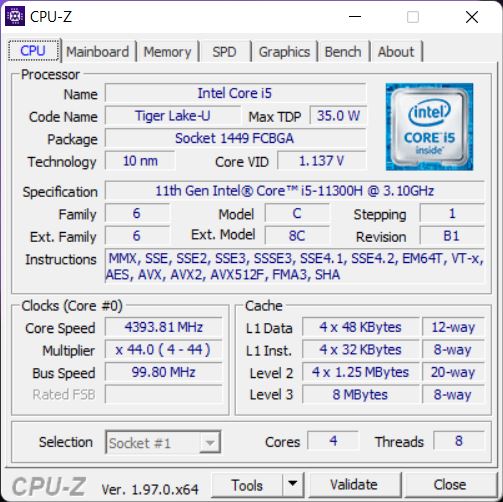
El procesador Intel Tiger Lake H35 es un viejo conocido. Es una versión ligeramente más rápida de sus hermanos Tiger Lake U con cuatro núcleos y una GPU Iris Xe integrada.El
Core i5-11300H de nuestra unidad de análisis tiene una potencia nominal de 42 W, por lo que rindió de forma muy consistente incluso bajo carga sostenida de larga duraciónCinebench R15 Multi Loop
Nuestras pruebas indican que, aunque elCore i5-11300H puede seguir el ritmo de sus competidores en el rendimiento de un solo núcleo, queda completamente destruido en los escenarios multinúcleo. La mayor ventaja del H35 Tiger Lake, la GPU Iris Xe, no sirve de nada en un portátil con GPU dedicada, y habríamos preferido una CPU diferente Tiger Lake, como por ejemplo la de 6 núcleos Core i5-11400H. Como demostraron las pruebas posteriores, el dispositivo sufre enormemente por el pobre rendimiento de su CPU, por ejemplo, a la hora de jugar. Como alternativa, el IdeaPad Gaming 3 también está disponible con unAMD Ryzen 5 5600H con un rendimiento multinúcleo mucho mayor.
En batería, la CPU se limita a sólo 25 W tras un corto periodo de tiempo. En consecuencia, rinde aún peor en situaciones de carga multinúcleo. Se pueden encontrar más pruebas de CPU en nuestra sección de tecnología.
Cinebench R23: Multi Core | Single Core
Cinebench R20: CPU (Multi Core) | CPU (Single Core)
Cinebench R15: CPU Multi 64Bit | CPU Single 64Bit
Blender: v2.79 BMW27 CPU
7-Zip 18.03: 7z b 4 | 7z b 4 -mmt1
Geekbench 5.5: Multi-Core | Single-Core
HWBOT x265 Benchmark v2.2: 4k Preset
LibreOffice : 20 Documents To PDF
R Benchmark 2.5: Overall mean
| CPU Performance rating | |
| Media de la clase Gaming | |
| Medion Erazer Deputy P25 | |
| Schenker XMG Focus 15 | |
| Lenovo Legion 5 15ACH-82JU00C6GE-FL | |
| Dell G15 5515 | |
| Gigabyte G5 GD | |
| Lenovo Ideapad Gaming 3 15IHU-82K1002RGE | |
| Medio Intel Core i5-11300H | |
| Cinebench R23 / Multi Core | |
| Media de la clase Gaming (10488 - 42661, n=107, últimos 2 años) | |
| Lenovo Legion 5 15ACH-82JU00C6GE-FL | |
| Medion Erazer Deputy P25 | |
| Dell G15 5515 | |
| Schenker XMG Focus 15 | |
| Gigabyte G5 GD | |
| Lenovo Ideapad Gaming 3 15IHU-82K1002RGE | |
| Medio Intel Core i5-11300H (3313 - 6581, n=10) | |
| Cinebench R23 / Single Core | |
| Media de la clase Gaming (1166 - 2415, n=107, últimos 2 años) | |
| Gigabyte G5 GD | |
| Medion Erazer Deputy P25 | |
| Dell G15 5515 | |
| Lenovo Legion 5 15ACH-82JU00C6GE-FL | |
| Schenker XMG Focus 15 | |
| Medio Intel Core i5-11300H (1218 - 1431, n=11) | |
| Lenovo Ideapad Gaming 3 15IHU-82K1002RGE | |
| Cinebench R20 / CPU (Multi Core) | |
| Media de la clase Gaming (4029 - 16433, n=106, últimos 2 años) | |
| Lenovo Legion 5 15ACH-82JU00C6GE-FL | |
| Medion Erazer Deputy P25 | |
| Dell G15 5515 | |
| Schenker XMG Focus 15 | |
| Gigabyte G5 GD | |
| Lenovo Ideapad Gaming 3 15IHU-82K1002RGE | |
| Medio Intel Core i5-11300H (1300 - 2533, n=10) | |
| Cinebench R20 / CPU (Single Core) | |
| Media de la clase Gaming (442 - 913, n=106, últimos 2 años) | |
| Gigabyte G5 GD | |
| Medion Erazer Deputy P25 | |
| Dell G15 5515 | |
| Lenovo Legion 5 15ACH-82JU00C6GE-FL | |
| Schenker XMG Focus 15 | |
| Medio Intel Core i5-11300H (431 - 548, n=11) | |
| Lenovo Ideapad Gaming 3 15IHU-82K1002RGE | |
| Cinebench R15 / CPU Multi 64Bit | |
| Media de la clase Gaming (1578 - 6330, n=105, últimos 2 años) | |
| Lenovo Legion 5 15ACH-82JU00C6GE-FL | |
| Medion Erazer Deputy P25 | |
| Dell G15 5515 | |
| Schenker XMG Focus 15 | |
| Gigabyte G5 GD | |
| Lenovo Ideapad Gaming 3 15IHU-82K1002RGE | |
| Medio Intel Core i5-11300H (632 - 990, n=11) | |
| Cinebench R15 / CPU Single 64Bit | |
| Media de la clase Gaming (188.8 - 350, n=106, últimos 2 años) | |
| Medion Erazer Deputy P25 | |
| Dell G15 5515 | |
| Lenovo Legion 5 15ACH-82JU00C6GE-FL | |
| Gigabyte G5 GD | |
| Schenker XMG Focus 15 | |
| Lenovo Ideapad Gaming 3 15IHU-82K1002RGE | |
| Medio Intel Core i5-11300H (123 - 211, n=8) | |
| Blender / v2.79 BMW27 CPU | |
| Medio Intel Core i5-11300H (466 - 862, n=10) | |
| Lenovo Ideapad Gaming 3 15IHU-82K1002RGE | |
| Gigabyte G5 GD | |
| Schenker XMG Focus 15 | |
| Dell G15 5515 | |
| Medion Erazer Deputy P25 | |
| Lenovo Legion 5 15ACH-82JU00C6GE-FL | |
| Media de la clase Gaming (79 - 330, n=104, últimos 2 años) | |
| 7-Zip 18.03 / 7z b 4 | |
| Media de la clase Gaming (33491 - 148086, n=105, últimos 2 años) | |
| Medion Erazer Deputy P25 | |
| Dell G15 5515 | |
| Lenovo Legion 5 15ACH-82JU00C6GE-FL | |
| Schenker XMG Focus 15 | |
| Gigabyte G5 GD | |
| Lenovo Ideapad Gaming 3 15IHU-82K1002RGE | |
| Medio Intel Core i5-11300H (17573 - 26001, n=10) | |
| 7-Zip 18.03 / 7z b 4 -mmt1 | |
| Media de la clase Gaming (4199 - 7436, n=105, últimos 2 años) | |
| Dell G15 5515 | |
| Medion Erazer Deputy P25 | |
| Lenovo Legion 5 15ACH-82JU00C6GE-FL | |
| Schenker XMG Focus 15 | |
| Gigabyte G5 GD | |
| Medio Intel Core i5-11300H (4603 - 4969, n=10) | |
| Lenovo Ideapad Gaming 3 15IHU-82K1002RGE | |
| Geekbench 5.5 / Multi-Core | |
| Media de la clase Gaming (6460 - 28263, n=105, últimos 2 años) | |
| Schenker XMG Focus 15 | |
| Lenovo Legion 5 15ACH-82JU00C6GE-FL | |
| Dell G15 5515 | |
| Medion Erazer Deputy P25 | |
| Gigabyte G5 GD | |
| Medio Intel Core i5-11300H (3631 - 5499, n=10) | |
| Lenovo Ideapad Gaming 3 15IHU-82K1002RGE | |
| Geekbench 5.5 / Single-Core | |
| Media de la clase Gaming (986 - 2474, n=105, últimos 2 años) | |
| Gigabyte G5 GD | |
| Schenker XMG Focus 15 | |
| Medion Erazer Deputy P25 | |
| Lenovo Legion 5 15ACH-82JU00C6GE-FL | |
| Dell G15 5515 | |
| Medio Intel Core i5-11300H (1342 - 1462, n=10) | |
| Lenovo Ideapad Gaming 3 15IHU-82K1002RGE | |
| HWBOT x265 Benchmark v2.2 / 4k Preset | |
| Media de la clase Gaming (11.5 - 44.4, n=105, últimos 2 años) | |
| Medion Erazer Deputy P25 | |
| Lenovo Legion 5 15ACH-82JU00C6GE-FL | |
| Dell G15 5515 | |
| Schenker XMG Focus 15 | |
| Gigabyte G5 GD | |
| Lenovo Ideapad Gaming 3 15IHU-82K1002RGE | |
| Medio Intel Core i5-11300H (4.32 - 8.38, n=10) | |
| LibreOffice / 20 Documents To PDF | |
| Lenovo Legion 5 15ACH-82JU00C6GE-FL | |
| Dell G15 5515 | |
| Medion Erazer Deputy P25 | |
| Lenovo Ideapad Gaming 3 15IHU-82K1002RGE | |
| Medio Intel Core i5-11300H (43.6 - 59.4, n=10) | |
| Media de la clase Gaming (33.2 - 88.8, n=105, últimos 2 años) | |
| Schenker XMG Focus 15 | |
| Gigabyte G5 GD | |
| R Benchmark 2.5 / Overall mean | |
| Medio Intel Core i5-11300H (0.6 - 0.644, n=10) | |
| Lenovo Ideapad Gaming 3 15IHU-82K1002RGE | |
| Schenker XMG Focus 15 | |
| Gigabyte G5 GD | |
| Lenovo Legion 5 15ACH-82JU00C6GE-FL | |
| Medion Erazer Deputy P25 | |
| Dell G15 5515 | |
| Media de la clase Gaming (0.3439 - 0.759, n=106, últimos 2 años) | |
* ... más pequeño es mejor
AIDA64: FP32 Ray-Trace | FPU Julia | CPU SHA3 | CPU Queen | FPU SinJulia | FPU Mandel | CPU AES | CPU ZLib | FP64 Ray-Trace | CPU PhotoWorxx
| Performance rating | |
| Media de la clase Gaming | |
| Lenovo Legion 5 15ACH-82JU00C6GE-FL | |
| Dell G15 5515 | |
| Medion Erazer Deputy P25 | |
| Gigabyte G5 GD | |
| Lenovo Ideapad Gaming 3 15IHU-82K1002RGE | |
| Medio Intel Core i5-11300H | |
| AIDA64 / FP32 Ray-Trace | |
| Media de la clase Gaming (10227 - 85542, n=105, últimos 2 años) | |
| Lenovo Legion 5 15ACH-82JU00C6GE-FL | |
| Medion Erazer Deputy P25 | |
| Dell G15 5515 | |
| Gigabyte G5 GD | |
| Lenovo Ideapad Gaming 3 15IHU-82K1002RGE | |
| Medio Intel Core i5-11300H (6128 - 8440, n=9) | |
| AIDA64 / FPU Julia | |
| Media de la clase Gaming (51376 - 238426, n=105, últimos 2 años) | |
| Lenovo Legion 5 15ACH-82JU00C6GE-FL | |
| Medion Erazer Deputy P25 | |
| Dell G15 5515 | |
| Gigabyte G5 GD | |
| Lenovo Ideapad Gaming 3 15IHU-82K1002RGE | |
| Medio Intel Core i5-11300H (25739 - 33986, n=9) | |
| AIDA64 / CPU SHA3 | |
| Media de la clase Gaming (2180 - 10115, n=105, últimos 2 años) | |
| Lenovo Legion 5 15ACH-82JU00C6GE-FL | |
| Medion Erazer Deputy P25 | |
| Dell G15 5515 | |
| Gigabyte G5 GD | |
| Lenovo Ideapad Gaming 3 15IHU-82K1002RGE | |
| Medio Intel Core i5-11300H (1773 - 2286, n=9) | |
| AIDA64 / CPU Queen | |
| Media de la clase Gaming (49785 - 173351, n=90, últimos 2 años) | |
| Lenovo Legion 5 15ACH-82JU00C6GE-FL | |
| Medion Erazer Deputy P25 | |
| Dell G15 5515 | |
| Gigabyte G5 GD | |
| Lenovo Ideapad Gaming 3 15IHU-82K1002RGE | |
| Medio Intel Core i5-11300H (41257 - 49312, n=9) | |
| AIDA64 / FPU SinJulia | |
| Media de la clase Gaming (4424 - 33636, n=105, últimos 2 años) | |
| Medion Erazer Deputy P25 | |
| Dell G15 5515 | |
| Lenovo Legion 5 15ACH-82JU00C6GE-FL | |
| Gigabyte G5 GD | |
| Lenovo Ideapad Gaming 3 15IHU-82K1002RGE | |
| Medio Intel Core i5-11300H (3925 - 4677, n=9) | |
| AIDA64 / FPU Mandel | |
| Media de la clase Gaming (25115 - 128721, n=105, últimos 2 años) | |
| Lenovo Legion 5 15ACH-82JU00C6GE-FL | |
| Medion Erazer Deputy P25 | |
| Dell G15 5515 | |
| Gigabyte G5 GD | |
| Lenovo Ideapad Gaming 3 15IHU-82K1002RGE | |
| Medio Intel Core i5-11300H (15820 - 20669, n=9) | |
| AIDA64 / CPU AES | |
| Lenovo Legion 5 15ACH-82JU00C6GE-FL | |
| Dell G15 5515 | |
| Media de la clase Gaming (39258 - 247074, n=105, últimos 2 años) | |
| Gigabyte G5 GD | |
| Lenovo Ideapad Gaming 3 15IHU-82K1002RGE | |
| Medio Intel Core i5-11300H (37694 - 71519, n=9) | |
| Medion Erazer Deputy P25 | |
| AIDA64 / CPU ZLib | |
| Media de la clase Gaming (574 - 2531, n=105, últimos 2 años) | |
| Lenovo Legion 5 15ACH-82JU00C6GE-FL | |
| Medion Erazer Deputy P25 | |
| Dell G15 5515 | |
| Gigabyte G5 GD | |
| Lenovo Ideapad Gaming 3 15IHU-82K1002RGE | |
| Medio Intel Core i5-11300H (269 - 390, n=9) | |
| AIDA64 / FP64 Ray-Trace | |
| Media de la clase Gaming (5509 - 45446, n=105, últimos 2 años) | |
| Medion Erazer Deputy P25 | |
| Lenovo Legion 5 15ACH-82JU00C6GE-FL | |
| Dell G15 5515 | |
| Gigabyte G5 GD | |
| Lenovo Ideapad Gaming 3 15IHU-82K1002RGE | |
| Medio Intel Core i5-11300H (3322 - 4613, n=9) | |
| AIDA64 / CPU PhotoWorxx | |
| Media de la clase Gaming (12271 - 89891, n=105, últimos 2 años) | |
| Gigabyte G5 GD | |
| Medio Intel Core i5-11300H (9705 - 38002, n=9) | |
| Dell G15 5515 | |
| Lenovo Legion 5 15ACH-82JU00C6GE-FL | |
| Medion Erazer Deputy P25 | |
| Lenovo Ideapad Gaming 3 15IHU-82K1002RGE | |
Rendimiento del sistema
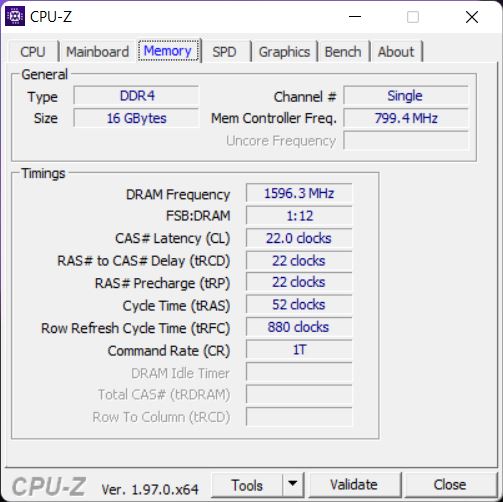
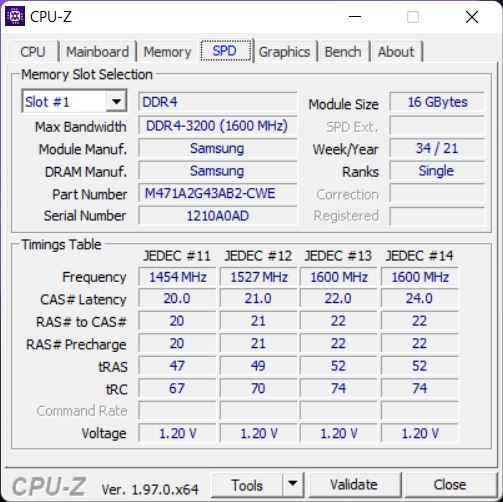
Subjetivamente, el dispositivo funcionó muy bien y respondió instantáneamente a las entradas. Por el contrario, a menudo rindió mal en las pruebas y sólo consiguió uno de los puestos en el extremo de la lista. Este pobre rendimiento se debe en parte al hecho de que la CPU no tiene más de cuatro núcleos y en parte a que nuestra unidad de pruebas estaba equipada con un único módulo de RAM DDR4-3200 funcionando en modo de canal único.
CrossMark: Overall | Productivity | Creativity | Responsiveness
| PCMark 10 / Score | |
| Media de la clase Gaming (5828 - 12414, n=93, últimos 2 años) | |
| Medion Erazer Deputy P25 | |
| Lenovo Legion 5 15ACH-82JU00C6GE-FL | |
| Schenker XMG Focus 15 | |
| Dell G15 5515 | |
| Gigabyte G5 GD | |
| Lenovo Ideapad Gaming 3 15IHU-82K1002RGE | |
| Medio Intel Core i5-11300H, NVIDIA GeForce RTX 3050 Ti Laptop GPU (5442 - 5641, n=2) | |
| PCMark 10 / Essentials | |
| Media de la clase Gaming (8810 - 11935, n=97, últimos 2 años) | |
| Lenovo Legion 5 15ACH-82JU00C6GE-FL | |
| Schenker XMG Focus 15 | |
| Medion Erazer Deputy P25 | |
| Dell G15 5515 | |
| Gigabyte G5 GD | |
| Medio Intel Core i5-11300H, NVIDIA GeForce RTX 3050 Ti Laptop GPU (8524 - 8829, n=2) | |
| Lenovo Ideapad Gaming 3 15IHU-82K1002RGE | |
| PCMark 10 / Productivity | |
| Media de la clase Gaming (6845 - 25323, n=95, últimos 2 años) | |
| Lenovo Legion 5 15ACH-82JU00C6GE-FL | |
| Lenovo Ideapad Gaming 3 15IHU-82K1002RGE | |
| Medion Erazer Deputy P25 | |
| Schenker XMG Focus 15 | |
| Dell G15 5515 | |
| Gigabyte G5 GD | |
| Medio Intel Core i5-11300H, NVIDIA GeForce RTX 3050 Ti Laptop GPU (7664 - 9112, n=2) | |
| PCMark 10 / Digital Content Creation | |
| Media de la clase Gaming (7602 - 19954, n=95, últimos 2 años) | |
| Medion Erazer Deputy P25 | |
| Schenker XMG Focus 15 | |
| Lenovo Legion 5 15ACH-82JU00C6GE-FL | |
| Dell G15 5515 | |
| Gigabyte G5 GD | |
| Medio Intel Core i5-11300H, NVIDIA GeForce RTX 3050 Ti Laptop GPU (6271 - 6462, n=2) | |
| Lenovo Ideapad Gaming 3 15IHU-82K1002RGE | |
| CrossMark / Overall | |
| Media de la clase Gaming (1366 - 2409, n=94, últimos 2 años) | |
| Lenovo Ideapad Gaming 3 15IHU-82K1002RGE | |
| Medio Intel Core i5-11300H, NVIDIA GeForce RTX 3050 Ti Laptop GPU (n=1) | |
| CrossMark / Productivity | |
| Media de la clase Gaming (1386 - 2254, n=94, últimos 2 años) | |
| Lenovo Ideapad Gaming 3 15IHU-82K1002RGE | |
| Medio Intel Core i5-11300H, NVIDIA GeForce RTX 3050 Ti Laptop GPU (n=1) | |
| CrossMark / Creativity | |
| Media de la clase Gaming (1343 - 2786, n=94, últimos 2 años) | |
| Lenovo Ideapad Gaming 3 15IHU-82K1002RGE | |
| Medio Intel Core i5-11300H, NVIDIA GeForce RTX 3050 Ti Laptop GPU (n=1) | |
| CrossMark / Responsiveness | |
| Media de la clase Gaming (1226 - 2334, n=94, últimos 2 años) | |
| Lenovo Ideapad Gaming 3 15IHU-82K1002RGE | |
| Medio Intel Core i5-11300H, NVIDIA GeForce RTX 3050 Ti Laptop GPU (n=1) | |
| PCMark 10 Score | 5641 puntos | |
ayuda | ||
| AIDA64 / Memory Copy | |
| Media de la clase Gaming (21750 - 129946, n=105, últimos 2 años) | |
| Gigabyte G5 GD | |
| Dell G15 5515 | |
| Medion Erazer Deputy P25 | |
| Lenovo Legion 5 15ACH-82JU00C6GE-FL | |
| Medio Intel Core i5-11300H (19947 - 60141, n=9) | |
| Lenovo Ideapad Gaming 3 15IHU-82K1002RGE | |
| AIDA64 / Memory Read | |
| Media de la clase Gaming (22956 - 118858, n=105, últimos 2 años) | |
| Gigabyte G5 GD | |
| Dell G15 5515 | |
| Lenovo Legion 5 15ACH-82JU00C6GE-FL | |
| Medion Erazer Deputy P25 | |
| Medio Intel Core i5-11300H (22688 - 62684, n=9) | |
| Lenovo Ideapad Gaming 3 15IHU-82K1002RGE | |
| AIDA64 / Memory Write | |
| Media de la clase Gaming (22297 - 135096, n=105, últimos 2 años) | |
| Gigabyte G5 GD | |
| Medio Intel Core i5-11300H (20959 - 65245, n=9) | |
| Medion Erazer Deputy P25 | |
| Dell G15 5515 | |
| Lenovo Legion 5 15ACH-82JU00C6GE-FL | |
| Lenovo Ideapad Gaming 3 15IHU-82K1002RGE | |
| AIDA64 / Memory Latency | |
| Media de la clase Gaming (75.3 - 259, n=105, últimos 2 años) | |
| Gigabyte G5 GD | |
| Lenovo Ideapad Gaming 3 15IHU-82K1002RGE | |
| Medio Intel Core i5-11300H (76.3 - 93.6, n=9) | |
| Lenovo Legion 5 15ACH-82JU00C6GE-FL | |
| Medion Erazer Deputy P25 | |
| Dell G15 5515 | |
* ... más pequeño es mejor
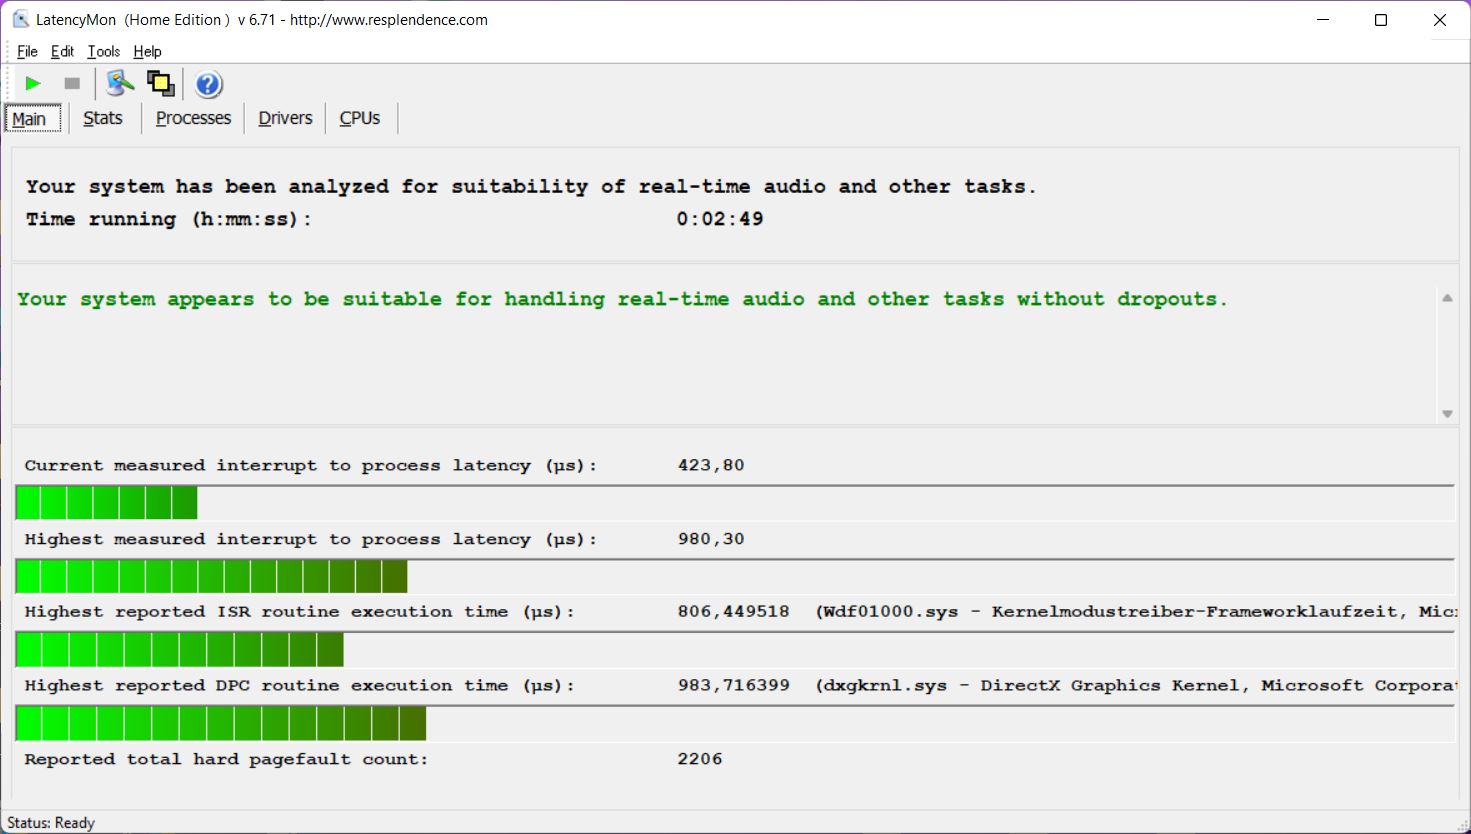
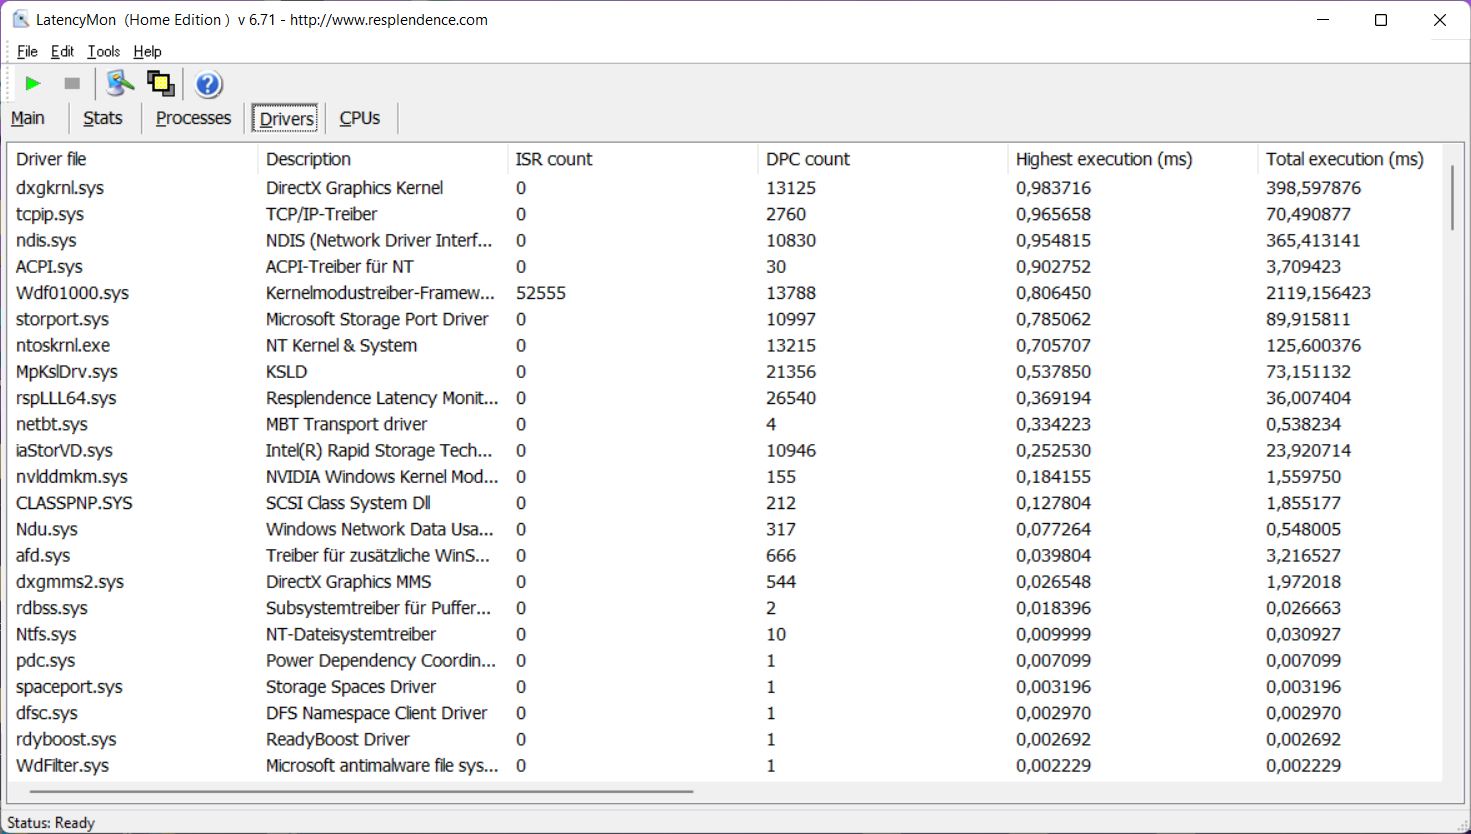
Latencias del CPD
Nuestro test de latencia no reveló ningún problema importante con la BIOS más reciente disponible en el momento de escribir este artículo. Dicho esto, encontramos algunas caídas de fotogramas durante nuestra prueba de reproducción de vídeo 4K.
| DPC Latencies / LatencyMon - interrupt to process latency (max), Web, Youtube, Prime95 | |
| Medion Erazer Deputy P25 | |
| Lenovo Ideapad Gaming 3 15IHU-82K1002RGE | |
| Lenovo Legion 5 15ACH-82JU00C6GE-FL | |
| Dell G15 5515 | |
| Schenker XMG Focus 15 | |
| Gigabyte G5 GD | |
* ... más pequeño es mejor
Dispositivos de almacenamiento
Dentro del IdeaPad Gaming 3 encontramos un SSD M.2-2280 fabricado por Micron conectado a una interfaz PCIe 3.0 x4. Rindió lo suficientemente rápido para el uso diario, pero no es particularmente rápido en comparación con sus competidores. Tras el primer arranque encontramos un total de 424 GB de espacio libre en el SSD de 512 GB, y el dispositivo también cuenta con una ranura secundaria de 2,5 pulgadas. Nota: todas las unidades vendidas en Estados Unidos tienen un disco duro de 1 TB combinado con un SSD de 256 GB por defecto. Se pueden encontrar más pruebas de rendimiento de las SSD aquí.

* ... más pequeño es mejor
Sustained Read: DiskSpd Read Loop, Queue Depth 8
Rendimiento gráfico
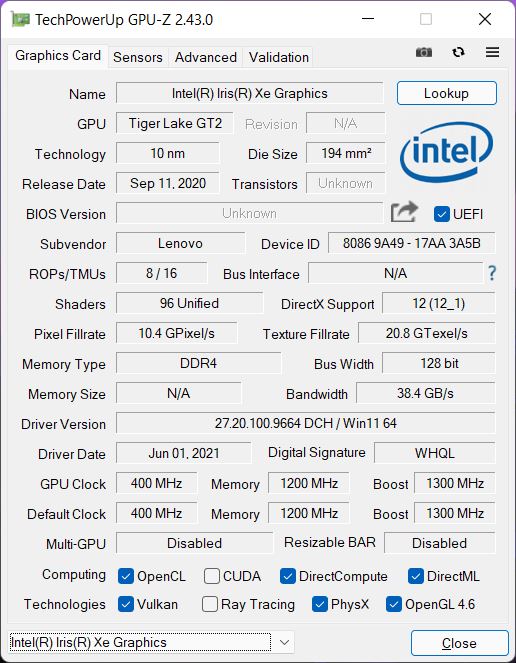
El IdeaPad Gaming 3 es compatible con Nvidia Optimus para el cambio de GPU totalmente automático basado en la carga entre la GPU dedicada y la integrada. Sin embargo, carece de soporte para MUX (Advanced Optimus), y la aplicación Vantage no soporta el anclaje de la GPU al chip dedicado GeForce. La única forma de anclaje de la GPU admitida es a través de la configuración de la BIOS, que permite desactivar la GPU dedicada y utilizar exclusivamente la integradaIris Xe.
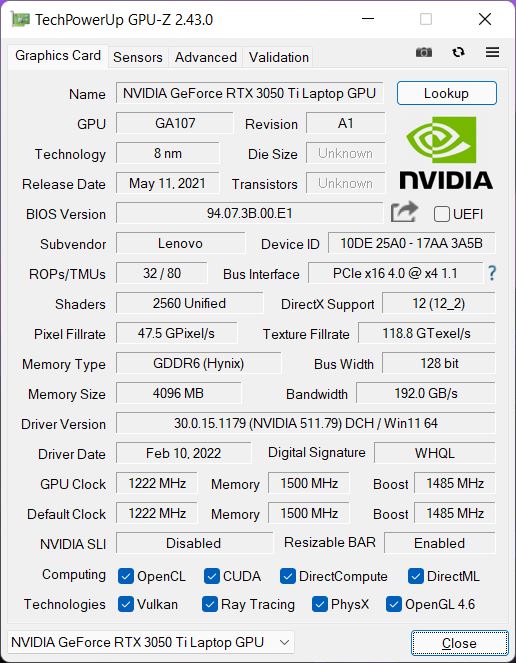
El chipGeForce RTX 3050 Ti instalado es el modelo más rápido disponible con un TGP de 90 W y una velocidad de reloj máxima de 1.702 MHz. En nuestros benchmarks, el dispositivo rindió por encima de la media para un dispositivo RTX 3050 Ti. Dicho esto, varios competidores equipados con RTX 3050 Ti y RTX 3060 han conseguido superar ligeramente al IdeaPad Gaming 3. El rendimiento de la GPU es constante a lo largo del tiempo, y el IdeaPad Gaming 3 completó la prueba de estrés Time Spy con una puntuación del 98,5 %.
El rendimiento de la GPU está limitado a sólo 30 W en batería. En consecuencia, el IdeaPad Gaming 3 sufre una pérdida de rendimiento del 50 % (2.815 frente a 5.677 en Time Spy Graphics). Se pueden encontrar más pruebas de GPU en nuestra sección de tecnología.
| 3DMark 11 Performance | 15615 puntos | |
| 3DMark Cloud Gate Standard Score | 26518 puntos | |
| 3DMark Fire Strike Score | 11894 puntos | |
| 3DMark Time Spy Score | 5512 puntos | |
ayuda | ||
Rendimiento de los juegos
Sobre el papel, el rendimiento de los juegos debería ser decente, incluso con juegos actuales, como Cyberpunk 2077, funcionando sin problemas en los ajustes más altos. Sin embargo, como ya observamos durante nuestras pruebas de CPU, la CPU comparativamente lenta es la principal responsable de que el IdeaPad Gaming 3 rinda ligeramente peor que la mayoría de sus competidores. Durante nuestro bucle Witcher 3 pudimos descubrir que el rendimiento gráfico se mantuvo constante durante largos periodos de tiempo. En batería, Witcher 3 Ultra bajó de 47 FPS a sólo 32 FPS. Se pueden encontrar más pruebas de juego en aquí
| The Witcher 3 | |
| 1920x1080 High Graphics & Postprocessing (Nvidia HairWorks Off) | |
| Media de la clase Gaming (341 - 404, n=2, últimos 2 años) | |
| Lenovo Legion 5 15ACH-82JU00C6GE-FL | |
| Medion Erazer Deputy P25 | |
| Schenker XMG Focus 15 | |
| Dell G15 5515 | |
| Gigabyte G5 GD | |
| Lenovo Ideapad Gaming 3 15IHU-82K1002RGE | |
| Medio NVIDIA GeForce RTX 3050 Ti Laptop GPU (30 - 110, n=26) | |
| 1920x1080 Ultra Graphics & Postprocessing (HBAO+) | |
| Media de la clase Gaming (104.7 - 240, n=7, últimos 2 años) | |
| Medion Erazer Deputy P25 | |
| Lenovo Legion 5 15ACH-82JU00C6GE-FL (Ultra Performance) | |
| Lenovo Legion 5 15ACH-82JU00C6GE-FL (Auto) | |
| Lenovo Legion 5 15ACH-82JU00C6GE-FL (Eco) | |
| Dell G15 5515 | |
| Schenker XMG Focus 15 | |
| Gigabyte G5 GD | |
| Medio NVIDIA GeForce RTX 3050 Ti Laptop GPU (19 - 58.5, n=29) | |
| Lenovo Ideapad Gaming 3 15IHU-82K1002RGE | |
| Final Fantasy XV Benchmark | |
| 1920x1080 High Quality | |
| Media de la clase Gaming (41 - 215, n=95, últimos 2 años) | |
| Lenovo Legion 5 15ACH-82JU00C6GE-FL (1.3) | |
| Medion Erazer Deputy P25 | |
| Schenker XMG Focus 15 | |
| Dell G15 5515 (1.3) | |
| Medio NVIDIA GeForce RTX 3050 Ti Laptop GPU (23.5 - 106, n=24) | |
| Gigabyte G5 GD (1.3) | |
| Lenovo Ideapad Gaming 3 15IHU-82K1002RGE (1.3) | |
| 1920x1080 Standard Quality | |
| Media de la clase Gaming (85.7 - 236, n=82, últimos 2 años) | |
| Lenovo Legion 5 15ACH-82JU00C6GE-FL (1.3) | |
| Schenker XMG Focus 15 | |
| Dell G15 5515 (1.3) | |
| Gigabyte G5 GD (1.3) | |
| Medio NVIDIA GeForce RTX 3050 Ti Laptop GPU (33.4 - 106, n=24) | |
| Lenovo Ideapad Gaming 3 15IHU-82K1002RGE (1.3) | |
| Strange Brigade | |
| 1920x1080 high AA:high AF:8 | |
| Media de la clase Gaming (129.5 - 494, n=75, últimos 2 años) | |
| Medion Erazer Deputy P25 (1.47.22.14 D3D12) | |
| Schenker XMG Focus 15 (1.47.22.14 D3D12) | |
| Dell G15 5515 (1.47.22.14 D3D12) | |
| Lenovo Ideapad Gaming 3 15IHU-82K1002RGE (1.47.22.14 D3D12) | |
| Gigabyte G5 GD (1.47.22.14 D3D12) | |
| Medio NVIDIA GeForce RTX 3050 Ti Laptop GPU (79.2 - 117.3, n=23) | |
| 1920x1080 ultra AA:ultra AF:16 | |
| Media de la clase Gaming (76.3 - 458, n=87, últimos 2 años) | |
| Medion Erazer Deputy P25 (1.47.22.14 D3D12) | |
| Dell G15 5515 (1.47.22.14 D3D12) | |
| Schenker XMG Focus 15 (1.47.22.14 D3D12) | |
| Gigabyte G5 GD (1.47.22.14 D3D12) | |
| Lenovo Ideapad Gaming 3 15IHU-82K1002RGE (1.47.22.14 D3D12) | |
| Medio NVIDIA GeForce RTX 3050 Ti Laptop GPU (34.8 - 101.3, n=25) | |
| F1 2021 | |
| 1920x1080 High Preset AA:T AF:16x | |
| Lenovo Legion 5 15ACH-82JU00C6GE-FL | |
| Dell G15 5515 (807588) | |
| Gigabyte G5 GD (824817) | |
| Medio NVIDIA GeForce RTX 3050 Ti Laptop GPU (68 - 131, n=11) | |
| Lenovo Ideapad Gaming 3 15IHU-82K1002RGE (852849) | |
| 1920x1080 Ultra High Preset + Raytracing AA:T AF:16x | |
| Lenovo Legion 5 15ACH-82JU00C6GE-FL | |
| Dell G15 5515 (807588) | |
| Gigabyte G5 GD (824817) | |
| Medio NVIDIA GeForce RTX 3050 Ti Laptop GPU (44.4 - 69, n=11) | |
| Lenovo Ideapad Gaming 3 15IHU-82K1002RGE (852849) | |
Witcher 3 FPS Graph
| bajo | medio | alto | ultra | |
|---|---|---|---|---|
| GTA V (2015) | 134 | 118 | 85.6 | 55 |
| The Witcher 3 (2015) | 172 | 136 | 91 | 47.1 |
| Dota 2 Reborn (2015) | 115 | 103 | 94.5 | 90.6 |
| Final Fantasy XV Benchmark (2018) | 98.9 | 68.9 | 47.9 | |
| X-Plane 11.11 (2018) | 87.5 | 72 | 61 | |
| Far Cry 5 (2018) | 88 | 67 | 66 | 62 |
| Strange Brigade (2018) | 208 | 129 | 106 | 90 |
| F1 2021 (2021) | 157 | 102 | 82.3 | 44.4 |
| GRID Legends (2022) | 91 | 84 | 73 | 56 |
| Cyberpunk 2077 1.6 (2022) | 55 | 50 | 39 | 37 |
Emisiones - Agradable portátil para juegos de Lenovo
Emisiones acústicas
El rendimiento del ventilador se puede ajustar fácilmente a su gusto gracias a los tres perfiles de potencia disponibles. Por ejemplo, puedes esperar emisiones de ruido ocasionalmente notables con el perfil de Rendimiento activado y es mejor seleccionar el perfil Silencioso si insistes en el máximo silencio sin ventilador u otro ruido como el de la bobina.
Bajo carga, encontramos diferencias significativas entre las emisiones de ruido mientras se juega y las emisiones de ruido durante nuestra prueba de estrés torturando tanto la CPU como la GPU al máximo. Al jugar, el IdeaPad se mantuvo comparativamente silencioso con sólo 43 dB(A) incluso con el perfil de rendimiento activado. Sin embargo, sugerimos encarecidamente que prueben sus juegos en los otros dos perfiles de energía, ya que algunos de ustedes podrían beneficiarse de ventiladores más silenciosos sin sacrificar demasiado rendimiento. La siguiente tabla muestra las emisiones de ruido de los ventiladores en los tres perfiles durante los juegos y nuestra prueba de estrés.
| Escenario | Silencioso | Auto | Rendimiento |
|---|---|---|---|
| Witcher 3 Ultra | 35,2 dB(A) (46 FPS) | 39,8 dB(A) (47 FPS) | 43,5 dB(A) (47 FPS) |
| Cyberpunk 2077 1.5 Ultra | 35,2 dB(A) (27 FPS) | 39,8 dB(A) (29 FPS) | 43,5 dB(A) (37 FPS) |
| Prueba de esfuerzo | 35,2 dB(A) | 48,3 dB(A) | 53,1 dB(A) |
Ruido
| Ocioso |
| 23.9 / 26.8 / 26.8 dB(A) |
| Carga |
| 43.5 / 53.1 dB(A) |
 | ||
30 dB silencioso 40 dB(A) audible 50 dB(A) ruidosamente alto |
||
min: | ||
| Lenovo Ideapad Gaming 3 15IHU-82K1002RGE GeForce RTX 3050 Ti Laptop GPU, i5-11300H, Micron 2210 MTFDHBA512QFD | Dell G15 5515 GeForce RTX 3050 Ti Laptop GPU, R7 5800H, Samsung PM991a MZ9LQ512HBLU-00BD1 | Gigabyte G5 GD GeForce RTX 3050 4GB Laptop GPU, i5-11400H, ESR512GTLG-E6GBTNB4 | Medion Erazer Deputy P25 GeForce RTX 3060 Laptop GPU, R7 5800H, Phison E12S-512GB-Phison-SSD-BICS4 | Schenker XMG Focus 15 GeForce RTX 3050 Ti Laptop GPU, i7-11800H, Samsung SSD 970 EVO Plus 1TB | Lenovo Legion 5 15ACH-82JU00C6GE-FL GeForce RTX 3060 Laptop GPU, R7 5800H, Micron 2300 512GB MTFDHBA512TDV | |
|---|---|---|---|---|---|---|
| Noise | -1% | -14% | -16% | -21% | -12% | |
| apagado / medio ambiente * (dB) | 23.9 | 24 -0% | 24 -0% | 25 -5% | 24 -0% | 24.2 -1% |
| Idle Minimum * (dB) | 23.9 | 25 -5% | 29 -21% | 27 -13% | 25 -5% | 29 -21% |
| Idle Average * (dB) | 26.8 | 26 3% | 30 -12% | 29 -8% | 30 -12% | 29 -8% |
| Idle Maximum * (dB) | 26.8 | 30 -12% | 32 -19% | 31 -16% | 43 -60% | 29 -8% |
| Load Average * (dB) | 43.5 | 44 -1% | 53 -22% | 57 -31% | 56 -29% | 53.5 -23% |
| Witcher 3 ultra * (dB) | 43.5 | 44 -1% | 52 -20% | 56 -29% | 56 -29% | 53.5 -23% |
| Load Maximum * (dB) | 53.1 | 48 10% | 54 -2% | 58 -9% | 58 -9% | 53.5 -1% |
* ... más pequeño es mejor
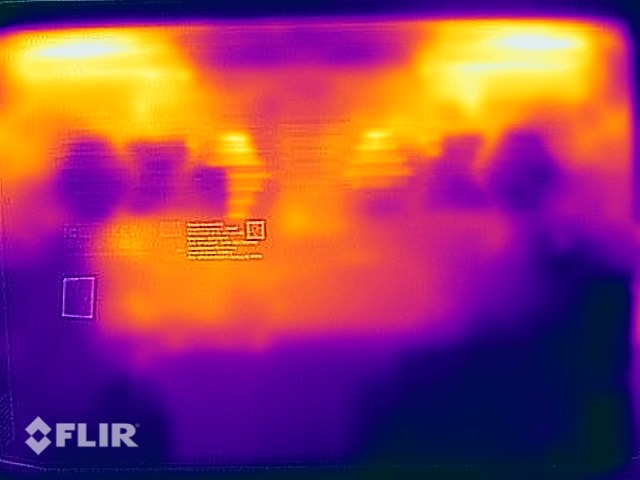
Temperatura
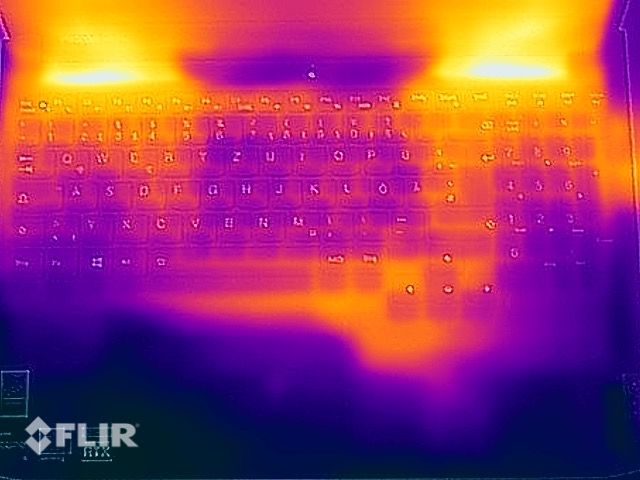
El sistema de refrigeración del IdeaPad Gaming 3 hace un trabajo decente, y las temperaturas superficiales se mantuvieron bastante bajas mientras jugábamos. Sólo en la parte inferior pudimos encontrar un único punto caliente que alcanzó un máximo de 45 °C, lo que significa que el dispositivo debería ser fácilmente utilizable en el regazo. El portátil se mantuvo muy fresco en reposo y en situaciones de baja carga.
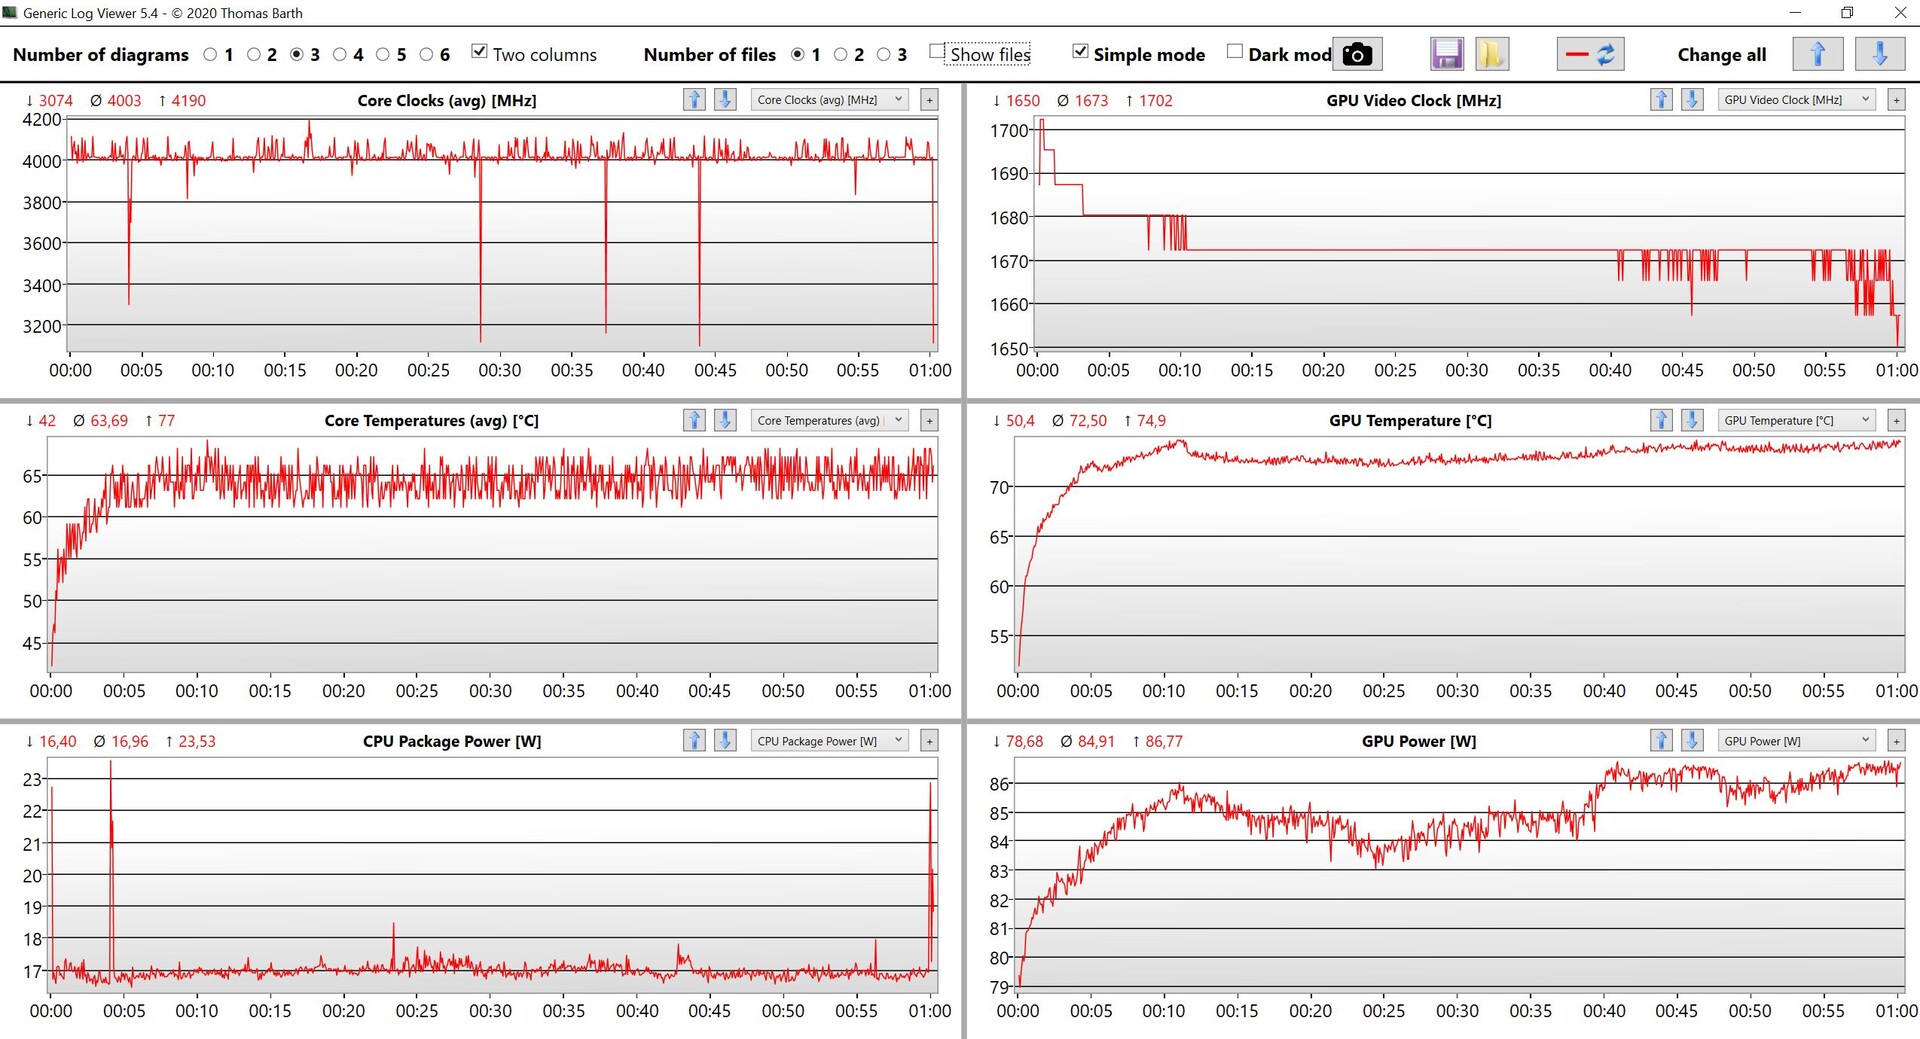
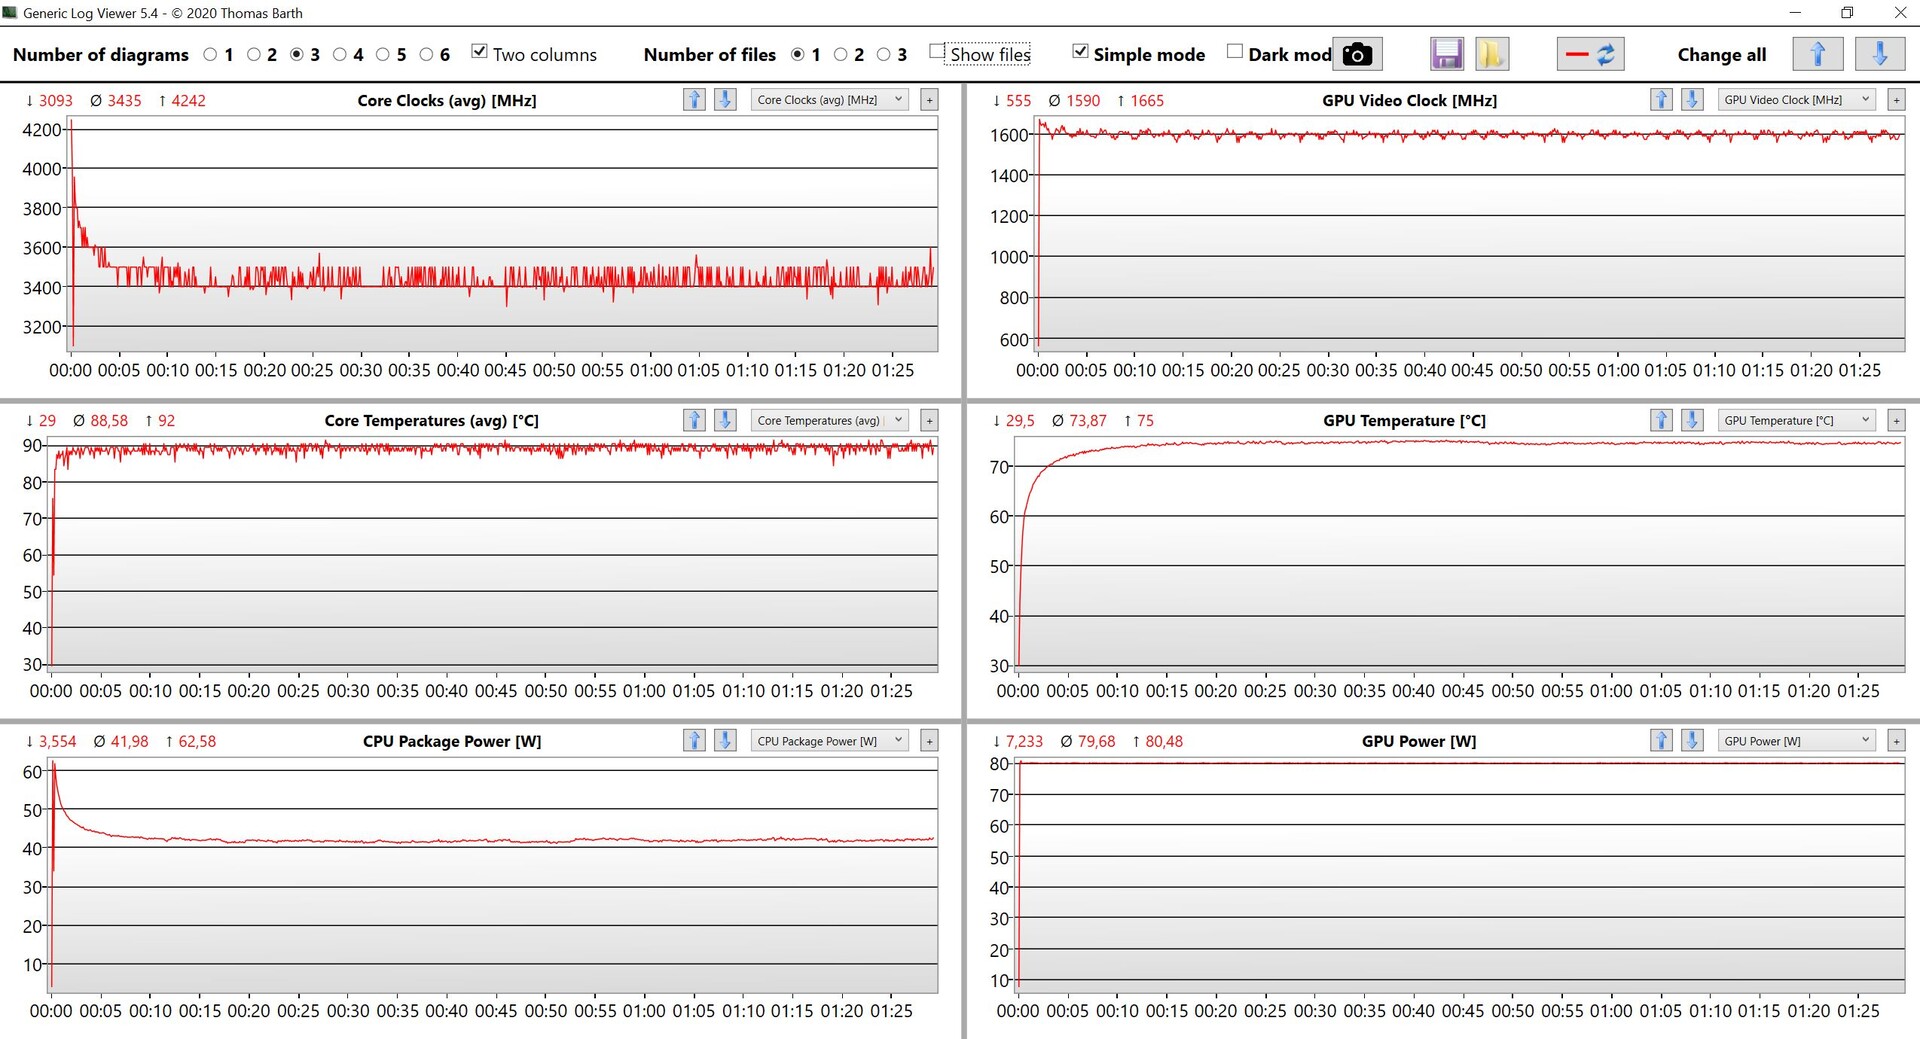
Durante nuestro test de estrés encontramos que tanto la CPU (42 W) como la GPU dedicada (80 W) fueron consistentes durante largos periodos de tiempo, y el rendimiento no se vio afectado en absoluto inmediatamente después del test de estrés.
(±) La temperatura máxima en la parte superior es de 43.2 °C / 110 F, frente a la media de 40.4 °C / 105 F, que oscila entre 21.2 y 68.8 °C para la clase Gaming.
(-) El fondo se calienta hasta un máximo de 47.9 °C / 118 F, frente a la media de 43.2 °C / 110 F
(+) En reposo, la temperatura media de la parte superior es de 24.2 °C / 76# F, frente a la media del dispositivo de 33.9 °C / 93 F.
(±) Jugando a The Witcher 3, la temperatura media de la parte superior es de 35.5 °C / 96 F, frente a la media del dispositivo de 33.9 °C / 93 F.
(±) El reposamanos y el touchpad pueden calentarse mucho al tacto con un máximo de 38.2 °C / 100.8 F.
(-) La temperatura media de la zona del reposamanos de dispositivos similares fue de 28.8 °C / 83.8 F (-9.4 °C / -17 F).
| Lenovo Ideapad Gaming 3 15IHU-82K1002RGE Intel Core i5-11300H, NVIDIA GeForce RTX 3050 Ti Laptop GPU | Dell G15 5515 AMD Ryzen 7 5800H, NVIDIA GeForce RTX 3050 Ti Laptop GPU | Gigabyte G5 GD Intel Core i5-11400H, NVIDIA GeForce RTX 3050 4GB Laptop GPU | Medion Erazer Deputy P25 AMD Ryzen 7 5800H, NVIDIA GeForce RTX 3060 Laptop GPU | Schenker XMG Focus 15 Intel Core i7-11800H, NVIDIA GeForce RTX 3050 Ti Laptop GPU | Lenovo Legion 5 15ACH-82JU00C6GE-FL AMD Ryzen 7 5800H, NVIDIA GeForce RTX 3060 Laptop GPU | |
|---|---|---|---|---|---|---|
| Heat | -5% | -9% | 4% | -25% | -1% | |
| Maximum Upper Side * (°C) | 43.2 | 50 -16% | 45 -4% | 37 14% | 43 -0% | 42.6 1% |
| Maximum Bottom * (°C) | 47.9 | 49 -2% | 50 -4% | 40 16% | 46 4% | 52.2 -9% |
| Idle Upper Side * (°C) | 24.9 | 26 -4% | 28 -12% | 27 -8% | 39 -57% | 24.9 -0% |
| Idle Bottom * (°C) | 27 | 26 4% | 31 -15% | 29 -7% | 40 -48% | 25.3 6% |
* ... más pequeño es mejor
Altavoces
Los altavoces estéreo tienen una potencia de 2 W cada uno y son lo suficientemente fuertes, pero muy pequeños en general. Y aunque el software Nahimic preinstalado permite algunos ajustes notables utilizando los perfiles preinstalados, encontramos que otros portátiles funcionan mucho mejor en este sentido. Por lo tanto, sugerimos encarecidamente que se conecten altavoces externos o auriculares para la mayoría de los casos de uso, desde los juegos hasta la música.
Lenovo Ideapad Gaming 3 15IHU-82K1002RGE análisis de audio
(±) | la sonoridad del altavoz es media pero buena (80 dB)
Graves 100 - 315 Hz
(-) | casi sin bajos - de media 23.8% inferior a la mediana
(±) | la linealidad de los graves es media (10.3% delta a frecuencia anterior)
Medios 400 - 2000 Hz
(±) | medias más altas - de media 6.7% más altas que la mediana
(+) | los medios son lineales (6% delta a la frecuencia anterior)
Altos 2 - 16 kHz
(+) | máximos equilibrados - a sólo 3.6% de la mediana
(±) | la linealidad de los máximos es media (7.4% delta a frecuencia anterior)
Total 100 - 16.000 Hz
(±) | la linealidad del sonido global es media (20.7% de diferencia con la mediana)
En comparación con la misma clase
» 74% de todos los dispositivos probados de esta clase eran mejores, 4% similares, 21% peores
» El mejor tuvo un delta de 6%, la media fue 18%, el peor fue ###max##%
En comparación con todos los dispositivos probados
» 56% de todos los dispositivos probados eran mejores, 8% similares, 36% peores
» El mejor tuvo un delta de 4%, la media fue 23%, el peor fue ###max##%
Lenovo Legion 5 15ACH-82JU00C6GE-FL análisis de audio
(±) | la sonoridad del altavoz es media pero buena (81 dB)
Graves 100 - 315 Hz
(-) | casi sin bajos - de media 22.1% inferior a la mediana
(±) | la linealidad de los graves es media (11.4% delta a frecuencia anterior)
Medios 400 - 2000 Hz
(+) | medios equilibrados - a sólo 4.5% de la mediana
(+) | los medios son lineales (5% delta a la frecuencia anterior)
Altos 2 - 16 kHz
(+) | máximos equilibrados - a sólo 2.9% de la mediana
(+) | los máximos son lineales (4.5% delta a la frecuencia anterior)
Total 100 - 16.000 Hz
(±) | la linealidad del sonido global es media (17.8% de diferencia con la mediana)
En comparación con la misma clase
» 53% de todos los dispositivos probados de esta clase eran mejores, 10% similares, 37% peores
» El mejor tuvo un delta de 6%, la media fue 18%, el peor fue ###max##%
En comparación con todos los dispositivos probados
» 36% de todos los dispositivos probados eran mejores, 8% similares, 56% peores
» El mejor tuvo un delta de 4%, la media fue 23%, el peor fue ###max##%
Gestión de la energía - Portátil para juegos de Lenovo con batería pequeña
Consumo de energía
Nuestro modelo de pruebas resultó ser sorprendentemente eficiente en reposo. Mientras jugaba consumía un total de 120-130 W y alcanzó un pico de 172 W durante nuestra prueba de estrés antes de establecerse en unos más razonables 150 W. La fuente de alimentación de 170 W incluida es, por tanto, adecuada.
| Off / Standby | |
| Ocioso | |
| Carga |
|
Clave:
min: | |
| Lenovo Ideapad Gaming 3 15IHU-82K1002RGE i5-11300H, GeForce RTX 3050 Ti Laptop GPU, Micron 2210 MTFDHBA512QFD, IPS, 1920x1080, 15.6" | Dell G15 5515 R7 5800H, GeForce RTX 3050 Ti Laptop GPU, Samsung PM991a MZ9LQ512HBLU-00BD1, IPS, 1920x1080, 15.6" | Gigabyte G5 GD i5-11400H, GeForce RTX 3050 4GB Laptop GPU, ESR512GTLG-E6GBTNB4, IPS, 1920x1080, 15.6" | Medion Erazer Deputy P25 R7 5800H, GeForce RTX 3060 Laptop GPU, Phison E12S-512GB-Phison-SSD-BICS4, IPS, 1920x1080, 15.6" | Schenker XMG Focus 15 i7-11800H, GeForce RTX 3050 Ti Laptop GPU, Samsung SSD 970 EVO Plus 1TB, IPS, 1920x1080, 15.6" | Lenovo Legion 5 15ACH-82JU00C6GE-FL R7 5800H, GeForce RTX 3060 Laptop GPU, Micron 2300 512GB MTFDHBA512TDV, , 1920x1080, 15.6" | Medio NVIDIA GeForce RTX 3050 Ti Laptop GPU | Media de la clase Gaming | |
|---|---|---|---|---|---|---|---|---|
| Power Consumption | -26% | -65% | -48% | -138% | -44% | -41% | -112% | |
| Idle Minimum * (Watt) | 4.9 | 5 -2% | 13 -165% | 8 -63% | 23 -369% | 7.3 -49% | 8.2 ? -67% | 13 ? -165% |
| Idle Average * (Watt) | 8.3 | 9 -8% | 15 -81% | 11 -33% | 25 -201% | 10.5 -27% | 12.6 ? -52% | 19 ? -129% |
| Idle Maximum * (Watt) | 8.9 | 20 -125% | 20 -125% | 16 -80% | 29 -226% | 15.7 -76% | 17.2 ? -93% | 24.6 ? -176% |
| Load Average * (Watt) | 81 | 94 -16% | 102 -26% | 109 -35% | 106 -31% | 108 -33% | 92 ? -14% | 110.7 ? -37% |
| Witcher 3 ultra * (Watt) | 119 | 123 -3% | 124 -4% | 183 -54% | 128 -8% | 175 -47% | ||
| Load Maximum * (Watt) | 172 | 172 -0% | 148 14% | 211 -23% | 156 9% | 228 -33% | 139.1 ? 19% | 259 ? -51% |
* ... más pequeño es mejor
Power Consumption Witcher 3 / stress test
Power Consumption with External Monitor
Duración de la batería
A pesar de su gran carcasa, el IdeaPad Gaming 3 viene con una pequeña batería de 3 celdas y 45 Wh que permite una duración decente de la batería, al menos en reposo. Bajo carga logró durar alrededor de una hora. En nuestra prueba de Wi-Fi navegando por la web duró entre 5,5 y 6,5 horas dependiendo del brillo de la pantalla. En nuestro test de vídeo duró más de 7,5 horas con el brillo de la pantalla normalizado a 150 nits (84 % en nuestro dispositivo). Cargar un dispositivo encendido desde que está casi vacío hasta que está lleno lleva unas dos horas.
| Lenovo Ideapad Gaming 3 15IHU-82K1002RGE i5-11300H, GeForce RTX 3050 Ti Laptop GPU, 45 Wh | Dell G15 5515 R7 5800H, GeForce RTX 3050 Ti Laptop GPU, 56 Wh | Gigabyte G5 GD i5-11400H, GeForce RTX 3050 4GB Laptop GPU, 41 Wh | Medion Erazer Deputy P25 R7 5800H, GeForce RTX 3060 Laptop GPU, 49 Wh | Schenker XMG Focus 15 i7-11800H, GeForce RTX 3050 Ti Laptop GPU, 49 Wh | Lenovo Legion 5 15ACH-82JU00C6GE-FL R7 5800H, GeForce RTX 3060 Laptop GPU, 80 Wh | Media de la clase Gaming | |
|---|---|---|---|---|---|---|---|
| Duración de Batería | 24% | -35% | 1% | -30% | -2% | 18% | |
| H.264 (h) | 7.7 | 8.8 14% | 3.6 -53% | 4.3 -44% | 8.32 ? 8% | ||
| WiFi v1.3 (h) | 6.6 | 8 21% | 3.1 -53% | 6.7 2% | 3.9 -41% | 4.8 -27% | 7.11 ? 8% |
| Load (h) | 1.1 | 1.5 36% | 1.1 0% | 1.1 0% | 0.9 -18% | 1.8 64% | 1.502 ? 37% |
| Reader / Idle (h) | 13.5 | 5.7 | 10.5 | 6.5 | 8.27 ? |
Pro
Contra
Veredicto - Los jugadores de presupuesto mejor con AMD
El IdeaPad Gaming 3i 15 G6 es un portátil de juego asequible equipado con una rápidaRTX 3050 Ti para un rendimiento de juego FHD adecuado. Sin embargo, nos sorprende la elección de Lenovo de la CPU. El procesador quad-core Tiger Lake de Intel, comparativamente lento, simplemente no tiene sentido en un dispositivo con una potente GPU dedicada. El resultado es un rendimiento de juego comparativamente bajo, y el portátil se habría beneficiado enormemente del Core i5-11400H de 6 núcleos . Y para colmo de males, esta CPU Tiger Lake habría sido incluso más barata que el i5-11300H por el que optó Lenovo. También está disponible un SKU equipado con AMD basado en elRyzen 5 5600H y ofrece un rendimiento general mucho mejor. Sin embargo, es difícil de conseguir en muchas regiones.
En general, el IdeaPad Gaming 3 cubre los aspectos básicos más importantes de los juegos sin ningún tipo de campanas y silbatos. Además de la lentitud de la CPU, también encontramos que la pantalla por defecto es deficiente. Puede ser mate y ofrecer amplios ángulos de visión gracias a su panel IPS integrado, pero su calidad de imagen (granulada) y la representación del color son bastante pobres. Sin duda, el panel por defecto es una unidad bastante barata, como atestiguan su escasa precisión de color y su baja cobertura sRGB. Opcionalmente, el IdeaPad Gaming 3 está disponible con un panel 1080p de 165 Hz con cobertura sRGB completa en regiones seleccionadas que, de estar disponible, sería sin duda una opción mucho mejor.
El IdeaPad Gaming 3i 15 es un portátil gaming económico con una RTX 3050 Ti y unrendimiento gaming FHD adecuado. Si puedes estirar un poco más tu presupuesto, recomendaríamos encarecidamente el panel opcional de 165 Hz.
Sus competidores, como el Dell G15,Medion Erazer,Schenker XMG Focus, o incluso el propio LenovoLegion 5 15 ofrecen un rendimiento mucho mayor y a menudo también pantallas significativamente mejores. Sin embargo, si usted está operando con un presupuesto ajustado el panel FHD por defecto sin duda será suficiente.
Precio y disponibilidad
Hay un total de cuatro SKU disponibles en Estados Unidos equipados con un Core i5-11300H y una GeForce GTX 1650 o un Core i7-11370H y una GTX 1650, RTX 3050 o RTX 3050 Ti. Los precios parten de unos 800 dólares para el modelo base, y los dispositivos se venden a través de la propia tienda web de Lenovo así como en varios minoristas como Amazon.
Lenovo Ideapad Gaming 3 15IHU-82K1002RGE
- 03/22/2022 v7 (old)
Andreas Osthoff
Price comparison

