Análisis del HP Victus 16: Portátil para juegos asequible con CPU AMD y GPU Nvidia

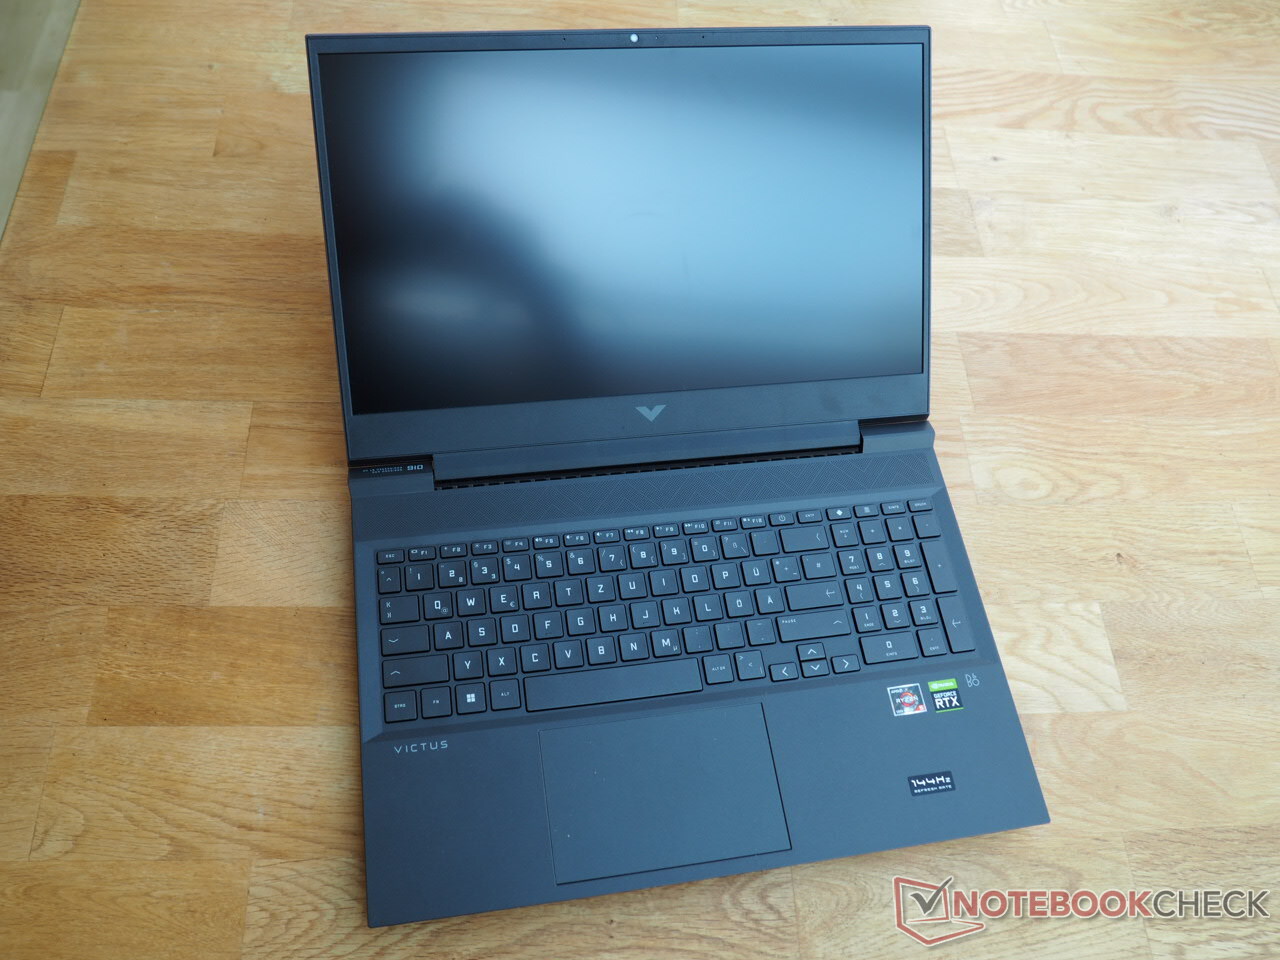
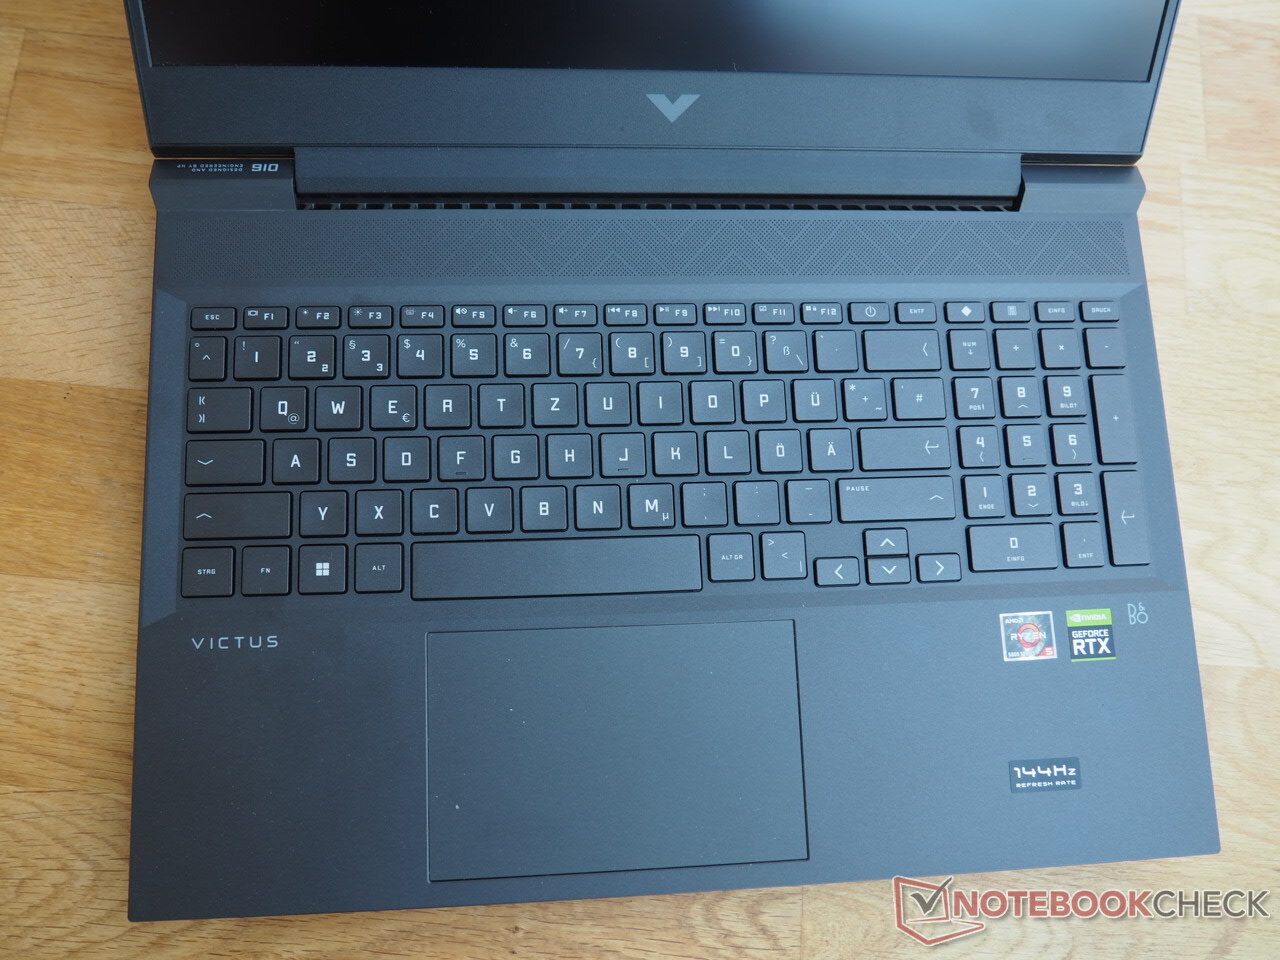
Después de que ya probáramos una versión más cara del Victus 16 con unRyzen 7 5800Hy GeForce RTX 3060hace varios meses, ahora ponemos a prueba el modelo asequible del Victus 16-0145ng. Aunque HP recorta costes al no incluir un sistema operativo Windows (instalamos Windows 11 Home), un Ryzen 5 5600Hy una GeForce RTX 3050 Tipor unos 920 euros (975 dólares) sigue siendo impresionante. Del mismo modo, incluir 16 GB de RAM DDR4 y un SSD NVMe de 512 GB a ese precio tampoco da motivos de queja. Al menos sobre el papel, la pantalla IPS también da una buena cifra, ya que los 144 Hz indican una adecuada reproducción de juegos rápidos.
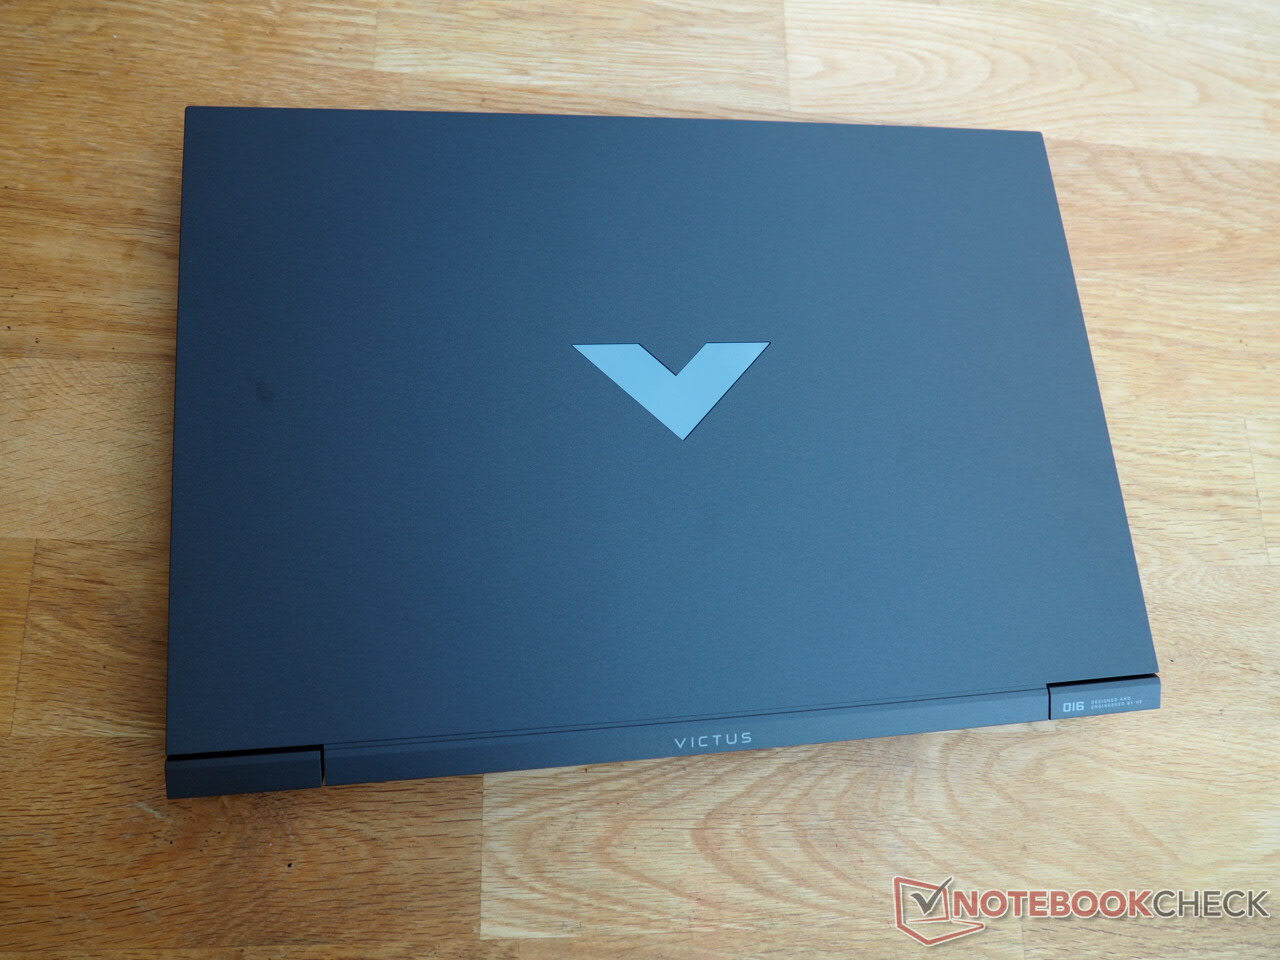
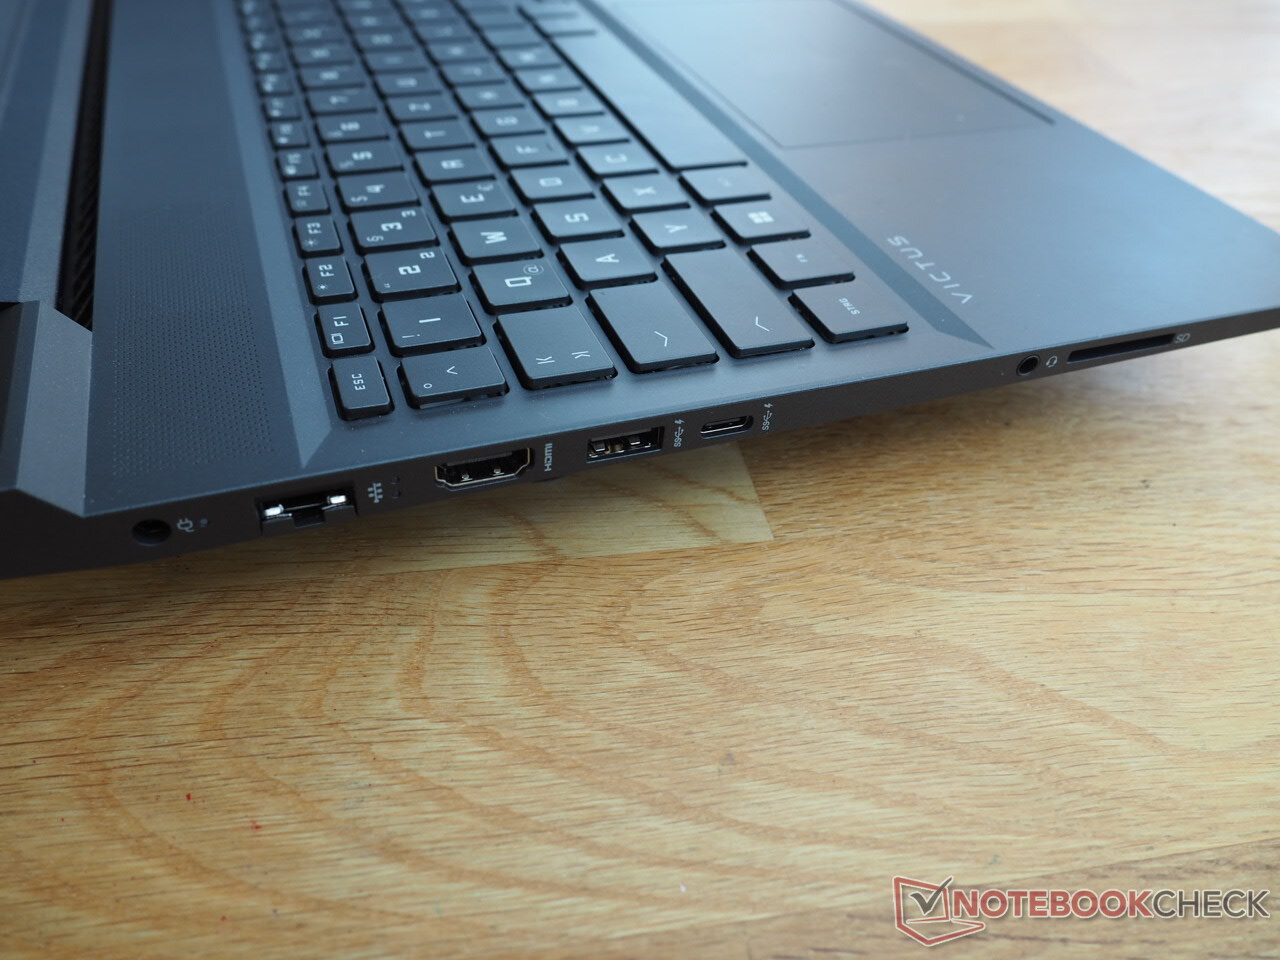
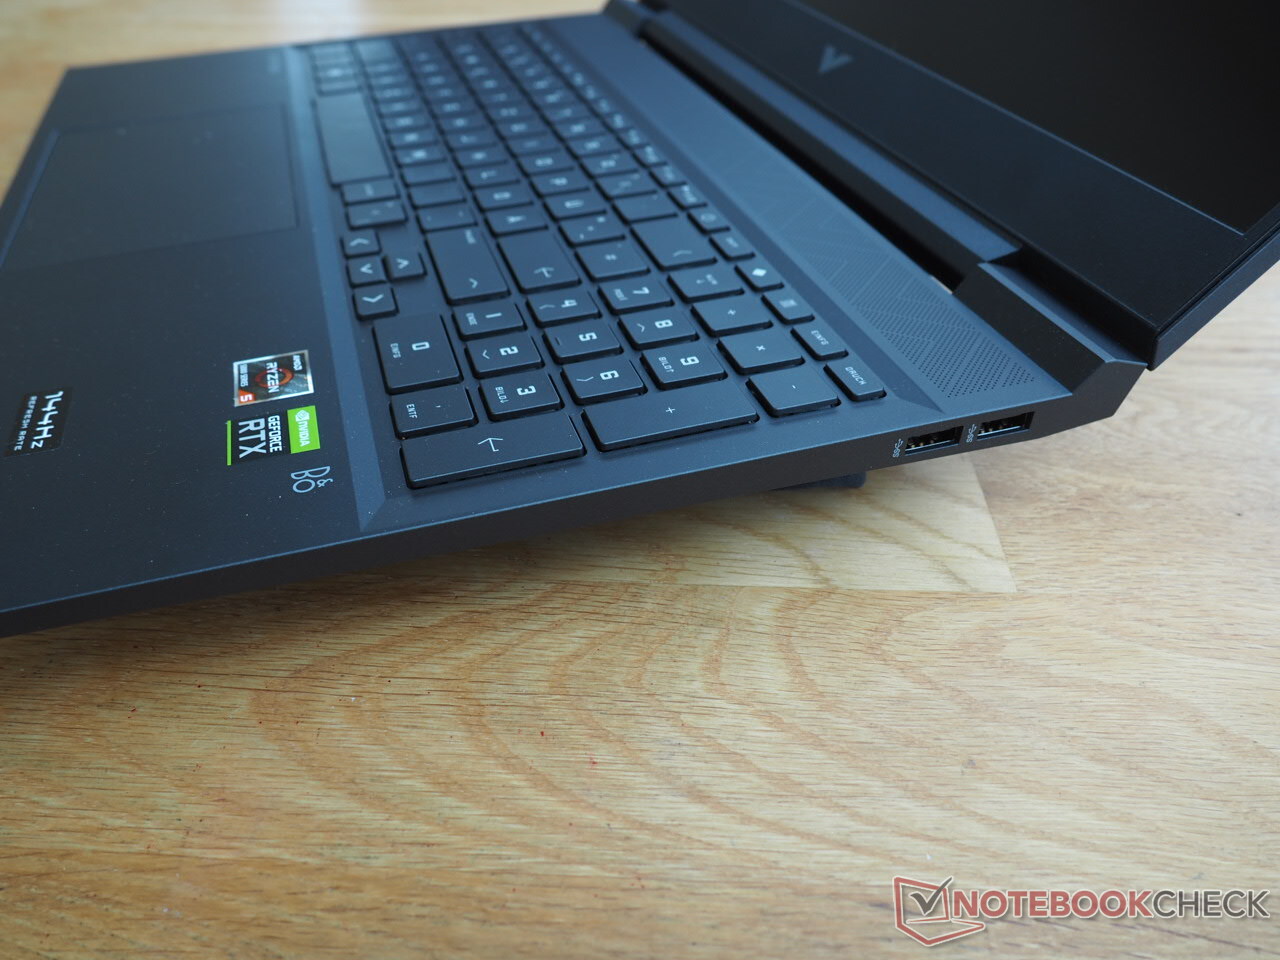
Dado que, aparte de algunos detalles menores, la carcasa es idéntica al modelo que probamos anteriormente, no hablaremos aquí de la carcasa, el equipo (conexiones, etc.) y los dispositivos de entrada. Puede encontrar la información correspondiente en el análisis del Victus 16-e0179ng.
Posibles contendientes en la comparación
Valoración | Fecha | Modelo | Peso | Altura | Tamaño | Resolución | Precio |
|---|---|---|---|---|---|---|---|
| 82.3 % v7 (old) | 05/2022 | HP Victus 16-e0145ng R5 5600H, GeForce RTX 3050 Ti Laptop GPU | 2.4 kg | 23.5 mm | 16.10" | 1920x1080 | |
| 84.3 % v7 (old) | 09/2021 | HP Victus 16-e0179ng R7 5800H, GeForce RTX 3060 Laptop GPU | 2.5 kg | 23.5 mm | 16.10" | 1920x1080 | |
| 79.7 % v7 (old) | 03/2022 | Lenovo Ideapad Gaming 3 15IHU-82K1002RGE i5-11300H, GeForce RTX 3050 Ti Laptop GPU | 2 kg | 24.2 mm | 15.60" | 1920x1080 | |
| 82.7 % v7 (old) | 10/2021 | Dell G15 5515 R7 5800H, GeForce RTX 3050 Ti Laptop GPU | 2.4 kg | 24.9 mm | 15.60" | 1920x1080 | |
| 83.4 % v7 (old) | 08/2021 | Asus ROG Strix G17 G713QE-RB74 R7 5800H, GeForce RTX 3050 Ti Laptop GPU | 2.5 kg | 24.6 mm | 17.30" | 1920x1080 |
Entre los competidores de este equipo de 16 pulgadas se encuentran otros portátiles para juegos asequibles con una GeForce RTX 3050 Ti, como el Lenovo Ideapad Gaming 3 15IHU, elDell G15 5515y el Asus Strix G17 G713QE. Estos portátiles aparecen en las tablas como dispositivos de comparación - siempre que los valores para ellos estén disponibles.
Lector de tarjetas SD
| SD Card Reader - average JPG Copy Test (av. of 3 runs) | |
| Media de la clase Gaming (20.9 - 210, n=54, últimos 2 años) | |
| HP Victus 16-e0179ng (AV PRO microSD 128 GB V60) | |
| HP Victus 16-e0145ng (AV PRO microSD 128 GB V60) | |
Comunicación
| Networking | |
| iperf3 transmit AXE11000 | |
| Media de la clase Gaming (560 - 1862, n=94, últimos 2 años) | |
| HP Victus 16-e0145ng | |
| iperf3 receive AXE11000 | |
| Media de la clase Gaming (680 - 1745, n=94, últimos 2 años) | |
| HP Victus 16-e0145ng | |
Cámara web


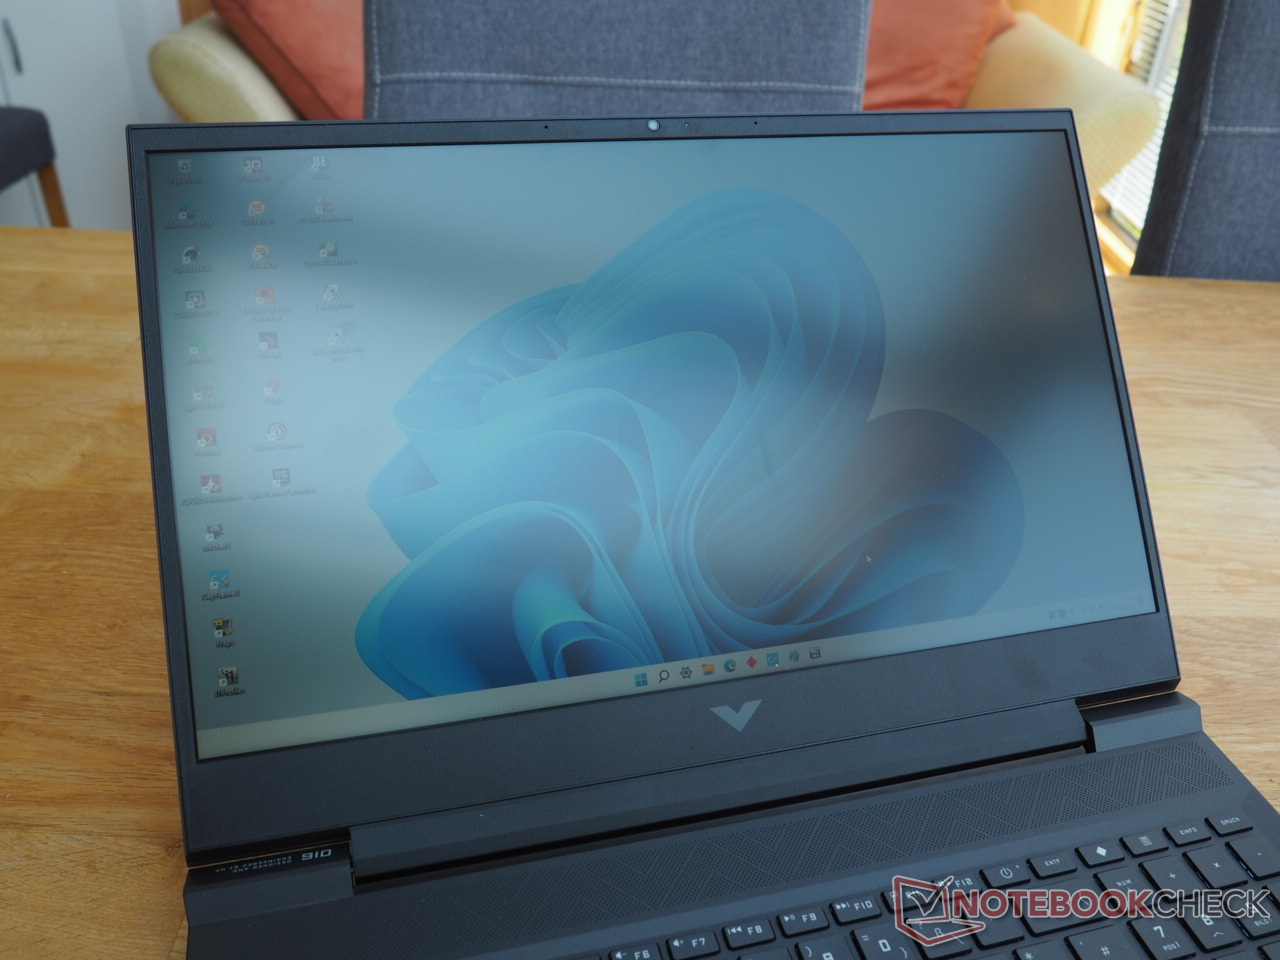
Mostrar
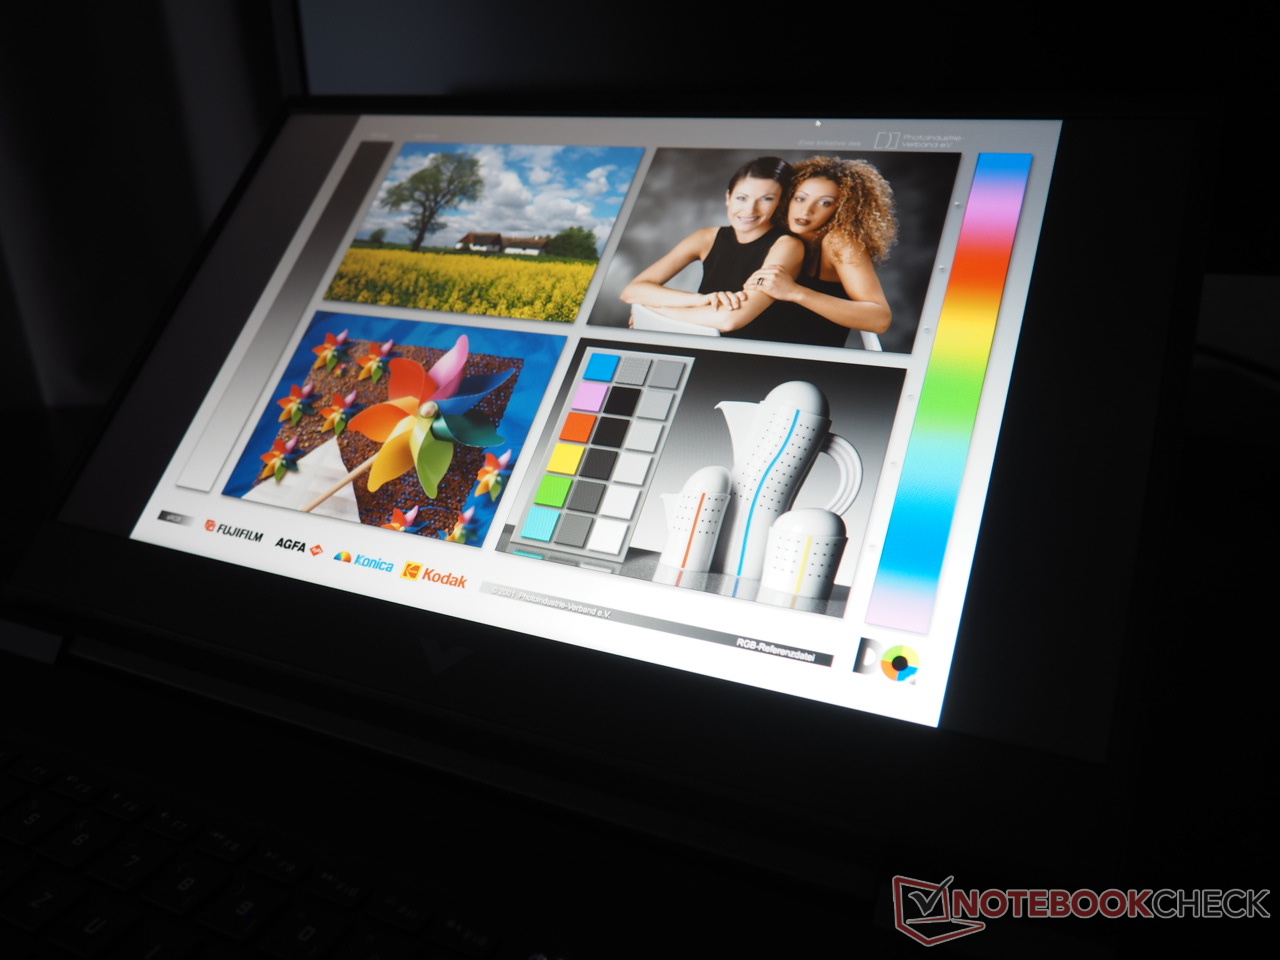
Mientras que el hermano más caro está equipado con una buena pantalla Full-HD, desafortunadamente algunas medidas de recorte de costes por parte del fabricante se notan claramente en el Victus 16-e0145ng.
| |||||||||||||||||||||||||
iluminación: 88 %
Brillo con batería: 257 cd/m²
Contraste: 1028:1 (Negro: 0.25 cd/m²)
ΔE ColorChecker Calman: 6.91 | ∀{0.5-29.43 Ø4.72}
calibrated: 3.61
ΔE Greyscale Calman: 7.5 | ∀{0.09-98 Ø4.97}
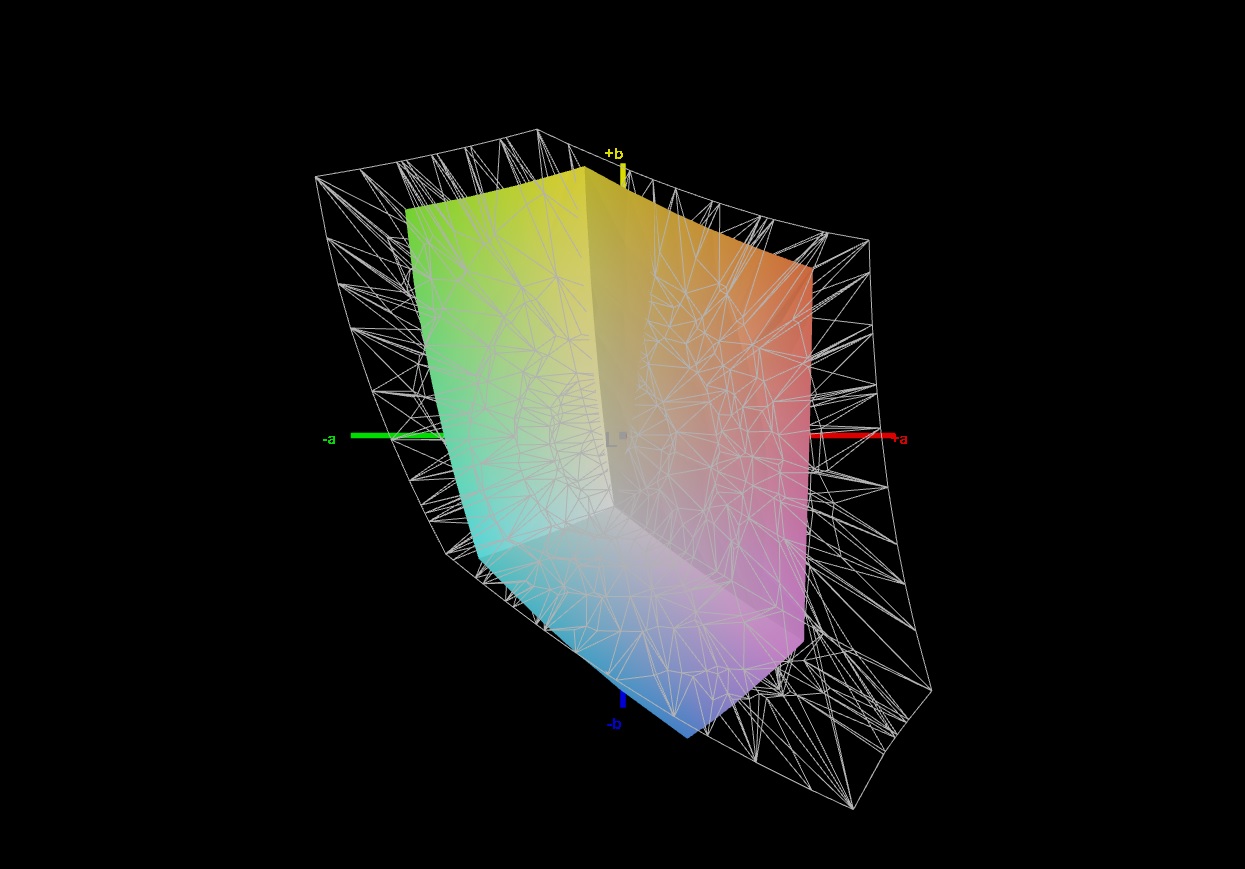
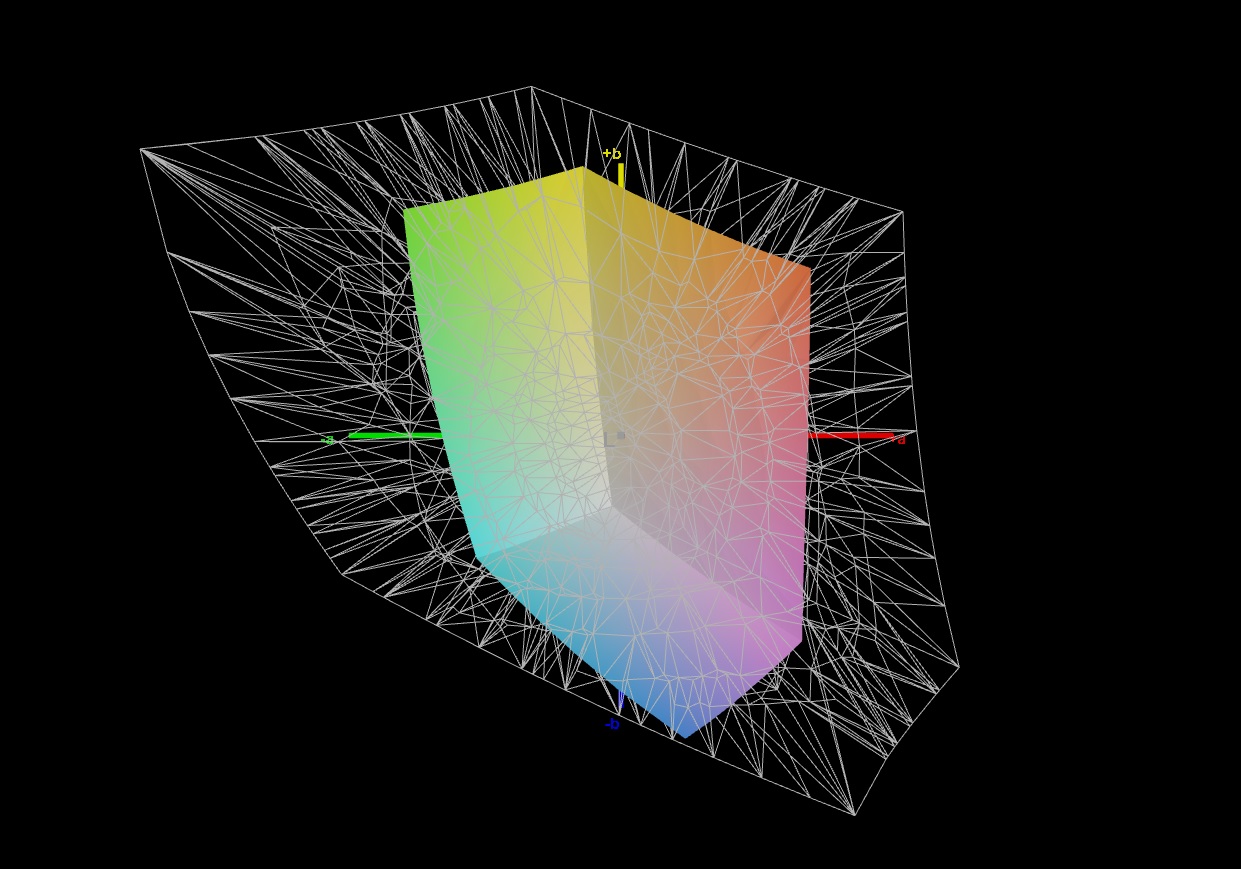
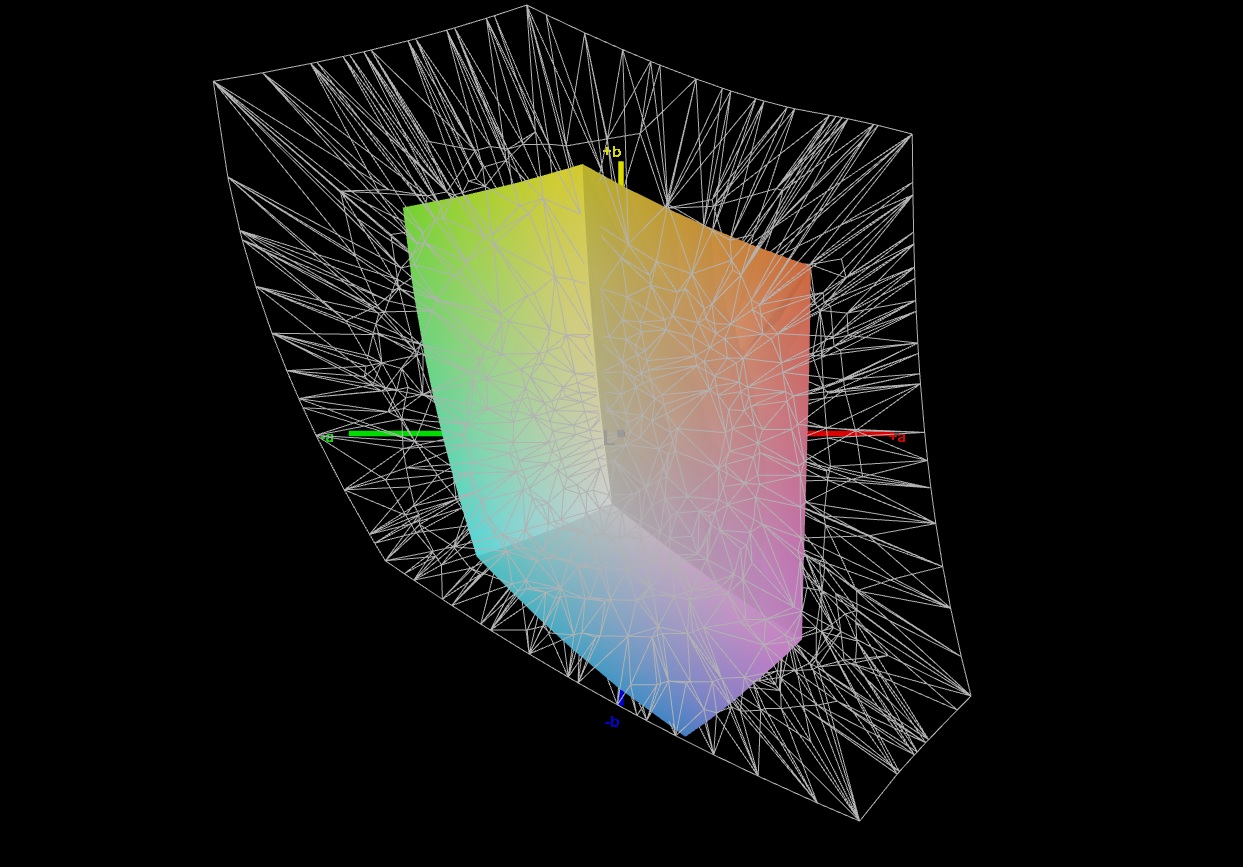
43% AdobeRGB 1998 (Argyll 3D)
61.9% sRGB (Argyll 3D)
41.6% Display P3 (Argyll 3D)
Gamma: 2.125
CCT: 6025 K
| HP Victus 16-e0145ng CMN1609, IPS, 1920x1080, 16.1" | HP Victus 16-e0179ng BOE09BE, IPS, 1920x1080, 16.1" | Lenovo Ideapad Gaming 3 15IHU-82K1002RGE LEN156FHD, IPS, 1920x1080, 15.6" | Dell G15 5515 BOE092A, IPS, 1920x1080, 15.6" | Asus ROG Strix G17 G713QE-RB74 AU Optronics B173HAN04.9, IPS, 1920x1080, 17.3" | |
|---|---|---|---|---|---|
| Display | 69% | -4% | -7% | -3% | |
| Display P3 Coverage (%) | 41.6 | 72.6 75% | 39.7 -5% | 39.1 -6% | 40.2 -3% |
| sRGB Coverage (%) | 61.9 | 100 62% | 59.6 -4% | 56.9 -8% | 60.3 -3% |
| AdobeRGB 1998 Coverage (%) | 43 | 73.5 71% | 41.1 -4% | 40.4 -6% | 41.6 -3% |
| Response Times | 47% | -69% | 14% | 5% | |
| Response Time Grey 50% / Grey 80% * (ms) | 29.6 ? | 9.6 ? 68% | 46.4 ? -57% | 25.2 ? 15% | 26.8 ? 9% |
| Response Time Black / White * (ms) | 19.4 ? | 14.4 ? 26% | 35.2 ? -81% | 16.8 ? 13% | 19.2 ? 1% |
| PWM Frequency (Hz) | 200 ? | ||||
| Screen | 36% | 13% | 0% | 27% | |
| Brightness middle (cd/m²) | 257 | 361 40% | 307 19% | 278 8% | 270.5 5% |
| Brightness (cd/m²) | 239 | 341 43% | 292 22% | 262 10% | 269 13% |
| Brightness Distribution (%) | 88 | 88 0% | 88 0% | 83 -6% | 92 5% |
| Black Level * (cd/m²) | 0.25 | 0.3 -20% | 0.21 16% | 0.36 -44% | 0.19 24% |
| Contrast (:1) | 1028 | 1203 17% | 1462 42% | 772 -25% | 1424 39% |
| Colorchecker dE 2000 * | 6.91 | 2.44 65% | 5.9 15% | 5.74 17% | 4.39 36% |
| Colorchecker dE 2000 max. * | 22.27 | 6.37 71% | 21.6 3% | 19.63 12% | 20.8 7% |
| Colorchecker dE 2000 calibrated * | 3.61 | 1.26 65% | 4.8 -33% | 4.7 -30% | 1.56 57% |
| Greyscale dE 2000 * | 7.5 | 4.6 39% | 4.9 35% | 3.1 59% | 3.1 59% |
| Gamma | 2.125 104% | 2.268 97% | 2.26 97% | 2.011 109% | 2.14 103% |
| CCT | 6025 108% | 6609 98% | 6504 100% | 6207 105% | 6927 94% |
| Media total (Programa/Opciones) | 51% /
44% | -20% /
-2% | 2% /
1% | 10% /
18% |
* ... más pequeño es mejor
Aunque los competidores tampoco son ejemplares en este aspecto, ofreciendo resultados igualmente escasos, ni el brillo ni la cobertura del espacio de color son ya adecuados en 2022. Sólo el 62% del espacio de color sRGB y un brillo medio de 239 cd/m² hacen que la imagen sea muy pálida y oscura, especialmente en entornos luminosos.
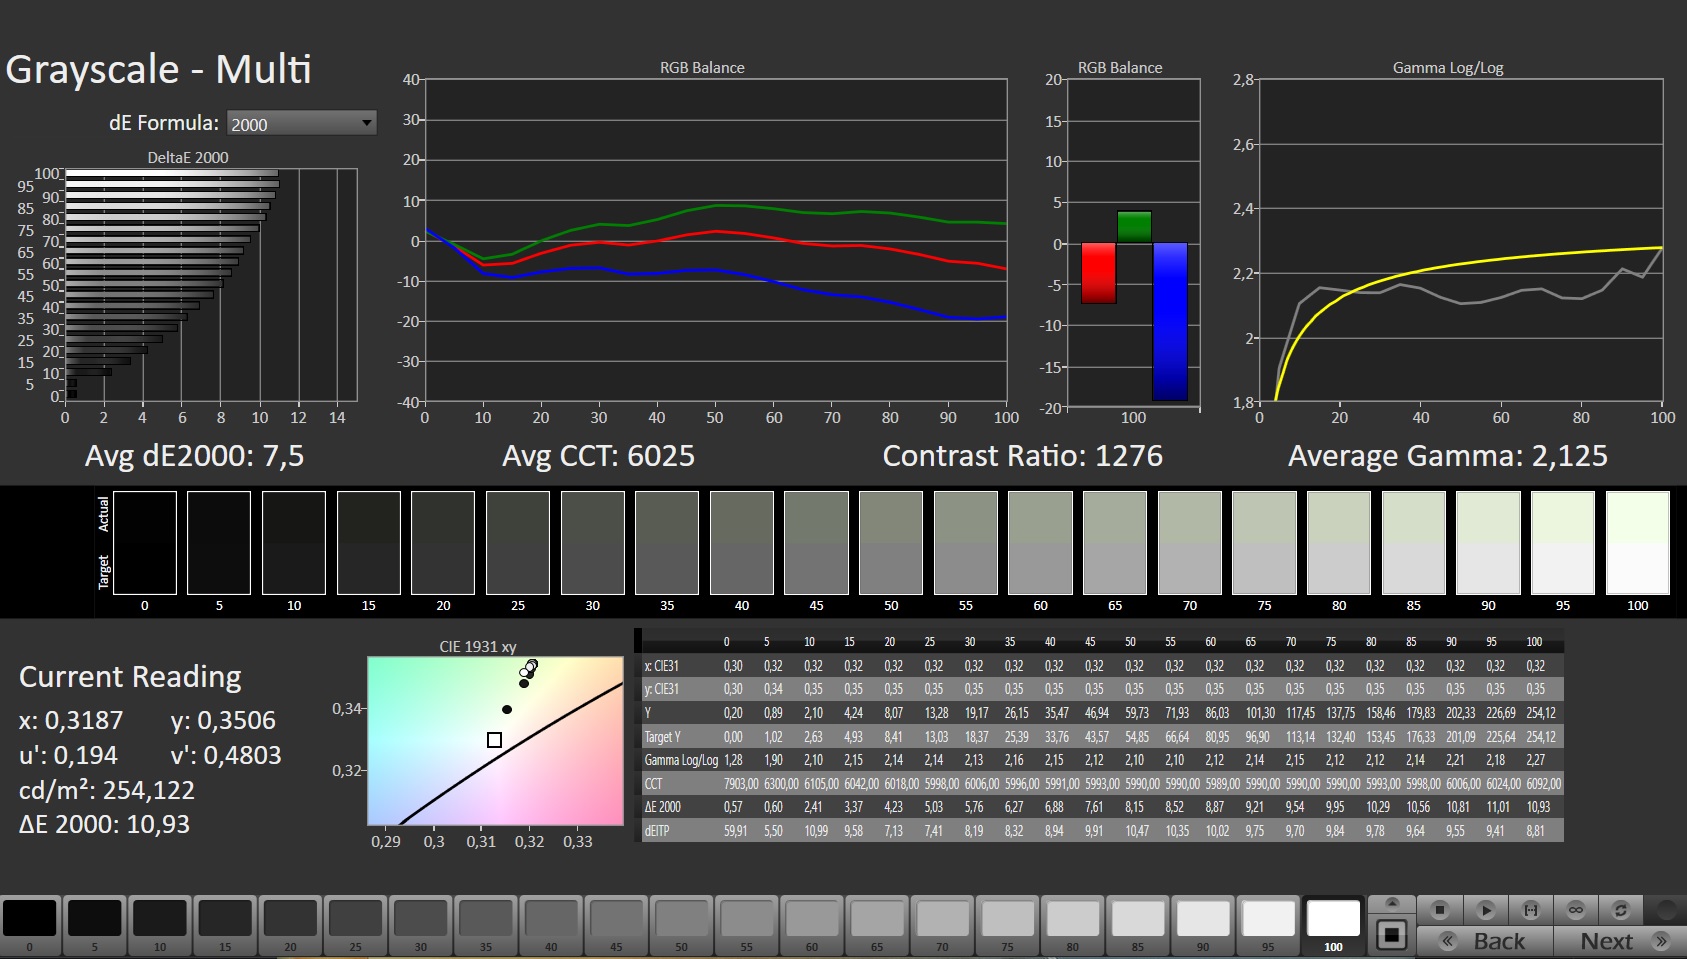
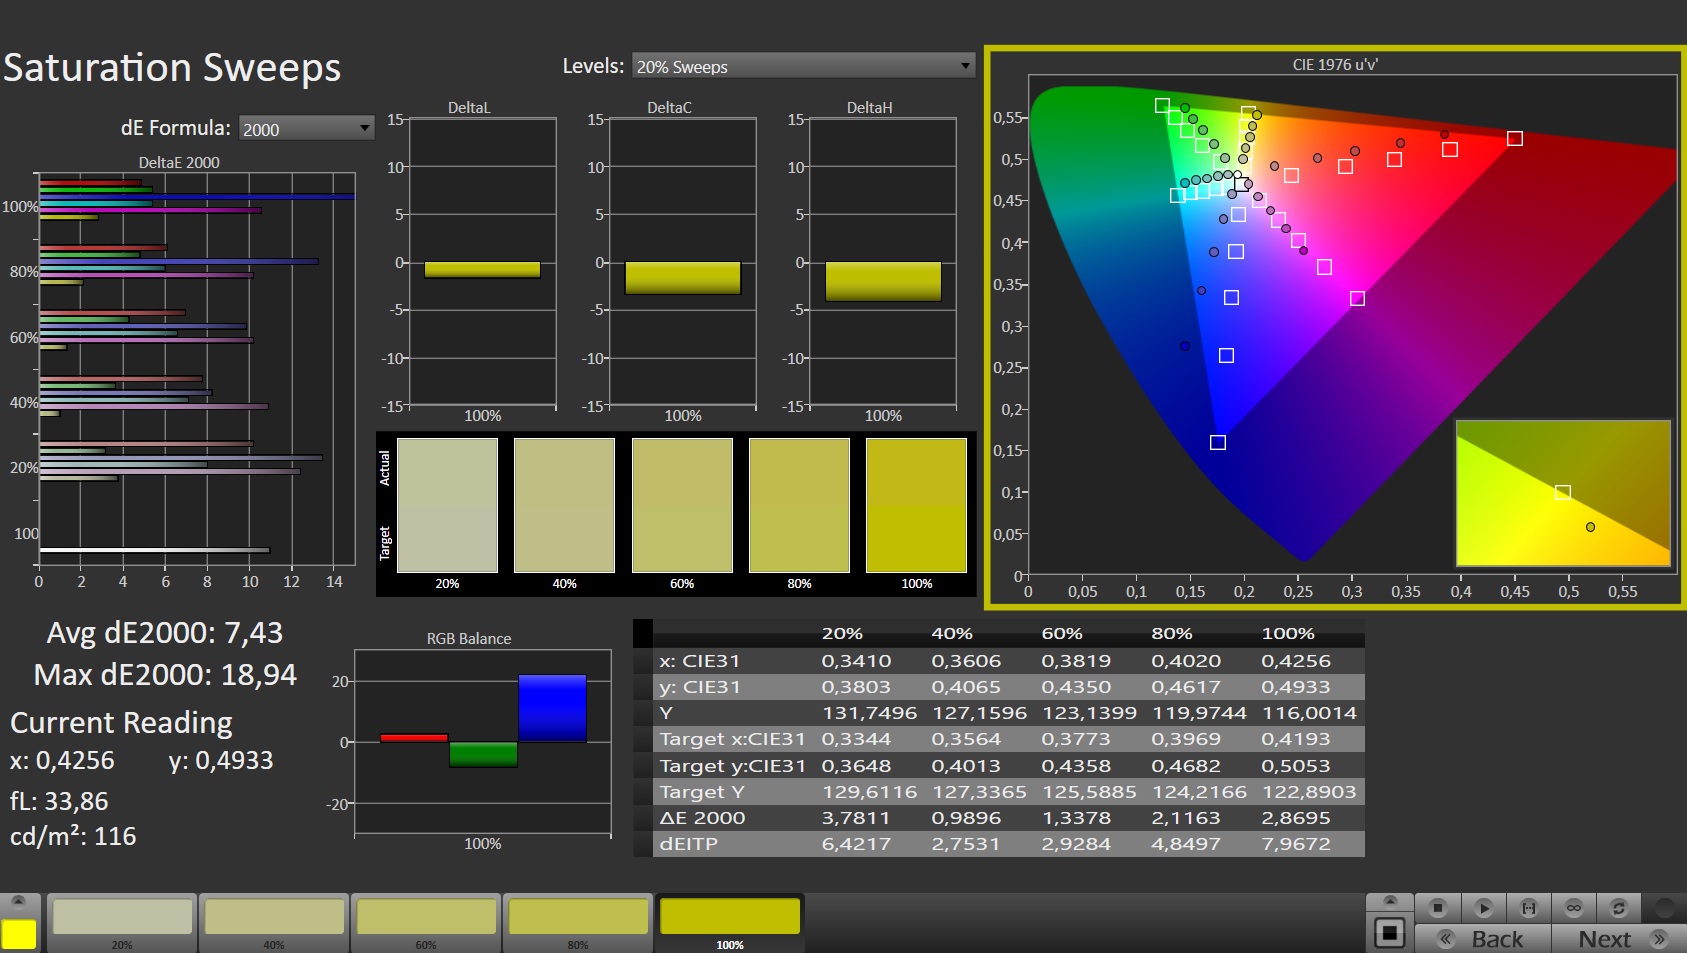
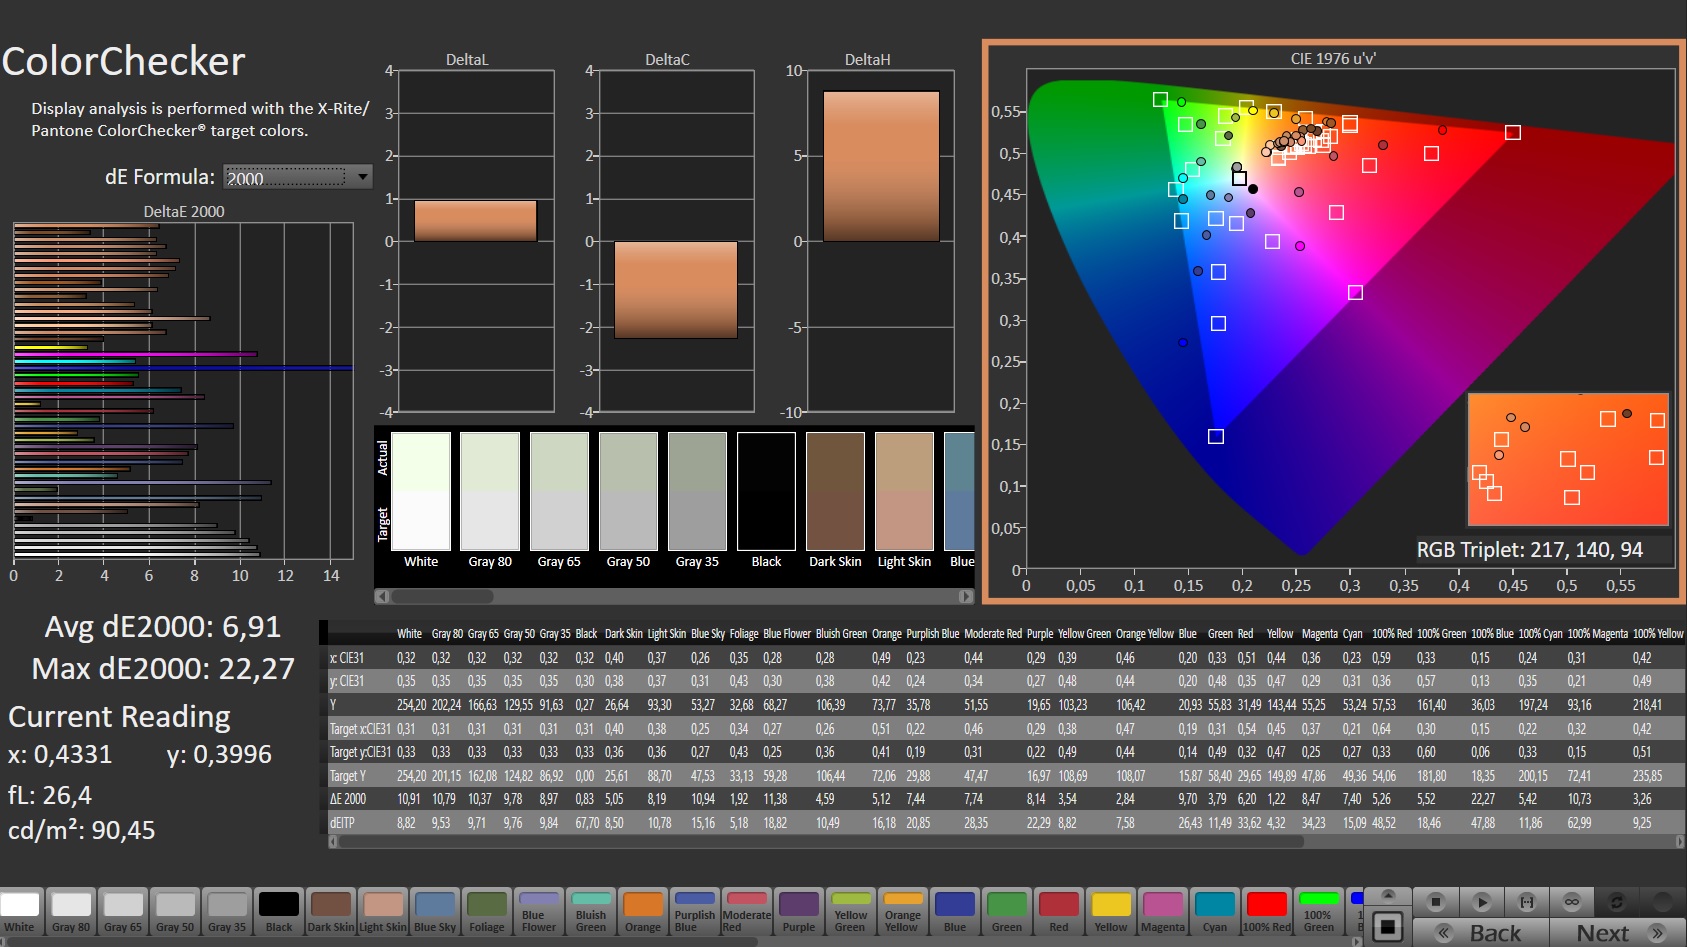
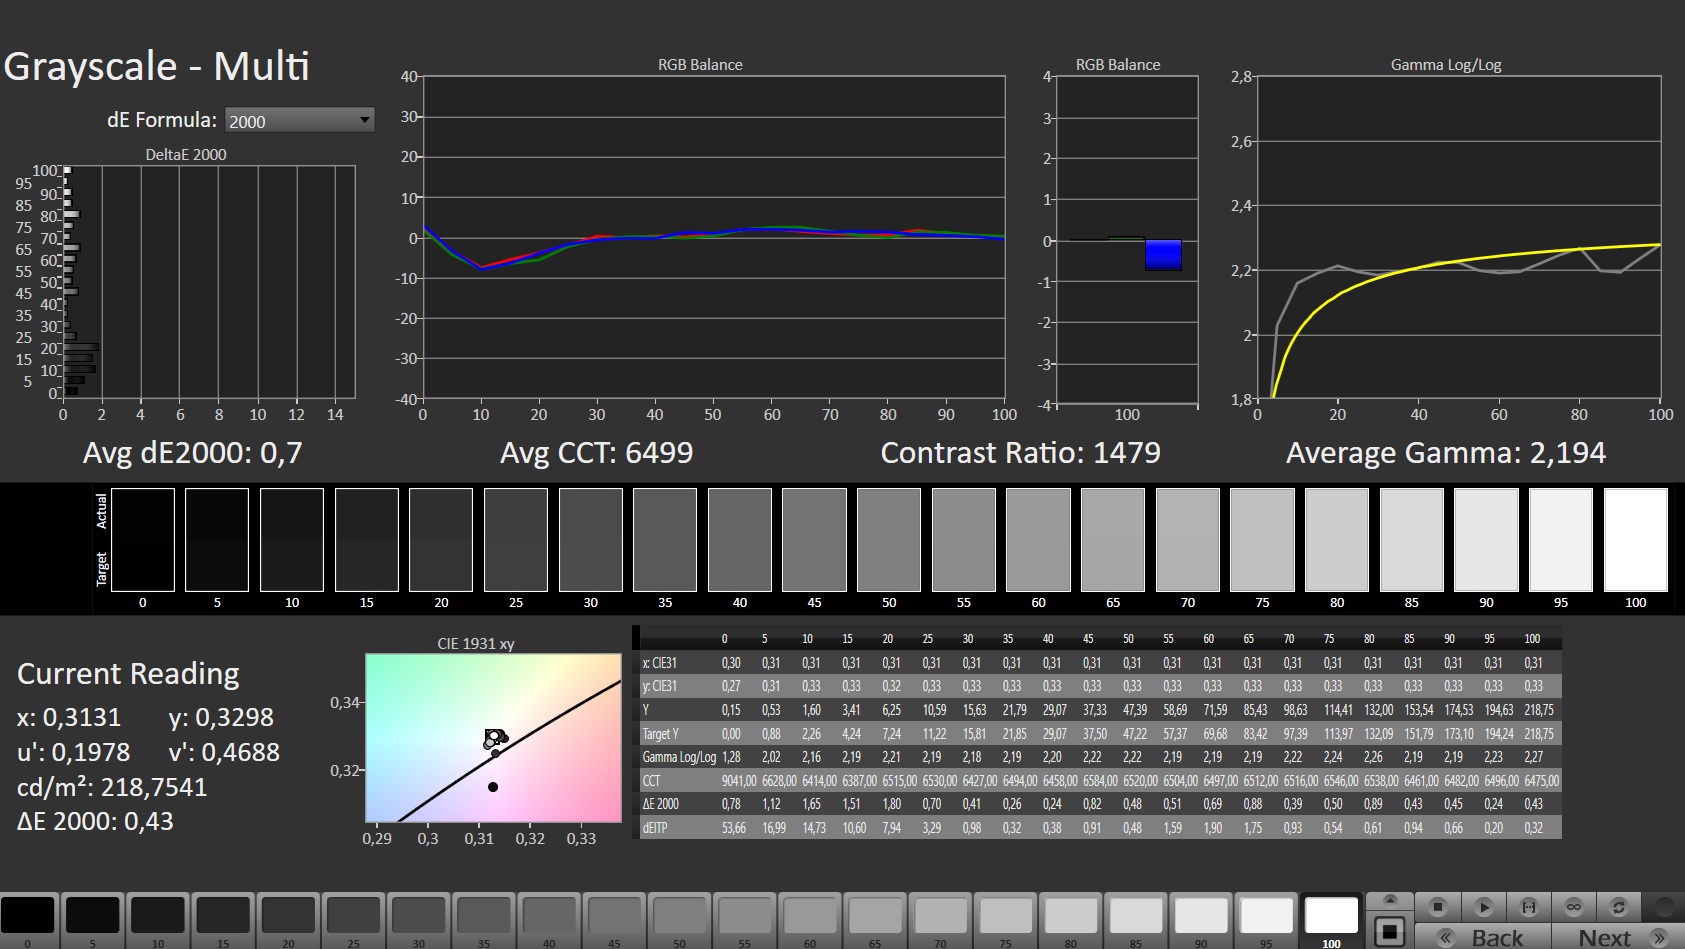
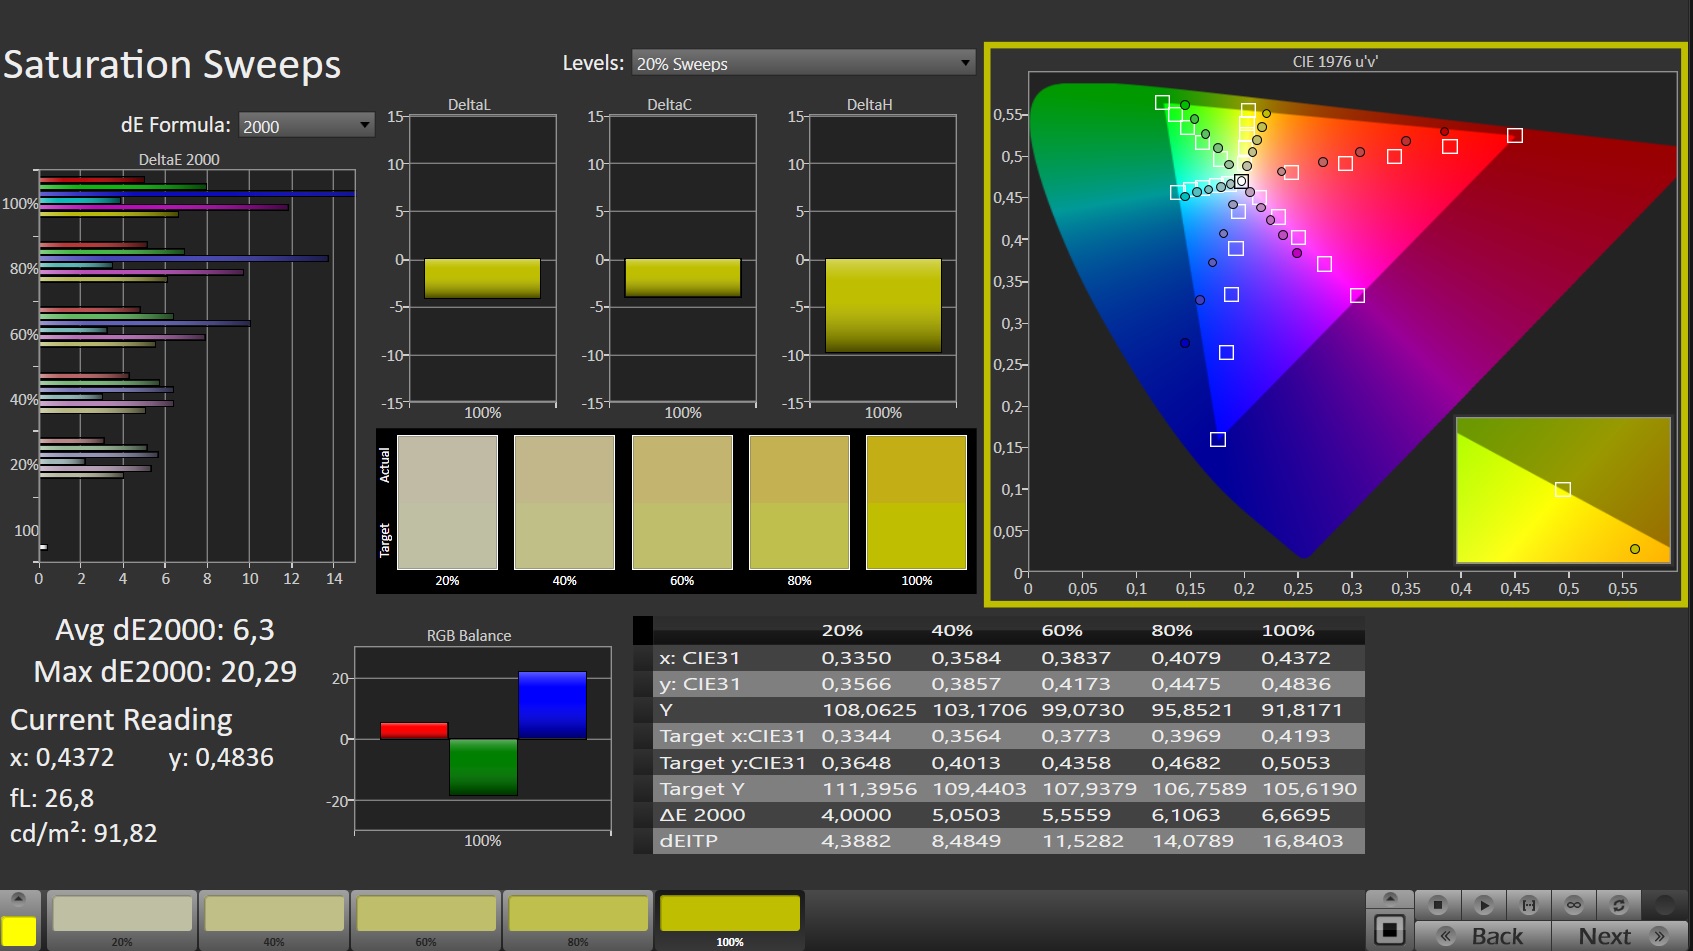
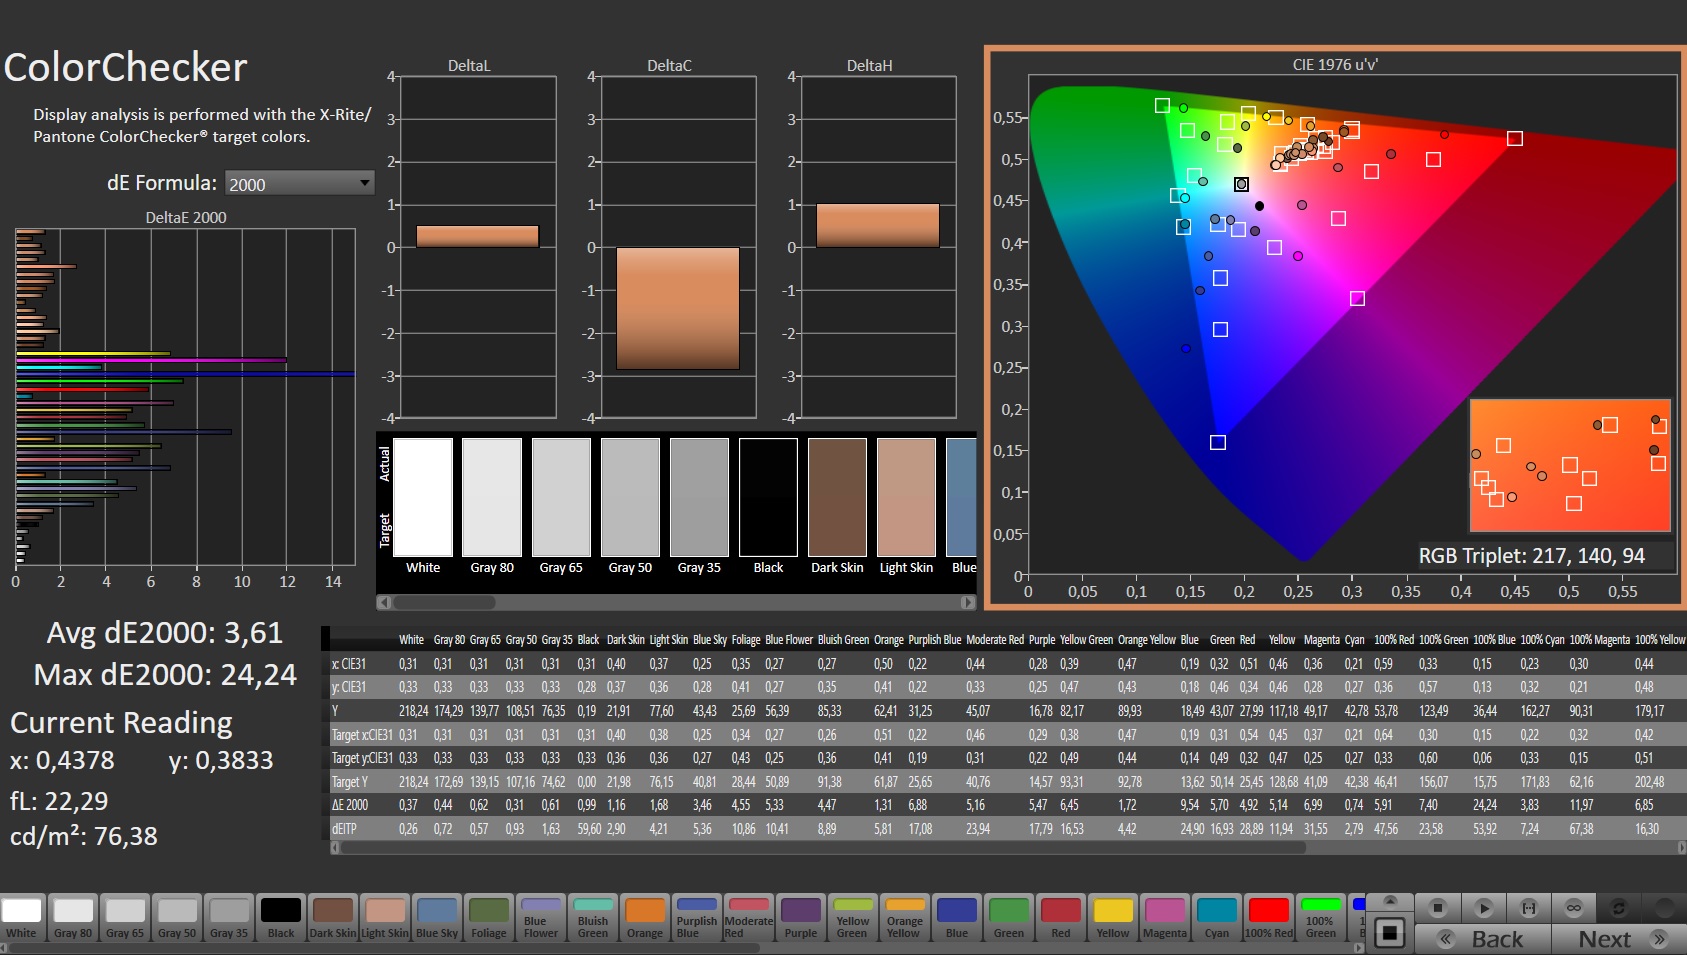
La precisión del color resulta igualmente decepcionante. En el estado de entrega, el panel lucha con un tinte verde, pero al menos puedes aliviarlo con una calibración (como siempre, puedes descargar nuestro archivo ICC desde el enlace a la derecha del esquema de distribución de brillo de arriba).
El tema de los tiempos de respuesta nos da menos motivos de queja. Teniendo en cuenta el precio, casi 19 ms de negro a blanco y 30 ms de gris a gris están bien. Lo mismo ocurre con la estabilidad del ángulo de visión, que oscila en un nivel típico para las pantallas IPS.
Tiempos de respuesta del display
| ↔ Tiempo de respuesta de Negro a Blanco | ||
|---|---|---|
| 19.4 ms ... subida ↗ y bajada ↘ combinada | ↗ 9.7 ms subida | 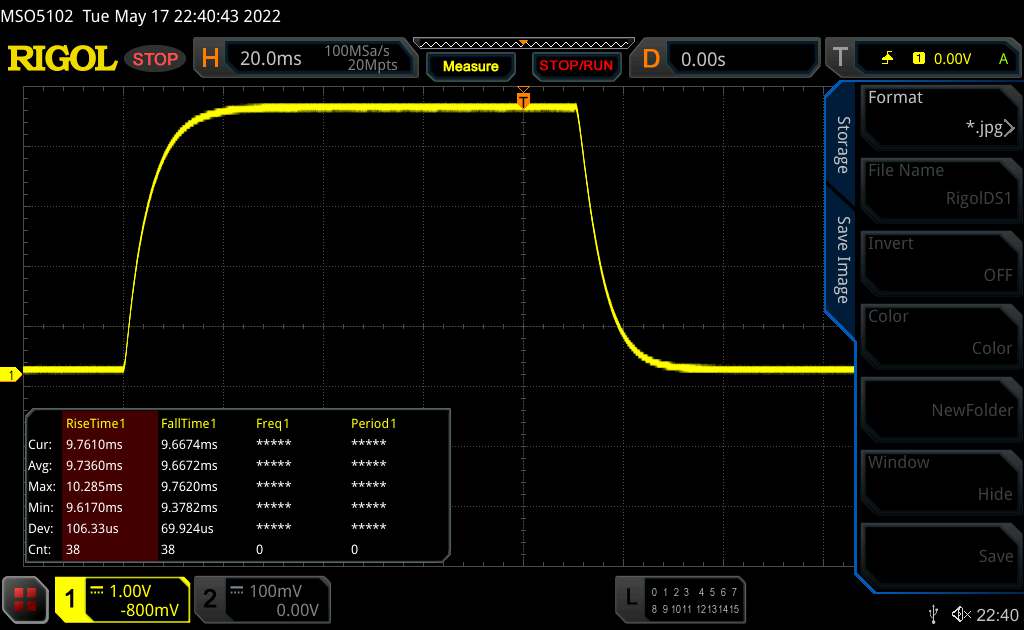 |
| ↘ 9.7 ms bajada | ||
| La pantalla mostró buenos tiempos de respuesta en nuestros tests pero podría ser demasiado lenta para los jugones competitivos. En comparación, todos los dispositivos de prueba van de ##min### (mínimo) a 240 (máximo) ms. » 43 % de todos los dispositivos son mejores. Eso quiere decir que el tiempo de respuesta es similar al dispositivo testado medio (19.8 ms). | ||
| ↔ Tiempo de respuesta 50% Gris a 80% Gris | ||
| 29.6 ms ... subida ↗ y bajada ↘ combinada | ↗ 13.8 ms subida | 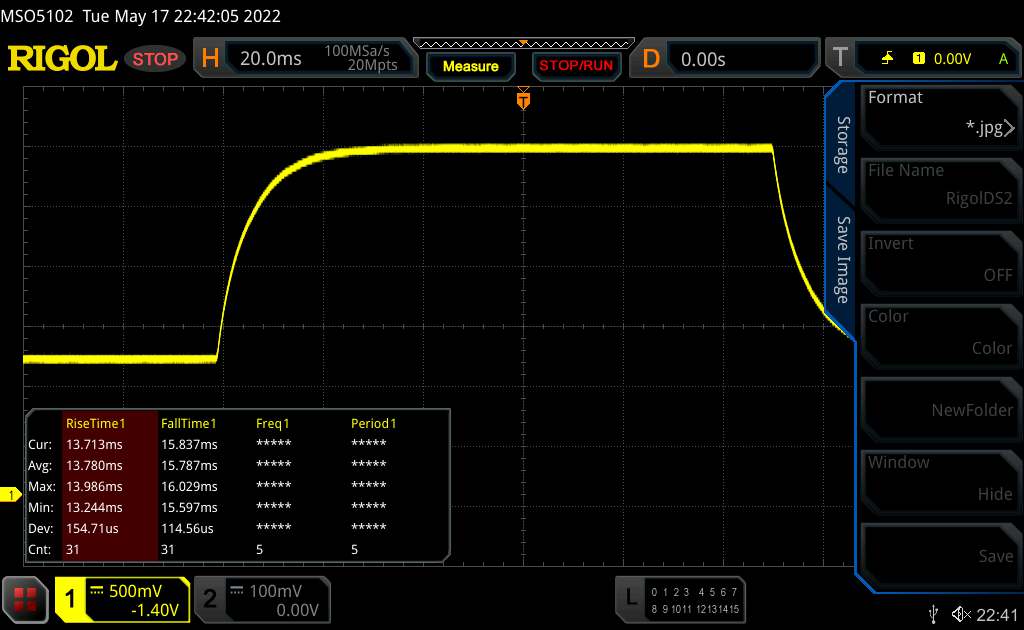 |
| ↘ 15.8 ms bajada | ||
| La pantalla mostró tiempos de respuesta relativamente lentos en nuestros tests pero podría ser demasiado lenta para los jugones. En comparación, todos los dispositivos de prueba van de ##min### (mínimo) a 636 (máximo) ms. » 40 % de todos los dispositivos son mejores. Eso quiere decir que el tiempo de respuesta es similar al dispositivo testado medio (31 ms). | ||
Parpadeo de Pantalla / PWM (Pulse-Width Modulation)
| Parpadeo de Pantalla / PWM no detectado | 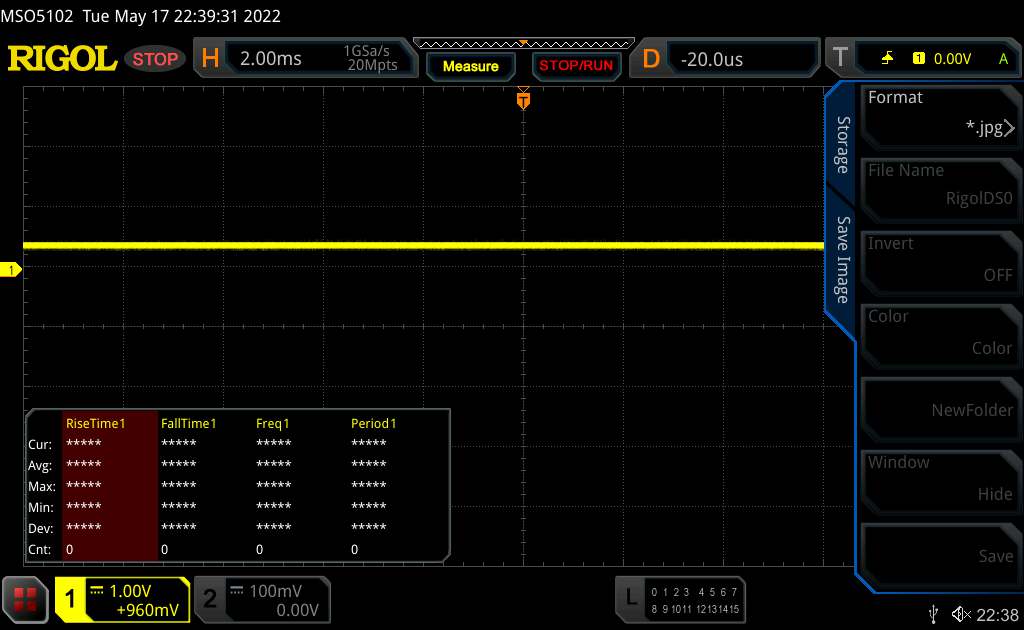 | ||
Comparación: 52 % de todos los dispositivos testados no usaron PWM para atenuar el display. Si se usó, medimos una media de 7781 (mínimo: 5 - máxmo: 343500) Hz. | |||
Rendimiento
Con el equipamiento de nuestra unidad de prueba, el Victus 16 pertenece a la gama media de juegos. Los componentes utilizados son equilibrados y deberían atraer a los jugadores preocupados por el precio.
Condiciones de la prueba
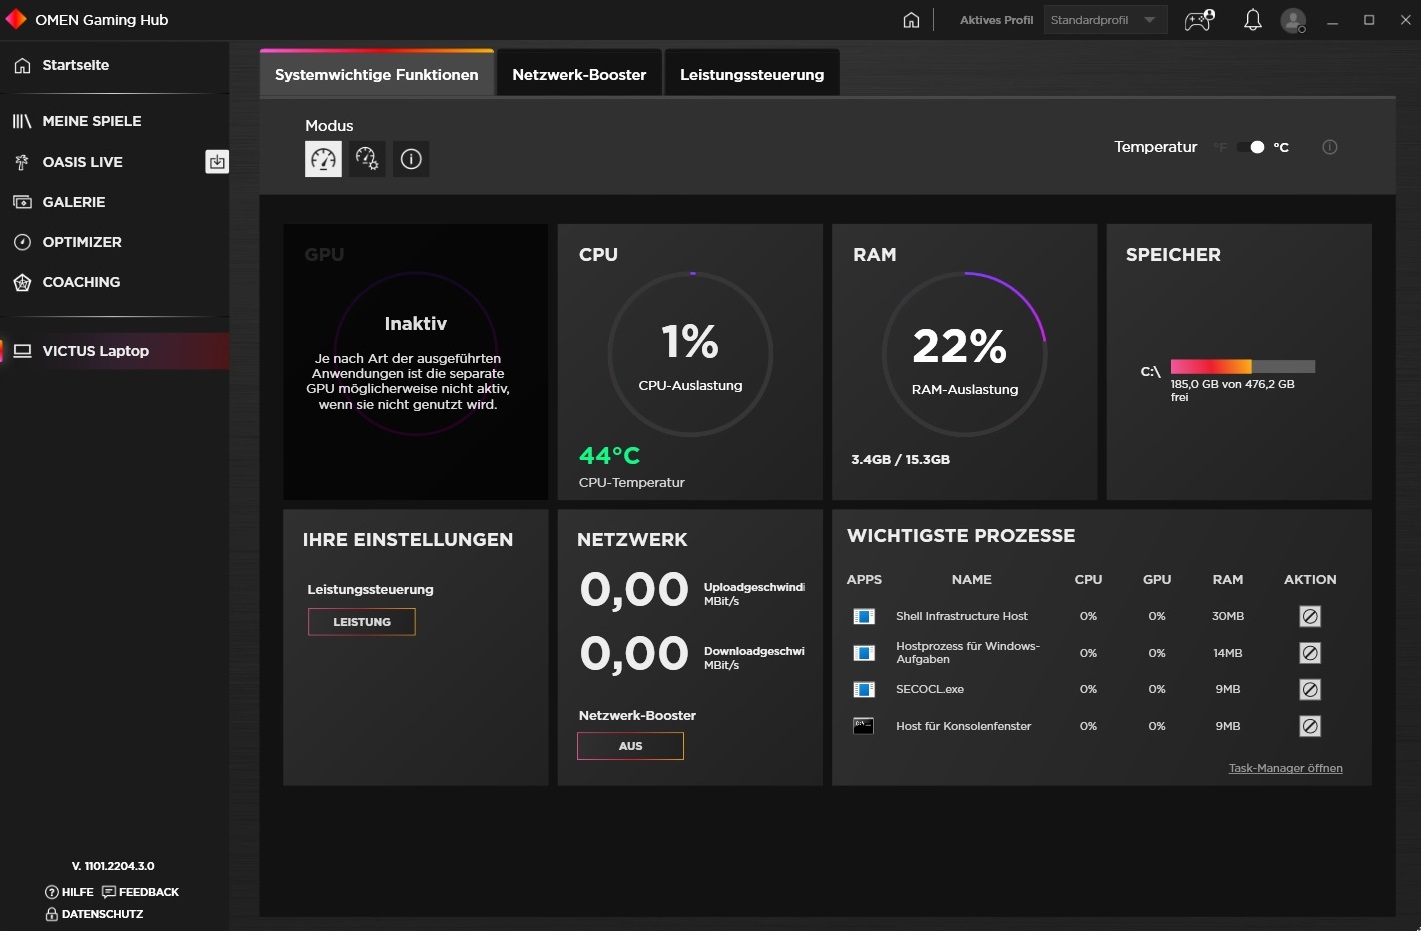
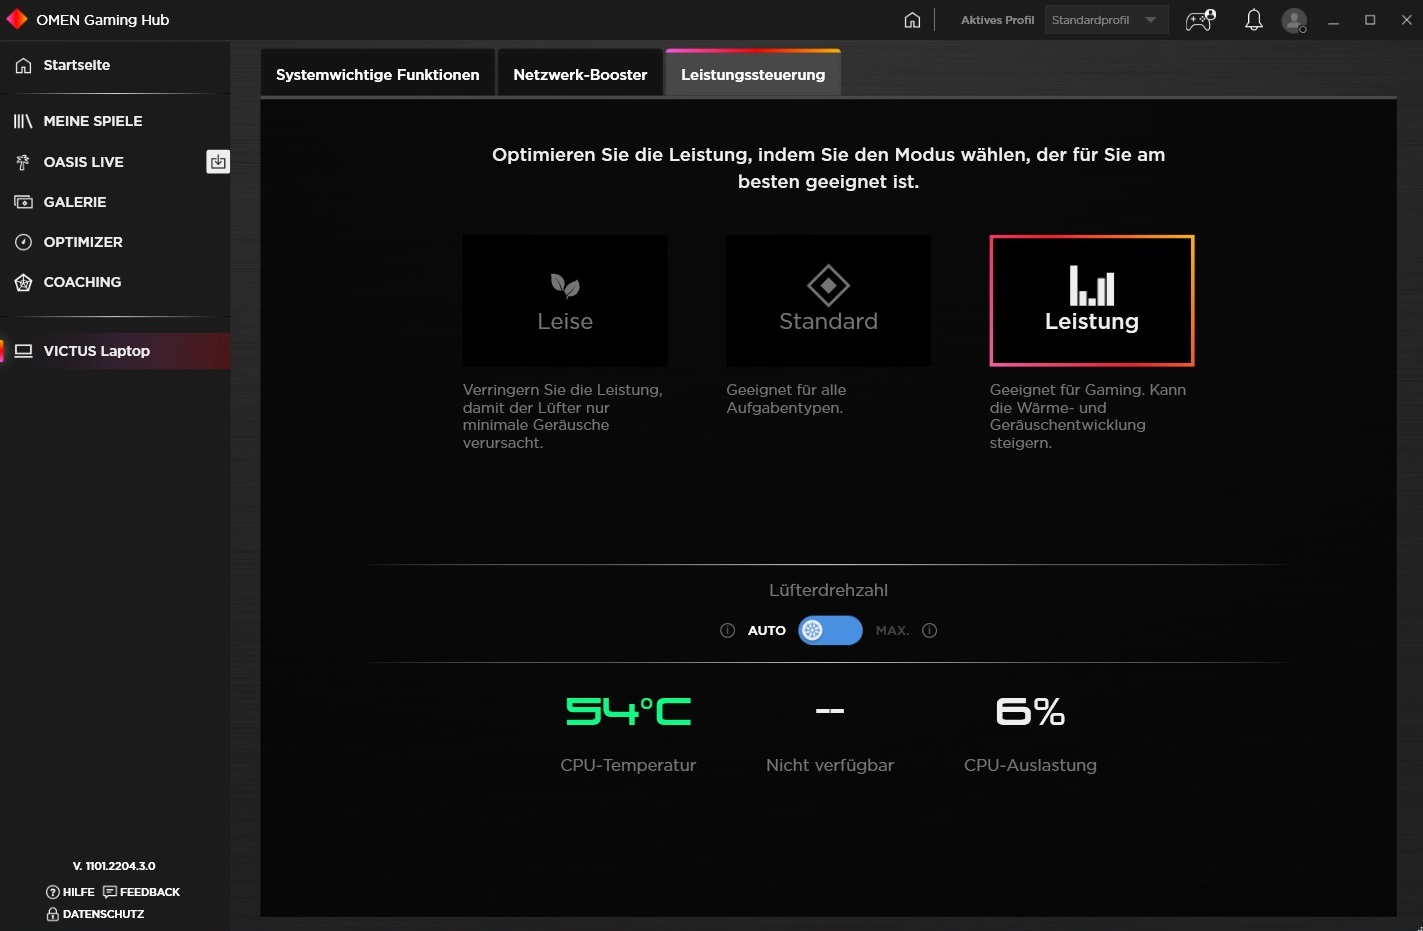
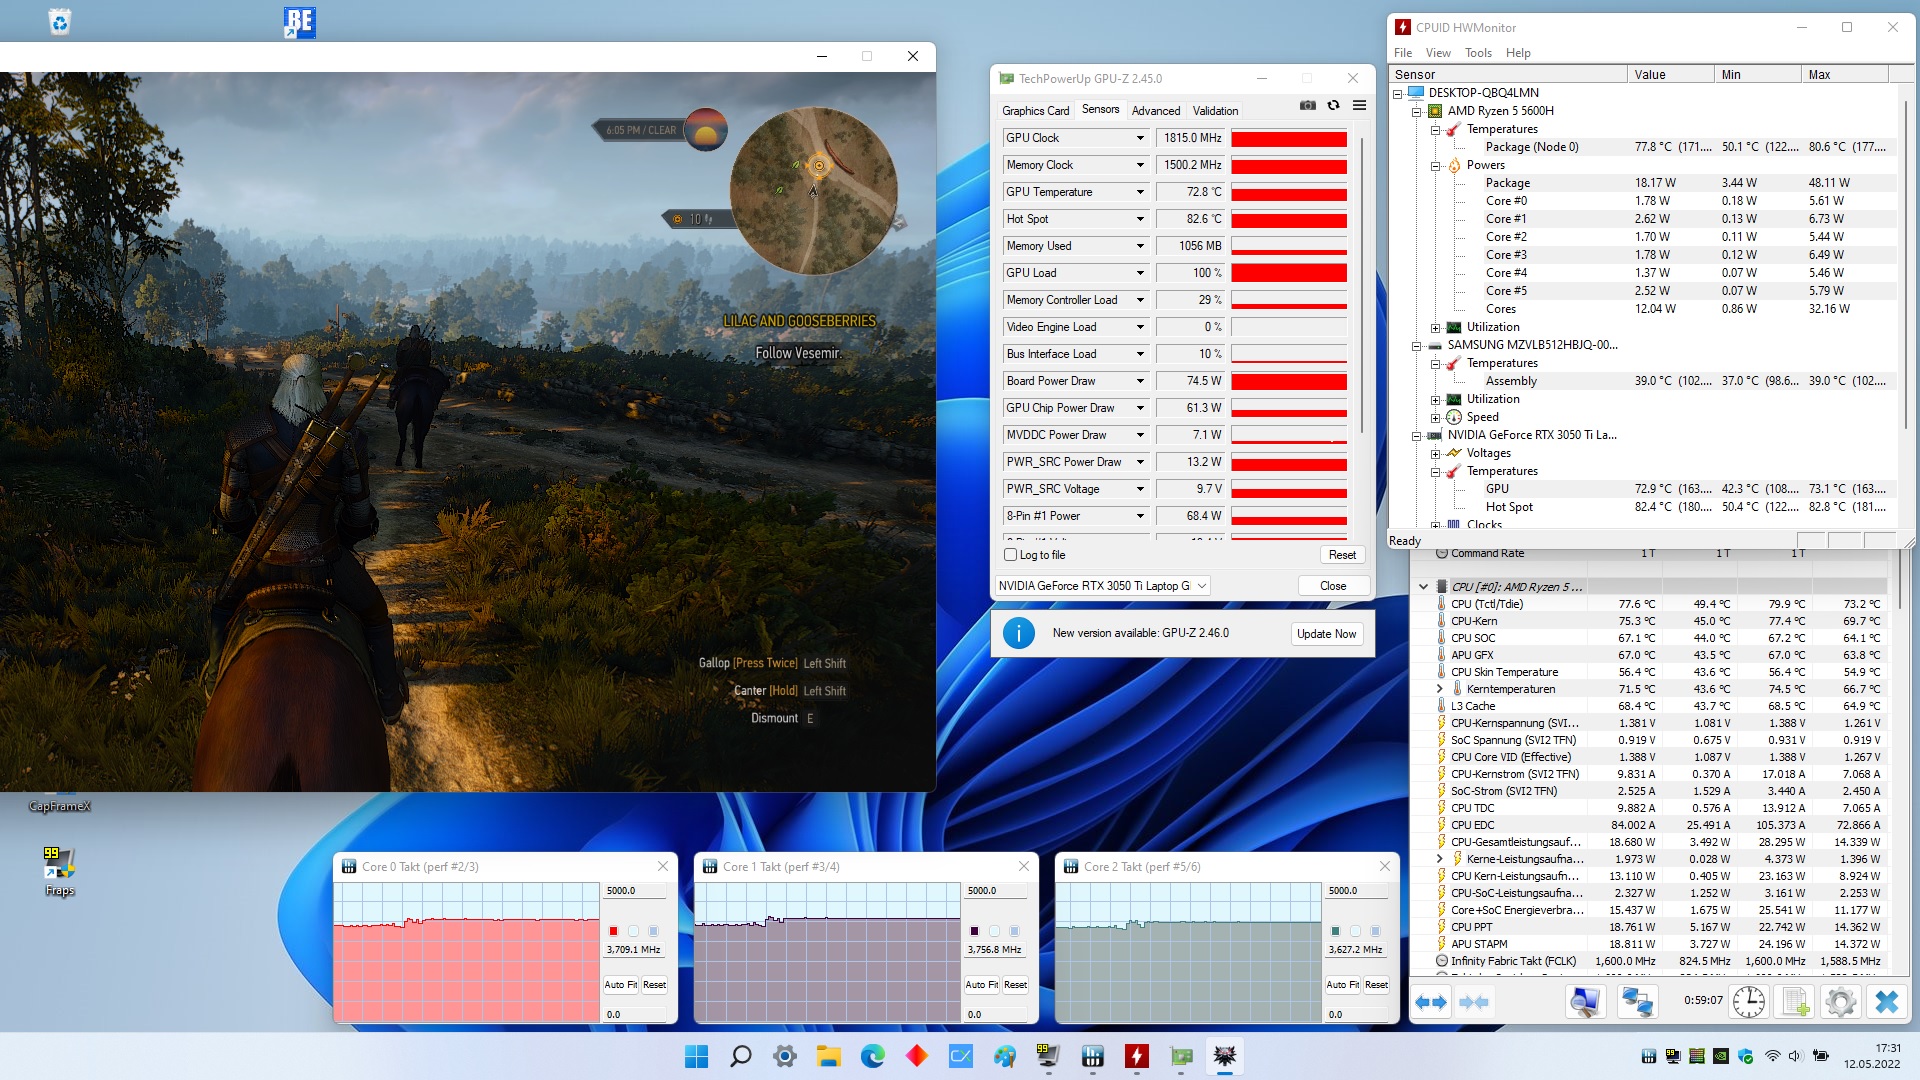
El Omen Gaming Hub, que debería estar preinstalado en los modelos con Windows, ofrece tres perfiles de rendimiento diferentes. Con la excepción de las pruebas de batería, todas las mediciones se realizaron usando el modo más alto (ver captura de pantalla #3). El control del ventilador se ajustó siempre en la configuración automática.
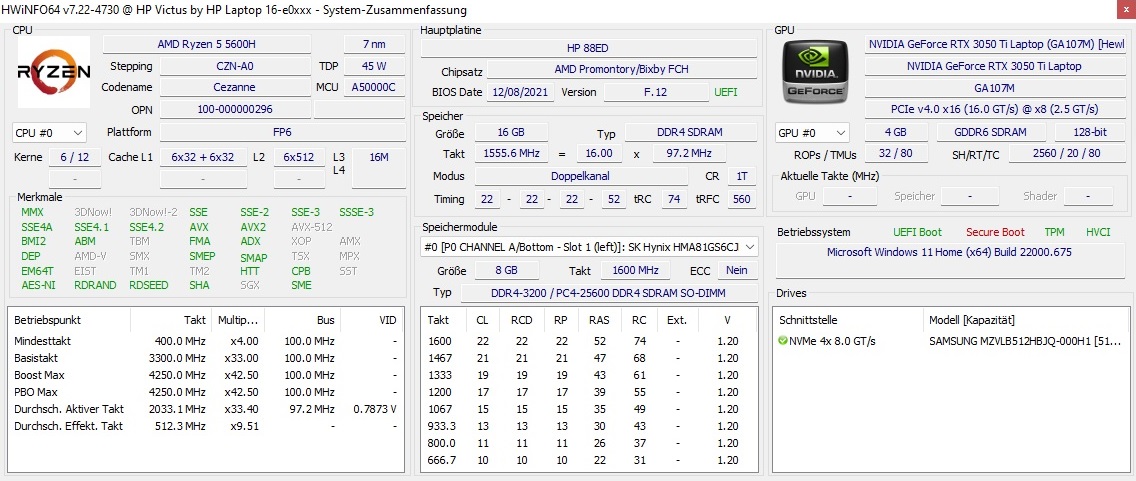
Procesador
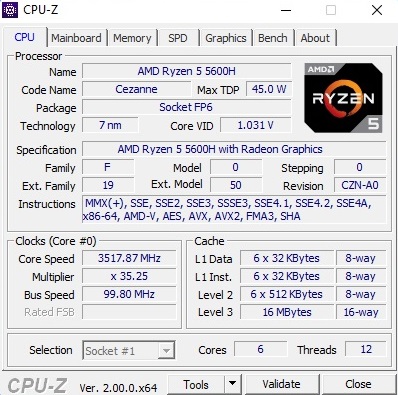
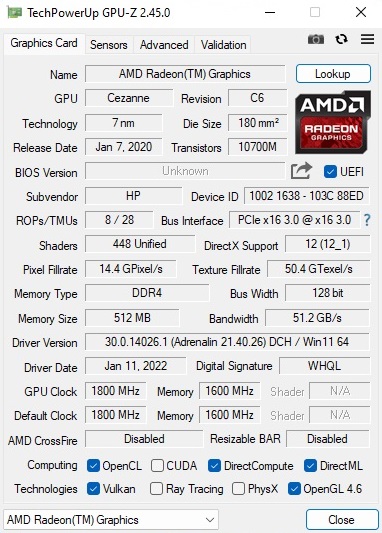
El Ryzen 5 5600H es un procesador hexacore que se especifica en 45 vatios y es capaz de funcionar con hasta 12 hilos simultáneamente. Bajo carga, el modelo de 7 nm tiene una velocidad de reloj de 3,3 a 4,2 GHz
En nuestro bucle de Cinebench, el rendimiento se desarrolla de forma muy uniforme, de forma similar a los competidores. Como puedes ver en la tabla, el Ryzen 5600H es significativamente más rápido que el Core i5-11300Hque, sin embargo, sólo contiene 4 núcleos (máximo 8 hilos). Gracias al uso del Ryzen 7 5800H (8C/16T), los otros competidores son ligeramente más rápidos.
Cinebench R15 Multi Constant Load Test
* ... más pequeño es mejor
AIDA64: FP32 Ray-Trace | FPU Julia | CPU SHA3 | CPU Queen | FPU SinJulia | FPU Mandel | CPU AES | CPU ZLib | FP64 Ray-Trace | CPU PhotoWorxx
| Performance rating | |
| Media de la clase Gaming | |
| Asus ROG Strix G17 G713QE-RB74 | |
| HP Victus 16-e0179ng | |
| Dell G15 5515 | |
| Medio AMD Ryzen 5 5600H | |
| HP Victus 16-e0145ng | |
| Lenovo Ideapad Gaming 3 15IHU-82K1002RGE | |
| AIDA64 / FP32 Ray-Trace | |
| Media de la clase Gaming (10227 - 85542, n=107, últimos 2 años) | |
| Asus ROG Strix G17 G713QE-RB74 | |
| HP Victus 16-e0179ng | |
| Dell G15 5515 | |
| HP Victus 16-e0145ng | |
| Medio AMD Ryzen 5 5600H (9181 - 12636, n=14) | |
| Lenovo Ideapad Gaming 3 15IHU-82K1002RGE | |
| AIDA64 / FPU Julia | |
| Media de la clase Gaming (51376 - 238426, n=107, últimos 2 años) | |
| Asus ROG Strix G17 G713QE-RB74 | |
| HP Victus 16-e0179ng | |
| Dell G15 5515 | |
| HP Victus 16-e0145ng | |
| Medio AMD Ryzen 5 5600H (51994 - 78250, n=14) | |
| Lenovo Ideapad Gaming 3 15IHU-82K1002RGE | |
| AIDA64 / CPU SHA3 | |
| Media de la clase Gaming (2180 - 9817, n=107, últimos 2 años) | |
| Asus ROG Strix G17 G713QE-RB74 | |
| HP Victus 16-e0179ng | |
| Dell G15 5515 | |
| HP Victus 16-e0145ng | |
| Medio AMD Ryzen 5 5600H (1587 - 2675, n=14) | |
| Lenovo Ideapad Gaming 3 15IHU-82K1002RGE | |
| AIDA64 / CPU Queen | |
| Media de la clase Gaming (49785 - 173351, n=98, últimos 2 años) | |
| Asus ROG Strix G17 G713QE-RB74 | |
| HP Victus 16-e0179ng | |
| Dell G15 5515 | |
| HP Victus 16-e0145ng | |
| Medio AMD Ryzen 5 5600H (66699 - 77213, n=14) | |
| Lenovo Ideapad Gaming 3 15IHU-82K1002RGE | |
| AIDA64 / FPU SinJulia | |
| Media de la clase Gaming (4424 - 33636, n=107, últimos 2 años) | |
| Dell G15 5515 | |
| HP Victus 16-e0179ng | |
| Asus ROG Strix G17 G713QE-RB74 | |
| HP Victus 16-e0145ng | |
| Medio AMD Ryzen 5 5600H (8340 - 9159, n=14) | |
| Lenovo Ideapad Gaming 3 15IHU-82K1002RGE | |
| AIDA64 / FPU Mandel | |
| Media de la clase Gaming (25115 - 128721, n=107, últimos 2 años) | |
| Asus ROG Strix G17 G713QE-RB74 | |
| HP Victus 16-e0179ng | |
| Dell G15 5515 | |
| HP Victus 16-e0145ng | |
| Medio AMD Ryzen 5 5600H (28268 - 43274, n=14) | |
| Lenovo Ideapad Gaming 3 15IHU-82K1002RGE | |
| AIDA64 / CPU AES | |
| Asus ROG Strix G17 G713QE-RB74 | |
| HP Victus 16-e0179ng | |
| Dell G15 5515 | |
| Media de la clase Gaming (39258 - 247074, n=107, últimos 2 años) | |
| Medio AMD Ryzen 5 5600H (39852 - 98939, n=14) | |
| Lenovo Ideapad Gaming 3 15IHU-82K1002RGE | |
| HP Victus 16-e0145ng | |
| AIDA64 / CPU ZLib | |
| Media de la clase Gaming (574 - 2531, n=107, últimos 2 años) | |
| Asus ROG Strix G17 G713QE-RB74 | |
| HP Victus 16-e0179ng | |
| Dell G15 5515 | |
| HP Victus 16-e0145ng | |
| Medio AMD Ryzen 5 5600H (507 - 649, n=14) | |
| Lenovo Ideapad Gaming 3 15IHU-82K1002RGE | |
| AIDA64 / FP64 Ray-Trace | |
| Media de la clase Gaming (5509 - 45446, n=107, últimos 2 años) | |
| Asus ROG Strix G17 G713QE-RB74 | |
| HP Victus 16-e0179ng | |
| Dell G15 5515 | |
| HP Victus 16-e0145ng | |
| Medio AMD Ryzen 5 5600H (4811 - 6652, n=14) | |
| Lenovo Ideapad Gaming 3 15IHU-82K1002RGE | |
| AIDA64 / CPU PhotoWorxx | |
| Media de la clase Gaming (12271 - 89891, n=107, últimos 2 años) | |
| HP Victus 16-e0145ng | |
| HP Victus 16-e0179ng | |
| Medio AMD Ryzen 5 5600H (7419 - 24746, n=14) | |
| Asus ROG Strix G17 G713QE-RB74 | |
| Dell G15 5515 | |
| Lenovo Ideapad Gaming 3 15IHU-82K1002RGE | |
Rendimiento del sistema
A pesar de estar equipado con el mejor SSD, sólo es suficiente para el penúltimo lugar de nuestro campo de pruebas en el rendimiento del sistema. Sin embargo, 6076 puntos en el PCMark 10 sigue siendo un buen resultado e indica un todoterreno capaz.
CrossMark: Overall | Productivity | Creativity | Responsiveness
| PCMark 10 / Score | |
| Media de la clase Gaming (5828 - 11574, n=95, últimos 2 años) | |
| HP Victus 16-e0179ng | |
| Asus ROG Strix G17 G713QE-RB74 | |
| Dell G15 5515 | |
| HP Victus 16-e0145ng | |
| Lenovo Ideapad Gaming 3 15IHU-82K1002RGE | |
| PCMark 10 / Essentials | |
| Media de la clase Gaming (8810 - 12600, n=99, últimos 2 años) | |
| Asus ROG Strix G17 G713QE-RB74 | |
| HP Victus 16-e0179ng | |
| HP Victus 16-e0145ng | |
| Dell G15 5515 | |
| Lenovo Ideapad Gaming 3 15IHU-82K1002RGE | |
| PCMark 10 / Productivity | |
| Media de la clase Gaming (6845 - 18766, n=97, últimos 2 años) | |
| Asus ROG Strix G17 G713QE-RB74 | |
| Lenovo Ideapad Gaming 3 15IHU-82K1002RGE | |
| HP Victus 16-e0179ng | |
| Dell G15 5515 | |
| HP Victus 16-e0145ng | |
| PCMark 10 / Digital Content Creation | |
| Media de la clase Gaming (7602 - 19657, n=97, últimos 2 años) | |
| HP Victus 16-e0179ng | |
| Asus ROG Strix G17 G713QE-RB74 | |
| HP Victus 16-e0145ng | |
| Dell G15 5515 | |
| Lenovo Ideapad Gaming 3 15IHU-82K1002RGE | |
| CrossMark / Overall | |
| Media de la clase Gaming (1366 - 2409, n=96, últimos 2 años) | |
| Lenovo Ideapad Gaming 3 15IHU-82K1002RGE | |
| CrossMark / Productivity | |
| Media de la clase Gaming (1386 - 2254, n=96, últimos 2 años) | |
| Lenovo Ideapad Gaming 3 15IHU-82K1002RGE | |
| CrossMark / Creativity | |
| Media de la clase Gaming (1343 - 2729, n=96, últimos 2 años) | |
| Lenovo Ideapad Gaming 3 15IHU-82K1002RGE | |
| CrossMark / Responsiveness | |
| Media de la clase Gaming (1226 - 2334, n=96, últimos 2 años) | |
| Lenovo Ideapad Gaming 3 15IHU-82K1002RGE | |
| PCMark 10 Score | 6076 puntos | |
ayuda | ||
| AIDA64 / Memory Copy | |
| Media de la clase Gaming (21750 - 129946, n=107, últimos 2 años) | |
| HP Victus 16-e0145ng | |
| HP Victus 16-e0179ng | |
| Dell G15 5515 | |
| Asus ROG Strix G17 G713QE-RB74 | |
| Medio AMD Ryzen 5 5600H (20549 - 42141, n=14) | |
| Lenovo Ideapad Gaming 3 15IHU-82K1002RGE | |
| AIDA64 / Memory Read | |
| Media de la clase Gaming (22956 - 118858, n=107, últimos 2 años) | |
| HP Victus 16-e0145ng | |
| HP Victus 16-e0179ng | |
| Dell G15 5515 | |
| Asus ROG Strix G17 G713QE-RB74 | |
| Medio AMD Ryzen 5 5600H (22917 - 47595, n=14) | |
| Lenovo Ideapad Gaming 3 15IHU-82K1002RGE | |
| AIDA64 / Memory Write | |
| Media de la clase Gaming (22297 - 135096, n=107, últimos 2 años) | |
| HP Victus 16-e0145ng | |
| HP Victus 16-e0179ng | |
| Medio AMD Ryzen 5 5600H (20226 - 44872, n=14) | |
| Dell G15 5515 | |
| Asus ROG Strix G17 G713QE-RB74 | |
| Lenovo Ideapad Gaming 3 15IHU-82K1002RGE | |
| AIDA64 / Memory Latency | |
| Media de la clase Gaming (75.3 - 259, n=107, últimos 2 años) | |
| Lenovo Ideapad Gaming 3 15IHU-82K1002RGE | |
| HP Victus 16-e0179ng | |
| Asus ROG Strix G17 G713QE-RB74 | |
| Medio AMD Ryzen 5 5600H (75 - 89.1, n=14) | |
| Dell G15 5515 | |
| HP Victus 16-e0145ng | |
* ... más pequeño es mejor
Latencias del CPD
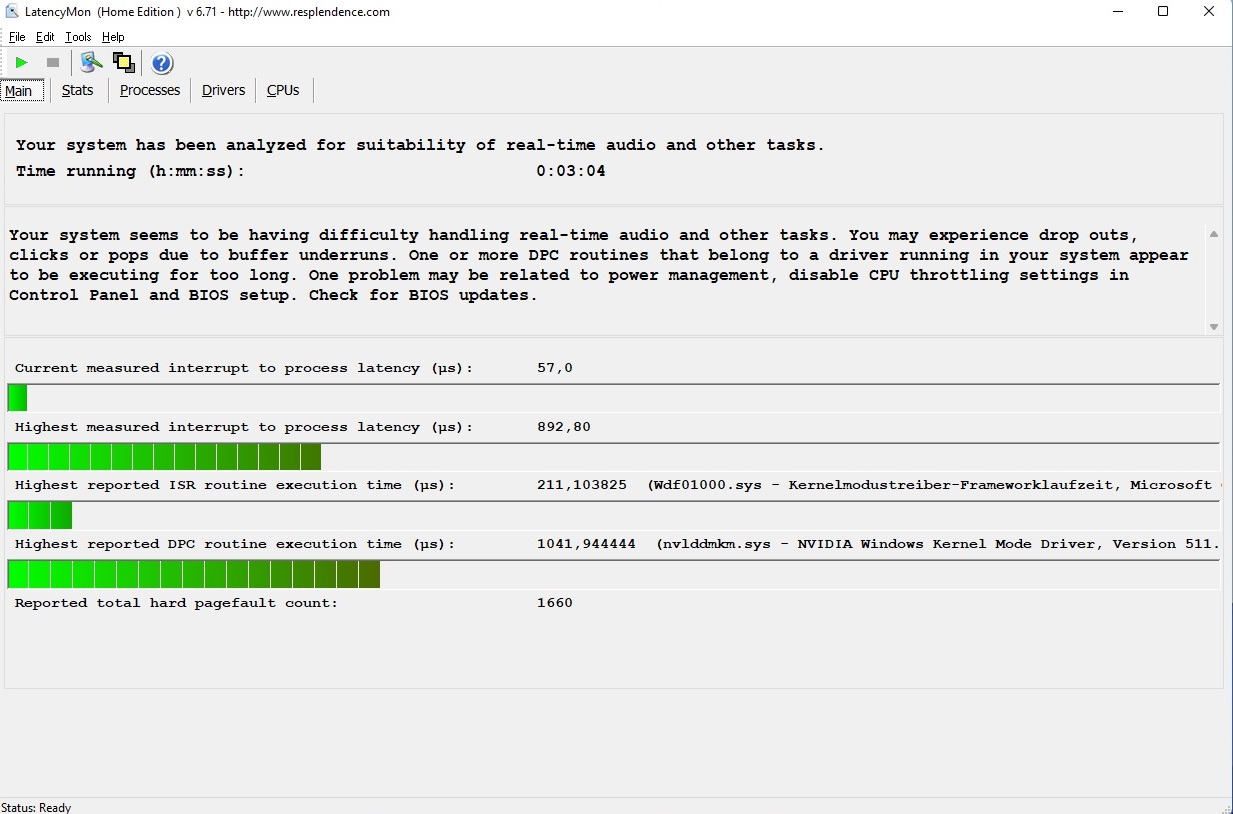
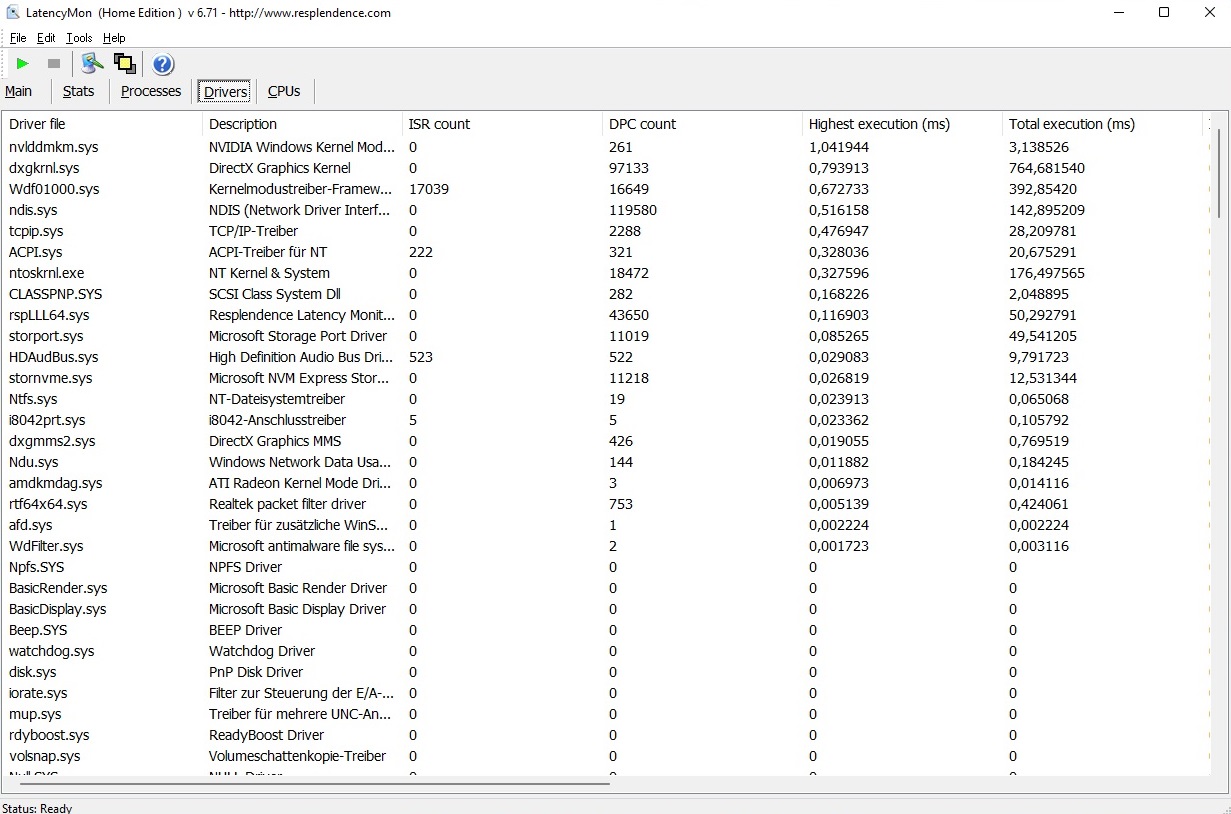
Como sucede a menudo, es necesario mejorar las latencias. Según la herramienta LatencyMon, el Victus 16, sin más ajustes, no es idóneo para el procesamiento de audio y vídeo en tiempo real.
| DPC Latencies / LatencyMon - interrupt to process latency (max), Web, Youtube, Prime95 | |
| HP Victus 16-e0179ng | |
| Asus ROG Strix G17 G713QE-RB74 | |
| Lenovo Ideapad Gaming 3 15IHU-82K1002RGE | |
| HP Victus 16-e0145ng | |
| Dell G15 5515 | |
* ... más pequeño es mejor
Solución de almacenamiento
Nuestra configuración de pruebas recoge algunos puntos positivos con su solución de almacenamiento. Aunque la capacidad de almacenamiento del Samsung PM981a con sus 512 GB no crea ningún entusiasmo, la unidad M.2 en base NVMe se comporta muy bien en los benchmarks, dejando incluso a la unidad de 1 TB del modelo más caro Victus 16 apenas por detrás.

| Drive Performance rating - Percent | |
| Media de la clase Gaming | |
| HP Victus 16-e0179ng | |
| HP Victus 16-e0145ng | |
| Dell G15 5515 | |
| Asus ROG Strix G17 G713QE-RB74 | |
| Lenovo Ideapad Gaming 3 15IHU-82K1002RGE | |
* ... más pequeño es mejor
Constant Performance Reading: DiskSpd Read Loop, Queue Depth 8
Tarjeta gráfica
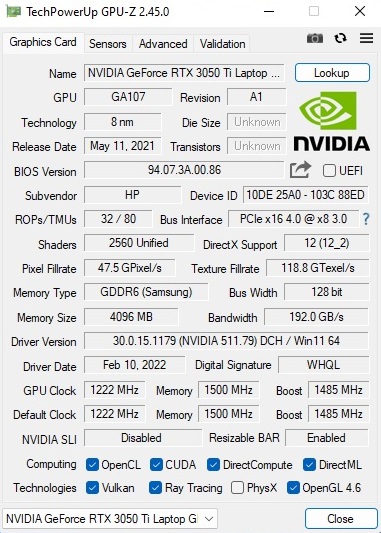
Con la GeForce RTX 3050 Ti, Nvidia ofrece una exitosa GPU de gama media, siempre que no se tenga en cuenta el mediocre rendimiento de raytracing. El modelo DirectX-12 es capaz de usar 2560 shaders e incluye 4 GB de GDDR6-VRAM. Por desgracia, esta última ya no está actualizada en este momento. Actualmente esperamos al menos 6 GB de los dispositivos de gama media. Los juegos exigentes, por tanto, alcanzarán sus límites en resoluciones y ajustes más altos.
En general, el rendimiento de los chips Ampere de Nvidia depende mucho del TGP configurado. Con 75 vatios (incluyendo Dynamic Boost), HD ha elegido un valor bastante alto para la RTX 3050 Ti, lo que también se refleja en las puntuaciones superiores a la media en los benchmarks gráficos sintéticos y en las pruebas con juegos reales. Sin embargo, el Victus 16 sigue teniendo dificultades frente a los competidores. Tanto el Asus Strix G17 G713QE como el Dell G5 5515 logran una pequeña ventaja en la mayoría de los casos. La GeForce RTX 3060 del Victus 16, más caro, queda por delante en un 30% la mayoría de las veces.
| 3DMark 11 Performance | 17816 puntos | |
| 3DMark Cloud Gate Standard Score | 36899 puntos | |
| 3DMark Fire Strike Score | 13022 puntos | |
| 3DMark Time Spy Score | 5910 puntos | |
ayuda | ||
Rendimiento de los juegos
Los juegos menos exigentes o no extremadamente intensivos en computación no crean ningún desafío insuperable para la GeForce RTX 3050 Ti, y los ajustes altos a máximos en la resolución nativa de 1920 x 1080 no son un problema la mayor parte del tiempo. Las cosas solo se ponen difíciles en juegos exigentes como Forza Horizon 5, Dying Light 2o God of War, donde no siempre es suficiente para conseguir una tasa de imágenes por segundo fluida con todos los controles al máximo.
| The Witcher 3 | |
| 1920x1080 High Graphics & Postprocessing (Nvidia HairWorks Off) | |
| Media de la clase Gaming (181 - 341, n=3, últimos 2 años) | |
| HP Victus 16-e0179ng | |
| Asus ROG Strix G17 G713QE-RB74 | |
| HP Victus 16-e0145ng | |
| Dell G15 5515 | |
| Lenovo Ideapad Gaming 3 15IHU-82K1002RGE | |
| Medio NVIDIA GeForce RTX 3050 Ti Laptop GPU (30 - 110, n=26) | |
| 1920x1080 Ultra Graphics & Postprocessing (HBAO+) | |
| Media de la clase Gaming (95 - 240, n=8, últimos 2 años) | |
| HP Victus 16-e0179ng | |
| Asus ROG Strix G17 G713QE-RB74 | |
| Dell G15 5515 | |
| HP Victus 16-e0145ng | |
| Medio NVIDIA GeForce RTX 3050 Ti Laptop GPU (19 - 58.5, n=29) | |
| Lenovo Ideapad Gaming 3 15IHU-82K1002RGE | |
Durante la prueba de carga constante conEl Witcher 3 (1 hora @FHD/Ultra), no vemos ningún comportamiento llamativo. El rendimiento se mantiene bastante estable durante todo el tiempo.
The Witcher 3 FPS Chart
| bajo | medio | alto | ultra | |
|---|---|---|---|---|
| GTA V (2015) | 167.7 | 131.4 | 73.7 | |
| The Witcher 3 (2015) | 176 | 104 | 54.9 | |
| Dota 2 Reborn (2015) | 139.6 | 125.3 | 118 | 113 |
| Final Fantasy XV Benchmark (2018) | 76.4 | 54.9 | ||
| X-Plane 11.11 (2018) | 99.3 | 91.2 | 74.2 | |
| Strange Brigade (2018) | 140.1 | 114.5 | 98.9 | |
| Alan Wake Remastered (2021) | 105.4 | 95.3 | ||
| Back 4 Blood (2021) | 142.8 | 123.8 | 116.2 | |
| Guardians of the Galaxy (2021) | 83 | 82 | 79 | |
| Riders Republic (2021) | 88 | 69 | 54 | |
| Forza Horizon 5 (2021) | 93 | 84 | 19 | |
| Farming Simulator 22 (2021) | 130 | 104.8 | 92.3 | |
| Halo Infinite (2021) | 89.1 | 59 | 51.5 | |
| God of War (2022) | 64.3 | 50.3 | 31.3 | |
| Rainbow Six Extraction (2022) | 116 | 112 | 86 | |
| Dying Light 2 (2022) | 47 | 39.6 | ||
| Elden Ring (2022) | 59.6 | 59.6 | 56.2 | |
| Ghostwire Tokyo (2022) | 91.1 | 90 | 88.2 | |
| Tiny Tina's Wonderlands (2022) | 99.3 | 68.6 | 51.8 | |
| Vampire Bloodhunt (2022) | 132.4 | 86.2 | 86.1 |
Emisiones
Emisiones acústicas
El desarrollo del ruido deja algunos sentimientos encontrados. Aunque algunos otros portátiles para juegos se vuelven aún más ruidosos bajo carga, los 44 a 53 dB(A) en operación 3D tampoco son nada buenos. Con estos valores, el Victus 16 se acerca a su hermano más rápido. Sorprendentemente, incluso medimos un nivel de ruido ligeramente superior durante el funcionamiento en reposo. Cuando el portátil no está ocupado por un momento, los ventiladores se apagan o funcionan ya con un nivel de ruido muy audible. Una velocidad de ventilador constante y discreta habría sido preferible aquí.
Ruido
| Ocioso |
| 26 / 28 / 34 dB(A) |
| Carga |
| 44 / 53 dB(A) |
 | ||
30 dB silencioso 40 dB(A) audible 50 dB(A) ruidosamente alto |
||
min: | ||
| HP Victus 16-e0145ng R5 5600H, GeForce RTX 3050 Ti Laptop GPU | HP Victus 16-e0179ng R7 5800H, GeForce RTX 3060 Laptop GPU | Lenovo Ideapad Gaming 3 15IHU-82K1002RGE i5-11300H, GeForce RTX 3050 Ti Laptop GPU | Dell G15 5515 R7 5800H, GeForce RTX 3050 Ti Laptop GPU | Asus ROG Strix G17 G713QE-RB74 R7 5800H, GeForce RTX 3050 Ti Laptop GPU | |
|---|---|---|---|---|---|
| Noise | 4% | 7% | 7% | 9% | |
| apagado / medio ambiente * (dB) | 26 | 24 8% | 23.9 8% | 24 8% | 24.9 4% |
| Idle Minimum * (dB) | 26 | 24 8% | 23.9 8% | 25 4% | 25.1 3% |
| Idle Average * (dB) | 28 | 25 11% | 26.8 4% | 26 7% | 25.1 10% |
| Idle Maximum * (dB) | 34 | 34 -0% | 26.8 21% | 30 12% | 25.1 26% |
| Load Average * (dB) | 44 | 44 -0% | 43.5 1% | 44 -0% | 36.3 17% |
| Witcher 3 ultra * (dB) | 48 | 50 -4% | 43.5 9% | 44 8% | 49.9 -4% |
| Load Maximum * (dB) | 53 | 52 2% | 53.1 -0% | 48 9% | 49.9 6% |
* ... más pequeño es mejor
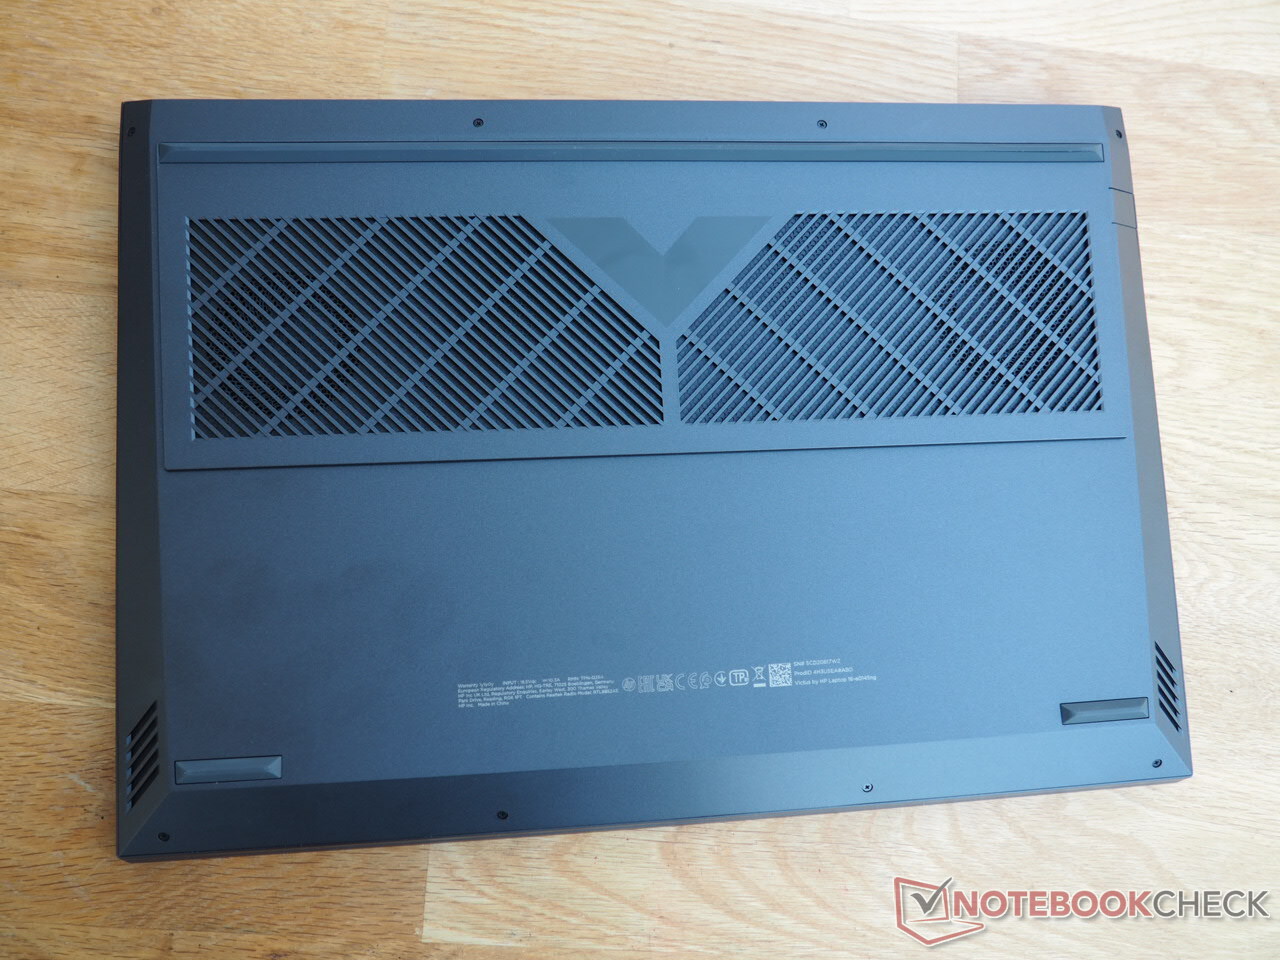
Temperaturas
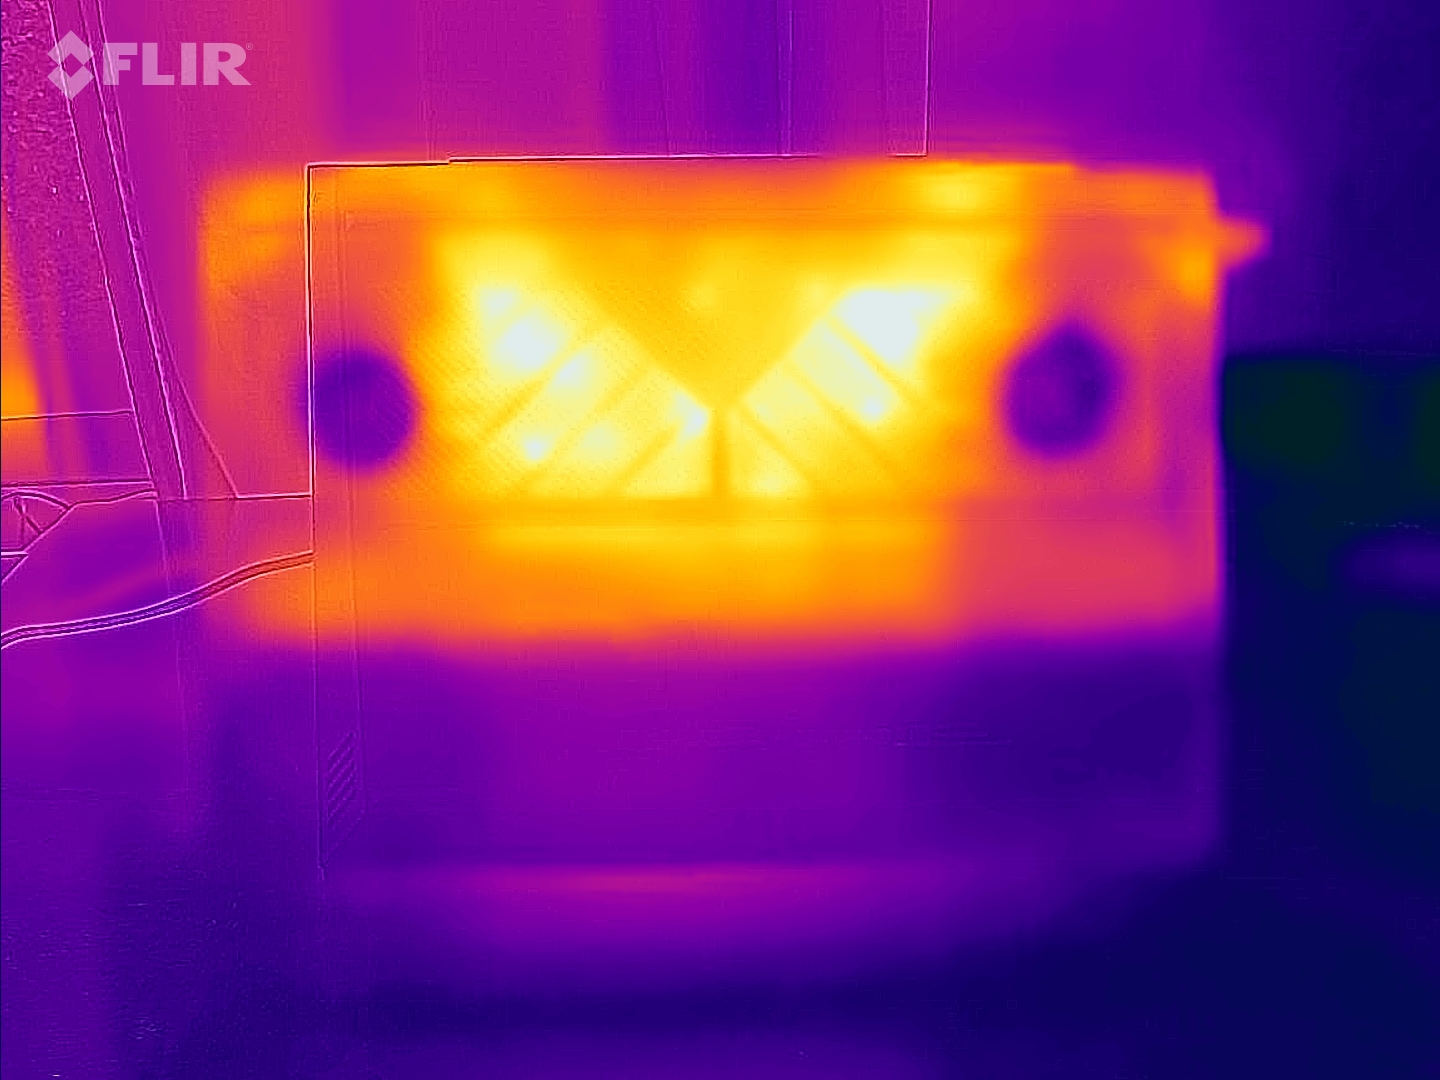
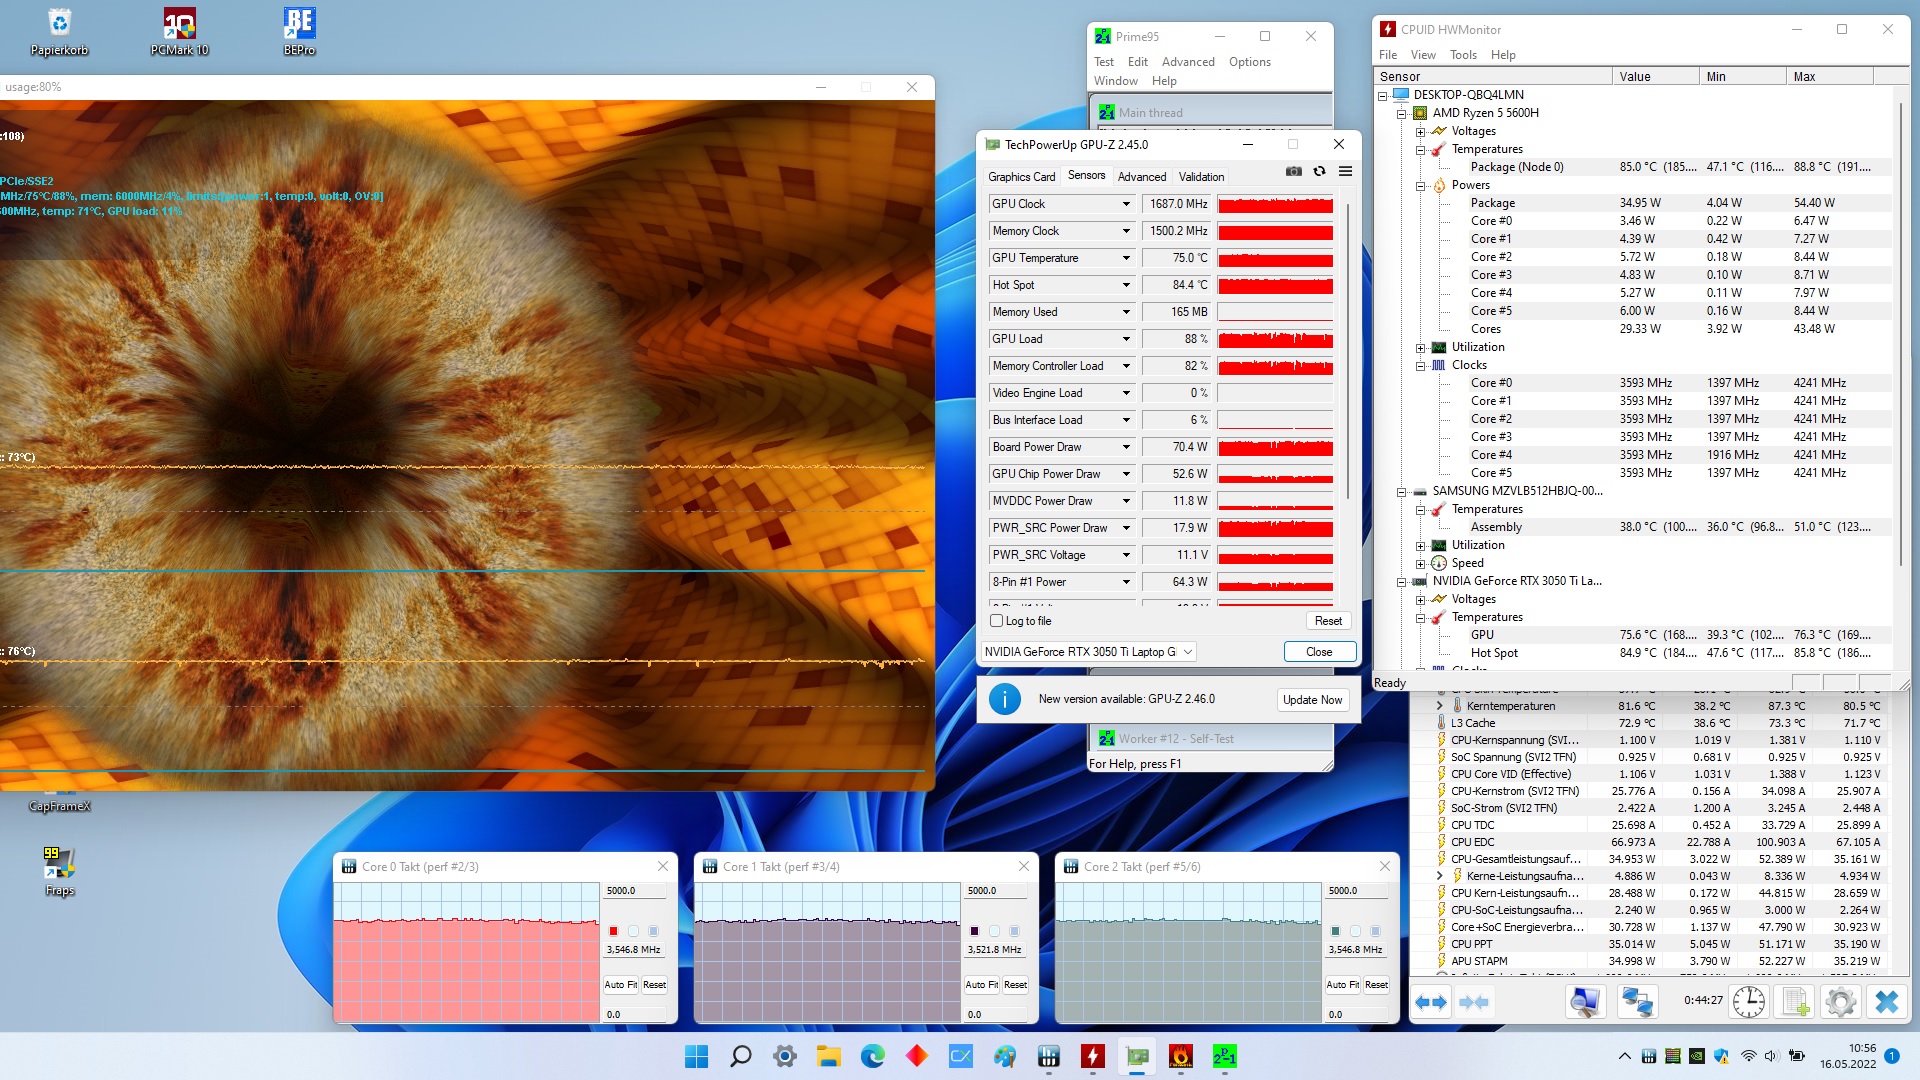
Como es habitual, la carcasa se calienta especialmente en la mitad trasera. En dos puntos del Victus 16, medimos más de 50 °C bajo carga. Sin embargo, este valor sigue estando dentro del rango típico de los portátiles para juegos. Dentro de la carcasa, se calienta principalmente el procesador. Tras una hora de prueba de estrés con las herramientas Furmark y Prime95, el Ryzen 5 5600H se mantiene a unos cómodos 85 °C. La GeForce RTX 3050 Ti alcanza unos moderados 75 °C (167 °F).
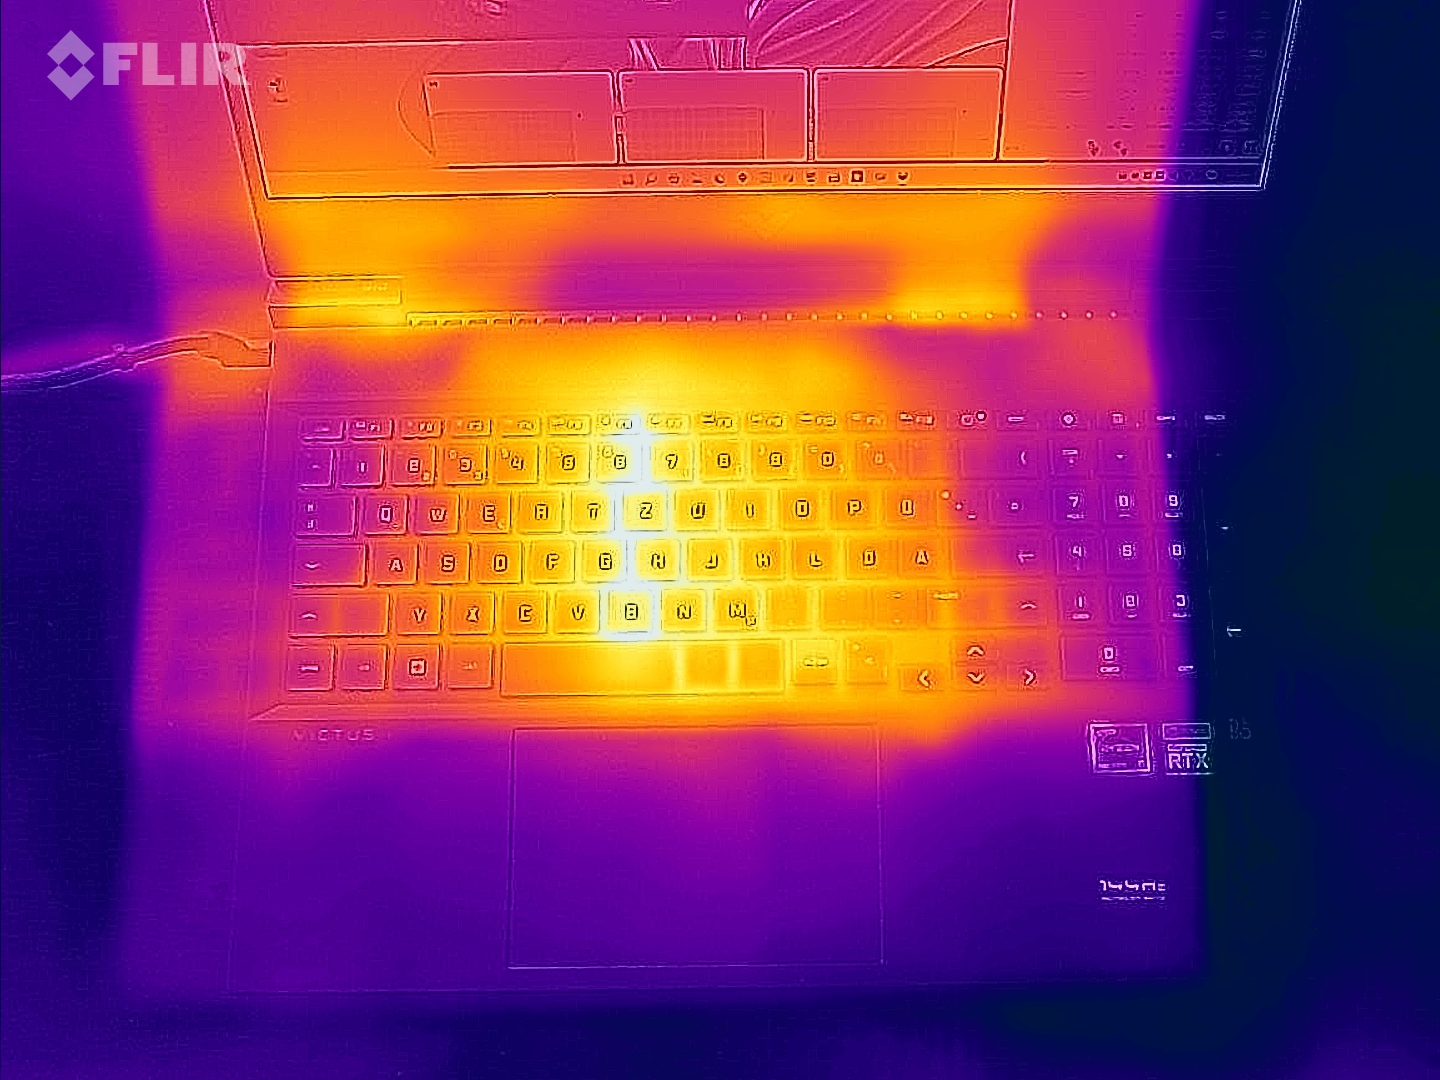
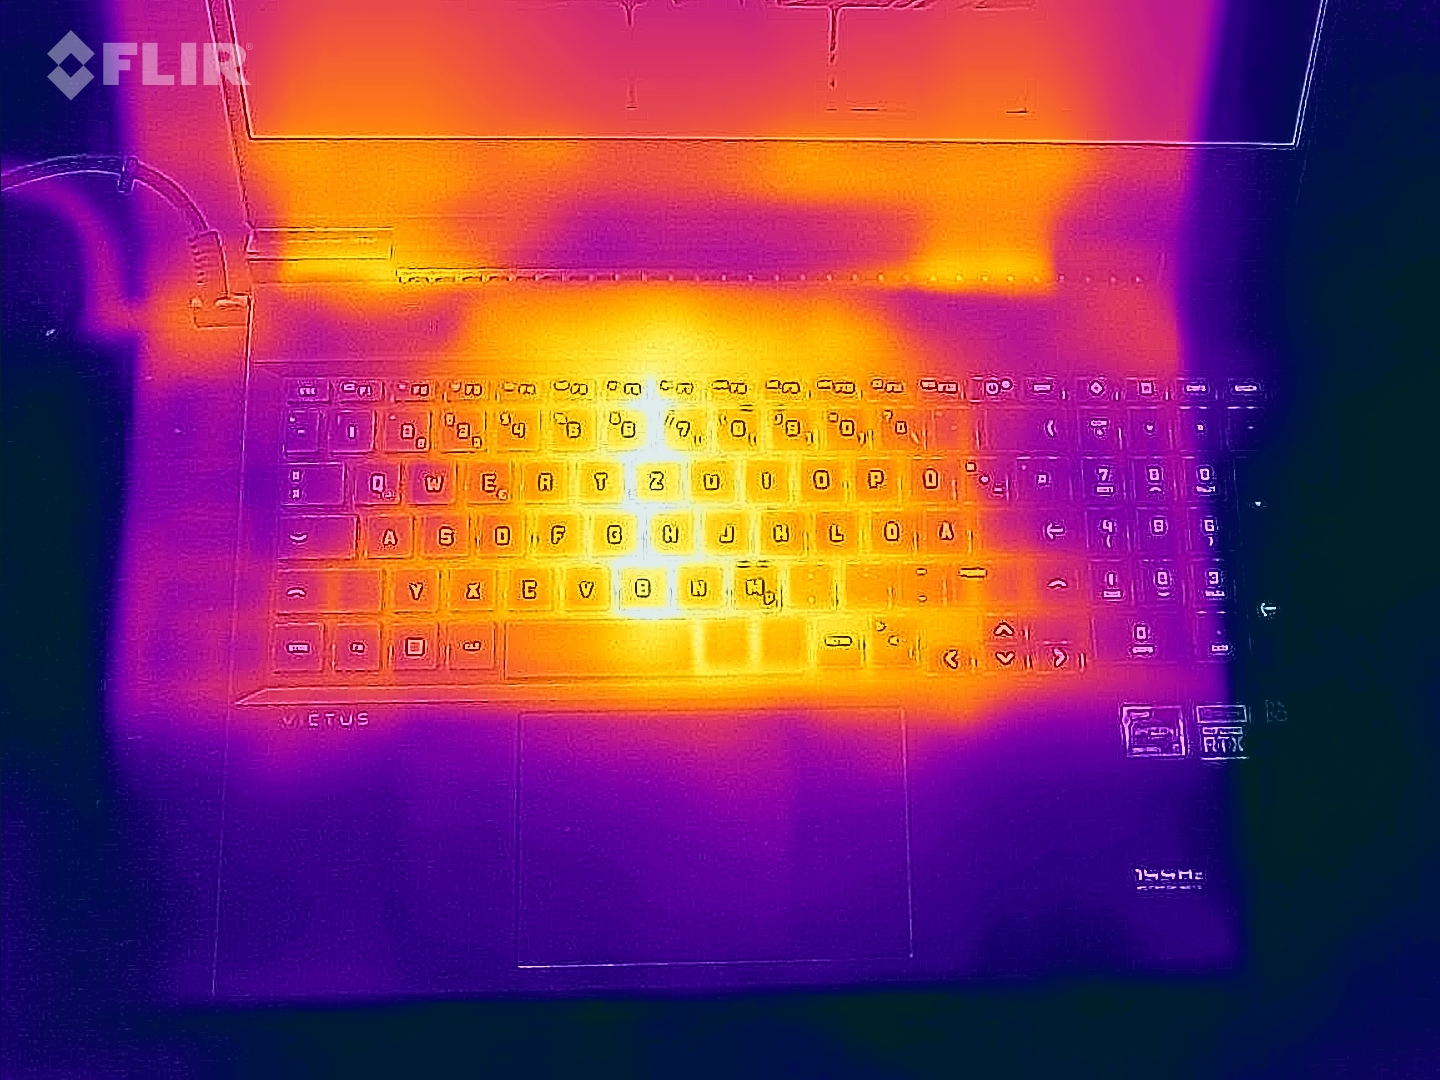
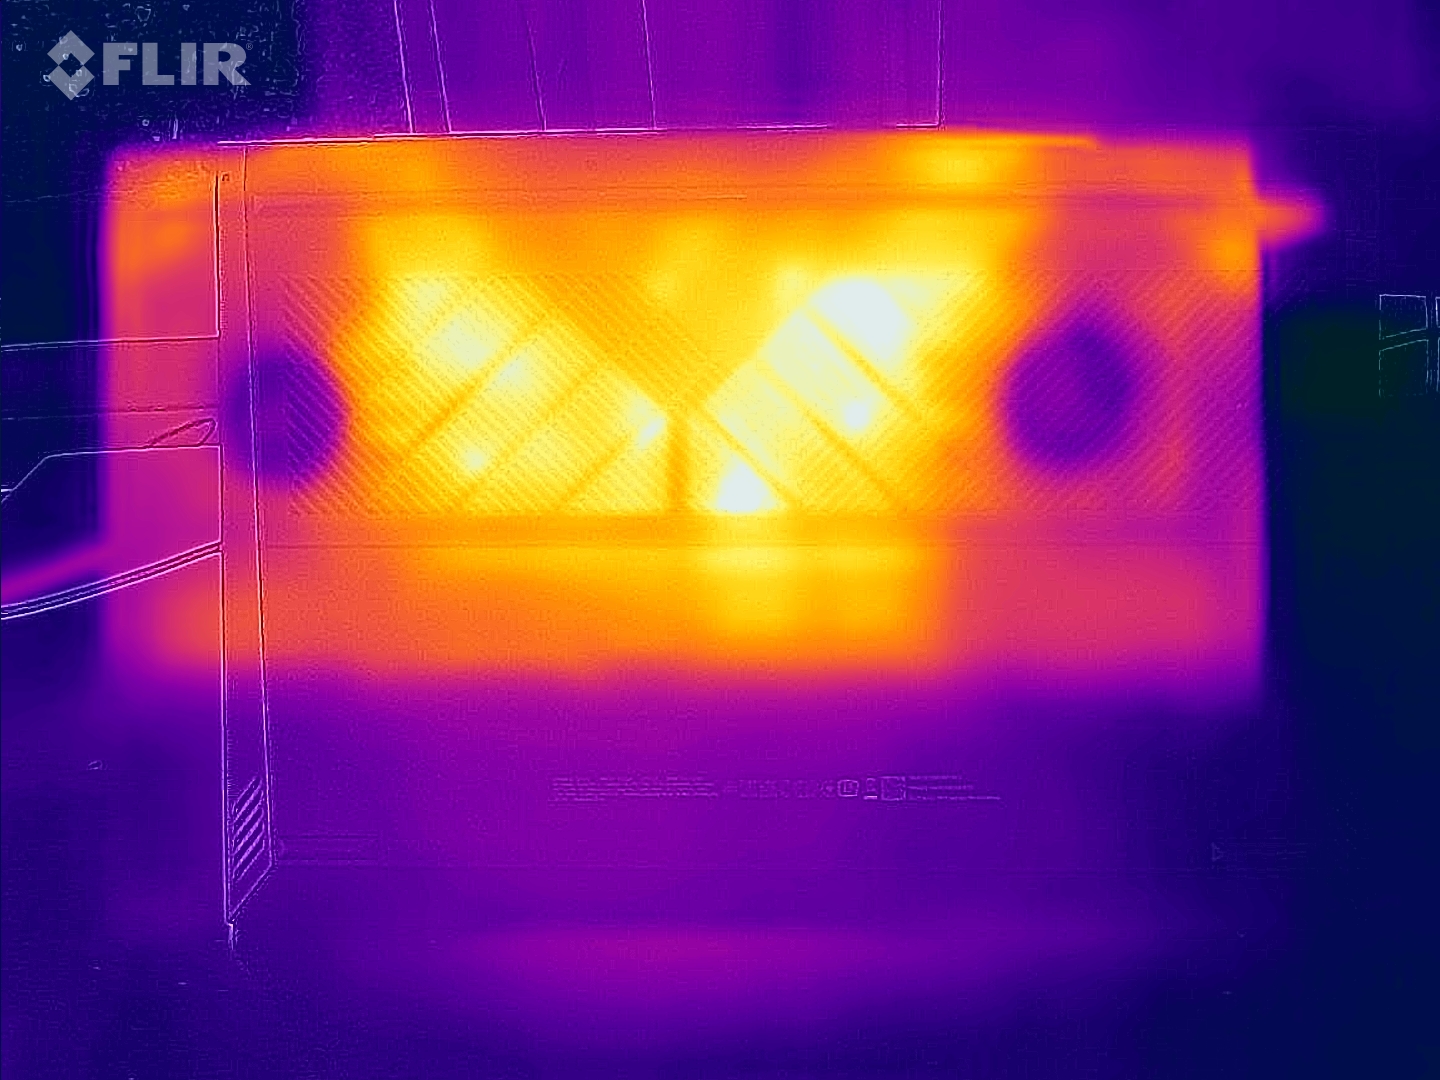
(-) La temperatura máxima en la parte superior es de 54 °C / 129 F, frente a la media de 40.4 °C / 105 F, que oscila entre 21.2 y 68.8 °C para la clase Gaming.
(-) El fondo se calienta hasta un máximo de 47 °C / 117 F, frente a la media de 43.2 °C / 110 F
(+) En reposo, la temperatura media de la parte superior es de 31.7 °C / 89# F, frente a la media del dispositivo de 33.9 °C / 93 F.
(-) Jugando a The Witcher 3, la temperatura media de la parte superior es de 40 °C / 104 F, frente a la media del dispositivo de 33.9 °C / 93 F.
(±) El reposamanos y el touchpad pueden calentarse mucho al tacto con un máximo de 37 °C / 98.6 F.
(-) La temperatura media de la zona del reposamanos de dispositivos similares fue de 28.8 °C / 83.8 F (-8.2 °C / -14.8 F).
| HP Victus 16-e0145ng R5 5600H, GeForce RTX 3050 Ti Laptop GPU | HP Victus 16-e0179ng R7 5800H, GeForce RTX 3060 Laptop GPU | Lenovo Ideapad Gaming 3 15IHU-82K1002RGE i5-11300H, GeForce RTX 3050 Ti Laptop GPU | Dell G15 5515 R7 5800H, GeForce RTX 3050 Ti Laptop GPU | Asus ROG Strix G17 G713QE-RB74 R7 5800H, GeForce RTX 3050 Ti Laptop GPU | |
|---|---|---|---|---|---|
| Heat | -12% | 18% | 14% | 3% | |
| Maximum Upper Side * (°C) | 54 | 51 6% | 43.2 20% | 50 7% | 43.8 19% |
| Maximum Bottom * (°C) | 47 | 52 -11% | 47.9 -2% | 49 -4% | 47.2 -0% |
| Idle Upper Side * (°C) | 41 | 46 -12% | 24.9 39% | 26 37% | 33.4 19% |
| Idle Bottom * (°C) | 31 | 41 -32% | 27 13% | 26 16% | 39.4 -27% |
* ... más pequeño es mejor
Altavoces
HP Victus 16-e0145ng análisis de audio
(±) | la sonoridad del altavoz es media pero buena (79 dB)
Graves 100 - 315 Hz
(-) | casi sin bajos - de media 21% inferior a la mediana
(±) | la linealidad de los graves es media (12.6% delta a frecuencia anterior)
Medios 400 - 2000 Hz
(+) | medios equilibrados - a sólo 1.1% de la mediana
(+) | los medios son lineales (3.6% delta a la frecuencia anterior)
Altos 2 - 16 kHz
(+) | máximos equilibrados - a sólo 4.2% de la mediana
(+) | los máximos son lineales (5.3% delta a la frecuencia anterior)
Total 100 - 16.000 Hz
(±) | la linealidad del sonido global es media (16.2% de diferencia con la mediana)
En comparación con la misma clase
» 40% de todos los dispositivos probados de esta clase eran mejores, 7% similares, 54% peores
» El mejor tuvo un delta de 6%, la media fue 18%, el peor fue ###max##%
En comparación con todos los dispositivos probados
» 26% de todos los dispositivos probados eran mejores, 6% similares, 68% peores
» El mejor tuvo un delta de 4%, la media fue 24%, el peor fue ###max##%
Lenovo Ideapad Gaming 3 15IHU-82K1002RGE análisis de audio
(±) | la sonoridad del altavoz es media pero buena (80 dB)
Graves 100 - 315 Hz
(-) | casi sin bajos - de media 23.8% inferior a la mediana
(±) | la linealidad de los graves es media (10.3% delta a frecuencia anterior)
Medios 400 - 2000 Hz
(±) | medias más altas - de media 6.7% más altas que la mediana
(+) | los medios son lineales (6% delta a la frecuencia anterior)
Altos 2 - 16 kHz
(+) | máximos equilibrados - a sólo 3.6% de la mediana
(±) | la linealidad de los máximos es media (7.4% delta a frecuencia anterior)
Total 100 - 16.000 Hz
(±) | la linealidad del sonido global es media (20.7% de diferencia con la mediana)
En comparación con la misma clase
» 74% de todos los dispositivos probados de esta clase eran mejores, 4% similares, 21% peores
» El mejor tuvo un delta de 6%, la media fue 18%, el peor fue ###max##%
En comparación con todos los dispositivos probados
» 56% de todos los dispositivos probados eran mejores, 8% similares, 37% peores
» El mejor tuvo un delta de 4%, la media fue 24%, el peor fue ###max##%
Gestión de la energía
Consumo de energía
El consumo de energía no es destacable. Entre 7 y 15 vatios en reposo y entre 93 y 185 vatios en funcionamiento 3D es relativamente eficiente para un portátil de juegos y apropiado para el hardware utilizado.
| Off / Standby | |
| Ocioso | |
| Carga |
|
Clave:
min: | |
| HP Victus 16-e0145ng R5 5600H, GeForce RTX 3050 Ti Laptop GPU | HP Victus 16-e0179ng R7 5800H, GeForce RTX 3060 Laptop GPU | Lenovo Ideapad Gaming 3 15IHU-82K1002RGE i5-11300H, GeForce RTX 3050 Ti Laptop GPU | Dell G15 5515 R7 5800H, GeForce RTX 3050 Ti Laptop GPU | Asus ROG Strix G17 G713QE-RB74 R7 5800H, GeForce RTX 3050 Ti Laptop GPU | Media de la clase Gaming | |
|---|---|---|---|---|---|---|
| Power Consumption | -7% | 19% | 2% | -19% | -63% | |
| Idle Minimum * (Watt) | 7 | 5 29% | 4.9 30% | 5 29% | 9.2 -31% | 13.2 ? -89% |
| Idle Average * (Watt) | 9 | 10 -11% | 8.3 8% | 9 -0% | 12.6 -40% | 18.9 ? -110% |
| Idle Maximum * (Watt) | 15 | 20 -33% | 8.9 41% | 20 -33% | 23.3 -55% | 24.3 ? -62% |
| Load Average * (Watt) | 93 | 108 -16% | 81 13% | 94 -1% | 89.3 4% | 108.3 ? -16% |
| Witcher 3 ultra * (Watt) | 134.5 | 145 -8% | 119 12% | 123 9% | 136 -1% | |
| Load Maximum * (Watt) | 185 | 189 -2% | 172 7% | 172 7% | 162.7 12% | 254 ? -37% |
* ... más pequeño es mejor
Power Consumption The Witcher 3 / Stress Test
Power Consumption With External Monitor
Duración de la batería
La capacidad de la batería es la misma que la del modelo más caro Victus 16. 70 Wh en combinación con el cambio automático de la gráfica aseguran una sólida duración de la batería. El portátil de 16 pulgadas dura unas buenas 7 horas en nuestro test WLAN con el brillo reducido a 150 cd/m².
| HP Victus 16-e0145ng R5 5600H, GeForce RTX 3050 Ti Laptop GPU, 70 Wh | HP Victus 16-e0179ng R7 5800H, GeForce RTX 3060 Laptop GPU, 70 Wh | Lenovo Ideapad Gaming 3 15IHU-82K1002RGE i5-11300H, GeForce RTX 3050 Ti Laptop GPU, 45 Wh | Dell G15 5515 R7 5800H, GeForce RTX 3050 Ti Laptop GPU, 56 Wh | Asus ROG Strix G17 G713QE-RB74 R7 5800H, GeForce RTX 3050 Ti Laptop GPU, 56 Wh | Media de la clase Gaming | |
|---|---|---|---|---|---|---|
| Duración de Batería | -17% | -7% | 13% | -15% | -1% | |
| WiFi v1.3 (h) | 7.1 | 5.9 -17% | 6.6 -7% | 8 13% | 6 -15% | 7.04 ? -1% |
| Reader / Idle (h) | 8.5 | 13.5 | 11.1 | 8.71 ? | ||
| Load (h) | 1.3 | 1.1 | 1.5 | 1.1 | 1.47 ? | |
| H.264 (h) | 7.7 | 8.8 | 8.26 ? |
Pro
Contra
Veredicto
A los jugadores que tengan en cuenta su presupuesto y no sean muy exigentes con la calidad de imagen les puede gustar el Victus 16-e0145ng que probamos aquí.
ElRyzen 5 5600Hy laGeForce RTX 3050 Tiy el SSD NVMe forman un paquete equilibrado y bastante potente, adecuado para diversas áreas de aplicación. Aparte del mediocre rendimiento del display (baja cobertura del espacio de color, escaso brillo, etc.), el portátil HP no muestra mayores debilidades. La elegante carcasa alberga dispositivos de entrada relativamente buenos y un número decente de puertos, aunque hay que vivir sin Thunderbolt. La duración de la batería y el sonido también son adecuados para el precio, aunque no inspiran realmente entusiasmo.
En general, el Victus 16-e0145ng nos ha gustado un poco más que el Lenovo Ideapad Gaming 3 15IHU. Por otro lado, el equipo comparable Dell G15 5515y Asus ROG Strix G17 G713QEestán ligeramente por delante en nuestra evaluación.
Precio y disponibilidad
Una versión del HP Victus 16 con un equipamiento similar, sólo con un Ryzen 7, está disponible en la tienda de HP por unos 950 dólares.
HP Victus 16-e0145ng
- 05/18/2022 v7 (old)
Florian Glaser
Price comparison

