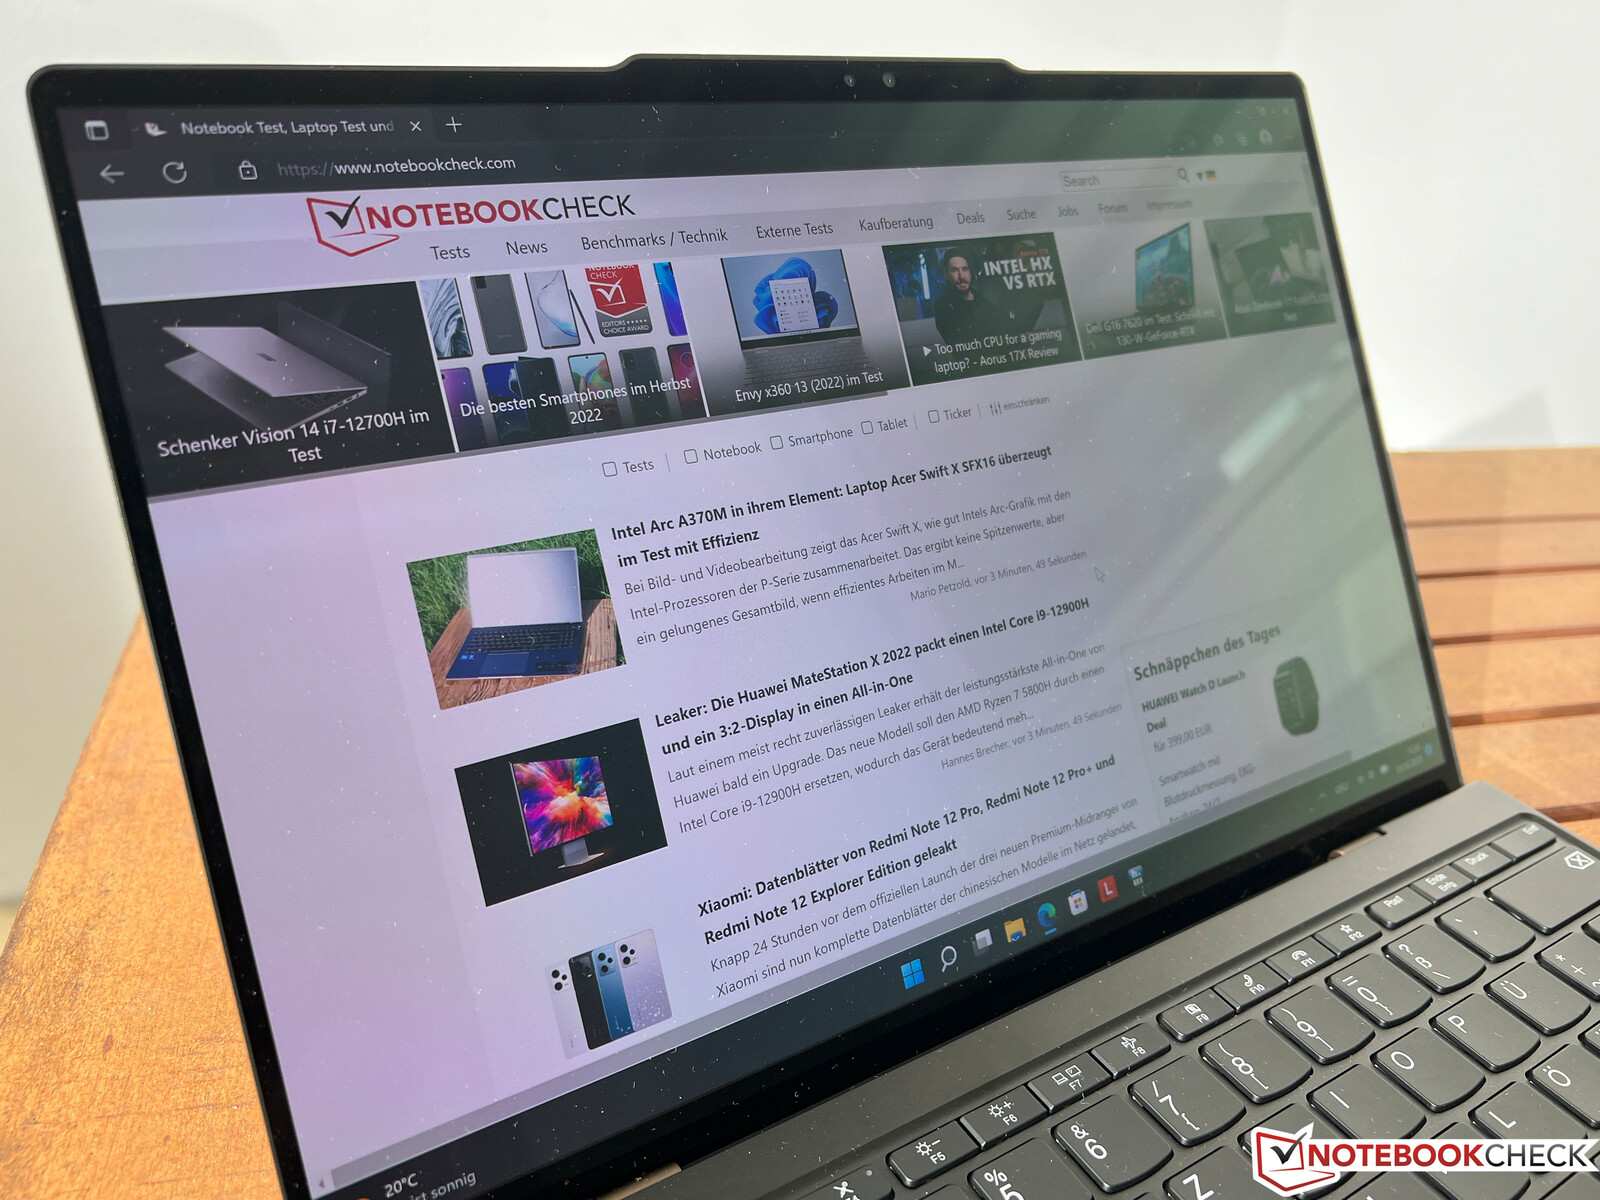
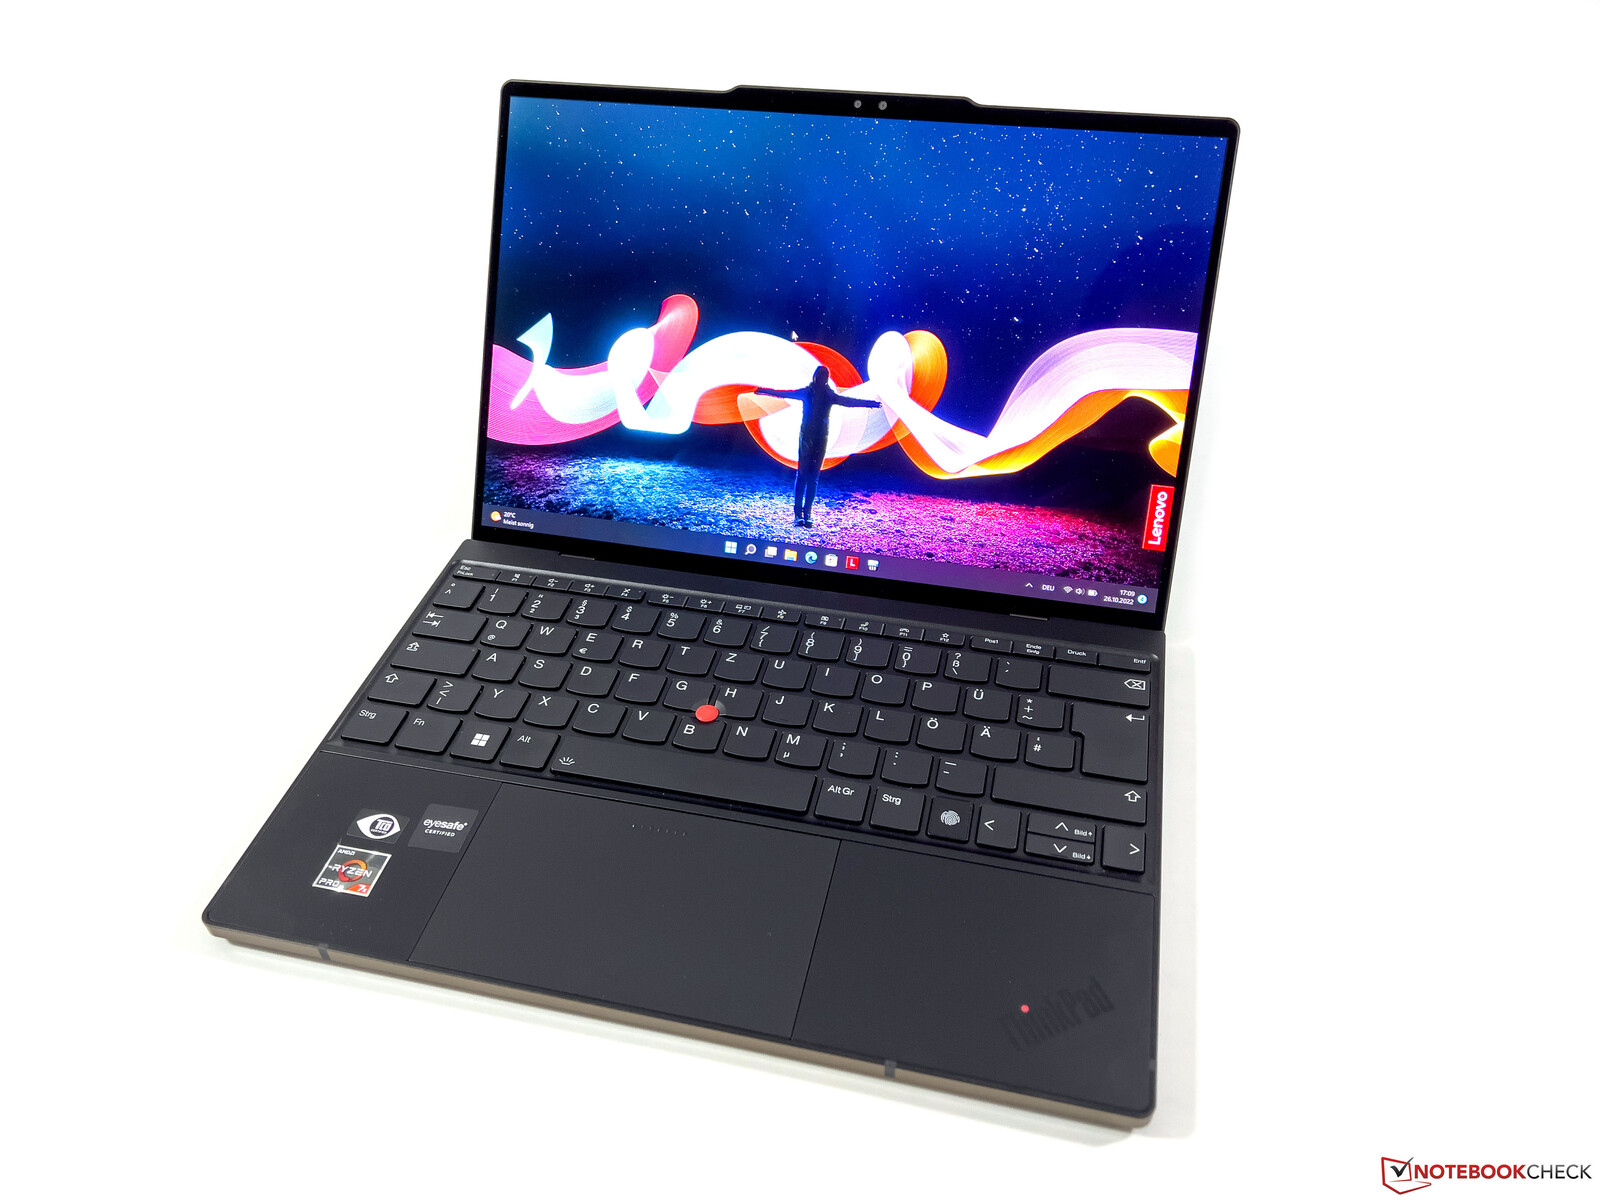
Análisis del Lenovo ThinkPad Z13 G1 OLED - Portátil de negocios con un AMD Ryzen 7 Pro 6860Z
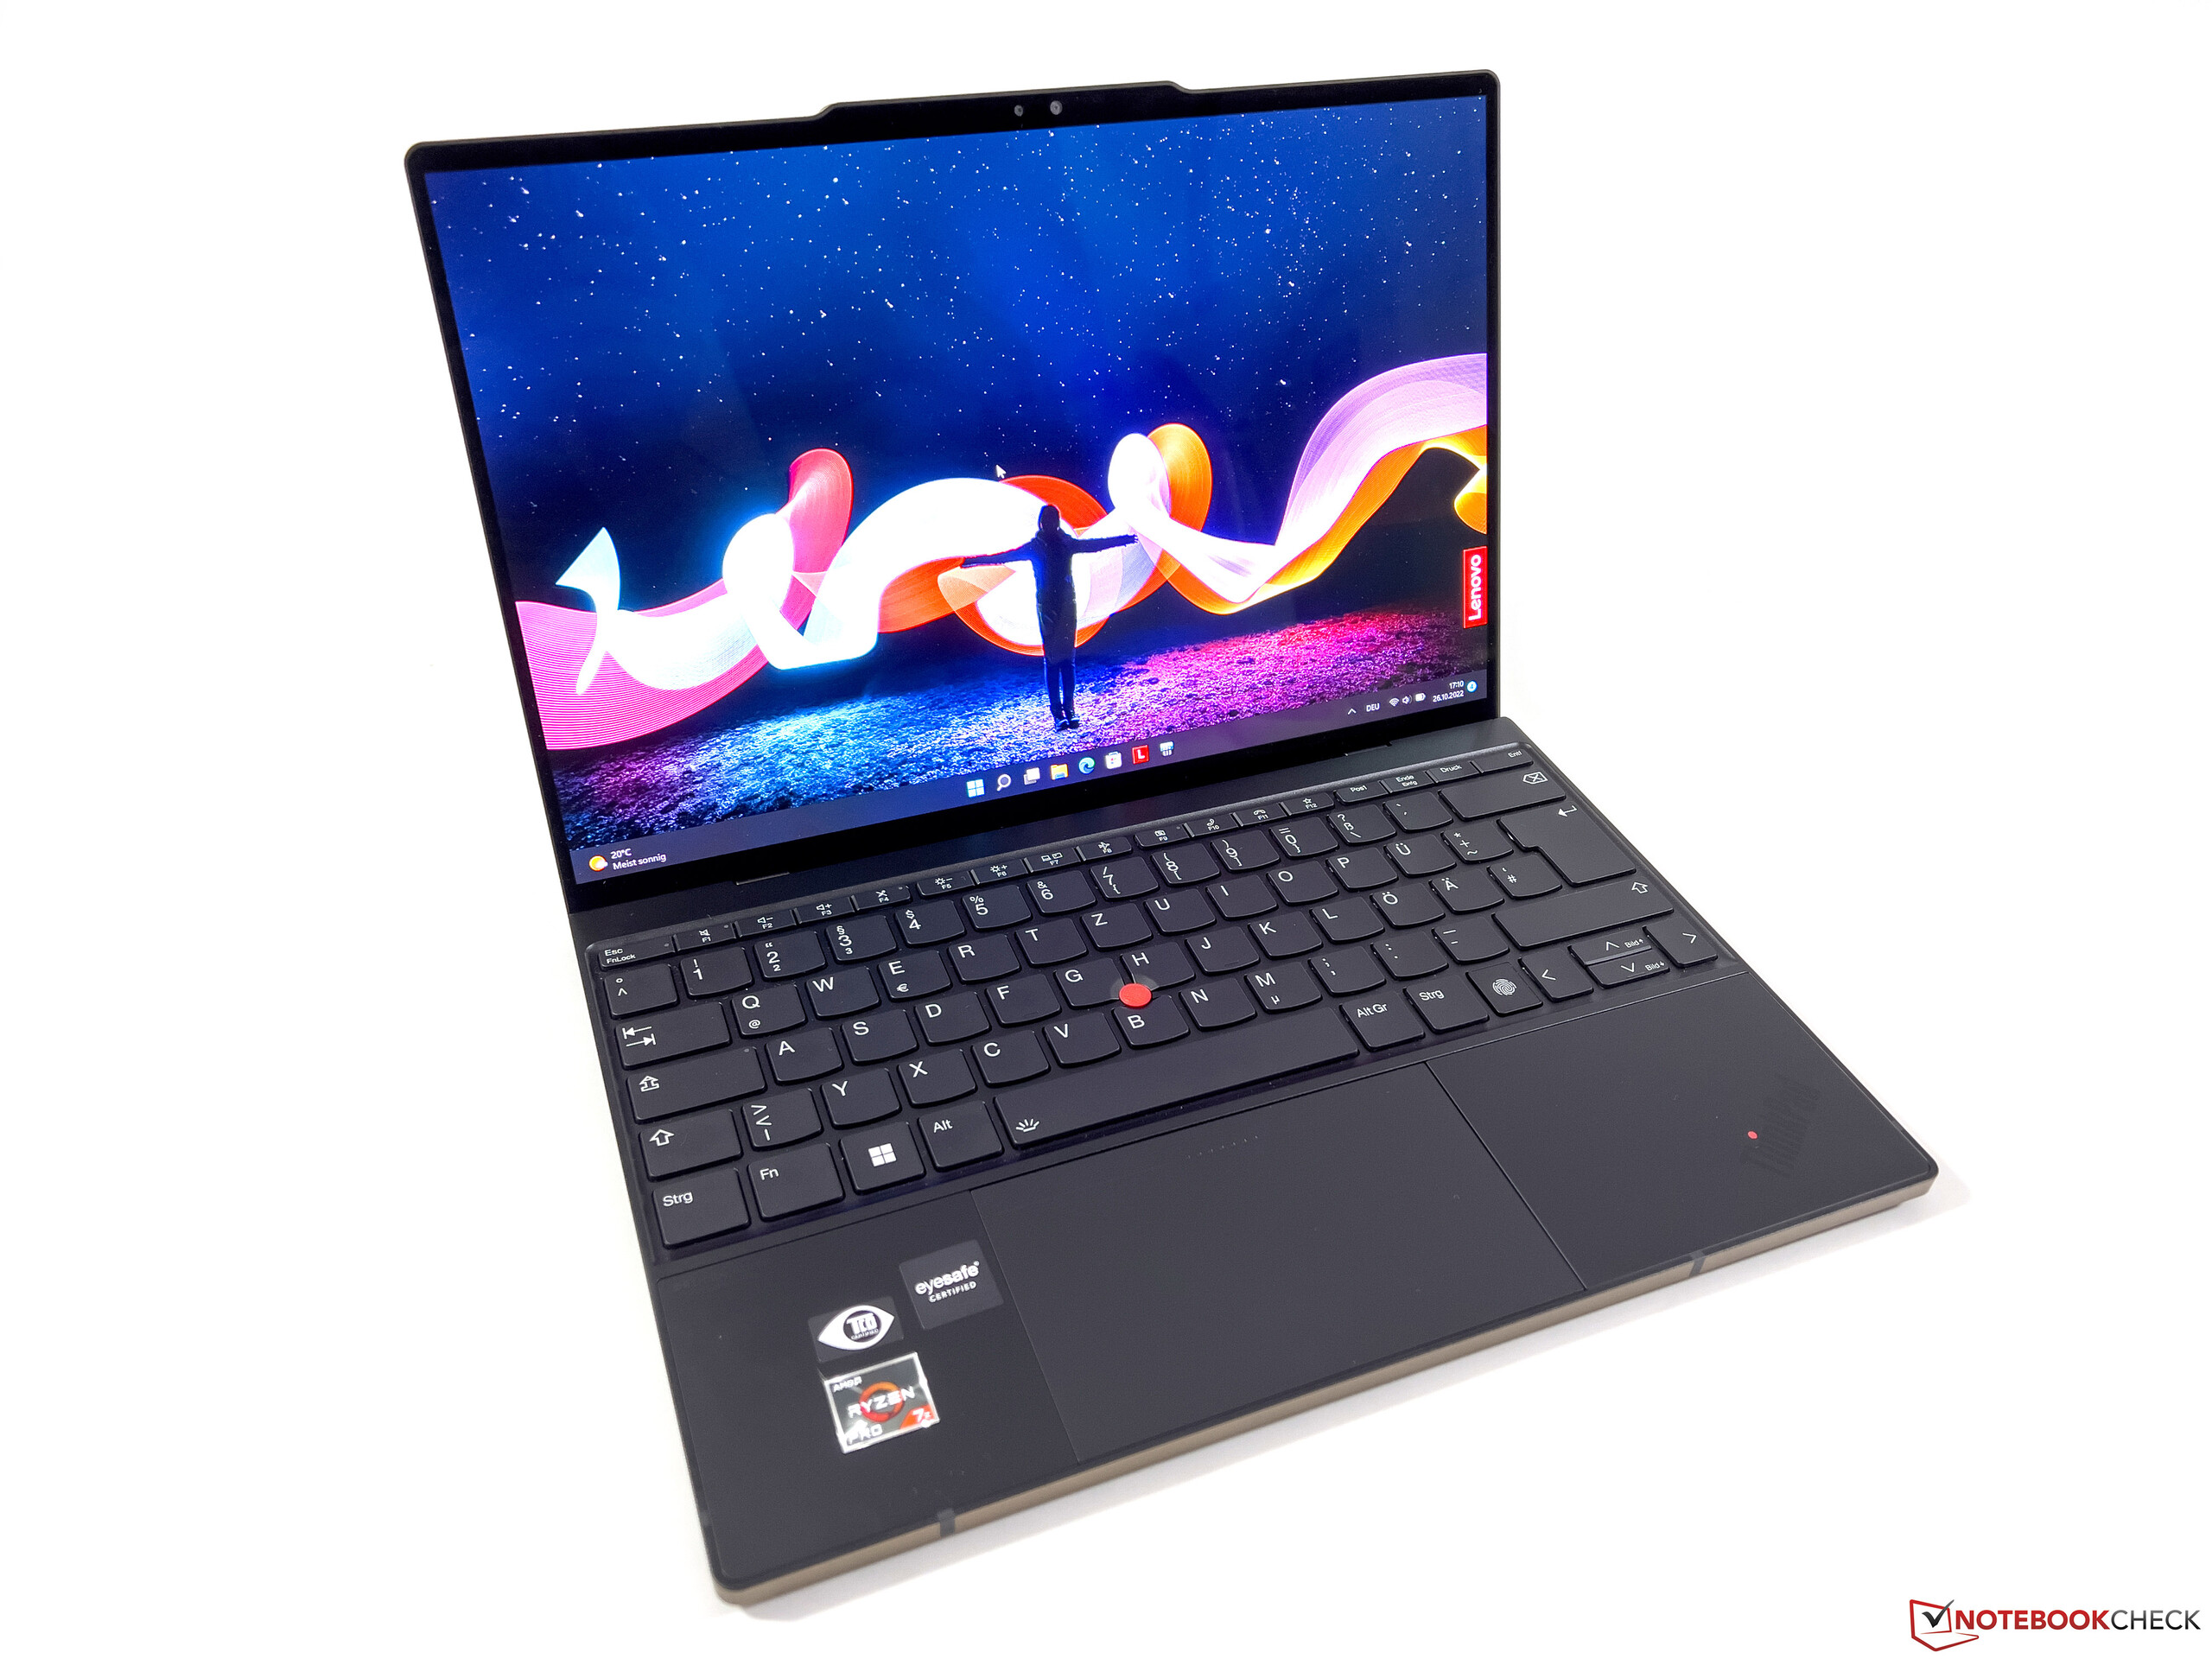
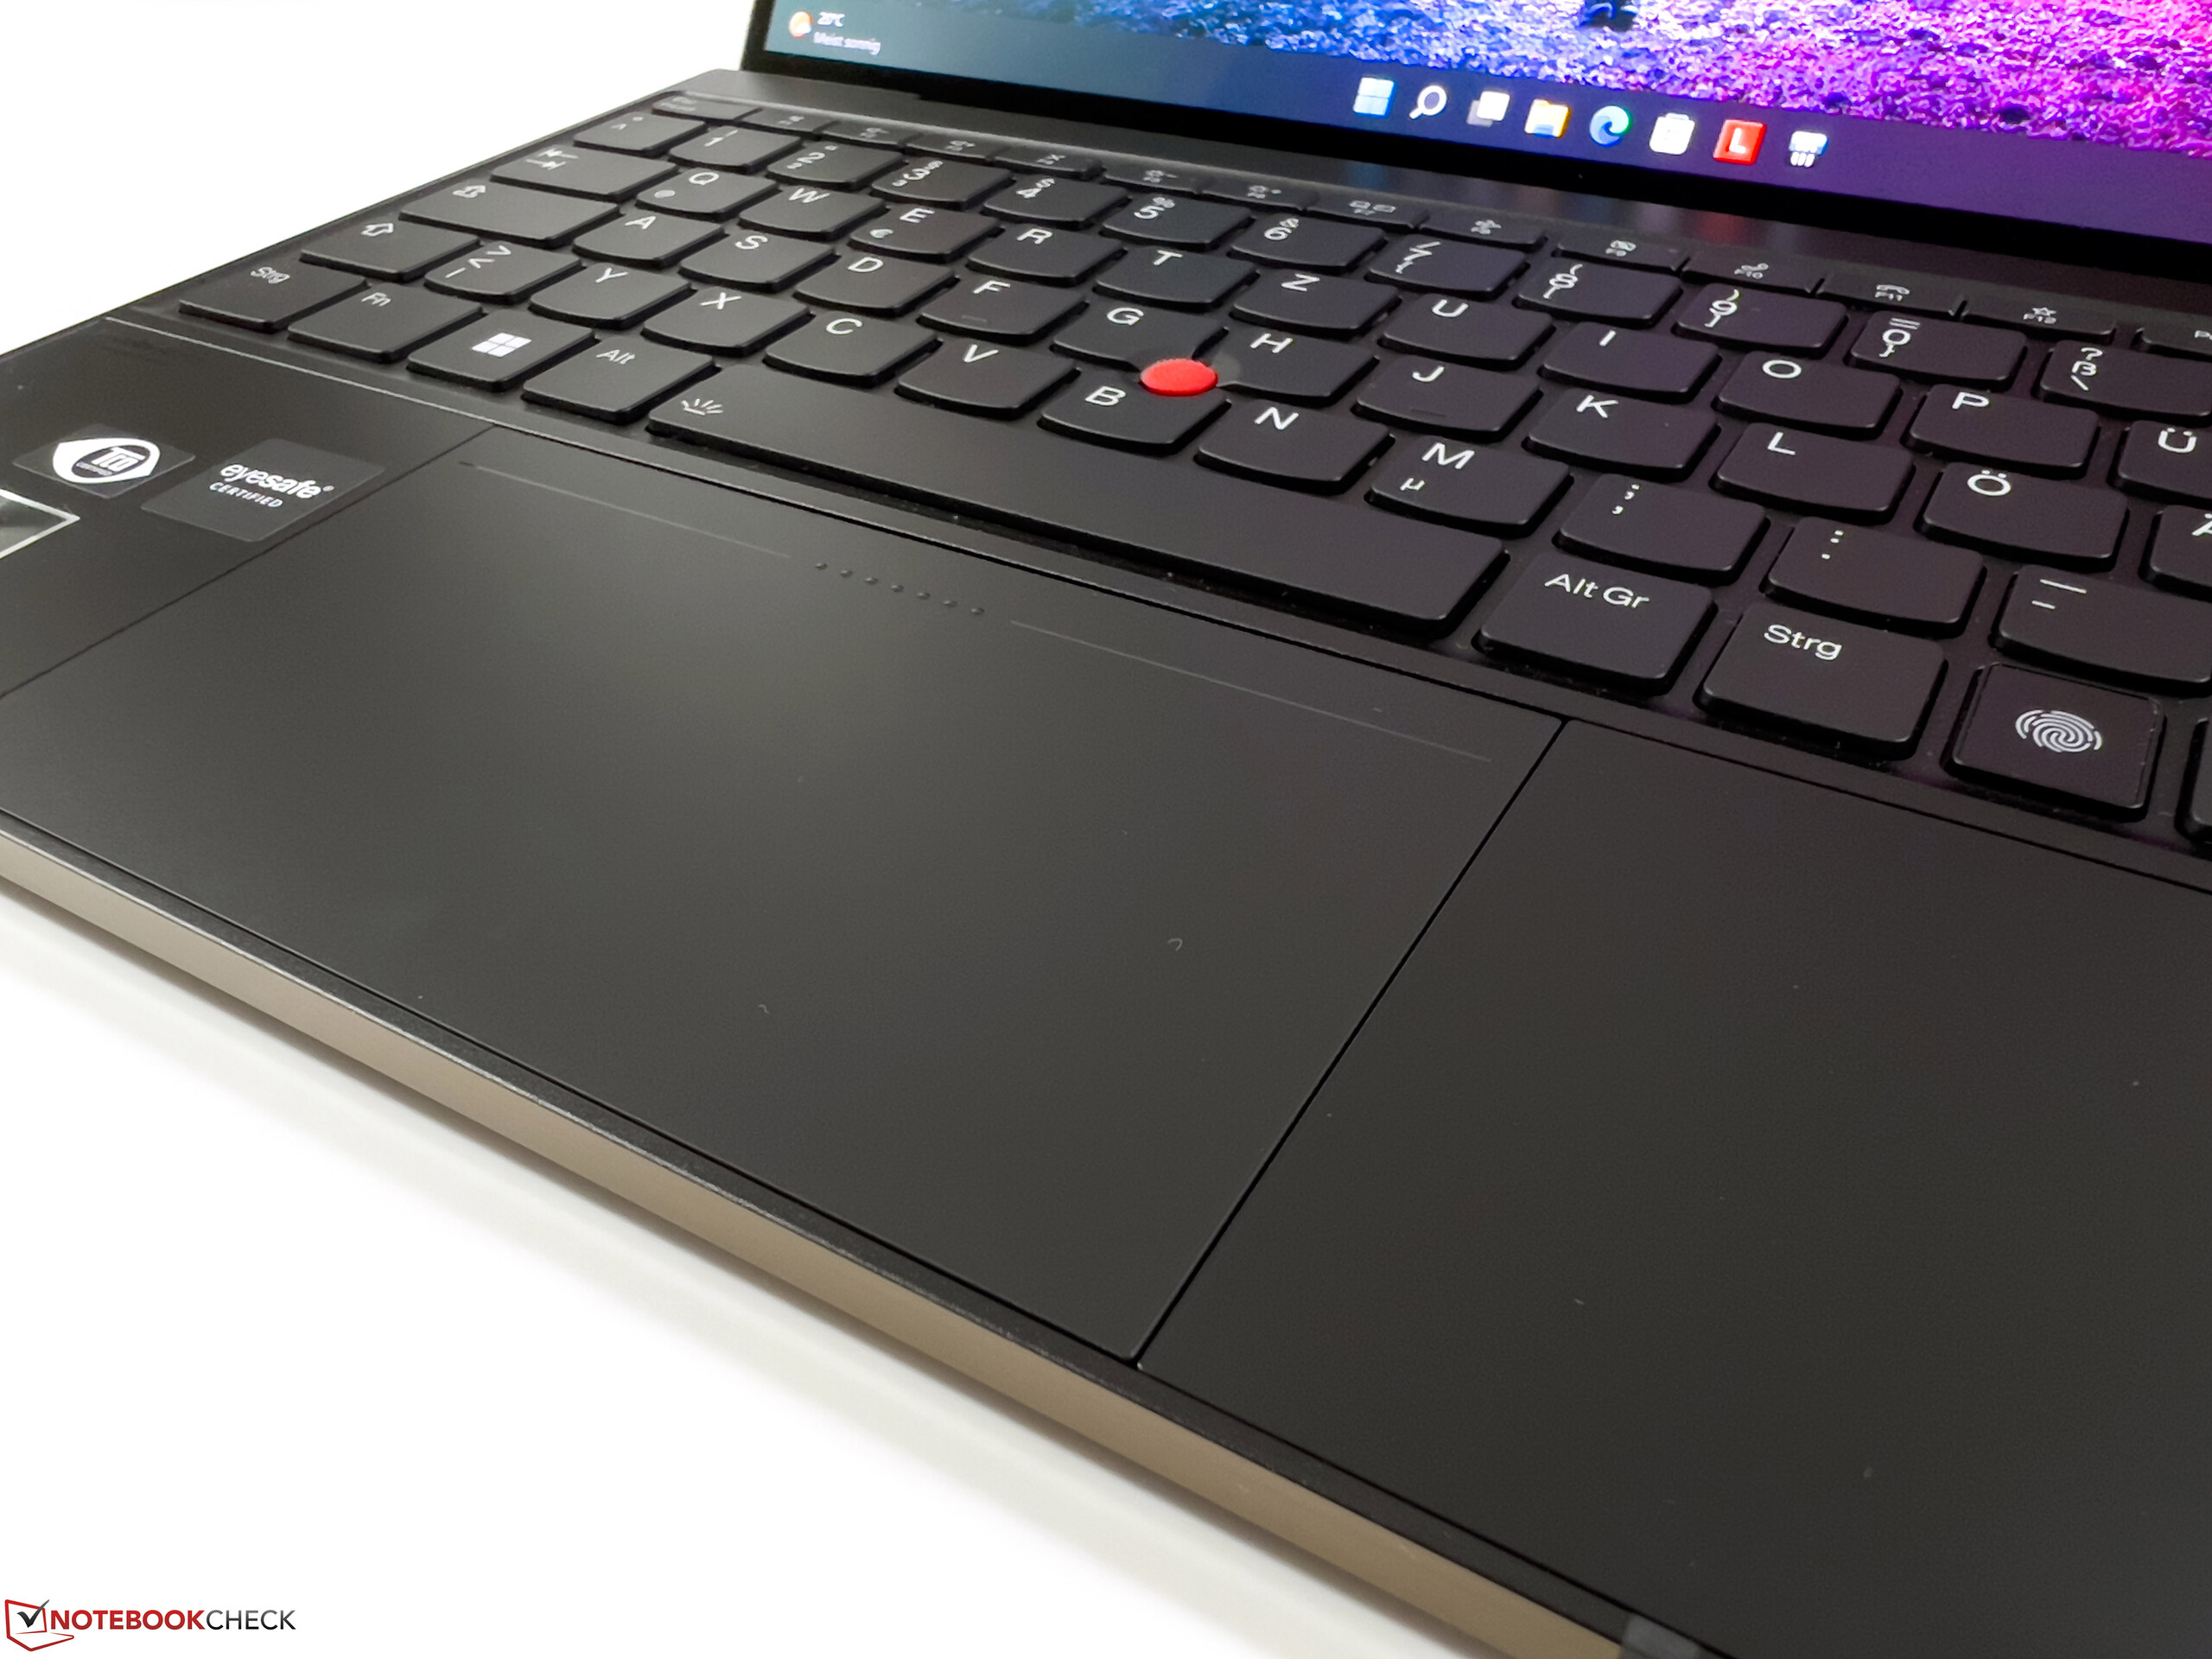
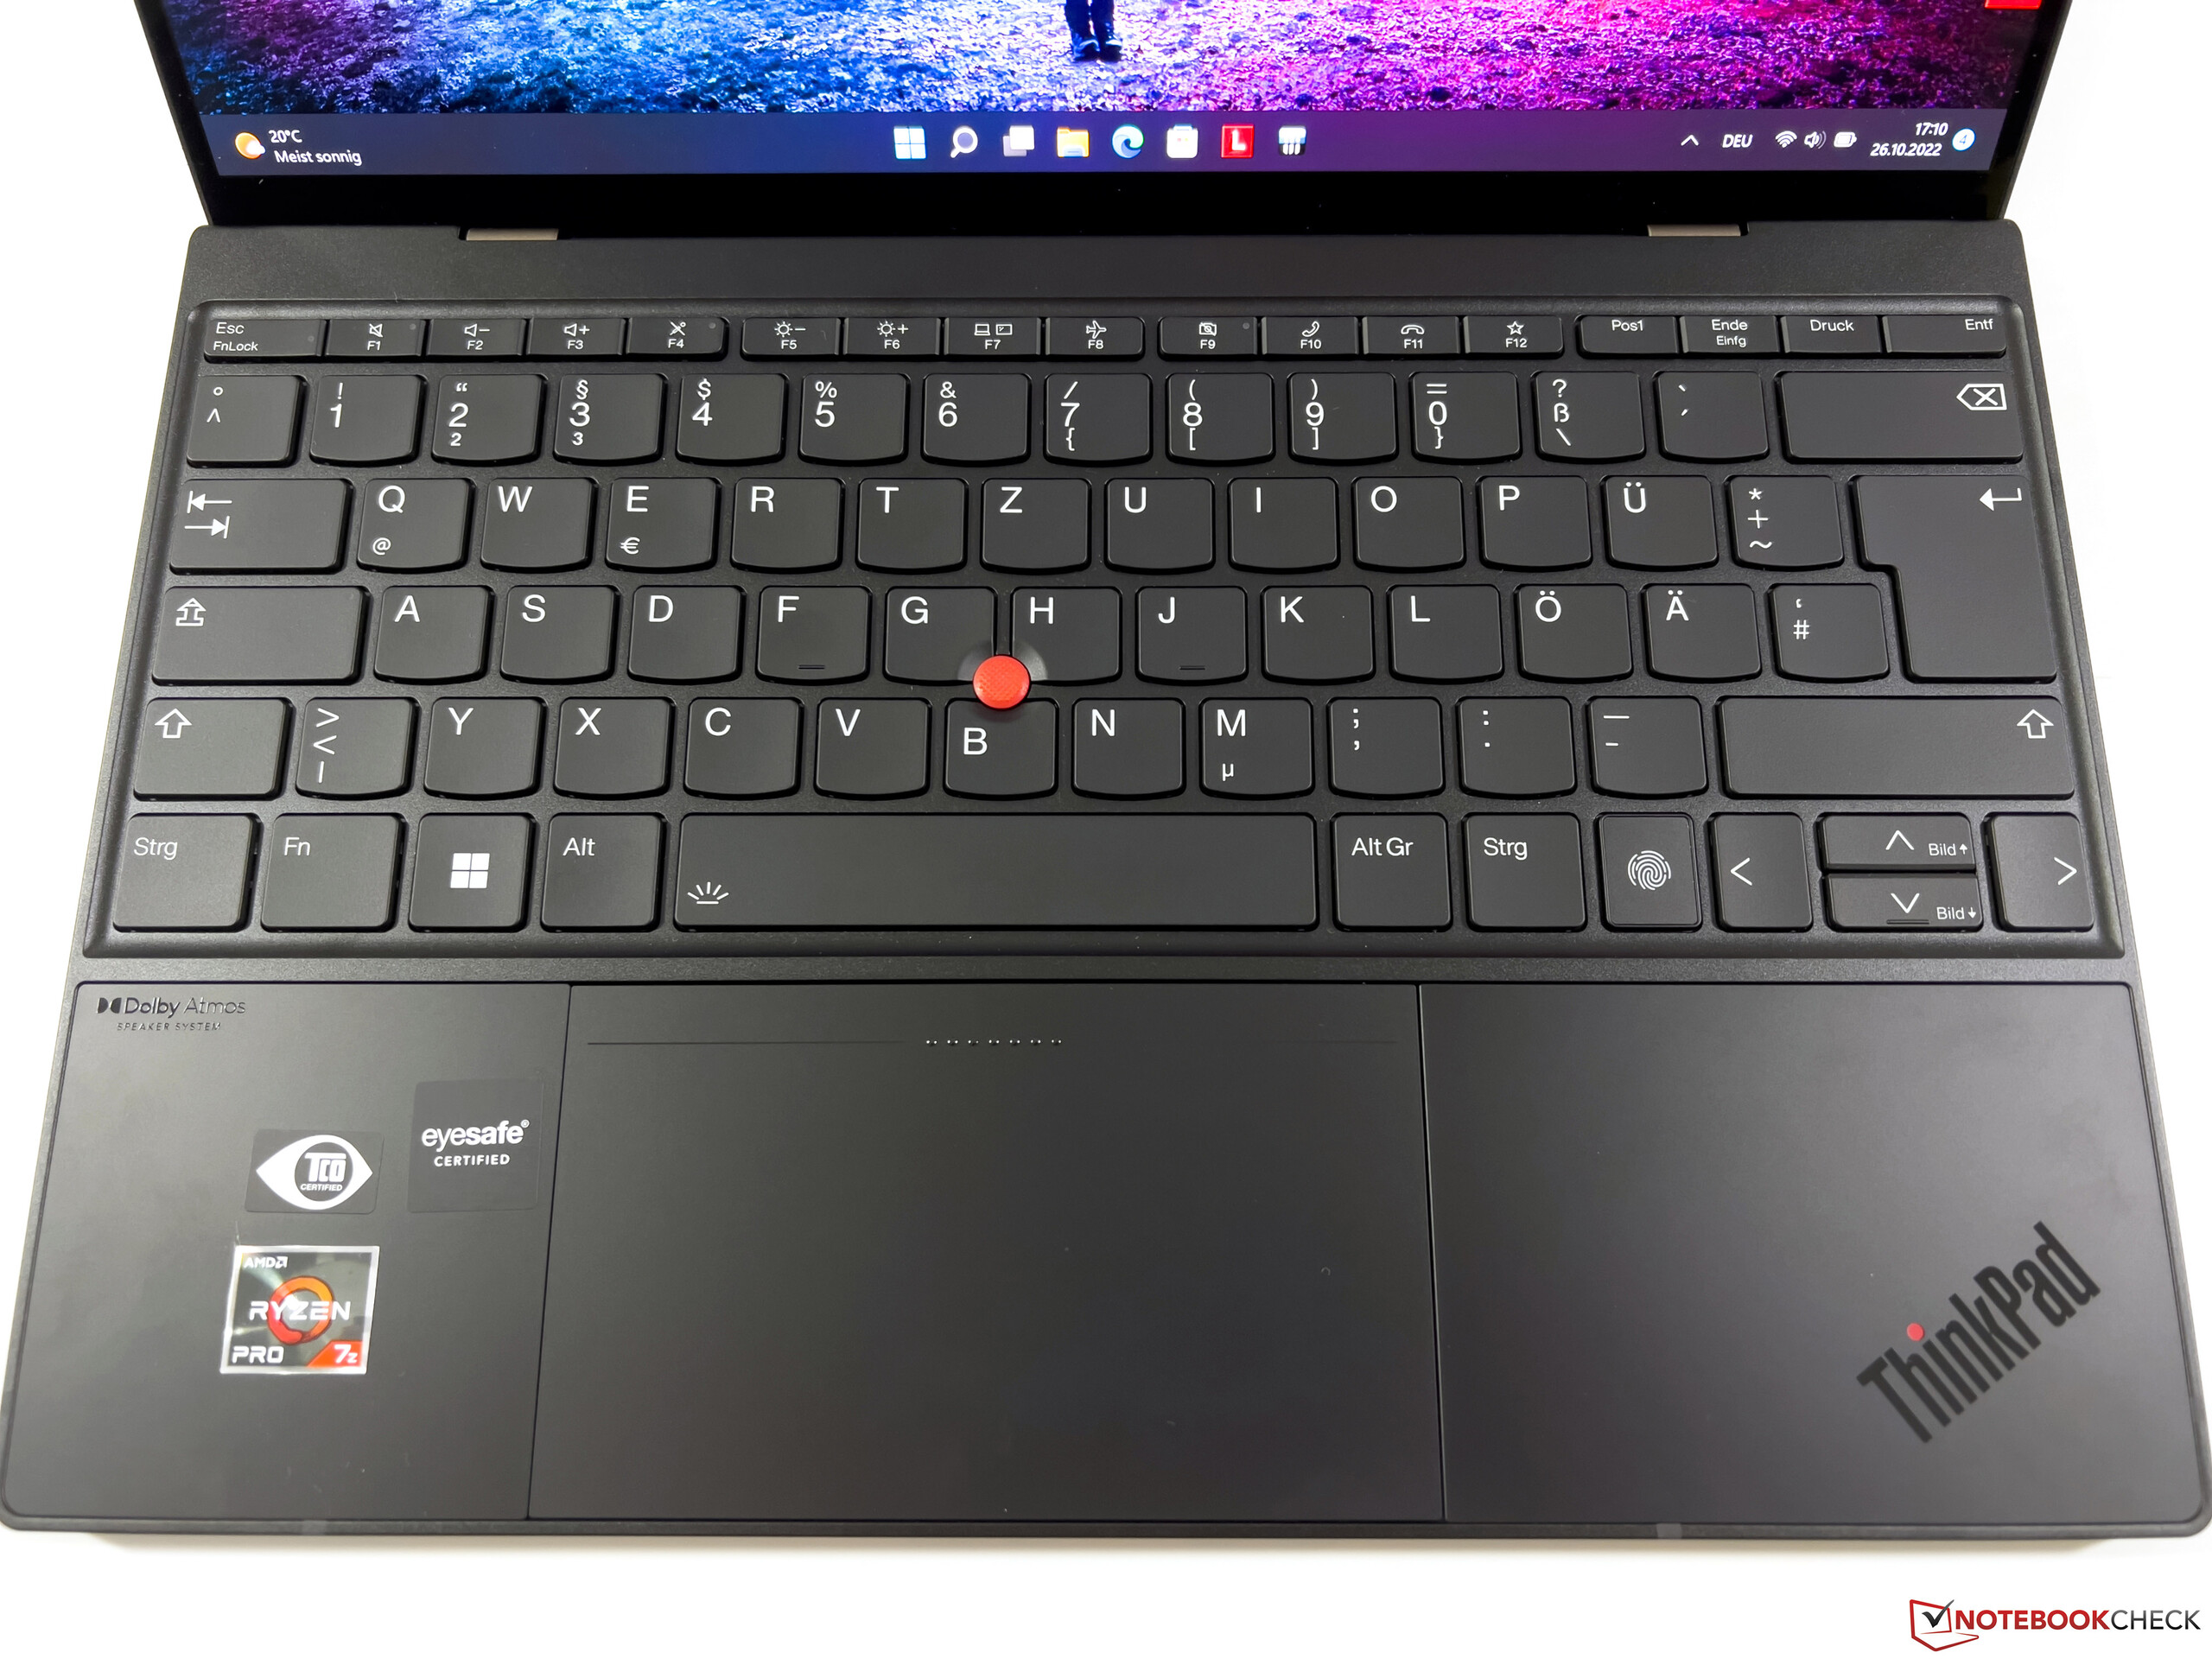
Con su serie ThinkPad Z, Lenovo tiene una línea de productos dedicada a sus modelos AMD desde hace varios meses. Ya hemos probado exhaustivamente el modelo básico del ThinkPad Z13 con un Ryzen 5 Pro y un panel IPS Full HD normal. El diseño completamente nuevo ofrece algunos enfoques nuevos y los usuarios de ThinkPad de toda la vida tendrán que acostumbrarse a algunos cambios (TrackPoint sin teclas dedicadas, bisagra que sólo se abre hasta 135 grados, reposicionamiento de la tecla Fn, sin bloqueo Kensington).
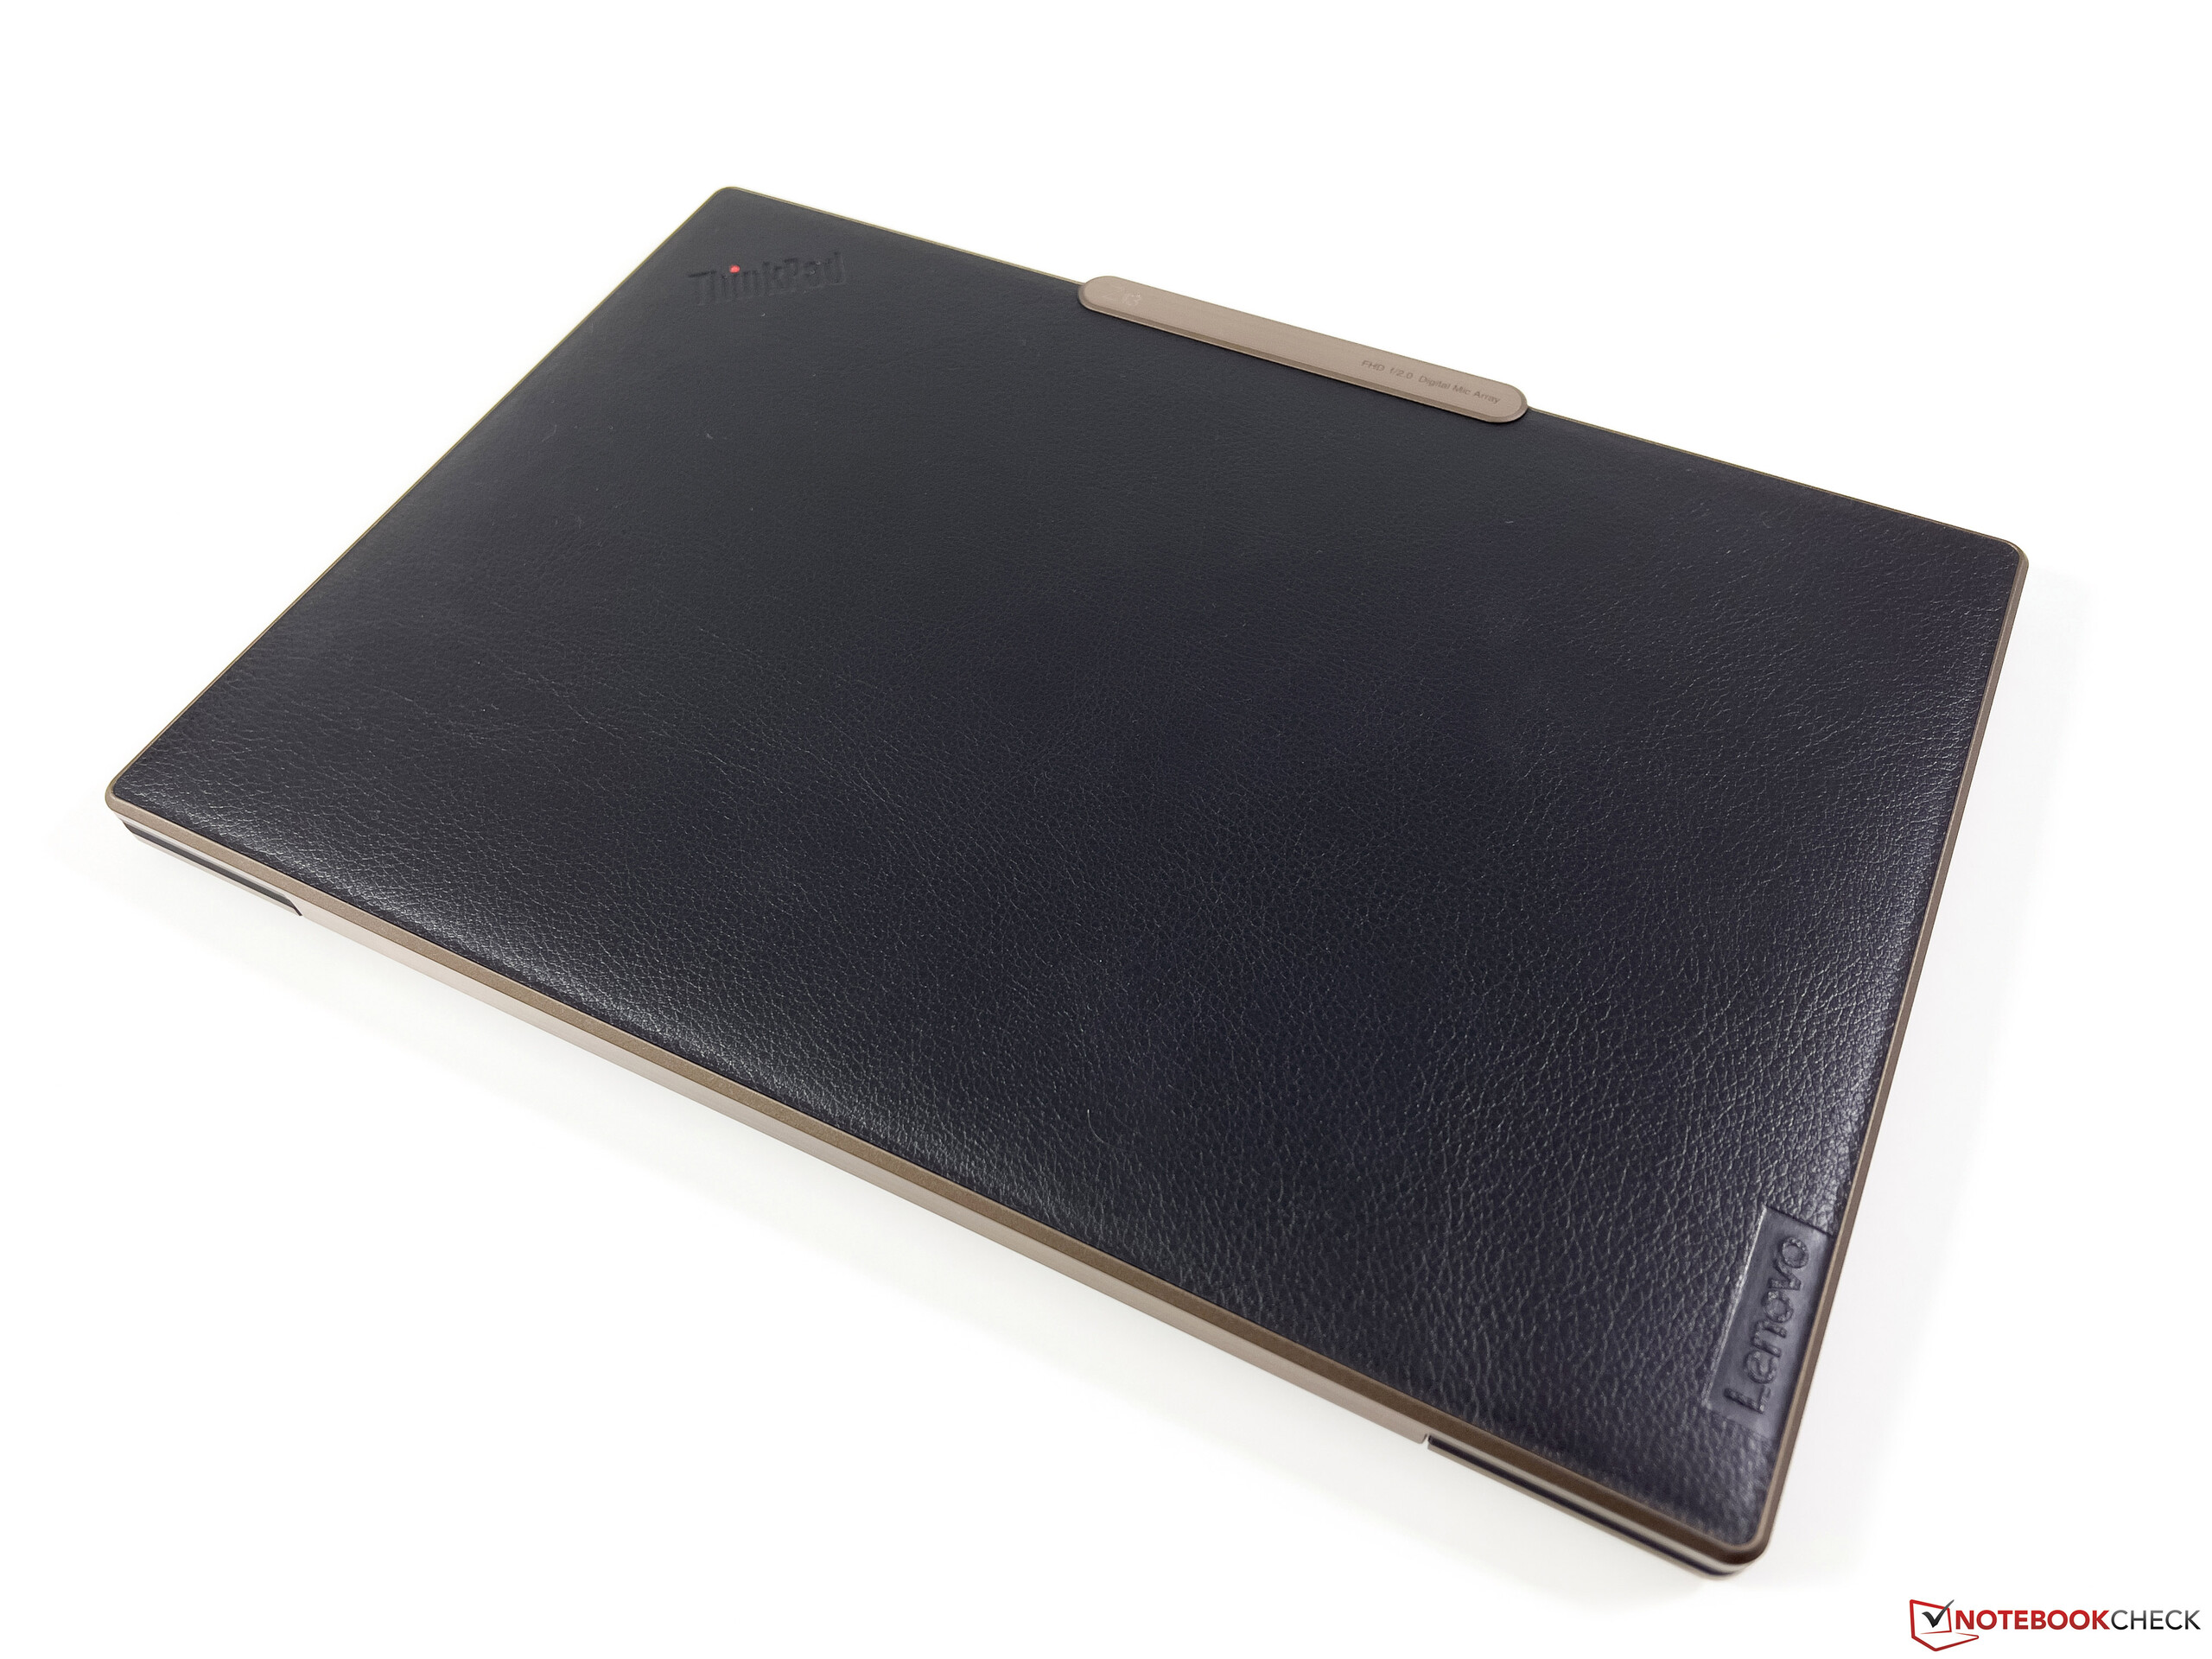
Hoy echamos un vistazo al modelo de gama alta del ThinkPad Z13 con su AMD Ryzen 7 Pro 6860Z que se ofrece en exclusiva en el ThinkPad Z13. Esta configuración tiene una pantalla OLED, un módulo LTE y un diseño especial con una tapa de pantalla de imitación de cuero con detalles en tono bronce. En este informe, nos centramos principalmente en las diferencias con el modelo básico y no repasaremos sus similitudes. Hay información pertinente en nuestro análisis detallado del ThinkPad Z13 con el Ryzen 5 Pro 6650U
- Análisis del portátil Lenovo ThinkPad Z13: El ThinkPad premium de AMD con batería de larga duración
- Análisis del portátil Lenovo ThinkPad Z16 G1: Potente buque insignia de AMD con una pega
Posibles contendientes en la comparación
Valoración | Fecha | Modelo | Peso | Altura | Tamaño | Resolución | Precio |
|---|---|---|---|---|---|---|---|
| 88.8 % v7 (old) | 10/2022 | Lenovo ThinkPad Z13 G1-21D20016GE R7 PRO 6860Z, Radeon 680M | 1.3 kg | 14 mm | 13.30" | 2880x1800 | |
| 90.1 % v7 (old) | 07/2022 | Asus Zenbook S 13 OLED R7 6800U, Radeon 680M | 1.1 kg | 14.9 mm | 13.30" | 2880x1800 | |
| 87.3 % v7 (old) | 09/2022 | Dell XPS 13 Plus 9320 i7-1280P OLED i7-1280P, Iris Xe G7 96EUs | 1.3 kg | 15.28 mm | 13.40" | 3456x2160 | |
| 92 % v7 (old) | 08/2022 | Apple MacBook Air M2 10C GPU M2, M2 10-Core GPU | 1.2 kg | 11.3 mm | 13.60" | 2560x1664 | |
| 90.5 % v7 (old) | 08/2022 | Lenovo ThinkPad Z13 21D2CTO1WW R5 PRO 6650U, Radeon 660M | 1.2 kg | 13.99 mm | 13.30" | 1920x1200 |
Caso
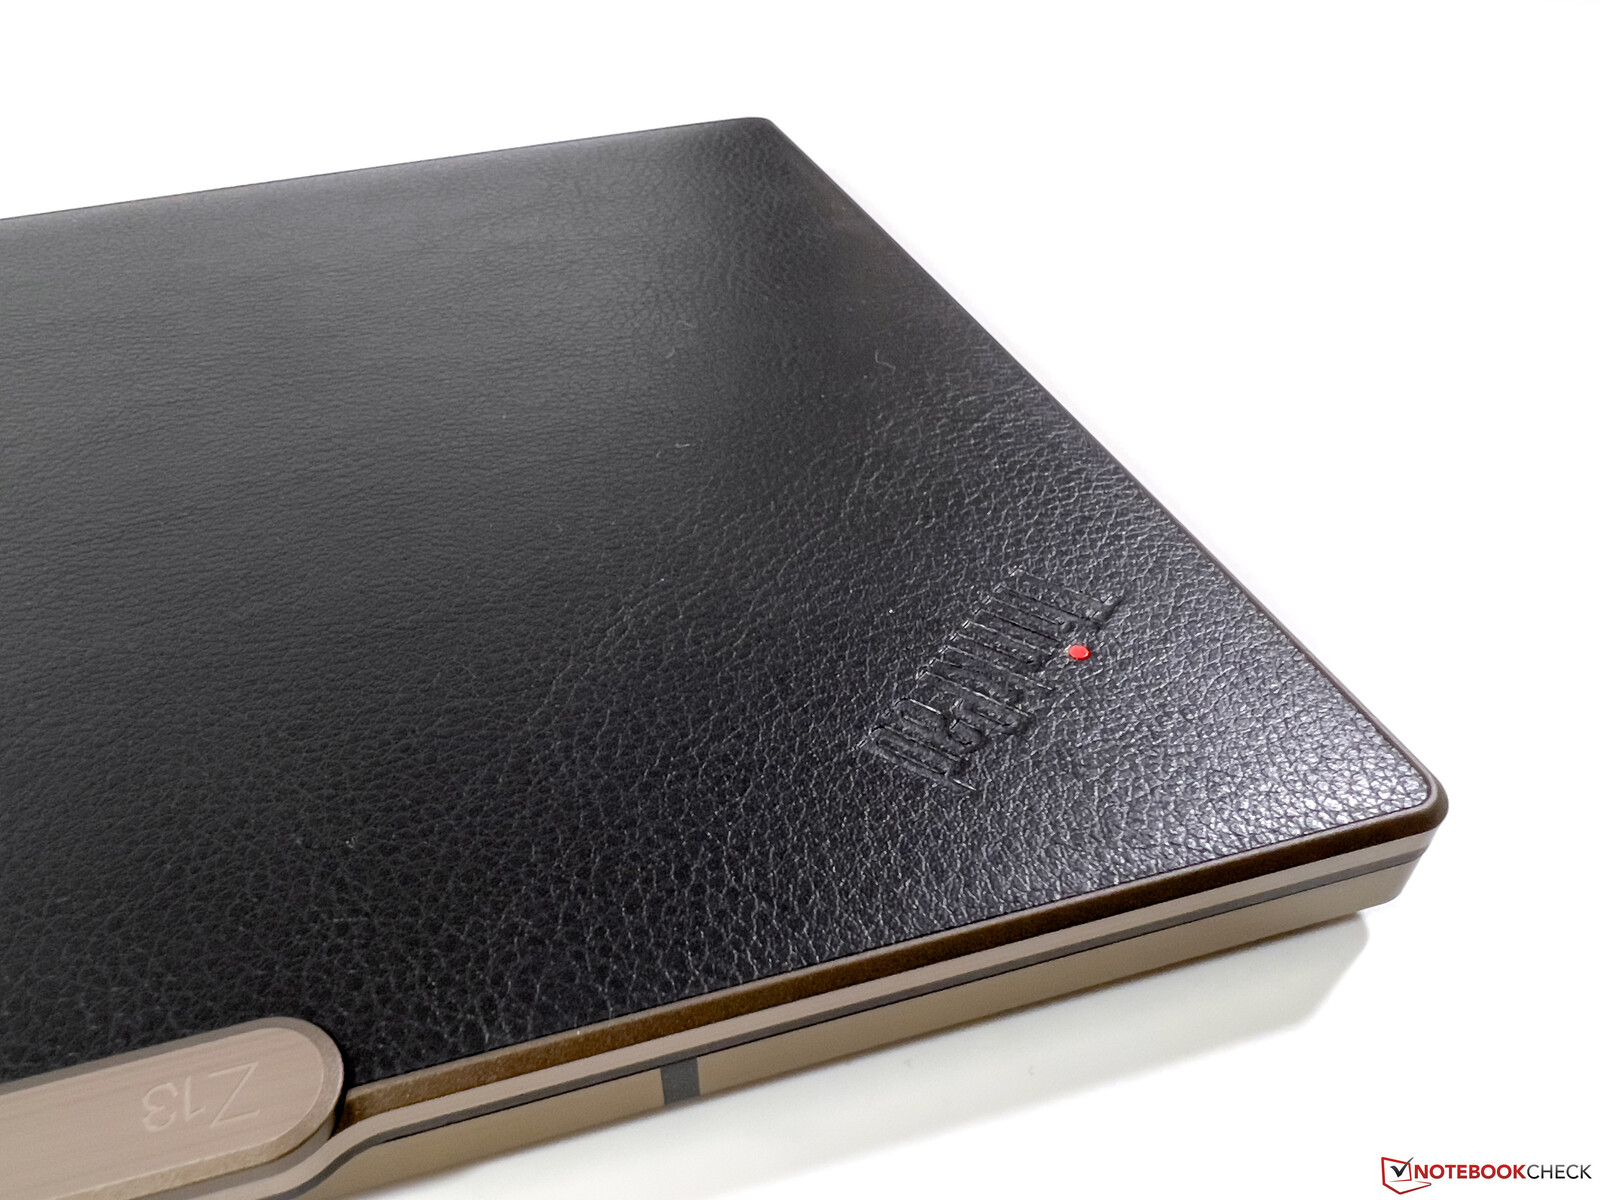
La carcasa es básicamente idéntica a la del modelo básico del ThinkPad Z13pero en la versión de gama alta hay una tapa de pantalla con una superficie negra de imitación de cuero con reflejos en tono bronce. Sin duda es una cuestión de gusto personal y Lenovo ofrece alternativas, pero la comparación con un bolso es difícil de evitar. Si el actual Z13 se ha convertido en un artículo de moda o visualmente sigue encajando en un entorno empresarial, es una cuestión de elección personal. Sin embargo, desde el punto de vista de la calidad, no hay nada malo en la carcasa y el ThinkPad Z13 es, de hecho, de muy alta calidad.

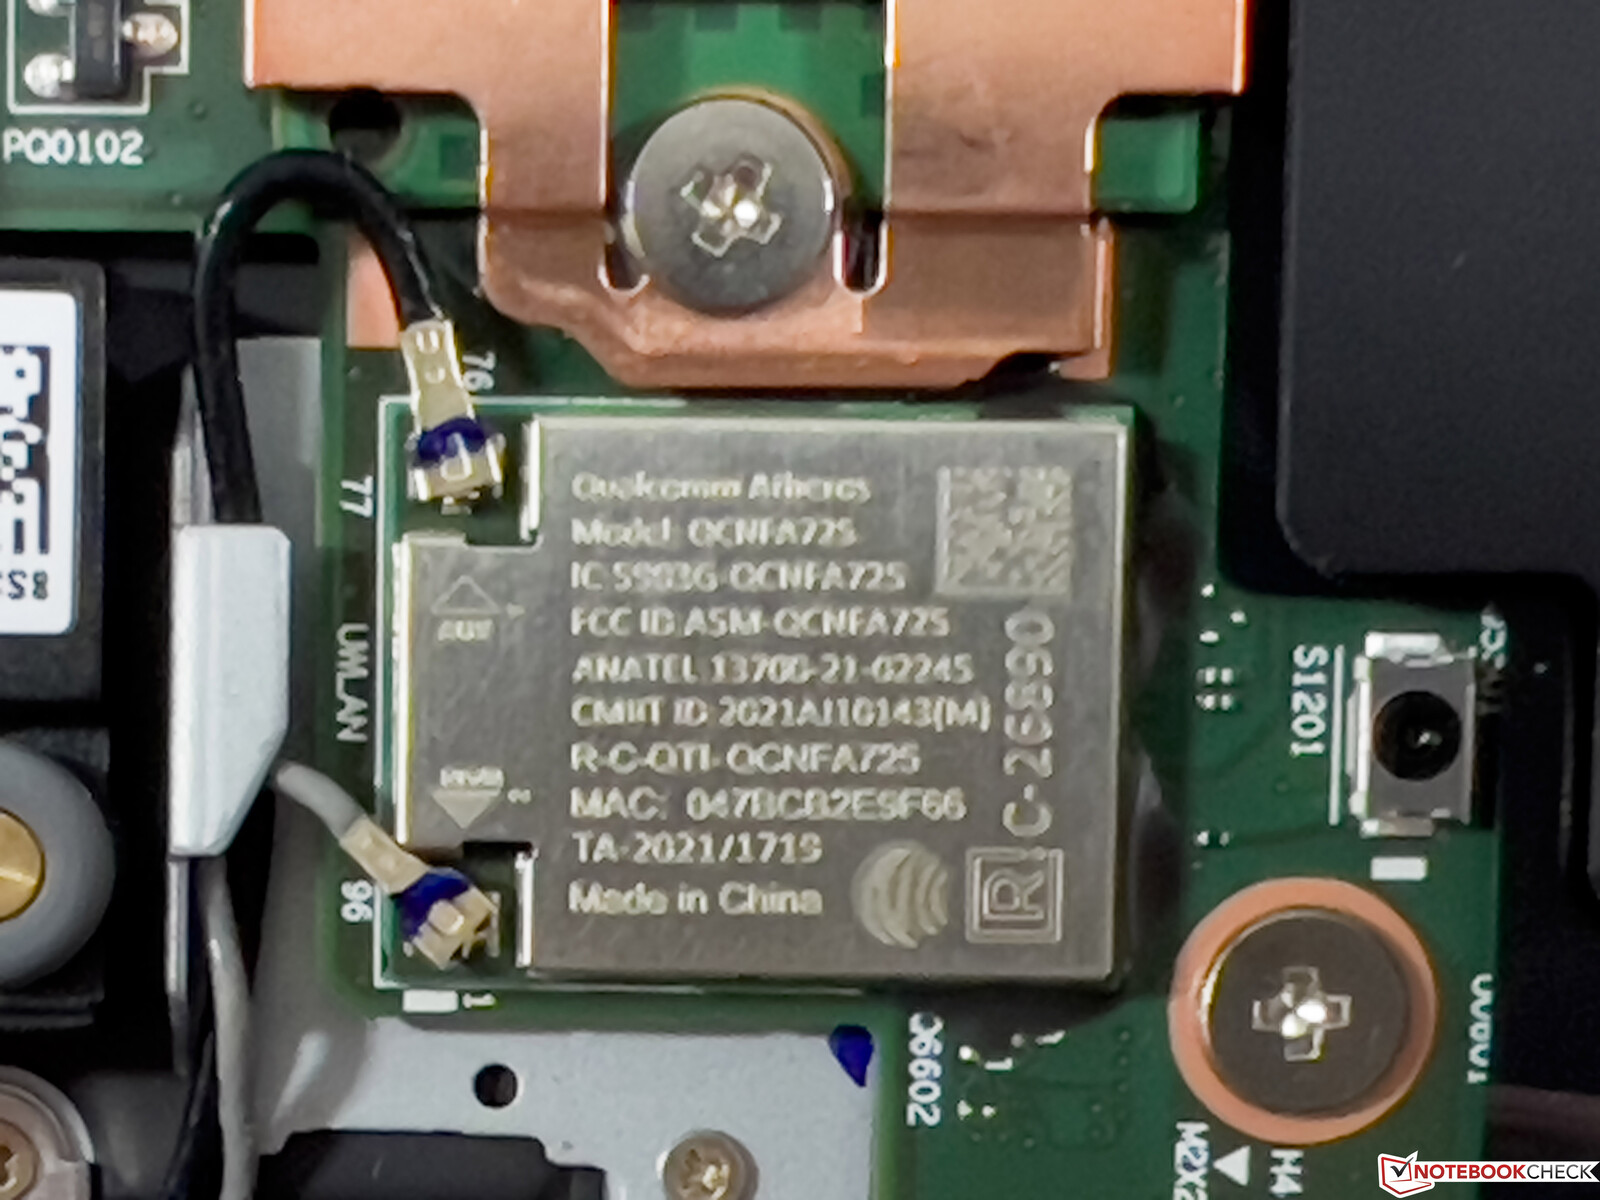
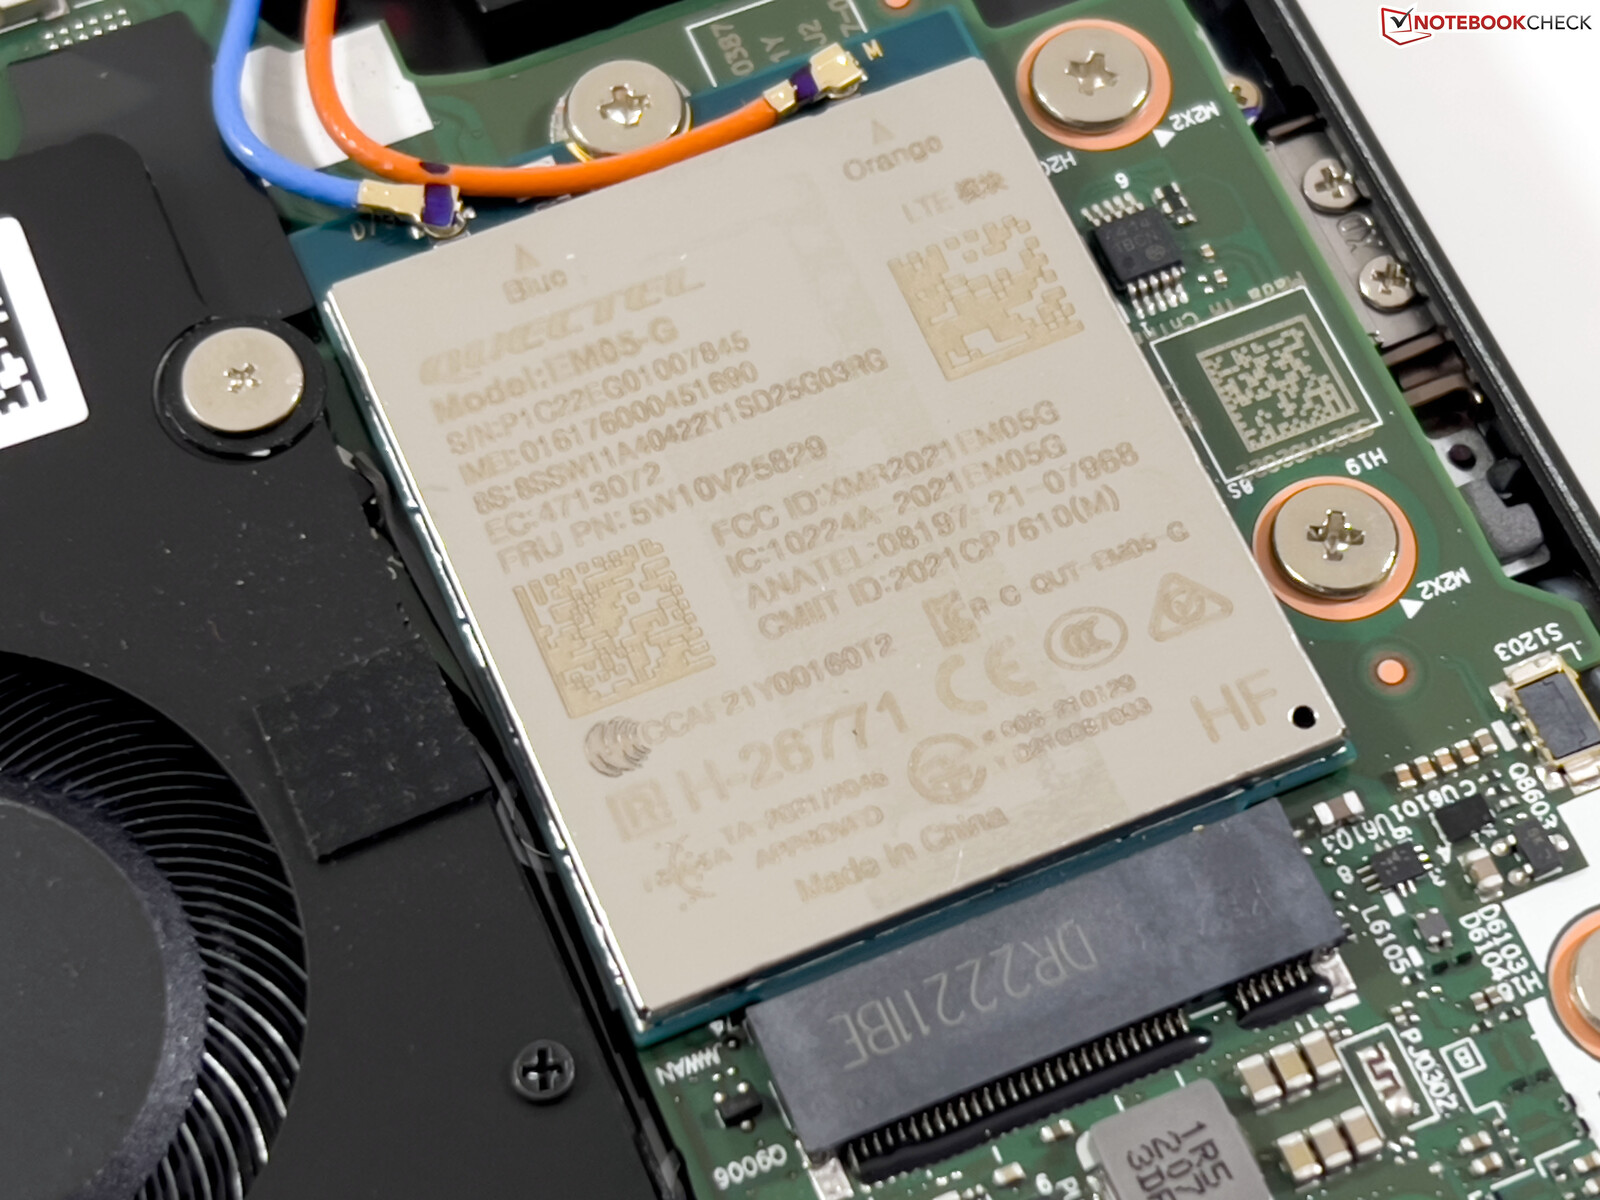
Conectividad - Z13 con Wi-Fi 6E y LTE
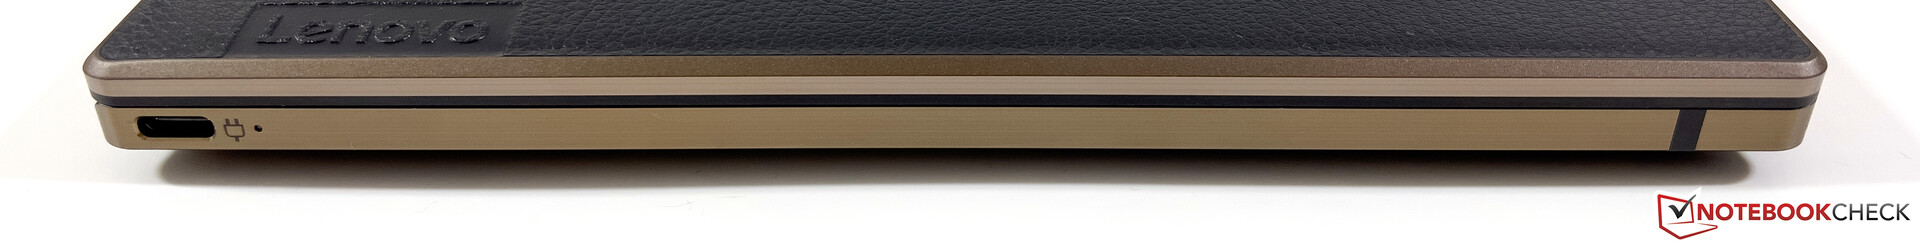
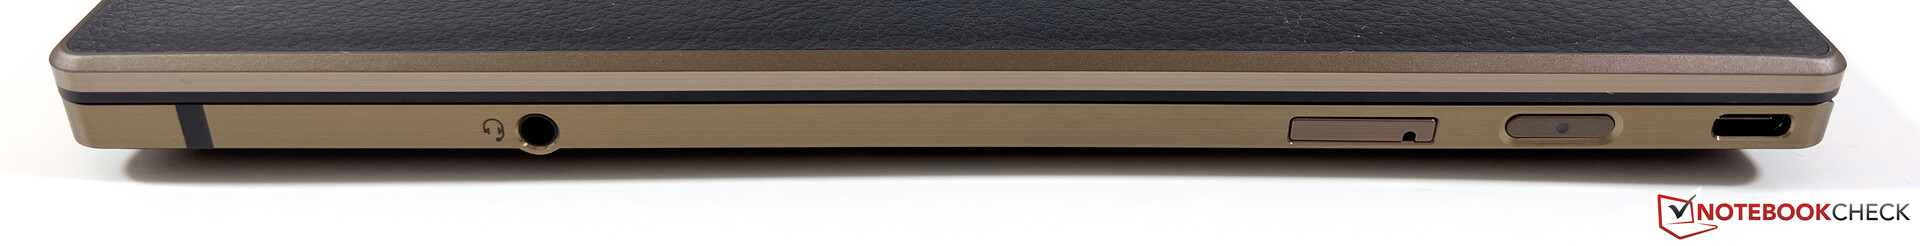
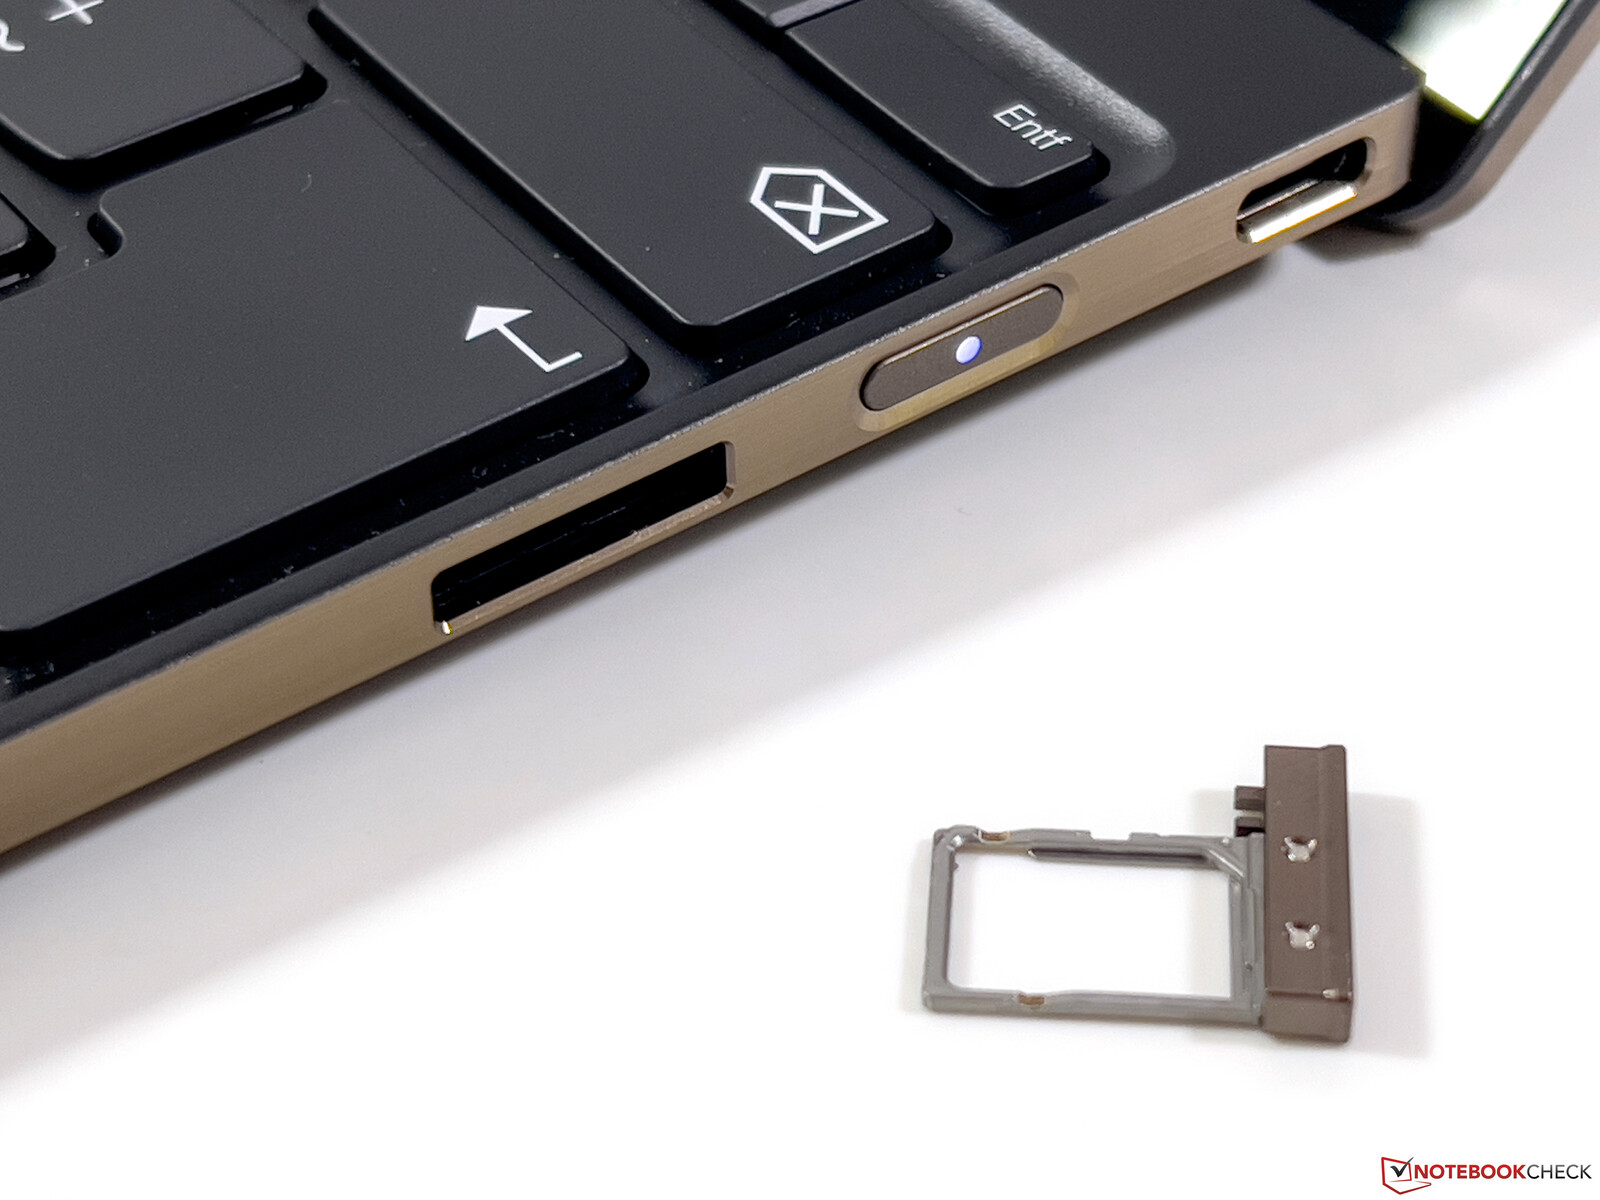
Nuestra unidad de pruebas estaba equipada con un módulo Wi-Fi 6E (Qualcomm WCN685x) y pudimos conectarnos fácilmente a la red de 6 GHz de nuestro router de referencia Asus. Las tasas de transferencia en la prueba fueron muy altas y también estables. También se instaló un módulo WWAN de Quectel en el dispositivo de pruebas, que sólo soporta LTE Cat.4. Además de una eSIM, también se puede insertar una tarjeta nano-SIM en el borde derecho. Pudimos usar una tarjeta SIM de Telekom (Alemania) en la red LTE sin problemas. Sin embargo, no hay un módulo 5G disponible.
| Networking | |
| Lenovo ThinkPad Z13 G1-21D20016GE | |
| iperf3 receive AXE11000 6GHz | |
| iperf3 transmit AXE11000 6GHz | |
| Asus Zenbook S 13 OLED | |
| iperf3 receive AXE11000 | |
| iperf3 transmit AXE11000 | |
| Lenovo ThinkPad Z13 21D2CTO1WW | |
| iperf3 receive AXE11000 6GHz | |
| iperf3 transmit AXE11000 6GHz | |
| Apple MacBook Air M2 Entry | |
| iperf3 receive AXE11000 | |
| iperf3 transmit AXE11000 | |
| Dell XPS 13 Plus 9320 4K | |
| iperf3 receive AXE11000 | |
| iperf3 transmit AXE11000 | |
| Medio Qualcomm WCN685x | |
| iperf3 receive AXE11000 6GHz | |
| iperf3 transmit AXE11000 6GHz | |
| iperf3 receive AXE11000 | |
| iperf3 transmit AXE11000 | |


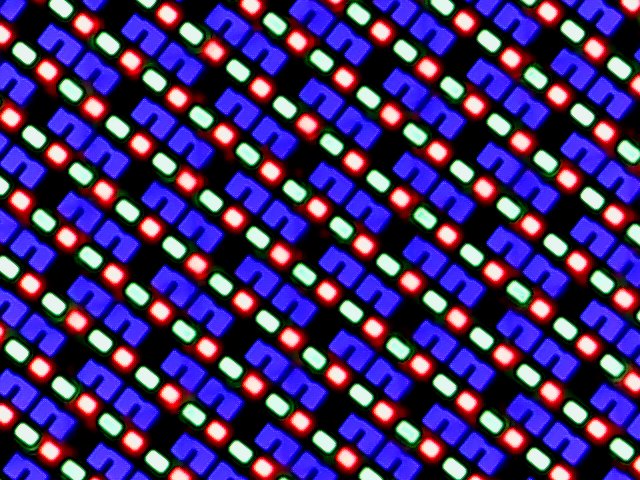
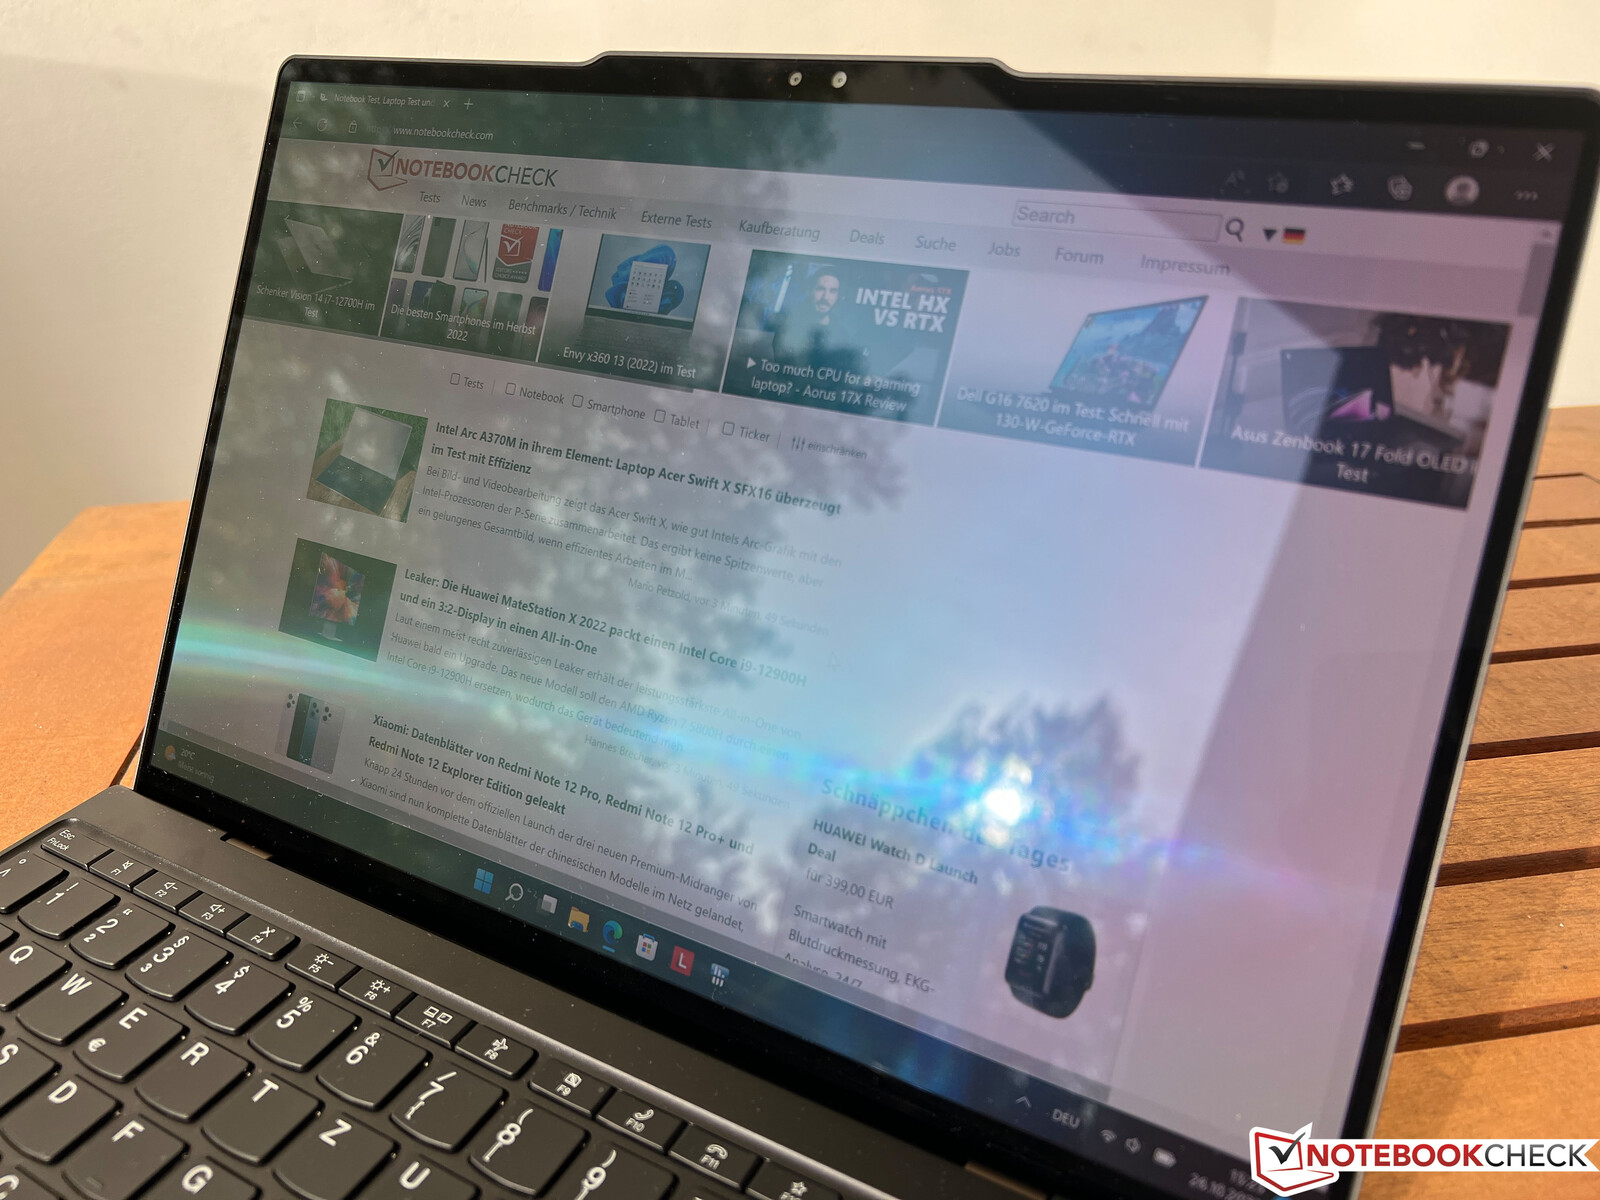
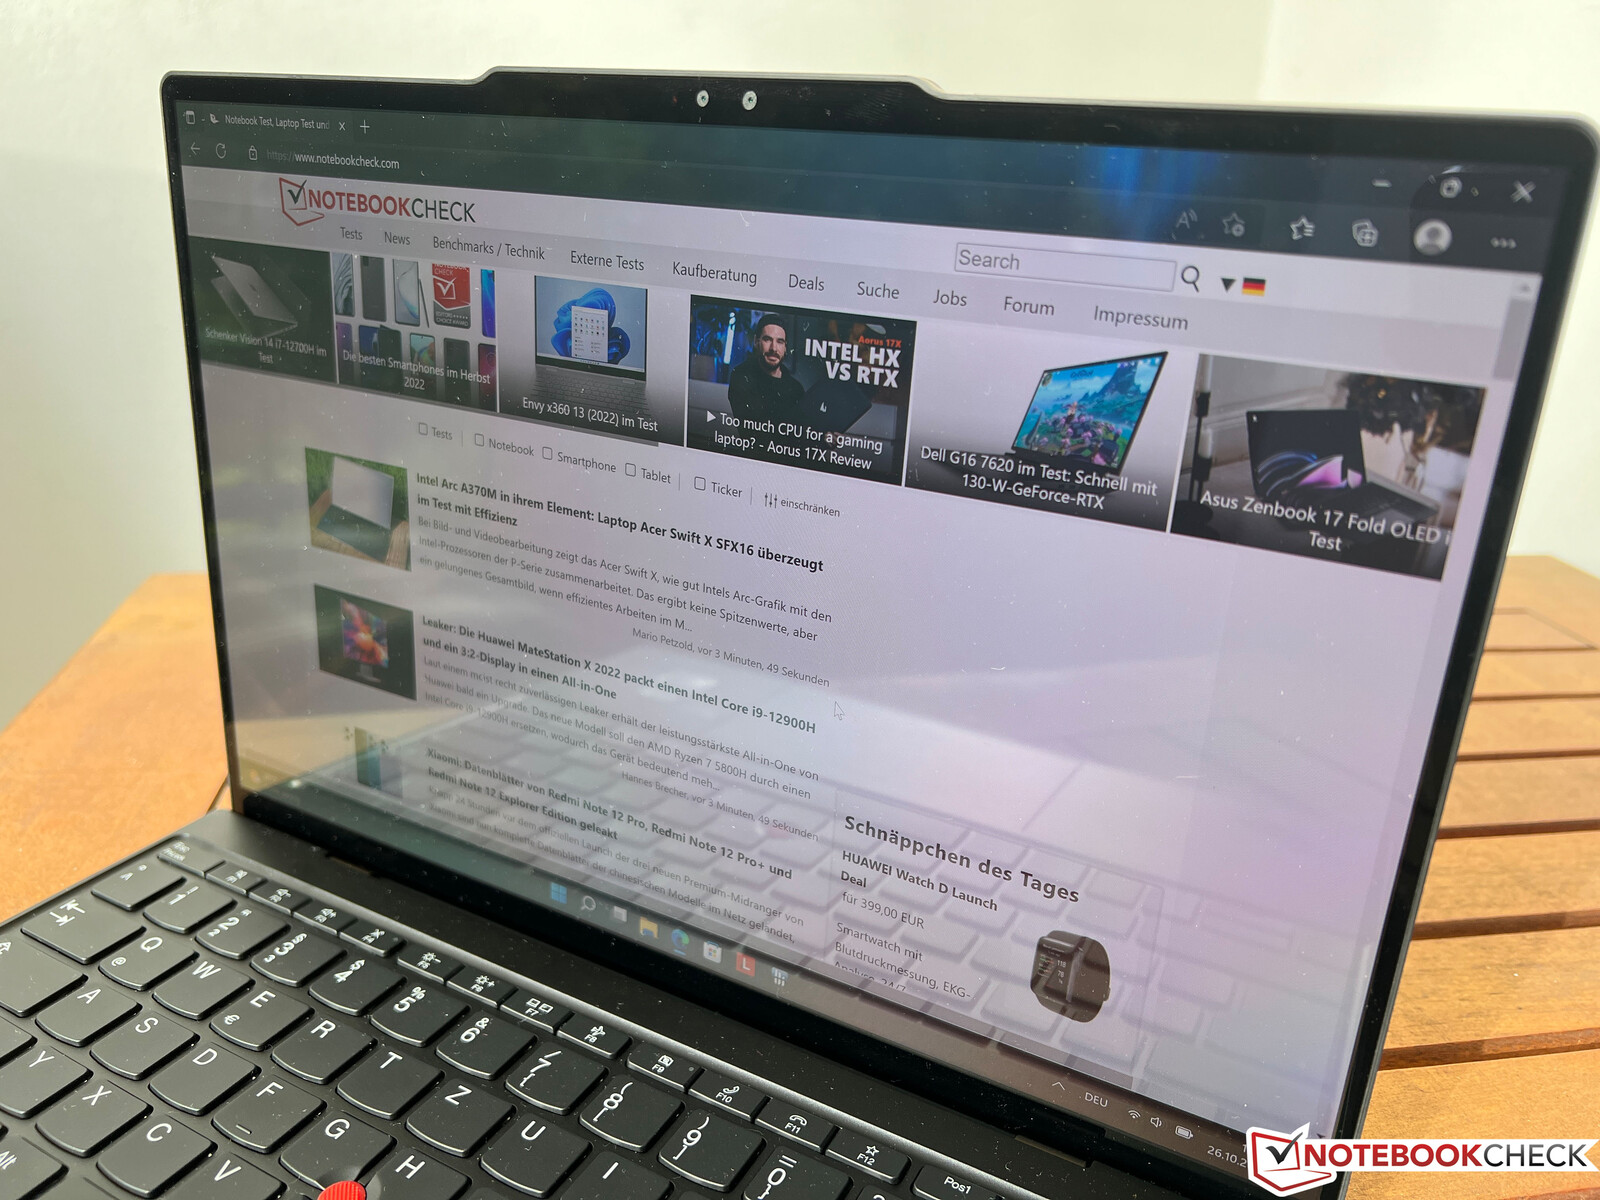
Pantalla - Pantalla táctil OLED de 2,8K
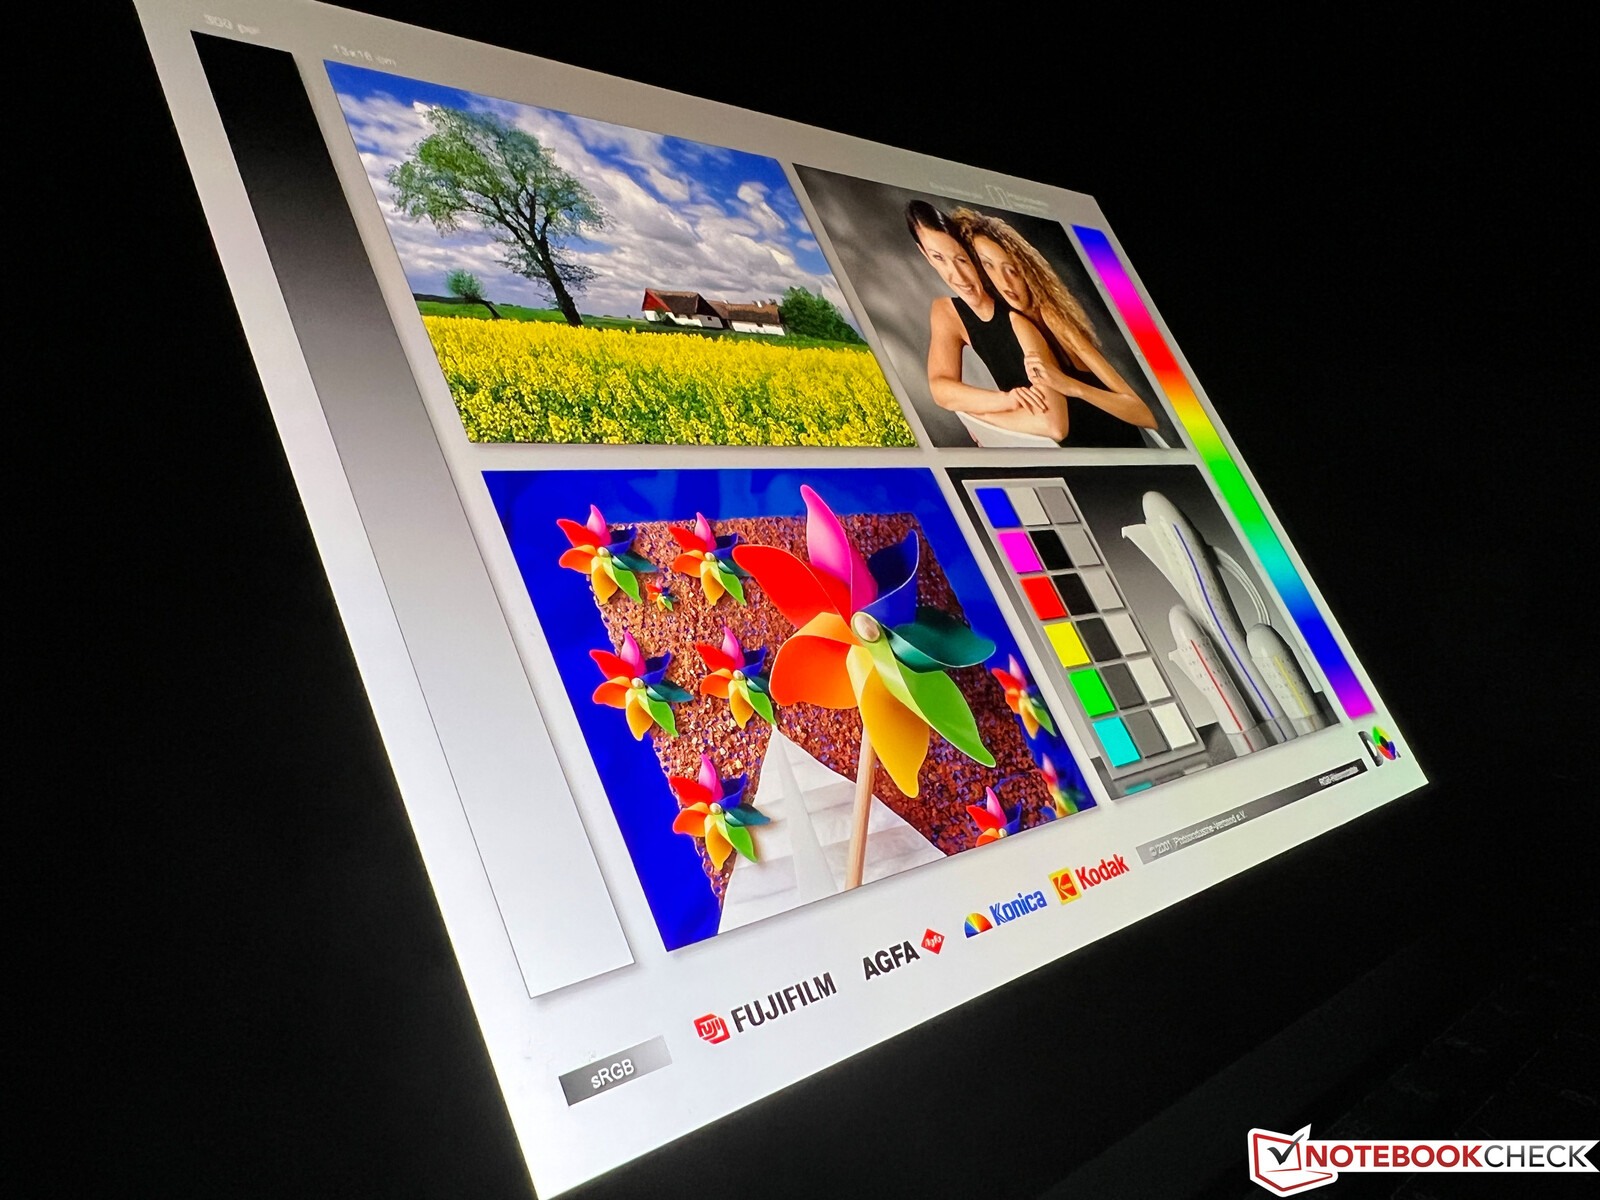
Nuestro dispositivo de prueba utiliza la pantalla táctil OLED opcional de 13,3 pulgadas con una resolución de 2.880 x 1.800 píxeles. Subjetivamente, la imagen del panel reflectante causa una buena impresión en principio. El contenido se muestra con mucha nitidez y los colores son muy fuertes. Sin embargo, con contenidos brillantes, se aprecia un efecto de rejilla (efecto moiré) que requiere que uno se siente relativamente cerca de la pantalla. Windows utiliza su modo de color oscuro por defecto para ahorrar energía, por lo que en la práctica el efecto no es perceptible.
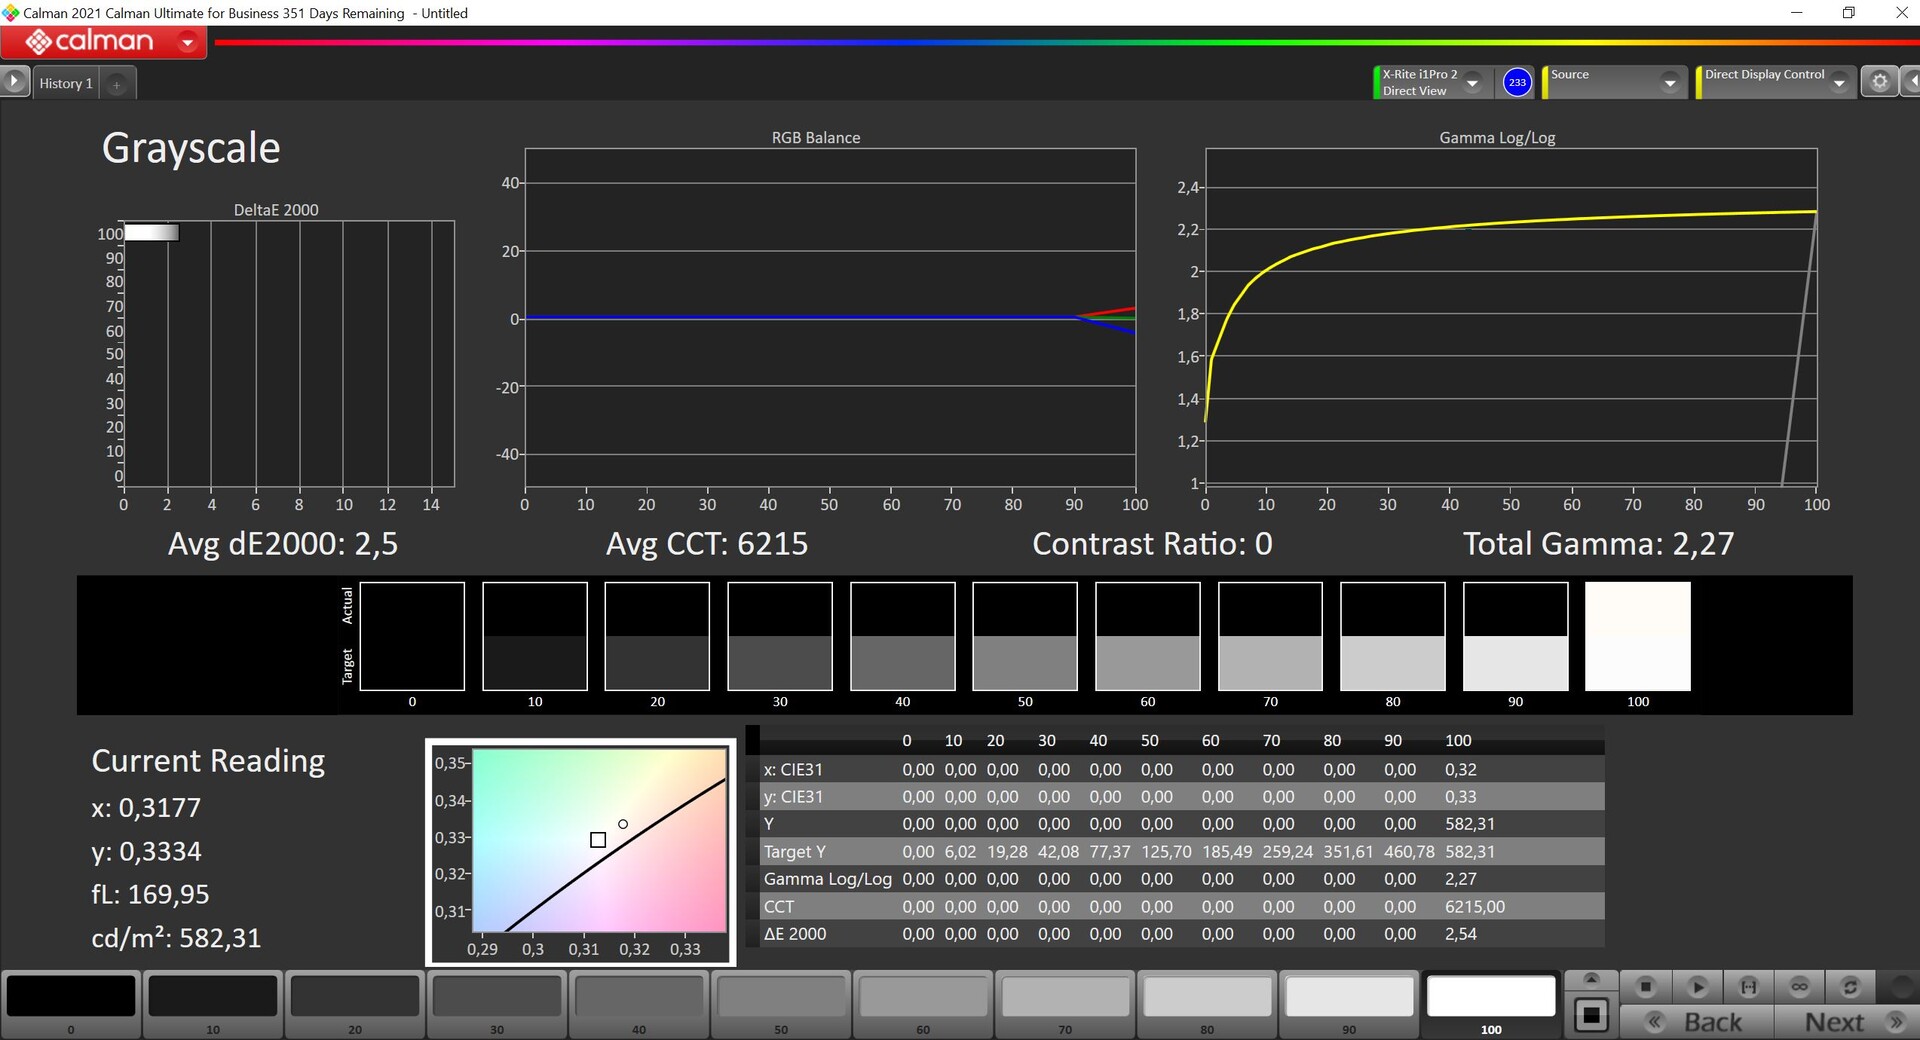
Lenovo anuncia un brillo de 400 cd/m², por lo que hay que distinguir aquí (como es habitual en los paneles OLED) entre contenido SDR y HDR. En el modo SDR normal, determinamos un brillo de alrededor de 380 cd/m² y junto con el nivel de negro extremadamente bajo, se obtiene una relación de contraste extremadamente alta. En el modo HDR (que hay que activar manualmente), se alcanza un máximo de 582 cd/m² para secciones de imagen pequeñas y alrededor de 470 cd/m² para una imagen casi completamente brillante. La estabilidad del ángulo de visión es muy buena y los tiempos de respuesta son extremadamente rápidos. No hay halos en los paneles OLED.
| |||||||||||||||||||||||||
iluminación: 98 %
Brillo con batería: 373 cd/m²
Contraste: 9275:1 (Negro: 0.04 cd/m²)
ΔE ColorChecker Calman: 2.5 | ∀{0.5-29.43 Ø4.71}
calibrated: 1.9
ΔE Greyscale Calman: 2 | ∀{0.09-98 Ø4.96}
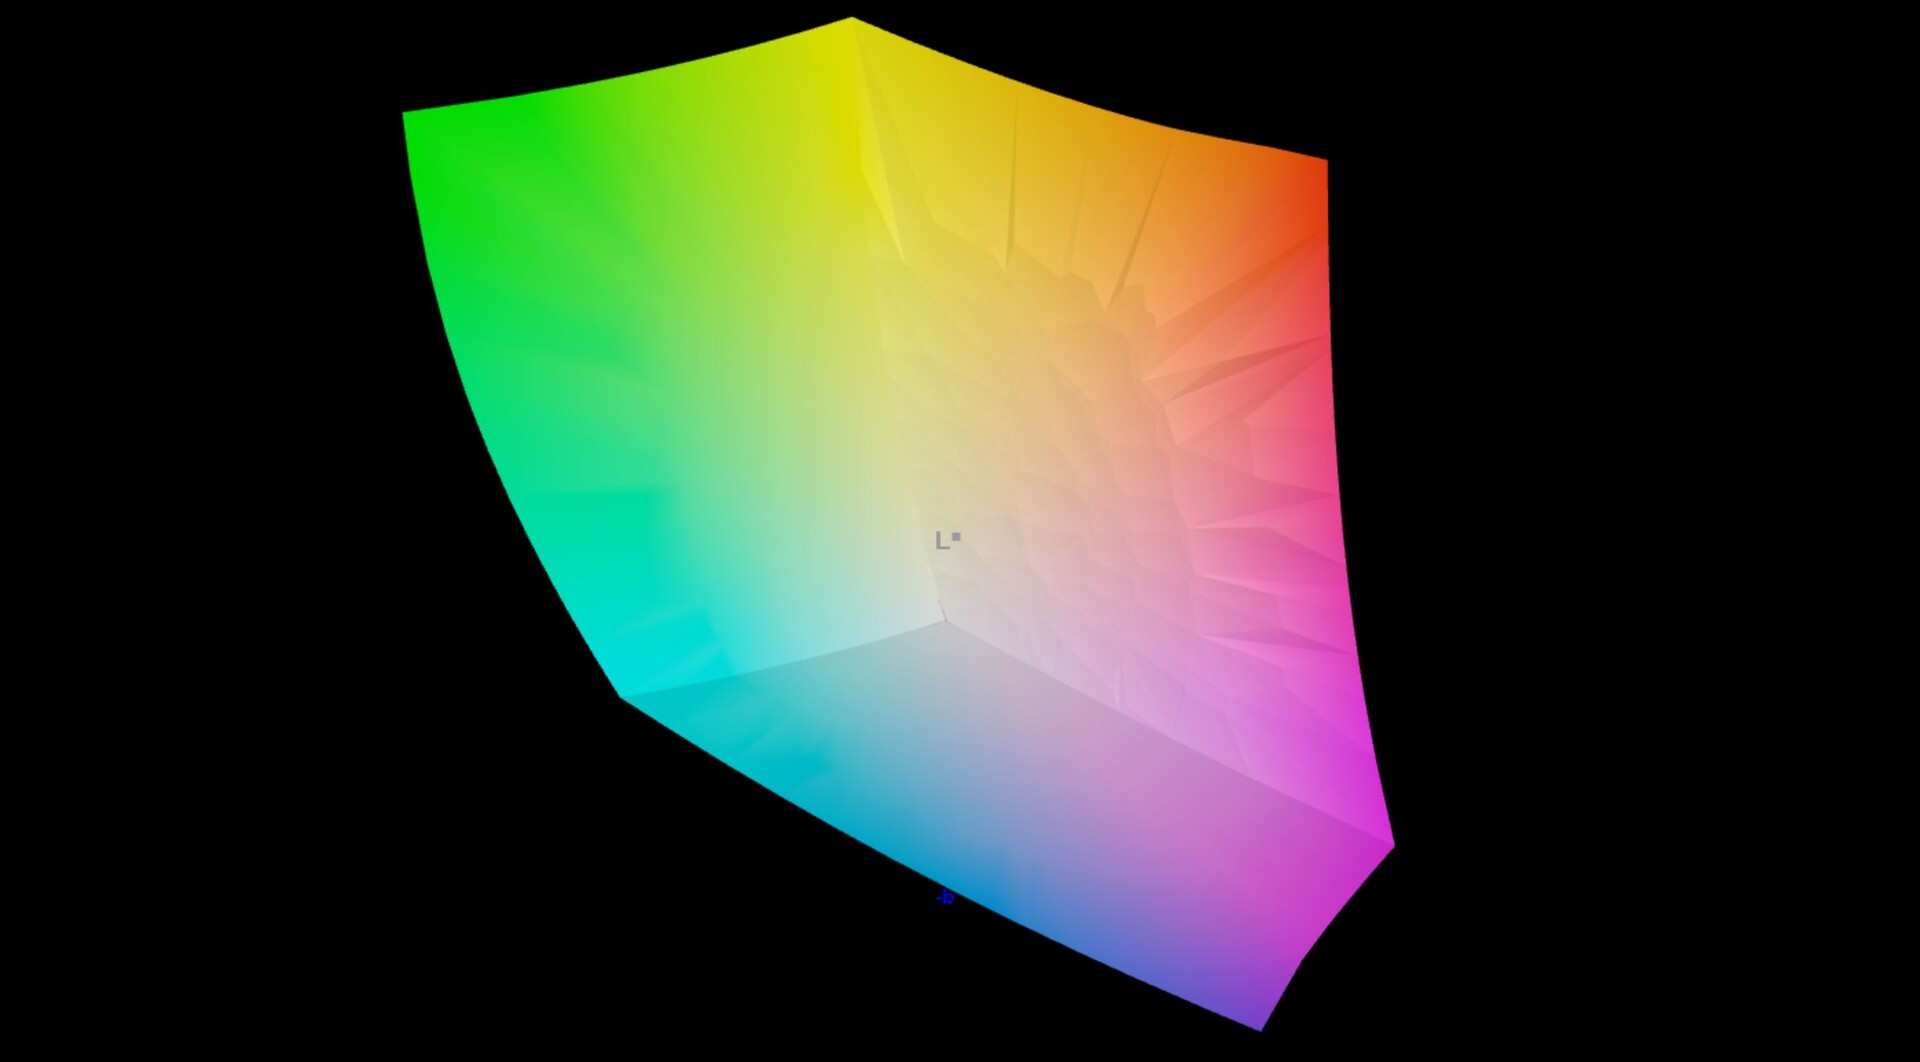
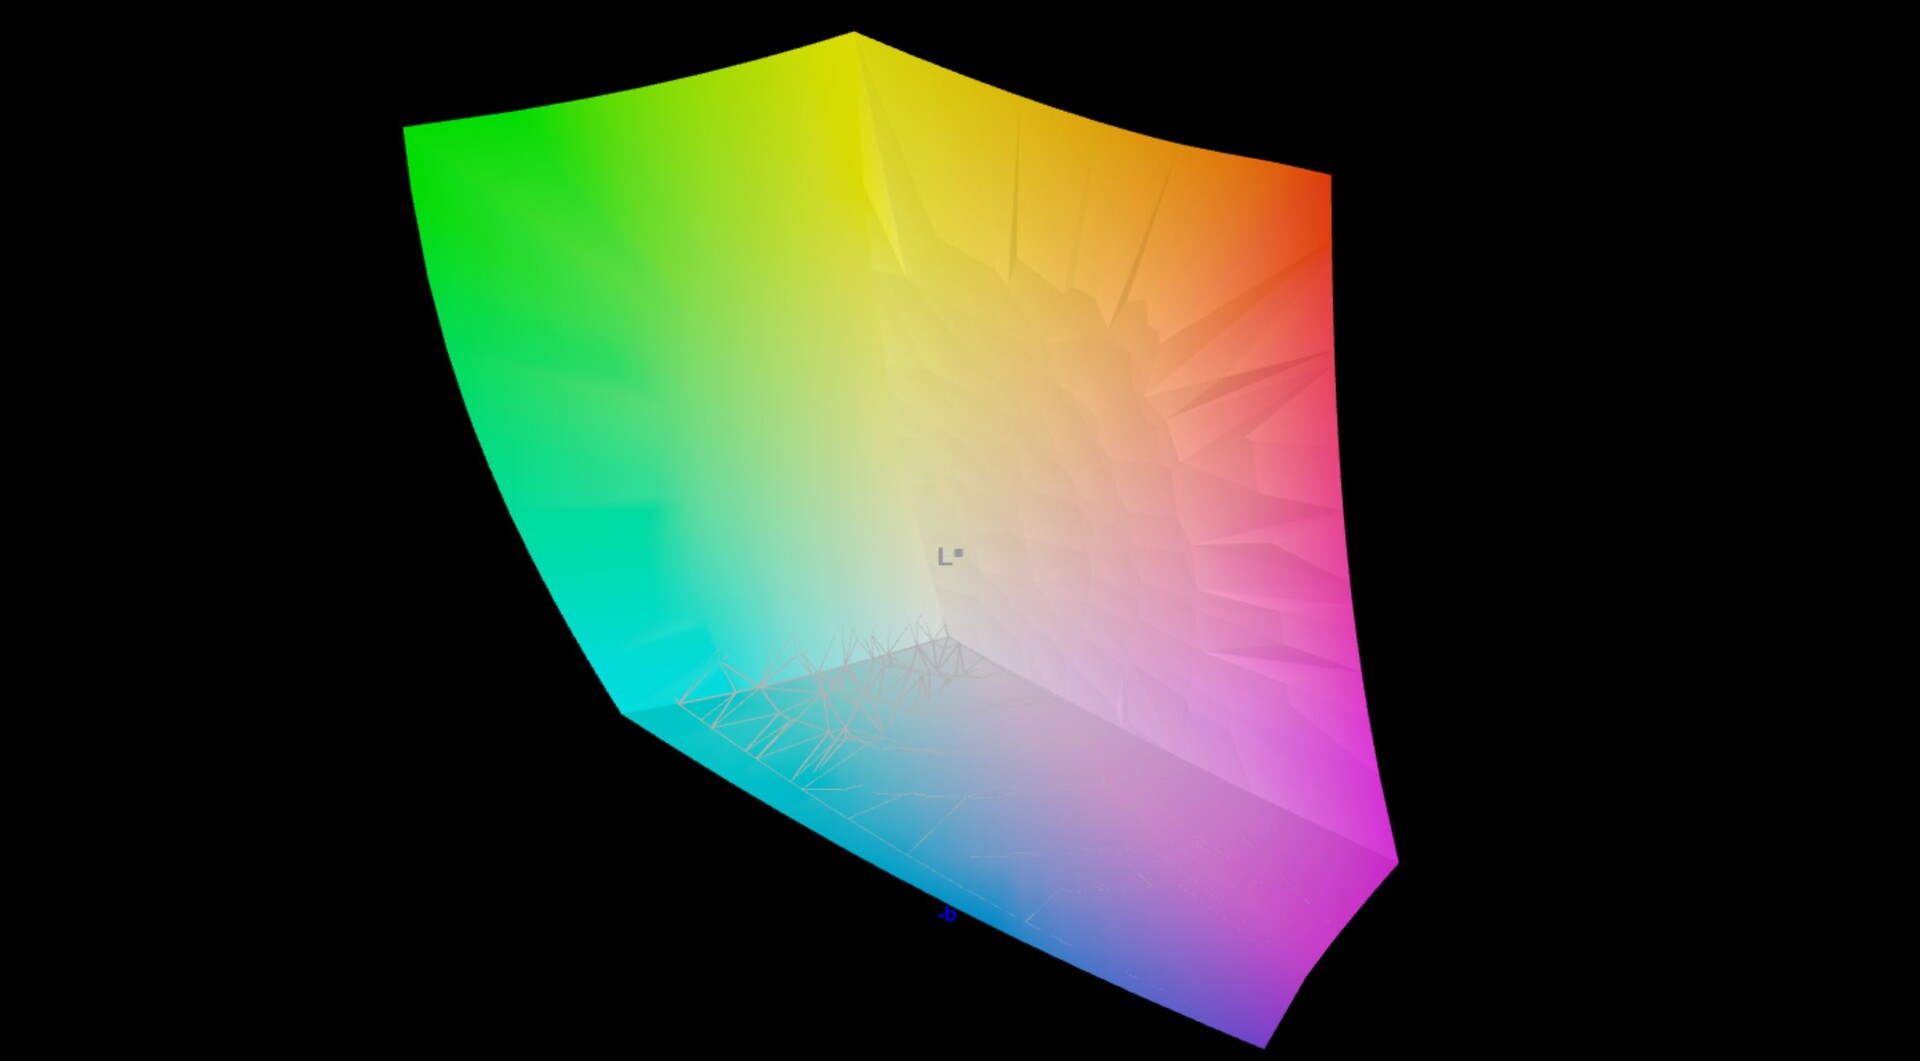
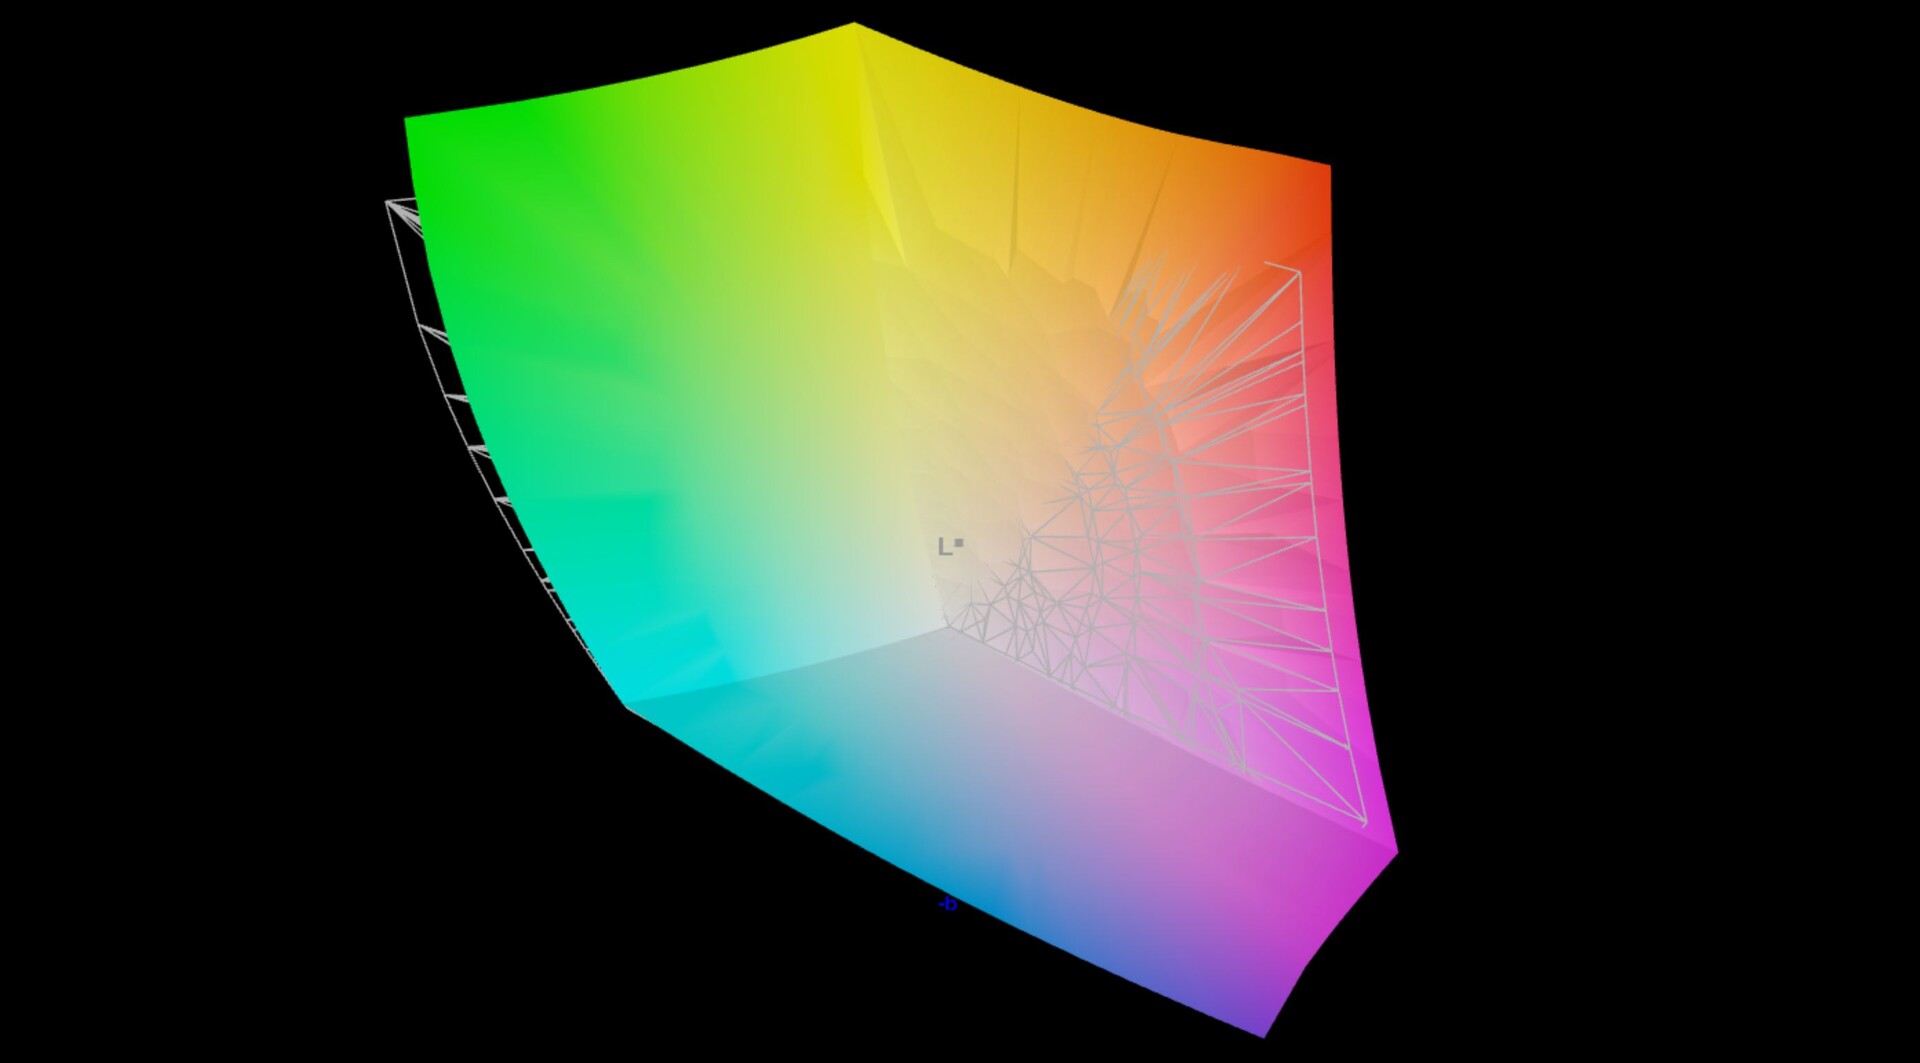
97.5% AdobeRGB 1998 (Argyll 3D)
100% sRGB (Argyll 3D)
99.9% Display P3 (Argyll 3D)
Gamma: 2.17
CCT: 6228 K
| Lenovo ThinkPad Z13 G1-21D20016GE ATNA33AA02-0, OLED, 2880x1800, 13.3" | Asus Zenbook S 13 OLED SDC4172, OLED, 2880x1800, 13.3" | Dell XPS 13 Plus 9320 i7-1280P OLED Samsung 134XK04, OLED, 3456x2160, 13.4" | Lenovo ThinkPad Z13 21D2CTO1WW NV133WUM-N63, IPS LED, 1920x1200, 13.3" | Apple MacBook Air M2 Entry IPS, 2560x1664, 13.6" | |
|---|---|---|---|---|---|
| Display | 0% | 0% | -21% | -4% | |
| Display P3 Coverage (%) | 99.9 | 99.8 0% | 99.5 0% | 67.7 -32% | 98.4 -2% |
| sRGB Coverage (%) | 100 | 100 0% | 100 0% | 96.5 -3% | 99.9 0% |
| AdobeRGB 1998 Coverage (%) | 97.5 | 97.8 0% | 98.4 1% | 69.7 -29% | 87.6 -10% |
| Response Times | -8% | -34% | -1909% | -1544% | |
| Response Time Grey 50% / Grey 80% * (ms) | 1.9 ? | 2.1 ? -11% | 2.6 ? -37% | 49 ? -2479% | 32.9 ? -1632% |
| Response Time Black / White * (ms) | 1.6 ? | 1.68 ? -5% | 2.1 ? -31% | 23 ? -1338% | 24.9 ? -1456% |
| PWM Frequency (Hz) | 240 ? | 240.4 ? | 59.5 | ||
| Screen | 24% | -6% | -81% | -81% | |
| Brightness middle (cd/m²) | 371 | 336 -9% | 371.8 0% | 418 13% | 526 42% |
| Brightness (cd/m²) | 378 | 338 -11% | 374 -1% | 379 0% | 486 29% |
| Brightness Distribution (%) | 98 | 99 1% | 98 0% | 81 -17% | 87 -11% |
| Black Level * (cd/m²) | 0.04 | 0.02 50% | 0.33 -725% | 0.38 -850% | |
| Contrast (:1) | 9275 | 16800 81% | 1267 -86% | 1384 -85% | |
| Colorchecker dE 2000 * | 2.5 | 1.8 28% | 2.37 5% | 1.7 32% | 1.3 48% |
| Colorchecker dE 2000 max. * | 4.4 | 3.8 14% | 6.1 -39% | 3.3 25% | 2.7 39% |
| Colorchecker dE 2000 calibrated * | 1.9 | 1.8 5% | 1.1 42% | 0.7 63% | |
| Greyscale dE 2000 * | 2 | 0.9 55% | 2 -0% | 2.3 -15% | 2 -0% |
| Gamma | 2.17 101% | 2.22 99% | 2.29 96% | 2.14 103% | 2.25 98% |
| CCT | 6228 104% | 6580 99% | 6261 104% | 6499 100% | 6858 95% |
| Media total (Programa/Opciones) | 5% /
14% | -13% /
-9% | -670% /
-329% | -543% /
-273% |
* ... más pequeño es mejor
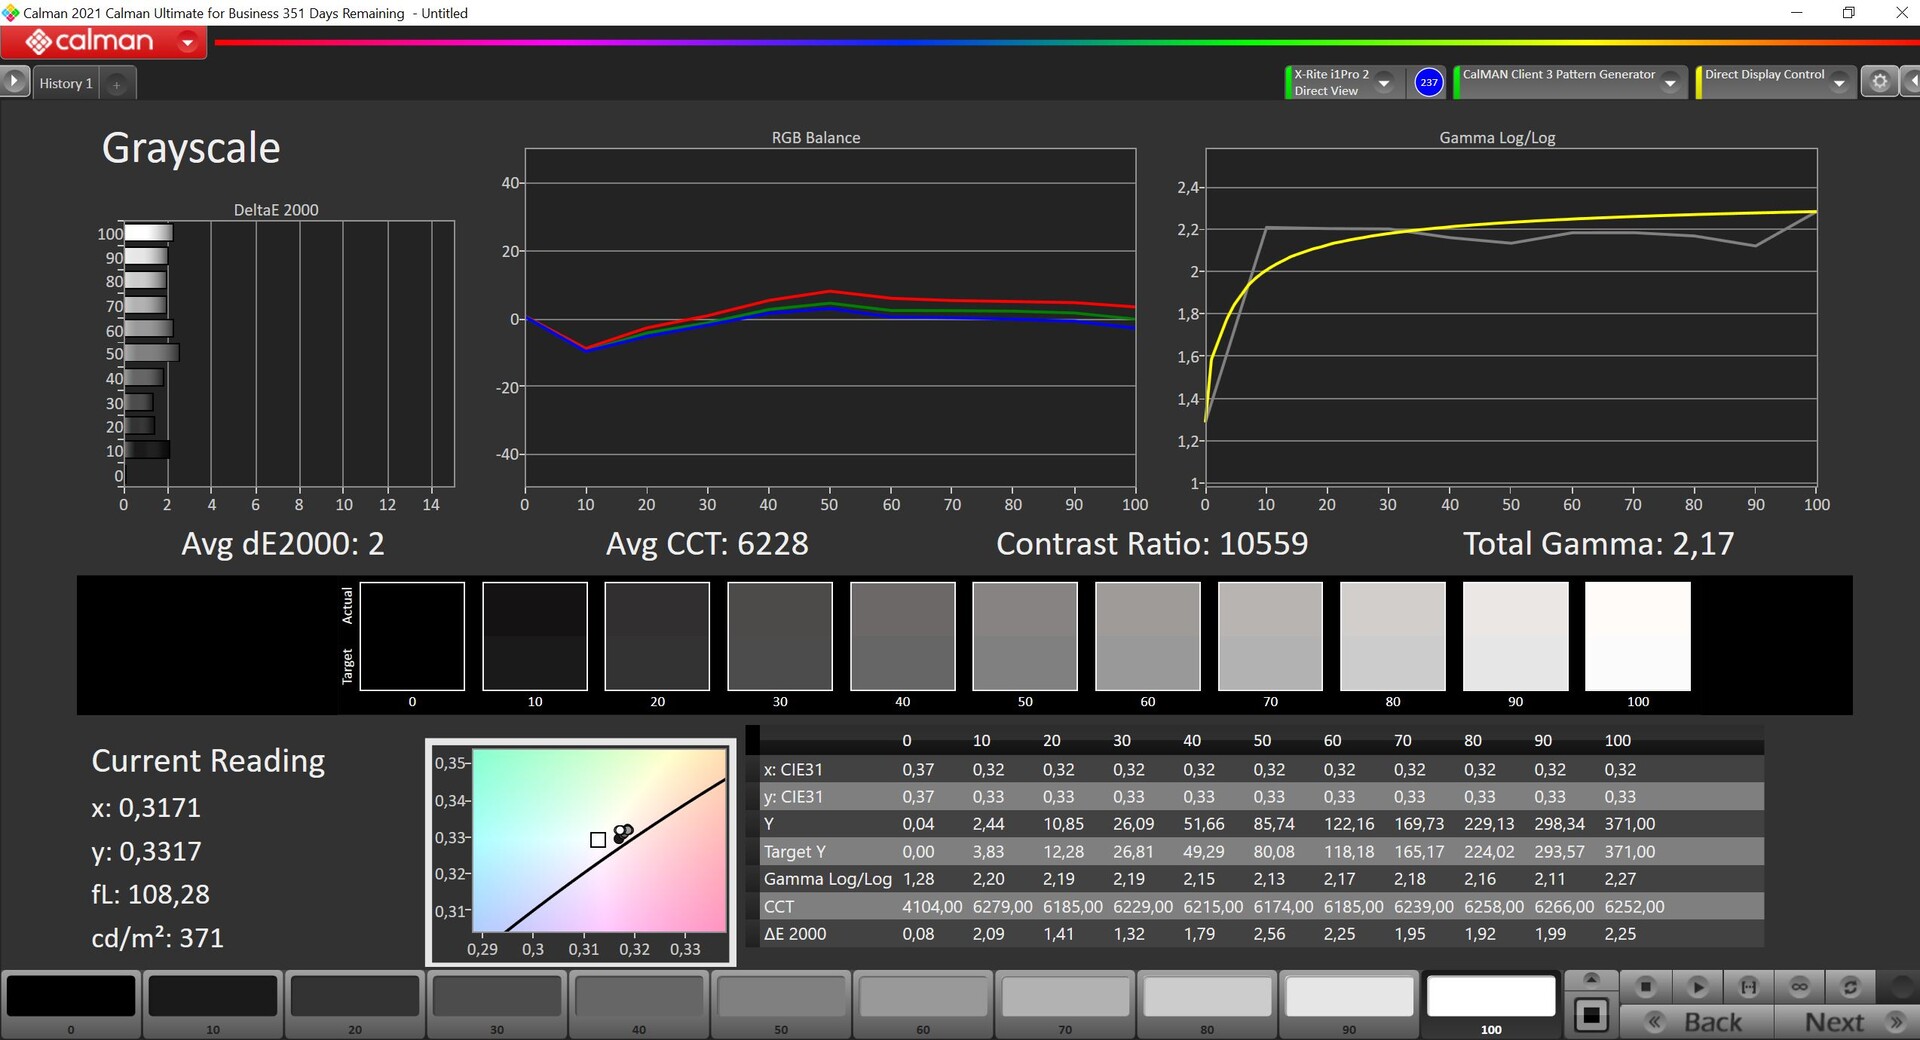
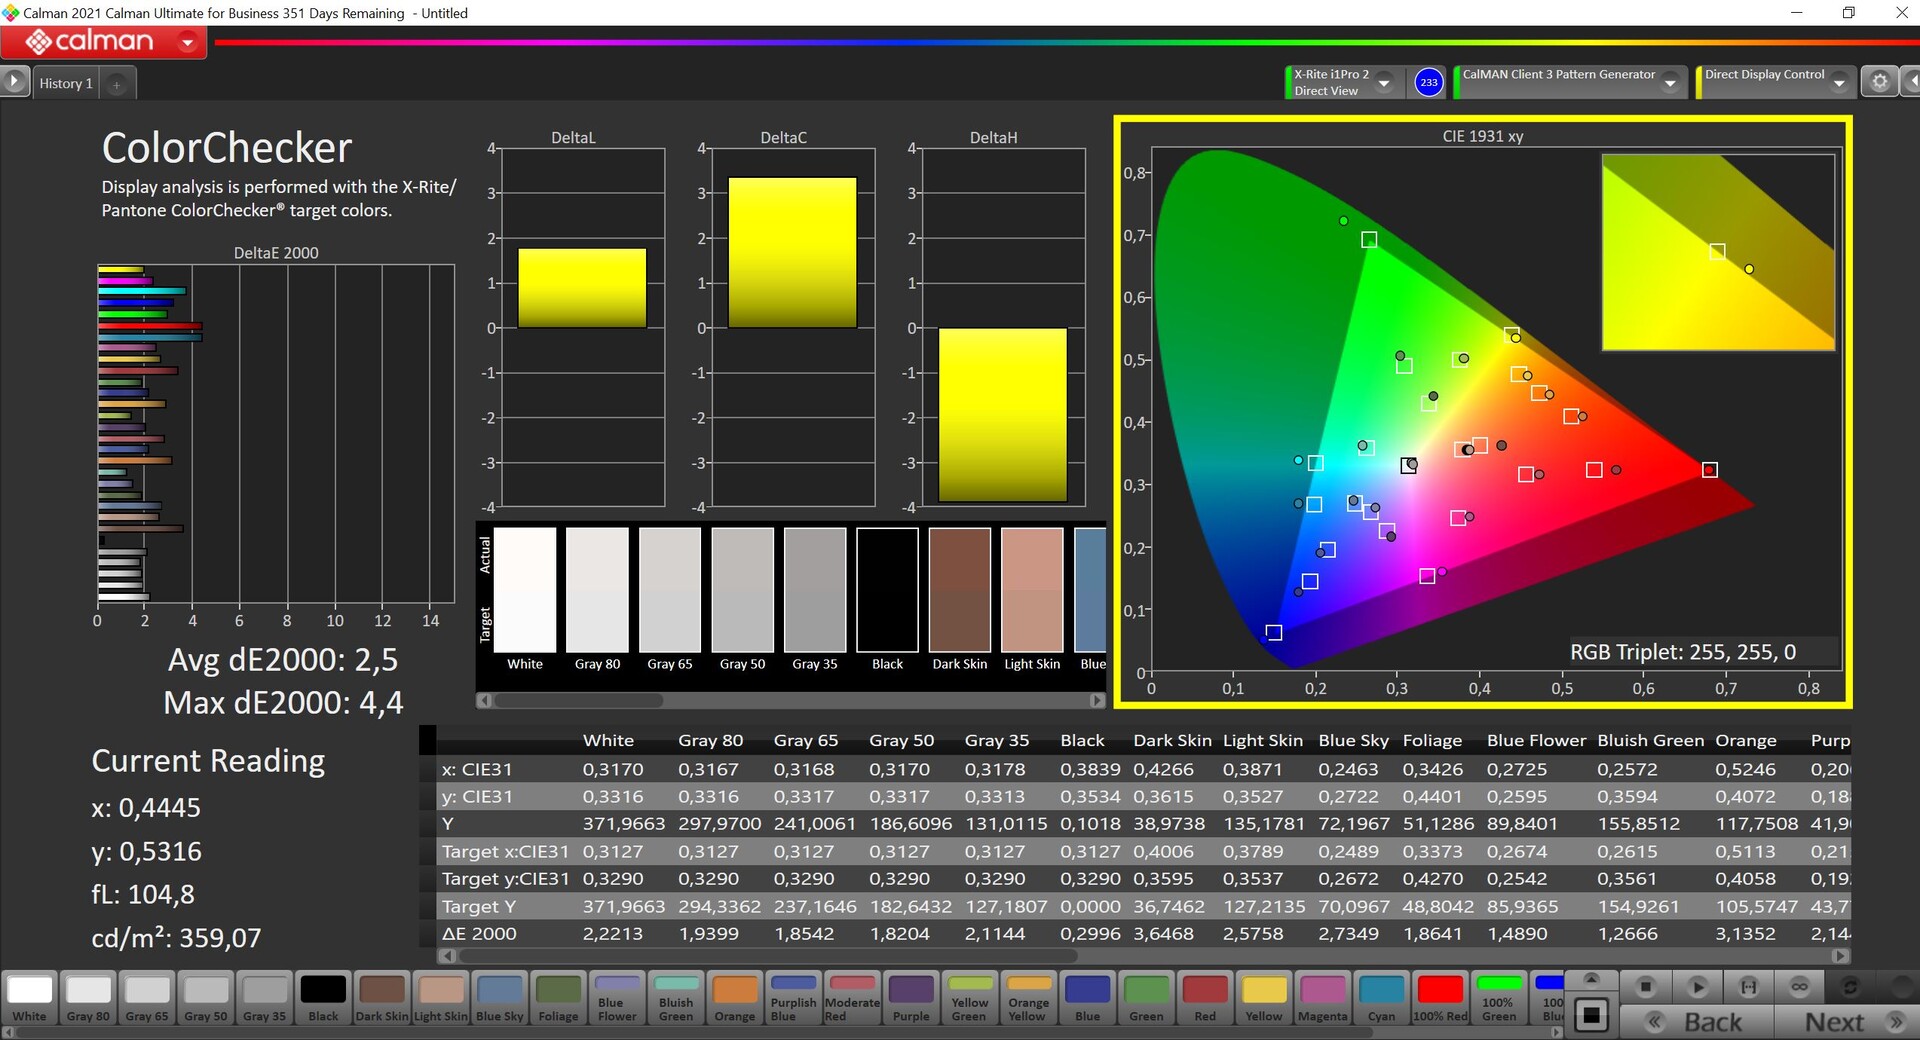

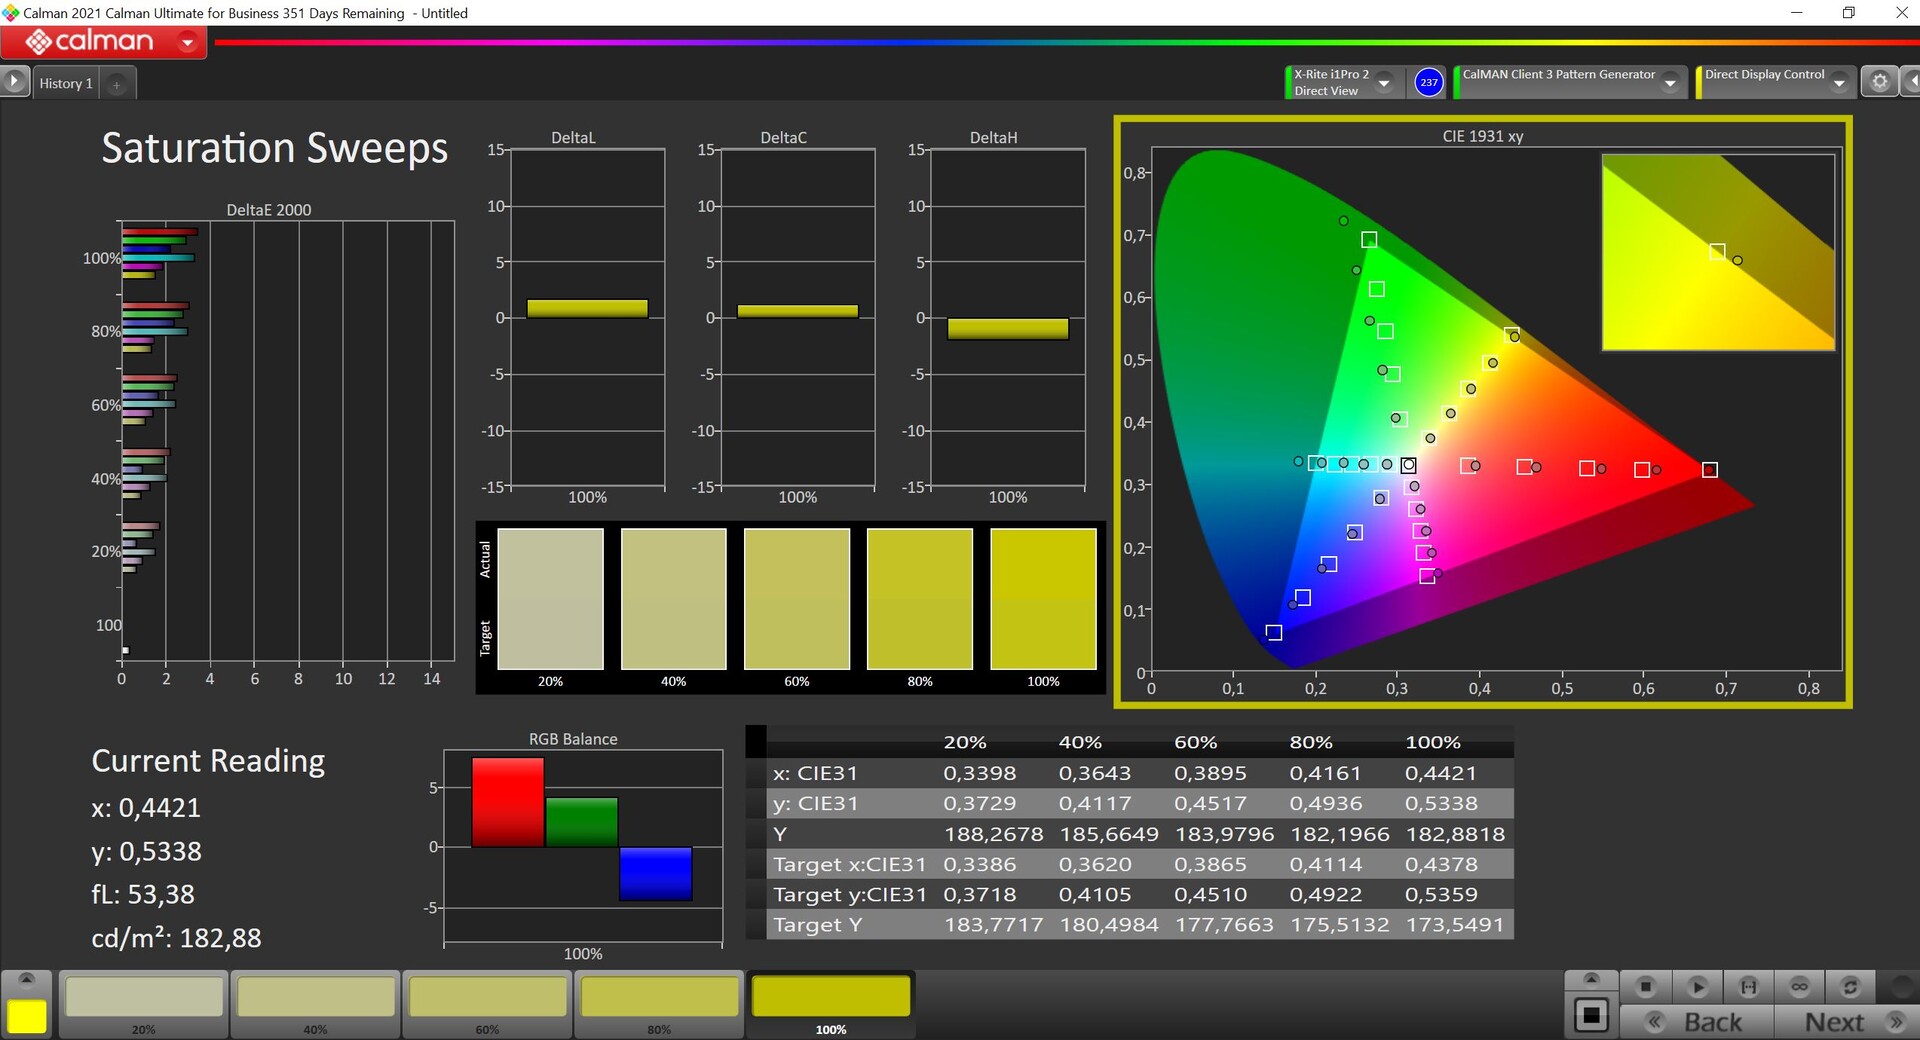
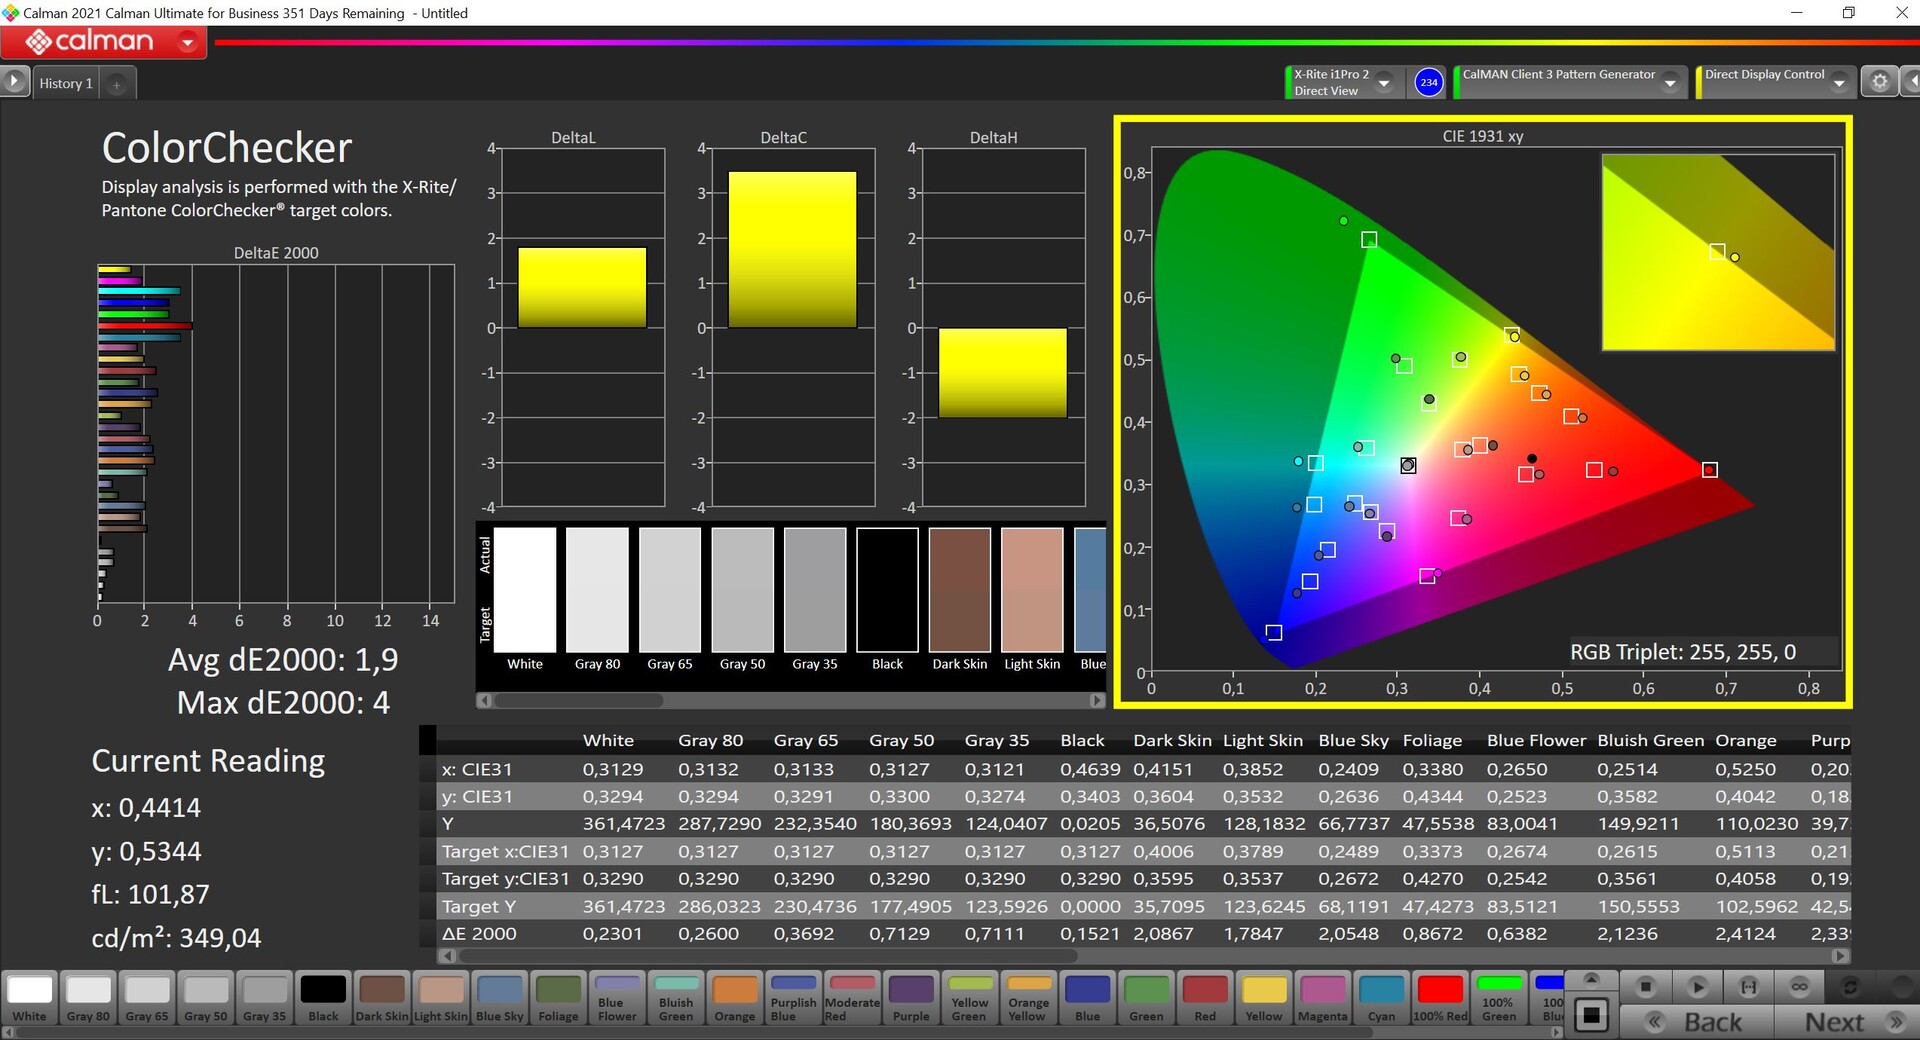
Nuestro análisis con el software profesional CalMAN (X-Rite i1 Pro 2) muestra que la pantalla OLED tal y como se entrega ya está correctamente calibrada. Hay un mínimo de emisión de color en el rojo verdadero junto con una temperatura de color que es ligeramente demasiado cálida. Pudimos mejorar aún más la pantalla con nuestra propia calibración (el perfil se puede descargar más arriba) y la mayoría de los colores están por debajo del importante límite de 3. El espacio de color P3 está totalmente cubierto
Tiempos de respuesta del display
| ↔ Tiempo de respuesta de Negro a Blanco | ||
|---|---|---|
| 1.6 ms ... subida ↗ y bajada ↘ combinada | ↗ 0.8 ms subida | 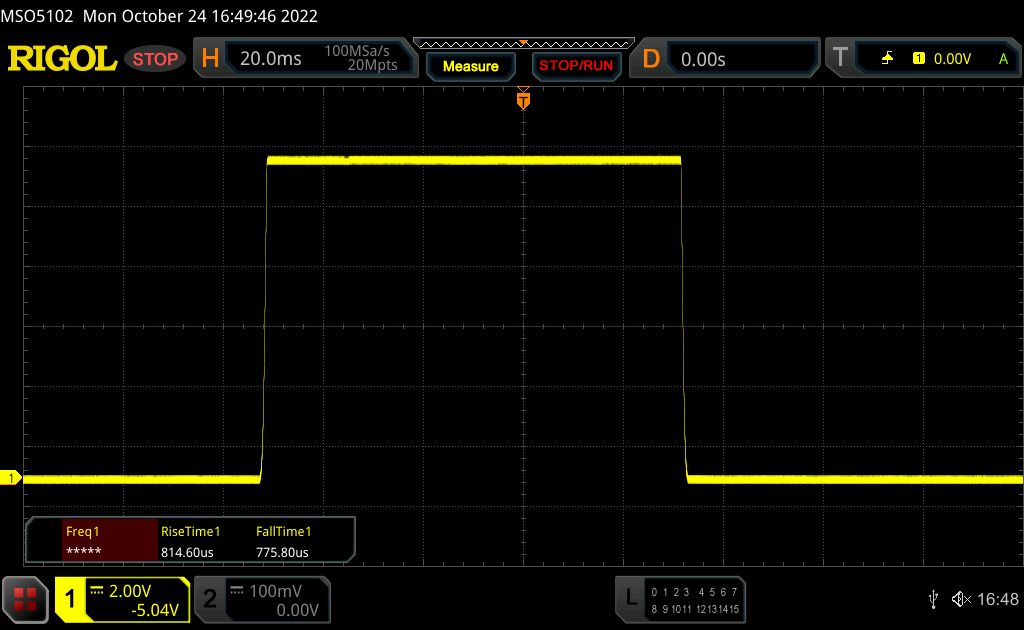 |
| ↘ 0.8 ms bajada | ||
| La pantalla mostró tiempos de respuesta muy rápidos en nuestros tests y debería ser adecuada para juegos frenéticos. En comparación, todos los dispositivos de prueba van de ##min### (mínimo) a 240 (máximo) ms. » 10 % de todos los dispositivos son mejores. Esto quiere decir que el tiempo de respuesta medido es mejor que la media (19.8 ms) de todos los dispositivos testados. | ||
| ↔ Tiempo de respuesta 50% Gris a 80% Gris | ||
| 1.9 ms ... subida ↗ y bajada ↘ combinada | ↗ 1 ms subida | 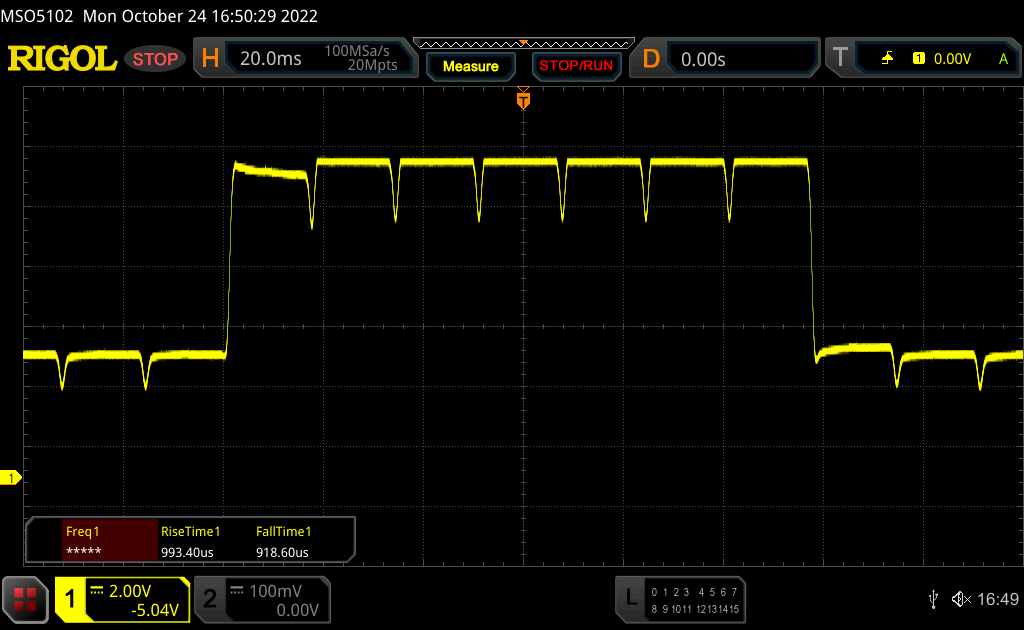 |
| ↘ 0.9 ms bajada | ||
| La pantalla mostró tiempos de respuesta muy rápidos en nuestros tests y debería ser adecuada para juegos frenéticos. En comparación, todos los dispositivos de prueba van de ##min### (mínimo) a 636 (máximo) ms. » 10 % de todos los dispositivos son mejores. Esto quiere decir que el tiempo de respuesta medido es mejor que la media (30.9 ms) de todos los dispositivos testados. | ||
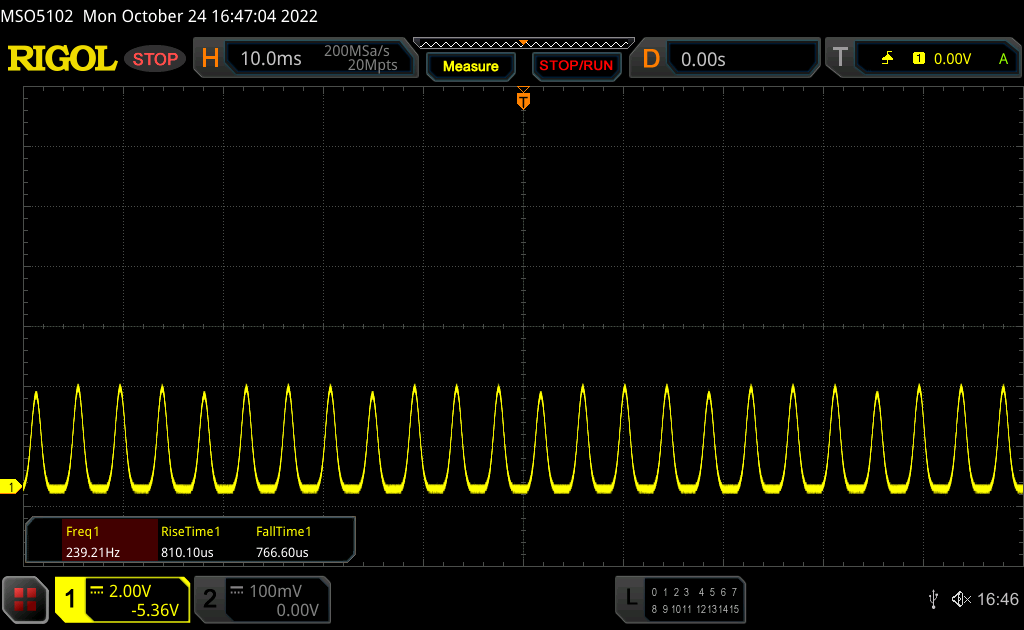
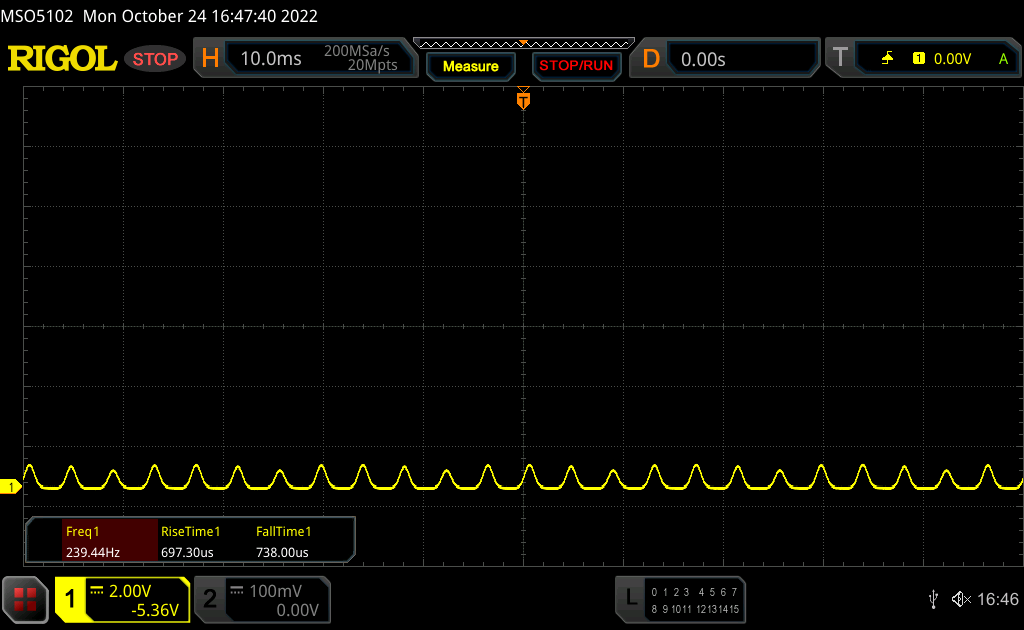
Parpadeo de Pantalla / PWM (Pulse-Width Modulation)
| Parpadeo de Pantalla / PWM detectado | 240 Hz | ≤ 50 % de brillo | 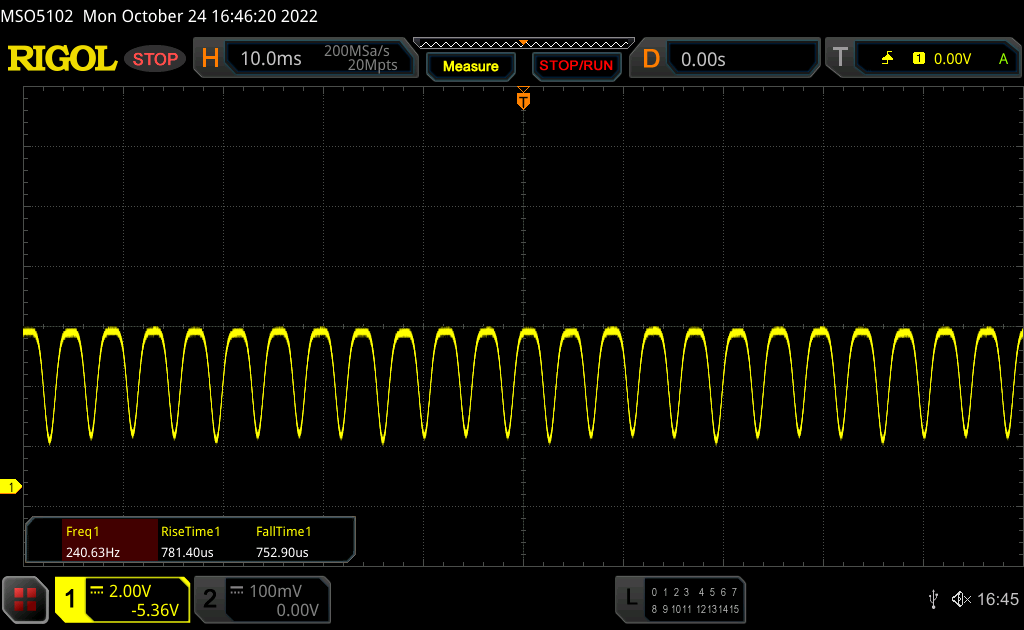 |
| ≤ 86 cd/m² brillo | |||
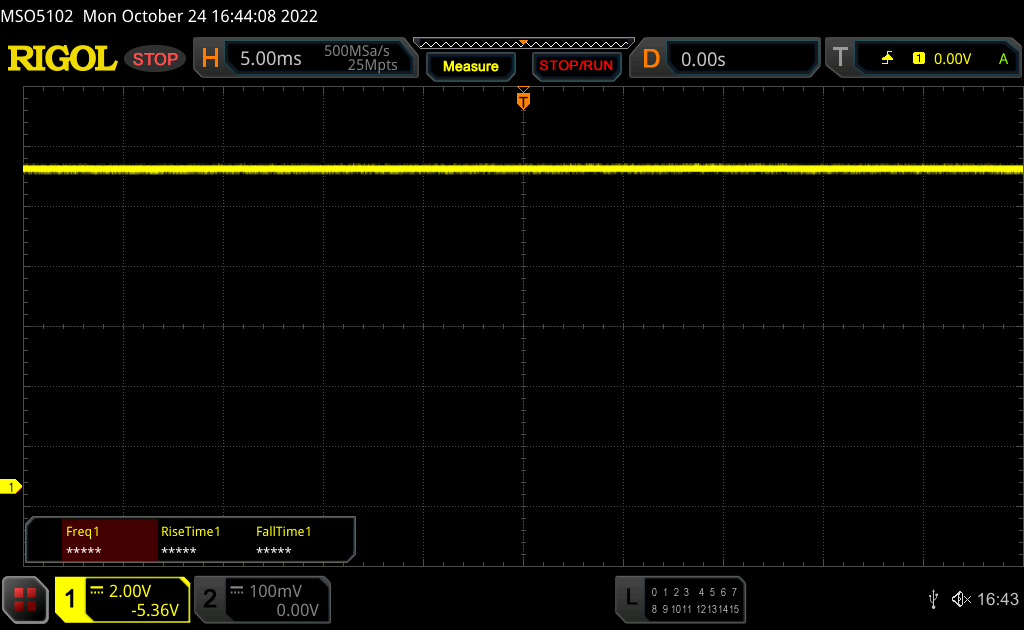
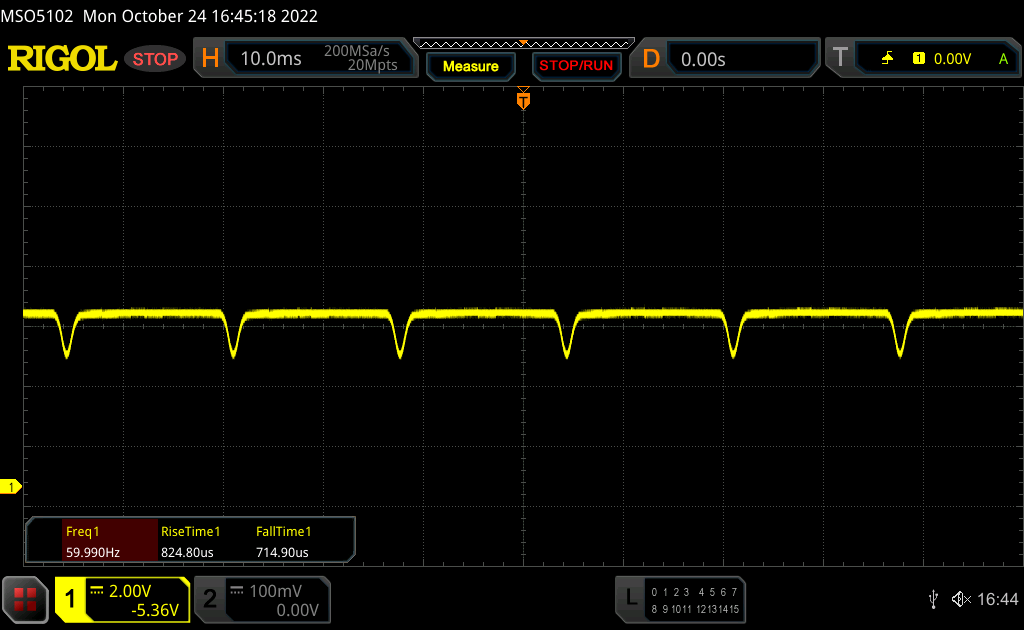
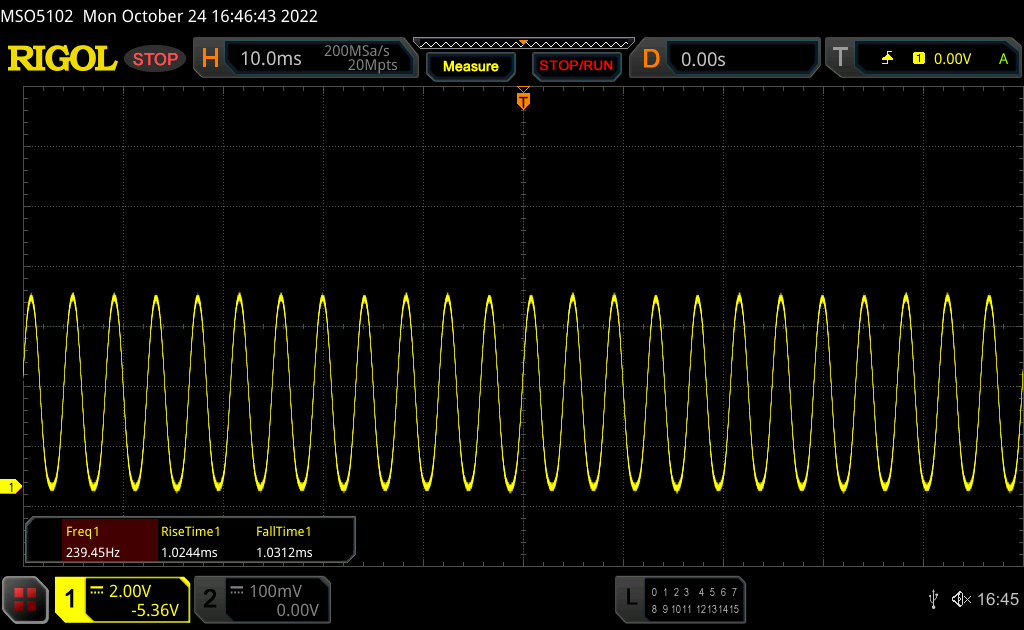
La retroiluminación del display parpadea a 240 Hz (seguramente usa PWM - Pulse-Width Modulation) a un brillo del 50 % (86 cd/m²) e inferior. Sobre este nivel de brillo no debería darse parpadeo / PWM. La frecuencia de 240 Hz es relativamente baja, por lo que la gente sensible debería ver parpadeos y padecer fatiga visual por la pantalla (usado al brillo indicado a continuación). El parpadeo se da a un brillo relativamente bajo, por lo que el uso prolongado en interiores con este nivel de brillo puede ser fatigoso. Comparación: 52 % de todos los dispositivos testados no usaron PWM para atenuar el display. Si se usó, medimos una media de 7741 (mínimo: 5 - máxmo: 343500) Hz. | |||
En el rango del 51-90% de brillo, se despliega la atenuación DC con una frecuencia de 60 Hz, pero como la amplitud es muy baja aquí, no debería haber ningún problema. A partir de un brillo del 50 % (~86 cd/m²) y menos podemos detectar el conocido parpadeo PWM a 240 Hz. Lenovo no ofrece una solución software como la del Asus Zenbook S 13 para permitir la atenuación DC incluso a niveles de brillo inferiores.

Los reflejos son, por supuesto, un problema en la pantalla reflectante cuando se producen, pero siempre que puedas evitarlos, el contenido de la pantalla se puede leer correctamente en exteriores gracias a la relación de contraste extremadamente alta incluso en días luminosos.
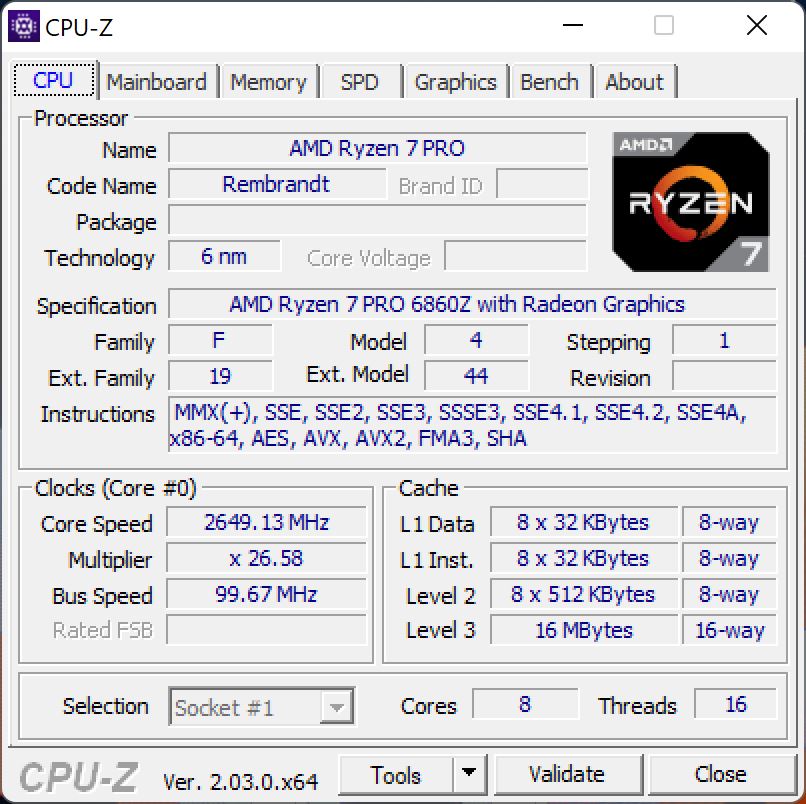
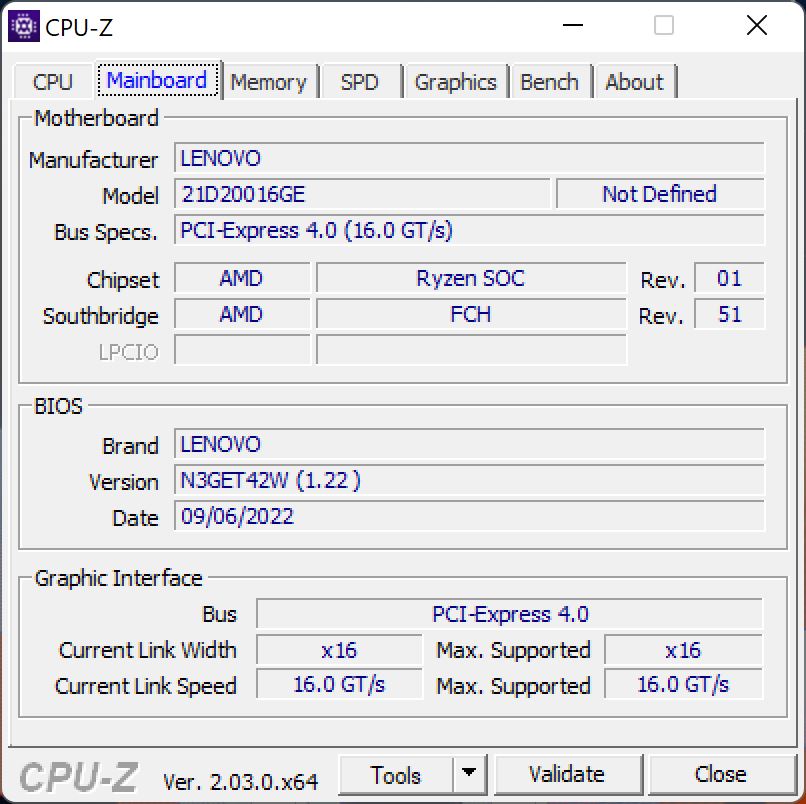
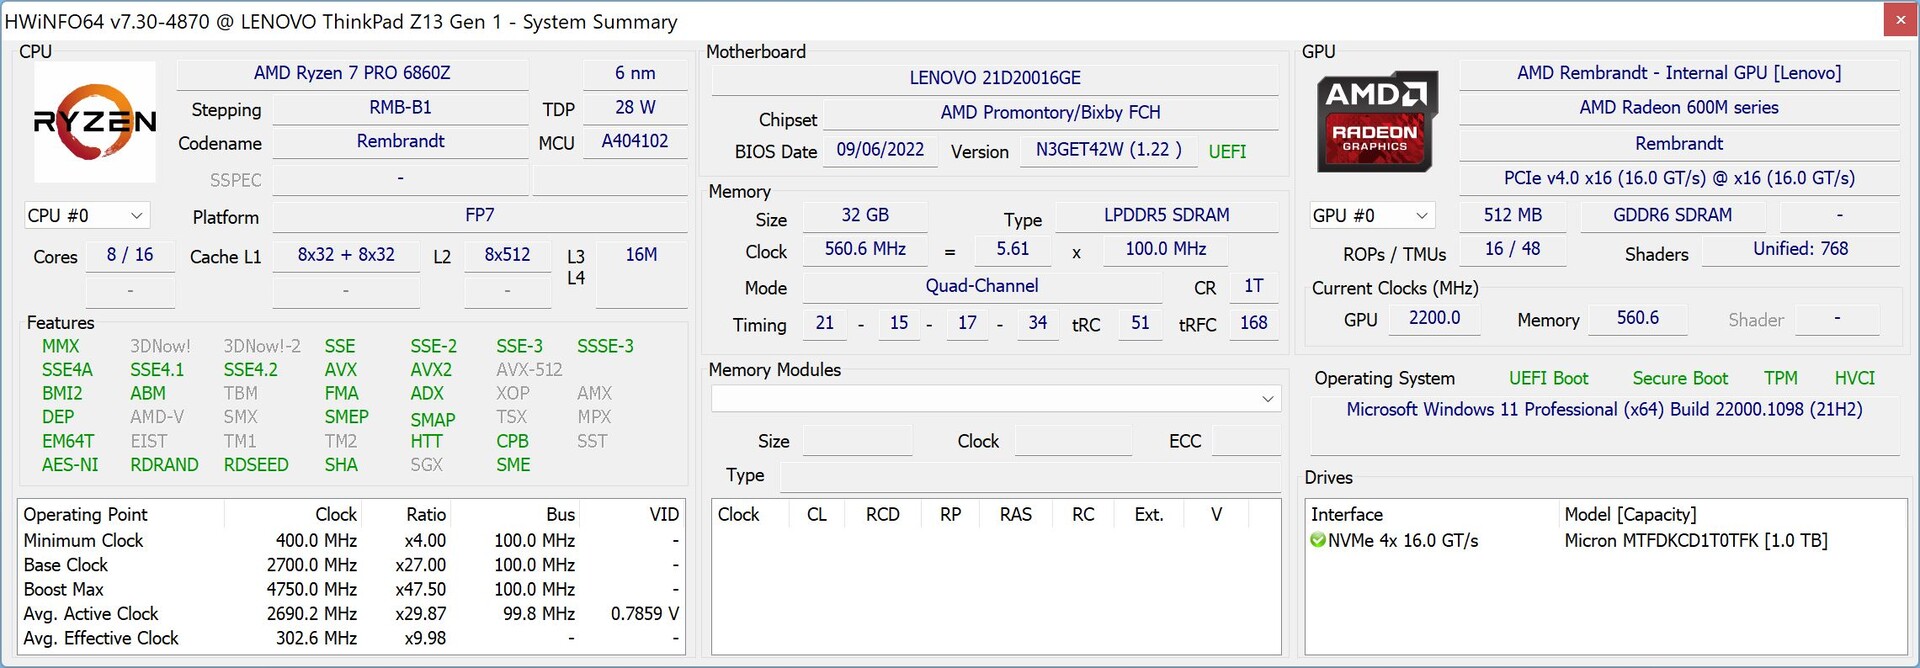
Rendimiento - AMD Ryzen 7 Pro 6860Z
Condiciones de la prueba
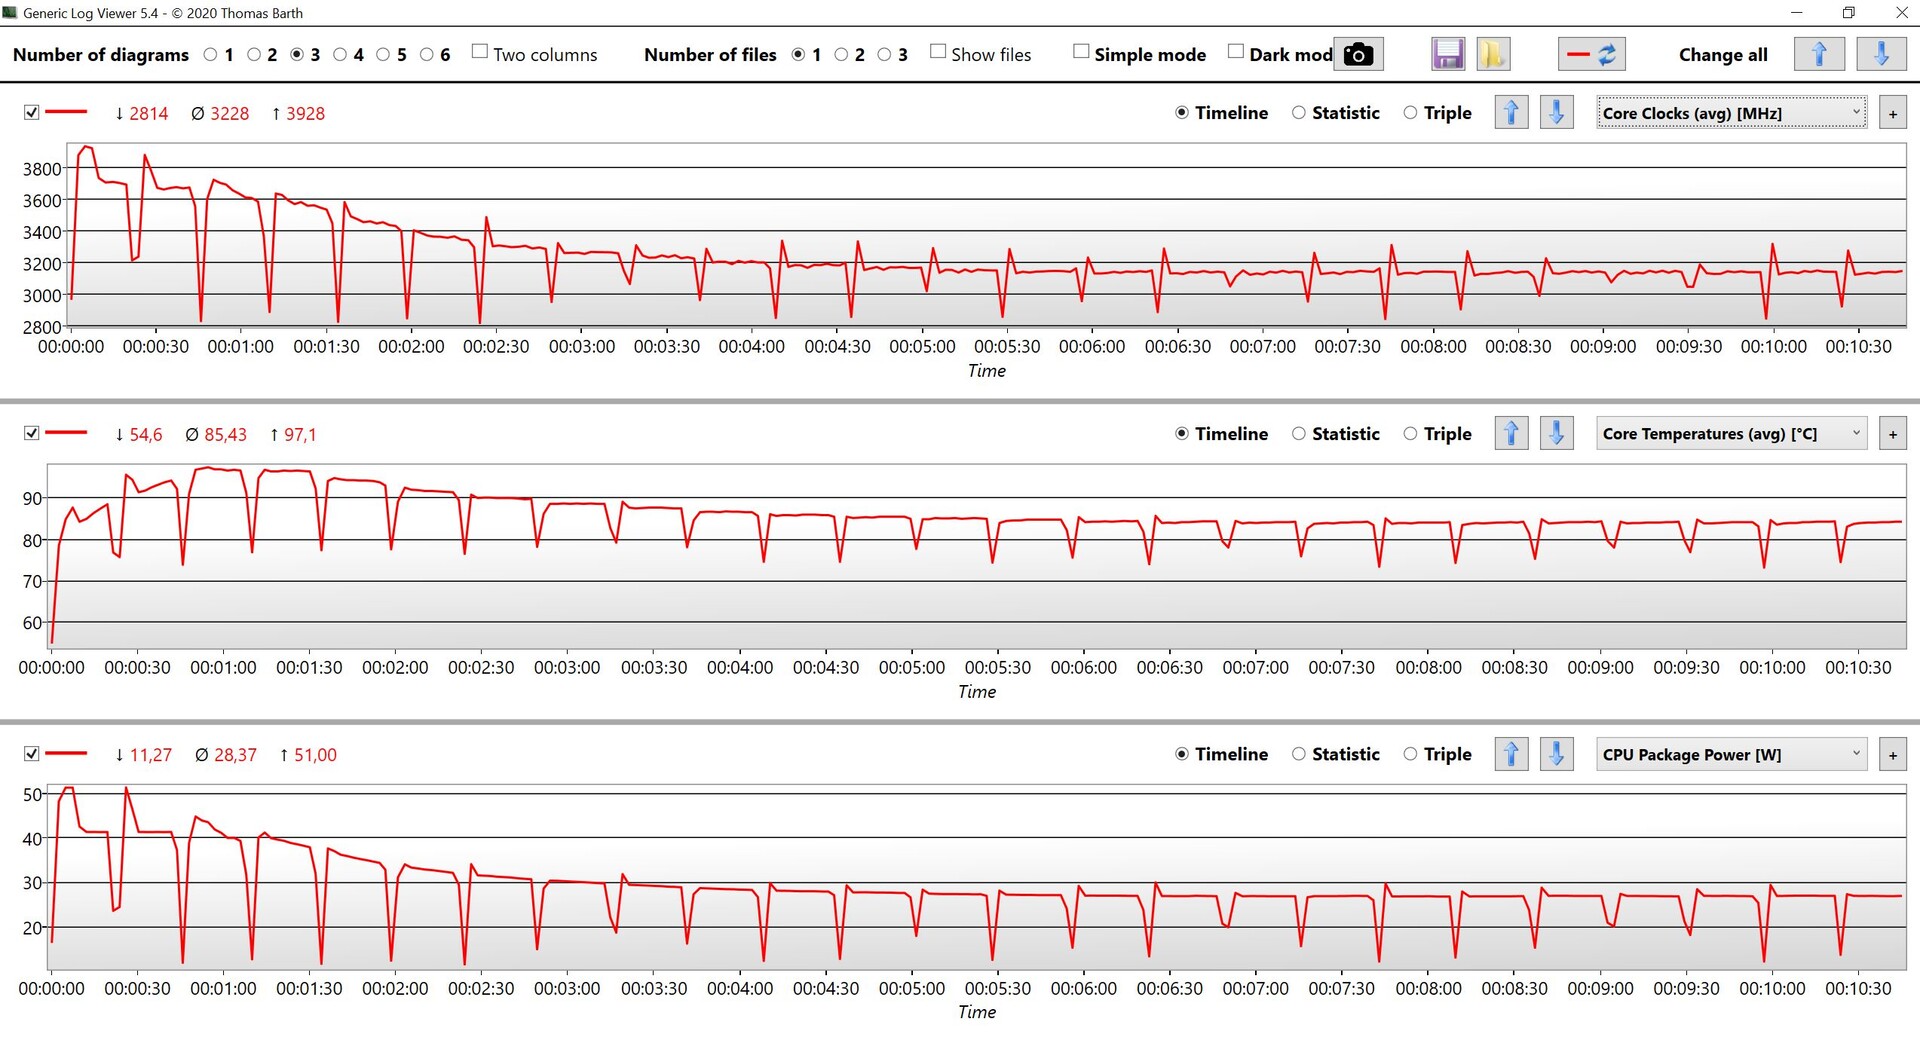
Además de los ajustes normales de rendimiento de Windows, el AMD ThinkPad ofrece refrigeración inteligente, que puede desactivarse con la combinación de teclas Fn+T. En nuestras pruebas con el Ryzen 7 Pro obtuvimos resultados ligeramente mejores cuando la función estaba activada. Básicamente, el procesador tiene asignados 51 vatios durante un breve periodo y luego se establece en 27 vatios.
Procesador
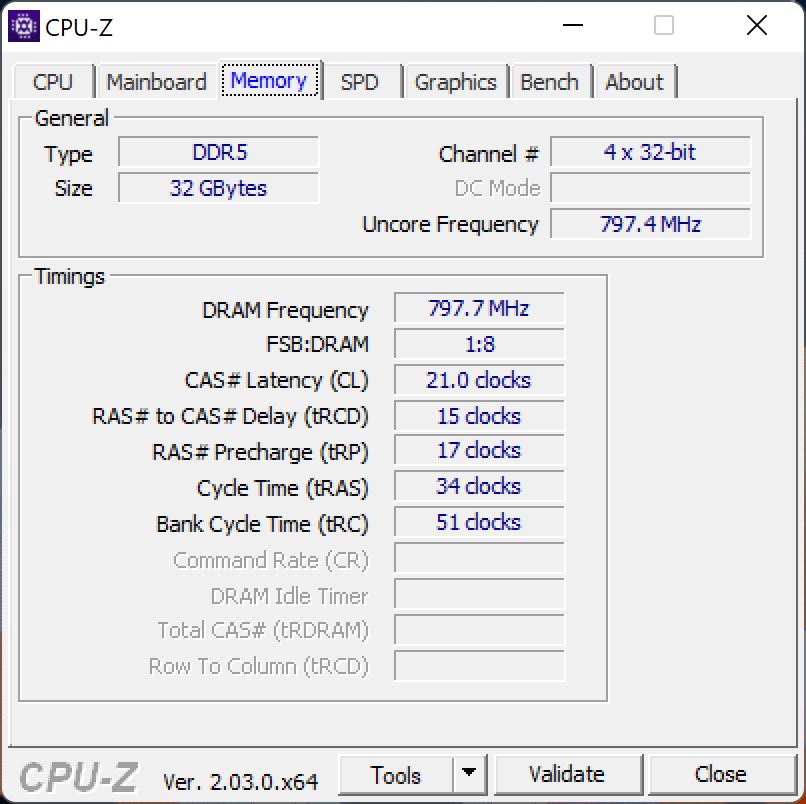
Lenovo equipa el modelo superior del ThinkPad Z13 con un AMD Ryzen 7 Pro 6860Z, que es exclusivo de este modelo. Hay muy poca documentación disponible sobre los ajustes de este chip, e incluso tras nuestra prueba no somos mucho más sabios. En principio, es un Ryzen 7 Pro 6850U estándar (que también está disponible para el Z13), sólo que el reloj boost máximo está fijado 50 MHz más alto, a 4,75 GHz. Ambos modelos Ryzen 7 Pro pueden configurarse con hasta 32 GB de RAM.
El rendimiento de la CPU es muy bueno, especialmente en los primeros minutos, ya que el consumo de energía no baja inmediatamente. Sin embargo, bajo carga permanente, el Ryzen 7 Pro 6860Z está a la par con el Ryzen 7 Pro 6850U y también con el Ryzen 7 6800U de consumo, si funcionan al mismo/similar TDP (generalmente 25 vatios). El Ryzen 5 Pro 6650U del ThinkPad Z13 es un 19% más lento de media en todas nuestras pruebas de CPU.
Cinebench R15 score
En cuanto a la batería, el rendimiento multinúcleo es aproximadamente un 30% inferior, pero el rendimiento mononúcleo se mantiene estable. Hay más pruebas de rendimiento de la CPU en nuestra sección de tecnología.
Cinebench R23: Multi Core | Single Core
Cinebench R20: CPU (Multi Core) | CPU (Single Core)
Cinebench R15: CPU Multi 64Bit | CPU Single 64Bit
Blender: v2.79 BMW27 CPU
7-Zip 18.03: 7z b 4 | 7z b 4 -mmt1
Geekbench 5.5: Multi-Core | Single-Core
HWBOT x265 Benchmark v2.2: 4k Preset
LibreOffice : 20 Documents To PDF
R Benchmark 2.5: Overall mean
| CPU Performance rating | |
| Media de la clase Subnotebook | |
| Lenovo ThinkPad Z16 G1 21D5S00T00 | |
| Dell XPS 13 Plus 9320 i7-1280P OLED | |
| Lenovo ThinkPad Z13 G1-21D20016GE | |
| Medio AMD Ryzen 7 PRO 6860Z | |
| Lenovo ThinkPad T14 G3-21CF004NGE | |
| Asus Zenbook S 13 OLED | |
| Apple MacBook Air M2 10C GPU -5! | |
| Lenovo ThinkPad Z13 21D2CTO1WW | |
| Cinebench R23 / Multi Core | |
| Media de la clase Subnotebook (1555 - 21812, n=59, últimos 2 años) | |
| Lenovo ThinkPad Z16 G1 21D5S00T00 | |
| Dell XPS 13 Plus 9320 i7-1280P OLED | |
| Lenovo ThinkPad Z13 G1-21D20016GE | |
| Medio AMD Ryzen 7 PRO 6860Z (n=1) | |
| Asus Zenbook S 13 OLED | |
| Lenovo ThinkPad T14 G3-21CF004NGE | |
| Lenovo ThinkPad Z13 21D2CTO1WW | |
| Apple MacBook Air M2 10C GPU | |
| Cinebench R23 / Single Core | |
| Media de la clase Subnotebook (358 - 2213, n=60, últimos 2 años) | |
| Dell XPS 13 Plus 9320 i7-1280P OLED | |
| Apple MacBook Air M2 10C GPU | |
| Lenovo ThinkPad T14 G3-21CF004NGE | |
| Lenovo ThinkPad Z16 G1 21D5S00T00 | |
| Asus Zenbook S 13 OLED | |
| Lenovo ThinkPad Z13 G1-21D20016GE | |
| Medio AMD Ryzen 7 PRO 6860Z (n=1) | |
| Lenovo ThinkPad Z13 21D2CTO1WW | |
| Cinebench R20 / CPU (Multi Core) | |
| Lenovo ThinkPad Z16 G1 21D5S00T00 | |
| Media de la clase Subnotebook (579 - 8541, n=56, últimos 2 años) | |
| Dell XPS 13 Plus 9320 i7-1280P OLED | |
| Lenovo ThinkPad Z13 G1-21D20016GE | |
| Medio AMD Ryzen 7 PRO 6860Z (n=1) | |
| Lenovo ThinkPad T14 G3-21CF004NGE | |
| Asus Zenbook S 13 OLED | |
| Lenovo ThinkPad Z13 21D2CTO1WW | |
| Apple MacBook Air M2 10C GPU | |
| Cinebench R20 / CPU (Single Core) | |
| Media de la clase Subnotebook (128 - 832, n=56, últimos 2 años) | |
| Dell XPS 13 Plus 9320 i7-1280P OLED | |
| Lenovo ThinkPad Z13 G1-21D20016GE | |
| Medio AMD Ryzen 7 PRO 6860Z (n=1) | |
| Lenovo ThinkPad T14 G3-21CF004NGE | |
| Lenovo ThinkPad Z16 G1 21D5S00T00 | |
| Lenovo ThinkPad Z13 21D2CTO1WW | |
| Asus Zenbook S 13 OLED | |
| Apple MacBook Air M2 10C GPU | |
| Cinebench R15 / CPU Multi 64Bit | |
| Lenovo ThinkPad Z16 G1 21D5S00T00 | |
| Media de la clase Subnotebook (327 - 3345, n=56, últimos 2 años) | |
| Lenovo ThinkPad Z13 G1-21D20016GE | |
| Medio AMD Ryzen 7 PRO 6860Z (n=1) | |
| Dell XPS 13 Plus 9320 i7-1280P OLED | |
| Lenovo ThinkPad T14 G3-21CF004NGE | |
| Asus Zenbook S 13 OLED | |
| Lenovo ThinkPad Z13 21D2CTO1WW | |
| Apple MacBook Air M2 10C GPU | |
| Cinebench R15 / CPU Single 64Bit | |
| Media de la clase Subnotebook (72.4 - 322, n=56, últimos 2 años) | |
| Lenovo ThinkPad Z16 G1 21D5S00T00 | |
| Asus Zenbook S 13 OLED | |
| Lenovo ThinkPad T14 G3-21CF004NGE | |
| Lenovo ThinkPad Z13 21D2CTO1WW | |
| Lenovo ThinkPad Z13 G1-21D20016GE | |
| Medio AMD Ryzen 7 PRO 6860Z (n=1) | |
| Dell XPS 13 Plus 9320 i7-1280P OLED | |
| Apple MacBook Air M2 10C GPU | |
| Blender / v2.79 BMW27 CPU | |
| Apple MacBook Air M2 10C GPU | |
| Lenovo ThinkPad Z13 21D2CTO1WW | |
| Media de la clase Subnotebook (159 - 2271, n=57, últimos 2 años) | |
| Asus Zenbook S 13 OLED | |
| Lenovo ThinkPad T14 G3-21CF004NGE | |
| Lenovo ThinkPad Z13 G1-21D20016GE | |
| Medio AMD Ryzen 7 PRO 6860Z (n=1) | |
| Dell XPS 13 Plus 9320 i7-1280P OLED | |
| Lenovo ThinkPad Z16 G1 21D5S00T00 | |
| 7-Zip 18.03 / 7z b 4 | |
| Lenovo ThinkPad Z16 G1 21D5S00T00 | |
| Lenovo ThinkPad Z13 G1-21D20016GE | |
| Medio AMD Ryzen 7 PRO 6860Z (n=1) | |
| Lenovo ThinkPad T14 G3-21CF004NGE | |
| Dell XPS 13 Plus 9320 i7-1280P OLED | |
| Asus Zenbook S 13 OLED | |
| Media de la clase Subnotebook (11668 - 77867, n=56, últimos 2 años) | |
| Lenovo ThinkPad Z13 21D2CTO1WW | |
| 7-Zip 18.03 / 7z b 4 -mmt1 | |
| Media de la clase Subnotebook (2643 - 6699, n=58, últimos 2 años) | |
| Asus Zenbook S 13 OLED | |
| Lenovo ThinkPad Z16 G1 21D5S00T00 | |
| Lenovo ThinkPad T14 G3-21CF004NGE | |
| Lenovo ThinkPad Z13 G1-21D20016GE | |
| Medio AMD Ryzen 7 PRO 6860Z (n=1) | |
| Lenovo ThinkPad Z13 21D2CTO1WW | |
| Dell XPS 13 Plus 9320 i7-1280P OLED | |
| Geekbench 5.5 / Multi-Core | |
| Dell XPS 13 Plus 9320 i7-1280P OLED | |
| Media de la clase Subnotebook (2557 - 17218, n=49, últimos 2 años) | |
| Apple MacBook Air M2 10C GPU | |
| Lenovo ThinkPad Z16 G1 21D5S00T00 | |
| Lenovo ThinkPad Z13 G1-21D20016GE | |
| Medio AMD Ryzen 7 PRO 6860Z (n=1) | |
| Lenovo ThinkPad T14 G3-21CF004NGE | |
| Asus Zenbook S 13 OLED | |
| Lenovo ThinkPad Z13 21D2CTO1WW | |
| Geekbench 5.5 / Single-Core | |
| Apple MacBook Air M2 10C GPU | |
| Media de la clase Subnotebook (726 - 2224, n=49, últimos 2 años) | |
| Dell XPS 13 Plus 9320 i7-1280P OLED | |
| Asus Zenbook S 13 OLED | |
| Lenovo ThinkPad T14 G3-21CF004NGE | |
| Lenovo ThinkPad Z16 G1 21D5S00T00 | |
| Lenovo ThinkPad Z13 21D2CTO1WW | |
| Lenovo ThinkPad Z13 G1-21D20016GE | |
| Medio AMD Ryzen 7 PRO 6860Z (n=1) | |
| HWBOT x265 Benchmark v2.2 / 4k Preset | |
| Lenovo ThinkPad Z16 G1 21D5S00T00 | |
| Lenovo ThinkPad Z13 G1-21D20016GE | |
| Medio AMD Ryzen 7 PRO 6860Z (n=1) | |
| Dell XPS 13 Plus 9320 i7-1280P OLED | |
| Media de la clase Subnotebook (0.97 - 25.1, n=56, últimos 2 años) | |
| Lenovo ThinkPad T14 G3-21CF004NGE | |
| Asus Zenbook S 13 OLED | |
| Lenovo ThinkPad Z13 21D2CTO1WW | |
| LibreOffice / 20 Documents To PDF | |
| Lenovo ThinkPad Z13 21D2CTO1WW | |
| Media de la clase Subnotebook (39.9 - 220, n=55, últimos 2 años) | |
| Asus Zenbook S 13 OLED | |
| Lenovo ThinkPad T14 G3-21CF004NGE | |
| Lenovo ThinkPad Z16 G1 21D5S00T00 | |
| Lenovo ThinkPad Z13 G1-21D20016GE | |
| Medio AMD Ryzen 7 PRO 6860Z (n=1) | |
| Dell XPS 13 Plus 9320 i7-1280P OLED | |
| R Benchmark 2.5 / Overall mean | |
| Lenovo ThinkPad Z13 21D2CTO1WW | |
| Asus Zenbook S 13 OLED | |
| Lenovo ThinkPad T14 G3-21CF004NGE | |
| Lenovo ThinkPad Z13 G1-21D20016GE | |
| Medio AMD Ryzen 7 PRO 6860Z (n=1) | |
| Media de la clase Subnotebook (0.4024 - 1.456, n=57, últimos 2 años) | |
| Lenovo ThinkPad Z16 G1 21D5S00T00 | |
| Dell XPS 13 Plus 9320 i7-1280P OLED | |
* ... más pequeño es mejor
Sin embargo, los altos valores de consumo de energía también tienen un efecto negativo en la eficiencia y se puede ver claramente que las CPUs Ryzen 7 funcionan de forma mucho más eficiente en el rango de 25-30 vatios. En el siguiente análisis, observamos la eficiencia en los dos benchmarks de CPU Cinebench R15 y Cinebench R23 Multi, cada uno ejecutado en un monitor externo. Así podemos excluir el rendimiento variable del monitor como factor de influencia. Aquí se puede ver claramente que el Ryzen 7 Pro 6860Z queda por detrás del Asus Zenbook S 13 (Ryzen 7 6800U) y el Lenovo ThinkPad T14 G3 (Ryzen 7 Pro 6850U).
| Power Consumption / Cinebench R23 Multi Power Efficiency - external Monitor | |
| Apple MacBook Air M2 10C GPU | |
| Lenovo ThinkPad T14 G3-21CF004NGE | |
| Lenovo Yoga 7-14ARB G7 | |
| Lenovo Yoga Slim 7 Carbon 13IAP7-82U9005FGE | |
| Lenovo ThinkPad Z13 G1-21D20016GE | |
| Schenker Vision 14 2022 RTX 3050 Ti | |
AIDA64: FP32 Ray-Trace | FPU Julia | CPU SHA3 | CPU Queen | FPU SinJulia | FPU Mandel | CPU AES | CPU ZLib | FP64 Ray-Trace | CPU PhotoWorxx
| Performance rating | |
| Lenovo ThinkPad Z16 G1 21D5S00T00 | |
| Lenovo ThinkPad Z13 G1-21D20016GE | |
| Medio AMD Ryzen 7 PRO 6860Z | |
| Media de la clase Subnotebook | |
| Asus Zenbook S 13 OLED | |
| Lenovo ThinkPad T14 G3-21CF004NGE | |
| Dell XPS 13 Plus 9320 i7-1280P OLED | |
| Lenovo ThinkPad Z13 21D2CTO1WW | |
| AIDA64 / FP32 Ray-Trace | |
| Lenovo ThinkPad Z16 G1 21D5S00T00 | |
| Media de la clase Subnotebook (1135 - 32888, n=57, últimos 2 años) | |
| Lenovo ThinkPad Z13 G1-21D20016GE | |
| Medio AMD Ryzen 7 PRO 6860Z (n=1) | |
| Lenovo ThinkPad T14 G3-21CF004NGE | |
| Asus Zenbook S 13 OLED | |
| Dell XPS 13 Plus 9320 i7-1280P OLED | |
| Lenovo ThinkPad Z13 21D2CTO1WW | |
| AIDA64 / FPU Julia | |
| Lenovo ThinkPad Z16 G1 21D5S00T00 | |
| Lenovo ThinkPad Z13 G1-21D20016GE | |
| Medio AMD Ryzen 7 PRO 6860Z (n=1) | |
| Lenovo ThinkPad T14 G3-21CF004NGE | |
| Asus Zenbook S 13 OLED | |
| Media de la clase Subnotebook (5218 - 123315, n=57, últimos 2 años) | |
| Lenovo ThinkPad Z13 21D2CTO1WW | |
| Dell XPS 13 Plus 9320 i7-1280P OLED | |
| AIDA64 / CPU SHA3 | |
| Lenovo ThinkPad Z16 G1 21D5S00T00 | |
| Media de la clase Subnotebook (444 - 5287, n=57, últimos 2 años) | |
| Lenovo ThinkPad Z13 G1-21D20016GE | |
| Medio AMD Ryzen 7 PRO 6860Z (n=1) | |
| Dell XPS 13 Plus 9320 i7-1280P OLED | |
| Lenovo ThinkPad T14 G3-21CF004NGE | |
| Asus Zenbook S 13 OLED | |
| Lenovo ThinkPad Z13 21D2CTO1WW | |
| AIDA64 / CPU Queen | |
| Lenovo ThinkPad Z16 G1 21D5S00T00 | |
| Lenovo ThinkPad Z13 G1-21D20016GE | |
| Medio AMD Ryzen 7 PRO 6860Z (n=1) | |
| Dell XPS 13 Plus 9320 i7-1280P OLED | |
| Lenovo ThinkPad T14 G3-21CF004NGE | |
| Asus Zenbook S 13 OLED | |
| Lenovo ThinkPad Z13 21D2CTO1WW | |
| Media de la clase Subnotebook (10579 - 95002, n=47, últimos 2 años) | |
| AIDA64 / FPU SinJulia | |
| Lenovo ThinkPad Z16 G1 21D5S00T00 | |
| Lenovo ThinkPad Z13 G1-21D20016GE | |
| Medio AMD Ryzen 7 PRO 6860Z (n=1) | |
| Lenovo ThinkPad T14 G3-21CF004NGE | |
| Asus Zenbook S 13 OLED | |
| Lenovo ThinkPad Z13 21D2CTO1WW | |
| Dell XPS 13 Plus 9320 i7-1280P OLED | |
| Media de la clase Subnotebook (744 - 18418, n=57, últimos 2 años) | |
| AIDA64 / FPU Mandel | |
| Lenovo ThinkPad Z16 G1 21D5S00T00 | |
| Lenovo ThinkPad Z13 G1-21D20016GE | |
| Medio AMD Ryzen 7 PRO 6860Z (n=1) | |
| Lenovo ThinkPad T14 G3-21CF004NGE | |
| Asus Zenbook S 13 OLED | |
| Media de la clase Subnotebook (3341 - 65433, n=57, últimos 2 años) | |
| Lenovo ThinkPad Z13 21D2CTO1WW | |
| Dell XPS 13 Plus 9320 i7-1280P OLED | |
| AIDA64 / CPU AES | |
| Asus Zenbook S 13 OLED | |
| Lenovo ThinkPad Z16 G1 21D5S00T00 | |
| Lenovo ThinkPad Z13 G1-21D20016GE | |
| Medio AMD Ryzen 7 PRO 6860Z (n=1) | |
| Dell XPS 13 Plus 9320 i7-1280P OLED | |
| Media de la clase Subnotebook (638 - 96917, n=57, últimos 2 años) | |
| Lenovo ThinkPad T14 G3-21CF004NGE | |
| Lenovo ThinkPad Z13 21D2CTO1WW | |
| AIDA64 / CPU ZLib | |
| Lenovo ThinkPad Z16 G1 21D5S00T00 | |
| Media de la clase Subnotebook (164.9 - 1379, n=57, últimos 2 años) | |
| Dell XPS 13 Plus 9320 i7-1280P OLED | |
| Lenovo ThinkPad T14 G3-21CF004NGE | |
| Lenovo ThinkPad Z13 G1-21D20016GE | |
| Medio AMD Ryzen 7 PRO 6860Z (n=1) | |
| Asus Zenbook S 13 OLED | |
| Lenovo ThinkPad Z13 21D2CTO1WW | |
| AIDA64 / FP64 Ray-Trace | |
| Lenovo ThinkPad Z16 G1 21D5S00T00 | |
| Media de la clase Subnotebook (610 - 17495, n=57, últimos 2 años) | |
| Lenovo ThinkPad Z13 G1-21D20016GE | |
| Medio AMD Ryzen 7 PRO 6860Z (n=1) | |
| Lenovo ThinkPad T14 G3-21CF004NGE | |
| Dell XPS 13 Plus 9320 i7-1280P OLED | |
| Asus Zenbook S 13 OLED | |
| Lenovo ThinkPad Z13 21D2CTO1WW | |
| AIDA64 / CPU PhotoWorxx | |
| Media de la clase Subnotebook (6569 - 85600, n=57, últimos 2 años) | |
| Dell XPS 13 Plus 9320 i7-1280P OLED | |
| Lenovo ThinkPad Z16 G1 21D5S00T00 | |
| Lenovo ThinkPad Z13 21D2CTO1WW | |
| Lenovo ThinkPad T14 G3-21CF004NGE | |
| Asus Zenbook S 13 OLED | |
| Lenovo ThinkPad Z13 G1-21D20016GE | |
| Medio AMD Ryzen 7 PRO 6860Z (n=1) | |
Rendimiento del sistema
El ThinkPad Z13 es un dispositivo muy sensible y los resultados del benchmark sintético también son muy buenos. No pudimos detectar ningún problema al ejecutar la prueba.
CrossMark: Overall | Productivity | Creativity | Responsiveness
| PCMark 10 / Score | |
| Media de la clase Subnotebook (4920 - 9939, n=46, últimos 2 años) | |
| Lenovo ThinkPad Z16 G1 21D5S00T00 | |
| Asus Zenbook S 13 OLED | |
| Lenovo ThinkPad Z13 G1-21D20016GE | |
| Medio AMD Ryzen 7 PRO 6860Z, AMD Radeon 680M (n=1) | |
| Lenovo ThinkPad T14 G3-21CF004NGE | |
| Dell XPS 13 Plus 9320 i7-1280P OLED | |
| Lenovo ThinkPad Z13 21D2CTO1WW | |
| PCMark 10 / Essentials | |
| Asus Zenbook S 13 OLED | |
| Dell XPS 13 Plus 9320 i7-1280P OLED | |
| Media de la clase Subnotebook (8552 - 11646, n=46, últimos 2 años) | |
| Lenovo ThinkPad Z13 G1-21D20016GE | |
| Medio AMD Ryzen 7 PRO 6860Z, AMD Radeon 680M (n=1) | |
| Lenovo ThinkPad Z16 G1 21D5S00T00 | |
| Lenovo ThinkPad T14 G3-21CF004NGE | |
| Lenovo ThinkPad Z13 21D2CTO1WW | |
| PCMark 10 / Productivity | |
| Media de la clase Subnotebook (5435 - 16606, n=46, últimos 2 años) | |
| Asus Zenbook S 13 OLED | |
| Lenovo ThinkPad T14 G3-21CF004NGE | |
| Lenovo ThinkPad Z16 G1 21D5S00T00 | |
| Lenovo ThinkPad Z13 G1-21D20016GE | |
| Medio AMD Ryzen 7 PRO 6860Z, AMD Radeon 680M (n=1) | |
| Lenovo ThinkPad Z13 21D2CTO1WW | |
| Dell XPS 13 Plus 9320 i7-1280P OLED | |
| PCMark 10 / Digital Content Creation | |
| Media de la clase Subnotebook (5722 - 13779, n=46, últimos 2 años) | |
| Lenovo ThinkPad Z16 G1 21D5S00T00 | |
| Lenovo ThinkPad Z13 G1-21D20016GE | |
| Medio AMD Ryzen 7 PRO 6860Z, AMD Radeon 680M (n=1) | |
| Lenovo ThinkPad T14 G3-21CF004NGE | |
| Asus Zenbook S 13 OLED | |
| Dell XPS 13 Plus 9320 i7-1280P OLED | |
| Lenovo ThinkPad Z13 21D2CTO1WW | |
| CrossMark / Overall | |
| Dell XPS 13 Plus 9320 i7-1280P OLED | |
| Media de la clase Subnotebook (365 - 2356, n=59, últimos 2 años) | |
| Lenovo ThinkPad Z13 G1-21D20016GE | |
| Medio AMD Ryzen 7 PRO 6860Z, AMD Radeon 680M (n=1) | |
| Apple MacBook Air M2 10C GPU | |
| Asus Zenbook S 13 OLED | |
| Lenovo ThinkPad Z16 G1 21D5S00T00 | |
| Lenovo ThinkPad Z13 21D2CTO1WW | |
| Lenovo ThinkPad T14 G3-21CF004NGE | |
| CrossMark / Productivity | |
| Dell XPS 13 Plus 9320 i7-1280P OLED | |
| Media de la clase Subnotebook (364 - 2277, n=59, últimos 2 años) | |
| Lenovo ThinkPad Z13 G1-21D20016GE | |
| Medio AMD Ryzen 7 PRO 6860Z, AMD Radeon 680M (n=1) | |
| Asus Zenbook S 13 OLED | |
| Lenovo ThinkPad Z16 G1 21D5S00T00 | |
| Lenovo ThinkPad Z13 21D2CTO1WW | |
| Lenovo ThinkPad T14 G3-21CF004NGE | |
| Apple MacBook Air M2 10C GPU | |
| CrossMark / Creativity | |
| Dell XPS 13 Plus 9320 i7-1280P OLED | |
| Media de la clase Subnotebook (372 - 2743, n=59, últimos 2 años) | |
| Apple MacBook Air M2 10C GPU | |
| Lenovo ThinkPad Z16 G1 21D5S00T00 | |
| Lenovo ThinkPad Z13 G1-21D20016GE | |
| Medio AMD Ryzen 7 PRO 6860Z, AMD Radeon 680M (n=1) | |
| Asus Zenbook S 13 OLED | |
| Lenovo ThinkPad Z13 21D2CTO1WW | |
| Lenovo ThinkPad T14 G3-21CF004NGE | |
| CrossMark / Responsiveness | |
| Dell XPS 13 Plus 9320 i7-1280P OLED | |
| Media de la clase Subnotebook (312 - 1854, n=59, últimos 2 años) | |
| Asus Zenbook S 13 OLED | |
| Lenovo ThinkPad Z13 G1-21D20016GE | |
| Medio AMD Ryzen 7 PRO 6860Z, AMD Radeon 680M (n=1) | |
| Lenovo ThinkPad Z16 G1 21D5S00T00 | |
| Lenovo ThinkPad T14 G3-21CF004NGE | |
| Lenovo ThinkPad Z13 21D2CTO1WW | |
| Apple MacBook Air M2 10C GPU | |
| PCMark 10 Score | 6240 puntos | |
ayuda | ||
| AIDA64 / Memory Copy | |
| Media de la clase Subnotebook (14554 - 131023, n=57, últimos 2 años) | |
| Dell XPS 13 Plus 9320 i7-1280P OLED | |
| Lenovo ThinkPad T14 G3-21CF004NGE | |
| Lenovo ThinkPad Z13 21D2CTO1WW | |
| Lenovo ThinkPad Z16 G1 21D5S00T00 | |
| Lenovo ThinkPad Z13 G1-21D20016GE | |
| Medio AMD Ryzen 7 PRO 6860Z (n=1) | |
| Asus Zenbook S 13 OLED | |
| AIDA64 / Memory Read | |
| Media de la clase Subnotebook (15948 - 127174, n=57, últimos 2 años) | |
| Dell XPS 13 Plus 9320 i7-1280P OLED | |
| Lenovo ThinkPad Z16 G1 21D5S00T00 | |
| Lenovo ThinkPad T14 G3-21CF004NGE | |
| Lenovo ThinkPad Z13 21D2CTO1WW | |
| Asus Zenbook S 13 OLED | |
| Lenovo ThinkPad Z13 G1-21D20016GE | |
| Medio AMD Ryzen 7 PRO 6860Z (n=1) | |
| AIDA64 / Memory Write | |
| Media de la clase Subnotebook (15709 - 135141, n=57, últimos 2 años) | |
| Dell XPS 13 Plus 9320 i7-1280P OLED | |
| Lenovo ThinkPad Z16 G1 21D5S00T00 | |
| Lenovo ThinkPad Z13 21D2CTO1WW | |
| Lenovo ThinkPad Z13 G1-21D20016GE | |
| Medio AMD Ryzen 7 PRO 6860Z (n=1) | |
| Lenovo ThinkPad T14 G3-21CF004NGE | |
| Asus Zenbook S 13 OLED | |
| AIDA64 / Memory Latency | |
| Lenovo ThinkPad Z16 G1 21D5S00T00 | |
| Lenovo ThinkPad Z13 21D2CTO1WW | |
| Lenovo ThinkPad Z13 G1-21D20016GE | |
| Medio AMD Ryzen 7 PRO 6860Z (n=1) | |
| Asus Zenbook S 13 OLED | |
| Lenovo ThinkPad T14 G3-21CF004NGE | |
| Dell XPS 13 Plus 9320 i7-1280P OLED | |
| Media de la clase Subnotebook (6.1 - 159.9, n=55, últimos 2 años) | |
* ... más pequeño es mejor
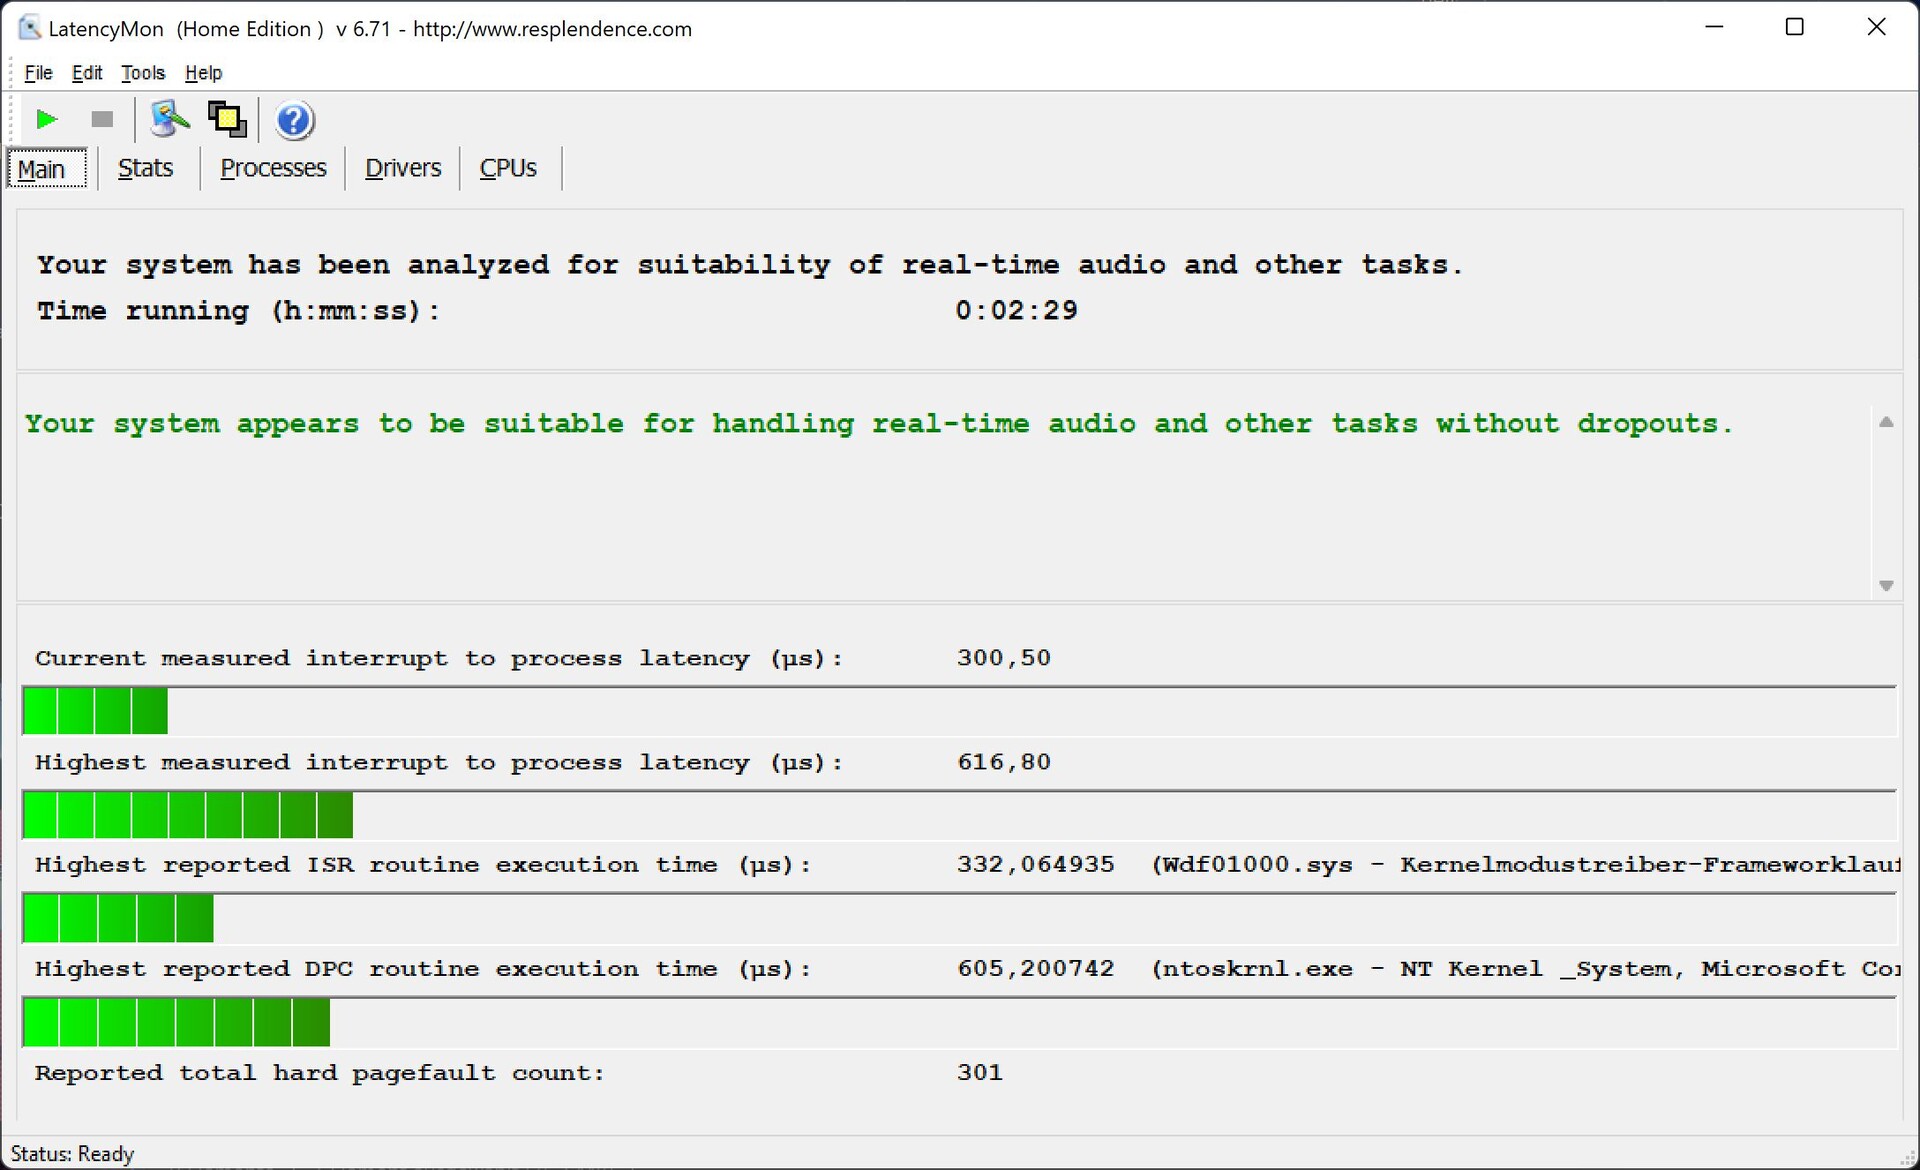
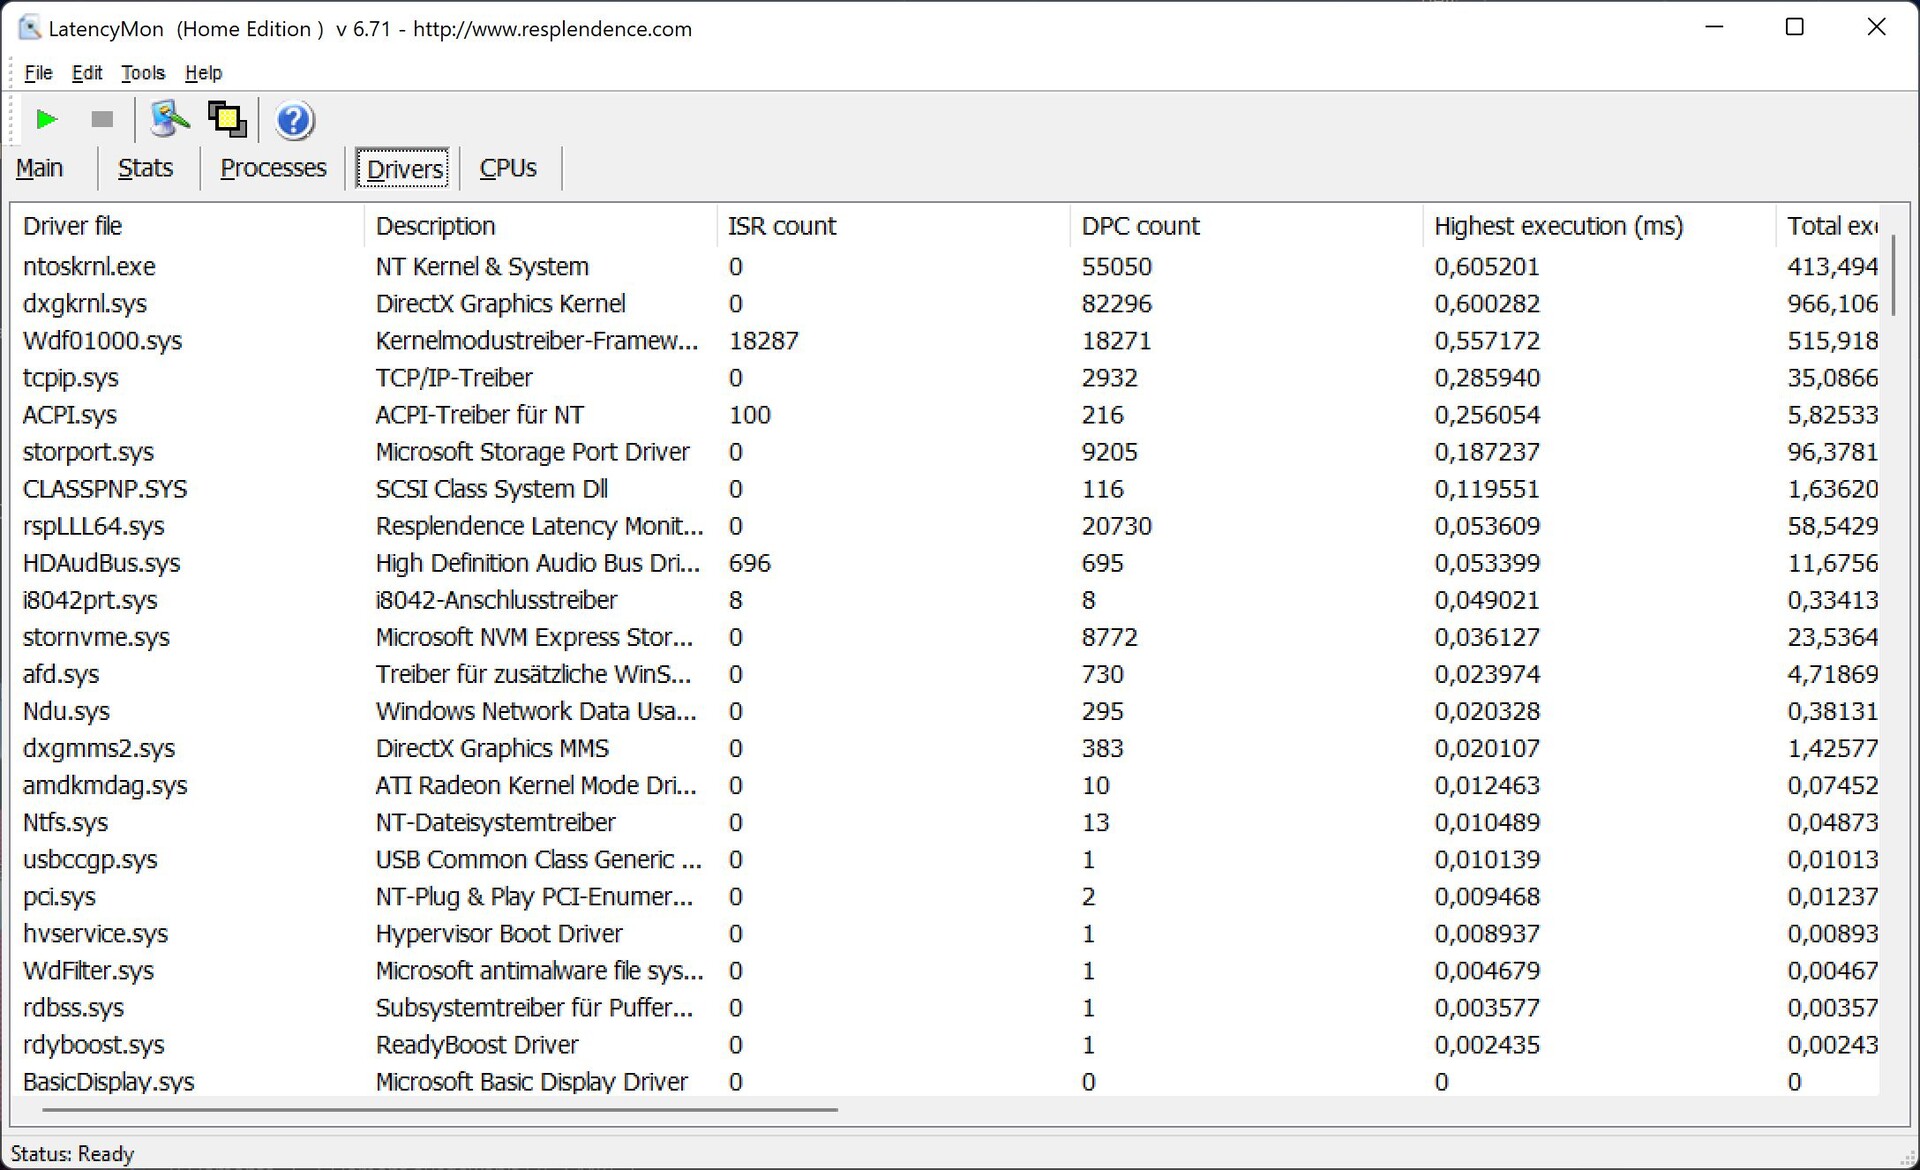
Latencia del CPD
En nuestra prueba de latencia estandarizada (navegación web, reproducción de YouTube en 4K, carga de la CPU), el dispositivo de prueba se comportó muy bien en la versión actual de la BIOS y no mostró ninguna evidencia de deficiencia de rendimiento técnico.
| DPC Latencies / LatencyMon - interrupt to process latency (max), Web, Youtube, Prime95 | |
| Lenovo ThinkPad Z13 21D2CTO1WW | |
| Lenovo ThinkPad T14 G3-21CF004NGE | |
| Lenovo ThinkPad Z16 G1 21D5S00T00 | |
| Lenovo ThinkPad Z13 G1-21D20016GE | |
| Asus Zenbook S 13 OLED | |
| Dell XPS 13 Plus 9320 i7-1280P OLED | |
* ... más pequeño es mejor
Dispositivos de almacenamiento
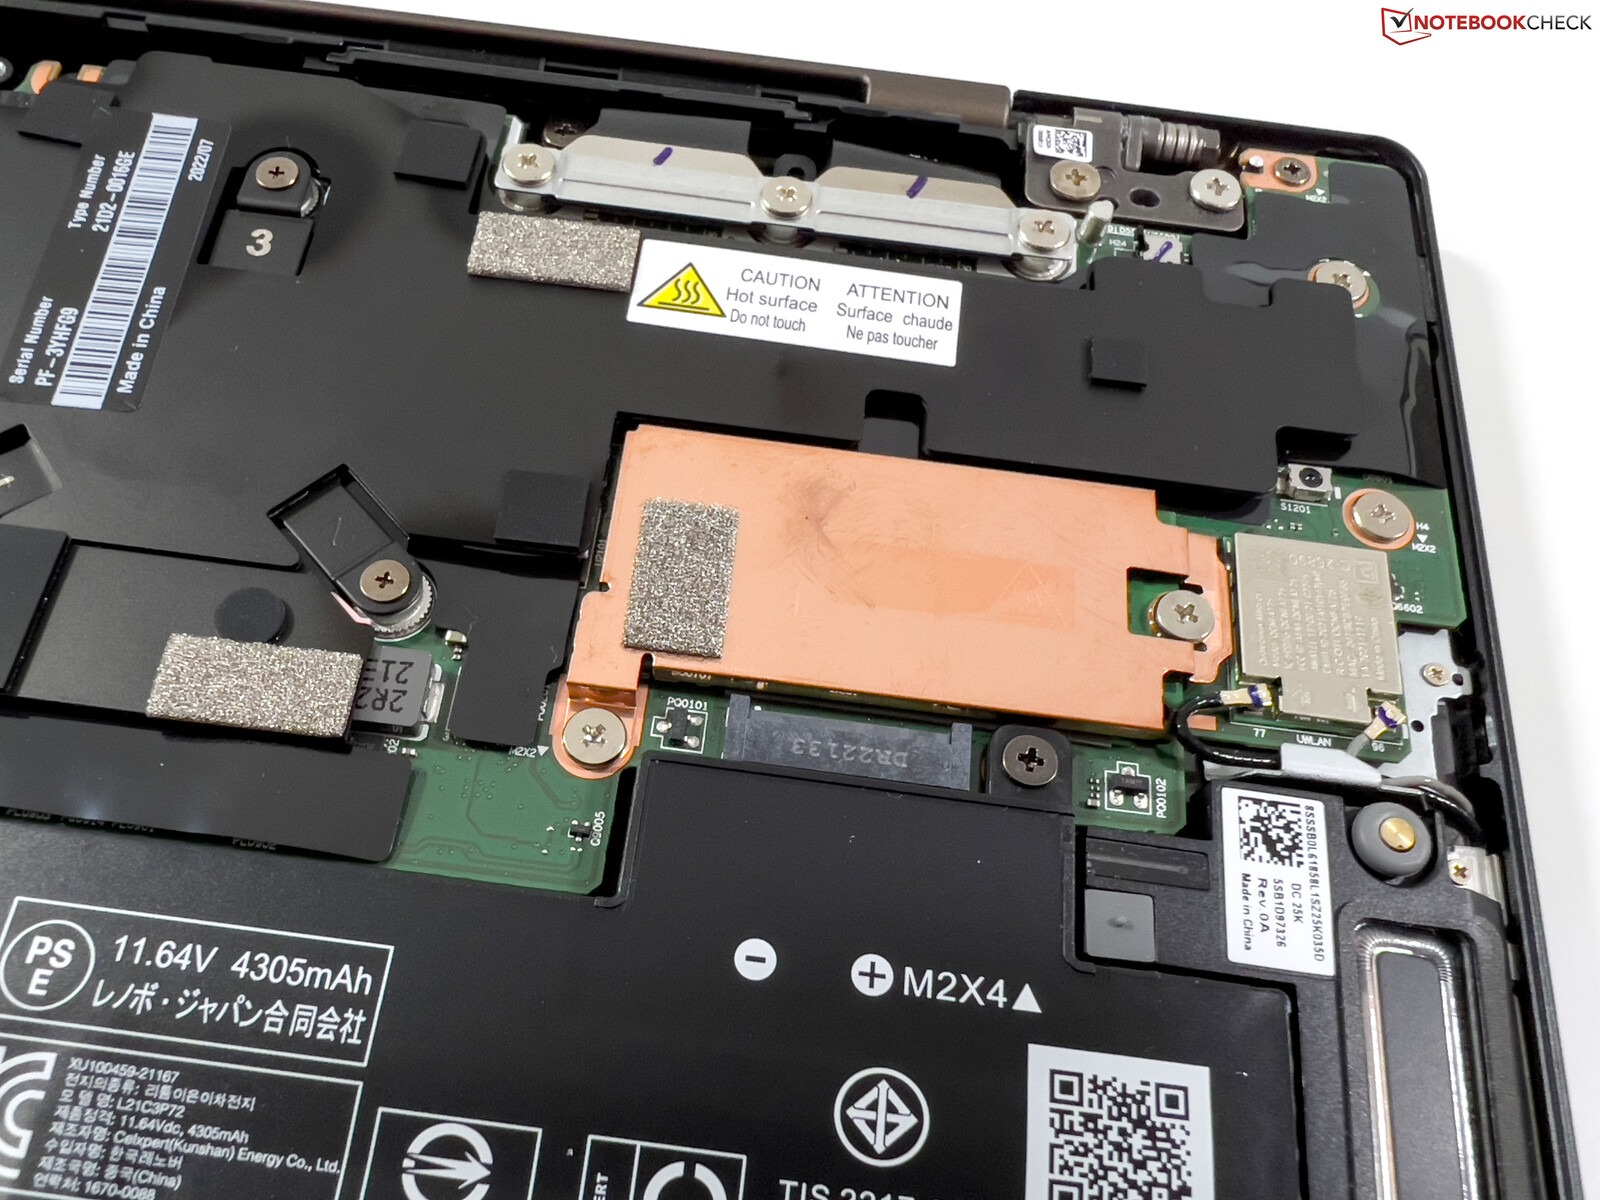
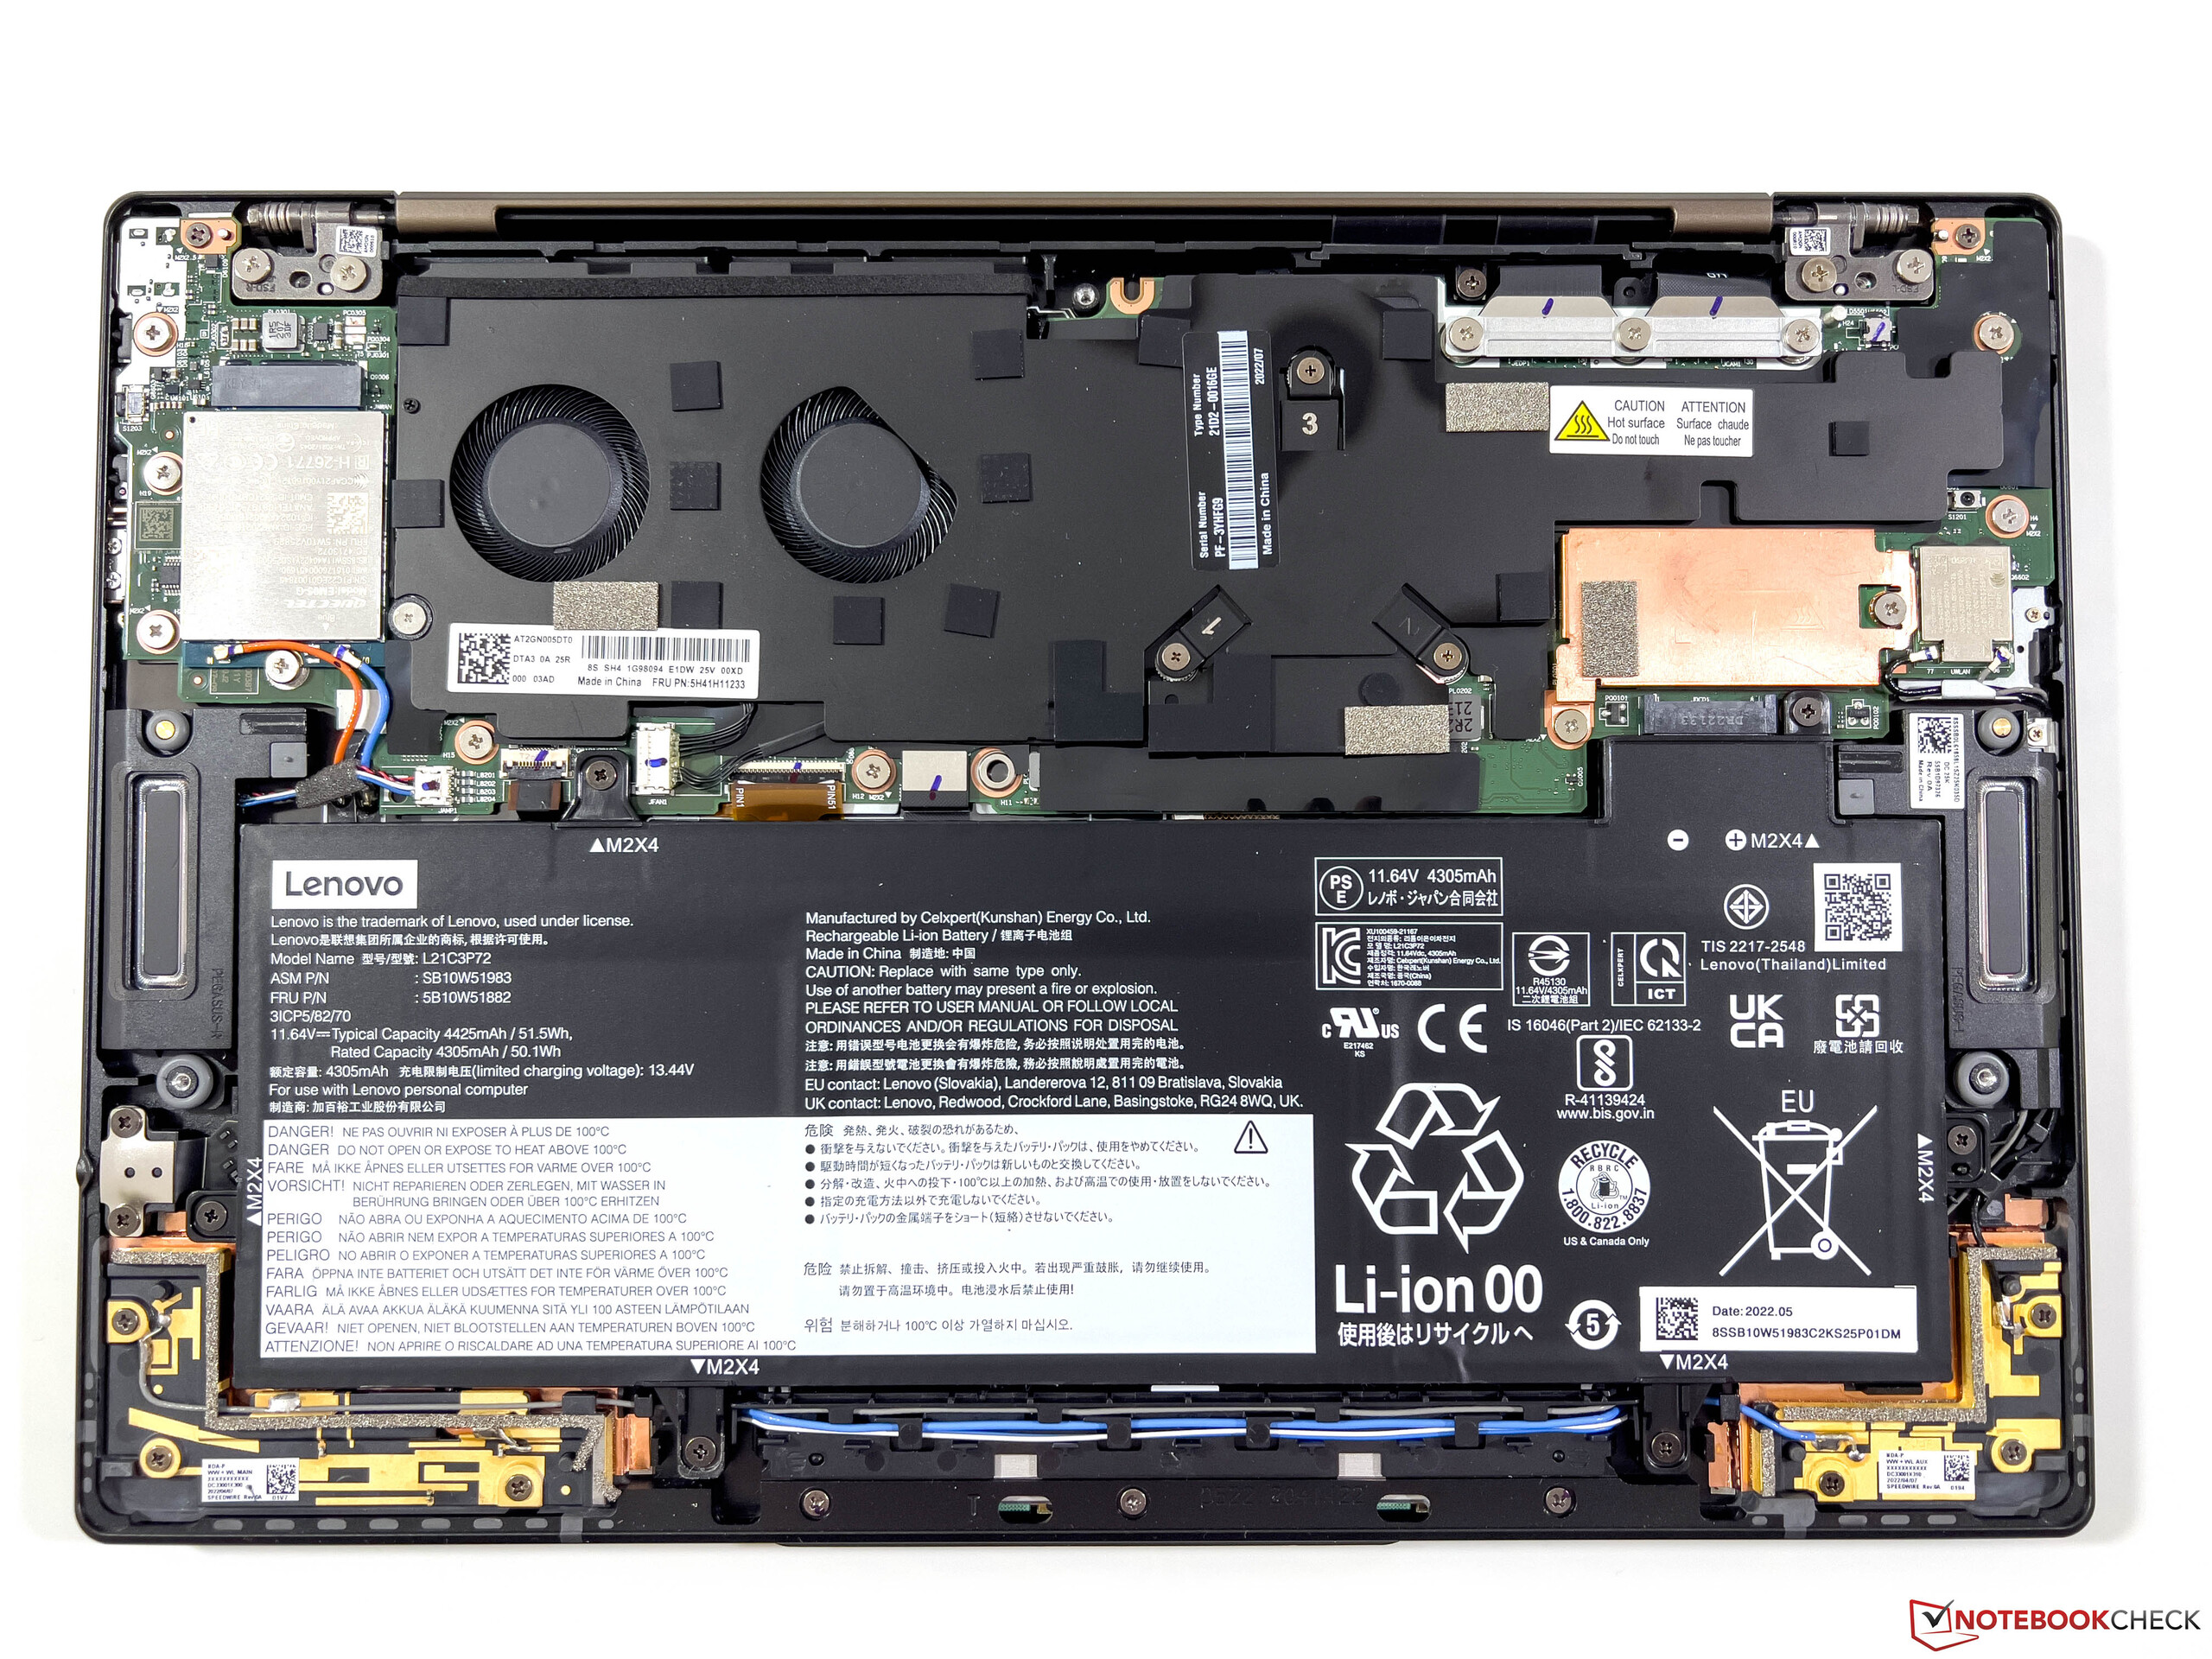
El ThinkPad Z13 sólo tiene espacio para una SSD M.2-2242 compacta, que al menos se conecta a través de una interfaz PCIe 4.0 actual. El Micron 2450, permite la instalación de un SSD PCIe 4.0 con tasas de transferencia máximas de unos 3.3 GB/s. Esto puede desperdiciar algo de capacidad potencial, pero al menos el rendimiento se mantiene constante incluso bajo carga permanente. De los 1 TB, unos 900 GB siguen estando a disposición del usuario en el primer uso del portátil. Se pueden encontrar más pruebas comparativas de SSD aquí.

* ... más pequeño es mejor
Disk Throttling: DiskSpd Read Loop, Queue Depth 8
Tarjeta gráfica
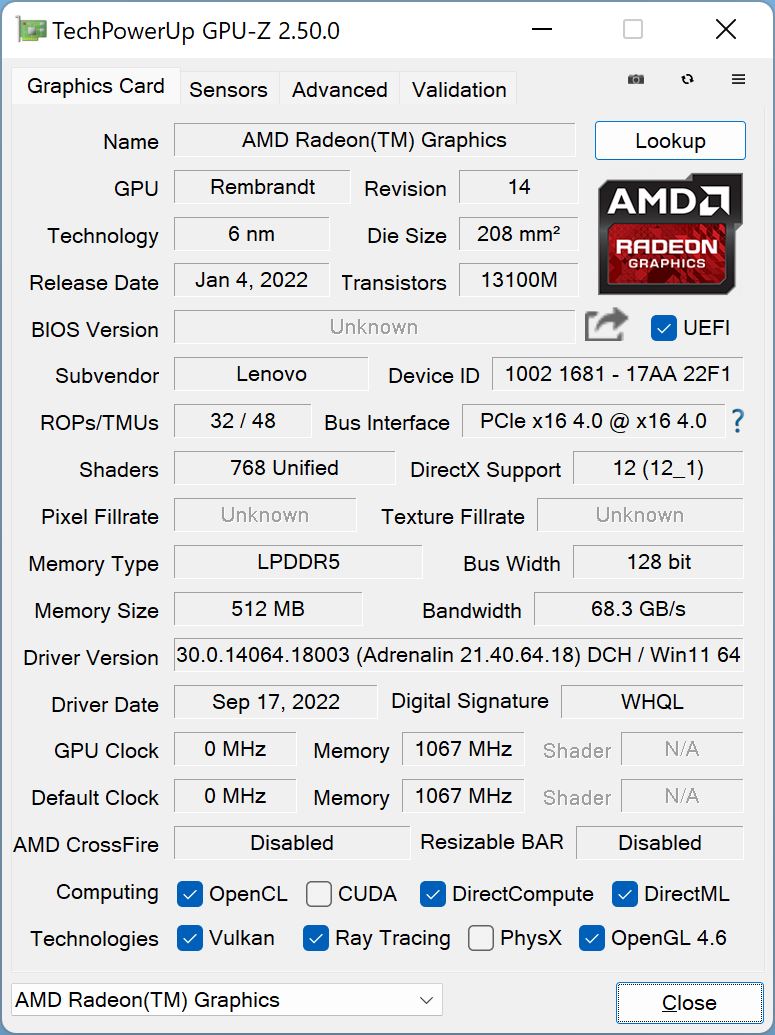
El Ryzen 7 Pro 6860Z utiliza la conocida GPU integrada Radeon 680M con una velocidad de reloj máxima de 2,2 GHz como en las CPUs Ryzen 7 convencionales. En las pruebas sintéticas, los resultados también son muy buenos al principio, pero el rendimiento no se mantiene estable. El test de estrés 3DMark (Time Spy) falla con un 82.7% y cuando se experimenta (lo que sería bastante posible con la Radeon 680M) con carga simultánea de CPU, el chip se ralentizó aún más (hasta un total de unos 19 vatios). El Asus Zenbook S 13 o el propio Lenovo ThinkPad T14 G3 rinden significativamente mejor bajo carga simultánea.
El Radeon 660M del ThinkPad Z13 básico es un 35% más lento y también se ve afectado por la ralentización. La energía de la batería no reduce el rendimiento gráfico. Hay más pruebas de GPU disponibles aquí
| 3DMark 11 Performance | 10387 puntos | |
| 3DMark Cloud Gate Standard Score | 31075 puntos | |
| 3DMark Fire Strike Score | 6287 puntos | |
| 3DMark Time Spy Score | 2416 puntos | |
ayuda | ||
* ... más pequeño es mejor
Witcher 3 FPS-Diagramm
| bajo | medio | alto | ultra | QHD | |
|---|---|---|---|---|---|
| GTA V (2015) | 136.9 | 122.7 | 46.8 | 20.9 | |
| The Witcher 3 (2015) | 131 | 78 | 33 | 18.3 | |
| Dota 2 Reborn (2015) | 107.7 | 91.8 | 72.2 | 60.6 | |
| Final Fantasy XV Benchmark (2018) | 59.3 | 30.5 | 21.7 | ||
| X-Plane 11.11 (2018) | 51.8 | 40.6 | 34.3 | ||
| Far Cry 5 (2018) | 55 | 34 | 30 | 28 | |
| Strange Brigade (2018) | 133.5 | 55.3 | 44.8 | 38.9 | |
| F1 2021 (2021) | 155.3 | 75.1 | 54.9 | 23 | 15.8 |
| F1 22 (2022) | 71.4 | 61.1 | 44.5 | 9.35 |
Emisiones y consumo de energía
Ruido del sistema
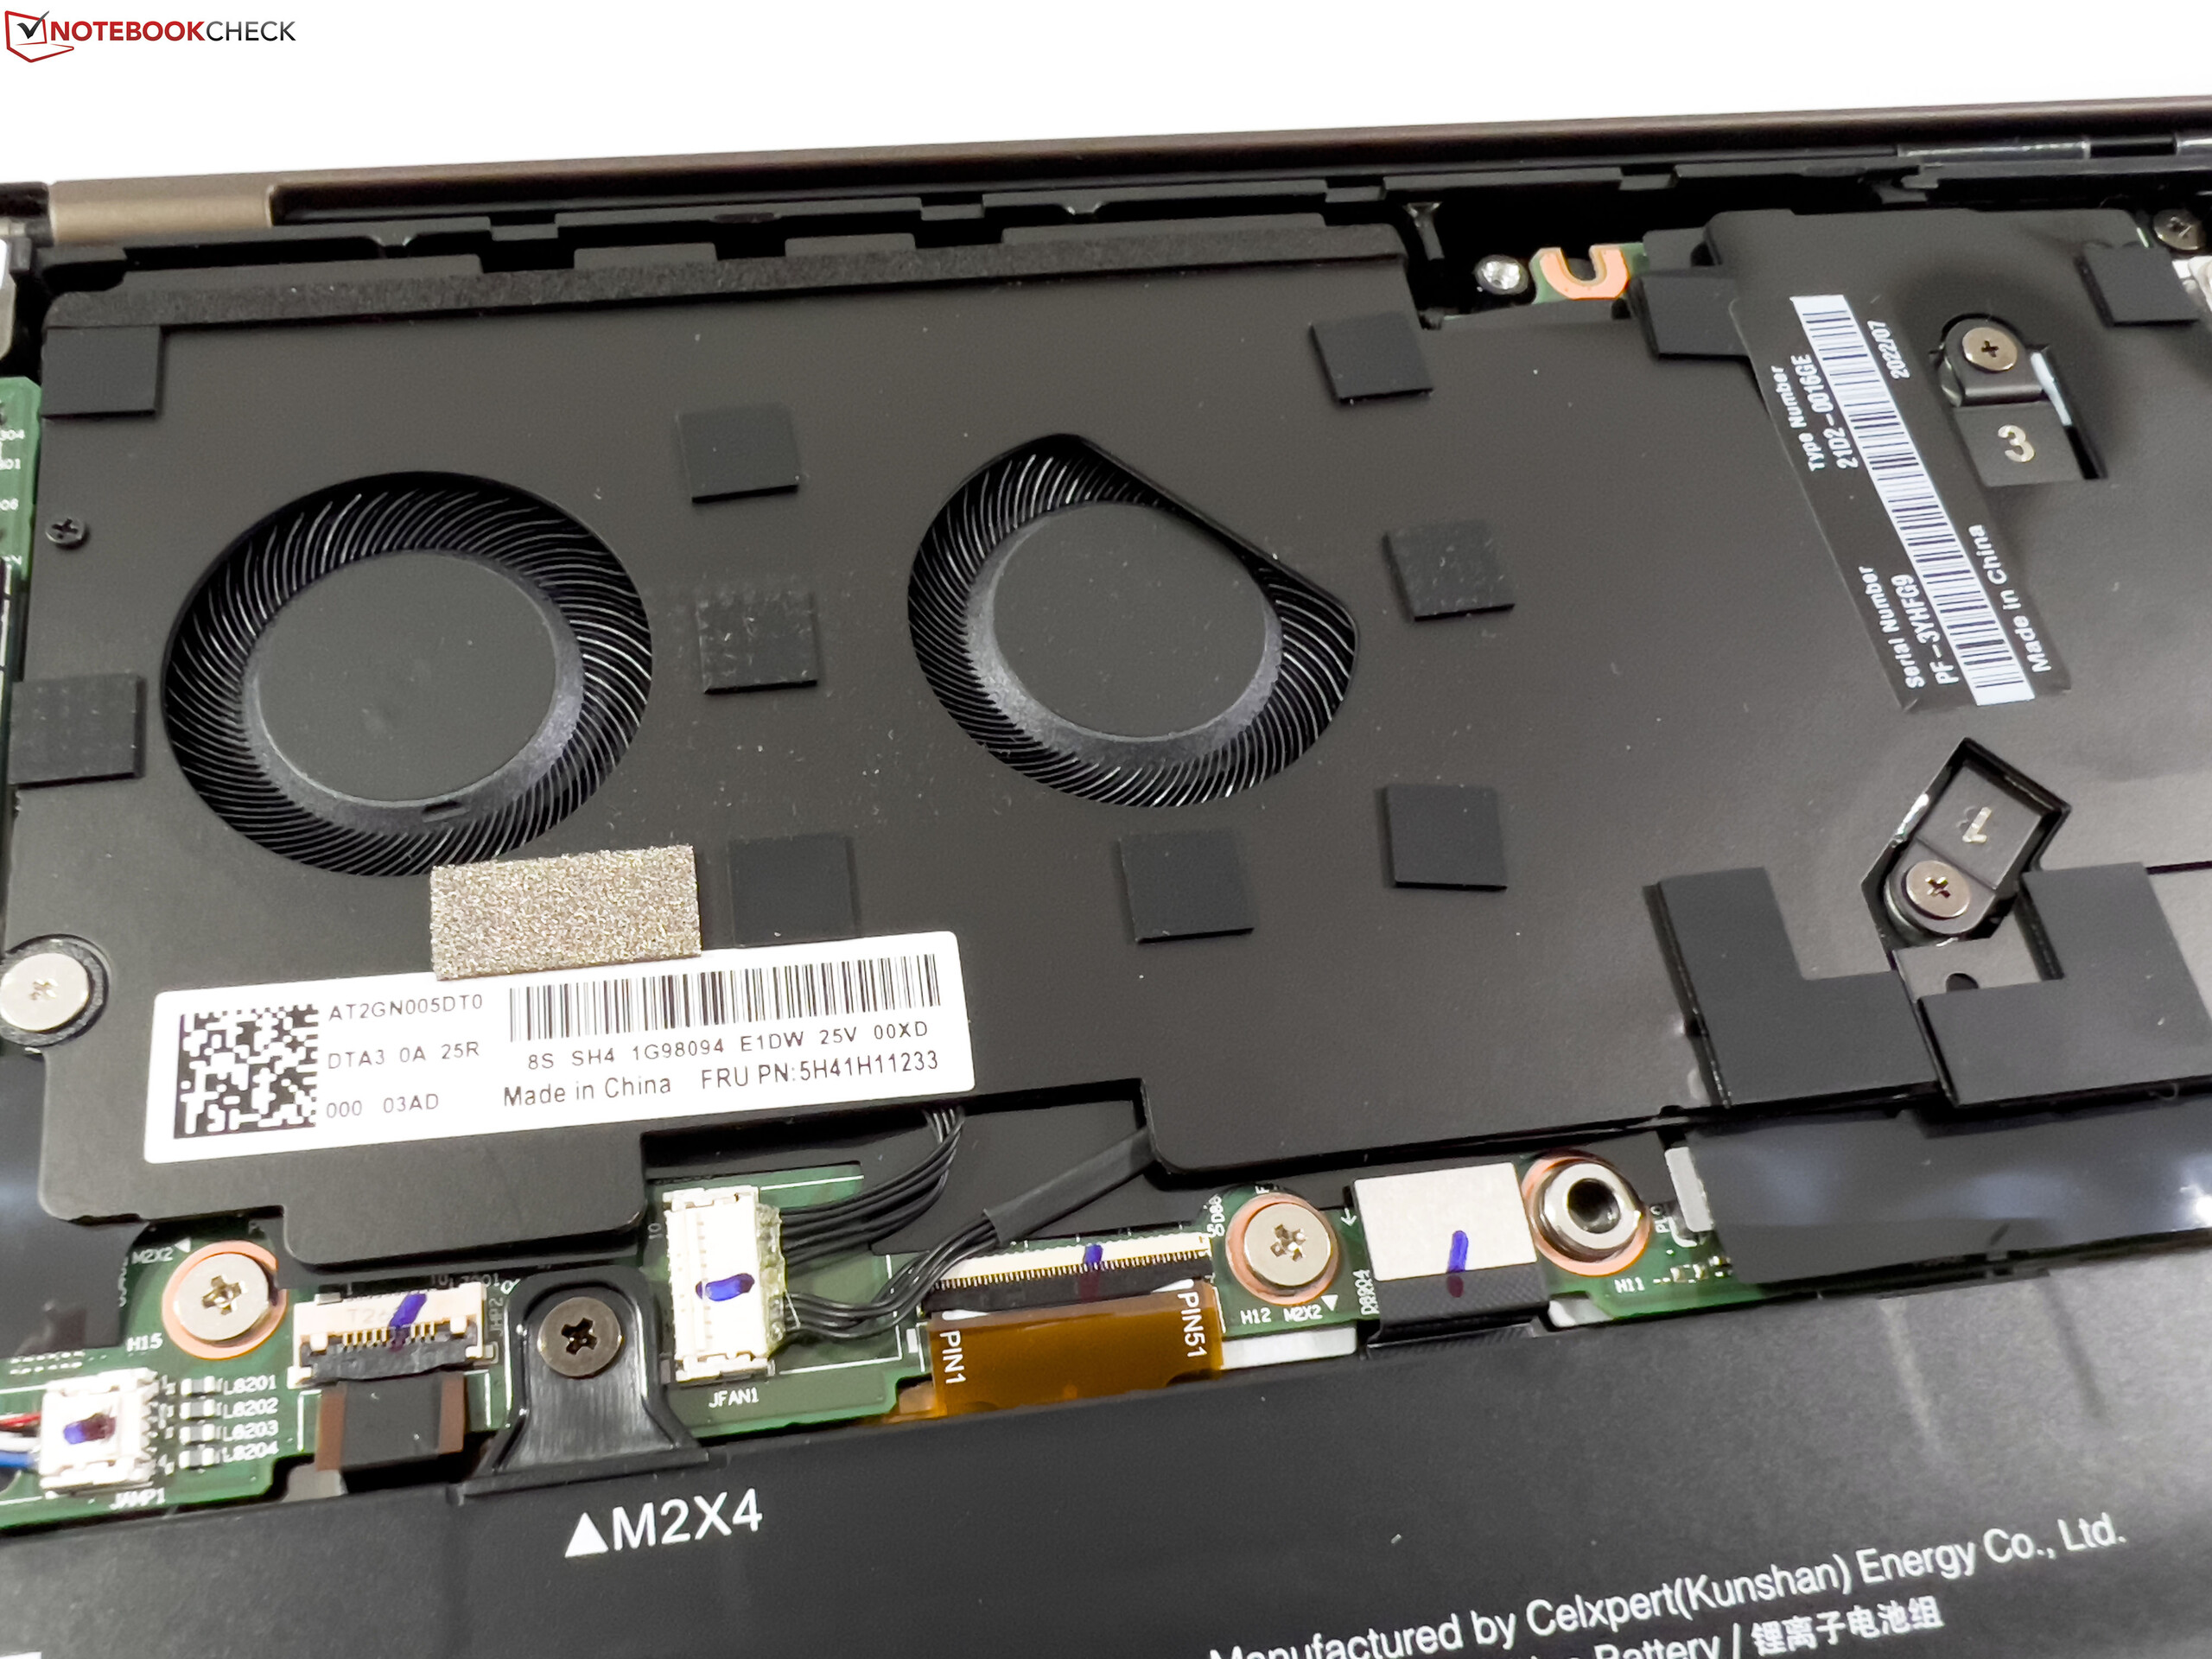
El ThinkPad Z13 usa refrigeración con dos pequeños ventiladores. Estos normalmente están inactivos y para tareas muy ligeras suelen ser silenciosos. Pero los ventiladores a veces se ponen en marcha incluso cuando sólo se navega. Debido a los altos valores de TDP, los ventiladores alcanzan su velocidad máxima casi inmediatamente bajo carga aumentada, lo que corresponde a unos 41 dB(A). El ruido es claramente audible, pero no hay frecuencias molestas. No pudimos detectar ningún otro ruido de origen electrónico.
Ruido
| Ocioso |
| 24.3 / 24.3 / 24.3 dB(A) |
| Carga |
| 41 / 41 dB(A) |
 | ||
30 dB silencioso 40 dB(A) audible 50 dB(A) ruidosamente alto |
||
min: | ||
| Lenovo ThinkPad Z13 G1-21D20016GE Radeon 680M, R7 PRO 6860Z, Micron 2450 1TB MTFDKCD1T0TFK | Asus Zenbook S 13 OLED Radeon 680M, R7 6800U, Samsung PM9A1 MZVL21T0HCLR | Dell XPS 13 Plus 9320 i7-1280P OLED Iris Xe G7 96EUs, i7-1280P, WDC PC SN810 512GB | Lenovo ThinkPad Z13 21D2CTO1WW Radeon 660M, R5 PRO 6650U, Lenovo UMIS AM630 RPJTJ512MGE1QDQ | Lenovo ThinkPad T14 G3-21CF004NGE Radeon 680M, R7 PRO 6850U, Kioxia BG5 KBG5AZNV512G | |
|---|---|---|---|---|---|
| Noise | 3% | 5% | 5% | 5% | |
| apagado / medio ambiente * (dB) | 24.3 | 24 1% | 23.4 4% | 23.71 2% | 24.2 -0% |
| Idle Minimum * (dB) | 24.3 | 24 1% | 23.4 4% | 23.71 2% | 24.2 -0% |
| Idle Average * (dB) | 24.3 | 24 1% | 23.4 4% | 23.71 2% | 24.2 -0% |
| Idle Maximum * (dB) | 24.3 | 24 1% | 23.4 4% | 23.71 2% | 25.8 -6% |
| Load Average * (dB) | 41 | 33.1 19% | 35 15% | 32.35 21% | 32.2 21% |
| Witcher 3 ultra * (dB) | 41 | 40.2 2% | 41.6 -1% | 38.8 5% | 34.1 17% |
| Load Maximum * (dB) | 41 | 41.7 -2% | 39.9 3% | 39.53 4% | 38.8 5% |
* ... más pequeño es mejor
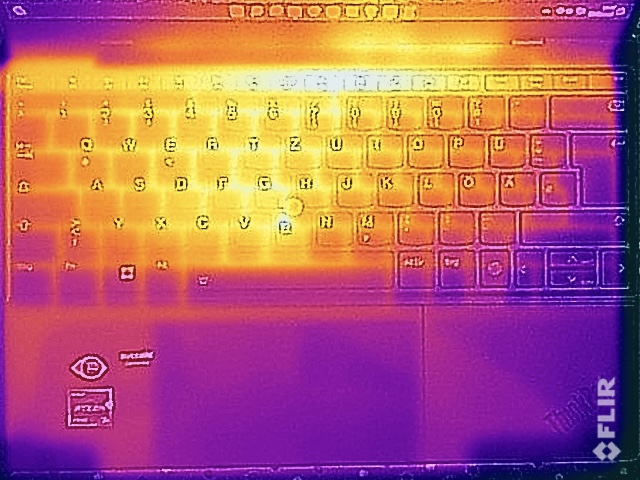
Temperatura
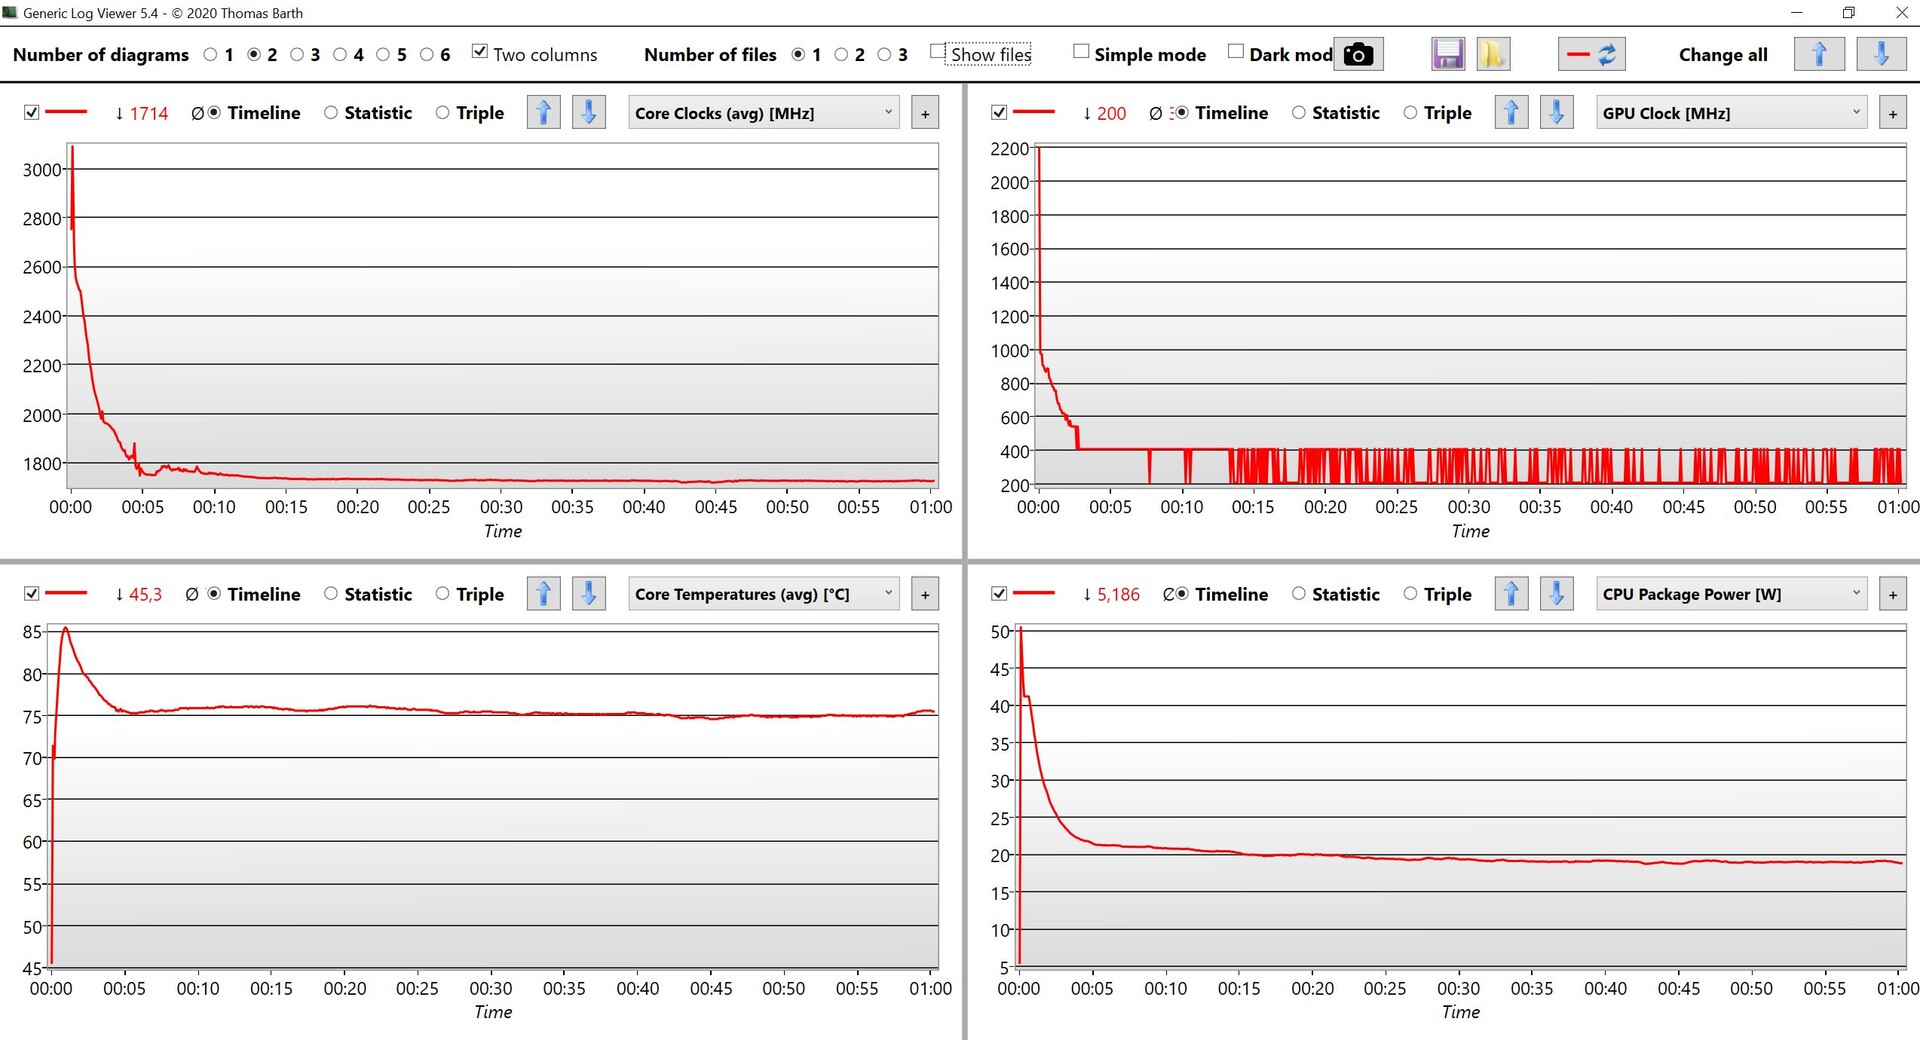
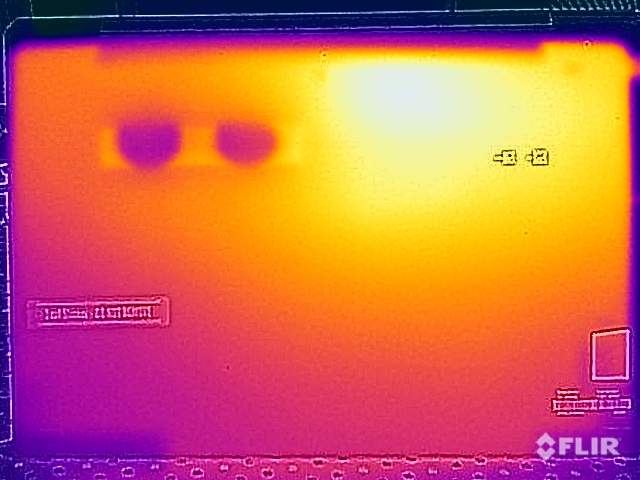
Las temperaturas superficiales del ThinkPad Z13 son intrascendentes a baja carga, pero bajo carga medimos valores más altos que el modelo básico. Esto no es sorprendente, ya que la refrigeración es idéntica y los ventiladores también funcionan a un nivel comparable, pero el TDP del procesador es mayor. Las temperaturas en la superficie de la cubierta superior se mantienen dentro de los límites normales, no superando los 45 °C, y siguen siendo seguras. Pero medimos más de 50 °C en la zona central superior de la superficie inferior, lo que, en contacto directo con la piel, puede resultar rápidamente incómodo.
Mientras que el consumo de energía del Ryzen 7 Pro se estabiliza en 27 vatios bajo carga pura de CPU, sólo es de 19 vatios en el test de estrés con carga combinada de CPU/GPU (en el Z13 con el Ryzen 5 Pro era de unos 14 vatios). A la vista de estos bajos valores, las temperaturas superficiales ya son bastante altas. Se tarda unos minutos en volver a disponer de toda la potencia inmediatamente después del test de estrés.
(-) La temperatura máxima en la parte superior es de 45.6 °C / 114 F, frente a la media de 35.9 °C / 97 F, que oscila entre 21.4 y 59 °C para la clase Subnotebook.
(-) El fondo se calienta hasta un máximo de 51 °C / 124 F, frente a la media de 39.2 °C / 103 F
(+) En reposo, la temperatura media de la parte superior es de 25.9 °C / 79# F, frente a la media del dispositivo de 30.8 °C / 87 F.
(-) Jugando a The Witcher 3, la temperatura media de la parte superior es de 38.9 °C / 102 F, frente a la media del dispositivo de 30.8 °C / 87 F.
(+) Los reposamanos y el panel táctil alcanzan como máximo la temperatura de la piel (33 °C / 91.4 F) y, por tanto, no están calientes.
(-) La temperatura media de la zona del reposamanos de dispositivos similares fue de 28.2 °C / 82.8 F (-4.8 °C / -8.6 F).
| Lenovo ThinkPad Z13 G1-21D20016GE AMD Ryzen 7 PRO 6860Z, AMD Radeon 680M | Asus Zenbook S 13 OLED AMD Ryzen 7 6800U, AMD Radeon 680M | Apple MacBook Air M2 10C GPU Apple M2, Apple M2 10-Core GPU | Lenovo ThinkPad Z13 21D2CTO1WW AMD Ryzen 5 PRO 6650U, AMD Radeon 660M | Lenovo ThinkPad T14 G3-21CF004NGE AMD Ryzen 7 PRO 6850U, AMD Radeon 680M | Dell XPS 13 Plus 9320 4K Intel Core i7-1260P, Intel Iris Xe Graphics G7 96EUs | |
|---|---|---|---|---|---|---|
| Heat | -3% | 8% | -4% | 3% | 1% | |
| Maximum Upper Side * (°C) | 45.6 | 47.9 -5% | 44.7 2% | 44.9 2% | 48.2 -6% | 41.1 10% |
| Maximum Bottom * (°C) | 51 | 56.1 -10% | 44.6 13% | 44.3 13% | 52.8 -4% | 48.8 4% |
| Idle Upper Side * (°C) | 27 | 26.8 1% | 25.1 7% | 31.4 -16% | 24.4 10% | 28 -4% |
| Idle Bottom * (°C) | 27.9 | 27.3 2% | 25.3 9% | 31.5 -13% | 24.5 12% | 29.3 -5% |
* ... más pequeño es mejor
Altavoces
Lenovo ThinkPad Z13 G1-21D20016GE análisis de audio
(±) | la sonoridad del altavoz es media pero buena (77.6 dB)
Graves 100 - 315 Hz
(-) | casi sin bajos - de media 15.4% inferior a la mediana
(±) | la linealidad de los graves es media (9.5% delta a frecuencia anterior)
Medios 400 - 2000 Hz
(+) | medios equilibrados - a sólo 3.2% de la mediana
(+) | los medios son lineales (5.1% delta a la frecuencia anterior)
Altos 2 - 16 kHz
(+) | máximos equilibrados - a sólo 3.1% de la mediana
(+) | los máximos son lineales (3.8% delta a la frecuencia anterior)
Total 100 - 16.000 Hz
(+) | el sonido global es lineal (14.7% de diferencia con la mediana)
En comparación con la misma clase
» 31% de todos los dispositivos probados de esta clase eran mejores, 5% similares, 64% peores
» El mejor tuvo un delta de 5%, la media fue 18%, el peor fue ###max##%
En comparación con todos los dispositivos probados
» 19% de todos los dispositivos probados eran mejores, 4% similares, 77% peores
» El mejor tuvo un delta de 4%, la media fue 23%, el peor fue ###max##%
Apple MacBook Air M2 10C GPU análisis de audio
(+) | los altavoces pueden reproducir a un volumen relativamente alto (#82.7 dB)
Graves 100 - 315 Hz
(±) | lubina reducida - en promedio 12.2% inferior a la mediana
(±) | la linealidad de los graves es media (12.6% delta a frecuencia anterior)
Medios 400 - 2000 Hz
(+) | medios equilibrados - a sólo 1.1% de la mediana
(+) | los medios son lineales (3.1% delta a la frecuencia anterior)
Altos 2 - 16 kHz
(+) | máximos equilibrados - a sólo 2.4% de la mediana
(+) | los máximos son lineales (1.9% delta a la frecuencia anterior)
Total 100 - 16.000 Hz
(+) | el sonido global es lineal (9.5% de diferencia con la mediana)
En comparación con la misma clase
» 5% de todos los dispositivos probados de esta clase eran mejores, 2% similares, 93% peores
» El mejor tuvo un delta de 5%, la media fue 18%, el peor fue ###max##%
En comparación con todos los dispositivos probados
» 4% de todos los dispositivos probados eran mejores, 1% similares, 95% peores
» El mejor tuvo un delta de 4%, la media fue 23%, el peor fue ###max##%
Consumo de energía
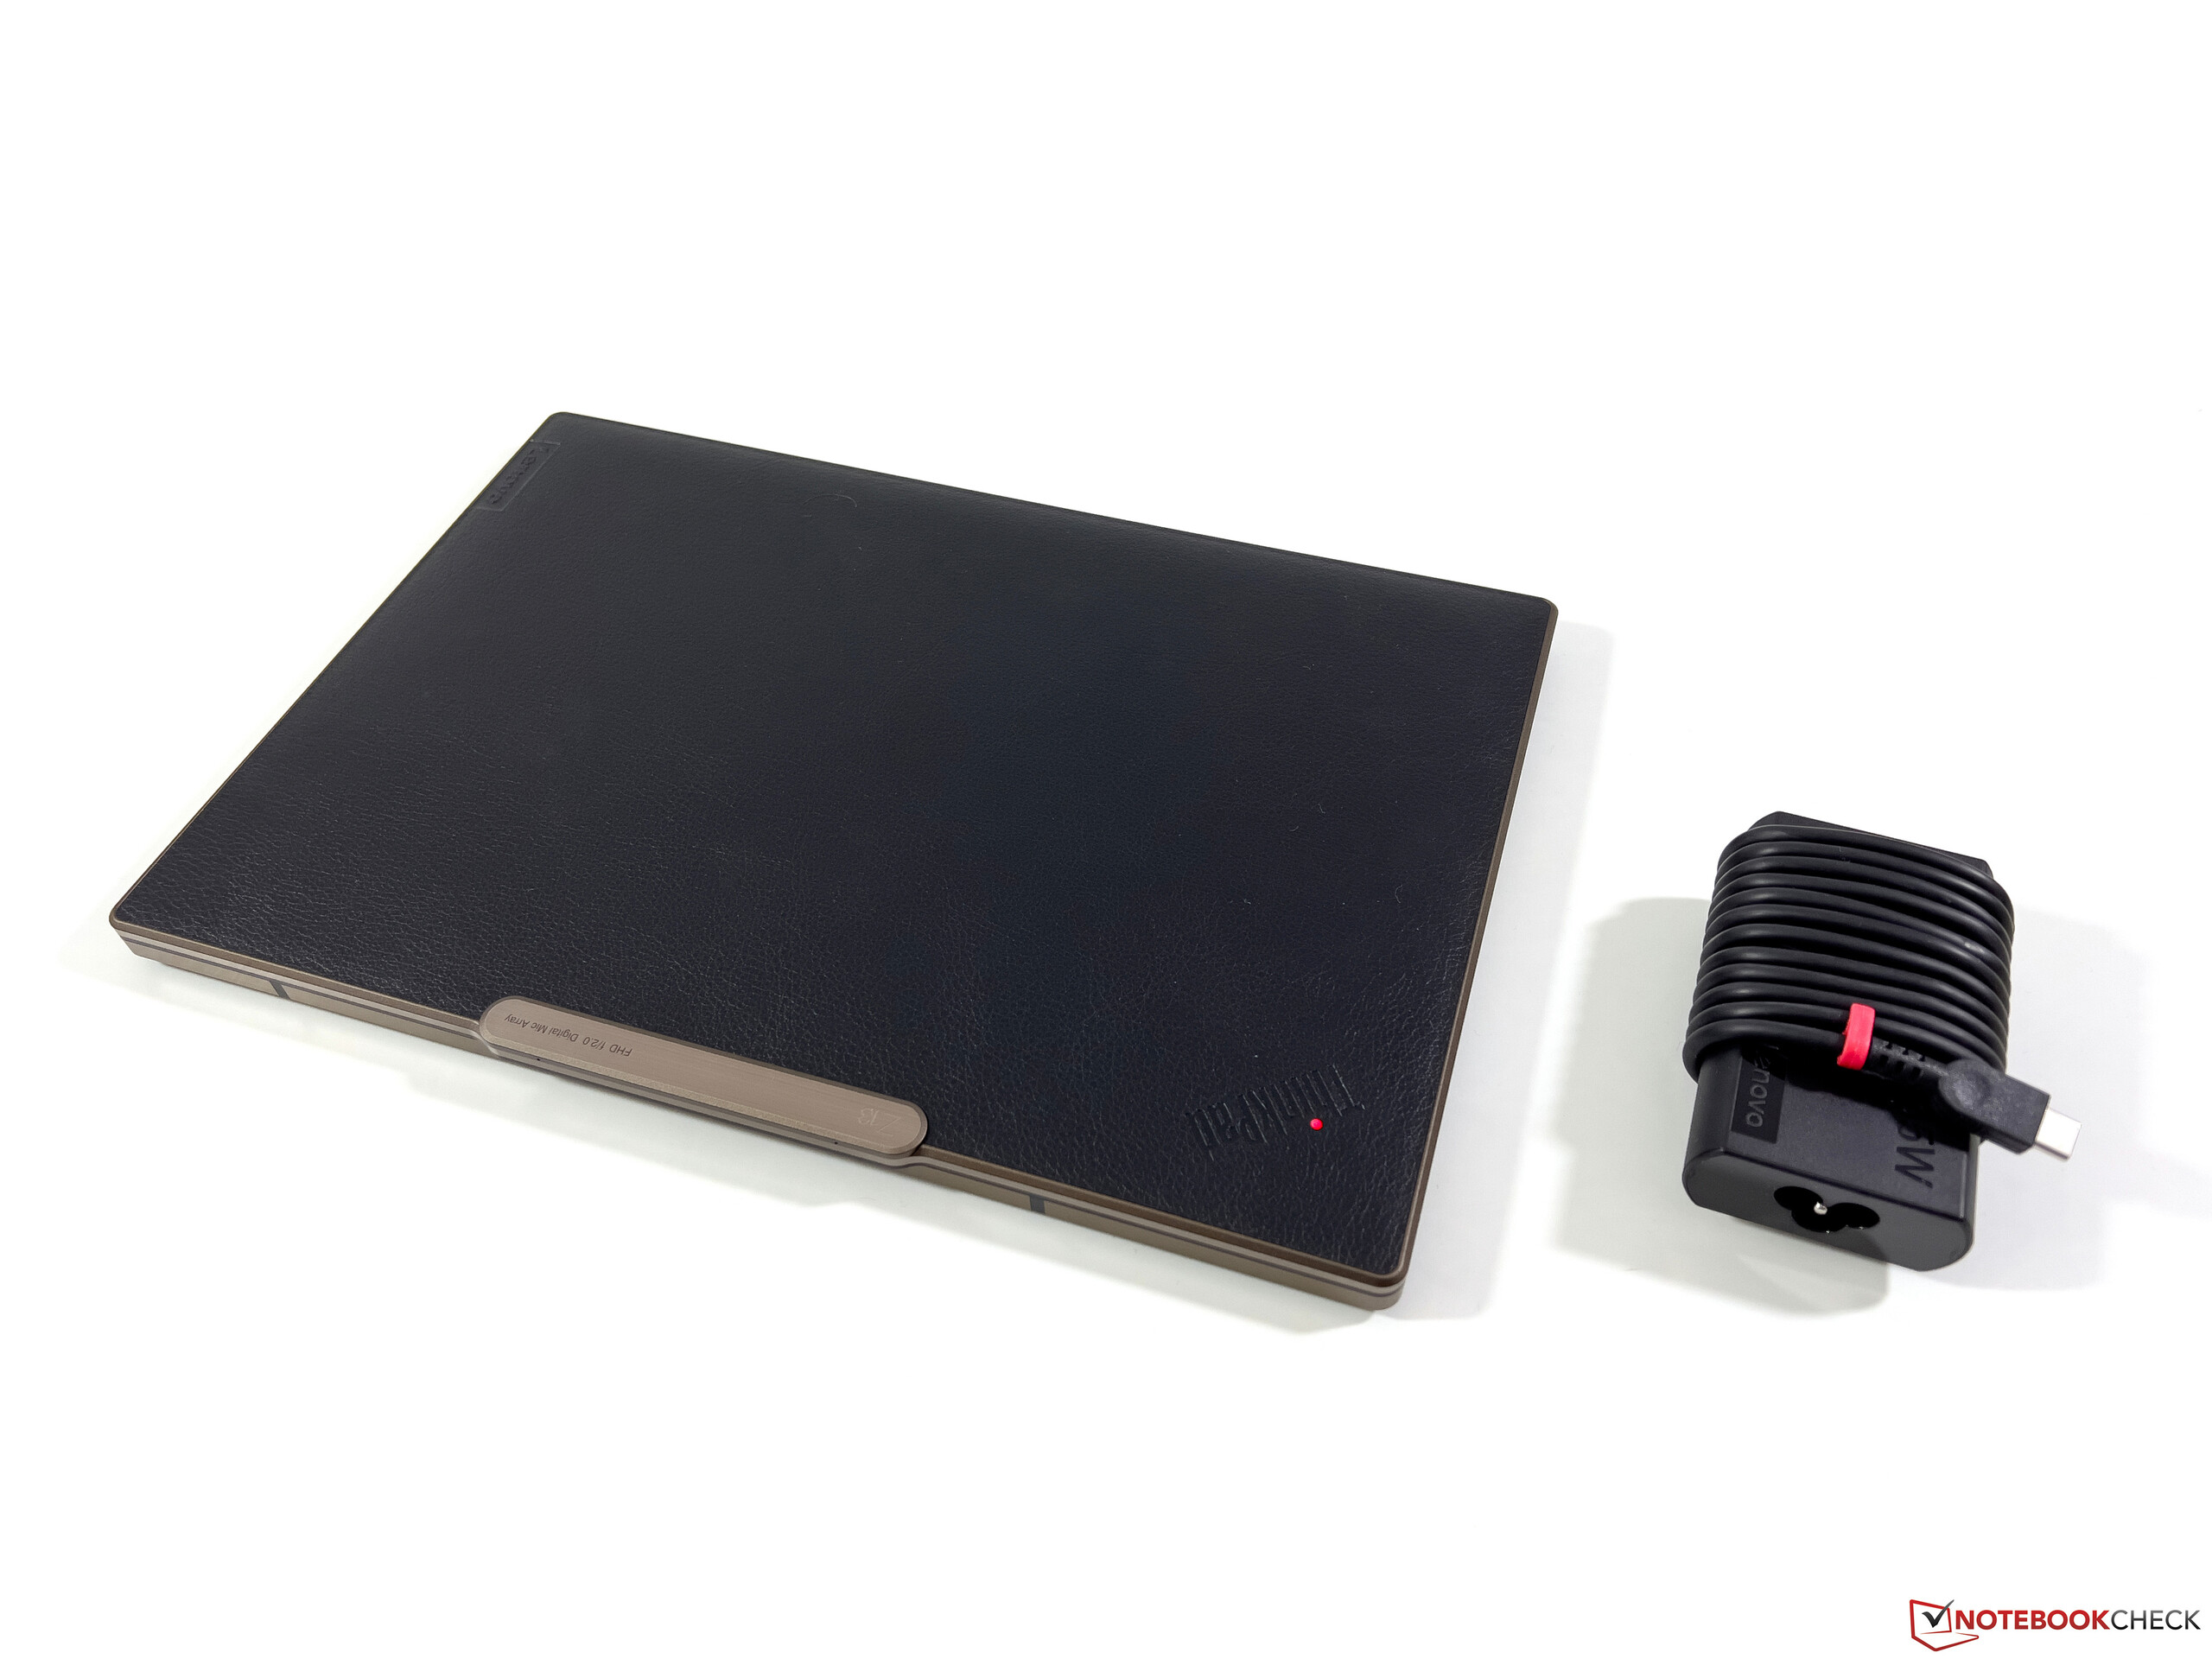
En las mediciones de consumo de energía, el impacto de la pantalla OLED es claramente perceptible. Incluso con la imagen de fondo bastante oscura, medimos un máximo de 8,4 vatios en reposo, pero con una imagen brillante era de 11-12 vatios. Bajo carga, el máximo es de unos 63 vatios, aunque el valor baja rápidamente a unos 46 vatios bajo carga continua y luego se estabiliza en unos 30 vatios. Por tanto, la fuente de alimentación de 65 vatios suministrada es completamente adecuada.
| Off / Standby | |
| Ocioso | |
| Carga |
|
Clave:
min: | |
Power Consumption Witcher 3 / Stresstest
Power Consumption external Monitor
Duración de la batería
La pantalla OLED reduce significativamente la duración de la batería, y nuestra prueba WLAN que incluye un gran número de sitios web evoca el peor escenario para los paneles OLED. La duración de la batería es significativamente peor que la del modelo básico del Z13 con el panel IPSque consiguió más de 10 horas incluso a pleno brillo. El modelo OLED, por otro lado, sólo logra 7.5 horas a 150 cd/m² y menos de 6 horas a pleno brillo SDR y, por tanto, también una duración significativamente menor que la del Zenbook S 13 con la mayor batería de 67 Wh.
La carga completa tarda algo más de dos horas con el dispositivo encendido; el 80% de la capacidad vuelve a estar disponible tras unos 64 minutos.
Pro
Contra
Veredicto - El ThinkPad Z13 plantea algunos interrogantes
Después de probar la versión de gama alta del ThinkPad Z13, nos preguntamos si realmente sigue siendo un portátil de negocios, si realmente sigue siendo un ThinkPad. En la configuración con la pantalla OLED y la tapa de cuero artificial, es en efecto un competidor ideal para el modelo de consumo Asus Zenbook S 13. Lo que es más, tiene que prescindir de algunas características típicas de ThinkPad. Éstas incluyen un ángulo de apertura limitado de la pantalla, la omisión de la ranura para un Bloqueo Kensington y también una distribución de botones cambiada que no incluye botones dedicados para Avance y Retroceso de Página. El mayor problema para los usuarios de ThinkPad de toda la vida, sin embargo, es la eliminación de las teclas TrackPoint dedicadas. Sólo podemos esperar que Lenovo no adopte esta solución para otras series de modelos.
El portátil en sí resulta convincente para el uso diario con su carcasa de alta calidad, su gran teclado y touchpad de cristal y también su excelente rendimiento de sistema. Sin embargo, uno tiene que cuestionar seriamente por qué el Ryzen 7 Pro 6860Z existe como procesador en primer lugar, ya que es en efecto un 6850U normal. Y aunque el alto límite de potencia asegura buenos resultados en los benchmarks, también conlleva más actividad de los ventiladores e inconsistencias en el rendimiento. Sobre todo, el rendimiento gráfico tiende a ser algo errático bajo carga permanente, algo que no afecta a otros dispositivos como el ThinkPad T14 G3 o el Asus Zenbook S 13. La pantalla OLED con su altísimo ratio de contraste ofrece básicamente una muy buena calidad de imagen, pero se nota un ligero efecto de rejilla en las zonas brillantes. Hay parpadeo PWM, y la pantalla OLED consume mucho la batería
Con el panel OLED y el uso de la imitación de cuero, el modelo de gama alta ThinkPad Z13 parece más un artículo de moda que un portátil de negocios. En general, es un muy buen subportátil, pero no necesariamente un muy buen portátil de negocios.
Para un uso productivo, el ThinkPad Z13 con un panel IPS normal es la mejor opción, ya que permite una duración de la batería significativamente mayor. Si has estado usando y te ha gustado el TrackPoint como usuario de ThinkPad, deberías probar el nuevo Z13 antes de comprarlo, ya que la omisión de las teclas dedicadas al TrackPoint sería una razón para no comprarlo para muchos usuarios. Por otro lado, si buscas un subportátil con panel OLED y CPU AMD, deberías echar un vistazo al Asus Zenbook S13que tiene un buen teclado, un rendimiento más estable, y una solución de software para el molesto parpadeo PWM. Es simplemente el mejor paquete en general.
Precio y disponibilidad
El ThinkPad Z13 con un AMD Ryzen 7 Pro 6860Z puede ser configurado en el sitio web de Lenovo con precios a partir de unos 2.700 euros (2.700 dólares).
Lenovo ThinkPad Z13 G1-21D20016GE
- 10/28/2022 v7 (old)
Andreas Osthoff
Price comparison

