Análisis del portátil Lenovo ThinkPad Z16 G1: Un potente buque insignia de AMD con un inconveniente
ThinkPad y AMD - una combinación que no se ha visto muy a menudo durante mucho tiempo. Sin embargo, en los últimos años esto ha cambiado definitivamente, culminando ahora con la serie Lenovo ThinkPad Z, la primera serie de gama alta con los chips Ryzen. A principios de año, Lenovo anunció dos modelos y tamaños. Ya pudimos probar el más pequeñoLenovo ThinkPad Z13y ahora sigue el modelo con la gran pantalla de 16 pulgadas, el Lenovo ThinkPad Z16.
2022 Análisis del portátil Dell XPS 15 9520 3.5K OLED: ¿Saltar o comprar?Mientras que el Z13 se centra claramente en la movilidad, el Z16 se dirige al sector multimedia y se supone que compite con portátiles como el Dell XPS 15 y Apple MacBook Pro 16, e incluso con el Lenovo ThinkPad X1 Extreme
, el actual perro de presa de Lenovo para los clientes multimedia.</p>
Posibles contendientes en la comparación
Valoración | Fecha | Modelo | Peso | Altura | Tamaño | Resolución | Precio |
|---|---|---|---|---|---|---|---|
| 87.3 % v7 (old) | 10/2022 | Lenovo ThinkPad Z16 G1 21D5S00T00 R7 PRO 6850H, Radeon RX 6500M | 1.9 kg | 15.8 mm | 16.00" | 1920x1200 | |
| 89 % v7 (old) | 11/2021 | Lenovo ThinkPad X1 Extreme G4-20Y5CTO1WW (3050 Ti) i7-11800H, GeForce RTX 3050 Ti Laptop GPU | 2 kg | 18.2 mm | 16.00" | 3840x2400 | |
| 88.3 % v7 (old) | 12/2021 | Lenovo ThinkPad X1 Extreme G4-20Y50040GE i9-11950H, GeForce RTX 3080 Laptop GPU | 1.9 kg | 18.2 mm | 16.00" | 3840x2400 | |
| 89.5 % v7 (old) | 05/2022 | Dell XPS 15 9520 RTX 3050 Ti i7-12700H, GeForce RTX 3050 Ti Laptop GPU | 1.9 kg | 18 mm | 15.60" | 3456x2160 | |
| 89.3 % v7 (old) | 06/2022 | Dell XPS 17 9720 i7-12700H, GeForce RTX 3050 4GB Laptop GPU | 2.5 kg | 19.5 mm | 17.00" | 3840x2400 | |
| 93.2 % v7 (old) | 11/2021 | Apple MacBook Pro 16 2021 M1 Pro M1 Pro, M1 Pro 16-Core GPU | 2.2 kg | 16.8 mm | 16.20" | 3456x2234 | |
| 92.5 % v7 (old) | 11/2021 | Apple MacBook Pro 16 2021 M1 Max M1 Max, M1 Max 32-Core GPU | 2.2 kg | 16.8 mm | 16.20" | 3456x2234 |
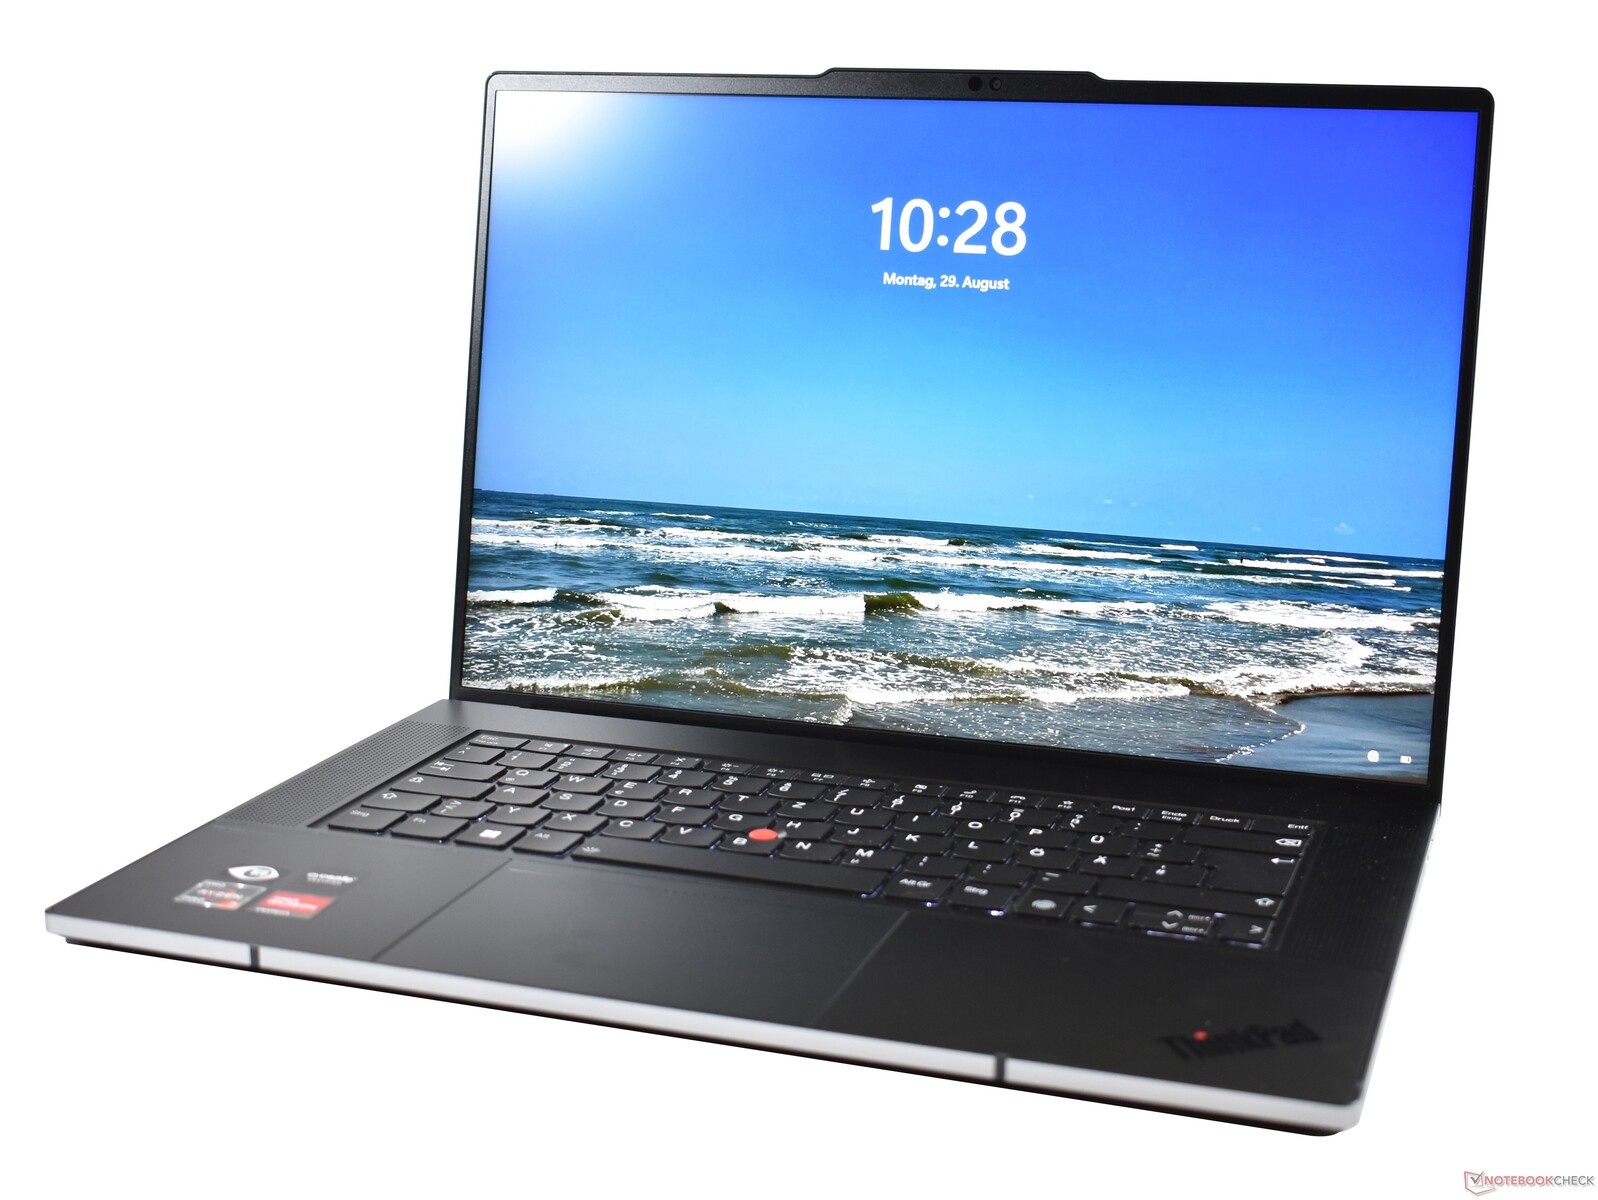
Una carcasa de aluminio compacta: Lenovo ThinkPad Z16 G1
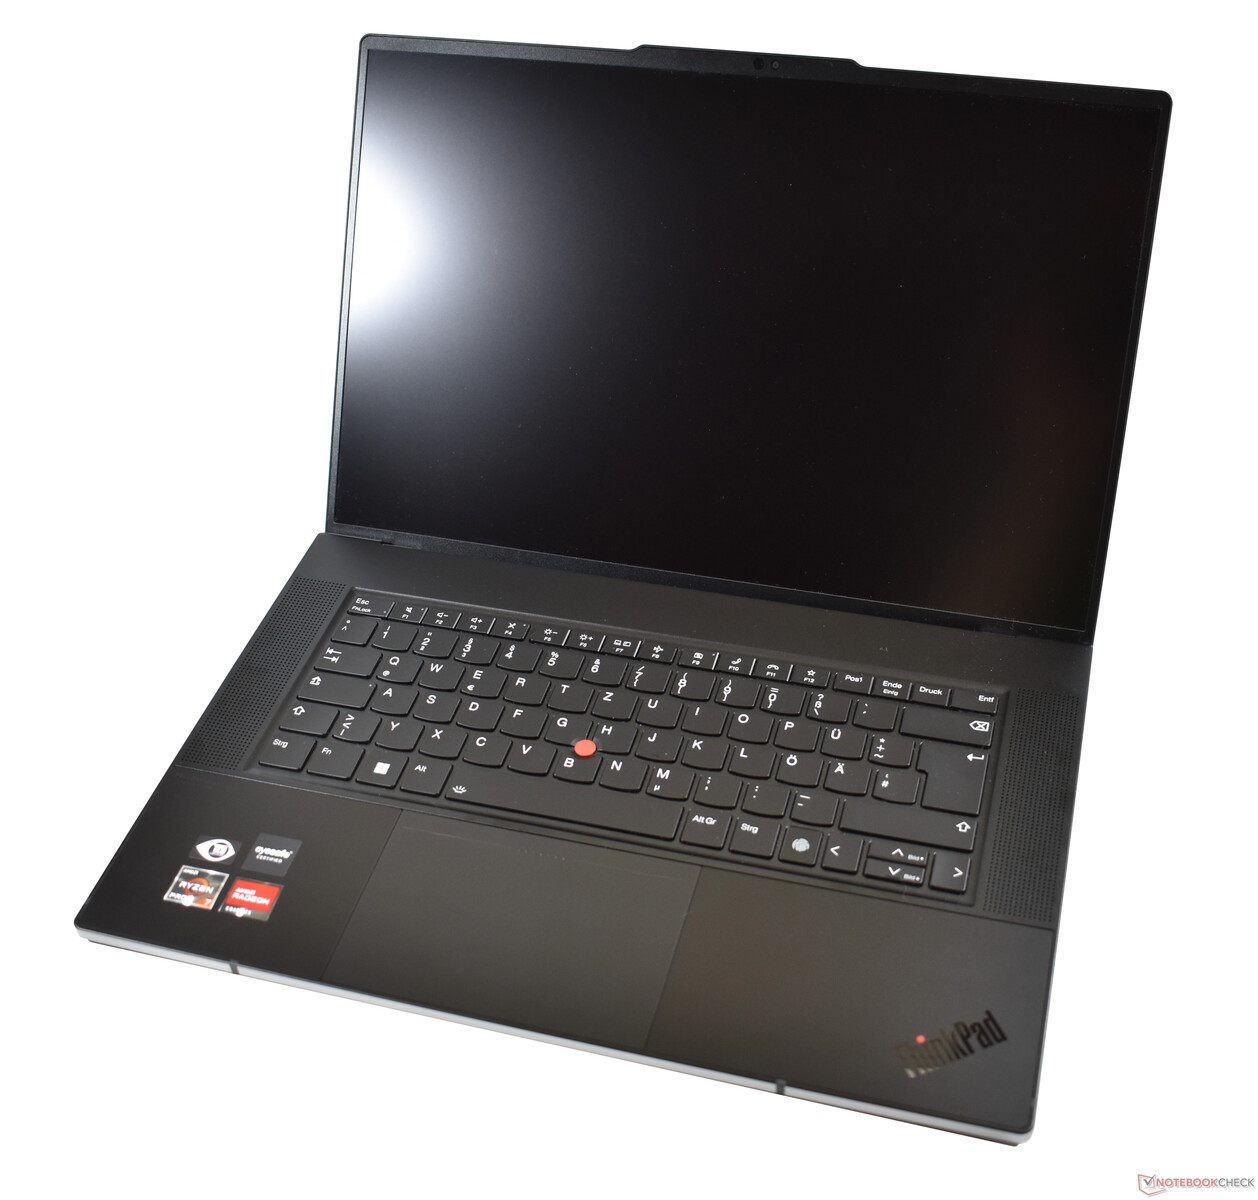
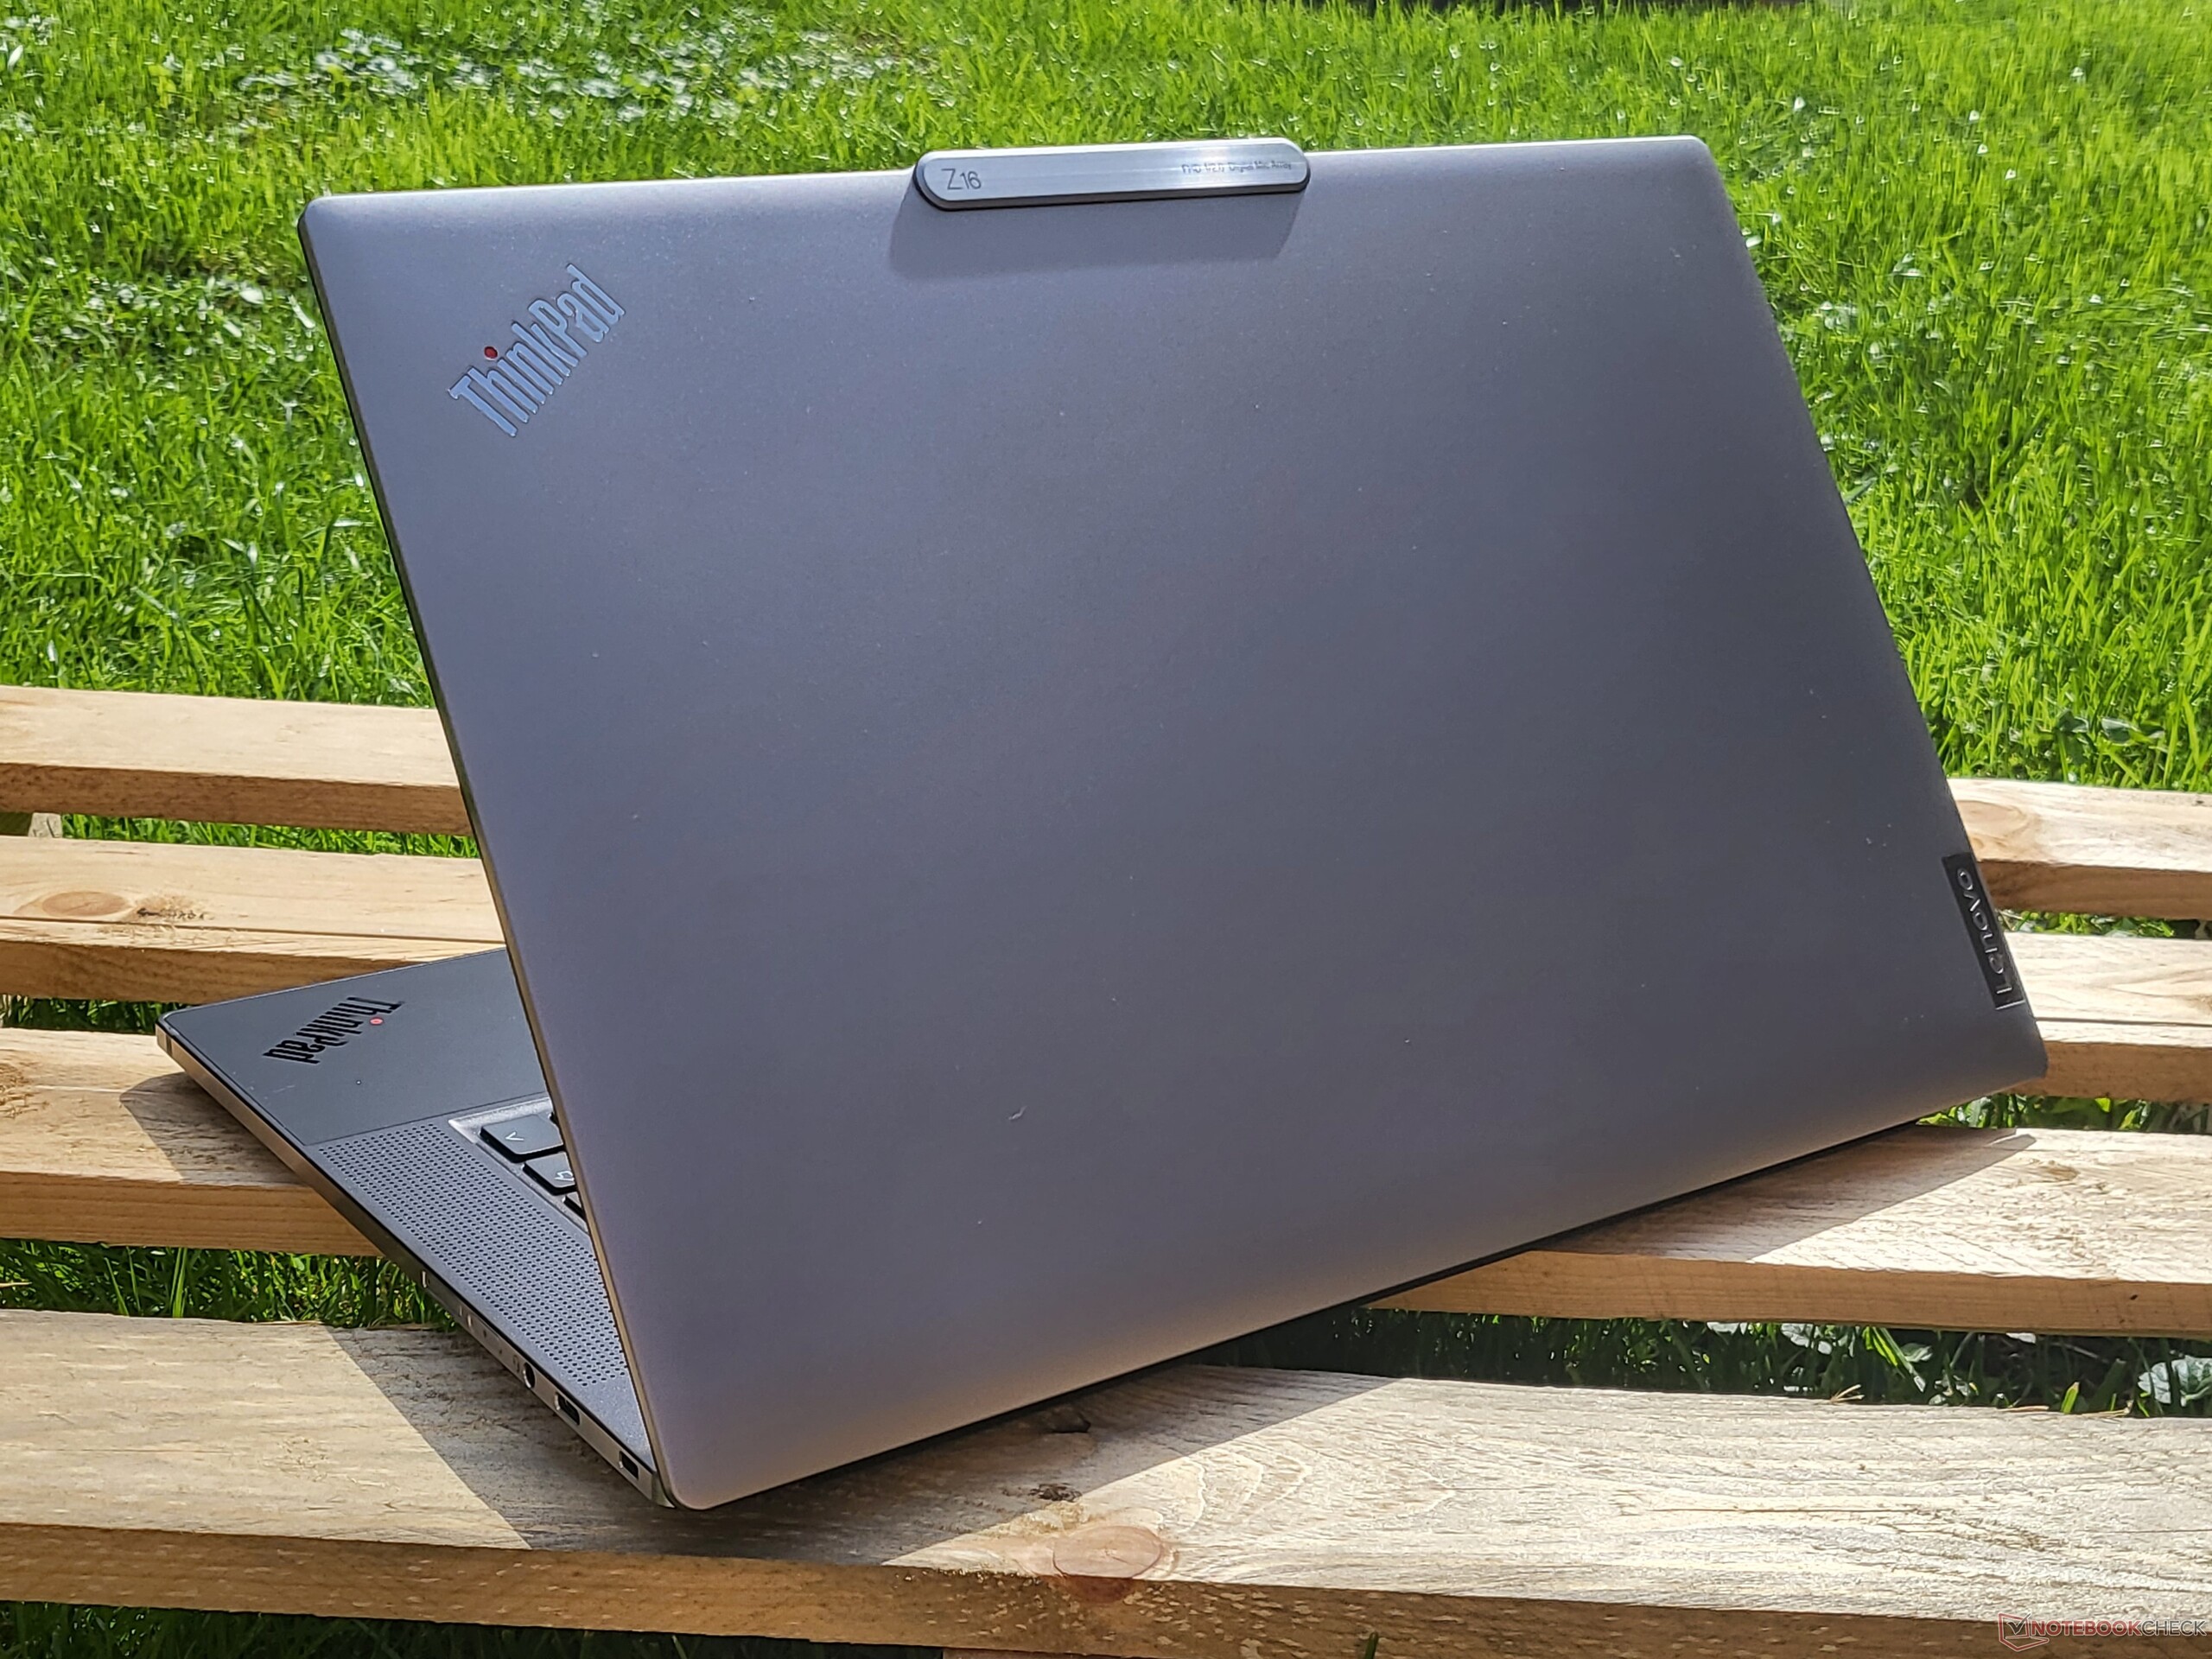
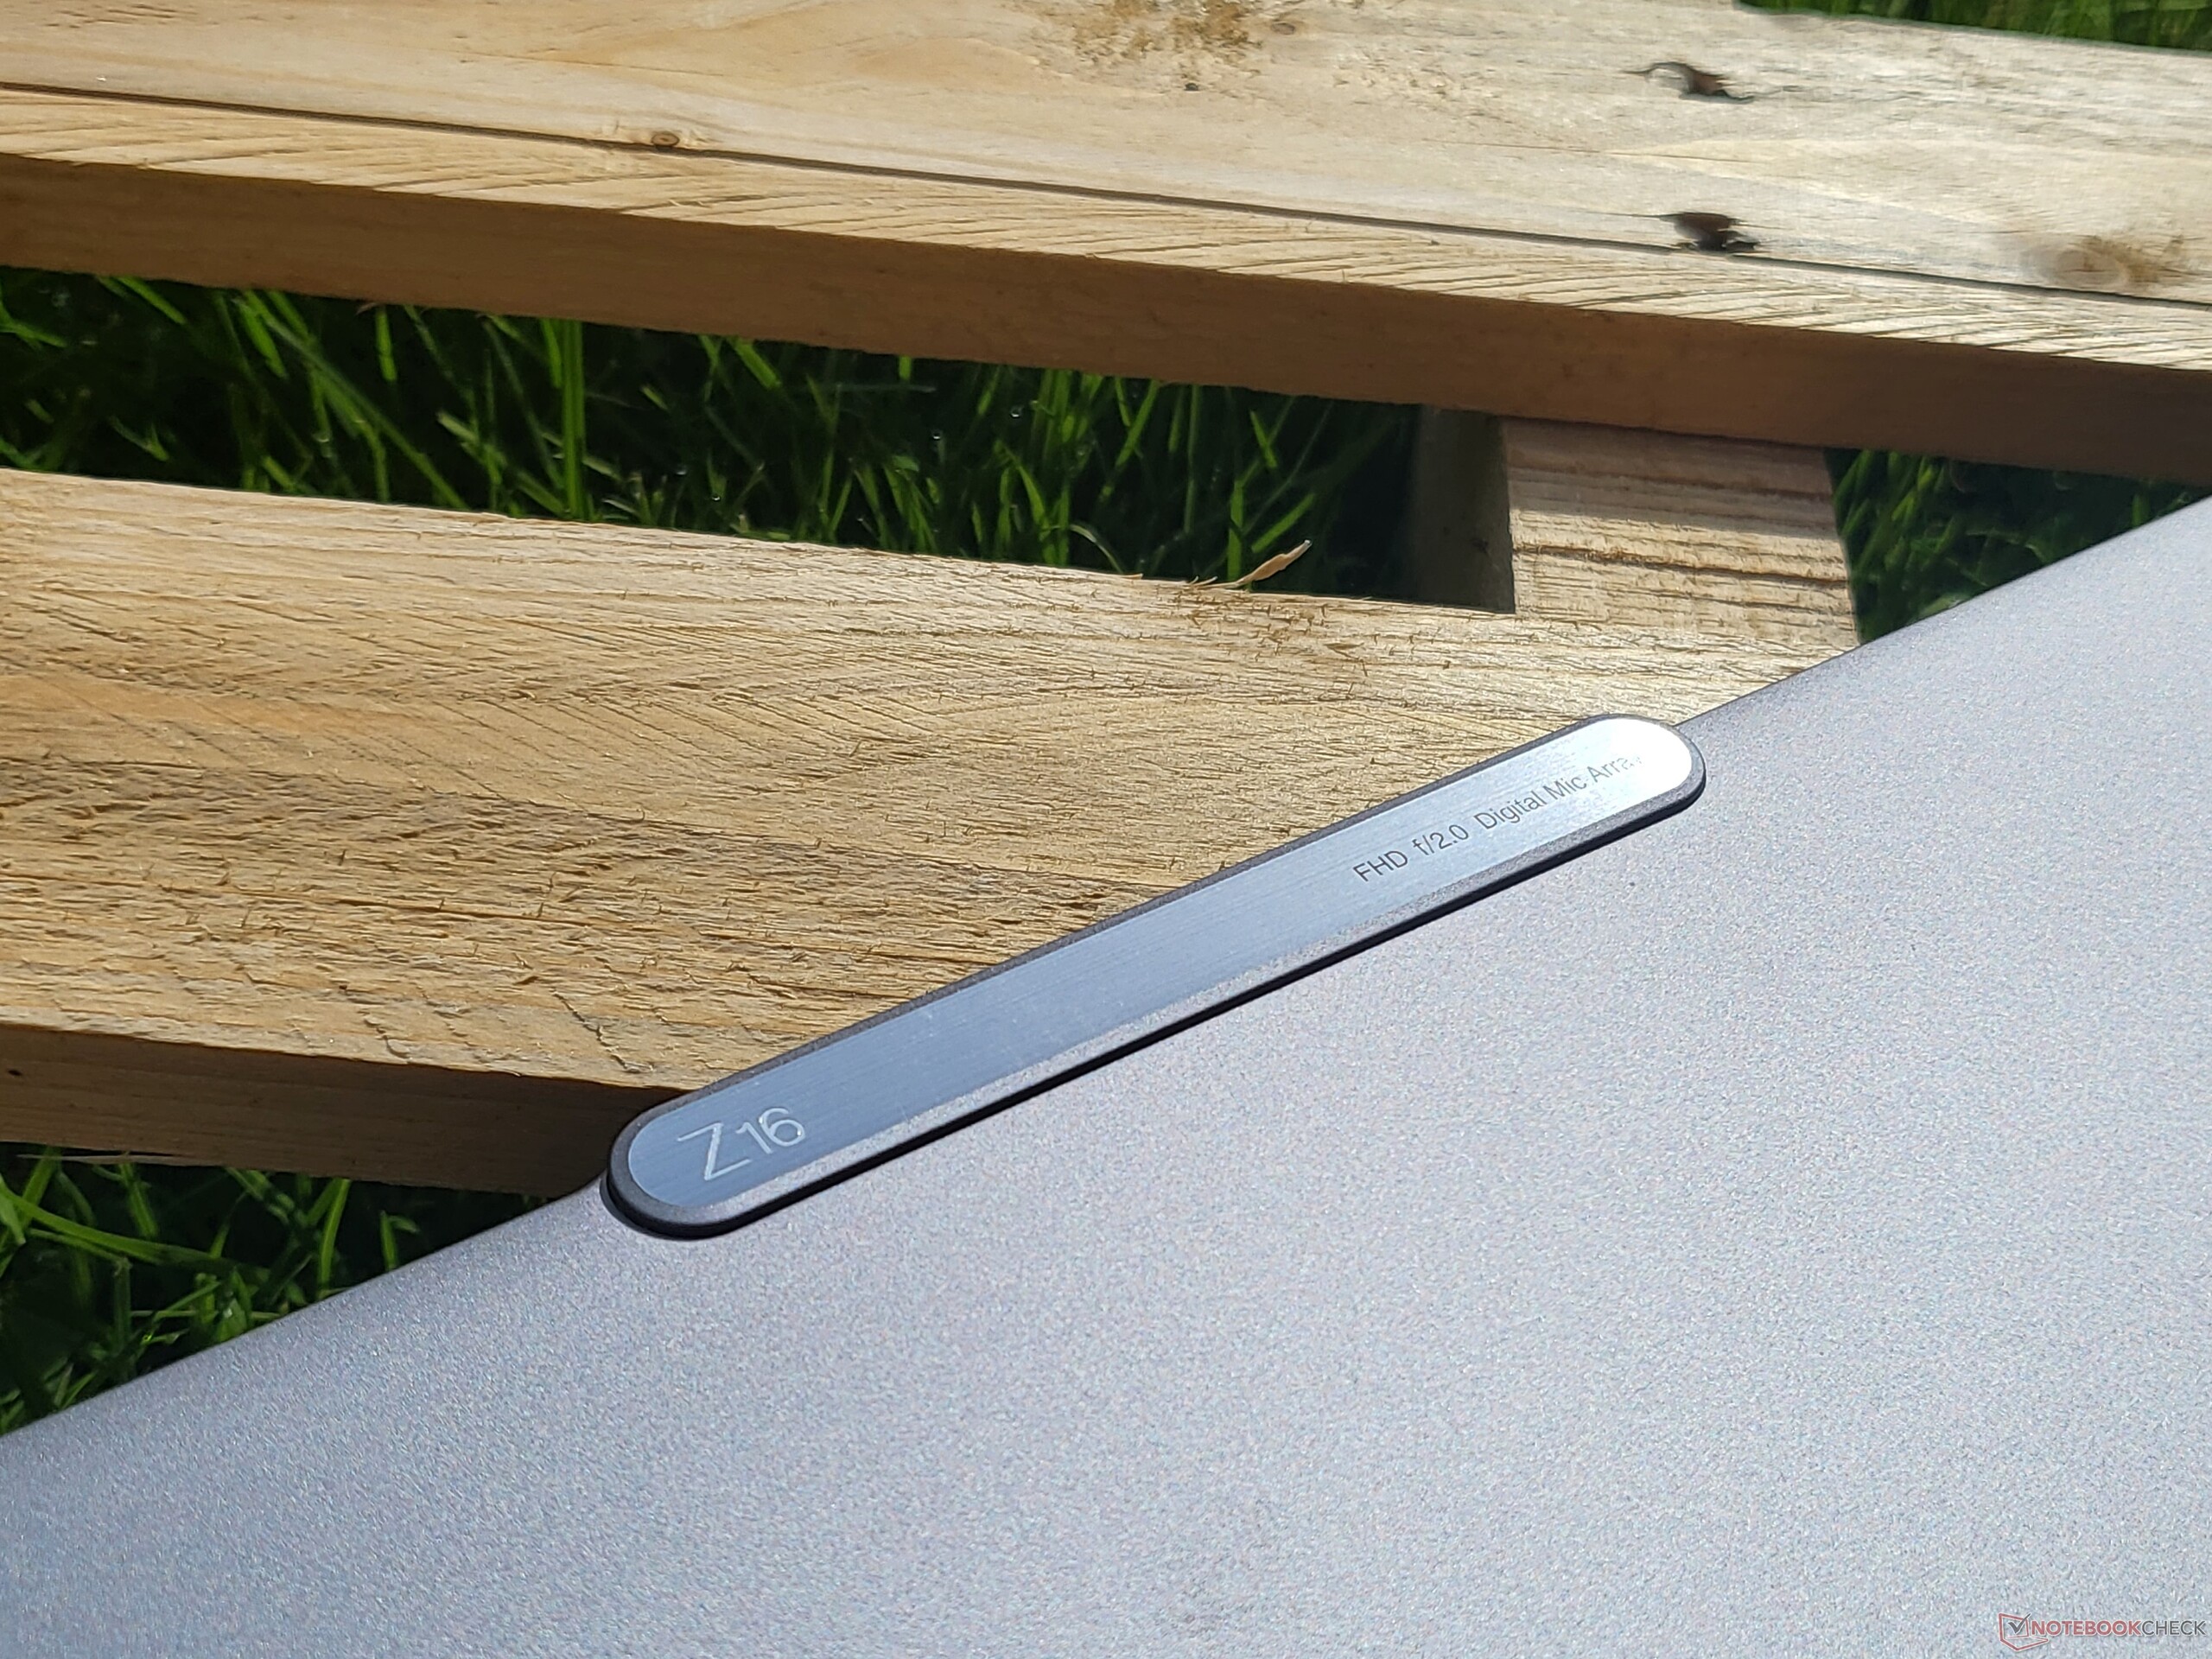
La mayor diferencia en comparación con la serie establecida ThinkPad X1 Extreme está en el diseño: Mientras que el X1 Extremeutiliza los atributos clásicos de ThinkPad, el aspecto del ThinkPad Z16 se acerca mucho más a la corriente principal del mercado de portátiles. Con su gran touchpad, el teclado rectangular y la tapa plateada de la pantalla, parece un híbrido entre un XPS o MacBook y un ThinkPad. Por supuesto, Lenovo también pone sus propios acentos, como la protuberancia de la cámara en la tapa de la pantalla, por ejemplo, que también es muy práctica para levantar la tapa. Esto puede hacerse fácilmente con una mano, pero sólo hasta un ángulo de apertura de unos 135 grados. 180 grados, como con otros ThinkPads, no son posibles aquí.
En cuanto a la elección de materiales, Lenovo también toma un camino diferente al de la serie X1. La tapa de la pantalla es de aluminio plateado, el marco del teclado es negro anodizado, y la parte inferior es de laca negra. Sólo el marco de la pantalla es de plástico. Otra característica interesante son los reposamanos, ya que están hechos de vidrio mate. Esto crea unas hápticas para el Z16 que están un nivel por encima del X1 Extreme, pero esto también podría ser una cuestión de gustos. Al menos, el Z16 definitivamente tendrá menos problemas con las superficies grasosas. La estabilidad de la carcasa también está a un nivel muy alto, pero naturalmente, la delgada tapa de la pantalla es más débil que la base.
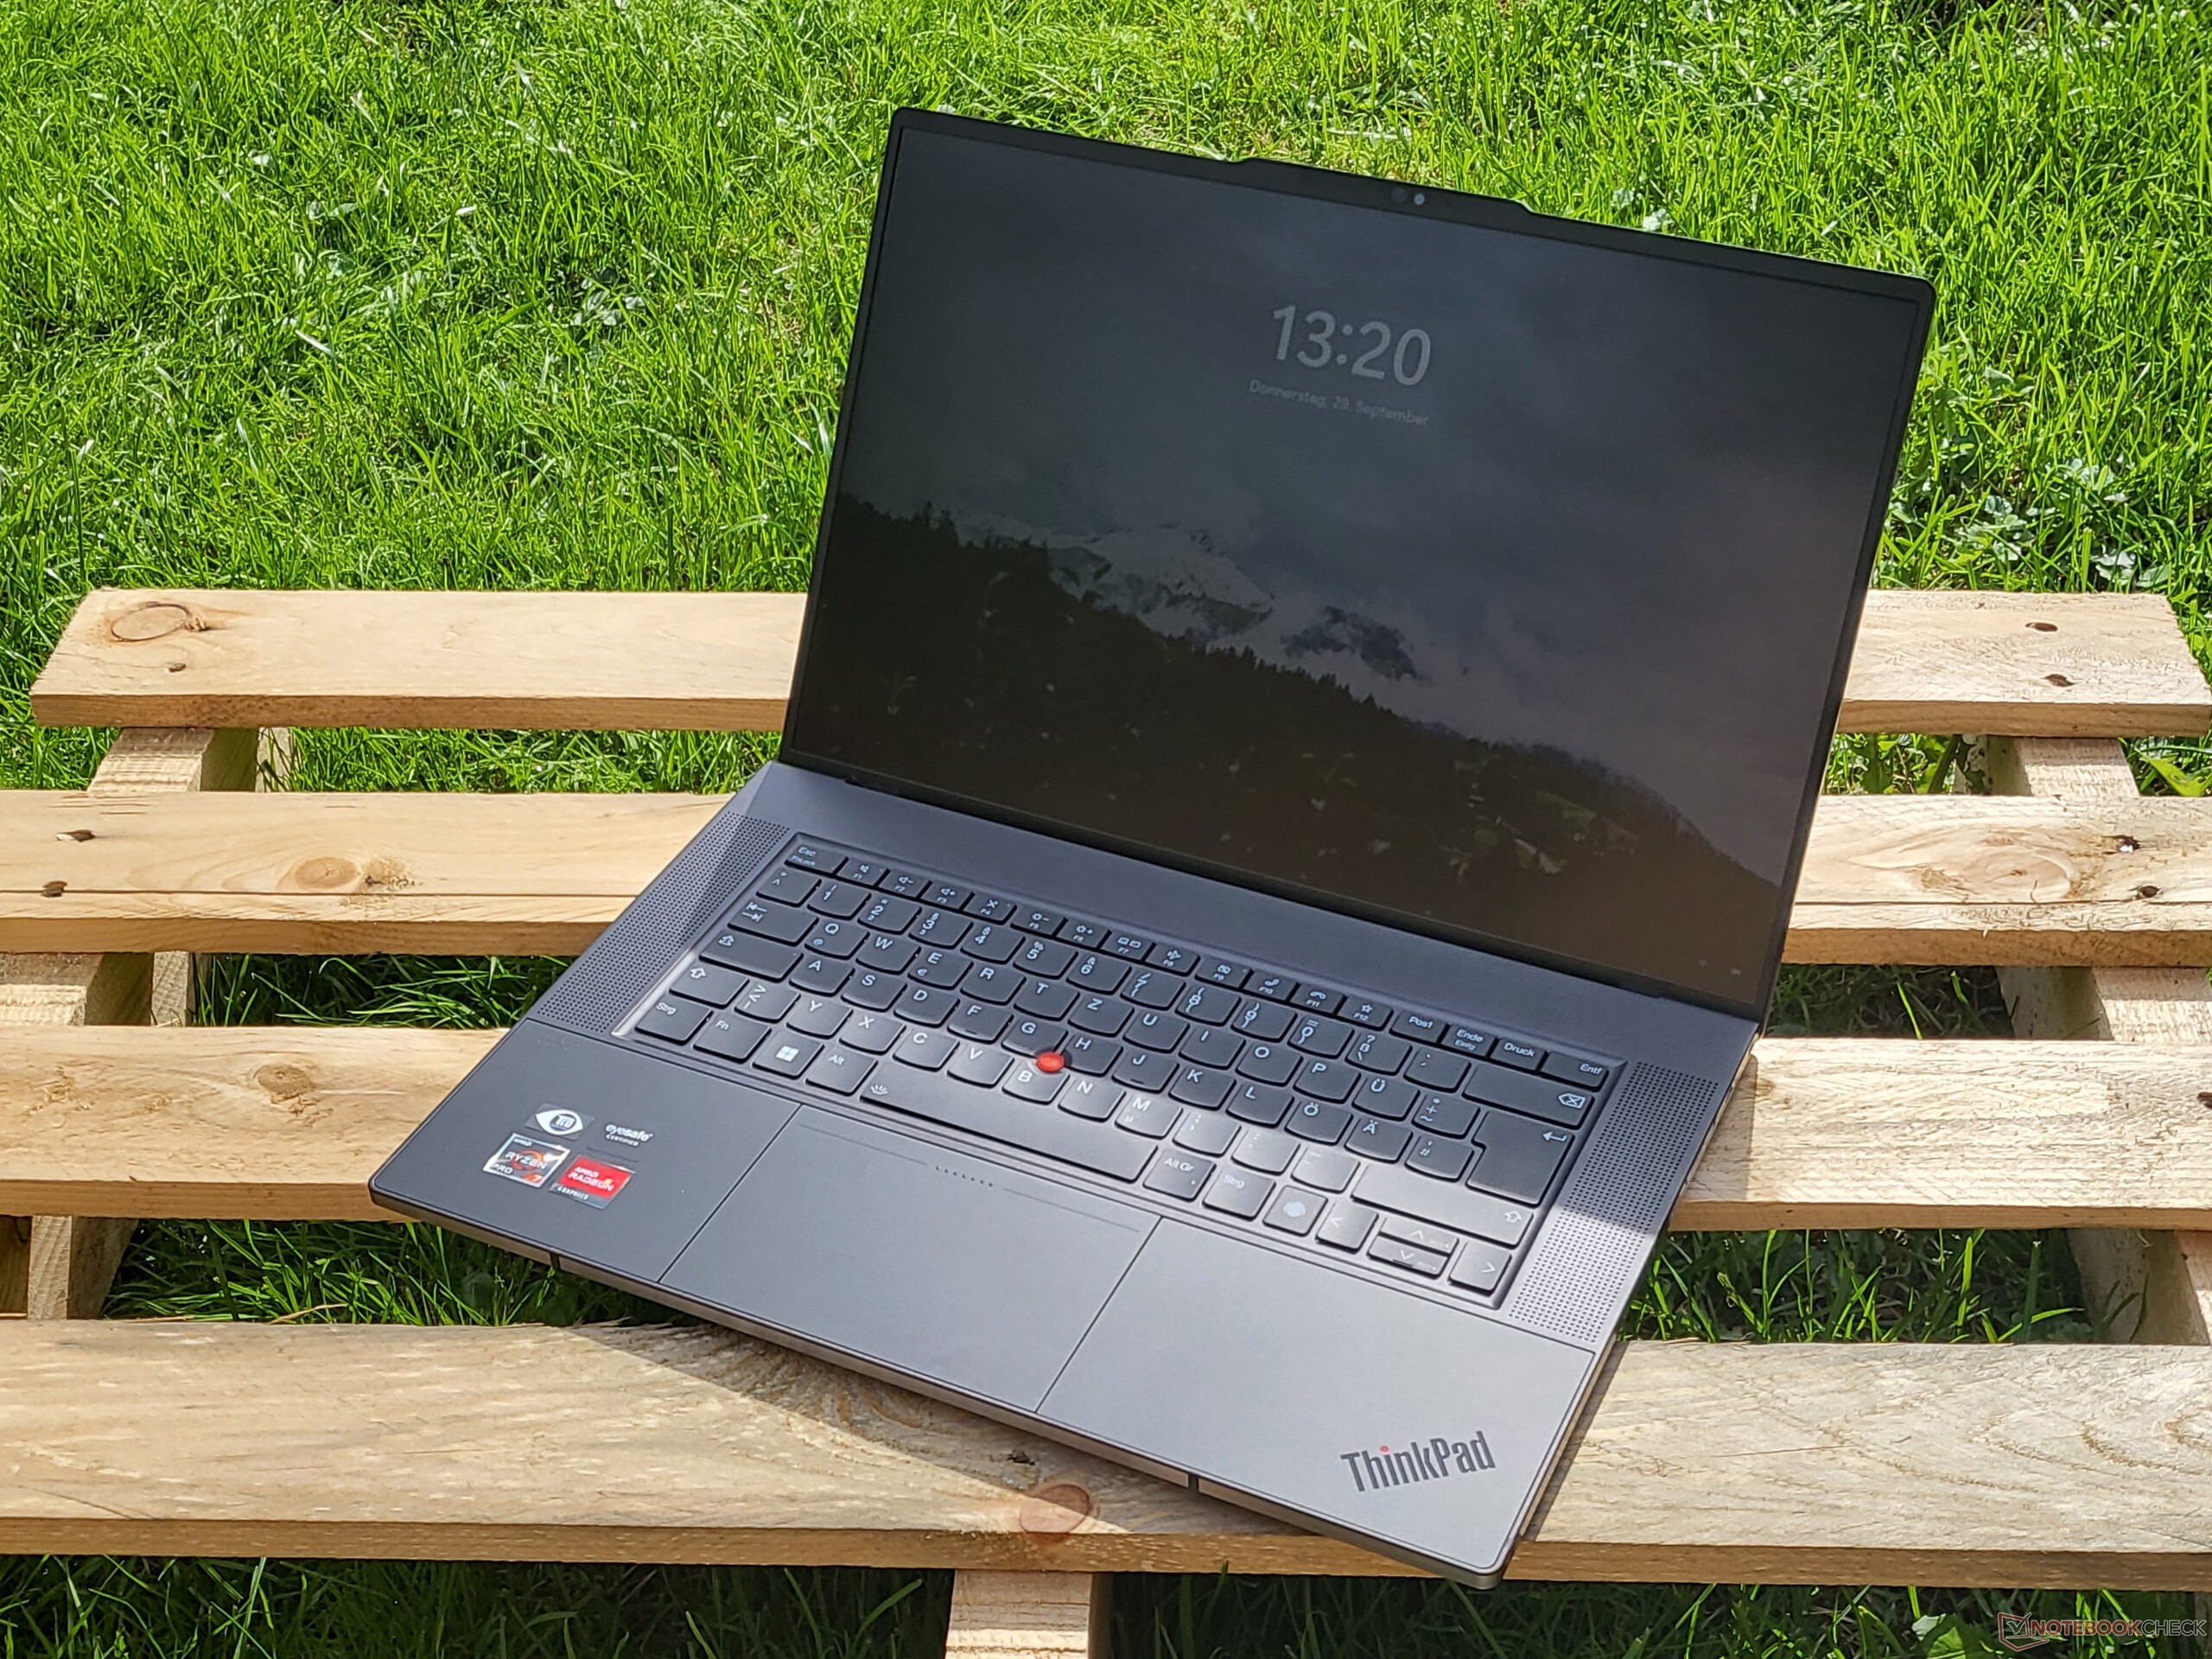
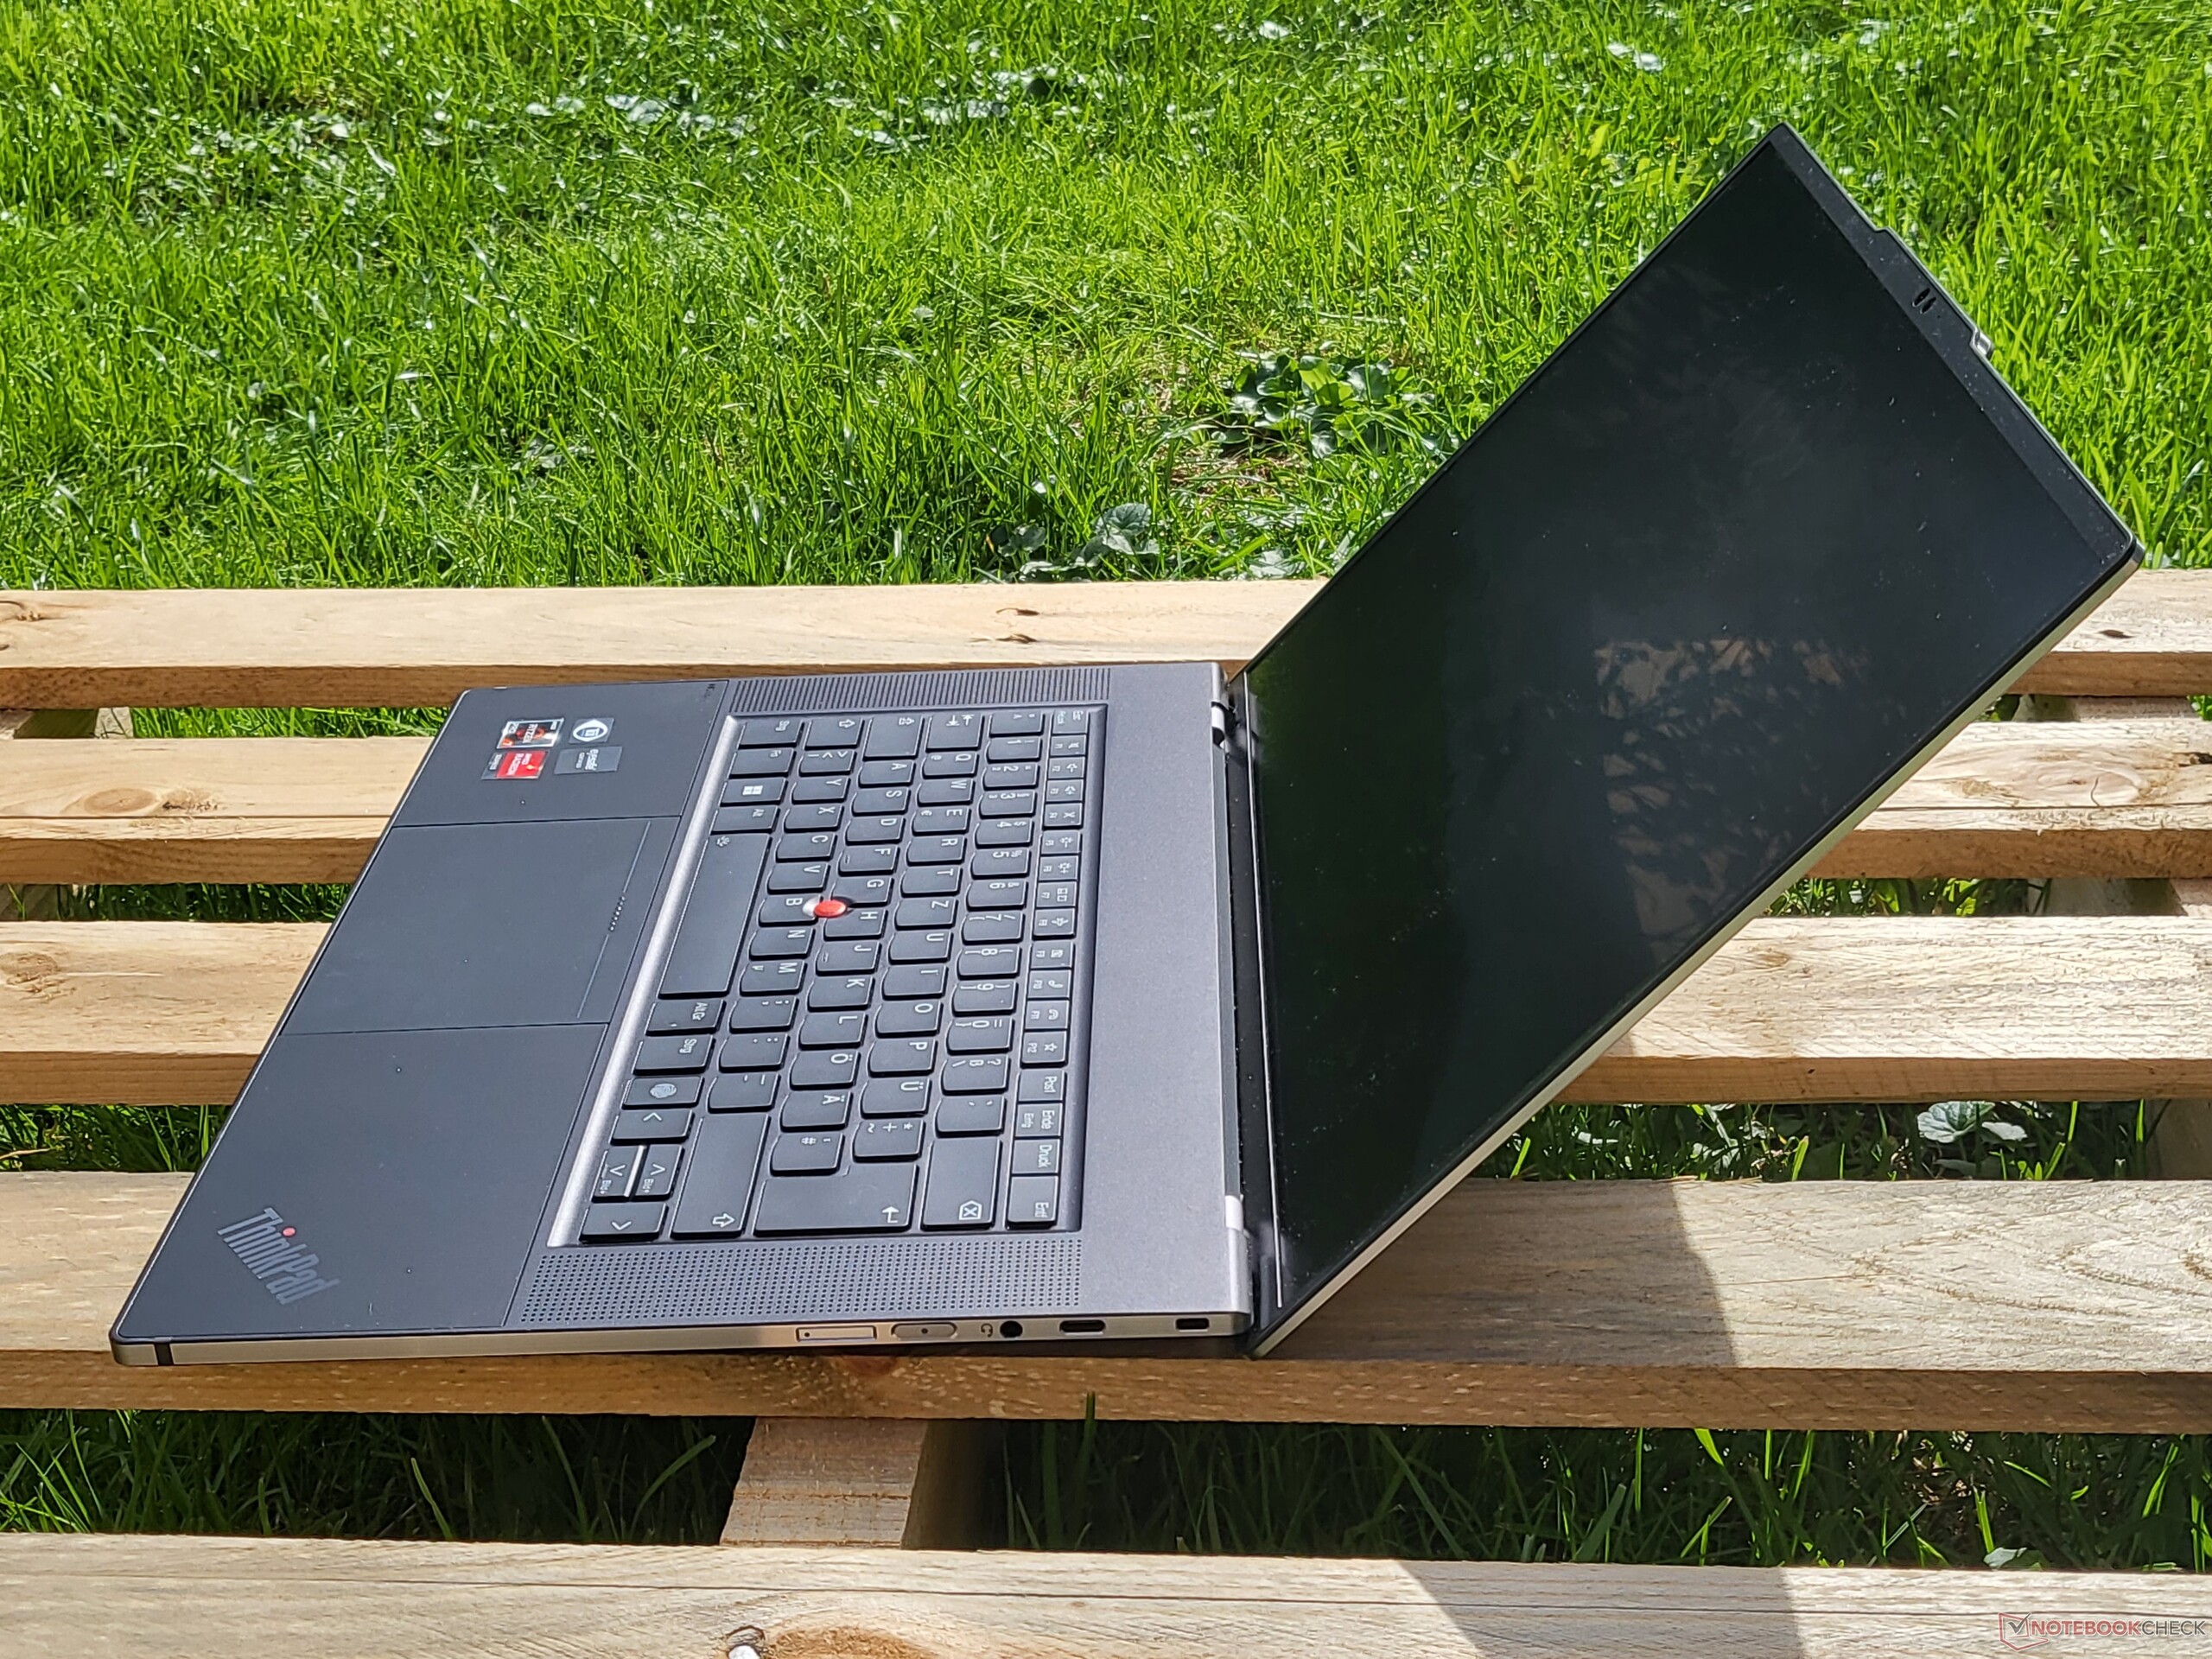
El ThinkPad Z16 es el portátil de 16 pulgadas más compacto de nuestra comparativa. El Dell XPS 15 es más pequeño, pero "sólo" ofrece una pantalla LCD de 15,6 pulgadas. En términos de grosor, el Z16 también está por delante, ya que es más delgado que todos los demás competidores. En términos de peso, todos los competidores están muy cerca unos de otros.
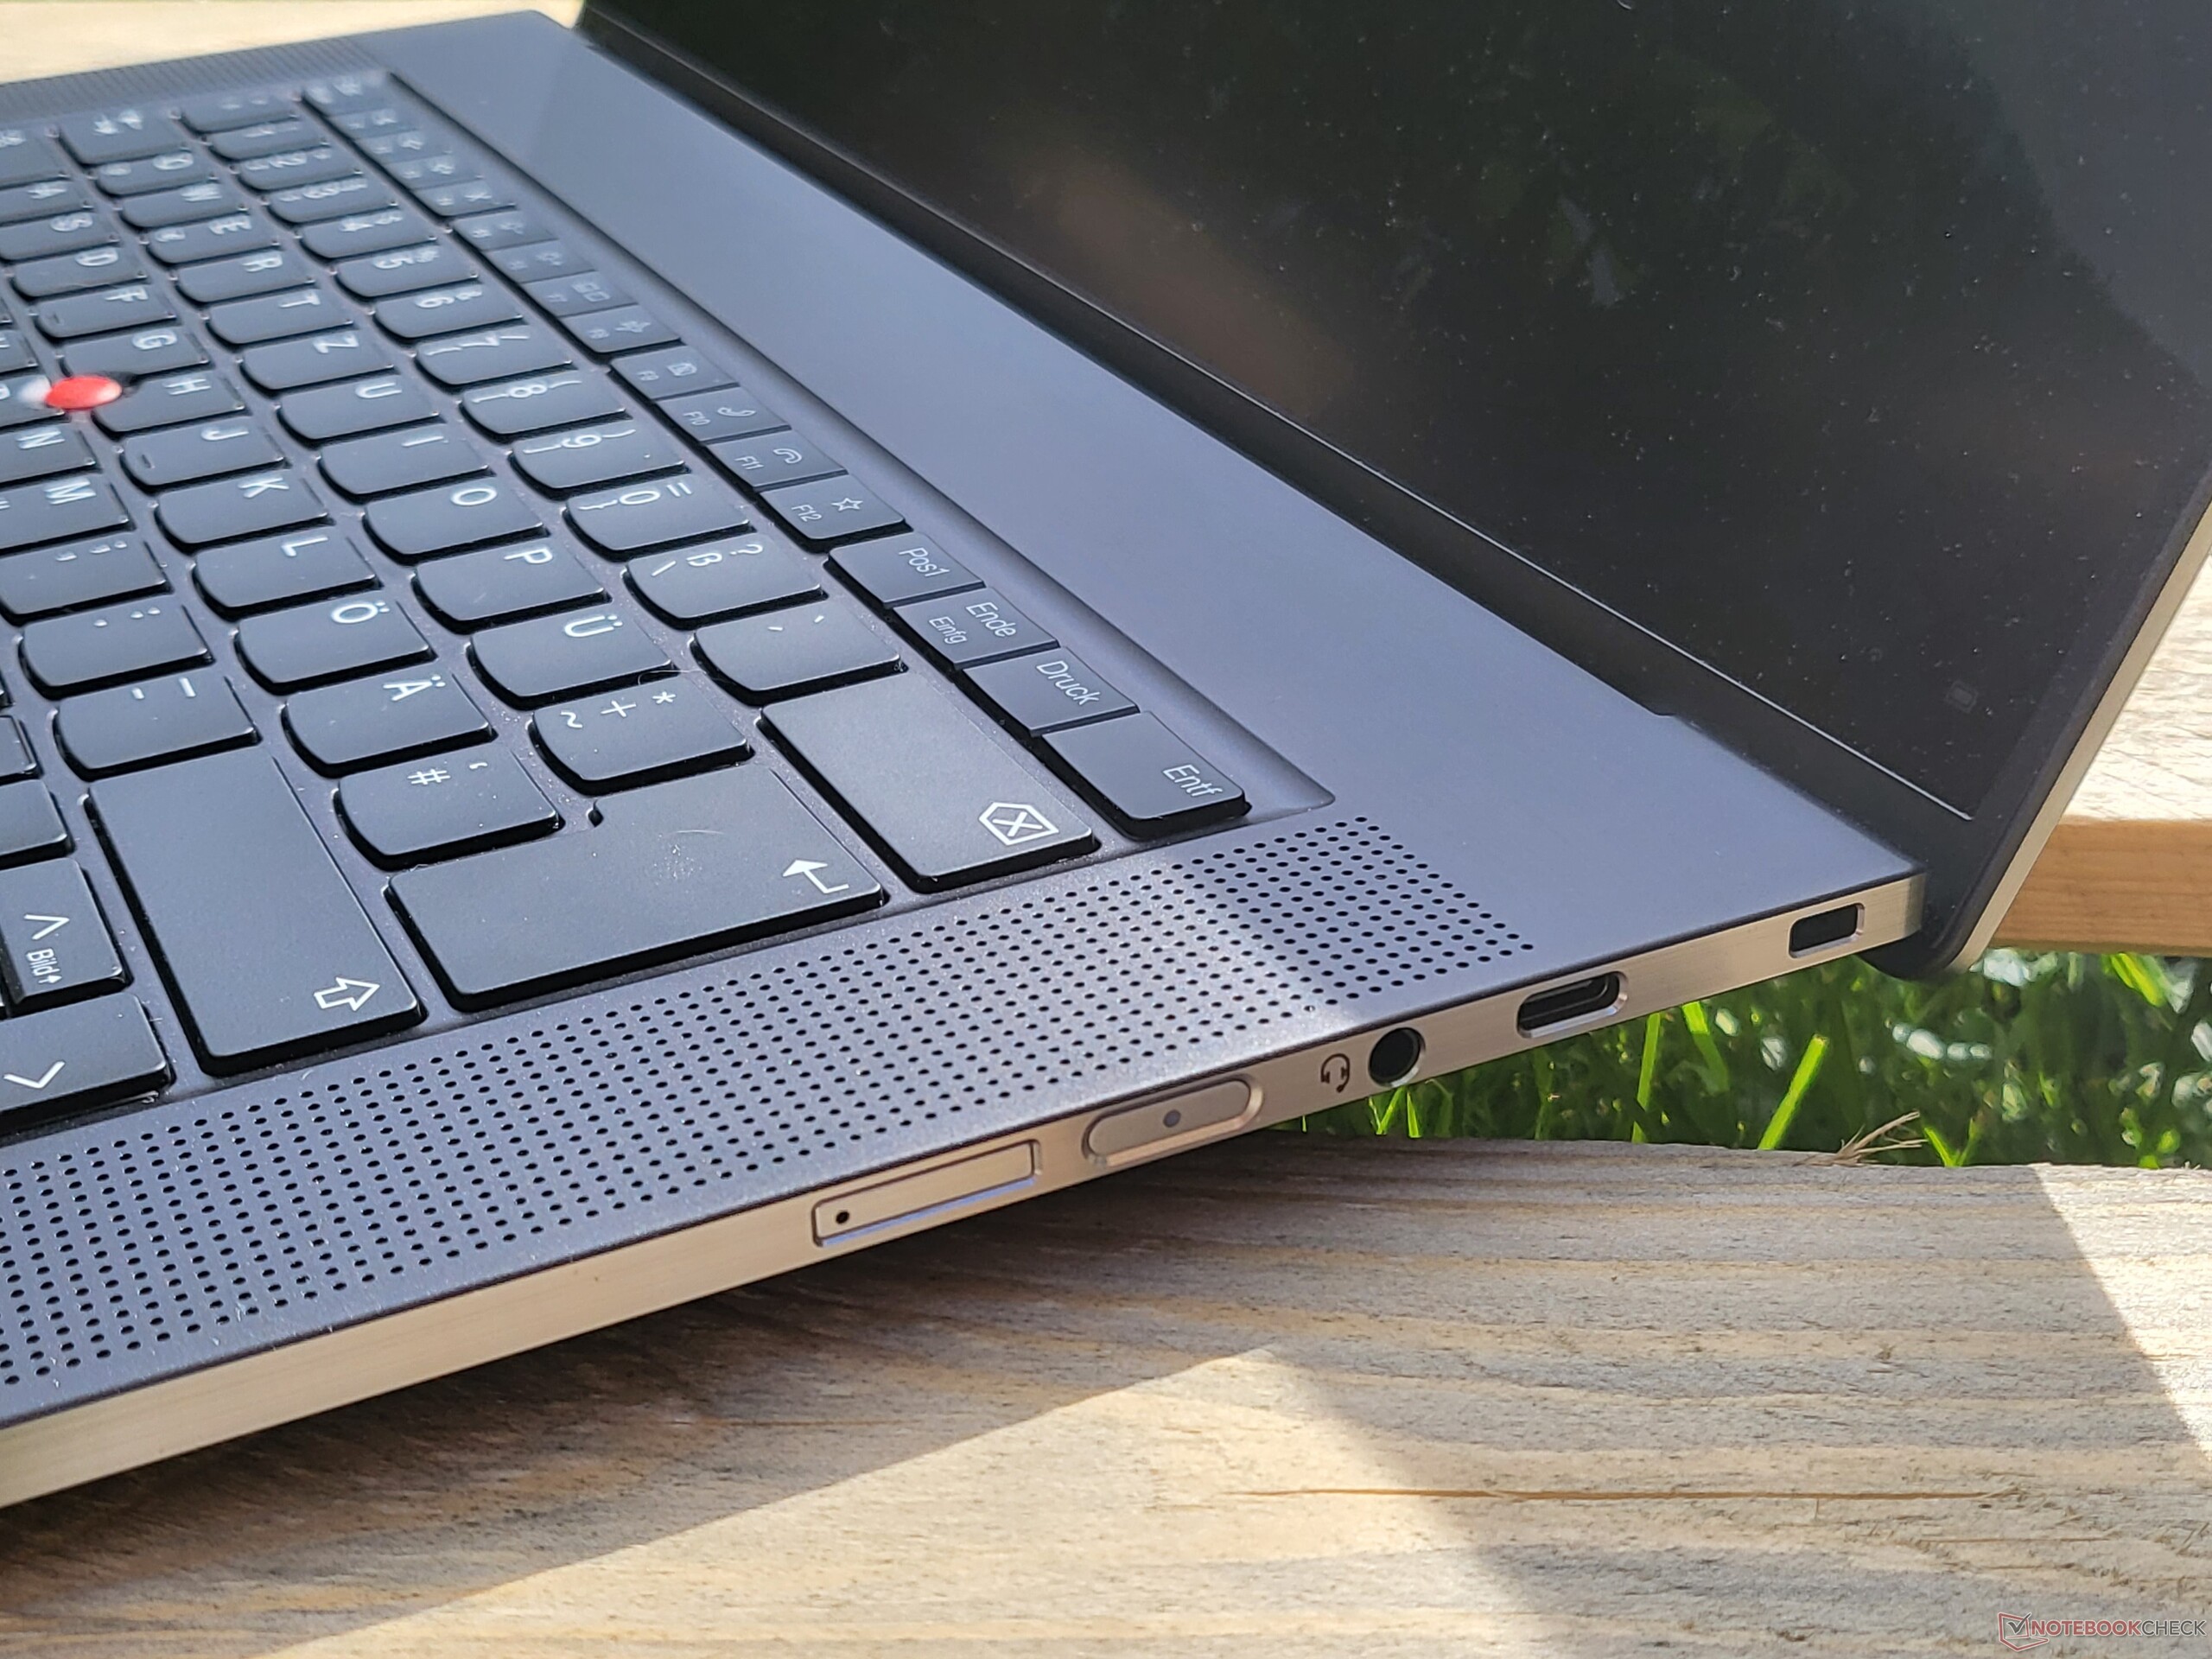
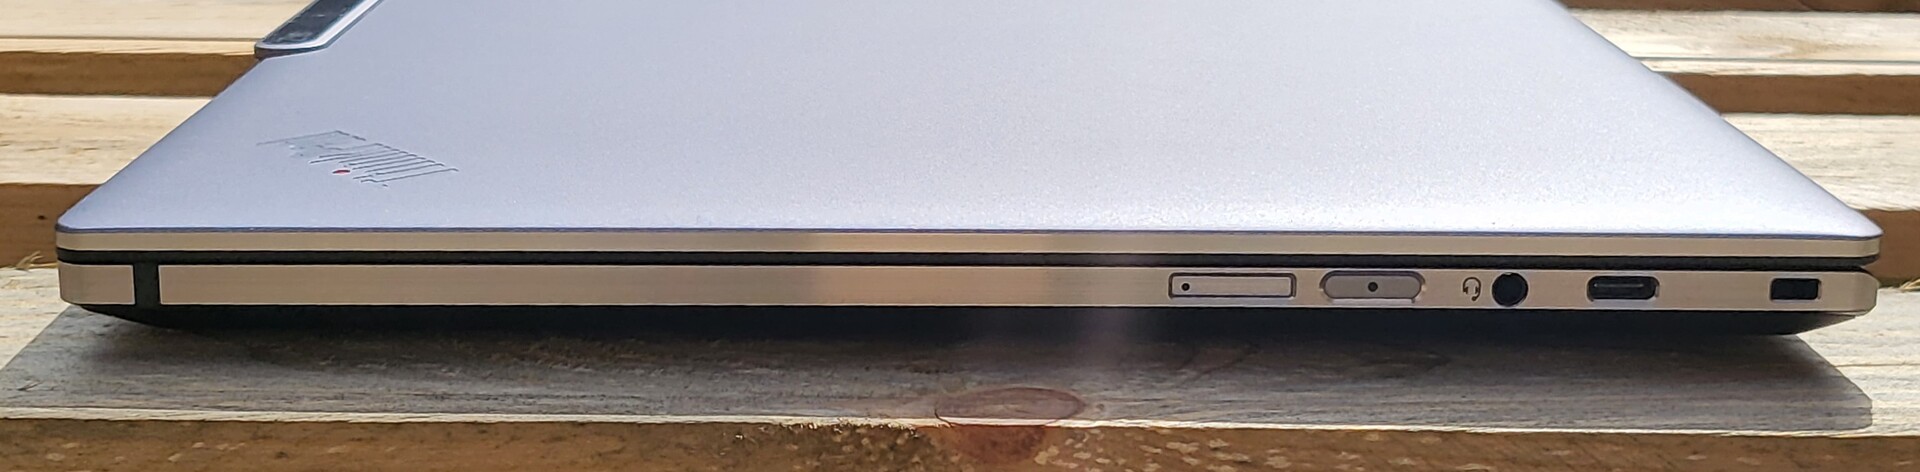
Equipo: Lenovo con una escasa selección de puertos
El equipo de conexión es idéntico al del Dell XPS 15 9520, lo que lo convierte en uno de los más débiles de nuestro campo de pruebas. En este punto, el Z16 queda claramente por detrás del ThinkPad X1 Extremee incluso del Apple MacBook Pro 16al menos ofrece HDMI.
En contraste con los portátiles Intel, no hay Thunderbolt 4 con AMD. Por otro lado, el ThinkPad Z16 incluye USB 4, que ofrece el mismo conjunto de características que Thunderbolt 3. Sin embargo, la compatibilidad con los accesorios Thunderbolt no está garantizada y tiene que ser determinada individualmente.
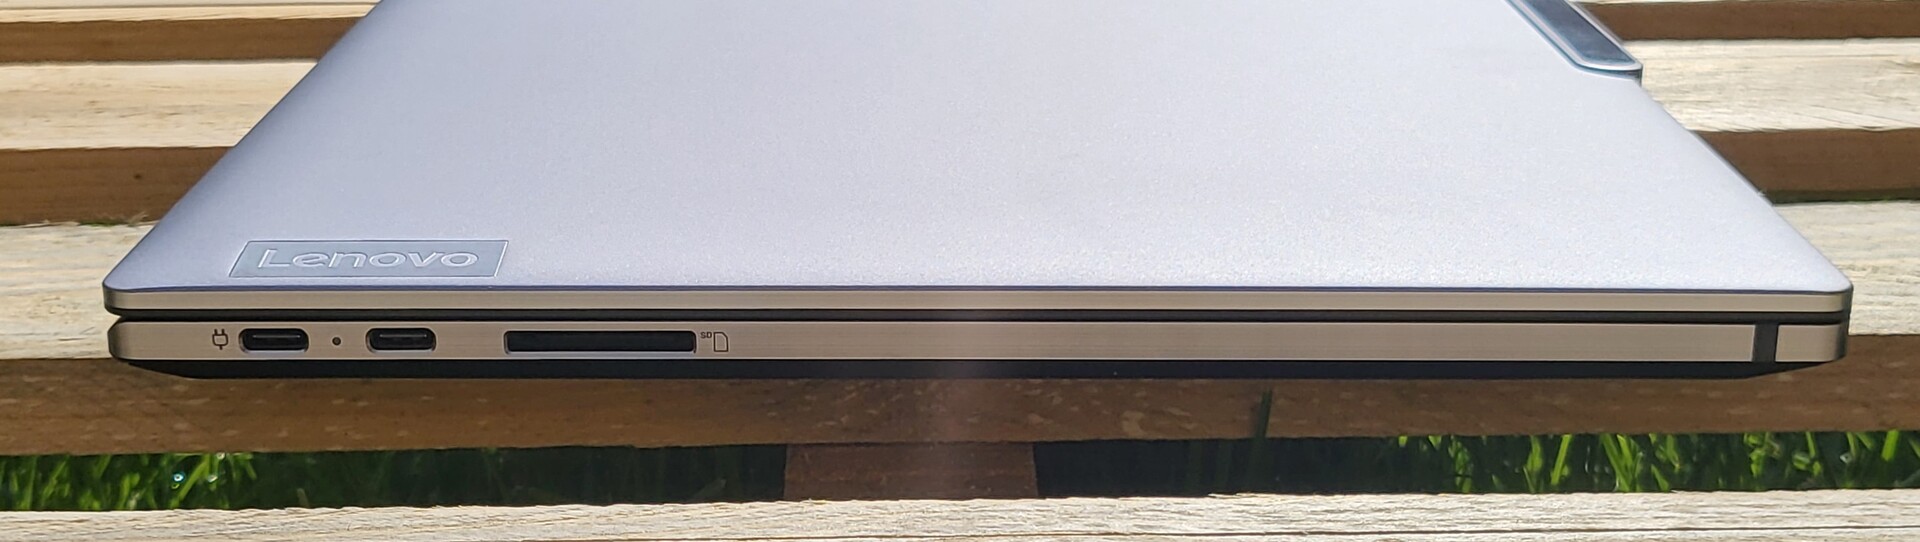
Lector de tarjetas SD
El Lenovo ThinkPad Z16 G1 incluye un lector de tarjetas SD de tamaño completo, pero las tarjetas SD no se pueden insertar completamente. El lector de tarjetas es extremadamente rápido, particularmente cuando lee datos. Lo probamos con nuestra tarjeta de referencia microSD AV Pro de 128 GB.
| SD Card Reader | |
| average JPG Copy Test (av. of 3 runs) | |
| Dell XPS 17 9720 (Toshiba Exceria Pro SDXC 64 GB UHS-II) | |
| Lenovo ThinkPad X1 Extreme G4-20Y5CTO1WW (3050 Ti) (AV Pro V60) | |
| Dell XPS 15 9520 RTX 3050 Ti (Toshiba Exceria Pro SDXC 64 GB UHS-II) | |
| Media de la clase Multimedia (23 - 531, n=37, últimos 2 años) | |
| Apple MacBook Pro 16 2021 M1 Pro (Angelbird AV Pro V60) | |
| Lenovo ThinkPad Z16 G1 21D5S00T00 | |
| maximum AS SSD Seq Read Test (1GB) | |
| Lenovo ThinkPad Z16 G1 21D5S00T00 | |
| Media de la clase Multimedia (37.3 - 1455, n=36, últimos 2 años) | |
| Dell XPS 17 9720 (Toshiba Exceria Pro SDXC 64 GB UHS-II) | |
| Dell XPS 15 9520 RTX 3050 Ti (Toshiba Exceria Pro SDXC 64 GB UHS-II) | |
| Lenovo ThinkPad X1 Extreme G4-20Y5CTO1WW (3050 Ti) (AV Pro V60) | |
Comunicación
Lenovo etiqueta el Qualcomm WCN685x (2x2) incorporado como "Qualcomm NFA-725A" Es una tarjeta Wi-Fi 6E. Con algunas ligeras variaciones, el ThinkPad Z16 logra muy buenos resultados con este módulo Wi-Fi.
Nuestra unidad de prueba también incluye un módulo 4G de Quectel. Si necesitas WWAN, tiene que estar ya incluido en tu pedido, ya que no puedes instalarlo después.
| Networking | |
| Lenovo ThinkPad Z16 G1 21D5S00T00 | |
| iperf3 receive AXE11000 6GHz | |
| iperf3 receive AXE11000 | |
| iperf3 transmit AXE11000 6GHz | |
| iperf3 transmit AXE11000 | |
| Lenovo ThinkPad X1 Extreme G4-20Y5CTO1WW (3050 Ti) | |
| iperf3 transmit AX12 | |
| iperf3 receive AX12 | |
| Dell XPS 15 9520 RTX 3050 Ti | |
| iperf3 receive AXE11000 | |
| iperf3 transmit AXE11000 | |
| Dell XPS 17 9720 | |
| iperf3 receive AXE11000 | |
| iperf3 transmit AXE11000 | |
| Apple MacBook Pro 16 2021 M1 Pro | |
| iperf3 transmit AX12 | |
| iperf3 receive AX12 | |
| iperf3 receive AXE11000 | |
| iperf3 transmit AXE11000 | |
Cámara web
Lenovo da mucho espacio a la cámara web en términos de diseño, y la cámara de 1080p también es relativamente buena para un portátil. Sin embargo, aún hay mucho margen de mejora, y el disparador de selfies de un smartphone sigue siendo mucho mejor.


Seguridad
Además de dTMP, el Lenovo ThinkPad Z16 también incluye un lector de huellas dactilares en el teclado, la cámara infrarroja para Windows Hello, y un bloqueo Kensington. Lo que no se incluye es un lector de tarjetas inteligentes y un obturador físico para la webcam, pero puedes apagar la cámara electrónicamente pulsando la tecla F9 en su lugar.
Accesorios
Además del cargador de 135 vatios con conector USB-C, no se incluye ningún otro accesorio.
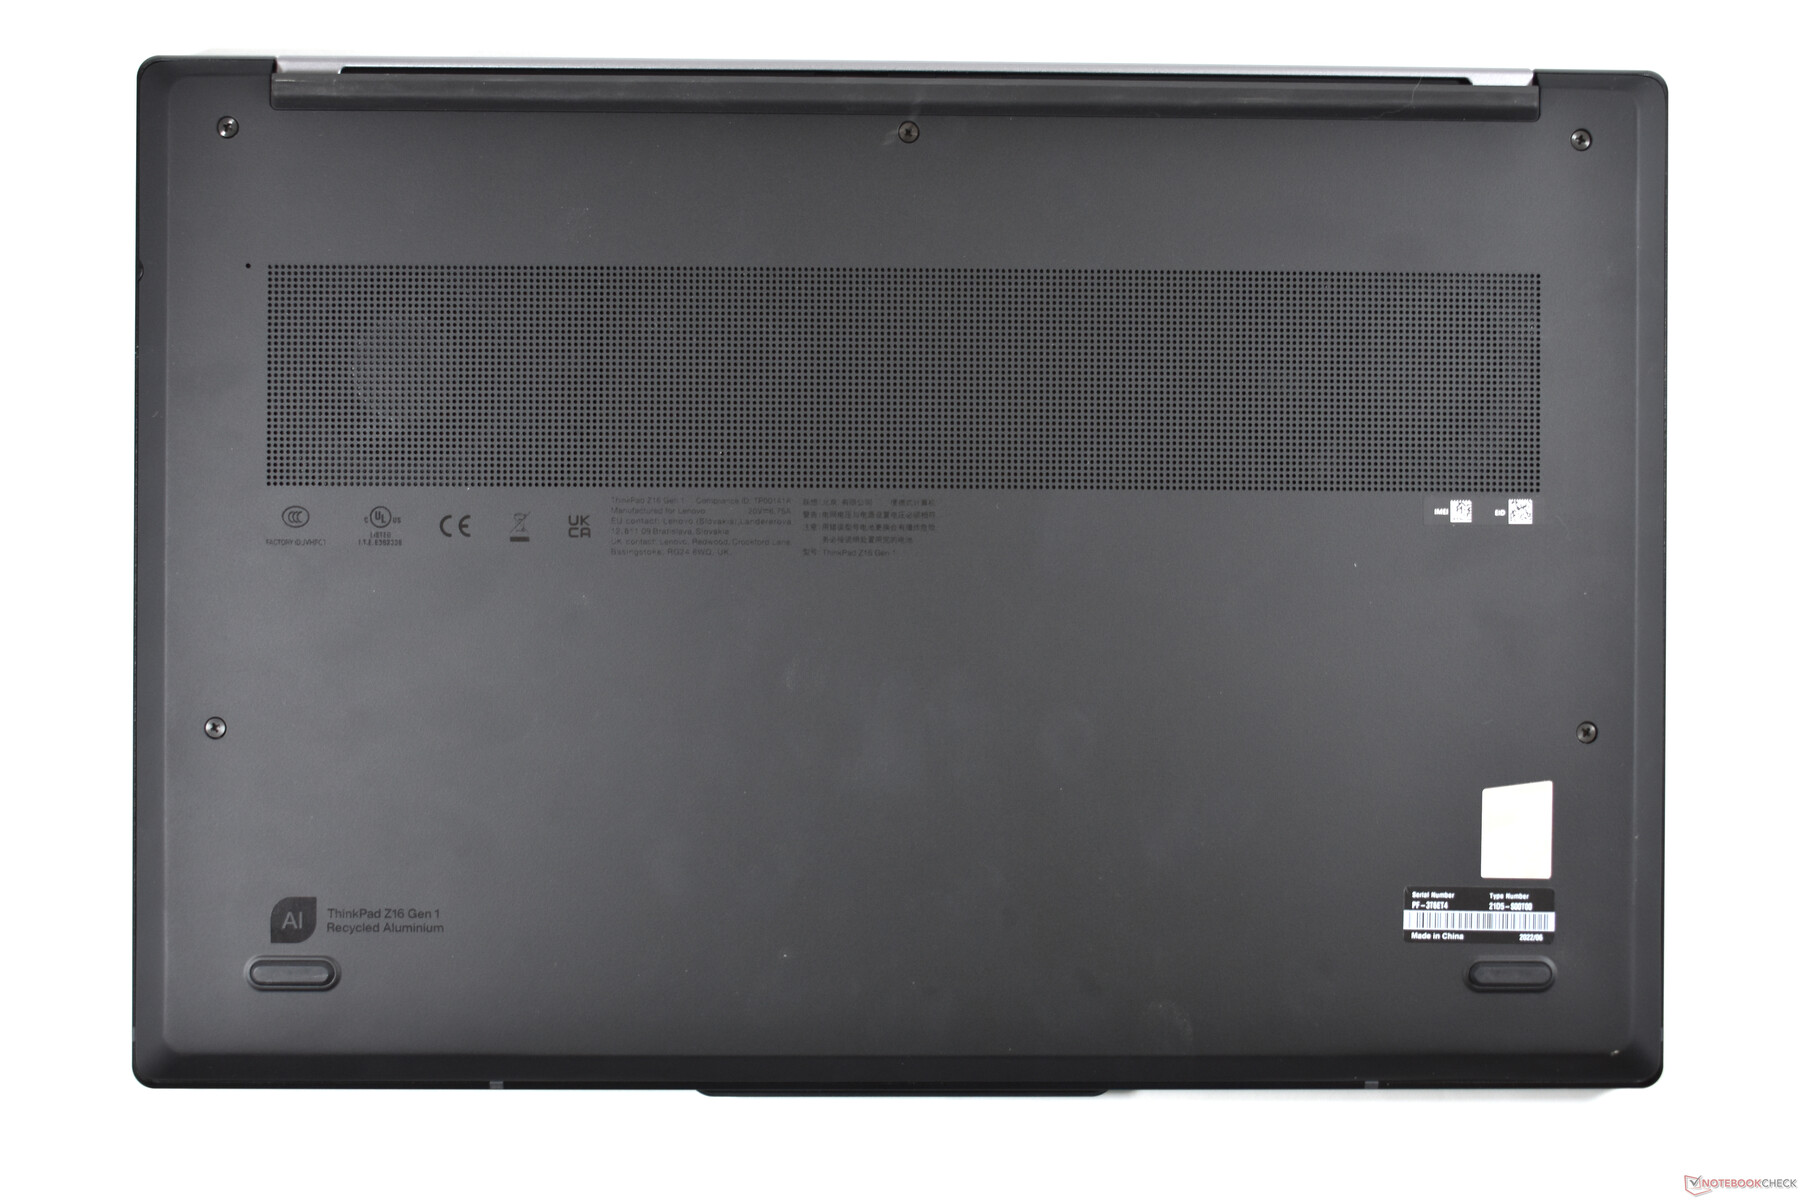
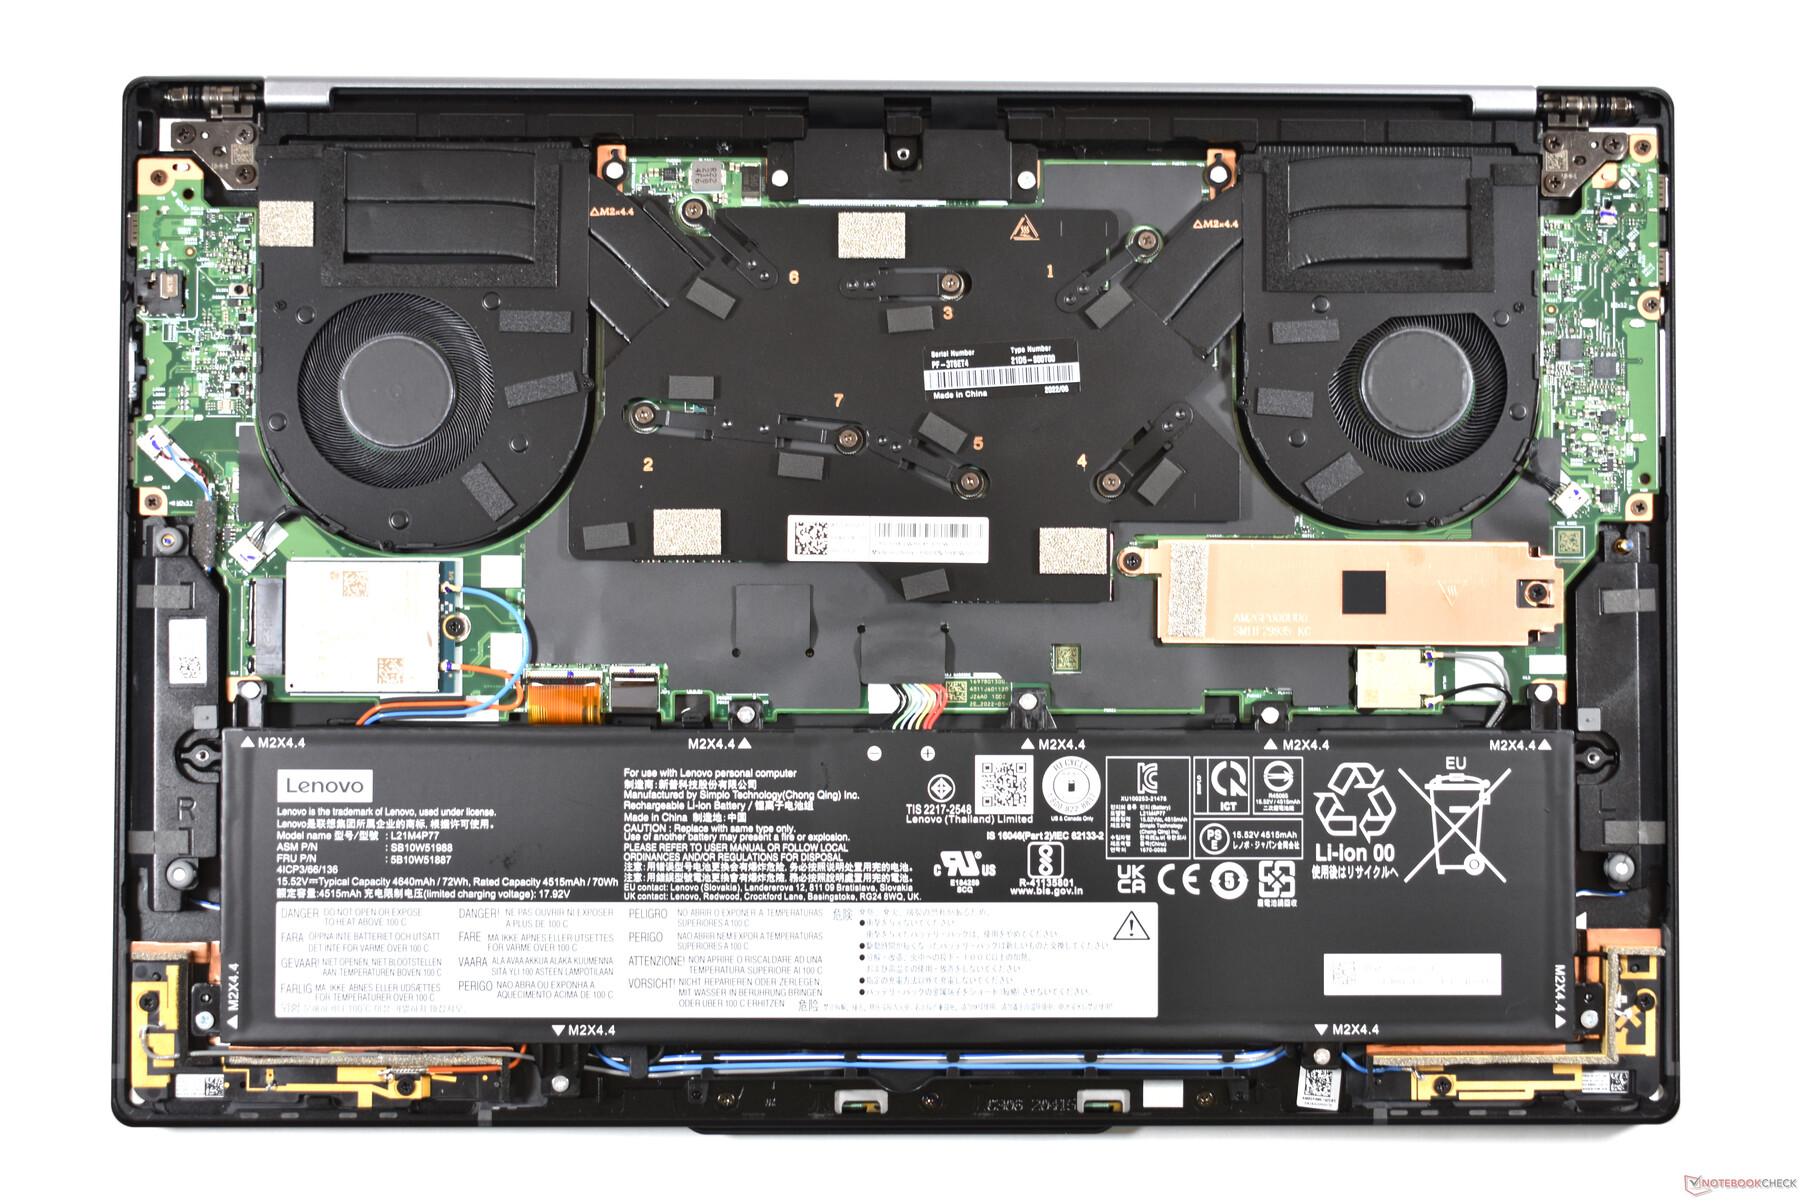
Mantenimiento
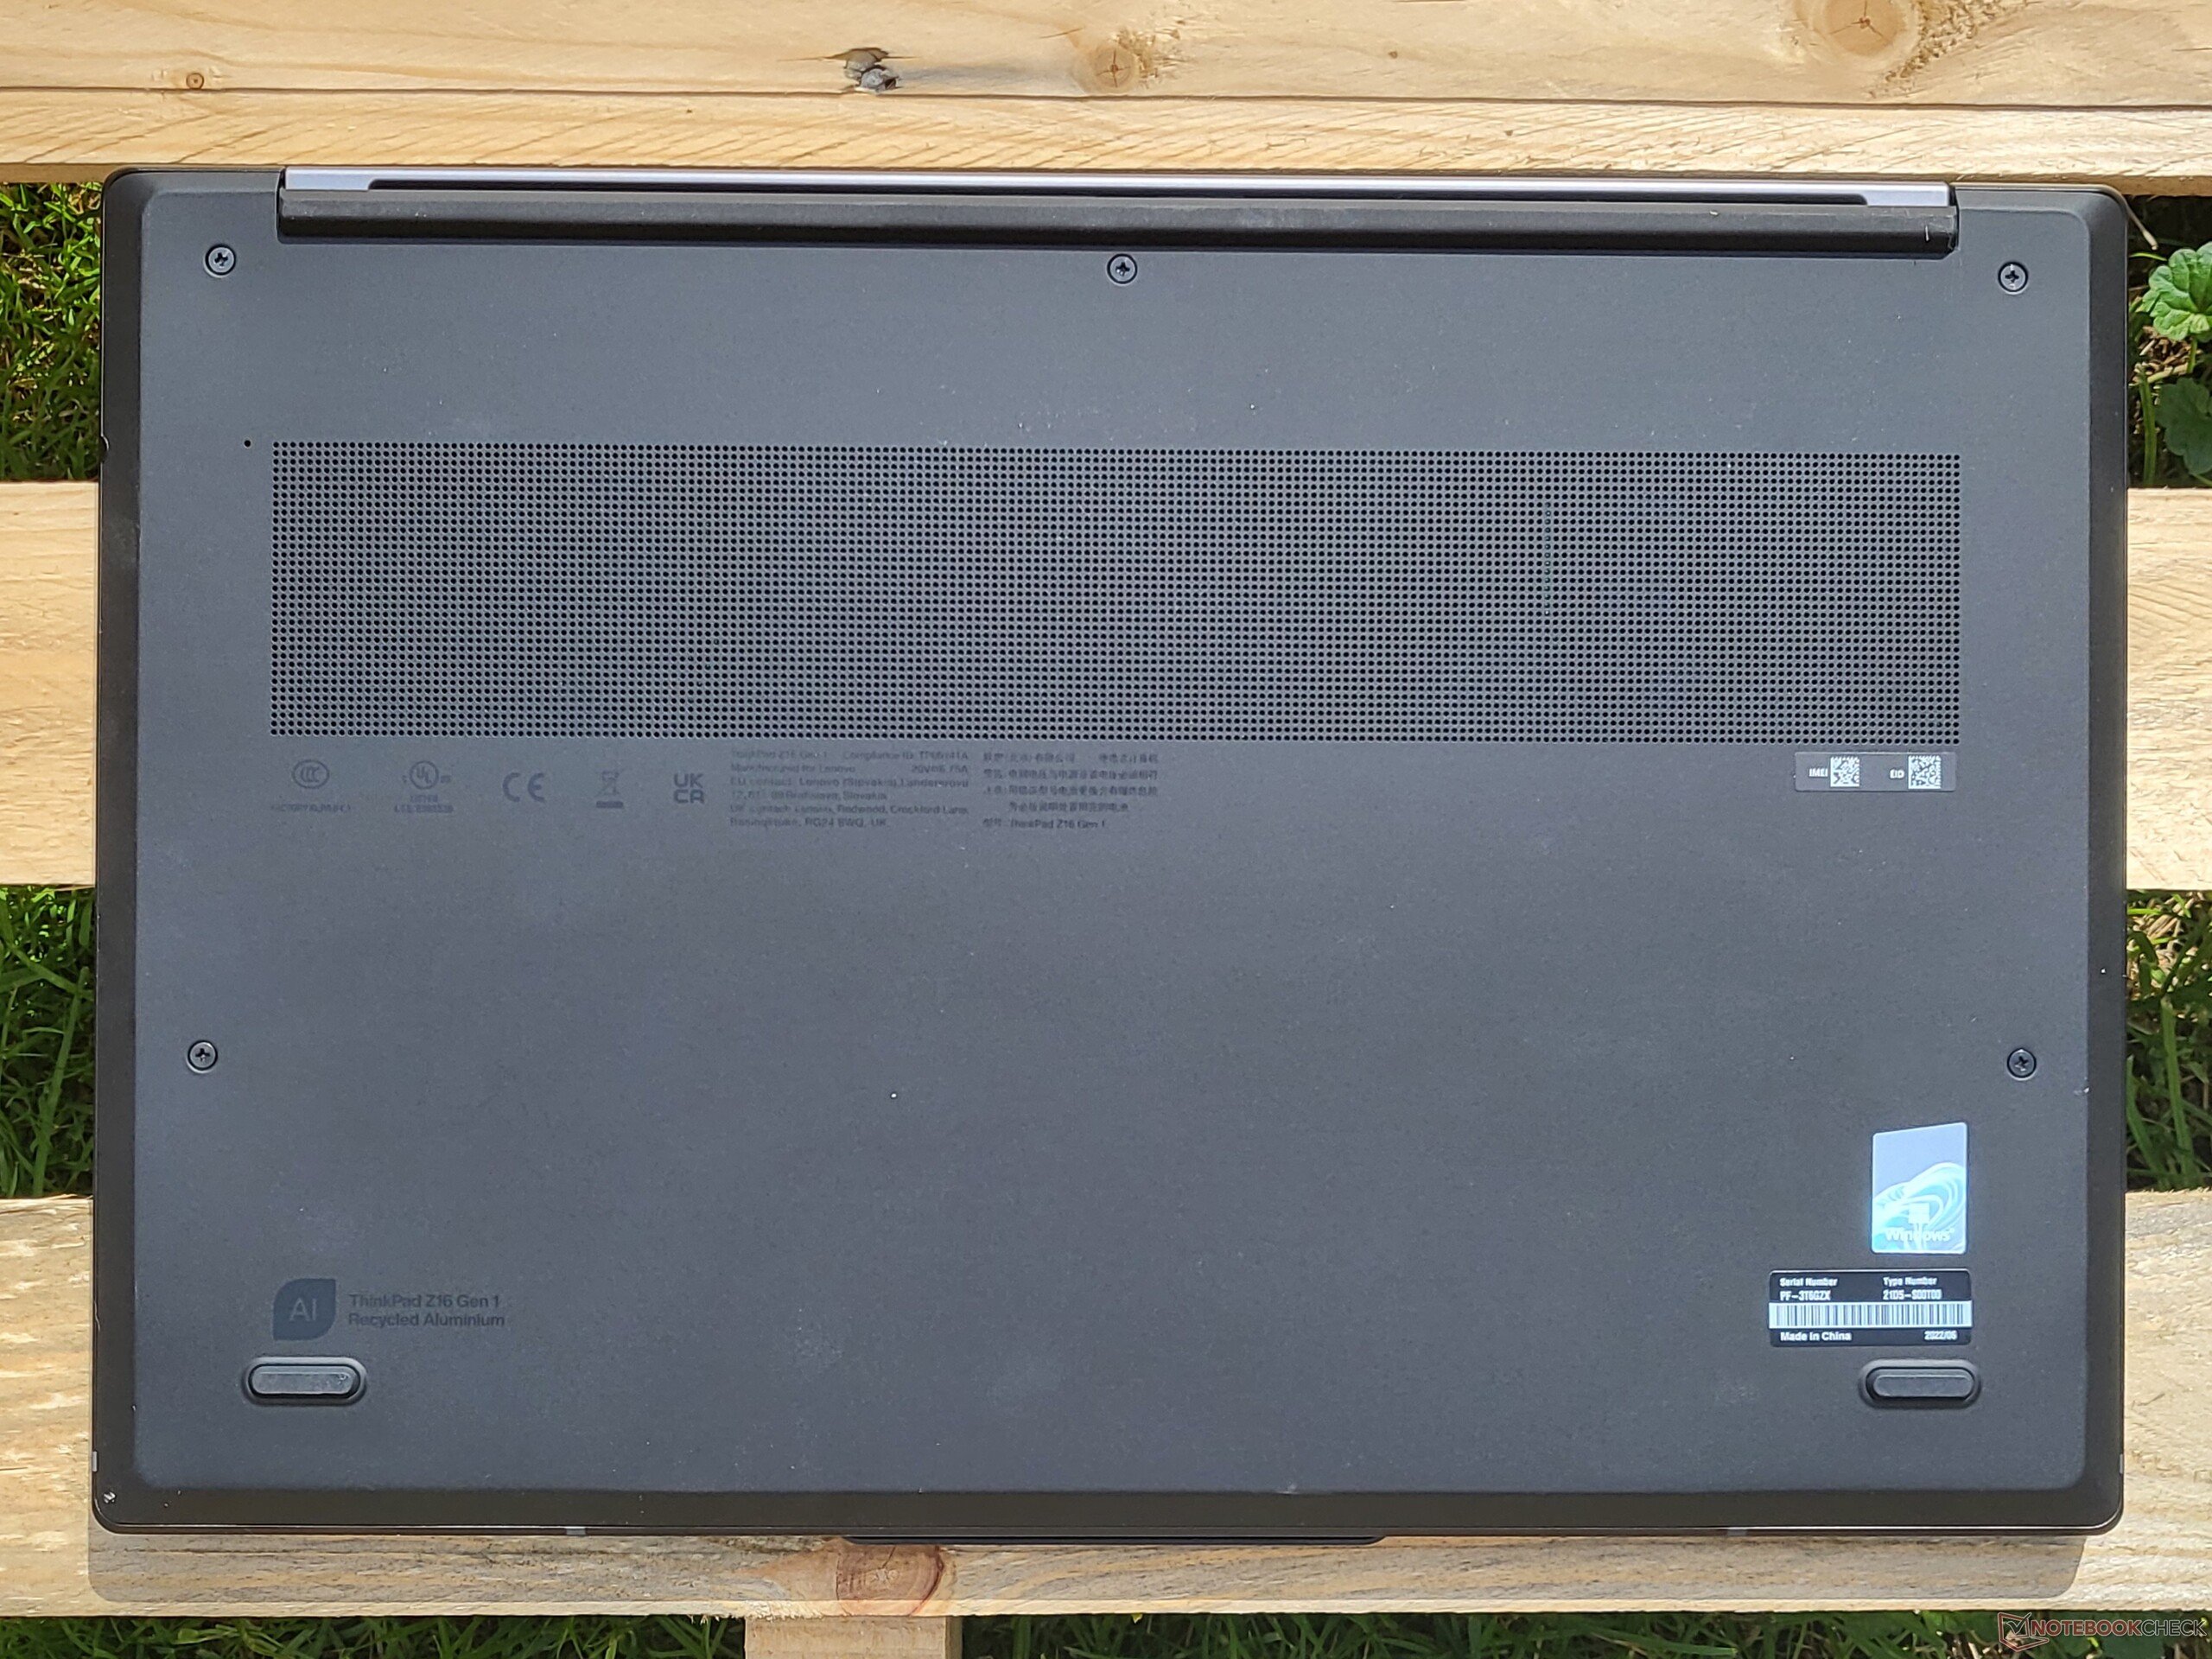
Lenovo hace que sea muy fácil acceder a las entrañas del ThinkPad Z16 Gen 1. Tras quitar los cinco tornillos Philips, puedes quitar directamente la tapa trasera. Por desgracia, no hay muchas opciones de actualización, y el ThinkPad Z16 no es muy modular para un portátil tan grande. La RAM y el módulo Wi-Fi están soldados, y sólo hay una única ranura M.2-2280. La tarjeta WWAN ocupa una ranura M.2-2242
Por supuesto, puedes limpiar los ventiladores o cambiar la batería, pero el portátil ThinkPad nos decepciona claramente en términos de opciones de actualización. Tanto los modelos Dell XPS como el ThinkPad X1 Extremeson significativamente más modulares.
Garantía
Nuestra unidad de prueba es un modelo especial de Campuspoint, que ofrece un paquete de garantía muy generoso: 36 meses de servicio in situ y "Soporte Premier" La garantía varía según el país, y los ThinkPads suelen venderse con sólo un año de garantía en Estados Unidos. Sin embargo, en todos los casos la garantía puede ampliarse hasta los cinco años y también puede mejorarse con servicios como la sustitución de la batería integrada. Además, el Z16 también incluye una garantía internacional como ThinkPad, pero no hay servicio in situ fuera de su país de compra.
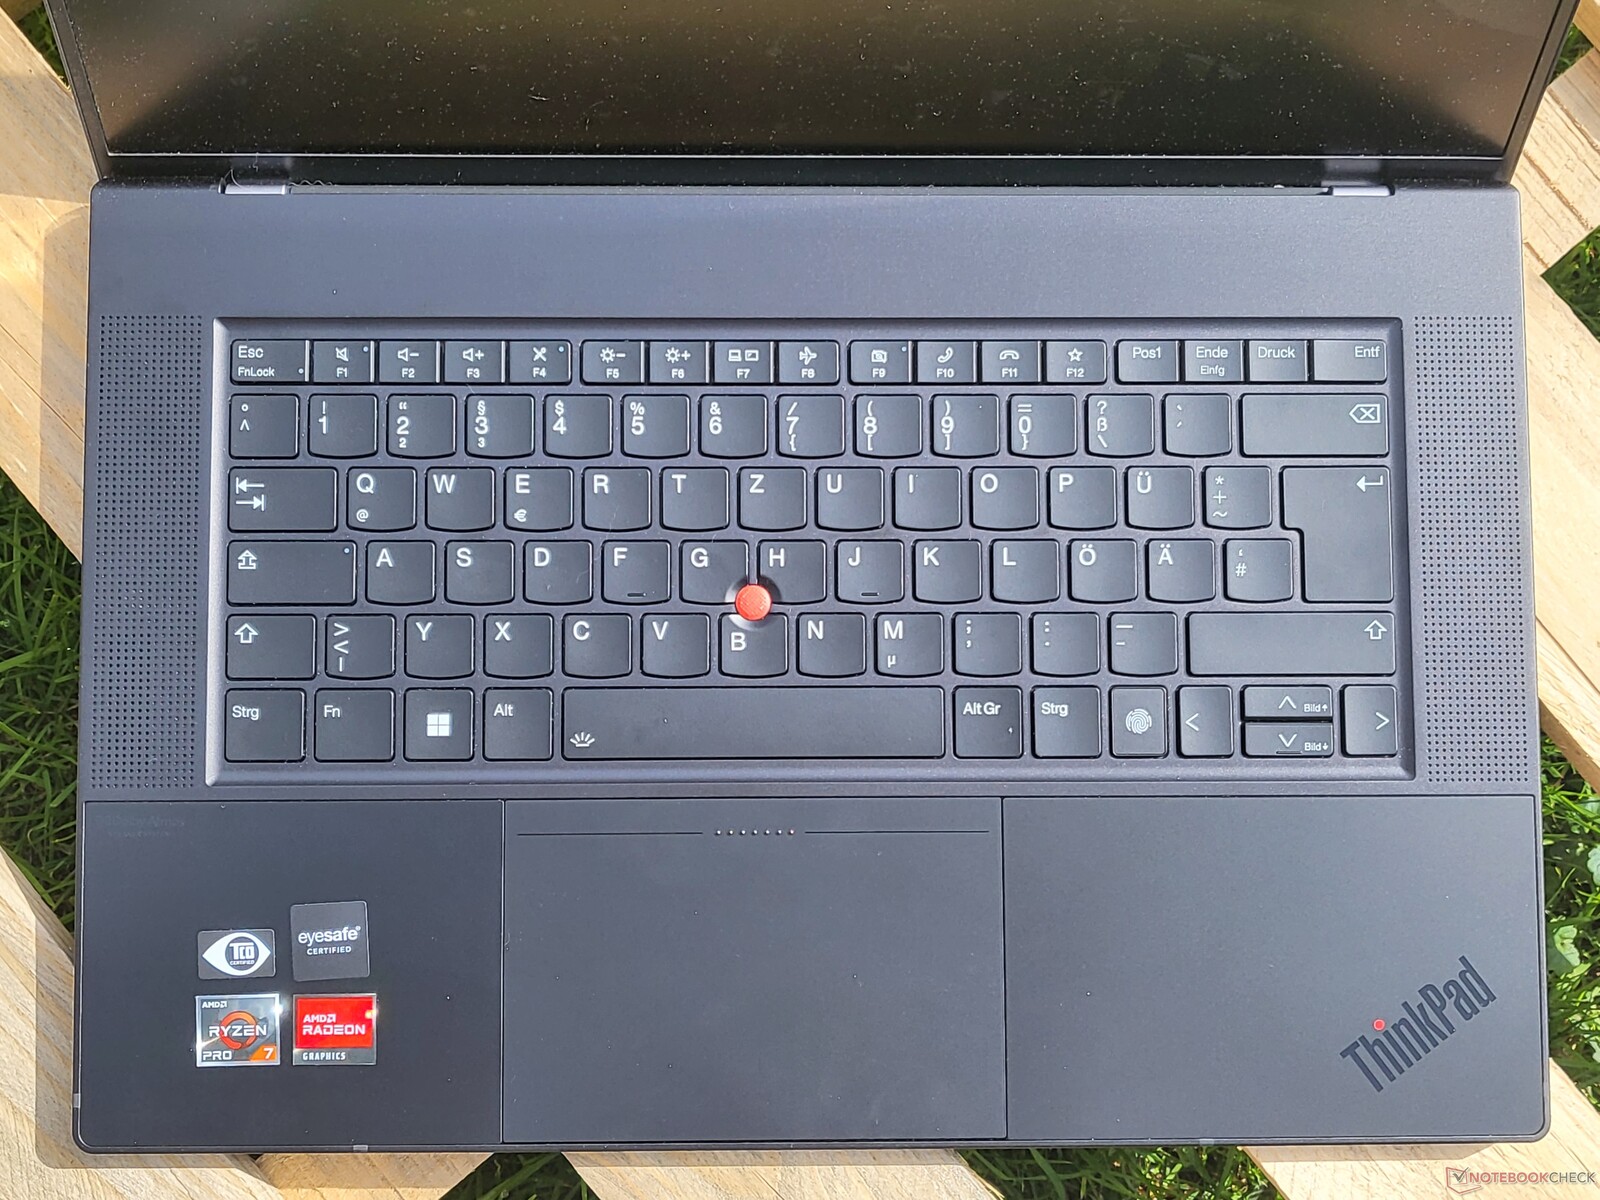
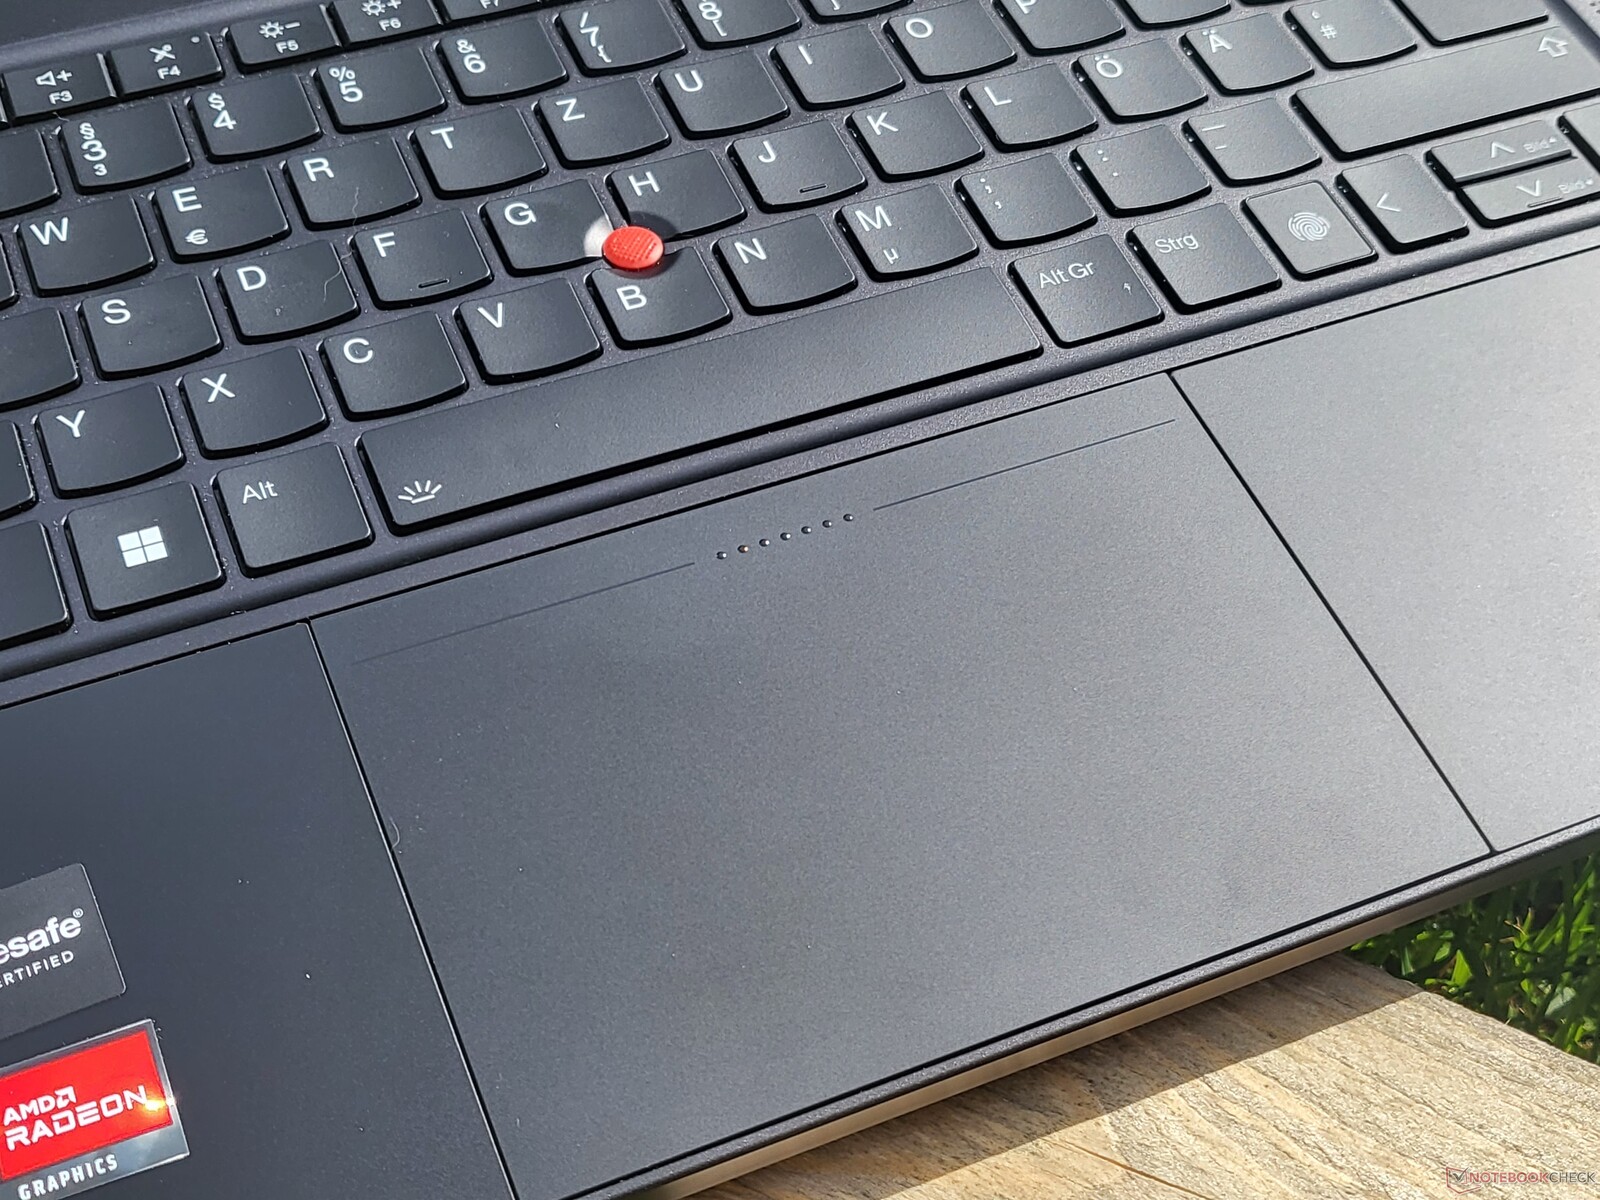
Dispositivos de entrada: El mejor touchpad en un Lenovo ThinkPad
Teclado
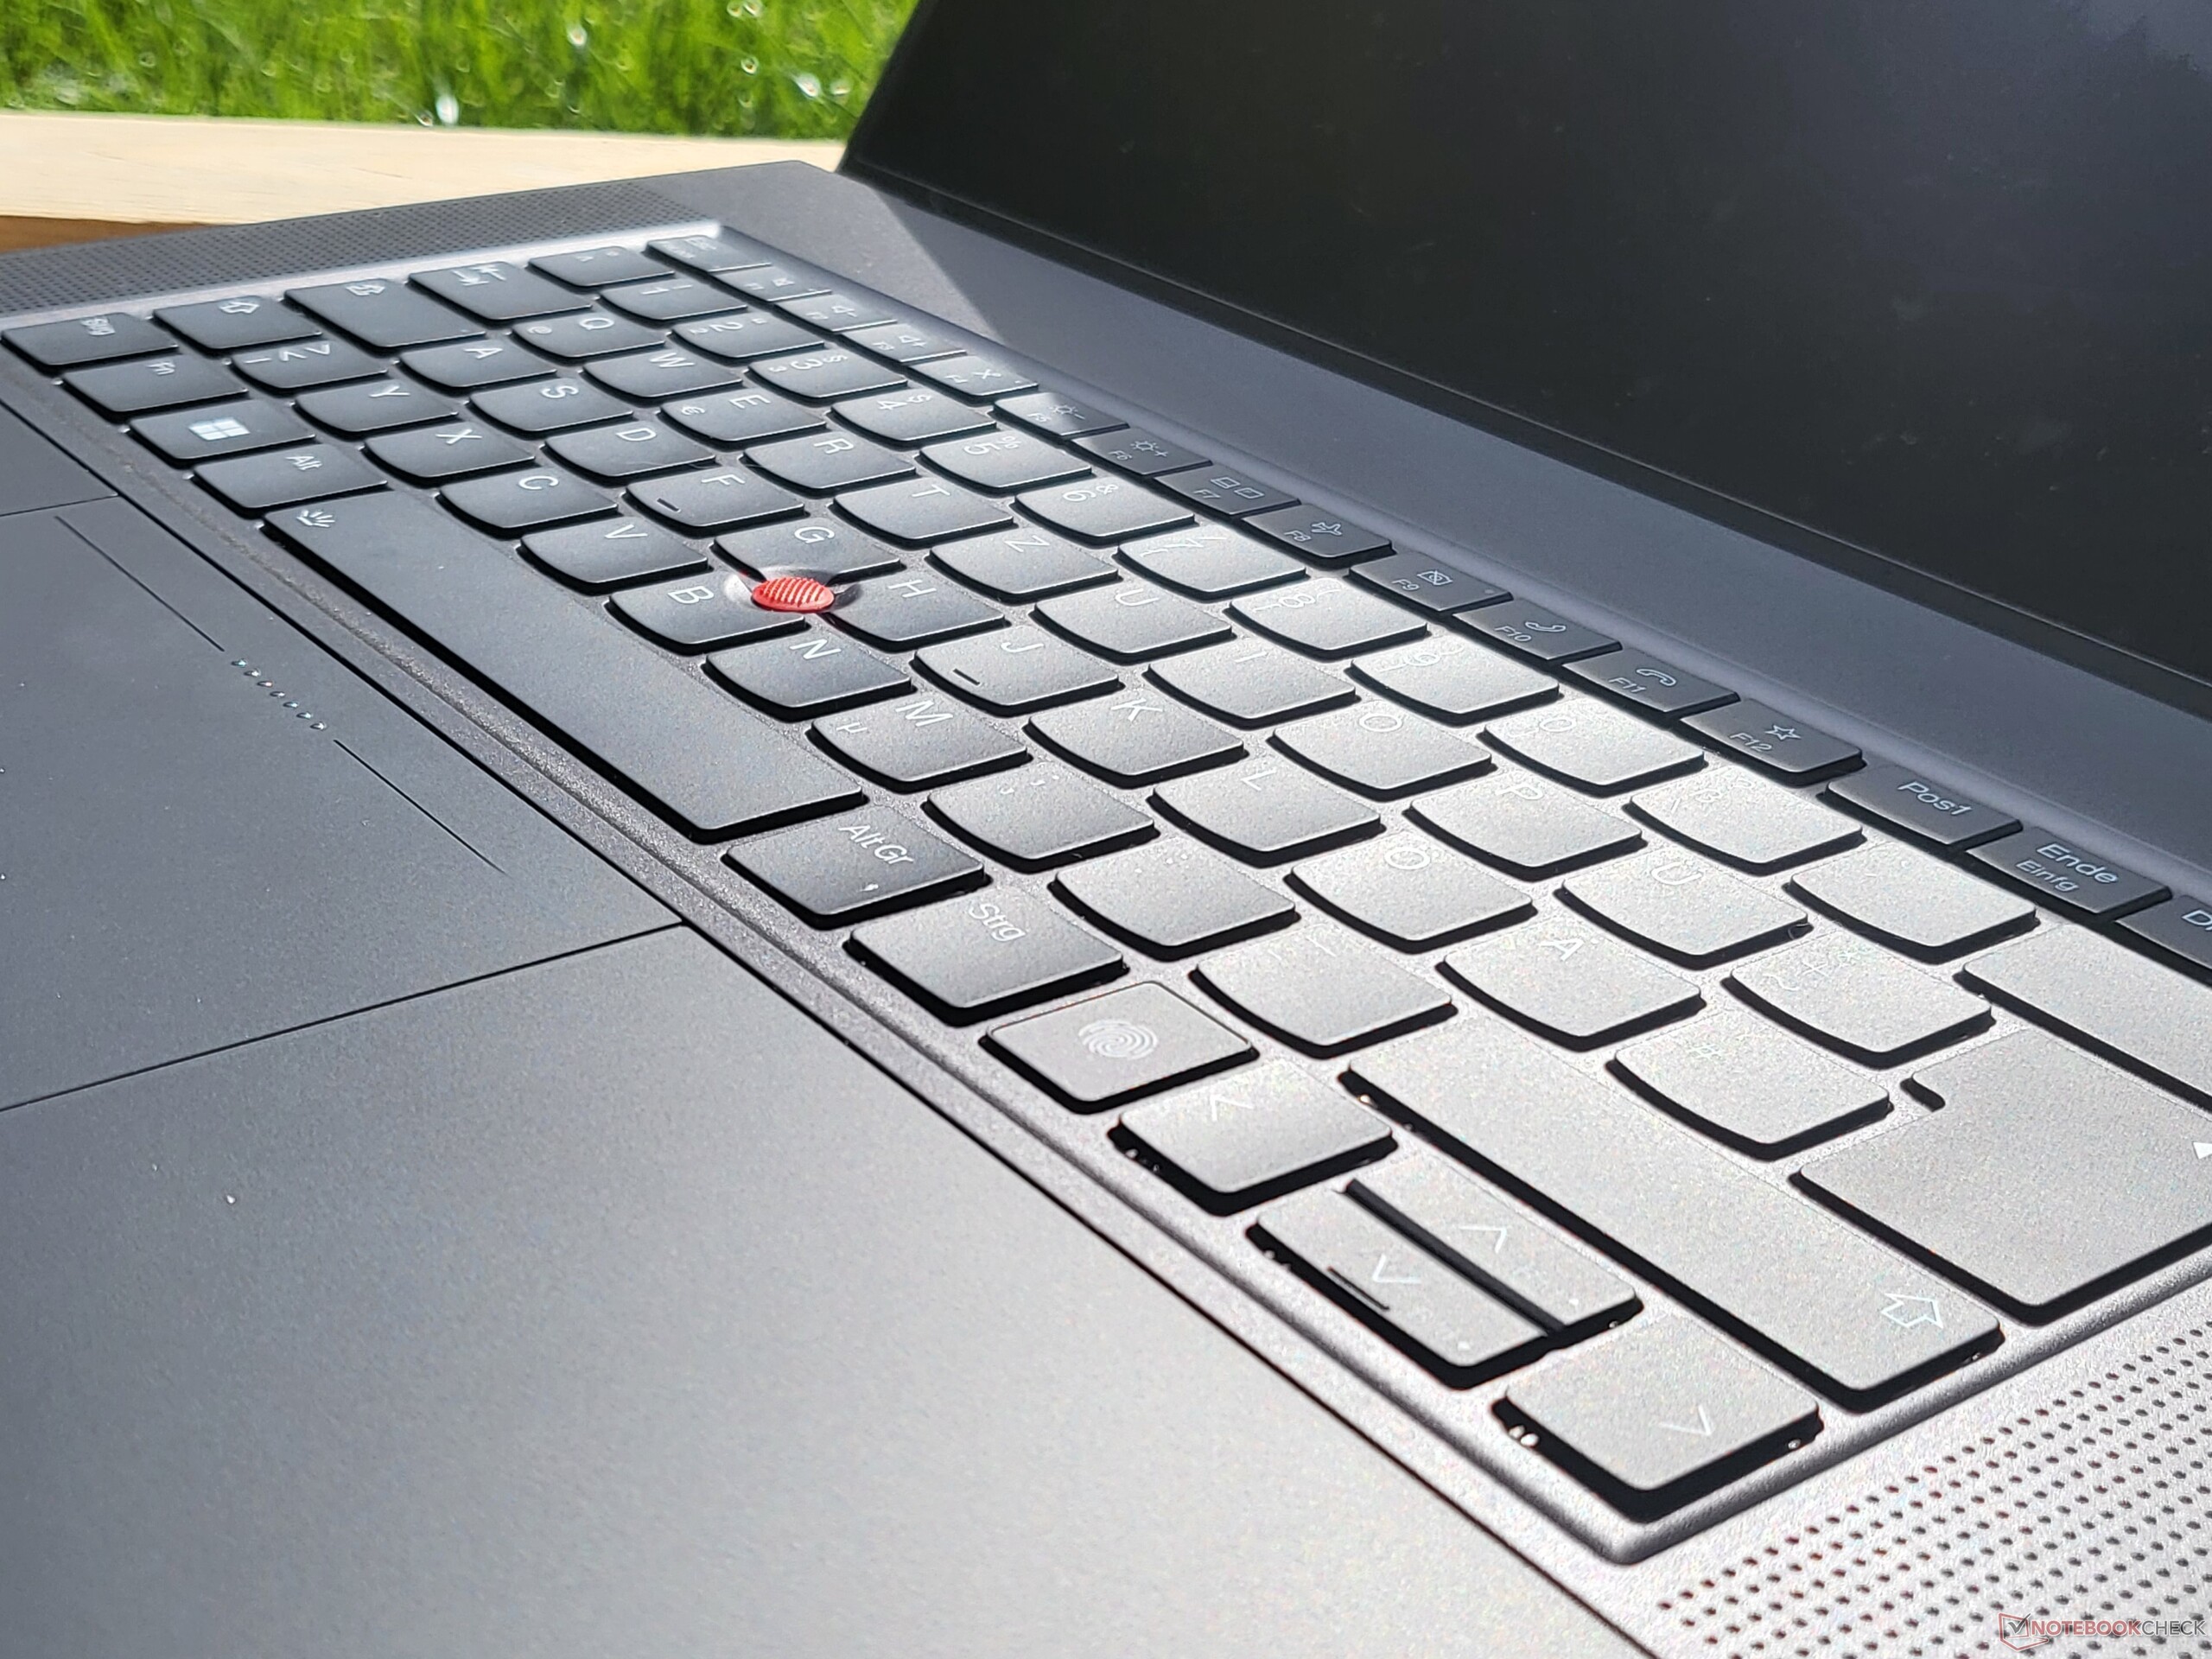
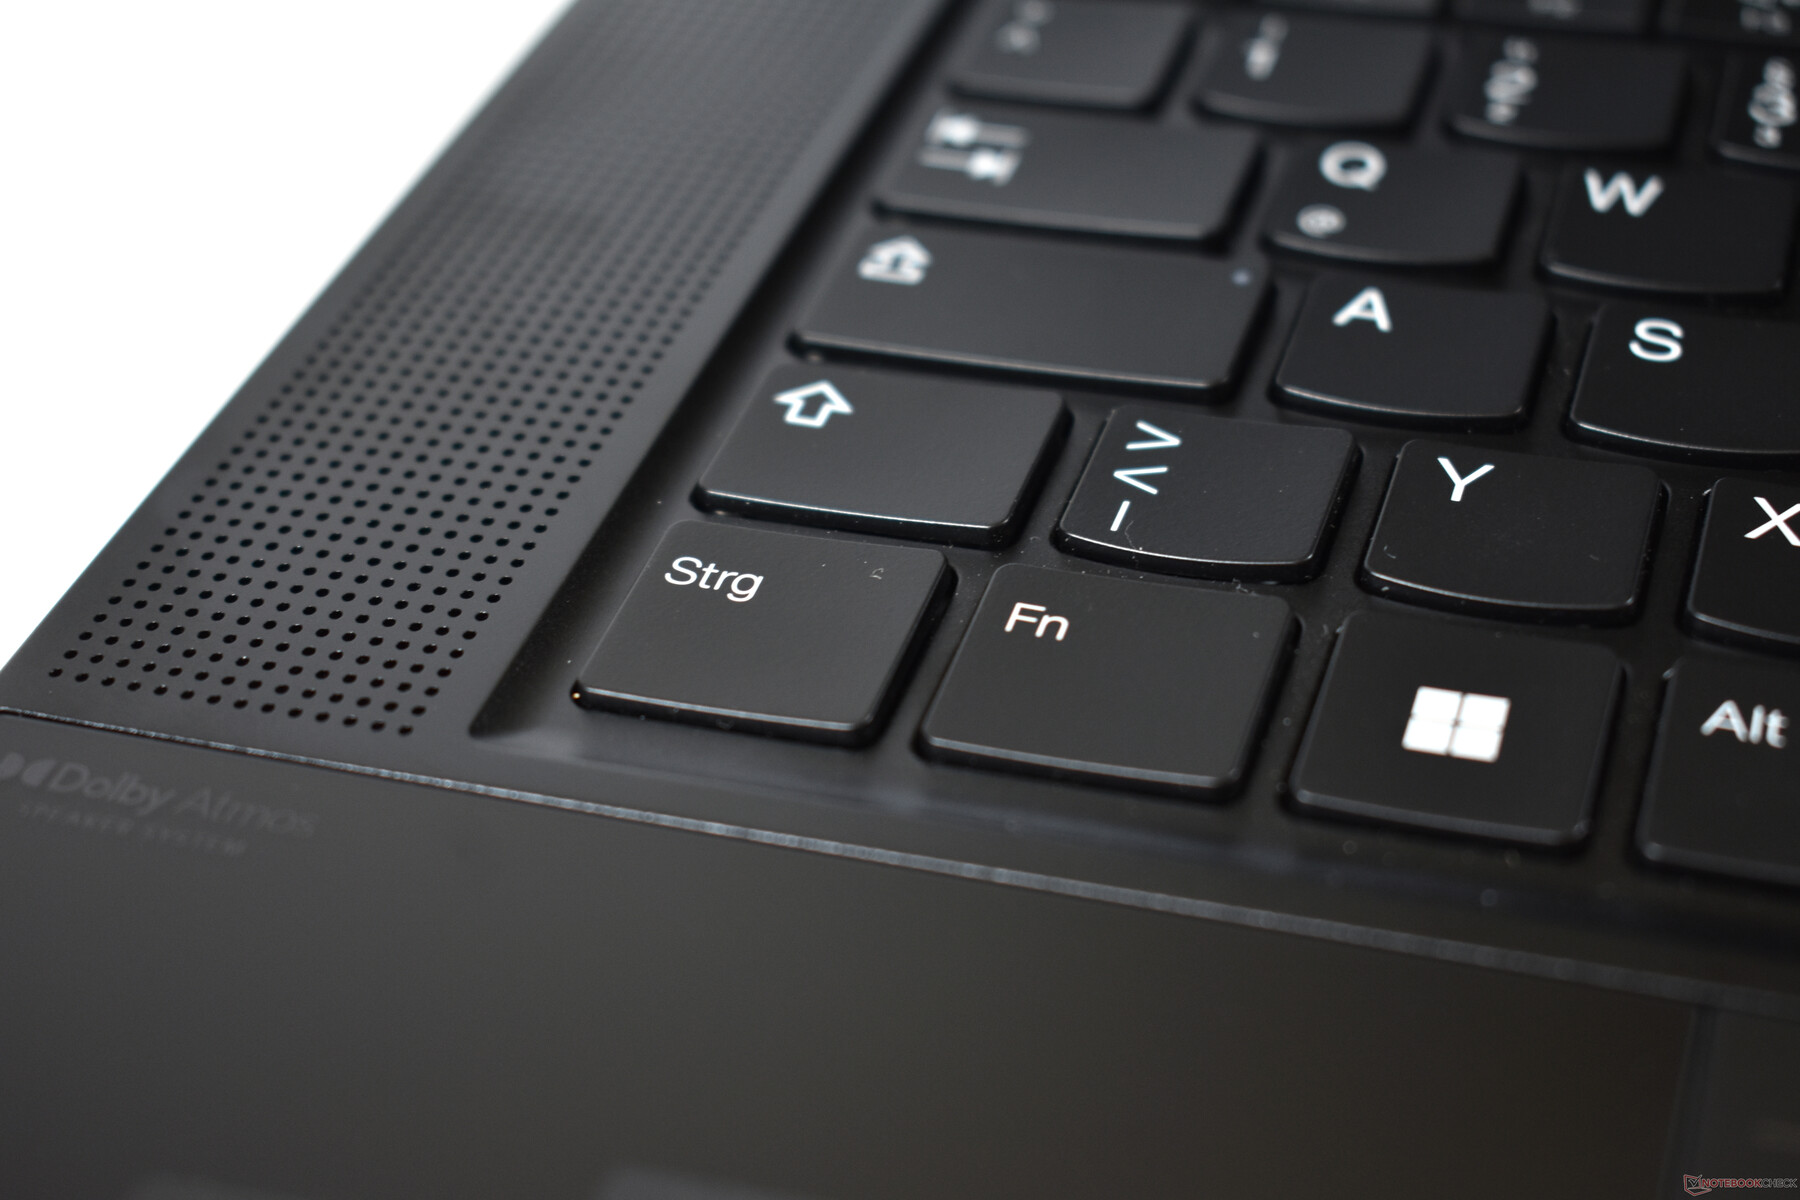
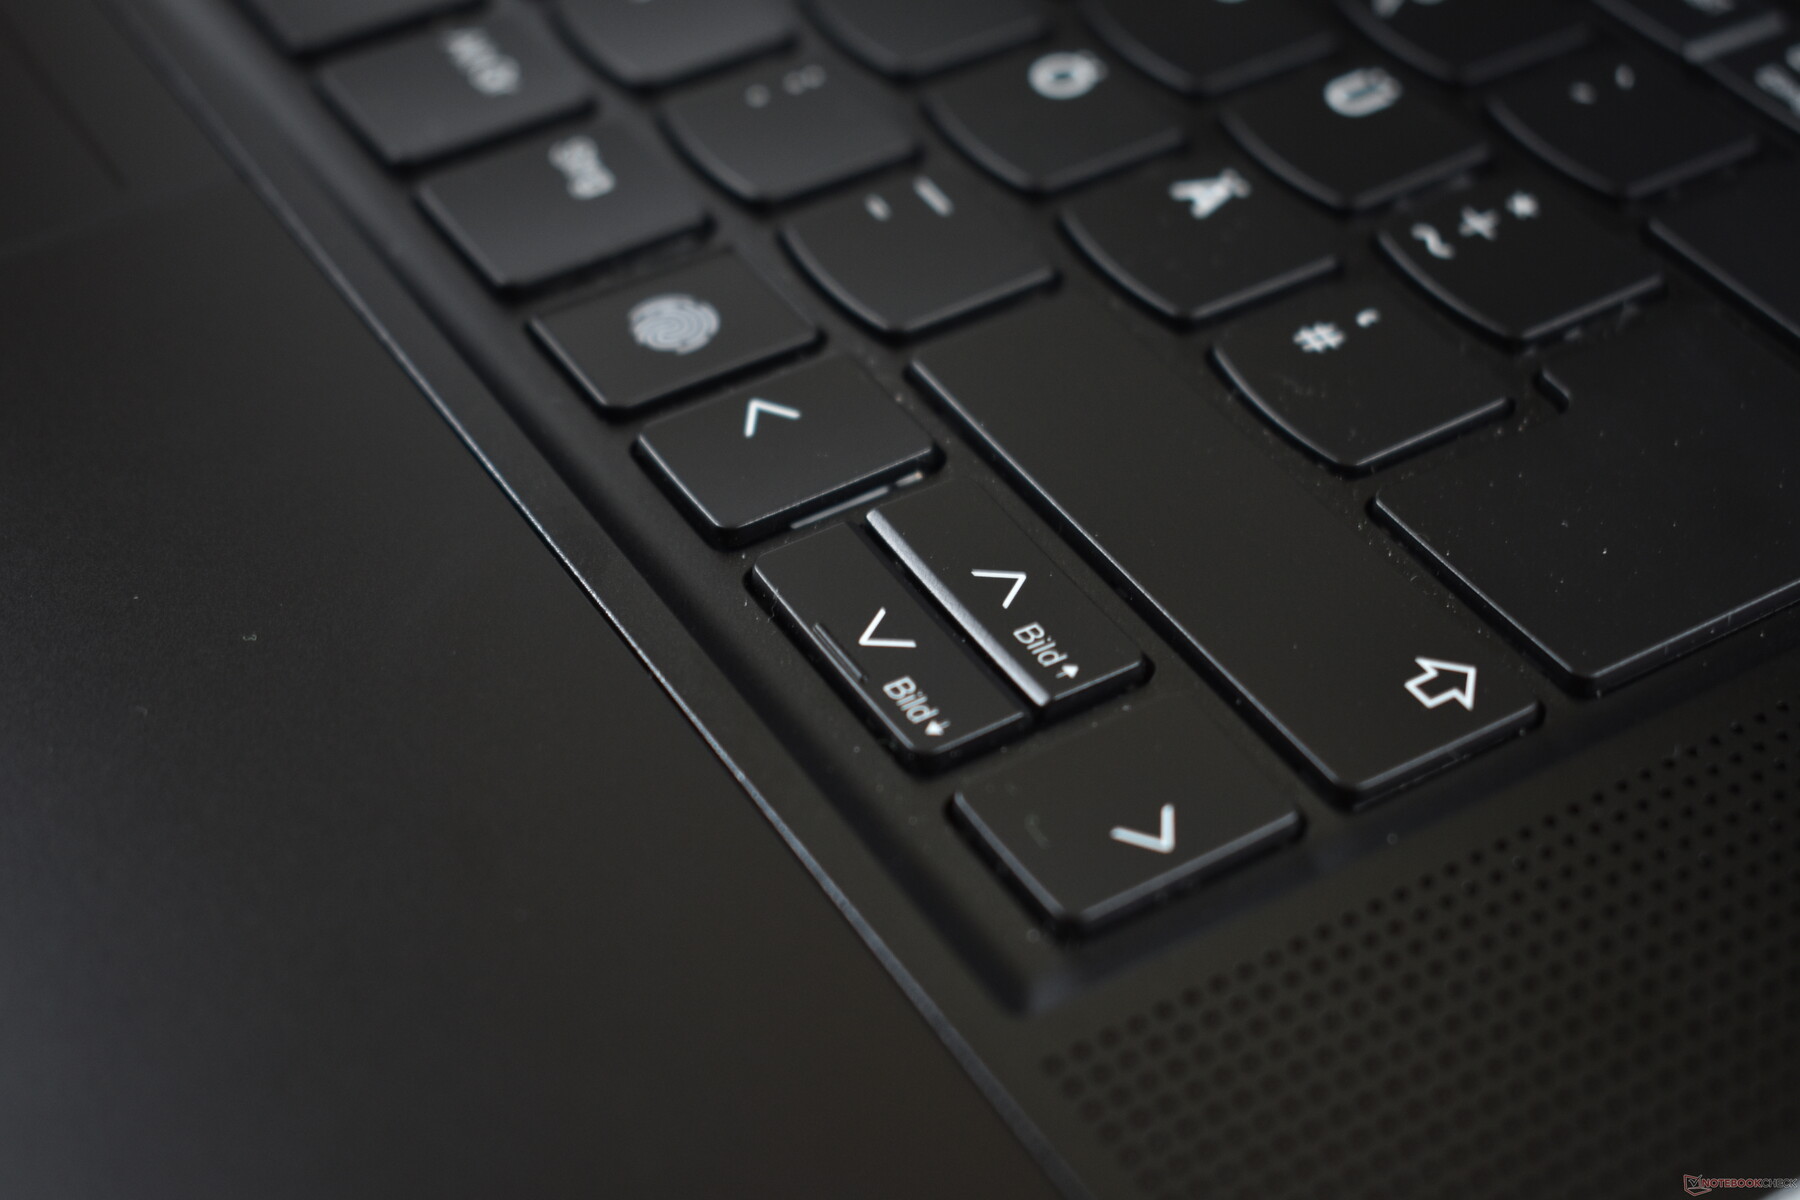
El teclado retroiluminado de dos niveles también está más cerca de la corriente principal de los portátiles, y las teclas exteriores ya no tienen la forma de tecla en U típica de ThinkPad. Lenovo también ha forzado el teclado en general a una forma rectangular y ha eliminado el hueco para las teclas de dirección que es habitual en los ThinkPads. Junto con este cambio, también se han eliminado las teclas de imagen arriba/abajo. Y finalmente, Lenovo también ha cambiado las teclas Ctrl y Fn, estando ahora la tecla Ctrl en el exterior.
Con un recorrido de las teclas de sólo 1,35 mm (~0,053 pulgadas), las teclas vuelven a ser más delgadas que en muchos otros portátiles ThinkPad actuales. Por ejemplo, el X1 Extreme ofrece 1,5 mm (~0,059 in). Además, la parte superior de las teclas es más plana. Esto hace que la experiencia de tecleo sea menos lujosa y no muy típica de ThinkPad. Sin embargo, comparado con el Dell XPS y el MacBook Pro, el teclado sigue siendo mejor, ofreciendo un punto de presión claro y nítido y una resistencia justa. Con 28.5 cm, el teclado también tiene toda la anchura estándar.
TrackPad y TrackPoint
Sin más preámbulos: El Z16 tiene el mejor y también más grande TrackPad (12 x 8 cm) de todos los ThinkPads actuales. La superficie está hecha de vidrio mate, al igual que el reposamanos. Esto tiene una calidad extremadamente alta y también asegura características ideales de deslizamiento. El motor háptico del ClickPad, que simula los clics reales, también es muy bueno. El ClickPad se puede pulsar de forma uniforme en todas partes, a diferencia de los TrackPads mecánicos habituales que sólo se pueden utilizar para pulsar en la zona inferior. Con su háptica de alta calidad, su implementación de software y su amplio tamaño, el portátil ThinkPad se puede manejar de forma muy cómoda con el touchpad.
En comparación con otros ThinkPad, lo que es ligeramente menos cómodo es el TrackPoint sin teclas dedicadas. Por otro lado, el TrackPoint sigue siendo una gran opción, si tienes que mover rápidamente el cursor del ratón mientras escribes. En esta solución háptica, las teclas integradas del TrackPoint son mejores de lo que hubiéramos pensado anteriormente.
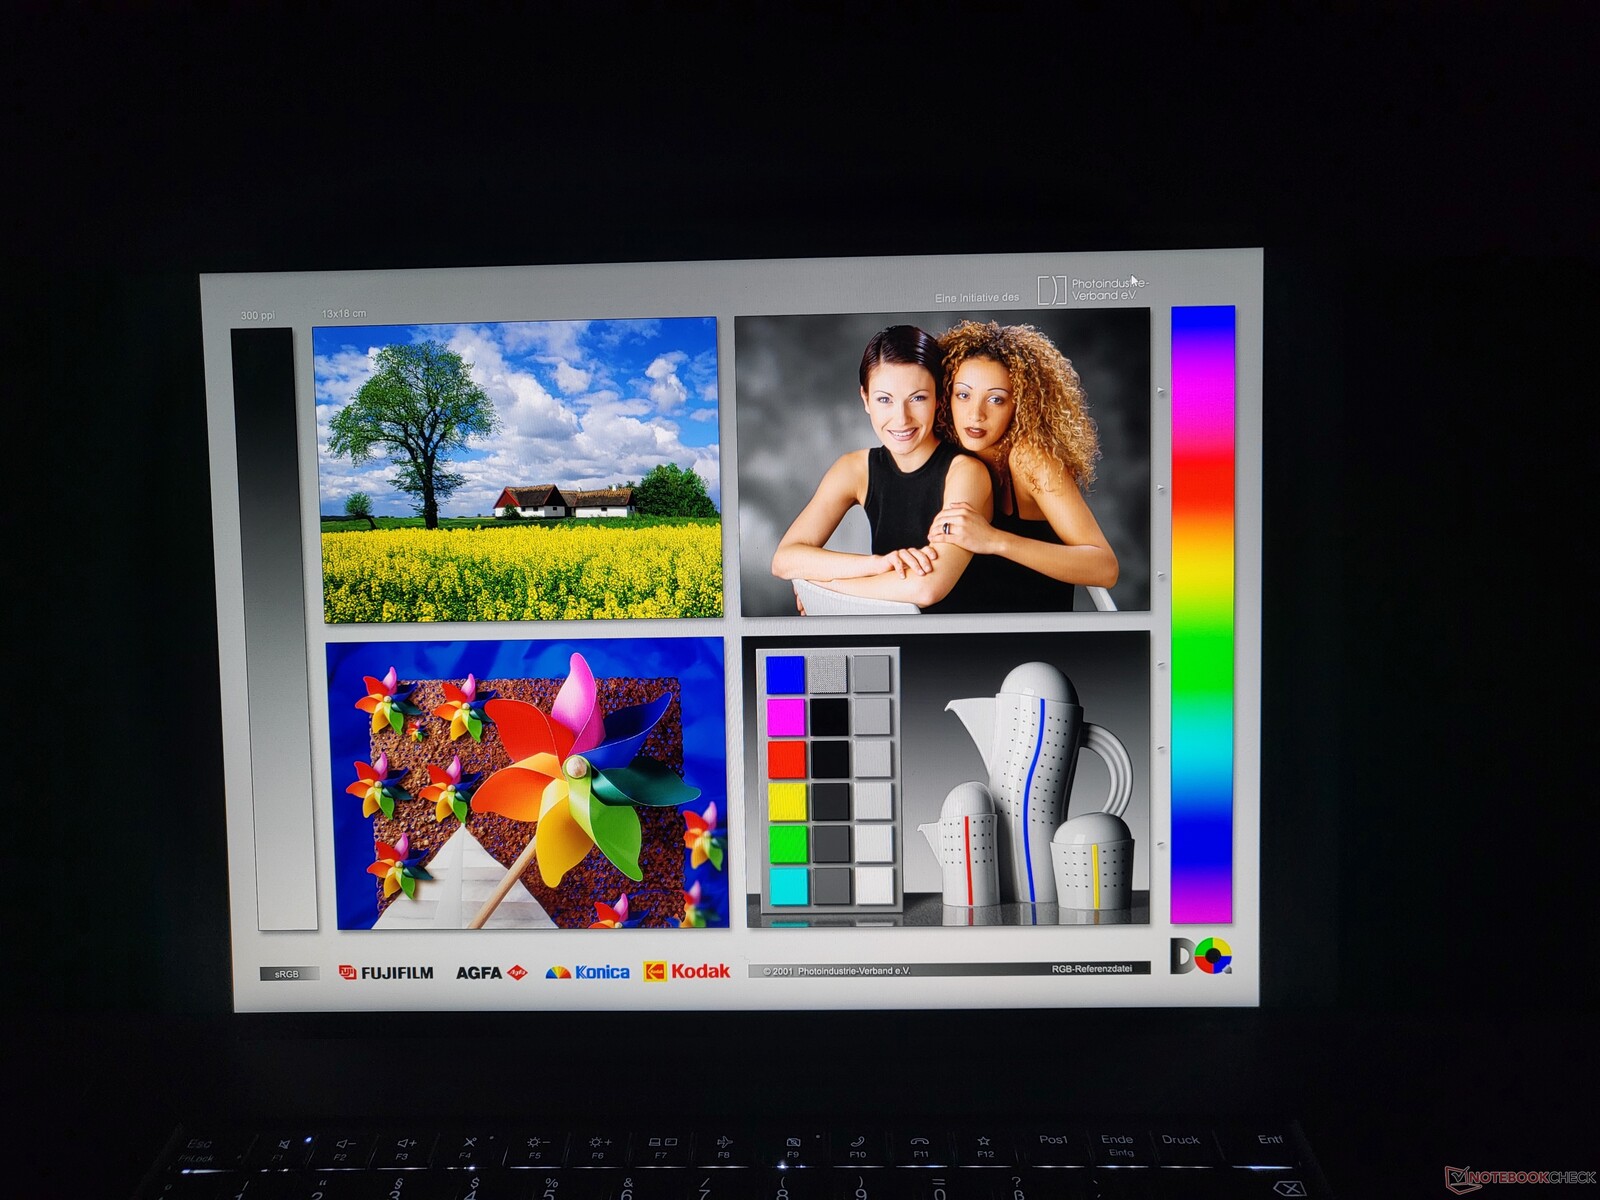
ThinkPad Z16 Gen 1: Pantalla WUXGA mate con un buen brillo
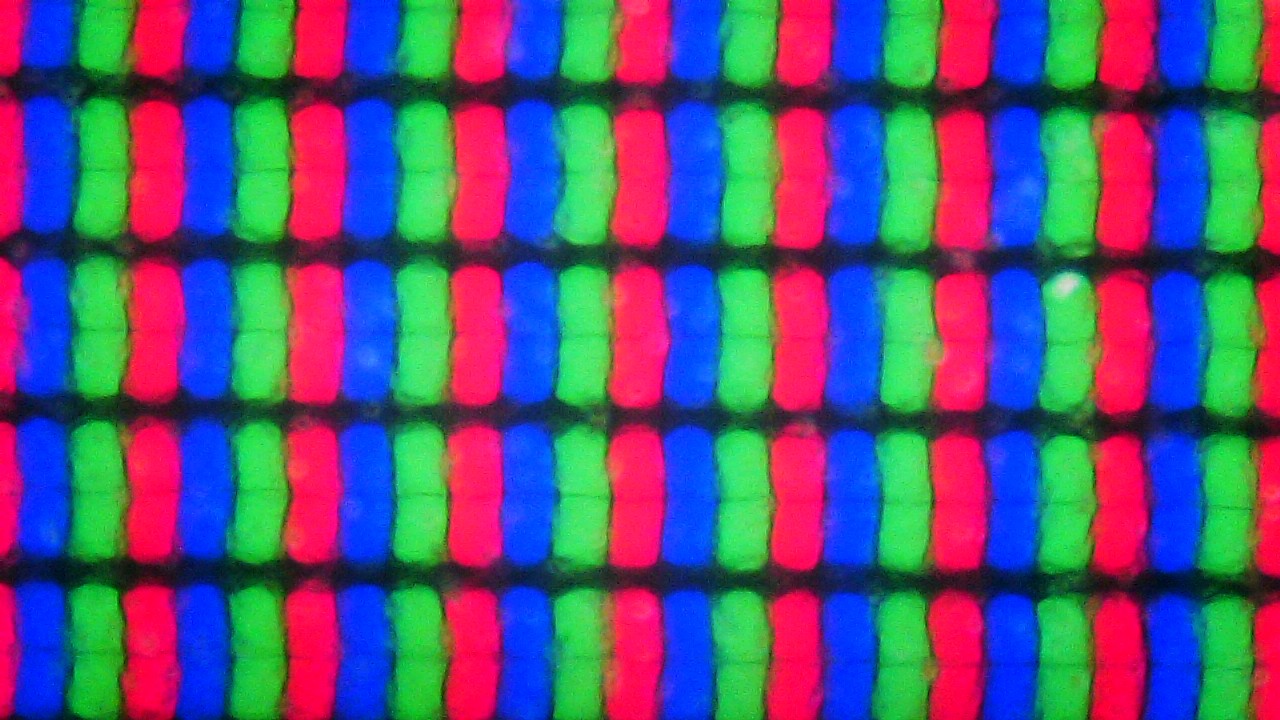
Lenovo casi siempre ofrece varias opciones de pantalla con sus portátiles ThinkPad, y el Lenovo ThinkPad Z16 Gen 1 no es una excepción a esta regla. Los compradores pueden elegir entre las siguientes pantallas que tienen en común el formato 16:10 y la diagonal de 16 pulgadas
- IPS WUXGA (1.920 x 1.200), 400 cd/m², mate, 100% sRGB, bajo consumo
- IPS WUXGA (1.920 x 1.200), 400 cd/m², semibrillante, 100% sRGB, bajo consumo, táctil
- OLED WQUXGA (3.840 x 2.400), 400 cd/m² (SDR), semibrillante, 100% DCI-P3, táctil, Dolby Vision
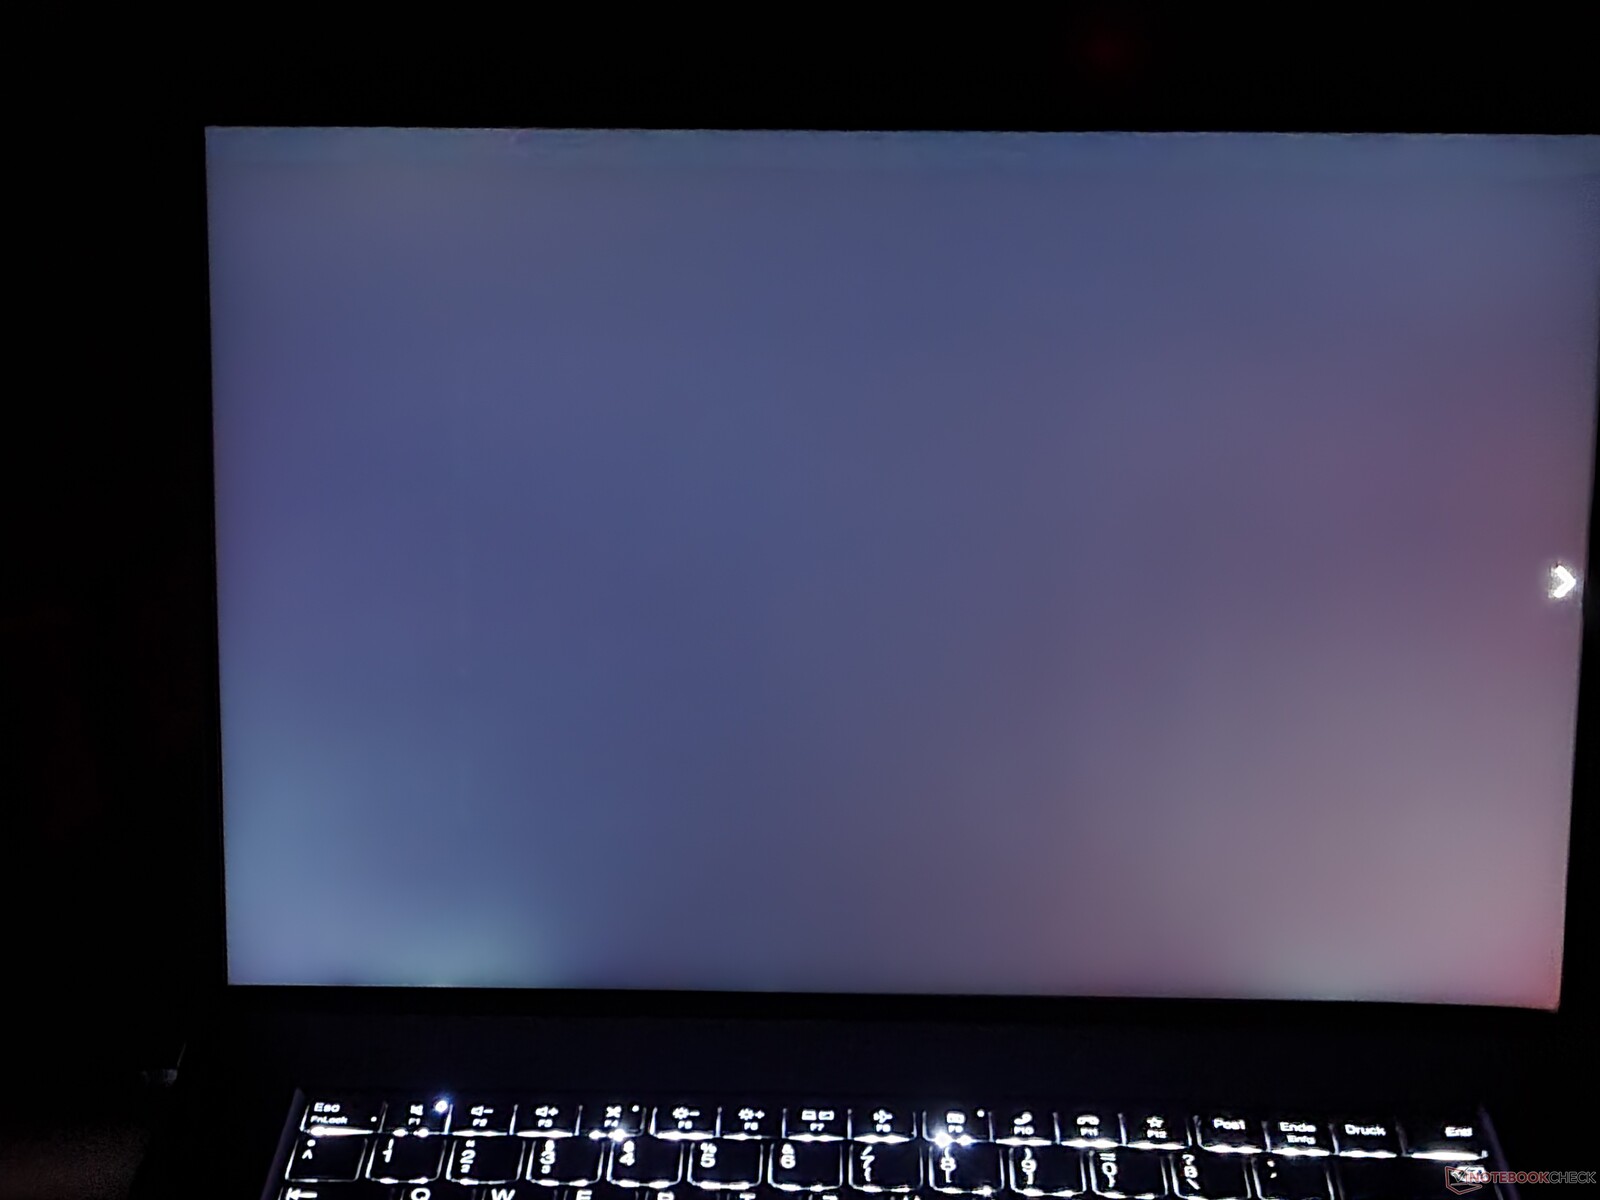
Lo que destaca en comparación con el ThinkPad X1 Extreme es que no hay opción de 2.5K (2,560 x 1,600). Los usuarios tienen que elegir entre una resolución bastante baja y una muy alta. En el caso de nuestra unidad de pruebas, tenemos la opción básica. Esto cumple con creces los 400 cd/m² prometidos, ya que el brillo medio es de 446 cd/m².
| |||||||||||||||||||||||||
iluminación: 83 %
Brillo con batería: 487 cd/m²
Contraste: 1571:1 (Negro: 0.31 cd/m²)
ΔE ColorChecker Calman: 1.8 | ∀{0.5-29.43 Ø4.71}
calibrated: 0.8
ΔE Greyscale Calman: 2.3 | ∀{0.09-98 Ø4.96}
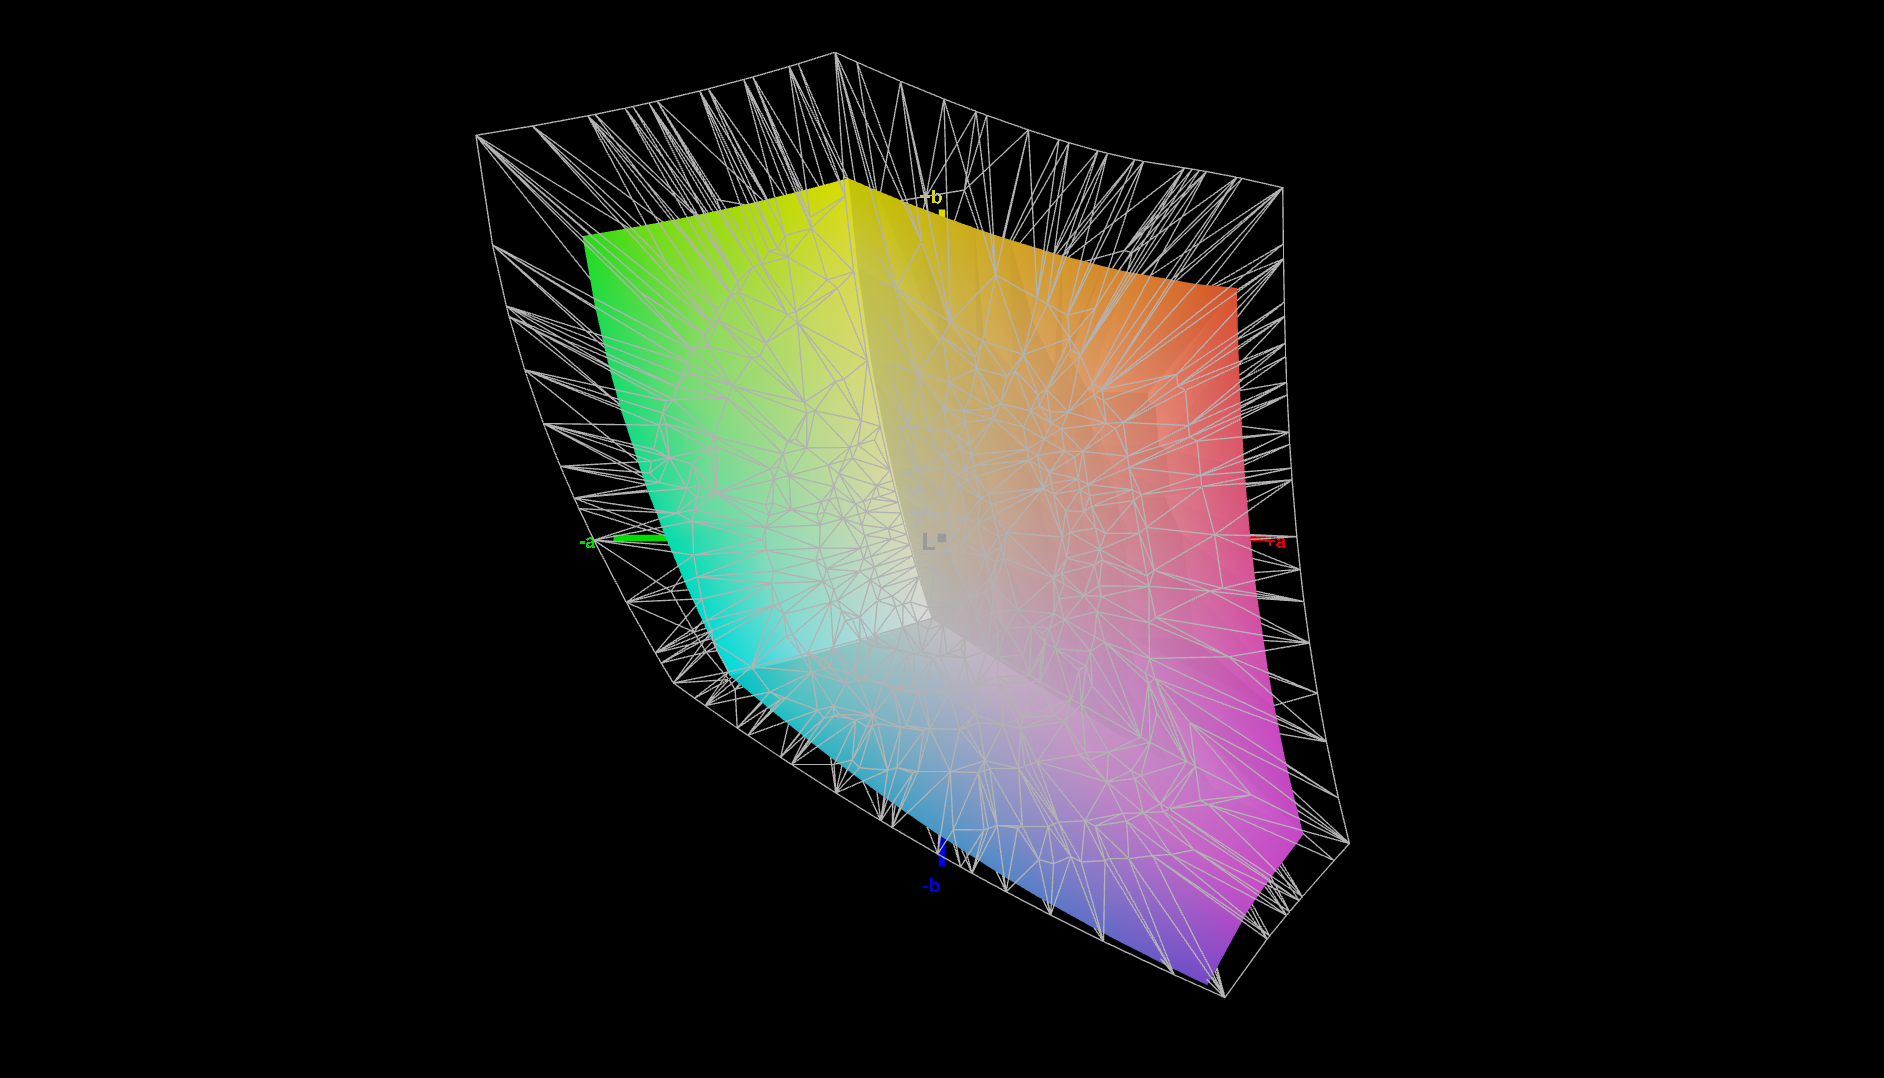
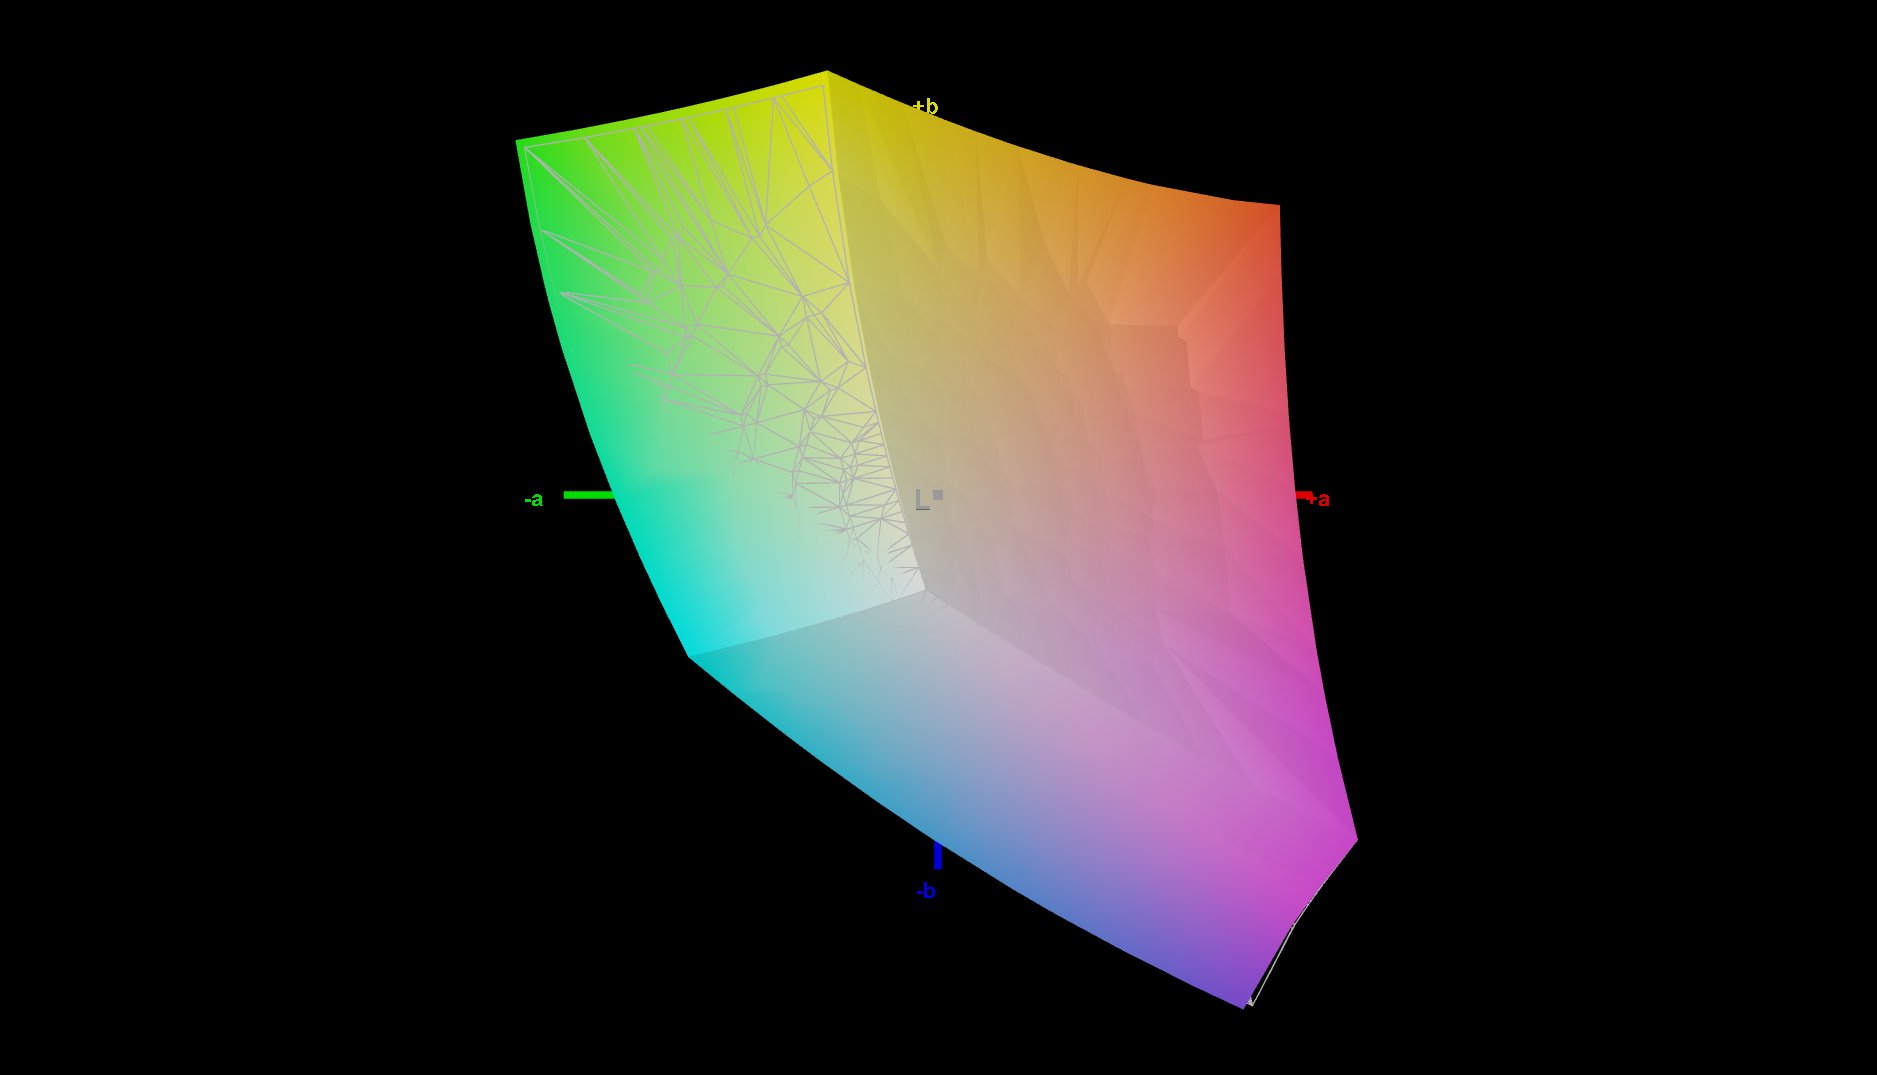
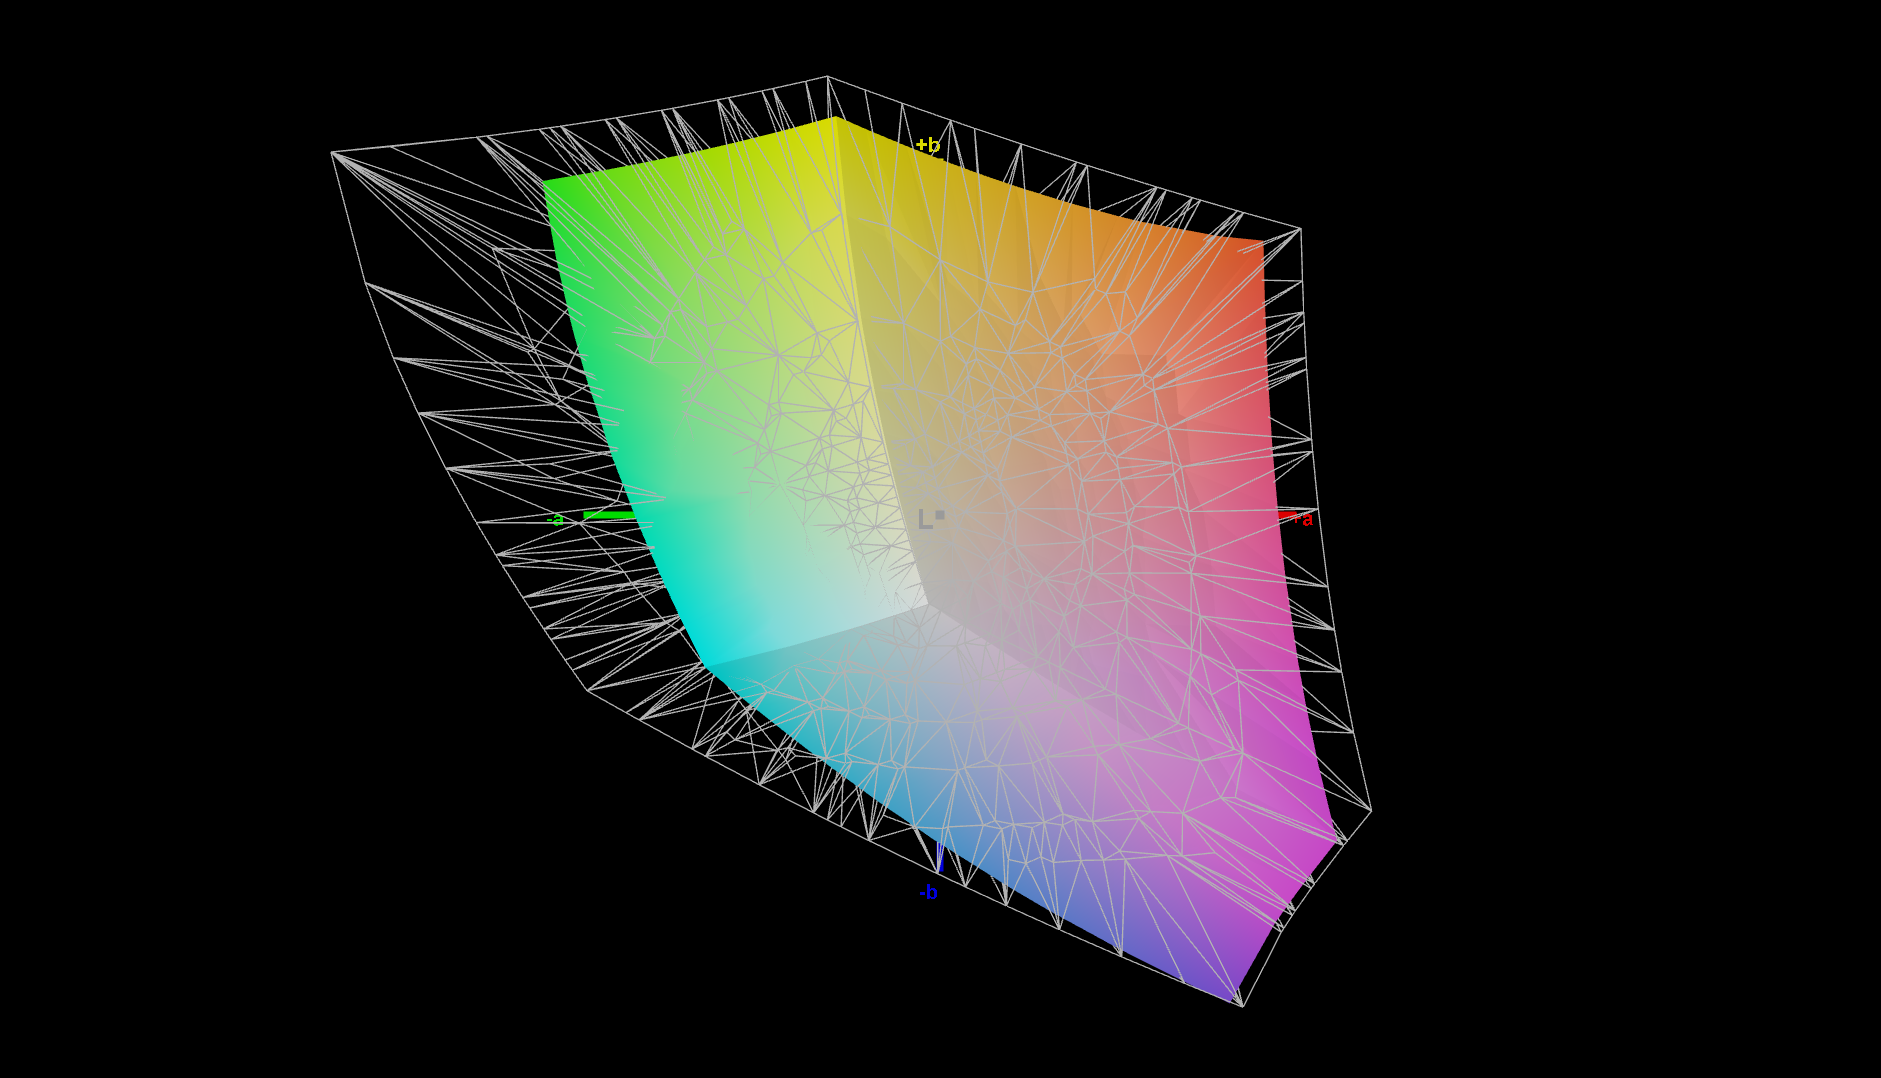
72.1% AdobeRGB 1998 (Argyll 3D)
99.7% sRGB (Argyll 3D)
70% Display P3 (Argyll 3D)
Gamma: 2.16
CCT: 6867 K
| Lenovo ThinkPad Z16 G1 21D5S00T00 NE160WUM-N62 , IPS LED, 1920x1200, 16" | Lenovo ThinkPad X1 Extreme G4-20Y5CTO1WW (3050 Ti) LP160UQ1-SPB1, IPS LED, 3840x2400, 16" | Dell XPS 15 9520 RTX 3050 Ti Samsung 156XG01, OLED, 3456x2160, 15.6" | Dell XPS 17 9720 Sharp LQ170R1, IPS, 3840x2400, 17" | Apple MacBook Pro 16 2021 M1 Pro Liquid Retina XDR, Mini-LED, 3456x2234, 16.2" | |
|---|---|---|---|---|---|
| Display | 18% | 20% | 25% | 21% | |
| Display P3 Coverage (%) | 70 | 84.3 20% | 97.8 40% | 94.8 35% | 99.1 42% |
| sRGB Coverage (%) | 99.7 | 98.3 -1% | 99.9 0% | 100 0% | 100 0% |
| AdobeRGB 1998 Coverage (%) | 72.1 | 97.8 36% | 86 19% | 100 39% | 88 22% |
| Response Times | -59% | 94% | -24% | -137% | |
| Response Time Grey 50% / Grey 80% * (ms) | 40 ? | 60 ? -50% | 1.9 ? 95% | 53.2 ? -33% | 42.8 ? -7% |
| Response Time Black / White * (ms) | 25 ? | 42 ? -68% | 1.9 ? 92% | 28.4 ? -14% | 91.6 ? -266% |
| PWM Frequency (Hz) | 59.52 ? | 17990 ? | 14880 | ||
| Screen | -14% | -55% | -23% | 212% | |
| Brightness middle (cd/m²) | 487 | 639 31% | 381.4 -22% | 438 -10% | 514 6% |
| Brightness (cd/m²) | 446 | 612 37% | 384 -14% | 411 -8% | 497 11% |
| Brightness Distribution (%) | 83 | 84 1% | 95 14% | 86 4% | 95 14% |
| Black Level * (cd/m²) | 0.31 | 0.47 -52% | 0.27 13% | 0.02 94% | |
| Contrast (:1) | 1571 | 1360 -13% | 1622 3% | 25700 1536% | |
| Colorchecker dE 2000 * | 1.8 | 2.2 -22% | 4.34 -141% | 2.5 -39% | 1.4 22% |
| Colorchecker dE 2000 max. * | 3.3 | 5.3 -61% | 9.24 -180% | 6.3 -91% | 2.8 15% |
| Colorchecker dE 2000 calibrated * | 0.8 | 1.4 -75% | 0.8 -0% | ||
| Greyscale dE 2000 * | 2.3 | 1.7 26% | 2 13% | 4.2 -83% | 2.3 -0% |
| Gamma | 2.16 102% | 2.31 95% | 2.13 103% | 2.22 99% | 2.27 97% |
| CCT | 6867 95% | 6390 102% | 6210 105% | 7034 92% | 6792 96% |
| Media total (Programa/Opciones) | -18% /
-14% | 20% /
-8% | -7% /
-13% | 32% /
115% |
* ... más pequeño es mejor
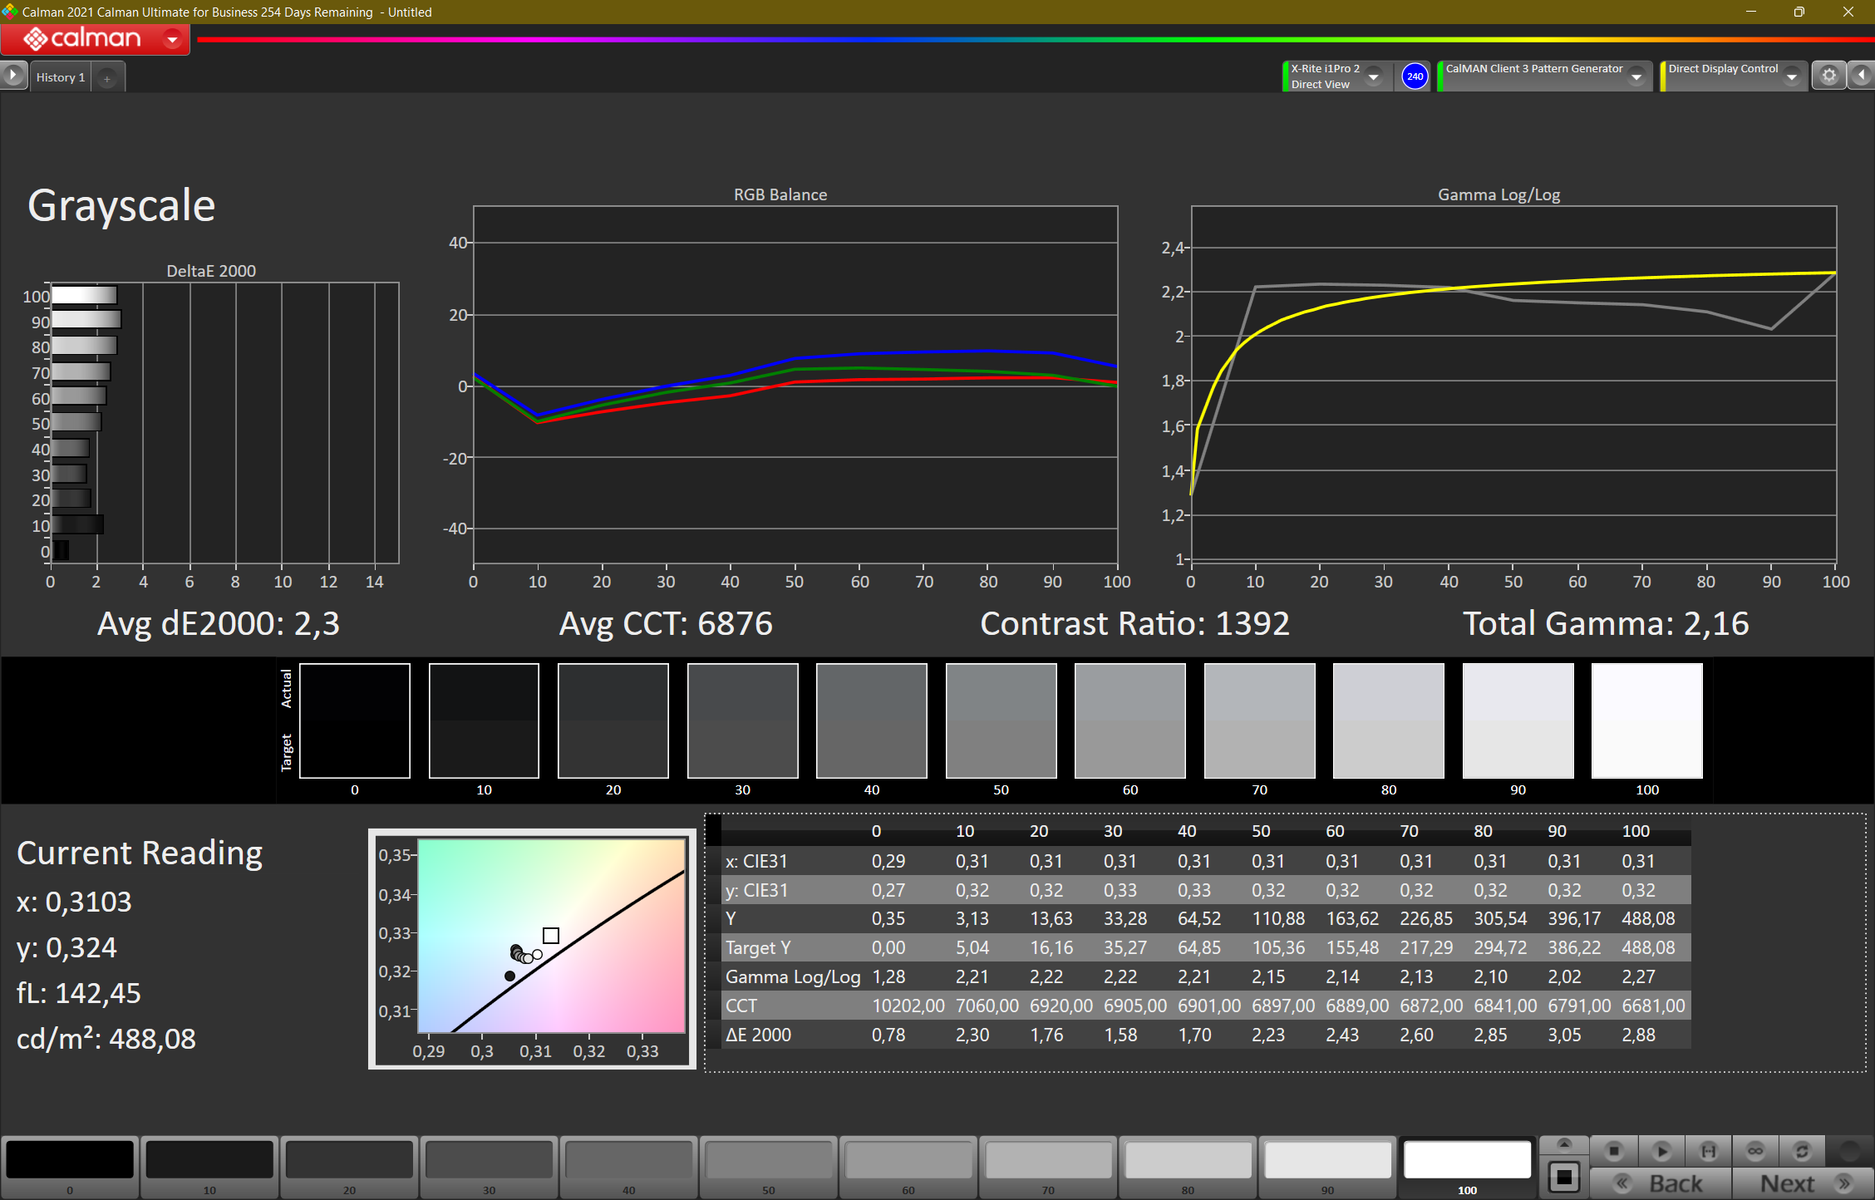
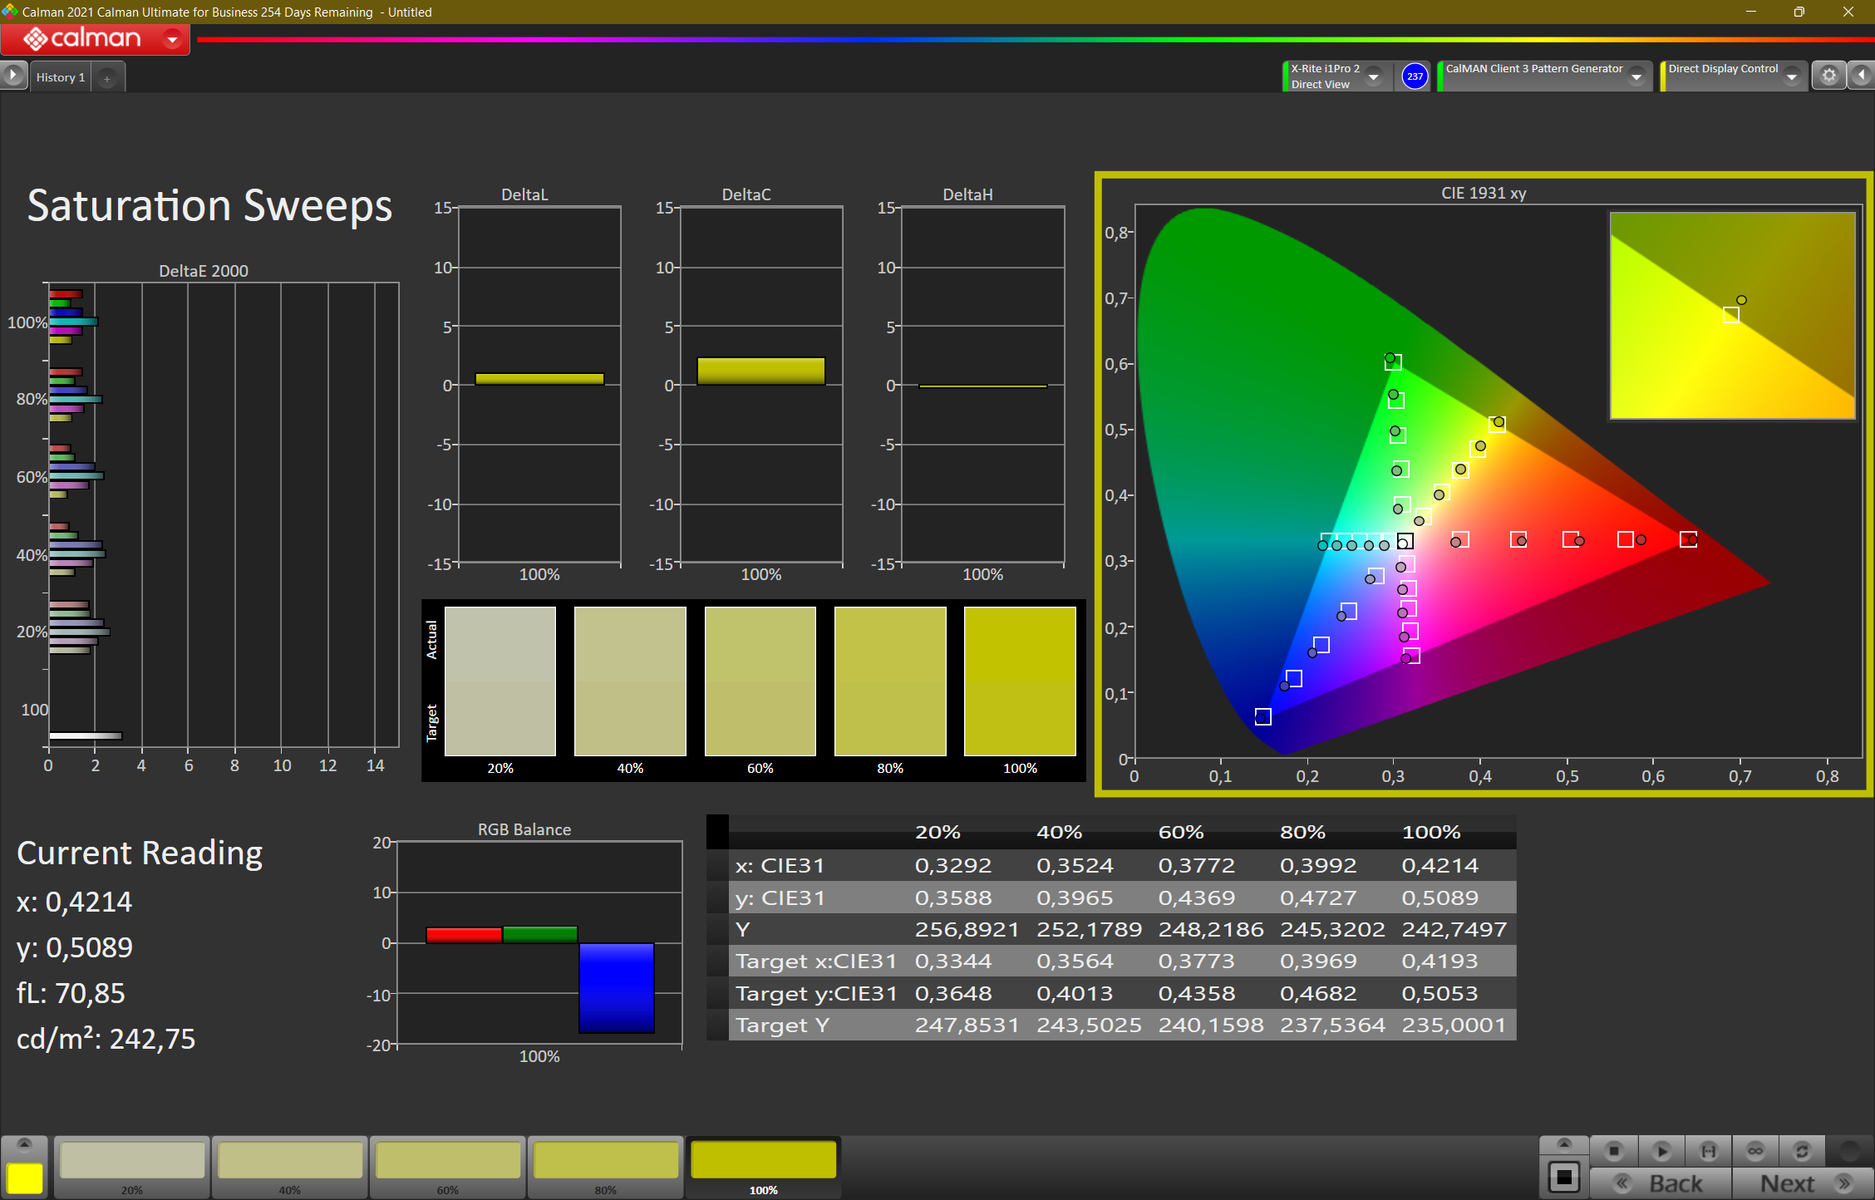
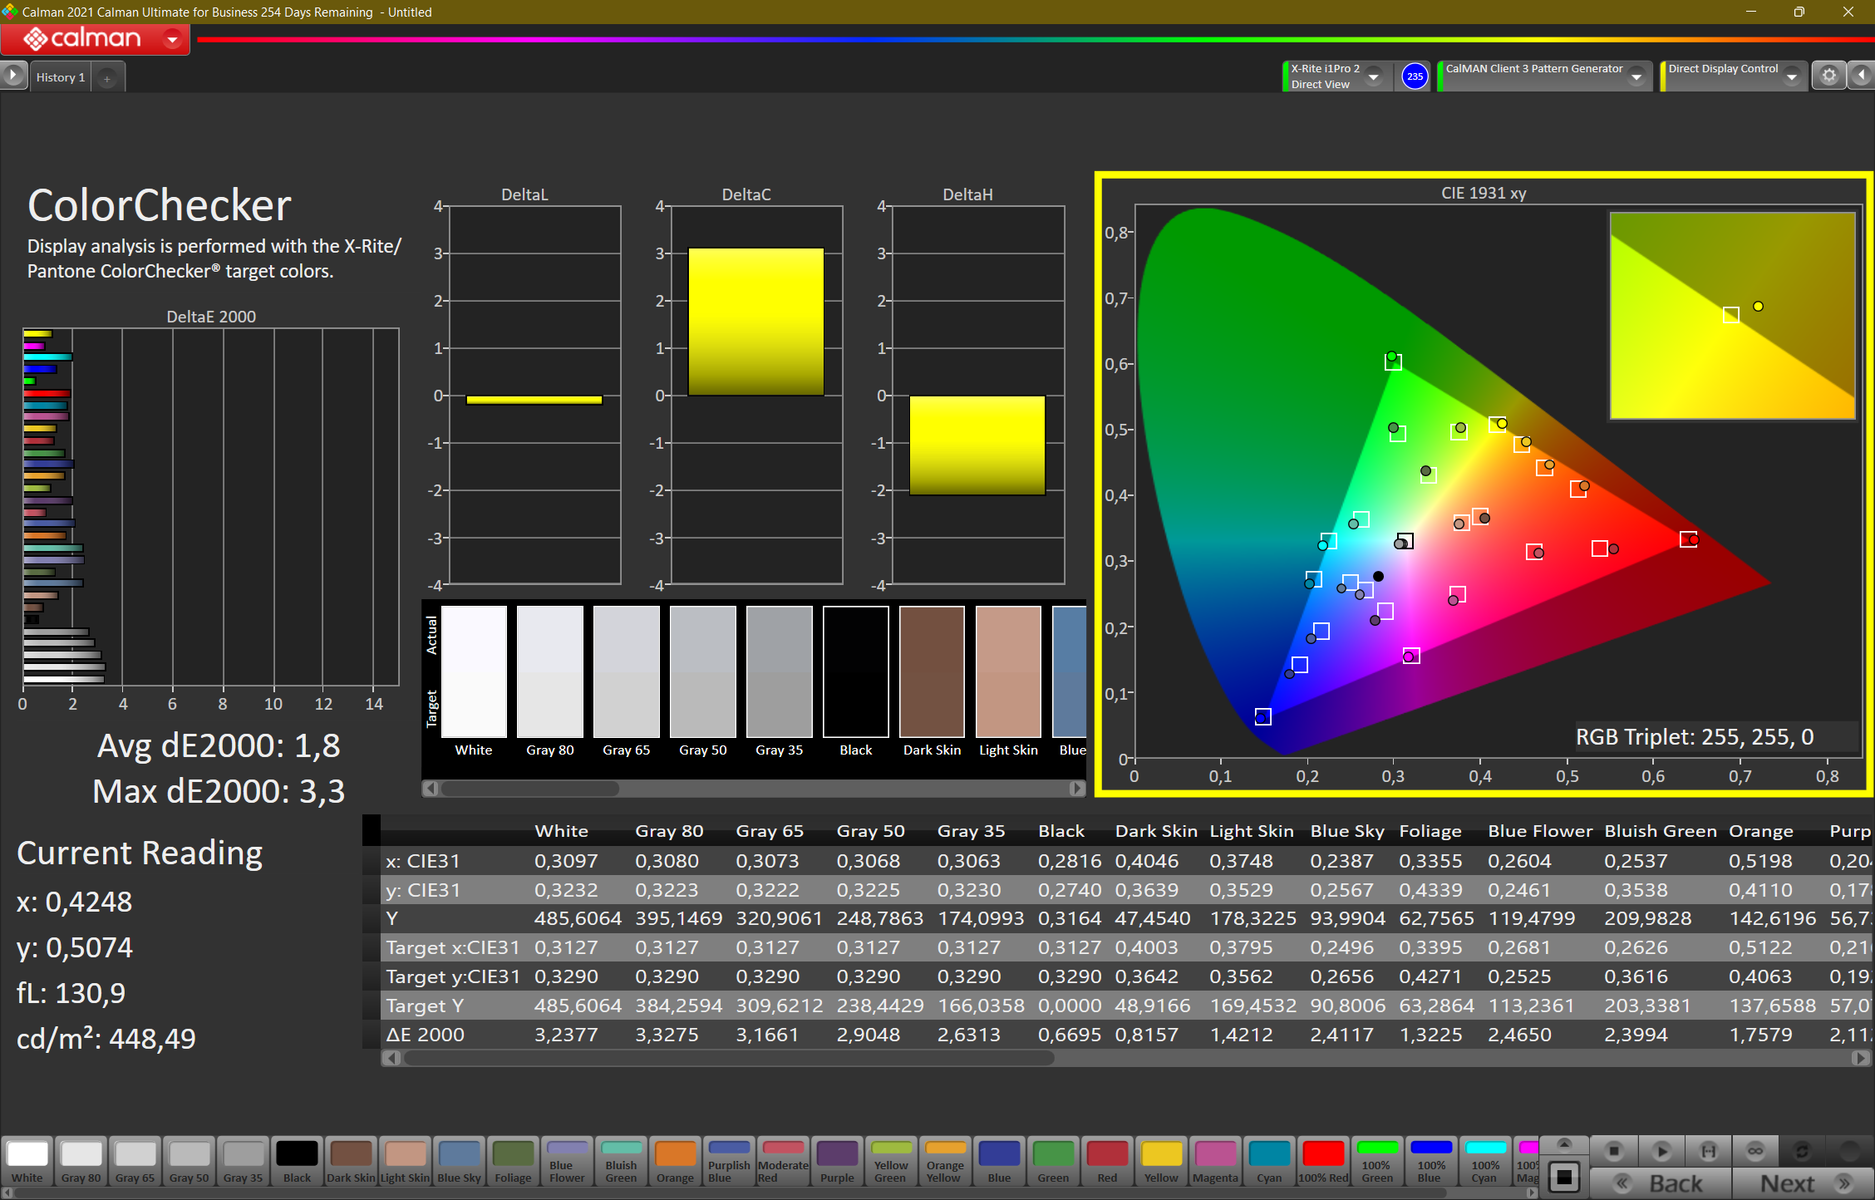
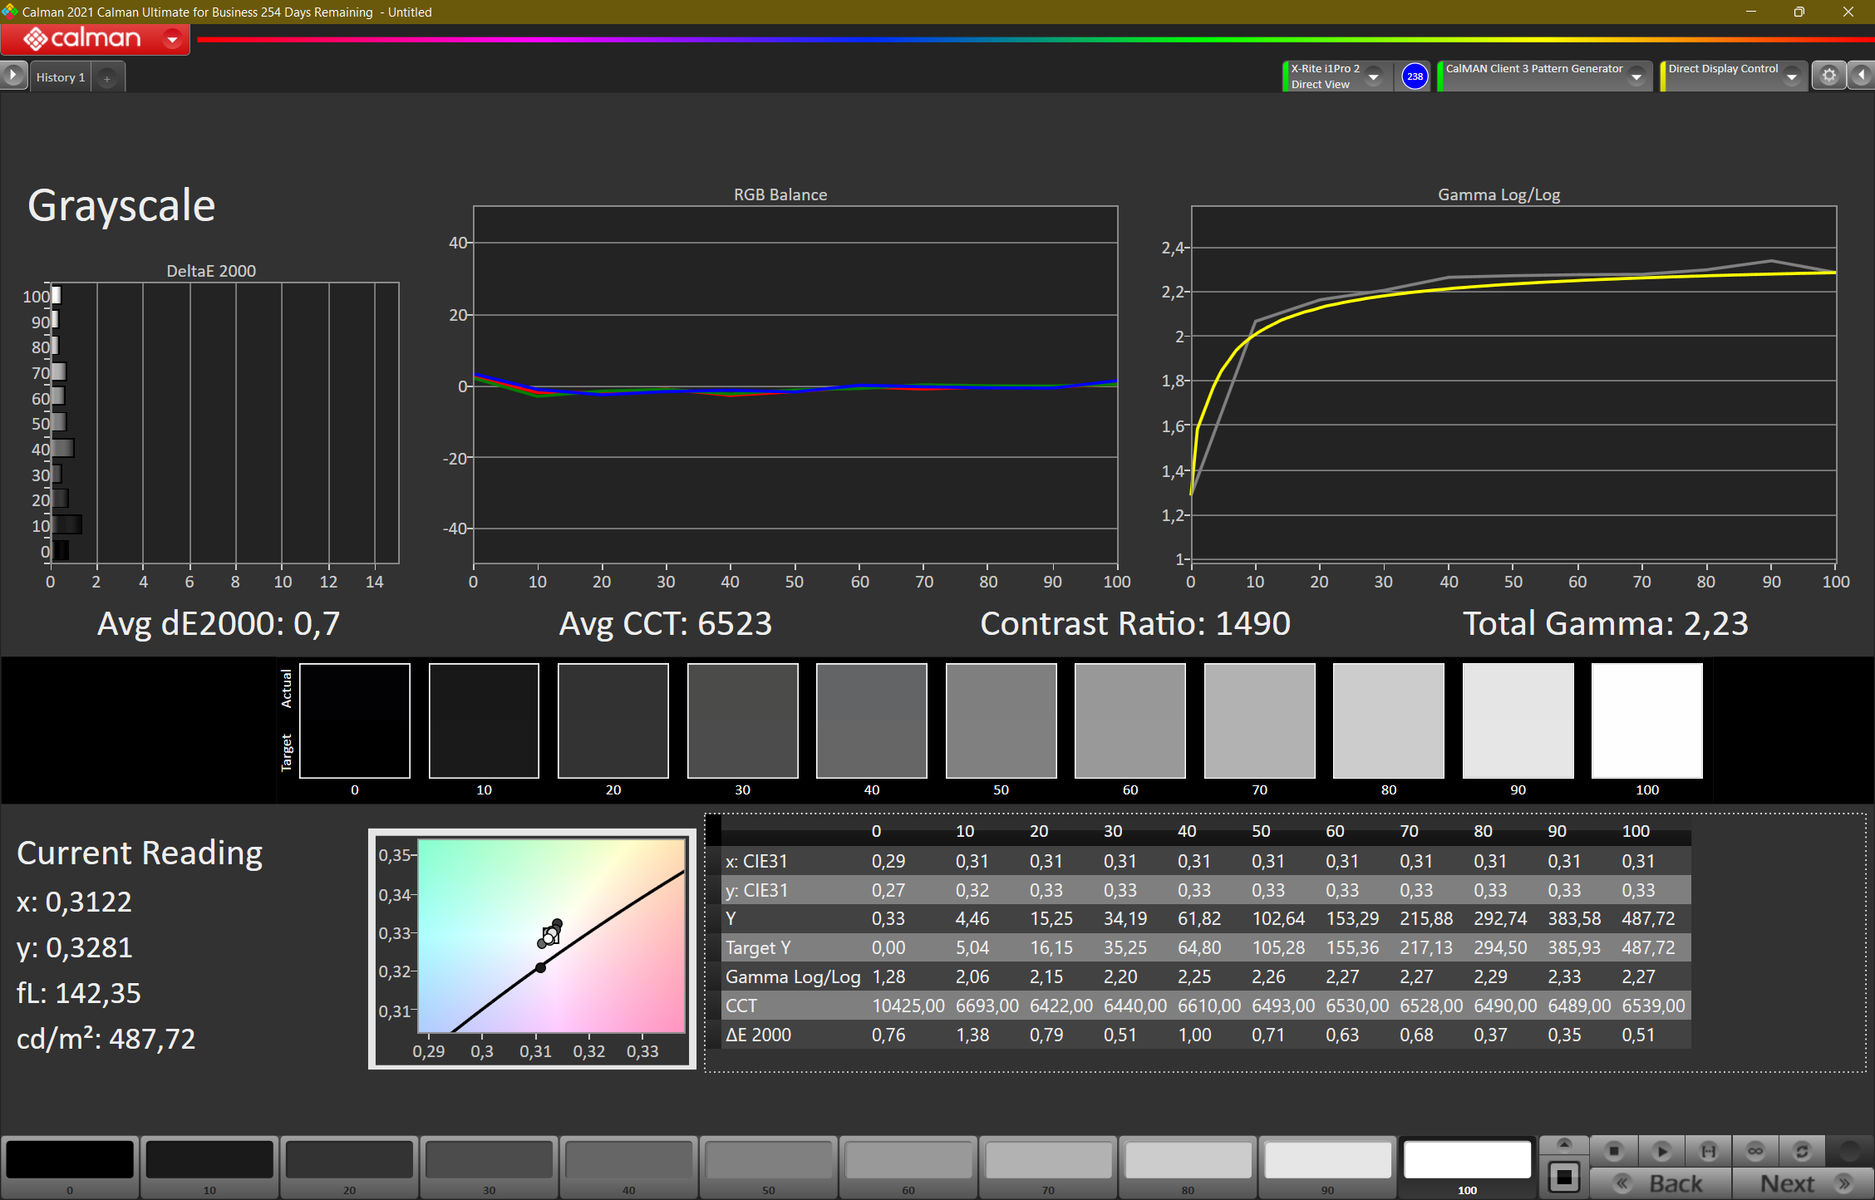
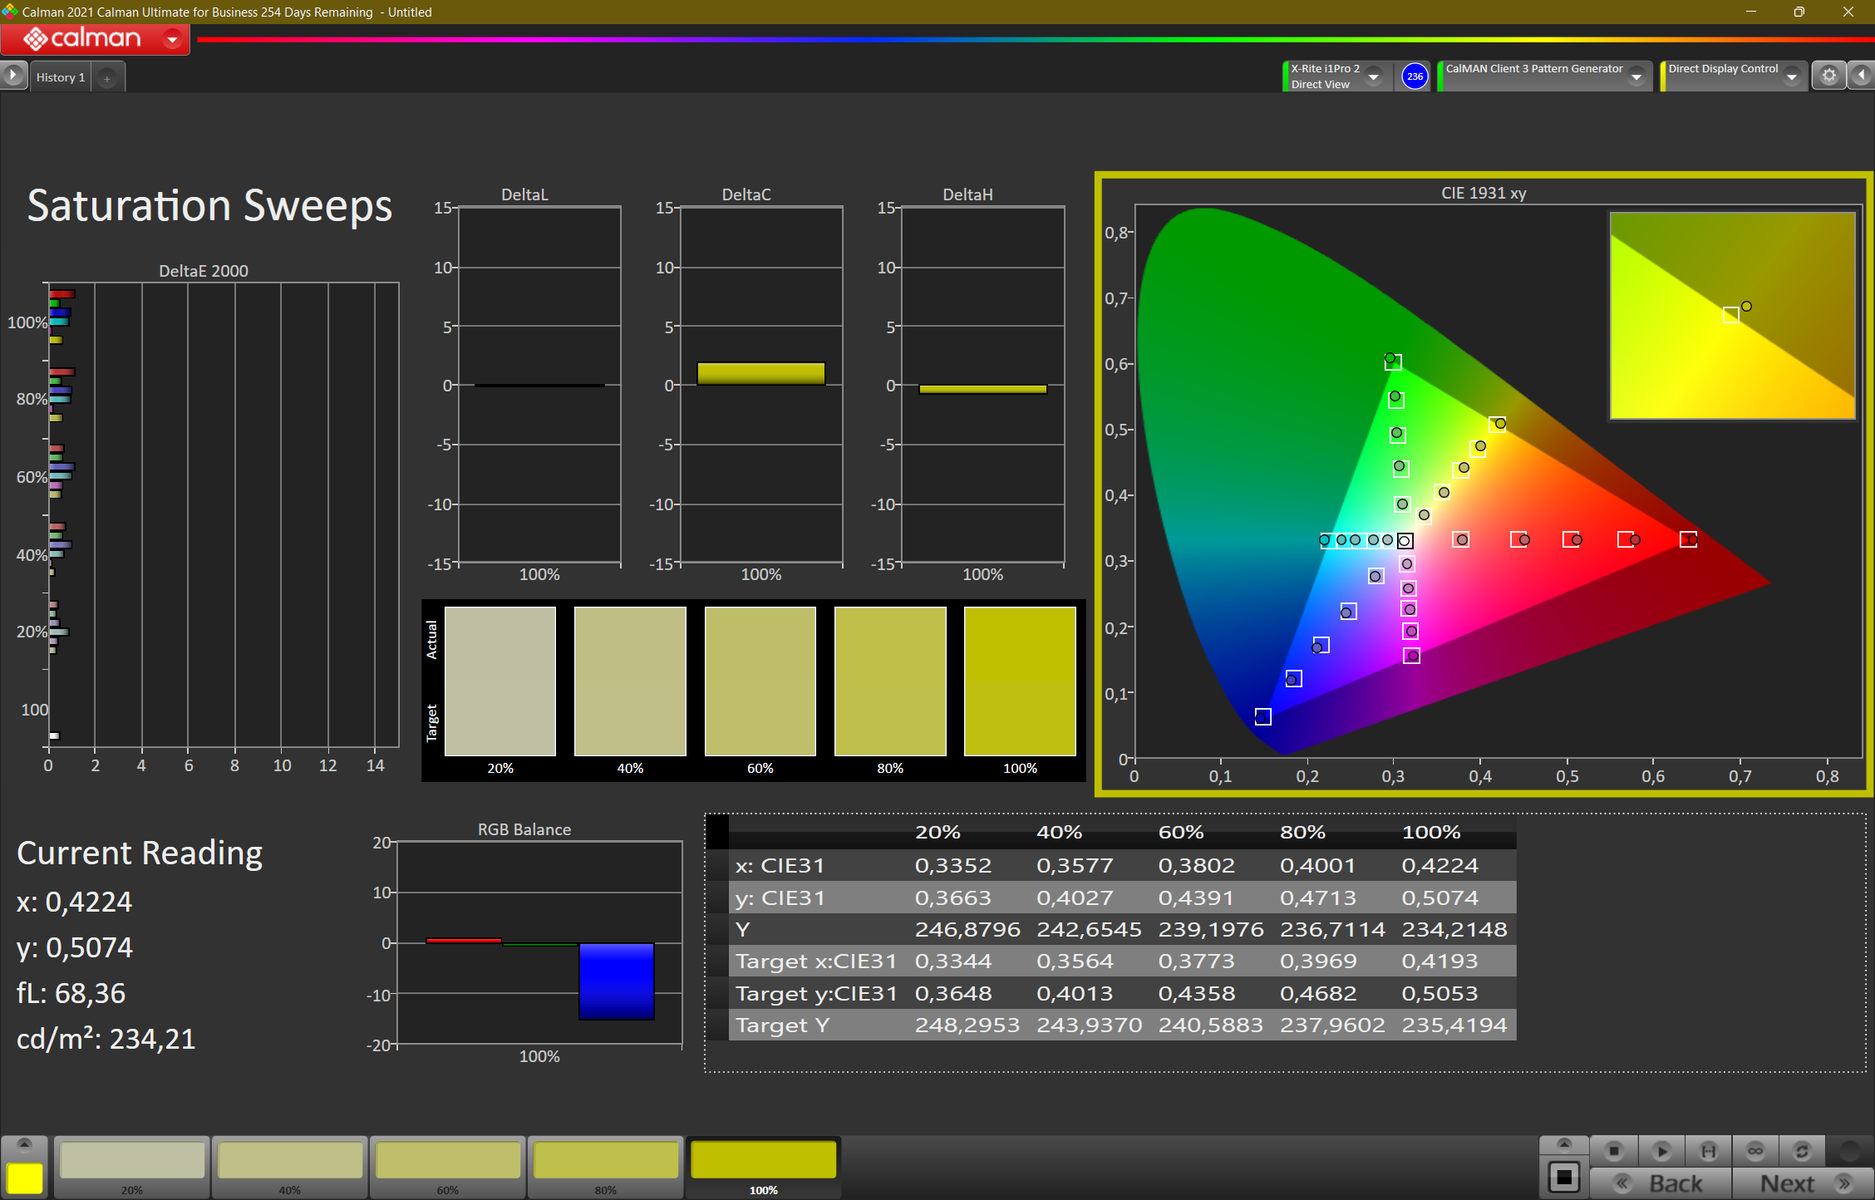
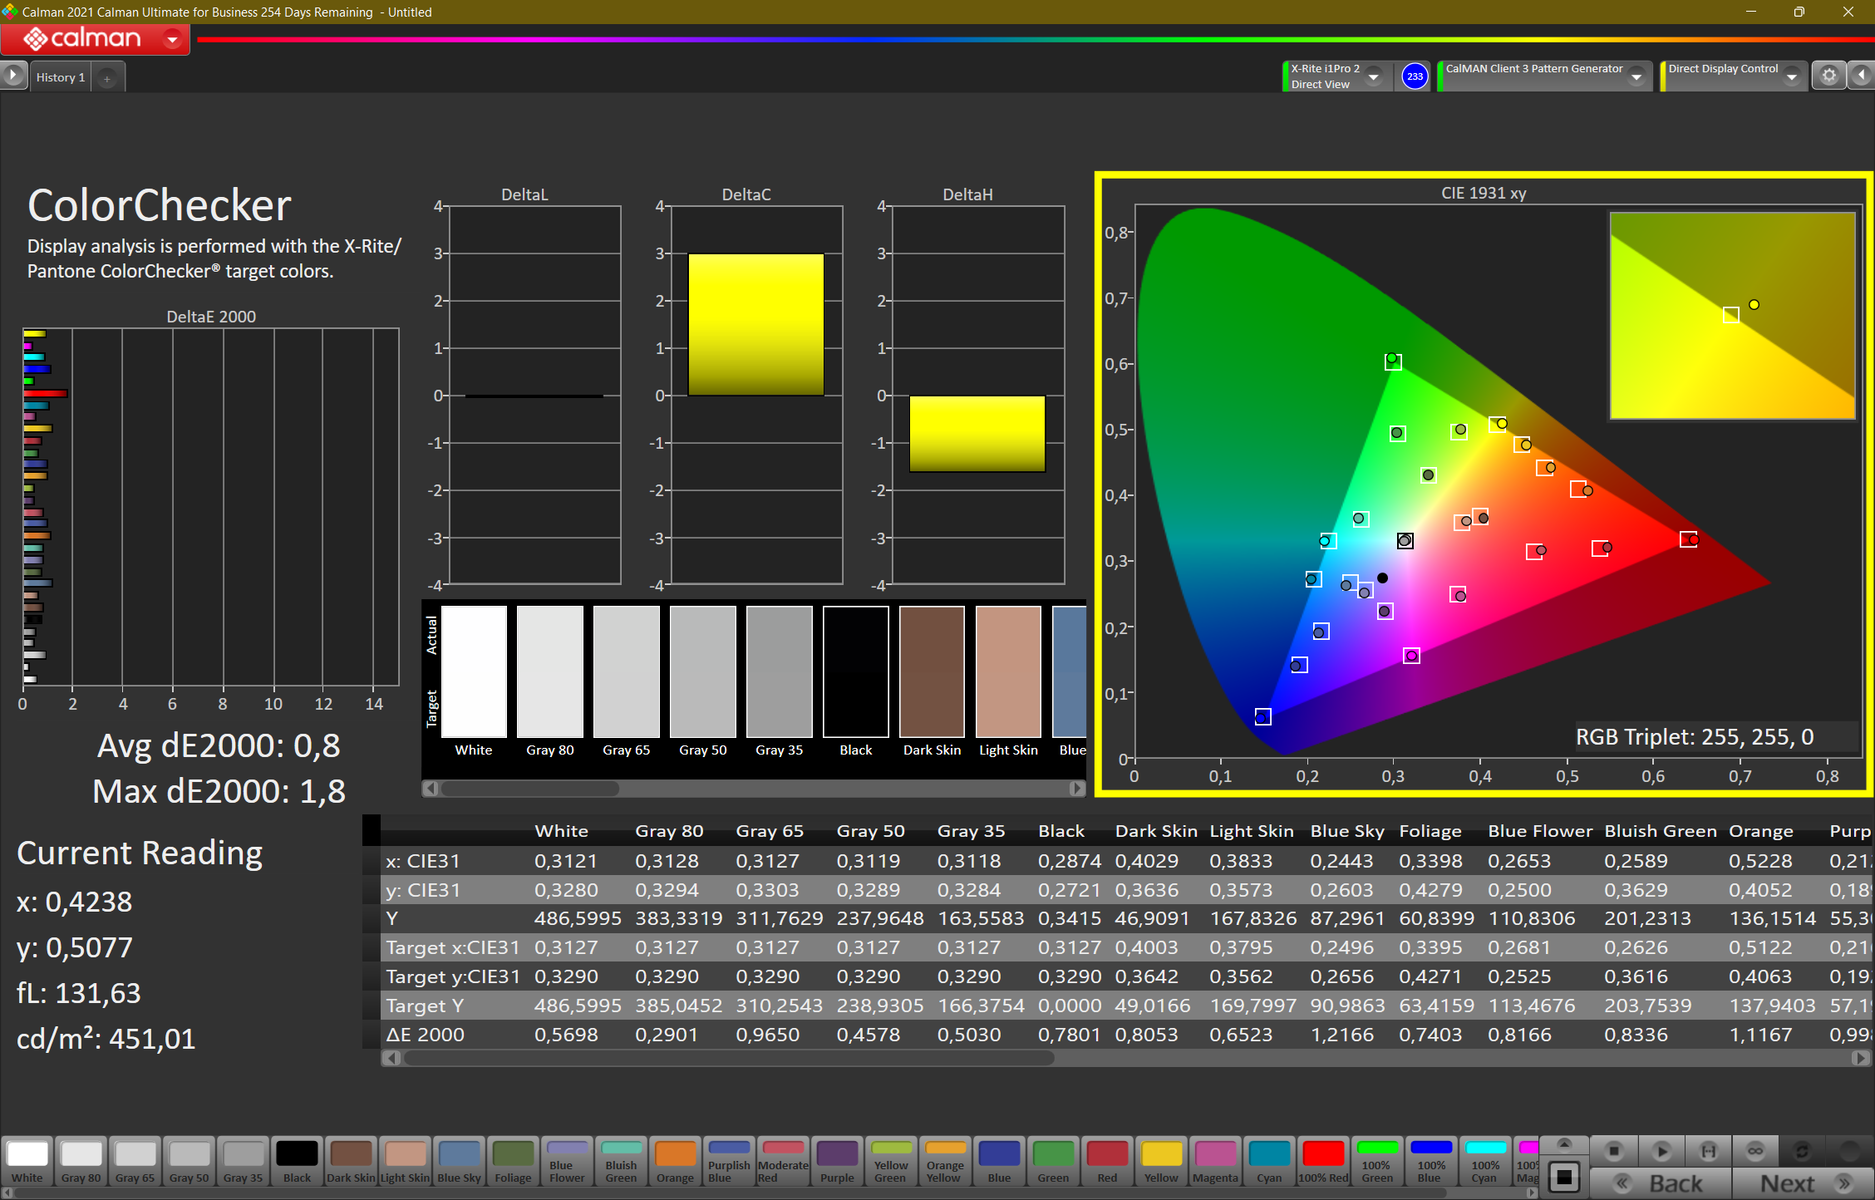
La pantalla del Lenovo ThinkPad Z16 G1 ya está relativamente bien ajustada en el estado de entrega, lo que se muestra en sus bajas desviaciones Delta-E. Medimos la pantalla usando CalMan y el colorímetro X-Rite i1 Pro 2. Una calibración con el i1 Profiler logró reducir aún más el valor Delta-E, lo que permitió obtener una reproducción del color bastante precisa. Como siempre, el perfil de color creado está disponible para su descarga gratuita arriba.
El marketing de Lenovo promete una cobertura del 100% del espacio de color sRGB, y hemos medido un 99,7%. Con esto, la pantalla LCD es adecuada para el procesamiento sencillo de imágenes. Para obtener una cobertura de espacio de color aún más amplia, tendrías que seleccionar el panel OLED opcional.
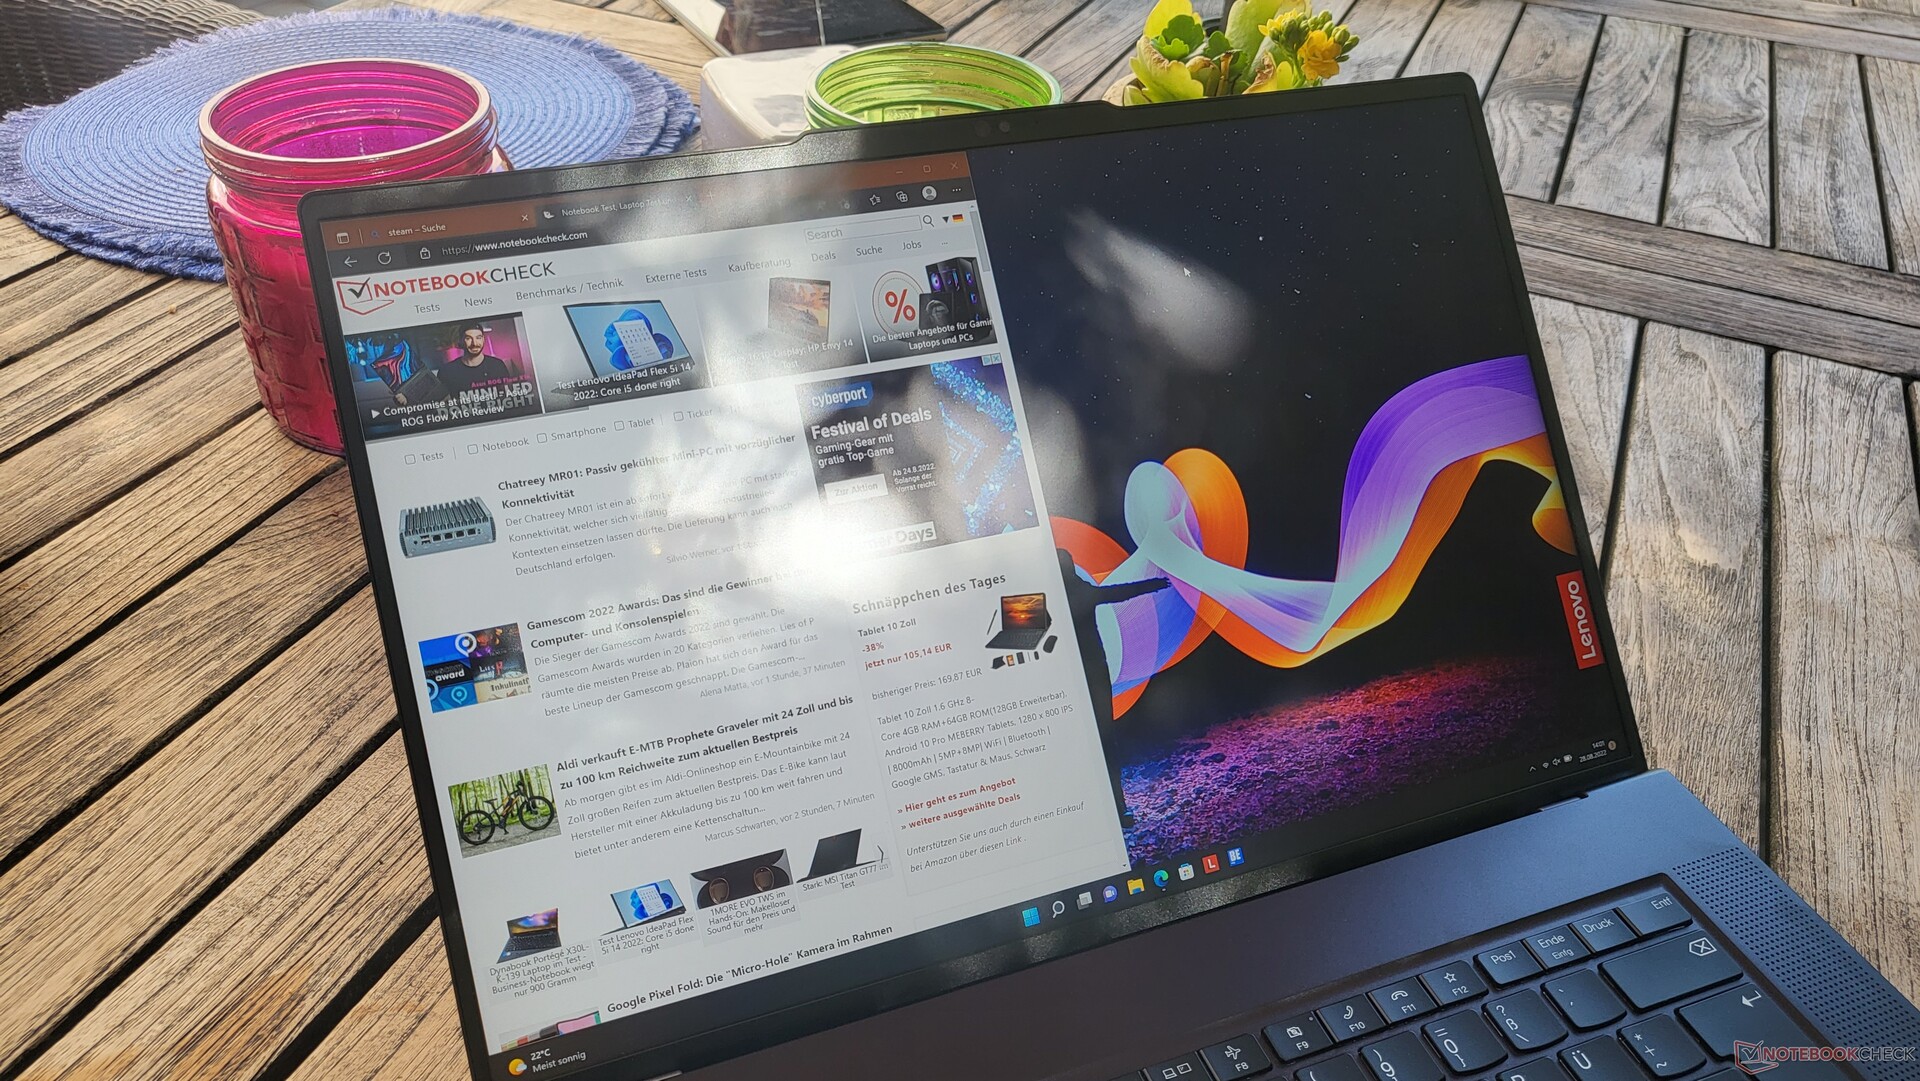
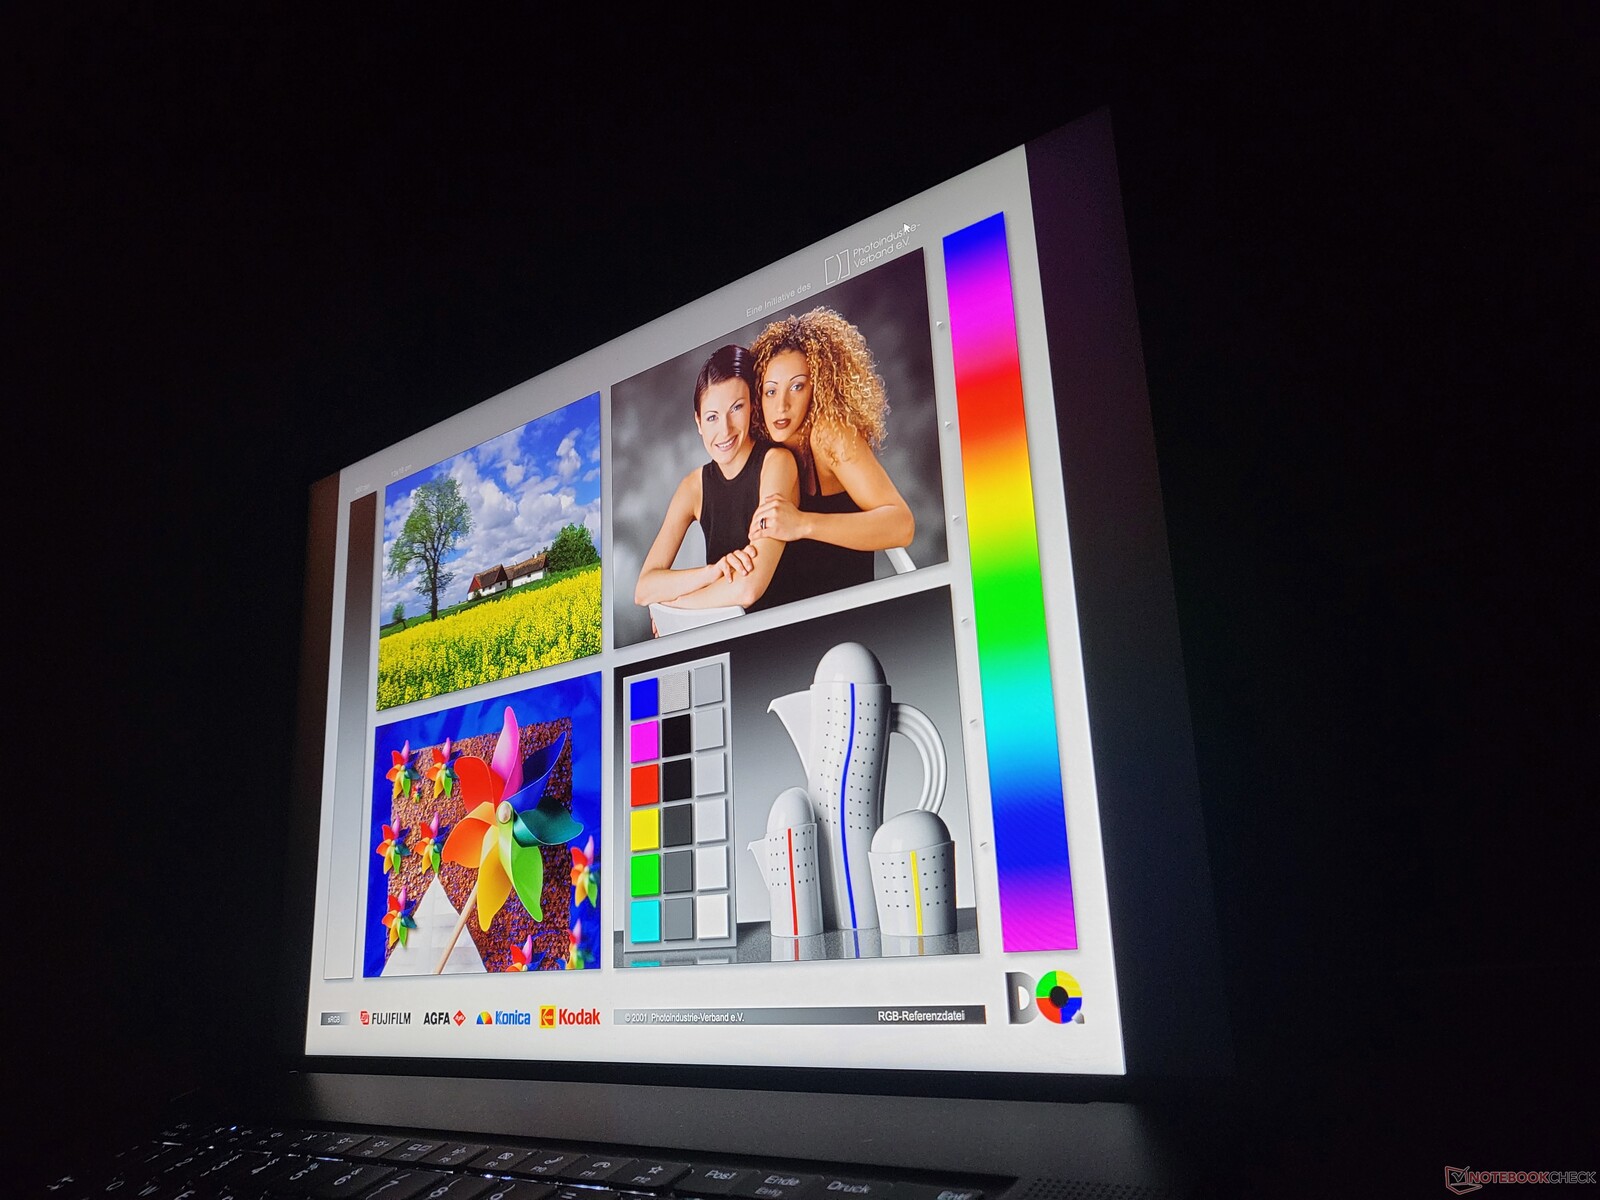
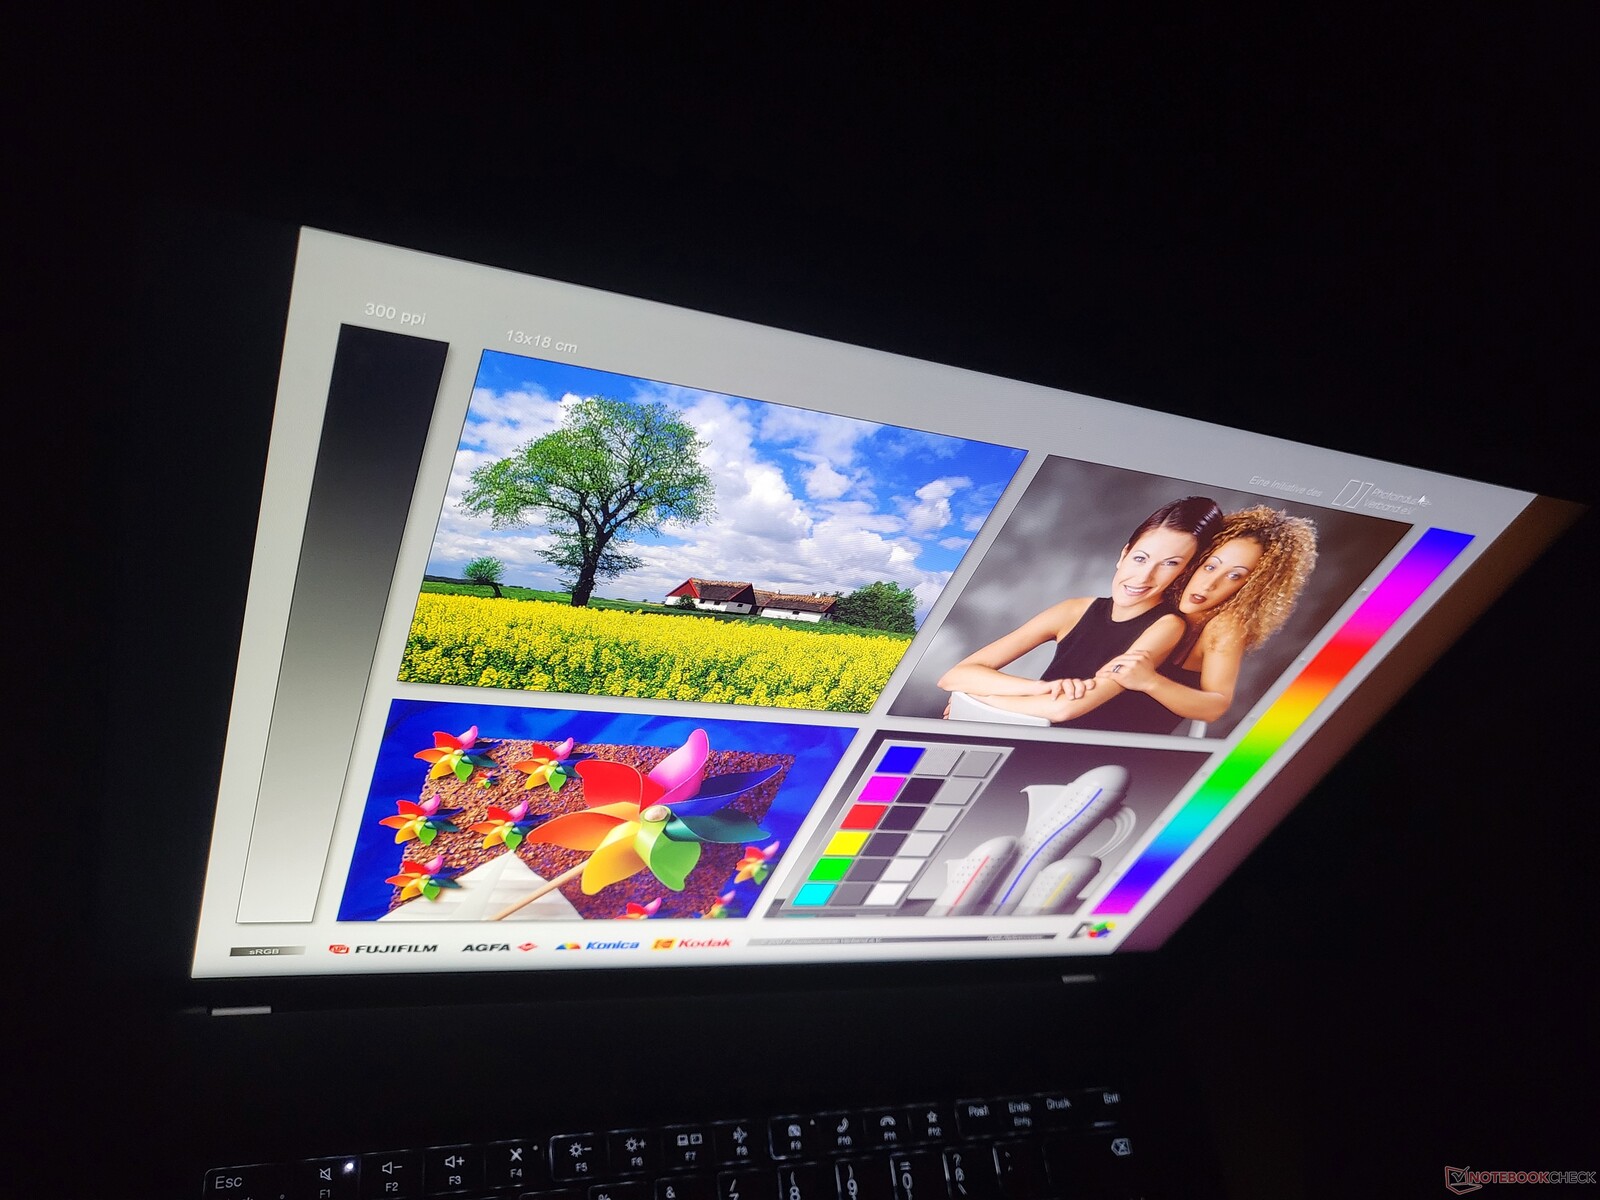
Gracias a su brillo relativamente alto y a la superficie mate de la pantalla, el portátil ThinkPad Z16 puede utilizarse en exteriores sin problemas, siempre que se evite la luz solar directa.
Tiempos de respuesta del display
| ↔ Tiempo de respuesta de Negro a Blanco | ||
|---|---|---|
| 25 ms ... subida ↗ y bajada ↘ combinada | ↗ 12 ms subida | 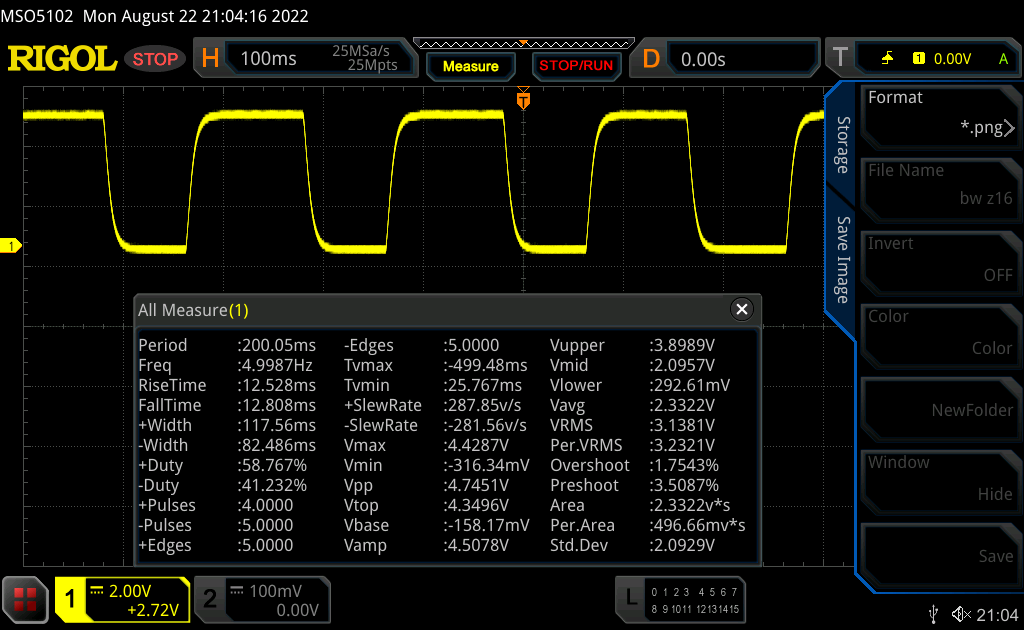 |
| ↘ 13 ms bajada | ||
| La pantalla mostró tiempos de respuesta relativamente lentos en nuestros tests pero podría ser demasiado lenta para los jugones. En comparación, todos los dispositivos de prueba van de ##min### (mínimo) a 240 (máximo) ms. » 59 % de todos los dispositivos son mejores. Eso quiere decir que el tiempo de respuesta es peor que la media (19.8 ms) de todos los dispositivos testados. | ||
| ↔ Tiempo de respuesta 50% Gris a 80% Gris | ||
| 40 ms ... subida ↗ y bajada ↘ combinada | ↗ 17 ms subida | 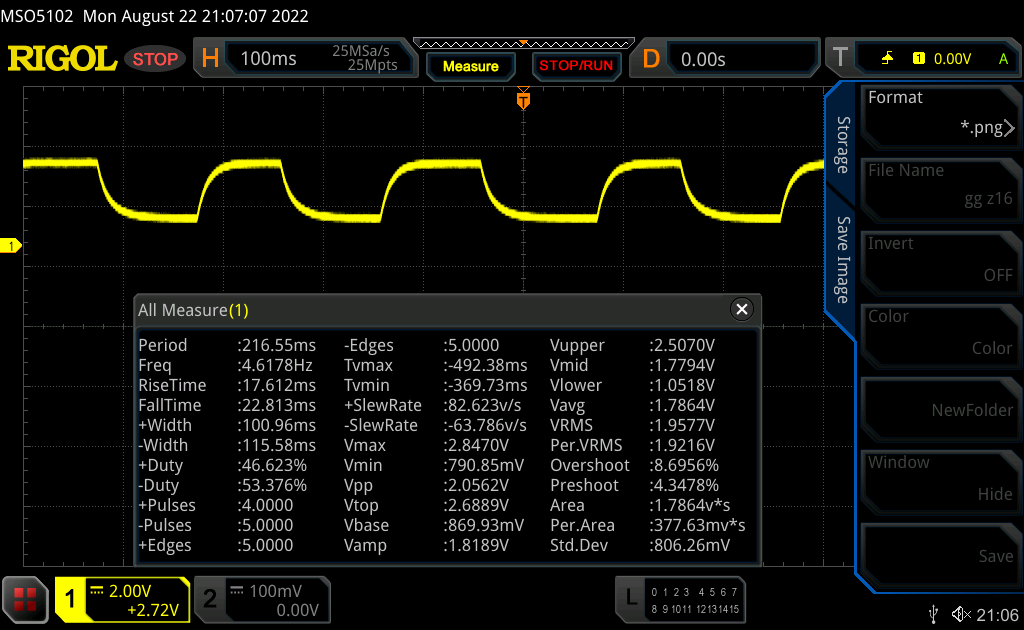 |
| ↘ 23 ms bajada | ||
| La pantalla mostró tiempos de respuesta lentos en nuestros tests y podría ser demasiado lenta para los jugones. En comparación, todos los dispositivos de prueba van de ##min### (mínimo) a 636 (máximo) ms. » 61 % de todos los dispositivos son mejores. Eso quiere decir que el tiempo de respuesta es peor que la media (31 ms) de todos los dispositivos testados. | ||
Parpadeo de Pantalla / PWM (Pulse-Width Modulation)
| Parpadeo de Pantalla / PWM no detectado | 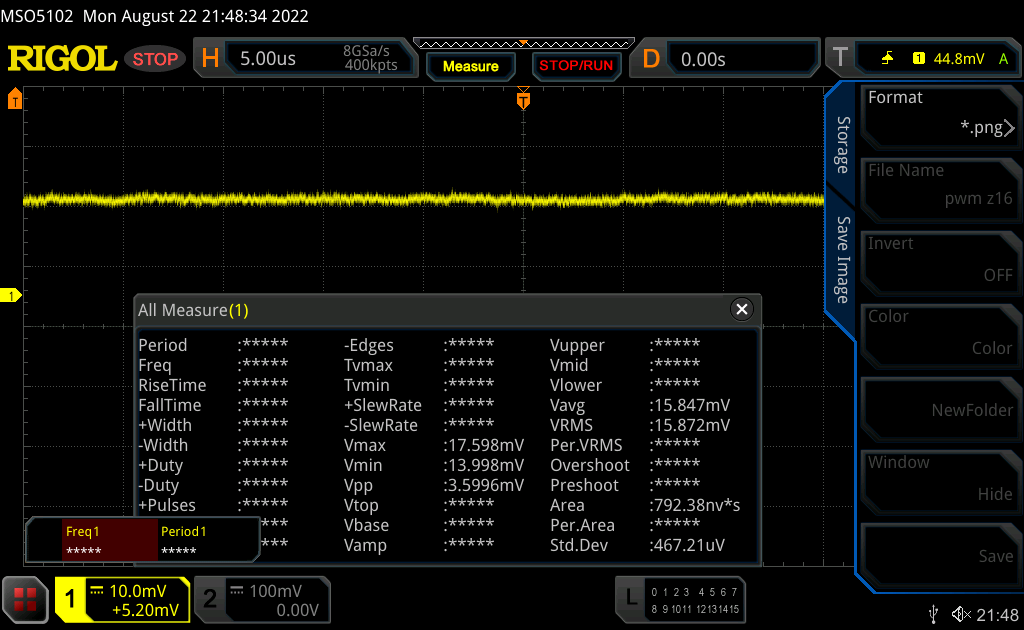 | ||
Comparación: 52 % de todos los dispositivos testados no usaron PWM para atenuar el display. Si se usó, medimos una media de 7754 (mínimo: 5 - máxmo: 343500) Hz. | |||
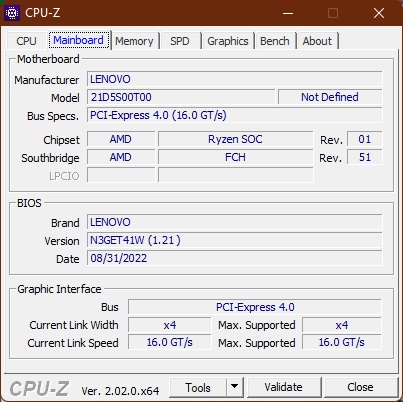
Rendimiento: AMD Ryzen 6000H y Radeon RX 6500M
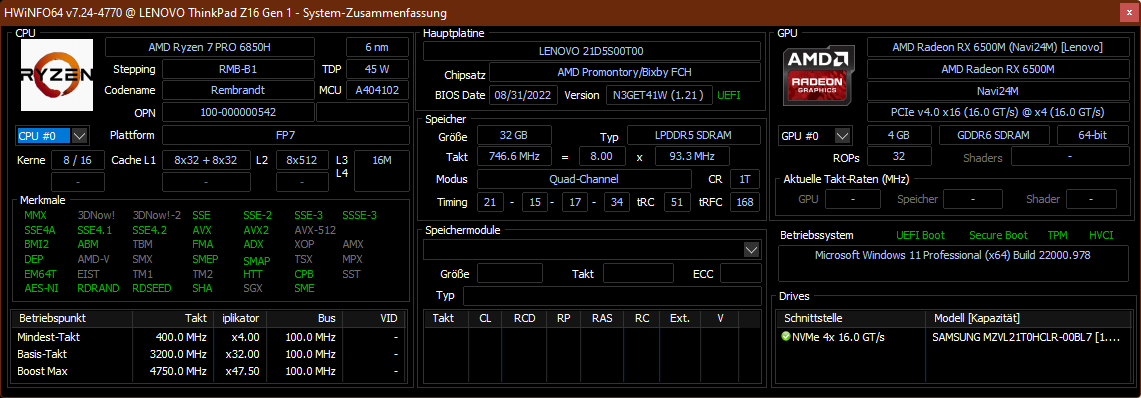
La selección de procesadores para el ThinkPad Z16 Gen 1 incluye tres opciones, siendo todas las CPU parte de la línea Ryzen Pro de AMD para clientes empresariales. ElAMD Ryzen 5 Pro 6650Hcon seis núcleos sirve como nivel de entrada, y también se puede obtener el Ryzen 7 Pro 6850Hy elRyzen 9 Pro 6950Hambos con ocho núcleos. Como chip gráfico, puedes usar la GPU Radeon integrada u obtener opcionalmente la AMD Radeon RX 6500M. El Lenovo ThinkPad Z16 es el primer ThinkPad que puedes comprar con una combinación de CPU AMD y dGPU AMD.
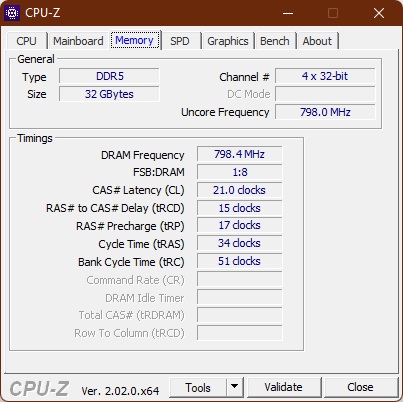
En la serie ThinkPad Z, Lenovo utiliza memoria LPDDR5-6400 soldada, y el Z16 ofrece 16 o 32 GB de RAM. Un único SSD M.2-2280 sirve de almacenamiento.
Condiciones de la prueba
Nuestra prueba se realizó en condiciones difíciles, ya que el Z16 nos creó algunos grandes problemas. Nuestra primera unidad de pruebas se reiniciaba constantemente cuando se activaba el Wi-Fi. Luego recibimos un dispositivo de intercambio, que resolvió los problemas en gran medida, y el ThinkPad de reemplazo fue significativamente más estable.
En el modo "Mejor Rendimiento" de Windows, la CPU del ThinkPad Z16 tiene un límite de energía a corto plazo de 65 vatios, y a largo plazo, el procesador puede consumir 47 vatios.
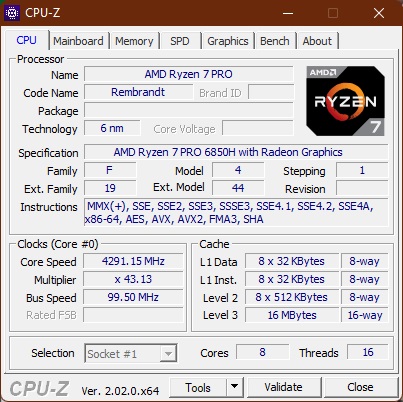
Procesador
ElAMD Ryzen 7 Pro 6850H es un procesador de la generación Rembrandt 2022 que tiene un TDP típico de 45 vatios como chip de la serie H. Sus ocho núcleos (16 hilos con Hyperthreading) tienen una velocidad de reloj básica de 3,2 GHz y una velocidad máxima de 4,7 GHz. Para algunas comparaciones adicionales con otros procesadores, recomendamos nuestra Lista de comparación de CPUs.
El Lenovo ThinkPad Z16 Gen 1 es el primer ThinkPad con la serie AMD-H. En las pruebas de benchmark, logra un muy buen rendimiento, aunque queda por detrás de los competidores en varias disciplinas. Las CPUs Intel Core-i de la 12ª generación son mejores tanto en el rendimiento mononúcleo como en el multinúcleo, aunque la ventaja no dura mucho en el rendimiento multinúcleo. Los procesadores M1 Pro y Max también tienen ventajas, aparte de los benchmarks emulados
Aunque el modo "Ultra Performance" no está disponible en el funcionamiento en batería, el rendimiento de la CPU permanece casi sin cambios en el funcionamiento en batería a pesar de ello (11.963 puntos en la prueba Cinebench R23 Multicore).
Cinebench R15 Multi Constant Load Test
Cinebench R23: Multi Core | Single Core
Cinebench R20: CPU (Multi Core) | CPU (Single Core)
Cinebench R15: CPU Multi 64Bit | CPU Single 64Bit
Blender: v2.79 BMW27 CPU
7-Zip 18.03: 7z b 4 | 7z b 4 -mmt1
Geekbench 5.5: Multi-Core | Single-Core
HWBOT x265 Benchmark v2.2: 4k Preset
LibreOffice : 20 Documents To PDF
R Benchmark 2.5: Overall mean
| CPU Performance rating | |
| Media de la clase Multimedia | |
| Dell XPS 17 9720 | |
| Dell XPS 15 9520 RTX 3050 Ti | |
| Lenovo ThinkPad X1 Extreme G4-20Y50040GE -3! | |
| Apple MacBook Pro 16 2021 M1 Pro -5! | |
| Lenovo ThinkPad Z16 G1 21D5S00T00 | |
| Apple MacBook Pro 16 2021 M1 Max -5! | |
| Lenovo ThinkPad X1 Extreme G4-20Y5CTO1WW (3050 Ti) | |
| Medio AMD Ryzen 7 PRO 6850H | |
| Cinebench R23 / Multi Core | |
| Media de la clase Multimedia (4861 - 33362, n=74, últimos 2 años) | |
| Dell XPS 17 9720 | |
| Dell XPS 15 9520 RTX 3050 Ti | |
| Lenovo ThinkPad X1 Extreme G4-20Y5CTO1WW (3050 Ti) | |
| Medio AMD Ryzen 7 PRO 6850H (12016 - 12770, n=2) | |
| Apple MacBook Pro 16 2021 M1 Max | |
| Apple MacBook Pro 16 2021 M1 Pro | |
| Lenovo ThinkPad X1 Extreme G4-20Y50040GE | |
| Lenovo ThinkPad Z16 G1 21D5S00T00 | |
| Cinebench R23 / Single Core | |
| Media de la clase Multimedia (1128 - 2459, n=66, últimos 2 años) | |
| Dell XPS 15 9520 RTX 3050 Ti | |
| Dell XPS 17 9720 | |
| Lenovo ThinkPad X1 Extreme G4-20Y50040GE | |
| Apple MacBook Pro 16 2021 M1 Pro | |
| Apple MacBook Pro 16 2021 M1 Max | |
| Lenovo ThinkPad X1 Extreme G4-20Y5CTO1WW (3050 Ti) | |
| Lenovo ThinkPad Z16 G1 21D5S00T00 | |
| Medio AMD Ryzen 7 PRO 6850H (1469 - 1491, n=2) | |
| Cinebench R20 / CPU (Multi Core) | |
| Media de la clase Multimedia (1887 - 12912, n=57, últimos 2 años) | |
| Dell XPS 15 9520 RTX 3050 Ti | |
| Lenovo ThinkPad Z16 G1 21D5S00T00 | |
| Dell XPS 17 9720 | |
| Lenovo ThinkPad X1 Extreme G4-20Y5CTO1WW (3050 Ti) | |
| Lenovo ThinkPad X1 Extreme G4-20Y50040GE | |
| Medio AMD Ryzen 7 PRO 6850H (2990 - 4946, n=3) | |
| Apple MacBook Pro 16 2021 M1 Max | |
| Apple MacBook Pro 16 2021 M1 Pro | |
| Cinebench R20 / CPU (Single Core) | |
| Media de la clase Multimedia (425 - 853, n=57, últimos 2 años) | |
| Dell XPS 15 9520 RTX 3050 Ti | |
| Dell XPS 17 9720 | |
| Lenovo ThinkPad X1 Extreme G4-20Y50040GE | |
| Lenovo ThinkPad X1 Extreme G4-20Y5CTO1WW (3050 Ti) | |
| Lenovo ThinkPad Z16 G1 21D5S00T00 | |
| Medio AMD Ryzen 7 PRO 6850H (564 - 583, n=3) | |
| Apple MacBook Pro 16 2021 M1 Pro | |
| Apple MacBook Pro 16 2021 M1 Max | |
| Cinebench R15 / CPU Multi 64Bit | |
| Dell XPS 17 9720 | |
| Dell XPS 17 9720 | |
| Media de la clase Multimedia (856 - 5224, n=61, últimos 2 años) | |
| Dell XPS 15 9520 RTX 3050 Ti | |
| Lenovo ThinkPad X1 Extreme G4-20Y50040GE | |
| Lenovo ThinkPad X1 Extreme G4-20Y50040GE | |
| Medio AMD Ryzen 7 PRO 6850H (2081 - 2090, n=2) | |
| Lenovo ThinkPad Z16 G1 21D5S00T00 | |
| Lenovo ThinkPad X1 Extreme G4-20Y5CTO1WW (3050 Ti) | |
| Apple MacBook Pro 16 2021 M1 Max | |
| Apple MacBook Pro 16 2021 M1 Pro | |
| Cinebench R15 / CPU Single 64Bit | |
| Media de la clase Multimedia (184.8 - 326, n=59, últimos 2 años) | |
| Dell XPS 17 9720 | |
| Dell XPS 15 9520 RTX 3050 Ti | |
| Lenovo ThinkPad X1 Extreme G4-20Y50040GE | |
| Lenovo ThinkPad Z16 G1 21D5S00T00 | |
| Lenovo ThinkPad X1 Extreme G4-20Y5CTO1WW (3050 Ti) | |
| Apple MacBook Pro 16 2021 M1 Pro | |
| Medio AMD Ryzen 7 PRO 6850H (166.2 - 244, n=2) | |
| Apple MacBook Pro 16 2021 M1 Max | |
| Blender / v2.79 BMW27 CPU | |
| Lenovo ThinkPad X1 Extreme G4-20Y5CTO1WW (3050 Ti) | |
| Media de la clase Multimedia (100 - 557, n=58, últimos 2 años) | |
| Medio AMD Ryzen 7 PRO 6850H (235 - 248, n=2) | |
| Dell XPS 17 9720 | |
| Lenovo ThinkPad Z16 G1 21D5S00T00 | |
| Dell XPS 15 9520 RTX 3050 Ti | |
| Apple MacBook Pro 16 2021 M1 Max | |
| Apple MacBook Pro 16 2021 M1 Pro | |
| 7-Zip 18.03 / 7z b 4 | |
| Dell XPS 15 9520 RTX 3050 Ti | |
| Dell XPS 17 9720 | |
| Media de la clase Multimedia (26062 - 130368, n=55, últimos 2 años) | |
| Lenovo ThinkPad Z16 G1 21D5S00T00 | |
| Medio AMD Ryzen 7 PRO 6850H (52391 - 56498, n=2) | |
| Lenovo ThinkPad X1 Extreme G4-20Y5CTO1WW (3050 Ti) | |
| 7-Zip 18.03 / 7z b 4 -mmt1 | |
| Media de la clase Multimedia (3666 - 7545, n=56, últimos 2 años) | |
| Dell XPS 17 9720 | |
| Dell XPS 15 9520 RTX 3050 Ti | |
| Lenovo ThinkPad X1 Extreme G4-20Y5CTO1WW (3050 Ti) | |
| Medio AMD Ryzen 7 PRO 6850H (5374 - 5460, n=2) | |
| Lenovo ThinkPad Z16 G1 21D5S00T00 | |
| Geekbench 5.5 / Multi-Core | |
| Dell XPS 17 9720 | |
| Media de la clase Multimedia (4652 - 20422, n=56, últimos 2 años) | |
| Apple MacBook Pro 16 2021 M1 Max | |
| Apple MacBook Pro 16 2021 M1 Pro | |
| Dell XPS 15 9520 RTX 3050 Ti | |
| Lenovo ThinkPad Z16 G1 21D5S00T00 | |
| Medio AMD Ryzen 7 PRO 6850H (8093 - 8851, n=2) | |
| Lenovo ThinkPad X1 Extreme G4-20Y5CTO1WW (3050 Ti) | |
| Lenovo ThinkPad X1 Extreme G4-20Y50040GE | |
| Geekbench 5.5 / Single-Core | |
| Media de la clase Multimedia (805 - 2974, n=56, últimos 2 años) | |
| Apple MacBook Pro 16 2021 M1 Max | |
| Dell XPS 15 9520 RTX 3050 Ti | |
| Apple MacBook Pro 16 2021 M1 Pro | |
| Dell XPS 17 9720 | |
| Lenovo ThinkPad X1 Extreme G4-20Y50040GE | |
| Lenovo ThinkPad X1 Extreme G4-20Y5CTO1WW (3050 Ti) | |
| Lenovo ThinkPad Z16 G1 21D5S00T00 | |
| Medio AMD Ryzen 7 PRO 6850H (1474 - 1481, n=2) | |
| HWBOT x265 Benchmark v2.2 / 4k Preset | |
| Media de la clase Multimedia (5.26 - 36.1, n=56, últimos 2 años) | |
| Lenovo ThinkPad Z16 G1 21D5S00T00 | |
| Dell XPS 15 9520 RTX 3050 Ti | |
| Dell XPS 17 9720 | |
| Medio AMD Ryzen 7 PRO 6850H (12.7 - 15.9, n=2) | |
| Lenovo ThinkPad X1 Extreme G4-20Y50040GE | |
| Lenovo ThinkPad X1 Extreme G4-20Y5CTO1WW (3050 Ti) | |
| LibreOffice / 20 Documents To PDF | |
| Medio AMD Ryzen 7 PRO 6850H (50.7 - 95.2, n=2) | |
| Lenovo ThinkPad Z16 G1 21D5S00T00 | |
| Media de la clase Multimedia (23.9 - 146.7, n=57, últimos 2 años) | |
| Dell XPS 17 9720 | |
| Lenovo ThinkPad X1 Extreme G4-20Y5CTO1WW (3050 Ti) | |
| Dell XPS 15 9520 RTX 3050 Ti | |
| Lenovo ThinkPad X1 Extreme G4-20Y50040GE | |
| R Benchmark 2.5 / Overall mean | |
| Lenovo ThinkPad X1 Extreme G4-20Y5CTO1WW (3050 Ti) | |
| Lenovo ThinkPad X1 Extreme G4-20Y50040GE | |
| Medio AMD Ryzen 7 PRO 6850H (0.516 - 0.524, n=2) | |
| Lenovo ThinkPad Z16 G1 21D5S00T00 | |
| Media de la clase Multimedia (0.3604 - 0.947, n=56, últimos 2 años) | |
| Dell XPS 15 9520 RTX 3050 Ti | |
| Dell XPS 17 9720 | |
* ... más pequeño es mejor
AIDA64: FP32 Ray-Trace | FPU Julia | CPU SHA3 | CPU Queen | FPU SinJulia | FPU Mandel | CPU AES | CPU ZLib | FP64 Ray-Trace | CPU PhotoWorxx
| Performance rating | |
| Media de la clase Multimedia | |
| Medio AMD Ryzen 7 PRO 6850H | |
| Lenovo ThinkPad Z16 G1 21D5S00T00 | |
| Lenovo ThinkPad X1 Extreme G4-20Y50040GE | |
| Lenovo ThinkPad X1 Extreme G4-20Y5CTO1WW (3050 Ti) | |
| Dell XPS 15 9520 RTX 3050 Ti | |
| Dell XPS 17 9720 | |
| AIDA64 / FP32 Ray-Trace | |
| Media de la clase Multimedia (2214 - 50388, n=53, últimos 2 años) | |
| Lenovo ThinkPad Z16 G1 21D5S00T00 | |
| Lenovo ThinkPad X1 Extreme G4-20Y50040GE | |
| Medio AMD Ryzen 7 PRO 6850H (15009 - 15301, n=2) | |
| Lenovo ThinkPad X1 Extreme G4-20Y5CTO1WW (3050 Ti) | |
| Dell XPS 15 9520 RTX 3050 Ti | |
| Dell XPS 17 9720 | |
| AIDA64 / FPU Julia | |
| Lenovo ThinkPad Z16 G1 21D5S00T00 | |
| Medio AMD Ryzen 7 PRO 6850H (93021 - 94997, n=2) | |
| Media de la clase Multimedia (12867 - 201874, n=54, últimos 2 años) | |
| Lenovo ThinkPad X1 Extreme G4-20Y50040GE | |
| Lenovo ThinkPad X1 Extreme G4-20Y5CTO1WW (3050 Ti) | |
| Dell XPS 15 9520 RTX 3050 Ti | |
| Dell XPS 17 9720 | |
| AIDA64 / CPU SHA3 | |
| Lenovo ThinkPad X1 Extreme G4-20Y50040GE | |
| Lenovo ThinkPad X1 Extreme G4-20Y5CTO1WW (3050 Ti) | |
| Media de la clase Multimedia (626 - 8623, n=54, últimos 2 años) | |
| Lenovo ThinkPad Z16 G1 21D5S00T00 | |
| Medio AMD Ryzen 7 PRO 6850H (3155 - 3169, n=2) | |
| Dell XPS 15 9520 RTX 3050 Ti | |
| Dell XPS 17 9720 | |
| AIDA64 / CPU Queen | |
| Lenovo ThinkPad Z16 G1 21D5S00T00 | |
| Medio AMD Ryzen 7 PRO 6850H (100724 - 102905, n=2) | |
| Dell XPS 17 9720 | |
| Dell XPS 15 9520 RTX 3050 Ti | |
| Lenovo ThinkPad X1 Extreme G4-20Y50040GE | |
| Lenovo ThinkPad X1 Extreme G4-20Y5CTO1WW (3050 Ti) | |
| Media de la clase Multimedia (13483 - 181505, n=41, últimos 2 años) | |
| AIDA64 / FPU SinJulia | |
| Lenovo ThinkPad Z16 G1 21D5S00T00 | |
| Medio AMD Ryzen 7 PRO 6850H (12309 - 12638, n=2) | |
| Lenovo ThinkPad X1 Extreme G4-20Y50040GE | |
| Lenovo ThinkPad X1 Extreme G4-20Y5CTO1WW (3050 Ti) | |
| Media de la clase Multimedia (886 - 28794, n=54, últimos 2 años) | |
| Dell XPS 15 9520 RTX 3050 Ti | |
| Dell XPS 17 9720 | |
| AIDA64 / FPU Mandel | |
| Lenovo ThinkPad Z16 G1 21D5S00T00 | |
| Medio AMD Ryzen 7 PRO 6850H (51299 - 51802, n=2) | |
| Media de la clase Multimedia (6395 - 105740, n=53, últimos 2 años) | |
| Lenovo ThinkPad X1 Extreme G4-20Y50040GE | |
| Lenovo ThinkPad X1 Extreme G4-20Y5CTO1WW (3050 Ti) | |
| Dell XPS 15 9520 RTX 3050 Ti | |
| Dell XPS 17 9720 | |
| AIDA64 / CPU AES | |
| Lenovo ThinkPad X1 Extreme G4-20Y50040GE | |
| Lenovo ThinkPad X1 Extreme G4-20Y5CTO1WW (3050 Ti) | |
| Medio AMD Ryzen 7 PRO 6850H (60476 - 128243, n=2) | |
| Dell XPS 15 9520 RTX 3050 Ti | |
| Dell XPS 17 9720 | |
| Media de la clase Multimedia (8171 - 126790, n=54, últimos 2 años) | |
| Lenovo ThinkPad Z16 G1 21D5S00T00 | |
| AIDA64 / CPU ZLib | |
| Media de la clase Multimedia (143.8 - 2022, n=54, últimos 2 años) | |
| Dell XPS 17 9720 | |
| Dell XPS 15 9520 RTX 3050 Ti | |
| Lenovo ThinkPad X1 Extreme G4-20Y50040GE | |
| Medio AMD Ryzen 7 PRO 6850H (806 - 809, n=2) | |
| Lenovo ThinkPad Z16 G1 21D5S00T00 | |
| Lenovo ThinkPad X1 Extreme G4-20Y5CTO1WW (3050 Ti) | |
| AIDA64 / FP64 Ray-Trace | |
| Media de la clase Multimedia (1014 - 26875, n=54, últimos 2 años) | |
| Lenovo ThinkPad X1 Extreme G4-20Y50040GE | |
| Lenovo ThinkPad Z16 G1 21D5S00T00 | |
| Medio AMD Ryzen 7 PRO 6850H (7876 - 8104, n=2) | |
| Lenovo ThinkPad X1 Extreme G4-20Y5CTO1WW (3050 Ti) | |
| Dell XPS 15 9520 RTX 3050 Ti | |
| Dell XPS 17 9720 | |
| AIDA64 / CPU PhotoWorxx | |
| Media de la clase Multimedia (8187 - 88154, n=54, últimos 2 años) | |
| Dell XPS 17 9720 | |
| Dell XPS 15 9520 RTX 3050 Ti | |
| Lenovo ThinkPad Z16 G1 21D5S00T00 | |
| Medio AMD Ryzen 7 PRO 6850H (18157 - 26176, n=2) | |
| Lenovo ThinkPad X1 Extreme G4-20Y5CTO1WW (3050 Ti) | |
| Lenovo ThinkPad X1 Extreme G4-20Y50040GE | |
Rendimiento del sistema
En el PCMark 10, el Lenovo ThinkPad Z16 G1 se coloca en el medio del campo pero en el Crossmark, más en el extremo inferior del campo de comparación. En el funcionamiento diario, el Lenovo ThinkPad Z16 G1 funciona de forma absolutamente fluida y rápida.
CrossMark: Overall | Productivity | Creativity | Responsiveness
| PCMark 10 / Score | |
| Media de la clase Multimedia (4325 - 10386, n=52, últimos 2 años) | |
| Dell XPS 15 9520 RTX 3050 Ti | |
| Lenovo ThinkPad X1 Extreme G4-20Y50040GE | |
| Dell XPS 17 9720 | |
| Lenovo ThinkPad Z16 G1 21D5S00T00 | |
| Medio AMD Ryzen 7 PRO 6850H, AMD Radeon RX 6500M (n=1) | |
| Lenovo ThinkPad X1 Extreme G4-20Y5CTO1WW (3050 Ti) | |
| PCMark 10 / Essentials | |
| Dell XPS 15 9520 RTX 3050 Ti | |
| Lenovo ThinkPad X1 Extreme G4-20Y5CTO1WW (3050 Ti) | |
| Lenovo ThinkPad X1 Extreme G4-20Y50040GE | |
| Media de la clase Multimedia (8025 - 11664, n=51, últimos 2 años) | |
| Dell XPS 17 9720 | |
| Lenovo ThinkPad Z16 G1 21D5S00T00 | |
| Medio AMD Ryzen 7 PRO 6850H, AMD Radeon RX 6500M (n=1) | |
| PCMark 10 / Productivity | |
| Media de la clase Multimedia (7323 - 18233, n=51, últimos 2 años) | |
| Dell XPS 15 9520 RTX 3050 Ti | |
| Dell XPS 17 9720 | |
| Lenovo ThinkPad X1 Extreme G4-20Y50040GE | |
| Lenovo ThinkPad X1 Extreme G4-20Y5CTO1WW (3050 Ti) | |
| Lenovo ThinkPad Z16 G1 21D5S00T00 | |
| Medio AMD Ryzen 7 PRO 6850H, AMD Radeon RX 6500M (n=1) | |
| PCMark 10 / Digital Content Creation | |
| Media de la clase Multimedia (3651 - 16240, n=51, últimos 2 años) | |
| Lenovo ThinkPad X1 Extreme G4-20Y50040GE | |
| Dell XPS 17 9720 | |
| Dell XPS 15 9520 RTX 3050 Ti | |
| Lenovo ThinkPad Z16 G1 21D5S00T00 | |
| Medio AMD Ryzen 7 PRO 6850H, AMD Radeon RX 6500M (n=1) | |
| Lenovo ThinkPad X1 Extreme G4-20Y5CTO1WW (3050 Ti) | |
| CrossMark / Overall | |
| Media de la clase Multimedia (866 - 2728, n=60, últimos 2 años) | |
| Dell XPS 15 9520 RTX 3050 Ti | |
| Dell XPS 17 9720 | |
| Lenovo ThinkPad X1 Extreme G4-20Y50040GE | |
| Apple MacBook Pro 16 2021 M1 Max | |
| Apple MacBook Pro 16 2021 M1 Pro | |
| Lenovo ThinkPad Z16 G1 21D5S00T00 | |
| Medio AMD Ryzen 7 PRO 6850H, AMD Radeon RX 6500M (n=1) | |
| CrossMark / Productivity | |
| Dell XPS 15 9520 RTX 3050 Ti | |
| Media de la clase Multimedia (931 - 2489, n=60, últimos 2 años) | |
| Dell XPS 17 9720 | |
| Lenovo ThinkPad X1 Extreme G4-20Y50040GE | |
| Lenovo ThinkPad Z16 G1 21D5S00T00 | |
| Medio AMD Ryzen 7 PRO 6850H, AMD Radeon RX 6500M (n=1) | |
| Apple MacBook Pro 16 2021 M1 Max | |
| Apple MacBook Pro 16 2021 M1 Pro | |
| CrossMark / Creativity | |
| Media de la clase Multimedia (907 - 3465, n=60, últimos 2 años) | |
| Apple MacBook Pro 16 2021 M1 Max | |
| Dell XPS 17 9720 | |
| Apple MacBook Pro 16 2021 M1 Pro | |
| Dell XPS 15 9520 RTX 3050 Ti | |
| Lenovo ThinkPad X1 Extreme G4-20Y50040GE | |
| Lenovo ThinkPad Z16 G1 21D5S00T00 | |
| Medio AMD Ryzen 7 PRO 6850H, AMD Radeon RX 6500M (n=1) | |
| CrossMark / Responsiveness | |
| Dell XPS 15 9520 RTX 3050 Ti | |
| Dell XPS 17 9720 | |
| Lenovo ThinkPad X1 Extreme G4-20Y50040GE | |
| Media de la clase Multimedia (605 - 2024, n=60, últimos 2 años) | |
| Lenovo ThinkPad Z16 G1 21D5S00T00 | |
| Medio AMD Ryzen 7 PRO 6850H, AMD Radeon RX 6500M (n=1) | |
| Apple MacBook Pro 16 2021 M1 Max | |
| Apple MacBook Pro 16 2021 M1 Pro | |
| PCMark 10 Score | 6530 puntos | |
ayuda | ||
| AIDA64 / Memory Copy | |
| Media de la clase Multimedia (11299 - 132135, n=54, últimos 2 años) | |
| Dell XPS 17 9720 | |
| Dell XPS 15 9520 RTX 3050 Ti | |
| Lenovo ThinkPad Z16 G1 21D5S00T00 | |
| Medio AMD Ryzen 7 PRO 6850H (30324 - 48504, n=2) | |
| Lenovo ThinkPad X1 Extreme G4-20Y5CTO1WW (3050 Ti) | |
| Lenovo ThinkPad X1 Extreme G4-20Y50040GE | |
| AIDA64 / Memory Read | |
| Media de la clase Multimedia (11624 - 174586, n=54, últimos 2 años) | |
| Dell XPS 17 9720 | |
| Dell XPS 15 9520 RTX 3050 Ti | |
| Lenovo ThinkPad Z16 G1 21D5S00T00 | |
| Lenovo ThinkPad X1 Extreme G4-20Y5CTO1WW (3050 Ti) | |
| Medio AMD Ryzen 7 PRO 6850H (33791 - 42736, n=2) | |
| Lenovo ThinkPad X1 Extreme G4-20Y50040GE | |
| AIDA64 / Memory Write | |
| Media de la clase Multimedia (11755 - 134998, n=54, últimos 2 años) | |
| Dell XPS 17 9720 | |
| Dell XPS 15 9520 RTX 3050 Ti | |
| Lenovo ThinkPad Z16 G1 21D5S00T00 | |
| Medio AMD Ryzen 7 PRO 6850H (32728 - 51157, n=2) | |
| Lenovo ThinkPad X1 Extreme G4-20Y5CTO1WW (3050 Ti) | |
| Lenovo ThinkPad X1 Extreme G4-20Y50040GE | |
| AIDA64 / Memory Latency | |
| Lenovo ThinkPad Z16 G1 21D5S00T00 | |
| Media de la clase Multimedia (7 - 535, n=53, últimos 2 años) | |
| Medio AMD Ryzen 7 PRO 6850H (93.5 - 132.1, n=2) | |
| Dell XPS 15 9520 RTX 3050 Ti | |
| Dell XPS 17 9720 | |
| Lenovo ThinkPad X1 Extreme G4-20Y50040GE | |
| Lenovo ThinkPad X1 Extreme G4-20Y5CTO1WW (3050 Ti) | |
* ... más pequeño es mejor
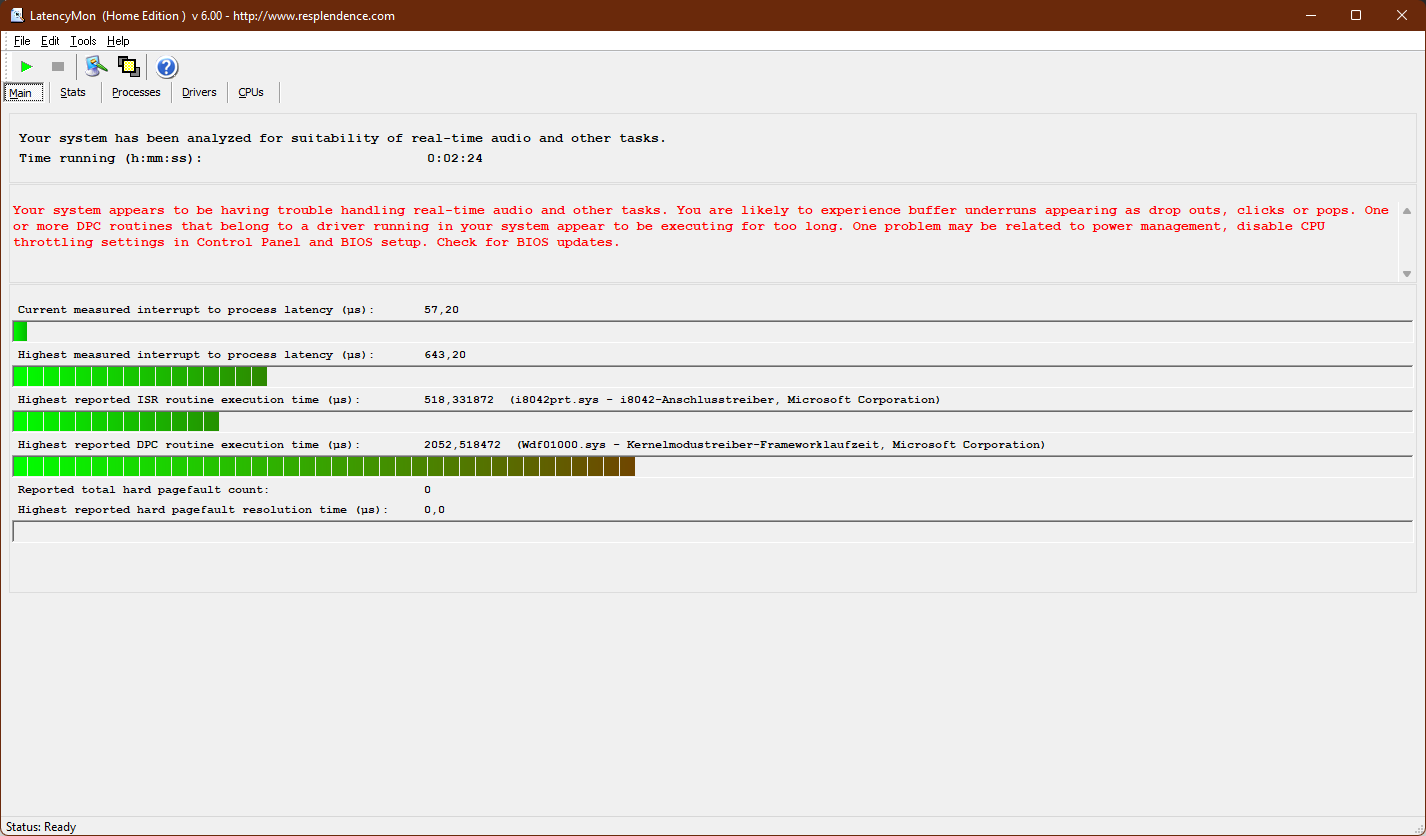
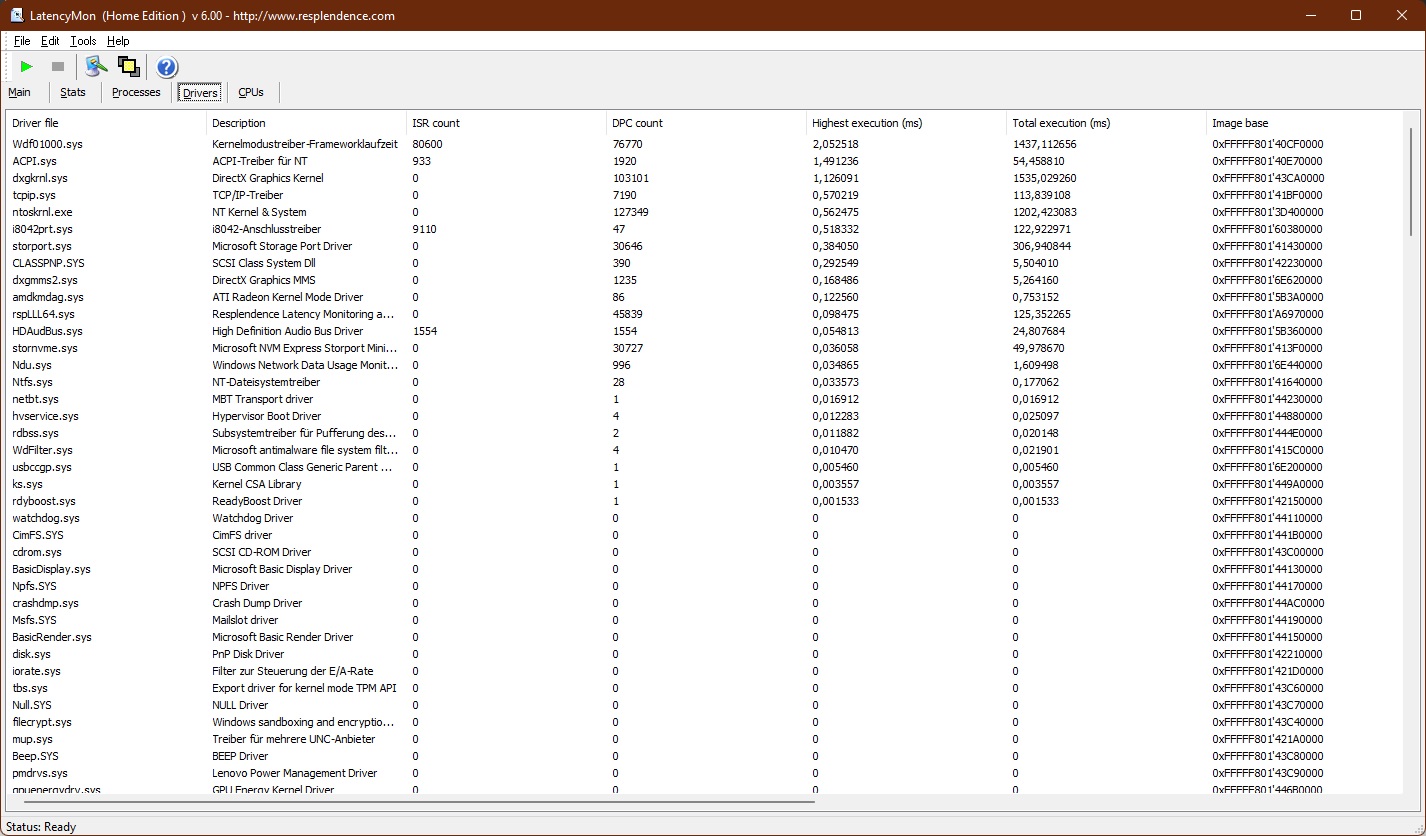
Latencias del CPD
Nuestra unidad de prueba del Lenovo ThinkPad Z16 G1 tiene problemas con las latencias del DPC, lo que podría llevar a algunas caídas durante el procesamiento de audio y video. Estos problemas pueden remediarse con actualizaciones de driver o firmware y podrían variar de una unidad a otra.
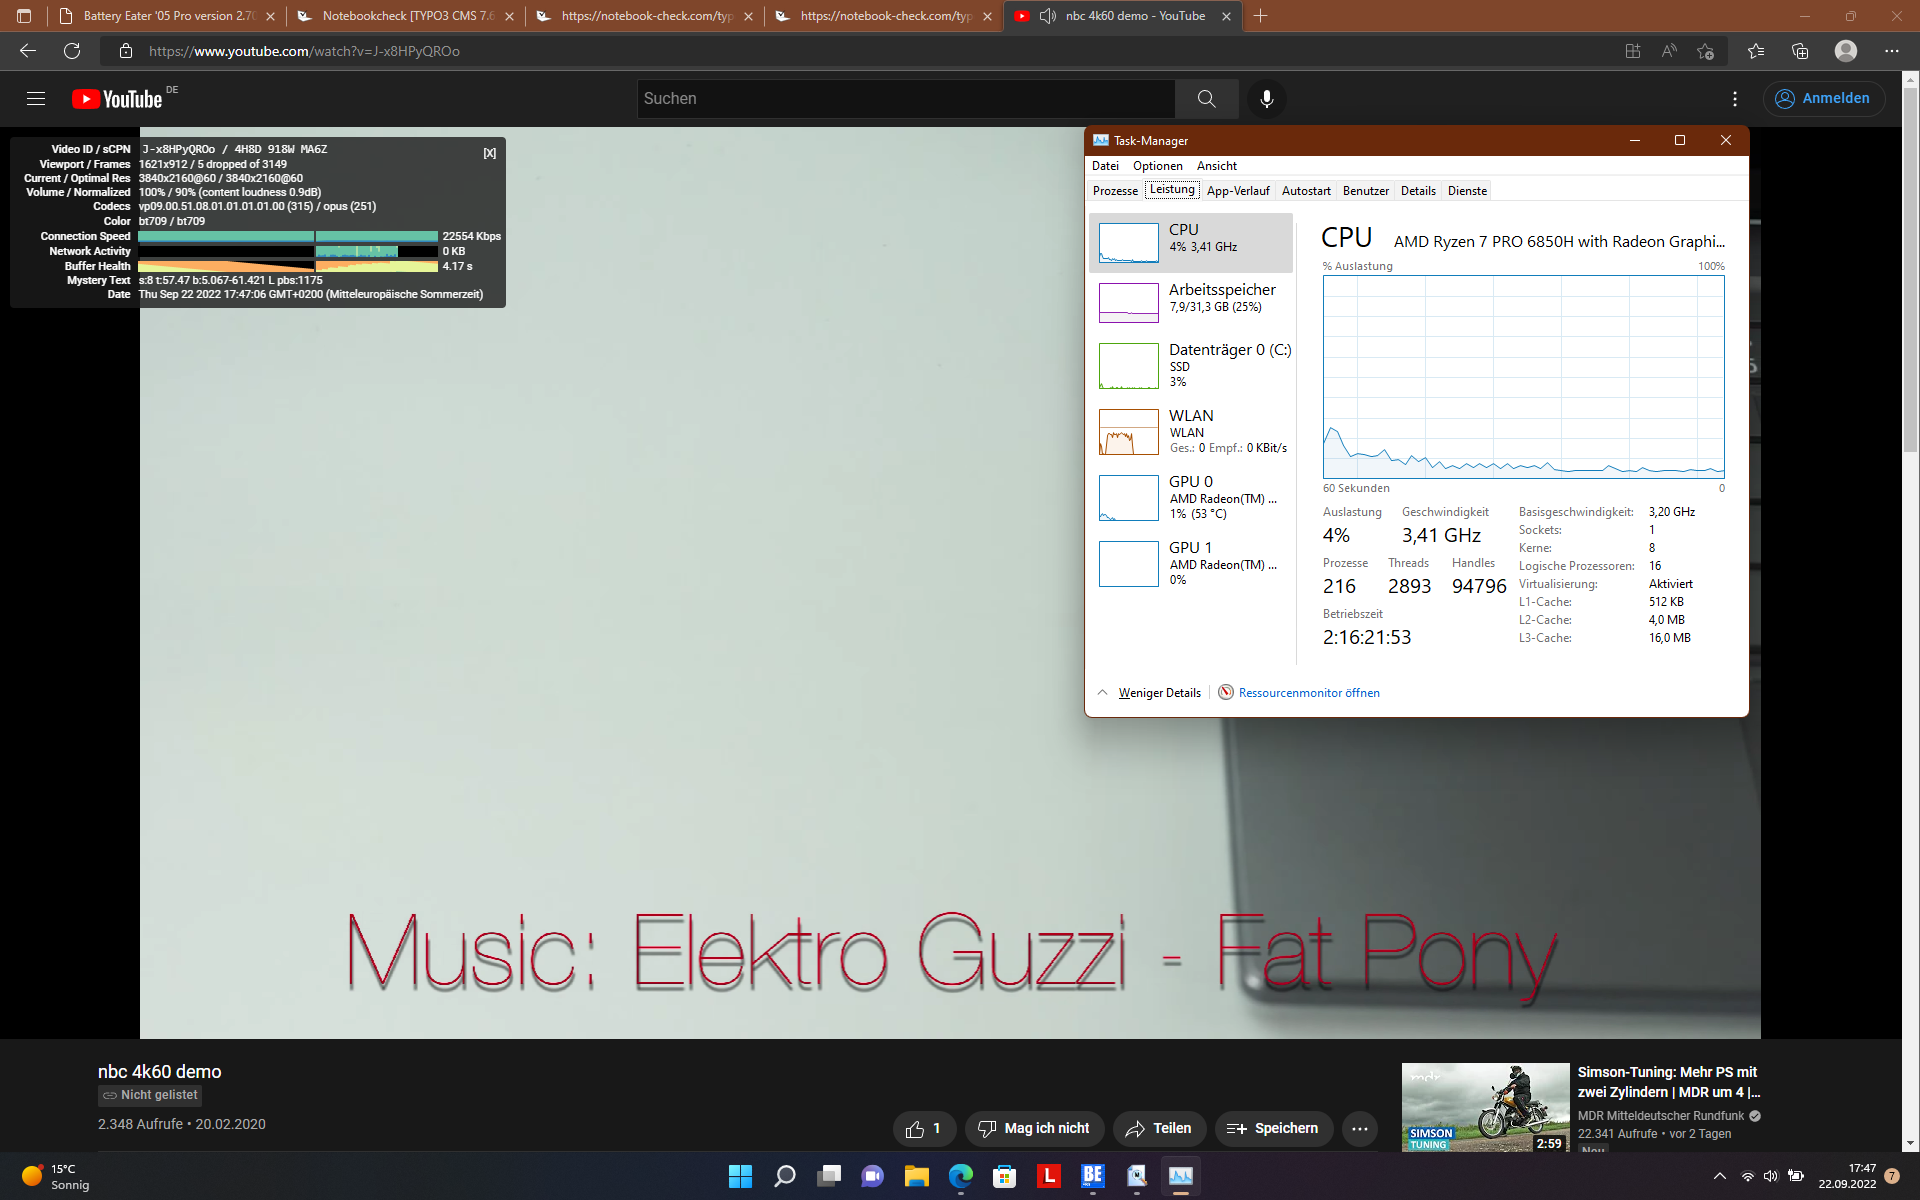
Apenas hay caídas en el test de YouTube, donde las cargas de CPU y GPU también se mantienen extremadamente bajas.
| DPC Latencies / LatencyMon - interrupt to process latency (max), Web, Youtube, Prime95 | |
| Lenovo ThinkPad X1 Extreme G4-20Y50040GE | |
| Dell XPS 17 9720 | |
| Lenovo ThinkPad X1 Extreme G4-20Y5CTO1WW (3050 Ti) | |
| Dell XPS 15 9520 RTX 3050 Ti | |
| Lenovo ThinkPad Z16 G1 21D5S00T00 | |
* ... más pequeño es mejor
Solución de almacenamiento
El SSD Samsung PM9A1 del Lenovo ThinkPad Z16 Gen 1 ofrece una capacidad de almacenamiento de 1 Terrabyte. Es un SSD M.2-2280 que está conectado con el más reciente estándar NVMe PCIe-4.0. Los resultados en nuestra prueba de referencia pintan una imagen mixta: Mirando la velocidad absoluta, es un SSD muy rápido, pero todos los demás portátiles de nuestra comparación son más rápidos, aunque la diferencia no sea muy grande. Además, el rendimiento bajo carga constante también varía.

* ... más pequeño es mejor
Constant Performance Reading: DiskSpd Read Loop, Queue Depth 8
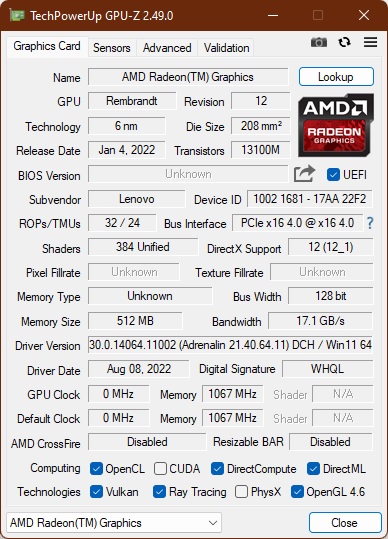
Tarjeta gráfica
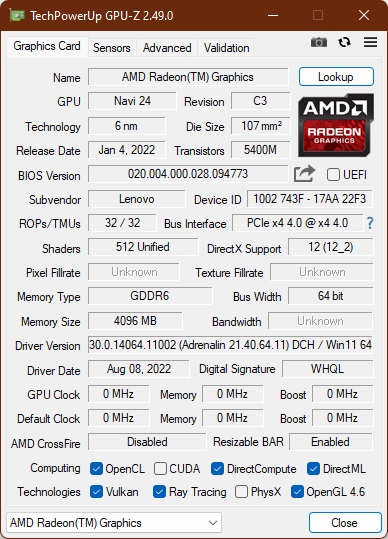
La última vez que Lenovo usó un chip gráfico dedicado de AMD en un ThinkPad (en ese momento en el ThinkPad T500que aún usaba la marca ATi), el iPhone tenía sólo un año de antigüedad. Por supuesto, Lenovo no eligió un procesador gráfico muy potente con la AMD Radeon RX 6500M. El consumo de energía típico de este chip de nivel básico es de 50 vatios, aunque es capaz de consumir 55 vatios en el ThinkPad Z16.
Con esto, el ThinkPad Z16 G1 rinde en el mismo rango que los modelos básicos del ThinkPad X1 Extremecon laNvidia GeForce RTX 3050 Tiy el Dell XPS 15con la misma GPU. Esto también vale para el rendimiento gráfico en sí, y en las pruebas gráficas 3DMark Time Spy y Fire Strike, la RX 6500M se sitúa al mismo nivel que la RTX 3050 Ti.
En funcionamiento en batería, el rendimiento gráfico resulta ligeramente inferior, en torno a un 23% en el 3DMark Time Spy (3429 puntos).
| 3DMark 06 Standard Score | 35958 puntos | |
| 3DMark Vantage P Result | 51599 puntos | |
| 3DMark 11 Performance | 17548 puntos | |
| 3DMark Ice Storm Standard Score | 116884 puntos | |
| 3DMark Cloud Gate Standard Score | 92553 puntos | |
| 3DMark Fire Strike Score | 12287 puntos | |
| 3DMark Time Spy Score | 4795 puntos | |
ayuda | ||
En nuestros informes de pruebas, la prueba Blender 3.3 es relativamente nueva. En la prueba Classroom en modo HIP, el ThinkPad Z16 con la Radeon RX 6500Mlogra un rendimiento similar al del Dell Inspiron 14 Plus 7420con laRTX 3050 en modo CUDA. El RTX 3050 Ti en elDell Inspiron 16 Plus 7620rinde un 30% más en esta prueba. En cualquier caso, el tiempo de renderizado se reduce significativamente en comparación con el modo CPU.
* ... más pequeño es mejor
Rendimiento de los juegos
Como en las pruebas sintéticas, el rendimiento en juegos está aproximadamente al nivel del Dell XPS 15 9520con la RTX 3050 Ti, con el X1 Extreme que tiene el mismo chip Nvidia tendiendo a resultar ligeramente mejor en los juegos. Incluso los juegos más nuevos pueden reproducirse en los ajustes de detalle altos o los más altos, pero sólo en la resolución Full-HD. El rendimiento de la Radeon de AMD con toda probabilidad no será suficiente para los juegos 4K.
Hay que tener en cuenta que el rendimiento de la GPU se ve afectado por el estrangulamiento. En nuestro bucle de Witcher 3, la tasa de FPS cae de los 45 iniciales a sólo 35 FPS.
| The Witcher 3 - 1920x1080 High Graphics & Postprocessing (Nvidia HairWorks Off) | |
| Lenovo ThinkPad X1 Extreme G4-20Y50040GE | |
| Dell XPS 17 9720 | |
| Lenovo ThinkPad X1 Extreme G4-20Y5CTO1WW (3050 Ti) | |
| Media de la clase Multimedia (22 - 224, n=7, últimos 2 años) | |
| Dell XPS 15 9520 RTX 3050 Ti | |
| Lenovo ThinkPad Z16 G1 21D5S00T00 | |
| Medio AMD Radeon RX 6500M (n=1) | |
| F1 2021 - 1920x1080 Ultra High Preset + Raytracing AA:T AF:16x | |
| Dell XPS 17 9720 | |
| Lenovo ThinkPad Z16 G1 21D5S00T00 | |
| Medio AMD Radeon RX 6500M (n=1) | |
| GTA V - 1920x1080 High/On (Advanced Graphics Off) AA:2xMSAA + FX AF:8x | |
| Dell XPS 17 9720 | |
| Lenovo ThinkPad X1 Extreme G4-20Y5CTO1WW (3050 Ti) | |
| Lenovo ThinkPad Z16 G1 21D5S00T00 | |
| Medio AMD Radeon RX 6500M (90 - 96.6, n=2) | |
| Dell XPS 15 9520 RTX 3050 Ti | |
| Media de la clase Multimedia (19.5 - 186.1, n=47, últimos 2 años) | |
The Witcher 3 FPS Chart
| bajo | medio | alto | ultra | |
|---|---|---|---|---|
| GTA V (2015) | 154.7 | 144.8 | 96.6 | 41.8 |
| The Witcher 3 (2015) | 195 | 136.2 | 57.4 | 39.1 |
| Dota 2 Reborn (2015) | 121.5 | 106.1 | 102.2 | 94.8 |
| Final Fantasy XV Benchmark (2018) | 126.6 | 65.8 | 46.9 | |
| X-Plane 11.11 (2018) | 47.7 | 40.7 | 36.8 | |
| Far Cry 5 (2018) | 90 | 75 | 71 | 66 |
| Strange Brigade (2018) | 266 | 119.1 | 98.8 | 86.3 |
| Metro Exodus (2019) | 137.4 | 66.7 | 46.7 | 37 |
| The Division 2 (2019) | 129 | 82 | 67 | 47 |
| Borderlands 3 (2019) | 78.2 | 66.6 | 47.1 | 34.5 |
| Hunt Showdown (2020) | 124.8 | 68.9 | 57.3 | |
| Doom Eternal (2020) | 232 | 101.2 | 57.5 | |
| Gears Tactics (2020) | 257.8 | 125.2 | 82.4 | 56.6 |
| Death Stranding (2020) | 130.4 | 89.3 | 82.2 | 78.9 |
| Horizon Zero Dawn (2020) | 103 | 71 | 59 | 54 |
| Crysis Remastered (2020) | 185.6 | 88.7 | 26.3 | 19.6 |
| Mafia Definitive Edition (2020) | 91.4 | 53 | 48.7 | |
| Star Wars Squadrons (2020) | 267 | 150.5 | 131.7 | 119.6 |
| Watch Dogs Legion (2020) | 81.1 | 70 | 59.1 | 24.6 |
| Dirt 5 (2020) | 159.4 | 72.9 | 56.3 | 37.4 |
| Assassin´s Creed Valhalla (2020) | 113 | 62 | 45 | 39 |
| Yakuza Like a Dragon (2020) | 80.3 | 60.6 | 58.4 | 54.5 |
| Immortals Fenyx Rising (2020) | 89 | 68 | 47 | 41 |
| Hitman 3 (2021) | 157.2 | 102.1 | 88.7 | 80.5 |
| Mass Effect Legendary Edition (2021) | 82.2 | 75.6 | ||
| Days Gone (2021) | 116.3 | 70.6 | 62.7 | 44.2 |
| F1 2021 (2021) | 245 | 139 | 105.1 | 42.9 |
| New World (2021) | 70.3 | 53 | 46.2 | 40.4 |
| Far Cry 6 (2021) | 91.7 | 69.8 | 62.5 | 54.5 |
| Back 4 Blood (2021) | 116 | 95.3 | 92.7 | |
| Guardians of the Galaxy (2021) | 83 | 48 | 47 | 44 |
| Riders Republic (2021) | 71 | 68 | 58 | 43 |
| Forza Horizon 5 (2021) | 152 | 101 | 81 | 27 |
| Battlefield 2042 (2021) | 129.7 | 71.2 | 53.3 | 23.3 |
| Farming Simulator 22 (2021) | 96.6 | 86 | ||
| Halo Infinite (2021) | 62.4 | 43.6 | 42.4 | |
| God of War (2022) | 64.5 | 54.1 | 39.6 | 11.9 |
| Rainbow Six Extraction (2022) | 96 | 69 | 61 | 34 |
| Dying Light 2 (2022) | 58.4 | 46.6 | 37 | |
| GRID Legends (2022) | 146.9 | 105 | 75.9 | 59.9 |
| Cyberpunk 2077 1.6 (2022) | 66.2 | 66.5 | 32.3 | 29.2 |
| Elex 2 (2022) | 53.4 | 51 | 44 | 37.6 |
| Ghostwire Tokyo (2022) | 72.7 | 71 | 65.5 | 66.3 |
| Tiny Tina's Wonderlands (2022) | 118.1 | 88.5 | 45.8 | 29.8 |
| Vampire Bloodhunt (2022) | 142.7 | 115 | 106.7 | 98.1 |
| F1 22 (2022) | 116.3 | 97.2 | 75.6 | 13.9 |
| The Quarry (2022) | 64.1 | 48.3 | 38.9 | 25.4 |
Emisiones: El ventilador sigue siendo silencioso, pero el ThinkPad Z16 se calienta
Emisiones acústicas
Bajo baja carga, el ventilador del Lenovo ThinkPad Z16 G1 funciona de forma muy silenciosa, por lo que apenas se nota. Incluso el MacBook Pro 16 mit M1 Pro es mínimamente más ruidoso en este punto. Esto cambia bajo carga máxima, ya que el MacBook es entonces más silencioso, incluso en la versión más potente con el M1 Max. Sin embargo, el ThinkPad Z16 sigue sin ser un portátil ruidoso, y el nivel máximo de ruido de los ventiladores sigue siendo significativamente inferior al del Lenovo ThinkPad X1 Extreme G4.
No notamos ningún ruido de bobina en el Z16.
Ruido
| Ocioso |
| 23.7 / 23.7 / 23.7 dB(A) |
| Carga |
| 25.9 / 46.9 dB(A) |
 | ||
30 dB silencioso 40 dB(A) audible 50 dB(A) ruidosamente alto |
||
min: | ||
| Lenovo ThinkPad Z16 G1 21D5S00T00 Radeon RX 6500M, R7 PRO 6850H, Samsung PM9A1 MZVL21T0HCLR | Lenovo ThinkPad X1 Extreme G4-20Y5CTO1WW (3050 Ti) GeForce RTX 3050 Ti Laptop GPU, i7-11800H, Samsung PM9A1 MZVL21T0HCLR | Lenovo ThinkPad X1 Extreme G4-20Y50040GE GeForce RTX 3080 Laptop GPU, i9-11950H, Kioxia XG7 KXG7AZNV1T02 | Dell XPS 15 9520 RTX 3050 Ti GeForce RTX 3050 Ti Laptop GPU, i7-12700H, WDC PC SN810 512GB | Dell XPS 17 9720 GeForce RTX 3050 4GB Laptop GPU, i7-12700H, Micron 3400 MTFDKBA512TFH 512GB | Apple MacBook Pro 16 2021 M1 Pro M1 Pro 16-Core GPU, M1 Pro, Apple SSD AP1024R | Apple MacBook Pro 16 2021 M1 Max M1 Max 32-Core GPU, M1 Max, Apple SSD AP2048R | |
|---|---|---|---|---|---|---|---|
| Noise | -12% | -15% | 3% | -11% | 1% | -7% | |
| apagado / medio ambiente * (dB) | 23.7 | 23.52 1% | 24.7 -4% | 22.8 4% | 24 -1% | 24.7 -4% | 24.2 -2% |
| Idle Minimum * (dB) | 23.7 | 23.52 1% | 24.7 -4% | 22.9 3% | 24 -1% | 24.7 -4% | 24.2 -2% |
| Idle Average * (dB) | 23.7 | 23.52 1% | 24.7 -4% | 22.9 3% | 24 -1% | 24.7 -4% | 24.2 -2% |
| Idle Maximum * (dB) | 23.7 | 23.52 1% | 28.1 -19% | 22.9 3% | 24 -1% | 24.7 -4% | 24.2 -2% |
| Load Average * (dB) | 25.9 | 42.9 -66% | 42.5 -64% | 30.9 -19% | 43.9 -69% | 26.1 -1% | 42.9 -66% |
| Witcher 3 ultra * (dB) | 46.9 | 52.5 -12% | 46.4 1% | 37.8 19% | 48.4 -3% | 39.5 16% | |
| Load Maximum * (dB) | 46.9 | 52.45 -12% | 52.1 -11% | 44.7 5% | 48.4 -3% | 37.4 20% | 42.9 9% |
* ... más pequeño es mejor
Temperaturas
El Lenovo ThinkPad Z16 Gen 1 permanece completamente fresco durante el funcionamiento en inactivo. Por otro lado, el ThinkPad Z16 se calienta bastante bajo carga, ya sea durante el test de estrés o el test Witcher 3. Medimos la temperatura máxima por encima del teclado en 56.8 ºC. Aunque puedes evitar fácilmente tocar esta zona, el resto de la carcasa también se calienta significativamente. El reposamanos alcanza una temperatura máxima de 36,5 ºC, que se siente notablemente caliente y puede llevar a que las manos suden
Durante la prueba de estrés, nuestra unidad de prueba de reemplazo tampoco se mantiene estable. Tanto el Prime95 como el FurMark en funcionamiento provocan frecuentes reinicios repentinos. Por tanto, no podemos incluir la prueba de estrés de una hora de duración.
(-) La temperatura máxima en la parte superior es de 56.8 °C / 134 F, frente a la media de 36.8 °C / 98 F, que oscila entre 21 y 71 °C para la clase Multimedia.
(-) El fondo se calienta hasta un máximo de 53.3 °C / 128 F, frente a la media de 39.1 °C / 102 F
(+) En reposo, la temperatura media de la parte superior es de 27 °C / 81# F, frente a la media del dispositivo de 31.3 °C / 88 F.
(-) Jugando a The Witcher 3, la temperatura media de la parte superior es de 43.8 °C / 111 F, frente a la media del dispositivo de 31.3 °C / 88 F.
(±) El reposamanos y el touchpad pueden calentarse mucho al tacto con un máximo de 36.6 °C / 97.9 F.
(-) La temperatura media de la zona del reposamanos de dispositivos similares fue de 28.7 °C / 83.7 F (-7.9 °C / -14.2 F).
| Lenovo ThinkPad Z16 G1 21D5S00T00 AMD Ryzen 7 PRO 6850H, AMD Radeon RX 6500M | Lenovo ThinkPad X1 Extreme G4-20Y5CTO1WW (3050 Ti) Intel Core i7-11800H, NVIDIA GeForce RTX 3050 Ti Laptop GPU | Lenovo ThinkPad X1 Extreme G4-20Y50040GE Intel Core i9-11950H, NVIDIA GeForce RTX 3080 Laptop GPU | Dell XPS 15 9520 RTX 3050 Ti Intel Core i7-12700H, NVIDIA GeForce RTX 3050 Ti Laptop GPU | Dell XPS 17 9720 Intel Core i7-12700H, NVIDIA GeForce RTX 3050 4GB Laptop GPU | Apple MacBook Pro 16 2021 M1 Pro Apple M1 Pro, Apple M1 Pro 16-Core GPU | Apple MacBook Pro 16 2021 M1 Max Apple M1 Max, Apple M1 Max 32-Core GPU | |
|---|---|---|---|---|---|---|---|
| Heat | 4% | 3% | -1% | 12% | 22% | 21% | |
| Maximum Upper Side * (°C) | 56.8 | 49 14% | 51.4 10% | 51.4 10% | 49.5 13% | 41 28% | 42.3 26% |
| Maximum Bottom * (°C) | 53.3 | 44.4 17% | 55.9 -5% | 51 4% | 38.4 28% | 39 27% | 41.7 22% |
| Idle Upper Side * (°C) | 28.2 | 32.1 -14% | 27.2 4% | 30 -6% | 28 1% | 24 15% | 23.9 15% |
| Idle Bottom * (°C) | 29.4 | 29.8 -1% | 28.8 2% | 33 -12% | 27.8 5% | 24 18% | 23.9 19% |
* ... más pequeño es mejor
Altavoz
A ambos lados del teclado están los altavoces estéreo del Lenovo ThinkPad Z16. Son bastante fuertes e incluso tienen un poco de bajos, pero aún así pierden en comparación con los del Apple MacBook Pro 16. El MacBook simplemente ofrece más bajos y volumen.
Lenovo ThinkPad Z16 G1 21D5S00T00 análisis de audio
(±) | la sonoridad del altavoz es media pero buena (75.56 dB)
Graves 100 - 315 Hz
(±) | lubina reducida - en promedio 11.3% inferior a la mediana
(±) | la linealidad de los graves es media (13% delta a frecuencia anterior)
Medios 400 - 2000 Hz
(+) | medios equilibrados - a sólo 2.6% de la mediana
(+) | los medios son lineales (3.2% delta a la frecuencia anterior)
Altos 2 - 16 kHz
(+) | máximos equilibrados - a sólo 2.6% de la mediana
(+) | los máximos son lineales (5.7% delta a la frecuencia anterior)
Total 100 - 16.000 Hz
(+) | el sonido global es lineal (12.5% de diferencia con la mediana)
En comparación con la misma clase
» 24% de todos los dispositivos probados de esta clase eran mejores, 3% similares, 73% peores
» El mejor tuvo un delta de 5%, la media fue 17%, el peor fue ###max##%
En comparación con todos los dispositivos probados
» 11% de todos los dispositivos probados eran mejores, 2% similares, 86% peores
» El mejor tuvo un delta de 4%, la media fue 23%, el peor fue ###max##%
Dell XPS 17 9720 análisis de audio
(+) | los altavoces pueden reproducir a un volumen relativamente alto (#83.6 dB)
Graves 100 - 315 Hz
(±) | lubina reducida - en promedio 7.3% inferior a la mediana
(±) | la linealidad de los graves es media (11.4% delta a frecuencia anterior)
Medios 400 - 2000 Hz
(+) | medios equilibrados - a sólo 3.4% de la mediana
(±) | la linealidad de los medios es media (7.6% delta respecto a la frecuencia anterior)
Altos 2 - 16 kHz
(+) | máximos equilibrados - a sólo 3.7% de la mediana
(±) | la linealidad de los máximos es media (7.1% delta a frecuencia anterior)
Total 100 - 16.000 Hz
(+) | el sonido global es lineal (8.8% de diferencia con la mediana)
En comparación con la misma clase
» 11% de todos los dispositivos probados de esta clase eran mejores, 2% similares, 87% peores
» El mejor tuvo un delta de 5%, la media fue 17%, el peor fue ###max##%
En comparación con todos los dispositivos probados
» 3% de todos los dispositivos probados eran mejores, 1% similares, 97% peores
» El mejor tuvo un delta de 4%, la media fue 23%, el peor fue ###max##%
Apple MacBook Pro 16 2021 M1 Pro análisis de audio
(+) | los altavoces pueden reproducir a un volumen relativamente alto (#84.7 dB)
Graves 100 - 315 Hz
(+) | buen bajo - sólo 3.8% lejos de la mediana
(+) | el bajo es lineal (5.2% delta a la frecuencia anterior)
Medios 400 - 2000 Hz
(+) | medios equilibrados - a sólo 1.3% de la mediana
(+) | los medios son lineales (2.1% delta a la frecuencia anterior)
Altos 2 - 16 kHz
(+) | máximos equilibrados - a sólo 1.9% de la mediana
(+) | los máximos son lineales (2.7% delta a la frecuencia anterior)
Total 100 - 16.000 Hz
(+) | el sonido global es lineal (4.6% de diferencia con la mediana)
En comparación con la misma clase
» 0% de todos los dispositivos probados de esta clase eran mejores, 0% similares, 100% peores
» El mejor tuvo un delta de 5%, la media fue 17%, el peor fue ###max##%
En comparación con todos los dispositivos probados
» 0% de todos los dispositivos probados eran mejores, 0% similares, 100% peores
» El mejor tuvo un delta de 4%, la media fue 23%, el peor fue ###max##%
Gestión de la energía: ThinkPad con una buena duración de la batería a pesar de la pequeña batería
Consumo de energía
En esta categoría, el Lenovo ThinkPad Z16 G1 es realmente el mejor de su clase, y ninguno de sus competidores directos funciona de forma más eficiente. Sólo el Apple MacBook Pro 16 con el M1 Pro es ligeramente más eficiente en términos de consumo mínimo en reposo. Sin embargo, también debemos mencionar aquí, que la pantalla de la ThinkPad Z16 Gen 1 tiene una resolución significativamente menor que las de los dispositivos de la comparación.
La fuente de alimentación de 135 vatios es lo suficientemente grande para el consumo máximo de unos 133 vatios
| Off / Standby | |
| Ocioso | |
| Carga |
|
Clave:
min: | |
| Lenovo ThinkPad Z16 G1 21D5S00T00 R7 PRO 6850H, Radeon RX 6500M, Samsung PM9A1 MZVL21T0HCLR, IPS LED, 1920x1200, 16" | Lenovo ThinkPad X1 Extreme G4-20Y5CTO1WW (3050 Ti) i7-11800H, GeForce RTX 3050 Ti Laptop GPU, Samsung PM9A1 MZVL21T0HCLR, IPS LED, 3840x2400, 16" | Lenovo ThinkPad X1 Extreme G4-20Y50040GE i9-11950H, GeForce RTX 3080 Laptop GPU, Kioxia XG7 KXG7AZNV1T02, IPS, 3840x2400, 16" | Dell XPS 15 9520 RTX 3050 Ti i7-12700H, GeForce RTX 3050 Ti Laptop GPU, WDC PC SN810 512GB, OLED, 3456x2160, 15.6" | Dell XPS 17 9720 i7-12700H, GeForce RTX 3050 4GB Laptop GPU, Micron 3400 MTFDKBA512TFH 512GB, IPS, 3840x2400, 17" | Apple MacBook Pro 16 2021 M1 Pro M1 Pro, M1 Pro 16-Core GPU, Apple SSD AP1024R, Mini-LED, 3456x2234, 16.2" | Apple MacBook Pro 16 2021 M1 Max M1 Max, M1 Max 32-Core GPU, Apple SSD AP2048R, Mini-LED, 3456x2234, 16.2" | Medio AMD Radeon RX 6500M | Media de la clase Multimedia | |
|---|---|---|---|---|---|---|---|---|---|
| Power Consumption | -79% | -80% | -13% | -50% | -17% | -38% | 0% | -9% | |
| Idle Minimum * (Watt) | 5.3 | 10.3 -94% | 12.3 -132% | 5.5 -4% | 7.8 -47% | 5 6% | 5.4 -2% | 5.3 ? -0% | 5.66 ? -7% |
| Idle Average * (Watt) | 8.6 | 22.06 -157% | 22.8 -165% | 7.2 16% | 15.1 -76% | 15.1 -76% | 16.4 -91% | 8.6 ? -0% | 10.2 ? -19% |
| Idle Maximum * (Watt) | 9.5 | 23 -142% | 13.9 -46% | 16 -68% | 17 -79% | 15.5 -63% | 16.7 -76% | 9.5 ? -0% | 12.5 ? -32% |
| Load Average * (Watt) | 65.2 | 102.57 -57% | 95.4 -46% | 91.8 -41% | 114 -75% | 54 17% | 94 -44% | 65.2 ? -0% | 65.2 ? -0% |
| Witcher 3 ultra * (Watt) | 93.6 | 106 -13% | 154 -65% | 74.6 20% | 115.2 -23% | 104 -11% | |||
| Load Maximum * (Watt) | 133.81 | 147.8 -10% | 170.7 -28% | 134.7 -1% | 135.6 -1% | 90 33% | 135 -1% | 133.8 ? -0% | 113.5 ? 15% |
* ... más pequeño es mejor
Power Consumption The Witcher 3 / Stress Test
Power Consumption With External Monitor
Duración de la batería
En cuanto a la capacidad de la batería, el Lenovo ThinkPad Z16 G1 se presenta como relativamente tacaño con sólo 72 Watthours. Con todo, la duración de la batería del portátil ThinkPad sigue siendo mejor, al menos en comparación con los competidores de Windows. Por otro lado, ni siquiera se acerca a los valores de Apple's MacBook Pro 16pero que también tiene la mayor batería de nuestra comparativa
Con alrededor de 10 horas en la prueba Wi-Fi (con un brillo de 150 cd/m²), el Z16 no tiene que esconderse. Con el brillo máximo, sigue durando 8 horas en nuestro test Wi-Fi automatizado. Sin embargo, esto sólo va para la versión WUXGA del Z16, y la pantalla opcional 4K UHD debería acortar la duración de la batería de manera significativa.
| Lenovo ThinkPad Z16 G1 21D5S00T00 R7 PRO 6850H, Radeon RX 6500M, 72 Wh | Lenovo ThinkPad X1 Extreme G4-20Y5CTO1WW (3050 Ti) i7-11800H, GeForce RTX 3050 Ti Laptop GPU, 90 Wh | Lenovo ThinkPad X1 Extreme G4-20Y50040GE i9-11950H, GeForce RTX 3080 Laptop GPU, 90 Wh | Dell XPS 15 9520 RTX 3050 Ti i7-12700H, GeForce RTX 3050 Ti Laptop GPU, 86 Wh | Apple MacBook Pro 16 2021 M1 Pro M1 Pro, M1 Pro 16-Core GPU, 99.6 Wh | Apple MacBook Pro 16 2021 M1 Max M1 Max, M1 Max 32-Core GPU, 99.6 Wh | Media de la clase Multimedia | |
|---|---|---|---|---|---|---|---|
| Duración de Batería | -40% | -40% | 21% | 59% | 15% | 15% | |
| H.264 (h) | 11.9 | 6.7 -44% | 6.9 -42% | 17.5 47% | 17 43% | 17.1 ? 44% | |
| WiFi v1.3 (h) | 9.9 | 6.6 -33% | 6.8 -31% | 8.8 -11% | 16.9 71% | 14.9 51% | 12.2 ? 23% |
| Load (h) | 2.1 | 1.2 -43% | 1.1 -48% | 3.2 52% | 1.1 -48% | 1.664 ? -21% |
Pro
Contra
Veredicto: El Lenovo ThinkPad Z16 G1 es un gran portátil, pero...

El Lenovo ThinkPad Z16 Gen 1 realmente nos dio algunos dolores de cabeza. Sobre el papel, podría ser un muy buen portátil, y en nuestra prueba, esto también resultó ser cierto. Sin embargo, seguimos sin poder darle una recomendación de "muy bueno".
En primer lugar, debemos enumerar todos los aspectos positivos del portátil ThinkPad: El ThinkPad Z16 G1 ofrece un muy buen rendimiento en una carcasa relativamente compacta. La calidad de la carcasa es excelente, y con la combinación de mucho aluminio y el reposamanos de cristal, Lenovo hace muchas cosas bien en este sentido. El fabricante también hace un buen trabajo con el touchpad, que es significativamente mejor que el de todos los demás ThinkPads. El teclado también es bueno, aunque no sea tan bueno como el de otros ThinkPads. El ThinkPad Z16 incluye una pantalla mate y brillante y ofrece una buena duración de la batería, aunque ésta sea relativamente pequeña.
El primer gran problema del Z16 son sus conexiones. El ThinkPad Z16 es un portátil de 16 pulgadas y un dispositivo de negocios. El hecho de que un dispositivo así no ofrezca ningún puerto USB-A, y particularmente tampoco HDMI, es difícilmente aceptable. La gestión de la temperatura también crea algunas dificultades, ya que el ThinkPad Z16 se calienta bastante. Es mejor no tocar el área por encima del teclado bajo carga. En un ThinkPad relativamente grande, encontramos que la RAM soldada es una limitación innecesaria. Un punto de queja significativamente menos importante pero aún relevante: El Z16 carece de una opción para una pantalla de 2.5K, y tampoco hay una pantalla con una mayor tasa de refresco.
Podría ser un muy buen portátil si sólo no existieran los problemas con el reinicio, ya que por lo demás, vemos muchos aspectos positivos en el Lenovo ThinkPad Z16 Gen 1.
Pero todas estas quejas no fueron las que causaron nuestros dolores de cabeza - ese fue el ya mencionado problema con los reinicios, lo que nos llevó a pedir una nueva unidad de prueba. Afortunadamente, el problema era significativamente menos pronunciado en nuestra unidad de pruebas de reemplazo, pero desafortunadamente, el problema seguía ocurriendo.
Esto lleva a una evaluación del ThinkPad Z16 significativamente peor de lo que tendría que ser. Esto es desafortunado, ya que por lo demás no nos disgusta el ThinkPad, incluso si su falta de equipo de conexión es menos convincente para su mercado objetivo que la del compacto ThinkPad Z13. En términos de puertos, el Lenovo ThinkPad X1 Extreme G4 es significativamente más flexible. Incluso el MacBook Pro 16 ofrece al menos HDMI, pero por otro lado, carece de la opción WWAN del ThinkPad Z16.
Nota: Debido al problema con la estabilidad del sistema, la evaluación del ThinkPad Z16 resultó 3 puntos porcentuales menos.
Precio y disponibilidad
El Lenovo ThinkPad Z16 Gen 1 está disponible a partir de 1.975 dólaresen la tienda web de Lenovo. Amazon también lista varias configuraciones del ThinkPad Z16 a partir de $1850 (enlace de afiliación).
Lenovo ThinkPad Z16 G1 21D5S00T00
- 09/29/2022 v7 (old)
Benjamin Herzig
Price comparison

