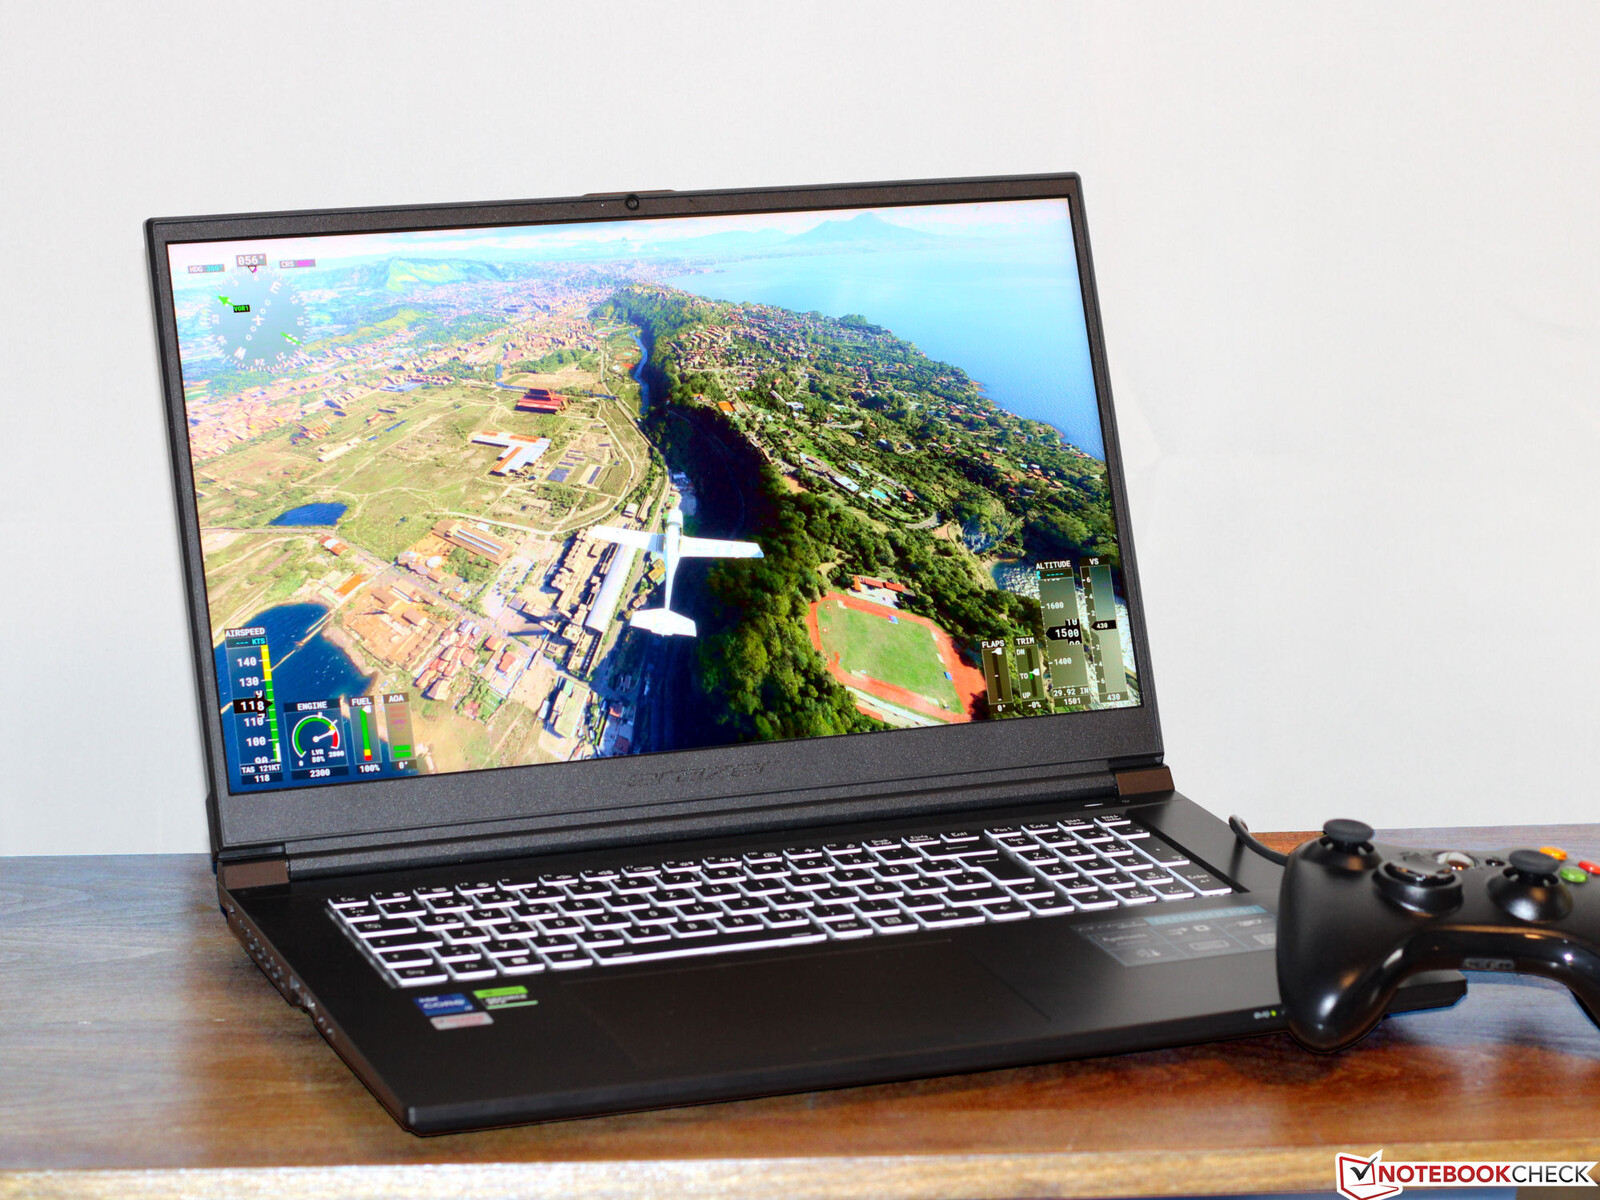
Análisis del Medion Erazer Defender P40: El portátil de juegos QHD asequible con una RTX 4060
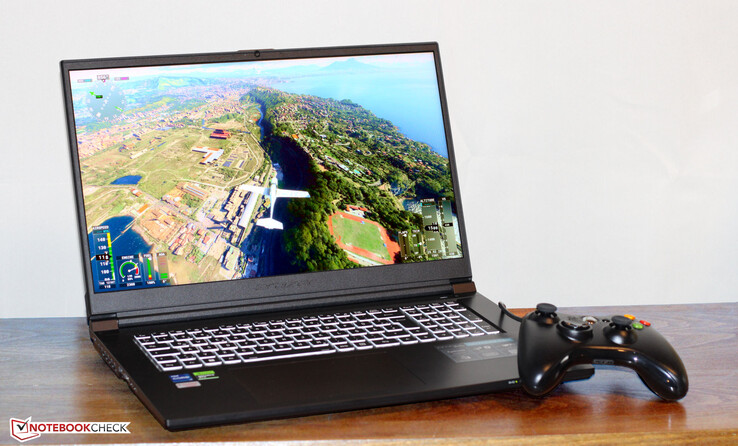
Medion ha presentado el Erazer Defender P40, un portátil para juegos QHD de gama media equipado con un Core-i7-13700HXy un procesadorGeForce-RTX-4060para portátiles. Está basado en un barebone (NP70SND) fabricado por la empresa Clevo y está disponible por unos 1.900 dólares. Entre sus competidores se encuentran dispositivos como elMSI Katana 17,Acer Predator Helios 300, Lenovo Legion Pro 5 16IRX8, Asus TUF Gaming A16 FA617y el Gigabyte G7 KE.
Posibles contendientes en la comparación
Valoración | Fecha | Modelo | Peso | Altura | Tamaño | Resolución | Precio |
|---|---|---|---|---|---|---|---|
| 84.6 % v7 (old) | 05/2023 | Medion Erazer Defender P40 i7-13700HX, GeForce RTX 4060 Laptop GPU | 2.9 kg | 33 mm | 17.30" | 2560x1440 | |
| 82.1 % v7 (old) | 02/2023 | MSI Katana 17 B13VFK i7-13620H, GeForce RTX 4060 Laptop GPU | 2.8 kg | 25.2 mm | 17.30" | 1920x1080 | |
| 86.5 % v7 (old) | 11/2022 | Acer Predator Helios 300 (i7-12700H, RTX 3070 Ti) i7-12700H, GeForce RTX 3070 Ti Laptop GPU | 3 kg | 27.65 mm | 17.30" | 2560x1440 | |
| 87.9 % v7 (old) | 05/2023 | Lenovo Legion Pro 5 16IRX8 i7-13700HX, GeForce RTX 4060 Laptop GPU | 2.5 kg | 26.8 mm | 16.00" | 2560x1600 | |
| 86.2 % v7 (old) | 02/2023 | Asus TUF Gaming A16 FA617 R7 7735HS, Radeon RX 7600S | 2.2 kg | 27 mm | 16.00" | 1920x1200 | |
| 83.3 % v7 (old) | 01/2023 | Gigabyte G7 KE i5-12500H, GeForce RTX 3060 Laptop GPU | 2.6 kg | 25 mm | 17.30" | 1920x1080 |
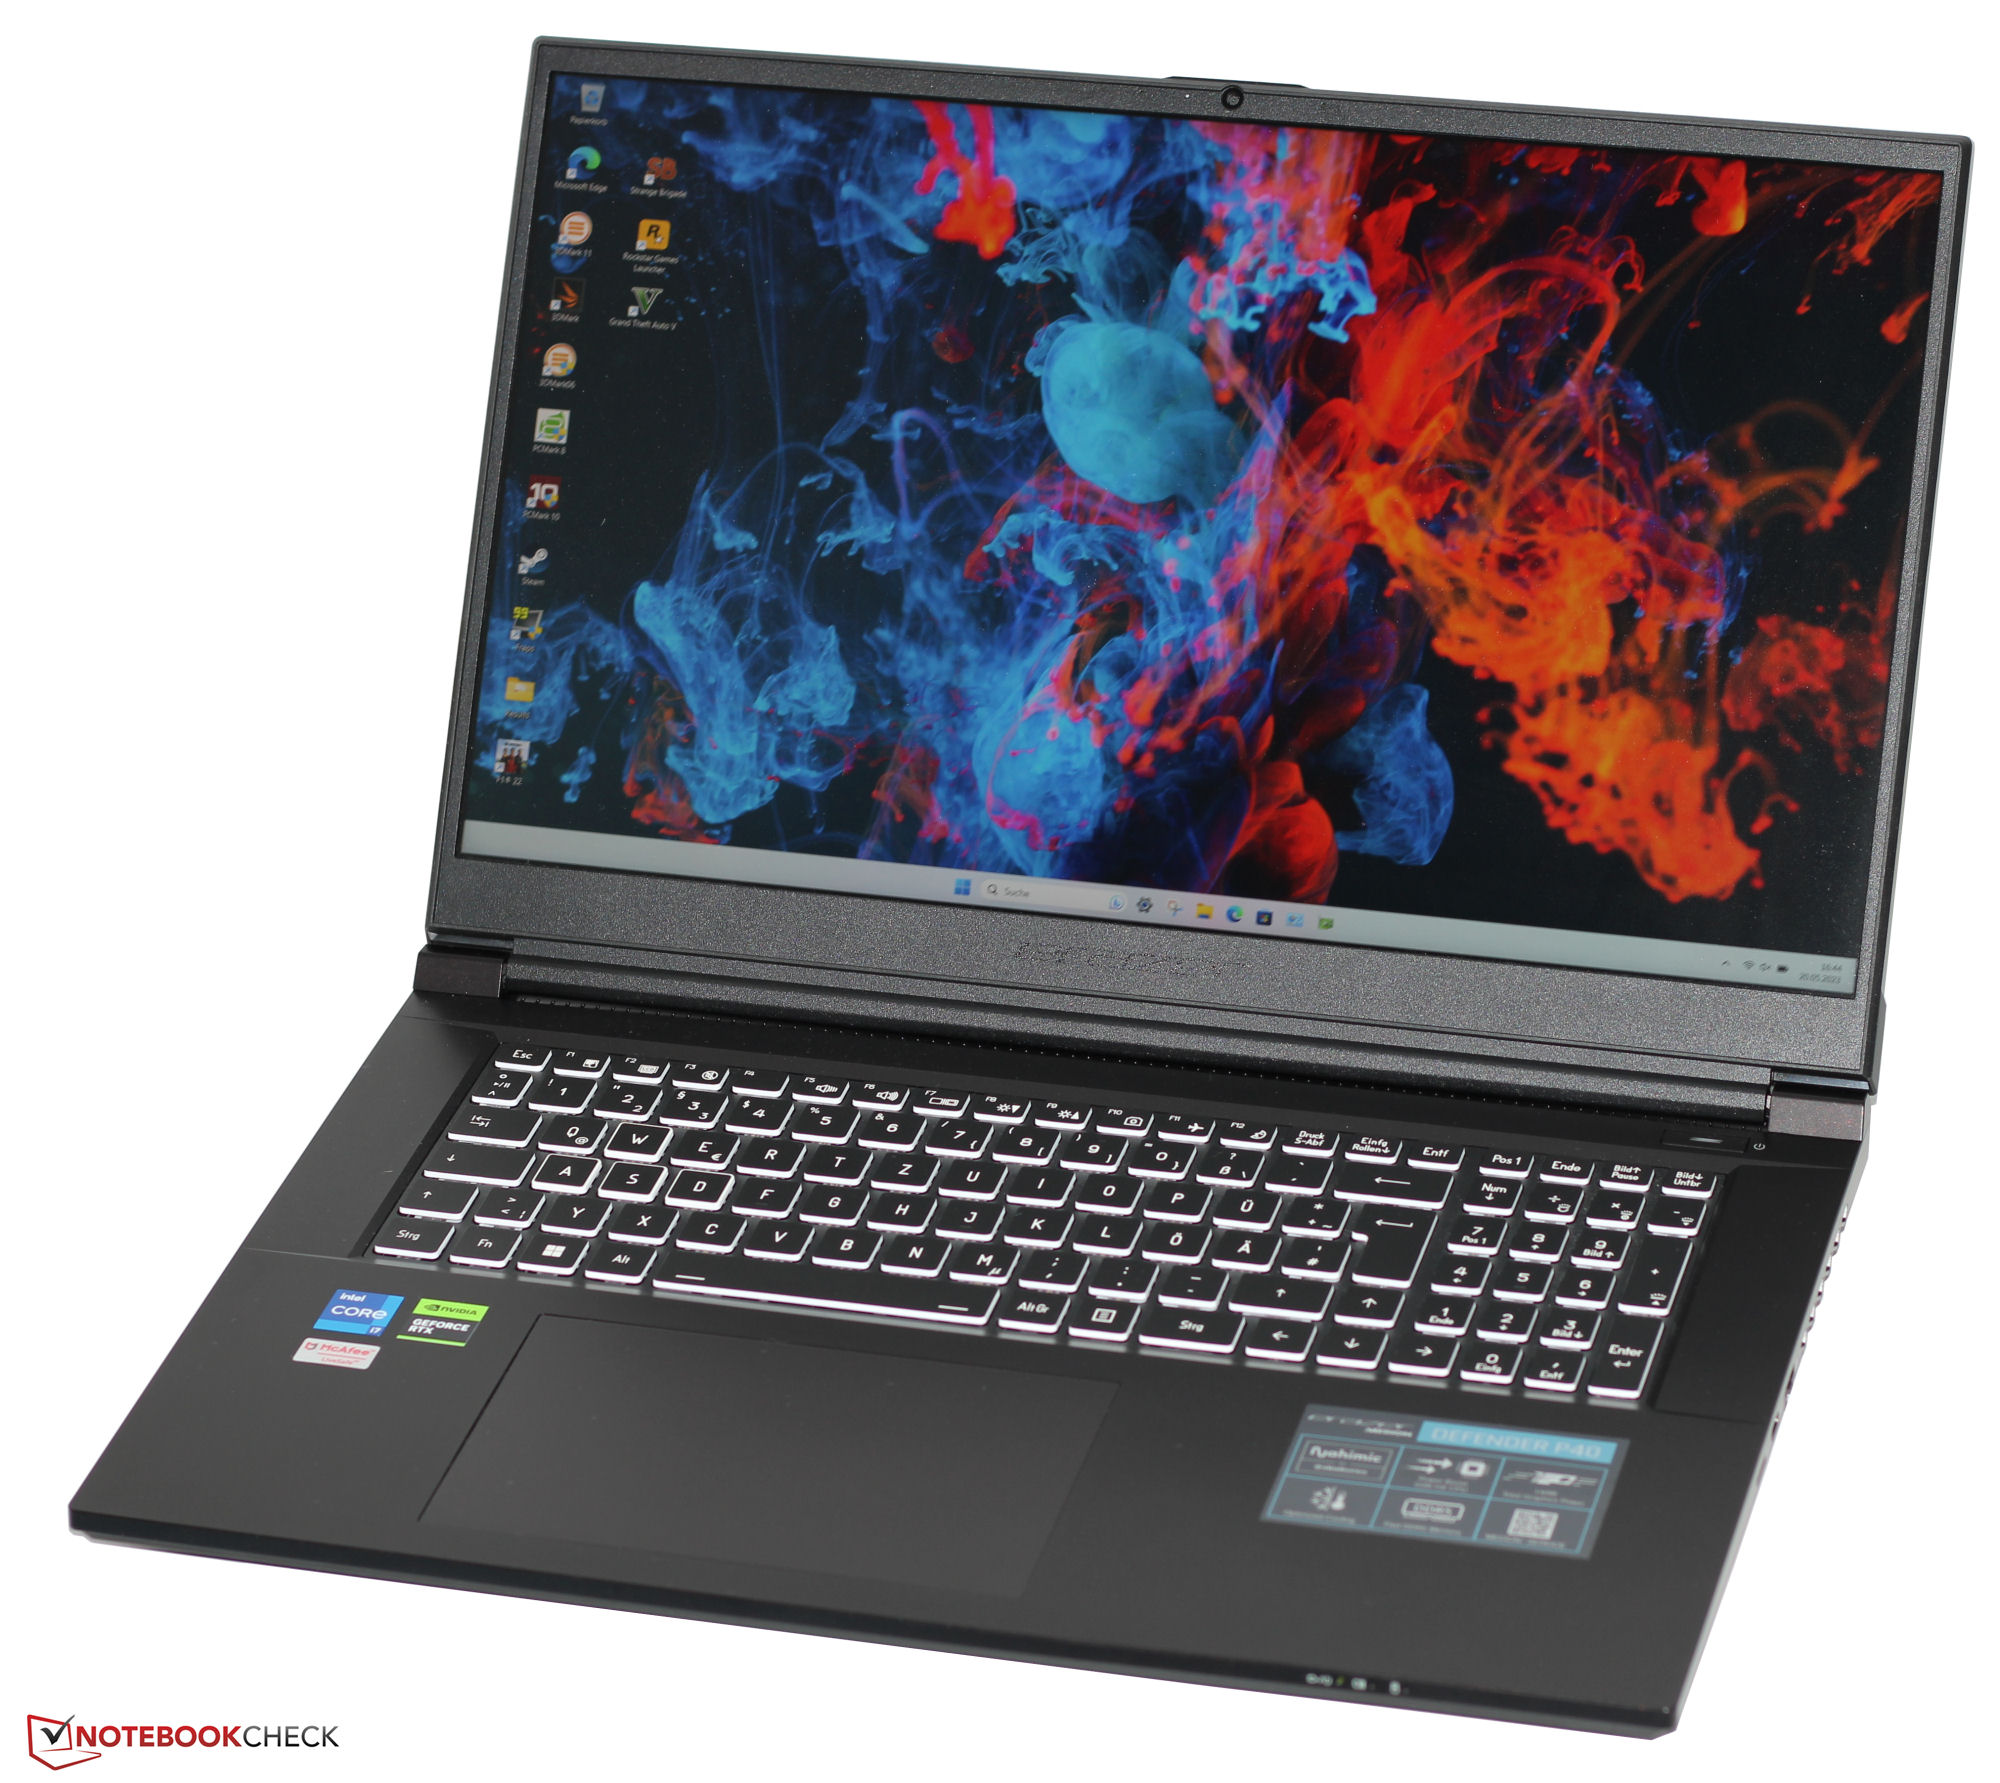
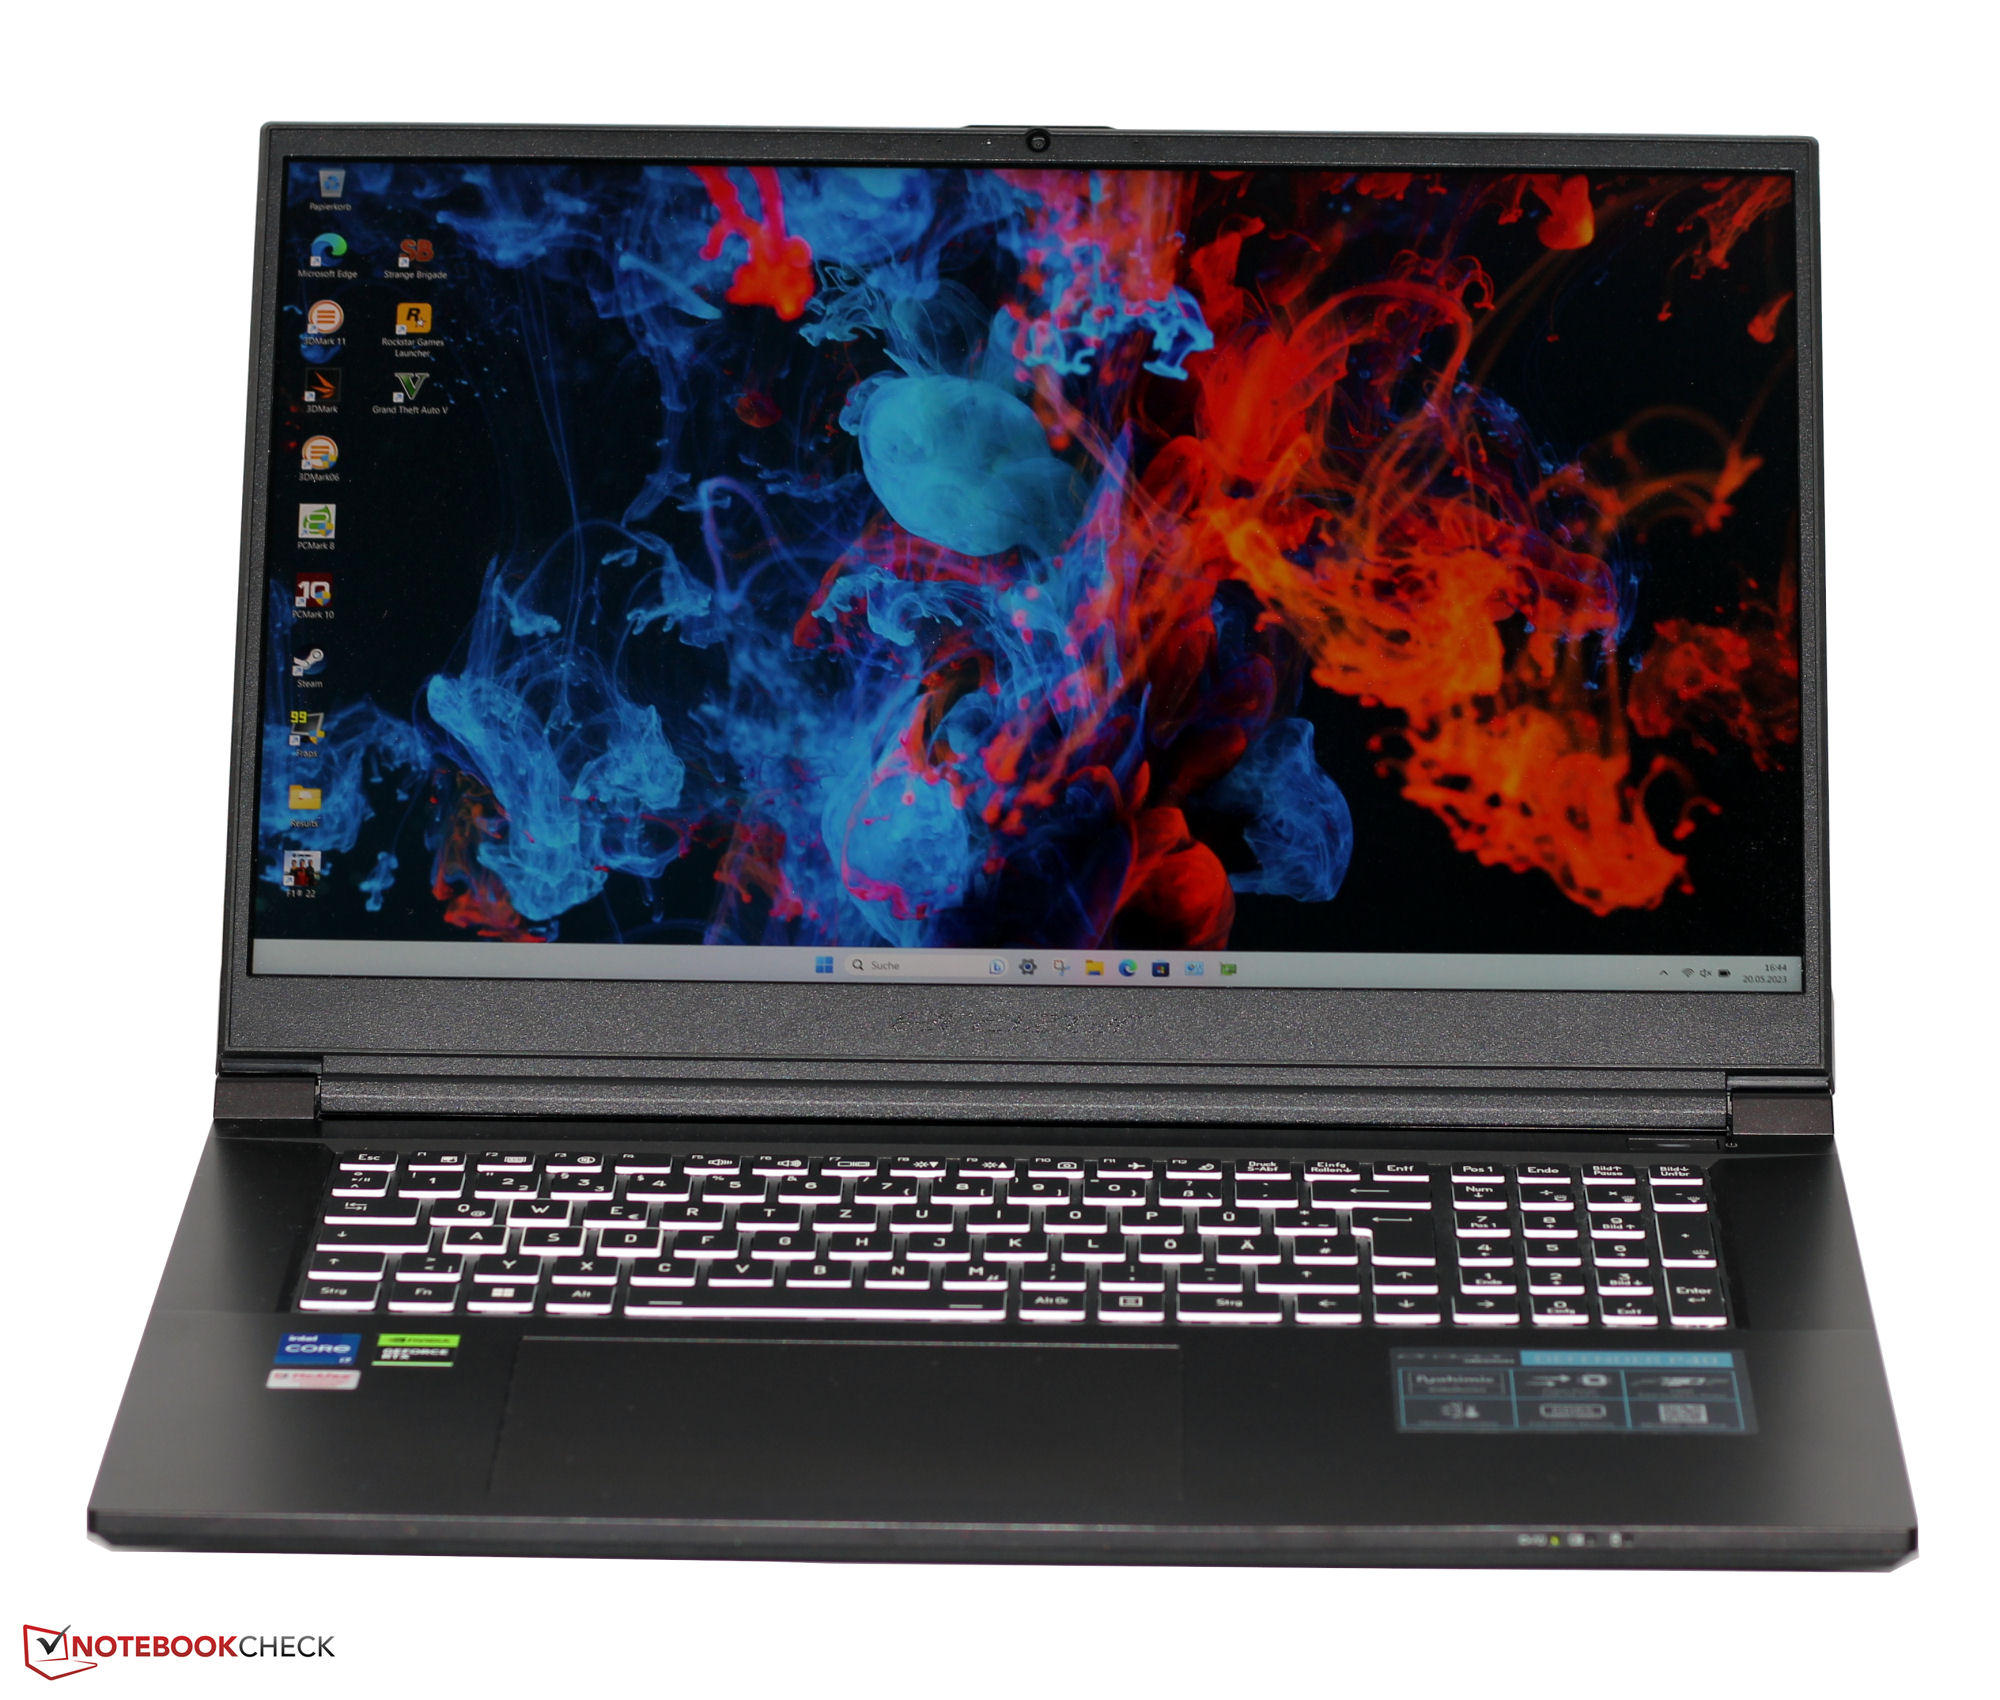
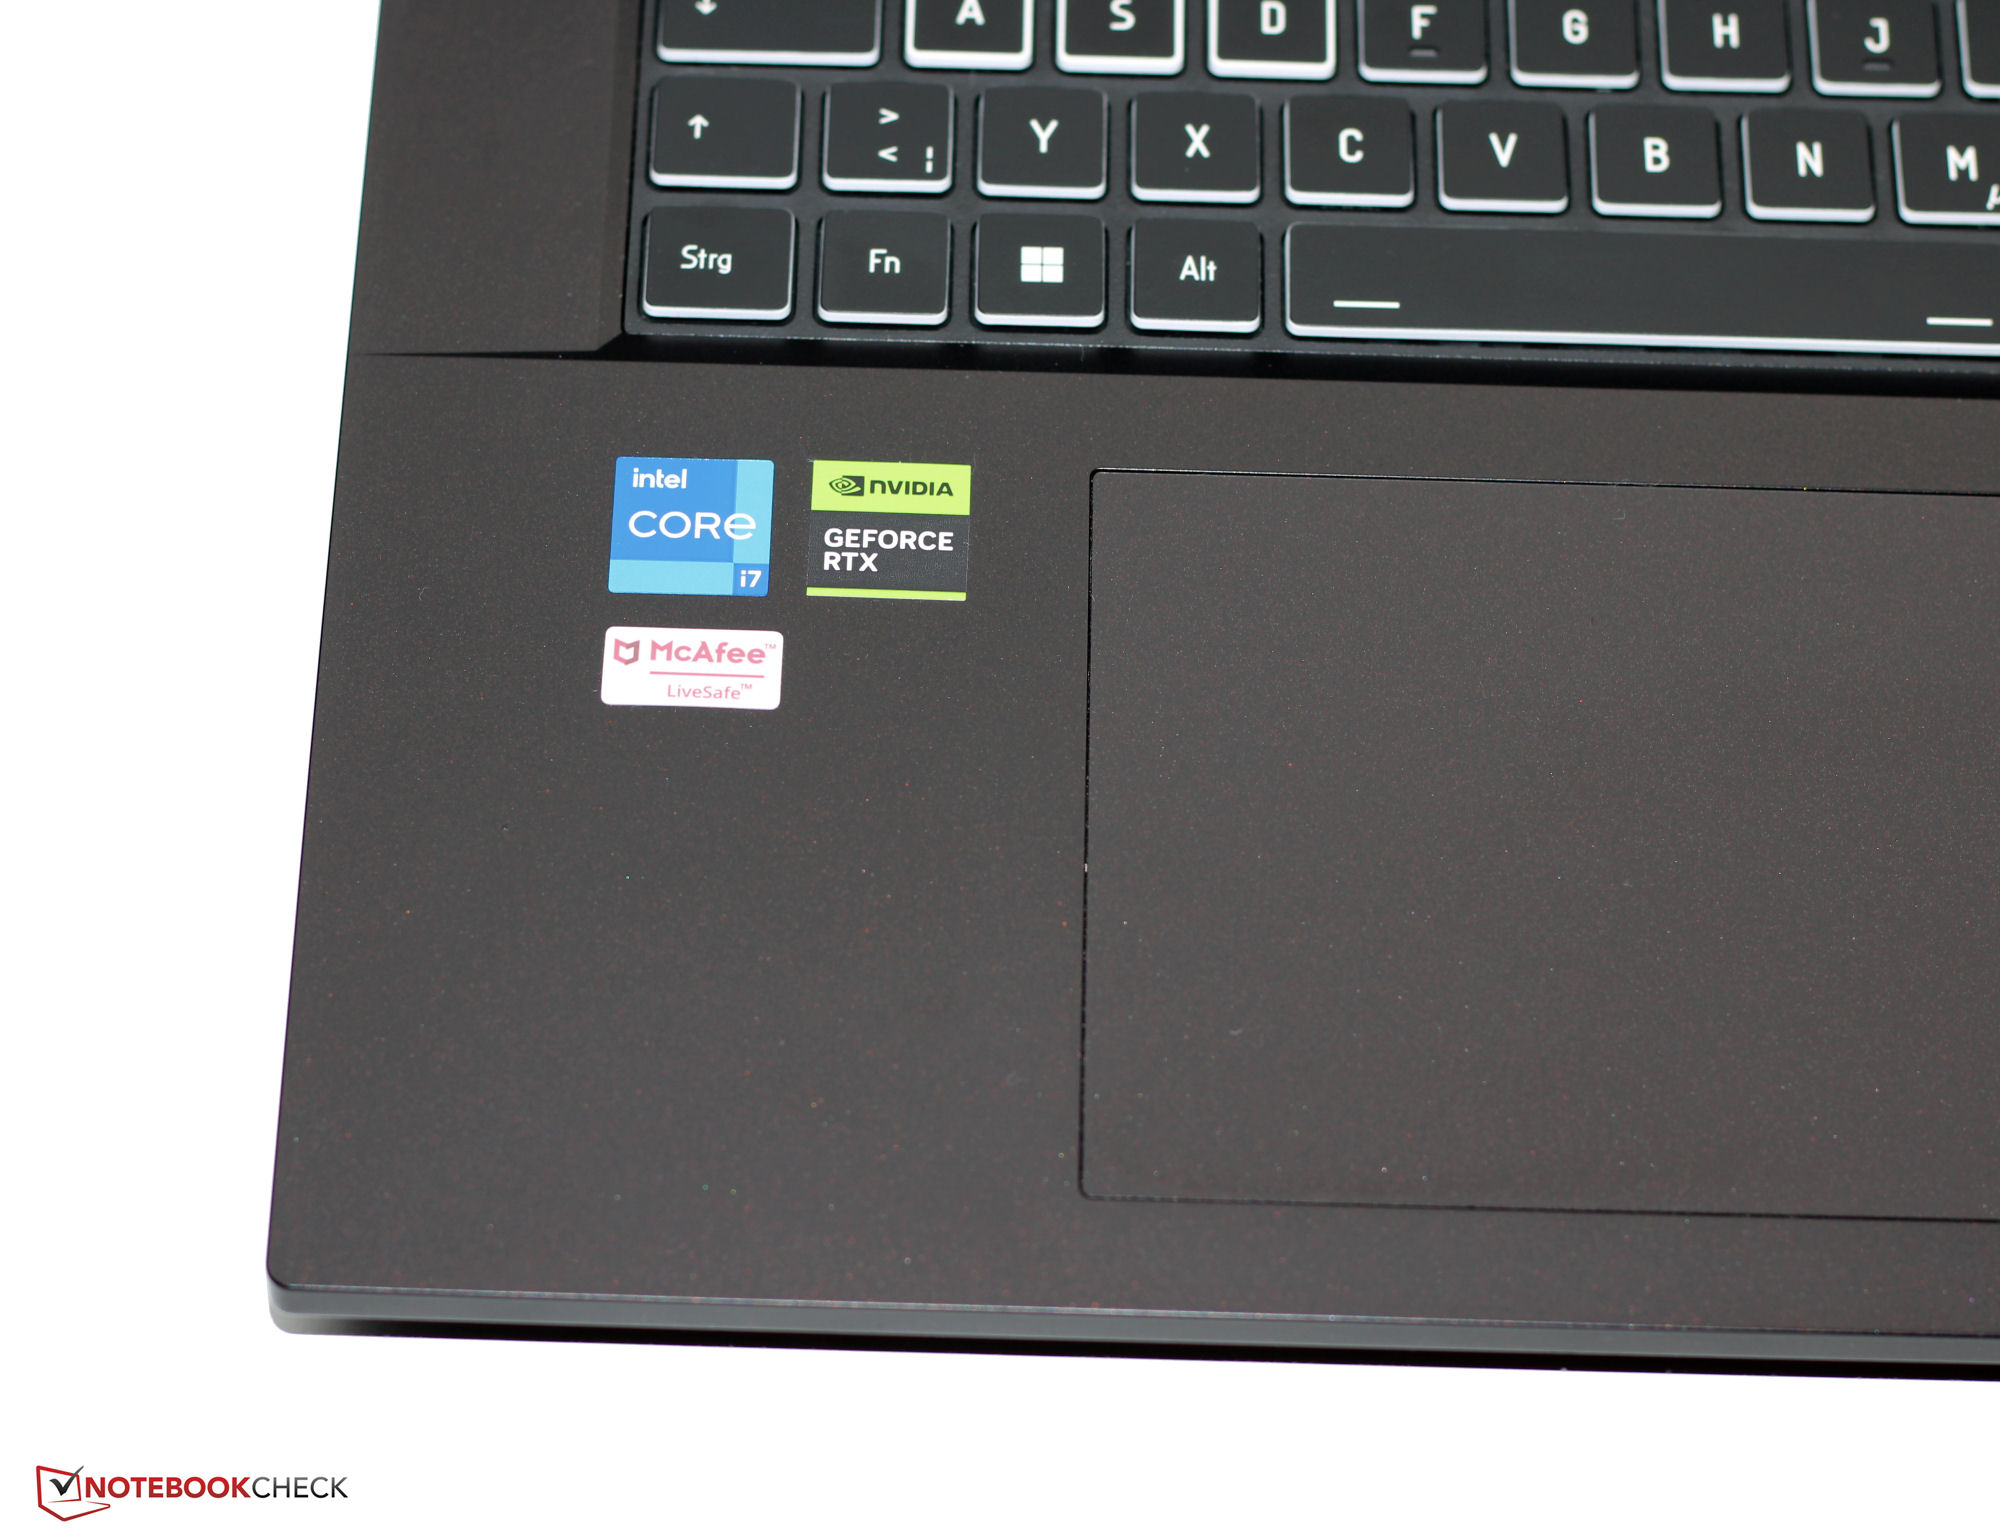
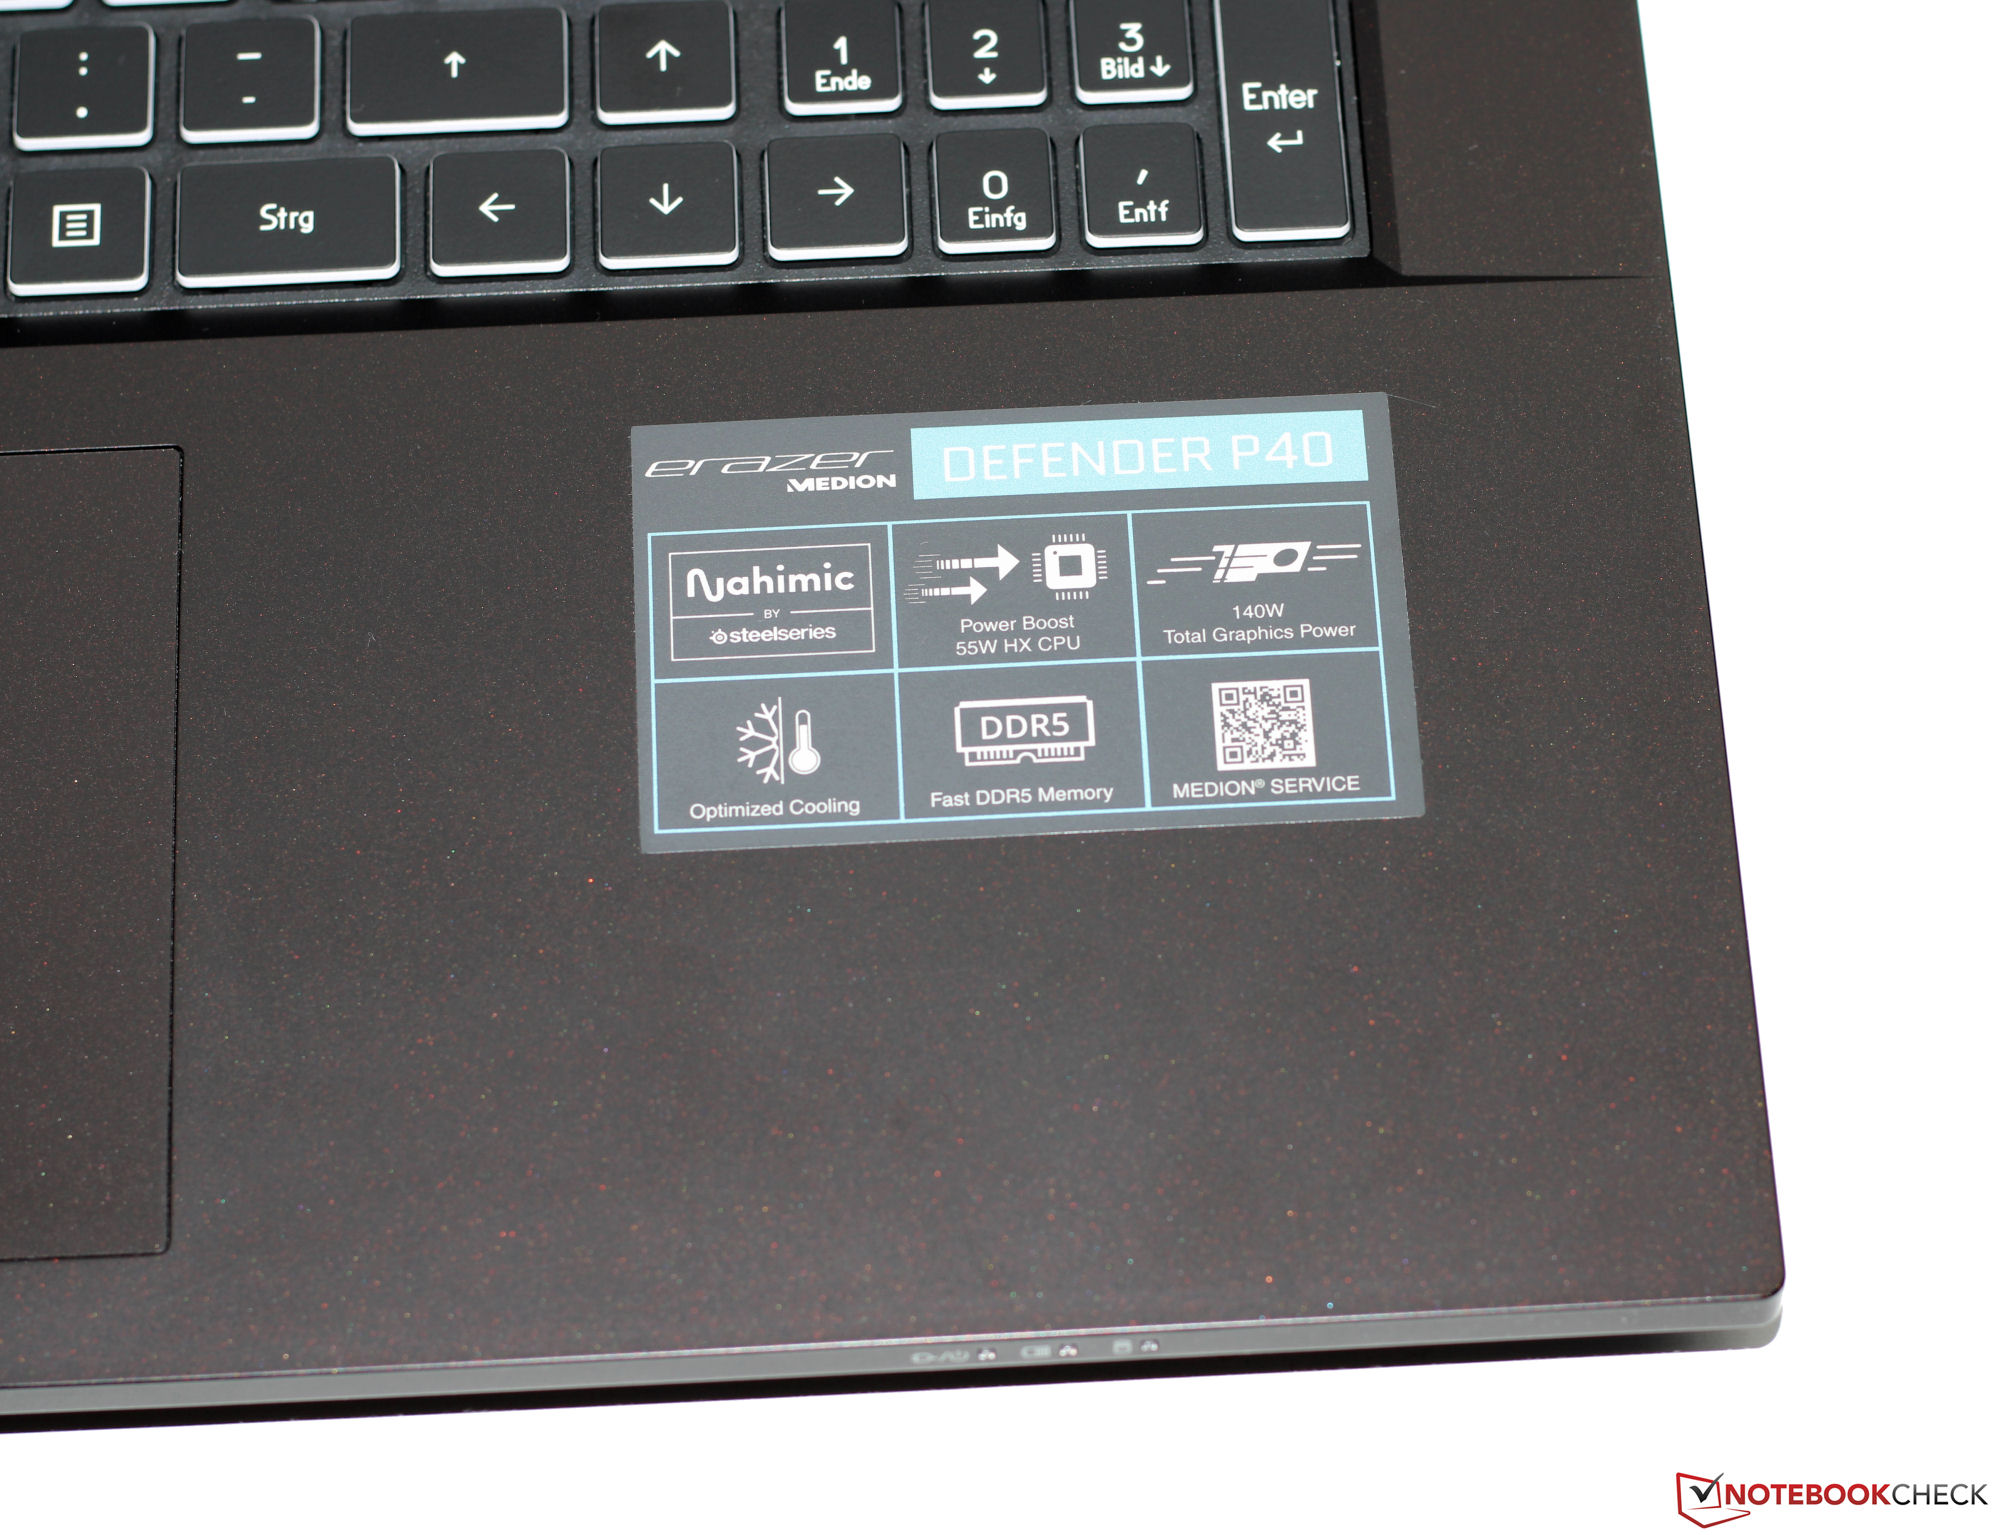
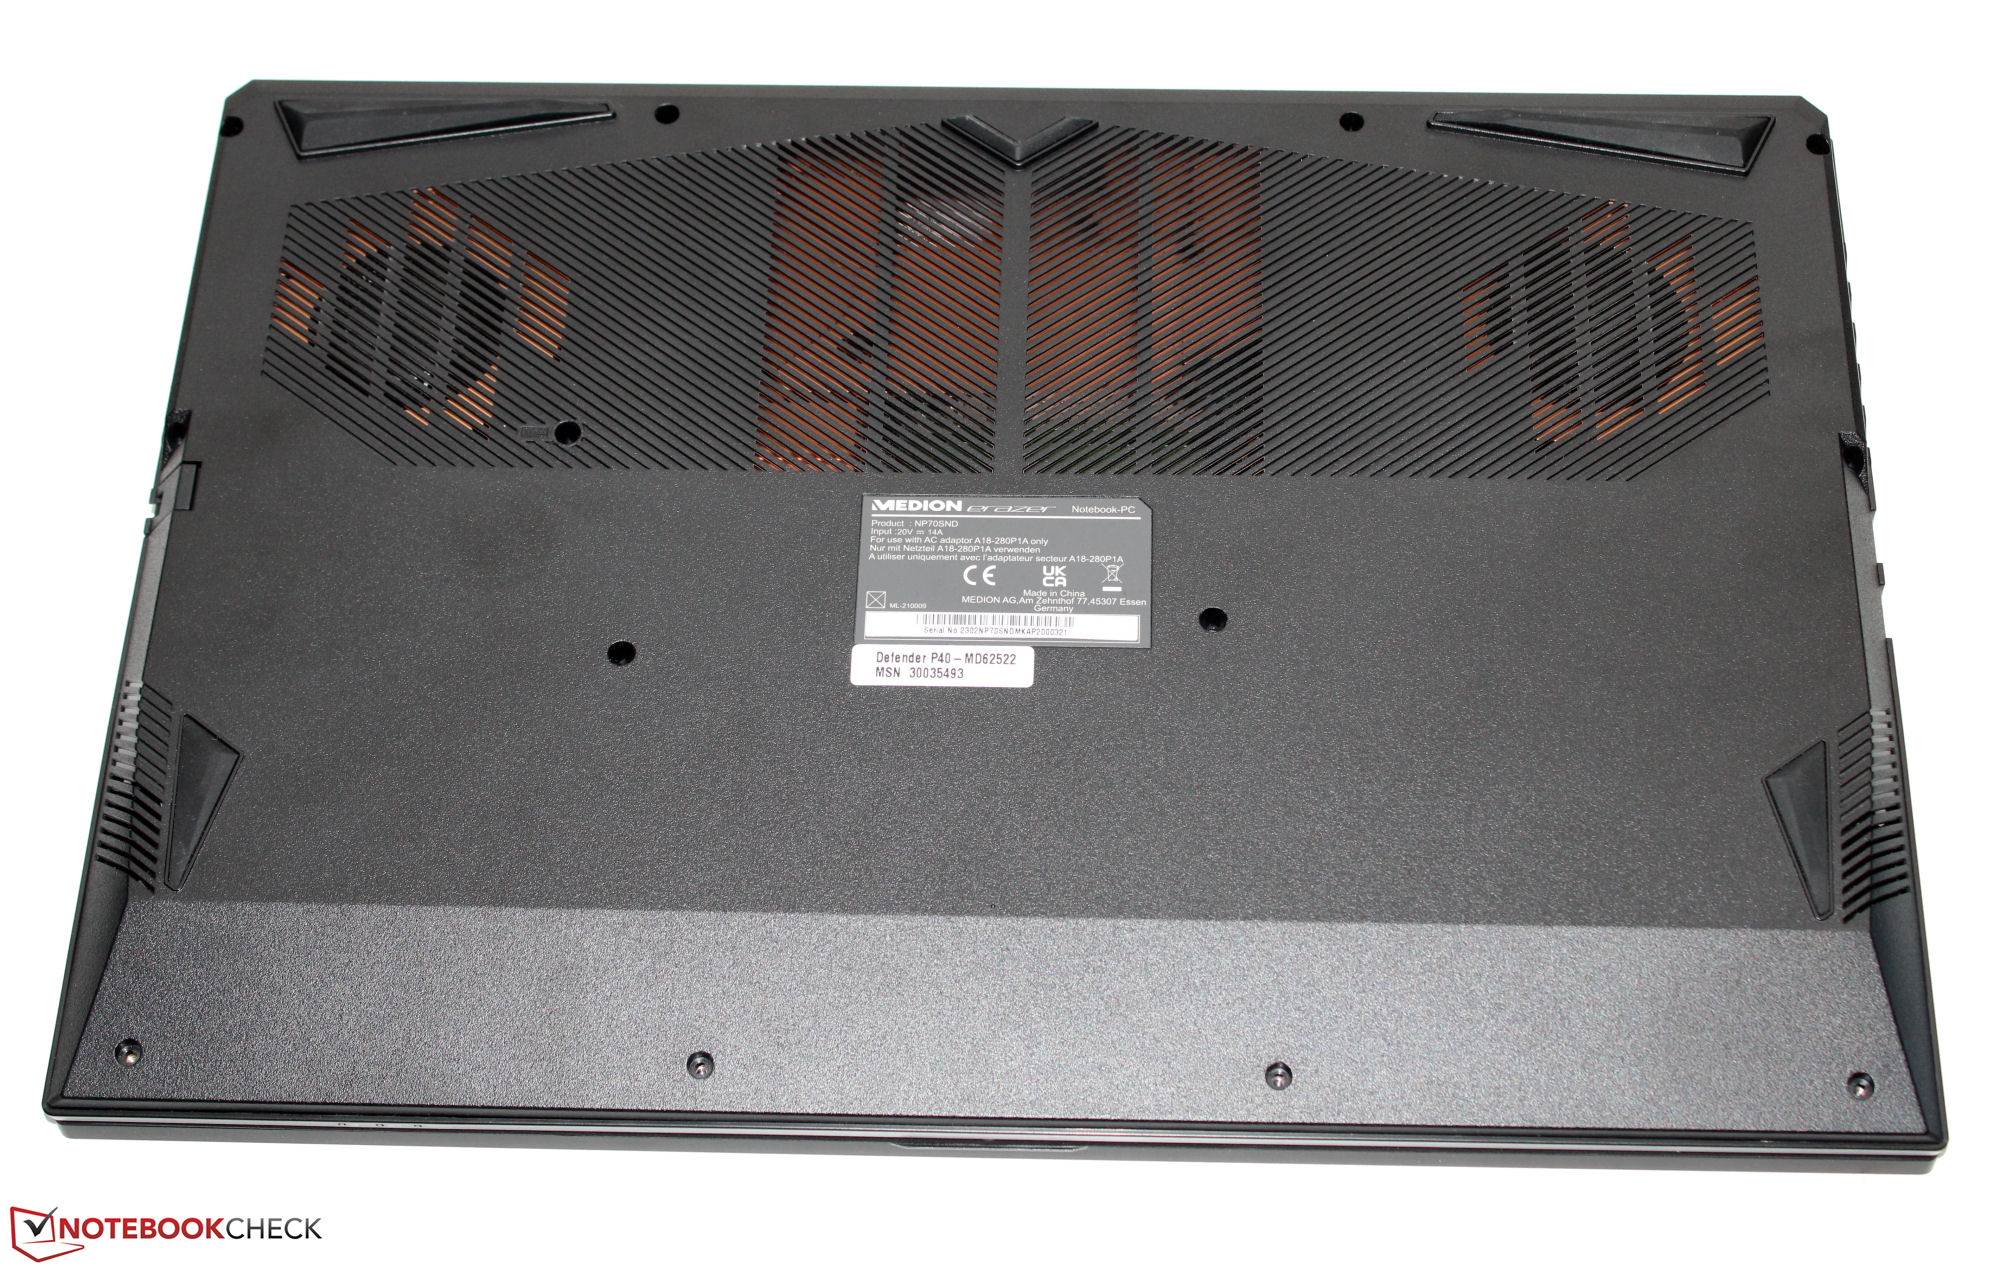
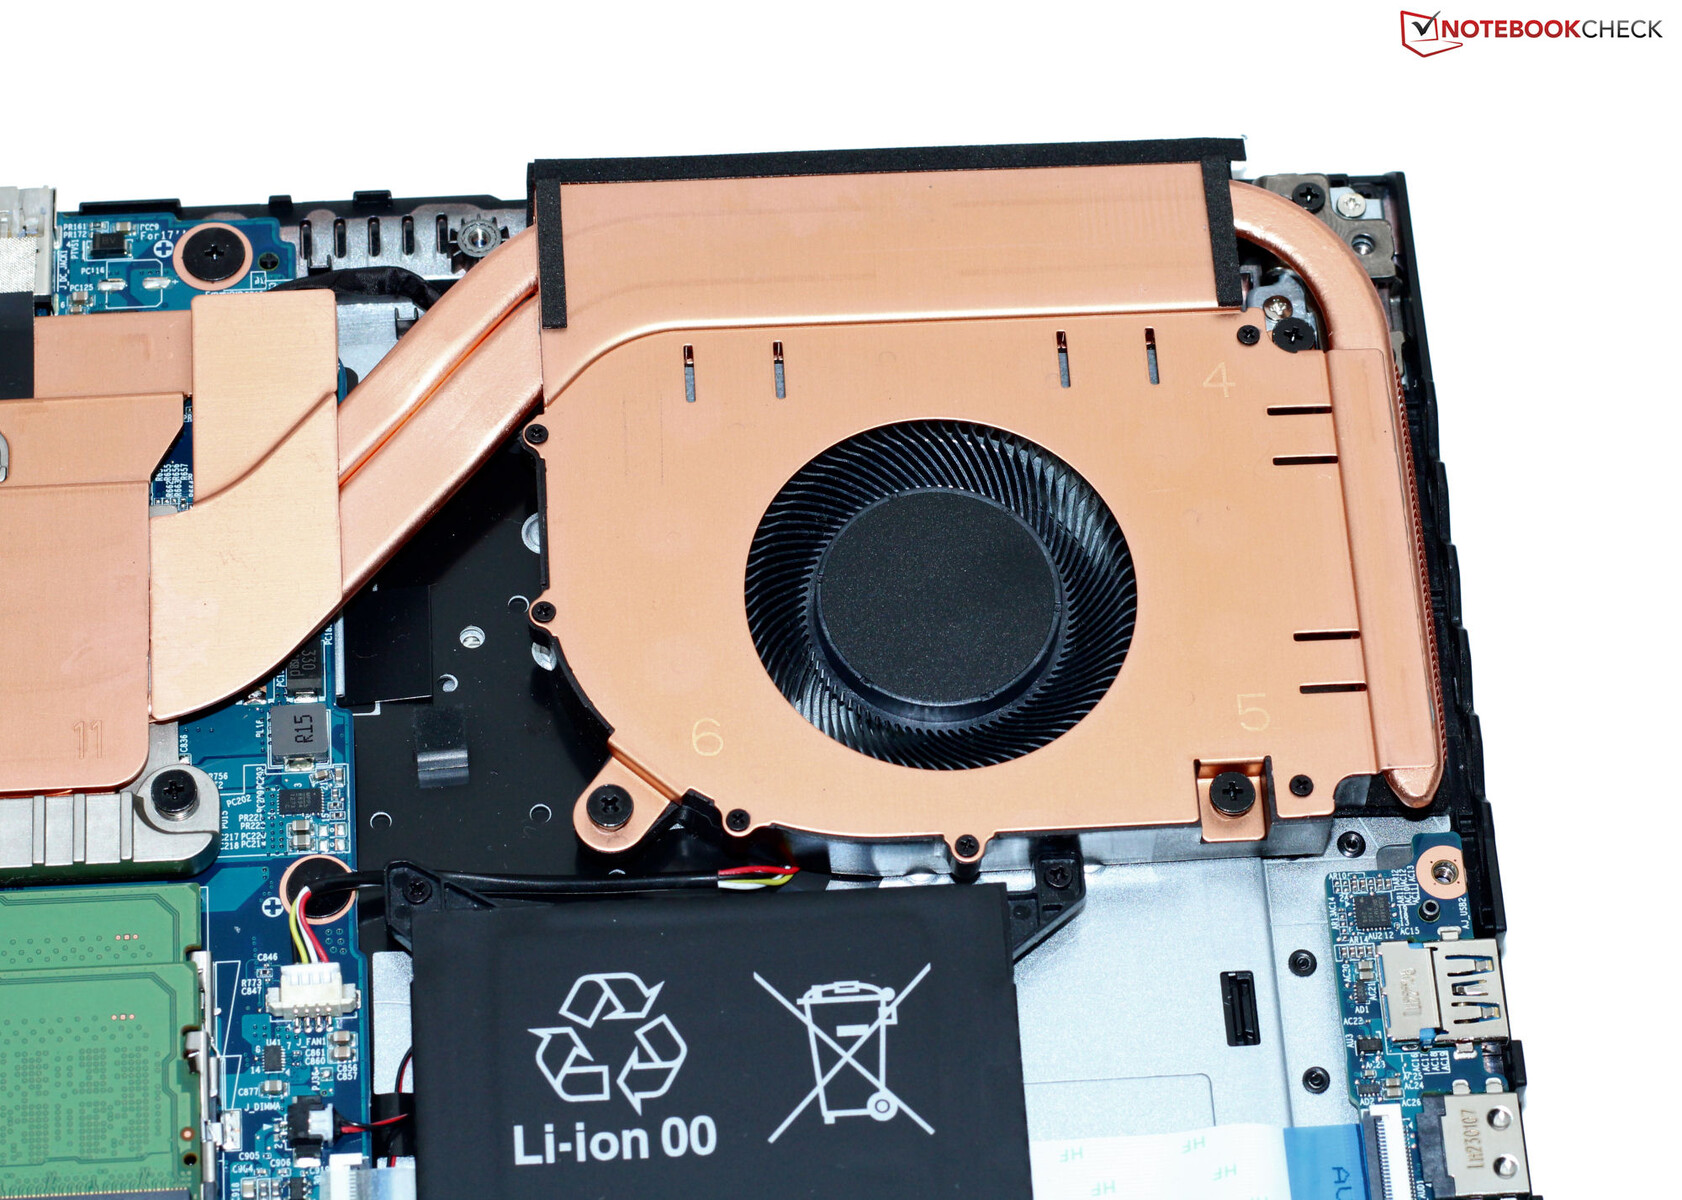
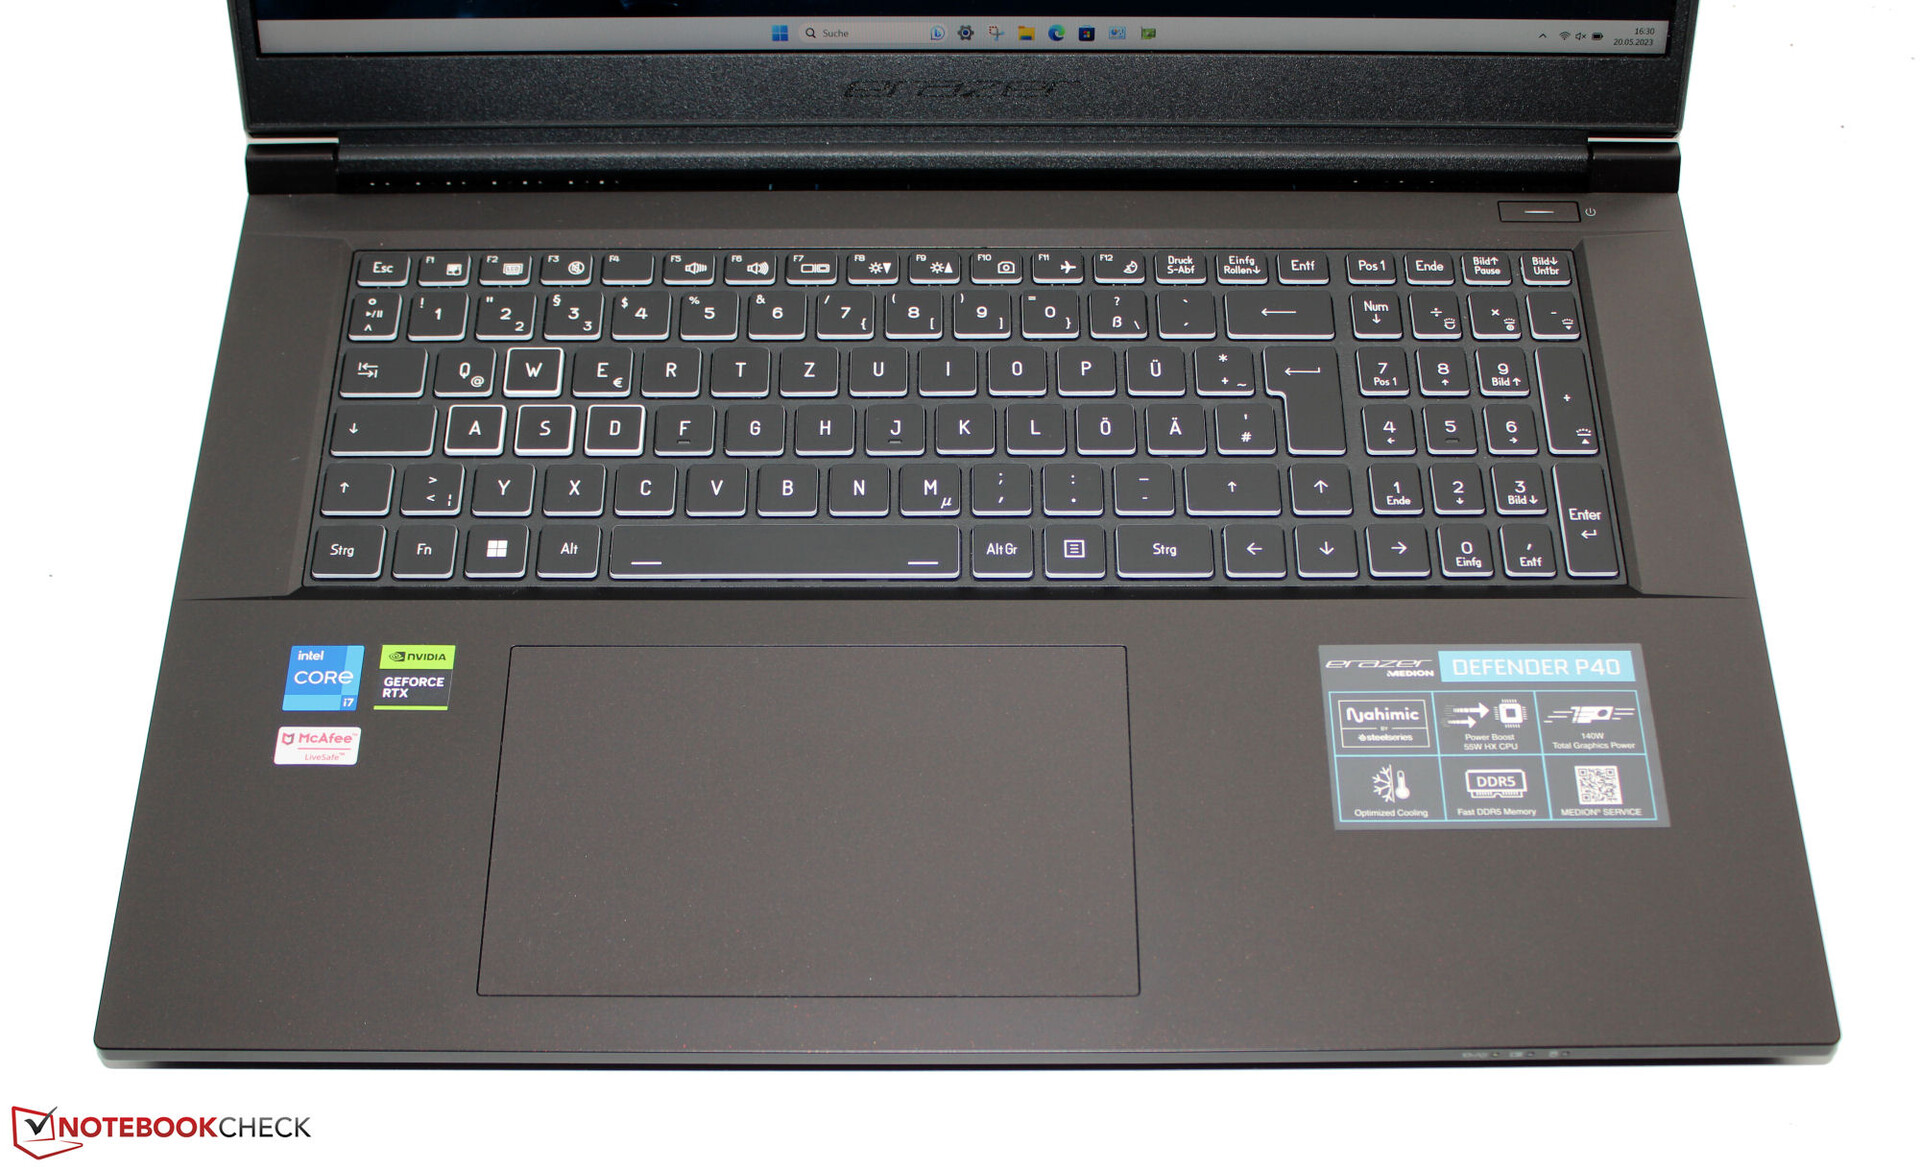
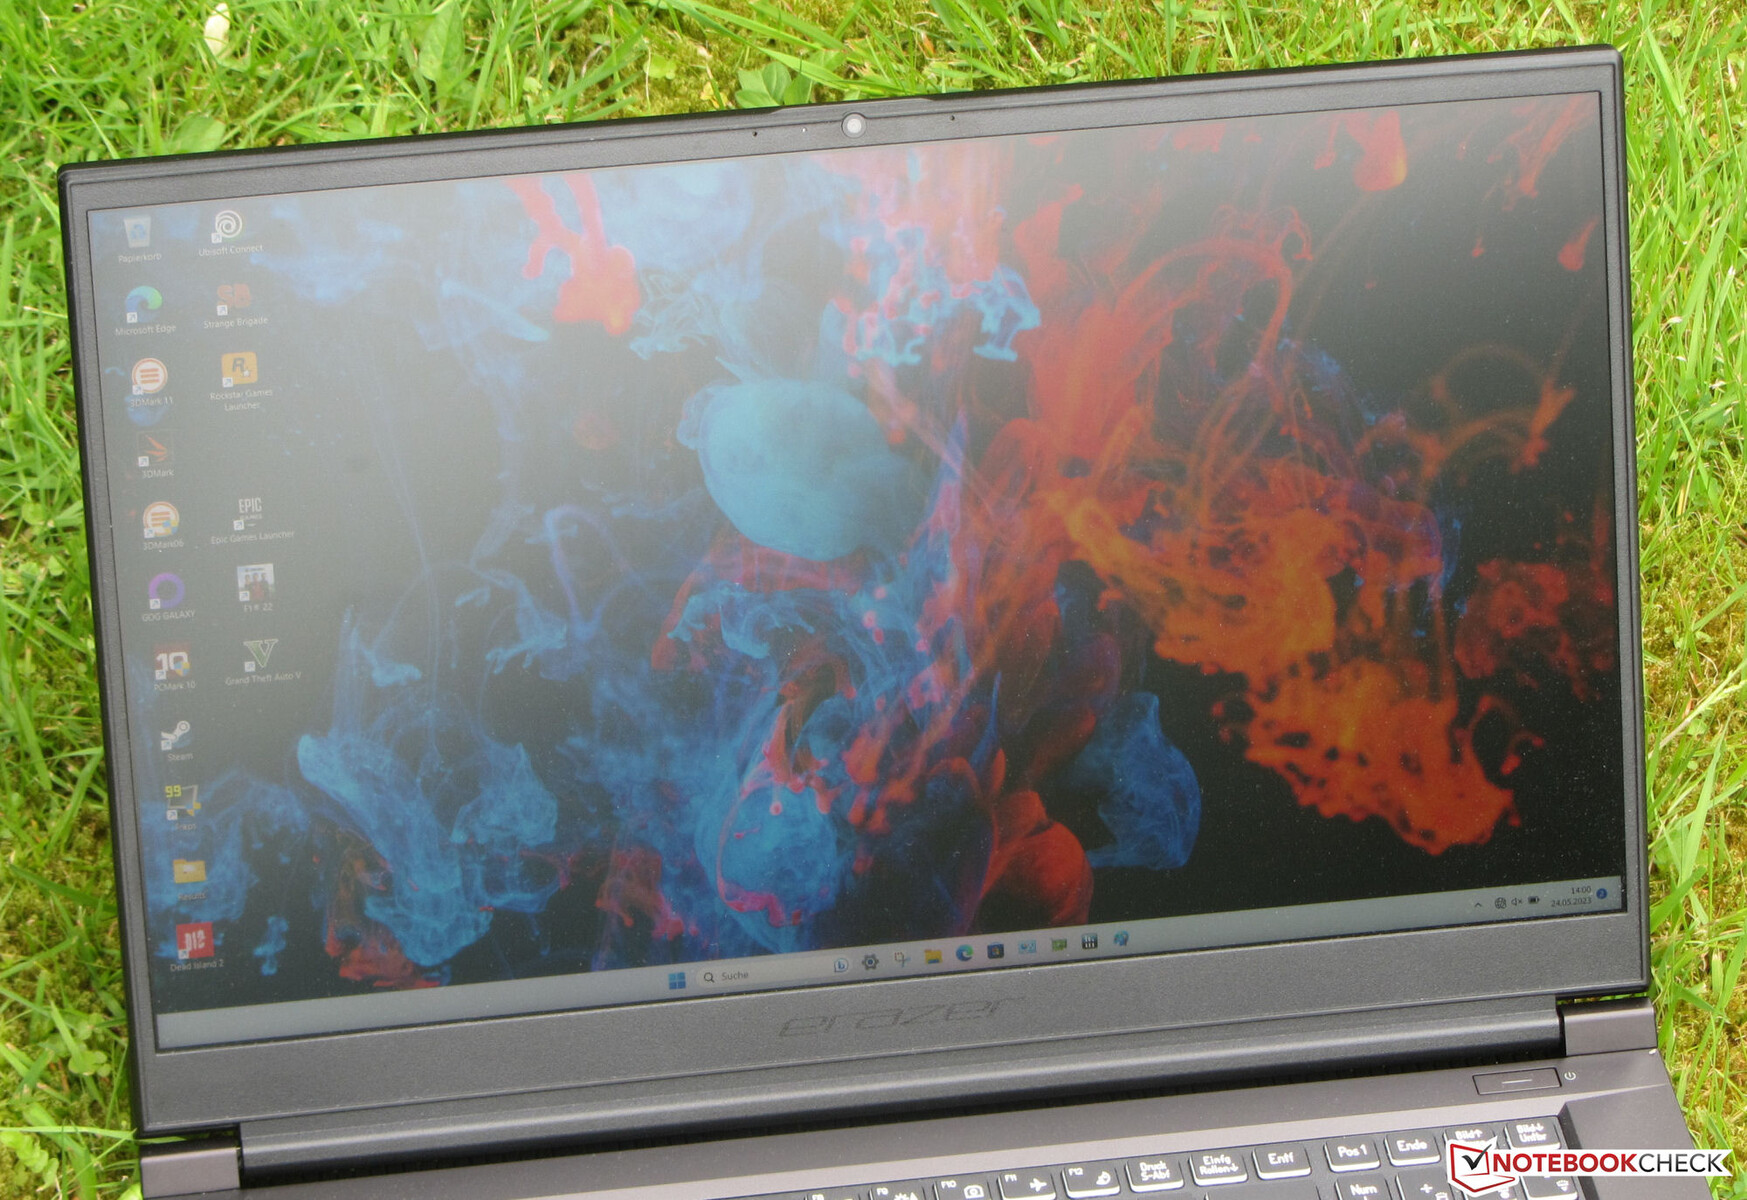
Carcasa - La P40 tiene una carcasa de plástico
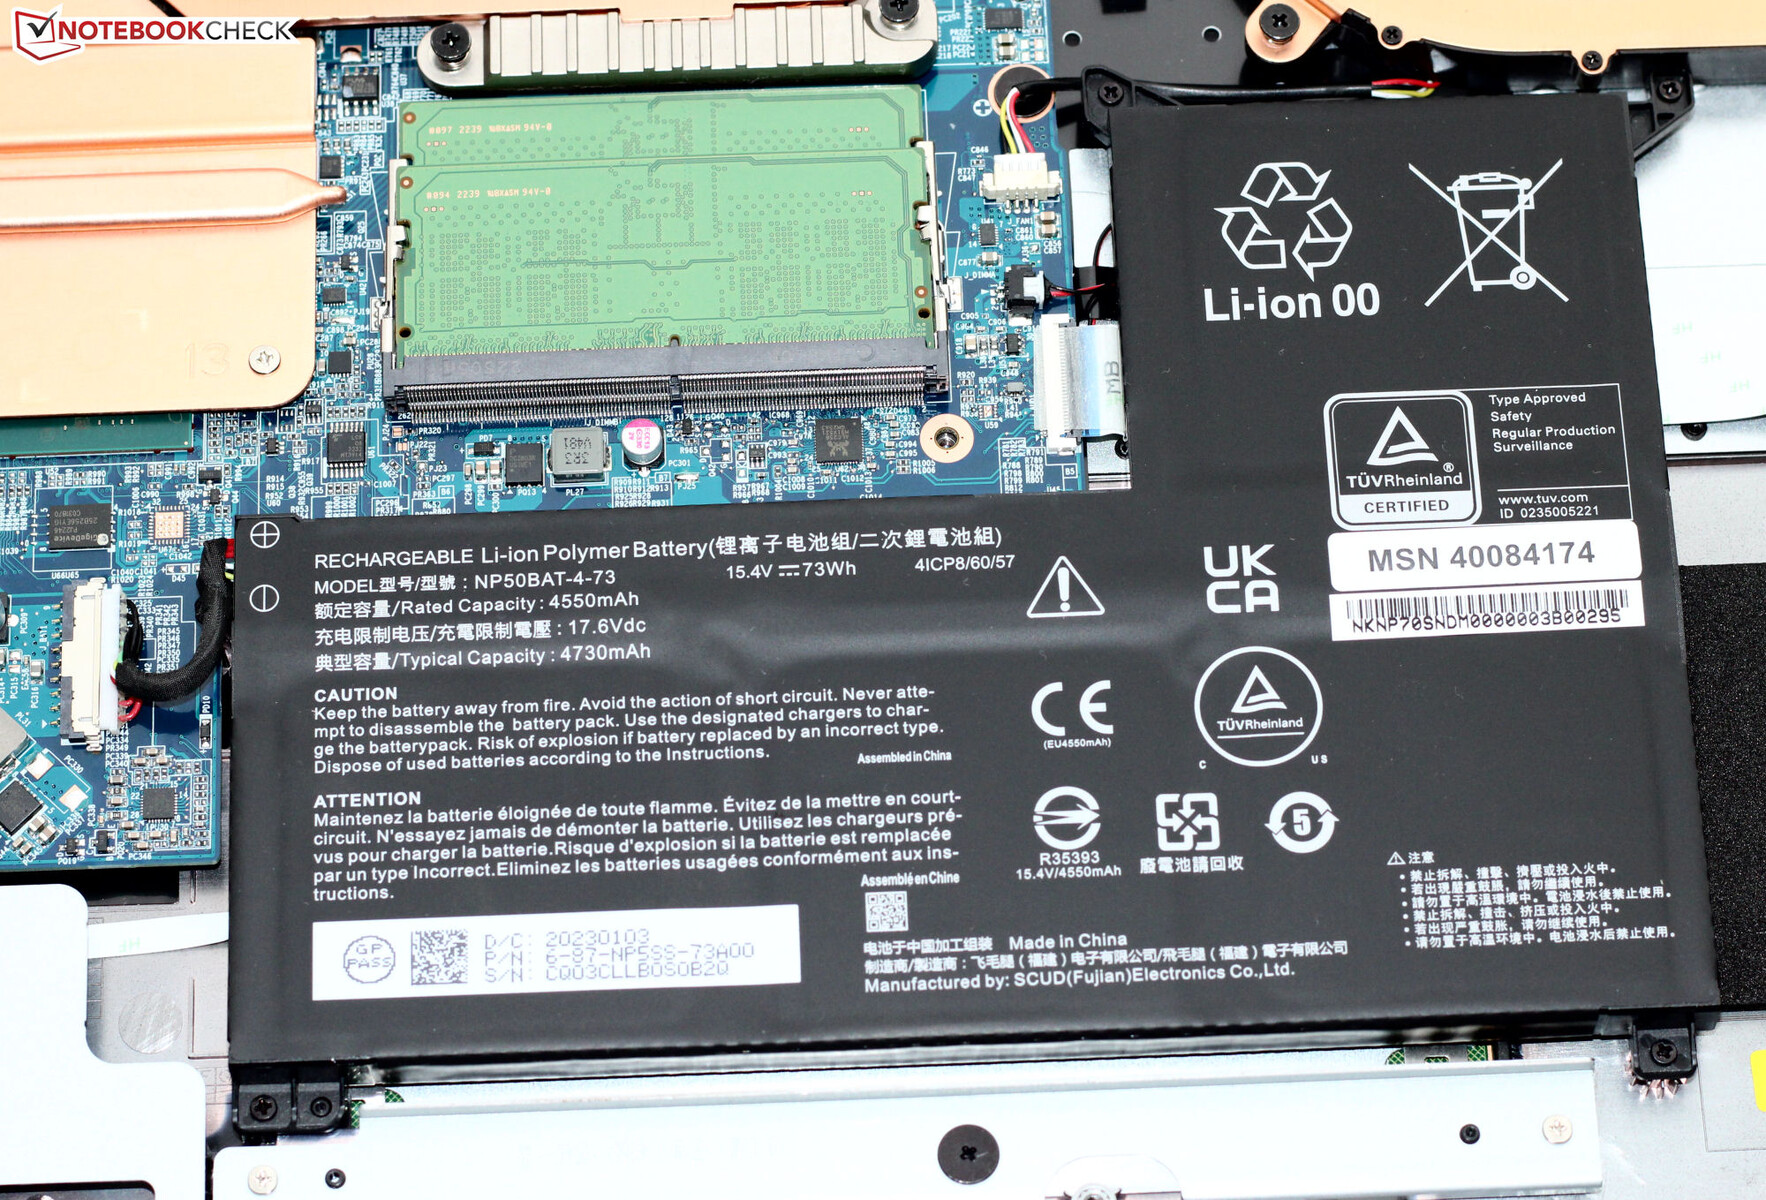
Medion ha elegido una carcasa negra para el P40 con superficies lisas y reflectantes mate. El portátil, de aspecto elegante, no tiene características de diseño extravagantes. Aparte de su teclado iluminado, el portátil no presenta elementos LED. Se puede acceder fácilmente a la batería (atornillada, no pegada) y al resto de las entrañas del portátil una vez retirada la parte inferior de la carcasa.
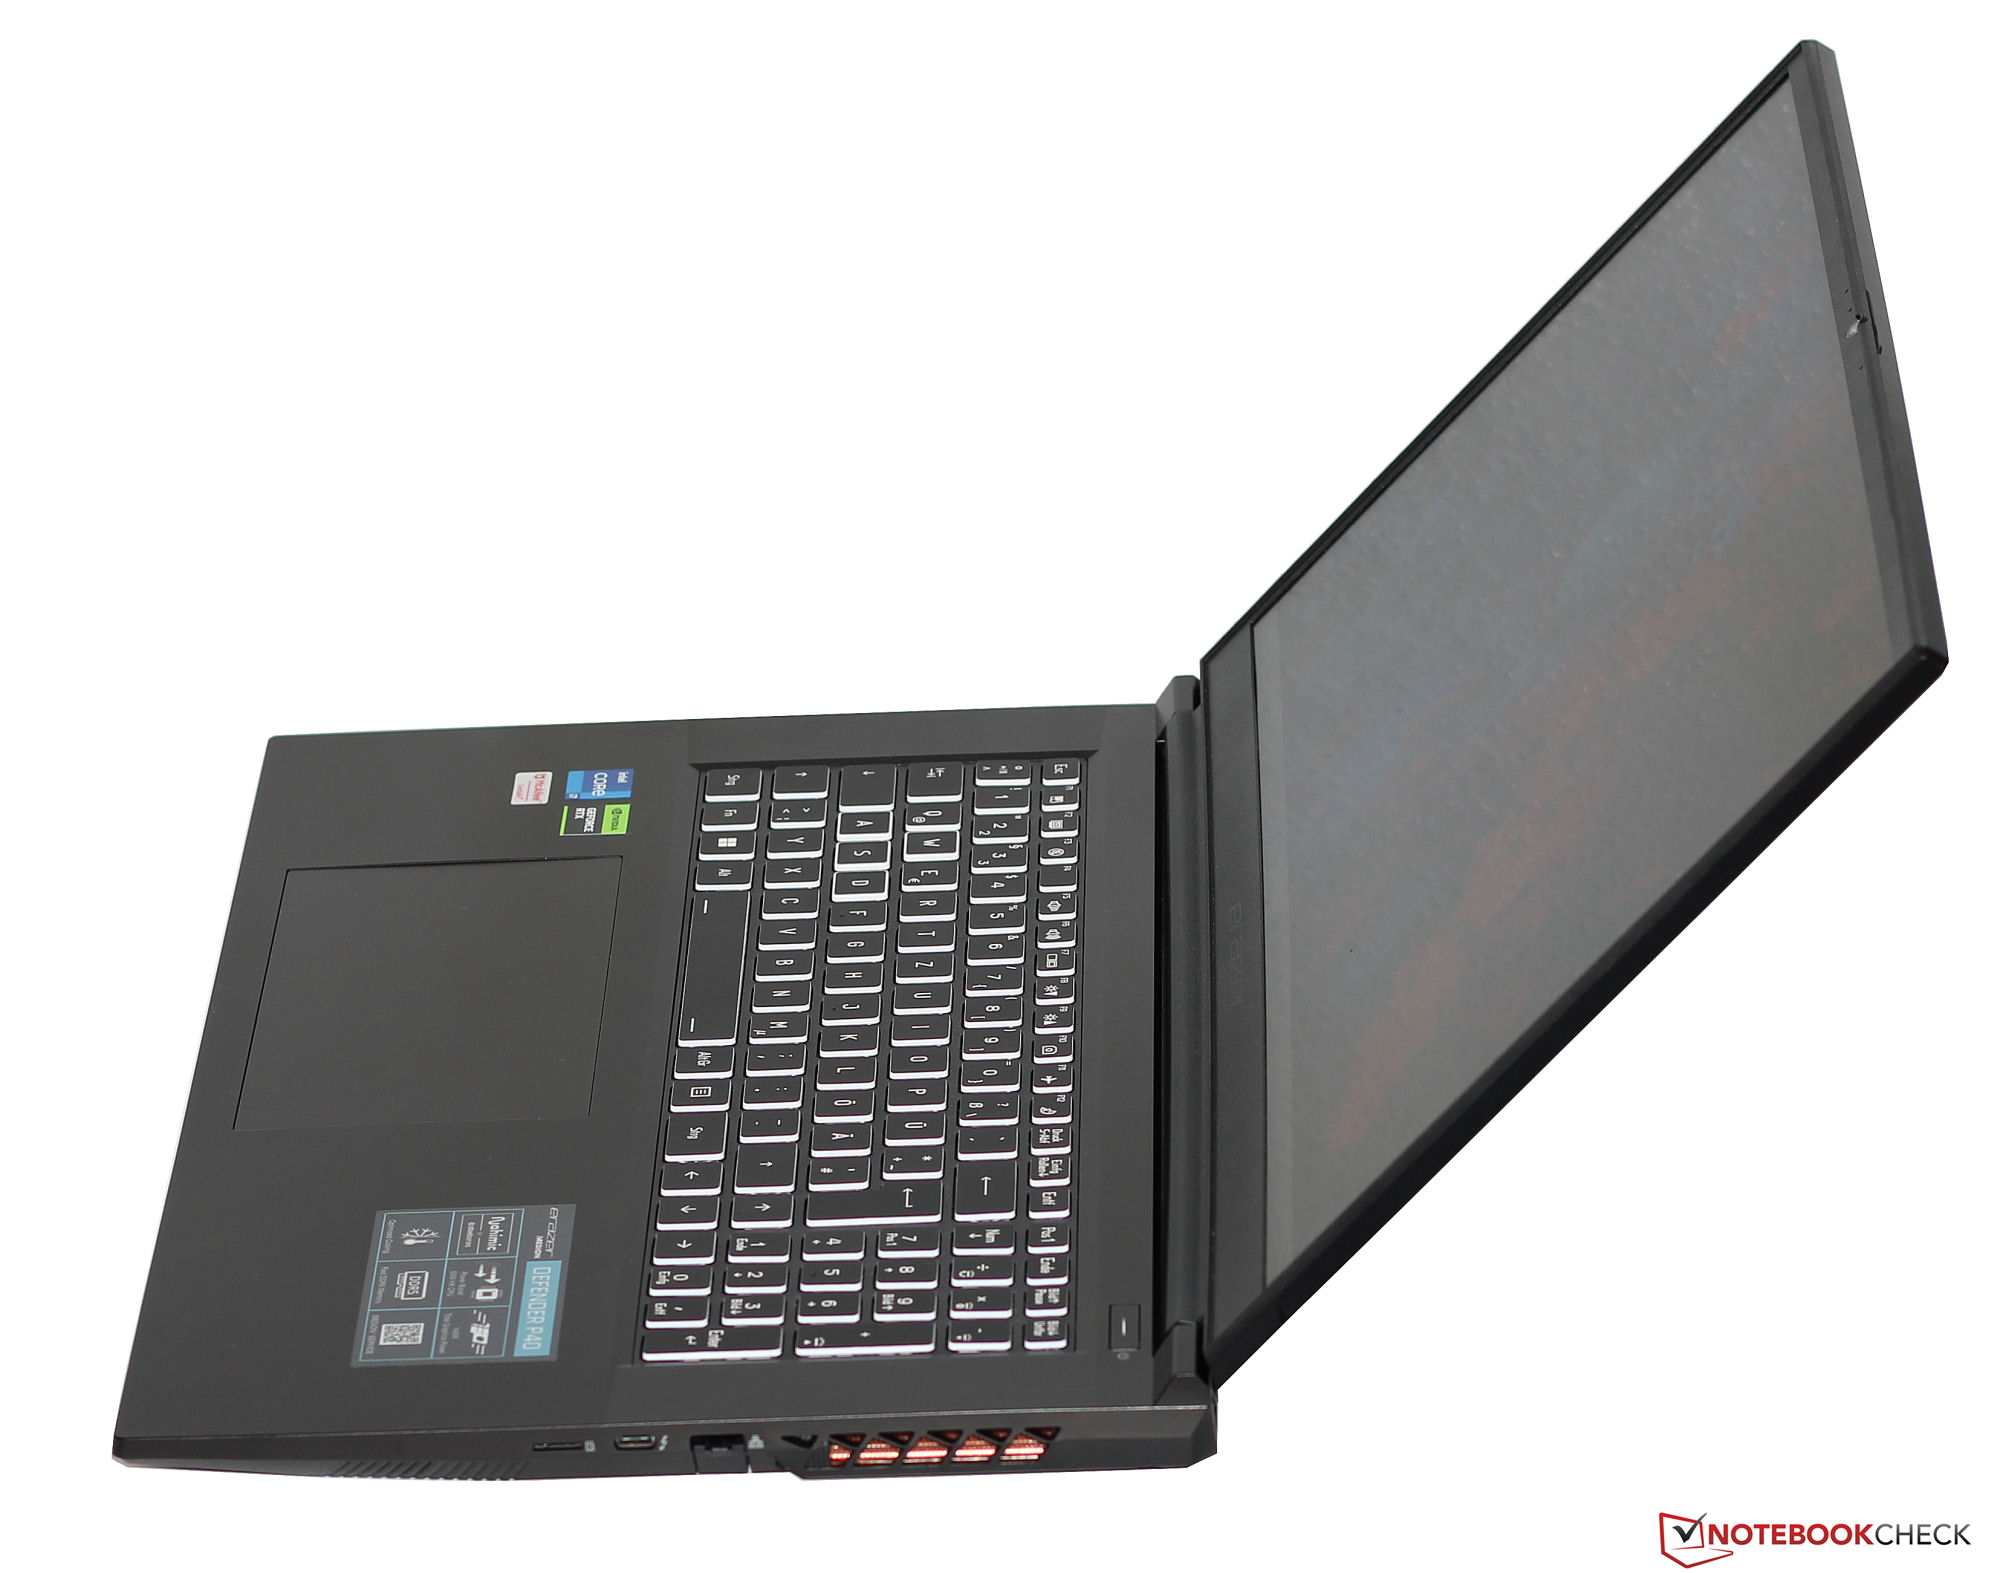
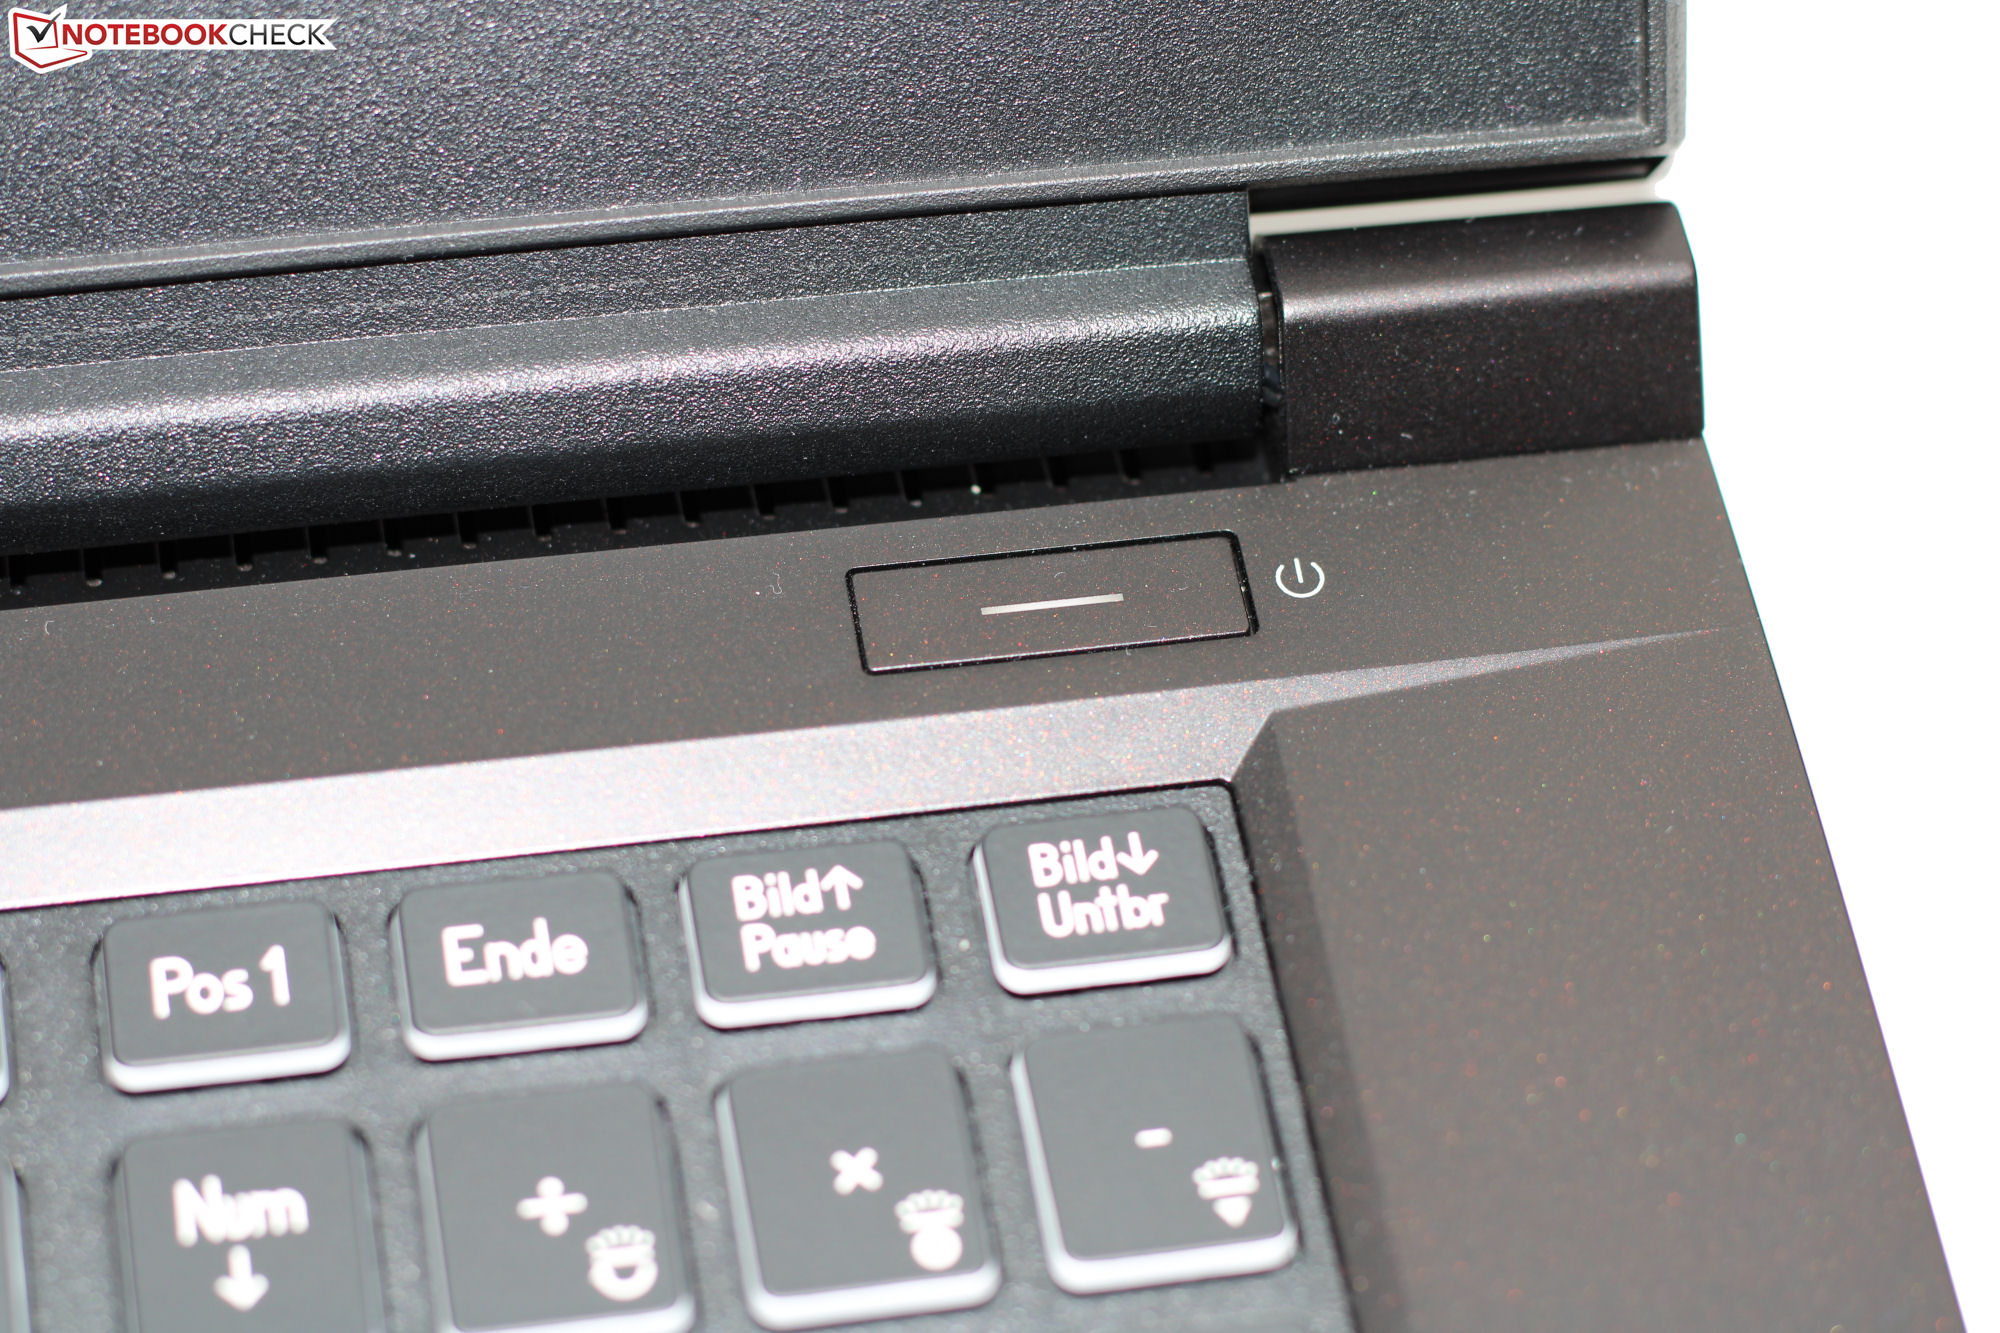
No hay problemas de construcción: todos los huecos coinciden y no hay bordes afilados. La unidad base y la tapa pueden torcerse ligeramente, pero no es nada fuera de lo normal. Las bisagras mantienen la tapa del portátil firmemente en su sitio y su ángulo máximo de apertura es de unos 135 grados. El portátil se puede abrir con una sola mano.
La P40 es un poco más compacta que laKatana 17pero pesa unos 100 gramos más. Ambos dispositivos son superados por elGigabyte G7 KEen estas categorías.
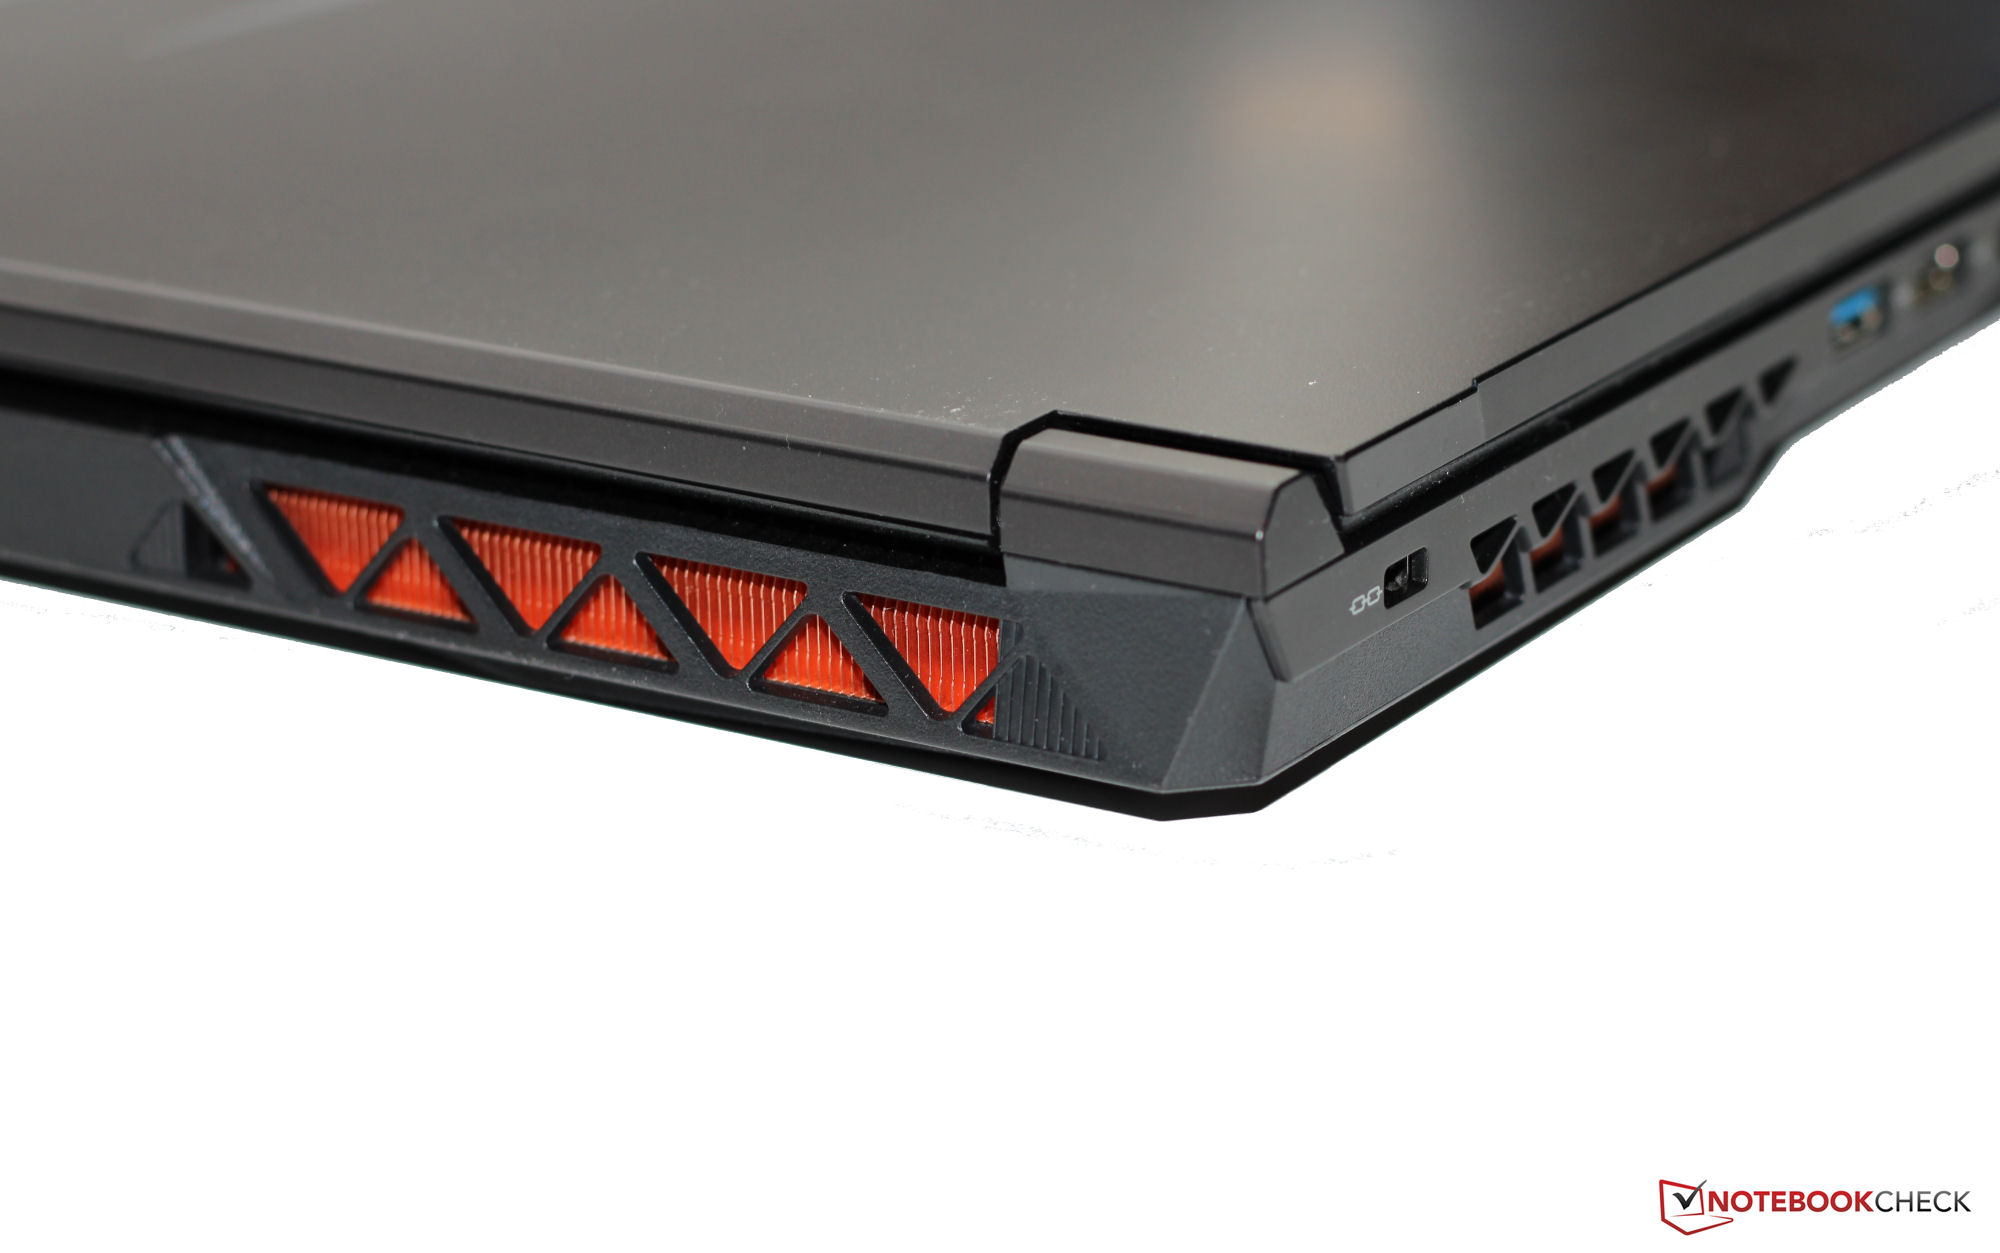
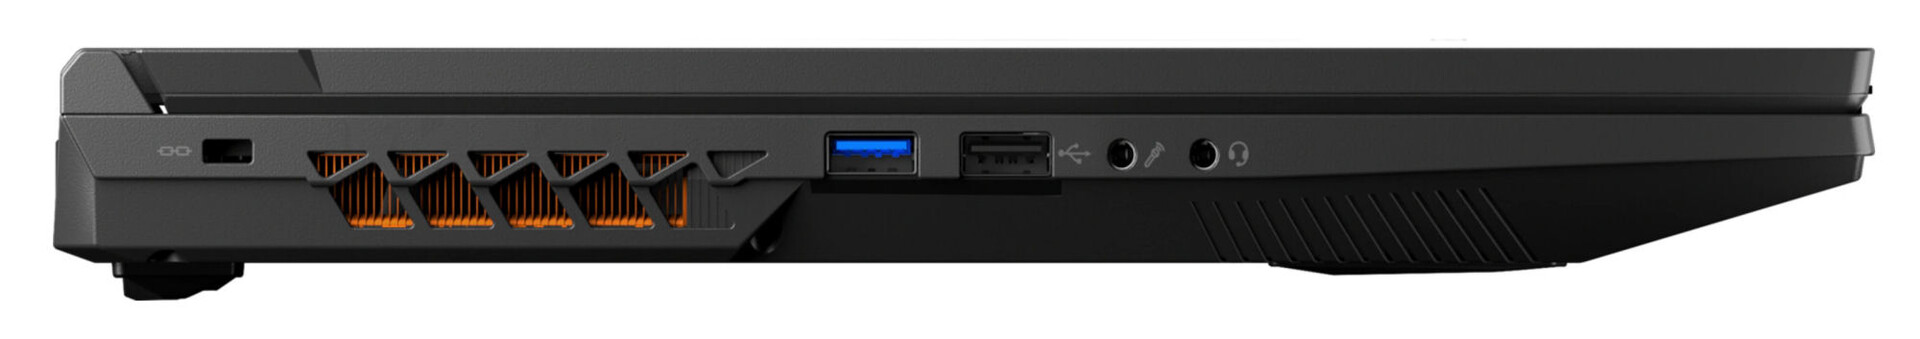
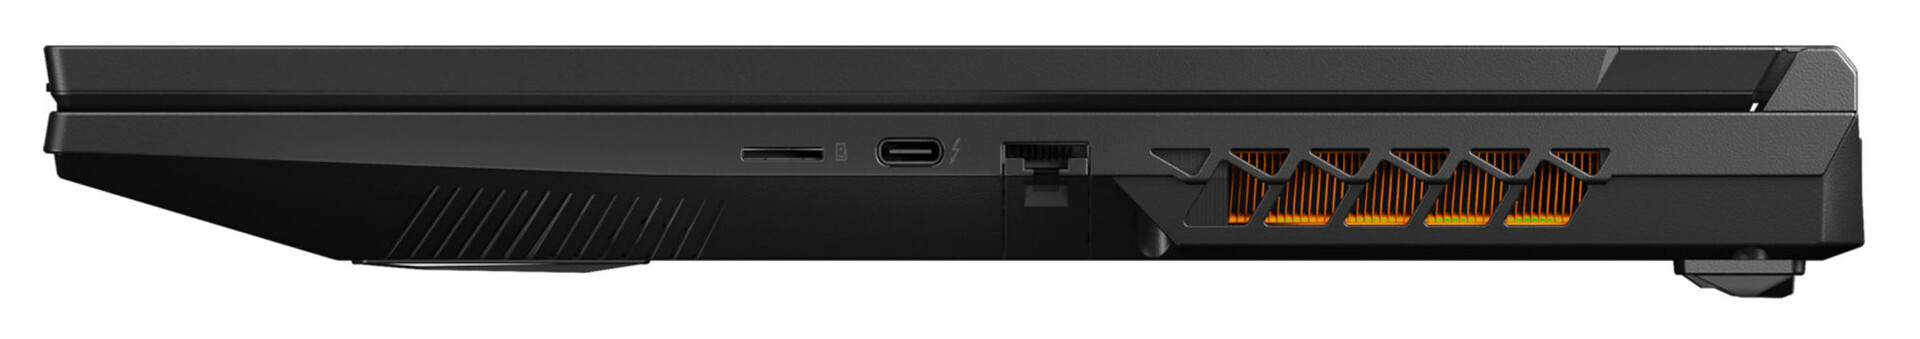
Conectividad - El Medion Defender tiene Thunderbolt pero no Power Delivery
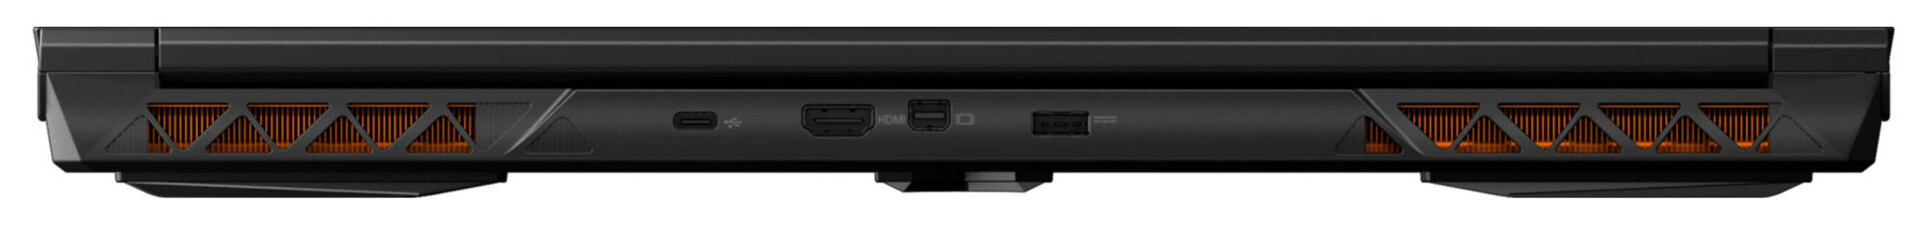
A pesar de su tamaño de 17.3", el portátil sólo tiene dos conexiones USB-A (1x USB 3.2 Gen 1, 1x USB 2.0) - un tercer puerto en el lado derecho del portátil sería realmente útil. Ninguno de los puertos USB-C (1x Thunderbolt 4, 1x USB 3.2 Gen 2) soporta Power Delivery, pero el puerto TB4 puede emitir una señal DisplayPort. En total, el dispositivo tiene tres salidas de vídeo (2x DP, 1x HDMI), dos puertos de audio y un puerto Gigabit Ethernet.
Dos salidas de vídeo y la conexión de alimentación están en la parte trasera del portátil. Los cables correspondientes salen de la parte trasera del dispositivo, lo que significa que no te estorbarán. Por desgracia, no se puede decir lo mismo del cable Ethernet, si es que se utiliza.
Lector de tarjetas SD
El lector de tarjetas SD (tarjeta de referencia: AV PRO microSD 128 GB V60) tiene unas velocidades máximas de transferencia de 86 MB/s (transfiriendo 250 imágenes jpg de unos 5 MB cada una) y 91 MB/s (copiando grandes bloques de datos), lo que lo convierte en un modelo con velocidades medias.
| SD Card Reader | |
| average JPG Copy Test (av. of 3 runs) | |
| Media de la clase Gaming (20.9 - 210, n=54, últimos 2 años) | |
| HP Omen 17-ck1075ng (AV Pro SD microSD 128 GB V60) | |
| Medion Erazer Defender P40 (AV PRO microSD 128 GB V60) | |
| MSI GE78HX 13VH-070US (Angelibird AV Pro V60) | |
| maximum AS SSD Seq Read Test (1GB) | |
| Media de la clase Gaming (25.5 - 261, n=51, últimos 2 años) | |
| HP Omen 17-ck1075ng (AV Pro SD microSD 128 GB V60) | |
| Medion Erazer Defender P40 (AV PRO microSD 128 GB V60) | |
| Gigabyte G7 KE (AV PRO microSD 128 GB V60) | |
| MSI GE78HX 13VH-070US (Angelibird AV Pro V60) | |
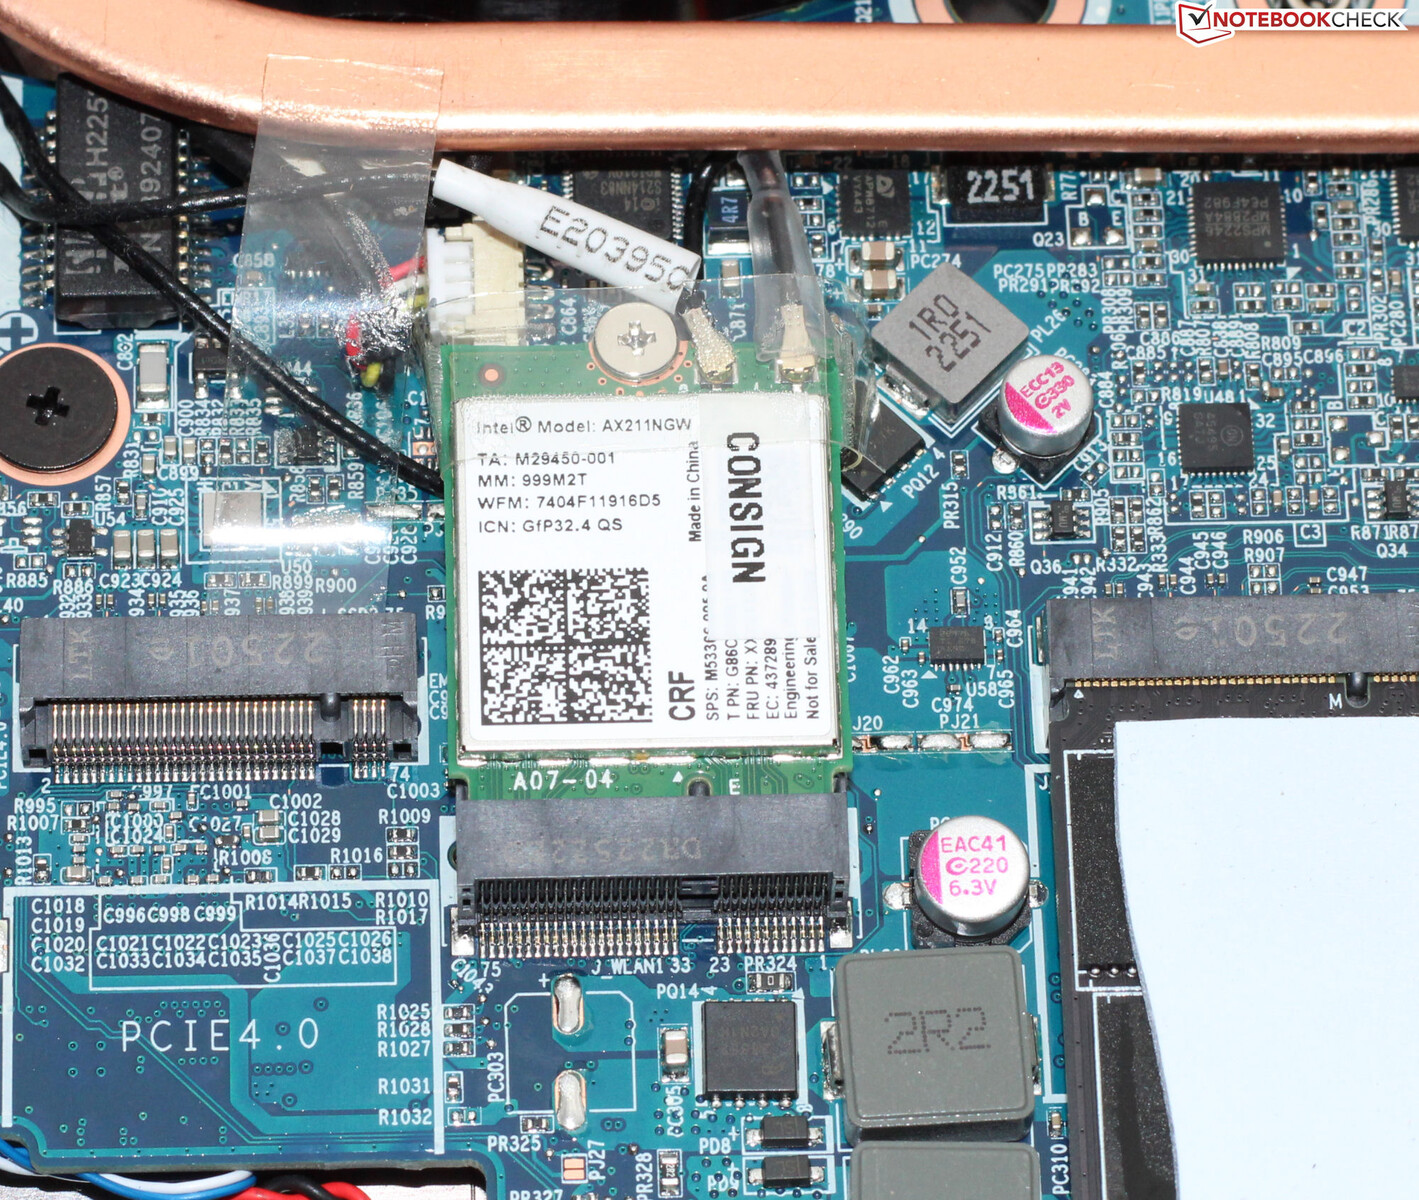
Comunicación
En condiciones óptimas (sin dispositivos WLAN en las proximidades, corta distancia entre el portátil y el PC servidor), el portátil pudo alcanzar velocidades de datos WiFi impresionantes. El portátil Medion utiliza un chip WiFi 6E (Intel AX211). De las conexiones por cable también se encarga un chip Intel (I219-V; 1 GBit/s).
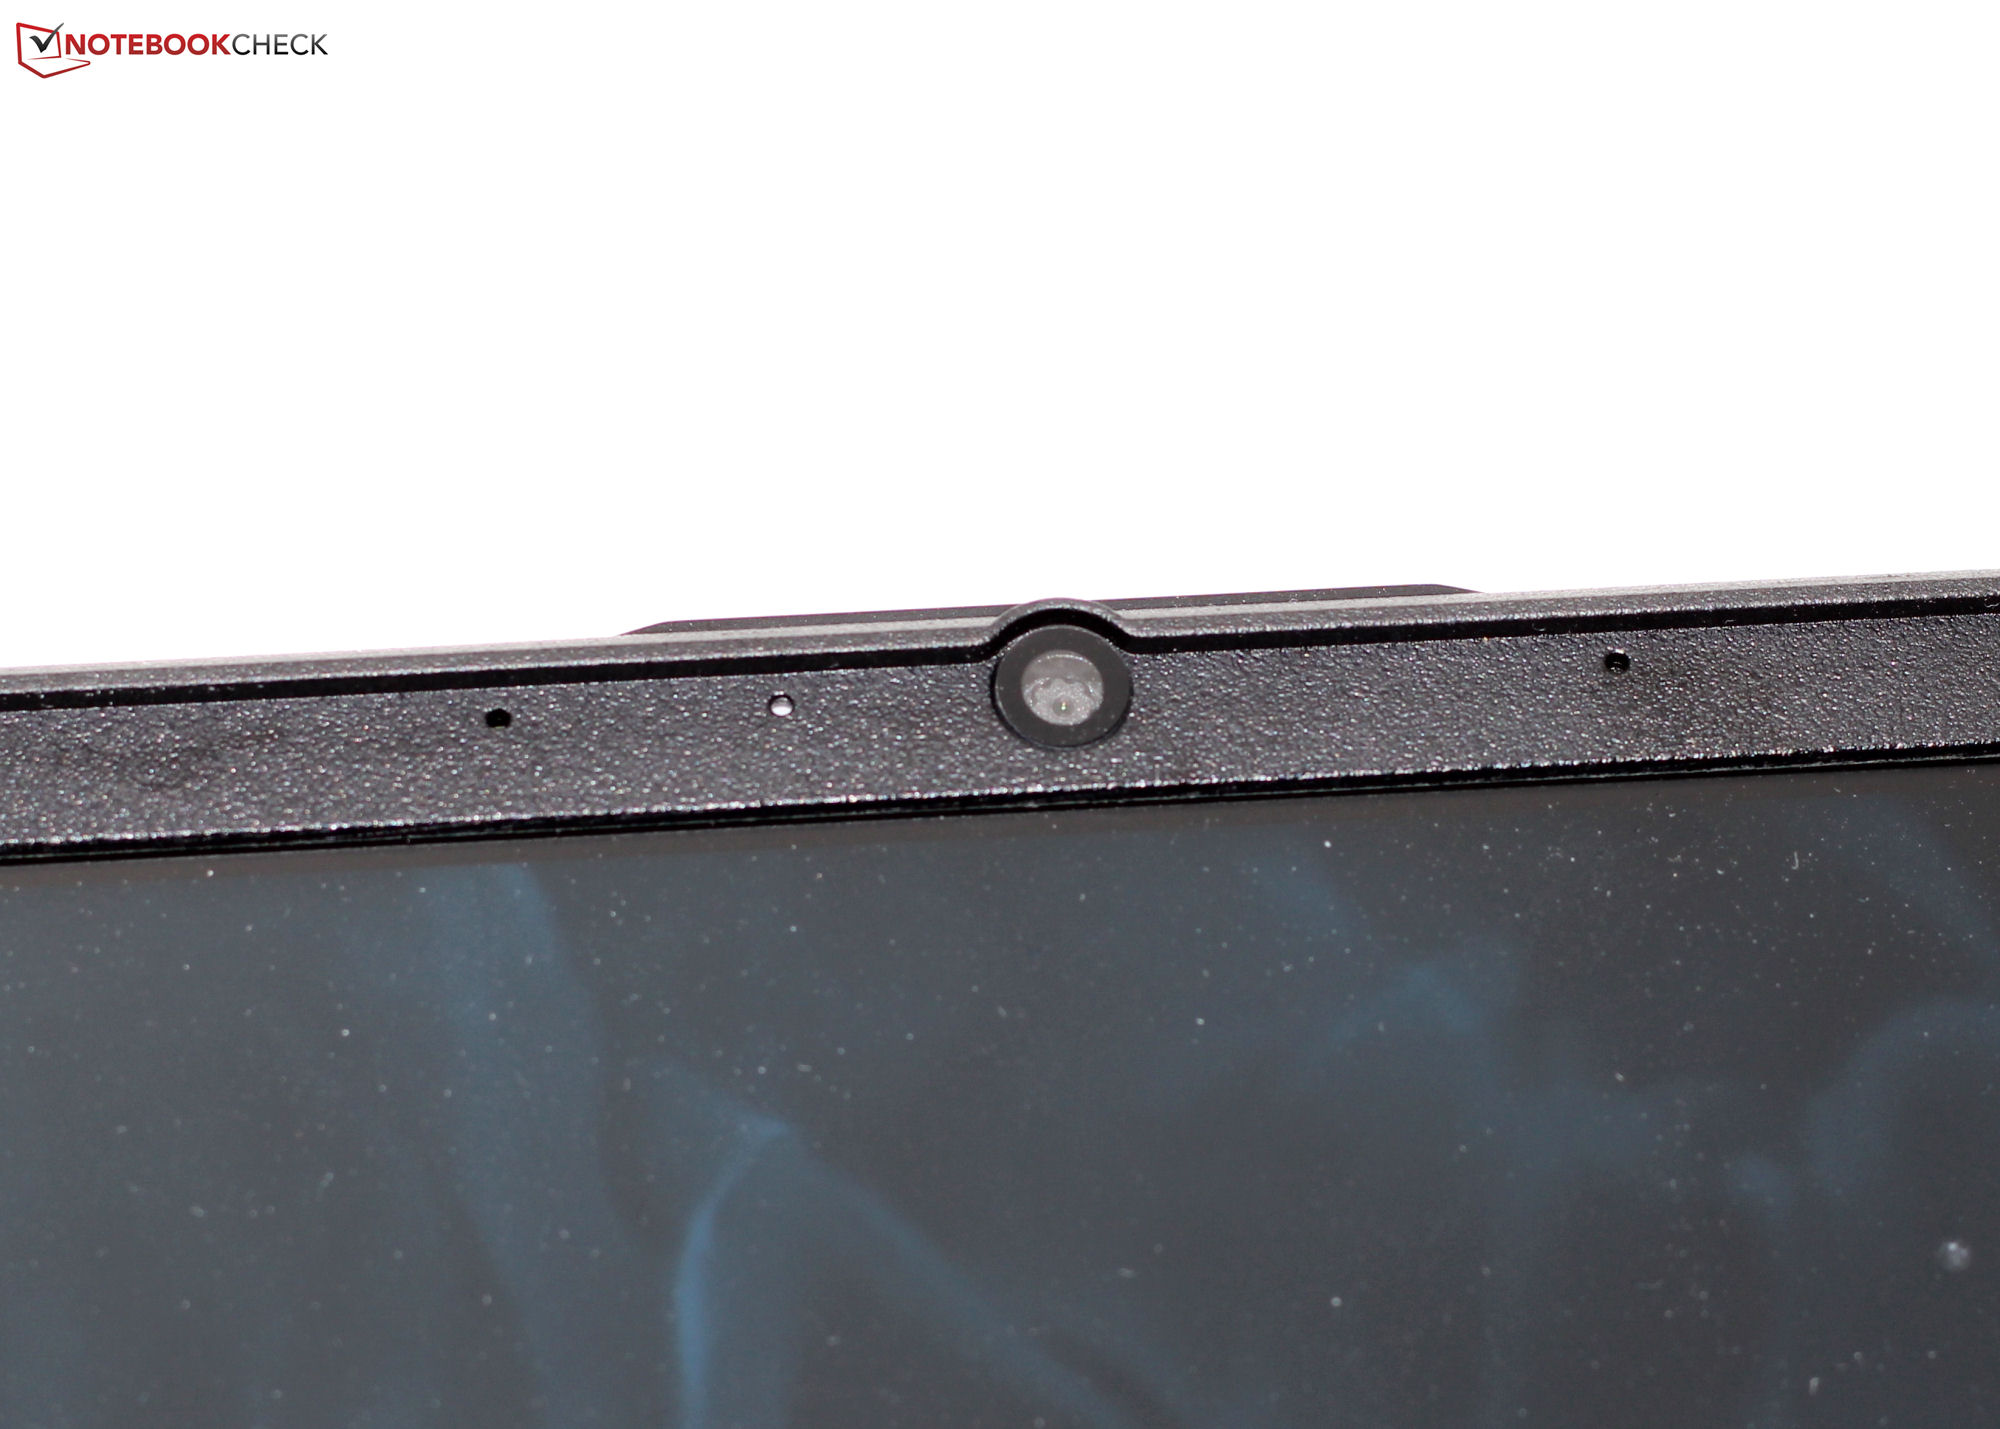
Cámara web
La webcam (0,9 MP, máx. 1.280 x 720 píxeles) no tiene cubierta mecánica. Su calidad, por desgracia, no es la mejor - sin embargo, en comparación, su desviación de color es realmente mínima.


Accesorios
Aparte de los documentos habituales (guía de inicio rápido e información sobre la garantía), el portátil no viene con ningún accesorio adicional.
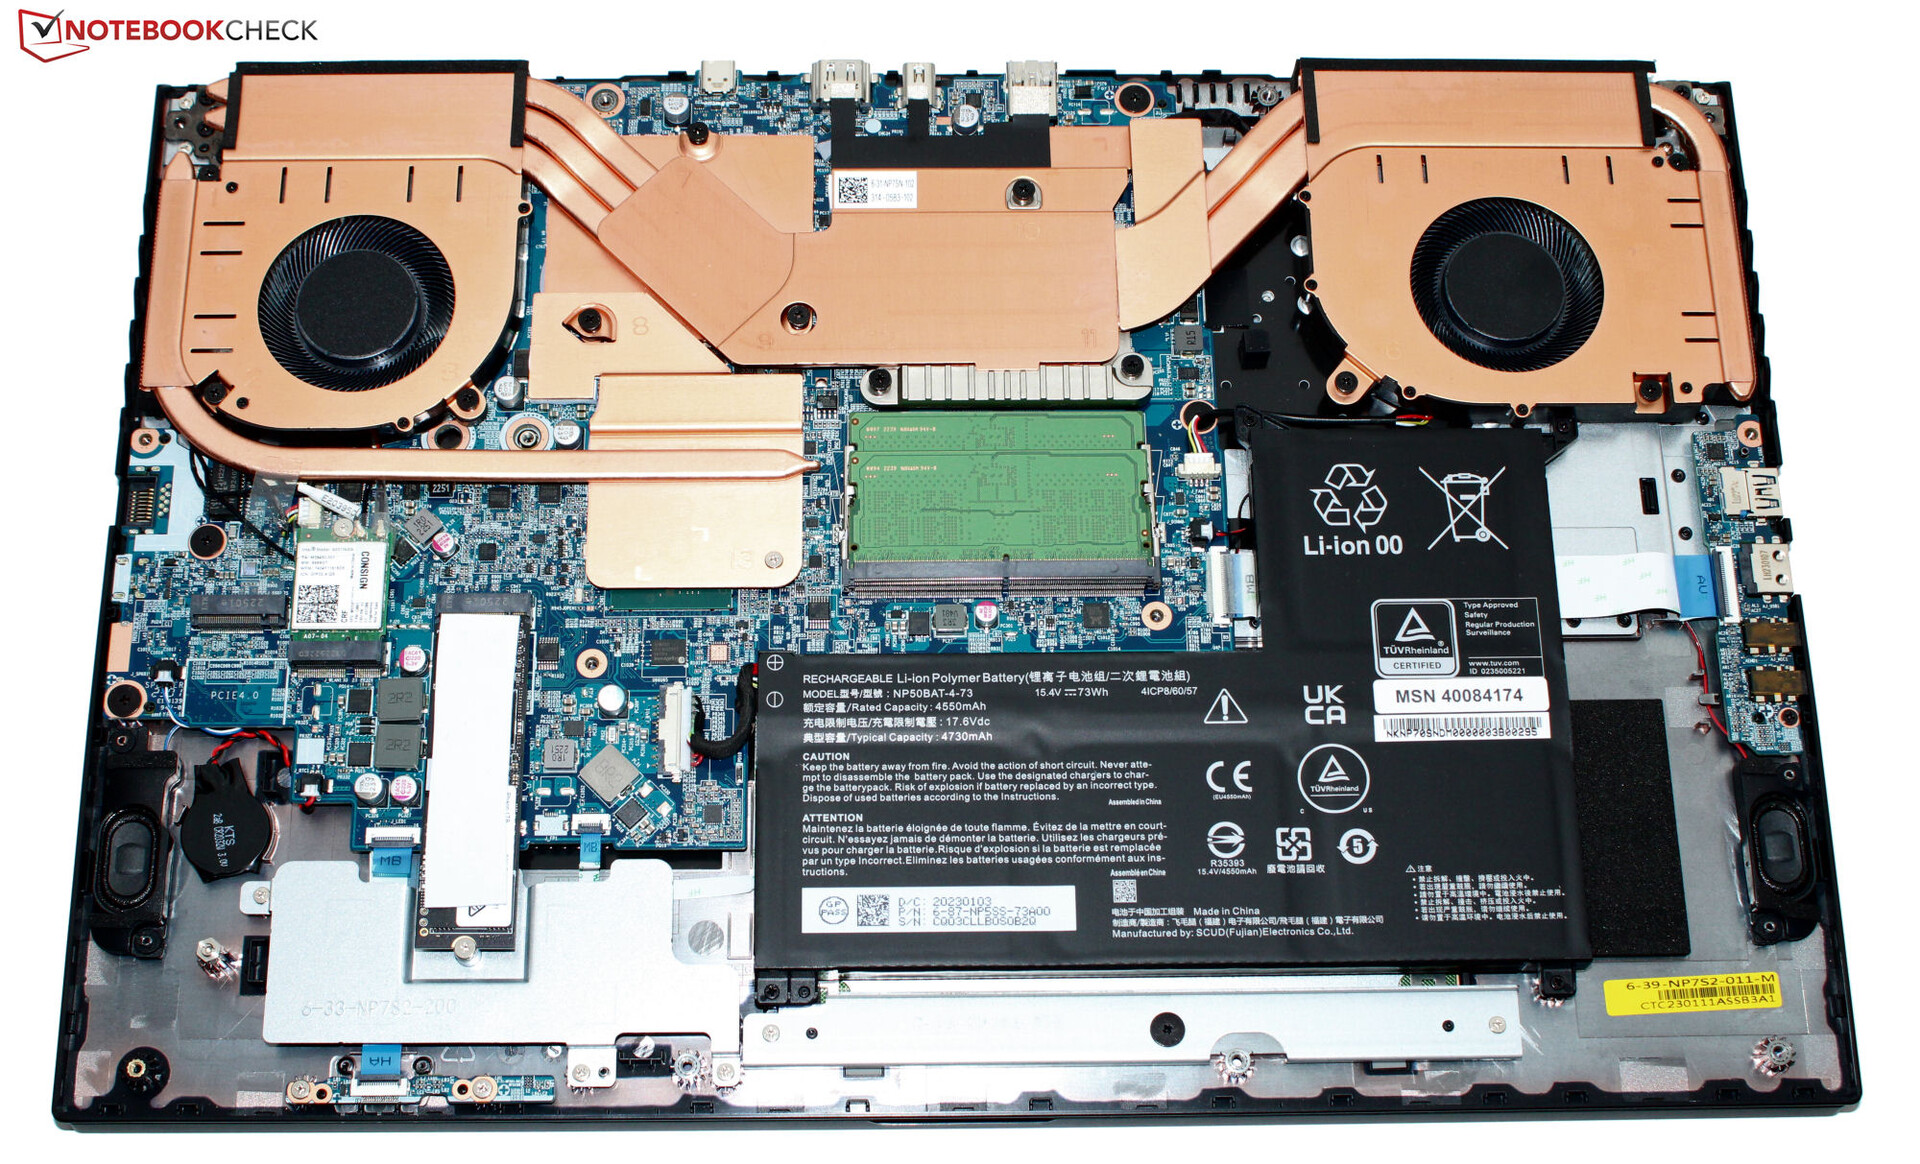
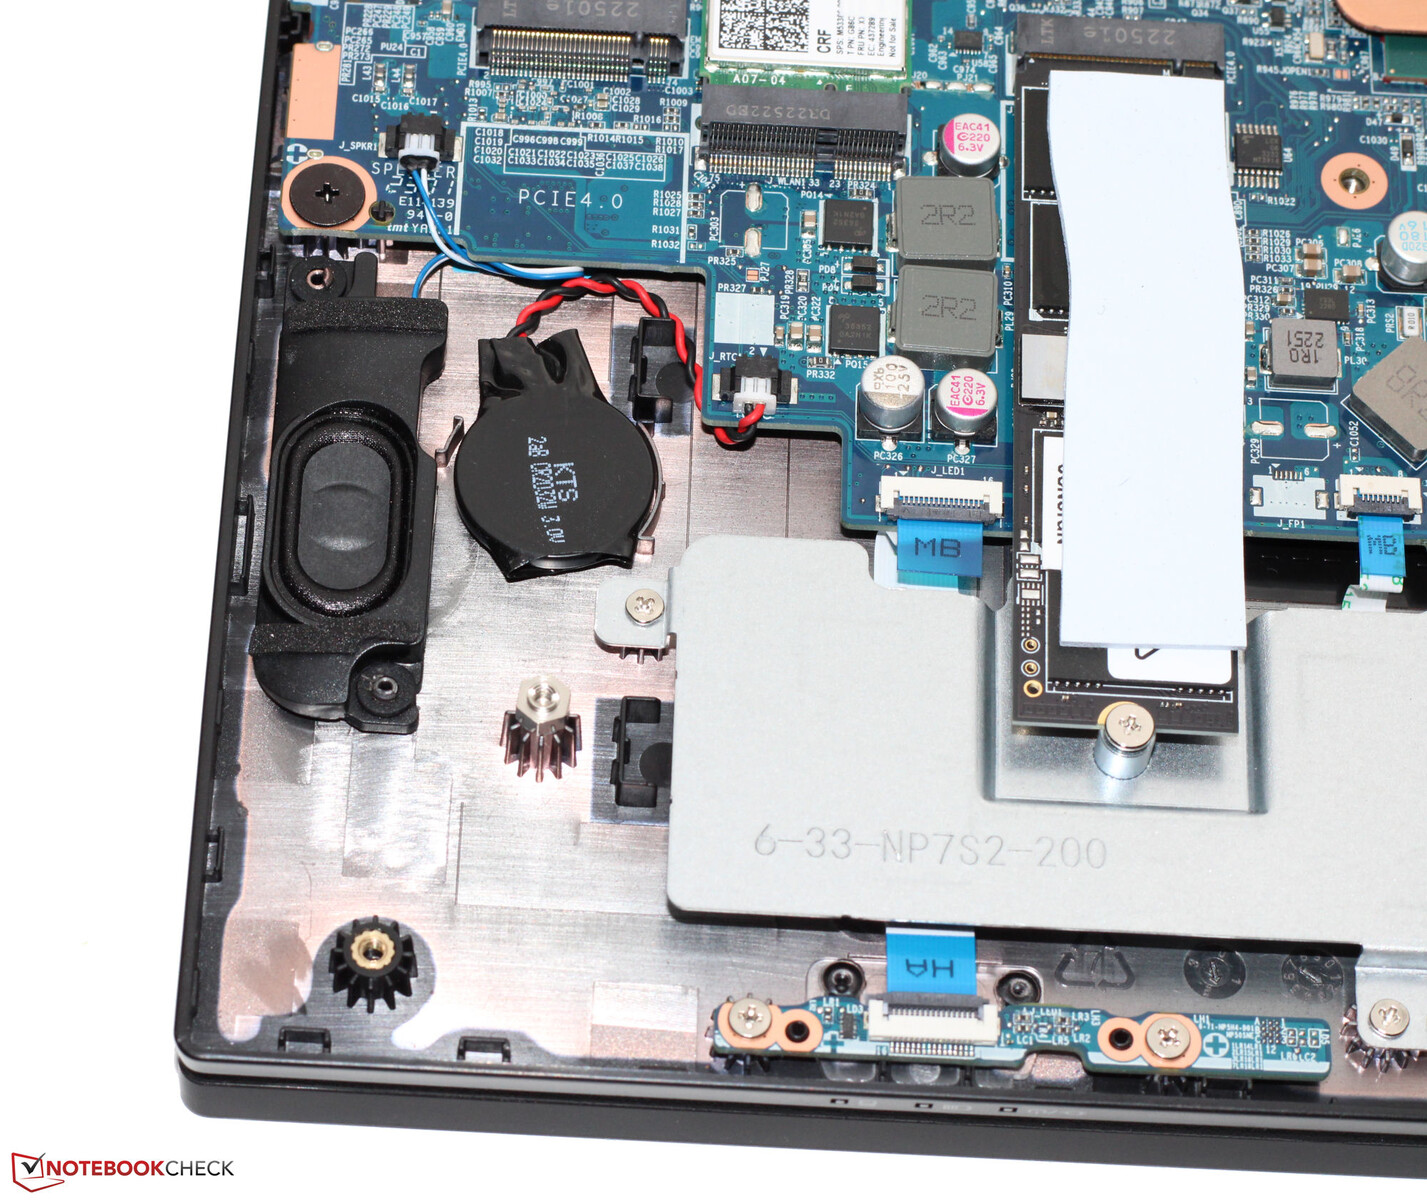
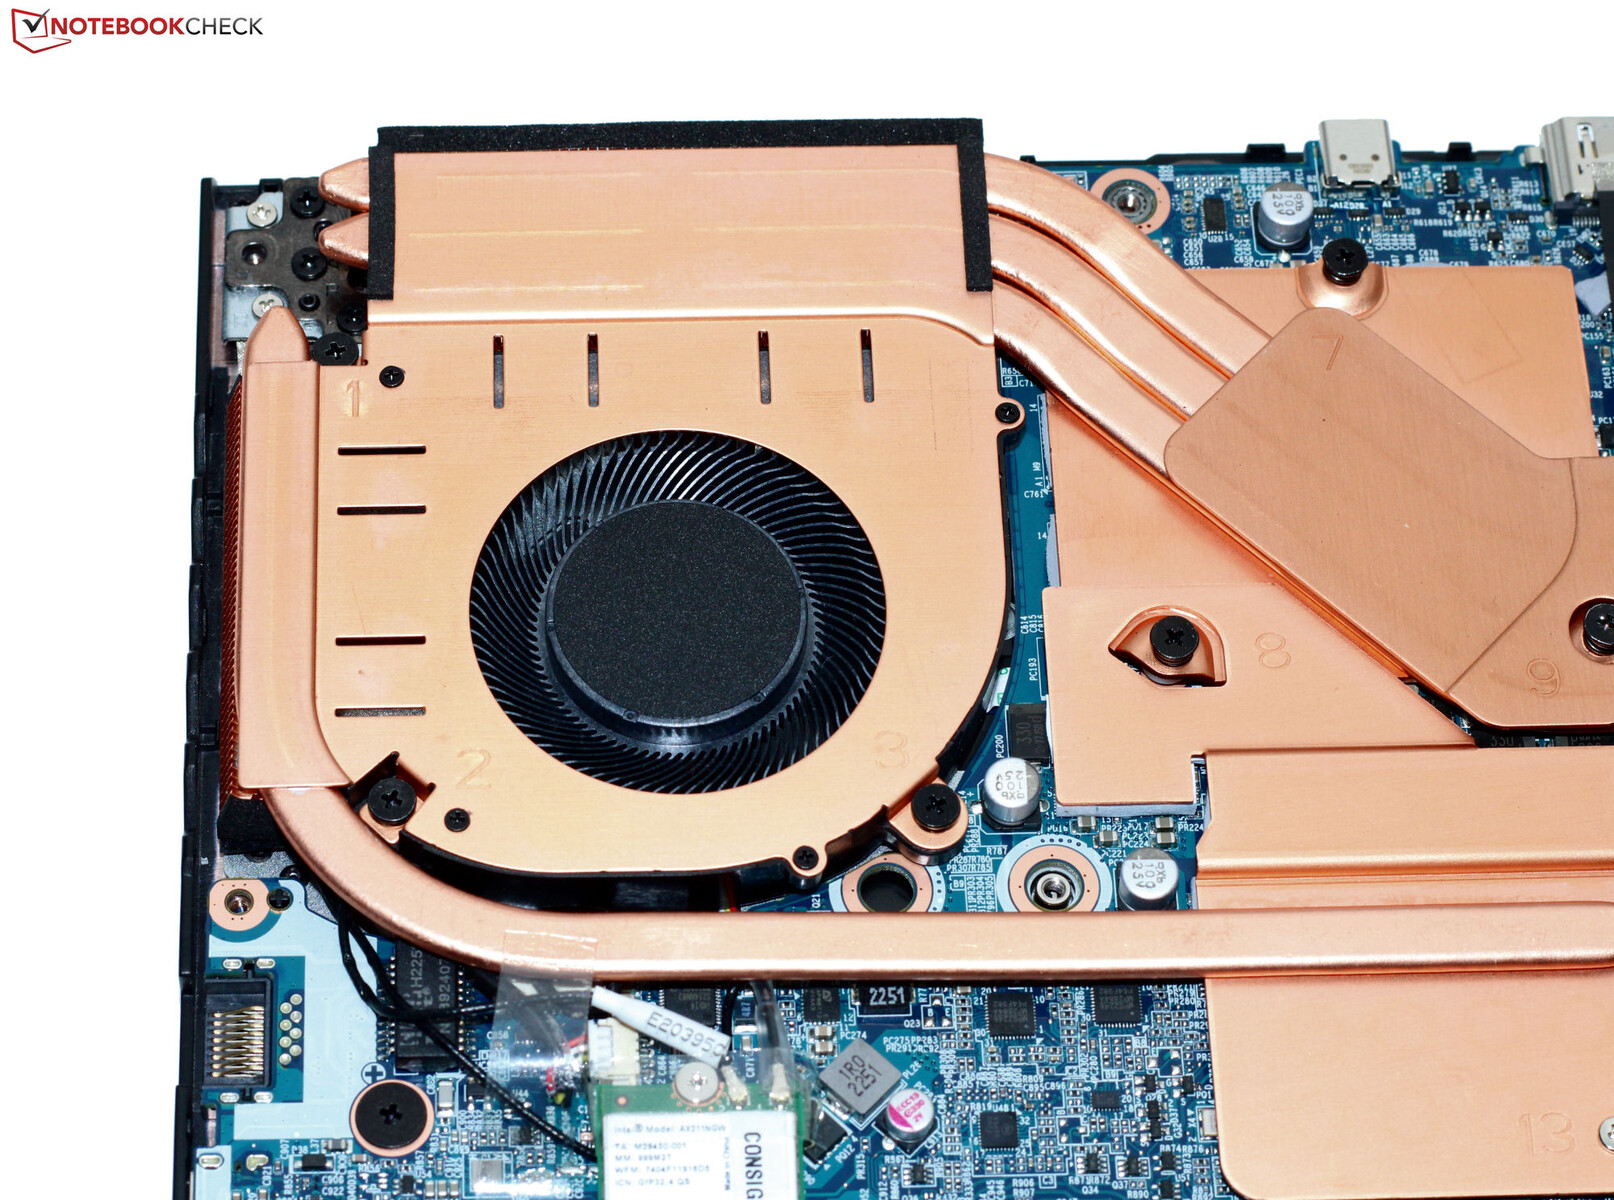
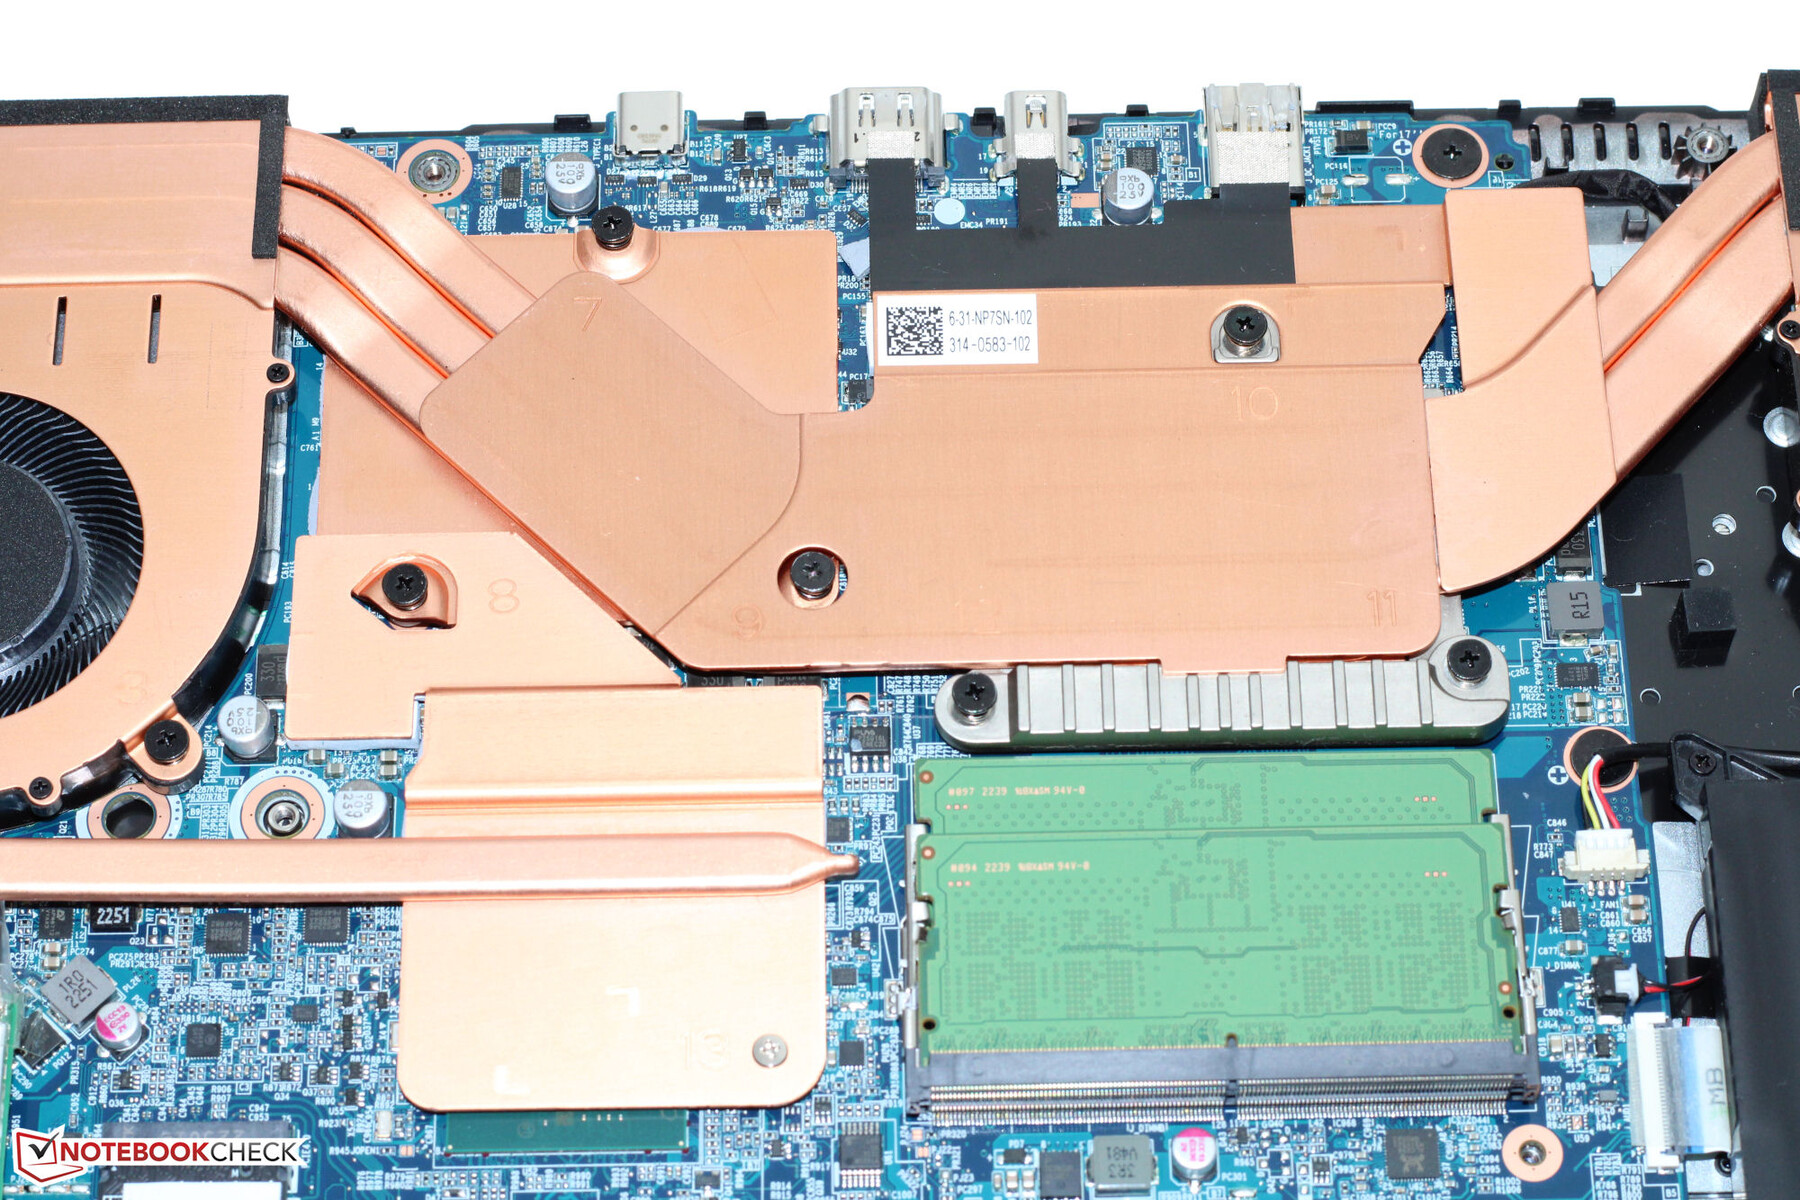
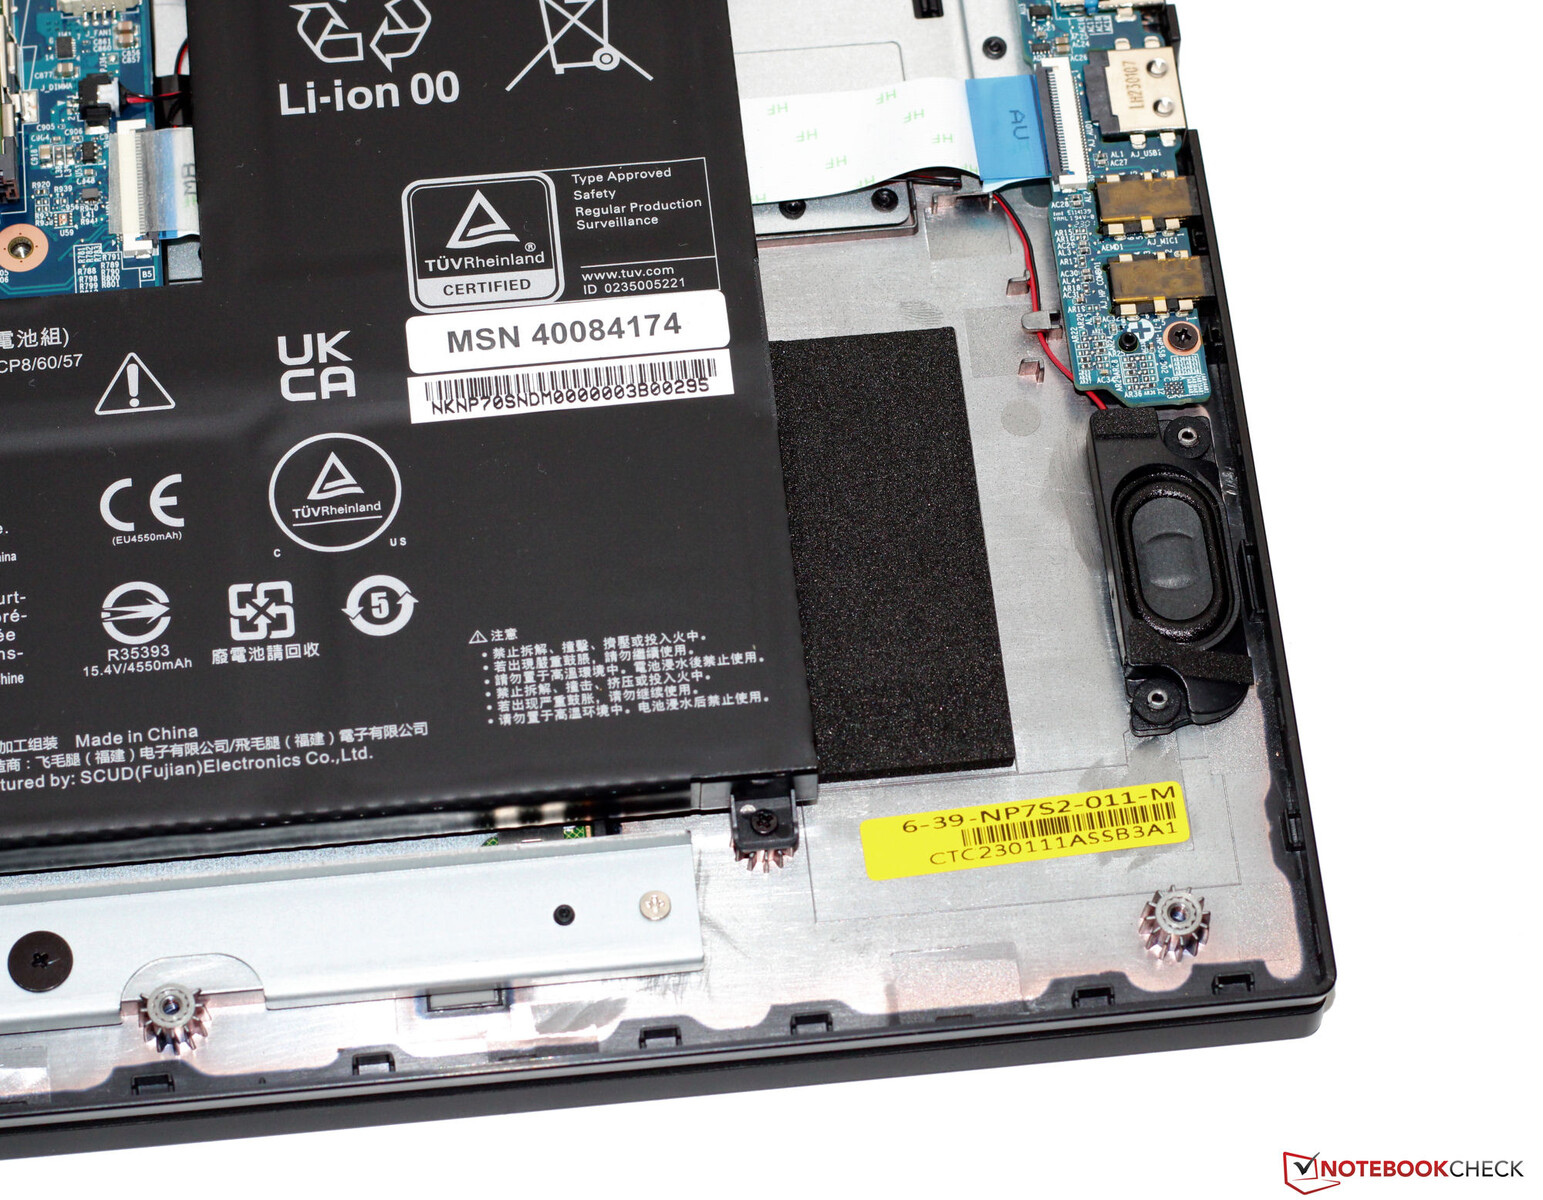
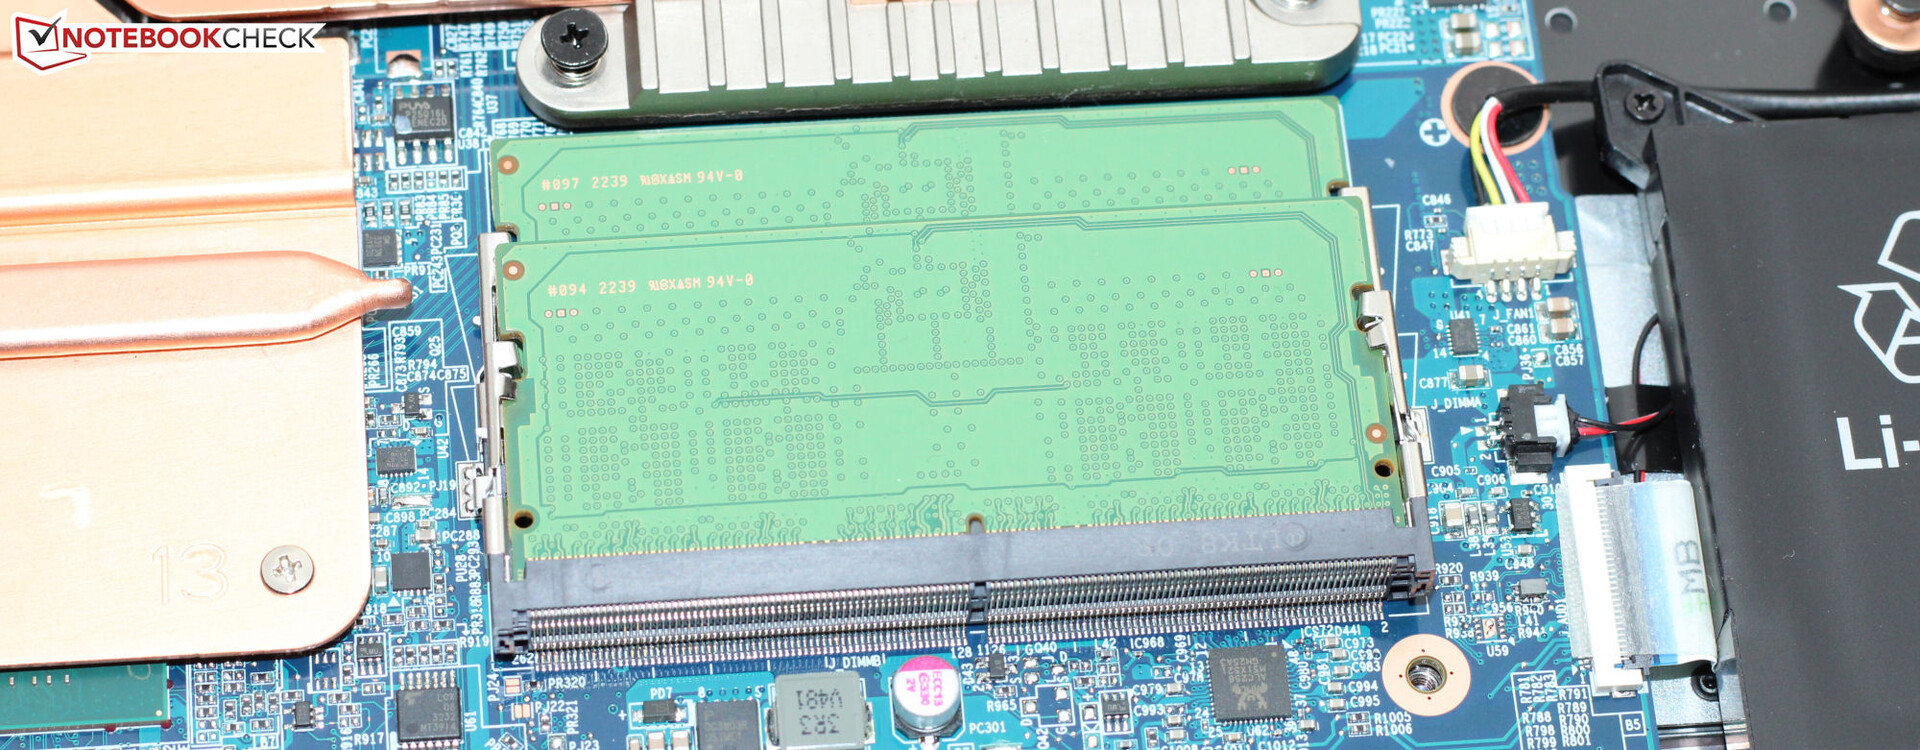
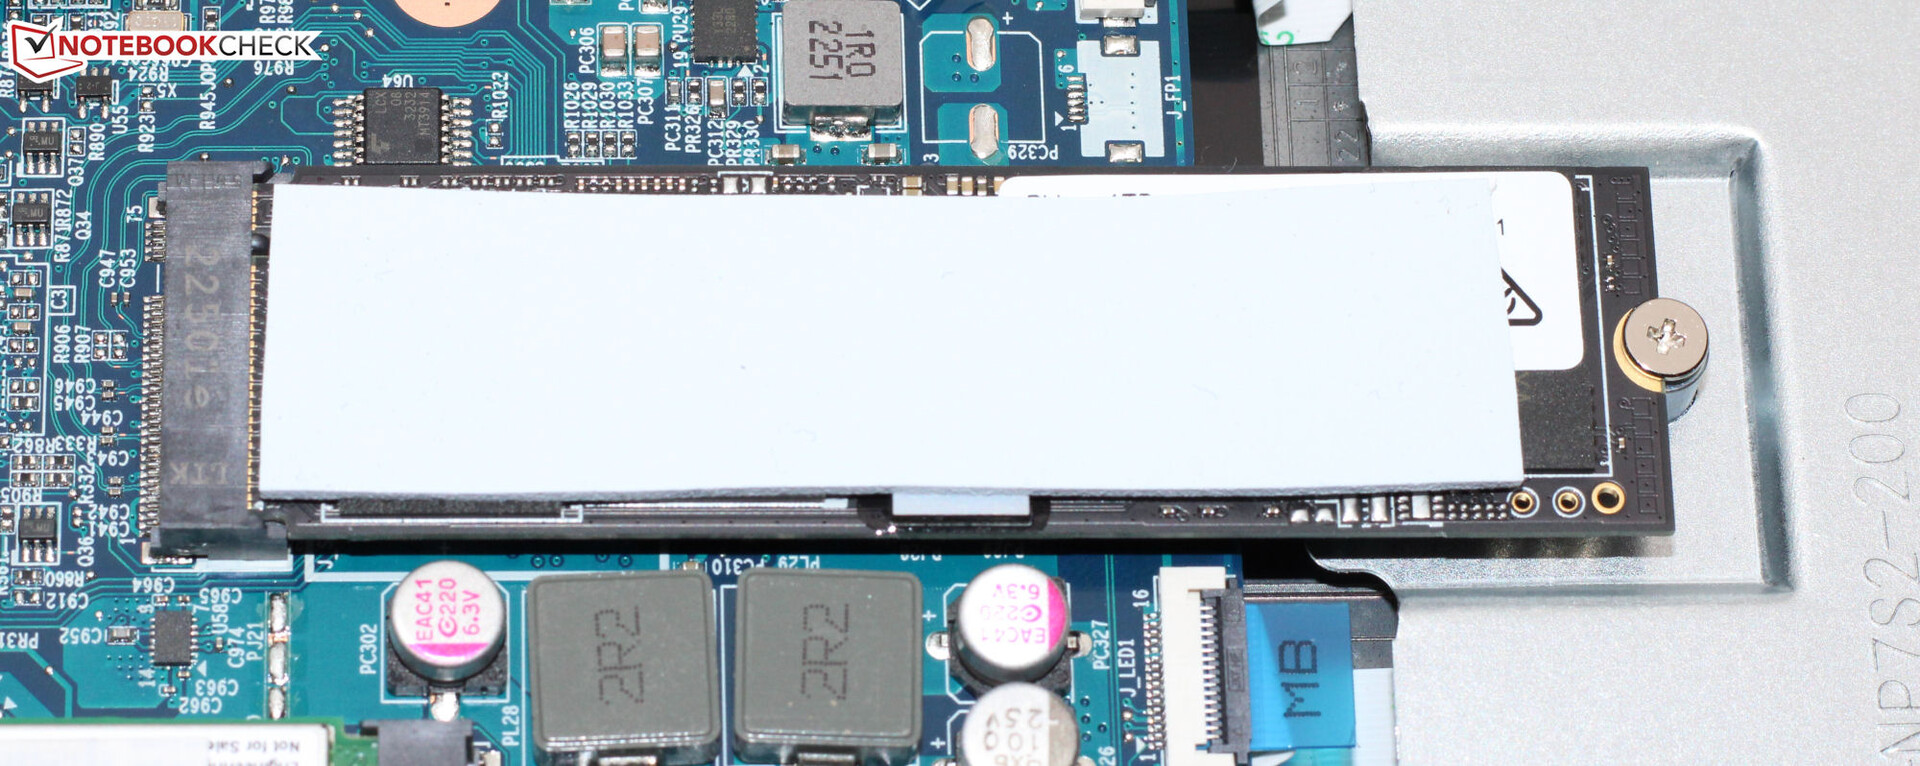
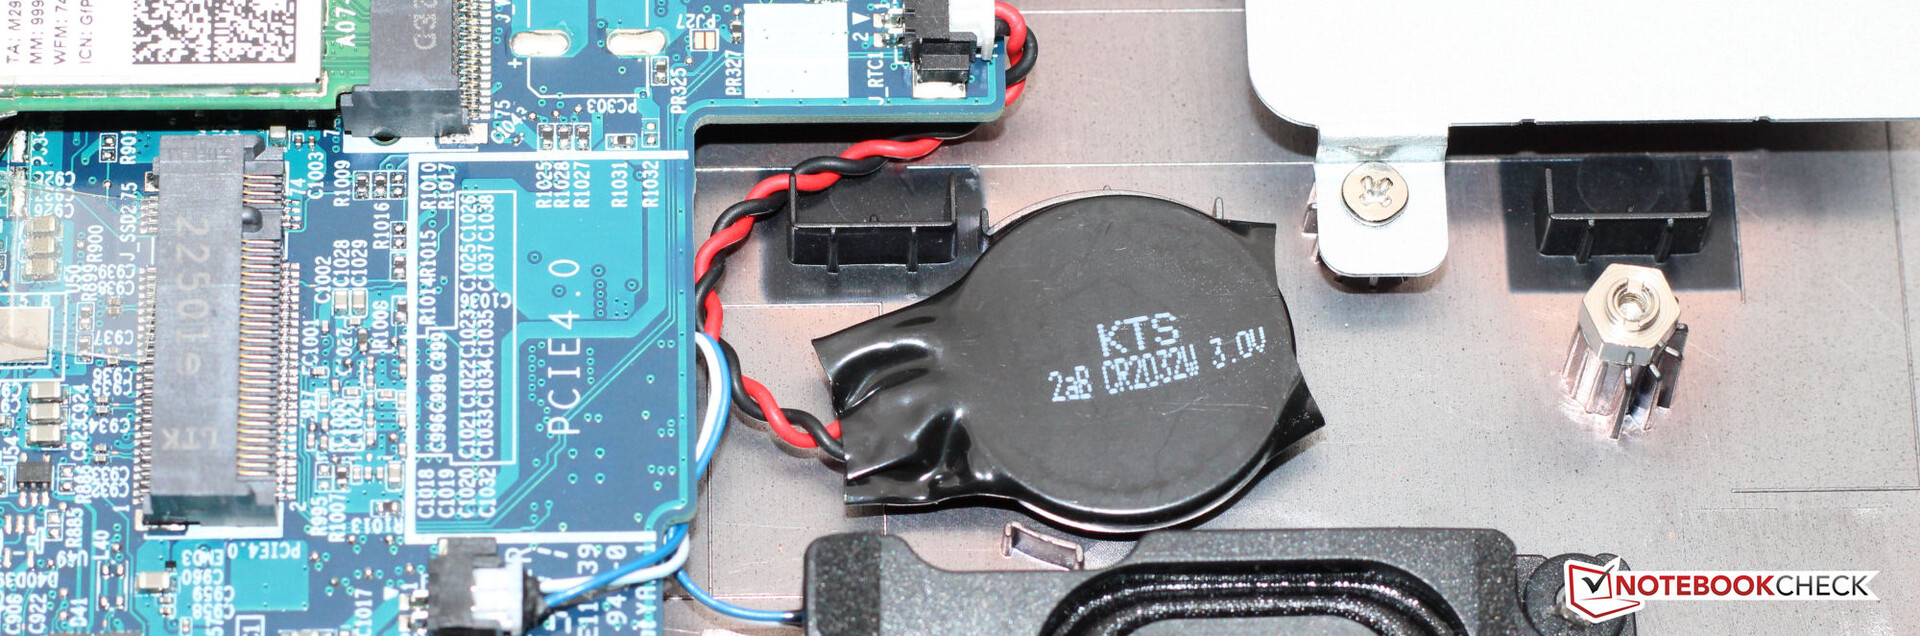
Mantenimiento
Tras quitar todos los tornillos de la parte inferior del dispositivo, se puede retirar la placa inferior con una espátula plana o una púa. Entonces se puede acceder a los dos bancos de memoria (en uso), a la segunda ranura SSD (PCIe 4, M.2-2280), al módulo WLAN, a la batería de la BIOS, a los ventiladores y a la batería.
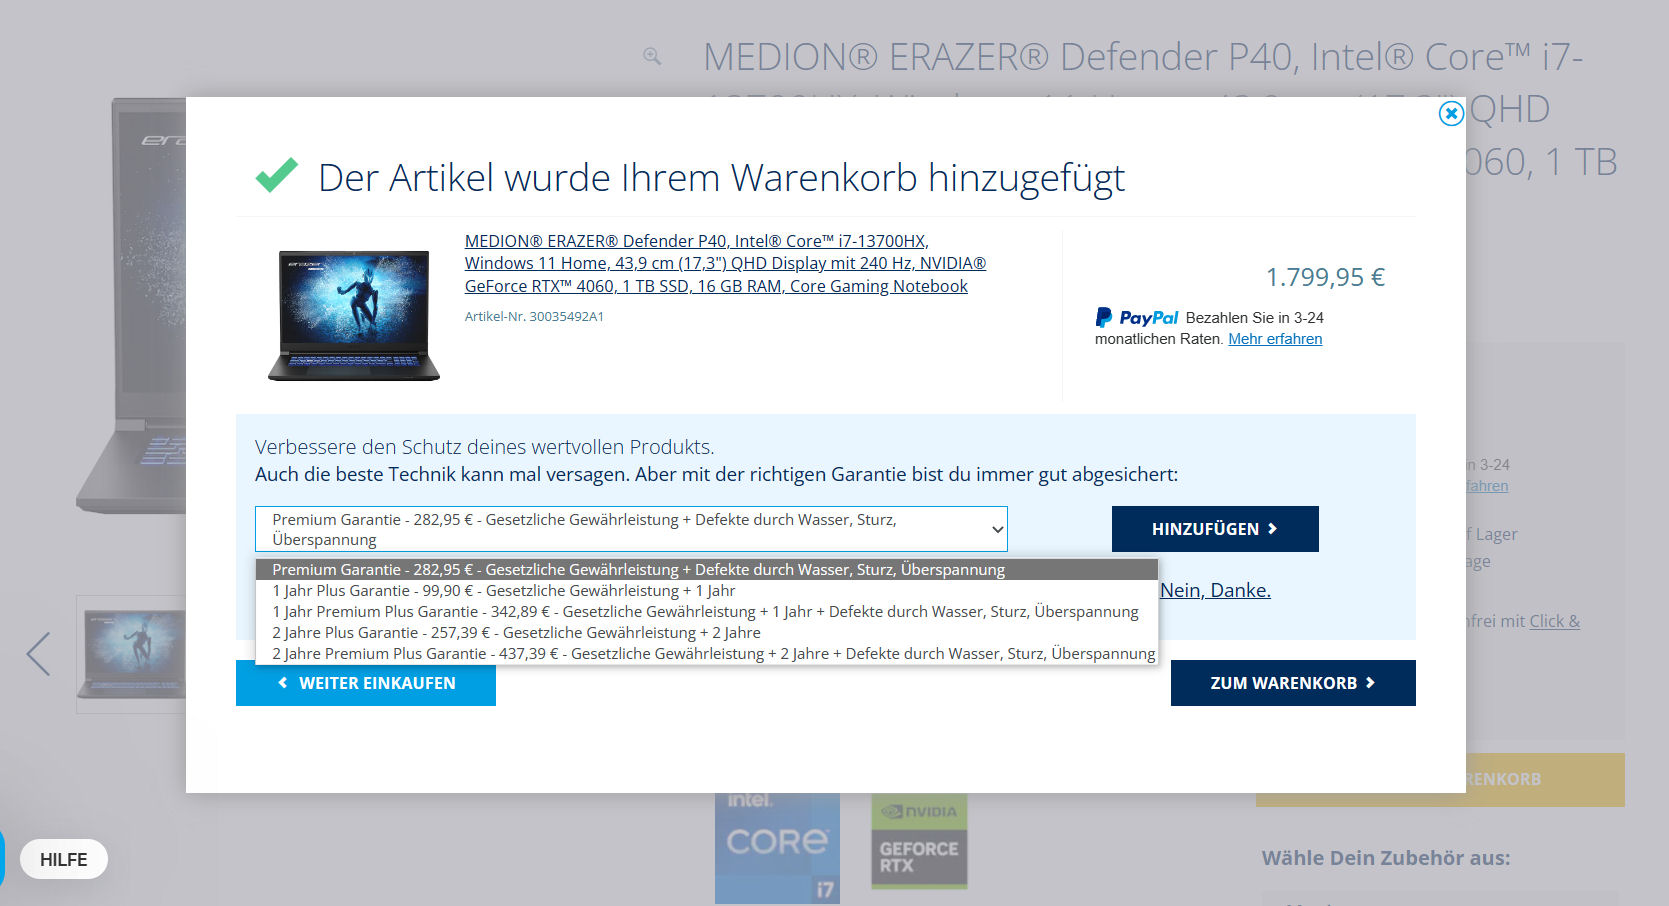
Garantía
El Erazer de Medion tiene una garantía de dos años. Hay extensiones de garantía disponibles, pero deben adquirirse junto con el portátil en la tienda en línea de Medion; no es posible comprar una extensión con carácter retroactivo.
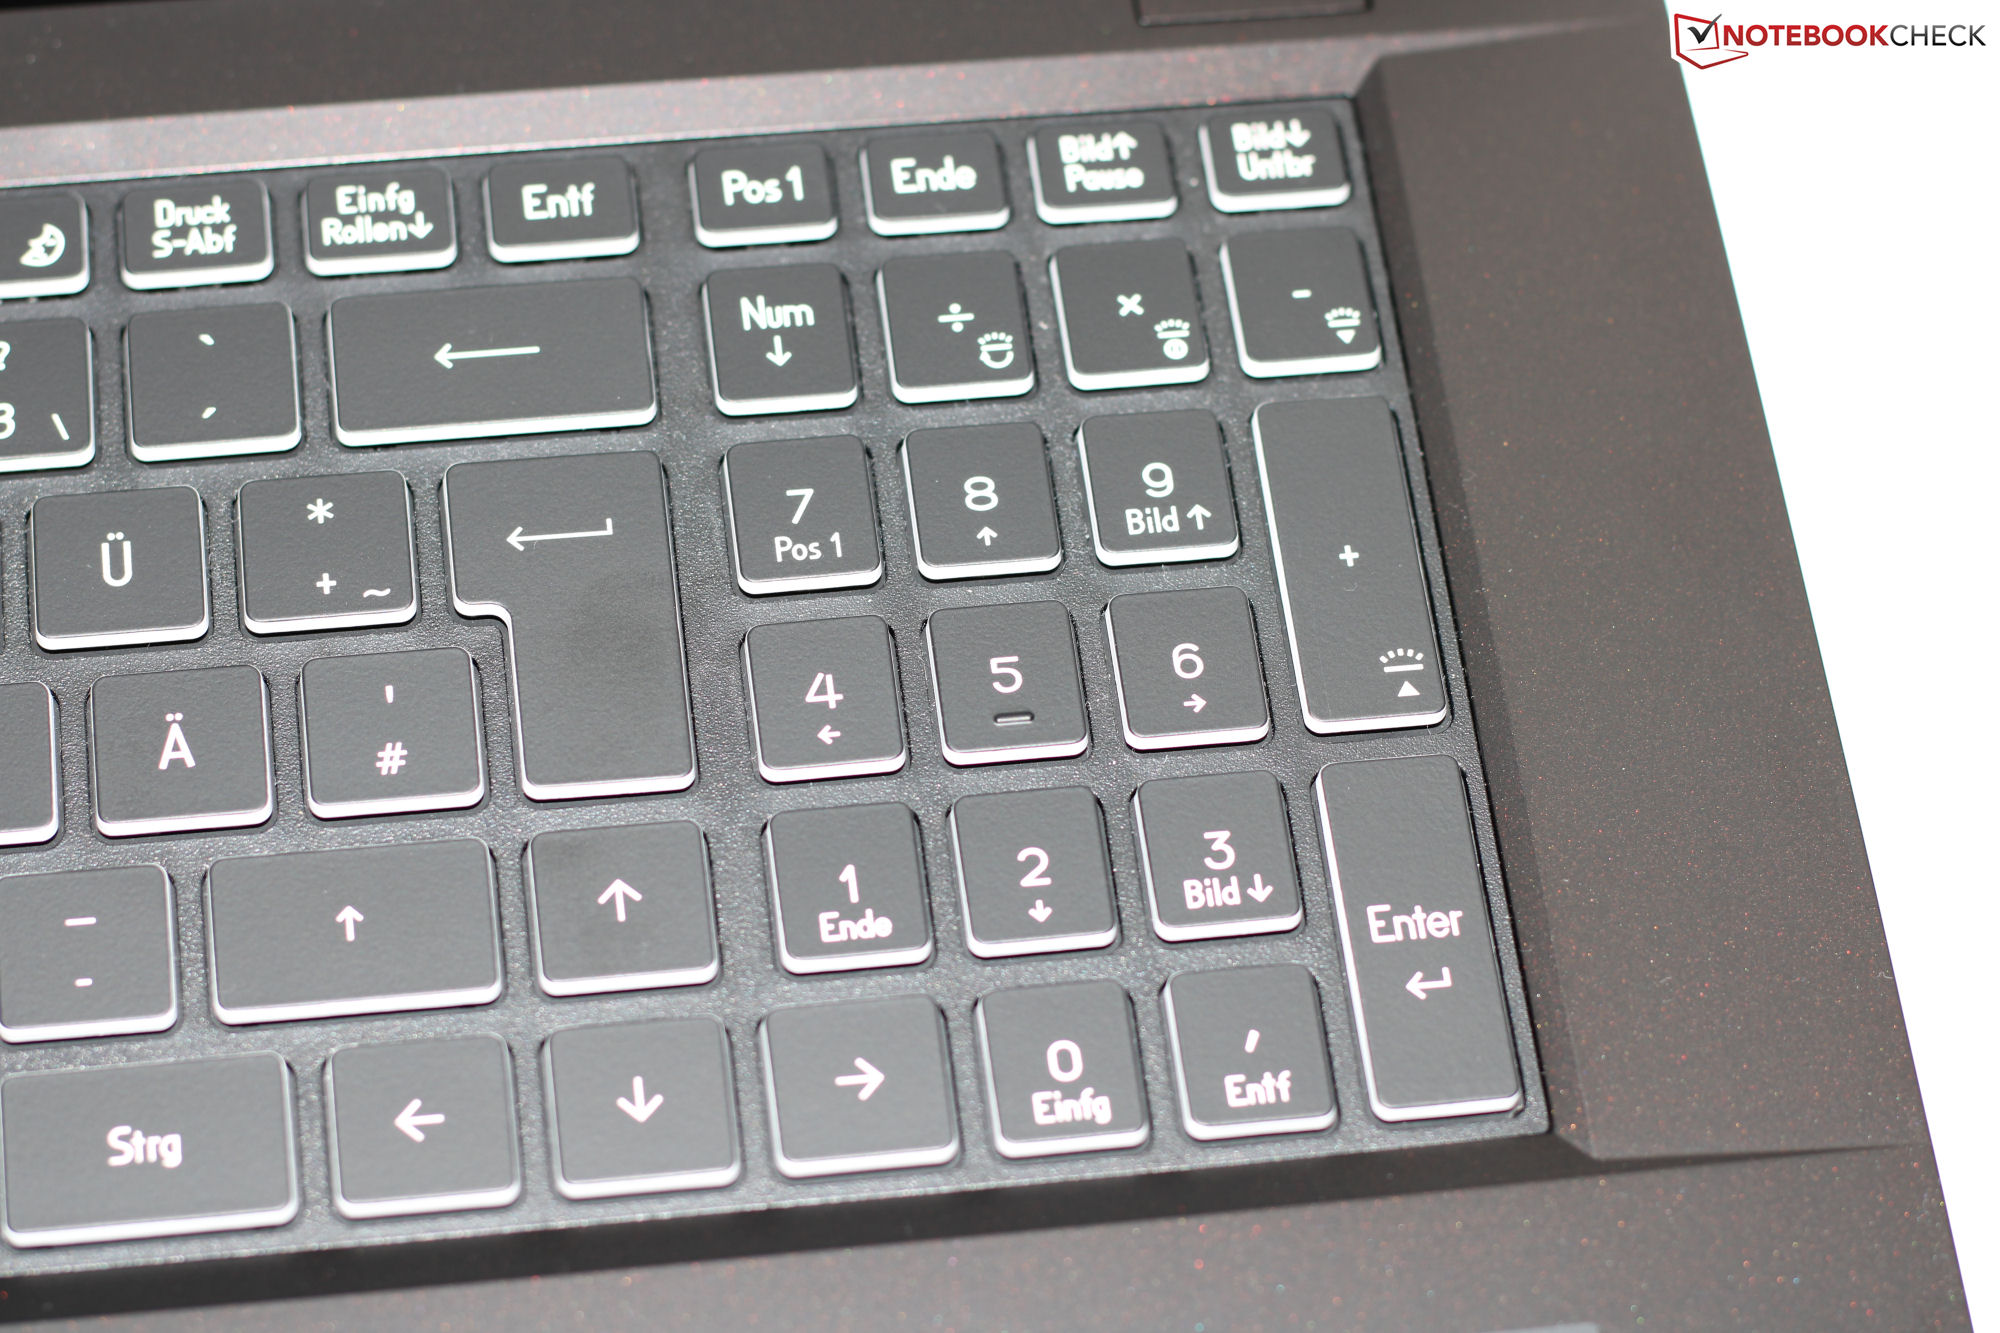
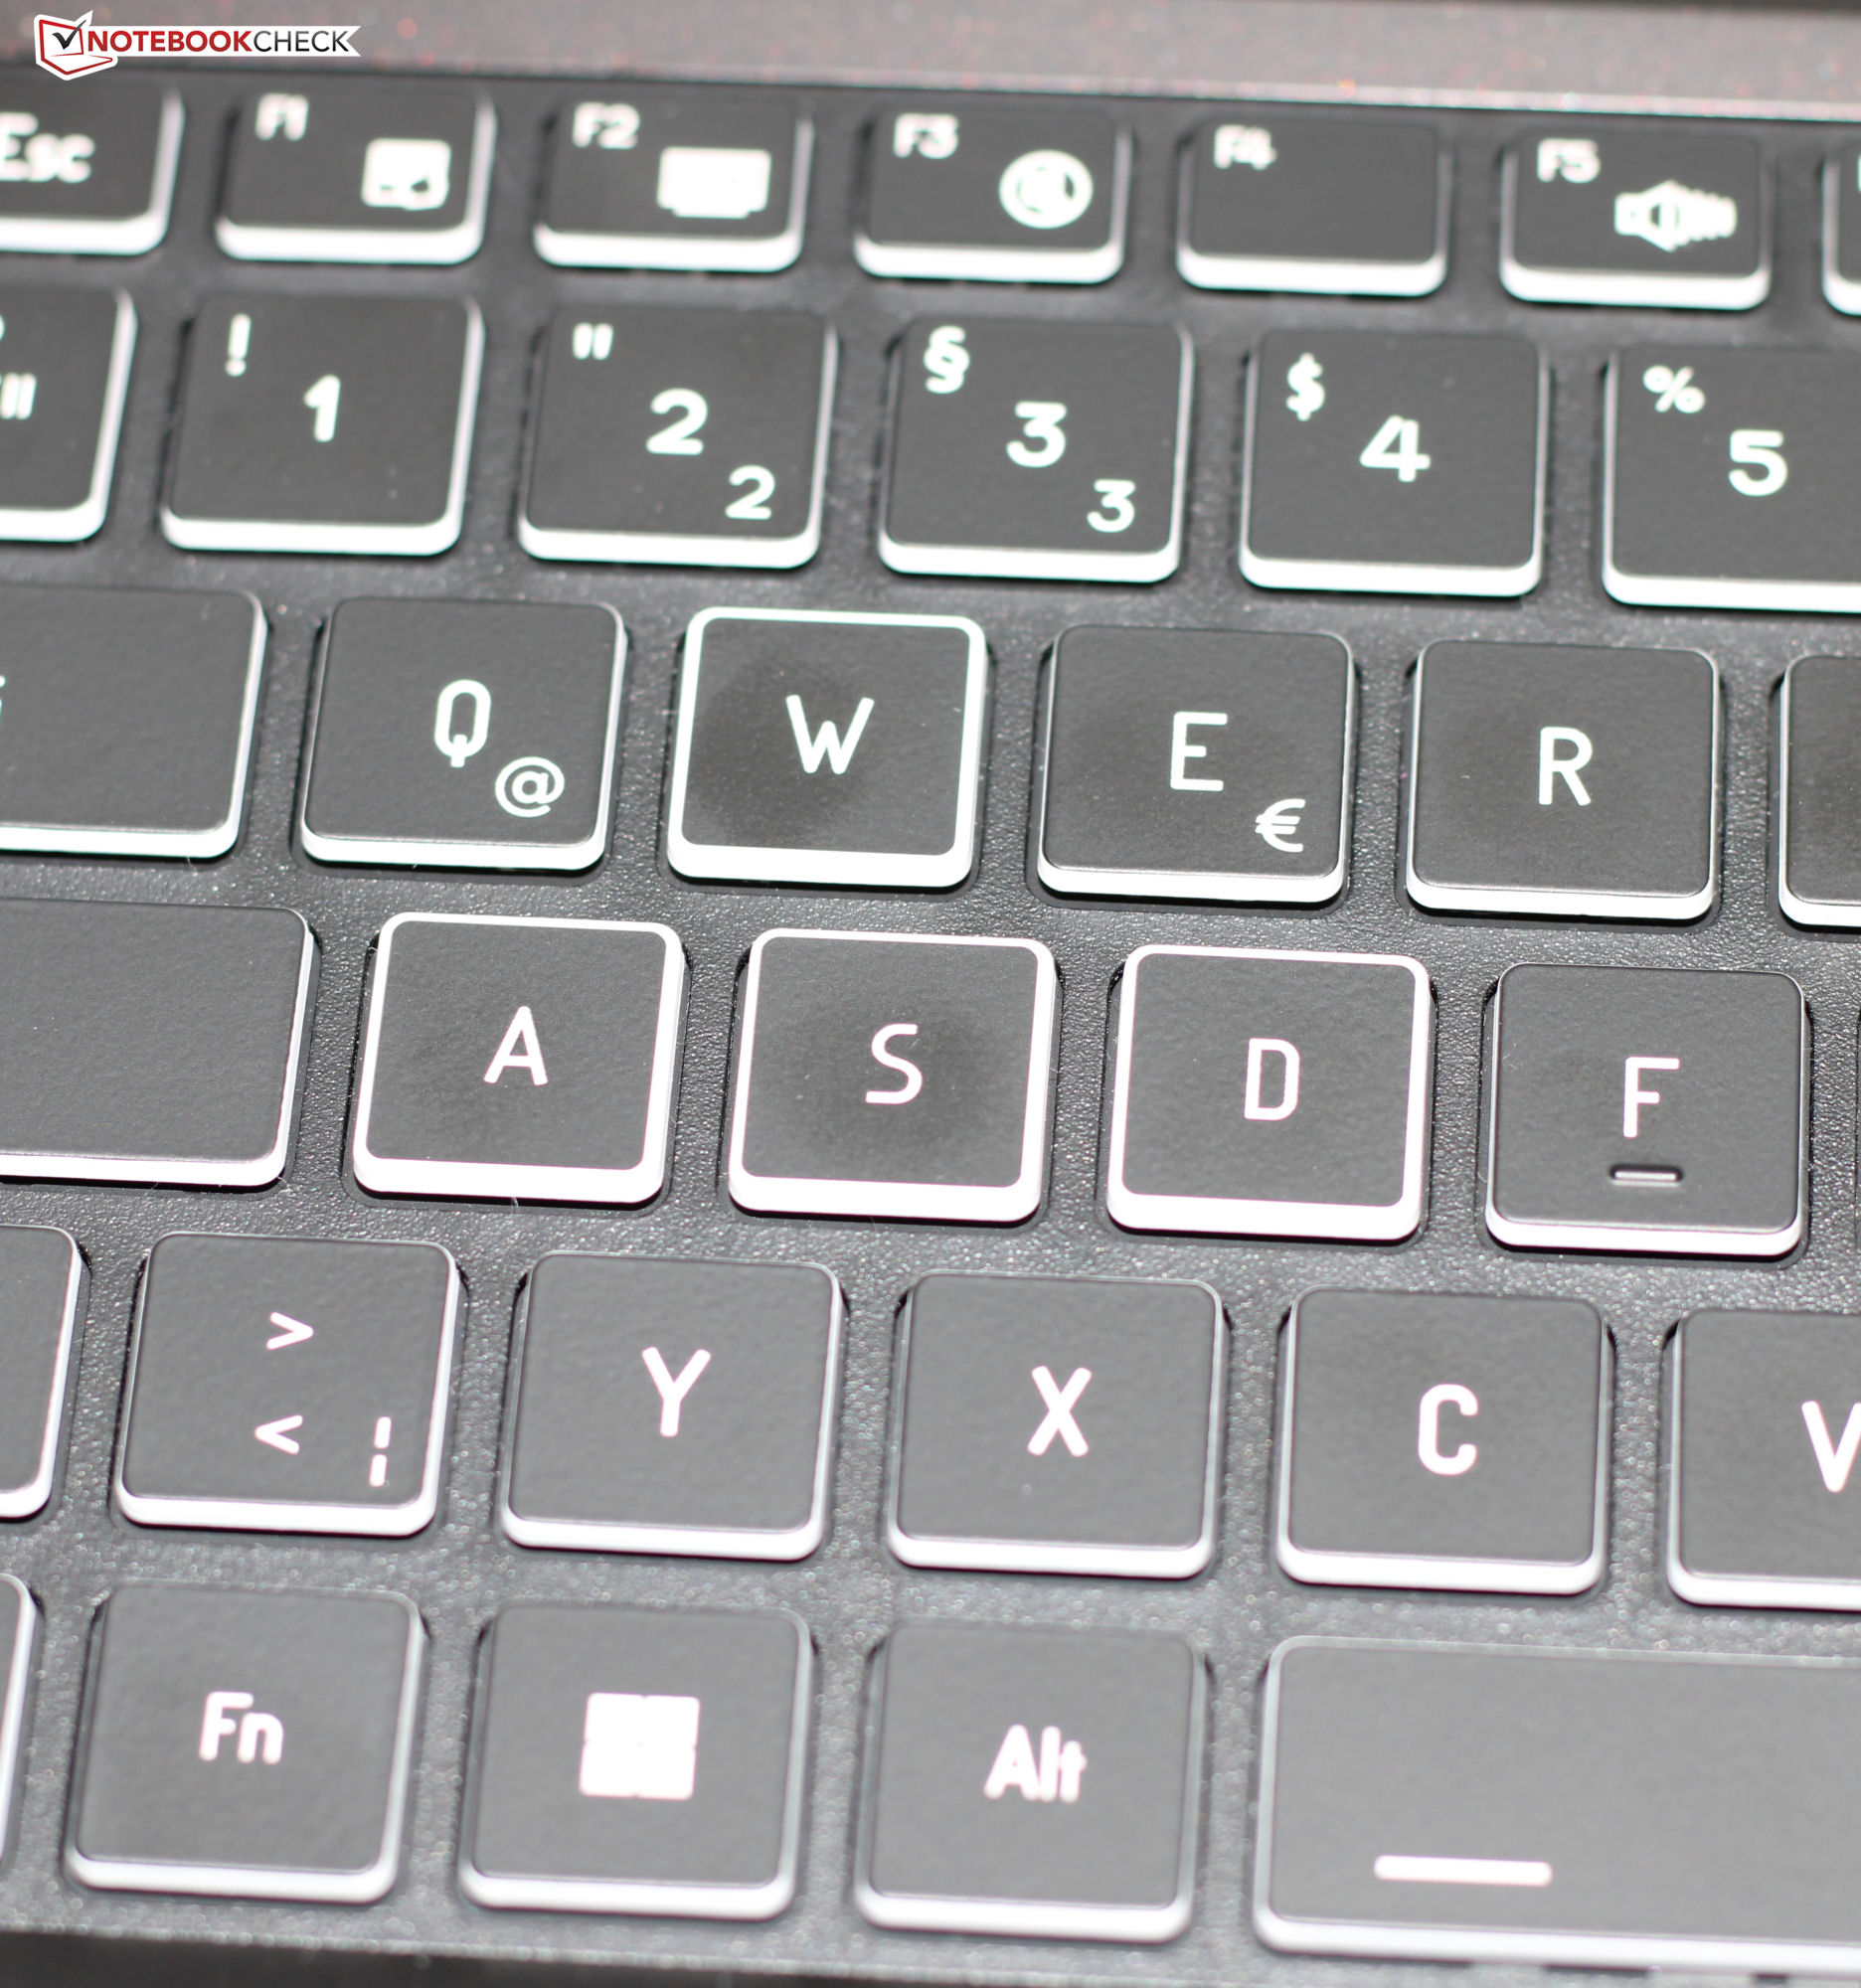
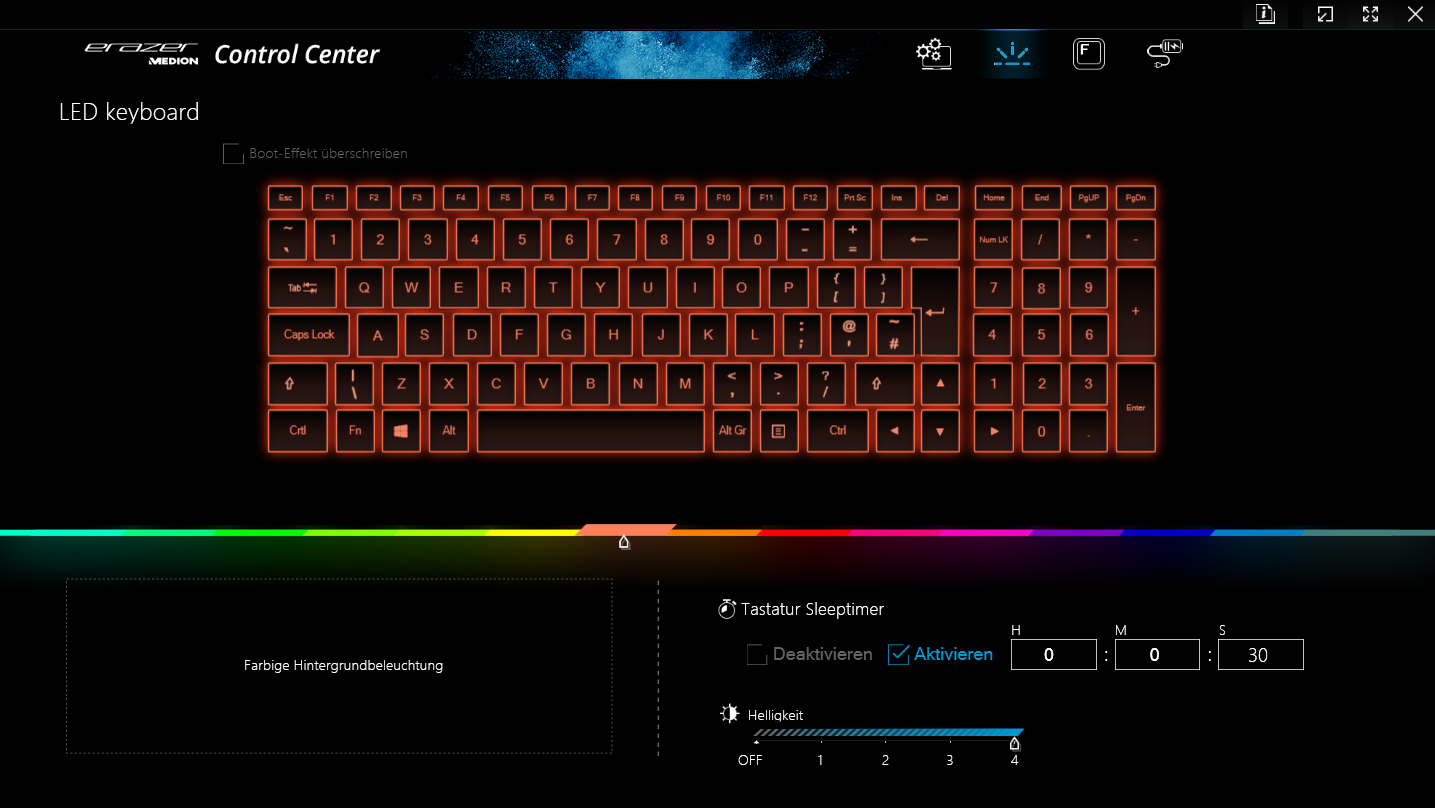
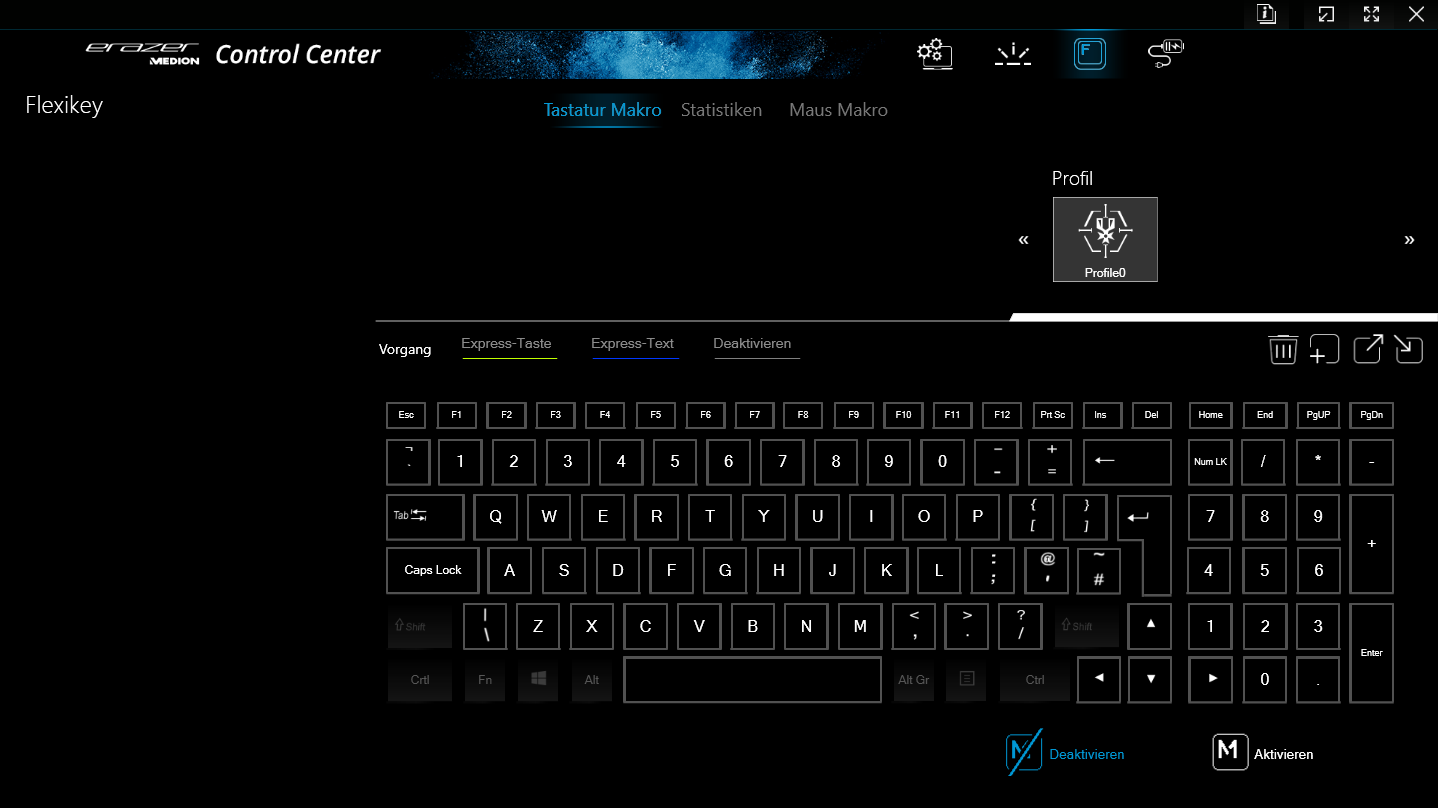
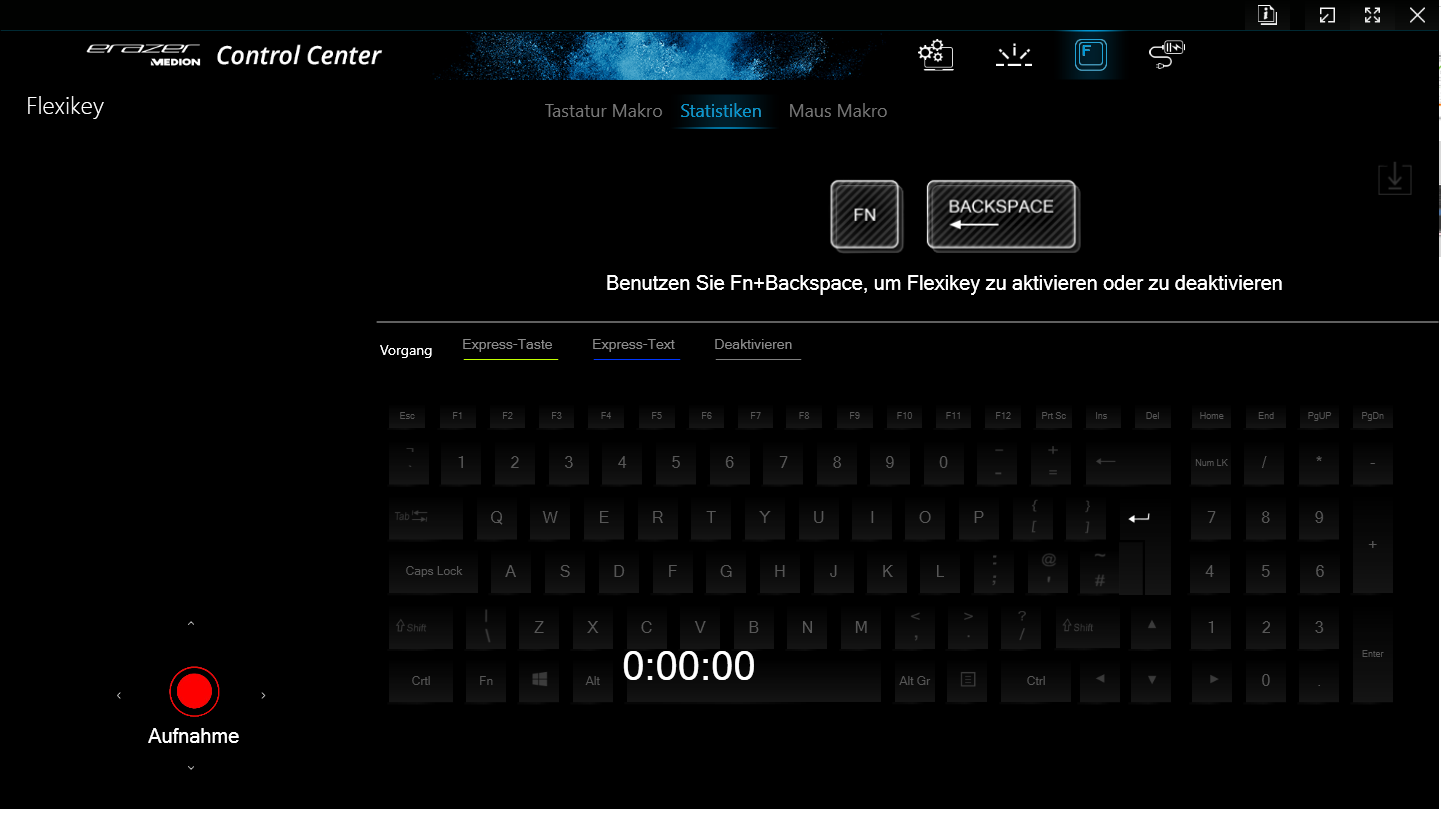
Dispositivos de entrada - El teclado del P40 es retroiluminado RGB
Teclado
El teclado chiclet iluminado (4 niveles) del portátil (que incluye un teclado numérico) consta de teclas suaves y uniformes. Tienen una elevación corta, un punto de presión claro y un buen nivel de resistencia. Al teclear, las teclas ceden ligeramente, pero esto no debería ser demasiado molesto. En resumen, Medion ha conseguido un teclado apto para el uso diario.
Panel táctil
Una alfombrilla de clic (de unos 15,1 x 9,2 cm) sustituye al ratón: tiene una superficie lisa por la que se deslizan fácilmente los dedos. Tiene una elevación corta y un punto de presión claro.
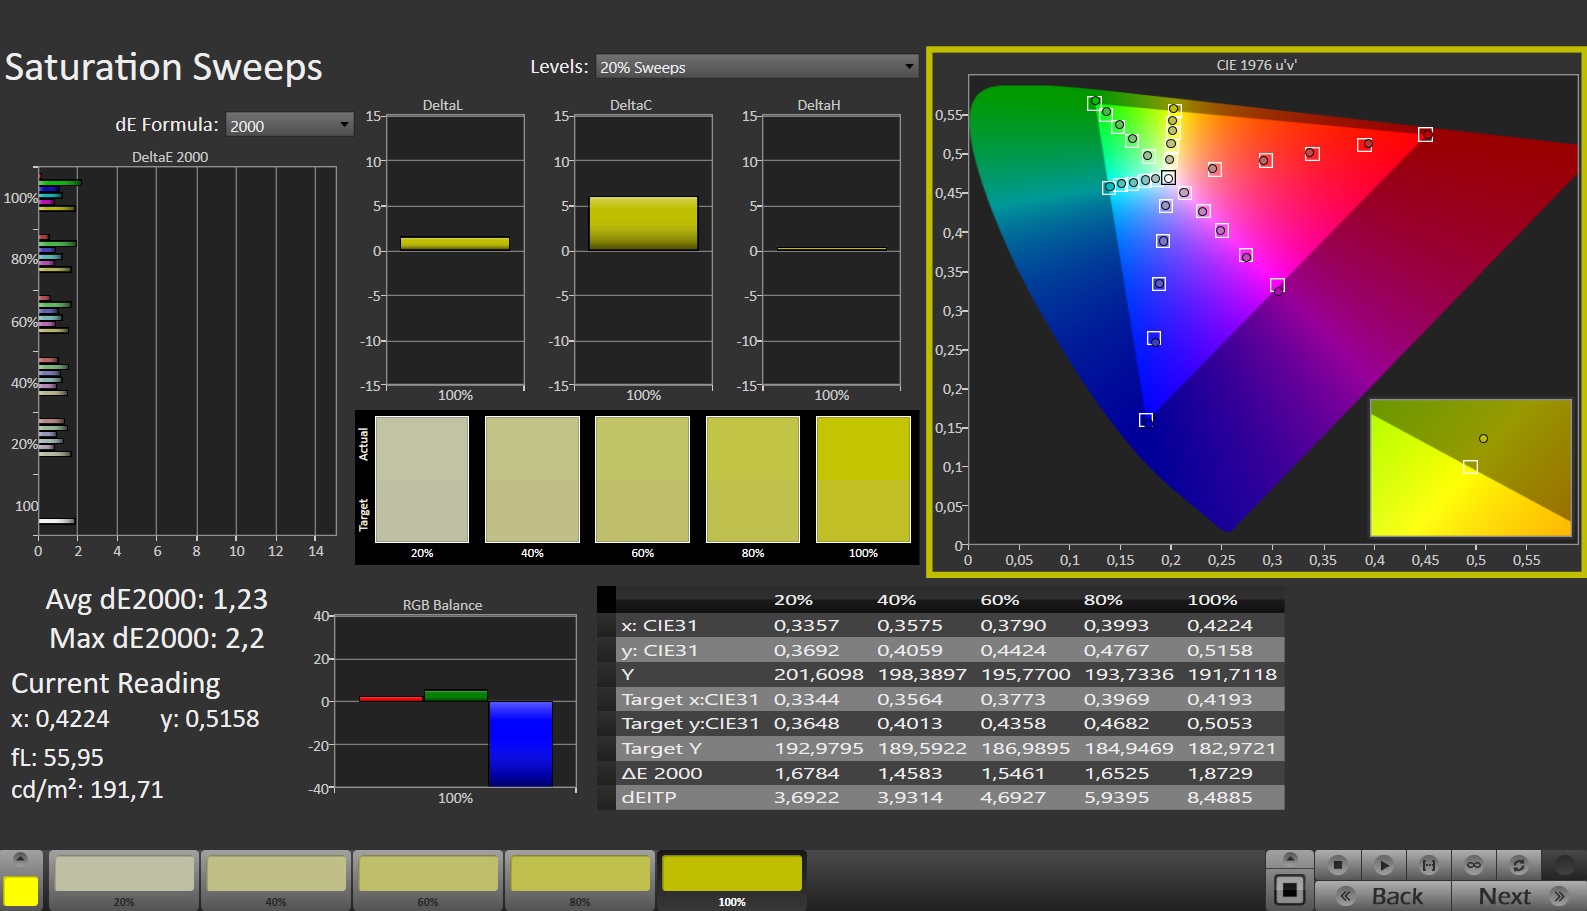
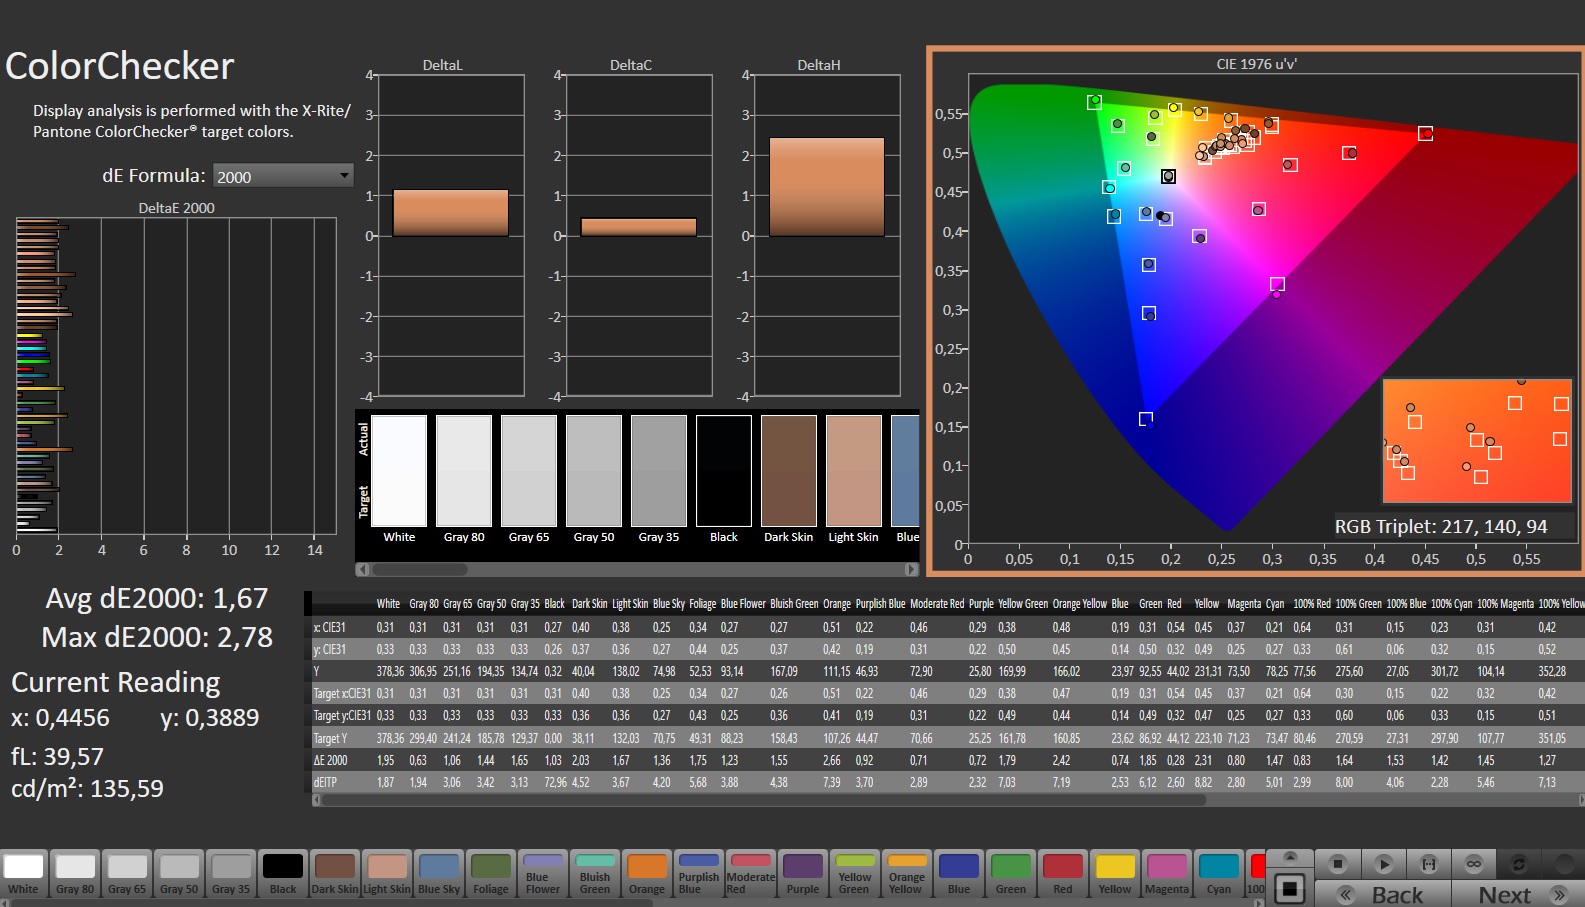
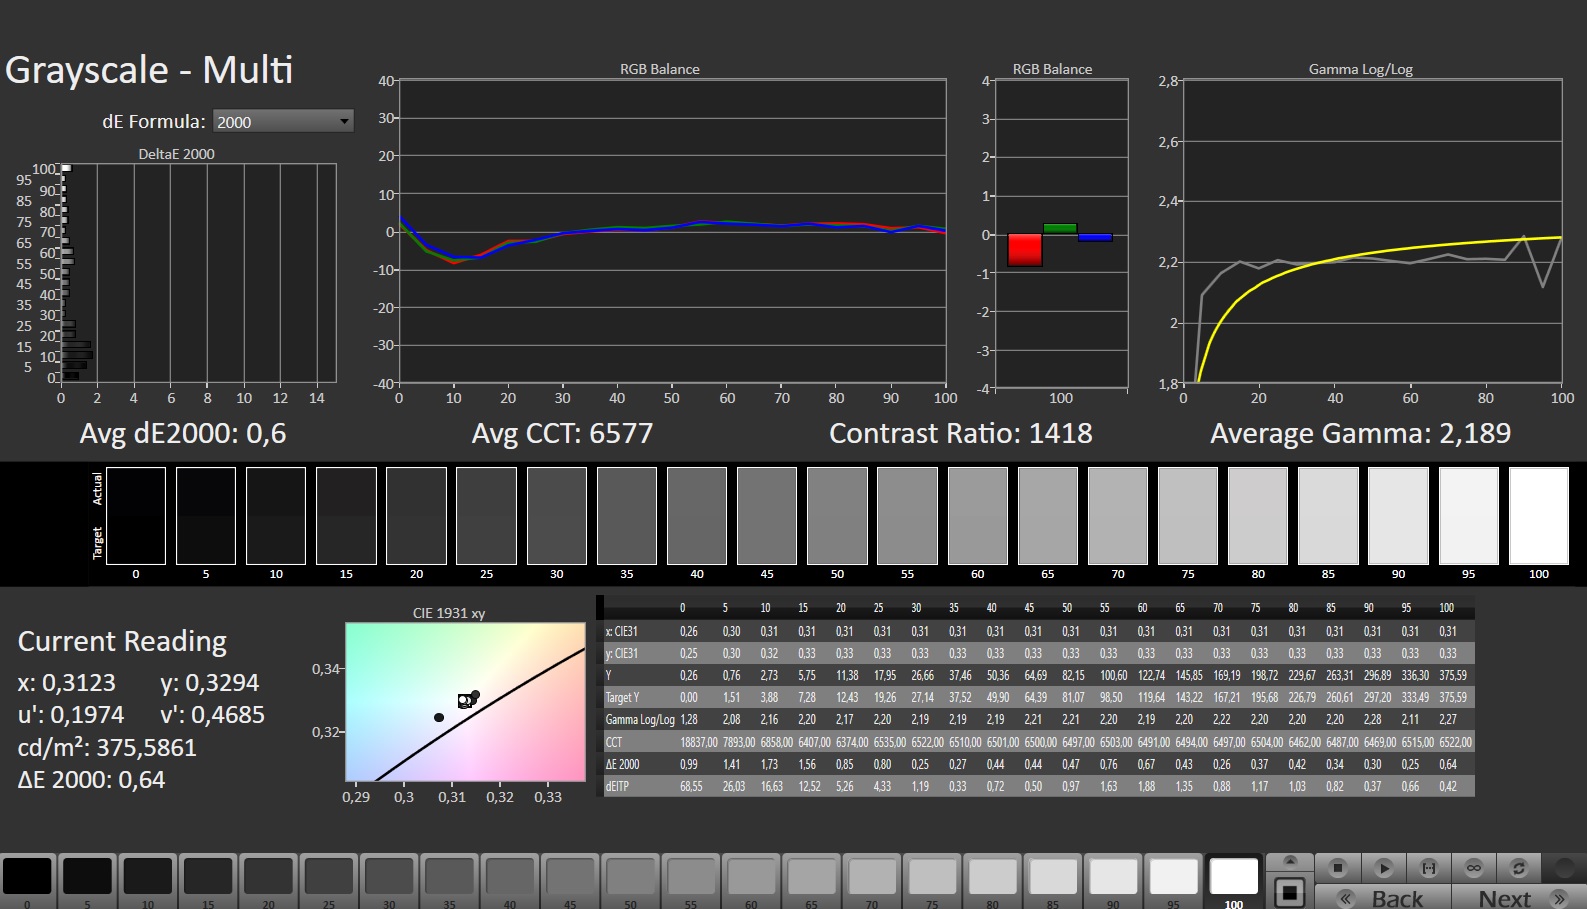
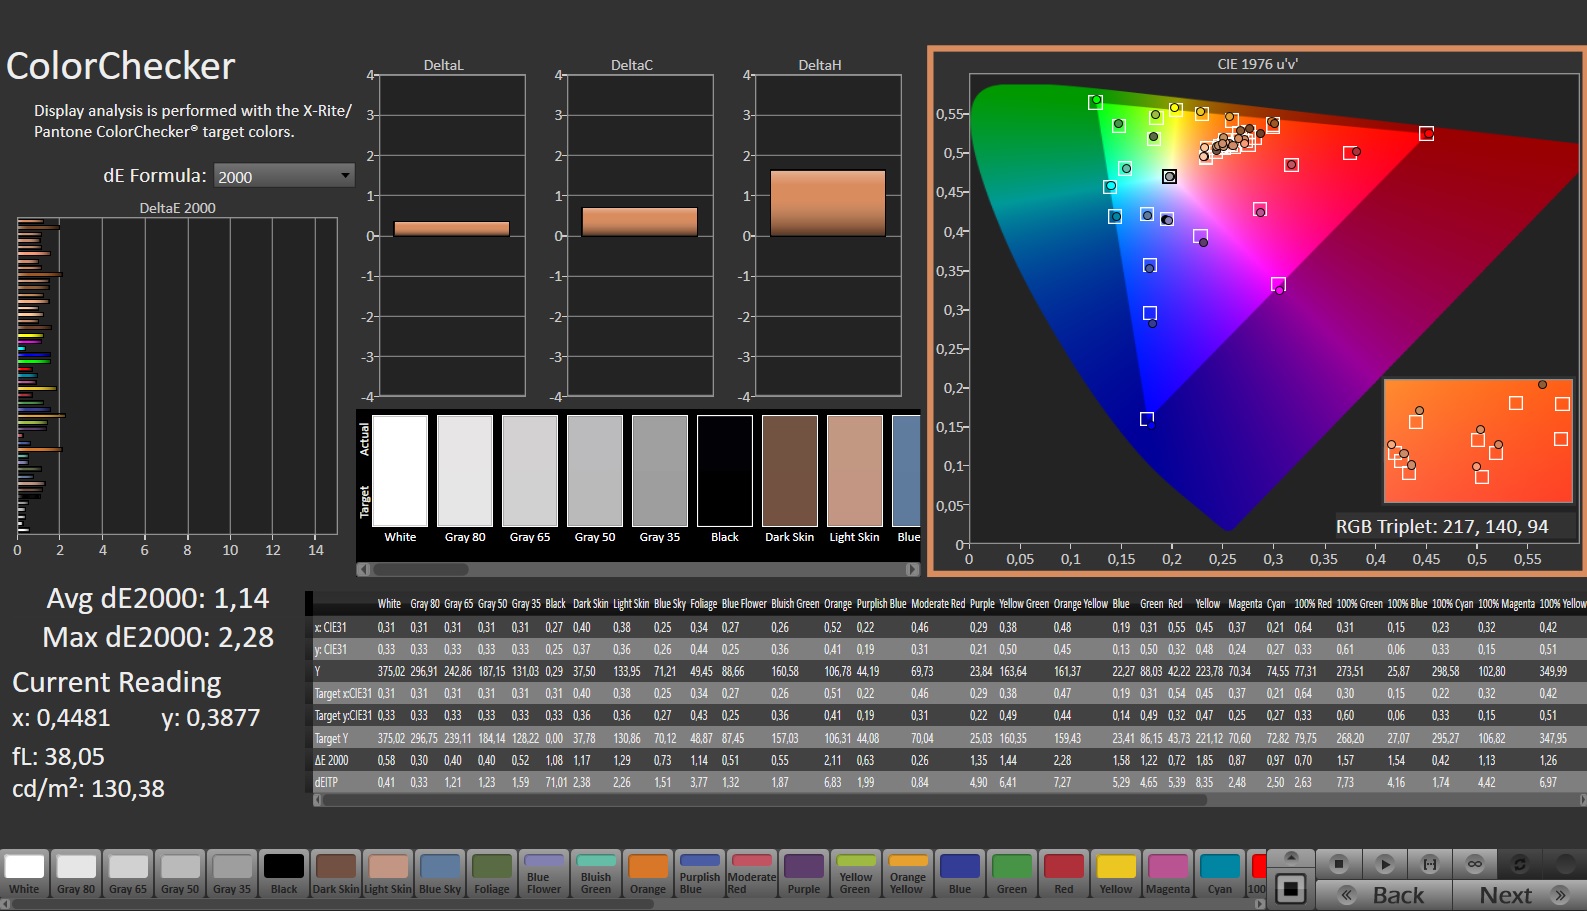
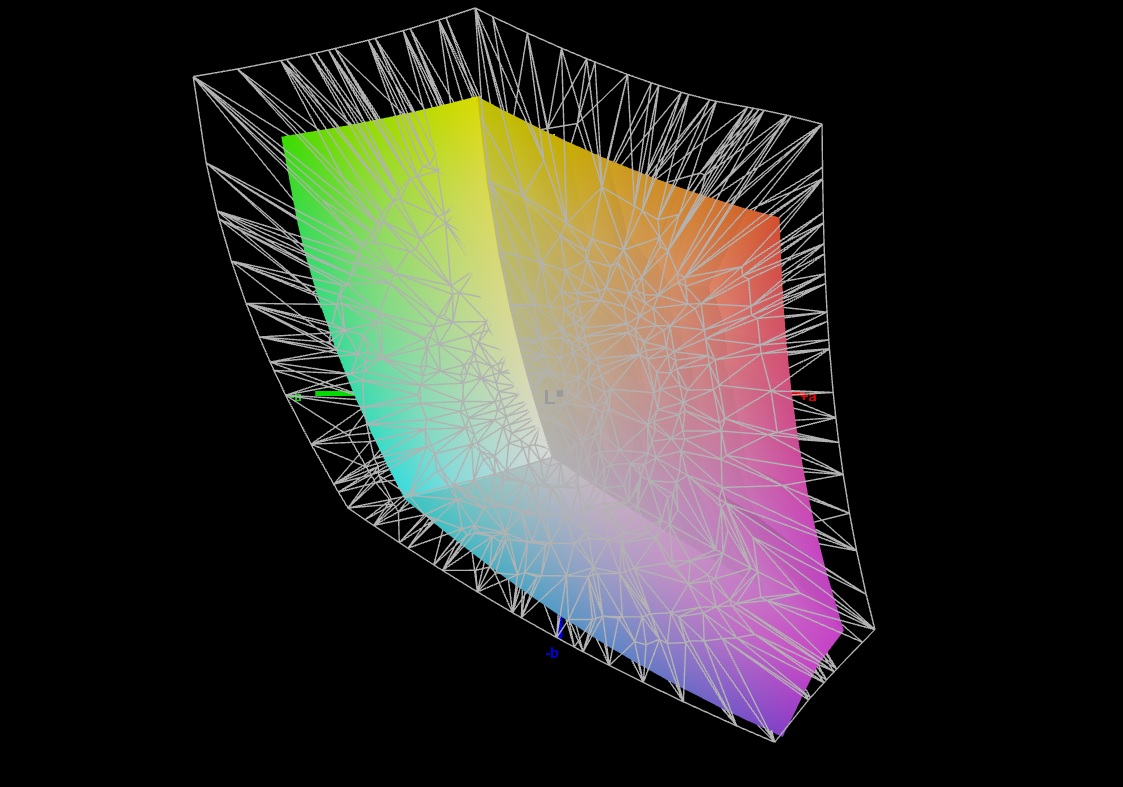
Pantalla - Pantalla QHD con cobertura sRGB
El veloz panel de 240 Hz con formato 16:9 no muestra parpadeo PWM en ningún nivel de brillo. El brillo y el contraste de la pantalla de 17,3 pulgadas (2.560 x 1.440 píxeles) son exactamente como deberían ser (> 300 cd/m² o 1.000:1). Medion no ofrece otras opciones de pantalla.
| |||||||||||||||||||||||||
iluminación: 86 %
Brillo con batería: 364 cd/m²
Contraste: 1300:1 (Negro: 0.28 cd/m²)
ΔE ColorChecker Calman: 1.67 | ∀{0.5-29.43 Ø4.71}
calibrated: 1.14
ΔE Greyscale Calman: 1.4 | ∀{0.09-98 Ø4.96}
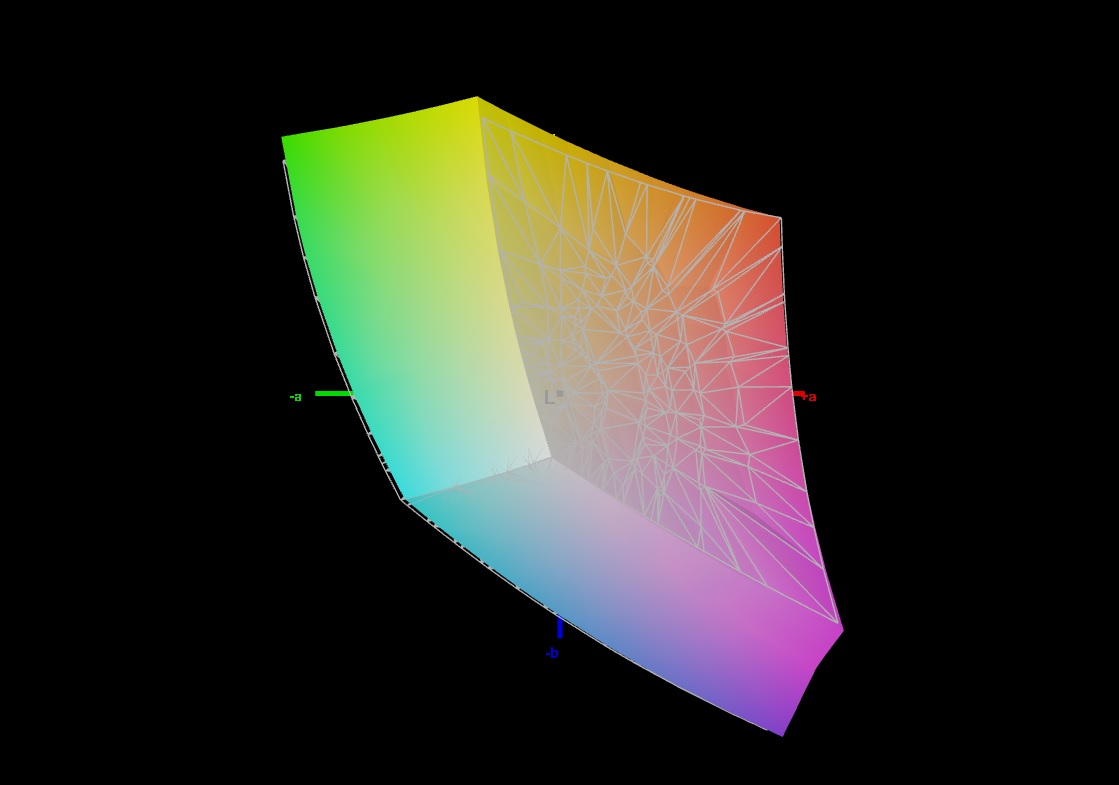
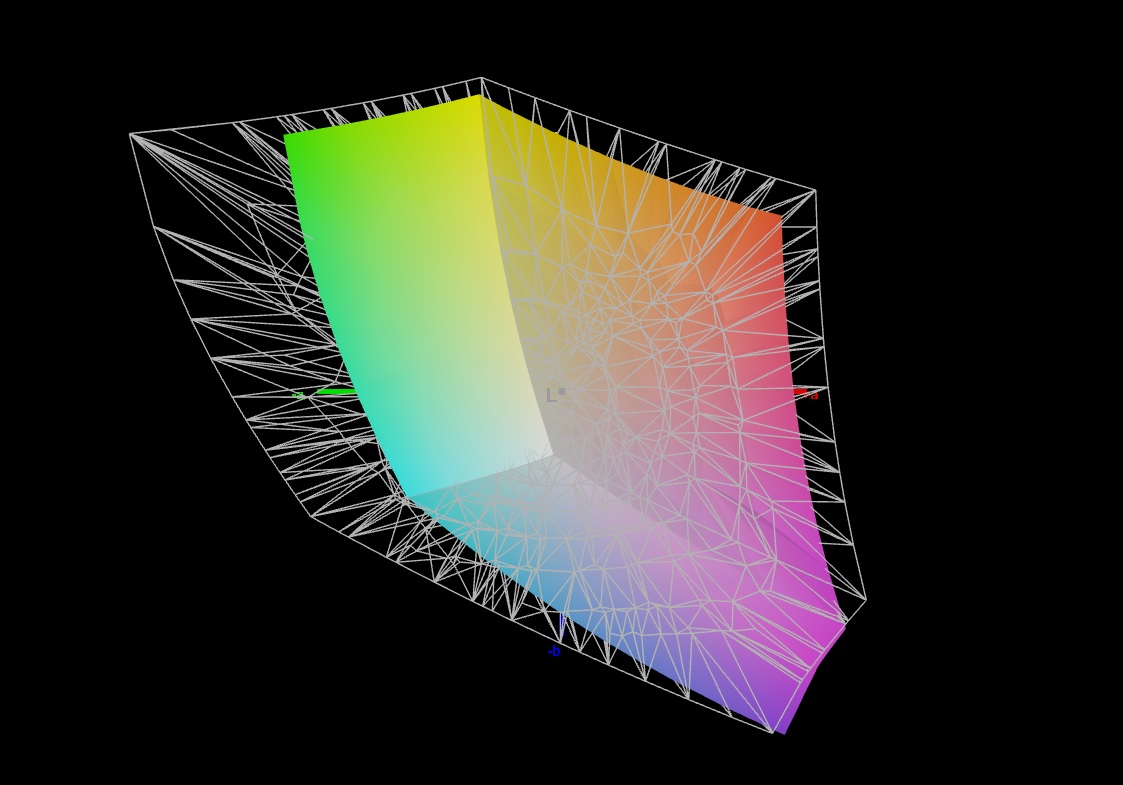
69.8% AdobeRGB 1998 (Argyll 3D)
98.1% sRGB (Argyll 3D)
68.3% Display P3 (Argyll 3D)
Gamma: 2.091
CCT: 6568 K
| Medion Erazer Defender P40 BOE CQ NE173QHM-NZ3, IPS, 2560x1440, 17.3" | MSI Katana 17 B13VFK B173HAN04.9, IPS LED, 1920x1080, 17.3" | Acer Predator Helios 300 (i7-12700H, RTX 3070 Ti) BOE0A1A, IPS, 2560x1440, 17.3" | Lenovo Legion Pro 5 16IRX8 AU Optronics B160QAN03.1, IPS, 2560x1600, 16" | Asus TUF Gaming A16 FA617 NE160WUM-NX2 (BOE0B33), IPS-Level, 1920x1200, 16" | Gigabyte G7 KE AU Optronics B173HAN05.1, IPS, 1920x1080, 17.3" | |
|---|---|---|---|---|---|---|
| Display | -39% | 22% | 3% | 1% | 3% | |
| Display P3 Coverage (%) | 68.3 | 40.8 -40% | 96.8 42% | 71.2 4% | 69.4 2% | 70.4 3% |
| sRGB Coverage (%) | 98.1 | 61 -38% | 99.9 2% | 98.8 1% | 97.8 0% | 99.8 2% |
| AdobeRGB 1998 Coverage (%) | 69.8 | 42.2 -40% | 84.8 21% | 73.3 5% | 70.9 2% | 71.7 3% |
| Response Times | -163% | -21% | -10% | -16% | 36% | |
| Response Time Grey 50% / Grey 80% * (ms) | 14.6 ? | 33 ? -126% | 16.4 ? -12% | 14.5 ? 1% | 17 ? -16% | 5 ? 66% |
| Response Time Black / White * (ms) | 8.7 ? | 26 ? -199% | 11.2 ? -29% | 10.4 ? -20% | 10.1 ? -16% | 8.3 ? 5% |
| PWM Frequency (Hz) | ||||||
| Screen | -126% | -59% | -2% | -5% | -6% | |
| Brightness middle (cd/m²) | 364 | 267 -27% | 366 1% | 405.7 11% | 308 -15% | 307 -16% |
| Brightness (cd/m²) | 343 | 256 -25% | 340 -1% | 368 7% | 293 -15% | 301 -12% |
| Brightness Distribution (%) | 86 | 93 8% | 85 -1% | 87 1% | 90 5% | 93 8% |
| Black Level * (cd/m²) | 0.28 | 0.21 25% | 0.31 -11% | 0.38 -36% | 0.23 18% | 0.2 29% |
| Contrast (:1) | 1300 | 1271 -2% | 1181 -9% | 1068 -18% | 1339 3% | 1535 18% |
| Colorchecker dE 2000 * | 1.67 | 4.7 -181% | 3.56 -113% | 1.65 1% | 1.47 12% | 1.32 21% |
| Colorchecker dE 2000 max. * | 2.78 | 20.4 -634% | 5.66 -104% | 4.2 -51% | 2.98 -7% | 4.6 -65% |
| Colorchecker dE 2000 calibrated * | 1.14 | 4.5 -295% | 3.31 -190% | 0.53 54% | 1.02 11% | 1.03 10% |
| Greyscale dE 2000 * | 1.4 | 1.5 -7% | 2.84 -103% | 1.2 14% | 2.2 -57% | 2.1 -50% |
| Gamma | 2.091 105% | 2.12 104% | 2.29 96% | 2.3 96% | 2.228 99% | 2.247 98% |
| CCT | 6568 99% | 6552 99% | 6835 95% | 6453 101% | 6228 104% | 6815 95% |
| Media total (Programa/Opciones) | -109% /
-113% | -19% /
-36% | -3% /
-2% | -7% /
-5% | 11% /
2% |
* ... más pequeño es mejor
Ex funciona, la pantalla ya tiene una gran representación del color: Una desviación de aproximadamente 1,7 es aceptable (DeltaE < 3). La calibración lleva a una desviación menor de 1,13 y a tonos grises más equilibrados.
El panel cubre todo el espacio de color sRGB - pero no AdobeRGB o DCI P3. Esto no difiere demasiado de los competidores del dispositivo. Sólo la pantalla del Acer Predator de
puede representar el espacio P3.<br>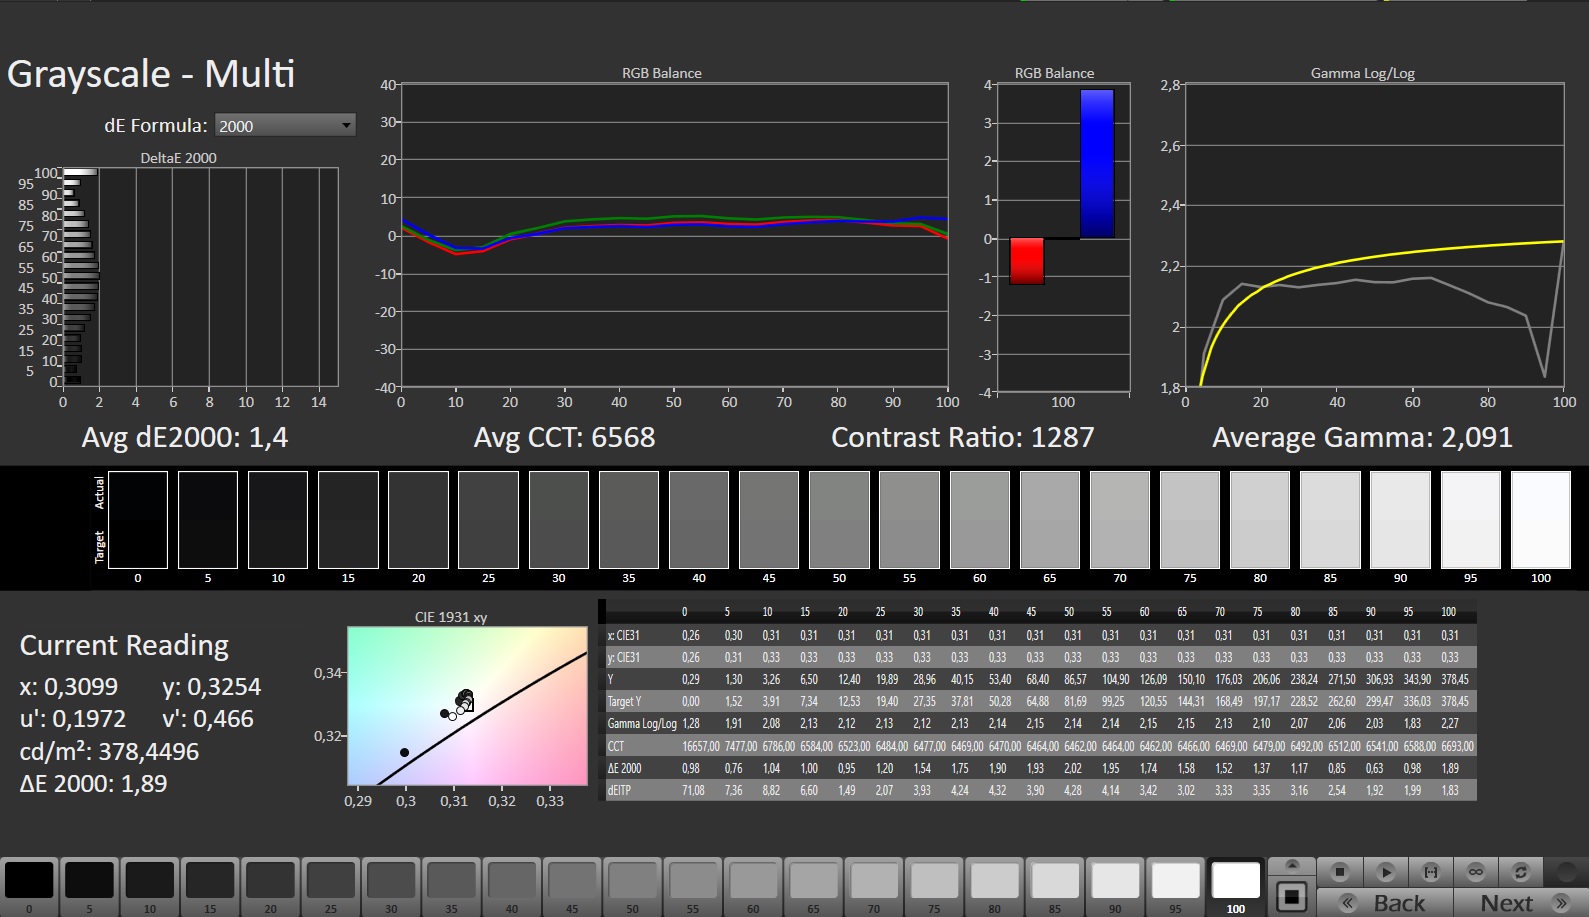

Tiempos de respuesta del display
| ↔ Tiempo de respuesta de Negro a Blanco | ||
|---|---|---|
| 8.7 ms ... subida ↗ y bajada ↘ combinada | ↗ 3.6 ms subida | 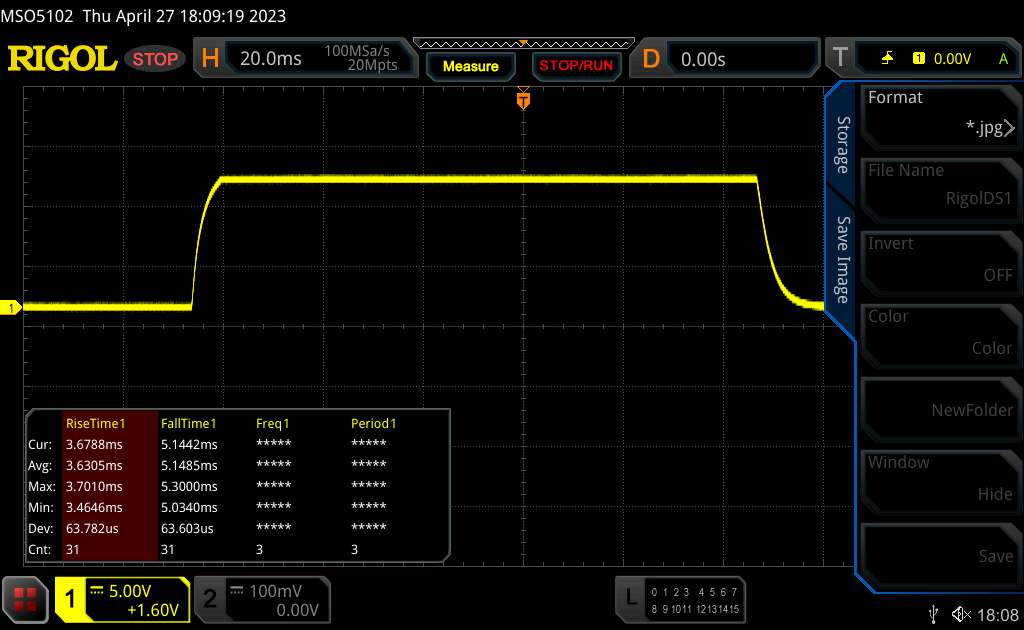 |
| ↘ 5.1 ms bajada | ||
| La pantalla mostró tiempos de respuesta rápidos en nuestros tests y debería ser adecuada para juegos. En comparación, todos los dispositivos de prueba van de ##min### (mínimo) a 240 (máximo) ms. » 24 % de todos los dispositivos son mejores. Esto quiere decir que el tiempo de respuesta medido es mejor que la media (19.8 ms) de todos los dispositivos testados. | ||
| ↔ Tiempo de respuesta 50% Gris a 80% Gris | ||
| 14.6 ms ... subida ↗ y bajada ↘ combinada | ↗ 7.1 ms subida | 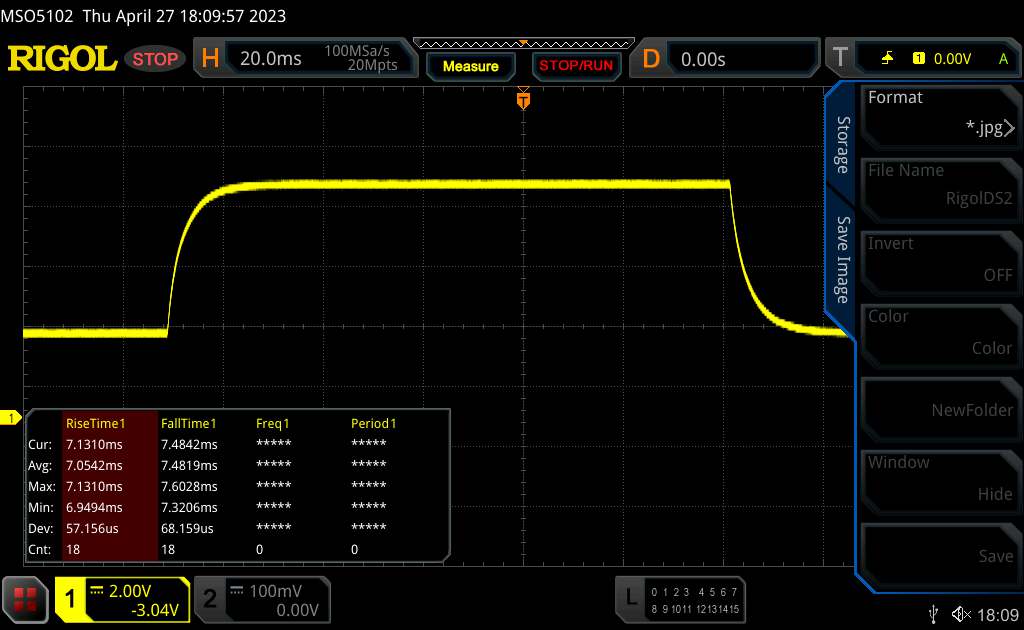 |
| ↘ 7.5 ms bajada | ||
| La pantalla mostró buenos tiempos de respuesta en nuestros tests pero podría ser demasiado lenta para los jugones competitivos. En comparación, todos los dispositivos de prueba van de ##min### (mínimo) a 636 (máximo) ms. » 29 % de todos los dispositivos son mejores. Esto quiere decir que el tiempo de respuesta medido es mejor que la media (31 ms) de todos los dispositivos testados. | ||
Parpadeo de Pantalla / PWM (Pulse-Width Modulation)
| Parpadeo de Pantalla / PWM no detectado | 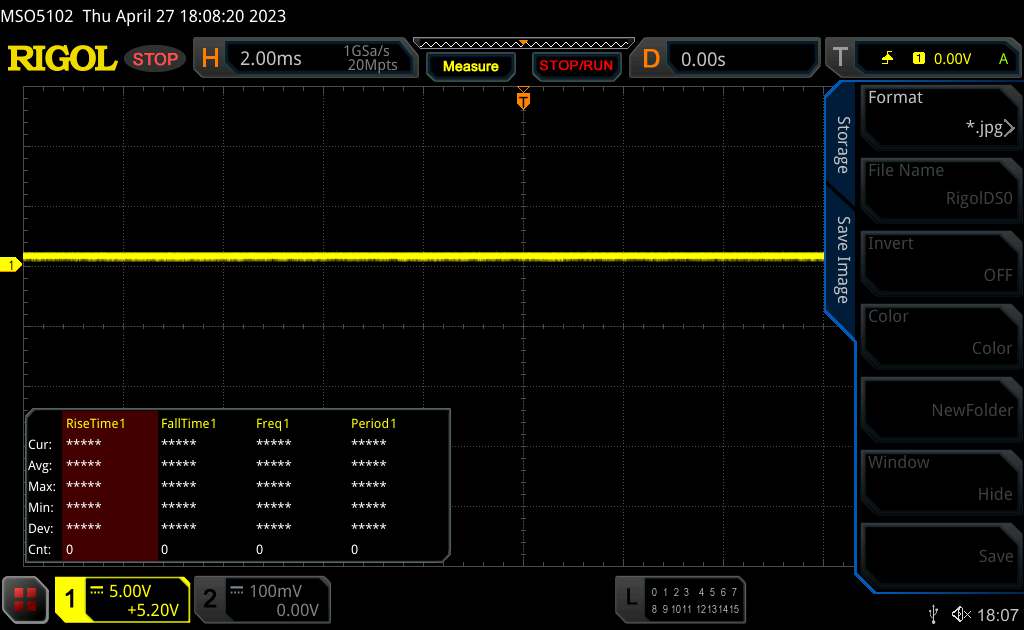 | ||
Comparación: 52 % de todos los dispositivos testados no usaron PWM para atenuar el display. Si se usó, medimos una media de 7757 (mínimo: 5 - máxmo: 343500) Hz. | |||
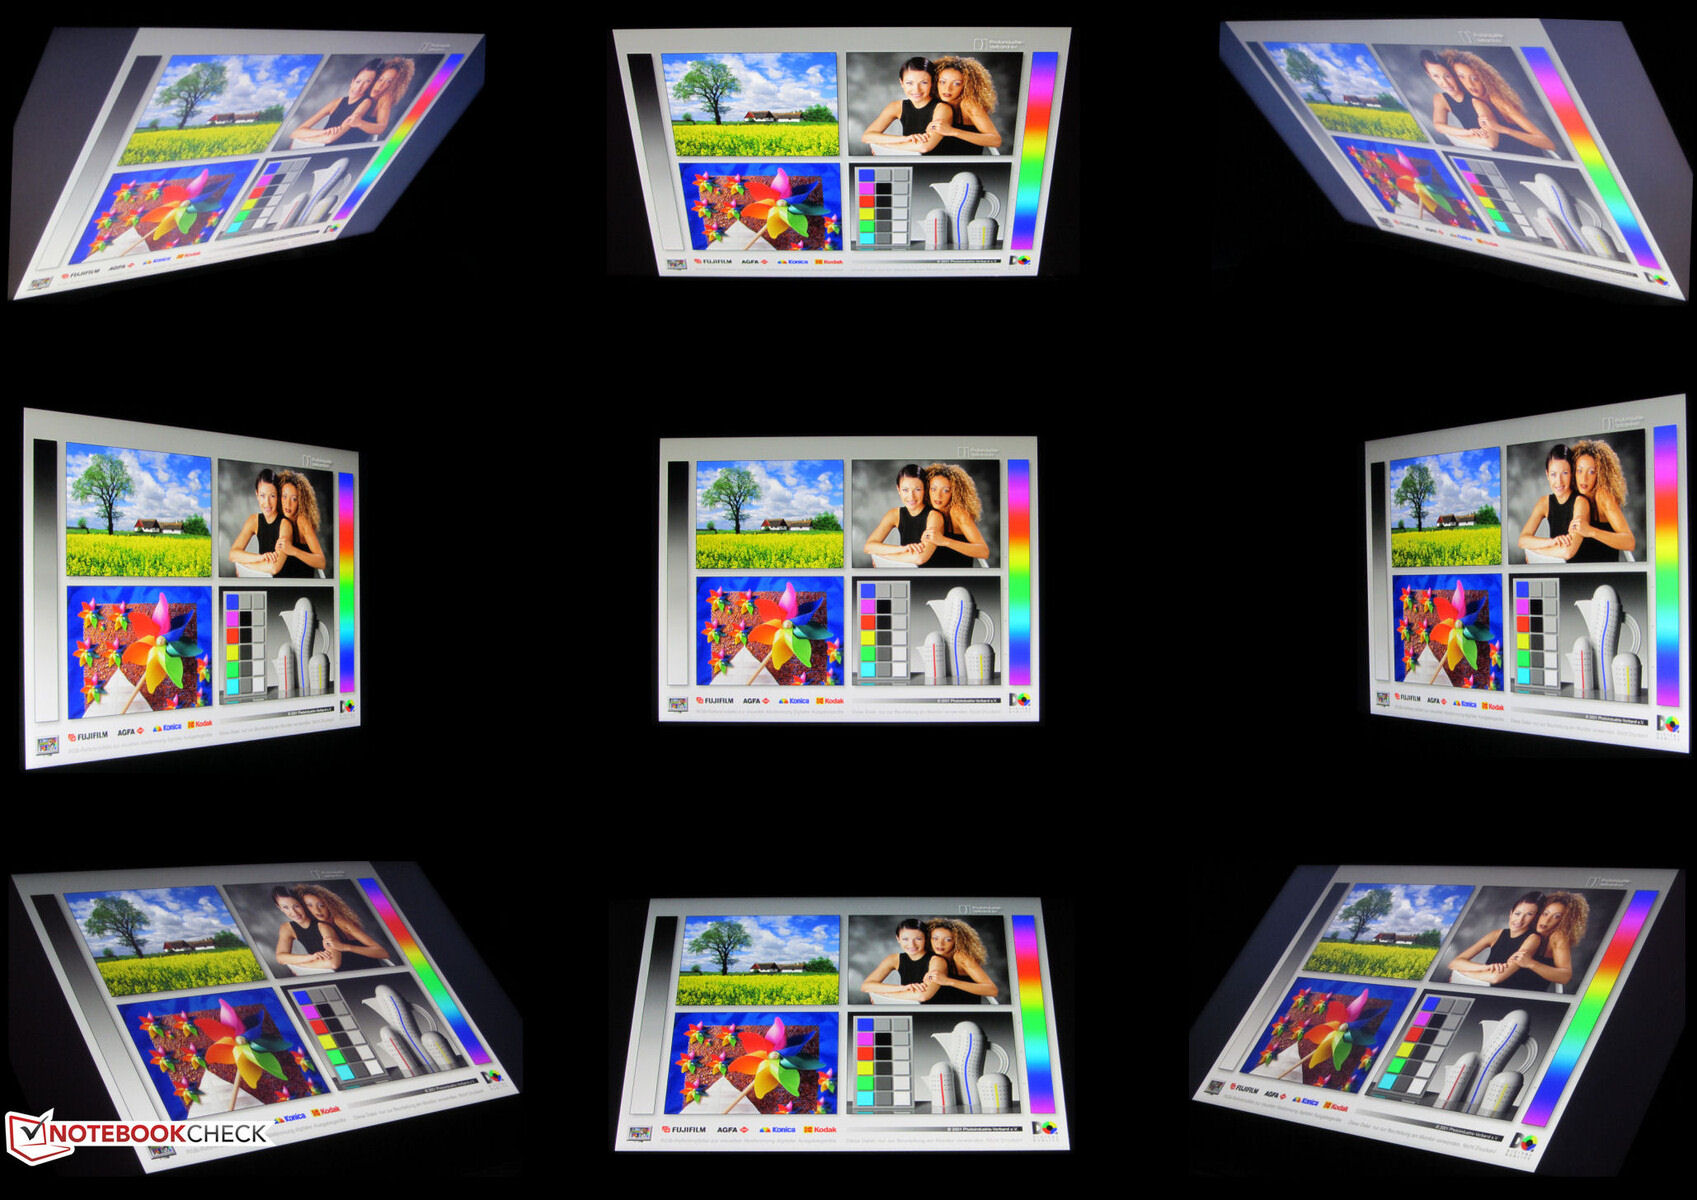
El panel IBS de ángulo de visión estable sigue siendo legible desde cualquier posición. En exteriores, la pantalla sigue siendo legible siempre que el sol no brille demasiado.
Rendimiento - El ordenador Erazer cuenta con hardware de gama media
El Erazer Defender P40 de Medion es un portátil para juegos QHD de gama media. Raptor Lake y Ada Lovelace ofrecen el rendimiento de proceso necesario. El modelo actual puede comprarse por unos 1.900 $ - otros modelos con características diferentes no están disponibles.
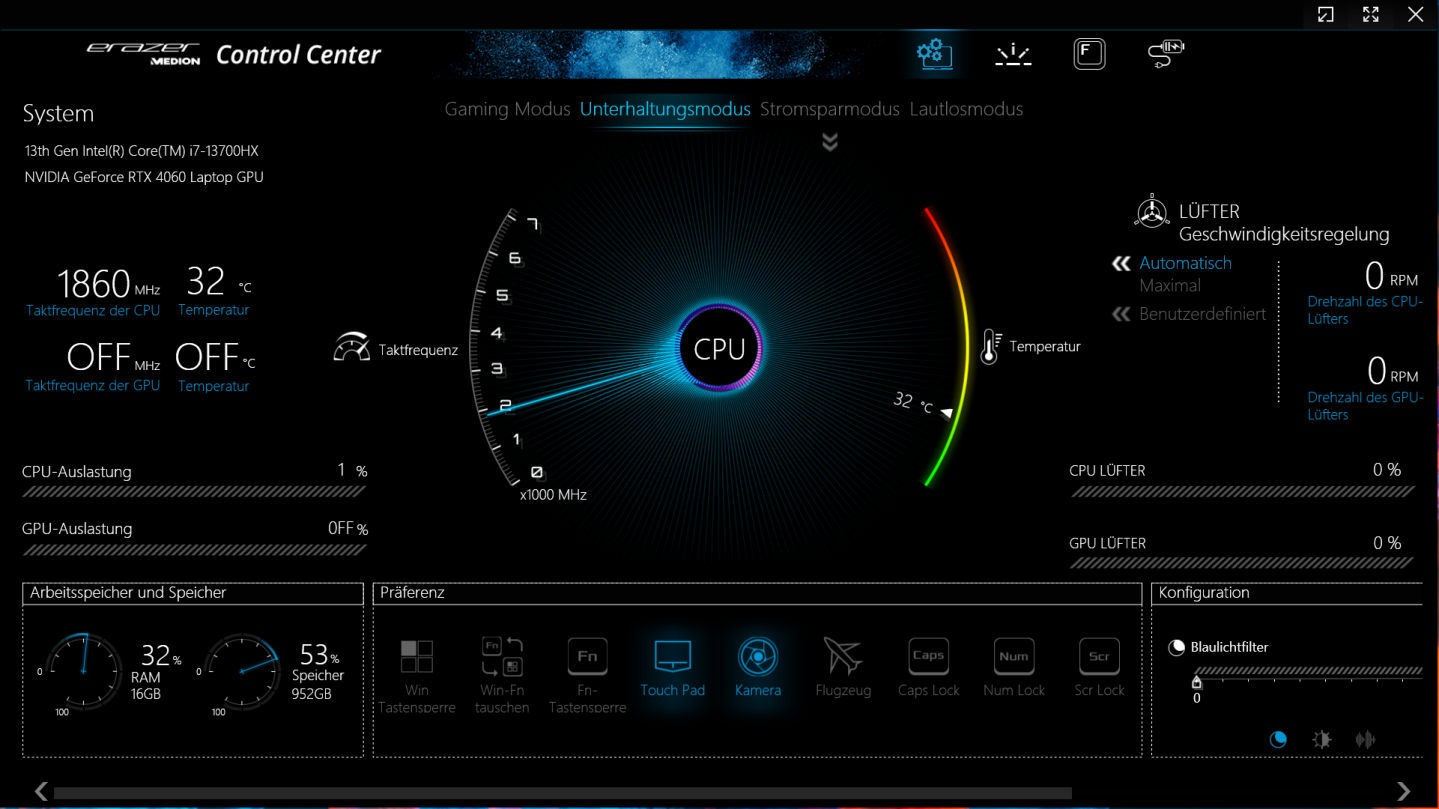
Condiciones de ensayo
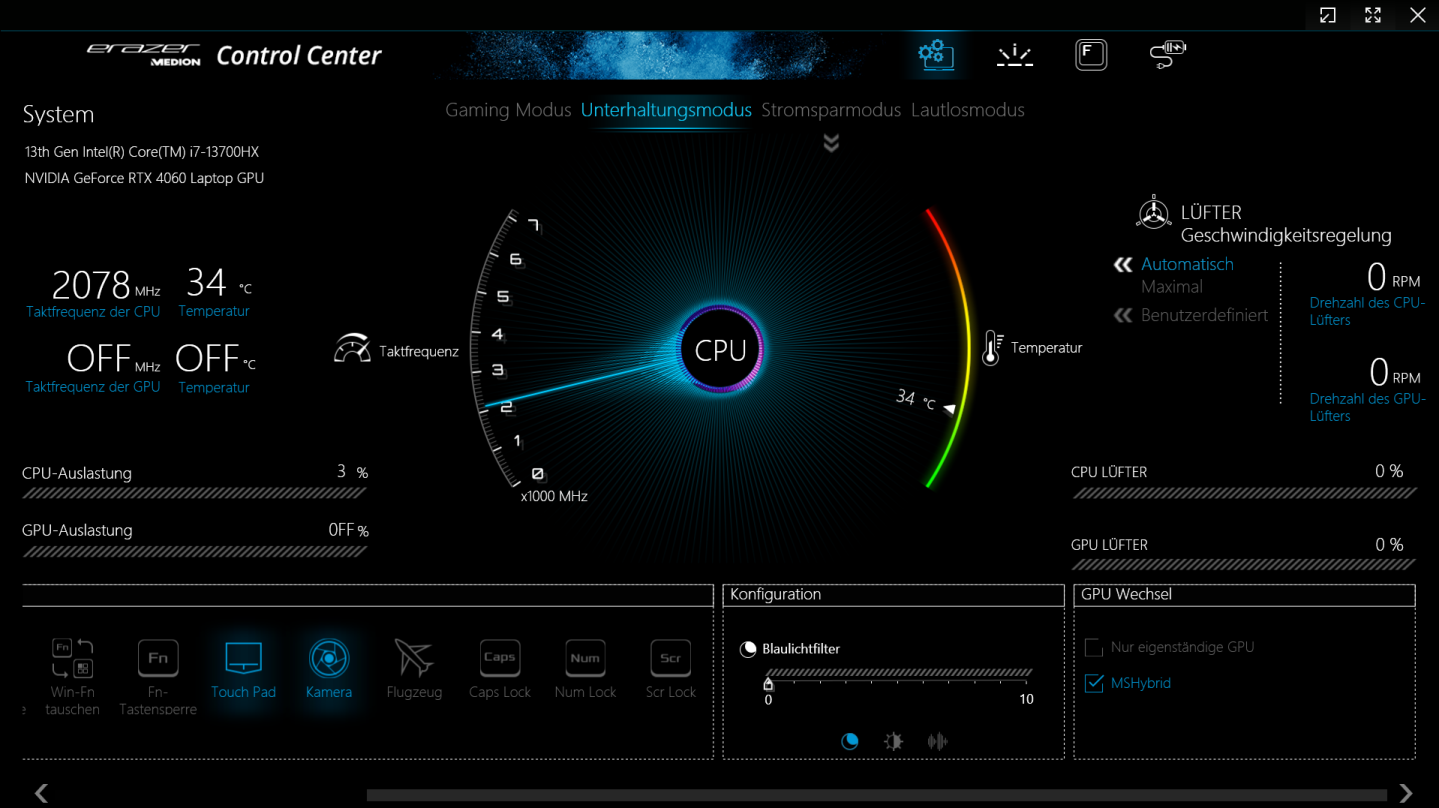
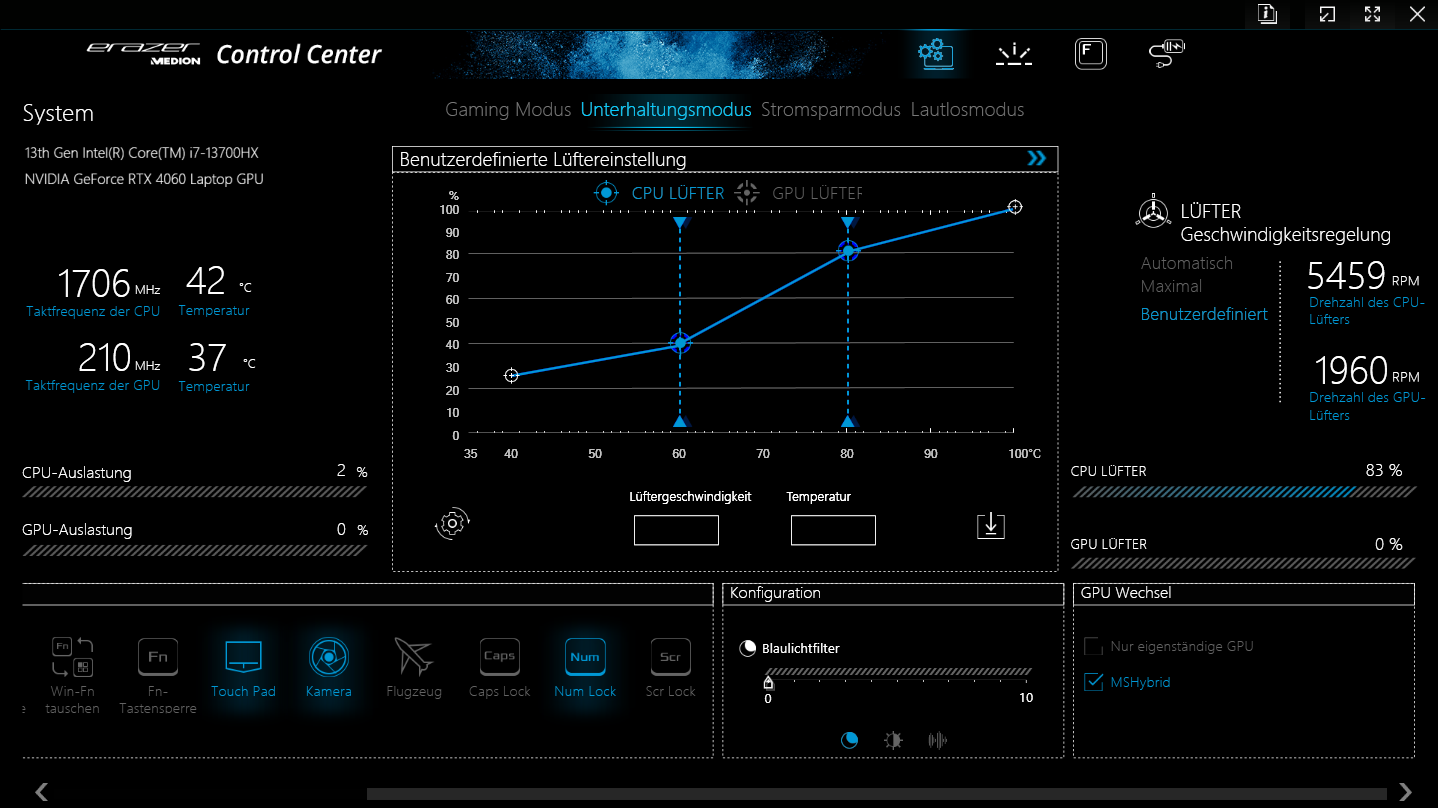
El P40 tiene cuatro modos de rendimiento específicos del fabricante (ver tabla) entre los que se puede cambiar a través del software del centro de control del portátil. Usamos el "modo entretenimiento" (pruebas) y el "modo ahorro de energía" (pruebas de batería; desactiva la RTX 4060). Optimus estaba activado. También probamos los otros dos modos: "modo juego" conlleva mejoras en el rendimiento de la CPU y "modo silencioso" permite jugar con menos emisiones de ruido.
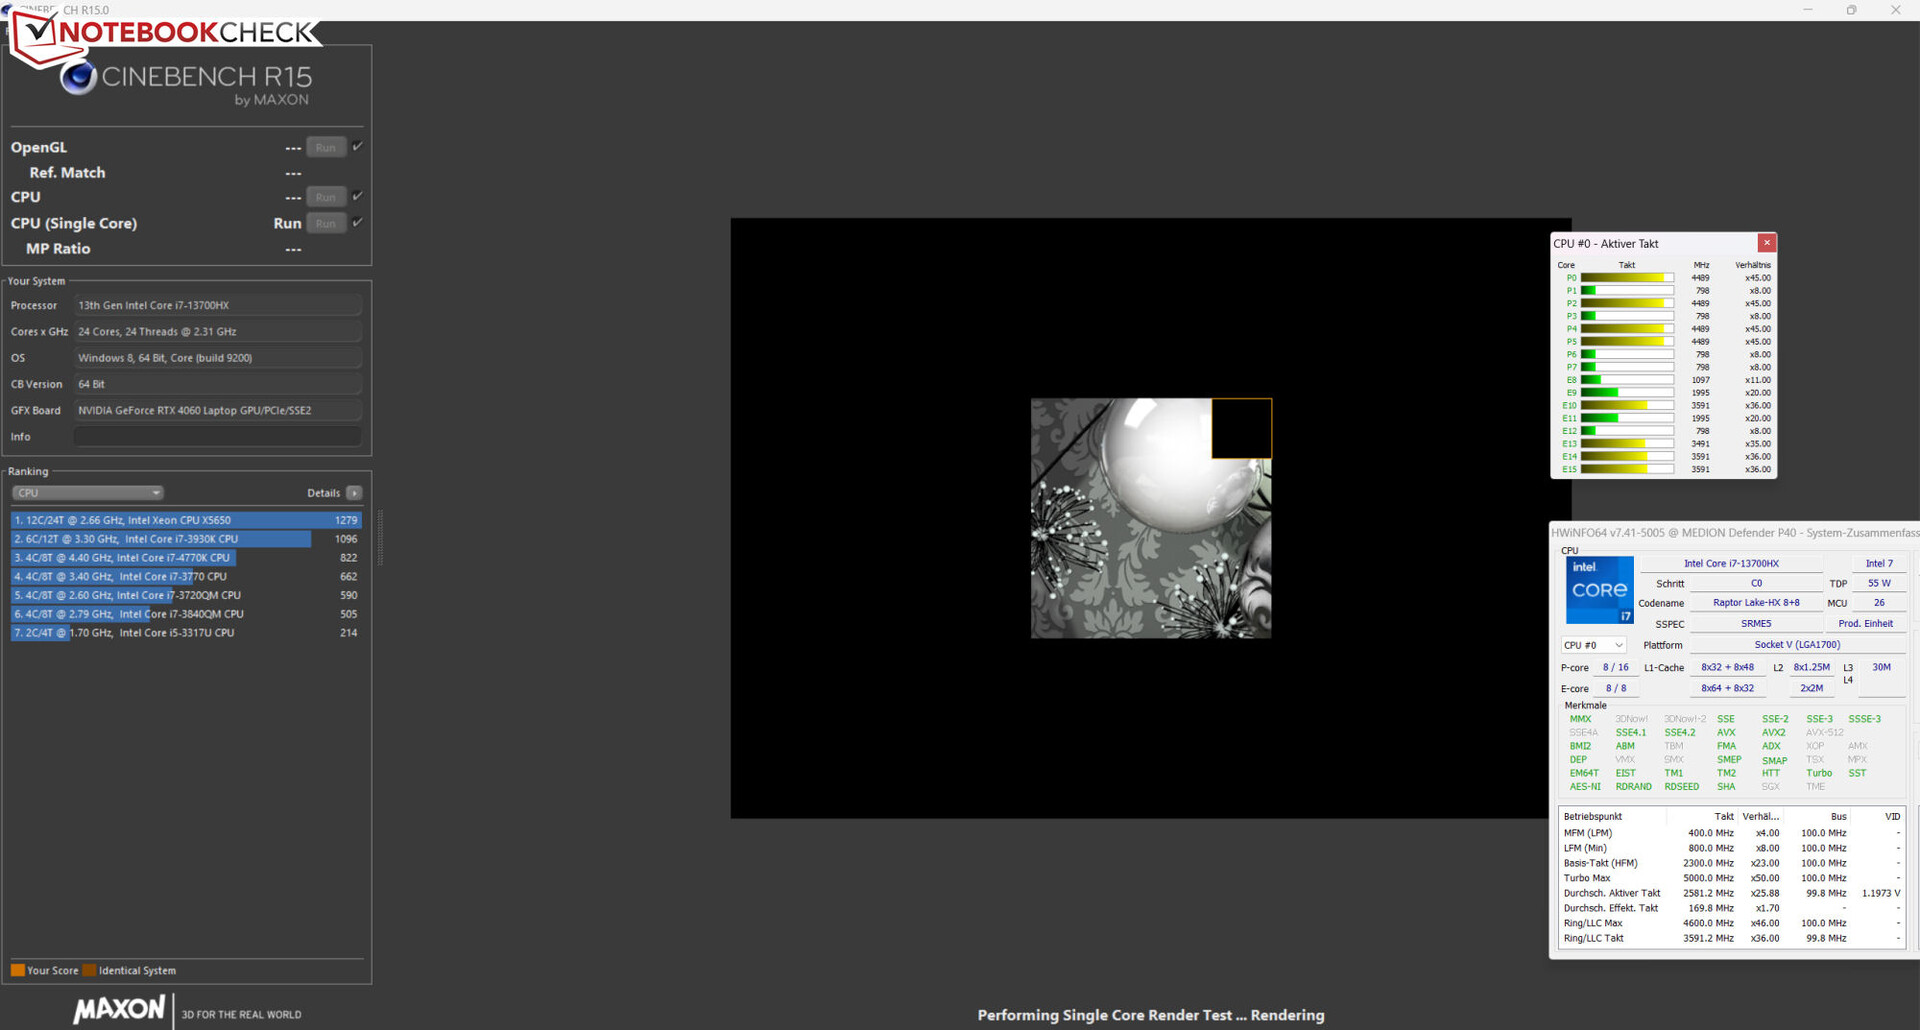
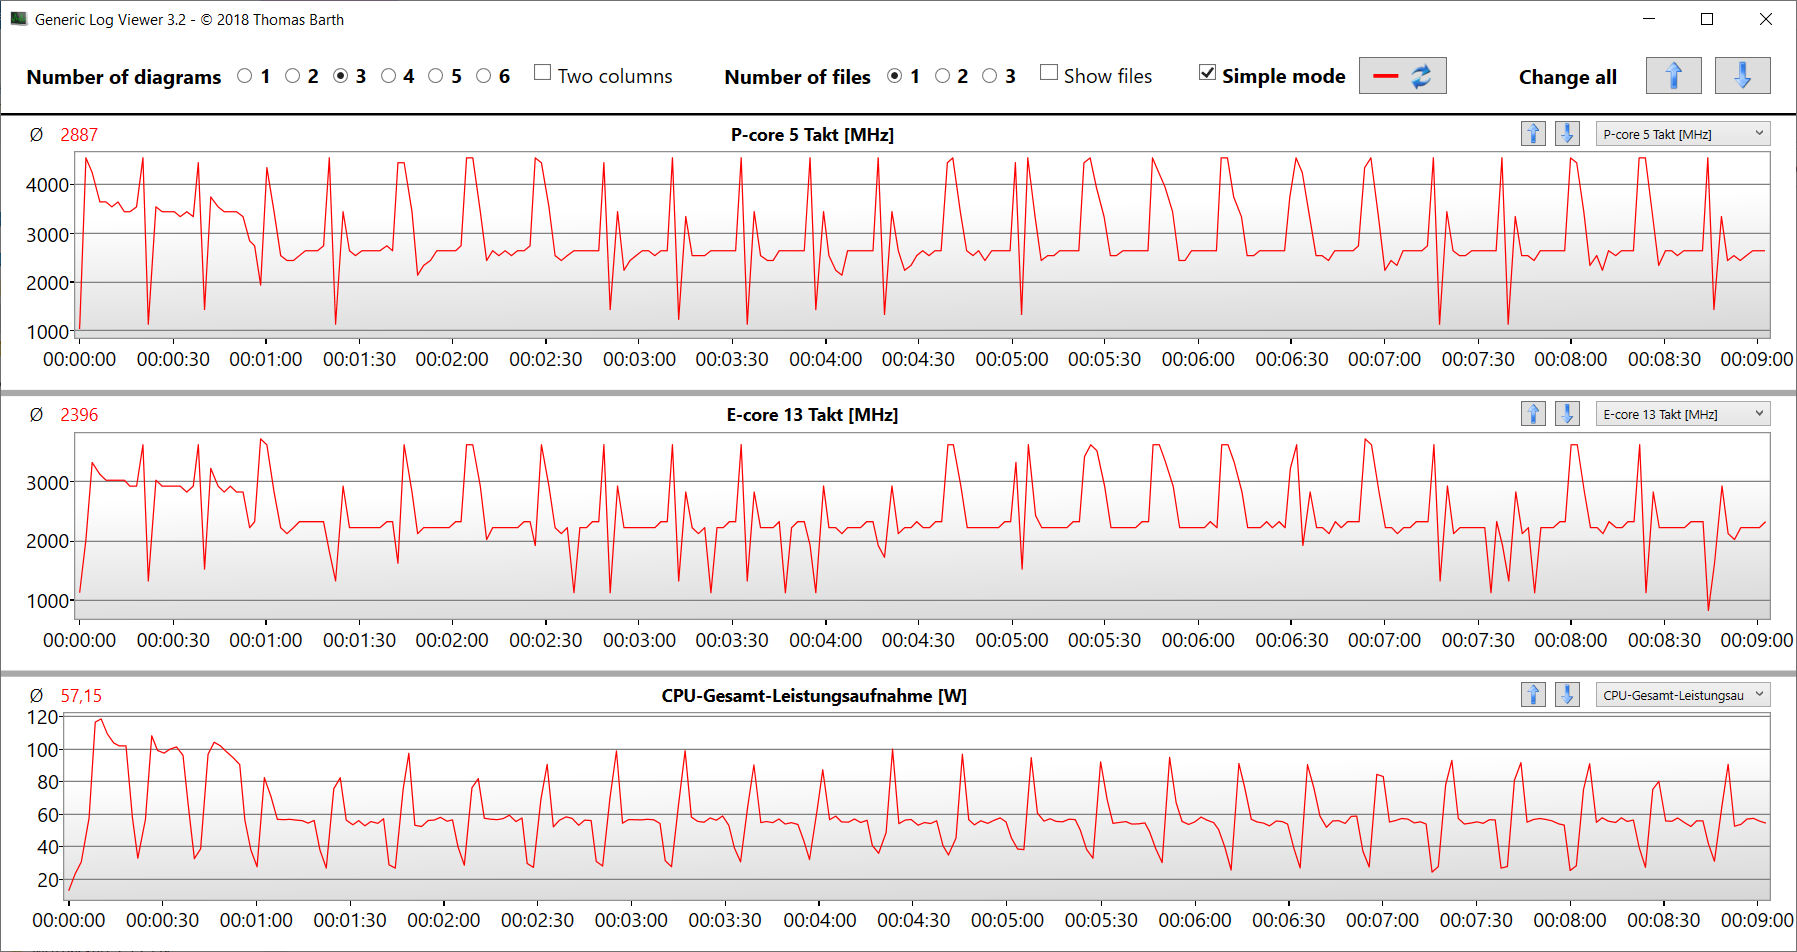
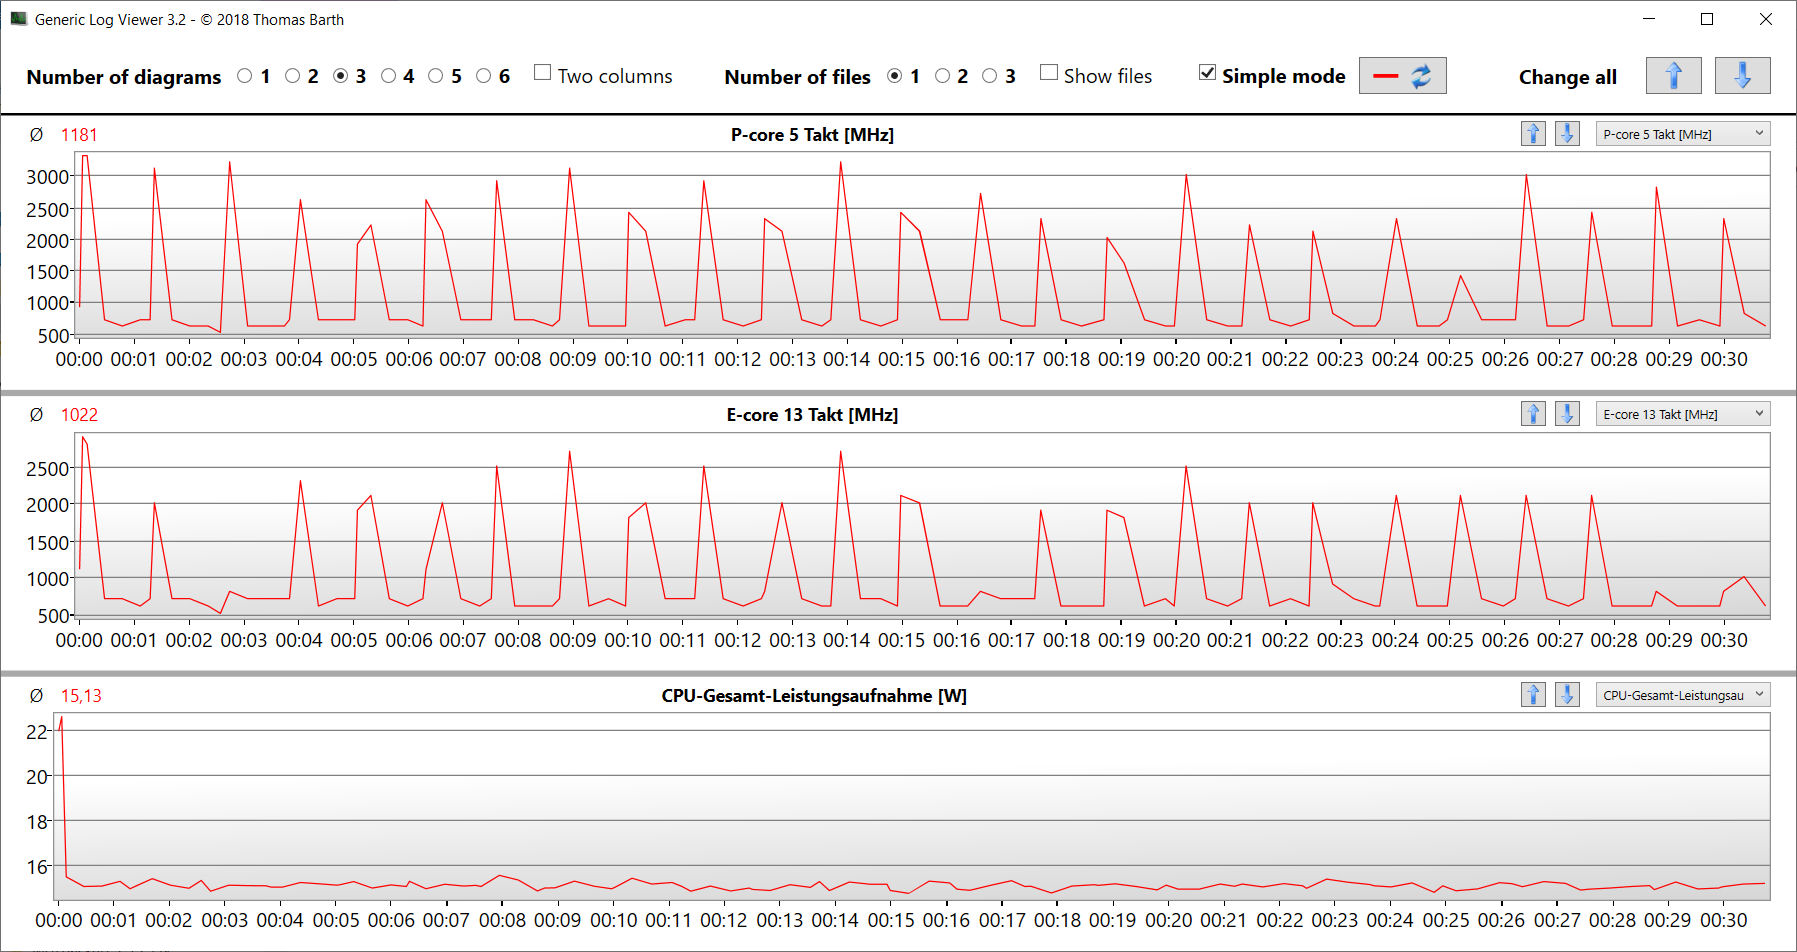
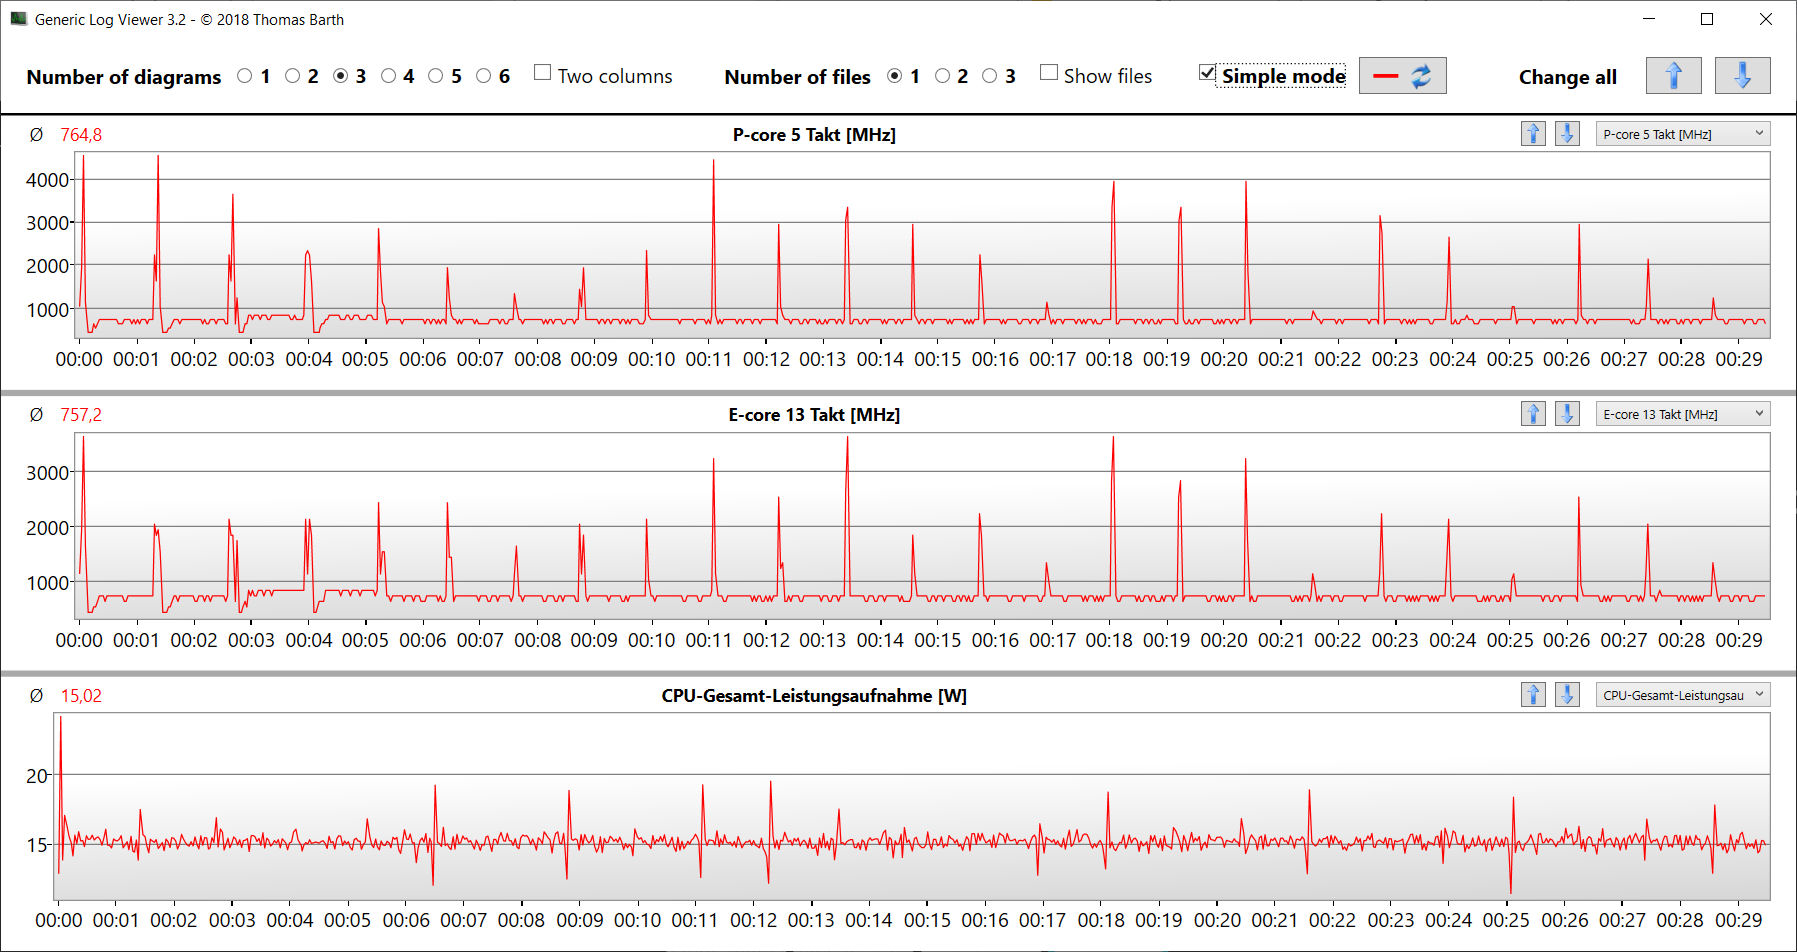
Según HWInfo, el "modo de ahorro de energía" pone el PL 1 (45 vatios) de la CPU a un nivel más alto que el PL 2 (30 vatios). Lo más probable es que se trate de un error. Durante la ejecución del bucle CB15, el consumo de energía de la CPU es de 15 vatios.
| Modo juego | Modo entretenimiento | Modo ahorro de energía | Modo silencio | |
|---|---|---|---|---|
| CPU PL1 (HWInfo) | 135 vatios | 65 vatios | 45 vatios | 15 vatios |
| CPU PL2 (HWInfo) | 162 vatios | 130 vatios | 30 vatios | 30 vatios |
| Ruido (Witcher 3) | 62 dB(A) | 56 dB(A) | - | 36 dB(A) |
| Rendimiento (Witcher 3) | ~102 fps | ~100 fps | - | 30 - 50 fps |
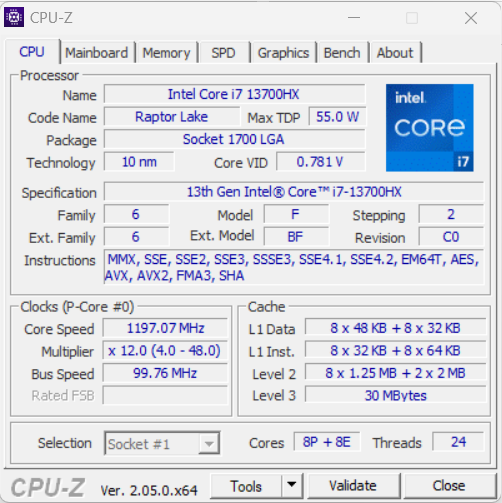
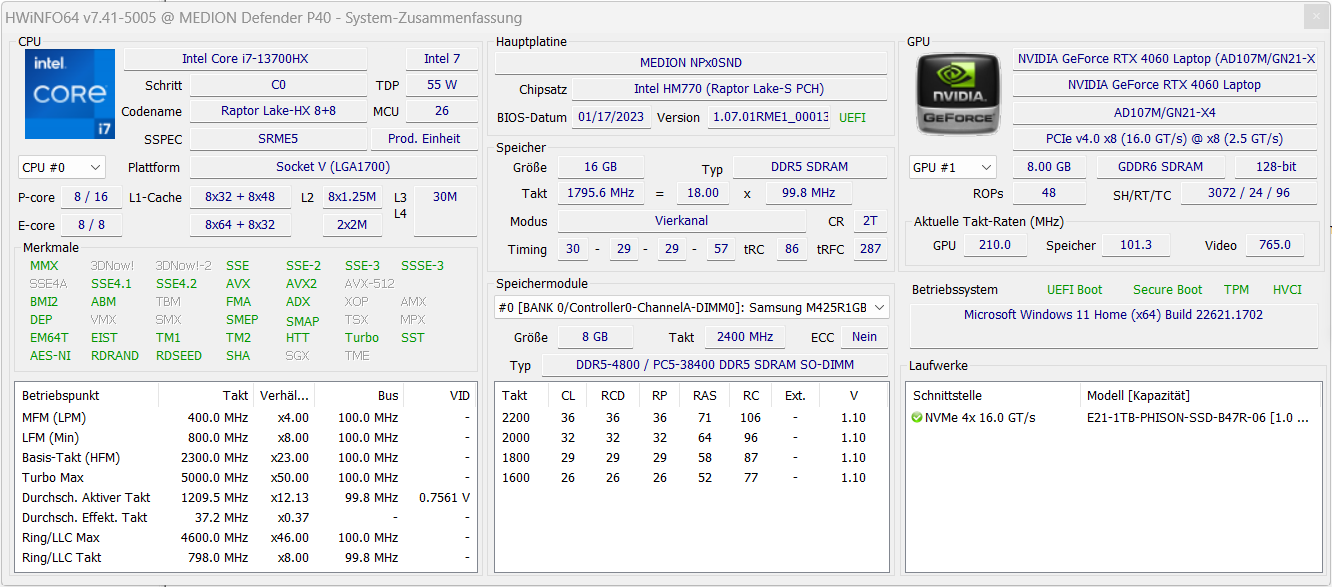
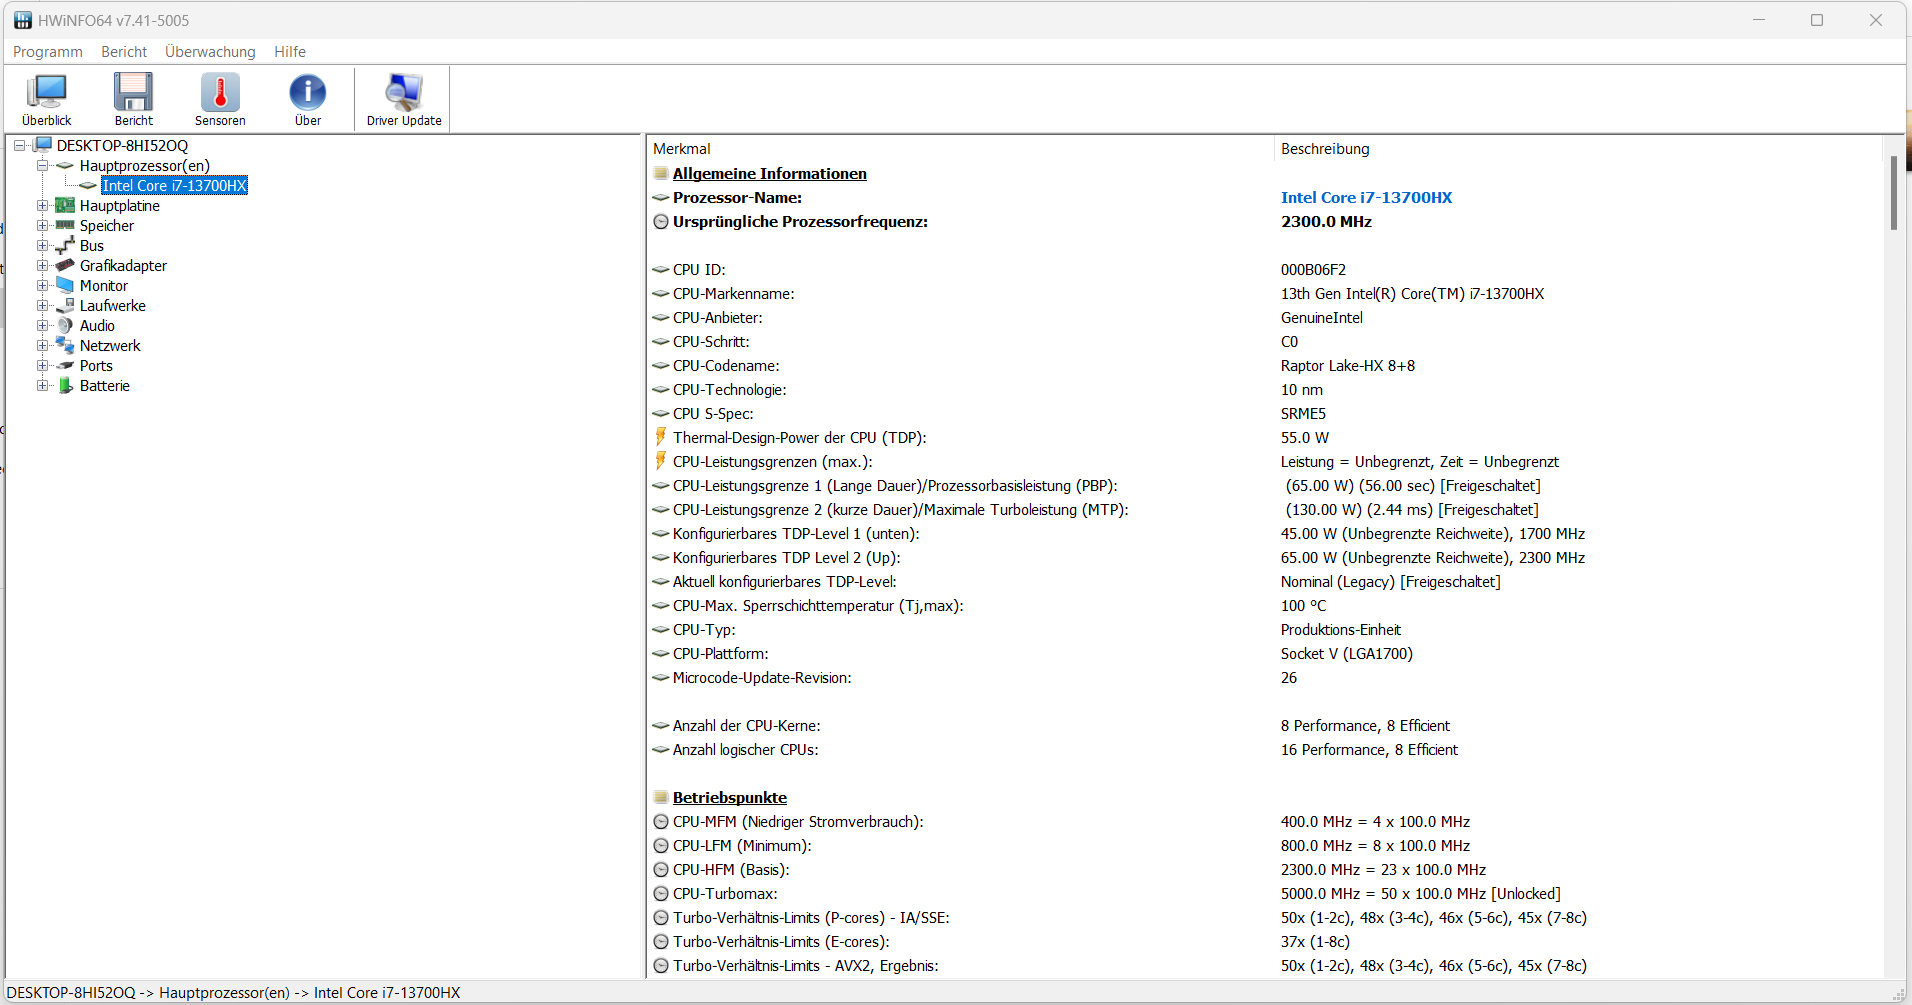
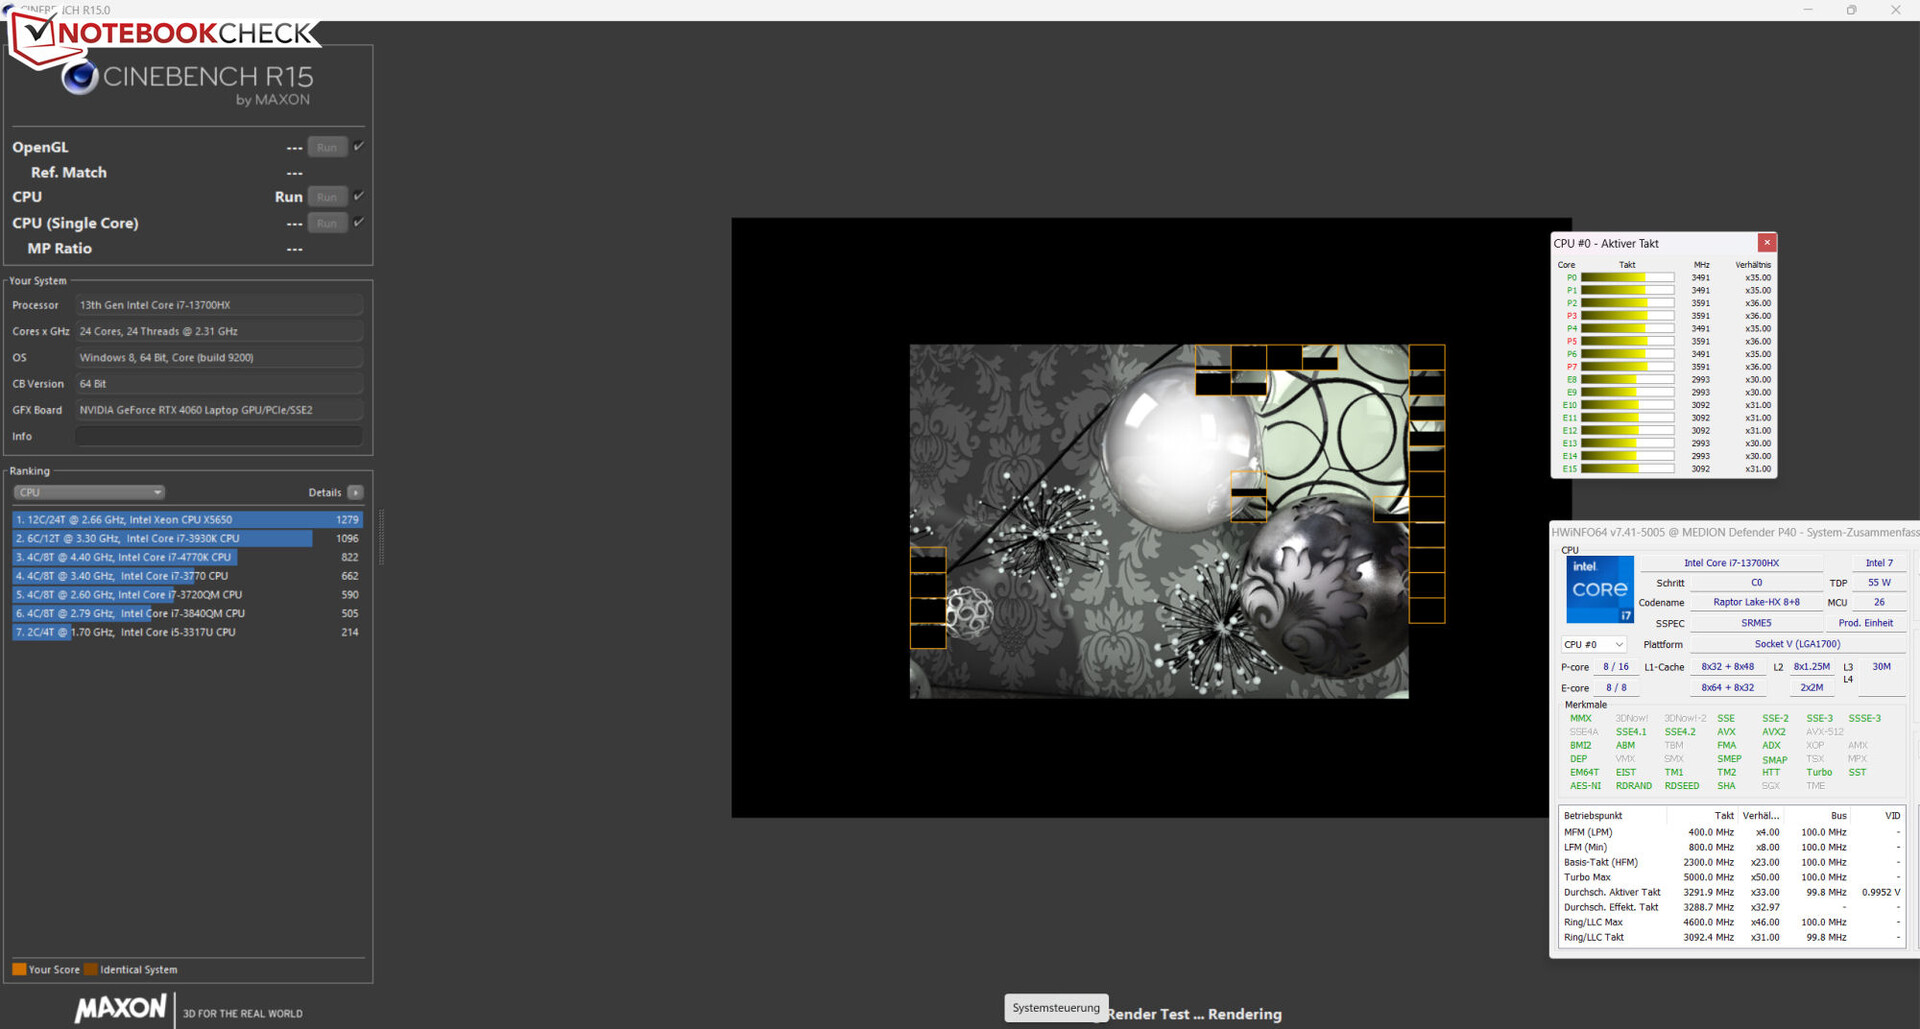
Procesador
ElCore-i7-13700HX(Raptor Lake) consta de ocho núcleos de eficiencia (sin hyperthreading, 1,5 - 3,7 GHz) y ocho núcleos de rendimiento (hyperthreading, 2,1 - 5 GHz). Esto suma un total de 24 núcleos lógicos de CPU.
Las pruebas arrojaron resultados justo por debajo de la media anterior de la CPU ("modo entretenimiento"). el "modo juego" normalmente sólo llevó a un aumento mínimo del rendimiento - con la excepción de las pruebas AIDA64. Sólo pudo mostrar sus cualidades mejoradas en carga continua. El rendimiento single-thread más relevante del portátil (205 puntos) se redujo menos en modo batería que su rendimiento multi-core (1.619 puntos).
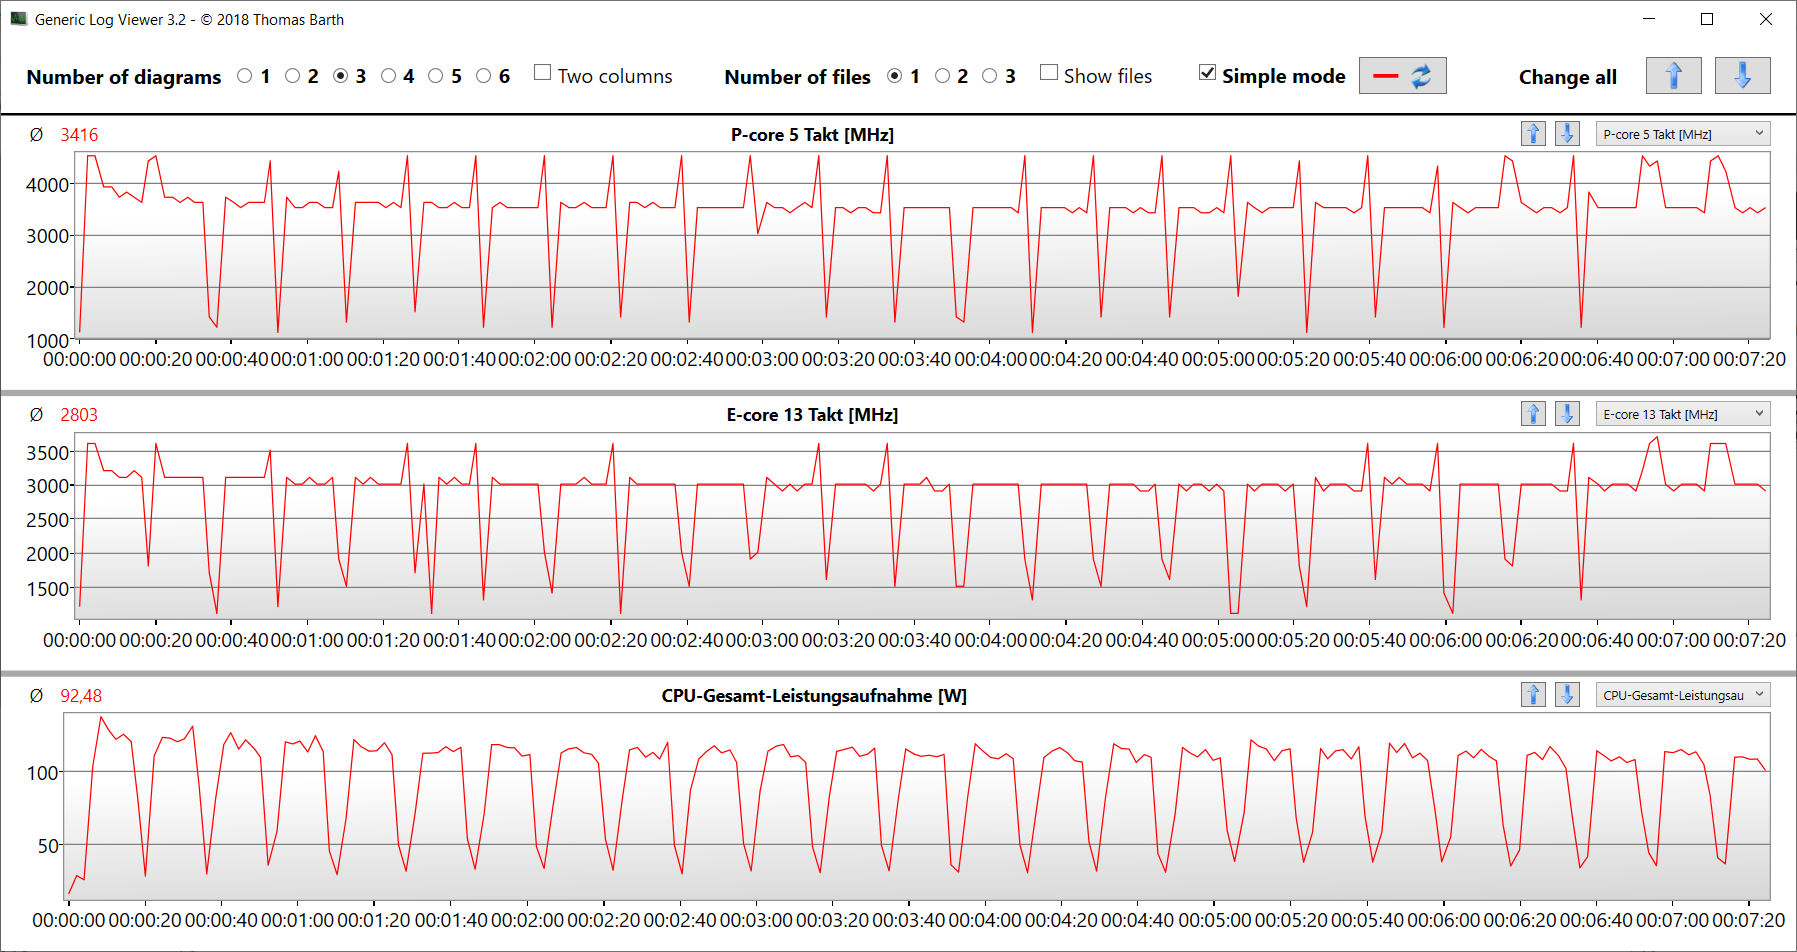
Así lo demostró la prueba de bucle CB15: La carga multihilo permanente hizo que la velocidad de reloj del turbo cayera de la primera a la cuarta ejecución. Posteriormente, mantuvo tasas constantes. el "modo de juego" llevó a velocidades de reloj continuamente más altas.
Cinebench R15 Multi continuous test
* ... más pequeño es mejor
AIDA64: FP32 Ray-Trace | FPU Julia | CPU SHA3 | CPU Queen | FPU SinJulia | FPU Mandel | CPU AES | CPU ZLib | FP64 Ray-Trace | CPU PhotoWorxx
| Performance rating | |
| Media de la clase Gaming | |
| Lenovo Legion Pro 5 16IRX8 | |
| Medio Intel Core i7-13700HX | |
| Acer Predator Helios 300 (i7-12700H, RTX 3070 Ti) | |
| Asus TUF Gaming A16 FA617 | |
| Medion Erazer Defender P40 | |
| Gigabyte G7 KE | |
| MSI Katana 17 B13VFK | |
| AIDA64 / FP32 Ray-Trace | |
| Media de la clase Gaming (10227 - 85542, n=105, últimos 2 años) | |
| Lenovo Legion Pro 5 16IRX8 (v6.85.6300) | |
| Medio Intel Core i7-13700HX (14261 - 21999, n=11) | |
| Acer Predator Helios 300 (i7-12700H, RTX 3070 Ti) (v6.75.6100) | |
| Asus TUF Gaming A16 FA617 (v6.85.6300) | |
| Medion Erazer Defender P40 (v6.75.6100) | |
| MSI Katana 17 B13VFK (v6.85.6300) | |
| Gigabyte G7 KE (v6.75.6100) | |
| AIDA64 / FPU Julia | |
| Media de la clase Gaming (51376 - 238426, n=105, últimos 2 años) | |
| Lenovo Legion Pro 5 16IRX8 (v6.85.6300) | |
| Asus TUF Gaming A16 FA617 (v6.85.6300) | |
| Medio Intel Core i7-13700HX (74636 - 109364, n=11) | |
| Acer Predator Helios 300 (i7-12700H, RTX 3070 Ti) (v6.75.6100) | |
| Medion Erazer Defender P40 (v6.75.6100) | |
| MSI Katana 17 B13VFK (v6.85.6300) | |
| Gigabyte G7 KE (v6.75.6100) | |
| AIDA64 / CPU SHA3 | |
| Media de la clase Gaming (2180 - 10115, n=105, últimos 2 años) | |
| Lenovo Legion Pro 5 16IRX8 (v6.85.6300) | |
| Medio Intel Core i7-13700HX (3359 - 5053, n=11) | |
| Acer Predator Helios 300 (i7-12700H, RTX 3070 Ti) (v6.75.6100) | |
| Asus TUF Gaming A16 FA617 (v6.85.6300) | |
| Medion Erazer Defender P40 (v6.75.6100) | |
| Gigabyte G7 KE (v6.75.6100) | |
| MSI Katana 17 B13VFK (v6.85.6300) | |
| AIDA64 / CPU Queen | |
| Media de la clase Gaming (49785 - 173351, n=90, últimos 2 años) | |
| Lenovo Legion Pro 5 16IRX8 (v6.85.6300) | |
| Medion Erazer Defender P40 (v6.75.6100) | |
| Medio Intel Core i7-13700HX (86532 - 114717, n=11) | |
| Asus TUF Gaming A16 FA617 (v6.85.6300) | |
| Acer Predator Helios 300 (i7-12700H, RTX 3070 Ti) (v6.75.6100) | |
| Gigabyte G7 KE (v6.75.6100) | |
| MSI Katana 17 B13VFK | |
| AIDA64 / FPU SinJulia | |
| Media de la clase Gaming (4424 - 33636, n=105, últimos 2 años) | |
| Lenovo Legion Pro 5 16IRX8 (v6.85.6300) | |
| Asus TUF Gaming A16 FA617 (v6.85.6300) | |
| Medio Intel Core i7-13700HX (9290 - 13519, n=11) | |
| Medion Erazer Defender P40 (v6.75.6100) | |
| Acer Predator Helios 300 (i7-12700H, RTX 3070 Ti) (v6.75.6100) | |
| MSI Katana 17 B13VFK | |
| Gigabyte G7 KE (v6.75.6100) | |
| AIDA64 / FPU Mandel | |
| Media de la clase Gaming (25115 - 128721, n=105, últimos 2 años) | |
| Asus TUF Gaming A16 FA617 (v6.85.6300) | |
| Lenovo Legion Pro 5 16IRX8 (v6.85.6300) | |
| Medio Intel Core i7-13700HX (35751 - 53484, n=11) | |
| Acer Predator Helios 300 (i7-12700H, RTX 3070 Ti) (v6.75.6100) | |
| Medion Erazer Defender P40 (v6.75.6100) | |
| MSI Katana 17 B13VFK (v6.85.6300) | |
| Gigabyte G7 KE (v6.75.6100) | |
| AIDA64 / CPU AES | |
| Medio Intel Core i7-13700HX (67846 - 182575, n=11) | |
| Gigabyte G7 KE (v6.75.6100) | |
| Media de la clase Gaming (39258 - 247074, n=105, últimos 2 años) | |
| Lenovo Legion Pro 5 16IRX8 (v6.85.6300) | |
| Acer Predator Helios 300 (i7-12700H, RTX 3070 Ti) (v6.75.6100) | |
| Medion Erazer Defender P40 (v6.75.6100) | |
| Asus TUF Gaming A16 FA617 (v6.85.6300) | |
| MSI Katana 17 B13VFK (v6.85.6300) | |
| AIDA64 / CPU ZLib | |
| Media de la clase Gaming (574 - 2531, n=105, últimos 2 años) | |
| Lenovo Legion Pro 5 16IRX8 (v6.85.6300) | |
| Medio Intel Core i7-13700HX (981 - 1451, n=11) | |
| Acer Predator Helios 300 (i7-12700H, RTX 3070 Ti) (v6.75.6100) | |
| Medion Erazer Defender P40 (v6.75.6100) | |
| Gigabyte G7 KE (v6.75.6100) | |
| Asus TUF Gaming A16 FA617 (v6.85.6300) | |
| MSI Katana 17 B13VFK (v6.85.6300) | |
| AIDA64 / FP64 Ray-Trace | |
| Media de la clase Gaming (5509 - 45446, n=105, últimos 2 años) | |
| Lenovo Legion Pro 5 16IRX8 (v6.85.6300) | |
| Medio Intel Core i7-13700HX (7728 - 11837, n=11) | |
| Acer Predator Helios 300 (i7-12700H, RTX 3070 Ti) (v6.75.6100) | |
| Asus TUF Gaming A16 FA617 (v6.85.6300) | |
| Medion Erazer Defender P40 (v6.75.6100) | |
| MSI Katana 17 B13VFK (v6.85.6300) | |
| Gigabyte G7 KE (v6.75.6100) | |
| AIDA64 / CPU PhotoWorxx | |
| Media de la clase Gaming (12271 - 89891, n=105, últimos 2 años) | |
| Acer Predator Helios 300 (i7-12700H, RTX 3070 Ti) (v6.75.6100) | |
| Lenovo Legion Pro 5 16IRX8 (v6.85.6300) | |
| Medion Erazer Defender P40 (v6.75.6100) | |
| Medio Intel Core i7-13700HX (19678 - 42415, n=11) | |
| MSI Katana 17 B13VFK (v6.85.6300) | |
| Gigabyte G7 KE (v6.75.6100) | |
| Asus TUF Gaming A16 FA617 (v6.85.6300) | |
Rendimiento del sistema
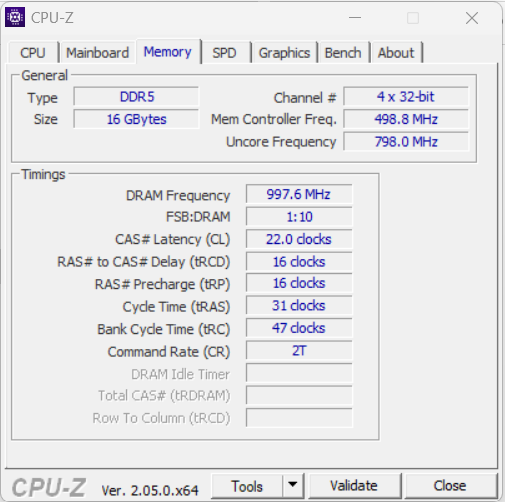
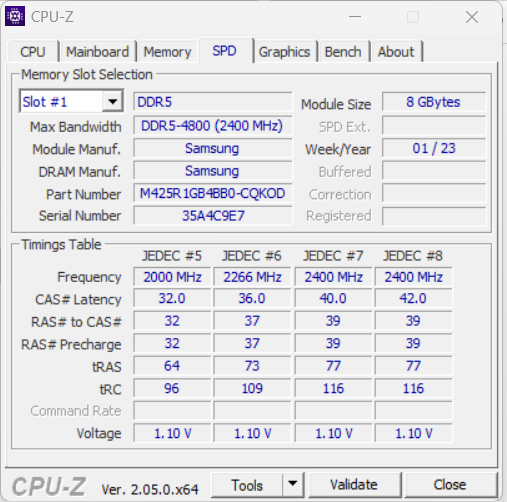
Su sistema de funcionamiento fluido está preparado para áreas de aplicación hambrientas de rendimiento como renderizado y juegos - los buenos resultados PCMark del portátil lo confirman. Las tasas de transferencia de la RAM están a un nivel normal para una RAM DDR5 4800.
CrossMark: Overall | Productivity | Creativity | Responsiveness
| PCMark 10 / Score | |
| Media de la clase Gaming (5828 - 12414, n=93, últimos 2 años) | |
| Acer Predator Helios 300 (i7-12700H, RTX 3070 Ti) | |
| Lenovo Legion Pro 5 16IRX8 | |
| Medio Intel Core i7-13700HX, NVIDIA GeForce RTX 4060 Laptop GPU (6909 - 7743, n=5) | |
| Asus TUF Gaming A16 FA617 | |
| MSI Katana 17 B13VFK | |
| Medion Erazer Defender P40 | |
| Gigabyte G7 KE | |
| PCMark 10 / Essentials | |
| Lenovo Legion Pro 5 16IRX8 | |
| MSI Katana 17 B13VFK | |
| Acer Predator Helios 300 (i7-12700H, RTX 3070 Ti) | |
| Media de la clase Gaming (8810 - 11935, n=97, últimos 2 años) | |
| Medio Intel Core i7-13700HX, NVIDIA GeForce RTX 4060 Laptop GPU (9760 - 11313, n=5) | |
| Asus TUF Gaming A16 FA617 | |
| Gigabyte G7 KE | |
| Medion Erazer Defender P40 | |
| PCMark 10 / Productivity | |
| Media de la clase Gaming (6845 - 25323, n=95, últimos 2 años) | |
| Acer Predator Helios 300 (i7-12700H, RTX 3070 Ti) | |
| Medion Erazer Defender P40 | |
| Medio Intel Core i7-13700HX, NVIDIA GeForce RTX 4060 Laptop GPU (9131 - 11018, n=5) | |
| Asus TUF Gaming A16 FA617 | |
| MSI Katana 17 B13VFK | |
| Lenovo Legion Pro 5 16IRX8 | |
| Gigabyte G7 KE | |
| PCMark 10 / Digital Content Creation | |
| Media de la clase Gaming (7602 - 19954, n=95, últimos 2 años) | |
| Acer Predator Helios 300 (i7-12700H, RTX 3070 Ti) | |
| Lenovo Legion Pro 5 16IRX8 | |
| Medio Intel Core i7-13700HX, NVIDIA GeForce RTX 4060 Laptop GPU (9393 - 12434, n=5) | |
| Asus TUF Gaming A16 FA617 | |
| MSI Katana 17 B13VFK | |
| Medion Erazer Defender P40 | |
| Gigabyte G7 KE | |
| CrossMark / Overall | |
| Media de la clase Gaming (1366 - 2409, n=94, últimos 2 años) | |
| Acer Predator Helios 300 (i7-12700H, RTX 3070 Ti) | |
| Medio Intel Core i7-13700HX, NVIDIA GeForce RTX 4060 Laptop GPU (1663 - 2105, n=5) | |
| MSI Katana 17 B13VFK | |
| Gigabyte G7 KE | |
| Medion Erazer Defender P40 | |
| Lenovo Legion Pro 5 16IRX8 | |
| CrossMark / Productivity | |
| Media de la clase Gaming (1386 - 2254, n=94, últimos 2 años) | |
| Gigabyte G7 KE | |
| Acer Predator Helios 300 (i7-12700H, RTX 3070 Ti) | |
| Medio Intel Core i7-13700HX, NVIDIA GeForce RTX 4060 Laptop GPU (1618 - 1989, n=5) | |
| MSI Katana 17 B13VFK | |
| Medion Erazer Defender P40 | |
| Lenovo Legion Pro 5 16IRX8 | |
| CrossMark / Creativity | |
| Media de la clase Gaming (1343 - 2786, n=94, últimos 2 años) | |
| Acer Predator Helios 300 (i7-12700H, RTX 3070 Ti) | |
| Medio Intel Core i7-13700HX, NVIDIA GeForce RTX 4060 Laptop GPU (1710 - 2274, n=5) | |
| MSI Katana 17 B13VFK | |
| Medion Erazer Defender P40 | |
| Gigabyte G7 KE | |
| Lenovo Legion Pro 5 16IRX8 | |
| CrossMark / Responsiveness | |
| Gigabyte G7 KE | |
| MSI Katana 17 B13VFK | |
| Acer Predator Helios 300 (i7-12700H, RTX 3070 Ti) | |
| Media de la clase Gaming (1226 - 2334, n=94, últimos 2 años) | |
| Medio Intel Core i7-13700HX, NVIDIA GeForce RTX 4060 Laptop GPU (1269 - 1983, n=5) | |
| Lenovo Legion Pro 5 16IRX8 | |
| Medion Erazer Defender P40 | |
| PCMark 8 Home Score Accelerated v2 | 4659 puntos | |
| PCMark 8 Work Score Accelerated v2 | 5797 puntos | |
| PCMark 10 Score | 6909 puntos | |
ayuda | ||
| AIDA64 / Memory Copy | |
| Media de la clase Gaming (21750 - 129946, n=105, últimos 2 años) | |
| Lenovo Legion Pro 5 16IRX8 | |
| Medion Erazer Defender P40 | |
| Acer Predator Helios 300 (i7-12700H, RTX 3070 Ti) | |
| Medio Intel Core i7-13700HX (36125 - 63990, n=11) | |
| MSI Katana 17 B13VFK | |
| Asus TUF Gaming A16 FA617 | |
| Gigabyte G7 KE | |
| AIDA64 / Memory Read | |
| Media de la clase Gaming (22956 - 118858, n=105, últimos 2 años) | |
| Lenovo Legion Pro 5 16IRX8 | |
| Medion Erazer Defender P40 | |
| MSI Katana 17 B13VFK | |
| Medio Intel Core i7-13700HX (36510 - 69729, n=11) | |
| Acer Predator Helios 300 (i7-12700H, RTX 3070 Ti) | |
| Asus TUF Gaming A16 FA617 | |
| Gigabyte G7 KE | |
| AIDA64 / Memory Write | |
| Media de la clase Gaming (22297 - 135096, n=105, últimos 2 años) | |
| Lenovo Legion Pro 5 16IRX8 | |
| Medio Intel Core i7-13700HX (33598 - 85675, n=11) | |
| Medion Erazer Defender P40 | |
| Acer Predator Helios 300 (i7-12700H, RTX 3070 Ti) | |
| Asus TUF Gaming A16 FA617 | |
| MSI Katana 17 B13VFK | |
| Gigabyte G7 KE | |
| AIDA64 / Memory Latency | |
| Media de la clase Gaming (75.3 - 259, n=105, últimos 2 años) | |
| MSI Katana 17 B13VFK | |
| Medion Erazer Defender P40 | |
| Acer Predator Helios 300 (i7-12700H, RTX 3070 Ti) | |
| Gigabyte G7 KE | |
| Medio Intel Core i7-13700HX (81.5 - 97.9, n=11) | |
| Asus TUF Gaming A16 FA617 | |
| Lenovo Legion Pro 5 16IRX8 | |
* ... más pequeño es mejor
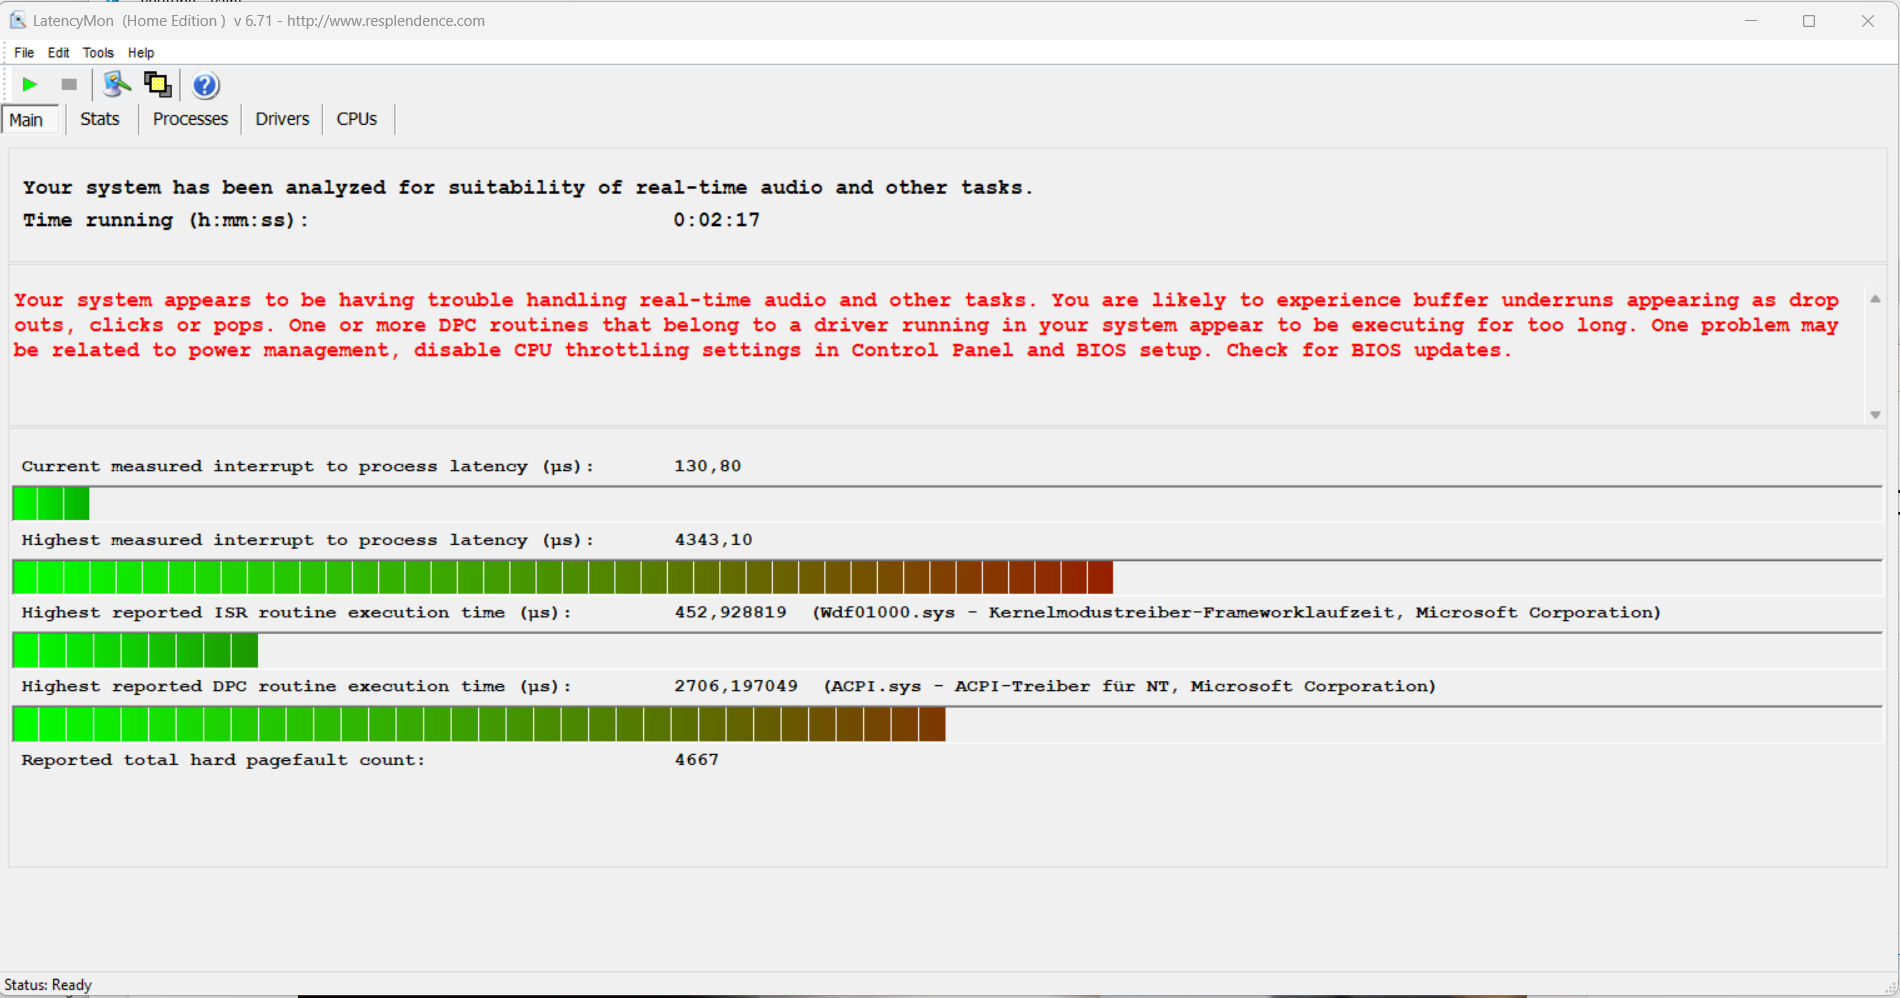
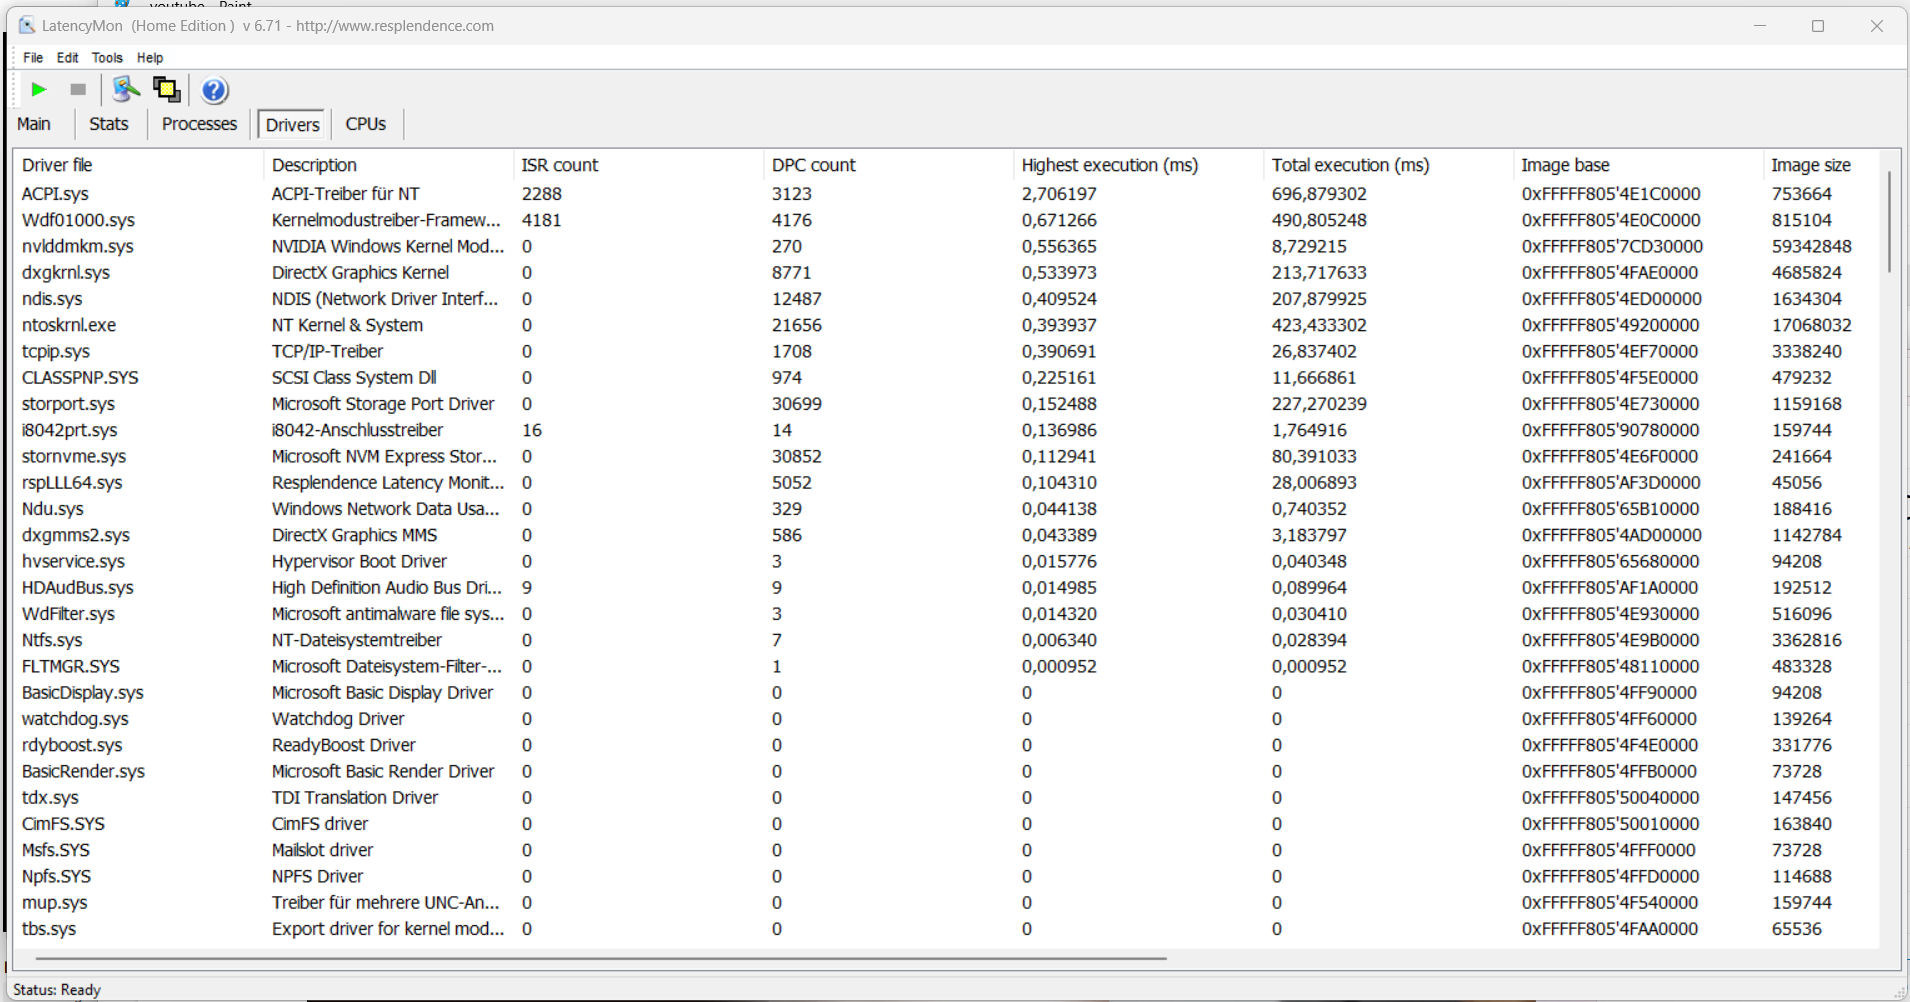
Latencia del CPD
La prueba de monitorización de latencia estandarizada (navegación web, reproducción de vídeo 4k, Prime95 a alta carga) reveló algunas anomalías. El sistema no parece adecuado para la edición de vídeo y audio en tiempo real. Futuras actualizaciones de software podrían suponer mejoras o incluso degradaciones.
| DPC Latencies / LatencyMon - interrupt to process latency (max), Web, Youtube, Prime95 | |
| Medion Erazer Defender P40 | |
| MSI Katana 17 B13VFK | |
| Gigabyte G7 KE | |
| Acer Predator Helios 300 (i7-12700H, RTX 3070 Ti) | |
| Lenovo Legion Pro 5 16IRX8 | |
| Asus TUF Gaming A16 FA617 | |
* ... más pequeño es mejor
Dispositivos de almacenamiento
El P40 tiene un SSD PCIe-4 (1 TB) en formato M.2-2280 de Phison. Ofrece muy buenas tasas de transferencia, pero no es uno de los mejores SSDs. No se dan caídas de rendimiento debidas al ahogo térmico. El portátil tiene espacio para un segundo SSD PCIe-4.

* ... más pequeño es mejor
Reading continuous performance: DiskSpd Read Loop, Queue Depth 8
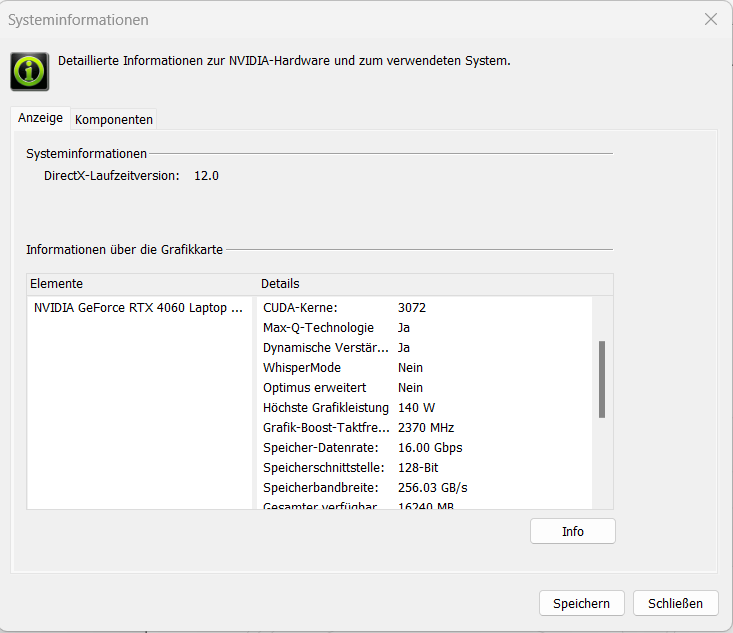
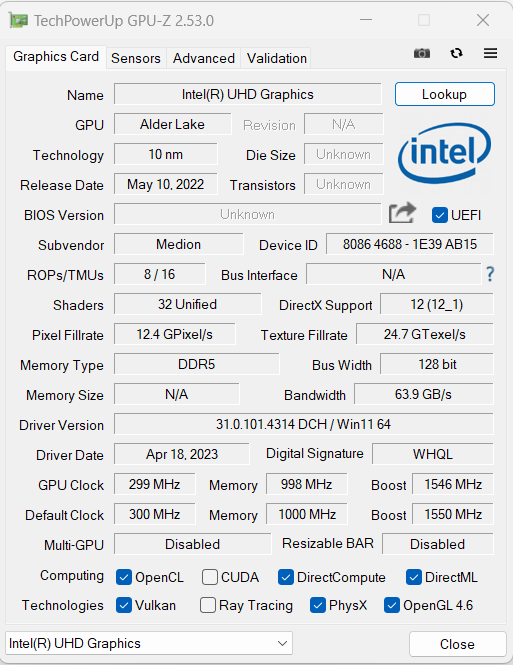
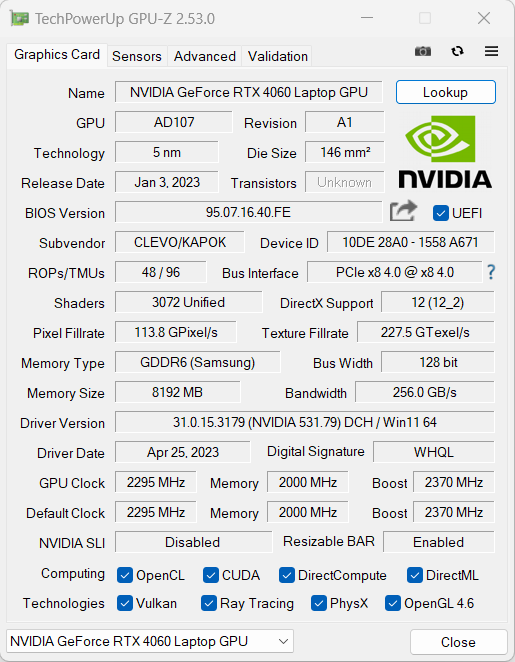
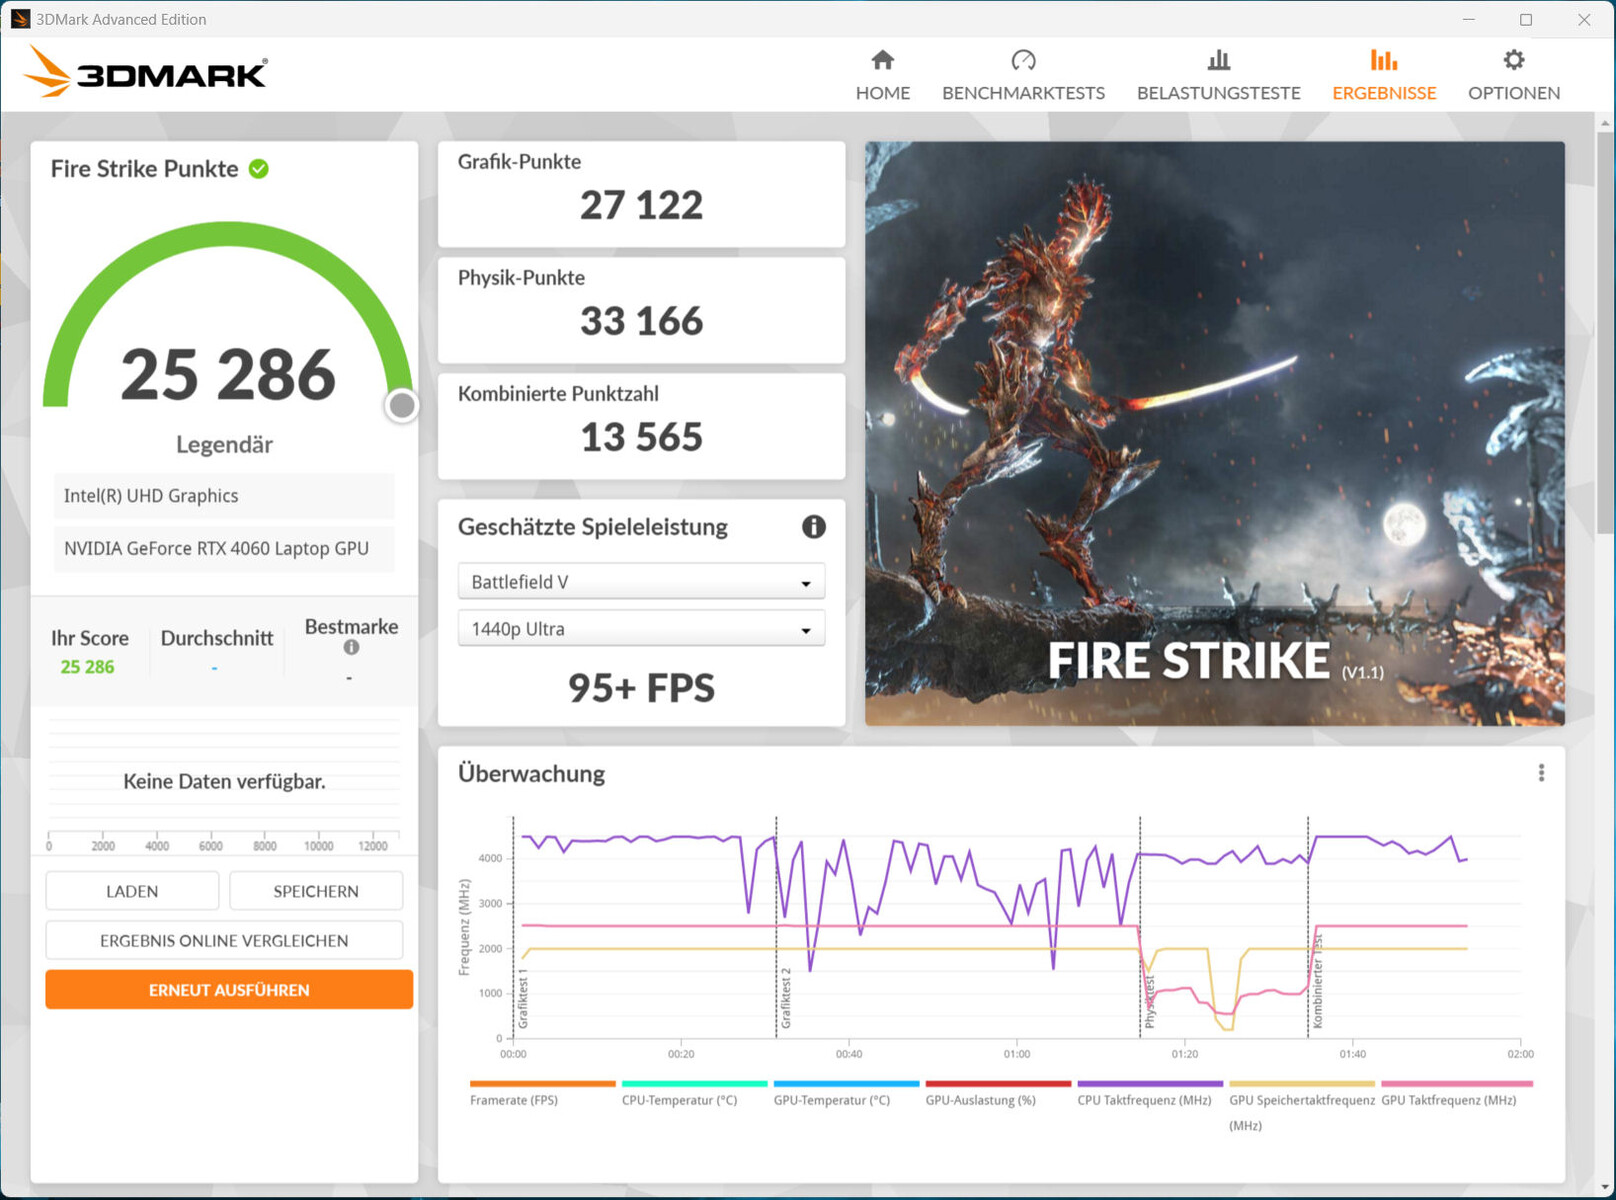
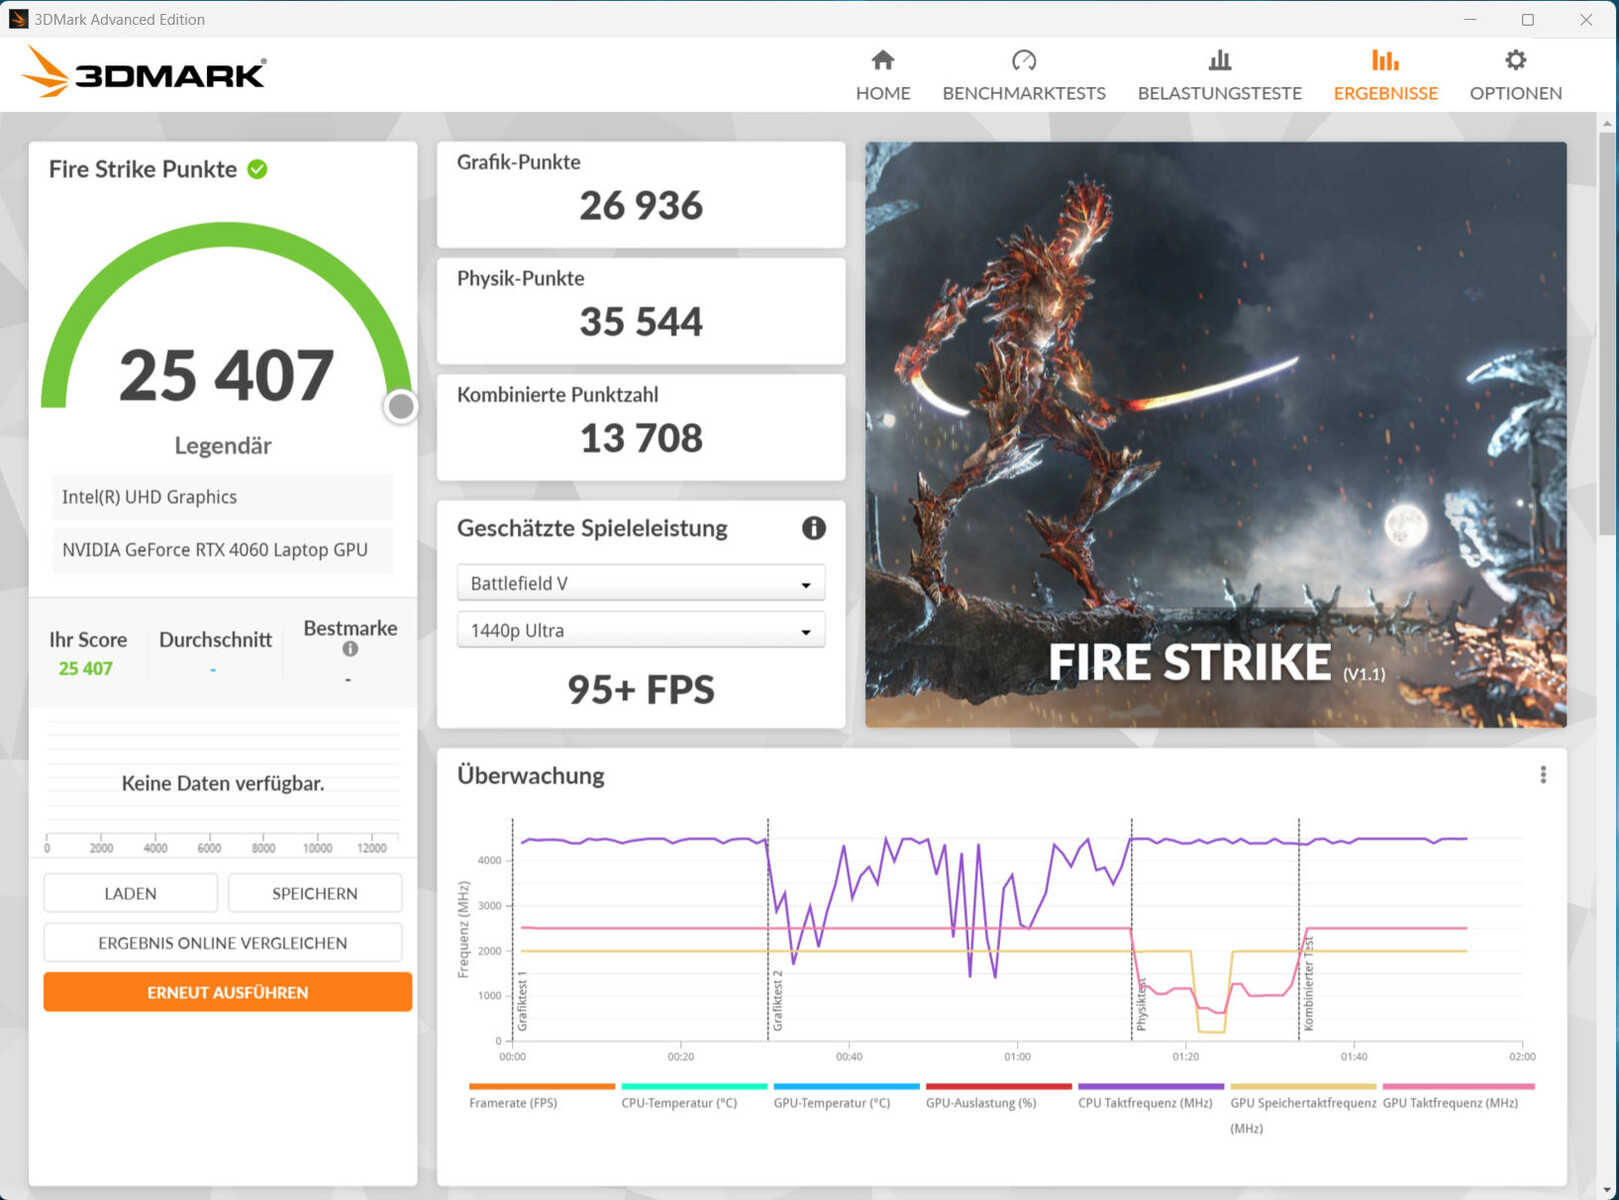
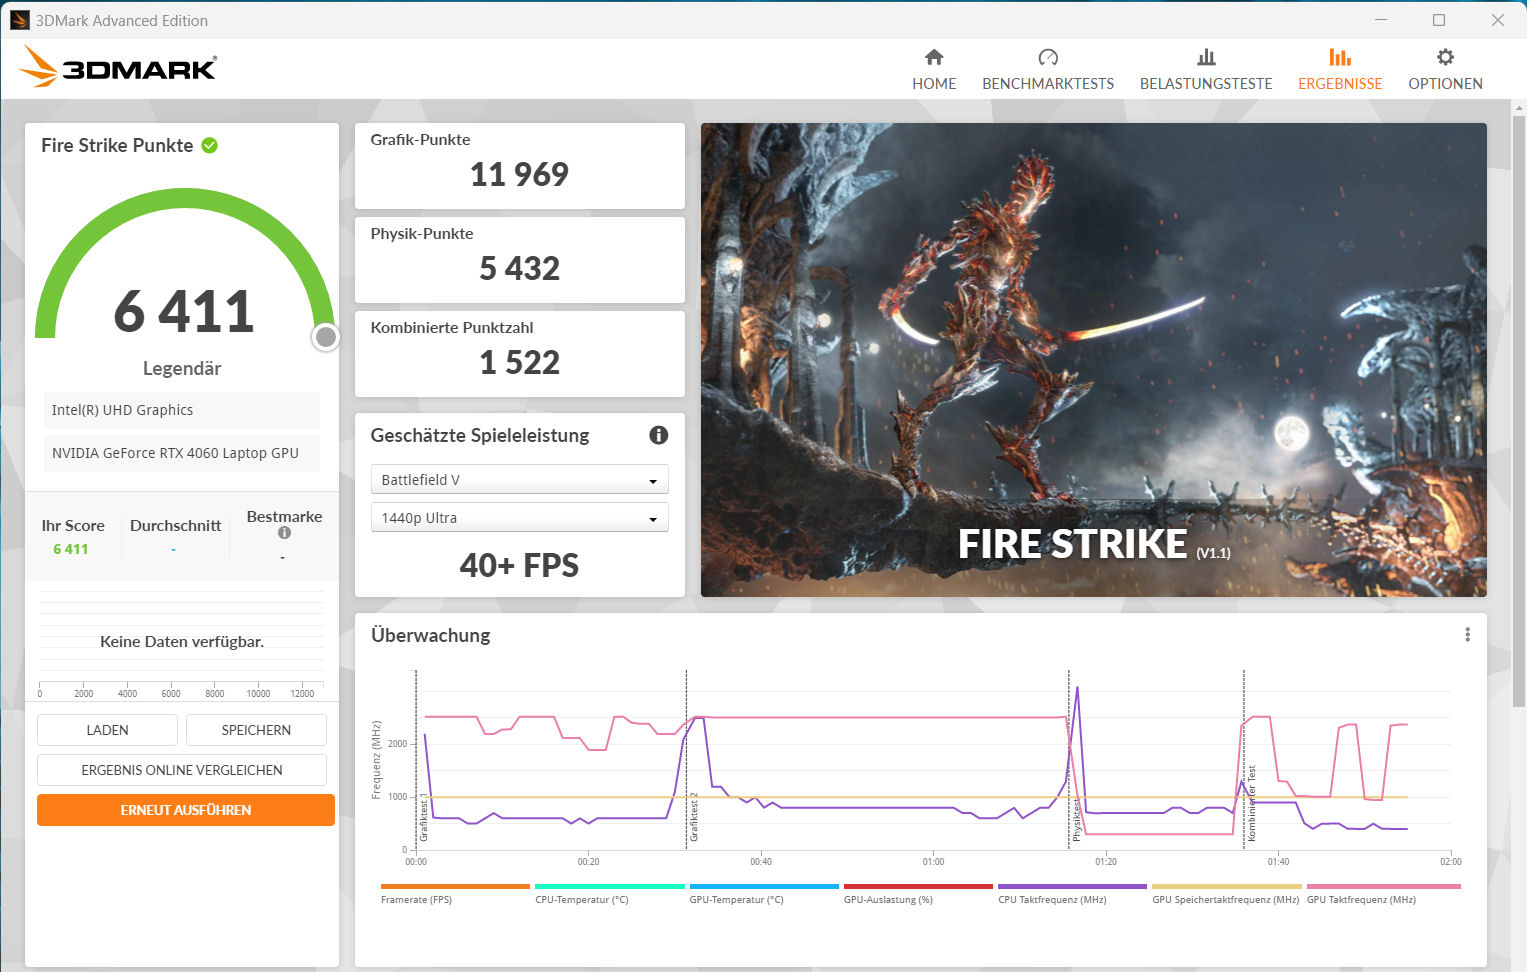
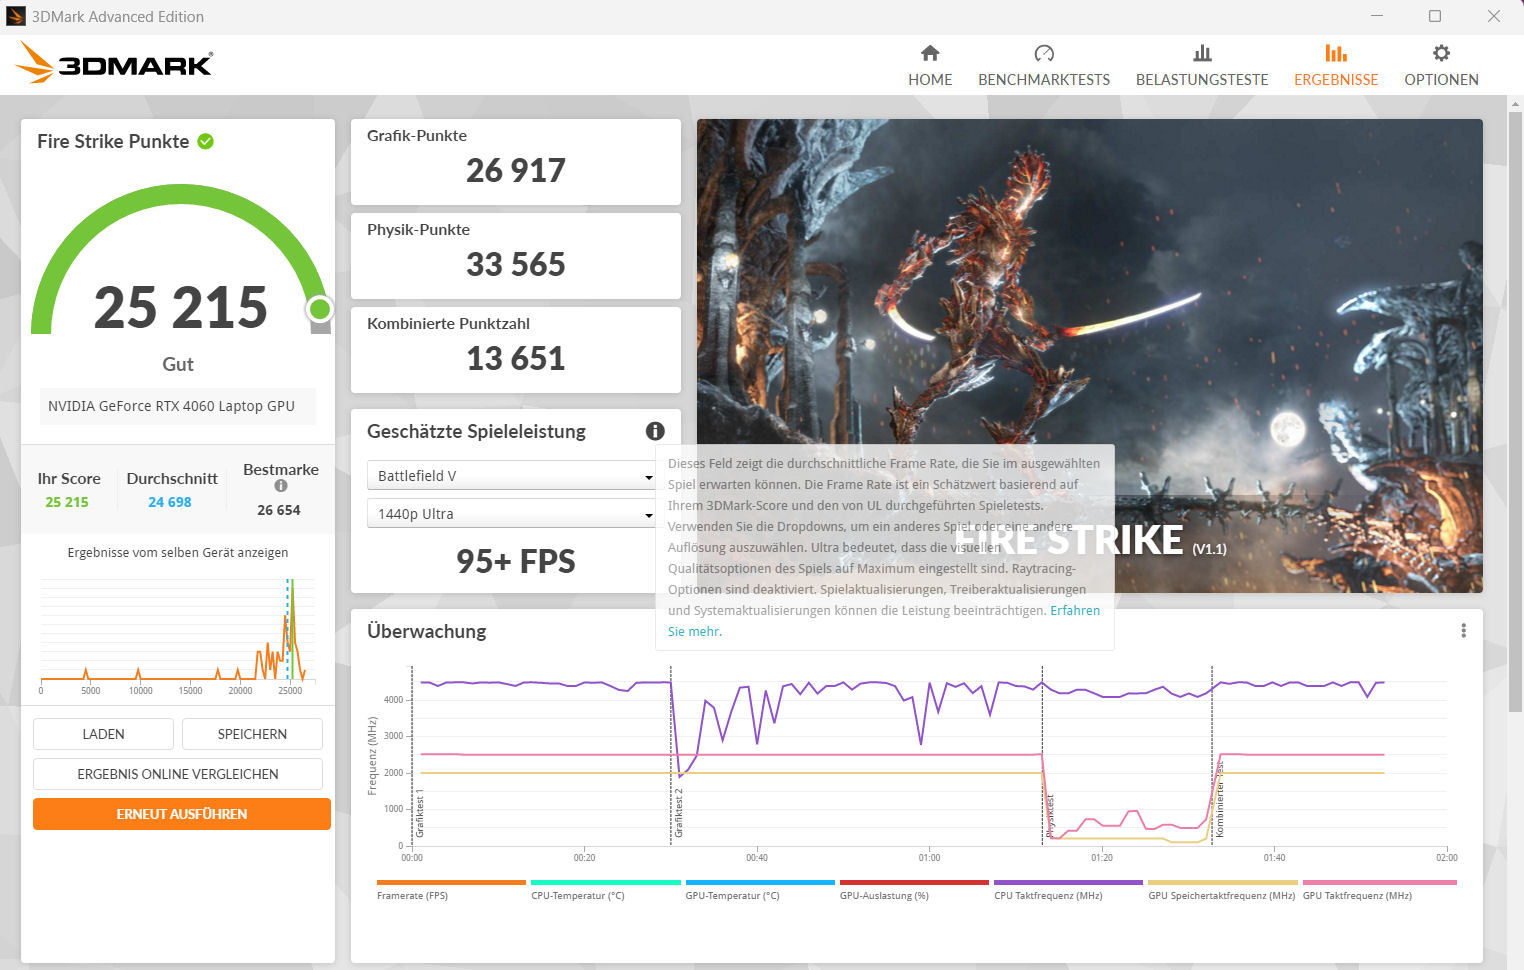
Tarjeta gráfica
Dentro de la actual gama de GPUs RTX 4000 para portátiles de Nvidia, laGeForce-RTX-4060 ocupa la cuarta posición, por lo que puede considerarse un modelo de gama media. Ofrece 3.072 sombreadores, un bus de 128 bits de ancho y memoria GDDR6 rápida (8.192 MB). Tiene un TGP máximo de 140 vatios (115 vatios + 25 vatios de Dynamic Boost) - más no es posible. Según la prueba, el TGP no se aprovecha al máximo Witcher 3 prueba.
Los resultados del benchmark están por encima de la media previamente determinada de la RTX 4060 ("modo entretenimiento") - a la par con las tasas de laMSI Katana 17 (RTX 4060, 140 vatios). Ni el "modo juego" ni la salida directa de imagen a través de la GPU GeForce (modo dGPU) supusieron un aumento del rendimiento. El cambio entre los modos Optimus y dGPU puede hacerse a través de la BIOS o del Centro de Control. Optimus avanzado no es compatible.
| 3DMark 06 Standard Score | 50480 puntos | |
| 3DMark 11 Performance | 31939 puntos | |
| 3DMark Cloud Gate Standard Score | 57165 puntos | |
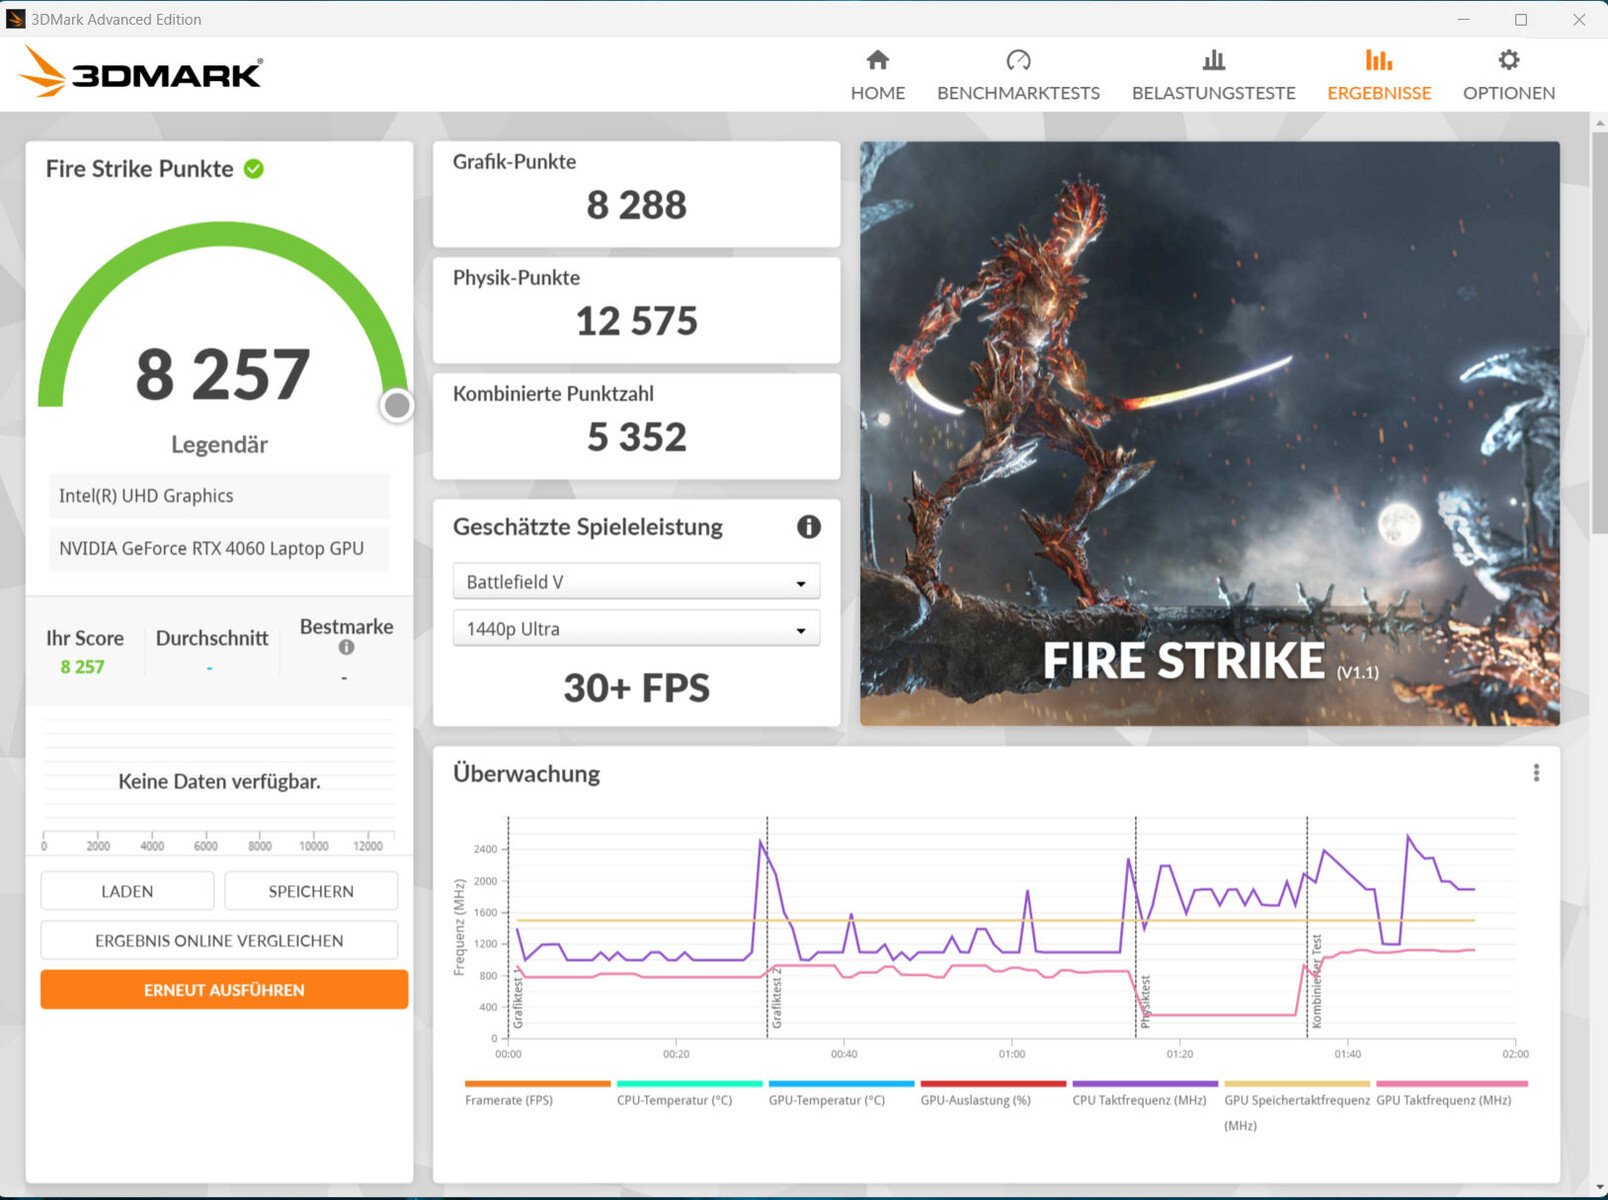
| 3DMark Fire Strike Score | 25286 puntos | |
| 3DMark Time Spy Score | 10764 puntos | |
ayuda | ||
| V-Ray Benchmark Next 4.10 | |
| GPU | |
| Media de la clase Gaming (427 - 1627, n=99, últimos 2 años) | |
| MSI Katana 17 B13VFK (v4.10.07 ) | |
| Medio NVIDIA GeForce RTX 4060 Laptop GPU (483 - 715, n=46) | |
| Medion Erazer Defender P40 (v4.10.07 ) | |
| Acer Predator Helios 300 (i7-12700H, RTX 3070 Ti) (v4.10.07 ) | |
| Gigabyte G7 KE (v4.10.07 ) | |
| Asus TUF Gaming A16 FA617 (v4.10.07 ) | |
| CPU | |
| Media de la clase Gaming (10048 - 45327, n=97, últimos 2 años) | |
| Medio NVIDIA GeForce RTX 4060 Laptop GPU (12680 - 32360, n=46) | |
| Medion Erazer Defender P40 (v4.10.07 ) | |
| Acer Predator Helios 300 (i7-12700H, RTX 3070 Ti) (v4.10.07 ) | |
| MSI Katana 17 B13VFK (v4.10.07 ) | |
| Asus TUF Gaming A16 FA617 (v4.10.07 ) | |
| Gigabyte G7 KE (v4.10.07 ) | |
* ... más pequeño es mejor
Rendimiento de juego
El Medion Defender está diseñado para juegos QHD con ajustes de altos a máximos. Se pueden conseguir resoluciones más altas con un monitor externo, con ajustes parcialmente reducidos. Se consiguen frame rates por encima de la media de RTX 4060. El modo dGPU puede - dependiendo del juego - conducir a un aumento mínimo de la velocidad de fotogramas.
El "modo silencioso" permite jugar con poco ruido de funcionamiento. Sin embargo, las frecuencias de cuadro jugables solo suelen alcanzarse con ajustes reducidos, ya que la potencia de cálculo del hardware se reduce considerablemente.
| The Witcher 3 - 1920x1080 Ultra Graphics & Postprocessing (HBAO+) | |
| Media de la clase Gaming (104.7 - 240, n=7, últimos 2 años) | |
| Acer Predator Helios 300 (i7-12700H, RTX 3070 Ti) | |
| Lenovo Legion Pro 5 16IRX8 | |
| MSI Katana 17 B13VFK | |
| Medion Erazer Defender P40 | |
| Medio NVIDIA GeForce RTX 4060 Laptop GPU (77 - 159.7, n=42) | |
| Asus TUF Gaming A16 FA617 | |
| Gigabyte G7 KE | |
| Final Fantasy XV Benchmark - 1920x1080 High Quality | |
| Media de la clase Gaming (41 - 215, n=95, últimos 2 años) | |
| Acer Predator Helios 300 (i7-12700H, RTX 3070 Ti) (1.3) | |
| Lenovo Legion Pro 5 16IRX8 (1.3) | |
| Medion Erazer Defender P40 (1.3) | |
| Medio NVIDIA GeForce RTX 4060 Laptop GPU (75.1 - 109.8, n=51) | |
| MSI Katana 17 B13VFK (1.3) | |
| Gigabyte G7 KE (1.3) | |
| Asus TUF Gaming A16 FA617 (1.3) | |
| Strange Brigade - 1920x1080 ultra AA:ultra AF:16 | |
| Media de la clase Gaming (76.3 - 458, n=87, últimos 2 años) | |
| Acer Predator Helios 300 (i7-12700H, RTX 3070 Ti) (1.47.22.14 D3D12) | |
| Medion Erazer Defender P40 (1.47.22.14 D3D12) | |
| MSI Katana 17 B13VFK (1.47.22.14 D3D12) | |
| Medio NVIDIA GeForce RTX 4060 Laptop GPU (135.3 - 210, n=50) | |
| Asus TUF Gaming A16 FA617 (1.47.22.14 D3D12) | |
| Gigabyte G7 KE (1.47.22.14 D3D12) | |
| Dead Space Remake | |
| 1920x1080 Ultra Preset AA:T | |
| Medion Erazer Defender P40 | |
| MSI Katana 17 B13VFK | |
| Medio NVIDIA GeForce RTX 4060 Laptop GPU (53.3 - 70.4, n=3) | |
| Gigabyte G7 KE | |
| Asus TUF Gaming A16 FA617 | |
| Media de la clase Gaming (n=1últimos 2 años) | |
| 2560x1440 Ultra Preset AA:T | |
| Medion Erazer Defender P40 | |
| Medio NVIDIA GeForce RTX 4060 Laptop GPU (43.4 - 44.5, n=2) | |
| MSI Katana 17 B13VFK | |
| Asus TUF Gaming A16 FA617 | |
| The Witcher 3 v4 | |
| 1920x1080 Ultra Preset / On AA:FX | |
| Asus TUF Gaming A16 FA617 | |
| Gigabyte G7 KE | |
| Medion Erazer Defender P40 | |
| MSI Katana 17 B13VFK | |
| Medio NVIDIA GeForce RTX 4060 Laptop GPU (50.3 - 72.8, n=3) | |
| 2560x1440 Ultra Preset / On AA:FX | |
| Asus TUF Gaming A16 FA617 | |
| Medion Erazer Defender P40 | |
| Medio NVIDIA GeForce RTX 4060 Laptop GPU (40.5 - 44.8, n=2) | |
| MSI Katana 17 B13VFK | |
| Resident Evil 4 Remake | |
| 1920x1080 Max Preset | |
| Medion Erazer Defender P40 | |
| Medio NVIDIA GeForce RTX 4060 Laptop GPU (50.9 - 72.7, n=3) | |
| 2560x1440 Max Preset | |
| Medio NVIDIA GeForce RTX 4060 Laptop GPU (52.1 - 55.1, n=2) | |
| Medion Erazer Defender P40 | |
| Dead Island 2 | |
| 1920x1080 Ultra Preset AA:High T | |
| XMG Pro 15 E23 | |
| Medio NVIDIA GeForce RTX 4060 Laptop GPU (148.5 - 158.8, n=2) | |
| Medion Erazer Defender P40 | |
| 2560x1440 Ultra Preset AA:High T | |
| XMG Pro 15 E23 | |
| Medio NVIDIA GeForce RTX 4060 Laptop GPU (98 - 101.9, n=2) | |
| Medion Erazer Defender P40 | |
| Star Wars Jedi Survivor | |
| 1920x1080 Epic Preset | |
| XMG Pro 15 E23 | |
| Medion Erazer Defender P40 | |
| Medio NVIDIA GeForce RTX 4060 Laptop GPU (45.5 - 66.7, n=10) | |
| 2560x1440 Epic Preset | |
| XMG Pro 15 E23 | |
| Medion Erazer Defender P40 | |
| Medio NVIDIA GeForce RTX 4060 Laptop GPU (30.3 - 41.7, n=10) | |
Para comprobar si las frecuencias de cuadro se mantienen constantes durante un periodo más largo, ejecutamos el juego The Witcher 3 durante unos 60 minutos en resolución Full HD y ajustes de máxima calidad. El personaje del juego no se movió. Sólo se produjo una caída de la frecuencia de imagen cuando estaba activo el "modo silencioso".
Witcher 3 FPS diagram
| bajo | medio | alto | ultra | QHD | |
|---|---|---|---|---|---|
| GTA V (2015) | 186.3 | 183.1 | 176 | 113.9 | 83.1 |
| The Witcher 3 (2015) | 459.5 | 318.2 | 195.9 | 103 | |
| Dota 2 Reborn (2015) | 178.7 | 163.1 | 151.3 | 144.3 | |
| Final Fantasy XV Benchmark (2018) | 188.5 | 141.9 | 100.8 | 74 | |
| X-Plane 11.11 (2018) | 159.8 | 139.1 | 109.3 | ||
| Far Cry 5 (2018) | 167 | 142 | 136 | 128 | 102 |
| Strange Brigade (2018) | 473 | 279 | 221 | 188.3 | 126.4 |
| F1 22 (2022) | 243 | 232 | 178 | 65.7 | 42 |
| The Witcher 3 v4 (2023) | 210 | 171.6 | 85.4 | 72.8 | 44.8 |
| Dead Space Remake (2023) | 88.5 | 83.2 | 71.1 | 70.4 | 44.5 |
| Resident Evil 4 Remake (2023) | 141.5 | 107.2 | 97.3 | 72.7 | 52.1 |
| Dead Island 2 (2023) | 189.9 | 181.7 | 153.5 | 148.5 | 98 |
| Star Wars Jedi Survivor (2023) | 77.2 | 69.1 | 64.8 | 61.7 | 38.5 |
Emisiones - Un portátil Medion con aumentos moderados de temperatura
Emisiones sonoras
En carga, el Erazer Defender puede producir mucho ruido. el "modo de juego" hizo que el nivel de presión sonora subiera hasta 62 dB(A), y se alcanzó un máximo de 56 dB(A) con el "modo de entretenimiento" activado - aún muy alto.
Los otros dos modos redujeron mucho el ruido a costa de la potencia de cálculo - probablemente una primera opción para el uso diario. Sin embargo, el "modo silencioso" no hace honor a su nombre. No obstante: Permite jugar con un volumen de funcionamiento bajo (Witcher 3: 36 dB(A)).
| HD Bajo | FHD Bajo | FHD Medio | FHD Alto | FHD Ultra | |
|---|---|---|---|---|---|
| Dota 2 Reborn | 85,8 fps | - | - | 51,7 fps | 45,1 fps |
| X-Plane 11.11 | 52,1 fps | - | 41,2 fps | 35,9 fps | - |
| Strange Brigade | - | - | - | - | 60 fps |
El portátil suele funcionar silenciosamente, a veces en silencio, tanto en modo inactivo como en el uso diario (oficina, Internet). Sin embargo, los ventiladores de vez en cuando se aceleran innecesariamente (un fenómeno típico de los barebones Clevo).
Ruido
| Ocioso |
| 26 / 27 / 32 dB(A) |
| Carga |
| 53 / 64 dB(A) |
 | ||
30 dB silencioso 40 dB(A) audible 50 dB(A) ruidosamente alto |
||
min: | ||
| Medion Erazer Defender P40 GeForce RTX 4060 Laptop GPU, i7-13700HX, Phison PS5021-E21 1TB | MSI Katana 17 B13VFK GeForce RTX 4060 Laptop GPU, i7-13620H, Micron 2400 MTFDKBA1T0QFM | Acer Predator Helios 300 (i7-12700H, RTX 3070 Ti) GeForce RTX 3070 Ti Laptop GPU, i7-12700H, Samsung PM9A1 MZVL21T0HCLR | Lenovo Legion Pro 5 16IRX8 GeForce RTX 4060 Laptop GPU, i7-13700HX, SK hynix PC801 HFS512GEJ9X115N | Asus TUF Gaming A16 FA617 Radeon RX 7600S, R7 7735HS, Micron 2400 MTFDKBA1T0QFM | Gigabyte G7 KE GeForce RTX 3060 Laptop GPU, i5-12500H, Gigabyte AG470S1TB-SI B10 | |
|---|---|---|---|---|---|---|
| Noise | 1% | 1% | 16% | 12% | -7% | |
| apagado / medio ambiente * (dB) | 25 | 24.5 2% | 23 8% | 23 8% | 24 4% | 27 -8% |
| Idle Minimum * (dB) | 26 | 24.5 6% | 23 12% | 23.1 11% | 24 8% | 27 -4% |
| Idle Average * (dB) | 27 | 24.5 9% | 25.92 4% | 23.1 14% | 25 7% | 35 -30% |
| Idle Maximum * (dB) | 32 | 40 -25% | 40.67 -27% | 26.6 17% | 28 12% | 38 -19% |
| Load Average * (dB) | 53 | 48.3 9% | 42.7 19% | 34.7 35% | 42 21% | 52 2% |
| Witcher 3 ultra * (dB) | 56 | 56 -0% | 62.48 -12% | 47.6 15% | 50 11% | 56 -0% |
| Load Maximum * (dB) | 64 | 59.1 8% | 62.67 2% | 54.8 14% | 50 22% | 59 8% |
* ... más pequeño es mejor
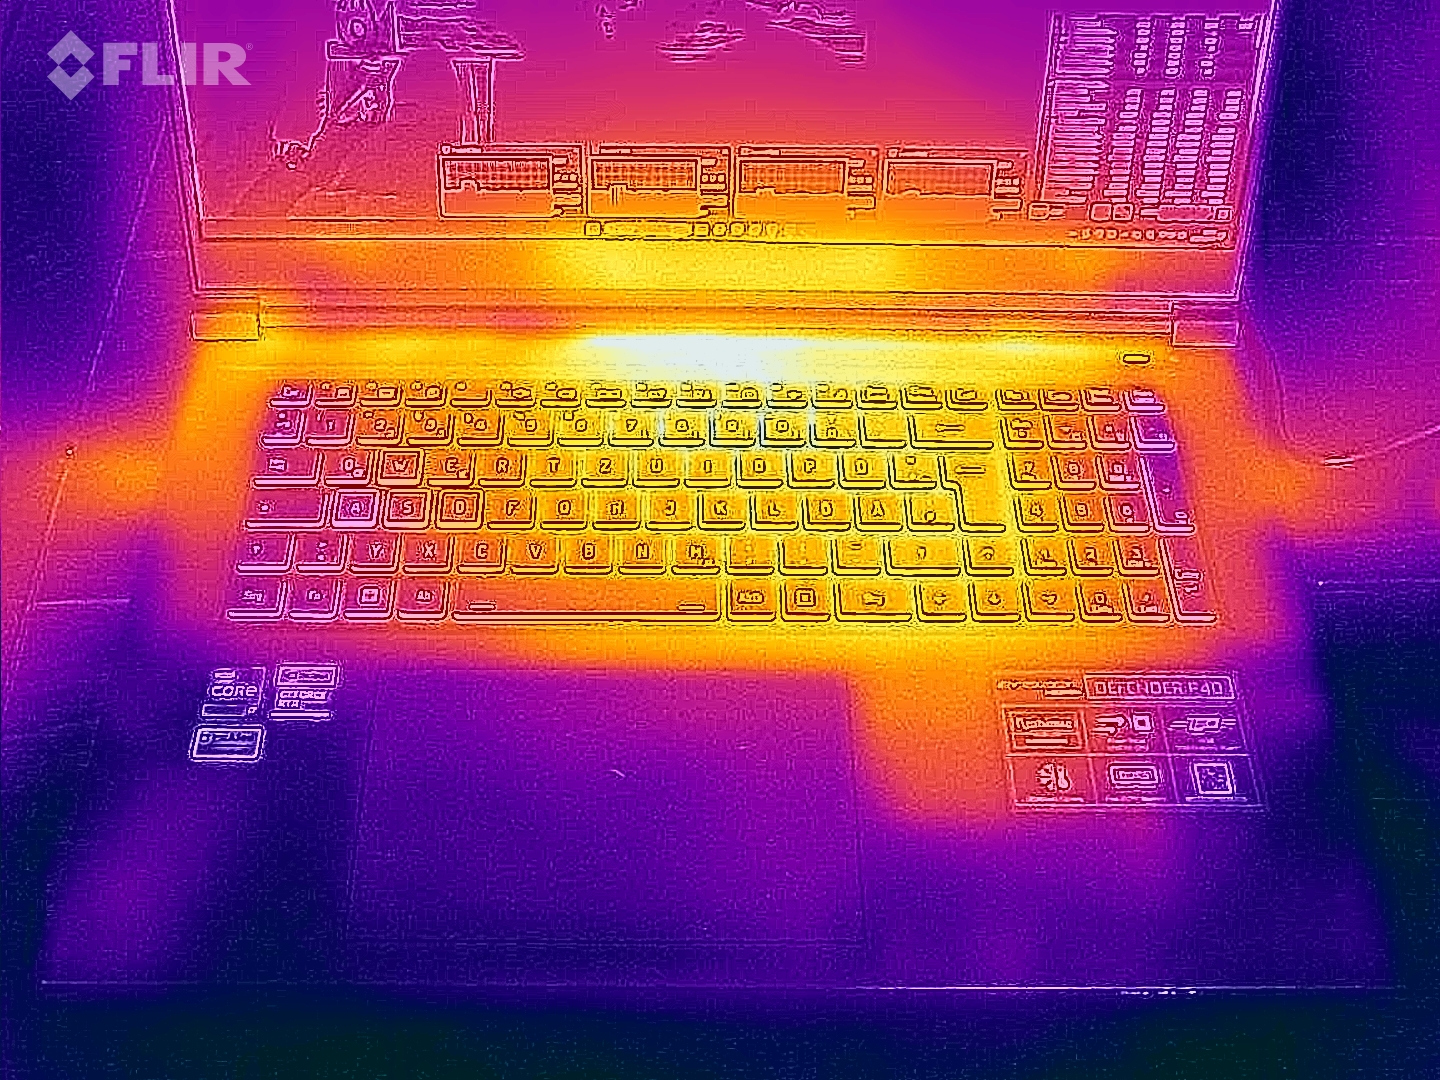
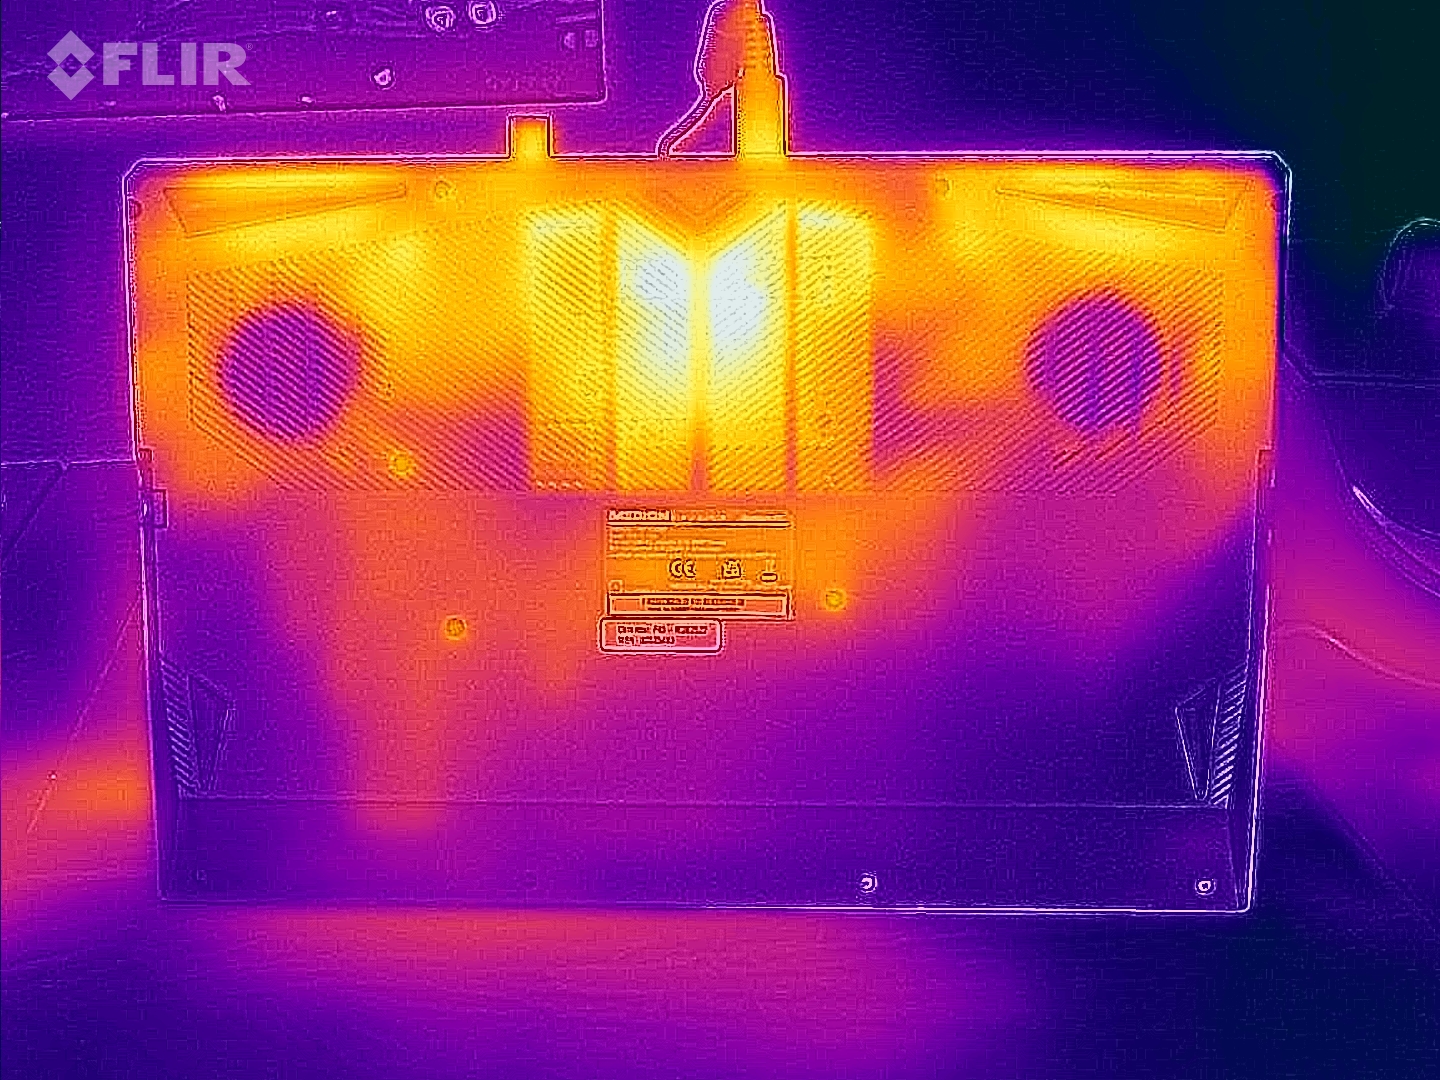
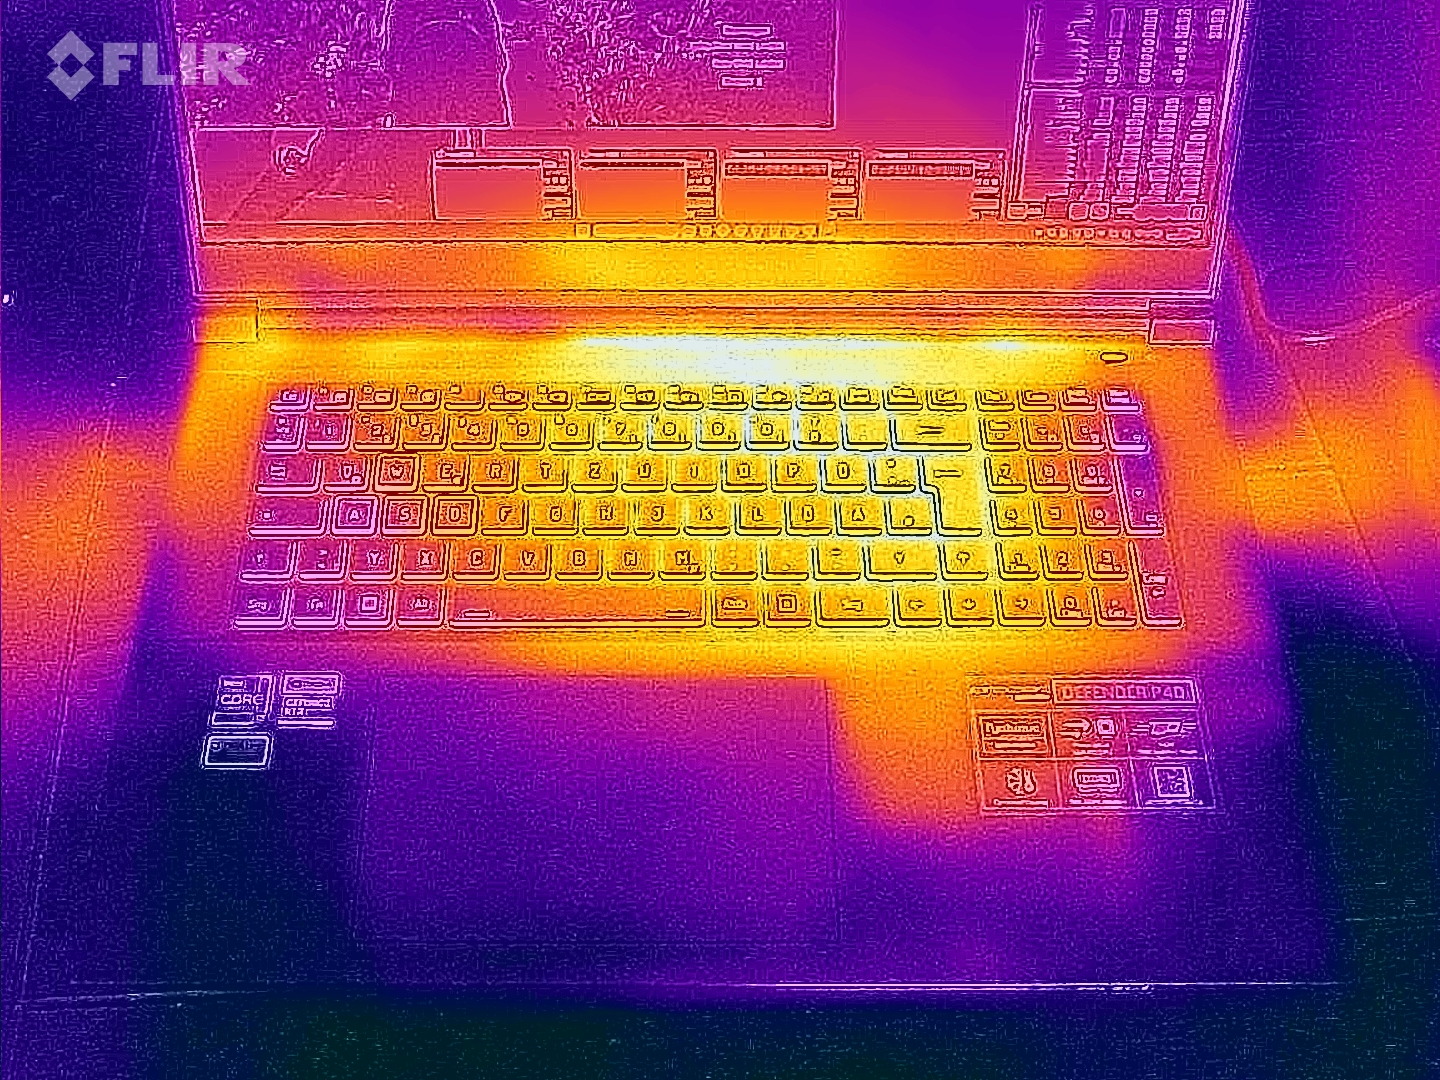
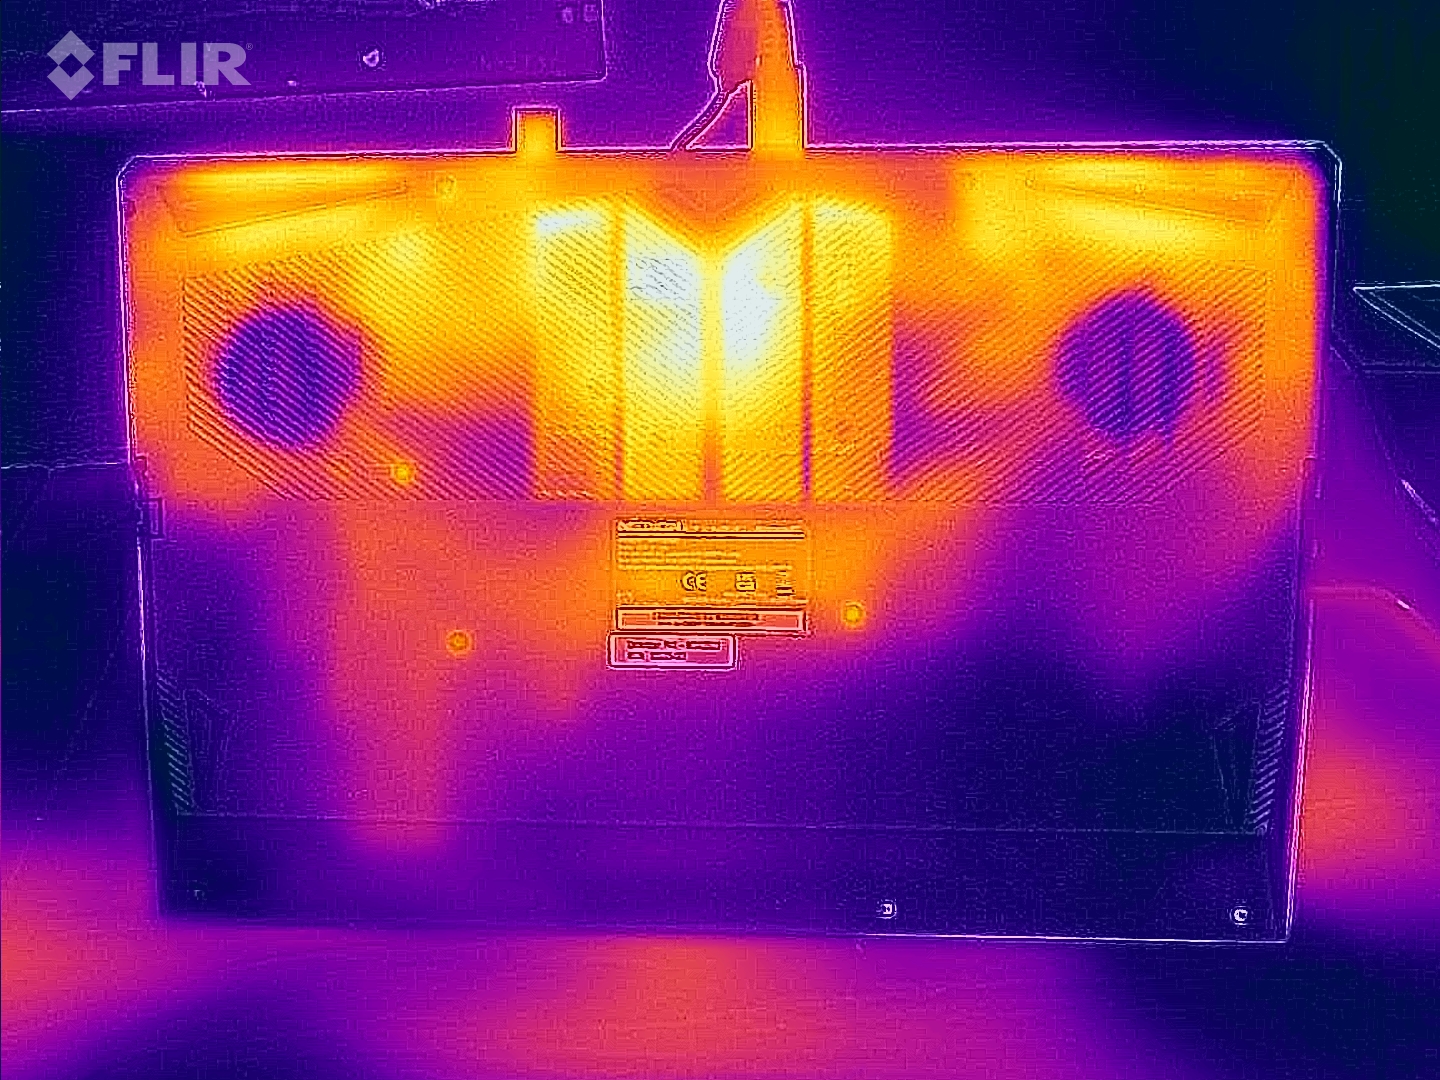
Temperatura
El portátil no se calienta mucho. Se registran temperaturas muy por debajo de los 50°C en todos los puntos de medición. Los índices están dentro de la zona verde en el uso diario.
(±) La temperatura máxima en la parte superior es de 42 °C / 108 F, frente a la media de 40.4 °C / 105 F, que oscila entre 21.2 y 68.8 °C para la clase Gaming.
(±) El fondo se calienta hasta un máximo de 45 °C / 113 F, frente a la media de 43.2 °C / 110 F
(+) En reposo, la temperatura media de la parte superior es de 26.6 °C / 80# F, frente a la media del dispositivo de 33.9 °C / 93 F.
(±) Jugando a The Witcher 3, la temperatura media de la parte superior es de 37.1 °C / 99 F, frente a la media del dispositivo de 33.9 °C / 93 F.
(+) El reposamanos y el panel táctil están a una temperatura inferior a la de la piel, con un máximo de 31 °C / 87.8 F y, por tanto, son fríos al tacto.
(-) La temperatura media de la zona del reposamanos de dispositivos similares fue de 28.8 °C / 83.8 F (-2.2 °C / -4 F).
| Medion Erazer Defender P40 Intel Core i7-13700HX, NVIDIA GeForce RTX 4060 Laptop GPU | MSI Katana 17 B13VFK Intel Core i7-13620H, NVIDIA GeForce RTX 4060 Laptop GPU | Acer Predator Helios 300 (i7-12700H, RTX 3070 Ti) Intel Core i7-12700H, NVIDIA GeForce RTX 3070 Ti Laptop GPU | Lenovo Legion Pro 5 16IRX8 Intel Core i7-13700HX, NVIDIA GeForce RTX 4060 Laptop GPU | Asus TUF Gaming A16 FA617 AMD Ryzen 7 7735HS, AMD Radeon RX 7600S | Gigabyte G7 KE Intel Core i5-12500H, NVIDIA GeForce RTX 3060 Laptop GPU | |
|---|---|---|---|---|---|---|
| Heat | -7% | -5% | -8% | -27% | -13% | |
| Maximum Upper Side * (°C) | 42 | 41.6 1% | 35 17% | 42.8 -2% | 54 -29% | 52 -24% |
| Maximum Bottom * (°C) | 45 | 43.1 4% | 53 -18% | 50 -11% | 47 -4% | 54 -20% |
| Idle Upper Side * (°C) | 28 | 32 -14% | 29 -4% | 29.6 -6% | 40 -43% | 28 -0% |
| Idle Bottom * (°C) | 30 | 35.8 -19% | 34 -13% | 34 -13% | 40 -33% | 32 -7% |
* ... más pequeño es mejor
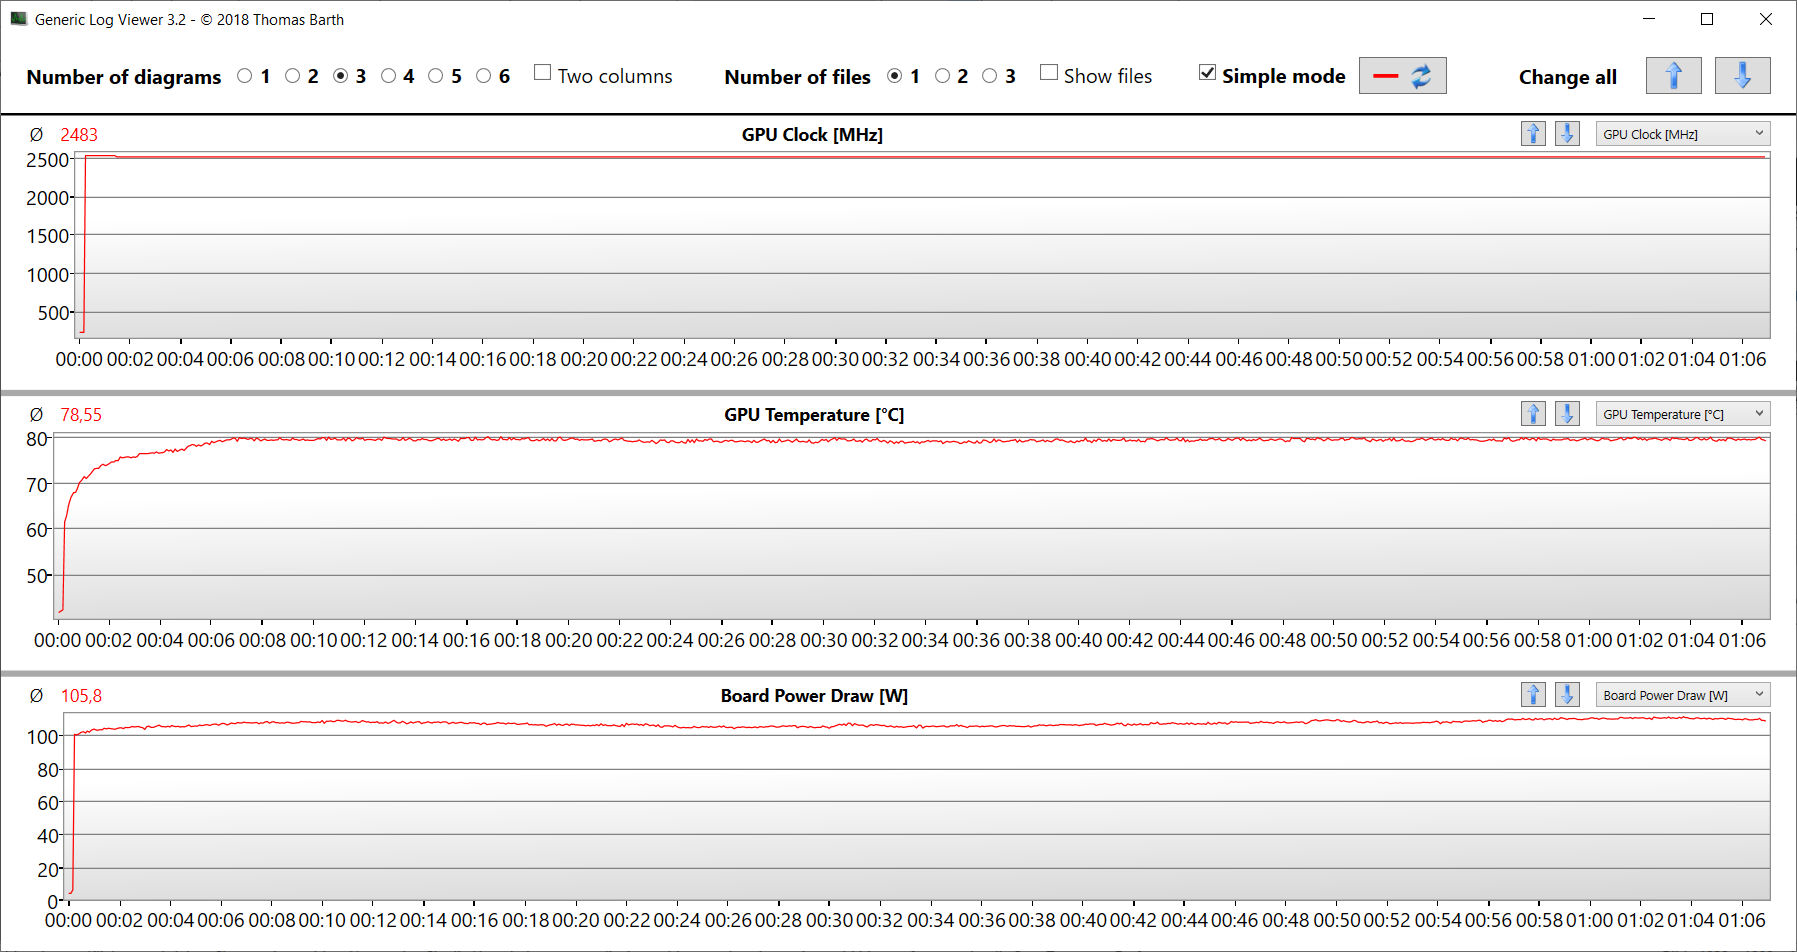
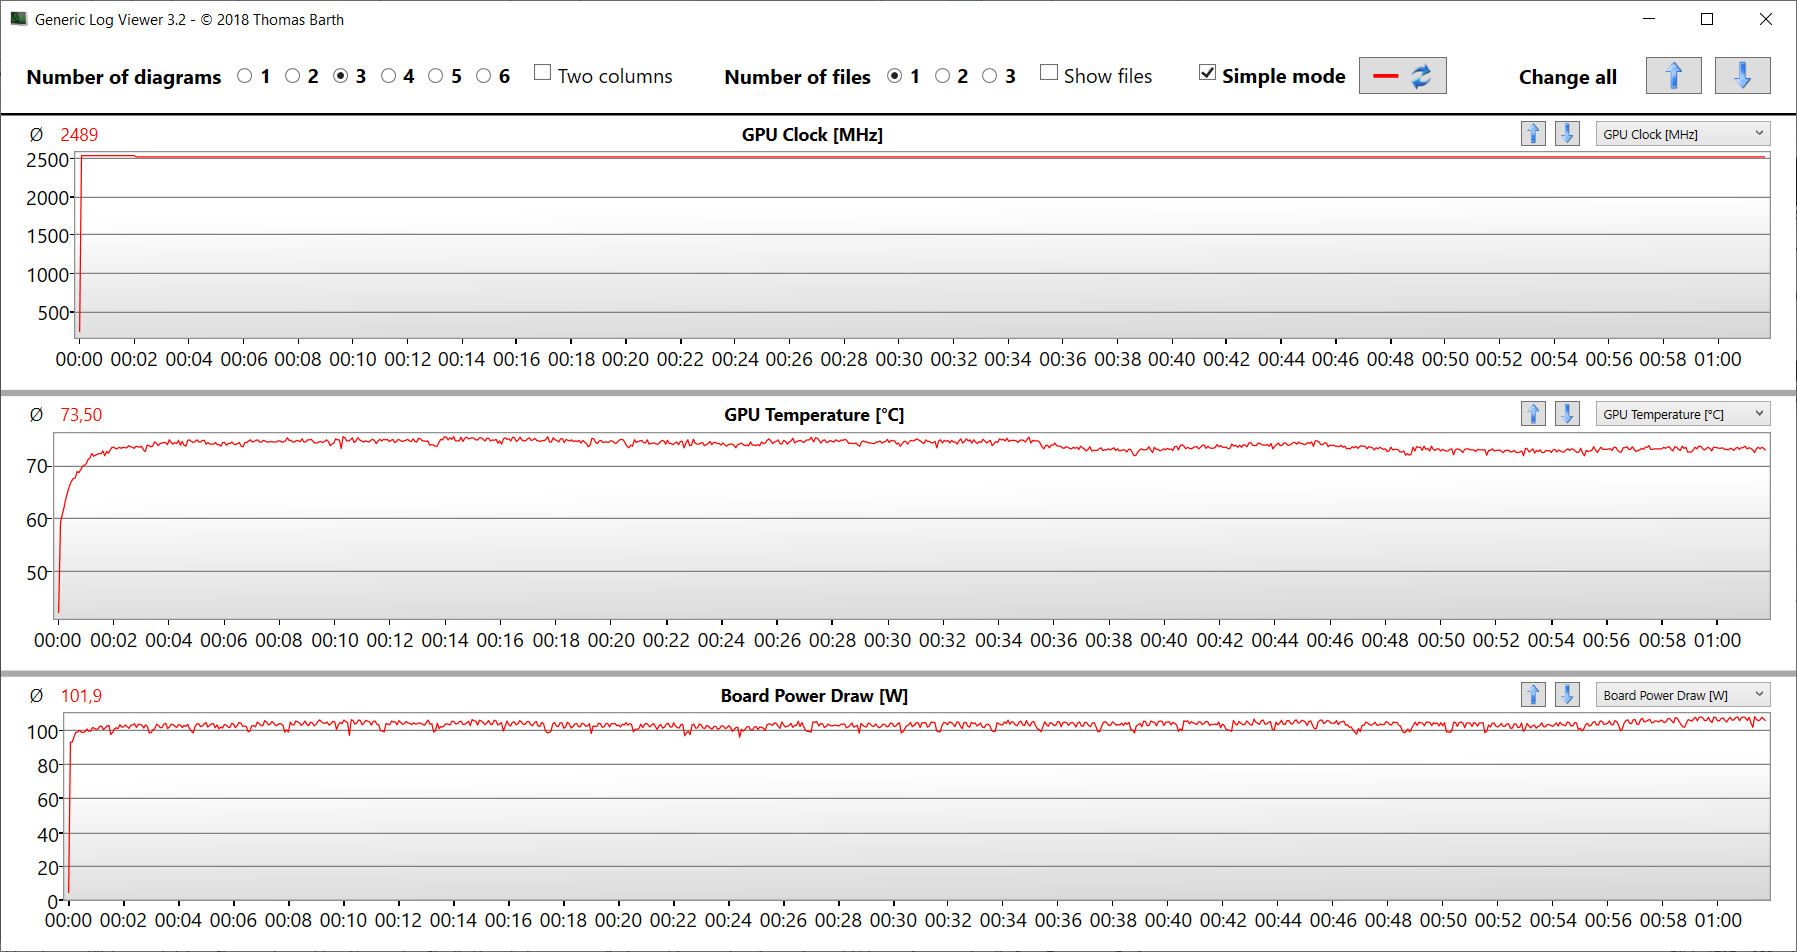
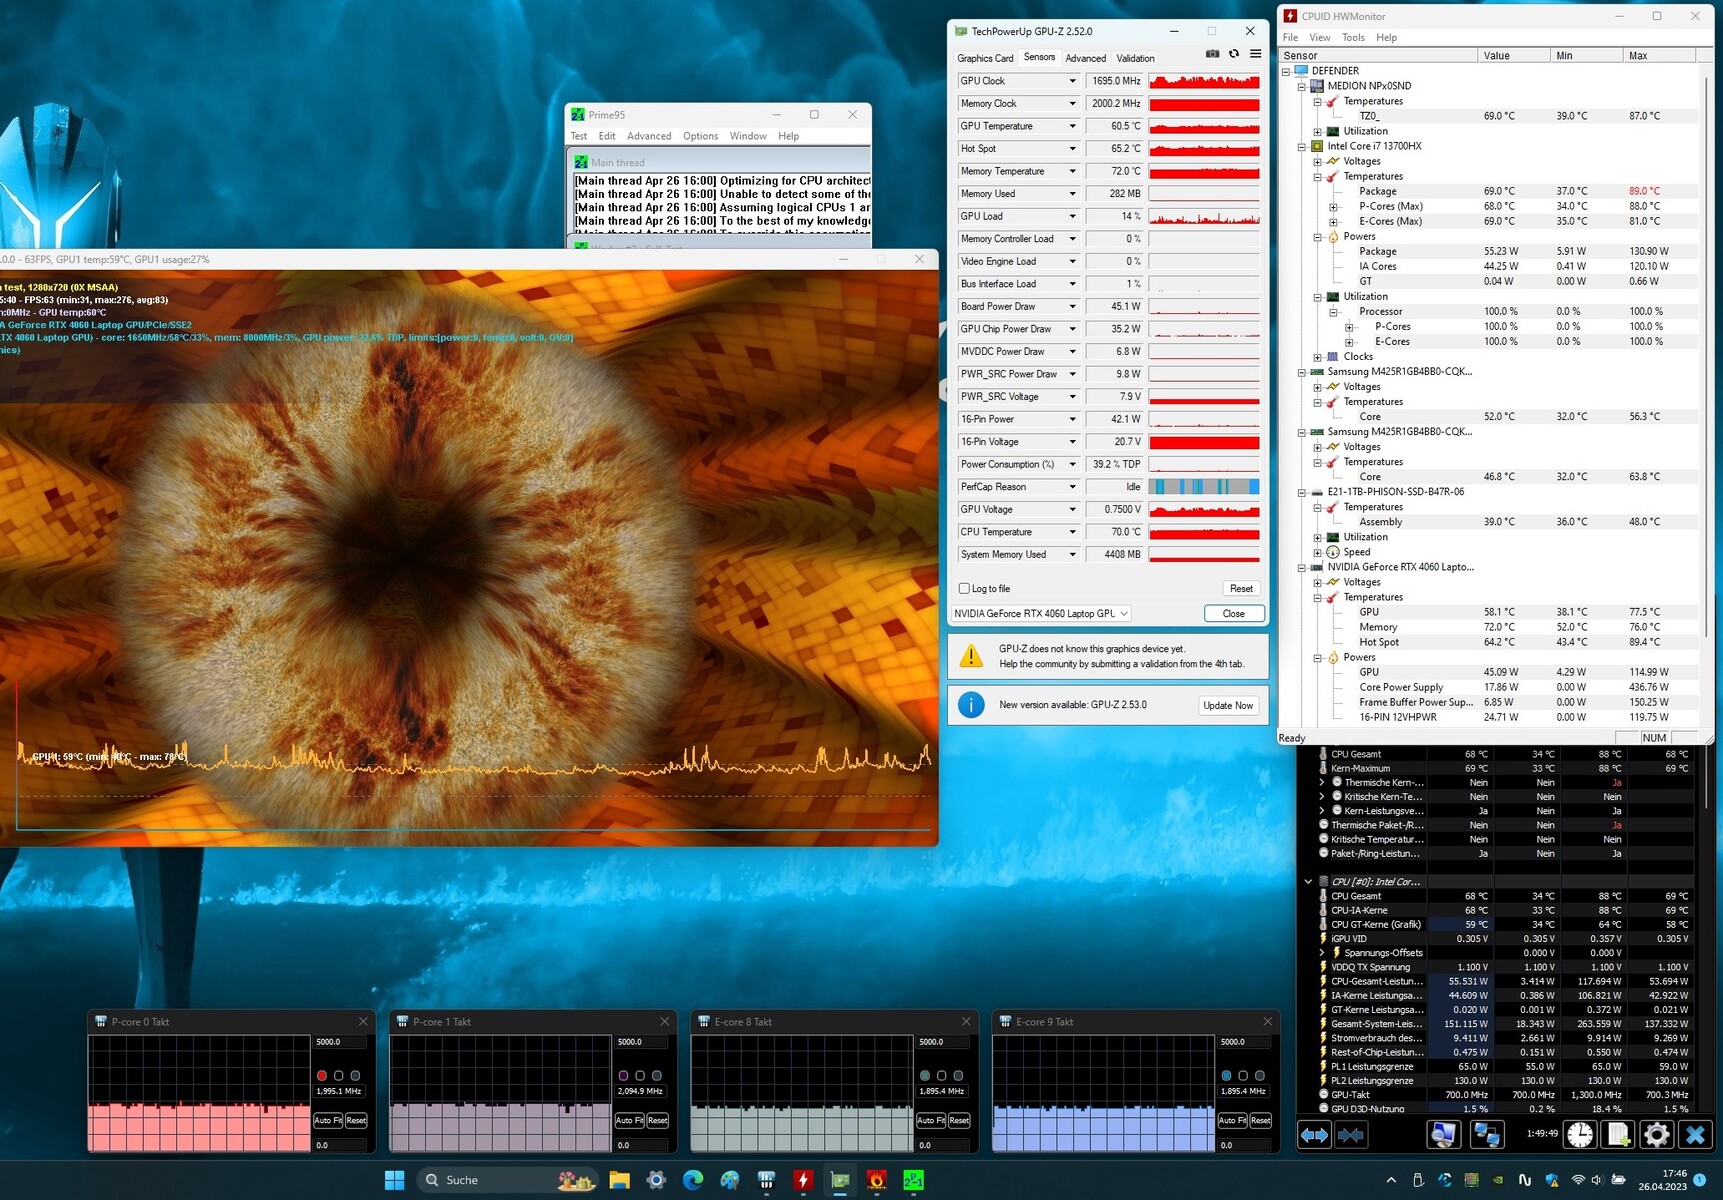
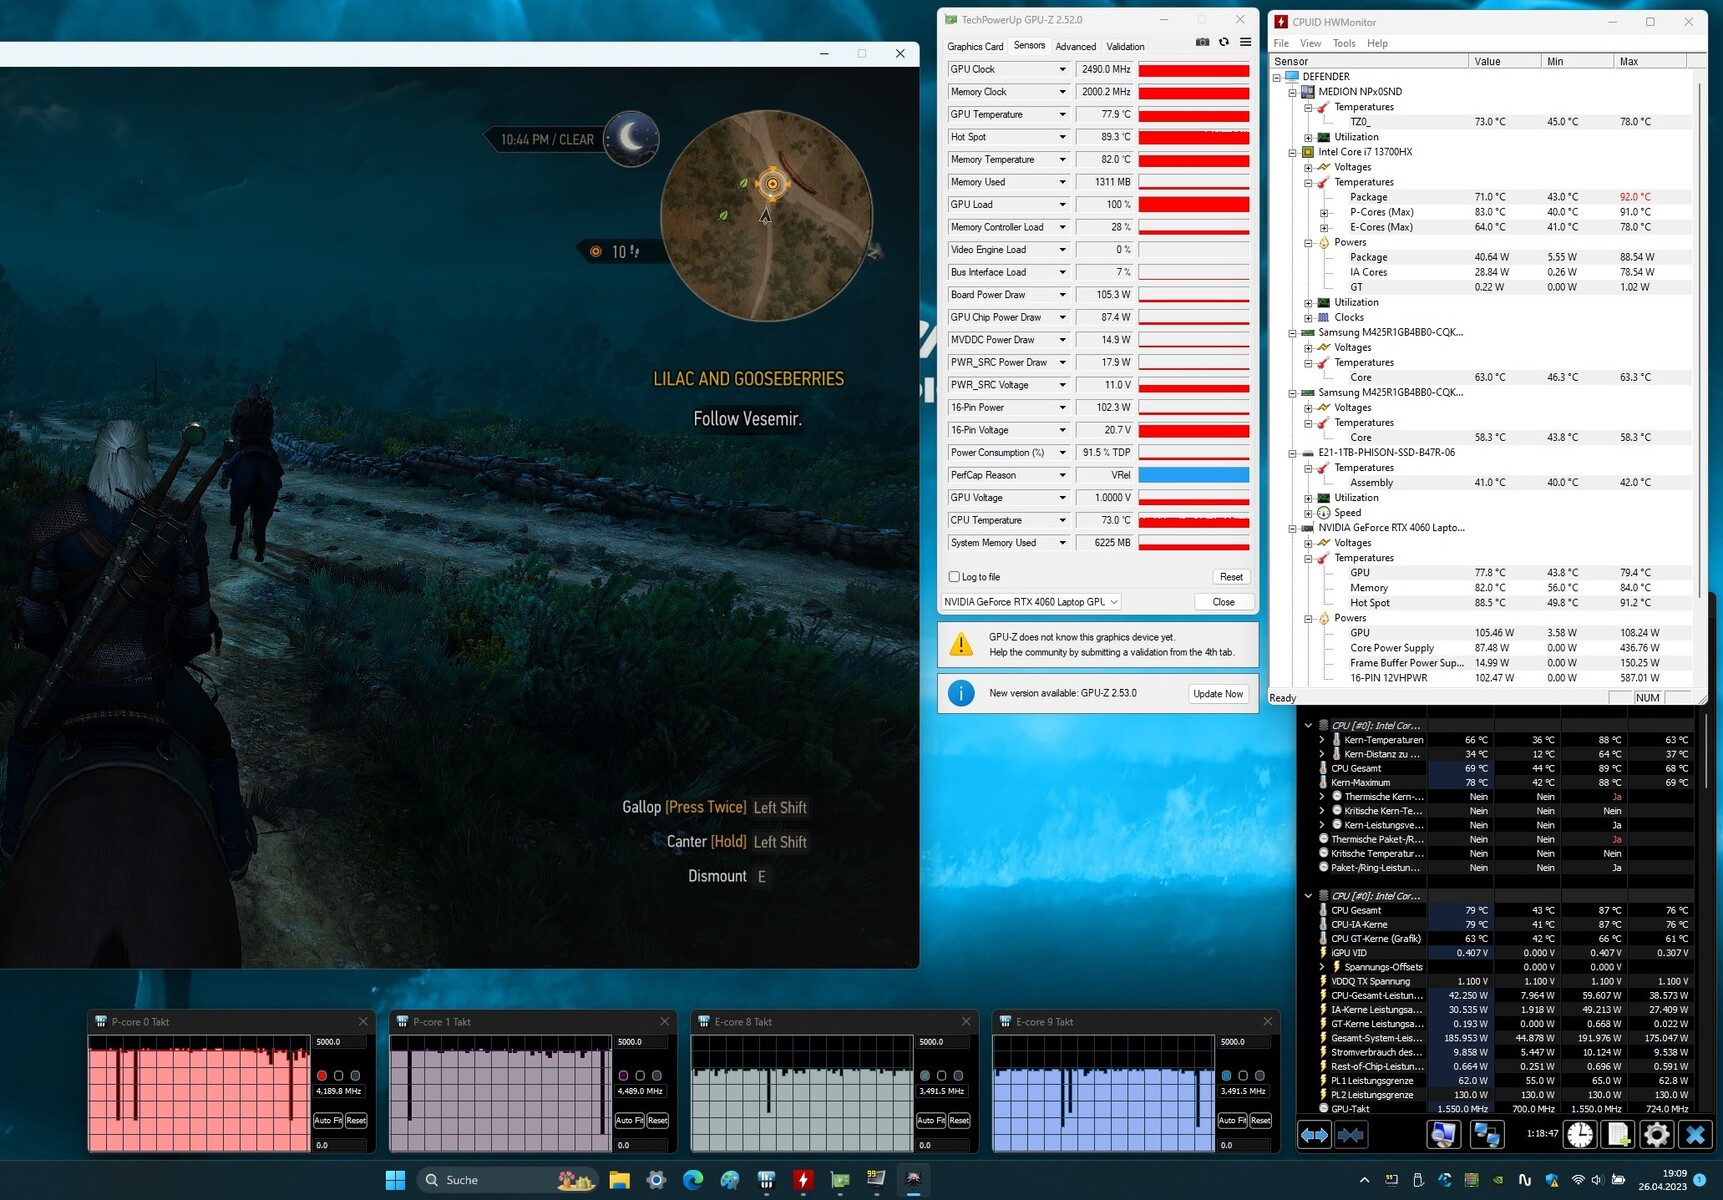
Prueba de esfuerzo
La prueba de estrés (Prime95 y Furmark en funcionamiento continuo) simula un escenario extremo para comprobar la estabilidad del sistema a plena carga. La CPU comenzó la prueba con frecuencias de reloj altas (P: 3,5 a 3,8 GHz, E: 3,1 a 3,2 GHz) y la GPU funcionando a 2,4 o 2,5 GHz. Mientras que el reloj de la CPU se redujo al cabo de poco menos de un minuto, la GPU funcionó a plena potencia durante todo el tiempo.
Altavoces
Los altavoces estéreo producen un sonido decente que, por desgracia, apenas ofrece graves. Se podría conseguir una mejor experiencia de sonido usando auriculares o altavoces externos.
Medion Erazer Defender P40 análisis de audio
(±) | la sonoridad del altavoz es media pero buena (81 dB)
Graves 100 - 315 Hz
(-) | casi sin bajos - de media 29.9% inferior a la mediana
(±) | la linealidad de los graves es media (12.4% delta a frecuencia anterior)
Medios 400 - 2000 Hz
(±) | medias más altas - de media 6.4% más altas que la mediana
(±) | la linealidad de los medios es media (8.1% delta respecto a la frecuencia anterior)
Altos 2 - 16 kHz
(+) | máximos equilibrados - a sólo 2.4% de la mediana
(+) | los máximos son lineales (3.6% delta a la frecuencia anterior)
Total 100 - 16.000 Hz
(±) | la linealidad del sonido global es media (22.4% de diferencia con la mediana)
En comparación con la misma clase
» 80% de todos los dispositivos probados de esta clase eran mejores, 6% similares, 14% peores
» El mejor tuvo un delta de 6%, la media fue 18%, el peor fue ###max##%
En comparación con todos los dispositivos probados
» 66% de todos los dispositivos probados eran mejores, 6% similares, 29% peores
» El mejor tuvo un delta de 4%, la media fue 23%, el peor fue ###max##%
MSI Katana 17 B13VFK análisis de audio
(±) | la sonoridad del altavoz es media pero buena (78.5 dB)
Graves 100 - 315 Hz
(-) | casi sin bajos - de media 17.7% inferior a la mediana
(±) | la linealidad de los graves es media (11.7% delta a frecuencia anterior)
Medios 400 - 2000 Hz
(±) | medias más altas - de media 6.8% más altas que la mediana
(+) | los medios son lineales (6.7% delta a la frecuencia anterior)
Altos 2 - 16 kHz
(+) | máximos equilibrados - a sólo 3.2% de la mediana
(±) | la linealidad de los máximos es media (7.2% delta a frecuencia anterior)
Total 100 - 16.000 Hz
(±) | la linealidad del sonido global es media (19.4% de diferencia con la mediana)
En comparación con la misma clase
» 67% de todos los dispositivos probados de esta clase eran mejores, 7% similares, 26% peores
» El mejor tuvo un delta de 6%, la media fue 18%, el peor fue ###max##%
En comparación con todos los dispositivos probados
» 48% de todos los dispositivos probados eran mejores, 7% similares, 45% peores
» El mejor tuvo un delta de 4%, la media fue 23%, el peor fue ###max##%
Gestión de la energía - El portátil para juegos con tiempos de ejecución decentes
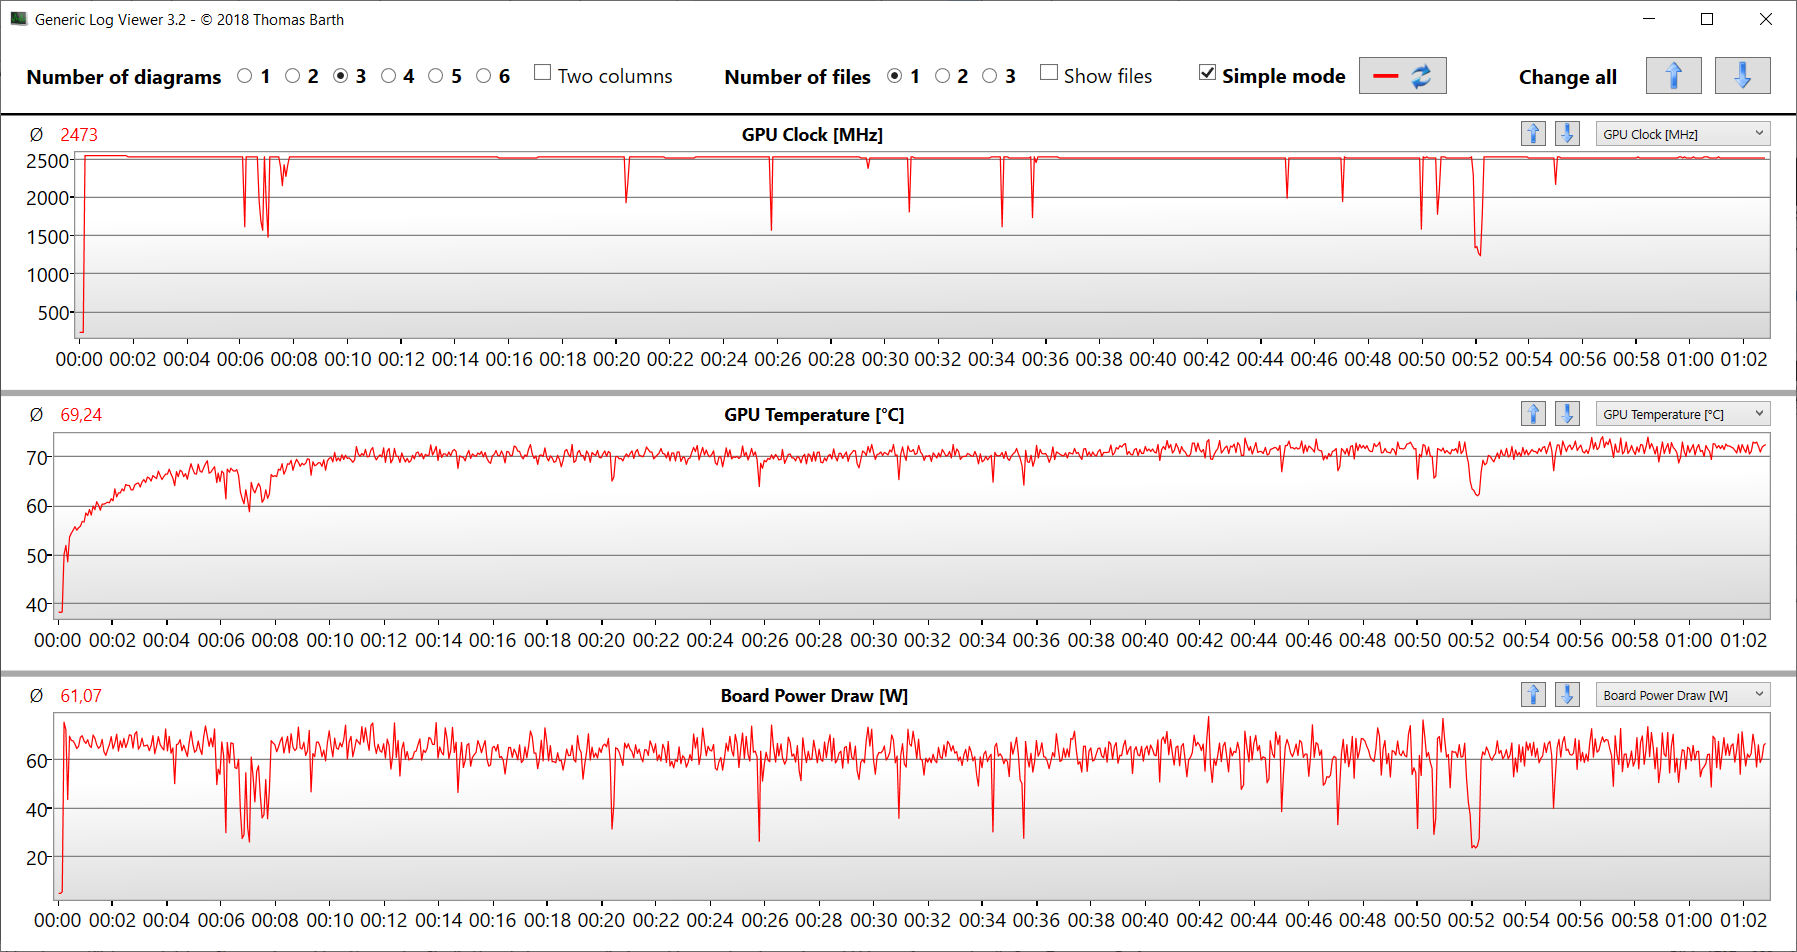
Consumo de energía
El consumo de energía del portátil Medion está en un nivel normal para el hardware instalado. La prueba Witcher 3 test y el test de estrés se ejecutaron con un consumo de energía constante o relativamente constante. La fuente de alimentación (280 vatios) está suficientemente dimensionada.
| Off / Standby | |
| Ocioso | |
| Carga |
|
Clave:
min: | |
| Medion Erazer Defender P40 i7-13700HX, GeForce RTX 4060 Laptop GPU, Phison PS5021-E21 1TB, IPS, 2560x1440, 17.3" | MSI Katana 17 B13VFK i7-13620H, GeForce RTX 4060 Laptop GPU, Micron 2400 MTFDKBA1T0QFM, IPS LED, 1920x1080, 17.3" | Acer Predator Helios 300 (i7-12700H, RTX 3070 Ti) i7-12700H, GeForce RTX 3070 Ti Laptop GPU, Samsung PM9A1 MZVL21T0HCLR, IPS, 2560x1440, 17.3" | Lenovo Legion Pro 5 16IRX8 i7-13700HX, GeForce RTX 4060 Laptop GPU, SK hynix PC801 HFS512GEJ9X115N, IPS, 2560x1600, 16" | Asus TUF Gaming A16 FA617 R7 7735HS, Radeon RX 7600S, Micron 2400 MTFDKBA1T0QFM, IPS-Level, 1920x1200, 16" | Gigabyte G7 KE i5-12500H, GeForce RTX 3060 Laptop GPU, Gigabyte AG470S1TB-SI B10, IPS, 1920x1080, 17.3" | Medio NVIDIA GeForce RTX 4060 Laptop GPU | Media de la clase Gaming | |
|---|---|---|---|---|---|---|---|---|
| Power Consumption | -1% | -40% | -71% | 13% | -24% | -11% | -32% | |
| Idle Minimum * (Watt) | 8 | 12.2 -53% | 15 -88% | 24.5 -206% | 8 -0% | 15 -88% | 11.5 ? -44% | 13 ? -63% |
| Idle Average * (Watt) | 12 | 14.9 -24% | 20 -67% | 29.2 -143% | 11 8% | 17 -42% | 16 ? -33% | 19 ? -58% |
| Idle Maximum * (Watt) | 18 | 15.8 12% | 22.3 -24% | 34.3 -91% | 16 11% | 24 -33% | 20.3 ? -13% | 24.6 ? -37% |
| Load Average * (Watt) | 101 | 85.22 16% | 133 -32% | 98.7 2% | 97 4% | 111 -10% | 92.9 ? 8% | 110.7 ? -10% |
| Witcher 3 ultra * (Watt) | 180.8 | 151.1 16% | 231 -28% | 178.6 1% | 161.5 11% | 174.1 4% | ||
| Load Maximum * (Watt) | 284 | 212.8 25% | 290 -2% | 249.6 12% | 168 41% | 208 27% | 210 ? 26% | 259 ? 9% |
* ... más pequeño es mejor
Power consumption Witcher 3 / stress test
Power consumption with external monitor
Duración de la batería
El portátil de 17,3 pulgadas logró tiempos de ejecución de 6:13 h y 5:39 h en la prueba WLAN (llamada a sitios web mediante un script) y la prueba de vídeo (cortometraje Big Buck Bunny (codificación H.264, FHD) en bucle), respectivamente. Durante ambas pruebas, se desactivaron las funciones de ahorro de energía del dispositivo y se ajustó el brillo de la pantalla a unos 150 cd/m². Los módulos inalámbricos también se desactivaron para la prueba de vídeo.
En general, el P40 logró unos índices de resistencia muy decentes. Se situó en el medio campo de los dispositivos de comparación. Ninguno de los ordenadores pudo estar a la altura de los excelentes tiempos de ejecución del Asus TUF Gaming A16. Este último se beneficia de la combinación de una APU frugal y una batería de gran capacidad.
| Medion Erazer Defender P40 i7-13700HX, GeForce RTX 4060 Laptop GPU, 73 Wh | MSI Katana 17 B13VFK i7-13620H, GeForce RTX 4060 Laptop GPU, 53.5 Wh | Acer Predator Helios 300 (i7-12700H, RTX 3070 Ti) i7-12700H, GeForce RTX 3070 Ti Laptop GPU, 90 Wh | Lenovo Legion Pro 5 16IRX8 i7-13700HX, GeForce RTX 4060 Laptop GPU, 80 Wh | Asus TUF Gaming A16 FA617 R7 7735HS, Radeon RX 7600S, 90 Wh | Gigabyte G7 KE i5-12500H, GeForce RTX 3060 Laptop GPU, 54 Wh | Media de la clase Gaming | |
|---|---|---|---|---|---|---|---|
| Duración de Batería | -38% | 13% | -38% | 80% | -24% | 18% | |
| Reader / Idle (h) | 8.8 | 6.7 -24% | 20.2 130% | 7.1 -19% | 8.27 ? -6% | ||
| H.264 (h) | 5.7 | 5.9 4% | 2.2 -61% | 8.32 ? 46% | |||
| WiFi v1.3 (h) | 6.2 | 2.9 -53% | 6 -3% | 3.4 -45% | 12.1 95% | 5.3 -15% | 7.11 ? 15% |
| Load (h) | 1.3 | 1 -23% | 1.8 38% | 0.7 -46% | 1.5 15% | 1.3 0% | 1.502 ? 16% |
Pro
Contra
Veredicto - Un asunto redondo
El P40 es apto para juegos QHD en configuraciones altas a máximas - pero el portátil debería ser genial para su uso en muchas otras áreas (edición de vídeo, renderizado) gracias a suCore i7-13700HXyGeForce RTX 4060. La CPU y la GPU funcionan con frecuencias de reloj constantemente altas y un veloz SSD PCIe 4 (1 TB) se traduce en tiempos de carga rápidos.
El Medion Erazer Defender P40 es un portátil de juego QHD de gama media bien equipado.
El portátil no se calienta especialmente bajo carga, pero puede resultar ruidoso. Para compensarlo, el dispositivo cuenta con un "modo silencioso", a costa de su rendimiento de procesamiento. Permite jugar de forma más silenciosa (pero no del todo).
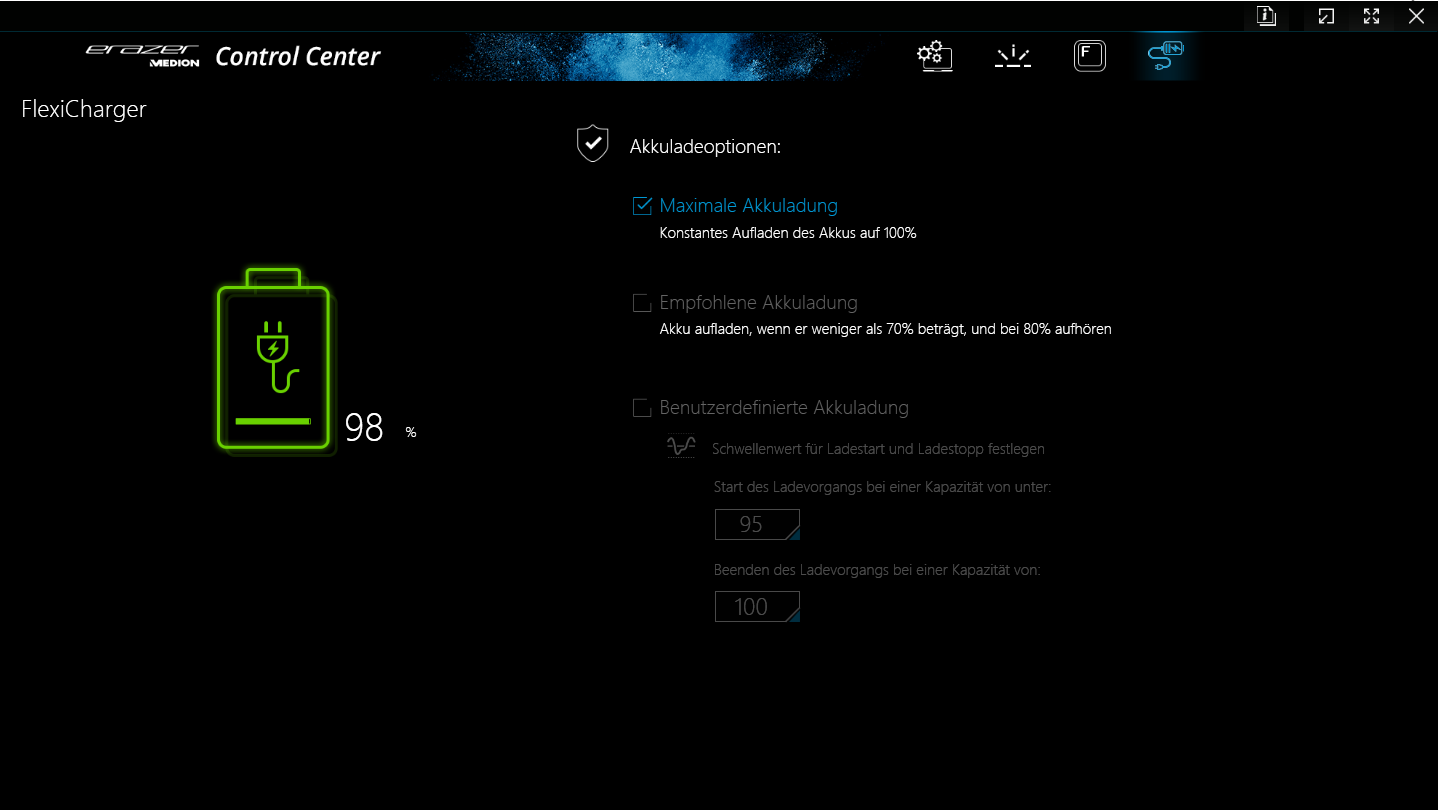
Una carga de batería (73 Wh) permite una autonomía realista de entre 5,5 y 6,5 horas, bastante decente. La batería no se puede cargar con un cargador USB-C, sino que hay que usar la voluminosa fuente de alimentación incluida con el portátil. En general, su pantalla mate de 17,3" (QHD, IPS, 240 Hz, sRGB) nos dejó una buena impresión.
El sitioMSI Katana 17se nos ocurre como posible alternativa al P40. Ofrece un rendimiento similar, pero peores tiempos de ejecución. ElGigabyte G7 KEes una alternativa algo más barata: por unos 1.000 dólares (sin Windows), permite jugar en FHD con ajustes de altos a máximos.
Precio y disponibilidad
El Medion Erazer Defender P40 se vende por unos 1.900 dólares. En el momento de la compra, no pudimos encontrar el portátil a la venta en las principales tiendas online de EE.UU., pero puedes echar un vistazo a dispositivos similares como el MSI Katana 17 o el Acer Predator Helios 300 en Amazon.
Medion Erazer Defender P40
- 05/24/2023 v7 (old)
Sascha Mölck
Transparencia
La selección de los dispositivos que se van a reseñar corre a cargo de nuestro equipo editorial. La muestra de prueba fue proporcionada al autor en calidad de préstamo por el fabricante o el minorista a los efectos de esta reseña. El prestamista no tuvo ninguna influencia en esta reseña, ni el fabricante recibió una copia de la misma antes de su publicación. No había ninguna obligación de publicar esta reseña. Como empresa de medios independiente, Notebookcheck no está sujeta a la autoridad de fabricantes, minoristas o editores.
Así es como prueba Notebookcheck
Cada año, Notebookcheck revisa de forma independiente cientos de portátiles y smartphones utilizando procedimientos estandarizados para asegurar que todos los resultados son comparables. Hemos desarrollado continuamente nuestros métodos de prueba durante unos 20 años y hemos establecido los estándares de la industria en el proceso. En nuestros laboratorios de pruebas, técnicos y editores experimentados utilizan equipos de medición de alta calidad. Estas pruebas implican un proceso de validación en varias fases. Nuestro complejo sistema de clasificación se basa en cientos de mediciones y puntos de referencia bien fundamentados, lo que mantiene la objetividad.Price comparison

