Análisis del portátil Lenovo Legion Pro 5 16IRX8: 1600 dólares por la GeForce RTX 4060
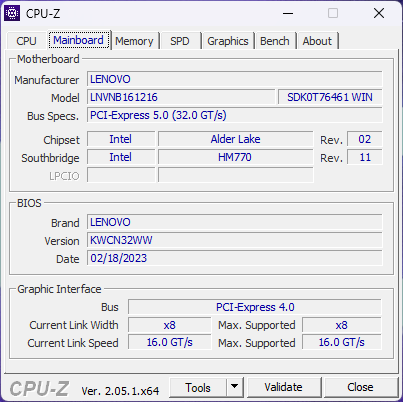
El Legion Pro 5 16 IRX8 (o Legion Pro 5i 16 Gen 8) es el sucesor del 2022 Legion Pro 5i 16 Gen 7. Introduce varios cambios, incluida una revisión del chasis con CPU Intel Raptor Lake-H de 13ª generación y GPU Nvidia Ada Lovelace para sustituir a las antiguas opciones Alder Lake-H y Ampere de 12ª generación, respectivamente. Se trata de un modelo gaming de gama media-alta que se sitúa entre la serie gaming IdeaPad de gama básica y la serie insignia Legion Serie Pro 7.
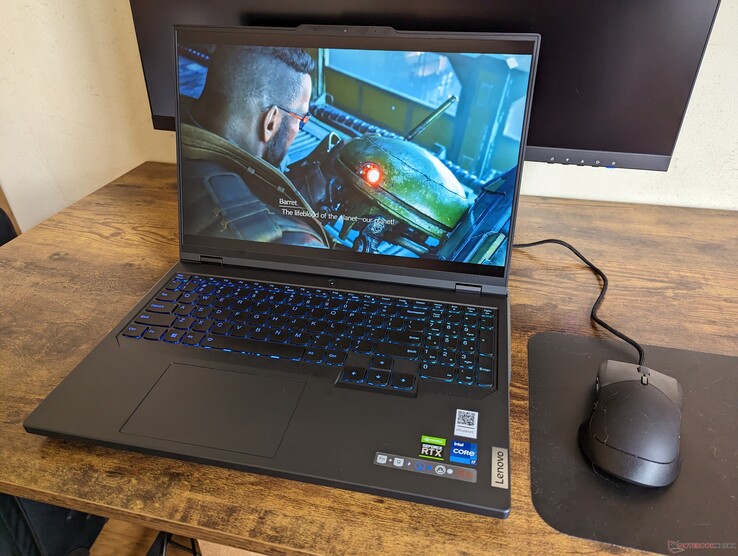
Nuestra unidad de pruebas específica es una configuración intermedia con el Core i7-13700HX, GeForce RTX 4060, y pantalla IPS de 165 Hz por aproximadamente $1400 a $1700 USD. Hay SKUs de gama baja y alta disponibles con el Core i5-12500HrTX 4050, RTX 4070 o pantalla IPS de 240 Hz, pero todas las opciones de pantalla tienen G-Sync y una resolución nativa de 2560 x 1600.
Entre los competidores del Legion Pro 5 16 se incluyen otros portátiles para juegos de 16 pulgadas como el Razer Blade 16,Asus ROG Zephyrus M16,Dell G16 7620o Gigabyte Aero 16.
Más opiniones sobre Lenovo:
Posibles contendientes en la comparación
Valoración | Fecha | Modelo | Peso | Altura | Tamaño | Resolución | Precio |
|---|---|---|---|---|---|---|---|
| 87.9 % v7 (old) | 05/2023 | Lenovo Legion Pro 5 16IRX8 i7-13700HX, GeForce RTX 4060 Laptop GPU | 2.5 kg | 26.8 mm | 16.00" | 2560x1600 | |
| 87.8 % v7 (old) | 02/2023 | Asus ROG Zephyrus M16 GU603Z i9-12900H, GeForce RTX 3070 Ti Laptop GPU | 2.1 kg | 19.9 mm | 16.00" | 2560x1600 | |
| 91.2 % v7 (old) | 02/2023 | Razer Blade 16 Early 2023 i9-13950HX, GeForce RTX 4080 Laptop GPU | 2.4 kg | 21.99 mm | 16.00" | 2560x1600 | |
| 89.4 % v7 (old) | 02/2023 | Lenovo Legion Pro 7 16IRX8H i9-13900HX, GeForce RTX 4080 Laptop GPU | 2.7 kg | 26 mm | 16.00" | 2560x1600 | |
| 87.7 % v7 (old) | 10/2022 | Lenovo Legion 5 Pro 16ARH7H RTX 3070 Ti R7 6800H, GeForce RTX 3070 Ti Laptop GPU | 2.6 kg | 26.6 mm | 16.00" | 2560x1600 | |
| 89.3 % v7 (old) | 01/2023 | Lenovo Legion S7 16ARHA7 R9 6900HX, Radeon RX 6800S | 2.2 kg | 16.9 mm | 16.00" | 2560x1600 |
Caso - Un Leaner Legion
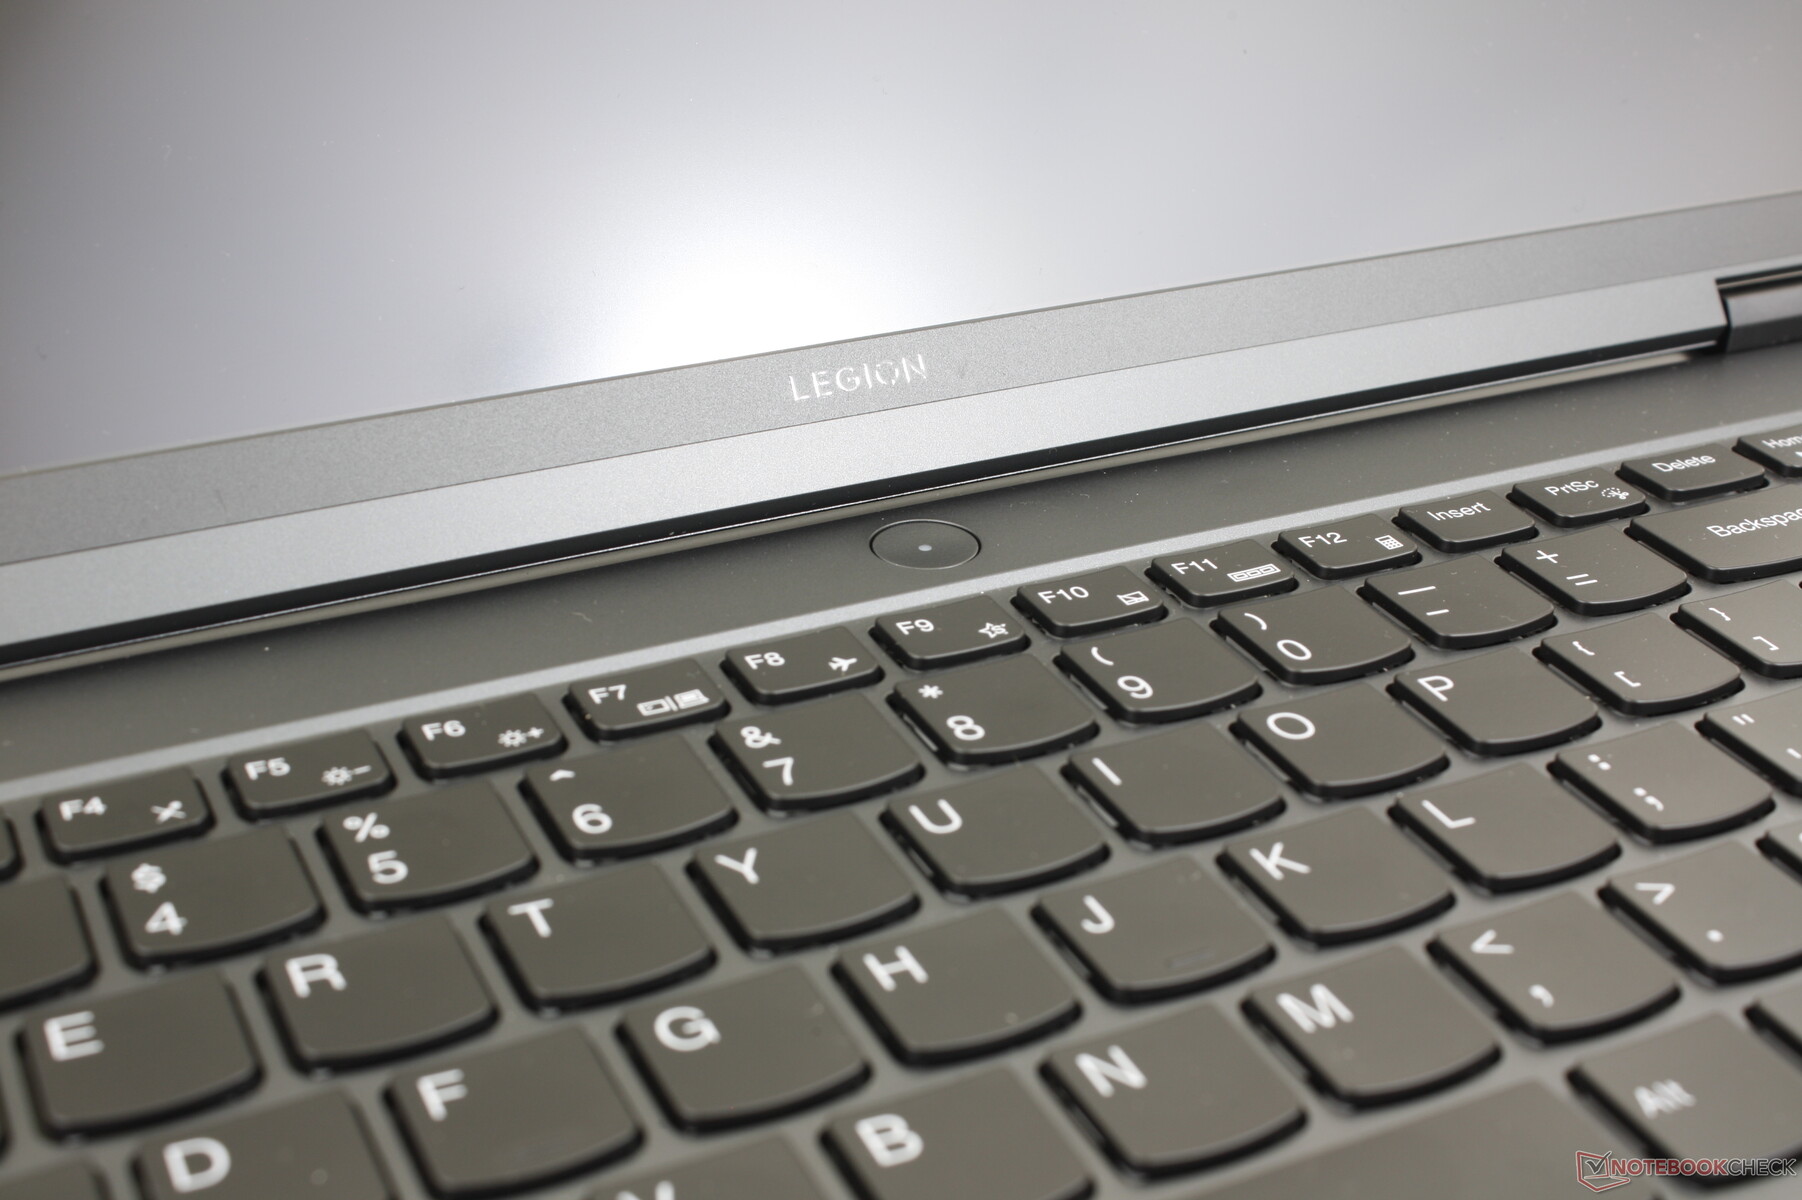
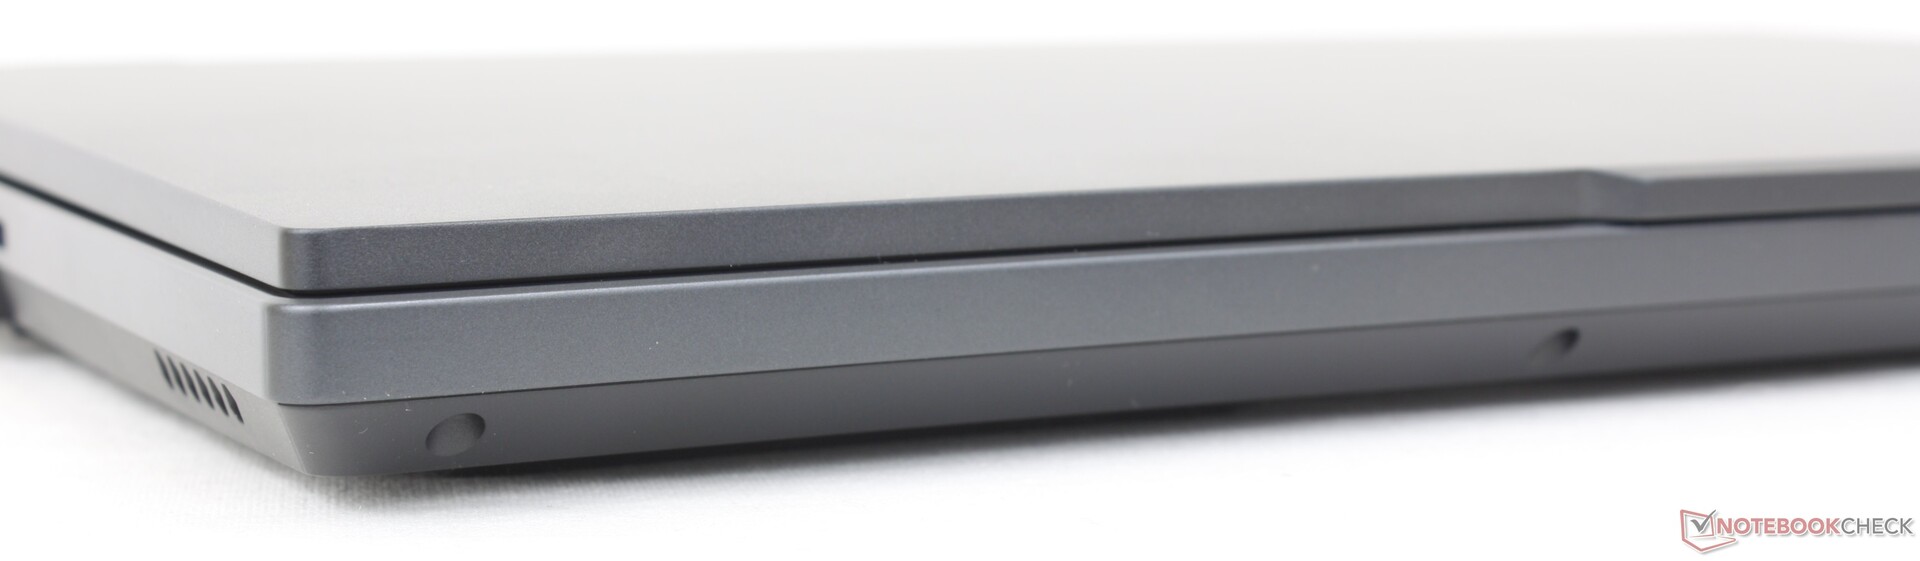
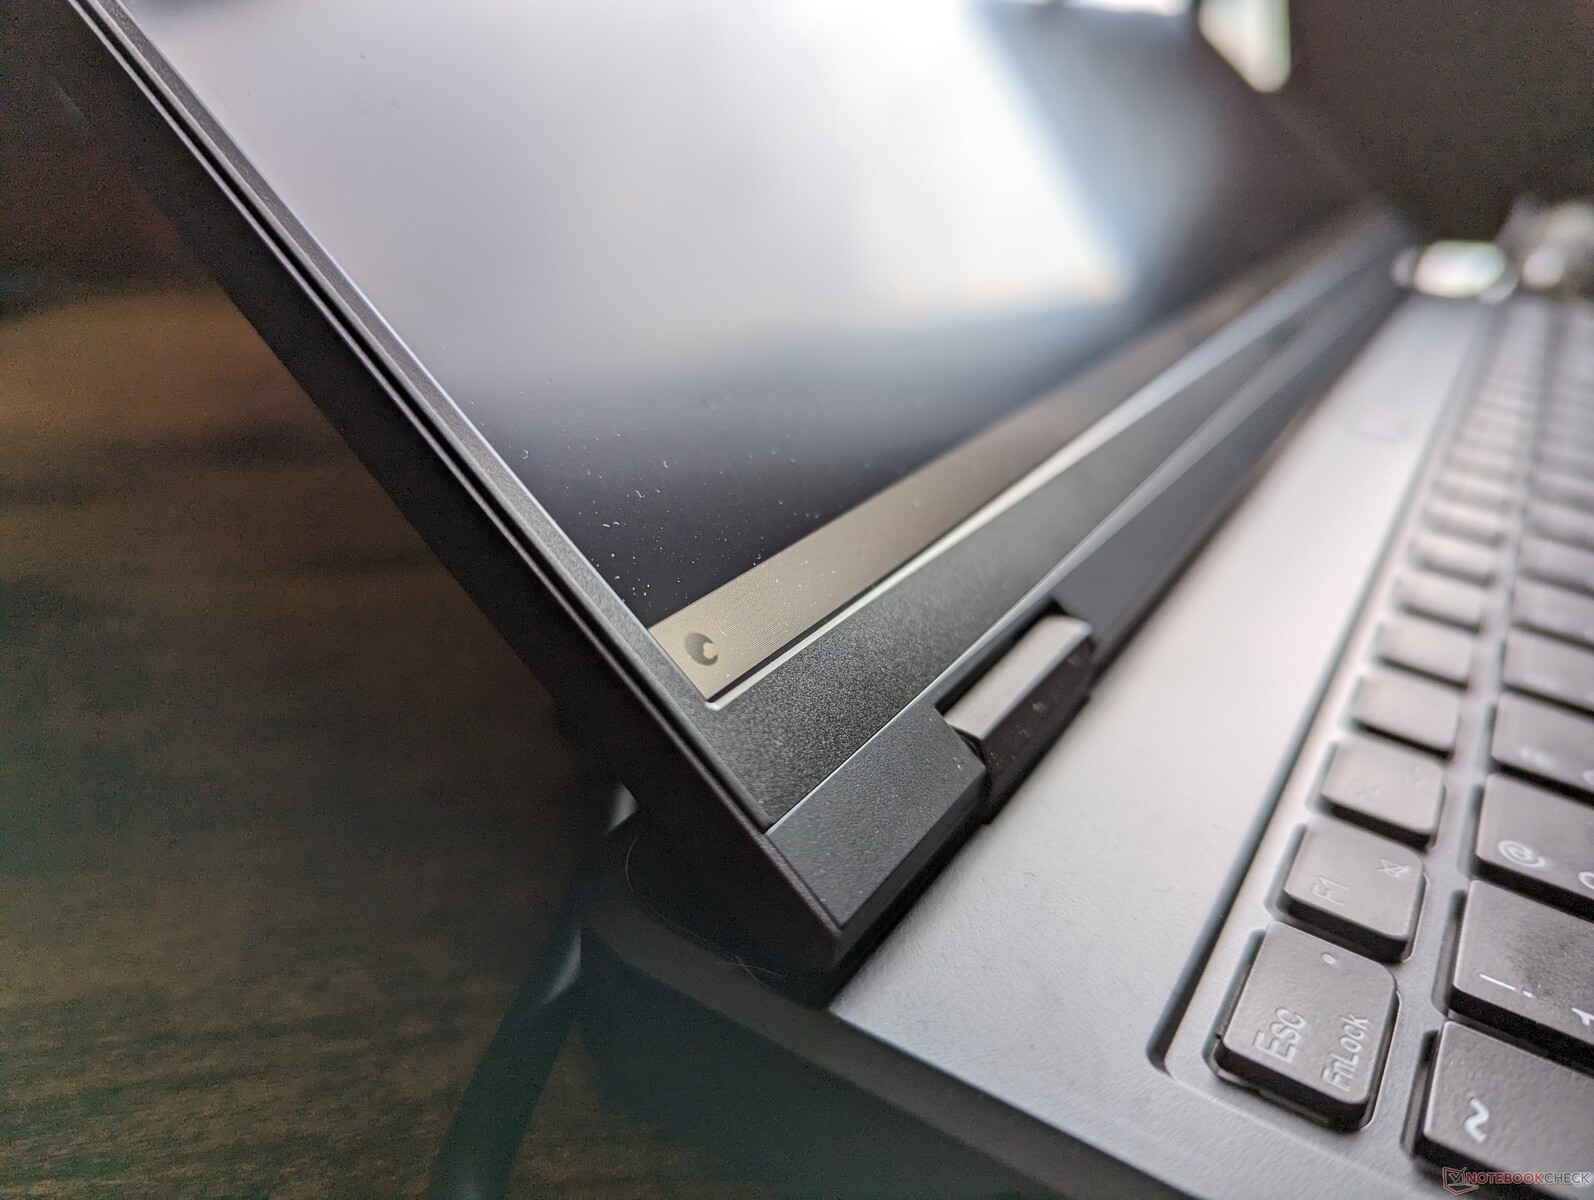
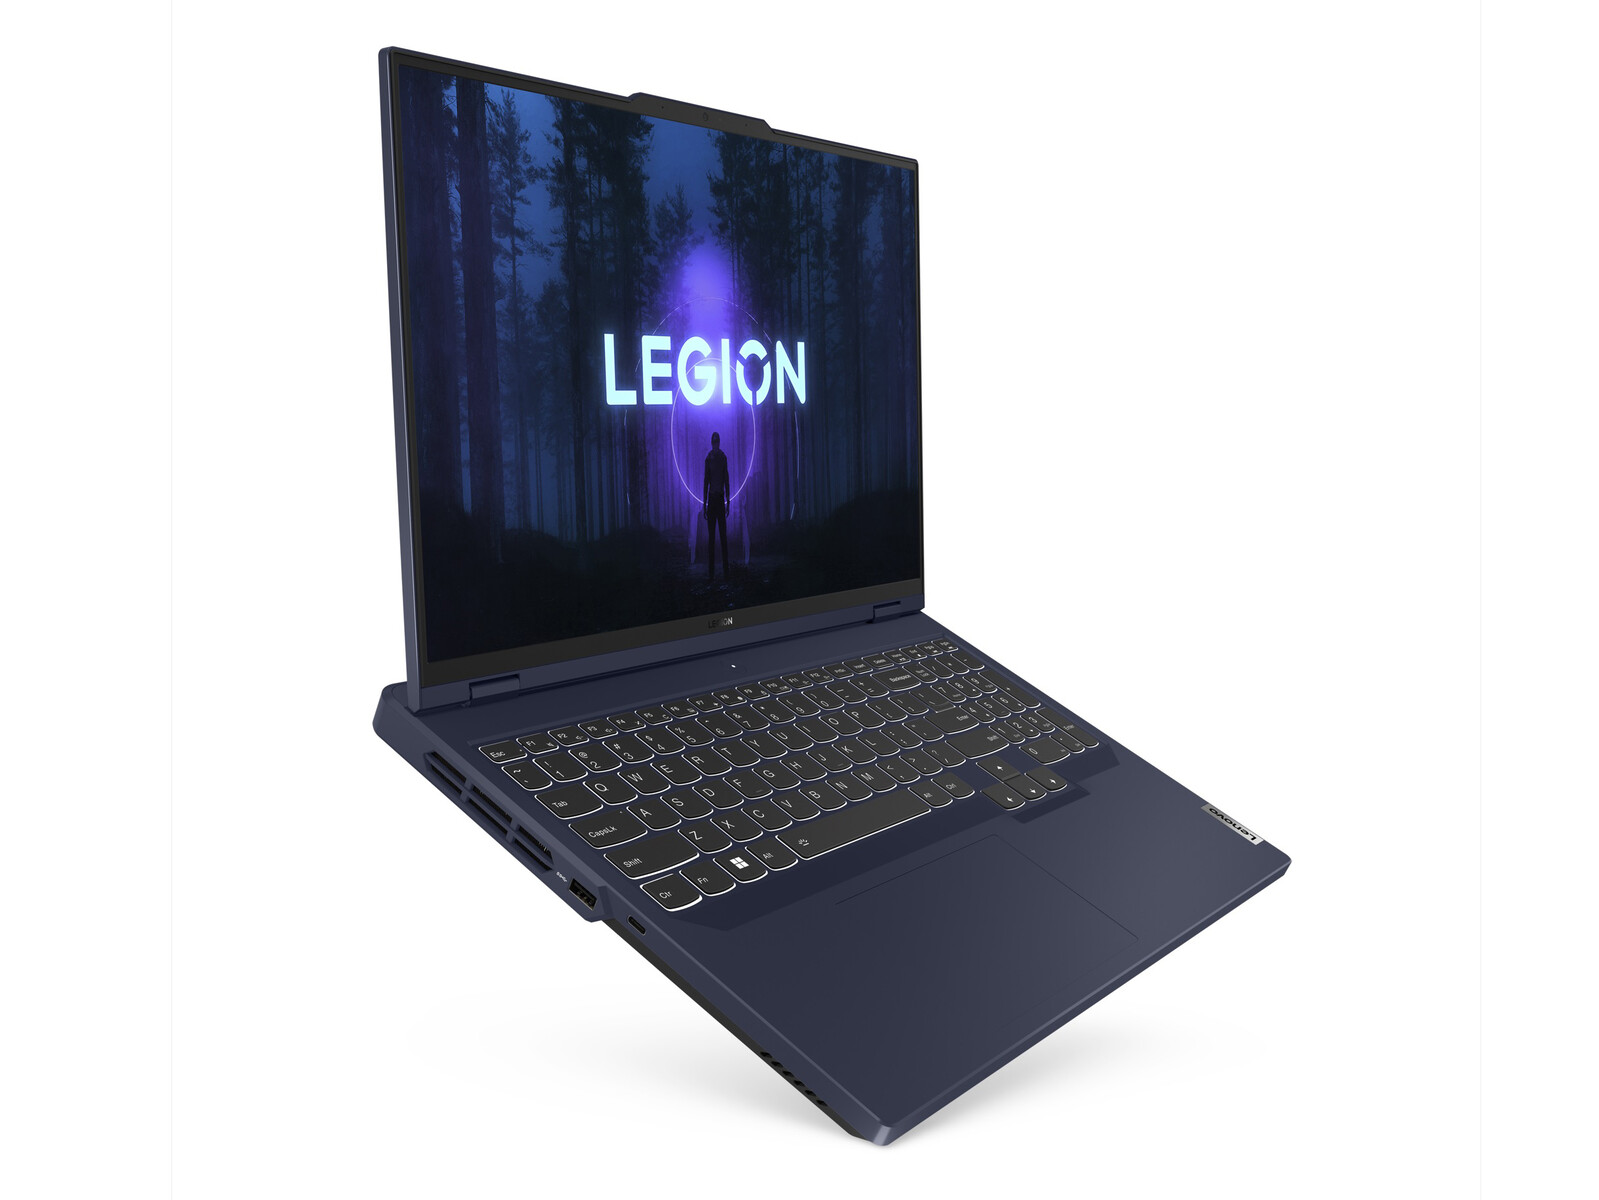
Visualmente, el chasis revisado tiene menos detalles y ángulos para ofrecer un aspecto más plano y profesional que el modelo del año pasado, especialmente en la parte trasera. La combinación de dos tonos de gris y plata ha desaparecido en favor de un aspecto más uniforme. Preferimos el nuevo diseño, ya que se inclina hacia el minimalismo al tiempo que mantiene muchas de las características distintivas de Legion.
La rigidez del chasis es excelente en nuestra unidad, sin crujidos audibles ni puntos terriblemente débiles. La base y la tapa exhiben más torsión que el más rígido Blade 16pero no lo suficiente como para ser motivo de gran preocupación.
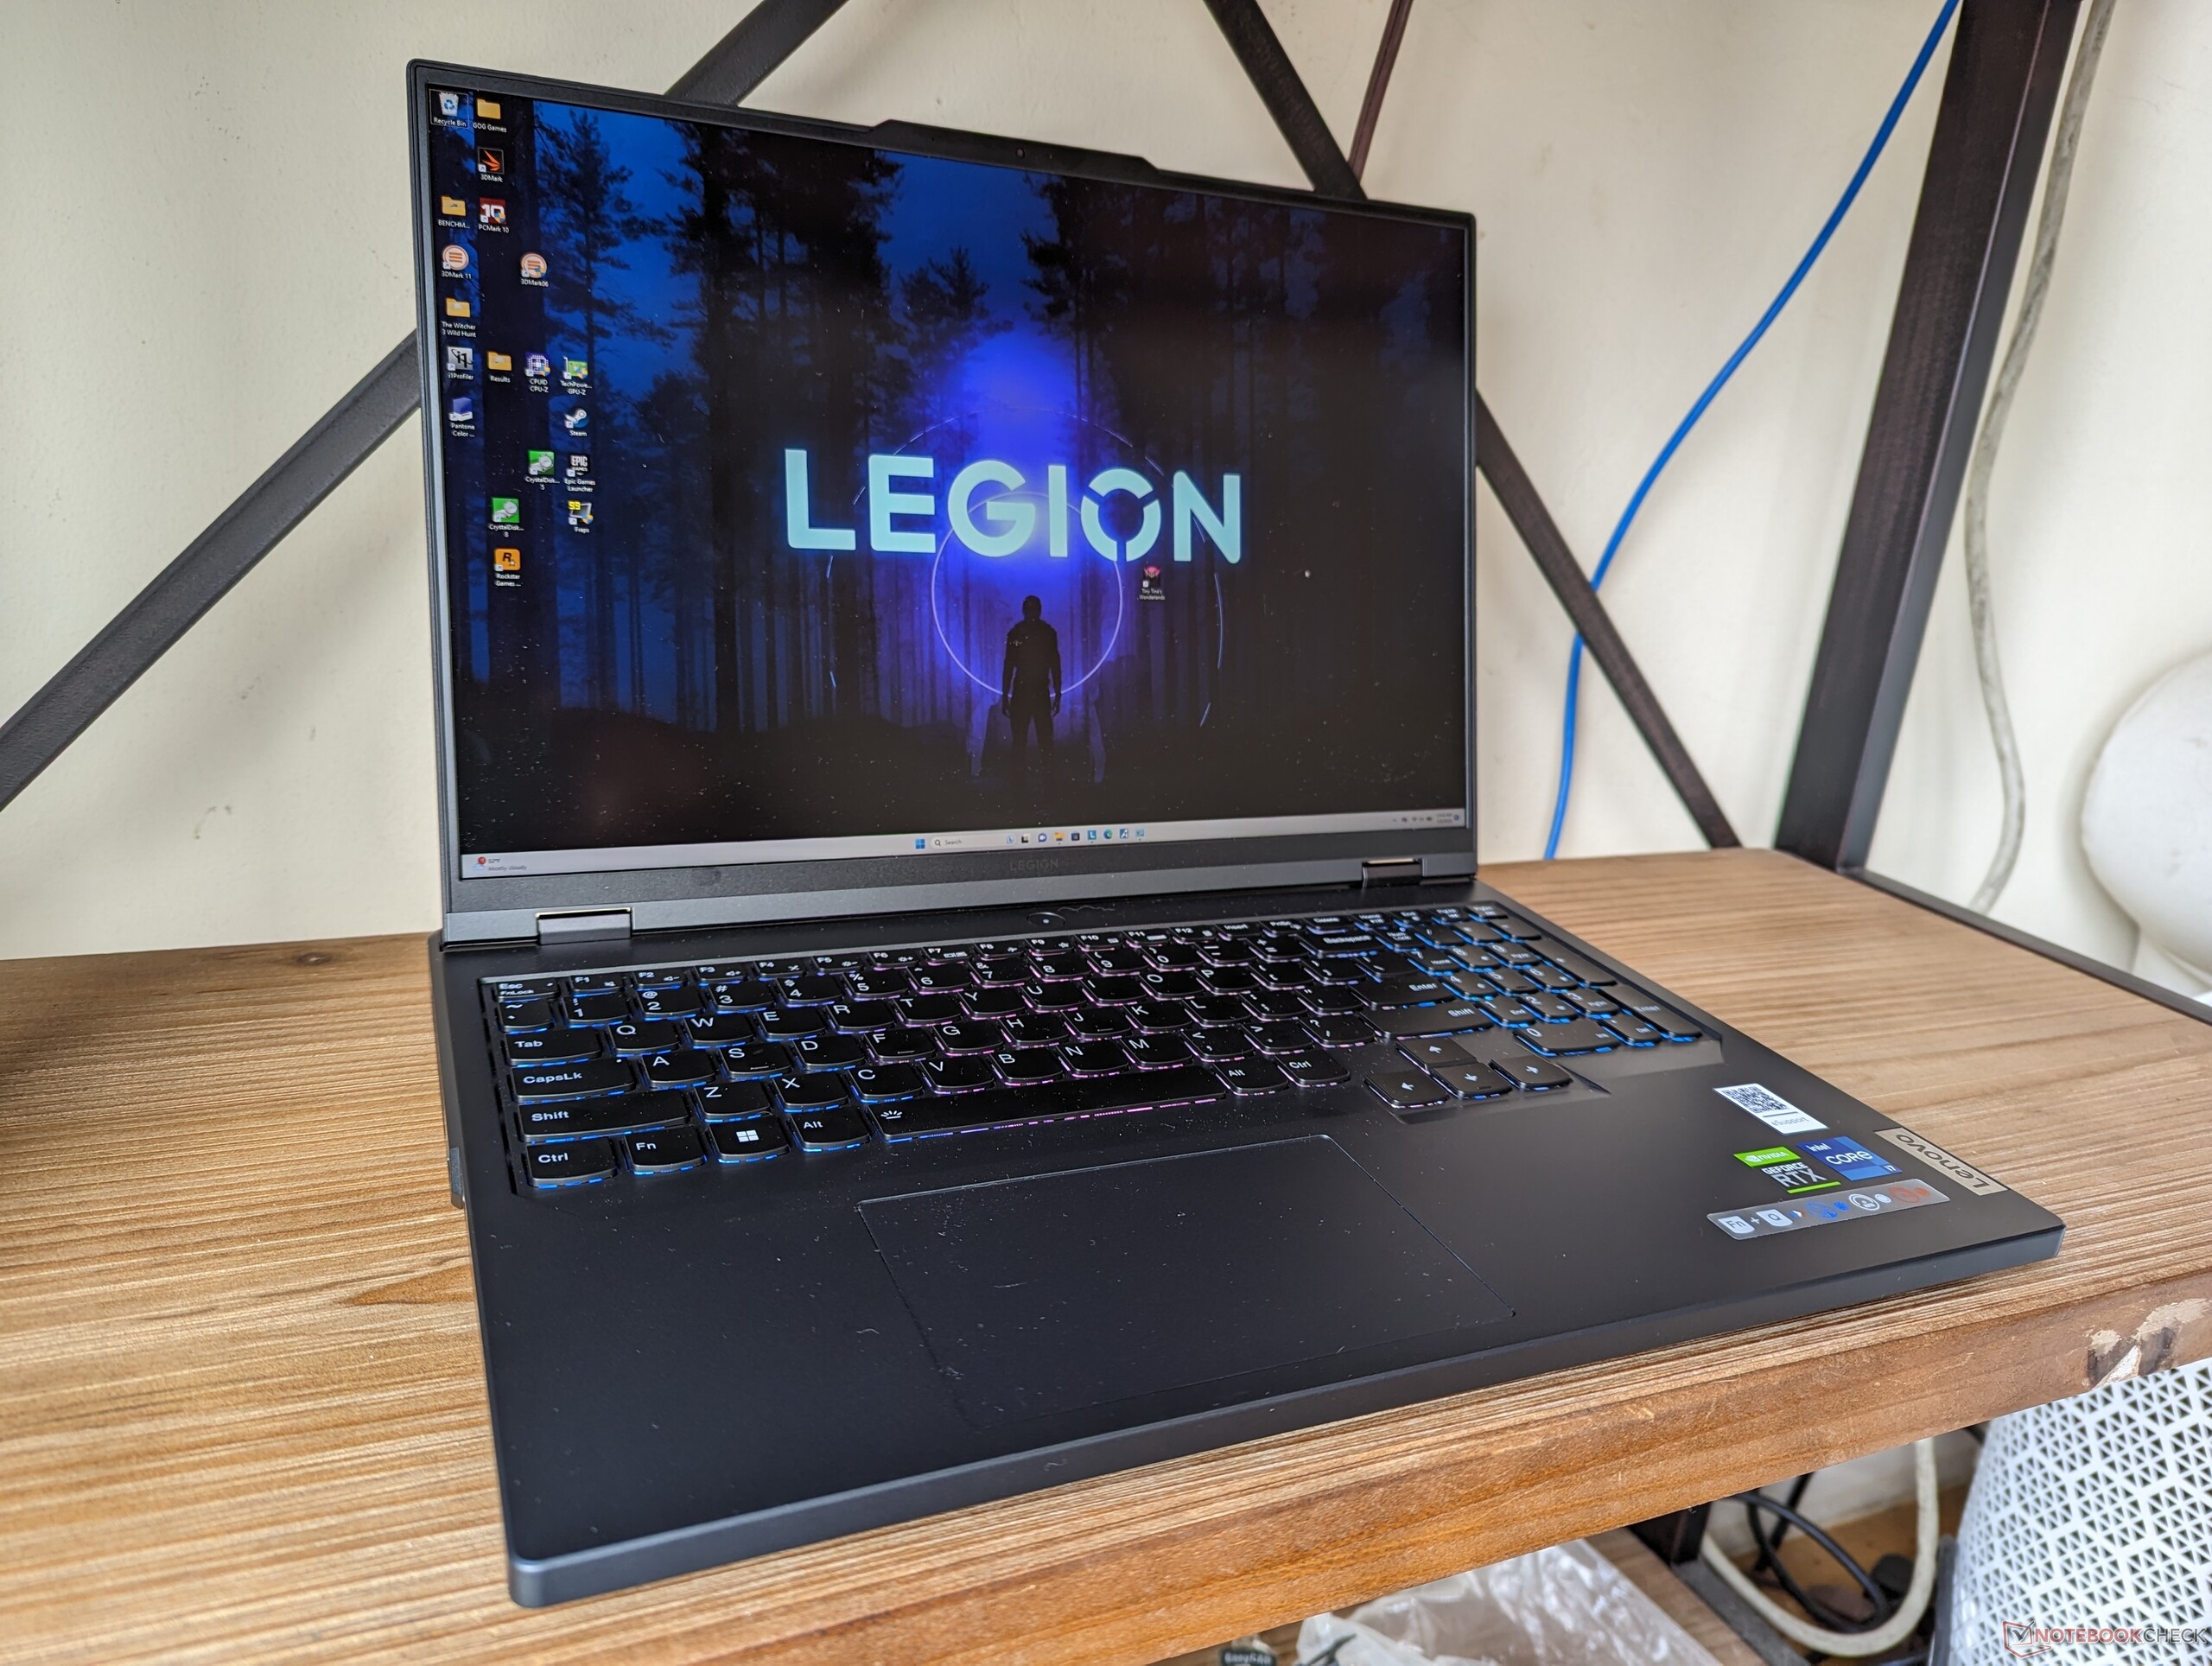
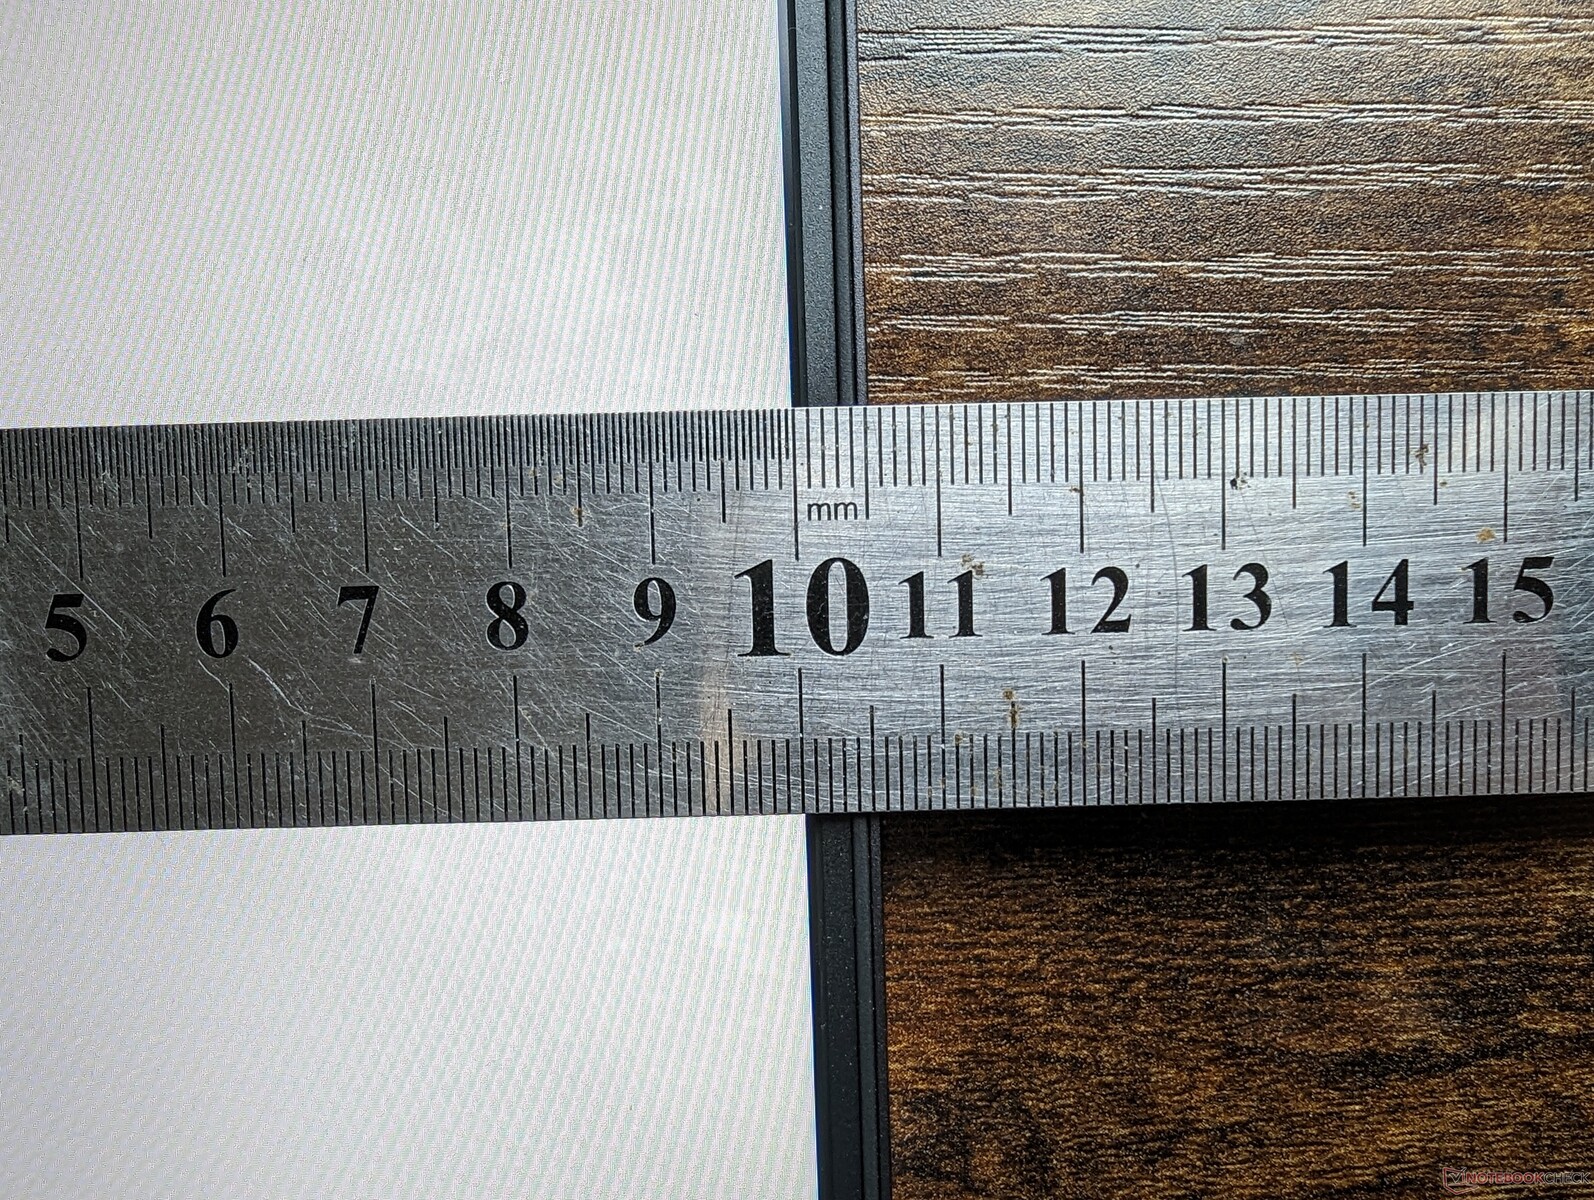
La Legion Pro 5 16 es notablemente más grande y pesada que muchas de sus compañeras. Aero 16, Blade 16 y Zephyrus M16 son todos más delgados y ligeros que el Lenovo en hasta 8 mm o 400 gramos, lo que no es insignificante. Aunque no es ni mucho menos tan voluminoso como muchos portátiles para juegos de 17,3 pulgadas, el Legion Pro 5 16 tampoco es exactamente la opción más cómoda para viajar en su categoría de tamaño de 16 pulgadas.
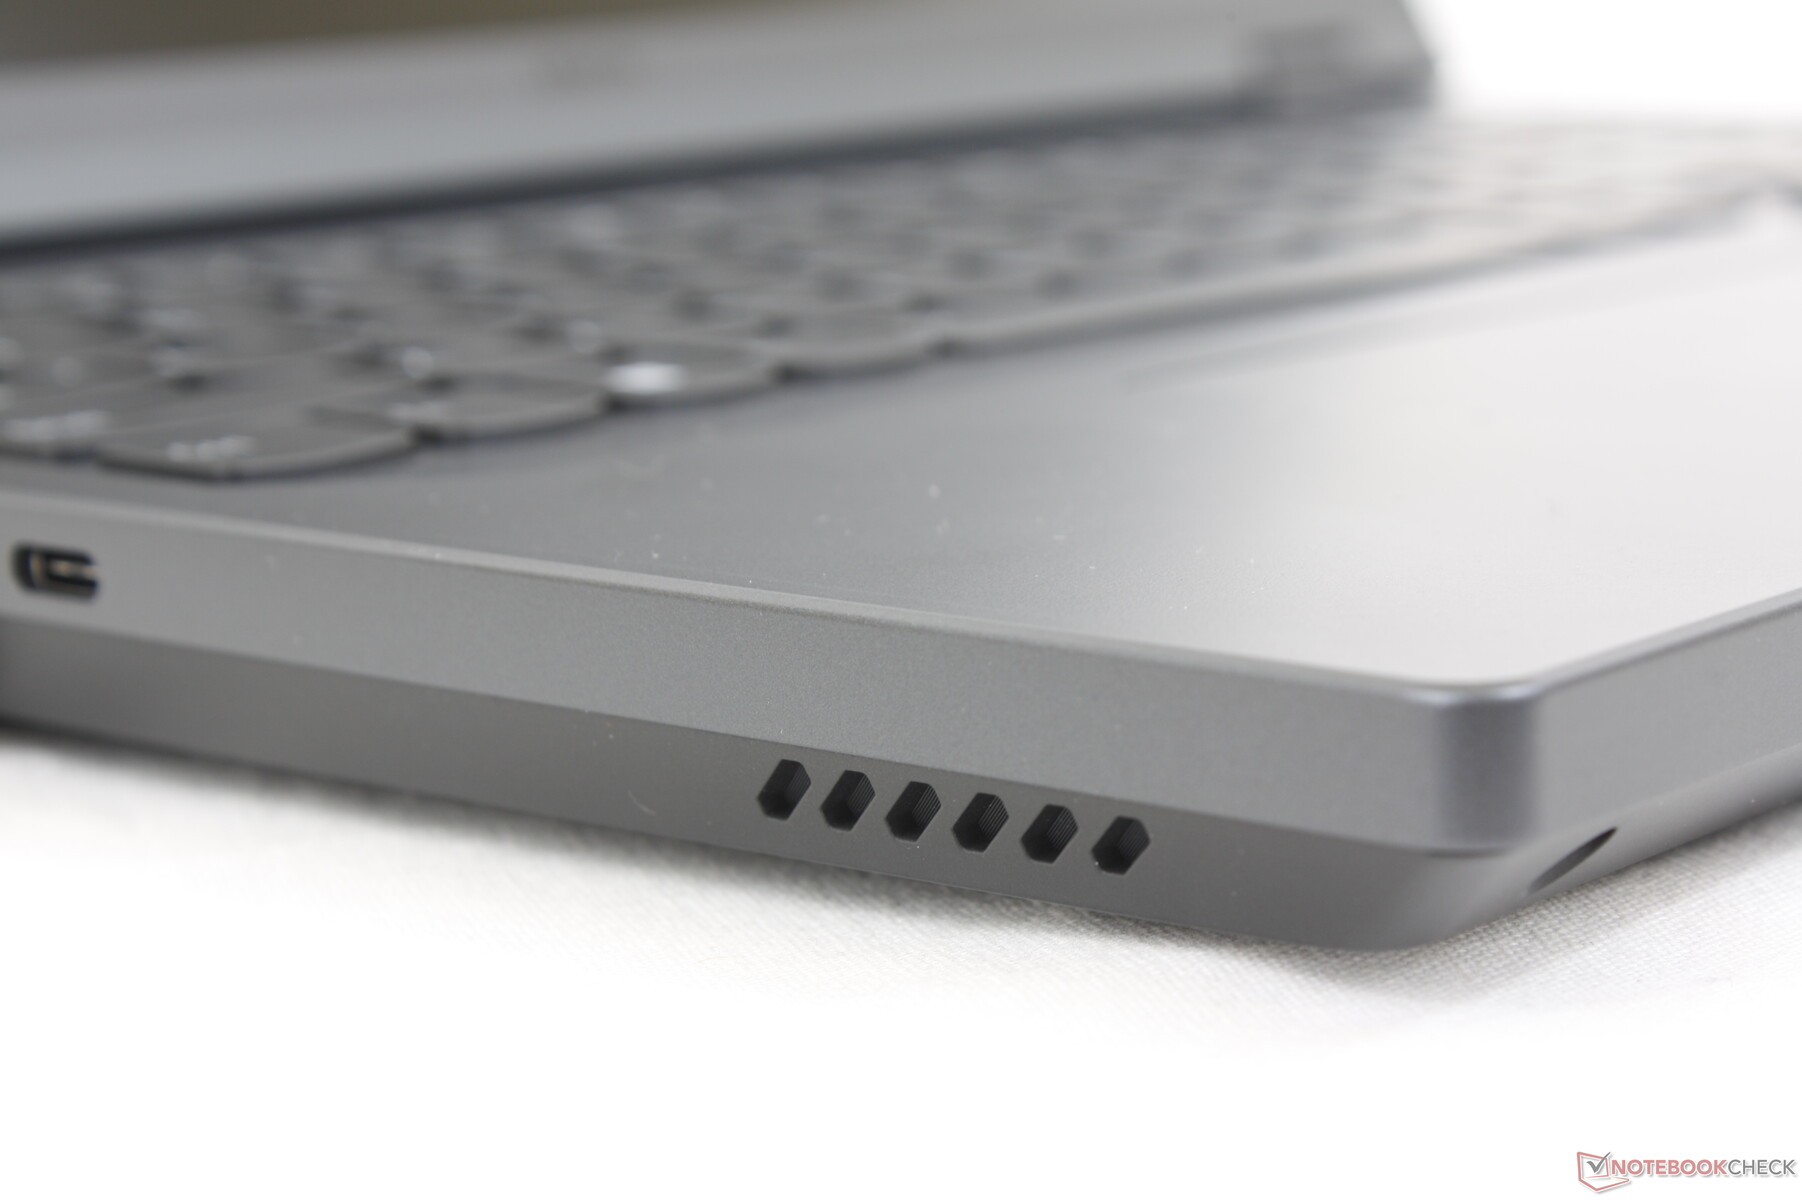
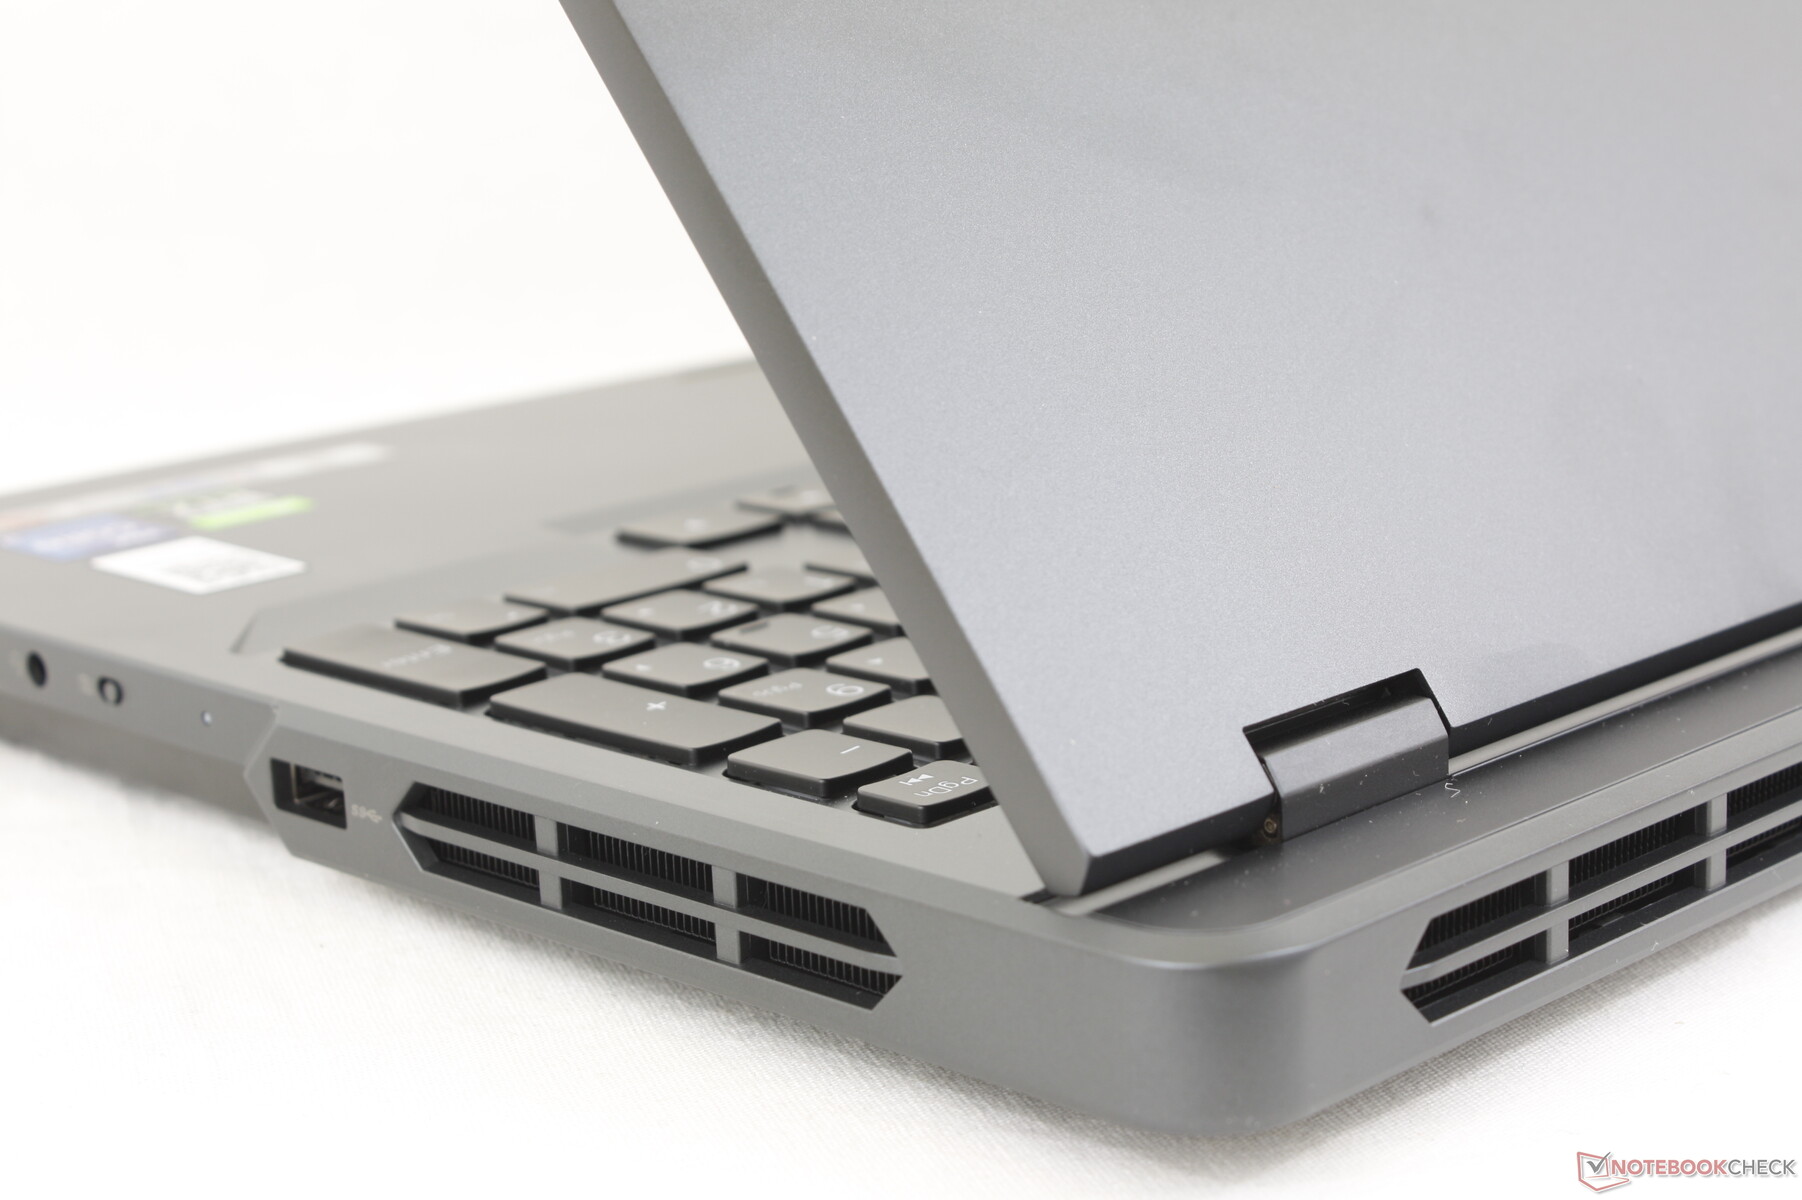
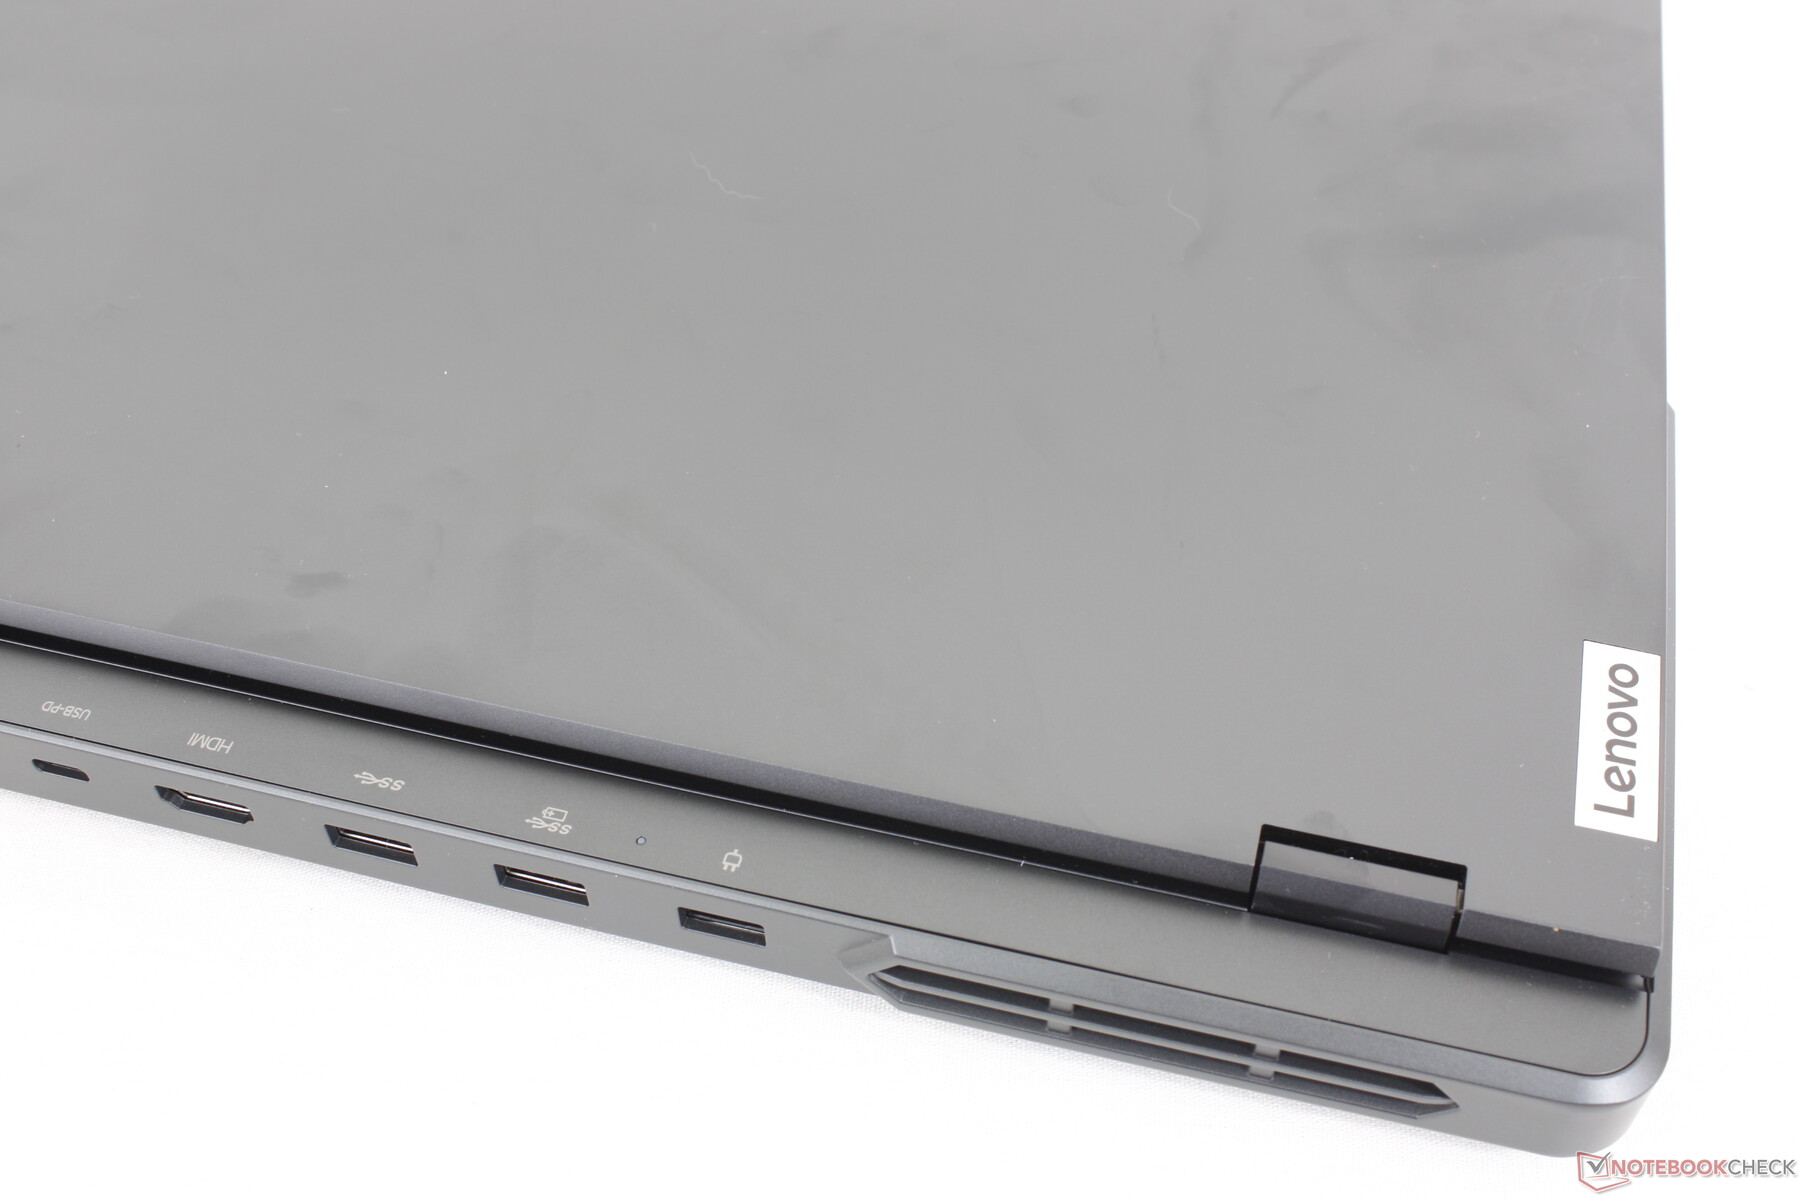
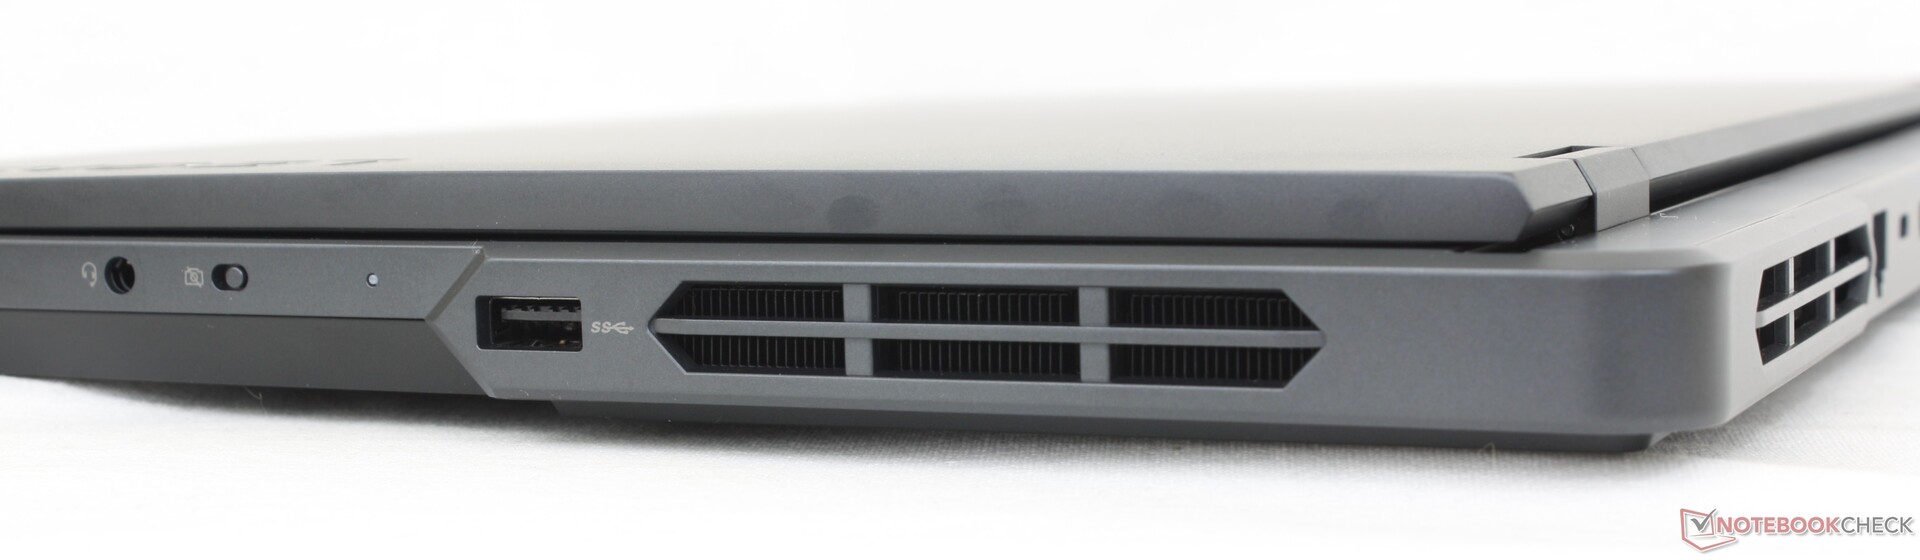
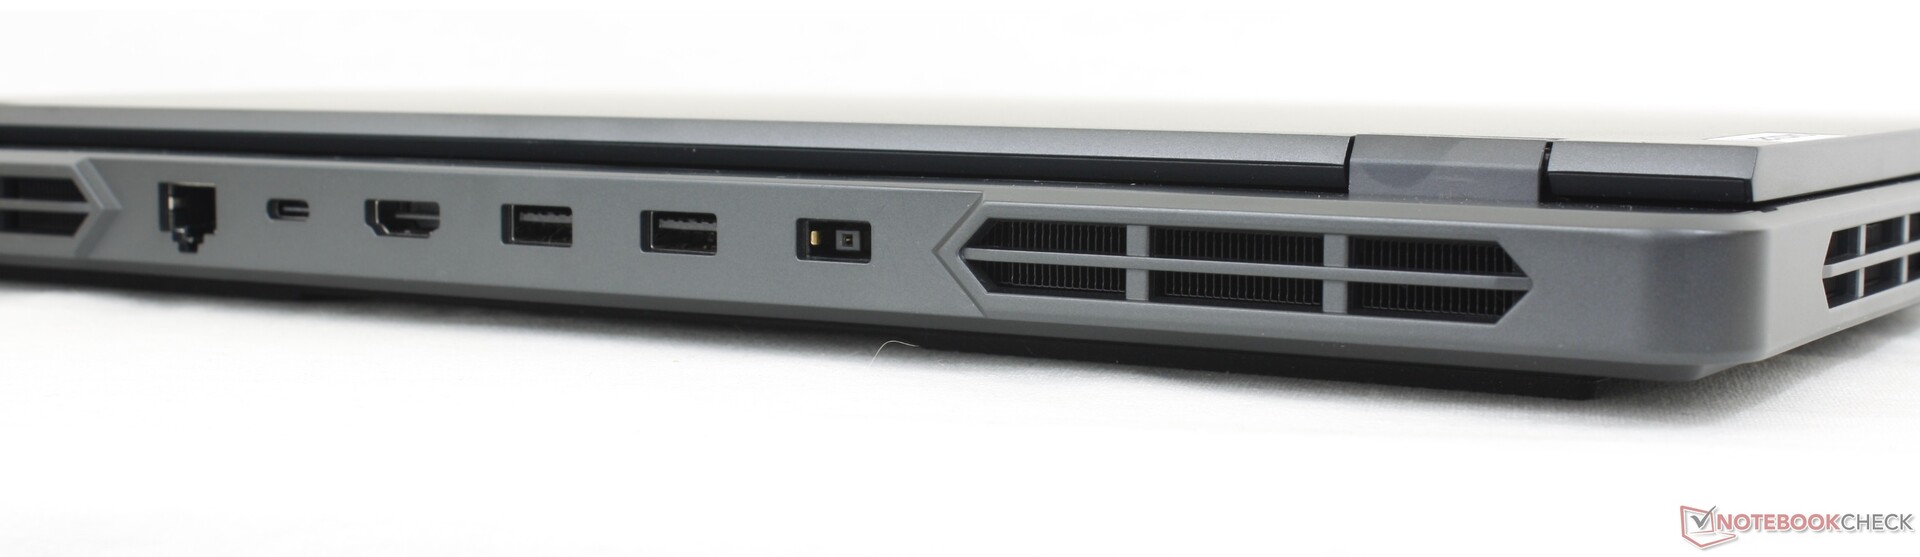
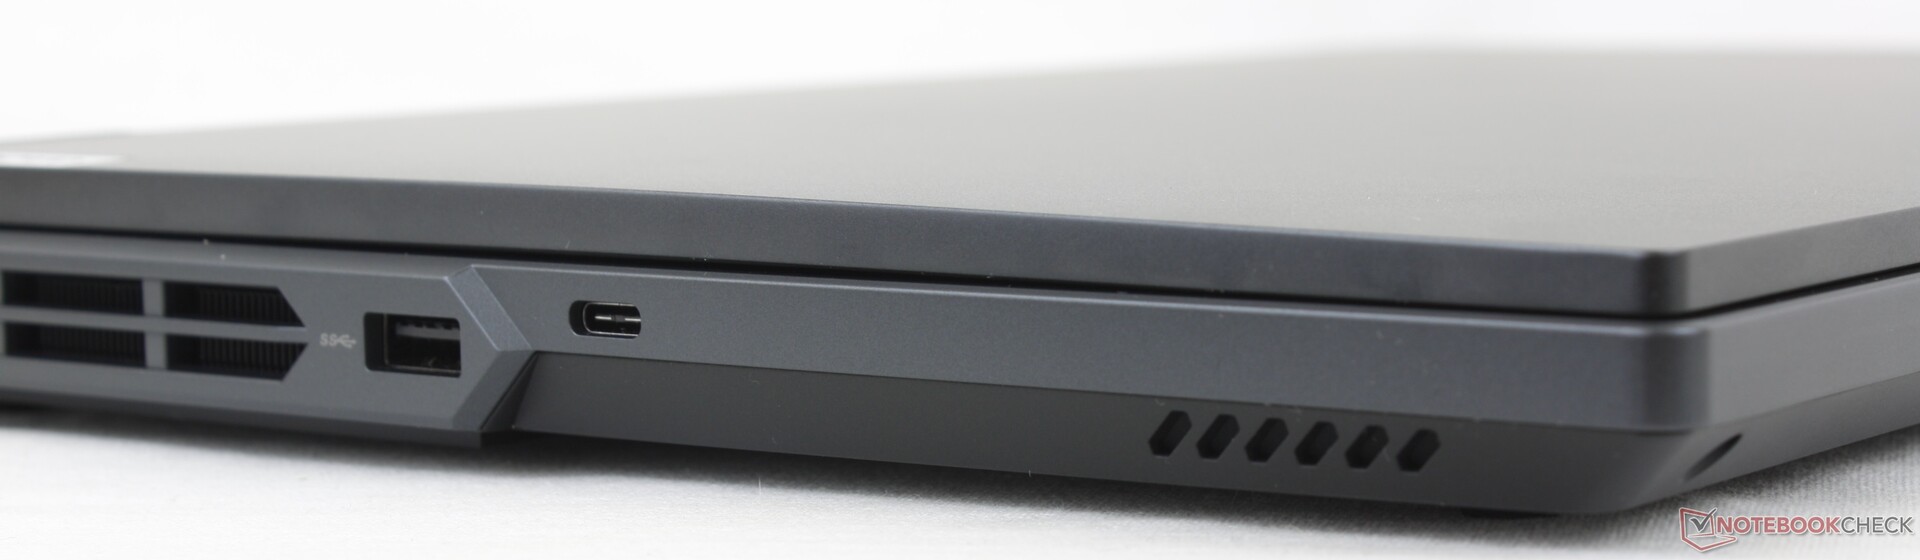
Conectividad: muchos puertos pero sin Thunderbolt
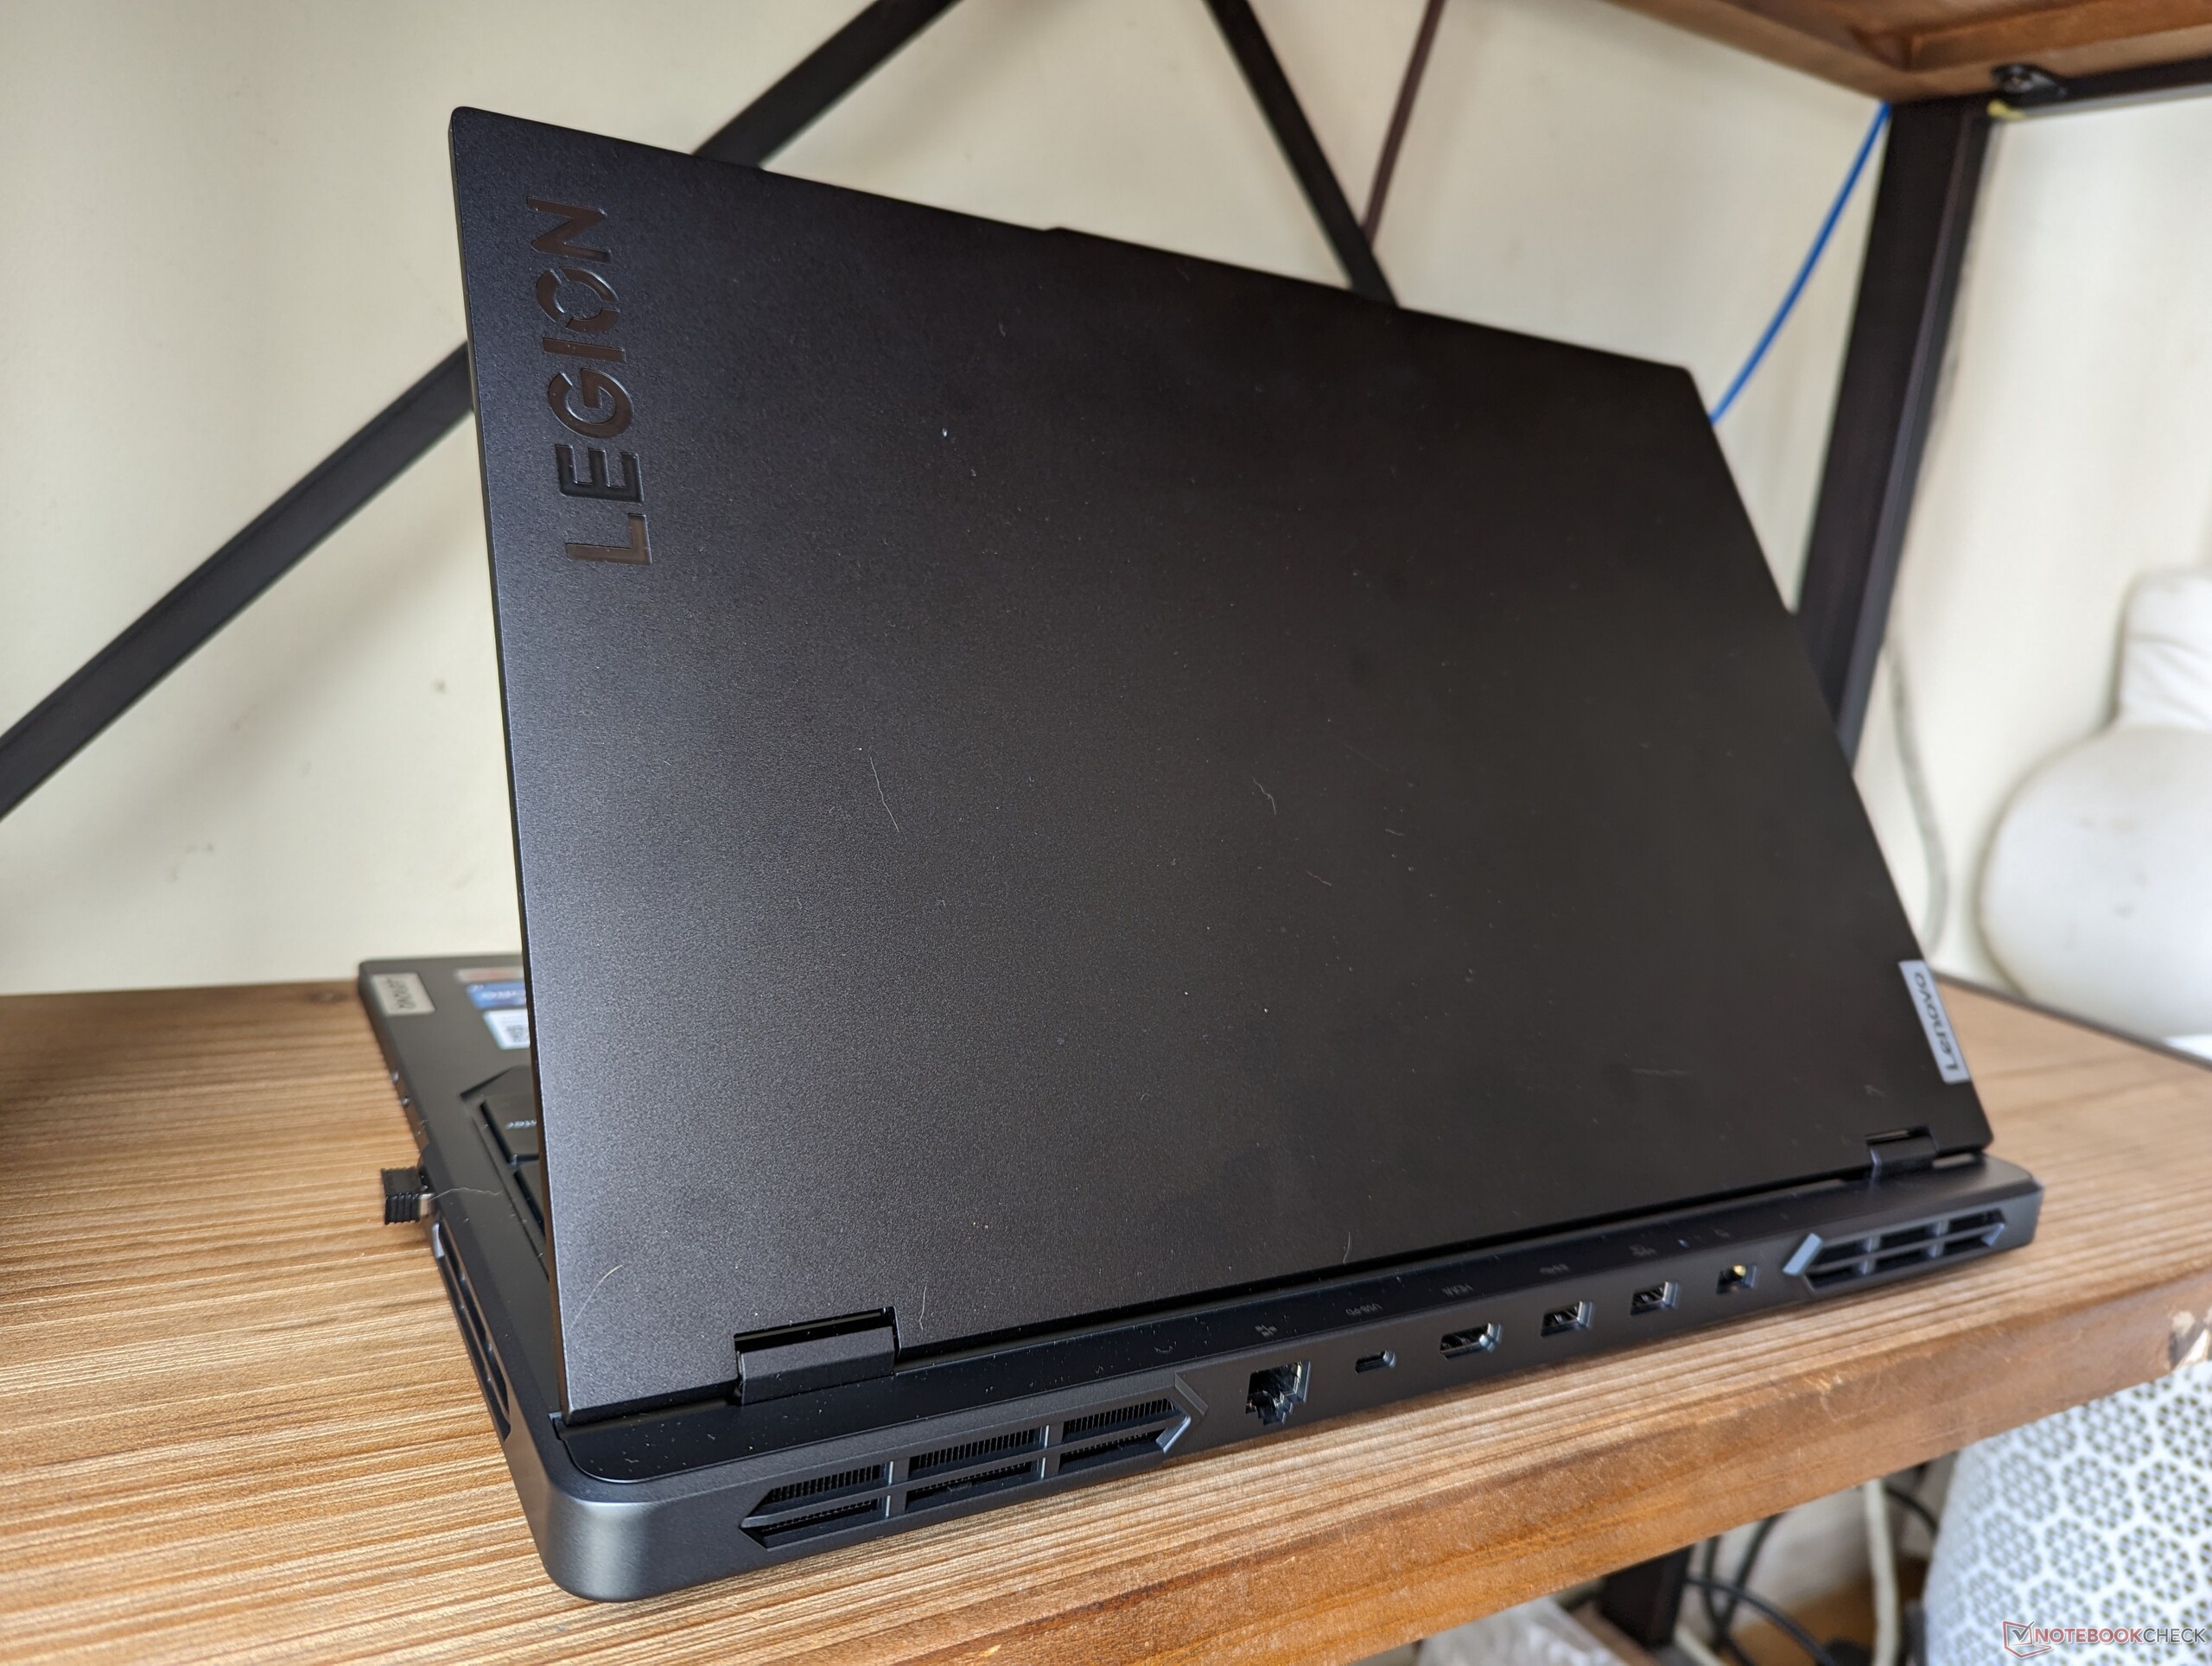
Hay una buena selección de puertos, la mayoría de ellos situados en la parte trasera. De hecho, el modelo comparte exactamente los mismos puertos y la misma posición que en el modelo de gama altaLegion Pro 7 16IRX8H a pesar de que ambos modelos son visualmente diferentes.
Nótese que el modelo no soporta Thunderbolt. Al menos viene con un puerto RJ-45 a diferencia del Blade 16.
Los puertos traseros están etiquetados con iconos visibles desde la parte superior del chasis como se muestra en la imagen de arriba. Los iconos facilitan la conexión de cables a diferencia de los puertos traseros del Alienware m18, pero desafortunadamente no se iluminan.
Comunicación
Un Intel AX211 viene de serie para la conectividad Wi-Fi 6E y Bluetooth 5.2. Experimentamos velocidades de transferencia estables y ningún problema al emparejarlo con nuestra red Asus AXE11000 de 6 GHz.
Cámara web
La webcam de 1080p o 2 MP se ha convertido en un estándar en los portátiles para juegos. En nuestro Lenovo, sin embargo, los ajustes automáticos de brillo se producían más lentamente de lo habitual, lo que resultaba en una imagen más oscura.
Hay un obturador electrónico de la webcam para controlar la privacidad, pero no hay sensor IR.


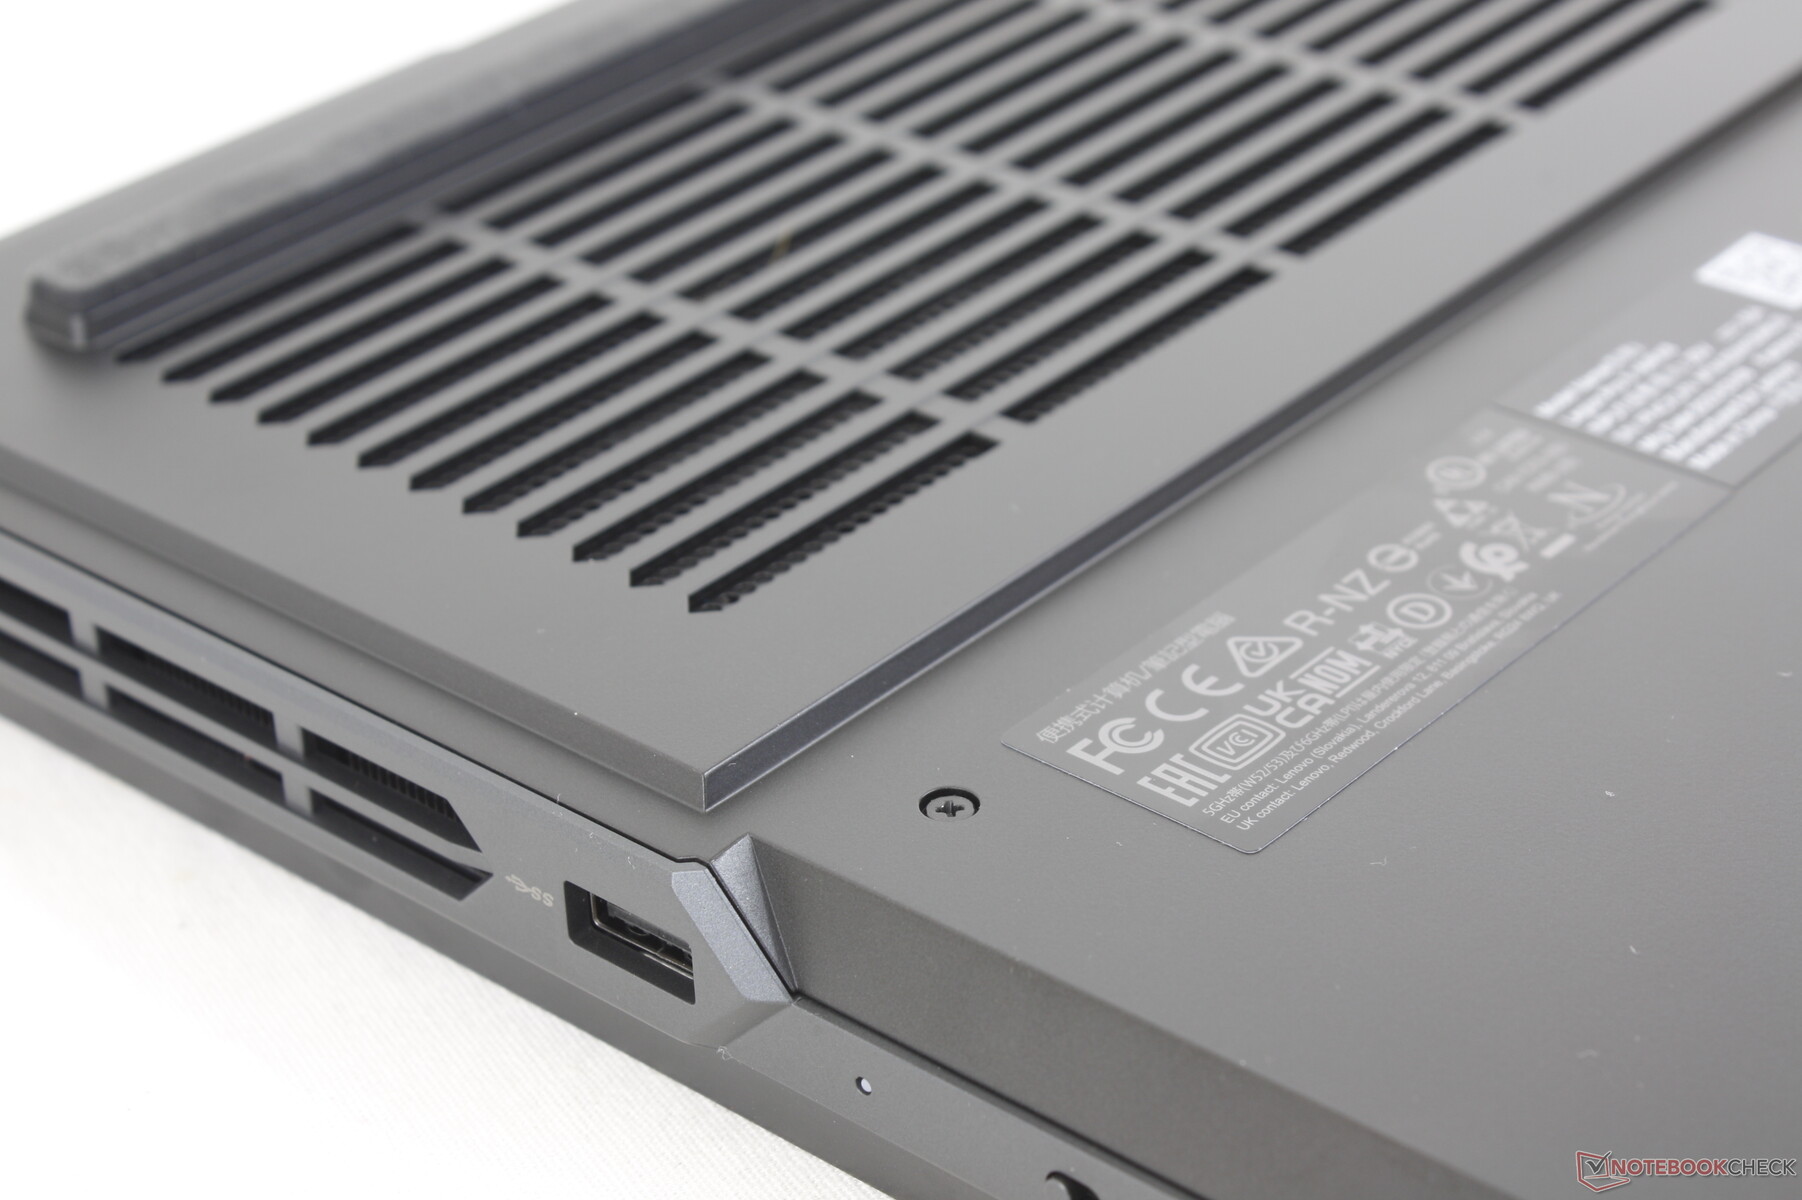
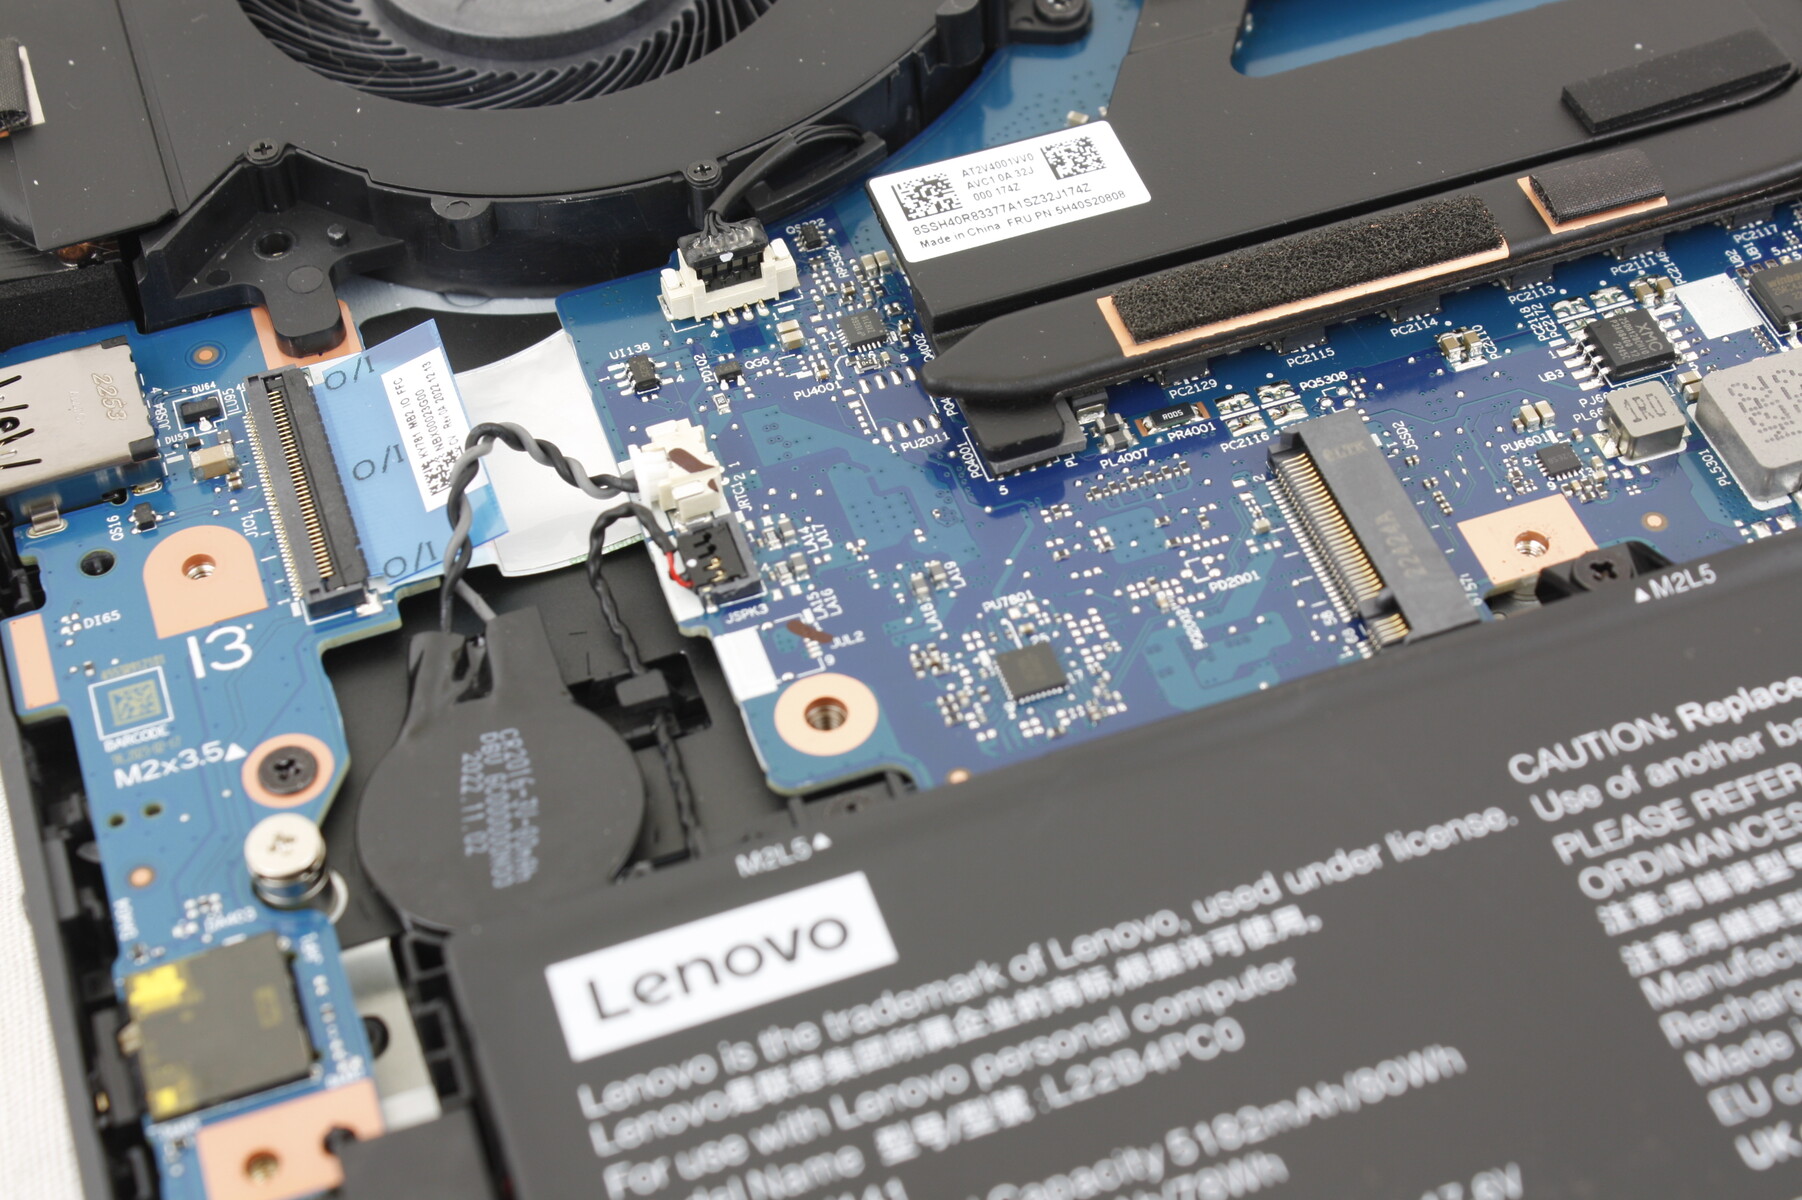
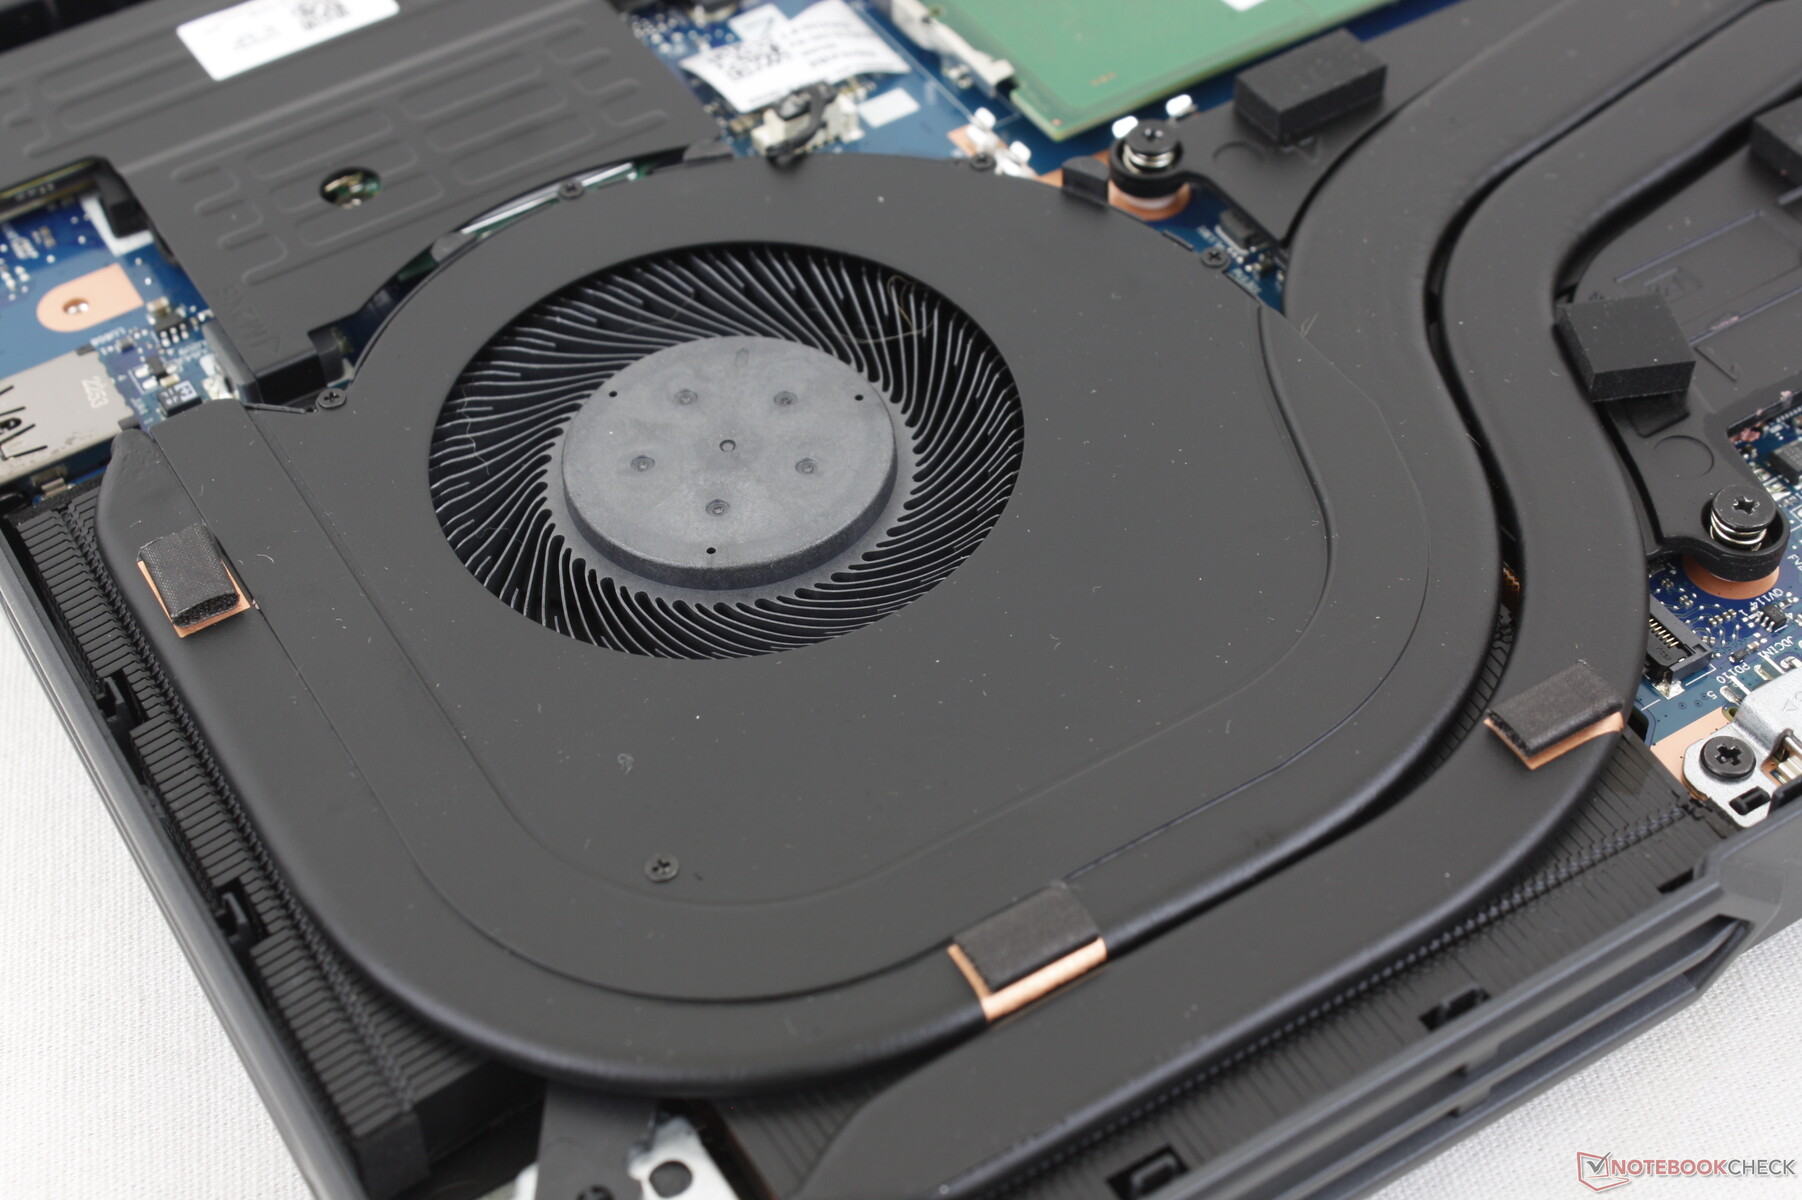
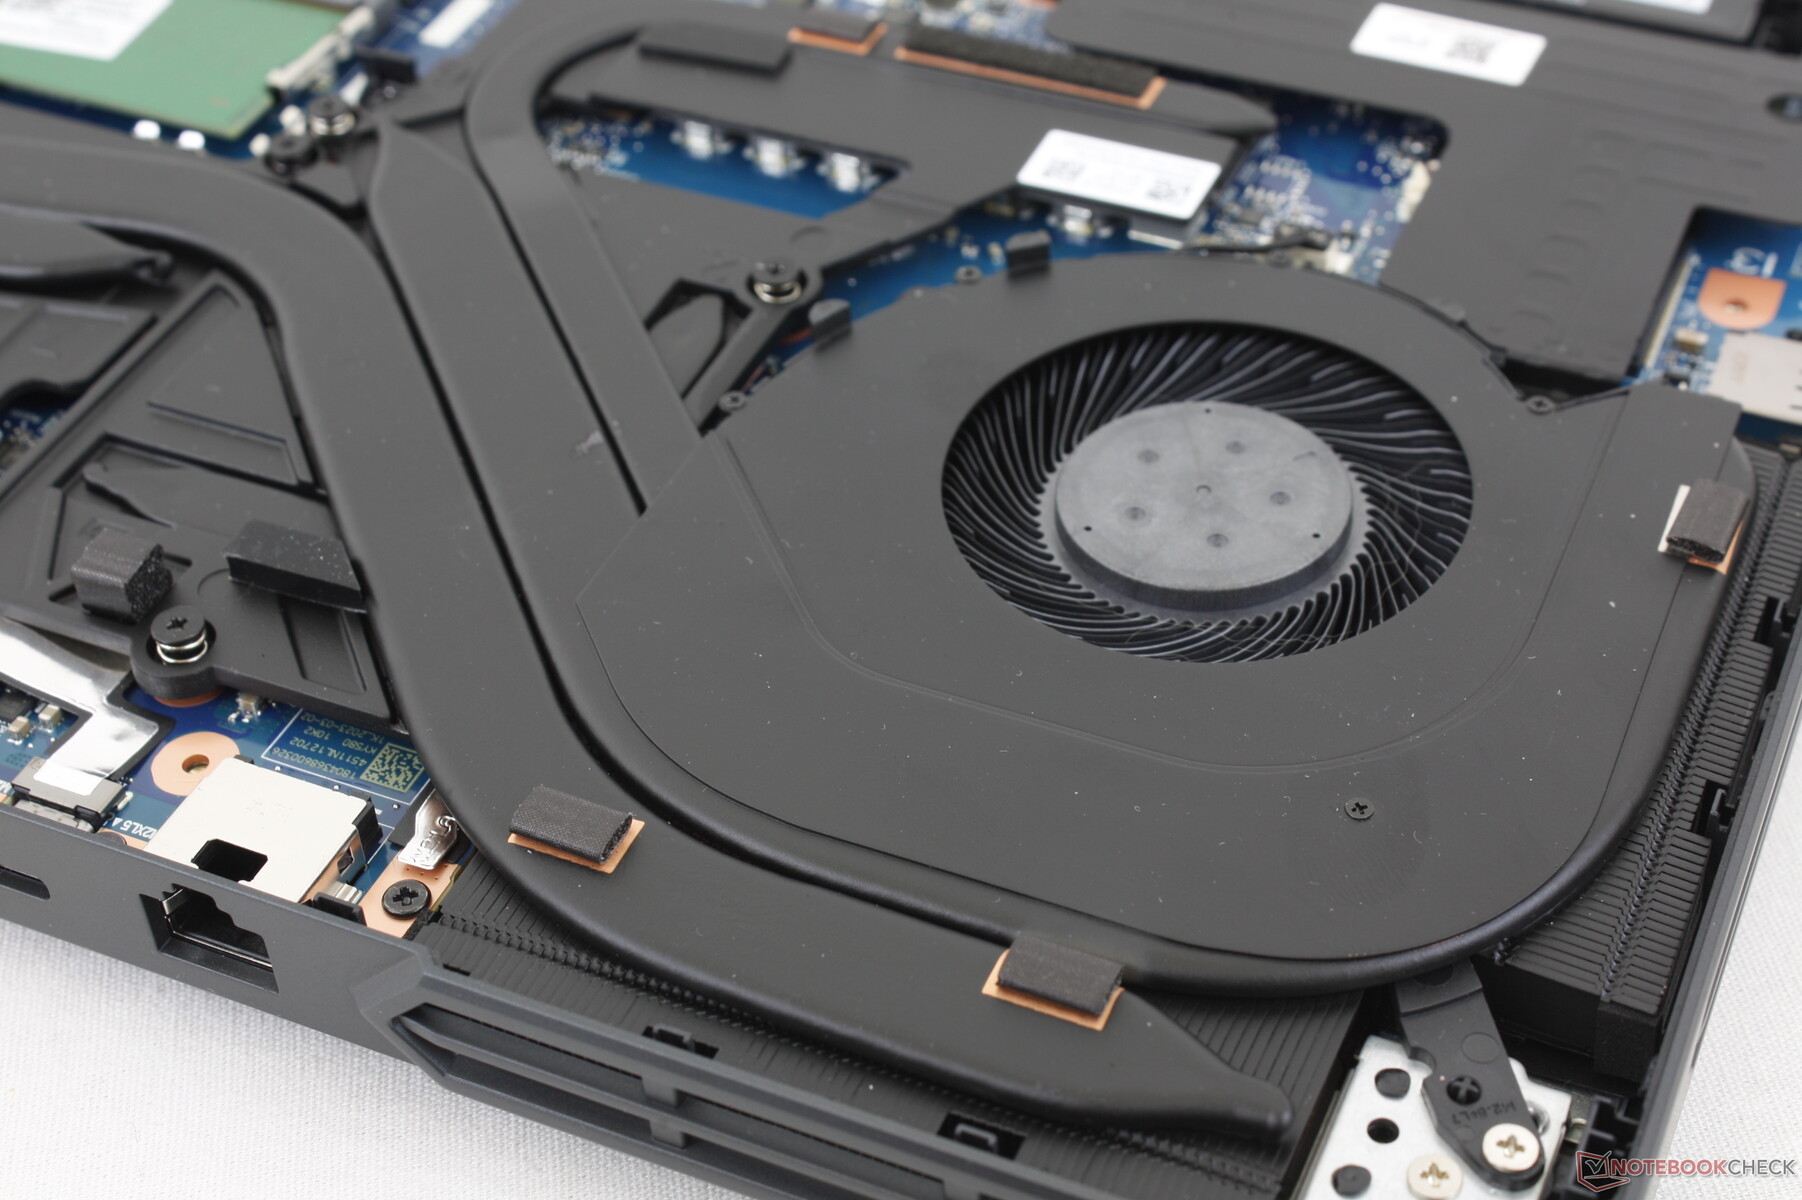
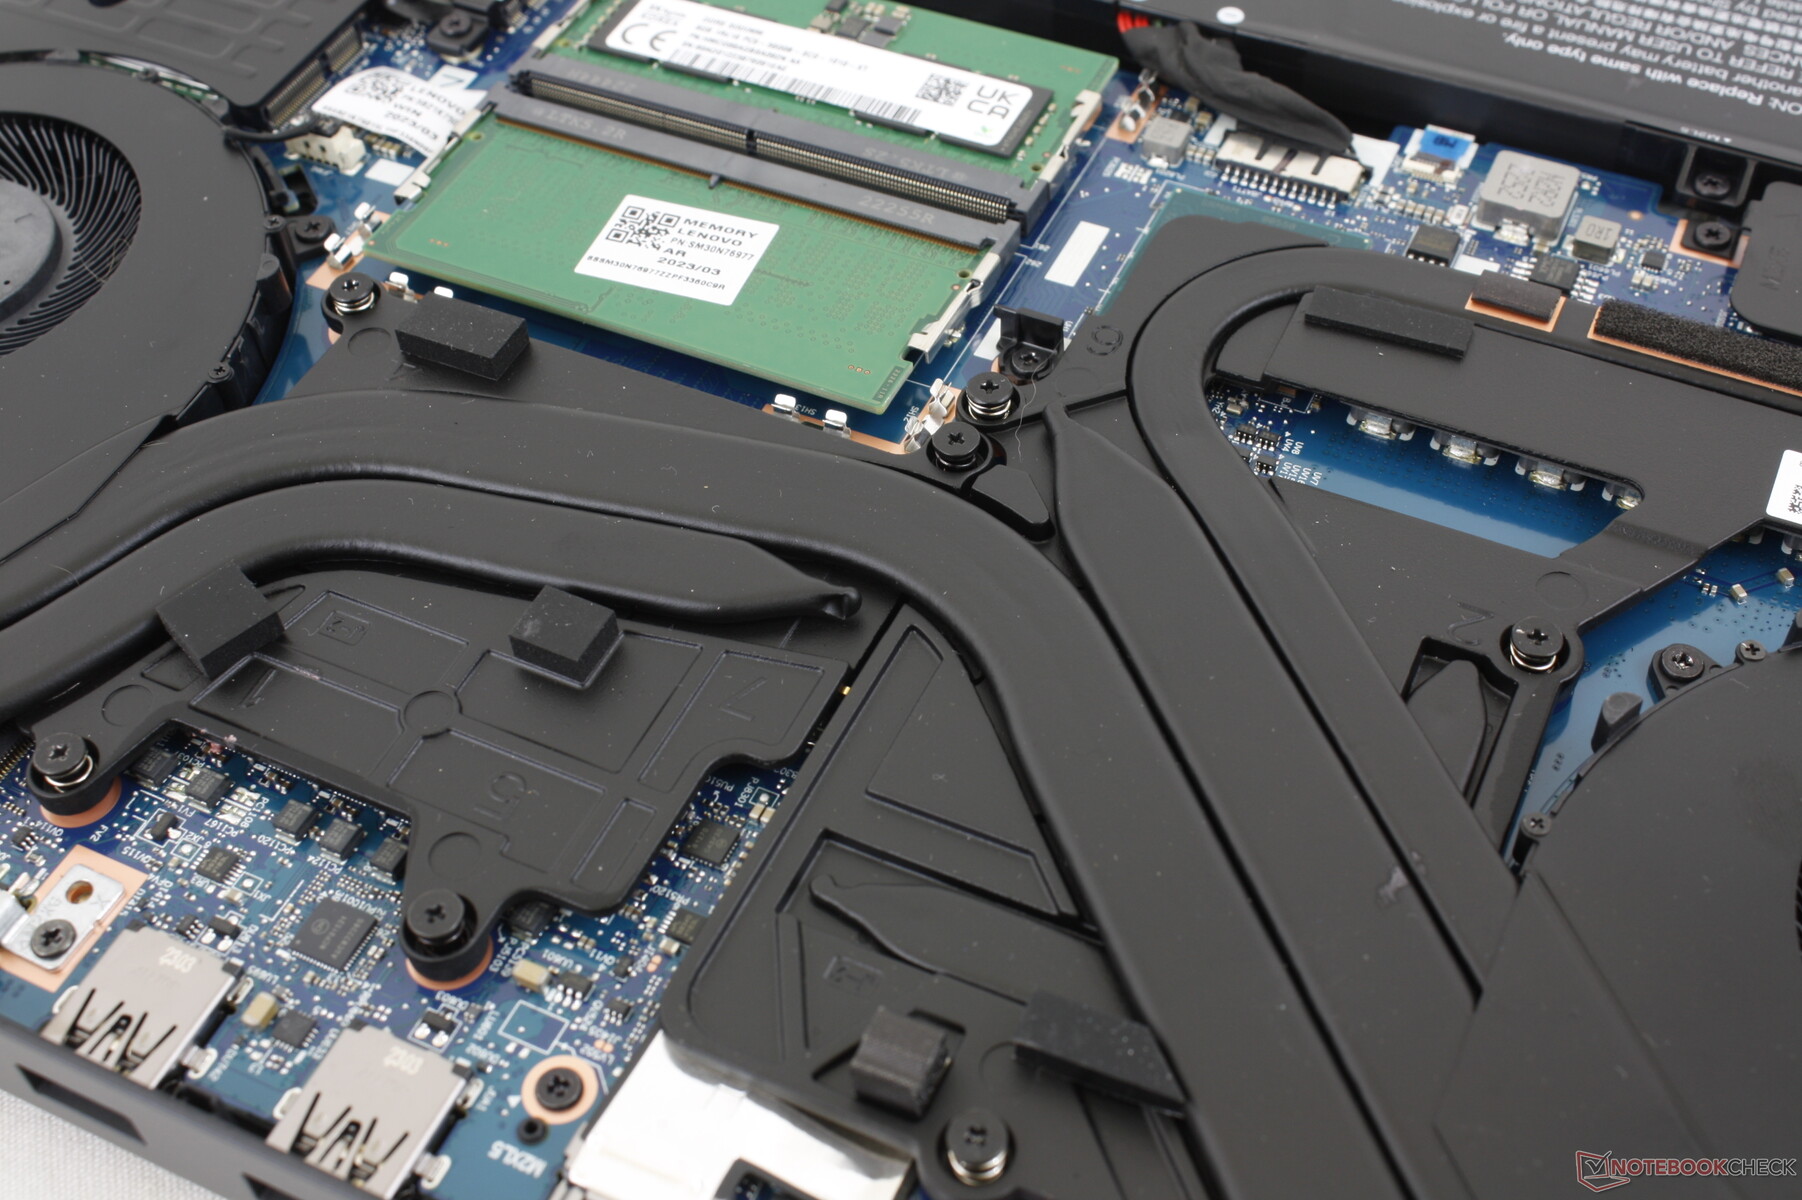
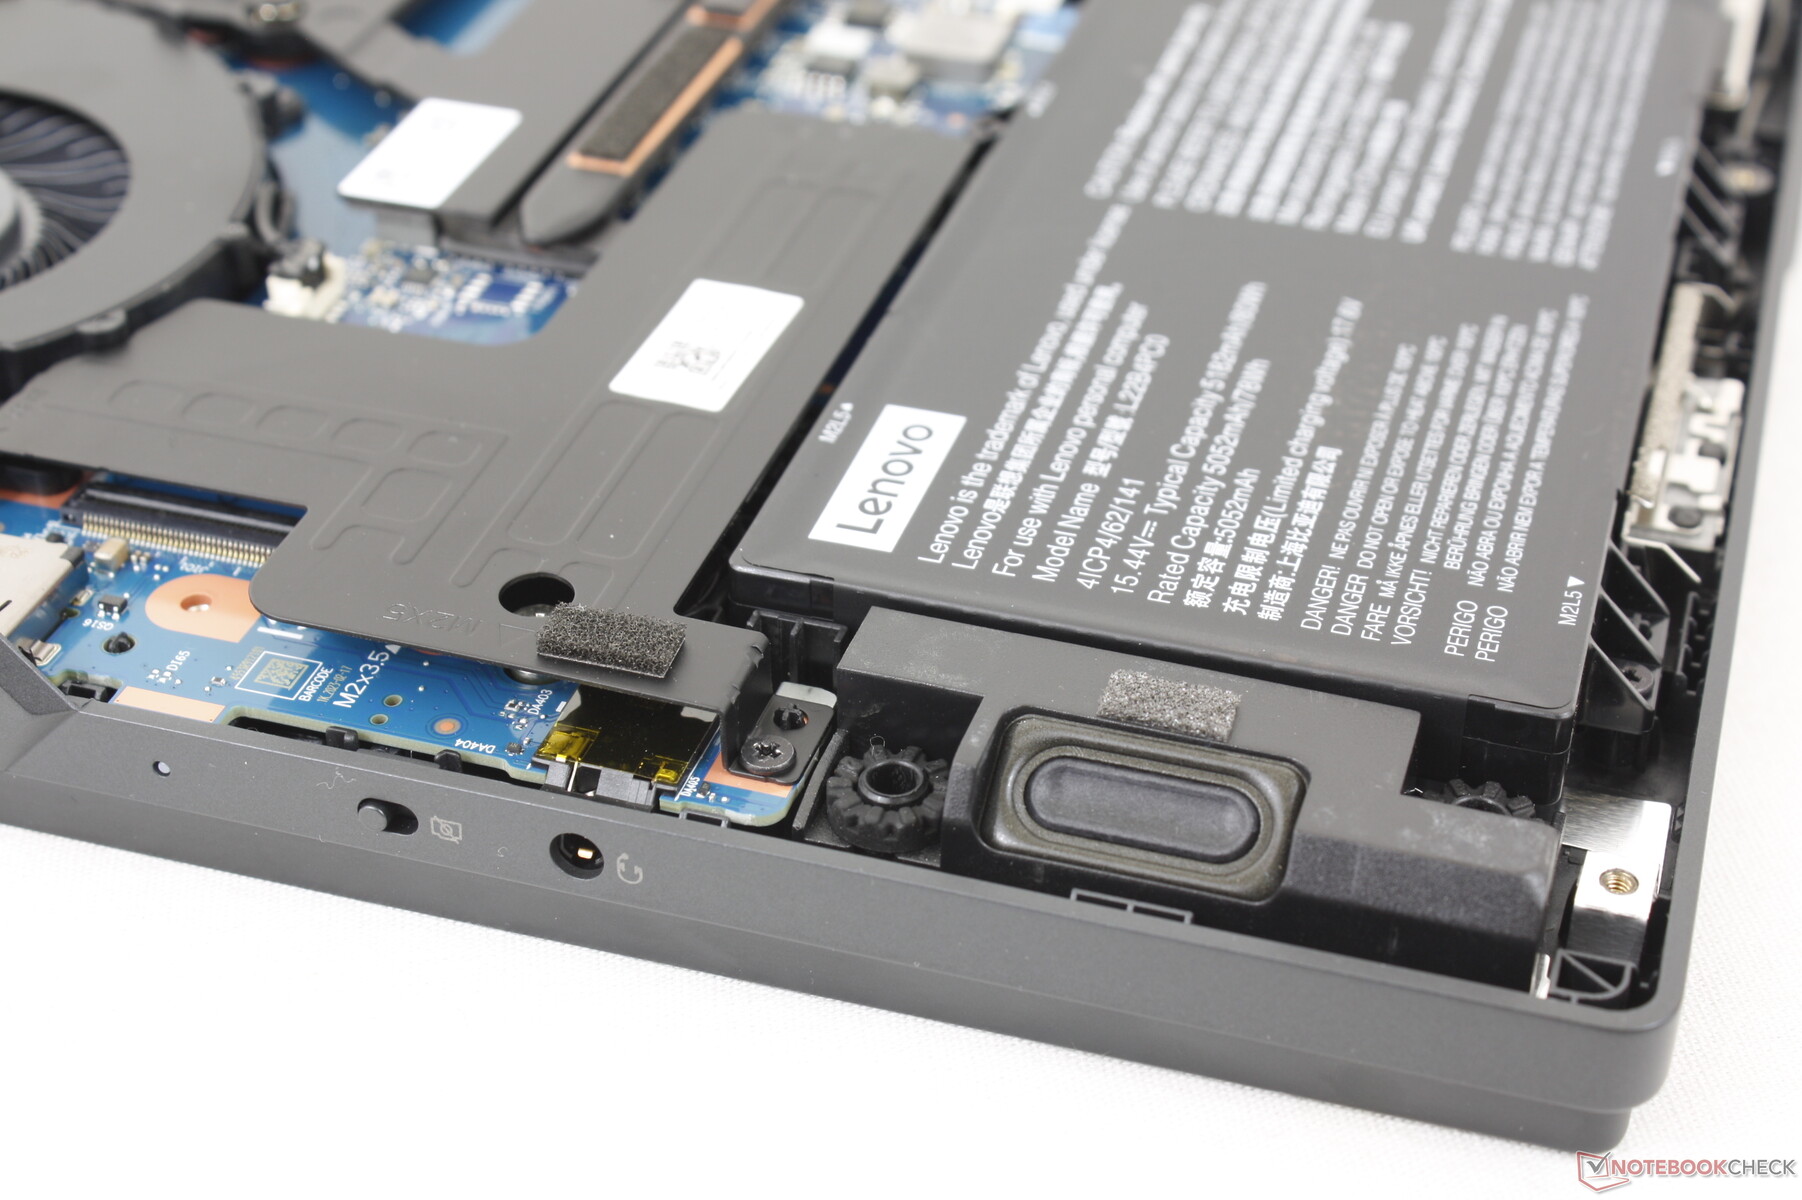
Mantenimiento
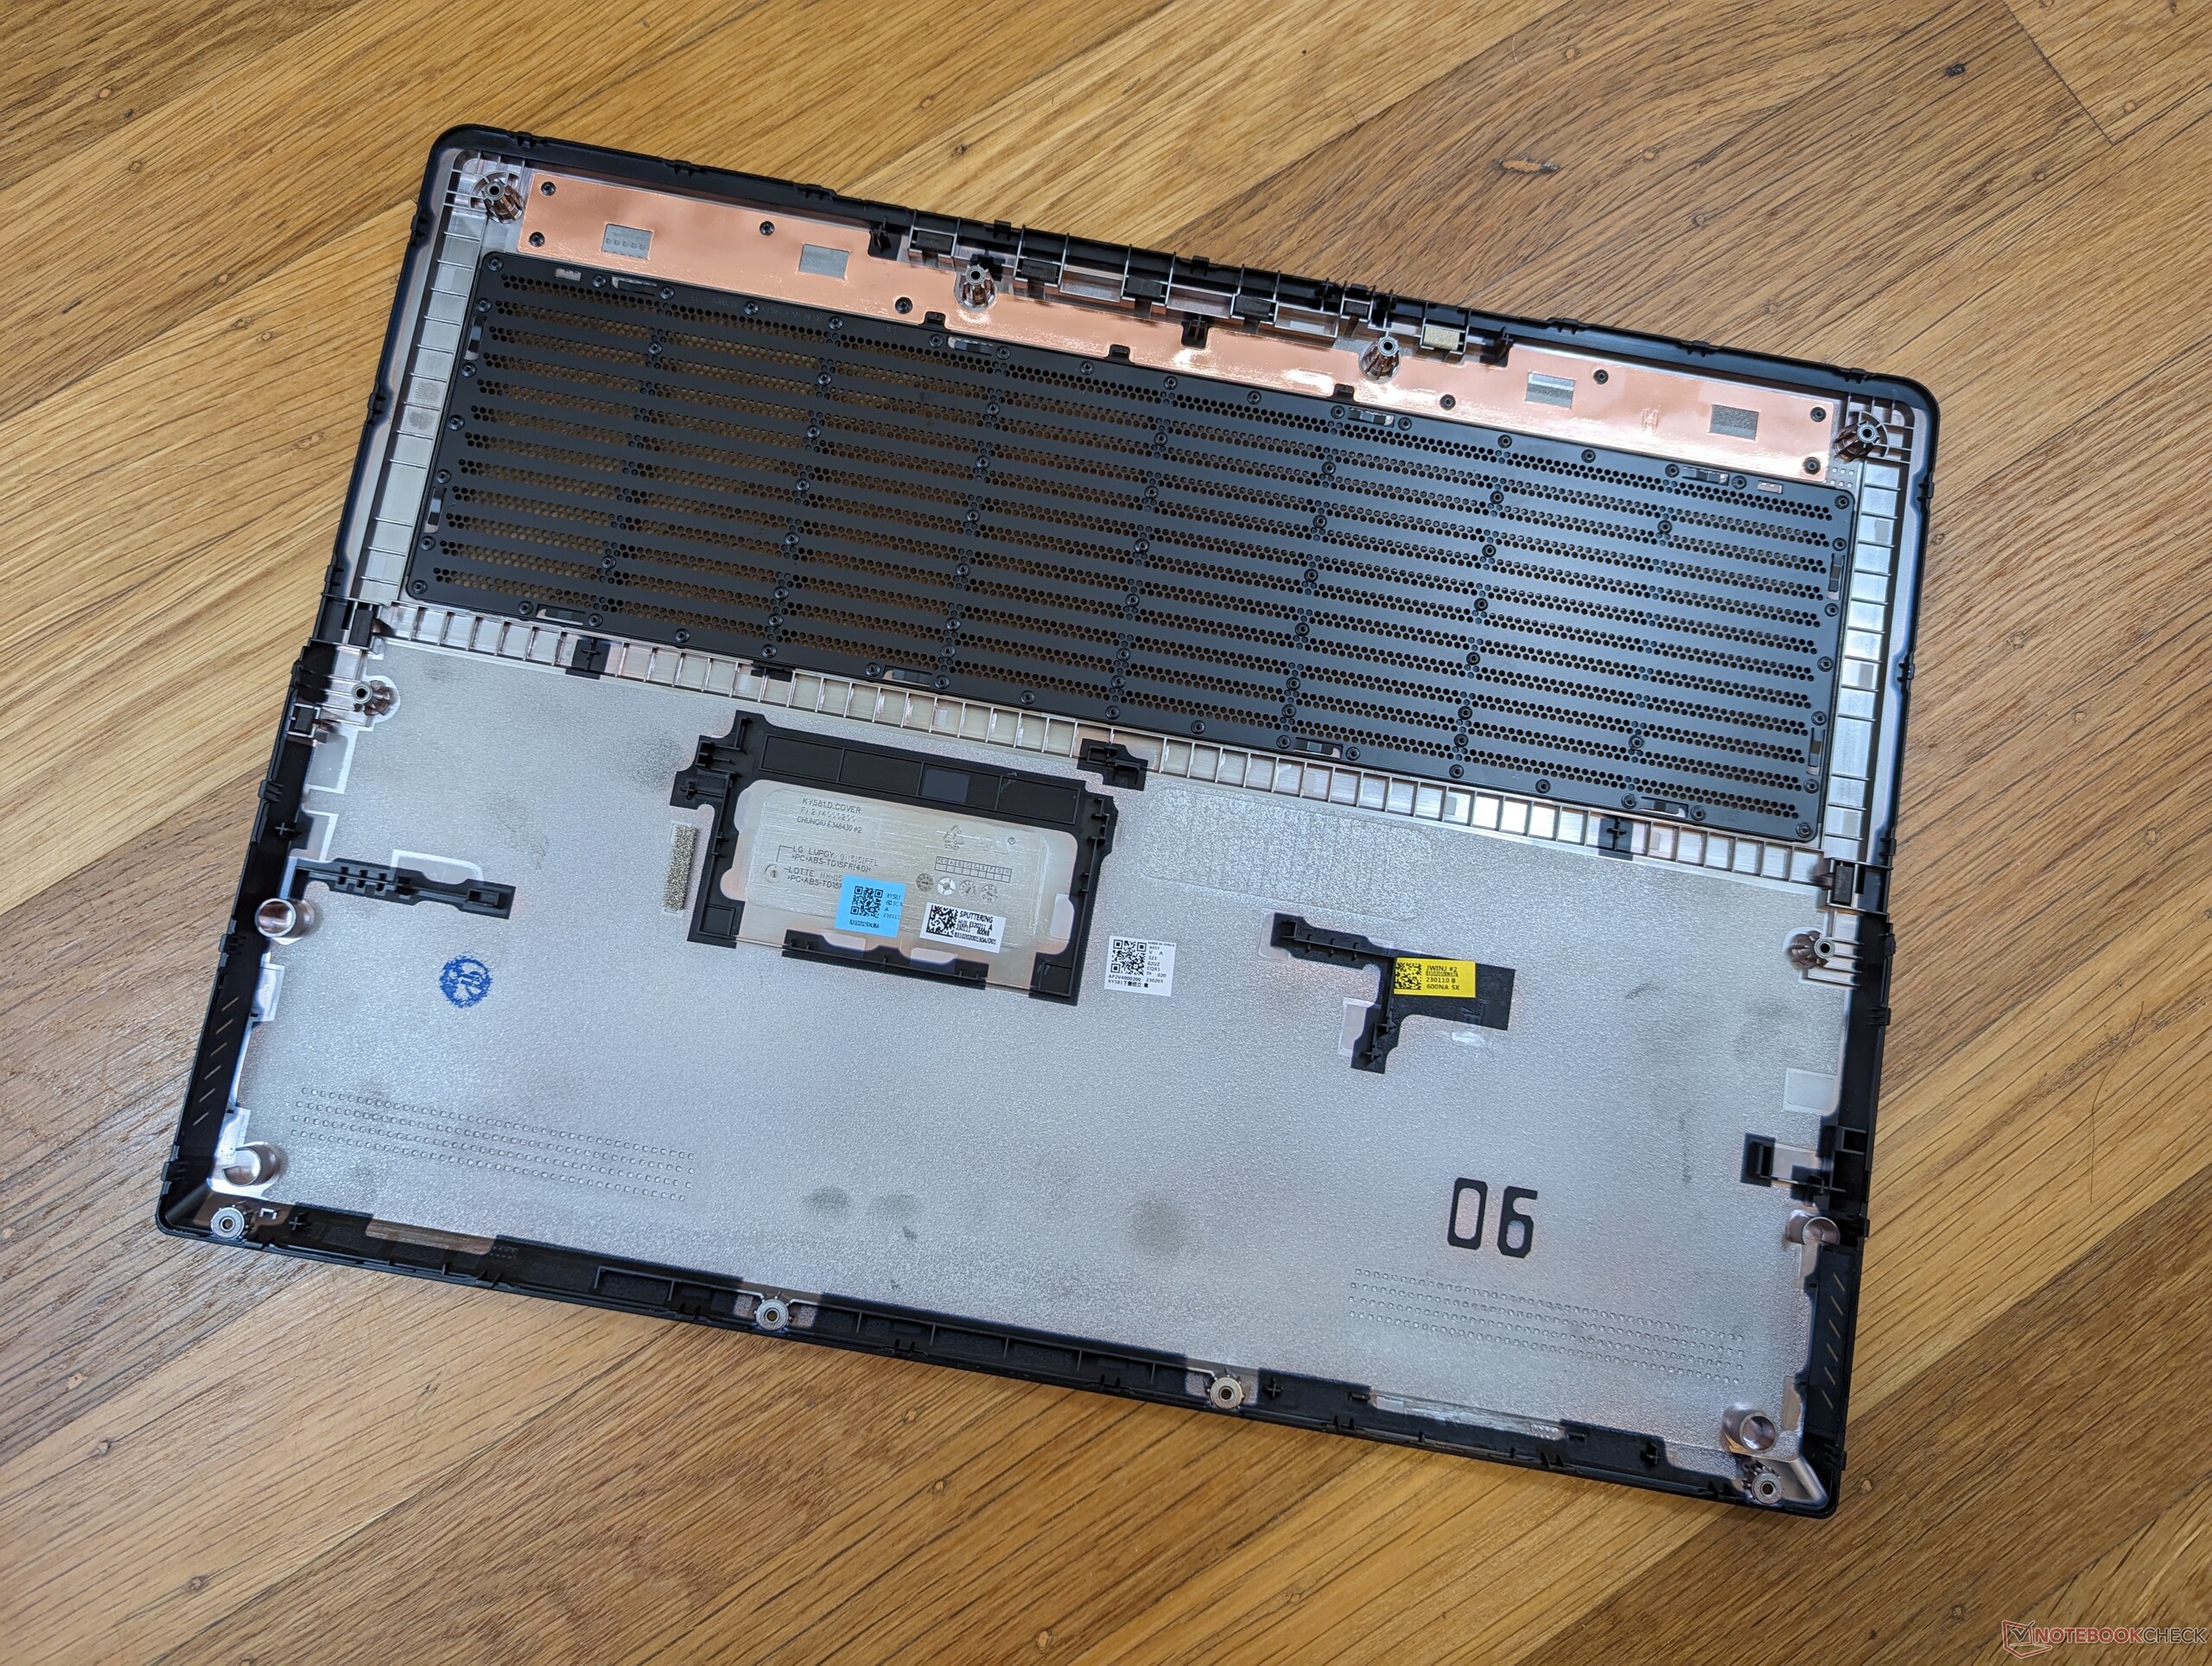
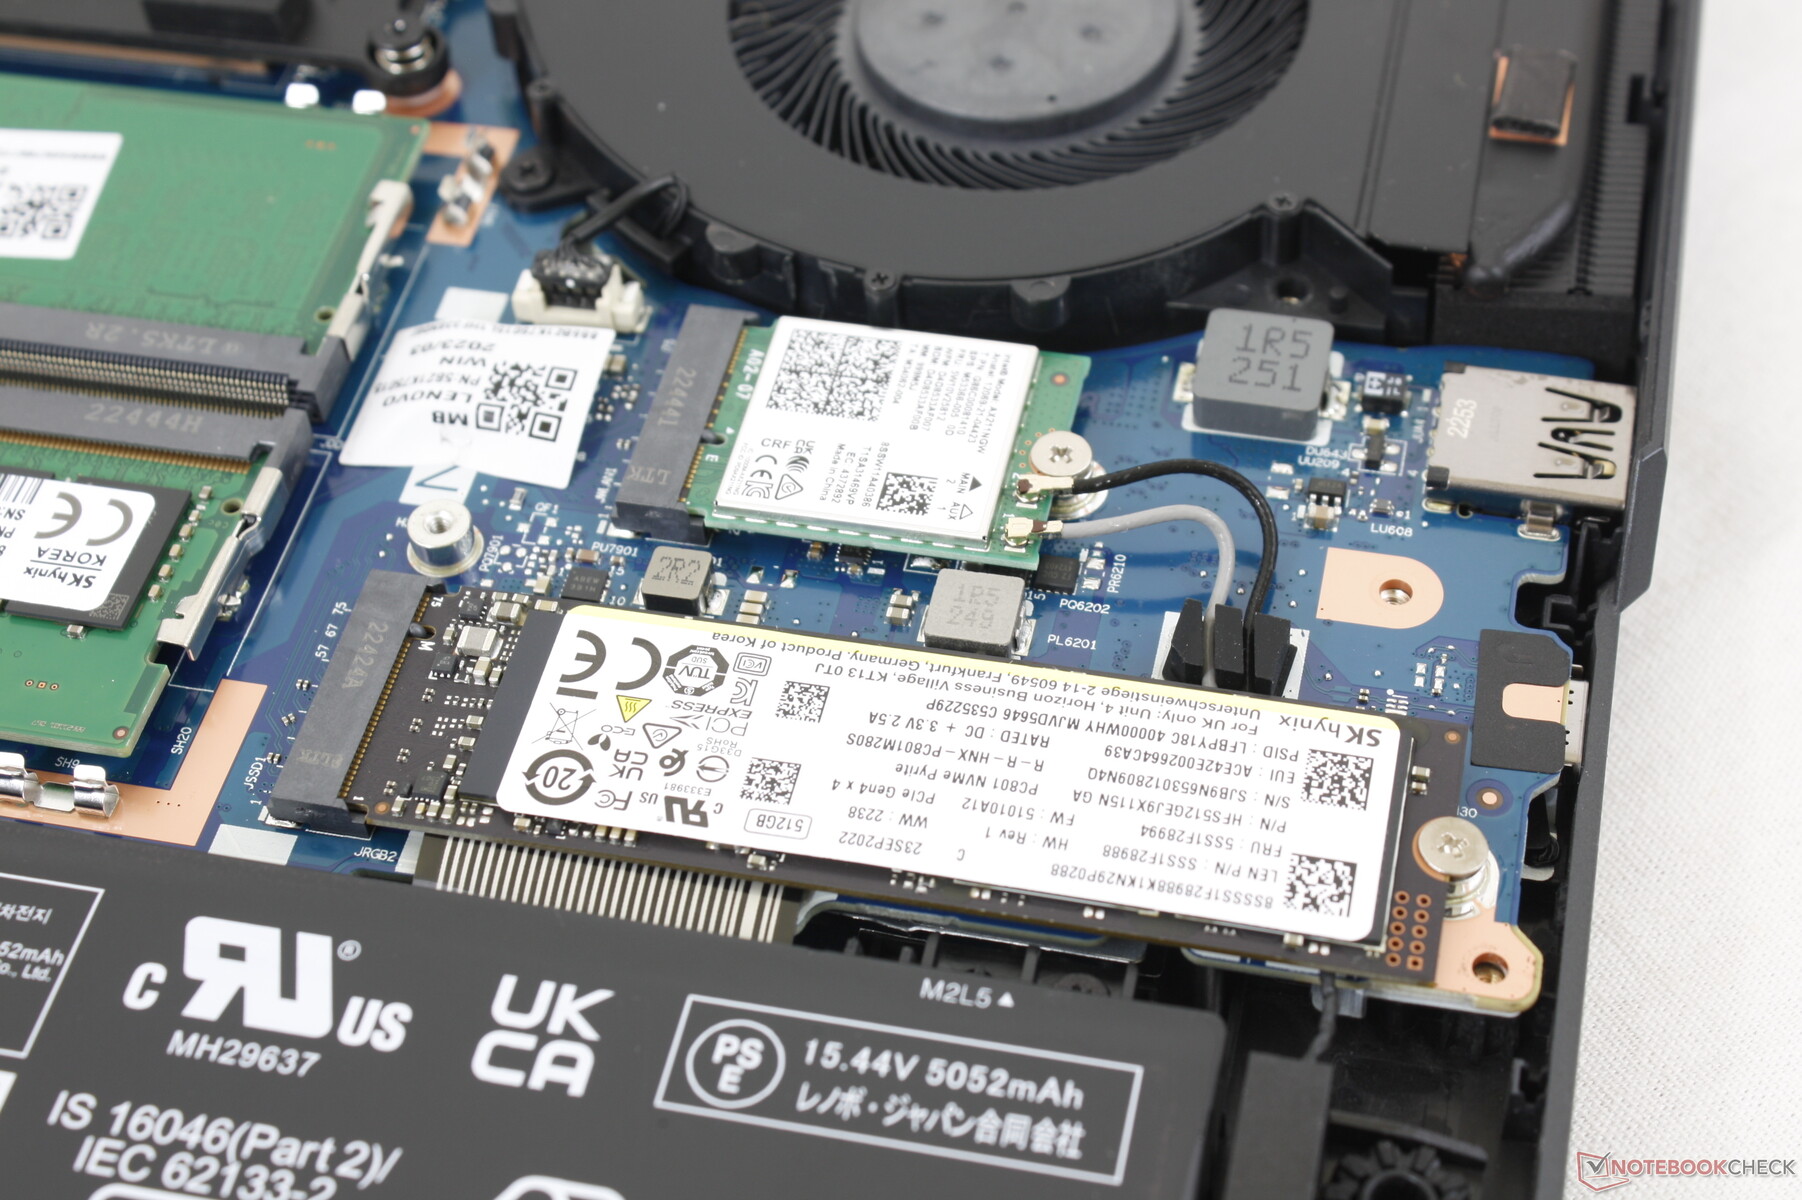
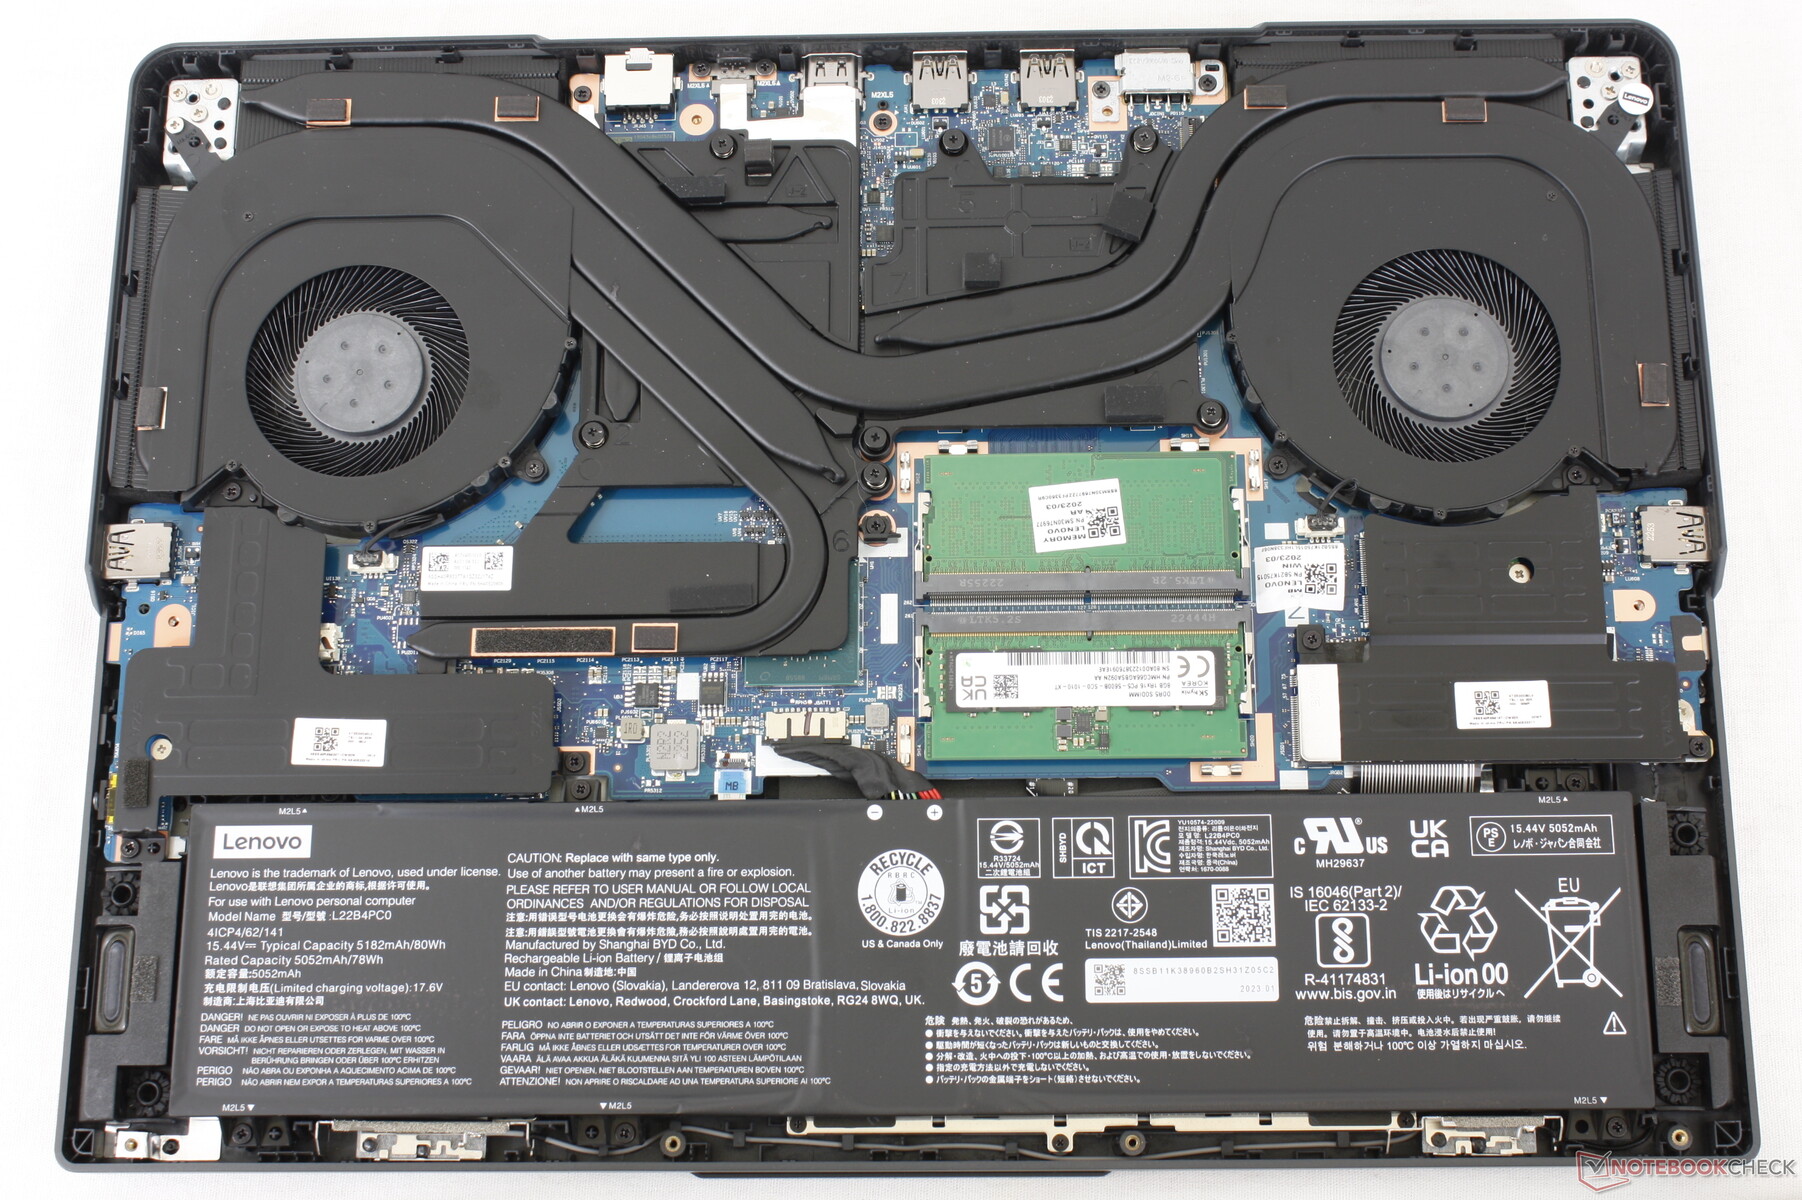
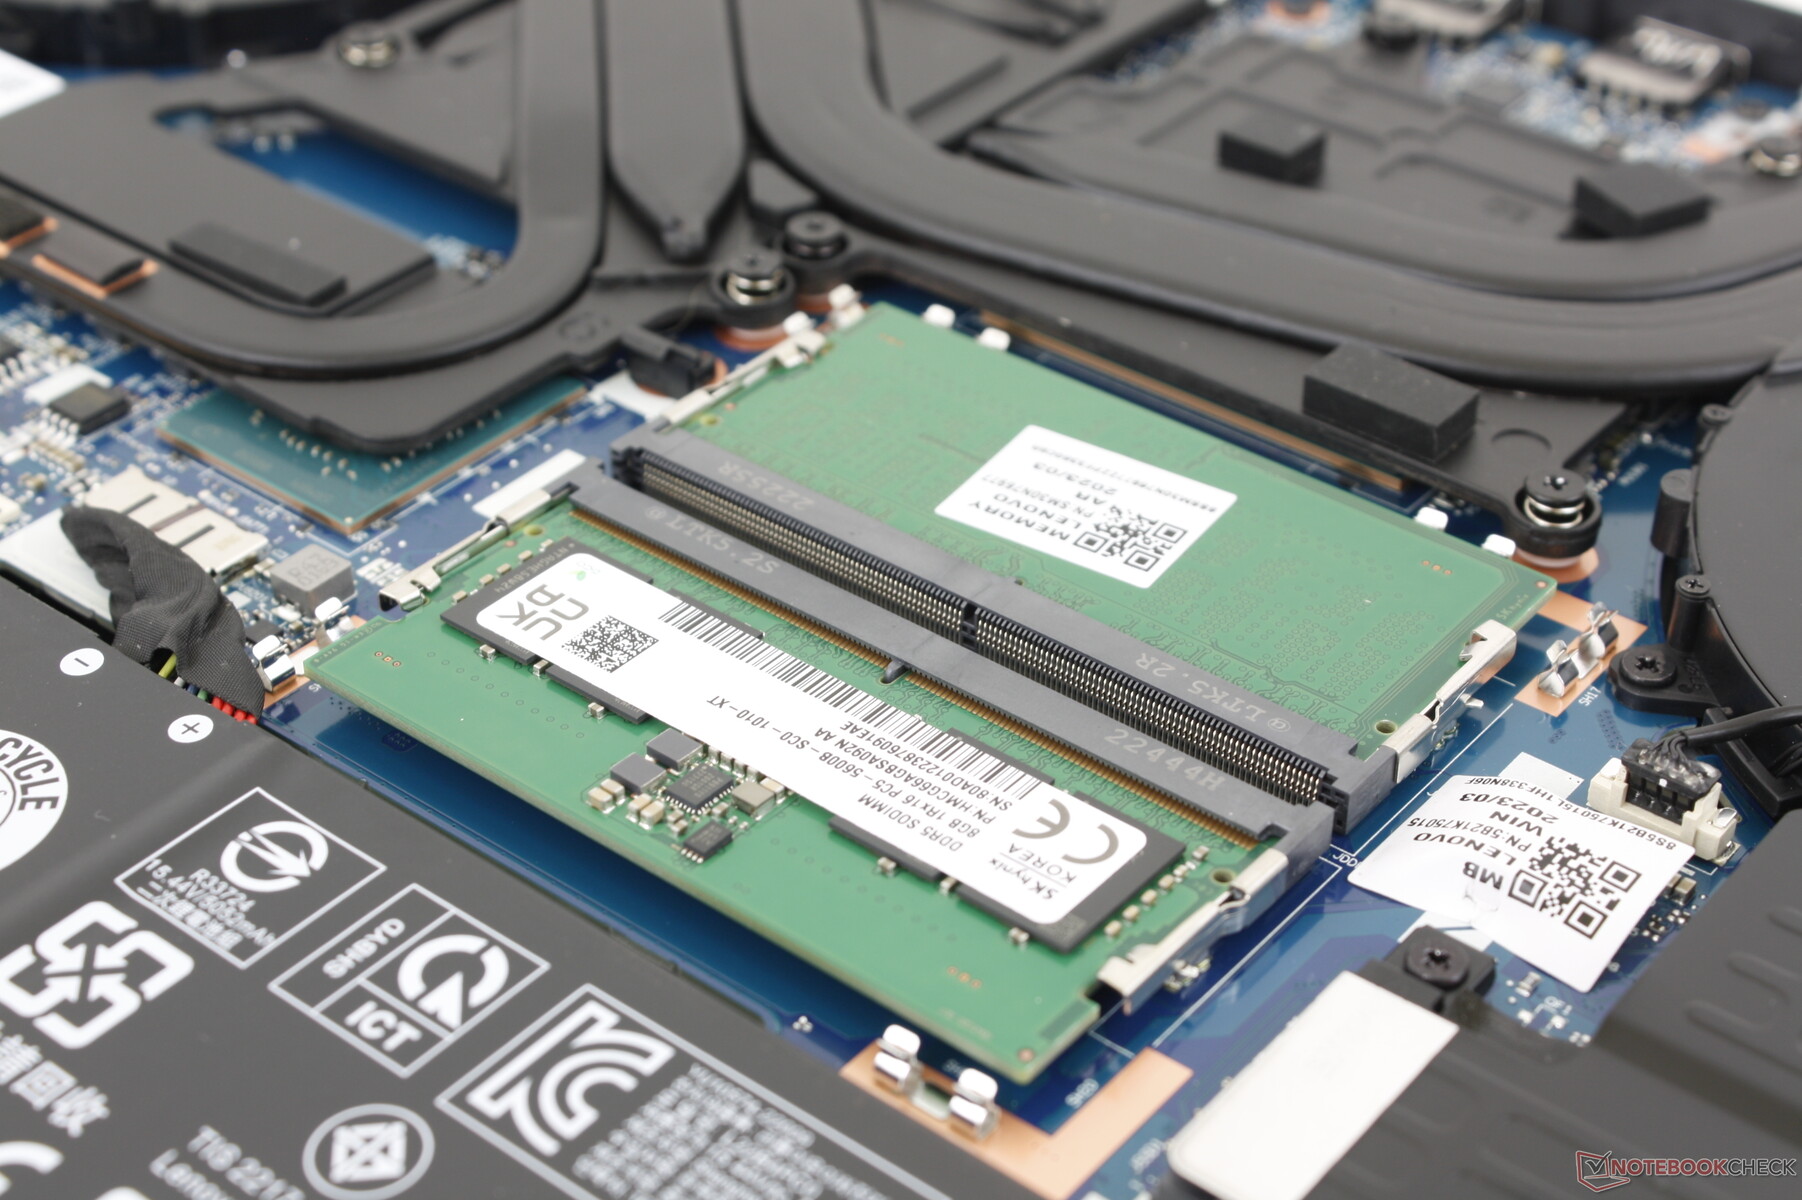
El panel inferior se quita fácilmente con un destornillador Philips para mostrar 2 bahías M.2 2280 PCIe4 x4, 2 ranuras SODIMM y el módulo WLAN extraíble. Observa que las bahías y la ranura WLAN están cubiertas por disipadores de calor de aluminio.
Accesorios y garantía
No hay más extras en la caja que el adaptador de CA y la documentación. Si se compra en EE.UU., se aplica la limitación habitual de un año del fabricante.
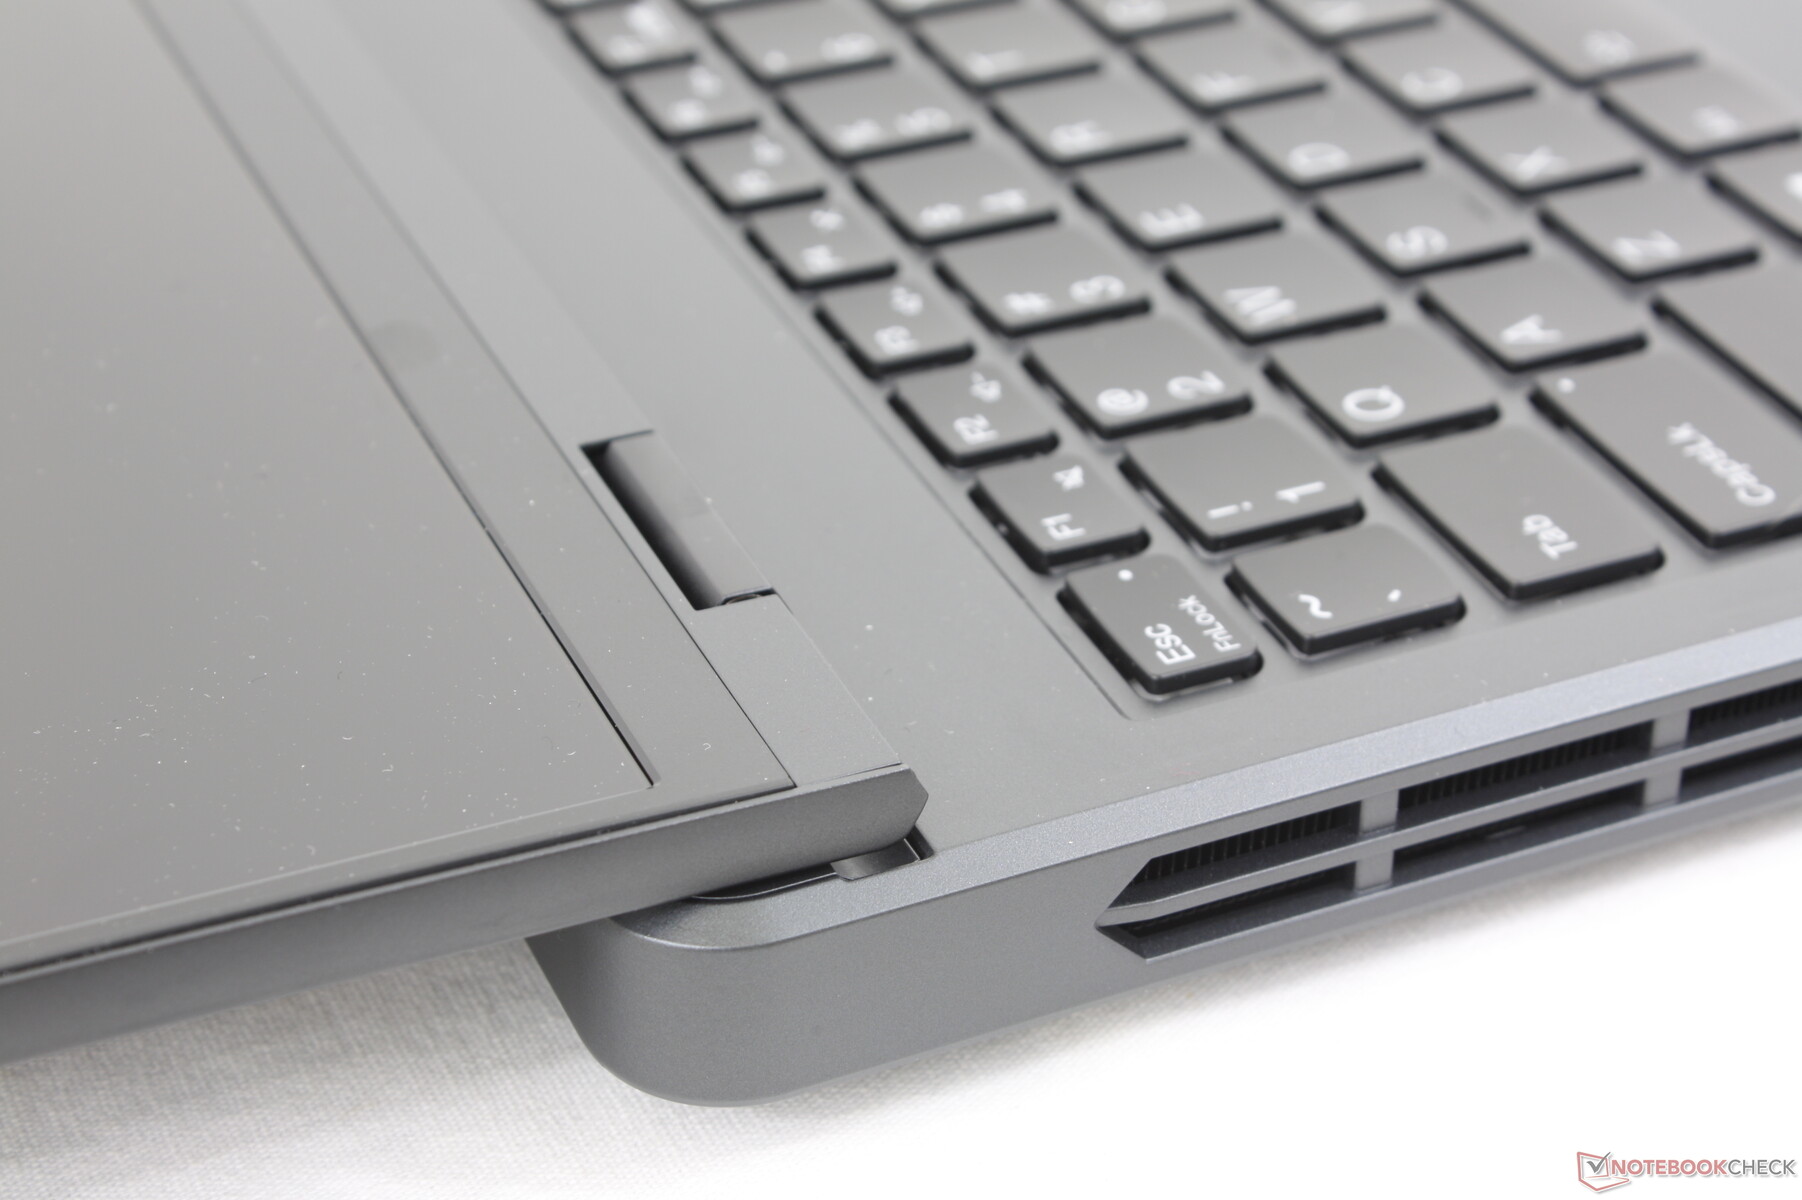
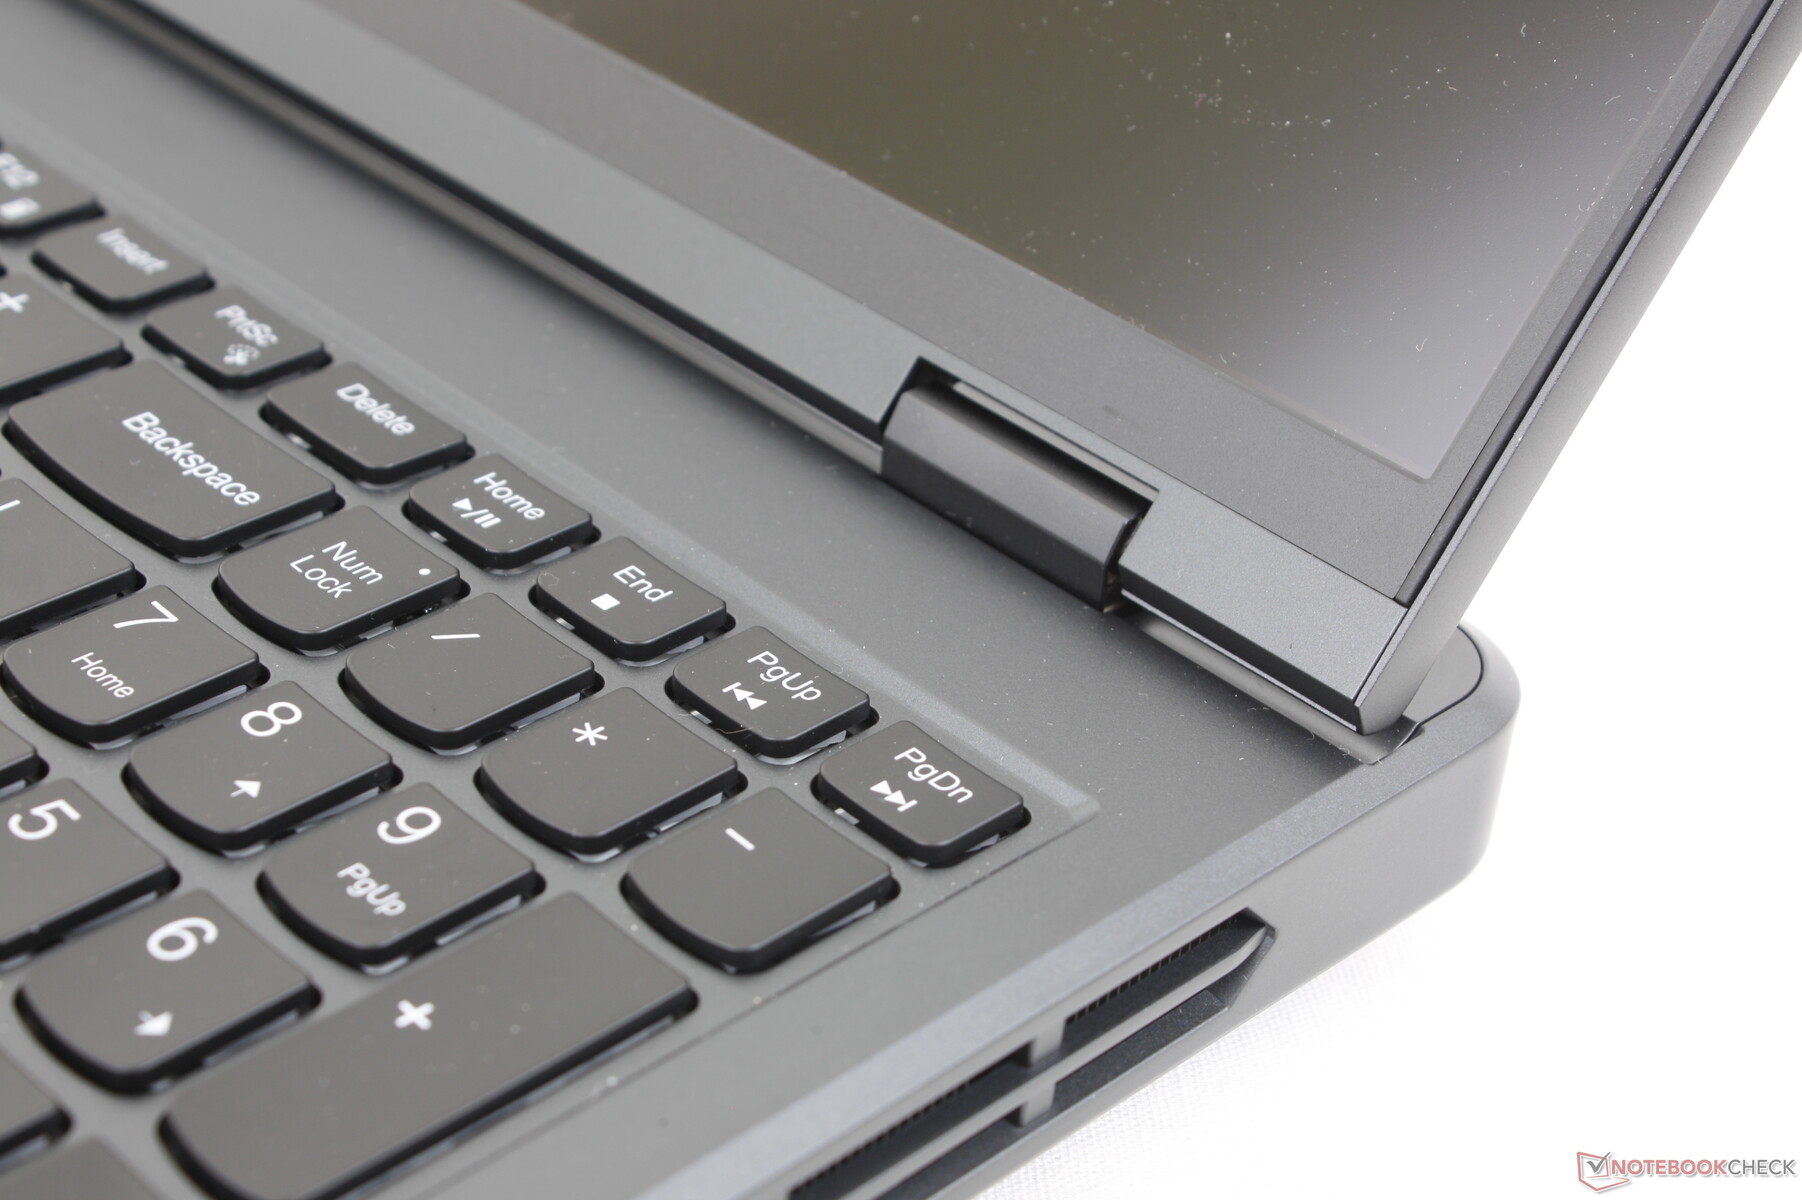
Dispositivos de entrada - Teclado cómodo y espacioso
Teclado
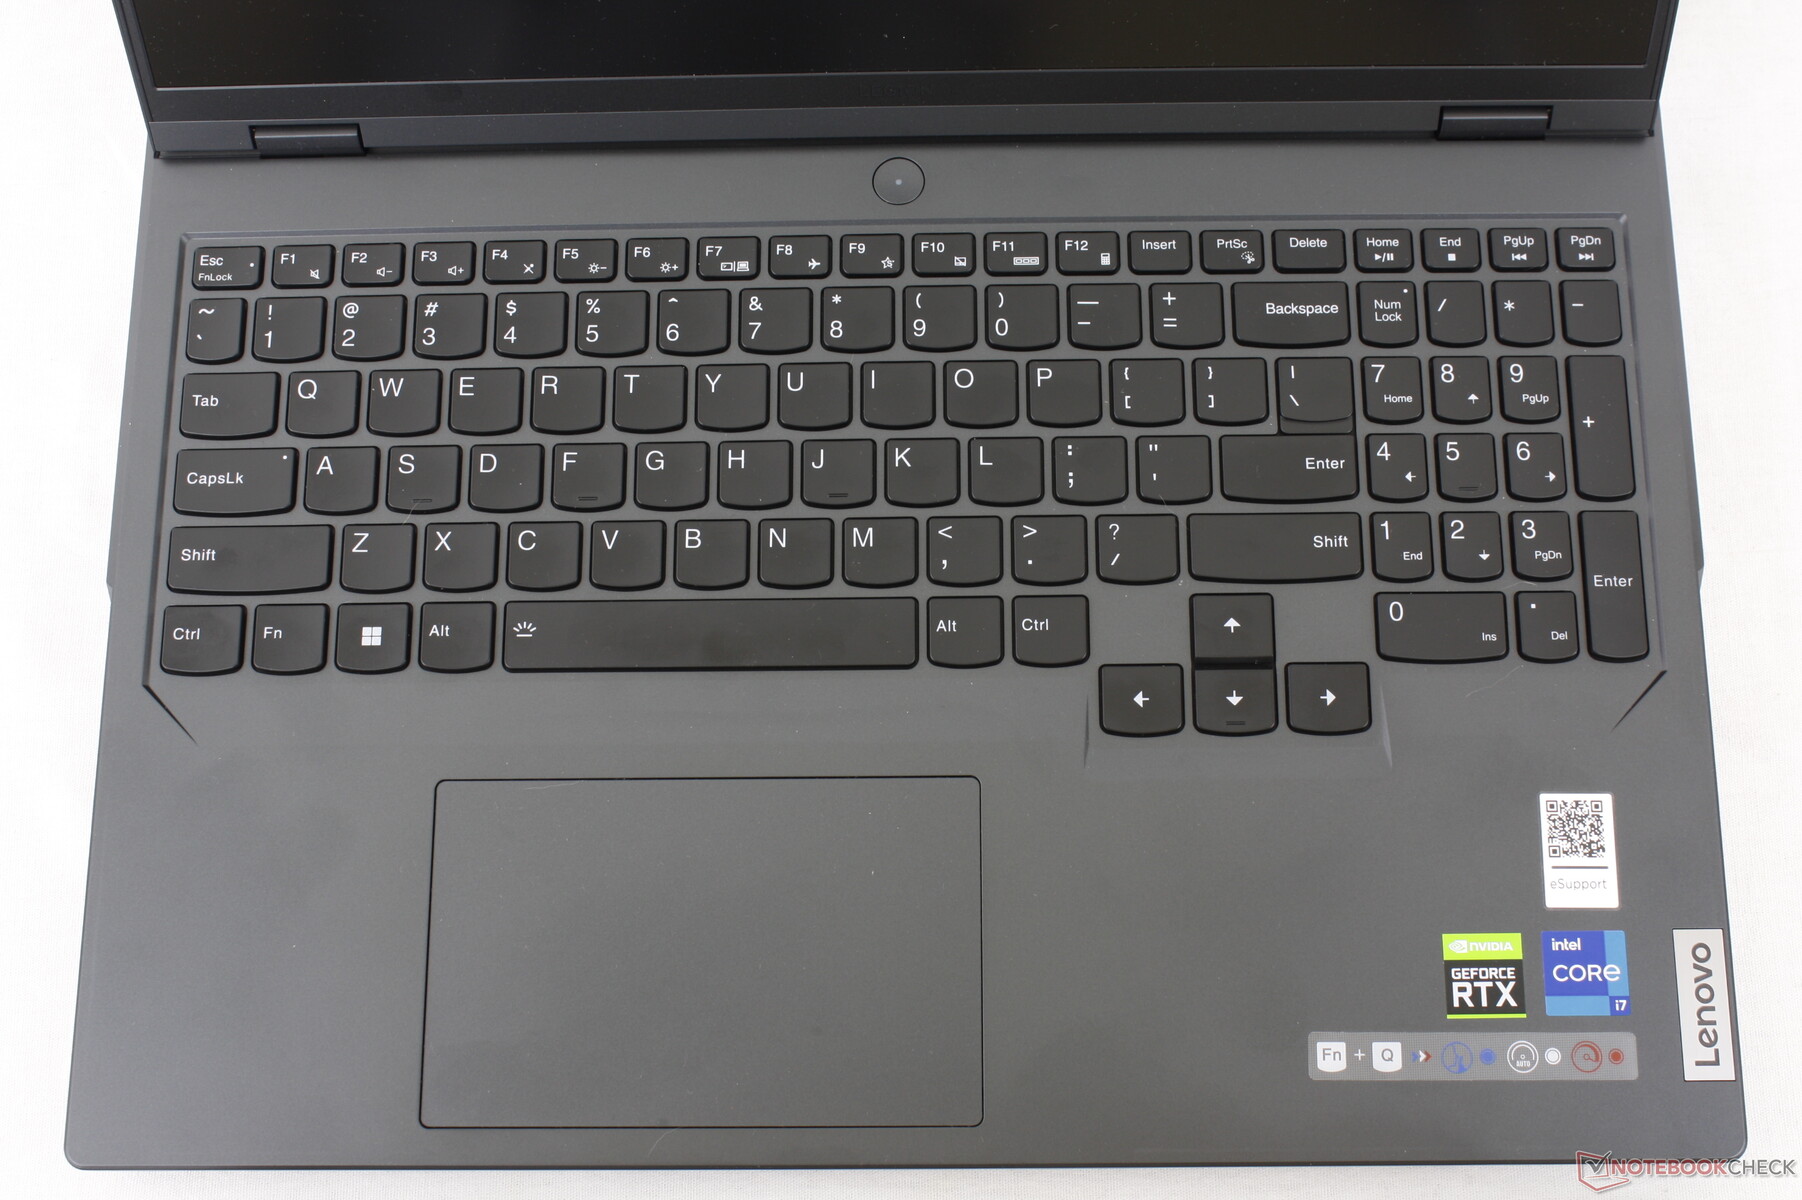
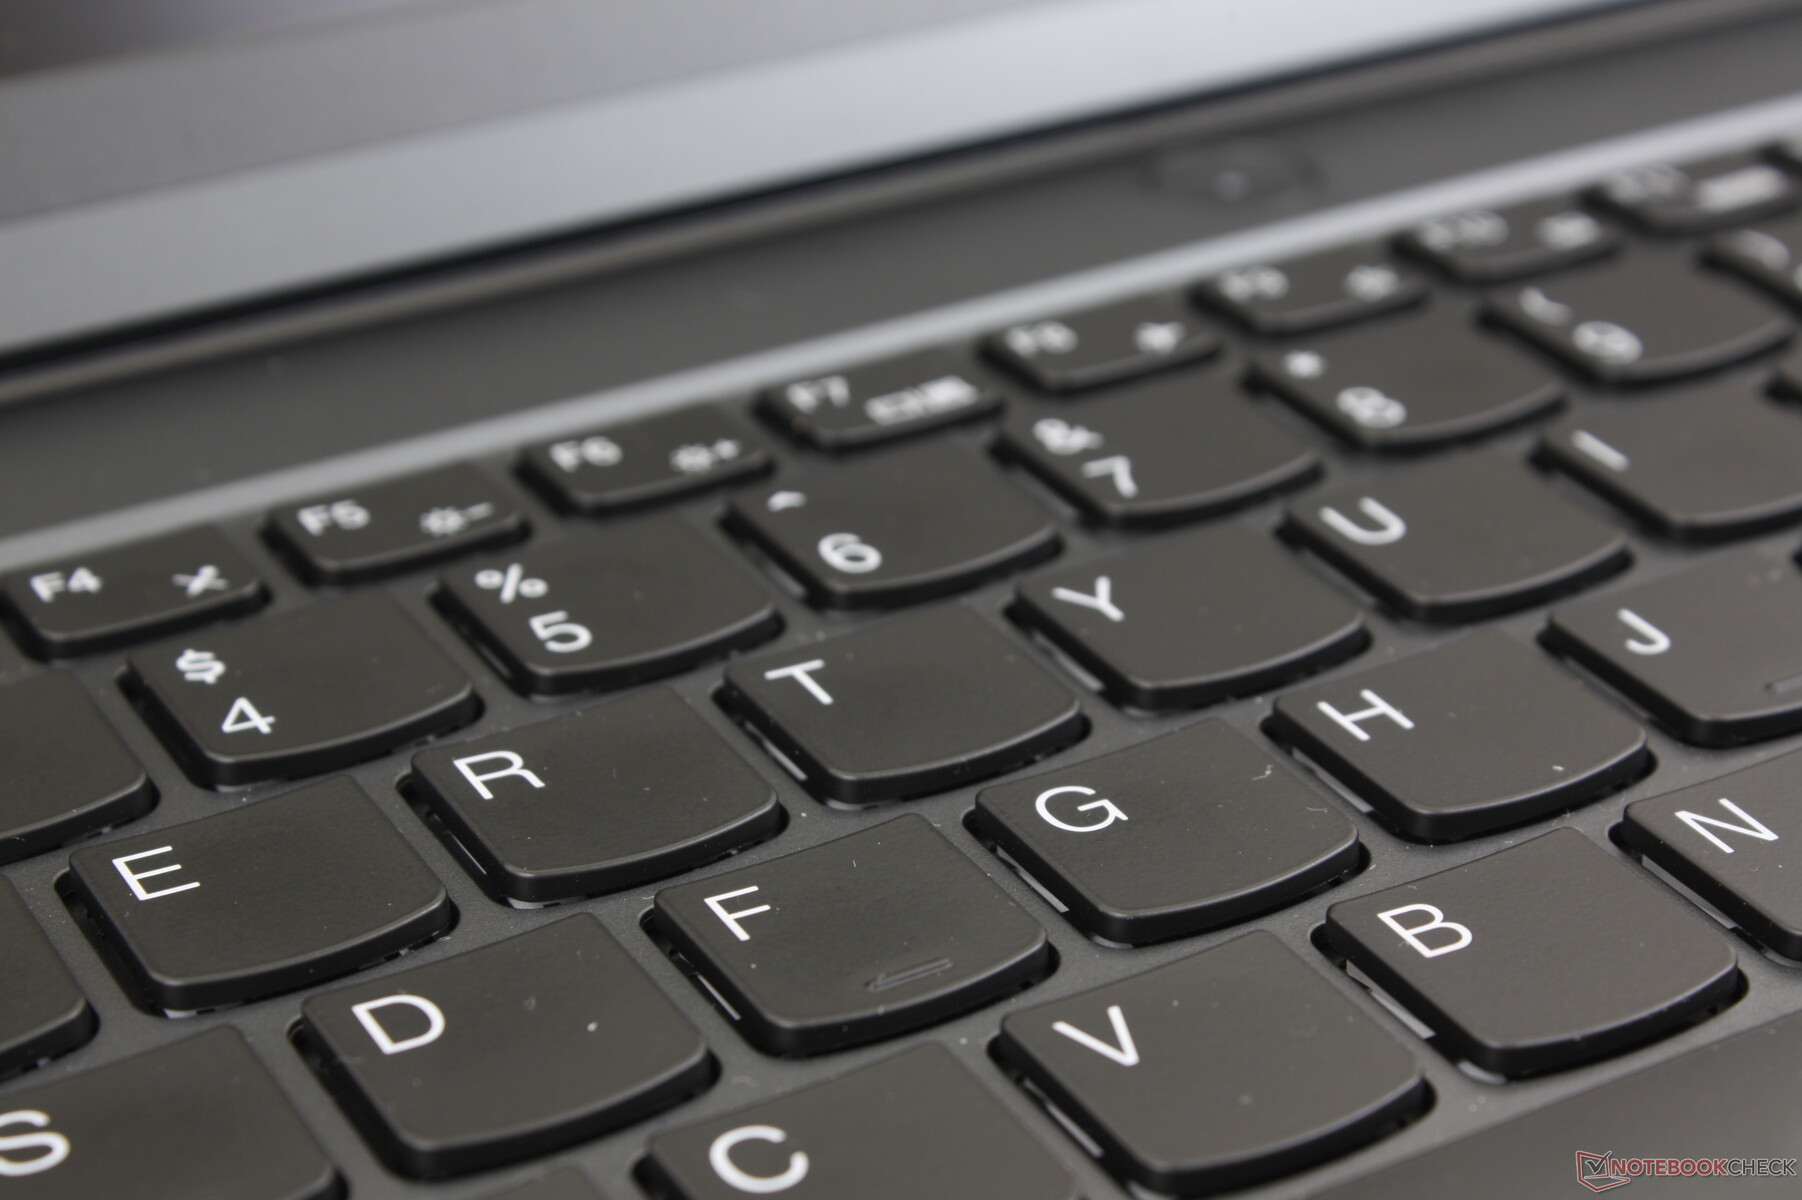
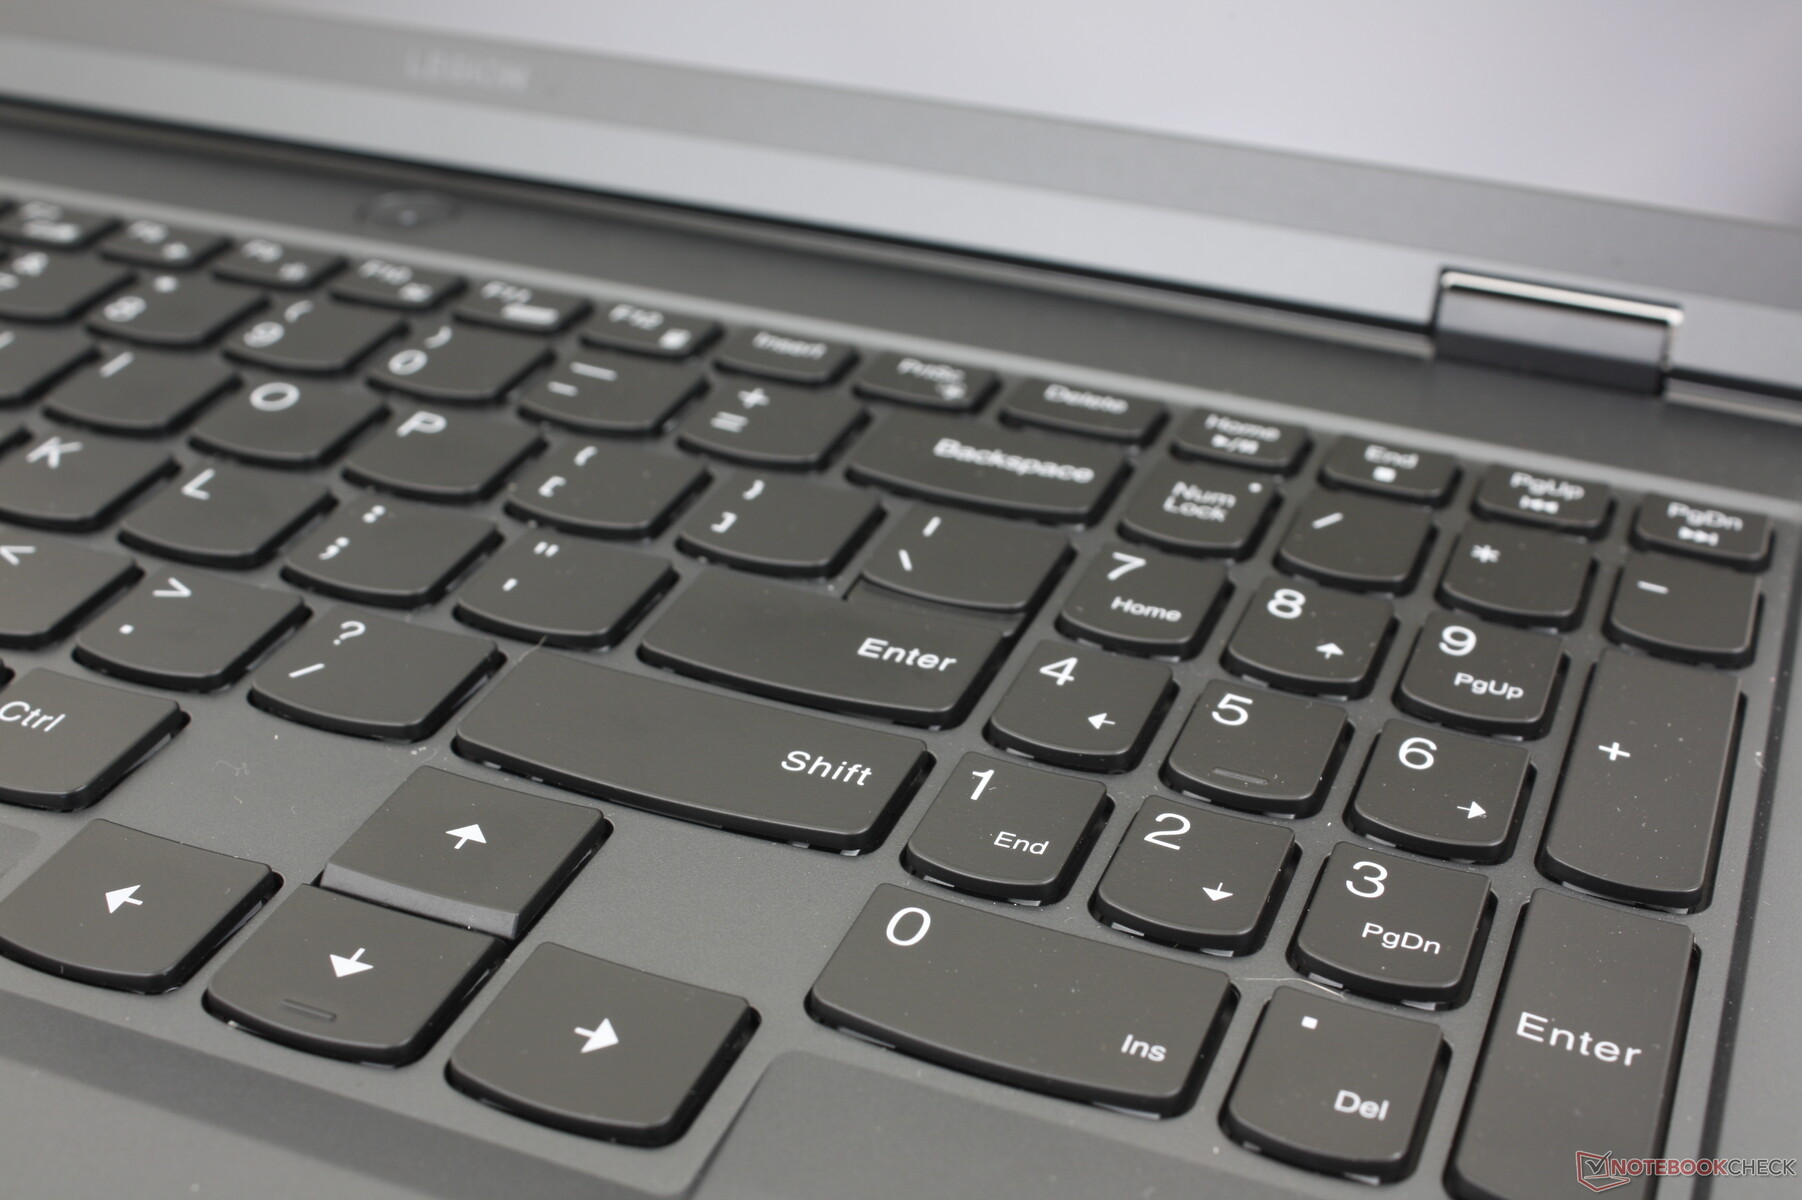
El teclado ofrece un recorrido de 1,5 mm, un paso de 0,2 mm y 100% anti-ghosting para juegos. Solo el recorrido y la retroalimentación ya son más profundos y fuertes, respectivamente, que los teclados del Razer Blade 16 o el Asus Zephyrus M16 para una experiencia de tecleo más satisfactoria que la de cualquiera de sus competidores.
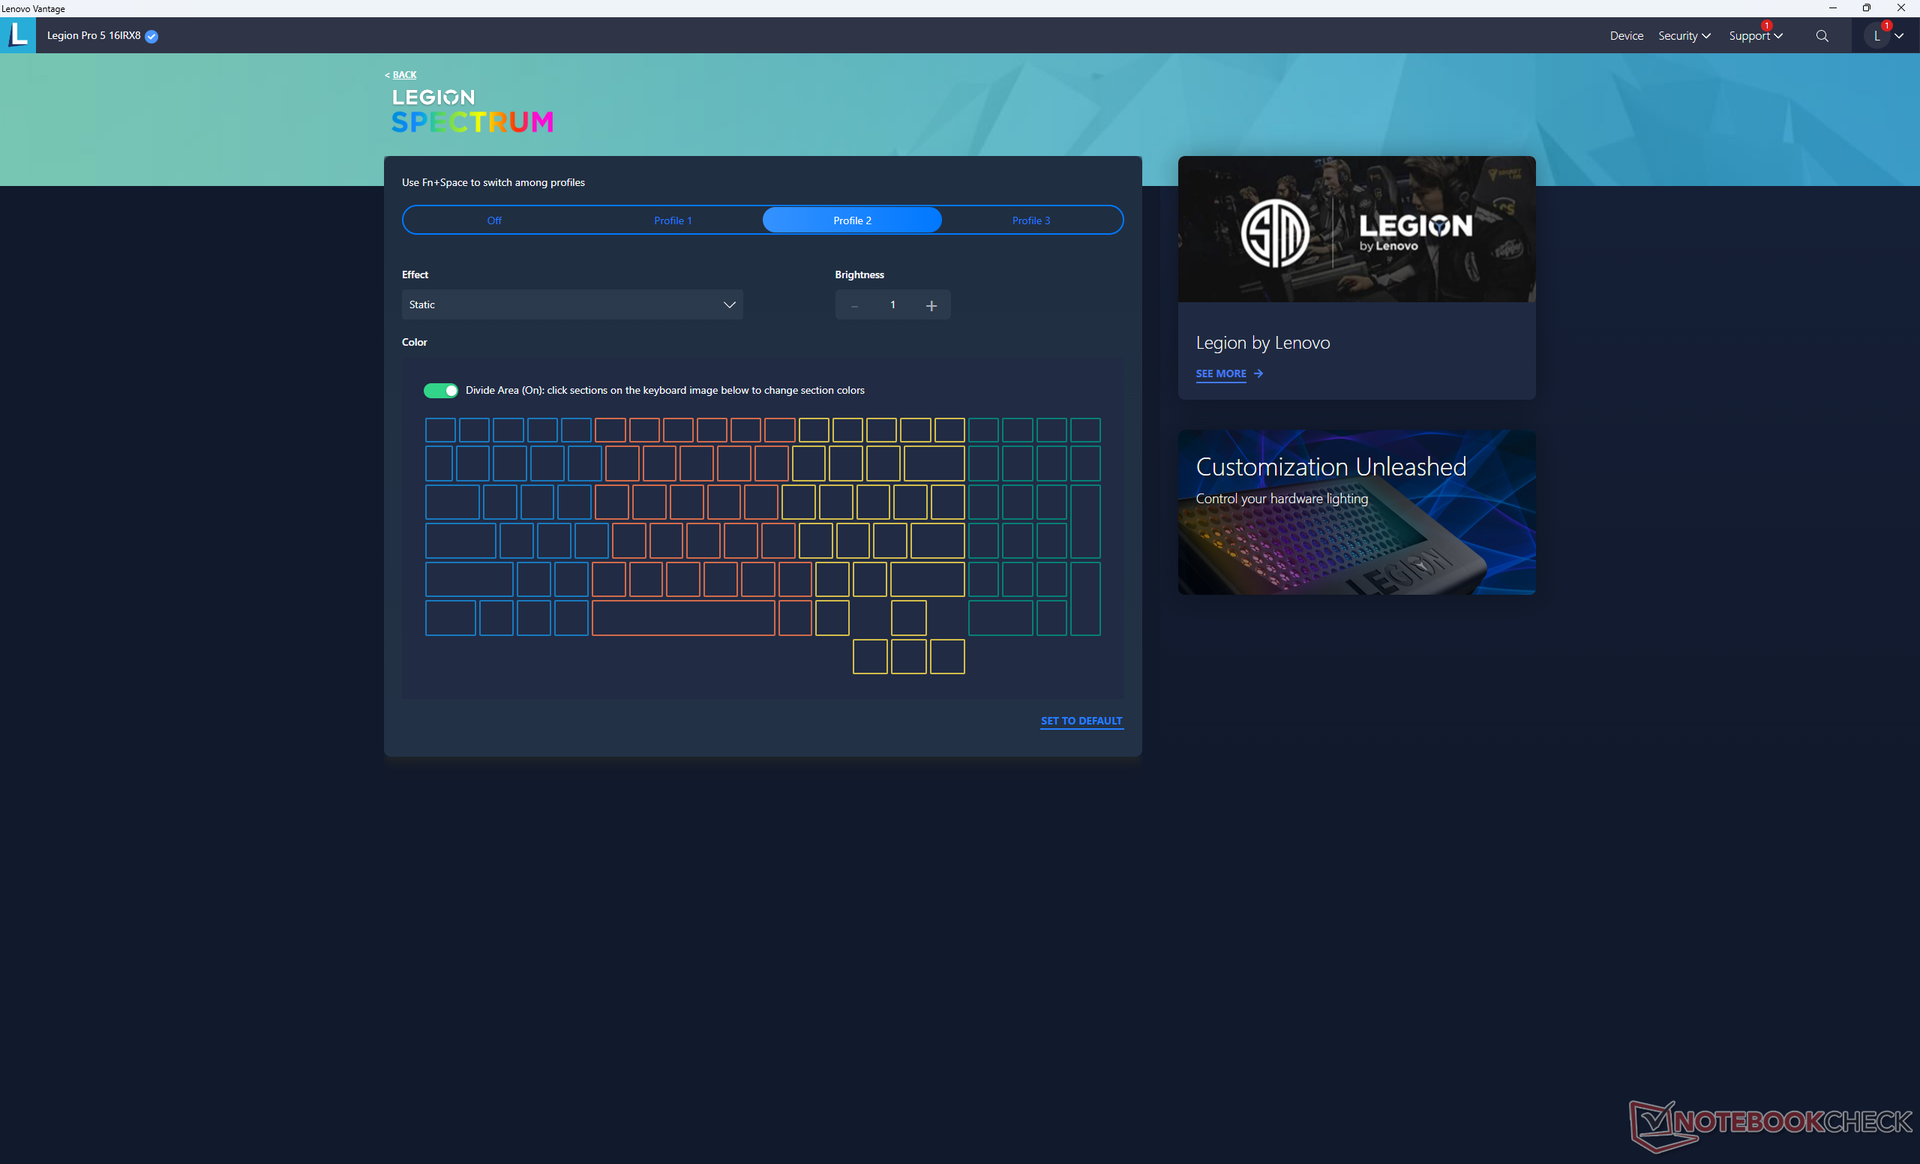
Ciertas características siguen siendo exclusivas de la serie Legion 7 Pro de gama más alta, como el teclado mecánico y la iluminación RGB por tecla. Lo primero es comprensible, pero nos parece ridículo que Lenovo no ofrezca lo segundo para nuestra configuración de más de 1.500 dólares. Los propietarios tienen que conformarse con la iluminación RGB de cuatro zonas.
Panel táctil
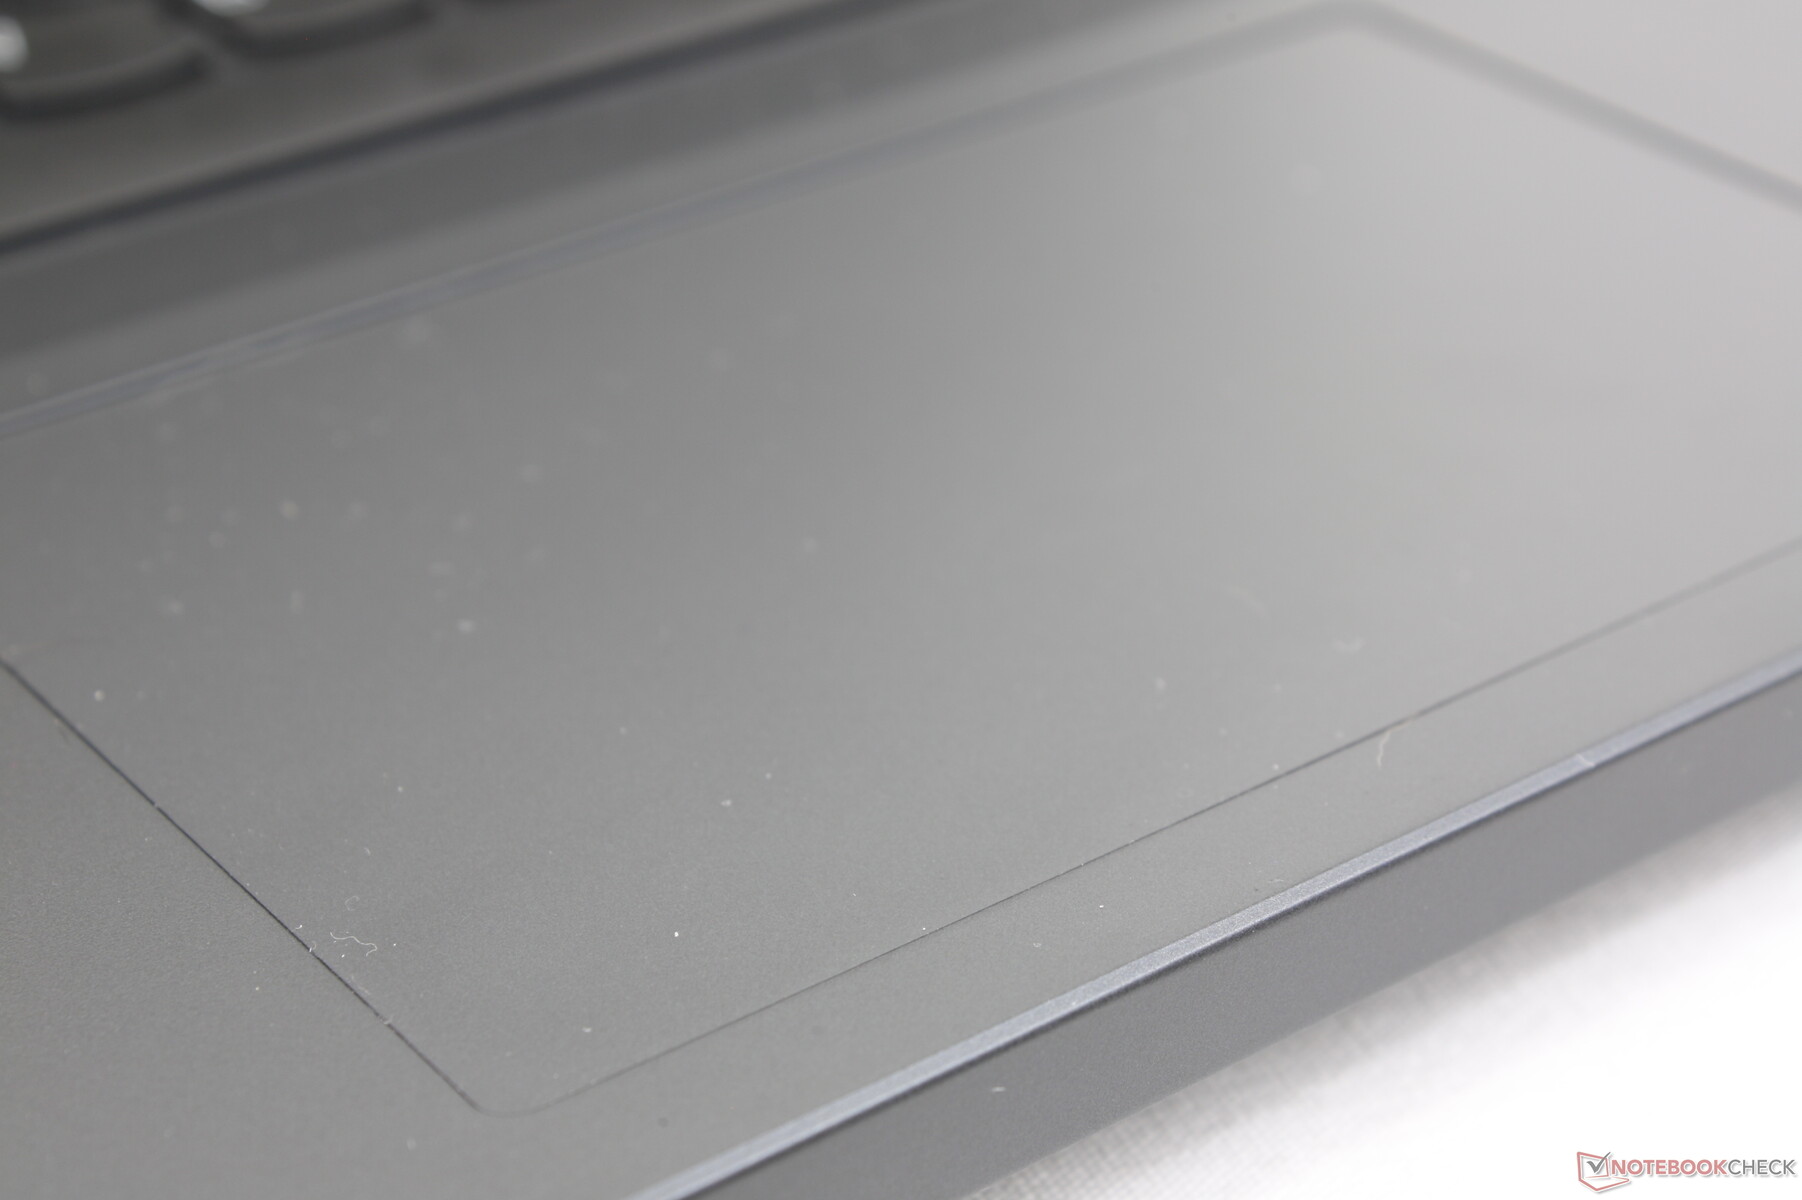
El clickpad (12 x 7,5 cm) tiene aproximadamente el mismo tamaño que el delInspiron 16 Plus 7620 (11,5 x 8 cm). El deslizamiento es suave y sensible con sólo un poco de adherencia a velocidades más lentas para clics más precisos. Sin embargo, el desplazamiento es muy superficial al hacer clic y la respuesta no es muy fuerte. No obstante, el clickpad funciona con suficiente fiabilidad para tareas sencillas cuando no se dispone de ratón.
Pantalla - 165 Hz mínimo
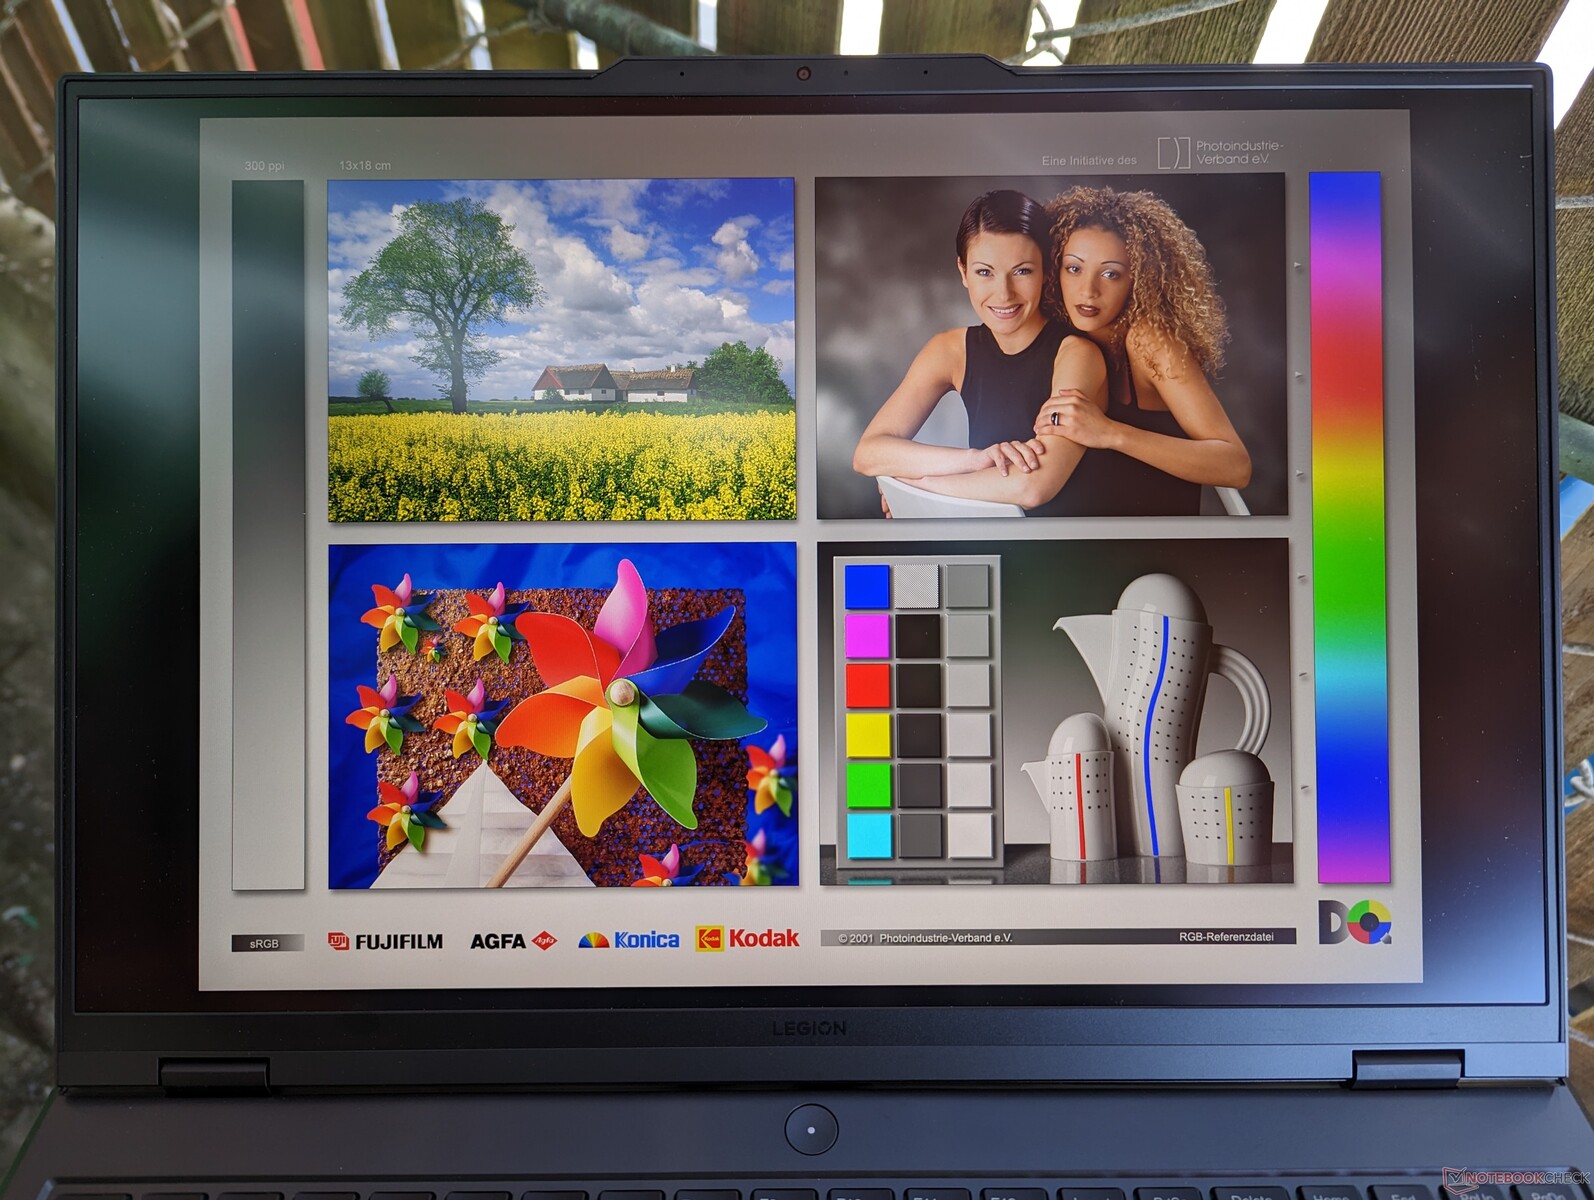
Hay dos opciones de pantalla para el 2023 Legion Pro 5 16: 165 Hz y 240 Hz. Ambos soportan G-Sync, resolución nativa de 2560 x 1600, y cobertura sRGB completa mientras que sólo el panel de 240 Hz soporta HDR400. La opción básica de 165 Hz debería ser más que suficiente para el jugador de gama media al que va dirigido. La calidad de imagen es excelente, con un grano sorprendentemente mínimo para un panel mate.
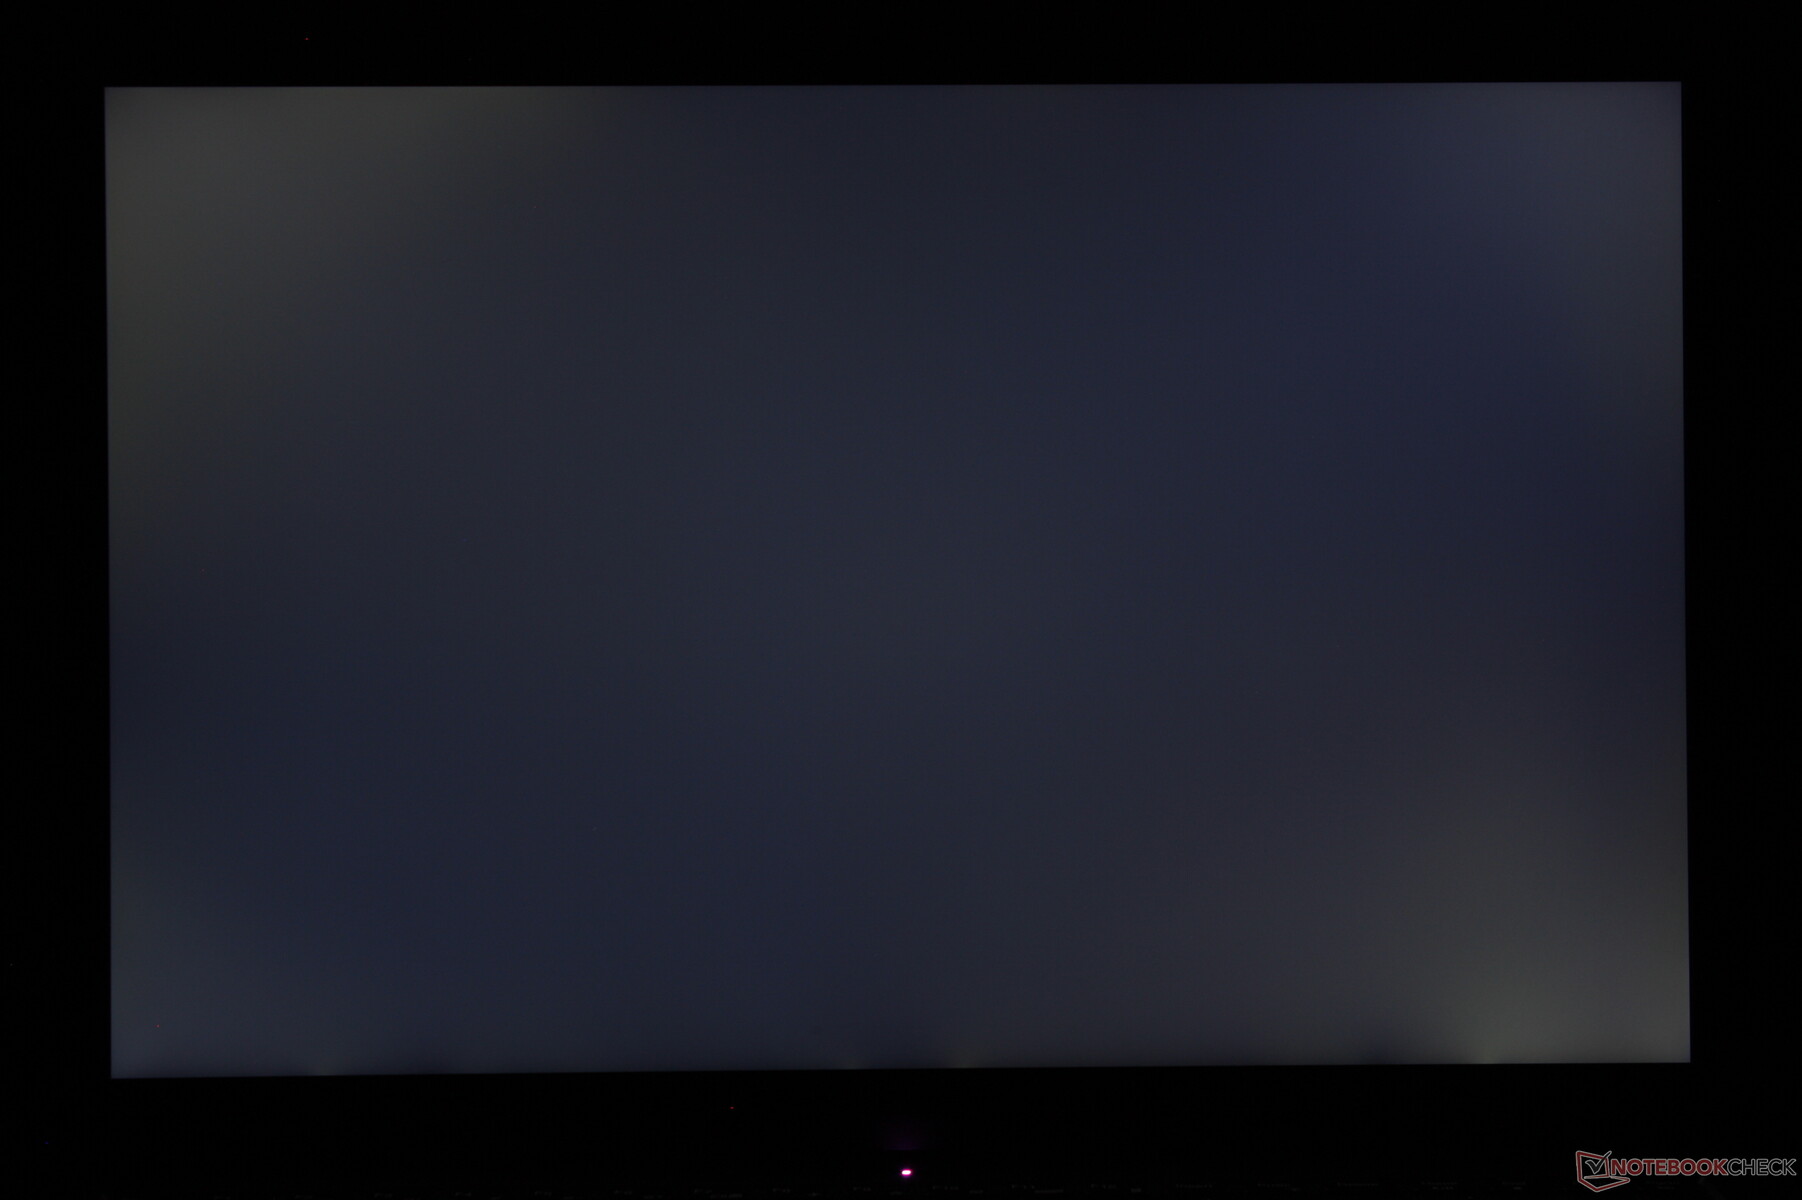
El sangrado a contraluz podría mejorarse. Nuestra unidad mostraba bastante sangrado de luz, lo que nos parece casi inaceptable en un portátil de juego de este precio.
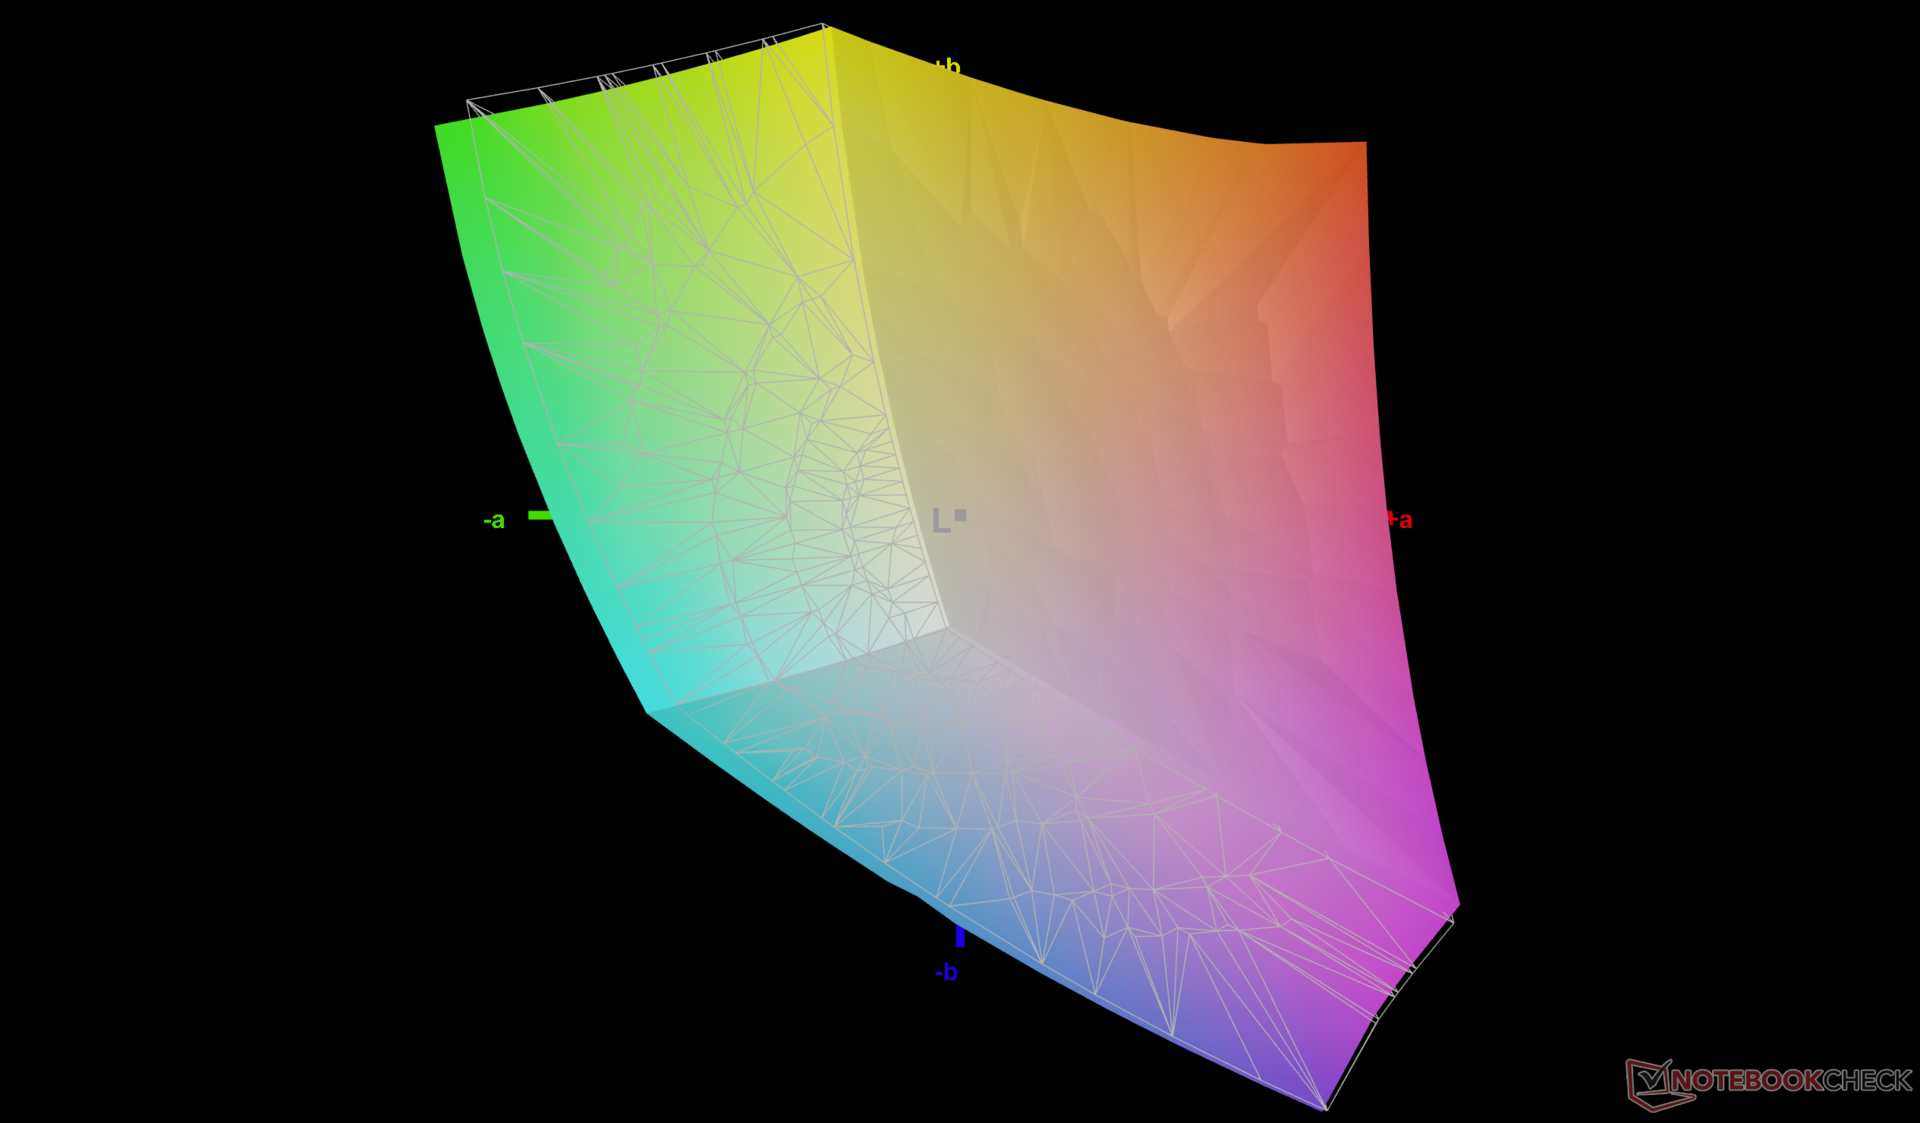
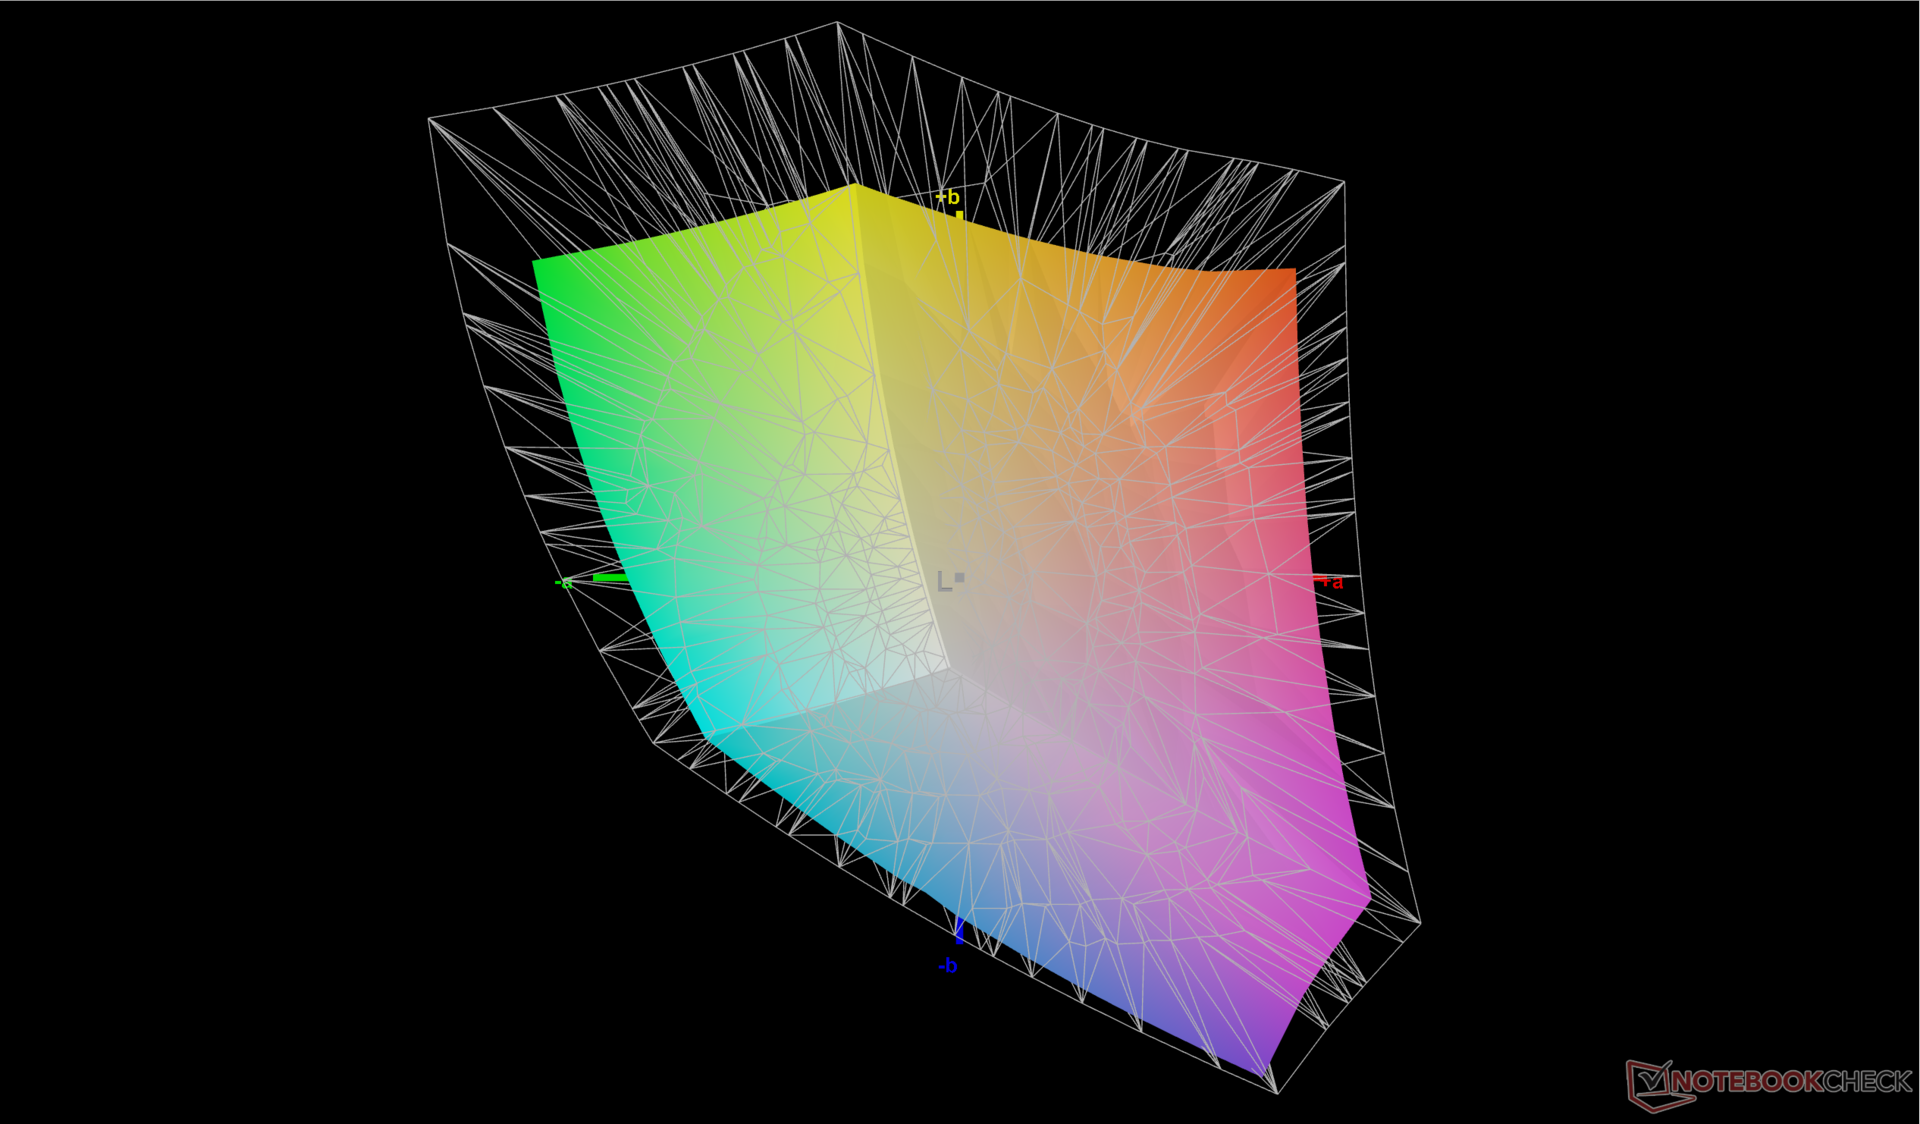
Los usuarios interesados en OLED o colores AdobeRGB más amplios tendrán que buscar más allá de la serie Legion Pro 5 de gama media.

| |||||||||||||||||||||||||
iluminación: 87 %
Brillo con batería: 405.7 cd/m²
Contraste: 1068:1 (Negro: 0.38 cd/m²)
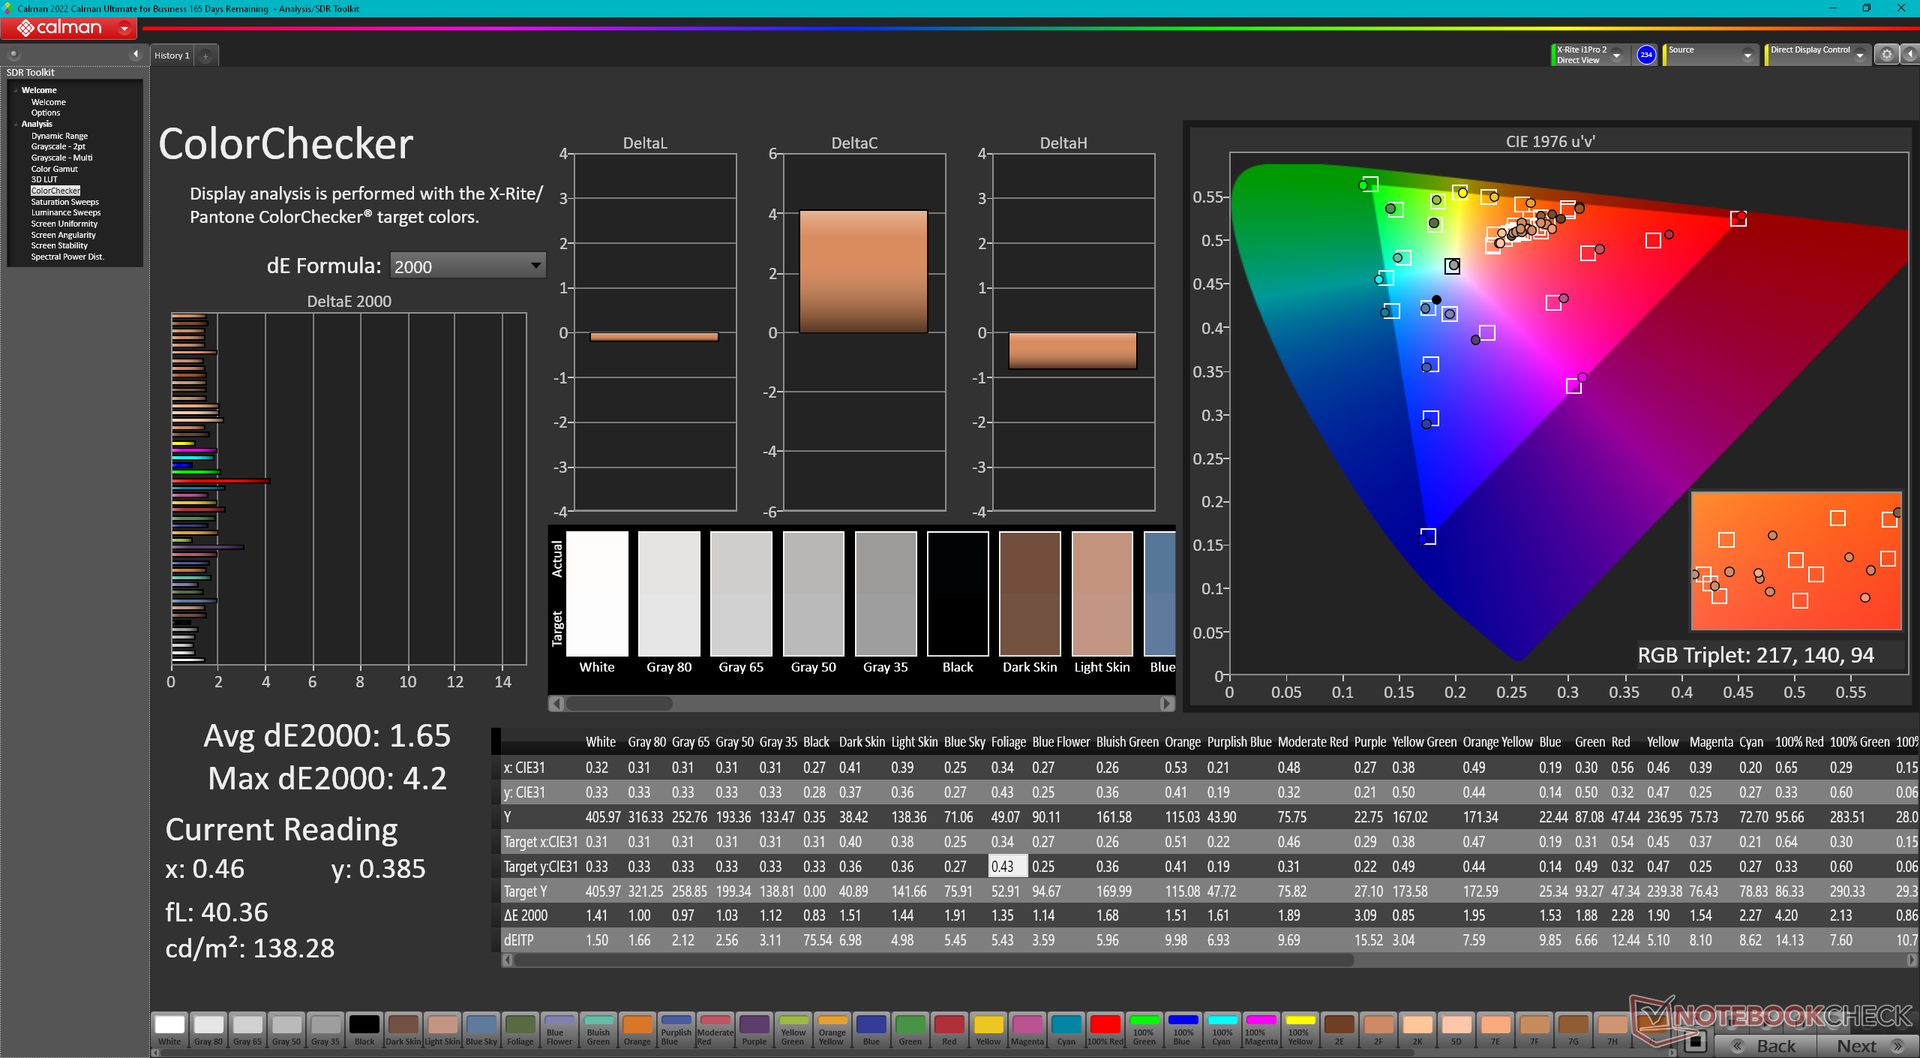
ΔE ColorChecker Calman: 1.65 | ∀{0.5-29.43 Ø4.71}
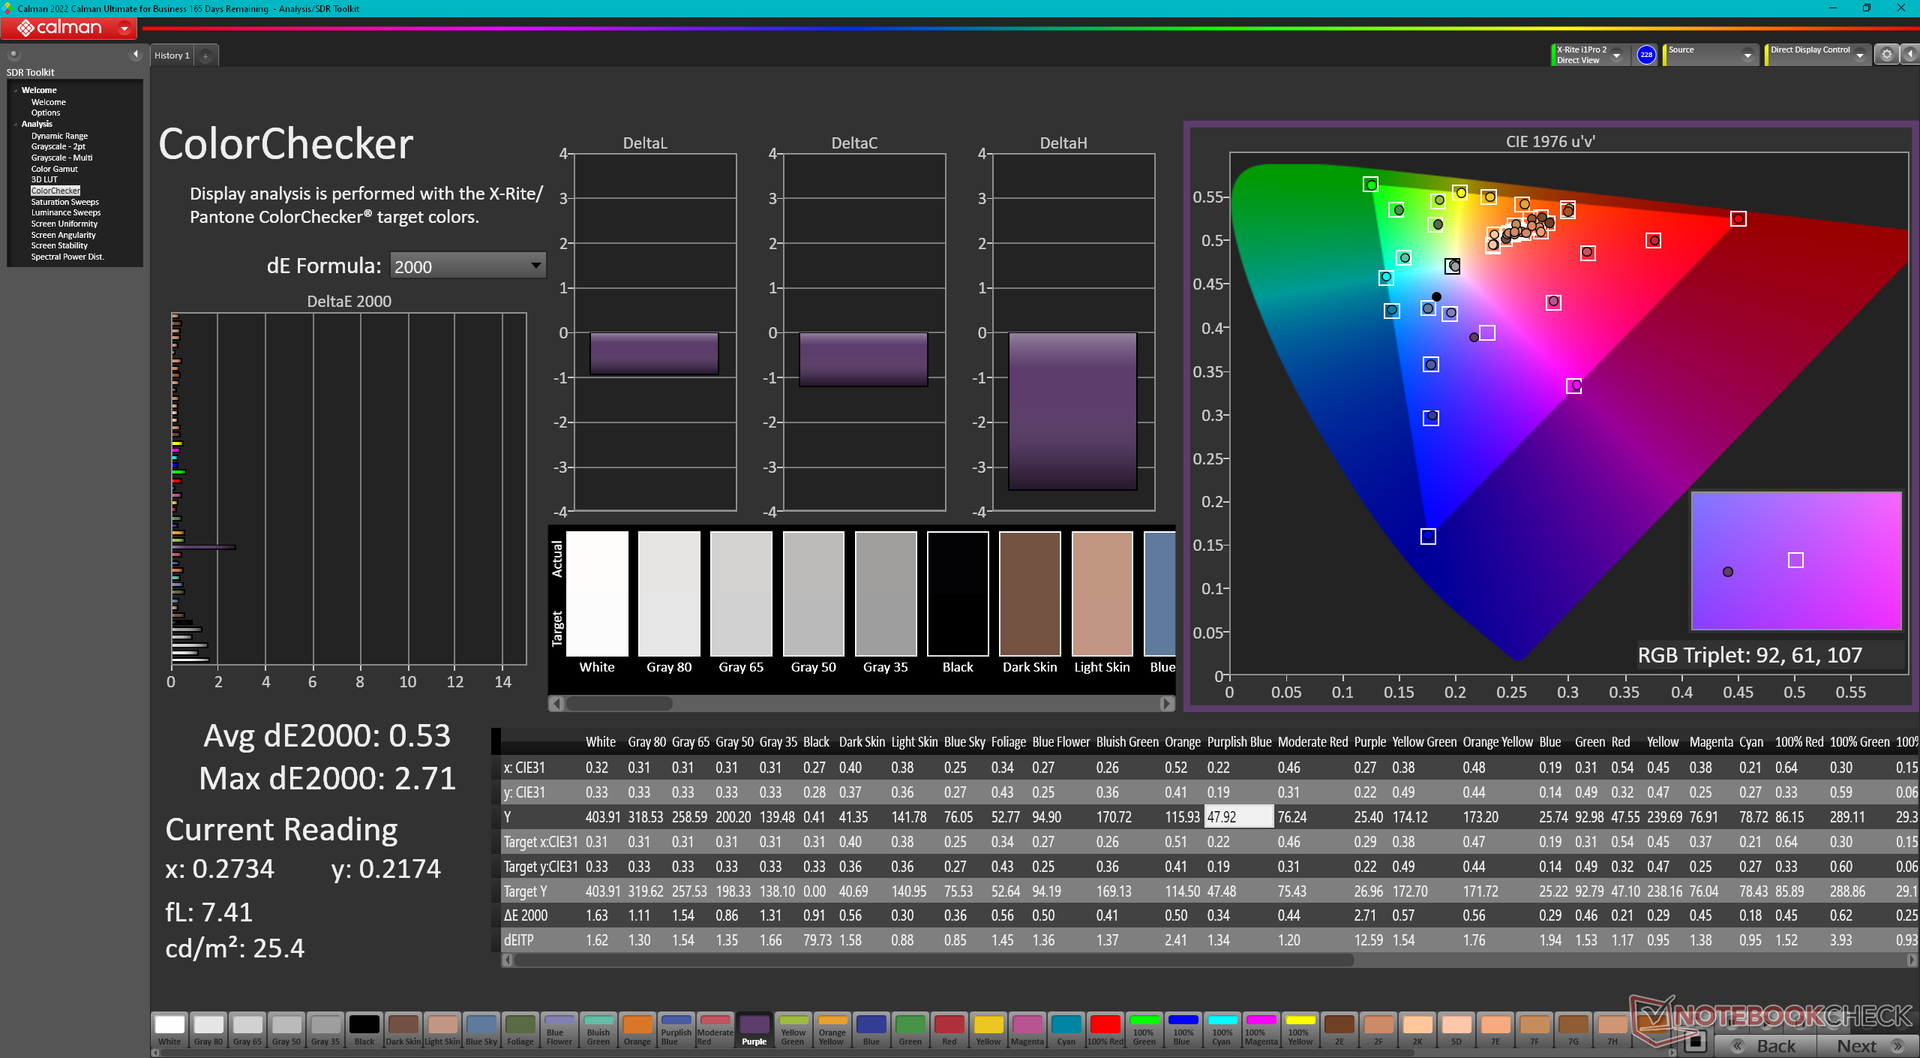
calibrated: 0.53
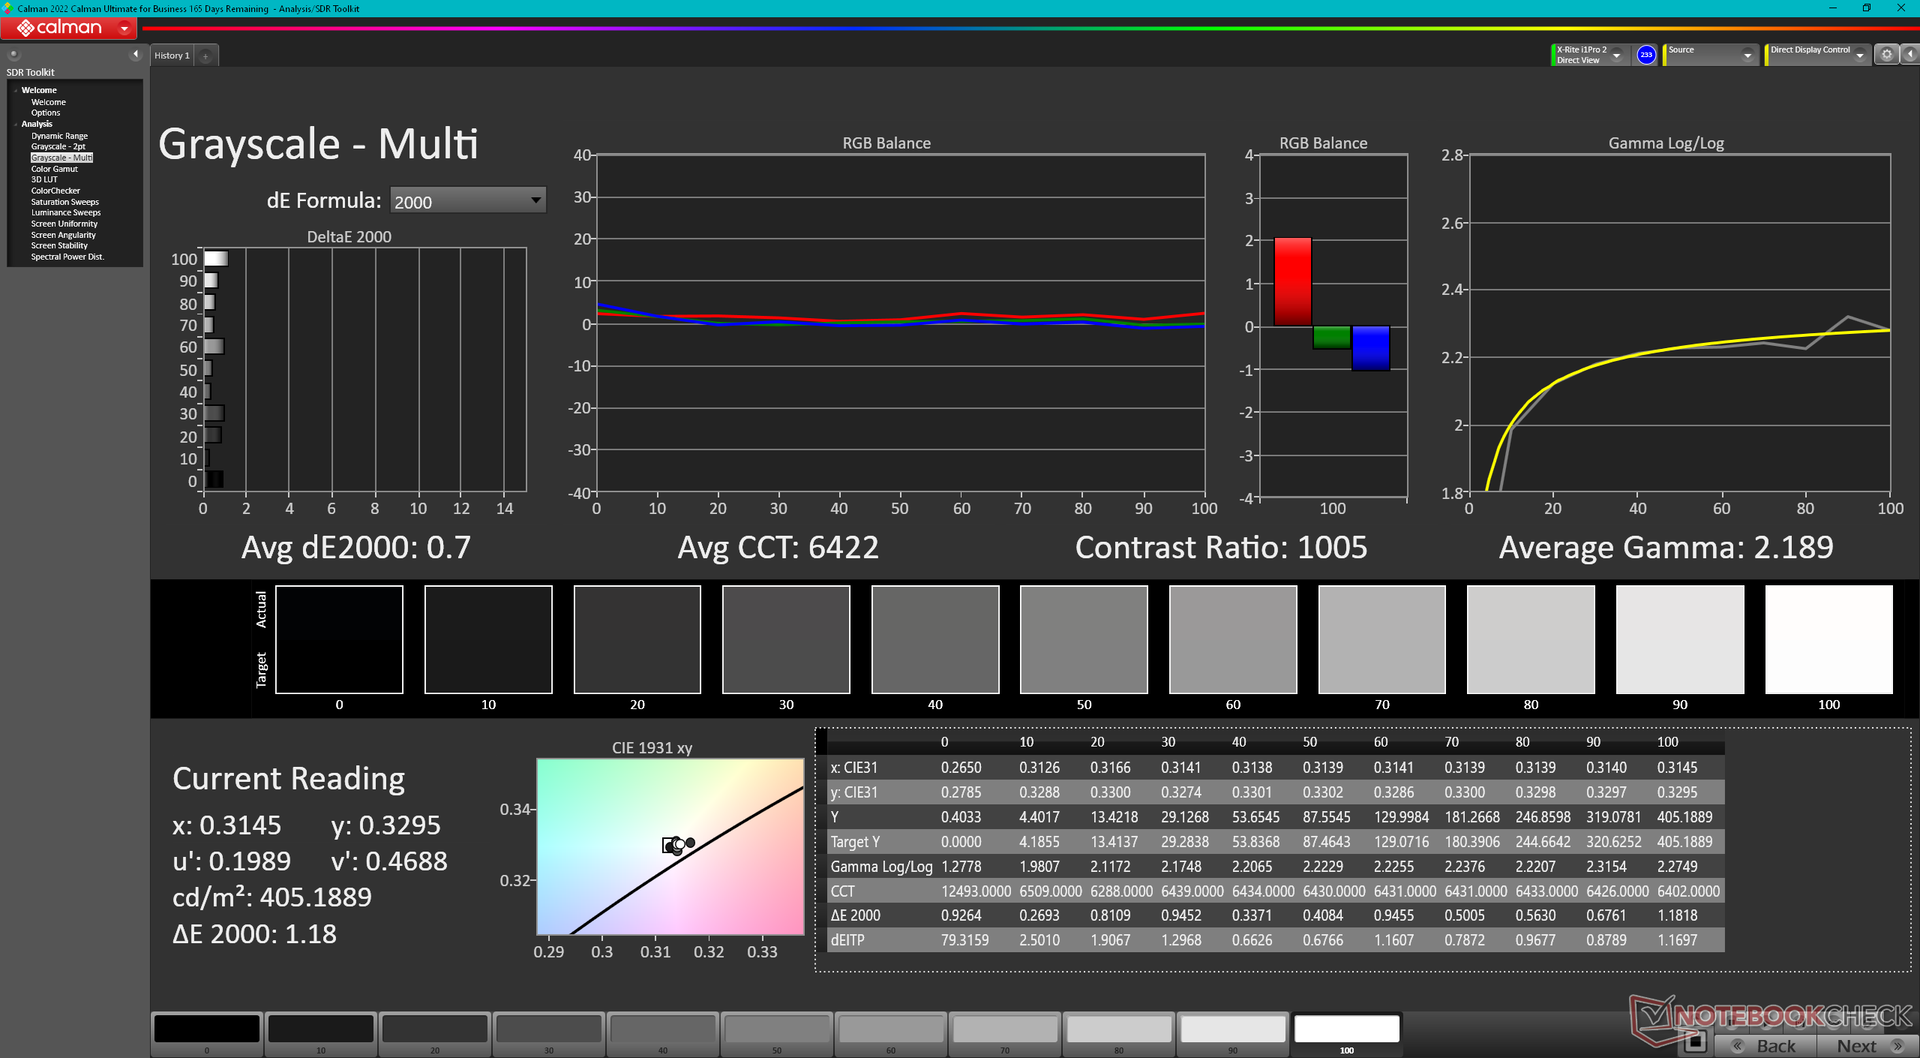
ΔE Greyscale Calman: 1.2 | ∀{0.09-98 Ø4.96}
73.3% AdobeRGB 1998 (Argyll 3D)
98.8% sRGB (Argyll 3D)
71.2% Display P3 (Argyll 3D)
Gamma: 2.3
CCT: 6453 K
| Lenovo Legion Pro 5 16IRX8 AU Optronics B160QAN03.1, IPS, 2560x1600, 16" | Asus ROG Zephyrus M16 GU603Z BOE0A0B (BOE CQ NE160QDM-NY3), IPS, 2560x1600, 16" | Razer Blade 16 Early 2023 CSOT T3 MNG007DA4-1, IPS, 2560x1600, 16" | Lenovo Legion Pro 7 16IRX8H MNG007DA2-3 (CSO1628), IPS, 2560x1600, 16" | Lenovo Legion 5 Pro 16ARH7H RTX 3070 Ti BOE CQ NE160QDM-NY1, IPS, 2560x1600, 16" | Lenovo Legion S7 16ARHA7 BOE CQ NE160QDM-NY1, IPS, 2560x1600, 16" | |
|---|---|---|---|---|---|---|
| Display | 14% | 20% | -2% | -4% | -2% | |
| Display P3 Coverage (%) | 71.2 | 92.8 30% | 98.5 38% | 69.1 -3% | 67.3 -5% | 69.8 -2% |
| sRGB Coverage (%) | 98.8 | 98.5 0% | 100 1% | 99.7 1% | 96.1 -3% | 98.1 -1% |
| AdobeRGB 1998 Coverage (%) | 73.3 | 83.1 13% | 89.7 22% | 71.2 -3% | 69.5 -5% | 71.9 -2% |
| Response Times | 26% | 20% | 29% | -4% | 4% | |
| Response Time Grey 50% / Grey 80% * (ms) | 14.5 ? | 7.6 ? 48% | 6.6 ? 54% | 12.3 ? 15% | 14.4 ? 1% | 10 ? 31% |
| Response Time Black / White * (ms) | 10.4 ? | 10 ? 4% | 12 ? -15% | 5.9 ? 43% | 11.2 ? -8% | 12.8 ? -23% |
| PWM Frequency (Hz) | ||||||
| Screen | -62% | -29% | 15% | -22% | -8% | |
| Brightness middle (cd/m²) | 405.7 | 497 23% | 456.8 13% | 511 26% | 522.8 29% | 492.4 21% |
| Brightness (cd/m²) | 368 | 481 31% | 437 19% | 469 27% | 503 37% | 471 28% |
| Brightness Distribution (%) | 87 | 82 -6% | 83 -5% | 86 -1% | 84 -3% | 90 3% |
| Black Level * (cd/m²) | 0.38 | 0.21 45% | 0.35 8% | 0.4 -5% | 0.41 -8% | 0.4 -5% |
| Contrast (:1) | 1068 | 2367 122% | 1305 22% | 1278 20% | 1275 19% | 1231 15% |
| Colorchecker dE 2000 * | 1.65 | 3.53 -114% | 3.7 -124% | 0.95 42% | 2.47 -50% | 1.9 -15% |
| Colorchecker dE 2000 max. * | 4.2 | 6.15 -46% | 6.42 -53% | 2.07 51% | 6.56 -56% | 3.81 9% |
| Colorchecker dE 2000 calibrated * | 0.53 | 3.53 -566% | 0.66 -25% | 0.91 -72% | 0.61 -15% | 0.99 -87% |
| Greyscale dE 2000 * | 1.2 | 1.74 -45% | 2.6 -117% | 0.6 50% | 3 -150% | 1.7 -42% |
| Gamma | 2.3 96% | 2.2 100% | 2.3 96% | 2.176 101% | 2.27 97% | 2.36 93% |
| CCT | 6453 101% | 6418 101% | 6108 106% | 6545 99% | 6719 97% | 6497 100% |
| Media total (Programa/Opciones) | -7% /
-33% | 4% /
-12% | 14% /
14% | -10% /
-16% | -2% /
-5% |
* ... más pequeño es mejor
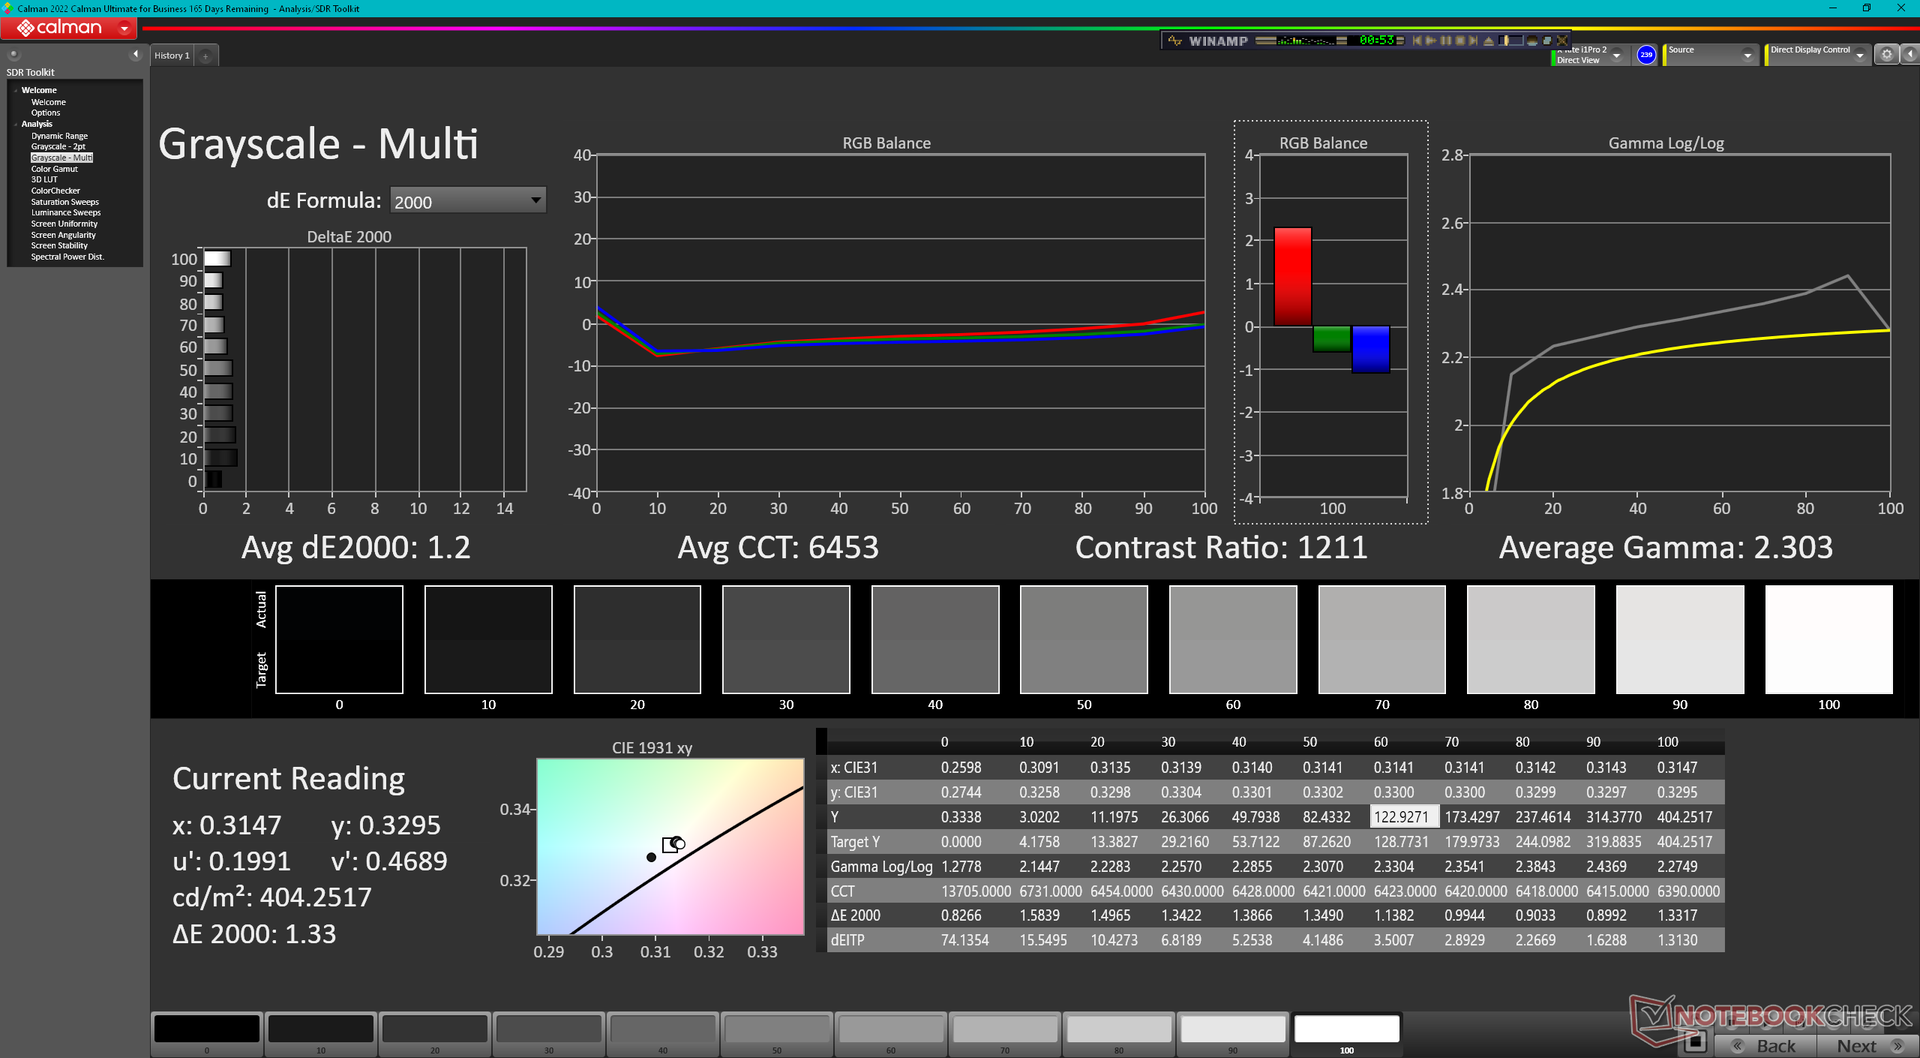
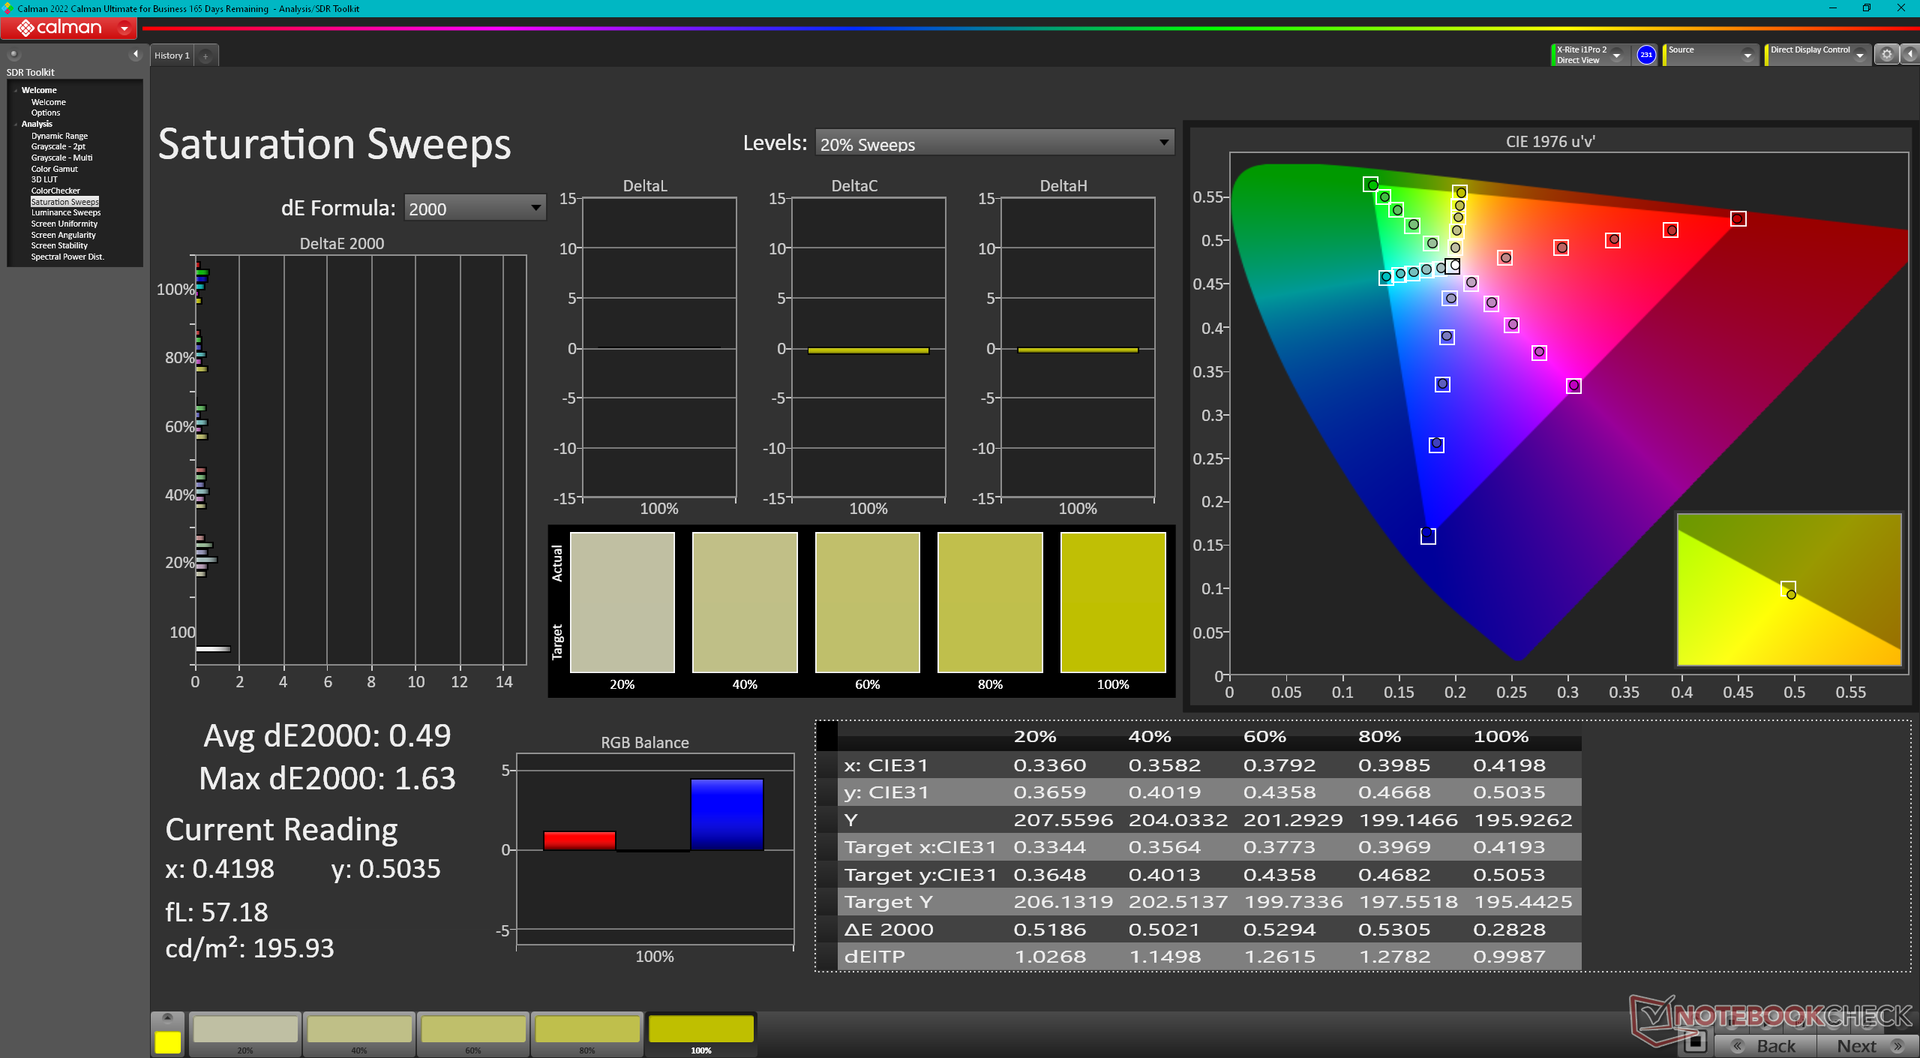
La pantalla viene bien calibrada de fábrica, con valores deltaE medios en escala de grises y color de sólo 1,2 y 1,65, respectivamente. Estos valores son lo bastante bajos como para no necesitar una calibración por parte del usuario final. Calibrar el panel de todos modos mejoraría la precisión del color aún más a <1 como se muestra en las capturas de pantalla a continuación. Si tenemos que ser puntillosos, el morado parece ser el que se representa con menos precisión de todos los colores probados, con un deltaE de 2,71.

Tiempos de respuesta del display
| ↔ Tiempo de respuesta de Negro a Blanco | ||
|---|---|---|
| 10.4 ms ... subida ↗ y bajada ↘ combinada | ↗ 5.7 ms subida | 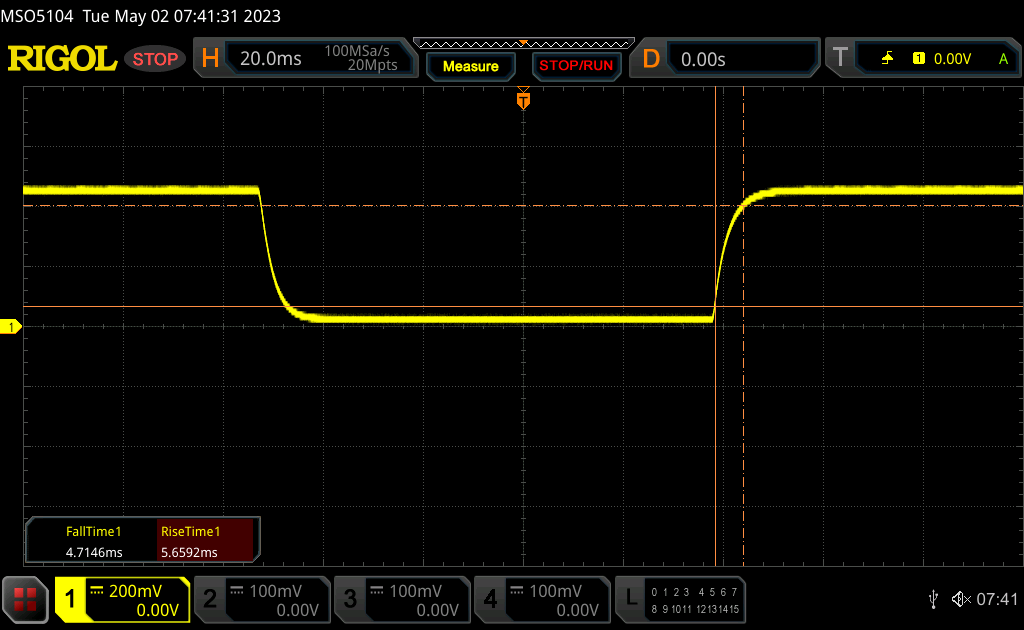 |
| ↘ 4.7 ms bajada | ||
| La pantalla mostró buenos tiempos de respuesta en nuestros tests pero podría ser demasiado lenta para los jugones competitivos. En comparación, todos los dispositivos de prueba van de ##min### (mínimo) a 240 (máximo) ms. » 28 % de todos los dispositivos son mejores. Esto quiere decir que el tiempo de respuesta medido es mejor que la media (19.8 ms) de todos los dispositivos testados. | ||
| ↔ Tiempo de respuesta 50% Gris a 80% Gris | ||
| 14.5 ms ... subida ↗ y bajada ↘ combinada | ↗ 7 ms subida | 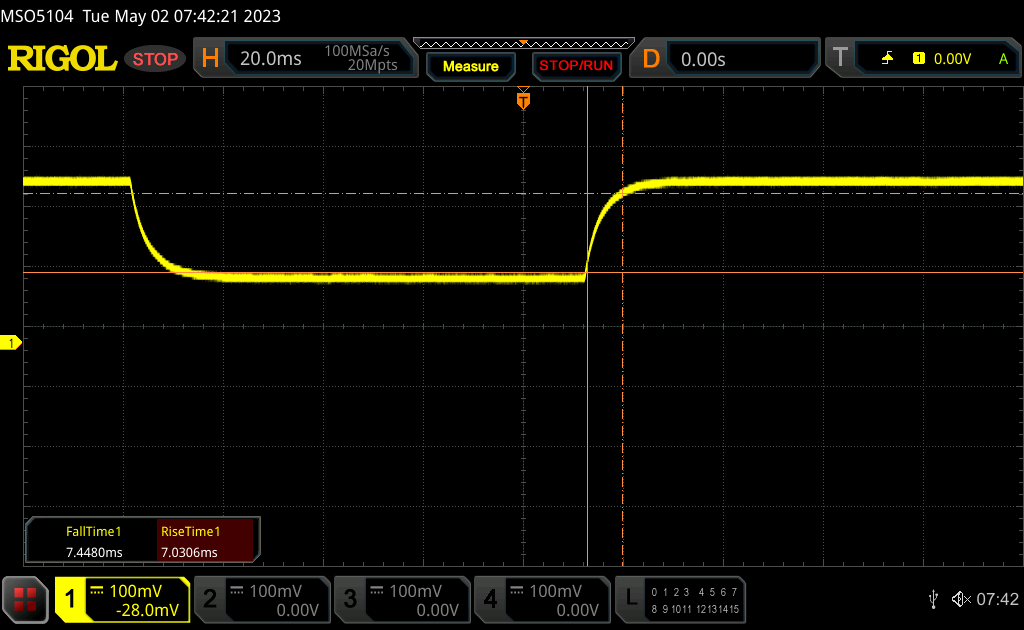 |
| ↘ 7.5 ms bajada | ||
| La pantalla mostró buenos tiempos de respuesta en nuestros tests pero podría ser demasiado lenta para los jugones competitivos. En comparación, todos los dispositivos de prueba van de ##min### (mínimo) a 636 (máximo) ms. » 29 % de todos los dispositivos son mejores. Esto quiere decir que el tiempo de respuesta medido es mejor que la media (31 ms) de todos los dispositivos testados. | ||
Parpadeo de Pantalla / PWM (Pulse-Width Modulation)
| Parpadeo de Pantalla / PWM no detectado | 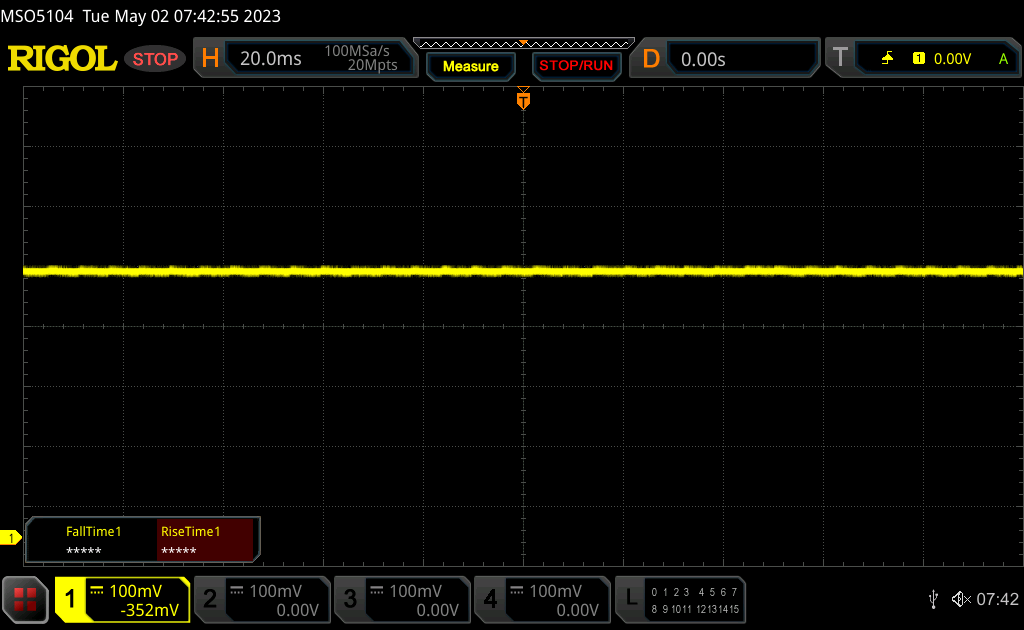 | ||
Comparación: 52 % de todos los dispositivos testados no usaron PWM para atenuar el display. Si se usó, medimos una media de 7757 (mínimo: 5 - máxmo: 343500) Hz. | |||
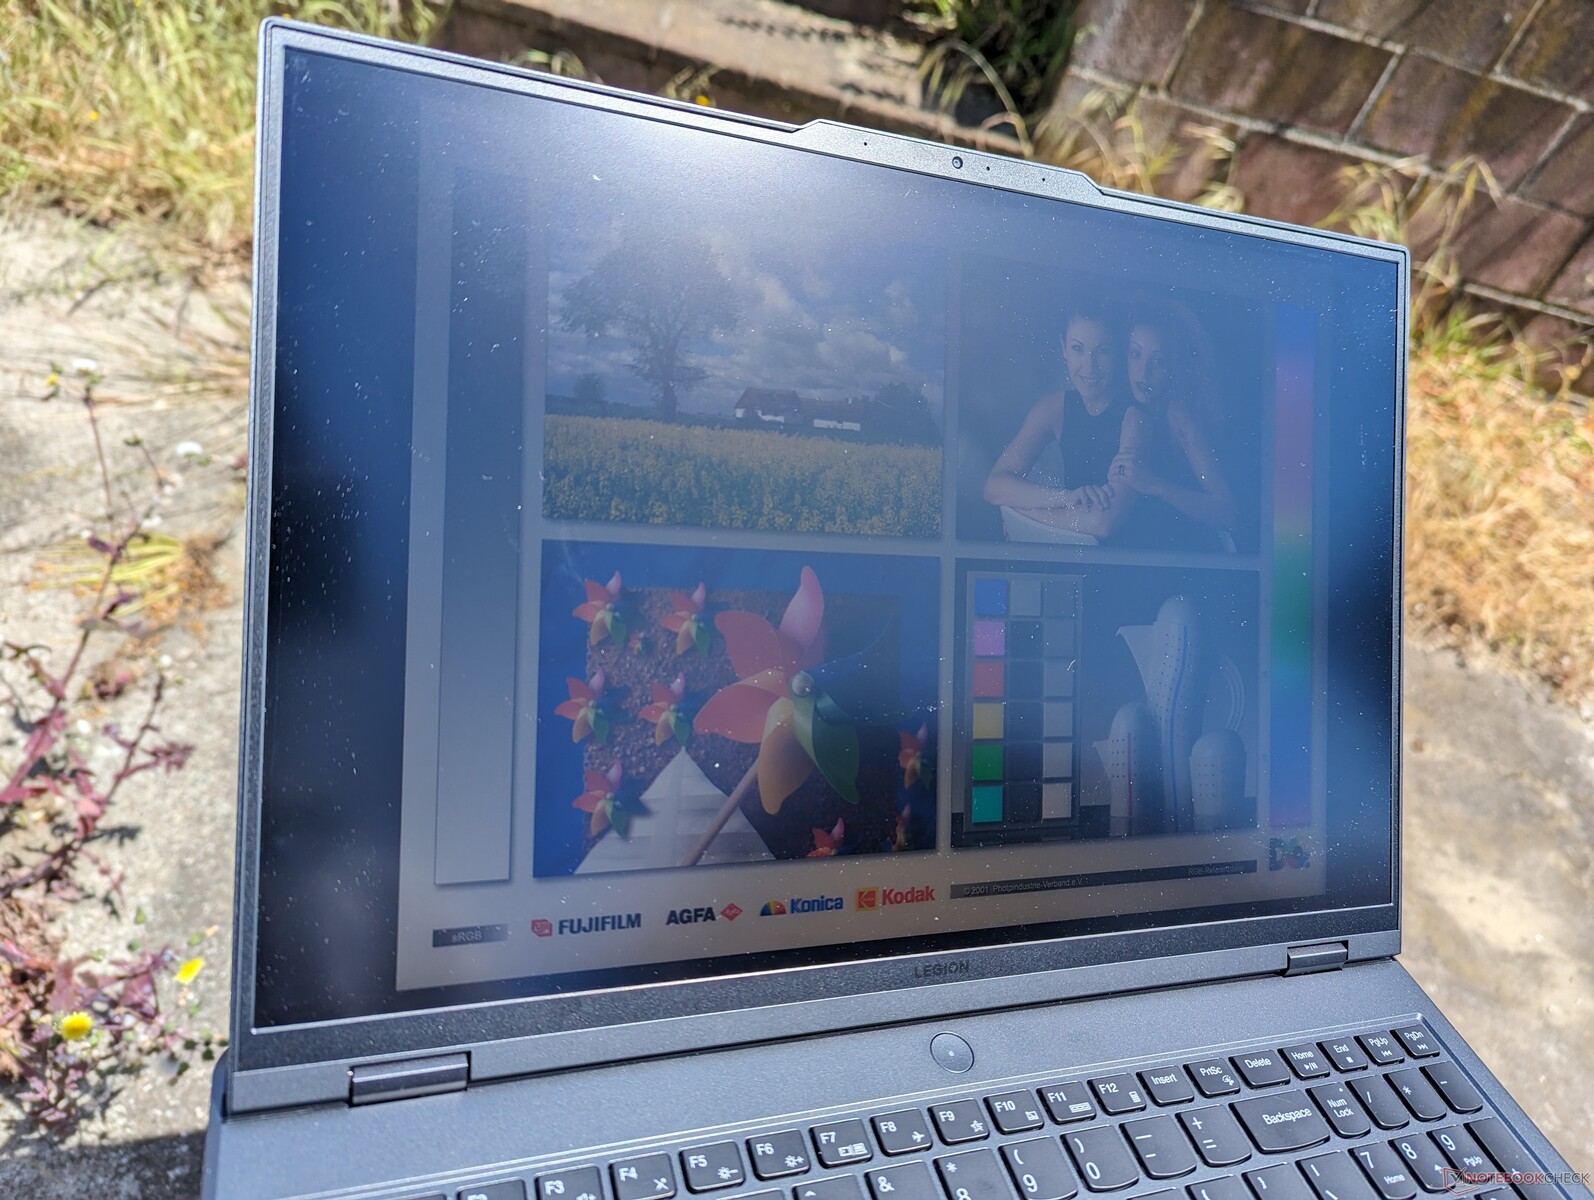
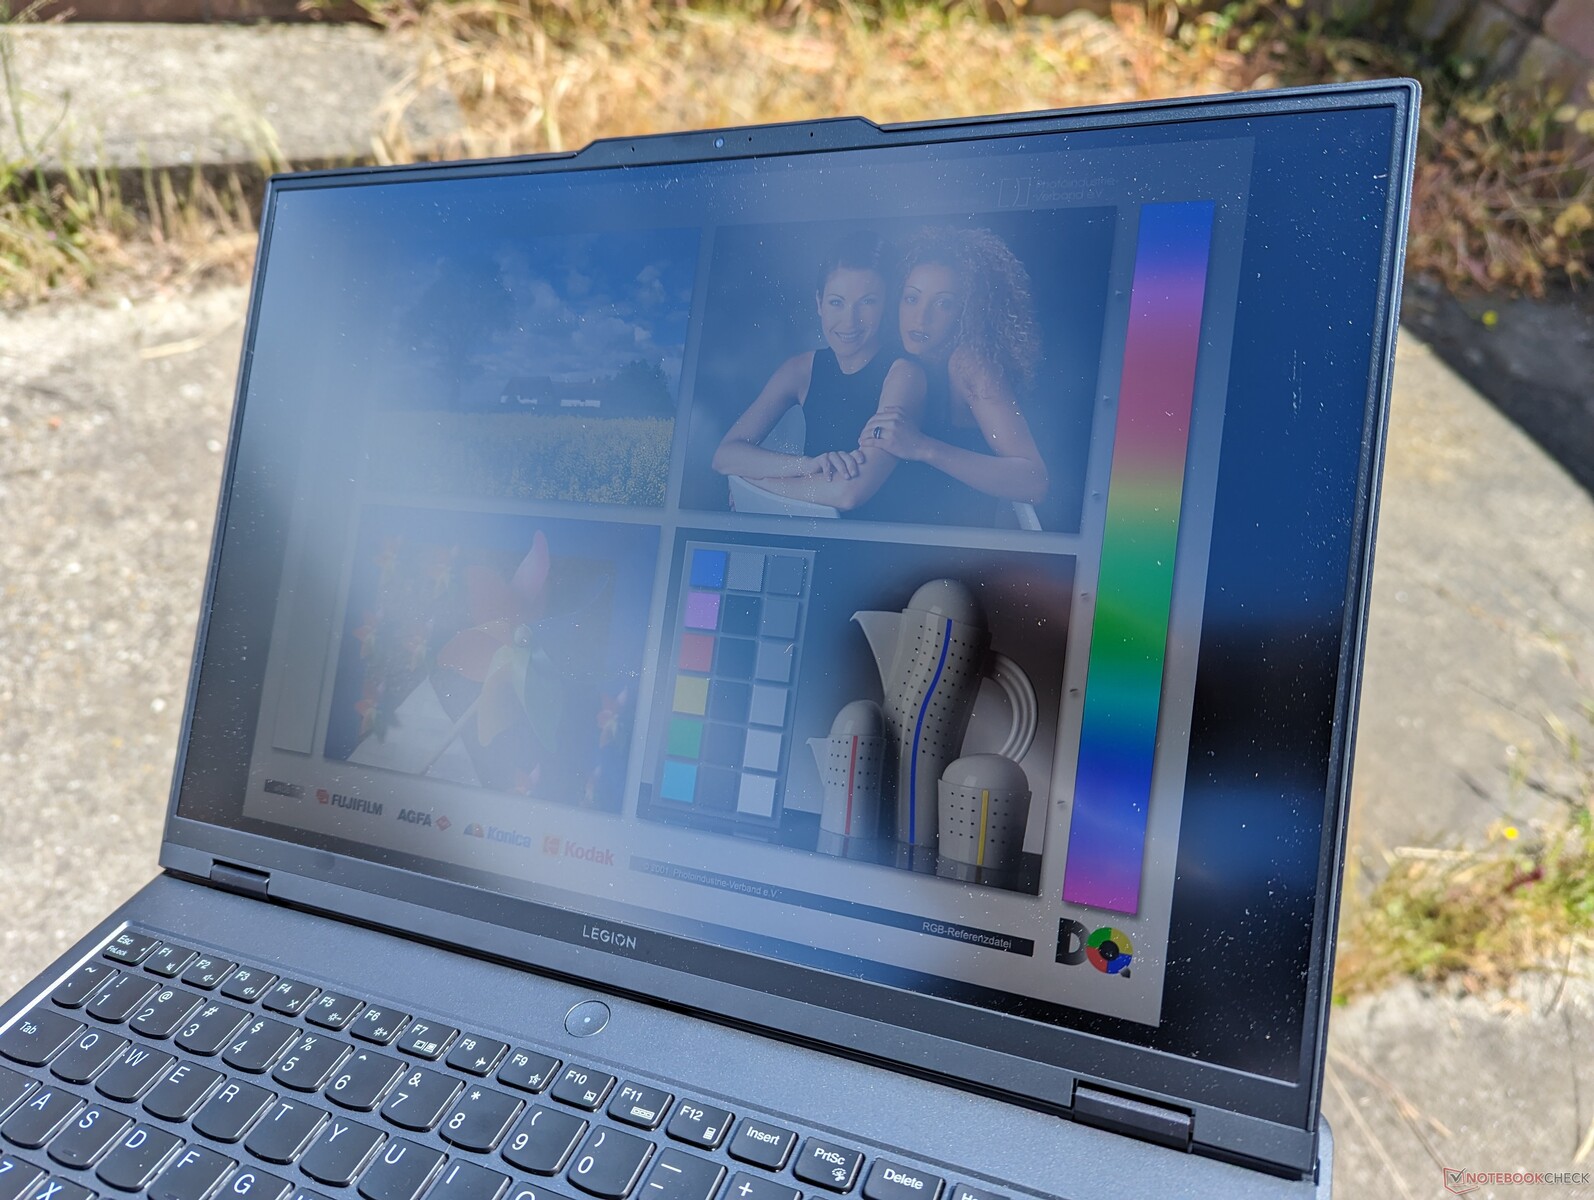
Con 400 nits, la pantalla es generalmente utilizable a la sombra. La opción de panel de 240 Hz es ligeramente más brillante si la visibilidad en exteriores es una preocupación. Los displays de la mayoría de máquinas de juego de 16 pulgadas ya son más brillantes que los de muchos Ultrabooks de gama media, donde lo habitual son 300 nits.
Rendimiento - 13ª generación Raptor Lake
Condiciones de ensayo
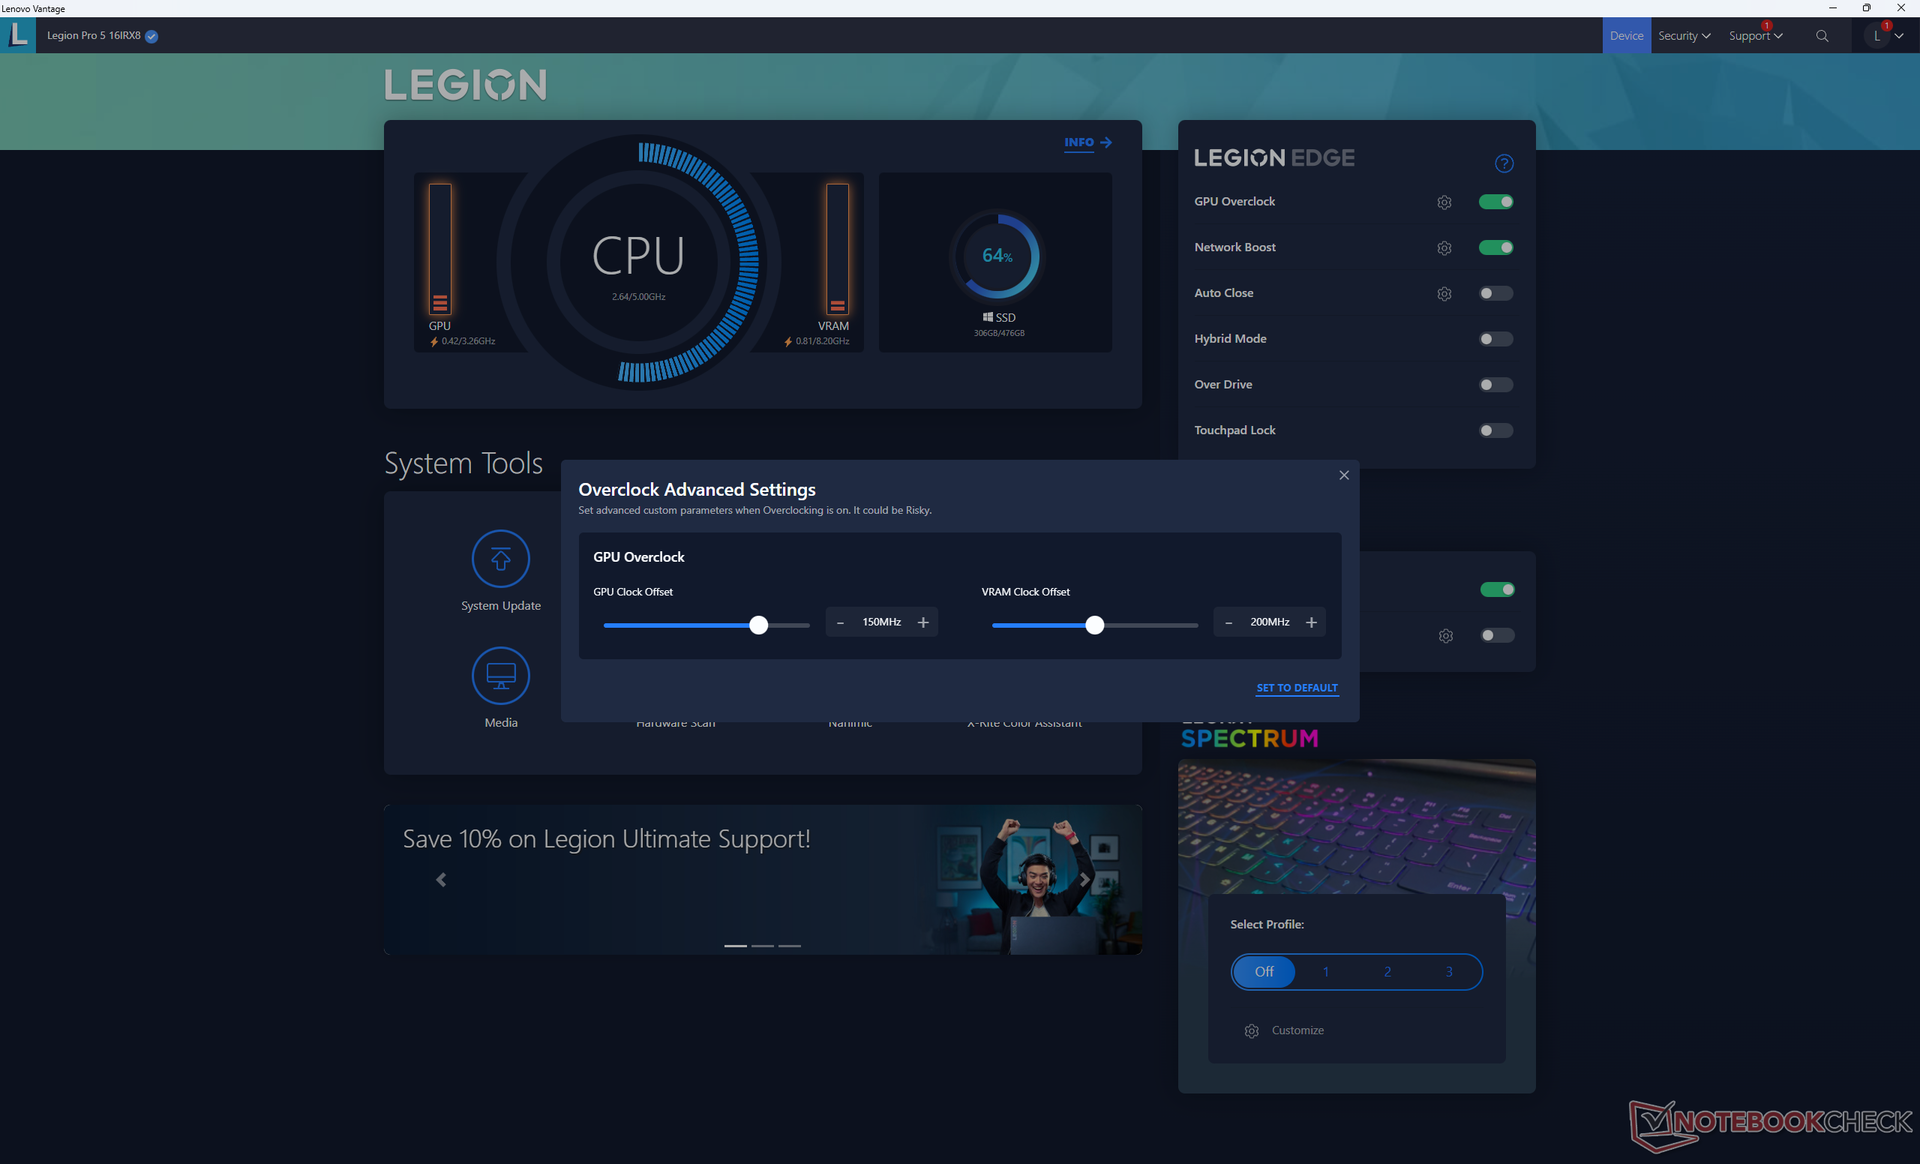
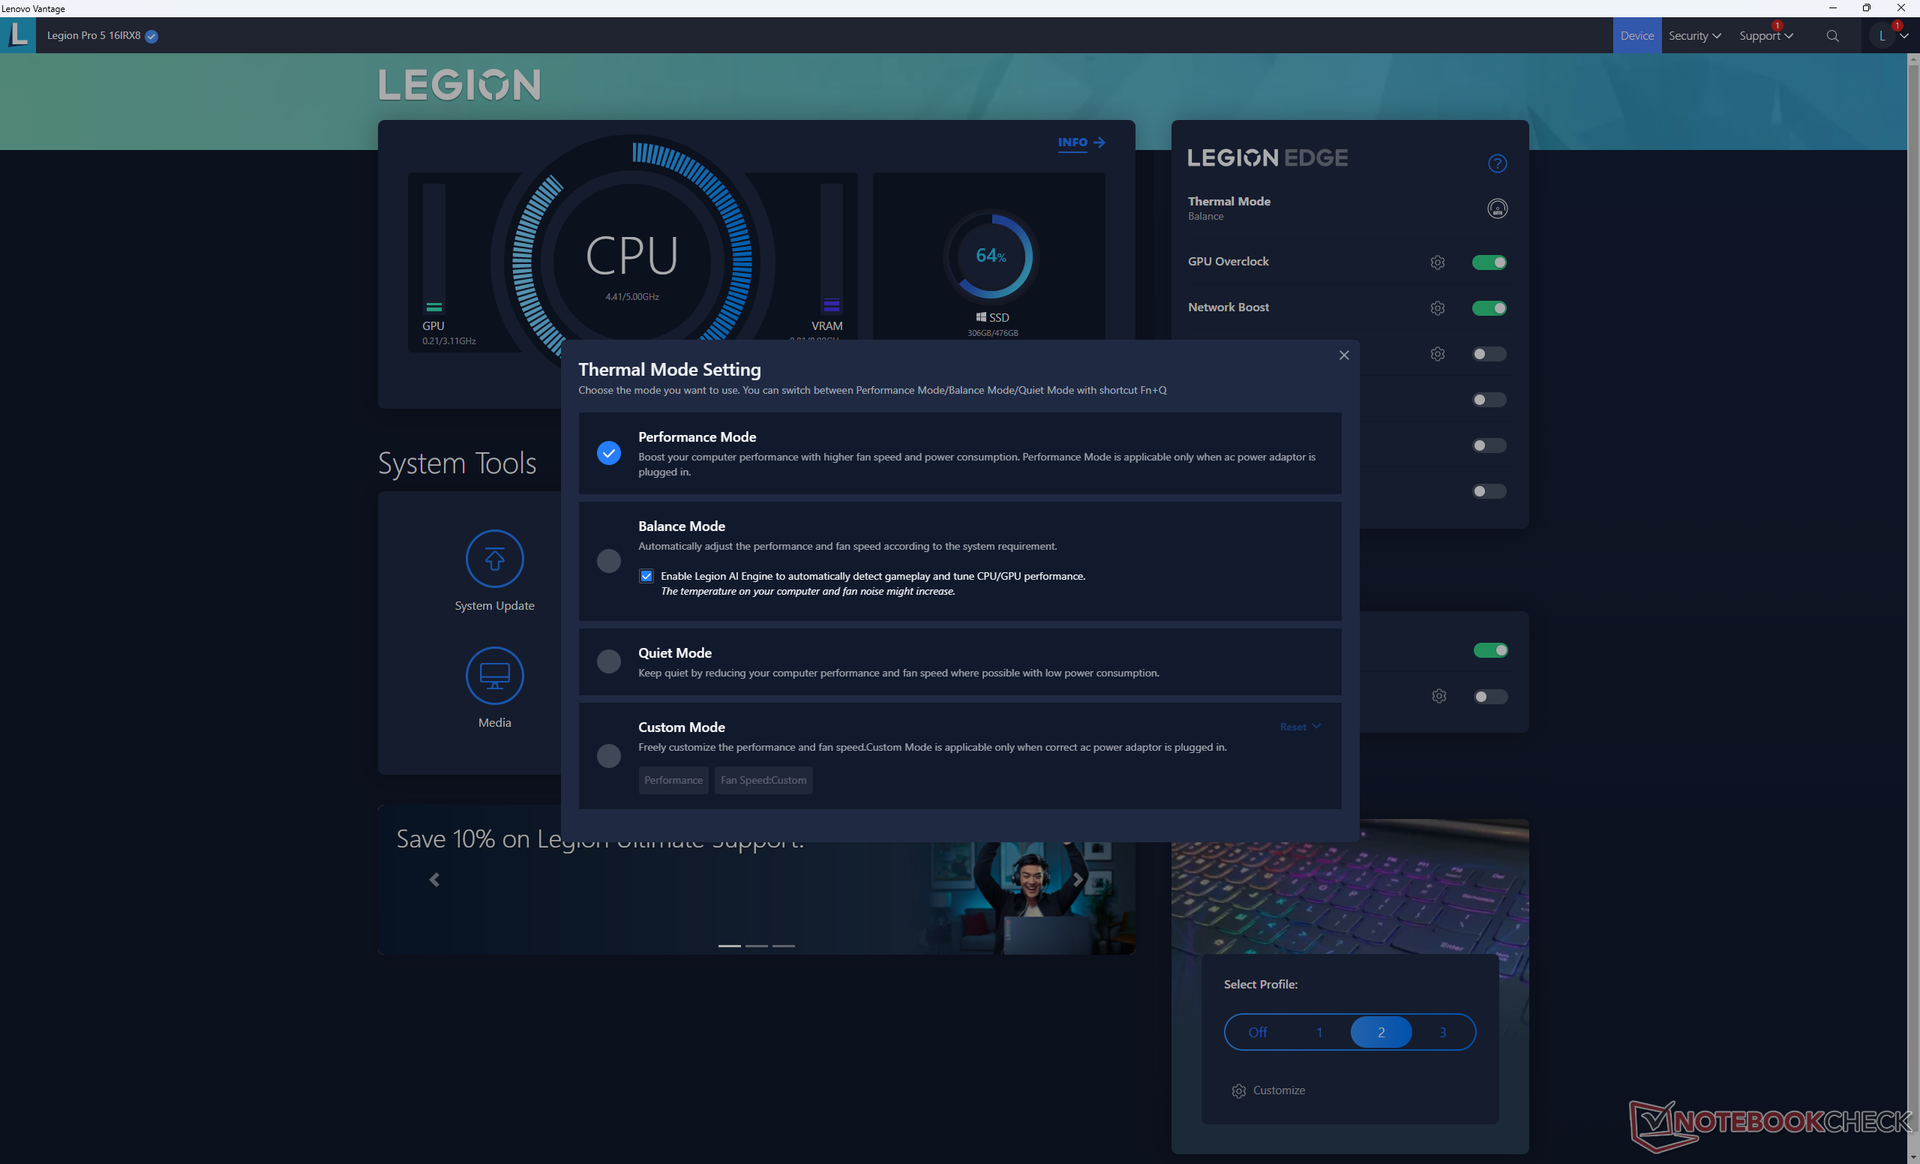
Configuramos nuestra unidad de pruebas en modo Rendimiento con GPU Overclock activo y modo Híbrido desactivado antes de ejecutar los benchmarks que se muestran a continuación. Afortunadamente, todos estos ajustes son fácilmente accesibles a través de la pantalla de inicio de Lenovo Vantage.
Ten en cuenta que aunque MUX es compatible para cambiar entre Optimus y el modo de GPU discreta, siempre será necesario reiniciar el sistema. Por lo tanto, Optimus avanzado no es compatible. G-Sync para la pantalla interna sólo funciona en modo dGPU.
Procesador
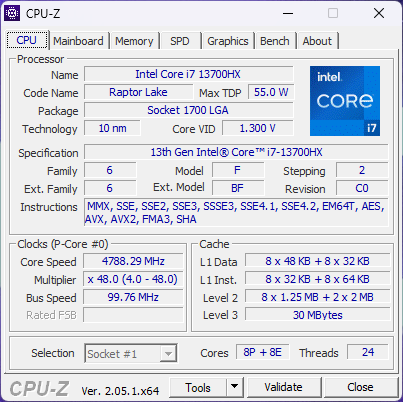
Nuestro Core i7-13700HX es sólo entre un 5 y un 15 por ciento más rápido en cargas multihilo que el antiguo Core i7-12700H al que sustituye. Las ventajas son medibles, aunque relativamente menores. El rendimiento general es comparable al del Core i9-12900H.
La sostenibilidad del rendimiento es excelente, sin caídas notables con el tiempo al ejecutar CineBench R15 xT en bucle.
La actualización al Core i9-13900HX Se espera que aumente significativamente el rendimiento multihilo entre un 50 y un 70 por ciento con respecto al Core i7-13700HX. Si valoras el rendimiento del procesador, puede que merezca la pena pasar de las opciones Core i5-13500H y Core i7-13700HX a Core i9.
Cinebench R15 Multi Loop
Cinebench R23: Multi Core | Single Core
Cinebench R20: CPU (Multi Core) | CPU (Single Core)
Cinebench R15: CPU Multi 64Bit | CPU Single 64Bit
Blender: v2.79 BMW27 CPU
7-Zip 18.03: 7z b 4 | 7z b 4 -mmt1
Geekbench 5.5: Multi-Core | Single-Core
HWBOT x265 Benchmark v2.2: 4k Preset
LibreOffice : 20 Documents To PDF
R Benchmark 2.5: Overall mean
* ... más pequeño es mejor
AIDA64: FP32 Ray-Trace | FPU Julia | CPU SHA3 | CPU Queen | FPU SinJulia | FPU Mandel | CPU AES | CPU ZLib | FP64 Ray-Trace | CPU PhotoWorxx
| Performance rating | |
| Lenovo Legion Pro 7 16IRX8H | |
| Razer Blade 16 Early 2023 | |
| Lenovo Legion Pro 5 16IRX8 | |
| Medio Intel Core i7-13700HX | |
| Lenovo Legion 5 Pro 16ARH7H RTX 3070 Ti | |
| Lenovo Legion S7 16ARHA7 | |
| Asus ROG Zephyrus M16 GU603Z | |
Rendimiento del sistema
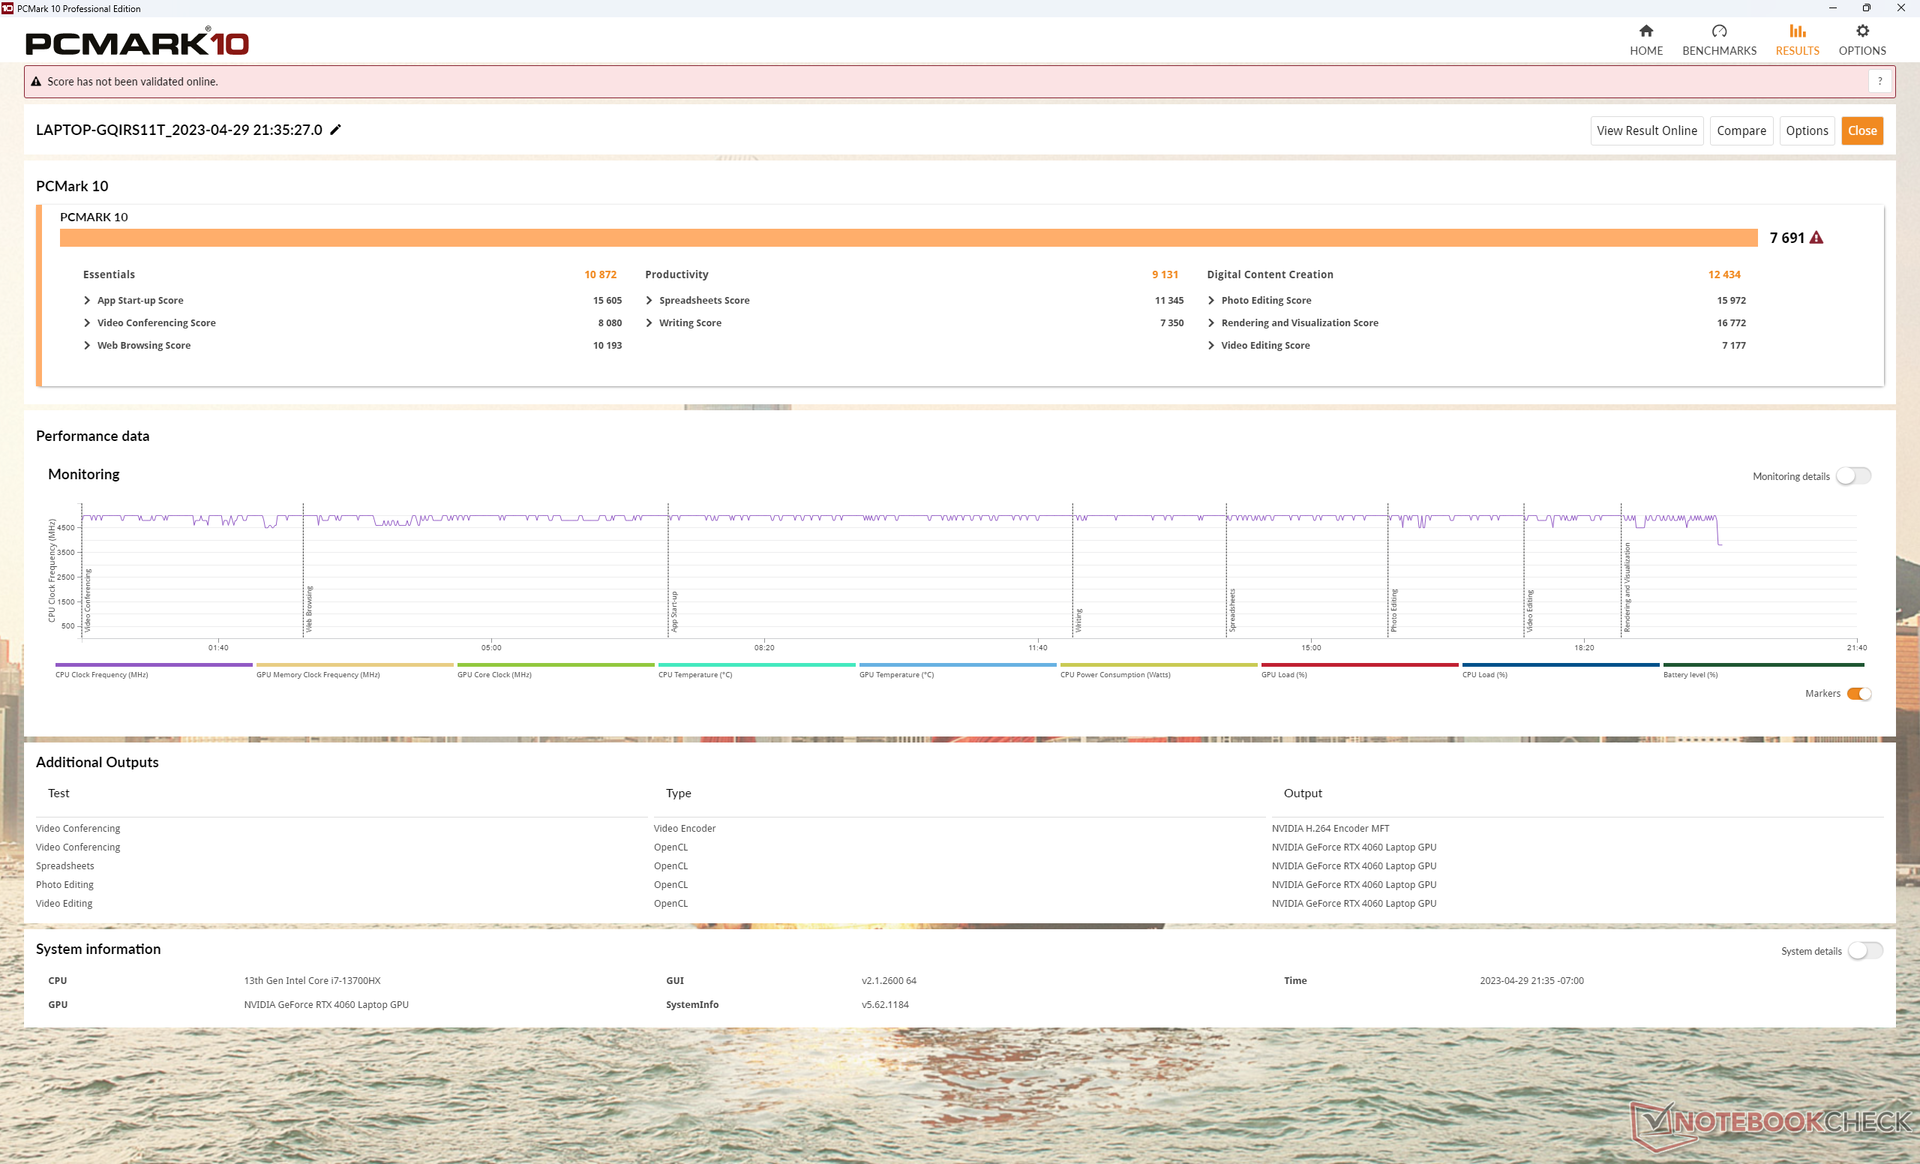
Los resultados de PCMark son comparables a los de otros modelos de Legion como el Legion 5 Pro 16 de 2022 a pesar de los procesadores de nueva generación de nuestra unidad 2023. Esto sugiere que, si bien la CPU y la GPU pueden ser más rápidas esta vez, no necesariamente ejecutarán aplicaciones del día a día como ofimática o navegadores notablemente más rápido que un portátil gaming de antaño.
CrossMark: Overall | Productivity | Creativity | Responsiveness
| PCMark 10 / Score | |
| Razer Blade 16 Early 2023 | |
| Asus ROG Zephyrus M16 GU603Z | |
| Lenovo Legion Pro 7 16IRX8H | |
| Lenovo Legion Pro 5 16IRX8 | |
| Lenovo Legion S7 16ARHA7 | |
| Lenovo Legion 5 Pro 16ARH7H RTX 3070 Ti | |
| Medio Intel Core i7-13700HX, NVIDIA GeForce RTX 4060 Laptop GPU (6909 - 7743, n=5) | |
| PCMark 10 / Essentials | |
| Lenovo Legion Pro 7 16IRX8H | |
| Razer Blade 16 Early 2023 | |
| Asus ROG Zephyrus M16 GU603Z | |
| Lenovo Legion Pro 5 16IRX8 | |
| Lenovo Legion S7 16ARHA7 | |
| Medio Intel Core i7-13700HX, NVIDIA GeForce RTX 4060 Laptop GPU (9760 - 11313, n=5) | |
| Lenovo Legion 5 Pro 16ARH7H RTX 3070 Ti | |
| PCMark 10 / Productivity | |
| Lenovo Legion Pro 7 16IRX8H | |
| Asus ROG Zephyrus M16 GU603Z | |
| Lenovo Legion S7 16ARHA7 | |
| Medio Intel Core i7-13700HX, NVIDIA GeForce RTX 4060 Laptop GPU (9131 - 11018, n=5) | |
| Lenovo Legion 5 Pro 16ARH7H RTX 3070 Ti | |
| Lenovo Legion Pro 5 16IRX8 | |
| Razer Blade 16 Early 2023 | |
| PCMark 10 / Digital Content Creation | |
| Razer Blade 16 Early 2023 | |
| Lenovo Legion Pro 5 16IRX8 | |
| Asus ROG Zephyrus M16 GU603Z | |
| Lenovo Legion 5 Pro 16ARH7H RTX 3070 Ti | |
| Lenovo Legion S7 16ARHA7 | |
| Medio Intel Core i7-13700HX, NVIDIA GeForce RTX 4060 Laptop GPU (9393 - 12434, n=5) | |
| Lenovo Legion Pro 7 16IRX8H | |
| CrossMark / Overall | |
| Asus ROG Zephyrus M16 GU603Z | |
| Medio Intel Core i7-13700HX, NVIDIA GeForce RTX 4060 Laptop GPU (1663 - 2105, n=5) | |
| Lenovo Legion S7 16ARHA7 | |
| Lenovo Legion Pro 5 16IRX8 | |
| Lenovo Legion 5 Pro 16ARH7H RTX 3070 Ti | |
| Razer Blade 16 Early 2023 | |
| CrossMark / Productivity | |
| Asus ROG Zephyrus M16 GU603Z | |
| Medio Intel Core i7-13700HX, NVIDIA GeForce RTX 4060 Laptop GPU (1618 - 1989, n=5) | |
| Lenovo Legion S7 16ARHA7 | |
| Lenovo Legion Pro 5 16IRX8 | |
| Lenovo Legion 5 Pro 16ARH7H RTX 3070 Ti | |
| Razer Blade 16 Early 2023 | |
| CrossMark / Creativity | |
| Medio Intel Core i7-13700HX, NVIDIA GeForce RTX 4060 Laptop GPU (1710 - 2274, n=5) | |
| Asus ROG Zephyrus M16 GU603Z | |
| Lenovo Legion S7 16ARHA7 | |
| Razer Blade 16 Early 2023 | |
| Lenovo Legion 5 Pro 16ARH7H RTX 3070 Ti | |
| Lenovo Legion Pro 5 16IRX8 | |
| CrossMark / Responsiveness | |
| Asus ROG Zephyrus M16 GU603Z | |
| Medio Intel Core i7-13700HX, NVIDIA GeForce RTX 4060 Laptop GPU (1269 - 1983, n=5) | |
| Lenovo Legion Pro 5 16IRX8 | |
| Lenovo Legion S7 16ARHA7 | |
| Lenovo Legion 5 Pro 16ARH7H RTX 3070 Ti | |
| Razer Blade 16 Early 2023 | |
| PCMark 10 Score | 7691 puntos | |
ayuda | ||
* ... más pequeño es mejor
Latencia del CPD
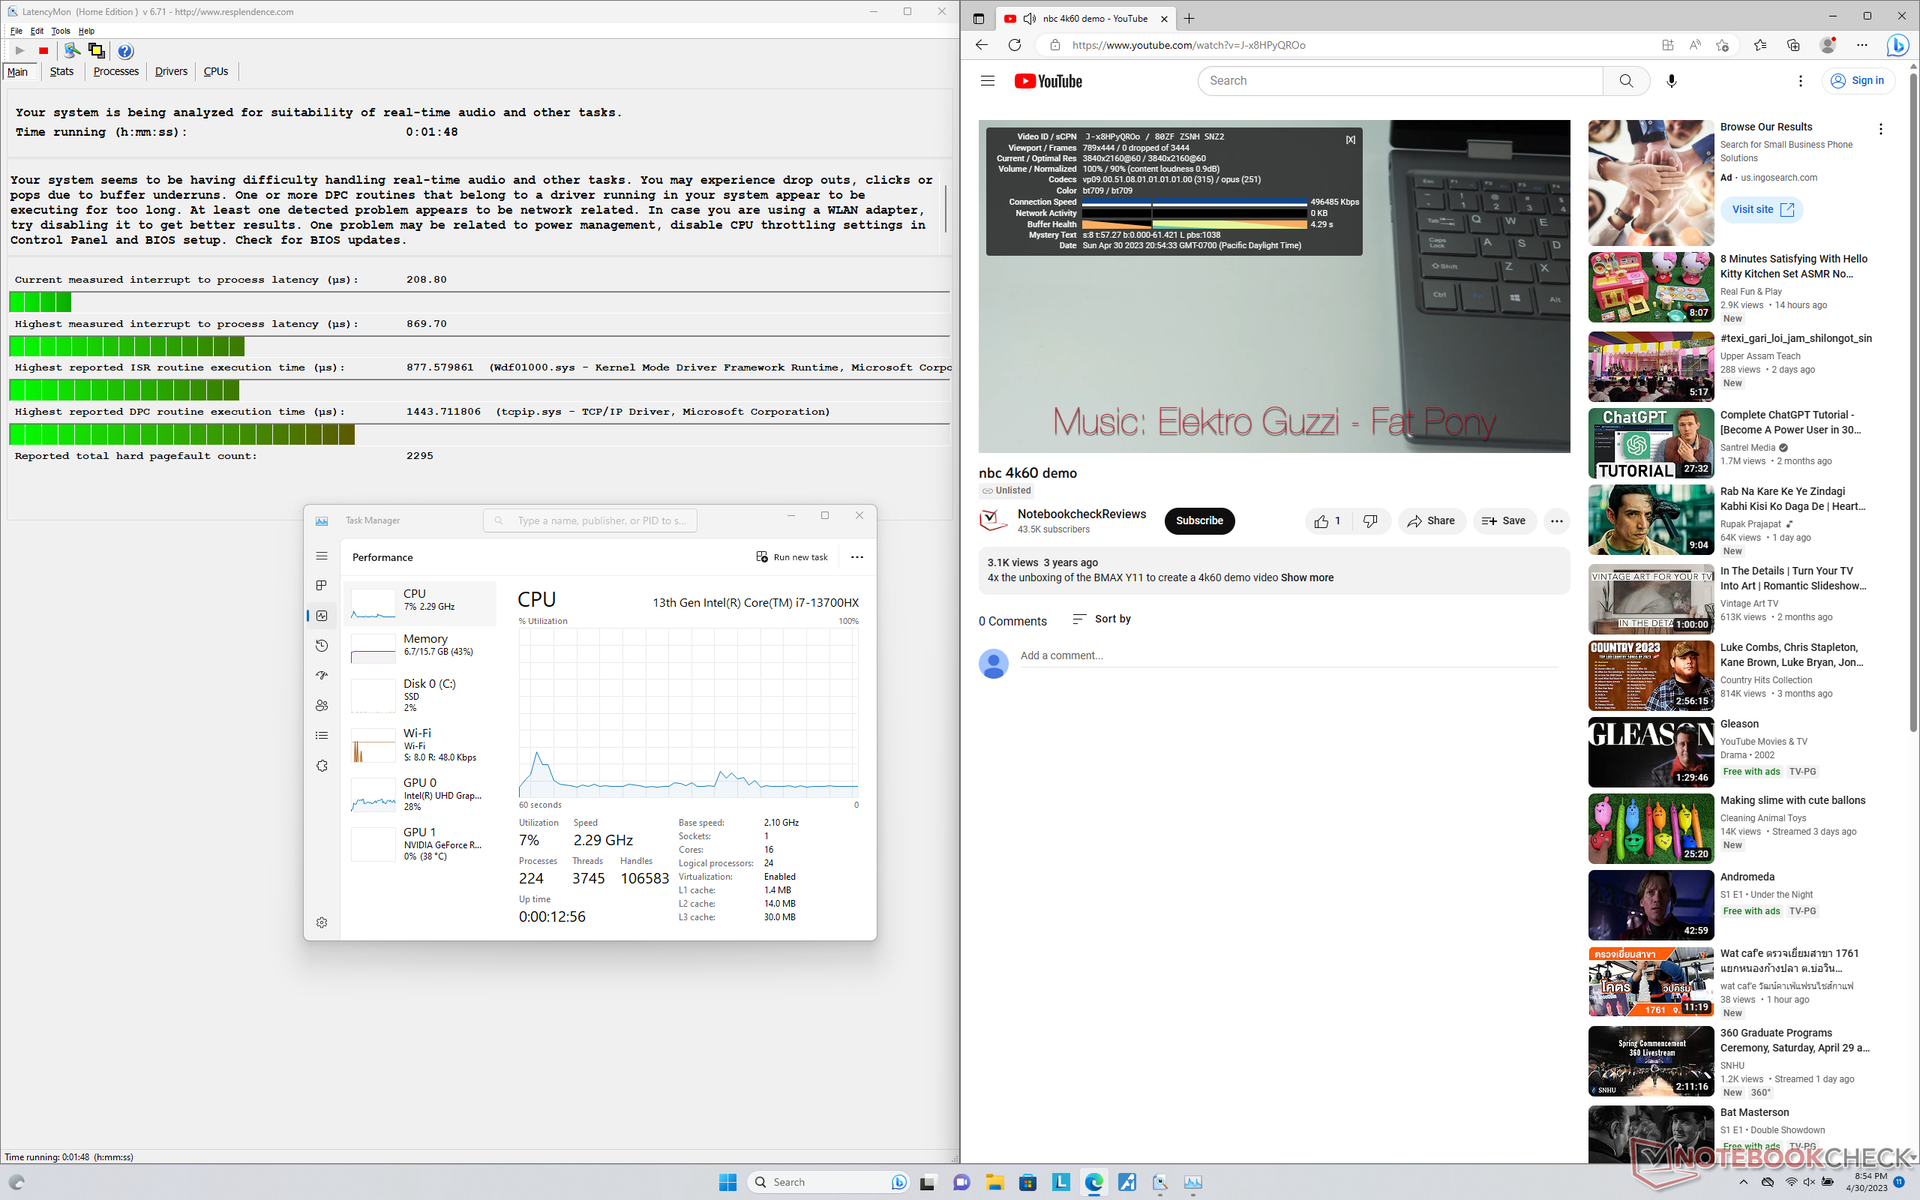
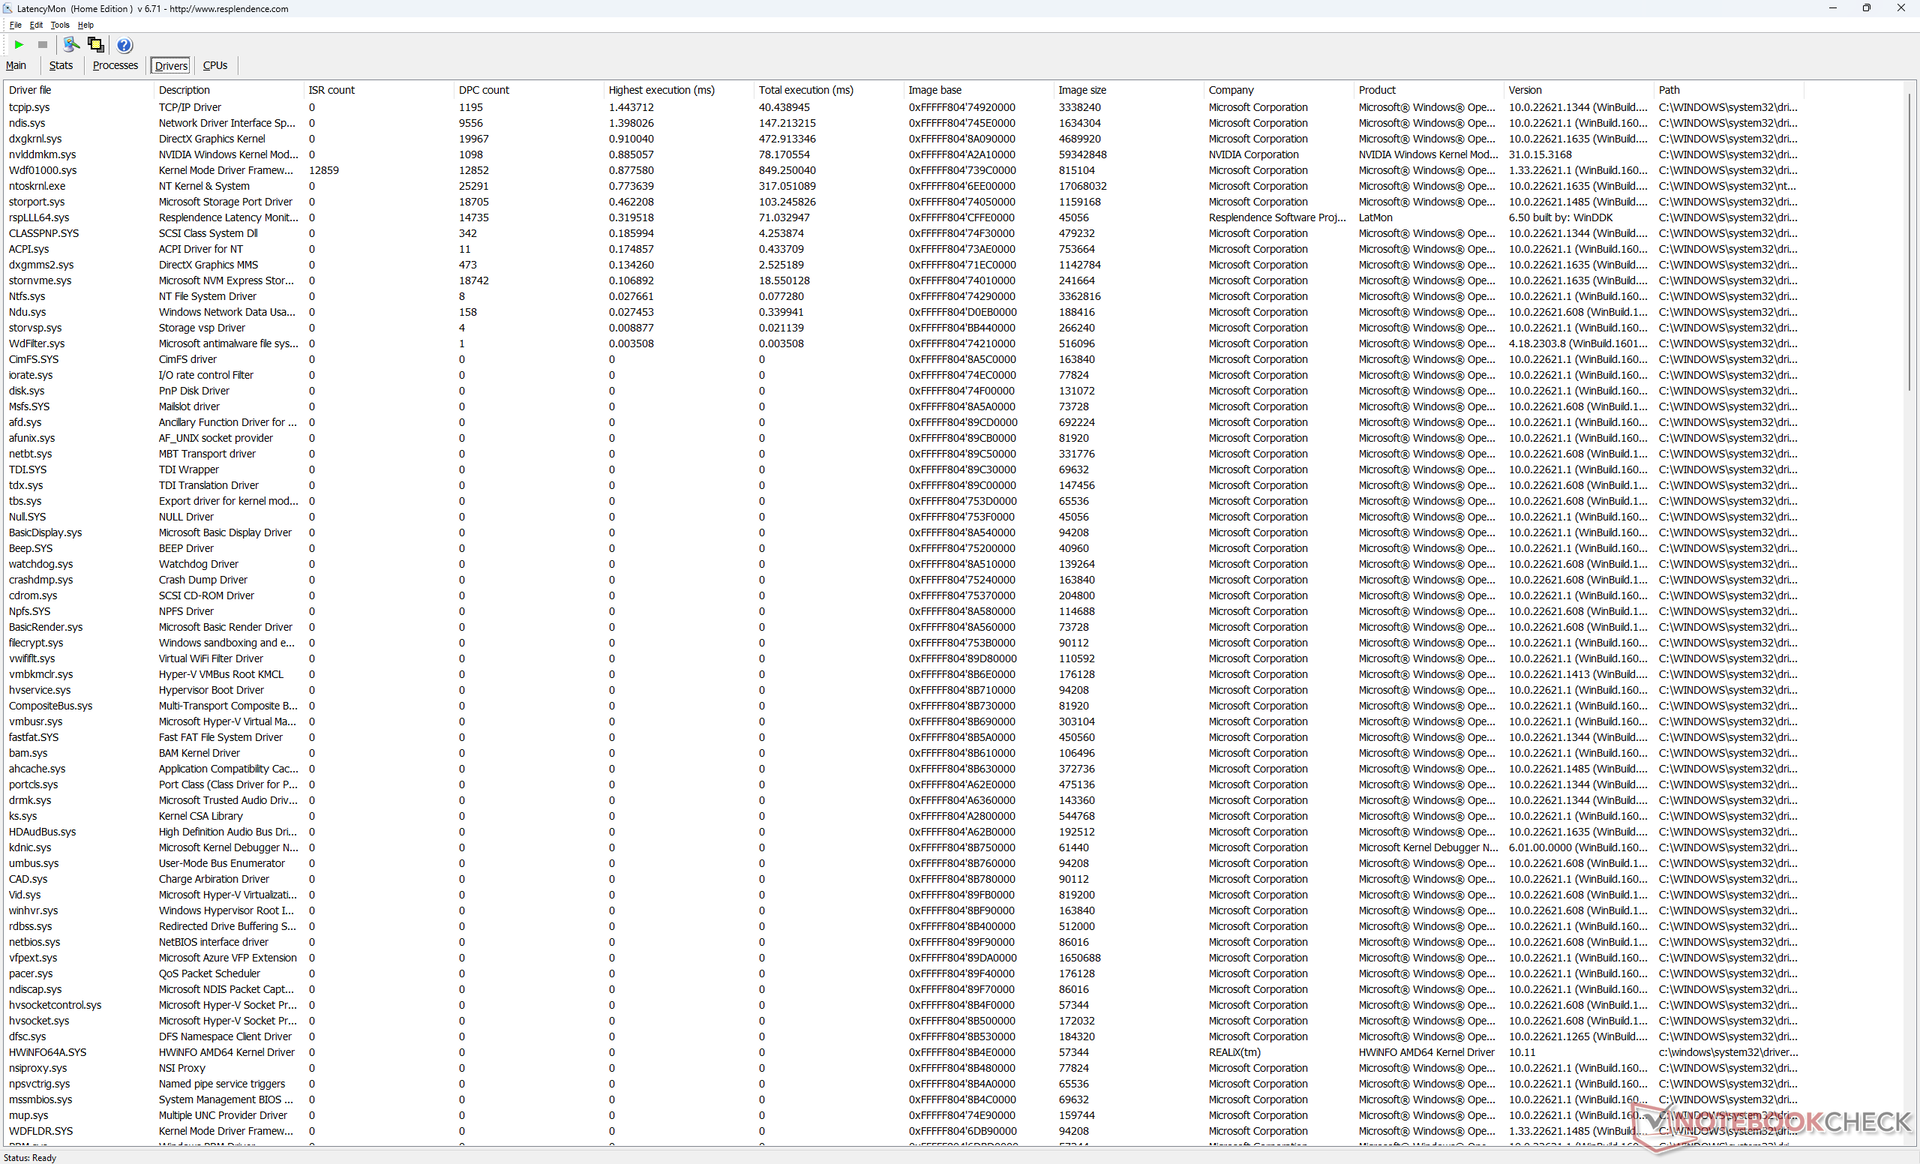
LatencyMon revela problemas menores de CPD al abrir varias pestañas de nuestra página de inicio incluso en modo iGPU. por lo demás, la reproducción de vídeo 4K a 60 FPS es perfecta y no se registran caídas de frames.
| DPC Latencies / LatencyMon - interrupt to process latency (max), Web, Youtube, Prime95 | |
| Razer Blade 16 Early 2023 | |
| Asus ROG Zephyrus M16 GU603Z | |
| Lenovo Legion S7 16ARHA7 | |
| Lenovo Legion Pro 5 16IRX8 | |
| Lenovo Legion 5 Pro 16ARH7H RTX 3070 Ti | |
| Lenovo Legion Pro 7 16IRX8H | |
* ... más pequeño es mejor
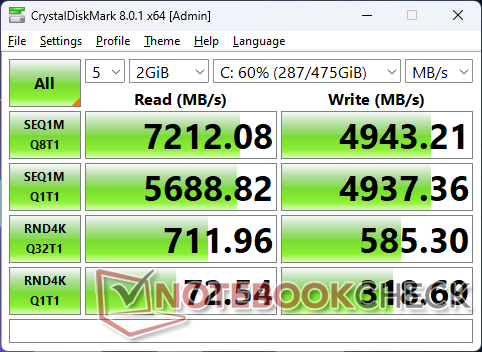
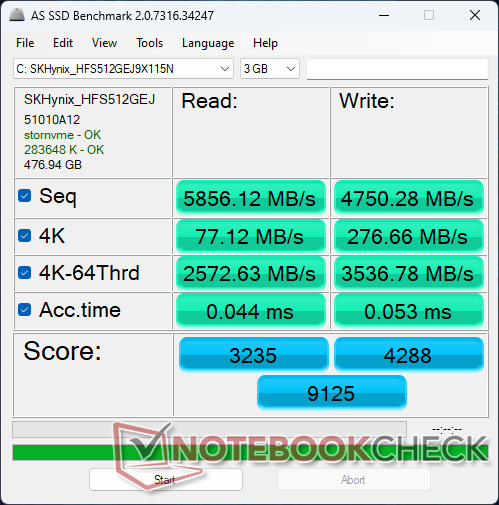
Dispositivos de almacenamiento: hasta dos unidades PCIe4 x4
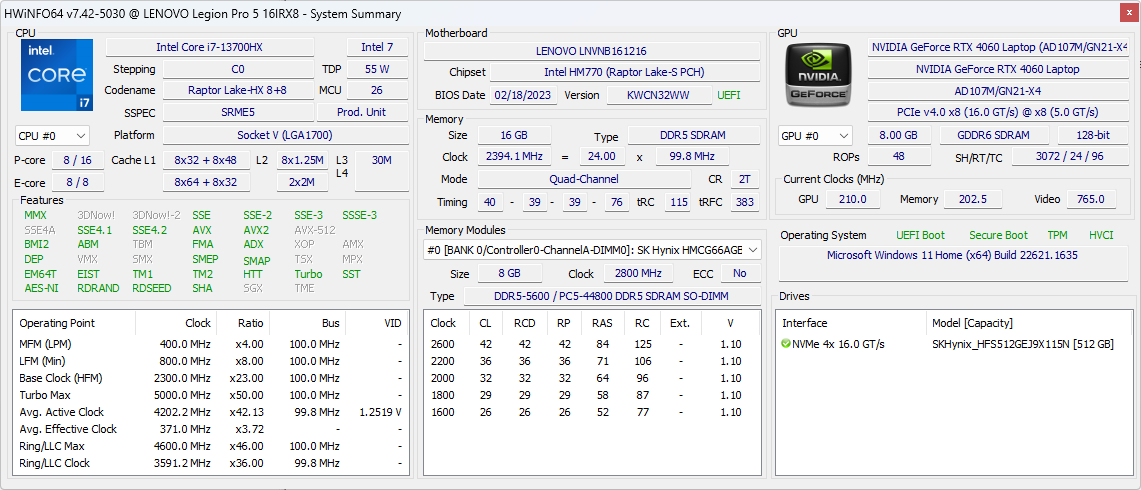
Nuestra unidad utiliza la misma PCIe4 x4 512 GB SK Hynix que se encuentra en el Lenovo Legion S7 16. El rendimiento es excelente, con velocidades de lectura y escritura secuenciales cercanas a 7.200 MB/s y 5.000 MB/s, respectivamente, rivalizando con la popular Samsung PM9A1. Aún así, todavía hay margen de mejora, ya que las tasas de transferencia pueden ralentizarse periódicamente hasta los 6300 MB/s en lugar de mantener un máximo plano de 7200 MB/s.

* ... más pequeño es mejor
Disk Throttling: DiskSpd Read Loop, Queue Depth 8
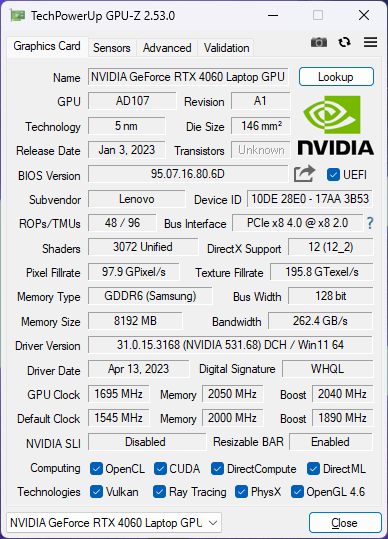
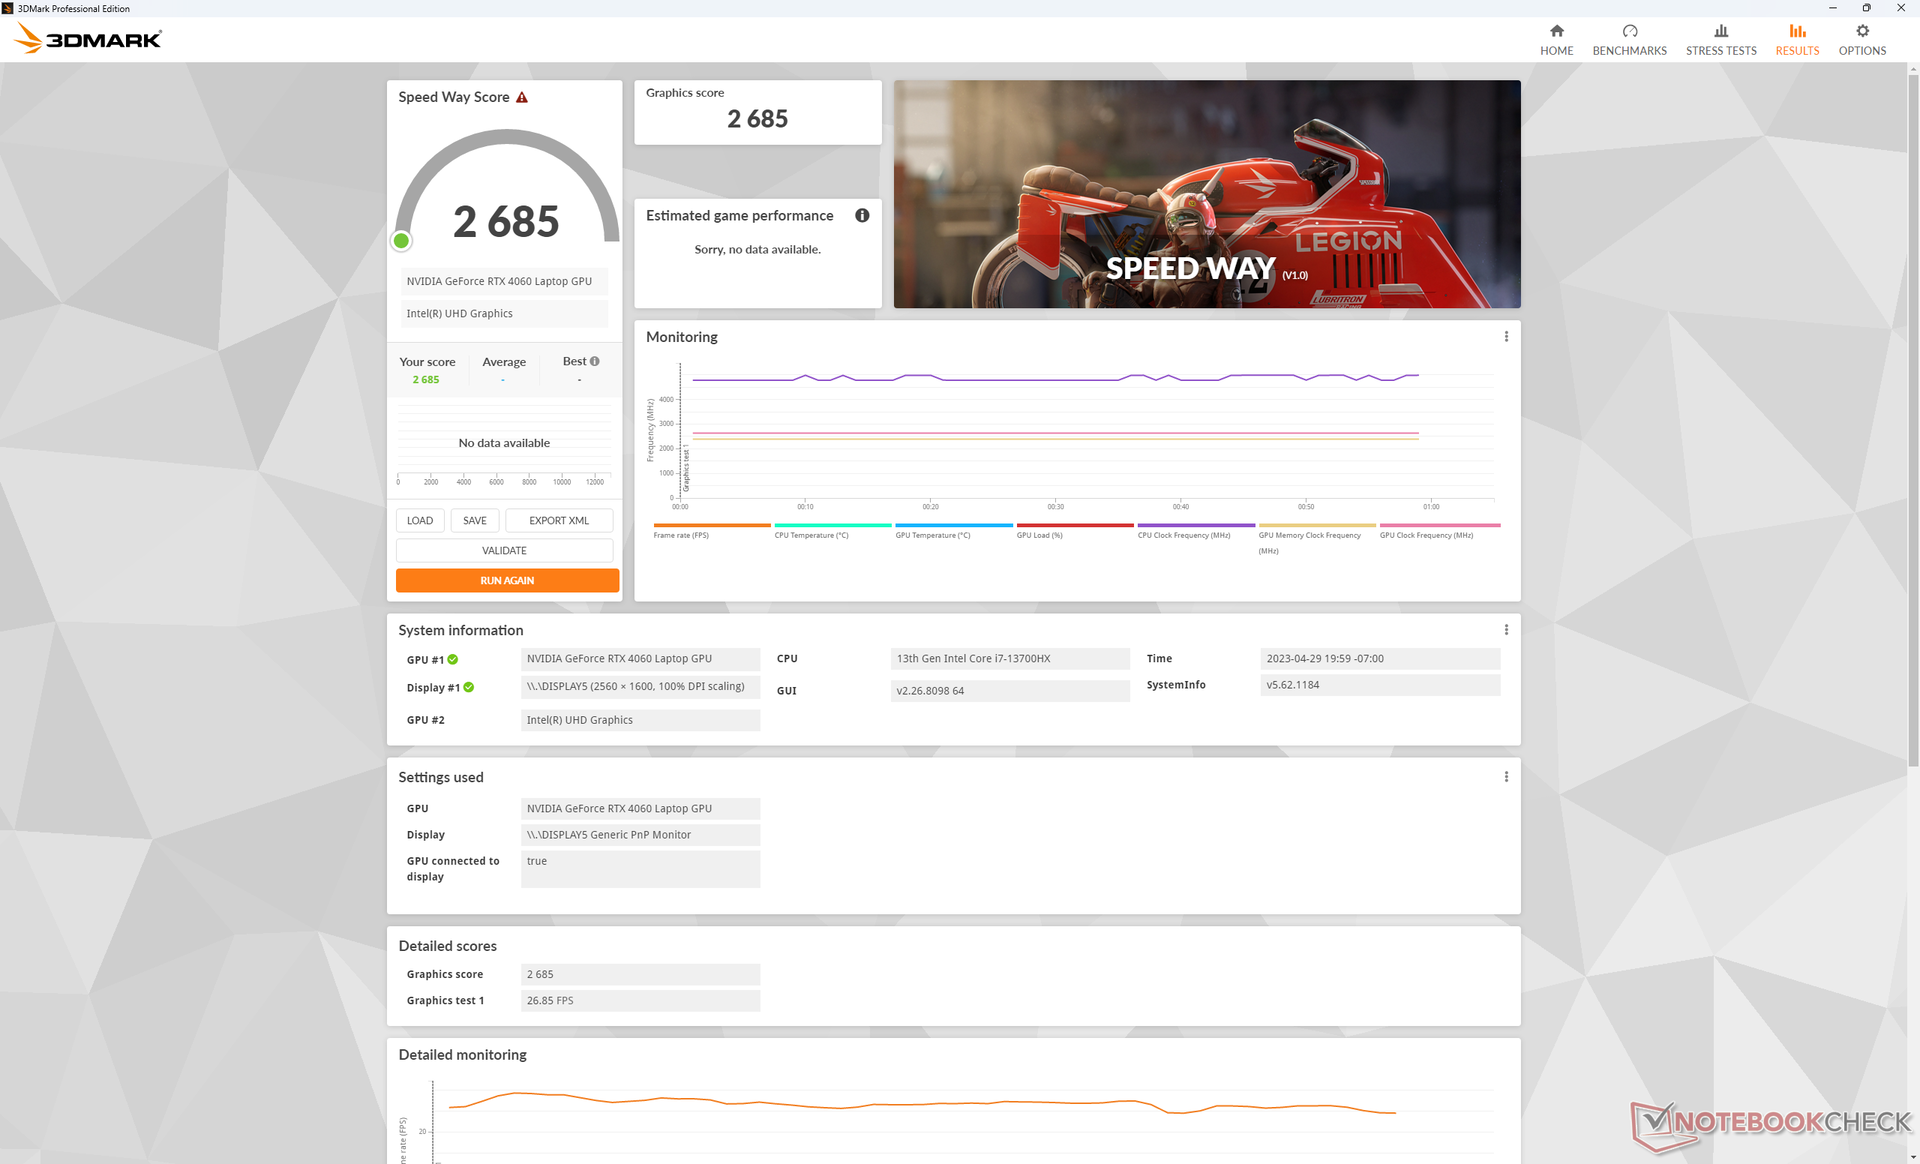
Rendimiento de la GPU - GeForce RTX 4060
El rendimiento gráfico es entre un 10 y un 15 por ciento más rápido que el del portátil medio de nuestra base de datos con el mismo gPU móvil GeForce RTX 4060 GPU. Por tanto, el Legion Pro 5 16 puede ser una buena opción para aquellos que quieran maximizar el rendimiento gráfico. El MSI Cyborg 15por ejemplo, viene con la misma GPU pero apunta a un TGP mucho más bajo de 45 W para un rendimiento general más lento.
El año pasado rTX 3070 Ti para portátiles del año pasado es ligeramente más rápida que nuestra RTX 4060 móvil en un 15%. Si se pasa de un portátil RTX 3060 portátil a nuestra RTX 4060 mejorará el rendimiento entre un 20% y un 25%, lo que no está nada mal para una tarjeta de gama media. Tendrías que jugar a títulos compatibles con DLSS3 para aprovechar mejor la RTX 4060, ya que esta función no está disponible en las GPU GeForce 30.
La actualización a la RTX 4070 Mejorará el rendimiento gráfico entre un 15 y un 20 por ciento con respecto a nuestra RTX 4060. Para las opciones RTX 4080 o RTX 4090, sin embargo, tendrás que considerar la serie Legion 7 Pro de gama más alta.
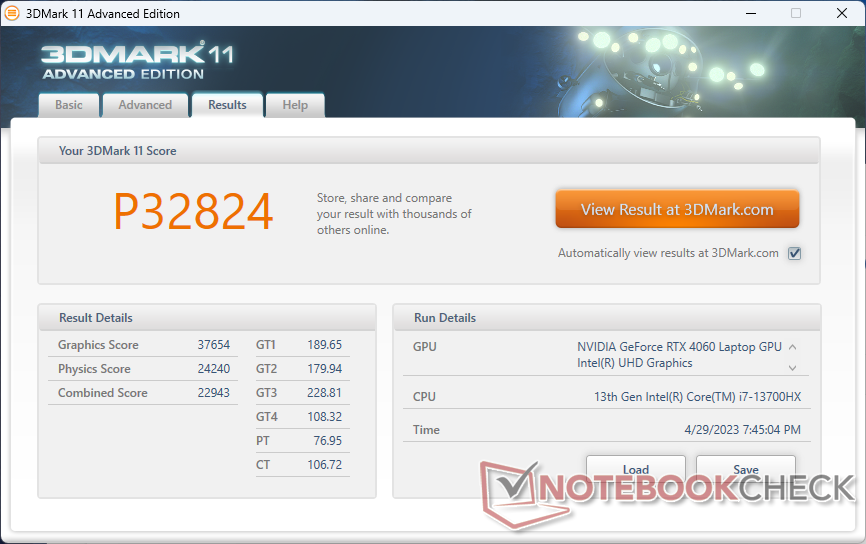
| 3DMark 11 Performance | 32824 puntos | |
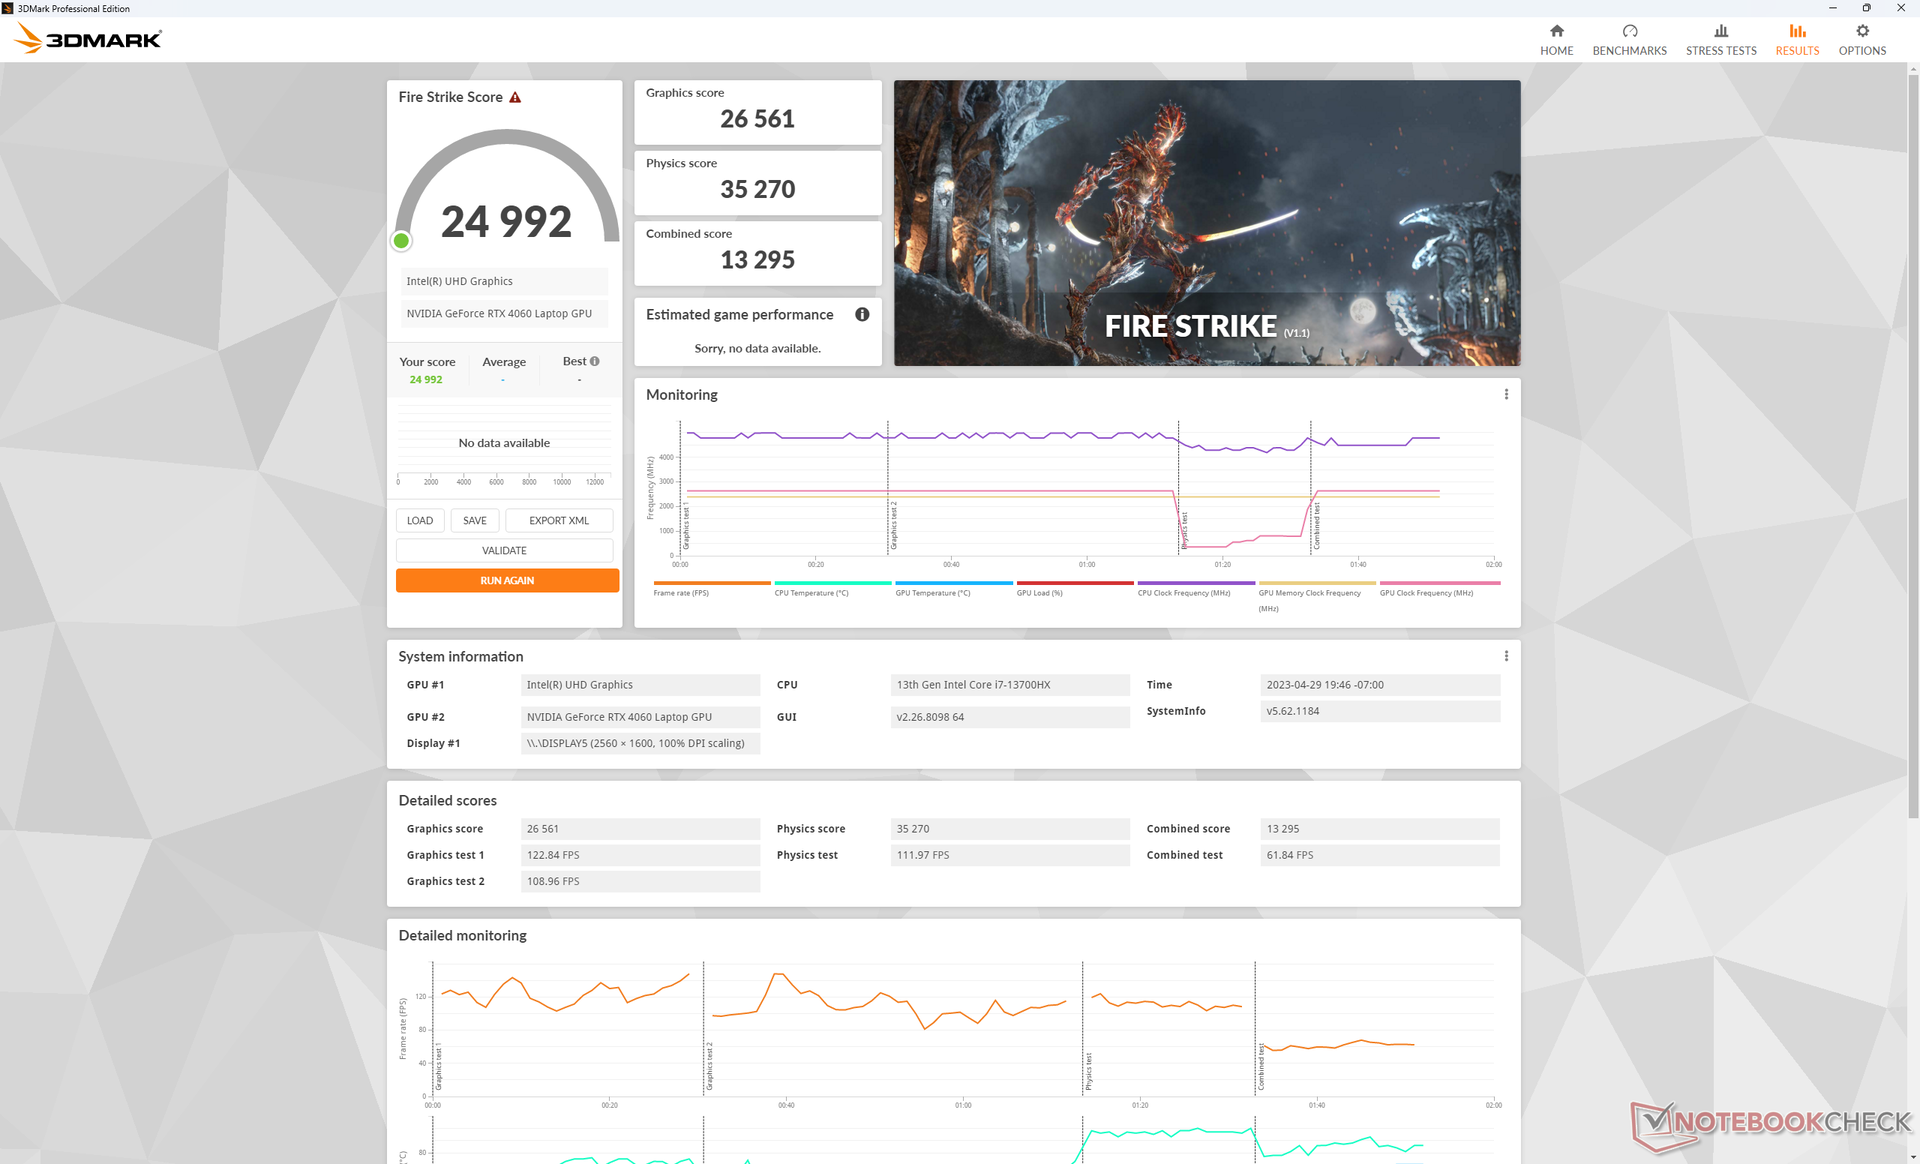
| 3DMark Fire Strike Score | 24992 puntos | |
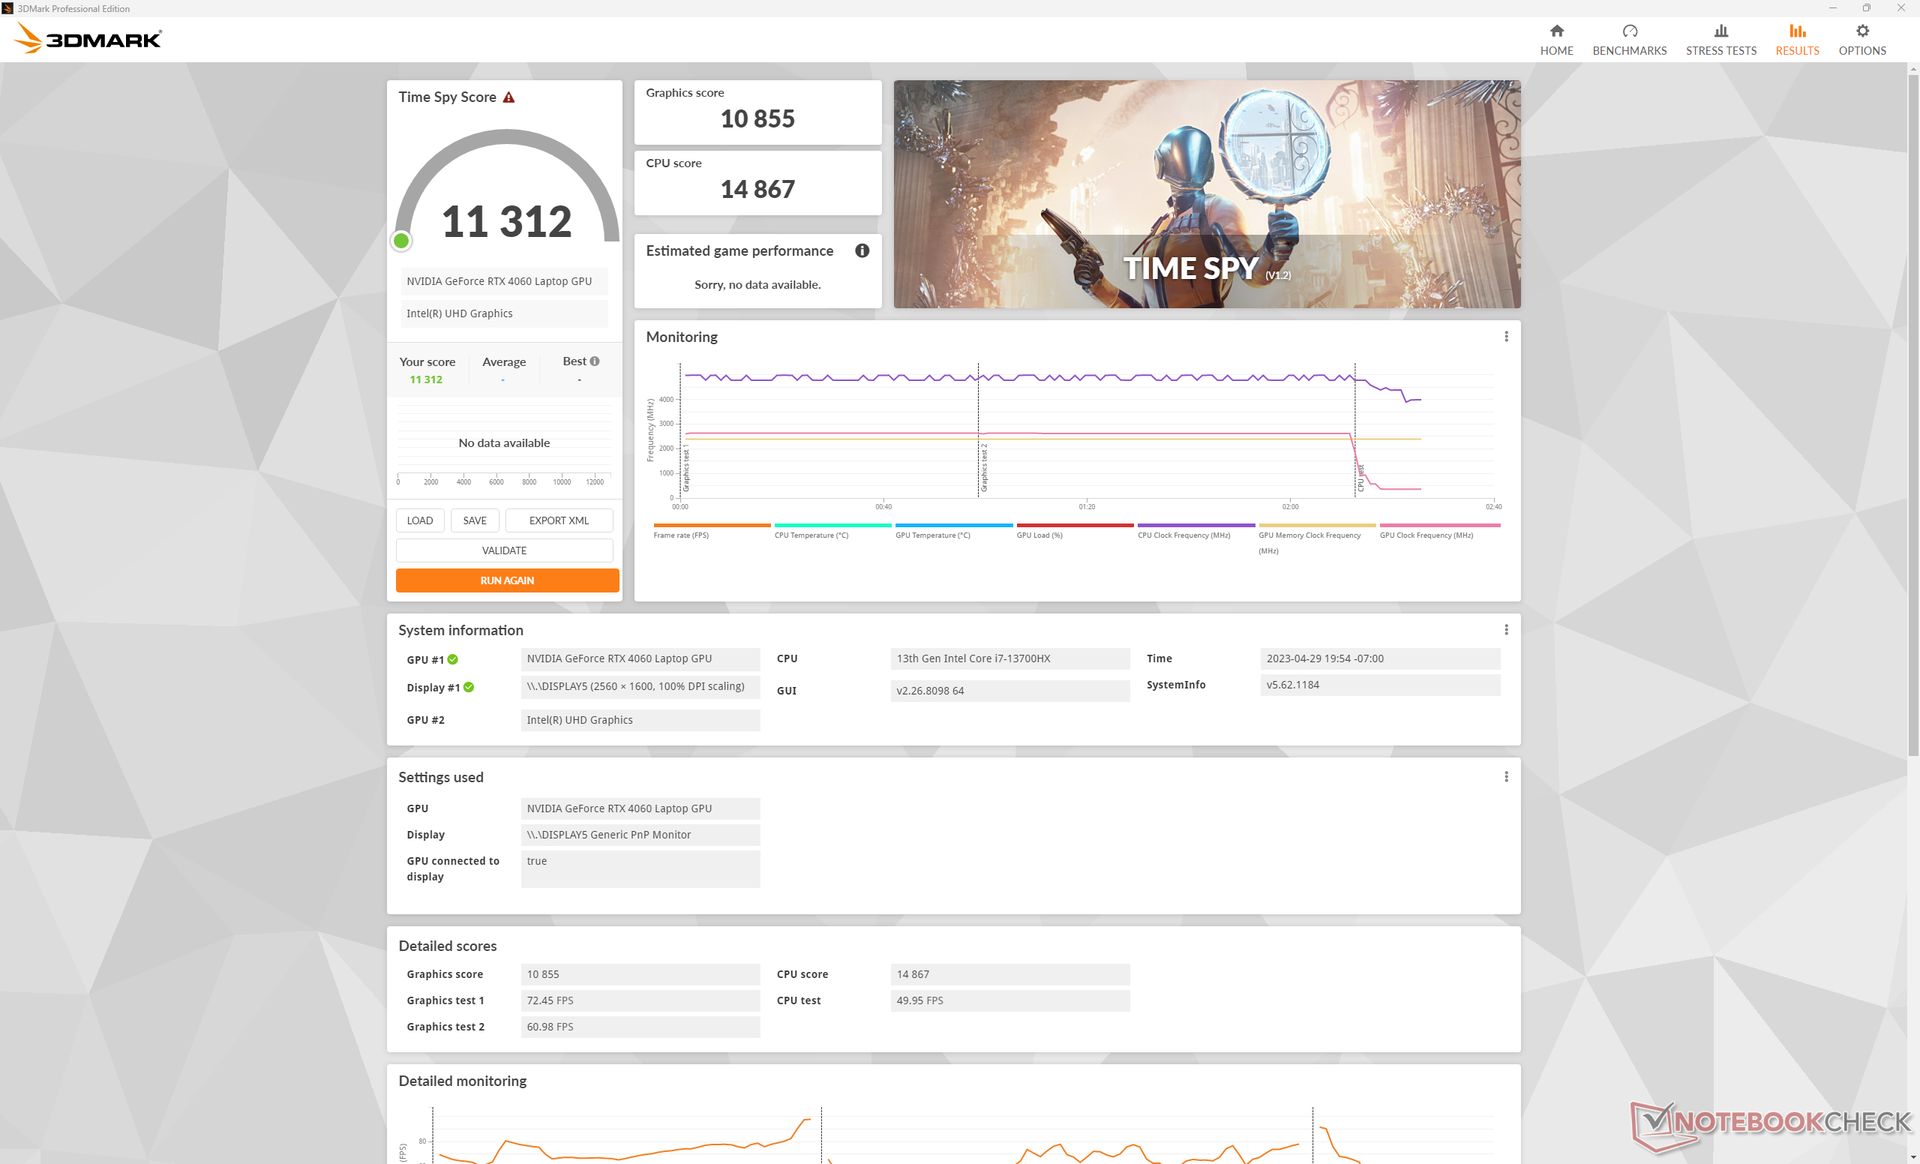
| 3DMark Time Spy Score | 11312 puntos | |
ayuda | ||
* ... más pequeño es mejor
Rendimiento en juegos
Cualquier título actual puede funcionar a más de 60 FPS con ajustes ultra 1080p. Sin embargo, a la resolución nativa QHD+ hay que ajustar algunos parámetros, especialmente en títulos exigentes como Returnal o F1 2022. Alcanzar 165 FPS estables para ajustarse a la frecuencia de refresco de 165 Hz es difícil en la mayoría de títulos con la RTX 3060 de gama media. En su lugar, recomendamos apuntar a 50 o 100 FPS con G-Sync activado para reducir el tearing de pantalla.
| Returnal | |
| 1920x1080 Low Preset | |
| Medio NVIDIA GeForce RTX 4060 Laptop GPU (71 - 99, n=5) | |
| Lenovo Legion Pro 5 16IRX8 | |
| 1920x1080 Medium Preset | |
| Medio NVIDIA GeForce RTX 4060 Laptop GPU (68 - 93, n=5) | |
| Lenovo Legion Pro 5 16IRX8 | |
| 1920x1080 High Preset | |
| Lenovo Legion Pro 5 16IRX8 | |
| Medio NVIDIA GeForce RTX 4060 Laptop GPU (63 - 87, n=6) | |
| 1920x1080 Epic Preset | |
| Lenovo Legion Pro 5 16IRX8 | |
| Medio NVIDIA GeForce RTX 4060 Laptop GPU (57 - 75, n=6) | |
| 2560x1440 Epic Preset | |
| Medio NVIDIA GeForce RTX 4060 Laptop GPU (39 - 59.4, n=5) | |
| Lenovo Legion Pro 5 16IRX8 | |
| 3840x2160 Epic Preset | |
| Medio NVIDIA GeForce RTX 4060 Laptop GPU (25 - 29, n=2) | |
| Lenovo Legion Pro 5 16IRX8 | |
Witcher 3 FPS Chart
| bajo | medio | alto | ultra | QHD | 4K | |
|---|---|---|---|---|---|---|
| GTA V (2015) | 186.7 | 184 | 178.9 | 119.6 | 88.9 | 85.5 |
| The Witcher 3 (2015) | 521.8 | 369.3 | 215.8 | 107.6 | 67.2 | |
| Dota 2 Reborn (2015) | 196.6 | 176.5 | 170.3 | 161.8 | 142.9 | |
| Final Fantasy XV Benchmark (2018) | 222 | 161.2 | 109.8 | 79.4 | 45.4 | |
| X-Plane 11.11 (2018) | 177.4 | 156.3 | 121.9 | 104.4 | ||
| Cyberpunk 2077 1.6 (2022) | 150.7 | 136.6 | 106 | 87.4 | 51.7 | 22.9 |
| Tiny Tina's Wonderlands (2022) | 234.6 | 192.3 | 121.2 | 92.7 | 64.2 | 33.6 |
| F1 22 (2022) | 276 | 274 | 208 | 70.1 | 44.8 | 21.5 |
| Returnal (2023) | 81 | 79 | 75 | 70 | 48 | 25 |
Emisiones
Ruido del sistema - Comportamiento constante de las RPM del ventilador
El ruido del ventilador durante cargas bajas como navegación o streaming de vídeo tiende a estabilizarse en 26,6 dB(A) frente a un fondo silencioso de 23 dB(A). Es lo bastante alto como para ser audible, pero no distrae. Los ventiladores son afortunadamente estables en RPM y no pulsan frecuentemente en este estado incluso en modo Rendimiento.
El ruido del ventilador cuando se ejecuta Witcher 3 en Rendimiento se estabiliza en 47.6 dB(A) comparado con los 55 dB(A) del Legion Pro 5 16 del año pasado con gráfica RTX 3070 Ti y del Legion Pro 7. Sin embargo, si la CPU y la GPU se estresan mucho más, como con pruebas o juegos muy exigentes, nuestro Legion Pro 5 16 puede alcanzar los mismos 55 dB(A) máximos.
Los juegos en modo equilibrado son ligeramente más silenciosos, con 46 dB(A) frente a los 47,6 dB(A) anteriores. La diferencia es tan pequeña que no hay razón para usar el modo equilibrado en la mayoría de los juegos...
Ruido
| Ocioso |
| 23.1 / 23.1 / 26.6 dB(A) |
| Carga |
| 34.7 / 54.8 dB(A) |
 | ||
30 dB silencioso 40 dB(A) audible 50 dB(A) ruidosamente alto |
||
min: | ||
| Lenovo Legion Pro 5 16IRX8 GeForce RTX 4060 Laptop GPU, i7-13700HX, SK hynix PC801 HFS512GEJ9X115N | Asus ROG Zephyrus M16 GU603Z GeForce RTX 3070 Ti Laptop GPU, i9-12900H, Micron 3400 1TB MTFDKBA1T0TFH | Razer Blade 16 Early 2023 GeForce RTX 4080 Laptop GPU, i9-13950HX, SSSTC CA6-8D1024 | Lenovo Legion Pro 7 16IRX8H GeForce RTX 4080 Laptop GPU, i9-13900HX, Samsung PM9A1 MZVL21T0HCLR | Lenovo Legion 5 Pro 16ARH7H RTX 3070 Ti GeForce RTX 3070 Ti Laptop GPU, R7 6800H, Samsung PM9A1 MZVL21T0HCLR | Lenovo Legion S7 16ARHA7 Radeon RX 6800S, R9 6900HX, SK Hynix HFS001TEJ9X115N | |
|---|---|---|---|---|---|---|
| Noise | -16% | -0% | -17% | -12% | 3% | |
| apagado / medio ambiente * (dB) | 23 | 23 -0% | 23 -0% | 24 -4% | 23.5 -2% | 23.1 -0% |
| Idle Minimum * (dB) | 23.1 | 23 -0% | 23 -0% | 26 -13% | 23.7 -3% | 23.1 -0% |
| Idle Average * (dB) | 23.1 | 24 -4% | 23 -0% | 28 -21% | 31.1 -35% | 23.1 -0% |
| Idle Maximum * (dB) | 26.6 | 47 -77% | 23.6 11% | 34 -28% | 32.2 -21% | 23.1 13% |
| Load Average * (dB) | 34.7 | 47.91 -38% | 39 -12% | 47 -35% | 38.4 -11% | 31.4 10% |
| Witcher 3 ultra * (dB) | 47.6 | 48.91 -3% | 51.6 -8% | 55 -16% | 54.8 -15% | 51.4 -8% |
| Load Maximum * (dB) | 54.8 | 50.25 8% | 51.3 6% | 56 -2% | 54.8 -0% | 51.2 7% |
* ... más pequeño es mejor
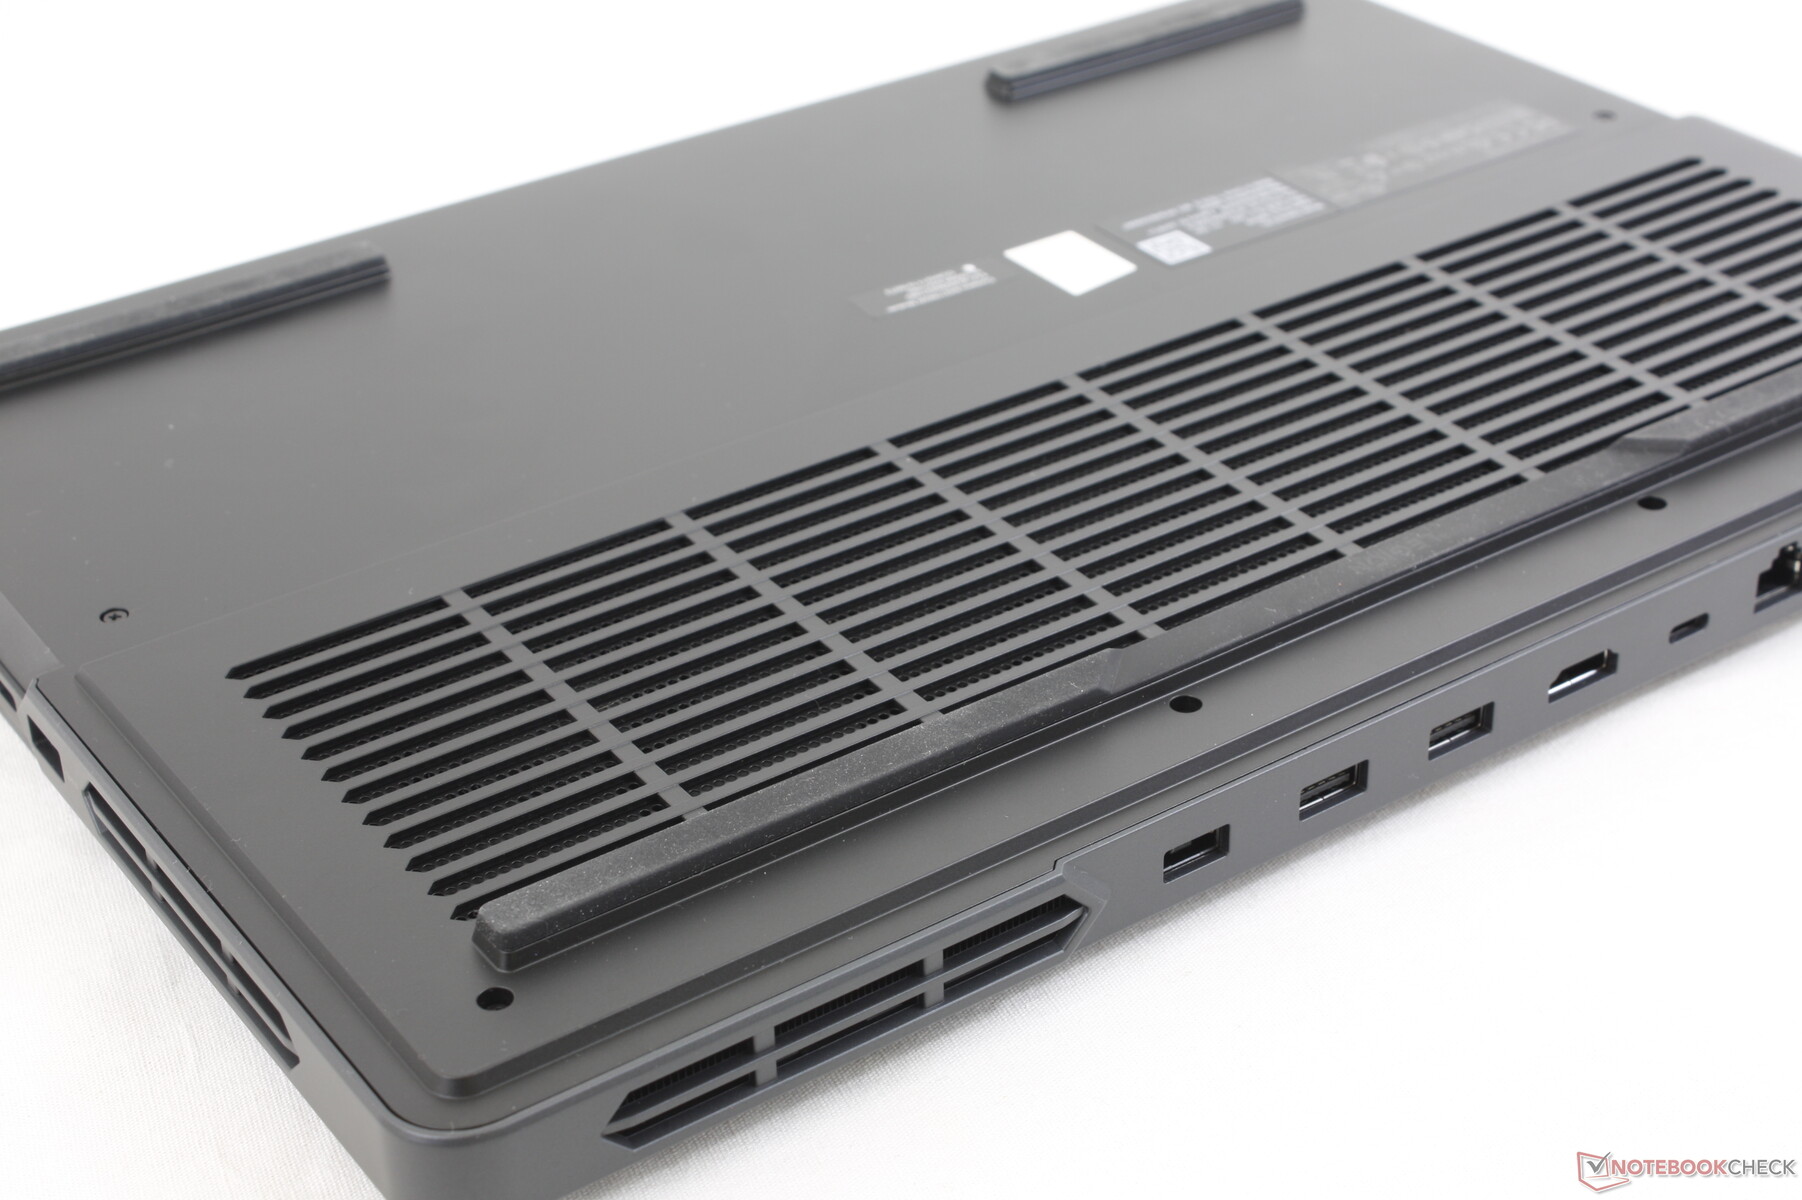
Temperatura - Reposamanos frío
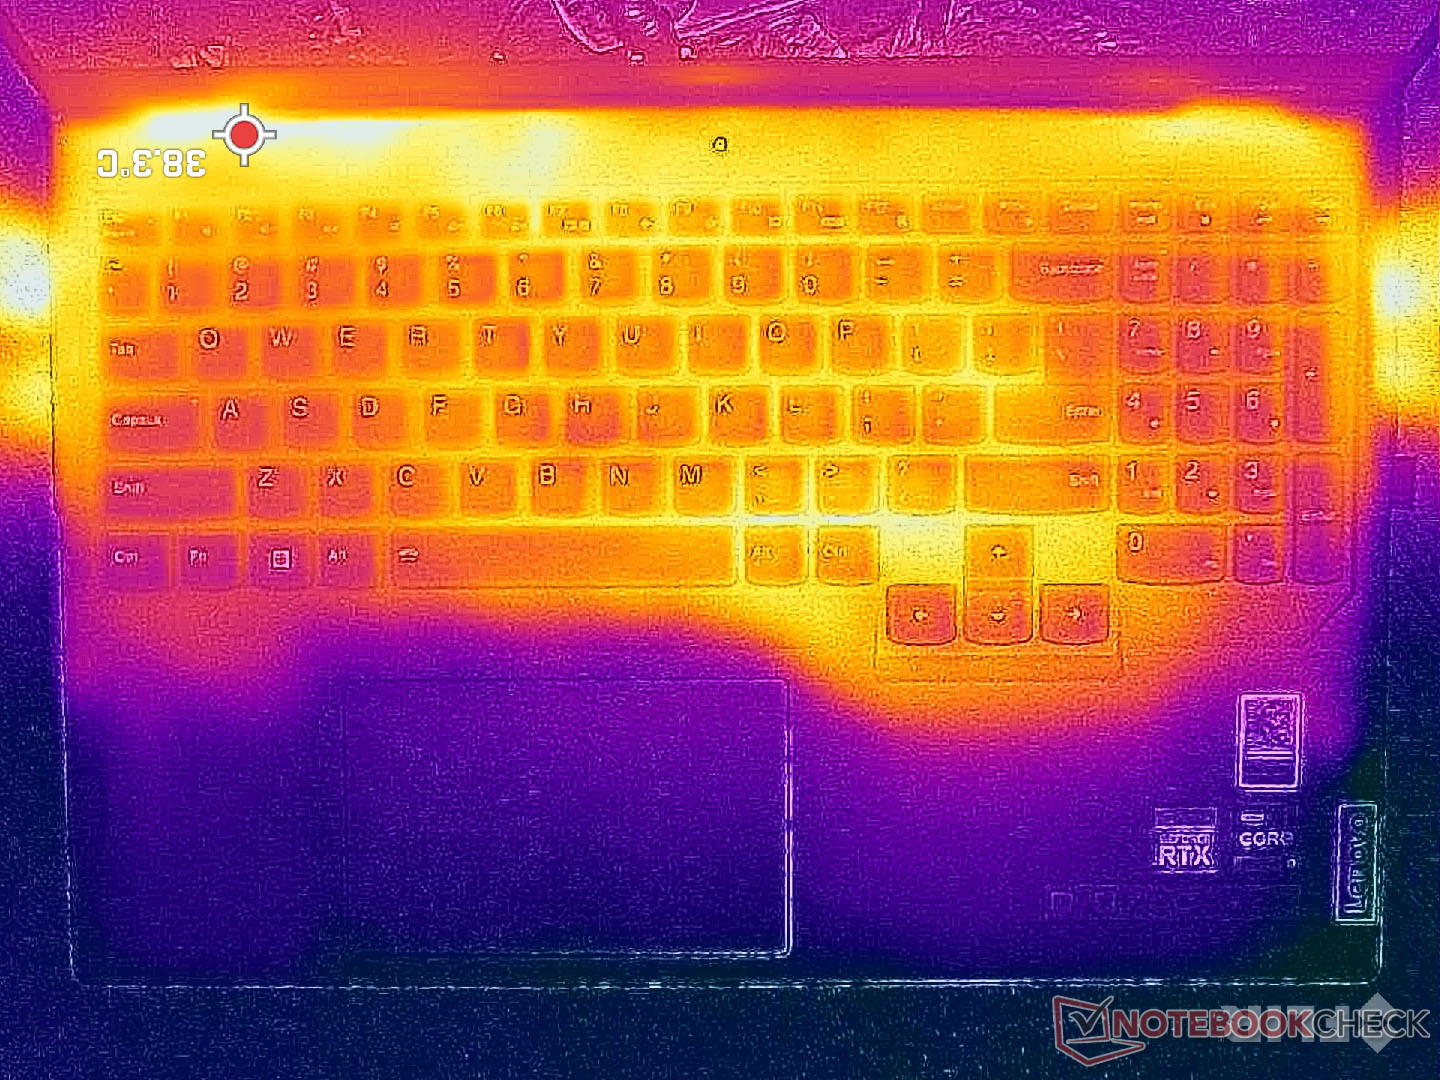
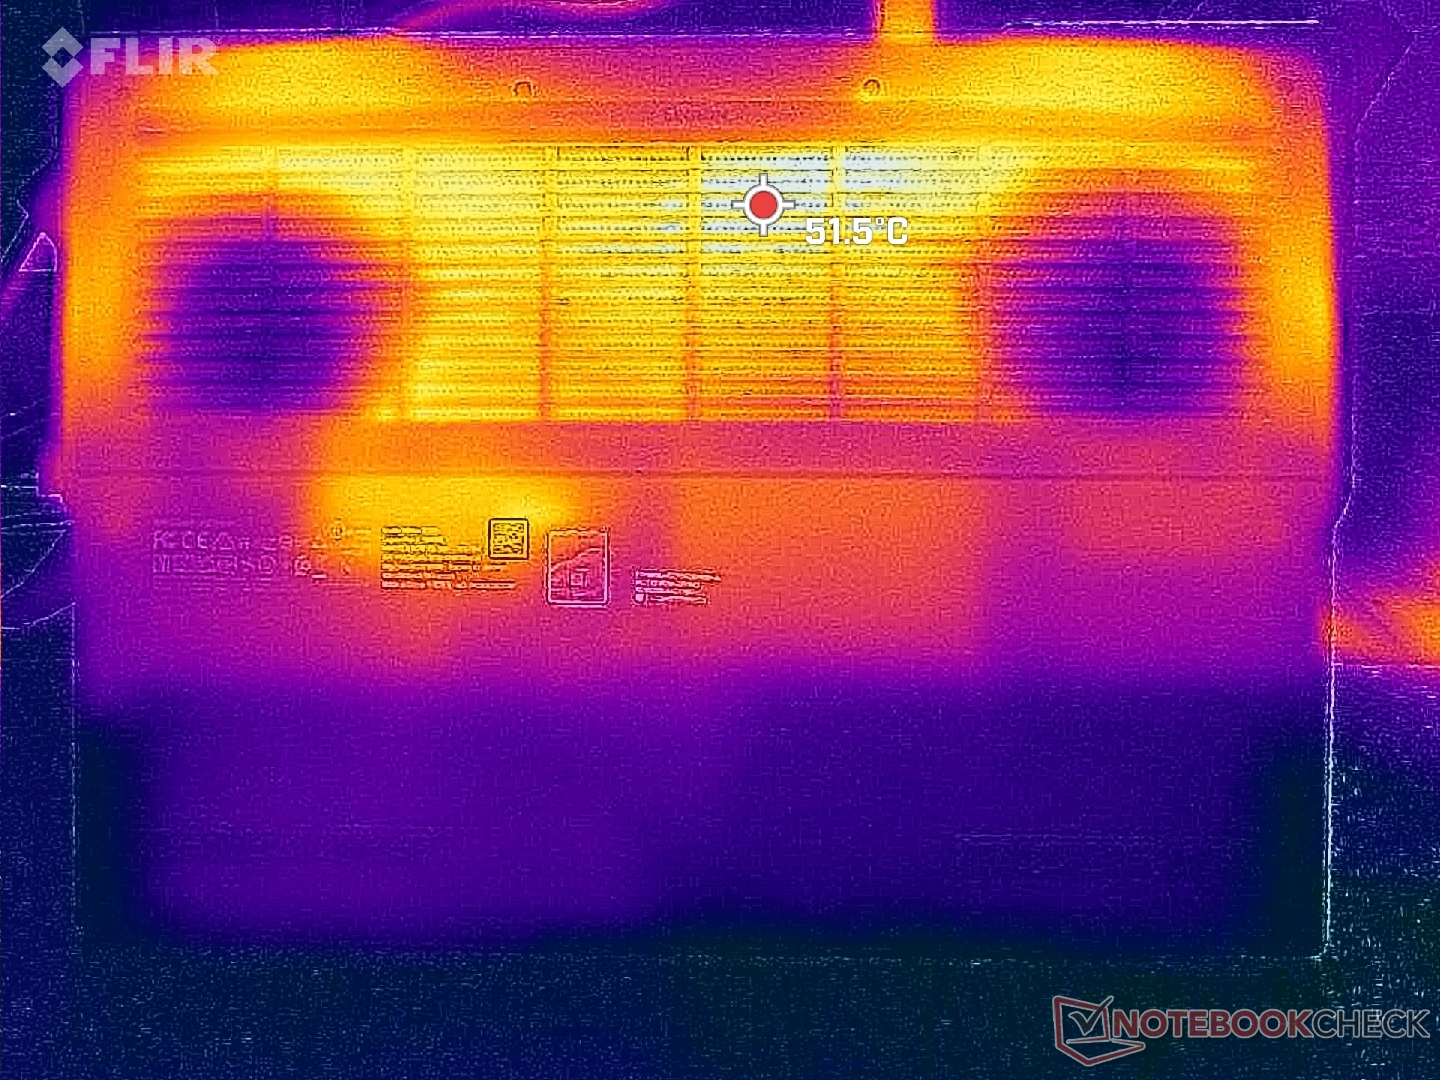
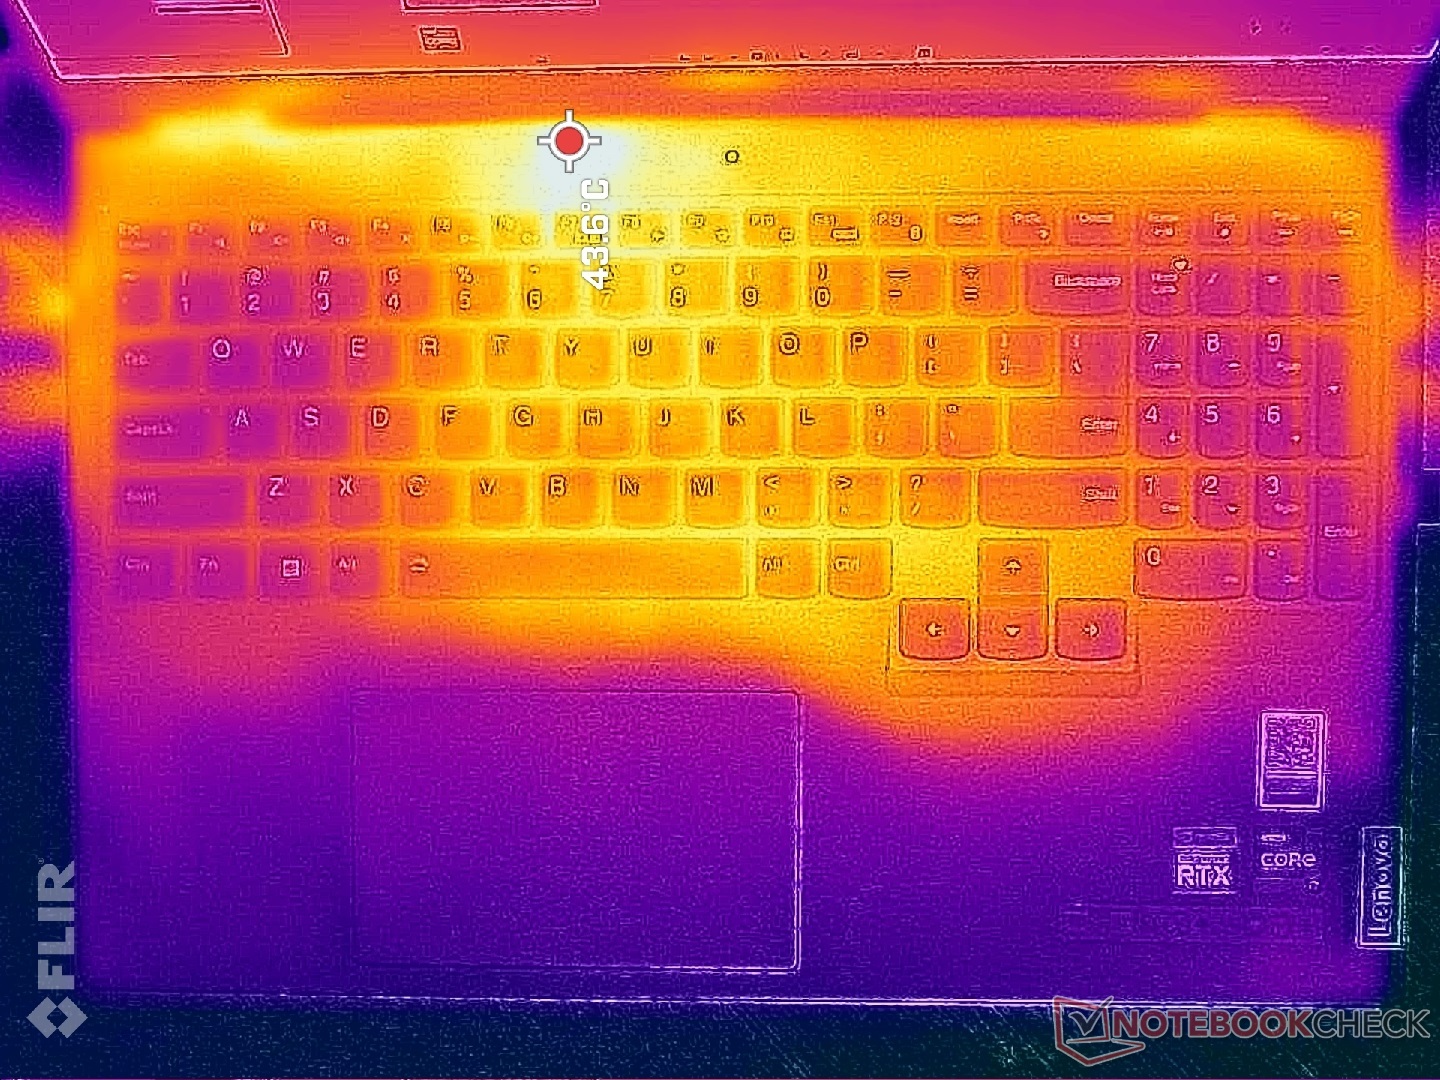
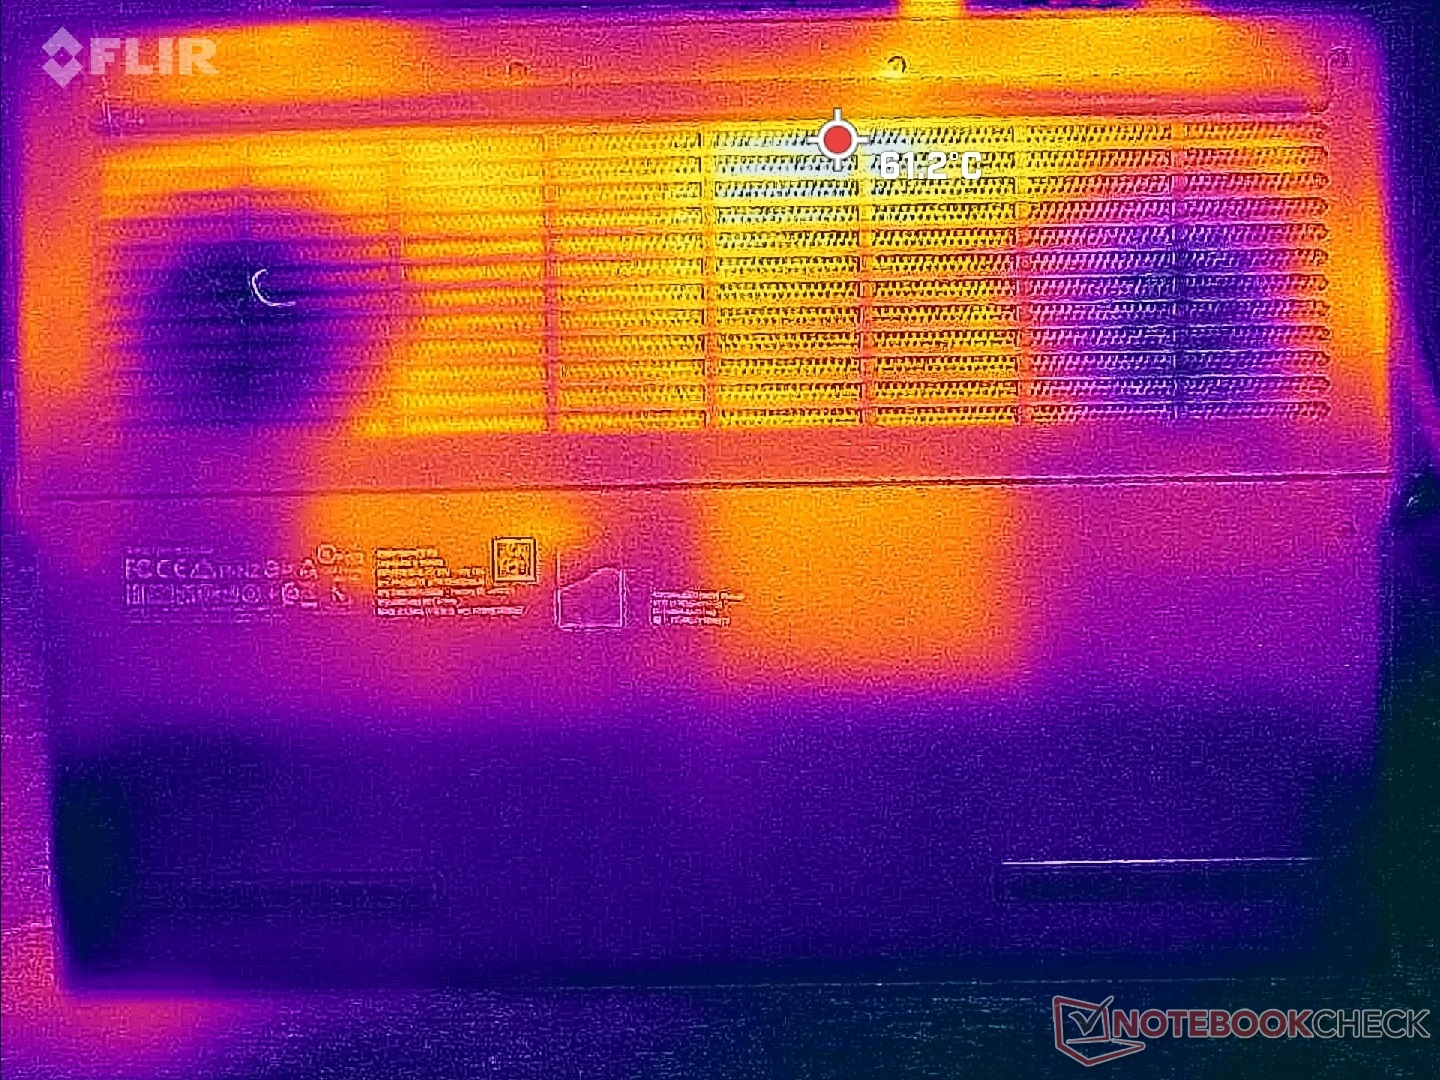
Las temperaturas de la superficie cuando se ejecutan juegos pueden llegar a ser de 43 C a 50 C en la parte superior e inferior, respectivamente. Afortunadamente, estos puntos calientes se concentran en la parte trasera, donde es poco probable que la piel entre en contacto. El más delgado ROG Zephyrus M16 puede ser aún más caliente en promedio y con puntos calientes más grandes.
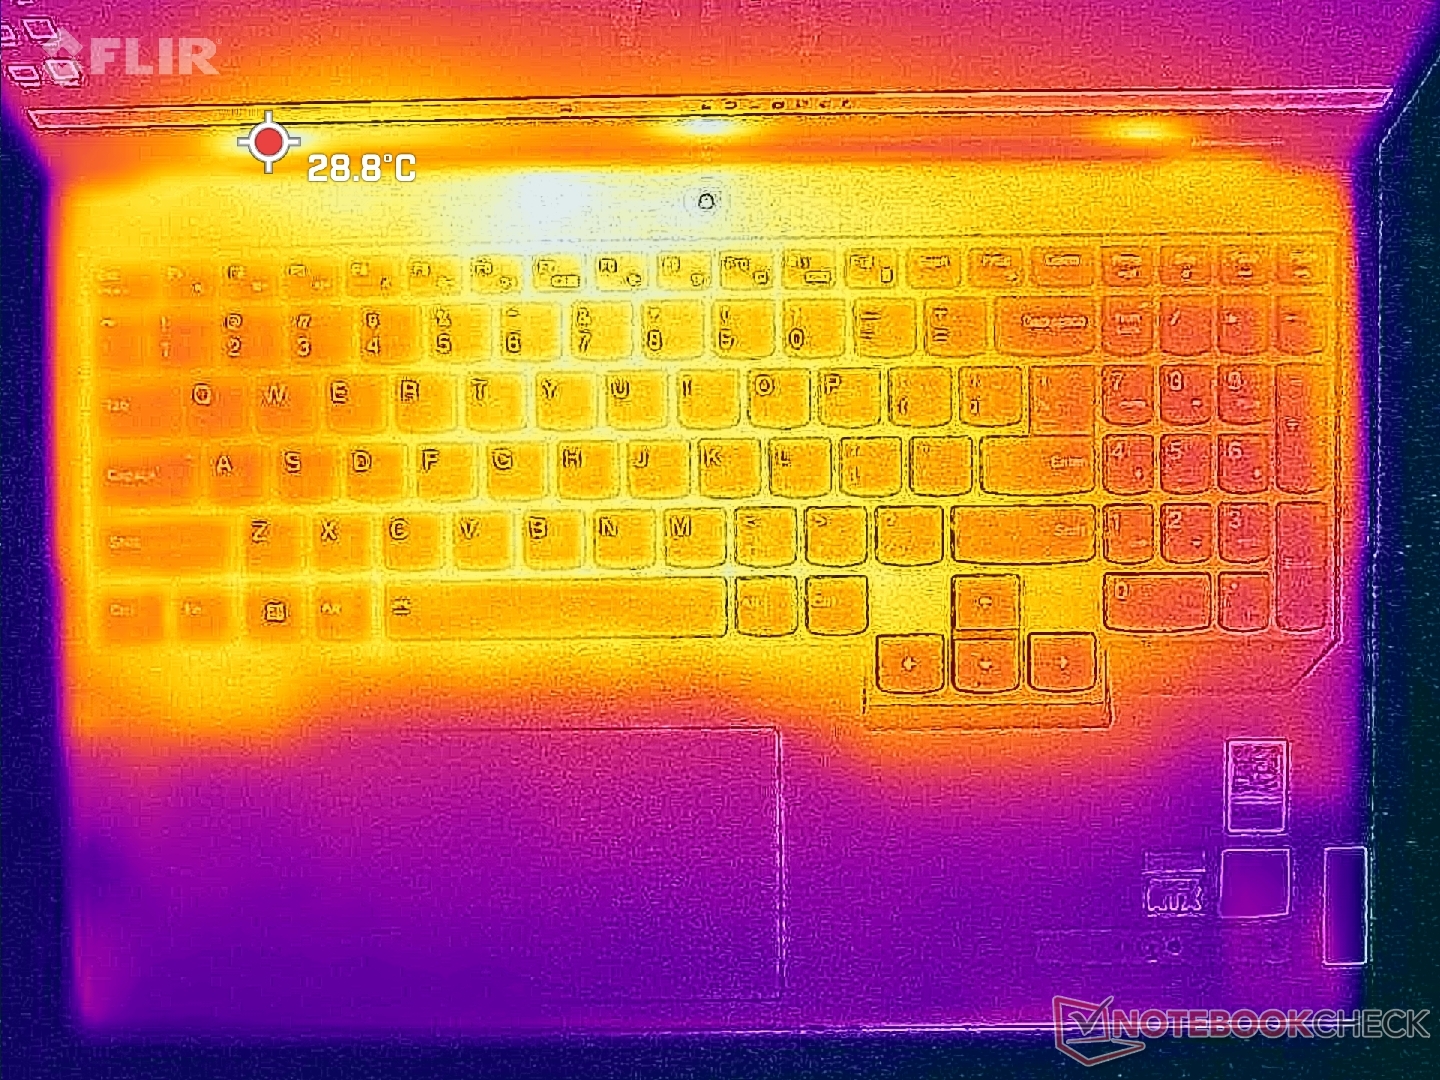
Los lados del teclado son generalmente más fríos que el centro por unos pocos grados C ya que los ventiladores están posicionados directamente debajo como muestran los mapas de temperatura de abajo. Las palmas y los dedos son por lo tanto menos propensos a ser incómodos cuando se juega.
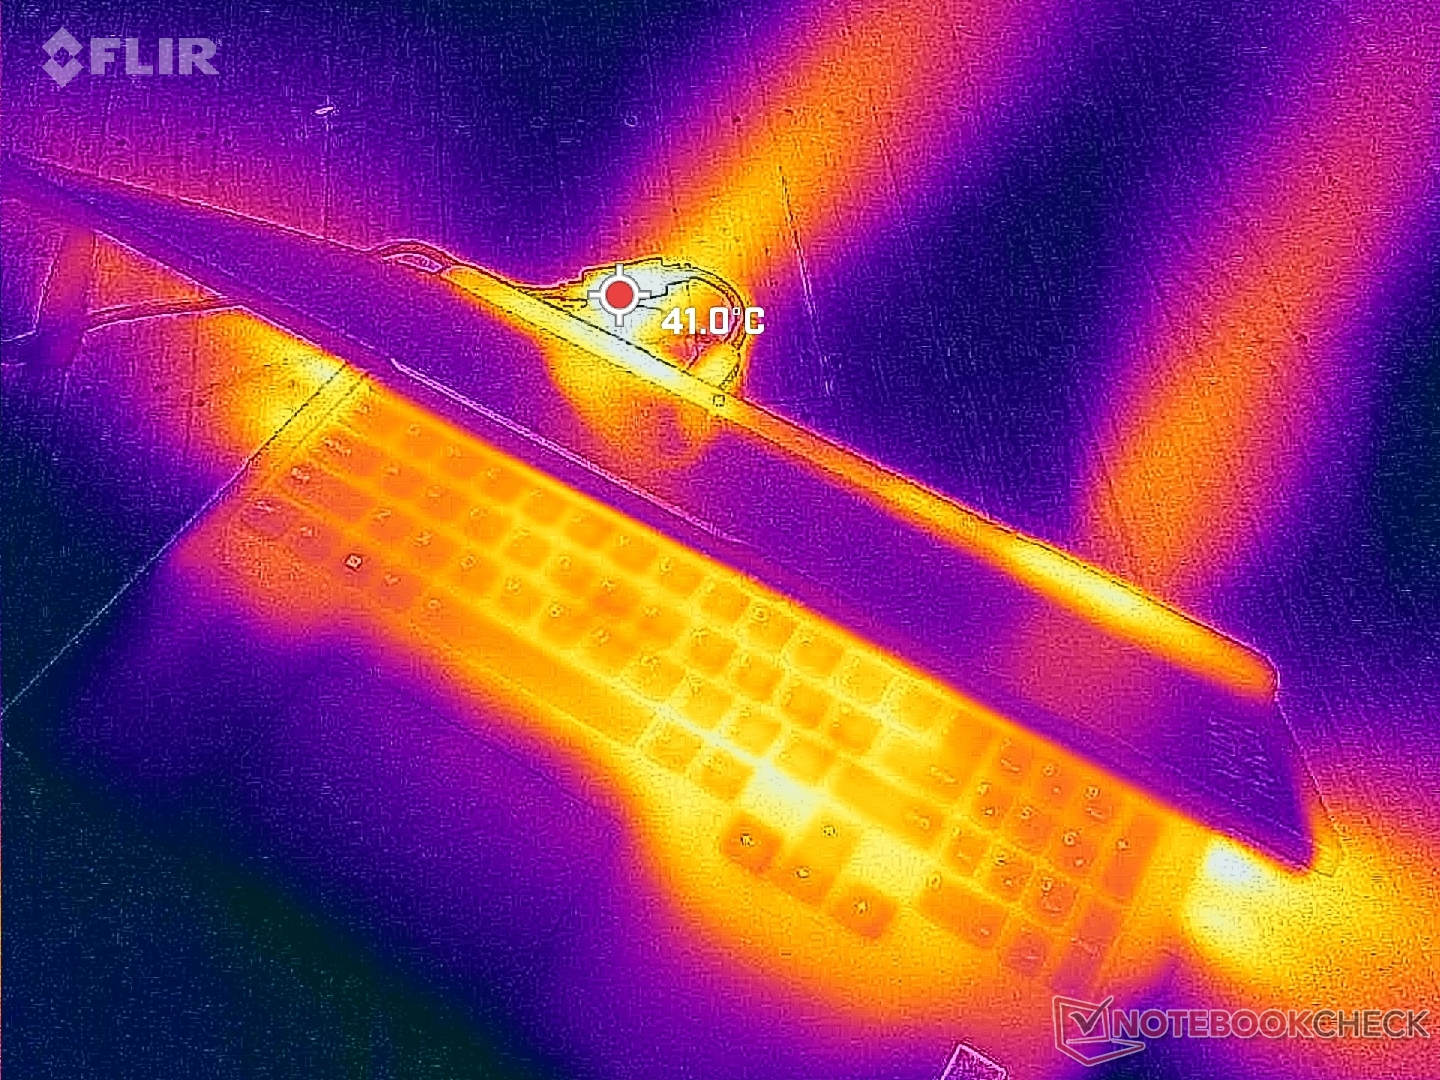
(±) La temperatura máxima en la parte superior es de 42.8 °C / 109 F, frente a la media de 40.4 °C / 105 F, que oscila entre 21.2 y 68.8 °C para la clase Gaming.
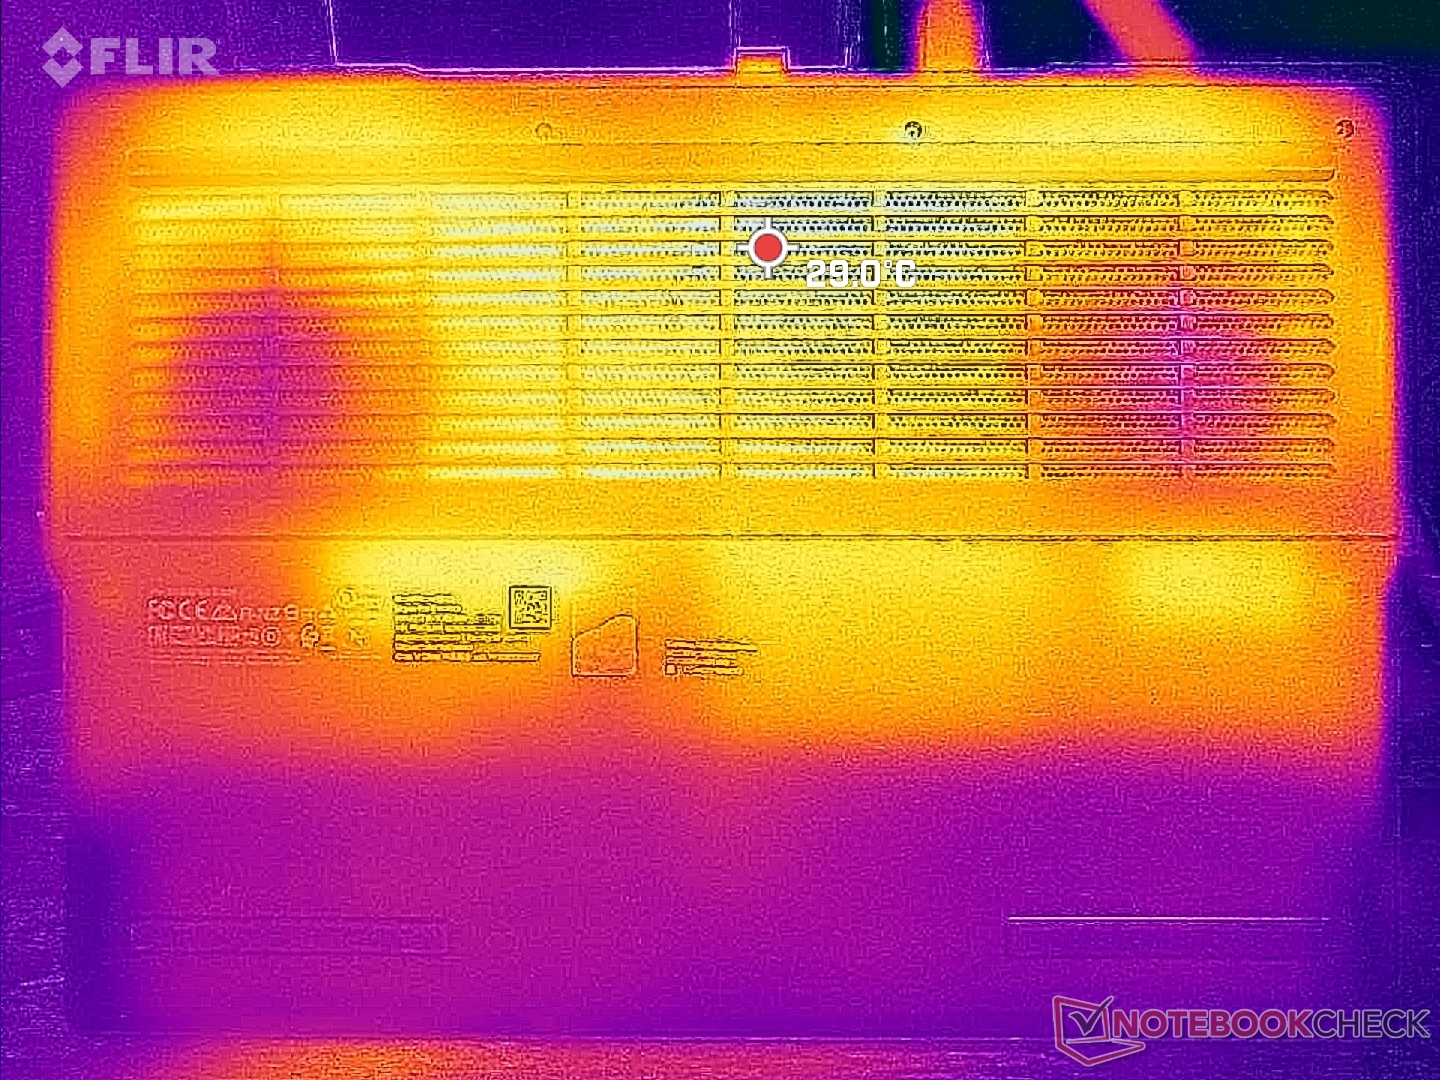
(-) El fondo se calienta hasta un máximo de 50 °C / 122 F, frente a la media de 43.2 °C / 110 F
(+) En reposo, la temperatura media de la parte superior es de 27.2 °C / 81# F, frente a la media del dispositivo de 33.9 °C / 93 F.
(±) Jugando a The Witcher 3, la temperatura media de la parte superior es de 32.4 °C / 90 F, frente a la media del dispositivo de 33.9 °C / 93 F.
(+) El reposamanos y el panel táctil están a una temperatura inferior a la de la piel, con un máximo de 26.2 °C / 79.2 F y, por tanto, son fríos al tacto.
(+) La temperatura media de la zona del reposamanos de dispositivos similares fue de 28.8 °C / 83.8 F (+2.6 °C / 4.6 F).
| Lenovo Legion Pro 5 16IRX8 Intel Core i7-13700HX, NVIDIA GeForce RTX 4060 Laptop GPU | Asus ROG Zephyrus M16 GU603Z Intel Core i9-12900H, NVIDIA GeForce RTX 3070 Ti Laptop GPU | Razer Blade 16 Early 2023 Intel Core i9-13950HX, NVIDIA GeForce RTX 4080 Laptop GPU | Lenovo Legion Pro 7 16IRX8H Intel Core i9-13900HX, NVIDIA GeForce RTX 4080 Laptop GPU | Lenovo Legion 5 Pro 16ARH7H RTX 3070 Ti AMD Ryzen 7 6800H, NVIDIA GeForce RTX 3070 Ti Laptop GPU | Lenovo Legion S7 16ARHA7 AMD Ryzen 9 6900HX, AMD Radeon RX 6800S | |
|---|---|---|---|---|---|---|
| Heat | -5% | 8% | -11% | -1% | 5% | |
| Maximum Upper Side * (°C) | 42.8 | 52 -21% | 40 7% | 48 -12% | 43.8 -2% | 46.6 -9% |
| Maximum Bottom * (°C) | 50 | 51 -2% | 37.6 25% | 49 2% | 53 -6% | 50.8 -2% |
| Idle Upper Side * (°C) | 29.6 | 29 2% | 32.4 -9% | 40 -35% | 30 -1% | 26.4 11% |
| Idle Bottom * (°C) | 34 | 33 3% | 31.4 8% | 33 3% | 31.8 6% | 27.2 20% |
* ... más pequeño es mejor
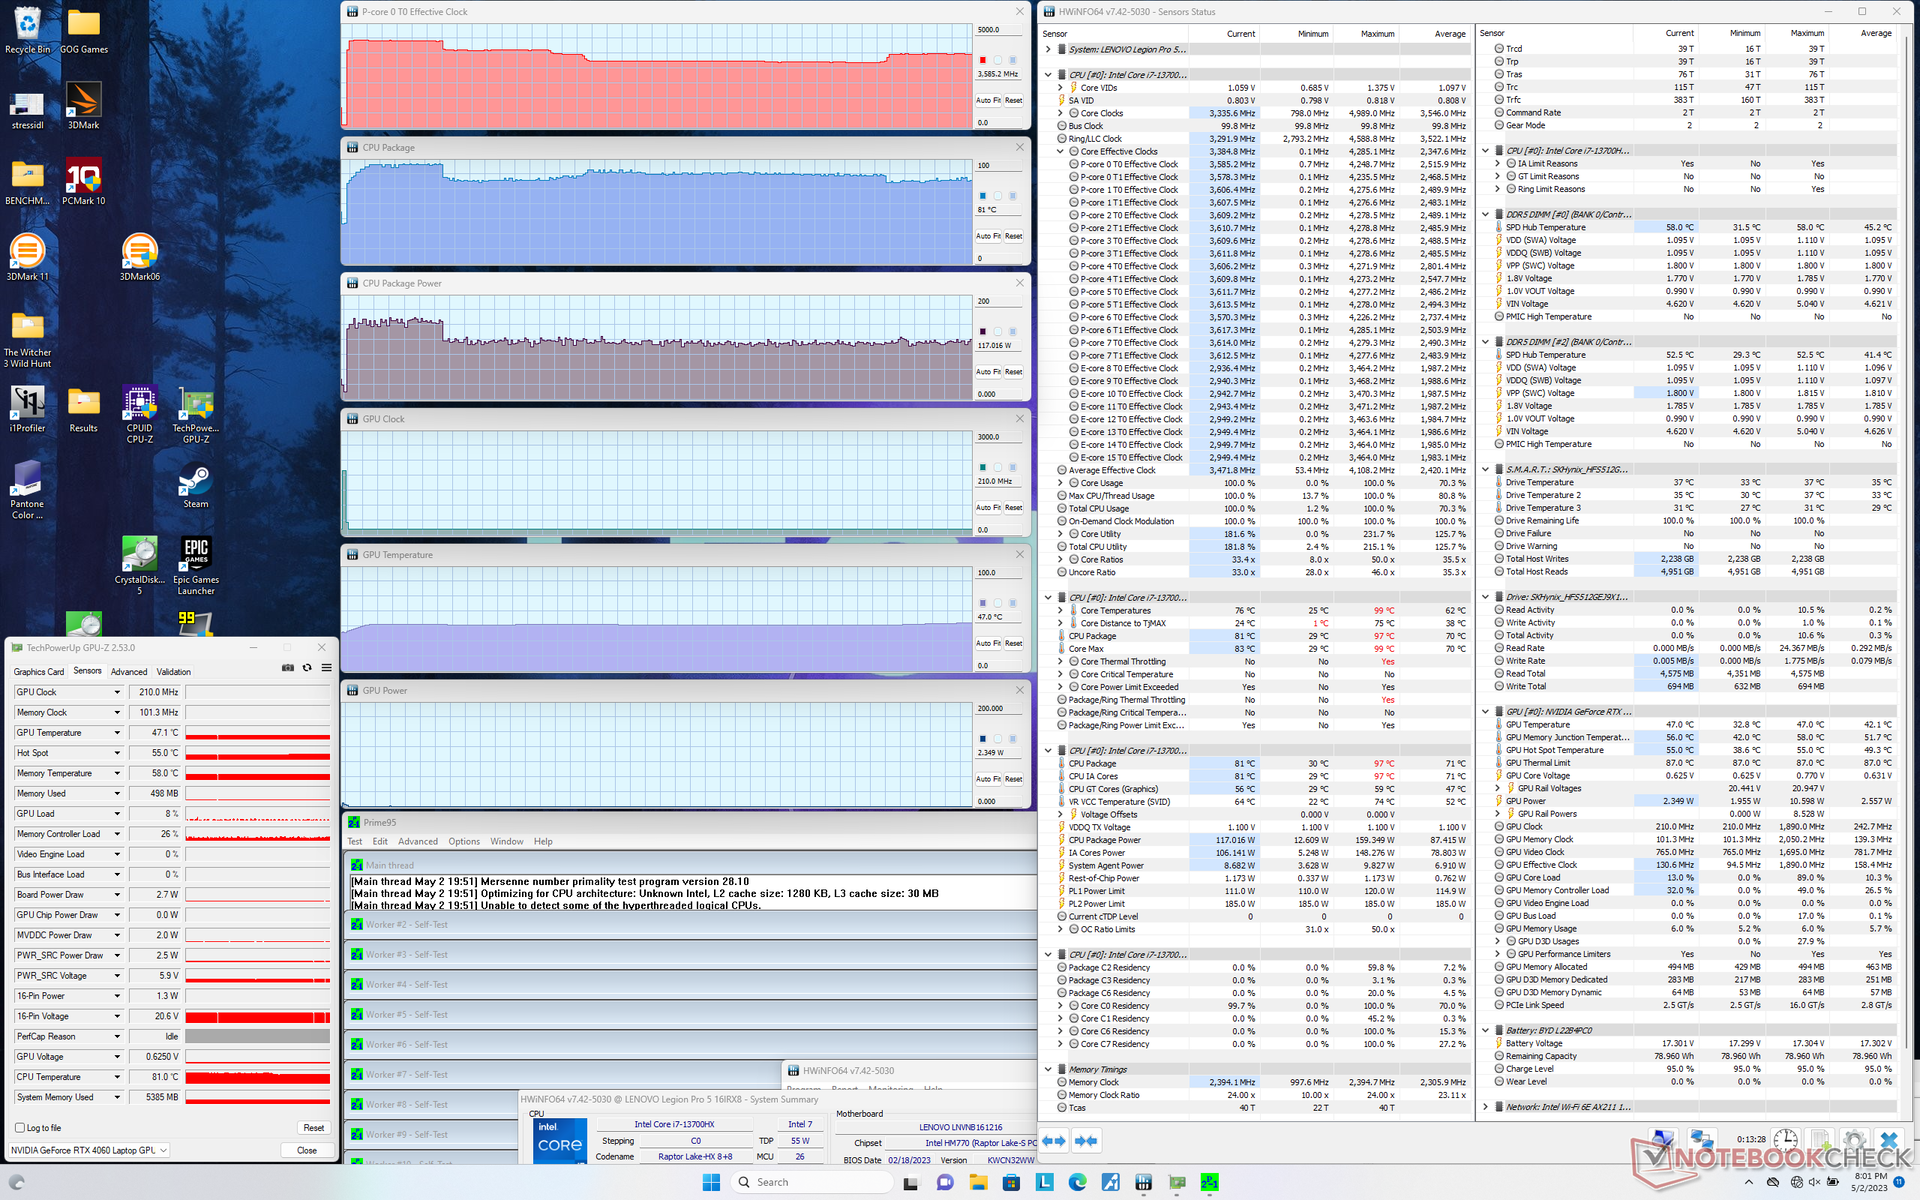
Prueba de resistencia
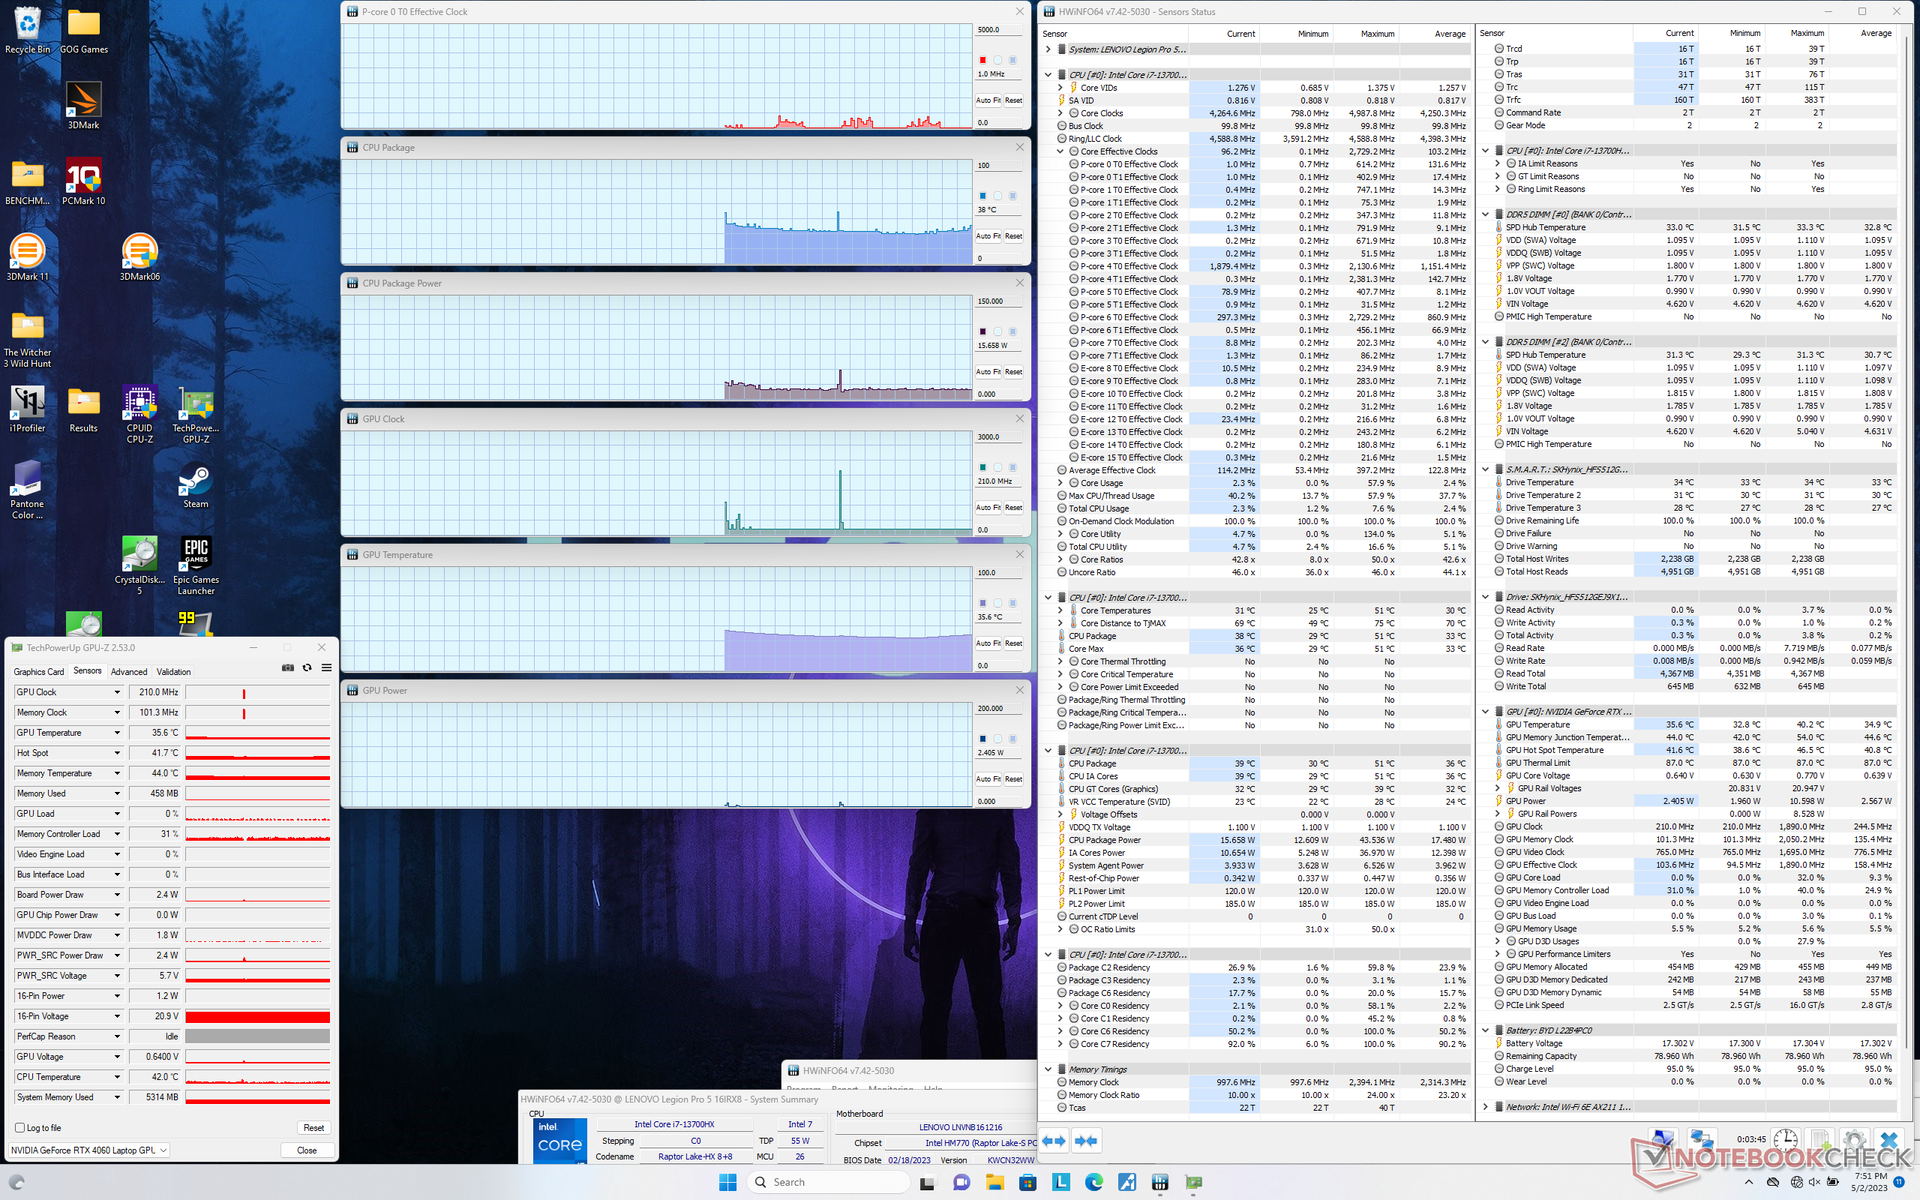
Cuando se somete a Prime95, la CPU alcanza los 4,3 GHz, 157 W y 97 C durante aproximadamente un minuto. A partir de entonces, las frecuencias de reloj y el consumo de la placa caen hasta el rango de 3,3 a 3,6 GHz y 117 W, respectivamente, para mantener una temperatura del núcleo de 81 C. Por tanto, el Turbo Boost máximo no es sostenible durante periodos prolongados. Repitiendo esta misma prueba en el AMD más lento del año pasado, el Legion Pro 5 16 del año pasado resultaría en una temperatura de CPU más cálida de 93 C.
Cuando se ejecuta Witcher 3en modo Rendimiento para representar cargas de juego típicas, nuestra GPU RTX 4060 se estabilizaría en 2640 MHz de reloj, 2050 MHz de RAM, 76 C y 109 W, lo que es claramente inferior a los 140 W indicados en el panel de control de Nvidia. En modo equilibrado, la GPU bajaría ligeramente a 2475 MHz de reloj, 2000 MHz de RAM y 105 W de consumo, mientras que la temperatura del núcleo seguiría siendo la misma. Por lo tanto, es mejor poner el sistema en modo Rendimiento para aprovechar al máximo la GPU. La temperatura del núcleo es unos 10 C más baja que en el modelo del año pasado con la RTX 3070 Ti, ya que esta última alcanza un consumo de 149 W más alto.
Funcionar con batería limita el rendimiento, como era de esperar. Un test Fire Strike a pilas devolvería puntuaciones de Física y Gráficos de 21363 y 12851 puntos, respectivamente, comparados con 35270 y 26561 puntos cuando está enchufado.
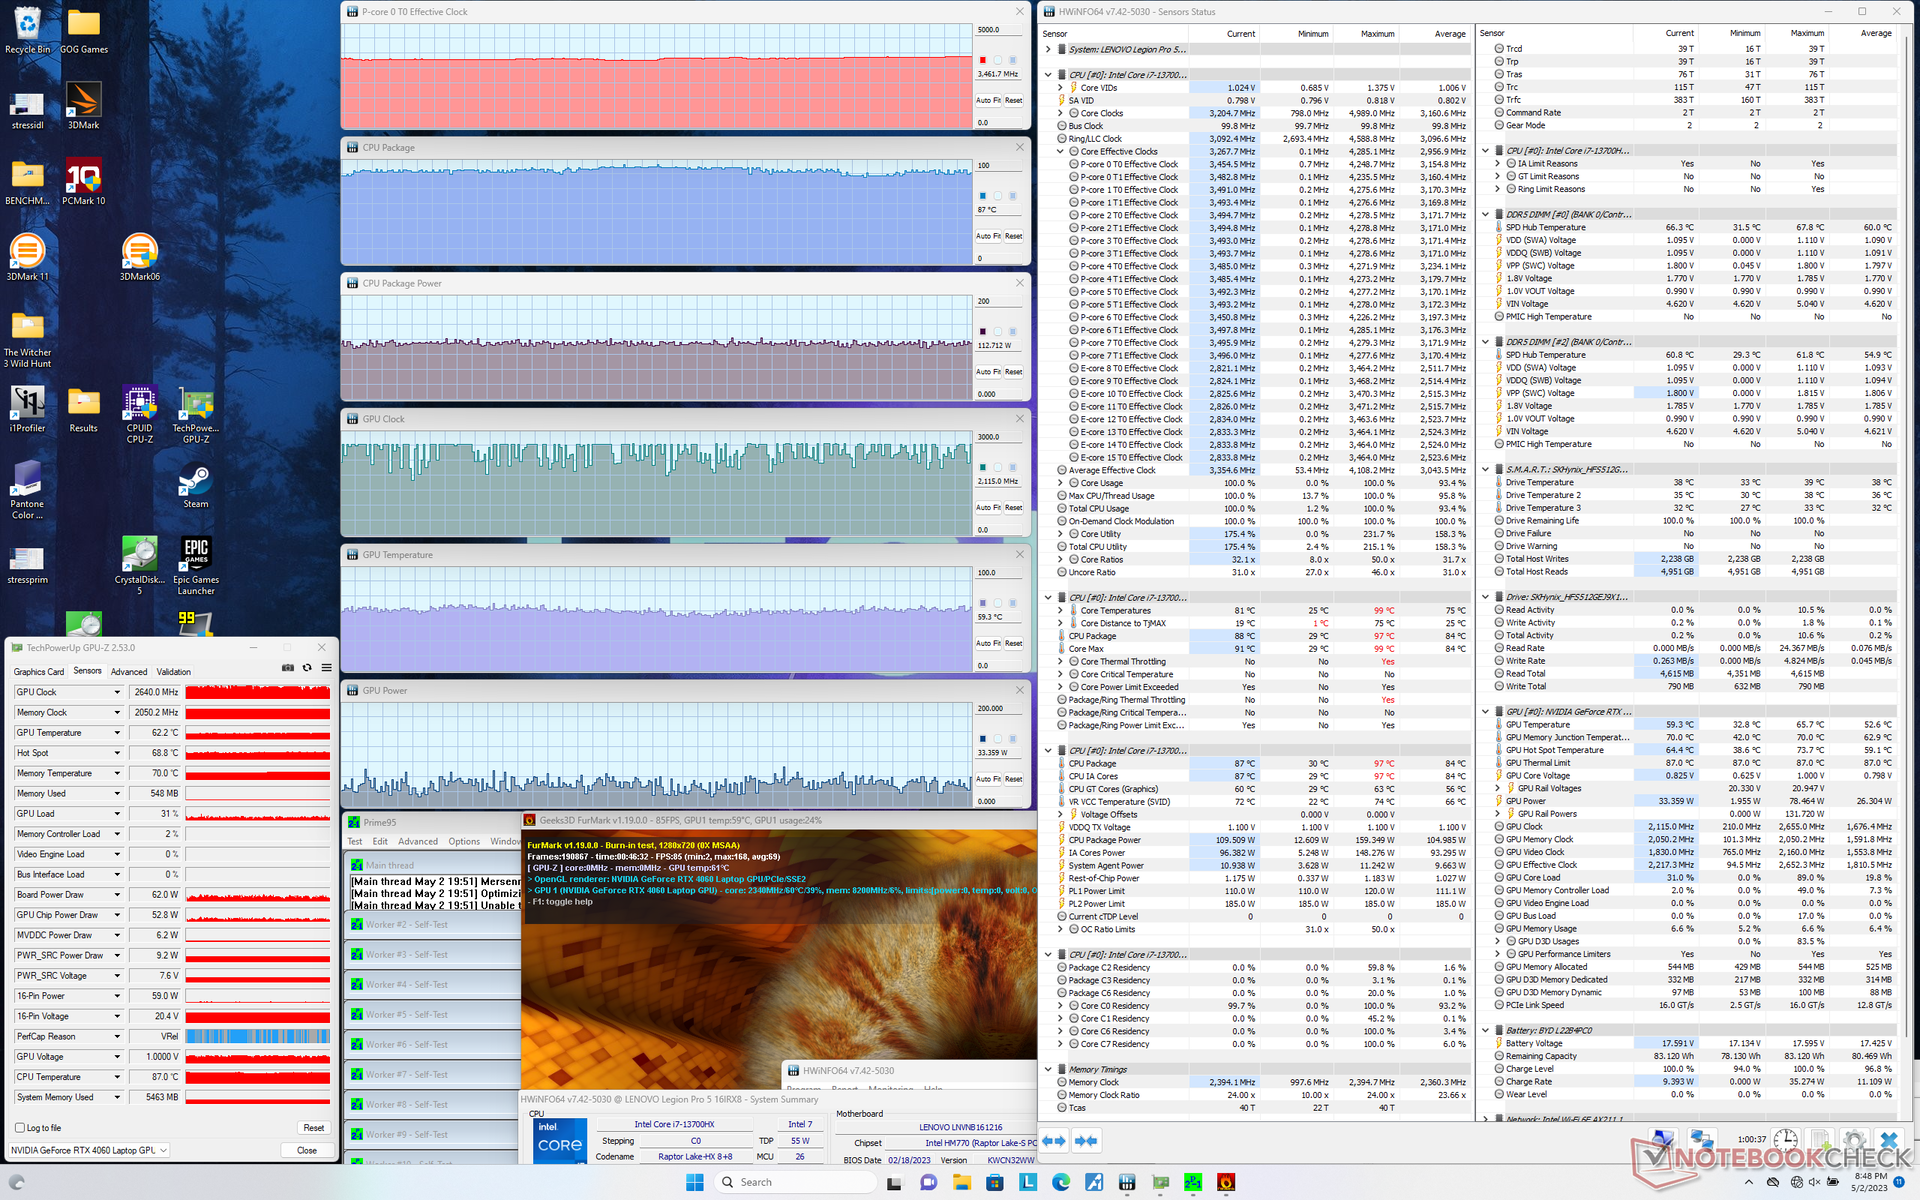
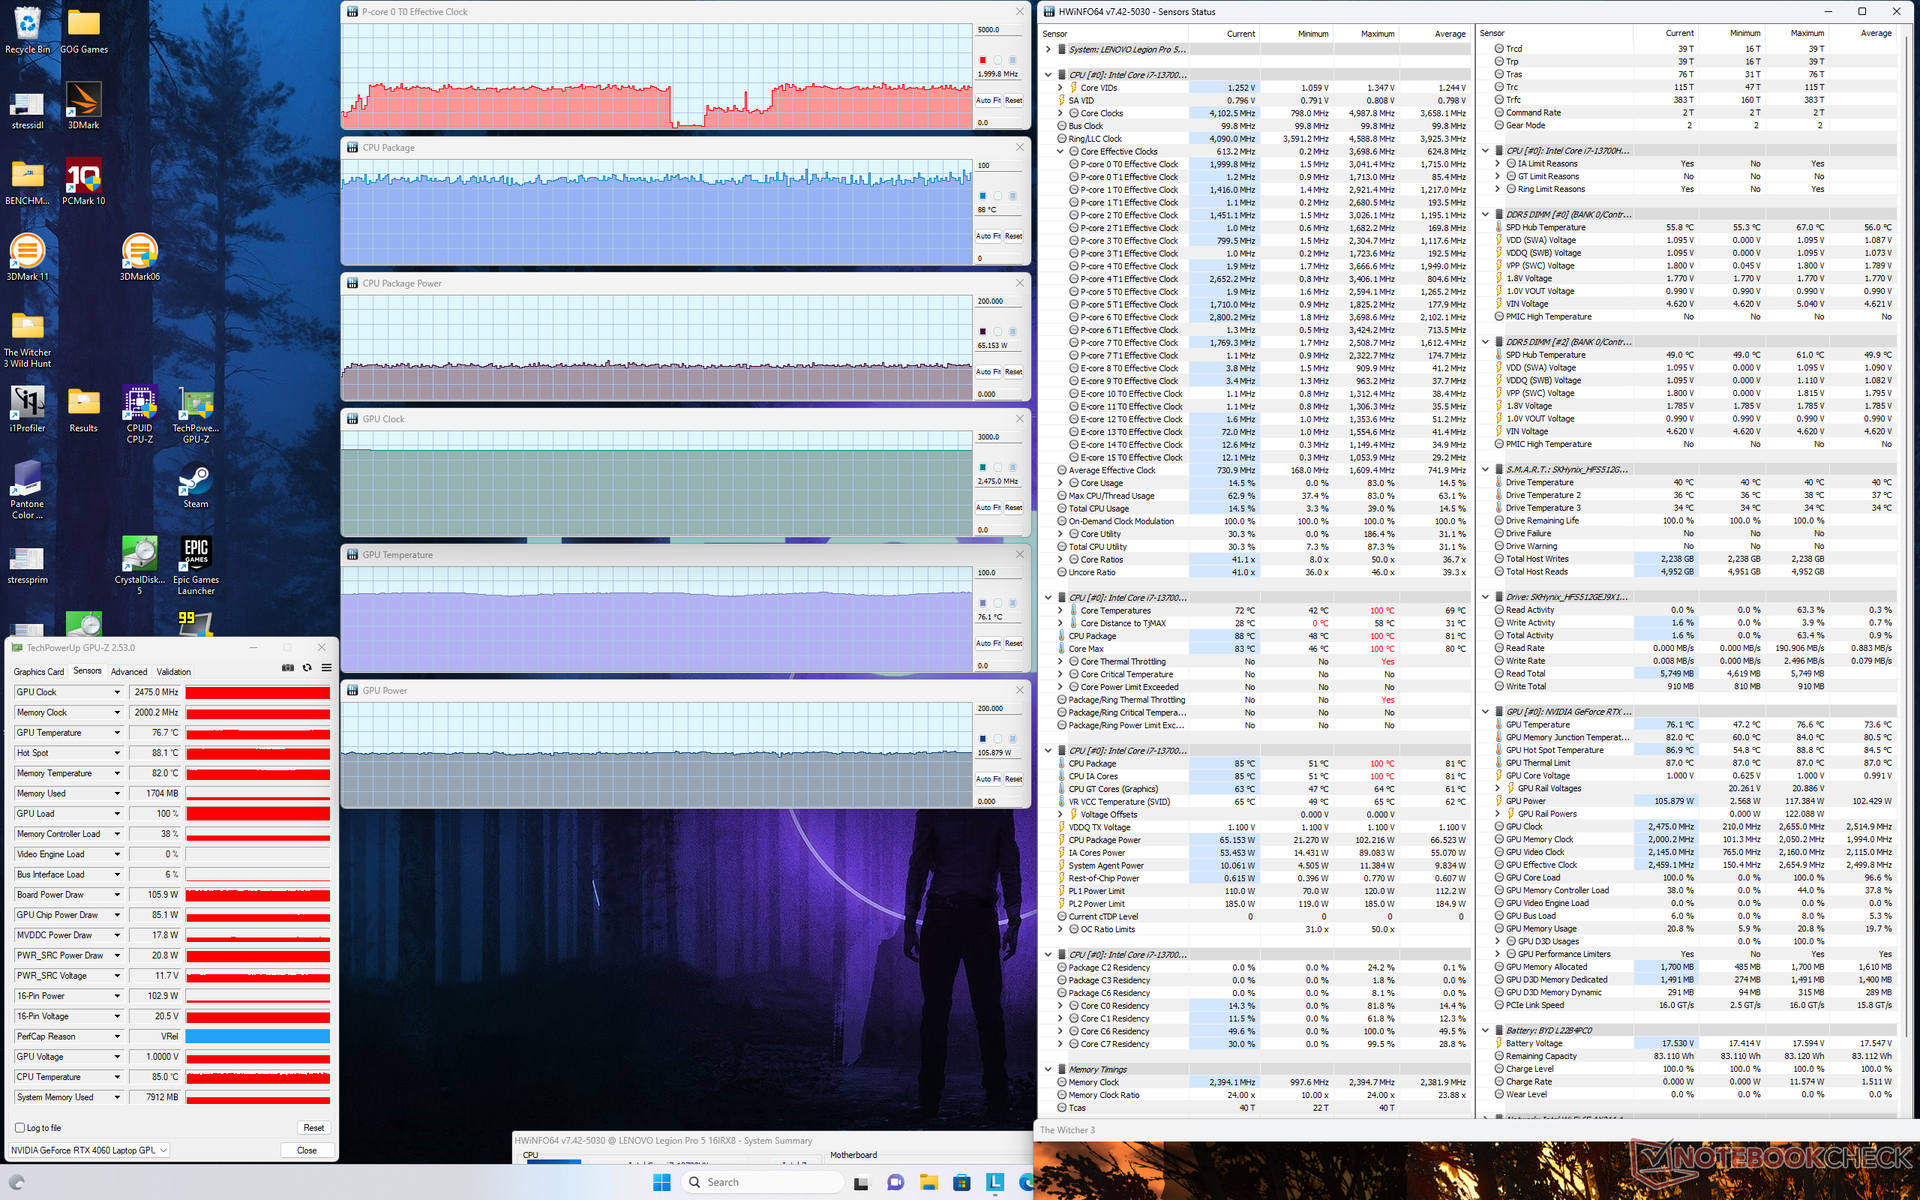
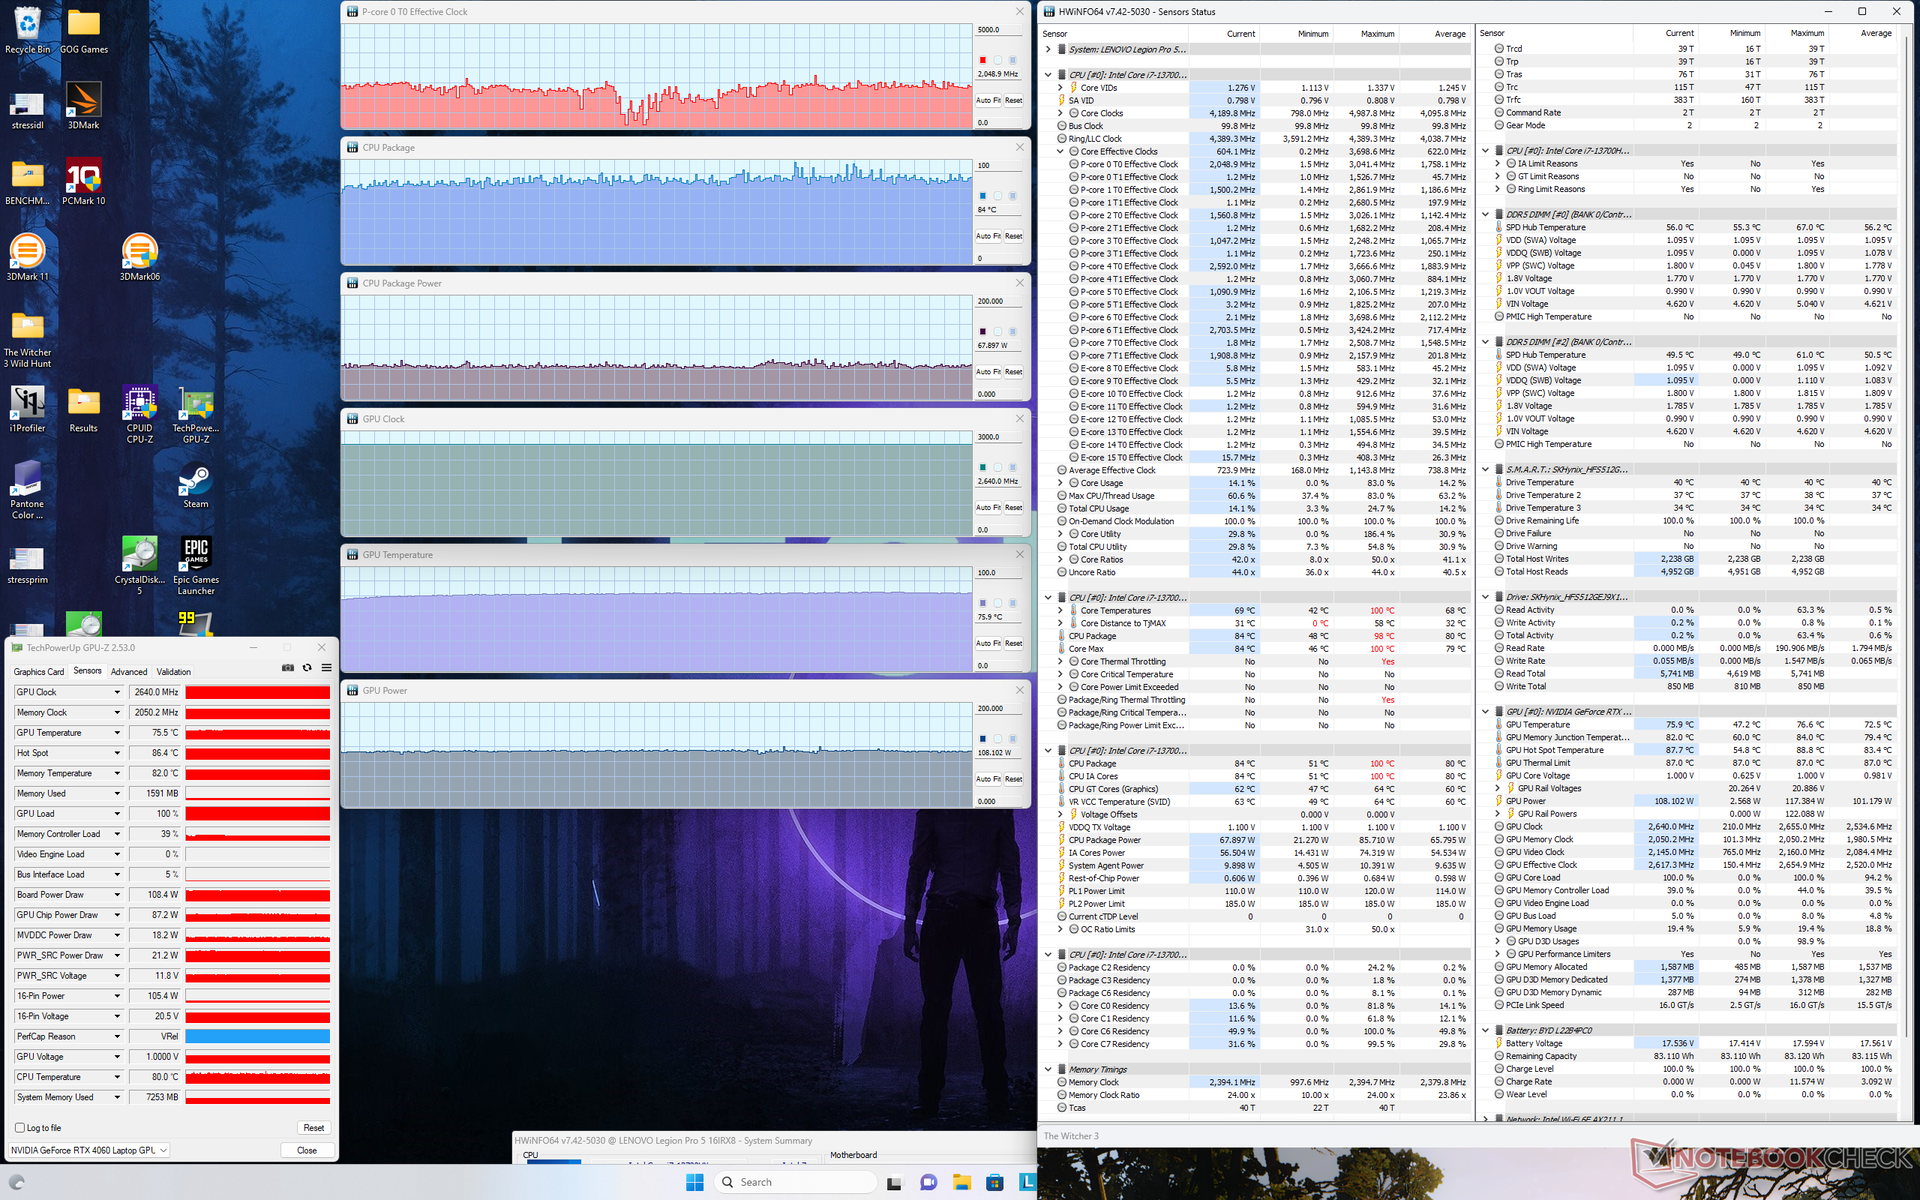
| RelojCPU (GHz) | Reloj GPU (MHz) | Temperatura mediaCPU (°C) | Temperatura media GPU (°C) | |
| Sistema en reposo | -- | -- | 37 | 36 |
| Prime95 Stress | 3,3 - 3,6 | -- | 81 - 86 | 47 |
| Prime95+ FurMark Estrés | 3,5 | 1714 - 2640 | 87 | 59 |
| Witcher 3 Estrés (modoequilibrado) | ~2,0 | 2475 | 88 | 76 |
| Witcher 3 Estrés (modoRendimiento) | ~2,0 | 2640 | 84 | 76 |
Altavoces
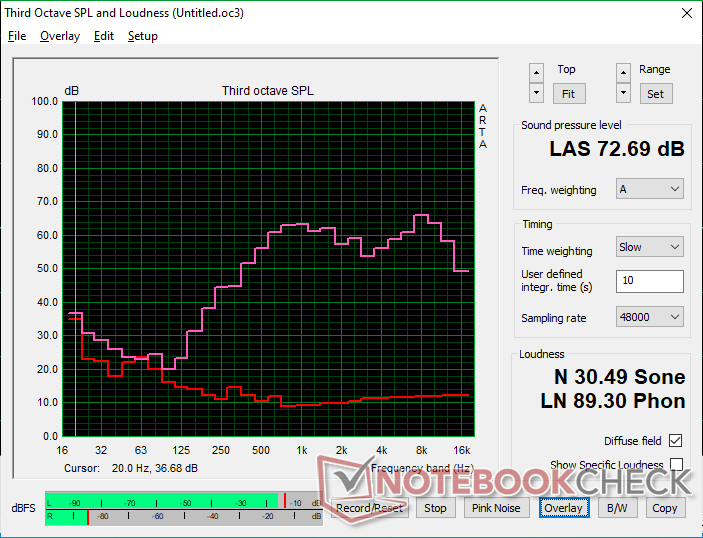
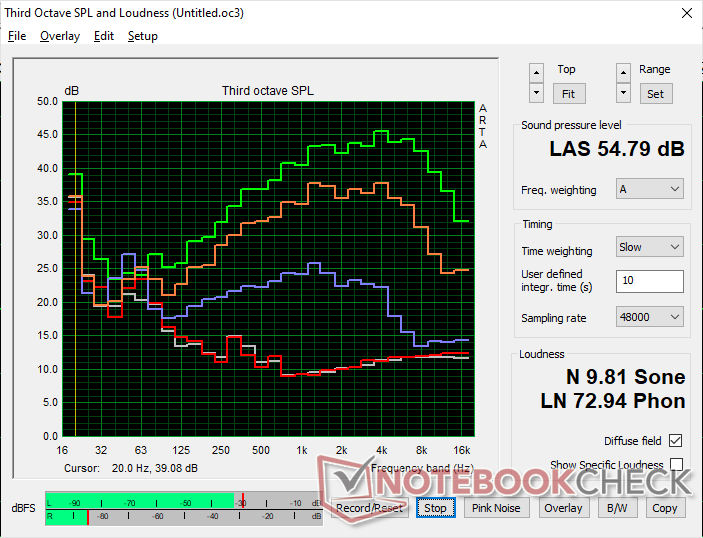
Lenovo Legion Pro 5 16IRX8 análisis de audio
(±) | la sonoridad del altavoz es media pero buena (72.7 dB)
Graves 100 - 315 Hz
(-) | casi sin bajos - de media 23.7% inferior a la mediana
(±) | la linealidad de los graves es media (10.7% delta a frecuencia anterior)
Medios 400 - 2000 Hz
(+) | medios equilibrados - a sólo 3.8% de la mediana
(±) | la linealidad de los medios es media (7.1% delta respecto a la frecuencia anterior)
Altos 2 - 16 kHz
(+) | máximos equilibrados - a sólo 3.7% de la mediana
(+) | los máximos son lineales (6.7% delta a la frecuencia anterior)
Total 100 - 16.000 Hz
(±) | la linealidad del sonido global es media (21.9% de diferencia con la mediana)
En comparación con la misma clase
» 79% de todos los dispositivos probados de esta clase eran mejores, 6% similares, 16% peores
» El mejor tuvo un delta de 6%, la media fue 18%, el peor fue ###max##%
En comparación con todos los dispositivos probados
» 63% de todos los dispositivos probados eran mejores, 7% similares, 30% peores
» El mejor tuvo un delta de 4%, la media fue 23%, el peor fue ###max##%
Apple MacBook Pro 16 2021 M1 Pro análisis de audio
(+) | los altavoces pueden reproducir a un volumen relativamente alto (#84.7 dB)
Graves 100 - 315 Hz
(+) | buen bajo - sólo 3.8% lejos de la mediana
(+) | el bajo es lineal (5.2% delta a la frecuencia anterior)
Medios 400 - 2000 Hz
(+) | medios equilibrados - a sólo 1.3% de la mediana
(+) | los medios son lineales (2.1% delta a la frecuencia anterior)
Altos 2 - 16 kHz
(+) | máximos equilibrados - a sólo 1.9% de la mediana
(+) | los máximos son lineales (2.7% delta a la frecuencia anterior)
Total 100 - 16.000 Hz
(+) | el sonido global es lineal (4.6% de diferencia con la mediana)
En comparación con la misma clase
» 0% de todos los dispositivos probados de esta clase eran mejores, 0% similares, 100% peores
» El mejor tuvo un delta de 5%, la media fue 17%, el peor fue ###max##%
En comparación con todos los dispositivos probados
» 0% de todos los dispositivos probados eran mejores, 0% similares, 100% peores
» El mejor tuvo un delta de 4%, la media fue 23%, el peor fue ###max##%
Gestión de la energía
Consumo energético: tan exigente como antes
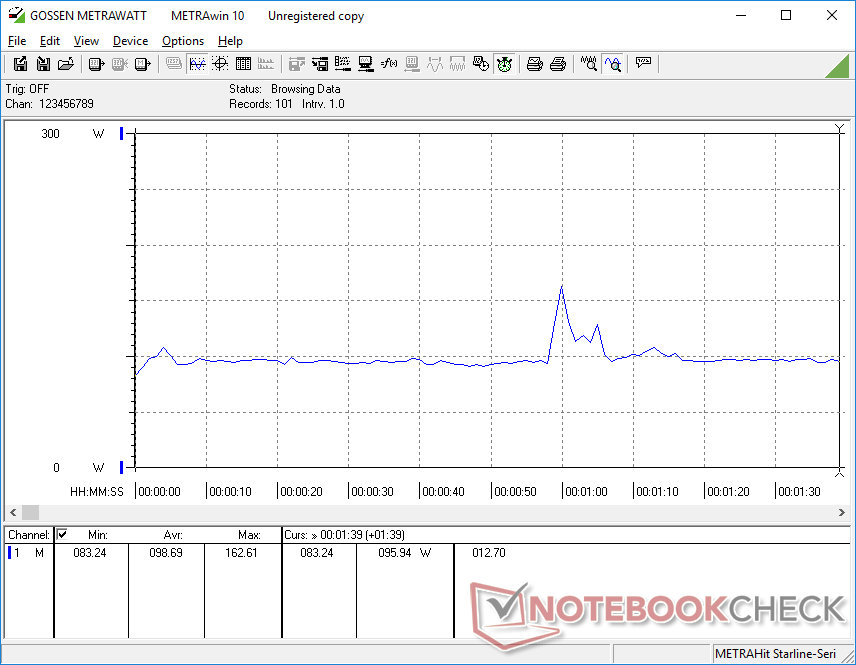
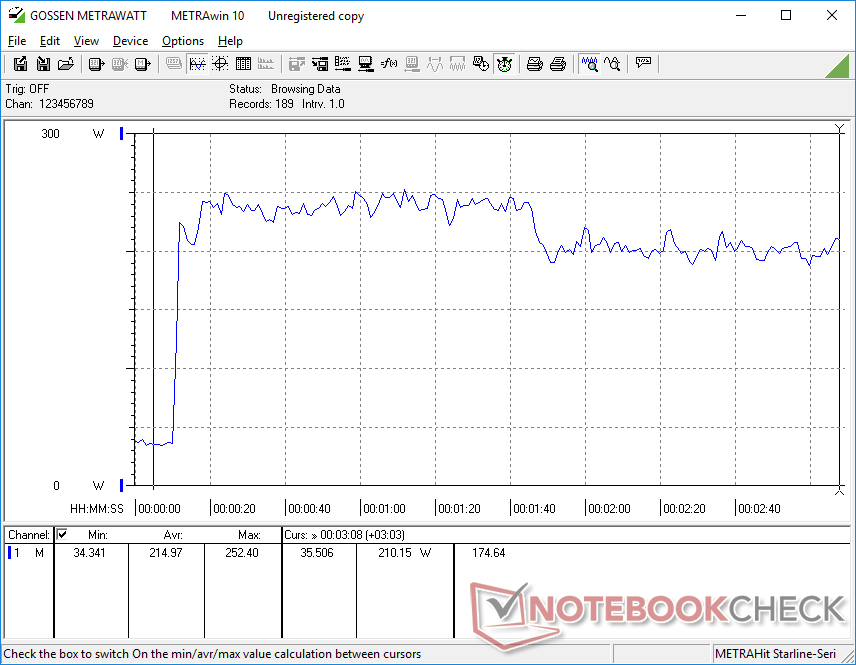
El sistema es inusualmente exigente cuando está en ralentí en el escritorio donde somos capaces de medir un mínimo de 24 W en comparación con sólo 10 W a 15 W en alternativas como el ROG Zephyrus M16 o Blade 16. Incluso nos aseguramos de poner el sistema en modo de ahorro de energía con la iGPU activa y al mínimo brillo, pero los resultados no mejoraron. El consumo relativamente alto puede ser en parte responsable de la duración de batería más corta de lo esperado, como se señala en la siguiente sección.
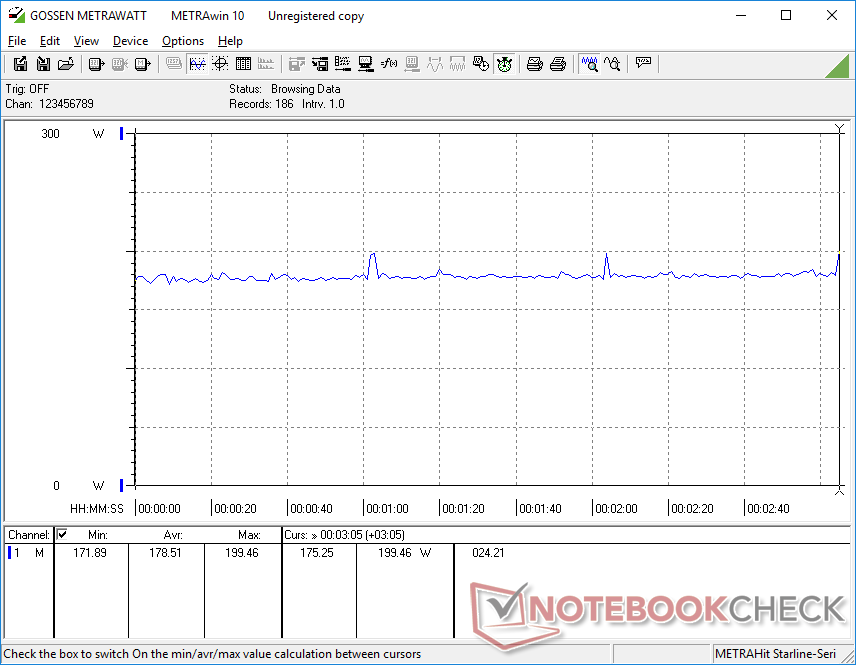
Si se ejecuta Witcher 3 consumiría 179 W frente a los 209 W del Legion 5 Pro 16 del año pasado con la RTX 3070 Ti. Esa GPU en concreto es entre un 15 y un 20 por ciento más rápida que nuestra RTX 4060 y con un objetivo de TGP más alto, como ya se ha dicho, lo que se correlaciona con su consumo de energía un 15 por ciento superior. En consecuencia, el rendimiento por vatio se mantiene relativamente lineal de un año a otro.
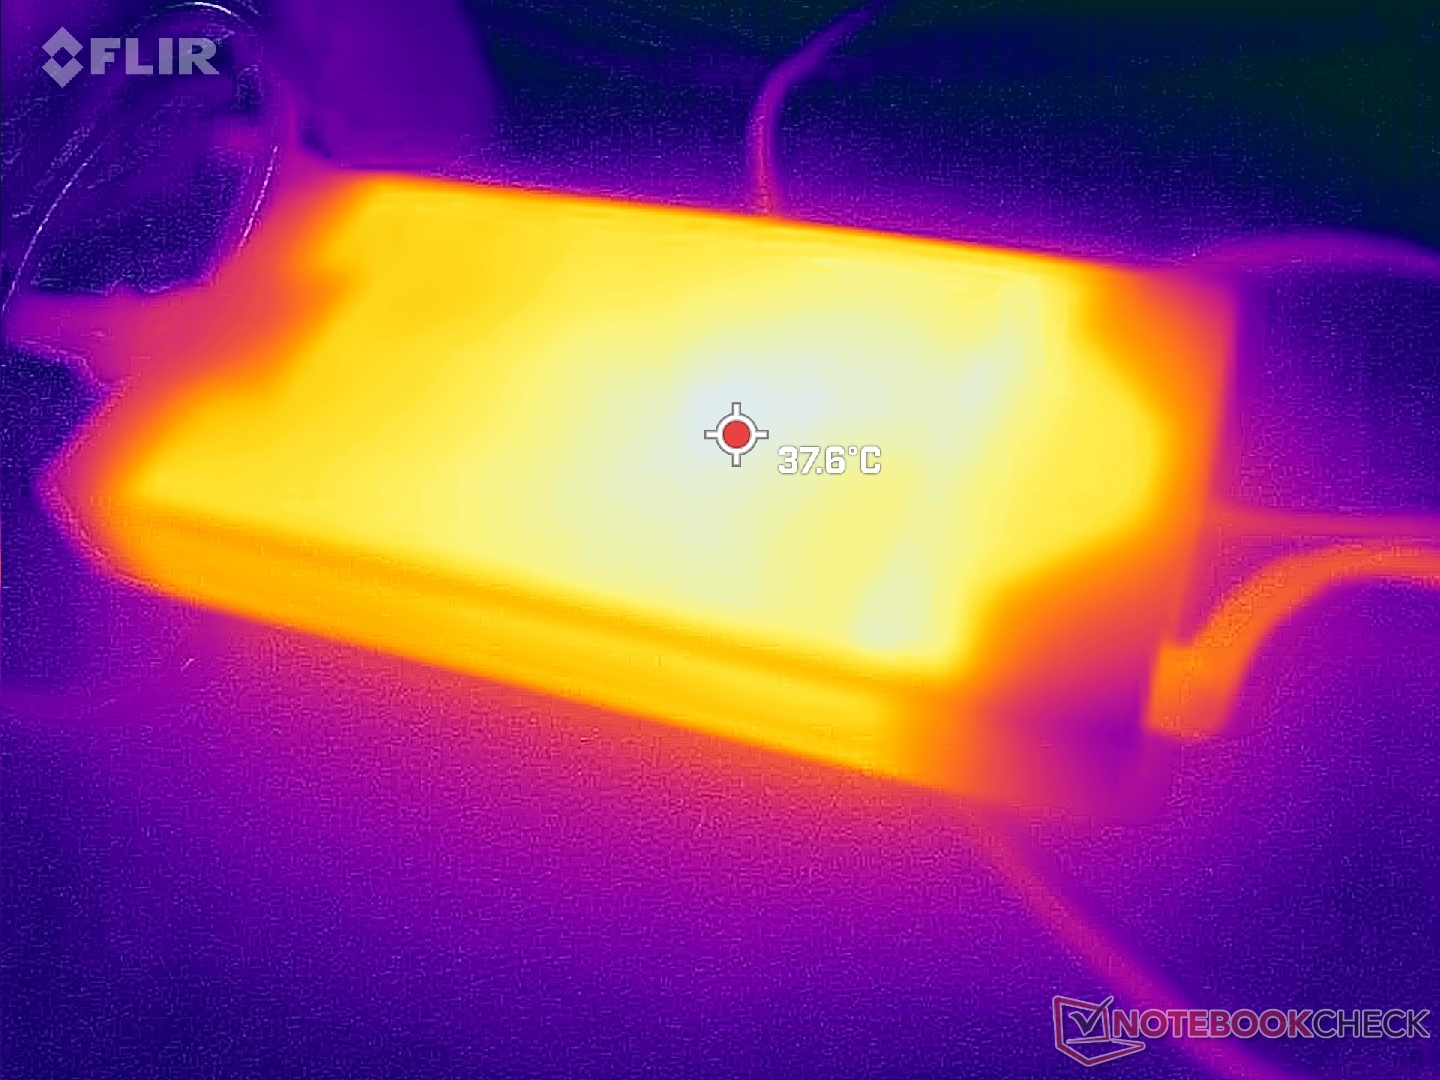
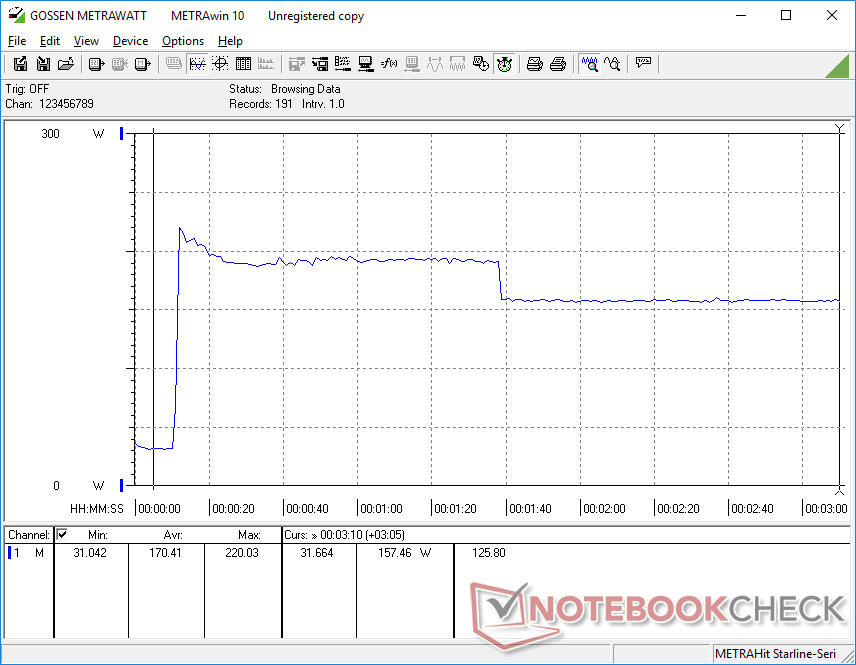
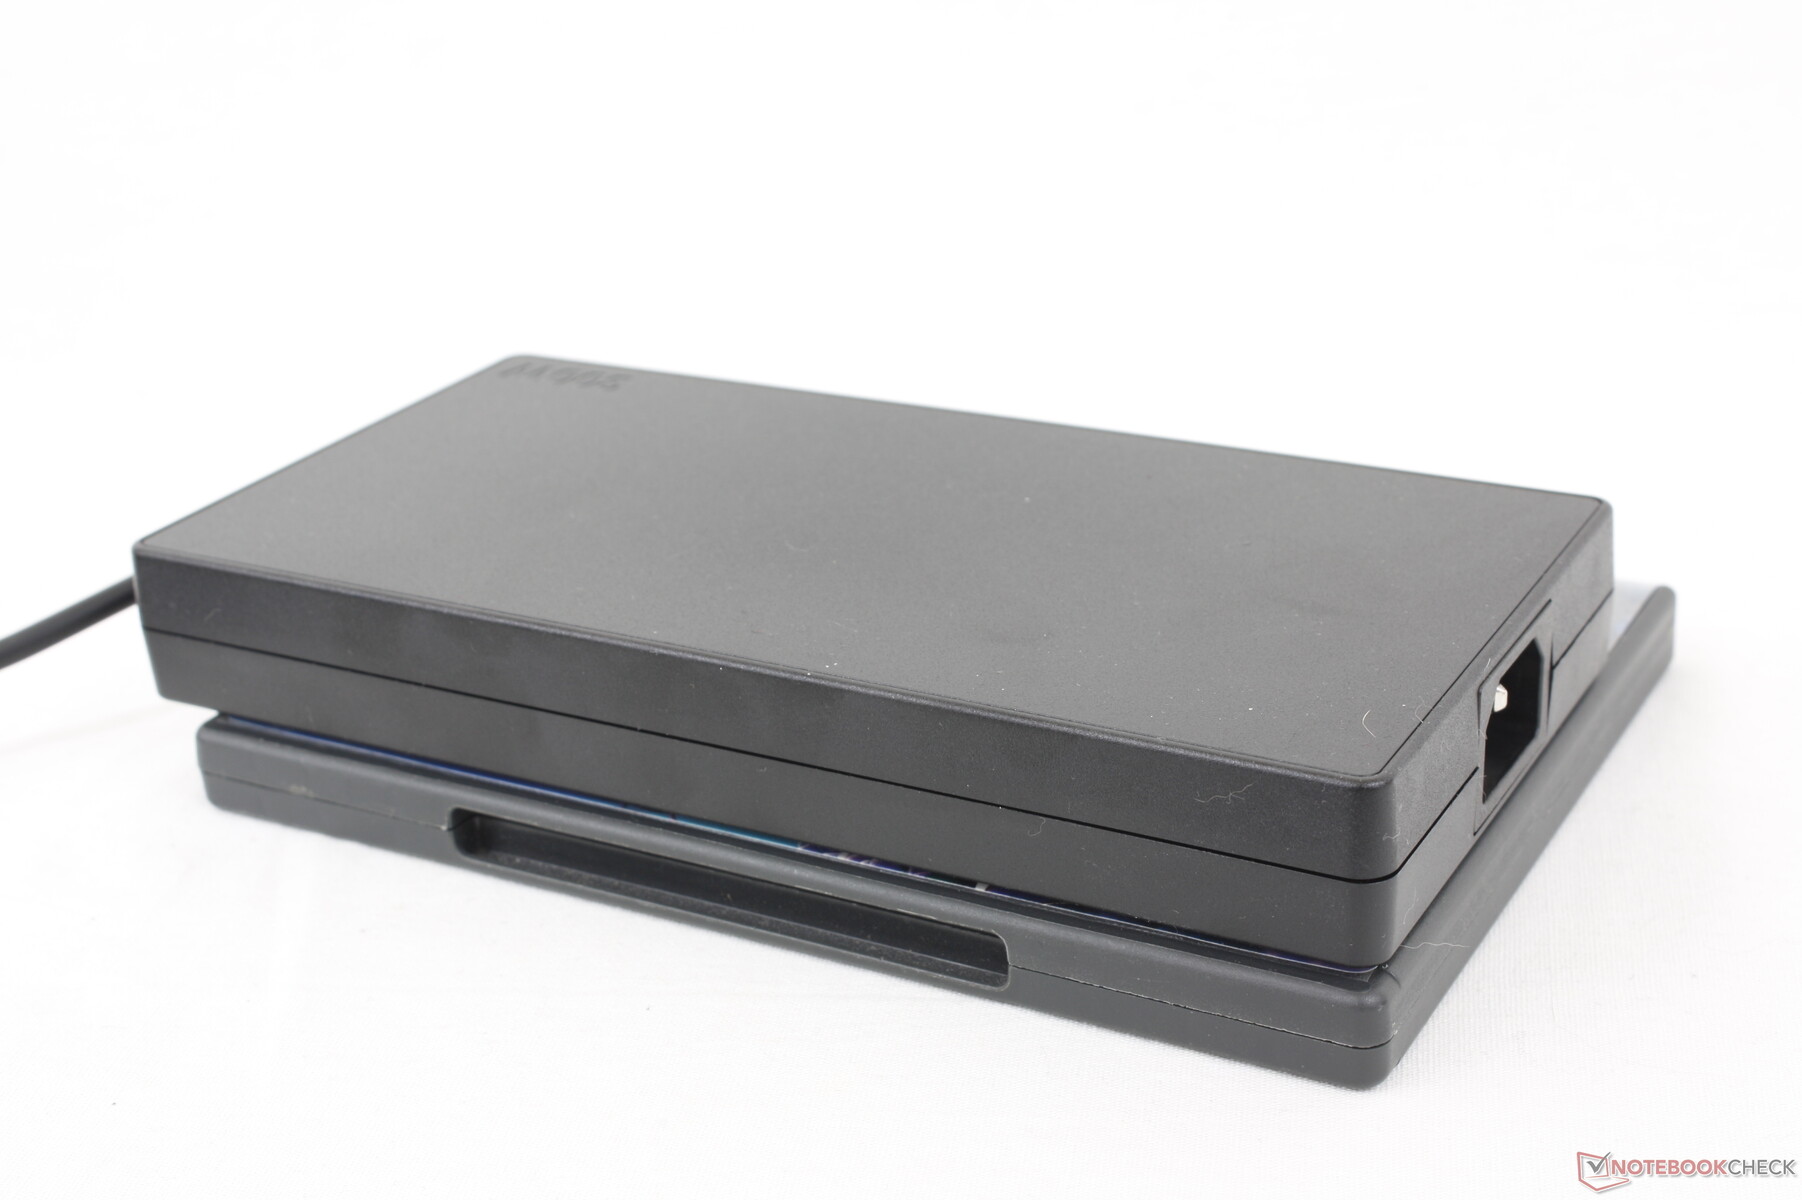
Podemos medir un consumo máximo de 250 W del gran adaptador de CA de 300 W (~19.9 x 9.9 x 2.6 cm) cuando CPU y GPU están al 100% de uso. Lenovo utiliza este mismo adaptador de 300 W para muchos de sus otros modelos Legion.
| Off / Standby | |
| Ocioso | |
| Carga |
|
Clave:
min: | |
| Lenovo Legion Pro 5 16IRX8 i7-13700HX, GeForce RTX 4060 Laptop GPU, SK hynix PC801 HFS512GEJ9X115N, IPS, 2560x1600, 16" | Asus ROG Zephyrus M16 GU603Z i9-12900H, GeForce RTX 3070 Ti Laptop GPU, Micron 3400 1TB MTFDKBA1T0TFH, IPS, 2560x1600, 16" | Razer Blade 16 Early 2023 i9-13950HX, GeForce RTX 4080 Laptop GPU, SSSTC CA6-8D1024, IPS, 2560x1600, 16" | Lenovo Legion Pro 7 16IRX8H i9-13900HX, GeForce RTX 4080 Laptop GPU, Samsung PM9A1 MZVL21T0HCLR, IPS, 2560x1600, 16" | Lenovo Legion 5 Pro 16ARH7H RTX 3070 Ti R7 6800H, GeForce RTX 3070 Ti Laptop GPU, Samsung PM9A1 MZVL21T0HCLR, IPS, 2560x1600, 16" | Lenovo Legion S7 16ARHA7 R9 6900HX, Radeon RX 6800S, SK Hynix HFS001TEJ9X115N, IPS, 2560x1600, 16" | |
|---|---|---|---|---|---|---|
| Power Consumption | 27% | -9% | -9% | 10% | 31% | |
| Idle Minimum * (Watt) | 24.5 | 10.8 56% | 15.2 38% | 18 27% | 9.7 60% | 8.8 64% |
| Idle Average * (Watt) | 29.2 | 17 42% | 22.8 22% | 24 18% | 14.8 49% | 14.7 50% |
| Idle Maximum * (Watt) | 34.3 | 17.8 48% | 49.8 -45% | 32 7% | 45.8 -34% | 19.8 42% |
| Load Average * (Watt) | 98.7 | 116 -18% | 121.2 -23% | 130 -32% | 87.2 12% | 85.3 14% |
| Witcher 3 ultra * (Watt) | 178.6 | 144 19% | 242 -35% | 260 -46% | 209 -17% | 167.5 6% |
| Load Maximum * (Watt) | 249.6 | 220 12% | 273.7 -10% | 320 -28% | 275.3 -10% | 230.7 8% |
* ... más pequeño es mejor
Power Consumption Witcher 3 / Stresstest
Power Consumption external Monitor
Duración de la batería: inferior a la de otros portátiles para juegos
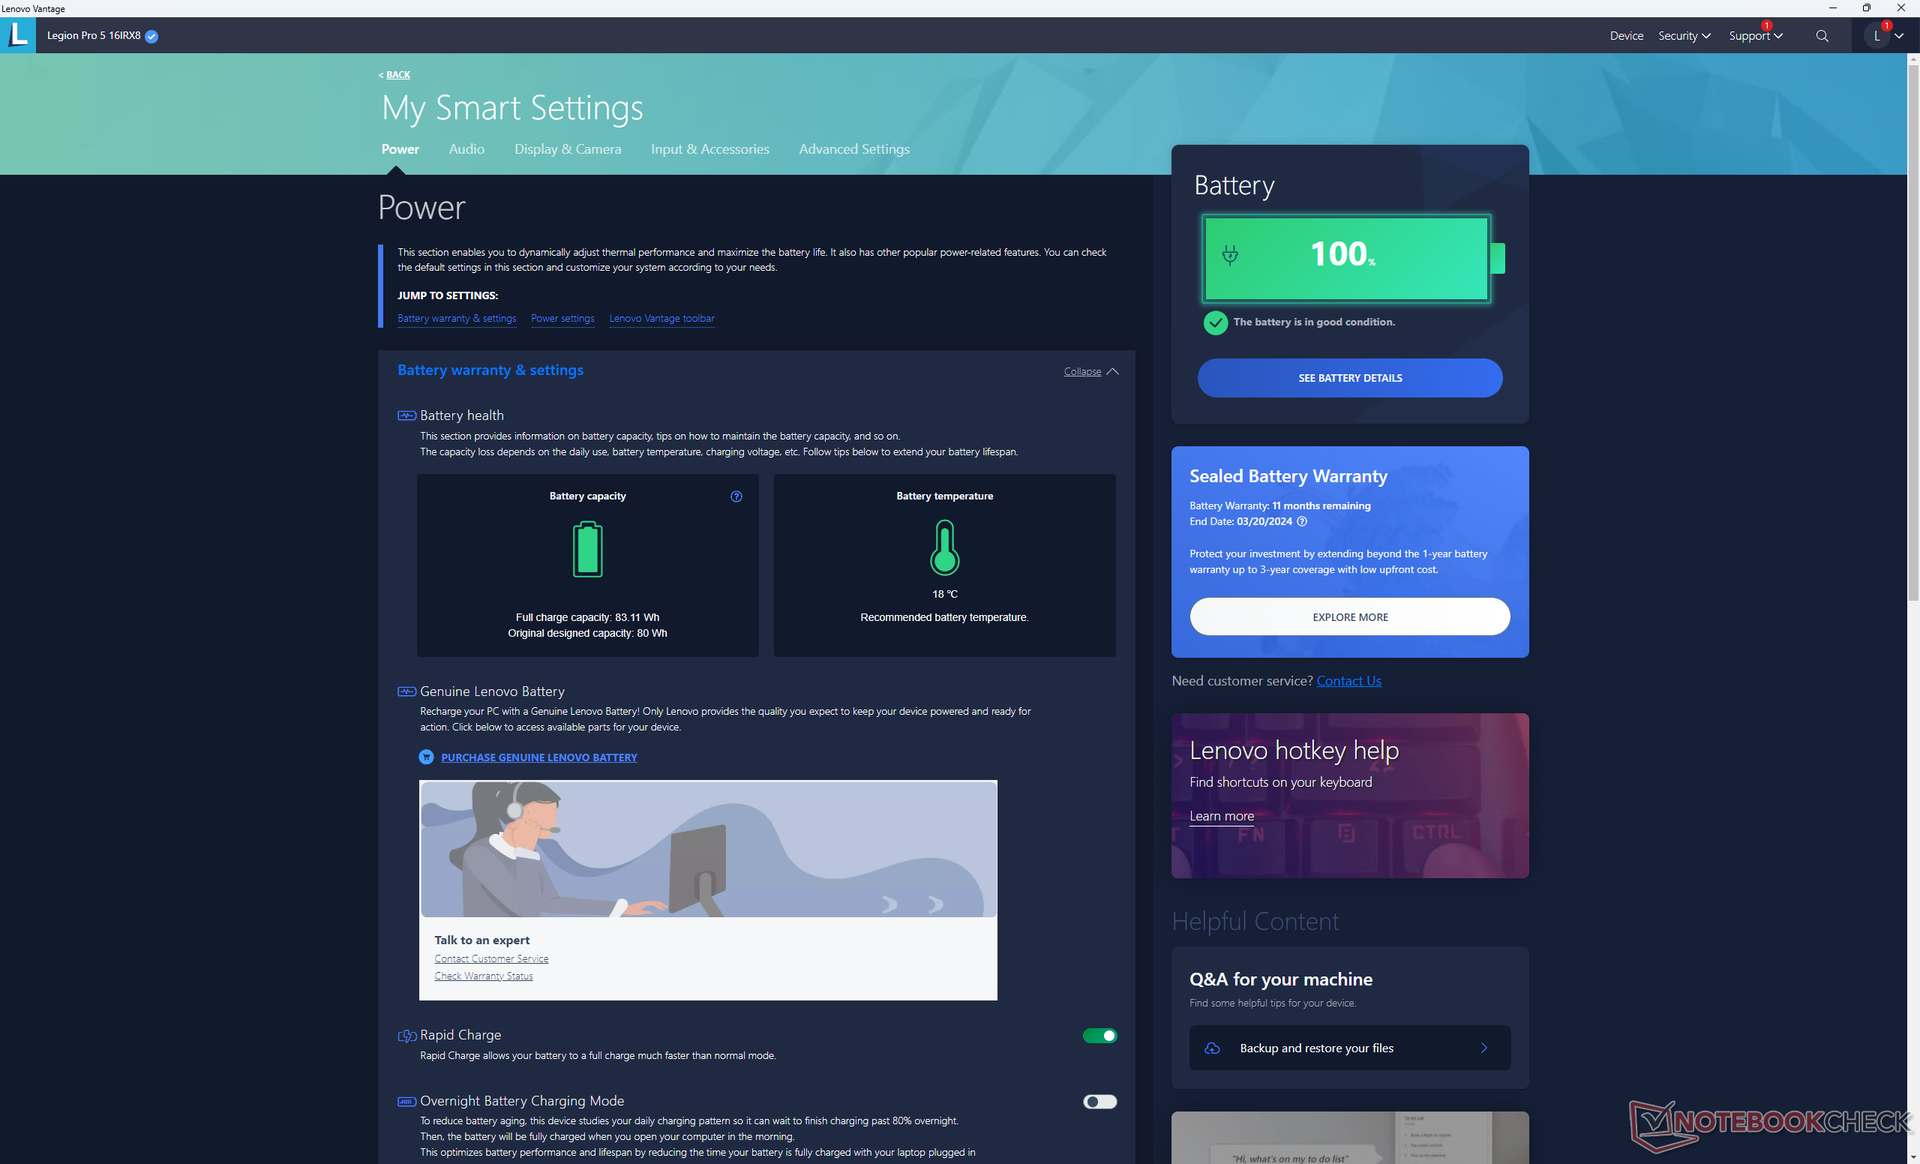
La capacidad de la batería sigue siendo de 80 Wh, frente a los 99 Wh del más caro Legion 7 Pro más cara. La duración es corta, lo que parece ser una tendencia entre los modelos Legion; sólo pudimos registrar una duración WLAN de menos de 3,5 horas incluso en los modos iGPU y perfil equilibrado. El Razer Blade 16 y Asus ROG Zephyrus M16 pueden durar varias horas más en comparación.
La carga de vacío a lleno es relativamente rápida, menos de 90 minutos con el adaptador de CA incluido. El sistema también se puede recargar con adaptadores USB-C más pequeños, aunque a menor velocidad y con rendimiento limitado.
| Lenovo Legion Pro 5 16IRX8 i7-13700HX, GeForce RTX 4060 Laptop GPU, 80 Wh | Asus ROG Zephyrus M16 GU603Z i9-12900H, GeForce RTX 3070 Ti Laptop GPU, 90 Wh | Razer Blade 16 Early 2023 i9-13950HX, GeForce RTX 4080 Laptop GPU, 95.2 Wh | Lenovo Legion Pro 7 16IRX8H i9-13900HX, GeForce RTX 4080 Laptop GPU, 99.9 Wh | Lenovo Legion 5 Pro 16ARH7H RTX 3070 Ti R7 6800H, GeForce RTX 3070 Ti Laptop GPU, 80 Wh | Lenovo Legion S7 16ARHA7 R9 6900HX, Radeon RX 6800S, 71 Wh | |
|---|---|---|---|---|---|---|
| Duración de Batería | 109% | 71% | 82% | 29% | 82% | |
| Reader / Idle (h) | 6.7 | 8.9 33% | 6.4 -4% | |||
| WiFi v1.3 (h) | 3.4 | 7.4 118% | 6.1 79% | 5.1 50% | 4.4 29% | 6.2 82% |
| Load (h) | 0.7 | 1.4 100% | 1.4 100% | 2.1 200% | ||
| H.264 (h) | 7.3 |
Pro
Contra
Veredicto - Se echan en falta algunas funciones por el precio
El 2023 Legion Pro 5 16 configurado con gráficos GeForce RTX 4060 no es un portátil de juegos barato, con un precio de 1600 dólares. Eso no es un problema, por supuesto, siempre que venga repleto de características que los jugones realmente quieren. G-Sync, QHD+ 165 Hz, colores sRGB completos, fácil mantenimiento y teclas de flecha grandes vienen de serie para hacer del modelo un portátil de juego completo.
No obstante, podemos notar algunos recortes incluso en este rango de precios. El modelo omite algunas características clave como la iluminación RGB por tecla, el soporte Thunderbolt, Advanced Optimus y las opciones de panel AdobeRGB. Esto último, en particular, significa que el Legion Pro 5 16 puede no ser la mejor solución para los usuarios que son a la vez creadores de contenidos o artistas digitales y jugadores. Modelos de la competencia como elRazer Blade 16, Aero 16o el Asus ROG Zephyrus M16 no sólo son más ligeros y delgados, sino que ofrecen opciones de pantalla más amplias junto con algunas de las características antes mencionadas que faltan.
El renovado Legion Pro 5 16 cubre casi todo lo que se puede pedir a un portátil de juegos de gama media. Sin embargo, lamentablemente se omiten algunas características deseables como AdobeRGB, Thunderbolt y Advanced Optimus.
En cuanto al rendimiento, los usuarios de sistemas con CPU Intel de 12ª generación y GPU GeForce RTX 3070 o superior no se beneficiarán demasiado de la actualización a Intel de 13ª generación con gráficos GeForce RTX 4060 o 4070. Las máquinas más antiguas que funcionen con GPU GeForce RTX 20 y CPU Intel o AMD Zen 3 de 11ª generación quizá deban plantearse dar el salto.
Precio y disponibilidad
Lenovo ya está distribuyendo el Legion Pro 5 16IRX8 en nuestra configuración de prueba por $1600 USD.
Lenovo Legion Pro 5 16IRX8
- 05/05/2023 v7 (old)
Allen Ngo
Transparencia
La selección de los dispositivos que se van a reseñar corre a cargo de nuestro equipo editorial. La muestra de prueba fue proporcionada al autor en calidad de préstamo por el fabricante o el minorista a los efectos de esta reseña. El prestamista no tuvo ninguna influencia en esta reseña, ni el fabricante recibió una copia de la misma antes de su publicación. No había ninguna obligación de publicar esta reseña. Como empresa de medios independiente, Notebookcheck no está sujeta a la autoridad de fabricantes, minoristas o editores.
Así es como prueba Notebookcheck
Cada año, Notebookcheck revisa de forma independiente cientos de portátiles y smartphones utilizando procedimientos estandarizados para asegurar que todos los resultados son comparables. Hemos desarrollado continuamente nuestros métodos de prueba durante unos 20 años y hemos establecido los estándares de la industria en el proceso. En nuestros laboratorios de pruebas, técnicos y editores experimentados utilizan equipos de medición de alta calidad. Estas pruebas implican un proceso de validación en varias fases. Nuestro complejo sistema de clasificación se basa en cientos de mediciones y puntos de referencia bien fundamentados, lo que mantiene la objetividad.Price comparison

