Análisis del Microsoft Surface Laptop 5 15: diseño antiguo por un precio superior
Microsoft actualizó su portátil Surface a finales del año pasado, pero esta nueva actualización en realidad no viene con muchas novedades. El fabricante decidió abandonar la opción AMD para la 5ª generación y, en su lugar, ofrece ahora las versiones de 13,5 y 15 pulgadas exclusivamente con procesadores Intel Alder Lake. Aparte de sus nuevos procesadores, no ha cambiado prácticamente nada más, ya que los portátiles siguen usando exactamente la misma carcasa. El precio, sin embargo, se mantiene dentro de la gama premium y nuestra configuración de pruebas - el modelo de 15 pulgadas con el procesador Core i7-1255U16 GB de RAM y un SSD de 512 GB - se vende actualmente en Microsoft por un PVPR de unos 4.000 $, un precio excesivo teniendo en cuenta las especificaciones técnicas del dispositivo. Sin embargo, el portátil se puede encontrar mucho más barato en otras tiendas, con precios a partir de unos 1.699 dólares. Hemos comprobado si el Surface Laptop 5 15 puede seguir compitiendo con otros dispositivos similares a principios de 2023.
Posibles contendientes en la comparación
Valoración | Fecha | Modelo | Peso | Altura | Tamaño | Resolución | Precio |
|---|---|---|---|---|---|---|---|
| 84.3 % v7 (old) | 04/2023 | Microsoft Surface Laptop 5 15, i7-1255U i7-1255U, Iris Xe G7 96EUs | 1.6 kg | 14.7 mm | 15.00" | 2496x1664 | |
| 84.9 % v7 (old) | 04/2021 | Microsoft Surface Laptop 4 15 AMD TFF_00028 R7 4980U, Vega 8 | 1.6 kg | 14.7 mm | 15.00" | 2496x1664 | |
| 85.9 % v7 (old) | 12/2022 | LG Gram 15Z90Q i5-1240P, Iris Xe G7 80EUs | 1.1 kg | 17.4 mm | 15.60" | 1920x1080 | |
| 89.5 % v7 (old) | 05/2022 | Dell XPS 15 9520 RTX 3050 Ti i7-12700H, GeForce RTX 3050 Ti Laptop GPU | 1.9 kg | 18 mm | 15.60" | 3456x2160 | |
| 87.3 % v7 (old) | 12/2021 | Samsung Galaxy Book Pro 15 NP950XDB-KC5US i7-1165G7, Iris Xe G7 96EUs | 1.1 kg | 11.7 mm | 15.60" | 1920x1080 | |
| 87.7 % v7 (old) | 05/2022 | Asus Zenbook Pro 15 OLED UM535Q R9 5900HX, GeForce RTX 3050 Ti Laptop GPU | 1.9 kg | 18 mm | 15.60" | 1920x1080 |
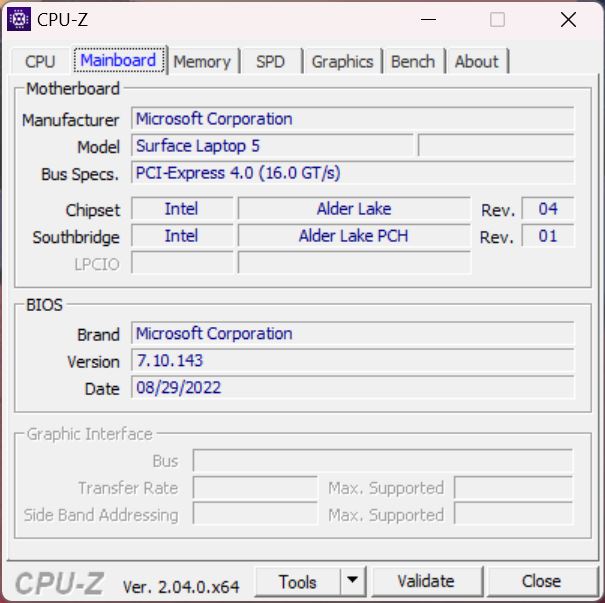
Caja y características
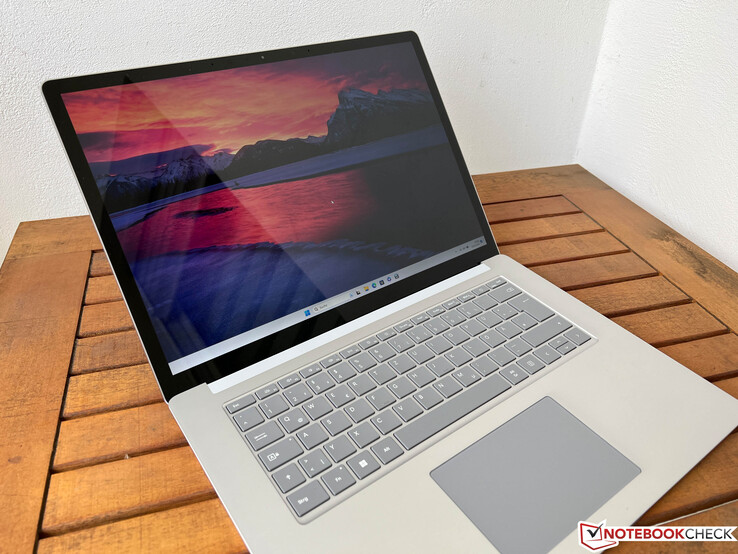
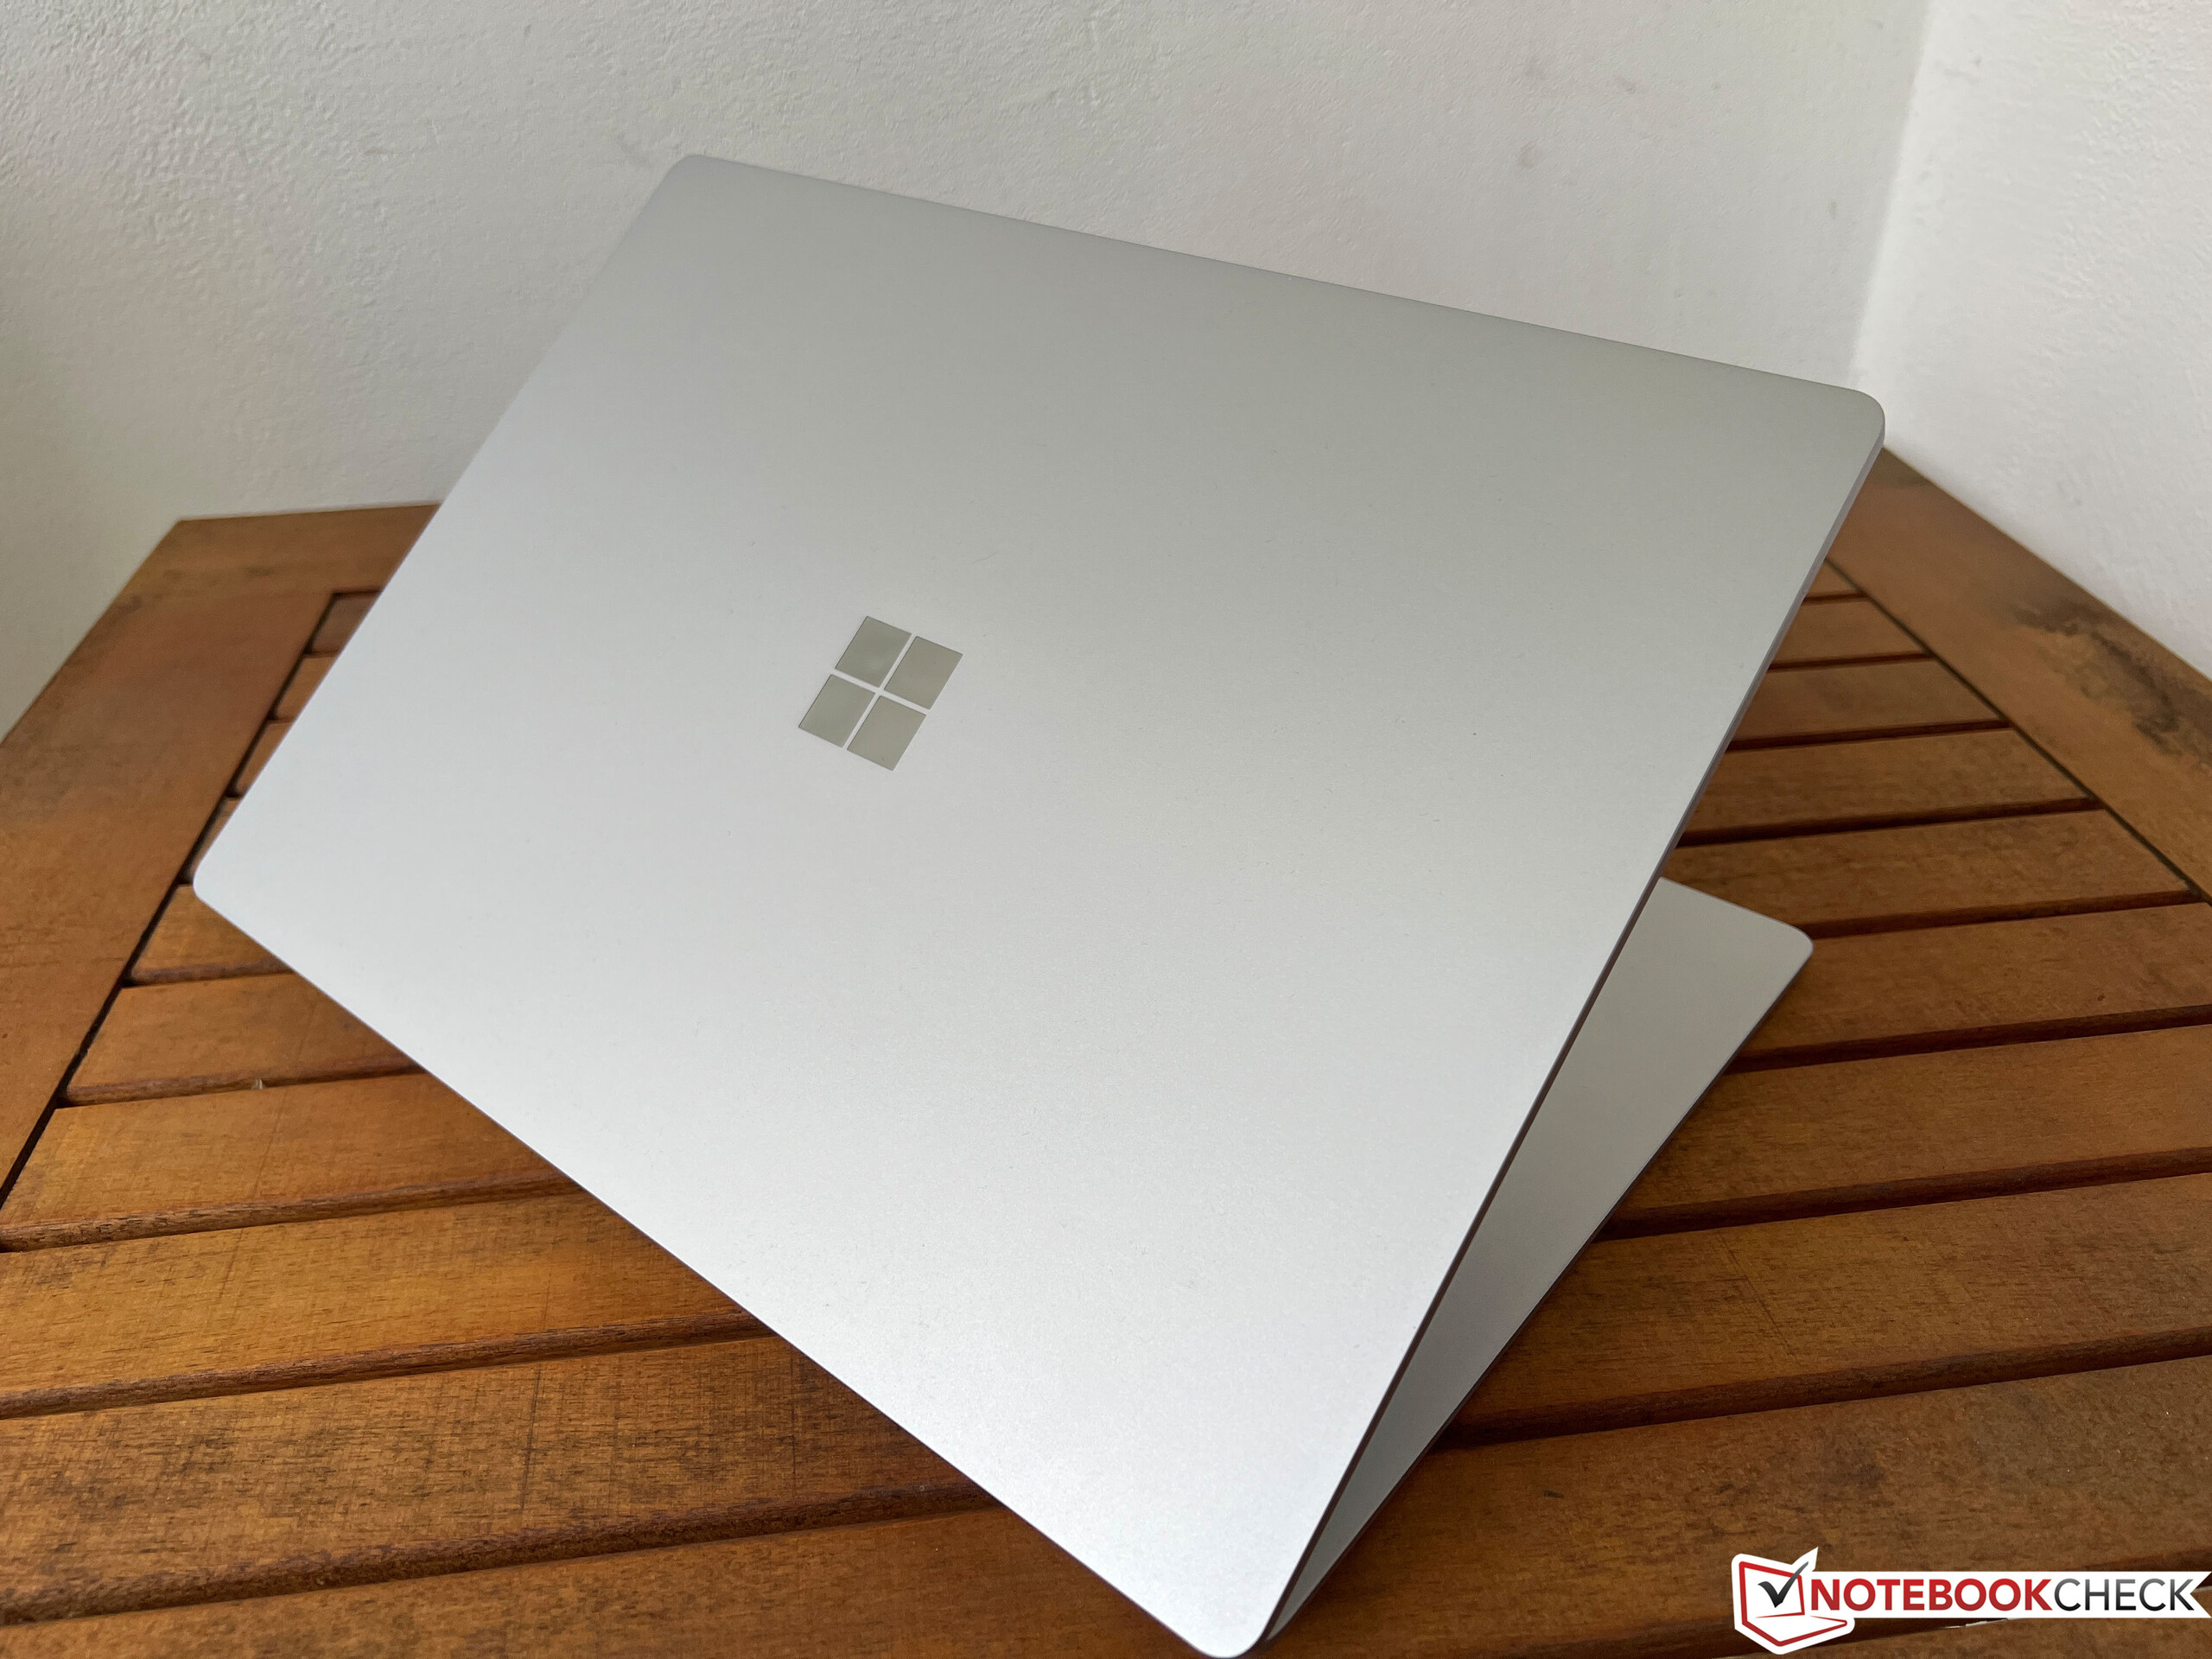
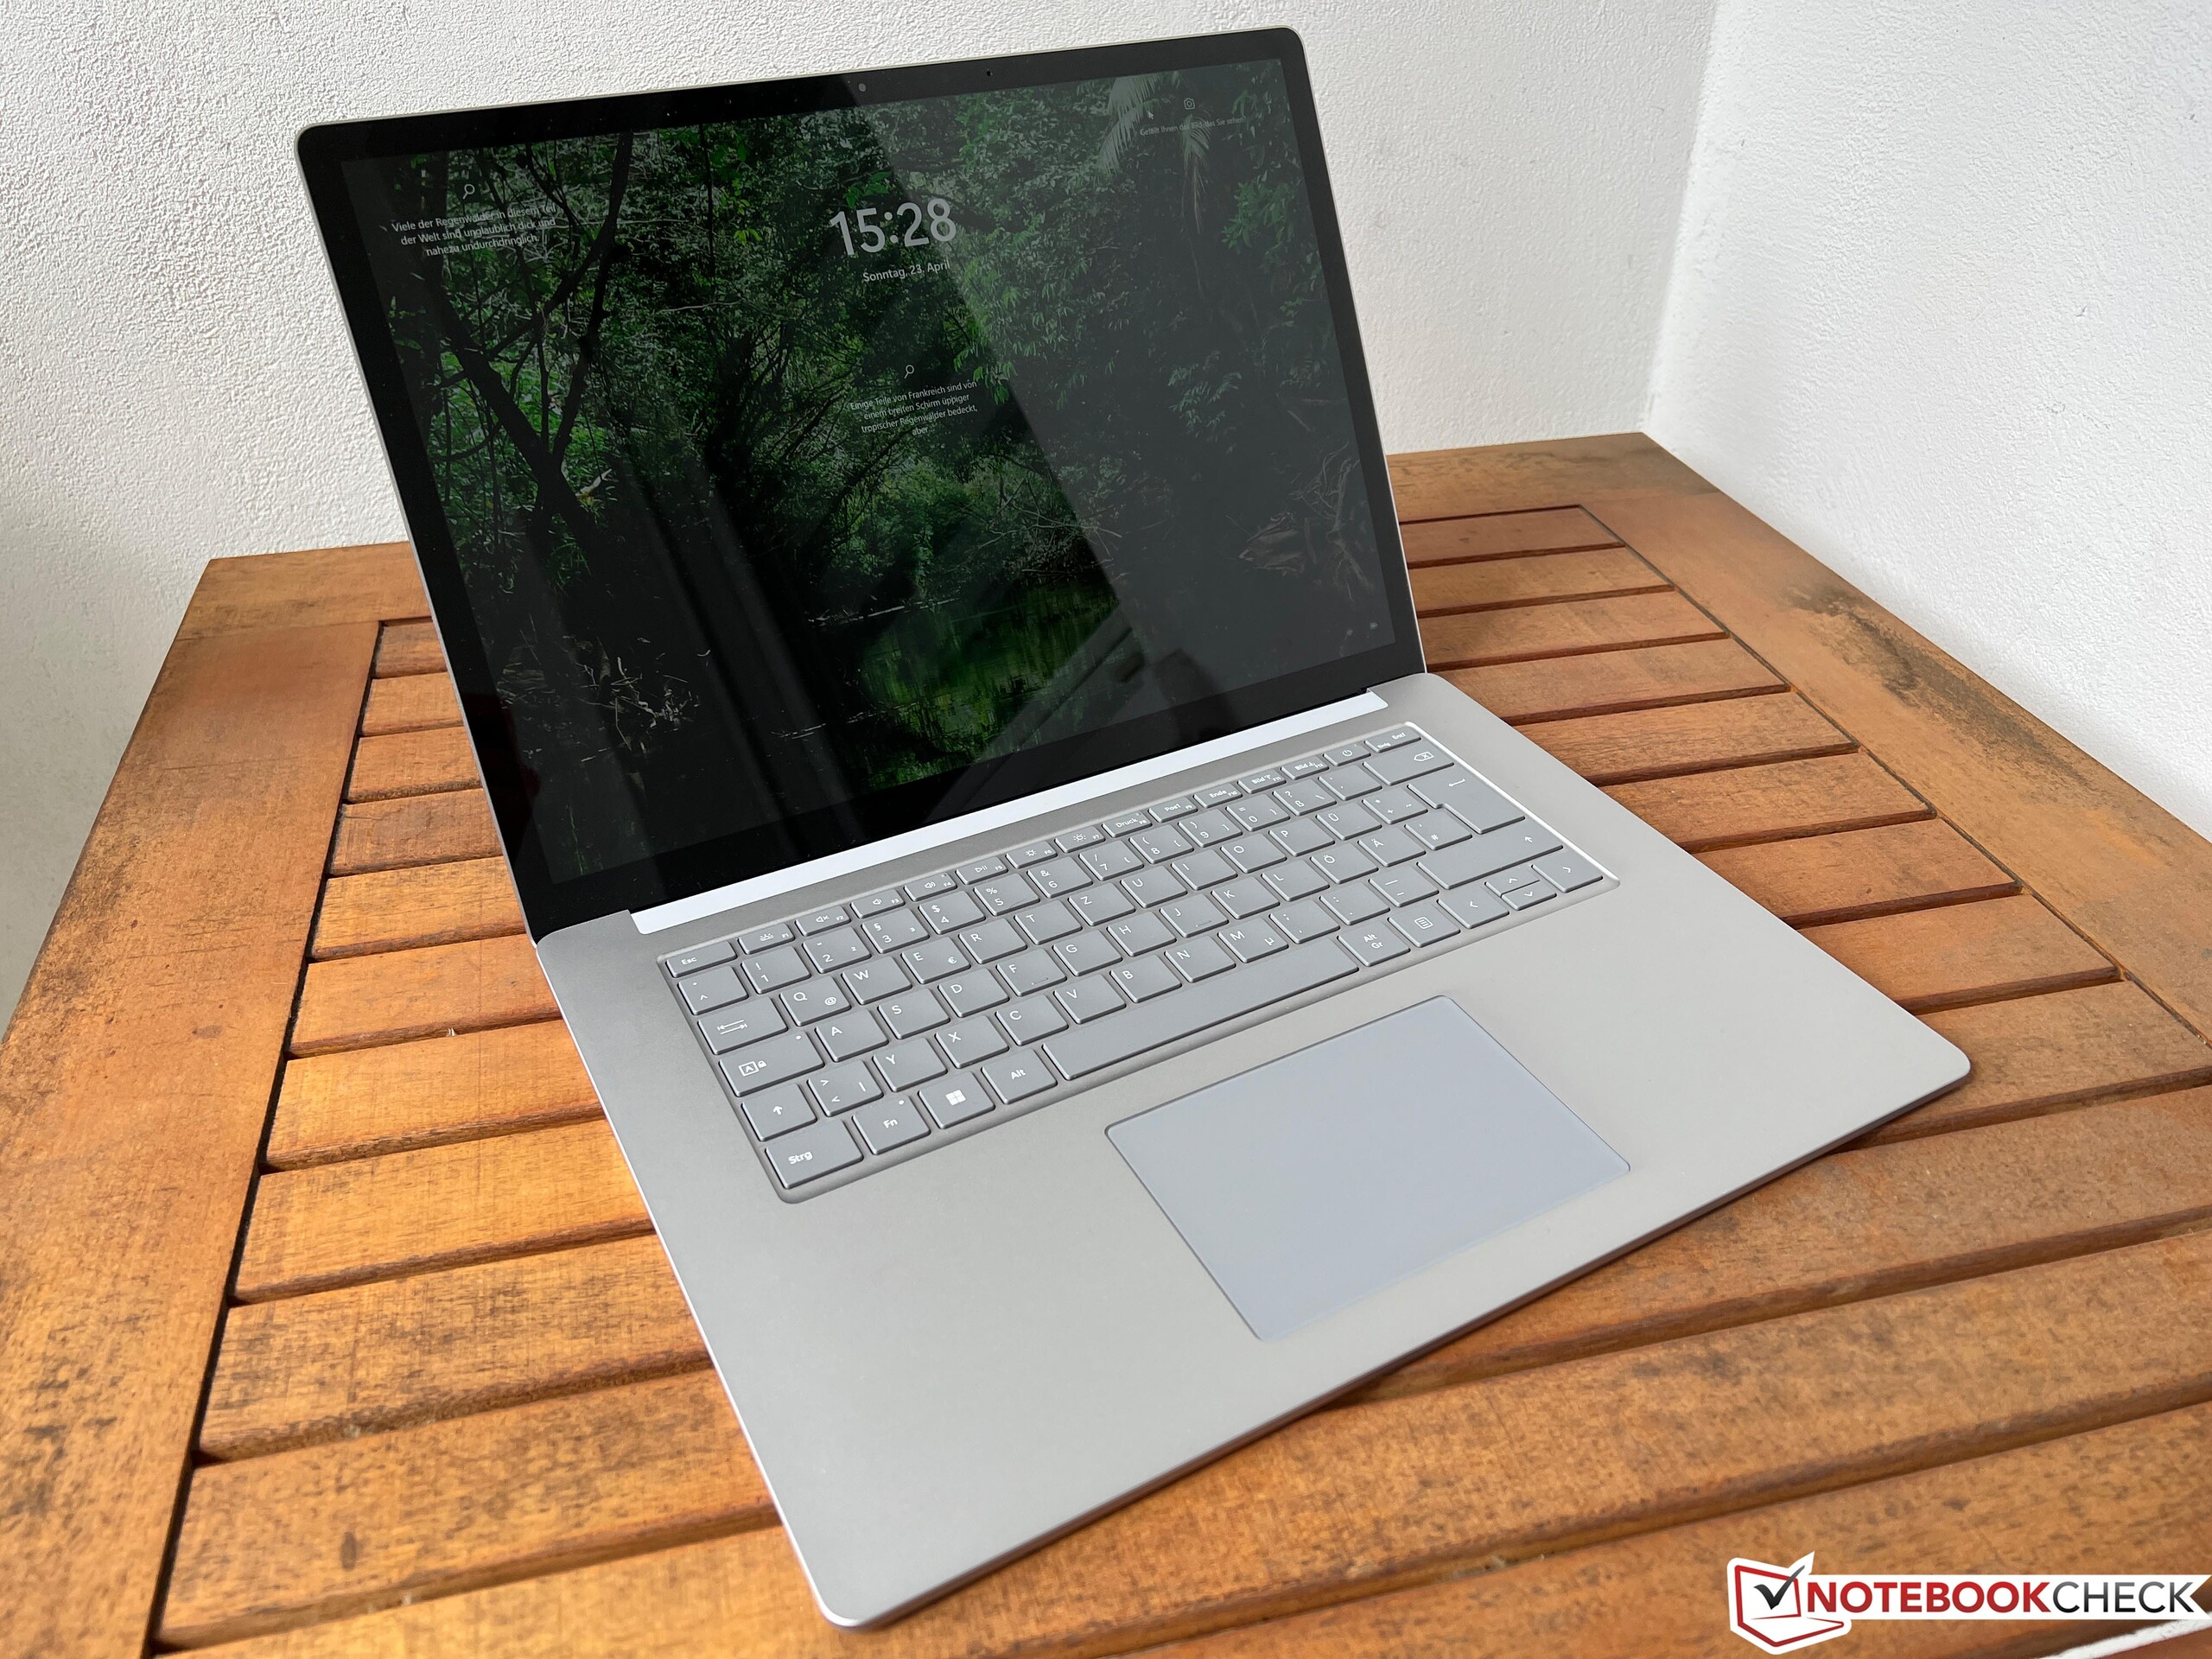
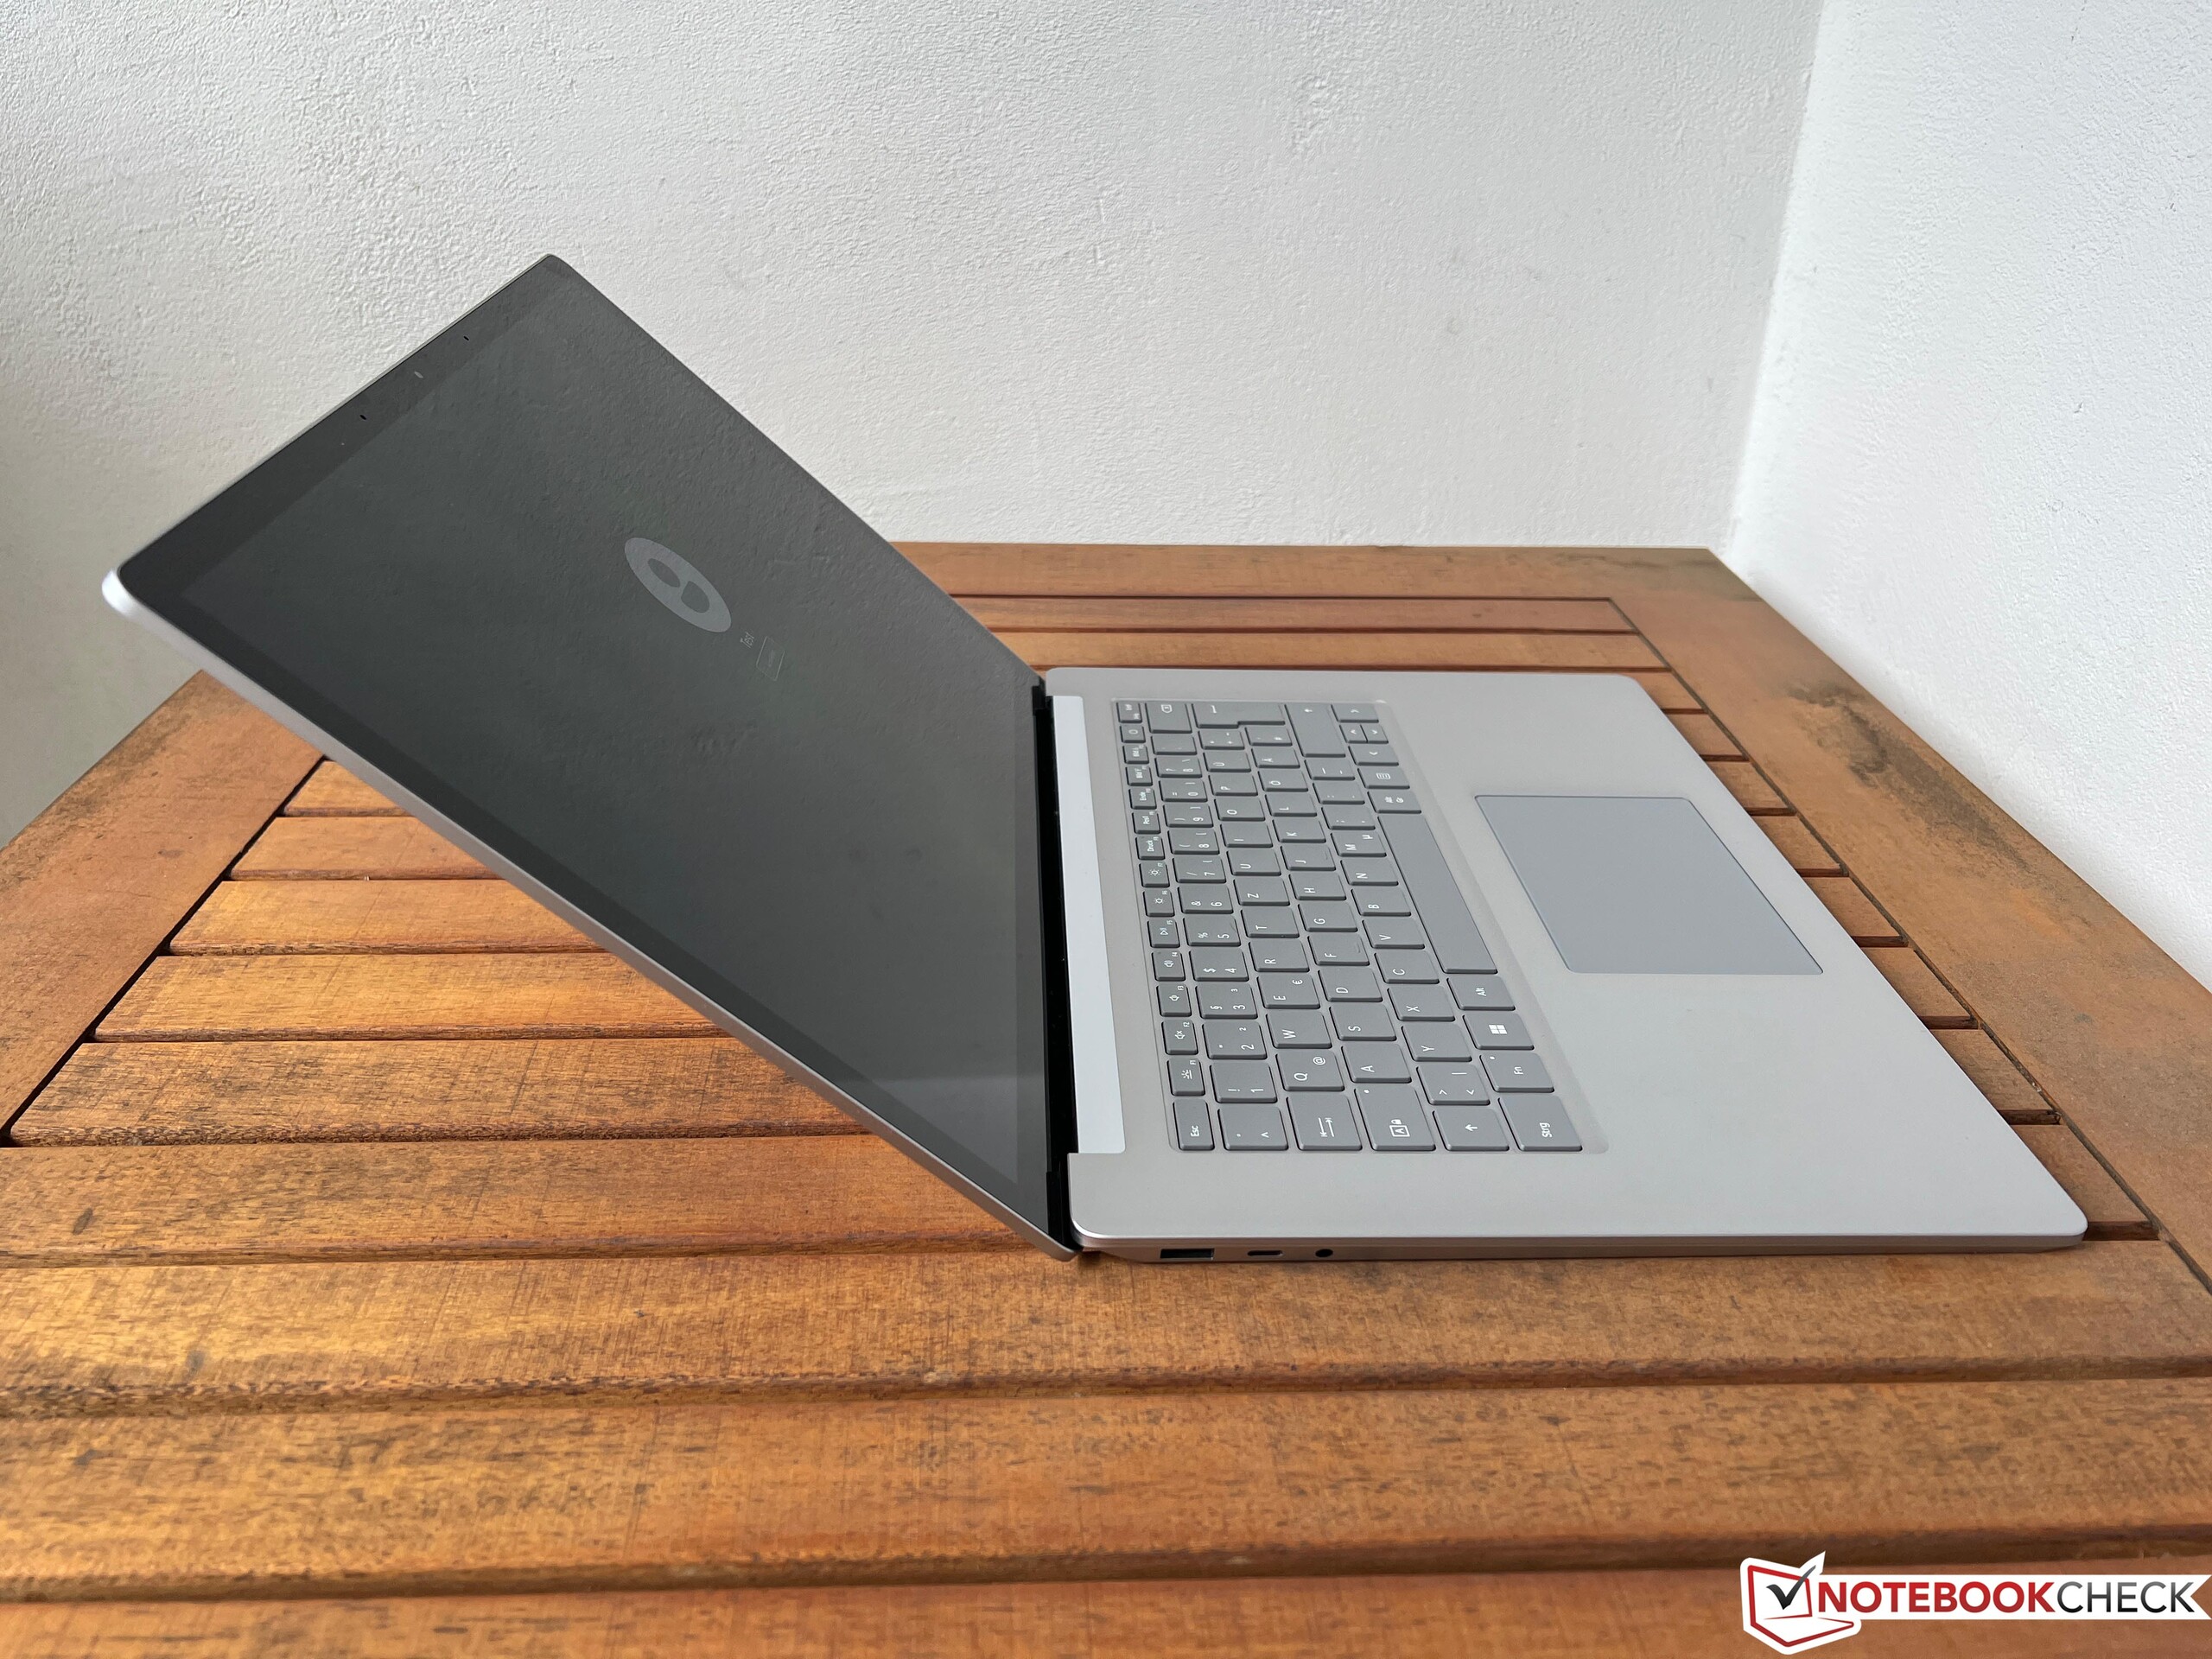
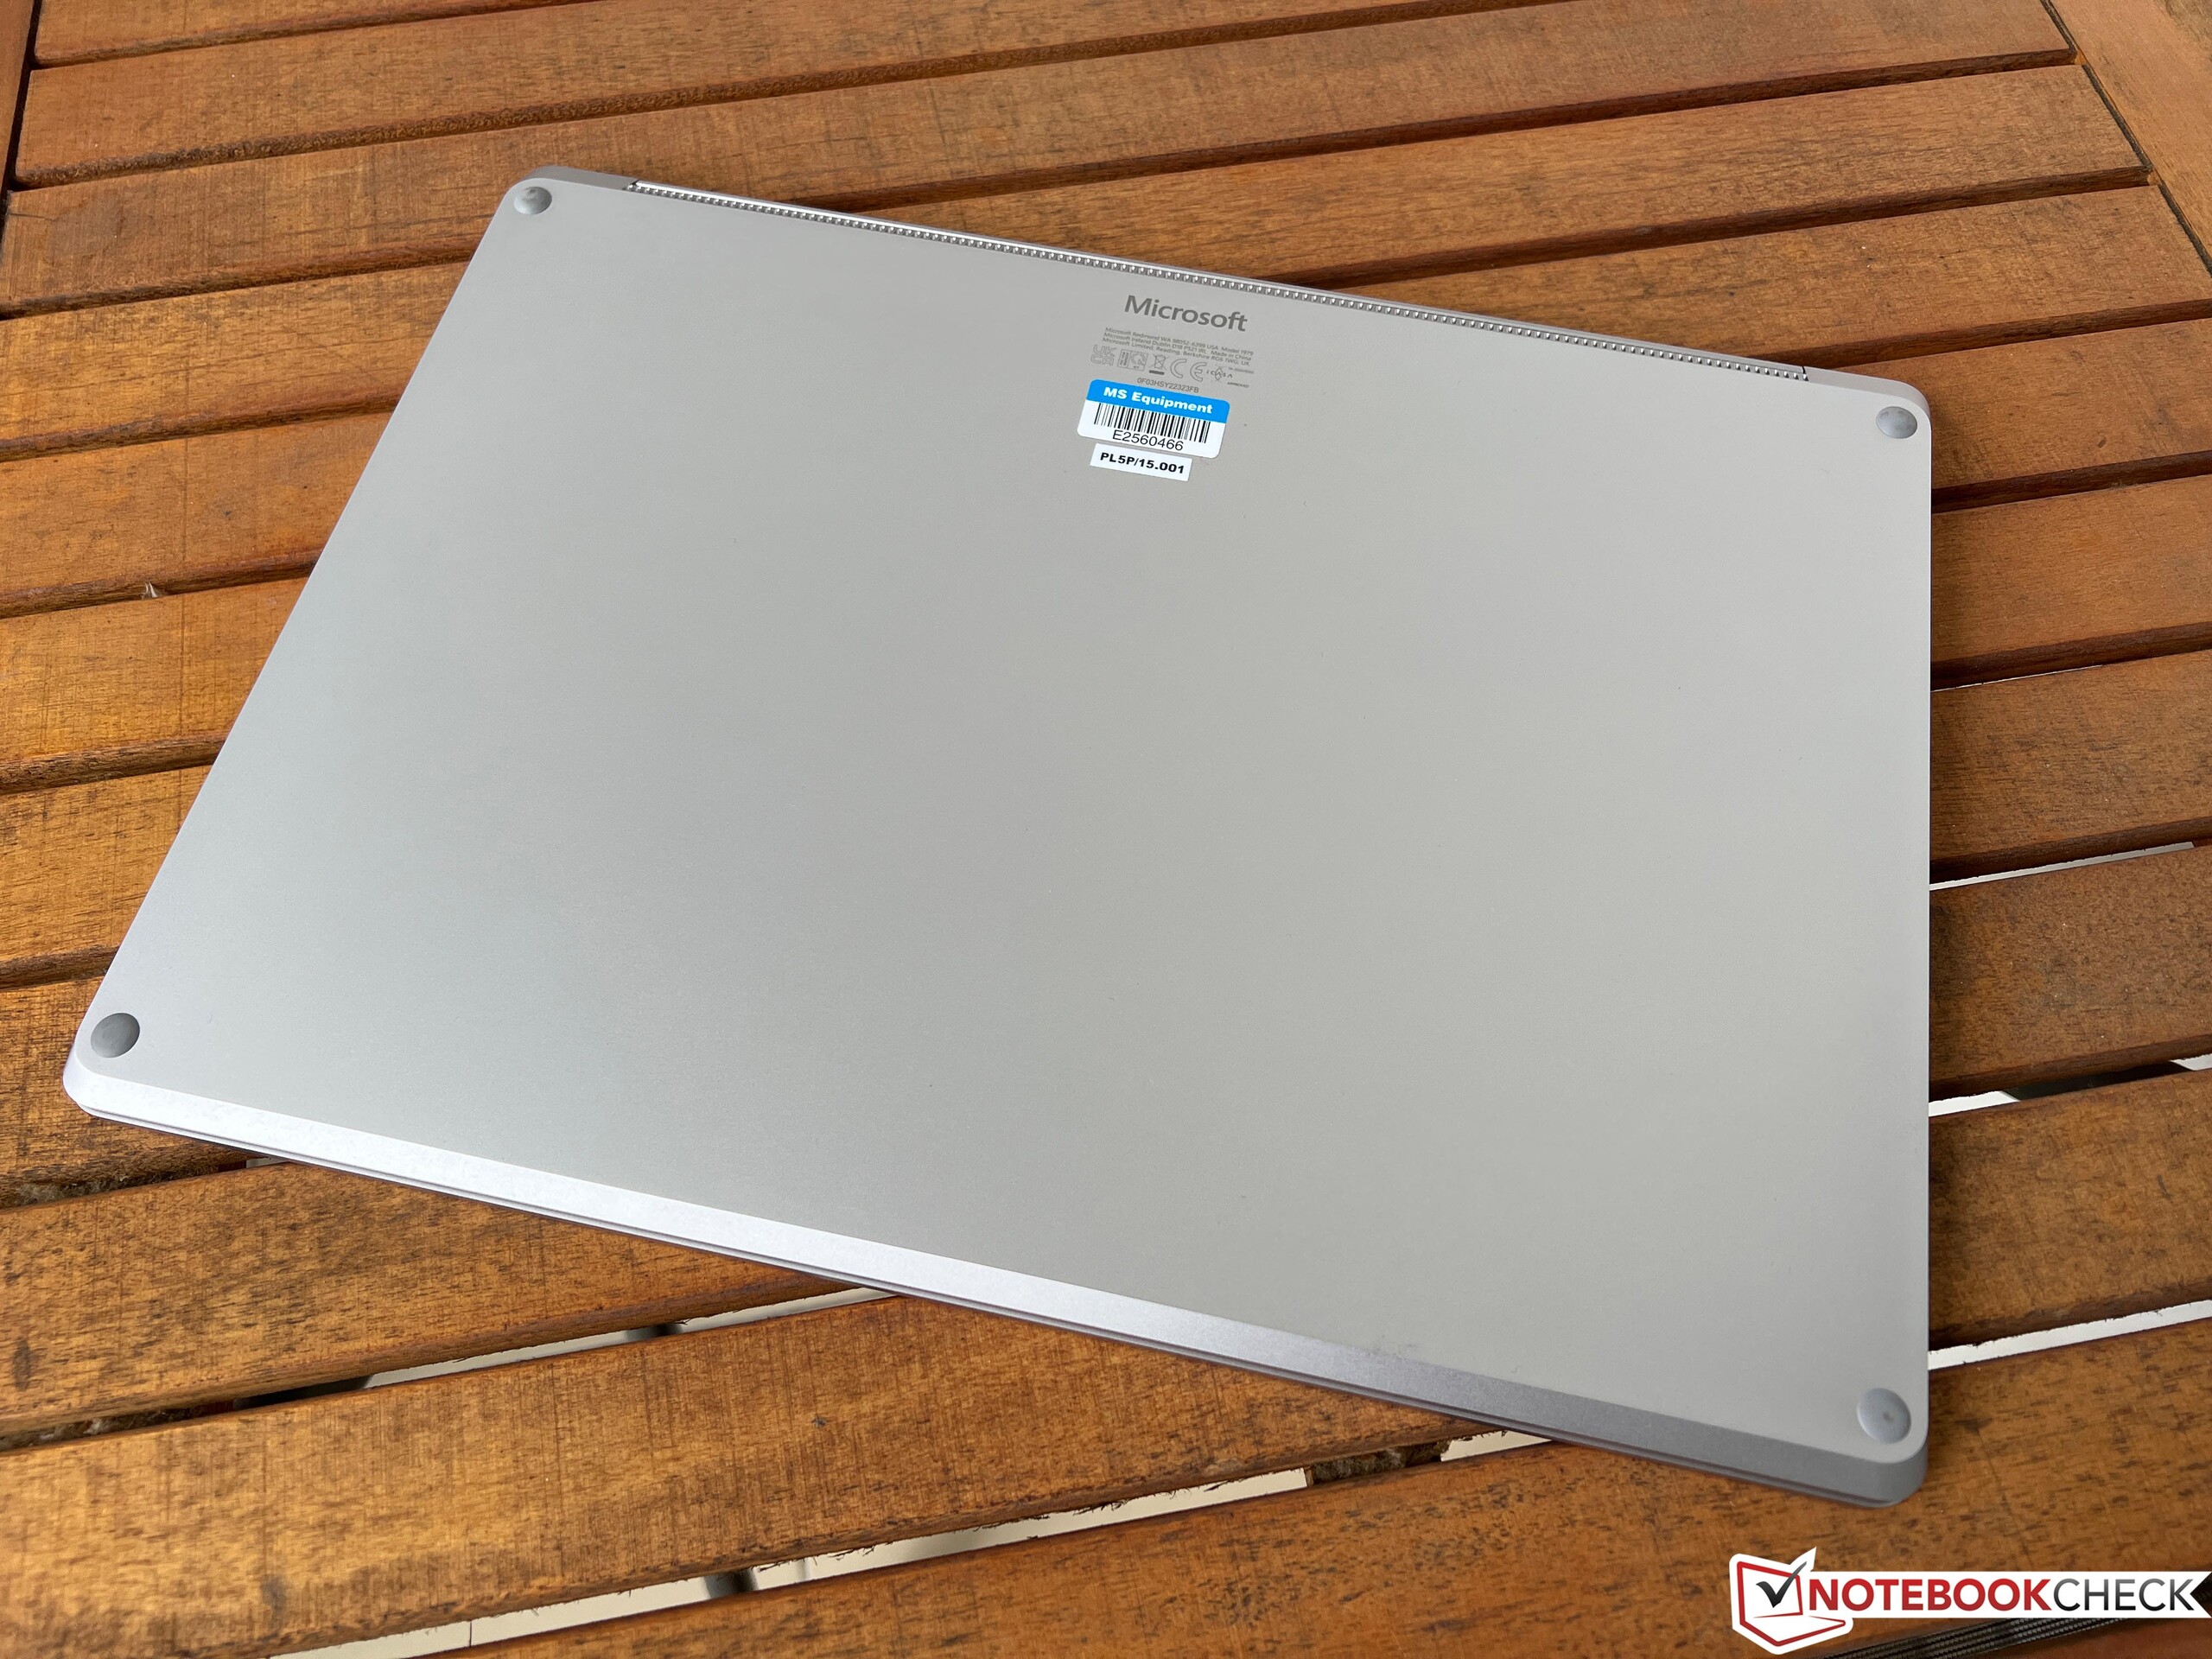
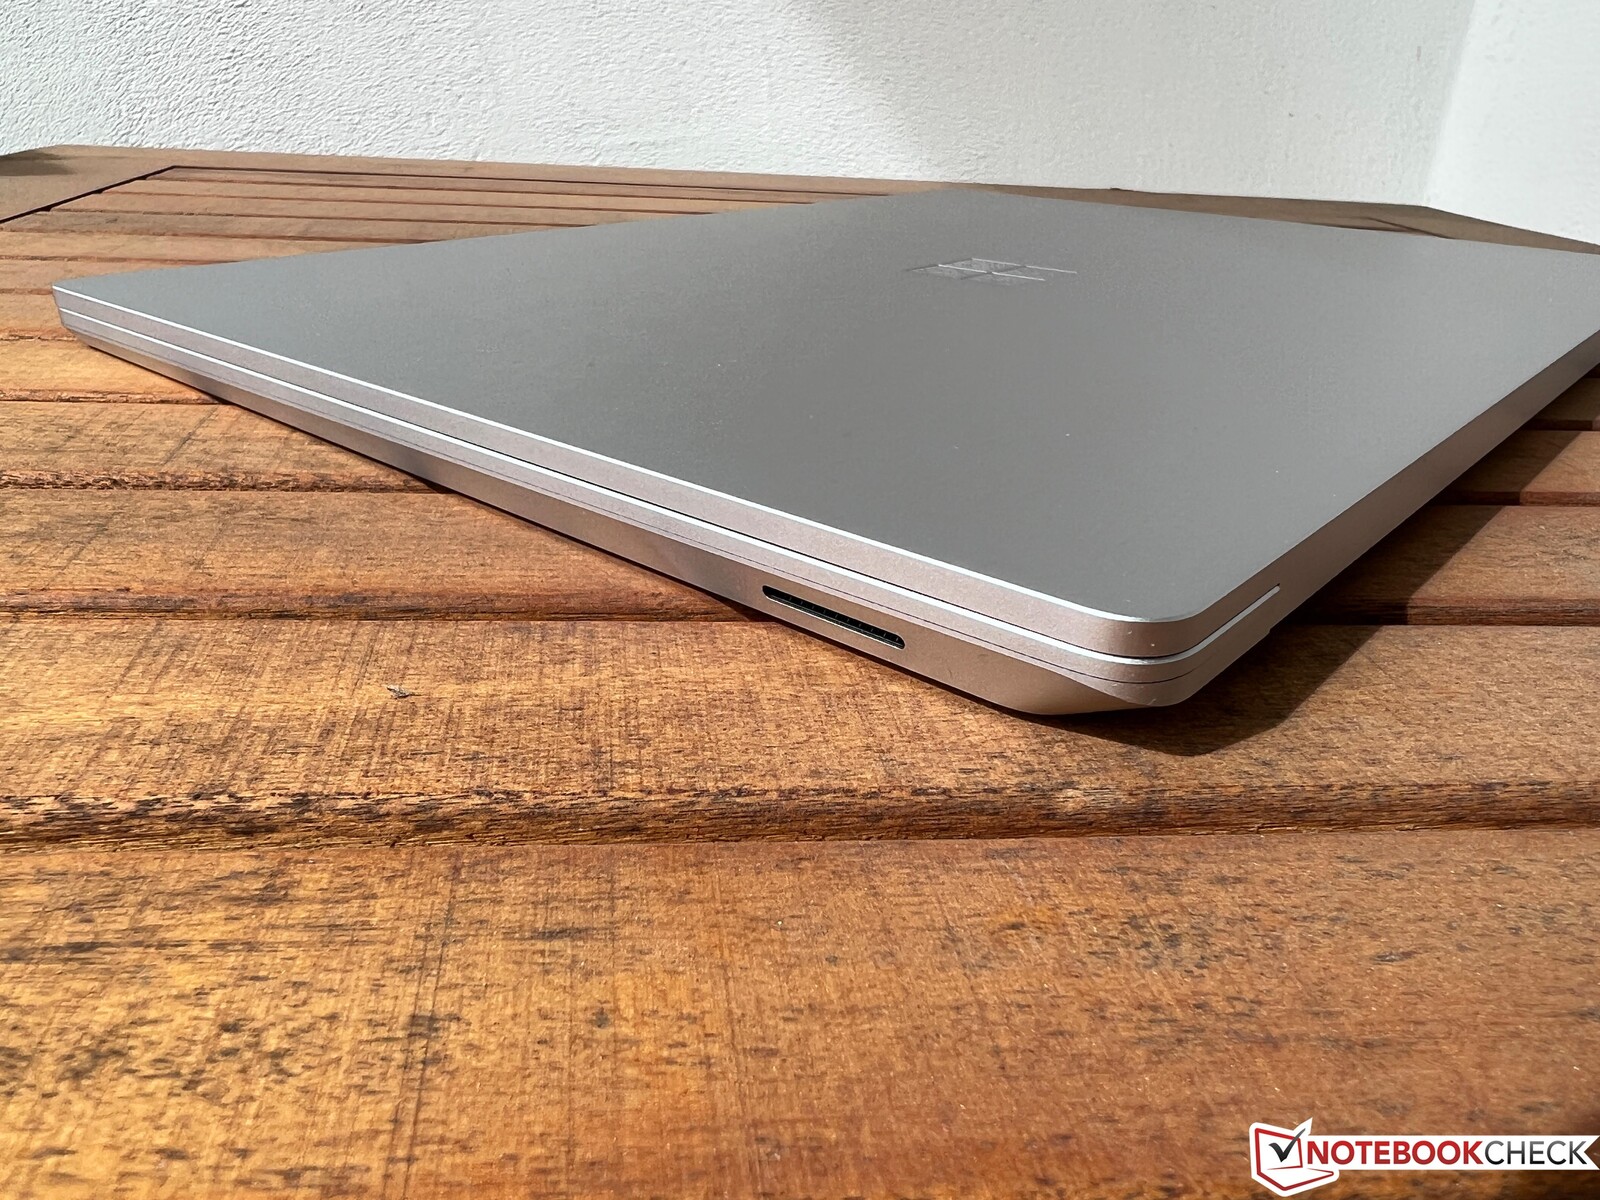
La carcasa del portátil sigue siendo la misma que la de su predecesor. Microsoft sigue ofreciendo las opciones de color platino y negro y, en general, la carcasa metálica del dispositivo está hecha de materiales de buena calidad - aunque, nuestro dispositivo de pruebas tendía a crujir mucho al manipularlo. Además, sus anchos biseles ya no son muy actuales, lo que acaba mostrando realmente la edad del diseño. Las bisagras de la pantalla están bien ajustadas (ángulo máximo de apertura ~135º), pero no pueden evitar un ligero tambaleo. La carcasa sigue sin poder abrirse, por lo que los usuarios no pueden limpiar los ventiladores ni cambiar o actualizar ninguno de los componentes del portátil.
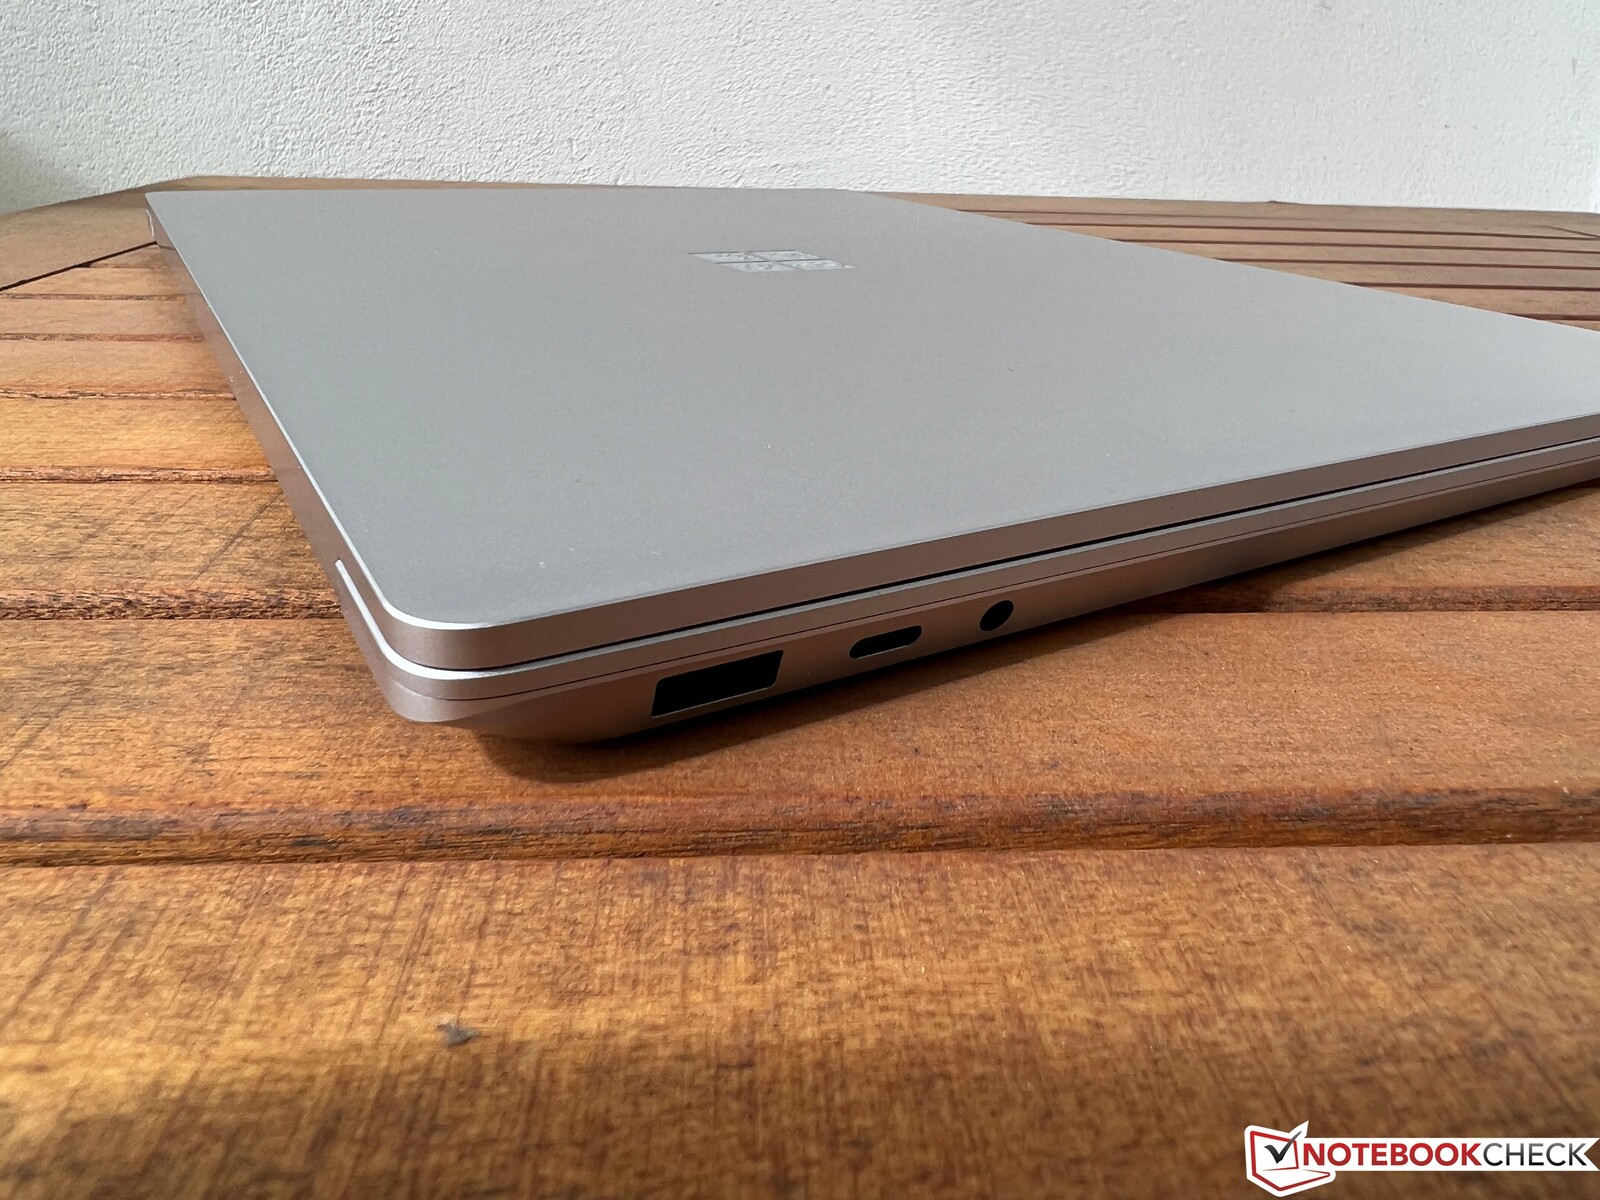
Las conexiones también son en su mayoría las mismas que antes - aunque ahora, la conexión USB-C por fin soporta Thunderbolt 4. El dispositivo sigue dependiendo de un puerto Surface Connect para cargar y conectar accesorios. Al menos hay algo de continuidad aquí, aunque seguimos sin encontrar el conector particularmente práctico. Sin embargo, la variedad de puertos del dispositivo es muy limitada a la vista del tamaño de la carcasa.
El portátil sigue sin tener lector de tarjetas SD y Microsoft ha mantenido el antiguo módulo WLAN AX201. La webcam sigue teniendo una resolución de 720p, aunque en buenas condiciones de luz la calidad de imagen es bastante decente.
| Networking | |
| Microsoft Surface Laptop 5 15, i7-1255U | |
| iperf3 transmit AXE11000 | |
| iperf3 receive AXE11000 | |
| Microsoft Surface Laptop 4 15 AMD TFF_00028 | |
| iperf3 transmit AX12 | |
| iperf3 receive AX12 | |
| LG Gram 15Z90Q | |
| iperf3 transmit AXE11000 | |
| iperf3 receive AXE11000 | |
| Dell XPS 15 9520 RTX 3050 Ti | |
| iperf3 transmit AXE11000 | |
| iperf3 receive AXE11000 | |
| Samsung Galaxy Book Pro 15 NP950XDB-KC5US | |
| iperf3 transmit AX12 | |
| iperf3 receive AX12 | |
| Asus Zenbook Pro 15 OLED UM535Q | |
| iperf3 transmit AX12 | |
| iperf3 receive AX12 | |


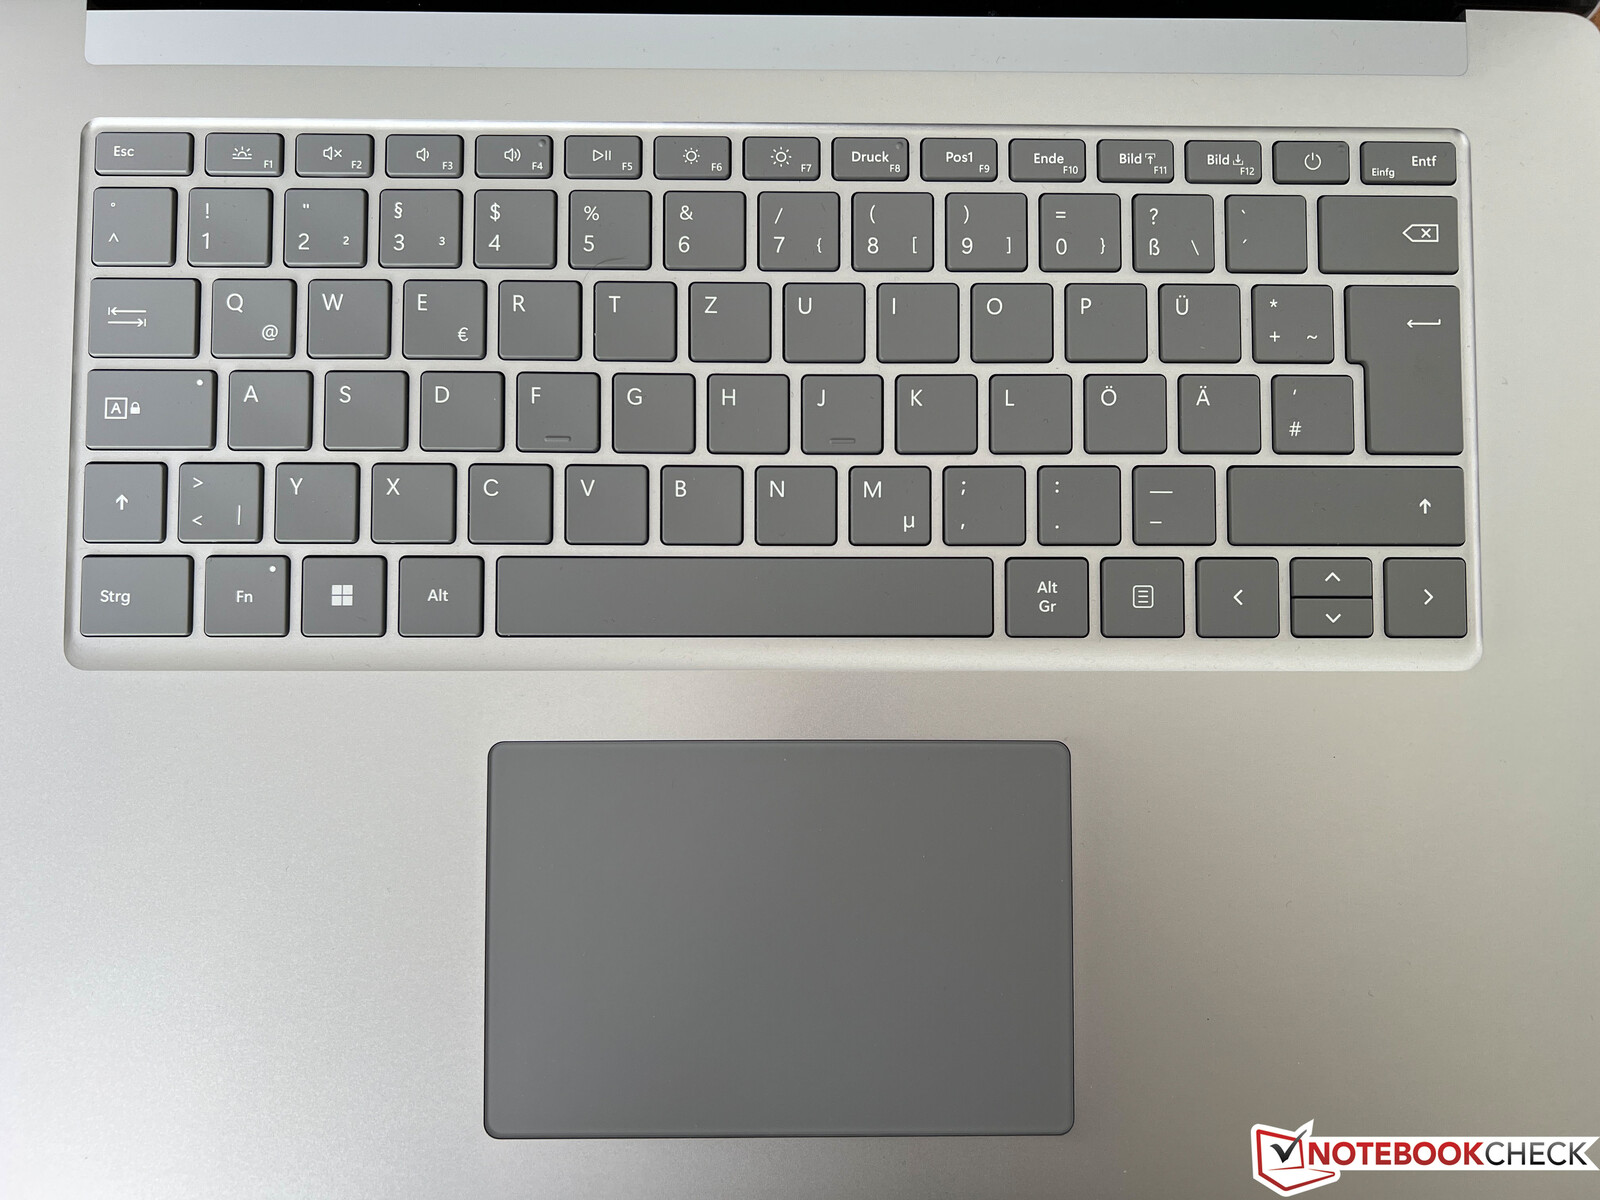
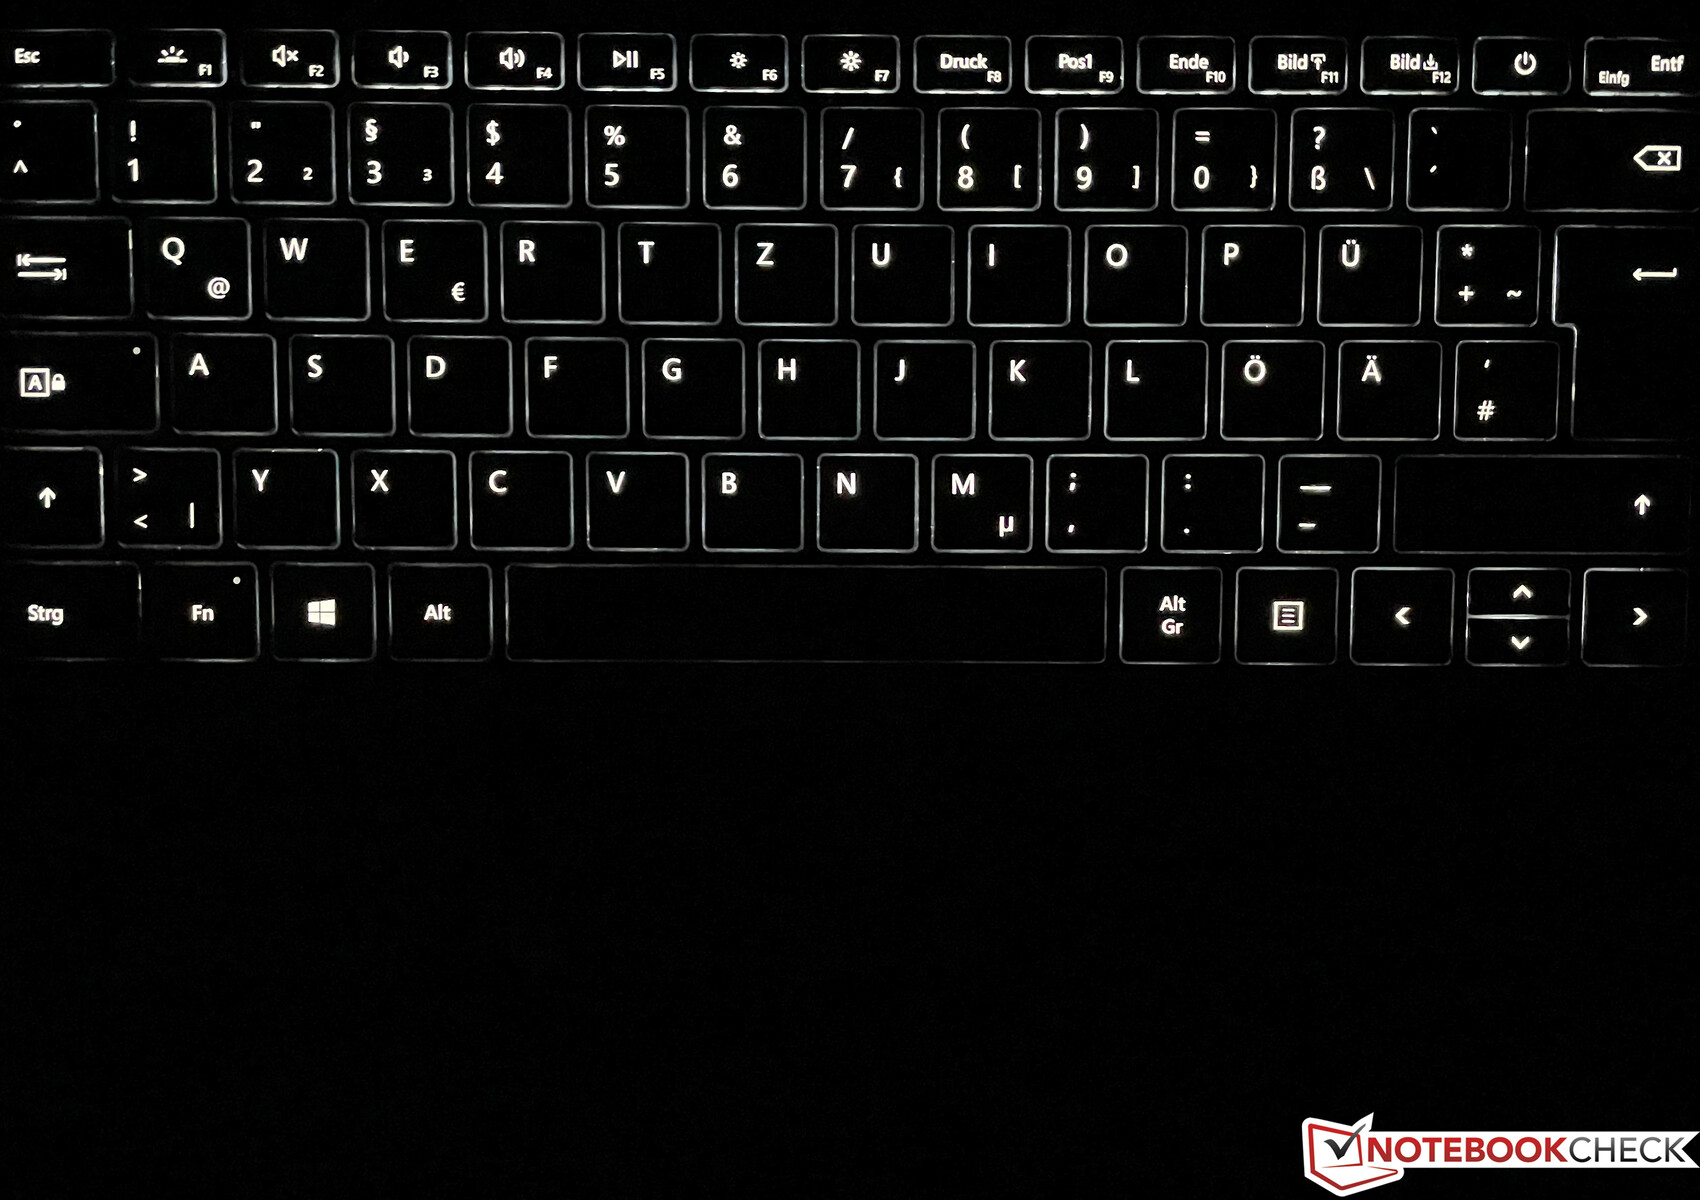
Dispositivos de entrada - Teclado retroiluminado y pequeño clickpad
Los dispositivos de entrada también se han adoptado del modelo anterior. En general, el teclado se siente bien al escribir, pero sus grandes teclas aún tienden a traquetear un poco. Se pueden escribir textos largos, pero hay teclados claramente mejores en el mercado. La retroiluminación blanca del teclado tiene tres niveles de ajuste.
El clickpad da bastante buena impresión y el control normal del puntero no causa ningún problema. El ruido de clic tampoco es demasiado alto. Su tamaño de 11,5 x 7,7 cm sigue siendo suficiente, pero sin duda habría mucho más espacio para un pad más grande.
Pantalla - Pantalla táctil PixelSense
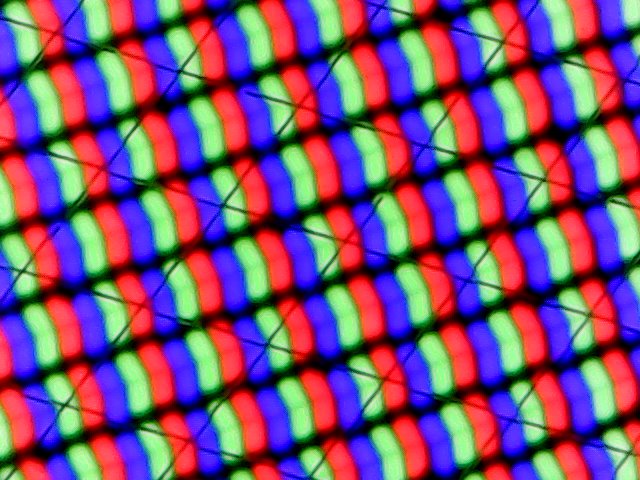
La pantalla de 15 pulgadas sigue teniendo una resolución de 2.496 x 1.664 píxeles en una relación de aspecto 3:2. Subjetivamente, la calidad de imagen de la pantalla táctil sigue siendo muy buena, pero las especificaciones técnicas del portátil de 60 Hz y cobertura sRGB ya no están muy al día, especialmente para este rango de precios. El dispositivo tiene un brillo de 400 cd/m², y medimos un máximo de 438 cd/m² (media ~400 cd/m²). Su valor de negro de 0.29 está bien y esto resulta en un ratio de contraste de casi 1400:1.
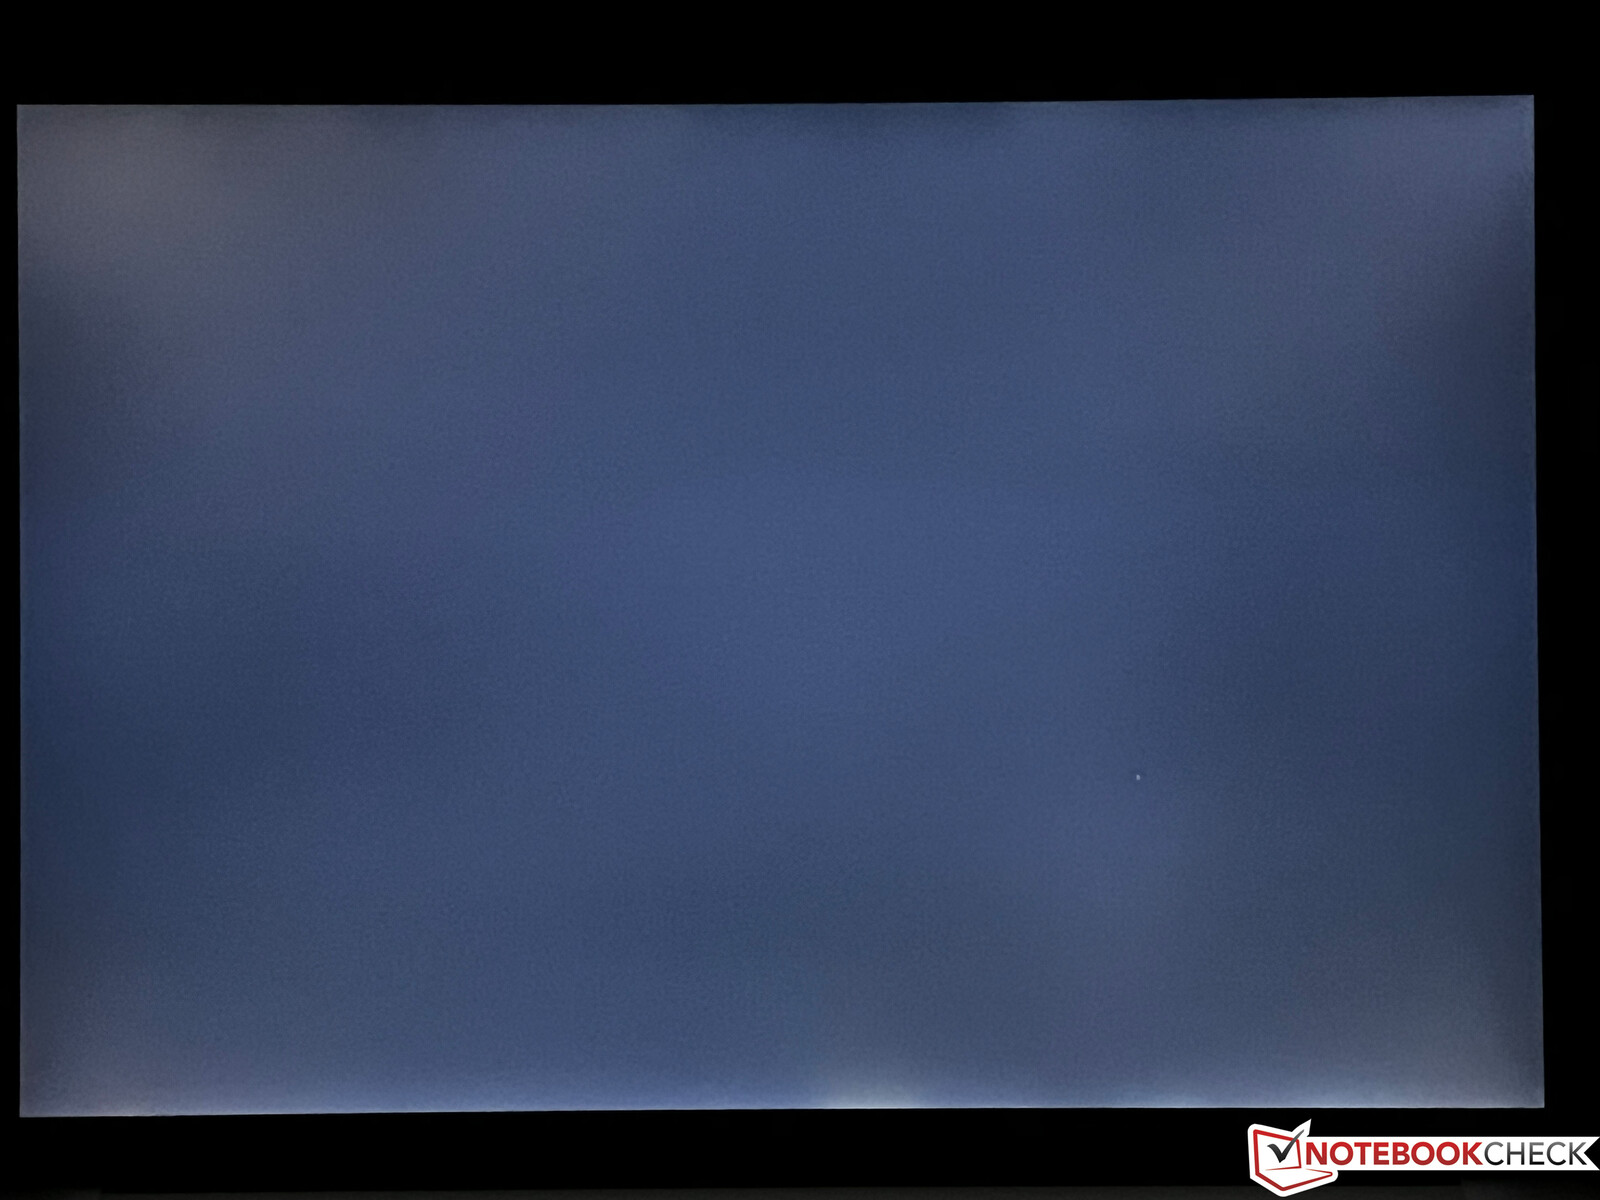
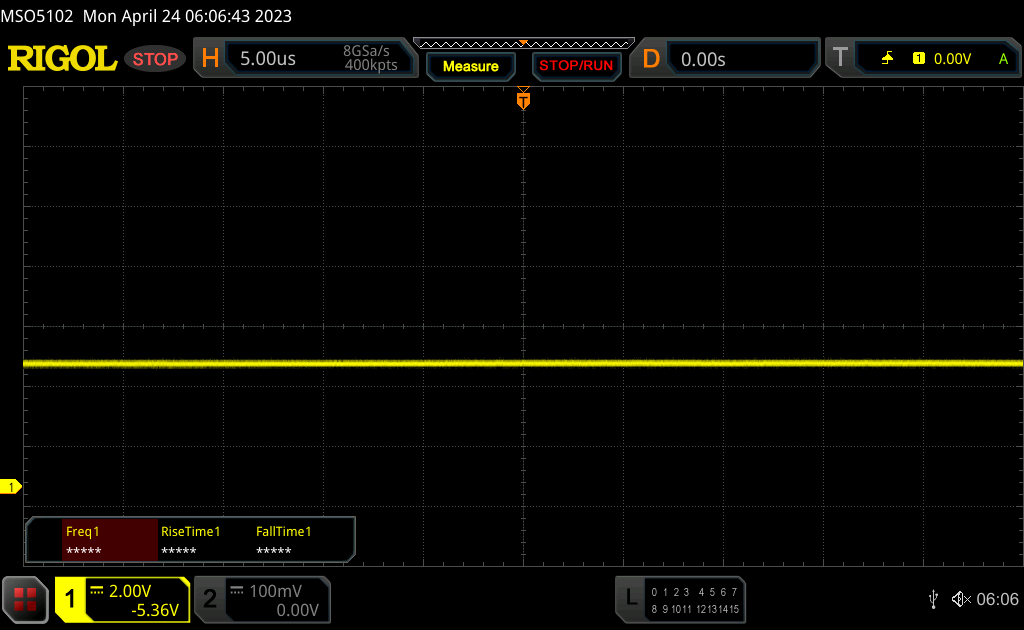
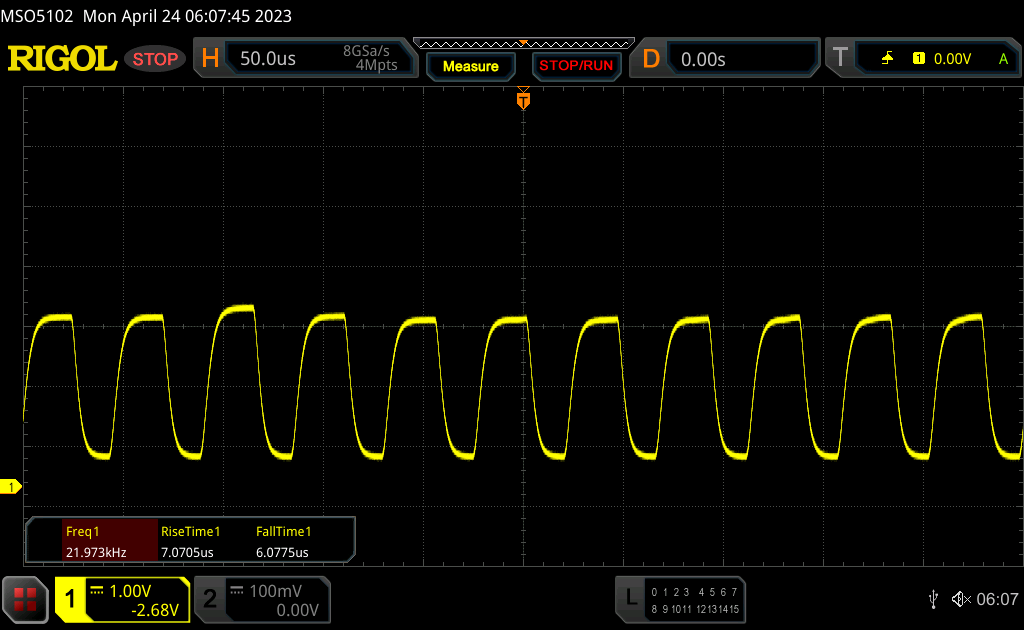
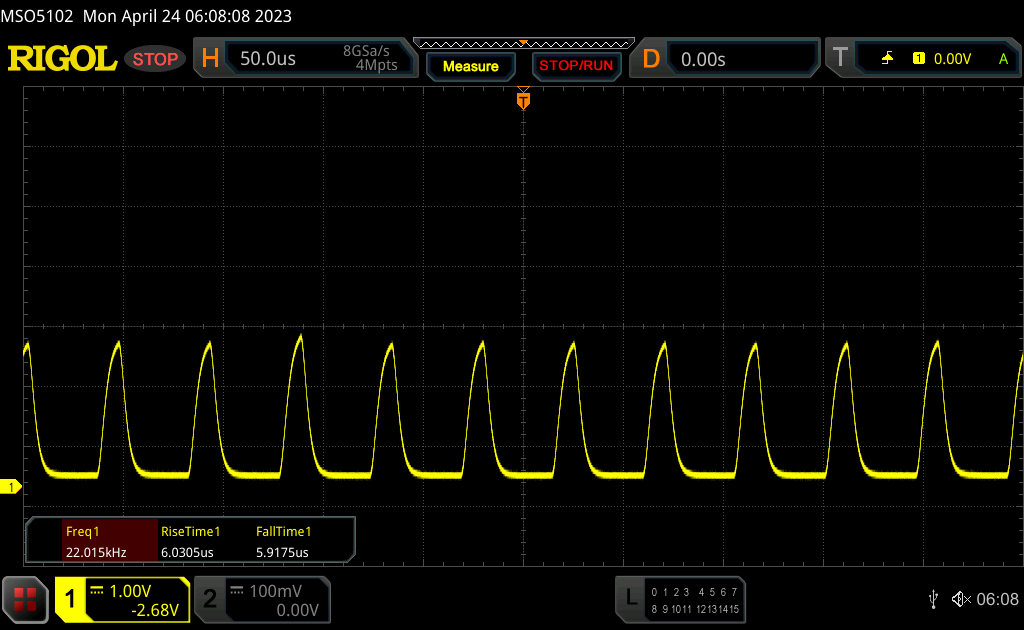
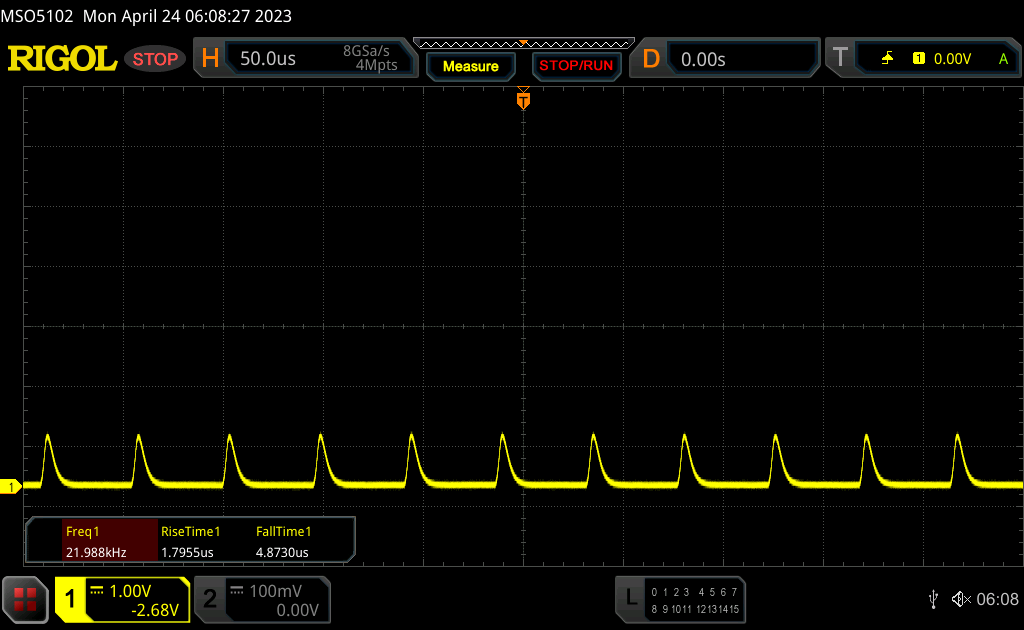
El panel muestra un ligero sangrado de pantalla hacia el borde inferior de la pantalla a altos niveles de brillo con un fondo negro, pero esto no debería ser demasiado molesto en el uso diario. El PWM también puede verse a un brillo del 50% o menos, pero su frecuencia de ~22 kHz es extremadamente alta y no debería causar problemas a los usuarios.
| |||||||||||||||||||||||||
iluminación: 85 %
Brillo con batería: 395 cd/m²
Contraste: 1369:1 (Negro: 0.29 cd/m²)
ΔE ColorChecker Calman: 0.8 | ∀{0.5-29.43 Ø4.71}
ΔE Greyscale Calman: 1.1 | ∀{0.09-98 Ø4.96}
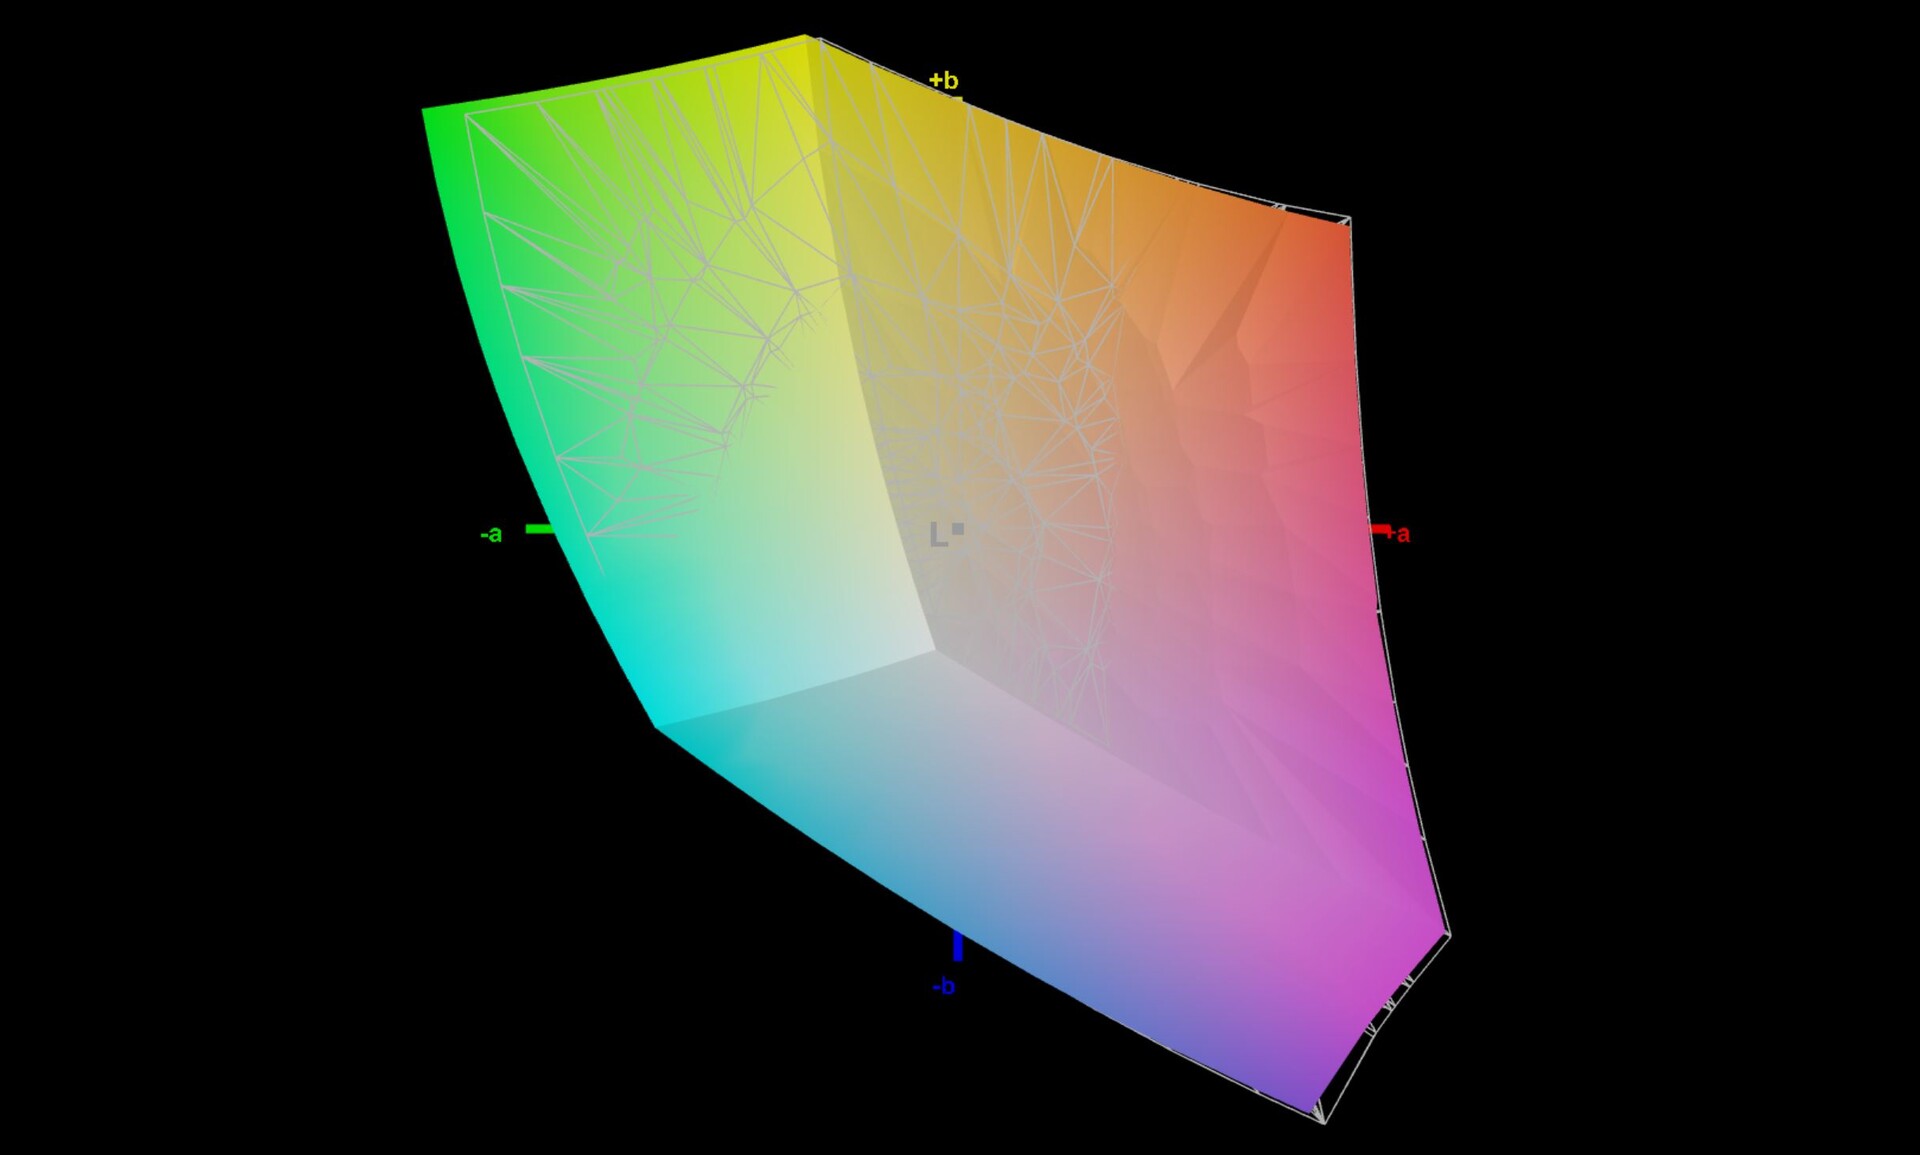
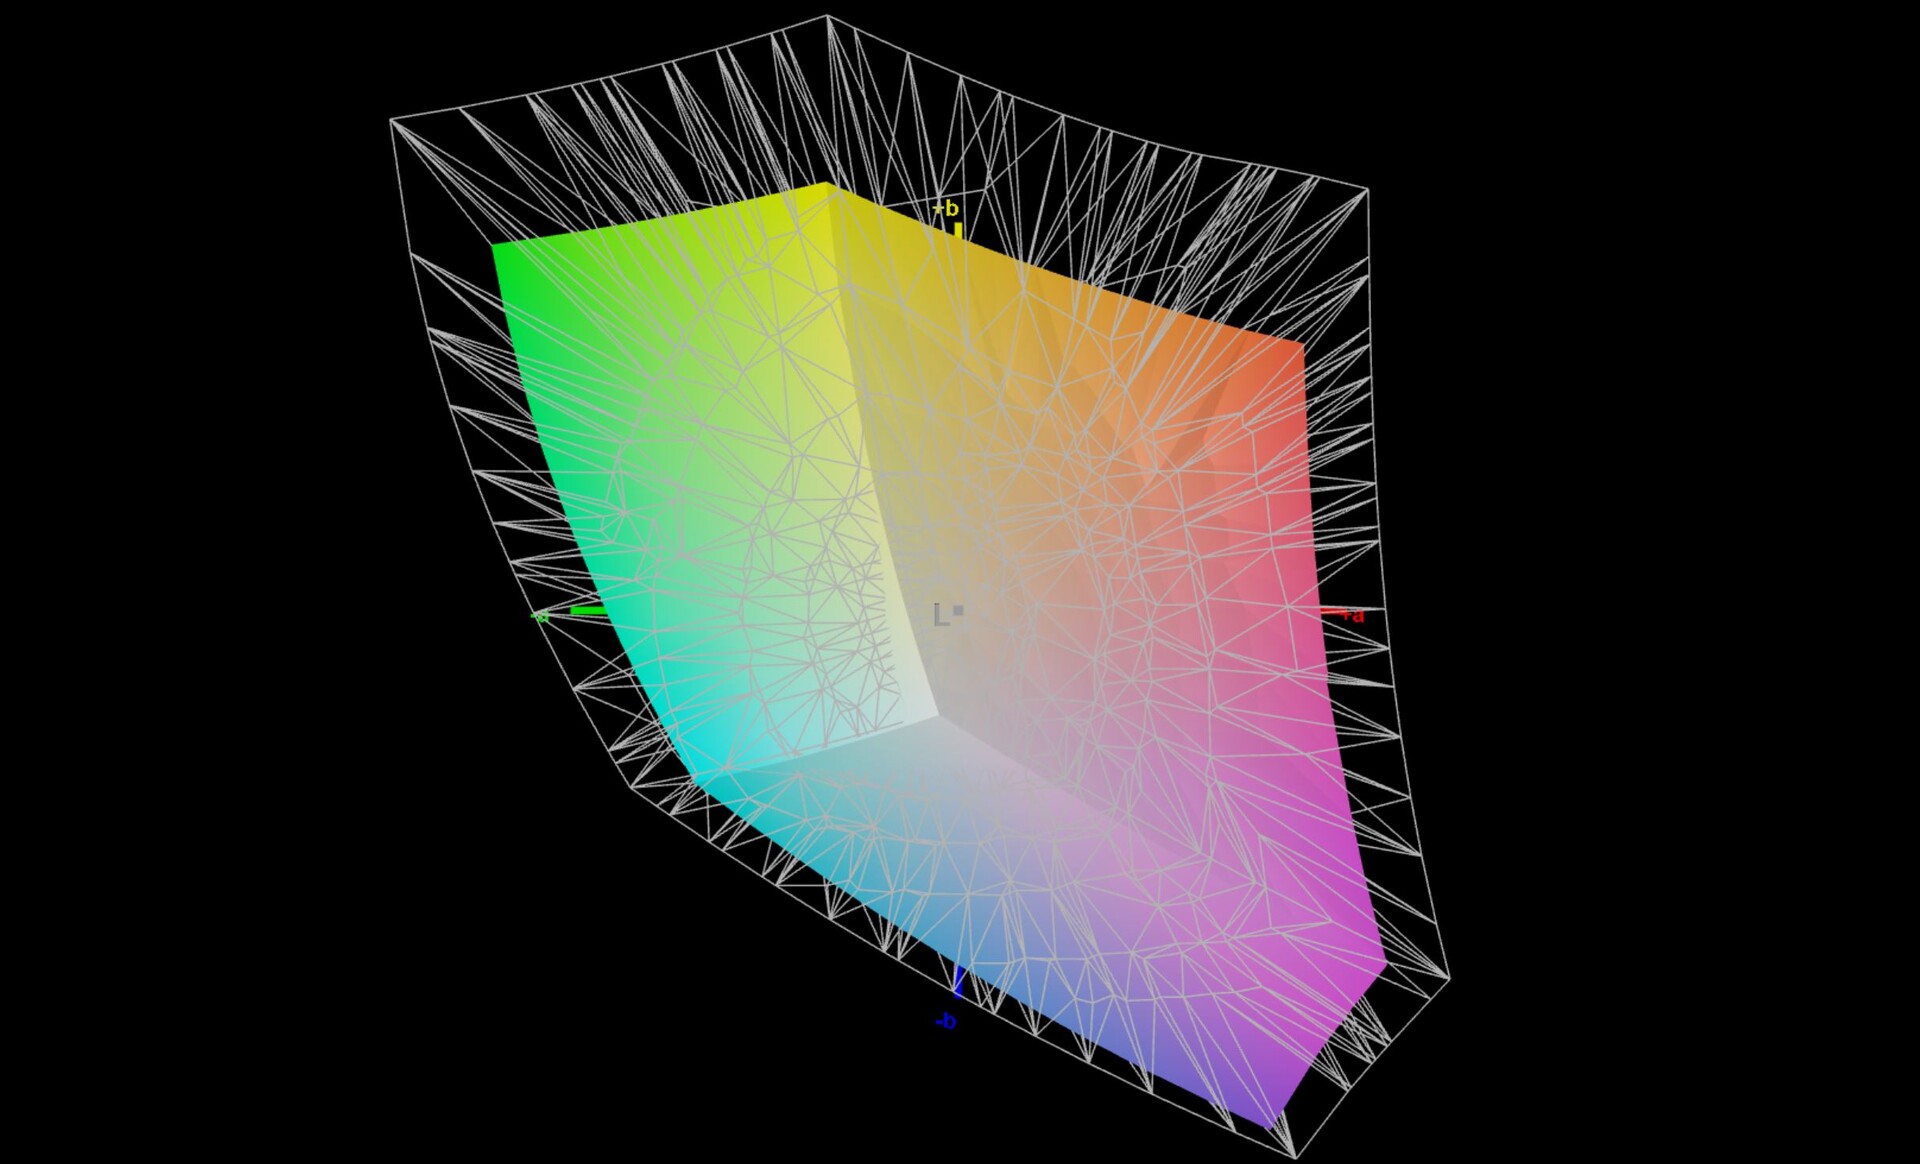
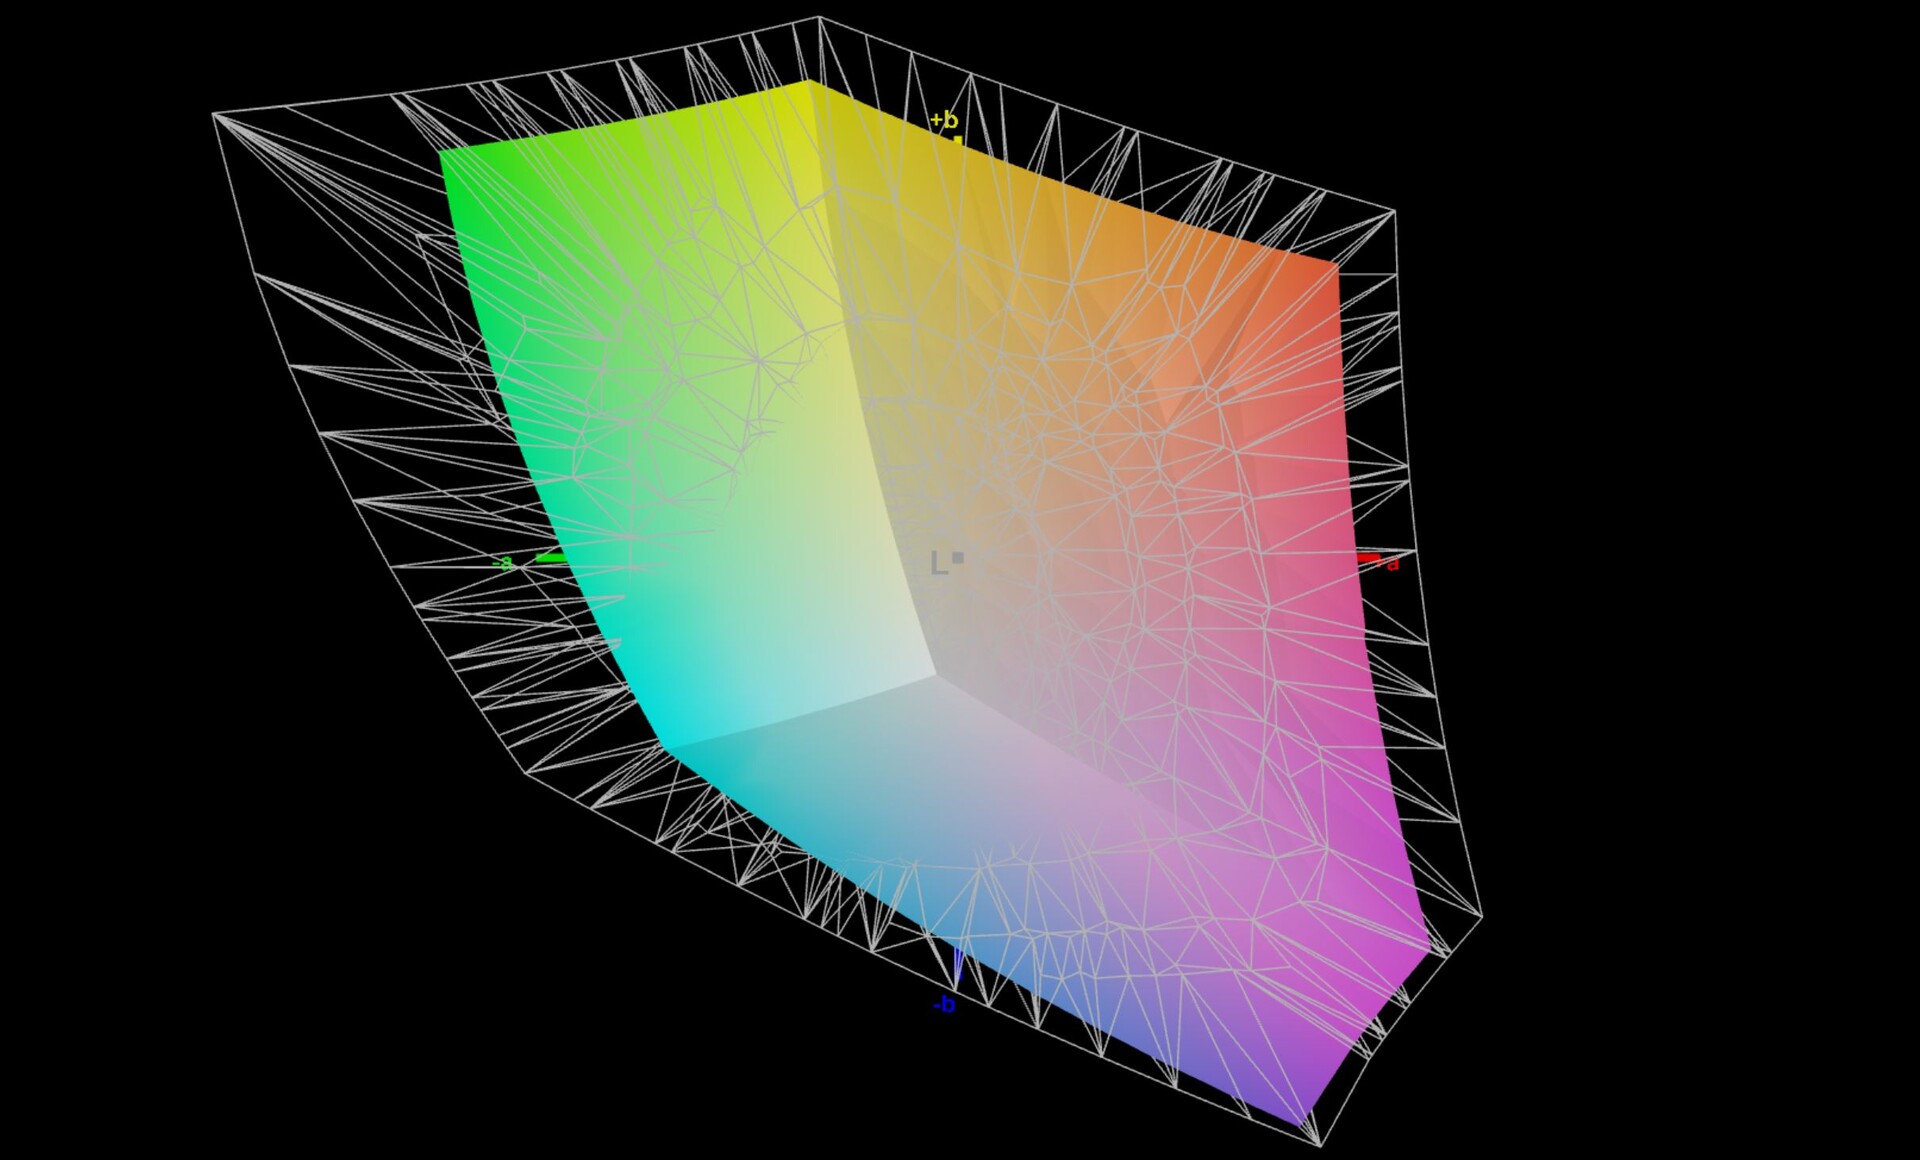
70.3% AdobeRGB 1998 (Argyll 3D)
97.3% sRGB (Argyll 3D)
68.1% Display P3 (Argyll 3D)
Gamma: 2.18
CCT: 6705 K
| Microsoft Surface Laptop 5 15, i7-1255U LQ150P1JX51, IPS, 2496x1664, 15" | Microsoft Surface Laptop 4 15 AMD TFF_00028 SHP14B4, IPS, 2496x1664, 15" | LG Gram 15Z90Q LG LP156WFC-SPZ2 (LGD0706), IPS, 1920x1080, 15.6" | Dell XPS 15 9520 RTX 3050 Ti Samsung 156XG01, OLED, 3456x2160, 15.6" | Samsung Galaxy Book Pro 15 NP950XDB-KC5US Samsung ATNA56YX02-0, AMOLED, 1920x1080, 15.6" | Asus Zenbook Pro 15 OLED UM535Q Samsung ATNA56YX03-0, OLED, 1920x1080, 15.6" | |
|---|---|---|---|---|---|---|
| Display | -3% | -5% | 23% | 24% | 13% | |
| Display P3 Coverage (%) | 68.1 | 65.2 -4% | 63.5 -7% | 97.8 44% | 87.6 29% | 79.3 16% |
| sRGB Coverage (%) | 97.3 | 97.7 0% | 95 -2% | 99.9 3% | 100 3% | 95.6 -2% |
| AdobeRGB 1998 Coverage (%) | 70.3 | 67.3 -4% | 65.1 -7% | 86 22% | 99.3 41% | 87.3 24% |
| Response Times | -10% | 20% | 95% | 94% | 94% | |
| Response Time Grey 50% / Grey 80% * (ms) | 52.4 ? | 58.4 ? -11% | 48.4 ? 8% | 1.9 ? 96% | 1.9 ? 96% | 2.1 ? 96% |
| Response Time Black / White * (ms) | 28.7 ? | 31.2 ? -9% | 19.6 ? 32% | 1.9 ? 93% | 2.2 ? 92% | 2.3 ? 92% |
| PWM Frequency (Hz) | 22000 ? | 21550 ? | 59.52 ? | 59 | 60.2 | |
| Screen | -82% | -99% | -180% | -122% | -83% | |
| Brightness middle (cd/m²) | 397 | 405 2% | 420 6% | 381.4 -4% | 296.8 -25% | 342.9 -14% |
| Brightness (cd/m²) | 399 | 379 -5% | 399 0% | 384 -4% | 298 -25% | 346 -13% |
| Brightness Distribution (%) | 85 | 79 -7% | 88 4% | 95 12% | 98 15% | 98 15% |
| Black Level * (cd/m²) | 0.29 | 0.26 10% | 0.32 -10% | |||
| Contrast (:1) | 1369 | 1558 14% | 1313 -4% | |||
| Colorchecker dE 2000 * | 0.8 | 2.6 -225% | 2.51 -214% | 4.34 -443% | 3.07 -284% | 2.42 -203% |
| Colorchecker dE 2000 max. * | 1.4 | 6.6 -371% | 6.64 -374% | 9.24 -560% | 5.29 -278% | 4.05 -189% |
| Greyscale dE 2000 * | 1.1 | 1.9 -73% | 3.3 -200% | 2 -82% | 2.6 -136% | 2.1 -91% |
| Gamma | 2.18 101% | 2.11 104% | 2.052 107% | 2.13 103% | 2.26 97% | 2.21 100% |
| CCT | 6705 97% | 6825 95% | 6921 94% | 6210 105% | 6904 94% | 6364 102% |
| Colorchecker dE 2000 calibrated * | 0.9 | 0.89 | ||||
| Color Space (Percent of AdobeRGB 1998) (%) | 62 | |||||
| Color Space (Percent of sRGB) (%) | 97.7 | |||||
| Media total (Programa/Opciones) | -32% /
-53% | -28% /
-59% | -21% /
-75% | -1% /
-43% | 8% /
-24% |
* ... más pequeño es mejor

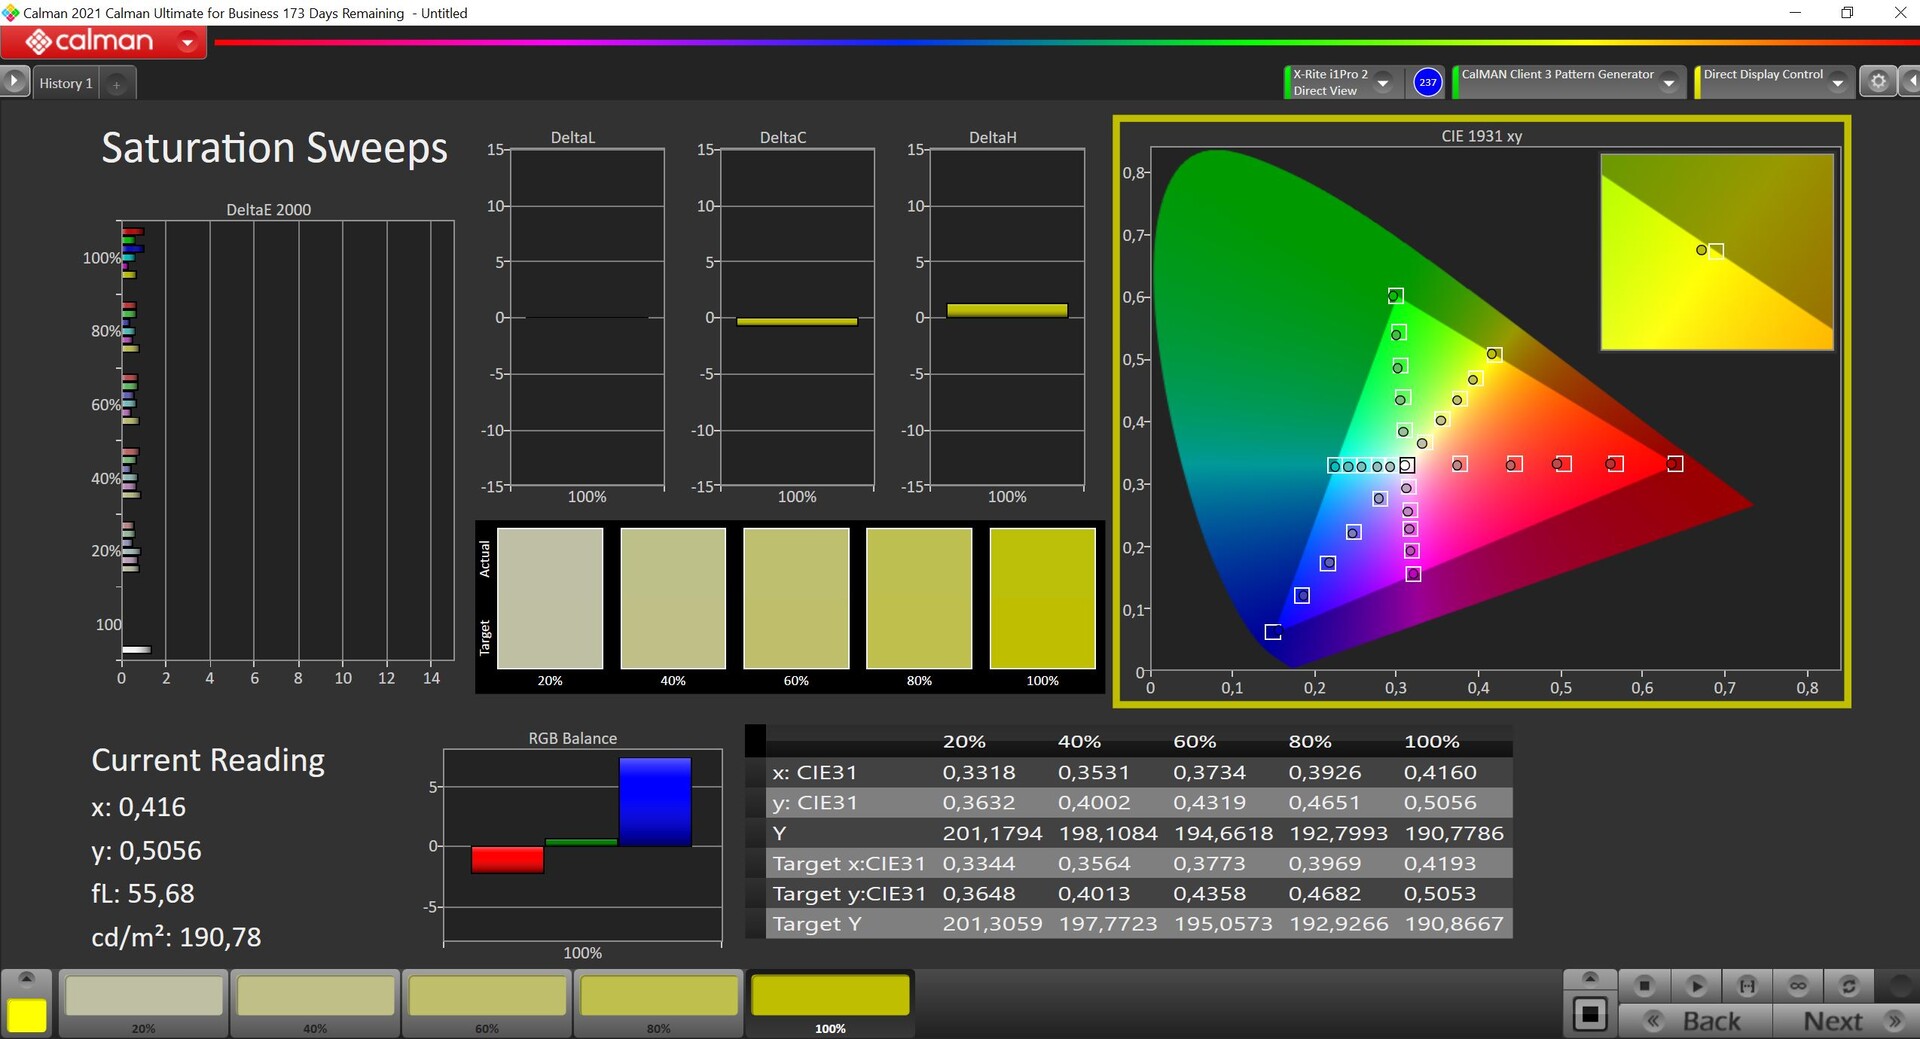
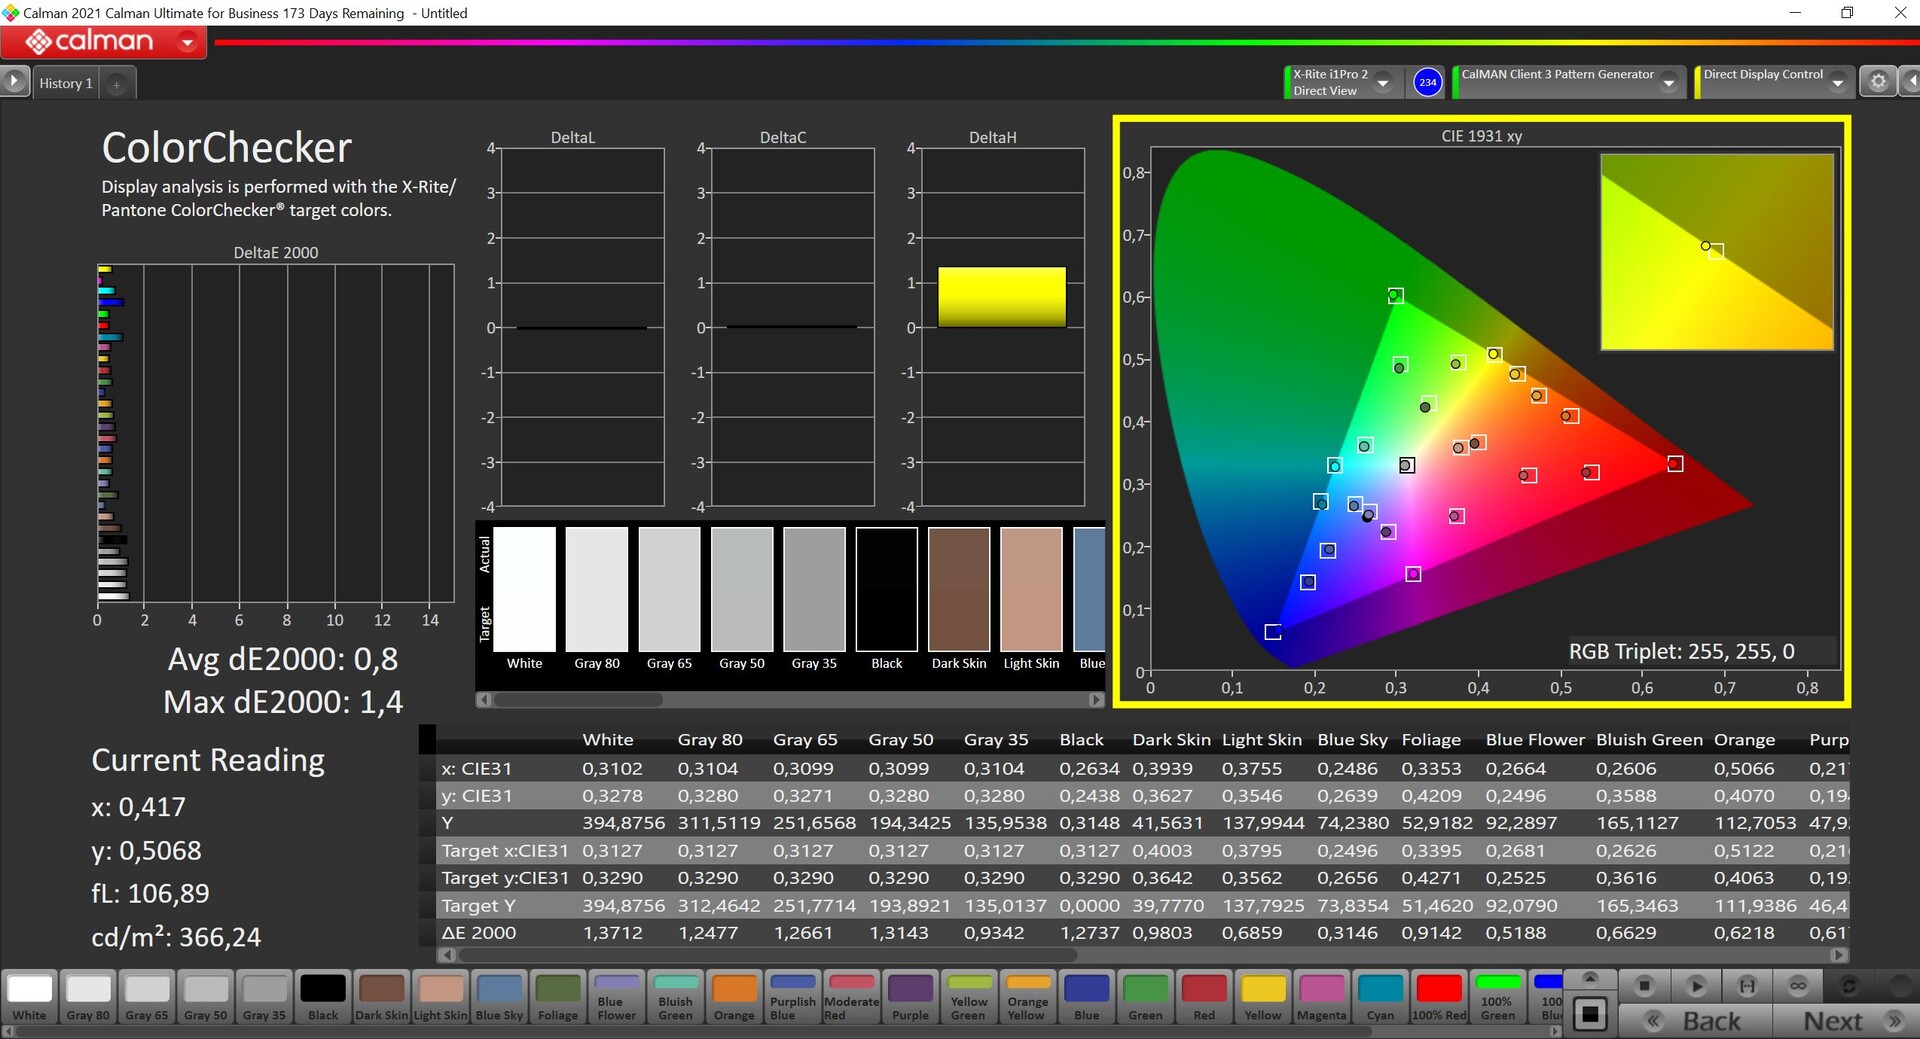
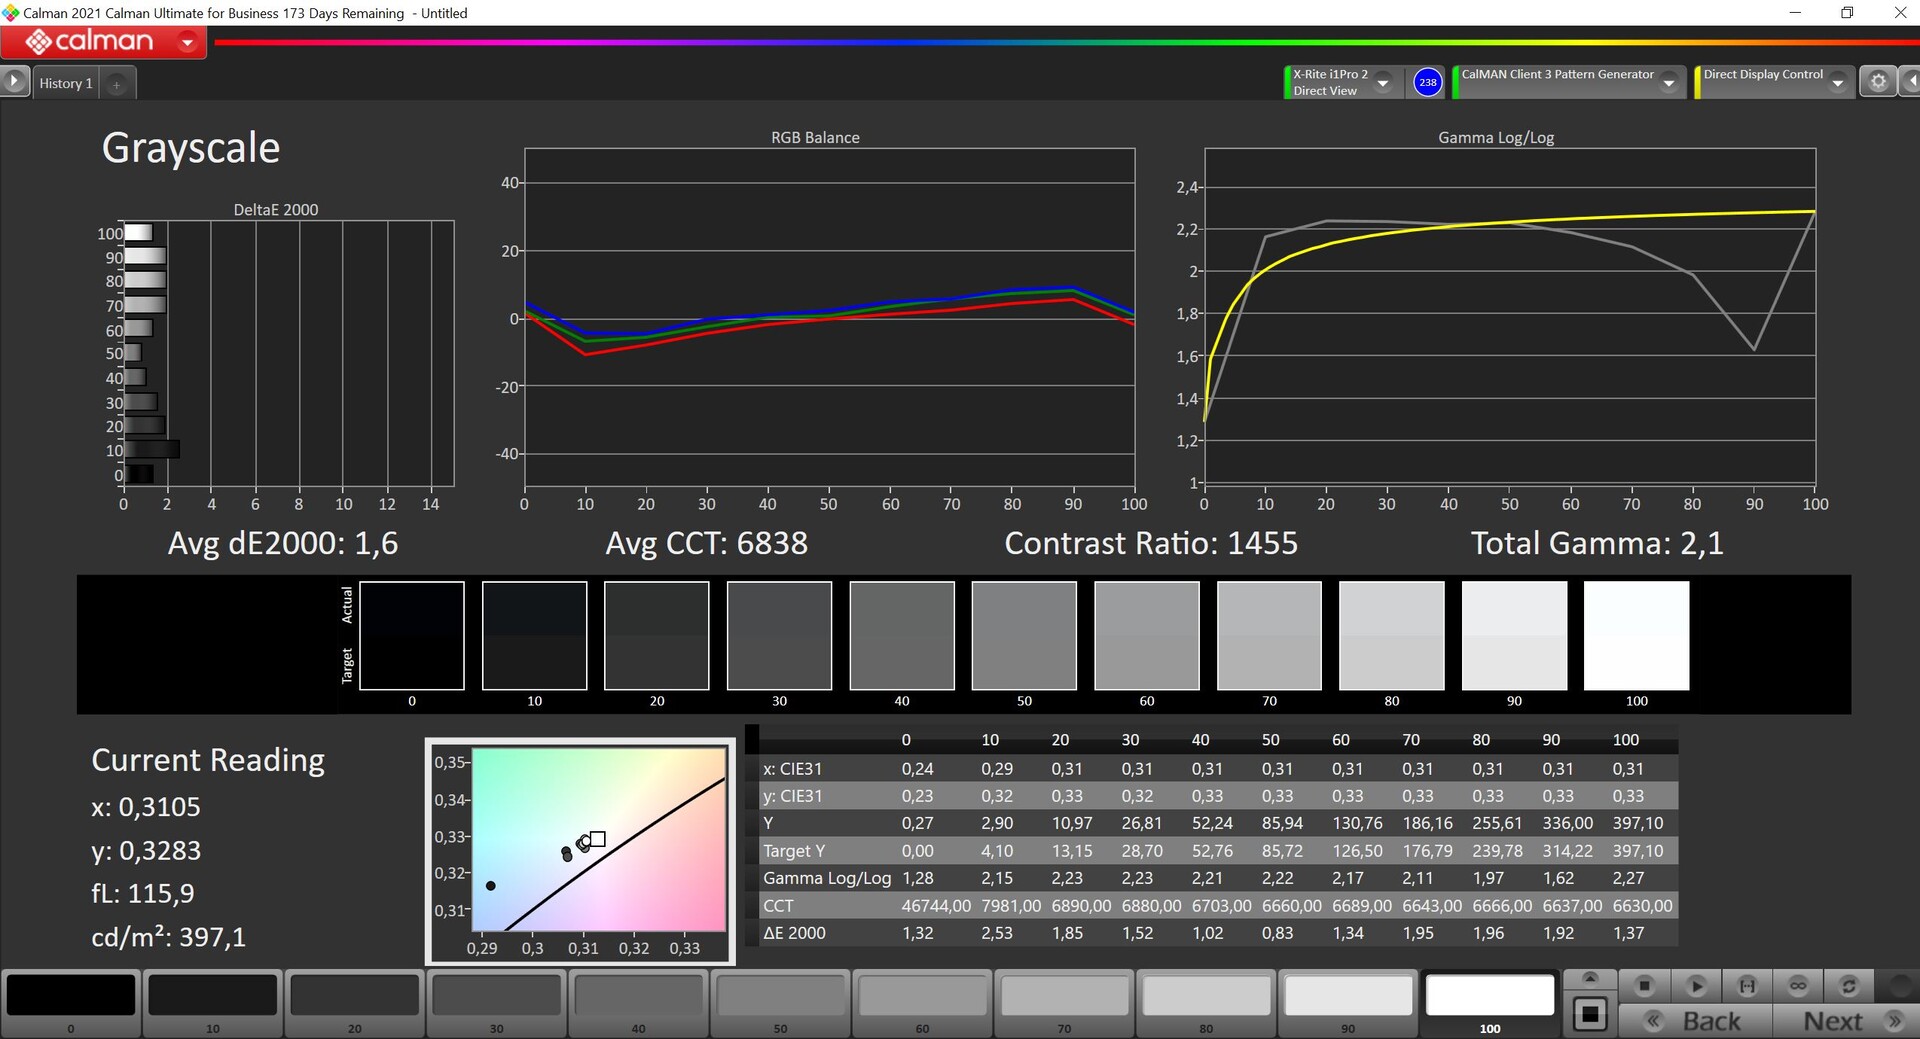
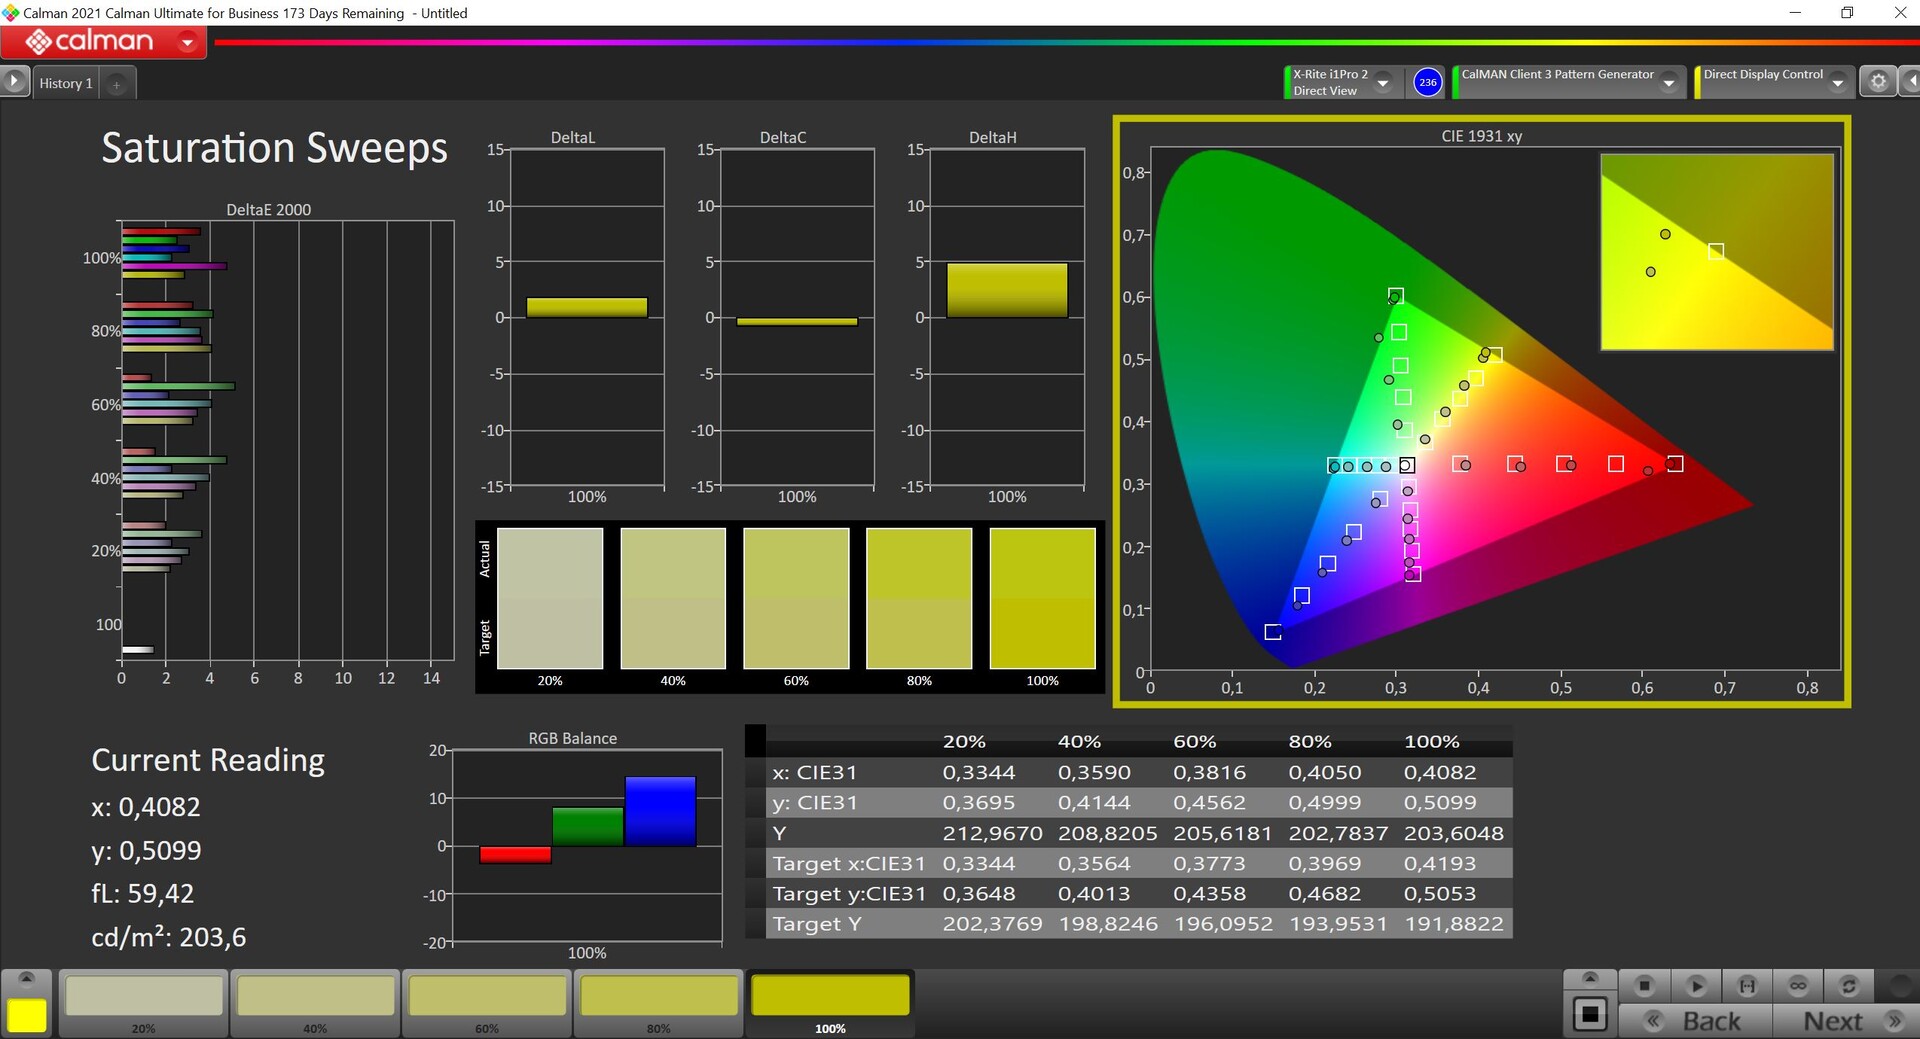
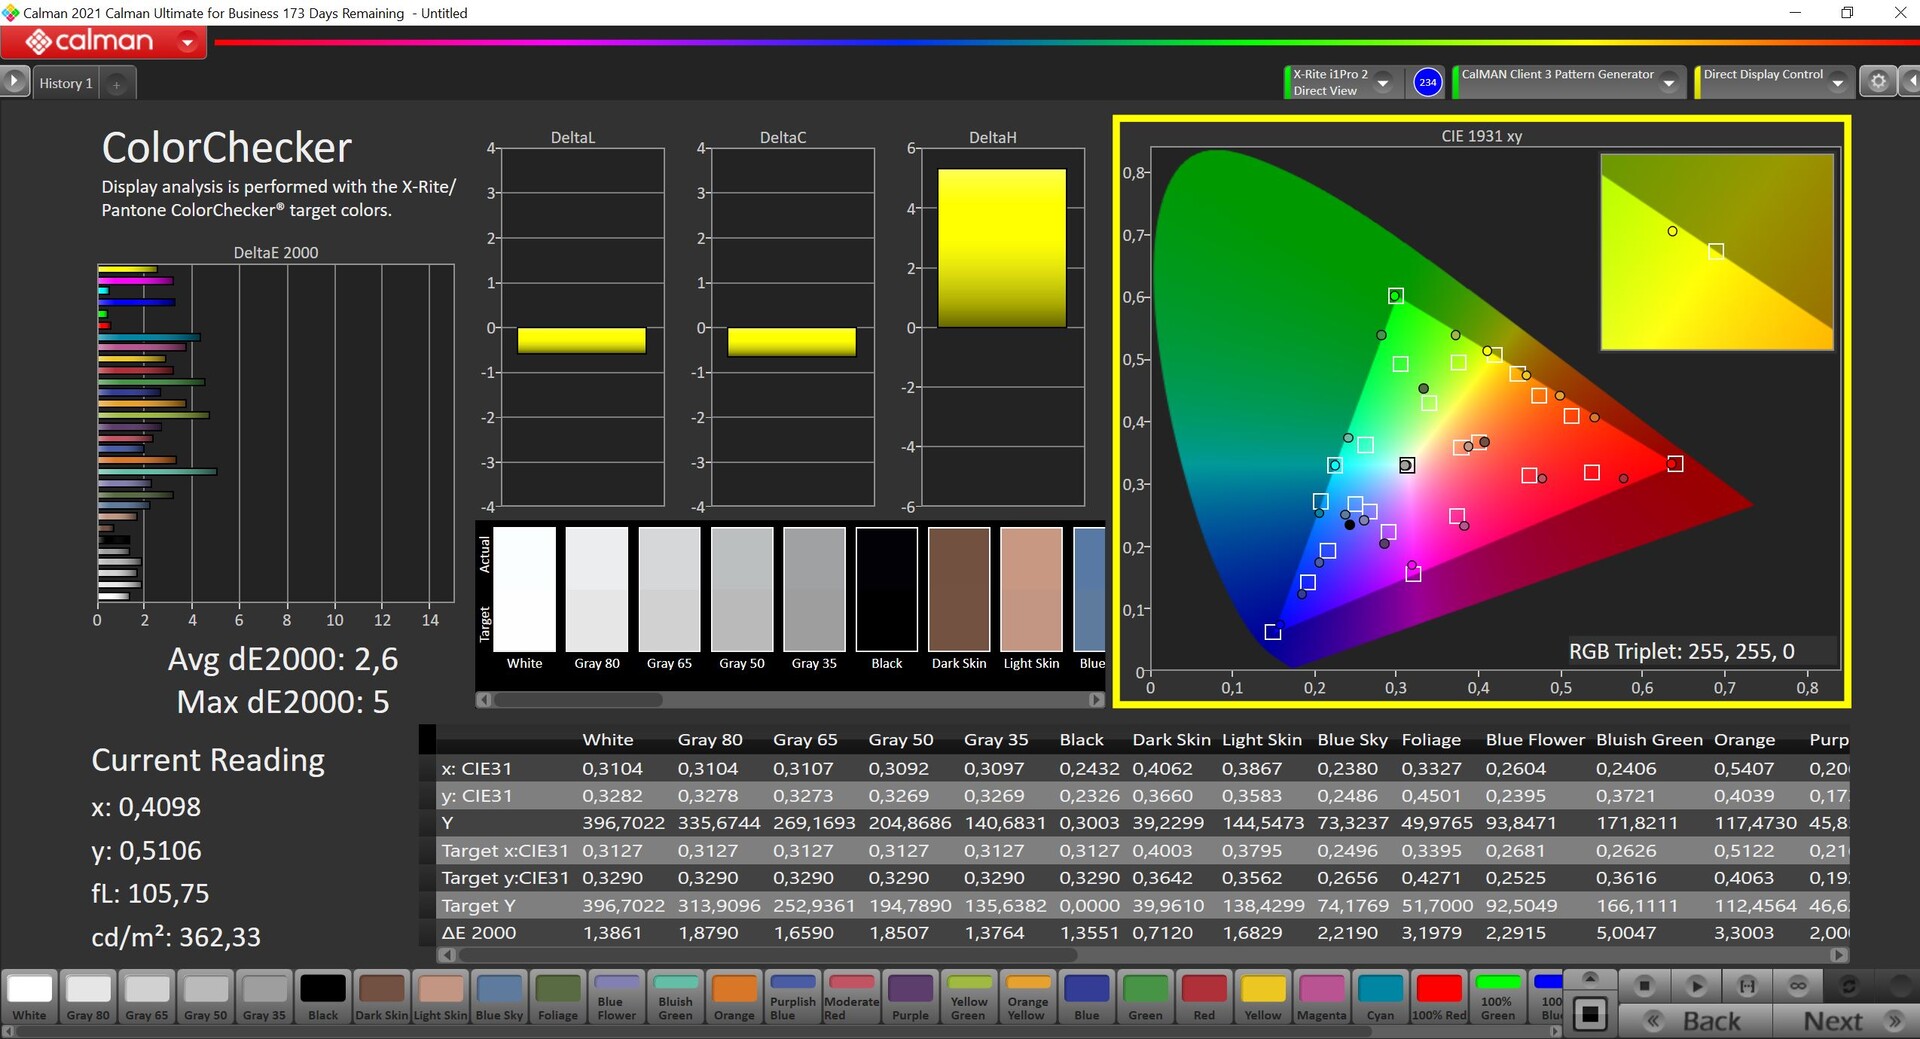
Analizamos el panel con el software profesional CalMAN (X-Rite i1 Pro 2) y el dispositivo viene con dos perfiles diferentes. Por defecto, está activado el perfil Mejorado, en el que los colores parecen algo más vivos y saturados - pero esto también lleva a mayores desviaciones de color. El perfil sRGB parece subjetivamente un poco más pálido, pero lo hizo muy bien en nuestro análisis y proporcionó valores muy precisos sin ningún valor atípico tanto para las representaciones en escala de grises como en color. Junto con la cobertura sRGB completa, es posible editar imágenes sin problemas nada más sacarlo de la caja. No pudimos mejorar más la pantalla con nuestro propio calibrado, por lo que no ofrecemos aquí un perfil descargable.
Tiempos de respuesta del display
| ↔ Tiempo de respuesta de Negro a Blanco | ||
|---|---|---|
| 28.7 ms ... subida ↗ y bajada ↘ combinada | ↗ 13 ms subida | 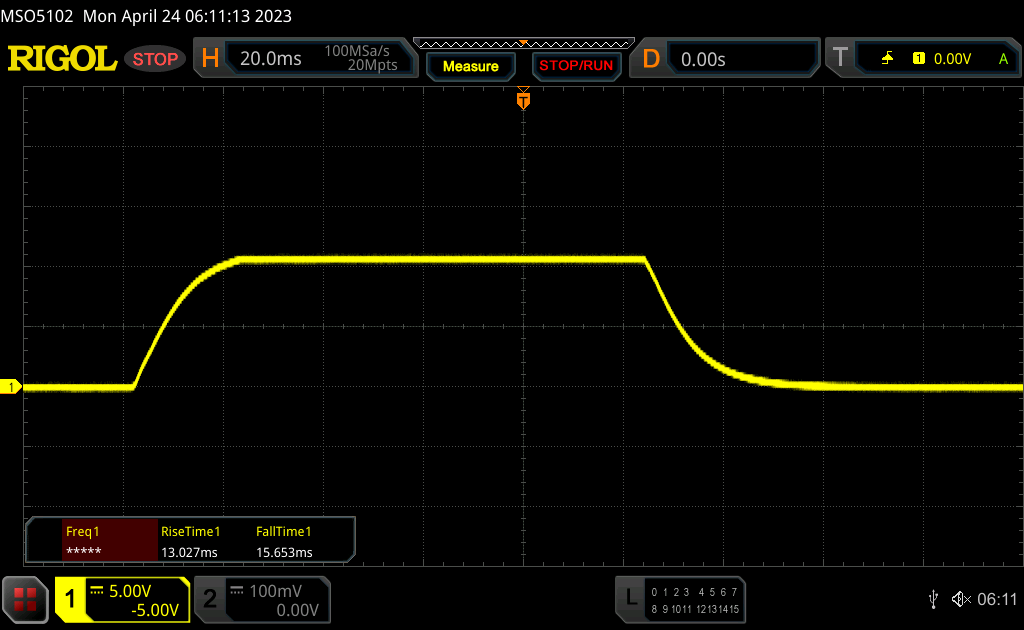 |
| ↘ 15.7 ms bajada | ||
| La pantalla mostró tiempos de respuesta relativamente lentos en nuestros tests pero podría ser demasiado lenta para los jugones. En comparación, todos los dispositivos de prueba van de ##min### (mínimo) a 240 (máximo) ms. » 76 % de todos los dispositivos son mejores. Eso quiere decir que el tiempo de respuesta es peor que la media (19.8 ms) de todos los dispositivos testados. | ||
| ↔ Tiempo de respuesta 50% Gris a 80% Gris | ||
| 52.4 ms ... subida ↗ y bajada ↘ combinada | ↗ 24.4 ms subida | 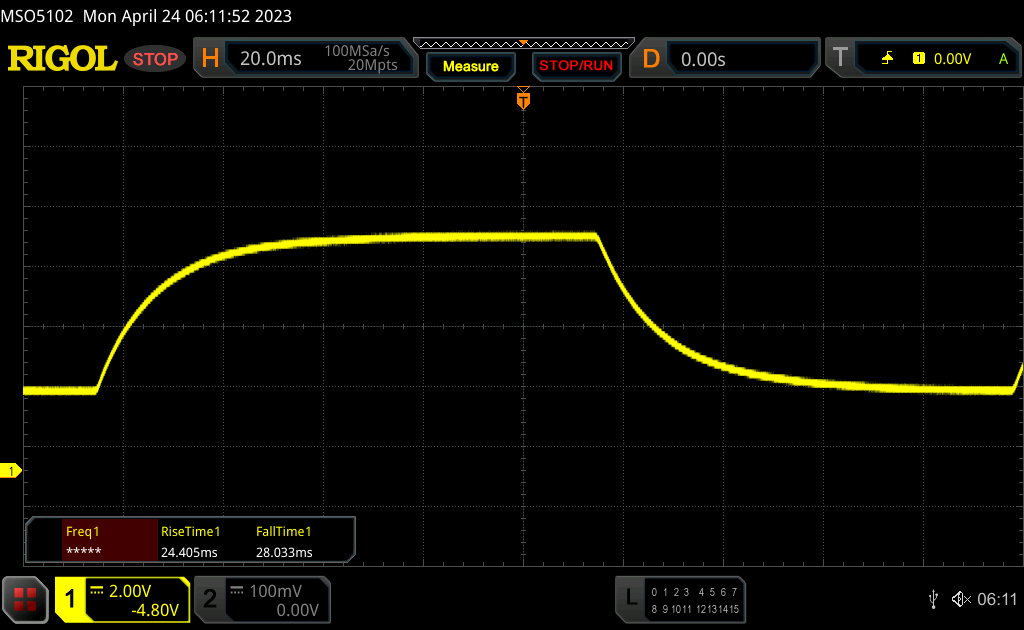 |
| ↘ 28 ms bajada | ||
| La pantalla mostró tiempos de respuesta lentos en nuestros tests y podría ser demasiado lenta para los jugones. En comparación, todos los dispositivos de prueba van de ##min### (mínimo) a 636 (máximo) ms. » 89 % de todos los dispositivos son mejores. Eso quiere decir que el tiempo de respuesta es peor que la media (31 ms) de todos los dispositivos testados. | ||
Parpadeo de Pantalla / PWM (Pulse-Width Modulation)
| Parpadeo de Pantalla / PWM detectado | 22000 Hz | ≤ 50 % de brillo | 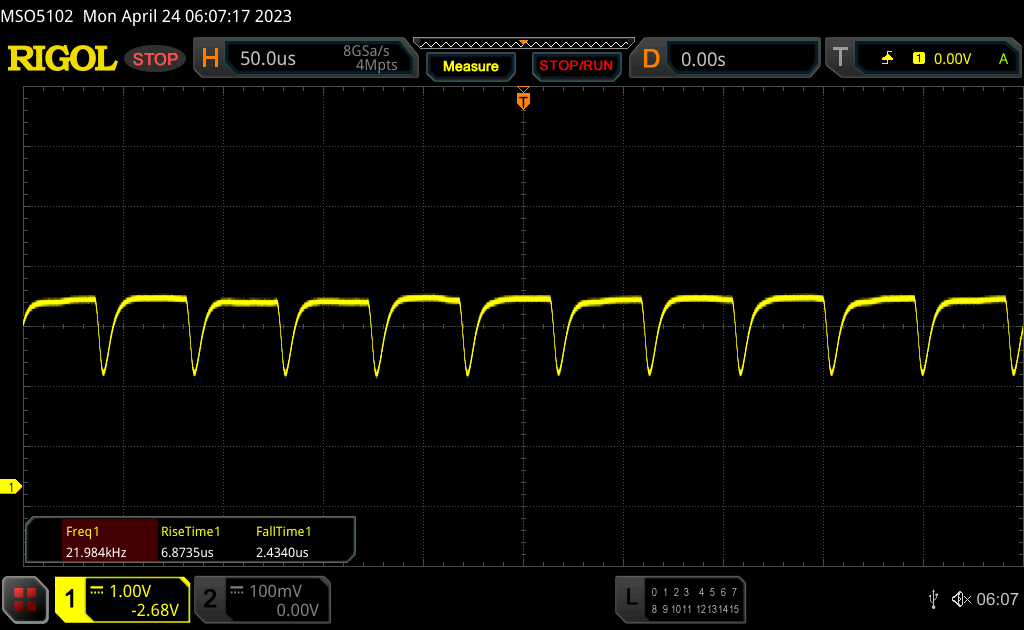 |
La retroiluminación del display parpadea a 22000 Hz (seguramente usa PWM - Pulse-Width Modulation) a un brillo del 50 % e inferior. Sobre este nivel de brillo no debería darse parpadeo / PWM. La frecuencia de 22000 Hz es bastante alta, por lo que la mayoría de gente sensible al parpadeo no debería ver parpadeo o tener fatiga visual. Comparación: 52 % de todos los dispositivos testados no usaron PWM para atenuar el display. Si se usó, medimos una media de 7757 (mínimo: 5 - máxmo: 343500) Hz. | |||
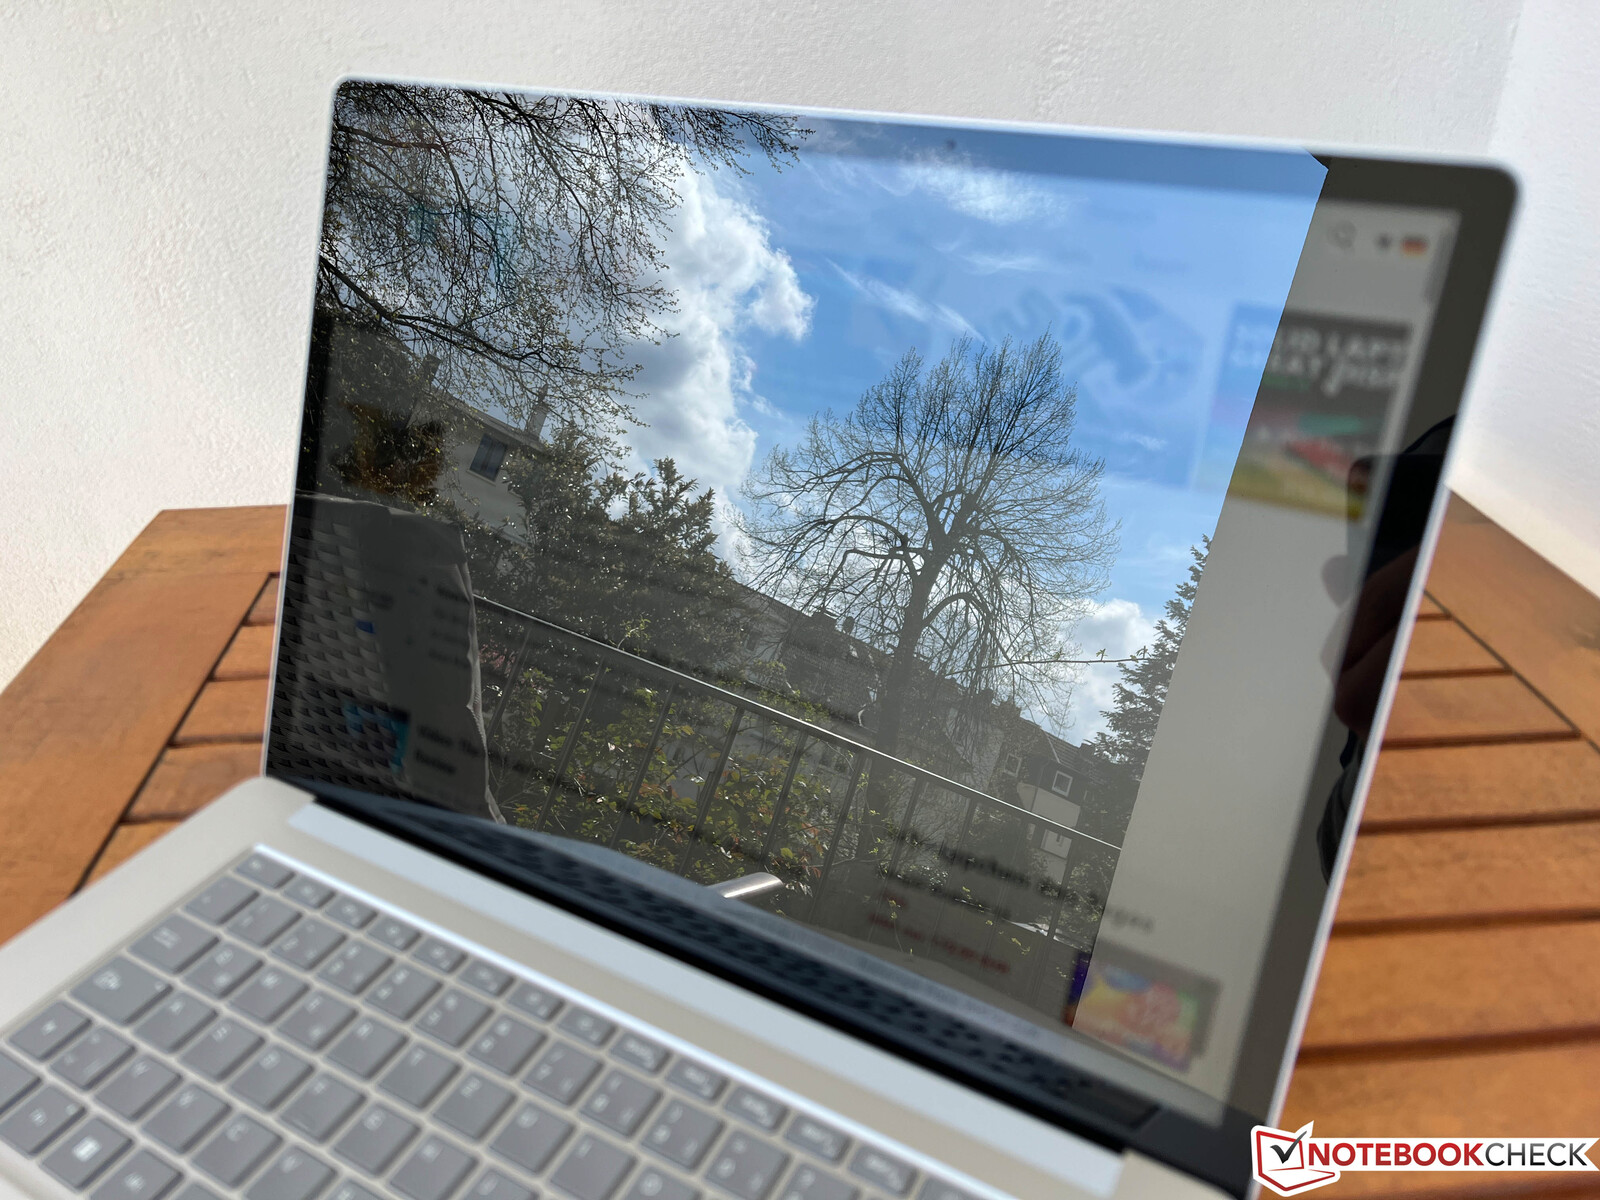
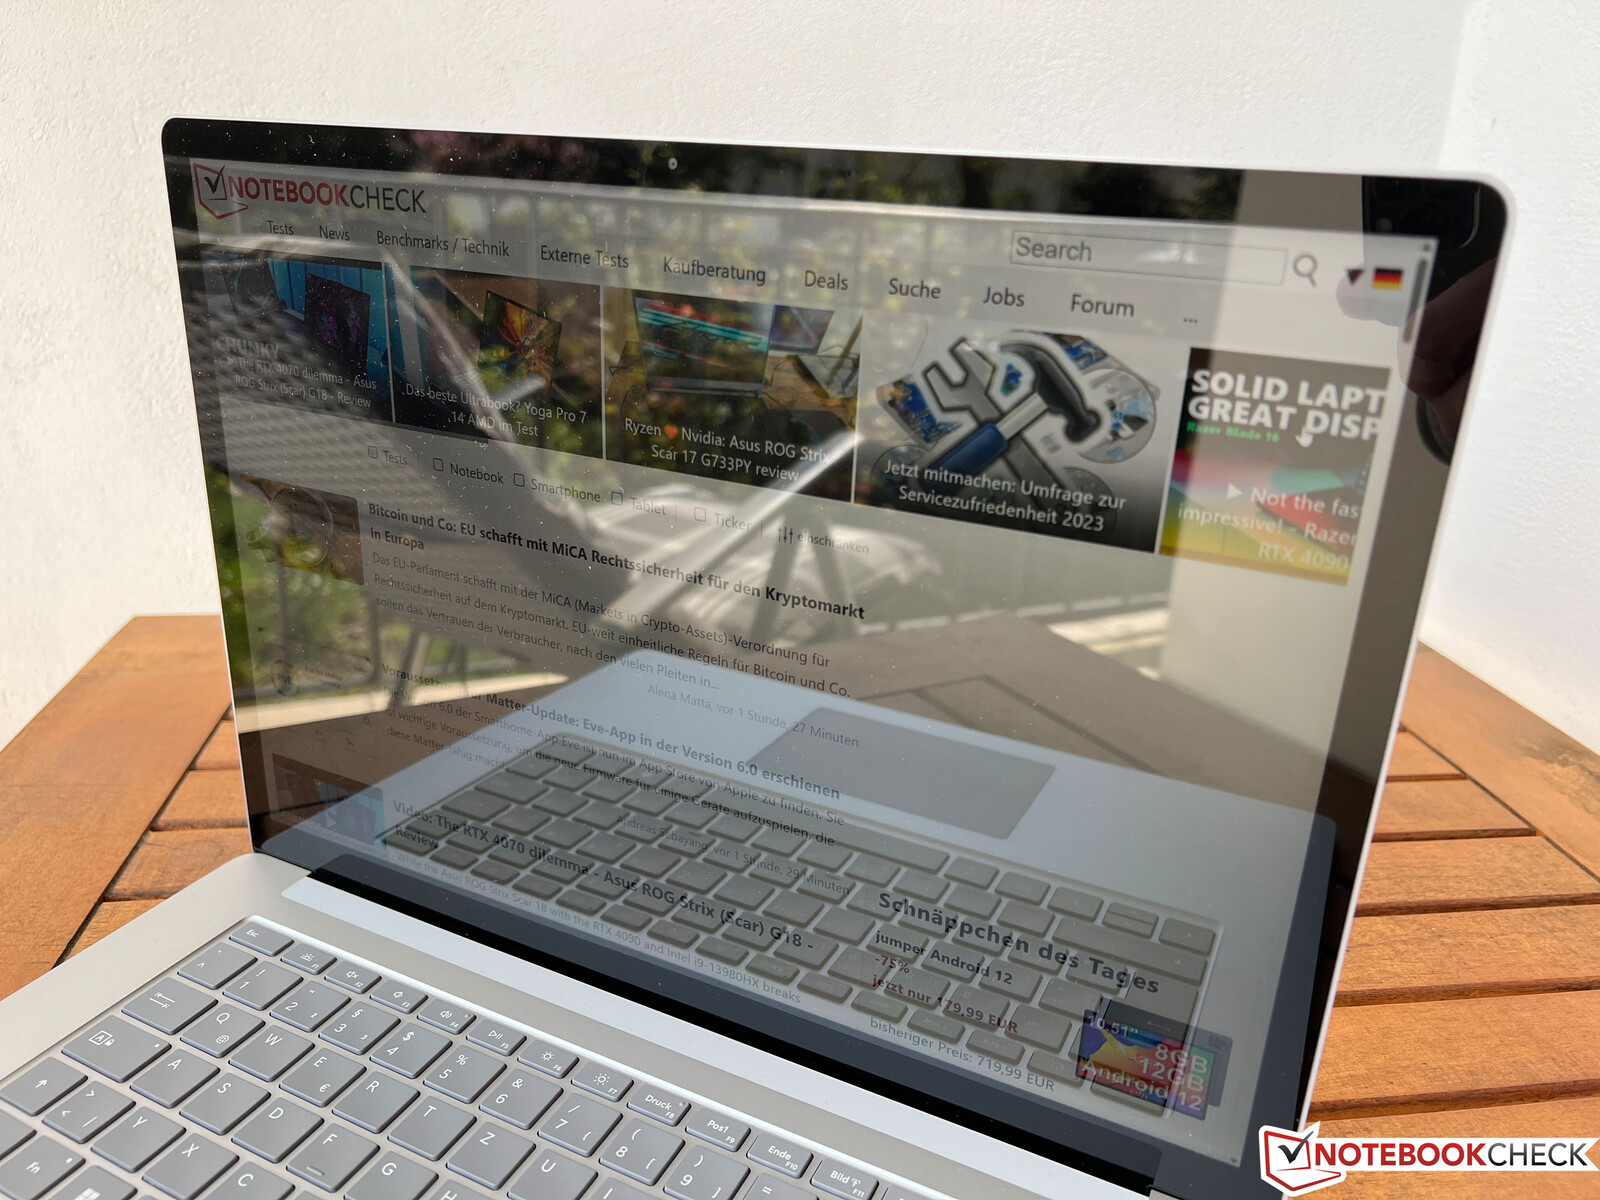
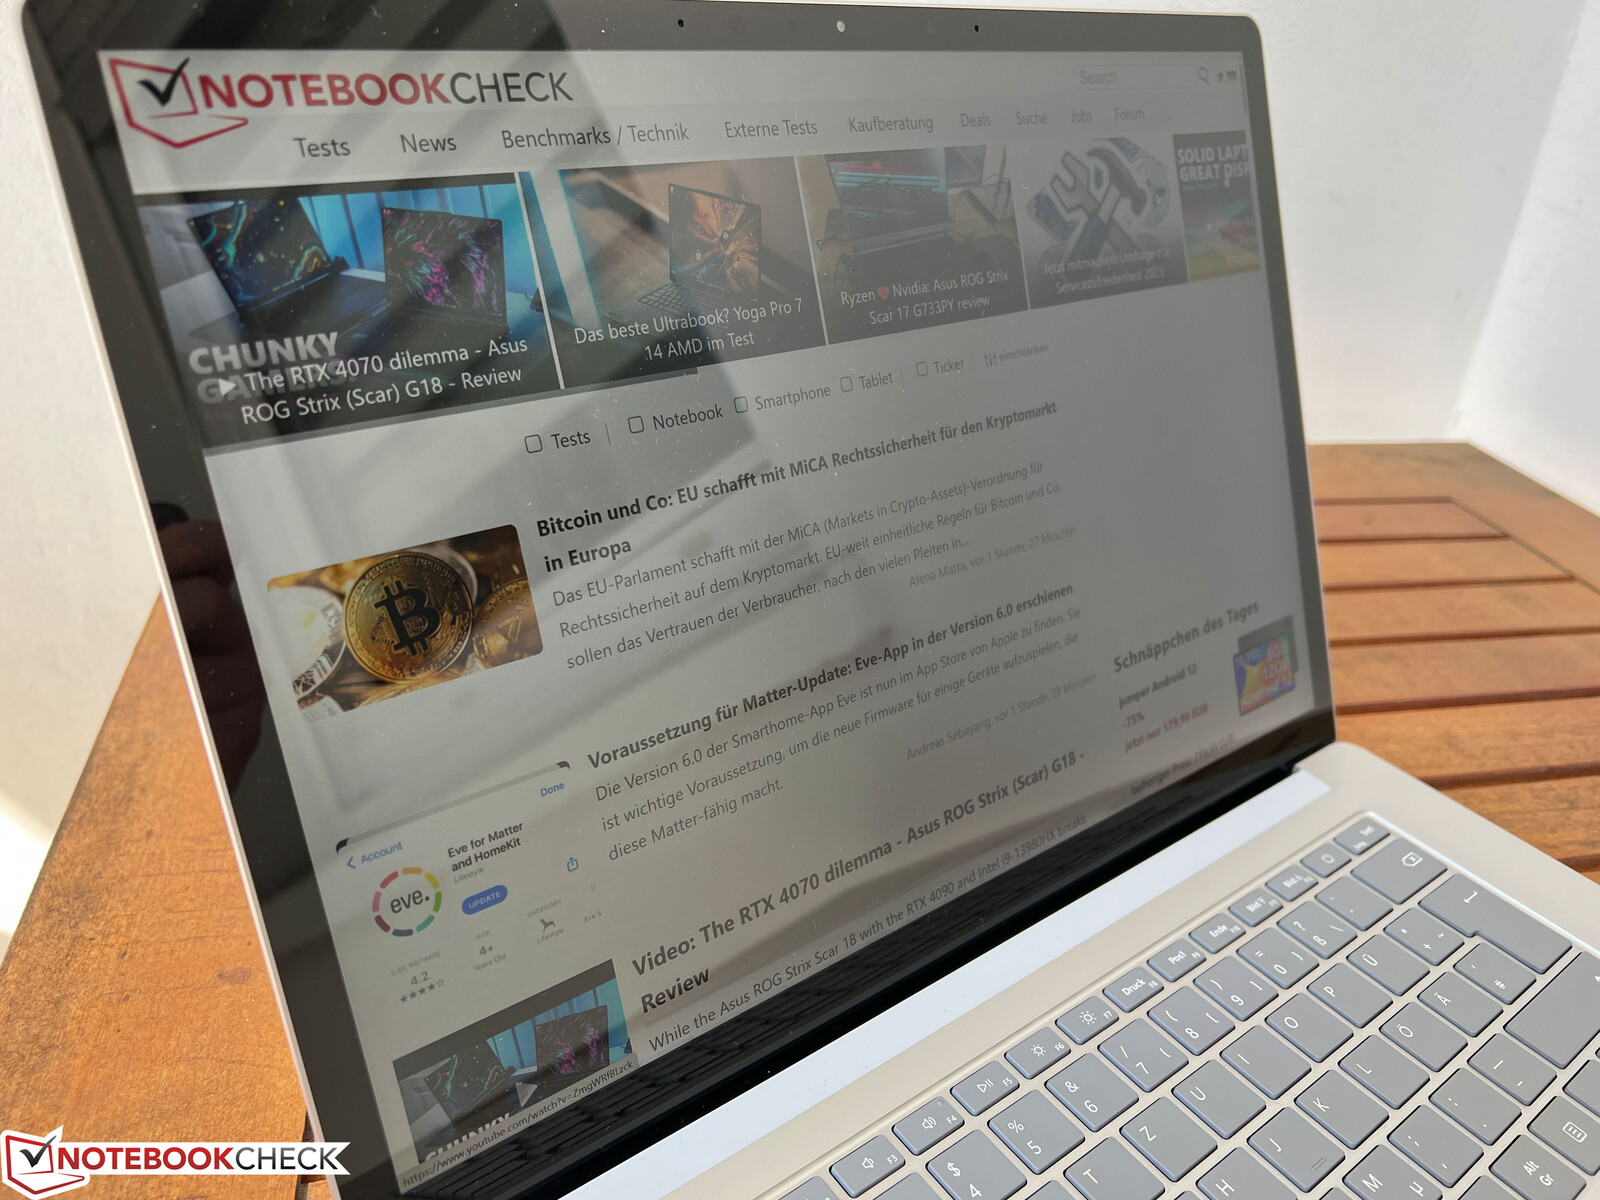
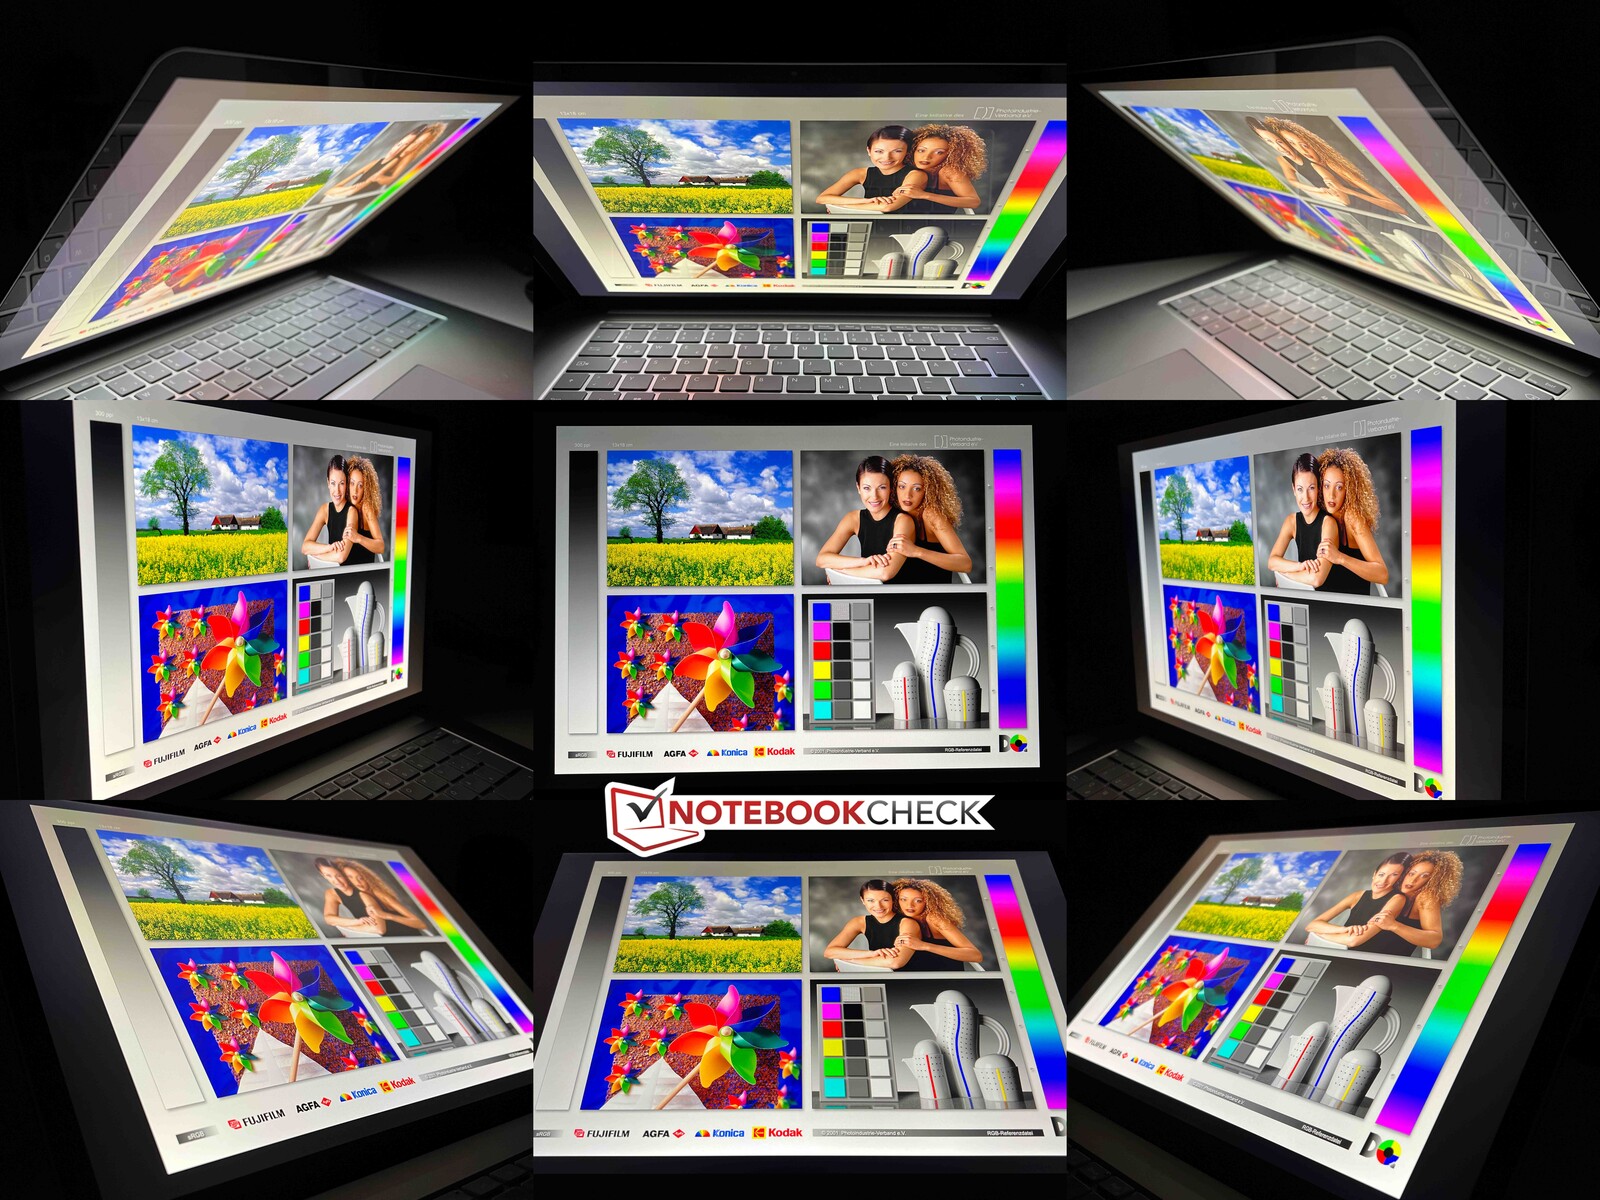
Usar el Surface Laptop 5 en exteriores se hace difícil porque su pantalla táctil es muy reflectante - el portátil casi actúa como un espejo en días luminosos. Esto significa que tendrás más suerte trabajando a la sombra. Su estabilidad de ángulo de visión es muy buena, pero los reflejos vuelven a ser un problema en ángulos grandes.
Rendimiento - Microsoft ha utilizado Alder Lake-U
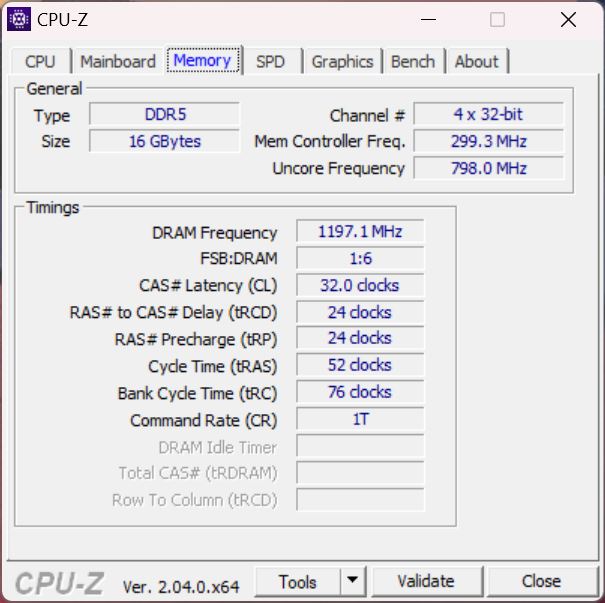
Microsoft ha abandonado la versión AMD del portátil Surface y ahora solo confía en las CPU Intel. Aquí es donde entran en juego los modelos Alder Lake de la serie U. Que aún no usen CPUs Raptor Lake (13ª generación) no es un problema, ya que ofrecen un rendimiento sólo marginalmente mejor. La RAM está soldada y no se puede actualizar, pero Microsoft al menos ofrece la posibilidad de elegir hasta 32 GB de RAM.
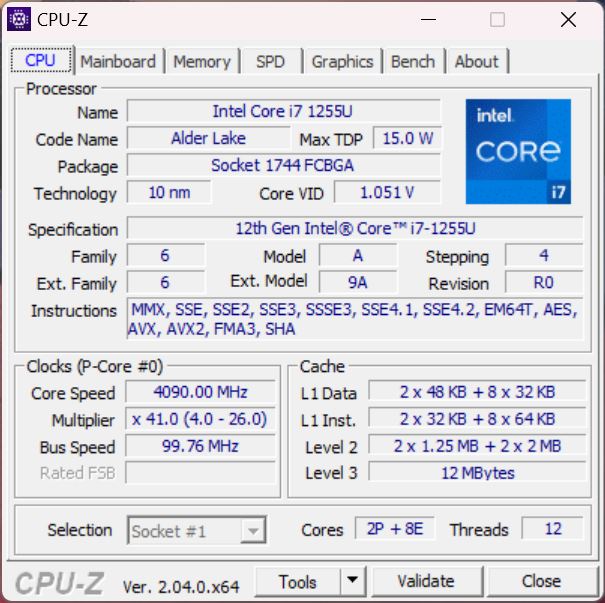
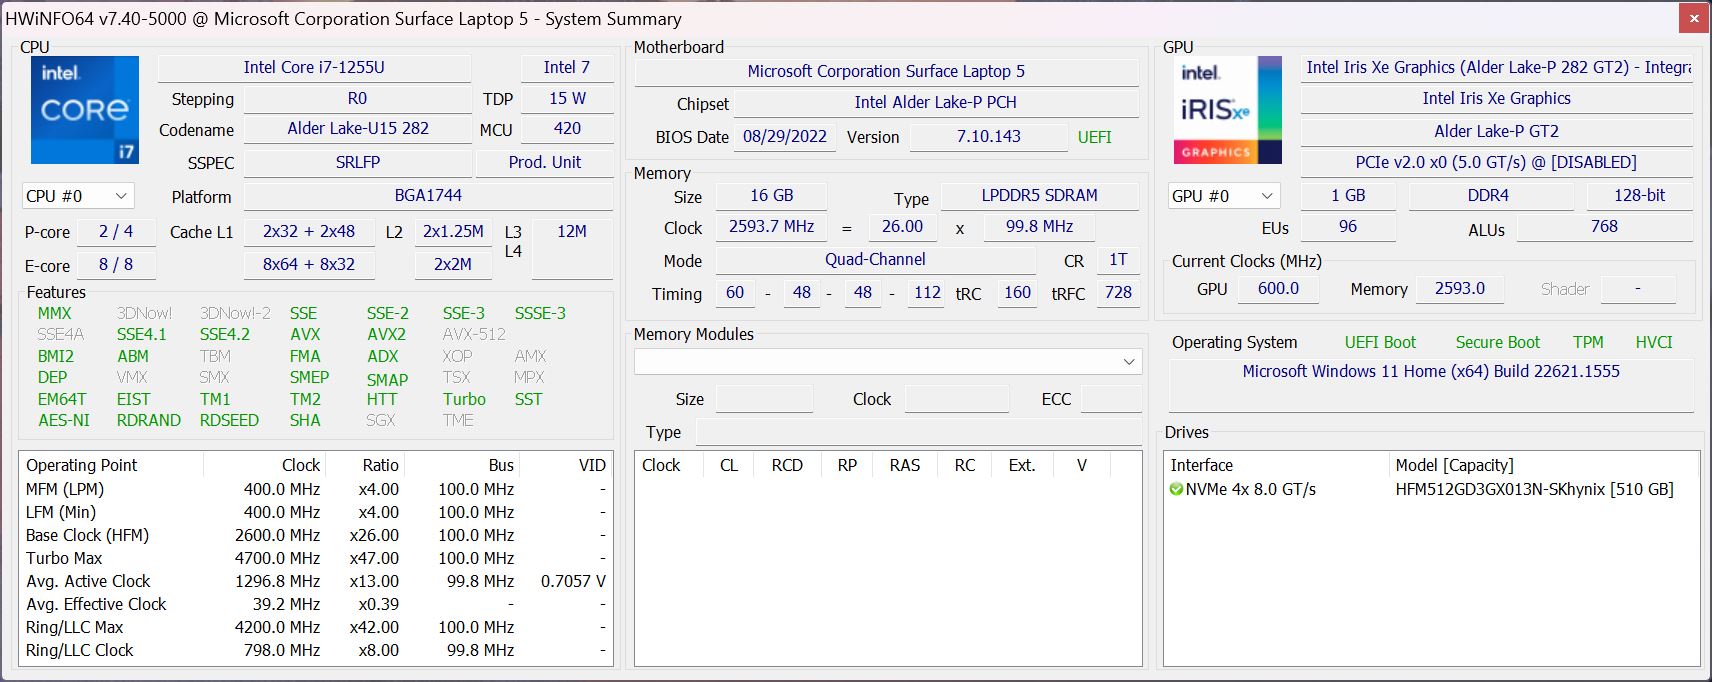
Procesador - Core i7-1255U
La serie Alder Lake (12ª generación) Intel Core i7-1255Ucuenta con dos núcleos de rendimiento rápido que incluyen Hyper-threading en combinación con 8 núcleos de eficiencia, lo que significa que se pueden procesar hasta 12 hilos simultáneamente. El procesador del Surface Laptop 5 consumió 60 vatios durante unos 1-2 segundos antes de estabilizarse en 30 vatios. Viendo estas tasas, no acabamos de entender por qué Microsoft no se decantó por un chip Alder Lake P en su lugar.
En comparación con elSurface Laptop 4 13 con un Core i7-1185G7el modelo más nuevo fue un 33% más rápido de media y su rendimiento mononúcleo en particular fue excelente. En comparación con su predecesor con un procesador AMDsin embargo, su rendimiento multinúcleo fue peor - aquí, lo comparamos con un Ryzen 7 4980U. El rendimiento de la CPU del portátil es definitivamente suficiente para las tareas diarias, pero en vista de su precio más alto, esperábamos más de sus niveles de rendimiento.
Cuando se alimenta con la batería, el rendimiento multinúcleo del dispositivo cae en torno a un 8%. Aquí, el procesador consumió un máximo de 35/25 vatios. Sin embargo, como las temperaturas no subieron tan rápido, la CPU logró mantenerse a 35 vatios durante mucho más tiempo, y luego bajó a 25 vatios. Esto también demuestra que su configuración TDP no es especialmente buena y que el límite de 60 vatios no tiene mucho sentido. Hay más pruebas de CPU disponibles ennuestra sección técnica.
Cinebench R15 Multi continuous test
Cinebench R23: Multi Core | Single Core
Cinebench R20: CPU (Multi Core) | CPU (Single Core)
Cinebench R15: CPU Multi 64Bit | CPU Single 64Bit
Blender: v2.79 BMW27 CPU
7-Zip 18.03: 7z b 4 | 7z b 4 -mmt1
Geekbench 5.5: Multi-Core | Single-Core
HWBOT x265 Benchmark v2.2: 4k Preset
LibreOffice : 20 Documents To PDF
R Benchmark 2.5: Overall mean
| CPU Performance rating | |
| Dell XPS 15 9520 RTX 3050 Ti | |
| Asus Zenbook Pro 15 OLED UM535Q | |
| Media de la clase Office | |
| Microsoft Surface Laptop 5 15, i7-1255U | |
| Medio Intel Core i7-1255U | |
| LG Gram 15Z90Q | |
| Microsoft Surface Laptop 4 15 AMD TFF_00028 | |
| Microsoft Surface Laptop 4 13 i7 | |
| Samsung Galaxy Book Pro 15 NP950XDB-KC5US | |
| Cinebench R23 / Multi Core | |
| Dell XPS 15 9520 RTX 3050 Ti | |
| Asus Zenbook Pro 15 OLED UM535Q | |
| Media de la clase Office (1673 - 22808, n=76, últimos 2 años) | |
| Microsoft Surface Laptop 4 15 AMD TFF_00028 | |
| Microsoft Surface Laptop 5 15, i7-1255U | |
| LG Gram 15Z90Q | |
| Medio Intel Core i7-1255U (5269 - 9628, n=11) | |
| Microsoft Surface Laptop 4 13 i7 | |
| Samsung Galaxy Book Pro 15 NP950XDB-KC5US | |
| Cinebench R23 / Single Core | |
| Dell XPS 15 9520 RTX 3050 Ti | |
| Media de la clase Office (708 - 2130, n=76, últimos 2 años) | |
| Microsoft Surface Laptop 5 15, i7-1255U | |
| Medio Intel Core i7-1255U (1408 - 1775, n=11) | |
| Microsoft Surface Laptop 4 13 i7 | |
| LG Gram 15Z90Q | |
| Asus Zenbook Pro 15 OLED UM535Q | |
| Samsung Galaxy Book Pro 15 NP950XDB-KC5US | |
| Microsoft Surface Laptop 4 15 AMD TFF_00028 | |
| Cinebench R20 / CPU (Multi Core) | |
| Dell XPS 15 9520 RTX 3050 Ti | |
| Asus Zenbook Pro 15 OLED UM535Q | |
| Media de la clase Office (648 - 8840, n=75, últimos 2 años) | |
| Microsoft Surface Laptop 4 15 AMD TFF_00028 | |
| Microsoft Surface Laptop 5 15, i7-1255U | |
| LG Gram 15Z90Q | |
| Medio Intel Core i7-1255U (2095 - 3702, n=11) | |
| Samsung Galaxy Book Pro 15 NP950XDB-KC5US | |
| Microsoft Surface Laptop 4 13 i7 | |
| Cinebench R20 / CPU (Single Core) | |
| Dell XPS 15 9520 RTX 3050 Ti | |
| Media de la clase Office (345 - 816, n=75, últimos 2 años) | |
| Microsoft Surface Laptop 5 15, i7-1255U | |
| Medio Intel Core i7-1255U (550 - 682, n=11) | |
| Microsoft Surface Laptop 4 13 i7 | |
| Asus Zenbook Pro 15 OLED UM535Q | |
| LG Gram 15Z90Q | |
| Samsung Galaxy Book Pro 15 NP950XDB-KC5US | |
| Microsoft Surface Laptop 4 15 AMD TFF_00028 | |
| Cinebench R15 / CPU Multi 64Bit | |
| Dell XPS 15 9520 RTX 3050 Ti | |
| Asus Zenbook Pro 15 OLED UM535Q | |
| Media de la clase Office (250 - 3380, n=77, últimos 2 años) | |
| Microsoft Surface Laptop 4 15 AMD TFF_00028 | |
| Microsoft Surface Laptop 5 15, i7-1255U | |
| LG Gram 15Z90Q | |
| Medio Intel Core i7-1255U (919 - 1577, n=11) | |
| Microsoft Surface Laptop 4 13 i7 | |
| Samsung Galaxy Book Pro 15 NP950XDB-KC5US | |
| Cinebench R15 / CPU Single 64Bit | |
| Dell XPS 15 9520 RTX 3050 Ti | |
| Media de la clase Office (99.5 - 316, n=77, últimos 2 años) | |
| Microsoft Surface Laptop 5 15, i7-1255U | |
| Asus Zenbook Pro 15 OLED UM535Q | |
| Medio Intel Core i7-1255U (161 - 251, n=12) | |
| Microsoft Surface Laptop 4 13 i7 | |
| LG Gram 15Z90Q | |
| Microsoft Surface Laptop 4 15 AMD TFF_00028 | |
| Samsung Galaxy Book Pro 15 NP950XDB-KC5US | |
| Blender / v2.79 BMW27 CPU | |
| Microsoft Surface Laptop 4 13 i7 | |
| Samsung Galaxy Book Pro 15 NP950XDB-KC5US | |
| LG Gram 15Z90Q | |
| Medio Intel Core i7-1255U (372 - 601, n=11) | |
| Microsoft Surface Laptop 5 15, i7-1255U | |
| Media de la clase Office (158 - 1940, n=76, últimos 2 años) | |
| Microsoft Surface Laptop 4 15 AMD TFF_00028 | |
| Asus Zenbook Pro 15 OLED UM535Q | |
| Dell XPS 15 9520 RTX 3050 Ti | |
| 7-Zip 18.03 / 7z b 4 | |
| Dell XPS 15 9520 RTX 3050 Ti | |
| Asus Zenbook Pro 15 OLED UM535Q | |
| Media de la clase Office (7098 - 76886, n=77, últimos 2 años) | |
| Microsoft Surface Laptop 4 15 AMD TFF_00028 | |
| Microsoft Surface Laptop 5 15, i7-1255U | |
| Medio Intel Core i7-1255U (24126 - 37365, n=11) | |
| LG Gram 15Z90Q | |
| Microsoft Surface Laptop 4 13 i7 | |
| Samsung Galaxy Book Pro 15 NP950XDB-KC5US | |
| 7-Zip 18.03 / 7z b 4 -mmt1 | |
| Dell XPS 15 9520 RTX 3050 Ti | |
| Asus Zenbook Pro 15 OLED UM535Q | |
| Media de la clase Office (3387 - 6469, n=77, últimos 2 años) | |
| Medio Intel Core i7-1255U (5059 - 5529, n=11) | |
| Microsoft Surface Laptop 5 15, i7-1255U | |
| Microsoft Surface Laptop 4 13 i7 | |
| Samsung Galaxy Book Pro 15 NP950XDB-KC5US | |
| LG Gram 15Z90Q | |
| Microsoft Surface Laptop 4 15 AMD TFF_00028 | |
| Geekbench 5.5 / Multi-Core | |
| Dell XPS 15 9520 RTX 3050 Ti | |
| Media de la clase Office (1483 - 16999, n=73, últimos 2 años) | |
| Microsoft Surface Laptop 5 15, i7-1255U | |
| LG Gram 15Z90Q | |
| Asus Zenbook Pro 15 OLED UM535Q | |
| Medio Intel Core i7-1255U (4463 - 8821, n=12) | |
| Microsoft Surface Laptop 4 15 AMD TFF_00028 | |
| Microsoft Surface Laptop 4 13 i7 | |
| Samsung Galaxy Book Pro 15 NP950XDB-KC5US | |
| Geekbench 5.5 / Single-Core | |
| Media de la clase Office (811 - 2175, n=73, últimos 2 años) | |
| Dell XPS 15 9520 RTX 3050 Ti | |
| Microsoft Surface Laptop 5 15, i7-1255U | |
| Medio Intel Core i7-1255U (1560 - 1712, n=12) | |
| LG Gram 15Z90Q | |
| Samsung Galaxy Book Pro 15 NP950XDB-KC5US | |
| Microsoft Surface Laptop 4 13 i7 | |
| Asus Zenbook Pro 15 OLED UM535Q | |
| Microsoft Surface Laptop 4 15 AMD TFF_00028 | |
| HWBOT x265 Benchmark v2.2 / 4k Preset | |
| Asus Zenbook Pro 15 OLED UM535Q | |
| Dell XPS 15 9520 RTX 3050 Ti | |
| Media de la clase Office (2.21 - 26, n=76, últimos 2 años) | |
| Microsoft Surface Laptop 5 15, i7-1255U | |
| Microsoft Surface Laptop 4 15 AMD TFF_00028 | |
| Medio Intel Core i7-1255U (6.31 - 10.1, n=11) | |
| LG Gram 15Z90Q | |
| Samsung Galaxy Book Pro 15 NP950XDB-KC5US | |
| Microsoft Surface Laptop 4 13 i7 | |
| LibreOffice / 20 Documents To PDF | |
| Microsoft Surface Laptop 4 15 AMD TFF_00028 | |
| Media de la clase Office (39.9 - 102.3, n=76, últimos 2 años) | |
| LG Gram 15Z90Q | |
| Samsung Galaxy Book Pro 15 NP950XDB-KC5US | |
| Microsoft Surface Laptop 4 13 i7 | |
| Asus Zenbook Pro 15 OLED UM535Q | |
| Medio Intel Core i7-1255U (35.6 - 52.5, n=11) | |
| Microsoft Surface Laptop 5 15, i7-1255U | |
| Dell XPS 15 9520 RTX 3050 Ti | |
| R Benchmark 2.5 / Overall mean | |
| Microsoft Surface Laptop 4 15 AMD TFF_00028 | |
| Samsung Galaxy Book Pro 15 NP950XDB-KC5US | |
| Microsoft Surface Laptop 4 13 i7 | |
| LG Gram 15Z90Q | |
| Media de la clase Office (0.393 - 0.888, n=76, últimos 2 años) | |
| Asus Zenbook Pro 15 OLED UM535Q | |
| Medio Intel Core i7-1255U (0.4688 - 0.558, n=11) | |
| Microsoft Surface Laptop 5 15, i7-1255U | |
| Dell XPS 15 9520 RTX 3050 Ti | |
* ... más pequeño es mejor
AIDA64: FP32 Ray-Trace | FPU Julia | CPU SHA3 | CPU Queen | FPU SinJulia | FPU Mandel | CPU AES | CPU ZLib | FP64 Ray-Trace | CPU PhotoWorxx
| Performance rating | |
| Asus Zenbook Pro 15 OLED UM535Q | |
| Media de la clase Office | |
| Microsoft Surface Laptop 4 15 AMD TFF_00028 | |
| Dell XPS 15 9520 RTX 3050 Ti | |
| Microsoft Surface Laptop 5 15, i7-1255U | |
| LG Gram 15Z90Q | |
| Medio Intel Core i7-1255U | |
| Samsung Galaxy Book Pro 15 NP950XDB-KC5US | |
| AIDA64 / FP32 Ray-Trace | |
| Asus Zenbook Pro 15 OLED UM535Q | |
| Media de la clase Office (2083 - 31245, n=83, últimos 2 años) | |
| Microsoft Surface Laptop 4 15 AMD TFF_00028 | |
| Dell XPS 15 9520 RTX 3050 Ti | |
| Microsoft Surface Laptop 5 15, i7-1255U | |
| Medio Intel Core i7-1255U (4313 - 8127, n=11) | |
| LG Gram 15Z90Q | |
| Samsung Galaxy Book Pro 15 NP950XDB-KC5US | |
| AIDA64 / FPU Julia | |
| Asus Zenbook Pro 15 OLED UM535Q | |
| Microsoft Surface Laptop 4 15 AMD TFF_00028 | |
| Media de la clase Office (8191 - 125394, n=83, últimos 2 años) | |
| Microsoft Surface Laptop 5 15, i7-1255U | |
| LG Gram 15Z90Q | |
| Dell XPS 15 9520 RTX 3050 Ti | |
| Medio Intel Core i7-1255U (19813 - 41353, n=11) | |
| Samsung Galaxy Book Pro 15 NP950XDB-KC5US | |
| AIDA64 / CPU SHA3 | |
| Asus Zenbook Pro 15 OLED UM535Q | |
| Media de la clase Office (433 - 5755, n=83, últimos 2 años) | |
| Dell XPS 15 9520 RTX 3050 Ti | |
| Microsoft Surface Laptop 4 15 AMD TFF_00028 | |
| Microsoft Surface Laptop 5 15, i7-1255U | |
| Medio Intel Core i7-1255U (1325 - 2135, n=11) | |
| LG Gram 15Z90Q | |
| Samsung Galaxy Book Pro 15 NP950XDB-KC5US | |
| AIDA64 / CPU Queen | |
| Asus Zenbook Pro 15 OLED UM535Q | |
| Dell XPS 15 9520 RTX 3050 Ti | |
| Microsoft Surface Laptop 4 15 AMD TFF_00028 | |
| LG Gram 15Z90Q | |
| Media de la clase Office (22784 - 115197, n=67, últimos 2 años) | |
| Microsoft Surface Laptop 5 15, i7-1255U | |
| Medio Intel Core i7-1255U (61375 - 65892, n=11) | |
| Samsung Galaxy Book Pro 15 NP950XDB-KC5US | |
| AIDA64 / FPU SinJulia | |
| Microsoft Surface Laptop 4 15 AMD TFF_00028 | |
| Asus Zenbook Pro 15 OLED UM535Q | |
| Dell XPS 15 9520 RTX 3050 Ti | |
| Media de la clase Office (1378 - 18321, n=83, últimos 2 años) | |
| Microsoft Surface Laptop 5 15, i7-1255U | |
| LG Gram 15Z90Q | |
| Medio Intel Core i7-1255U (3577 - 5095, n=11) | |
| Samsung Galaxy Book Pro 15 NP950XDB-KC5US | |
| AIDA64 / FPU Mandel | |
| Asus Zenbook Pro 15 OLED UM535Q | |
| Microsoft Surface Laptop 4 15 AMD TFF_00028 | |
| Media de la clase Office (4601 - 66922, n=83, últimos 2 años) | |
| Dell XPS 15 9520 RTX 3050 Ti | |
| Microsoft Surface Laptop 5 15, i7-1255U | |
| Medio Intel Core i7-1255U (11759 - 20187, n=11) | |
| LG Gram 15Z90Q | |
| Samsung Galaxy Book Pro 15 NP950XDB-KC5US | |
| AIDA64 / CPU AES | |
| Asus Zenbook Pro 15 OLED UM535Q | |
| Dell XPS 15 9520 RTX 3050 Ti | |
| Media de la clase Office (4854 - 155900, n=83, últimos 2 años) | |
| Microsoft Surface Laptop 4 15 AMD TFF_00028 | |
| Medio Intel Core i7-1255U (27900 - 67458, n=11) | |
| Microsoft Surface Laptop 5 15, i7-1255U | |
| LG Gram 15Z90Q | |
| Samsung Galaxy Book Pro 15 NP950XDB-KC5US | |
| AIDA64 / CPU ZLib | |
| Dell XPS 15 9520 RTX 3050 Ti | |
| Asus Zenbook Pro 15 OLED UM535Q | |
| Microsoft Surface Laptop 4 15 AMD TFF_00028 | |
| Media de la clase Office (114.6 - 1366, n=83, últimos 2 años) | |
| Microsoft Surface Laptop 5 15, i7-1255U | |
| Medio Intel Core i7-1255U (393 - 640, n=11) | |
| LG Gram 15Z90Q | |
| Samsung Galaxy Book Pro 15 NP950XDB-KC5US | |
| AIDA64 / FP64 Ray-Trace | |
| Asus Zenbook Pro 15 OLED UM535Q | |
| Media de la clase Office (1109 - 17834, n=83, últimos 2 años) | |
| Microsoft Surface Laptop 4 15 AMD TFF_00028 | |
| Dell XPS 15 9520 RTX 3050 Ti | |
| Microsoft Surface Laptop 5 15, i7-1255U | |
| Medio Intel Core i7-1255U (2474 - 4400, n=11) | |
| Samsung Galaxy Book Pro 15 NP950XDB-KC5US | |
| LG Gram 15Z90Q | |
| AIDA64 / CPU PhotoWorxx | |
| LG Gram 15Z90Q | |
| Microsoft Surface Laptop 5 15, i7-1255U | |
| Media de la clase Office (11090 - 65229, n=83, últimos 2 años) | |
| Samsung Galaxy Book Pro 15 NP950XDB-KC5US | |
| Dell XPS 15 9520 RTX 3050 Ti | |
| Medio Intel Core i7-1255U (13899 - 44054, n=11) | |
| Microsoft Surface Laptop 4 15 AMD TFF_00028 | |
| Asus Zenbook Pro 15 OLED UM535Q | |
Rendimiento del sistema
El Surface Laptop 5 es un buen compañero para el uso diario y no pudimos identificar ningún problema durante nuestra prueba.
CrossMark: Overall | Productivity | Creativity | Responsiveness
| PCMark 10 / Score | |
| Dell XPS 15 9520 RTX 3050 Ti | |
| Asus Zenbook Pro 15 OLED UM535Q | |
| Media de la clase Office (2601 - 9298, n=68, últimos 2 años) | |
| Microsoft Surface Laptop 5 15, i7-1255U | |
| Medio Intel Core i7-1255U, Intel Iris Xe Graphics G7 96EUs (4676 - 5523, n=9) | |
| Microsoft Surface Laptop 4 15 AMD TFF_00028 | |
| LG Gram 15Z90Q | |
| Samsung Galaxy Book Pro 15 NP950XDB-KC5US | |
| PCMark 10 / Essentials | |
| Dell XPS 15 9520 RTX 3050 Ti | |
| Medio Intel Core i7-1255U, Intel Iris Xe Graphics G7 96EUs (9381 - 11654, n=9) | |
| Asus Zenbook Pro 15 OLED UM535Q | |
| Microsoft Surface Laptop 5 15, i7-1255U | |
| Media de la clase Office (3245 - 11594, n=68, últimos 2 años) | |
| Samsung Galaxy Book Pro 15 NP950XDB-KC5US | |
| LG Gram 15Z90Q | |
| Microsoft Surface Laptop 4 15 AMD TFF_00028 | |
| PCMark 10 / Productivity | |
| Media de la clase Office (5336 - 17243, n=68, últimos 2 años) | |
| Asus Zenbook Pro 15 OLED UM535Q | |
| Dell XPS 15 9520 RTX 3050 Ti | |
| Microsoft Surface Laptop 5 15, i7-1255U | |
| Microsoft Surface Laptop 4 15 AMD TFF_00028 | |
| Medio Intel Core i7-1255U, Intel Iris Xe Graphics G7 96EUs (6530 - 7418, n=9) | |
| Samsung Galaxy Book Pro 15 NP950XDB-KC5US | |
| LG Gram 15Z90Q | |
| PCMark 10 / Digital Content Creation | |
| Dell XPS 15 9520 RTX 3050 Ti | |
| Media de la clase Office (2049 - 13541, n=68, últimos 2 años) | |
| Asus Zenbook Pro 15 OLED UM535Q | |
| Microsoft Surface Laptop 5 15, i7-1255U | |
| LG Gram 15Z90Q | |
| Microsoft Surface Laptop 4 15 AMD TFF_00028 | |
| Medio Intel Core i7-1255U, Intel Iris Xe Graphics G7 96EUs (4498 - 6203, n=9) | |
| Samsung Galaxy Book Pro 15 NP950XDB-KC5US | |
| CrossMark / Overall | |
| Dell XPS 15 9520 RTX 3050 Ti | |
| Media de la clase Office (381 - 2010, n=75, últimos 2 años) | |
| Microsoft Surface Laptop 5 15, i7-1255U | |
| Medio Intel Core i7-1255U, Intel Iris Xe Graphics G7 96EUs (1329 - 1573, n=9) | |
| Asus Zenbook Pro 15 OLED UM535Q | |
| CrossMark / Productivity | |
| Dell XPS 15 9520 RTX 3050 Ti | |
| Microsoft Surface Laptop 5 15, i7-1255U | |
| Media de la clase Office (464 - 1880, n=75, últimos 2 años) | |
| Medio Intel Core i7-1255U, Intel Iris Xe Graphics G7 96EUs (1364 - 1554, n=9) | |
| Asus Zenbook Pro 15 OLED UM535Q | |
| CrossMark / Creativity | |
| Dell XPS 15 9520 RTX 3050 Ti | |
| Media de la clase Office (319 - 2361, n=75, últimos 2 años) | |
| Microsoft Surface Laptop 5 15, i7-1255U | |
| Medio Intel Core i7-1255U, Intel Iris Xe Graphics G7 96EUs (1372 - 1660, n=9) | |
| Asus Zenbook Pro 15 OLED UM535Q | |
| CrossMark / Responsiveness | |
| Dell XPS 15 9520 RTX 3050 Ti | |
| Medio Intel Core i7-1255U, Intel Iris Xe Graphics G7 96EUs (1117 - 1434, n=9) | |
| Media de la clase Office (360 - 1820, n=75, últimos 2 años) | |
| Microsoft Surface Laptop 5 15, i7-1255U | |
| Asus Zenbook Pro 15 OLED UM535Q | |
| PCMark 10 Score | 5472 puntos | |
ayuda | ||
| AIDA64 / Memory Copy | |
| LG Gram 15Z90Q | |
| Media de la clase Office (20075 - 110930, n=80, últimos 2 años) | |
| Microsoft Surface Laptop 5 15, i7-1255U | |
| Dell XPS 15 9520 RTX 3050 Ti | |
| Samsung Galaxy Book Pro 15 NP950XDB-KC5US | |
| Medio Intel Core i7-1255U (22846 - 67017, n=11) | |
| Asus Zenbook Pro 15 OLED UM535Q | |
| Microsoft Surface Laptop 4 15 AMD TFF_00028 | |
| AIDA64 / Memory Read | |
| LG Gram 15Z90Q | |
| Microsoft Surface Laptop 5 15, i7-1255U | |
| Media de la clase Office (10084 - 128030, n=81, últimos 2 años) | |
| Dell XPS 15 9520 RTX 3050 Ti | |
| Samsung Galaxy Book Pro 15 NP950XDB-KC5US | |
| Medio Intel Core i7-1255U (22877 - 67398, n=11) | |
| Microsoft Surface Laptop 4 15 AMD TFF_00028 | |
| Asus Zenbook Pro 15 OLED UM535Q | |
| AIDA64 / Memory Write | |
| Media de la clase Office (20073 - 119858, n=81, últimos 2 años) | |
| LG Gram 15Z90Q | |
| Microsoft Surface Laptop 5 15, i7-1255U | |
| Samsung Galaxy Book Pro 15 NP950XDB-KC5US | |
| Dell XPS 15 9520 RTX 3050 Ti | |
| Medio Intel Core i7-1255U (22883 - 65839, n=11) | |
| Asus Zenbook Pro 15 OLED UM535Q | |
| Microsoft Surface Laptop 4 15 AMD TFF_00028 | |
| AIDA64 / Memory Latency | |
| Microsoft Surface Laptop 5 15, i7-1255U | |
| Microsoft Surface Laptop 4 15 AMD TFF_00028 | |
| LG Gram 15Z90Q | |
| Media de la clase Office (7.6 - 162.9, n=76, últimos 2 años) | |
| Samsung Galaxy Book Pro 15 NP950XDB-KC5US | |
| Dell XPS 15 9520 RTX 3050 Ti | |
| Asus Zenbook Pro 15 OLED UM535Q | |
| Medio Intel Core i7-1255U (76 - 163.2, n=11) | |
* ... más pequeño es mejor
Latencia del CPD
Con la versión actual de la BIOS, nuestro dispositivo de prueba mostró algunas limitaciones en nuestra prueba de latencia estandarizada.
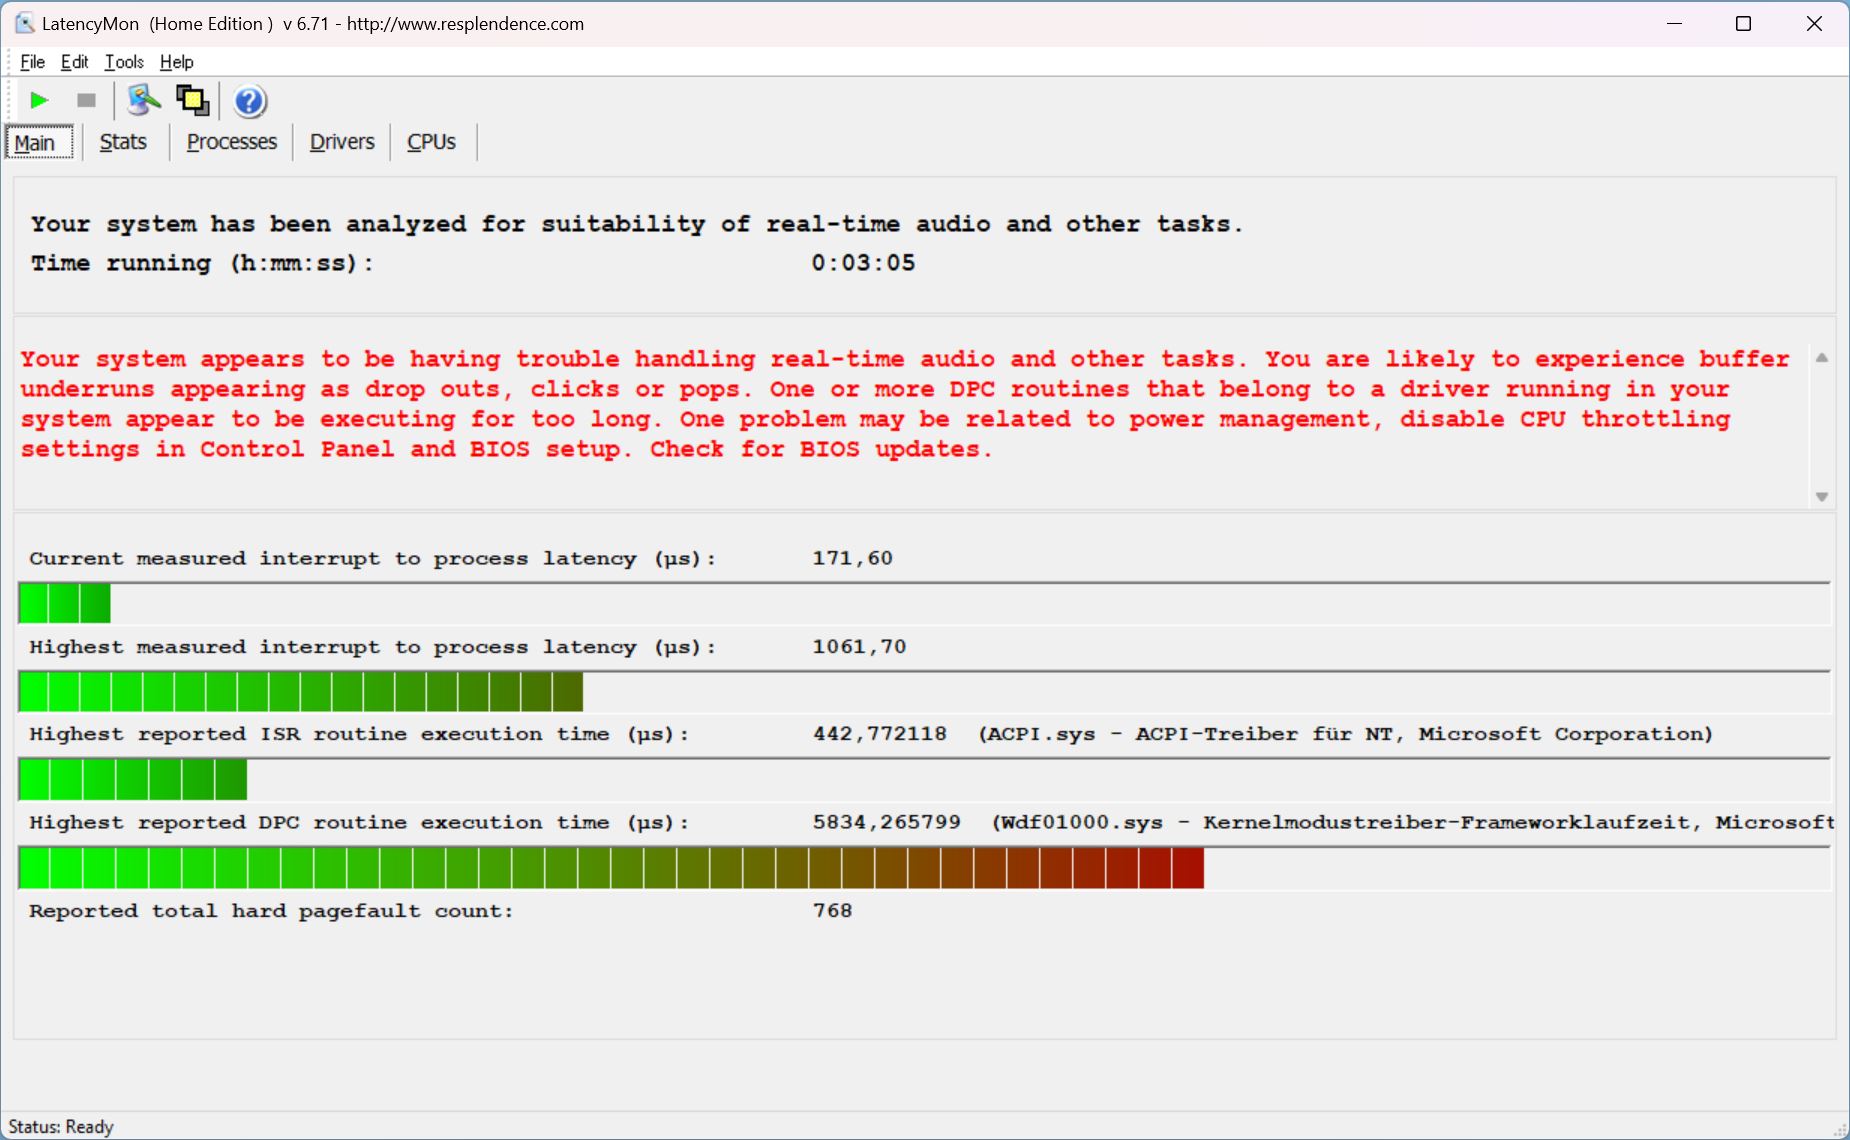
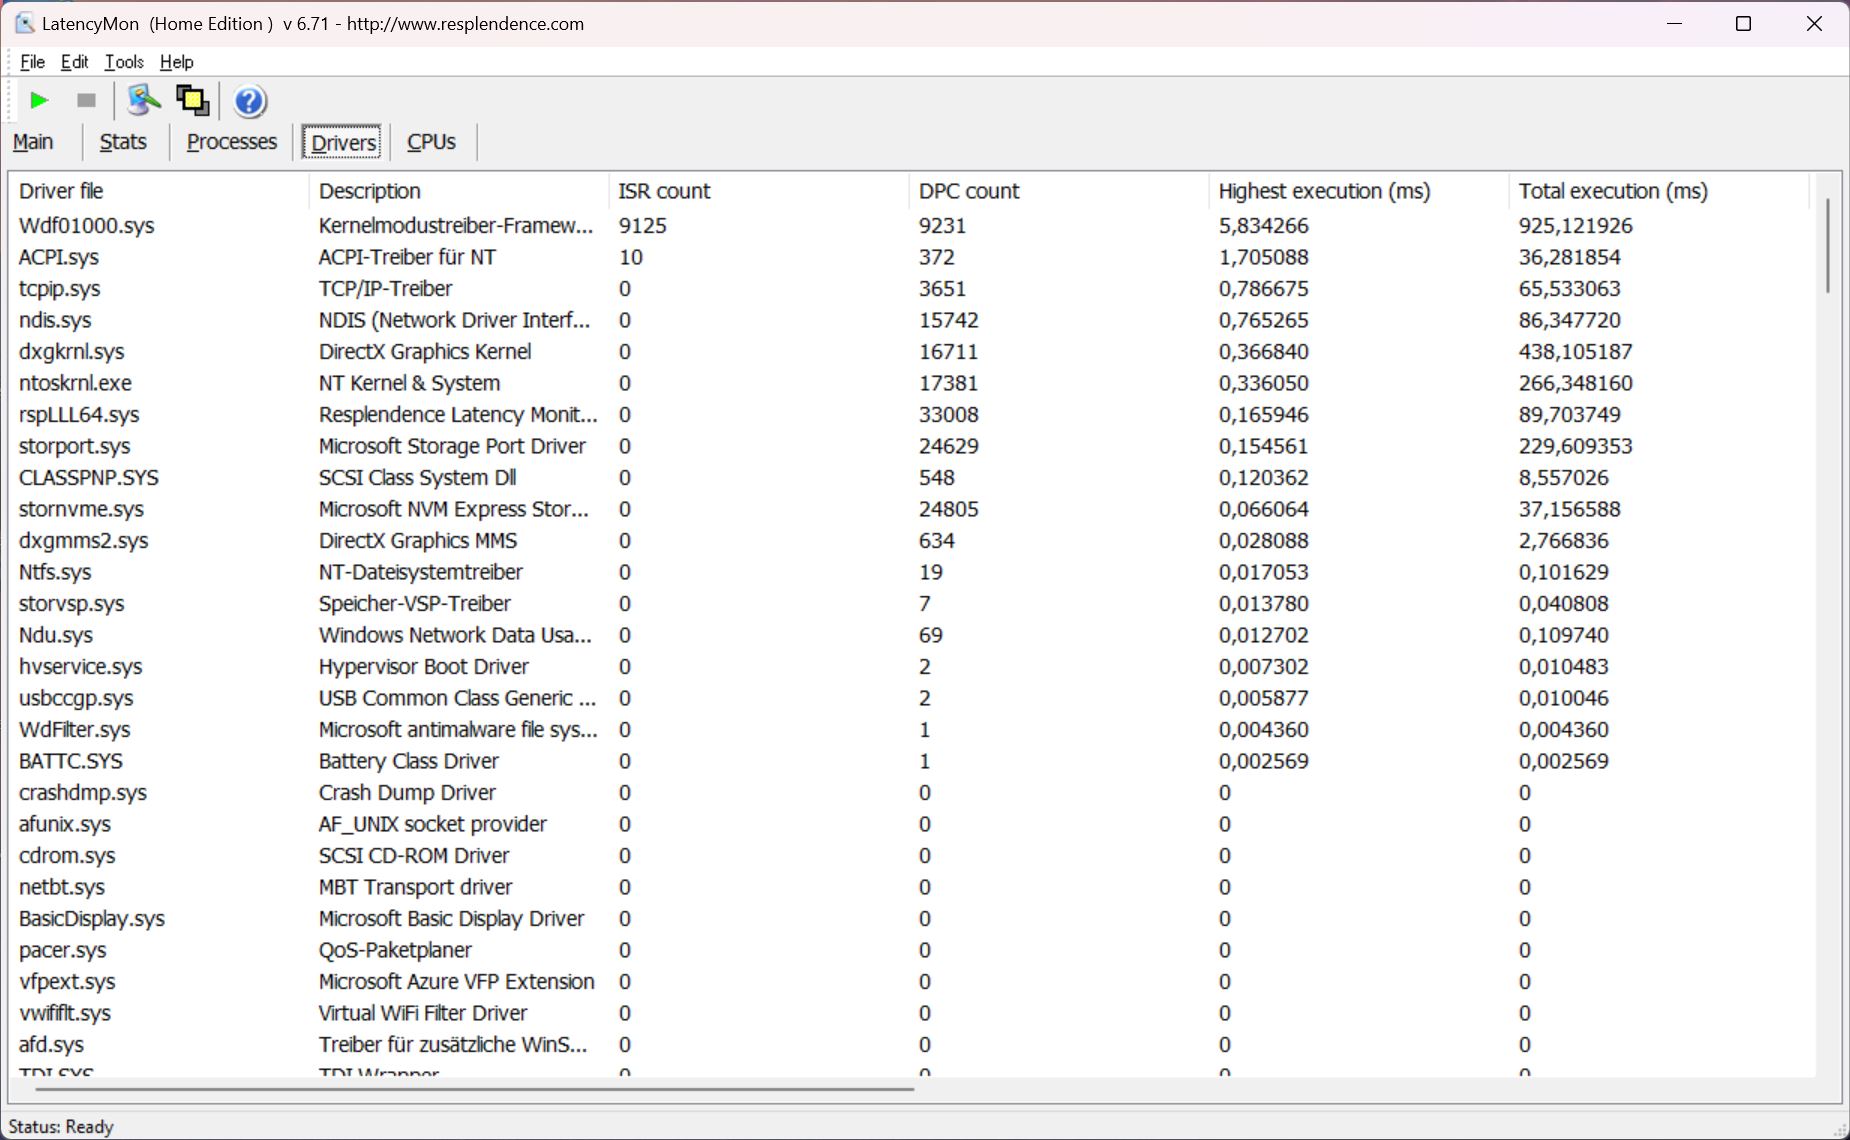
| DPC Latencies / LatencyMon - interrupt to process latency (max), Web, Youtube, Prime95 | |
| Microsoft Surface Laptop 5 15, i7-1255U | |
| Dell XPS 15 9520 RTX 3050 Ti | |
| LG Gram 15Z90Q | |
| Microsoft Surface Laptop 4 15 AMD TFF_00028 | |
| Samsung Galaxy Book Pro 15 NP950XDB-KC5US | |
| Asus Zenbook Pro 15 OLED UM535Q | |
* ... más pequeño es mejor
Dispositivos de almacenamiento
El portátil tiene instalado un SSD NVMe de SK hynix (BC711) con una capacidad de almacenamiento de 512 GB, de los que 415 GB siguen disponibles tras el primer arranque. La unidad está conectada por PCIe 3.0 - la nueva interfaz 4.0 aún no es compatible con el Surface Laptop 5. Las tasas de transferencia del dispositivo fueron en general perfectamente suficientes, con un máximo de 3,5 GB/s, y su rendimiento se mantuvo completamente estable incluso bajo carga prolongada. Puedes encontrar más pruebas de SSD aquí.

* ... más pequeño es mejor
Reading continuous performance: DiskSpd Read Loop, Queue Depth 8
Tarjeta gráfica
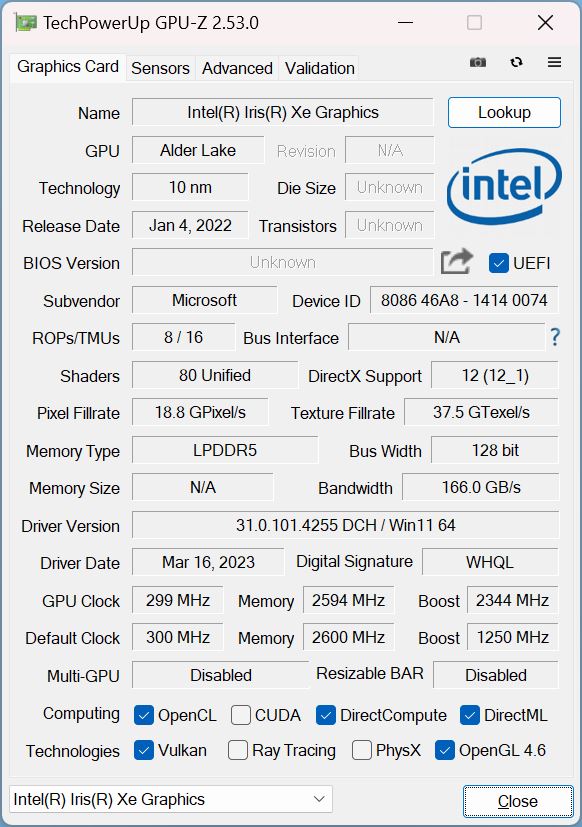
El procesador Alder Lake utiliza una Iris Xe Graphics G7 con 96 UEsque conocemos desde hace tiempo y que se sigue utilizando en las actuales CPU Raptor Lake. No hay tarjeta gráfica dedicada. Para tareas sencillas incluyendo la reproducción de vídeo a alta resolución, la Iris Xe Graphics G7 rindió lo suficiente y quedó en torno a un 40% por delante de la antigua Vega 8 de su predecesor AMD - pero seguimos hablando de un nivel de rendimiento bajo en general. Sus competidores de 15 pulgadas con tarjetas gráficas dedicadas como laRTX 3050 Ti ofrecen un rendimiento significativamente mayor, incluso para juegos. Con el Surface Laptop 5, tienes que conformarte con jugar a juegos más antiguos o menos exigentes con detalles reducidos.
Su rendimiento GPU se mantuvo estable bajo carga prolongada, pero hubo un ligero déficit de alrededor del 15% en modo batería (1.359 puntos @Time Spy Graphics). Hay más pruebas comparativas de GPU disponibles aquí.
| 3DMark 11 Performance | 6844 puntos | |
| 3DMark Fire Strike Score | 4739 puntos | |
| 3DMark Time Spy Score | 1782 puntos | |
ayuda | ||
| Blender / v3.3 Classroom CPU | |
| LG Gram 15Z90Q | |
| Microsoft Surface Laptop 5 15, i7-1255U | |
| Medio Intel Iris Xe Graphics G7 96EUs (336 - 1259, n=109) | |
| Media de la clase Office (245 - 3219, n=75, últimos 2 años) | |
* ... más pequeño es mejor
| The Witcher 3 - 1920x1080 Ultra Graphics & Postprocessing (HBAO+) | |
| Asus Zenbook Pro 15 OLED UM535Q | |
| Dell XPS 15 9520 RTX 3050 Ti | |
| Media de la clase Office (14.8 - 28.1, n=3, últimos 2 años) | |
| Samsung Galaxy Book Pro 15 NP950XDB-KC5US | |
| Microsoft Surface Laptop 4 15 AMD TFF_00028 | |
| Microsoft Surface Laptop 5 15, i7-1255U | |
| LG Gram 15Z90Q | |
| GTA V - 1920x1080 Highest AA:4xMSAA + FX AF:16x | |
| Asus Zenbook Pro 15 OLED UM535Q | |
| Dell XPS 15 9520 RTX 3050 Ti | |
| Media de la clase Office (5.77 - 45.3, n=69, últimos 2 años) | |
| Samsung Galaxy Book Pro 15 NP950XDB-KC5US | |
| Microsoft Surface Laptop 5 15, i7-1255U | |
| Final Fantasy XV Benchmark - 1920x1080 High Quality | |
| Asus Zenbook Pro 15 OLED UM535Q | |
| Dell XPS 15 9520 RTX 3050 Ti | |
| Samsung Galaxy Book Pro 15 NP950XDB-KC5US | |
| Media de la clase Office (8.09 - 79.5, n=71, últimos 2 años) | |
| Microsoft Surface Laptop 5 15, i7-1255U | |
| LG Gram 15Z90Q | |
| Strange Brigade - 1920x1080 ultra AA:ultra AF:16 | |
| Asus Zenbook Pro 15 OLED UM535Q | |
| Dell XPS 15 9520 RTX 3050 Ti | |
| Media de la clase Office (12.9 - 142.1, n=53, últimos 2 años) | |
| Samsung Galaxy Book Pro 15 NP950XDB-KC5US | |
| Microsoft Surface Laptop 5 15, i7-1255U | |
Witcher 3 FPS diagram
| bajo | medio | alto | ultra | |
|---|---|---|---|---|
| GTA V (2015) | 98.5 | 87.9 | 22.7 | 9.87 |
| The Witcher 3 (2015) | 88 | 56 | 31 | 12.4 |
| Dota 2 Reborn (2015) | 105.4 | 79.8 | 61.2 | 55.2 |
| Final Fantasy XV Benchmark (2018) | 42.9 | 23.8 | 16.4 | |
| X-Plane 11.11 (2018) | 42.5 | 35 | 28.8 | |
| Strange Brigade (2018) | 87.2 | 38 | 30 | 24.3 |
| F1 2021 (2021) | 101.7 | 50.3 | 39.4 | 27.1 |
| F1 22 (2022) | 45 | 41.4 | 29.6 | 22.3 |
Emisiones y potencia
Emisiones sonoras
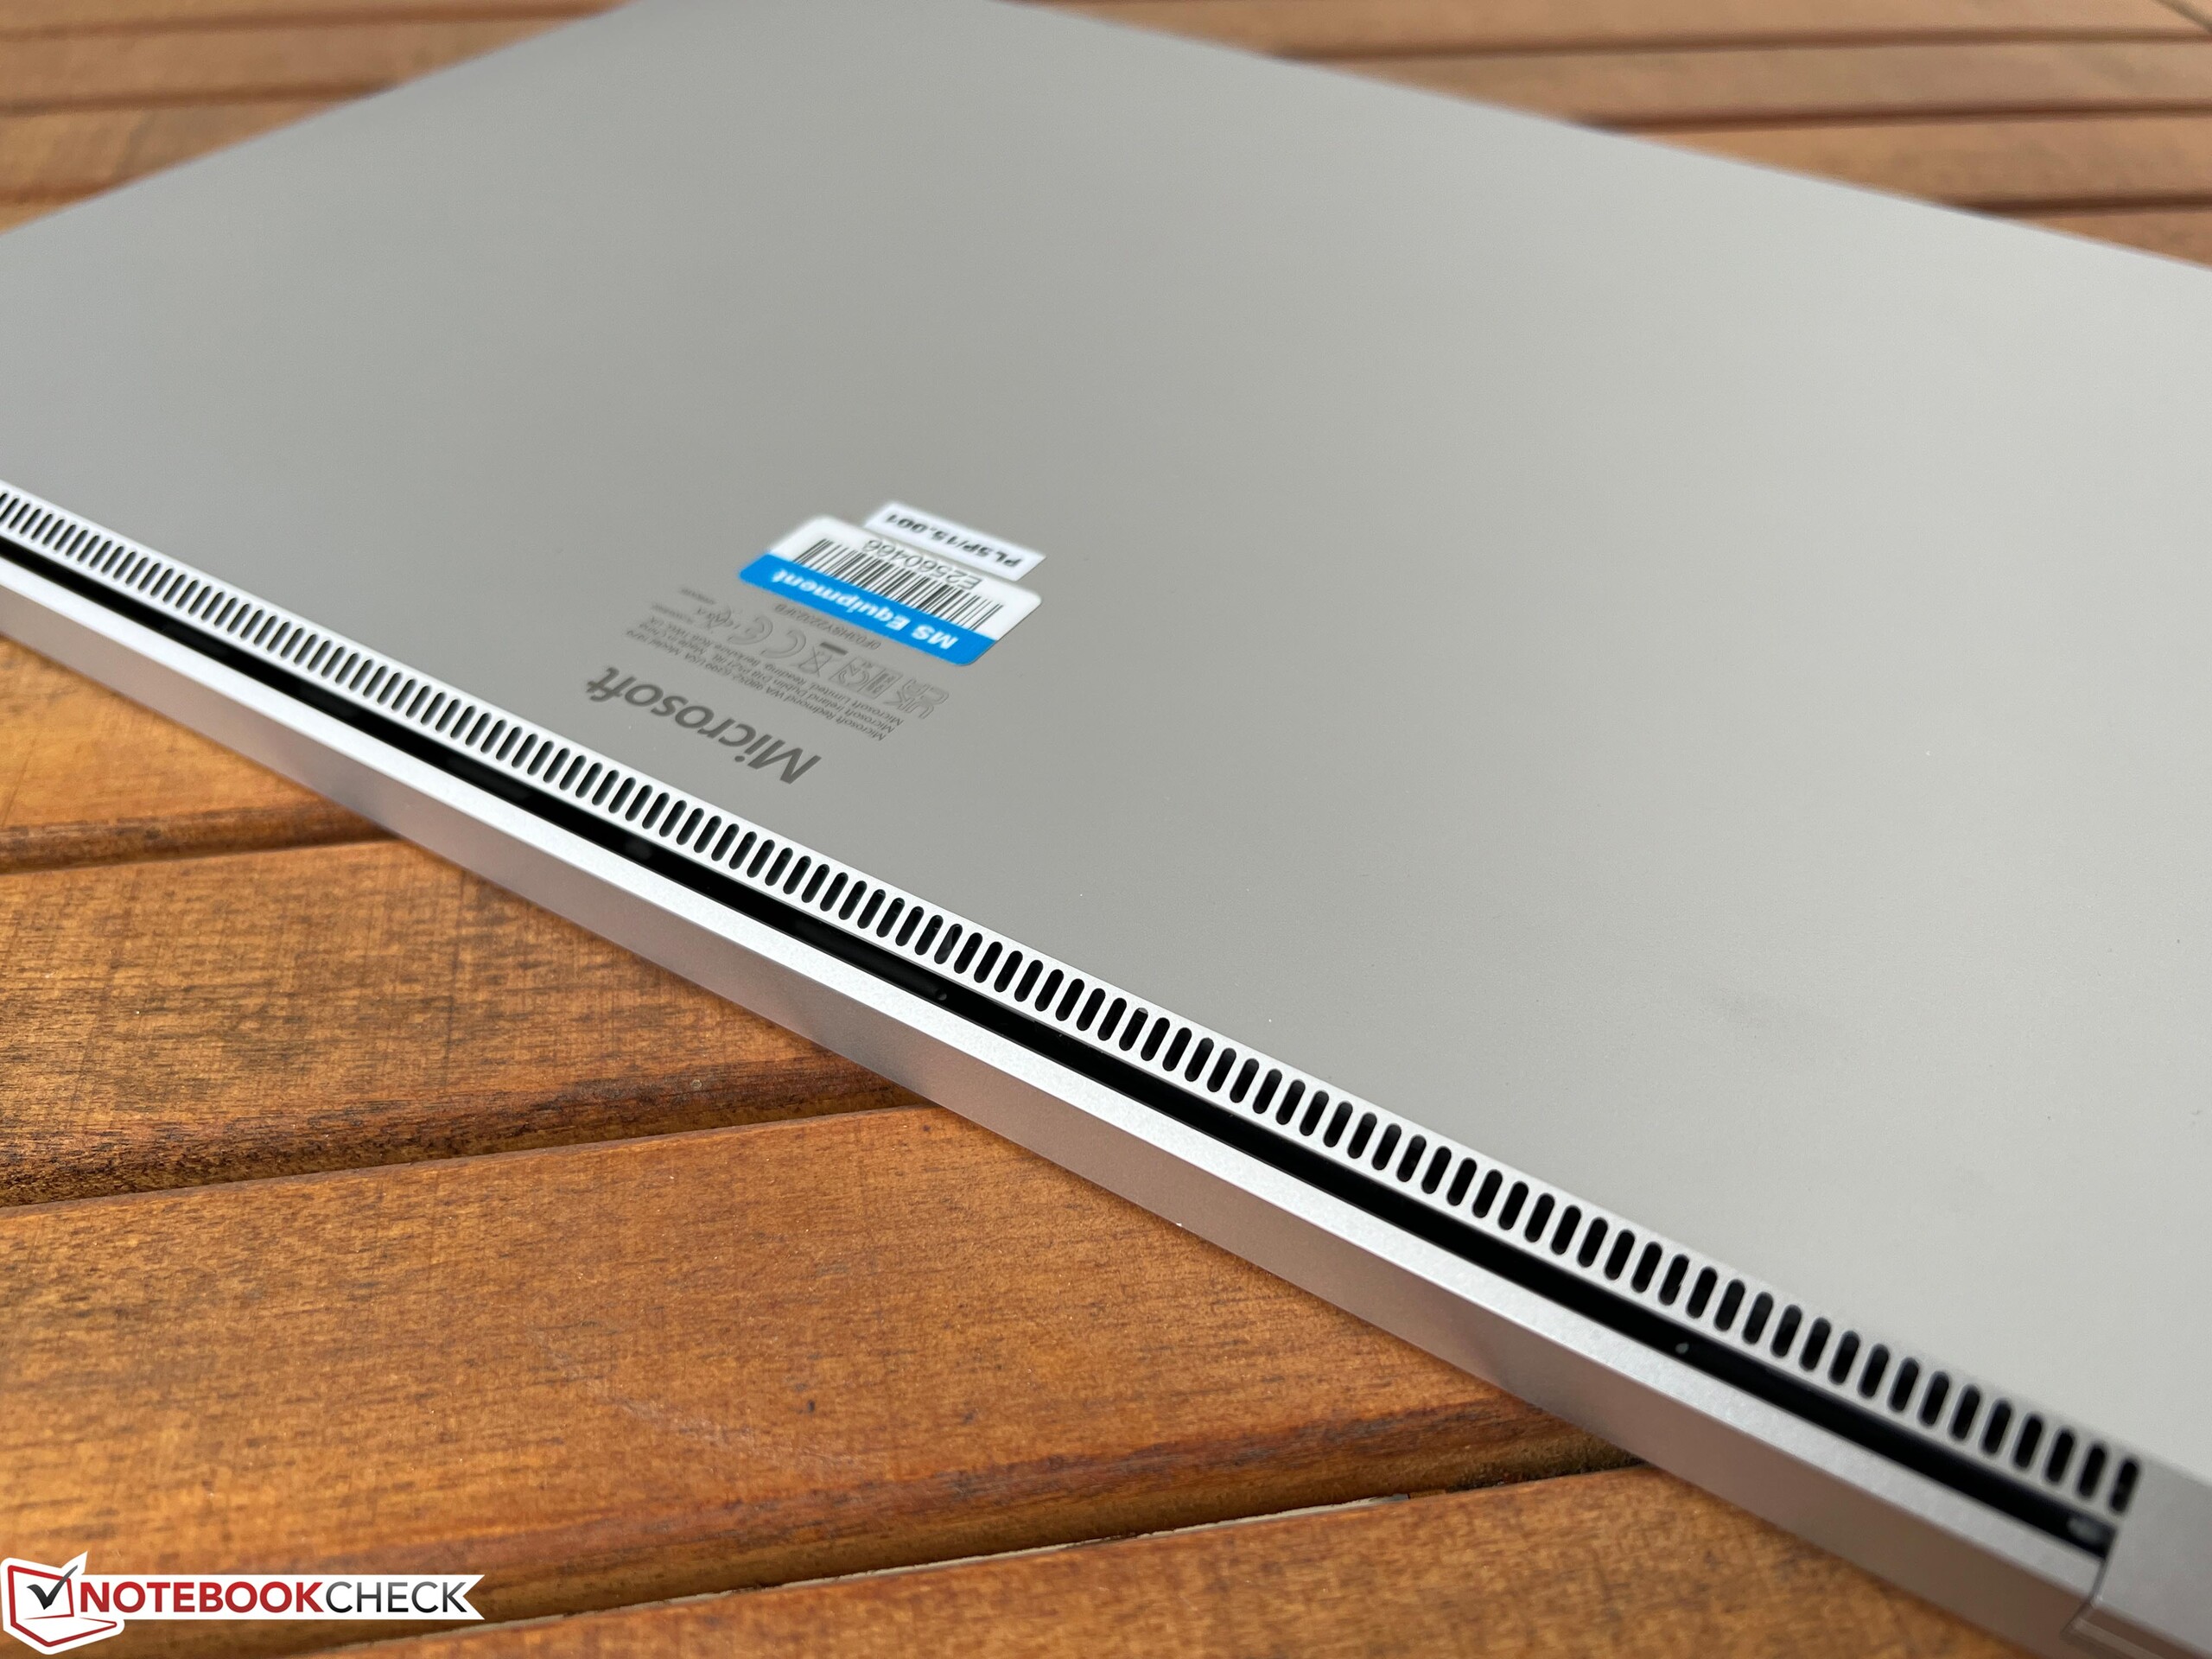
Al igual que su predecesorla curva de ventilador del Surface Laptop 5 15 es extremadamente defensiva e incluso a plena carga tardó un minuto en entrar en funcionamiento. Sus niveles de ruido han bajado un poco en general - medimos 38.1 dB(A) jugando y durante el test de estrés. El ruido nunca alcanzó niveles molestos (o se volvió agudo), pero estos resultados siguen sin ser sobresalientes teniendo en cuenta el bajo nivel de rendimiento del portátil y su gran carcasa. Sin embargo, el dispositivo a menudo permaneció silencioso en el uso diario y no se oyeron otros ruidos electrónicos.
Ruido
| Ocioso |
| 23.3 / 23.3 / 23.3 dB(A) |
| Carga |
| 35 / 38.1 dB(A) |
 | ||
30 dB silencioso 40 dB(A) audible 50 dB(A) ruidosamente alto |
||
min: | ||
| Microsoft Surface Laptop 5 15, i7-1255U Iris Xe G7 96EUs, i7-1255U, SK Hynix BC711 512GB HFM512GD3GX013N | Microsoft Surface Laptop 4 15 AMD TFF_00028 Vega 8, R7 4980U, SK Hynix BC511 HFM512GDJTNI | LG Gram 15Z90Q Iris Xe G7 80EUs, i5-1240P, Samsung PM9A1 MZVL21T0HCLR | Dell XPS 15 9520 RTX 3050 Ti GeForce RTX 3050 Ti Laptop GPU, i7-12700H, WDC PC SN810 512GB | Samsung Galaxy Book Pro 15 NP950XDB-KC5US Iris Xe G7 96EUs, i7-1165G7, Samsung PM991a MZ9LQ1T0HBLB-00BKN | Asus Zenbook Pro 15 OLED UM535Q GeForce RTX 3050 Ti Laptop GPU, R9 5900HX, WDC PC SN730 SDBPNTY-1T00 | |
|---|---|---|---|---|---|---|
| Noise | -6% | -8% | 1% | -3% | -7% | |
| apagado / medio ambiente * (dB) | 23.3 | 24.2 -4% | 25 -7% | 22.8 2% | 23 1% | 22.8 2% |
| Idle Minimum * (dB) | 23.3 | 24.2 -4% | 26 -12% | 22.9 2% | 23.2 -0% | 22.9 2% |
| Idle Average * (dB) | 23.3 | 24.2 -4% | 27 -16% | 22.9 2% | 23.2 -0% | 22.9 2% |
| Idle Maximum * (dB) | 23.3 | 24.2 -4% | 28 -20% | 22.9 2% | 23.2 -0% | 22.9 2% |
| Load Average * (dB) | 35 | 39.9 -14% | 37 -6% | 30.9 12% | 35.8 -2% | 33.2 5% |
| Witcher 3 ultra * (dB) | 38.1 | 39.9 -5% | 37 3% | 37.8 1% | 41.9 -10% | 47.3 -24% |
| Load Maximum * (dB) | 38.1 | 39.9 -5% | 37 3% | 44.7 -17% | 41.9 -10% | 52.8 -39% |
* ... más pequeño es mejor
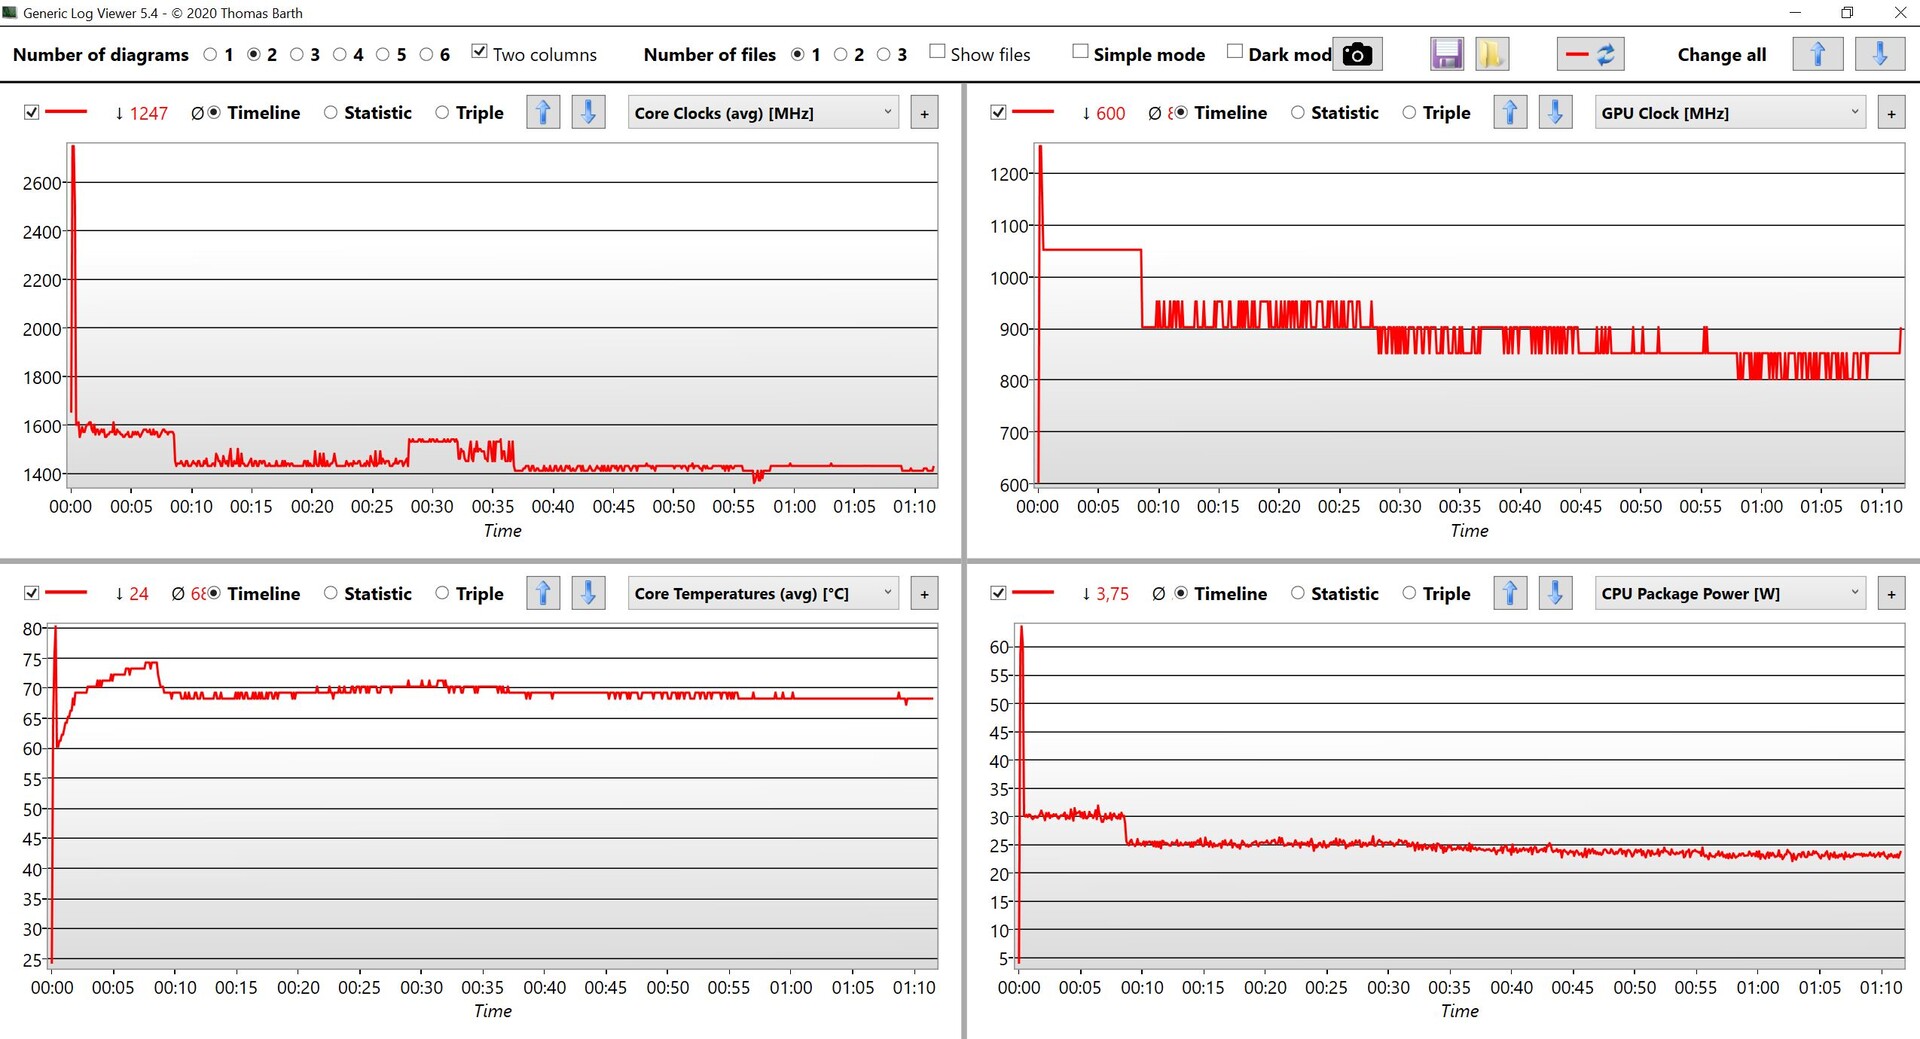
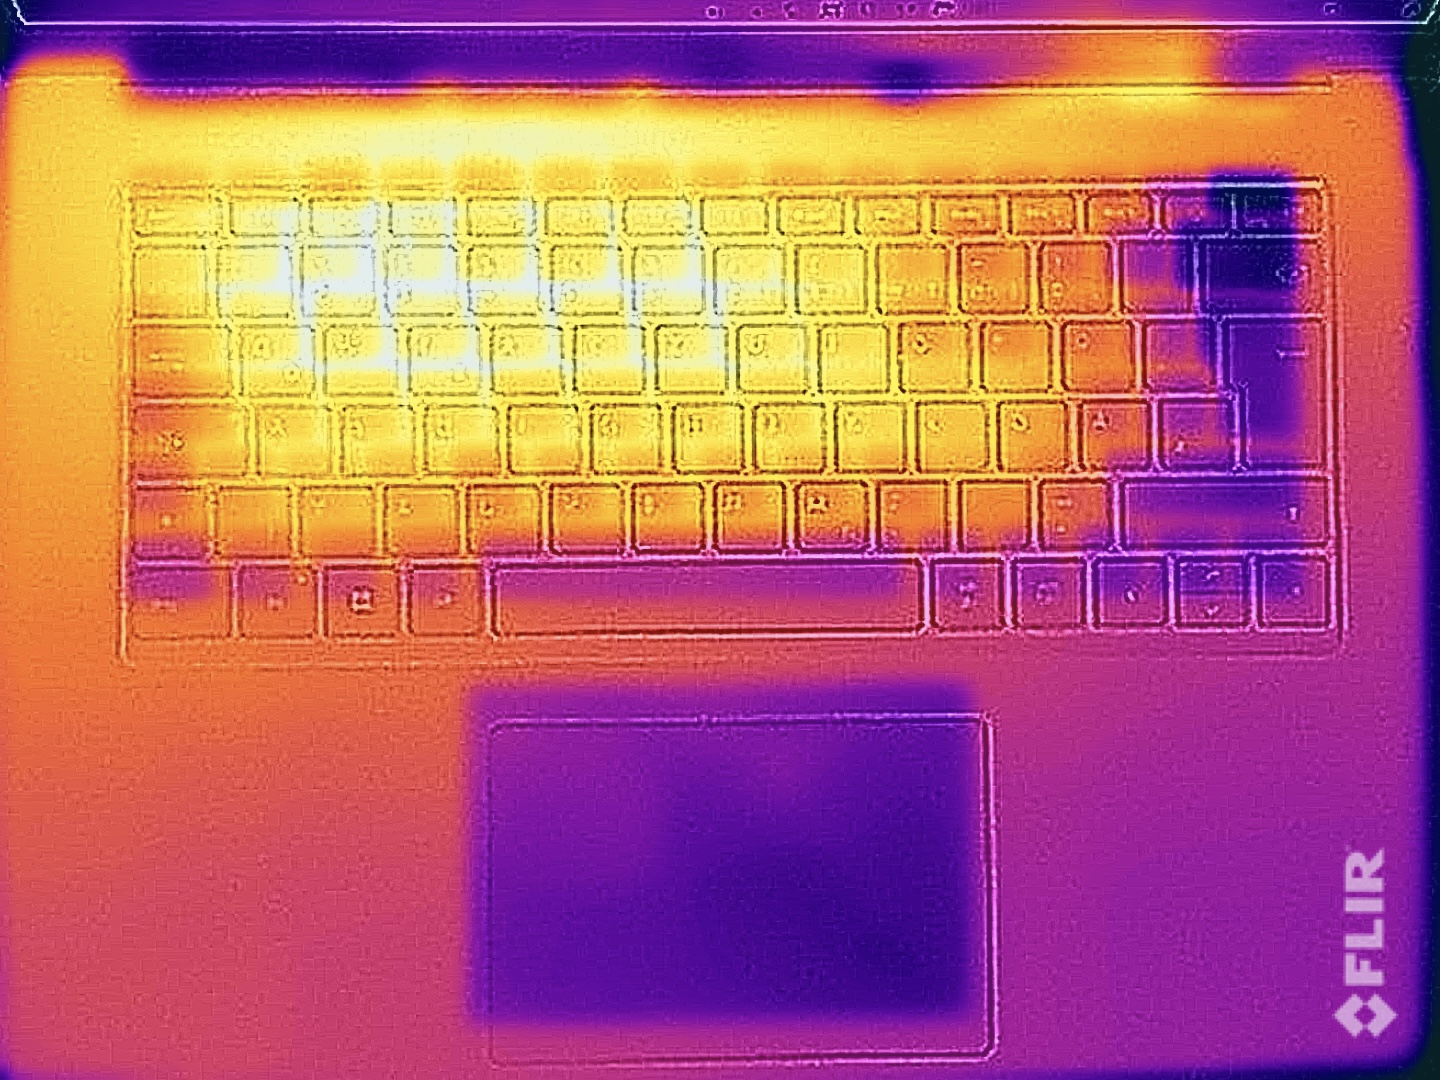
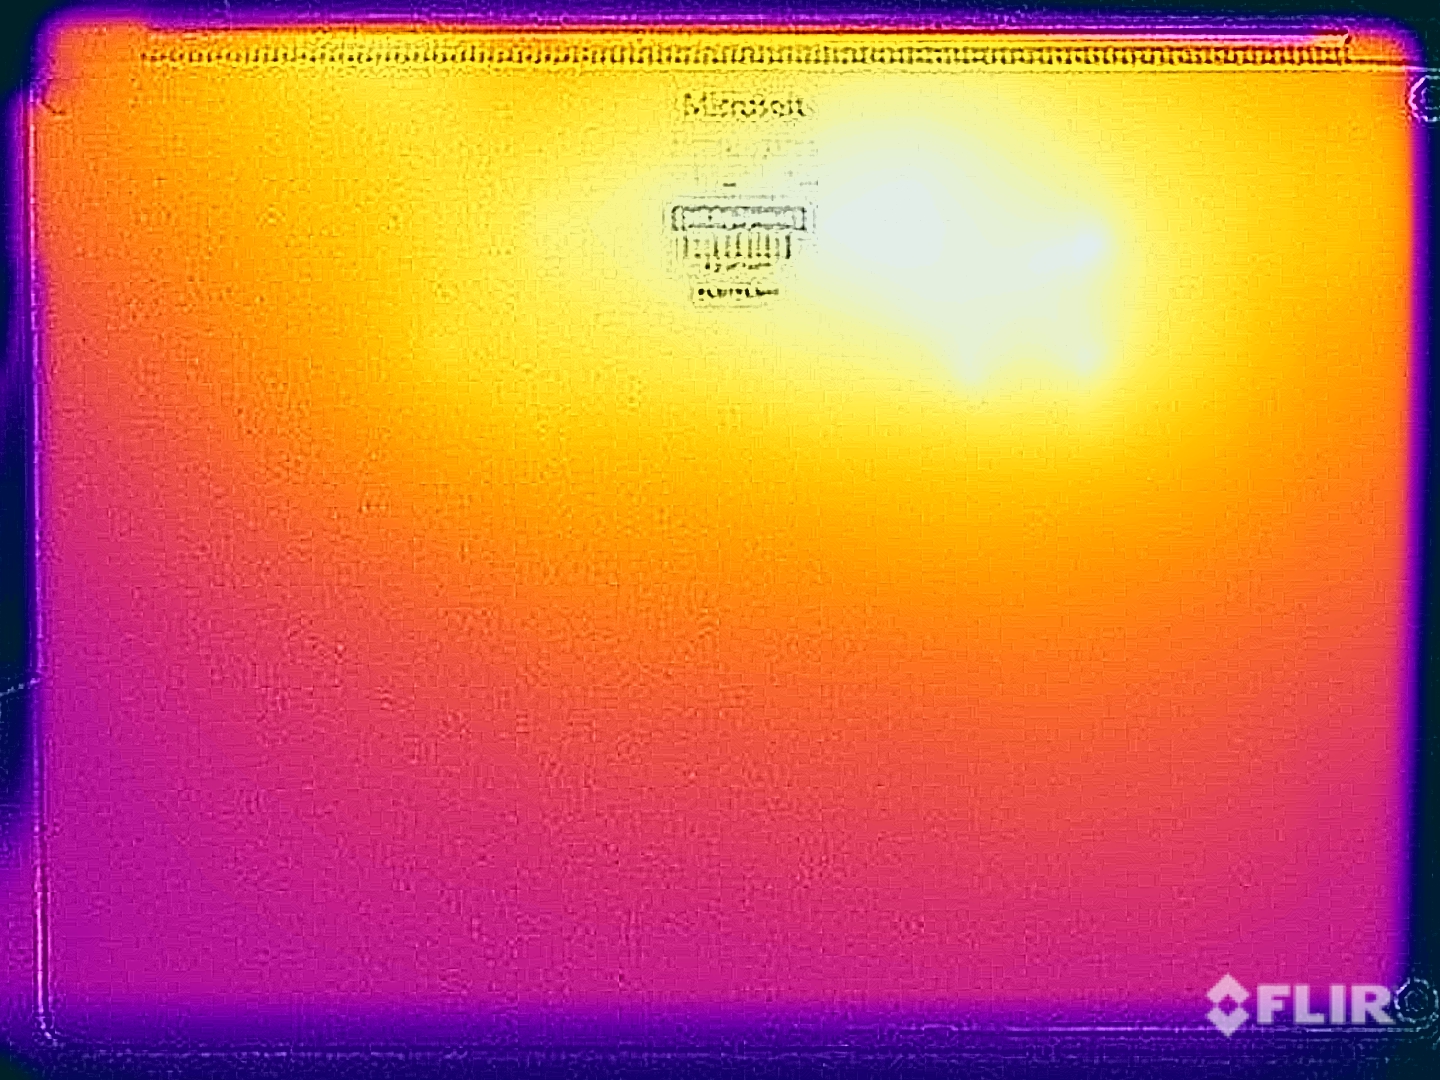
Temperatura
La carcasa apenas se calentó durante tareas sencillas, pero medimos hasta 47 °C en la parte inferior de la carcasa bajo carga. Debido a sus superficies metálicas, esta temperatura ya resulta incómoda al tacto, por lo que desaconsejamos colocar el dispositivo sobre los muslos en este escenario.
Estas altas temperaturas fueron un poco sorprendentes porque el consumo de energía del dispositivo sólo se estableció en 25 vatios después de unos minutos en nuestra prueba de estrés, pero cayó aún más a alrededor de 23 vatios después de 30 minutos - no es particularmente bueno teniendo en cuenta el tamaño de la caja. Sin embargo, no notamos ninguna reducción de potencia directamente después de la prueba de estrés.
(±) La temperatura máxima en la parte superior es de 44.6 °C / 112 F, frente a la media de 34.3 °C / 94 F, que oscila entre 21.2 y 62.5 °C para la clase Office.
(-) El fondo se calienta hasta un máximo de 47.4 °C / 117 F, frente a la media de 36.8 °C / 98 F
(+) En reposo, la temperatura media de la parte superior es de 22.2 °C / 72# F, frente a la media del dispositivo de 29.5 °C / 85 F.
(±) Jugando a The Witcher 3, la temperatura media de la parte superior es de 37.8 °C / 100 F, frente a la media del dispositivo de 29.5 °C / 85 F.
(±) El reposamanos y el touchpad pueden calentarse mucho al tacto con un máximo de 36.5 °C / 97.7 F.
(-) La temperatura media de la zona del reposamanos de dispositivos similares fue de 27.5 °C / 81.5 F (-9 °C / -16.2 F).
| Microsoft Surface Laptop 5 15, i7-1255U Intel Core i7-1255U, Intel Iris Xe Graphics G7 96EUs | Microsoft Surface Laptop 4 15 AMD TFF_00028 AMD Ryzen 7 4980U, AMD Radeon RX Vega 8 (Ryzen 4000/5000) | LG Gram 15Z90Q Intel Core i5-1240P, Intel Iris Xe Graphics G7 80EUs | Dell XPS 15 9520 RTX 3050 Ti Intel Core i7-12700H, NVIDIA GeForce RTX 3050 Ti Laptop GPU | Samsung Galaxy Book Pro 15 NP950XDB-KC5US Intel Core i7-1165G7, Intel Iris Xe Graphics G7 96EUs | Asus Zenbook Pro 15 OLED UM535Q AMD Ryzen 9 5900HX, NVIDIA GeForce RTX 3050 Ti Laptop GPU | |
|---|---|---|---|---|---|---|
| Heat | 2% | -3% | -25% | 5% | -28% | |
| Maximum Upper Side * (°C) | 44.6 | 41.8 6% | 46 -3% | 51.4 -15% | 37.2 17% | 36 19% |
| Maximum Bottom * (°C) | 47.4 | 44.8 5% | 45 5% | 51 -8% | 47 1% | 47.2 -0% |
| Idle Upper Side * (°C) | 22.6 | 23 -2% | 25 -11% | 30 -33% | 22 3% | 37 -64% |
| Idle Bottom * (°C) | 23.3 | 23.6 -1% | 24 -3% | 33 -42% | 23.6 -1% | 39.2 -68% |
* ... más pequeño es mejor
Altavoces
No hay rejillas de altavoz visibles, ya que el sonido se emite a través de las aberturas del teclado. Esto funciona muy bien en la práctica, porque aunque hay módulos aún más ruidosos, la calidad general es muy buena y no hacen falta altavoces externos.
Microsoft Surface Laptop 5 15, i7-1255U análisis de audio
(±) | la sonoridad del altavoz es media pero buena (78.1 dB)
Graves 100 - 315 Hz
(±) | lubina reducida - en promedio 14% inferior a la mediana
(±) | la linealidad de los graves es media (9.3% delta a frecuencia anterior)
Medios 400 - 2000 Hz
(+) | medios equilibrados - a sólo 2.3% de la mediana
(+) | los medios son lineales (4.1% delta a la frecuencia anterior)
Altos 2 - 16 kHz
(+) | máximos equilibrados - a sólo 2.8% de la mediana
(+) | los máximos son lineales (3.2% delta a la frecuencia anterior)
Total 100 - 16.000 Hz
(+) | el sonido global es lineal (12.9% de diferencia con la mediana)
En comparación con la misma clase
» 6% de todos los dispositivos probados de esta clase eran mejores, 2% similares, 91% peores
» El mejor tuvo un delta de 7%, la media fue 21%, el peor fue ###max##%
En comparación con todos los dispositivos probados
» 12% de todos los dispositivos probados eran mejores, 3% similares, 85% peores
» El mejor tuvo un delta de 4%, la media fue 23%, el peor fue ###max##%
Dell XPS 15 9520 RTX 3050 Ti análisis de audio
(+) | los altavoces pueden reproducir a un volumen relativamente alto (#83.1 dB)
Graves 100 - 315 Hz
(+) | buen bajo - sólo 4.4% lejos de la mediana
(+) | el bajo es lineal (6.8% delta a la frecuencia anterior)
Medios 400 - 2000 Hz
(+) | medios equilibrados - a sólo 2.6% de la mediana
(+) | los medios son lineales (4.1% delta a la frecuencia anterior)
Altos 2 - 16 kHz
(+) | máximos equilibrados - a sólo 1.9% de la mediana
(+) | los máximos son lineales (5.4% delta a la frecuencia anterior)
Total 100 - 16.000 Hz
(+) | el sonido global es lineal (6.4% de diferencia con la mediana)
En comparación con la misma clase
» 4% de todos los dispositivos probados de esta clase eran mejores, 1% similares, 95% peores
» El mejor tuvo un delta de 5%, la media fue 17%, el peor fue ###max##%
En comparación con todos los dispositivos probados
» 1% de todos los dispositivos probados eran mejores, 0% similares, 99% peores
» El mejor tuvo un delta de 4%, la media fue 23%, el peor fue ###max##%
Consumo de energía
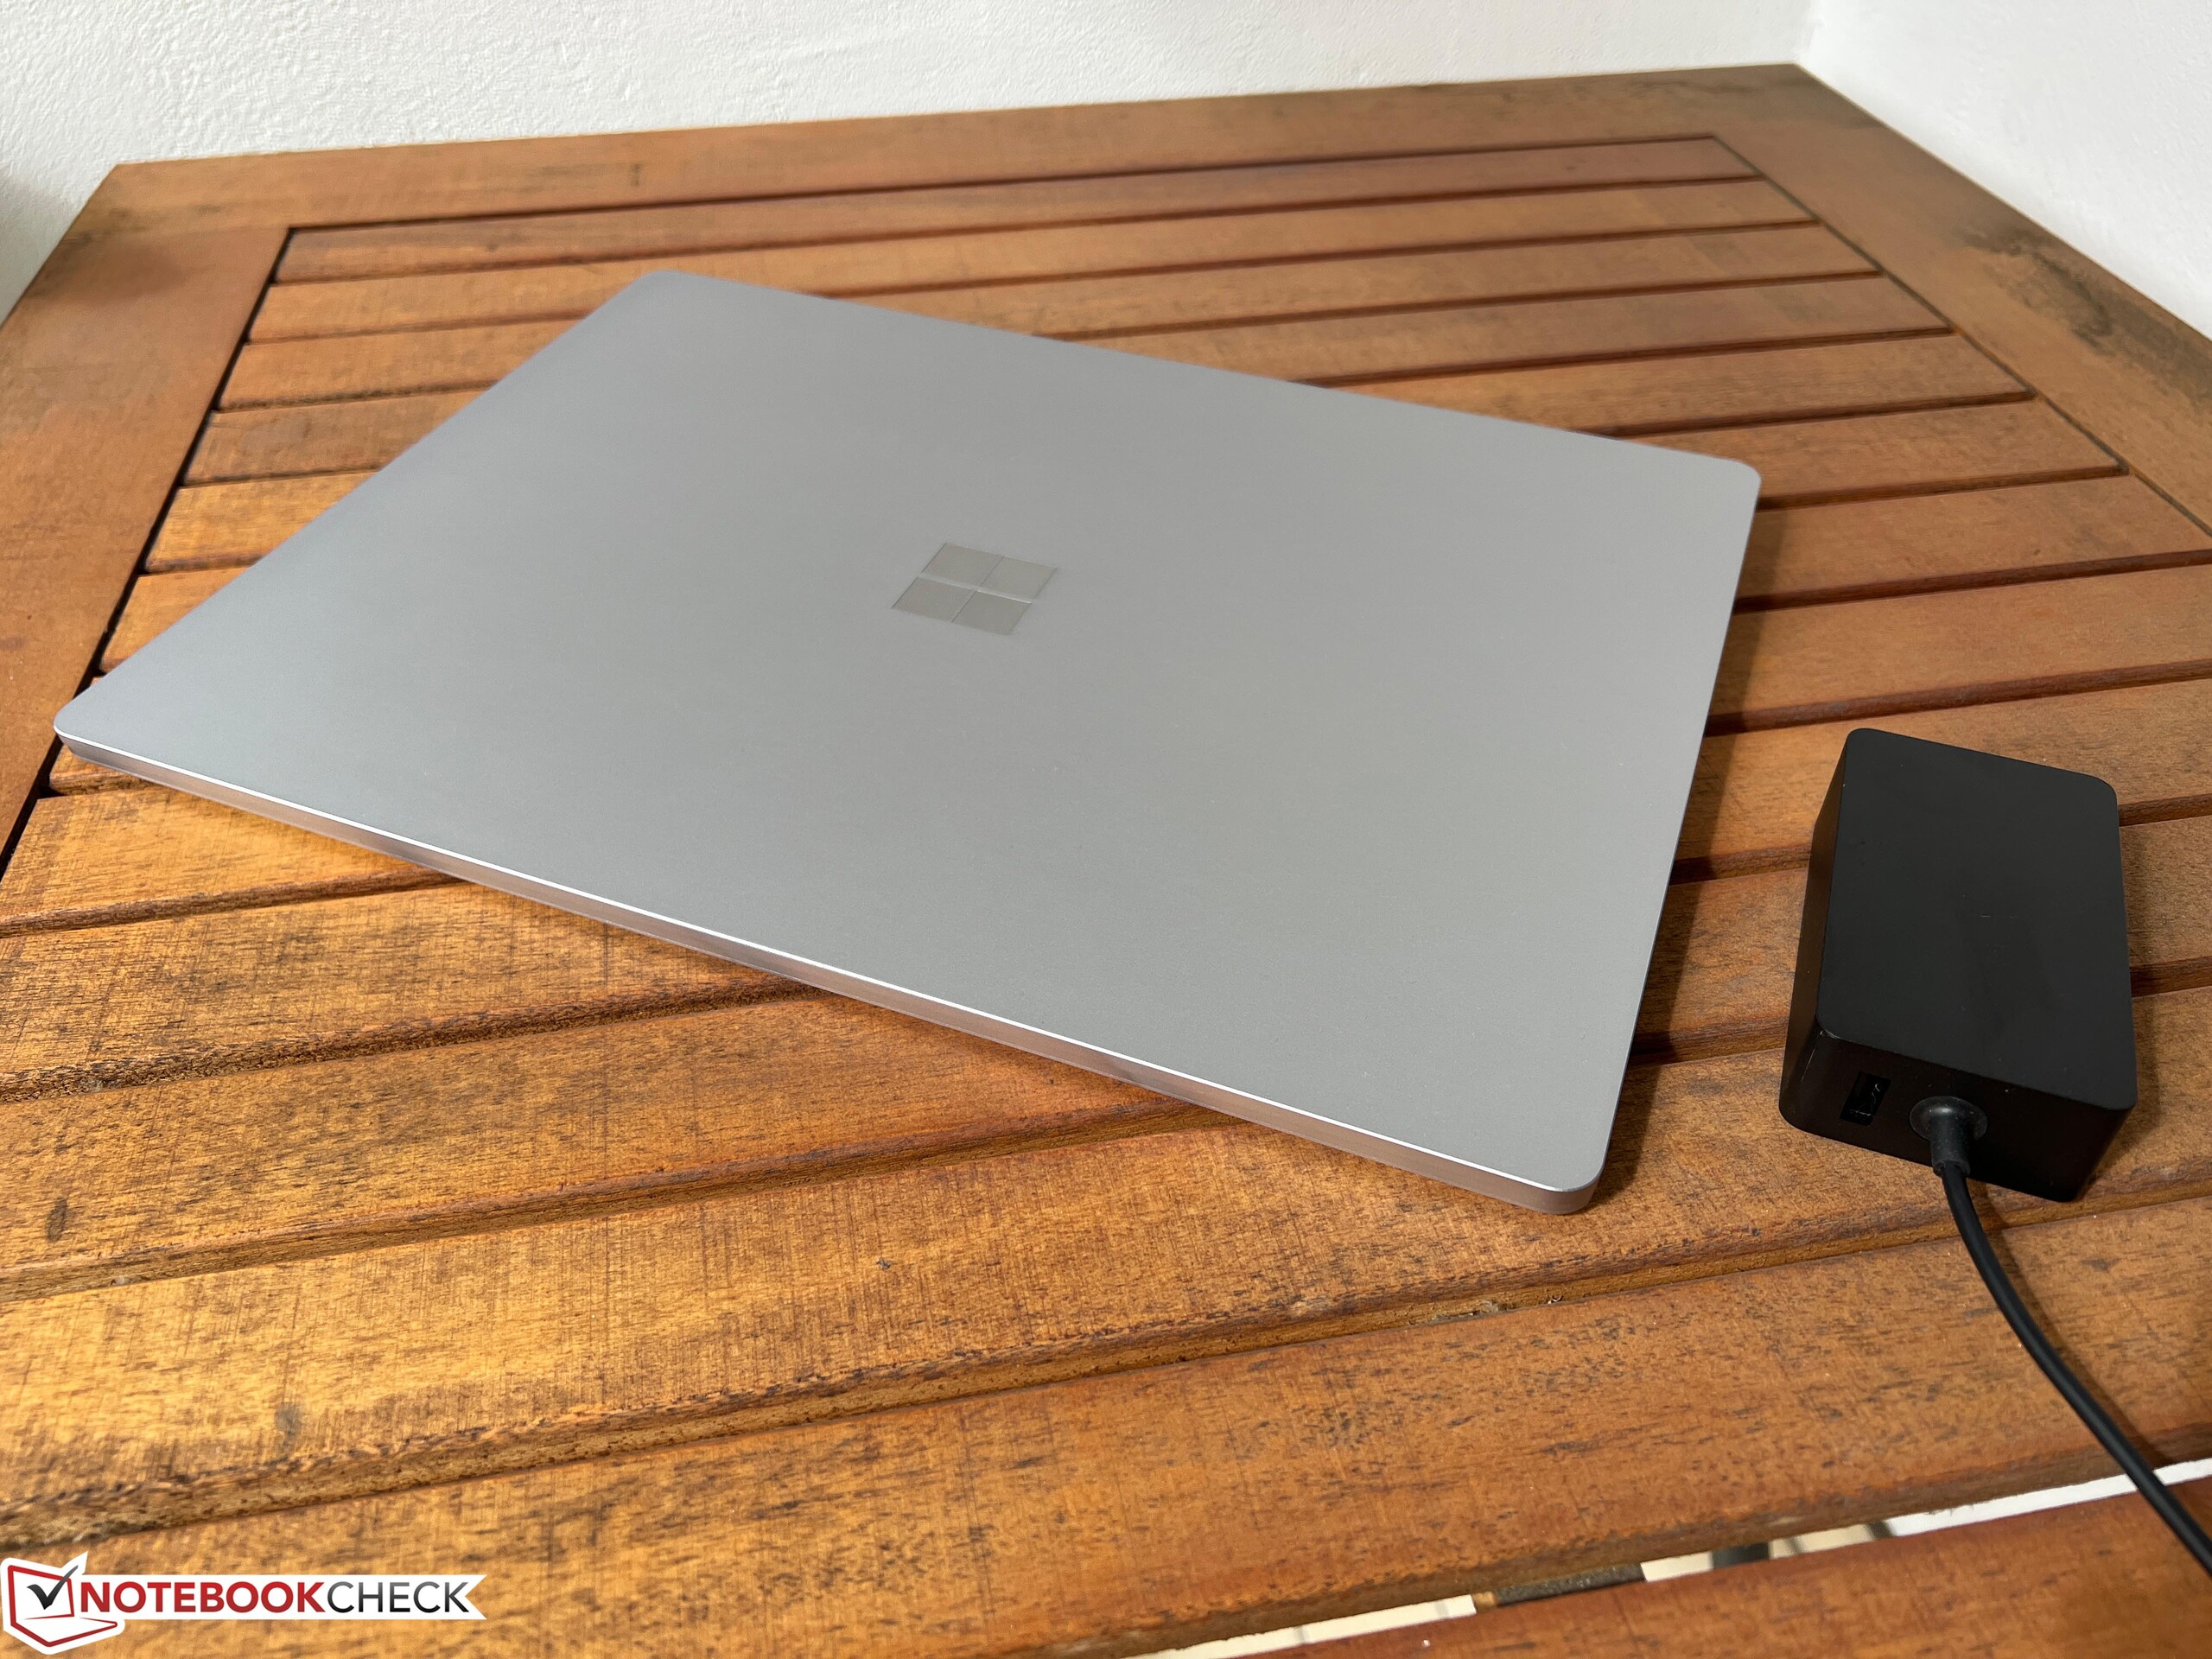
Las mediciones de consumo no mostraron sorpresas y el consumo máximo en reposo (brillo máximo) fue de 8,4 vatios. El dispositivo llegó a los límites de la fuente de alimentación durante unos segundos cuando la CPU estaba muy cargada, lo que es bastante habitual hoy en día debido a los altos límites de consumo de las CPUs Intel actuales. Durante nuestra prueba de estrés, el consumo se estabilizó rápidamente en 45 vatios y la fuente de alimentación de 65 vatios, que también ofrece otra salida USB-A para carga, fue en general suficiente.
| Off / Standby | |
| Ocioso | |
| Carga |
|
Clave:
min: | |
Power consumption Witcher 3 / stress test
Power consumption with external monitor
Tiempos de ejecución
La capacidad de la batería se mantiene sin cambios en 47,4 vatios hora y los tiempos de ejecución terminaron peor en todos los ámbitos en comparación con su predecesor con procesador AMD. Notamos algo más de 8.5 horas en el test WLAN con 150 cd/m² (corresponde al 64% del brillo máximo en el dispositivo de pruebas) y 6.5 horas a brillo máximo. El predecesor AMD logró unas 10.5 y 7 horas, respectivamente. El modelo Intel también lo hizo peor en el test de vídeo con 9:44 horas frente a unas 15 horas (Surface Laptop 4 AMD).
| Microsoft Surface Laptop 5 15, i7-1255U i7-1255U, Iris Xe G7 96EUs, 47.4 Wh | Microsoft Surface Laptop 4 15 AMD TFF_00028 R7 4980U, Vega 8, 47.4 Wh | LG Gram 15Z90Q i5-1240P, Iris Xe G7 80EUs, 80 Wh | Dell XPS 15 9520 RTX 3050 Ti i7-12700H, GeForce RTX 3050 Ti Laptop GPU, 86 Wh | Samsung Galaxy Book Pro 15 NP950XDB-KC5US i7-1165G7, Iris Xe G7 96EUs, 68 Wh | Asus Zenbook Pro 15 OLED UM535Q R9 5900HX, GeForce RTX 3050 Ti Laptop GPU, 96 Wh | Media de la clase Office | |
|---|---|---|---|---|---|---|---|
| Duración de Batería | 28% | 32% | 21% | -5% | 53% | 31% | |
| H.264 (h) | 9.7 | 14.8 53% | 15.5 ? 60% | ||||
| WiFi v1.3 (h) | 8.6 | 10.4 21% | 11.9 38% | 8.8 2% | 10.1 17% | 12.8 49% | 13.2 ? 53% |
| Load (h) | 2.3 | 2.5 9% | 2.9 26% | 3.2 39% | 1.7 -26% | 3.6 57% | 1.808 ? -21% |
Pro
Contra
Veredicto - El Surface Laptop 5 necesita urgentemente una actualización mayor

La quinta generación del portátil Surface empieza a mostrar claramente su edad. No nos referimos al procesador Alder-Lake del año pasado, ya que los últimos modelos Raptor-Lake sólo ofrecen un rendimiento ligeramente superior, sino al propio diseño del dispositivo. Los bordes de la pantalla son simplemente demasiado anchos para un dispositivo moderno, la webcam de 720p ya no está a la altura y un sistema de refrigeración más potente también vendría bien. Su rendimiento general es bastante modesto para una carcasa de 15 pulgadas, y carece claramente de opciones de mantenimiento.
Entendemos que Microsoft haya cancelado la versión AMD debido a la situación del suministro y que su menor rendimiento multinúcleo probablemente no sea un gran problema para un portátil de oficina, pero también notamos duraciones de batería significativamente más cortas. Así pues, el nuevo Surface Laptop 5 no es realmente un paso en la dirección correcta.
El Microsoft Surface Laptop 5 necesita urgentemente una actualización exhaustiva - desde hace años, parece que sólo se obtiene el mismo producto una y otra vez. A menudo, sus competidores ofrecen muchas más funciones y mejor rendimiento, y además por un precio más bajo. En 2023, el paquete que se ofrece simplemente no basta para justificar su elevado precio.
La pantalla de formato 3:2 del dispositivo sigue siendo adecuada para el trabajo productivo y también tiene una buena calidad de imagen subjetiva, pero Microsoft se está quedando claramente atrás en cuanto a especificaciones. Habría mucho más potencial aquí con una frecuencia más alta y una mayor cobertura del espacio de color.
Aparte de la carcasa algo chirriante del modelo de pruebas, el Surface Laptop 5 es un dispositivo sólido; el gran problema es el precio. El MSRP de nuestro dispositivo de pruebas con 16 GB de RAM y un SSD de 512 GB (no es ni mucho menos una variante de gama alta) ronda los 4.000 $, y Microsoft sigue cobrando este precio a día de hoy. Es claramente demasiado para el producto ofrecido, e incluso el precio actual en la calle de 1.699 $ sigue siendo demasiado alto si miramos al recientemente analizado Lenovo Yoga Pro 7 14por ejemplo, que obtuvo una puntuación mucho mejor en prácticamente todas las disciplinas y cuesta sólo unos 1.449 $.
Precio y disponibilidad
Puedes encontrar el Surface Laptop 5 15 mucho más barato que el MRSP en Amazon por 1.699 dólares.
Microsoft Surface Laptop 5 15, i7-1255U
- 04/24/2023 v7 (old)
Andreas Osthoff
Transparencia
La selección de los dispositivos que se van a reseñar corre a cargo de nuestro equipo editorial. La muestra de prueba fue proporcionada al autor en calidad de préstamo por el fabricante o el minorista a los efectos de esta reseña. El prestamista no tuvo ninguna influencia en esta reseña, ni el fabricante recibió una copia de la misma antes de su publicación. No había ninguna obligación de publicar esta reseña. Como empresa de medios independiente, Notebookcheck no está sujeta a la autoridad de fabricantes, minoristas o editores.
Así es como prueba Notebookcheck
Cada año, Notebookcheck revisa de forma independiente cientos de portátiles y smartphones utilizando procedimientos estandarizados para asegurar que todos los resultados son comparables. Hemos desarrollado continuamente nuestros métodos de prueba durante unos 20 años y hemos establecido los estándares de la industria en el proceso. En nuestros laboratorios de pruebas, técnicos y editores experimentados utilizan equipos de medición de alta calidad. Estas pruebas implican un proceso de validación en varias fases. Nuestro complejo sistema de clasificación se basa en cientos de mediciones y puntos de referencia bien fundamentados, lo que mantiene la objetividad.Price comparison

