2022 Análisis del portátil Dell XPS 15 9520 3.5K OLED: ¿Saltar o comprar?
Dell comenzó la década con una explosión al presentar el XPS 15 9500 totalmente renovado para suceder a la generación anterior Serie XPS 15 7590. El modelo cambió la familia XPS 15 de 16:9 a 16:10 junto con un nuevo diseño de chasis con CPUs Intel 10th gen Comet Lake-H y la GPU GeForce GTX 1650 Ti. El XPS 15 9510 dio un paso más allá con las CPUs de la 11ª generación Tiger Lake-H y los paneles OLED de 3,5K opcionales. Ahora, el XPS 15 9520 es otra actualización incremental con CPU Alder Lake-H de 12ª generación y memoria RAM DDR5 más rápida.
Recomendamos consultar nuestro análisis del XPS 15 9500 ya que el chasis del XPS 15 9520 sigue siendo idéntico. Esta página de análisis se centrará en el rendimiento del XPS 15 9520 y otras diferencias que los usuarios pueden esperar en comparación con los modelos anteriores.
Las alternativas al Dell XPS 15 9520 incluyen otros portátiles multimedia de gama alta de 15,6 pulgadas con gráficos discretos como el Asus Zenbook Pro 15 OLED, Lenovo Yoga Creator 7 15, HP Spectre x360 15, HP Envy 15, o el MSI Creator 15.
Más opiniones de Dell:
Posibles contendientes en la comparación
Valoración | Fecha | Modelo | Peso | Altura | Tamaño | Resolución | Precio |
|---|---|---|---|---|---|---|---|
| 89.5 % v7 (old) | 05/2022 | Dell XPS 15 9520 RTX 3050 Ti i7-12700H, GeForce RTX 3050 Ti Laptop GPU | 1.9 kg | 18 mm | 15.60" | 3456x2160 | |
| 88.4 % v7 (old) | 08/2021 | Dell XPS 15 9510 11800H RTX 3050 Ti OLED i7-11800H, GeForce RTX 3050 Ti Laptop GPU | 1.9 kg | 18 mm | 15.60" | 3456x2160 | |
| 85 % v7 (old) | 01/2020 | HP Spectre X360 15-5ZV31AV i7-10510U, GeForce MX250 | 2.1 kg | 19.3 mm | 15.60" | 3840x2160 | |
| 87.7 % v7 (old) | 05/2022 | Asus Zenbook Pro 15 OLED UM535Q R9 5900HX, GeForce RTX 3050 Ti Laptop GPU | 1.9 kg | 18 mm | 15.60" | 1920x1080 | |
| 82.4 % v7 (old) | 02/2021 | MSI Stealth 15M A11SEK i7-1185G7, GeForce RTX 2060 Max-Q | 1.7 kg | 16.15 mm | 15.60" | 1920x1080 | |
| 93.2 % v7 (old) | 11/2021 | Apple MacBook Pro 16 2021 M1 Pro M1 Pro, M1 Pro 16-Core GPU | 2.2 kg | 16.8 mm | 16.20" | 3456x2234 |
Caso
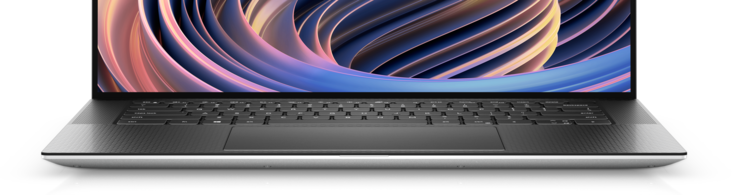
El chasis del XPS 15 9520 sigue siendo uno de los diseños más pequeños en su categoría de tamaño a pesar de tener dos años. Los estrechísimos biseles de los cuatro lados, incluida la barbilla, ayudan a reducir el espacio en mayor medida que, por ejemplo, el Zenbook Pro 15 o el Spectre x360 15.
Lector de tarjetas SD
| SD Card Reader | |
| average JPG Copy Test (av. of 3 runs) | |
| Dell XPS 15 9510 11800H RTX 3050 Ti OLED (AV Pro V60) | |
| Dell XPS 15 9500 Core i7 4K UHD (Toshiba Exceria Pro SDXC 64 GB UHS-II) | |
| MSI Stealth 15M A11SEK (Toshiba Exceria Pro M501 microSDXC 32GB) | |
| Dell XPS 15 9520 RTX 3050 Ti (Toshiba Exceria Pro SDXC 64 GB UHS-II) | |
| HP Spectre X360 15-5ZV31AV (Toshiba Exceria Pro M501 UHS-II) | |
| Asus Zenbook Pro 15 OLED UM535Q (Toshiba Exceria Pro SDXC 64 GB UHS-II) | |
| maximum AS SSD Seq Read Test (1GB) | |
| MSI Stealth 15M A11SEK (Toshiba Exceria Pro M501 microSDXC 32GB) | |
| Dell XPS 15 9510 11800H RTX 3050 Ti OLED (AV Pro V60) | |
| Dell XPS 15 9500 Core i7 4K UHD (Toshiba Exceria Pro SDXC 64 GB UHS-II) | |
| HP Spectre X360 15-5ZV31AV (Toshiba Exceria Pro M501 UHS-II) | |
| Dell XPS 15 9520 RTX 3050 Ti (Toshiba Exceria Pro SDXC 64 GB UHS-II) | |
| Asus Zenbook Pro 15 OLED UM535Q (Toshiba Exceria Pro SDXC 64 GB UHS-II) | |
Comunicación
Un Intel AX211 viene de serie para la conectividad Wi-Fi 6E y Bluetooth 5.2. Sin embargo, Dell nos ha confirmado que el XPS 15 9520 no fue diseñado para soportar redes Wi-Fi 6E de 6 GHz a pesar de que el chip AX211 puede hacerlo. Así, los propietarios del XPS 15 9520 sólo podrán conectarse a redes de 2,4 GHz y 5 GHz hasta Wi-Fi 6.
| Networking | |
| iperf3 transmit AX12 | |
| Dell XPS 15 9510 11800H RTX 3050 Ti OLED | |
| Dell XPS 15 9500 Core i7 4K UHD | |
| MSI Stealth 15M A11SEK | |
| Asus Zenbook Pro 15 OLED UM535Q | |
| iperf3 receive AX12 | |
| Dell XPS 15 9500 Core i7 4K UHD | |
| Dell XPS 15 9510 11800H RTX 3050 Ti OLED | |
| MSI Stealth 15M A11SEK | |
| Asus Zenbook Pro 15 OLED UM535Q | |
| iperf3 receive AXE11000 | |
| Dell XPS 15 9520 RTX 3050 Ti | |
| iperf3 transmit AXE11000 | |
| Dell XPS 15 9520 RTX 3050 Ti | |
Cámara web
Dell ha mejorado los colores de la webcam separando los sensores IR y RGB en comparación con el XPS 15 9510 o 9500. Sin embargo, sigue siendo de sólo 1 MP, en comparación con los 2 MP de otros portátiles de 15,6 pulgadas emblemáticos como el Razer Blade 15. Así, aunque los colores pueden ser un poco mejores, la imagen sigue siendo turbia.


Mantenimiento
Accesorios y garantía
La caja incluye el adaptador de CA USB-C, documentación y un adaptador de USB-C a HDMI y USB-A de tamaño completo. Este último es especialmente útil, ya que el sistema solo integra puertos USB-C.
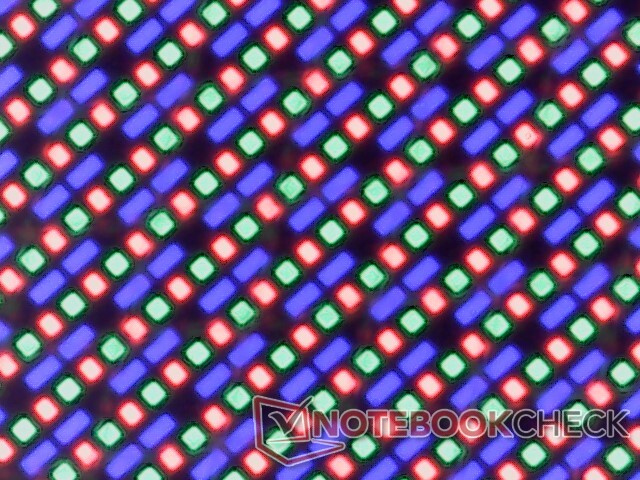
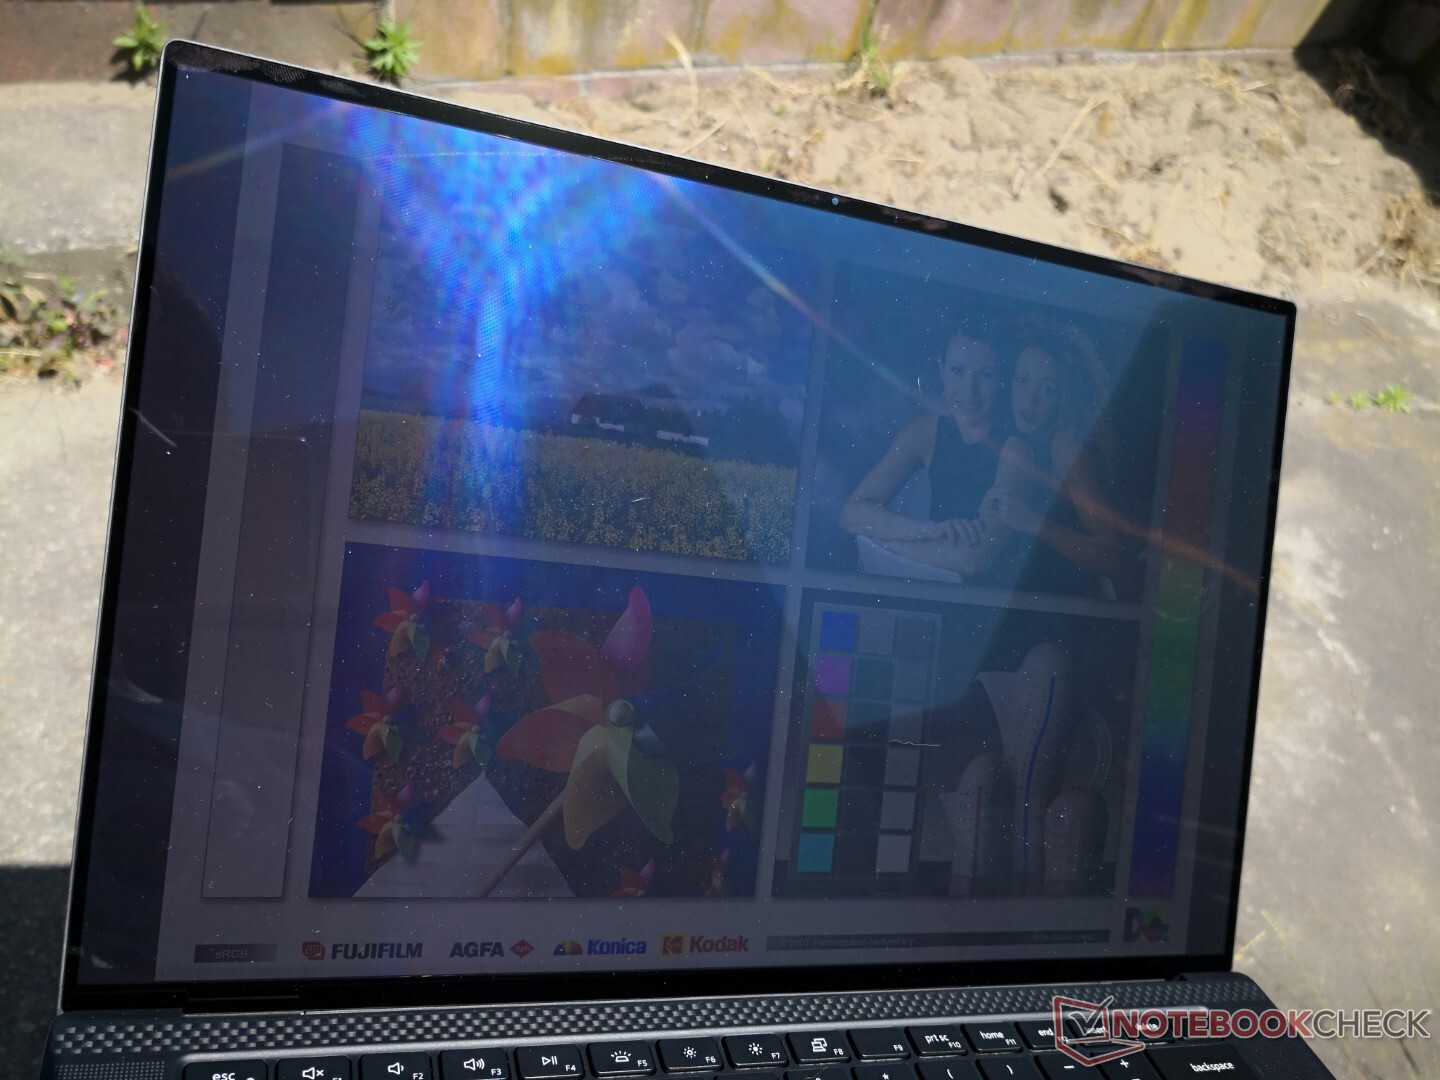
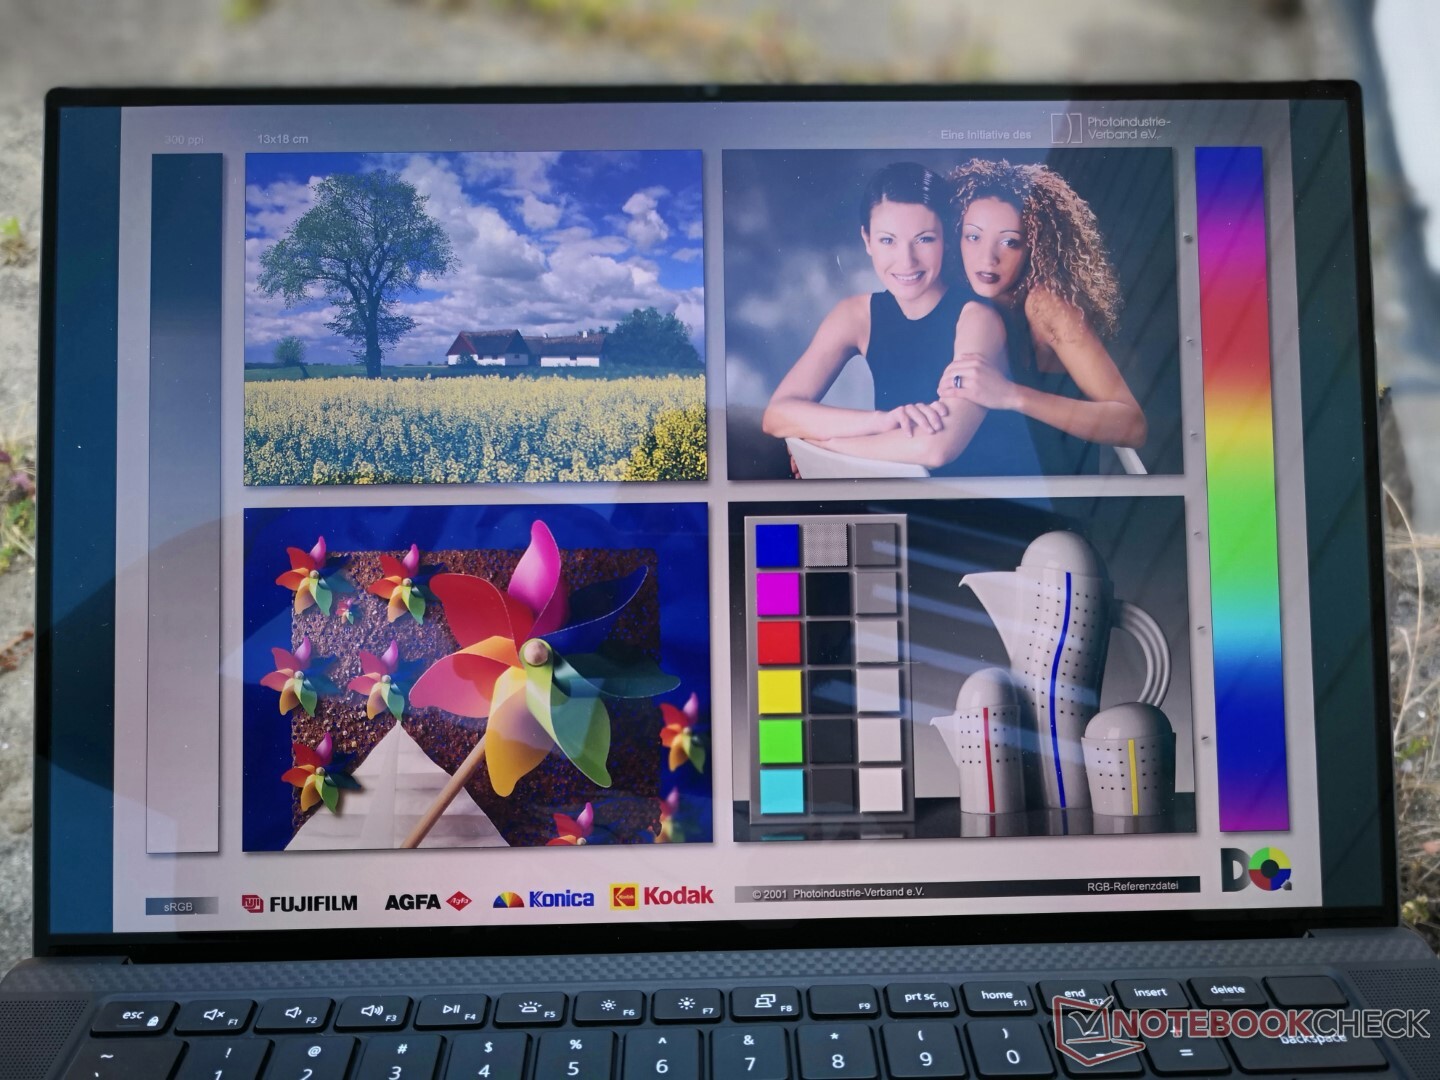
Pantalla - Uncommon 3.5K OLED
Nuestro modelo de pruebas viene con la misma pantalla táctil OLED de 3.5K que estaba disponible en el XPS 15 9510 del año pasado, lo que significa que la experiencia visual no ha cambiado año tras año. También hay disponible una opción IPS de menor resolución de 1920 x 1200 y una opción IPS de mayor resolución de 3840 x 2400, pero todos los paneles están desgraciadamente limitados a una tasa de refresco de 60 Hz. Algunos Ultrabooks como el Lenovo IdeaPad Slim 7i Pro o el Asus Vivobook Pro 14 ya se comercializan con paneles más rápidos de 90 Hz para una experiencia de interfaz de usuario notablemente más fluida.
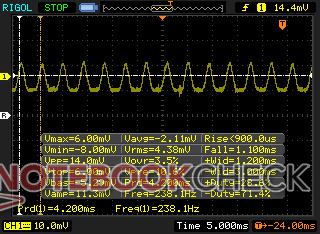
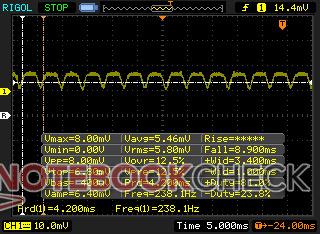
Hay que tener en cuenta que la modulación de ancho de pulso está presente en todos los brillos a 238 Hz desde el 0 por ciento hasta el 25 por ciento de brillo y a 59 Hz desde el 26 por ciento hasta el 100 por ciento de brillo. Si el parpadeo de la pantalla es un problema, entonces recomendamos configurar con IPS en su lugar.
| |||||||||||||||||||||||||
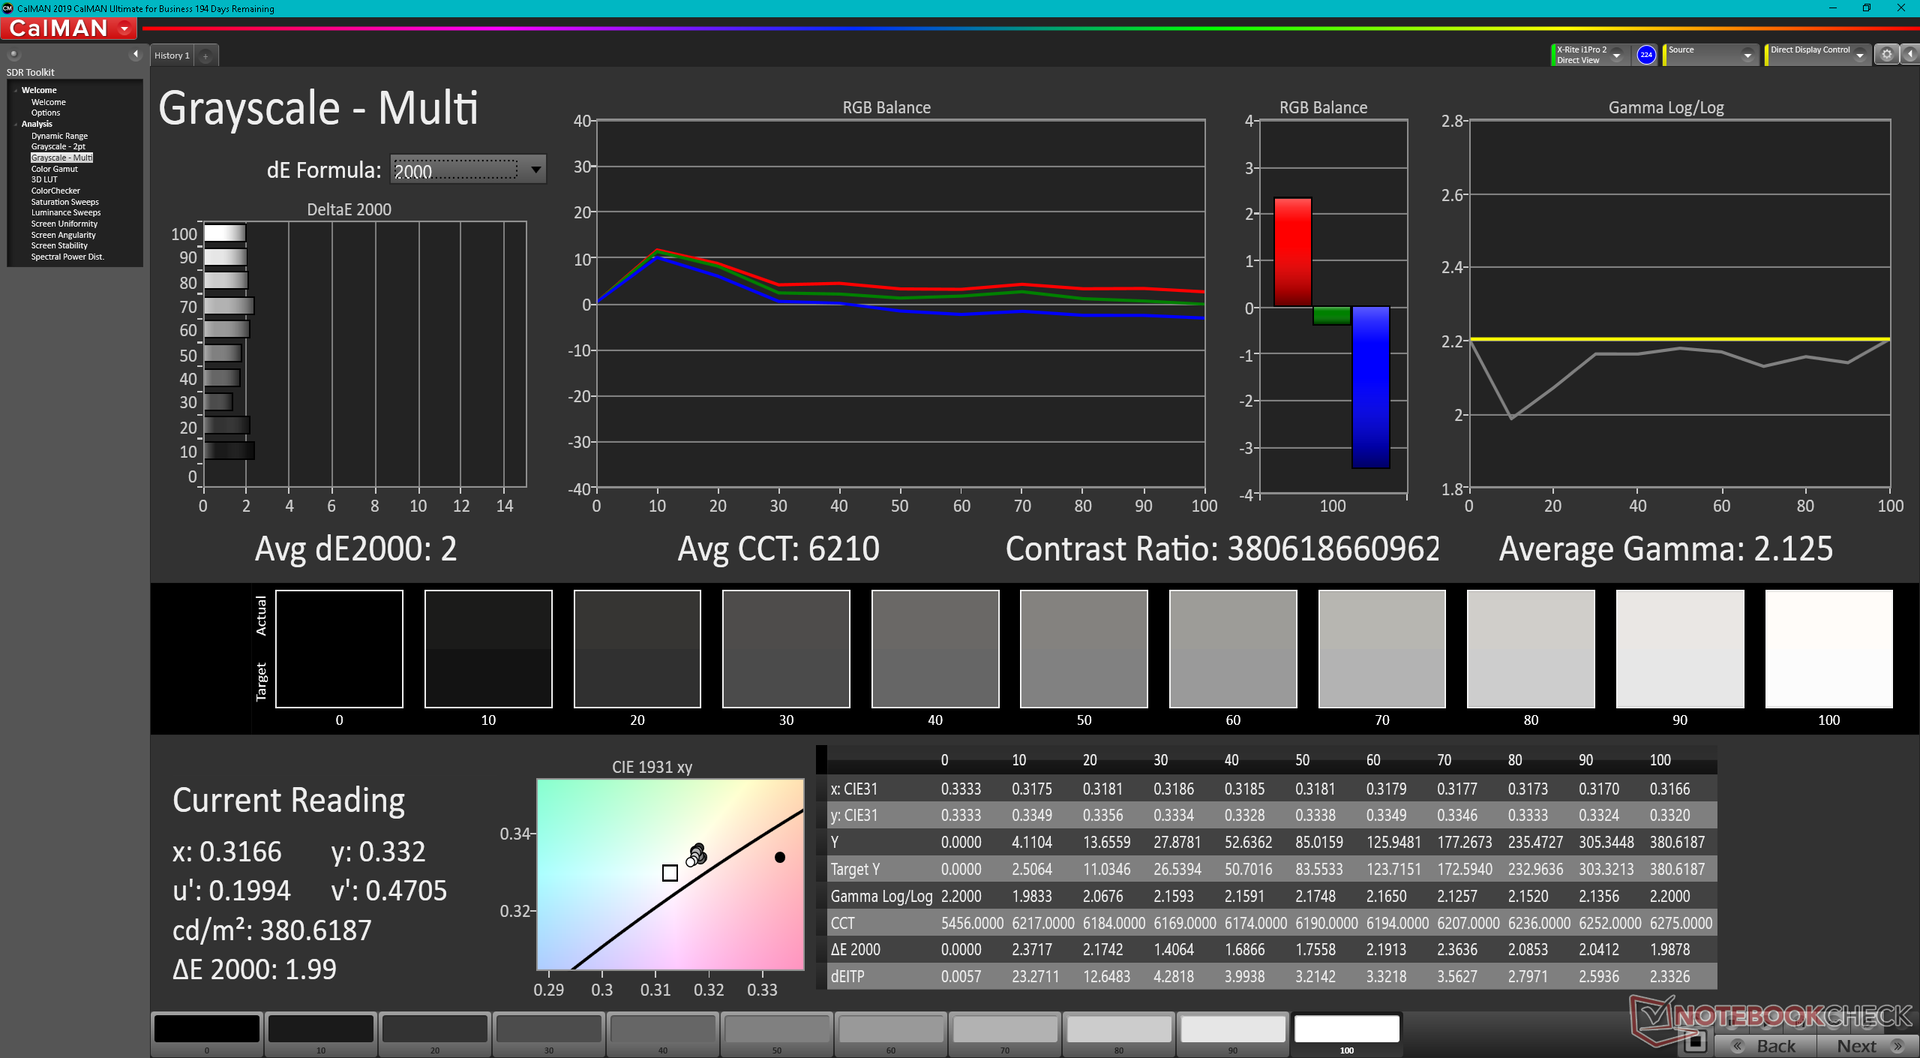
iluminación: 95 %
Brillo con batería: 381.4 cd/m²
Contraste: ∞:1 (Negro: 0 cd/m²)
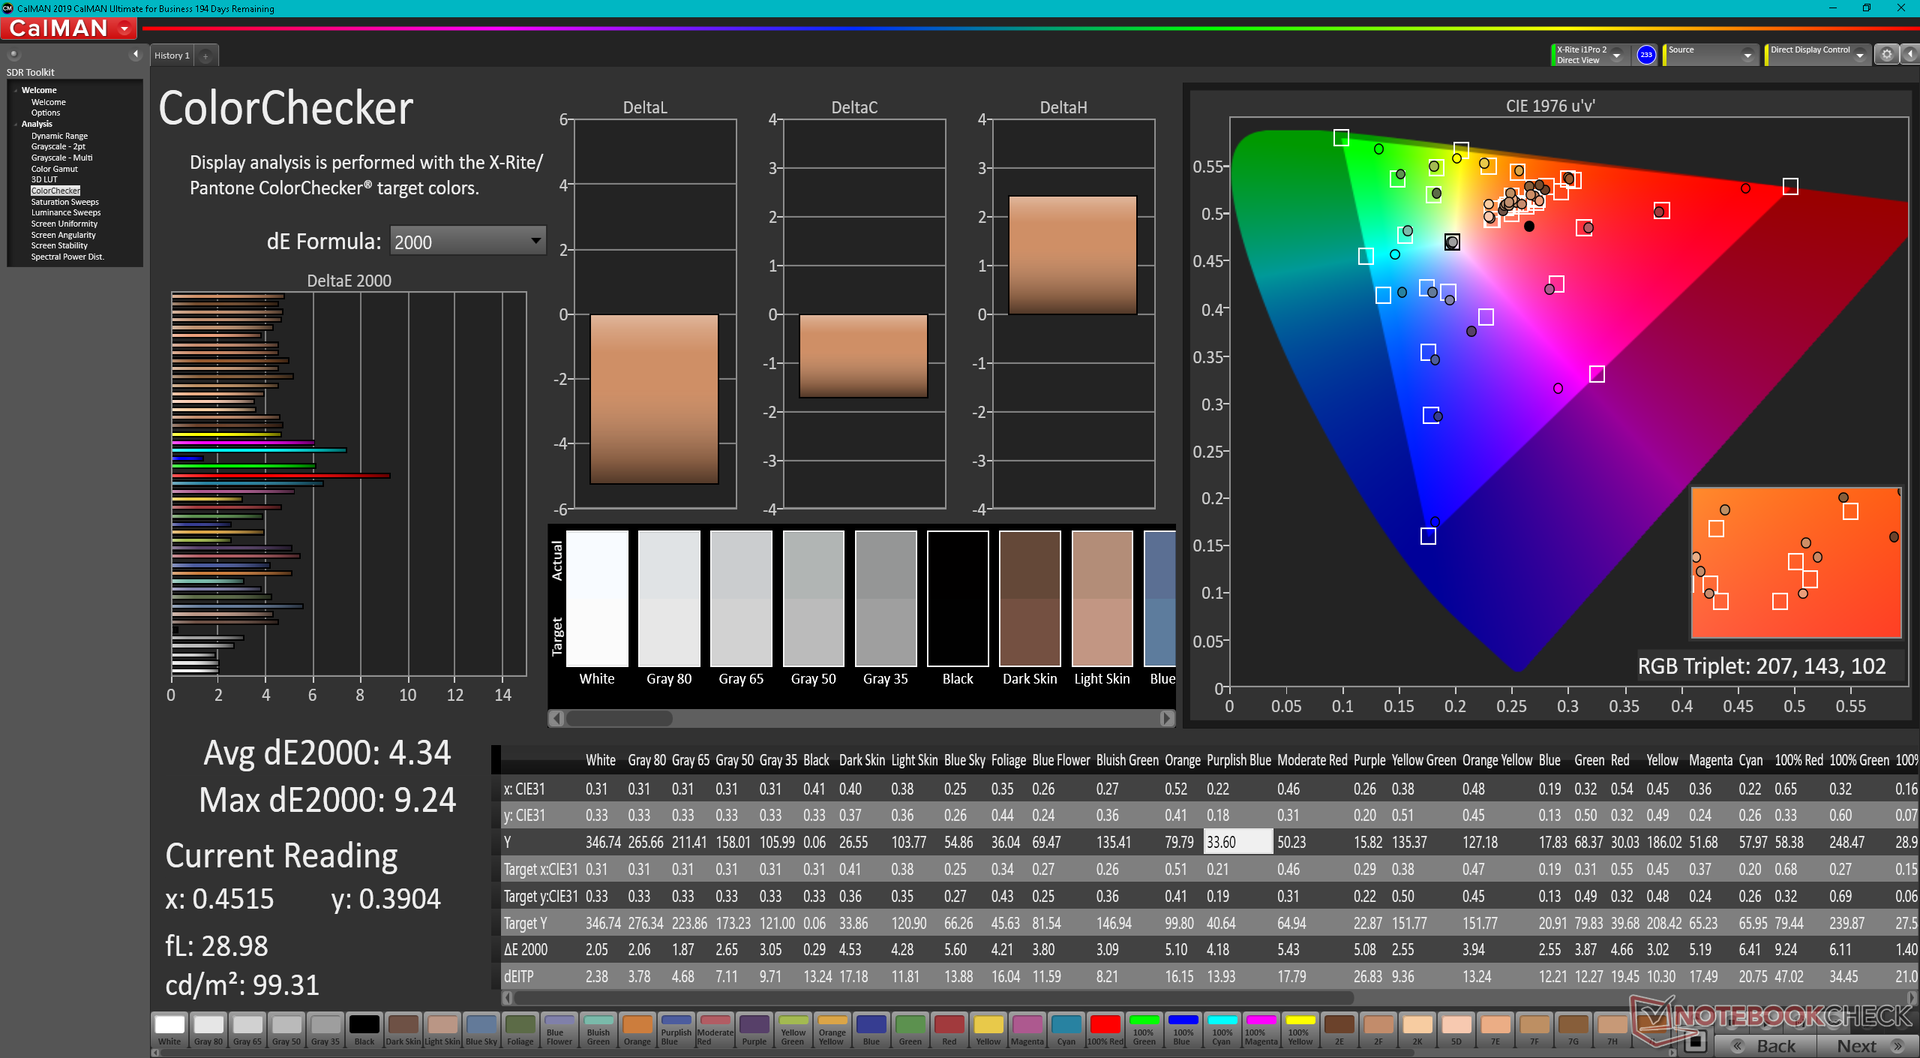
ΔE ColorChecker Calman: 4.34 | ∀{0.5-29.43 Ø4.71}
ΔE Greyscale Calman: 2 | ∀{0.09-98 Ø4.96}
86% AdobeRGB 1998 (Argyll 3D)
99.9% sRGB (Argyll 3D)
97.8% Display P3 (Argyll 3D)
Gamma: 2.13
CCT: 6210 K
| Dell XPS 15 9520 RTX 3050 Ti Samsung 156XG01, OLED, 3456x2160, 15.6" | Dell XPS 15 9510 11800H RTX 3050 Ti OLED SDC414D, OLED, 3456x2160, 15.6" | Dell XPS 15 9500 Core i7 4K UHD Sharp LQ156R1, IPS, 3840x2400, 15.6" | HP Spectre X360 15-5ZV31AV AU Optronics AUO30EB, IPS, 3840x2160, 15.6" | Asus Zenbook Pro 15 OLED UM535Q Samsung ATNA56YX03-0, OLED, 1920x1080, 15.6" | MSI Stealth 15M A11SEK Chi Mei N156HCE-EN1, IPS, 1920x1080, 15.6" | |
|---|---|---|---|---|---|---|
| Display | 5% | 3% | -19% | -7% | -23% | |
| Display P3 Coverage (%) | 97.8 | 99.9 2% | 89.7 -8% | 68.3 -30% | 79.3 -19% | 62 -37% |
| sRGB Coverage (%) | 99.9 | 100 0% | 100 0% | 94.3 -6% | 95.6 -4% | 93.4 -7% |
| AdobeRGB 1998 Coverage (%) | 86 | 98.1 14% | 99.8 16% | 68.4 -20% | 87.3 2% | 64.1 -25% |
| Response Times | -68% | -2195% | -2468% | -16% | -2079% | |
| Response Time Grey 50% / Grey 80% * (ms) | 1.9 ? | 3.6 ? -89% | 54 ? -2742% | 56.8 ? -2889% | 2.1 ? -11% | 47.6 ? -2405% |
| Response Time Black / White * (ms) | 1.9 ? | 2.8 ? -47% | 33.2 ? -1647% | 40.8 ? -2047% | 2.3 ? -21% | 35.2 ? -1753% |
| PWM Frequency (Hz) | 59.52 ? | 59.5 ? | 60.2 | 25000 ? | ||
| Screen | 22% | 5% | -11% | 13% | -4% | |
| Brightness middle (cd/m²) | 381.4 | 362 -5% | 557.9 46% | 284.6 -25% | 342.9 -10% | 279 -27% |
| Brightness (cd/m²) | 384 | 367 -4% | 541 41% | 285 -26% | 346 -10% | 252 -34% |
| Brightness Distribution (%) | 95 | 97 2% | 91 -4% | 85 -11% | 98 3% | 82 -14% |
| Black Level * (cd/m²) | 0.06 | 0.39 | 0.25 | 0.32 | ||
| Colorchecker dE 2000 * | 4.34 | 2.1 52% | 4.54 -5% | 3.52 19% | 2.42 44% | 1.72 60% |
| Colorchecker dE 2000 max. * | 9.24 | 4.1 56% | 7.92 14% | 5.56 40% | 4.05 56% | 5.62 39% |
| Greyscale dE 2000 * | 2 | 1.4 30% | 3.2 -60% | 3.2 -60% | 2.1 -5% | 2.9 -45% |
| Gamma | 2.13 103% | 2.18 101% | 1.99 111% | 2.28 96% | 2.21 100% | 2.3 96% |
| CCT | 6210 105% | 6608 98% | 6451 101% | 7070 92% | 6364 102% | 6700 97% |
| Contrast (:1) | 6033 | 1431 | 1138 | 872 | ||
| Colorchecker dE 2000 calibrated * | 2.5 | 3.82 | 3 | 1.39 | ||
| Color Space (Percent of AdobeRGB 1998) (%) | 89.5 | 61.1 | 59 | |||
| Color Space (Percent of sRGB) (%) | 100 | 93.8 | 93.2 | |||
| Media total (Programa/Opciones) | -14% /
1% | -729% /
-395% | -833% /
-460% | -3% /
2% | -702% /
-386% |
* ... más pequeño es mejor
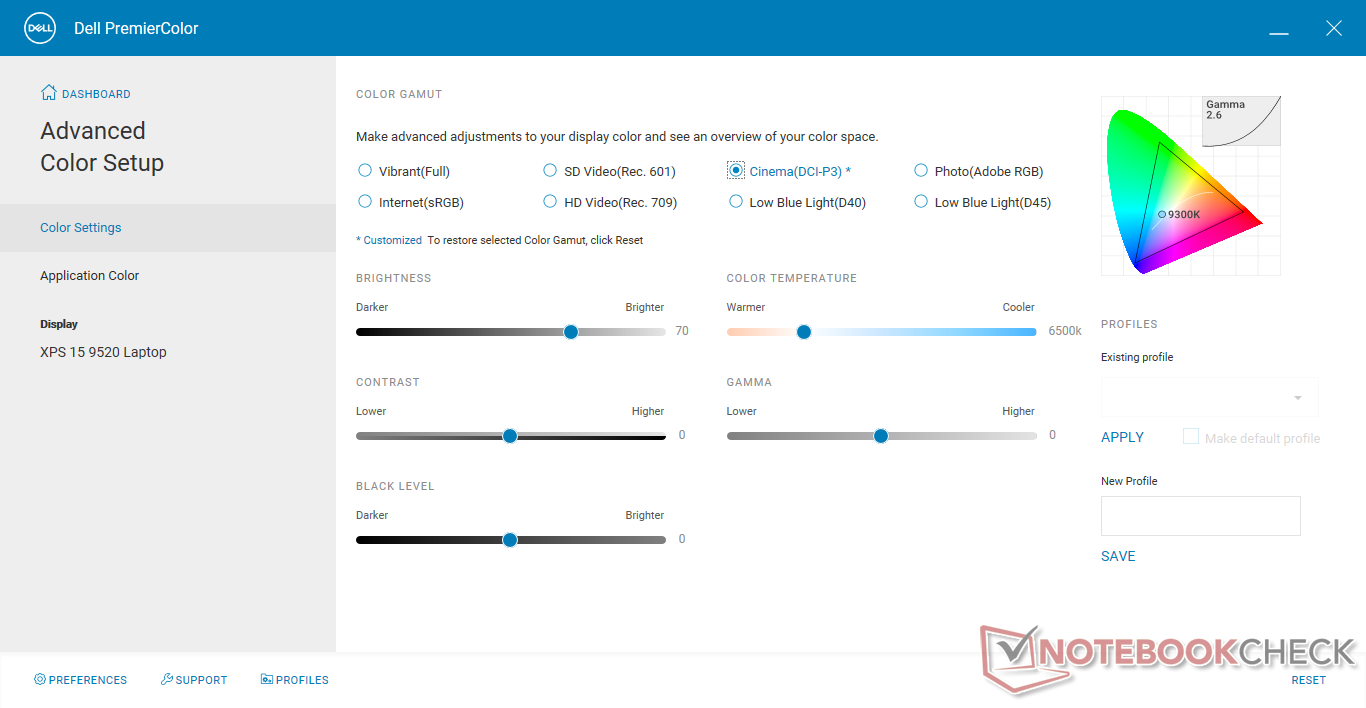
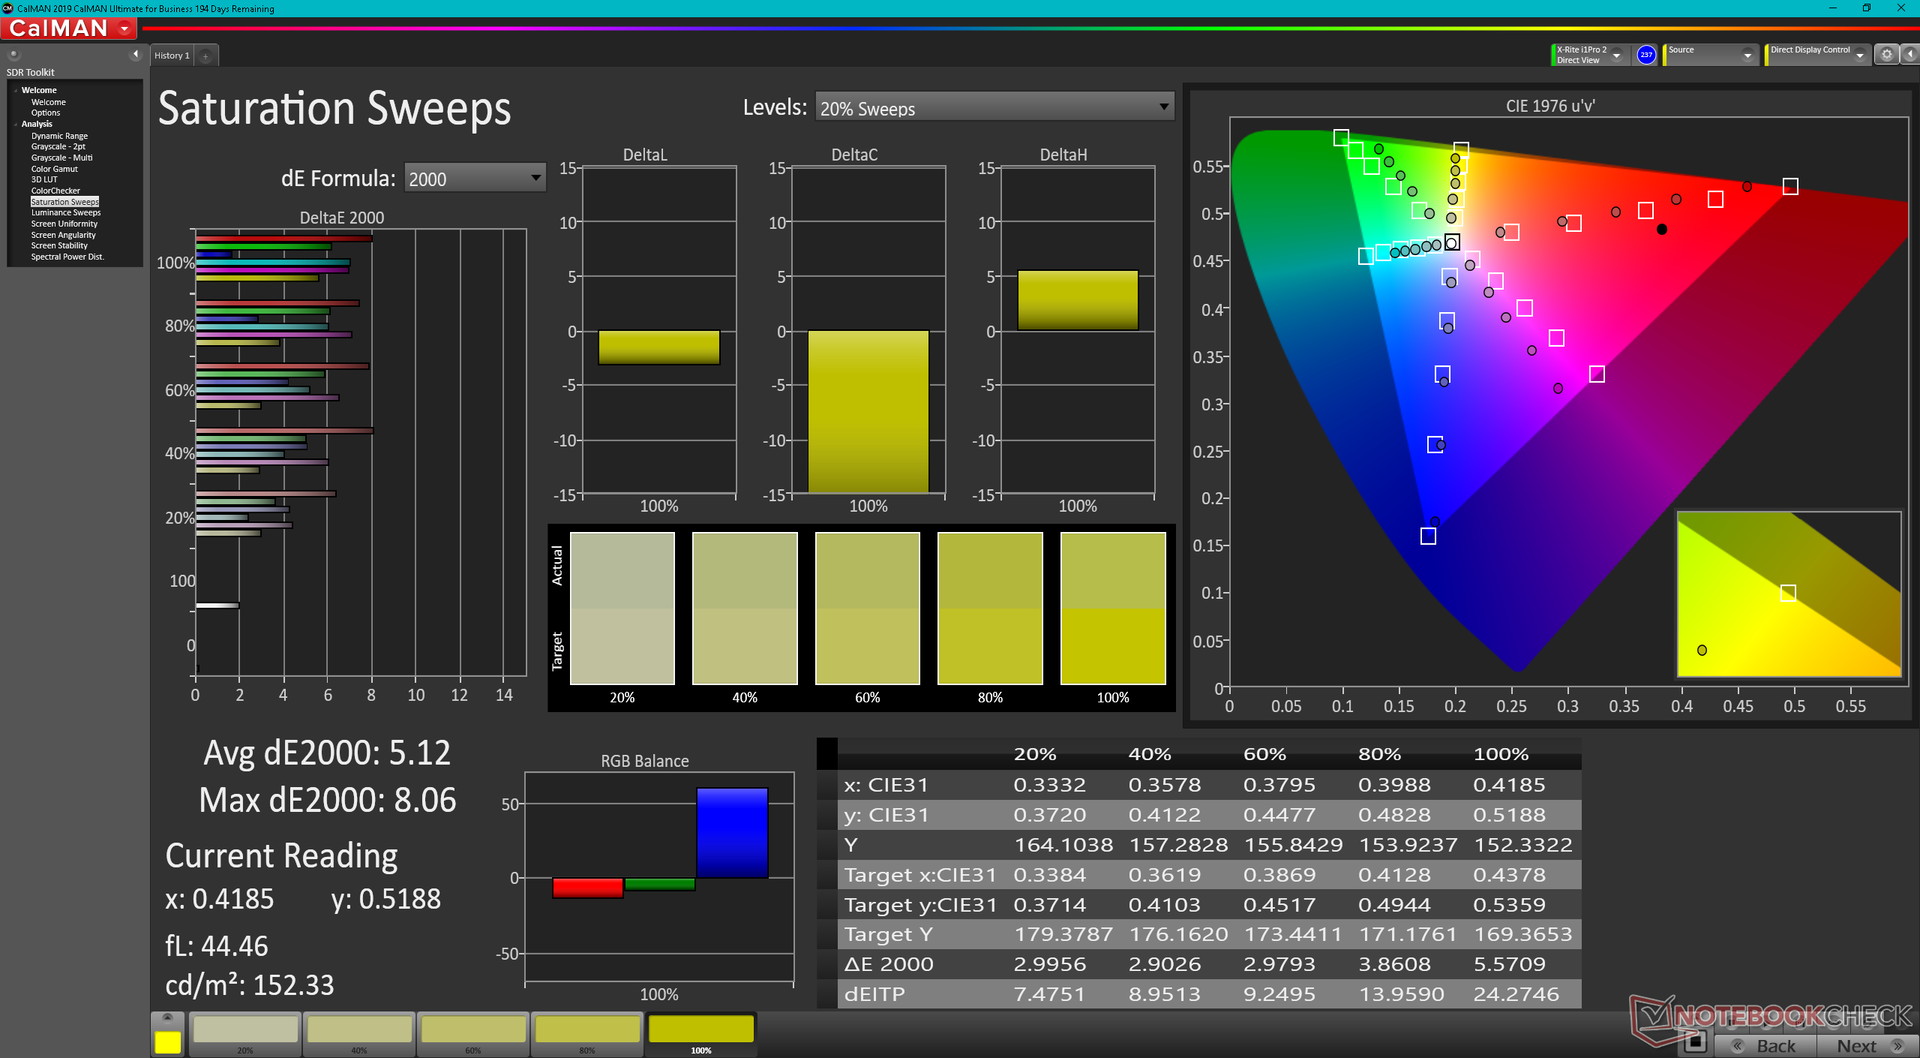
Aunque podemos confirmar una cobertura DCI-P3 de al menos el 98%, los colores de nuestra unidad no se han calibrado bien con respecto al estándar, incluso cuando se ajustan a DCI-P3 mediante el software PremierColor.
Tiempos de respuesta del display
| ↔ Tiempo de respuesta de Negro a Blanco | ||
|---|---|---|
| 1.9 ms ... subida ↗ y bajada ↘ combinada | ↗ 1.1 ms subida | 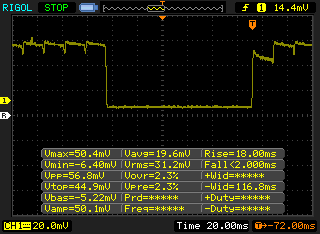 |
| ↘ 0.8 ms bajada | ||
| La pantalla mostró tiempos de respuesta muy rápidos en nuestros tests y debería ser adecuada para juegos frenéticos. En comparación, todos los dispositivos de prueba van de ##min### (mínimo) a 240 (máximo) ms. » 11 % de todos los dispositivos son mejores. Esto quiere decir que el tiempo de respuesta medido es mejor que la media (19.8 ms) de todos los dispositivos testados. | ||
| ↔ Tiempo de respuesta 50% Gris a 80% Gris | ||
| 1.9 ms ... subida ↗ y bajada ↘ combinada | ↗ 1.1 ms subida | 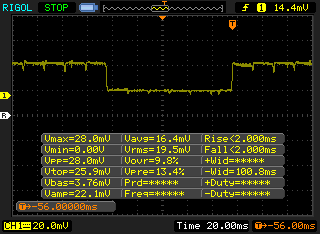 |
| ↘ 0.8 ms bajada | ||
| La pantalla mostró tiempos de respuesta muy rápidos en nuestros tests y debería ser adecuada para juegos frenéticos. En comparación, todos los dispositivos de prueba van de ##min### (mínimo) a 636 (máximo) ms. » 9 % de todos los dispositivos son mejores. Esto quiere decir que el tiempo de respuesta medido es mejor que la media (31 ms) de todos los dispositivos testados. | ||
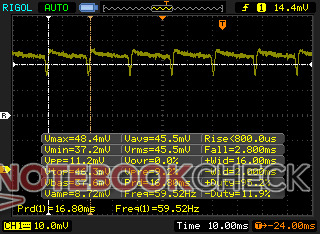
Parpadeo de Pantalla / PWM (Pulse-Width Modulation)
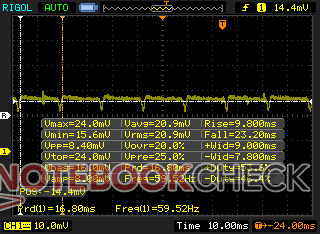
| Parpadeo de Pantalla / PWM detectado | 59.52 Hz | ≤ 100 % de brillo | 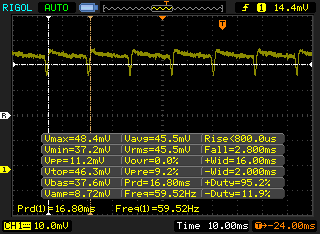 |
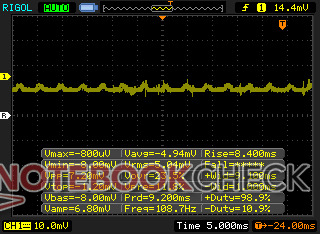
La retroiluminación del display parpadea a 59.52 Hz (seguramente usa PWM - Pulse-Width Modulation) a un brillo del 100 % e inferior. Sobre este nivel de brillo no debería darse parpadeo / PWM. La frecuencia de 59.52 Hz es bajísima, por lo que el parpadeo puede causar fatiga visual y cefaleas cuando se usa mucho tiempo. Comparación: 52 % de todos los dispositivos testados no usaron PWM para atenuar el display. Si se usó, medimos una media de 7757 (mínimo: 5 - máxmo: 343500) Hz. | |||
Desempeño - Opciones de la 12ª generación de Intel
Condiciones de la prueba
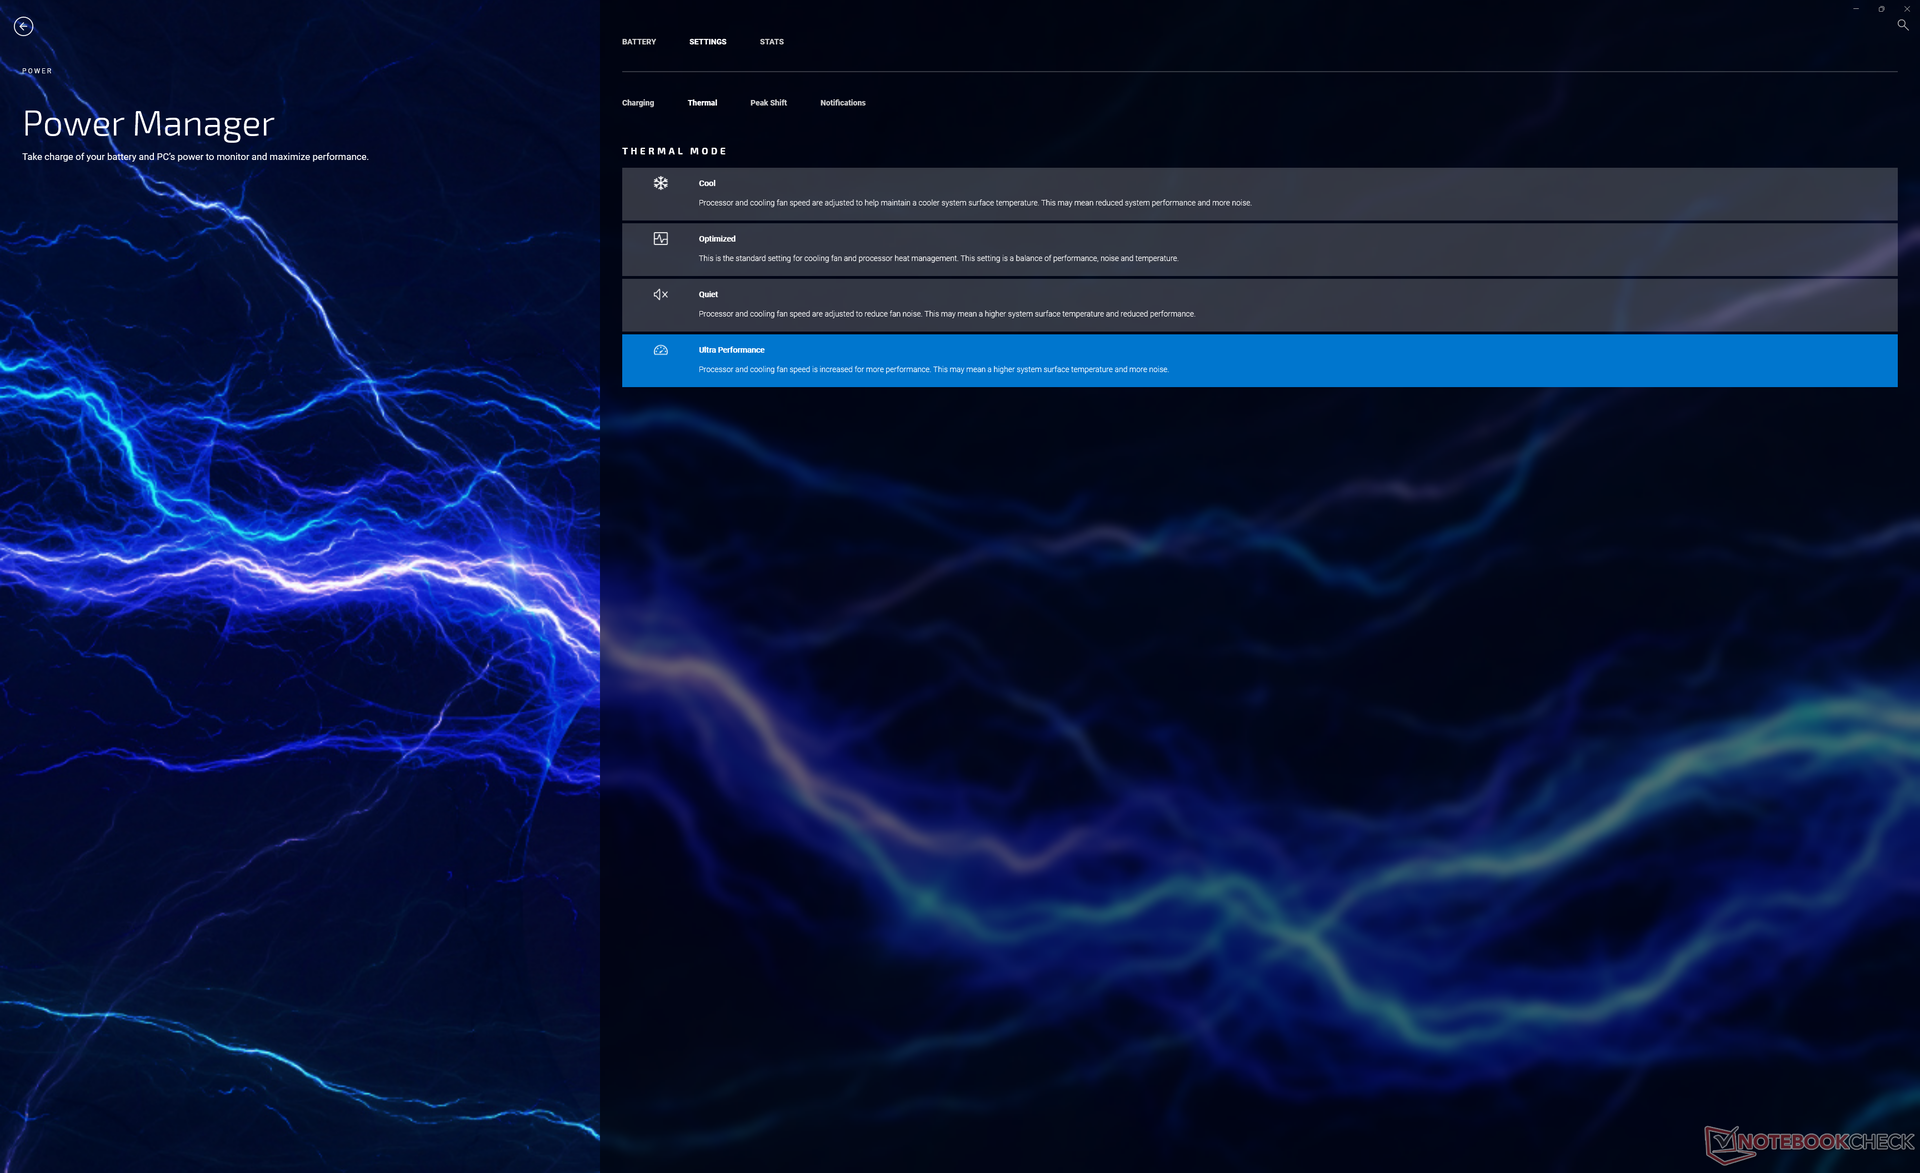
Nuestra unidad fue configurada en el modo Rendimiento a través de Windows y en el modo Ultra Rendimiento a través de la aplicación My Dell antes de ejecutar los benchmarks que se muestran a continuación para obtener las puntuaciones más altas posibles. Tenga en cuenta que My Dell ha reemplazado efectivamente el antiguo software Dell Power Manager. Recomendamos a los usuarios que se familiaricen con la nueva aplicación, ya que es la ventanilla única para las actualizaciones y los ajustes de rendimiento de Dell
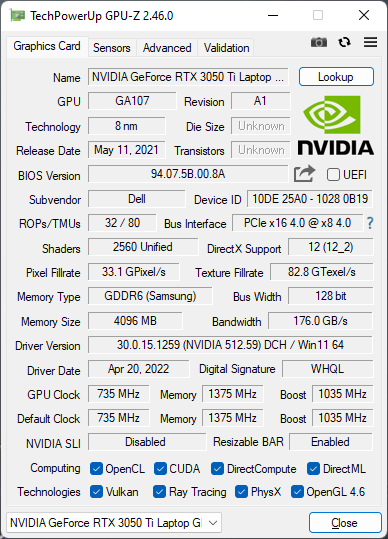
La GPU TGP GeForce RTX 3050 Ti de 45 W no ha cambiado respecto al anterior XPS 15 9510. Es de esperar que no haya interruptor MUX ni sincronización adaptativa, ya que el XPS 15 no está diseñado para los juegos.
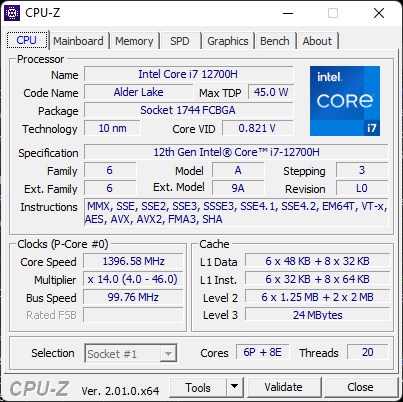
Procesador
El aumento del rendimiento de la CPU del XPS 15 9510 al 9520 es más significativo que el aumento del rendimiento de la CPU del XPS 9500 al 9510. El salto delCore i7-11800H del XPS 15 9510 al Core i7-12700H de nuestro 9520 supondrá un aumento del 35 al 40 por ciento en el rendimiento multihilo y del 15 al 20 por ciento en el rendimiento monohilo. El salto es suficiente para impulsar la CPU Intel de 12ª generación ligeramente por delante del popular Ryzen 7 5800H que ha superado de forma infame a la mayoría de las CPU de la serie Intel Core-H de 11ª generación en las cargas de trabajo multihilo
El rendimiento de la CPU podría haber sido mejor a pesar del mencionado aumento interanual. Cuando se compara con los más de 20 portátiles que hemos probado hasta ahora con la misma CPU Core i7-12700H, la de nuestro XPS 15 9520 es más lenta que la media en un 5 a 15 por ciento. La ejecución de CineBench R15 xT en bucle muestra que la CPU del Dell no es capaz de mantener altas velocidades de reloj Turbo Boost durante tanto tiempo como la mayoría de los otros portátiles con el mismo procesador. Modelos como elAsus TUF Gaming F15 FX507ZM pueden ejecutar la misma CPU hasta un 36 por ciento más rápido que en nuestro Dell.
Cinebench R15 Multi Loop
Cinebench R23: Multi Core | Single Core
Cinebench R15: CPU Multi 64Bit | CPU Single 64Bit
Blender: v2.79 BMW27 CPU
7-Zip 18.03: 7z b 4 | 7z b 4 -mmt1
Geekbench 5.5: Multi-Core | Single-Core
HWBOT x265 Benchmark v2.2: 4k Preset
LibreOffice : 20 Documents To PDF
R Benchmark 2.5: Overall mean
* ... más pequeño es mejor
AIDA64: FP32 Ray-Trace | FPU Julia | CPU SHA3 | CPU Queen | FPU SinJulia | FPU Mandel | CPU AES | CPU ZLib | FP64 Ray-Trace | CPU PhotoWorxx
| Performance rating | |
| Asus Zenbook Pro 15 OLED UM535Q | |
| Medio Intel Core i7-12700H | |
| Dell XPS 15 9520 RTX 3050 Ti | |
| Dell XPS 15 9500 Core i7 4K UHD | |
| Dell XPS 15 9510 11800H RTX 3050 Ti OLED -9! | |
| AIDA64 / FP32 Ray-Trace | |
| Asus Zenbook Pro 15 OLED UM535Q | |
| Medio Intel Core i7-12700H (2585 - 17957, n=64) | |
| Dell XPS 15 9500 Core i7 4K UHD | |
| Dell XPS 15 9520 RTX 3050 Ti | |
| AIDA64 / FPU Julia | |
| Asus Zenbook Pro 15 OLED UM535Q | |
| Dell XPS 15 9500 Core i7 4K UHD | |
| Medio Intel Core i7-12700H (12439 - 90760, n=64) | |
| Dell XPS 15 9520 RTX 3050 Ti | |
| AIDA64 / CPU SHA3 | |
| Asus Zenbook Pro 15 OLED UM535Q | |
| Medio Intel Core i7-12700H (833 - 4242, n=64) | |
| Dell XPS 15 9500 Core i7 4K UHD | |
| Dell XPS 15 9520 RTX 3050 Ti | |
| AIDA64 / CPU Queen | |
| Asus Zenbook Pro 15 OLED UM535Q | |
| Dell XPS 15 9520 RTX 3050 Ti | |
| Medio Intel Core i7-12700H (57923 - 103202, n=63) | |
| Dell XPS 15 9500 Core i7 4K UHD | |
| AIDA64 / FPU SinJulia | |
| Asus Zenbook Pro 15 OLED UM535Q | |
| Dell XPS 15 9500 Core i7 4K UHD | |
| Medio Intel Core i7-12700H (3249 - 9939, n=64) | |
| Dell XPS 15 9520 RTX 3050 Ti | |
| AIDA64 / FPU Mandel | |
| Asus Zenbook Pro 15 OLED UM535Q | |
| Dell XPS 15 9500 Core i7 4K UHD | |
| Medio Intel Core i7-12700H (7135 - 44760, n=64) | |
| Dell XPS 15 9520 RTX 3050 Ti | |
| AIDA64 / CPU AES | |
| Asus Zenbook Pro 15 OLED UM535Q | |
| Medio Intel Core i7-12700H (31839 - 144360, n=64) | |
| Dell XPS 15 9520 RTX 3050 Ti | |
| Dell XPS 15 9500 Core i7 4K UHD | |
| AIDA64 / CPU ZLib | |
| Medio Intel Core i7-12700H (305 - 1171, n=64) | |
| Dell XPS 15 9520 RTX 3050 Ti | |
| Asus Zenbook Pro 15 OLED UM535Q | |
| Dell XPS 15 9500 Core i7 4K UHD | |
| Dell XPS 15 9510 11800H RTX 3050 Ti OLED | |
| AIDA64 / FP64 Ray-Trace | |
| Asus Zenbook Pro 15 OLED UM535Q | |
| Medio Intel Core i7-12700H (1437 - 9692, n=64) | |
| Dell XPS 15 9520 RTX 3050 Ti | |
| Dell XPS 15 9500 Core i7 4K UHD | |
| AIDA64 / CPU PhotoWorxx | |
| Dell XPS 15 9520 RTX 3050 Ti | |
| Medio Intel Core i7-12700H (12863 - 52207, n=64) | |
| Dell XPS 15 9500 Core i7 4K UHD | |
| Asus Zenbook Pro 15 OLED UM535Q | |
Rendimiento del sistema
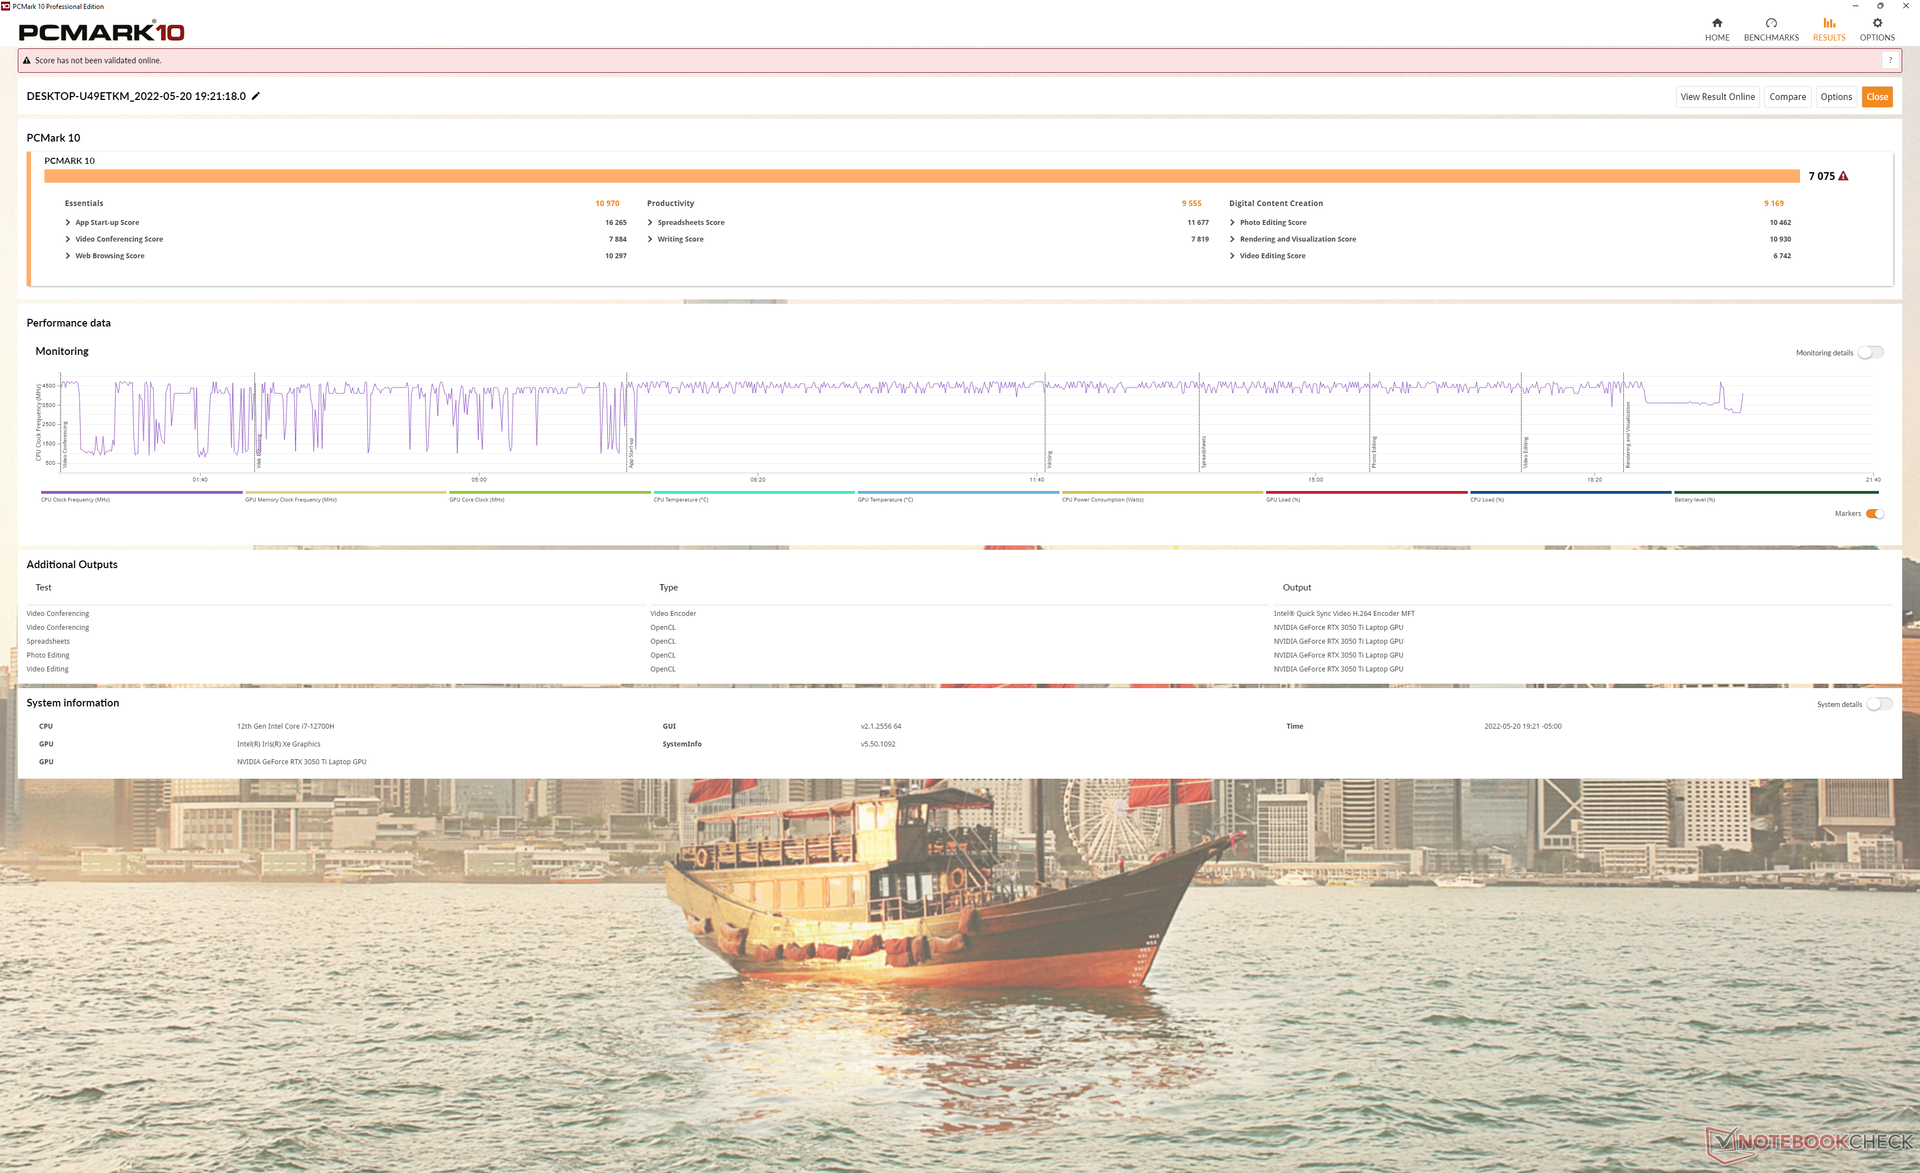
Los resultados de PCMark 10 son sistemáticamente superiores a los que registramos en los antiguos XPS 15 9510 y 9500, debido en gran medida al aumento del rendimiento de la CPU y la SSD.
CrossMark: Overall | Productivity | Creativity | Responsiveness
| PCMark 10 / Score | |
| Dell XPS 15 9520 RTX 3050 Ti | |
| Medio Intel Core i7-12700H, NVIDIA GeForce RTX 3050 Ti Laptop GPU (6623 - 7075, n=5) | |
| Asus Zenbook Pro 15 OLED UM535Q | |
| Dell XPS 15 9510 11800H RTX 3050 Ti OLED | |
| MSI Stealth 15M A11SEK | |
| Dell XPS 15 9500 Core i7 4K UHD | |
| HP Spectre X360 15-5ZV31AV | |
| PCMark 10 / Essentials | |
| Dell XPS 15 9520 RTX 3050 Ti | |
| Asus Zenbook Pro 15 OLED UM535Q | |
| Medio Intel Core i7-12700H, NVIDIA GeForce RTX 3050 Ti Laptop GPU (9540 - 10970, n=5) | |
| Dell XPS 15 9500 Core i7 4K UHD | |
| MSI Stealth 15M A11SEK | |
| Dell XPS 15 9510 11800H RTX 3050 Ti OLED | |
| HP Spectre X360 15-5ZV31AV | |
| PCMark 10 / Productivity | |
| Asus Zenbook Pro 15 OLED UM535Q | |
| Dell XPS 15 9520 RTX 3050 Ti | |
| Medio Intel Core i7-12700H, NVIDIA GeForce RTX 3050 Ti Laptop GPU (8530 - 9555, n=5) | |
| MSI Stealth 15M A11SEK | |
| Dell XPS 15 9510 11800H RTX 3050 Ti OLED | |
| Dell XPS 15 9500 Core i7 4K UHD | |
| HP Spectre X360 15-5ZV31AV | |
| PCMark 10 / Digital Content Creation | |
| Medio Intel Core i7-12700H, NVIDIA GeForce RTX 3050 Ti Laptop GPU (8855 - 9542, n=5) | |
| Dell XPS 15 9520 RTX 3050 Ti | |
| Asus Zenbook Pro 15 OLED UM535Q | |
| Dell XPS 15 9510 11800H RTX 3050 Ti OLED | |
| MSI Stealth 15M A11SEK | |
| Dell XPS 15 9500 Core i7 4K UHD | |
| HP Spectre X360 15-5ZV31AV | |
| CrossMark / Overall | |
| Dell XPS 15 9520 RTX 3050 Ti | |
| Medio Intel Core i7-12700H, NVIDIA GeForce RTX 3050 Ti Laptop GPU (1654 - 1872, n=5) | |
| Asus Zenbook Pro 15 OLED UM535Q | |
| CrossMark / Productivity | |
| Dell XPS 15 9520 RTX 3050 Ti | |
| Medio Intel Core i7-12700H, NVIDIA GeForce RTX 3050 Ti Laptop GPU (1595 - 1792, n=5) | |
| Asus Zenbook Pro 15 OLED UM535Q | |
| CrossMark / Creativity | |
| Dell XPS 15 9520 RTX 3050 Ti | |
| Medio Intel Core i7-12700H, NVIDIA GeForce RTX 3050 Ti Laptop GPU (1699 - 1993, n=5) | |
| Asus Zenbook Pro 15 OLED UM535Q | |
| CrossMark / Responsiveness | |
| Dell XPS 15 9520 RTX 3050 Ti | |
| Medio Intel Core i7-12700H, NVIDIA GeForce RTX 3050 Ti Laptop GPU (1383 - 1768, n=5) | |
| Asus Zenbook Pro 15 OLED UM535Q | |
| PCMark 10 Score | 7075 puntos | |
ayuda | ||
| AIDA64 / Memory Copy | |
| Dell XPS 15 9520 RTX 3050 Ti | |
| Medio Intel Core i7-12700H (25615 - 80511, n=64) | |
| Asus Zenbook Pro 15 OLED UM535Q | |
| Dell XPS 15 9500 Core i7 4K UHD | |
| AIDA64 / Memory Read | |
| Dell XPS 15 9520 RTX 3050 Ti | |
| Medio Intel Core i7-12700H (25586 - 79442, n=64) | |
| Asus Zenbook Pro 15 OLED UM535Q | |
| Dell XPS 15 9500 Core i7 4K UHD | |
| AIDA64 / Memory Write | |
| Dell XPS 15 9520 RTX 3050 Ti | |
| Medio Intel Core i7-12700H (23679 - 88660, n=64) | |
| Asus Zenbook Pro 15 OLED UM535Q | |
| Dell XPS 15 9500 Core i7 4K UHD | |
| AIDA64 / Memory Latency | |
| Dell XPS 15 9520 RTX 3050 Ti | |
| Asus Zenbook Pro 15 OLED UM535Q | |
| Medio Intel Core i7-12700H (76.2 - 133.9, n=62) | |
| Dell XPS 15 9500 Core i7 4K UHD | |
| Dell XPS 15 9510 11800H RTX 3050 Ti OLED | |
* ... más pequeño es mejor
Latencia del CPD
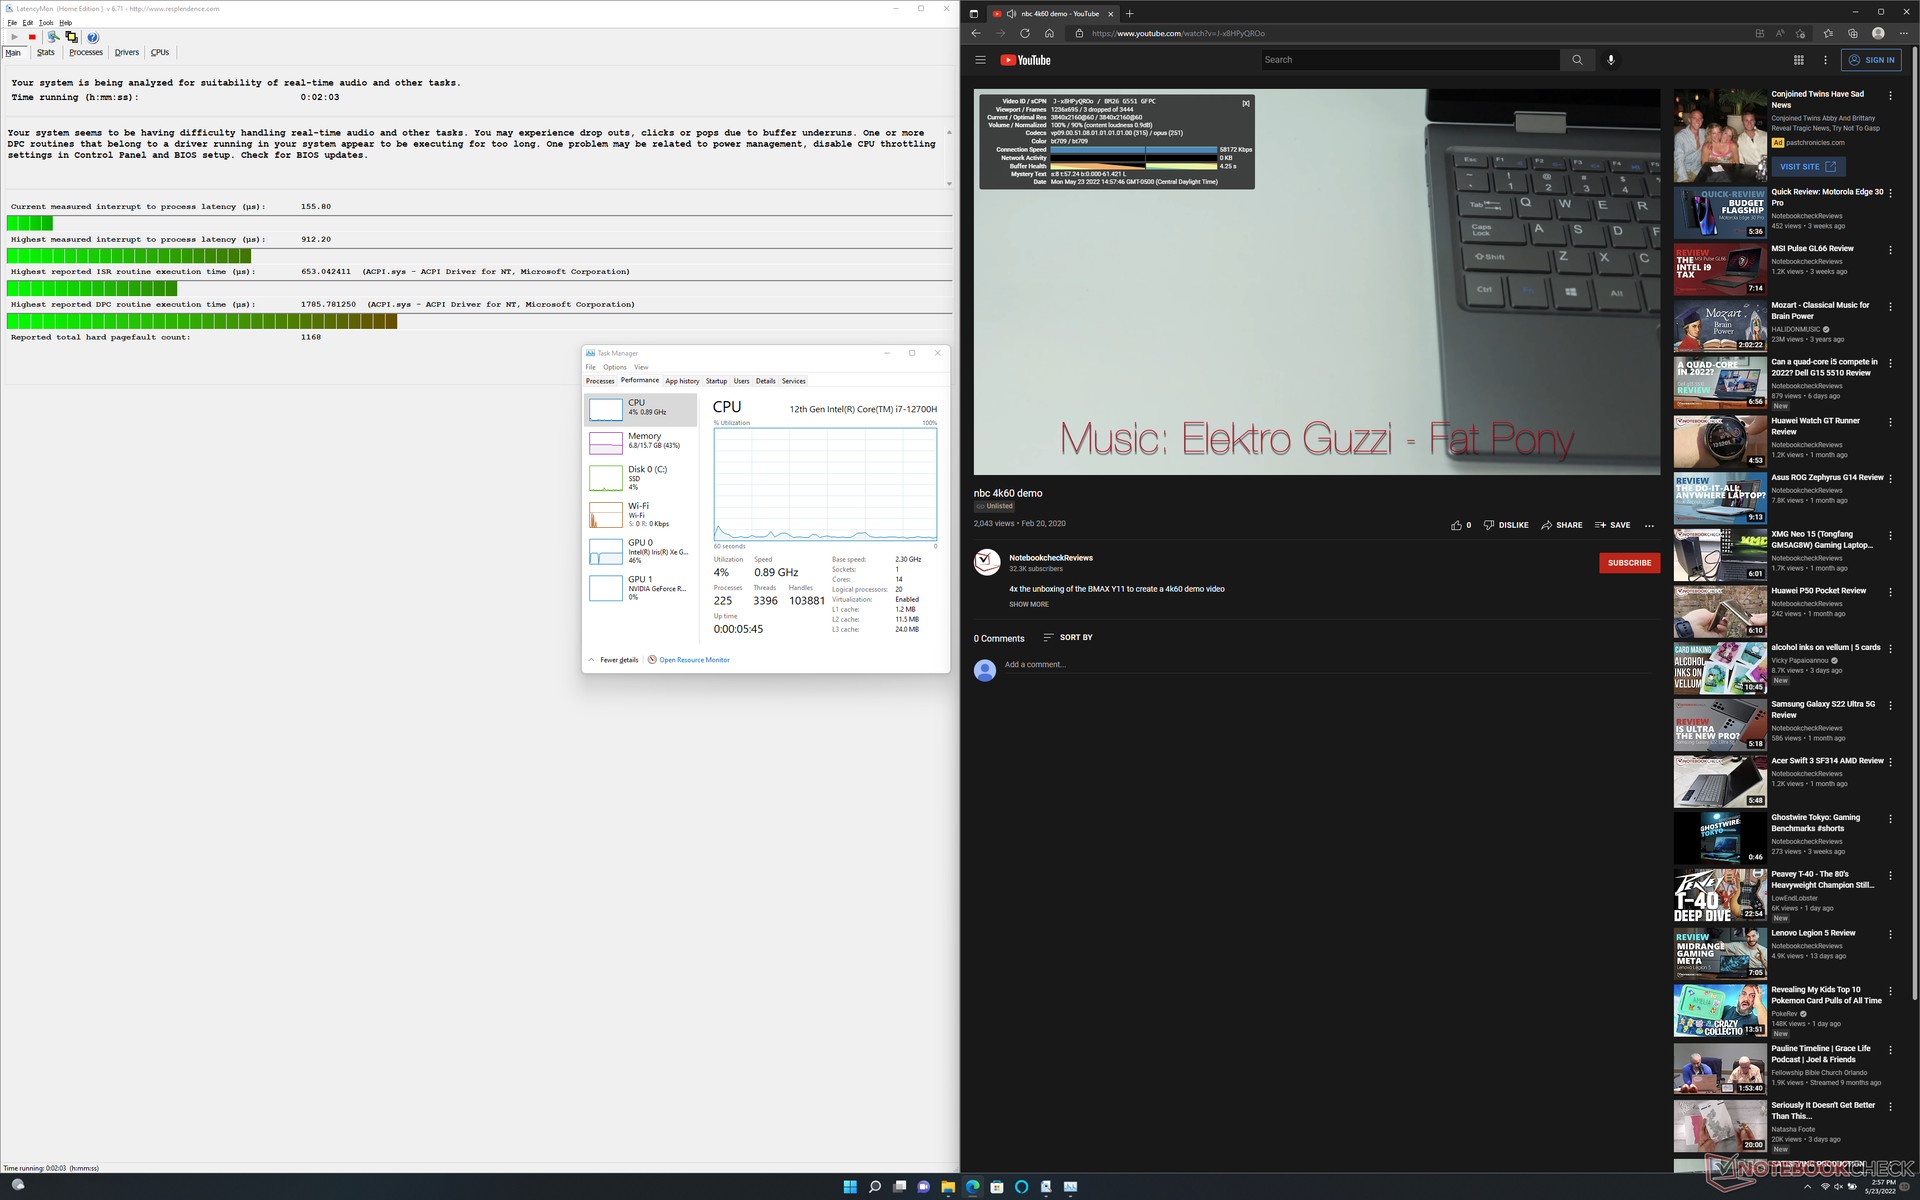
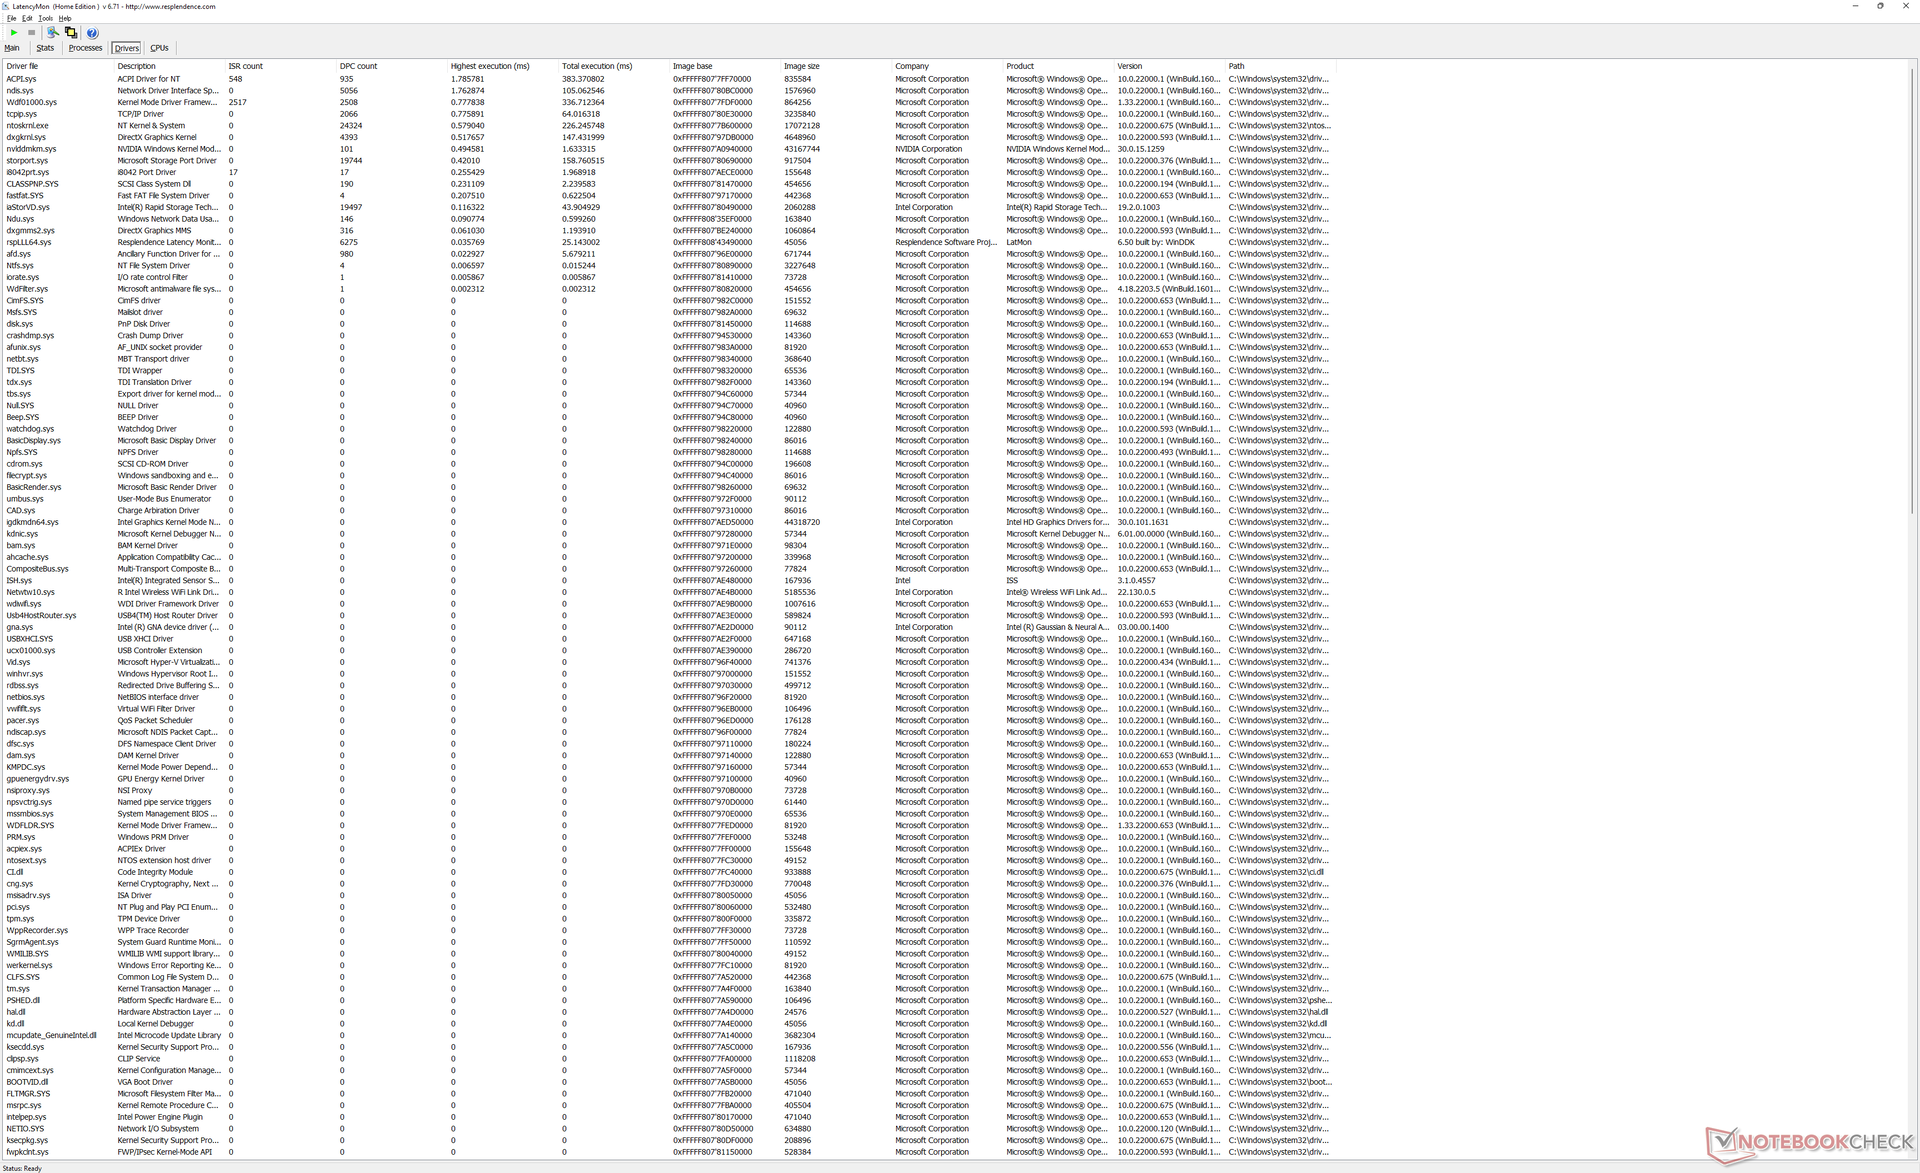
LatencyMon revela problemas menores de CPD al abrir varias pestañas del navegador en nuestra página de inicio. la reproducción de vídeo 4K a 60 FPS es, por lo demás, fluida y con sólo 3 fotogramas perdidos durante nuestra prueba de vídeo de un minuto de duración.
| DPC Latencies / LatencyMon - interrupt to process latency (max), Web, Youtube, Prime95 | |
| Dell XPS 15 9500 Core i7 4K UHD | |
| Dell XPS 15 9510 11800H RTX 3050 Ti OLED | |
| Dell XPS 15 9520 RTX 3050 Ti | |
| MSI Stealth 15M A11SEK | |
| Asus Zenbook Pro 15 OLED UM535Q | |
* ... más pequeño es mejor
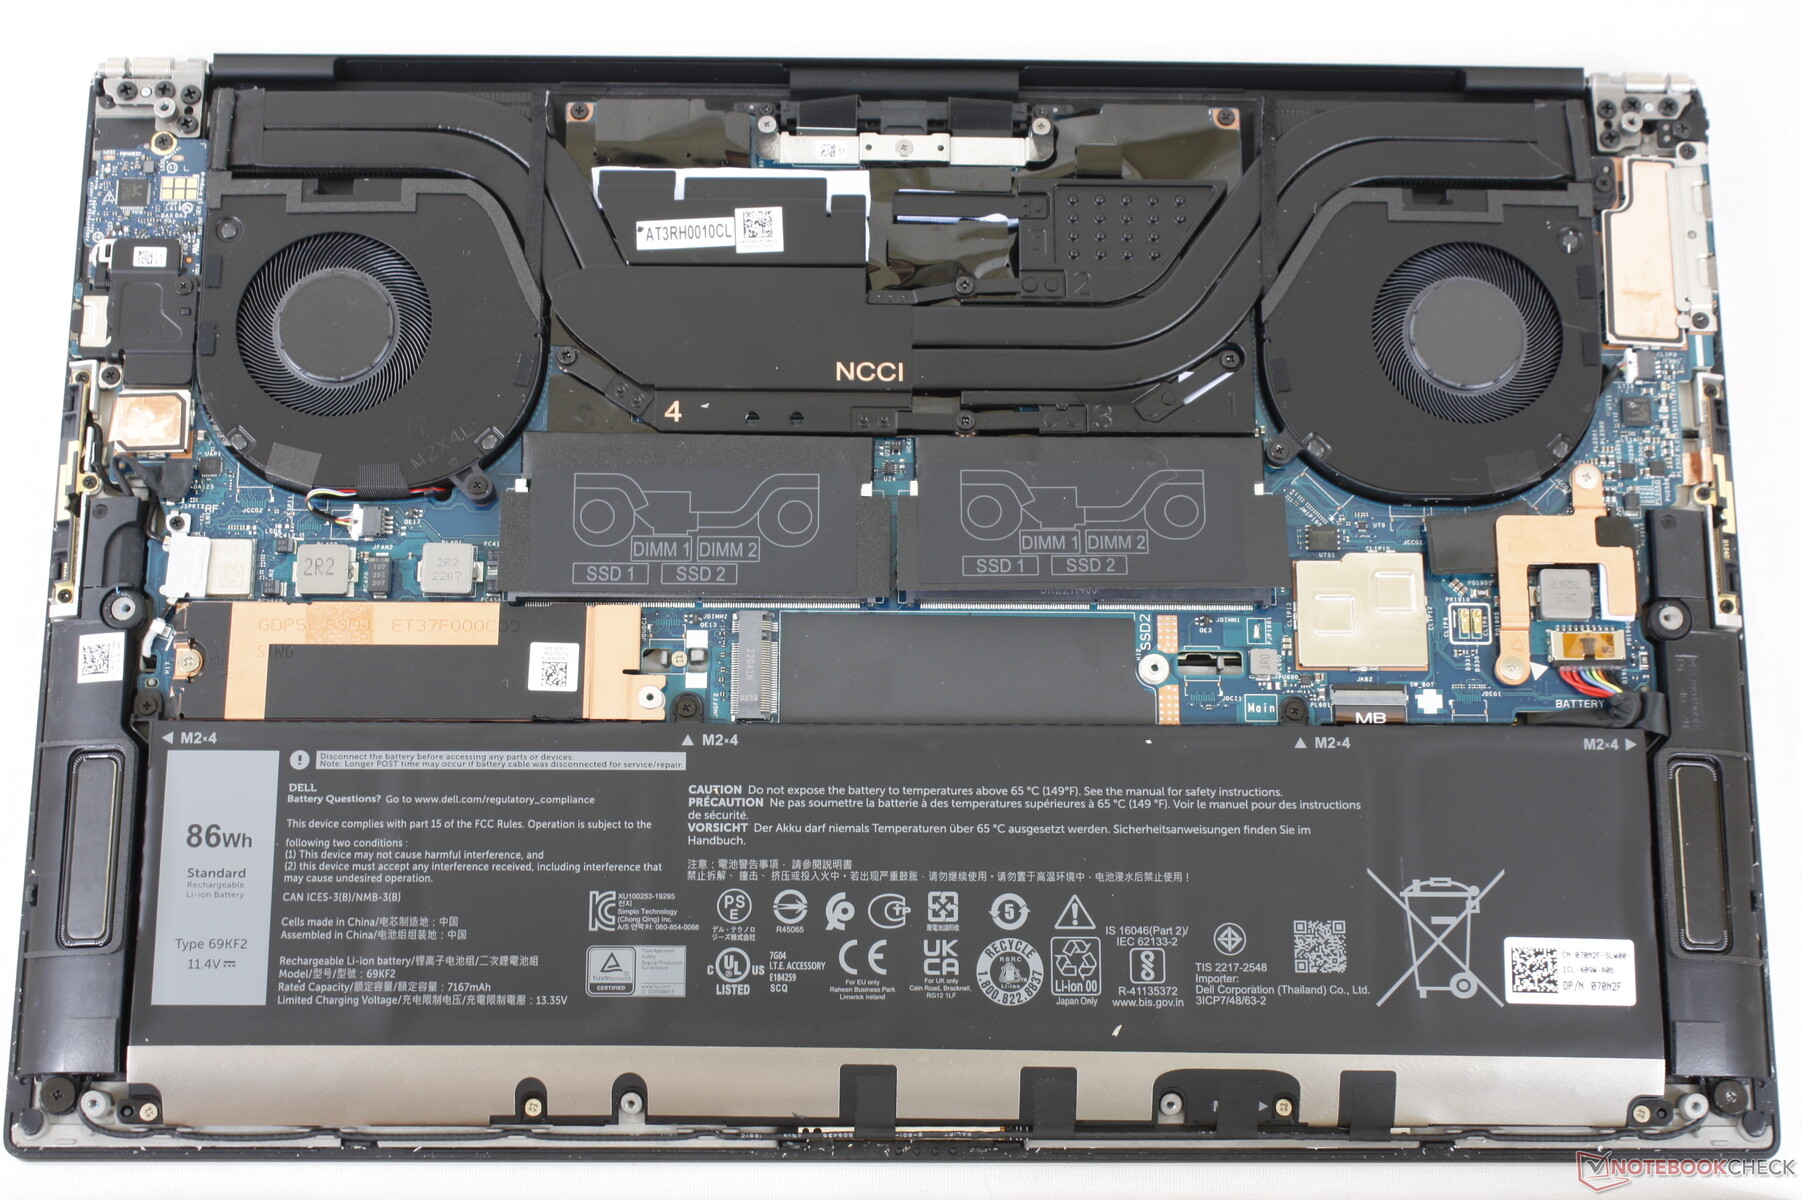
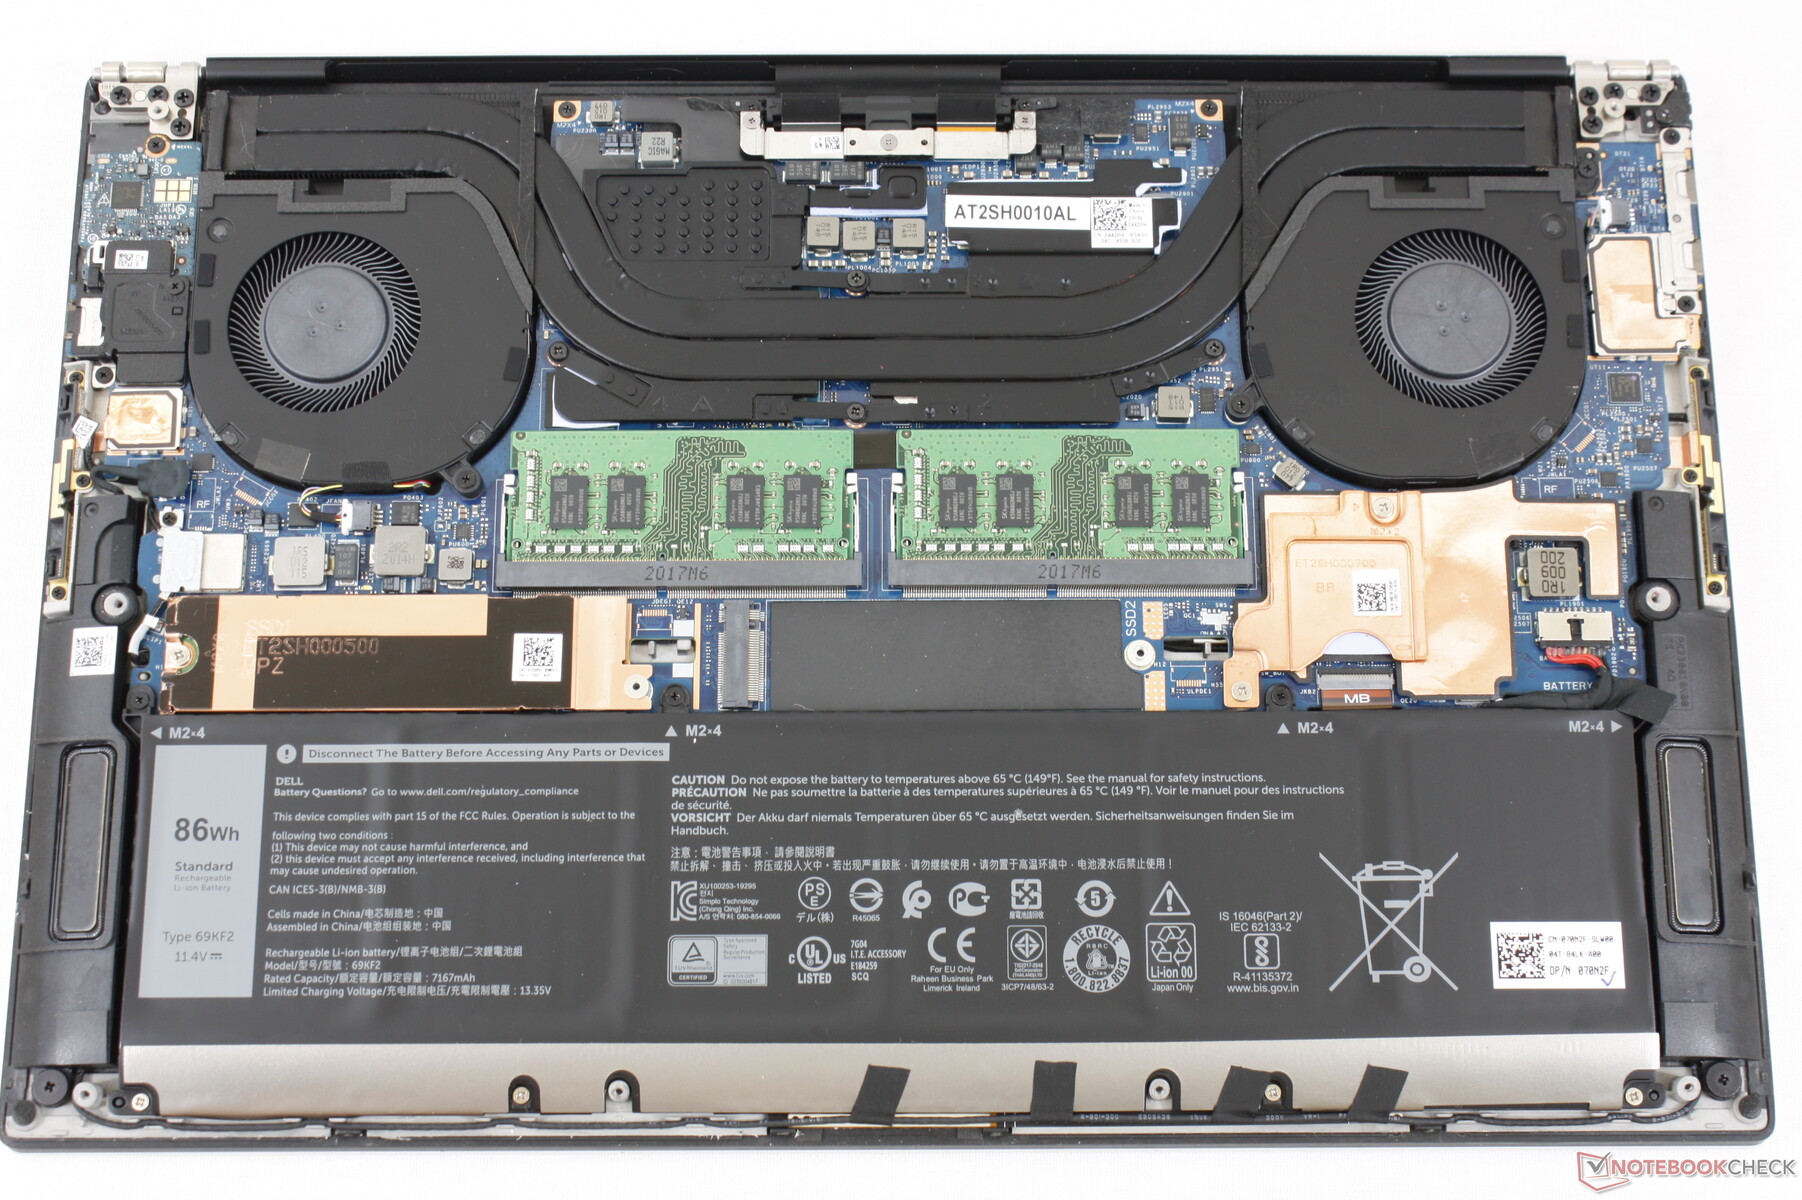
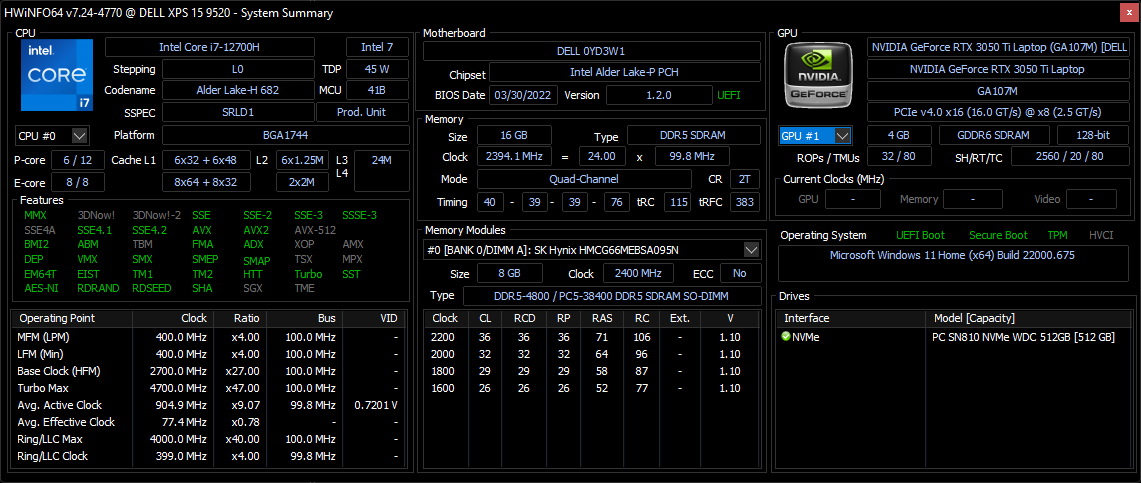
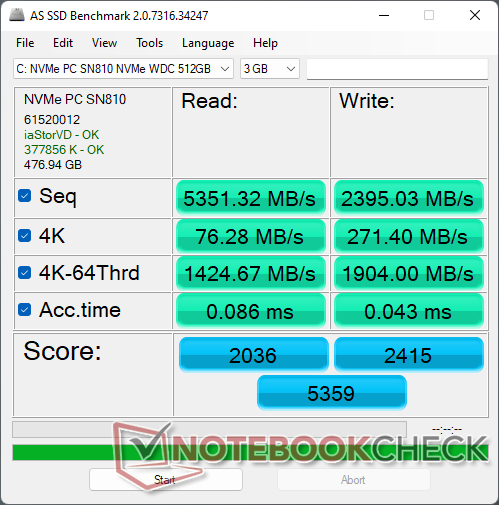
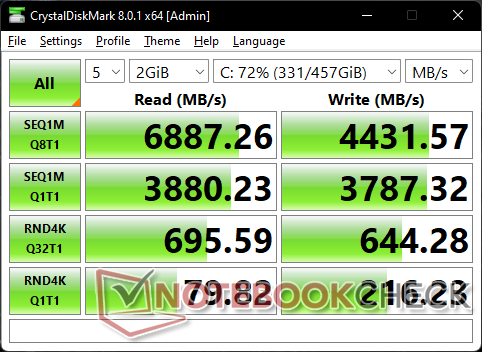
Dispositivos de almacenamiento: admite hasta dos SSD PCIe4 NVMe
Nuestra unidad de prueba viene con un PCIe4 x4 Western Digital SN810 NVMe SSD a diferencia de las soluciones PCIe3 x4 de los modelos anteriores. Las tasas de transferencia son significativamente más rápidas como resultado, hasta ~6700 MB/s o más del doble que la mayoría de unidades PCIe3. El SN810 de nuestra unidad no tuvo problemas para mantener su tasa de transferencia máxima durante periodos prolongados cuando se estresó con DiskSpd, lo que sugiere una excelente disipación del calor.

* ... más pequeño es mejor
Disk Throttling: DiskSpd Read Loop, Queue Depth 8
Rendimiento de la GPU - GeForce RTX 3050 Ti por segundo año consecutivo
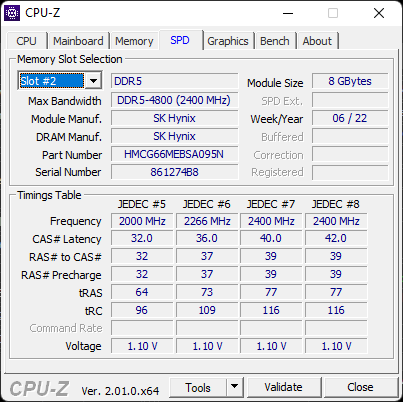
El XPS 15 9520 viene con una memoria RAM más rápida que la del XPS 15 9510 (DDR5-4800 frente a DDR4-3200), lo que debería llevar a un rendimiento gráfico ligeramente más rápido. Desgraciadamente, Dell ha reducido la velocidad de la GPU de 1530 MHz en el XPS 15 9510 a 1035 MHz en el 9520, por lo que se ha anulado cualquier ganancia de rendimiento potencial de la RAM más rápida GeForce RTX 3050 Ti los resultados de 3DMark entre el XPS 15 9510 y el 9520 son casi idénticos.
El rendimiento gráfico sigue siendo entre un 20 y un 30 por ciento más rápido que la GTX 1650 Ti en el antiguo XPS 15 9500.
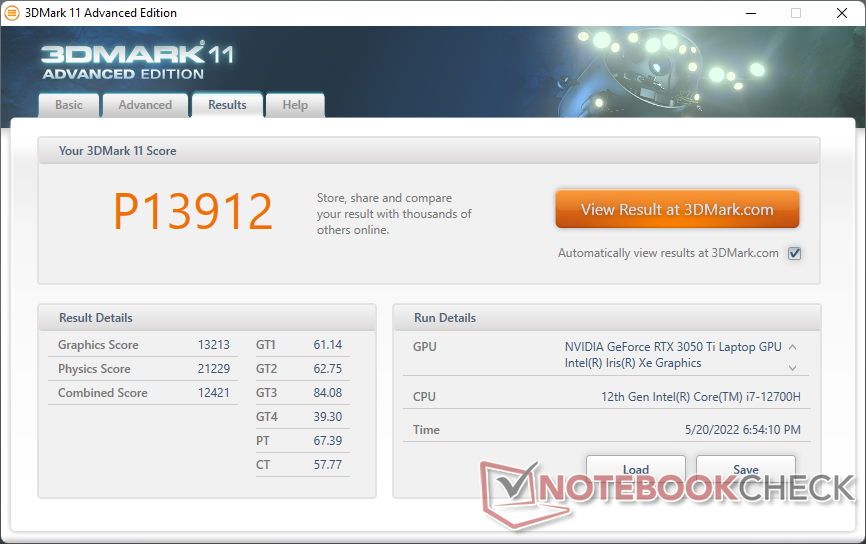
| 3DMark 11 Performance | 13912 puntos | |
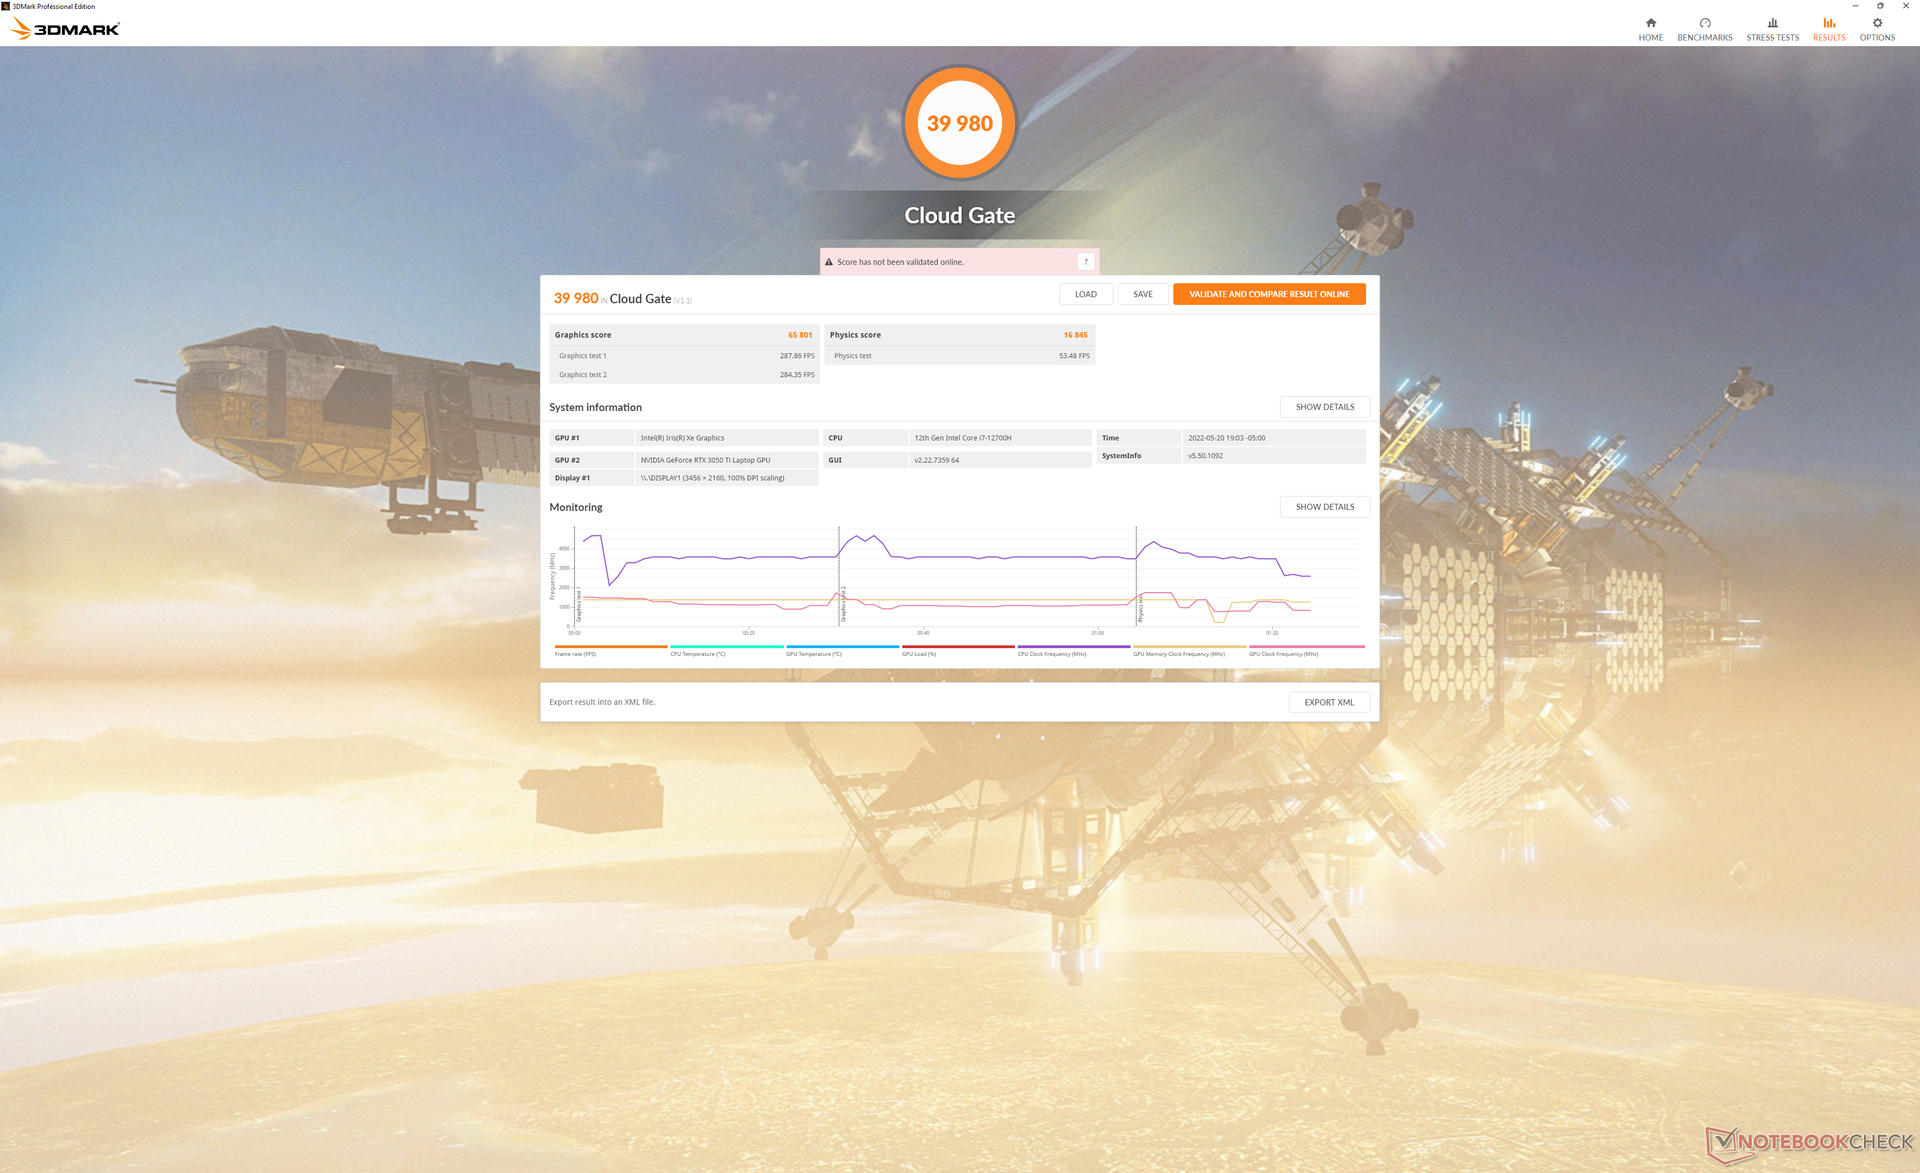
| 3DMark Cloud Gate Standard Score | 39980 puntos | |
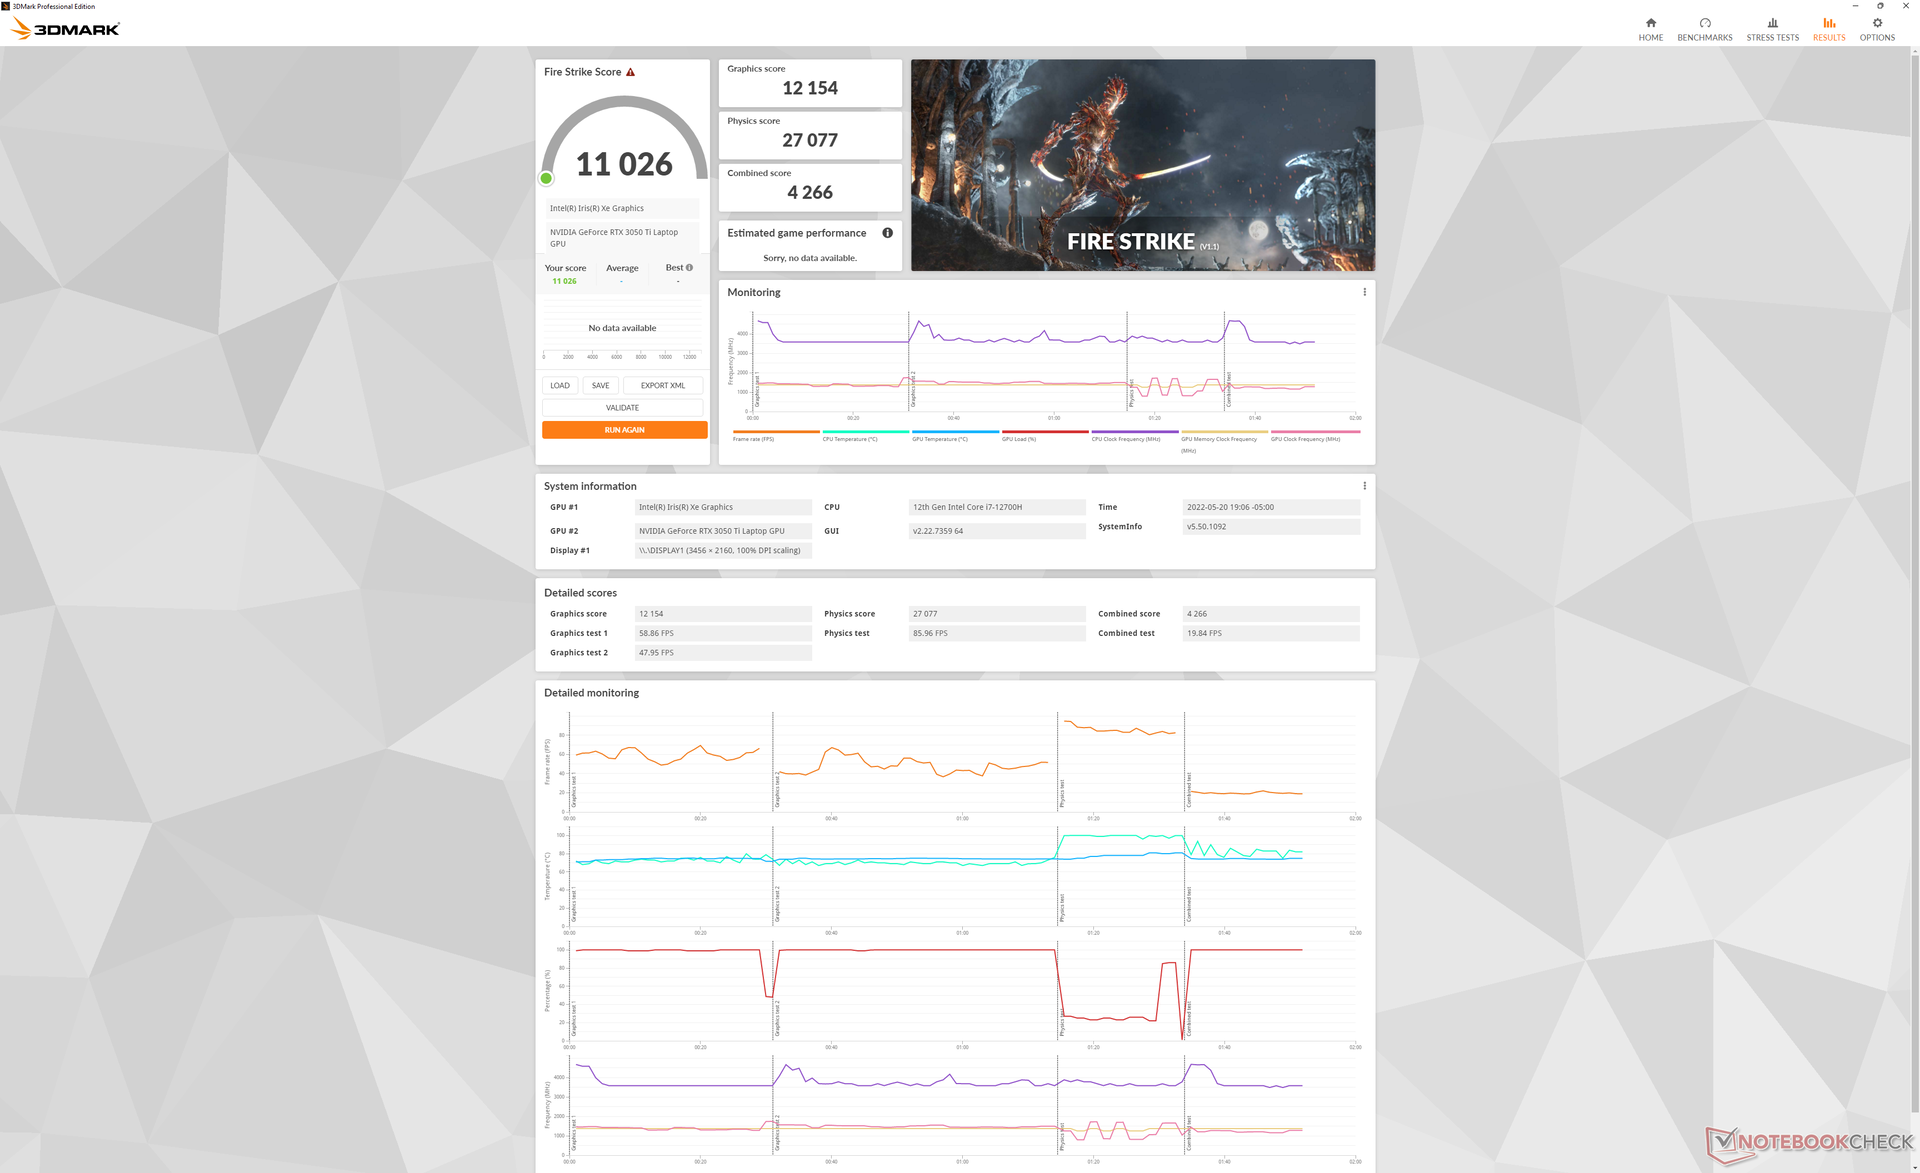
| 3DMark Fire Strike Score | 11026 puntos | |
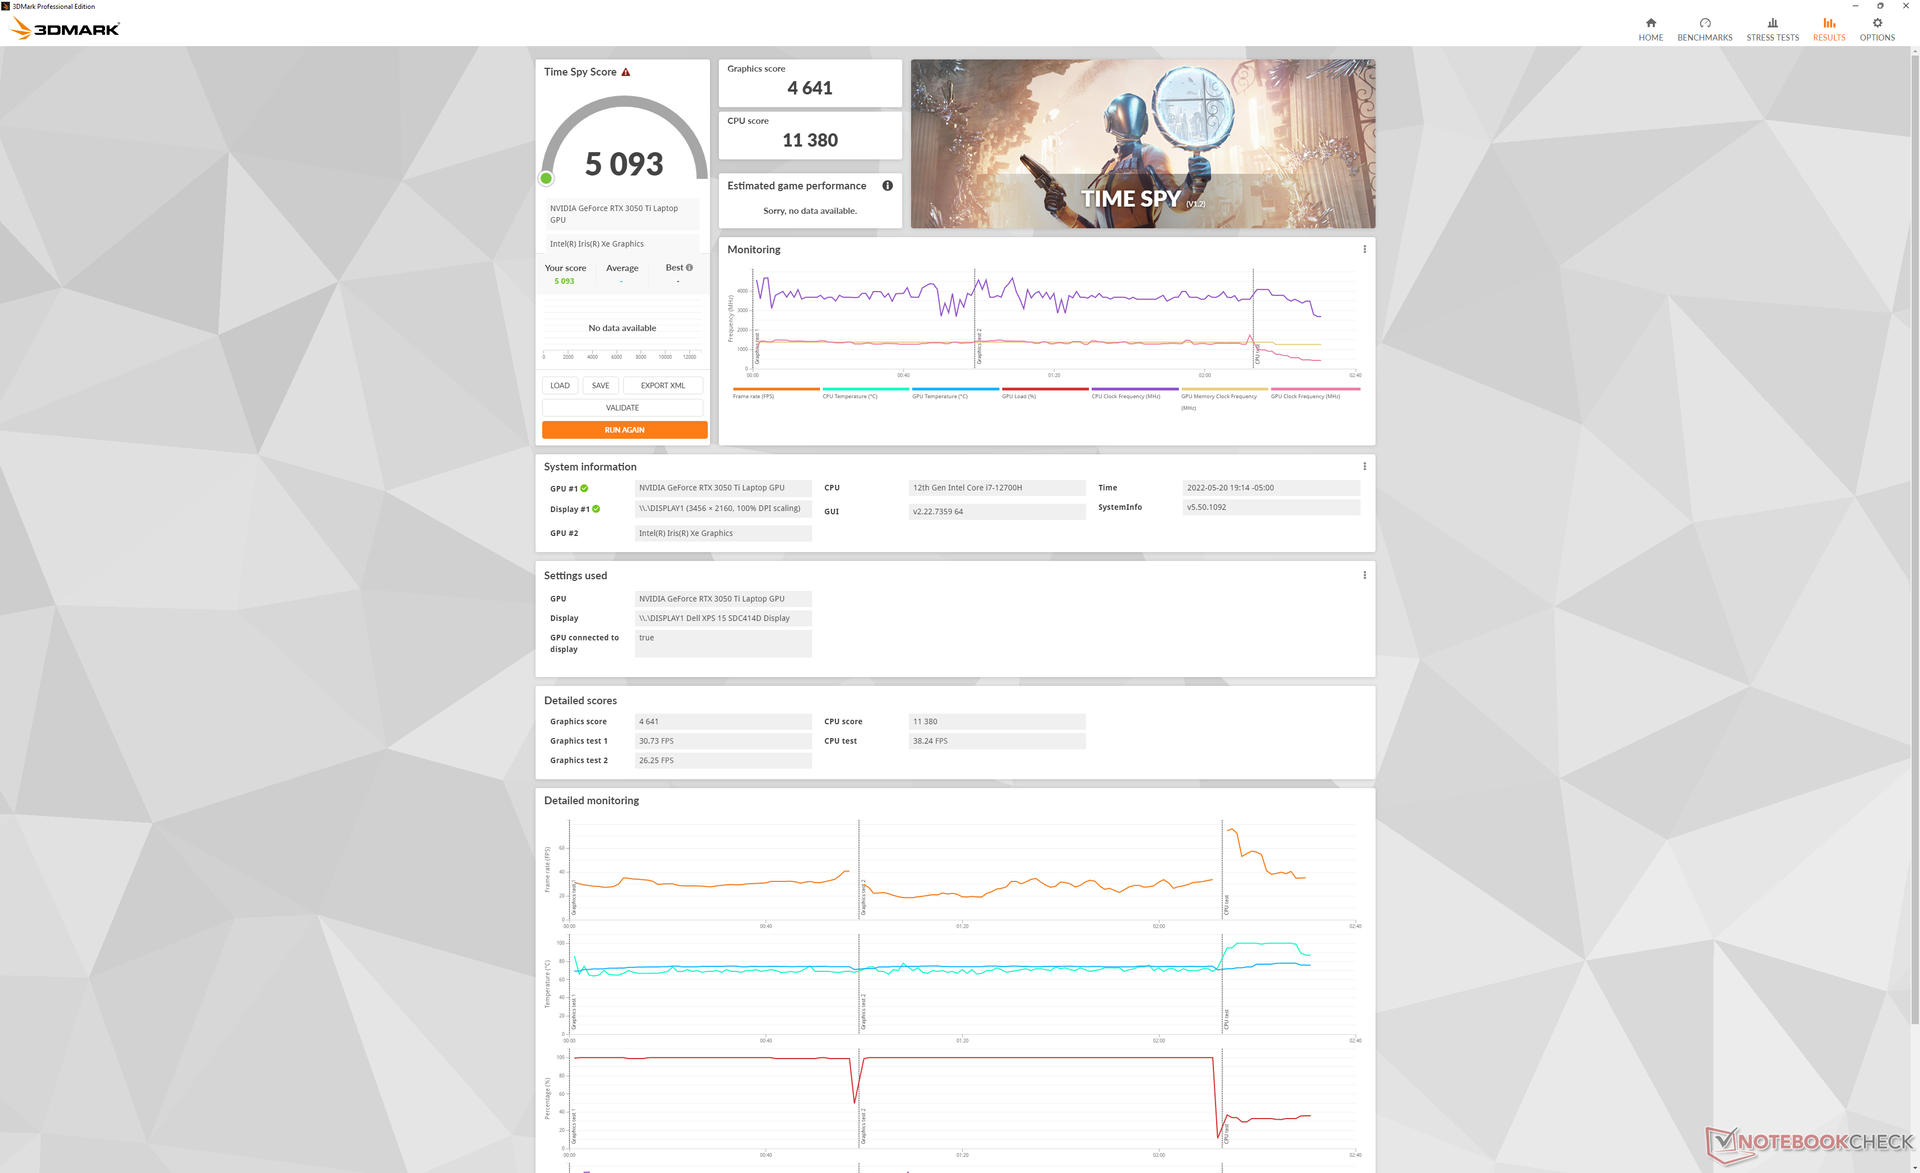
| 3DMark Time Spy Score | 5093 puntos | |
ayuda | ||
| Cyberpunk 2077 1.6 | |
| 1920x1080 Low Preset | |
| Asus Zenbook Pro 15 OLED UM535Q | |
| Medio NVIDIA GeForce RTX 3050 Ti Laptop GPU (48.2 - 81.9, n=9) | |
| Dell XPS 15 9520 RTX 3050 Ti | |
| 1920x1080 Medium Preset | |
| Asus Zenbook Pro 15 OLED UM535Q | |
| Medio NVIDIA GeForce RTX 3050 Ti Laptop GPU (47.4 - 67.4, n=9) | |
| Dell XPS 15 9520 RTX 3050 Ti | |
| 1920x1080 High Preset | |
| Medio NVIDIA GeForce RTX 3050 Ti Laptop GPU (39 - 51.5, n=9) | |
| Asus Zenbook Pro 15 OLED UM535Q | |
| Dell XPS 15 9520 RTX 3050 Ti | |
| 1920x1080 Ultra Preset | |
| Asus Zenbook Pro 15 OLED UM535Q | |
| Medio NVIDIA GeForce RTX 3050 Ti Laptop GPU (31 - 50.5, n=9) | |
| Dell XPS 15 9520 RTX 3050 Ti | |
Witcher 3 FPS Chart
| bajo | medio | alto | ultra | QHD | 4K | |
|---|---|---|---|---|---|---|
| GTA V (2015) | 185 | 181.3 | 90.3 | 49.9 | 37.4 | |
| The Witcher 3 (2015) | 226.5 | 127.1 | 62.4 | 34.2 | ||
| Dota 2 Reborn (2015) | 180.3 | 166.1 | 116.1 | 104.5 | 47.1 | |
| Final Fantasy XV Benchmark (2018) | 106.6 | 62.9 | 45.7 | 34.1 | ||
| X-Plane 11.11 (2018) | 137.6 | 117 | 100.6 | 73.7 | ||
| Strange Brigade (2018) | 206 | 109.6 | 91.1 | 79.4 | 60.4 | |
| Cyberpunk 2077 1.6 (2022) | 59.4 | 47.4 | 39.3 | 39.5 | 20.2 |
Emisiones
Ruido del sistema
El ruido de los ventiladores parece ser más silencioso que en los modelos XPS más antiguos cuando se someten a cargas similares. O, al menos, los ventiladores del 9520 tardan un poco más en aumentar las RPM cuando se introducen cargas exigentes. Al final de la primera escena del benchmark 3DMark 06, por ejemplo, el ruido de los ventiladores es de sólo 31 dB(A) comparado con los 36 dB(A) y 46 dB(A) de los XPS 15 9510 y 9500, respectivamente. El sistema sigue siendo más silencioso de lo esperado en la mayoría de las condiciones incluso cuando se pone en modo Ultra Performance.
Ruido
| Ocioso |
| 22.9 / 22.9 / 22.9 dB(A) |
| Carga |
| 30.9 / 44.7 dB(A) |
 | ||
30 dB silencioso 40 dB(A) audible 50 dB(A) ruidosamente alto |
||
min: | ||
| Dell XPS 15 9520 RTX 3050 Ti GeForce RTX 3050 Ti Laptop GPU, i7-12700H, WDC PC SN810 512GB | Dell XPS 15 9510 11800H RTX 3050 Ti OLED GeForce RTX 3050 Ti Laptop GPU, i7-11800H, Micron 2300 512GB MTFDHBA512TDV | Dell XPS 15 9500 Core i7 4K UHD GeForce GTX 1650 Ti Mobile, i7-10875H, SK Hynix PC611 512GB | HP Spectre X360 15-5ZV31AV GeForce MX250, i7-10510U, Intel SSD 660p 2TB SSDPEKNW020T8 | Asus Zenbook Pro 15 OLED UM535Q GeForce RTX 3050 Ti Laptop GPU, R9 5900HX, WDC PC SN730 SDBPNTY-1T00 | MSI Stealth 15M A11SEK GeForce RTX 2060 Max-Q, i7-1185G7, WDC PC SN530 SDBPNPZ-1T00 | |
|---|---|---|---|---|---|---|
| Noise | -2% | -23% | -17% | -7% | -34% | |
| apagado / medio ambiente * (dB) | 22.8 | 23.8 -4% | 28.4 -25% | 30.1 -32% | 22.8 -0% | 27.5 -21% |
| Idle Minimum * (dB) | 22.9 | 23.8 -4% | 28.4 -24% | 30.1 -31% | 22.9 -0% | 32.3 -41% |
| Idle Average * (dB) | 22.9 | 23.8 -4% | 28.4 -24% | 30.1 -31% | 22.9 -0% | 32.3 -41% |
| Idle Maximum * (dB) | 22.9 | 23.8 -4% | 28.4 -24% | 30.1 -31% | 22.9 -0% | 33.7 -47% |
| Load Average * (dB) | 30.9 | 36 -17% | 46 -49% | 30.1 3% | 33.2 -7% | 46.3 -50% |
| Witcher 3 ultra * (dB) | 37.8 | 36 5% | 42 -11% | 39.7 -5% | 47.3 -25% | 41.3 -9% |
| Load Maximum * (dB) | 44.7 | 38.2 15% | 47.1 -5% | 42 6% | 52.8 -18% | 56.2 -26% |
* ... más pequeño es mejor
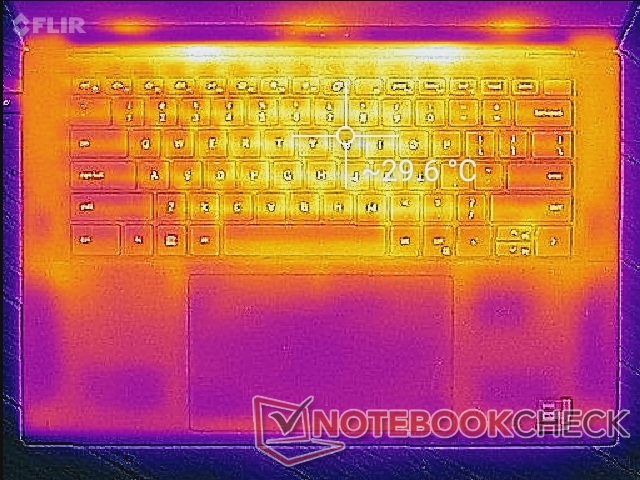
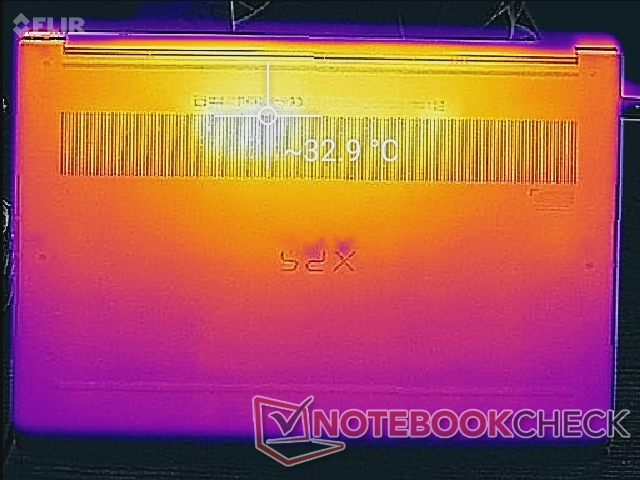
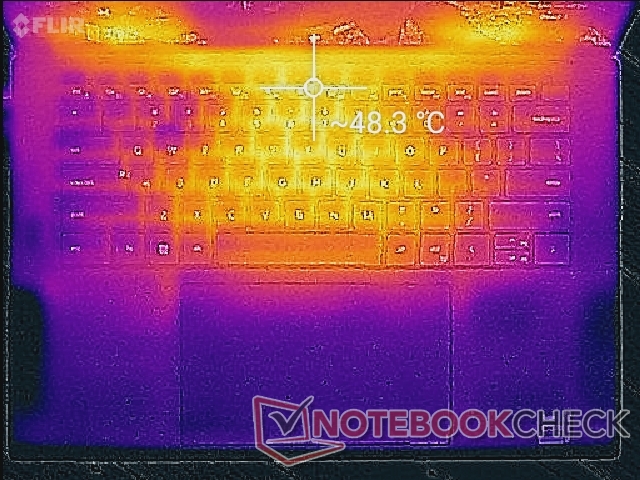
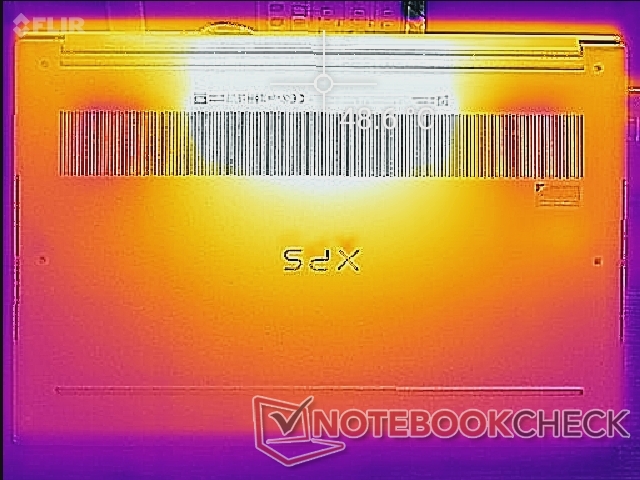
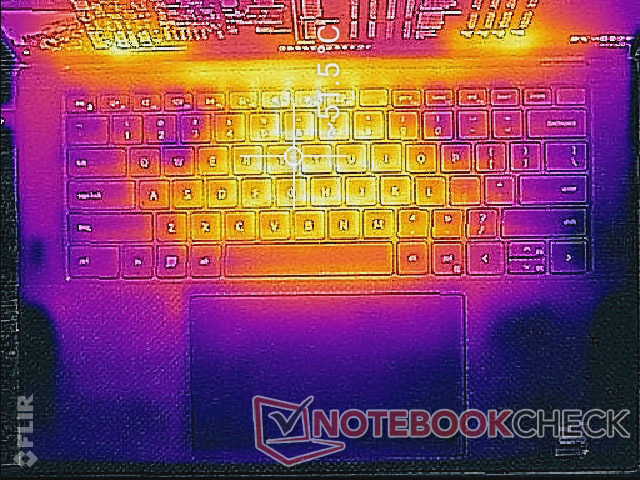
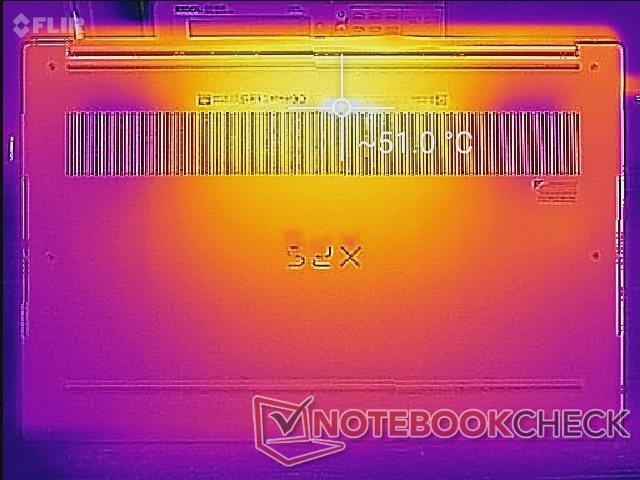
Temperatura - Ligeramente más cálida en general
Las temperaturas de la superficie bajo carga son más cálidas que las que registramos en los antiguos modelos XPS 15 9510 y 9500. Los puntos calientes pueden alcanzar de 51 C a 52 C en la parte superior e inferior, respectivamente, comparado con los 44 C a 47 C de las versiones anteriores. Los puntos calientes de competidores como el Zenbook Pro 15 OLED son más fríos por unos pocos grados C cuando están bajo condiciones similares. El XPS 9520 es uno de los portátiles de 15.6 pulgadas con Core H más pequeños del mercado, después de todo.
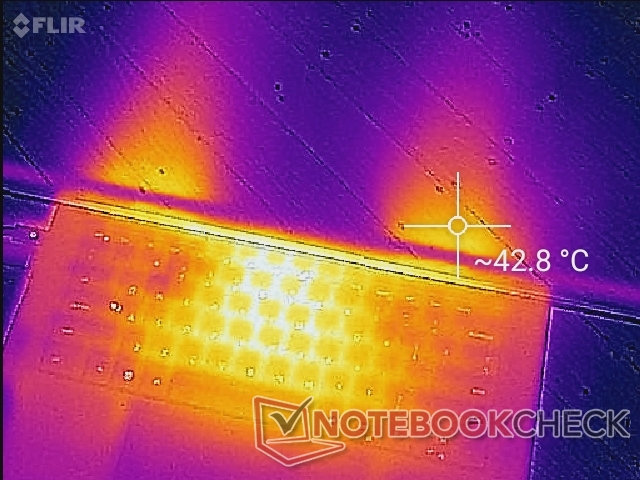
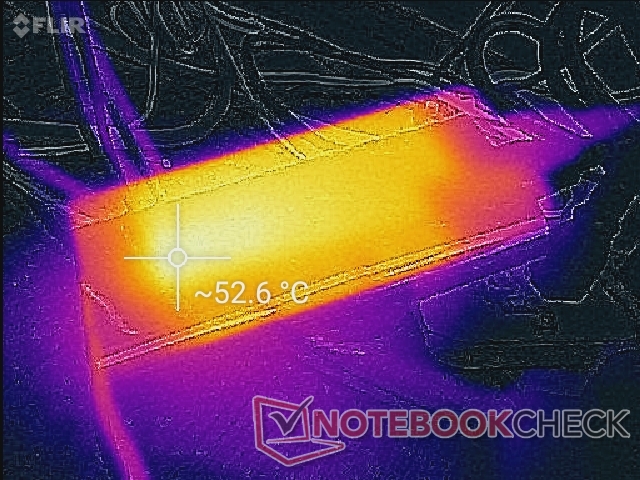
(-) La temperatura máxima en la parte superior es de 51.4 °C / 125 F, frente a la media de 36.8 °C / 98 F, que oscila entre 21 y 71 °C para la clase Multimedia.
(-) El fondo se calienta hasta un máximo de 51 °C / 124 F, frente a la media de 39.1 °C / 102 F
(+) En reposo, la temperatura media de la parte superior es de 27.8 °C / 82# F, frente a la media del dispositivo de 31.3 °C / 88 F.
(±) Jugando a The Witcher 3, la temperatura media de la parte superior es de 35.2 °C / 95 F, frente a la media del dispositivo de 31.3 °C / 88 F.
(+) El reposamanos y el panel táctil están a una temperatura inferior a la de la piel, con un máximo de 31.6 °C / 88.9 F y, por tanto, son fríos al tacto.
(-) La temperatura media de la zona del reposamanos de dispositivos similares fue de 28.7 °C / 83.7 F (-2.9 °C / -5.2 F).
| Dell XPS 15 9520 RTX 3050 Ti Intel Core i7-12700H, NVIDIA GeForce RTX 3050 Ti Laptop GPU | Dell XPS 15 9510 11800H RTX 3050 Ti OLED Intel Core i7-11800H, NVIDIA GeForce RTX 3050 Ti Laptop GPU | Dell XPS 15 9500 Core i7 4K UHD Intel Core i7-10875H, NVIDIA GeForce GTX 1650 Ti Mobile | HP Spectre X360 15-5ZV31AV Intel Core i7-10510U, NVIDIA GeForce MX250 | Asus Zenbook Pro 15 OLED UM535Q AMD Ryzen 9 5900HX, NVIDIA GeForce RTX 3050 Ti Laptop GPU | MSI Stealth 15M A11SEK Intel Core i7-1185G7, NVIDIA GeForce RTX 2060 Max-Q | |
|---|---|---|---|---|---|---|
| Heat | 13% | 3% | 17% | -1% | 10% | |
| Maximum Upper Side * (°C) | 51.4 | 45.5 11% | 44 14% | 47 9% | 36 30% | 47.2 8% |
| Maximum Bottom * (°C) | 51 | 44.2 13% | 48.8 4% | 47.4 7% | 47.2 7% | 47.4 7% |
| Idle Upper Side * (°C) | 30 | 27 10% | 33 -10% | 22.8 24% | 37 -23% | 27.2 9% |
| Idle Bottom * (°C) | 33 | 26.7 19% | 32.4 2% | 23.6 28% | 39.2 -19% | 28.2 15% |
* ... más pequeño es mejor
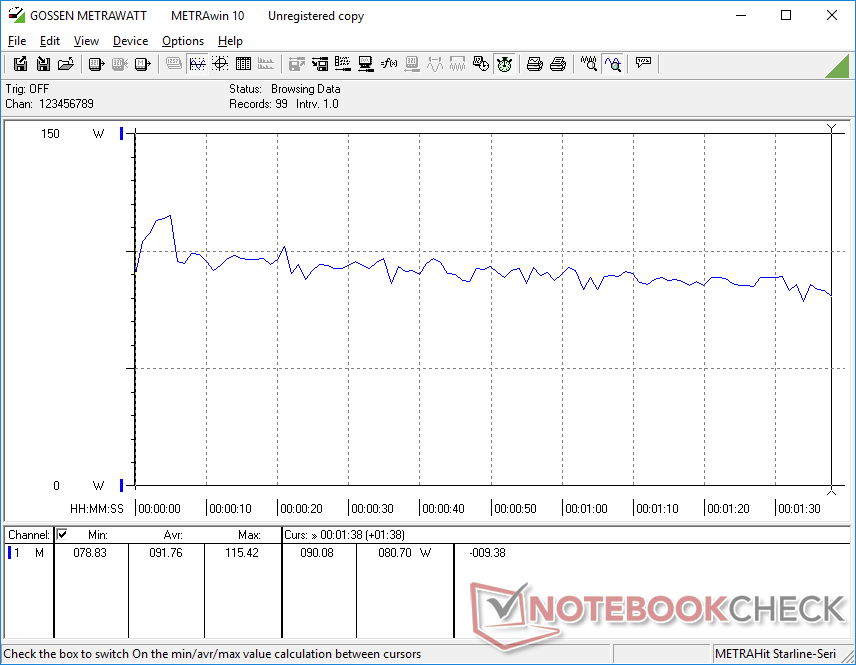
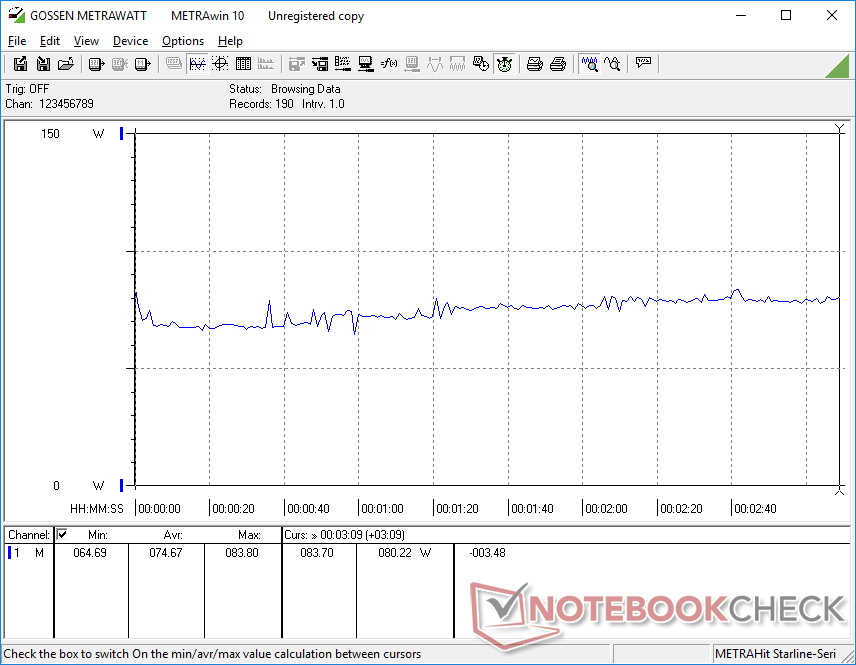
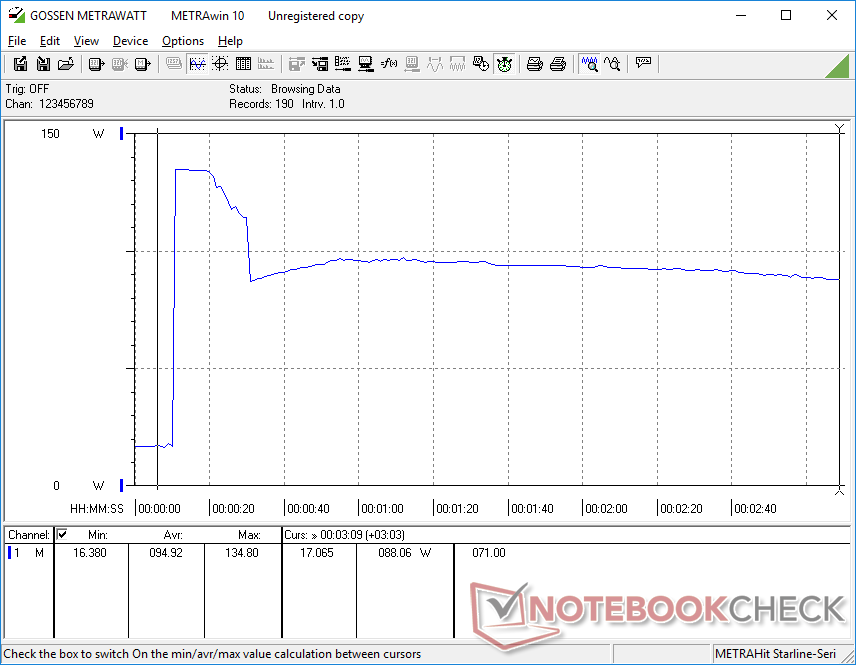
Prueba de esfuerzo
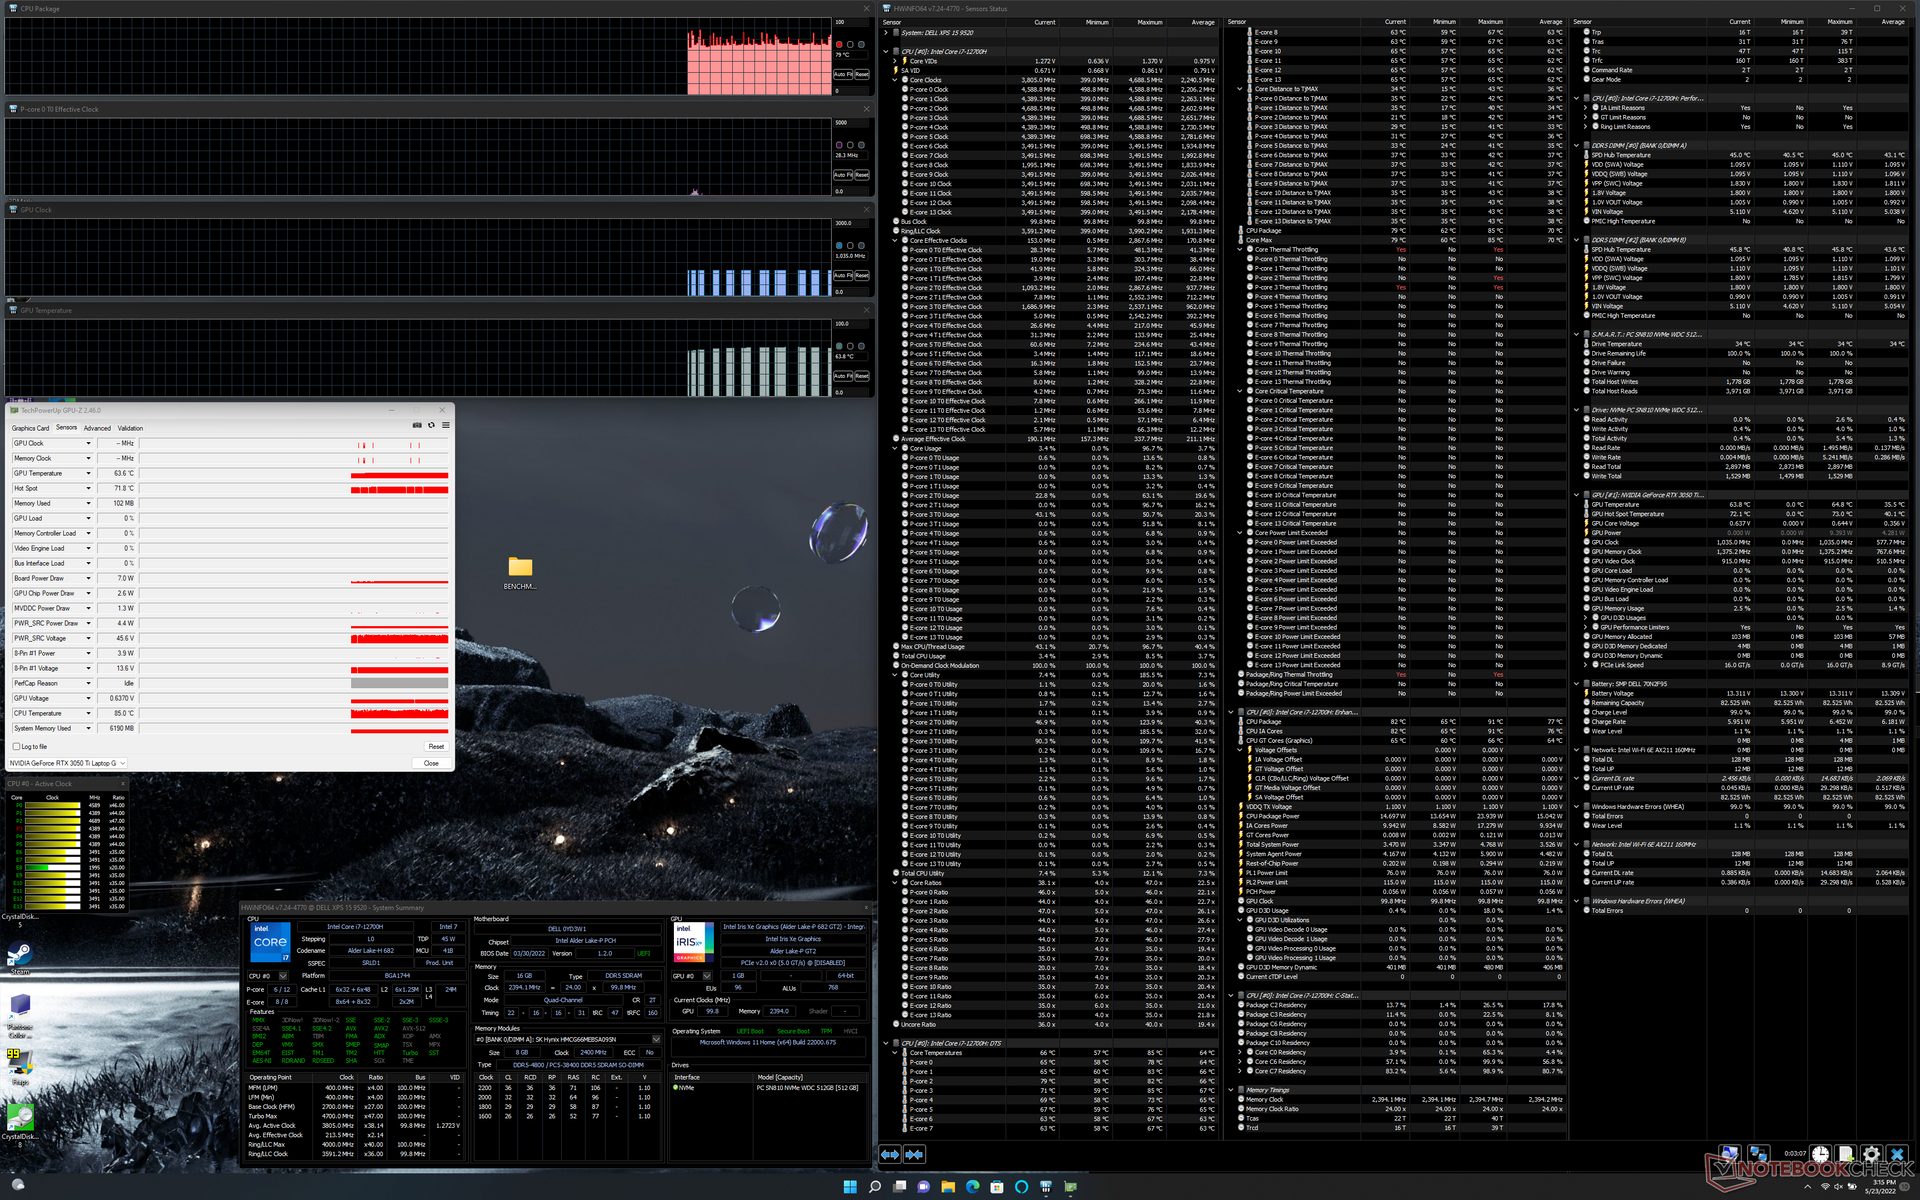
Cuando se estresa bajo Prime95, la CPU aumenta hasta 81 W, 100 C y 3,3 GHz durante los primeros 10 segundos más o menos antes de caer rápidamente y estabilizarse en 45 W, 85 C y 2,5 GHz para mantener las temperaturas bajo control. Si se ejecuta esta misma prueba en el XPS 15 9500, la temperatura estable de la CPU sería de 73 C en comparación. Por lo tanto, parece que el XPS 15 9520 está funcionando más caliente que sus predecesores con el fin de extraer más rendimiento del procesador del mismo diseño general del chasis.
La velocidad de reloj de la GPU, el consumo de energía y la temperatura se estabilizarían en 1477 MHz, 46 W y 74 C, respectivamente, cuando se ejecuta Witcher 3 en el modo de Ultra Rendimiento. Si se ejecuta en el modo optimizado, las velocidades de reloj y las temperaturas son ligeramente inferiores, como se muestra en la tabla siguiente, y el consumo de energía es menor, de 41 W. Los usuarios deben ejecutar el sistema en el modo Ultra Performance si quieren extraer el máximo rendimiento posible de la GPU. La ejecución de esta misma prueba en el XPS 15 9500 con la GeForce GTX 1650 Ti, más lenta, daría como resultado temperaturas similares en la CPU y la GPU.
Funcionar con batería limita el rendimiento. Una prueba de Fire Strike en baterías devolvería puntuaciones de Física y Gráficos de 9450 y 8332 puntos, respectivamente, comparado con 27077 y 12154 puntos cuando está conectado a la red eléctrica.
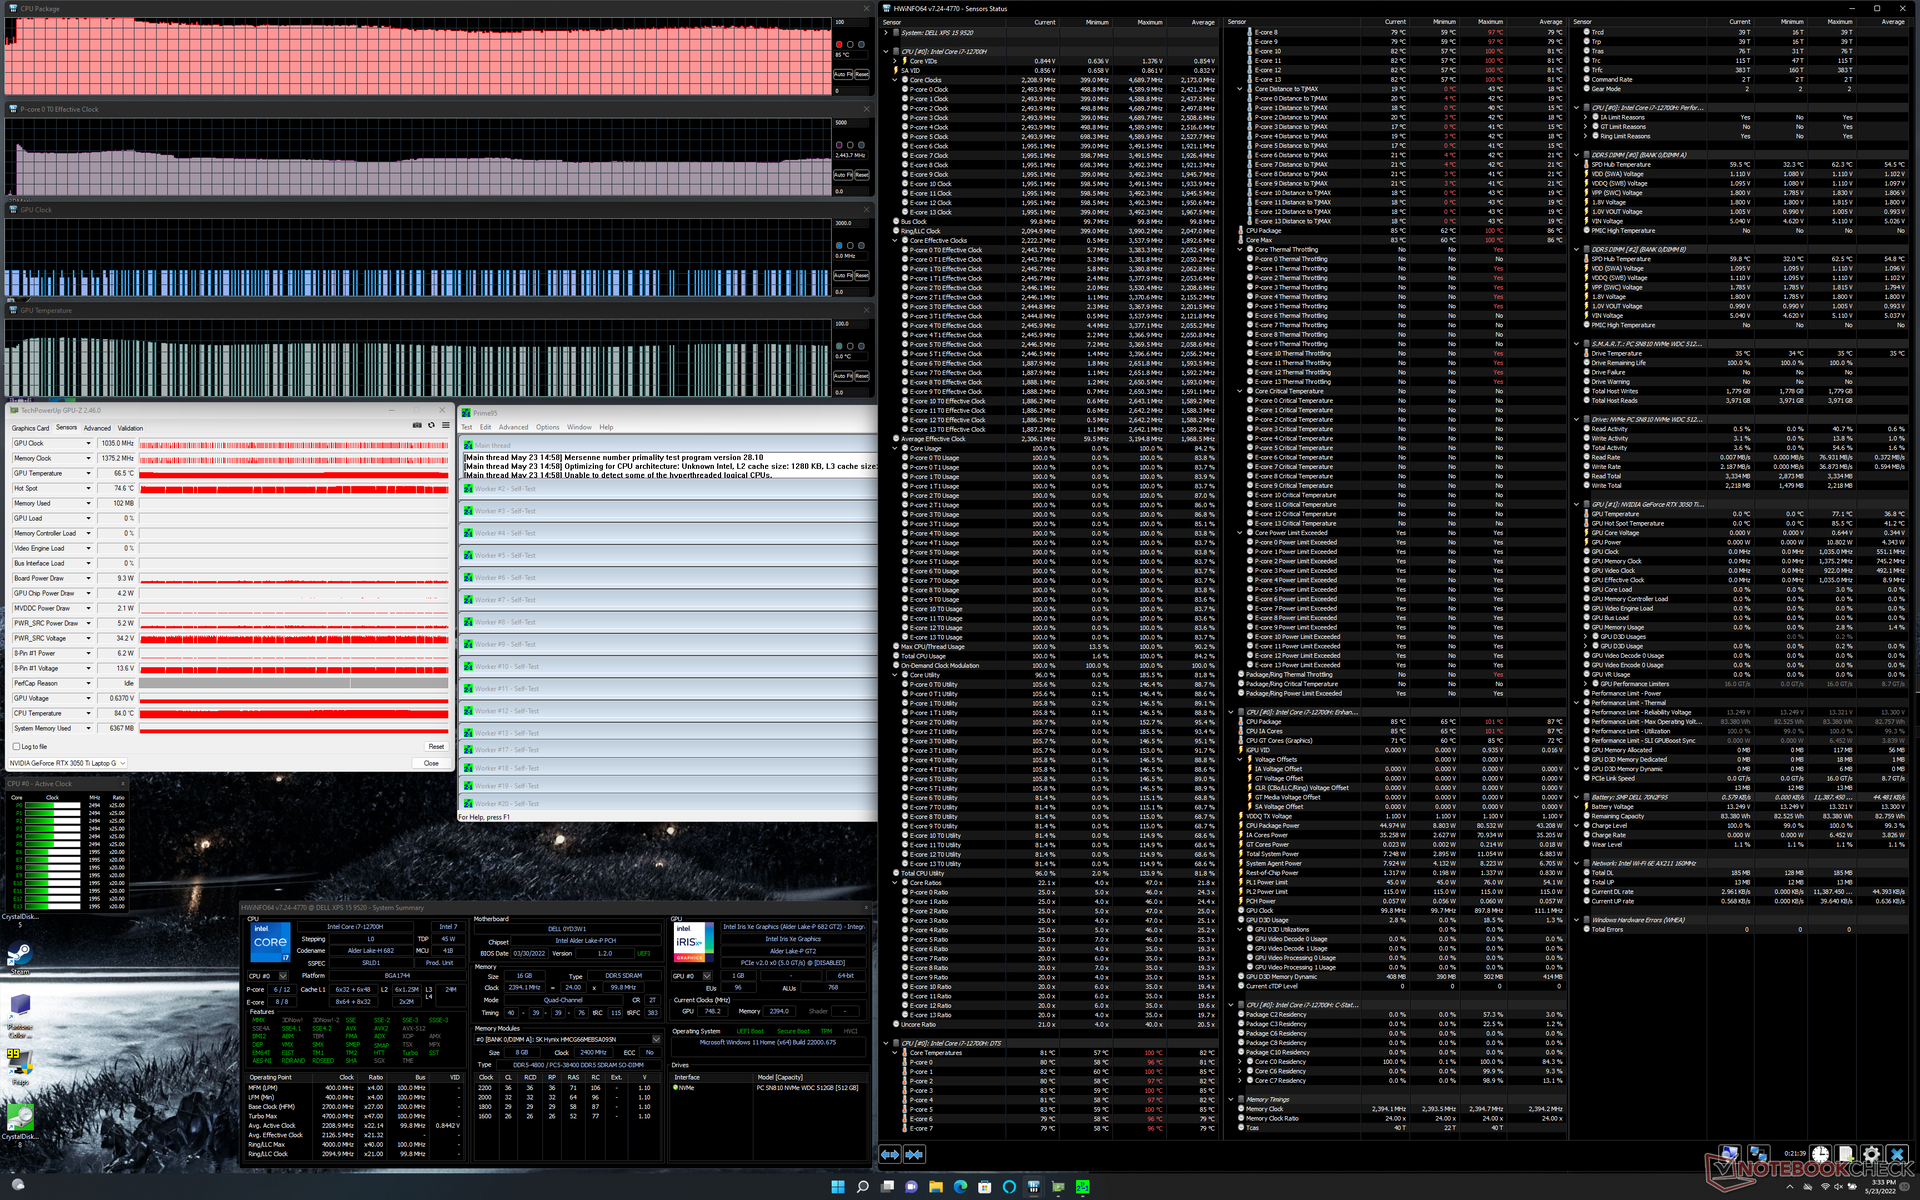
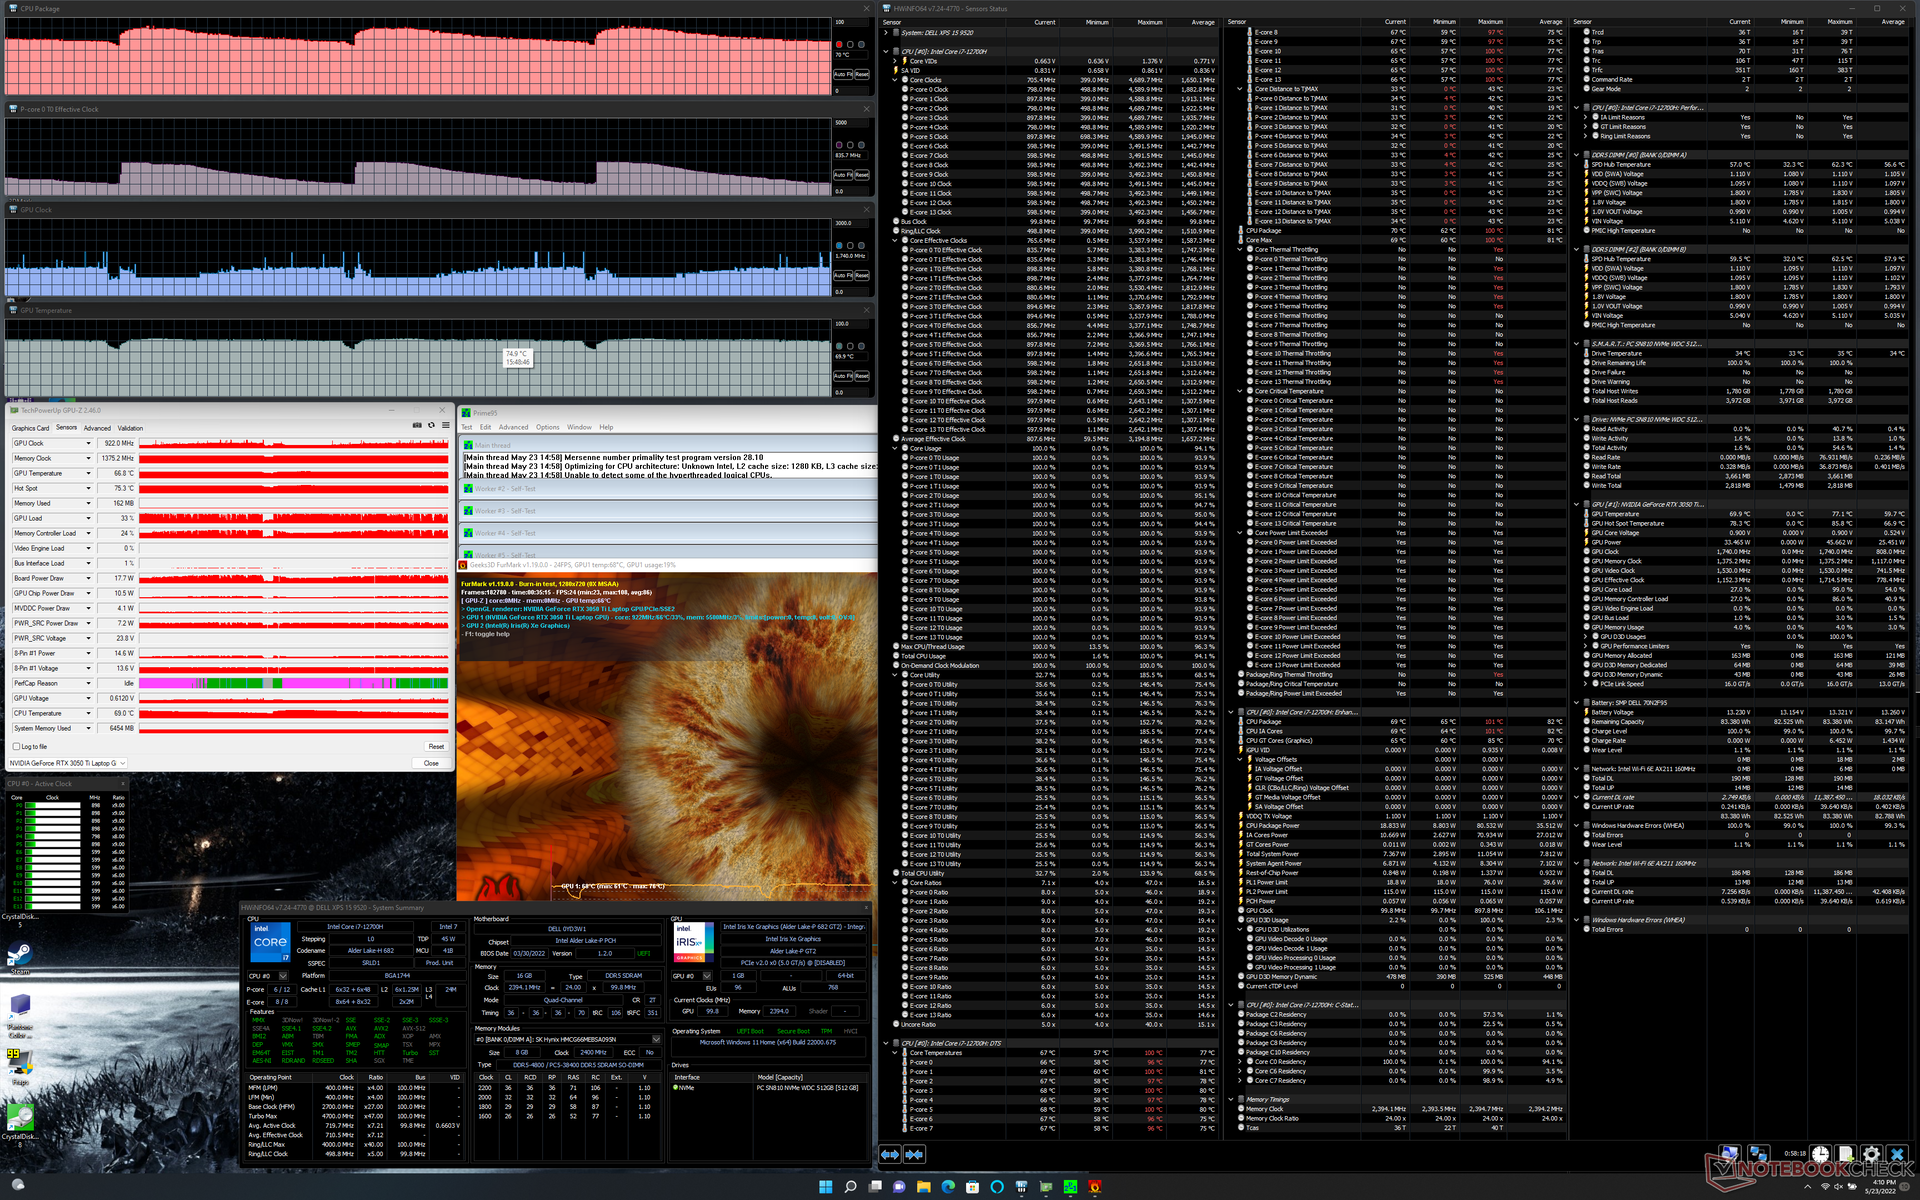
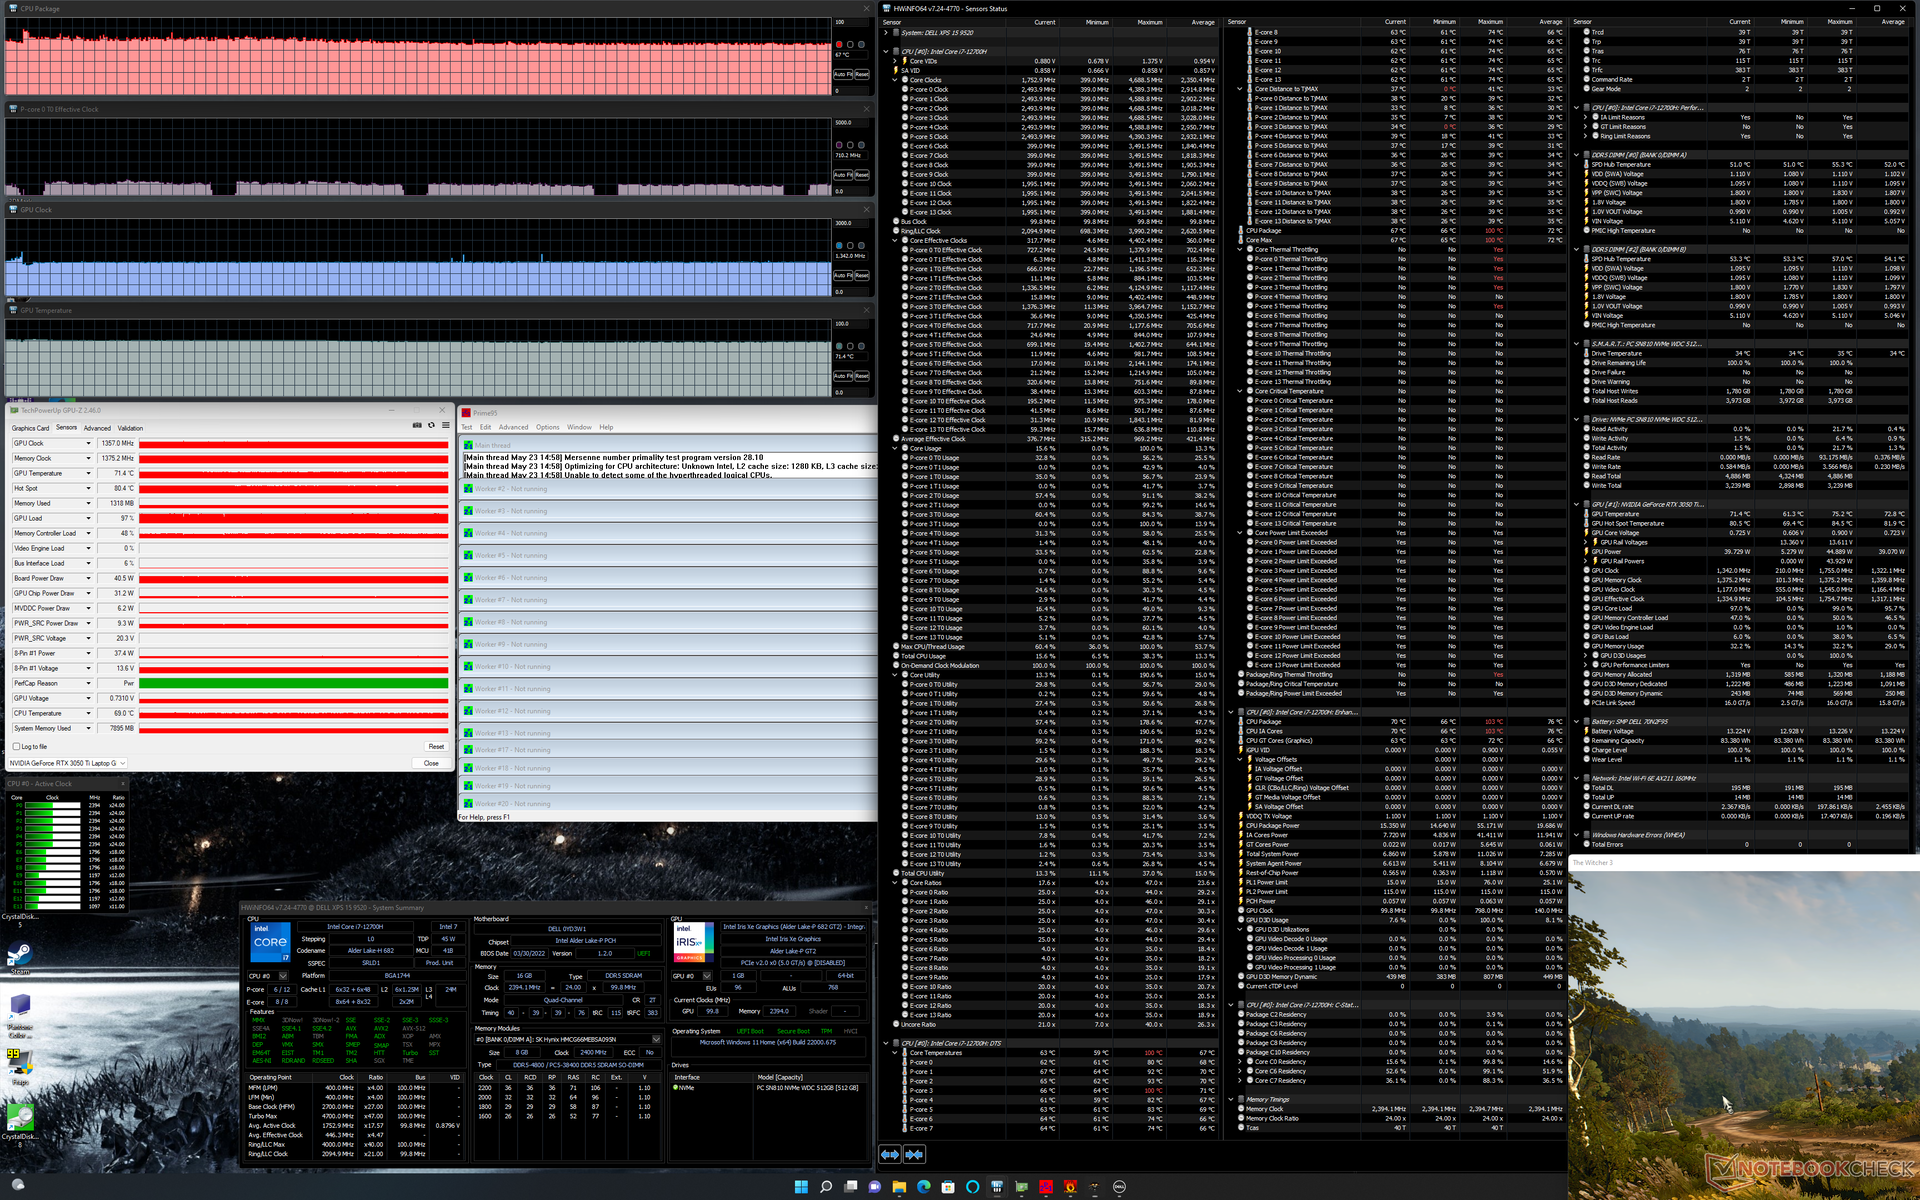
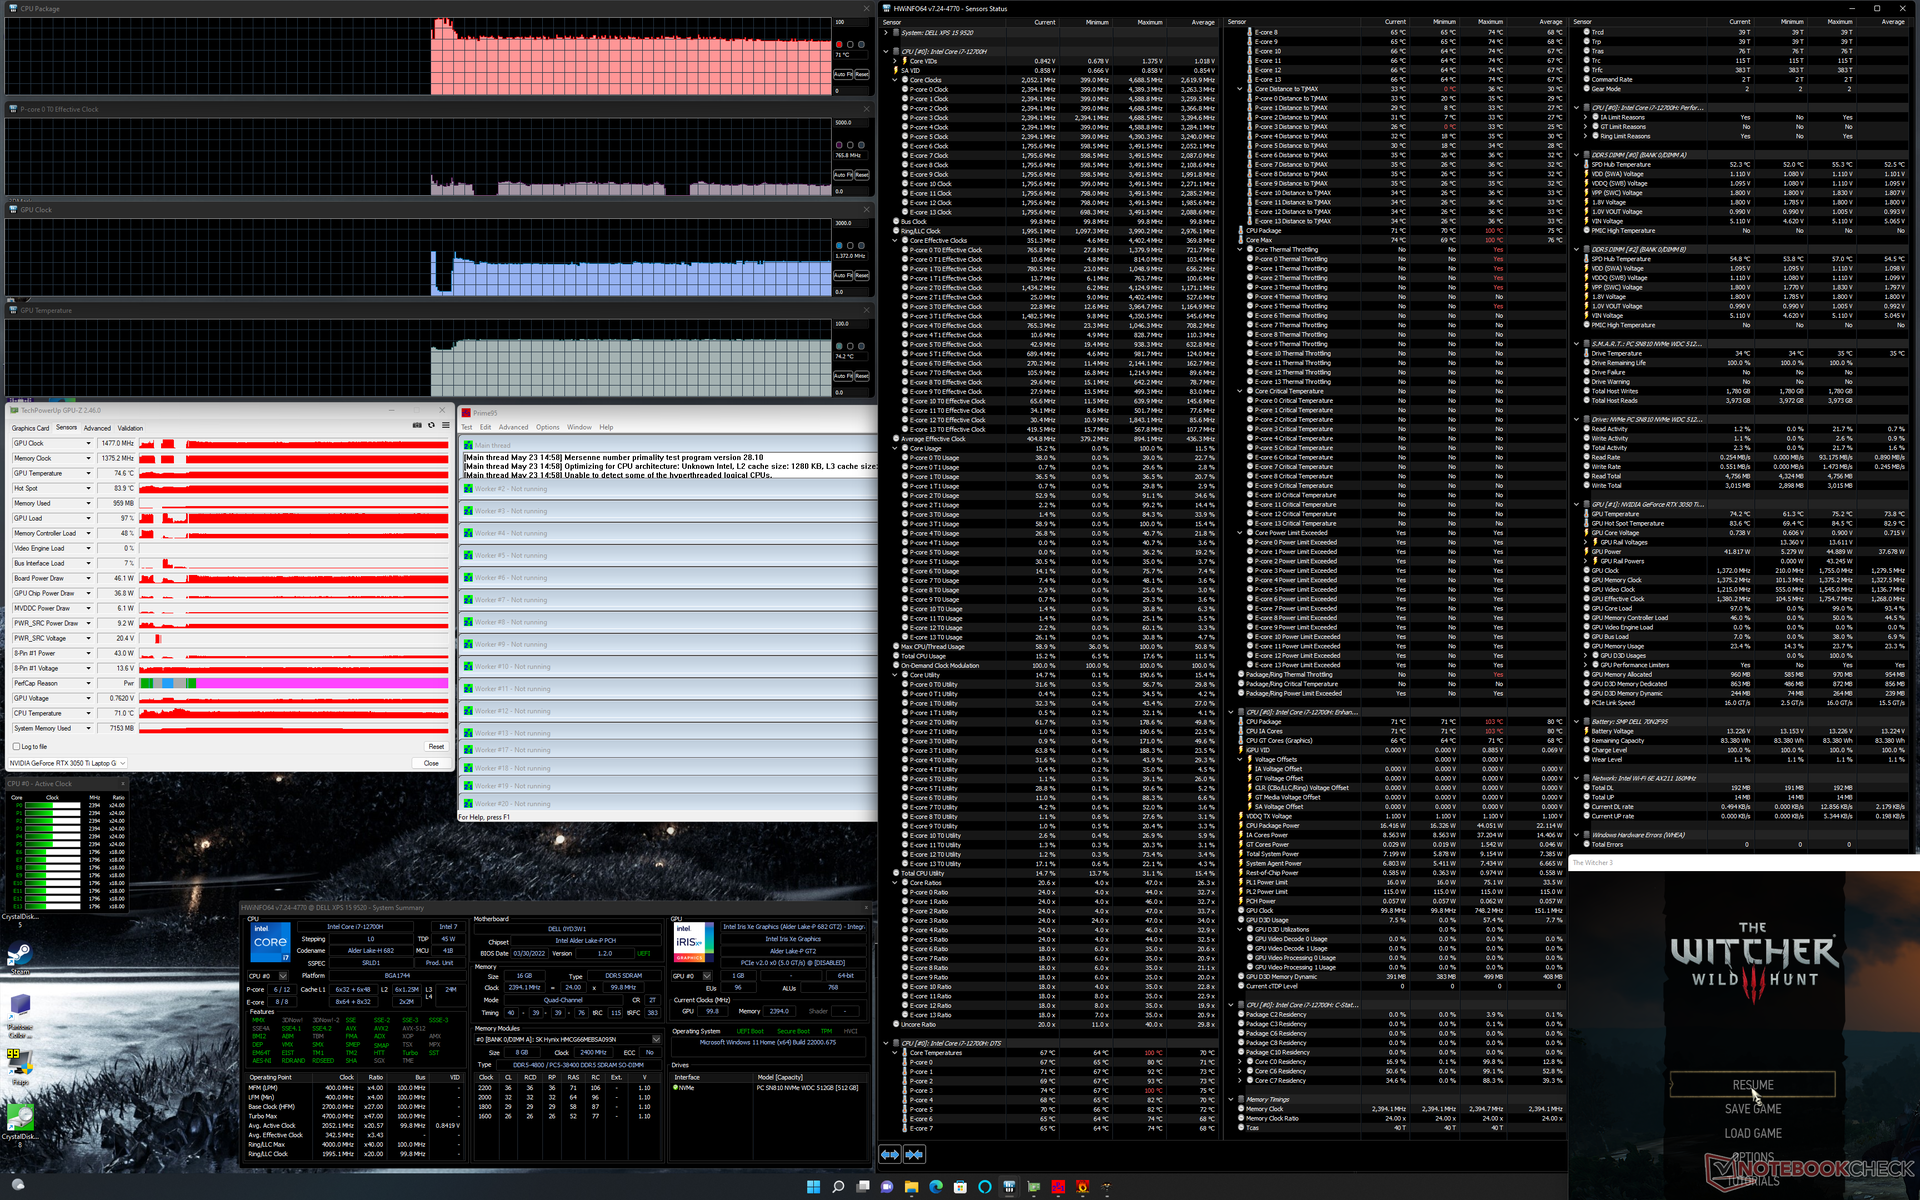
| Reloj dela CPU (GHz) | Reloj de la GPU (MHz) | Temperatura media dela CPU (°C) | Temperatura media de la GPU (°C) | |
| Sistema en reposo | -- | -- | 79 | 64 |
| Prime95Stress | 2.4 | 85 | -- | 67 |
| Prime95+ FurMarkStress | 0,8 - 2,3 | 700 - 1100 | 79 - 86 | 62 - 75 |
| Witcher 3 Estrés (modoequilibrado) | 0,7 | 1357 | 67 | 71 |
| Witcher 3 Estrés (modorendimiento) | 0,8 | 1477 | 71 | 74 |
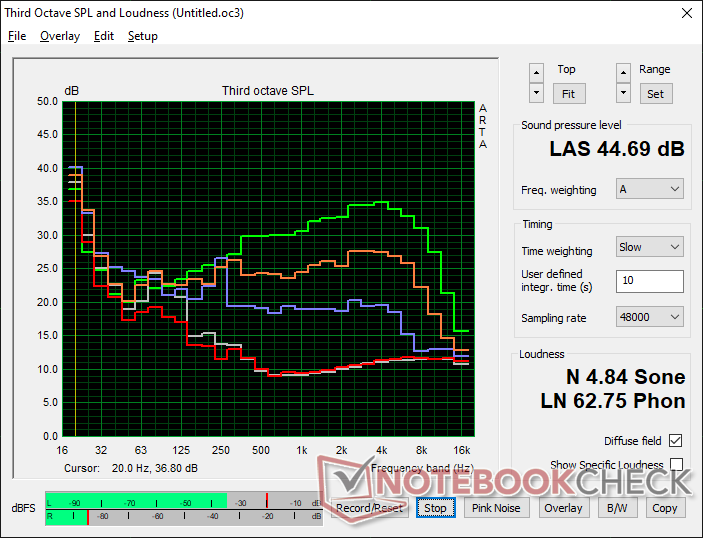
Altavoces
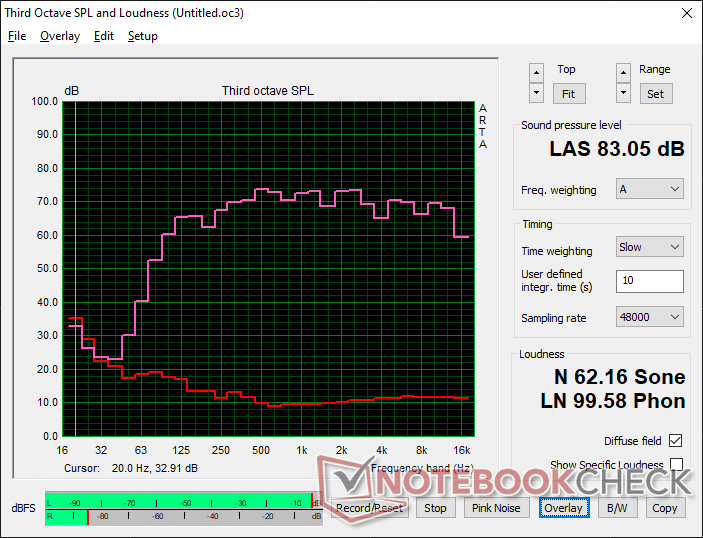
Dell XPS 15 9520 RTX 3050 Ti análisis de audio
(+) | los altavoces pueden reproducir a un volumen relativamente alto (#83.1 dB)
Graves 100 - 315 Hz
(+) | buen bajo - sólo 4.4% lejos de la mediana
(+) | el bajo es lineal (6.8% delta a la frecuencia anterior)
Medios 400 - 2000 Hz
(+) | medios equilibrados - a sólo 2.6% de la mediana
(+) | los medios son lineales (4.1% delta a la frecuencia anterior)
Altos 2 - 16 kHz
(+) | máximos equilibrados - a sólo 1.9% de la mediana
(+) | los máximos son lineales (5.4% delta a la frecuencia anterior)
Total 100 - 16.000 Hz
(+) | el sonido global es lineal (6.4% de diferencia con la mediana)
En comparación con la misma clase
» 4% de todos los dispositivos probados de esta clase eran mejores, 1% similares, 95% peores
» El mejor tuvo un delta de 5%, la media fue 17%, el peor fue ###max##%
En comparación con todos los dispositivos probados
» 1% de todos los dispositivos probados eran mejores, 0% similares, 99% peores
» El mejor tuvo un delta de 4%, la media fue 23%, el peor fue ###max##%
Apple MacBook Pro 16 2021 M1 Pro análisis de audio
(+) | los altavoces pueden reproducir a un volumen relativamente alto (#84.7 dB)
Graves 100 - 315 Hz
(+) | buen bajo - sólo 3.8% lejos de la mediana
(+) | el bajo es lineal (5.2% delta a la frecuencia anterior)
Medios 400 - 2000 Hz
(+) | medios equilibrados - a sólo 1.3% de la mediana
(+) | los medios son lineales (2.1% delta a la frecuencia anterior)
Altos 2 - 16 kHz
(+) | máximos equilibrados - a sólo 1.9% de la mediana
(+) | los máximos son lineales (2.7% delta a la frecuencia anterior)
Total 100 - 16.000 Hz
(+) | el sonido global es lineal (4.6% de diferencia con la mediana)
En comparación con la misma clase
» 0% de todos los dispositivos probados de esta clase eran mejores, 0% similares, 100% peores
» El mejor tuvo un delta de 5%, la media fue 17%, el peor fue ###max##%
En comparación con todos los dispositivos probados
» 0% de todos los dispositivos probados eran mejores, 0% similares, 100% peores
» El mejor tuvo un delta de 4%, la media fue 23%, el peor fue ###max##%
Gestión de la energía - Más potencia
Consumo de energía
Los XPS 15 9500, 9510 y 9520 son los únicos portátiles importantes del mercado en este momento con adaptadores USB-C de 130 W para superar el límite de 100 W de USB-C Power Delivery establecido por el USB-IF. La mayor sobrecarga permite que la batería siga cargándose a un ritmo decente incluso cuando se ejecutan cargas exigentes como los juegos. También vale la pena señalar que nuestra unidad de prueba no mostró ningún problema de carga que experimentamos en el XPS 17 9700.
Ejecutando Witcher 3 consume 75 W para acercarse a lo que registramos en el XPS 15 9510 o en el competidor Zenbook Pro 15 OLED con motor AMD. Quizá lo más interesante es que al ejecutar Prime95 se consumen 88 W constantes frente a los 65 W del XPS 15 9510 con Core 7-11800H. Por lo tanto, el consumo de energía ha aumentado en aproximadamente un 35 por ciento para la ganancia de 35 a 42 por ciento año tras año en el rendimiento multihilo que registramos anteriormente. El consumo de energía generalmente más alto se alinea con lo que estamos observando en la plataforma Plataforma Alder Lake en su conjunto
El adaptador de CA USB-C de 130 W de tamaño pequeño-mediano (~14,3 x 6,6 x 2,3 cm) que viene con el XPS 15 9520 es idéntico a los que se enviaron con el XPS 9500 y 9510.
| Off / Standby | |
| Ocioso | |
| Carga |
|
Clave:
min: | |
| Dell XPS 15 9520 RTX 3050 Ti i7-12700H, GeForce RTX 3050 Ti Laptop GPU, WDC PC SN810 512GB, OLED, 3456x2160, 15.6" | Dell XPS 15 9510 11800H RTX 3050 Ti OLED i7-11800H, GeForce RTX 3050 Ti Laptop GPU, Micron 2300 512GB MTFDHBA512TDV, OLED, 3456x2160, 15.6" | Dell XPS 15 9500 Core i7 4K UHD i7-10875H, GeForce GTX 1650 Ti Mobile, SK Hynix PC611 512GB, IPS, 3840x2400, 15.6" | HP Spectre X360 15-5ZV31AV i7-10510U, GeForce MX250, Intel SSD 660p 2TB SSDPEKNW020T8, IPS, 3840x2160, 15.6" | Asus Zenbook Pro 15 OLED UM535Q R9 5900HX, GeForce RTX 3050 Ti Laptop GPU, WDC PC SN730 SDBPNTY-1T00, OLED, 1920x1080, 15.6" | MSI Stealth 15M A11SEK i7-1185G7, GeForce RTX 2060 Max-Q, WDC PC SN530 SDBPNPZ-1T00, IPS, 1920x1080, 15.6" | |
|---|---|---|---|---|---|---|
| Power Consumption | -5% | -27% | 20% | 5% | -25% | |
| Idle Minimum * (Watt) | 5.5 | 7.6 -38% | 5.7 -4% | 5.2 5% | 5.5 -0% | 7.3 -33% |
| Idle Average * (Watt) | 7.2 | 9.9 -38% | 13.5 -88% | 8.5 -18% | 7.4 -3% | 10.1 -40% |
| Idle Maximum * (Watt) | 16 | 10.8 32% | 19.6 -23% | 8.7 46% | 14.9 7% | 17.6 -10% |
| Load Average * (Watt) | 91.8 | 81 12% | 114.1 -24% | 65.6 29% | 78.2 15% | 106.6 -16% |
| Witcher 3 ultra * (Watt) | 74.6 | 76.2 -2% | 93 -25% | 56.5 24% | 80.1 -7% | 105.4 -41% |
| Load Maximum * (Watt) | 134.7 | 131 3% | 135.2 -0% | 92.4 31% | 110.9 18% | 151.2 -12% |
* ... más pequeño es mejor
Power Consumption Witcher 3 / Stresstest
Power Consumption external Monitor
Duración de la batería
Con casi 9 horas de uso constante de WLAN en el mundo real, los tiempos de ejecución son en general similares a los que registramos en el XPS 9500 y casi 2 horas más que en el XPS 9510. Sin embargo, hay que tener en cuenta que los colores blancos exigirán unos cuantos vatios más que los colores más oscuros cuando se encuentren en la misma configuración de brillo, ya que nuestra configuración utiliza un panel OLED.
La carga desde el vacío hasta la capacidad total con el adaptador de CA incluido. tarda entre 2 y 2,5 horas en reposo o con cargas bajas.
| Dell XPS 15 9520 RTX 3050 Ti i7-12700H, GeForce RTX 3050 Ti Laptop GPU, 86 Wh | Dell XPS 15 9510 11800H RTX 3050 Ti OLED i7-11800H, GeForce RTX 3050 Ti Laptop GPU, 86 Wh | Dell XPS 15 9500 Core i7 4K UHD i7-10875H, GeForce GTX 1650 Ti Mobile, 86 Wh | HP Spectre X360 15-5ZV31AV i7-10510U, GeForce MX250, 84 Wh | Asus Zenbook Pro 15 OLED UM535Q R9 5900HX, GeForce RTX 3050 Ti Laptop GPU, 96 Wh | MSI Stealth 15M A11SEK i7-1185G7, GeForce RTX 2060 Max-Q, 52 Wh | |
|---|---|---|---|---|---|---|
| Duración de Batería | -32% | 7% | 22% | 45% | -42% | |
| Reader / Idle (h) | 14.8 | 23 55% | 22.6 53% | 26.2 77% | 10.5 -29% | |
| WiFi v1.3 (h) | 8.8 | 7 -20% | 9.1 3% | 10.8 23% | 12.8 45% | 6.3 -28% |
| Load (h) | 3.2 | 1.8 -44% | 2 -37% | 2.9 -9% | 3.6 13% | 1 -69% |
| H.264 (h) | 10.4 |
Pro
Contra
Veredicto - La diferencia de Alder Lake
Si las CPUs del XPS 15 9500 o 9510 fueran demasiado lentas para tus aplicaciones específicas, entonces valdría la pena considerar el 9520. Su procesador de 12ª generación Core i7-12700H puede ofrecer un 70 por ciento y un 40 por ciento más de rendimiento multihilo que el Core i7-10875H y el 11º genCore i7-11800Hrespectivamente, sin afectar significativamente a la duración de la batería. El impulso inherente al rendimiento de los gráficos integrados también puede ser suficiente para satisfacer a la mayoría de los usuarios de oficina sin necesidad de actualizar a ninguna de las costosas opciones discretas de Nvidia.
Los usuarios avanzados apreciarán las mejoras significativas en el rendimiento del procesador con respecto a las opciones de la 11ª o 10ª generación de Intel. Sin embargo, para tareas ofimáticas más básicas o moderadas, la potencia extra de la serie 12 puede no merecer el aumento de precio.
Sin embargo, fuera del rendimiento de la CPU, la experiencia sigue siendo la misma que en el XPS 9510 o incluso el 9500. La GPU Nvidia ha sido reducida con respecto a la 9510, por lo que los beneficios de una RAM DDR5 más rápida se han minimizado. Ciertos cambios que nos hubiera encantado ver como pantallas de mayor refresco, una webcam de mayor resolución, soporte adecuado para Wi-Fi 6E, o un obturador de privacidad siguen estando ausentes. Si la CPU de 12ª generación más rápida no es atractiva, entonces puedes comprar el XPS 15 9510 que tiene exactamente las mismas opciones de pantalla y GPU que nuestro 9520 pero a precios más bajos.
Precio y disponibilidad
Dell actualmente está enviando su serie XPS 15 9520 a partir de $1500 USD para el modelo base hasta $3500 USD si se configura con todo al máximo.
Dell XPS 15 9520 RTX 3050 Ti
- 08/30/2022 v7 (old)
Allen Ngo
Price comparison

