Análisis del PC de sobremesa Zotac Magnus One con Core i7 y GeForce RTX 3070
Con la nueva serie Magnus One, Zotac introduce otro ordenador de juego compacto en su cartera. Sin embargo, hay que mencionar de inmediato que el Zotac Magnus One es un sistema barebone. Esto significa que la RAM, el almacenamiento masivo y también el sistema operativo tienen que comprarse por separado. Zotac ha adoptado un enfoque similar con su ZBOX Magnus, que es aún más compacto.
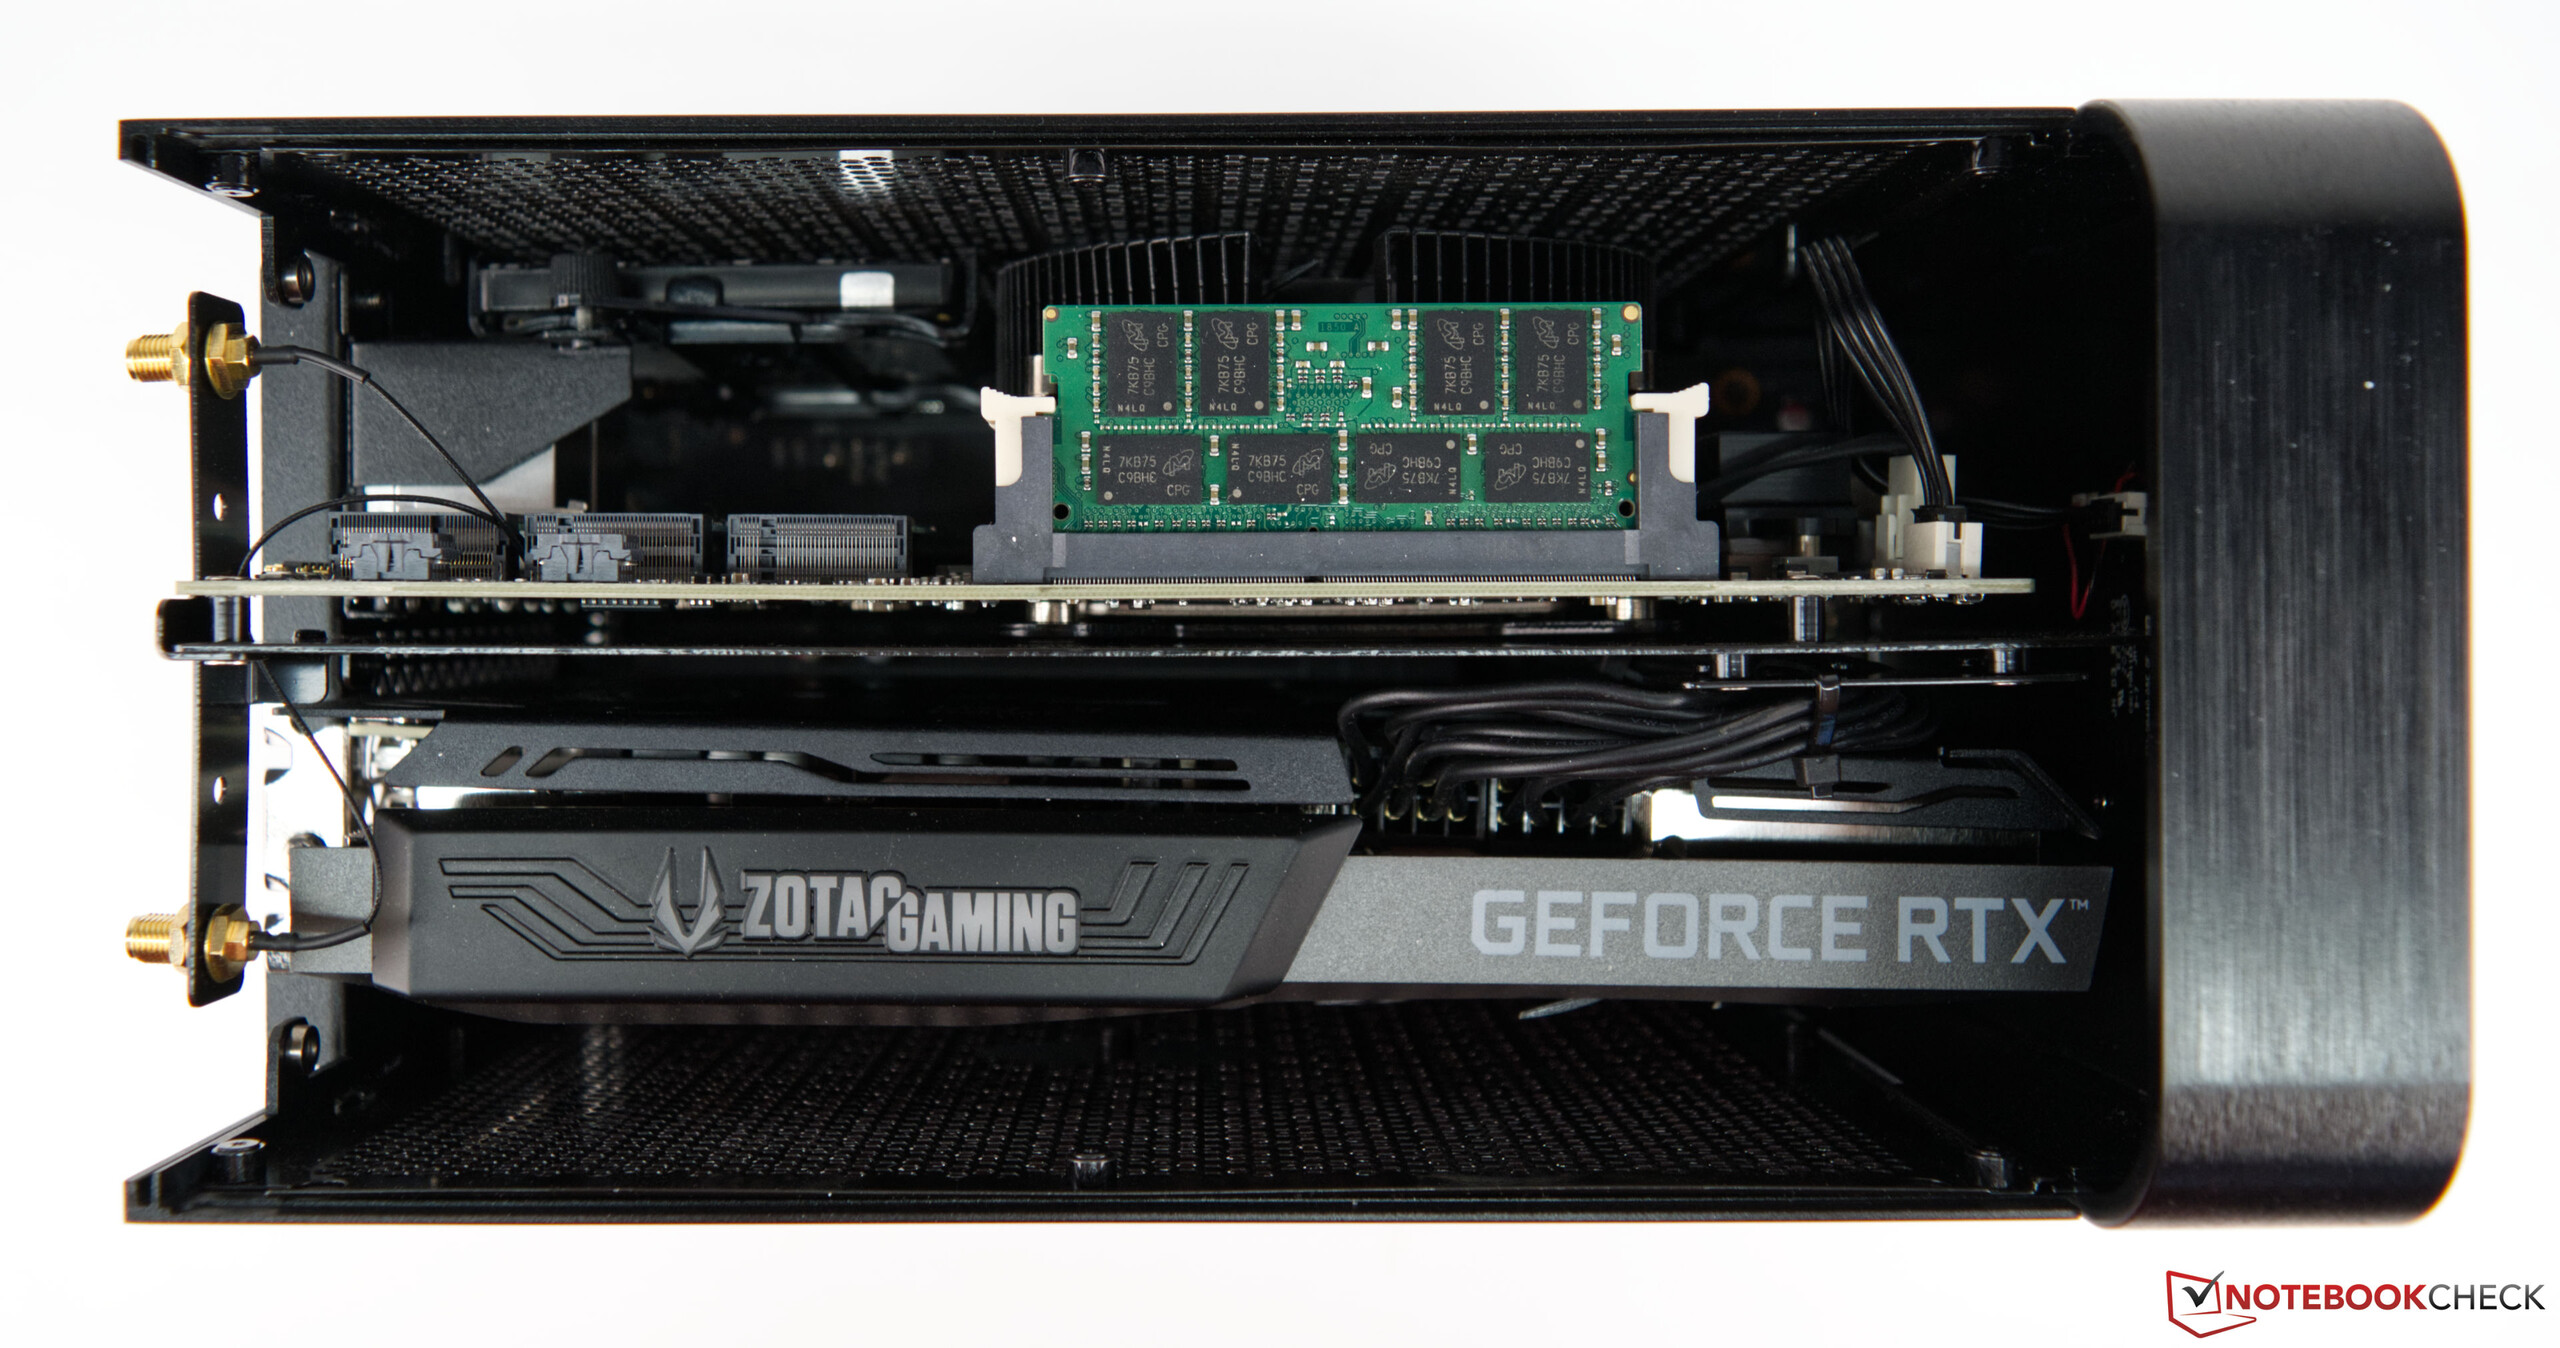
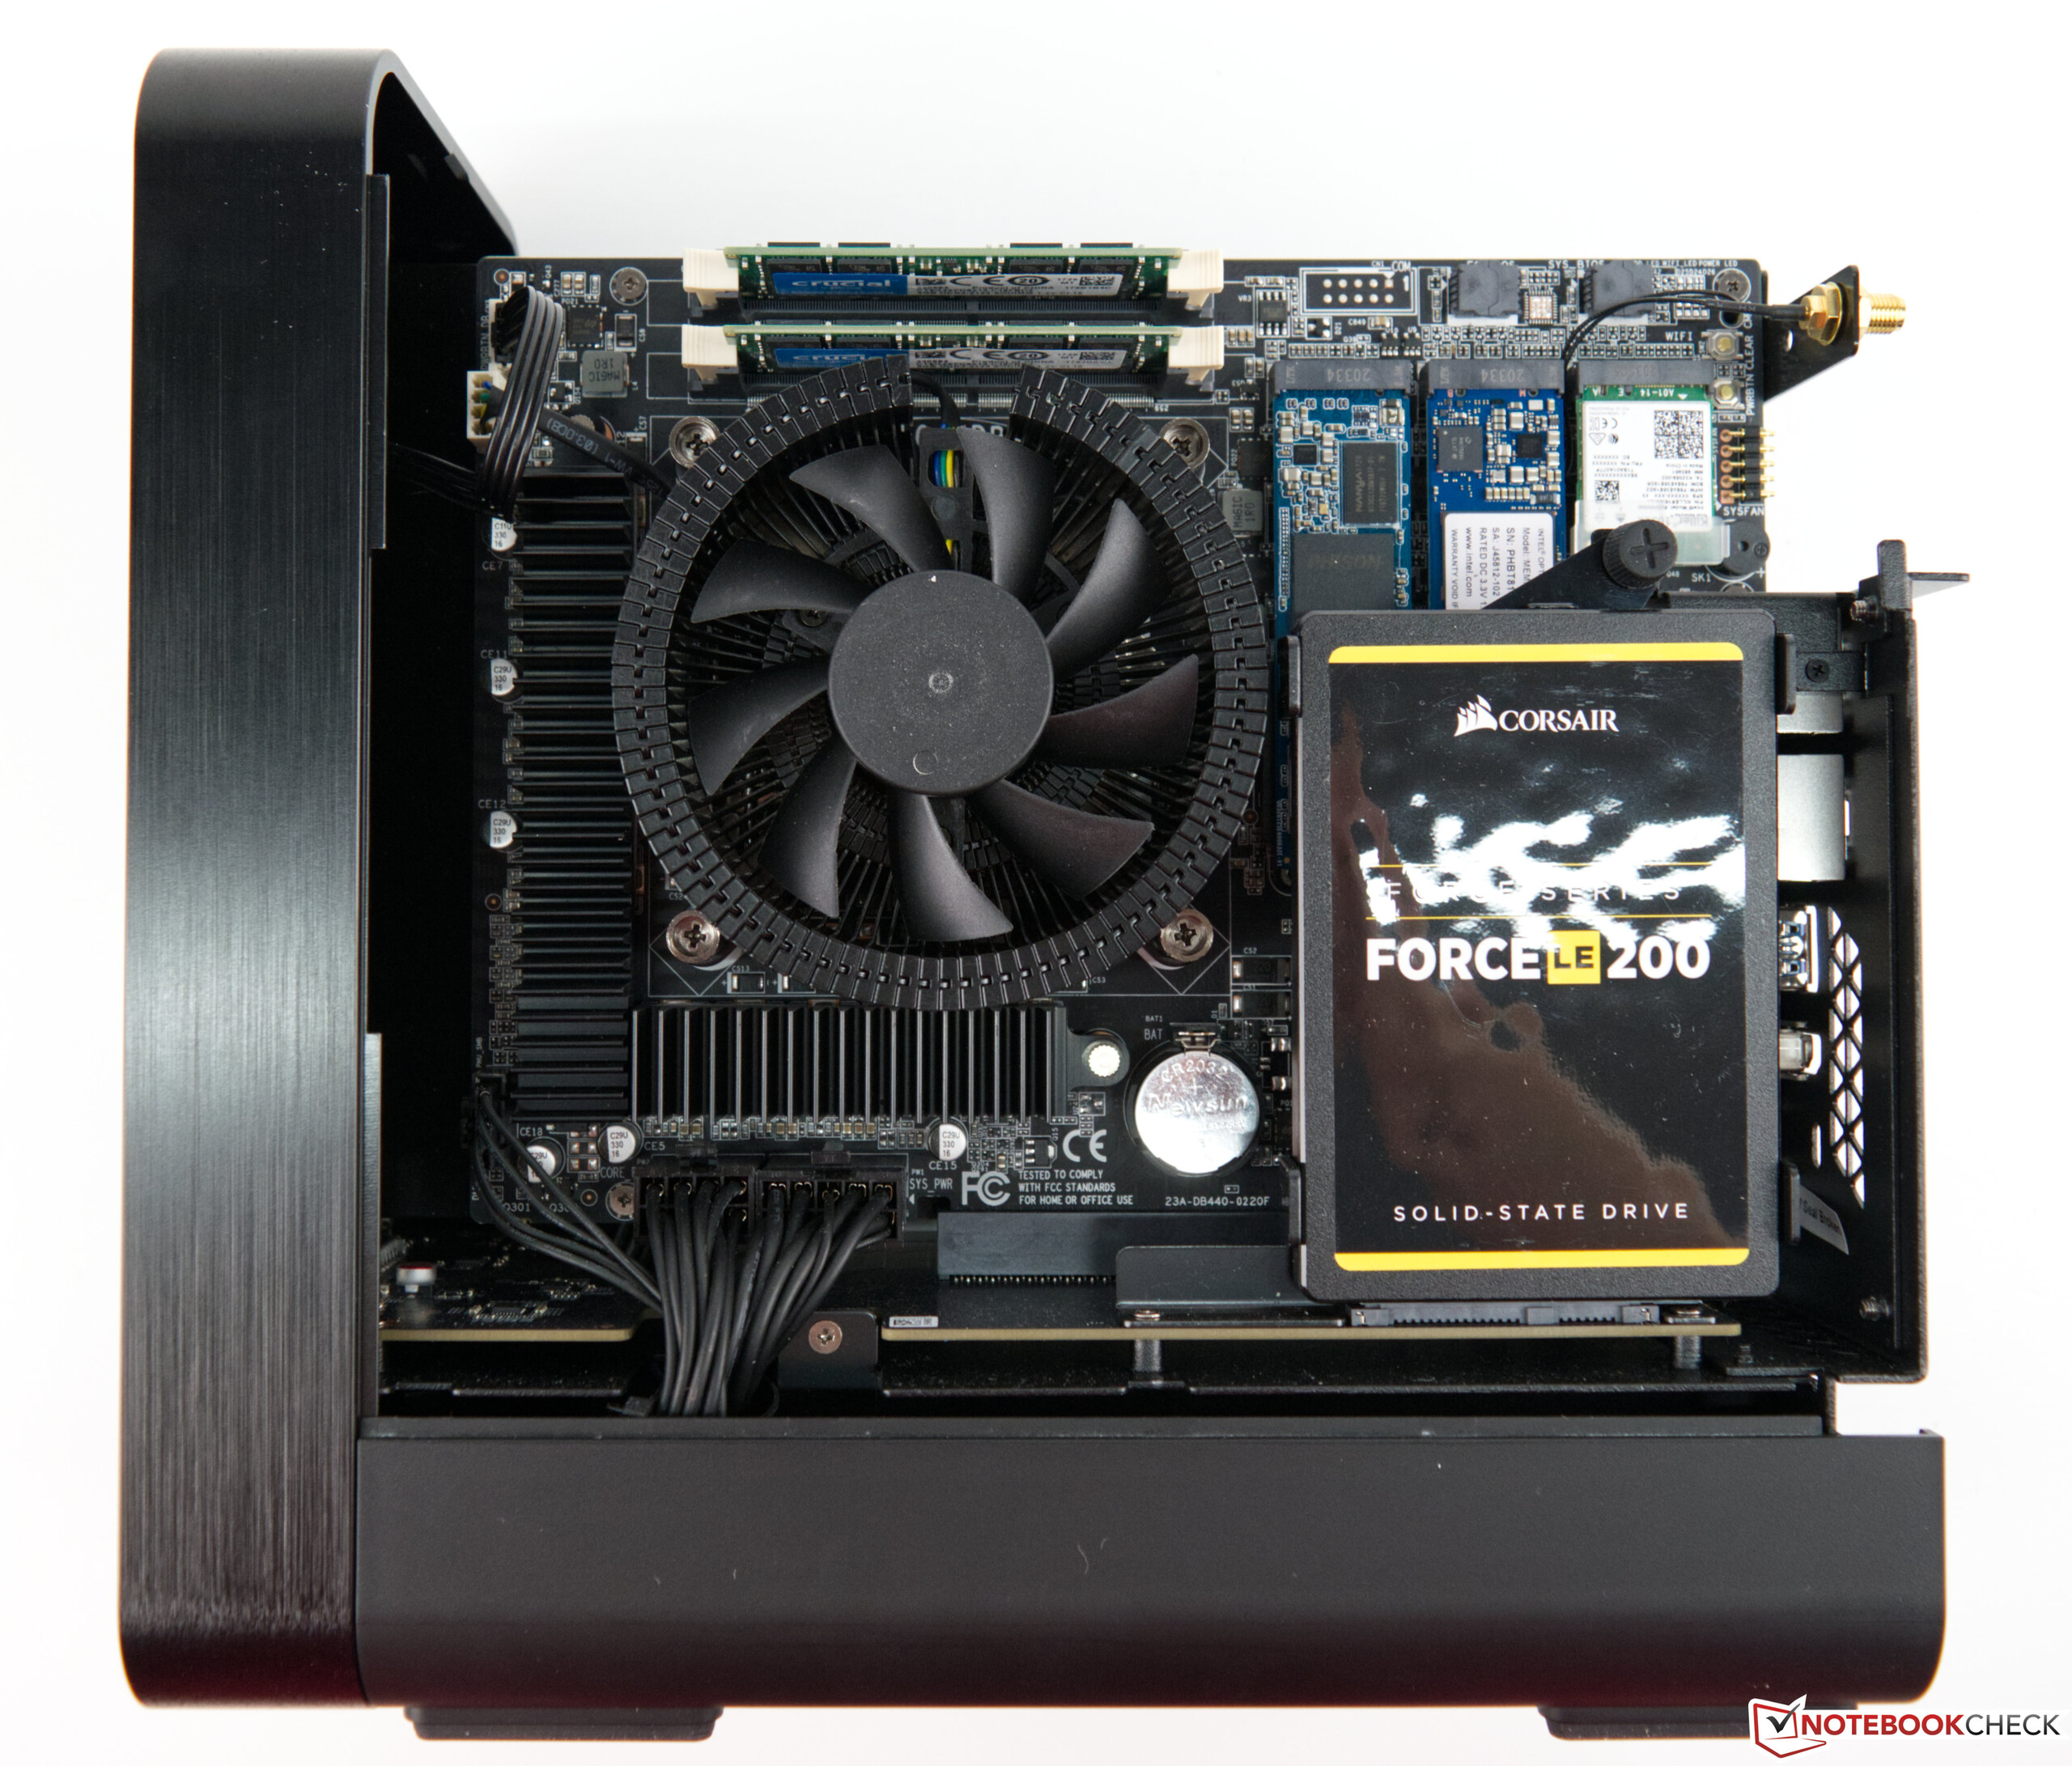
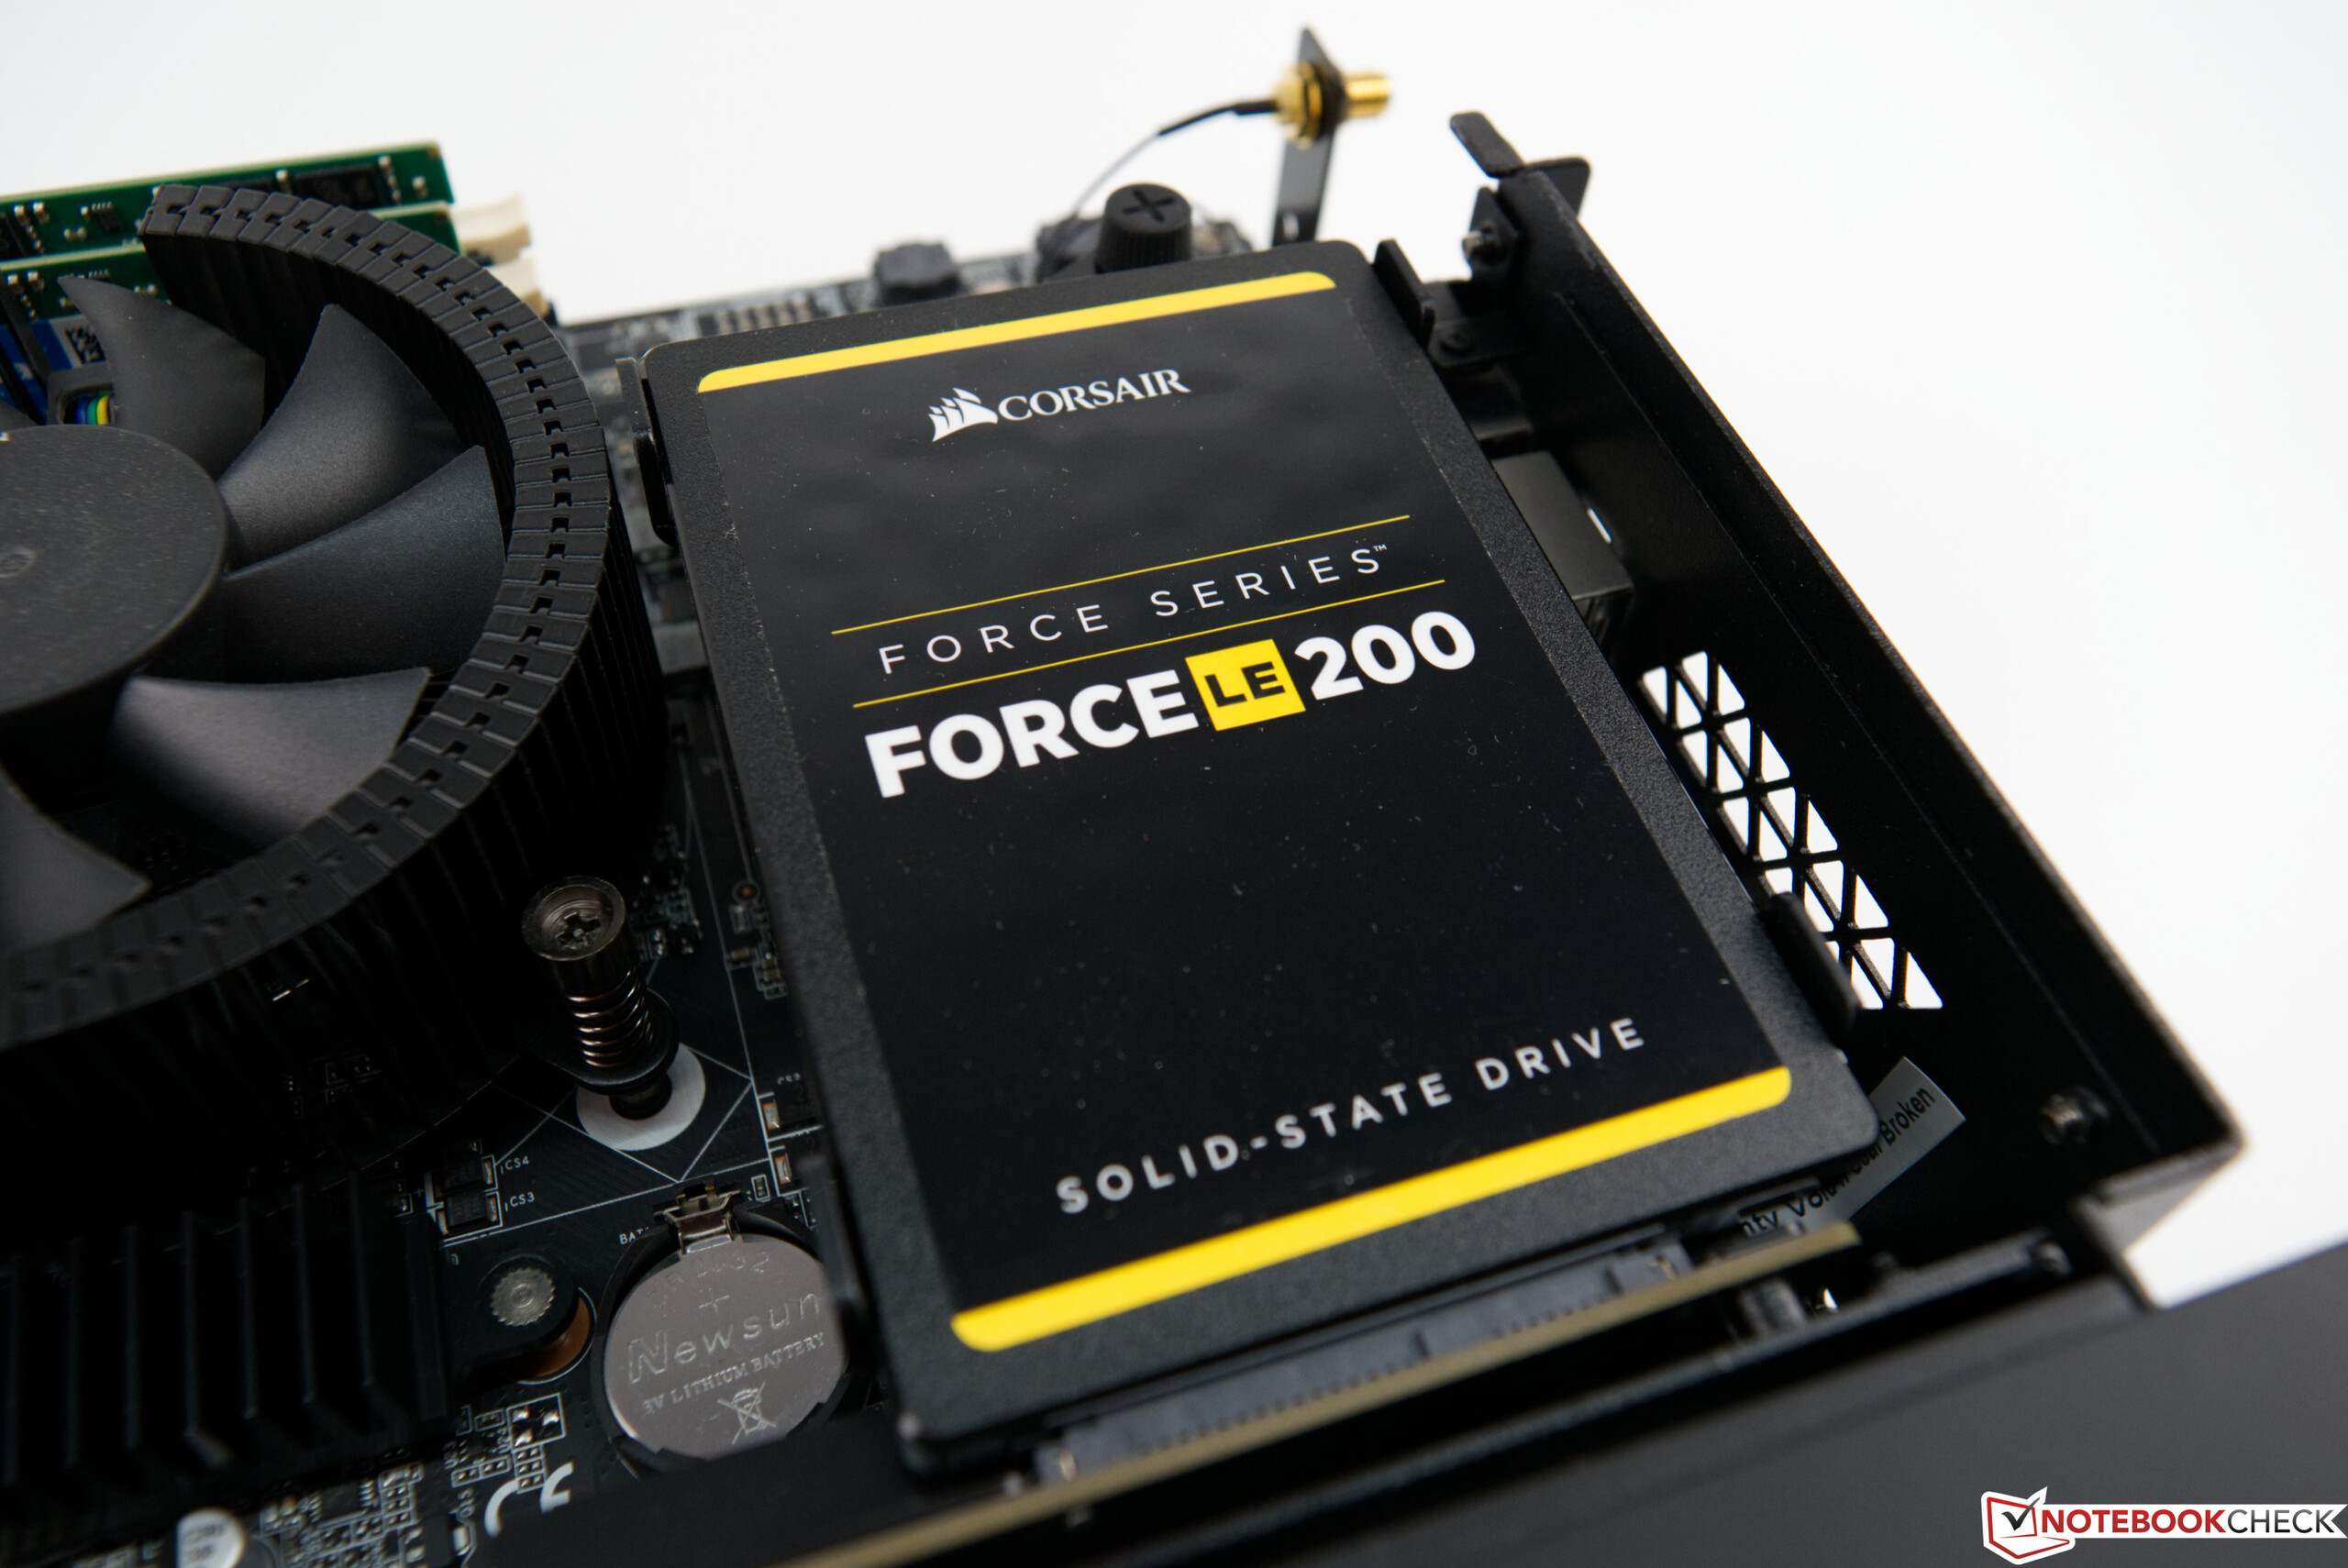
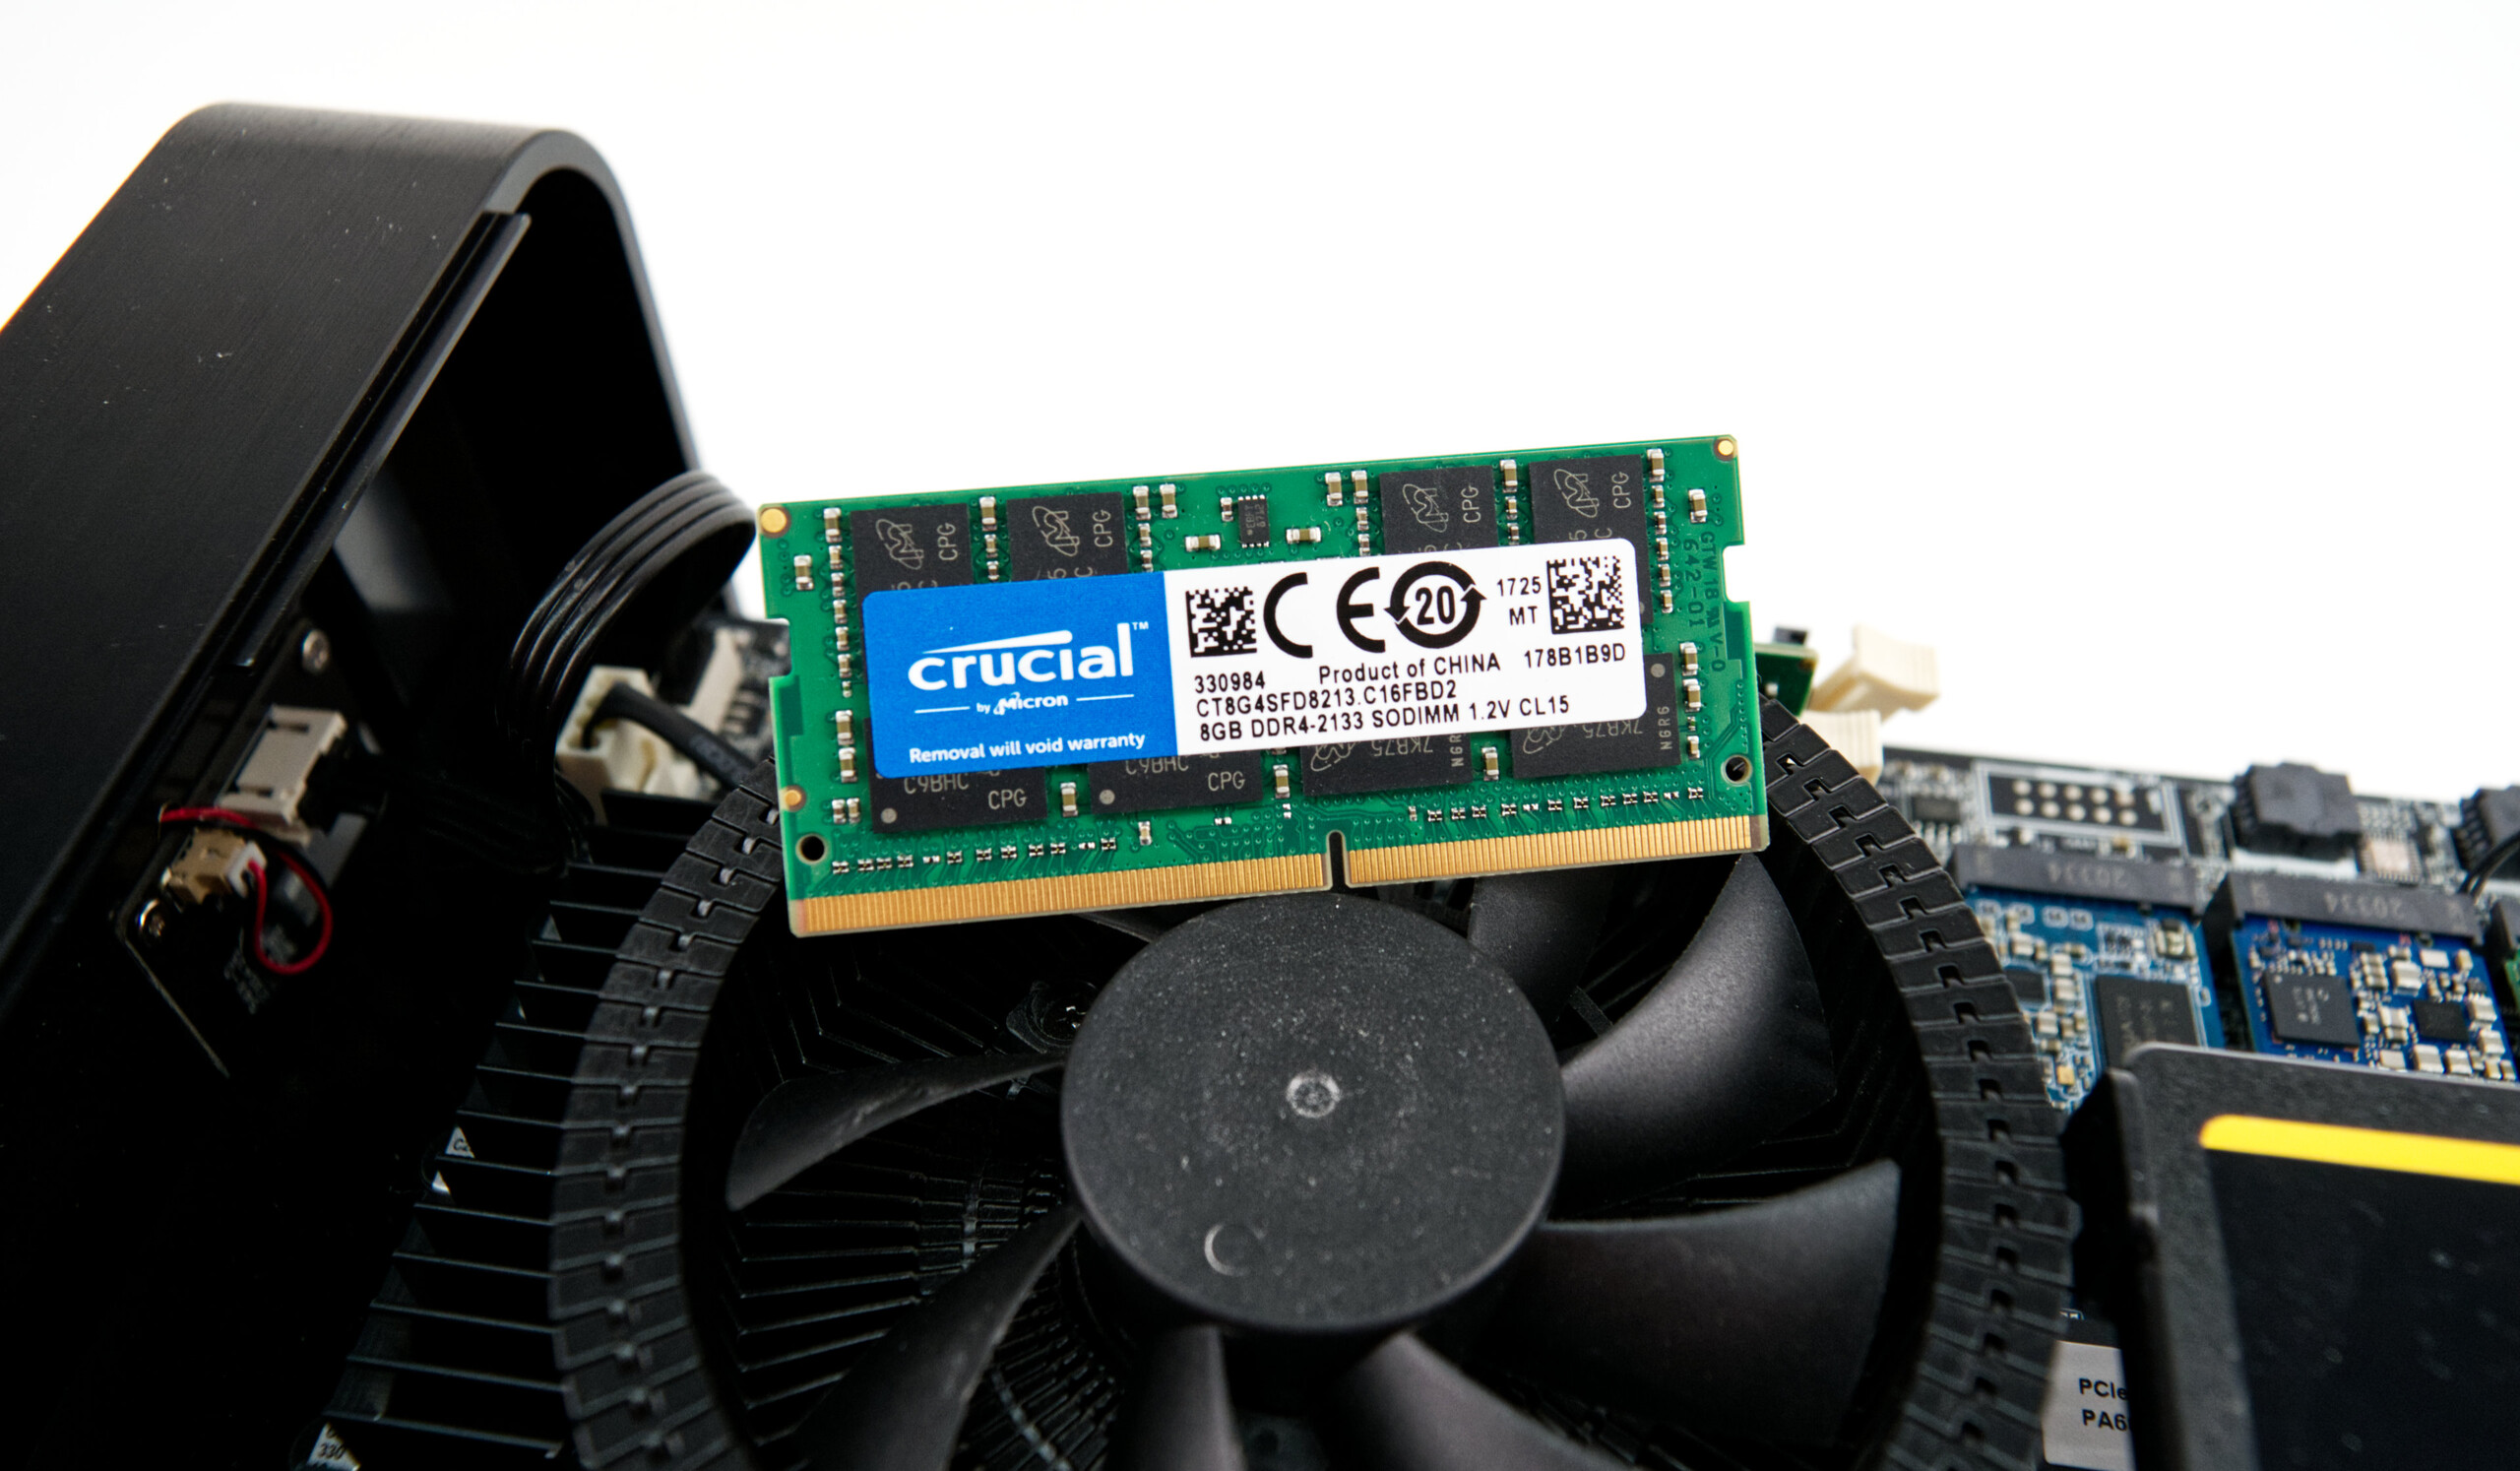
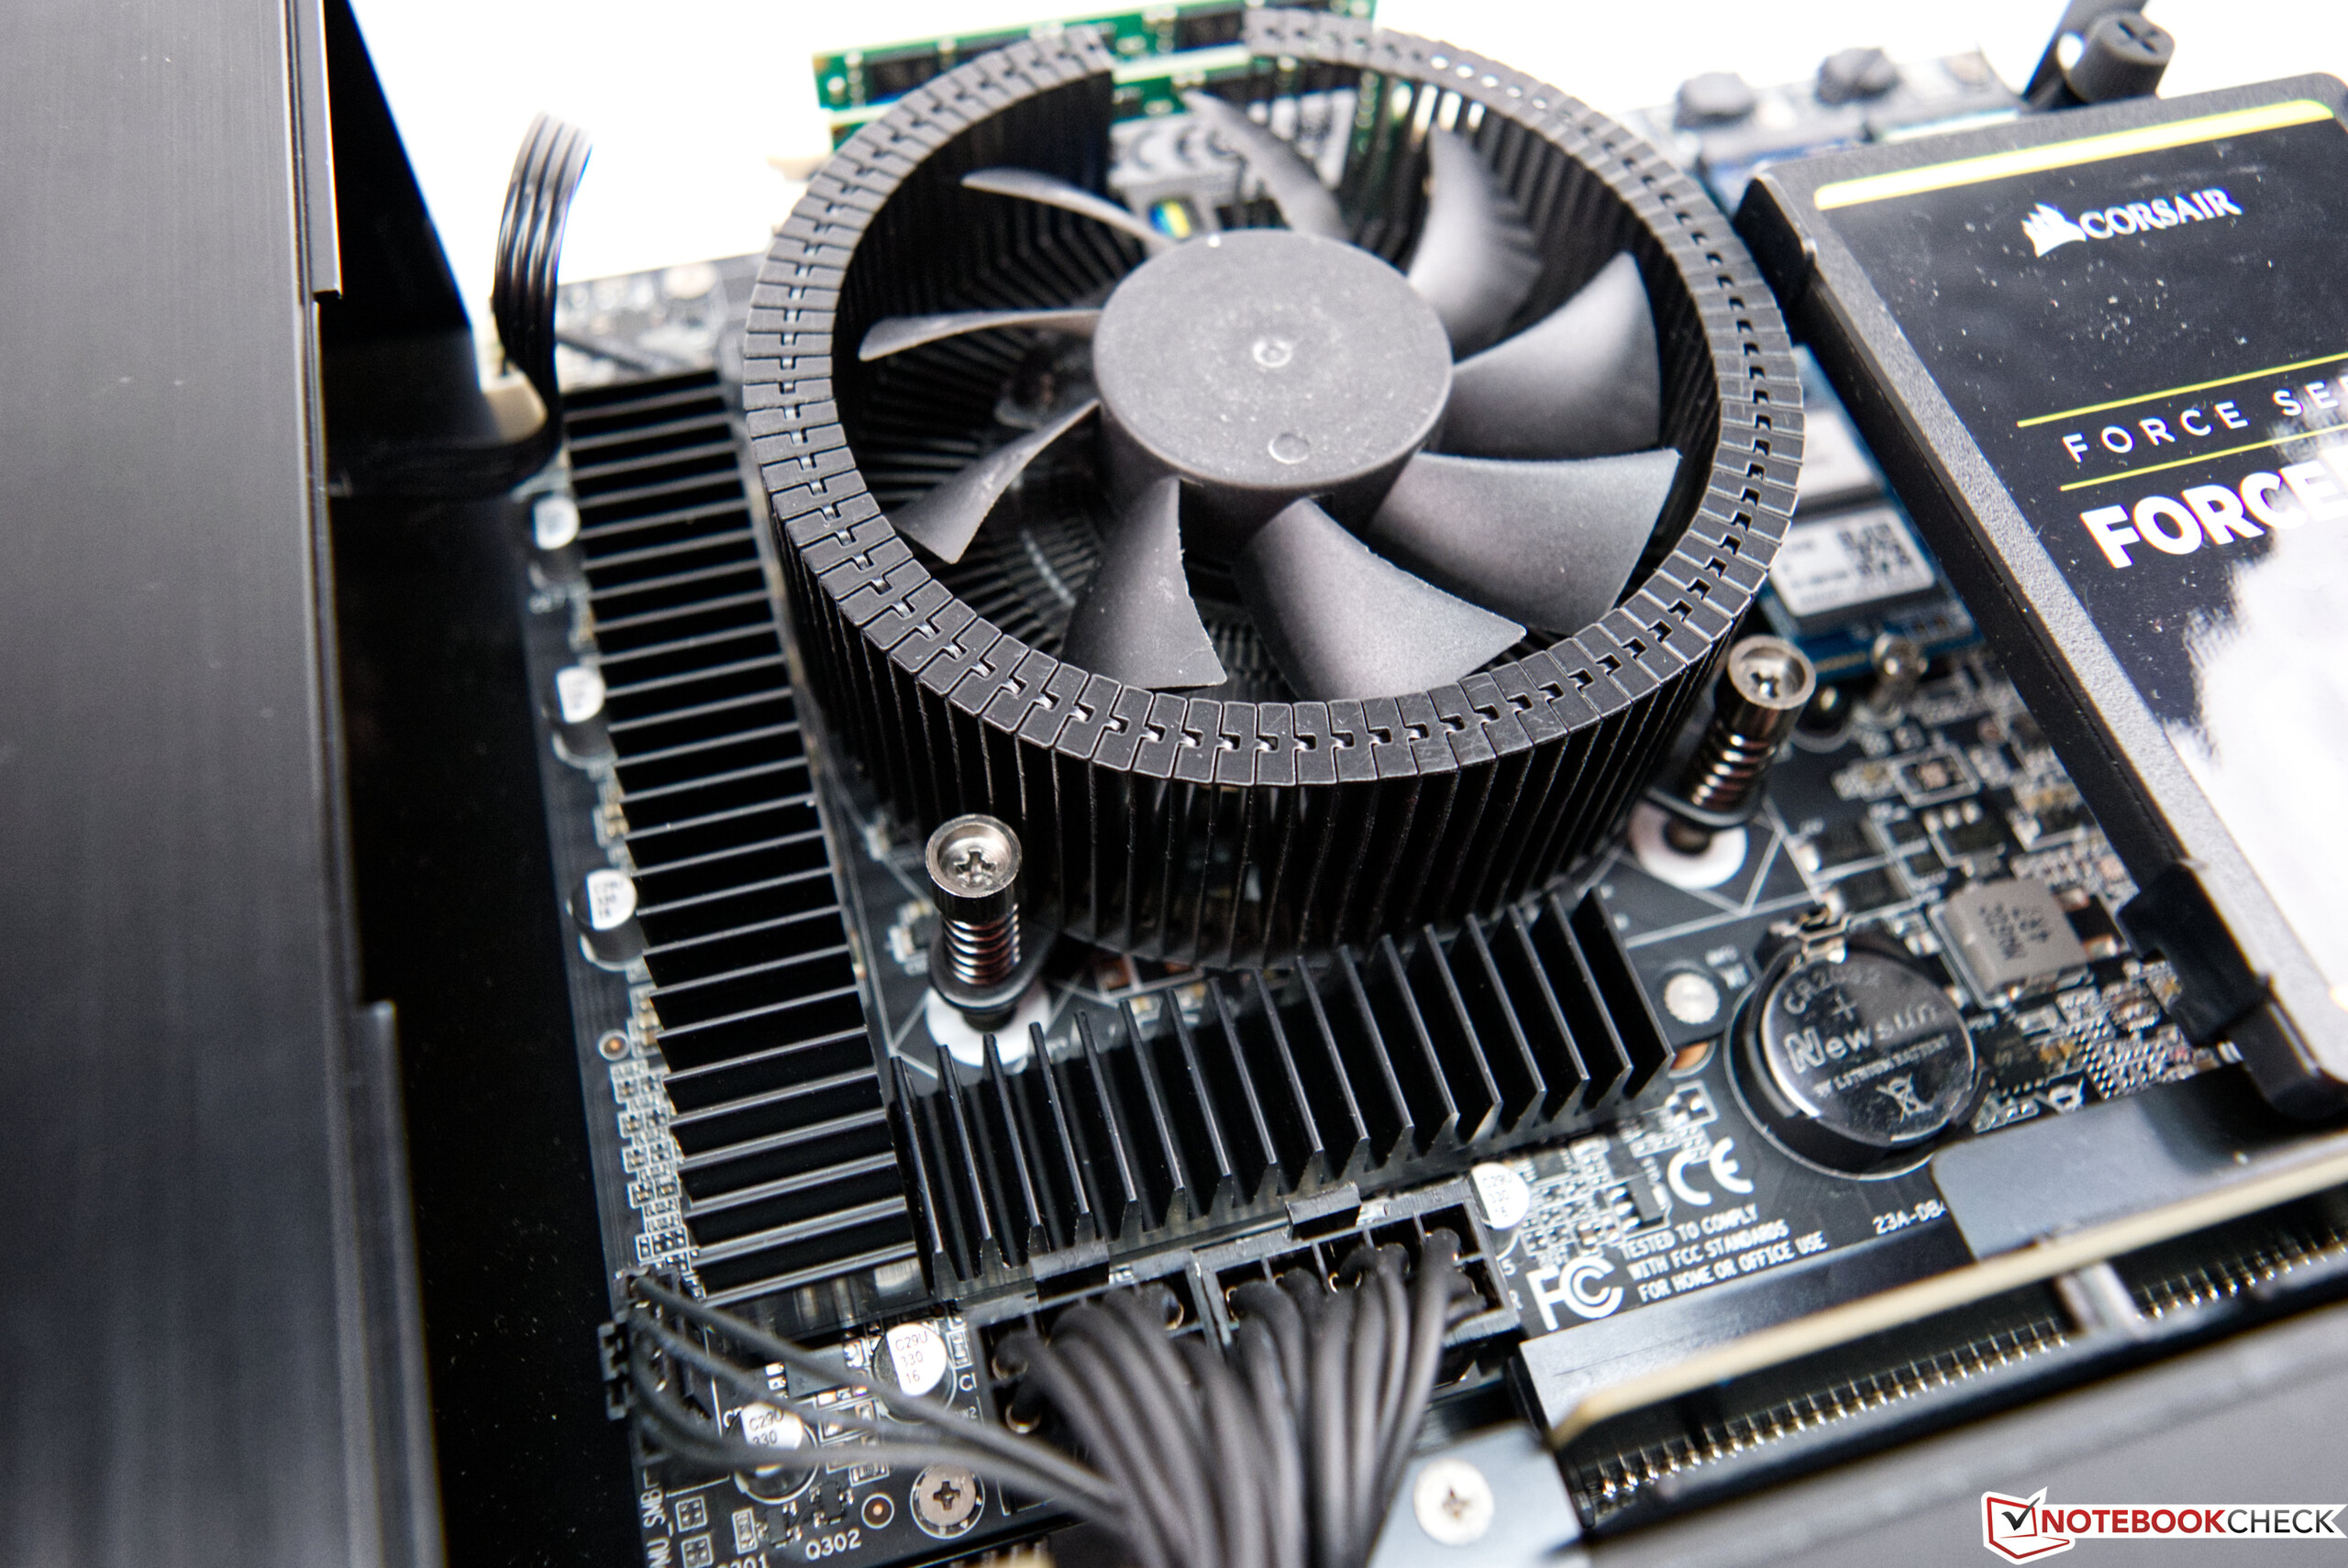
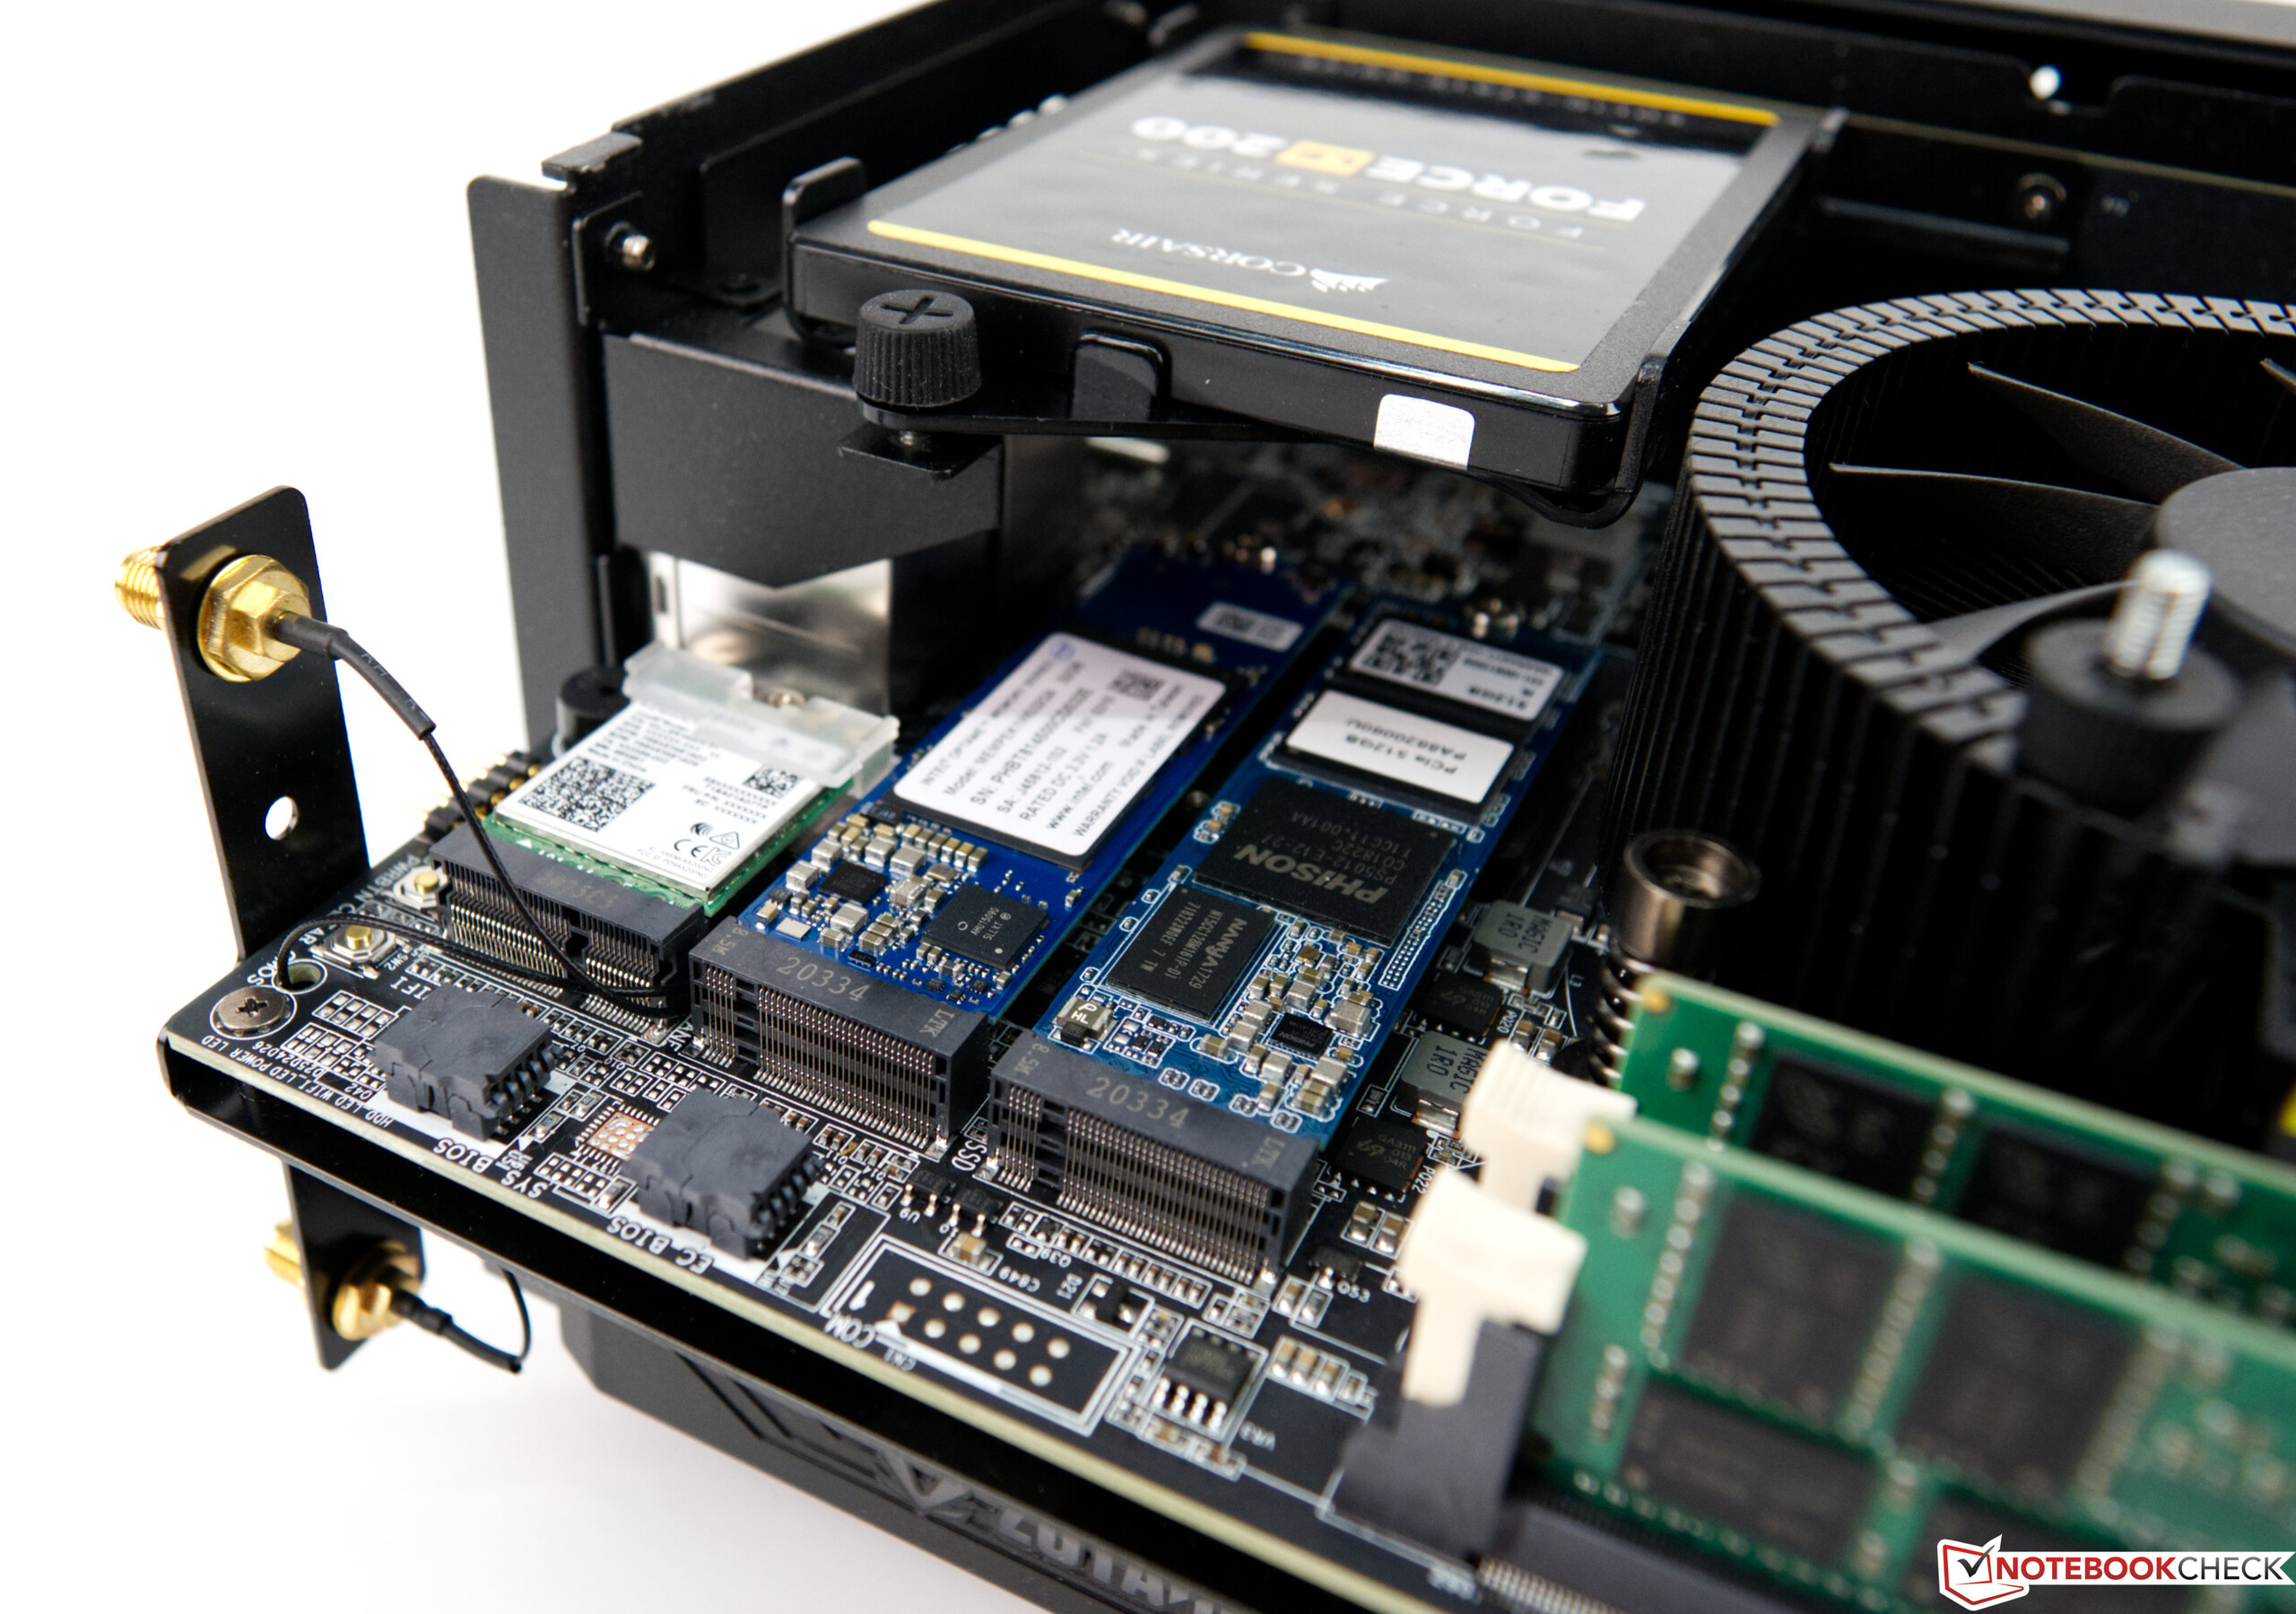
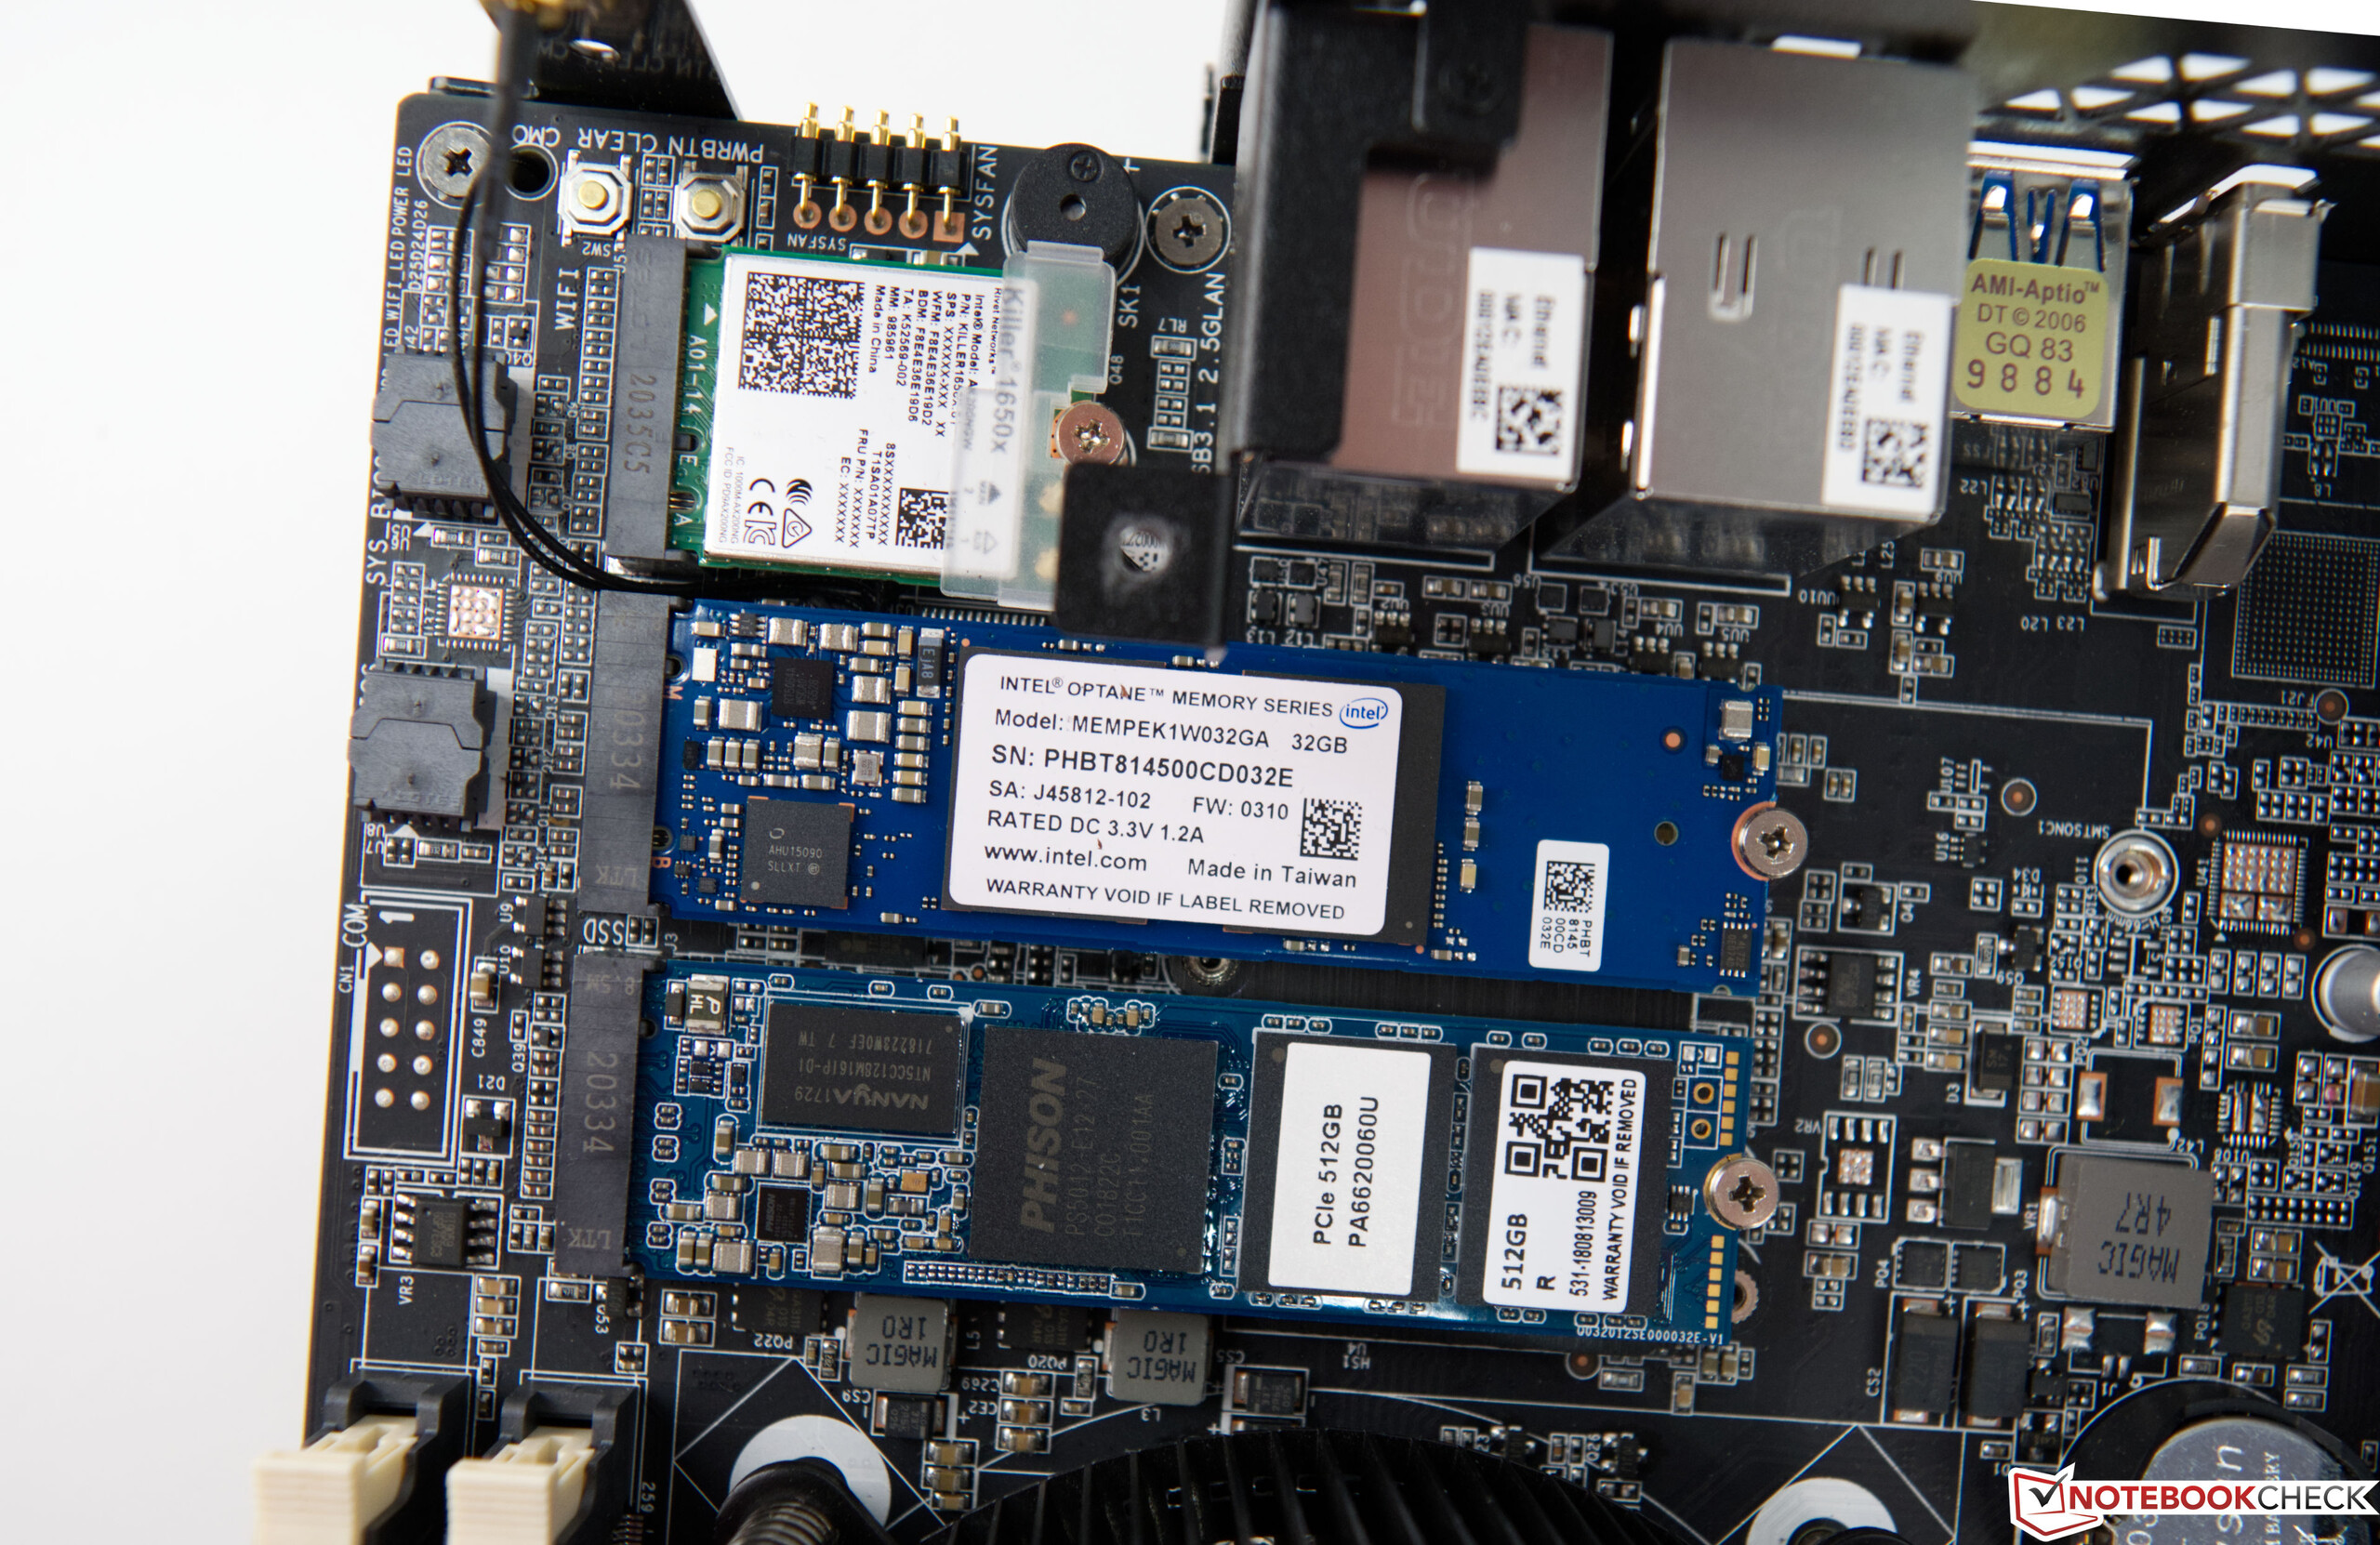
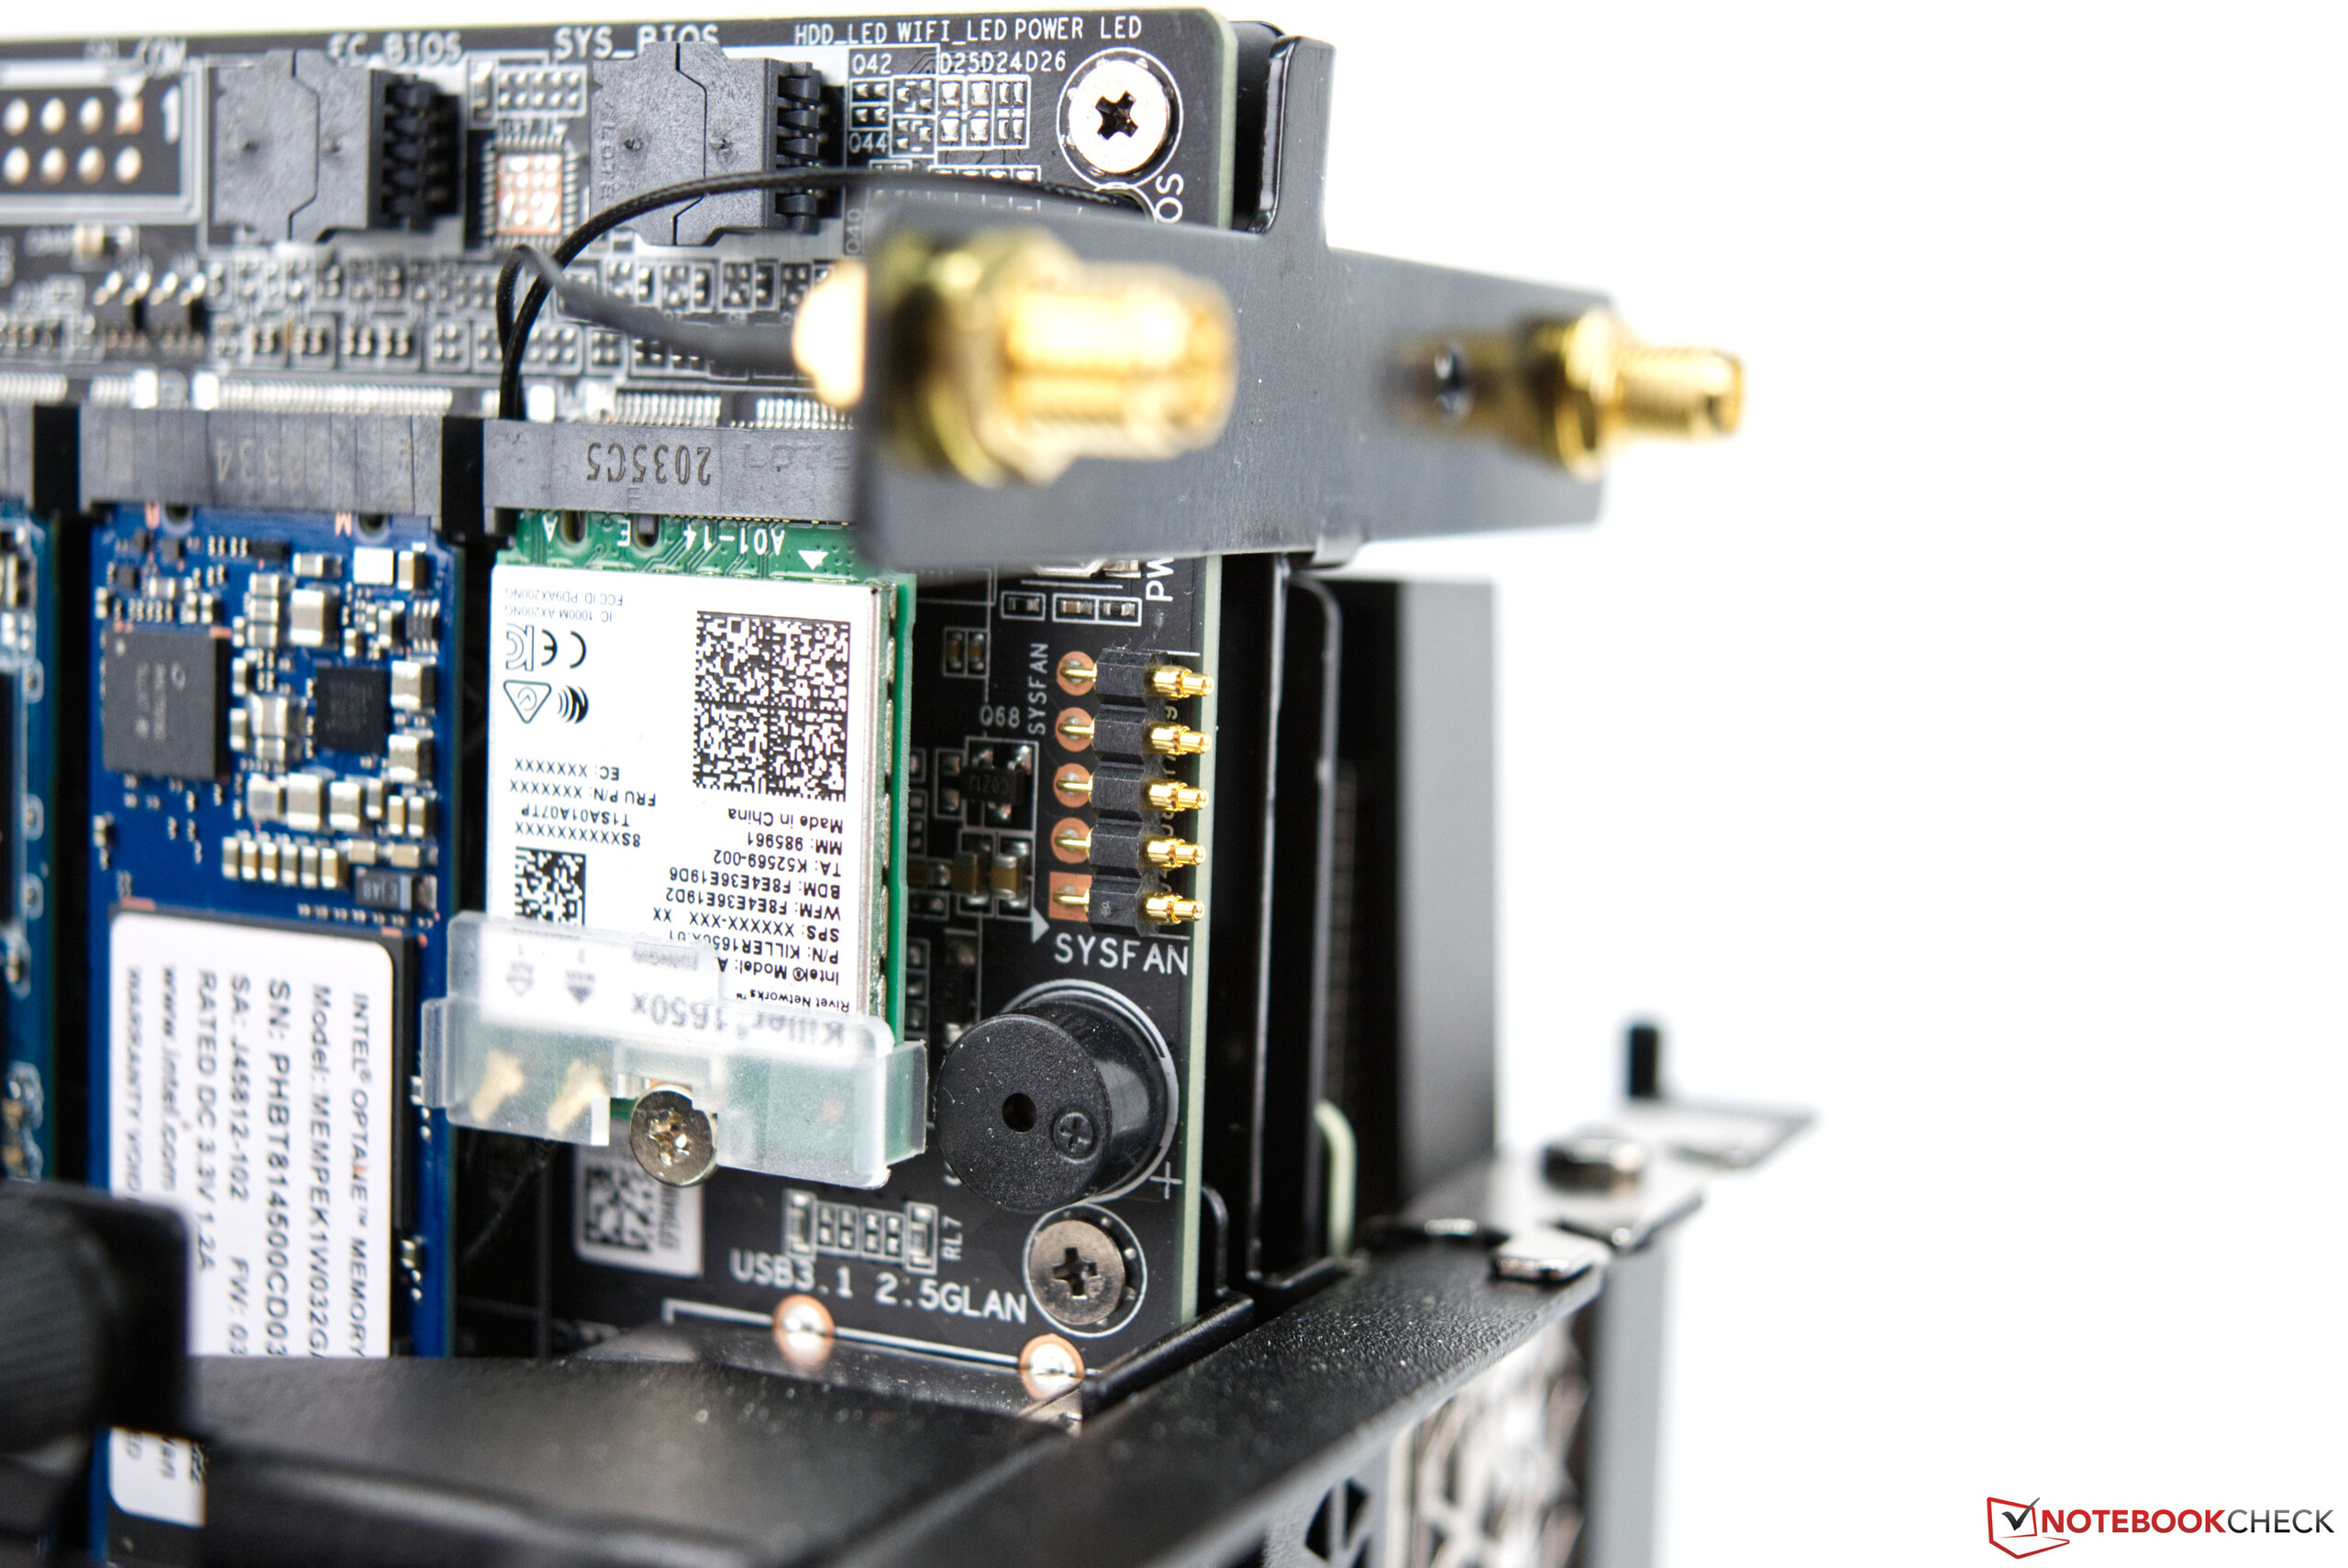
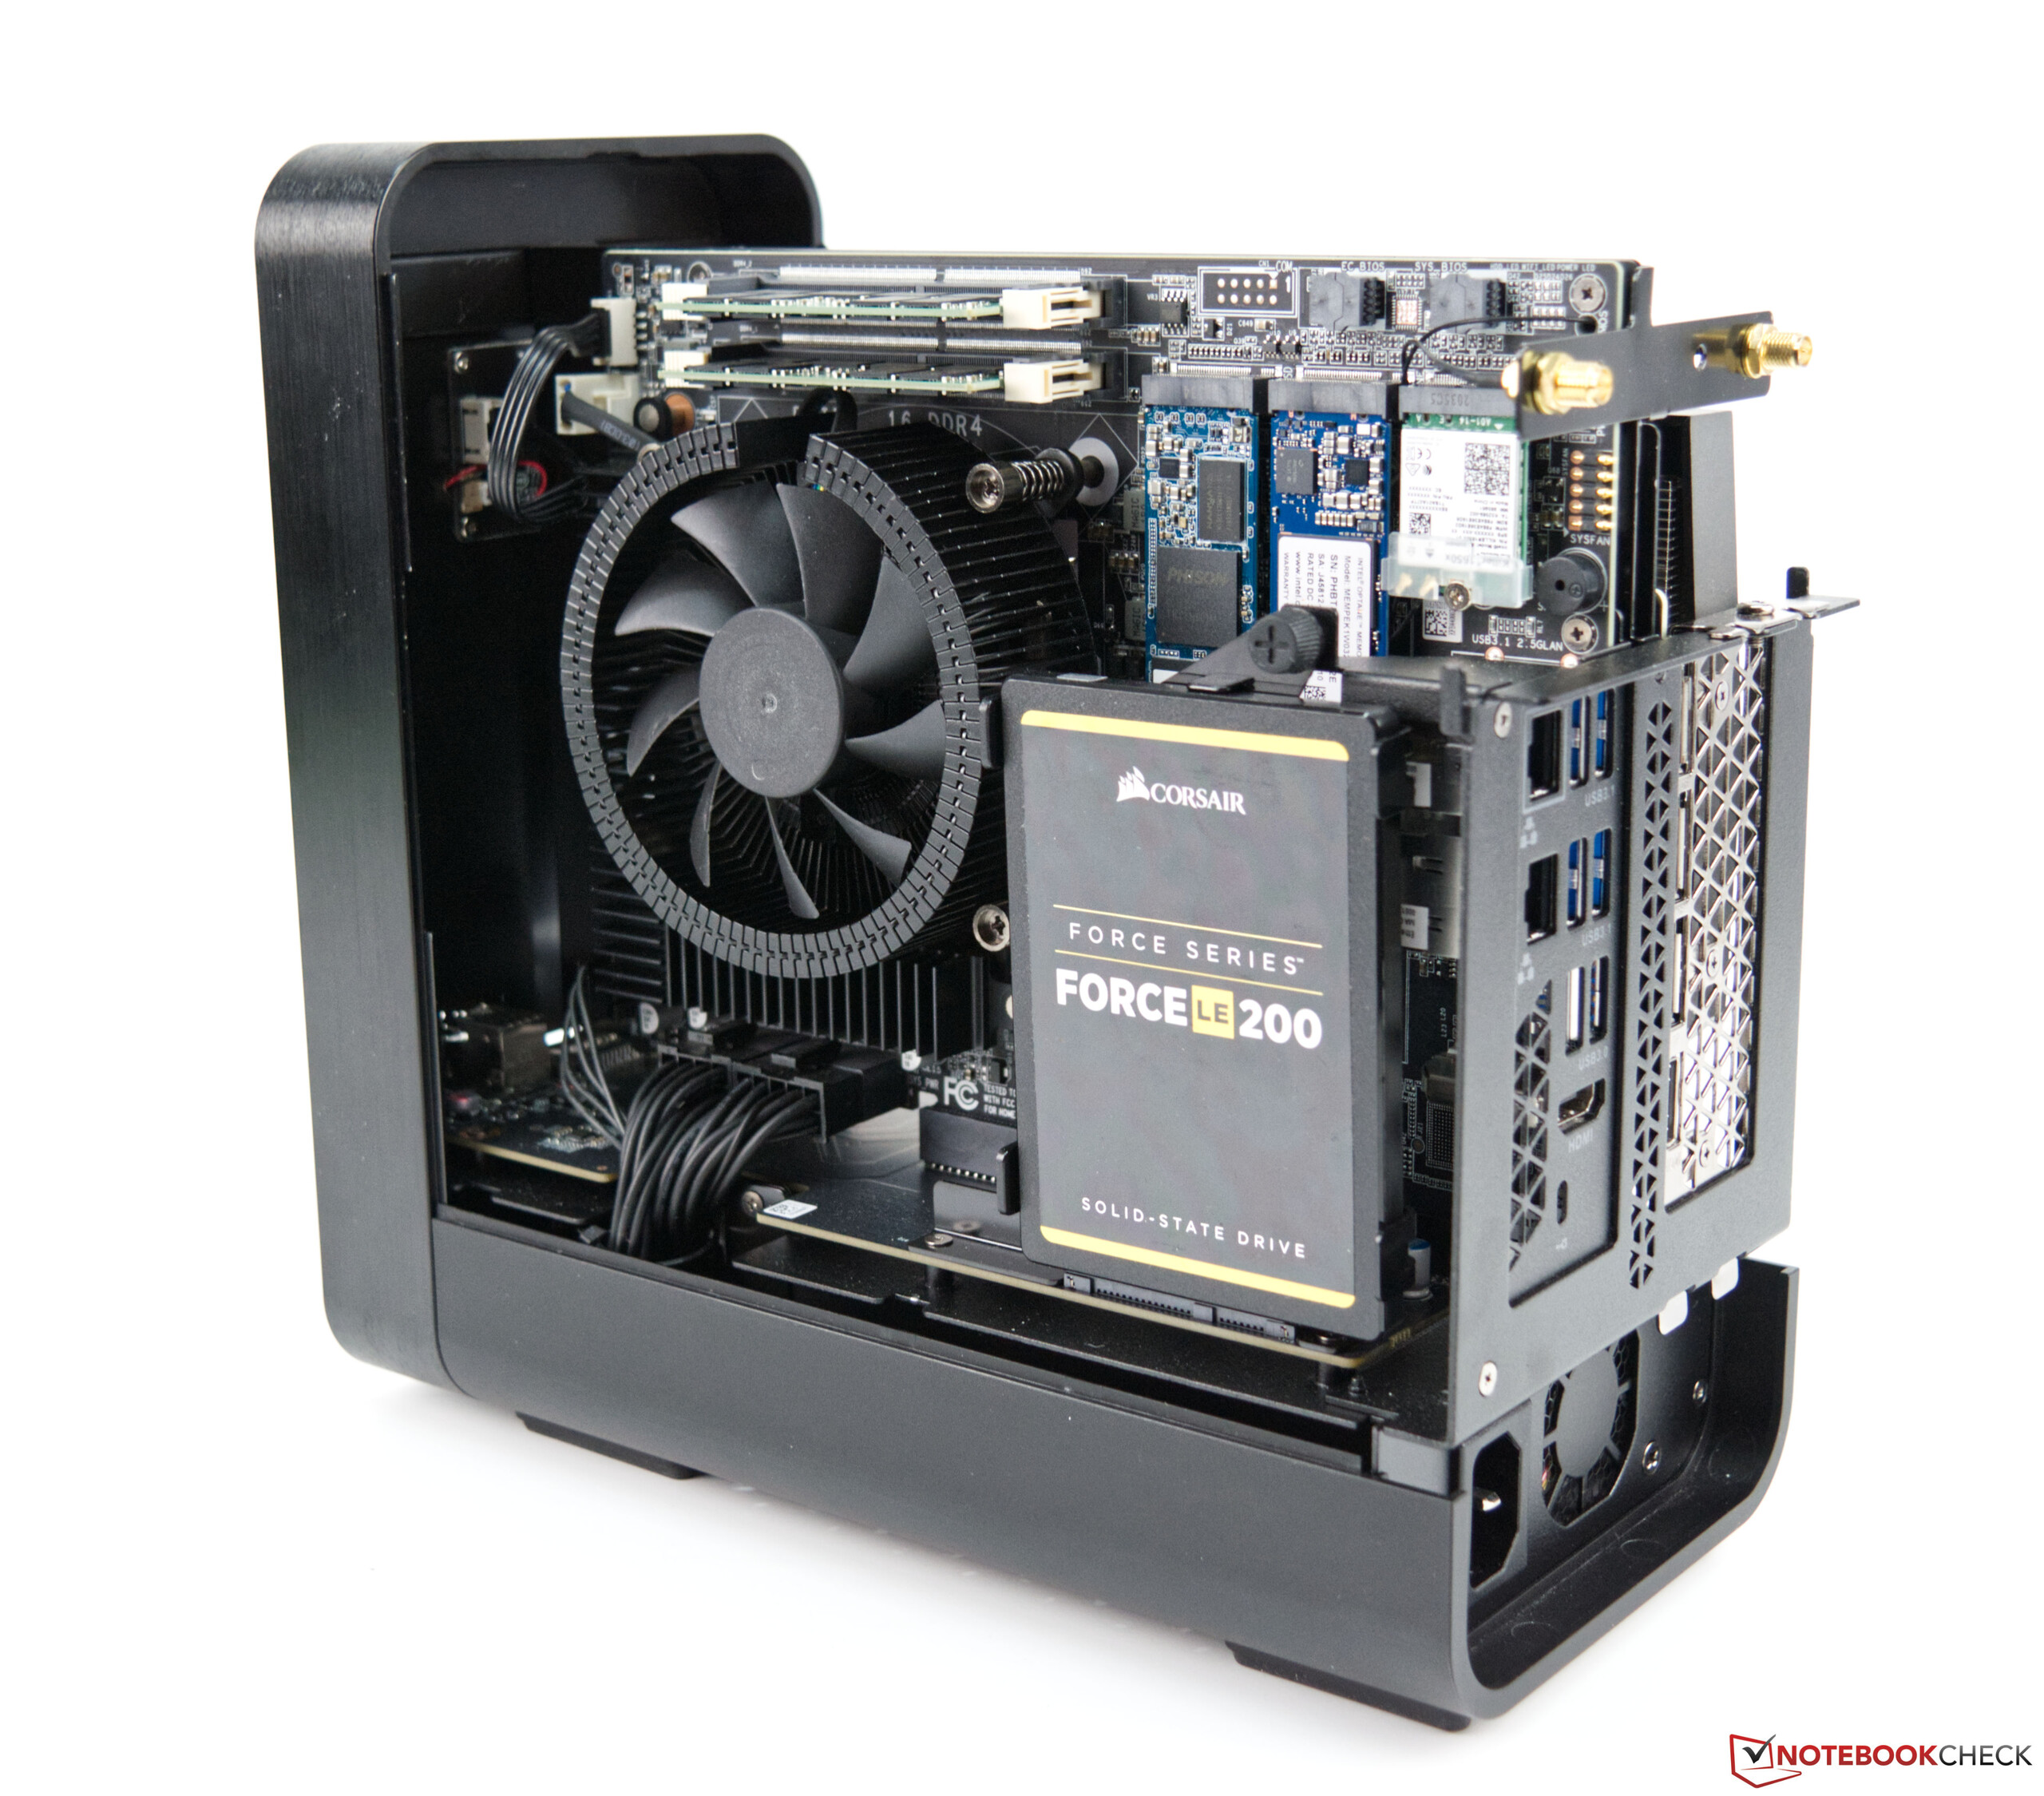
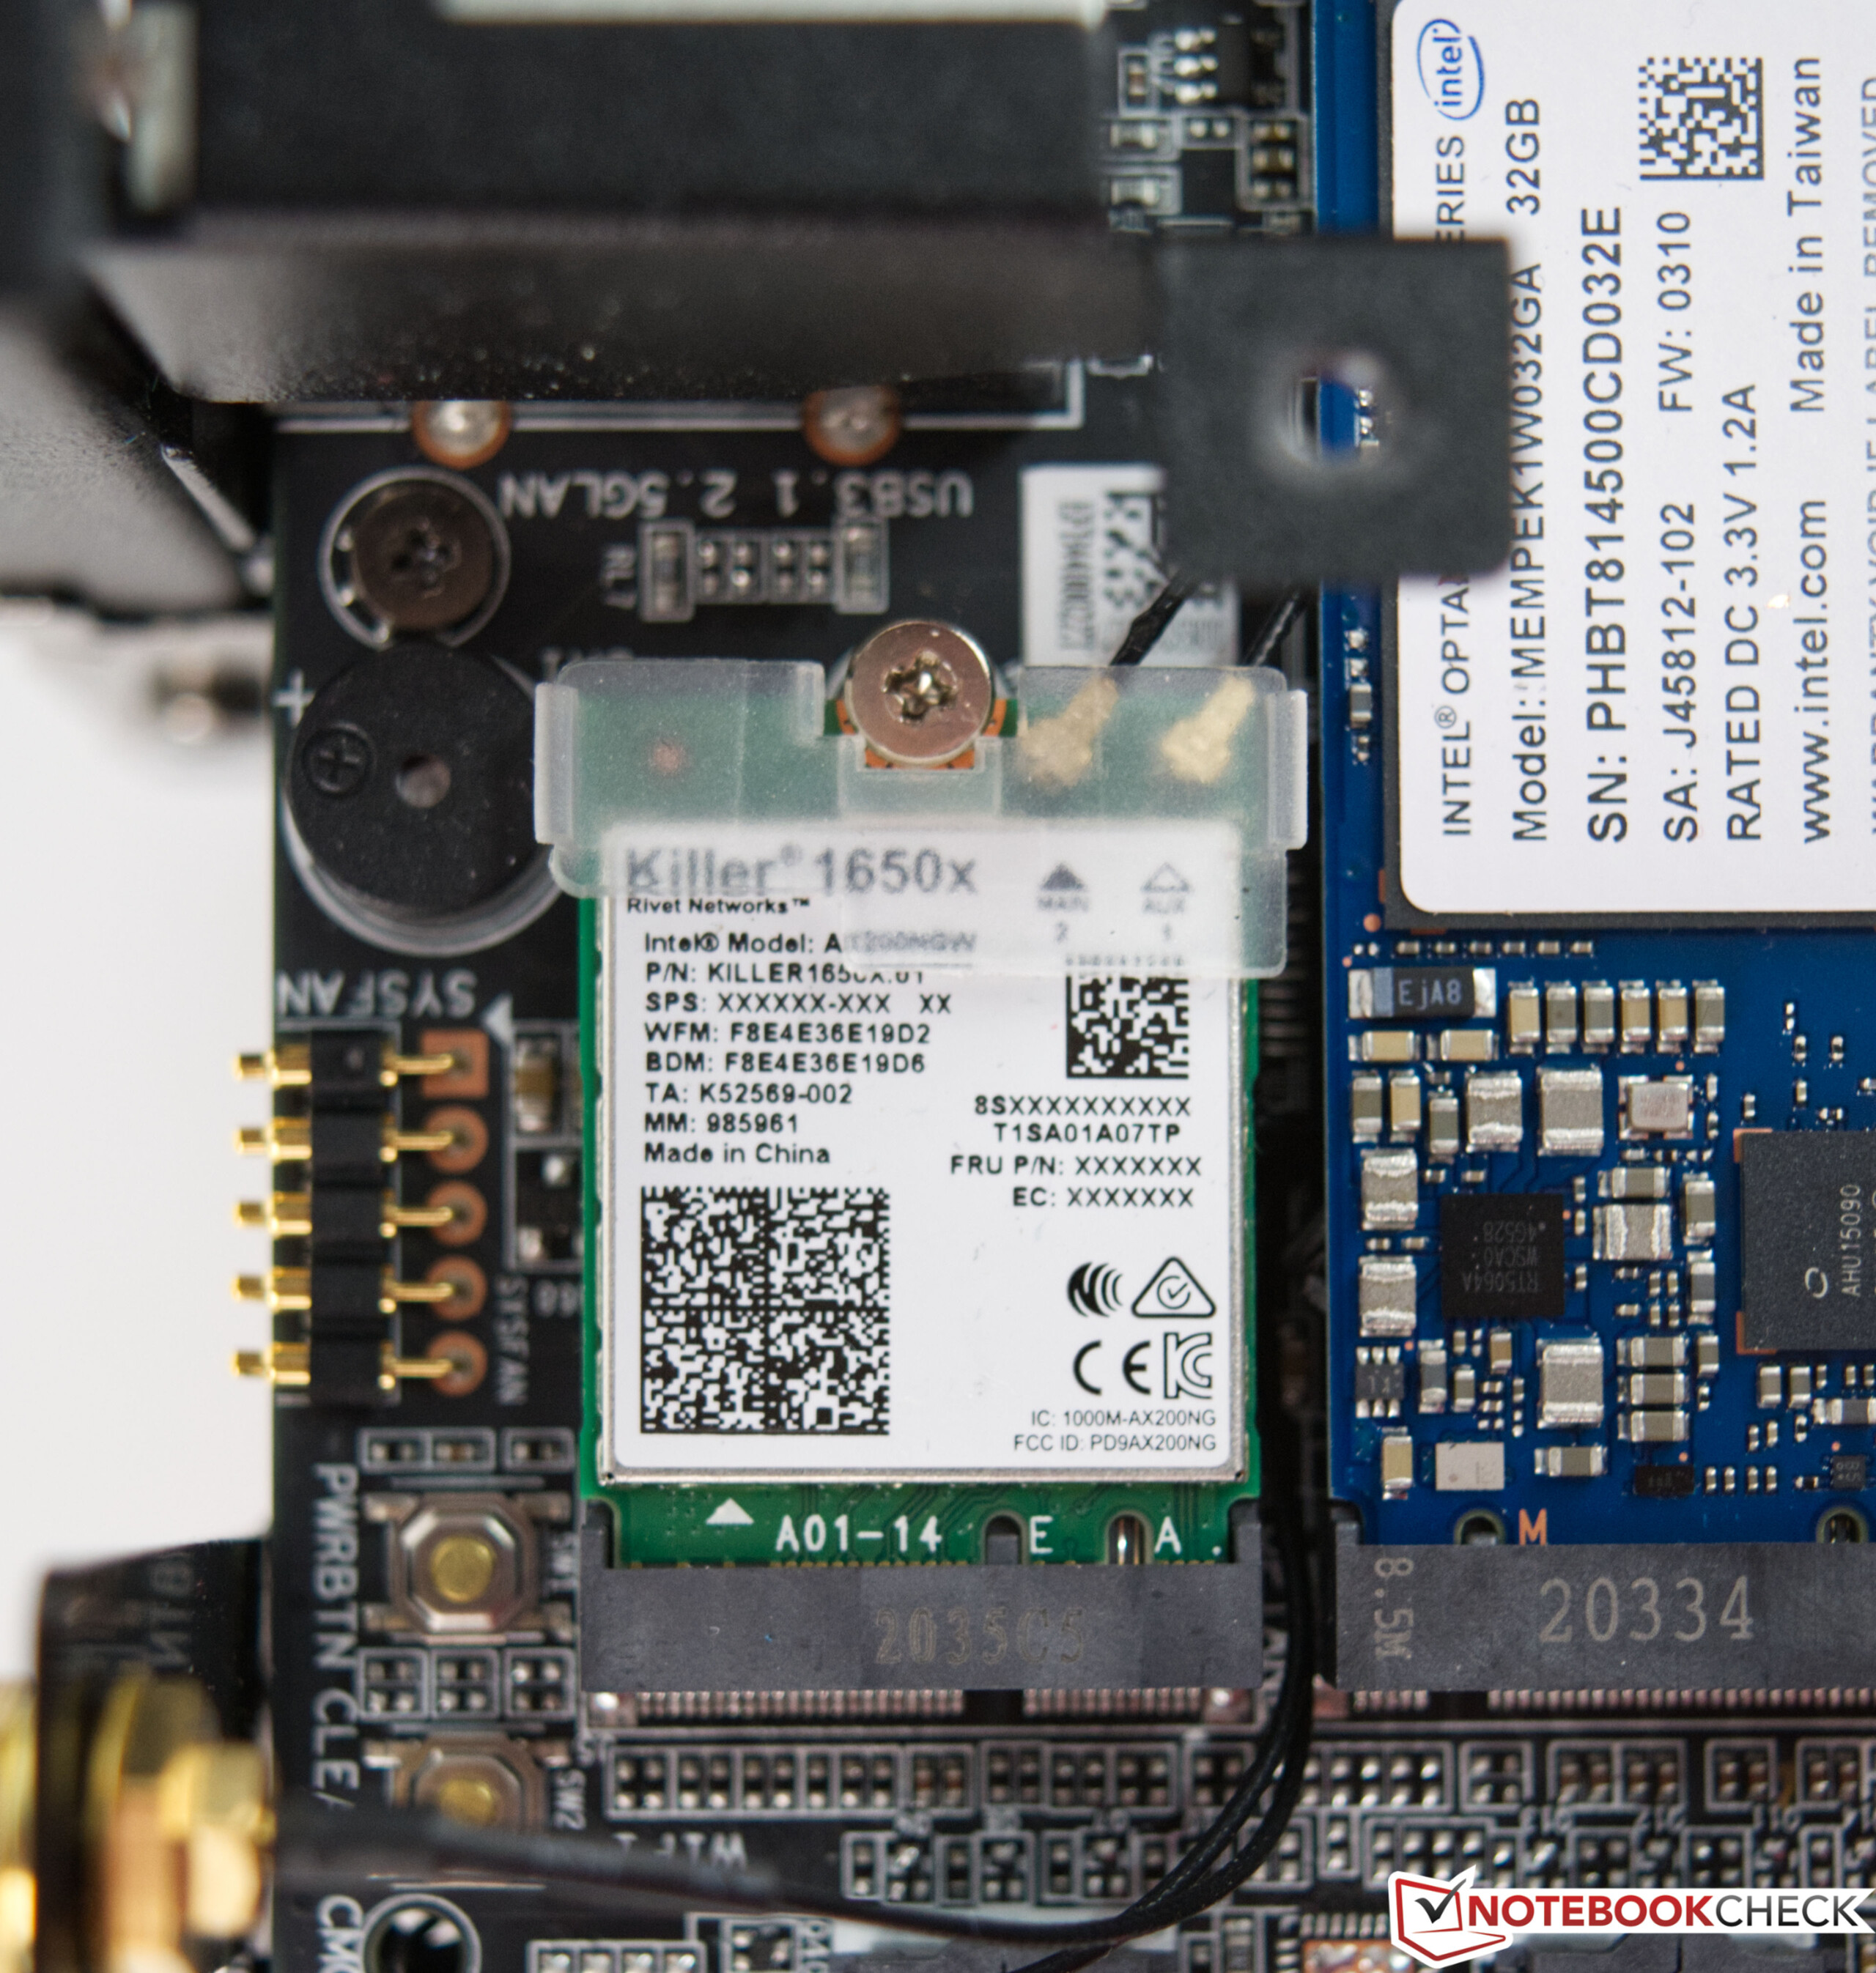
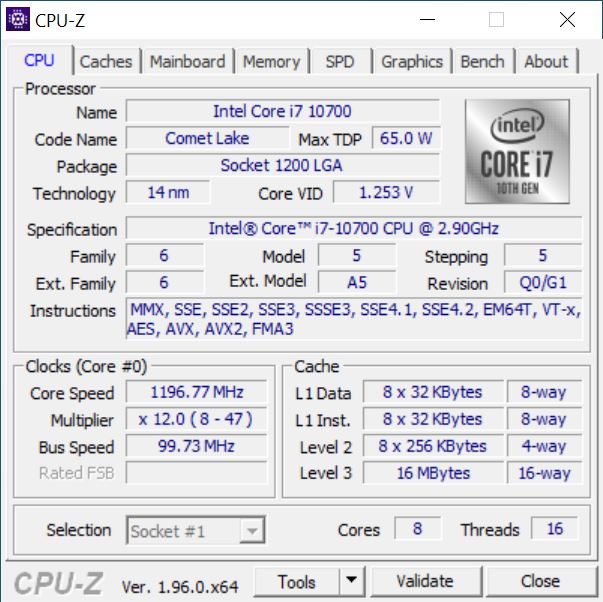
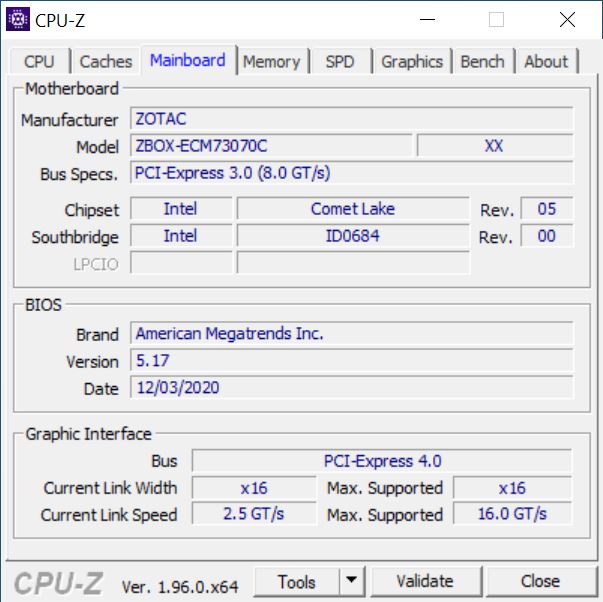
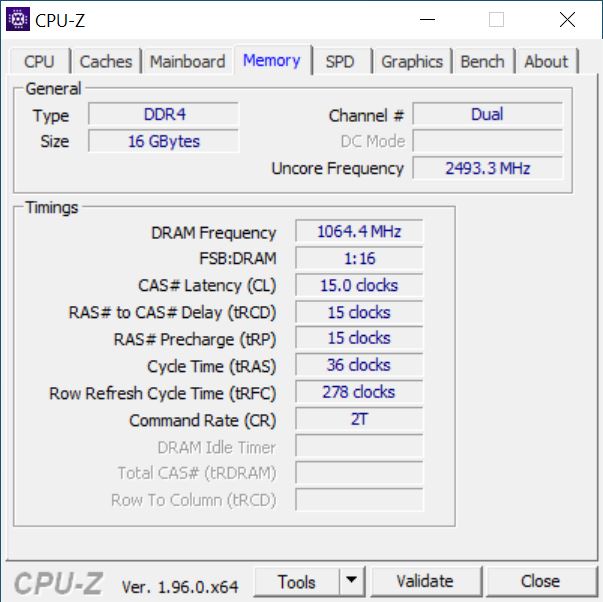
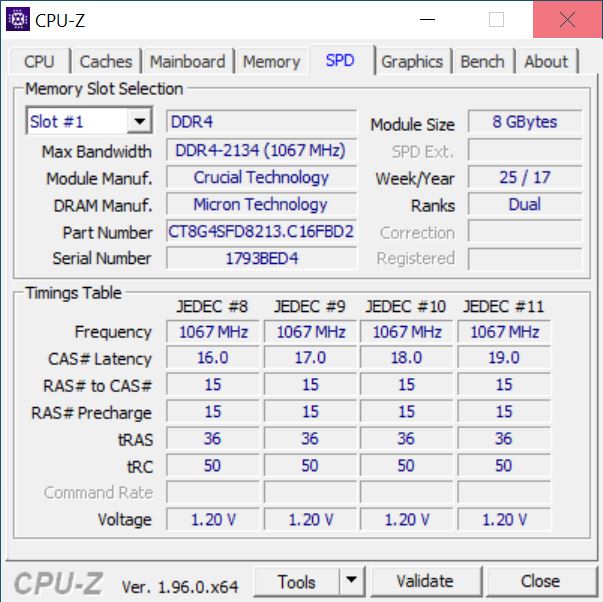
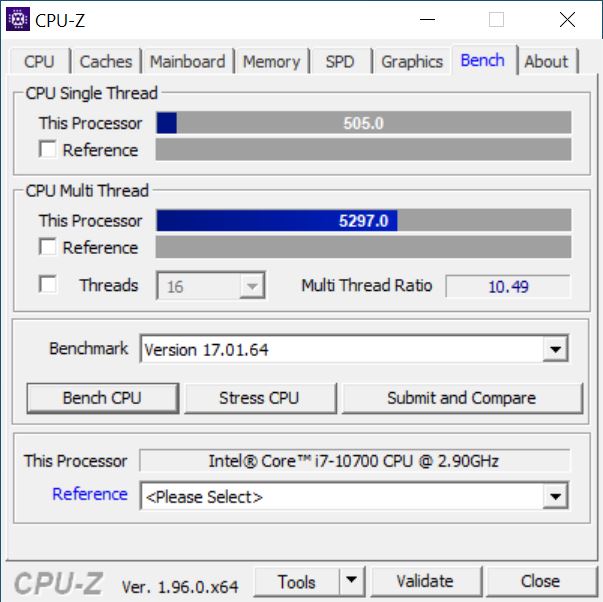
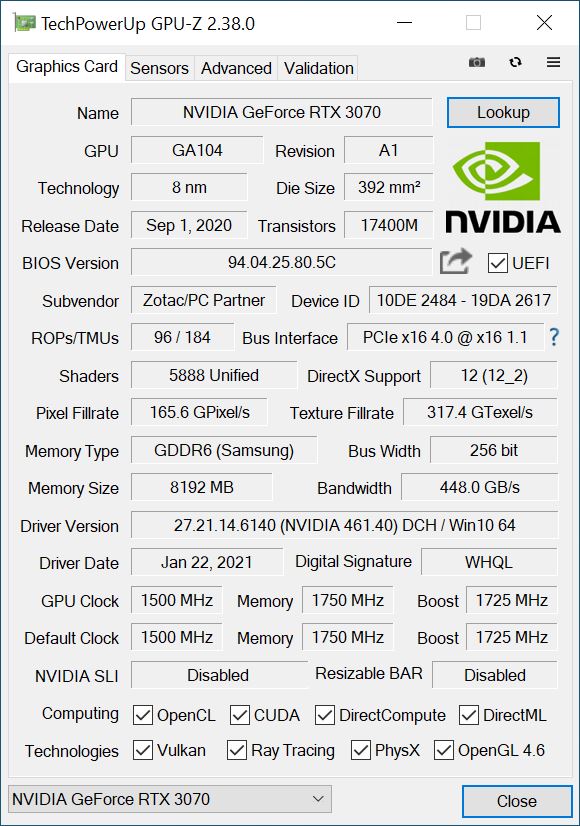
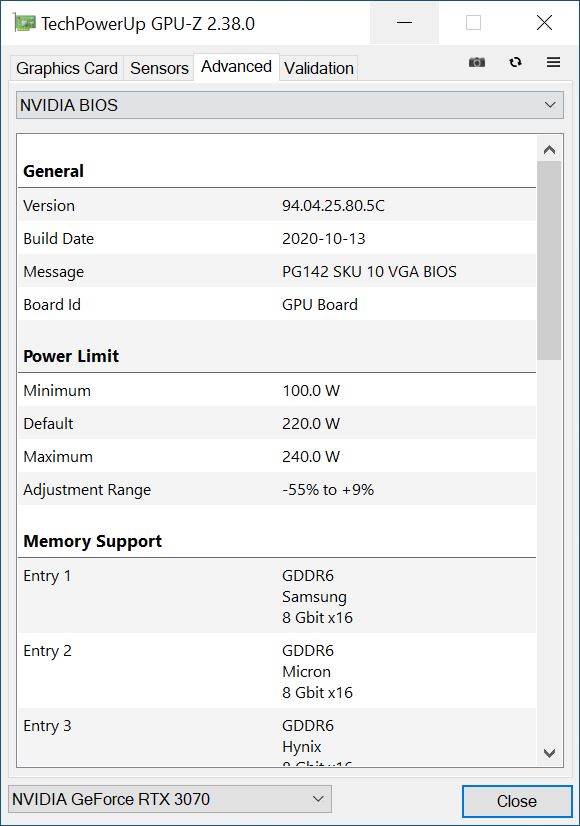
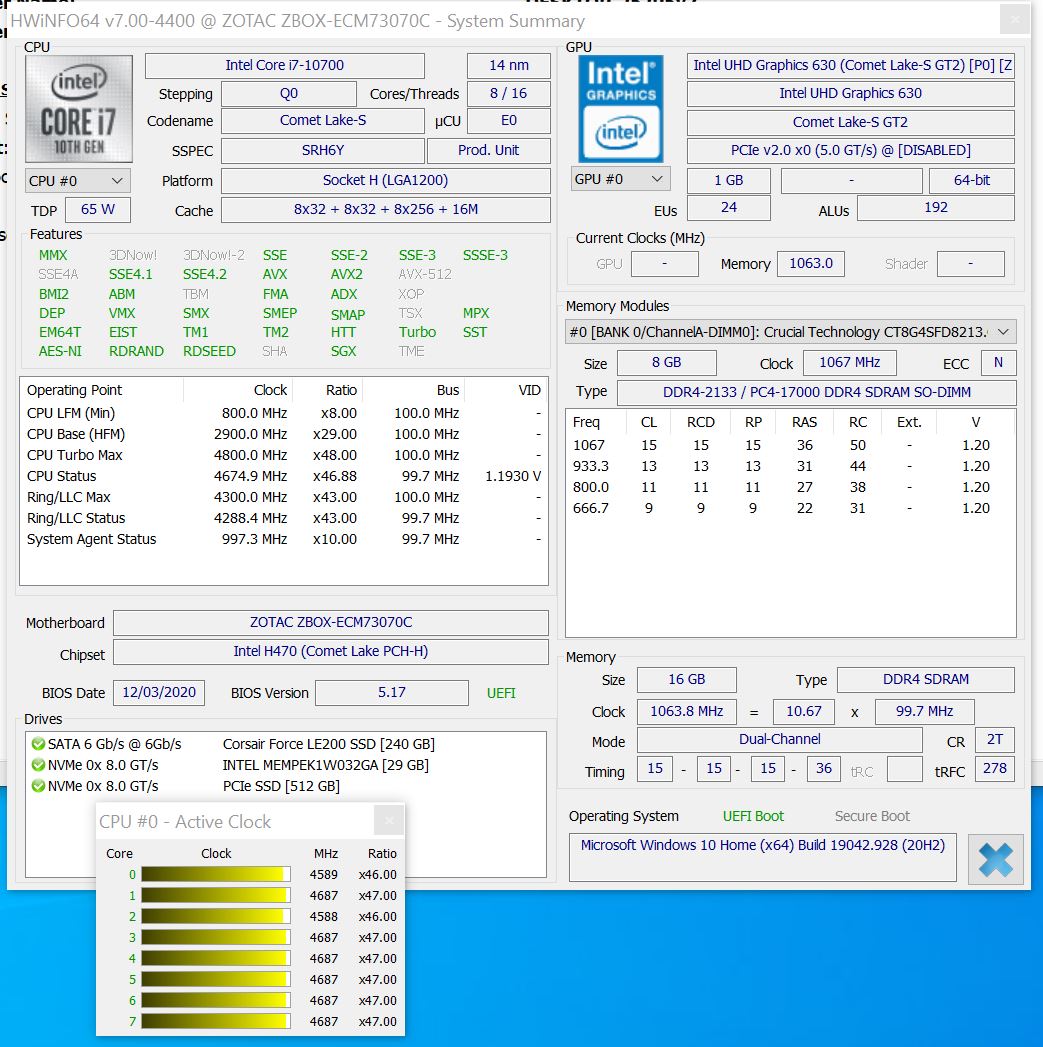
La caja, muy compacta, incluye todo lo necesario para un PC de juegos completo. Incluso la fuente de alimentación está dentro de la caja, y no es necesario conectarla por separado como en el MEK Mini. Una plataforma especialmente desarrollada basada en el socket 1200 de Intel sirve de base. Con el Intel Core i7-10700, se obtiene un procesador razonablemente moderno que hace bien su trabajo, ya que incluso las tareas más exigentes se pueden dominar muy bien con sus 8 núcleos y 16 hilos. El modelo de 65 vatios es una buena elección, porque el desarrollo del calor no debe pasarse por alto. Además, el sistema está equipado con una Zotac GeForce RTX 3070. Debido al espacio limitado, Zotac ha decidido usar un módulo SO-DIMM para la RAM, que se encuentra sobre todo en los portátiles. Puedes elegir entre una variante convencional de 2,5 pulgadas o una variante M.2 para el almacenamiento masivo. Sin embargo, también es posible combinar ambas. Las ranuras no interfieren entre sí
Zotac nos proporcionó un Magnus One con 16 GB de RAM DDR4 y SSDs que ofrecen un total de 750 GB de espacio de almacenamiento. El sistema barebone con la GeForce RTX 3070 es ofrecido oficialmente por Zotac a un MSRP de 1,499 Euros (~$1,825). Sin embargo, los modelos disponibles están listados significativamente por encima del MSRP (a partir de 1,650 Euros) en el momento de las pruebas, lo que está relacionado con los bajos niveles de stock de las tarjetas gráficas.
Puntos de referencia de los procesadores
ElIntel Core i7-10700es un procesador octa-core con un TDP de 65 vatios. La velocidad de reloj base es de 2,9 GHz y la velocidad máxima de refuerzo está especificada en 4,8 GHz. El Core i7-10700 consigue un resultado sólido en el Zotac Magnus One, sin dejar espacio para más debido a la compacidad de este último. No obstante, el sistema rinde bien y puede dejaratrás alIntel Core i7-9700K en las pruebas multihilo. En las pruebas mononúcleo, el Intel Core i7-10700 de nuestro sistema de pruebas está algo a la par con el Intel Core i5-10600K
.Para más comparaciones y pruebas de referencia, nos remitimos a nuestratabla de comparación de CPUsProcesadores mobiles - lista de benchmarks (nueva) aquí.
| Cinebench R20 | |
| CPU (Single Core) | |
| AMD Ryzen 7 5800X, AMD Ryzen 7 5800X | |
| AMD Ryzen 5 5600X, AMD Ryzen 5 5600X | |
| Intel Core i9-10900K, Intel Core i9-10900K | |
| Corsair One i160, Intel Core i9-9900K | |
| Intel Core i7-9700K, AMD Radeon RX Vega 64, Intel Core i7-9700K | |
| Intel Core i5-10600K, Intel Core i5-10600K | |
| Intel Core i5-10400F, Intel Core i5-10400F | |
| CPU (Multi Core) | |
| Intel Core i9-10900K, Intel Core i9-10900K | |
| AMD Ryzen 7 5800X, AMD Ryzen 7 5800X | |
| Corsair One i160, Intel Core i9-9900K | |
| AMD Ryzen 5 5600X, AMD Ryzen 5 5600X | |
| Intel Core i5-10600K, Intel Core i5-10600K | |
| Intel Core i7-9700K, AMD Radeon RX Vega 64, Intel Core i7-9700K | |
| Intel Core i5-10400F, Intel Core i5-10400F | |
| Cinebench R10 | |
| Rendering Single CPUs 64Bit | |
| AMD Ryzen 7 5800X, AMD Ryzen 7 5800X | |
| AMD Ryzen 5 5600X, AMD Ryzen 5 5600X | |
| Intel Core i9-10900K, Intel Core i9-10900K | |
| Corsair One i160, Intel Core i9-9900K | |
| Zotac Magnus One (ECM73070C), Intel Core i7-10700 | |
| Intel Core i7-9700K, AMD Radeon RX Vega 64, Intel Core i7-9700K | |
| Intel Core i5-10600K, Intel Core i5-10600K | |
| Intel Core i5-10400F, Intel Core i5-10400F | |
| Rendering Multiple CPUs 64Bit | |
| AMD Ryzen 7 5800X, AMD Ryzen 7 5800X | |
| Intel Core i9-10900K, Intel Core i9-10900K | |
| AMD Ryzen 5 5600X, AMD Ryzen 5 5600X | |
| Corsair One i160, Intel Core i9-9900K | |
| Intel Core i7-9700K, AMD Radeon RX Vega 64, Intel Core i7-9700K | |
| Zotac Magnus One (ECM73070C), Intel Core i7-10700 | |
| Intel Core i5-10600K, Intel Core i5-10600K | |
| Intel Core i5-10400F, Intel Core i5-10400F | |
| Blender - v2.79 BMW27 CPU | |
| Intel Core i3-10100, Intel Core i3-10100 | |
| Intel Core i5-10400F, Intel Core i5-10400F | |
| Zotac Magnus One (ECM73070C), Intel Core i7-10700 | |
| Intel Core i7-9700K, AMD Radeon RX Vega 64, Intel Core i7-9700K | |
| Intel Core i5-10600K, Intel Core i5-10600K | |
| AMD Ryzen 5 5600X, AMD Ryzen 5 5600X | |
| Corsair One i160, Intel Core i9-9900K | |
| AMD Ryzen 7 5800X, AMD Ryzen 7 5800X | |
| Intel Core i9-10900K, Intel Core i9-10900K | |
| Geekbench 5.5 | |
| Multi-Core | |
| Intel Core i9-10900K, Intel Core i9-10900K | |
| AMD Ryzen 7 5800X, AMD Ryzen 7 5800X | |
| AMD Ryzen 5 5600X, AMD Ryzen 5 5600X | |
| Zotac Magnus One (ECM73070C), Intel Core i7-10700 | |
| Intel Core i7-9700K, AMD Radeon RX Vega 64, Intel Core i7-9700K | |
| Intel Core i5-10600K, Intel Core i5-10600K | |
| Intel Core i5-10400F, Intel Core i5-10400F | |
| Intel Core i5-10400F, Intel Core i5-10400F | |
| Intel Core i3-10100, Intel Core i3-10100 | |
| Single-Core | |
| AMD Ryzen 7 5800X, AMD Ryzen 7 5800X | |
| AMD Ryzen 5 5600X, AMD Ryzen 5 5600X | |
| Intel Core i9-10900K, Intel Core i9-10900K | |
| Intel Core i7-9700K, AMD Radeon RX Vega 64, Intel Core i7-9700K | |
| Zotac Magnus One (ECM73070C), Intel Core i7-10700 | |
| Intel Core i5-10600K, Intel Core i5-10600K | |
| Intel Core i5-10400F, Intel Core i5-10400F | |
| Intel Core i5-10400F, Intel Core i5-10400F | |
| Intel Core i3-10100, Intel Core i3-10100 | |
| Geekbench 5.0 | |
| 5.0 Multi-Core | |
| Intel Core i9-10900K, Intel Core i9-10900K | |
| AMD Ryzen 7 5800X, AMD Ryzen 7 5800X | |
| AMD Ryzen 5 5600X, AMD Ryzen 5 5600X | |
| Zotac Magnus One (ECM73070C), Intel Core i7-10700 | |
| Intel Core i5-10600K, Intel Core i5-10600K | |
| Intel Core i5-10400F, Intel Core i5-10400F | |
| Intel Core i3-10100, Intel Core i3-10100 | |
| 5.0 Single-Core | |
| AMD Ryzen 7 5800X, AMD Ryzen 7 5800X | |
| AMD Ryzen 5 5600X, AMD Ryzen 5 5600X | |
| Intel Core i9-10900K, Intel Core i9-10900K | |
| Zotac Magnus One (ECM73070C), Intel Core i7-10700 | |
| Intel Core i5-10600K, Intel Core i5-10600K | |
| Intel Core i5-10400F, Intel Core i5-10400F | |
| Intel Core i3-10100, Intel Core i3-10100 | |
| Geekbench 4.4 | |
| 64 Bit Single-Core Score | |
| AMD Ryzen 7 5800X, AMD Ryzen 7 5800X | |
| AMD Ryzen 5 5600X, AMD Ryzen 5 5600X | |
| Intel Core i9-10900K, Intel Core i9-10900K | |
| Intel Core i7-9700K, AMD Radeon RX Vega 64, Intel Core i7-9700K | |
| Corsair One i160, Intel Core i9-9900K | |
| Intel Core i5-10600K, Intel Core i5-10600K | |
| Zotac Magnus One (ECM73070C), Intel Core i7-10700 | |
| Intel Core i5-10400F, Intel Core i5-10400F | |
| Intel Core i3-10100, Intel Core i3-10100 | |
| 64 Bit Multi-Core Score | |
| AMD Ryzen 7 5800X, AMD Ryzen 7 5800X | |
| Intel Core i9-10900K, Intel Core i9-10900K | |
| AMD Ryzen 5 5600X, AMD Ryzen 5 5600X | |
| Corsair One i160, Intel Core i9-9900K | |
| Zotac Magnus One (ECM73070C), Intel Core i7-10700 | |
| Intel Core i7-9700K, AMD Radeon RX Vega 64, Intel Core i7-9700K | |
| Intel Core i5-10600K, Intel Core i5-10600K | |
| Intel Core i5-10400F, Intel Core i5-10400F | |
| Intel Core i3-10100, Intel Core i3-10100 | |
| 3DMark 11 - 1280x720 Performance Physics | |
| AMD Ryzen 7 5800X, AMD Ryzen 7 5800X | |
| Intel Core i9-10900K, Intel Core i9-10900K | |
| AMD Ryzen 5 5600X, AMD Ryzen 5 5600X | |
| Corsair One i160, Intel Core i9-9900K | |
| Intel Core i7-9700K, AMD Radeon RX Vega 64, Intel Core i7-9700K | |
| Intel Core i5-10600K, Intel Core i5-10600K | |
| Zotac Magnus One (ECM73070C), Intel Core i7-10700 | |
| Intel Core i5-10400F, Intel Core i5-10400F | |
| 7-Zip 18.03 | |
| 7z b 4 | |
| AMD Ryzen 7 5800X, AMD Ryzen 7 5800X | |
| Intel Core i9-10900K, Intel Core i9-10900K | |
| AMD Ryzen 5 5600X, AMD Ryzen 5 5600X | |
| Corsair One i160, Intel Core i9-9900K | |
| Zotac Magnus One (ECM73070C), Intel Core i7-10700 | |
| Intel Core i5-10600K, Intel Core i5-10600K | |
| Intel Core i5-10400F, Intel Core i5-10400F | |
| Intel Core i3-10100, Intel Core i3-10100 | |
| 7z b 4 -mmt1 | |
| AMD Ryzen 7 5800X, AMD Ryzen 7 5800X | |
| AMD Ryzen 5 5600X, AMD Ryzen 5 5600X | |
| Intel Core i9-10900K, Intel Core i9-10900K | |
| Corsair One i160, Intel Core i9-9900K | |
| Zotac Magnus One (ECM73070C), Intel Core i7-10700 | |
| Intel Core i5-10600K, Intel Core i5-10600K | |
| Intel Core i5-10400F, Intel Core i5-10400F | |
| Intel Core i3-10100, Intel Core i3-10100 | |
| HWBOT x265 Benchmark v2.2 - 4k Preset | |
| Intel Core i9-10900K, Intel Core i9-10900K | |
| AMD Ryzen 7 5800X, AMD Ryzen 7 5800X | |
| Corsair One i160, Intel Core i9-9900K | |
| AMD Ryzen 5 5600X, AMD Ryzen 5 5600X | |
| Intel Core i7-9700K, AMD Radeon RX Vega 64, Intel Core i7-9700K | |
| Intel Core i5-10600K, Intel Core i5-10600K | |
| Zotac Magnus One (ECM73070C), Intel Core i7-10700 | |
| Intel Core i5-10400F, Intel Core i5-10400F | |
| Intel Core i3-10100, Intel Core i3-10100 | |
| R Benchmark 2.5 - Overall mean | |
| Intel Core i3-10100, Intel Core i3-10100 | |
| Intel Core i5-10400F, Intel Core i5-10400F | |
| Intel Core i5-10600K, Intel Core i5-10600K | |
| Zotac Magnus One (ECM73070C), Intel Core i7-10700 | |
| Intel Core i9-10900K, Intel Core i9-10900K | |
| AMD Ryzen 5 5600X, AMD Ryzen 5 5600X | |
| AMD Ryzen 7 5800X, AMD Ryzen 7 5800X | |
| LibreOffice - 20 Documents To PDF | |
| Intel Core i9-10900K, Intel Core i9-10900K | |
| Zotac Magnus One (ECM73070C), Intel Core i7-10700 | |
| Intel Core i3-10100, Intel Core i3-10100 | |
| Intel Core i5-10400F, Intel Core i5-10400F | |
| Intel Core i5-10600K, Intel Core i5-10600K | |
| AMD Ryzen 5 5600X, AMD Ryzen 5 5600X | |
| AMD Ryzen 7 5800X, AMD Ryzen 7 5800X | |
| WebXPRT 3 - Overall | |
| AMD Ryzen 7 5800X, AMD Ryzen 7 5800X | |
| AMD Ryzen 5 5600X, AMD Ryzen 5 5600X | |
| Intel Core i9-10900K, Intel Core i9-10900K | |
| Zotac Magnus One (ECM73070C), Intel Core i7-10700 | |
| Intel Core i5-10600K, Intel Core i5-10600K | |
| Intel Core i5-10400F, Intel Core i5-10400F | |
| Intel Core i3-10100, Intel Core i3-10100 | |
| Mozilla Kraken 1.1 - Total | |
| Intel Core i5-10400F, Intel Core i5-10400F | |
| Intel Core i3-10100, Intel Core i3-10100 | |
| Intel Core i5-10600K, Intel Core i5-10600K | |
| Zotac Magnus One (ECM73070C), Intel Core i7-10700 | |
| Intel Core i9-10900K, Intel Core i9-10900K | |
| AMD Ryzen 5 5600X, AMD Ryzen 5 5600X | |
| AMD Ryzen 7 5800X, AMD Ryzen 7 5800X | |
* ... más pequeño es mejor
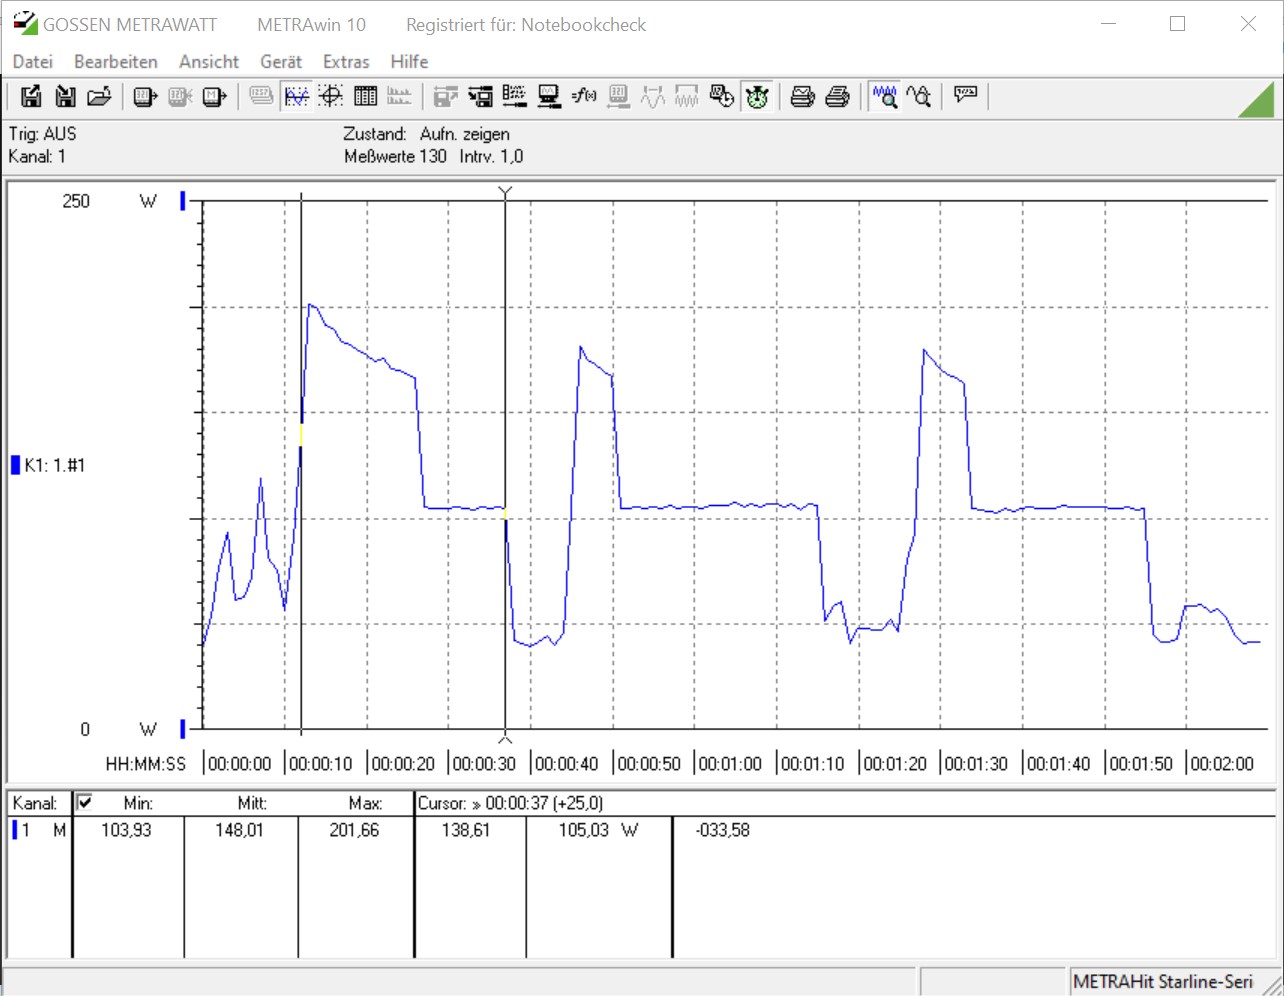
Zotac Magnus One en el multibucle de Cinebench R15
El Intel Core i7-10700 experimenta una ligera caída de rendimiento tras la primera ejecución, pero se vuelve cada vez más estable en el transcurso de la prueba. No obstante, el rendimiento está a un alto nivel con una media de 1.338 puntos
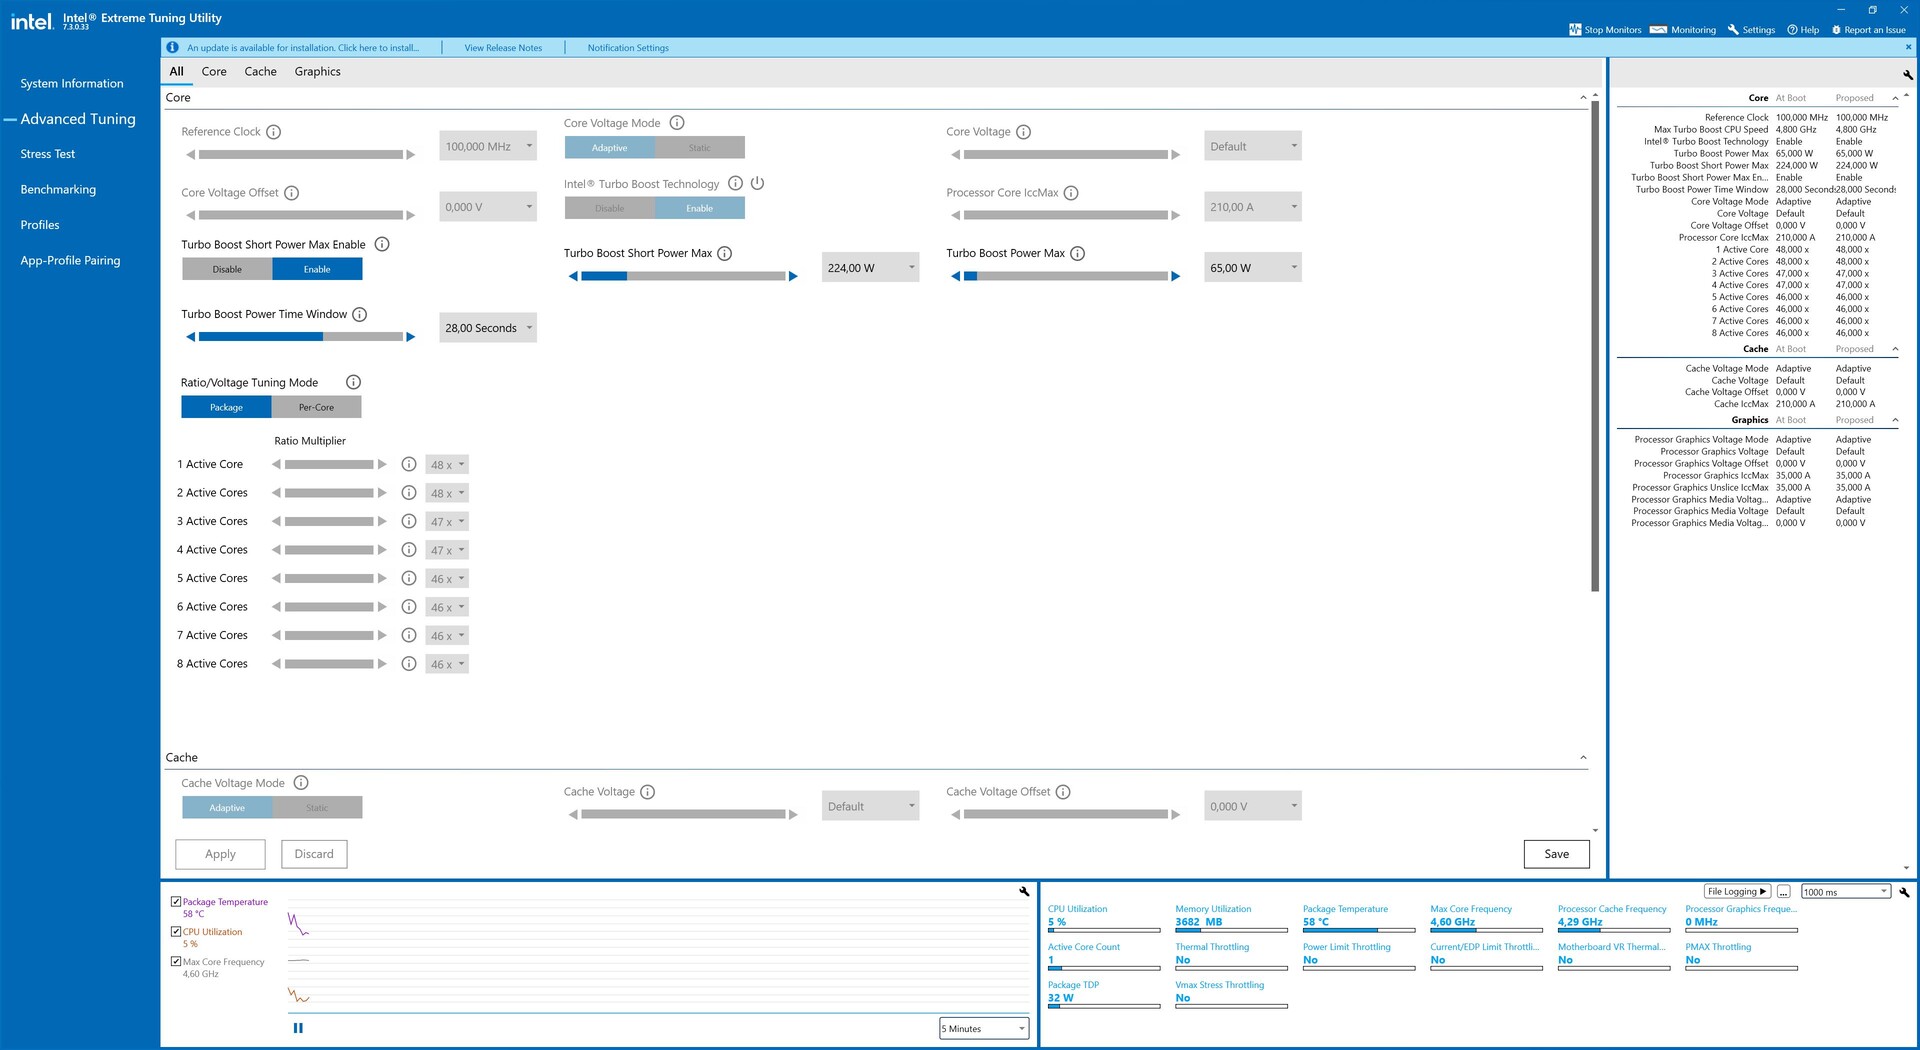
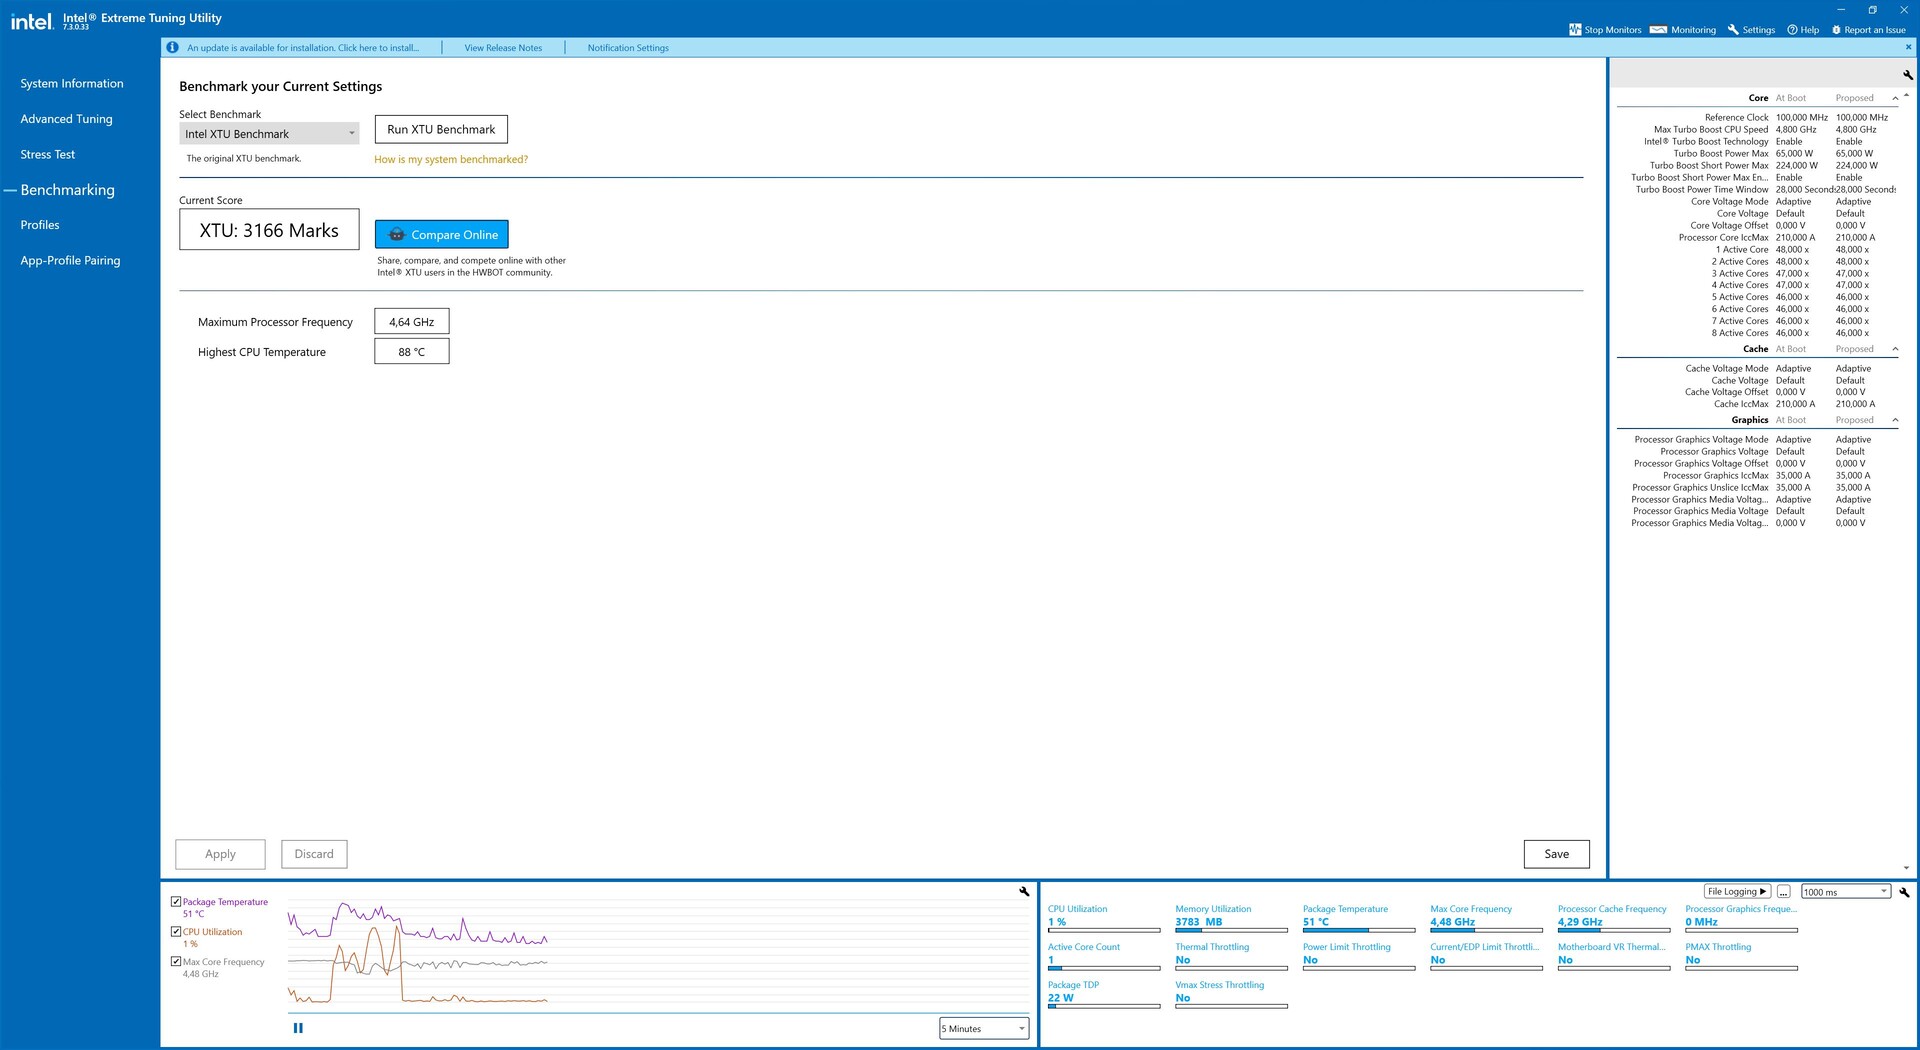
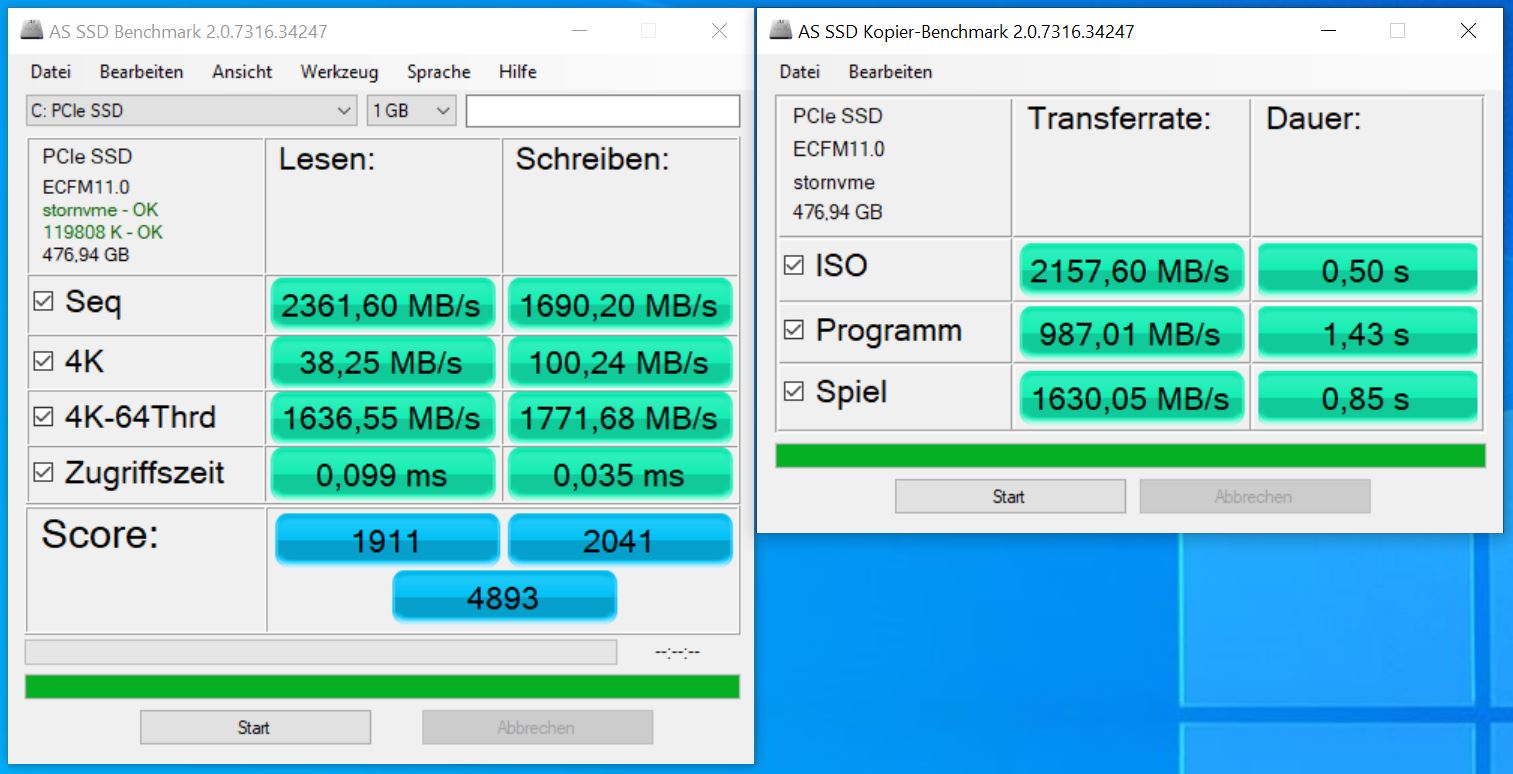
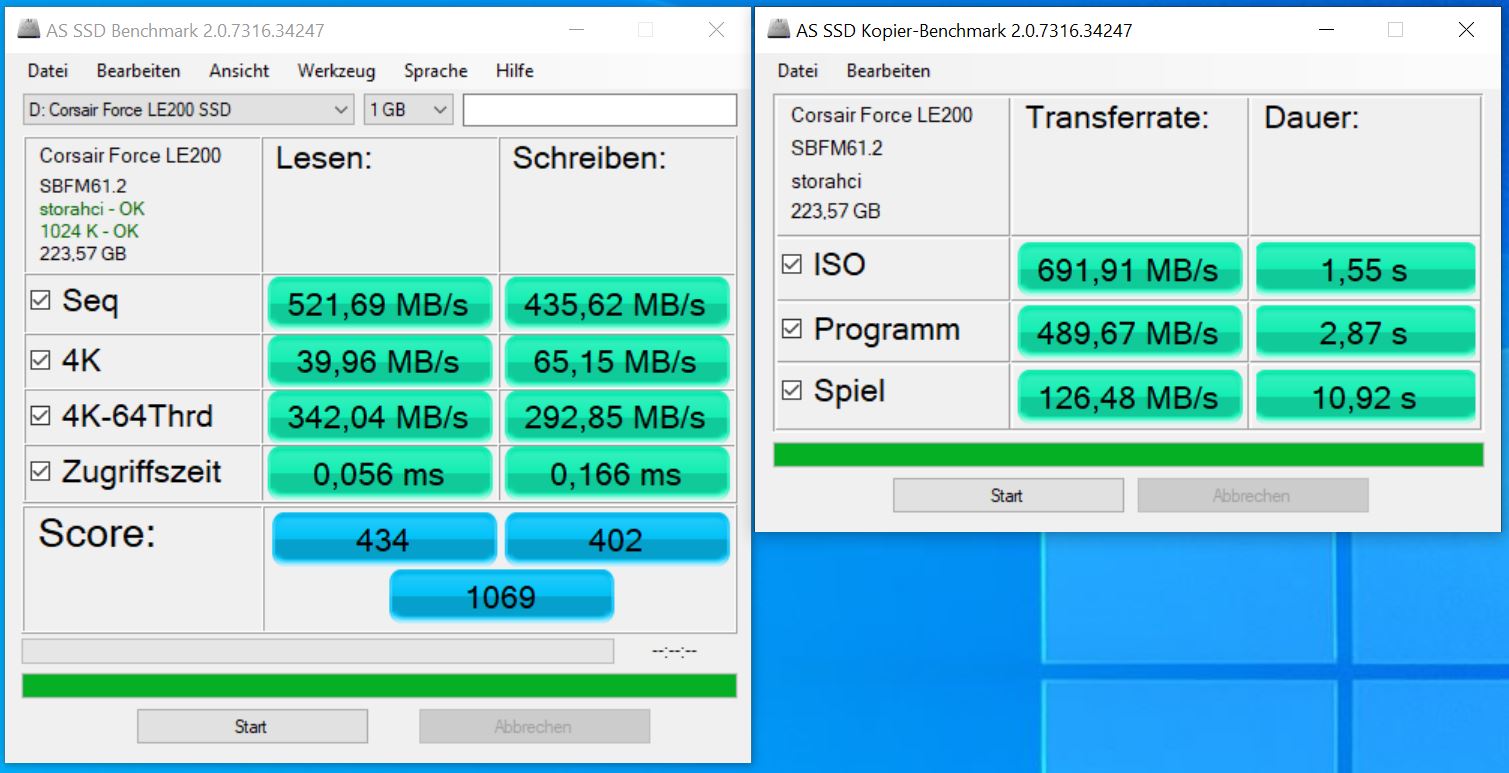
Rendimiento de la aplicación
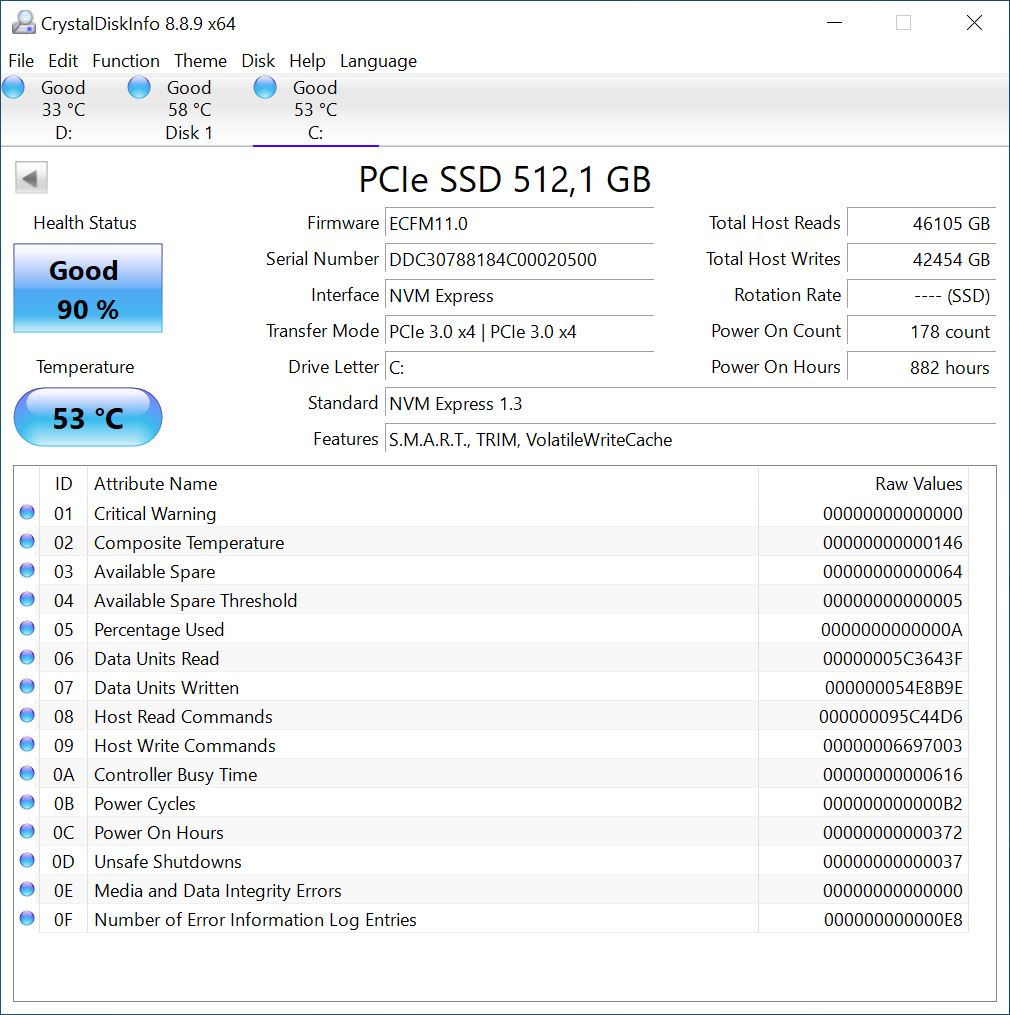
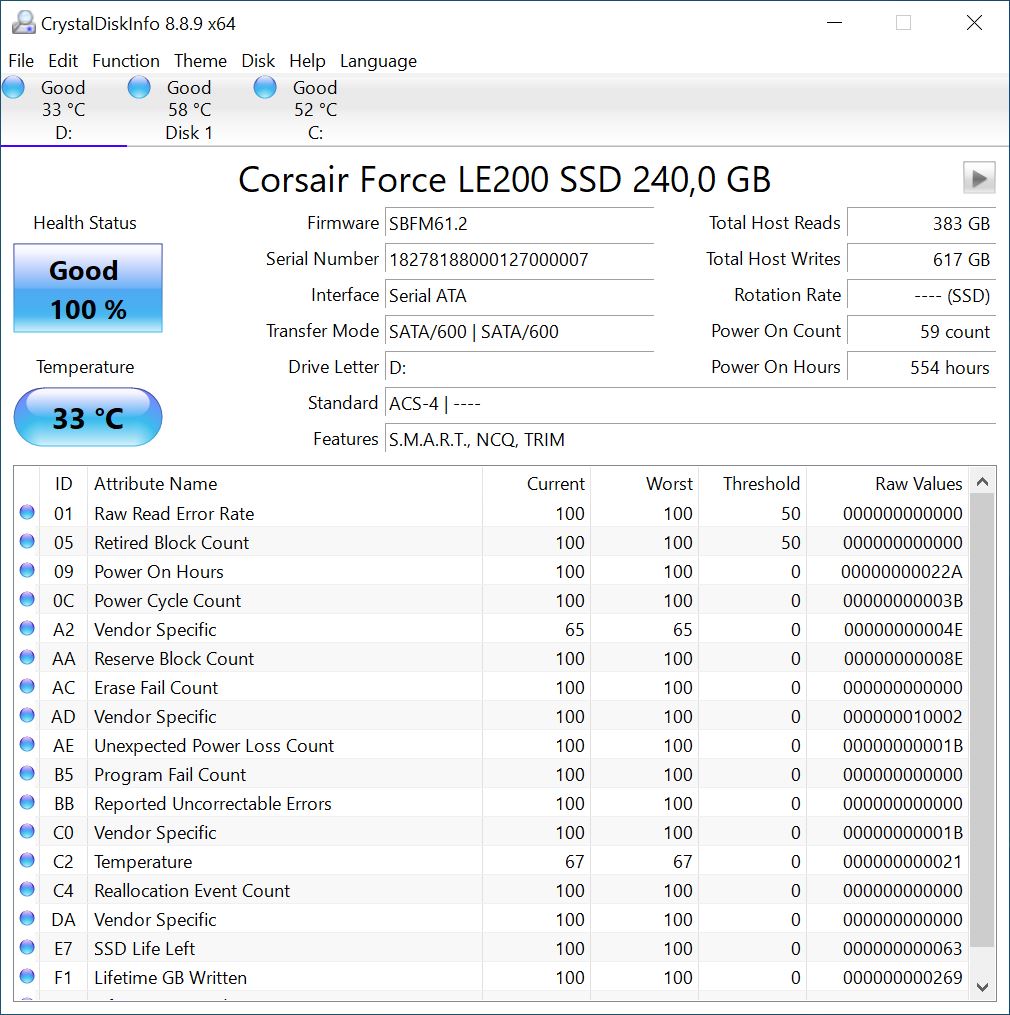
Nuestra configuración de prueba del Magnus One consigue unos índices relativamente buenos en nuestros benchmarks de aplicaciones. No obstante, esperábamos un mejor rendimiento debido a los componentes incorporados. En comparación con nuestros otros sistemas de prueba, el Magnus One se queda a menudo atrás. Nos gusta el hecho de que no tenga un disco duro convencional. Sin embargo, los usuarios tienen la libertad de elegir el tipo de dispositivo de almacenamiento masivo que quieren utilizar. Las capturas de pantalla adjuntas dan una idea aproximada del rendimiento que se puede esperar. El maletín puede albergar un total de tres dispositivos de almacenamiento masivo
Rendimiento en 3D y en juegos
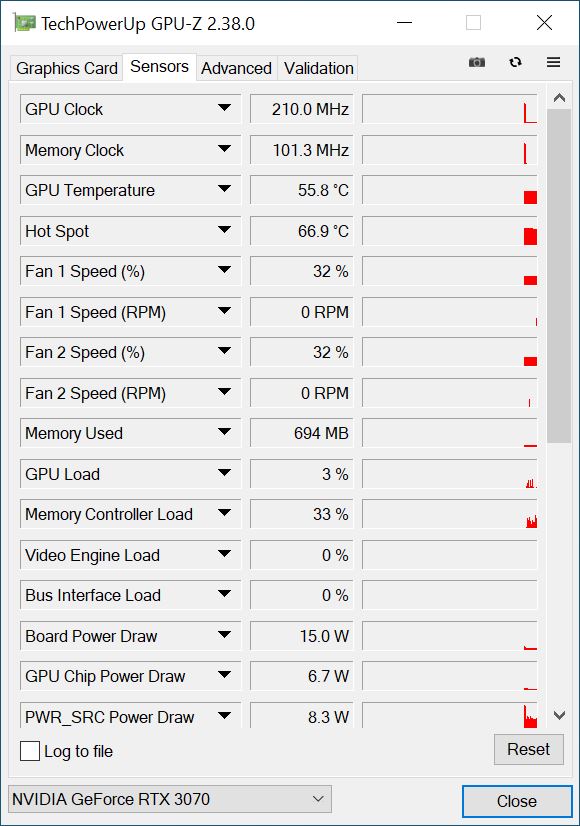
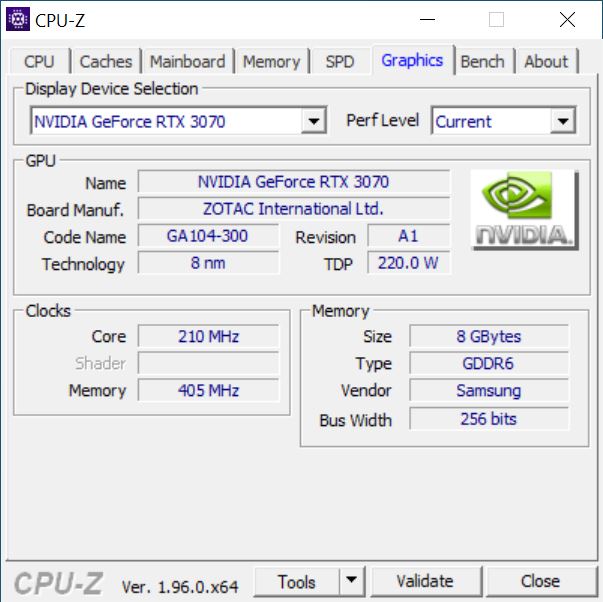
UnNvidia GeForce RTX 3070que viene directamente de la cartera interna de Zotac es responsable del buen rendimiento 3D. El sistema ofreció un sólido rendimiento en la prueba y puntuó un poco mejor en general que en las pruebas anteriores que sólo examinaban la CPU. En términos de rendimiento puro, el Magnus One con la GeForce RTX 3070 se sitúa justo detrás de nuestro sistema de pruebas basado en el AMD Ryzen 9 5900X, ligeramente más rápido, y el MSI GeForce RTX 3070 Ventus 3X. Sin embargo, el rendimiento algo inferior no se puede calificar de notable. No obstante, la RTX 3070 lo tiene fácil cuando se trata de la generación anterior equipada con la RTX 2070 Super. Una mejora de hasta el 30% en el rendimiento es posible, y es definitivamente perceptible también al jugar. El equipamiento del Magnus One ciertamente permite disfrutar de muchos juegos en 2160p, aunque el juego a 1440p debería ser el objetivo principal.
Para más comparaciones y benchmarks sobre el rendimiento de la RTX 3070, consulta nuestra tabla comparativa de GPUs enTarjetas gráficas moviles - lista de Benchmarks (nueva).
| Borderlands 3 - 1920x1080 Badass Overall Quality (DX11) | |
| Zotac Magnus One (ECM73070C) | |
| MSI GeForce RTX 3070 Ventus 3X | |
| Medio NVIDIA GeForce RTX 2070 Super (Desktop) (74.3 - 86, n=5) | |
| Nvidia GeForce RTX 2070 Super | |
| KFA2 GeForce RTX 2070 Super Work The Frames | |
| Medio NVIDIA GeForce RTX 2070 (Desktop) (70.9 - 74.4, n=2) | |
| Medio NVIDIA GeForce RTX 2060 Super (Desktop) (68.6 - 74.1, n=4) | |
| bajo | medio | alto | ultra | QHD | 4K | |
|---|---|---|---|---|---|---|
| GTA V (2015) | 180 | 173 | 161 | 95.6 | 91.6 | 110 |
| The Witcher 3 (2015) | 367 | 316 | 235 | 121 | 84 | |
| Dota 2 Reborn (2015) | 164.2 | 143.8 | 138.2 | 129.7 | 127.4 | |
| Final Fantasy XV Benchmark (2018) | 167 | 146 | 112 | 89.2 | 54.8 | |
| X-Plane 11.11 (2018) | 124 | 110 | 91 | 78.8 | ||
| Far Cry 5 (2018) | 150 | 133 | 126 | 117 | 112 | 70 |
| Strange Brigade (2018) | 430 | 311 | 253 | 222 | 165 | 97.1 |
| Far Cry New Dawn (2019) | 126 | 110 | 106 | 95 | 92 | 70 |
| Metro Exodus (2019) | 166 | 136 | 116 | 93.1 | 76.1 | 49 |
| Borderlands 3 (2019) | 149 | 132 | 118 | 98.8 | 75.5 | 42.7 |
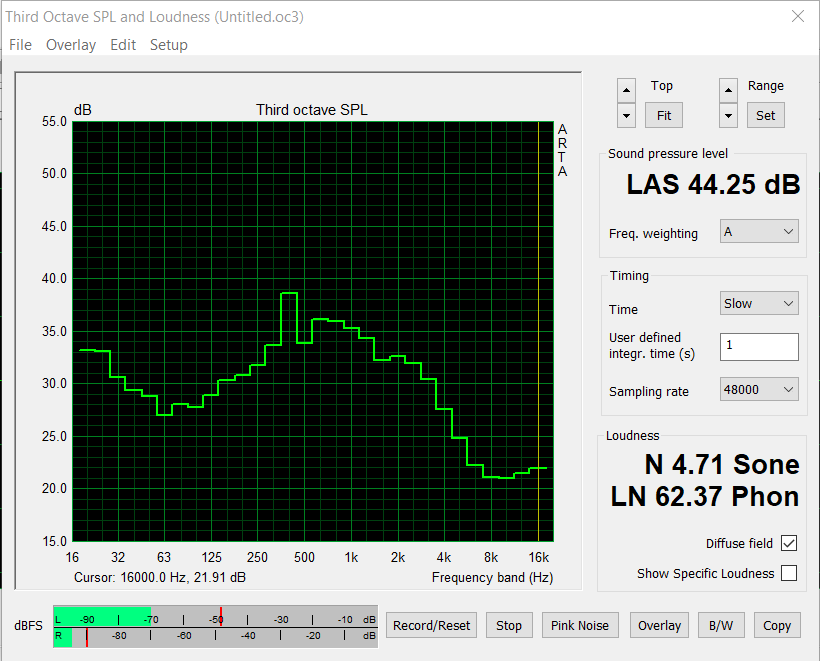
Emisiones
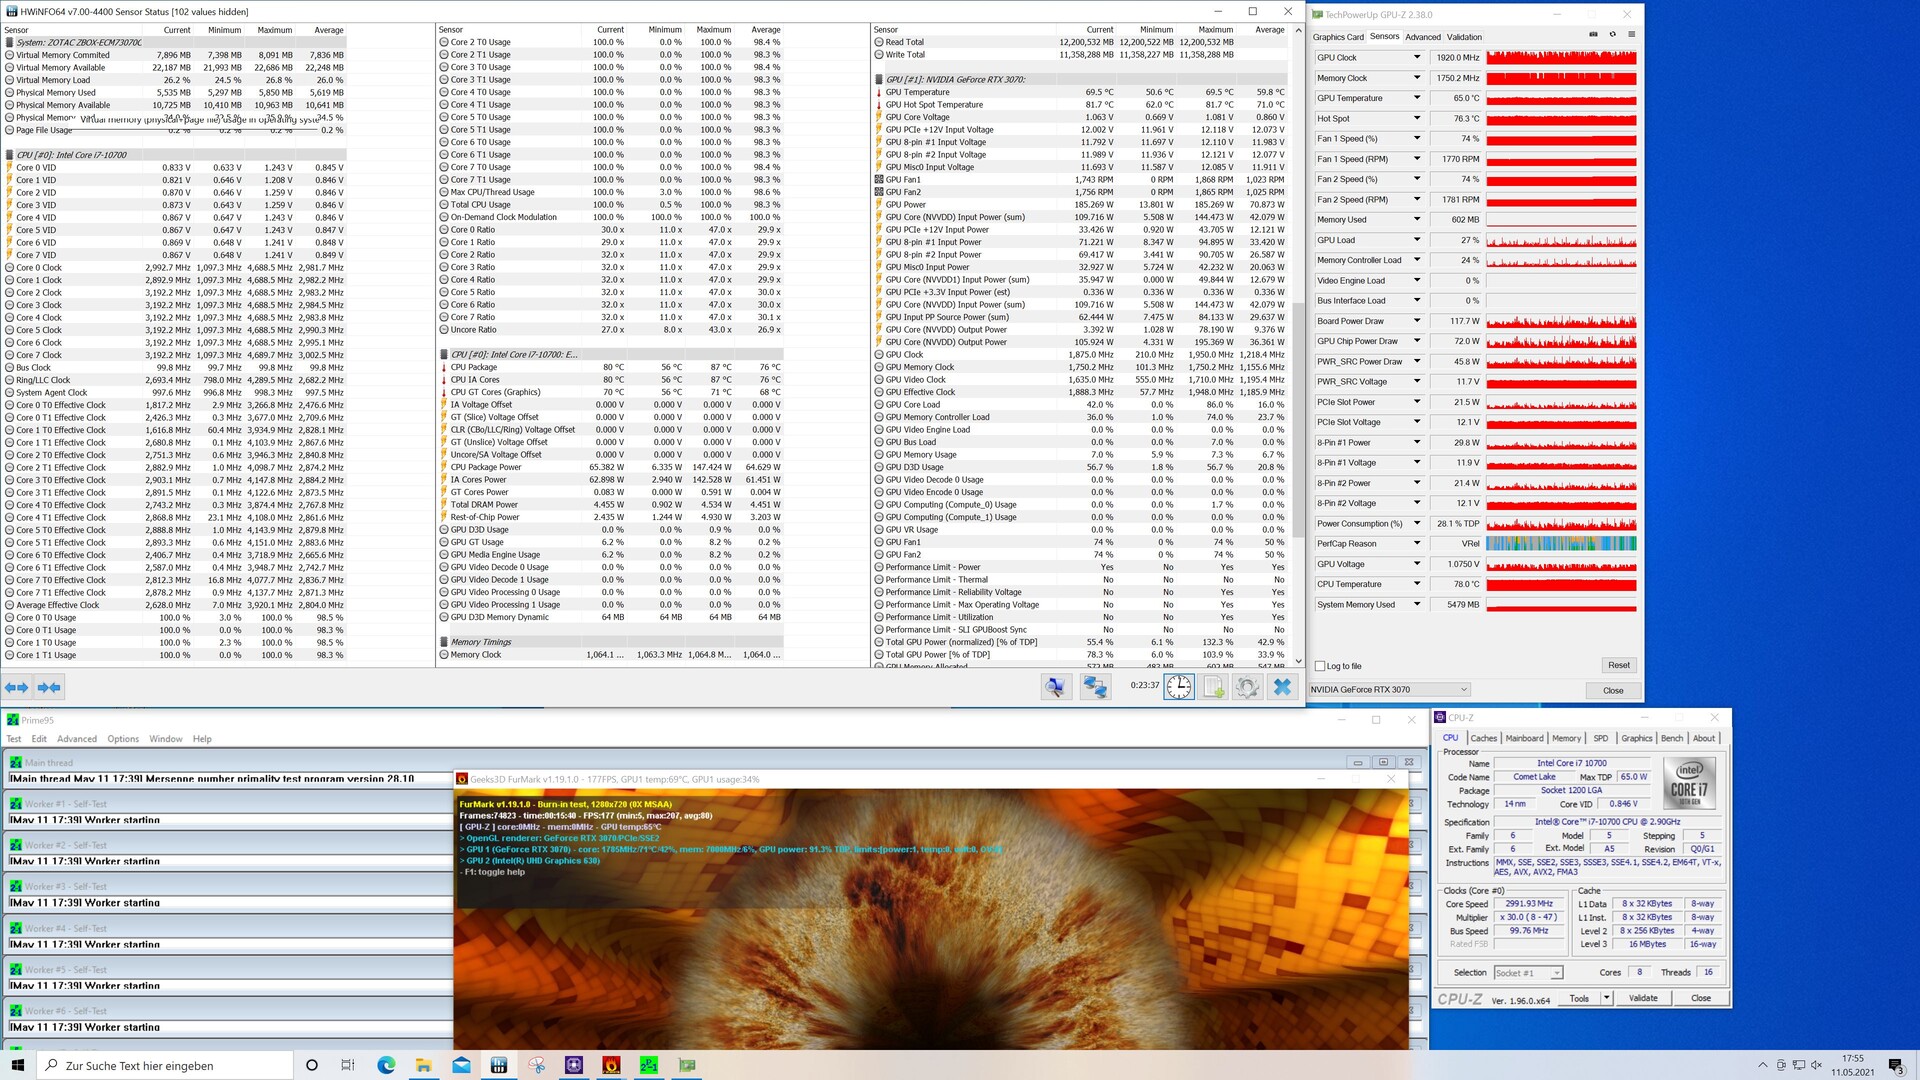
El Zotac Magnus One en la prueba de esfuerzo
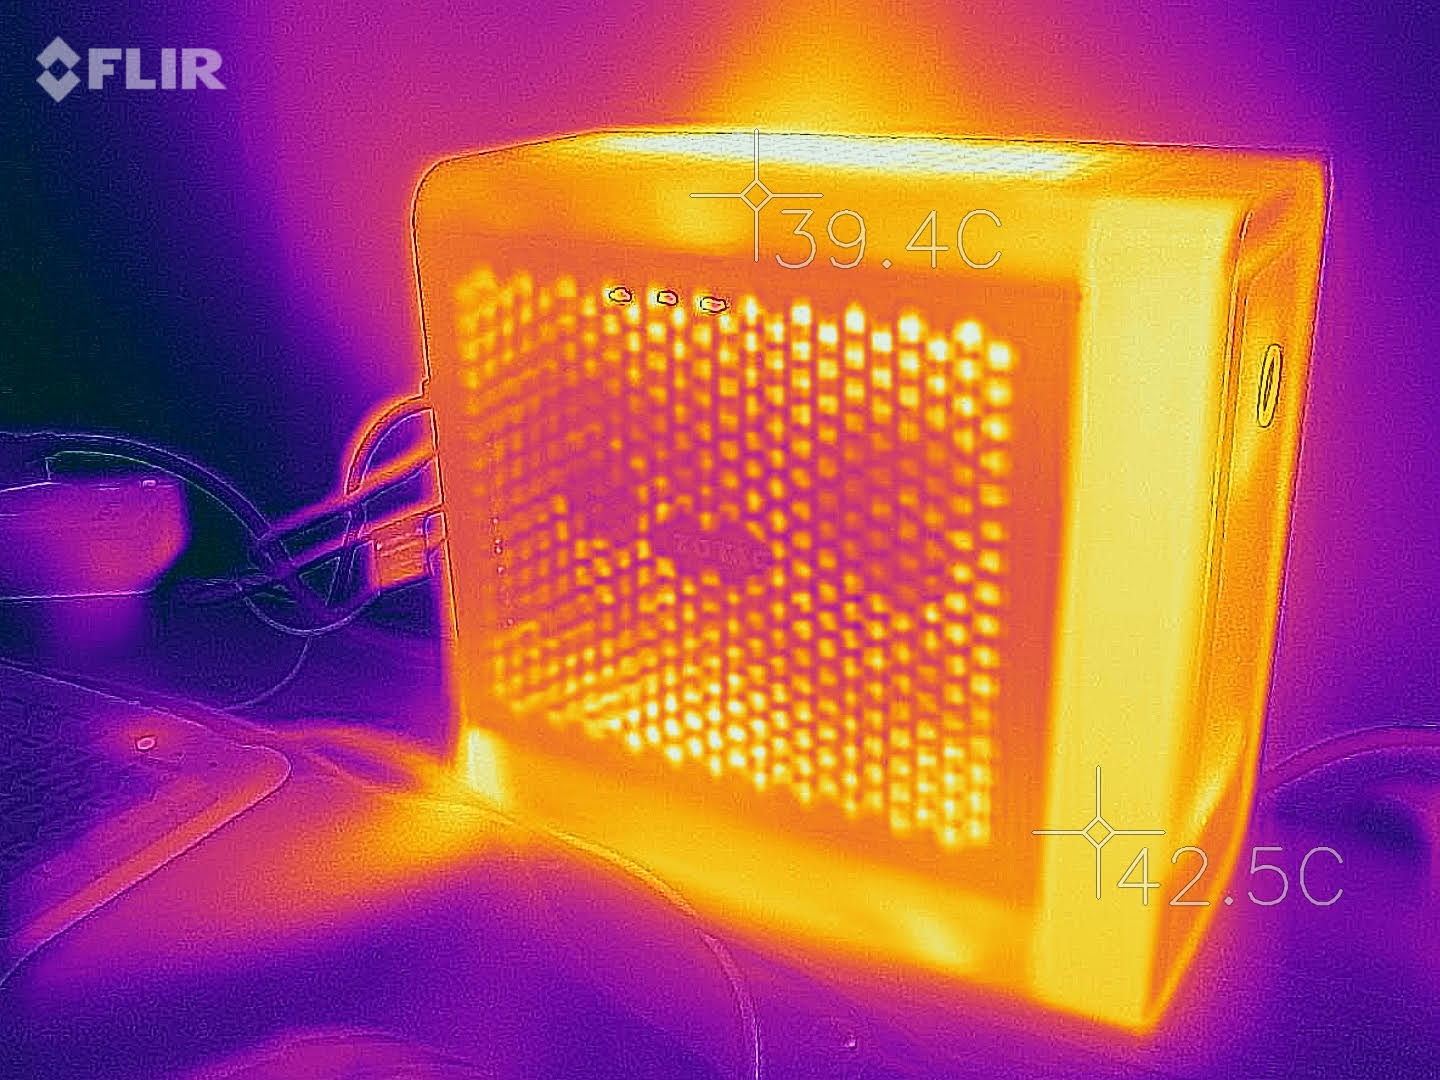
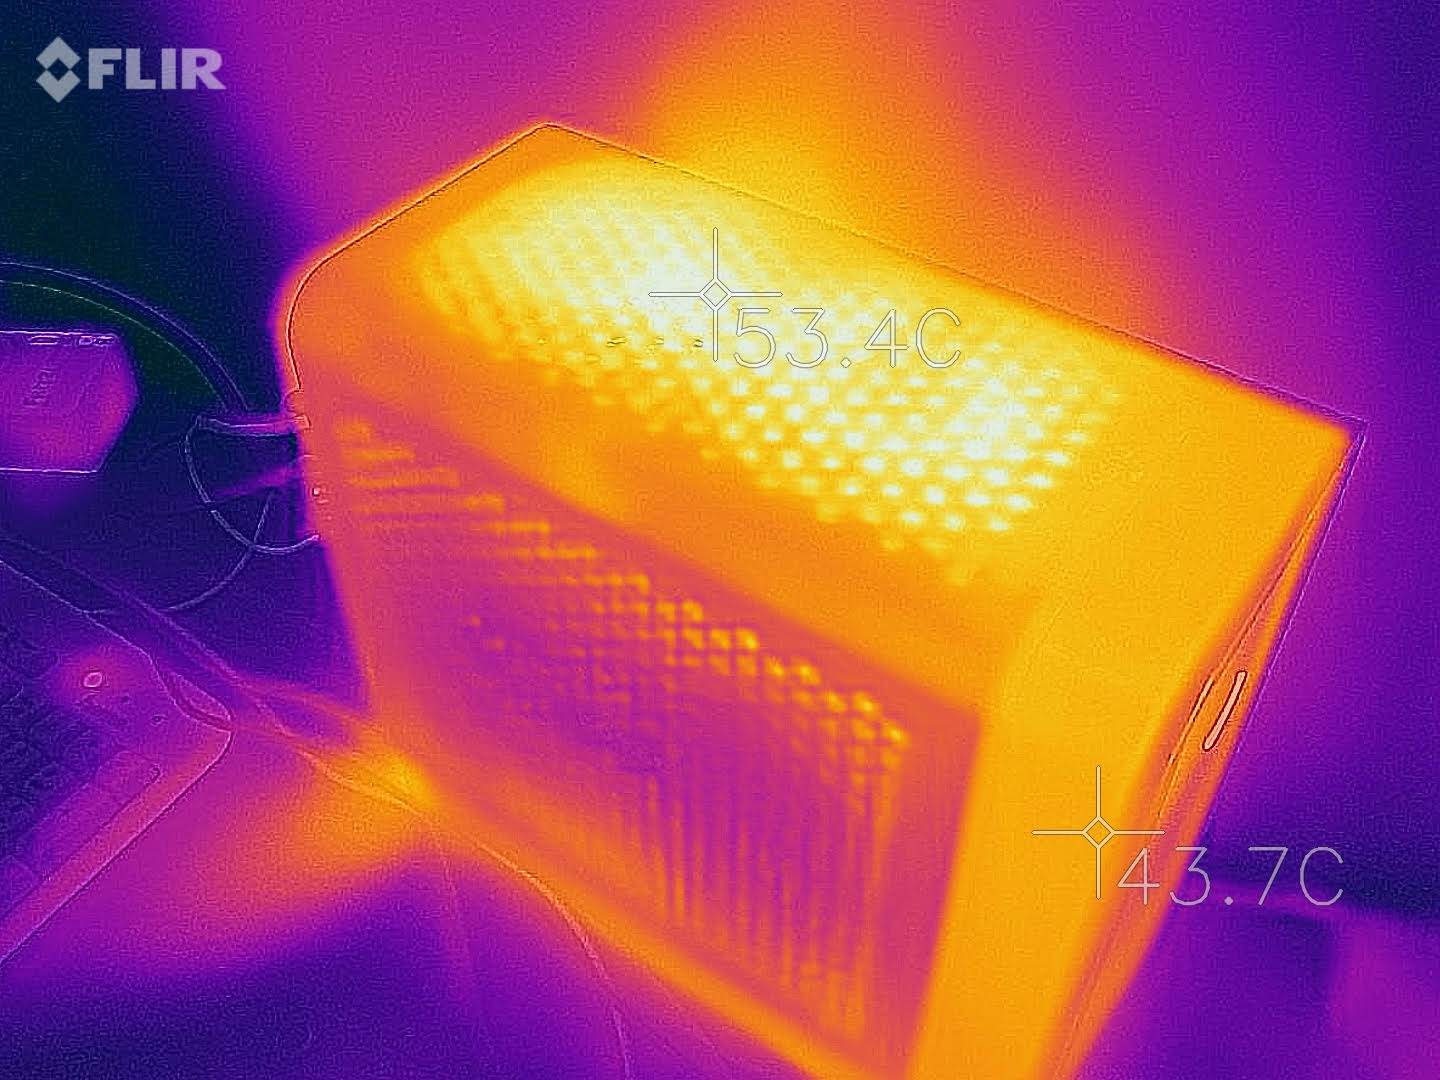
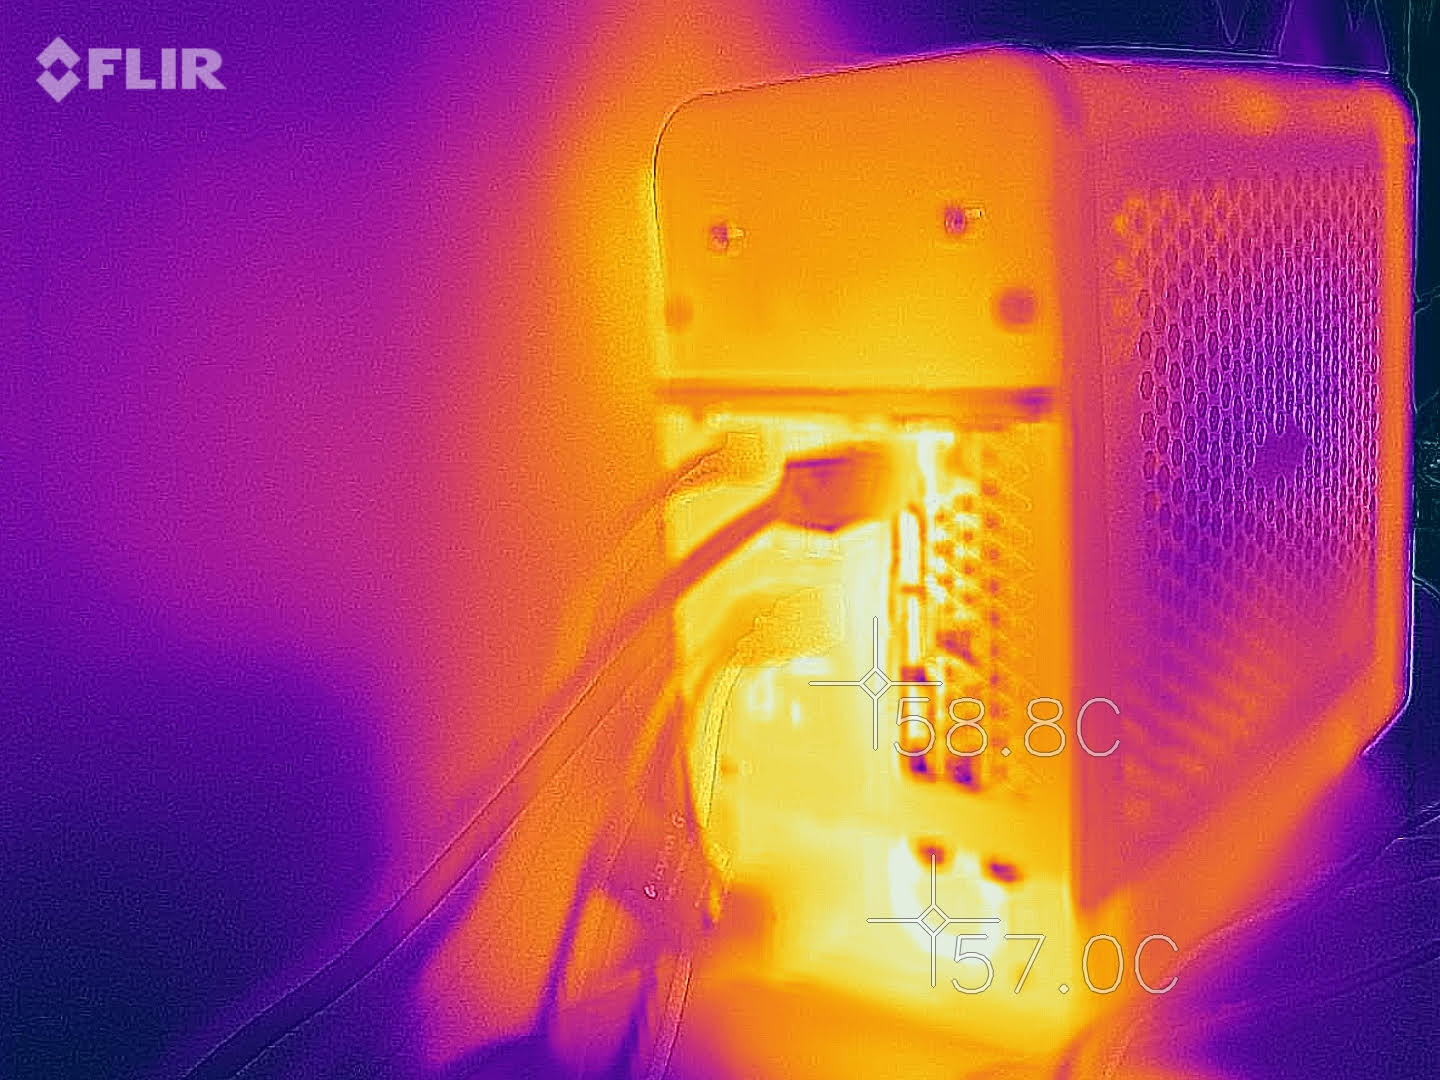
El diseño compacto requiere un sistema de refrigeración inteligente. Zotac usa el llamado "efecto chimenea" aquí e instala dos ventiladores en la parte superior que transportan el calor residual resultante fuera de la carcasa. No obstante, el Intel Core i7-10700 se calienta hasta un máximo de 87 °C durante la prueba de estrés. Además, la temperatura de la GeForce RTX 3070subió hasta casi 81 °C durantela prueba de estrés.
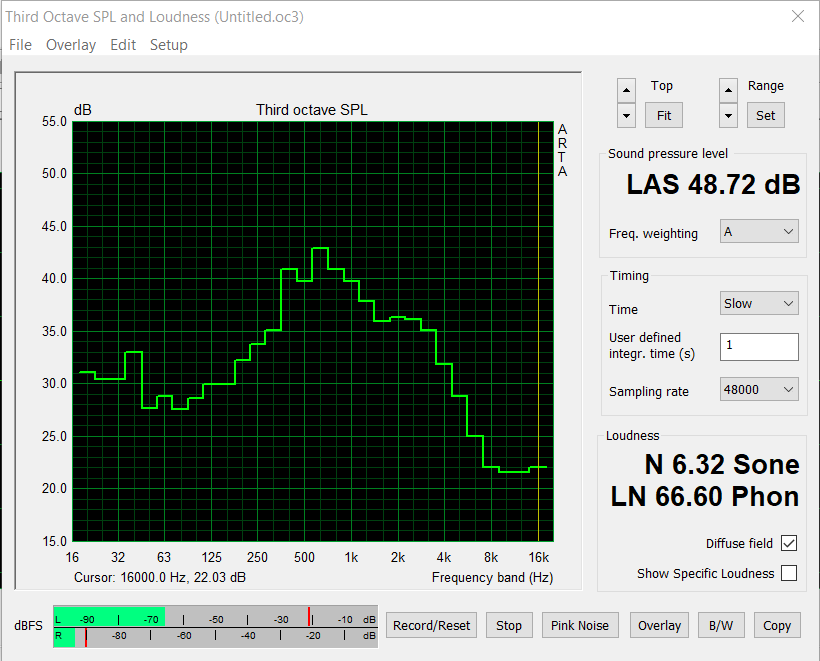
Todo esto sigue estando dentro de los límites aceptables, y no hay razón para preocuparse. Incluso durante largas sesiones de juego, no hubo caídas de rendimiento notables que indicaran que las temperaturas eran demasiado altas.Para un sistema de sobremesa, sin embargo, el Magnus One es claramente audible bajo carga debido a su situación de refrigeración. Sólo medimos 33,5 dB(A) en uso en reposo, aunque se volvió considerablemente más ruidoso con 48,7 dB(A) al jugar. El nivel de ruido fue un poco menor en la prueba de estrés con 44,2 dB(A). En este punto, nos gustaría hacer una nota positiva sobre el hecho de que no notamos ningún ruido de alta frecuencia del ventilador o el silbido de la bobina
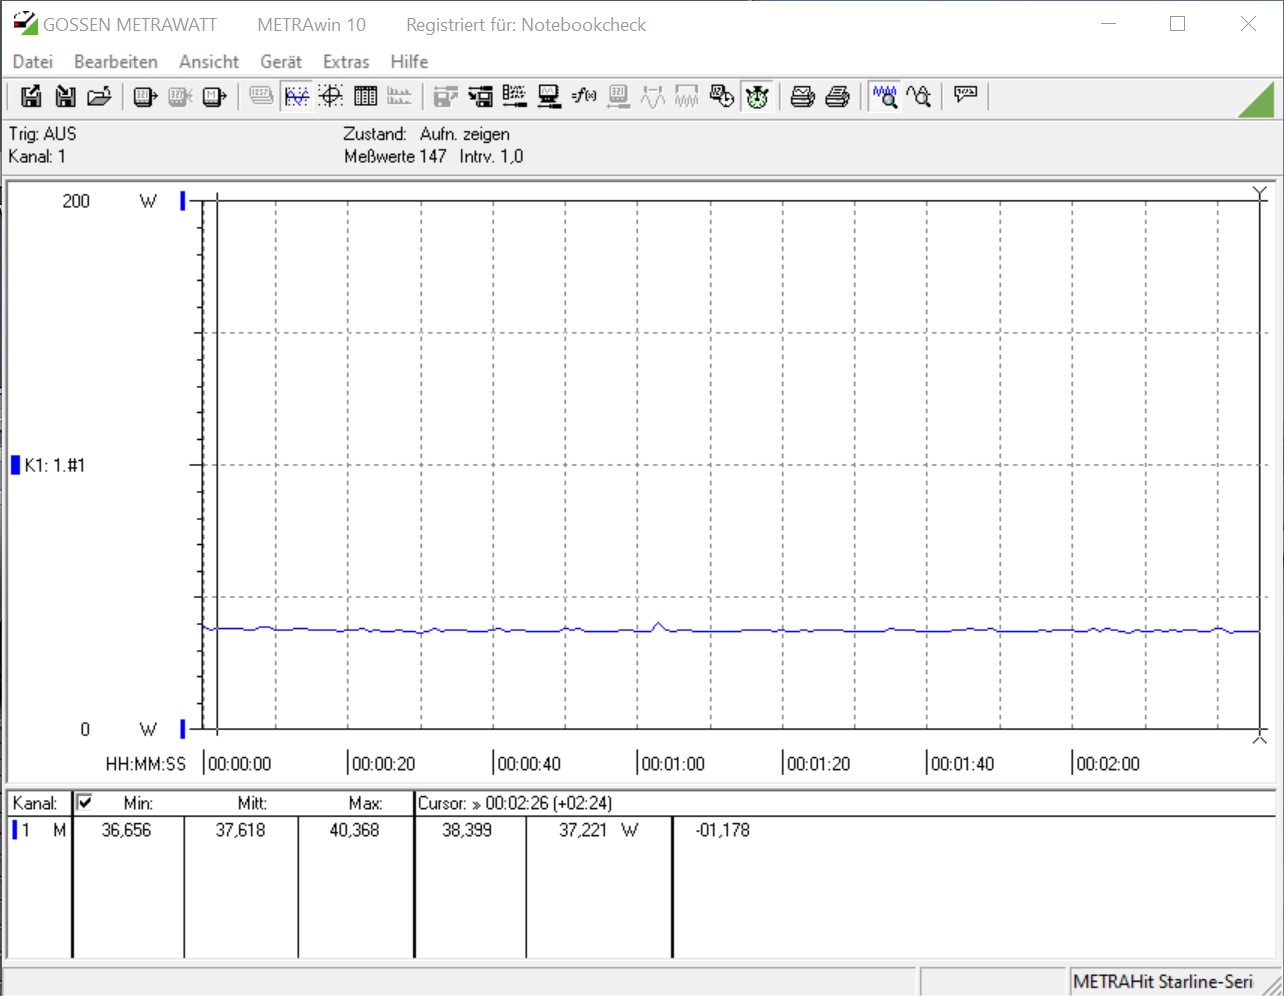
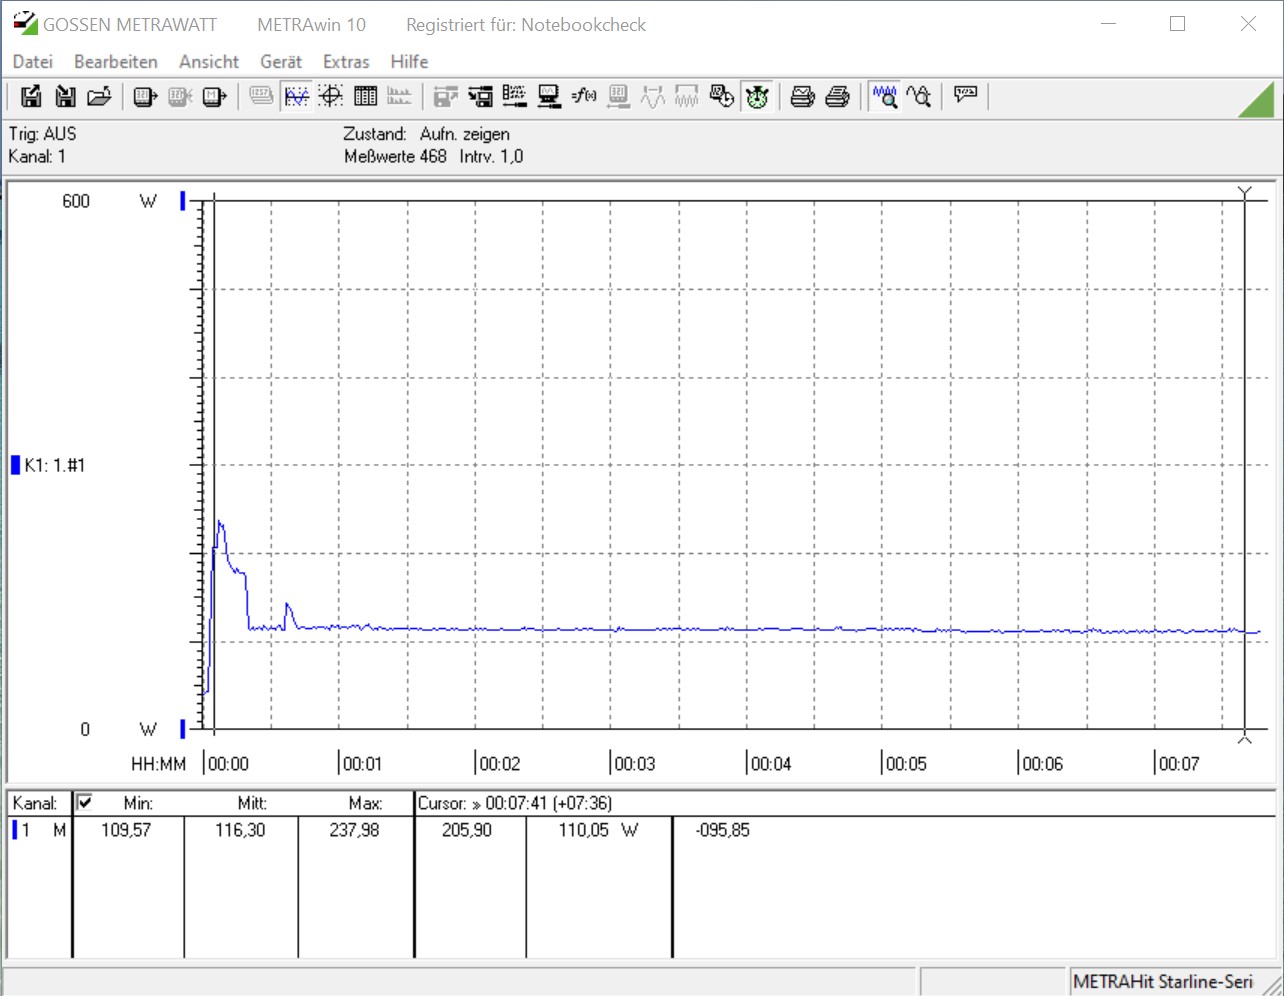
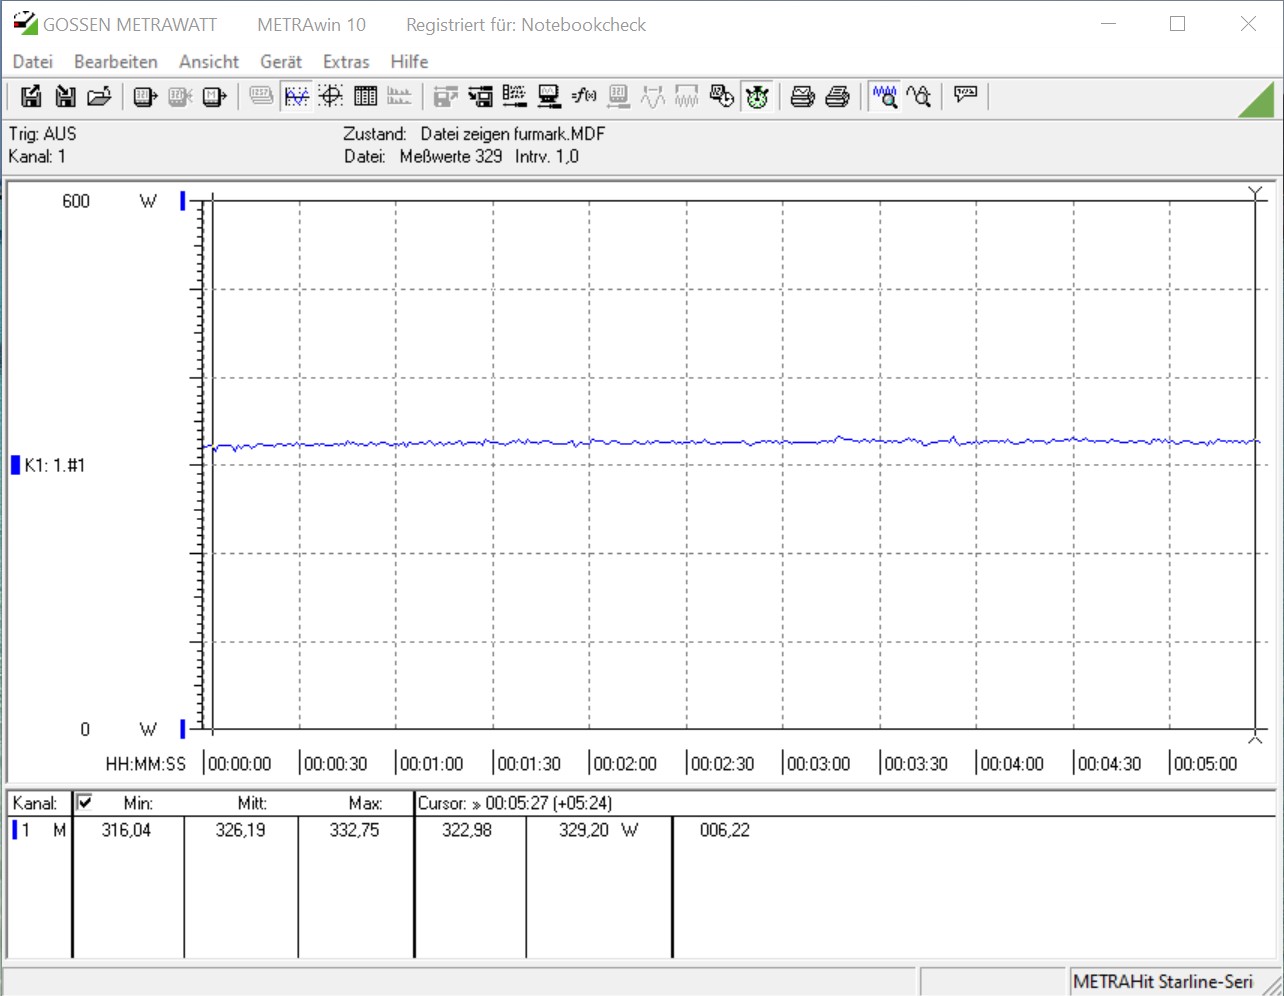
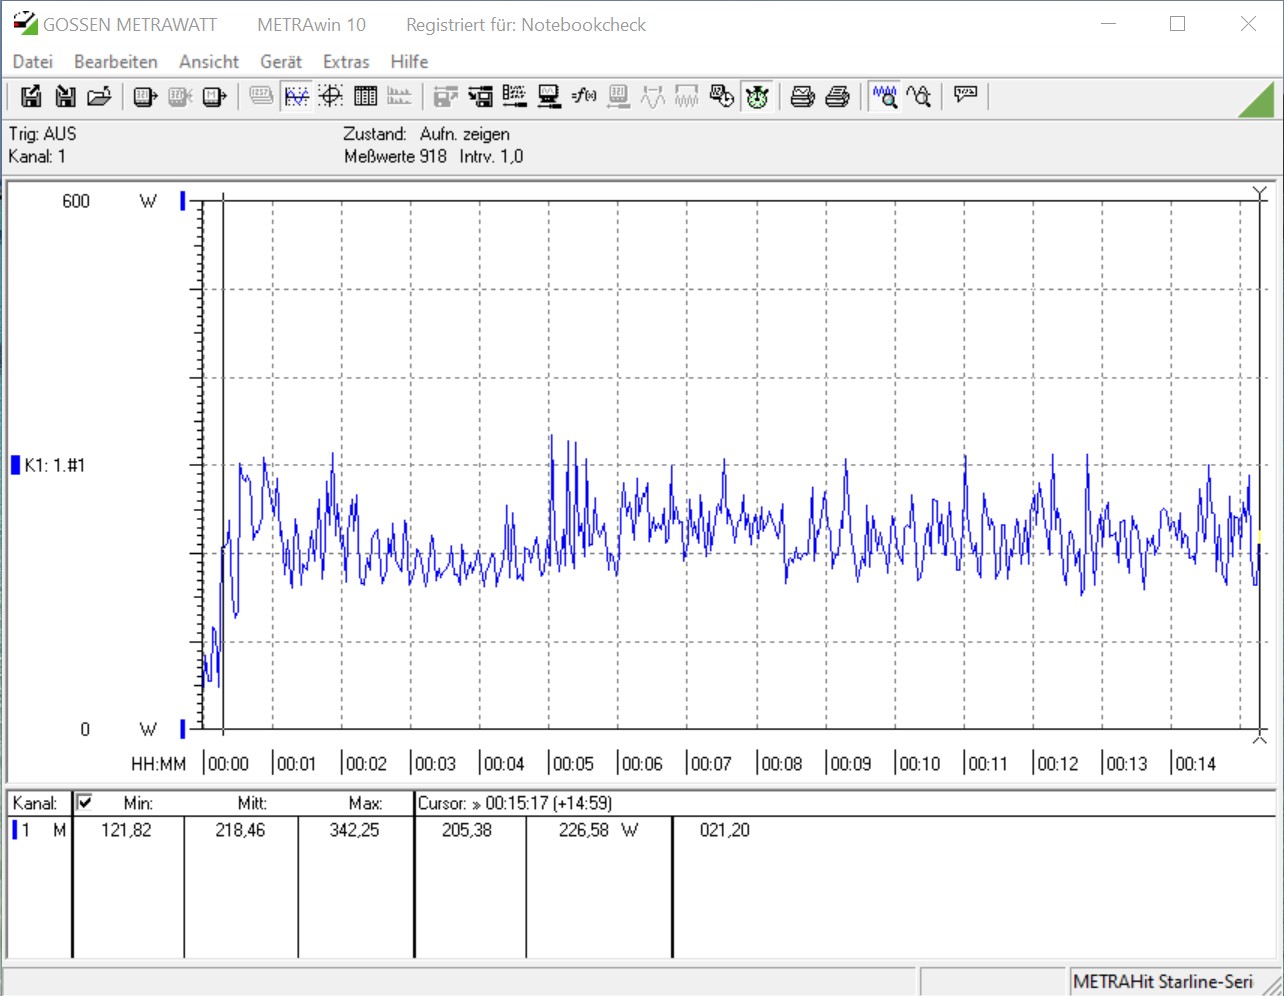
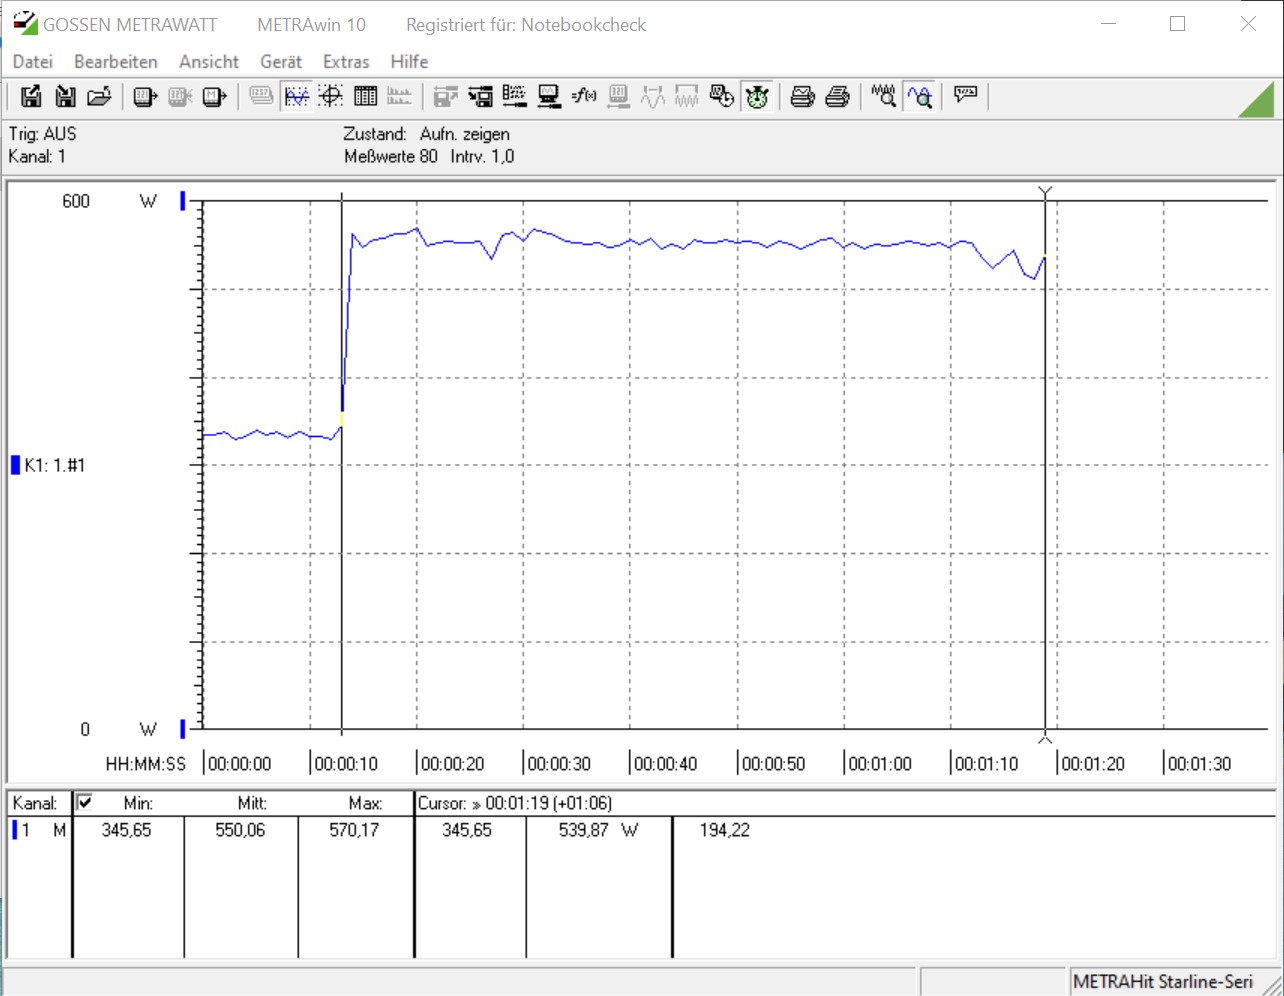
Por un lado, el Magnus One es relativamente económico en términos de consumo de energía, pero por otro lado, también es muy hambriento de energía cuando se trata de jugar. Nuestro dispositivo de medición mostró una media de 550 vatios en la prueba de juegos. La fuente de alimentación instalada está especificada en 500 vatios. No obstante, no hubo caídas durante la prueba que apuntaran a una sobrecarga.
| Power Consumption | |
| 1920x1080 The Witcher 3 ultra (external Monitor) | |
| Zotac Magnus One (ECM73070C) (Idle: 37.6 W) | |
| AMD Ryzen 7 5800X (Idle: 77.5 W) | |
| AMD Ryzen 5 5600X (Idle: 79.23 W) | |
| Intel Core i5-10600K (Idle: 52.2 W) | |
| Intel Core i7-9700K, AMD Radeon RX Vega 64 | |
| MSI GeForce RTX 3070 Ventus 3X (Idle: 91.46 W) | |
| Prime95 V2810 Stress (external Monitor) | |
| AMD Ryzen 7 5800X (Idle: 77.5 W) | |
| Intel Core i7-9700K, AMD Radeon RX Vega 64 | |
| Intel Core i5-10600K (Idle: 52.2 W) | |
| AMD Ryzen 5 5600X (Idle: 79.23 W) | |
| Zotac Magnus One (ECM73070C) (Idle: 37.6 W) | |
| Cinebench R15 Multi (external Monitor) | |
| AMD Ryzen 7 5800X (Idle: 77.5 W) | |
| Intel Core i7-9700K, AMD Radeon RX Vega 64 | |
| Intel Core i5-10600K (Idle: 52.2 W) | |
| AMD Ryzen 5 5600X (Idle: 79.23 W) | |
| Zotac Magnus One (ECM73070C) (Idle: 37.6 W) | |
| Temperatures - CPU Temperature Prime95 | |
| AMD Ryzen 7 5800X | |
| Intel Core i5-10600K | |
* ... más pequeño es mejor
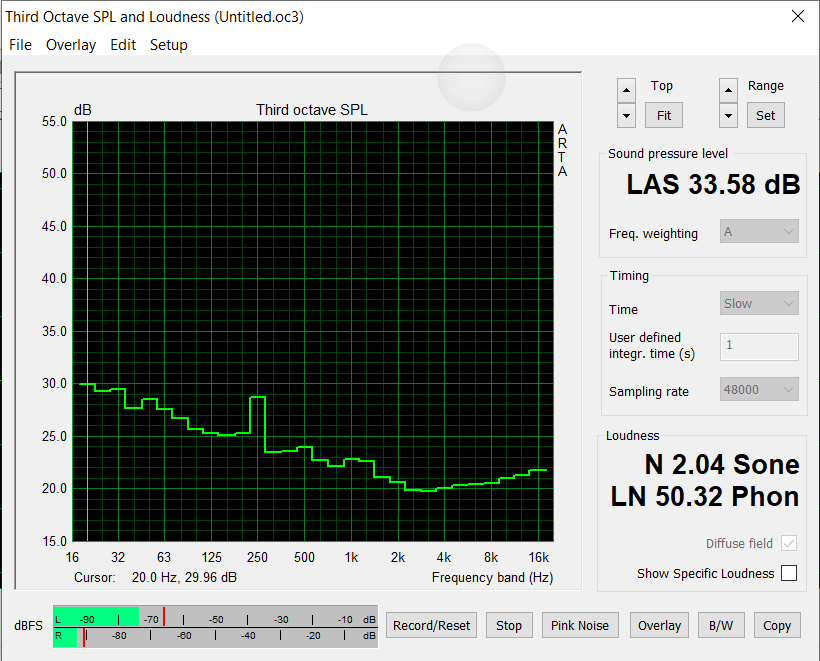
Ruido
| Ocioso |
| 33.58 / / dB(A) |
| Carga |
| 44.25 / 48.72 dB(A) |
 | ||
30 dB silencioso 40 dB(A) audible 50 dB(A) ruidosamente alto |
||
min: | ||
Pro
Contra
Veredicto - Buen rendimiento y buena conectividad
El Magnus One de Zotac es un dispositivo compacto que ofrece muy buen rendimiento en el espacio más pequeño. Hay que tener en cuenta que se trata de un sistema barebone en el que la RAM, el almacenamiento masivo y el sistema operativo no forman parte del MSRP de 1.499 Euros. Sin embargo, en el momento de las pruebas, los precios reales en la calle empiezan a partir de los 1.650 euros (~2.009 dólares). Los usuarios que puedan hacerse con el Magnus One a buen precio podrían incluso conseguir una ganga, ya que la GeForce RTX 3070 por sí sola ya cuesta bastante más de 1.000 euros. El Intel Core i7-10700 no es la última versión de los procesadores Core, pero esto no es un problema en el uso diario. En general, el pequeño Core i7-10700, que no ha sido limitado en términos de TDP, encaja bien en el sistema general. Sin embargo, el Magnus One puntúa mejor en nuestros benchmarks 3D y de juegos que en las pruebas de CPU dedicadas. AMD está algo mejor posicionada aquí con la serie Ryzen 5000. Quizá Zotac considere desarrollar un sistema basado en AMD también.
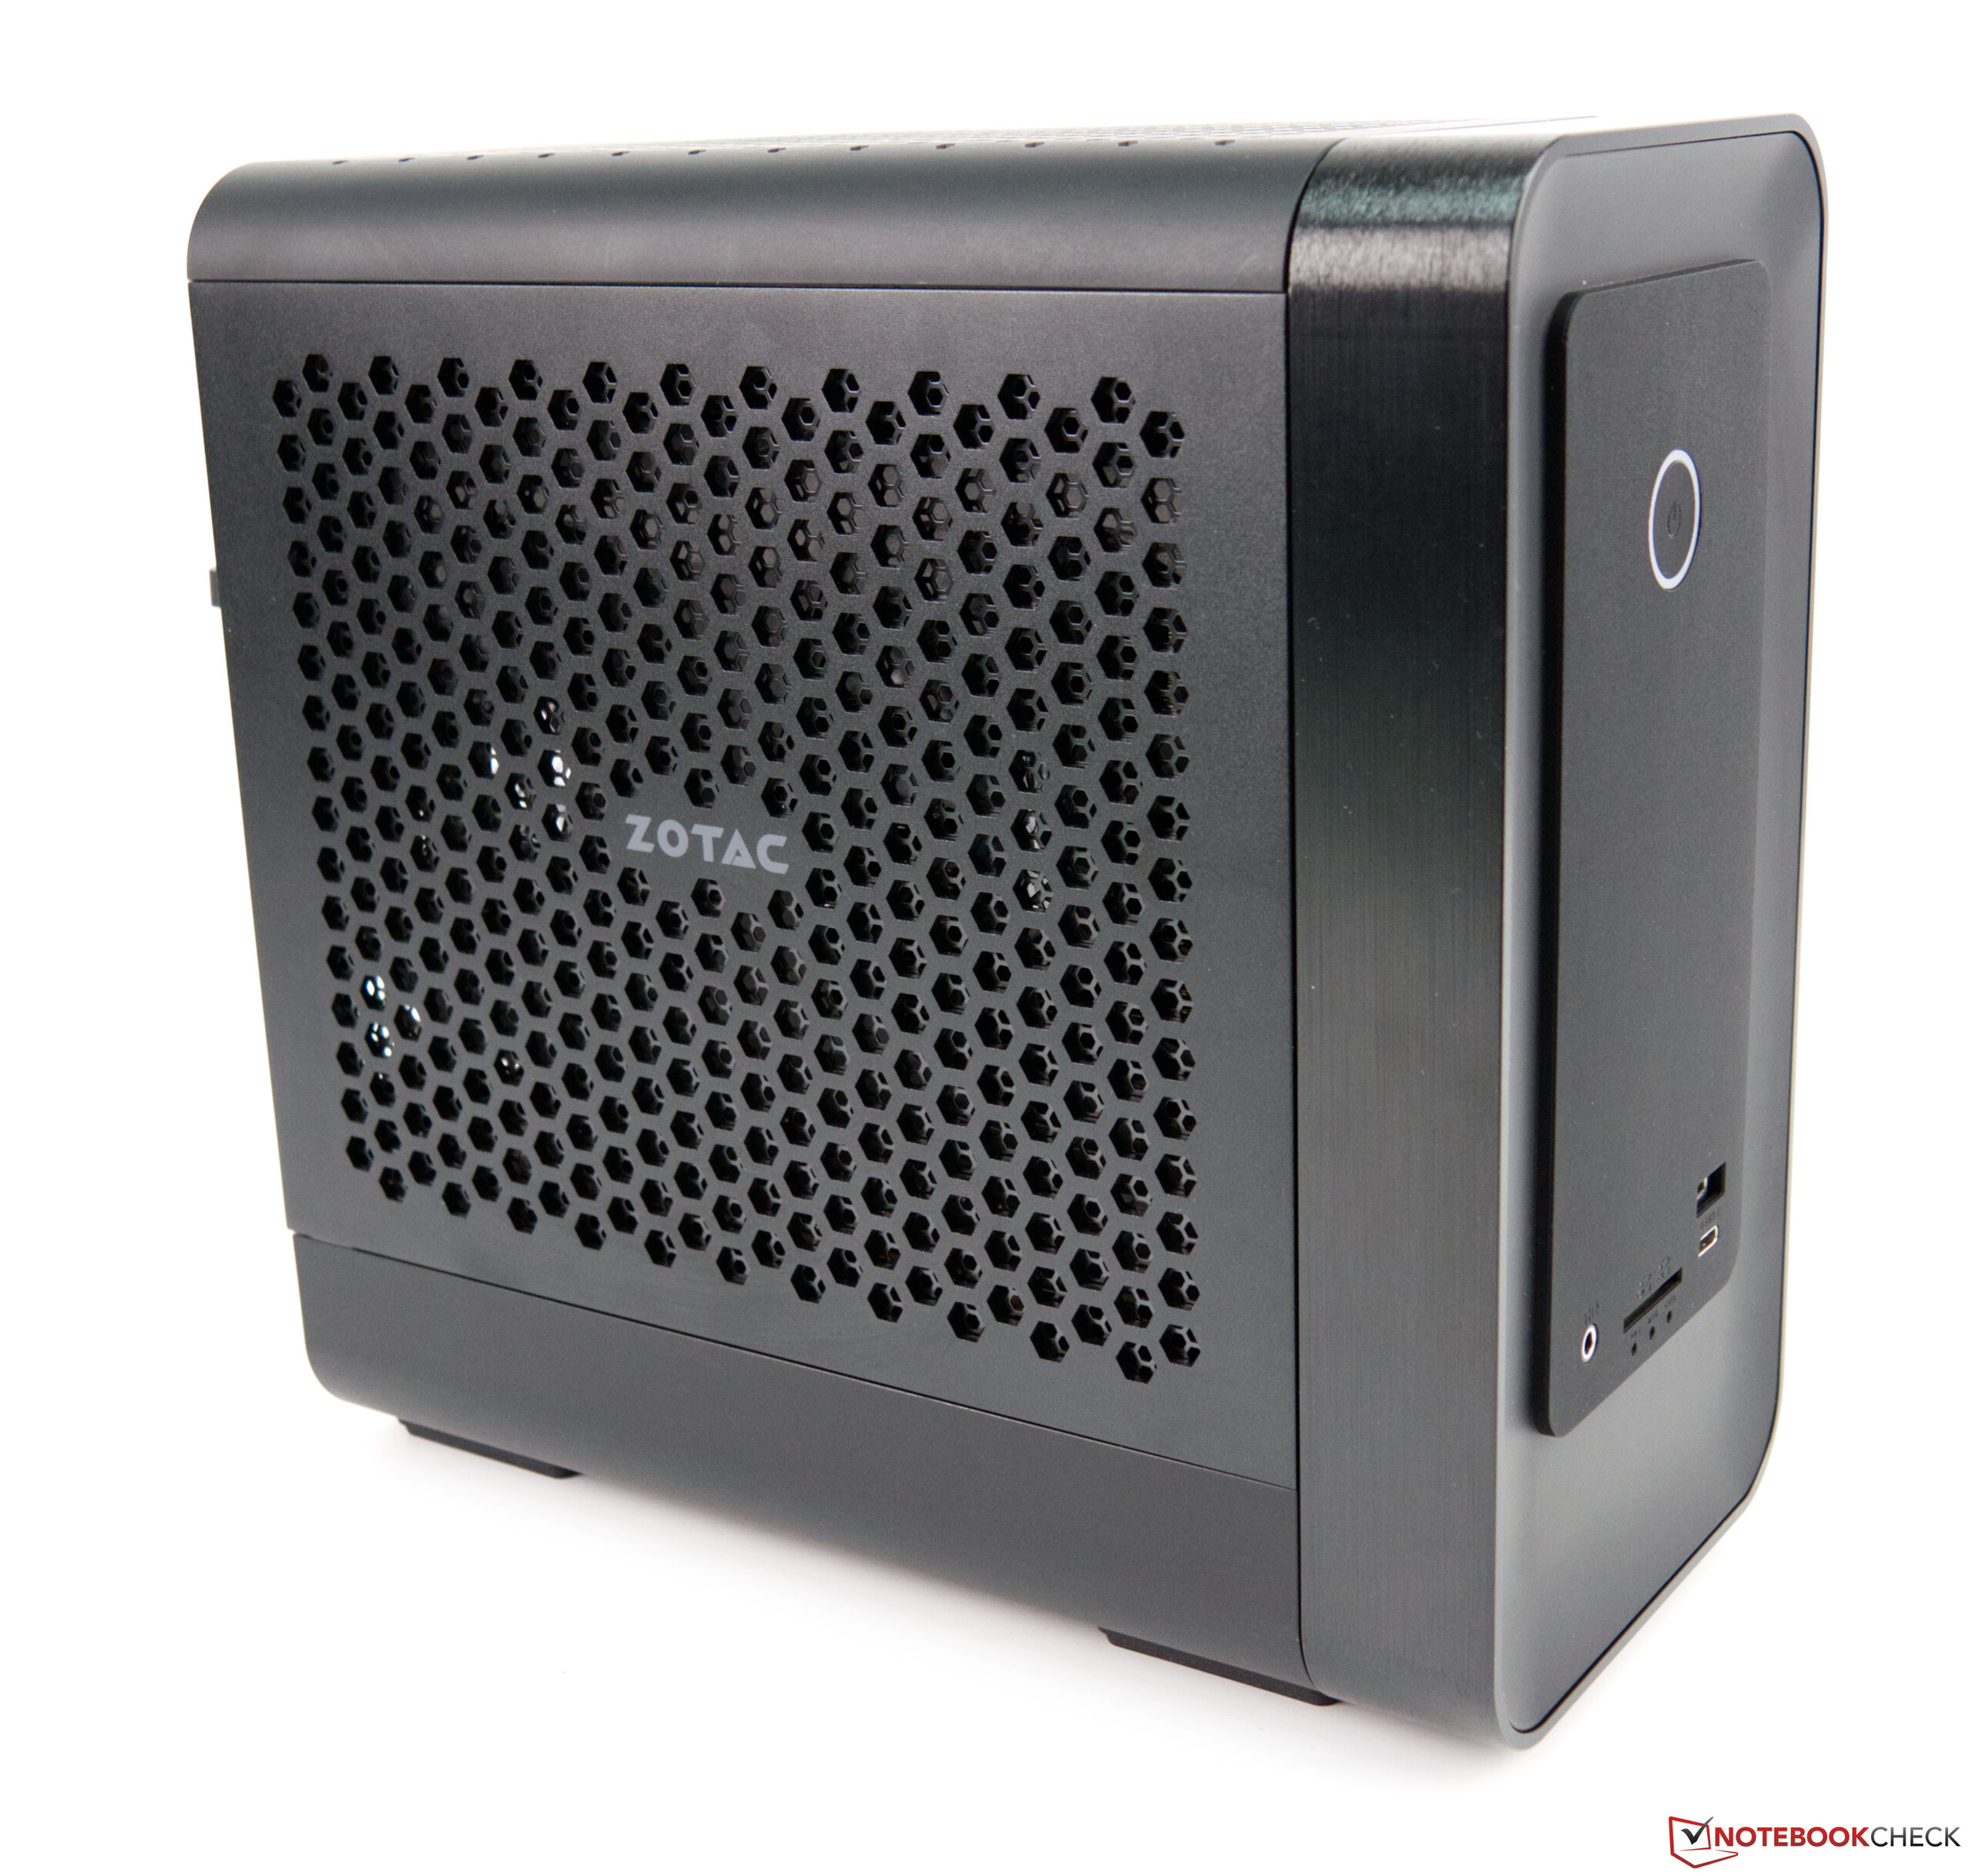
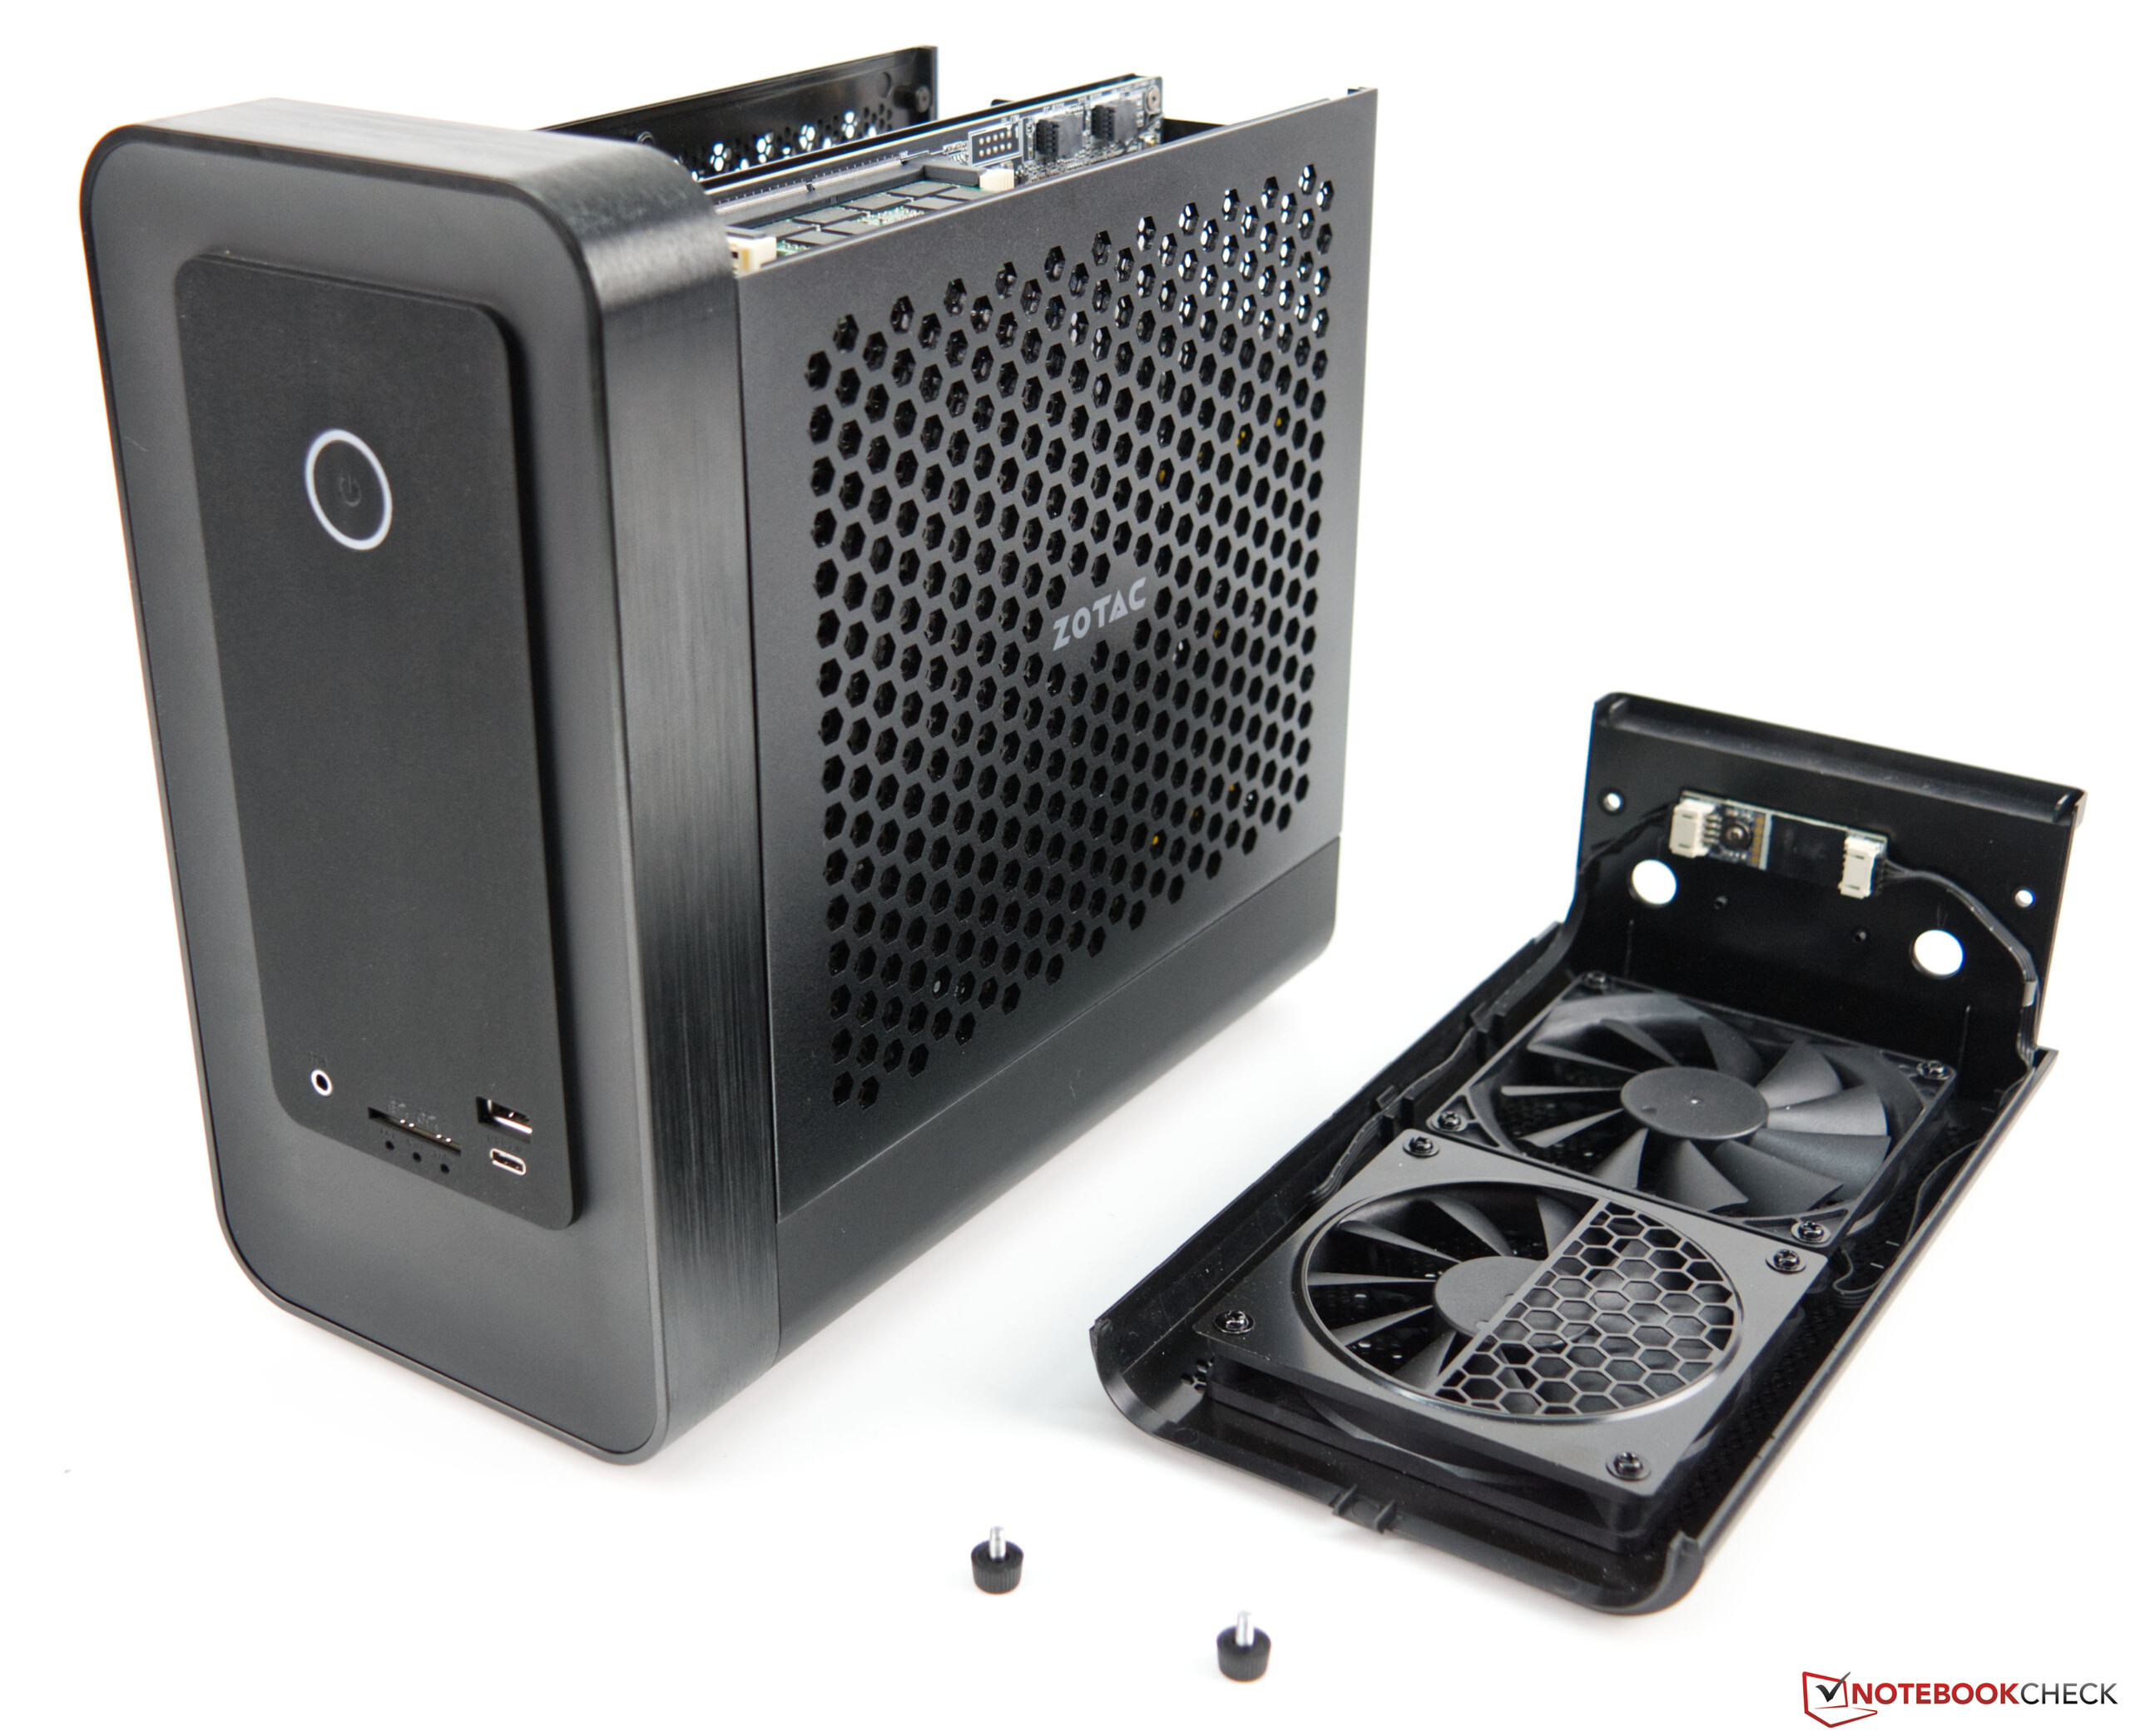
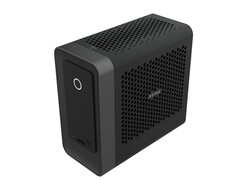
El Magnus One es un sistema potente y compacto que llama la atención incluso sin RGB.
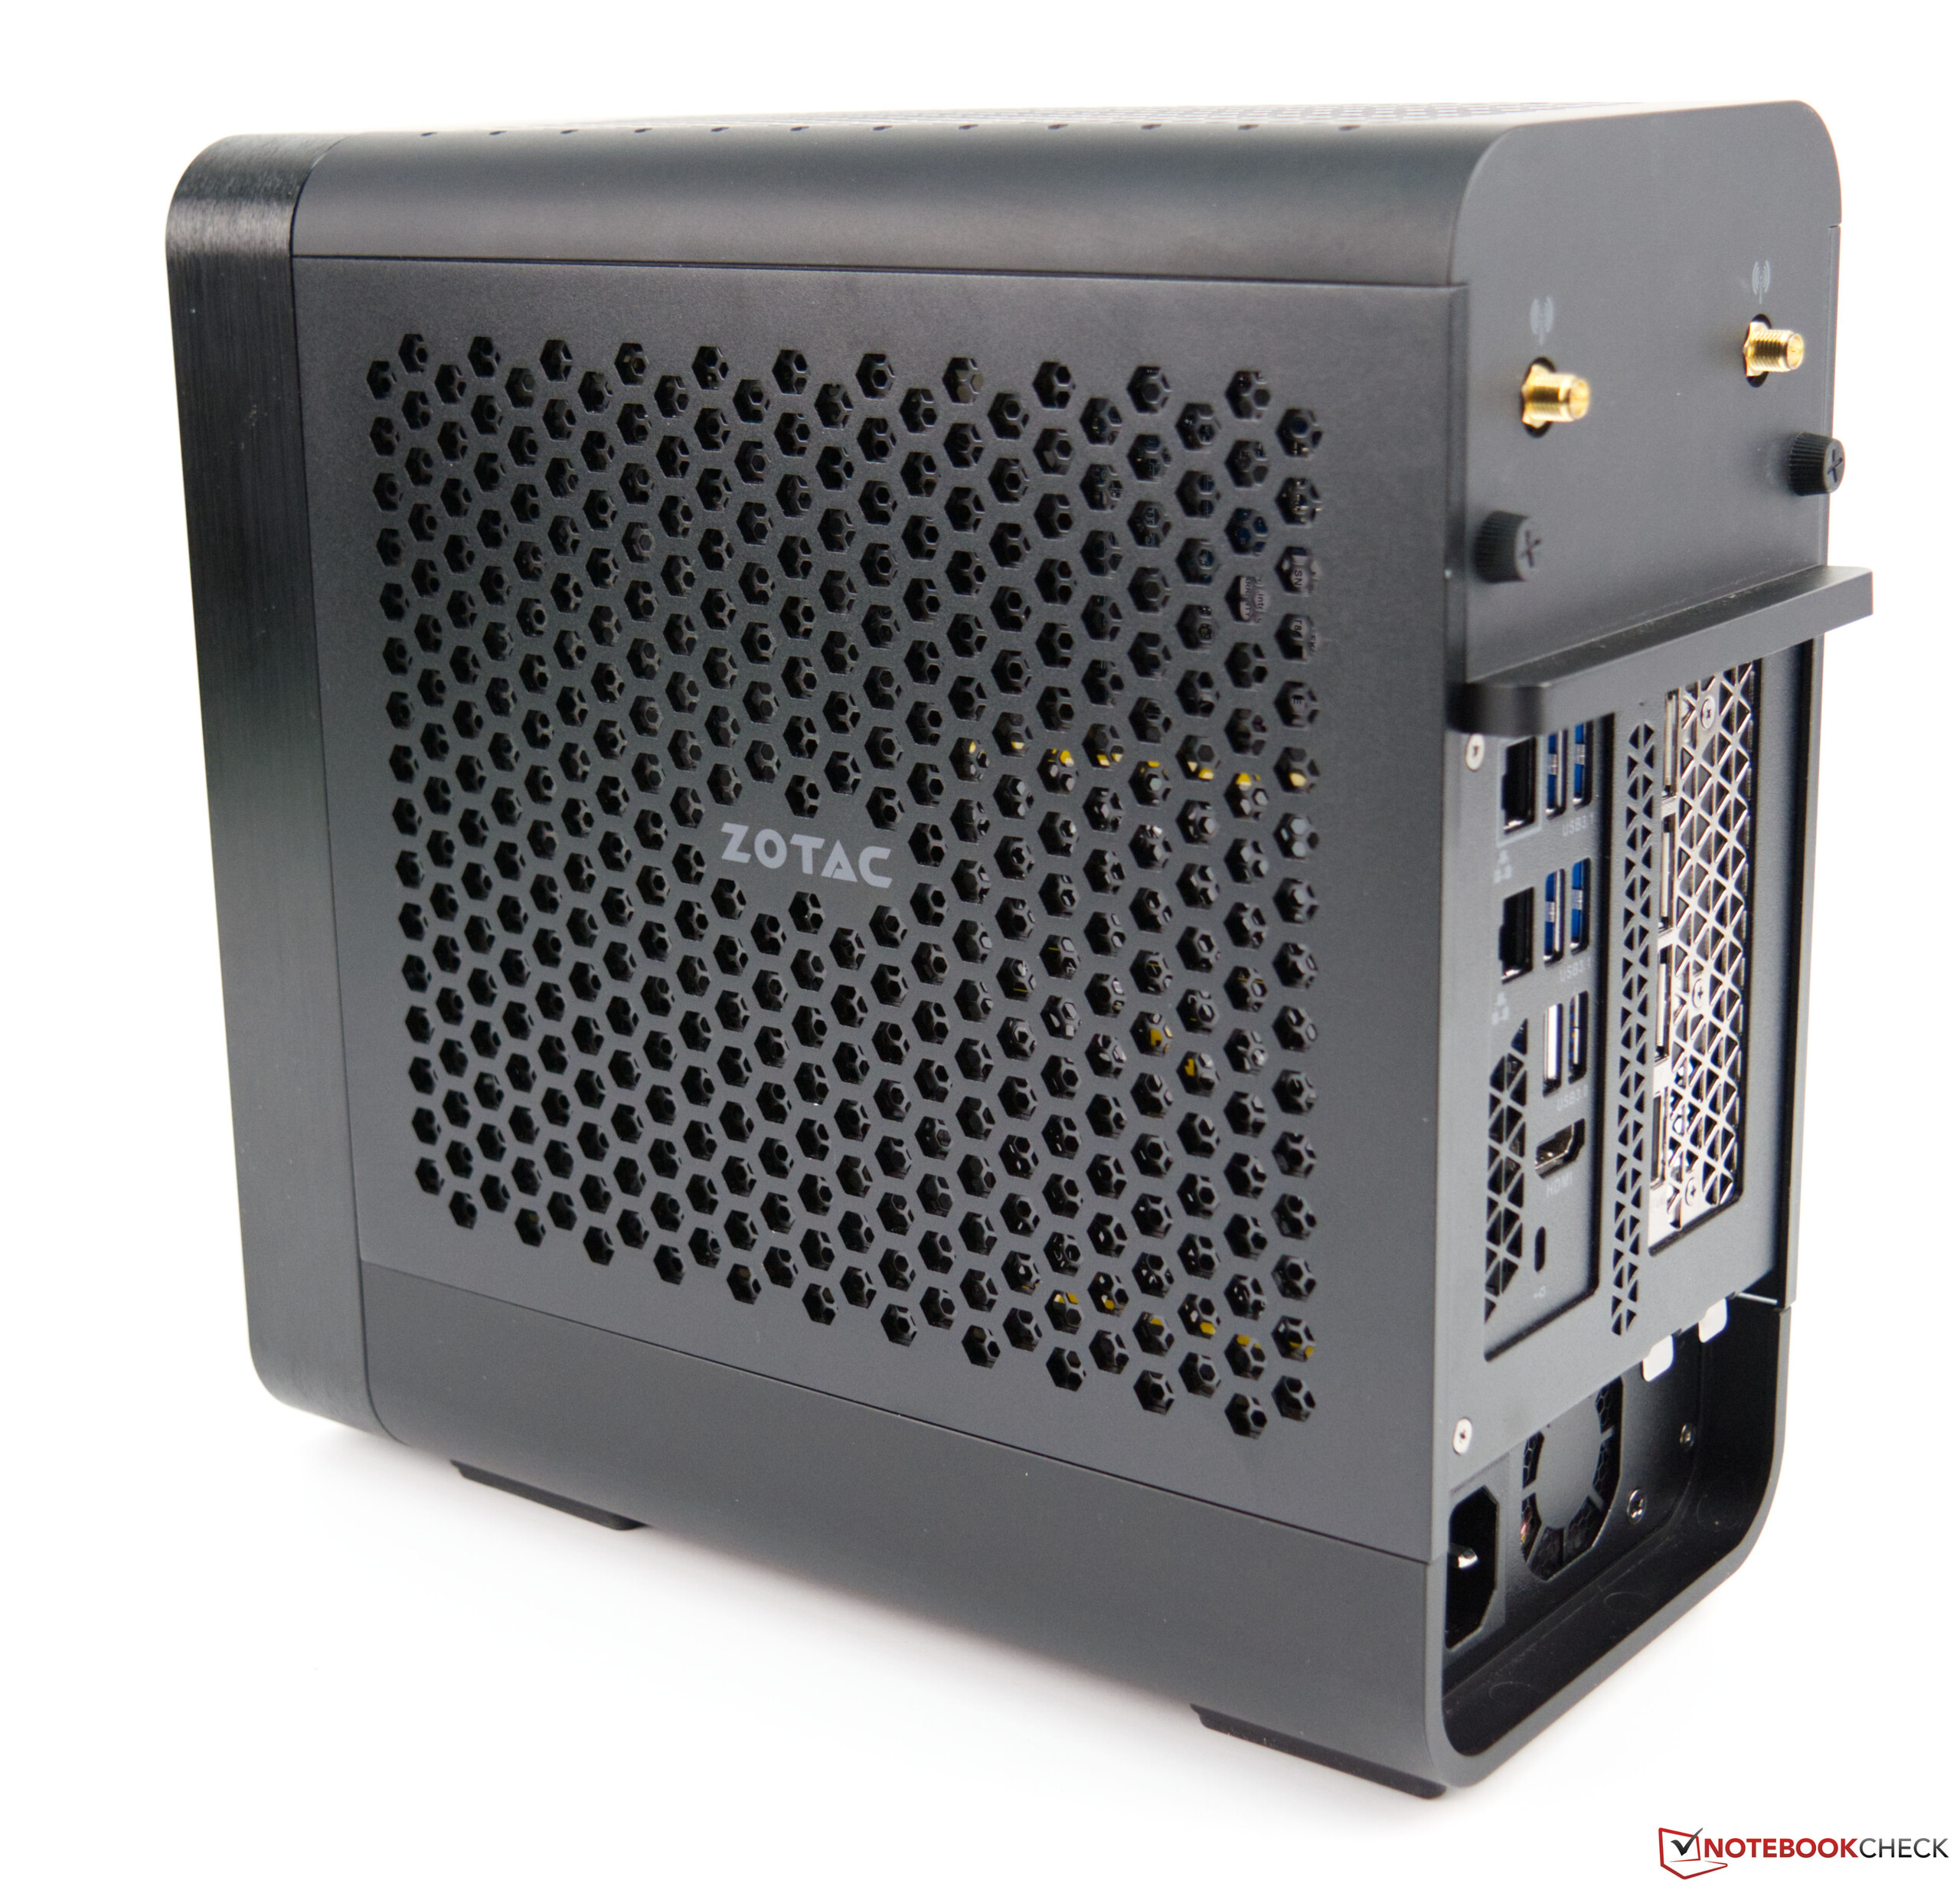
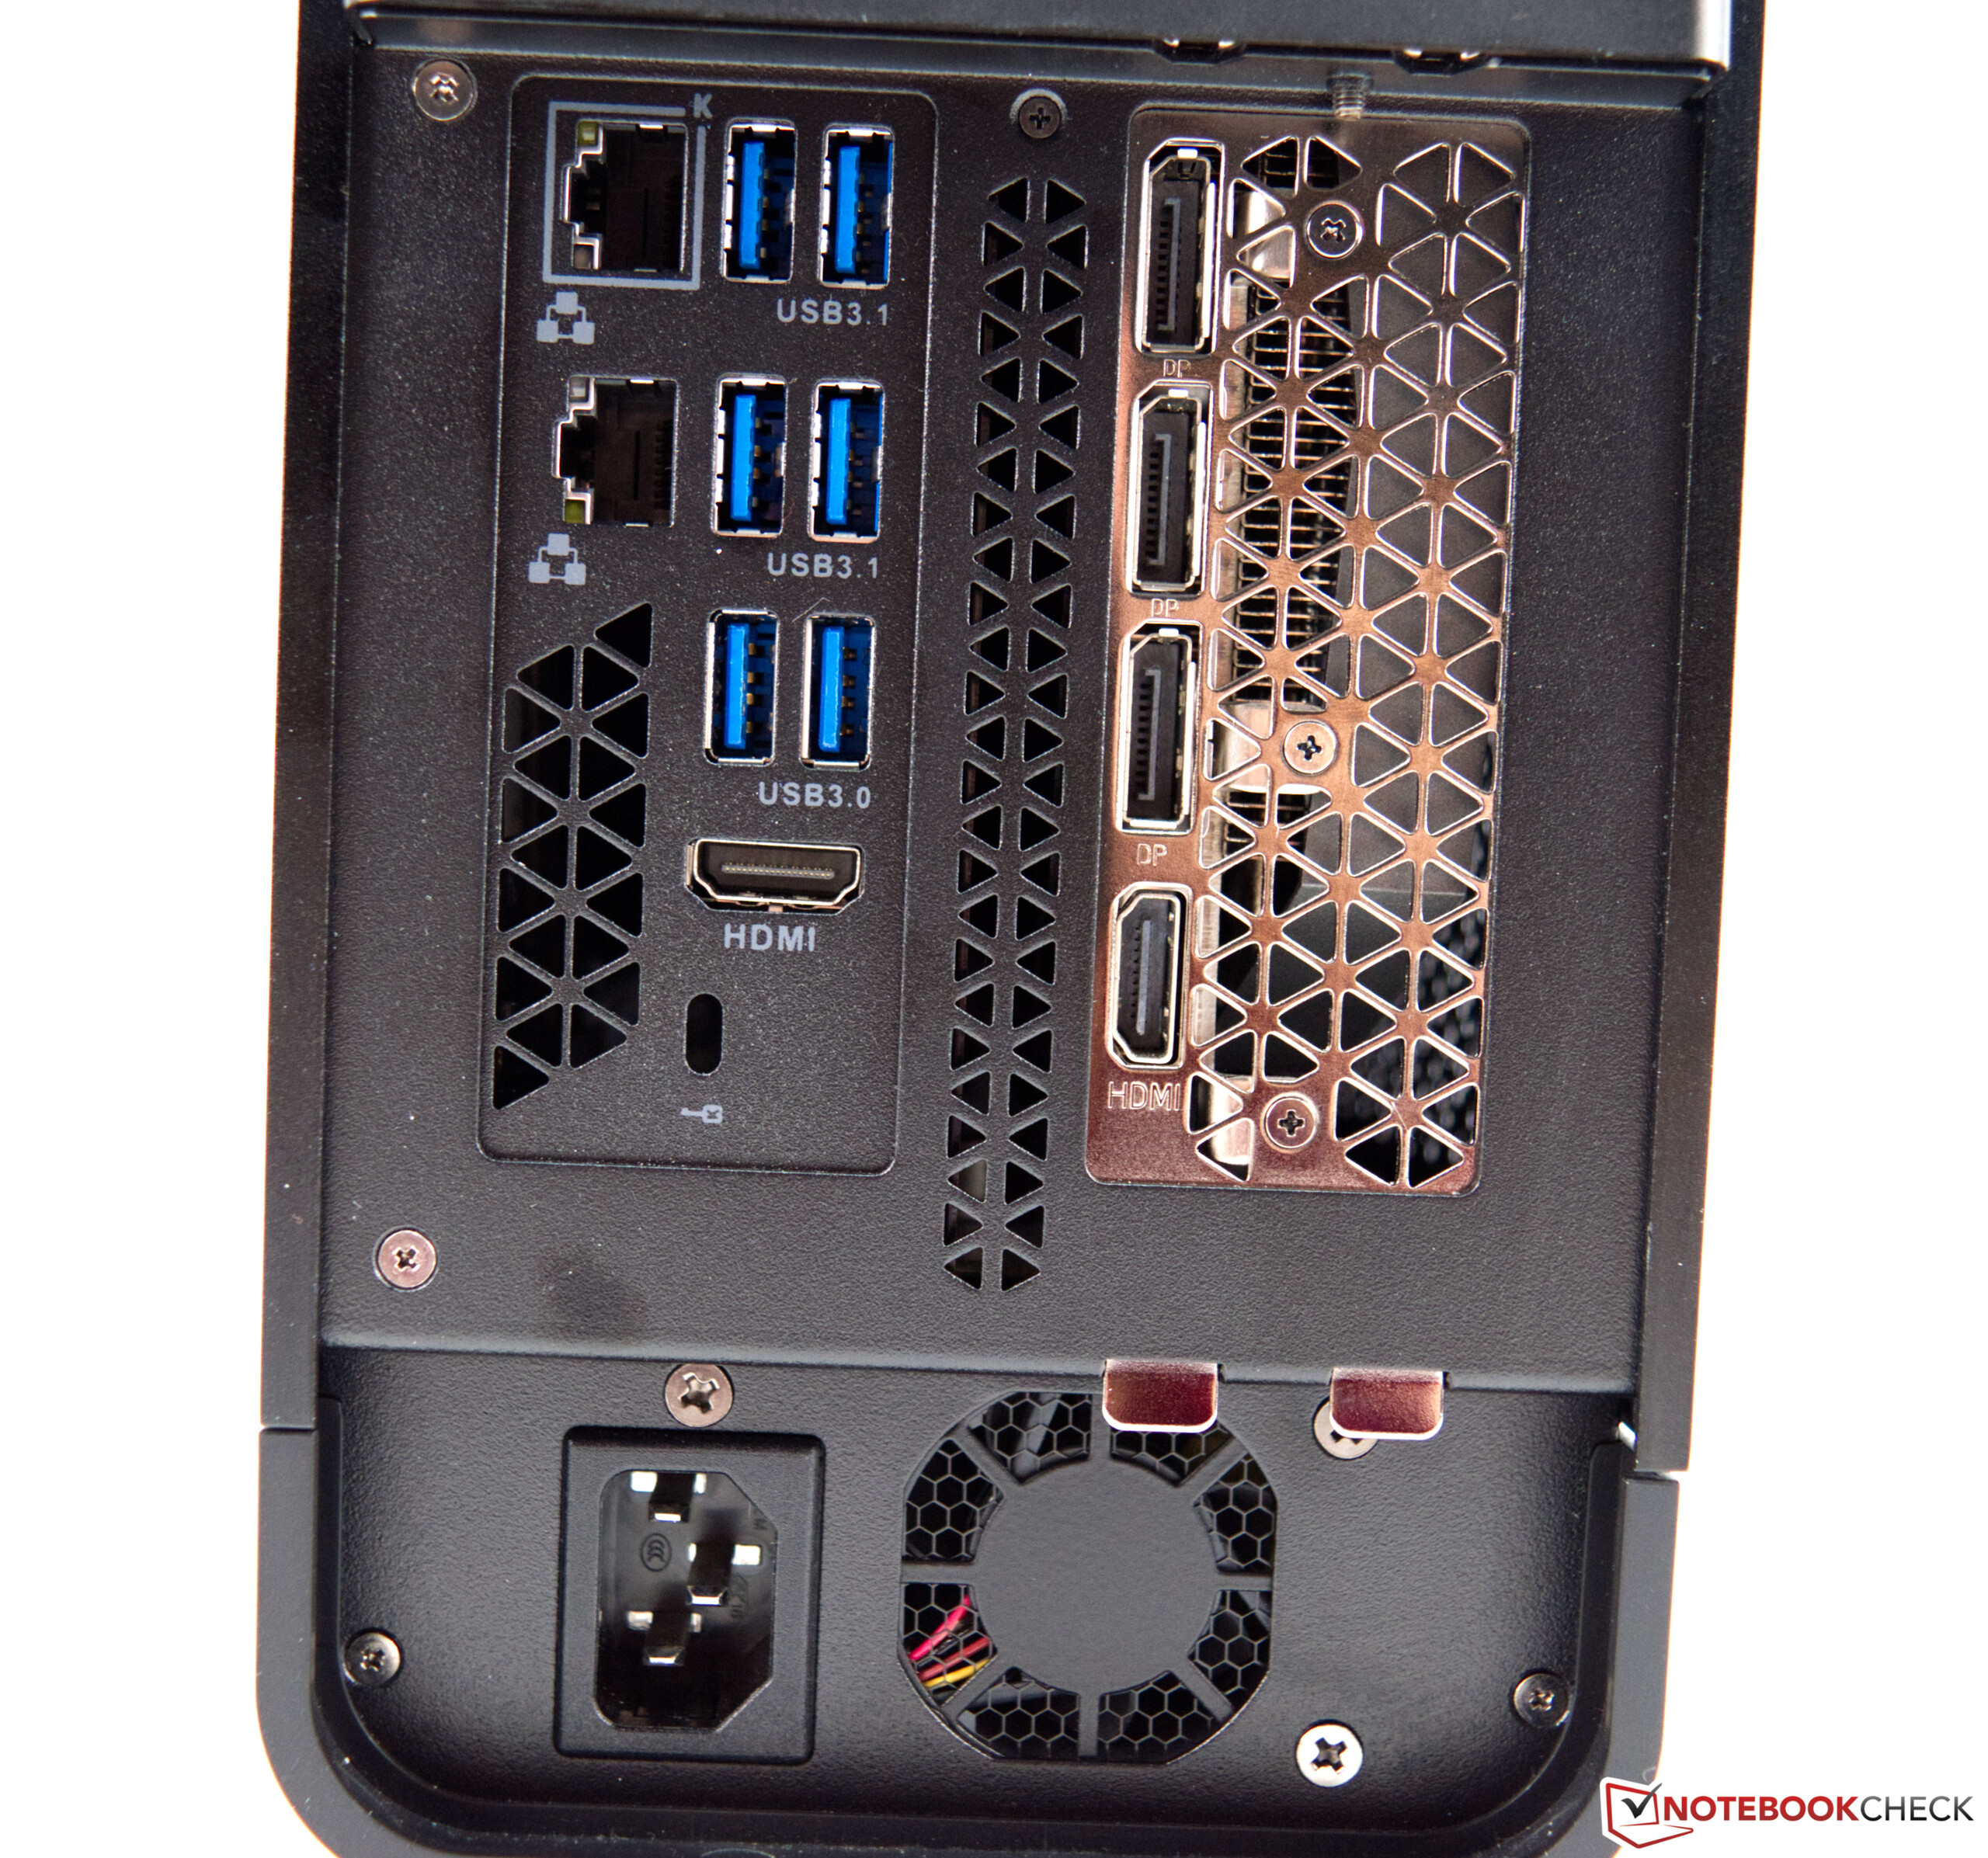
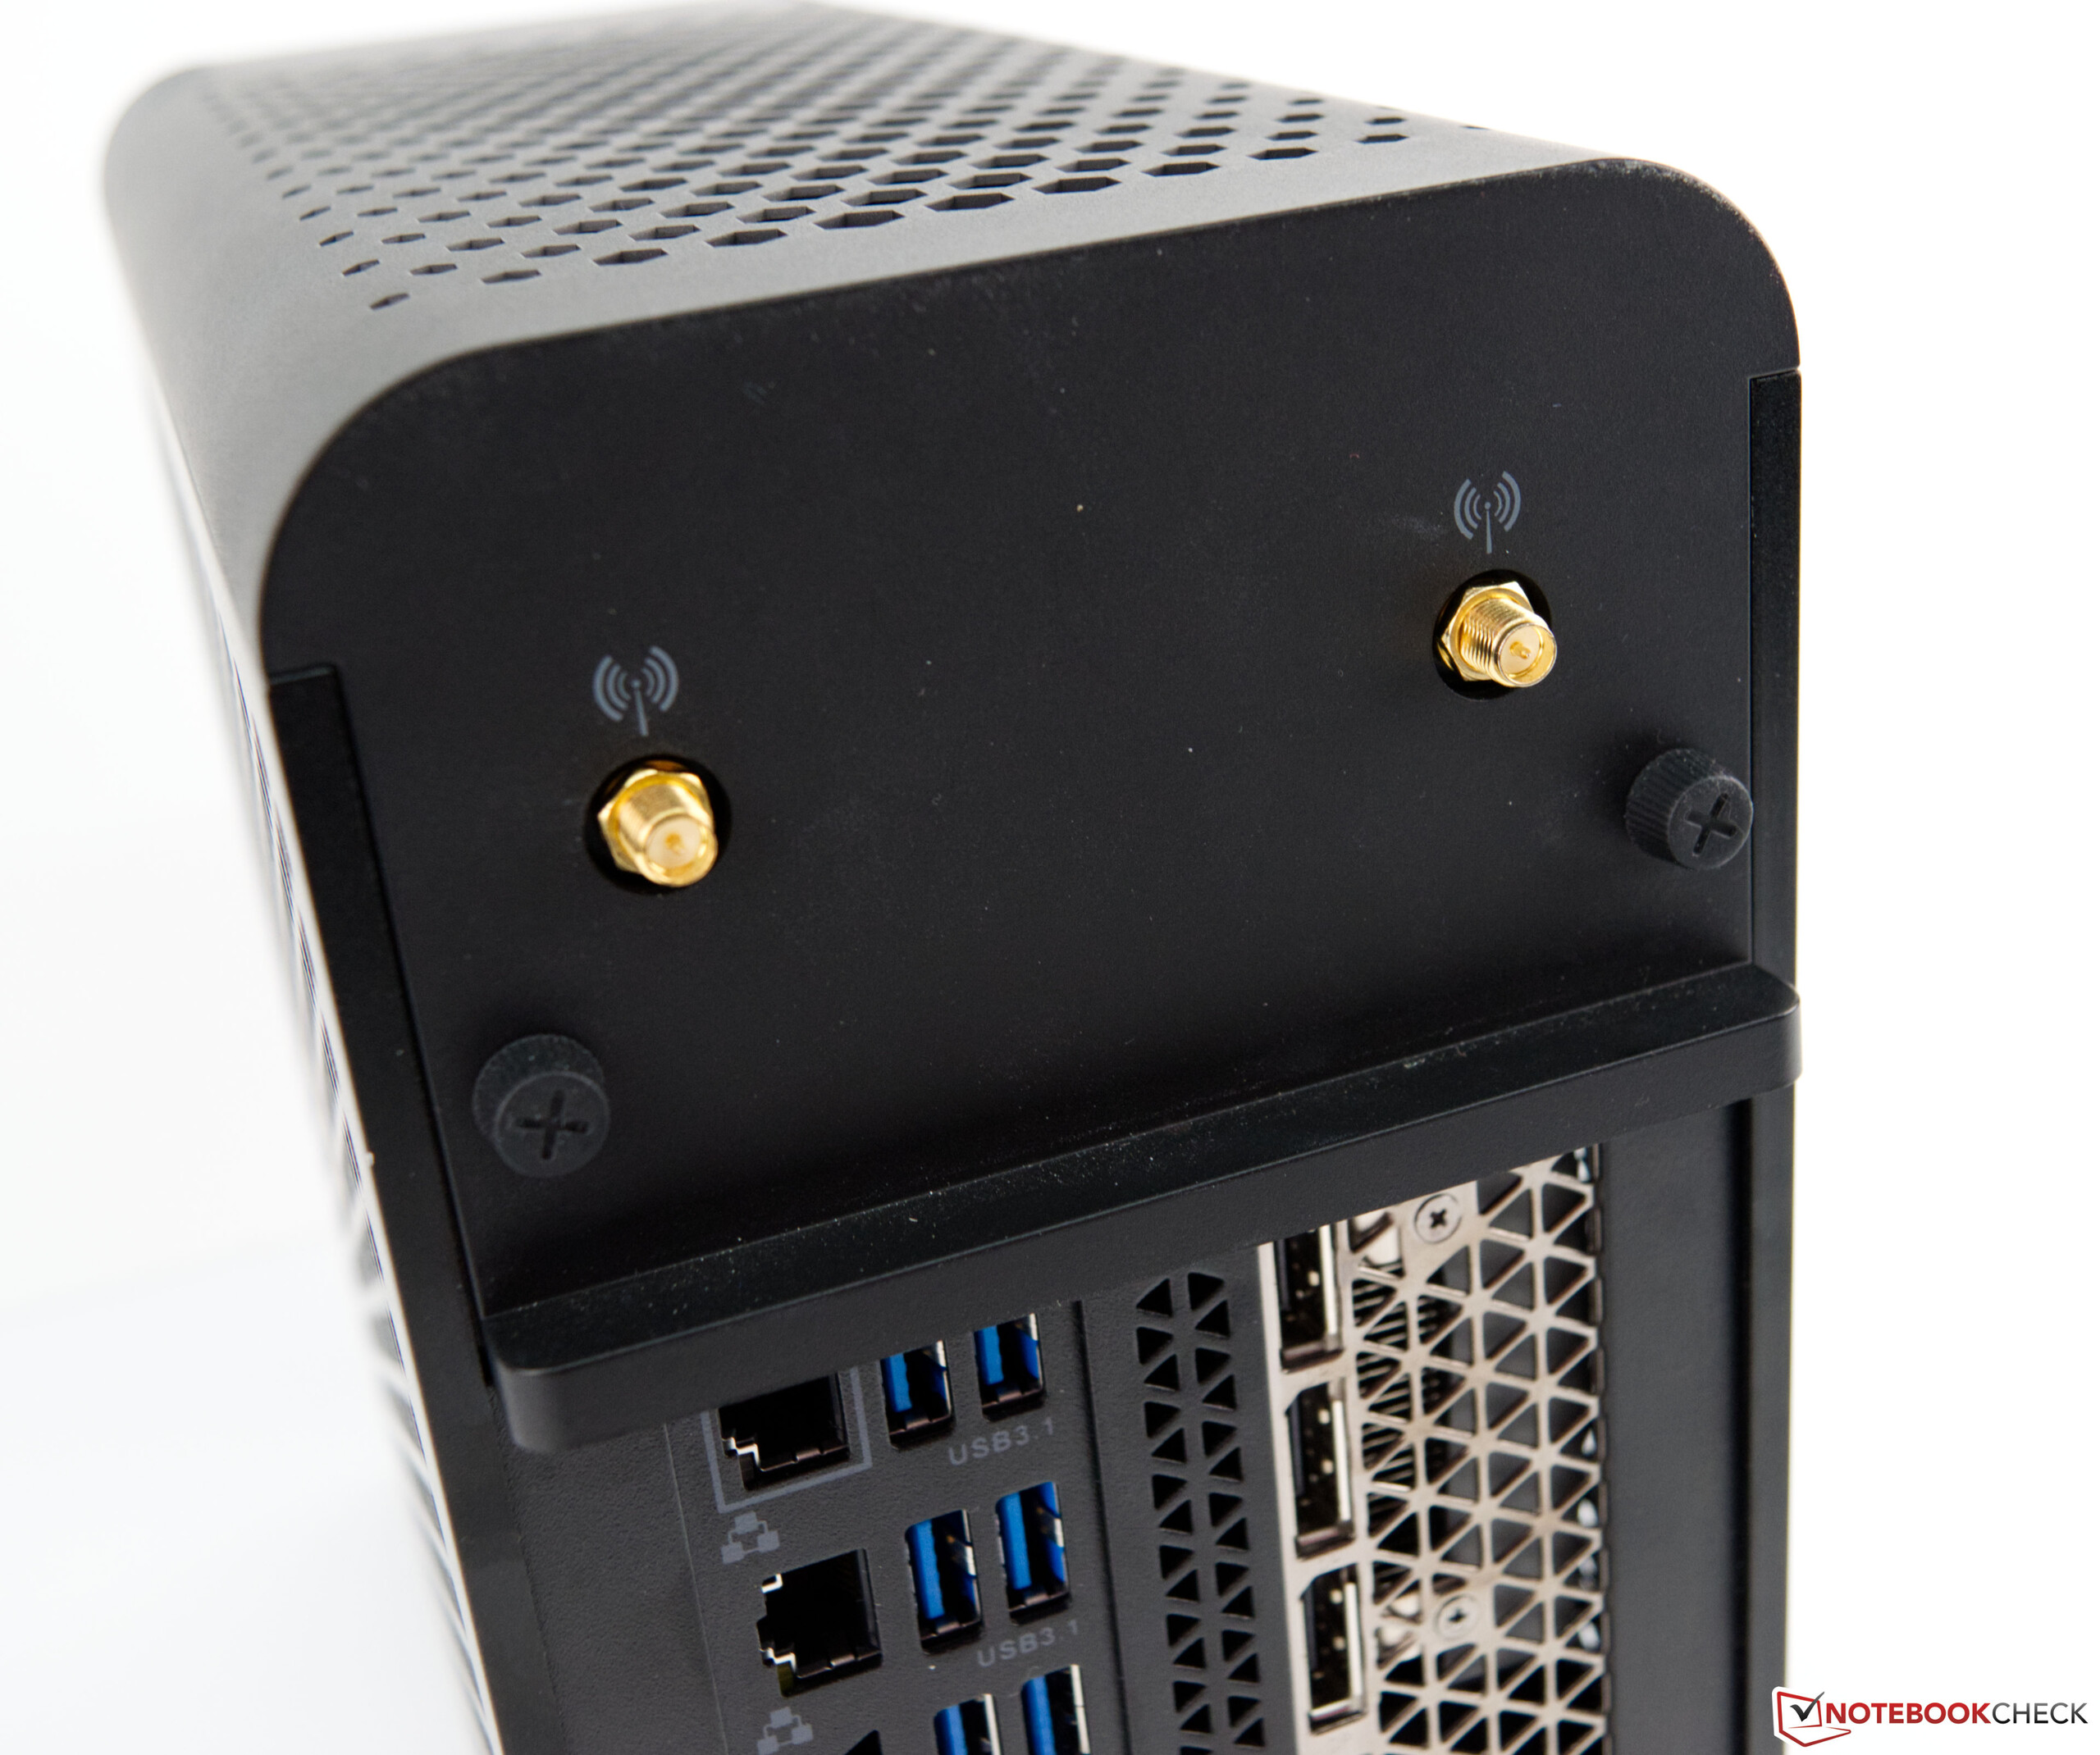
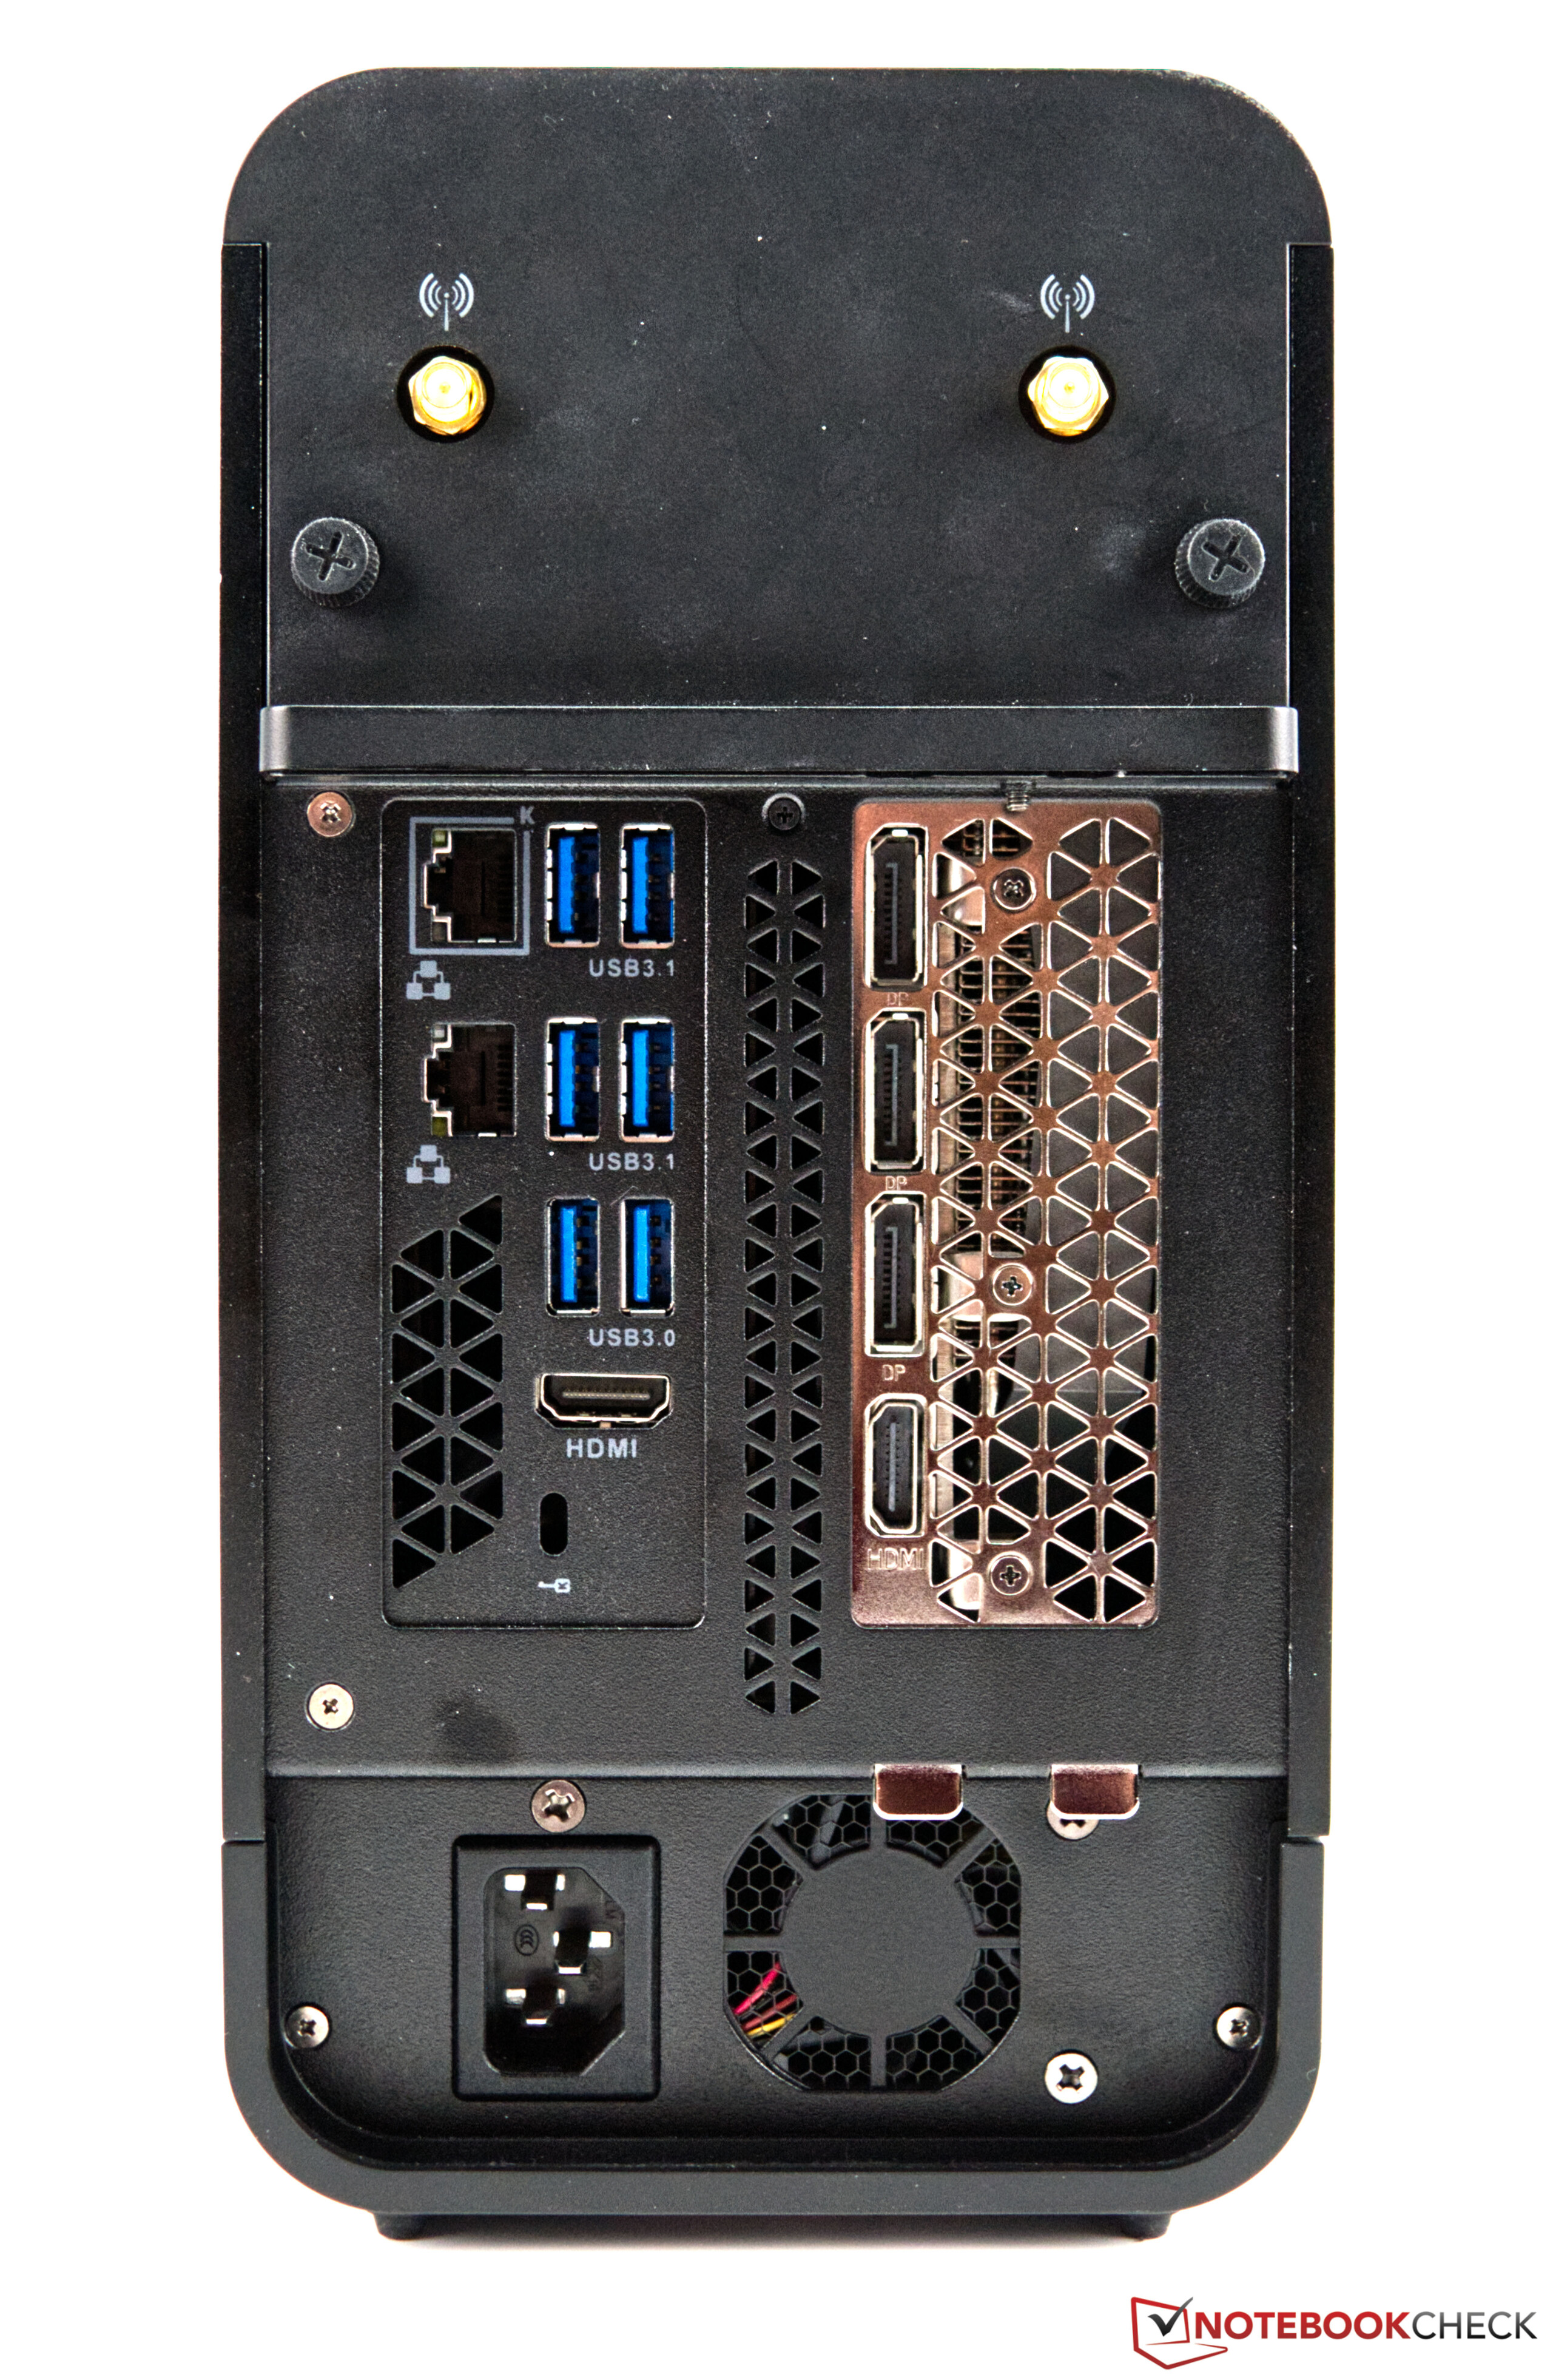
La carcasa del PC se ve bien sin muchas campanas y silbatos, y también se ha renunciado completamente a las gafas RGB. Esto no es necesariamente algo malo, porque muchos usuarios buscan una carcasa sobria, y Zotac ha conseguido crearla con el Magnus One. Además, la elección de los materiales es muy buena, ya que la carcasa está hecha principalmente de metal. La selección de puertos también es versátil, y apenas deja nada que desear. Sin embargo, tenemos que criticar la refrigeración algo molesta bajo carga.
No hay muchas alternativas al Zotac Magnus One, ya que los fabricantes más populares suelen centrarse en sistemas completos. Para comparar, sin embargo, puedes echar un vistazo a la serie MSI MEG Trident X. Ofrece una configuración similar en una carcasa atractiva y compacta.

