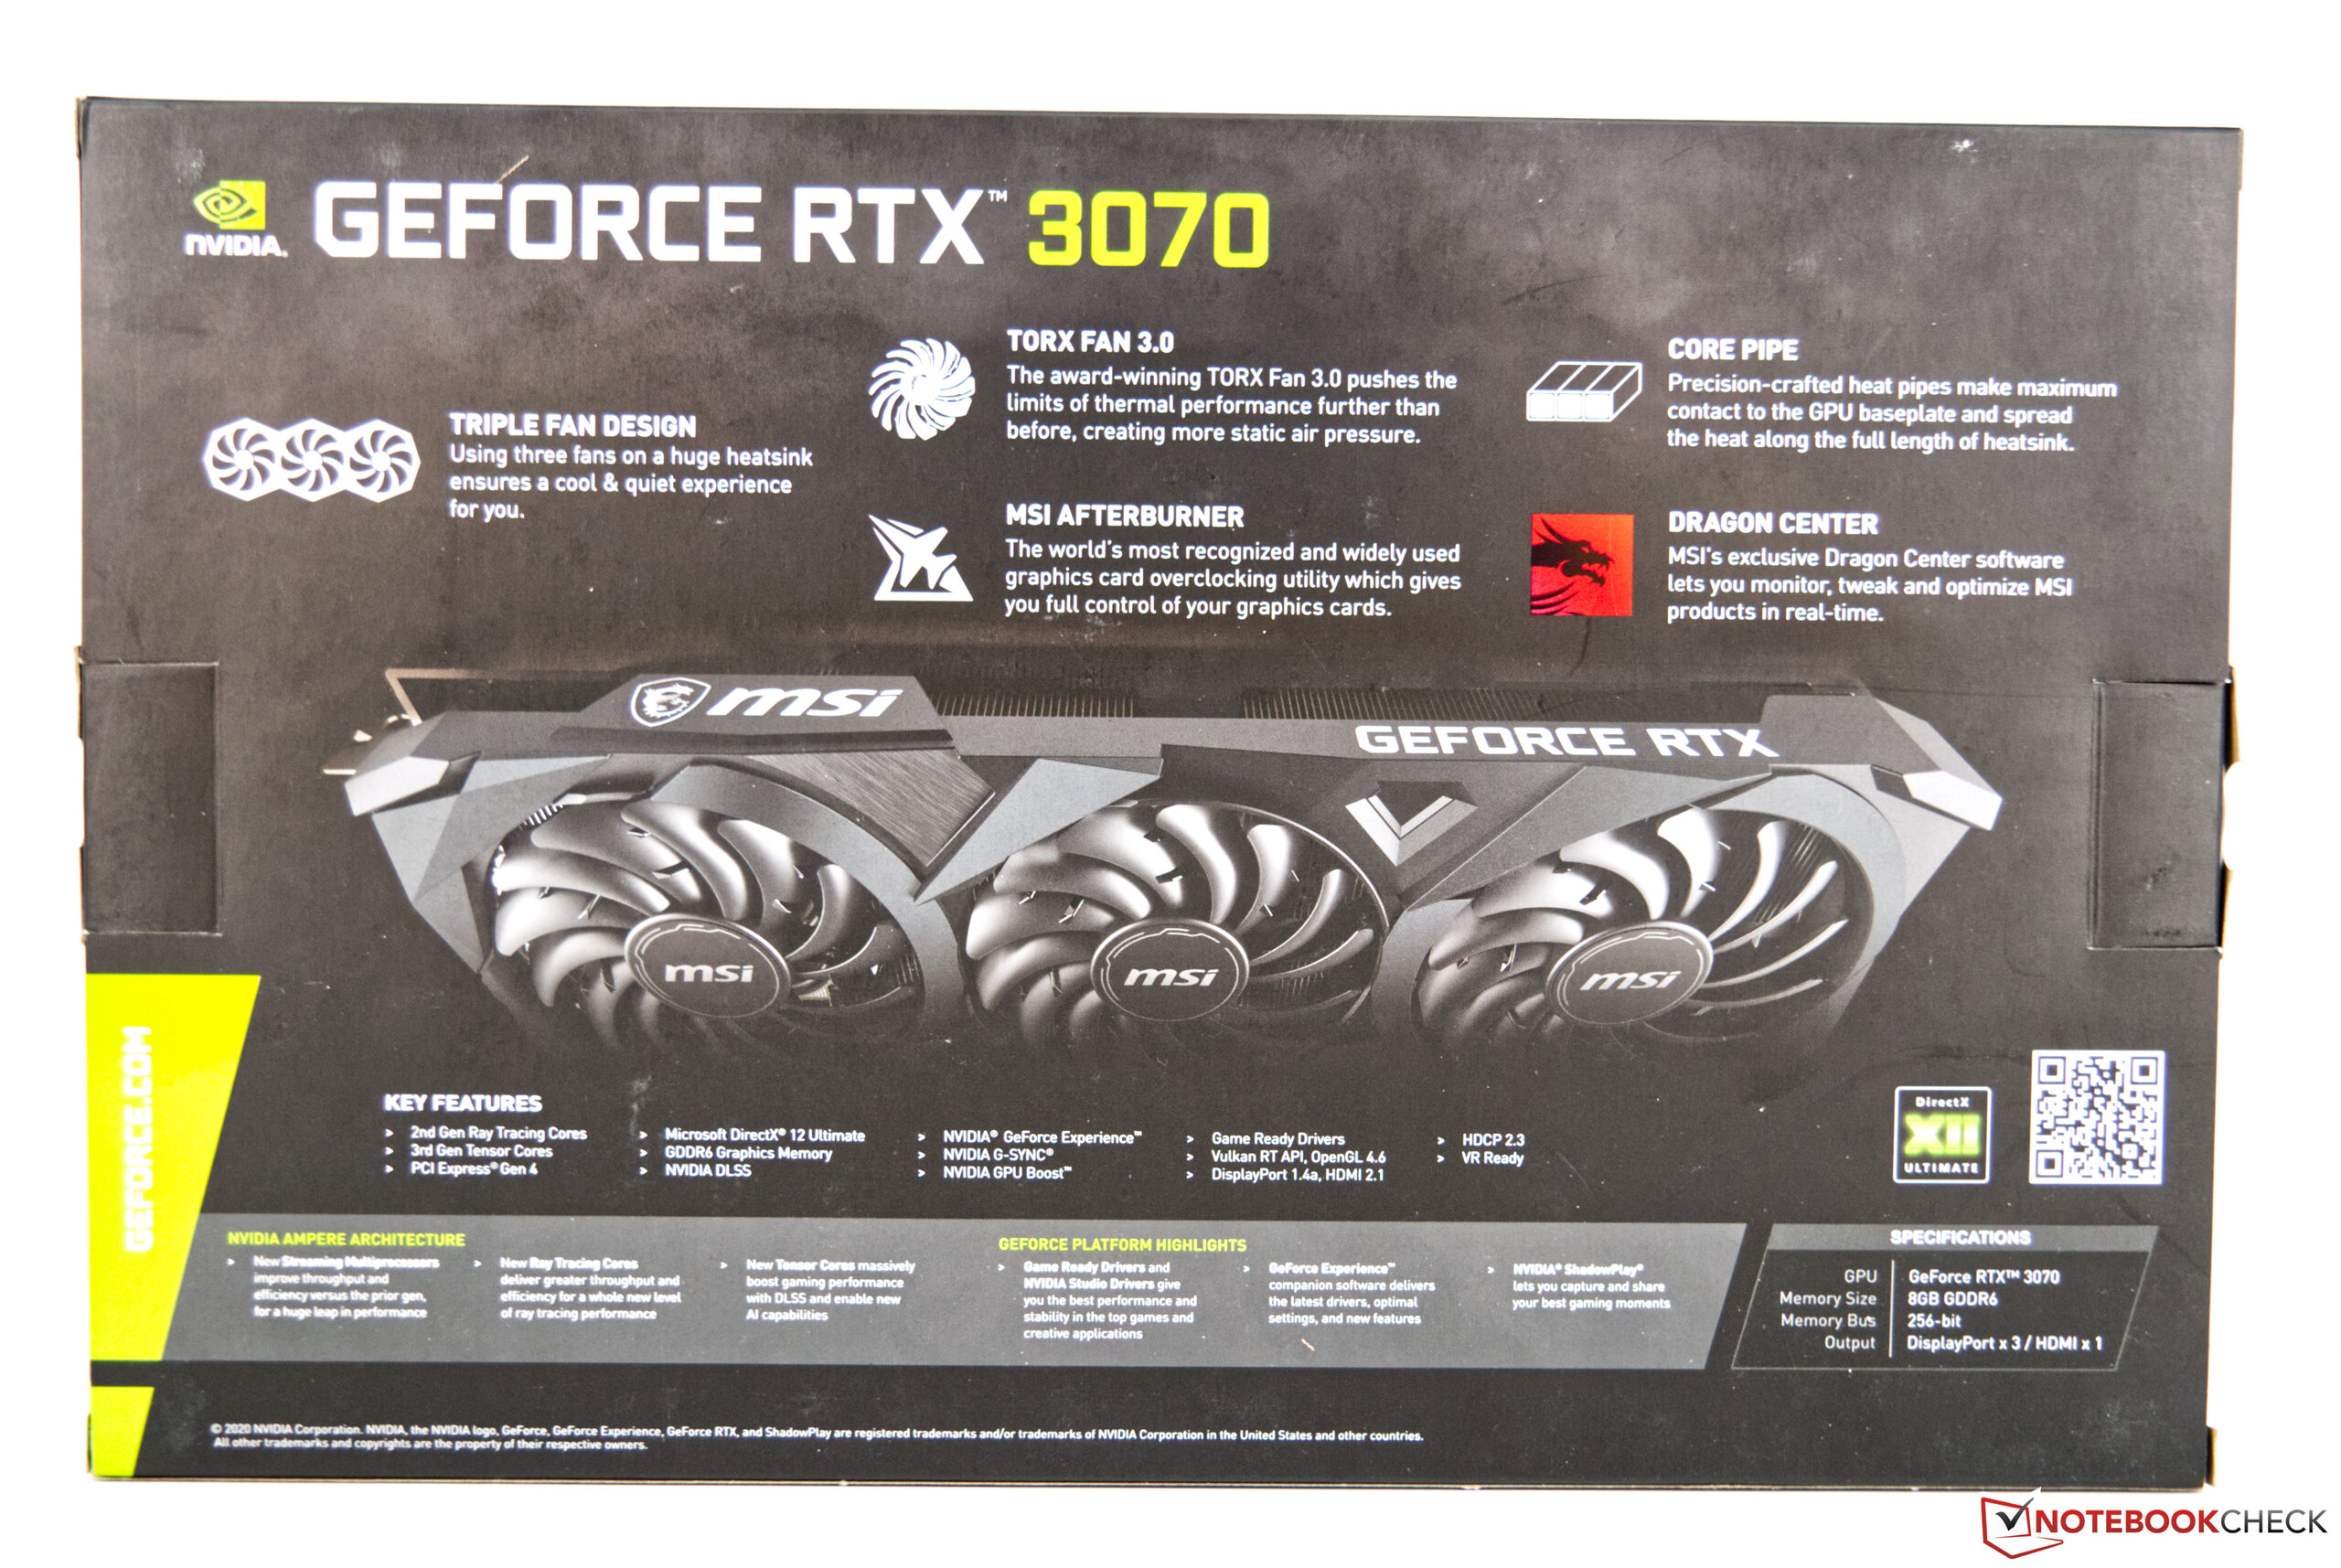
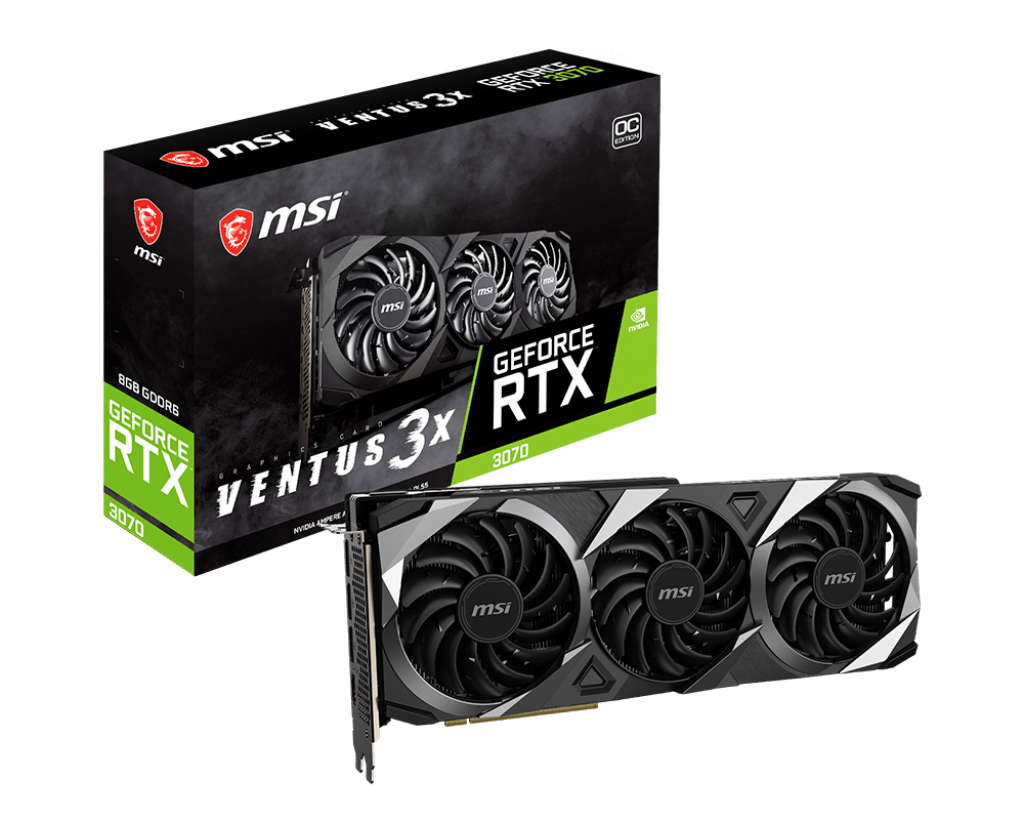
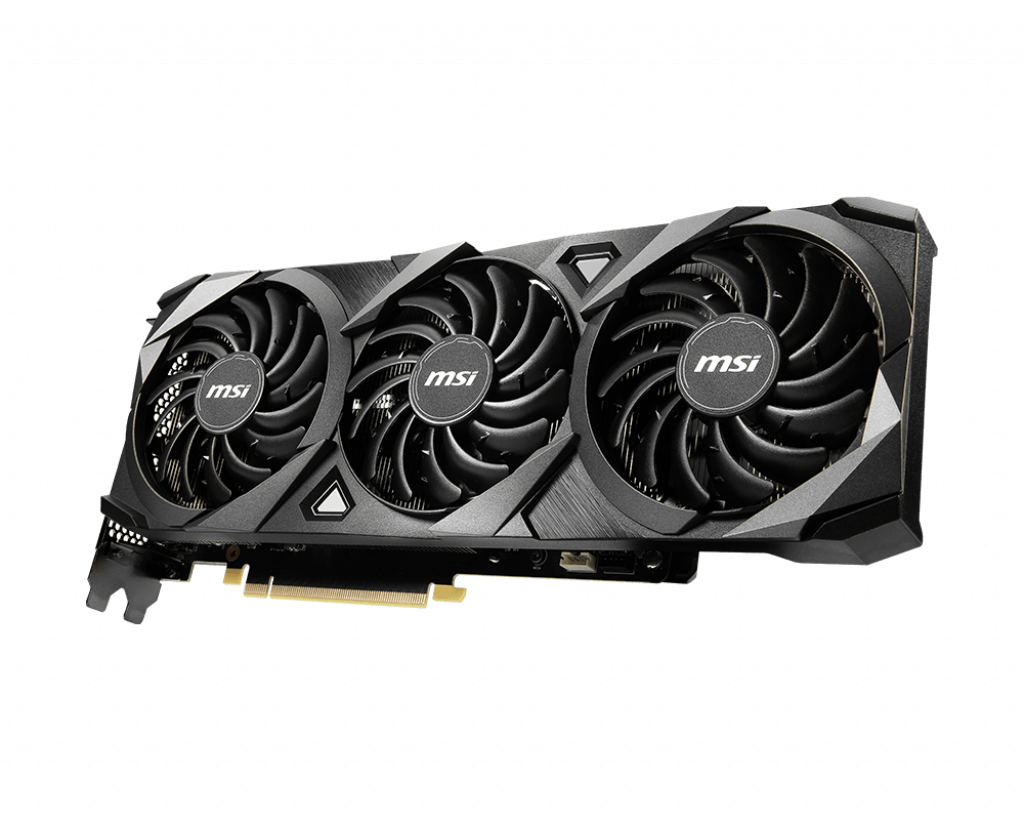
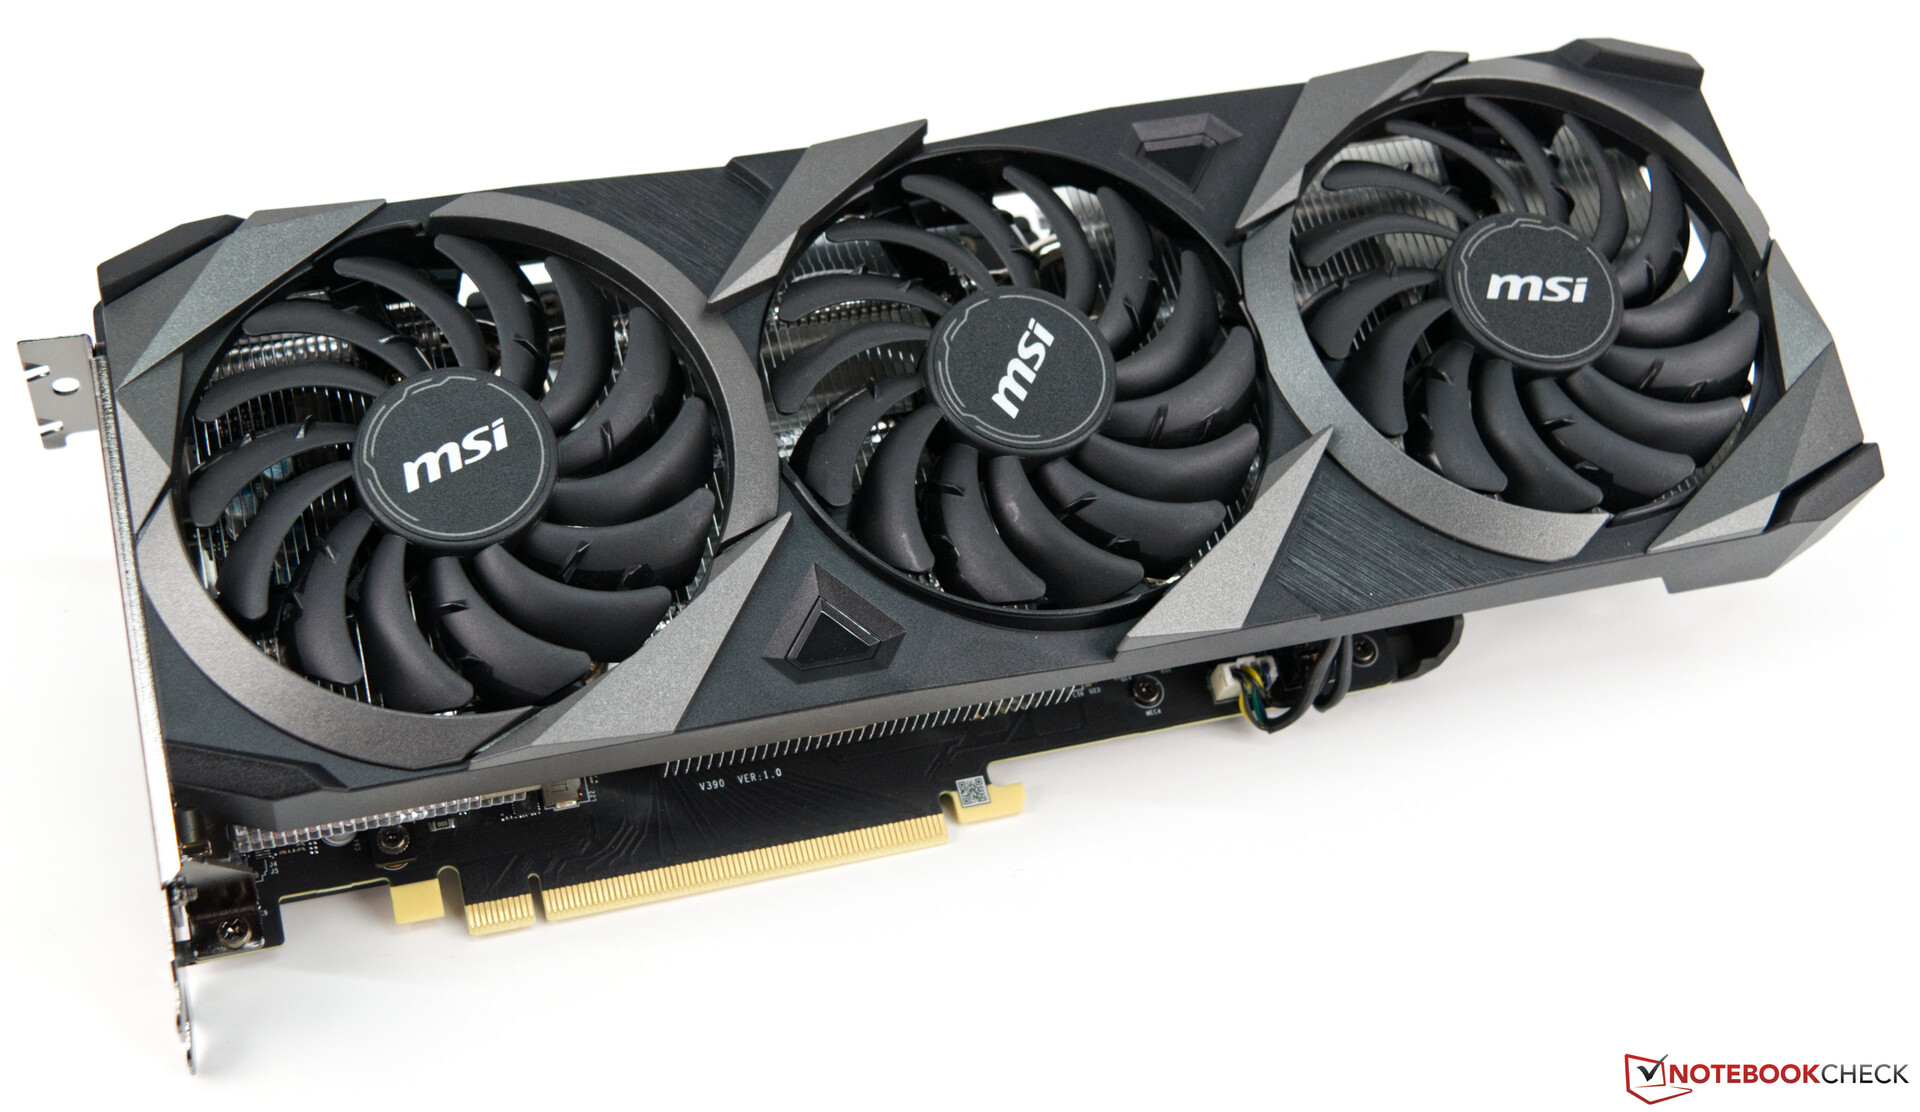
MSI GeForce RTX 3070 Tarjeta gráfica de escritorio Ventus 3X OC en revisión

Ya hemos probado ampliamente las nuevas tarjetas gráficas RTX 3000. Sin embargo, con la MSI GeForce RTX 3070 Ventus 3X OC, ahora tenemos un representante comparativamente barato de la nueva serie Ampere en nuestra prueba. Con un MSRP de sólo 529 Euros (~$642), el modelo personalizado no es mucho más caro que el modelo de referencia de Nvidia (499 Euros/~$606). Sin embargo, la tensa situación del mercado todavía asegura una muy baja disponibilidad y por lo tanto también hace que el precio de compra sea extremadamente alto, por lo que los precios a partir de 800 Euros (~$971) son llamados para los modelos de stock en el momento de la prueba. Esta es una situación muy frustrante si actualmente quieres comprar un nuevo sistema de juego para jugar a nuevos éxitos de taquilla como Cyberpunk 2077
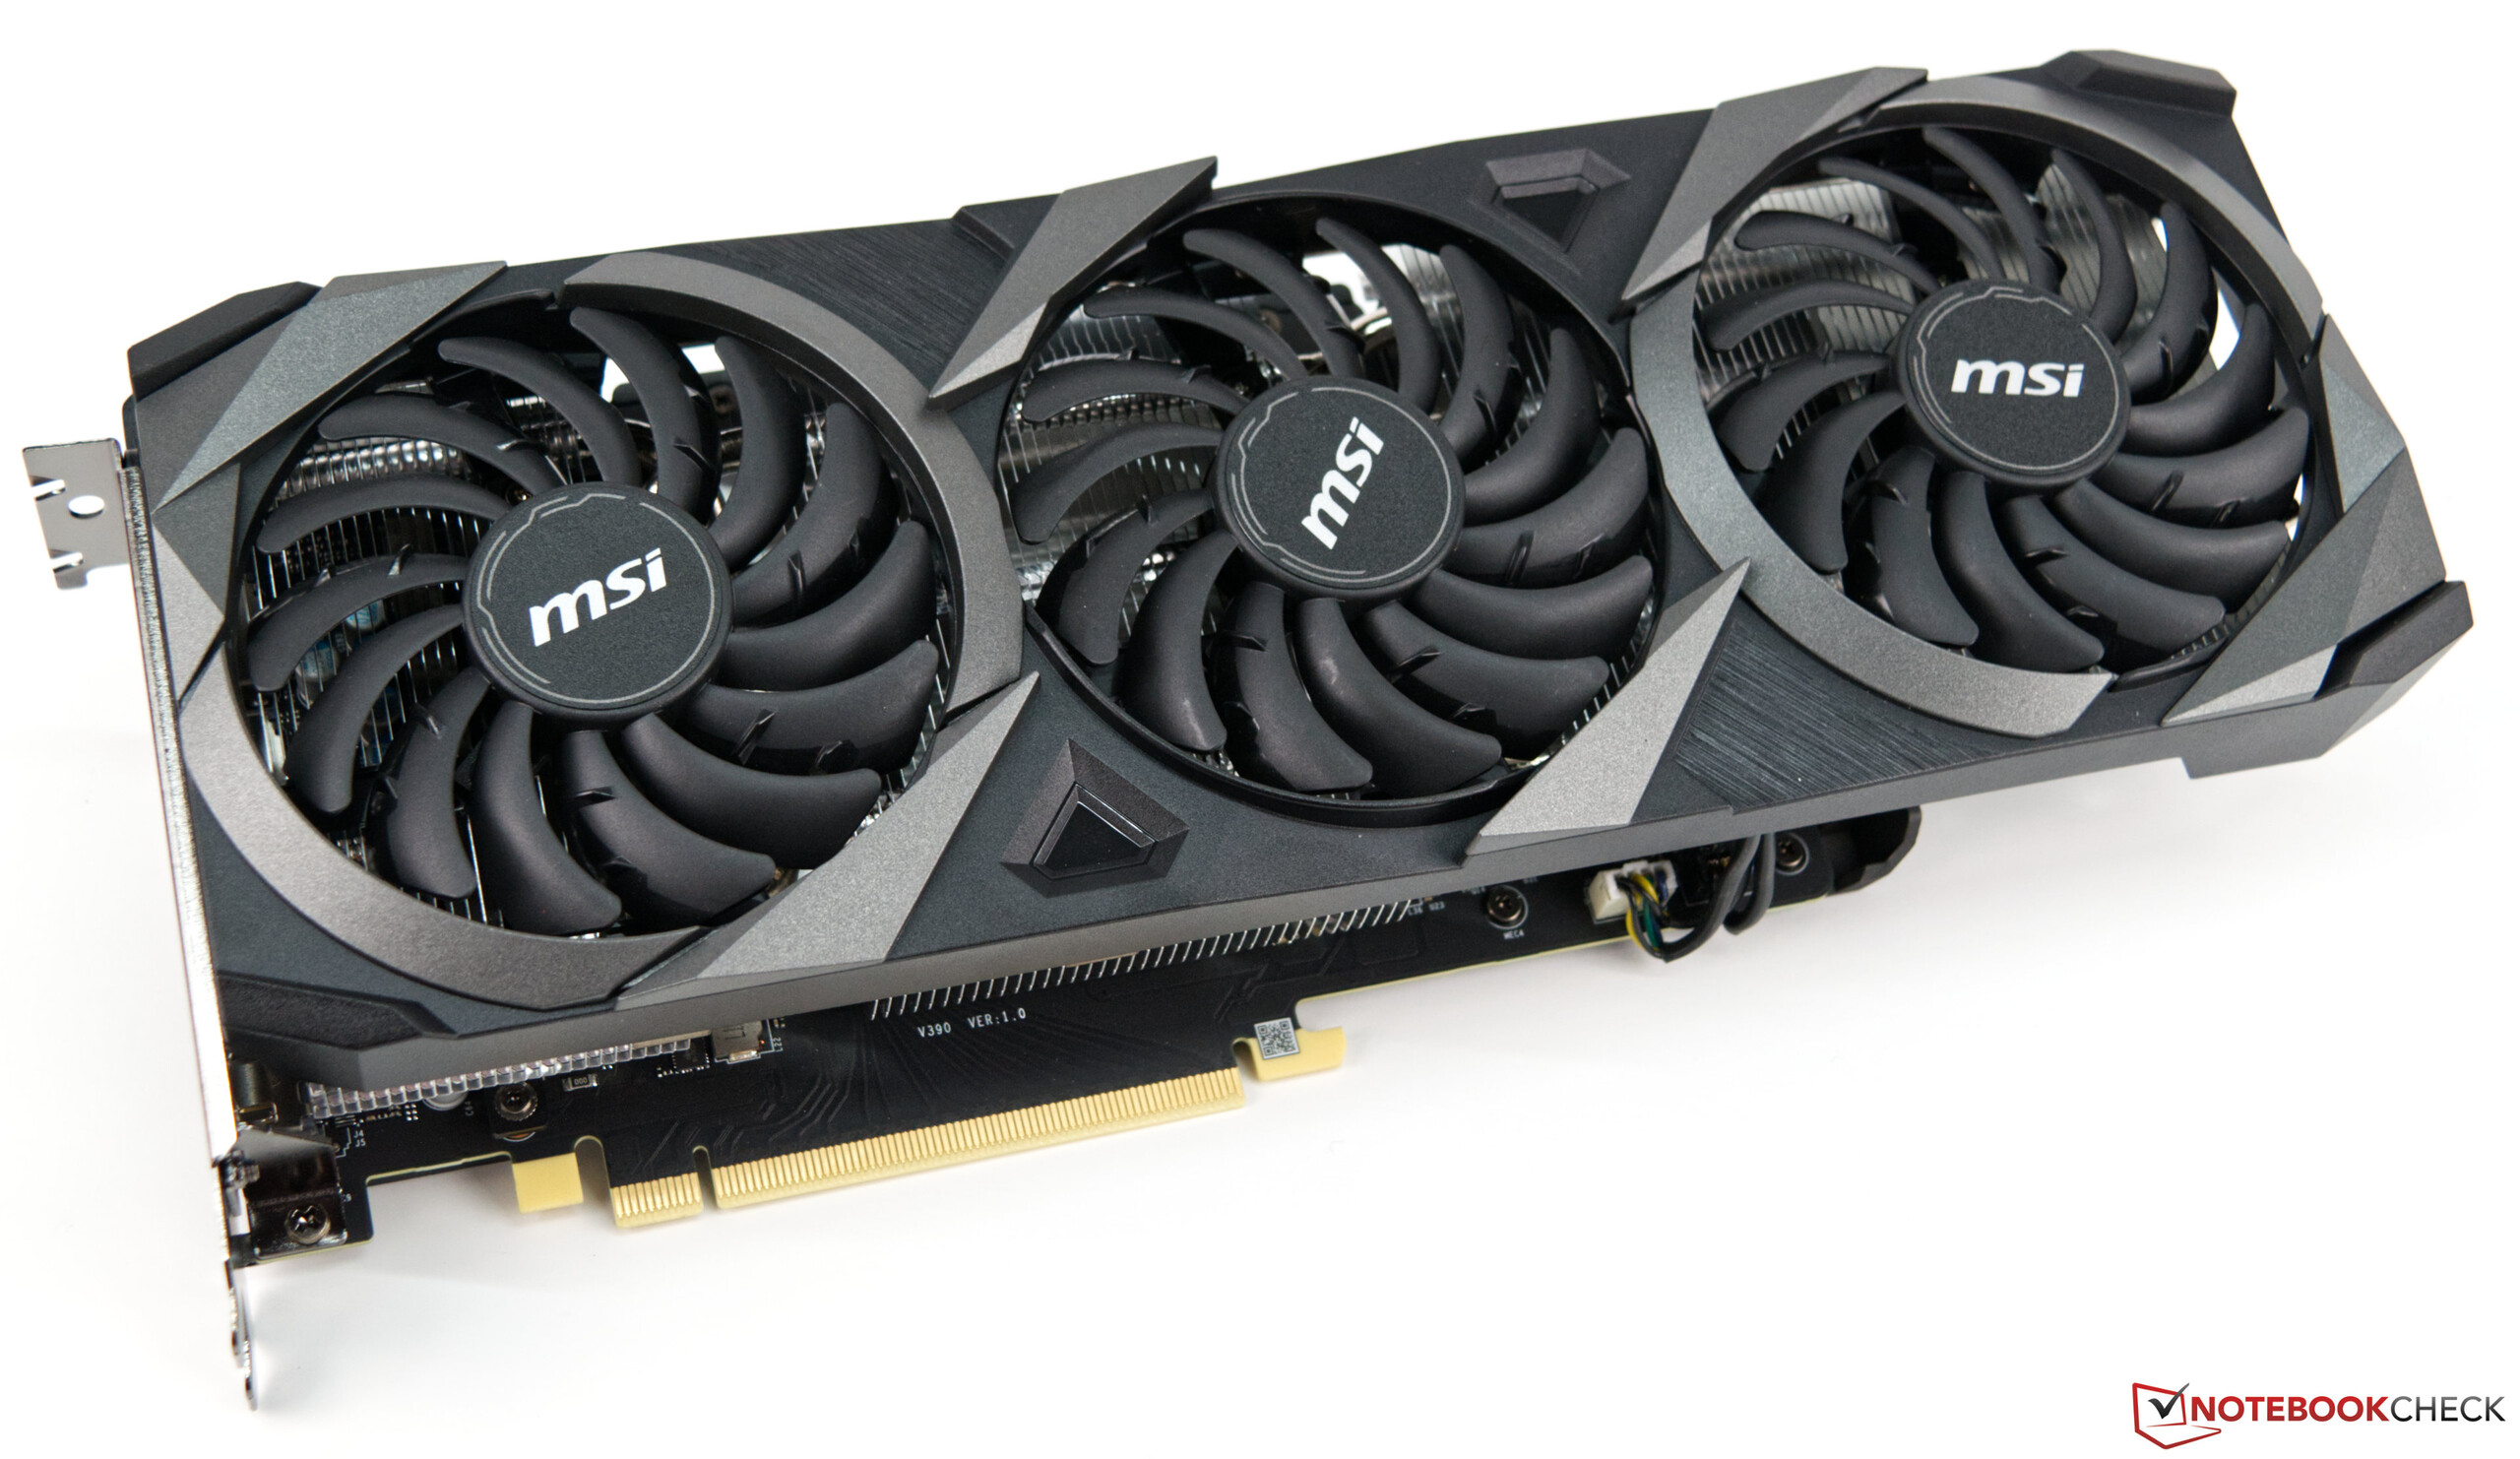
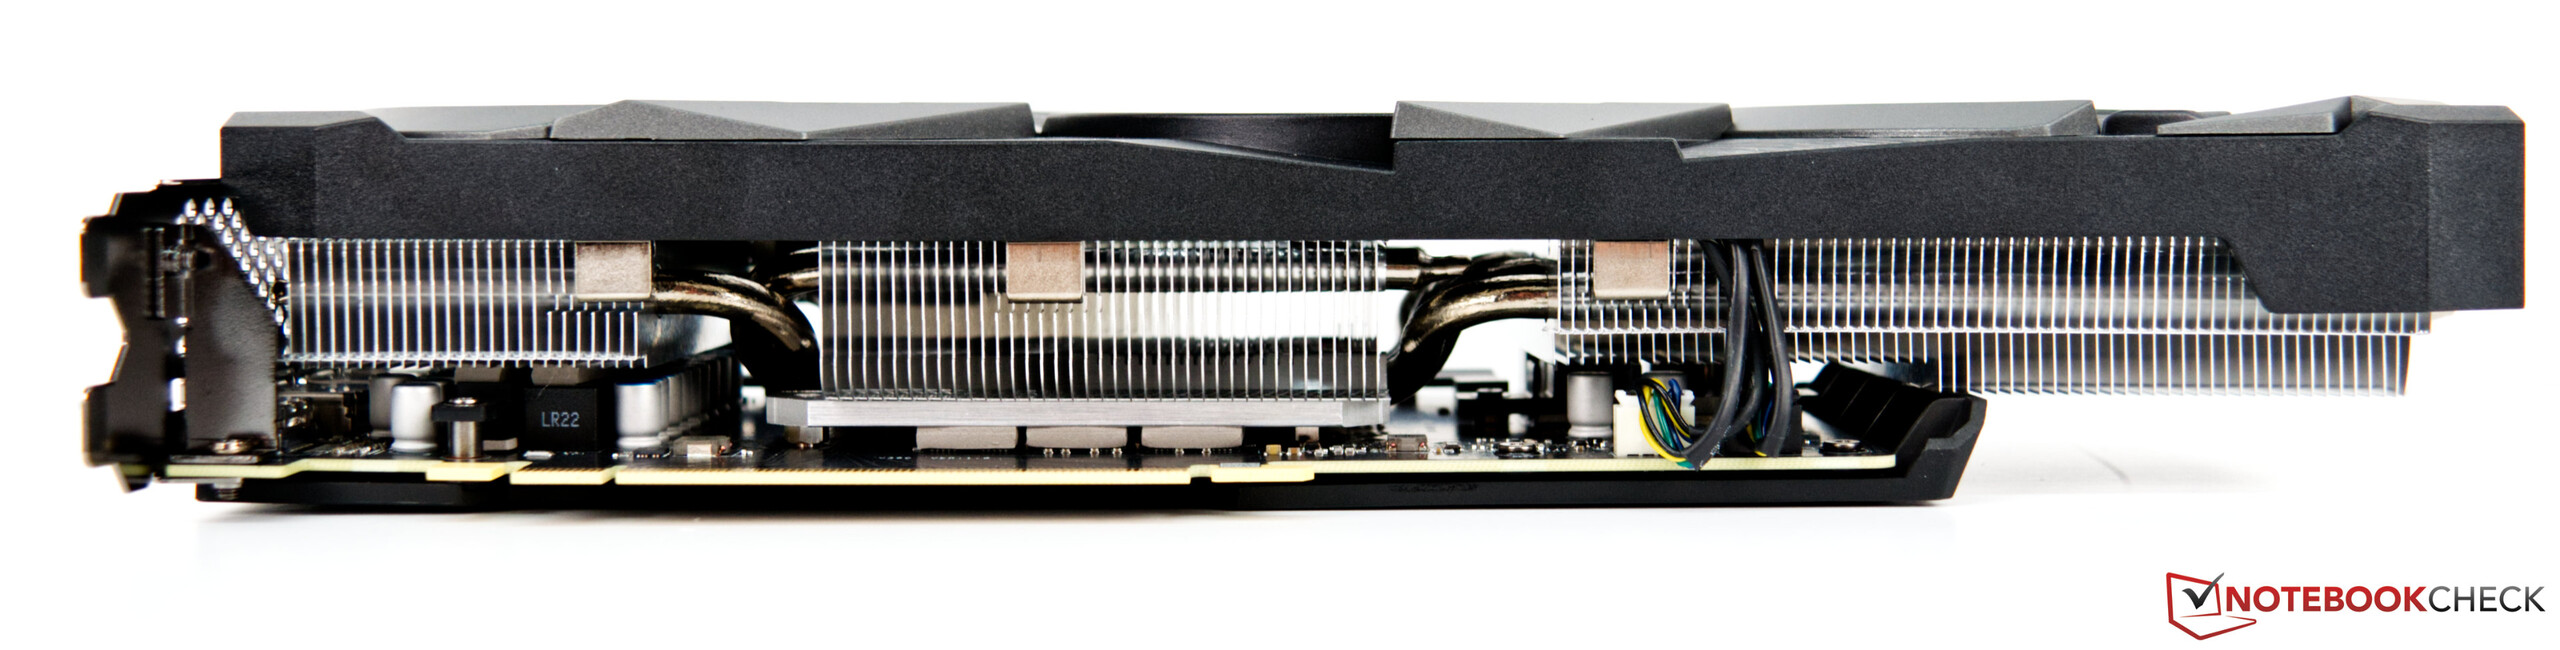
Afortunadamente, la escasez no afecta al rendimiento y el modelo de MSI fue bastante convincente en la prueba. Y aquellos que pueden prescindir de todas las orgías de iluminación a través de RGB deberían mirar más de cerca la serie Ventus 3X. El MSI GeForce RTX 3070 Ventus 3X OC tiene un gran disipador térmico con tres ventiladores axiales, pero se mantienen completamente inmóviles en modo 2D y a baja carga y por lo tanto no causan ninguna emisión de ruido. Pero incluso bajo carga, esta tarjeta gráfica nunca hace ruido. El modelo puede usar un máximo de 220 vatios, que es exactamente lo mismo que la edición de los fundadores. El modelo de la gama Gaming X Trio que también probamos recientemente estaba equipado con una BIOS de 240 vatios. Llegaremos a lo que esto significa en última instancia para el rendimiento más adelante en la revisión
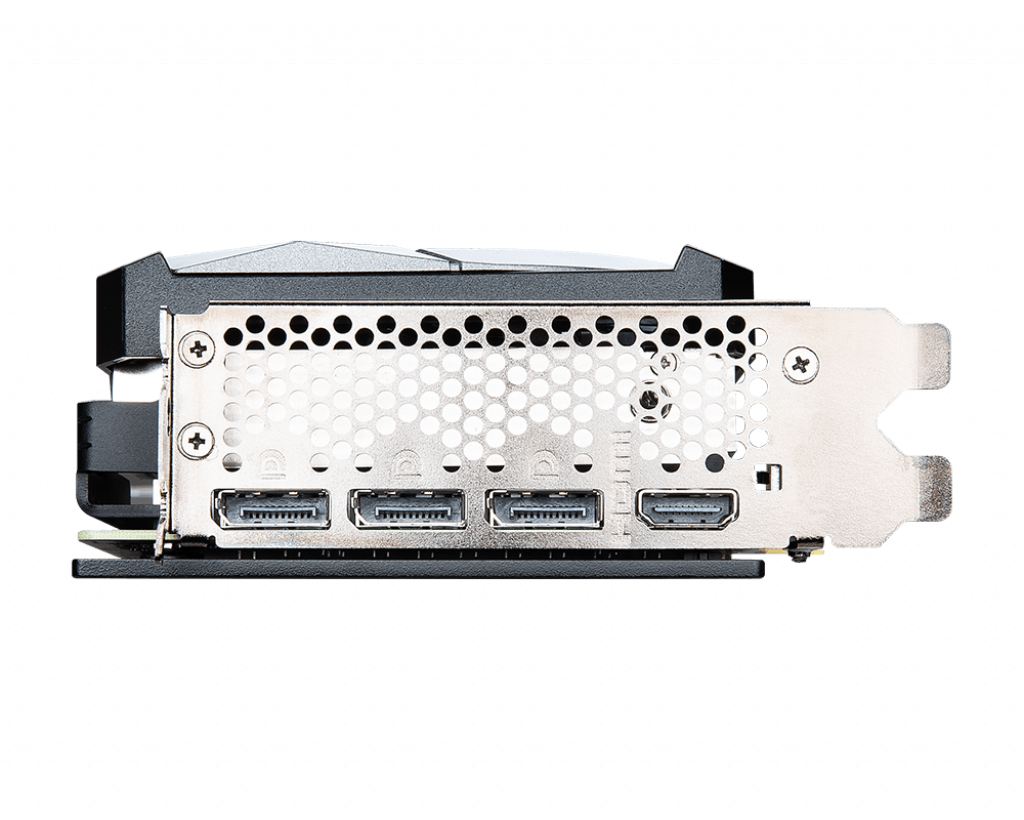
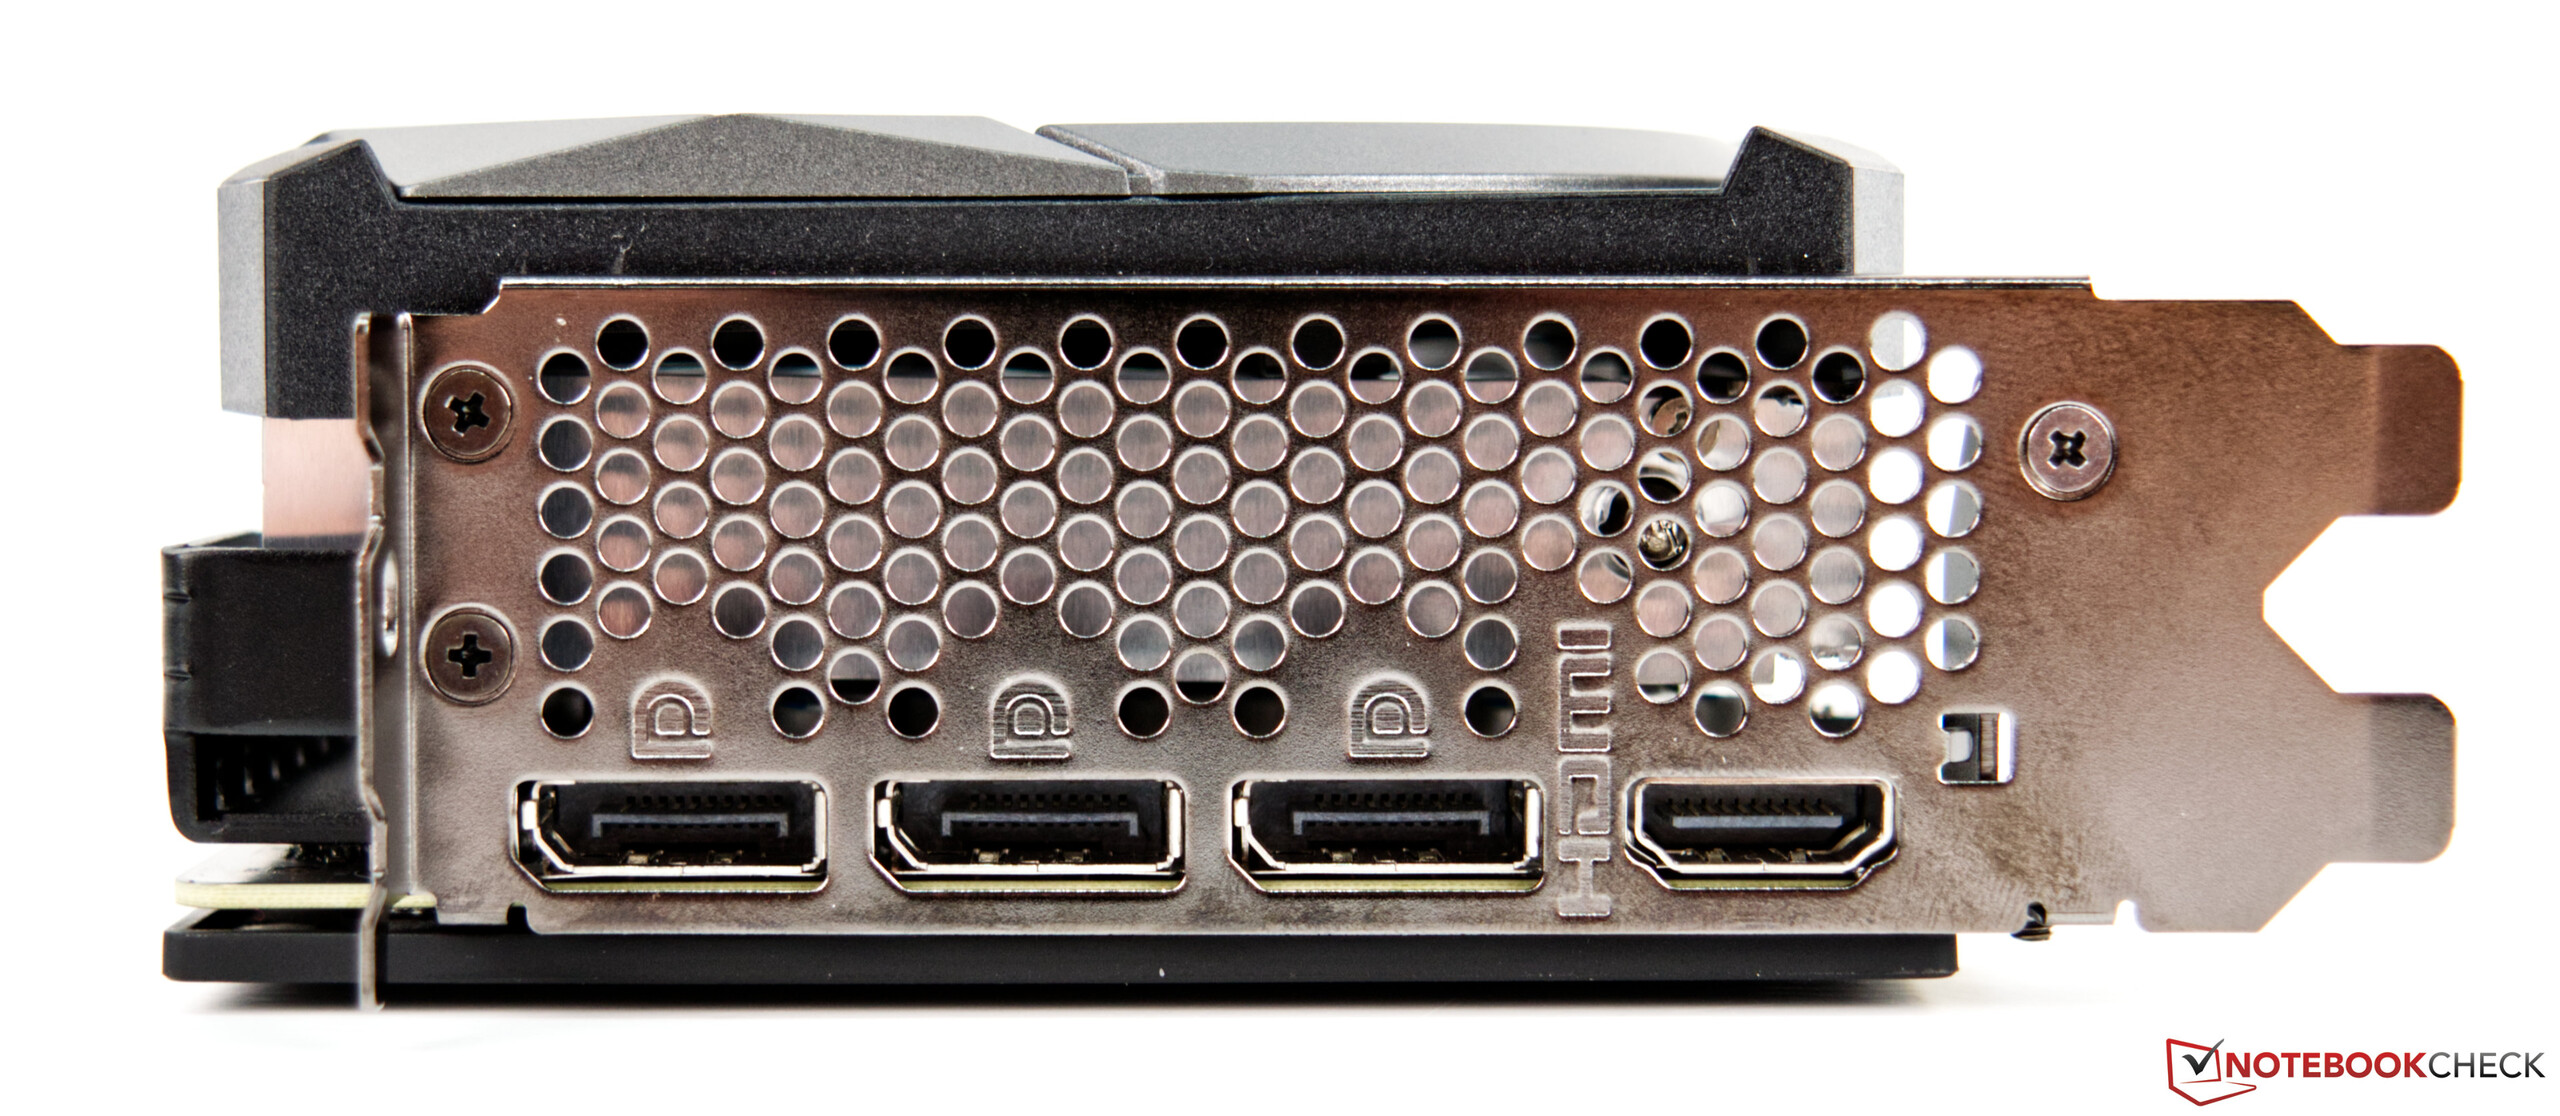
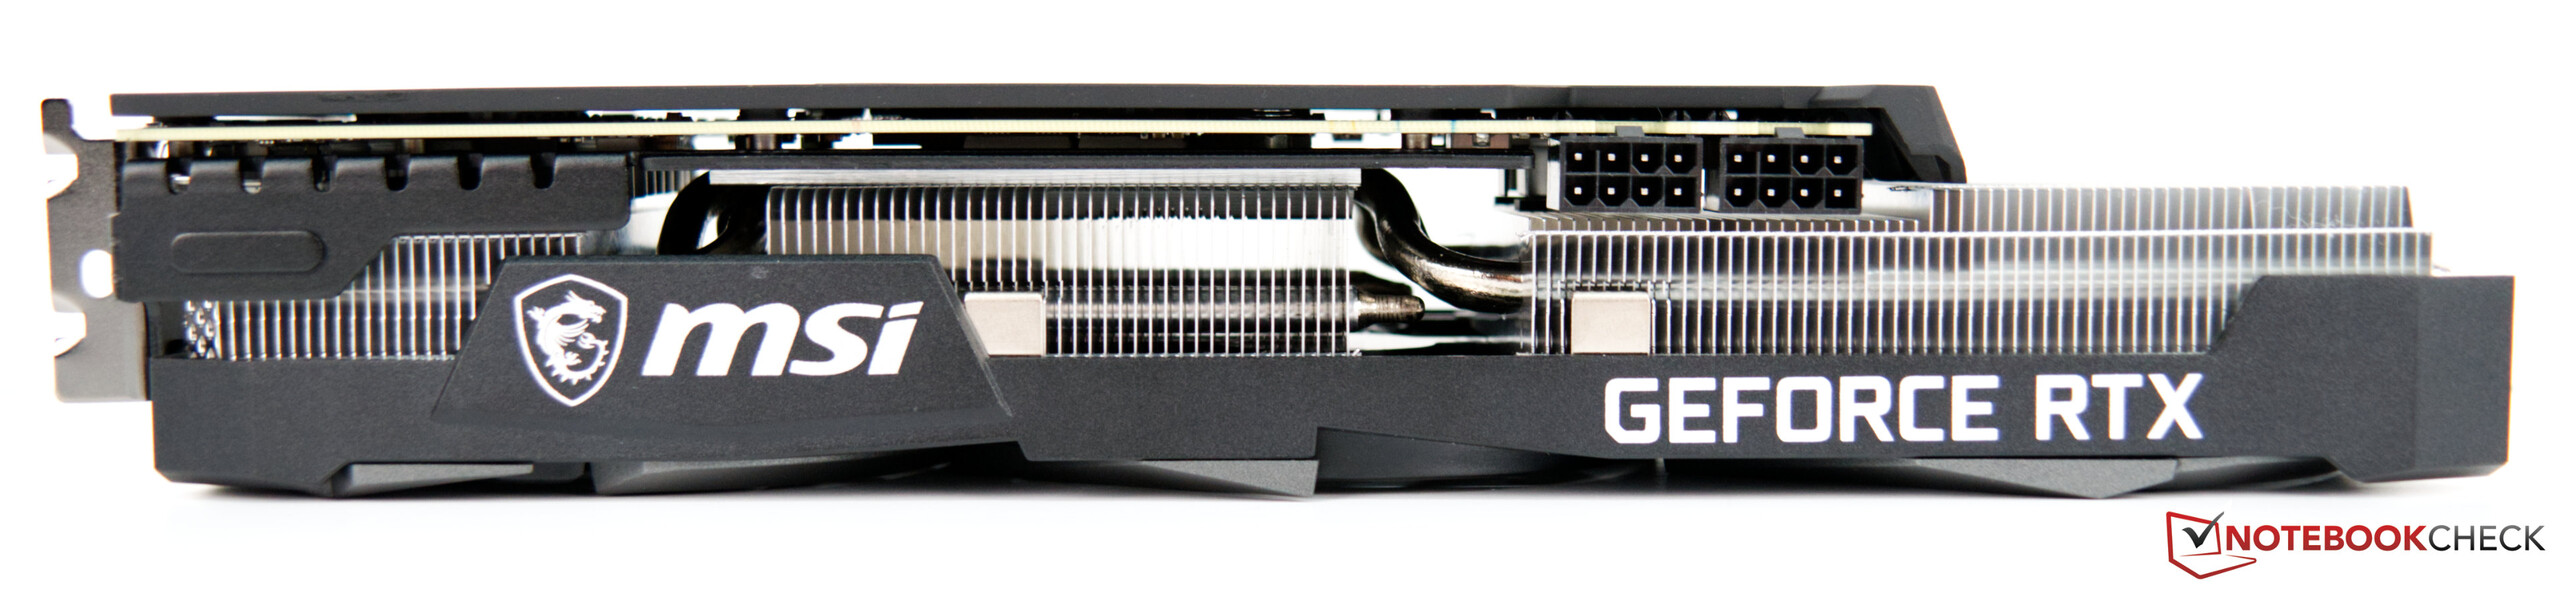
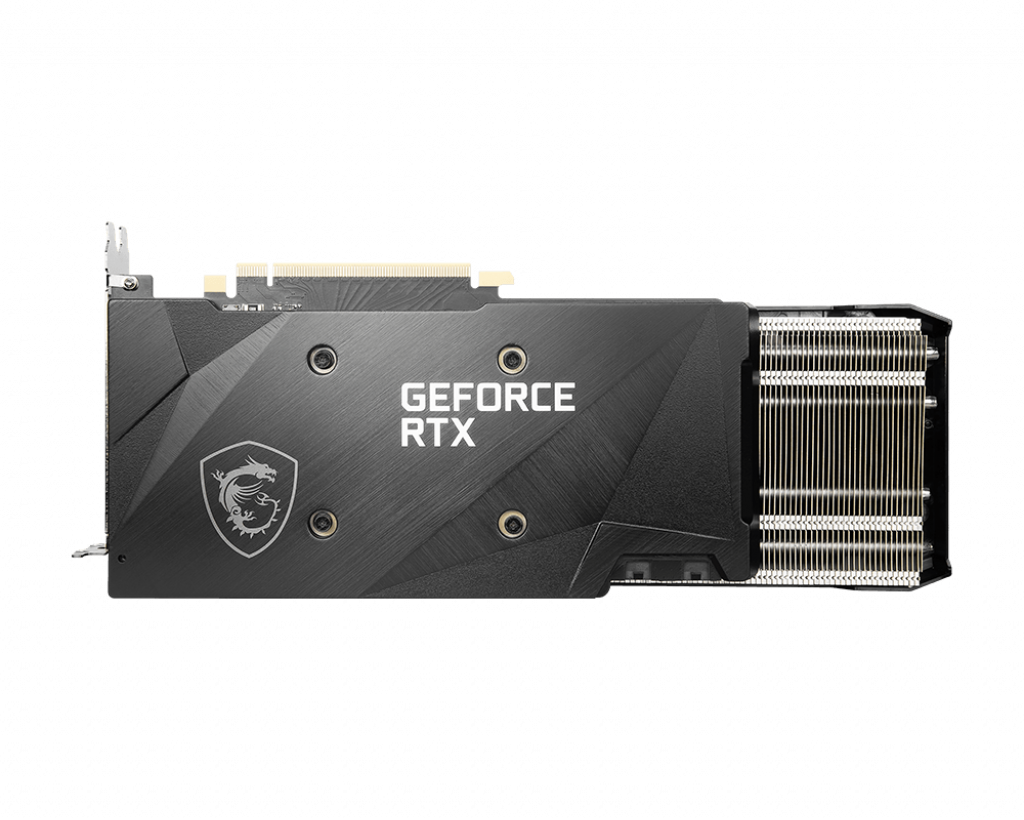
Sin embargo, con poco menos de 31 centímetros, nuestra muestra de prueba es sólo ligeramente más corta que el MSI GeForce RTX 3070 Gaming X Trio, lo que significa que también deberías comprobar si este modelo cabe en la maleta antes de comprarlo. Además, el MSI GeForce RTX 3070 Ventus 3X OC está equipado con dos conectores de alimentación de 8 pines y externamente se pueden operar hasta cuatro monitores simultáneamente. Para ello, hay un HDMI con el último estándar (2.1) y tres puertos DisplayPort (1.4a).
Comparación del RTX 3080 con otras GPU NVIDIA
| Características: RTX 3090 FE, RTX 3080 FE, MSI RTX3070, RTX 3070 FE, Titán RTX 2080, Ti, RTX 2080, RTX 2070 S |
| Chip |
| FinFET Process |
| CUDA Cores |
| TextureUnits |
| Tensor Cores |
| RTCores |
| Reloj de la base de la GPU 1.395 MHz 1.440 MHz 1.500 MHz 1.350 MHz 1.350 MHz 1.515 MHz 1.605 MHz |
| Reloj de aumento de la GPU |
| MemoryBus |
| Anchura de banda de la memoria |
| Memoria de video |
| Consumo de energía... 350 W... 320 W... 220 W... 280 W... 250 W... 250 W... 215 W.. |
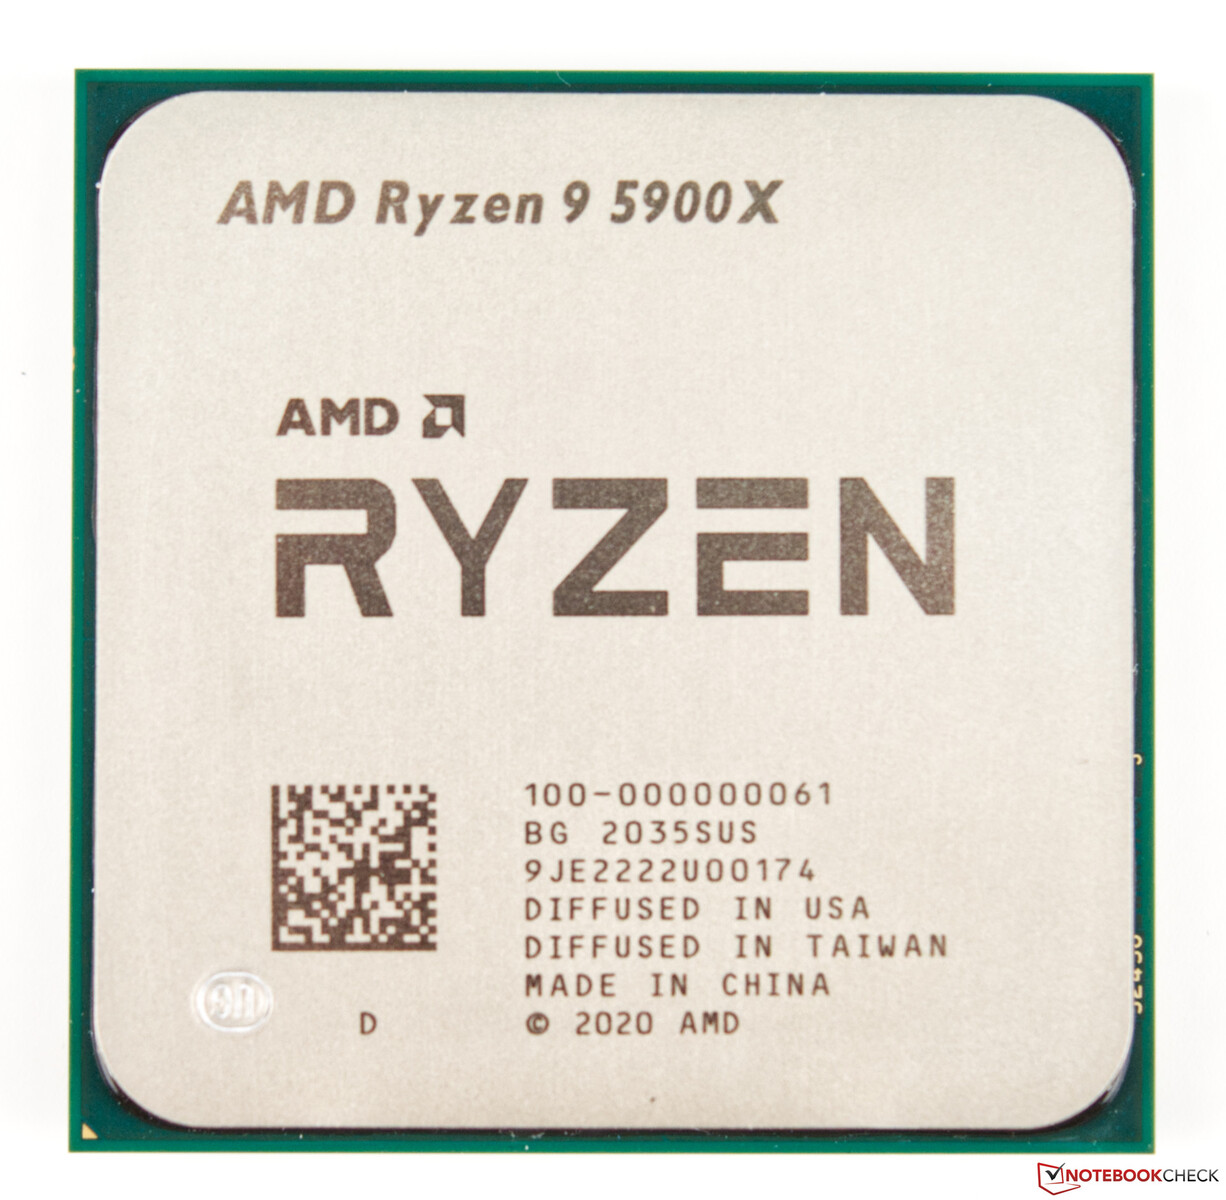
Nuestro sistema de pruebas con el AMD Ryzen 9 5900X como base
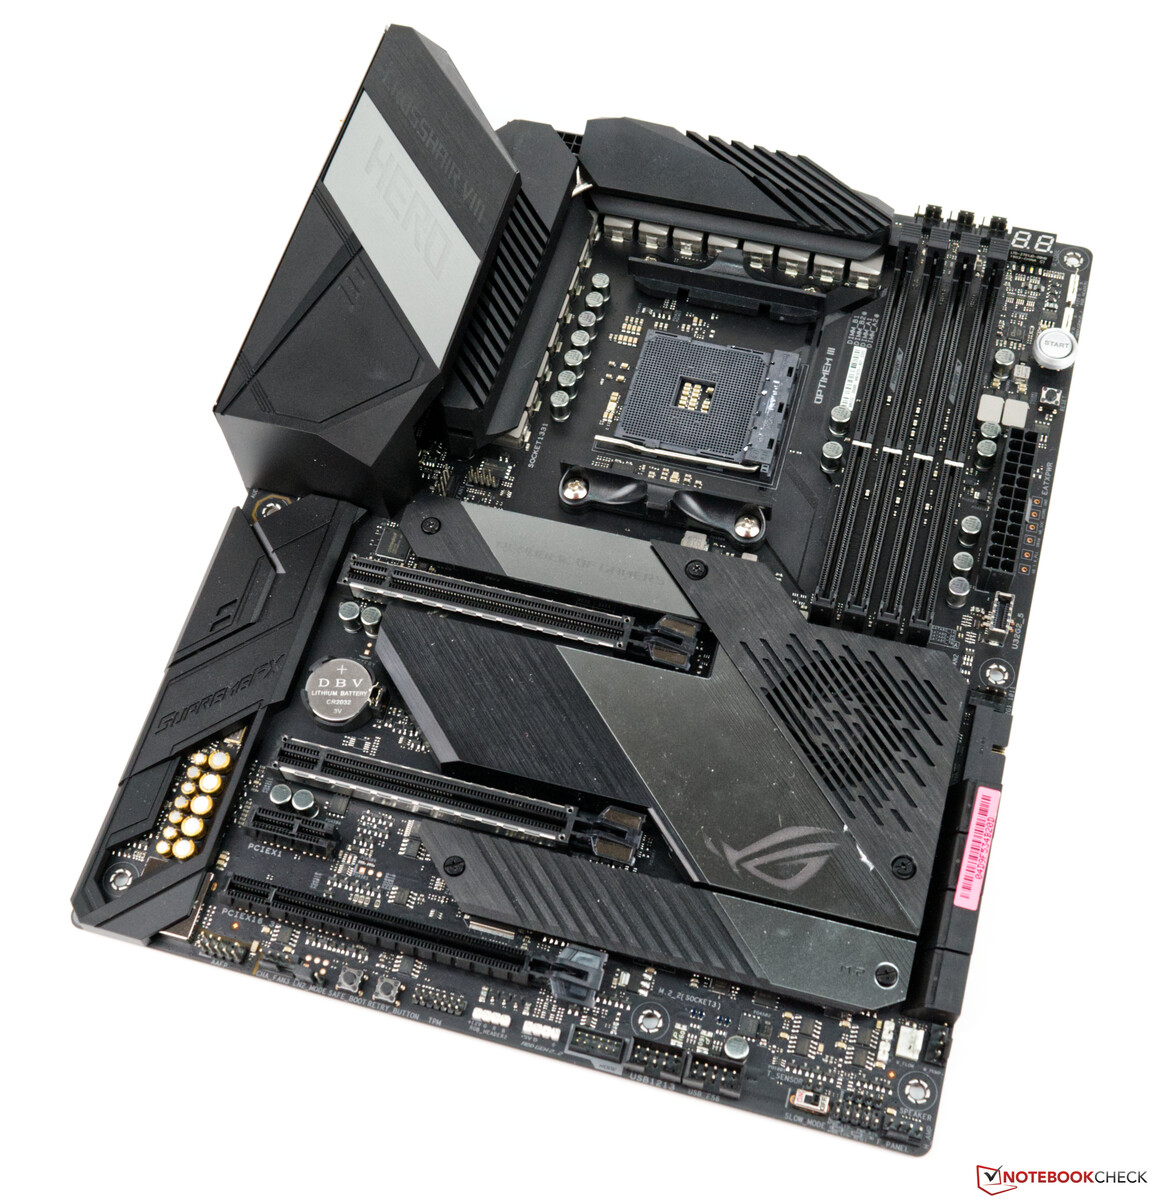
Una plataforma actual de AMD basada en el Asus X570 ROG Crosshair VIII sirve como sistema de prueba. La CPU (AMD Ryzen 9 5900X)ofrece un buen rendimiento de la CPU y usamos un AIO (Alphacool Eisbear Aurora 360mm) para la refrigeración. La memoria de trabajo de 32 GB proviene del Corsair y de los relojes con 4000 MHz. Usamos el Acer Predator XB321HK como monitor. Este no nos limita debido a su capacidad de UHD. Queremos agradecer a AMD por proporcionar la plataforma de prueba y a Corsair por el kit de RAM.
Utilizamos el siguiente sistema para los siguientes puntos de referencia y pruebas:
- Lian Li O11 Dynamic
- AMD Ryzen 9 5900X
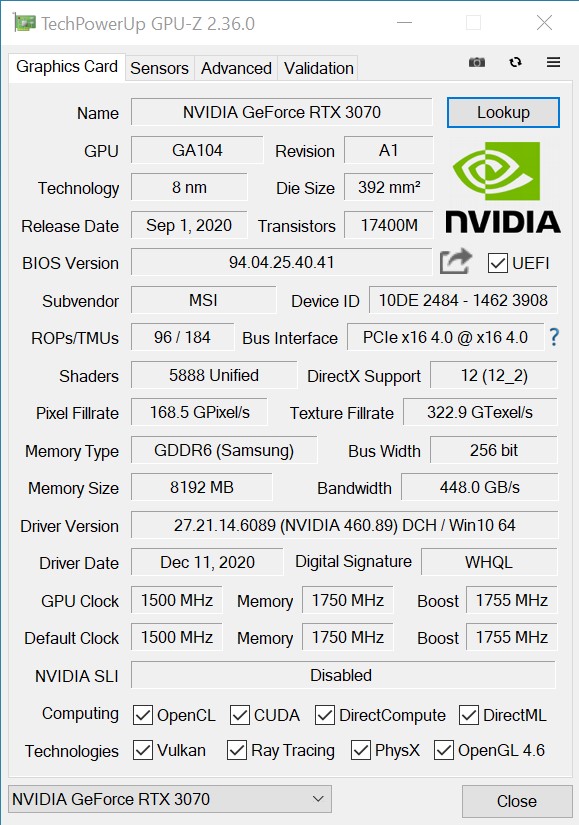
- MSI GeForce RTX 3070 Ventus 3X OC(controlador Nvidia 460.89)
- Asus X570 ROG Crosshair VIII Hero WiFi (BIOS 2402, Configuración por defecto, XMP 1 para DDR4-4000)
- Adaptador de corriente Corsair RM1000X de 1000 vatios
- Kit de memoria Corsair Vengeance RGB Pro DDR4-4000 2 x 16 GB
- Corsair MP600 2TB M.2 PCIe-4.0 SSD
- Crucial MX500 2TB (para juegos)
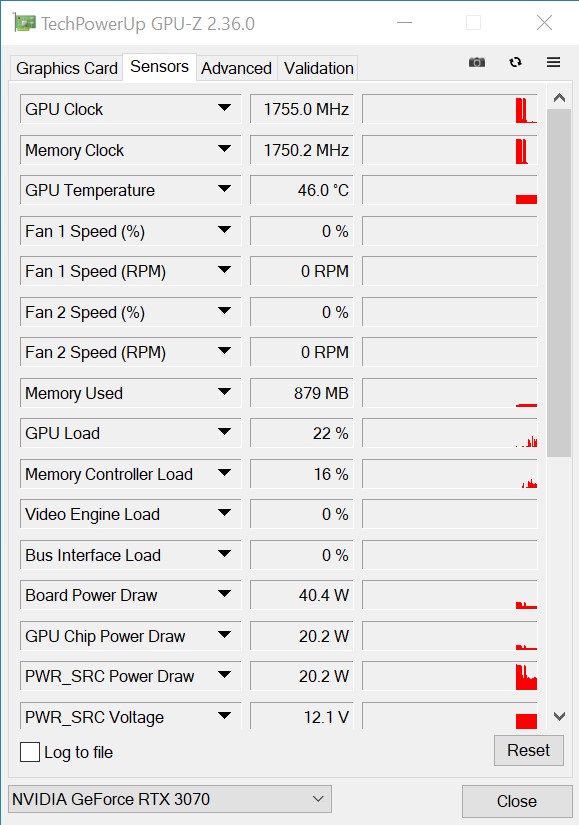
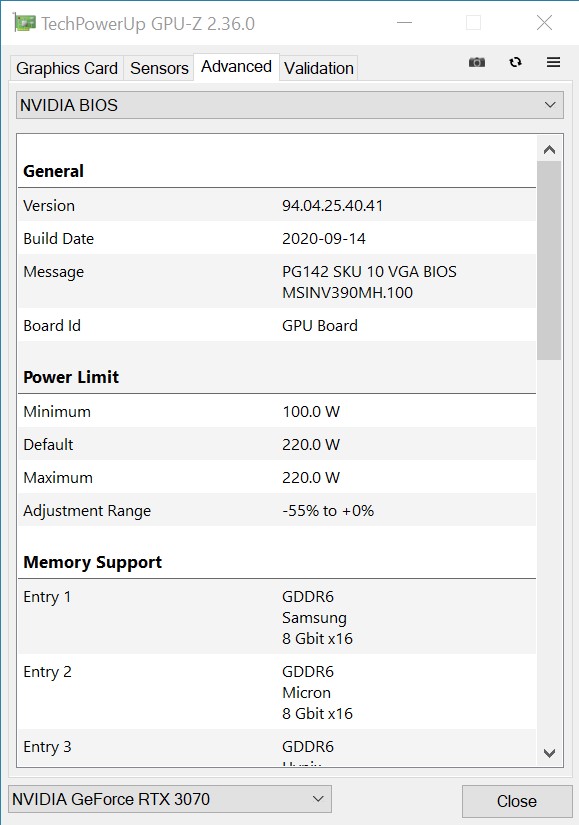
Las velocidades de reloj del MSI GeForce RTX 3070 Ventus 3X OC
Como se mencionó al principio, las velocidades de reloj del MSI GeForce RTX 3070 Ventus 3X OC están a la par con las de la Edición Fundadora de Nvidia. Lo mismo se aplica al límite de potencia, que es de 220 vatios para toda la tarjeta gráfica. Además, el objetivo de potencia no puede ser aumentado más en nuestra muestra de prueba.
Puntos de referencia sintéticos
Tenemos una primera impresión del rendimiento del MSI GeForce RTX 3070 Ventus 3X OC en las pruebas sintéticas. Como ya pueden ver en los datos técnicos, nuestra muestra de prueba está detrás del GeForce RTX 3070 Gaming X Trio, aunque la diferencia es mínima y sólo medible. El RTX 3070 se desempeña muy bien contra el GeForce RTX 2080 Ti, que probamos como una versión personalizada de KFA2, y casi siempre puede superar al modelo superior de la generación anterior
| 3DMark 03 Standard | 136483 puntos | |
| 3DMark 05 Standard | 34535 puntos | |
| 3DMark 06 Standard Score | 35659 puntos | |
| 3DMark Vantage P Result | 62128 puntos | |
| 3DMark 11 Performance | 26565 puntos | |
| 3DMark Ice Storm Standard Score | 197964 puntos | |
| 3DMark Cloud Gate Standard Score | 48366 puntos | |
| 3DMark Fire Strike Score | 20451 puntos | |
| 3DMark Fire Strike Extreme Score | 12092 puntos | |
| 3DMark Time Spy Score | 8797 puntos | |
ayuda | ||
Los puntos de referencia del juego
En nuestras pruebas de juego, el MSI GeForce RTX 3070 Ventus 3X OC hace un trabajo ligeramente mejor que en las pruebas sintéticas, lo que significa que el modelo Gaming X Trio es superado en algunas pruebas. Ambos modelos MSI están por lo tanto más juntos aquí y son virtualmente igual de rápidos. Nuestra muestra de prueba también puede prevalecer en su mayoría contra el RTX 2080 Ti. Sin embargo, el GeForce RTX 3070 Ventus 3X OC se agota en muy altas resoluciones, por lo que el modelo superior más antiguo tiene la ventaja aquí. El GeForce RTX 3070 sólo es adecuado para juegos de 4K en una medida limitada porque las velocidades de cuadro varían mucho de un juego a otro. El MSI GeForce RTX 3070 Ventus 3X OC a veces tiene problemas con la fluidez del juego en 2160p con los últimos juegos. Por lo tanto, consideramos que esta tarjeta gráfica es más adecuada cuando se trata de juegos de 1440p. Aquí, el MSI GeForce RTX 3070 Ventus 3X OC funciona consistentemente bien y siempre puede traer buenas velocidades de cuadro a la pantalla en los juegos que probamos.
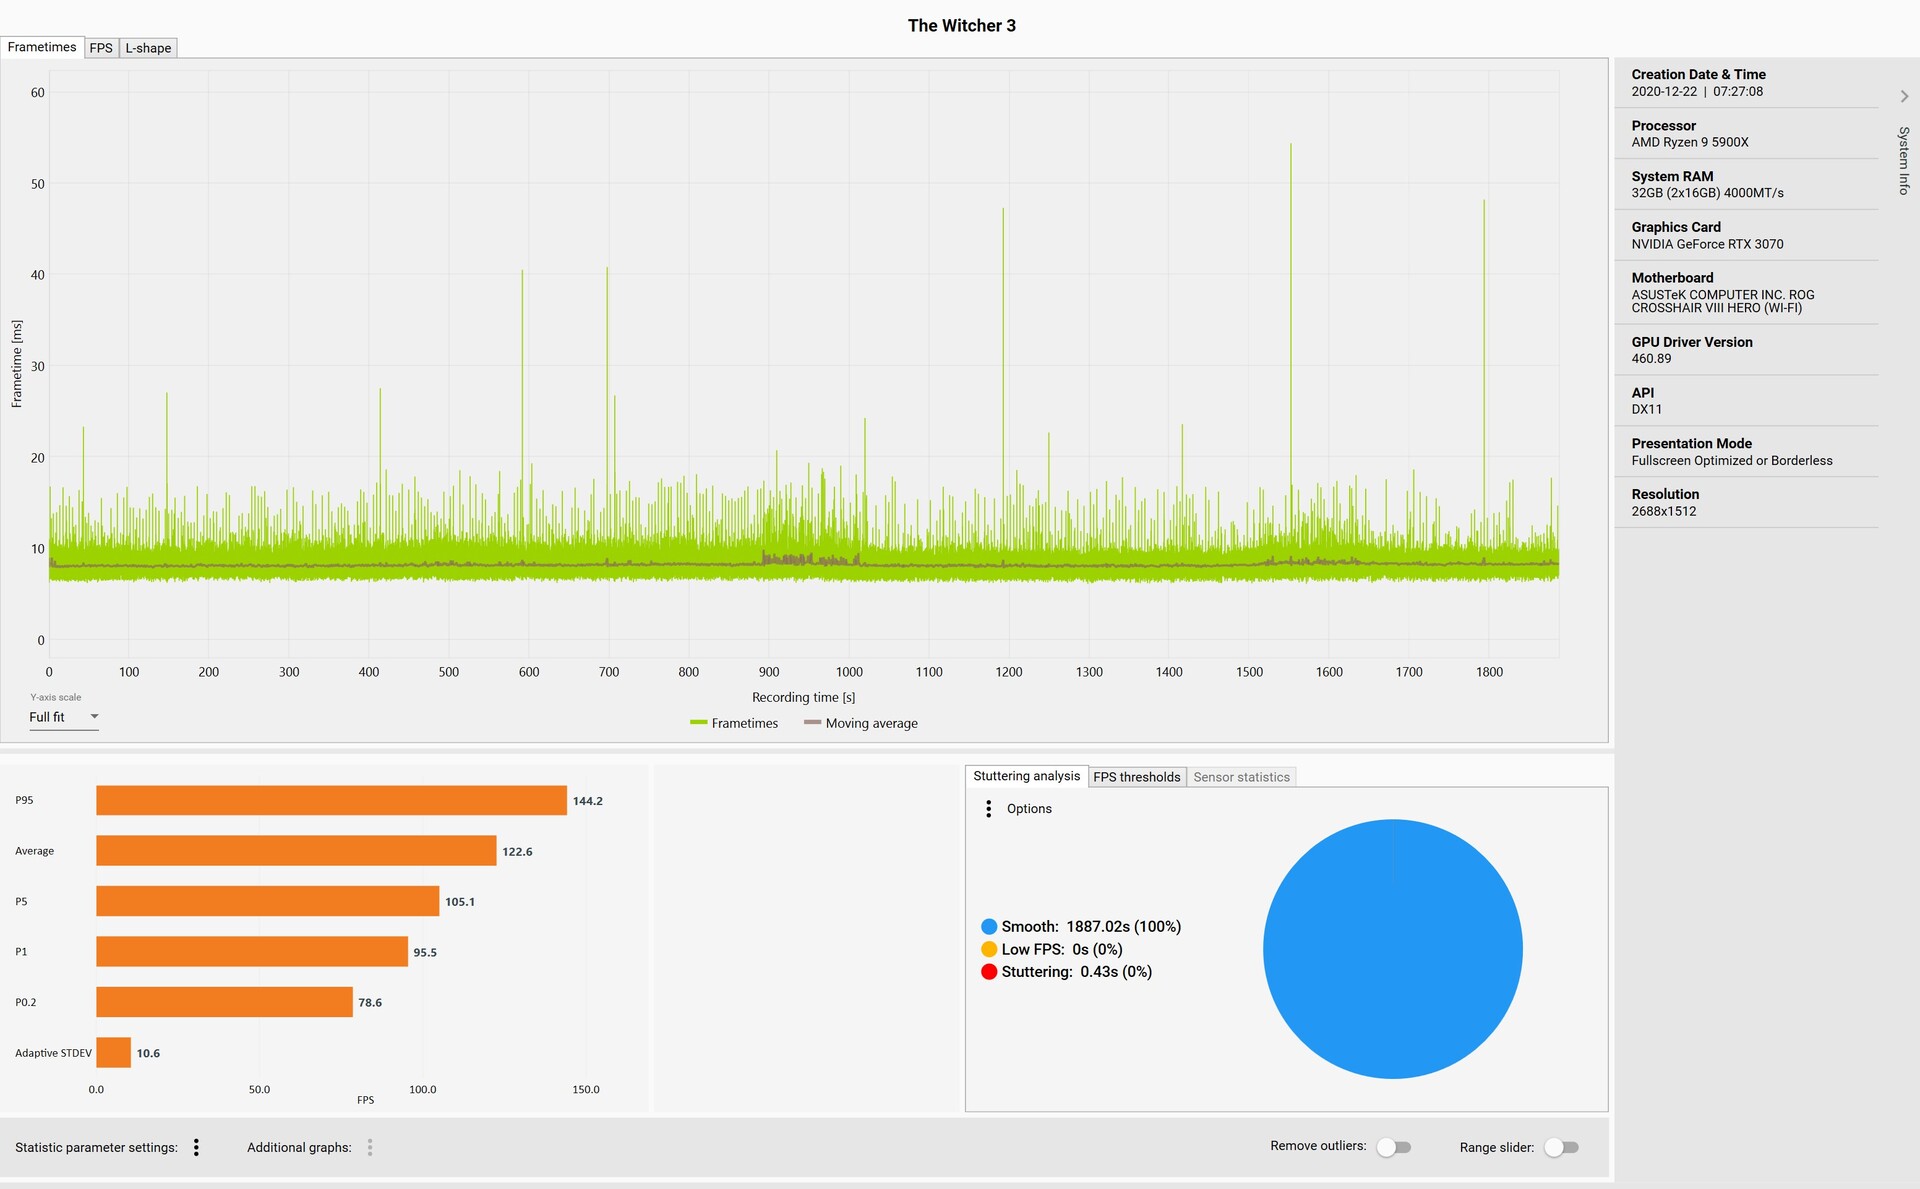
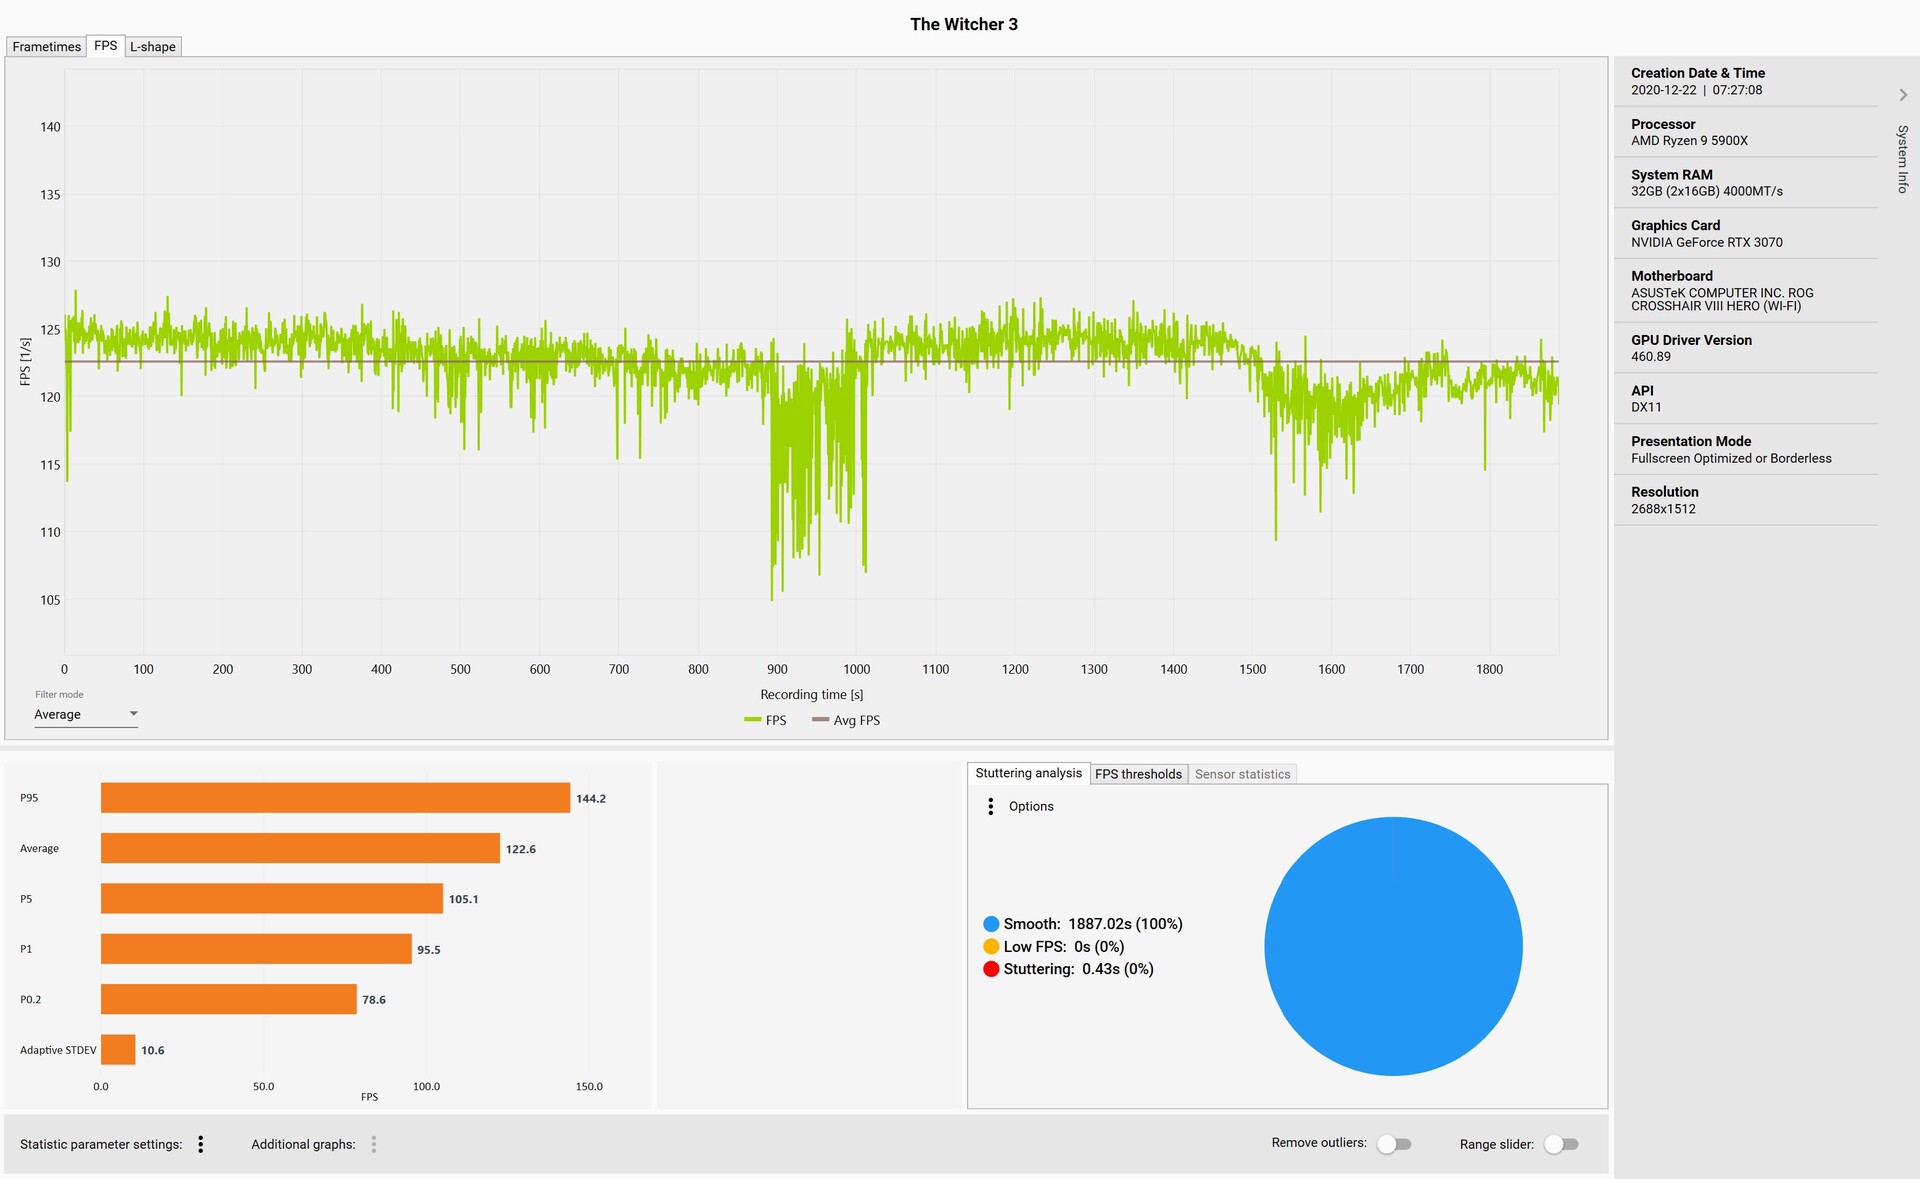
Aquellos que jueguen principalmente en 1080p o 1440p estarán bastante contentos con el rendimiento del MSI GeForce RTX 3070 Ventus 3X OC. Sin embargo, el VRAM de 8 GB deja un sabor soso si quieres estar preparado para el futuro. Sin embargo, los 8 GB VRAM son todavía suficientes por el momento. Como siempre, usamos el juego The Witcher 3 (1080p Ultra Preset) para los tiempos y la velocidad de cuadro. Sólo notamos algunas latencias más altas de vez en cuando durante la grabación, pero no afectaron notablemente a la jugabilidad. La frecuencia de fotogramas también es relativamente constante a lo largo del tiempo. Hay algunas caídas de cuadro en el medio y al final, pero esto no afecta la fluidez del juego ya que siempre hay al menos 105 FPS.
| F1 2020 | |
| 3840x2160 Ultra High Preset AA:T AF:16x | |
| MSI GeForce RTX 3090 Suprim X | |
| AMD Radeon RX 6800 XT | |
| ASUS GeForce RTX 3080 ROG STRIX OC GAMING | |
| MSI GeForce RTX 3070 Gaming X Trio | |
| MSI GeForce RTX 3070 Ventus 3X OC | |
| 2560x1440 Ultra High Preset AA:T AF:16x | |
| MSI GeForce RTX 3090 Suprim X | |
| AMD Radeon RX 6800 XT | |
| ASUS GeForce RTX 3080 ROG STRIX OC GAMING | |
| MSI GeForce RTX 3070 Gaming X Trio | |
| MSI GeForce RTX 3070 Ventus 3X OC | |
| Borderlands 3 | |
| 3840x2160 Badass Overall Quality (DX11) | |
| MSI GeForce RTX 3090 Suprim X | |
| ASUS GeForce RTX 3080 ROG STRIX OC GAMING | |
| AMD Radeon RX 6800 XT | |
| MSI GeForce RTX 3070 Gaming X Trio | |
| MSI GeForce RTX 3070 Ventus 3X OC | |
| KFA2 GeForce RTX 2080 Ti EX | |
| 2560x1440 Badass Overall Quality (DX11) | |
| MSI GeForce RTX 3090 Suprim X | |
| ASUS GeForce RTX 3080 ROG STRIX OC GAMING | |
| AMD Radeon RX 6800 XT | |
| KFA2 GeForce RTX 2080 Ti EX | |
| MSI GeForce RTX 3070 Gaming X Trio | |
| MSI GeForce RTX 3070 Ventus 3X OC | |
| Red Dead Redemption 2 | |
| 3840x2160 Maximum Settings | |
| MSI GeForce RTX 3090 Suprim X | |
| ASUS GeForce RTX 3080 ROG STRIX OC GAMING | |
| AMD Radeon RX 6800 XT | |
| MSI GeForce RTX 3070 Gaming X Trio | |
| MSI GeForce RTX 3070 Ventus 3X OC | |
| 2560x1440 Maximum Settings | |
| MSI GeForce RTX 3090 Suprim X | |
| AMD Radeon RX 6800 XT | |
| ASUS GeForce RTX 3080 ROG STRIX OC GAMING | |
| MSI GeForce RTX 3070 Gaming X Trio | |
| MSI GeForce RTX 3070 Ventus 3X OC | |
| Mafia Definitive Edition | |
| 3840x2160 High Preset | |
| MSI GeForce RTX 3090 Suprim X | |
| ASUS GeForce RTX 3080 ROG STRIX OC GAMING | |
| AMD Radeon RX 6800 XT | |
| MSI GeForce RTX 3070 Gaming X Trio | |
| MSI GeForce RTX 3070 Ventus 3X OC | |
| 2560x1440 High Preset | |
| MSI GeForce RTX 3090 Suprim X | |
| ASUS GeForce RTX 3080 ROG STRIX OC GAMING | |
| AMD Radeon RX 6800 XT | |
| MSI GeForce RTX 3070 Gaming X Trio | |
| MSI GeForce RTX 3070 Ventus 3X OC | |
| Watch Dogs Legion | |
| 3840x2160 Ultra Preset (DX12) | |
| MSI GeForce RTX 3090 Suprim X | |
| ASUS GeForce RTX 3080 ROG STRIX OC GAMING | |
| AMD Radeon RX 6800 XT | |
| MSI GeForce RTX 3070 Ventus 3X OC | |
| MSI GeForce RTX 3070 Gaming X Trio | |
| 2560x1440 Ultra Preset (DX12) | |
| MSI GeForce RTX 3090 Suprim X | |
| AMD Radeon RX 6800 XT | |
| ASUS GeForce RTX 3080 ROG STRIX OC GAMING | |
| MSI GeForce RTX 3070 Ventus 3X OC | |
| MSI GeForce RTX 3070 Gaming X Trio | |
| The Witcher 3 | |
| 3840x2160 High Graphics & Postprocessing (Nvidia HairWorks Off) | |
| MSI GeForce RTX 3090 Suprim X | |
| ASUS GeForce RTX 3080 ROG STRIX OC GAMING | |
| AMD Radeon RX 6800 XT | |
| KFA2 GeForce RTX 2080 Ti EX | |
| MSI GeForce RTX 3070 Ventus 3X OC | |
| MSI GeForce RTX 3070 Gaming X Trio | |
| Nvidia GeForce RTX 2080 Super | |
| MSI RTX 2080 Gaming X Trio | |
| Nvidia GeForce RTX 2070 Super | |
| MSI RTX 2070 Gaming Z 8G | |
| Nvidia GeForce RTX 2060 Super | |
| AMD Radeon VII | |
| AMD Radeon RX 5700 XT | |
| MSI RTX 2060 Gaming Z 6G | |
| AMD Radeon RX Vega 64 | |
| AMD Radeon RX 5700 | |
| 1920x1080 Ultra Graphics & Postprocessing (HBAO+) | |
| MSI GeForce RTX 3090 Suprim X | |
| AMD Radeon RX 6800 XT | |
| ASUS GeForce RTX 3080 ROG STRIX OC GAMING | |
| KFA2 GeForce RTX 2080 Ti EX | |
| MSI GeForce RTX 3070 Gaming X Trio | |
| MSI GeForce RTX 3070 Ventus 3X OC | |
| MSI RTX 2080 Gaming X Trio | |
| Nvidia GeForce RTX 2080 Super | |
| Nvidia GeForce RTX 2070 Super | |
| AMD Radeon RX 5700 XT | |
| MSI RTX 2070 Gaming Z 8G | |
| AMD Radeon RX 5700 | |
| Nvidia GeForce RTX 2060 Super | |
| AMD Radeon RX Vega 64 | |
| AMD Radeon VII | |
| MSI RTX 2060 Gaming Z 6G | |
| bajo | medio | alto | ultra | QHD | 4K | |
|---|---|---|---|---|---|---|
| GTA V (2015) | 184 | 175 | 170 | 108 | 98.3 | 117 |
| The Witcher 3 (2015) | 407 | 363 | 176 | 121 | 90.9 | |
| Dota 2 Reborn (2015) | 171 | 157 | 153.6 | 136.3 | 128.5 | |
| Rise of the Tomb Raider (2016) | 226 | 159 | 156 | 151 | 80.9 | |
| Final Fantasy XV Benchmark (2018) | 209 | 159 | 122 | 94.1 | 57.6 | |
| X-Plane 11.11 (2018) | 141 | 123 | 95.4 | 84.3 | ||
| Far Cry 5 (2018) | 184 | 161 | 154 | 143 | 125 | 70 |
| Strange Brigade (2018) | 413 | 302 | 251 | 222 | 166 | 96.8 |
| Shadow of the Tomb Raider (2018) | 200 | 176 | 168 | 160 | 116 | 63.5 |
| Battlefield V (2018) | 188.9 | 154.3 | 137.4 | 125.2 | 106.8 | 70.9 |
| Apex Legends (2019) | 144 | 144 | 144 | 144 | 144 | 106 |
| Far Cry New Dawn (2019) | 152 | 135 | 130 | 116 | 107 | 72 |
| Metro Exodus (2019) | 193 | 148 | 117 | 93.7 | 74.8 | 48.6 |
| Anno 1800 (2019) | 170 | 147 | 100 | 52 | 50.5 | 35 |
| Control (2019) | 238 | 149 | 117 | 79.8 | 41 | |
| Borderlands 3 (2019) | 134 | 123 | 94.5 | 95.3 | 75.1 | 43.8 |
| Star Wars Jedi Fallen Order (2019) | 130 | 128 | 128 | 125 | 70.1 | |
| Red Dead Redemption 2 (2019) | 156.5 | 149 | 112.8 | 76.2 | 63.4 | 42.1 |
| Hunt Showdown (2020) | 174 | 152 | 137 | 128 | 74.2 | |
| Doom Eternal (2020) | 246 | 246 | 244 | 237 | 208 | 116 |
| F1 2020 (2020) | 327 | 268 | 252 | 181 | 143 | 88.7 |
| Death Stranding (2020) | 224 | 190 | 173 | 170 | 126 | 74.1 |
| Horizon Zero Dawn (2020) | 189 | 153 | 138 | 124 | 104 | 61 |
| Crysis Remastered (2020) | 221 | 182 | 97.7 | 75.8 | 64.3 | 38.9 |
| Serious Sam 4 (2020) | 148.8 | 122 | 120.9 | 99 | 92 | 66.6 |
| Mafia Definitive Edition (2020) | 184 | 140 | 132 | 98.1 | 55.2 | |
| Star Wars Squadrons (2020) | 437 | 344 | 333 | 312 | 228 | 136 |
| FIFA 21 (2020) | 203 | 195 | 200 | 191 | 193 | 194 |
| Watch Dogs Legion (2020) | 122 | 118 | 112 | 86 | 66.3 | 39.2 |
| Dirt 5 (2020) | 179 | 122 | 106 | 89.3 | 75.9 | 54.7 |
| Assassin´s Creed Valhalla (2020) | 133 | 103 | 87 | 80 | 65 | 42 |
| Call of Duty Black Ops Cold War (2020) | 141 | 133 | 117 | 95.7 | 83 | 50.2 |
| Yakuza Like a Dragon (2020) | 109 | 109 | 116 | 111 | 96 | 51.7 |
| Immortals Fenyx Rising (2020) | 115 | 92 | 83 | 81 | 68 | 50 |
| Cyberpunk 2077 1.0 (2020) | 132 | 108 | 92.4 | 81 | 54.8 | 27.9 |
Computación del rendimiento
En LuxMark y ComputeMark, nuestro GeForce RTX 3070 Ventus 3X OC pierde el duelo interno MSI. El menor TDP y el menor Boost resultan en una derrota muy ajustada. Sin embargo, el modelo barato no tiene que esconderse porque los resultados de las pruebas de referencia están en un buen nivel en general. Las soluciones gráficas profesionales, como los modelos Quadro o Fire Pro, ofrecen un rendimiento significativamente mayor en el área de la computación debido a las unidades adaptadas.
Emisiones del MSI GeForce RTX 3070 Ventus 3X OC
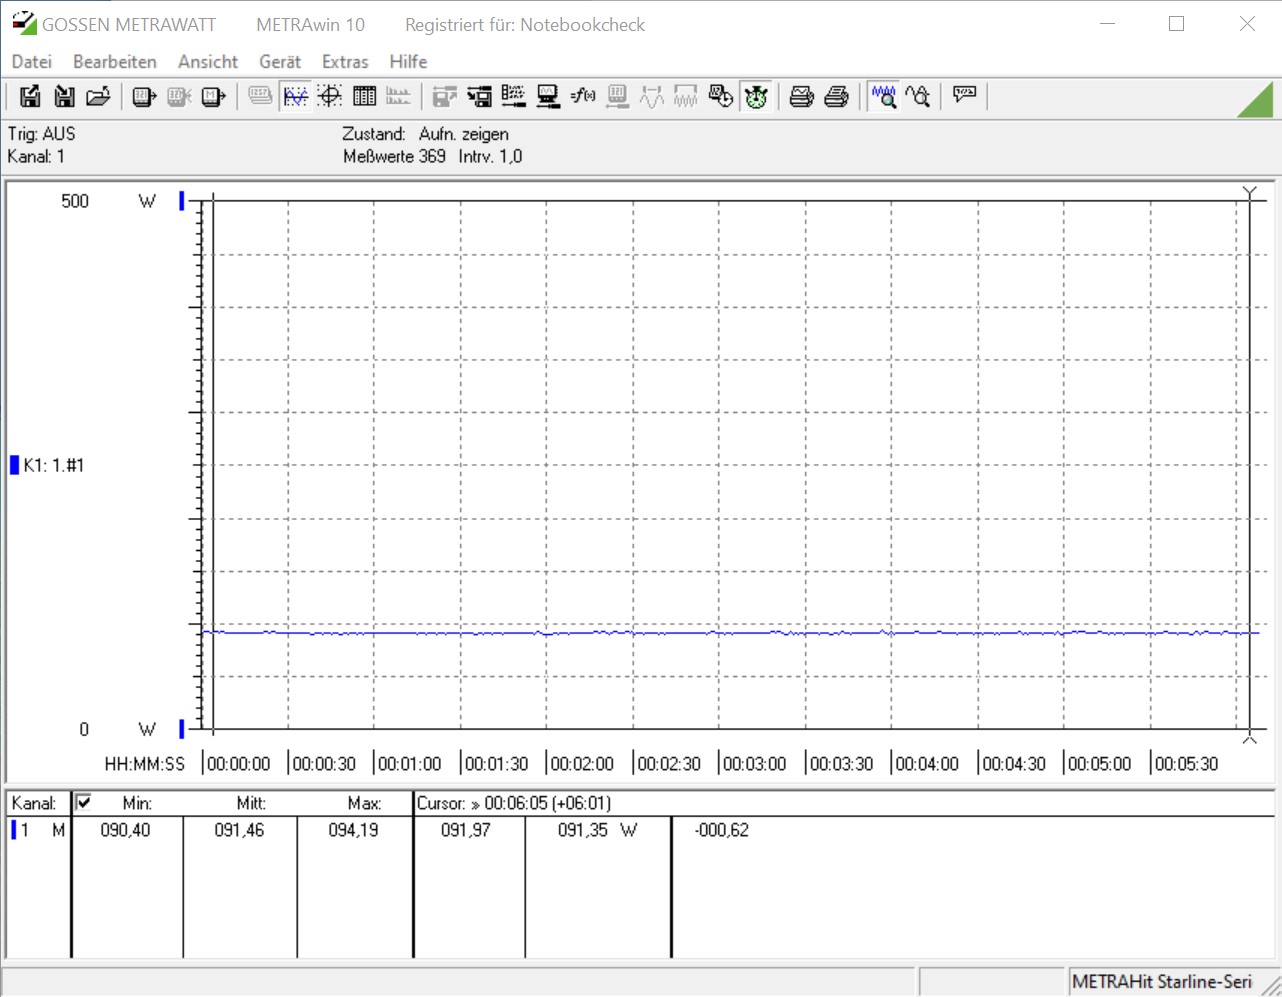
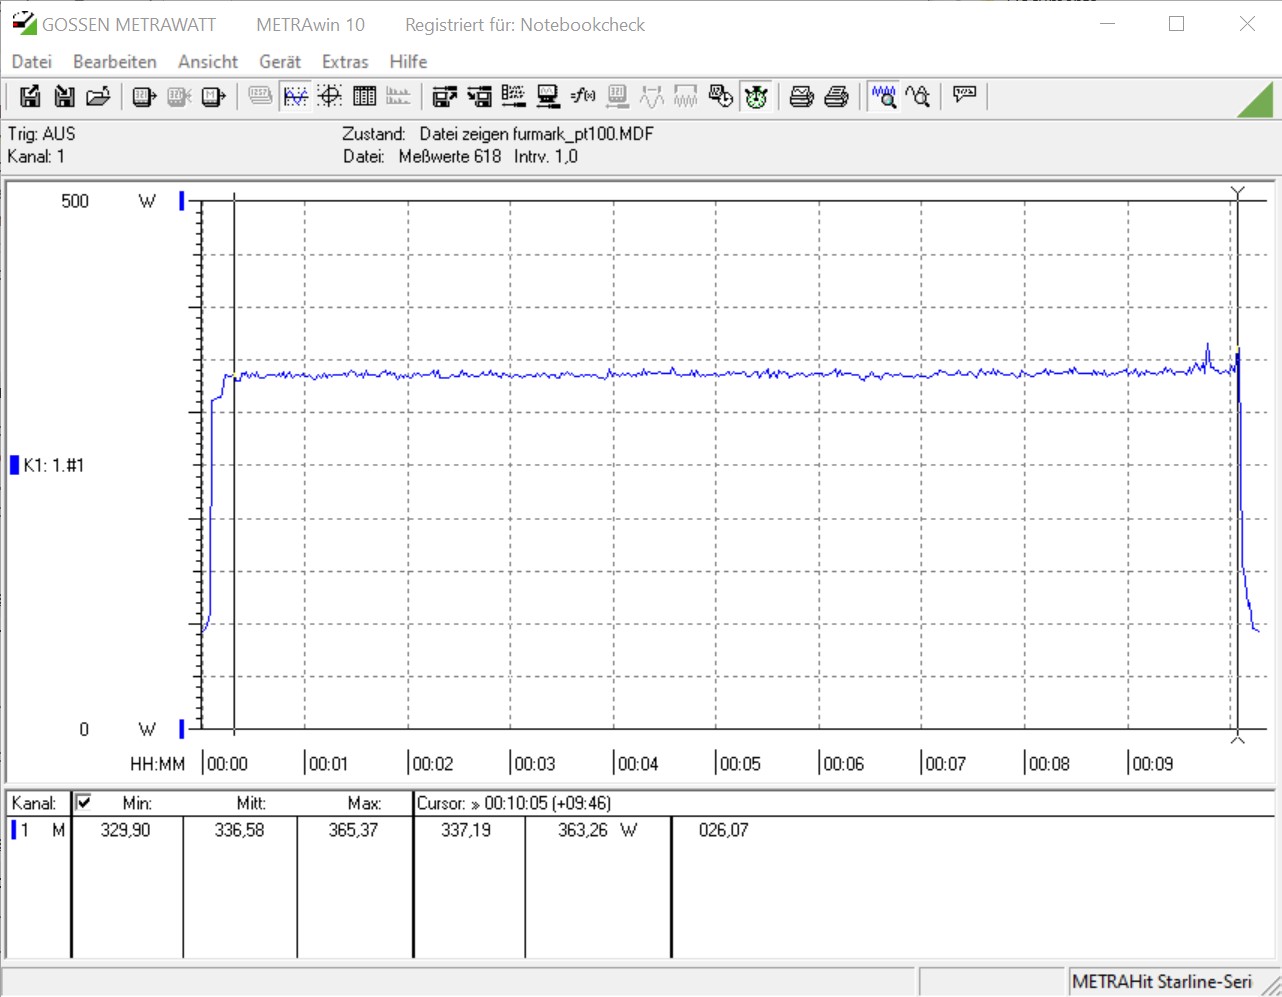
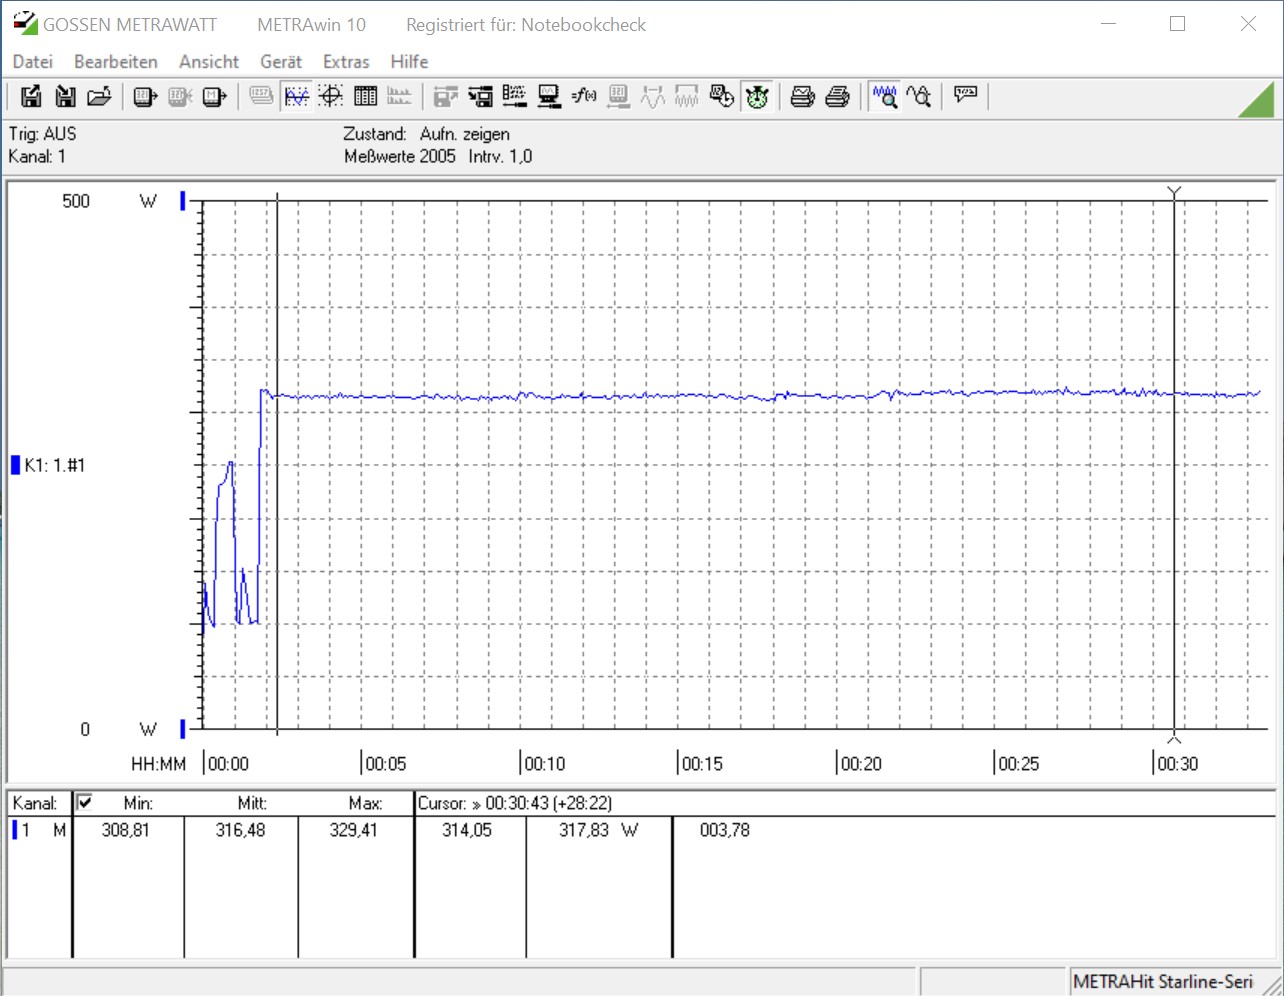
MSI's GeForce RTX 3070 Ventus 3X OC puede convencer a todos en términos de emisiones. Según el fabricante, la tarjeta gráfica es ligeramente más frugal que una GeForce RTX 2080 Ti con 220 vatios y a la par con el modelo de gama alta de la generación Turing en términos de rendimiento. En nuestro sistema de pruebas, esto significa un consumo de energía en reposo de 91 vatios y un promedio de 336 vatios en la prueba de esfuerzo. Incluso medimos un promedio de sólo 316 vatios durante el juego, lo que es un resultado realmente bueno en comparación.
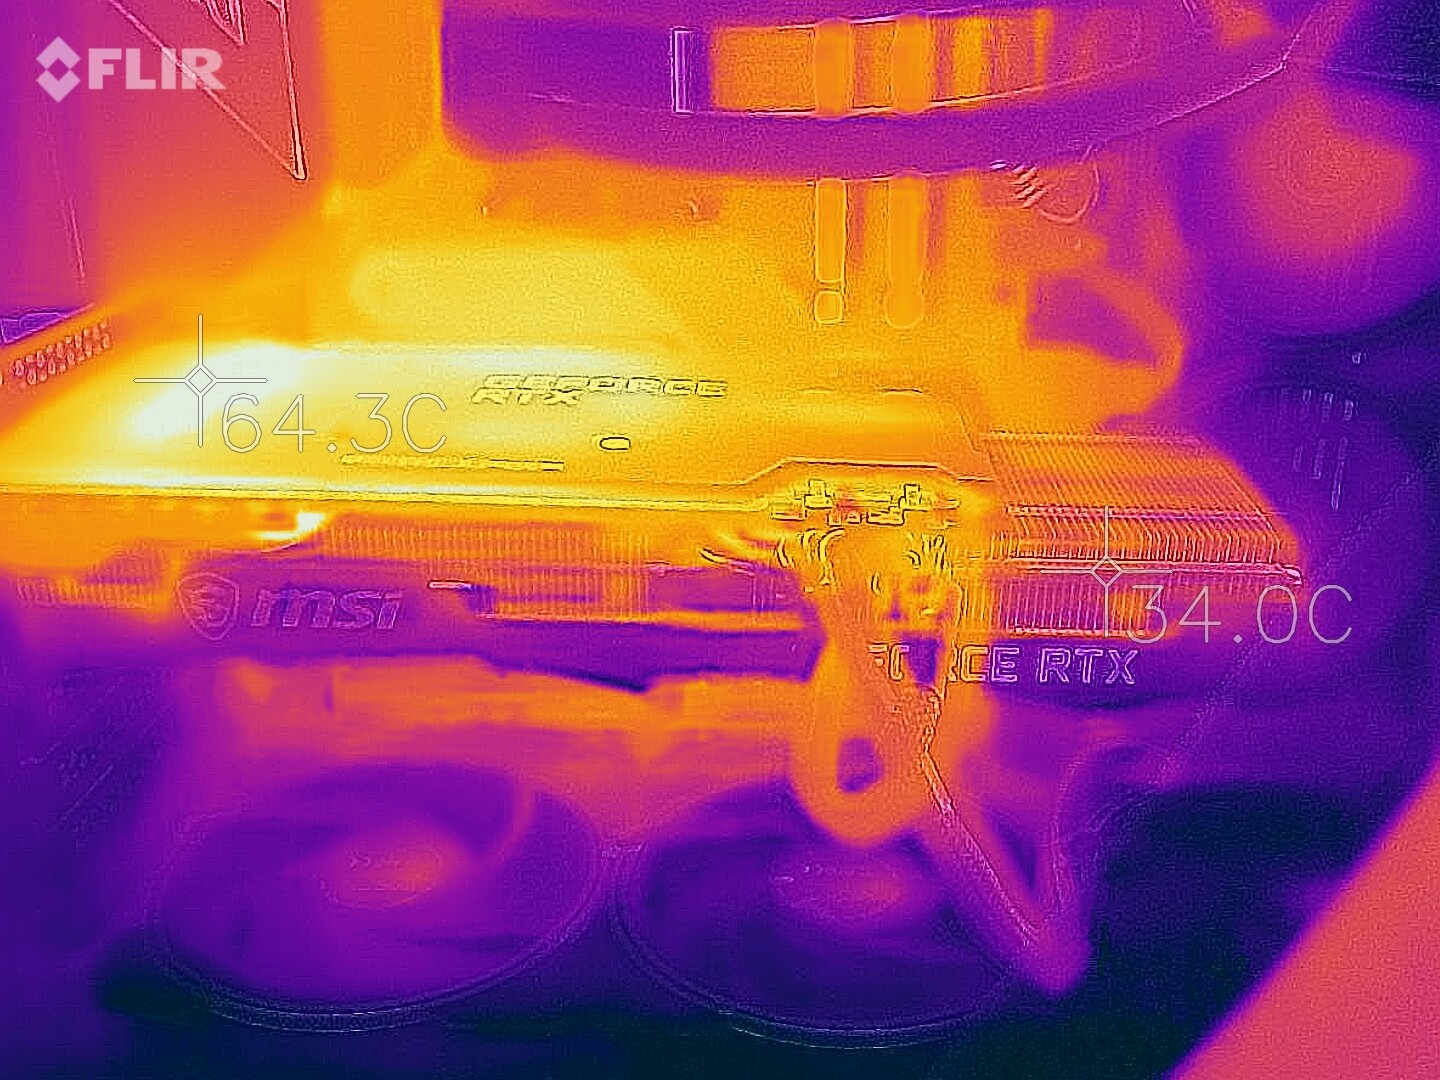
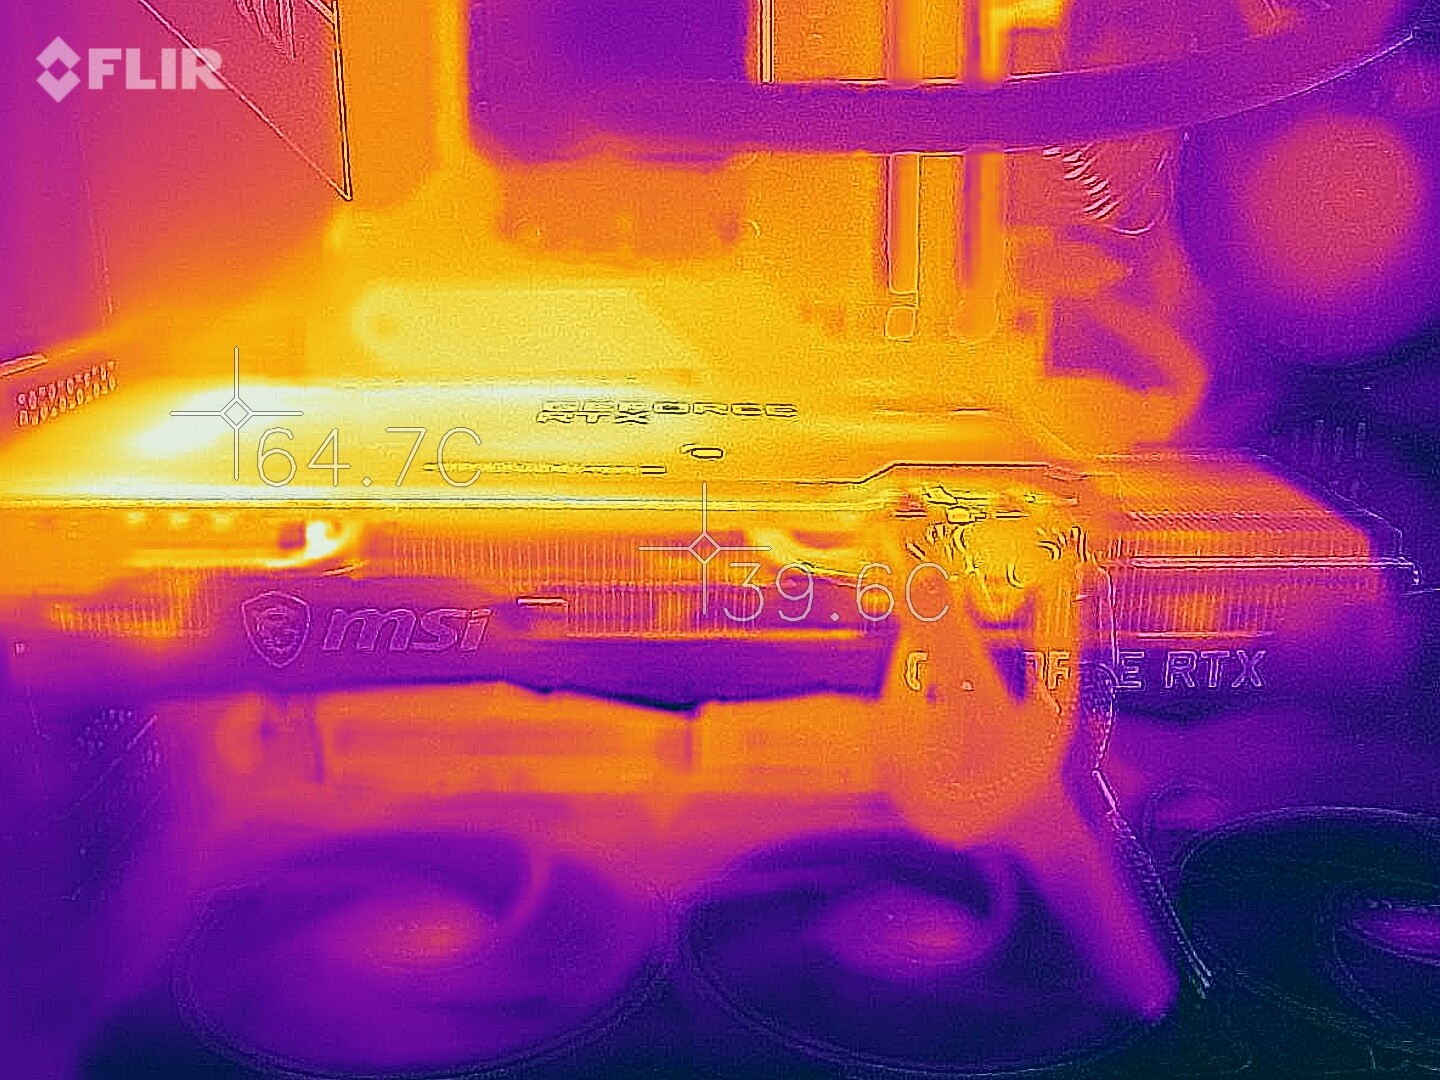
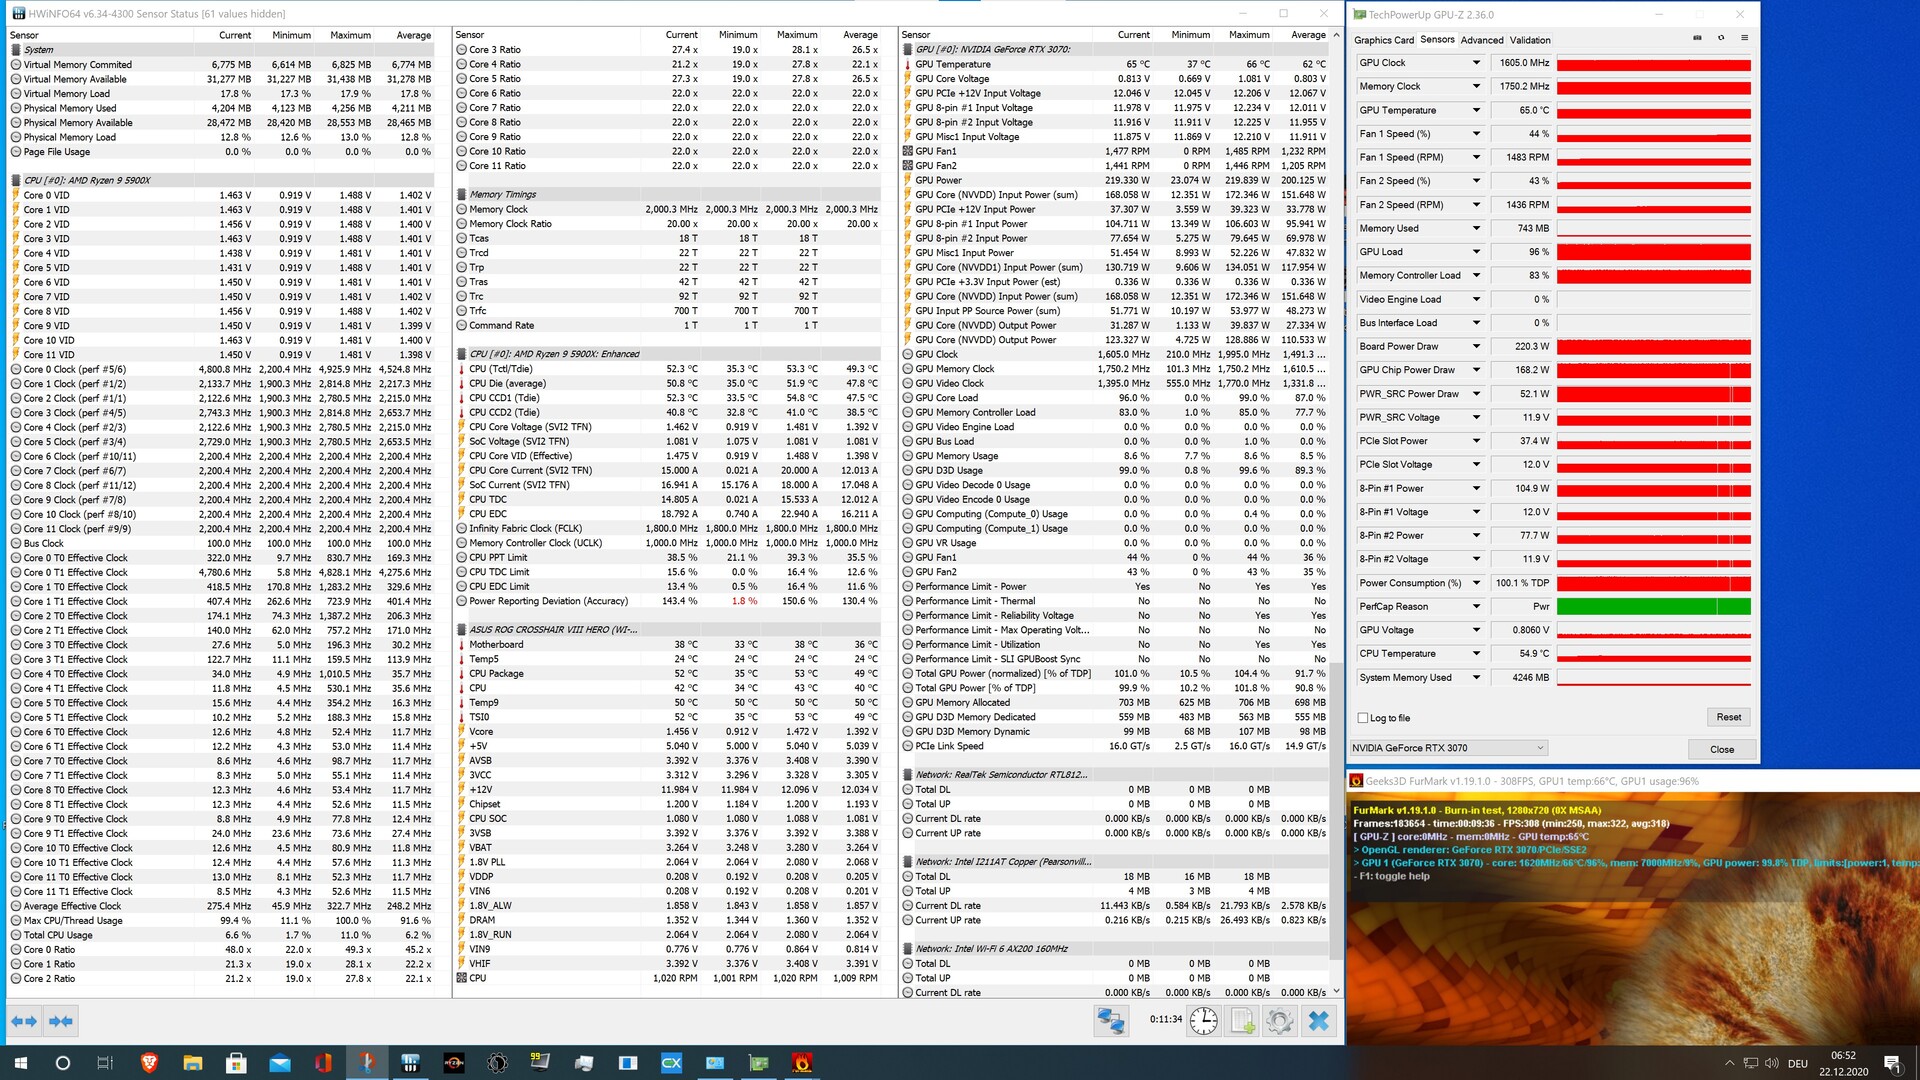
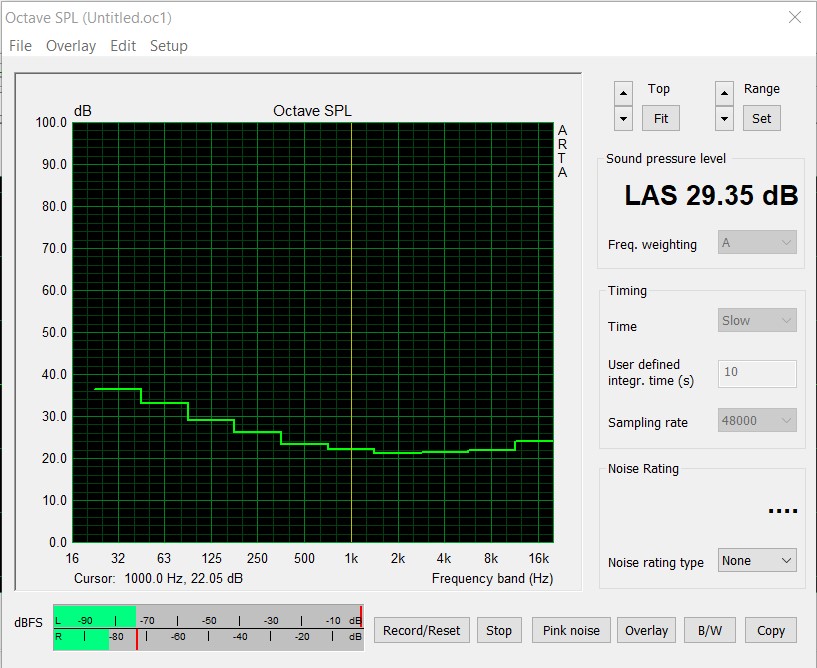
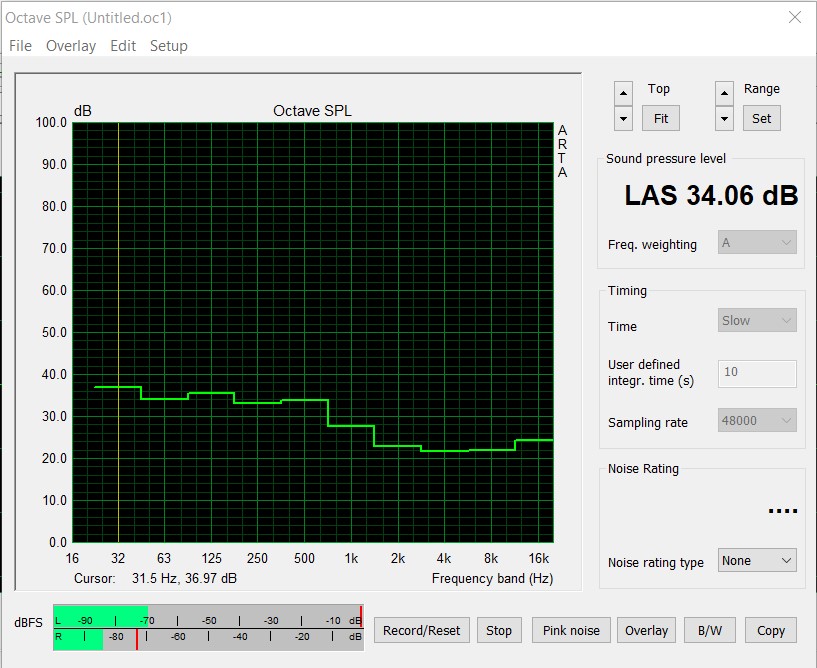
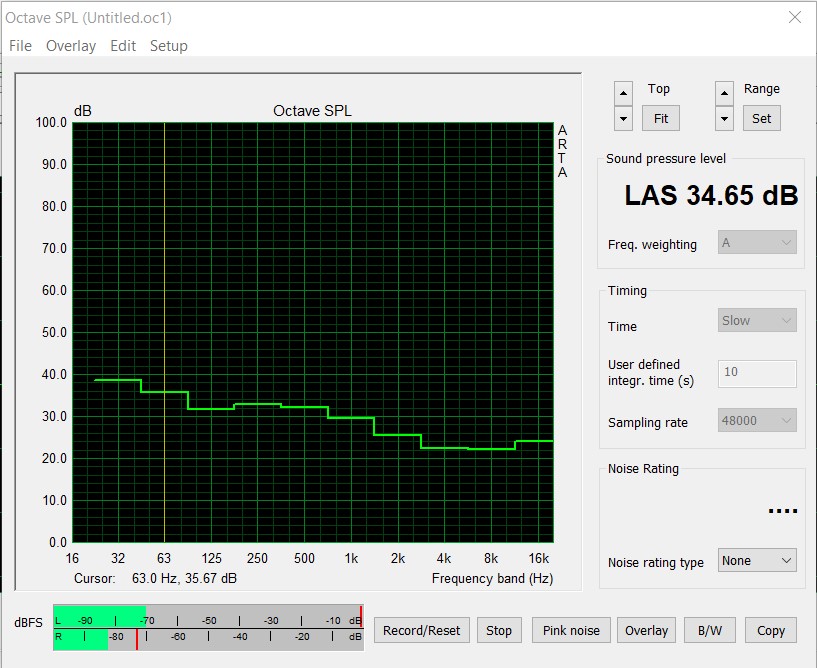
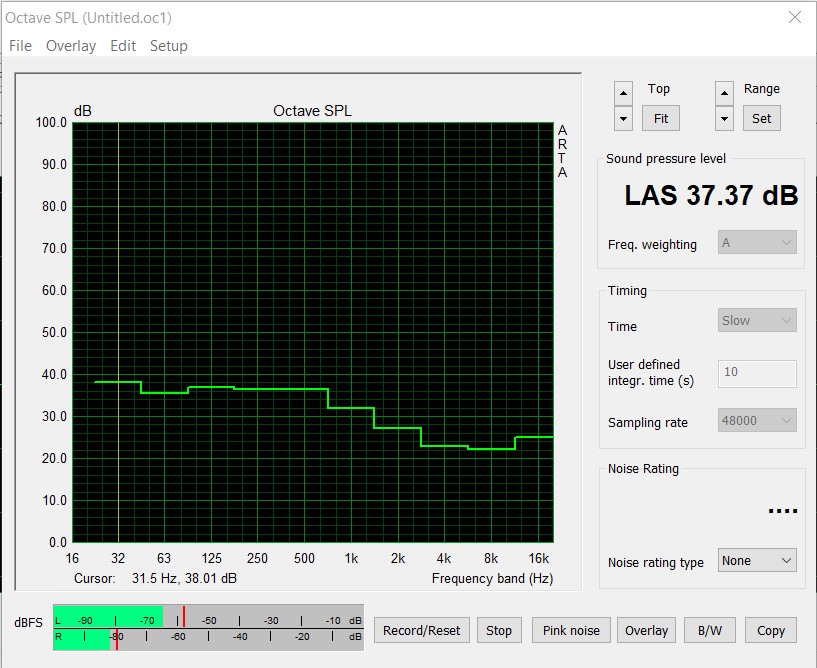
En cuanto a las emisiones de ruido, el MSI GeForce RTX 3070 Ventus 3X OC también es muy recomendable. Durante la prueba de esfuerzo, medimos 34,6 dB(A) a una distancia de 20 centímetros de la caja. Aquí, apagamos todos los ventiladores de la caja para grabar sólo la tarjeta gráfica. Si volvemos a encender los ventiladores de la caja, el nivel de ruido aumenta a 37,3 dB(A) durante la prueba de esfuerzo, lo que sigue siendo un resultado muy bueno. La velocidad del ventilador de la tarjeta gráfica fue de poco menos de 1.500 rpm, lo que corresponde a un 44 por ciento. Con un máximo de 65 °C (149 °F), nuestra muestra de prueba se mantuvo relativamente fría incluso bajo carga. Aunque el refrigerador instalado parece un poco barato en comparación con la variante Gaming X Trio, obtuvo muy buenos resultados con el RTX 3070 Ventus 3X OC.
* ... más pequeño es mejor
Pro
Contra
Conclusión - Rápido, silencioso y con bajas emisiones

El MSI GeForce RTX 3070 Ventus 3X OC es una moderna y rápida tarjeta gráfica sin mucho bling bling y también es lo suficientemente rápida para reproducir todos los títulos actuales en 1440p. Este modelo también domina parcialmente los juegos en 4K, aunque hay que mirar de un juego a otro aquí.
Si comparas el rendimiento con la generación de Turing, el GeForce RTX 3070 está a la par con el GeForce RTX 2080 Ti, que se ofrecía con un MSRP de 1.249 euros (~ $1516 dólares) en el lanzamiento. Para nuestro modelo de MSI, el MSRP es ahora de 529 Euros (~$642). Desafortunadamente, estos precios son sólo una ilusión por el momento porque la situación del mercado ha sido muy tensa desde el lanzamiento de las nuevas tarjetas gráficas Ampere. Esto, por supuesto, tiene un impacto en el precio, que está justo por debajo de 800 euros (~ $ 971) para nuestra muestra de prueba en el momento de la prueba. Por lo tanto, si no necesitas absolutamente una nueva tarjeta gráfica, debes tener paciencia hasta que Nvidia y los socios de la junta puedan entregar las tarjetas gráficas en cantidades suficientes. Sólo entonces se puede esperar que la situación actual se alivie. Por otro lado, las cosas no se ven mejor para AMD.
Con el MSI GeForce RTX 3070 Ventus 3X OC, obtienes una rápida y moderna tarjeta gráfica Ampere que convence en términos de emisiones.
Pero volviendo a la tarjeta gráfica. En general, la MSI GeForce RTX 3070 Ventus 3X OC ofrece un buen rendimiento y también puede convencer completamente en términos de emisiones. El modo de paro del ventilador asegura un funcionamiento silencioso con poca carga, lo que complacerá a los fanáticos del silencio.
El único punto de crítica que podemos mencionar aquí es el precio. Sin embargo, también hay que tener en cuenta la longitud de la tarjeta gráfica, porque aquí se podrían descartar las cajas compactas. Si planea comprar un RTX 3070, debería al menos elegir un modelo de 750 vatios al alcanzar la fuente de alimentación.
Todos los puntos de referencia y los valores de prueba del RTX 3070 se pueden encontrar en la página de la tarjeta gráficadelGeForce RTX 3070 (continuamente actualizada).
