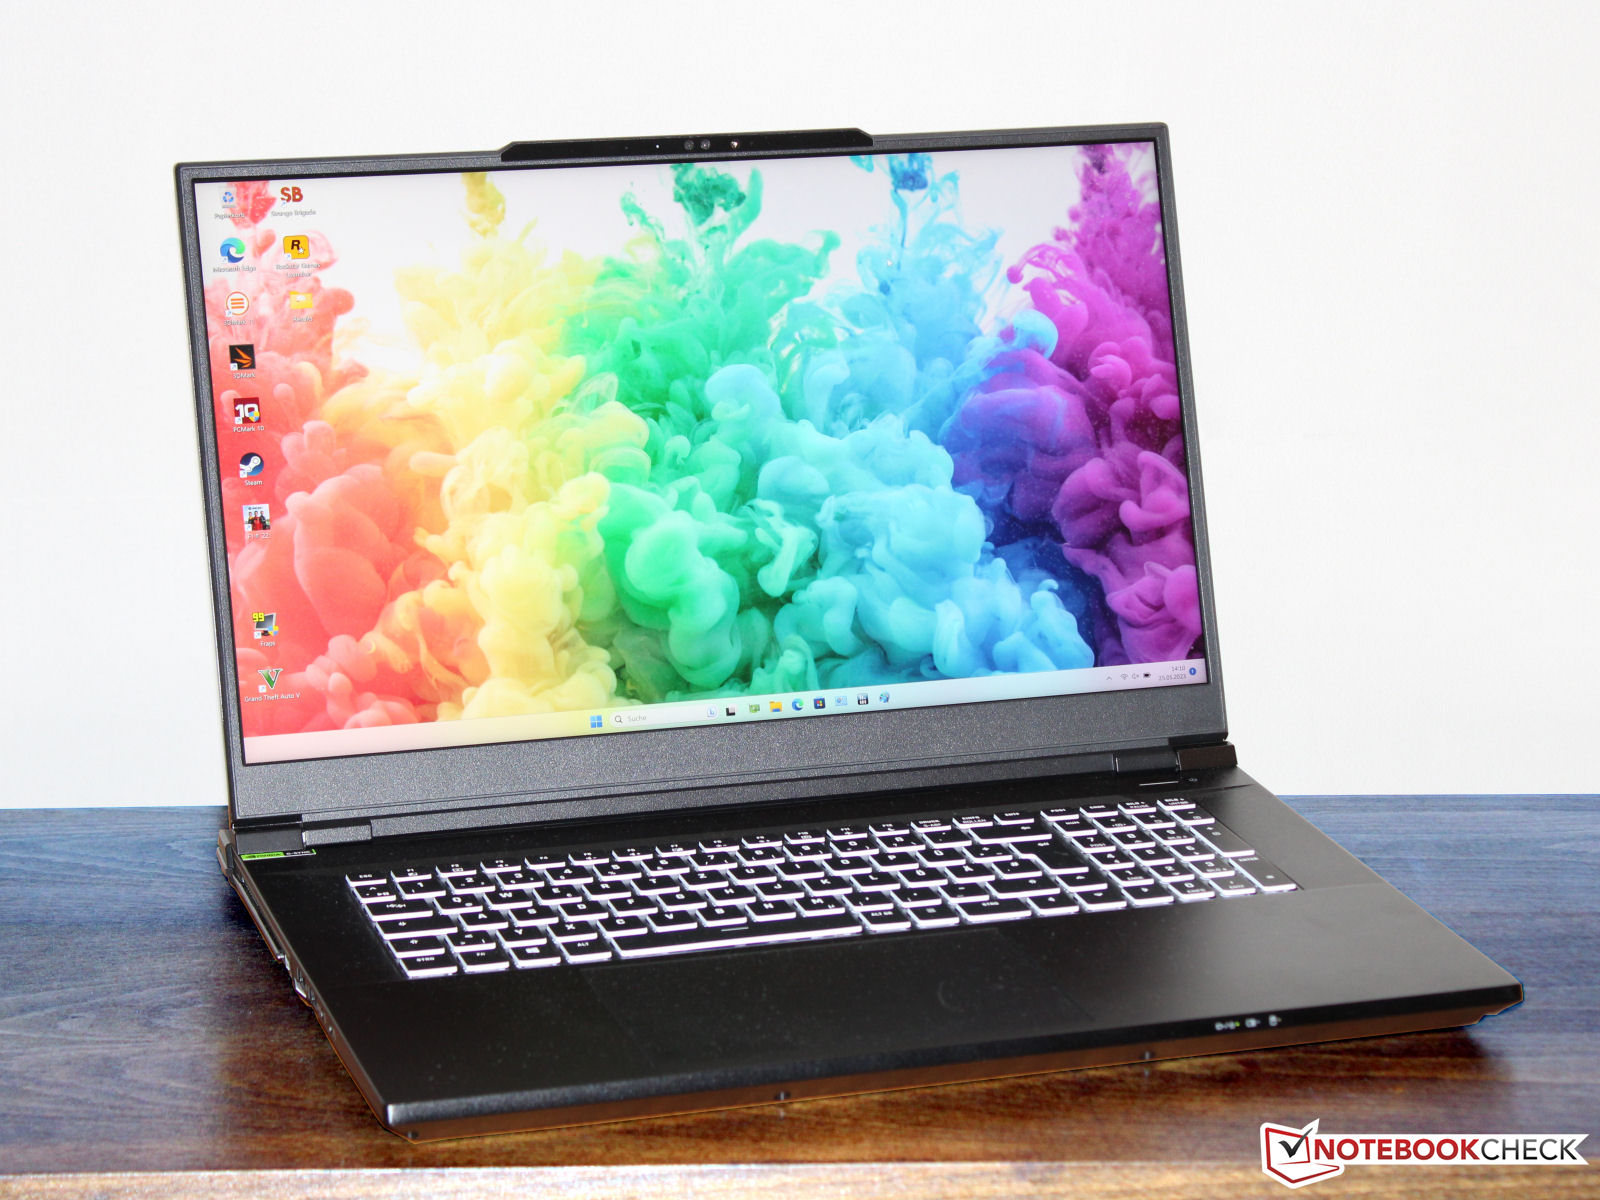
Análisis del Schenker Key 17 Pro (Early 23): portátil para juegos 4k con Core i9 y RTX 4090
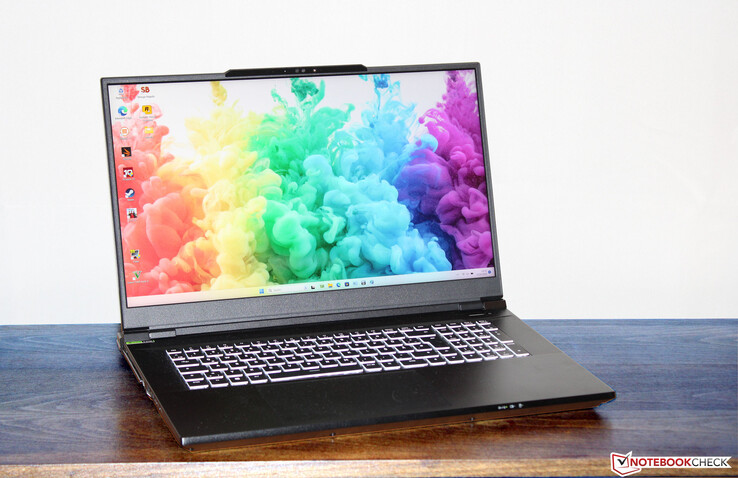
El potente Key 17 Pro está dirigido a creativos y jugadores. Raptor Lake y Ada Lovelace proporcionan la potencia informática necesaria en el portátil, que cuenta con un Core i9-13900HX y unaGeForce RTX 4090y está basado en un barebone Clevo (X370SNW-G). Compite contra dispositivos como el MSI Stealth 17 Studio A13VHel Asus ROG Strix Scar 17 G733PYel Aorus 17X AZF y el Medion Erazer Beast X40.
Posibles contendientes en la comparación
Valoración | Fecha | Modelo | Peso | Altura | Tamaño | Resolución | Precio |
|---|---|---|---|---|---|---|---|
| 85.5 % v7 (old) | 06/2023 | Schenker Key 17 Pro (Early 23) i9-13900HX, GeForce RTX 4090 Laptop GPU | 3.4 kg | 24.9 mm | 17.30" | 3840x2160 | |
| 89.2 % v7 (old) | 04/2023 | MSI Stealth 17 Studio A13VH-014 i9-13900H, GeForce RTX 4080 Laptop GPU | 3 kg | 21.3 mm | 17.30" | 3840x2160 | |
| 88.3 % v7 (old) | 04/2023 | Asus ROG Strix Scar 17 G733PY-XS96 R9 7945HX, GeForce RTX 4090 Laptop GPU | 2.9 kg | 28.3 mm | 17.30" | 2560x1440 | |
| 86 % v7 (old) | 04/2023 | Aorus 17X AZF i9-13900HX, GeForce RTX 4090 Laptop GPU | 2.9 kg | 21.8 mm | 17.30" | 2560x1440 | |
| 88.4 % v7 (old) | 03/2023 | Medion Erazer Beast X40 i9-13900HX, GeForce RTX 4090 Laptop GPU | 2.9 kg | 33 mm | 17.00" | 2560x1600 |
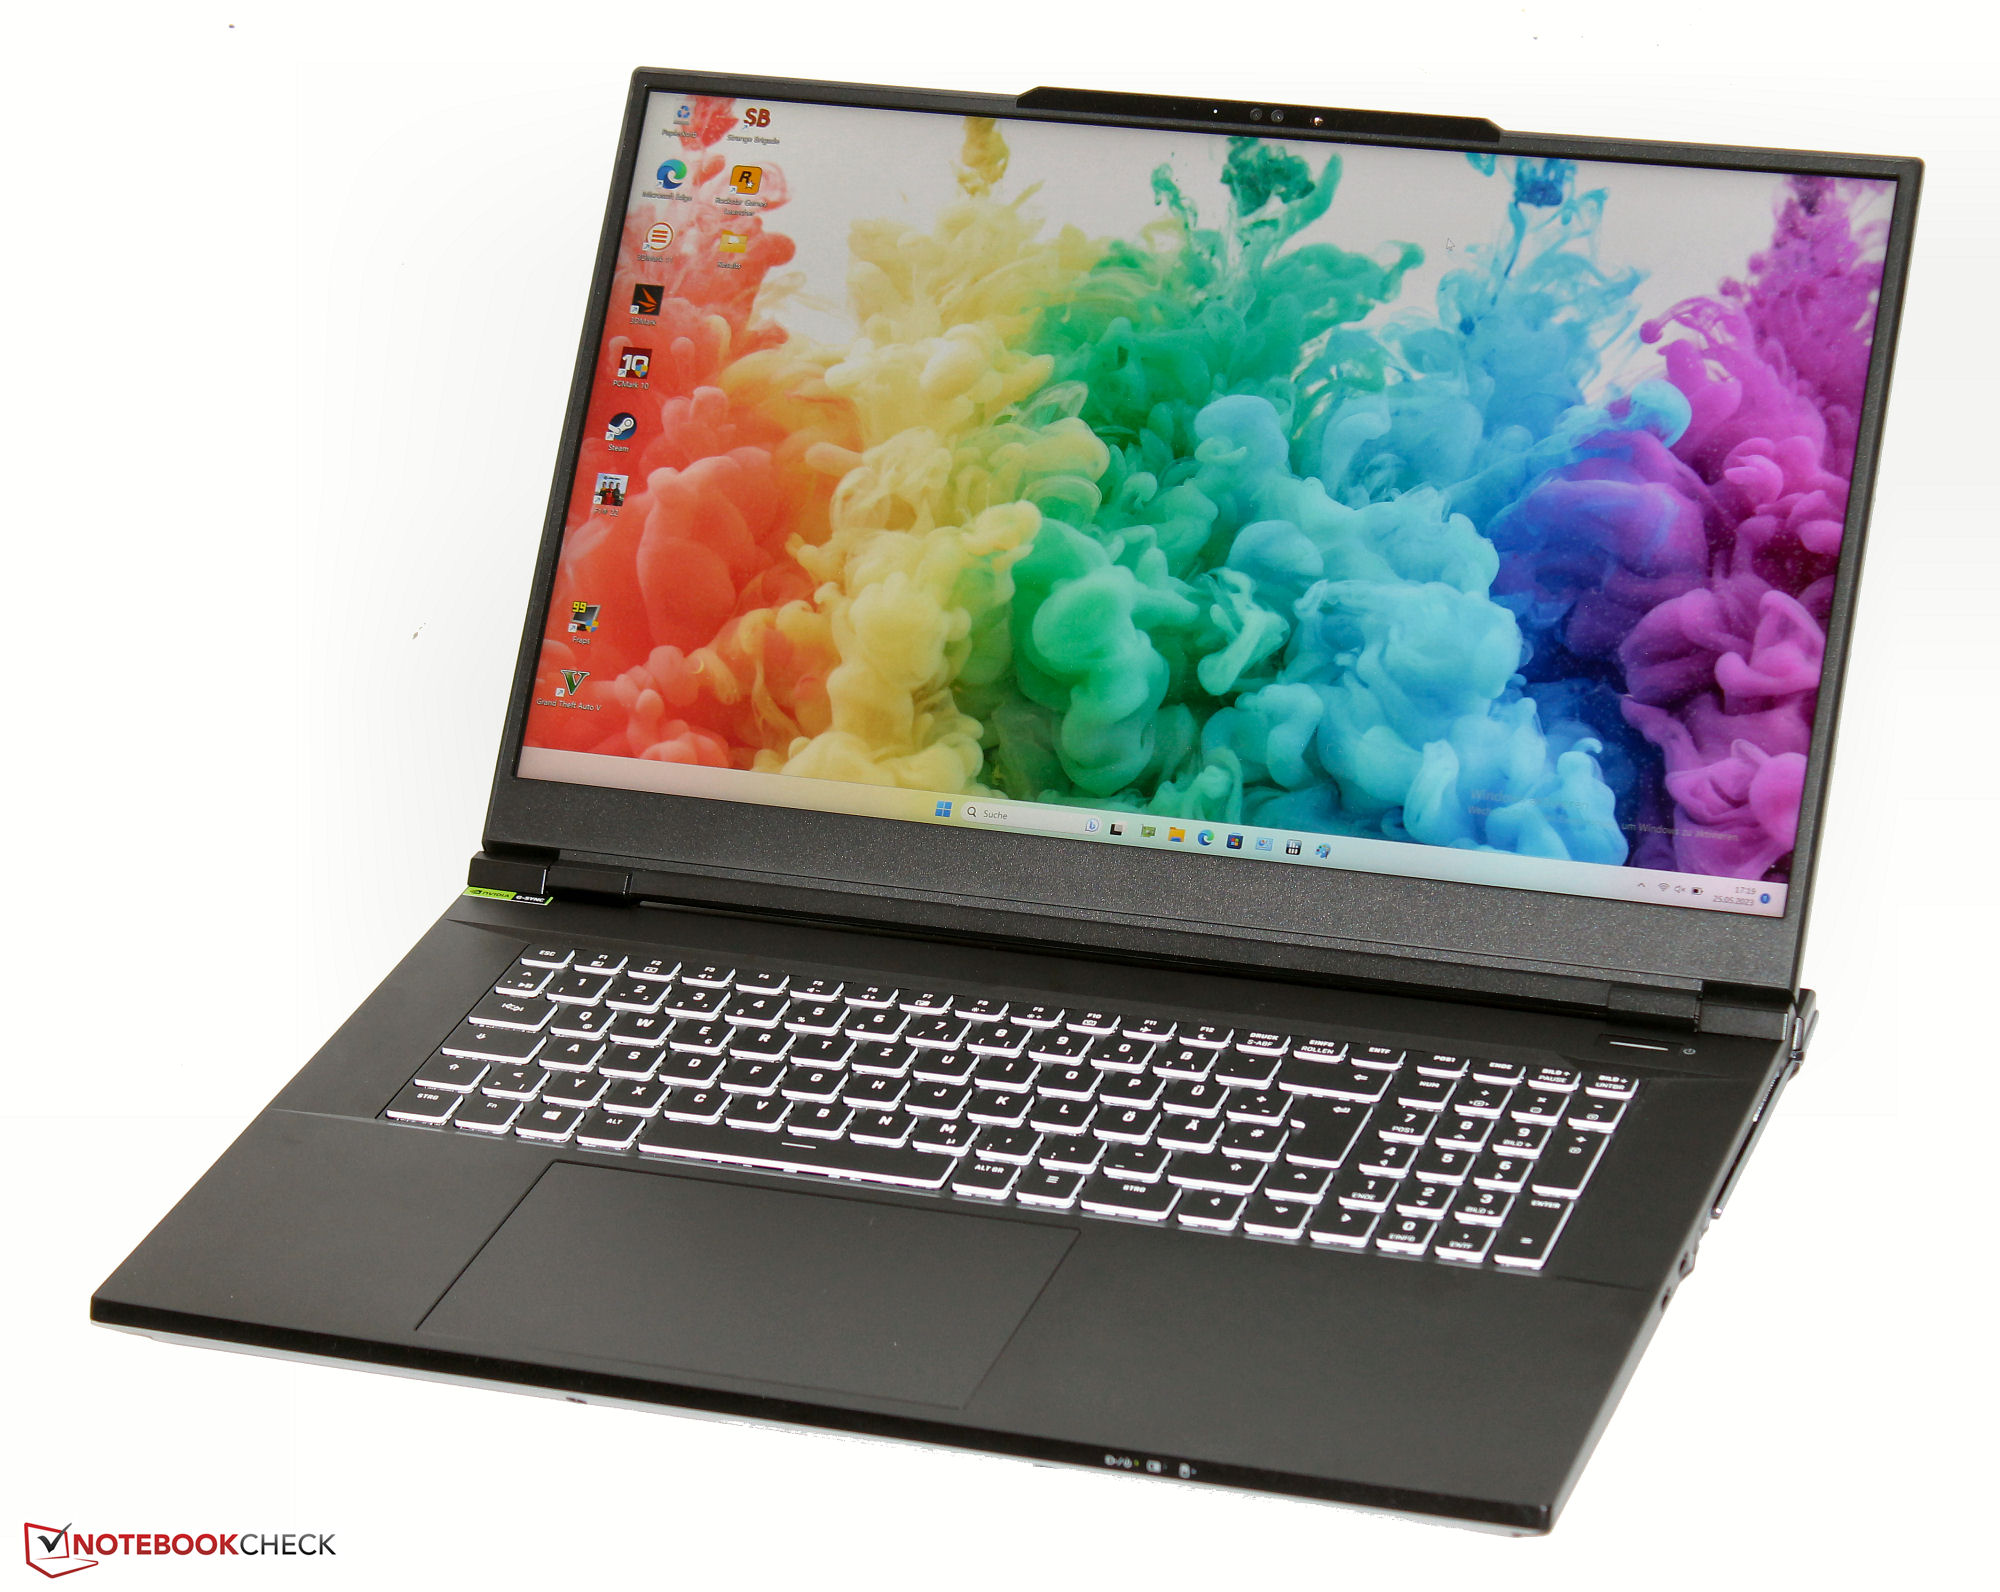
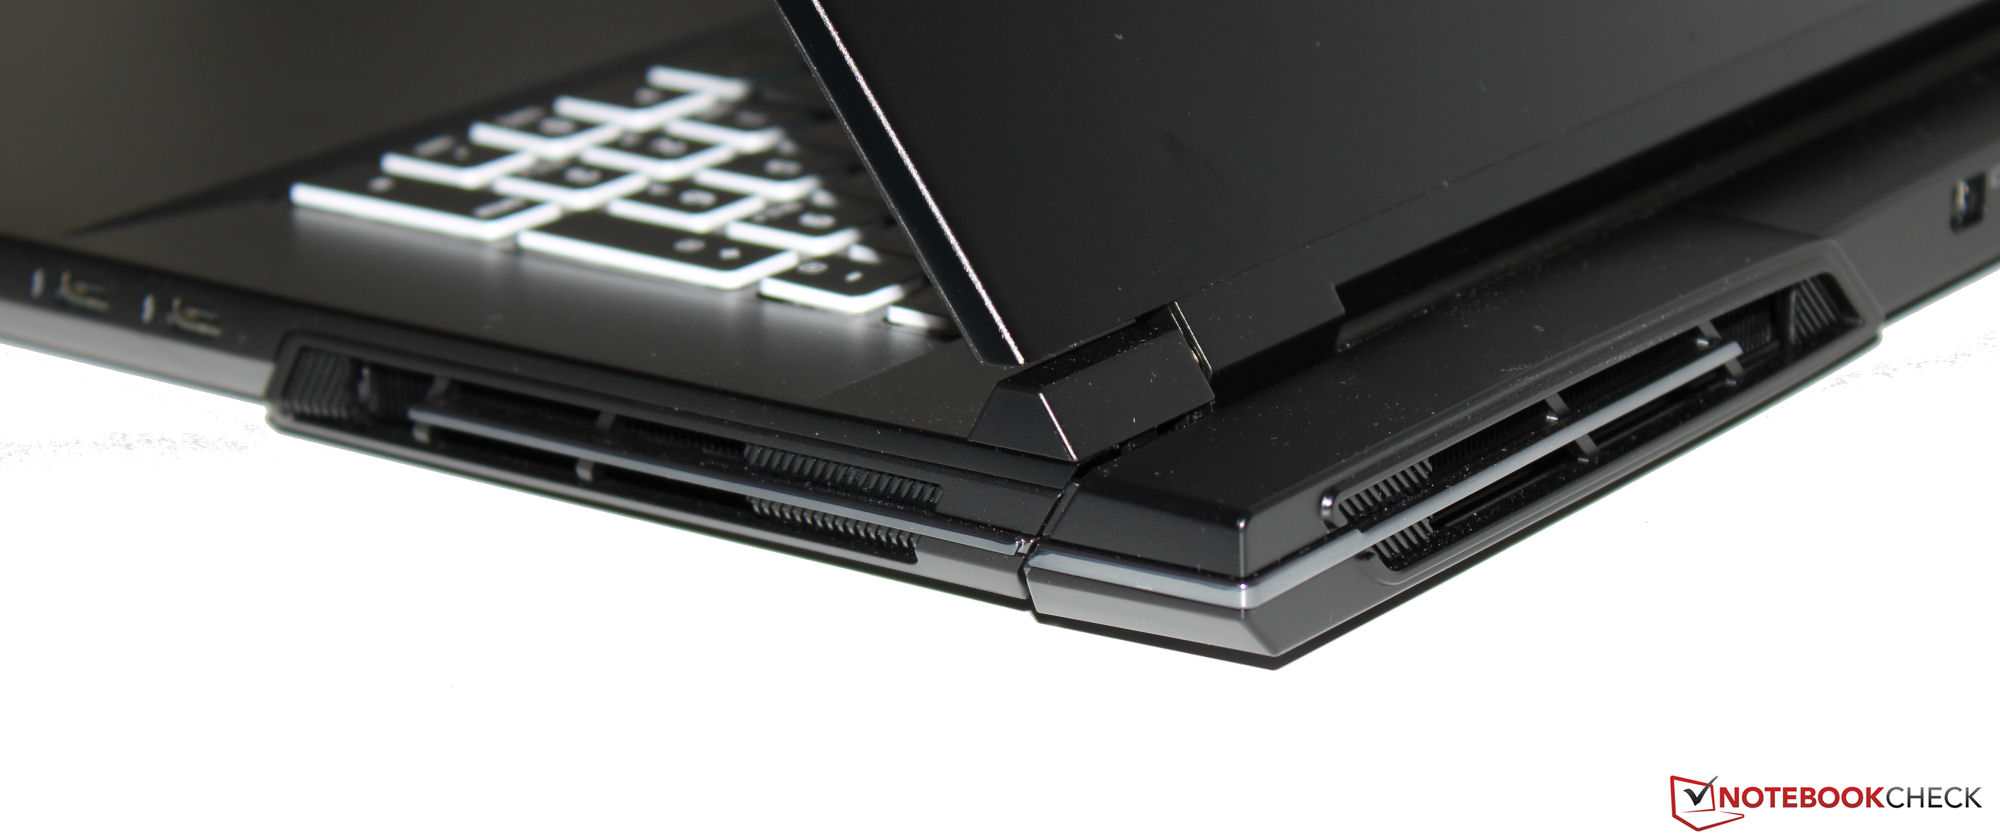
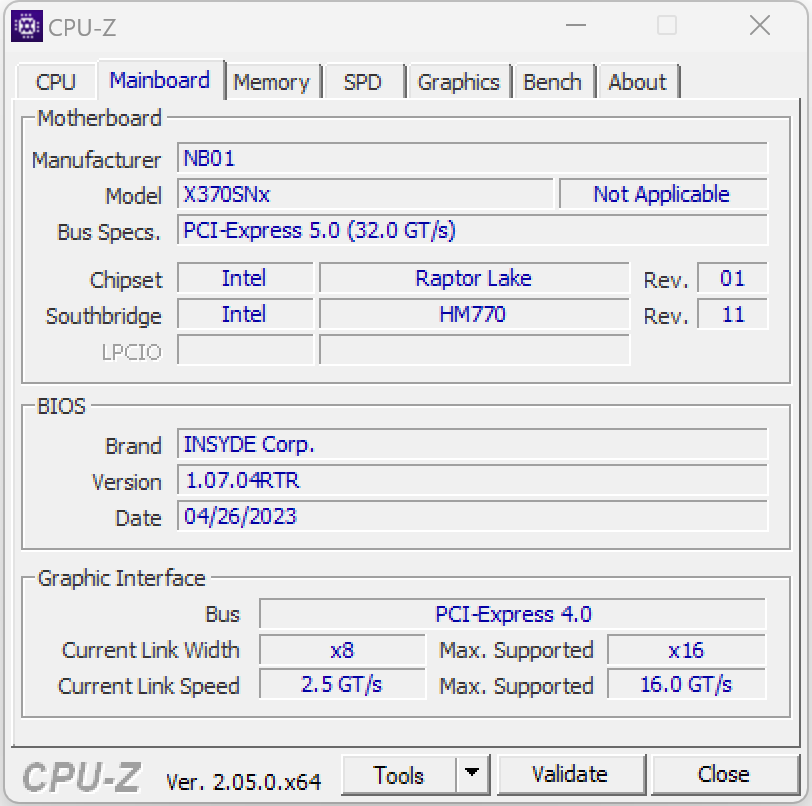
Caja y especificaciones - Clevo barebone que ofrece Thunderbolt 4
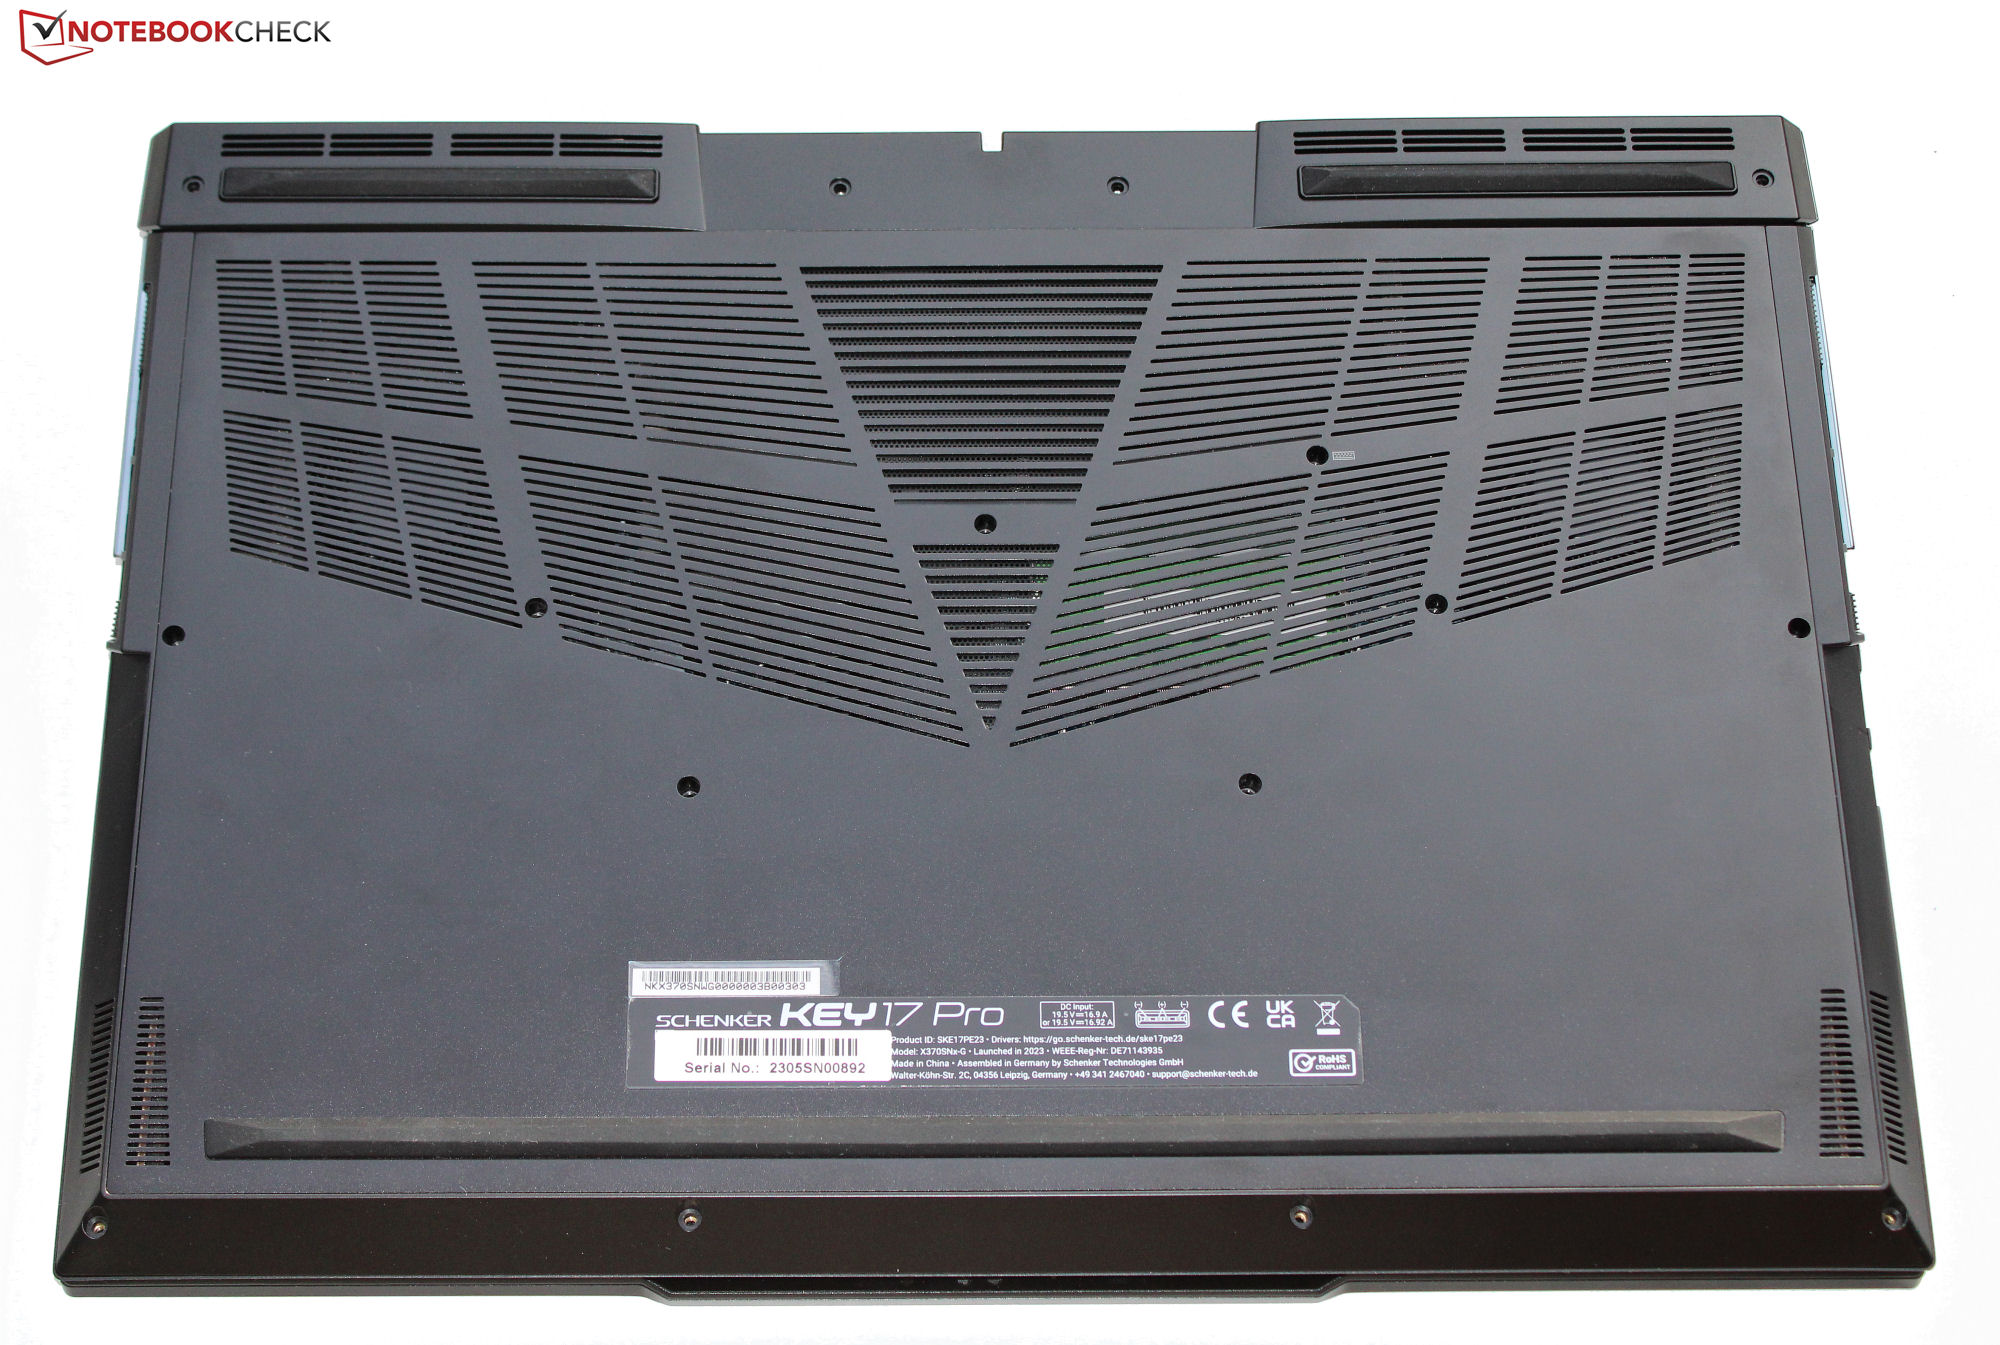
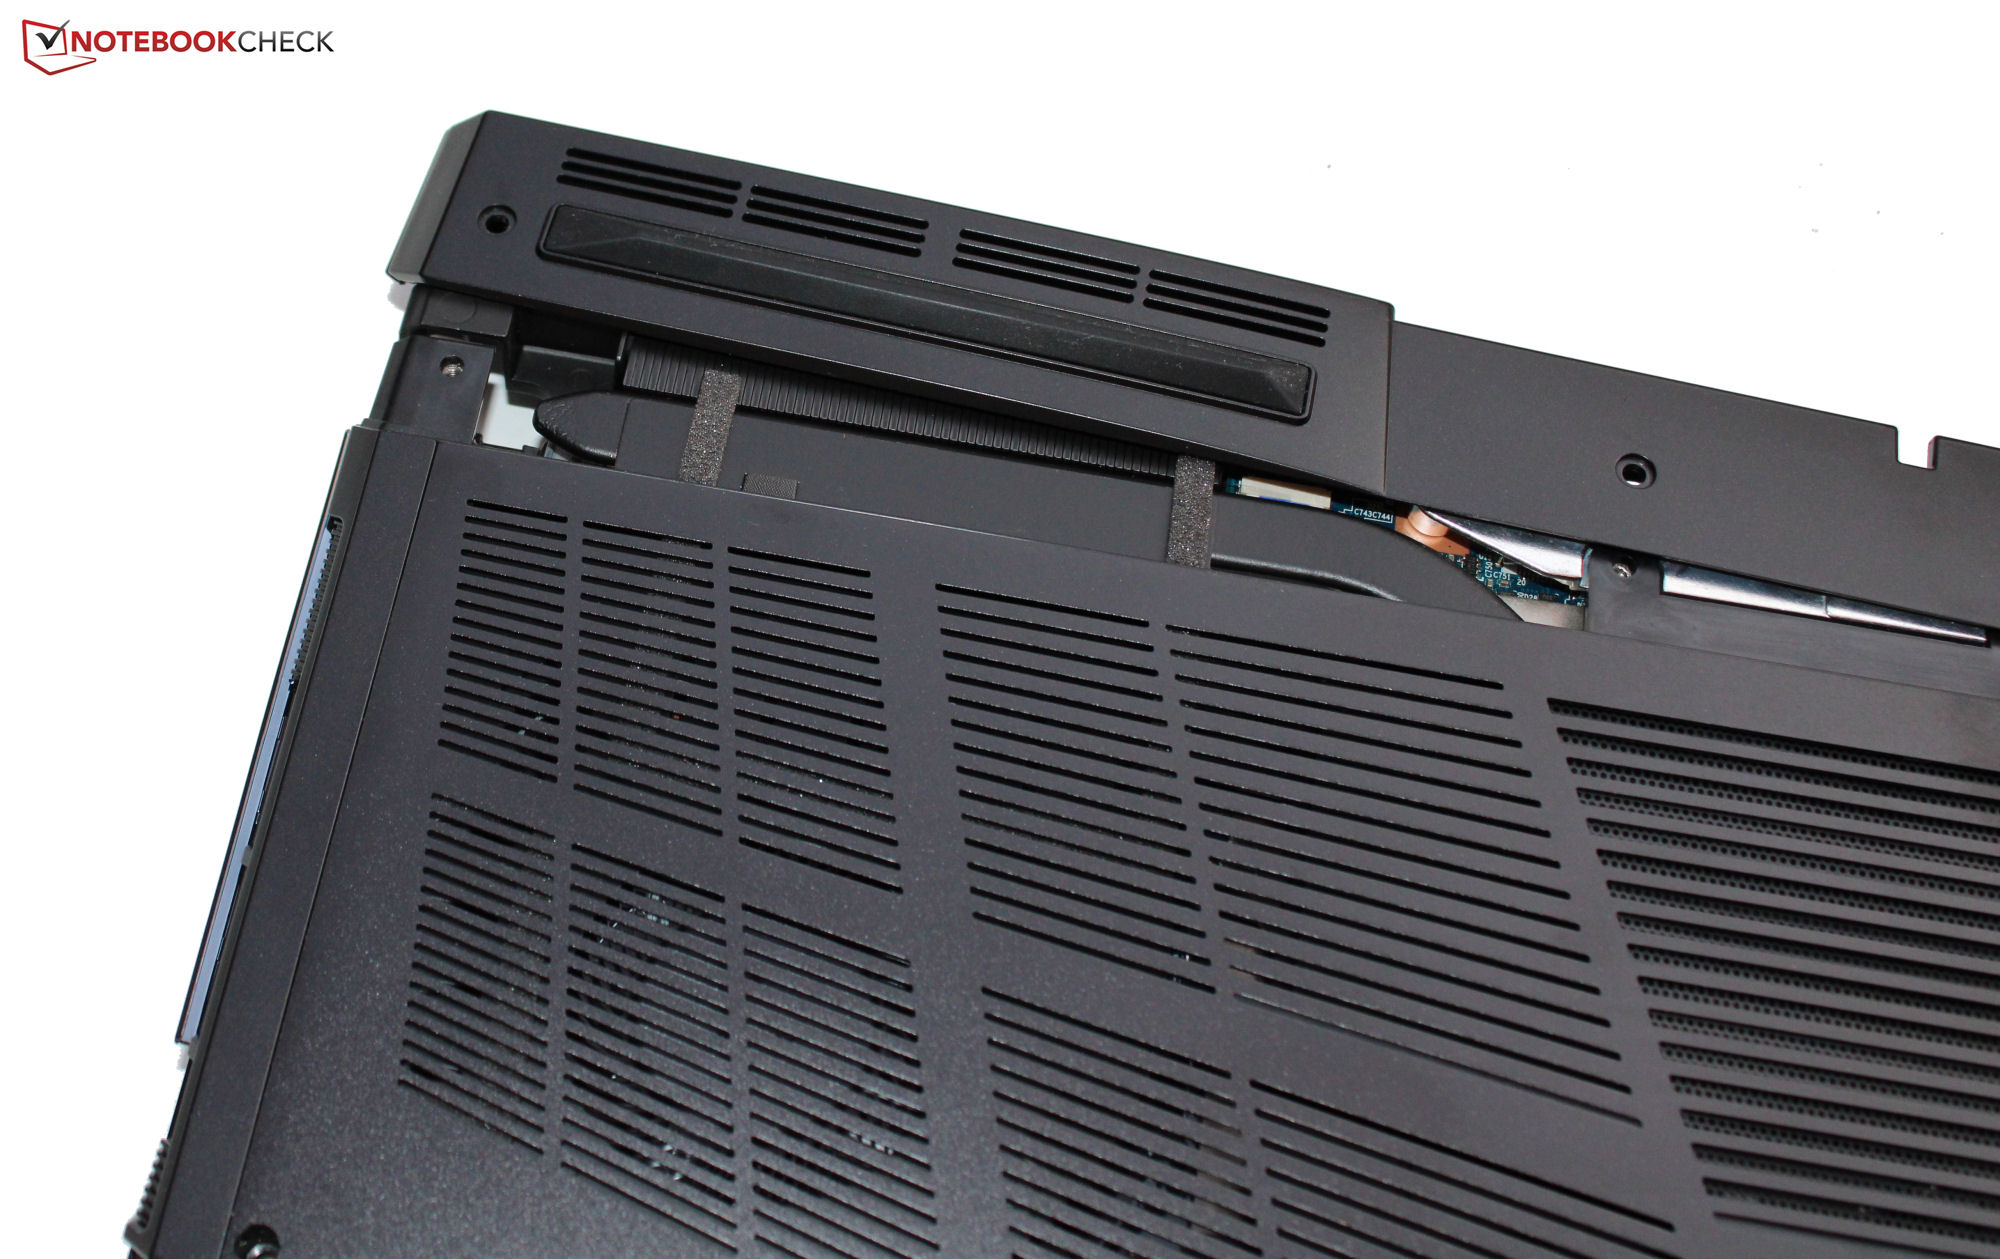
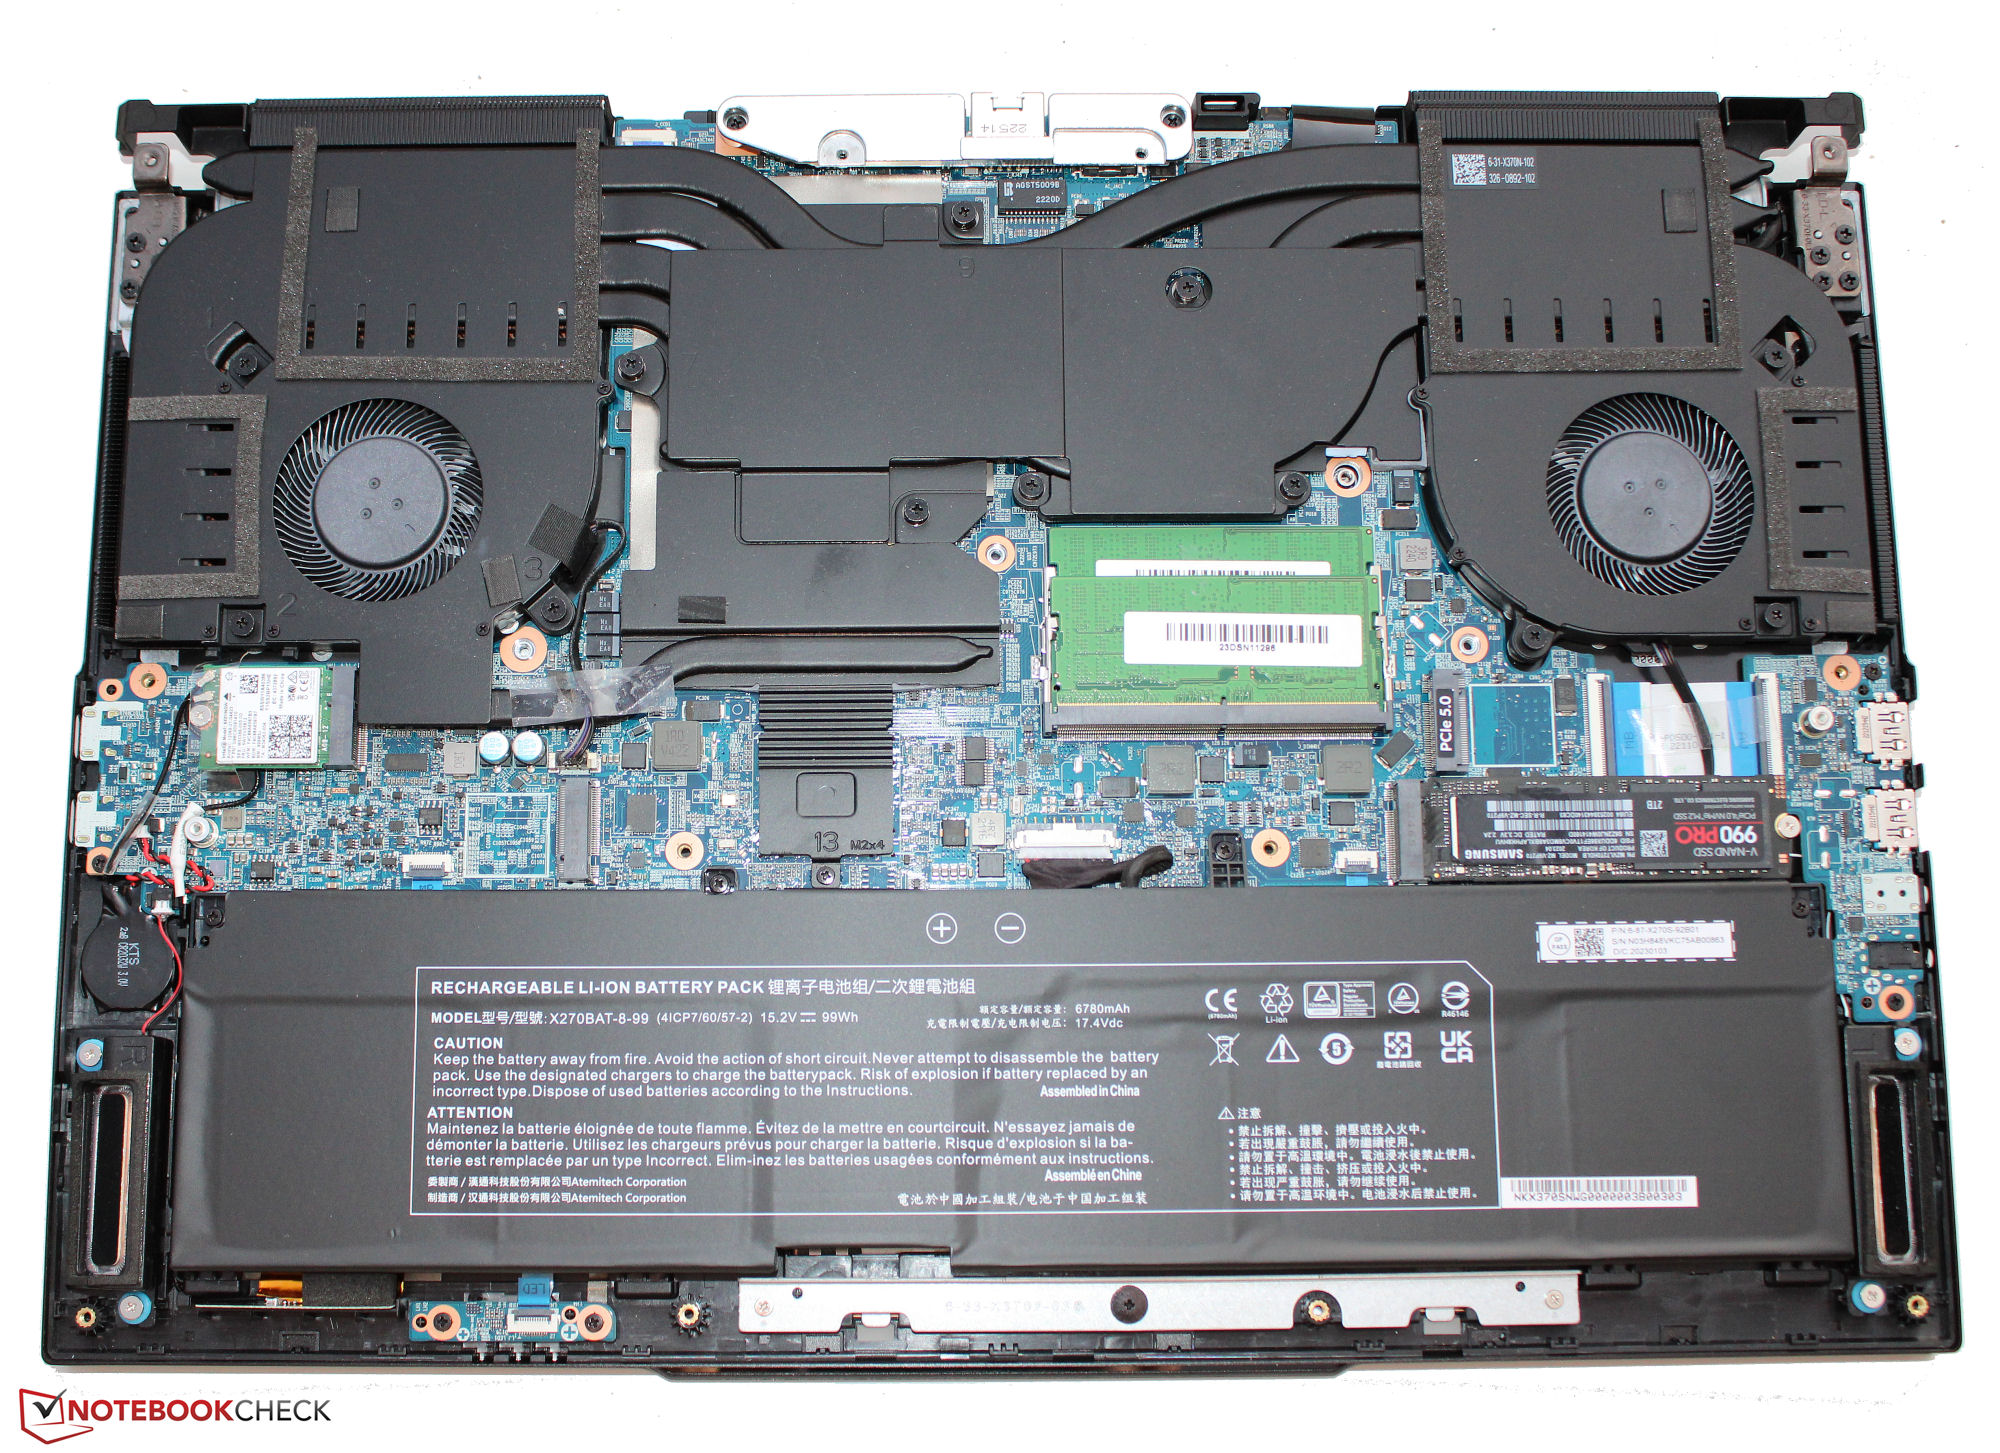
El sutil chasis de metal negro mate de nuestra unidad de pruebas no presenta ningún problema de acabado. La base apenas se flexiona, y la tapa tiene una pequeña pero muy aceptable holgura. La batería del portátil (atornillada, no pegada) y otras partes internas son accesibles una vez que se retira la cubierta inferior de dos piezas.
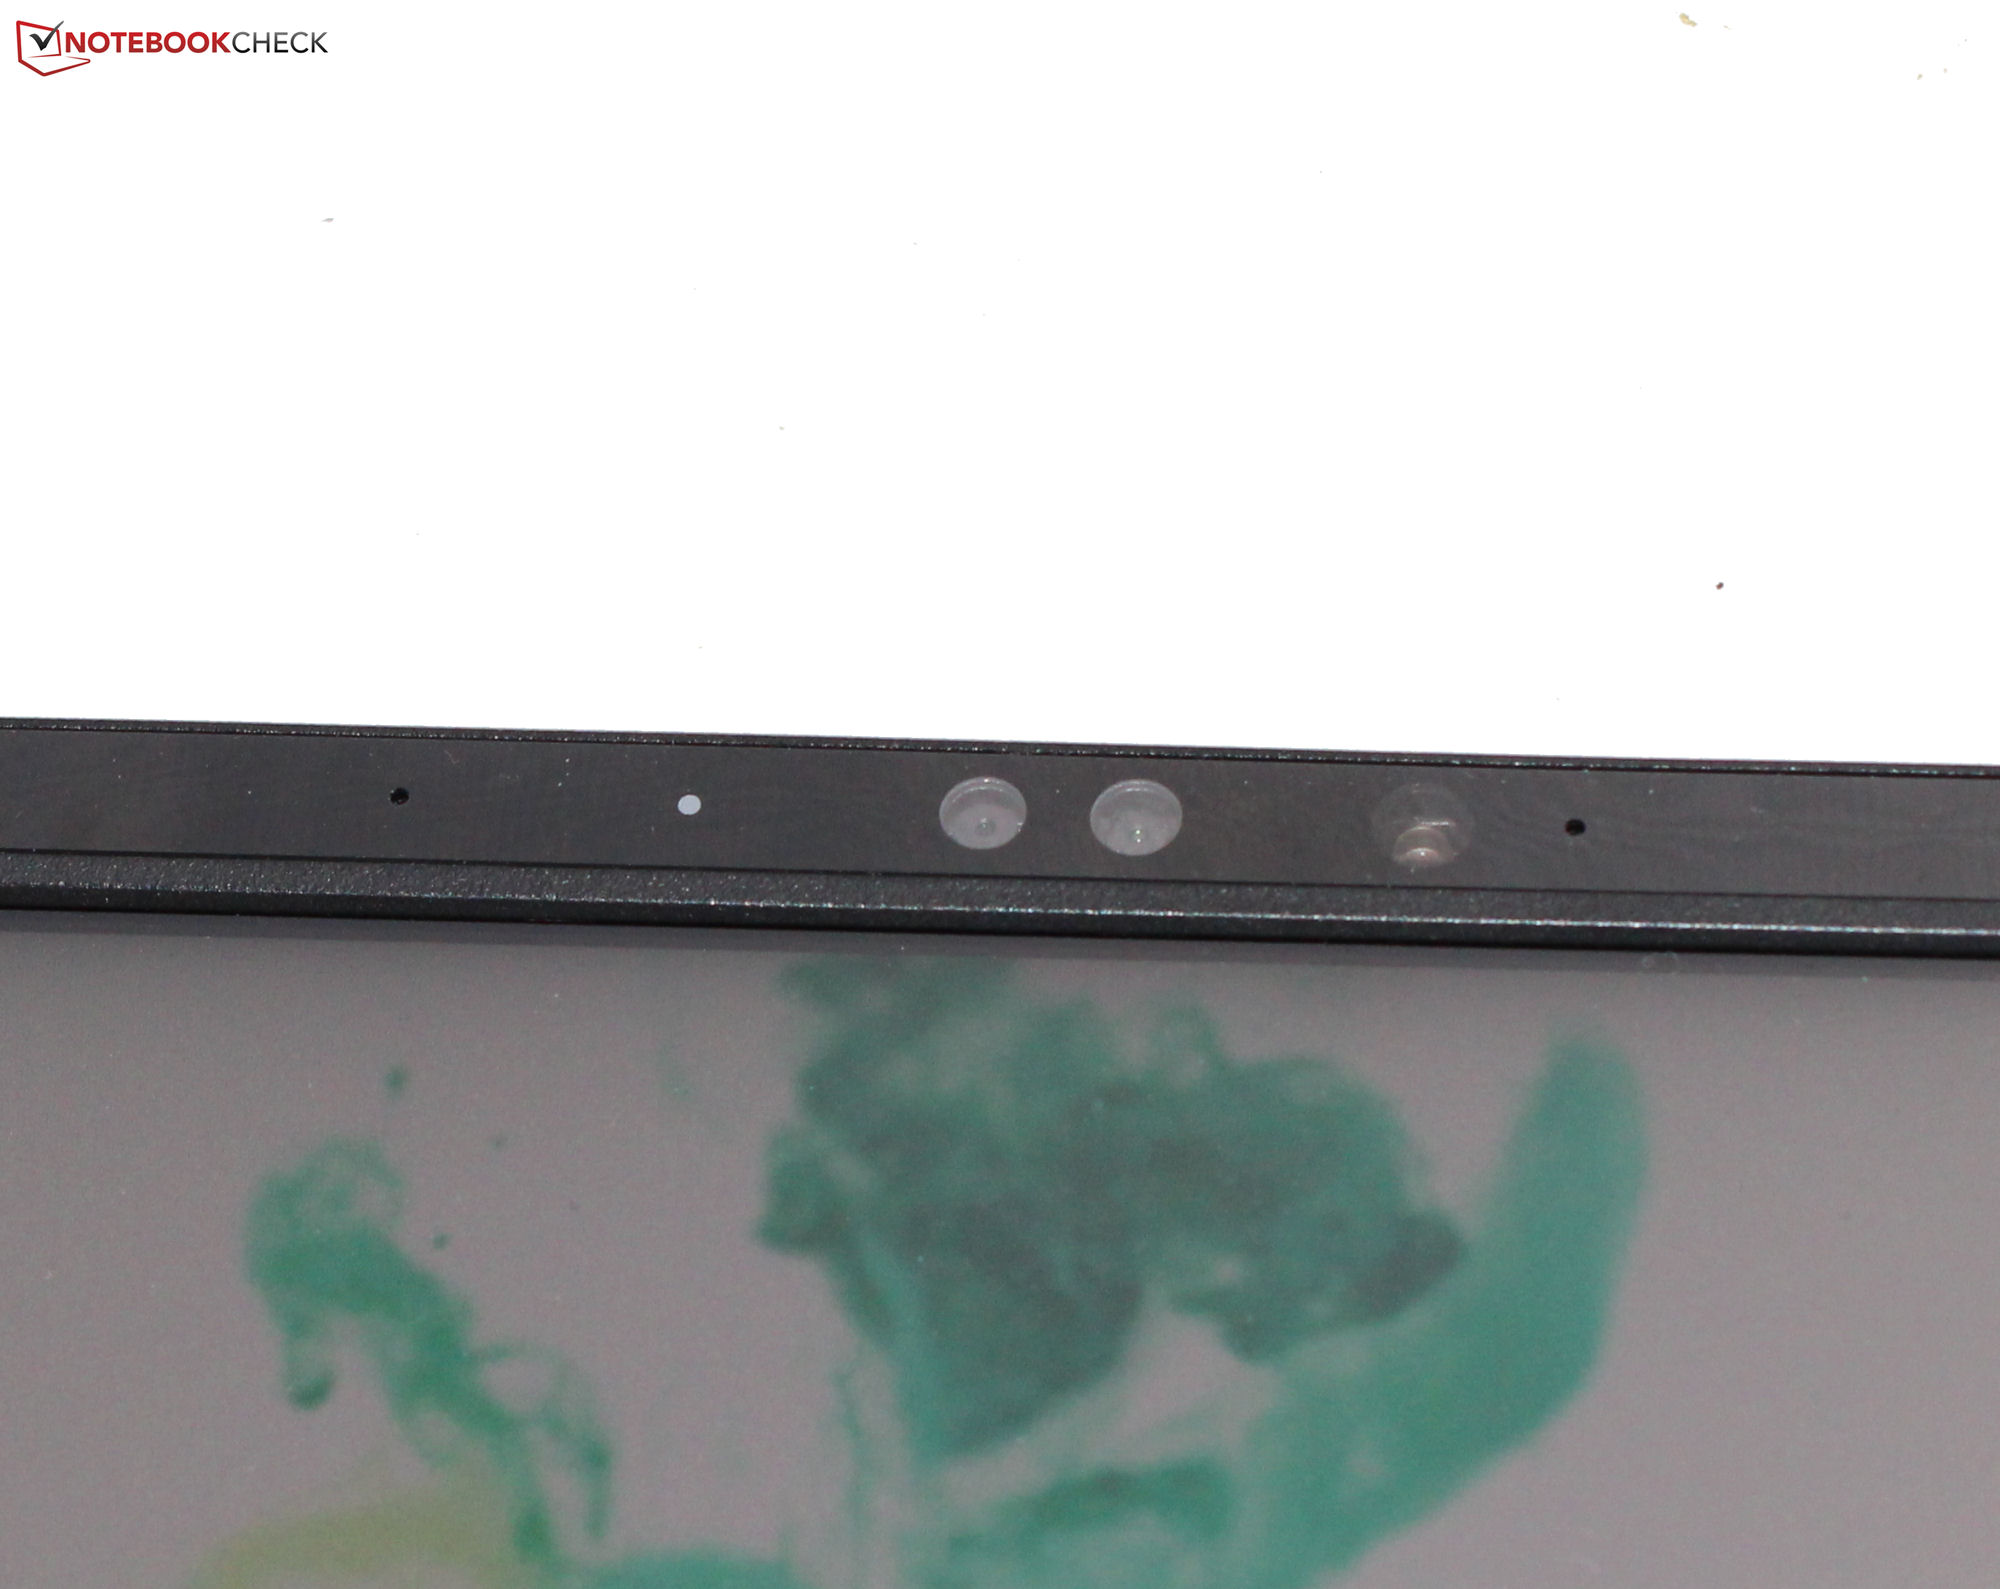
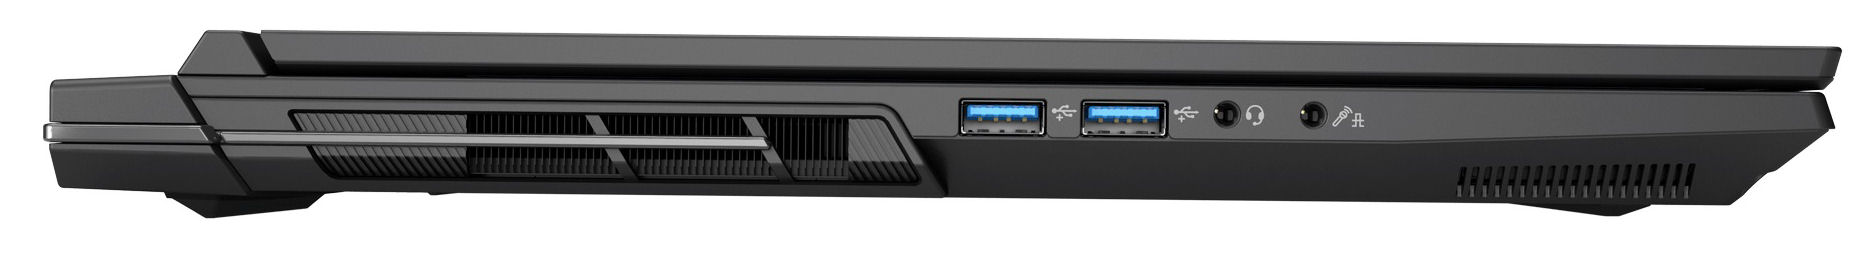
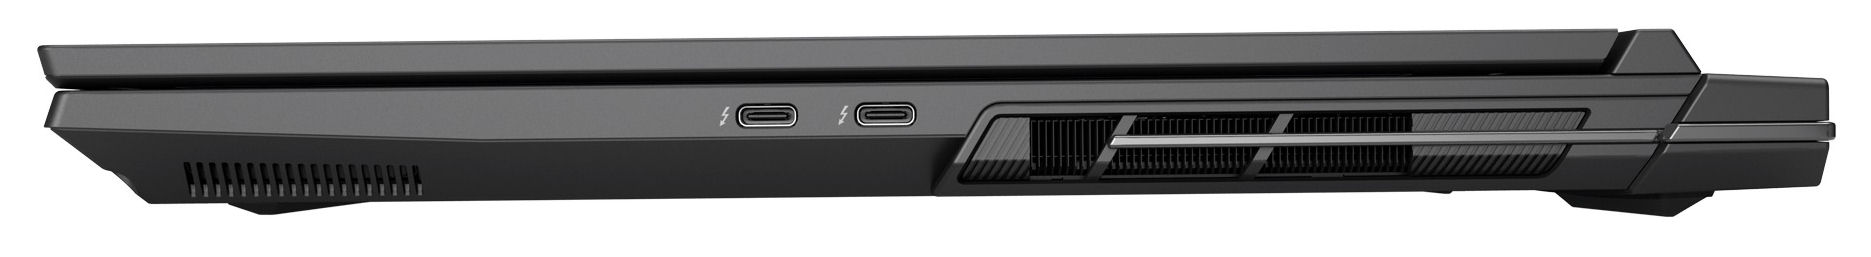
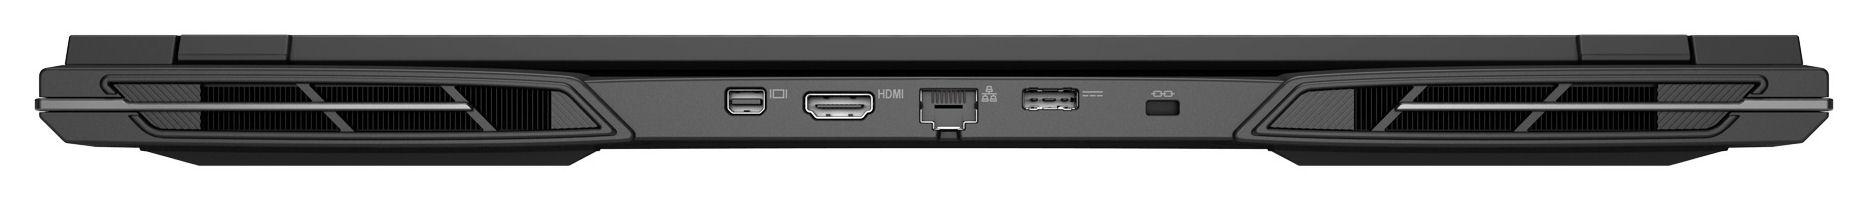
La Key tiene dos puertos USB-A (USB 3.2 Gen 2) y dos USB-C (Thunderbolt 4). Solo uno de los puertos Thunderbolt 4 soporta Power Delivery, pero ambos son capaces de emitir una señal DisplayPort. El portátil ofrece un total de cuatro salidas de vídeo (1x HDMI, 3x DP). Por desgracia, el dispositivo no viene con lector de tarjetas, y la webcam (2,1MP, resolución máxima de 1.920 x 1.080, sin obturador de privacidad) no es nada del otro mundo.
Gracias a su tarjeta Wi-Fi 6E (Intel AX211), el Key 17 Pro es capaz de alcanzar excelentes velocidades de datos Wi-Fi en condiciones ideales (es decir, sin otros dispositivos Wi-Fi cerca, corta distancia entre el portátil y el PC servidor). De las conexiones por cable se encarga un controlador Killer E3100X (2,5 Gbit/s).

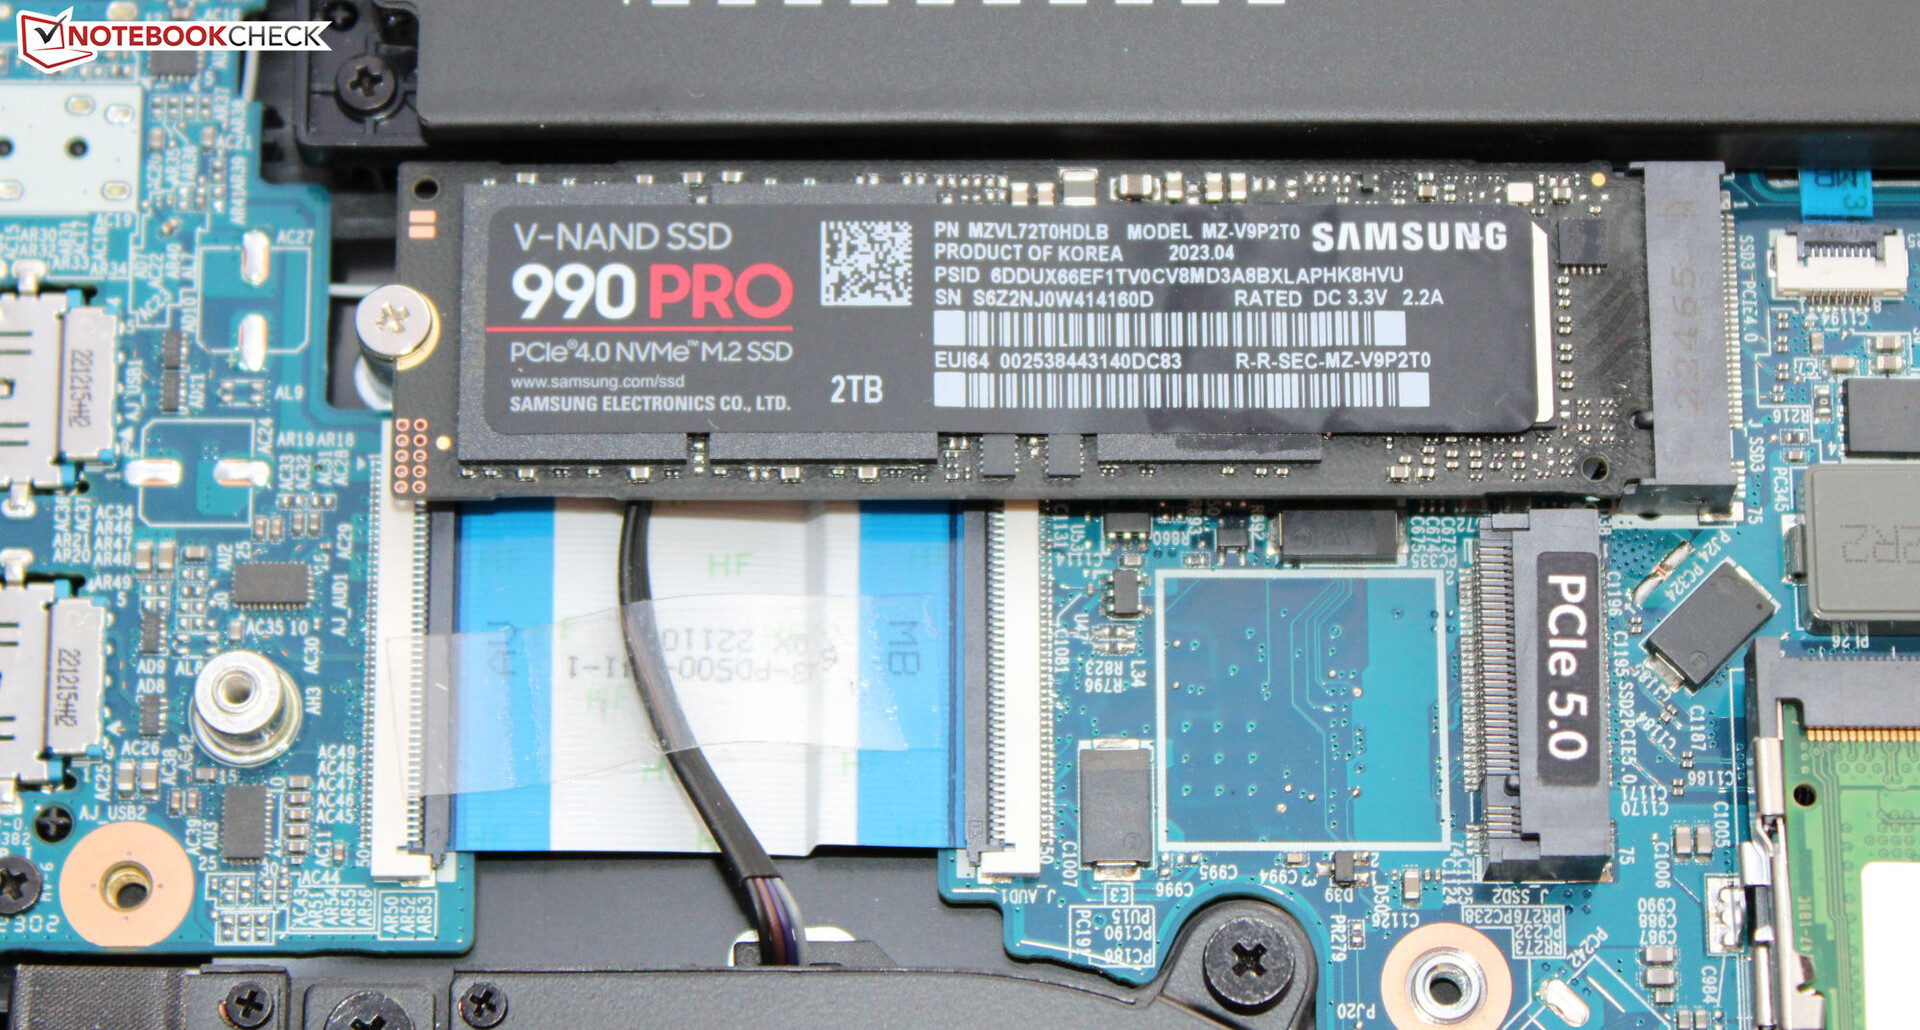
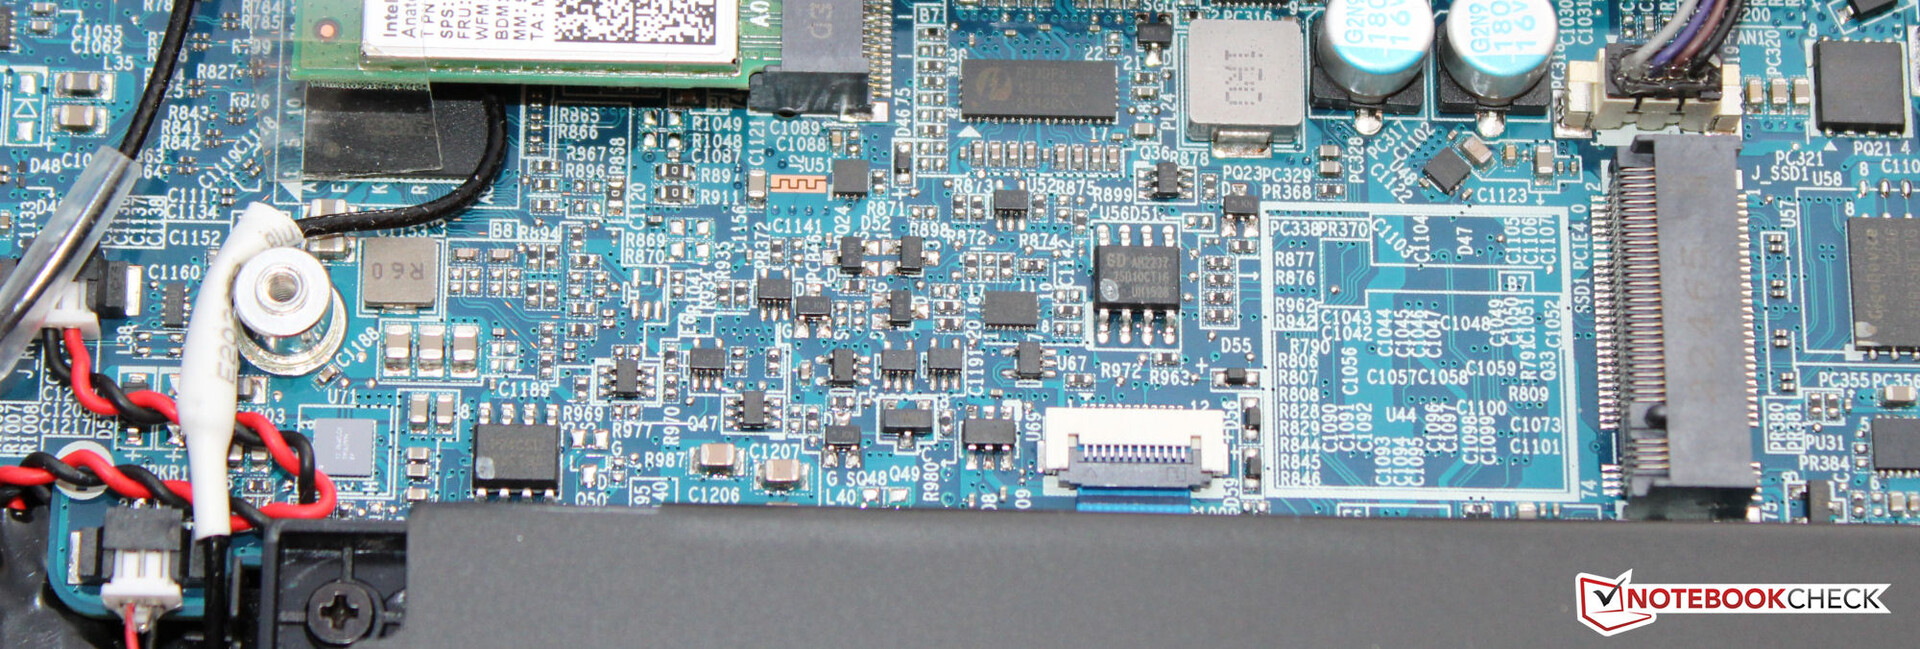
 GeForce RTX 4090 Laptop GPU, i9-13900HX, Samsung 990 Pro 2 TB MZVL72T0HDLB")
 GeForce RTX 4090 Laptop GPU, i9-13900HX, Samsung 990 Pro 2 TB MZVL72T0HDLB")
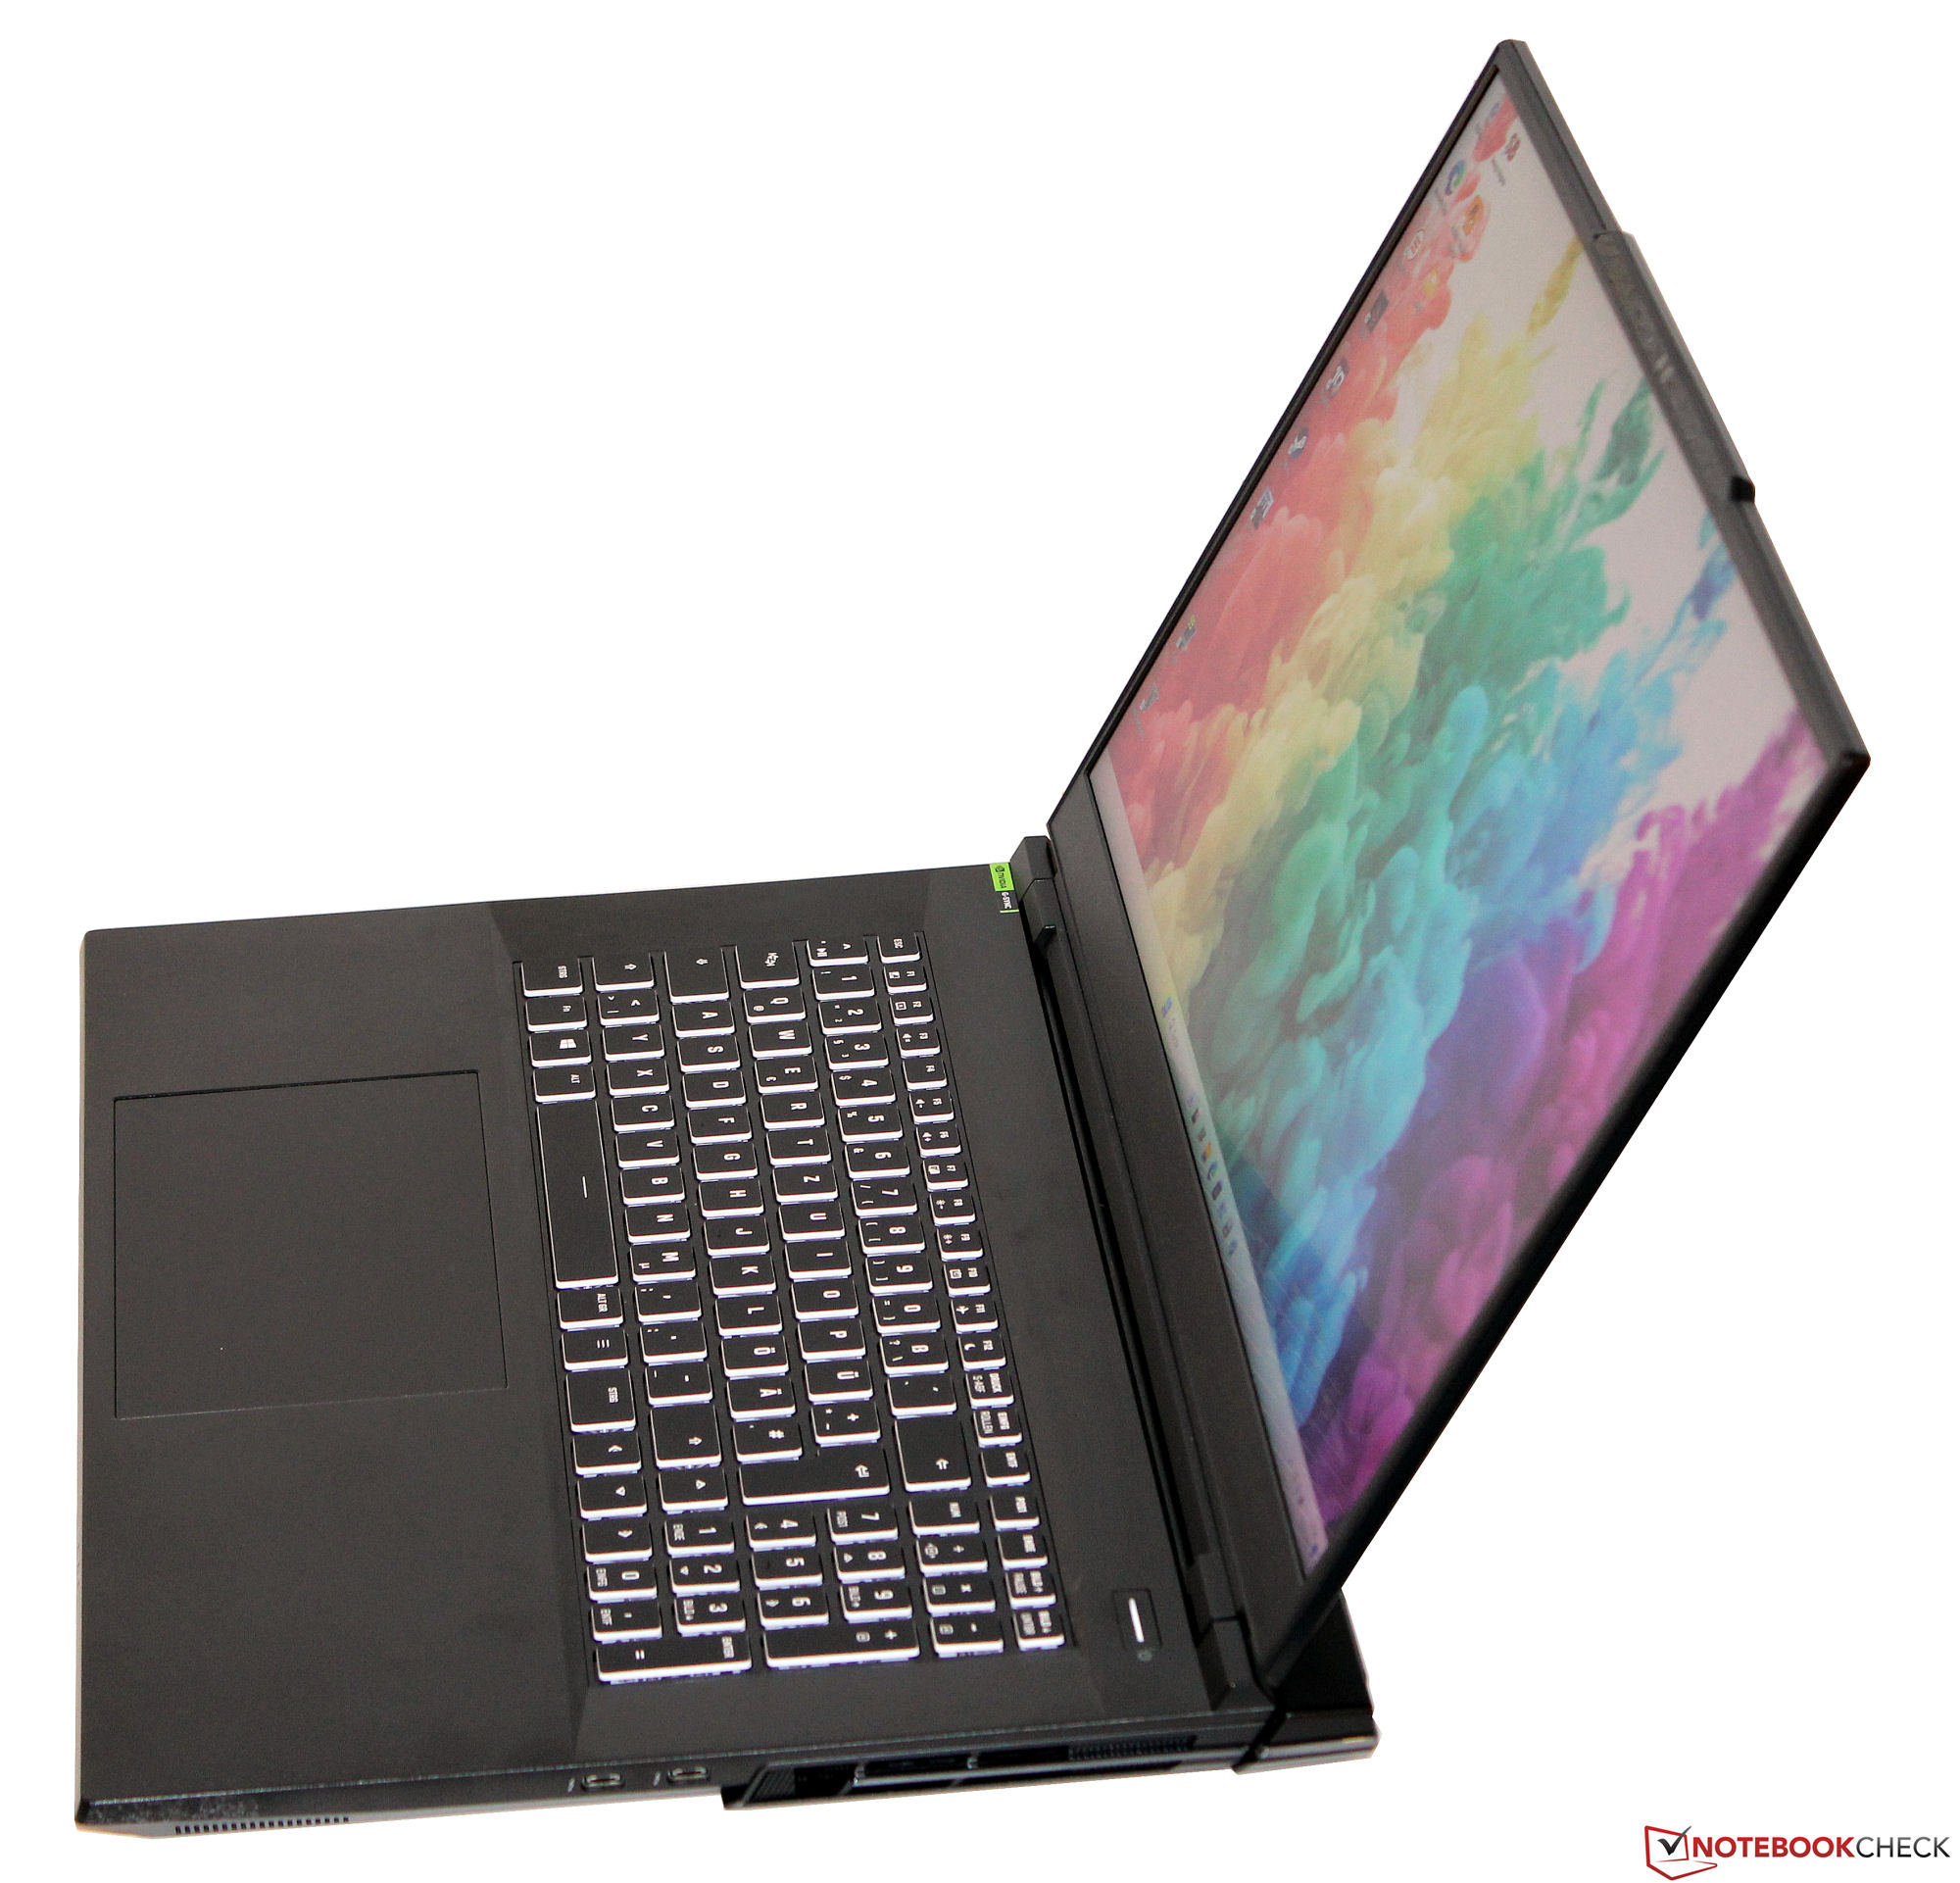
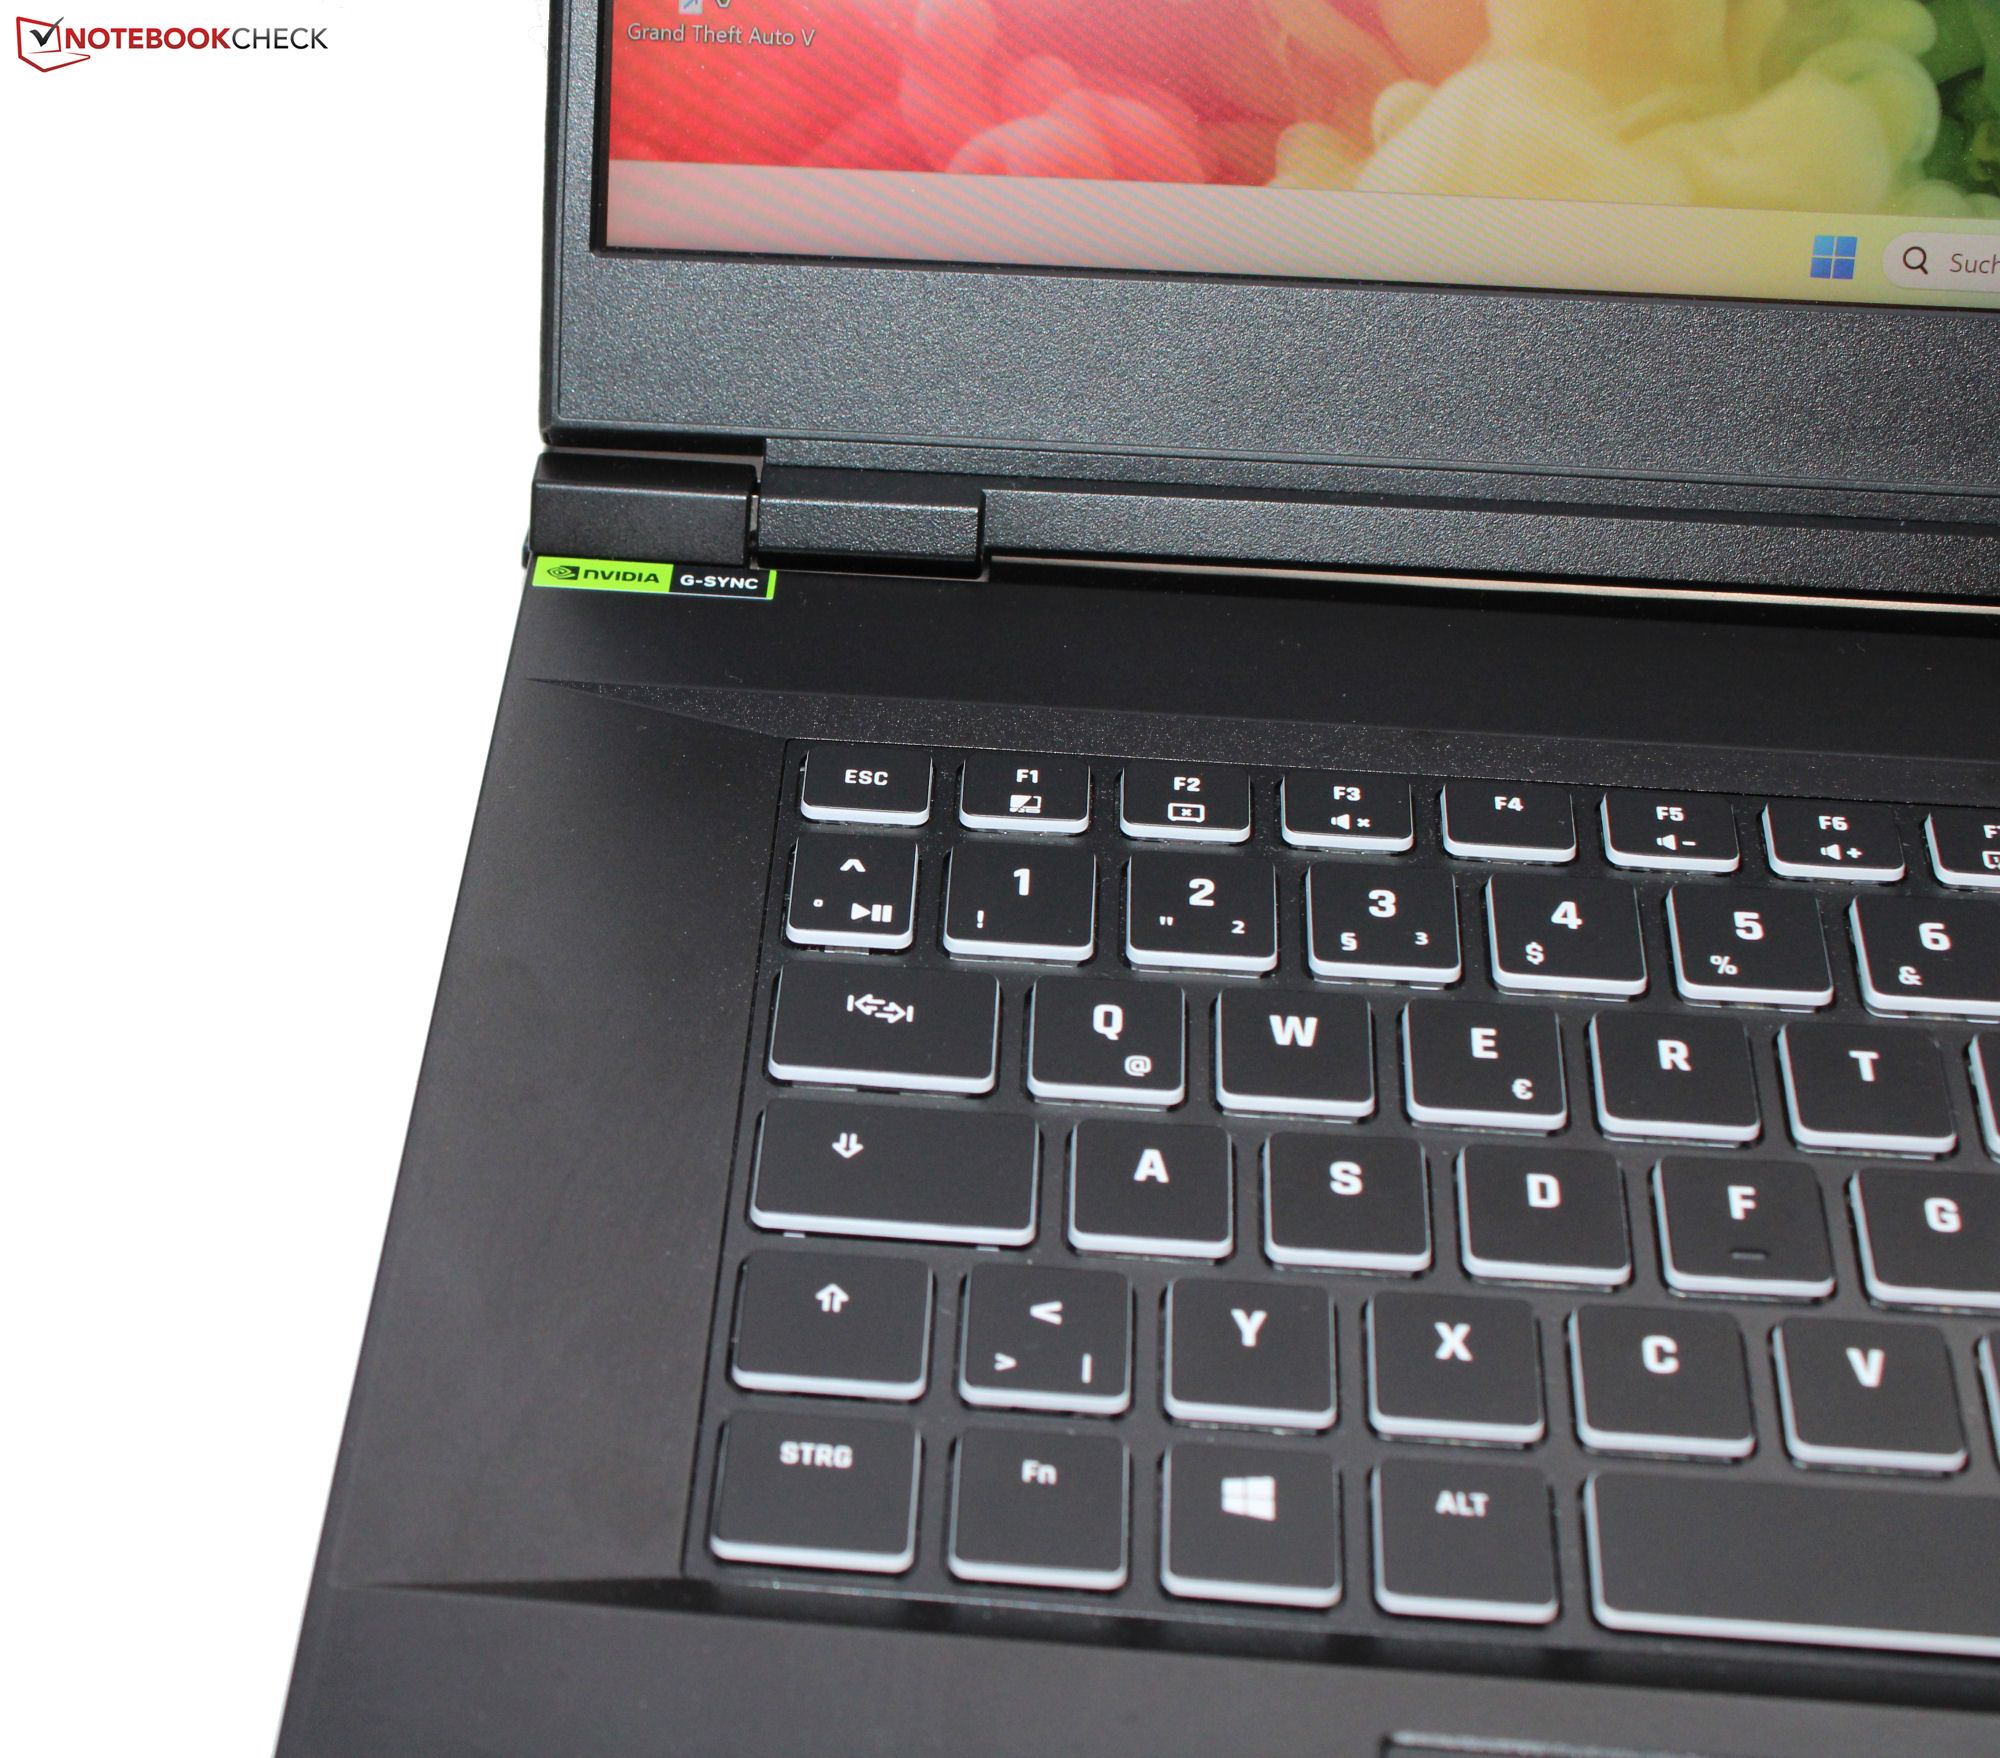
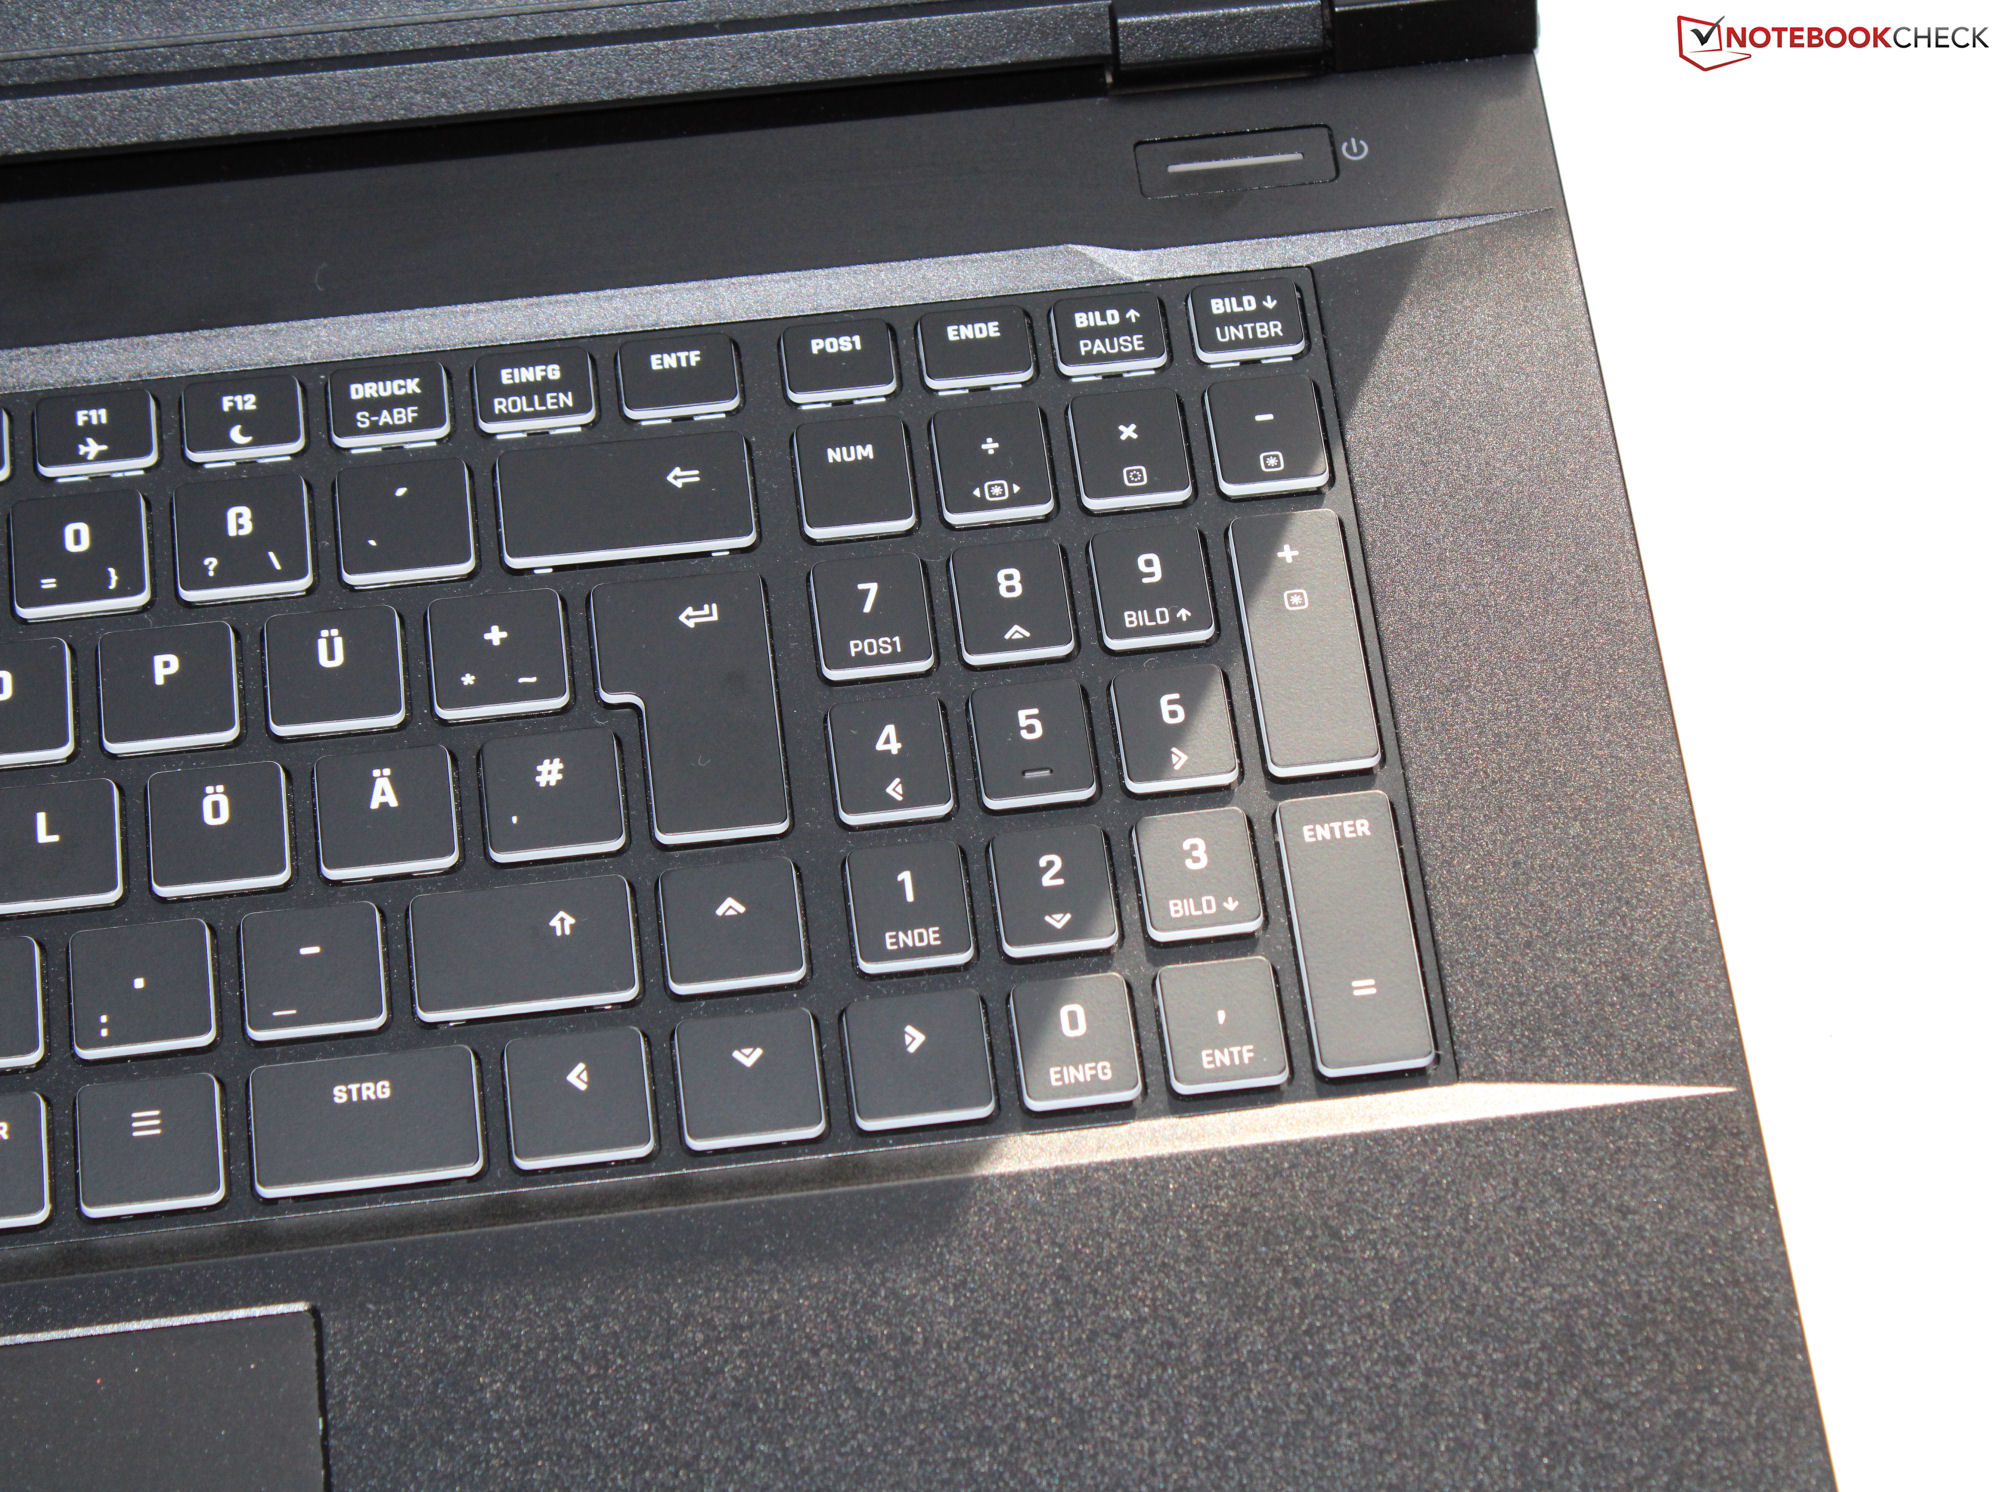
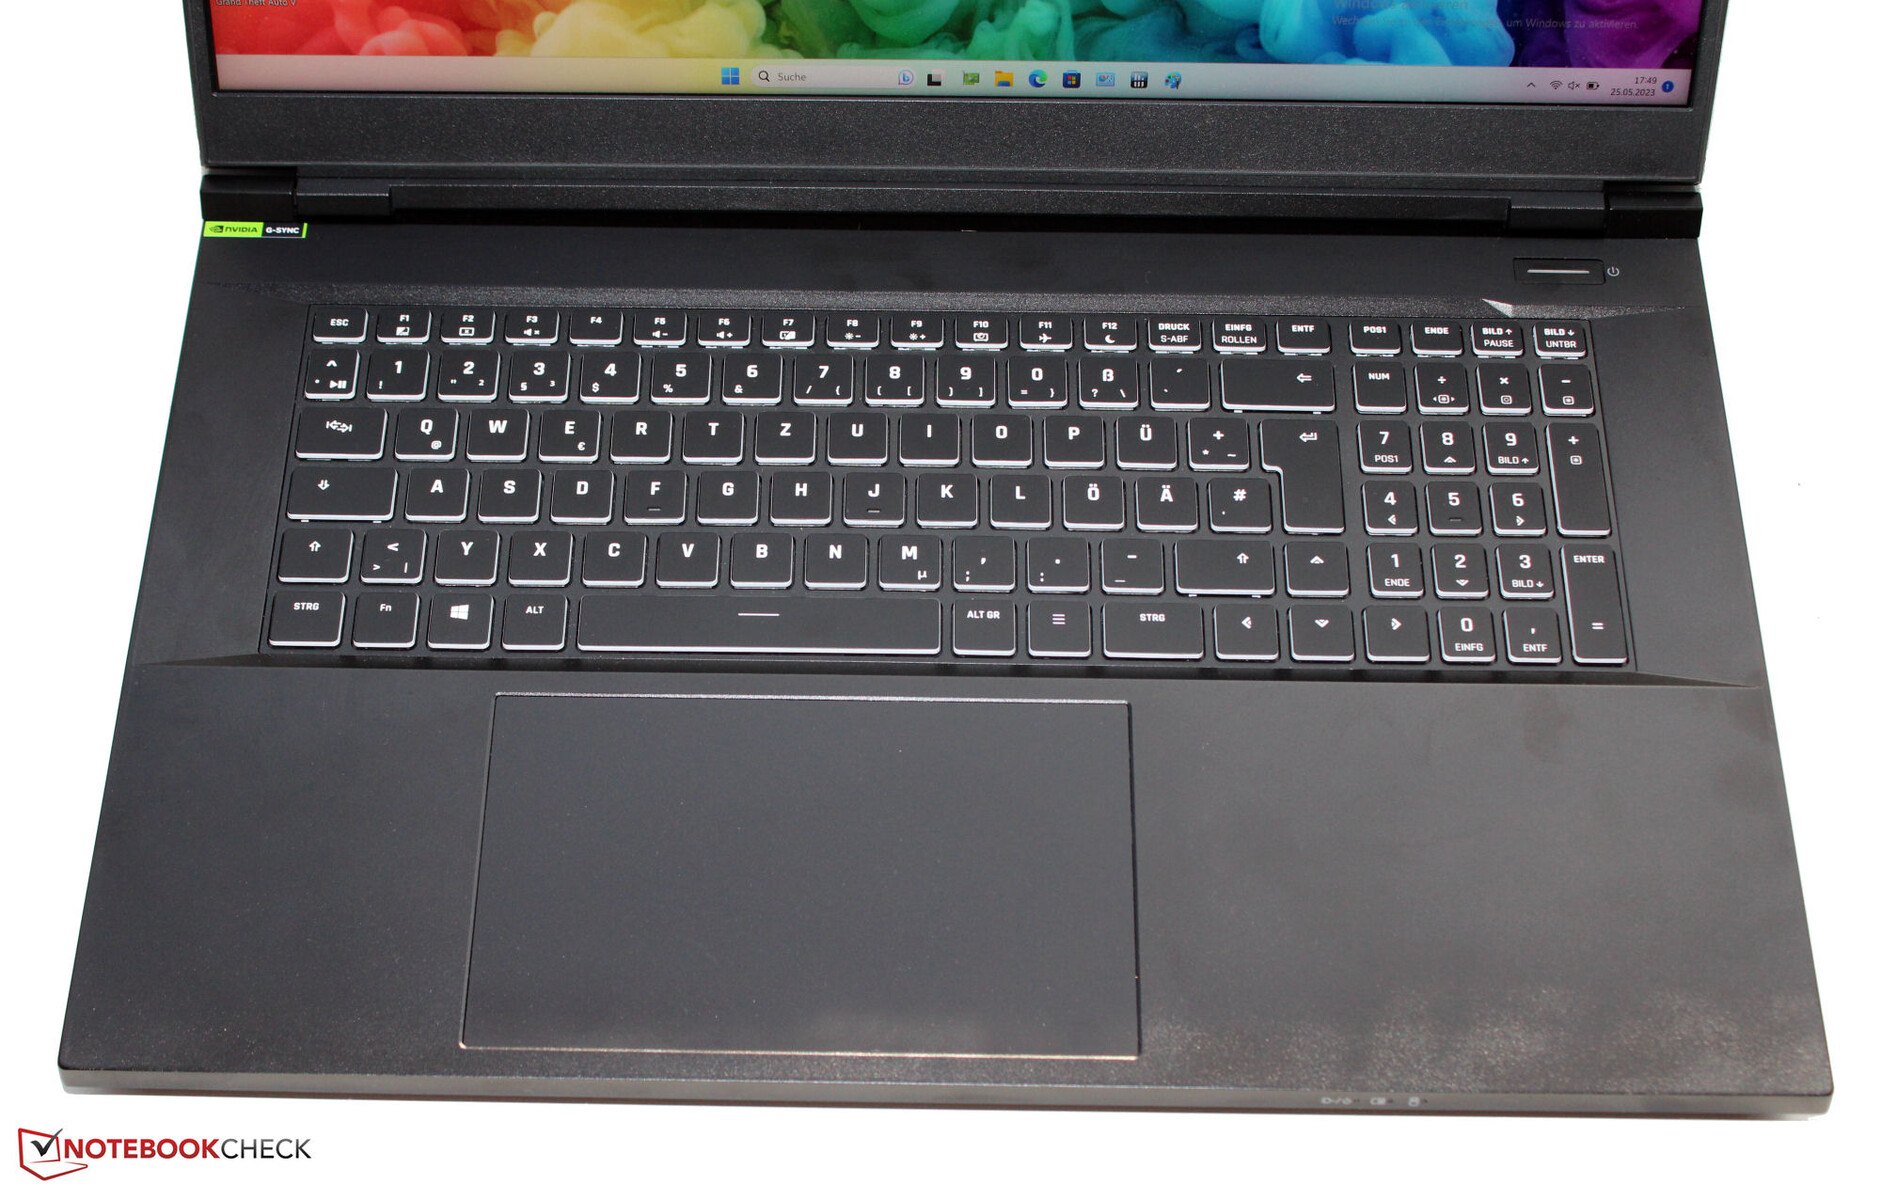
Dispositivos de entrada - Portátil Schenker con RGB por tecla
Las teclas planas y suaves del teclado chiclet (con iluminación RGB por tecla) tienen un recorrido moderado y un punto de accionamiento característico. Aunque, en nuestra opinión, la resistencia de las teclas podría ser más nítida. El teclado se flexiona un poco al escribir, pero Schenker ha conseguido un teclado adecuado para el uso diario. El Key 17 Pro también cuenta con un touchpad (que mide aprox. 15 x 9,1 cm, o 5,9 x 3,6") con un recorrido corto y un punto de pulsación claro.
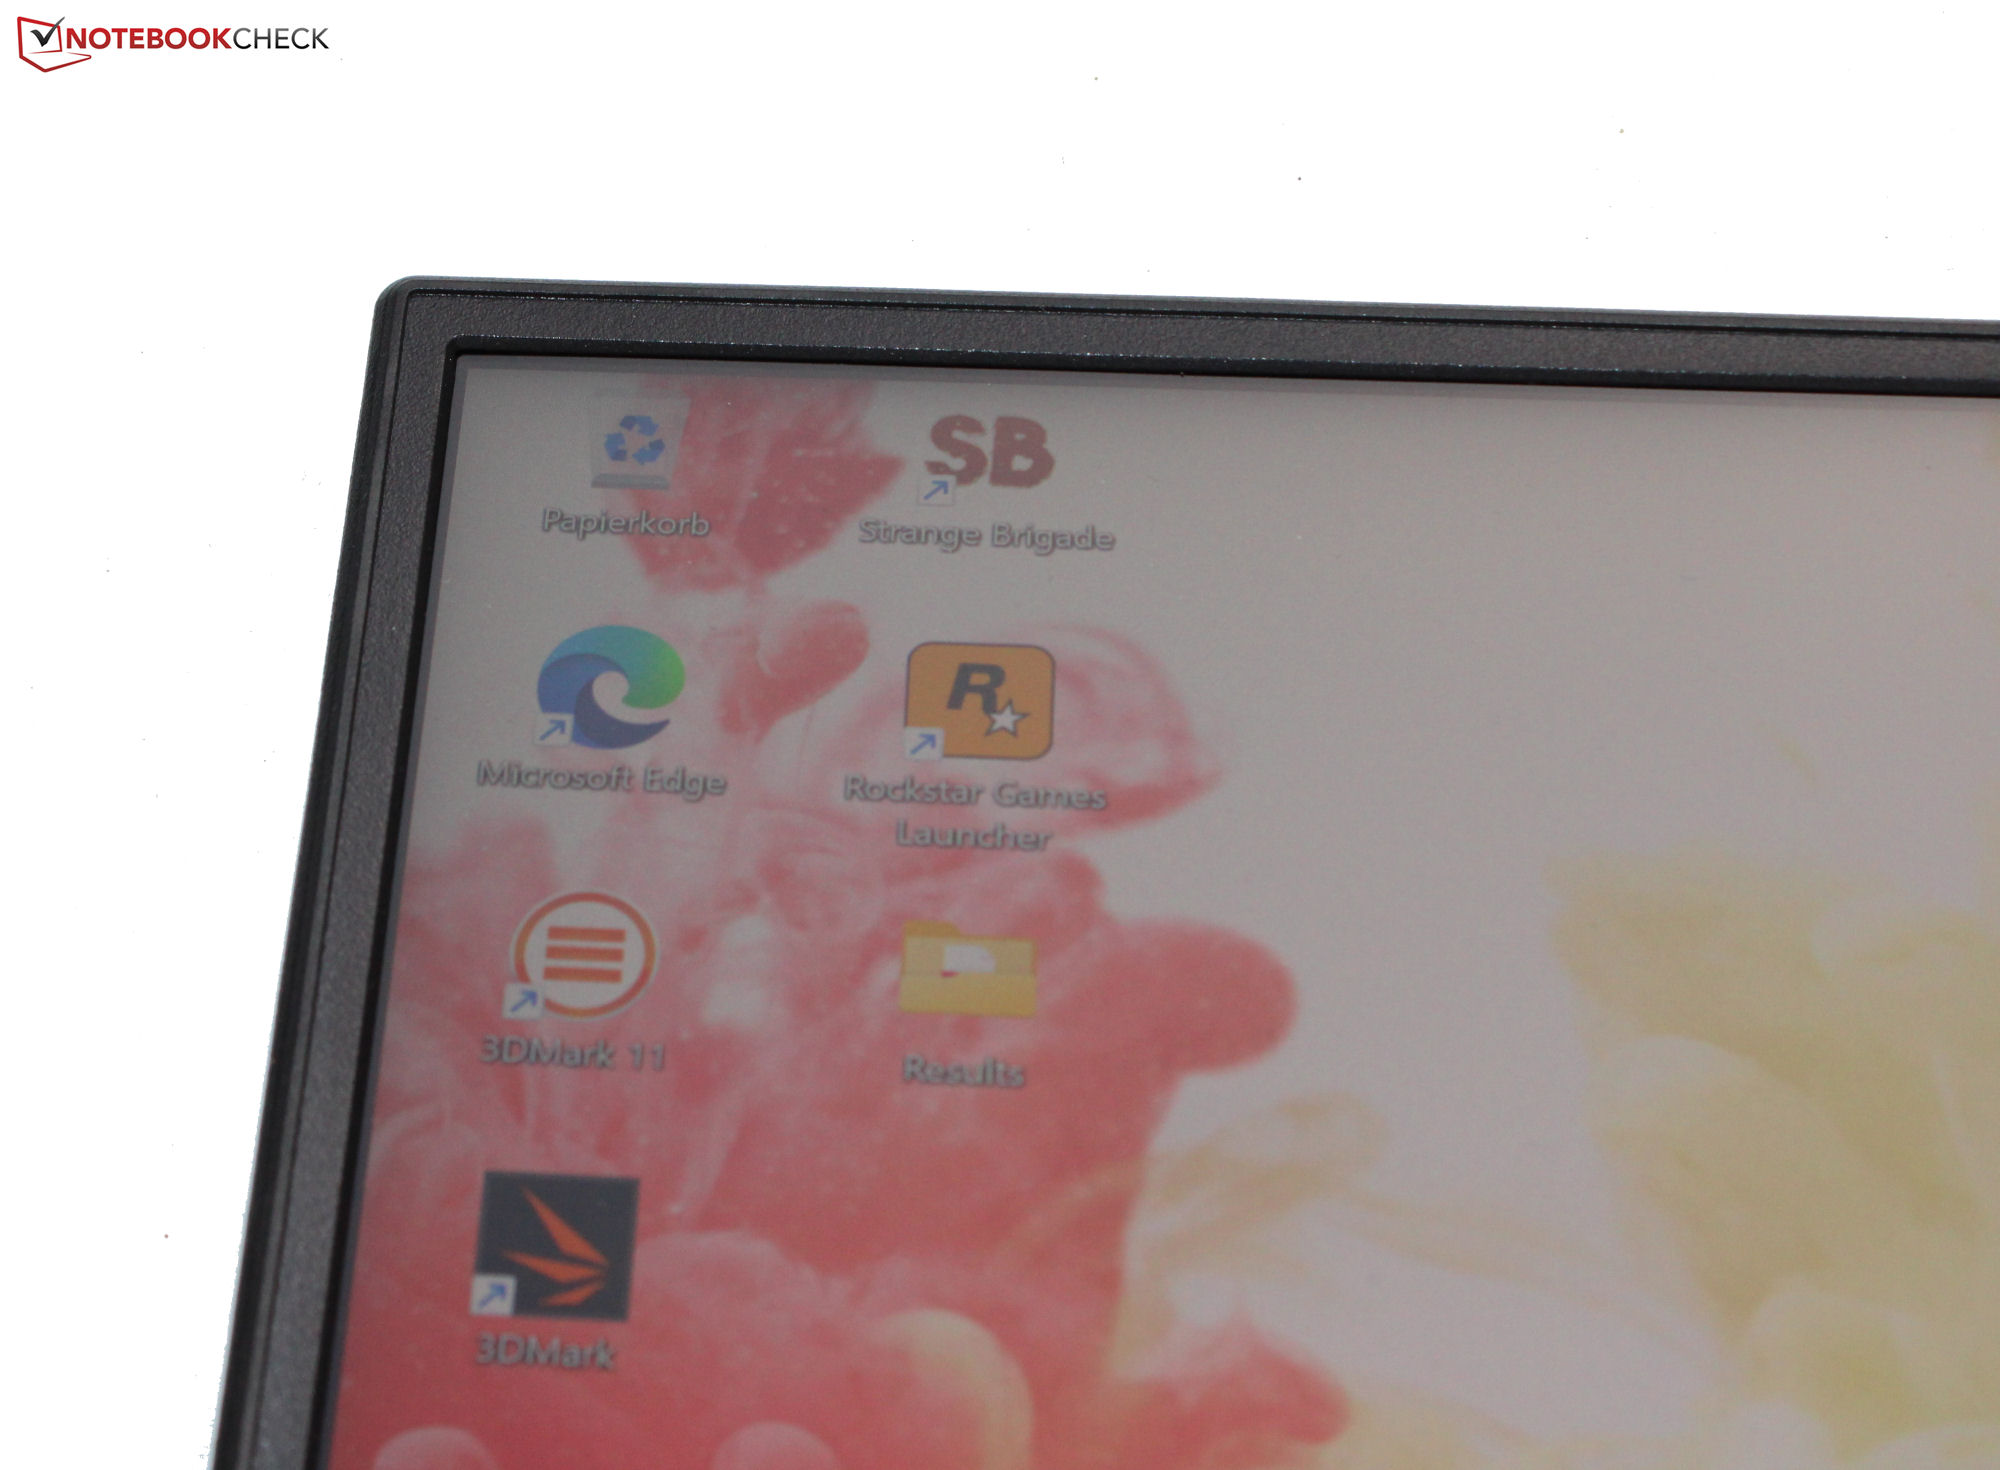
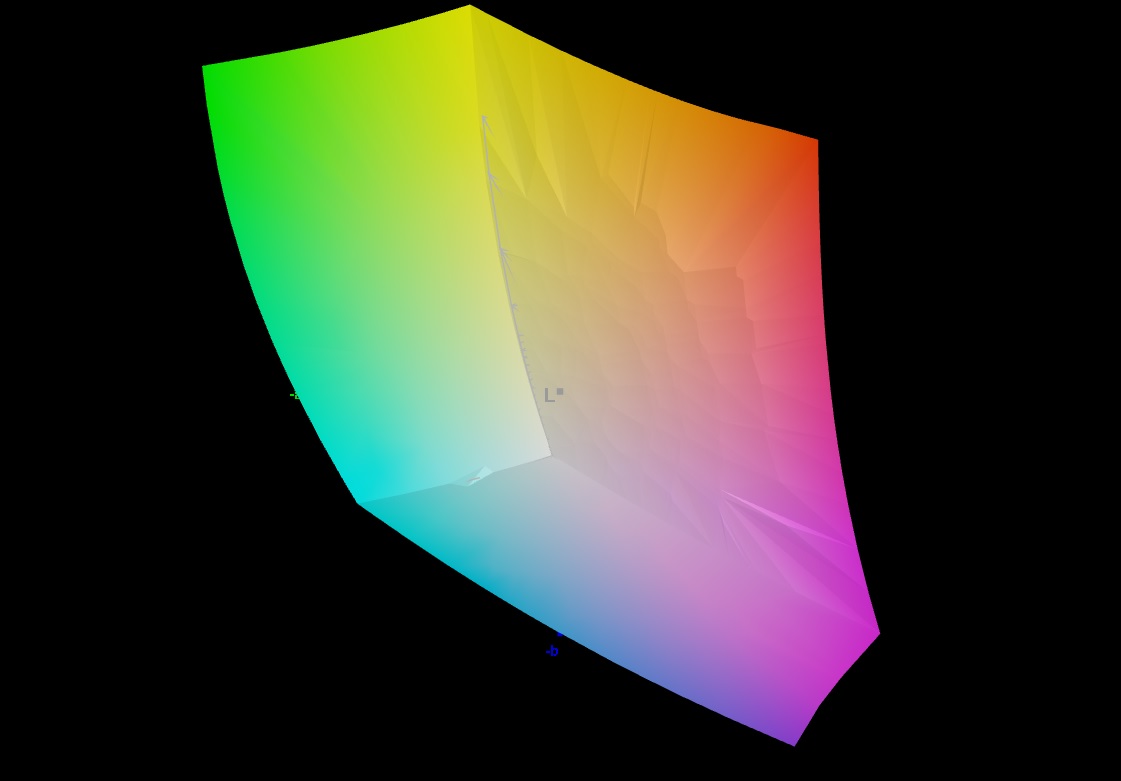
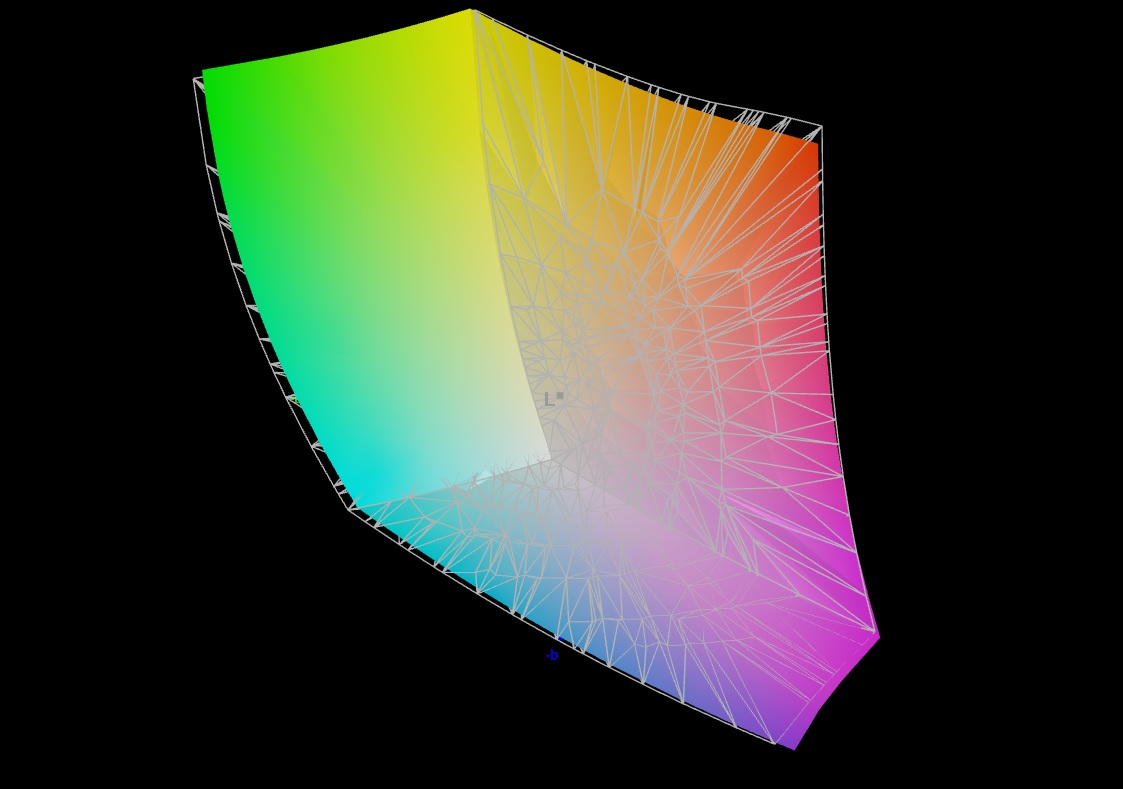
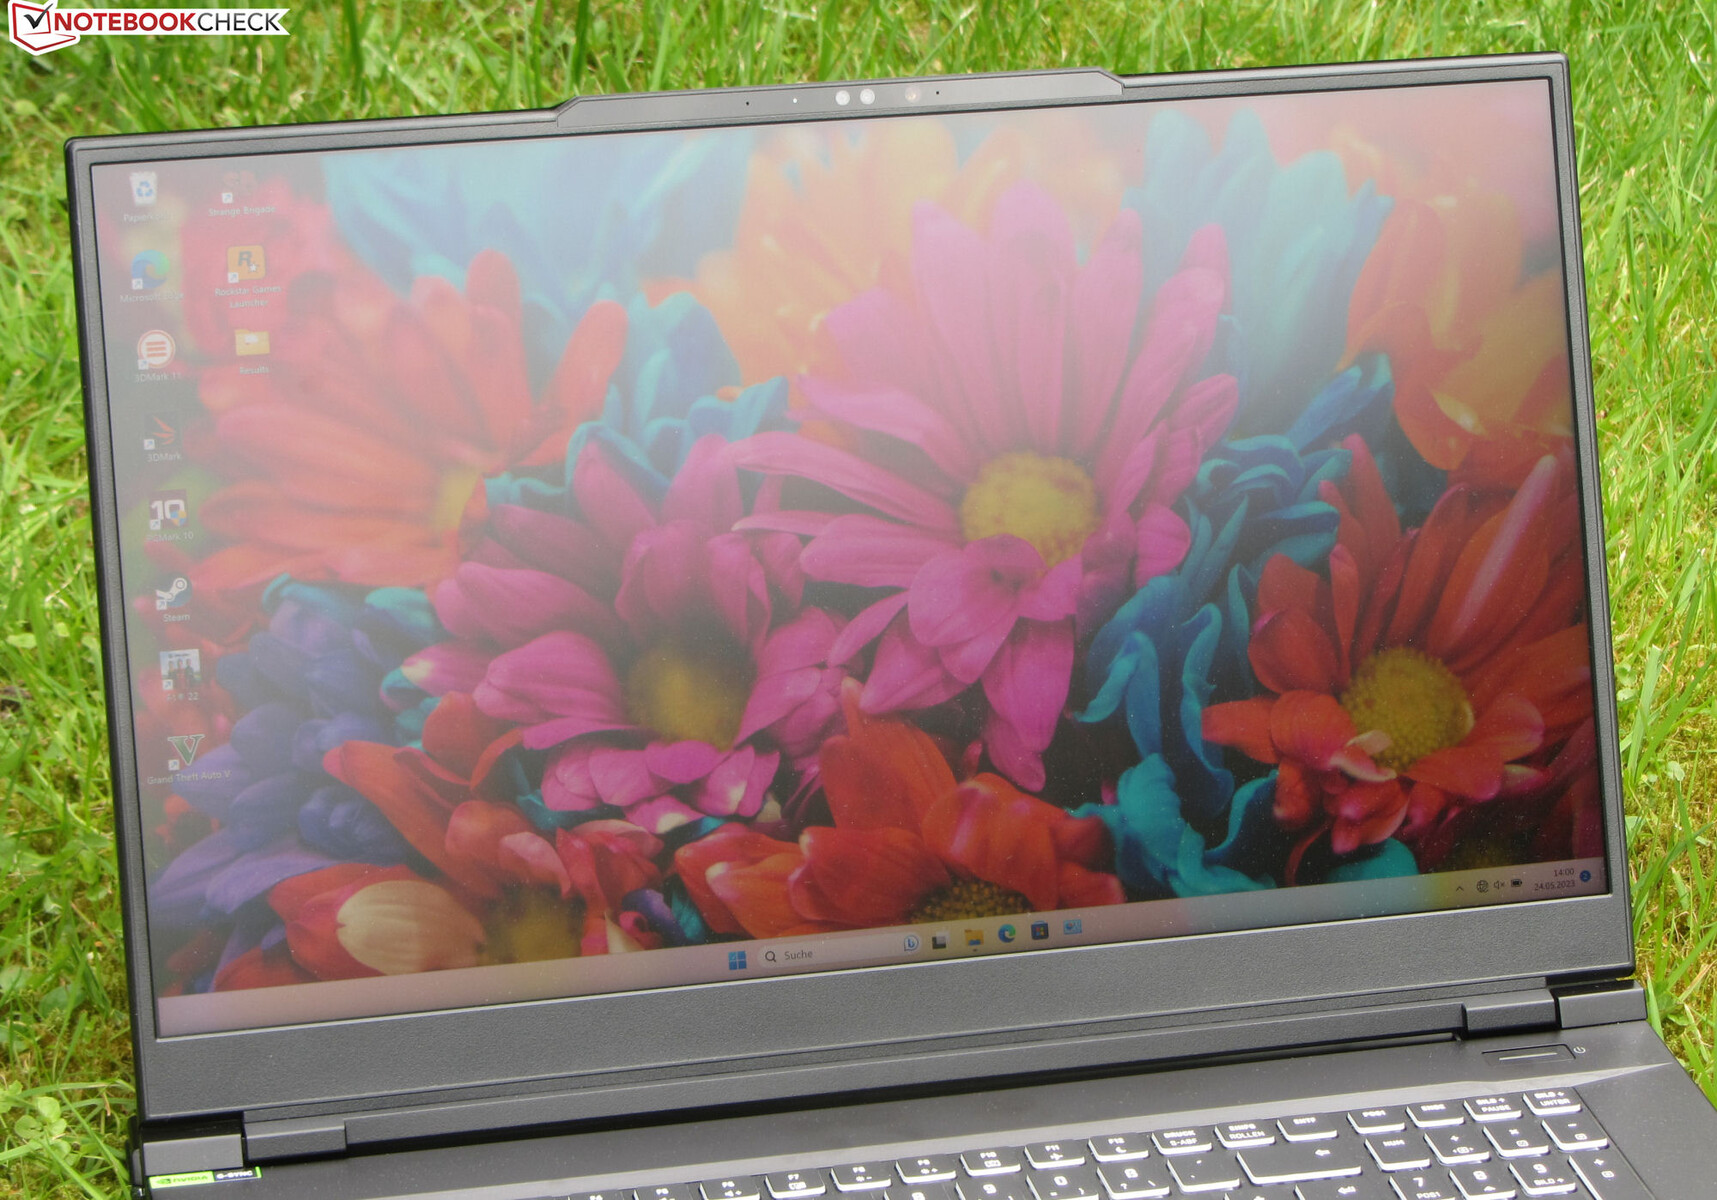
Pantalla: panel UHD con cobertura DCI-P3
Además de la pantalla IPS 4K (3,840 x 2,150 pixels, 144Hz) del modelo de pruebas, Schenker también ofrece el Key 17 Pro con un panel IPS QHD (2,560 x 1,440 pixels, 240Hz) - ambas pantallas de 17.3 pulgadas soportan G-Sync.
El panel 4K se caracteriza por su alto brillo y la ausencia de parpadeo PWM, y también ofrece una alta tasa de refresco (144Hz) y rápidos tiempos de respuesta. Dicho esto, no da la talla (> 1.000:1) en lo que respecta a la relación de contraste.
| |||||||||||||||||||||||||
iluminación: 87 %
Brillo con batería: 487 cd/m²
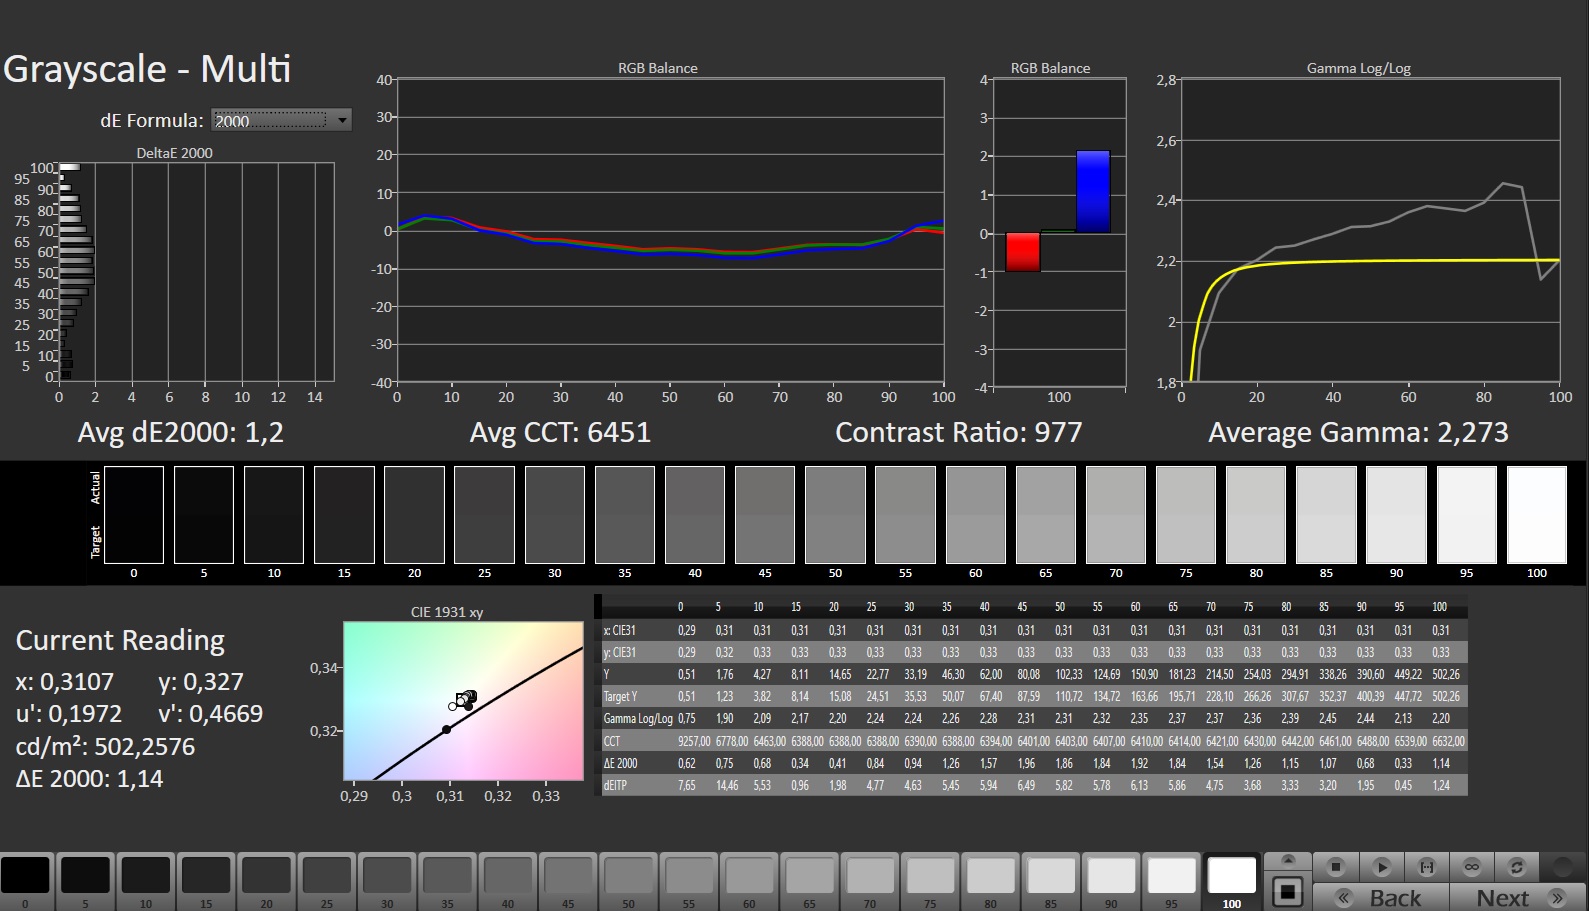
Contraste: 955:1 (Negro: 0.51 cd/m²)
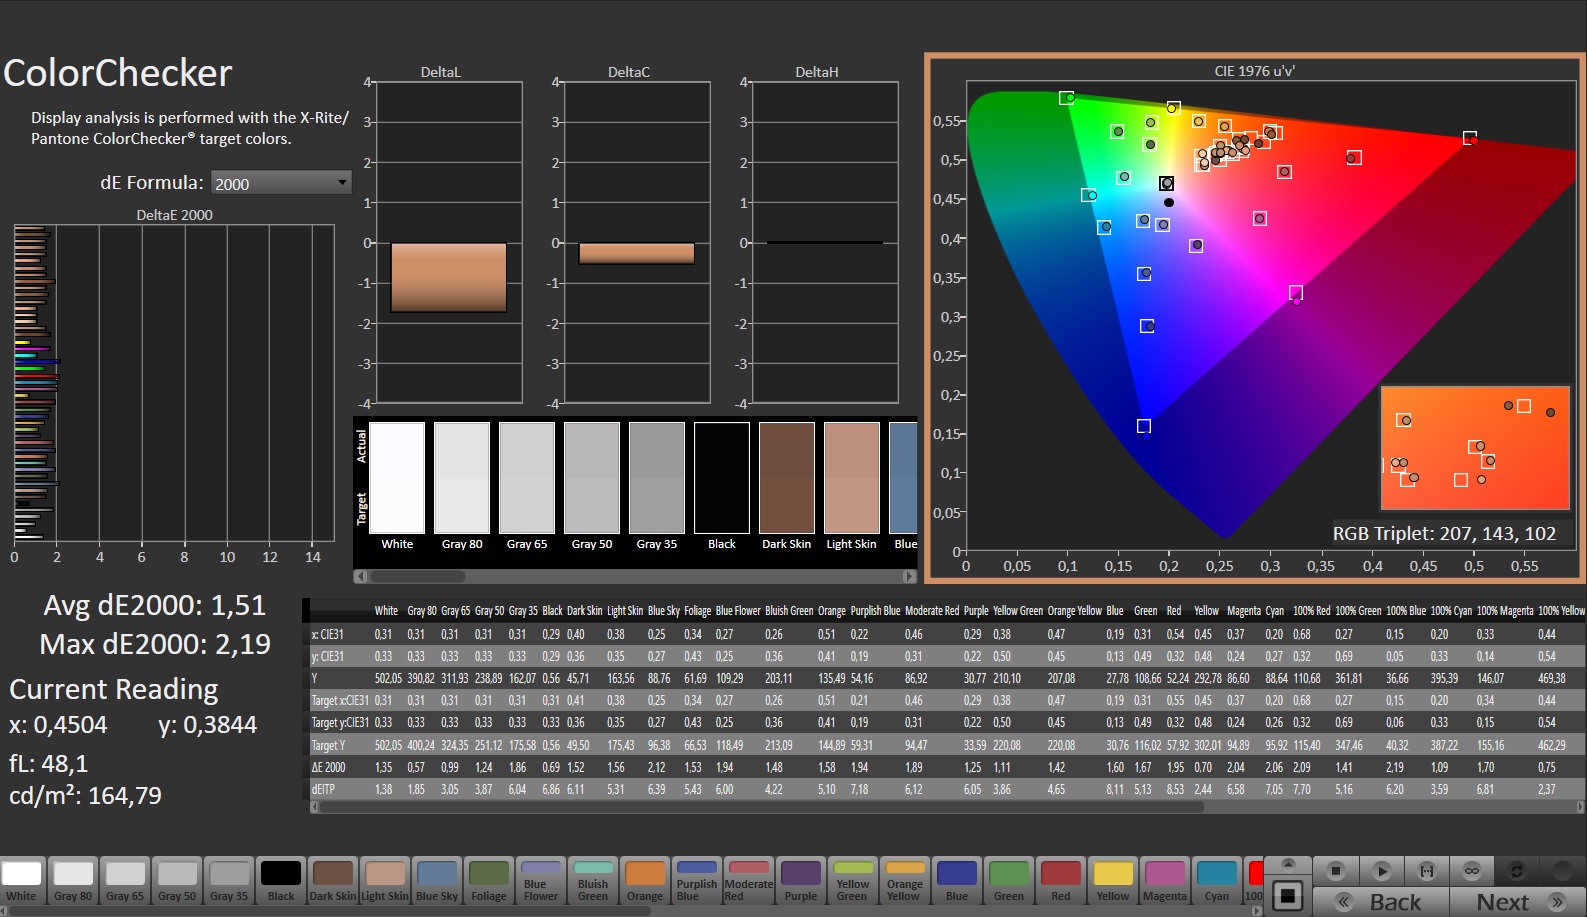
ΔE ColorChecker Calman: 1.51 | ∀{0.5-29.43 Ø4.71}
ΔE Greyscale Calman: 1.2 | ∀{0.09-98 Ø4.96}
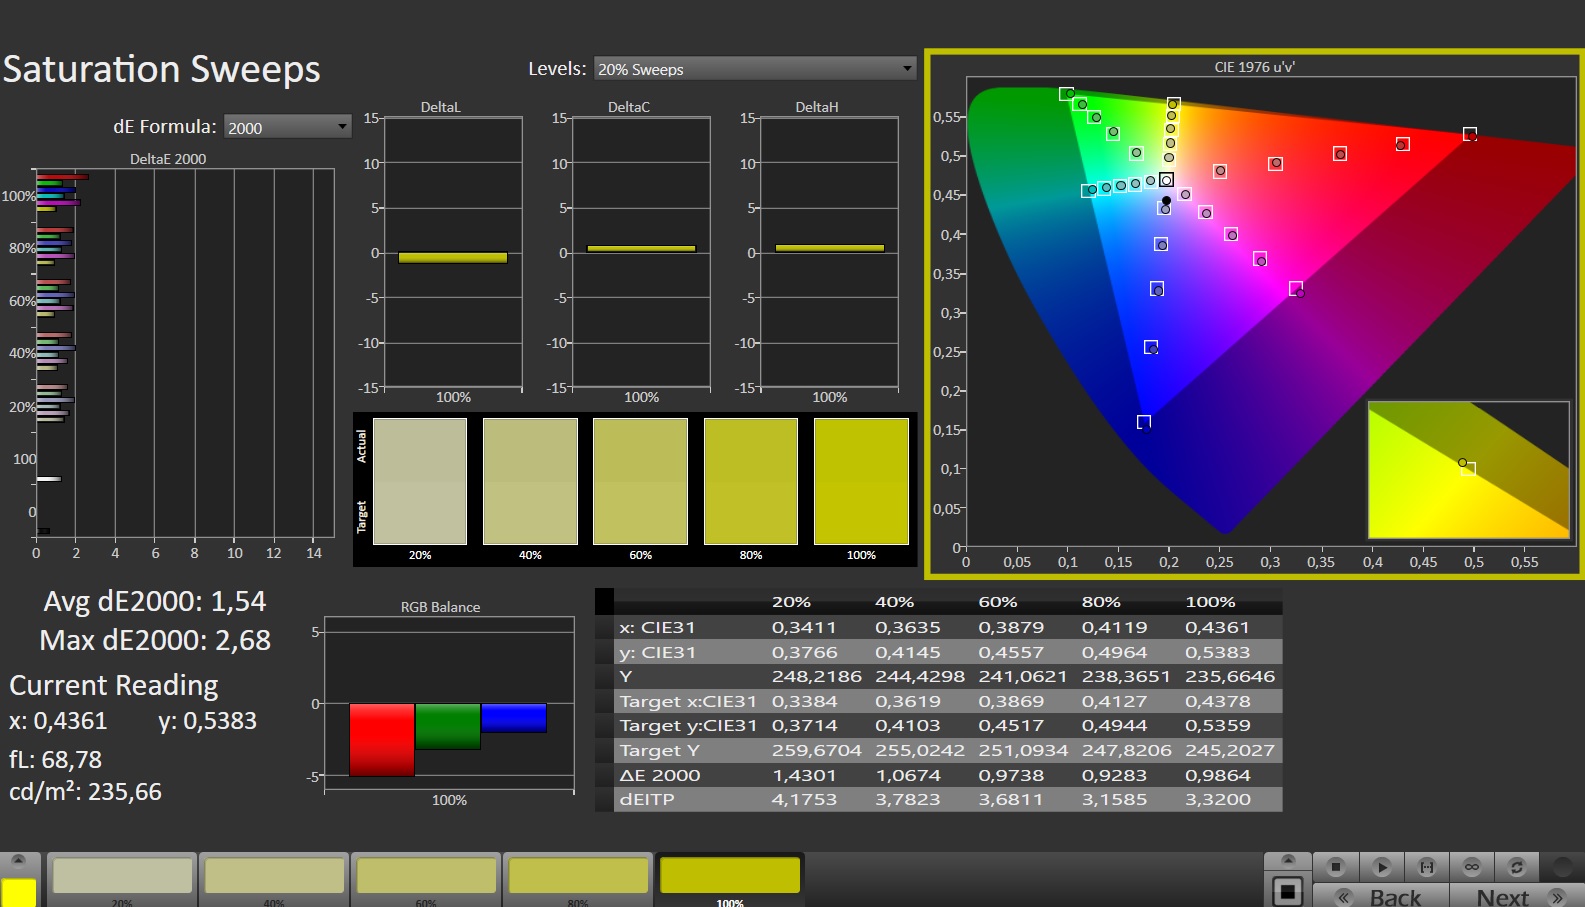
84.3% AdobeRGB 1998 (Argyll 3D)
99.9% sRGB (Argyll 3D)
96.4% Display P3 (Argyll 3D)
Gamma: 2.273
CCT: 6451 K
| Schenker Key 17 Pro (Early 23) BOE CQ NE173QUM-NY1, IPS, 3840x2160, 17.3" | MSI Stealth 17 Studio A13VH-014 AUO41A2 B173ZAN06.C, Mini LED, 3840x2160, 17.3" | Asus ROG Strix Scar 17 G733PY-XS96 NE173QHM-NZ2, IPS, 2560x1440, 17.3" | Aorus 17X AZF BOE09F9, IPS, 2560x1440, 17.3" | Medion Erazer Beast X40 BOE NE170QDM-NZ1, IPS, 2560x1600, 17" | |
|---|---|---|---|---|---|
| Display | 2% | 1% | 0% | -16% | |
| Display P3 Coverage (%) | 96.4 | 92 -5% | 98 2% | 96.7 0% | 68.6 -29% |
| sRGB Coverage (%) | 99.9 | 99.1 -1% | 100 0% | 99.9 0% | 99.8 0% |
| AdobeRGB 1998 Coverage (%) | 84.3 | 94.07 12% | 85.6 2% | 84.5 0% | 69.4 -18% |
| Response Times | -62% | 0% | -18% | 10% | |
| Response Time Grey 50% / Grey 80% * (ms) | 14.8 ? | 46.4 ? -214% | 6.2 ? 58% | 14 ? 5% | 11.3 ? 24% |
| Response Time Black / White * (ms) | 7.2 ? | 0.62 ? 91% | 11.4 ? -58% | 10.1 ? -40% | 7.5 ? -4% |
| PWM Frequency (Hz) | 2400 | ||||
| Screen | 221% | -8% | -57% | -29% | |
| Brightness middle (cd/m²) | 487 | 397.29 -18% | 322.5 -34% | 294 -40% | 384 -21% |
| Brightness (cd/m²) | 485 | 392 -19% | 317 -35% | 276 -43% | 377 -22% |
| Brightness Distribution (%) | 87 | 93 7% | 86 -1% | 90 3% | 90 3% |
| Black Level * (cd/m²) | 0.51 | 0.02 96% | 0.29 43% | 0.28 45% | 0.45 12% |
| Contrast (:1) | 955 | 19865 1980% | 1112 16% | 1050 10% | 853 -11% |
| Colorchecker dE 2000 * | 1.51 | 2.52 -67% | 1.15 24% | 2.81 -86% | 2.05 -36% |
| Colorchecker dE 2000 max. * | 2.19 | 3.91 -79% | 3.03 -38% | 5.7 -160% | 3.64 -66% |
| Greyscale dE 2000 * | 1.2 | 2.78 -132% | 1.7 -42% | 3.4 -183% | 2.3 -92% |
| Gamma | 2.273 97% | 2.63 84% | 2.27 97% | 2.301 96% | 2.017 109% |
| CCT | 6451 101% | 6412 101% | 6299 103% | 7389 88% | 6546 99% |
| Colorchecker dE 2000 calibrated * | 2.52 | 0.56 | 0.86 | 0.74 | |
| Media total (Programa/Opciones) | 54% /
127% | -2% /
-5% | -25% /
-38% | -12% /
-20% |
* ... más pequeño es mejor
La pantalla ya tenía una excelente reproducción del color nada más sacarla de la caja. Con aproximadamente 1,5, su diferencia media de color entra dentro de lo que consideramos bueno (Delta E < 3). La precisión del color es un hecho: el panel tiene cobertura sRGB completa y puede cubrir casi todo el espacio DCI-P3; también es capaz de reproducir hasta el 84% de la gama AdobeRGB.

Tiempos de respuesta del display
| ↔ Tiempo de respuesta de Negro a Blanco | ||
|---|---|---|
| 7.2 ms ... subida ↗ y bajada ↘ combinada | ↗ 2.2 ms subida | 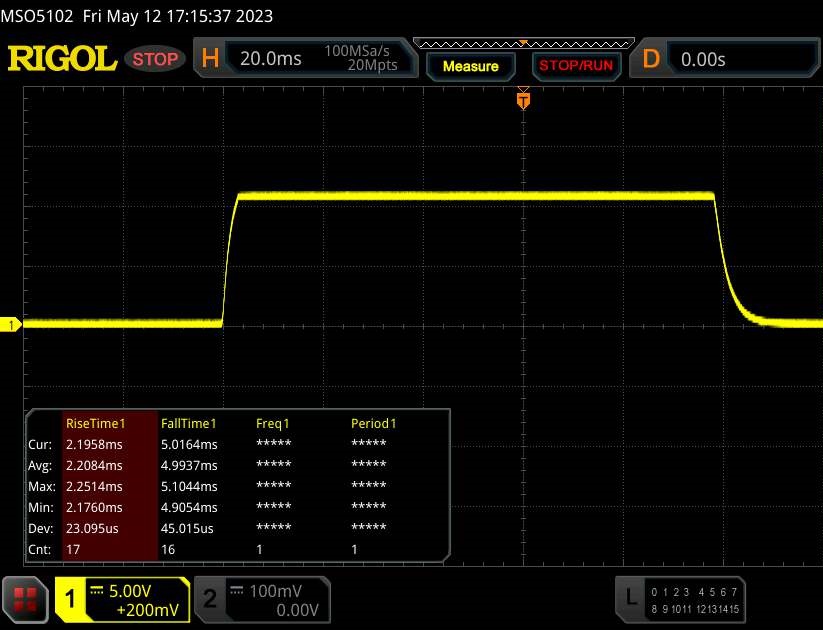 |
| ↘ 5 ms bajada | ||
| La pantalla mostró tiempos de respuesta muy rápidos en nuestros tests y debería ser adecuada para juegos frenéticos. En comparación, todos los dispositivos de prueba van de ##min### (mínimo) a 240 (máximo) ms. » 21 % de todos los dispositivos son mejores. Esto quiere decir que el tiempo de respuesta medido es mejor que la media (19.8 ms) de todos los dispositivos testados. | ||
| ↔ Tiempo de respuesta 50% Gris a 80% Gris | ||
| 14.8 ms ... subida ↗ y bajada ↘ combinada | ↗ 7.2 ms subida | 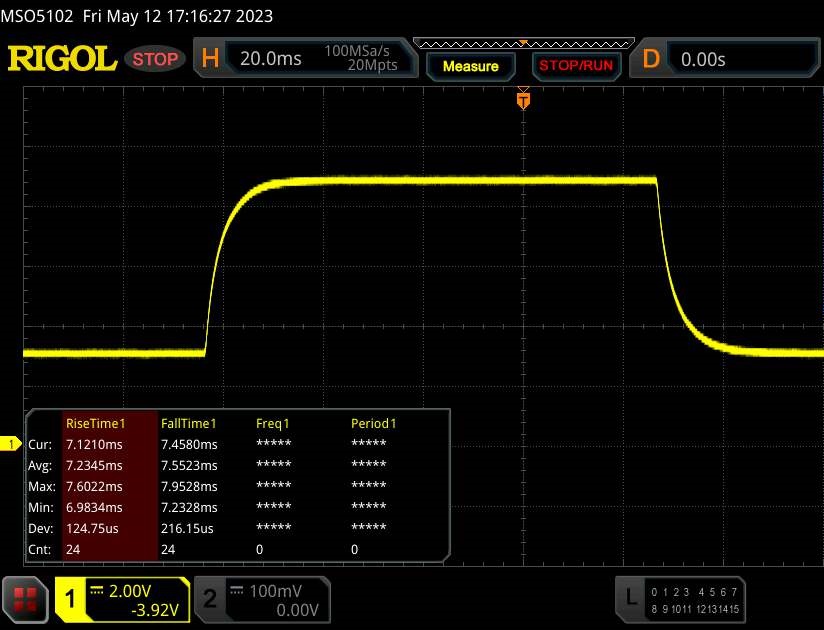 |
| ↘ 7.6 ms bajada | ||
| La pantalla mostró buenos tiempos de respuesta en nuestros tests pero podría ser demasiado lenta para los jugones competitivos. En comparación, todos los dispositivos de prueba van de ##min### (mínimo) a 636 (máximo) ms. » 29 % de todos los dispositivos son mejores. Esto quiere decir que el tiempo de respuesta medido es mejor que la media (31 ms) de todos los dispositivos testados. | ||
Parpadeo de Pantalla / PWM (Pulse-Width Modulation)
| Parpadeo de Pantalla / PWM no detectado | 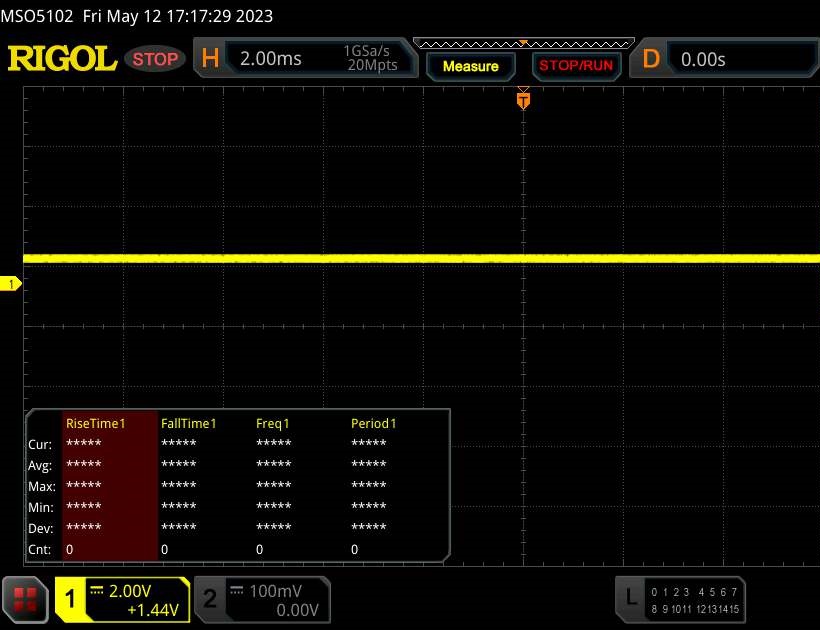 | ||
Comparación: 52 % de todos los dispositivos testados no usaron PWM para atenuar el display. Si se usó, medimos una media de 7757 (mínimo: 5 - máxmo: 343500) Hz. | |||
La pantalla IPS es legible desde cualquier posición gracias a su amplio ángulo de visión. Podrás distinguir el contenido de la pantalla incluso en exteriores, siempre que el sol no brille demasiado.
Rendimiento: la Key 17 incorpora hardware de gama alta
El Schenker Key 17 Pro es un portátil de gama alta de 17,3 pulgadas que aprovecha la potencia de Raptor Lake y Ada Lovelace. Puedes configurar el portátil según tus necesidades en la tienda online de Schenker. Nuestra unidad de prueba cuesta unos 4.500 euros (4.820 dólares). Y los precios empiezan en 3.200 euros (3.427 dólares).
Condiciones de la prueba
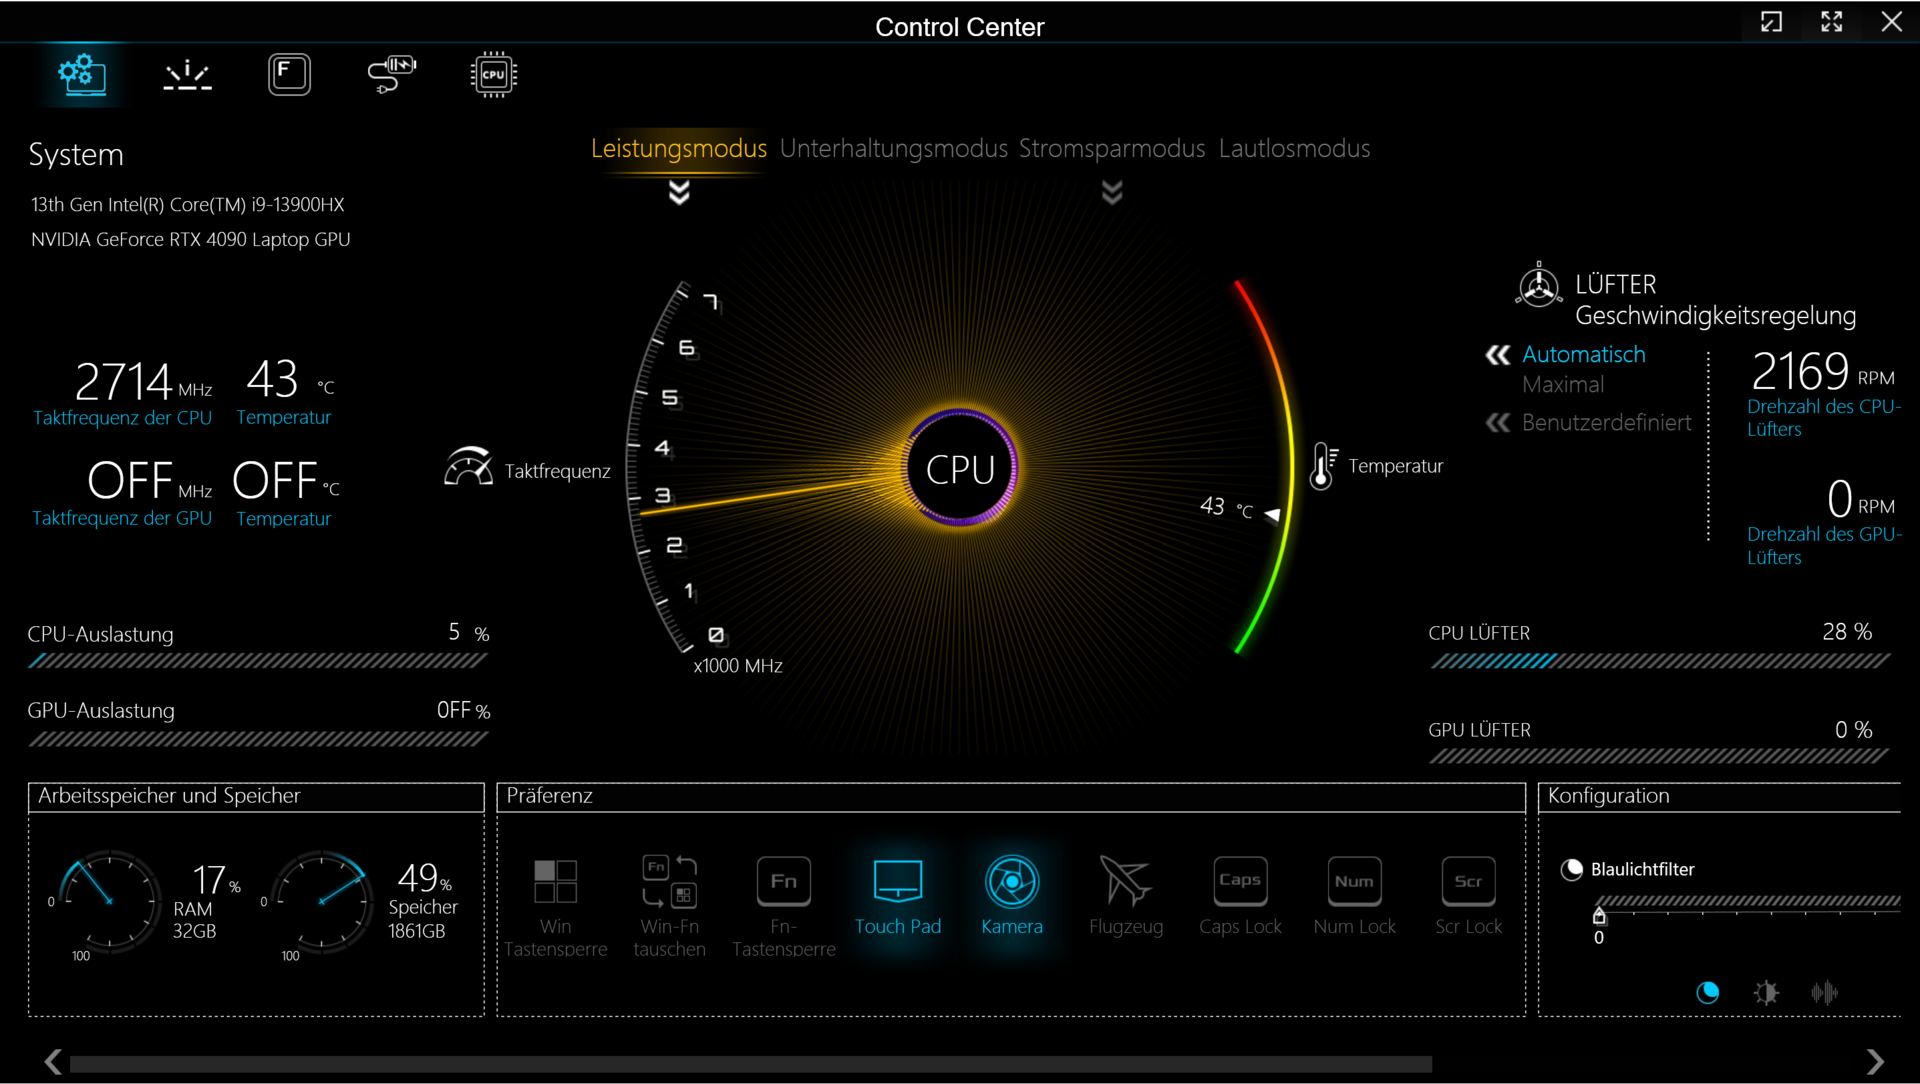
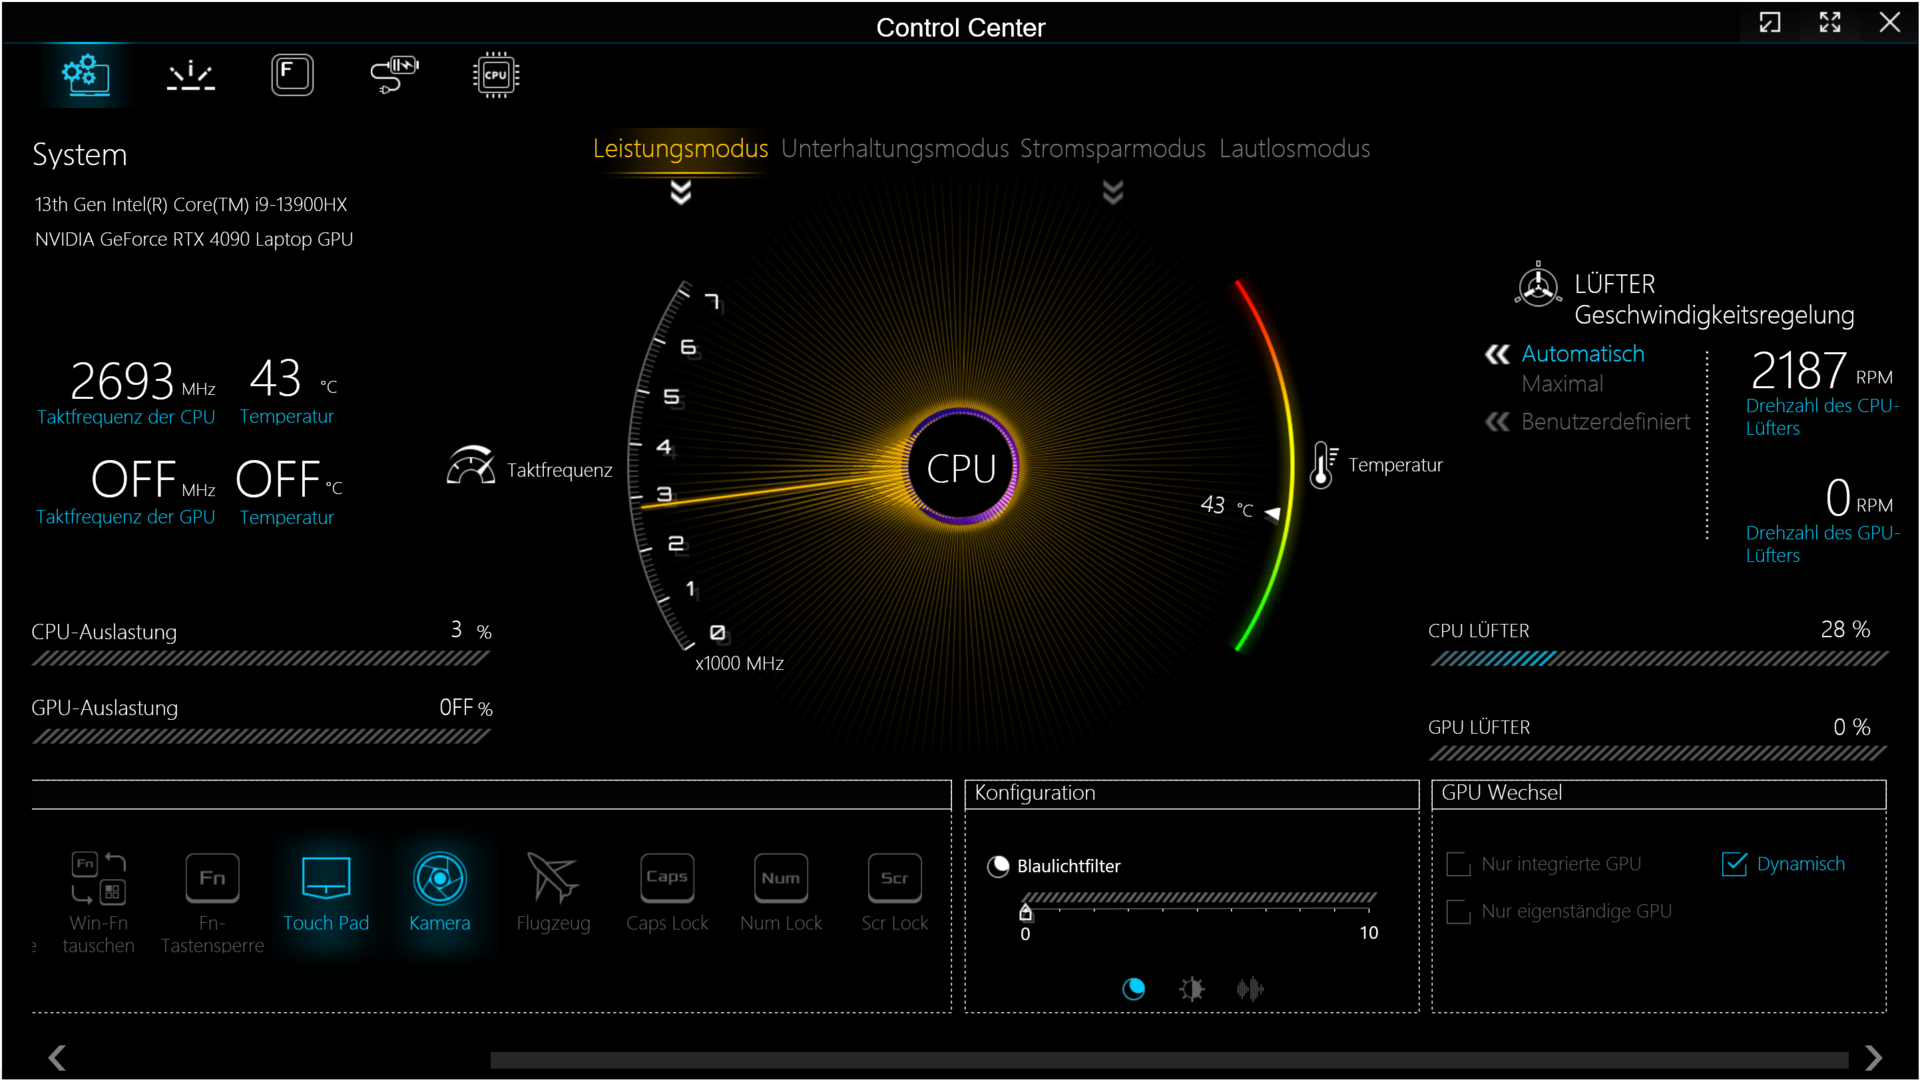
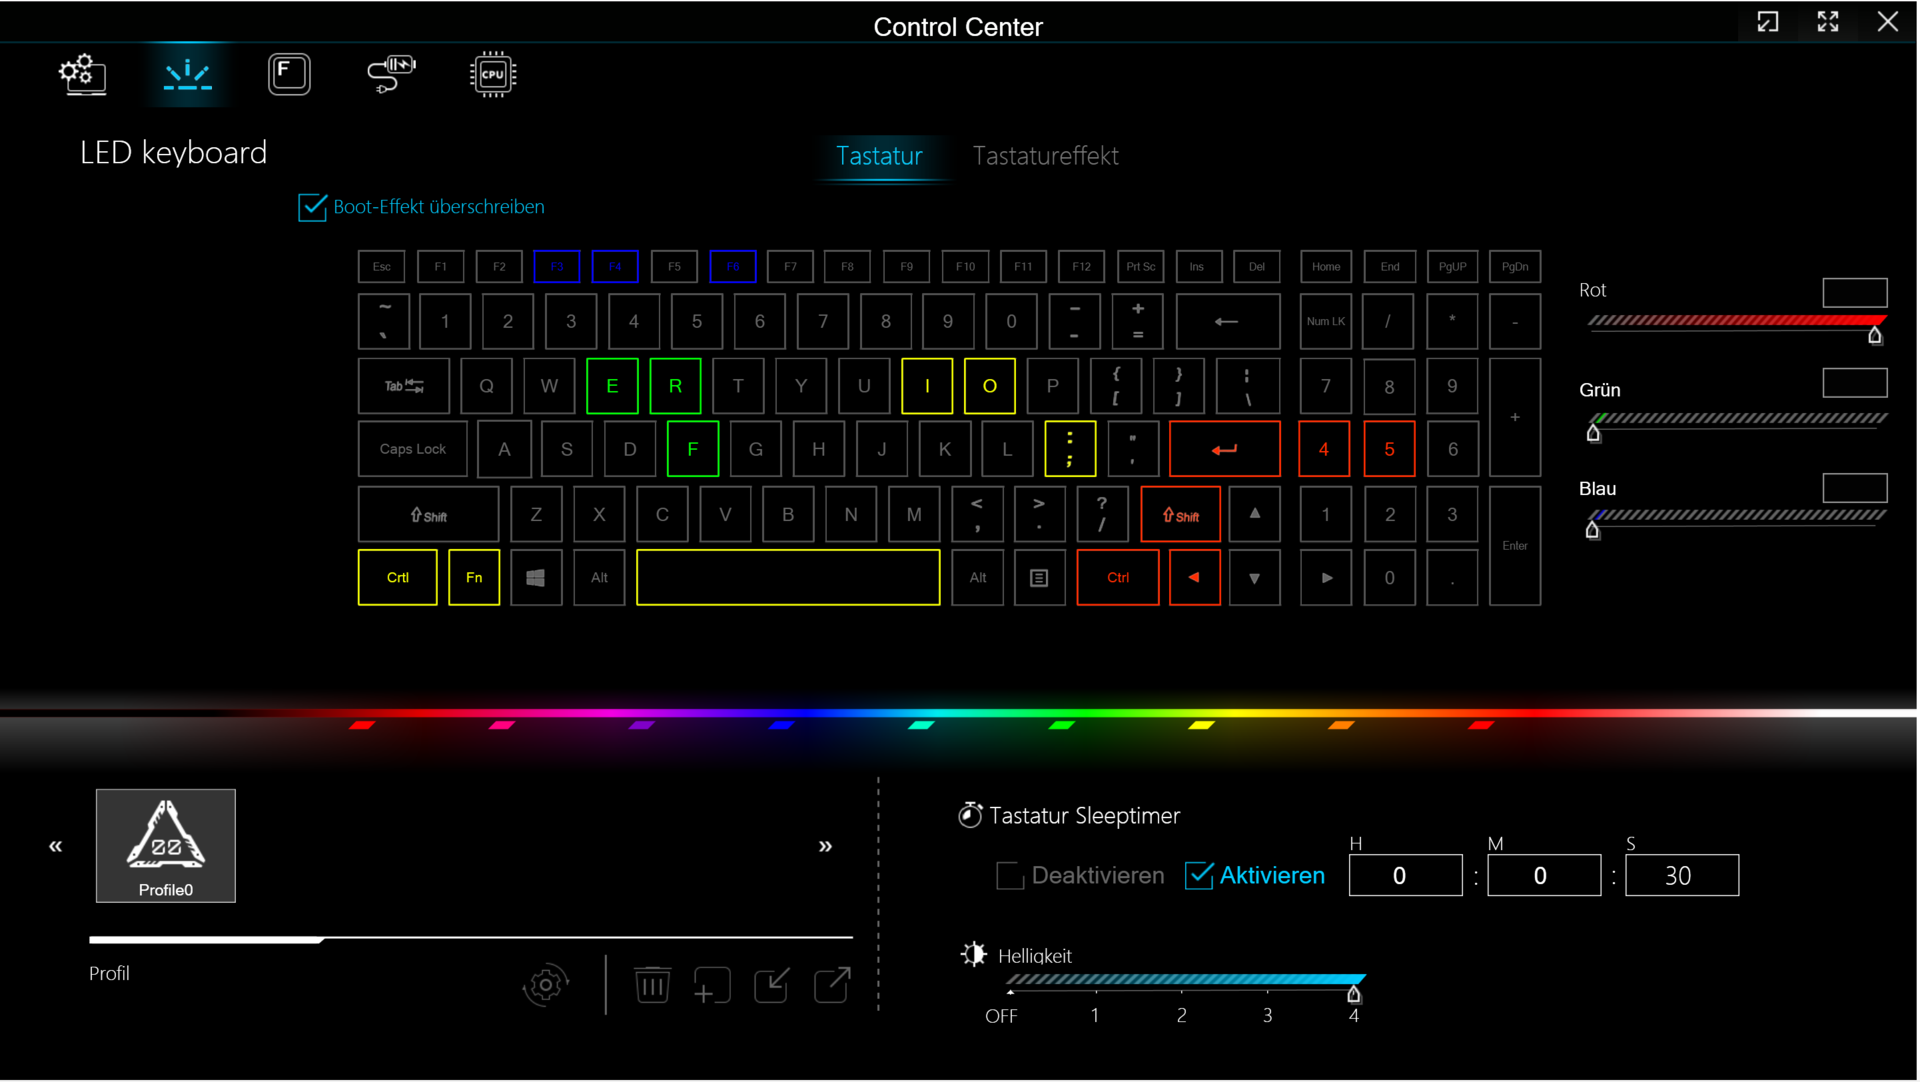
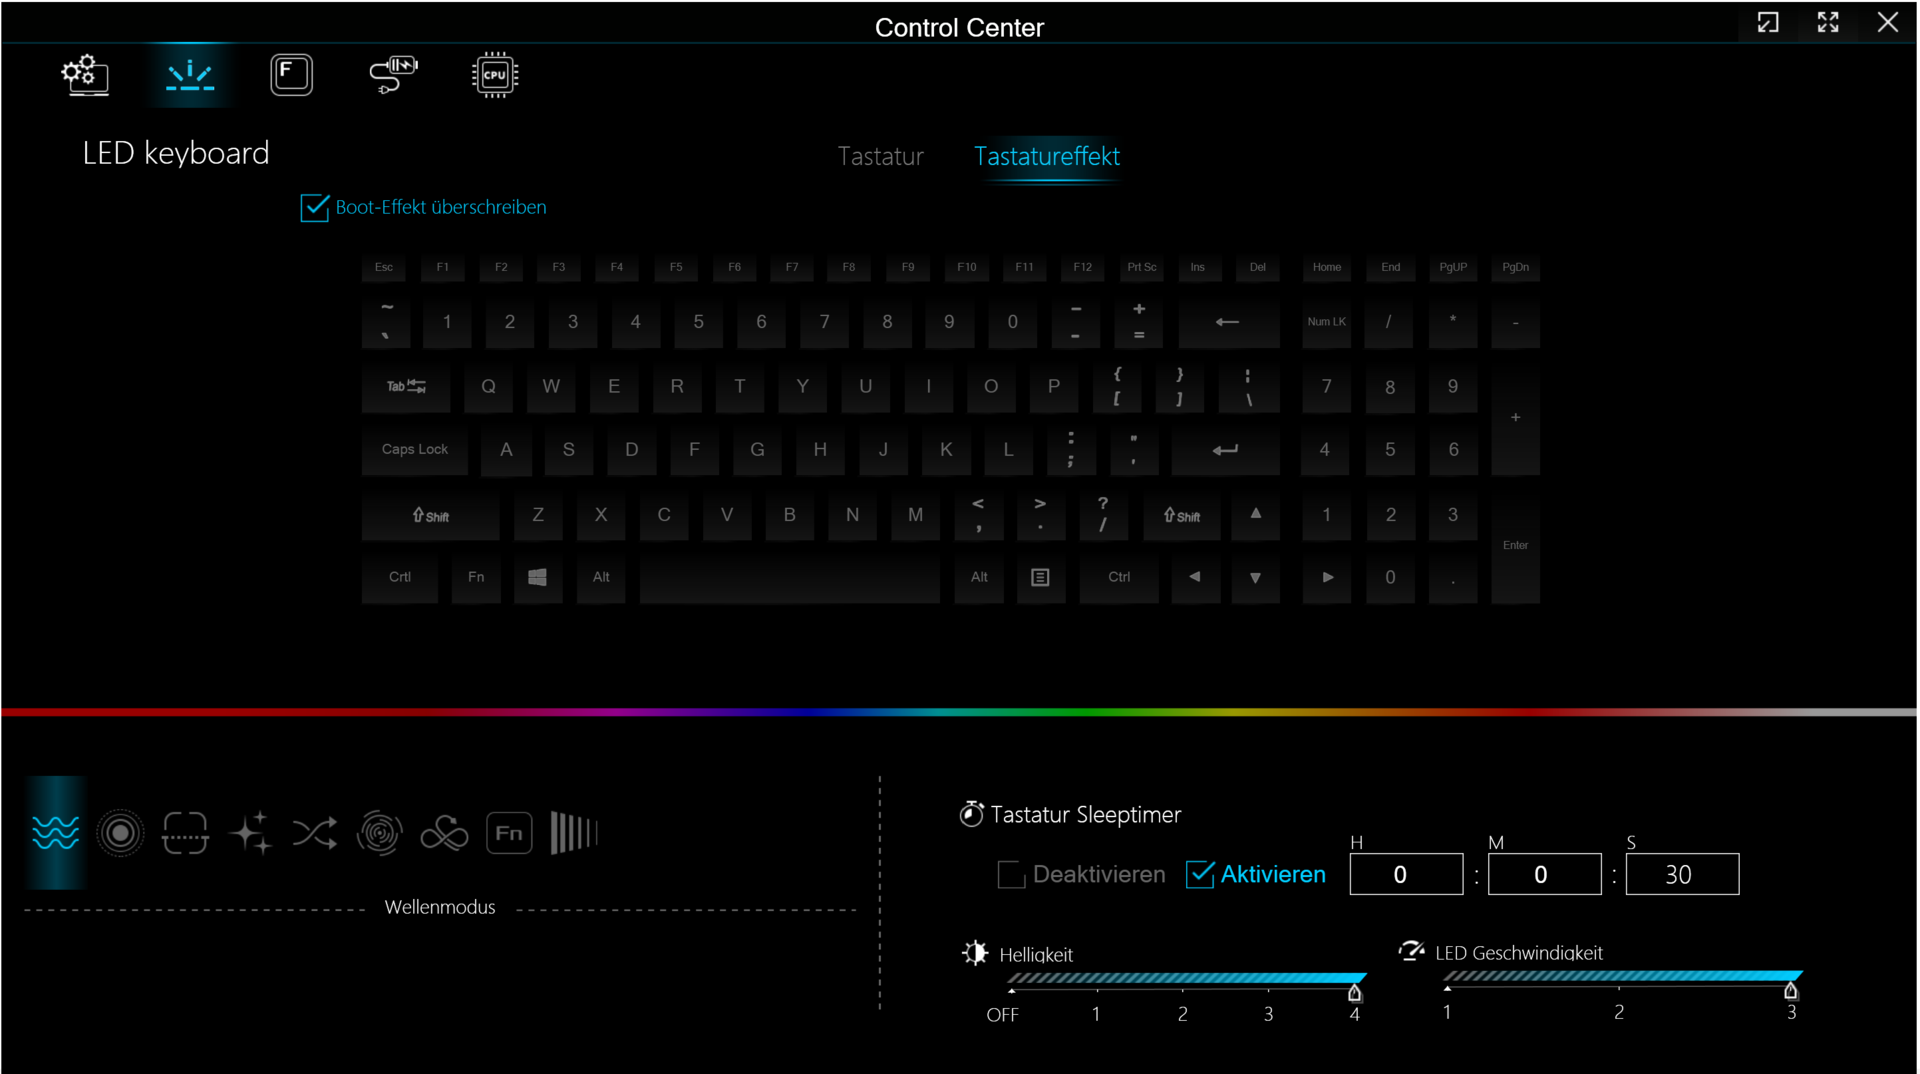
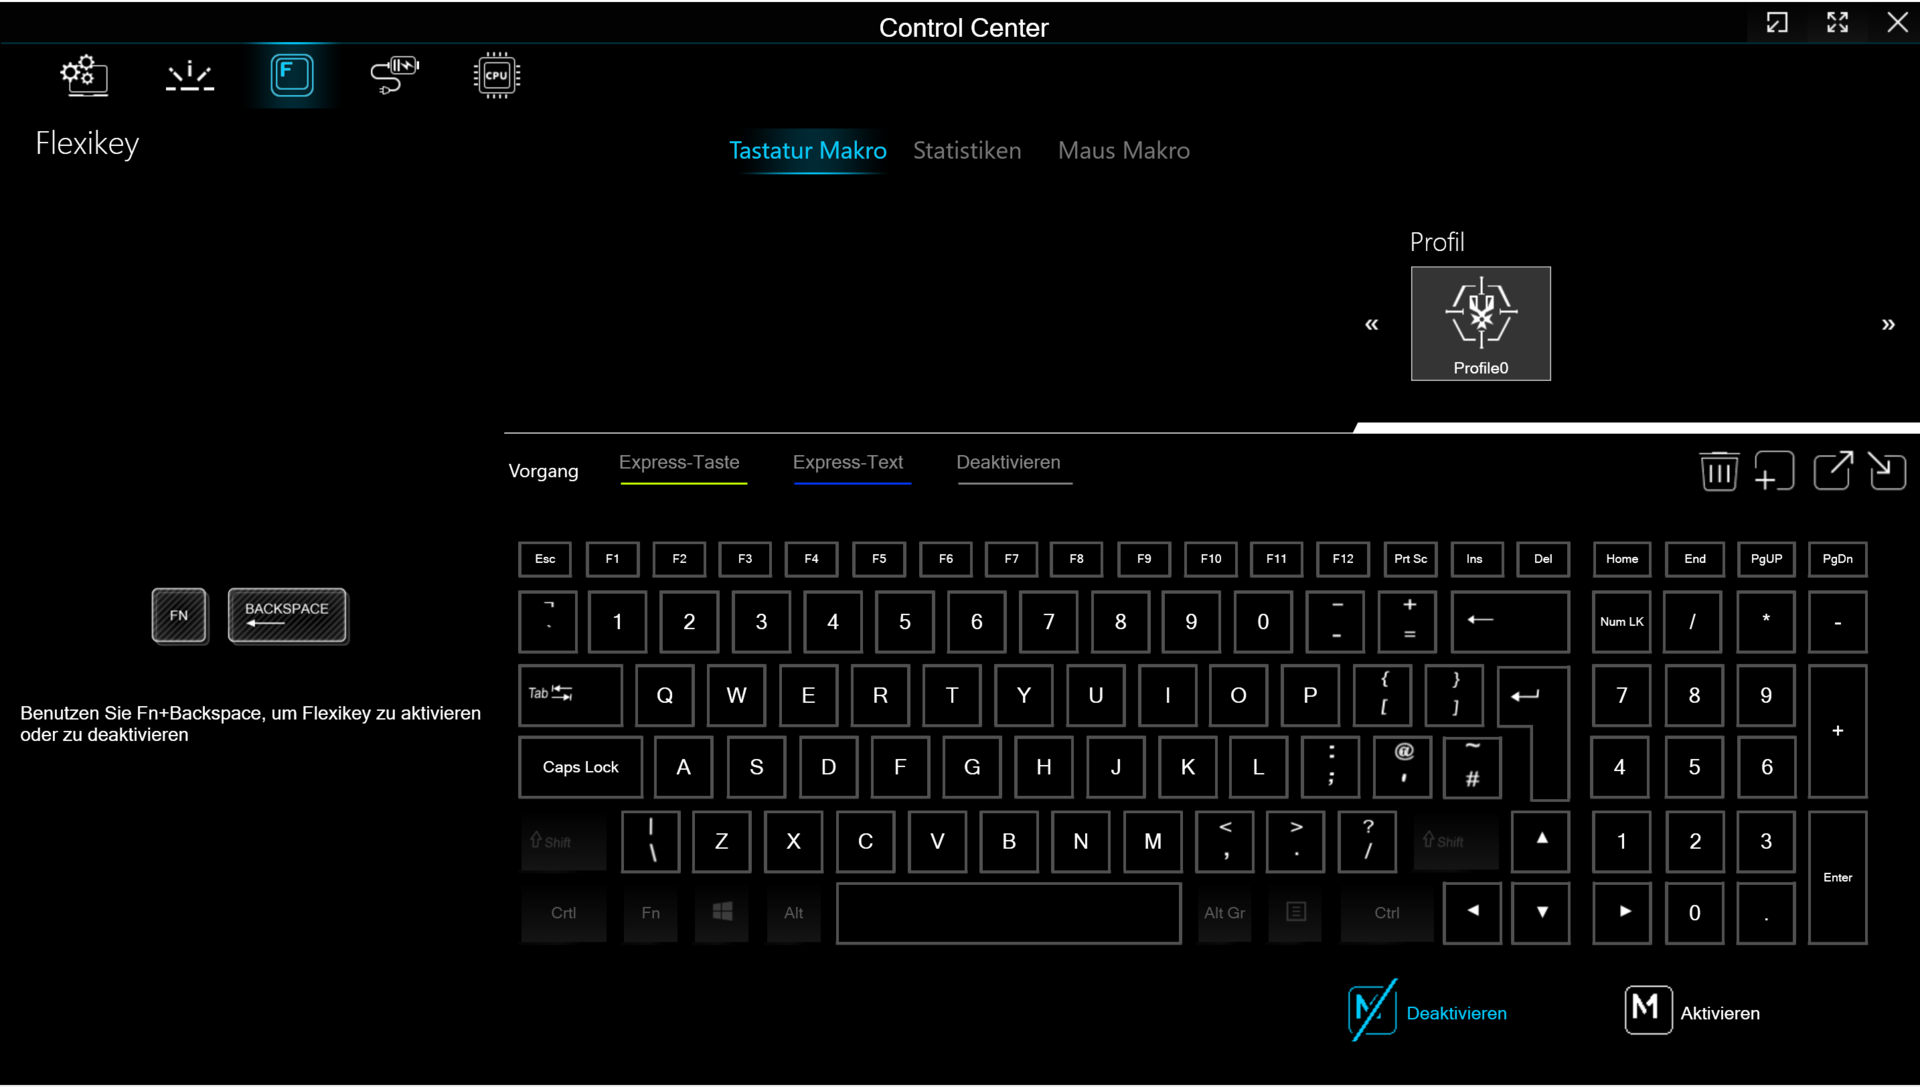
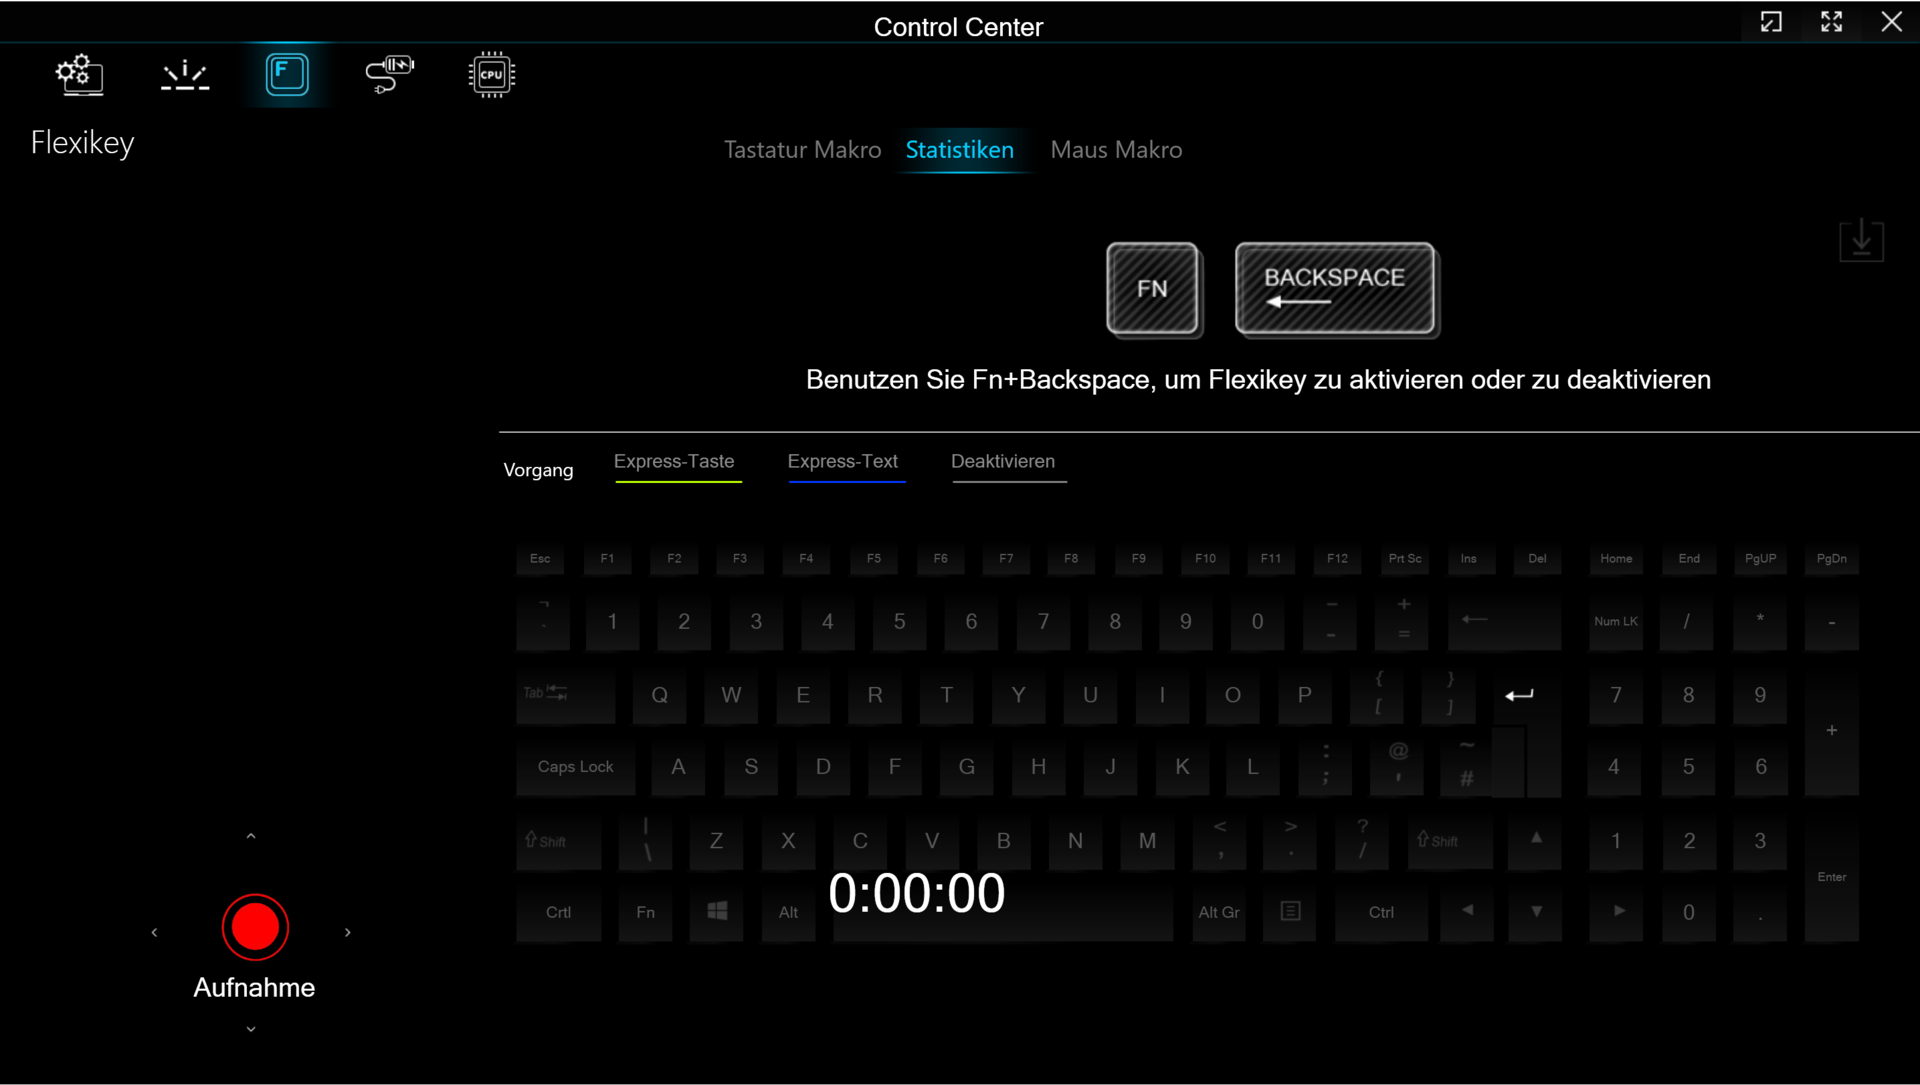
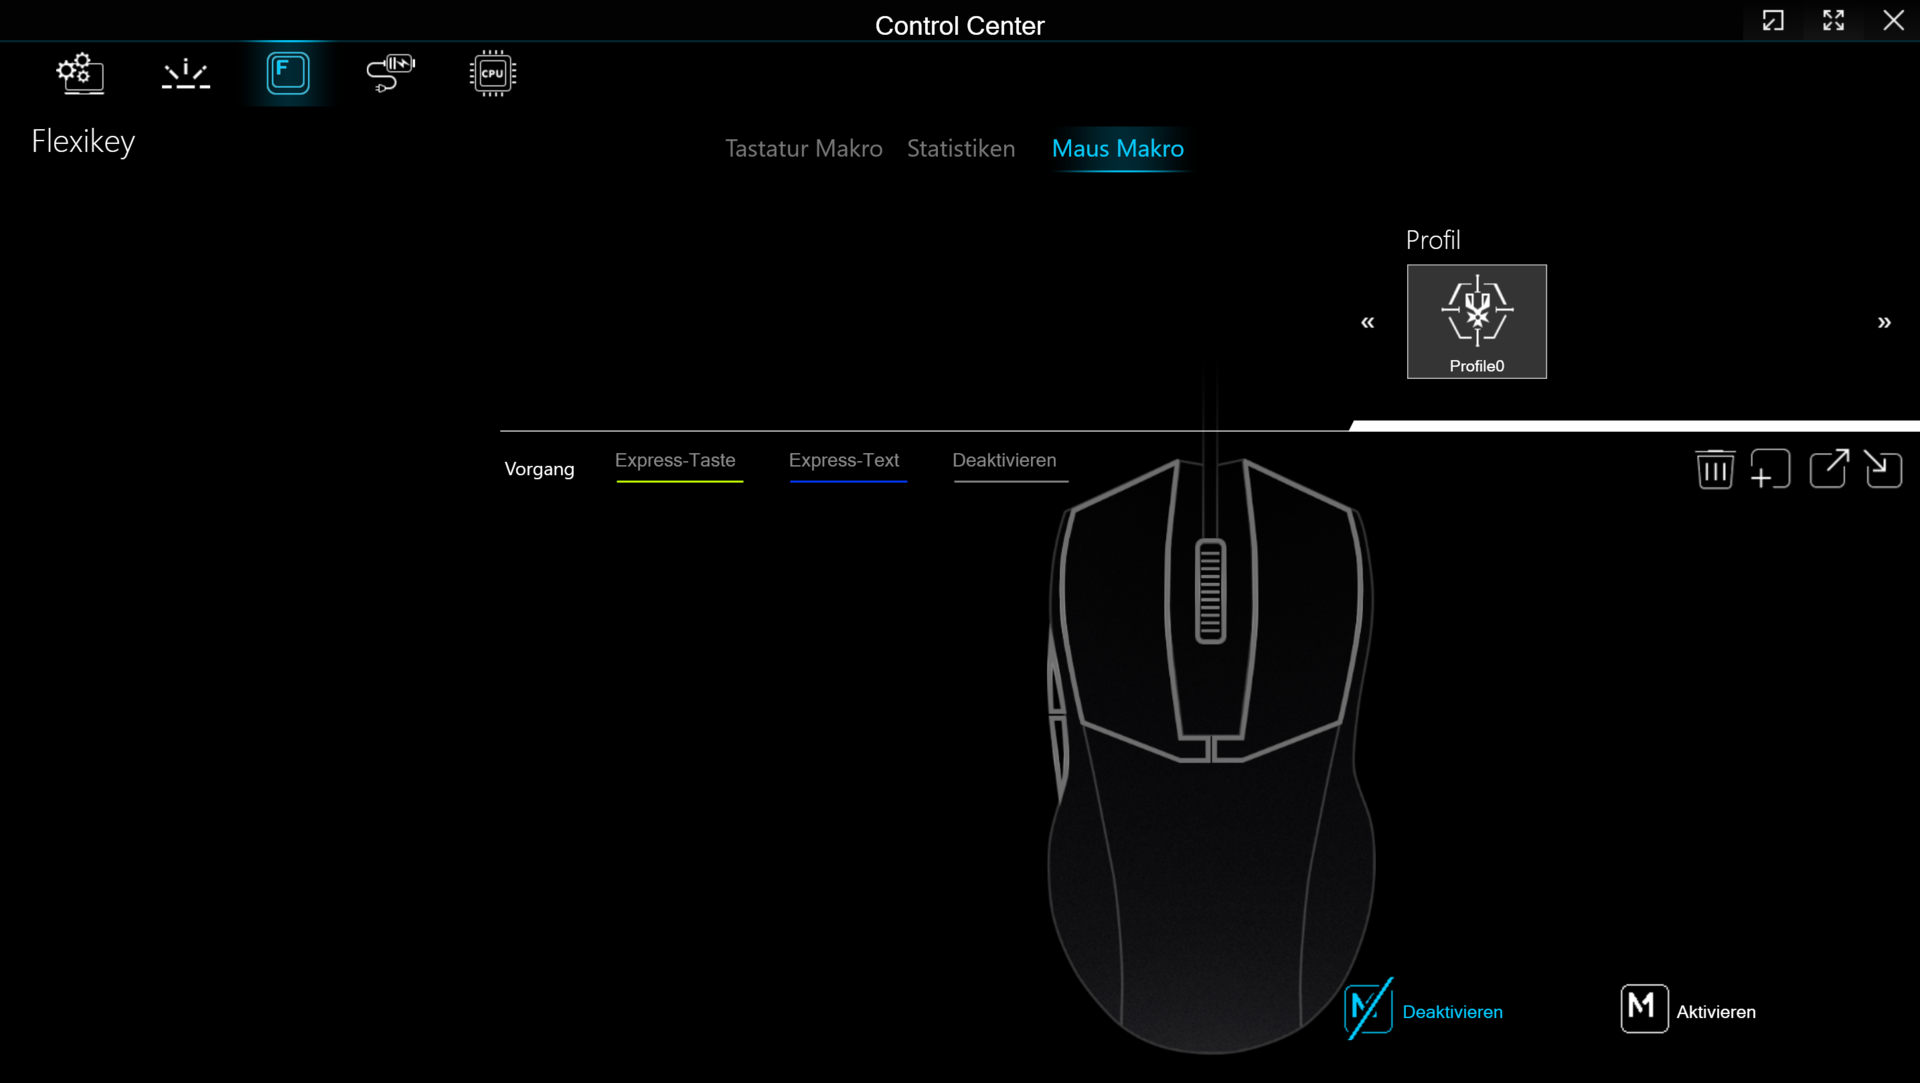
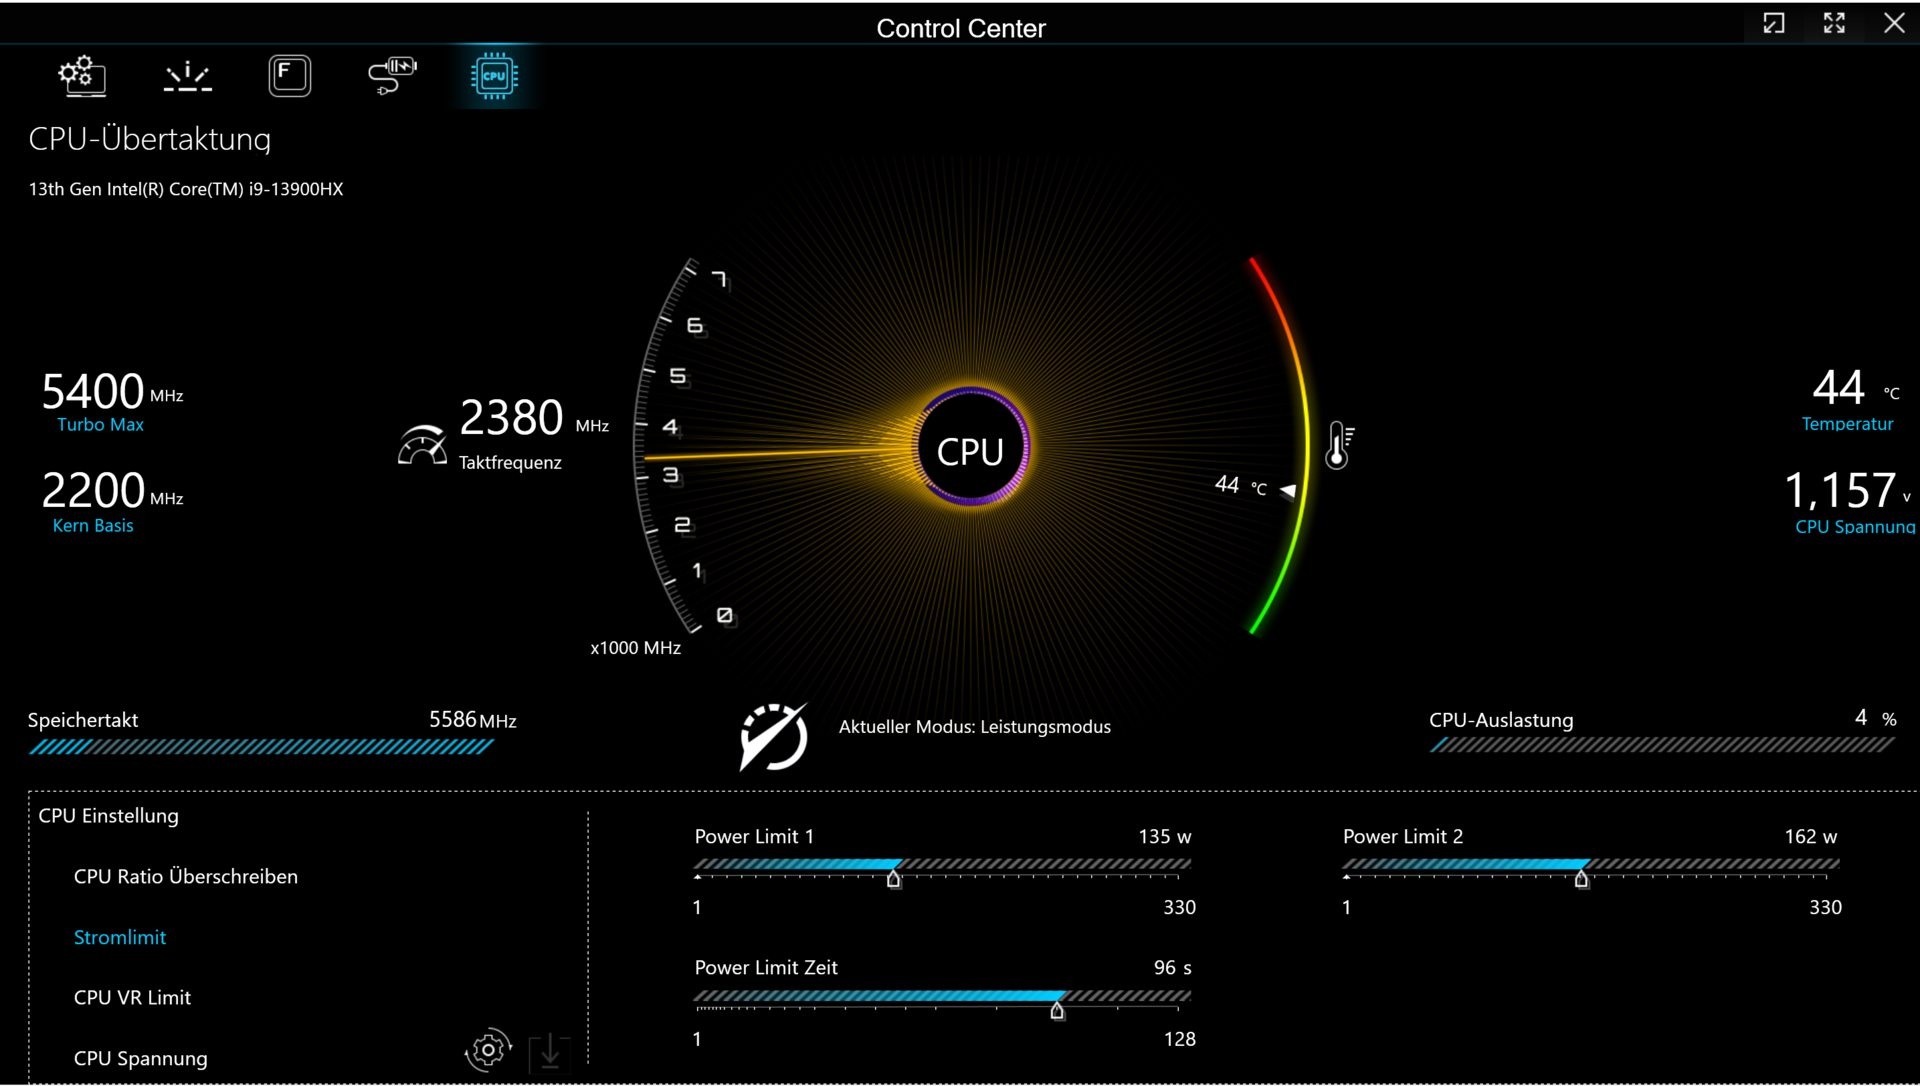
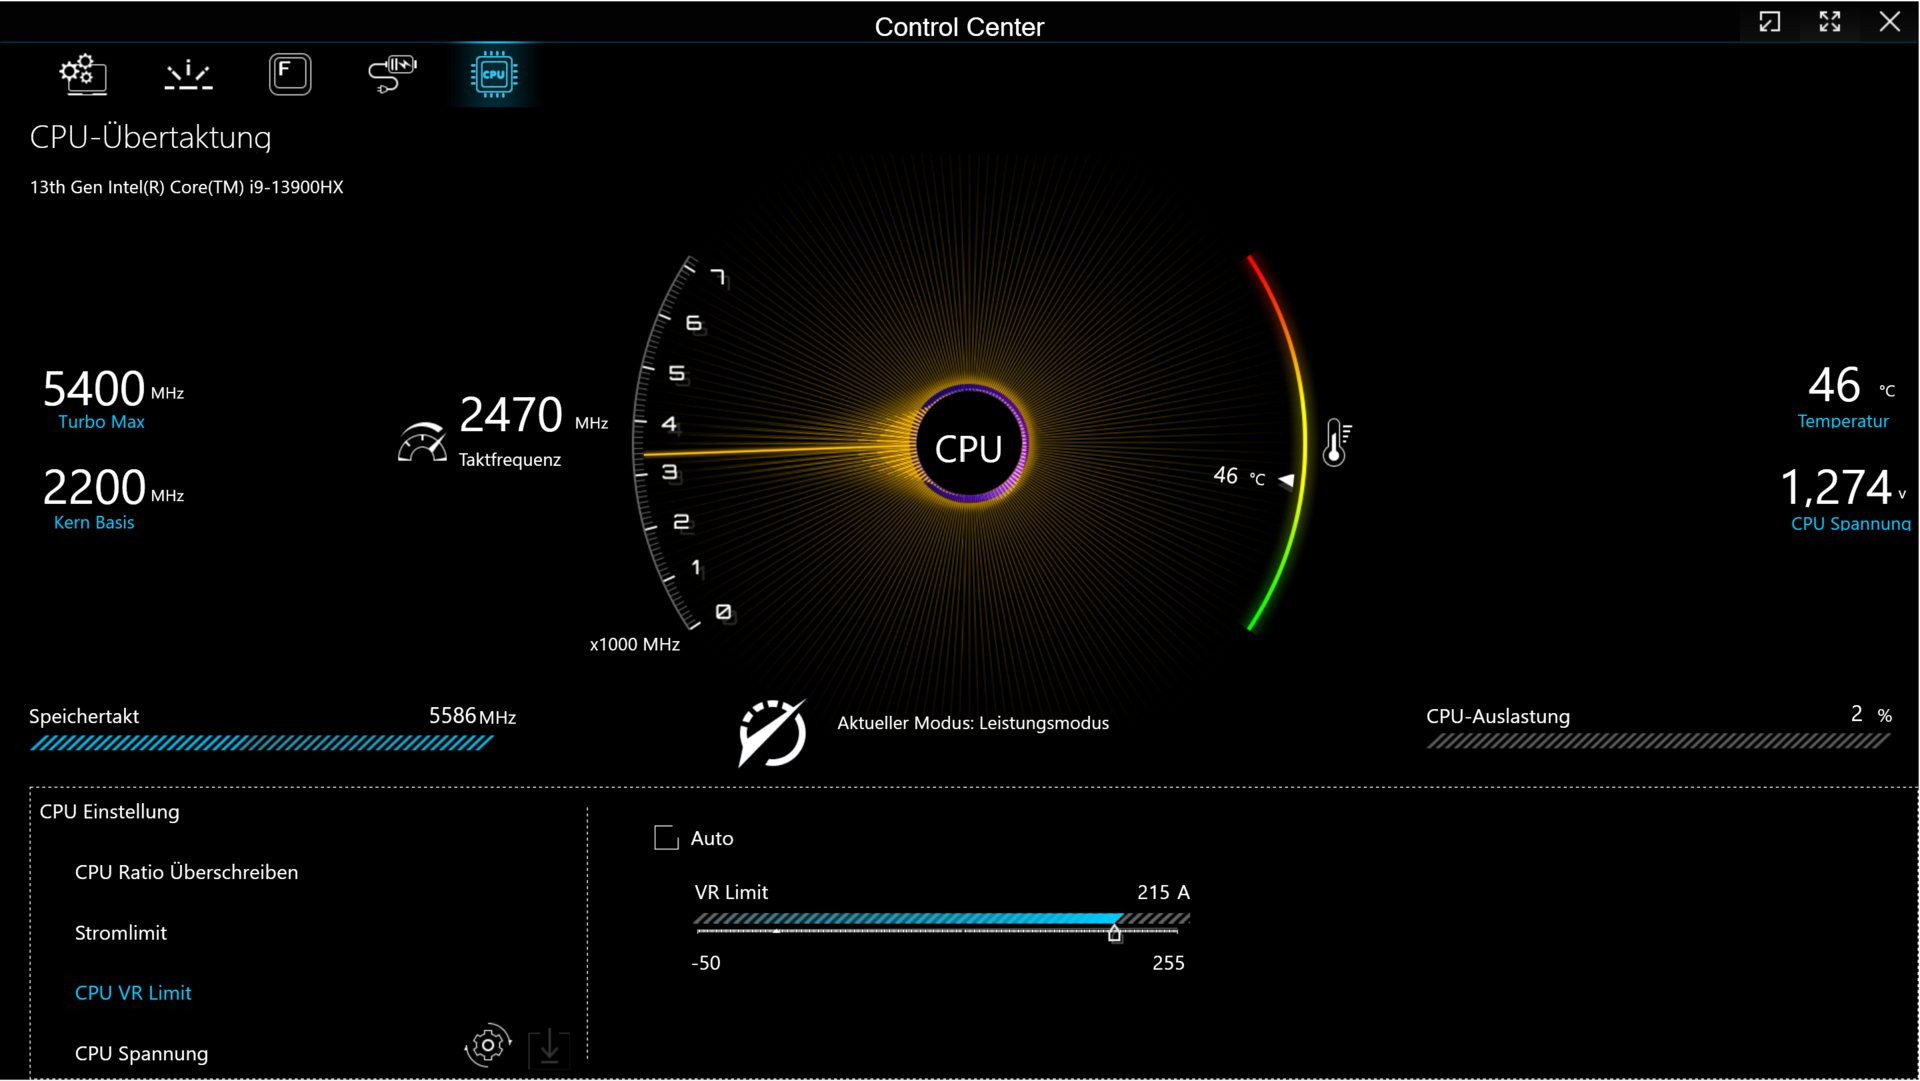
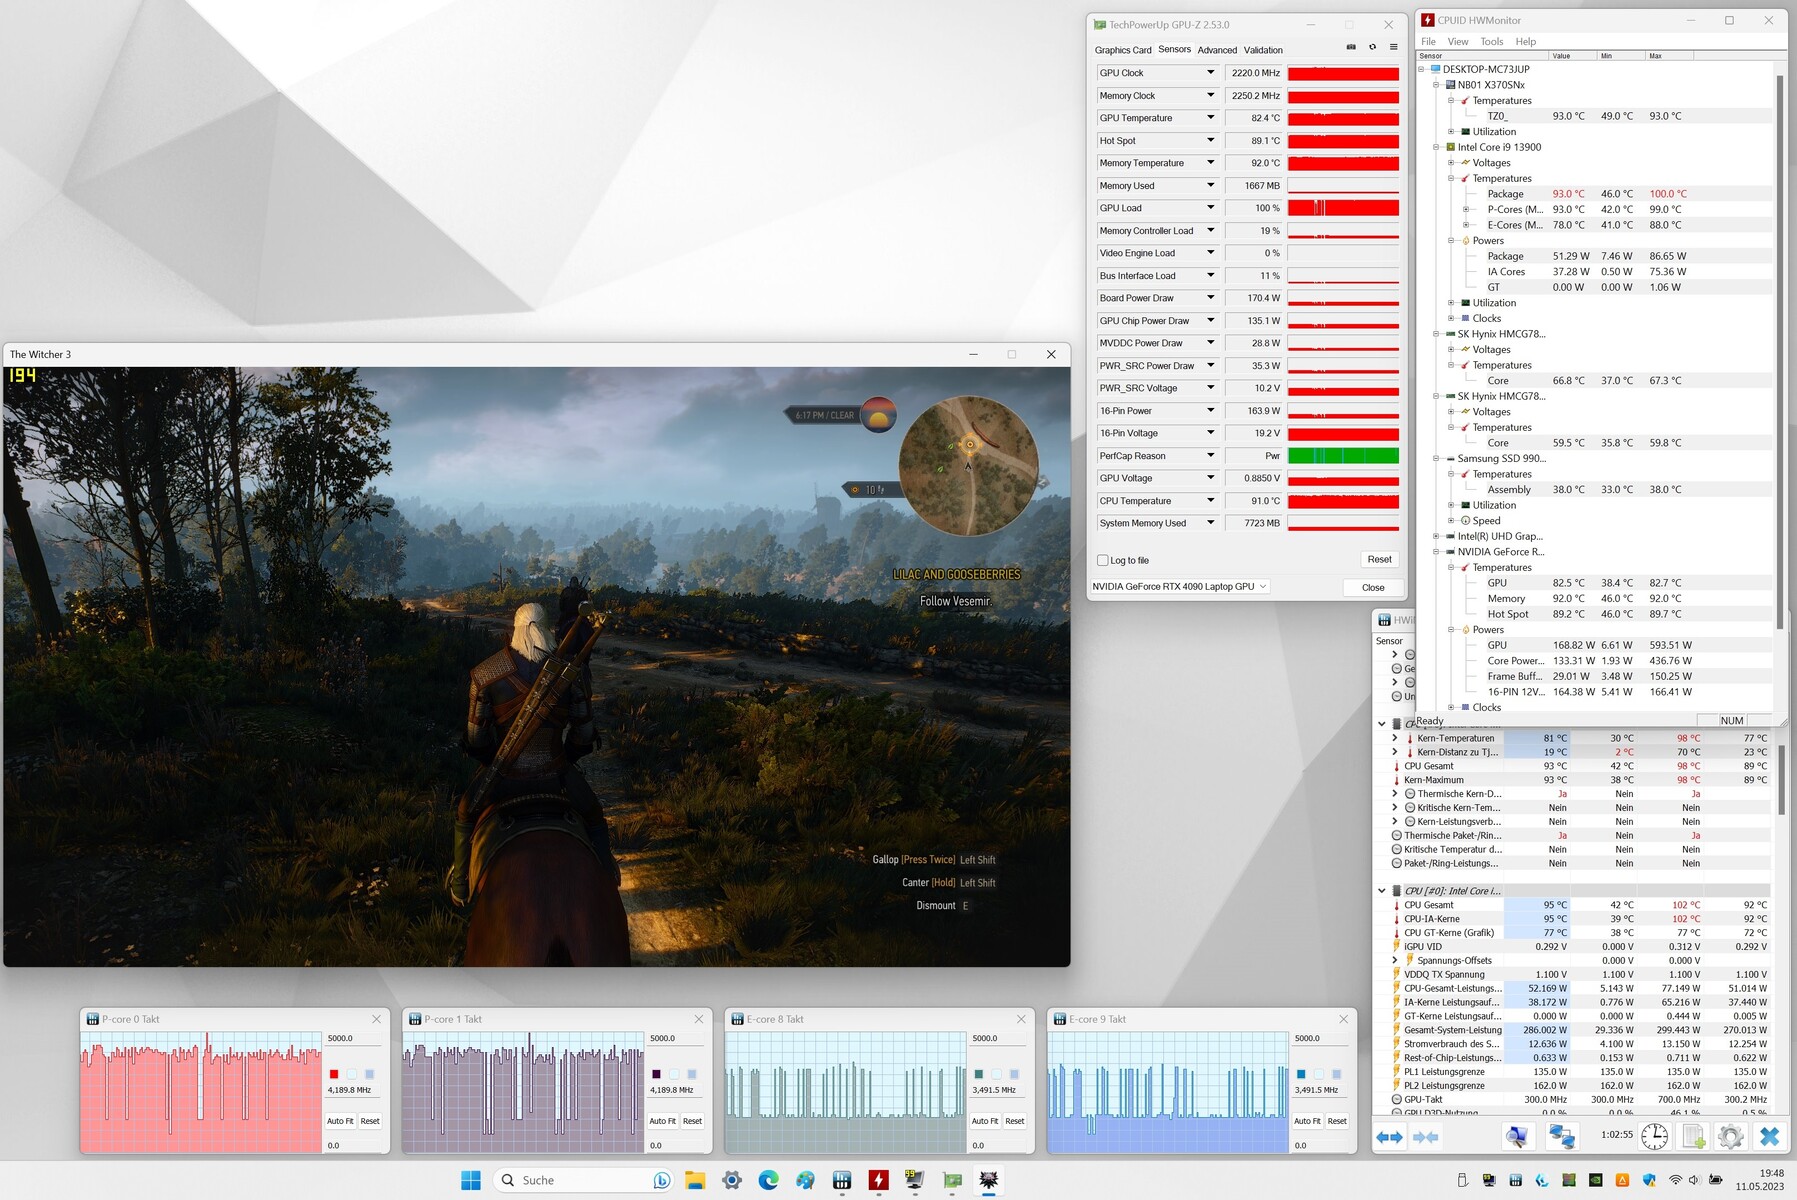
El Key 17 Pro ofrece cuatro modos de energía especificados por el fabricante (ver tabla). Puedes cambiar entre ellos usando el software Control Center instalado en el portátil. Ejecutamos nuestras pruebas en "Modo Rendimiento" y nuestro test de duración de batería en "Modo Ahorro de Energía" (con la RTX 4090 desactivada. Optimus estaba activado durante nuestras pruebas.
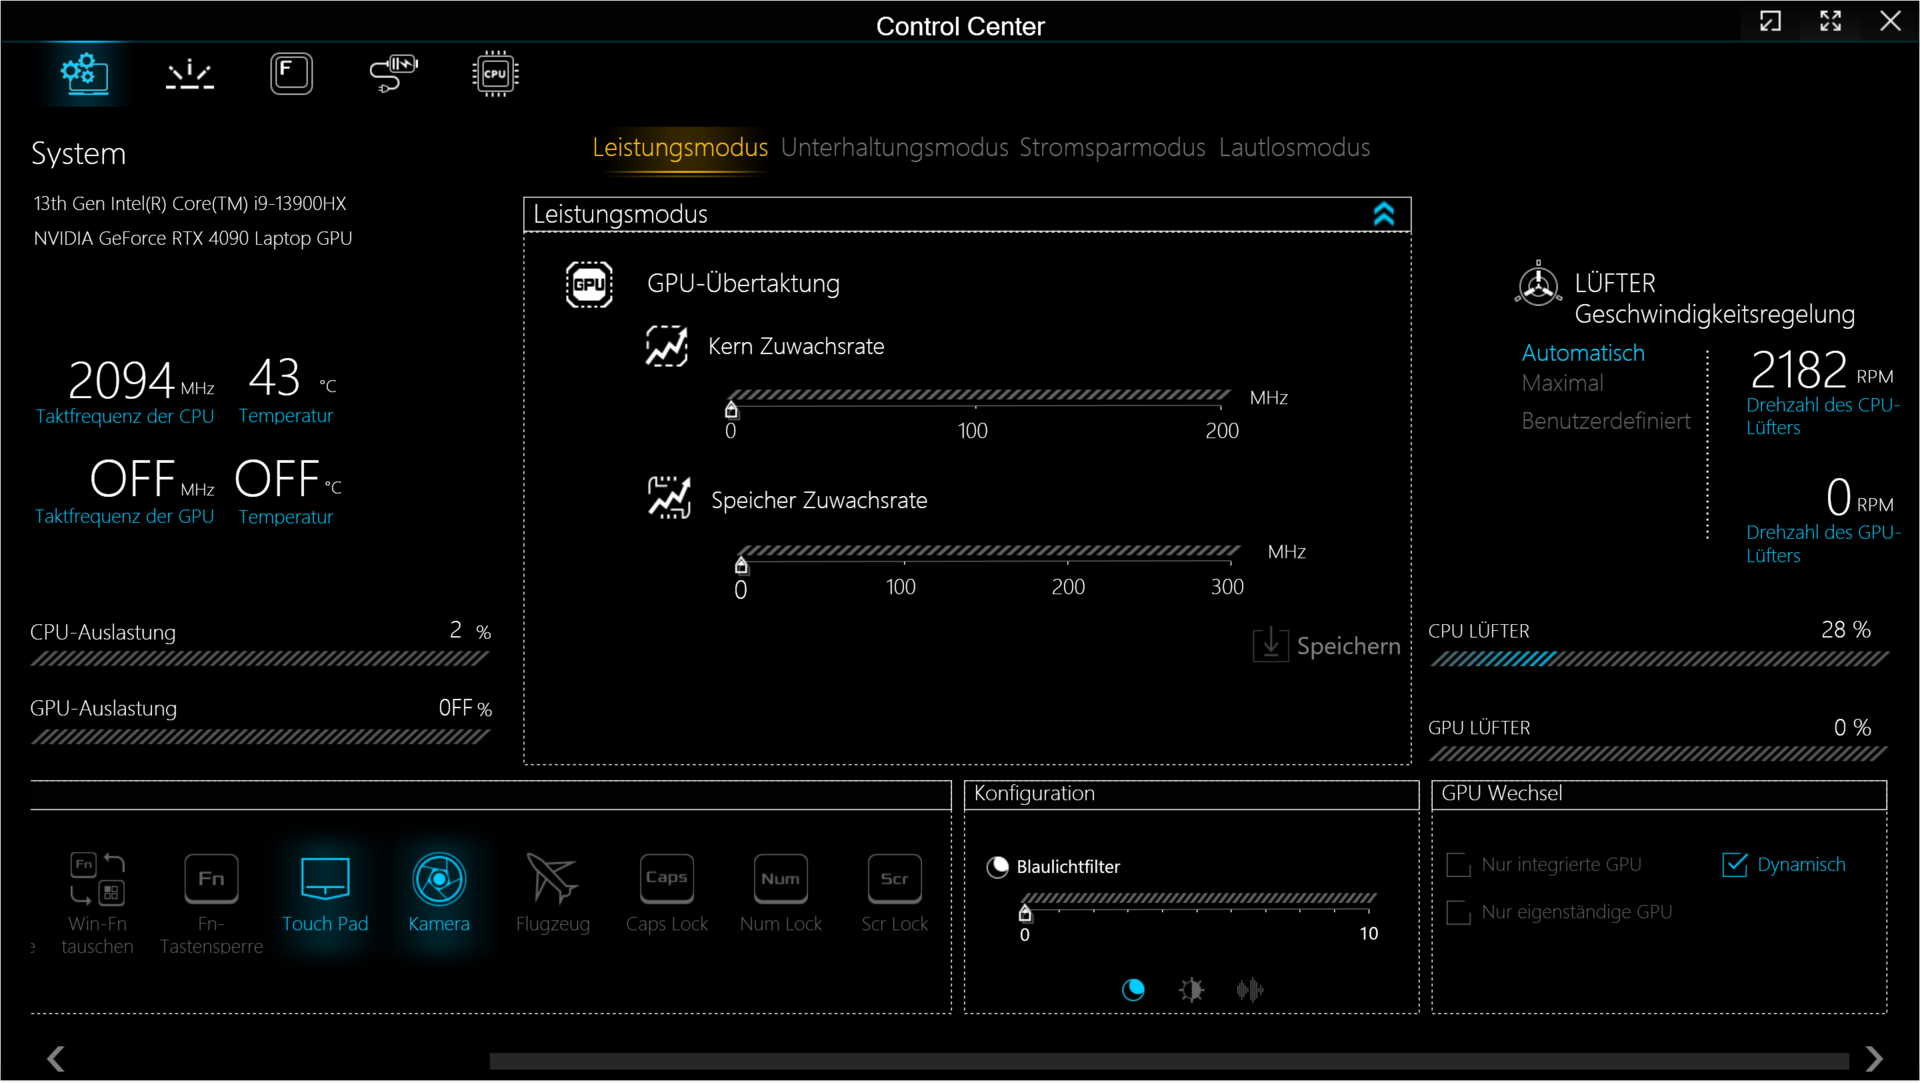
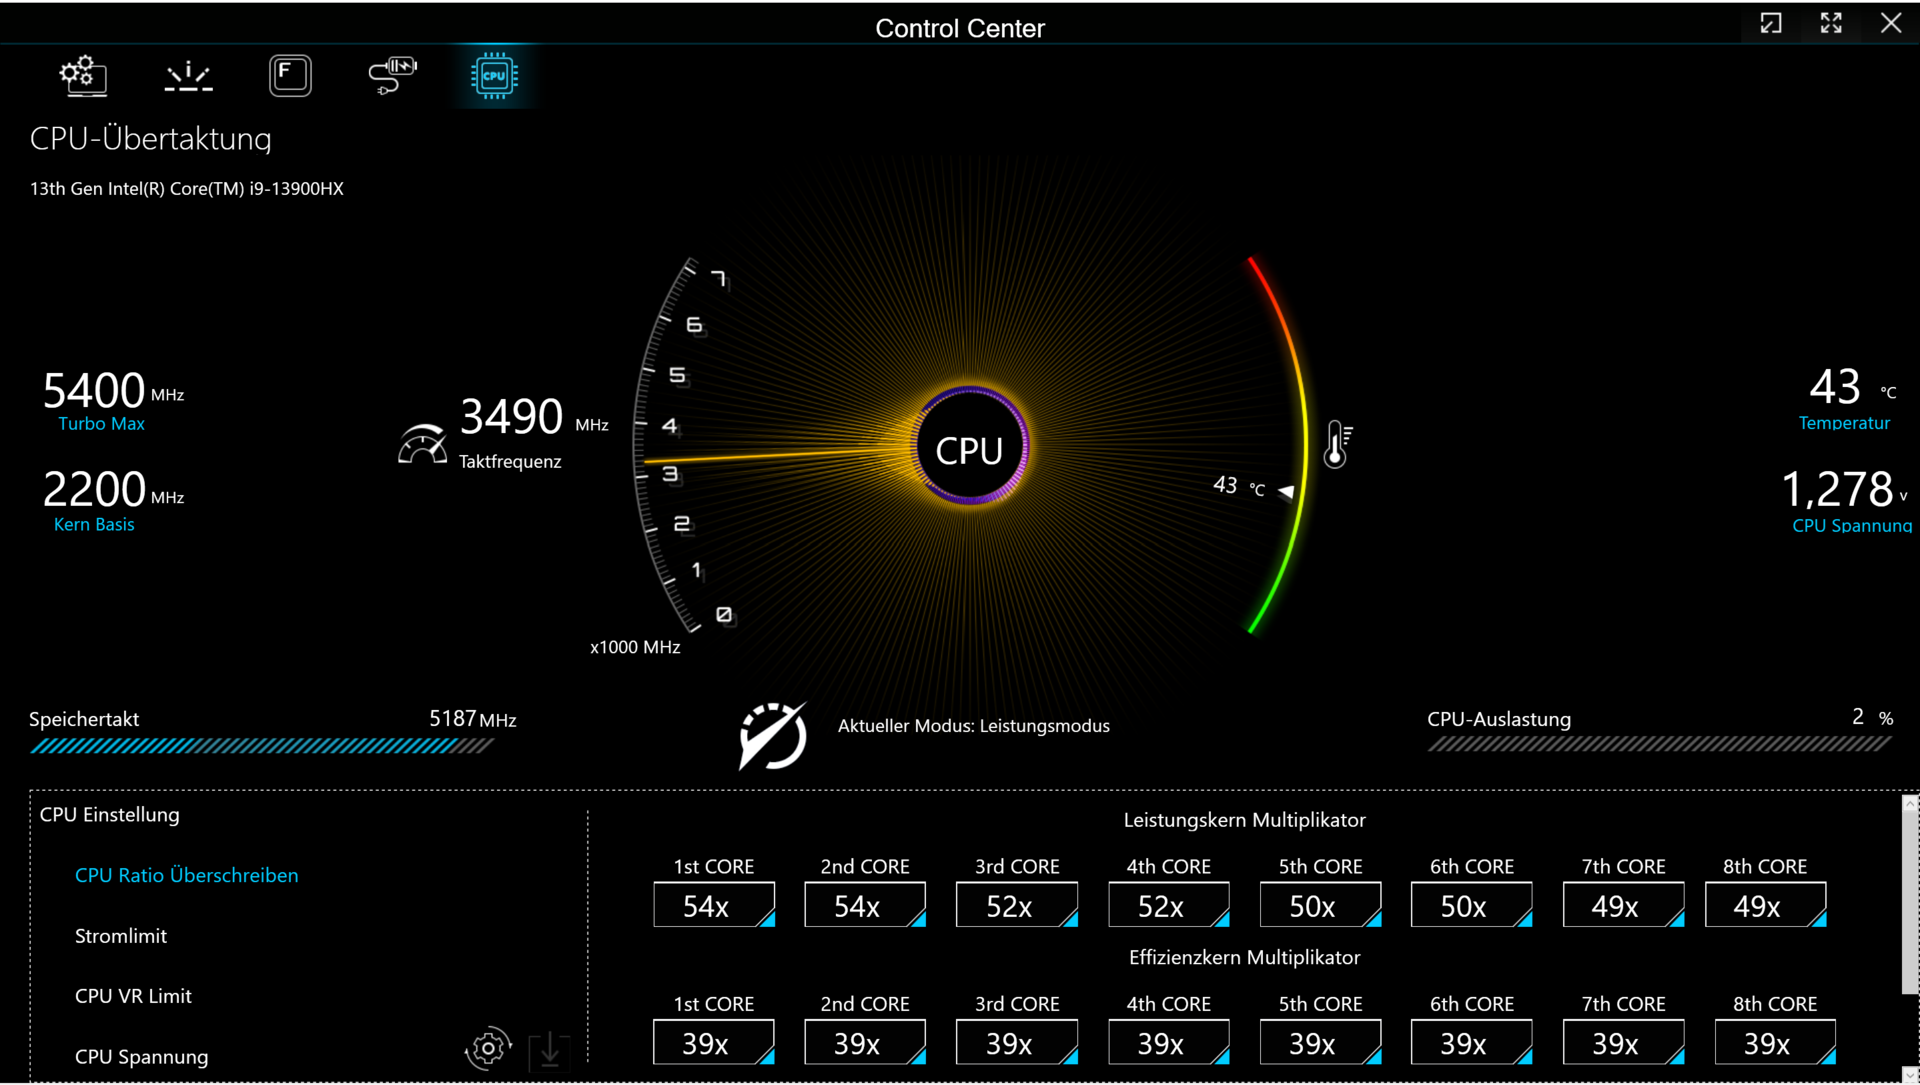
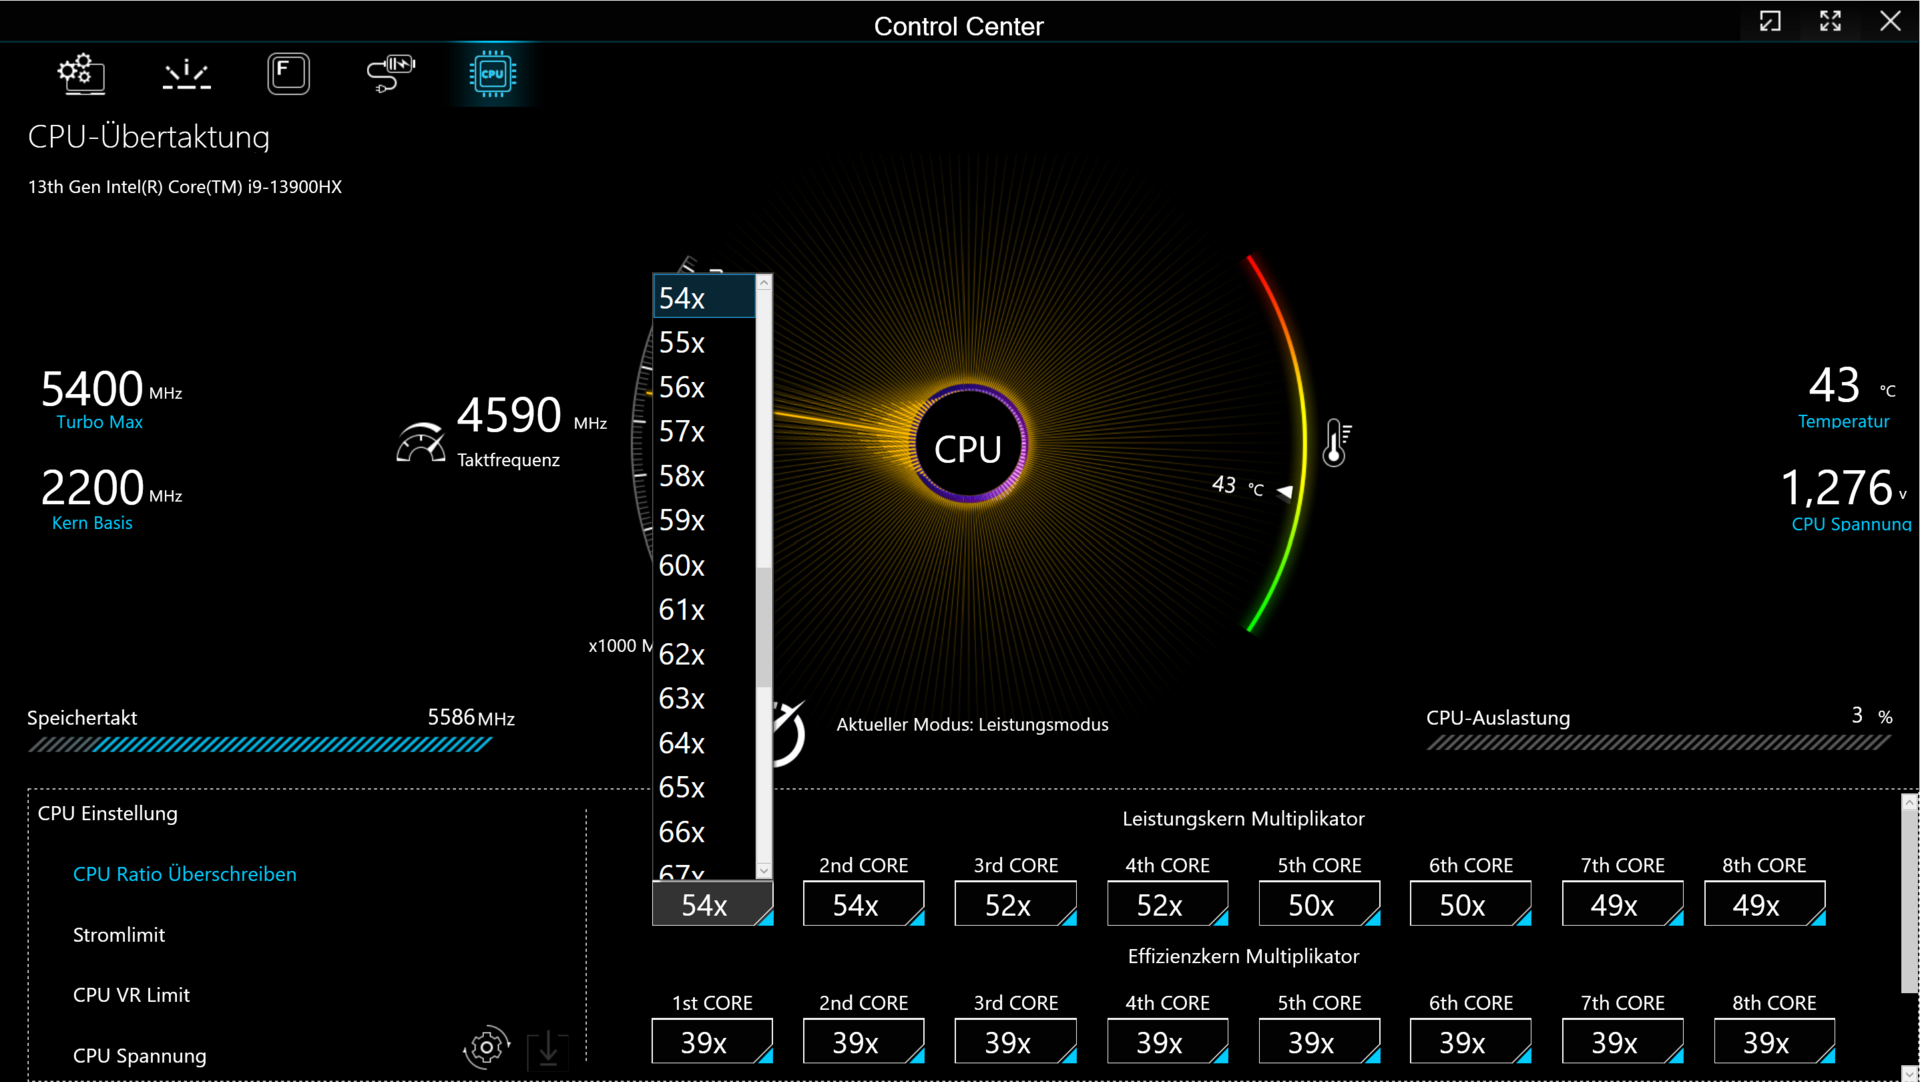
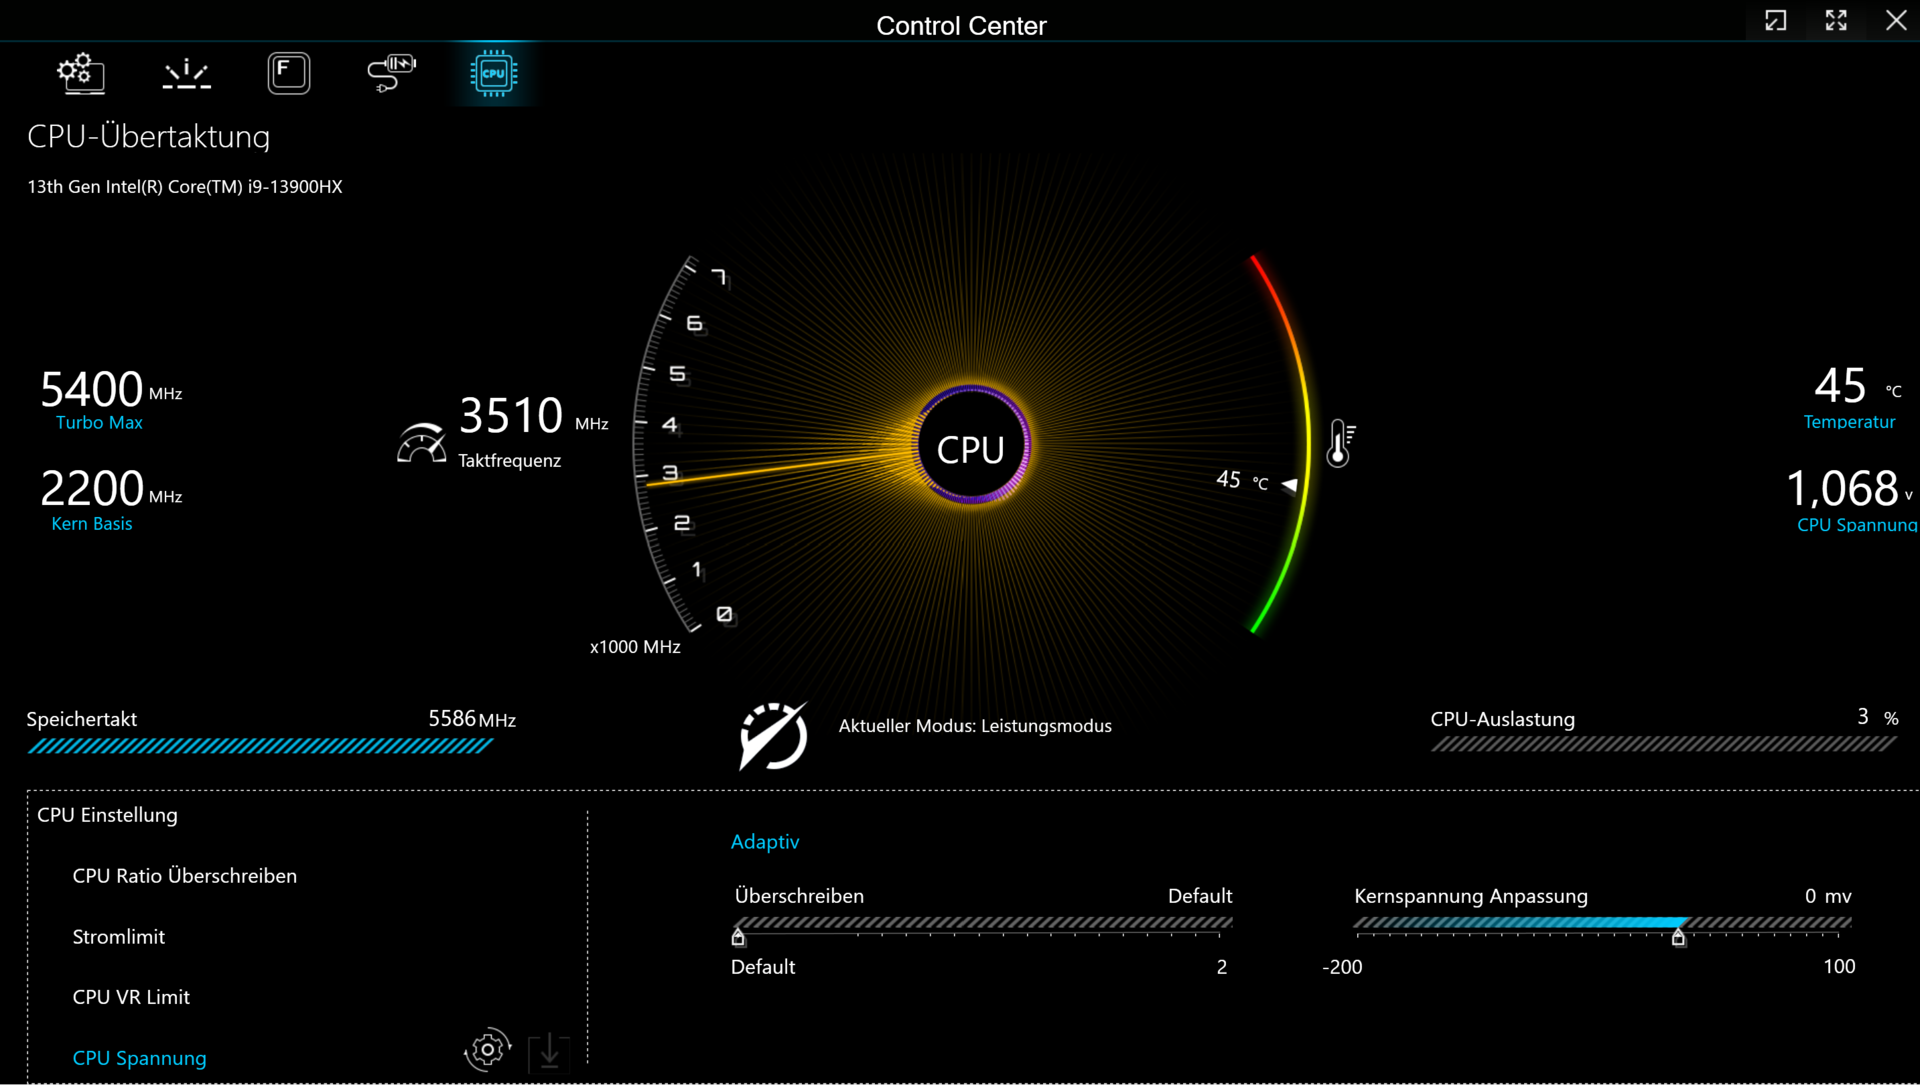
el "Modo Rendimiento" permite a los usuarios overclockear la GPU y la VRAM en el Centro de Control. Al hacer clic en las dos flechas hacia abajo se abrirá el menú correspondiente (figura 3). Tendrás que activar el overclocking de la CPU en la BIOS para que aparezca una nueva pestaña en el Centro de Control (ver figuras 12 a 16). Pero cuidado: overclockea el hardware bajo tu propia responsabilidad - eres responsable de cualquier daño derivado de ello.
| Modo rendimiento | Modo entretenimiento | Modo ahorro de energía | Modo silencio | |
|---|---|---|---|---|
| CPU PL1 (HWInfo) | 135 vatios | 75 vatios | 15 vatios | 15 vatios |
| CPU PL2 (HWInfo) | 162 vatios | 130 vatios | 30 vatios | 30 vatios |
| Ruido (Witcher 3) | 62 dB(A) | 54 dB(A) | - | 42 dB(A) |
| Rendimiento (Witcher 3) | ~204 fps | ~188 fps | - | 50 bis 60 fps |
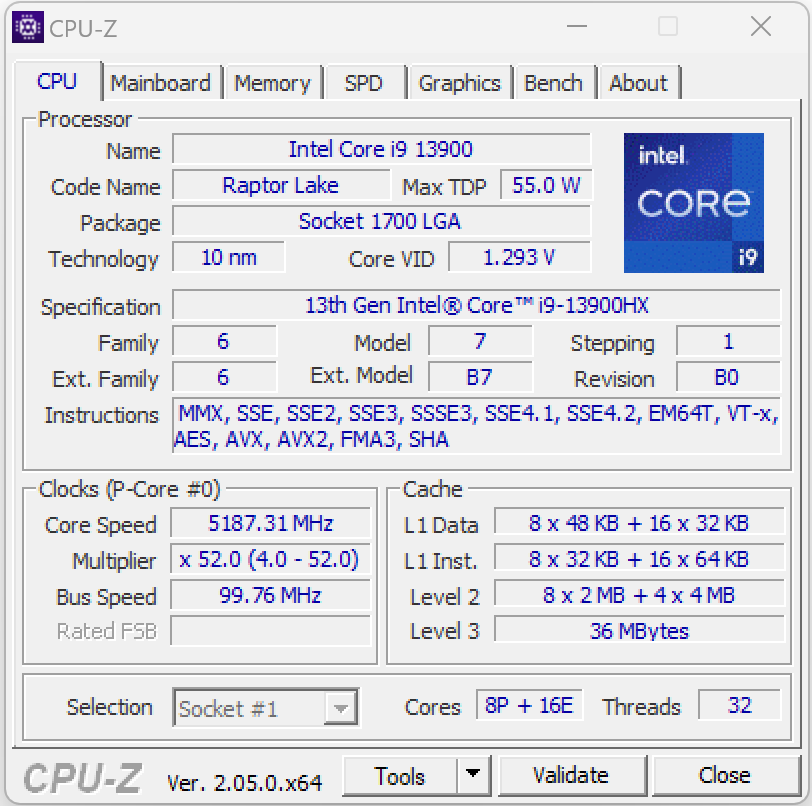
Procesador
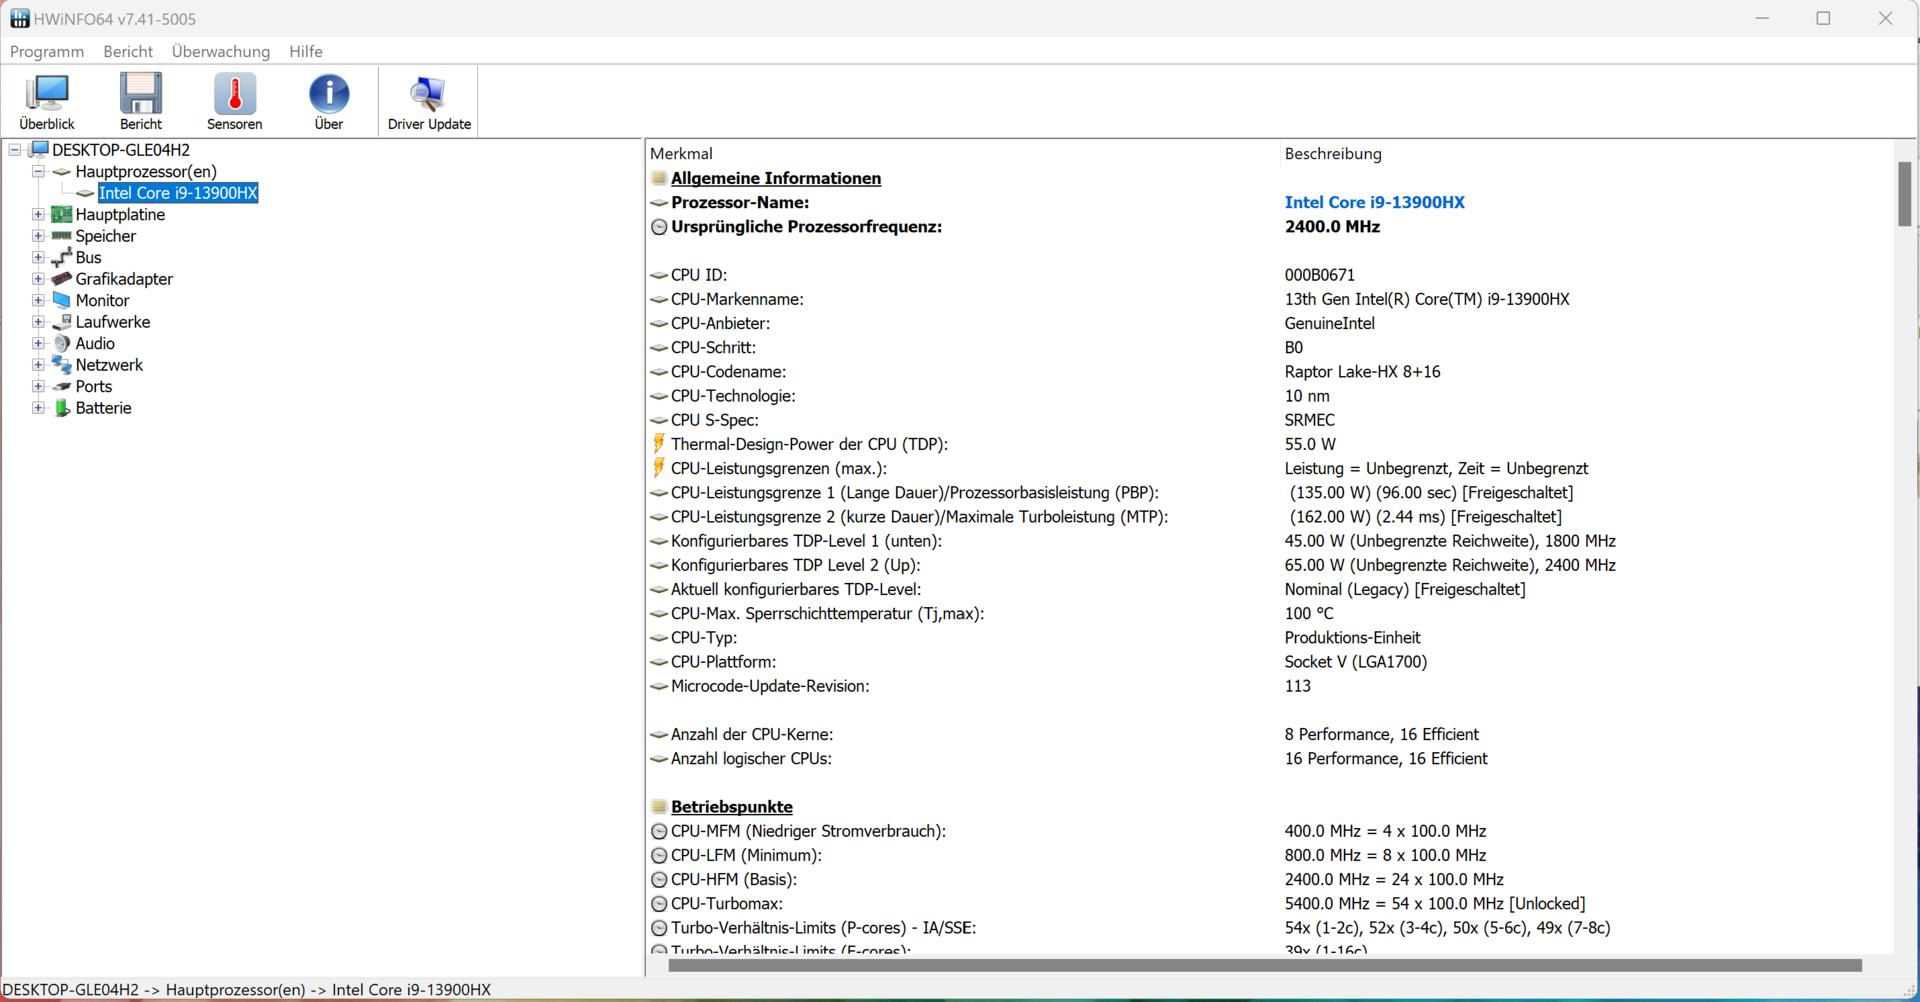
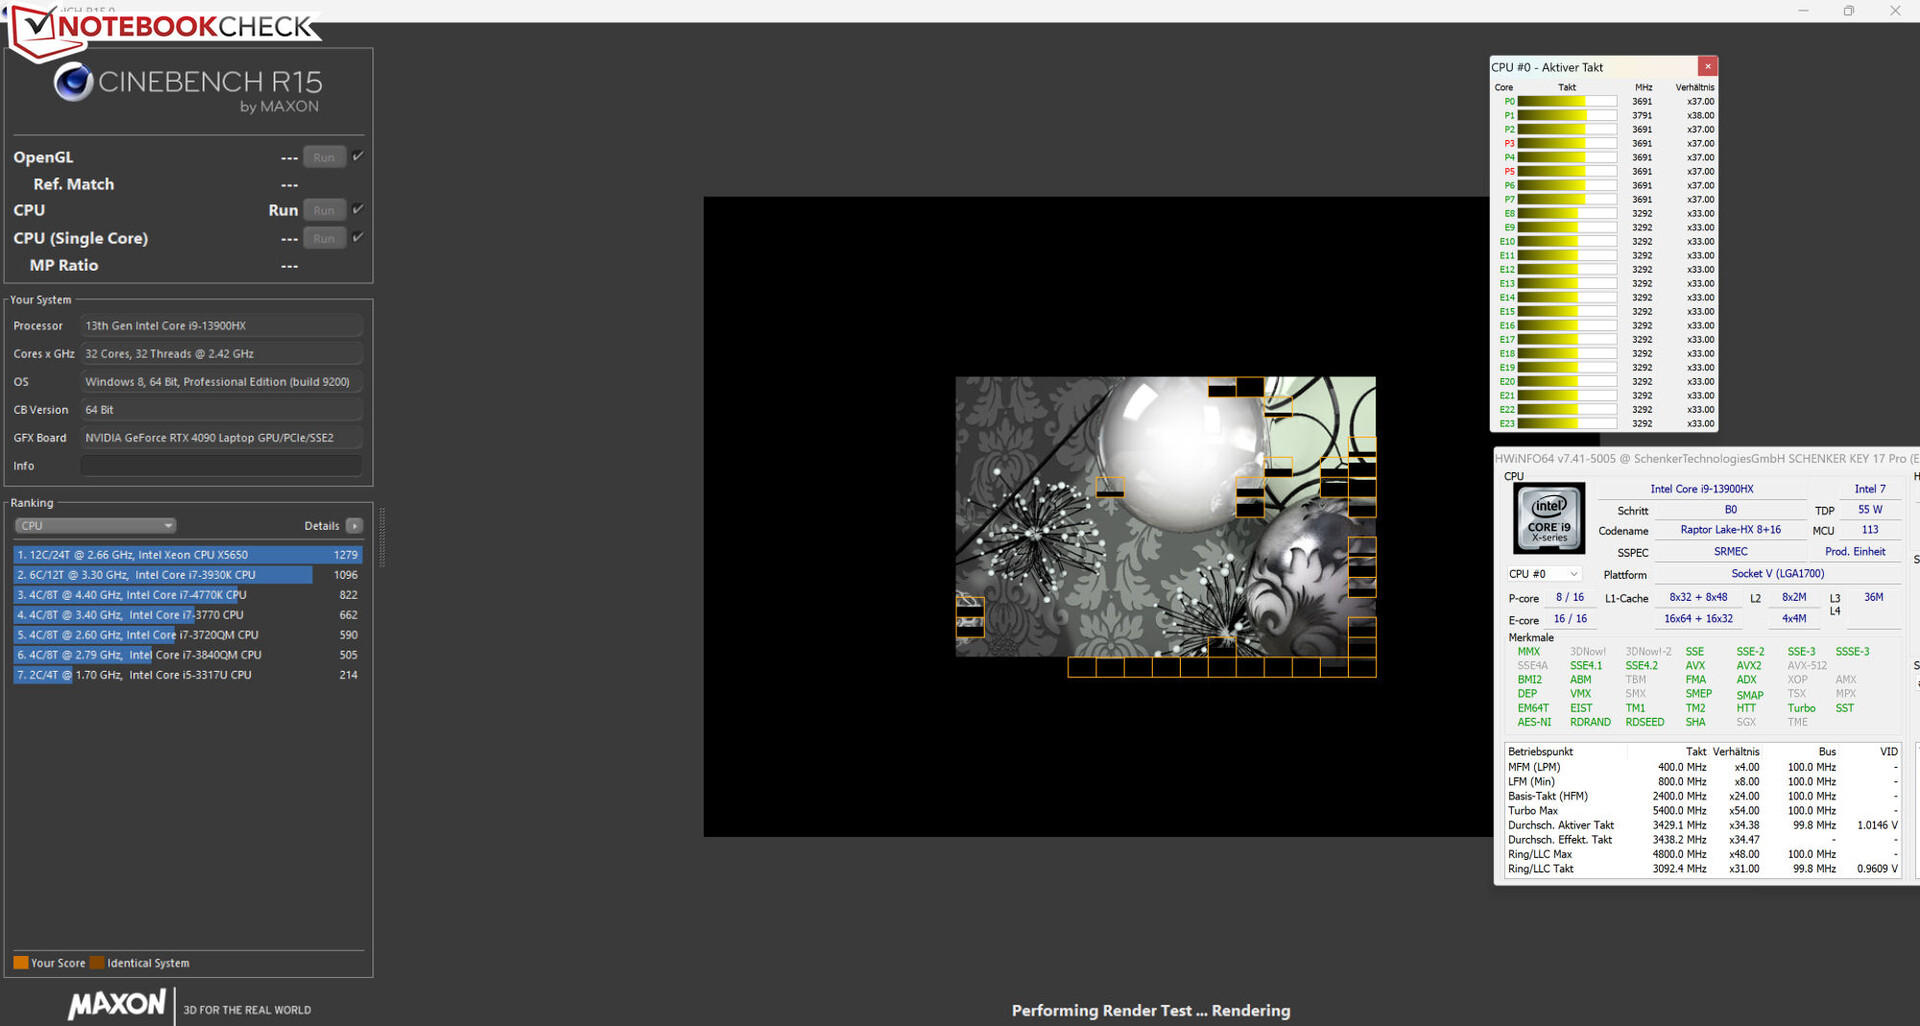
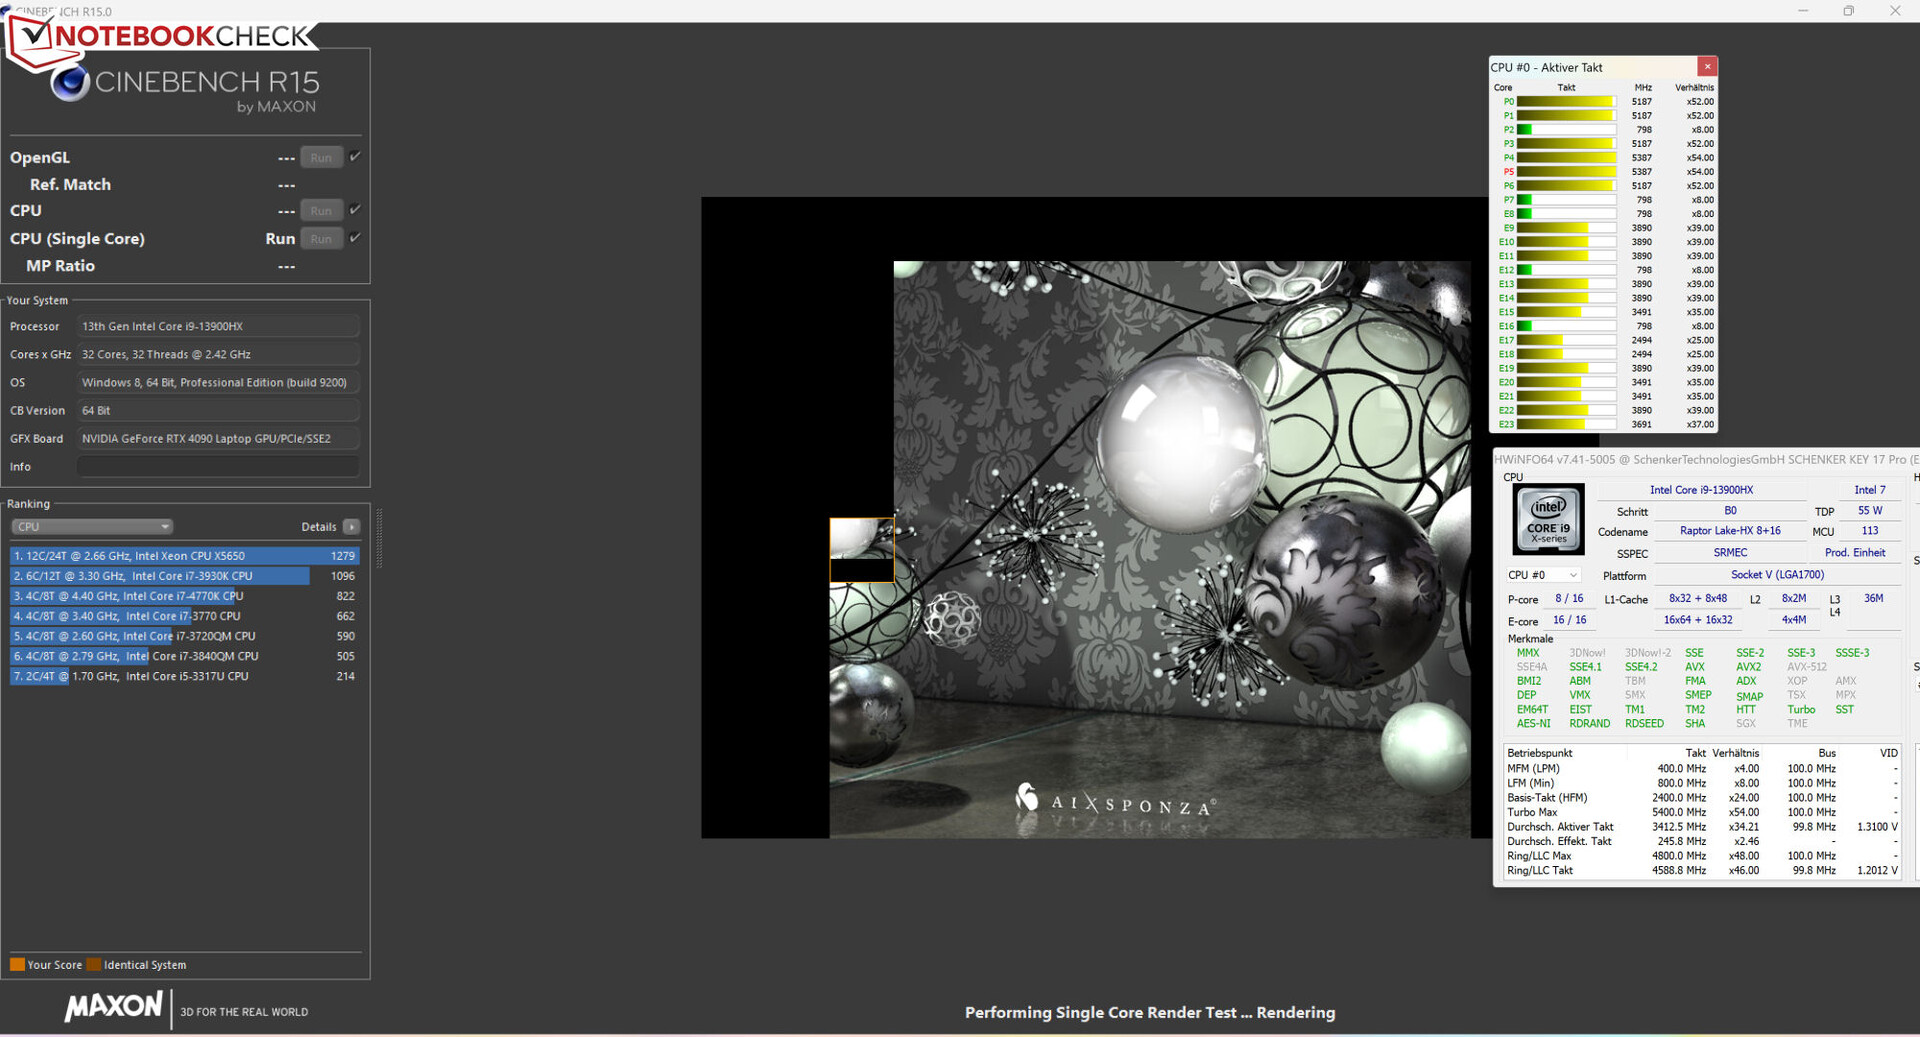
El procesador Core i9-13900HX Raptor Lake consta de ocho núcleos de rendimiento (Hyperthreading, 2.2 a 5.4GHz) y dieciséis núcleos de eficiencia (sin Hyperthreading, 1.6 a 3.9GHz), lo que da un total de 32 núcleos lógicos de CPU.
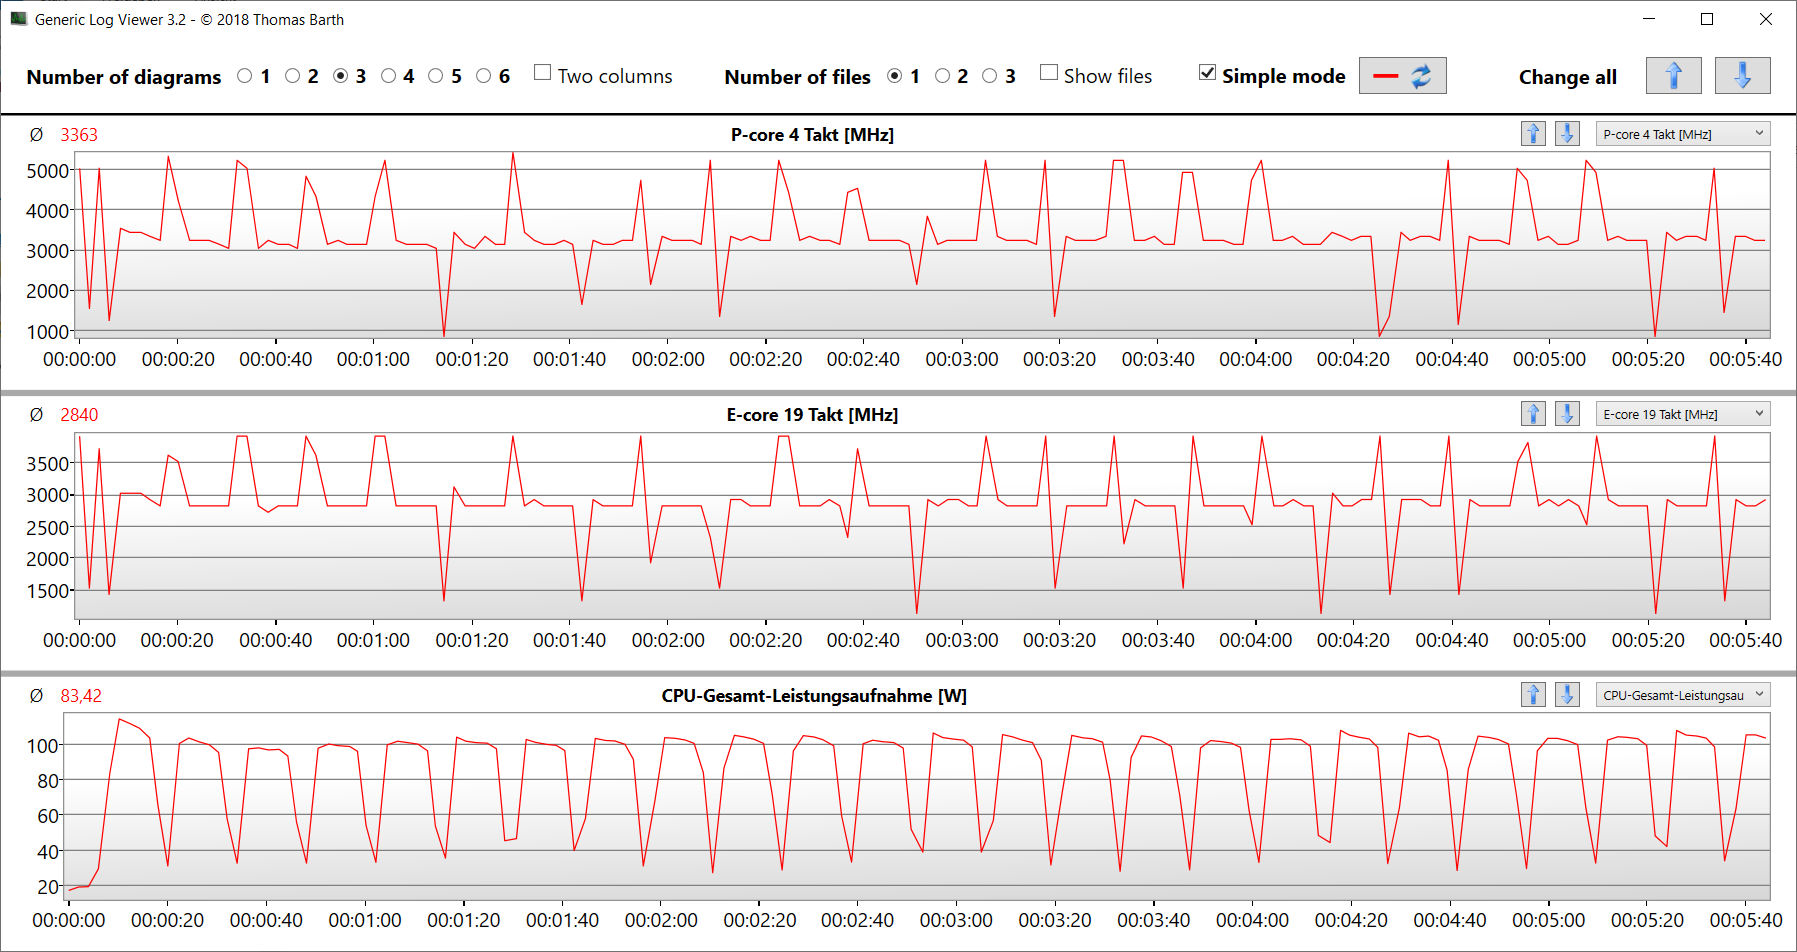
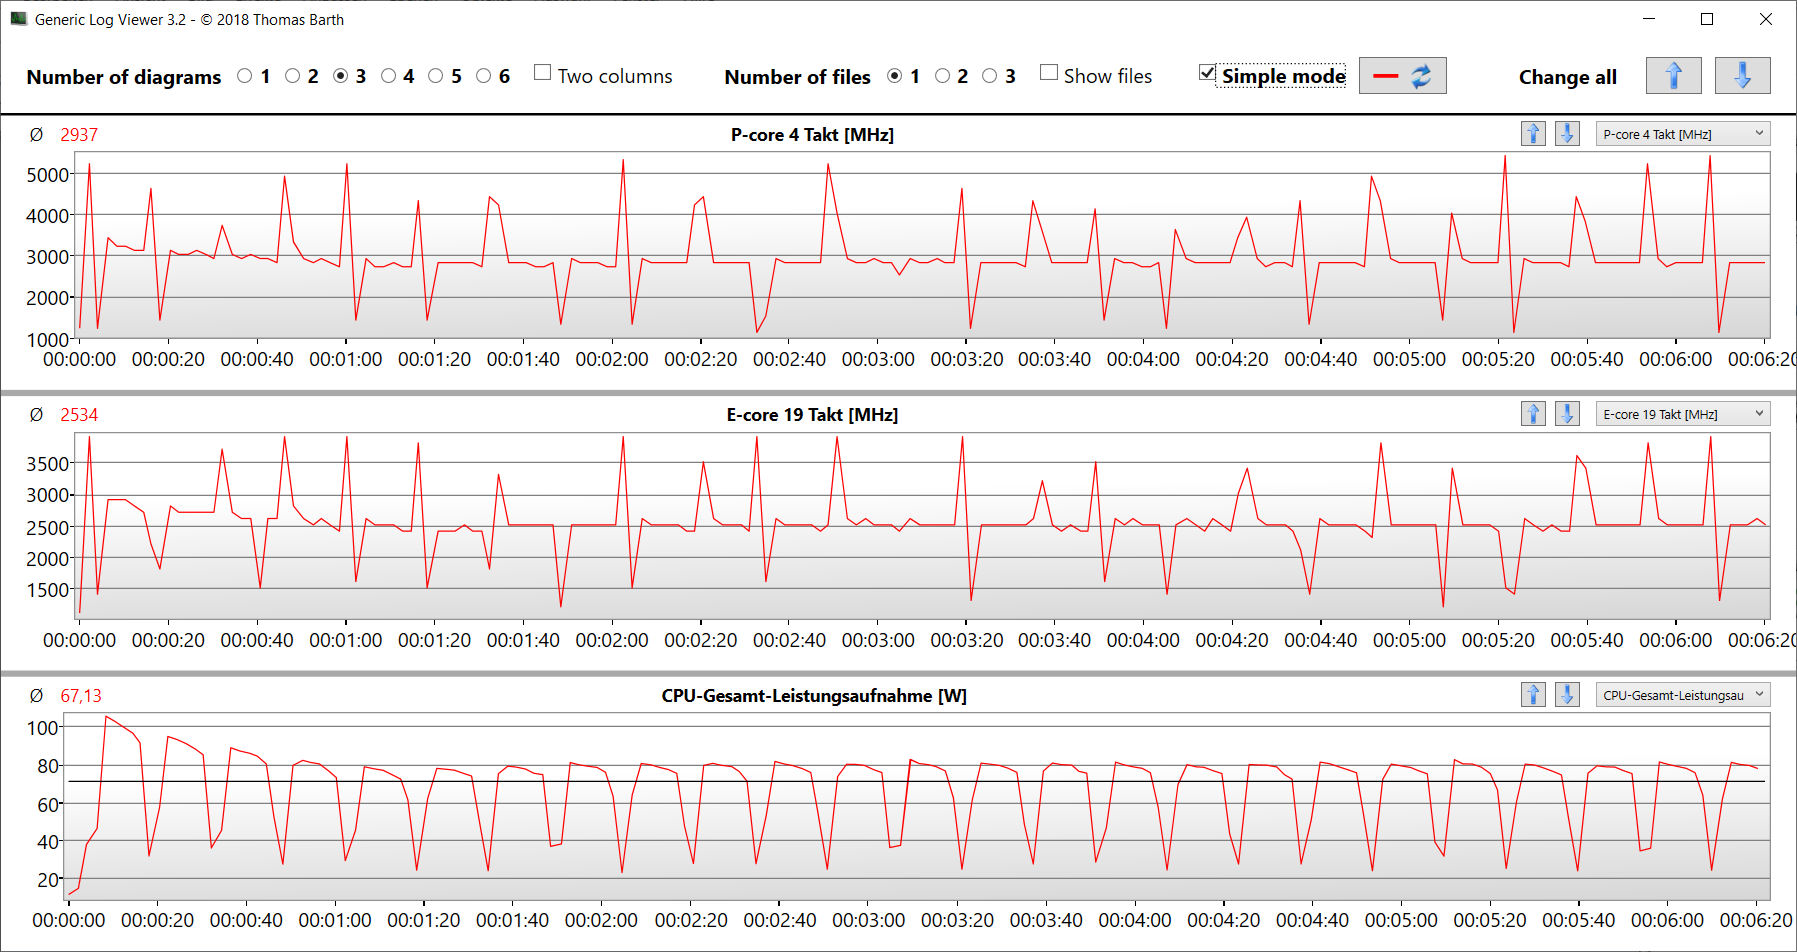
Los resultados obtenidos por la Key 17 Pro en las pruebas de rendimiento están más o menos en la misma línea de lo que hemos visto de esta CPU por término medio. Durante nuestra prueba de bucle Cinebench 15, la carga multihilo sostenida hizo que la velocidad de reloj turbo de la CPU cayera ligeramente durante las dos primeras ejecuciones antes de estabilizarse finalmente a un nivel constante.
Cinebench R15 Multi sustained load
* ... más pequeño es mejor
AIDA64: FP32 Ray-Trace | FPU Julia | CPU SHA3 | CPU Queen | FPU SinJulia | FPU Mandel | CPU AES | CPU ZLib | FP64 Ray-Trace | CPU PhotoWorxx
| Performance rating | |
| Asus ROG Strix Scar 17 G733PY-XS96 | |
| Schenker Key 17 Pro (Early 23) | |
| Medion Erazer Beast X40 | |
| Media de la clase Gaming | |
| Medio Intel Core i9-13900HX | |
| Aorus 17X AZF | |
| MSI Stealth 17 Studio A13VH-014 | |
| AIDA64 / FP32 Ray-Trace | |
| Asus ROG Strix Scar 17 G733PY-XS96 | |
| Media de la clase Gaming (10227 - 85542, n=105, últimos 2 años) | |
| Medion Erazer Beast X40 | |
| Medio Intel Core i9-13900HX (17589 - 27615, n=22) | |
| Schenker Key 17 Pro (Early 23) | |
| MSI Stealth 17 Studio A13VH-014 | |
| Aorus 17X AZF | |
| AIDA64 / FPU Julia | |
| Asus ROG Strix Scar 17 G733PY-XS96 | |
| Media de la clase Gaming (51376 - 238426, n=105, últimos 2 años) | |
| Medion Erazer Beast X40 | |
| Medio Intel Core i9-13900HX (88686 - 137015, n=22) | |
| Schenker Key 17 Pro (Early 23) | |
| MSI Stealth 17 Studio A13VH-014 | |
| Aorus 17X AZF | |
| AIDA64 / CPU SHA3 | |
| Asus ROG Strix Scar 17 G733PY-XS96 | |
| Medion Erazer Beast X40 | |
| Media de la clase Gaming (2180 - 10115, n=105, últimos 2 años) | |
| Medio Intel Core i9-13900HX (4362 - 7029, n=22) | |
| Schenker Key 17 Pro (Early 23) | |
| Aorus 17X AZF | |
| MSI Stealth 17 Studio A13VH-014 | |
| AIDA64 / CPU Queen | |
| Asus ROG Strix Scar 17 G733PY-XS96 | |
| Schenker Key 17 Pro (Early 23) | |
| Medio Intel Core i9-13900HX (125644 - 141385, n=22) | |
| Medion Erazer Beast X40 | |
| Aorus 17X AZF | |
| Media de la clase Gaming (49785 - 173351, n=90, últimos 2 años) | |
| MSI Stealth 17 Studio A13VH-014 | |
| AIDA64 / FPU SinJulia | |
| Asus ROG Strix Scar 17 G733PY-XS96 | |
| Medion Erazer Beast X40 | |
| Medio Intel Core i9-13900HX (12334 - 17179, n=22) | |
| Schenker Key 17 Pro (Early 23) | |
| Media de la clase Gaming (4424 - 33636, n=105, últimos 2 años) | |
| Aorus 17X AZF | |
| MSI Stealth 17 Studio A13VH-014 | |
| AIDA64 / FPU Mandel | |
| Asus ROG Strix Scar 17 G733PY-XS96 | |
| Media de la clase Gaming (25115 - 128721, n=105, últimos 2 años) | |
| Medion Erazer Beast X40 | |
| Medio Intel Core i9-13900HX (43850 - 69202, n=22) | |
| Schenker Key 17 Pro (Early 23) | |
| MSI Stealth 17 Studio A13VH-014 | |
| Aorus 17X AZF | |
| AIDA64 / CPU AES | |
| Schenker Key 17 Pro (Early 23) | |
| Asus ROG Strix Scar 17 G733PY-XS96 | |
| Aorus 17X AZF | |
| Medio Intel Core i9-13900HX (89413 - 237881, n=22) | |
| Medion Erazer Beast X40 | |
| Media de la clase Gaming (39258 - 247074, n=105, últimos 2 años) | |
| MSI Stealth 17 Studio A13VH-014 | |
| AIDA64 / CPU ZLib | |
| Asus ROG Strix Scar 17 G733PY-XS96 | |
| Medion Erazer Beast X40 | |
| Medio Intel Core i9-13900HX (1284 - 1958, n=22) | |
| Schenker Key 17 Pro (Early 23) | |
| Media de la clase Gaming (574 - 2531, n=105, últimos 2 años) | |
| Aorus 17X AZF | |
| MSI Stealth 17 Studio A13VH-014 | |
| AIDA64 / FP64 Ray-Trace | |
| Asus ROG Strix Scar 17 G733PY-XS96 | |
| Media de la clase Gaming (5509 - 45446, n=105, últimos 2 años) | |
| Medion Erazer Beast X40 | |
| Medio Intel Core i9-13900HX (9481 - 15279, n=22) | |
| Schenker Key 17 Pro (Early 23) | |
| MSI Stealth 17 Studio A13VH-014 | |
| Aorus 17X AZF | |
| AIDA64 / CPU PhotoWorxx | |
| Schenker Key 17 Pro (Early 23) | |
| MSI Stealth 17 Studio A13VH-014 | |
| Aorus 17X AZF | |
| Medio Intel Core i9-13900HX (42994 - 51994, n=22) | |
| Media de la clase Gaming (12271 - 89891, n=105, últimos 2 años) | |
| Medion Erazer Beast X40 | |
| Asus ROG Strix Scar 17 G733PY-XS96 | |
Rendimiento del sistema
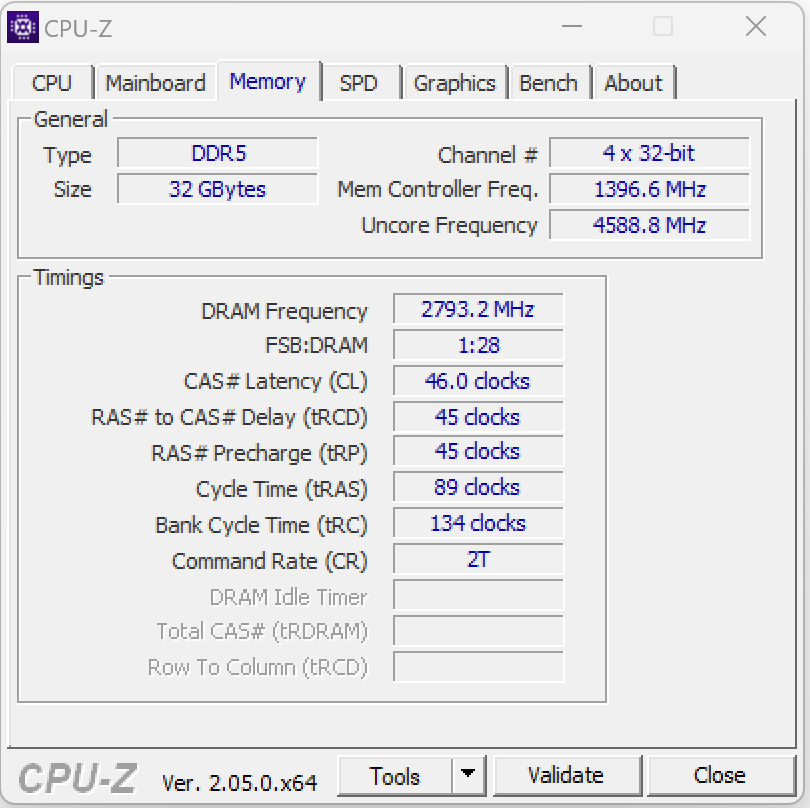
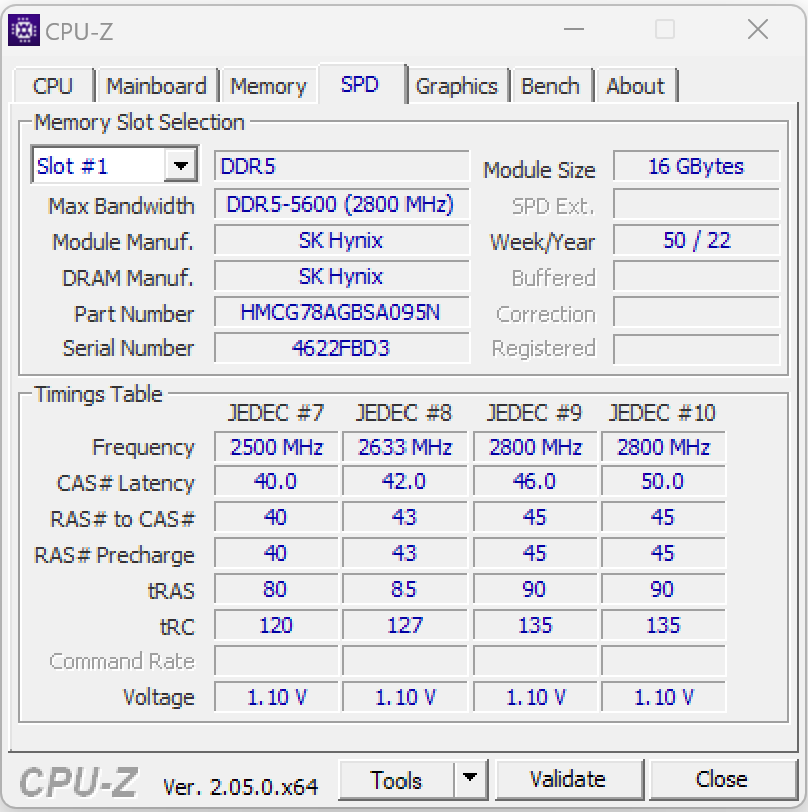
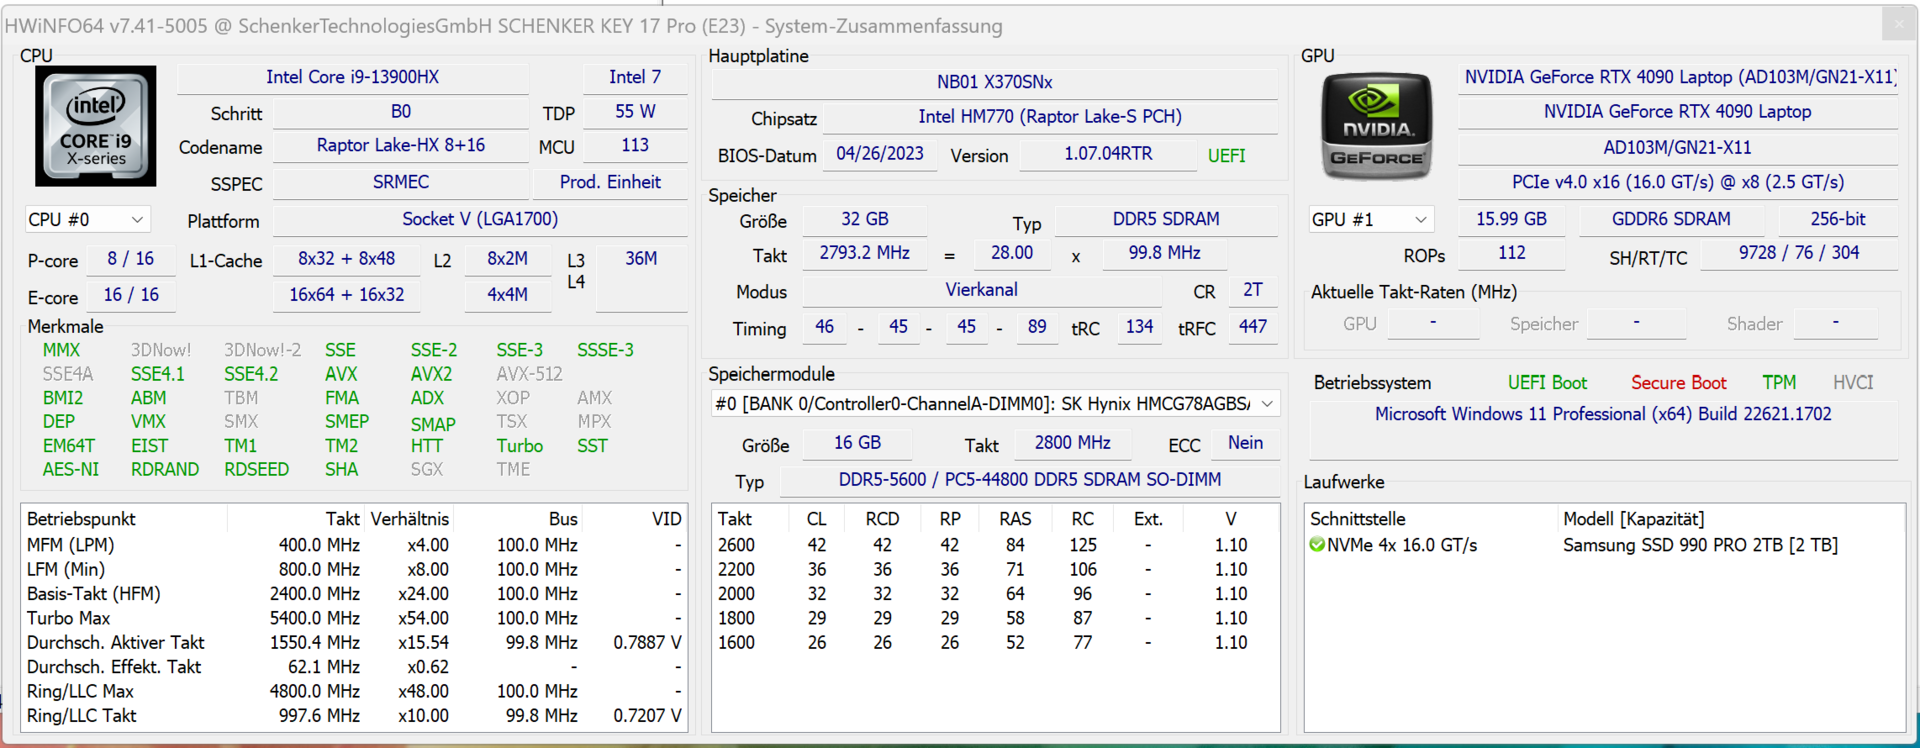
El sistema funciona sin problemas y tiene suficiente potencia de cálculo para manejar cómodamente el renderizado, la edición de vídeo y los juegos. Las tasas de transferencia de la RAM son bastante estándar para una memoria DDR5-5600.
CrossMark: Overall | Productivity | Creativity | Responsiveness
| PCMark 10 / Score | |
| Schenker Key 17 Pro (Early 23) | |
| Asus ROG Strix Scar 17 G733PY-XS96 | |
| Medio Intel Core i9-13900HX, NVIDIA GeForce RTX 4090 Laptop GPU (7690 - 9331, n=8) | |
| Media de la clase Gaming (5828 - 12414, n=93, últimos 2 años) | |
| Medion Erazer Beast X40 | |
| Aorus 17X AZF | |
| MSI Stealth 17 Studio A13VH-014 | |
| PCMark 10 / Essentials | |
| Schenker Key 17 Pro (Early 23) | |
| Medio Intel Core i9-13900HX, NVIDIA GeForce RTX 4090 Laptop GPU (10972 - 11983, n=8) | |
| Medion Erazer Beast X40 | |
| Aorus 17X AZF | |
| Asus ROG Strix Scar 17 G733PY-XS96 | |
| Media de la clase Gaming (8810 - 11935, n=97, últimos 2 años) | |
| MSI Stealth 17 Studio A13VH-014 | |
| PCMark 10 / Productivity | |
| Medion Erazer Beast X40 | |
| Schenker Key 17 Pro (Early 23) | |
| Media de la clase Gaming (6845 - 25323, n=95, últimos 2 años) | |
| Medio Intel Core i9-13900HX, NVIDIA GeForce RTX 4090 Laptop GPU (9038 - 11680, n=8) | |
| Aorus 17X AZF | |
| Asus ROG Strix Scar 17 G733PY-XS96 | |
| MSI Stealth 17 Studio A13VH-014 | |
| PCMark 10 / Digital Content Creation | |
| Asus ROG Strix Scar 17 G733PY-XS96 | |
| Schenker Key 17 Pro (Early 23) | |
| Media de la clase Gaming (7602 - 19954, n=95, últimos 2 años) | |
| Medio Intel Core i9-13900HX, NVIDIA GeForce RTX 4090 Laptop GPU (10605 - 16395, n=8) | |
| MSI Stealth 17 Studio A13VH-014 | |
| Medion Erazer Beast X40 | |
| Aorus 17X AZF | |
| CrossMark / Overall | |
| Schenker Key 17 Pro (Early 23) | |
| Aorus 17X AZF | |
| Medion Erazer Beast X40 | |
| Medio Intel Core i9-13900HX, NVIDIA GeForce RTX 4090 Laptop GPU (1825 - 2295, n=8) | |
| Asus ROG Strix Scar 17 G733PY-XS96 | |
| Media de la clase Gaming (1366 - 2409, n=94, últimos 2 años) | |
| MSI Stealth 17 Studio A13VH-014 | |
| CrossMark / Productivity | |
| Schenker Key 17 Pro (Early 23) | |
| Aorus 17X AZF | |
| Medion Erazer Beast X40 | |
| Medio Intel Core i9-13900HX, NVIDIA GeForce RTX 4090 Laptop GPU (1666 - 2166, n=8) | |
| Media de la clase Gaming (1386 - 2254, n=94, últimos 2 años) | |
| Asus ROG Strix Scar 17 G733PY-XS96 | |
| MSI Stealth 17 Studio A13VH-014 | |
| CrossMark / Creativity | |
| Schenker Key 17 Pro (Early 23) | |
| Medion Erazer Beast X40 | |
| Medio Intel Core i9-13900HX, NVIDIA GeForce RTX 4090 Laptop GPU (2162 - 2514, n=8) | |
| Asus ROG Strix Scar 17 G733PY-XS96 | |
| Aorus 17X AZF | |
| Media de la clase Gaming (1343 - 2786, n=94, últimos 2 años) | |
| MSI Stealth 17 Studio A13VH-014 | |
| CrossMark / Responsiveness | |
| Schenker Key 17 Pro (Early 23) | |
| Aorus 17X AZF | |
| Medion Erazer Beast X40 | |
| Medio Intel Core i9-13900HX, NVIDIA GeForce RTX 4090 Laptop GPU (1441 - 2275, n=8) | |
| Media de la clase Gaming (1226 - 2334, n=94, últimos 2 años) | |
| Asus ROG Strix Scar 17 G733PY-XS96 | |
| MSI Stealth 17 Studio A13VH-014 | |
| PCMark 10 Score | 8913 puntos | |
ayuda | ||
| AIDA64 / Memory Copy | |
| Schenker Key 17 Pro (Early 23) | |
| Aorus 17X AZF | |
| Medio Intel Core i9-13900HX (67716 - 79193, n=22) | |
| MSI Stealth 17 Studio A13VH-014 | |
| Media de la clase Gaming (21750 - 129946, n=105, últimos 2 años) | |
| Medion Erazer Beast X40 | |
| Asus ROG Strix Scar 17 G733PY-XS96 | |
| AIDA64 / Memory Read | |
| Aorus 17X AZF | |
| Schenker Key 17 Pro (Early 23) | |
| Medio Intel Core i9-13900HX (73998 - 88462, n=22) | |
| MSI Stealth 17 Studio A13VH-014 | |
| Medion Erazer Beast X40 | |
| Media de la clase Gaming (22956 - 118858, n=105, últimos 2 años) | |
| Asus ROG Strix Scar 17 G733PY-XS96 | |
| AIDA64 / Memory Write | |
| Schenker Key 17 Pro (Early 23) | |
| Aorus 17X AZF | |
| Media de la clase Gaming (22297 - 135096, n=105, últimos 2 años) | |
| MSI Stealth 17 Studio A13VH-014 | |
| Medio Intel Core i9-13900HX (65472 - 77045, n=22) | |
| Medion Erazer Beast X40 | |
| Asus ROG Strix Scar 17 G733PY-XS96 | |
| AIDA64 / Memory Latency | |
| Media de la clase Gaming (75.3 - 259, n=105, últimos 2 años) | |
| MSI Stealth 17 Studio A13VH-014 | |
| Schenker Key 17 Pro (Early 23) | |
| Medion Erazer Beast X40 | |
| Medio Intel Core i9-13900HX (75.3 - 91.1, n=22) | |
| Asus ROG Strix Scar 17 G733PY-XS96 | |
| Aorus 17X AZF | |
* ... más pequeño es mejor
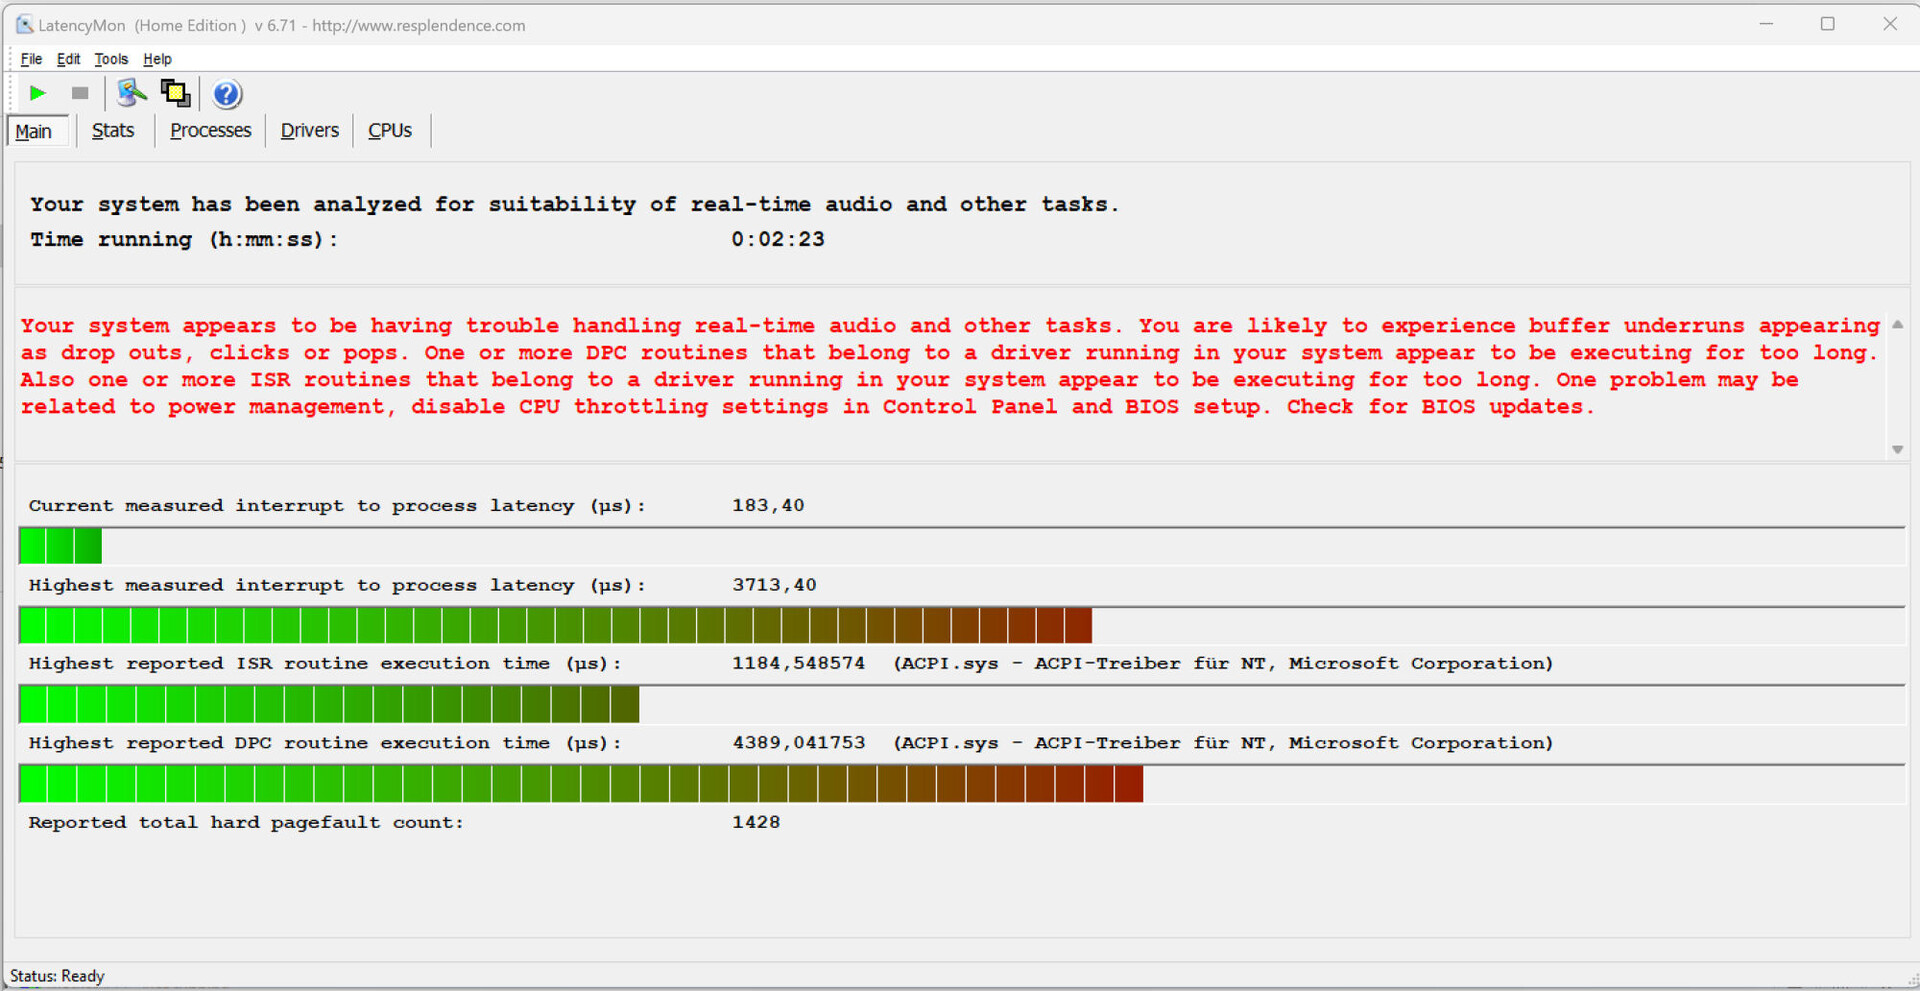
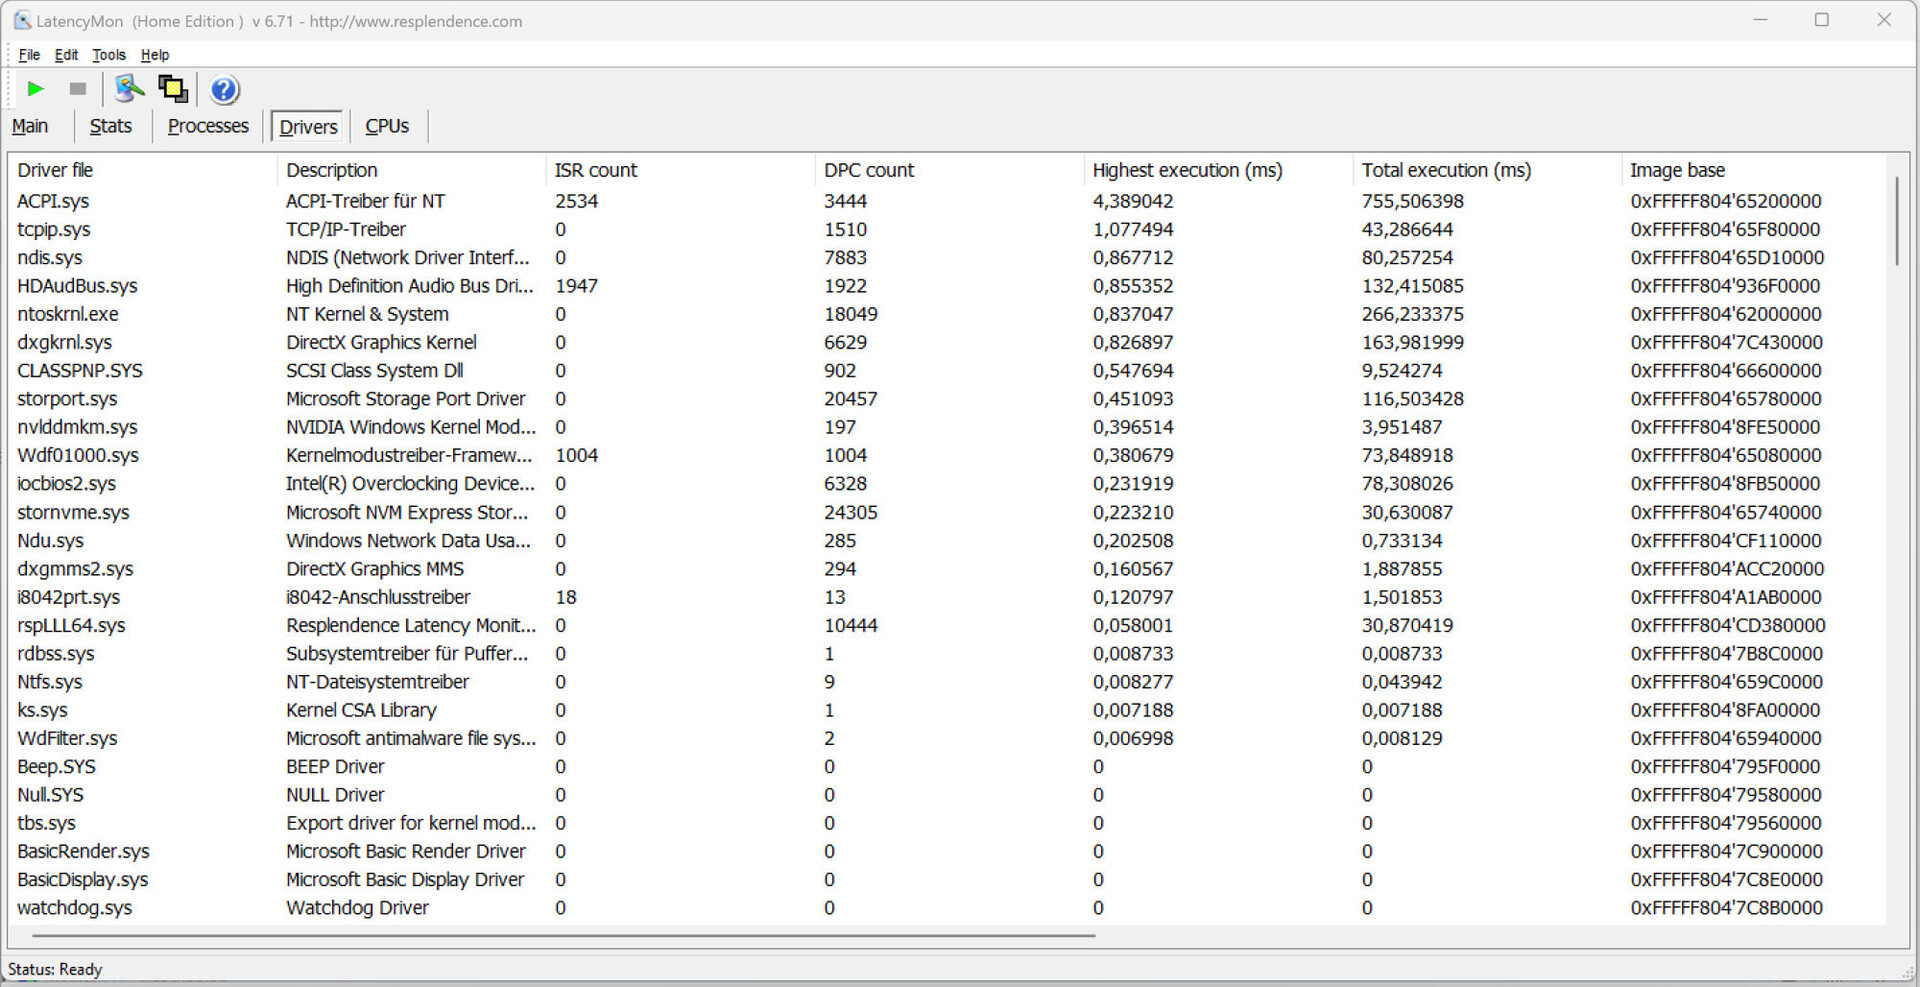
Latencia del CPD
Nuestra prueba de monitorización de latencia estandarizada (navegación por internet, reproducción de vídeo 4K, carga alta de Prime95) reveló algunos problemas de latencia. El sistema no parece adecuado para manejar tareas de vídeo y audio en tiempo real. Esperemos que estos problemas se solucionen en futuras actualizaciones de software.
| DPC Latencies / LatencyMon - interrupt to process latency (max), Web, Youtube, Prime95 | |
| Aorus 17X AZF | |
| Schenker Key 17 Pro (Early 23) | |
| MSI Stealth 17 Studio A13VH-014 | |
| Medion Erazer Beast X40 | |
| Asus ROG Strix Scar 17 G733PY-XS96 | |
* ... más pequeño es mejor
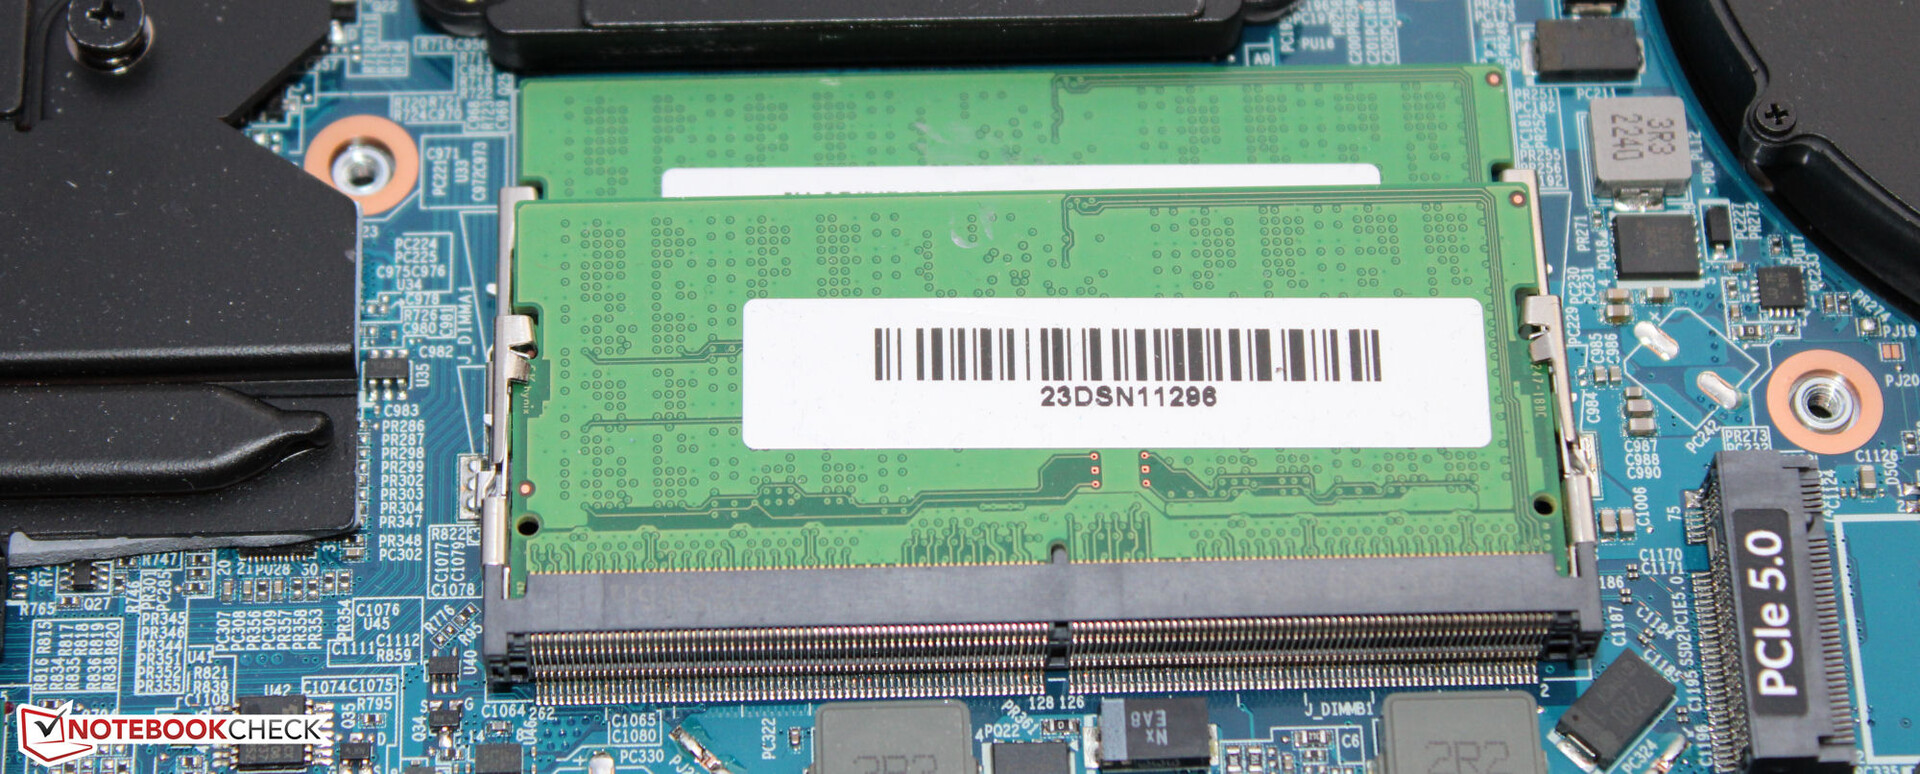
Almacenamiento masivo
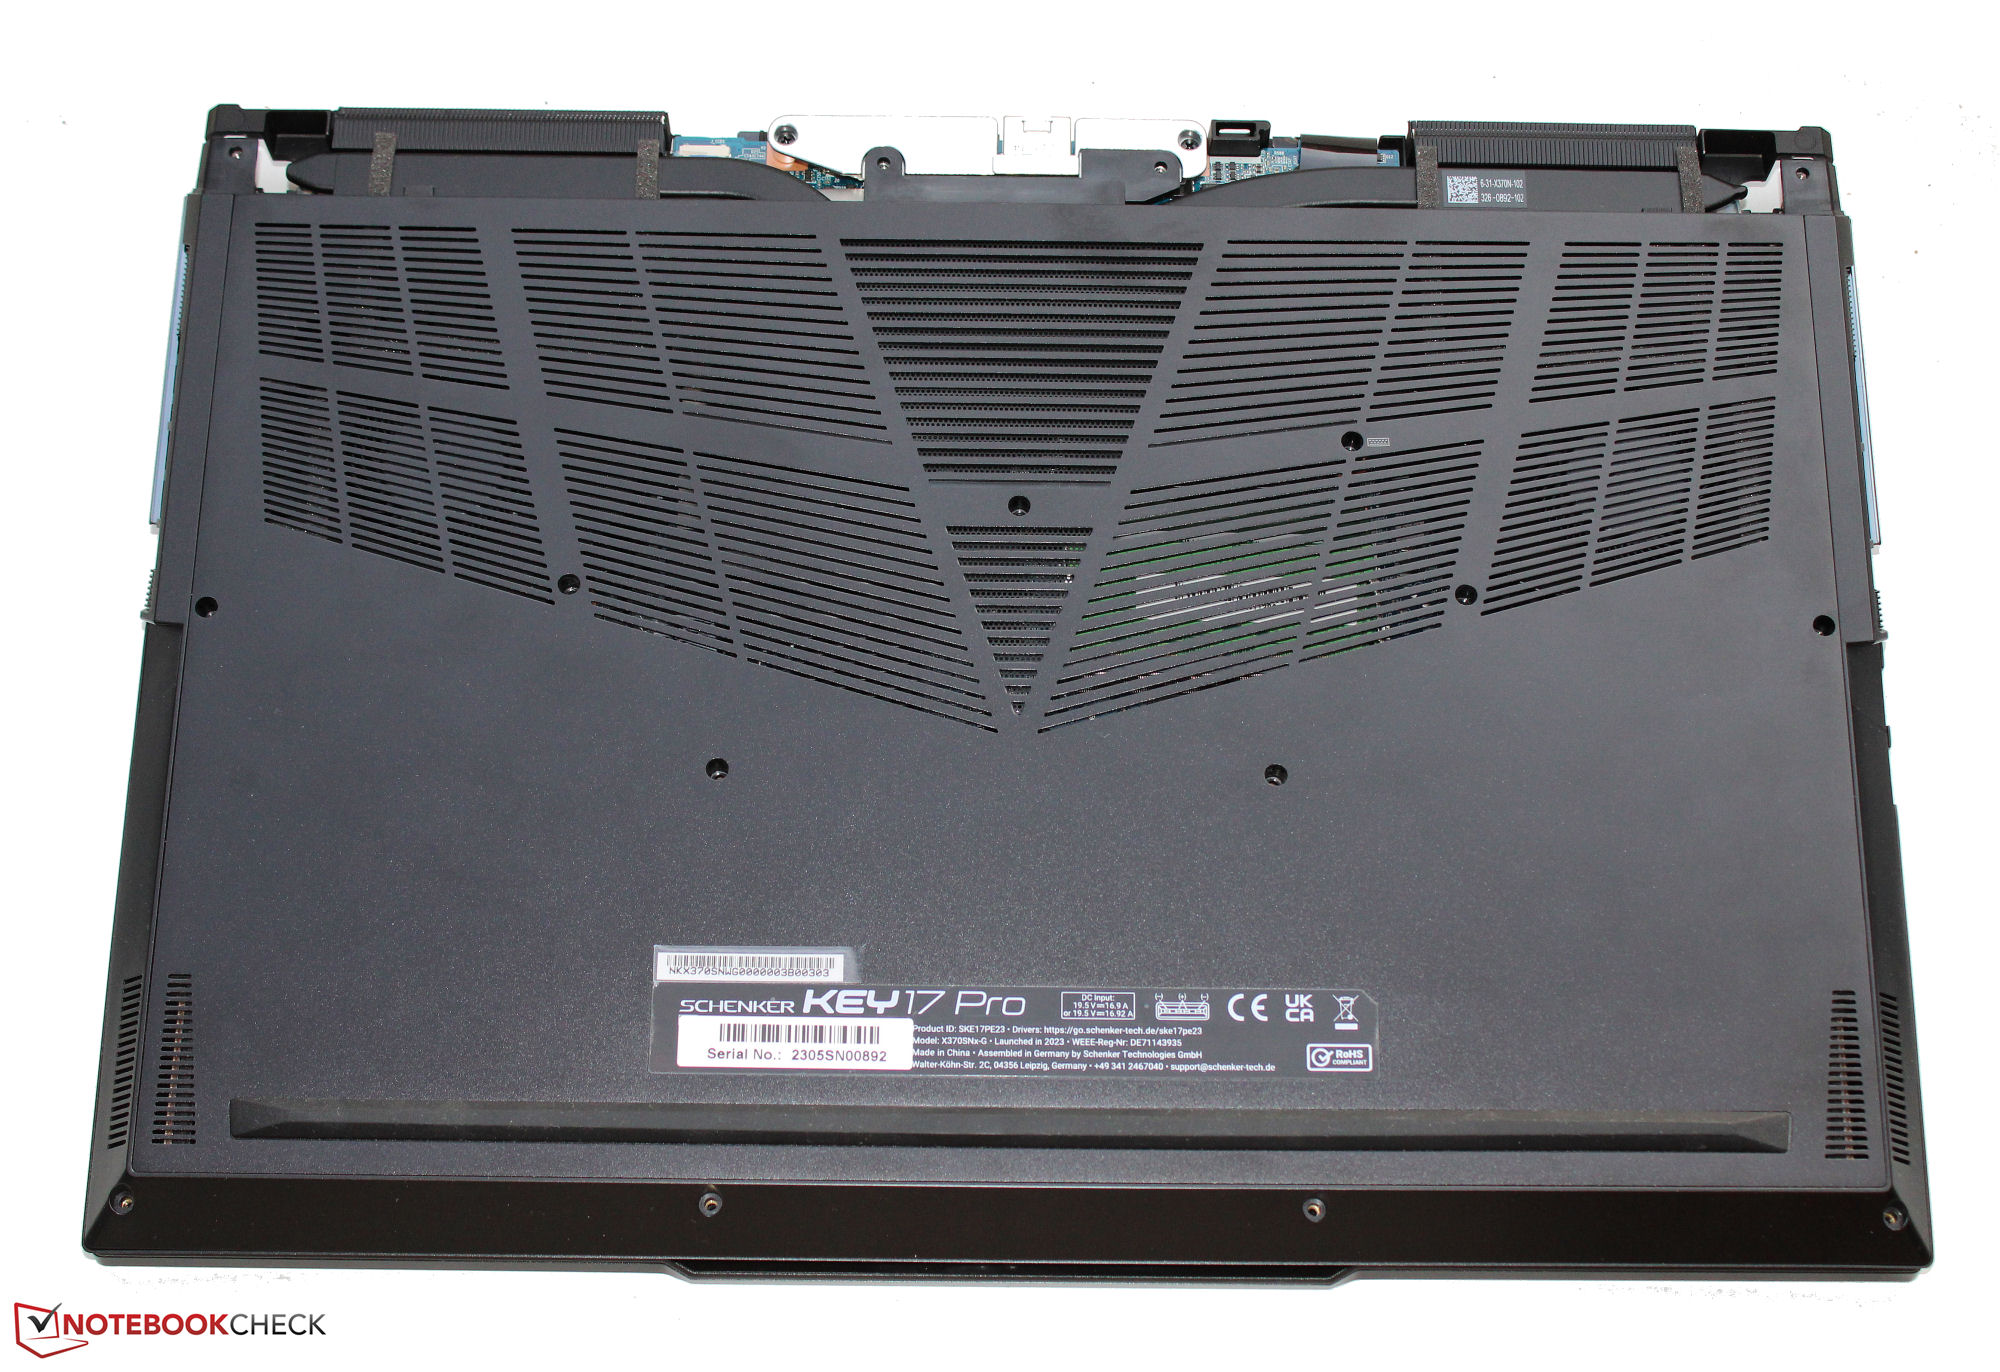
El Schenker Key 17 Pro puede alojar hasta tres SSD M.2-2280 (2x PCIe 4.0, 1x PCIe 5.0). La unidad PCIe 4.0 Samsung preinstalada ofrece almacenamiento de sobra (2 TB) y ofrece unas tasas de transferencia fantásticas. No notamos caídas de rendimiento causadas por la ralentización térmica.

* ... más pequeño es mejor
Sustained load Read: DiskSpd Read Loop, Queue Depth 8
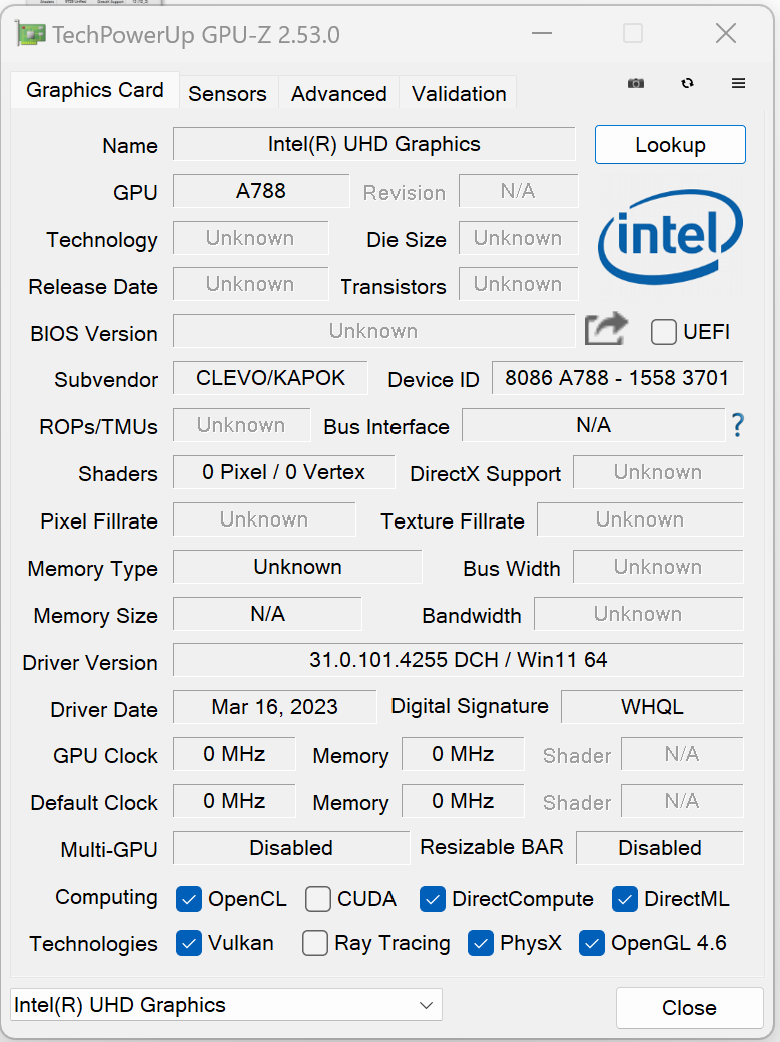
Tarjeta gráfica
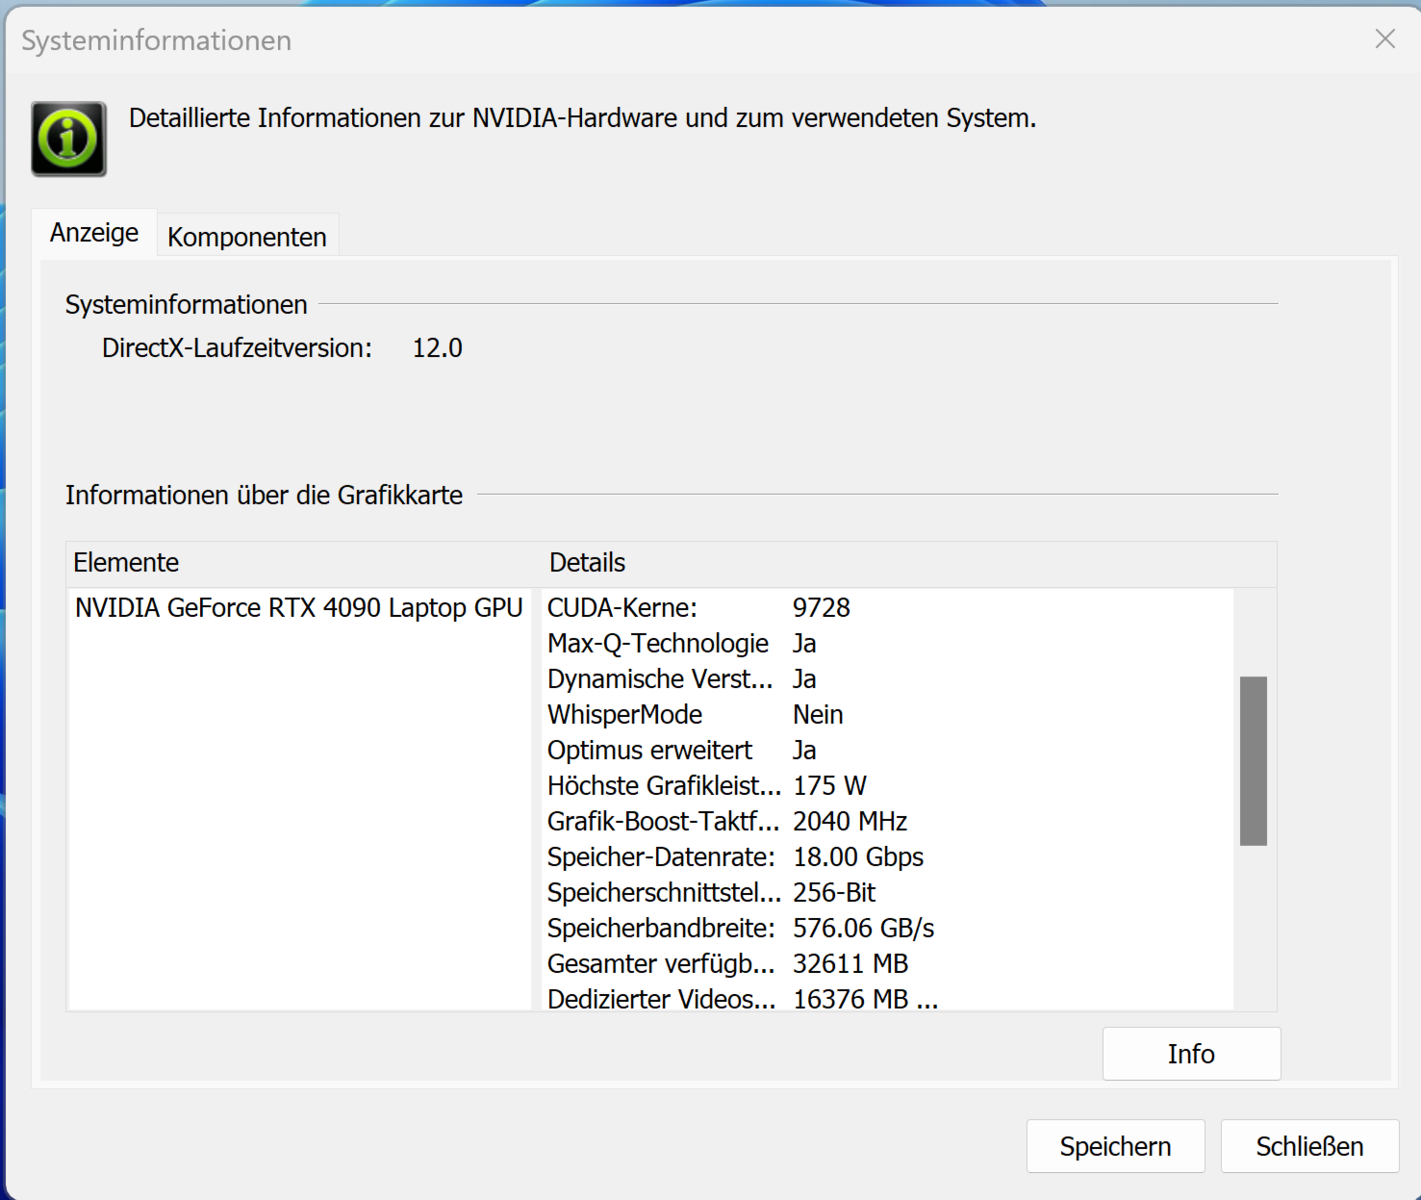
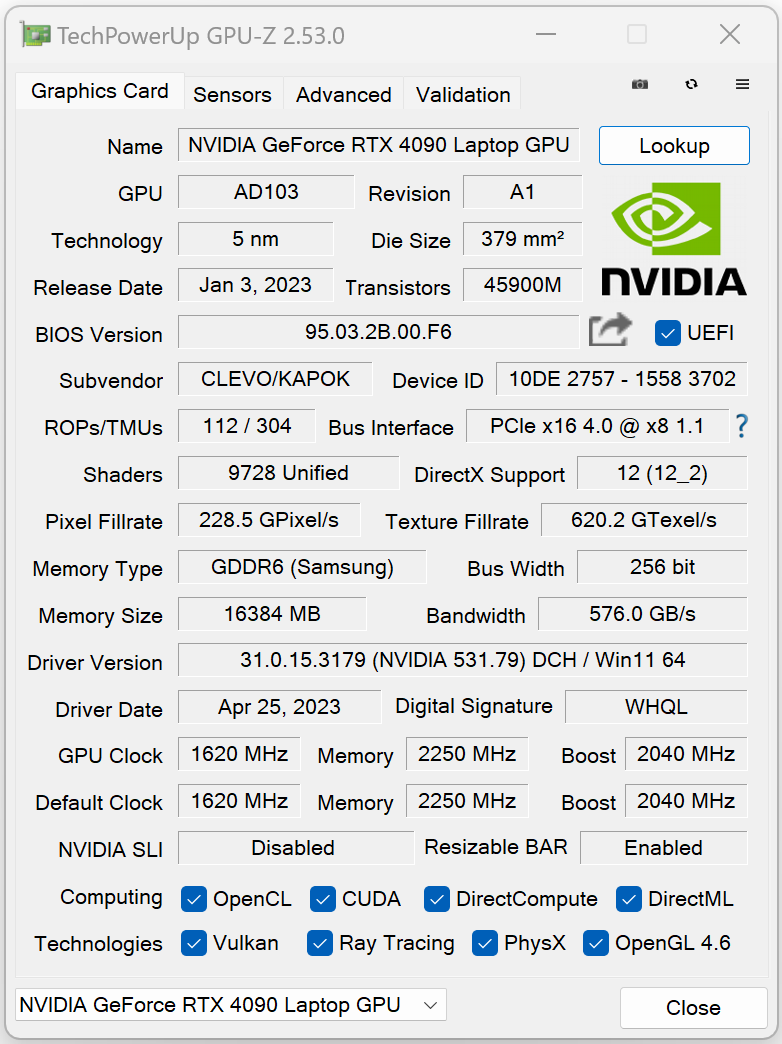
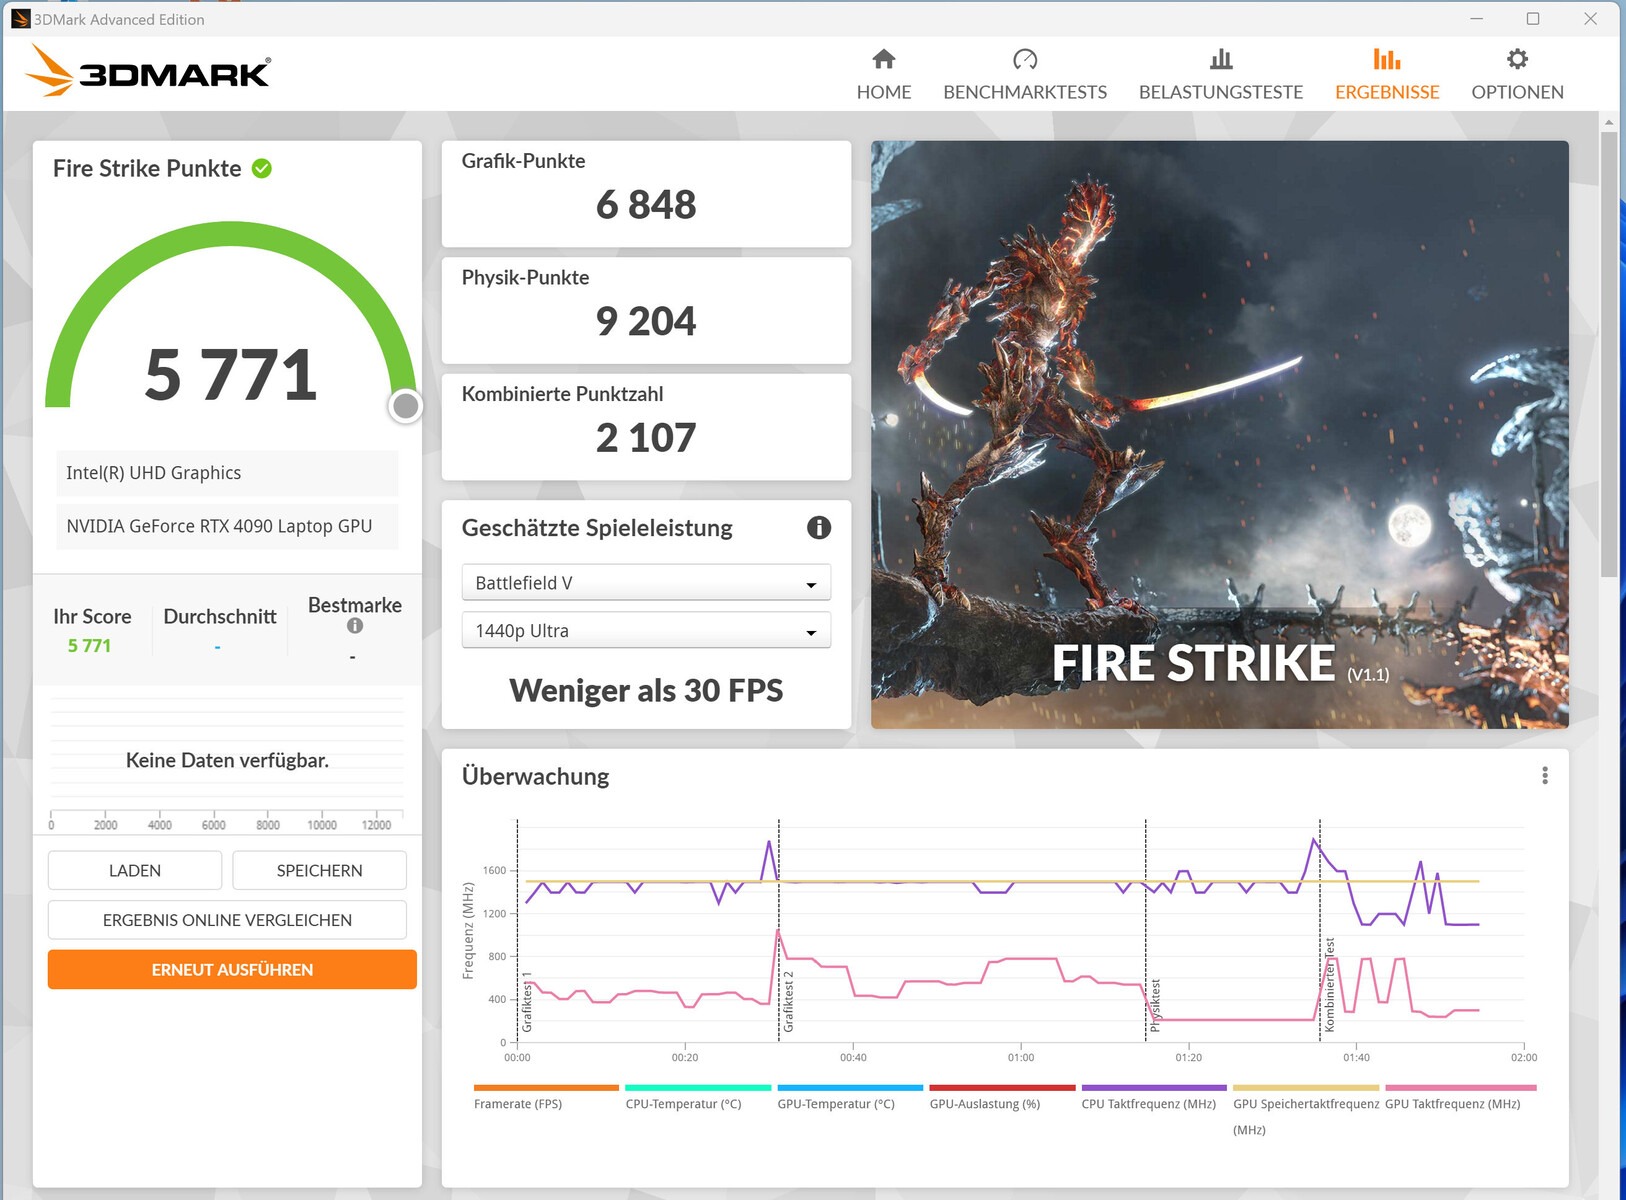
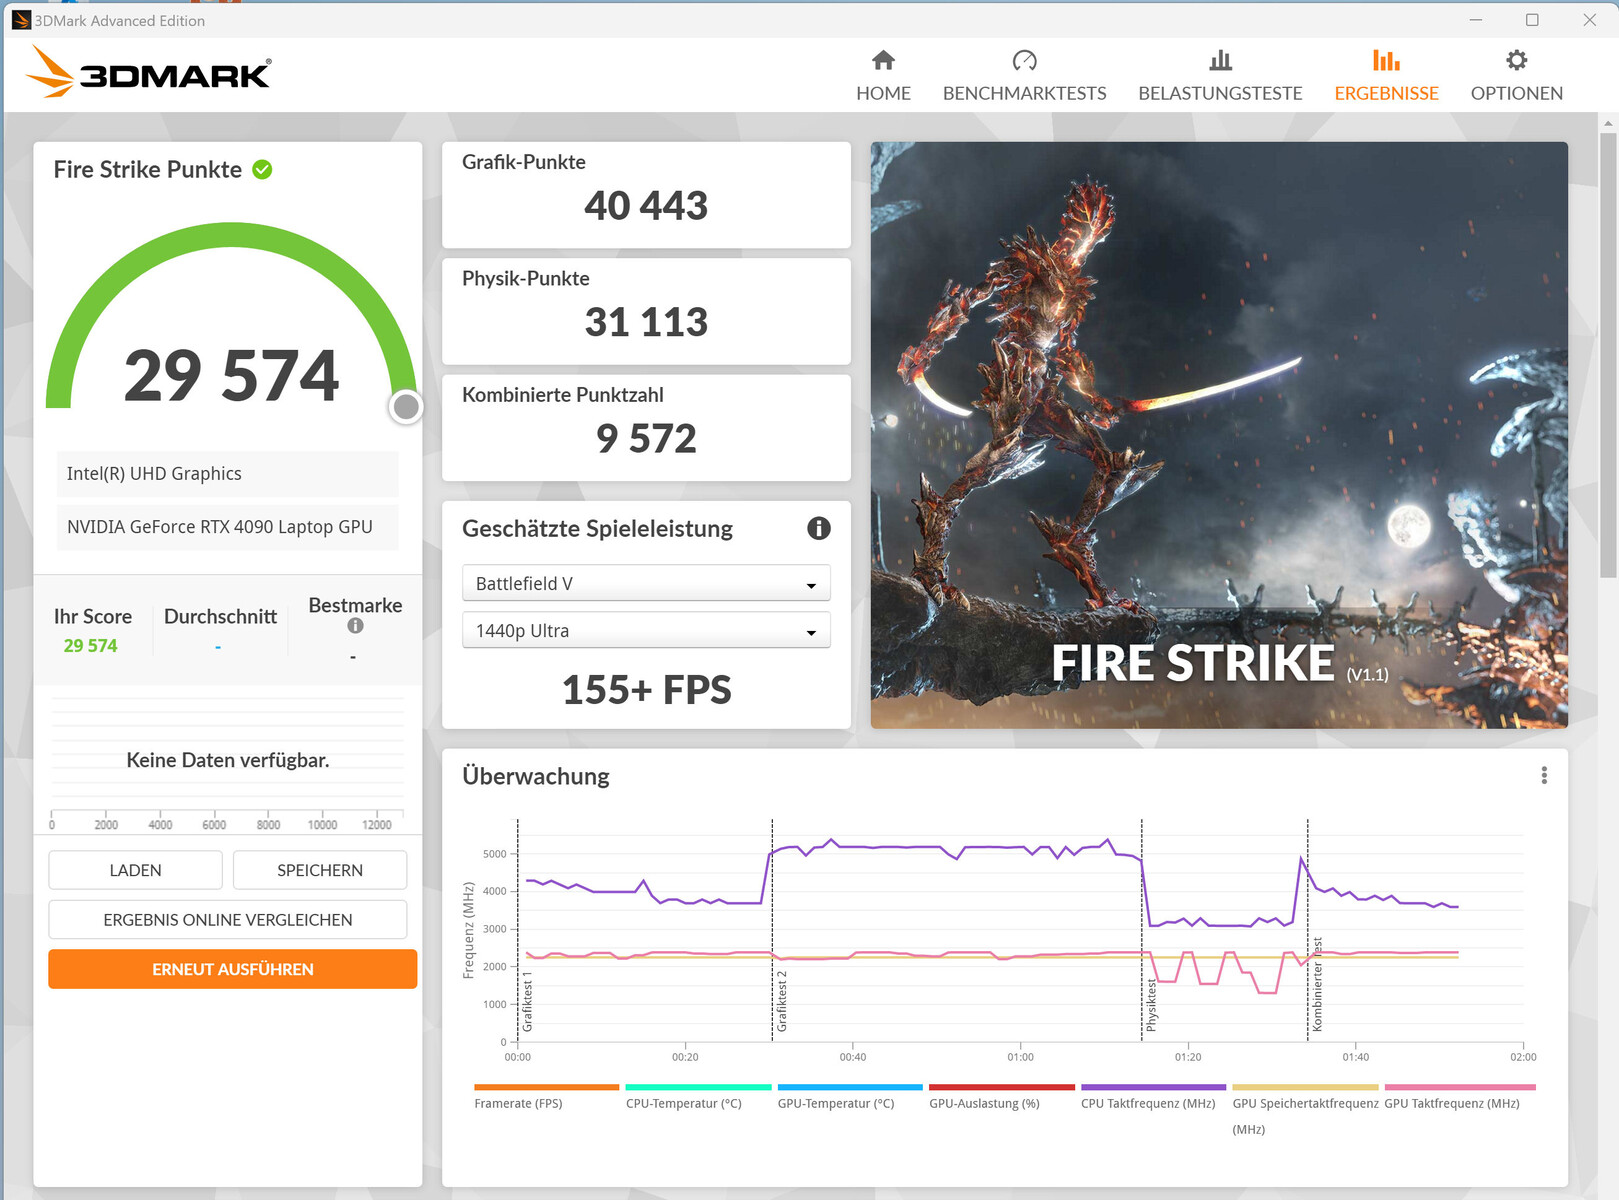
La GeForce RTX 4090 Laptop es la actual GPU móvil de gama alta de Nvidia. Está equipada con 9.728 unidades de sombreado, un bus de memoria de 256 bits y 16 GB de veloz memoria RAM GDDR6. La tarjeta gráfica tiene un TGP máximo de 175 vatios (150 vatios + 25 vatios de Dynamic Boost). El TGP no se utilizó al máximo durante nuestra prueba en Witcher 3.
Aunque la GPU ofreció resultados por debajo de la media en las pruebas sintéticas, su rendimiento en juegos reales fue superior a la media. El cambio al modo dGPU (a través del Centro de Control) también aumentó el rendimiento. Con un hardware tan potente, el portátil es capaz de jugar a 4K con ajustes altos o máximos.


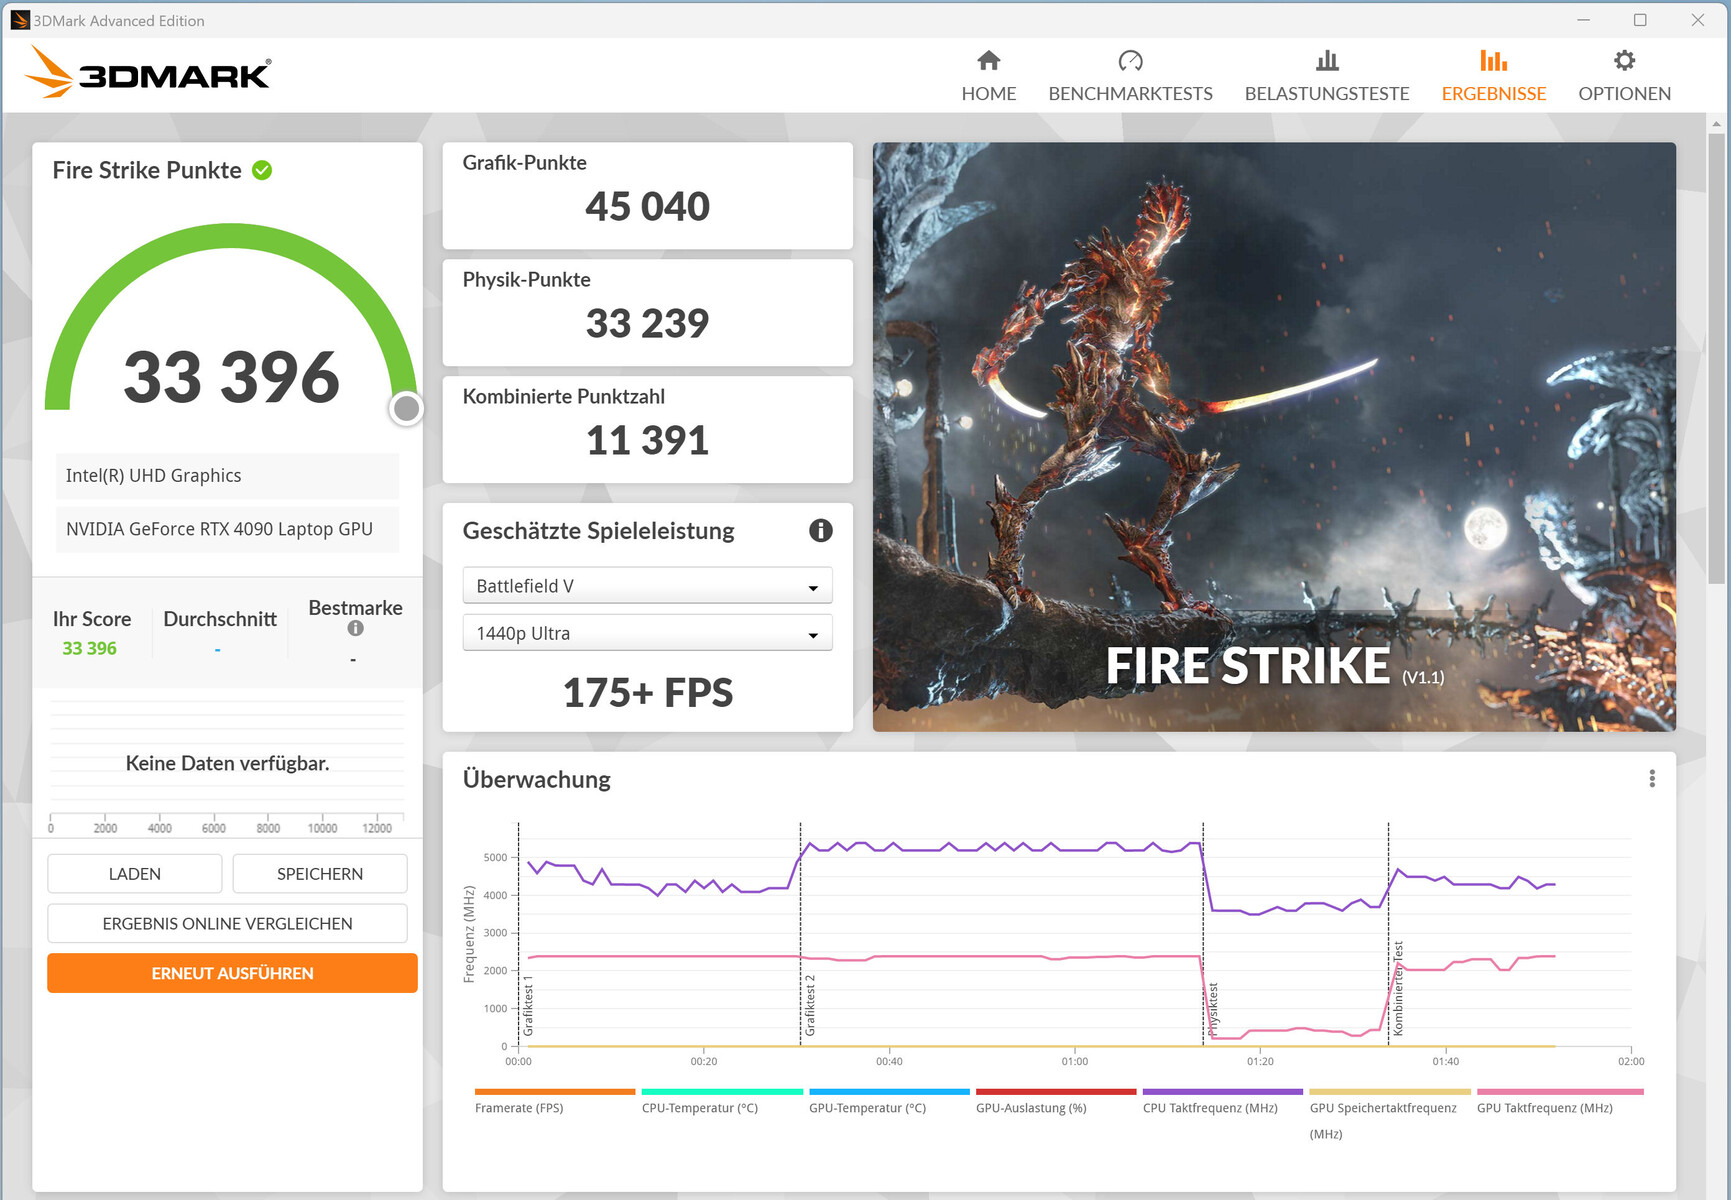
| 3DMark 11 Performance | 44742 puntos | |
| 3DMark Cloud Gate Standard Score | 54257 puntos | |
| 3DMark Fire Strike Score | 31208 puntos | |
| 3DMark Time Spy Score | 19893 puntos | |
ayuda | ||
* ... más pequeño es mejor
| The Witcher 3 - 1920x1080 Ultra Graphics & Postprocessing (HBAO+) | |
| Schenker Key 17 Pro (Early 23) | |
| Asus ROG Strix Scar 17 G733PY-XS96 | |
| Aorus 17X AZF | |
| Medio NVIDIA GeForce RTX 4090 Laptop GPU (139.2 - 216, n=35) | |
| Media de la clase Gaming (104.7 - 240, n=7, últimos 2 años) | |
| Medion Erazer Beast X40 | |
| MSI Stealth 17 Studio A13VH-014 | |
| Strange Brigade - 1920x1080 ultra AA:ultra AF:16 | |
| Aorus 17X AZF | |
| Schenker Key 17 Pro (Early 23) | |
| Medion Erazer Beast X40 | |
| Medio NVIDIA GeForce RTX 4090 Laptop GPU (233 - 421, n=39) | |
| Media de la clase Gaming (76.3 - 458, n=87, últimos 2 años) | |
| MSI Stealth 17 Studio A13VH-014 | |
| Sons of the Forest | |
| 1920x1080 Ultra Preset AA:T | |
| Schenker Key 17 Pro (Early 23) | |
| Medio NVIDIA GeForce RTX 4090 Laptop GPU (85.7 - 93.9, n=2) | |
| Medion Erazer Beast X40 | |
| 3840x2160 Ultra Preset AA:T | |
| Schenker Key 17 Pro (Early 23) | |
| Medio NVIDIA GeForce RTX 4090 Laptop GPU (n=1) | |
| Star Wars Jedi Survivor | |
| 1920x1080 Epic Preset | |
| Schenker Key 17 Pro (Early 23) | |
| Medio NVIDIA GeForce RTX 4090 Laptop GPU (103 - 148, n=6) | |
| Asus ROG Strix Scar 17 G733PY-XS96 | |
| 3840x2160 Epic Preset | |
| Medio NVIDIA GeForce RTX 4090 Laptop GPU (39 - 59, n=6) | |
| Asus ROG Strix Scar 17 G733PY-XS96 | |
| Schenker Key 17 Pro (Early 23) | |
| Resident Evil 4 Remake | |
| 1920x1080 Max Preset | |
| Schenker Key 17 Pro (Early 23) | |
| Medio NVIDIA GeForce RTX 4090 Laptop GPU (136.3 - 143.2, n=2) | |
| Aorus 17X AZF | |
| 3840x2160 Max Preset | |
| Schenker Key 17 Pro (Early 23) | |
| Medio NVIDIA GeForce RTX 4090 Laptop GPU (63.4 - 64.9, n=2) | |
| Aorus 17X AZF | |
| Dead Island 2 | |
| 1920x1080 Ultra Preset AA:High T | |
| Medio NVIDIA GeForce RTX 4090 Laptop GPU (181.7 - 206, n=2) | |
| Schenker Key 17 Pro (Early 23) | |
| 3840x2160 Ultra Preset AA:High T | |
| Medio NVIDIA GeForce RTX 4090 Laptop GPU (94.8 - 101.2, n=2) | |
| Schenker Key 17 Pro (Early 23) | |
| The Callisto Protocol | |
| 1920x1080 Ultra Preset (without FSR Upscaling) | |
| Schenker Key 17 Pro (Early 23) | |
| Aorus 17X AZF | |
| Medio NVIDIA GeForce RTX 4090 Laptop GPU (102.6 - 150.7, n=6) | |
| 3840x2160 Ultra Preset (without FSR Upscaling) | |
| Schenker Key 17 Pro (Early 23) | |
| Medio NVIDIA GeForce RTX 4090 Laptop GPU (48.1 - 81.4, n=6) | |
| Aorus 17X AZF | |
Witcher 3 FPS chart
| bajo | medio | alto | ultra | QHD | 4K | |
|---|---|---|---|---|---|---|
| GTA V (2015) | 187.7 | 186.4 | 184.8 | 142.3 | 141.5 | 167.9 |
| The Witcher 3 (2015) | 474.4 | 382.6 | 299.2 | 206 | 96.3 | |
| Dota 2 Reborn (2015) | 231 | 207 | 195.3 | 182.5 | 141.9 | |
| Final Fantasy XV Benchmark (2018) | 230 | 217 | 183.1 | 156.4 | 91.9 | |
| X-Plane 11.11 (2018) | 180.8 | 171.7 | 136.6 | 109.7 | ||
| Strange Brigade (2018) | 558 | 437 | 410 | 378 | 291 | 153.4 |
| The Callisto Protocol (2022) | 194.5 | 182.6 | 175.5 | 150.7 | 126.7 | 81.4 |
| Sons of the Forest (2023) | 103.2 | 97.5 | 93.9 | 93.9 | 89.6 | 72.5 |
| Resident Evil 4 Remake (2023) | 203 | 194.6 | 173.1 | 143.2 | 113.2 | 64.9 |
| Dead Island 2 (2023) | 226 | 212 | 190.3 | 181.7 | 178.5 | 94.8 |
| Star Wars Jedi Survivor (2023) | 131.2 | 127.6 | 122.1 | 117.4 | 84.4 | 41.8 |
Emisiones y gestión de la energía - El portátil Schenker puede llegar a ser bastante ruidoso
Emisiones sonoras
Un portátil potente como el Key 17 Pro puede producir una enorme cantidad de ruido bajo carga: el nivel de ruido alcanzó un máximo de 62 dB(A) cuando el portátil ejecutaba juegos en "modo Rendimiento". Incluso en "Modo Entretenimiento", el dispositivo alcanzó unos extremadamente altos 54 dB(A). Los otros dos modos de energía ayudan al Key 17 Pro a funcionar silenciosamente en su mayor parte con un rendimiento significativamente reducido.
El portátil es generalmente silencioso, a veces incluso silencioso, en inactivo o en el uso diario (p.ej. software ofimático, navegación por internet). Sin embargo, los ventiladores giran ocasionalmente sin motivo (un fenómeno que suele ocurrir con los barebones Clevo).
Ruido
| Ocioso |
| 26 / 33 / 46 dB(A) |
| Carga |
| 56 / 64 dB(A) |
 | ||
30 dB silencioso 40 dB(A) audible 50 dB(A) ruidosamente alto |
||
min: | ||
| Schenker Key 17 Pro (Early 23) i9-13900HX, GeForce RTX 4090 Laptop GPU | MSI Stealth 17 Studio A13VH-014 i9-13900H, GeForce RTX 4080 Laptop GPU | Asus ROG Strix Scar 17 G733PY-XS96 R9 7945HX, GeForce RTX 4090 Laptop GPU | Aorus 17X AZF i9-13900HX, GeForce RTX 4090 Laptop GPU | Medion Erazer Beast X40 i9-13900HX, GeForce RTX 4090 Laptop GPU | |
|---|---|---|---|---|---|
| Noise | 25% | 22% | 10% | 13% | |
| apagado / medio ambiente * (dB) | 26 | 24 8% | 22.7 13% | 25 4% | 24 8% |
| Idle Minimum * (dB) | 26 | 24 8% | 23.5 10% | 28 -8% | 25 4% |
| Idle Average * (dB) | 33 | 24 27% | 27.7 16% | 29 12% | 29 12% |
| Idle Maximum * (dB) | 46 | 24 48% | 27.7 40% | 34 26% | 35 24% |
| Load Average * (dB) | 56 | 34.49 38% | 30.5 46% | 51 9% | 51 9% |
| Witcher 3 ultra * (dB) | 62 | 48.29 22% | 51.4 17% | 57 8% | 51 18% |
| Load Maximum * (dB) | 64 | 49.66 22% | 54.1 15% | 54 16% | 53 17% |
* ... más pequeño es mejor
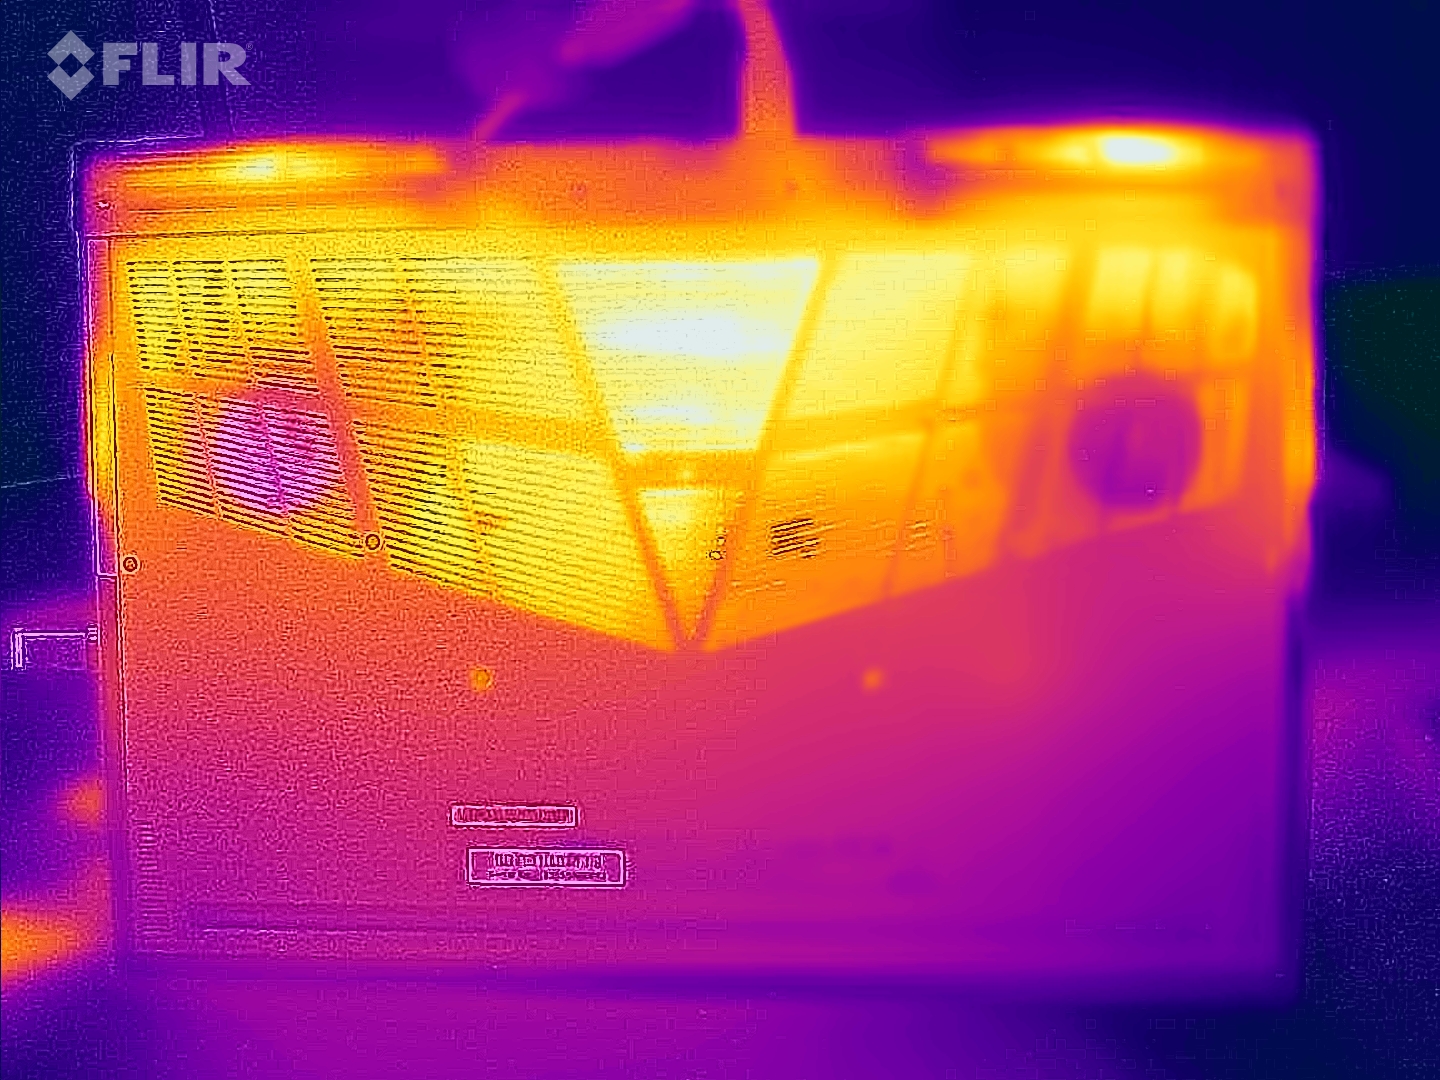
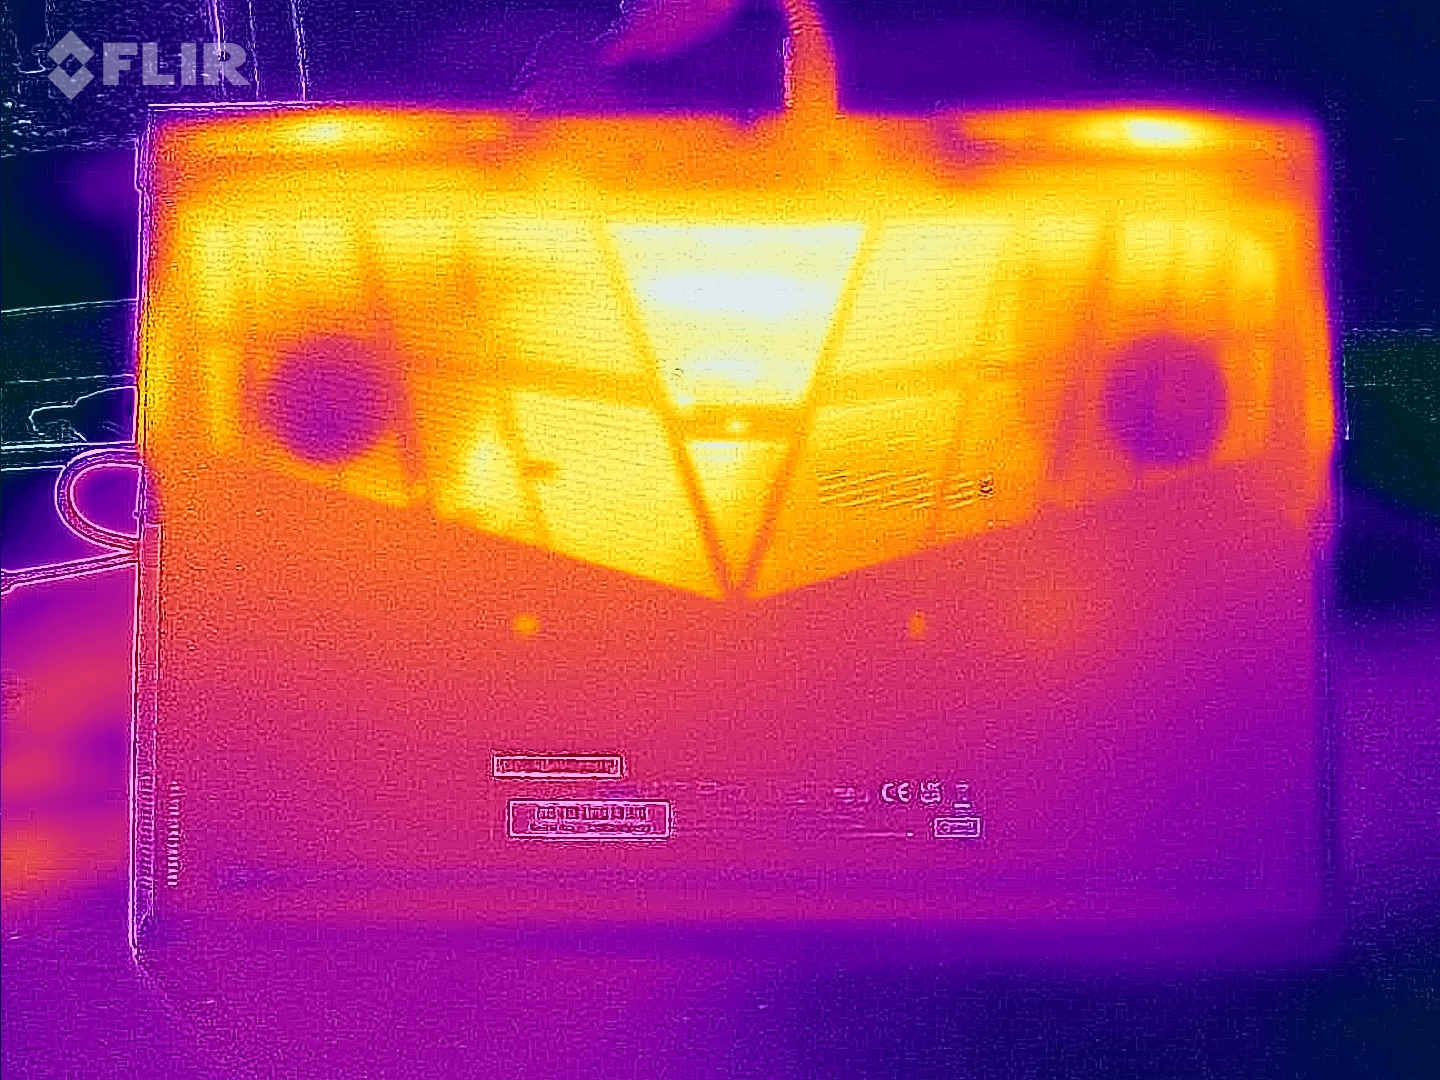
Temperatura
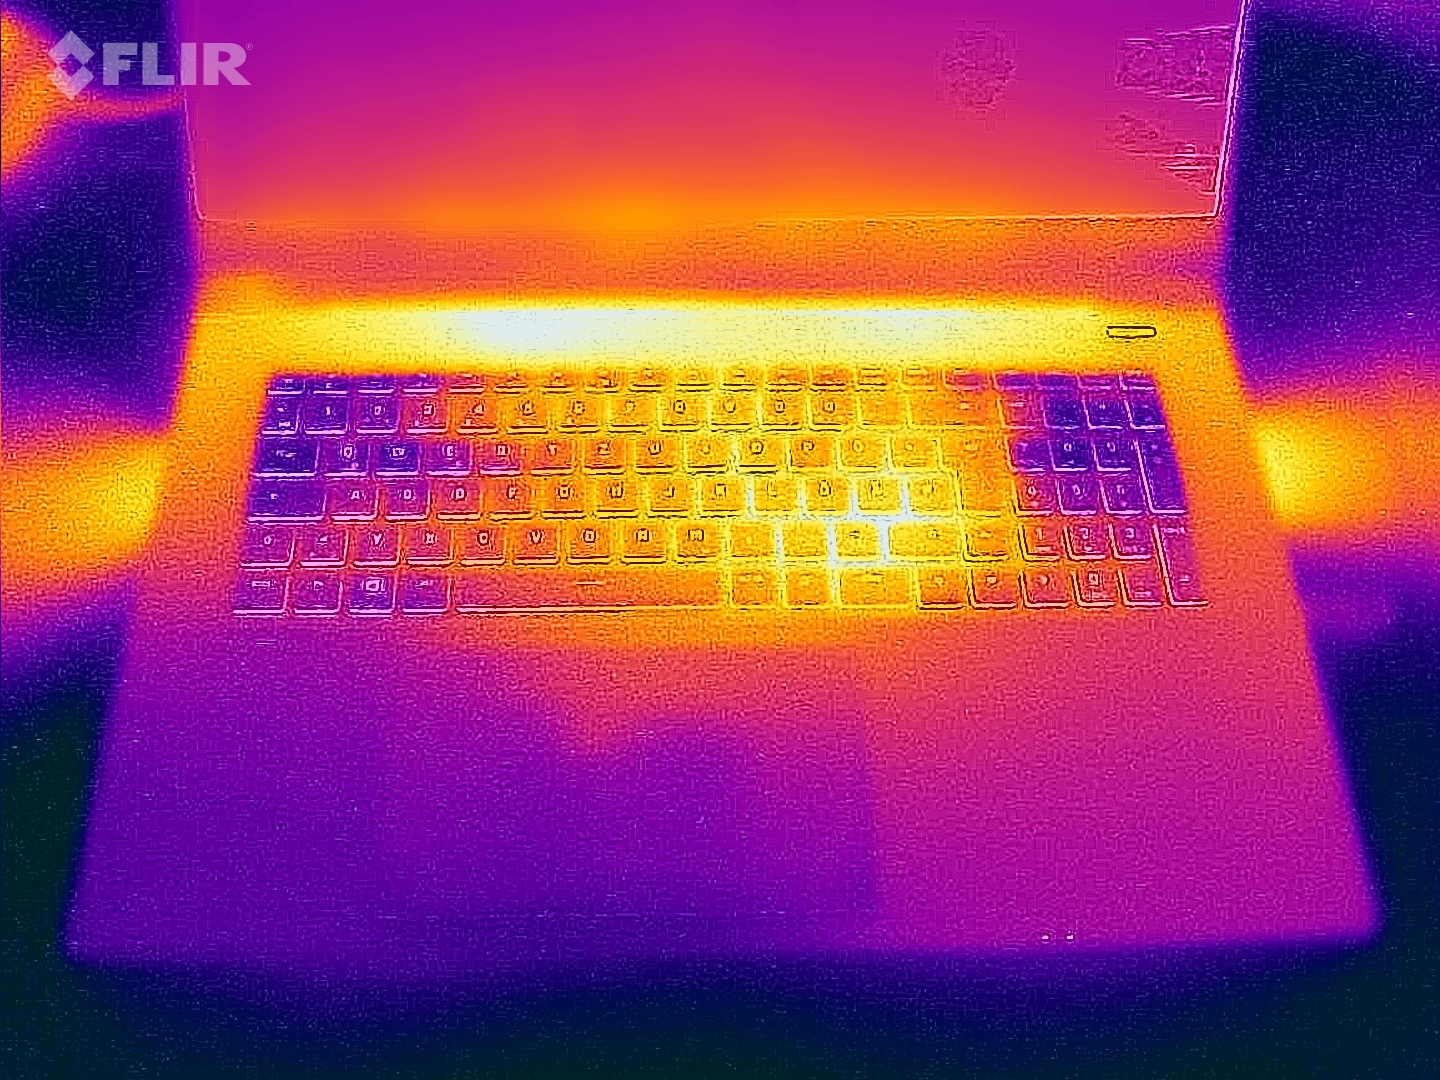
El portátil se calienta notablemente bajo carga: medimos temperaturas de entre 55 y 60°C en ciertos puntos del chasis. En uso normal, sin embargo, las temperaturas del chasis se mantuvieron dentro de un rango confortable
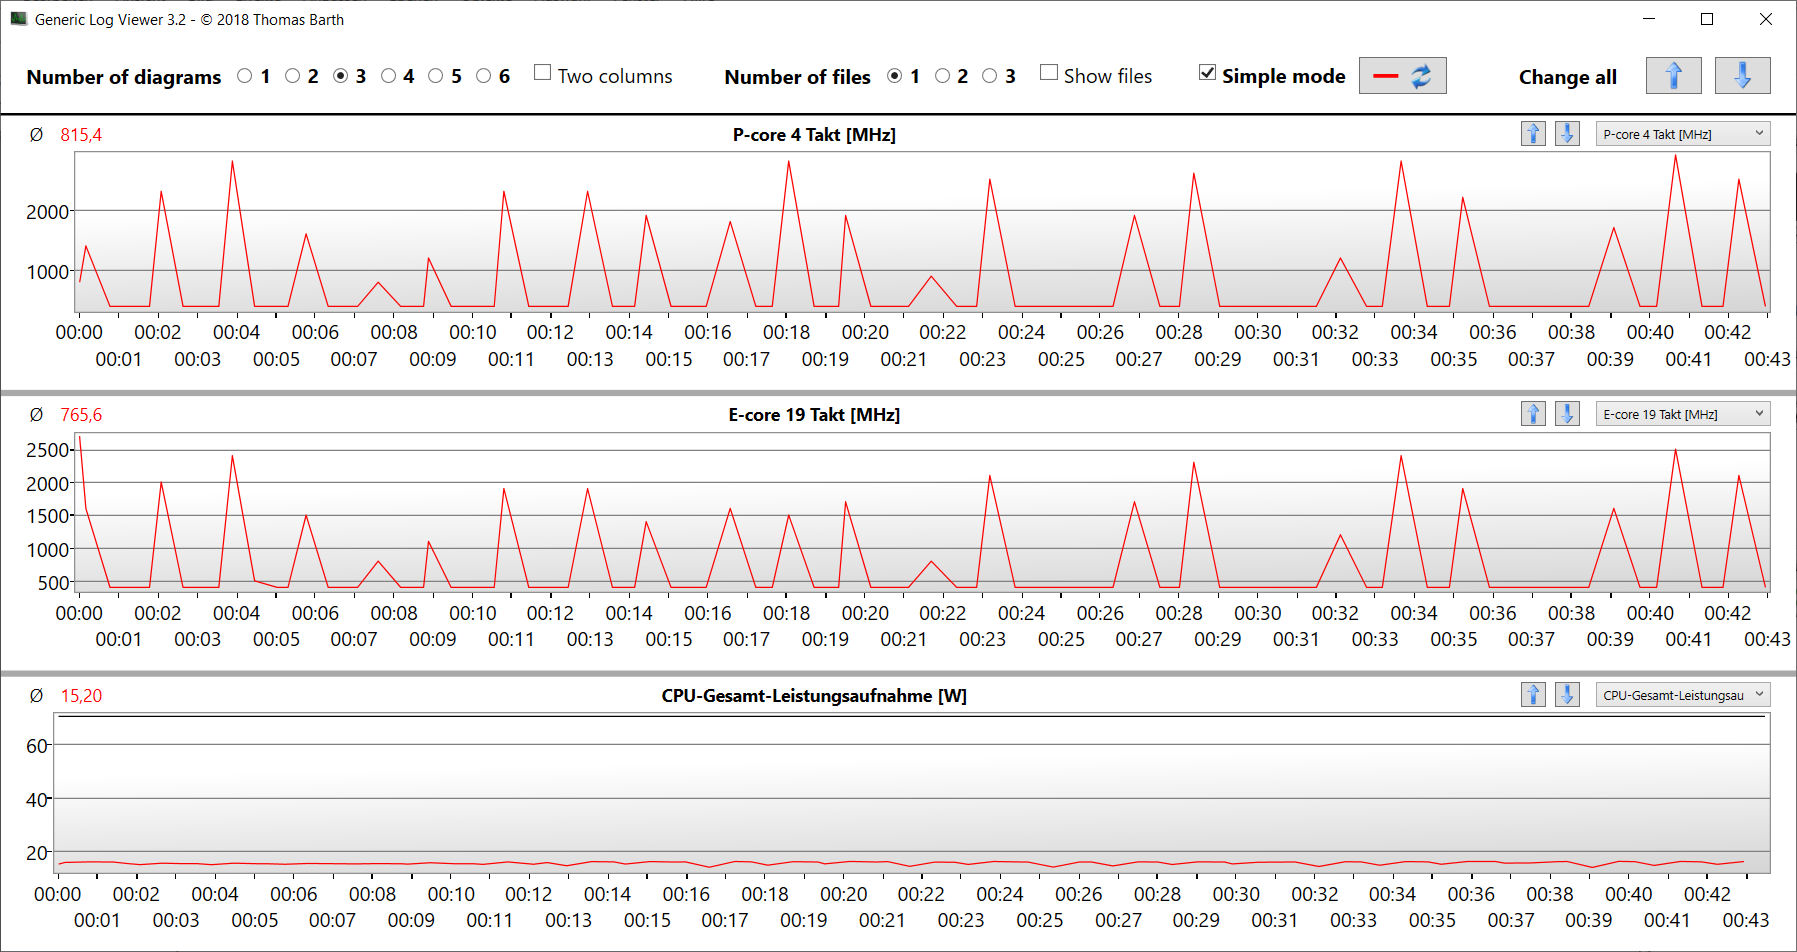
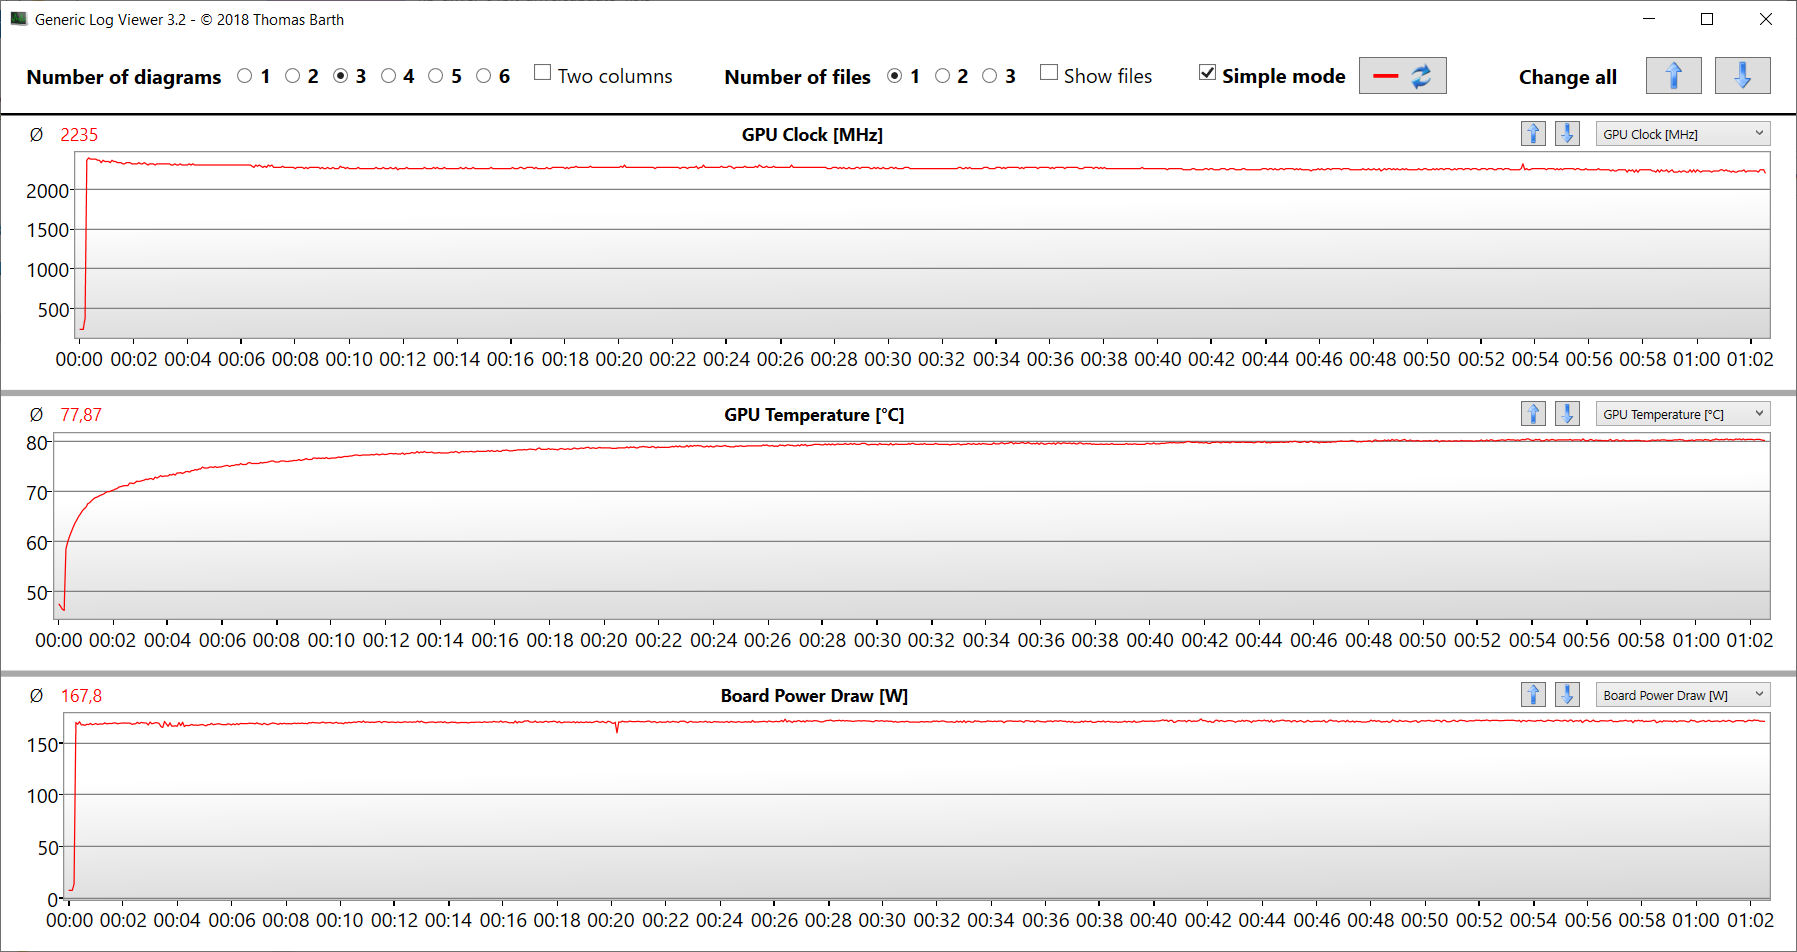
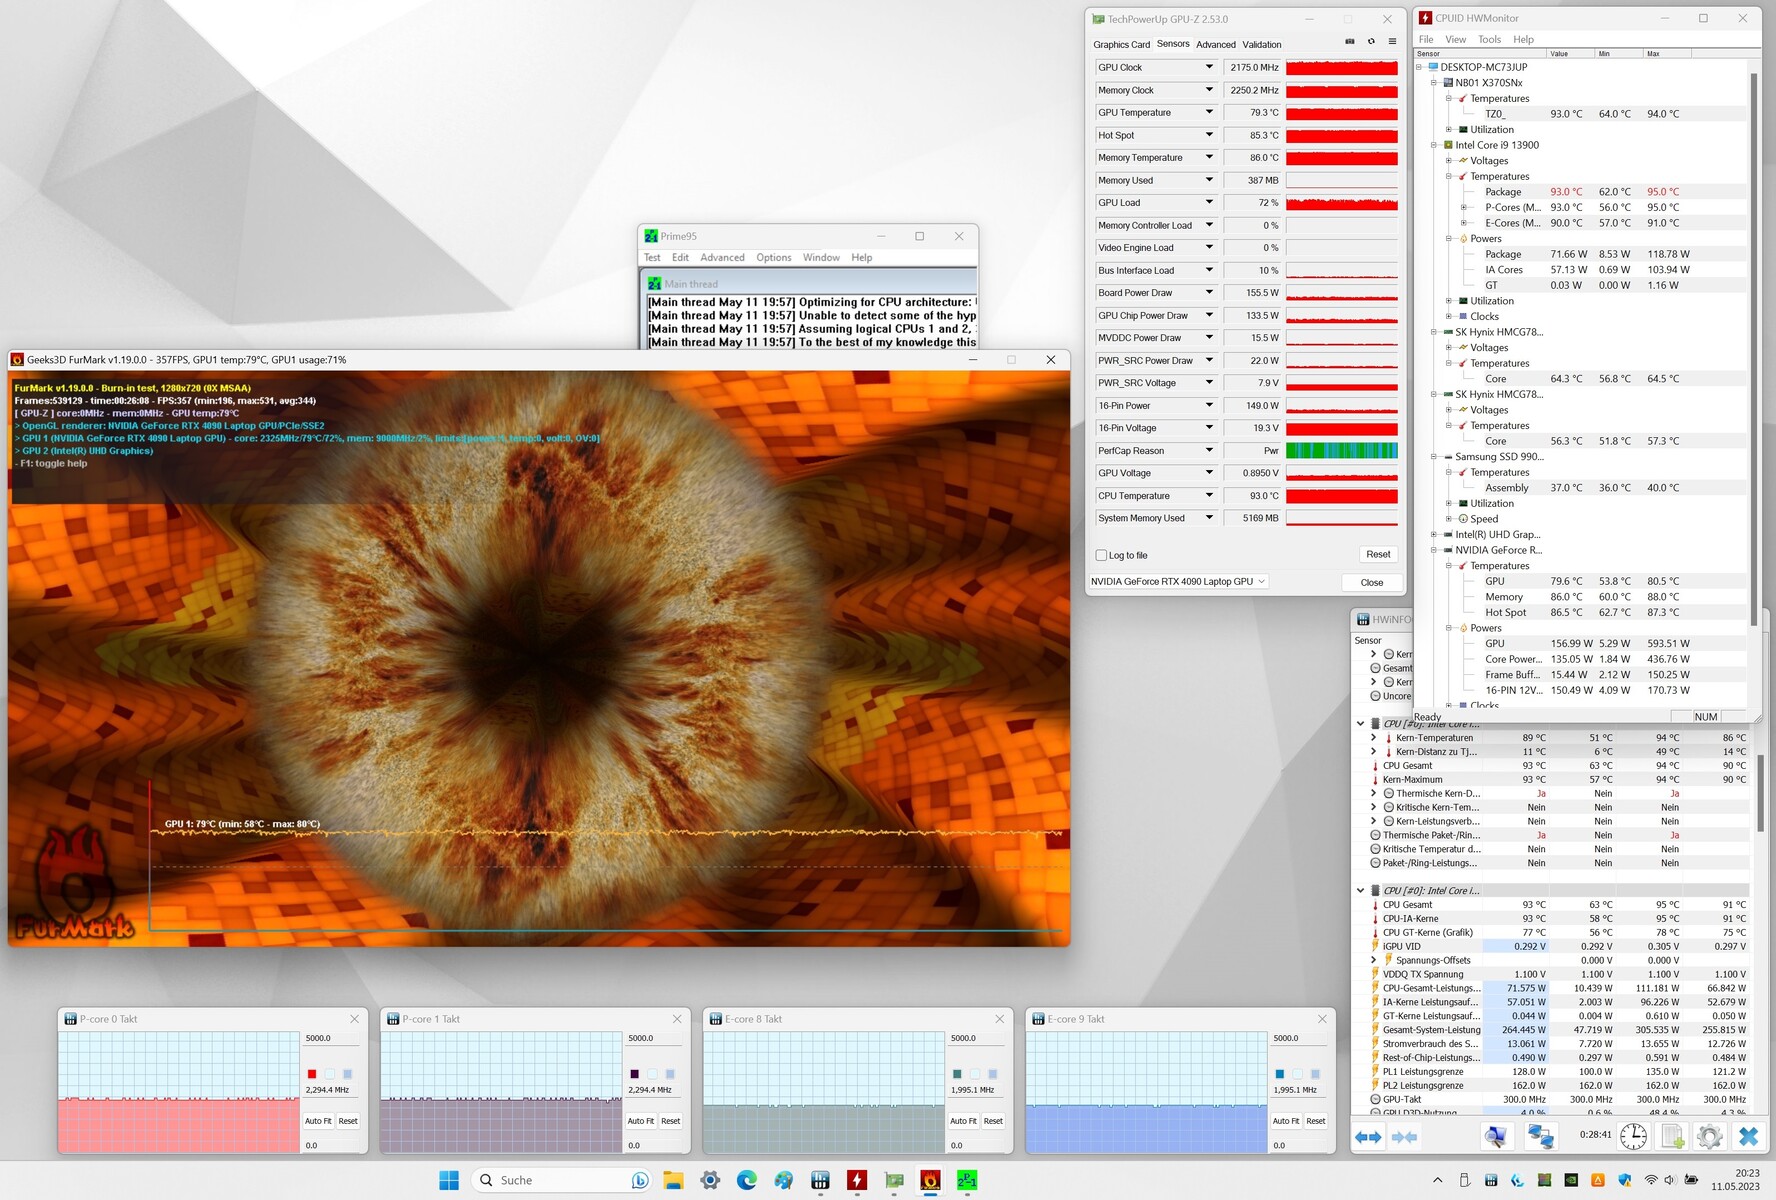
Nuestro test de estrés (ejecutando Prime95 y FurMark durante un periodo prolongado) representa un escenario extremo diseñado para comprobar la estabilidad de un sistema a plena carga. La CPU funcionó a altas velocidades de reloj (núcleos P: 3,4 a 3,5 GHz, núcleos E: 3,1 a 3,2 GHz) desde el principio, y la GPU funcionó a entre 1,0 y 1,6 GHz. Posteriormente, el reloj de la CPU descendió con relativa rapidez, mientras que el de la GPU superaba los 2 GHz.
(-) La temperatura máxima en la parte superior es de 57 °C / 135 F, frente a la media de 40.4 °C / 105 F, que oscila entre 21.2 y 68.8 °C para la clase Gaming.
(-) El fondo se calienta hasta un máximo de 60 °C / 140 F, frente a la media de 43.2 °C / 110 F
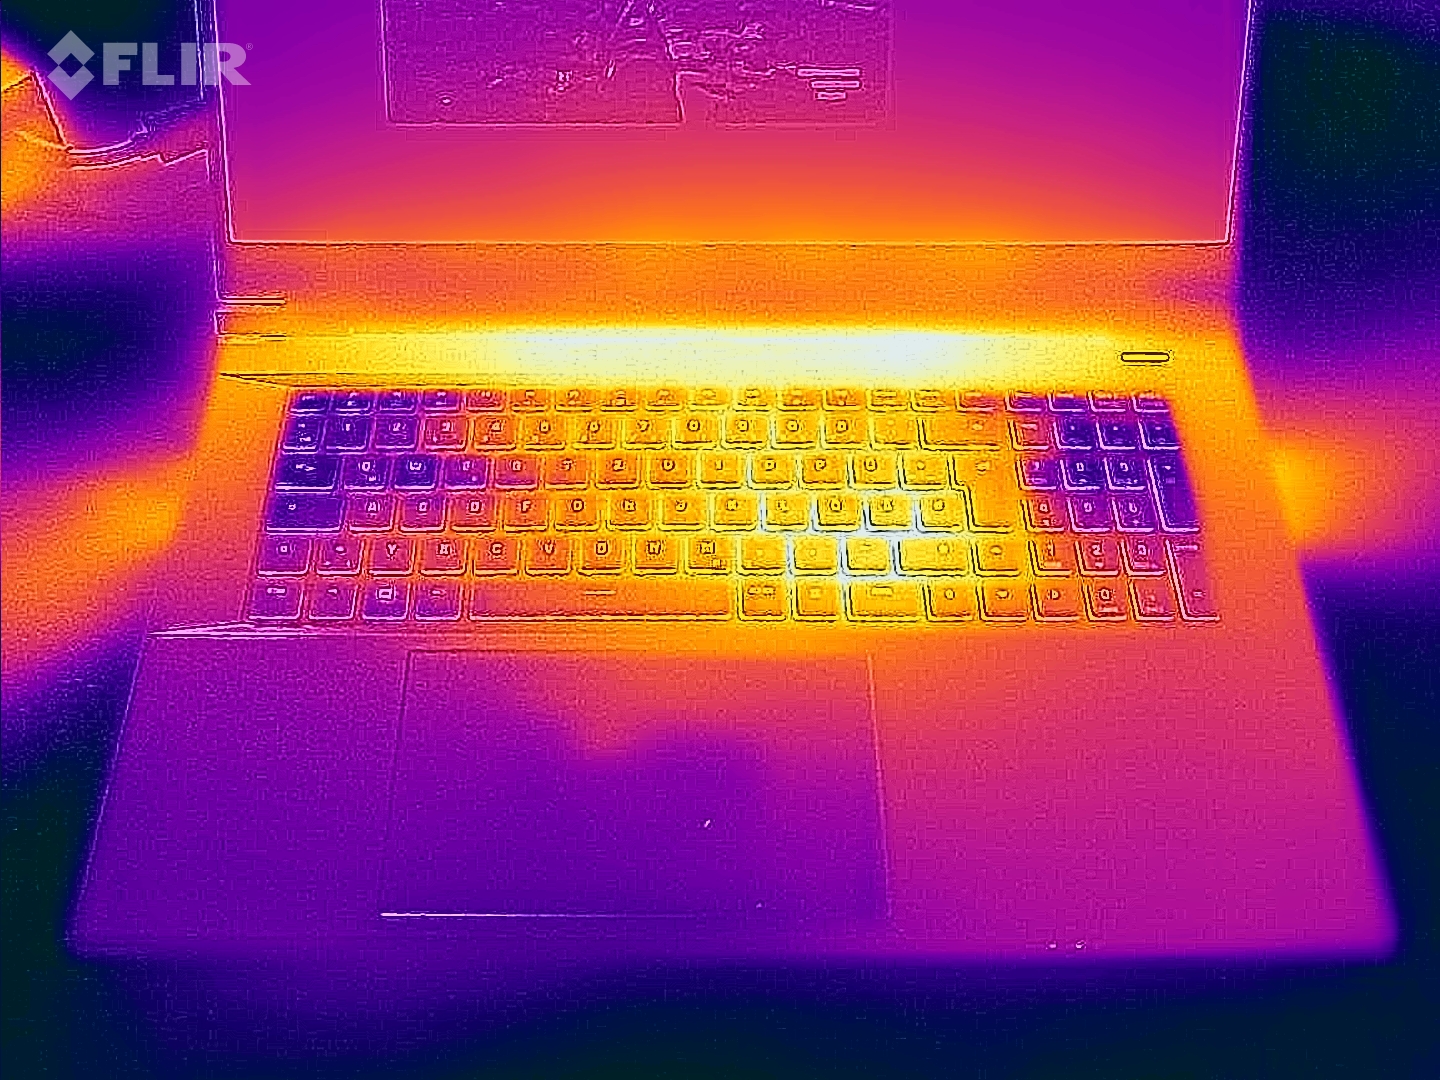
(+) En reposo, la temperatura media de la parte superior es de 28.7 °C / 84# F, frente a la media del dispositivo de 33.9 °C / 93 F.
(-) Jugando a The Witcher 3, la temperatura media de la parte superior es de 47.3 °C / 117 F, frente a la media del dispositivo de 33.9 °C / 93 F.
(±) El reposamanos y el touchpad pueden calentarse mucho al tacto con un máximo de 38 °C / 100.4 F.
(-) La temperatura media de la zona del reposamanos de dispositivos similares fue de 28.8 °C / 83.8 F (-9.2 °C / -16.6 F).
| Schenker Key 17 Pro (Early 23) Intel Core i9-13900HX, NVIDIA GeForce RTX 4090 Laptop GPU | MSI Stealth 17 Studio A13VH-014 Intel Core i9-13900H, NVIDIA GeForce RTX 4080 Laptop GPU | Asus ROG Strix Scar 17 G733PY-XS96 AMD Ryzen 9 7945HX, NVIDIA GeForce RTX 4090 Laptop GPU | Aorus 17X AZF Intel Core i9-13900HX, NVIDIA GeForce RTX 4090 Laptop GPU | Medion Erazer Beast X40 Intel Core i9-13900HX, NVIDIA GeForce RTX 4090 Laptop GPU | |
|---|---|---|---|---|---|
| Heat | 10% | 27% | 12% | 11% | |
| Maximum Upper Side * (°C) | 57 | 47 18% | 34.6 39% | 47 18% | 48 16% |
| Maximum Bottom * (°C) | 60 | 54 10% | 35.6 41% | 51 15% | 52 13% |
| Idle Upper Side * (°C) | 32 | 30 6% | 27.2 15% | 30 6% | 30 6% |
| Idle Bottom * (°C) | 34 | 32 6% | 30 12% | 31 9% | 31 9% |
* ... más pequeño es mejor
Altavoces
Los altavoces estéreo suenan bastante bien en general.
Schenker Key 17 Pro (Early 23) análisis de audio
(±) | la sonoridad del altavoz es media pero buena (78 dB)
Graves 100 - 315 Hz
(±) | lubina reducida - en promedio 11.7% inferior a la mediana
(±) | la linealidad de los graves es media (7.1% delta a frecuencia anterior)
Medios 400 - 2000 Hz
(+) | medios equilibrados - a sólo 2.1% de la mediana
(+) | los medios son lineales (3.5% delta a la frecuencia anterior)
Altos 2 - 16 kHz
(+) | máximos equilibrados - a sólo 1.8% de la mediana
(+) | los máximos son lineales (6.4% delta a la frecuencia anterior)
Total 100 - 16.000 Hz
(+) | el sonido global es lineal (11.9% de diferencia con la mediana)
En comparación con la misma clase
» 12% de todos los dispositivos probados de esta clase eran mejores, 4% similares, 84% peores
» El mejor tuvo un delta de 6%, la media fue 18%, el peor fue ###max##%
En comparación con todos los dispositivos probados
» 9% de todos los dispositivos probados eran mejores, 2% similares, 89% peores
» El mejor tuvo un delta de 4%, la media fue 23%, el peor fue ###max##%
MSI Stealth 17 Studio A13VH-014 análisis de audio
(+) | los altavoces pueden reproducir a un volumen relativamente alto (#82.44 dB)
Graves 100 - 315 Hz
(±) | lubina reducida - en promedio 8% inferior a la mediana
(±) | la linealidad de los graves es media (8.8% delta a frecuencia anterior)
Medios 400 - 2000 Hz
(±) | medias más altas - de media 8.2% más altas que la mediana
(+) | los medios son lineales (6.8% delta a la frecuencia anterior)
Altos 2 - 16 kHz
(+) | máximos equilibrados - a sólo 1% de la mediana
(+) | los máximos son lineales (4% delta a la frecuencia anterior)
Total 100 - 16.000 Hz
(+) | el sonido global es lineal (11.6% de diferencia con la mediana)
En comparación con la misma clase
» 10% de todos los dispositivos probados de esta clase eran mejores, 3% similares, 87% peores
» El mejor tuvo un delta de 6%, la media fue 18%, el peor fue ###max##%
En comparación con todos los dispositivos probados
» 8% de todos los dispositivos probados eran mejores, 2% similares, 90% peores
» El mejor tuvo un delta de 4%, la media fue 23%, el peor fue ###max##%
Consumo de energía
El Key 17 Pro no mostró ningún problema de consumo de energía. Mantuvo un consumo de energía constante mientras se sometía a la prueba de estrés y al test Witcher 3. El adaptador incluido (330 vatios) es lo bastante potente para el dispositivo.
| Off / Standby | |
| Ocioso | |
| Carga |
|
Clave:
min: | |
Power consumption Witcher 3 / Stresstest
Power consumption with external monitor
Duración de la batería
Nuestro test Wi-Fi está diseñado para simular el uso en la vida real y consiste en acceder a varias webs usando un script. El portátil de 17,3 pulgadas logró aguantar 6h 51m durante la prueba - un resultado muy respetable para un portátil 4K tan potente.
Pro
Contra
Veredicto: potencia personalizable
El Key 17 Pro está hecho para escenarios de uso que requieren mucha potencia de cálculo, como la edición de vídeo, los juegos y el renderizado. El GeForce Portátil RTX 4090 y Core i9-13900HX en su interior ofrecen el músculo necesario para manejar estas tareas - ambos componentes son capaces de funcionar constantemente a altas velocidades. El portátil genera una cantidad normal de calor y ruido para esta clase de dispositivo.
Schenker ha creado un potente portátil de gama alta con el Key 17 Pro (principios del 23).
El Key 17 Pro cuenta con tres ranuras SSD (1x PCIe 5.0, 2x PCIe 4.0; M.2-2280), lo que significa que puedes añadir rápidamente más unidades si alguna vez te quedas corto de almacenamiento. Las dos ranuras PCIe 4.0 admiten RAID 0/1. La instalación de unidades SSD adicionales no es un asunto demasiado complicado. El panel inferior se puede quitar sin necesidad de herramientas después de aflojar todos los tornillos.
Los dos puertos USB-C (Thunderbolt 4) permiten integrar el portátil sin esfuerzo en una configuración de sobremesa existente y abrir opciones de expansión (por ejemplo, GPU externa). Uno de los puertos también soporta Power Delivery. La duración de la batería es muy decente en el dispositivo. La pantalla mate de 17.3 pulgadas (4K, IPS, 144 Hz, G-Sync y DCI-P3) dejó una impresión mayormente positiva durante nuestras pruebas, aunque se beneficiaría de tener mayor contraste.
Una alternativa al Key 17 Pro es el MSI Stealth 17 Studio. Viene con una pantalla mini-LED y produce mucho menos ruido a pleno rendimiento. En el momento de realizar este análisis, el modelo con especificaciones casi idénticas Aorus 17X AZF (aunque con un panel QHD en lugar de 4K) se puede conseguir por bastante menos que el Key y, por tanto, es una opción más asequible para el bolsillo.
Precio y disponibilidad
El Schenker Key 17 Pro (Early 23) con las especificaciones de este análisis cuesta unos 4.479 euros (4.820 dólares). También puedes configurar el dispositivo según tus necesidades en la tienda online de Schenker. Los precios empiezan en 3.199 euros (3.445 dólares).
Schenker Key 17 Pro (Early 23)
- 05/30/2023 v7 (old)
Sascha Mölck
Transparencia
La selección de los dispositivos que se van a reseñar corre a cargo de nuestro equipo editorial. La muestra de prueba fue proporcionada al autor en calidad de préstamo por el fabricante o el minorista a los efectos de esta reseña. El prestamista no tuvo ninguna influencia en esta reseña, ni el fabricante recibió una copia de la misma antes de su publicación. No había ninguna obligación de publicar esta reseña. Como empresa de medios independiente, Notebookcheck no está sujeta a la autoridad de fabricantes, minoristas o editores.
Así es como prueba Notebookcheck
Cada año, Notebookcheck revisa de forma independiente cientos de portátiles y smartphones utilizando procedimientos estandarizados para asegurar que todos los resultados son comparables. Hemos desarrollado continuamente nuestros métodos de prueba durante unos 20 años y hemos establecido los estándares de la industria en el proceso. En nuestros laboratorios de pruebas, técnicos y editores experimentados utilizan equipos de medición de alta calidad. Estas pruebas implican un proceso de validación en varias fases. Nuestro complejo sistema de clasificación se basa en cientos de mediciones y puntos de referencia bien fundamentados, lo que mantiene la objetividad.Price comparison

